Exhibit (c)(3)
Preliminary Draft Subject to Change Discussion Materials Prepared for The Conflicts Committee of the Board of Directors of American Midstream Partners GP, LLC Regarding Project Harpoon December 20, 2018Preliminary Draft Subject to Change These materials have been prepared by Evercore Group L.L.C. (“Evercore”) for the Conflicts Committee of the Board of Directors of American Midstream Partners GP, LLC (the “Conflicts Committee”), the general partner of American Midstream Partners, L.P., to whom such materials are directly addressed and delivered and may not be used or relied upon for any purpose other than as specifically contemplated by a written agreement with Evercore. These materials are based on information provided by or on behalf of the Conflicts Committee, from public sources or otherwise reviewed by Evercore. Evercore assumes no responsibility for independent investigation or verification of such information and has relied on such information being complete and accurate in all material respects. To the extent such information includes estimates and forecasts of future financial performance prepared by or reviewed with the management of the Partnership and/or other potential transaction participants or obtained from public sources, Evercore has assumed that such estimates and forecasts have been reasonably prepared on bases reflecting the best currently available estimates and judgments of such management (or, with respect to estimates and forecasts obtained from public sources, represent reasonable estimates). No representation or warranty, express or implied, is made as to the accuracy or completeness of such information and nothing contained herein is, or shall be relied upon as, a representation, whether as to the past, the present or the future. These materials were designed for use by specific persons familiar with the business and affairs of the Partnership. These materials are not intended to provide the sole basis for evaluating, and should not be considered a recommendation with respect to, any transaction or other matter. These materials have been developed by and are proprietary to Evercore and were prepared for the benefit and internal use of the Conflicts Committee. These materials were compiled on a confidential basis for use by the Conflicts Committee and not with a view to public disclosure or filing thereof under state or federal securities laws, and may not be reproduced, disseminated, quoted or referred to, in whole or in part, without the prior written consent of Evercore. These materials do not constitute an offer or solicitation to sell or purchase any securities and are not a commitment by
Preliminary Draft Subject to Change Table of Contents Section Executive Summary I Situation Analysis II Asset Overview III AMID Financial Projections IV Preliminary Valuation V A. Preliminary Valuation of Natural Gas Gathering & Processing B. Preliminary Valuation of Natural Gas Transportation C. Preliminary Valuation of Offshore Pipelines (Excl. Delta House) D. Preliminary Valuation of Delta House E. Preliminary Valuation of Bakken Crude Oil Gathering F. Preliminary Valuation of Silver Dollar Pipeline G. Preliminary Valuation of Cushing Terminal H. Preliminary Valuation of NGL JV Interests I. Preliminary Valuation of AMID Corporate G&A Expenses Illustrative AMID Unitholder Tax Analysis VI Appendix A. Weighted Average Cost of Capital B. Detailed Segment Financial ProjectionsPreliminary Draft Subject to Change I. Executive Summary
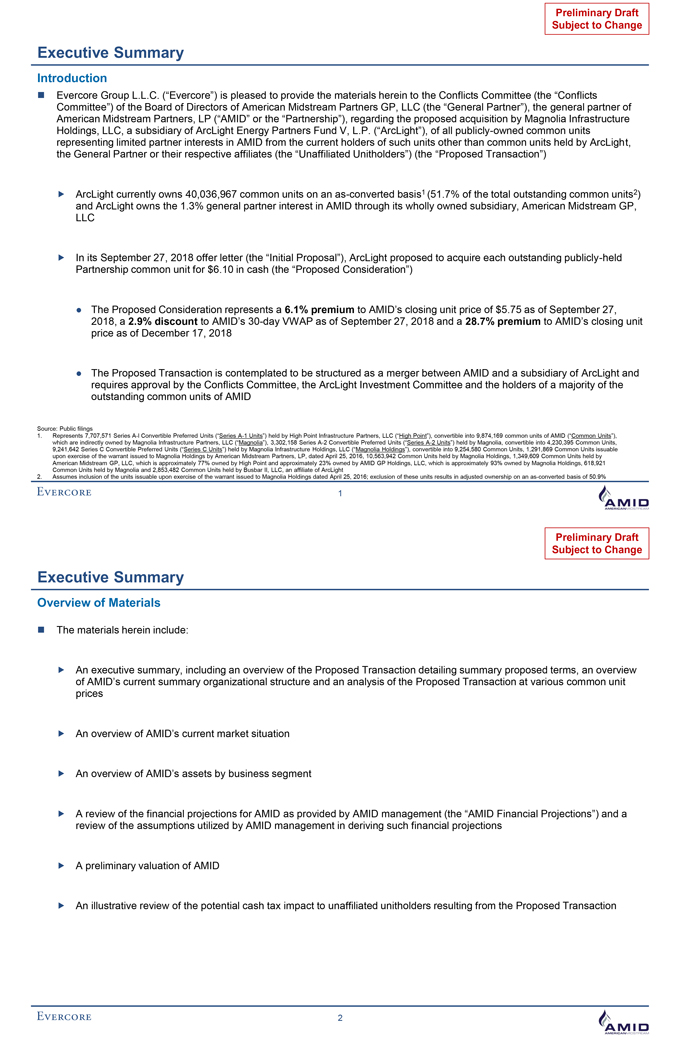
Preliminary Draft Subject to Change Executive Summary Introduction Evercore Group L.L.C. (“Evercore”) is pleased to provide the materials herein to the Conflicts Committee (the “Conflicts Committee”) of the Board of Directors of American Midstream Partners GP, LLC (the “General Partner”), the general partner of American Midstream Partners, LP (“AMID” or the “Partnership”), regarding the proposed acquisition by Magnolia Infrastructure Holdings, LLC, a subsidiary of ArcLight Energy Partners Fund V, L.P. (“ArcLight”), of all publicly-owned common units representing limited partner interests in AMID from the current holders of such units other than common units held by ArcLight, the General Partner or their respective affiliates (the “Unaffiliated Unitholders”) (the “Proposed Transaction”) ArcLight currently owns 40,036,967 common units on an as-converted basis1 (51.7% of the total outstanding common units2) and ArcLight owns the 1.3% general partner interest in AMID through its wholly owned subsidiary, American Midstream GP, LLC In its September 27, 2018 offer letter (the “Initial Proposal”), ArcLight proposed to acquire each outstanding publicly-held Partnership common unit for $6.10 in cash (the “Proposed Consideration”) The Proposed Consideration represents a 6.1% premium to AMID’s closing unit price of $5.75 as of September 27, 2018, a 2.9% discount to AMID’s 30-day VWAP as of September 27, 2018 and a 28.7% premium to AMID’s closing unit price as of December 17, 2018 The Proposed Transaction is contemplated to be structured as a merger between AMID and a subsidiary of ArcLight and requires approval by the Conflicts Committee, the ArcLight Investment Committee and the holders of a majority of the outstanding common units of AMID Source: Public filings 1. Represents 7,707,571 Series A-l Convertible Preferred Units (“Series A-1 Units”) held by High Point Infrastructure Partners, LLC (“High Point”), convertible into 9,874,169 common units of AMID (“Common Units”), which are indirectly owned by Magnolia Infrastructure Partners, LLC (“Magnolia”), 3,302,158 Series A-2 Convertible Preferred Units (“Series A-2 Units”) held by Magnolia, convertible into 4,230,395 Common Units, 9,241,642 Series C Convertible Preferred Units (“Series C Units”) held by Magnolia Infrastructure Holdings, LLC (“Magnolia Holdings”), convertible into 9,254,580 Common Units, 1,291,869 Common Units issuable upon exercise of the warrant issued to Magnolia Holdings by American Midstream Partners, LP, dated April 25, 2016, 10,563,942 Common Units held by Magnolia Holdings, 1,349,609 Common Units held by American Midstream GP, LLC, which is approximately 77% owned by High Point and approximately 23% owned by AMID GP Holdings, LLC, which is approximately 93% owned by Magnolia Holdings, 618,921 Common Units held by Magnolia and 2,853,482 Common Units held by Busbar II, LLC, an affiliate of ArcLight 2. Assumes inclusion of the units issuable upon exercise of the warrant issued to Magnolia Holdings dated April 25, 2016; exclusion of these units results in adjusted ownership on an as-converted basis of 50.9% 1 Preliminary Draft Subject to Change Executive Summary Overview of Materials The materials herein include: An executive summary, including an overview of the Proposed Transaction detailing summary proposed terms, an overview of AMID’s current summary organizational structure and an analysis of the Proposed Transaction at various common unit prices An overview of AMID’s current market situation An overview of AMID’s assets by business segment A review of the financial projections for AMID as provided by AMID management (the “AMID Financial Projections”) and a review of the assumptions utilized by AMID management in deriving such financial projections A preliminary valuation of AMID An illustrative review of the potential cash tax impact to unaffiliated unitholders resulting from the Proposed Transaction 2
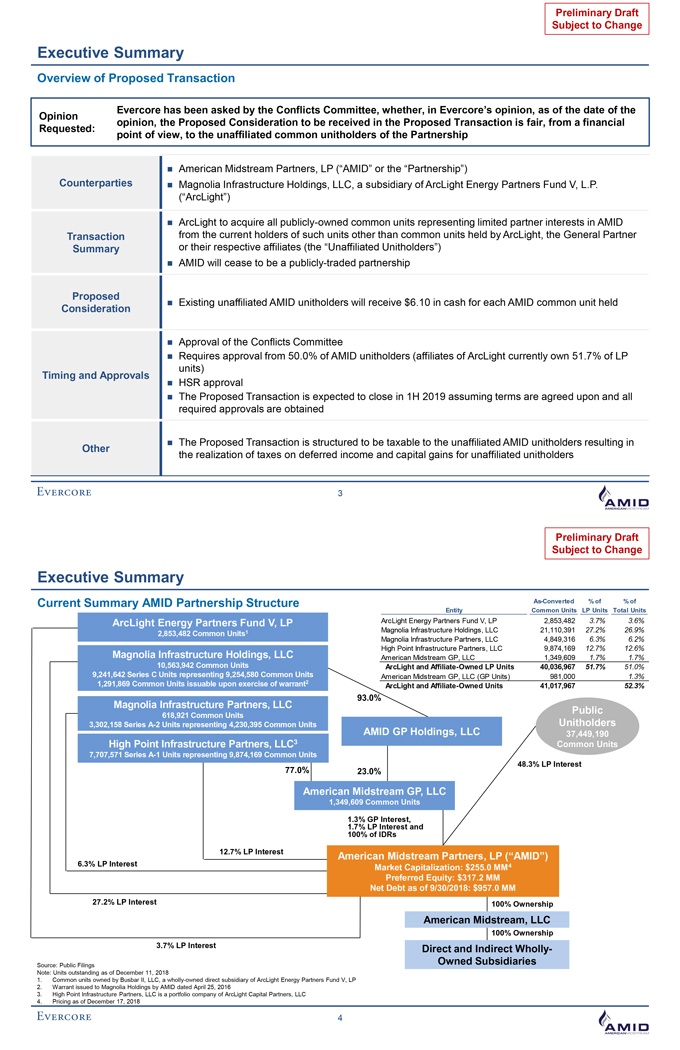
Preliminary Draft Subject to Change Executive Summary Overview of Proposed Transaction Evercore has been asked by the Conflicts Committee, whether, in Evercore’s opinion, as of the date of the Opinion opinion, the Proposed Consideration to be received in the Proposed Transaction is fair, from a financial Requested: point of view, to the unaffiliated common unitholders of the Partnership American Midstream Partners, LP (“AMID” or the “Partnership”) Counterparties Magnolia Infrastructure Holdings, LLC, a subsidiary of ArcLight Energy Partners Fund V, L.P. (“ArcLight”) ArcLight to acquire all publicly-owned common units representing limited partner interests in AMID Transaction from the current holders of such units other than common units held by ArcLight, the General Partner Summary or their respective affiliates (the “Unaffiliated Unitholders”) AMID will cease to be a publicly-traded partnership Proposed Existing unaffiliated AMID unitholders will receive $6.10 in cash for each AMID common unit held Consideration Approval of the Conflicts Committee Requires approval from 50.0% of AMID unitholders (affiliates of ArcLight currently own 51.7% of LP units) Timing and Approvals HSR approval The Proposed Transaction is expected to close in 1H 2019 assuming terms are agreed upon and all required approvals are obtained The ProposedTransaction is structured to be taxable to the unaffiliated AMID unitholders resulting in Other the realization of taxes on deferred income and capital gains for unaffiliated unitholders 3 Preliminary Draft Subject to Change Executive Summary Current Summary AMID Partnership Structure As-Converted % of % of Entity Common Units LP Units Total Units ArcLight Energy Partners Fund V, LP ArcLight Energy Partners Fund V, LP 2,853,482 3.7% 3.6% 1 Magnolia Infrastructure Holdings, LLC 21,110,391 27.2% 26.9% 2,853,482 Common Units Magnolia Infrastructure Partners, LLC 4,849,316 6.3% 6.2% High Point Infrastructure Partners, LLC 9,874,169 12.7% 12.6% Magnolia Infrastructure Holdings, LLC American Midstream GP, LLC 1,349,609 1.7% 1.7% 10,563,942 Common Units ArcLight and Affiliate-Owned LP Units 40,036,967 51.7% 51.0% 9,241,642 Series C Units representing 9,254,580 Common Units American Midstream GP, LLC (GP Units) 981,000 1.3% 1,291,869 Common Units issuable upon exercise of warrant2 ArcLight and Affiliate-Owned Units 41,017,967 52.3% 93.0% Magnolia Infrastructure Partners, LLC Public 618,921 Common Units 3,302,158 Series A-2 Units representing 4,230,395 Common Units AMID GP Holdings, LLC Unitholders 37,449,190 High Point Infrastructure Partners, LLC3 Common Units 7,707,571 Series A-1 Units representing 9,874,169 Common Units 48.3% LP Interest 77.0% 23.0% American Midstream GP, LLC 1,349,609 Common Units 1.3% GP Interest, 1.7% LP Interest and 100% of IDRs 12.7% LP Interest American Midstream Partners, LP (“AMID”) 6.3% LP Interest Market Capitalization: $255.0 MM4 Preferred Equity: $317.2 MM Net Debt as of 9/30/2018: $957.0 MM 27.2% LP Interest 100% Ownership American Midstream, LLC 100% Ownership 3.7% LP Interest Direct and Indirect Wholly-Owned Subsidiaries Source: Public Filings Note: Units outstanding as of December 11, 2018 1. Common units owned by Busbar II, LLC, a wholly-owned direct subsidiary of ArcLight Energy Partners Fund V, LP 2. Warrant issued to Magnolia Holdings by AMID dated April 25, 2016 3. High Point Infrastructure Partners, LLC is a portfolio company of ArcLight Capital Partners, LLC 4. Pricing as of December 17, 2018 4
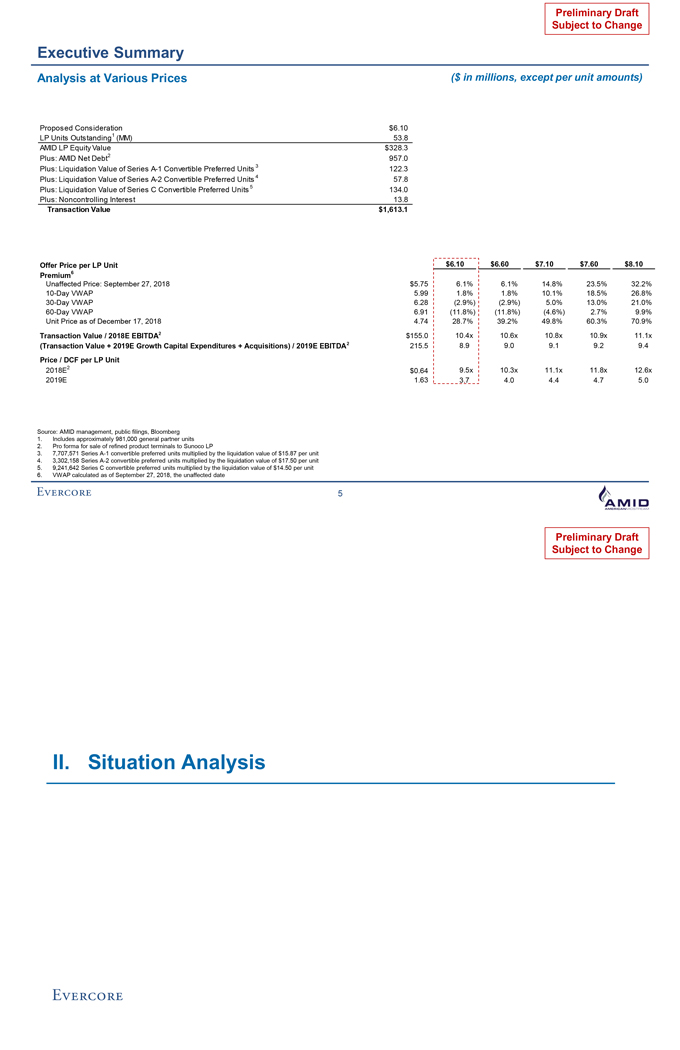
Preliminary Draft Subject to Change Executive Summary Analysis at Various Prices ($ in millions, except per unit amounts) Proposed Consideration $6.10 LP Units Outstanding1 (MM) 53.8 AMID LP Equity Value $328.3 Plus: AMID Net Debt2 957.0 Plus: Liquidation Value of Series A-1 Convertible Preferred Units 3 122.3 Plus: Liquidation Value of Series A-2 Convertible Preferred Units 4 57.8 Plus: Liquidation Value of Series C Convertible Preferred Units 5 134.0 Plus: Noncontrolling Interest 13.8 Transaction Value $1,613.1 Offer Price per LP Unit $6.10 $6.60 $7.10 $7.60 $8.10 Premium6 Unaffected Price: September 27, 2018 $5.75 6.1% 6.1% 14.8% 23.5% 32.2% 10-Day VWAP 5.99 1.8% 1.8% 10.1% 18.5% 26.8% 30-Day VWAP 6.28 (2.9%) (2.9%) 5.0% 13.0% 21.0% 60-Day VWAP 6.91 (11.8%) (11.8%) (4.6%) 2.7% 9.9% Unit Price as of December 17, 2018 4.74 28.7% 39.2% 49.8% 60.3% 70.9% Transaction Value / 2018E EBITDA2 $155.0 10.4x 10.6x 10.8x 10.9x 11.1x (Transaction Value + 2019E Growth Capital Expenditures + Acquisitions) / 2019E EBITDA2 215.5 8.9 9.0 9.1 9.2 9.4 Price / DCF per LP Unit 2018E2 $0.64 9.5x 10.3x 11.1x 11.8x 12.6x 2019E 1.63 3.7 4.0 4.4 4.7 5.0 Source: AMID management, public filings, Bloomberg 1. Includes approximately 981,000 general partner units 2. Pro forma for sale of refined product terminals to Sunoco LP 3. 7,707,571 Series A-1 convertible preferred units multiplied by the liquidation value of $15.87 per unit 4. 3,302,158 Series A-2 convertible preferred units multiplied by the liquidation value of $17.50 per unit 5. 9,241,642 Series C convertible preferred units multiplied by the liquidation value of $14.50 per unit 6. VWAP calculated as of September 27, 2018, the unaffected date 5 Preliminary Draft Subject to Change II. Situation Analysis
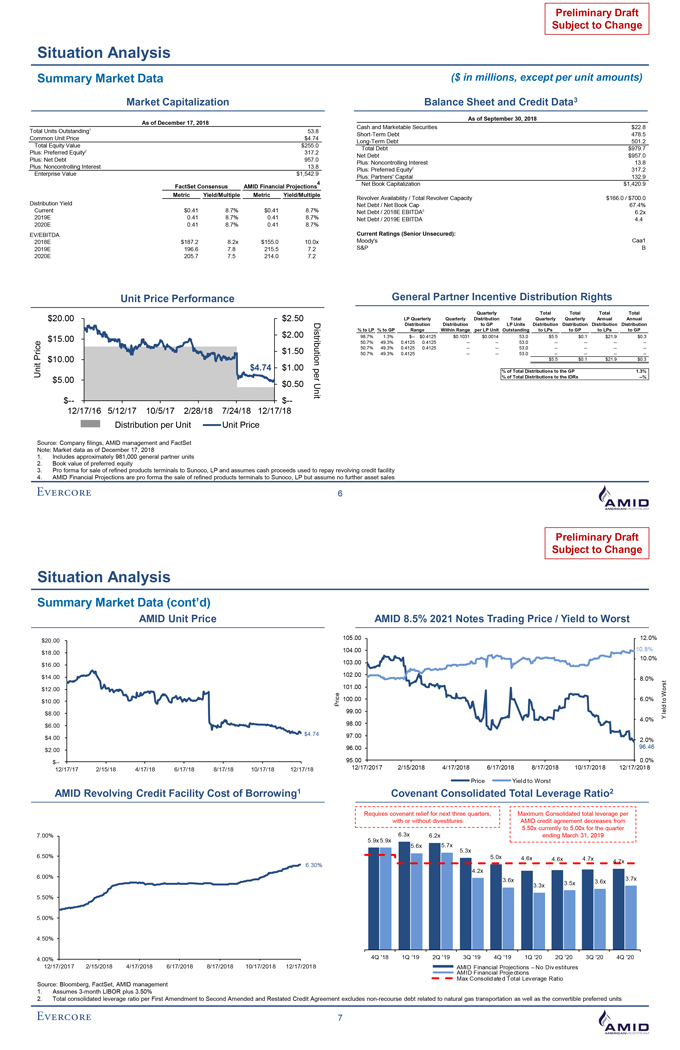
Preliminary Draft Subject to Change Situation Analysis Summary Market Data ($ in millions, except per unit amounts) Market Capitalization Balance Sheet and Credit Data3 As of September 30, 2018 As of December 17, 2018 Cash and Marketable Securities $22.8 Total Units Outstanding1 53.8 Short-Term Debt 478.5 Common Unit Price $4.74 Long-Term Debt 501.2 Total Equity Value $255.0 Total Debt $979.7 Plus: Preferred Equity2 317.2 Net Debt $957.0 Plus: Net Debt 957.0 Plus: Noncontrolling Interest 13.8 Plus: Noncontrolling Interest 13.8 2 Plus: Preferred Equity 317.2 Enterprise Value $1,542.9 Plus: Partners’ Capital 132.9 4 Net Book Capitalization $1,420.9 FactSet Consensus AMID Financial Projections Metric Yield/Multiple Metric Yield/Multiple Distribution Yield Revolver Availability / Total Revolver Capacity $166.0 / $700.0 Net Debt / Net Book Cap 67.4% Current $0.41 8.7% $0.41 8.7% Net Debt / 2018E EBITDA5 6.2x 2019E 0.41 8.7% 0.41 8.7% Net Debt / 2019E EBITDA 4.4 2020E 0.41 8.7% 0.41 8.7% EV/EBITDA Current Ratings (Senior Unsecured): 2018E $187.2 8.2x $155.0 10.0x Moody’s Caa1 2019E 196.6 7.8 215.5 7.2 S&P B 2020E 205.7 7.5 214.0 7.2 Unit Price Performance General Partner Incentive Distribution Rights Quarterly Total Total Total Total $20.00 $2.50 LP Quarterly Quarterly Distribution Total Quarterly Quarterly Annual Annual Di Distribution Distribution to GP LP Units Distribution Distribution Distribution Distribution % to LP % to GP Range Within Range per LP Unit Outstanding to LPs to GP to LPs to GP $2.00 str 98.7% 1.3% $-- $0.4125 $0.1031 $0.0014 53.0 $5.5 $0.1 $21.9 $0.3 $15.00 i 50.7% 49.3% 0.4125 0.4125 -- -- 53.0 -- -- -- --ce ri $1.50 bu 50.7% 49.3% 0.4125 0.4125 -- -- 53.0 -- -- -- --50.7% 49.3% 0.4125 -- -- 53.0 -- -- -- --P $10.00 tion $5.5 $0.1 $21.9 $0.3 $4.74 $1.00 Unit pe % of Total Distributions to the GP 1.3% $5.00 % of Total Distributions to the IDRs --% $0.50 r Uni $-- $-- t 12/17/16 5/12/17 10/5/17 2/28/18 7/24/18 12/17/18 Distribution per Unit Unit Price Source: Company filings, AMID management and FactSet Note: Market data as of December 17, 2018 1. Includes approximately 981,000 general partner units 2. Book value of preferred equity 3. Pro forma for sale of refined products terminals to Sunoco, LP and assumes cash proceeds used to repay revolving credit facility 4. AMID Financial Projections are pro forma the sale of refined products terminals to Sunoco, LP but assume no further asset sales 6 Preliminary Draft Subject to Change Situation Analysis Summary Market Data (cont’d) AMID Unit Price AMID 8.5% 2021 Notes Trading Price / Yield to Worst $20.00 105.00 12.0% 104.00 10.8% $18.00 10.0% $16.00 103.00 $14.00 102.00 8.0% rst 101.00 $12.00 o c eW $10.00 i 100.00 6.0% to Pr $8.00 99.00 YIeld 4.0% $6.00 98.00 $4.74 97.00 $4.00 2.0% 96.00 96.46 $2.00 $-- 95.00 0.0% 12/17/17 2/15/18 4/17/18 6/17/18 8/17/18 10/17/18 12/17/18 12/17/2017 2/15/2018 4/17/2018 6/17/2018 8/17/2018 10/17/2018 12/17/2018 Price Yield to Worst AMID Revolving Credit Facility Cost of Borrowing1 Covenant Consolidated Total Leverage Ratio2 Requires covenant relief for next three quarters, Maximum Consolidated total leverage per with or without divestitures AMID credit agreement decreases from 5.50x currently to 5.00x for the quarter 7.00% 6.3x 6.2x ending March 31, 2019 5.9x 5.9x 5.6x 5.7x 6.50% 5.3x 5.0x 4.6x 4.6x 4.7x 4.7x 6.30% 4.2x 6.00% 3.7x 3.6x 3.6x 3.3x 3.5x 5.50% 5.00% 4.50% 4.00% 4Q ‘18 1Q ‘19 2Q ‘19 3Q ‘19 4Q ‘19 1Q ‘20 2Q ‘20 3Q ‘20 4Q ‘20 12/17/2017 2/15/2018 4/17/2018 6/17/2018 8/17/2018 10/17/2018 12/17/2018 AMID Financial Projections – No Divestitures AMID Financial Projections Max Consolidated Total Leverage Ratio Source: Bloomberg, FactSet, AMID management 1. Assumes 3-month LIBOR plus 3.50% 2. Total consolidated leverage ratio per First Amendment to Second Amended and Restated Credit Agreement excludes non-recourse debt related to natural gas transportation as well as the convertible preferred units 7
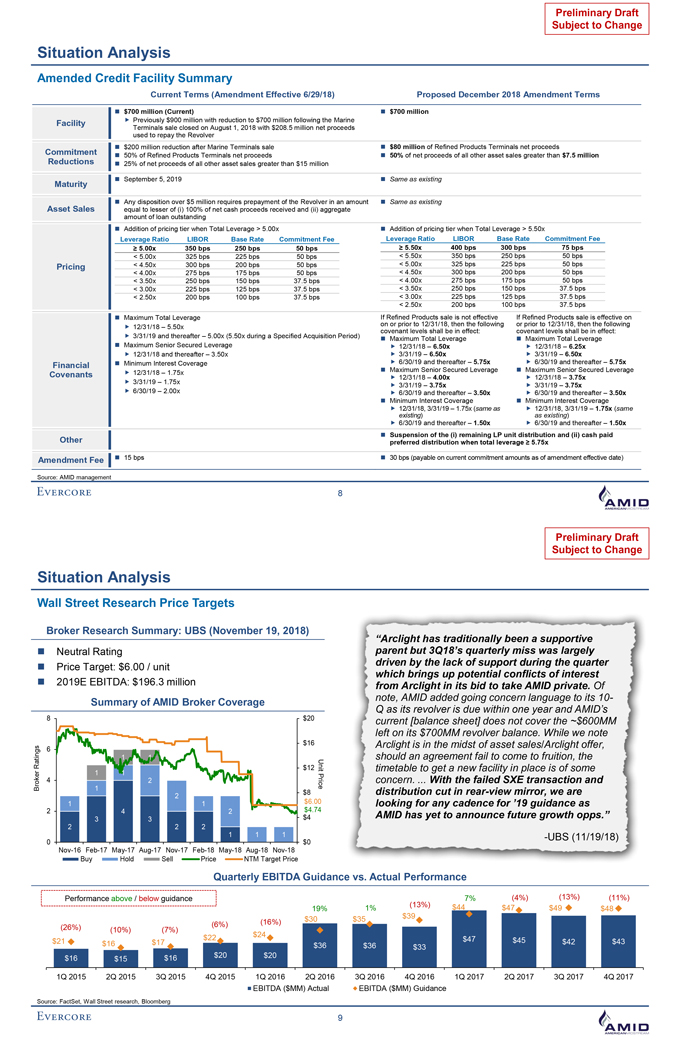
Preliminary Draft Subject to Change Situation Analysis Amended Credit Facility Summary Current Terms (Amendment Effective 6/29/18) Proposed December 2018 Amendment Terms $700 million (Current) $700 million Facility Previously $900 million with reduction to $700 million following the Marine Terminals sale closed on August 1, 2018 with $208.5 million net proceeds used to repay the Revolver $200 million reduction after Marine Terminals sale $80 million of Refined Products Terminals net proceeds Commitment 50% of Refined Products Terminals net proceeds 50% of net proceeds of all other asset sales greater than $7.5 million Reductions 25% of net proceeds of all other asset sales greater than $15 million September 5, 2019 Same as existing Maturity Any disposition over $5 million requires prepayment of the Revolver in an amount Same as existing Asset Sales equal to lesser of (i) 100% of net cash proceeds received and (ii) aggregate amount of loan outstanding Addition of pricing tier when Total Leverage > 5.00x Addition of pricing tier when Total Leverage > 5.50x Leverage Ratio LIBOR Base Rate Commitment Fee Leverage Ratio LIBOR Base Rate Commitment Fee ? 5.00x 350 bps 250 bps 50 bps ? 5.50x 400 bps 300 bps 75 bps < 5.00x 325 bps 225 bps 50 bps < 5.50x 350 bps 250 bps 50 bps Pricing < 4.50x 300 bps 200 bps 50 bps < 5.00x 325 bps 225 bps 50 bps < 4.00x 275 bps 175 bps 50 bps < 4.50x 300 bps 200 bps 50 bps < 3.50x 250 bps 150 bps 37.5 bps < 4.00x 275 bps 175 bps 50 bps < 3.00x 225 bps 125 bps 37.5 bps < 3.50x 250 bps 150 bps 37.5 bps < 2.50x 200 bps 100 bps 37.5 bps < 3.00x 225 bps 125 bps 37.5 bps < 2.50x 200 bps 100 bps 37.5 bps Maximum Total Leverage If Refined Products sale is not effective If Refined Products sale is effective on 12/31/18 – 5.50x on or prior to 12/31/18, then the following or prior to 12/31/18, then the following covenant levels shall be in effect: covenant levels shall be in effect: 3/31/19 and thereafter – 5.00x (5.50x during a Specified Acquisition Period) Maximum Total Leverage Maximum Total Leverage Maximum Senior Secured Leverage 12/31/18 – 6.50x 12/31/18 – 6.25x 12/31/18 and thereafter – 3.50x 3/31/19 – 6.50x 3/31/19 – 6.50x Financial Minimum Interest Coverage 6/30/19 and thereafter – 5.75x 6/30/19 and thereafter – 5.75x 12/31/18 – 1.75x Maximum Senior Secured Leverage Maximum Senior Secured Leverage Covenants 12/31/18 – 4.00x 12/31/18 – 3.75x 3/31/19 – 1.75x 6/30/19 – 2.00x 3/31/19 – 3.75x 3/31/19 – 3.75x 6/30/19 and thereafter – 3.50x 6/30/19 and thereafter – 3.50x Minimum Interest Coverage Minimum Interest Coverage 12/31/18, 3/31/19 – 1.75x (same as 12/31/18, 3/31/19 – 1.75x (same existing) as existing) 6/30/19 and thereafter – 1.50x 6/30/19 and thereafter – 1.50x Suspension of the (i) remaining LP unit distribution and (ii) cash paid Other preferred distribution when total leverage ? 5.75x Amendment Fee 15 bps 30 bps (payable on current commitment amounts as of amendment effective date) Source: AMID management 8 Preliminary Draft Subject to Change Situation Analysis Wall Street Research Price Targets Broker Research Summary: UBS (November 19, 2018) “Arclight has traditionally been a supportive Neutral Rating parent but 3Q18’s quarterly miss was largely driven by the lack of support during the quarter Price Target: $6.00 / unit which brings up potential conflicts of interest 2019E EBITDA: $196.3 million from Arclight in its bid to take AMID private. Of note, AMID added going concern language to its 10- Summary of AMID Broker Coverage Q as its revolver is due within one year and AMID’s 8 $20 current [balance sheet] does not cover the ~$600MM left on its $700MM revolver balance. While we note 6 $16 Arclight is in the midst of asset sales/Arclight offer, 1 1 should an agreement fail to come to fruition, the $12 Unit timetable to get a new facility in place is of some 1 1 4 2 Price concern. . With the failed SXE transaction and Broker Ratings 1 distribution cut in rear-view mirror, we are $8 2 1 1 $6.00 looking for any cadence for ’19 guidance as 2 4 2 $4.74 $4 AMID has yet to announce future growth opps.” 3 3 2 2 2 1 1 1 -UBS (11/19/18) 0 $0 Nov-16 Feb-17 May-17 Aug-17 Nov-17 Feb-18 May-18 Aug-18 Nov-18 Buy Hold Sell Price NTM Target Price Quarterly EBITDA Guidance vs. Actual Performance Performance above / below guidance 7% (4%) (13%) (11%) 1% (13%) $44 $47 $49 19% $48 $30 $35 $39 (6%) (16%) (26%) (10%) (7%) $24 $22 $47 $45 $21 $16 $17 $42 $43 $36 $36 $33 $16 $16 $20 $20 $15 1Q 2015 2Q 2015 3Q 2015 4Q 2015 1Q 2016 2Q 2016 3Q 2016 4Q 2016 1Q 2017 2Q 2017 3Q 2017 4Q 2017 EBITDA ($MM) Actual EBITDA ($MM) Guidance Source: FactSet, Wall Street research, Bloomberg 9
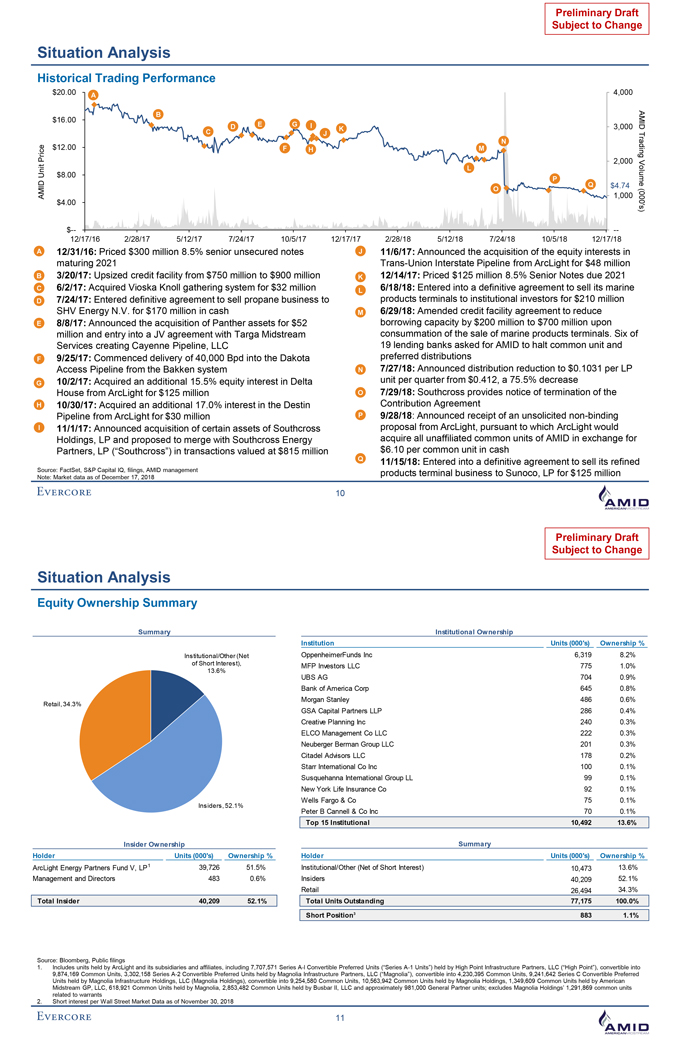
Preliminary Draft Subject to Change Situation Analysis Historical Trading Performance $20.00 A 4,000 B AM $16.00 D E G I 3,000 K C J ID T $12.00 N ra ce F H M din Prig 2,000 t Vo Uni $8.00 L l P Q $4.74 ume O 00’s(0 AMID $4.00 1,000 ) $-- --12/17/16 2/28/17 5/12/17 7/24/17 10/5/17 12/17/17 2/28/18 5/12/18 7/24/18 10/5/18 12/17/18 A • 12/31/16: Priced $300 million 8.5% senior unsecured notes J • 11/6/17: Announced the acquisition of the equity interests in maturing 2021 Trans-Union Interstate Pipeline from ArcLight for $48 million B • 3/20/17: Upsized credit facility from $750 million to $900 million K• 12/14/17: Priced $125 million 8.5% Senior Notes due 2021 C • 6/2/17: Acquired Vioska Knoll gathering system for $32 million L• 6/18/18: Entered into a definitive agreement to sell its marine D • 7/24/17: Entered definitive agreement to sell propane business to products terminals to institutional investors for $210 million SHV Energy N.V. for $170 million in cash M • 6/29/18: Amended credit facility agreement to reduce E • 8/8/17: Announced the acquisition of Panther assets for $52 borrowing capacity by $200 million to $700 million upon million and entry into a JV agreement with Targa Midstream consummation of the sale of marine products terminals. Six of Services creating Cayenne Pipeline, LLC 19 lending banks asked for AMID to halt common unit and F • 9/25/17: Commenced delivery of 40,000 Bpd into the Dakota preferred distributions Access Pipeline from the Bakken system N • 7/27/18: Announced distribution reduction to $0.1031 per LP G • 10/2/17: Acquired an additional 15.5% equity interest in Delta unit per quarter from $0.412, a 75.5% decrease House from ArcLight for $125 million O • 7/29/18: Southcross provides notice of termination of the H • 10/30/17: Acquired an additional 17.0% interest in the Destin Contribution Agreement Pipeline from ArcLight for $30 million P • 9/28/18: Announced receipt of an unsolicited non-binding • I 11/1/17: Announced acquisition of certain assets of Southcross proposal from ArcLight, pursuant to which ArcLight would Holdings, LP and proposed to merge with Southcross Energy acquire all unaffiliated common units of AMID in exchange for Partners, LP (“Southcross”) in transactions valued at $815 million $6.10 per common unit in cash Q • 11/15/18: Entered into a definitive agreement to sell its refined Source: FactSet, S&P Capital IQ, filings, AMID management products terminal business to Sunoco, LP for $125 million Note: Market data as of December 17, 2018 10 Preliminary Draft Subject to Change Situation Analysis Equity Ownership Summary Summary Institutional Ownership Institution Units (000’s) Ownership % Institutional/Other (Net OppenheimerFunds Inc 6,319 8.2% of Short Interest), MFP Investors LLC 775 1.0% 13.6% UBS AG 704 0.9% Bank of America Corp 645 0.8% Morgan Stanley 486 0.6% Retail, 34.3% GSA Capital Partners LLP 286 0.4% Creative Planning Inc 240 0.3% ELCO Management Co LLC 222 0.3% Neuberger Berman Group LLC 201 0.3% Citadel Advisors LLC 178 0.2% Starr International Co Inc 100 0.1% Susquehanna International Group LL 99 0.1% New York Life Insurance Co 92 0.1% Insiders, 52.1% Wells Fargo & Co 75 0.1% Peter B Cannell & Co Inc 70 0.1% Top 15 Institutional 10,492 13.6% Insider Ownership Summary Holder Units (000’s) Ownership % Holder Units (000’s) Ownership % ArcLight Energy Partners Fund V, LP1 39,726 51.5% Institutional/Other (Net of Short Interest) 10,473 13.6% Management and Directors 483 0.6% Insiders 40,209 52.1% Retail 26,494 34.3% Total Insider 40,209 52.1% Total Units Outstanding 77,175 100.0% Short Position3 883 1.1% Source: Bloomberg, Public filings 1. Includes units held by ArcLight and its subsidiaries and affiliates, including 7,707,571 Series A-l Convertible Preferred Units (“Series A-1 Units”) held by High Point Infrastructure Partners, LLC (“High Point”), convertible into 9,874,169 Common Units, 3,302,158 Series A-2 Convertible Preferred Units held by Magnolia Infrastructure Partners, LLC (“Magnolia”), convertible into 4,230,395 Common Units, 9,241,642 Series C Convertible Preferred Units held by Magnolia Infrastructure Holdings, LLC (Magnolia Holdings), convertible into 9,254,580 Common Units, 10,563,942 Common Units held by Magnolia Holdings, 1,349,609 Common Units held by American Midstream GP, LLC, 618,921 Common Units held by Magnolia, 2,853,482 Common Units held by Busbar II, LLC and approximately 981,000 General Partner units; excludes Magnolia Holdings’ 1,291,869 common units related to warrants 2. Short interest per Wall Street Market Data as of November 30, 2018 11
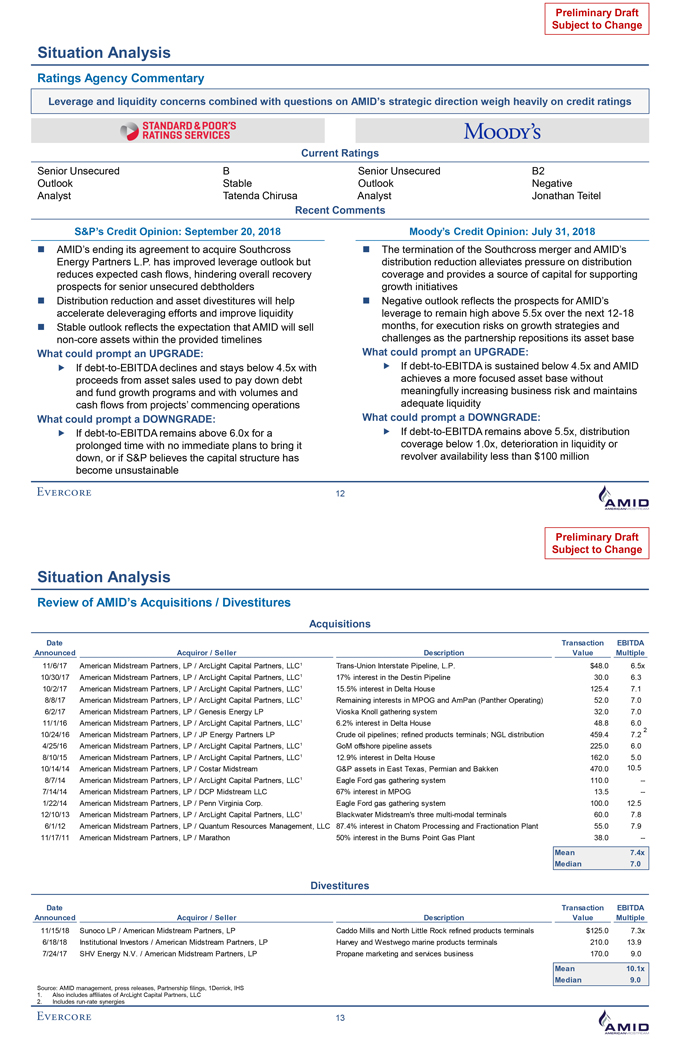
Preliminary Draft Subject to Change Situation Analysis Ratings Agency Commentary Leverage and liquidity concerns combined with questions on AMID’s strategic direction weigh heavily on credit ratings Current Ratings Senior Unsecured B Senior Unsecured B2 Outlook Stable Outlook Negative Analyst Tatenda Chirusa Analyst Jonathan Teitel Recent Comments S&P’s Credit Opinion: September 20, 2018 Moody’s Credit Opinion: July 31, 2018 AMID’s ending its agreement to acquire Southcross The termination of the Southcross merger and AMID’s Energy Partners L.P. has improved leverage outlook but distribution reduction alleviates pressure on distribution reduces expected cash flows, hindering overall recovery coverage and provides a source of capital for supporting prospects for senior unsecured debtholders growth initiatives Distribution reduction and asset divestitures will help Negative outlook reflects the prospects for AMID’s accelerate deleveraging efforts and improve liquidity leverage to remain high above 5.5x over the next 12-18 Stable outlook reflects the expectation that AMID will sell months, for execution risks on growth strategies and non-core assets within the provided timelines challenges as the partnership repositions its asset base What could prompt an UPGRADE: What could prompt an UPGRADE: If debt-to-EBITDA declines and stays below 4.5x with If debt-to-EBITDA is sustained below 4.5x and AMID proceeds from asset sales used to pay down debt achieves a more focused asset base without and fund growth programs and with volumes and meaningfully increasing business risk and maintains cash flows from projects’ commencing operations adequate liquidity What could prompt a DOWNGRADE: What could prompt a DOWNGRADE: If debt-to-EBITDA remains above 6.0x for a If debt-to-EBITDA remains above 5.5x, distribution prolonged time with no immediate plans to bring it coverage below 1.0x, deterioration in liquidity or down, or if S&P believes the capital structure has revolver availability less than $100 million become unsustainable 12 Preliminary Draft Subject to Change Situation Analysis Review of AMID’s Acquisitions / Divestitures Acquisitions Date Transaction EBITDA Announced Acquiror / Seller Description Value Multiple 11/6/17 American Midstream Partners, LP / ArcLight Capital Partners, LLC1 Trans-Union Interstate Pipeline, L.P. $48.0 6.5x 10/30/17 American Midstream Partners, LP / ArcLight Capital Partners, LLC1 17% interest in the Destin Pipeline 30.0 6.3 10/2/17 American Midstream Partners, LP / ArcLight Capital Partners, LLC1 15.5% interest in Delta House 125.4 7.1 8/8/17 American Midstream Partners, LP / ArcLight Capital Partners, LLC1 Remaining interests in MPOG and AmPan (Panther Operating) 52.0 7.0 6/2/17 American Midstream Partners, LP / Genesis Energy LP Vioska Knoll gathering system 32.0 7.0 11/1/16 American Midstream Partners, LP / ArcLight Capital Partners, LLC1 6.2% interest in Delta House 48.8 6.0 2 10/24/16 American Midstream Partners, LP / JP Energy Partners LP Crude oil pipelines; refined products terminals; NGL distribution 459.4 7.2 4/25/16 American Midstream Partners, LP / ArcLight Capital Partners, LLC1 GoM offshore pipeline assets 225.0 6.0 8/10/15 American Midstream Partners, LP / ArcLight Capital Partners, LLC1 12.9% interest in Delta House 162.0 5.0 10/14/14 American Midstream Partners, LP / Costar Midstream G&P assets in East Texas, Permian and Bakken 470.0 10.5 8/7/14 American Midstream Partners, LP / ArcLight Capital Partners, LLC1 Eagle Ford gas gathering system 110.0 --7/14/14 American Midstream Partners, LP / DCP Midstream LLC 67% interest in MPOG 13.5 --1/22/14 American Midstream Partners, LP / Penn Virginia Corp. Eagle Ford gas gathering system 100.0 12.5 12/10/13 American Midstream Partners, LP / ArcLight Capital Partners, LLC1 Blackwater Midstream’s three multi-modal terminals 60.0 7.8 6/1/12 American Midstream Partners, LP / Quantum Resources Management, LLC 87.4% interest in Chatom Processing and Fractionation Plant 55.0 7.9 11/17/11 American Midstream Partners, LP / Marathon 50% interest in the Burns Point Gas Plant 38.0 -- Mean 7.4x Median 7.0 Divestitures Date Transaction EBITDA Announced Acquiror / Seller Description Value Multiple 11/15/18 Sunoco LP / American Midstream Partners, LP Caddo Mills and North Little Rock refined products terminals $125.0 7.3x 6/18/18 Institutional Investors / American Midstream Partners, LP Harvey and Westwego marine products terminals 210.0 13.9 7/24/17 SHV Energy N.V. / American Midstream Partners, LP Propane marketing and services business 170.0 9.0 Mean 10.1x Median 9.0 Source: AMID management, press releases, Partnership filings, 1Derrick, IHS 1. Also includes affiliates of ArcLight Capital Partners, LLC 2. Includes run-rate synergies 13
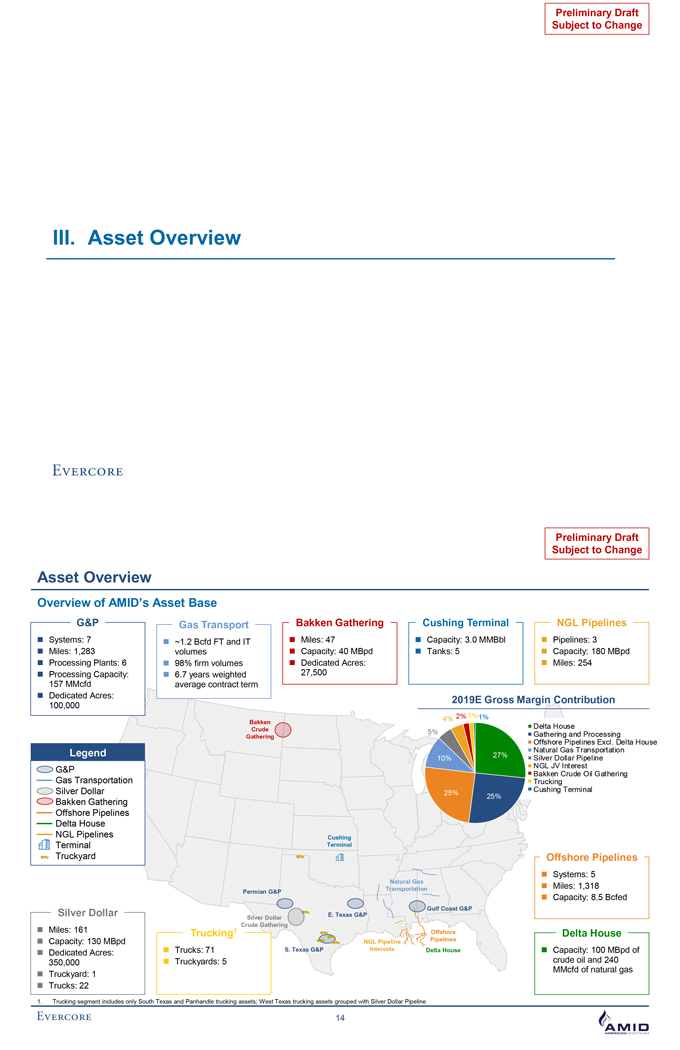
Preliminary Draft Subject to Change III. Asset Overview Preliminary Draft Subject to Change Asset Overview Overview of AMID’s Asset Base G&P Gas Transport Bakken Gathering Cushing Terminal NGL Pipelines Systems: 7 ~1.2 Bcfd FT and IT Miles: 47 Capacity: 3.0 MMBbl Pipelines: 3 Miles: 1,283 volumes Capacity: 40 MBpd Tanks: 5 Capacity: 180 MBpd Processing Plants: 6 98% firm volumes Dedicated Acres: Miles: 254 Processing Capacity: 6.7 years weighted 27,500 157 MMcfd average contract term Dedicated Acres: 2019E Gross Margin Contribution 100,000 Bakken 4% 2% 1%1% Crude Delta House 5% Gathering and Processing Gathering Offshore Pipelines Excl. Delta House Legend Natural Gas Transportation 10% 27% Silver Dollar Pipeline G&P NGL JV Interest Bakken Crude Oil Gathering Gas Transportation Trucking Silver Dollar Cushing Terminal 25% 25% Bakken Gathering Offshore Pipelines Delta House NGL Pipelines Cushing Terminal Terminal Truckyard Offshore Pipelines Systems: 5 Natural Gas Permian G&P Transportation Miles: 1,318 Capacity: 8.5 Bcfed Silver Dollar Gulf Coast G&P E. Texas G&P Silver Dollar Crude Gathering Miles: 161 Trucking1 Offshore Delta House Capacity: 130 MBpd NGL Pipeline Pipelines Dedicated Acres: Trucks: 71 S. Texas G&P Interests Delta House Capacity: 100 MBpd of 350,000 Truckyards: 5 crude oil and 240 MMcfd of natural gas Truckyard: 1 Trucks: 22 1. Trucking segment includes only South Texas and Panhandle trucking assets; West Texas trucking assets grouped with Silver Dollar Pipeline 14
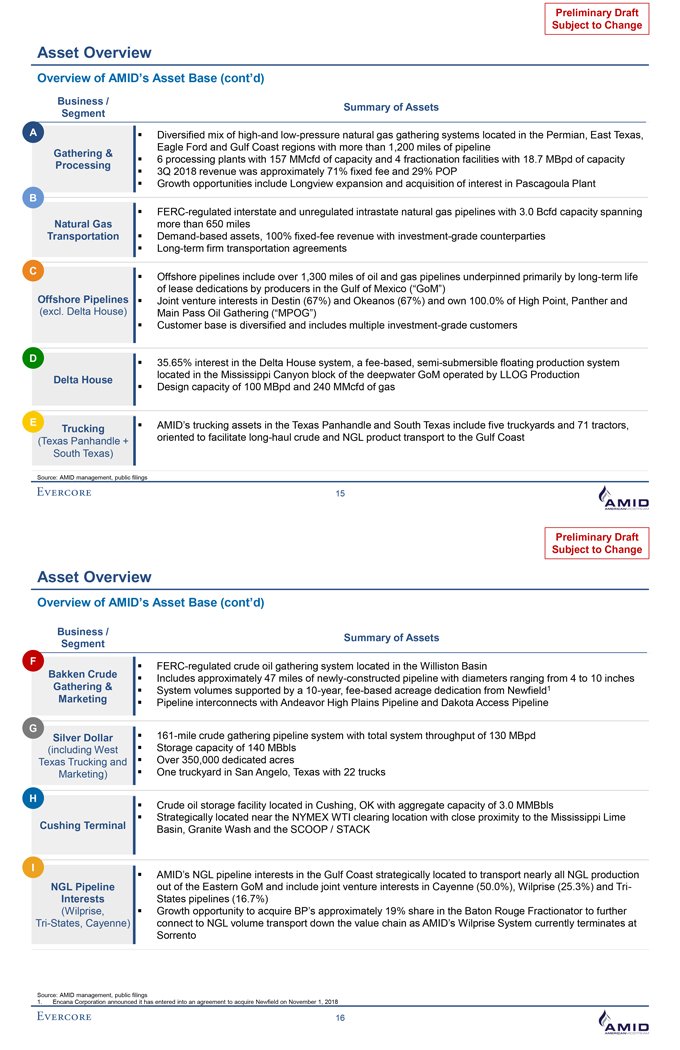
Preliminary Draft Subject to Change Asset Overview Overview of AMID’s Asset Base (cont’d) Business / Summary of Assets Segment A? Diversified mix of high-and low-pressure natural gas gathering systems located in the Permian, East Texas, Eagle Ford and Gulf Coast regions with more than 1,200 miles of pipeline Gathering & ? 6 processing plants with 157 MMcfd of capacity and 4 fractionation facilities with 18.7 MBpd of capacity Processing ? 3Q 2018 revenue was approximately 71% fixed fee and 29% POP ? Growth opportunities include Longview expansion and acquisition of interest in Pascagoula Plant B ? FERC-regulated interstate and unregulated intrastate natural gas pipelines with 3.0 Bcfd capacity spanning Natural Gas more than 650 miles Transportation? Demand-based assets, 100% fixed-fee revenue with investment-grade counterparties? Long-term firm transportation agreements C ? Offshore pipelines include over 1,300 miles of oil and gas pipelines underpinned primarily by long-term life of lease dedications by producers in the Gulf of Mexico (“GoM”) Offshore Pipelines ? Joint venture interests in Destin (67%) and Okeanos (67%) and own 100.0% of High Point, Panther and (excl. Delta House) Main Pass Oil Gathering (“MPOG”) ? Customer base is diversified and includes multiple investment-grade customers D? 35.65% interest in the Delta House system, a fee-based, semi-submersible floating production system located in the Mississippi Canyon block of the deepwater GoM operated by LLOG Production Delta House ? Design capacity of 100 MBpd and 240 MMcfd of gas E? AMID’s trucking assets in the Texas Panhandle and South Texas include five truckyards and 71 tractors, Trucking oriented to facilitate long-haul crude and NGL product transport to the Gulf Coast (Texas Panhandle + South Texas) Source: AMID management, public filings 15 Preliminary Draft Subject to Change Asset Overview Overview of AMID’s Asset Base (cont’d) Business / Summary of Assets Segment F ? FERC-regulated crude oil gathering system located in the Williston Basin Bakken Crude ? Includes approximately 47 miles of newly-constructed pipeline with diameters ranging from 4 to 10 inches Gathering & ? System volumes supported by a 10-year, fee-based acreage dedication from Newfield1 Marketing? Pipeline interconnects with Andeavor High Plains Pipeline and Dakota Access Pipeline G Silver Dollar ? 161-mile crude gathering pipeline system with total system throughput of 130 MBpd (including West ? Storage capacity of 140 MBbls Texas Trucking and ? Over 350,000 dedicated acres Marketing)? One truckyard in San Angelo, Texas with 22 trucks H ? Crude oil storage facility located in Cushing, OK with aggregate capacity of 3.0 MMBbls ? Strategically located near the NYMEX WTI clearing location with close proximity to the Mississippi Lime Cushing Terminal Basin, Granite Wash and the SCOOP / STACK I ? AMID’s NGL pipeline interests in the Gulf Coast strategically located to transport nearly all NGL production NGL Pipeline out of the Eastern GoM and include joint venture interests in Cayenne (50.0%), Wilprise (25.3%) and Tri-Interests States pipelines (16.7%) (Wilprise, ? Growth opportunity to acquire BP’s approximately 19% share in the Baton Rouge Fractionator to further Tri-States, Cayenne) connect to NGL volume transport down the value chain as AMID’s Wilprise System currently terminates at Sorrento Source: AMID management, public filings 1. Encana Corporation announced it has entered into an agreement to acquire Newfield on November 1, 2018 16
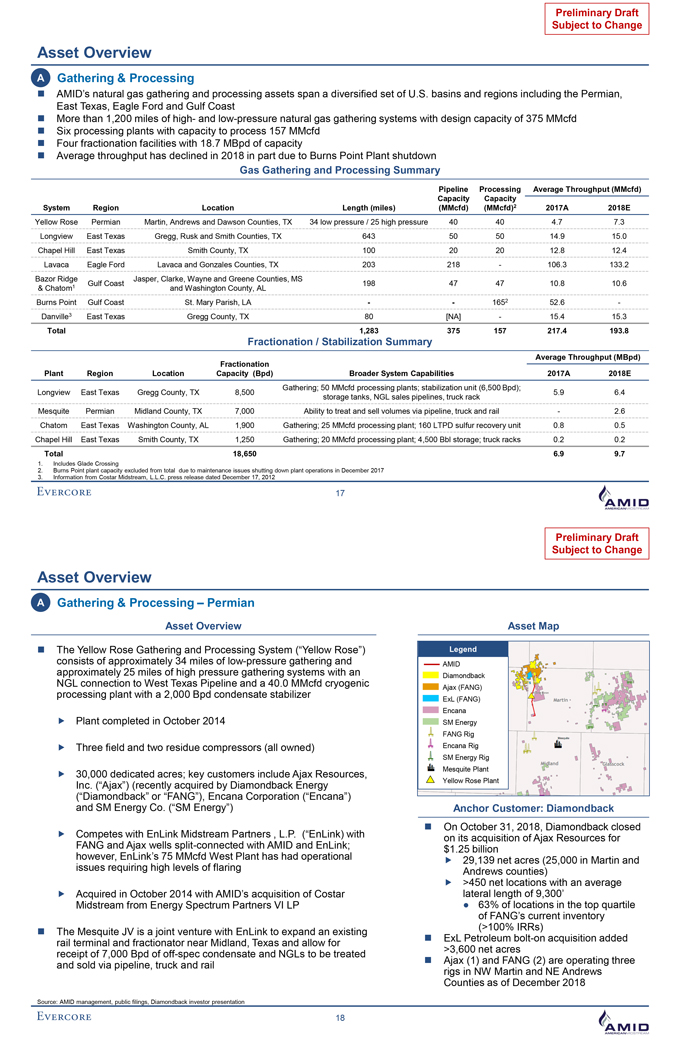
Preliminary Draft Subject to Change Asset Overview A Gathering & Processing AMID’s natural gas gathering and processing assets span a diversified set of U.S. basins and regions including the Permian, East Texas, Eagle Ford and Gulf Coast More than 1,200 miles of high- and low-pressure natural gas gathering systems with design capacity of 375 MMcfd Six processing plants with capacity to process 157 MMcfd Four fractionation facilities with 18.7 MBpd of capacity Average throughput has declined in 2018 in part due to Burns Point Plant shutdown Gas Gathering and Processing Summary Pipeline Processing Average Throughput (MMcfd) Capacity Capacity System Region Location Length (miles) (MMcfd) (MMcfd)2 2017A 2018E Yellow Rose Permian Martin, Andrews and Dawson Counties, TX 34 low pressure / 25 high pressure 40 40 4.7 7.3 Longview East Texas Gregg, Rusk and Smith Counties, TX 643 50 50 14.9 15.0 Chapel Hill East Texas Smith County, TX 100 20 20 12.8 12.4 Lavaca Eagle Ford Lavaca and Gonzales Counties, TX 203 218 - 106.3 133.2 Bazor Ridge Jasper, Clarke, Wayne and Greene Counties, MS Gulf Coast 198 47 47 10.8 10.6 & Chatom1 and Washington County, AL Burns Point Gulf Coast St. Mary Parish, LA - - 1652 52.6 -Danville3 East Texas Gregg County, TX 80 [NA] - 15.4 15.3 Total 1,283 375 157 217.4 193.8 Fractionation / Stabilization Summary Fractionation Average Throughput (MBpd) Plant Region Location Capacity (Bpd) Broader System Capabilities 2017A 2018E Gathering; 50 MMcfd processing plants; stabilization unit (6,500Bpd); Longview East Texas Gregg County, TX 8,500 5.9 6.4 storage tanks, NGL sales pipelines, truck rack Mesquite Permian Midland County, TX 7,000 Ability to treat and sell volumes via pipeline, truck and rail - 2.6 Chatom East Texas Washington County, AL 1,900 Gathering; 25 MMcfd processing plant; 160 LTPD sulfur recovery unit 0.8 0.5 Chapel Hill East Texas Smith County, TX 1,250 Gathering; 20 MMcfd processing plant; 4,500 Bbl storage; truck racks 0.2 0.2 Total 18,650 6.9 9.7 1. Includes Glade Crossing 2. Burns Point plant capacity excluded from total due to maintenance issues shutting down plant operations in December 2017 3. Information from Costar Midstream, L.L.C. press release dated December 17, 2012 17Preliminary Draft Subject to Change Asset Overview A Gathering & Processing – Permian Asset Overview Asset Map The Yellow Rose Gathering and Processing System (“Yellow Rose”) Legend consists of approximately 34 miles of low-pressure gathering and AMID approximately 25 miles of high pressure gathering systems with an Diamondback NGL connection to West Texas Pipeline and a 40.0 MMcfd cryogenic Ajax (FANG) processing plant with a 2,000 Bpd condensate stabilizer ExL (FANG) Encana Plant completed in October 2014 SM Energy FANG Rig Three field and two residue compressors (all owned) Encana Rig SM Energy Rig Mesquite Plant 30,000 dedicated acres; key customers include Ajax Resources, Inc. (“Ajax”) (recently acquired by Diamondback Energy Yellow Rose Plant (“Diamondback” or “FANG”), Encana Corporation (“Encana”) and SM Energy Co. (“SM Energy”) Anchor Customer: Diamondback On October 31, 2018, Diamondback closed Competes with EnLink Midstream Partners , L.P. (“EnLink) with on its acquisition of Ajax Resources for FANG and Ajax wells split-connected with AMID and EnLink; $1.25 billion however, EnLink’s 75 MMcfd West Plant has had operational 29,139 net acres (25,000 in Martin and issues requiring high levels of flaring Andrews counties) >450 net locations with an average Acquired in October 2014 with AMID’s acquisition of Costar lateral length of 9,300’ Midstream from Energy Spectrum Partners VI LP 63% of locations in the top quartile of FANG’s current inventory (>100% IRRs) The Mesquite JV is a joint venture with EnLink to expand an existing ExL Petroleum bolt-on acquisition added rail terminal and fractionator near Midland, Texas and allow for >3,600 net acres receipt of 7,000 Bpd of off-spec condensate and NGLs to be treated Ajax (1) and FANG (2) are operating three and sold via pipeline, truck and rail rigs in NW Martin and NE Andrews Counties as of December 2018 Source: AMID management, public filings, Diamondback investor presentation 18
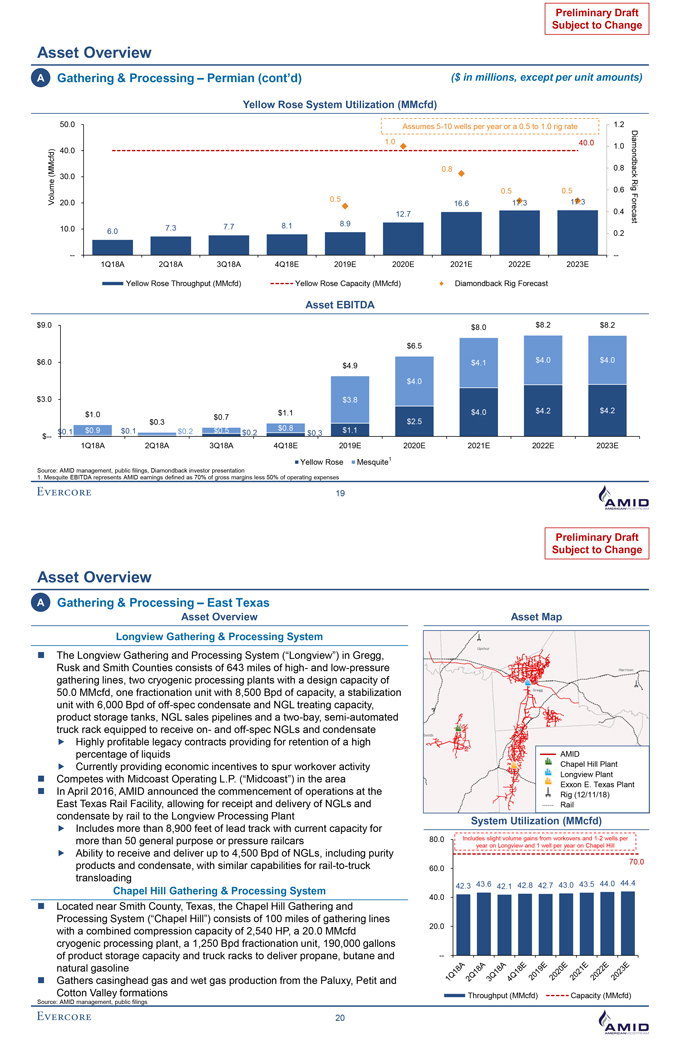
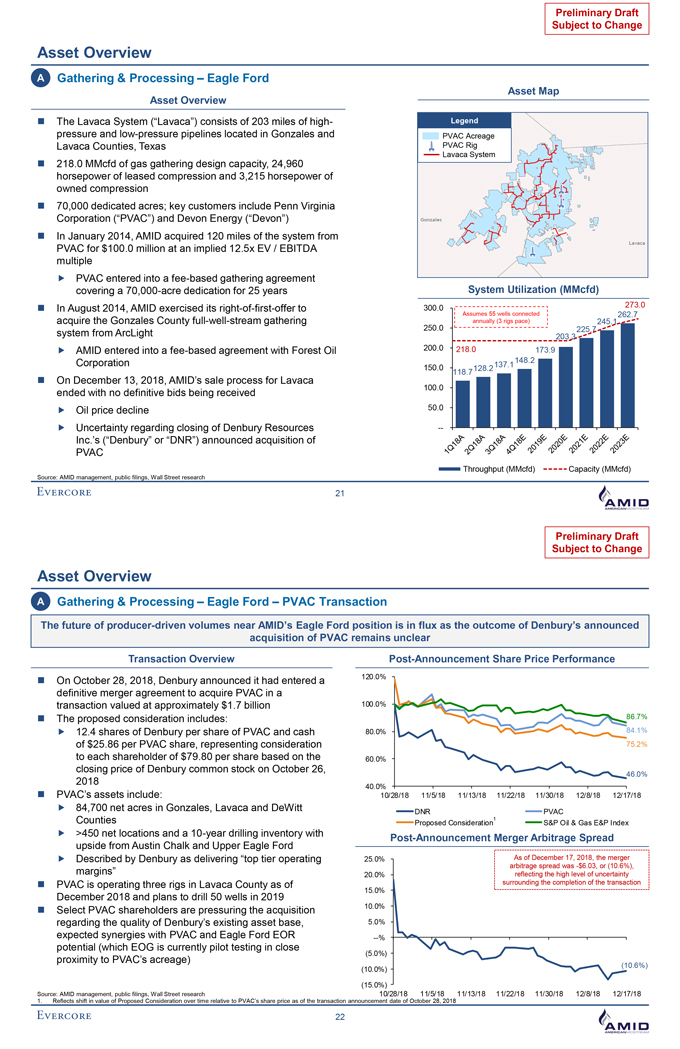
Preliminary Draft Subject to Change Asset Overview A Gathering & Processing –Permian (cont’d) ($ in millions, except per unit amounts) Yellow Rose System Utilization (MMcfd) 50.0 Assumes 5-10 wells per year or a 0.5 to 1.0 rig rate 1.2 1.0 Diamondbac 40.0 1.0 (MMcfd) 40.0 0.8 0.8 k Volume 30.0 0.5 0.5 0.6 Rig F 0.5 17.3 o 20.0 16.6 17.3 c re 12.7 0.4 s a 8.1 8.9 t 10.0 7.3 7.7 6.0 0.2 -- --1Q18A 2Q18A 3Q18A 4Q18E 2019E 2020E 2021E 2022E 2023E Yellow Rose Throughput (MMcfd) Yellow Rose Capacity (MMcfd) Diamondback Rig Forecast Asset EBITDA $9.0 $8.0 $8.2 $8.2 $6.5 $6.0 $4.1 $4.0 $4.0 $4.9 $4.0 $3.0 $3.8 $1.1 $4.0 $4.2 $4.2 $1.0 $0.7 $2.5 $0.3 $0.9 $0.1 $0.5 $0.8 $1.1 $0.1 $0.2 $0.2 $0.3 $--1Q18A 2Q18A 3Q18A 4Q18E 2019E 2020E 2021E 2022E 2023E Yellow Rose Mesquite1 Source: AMID management, public filings, Diamondback investor presentation 1. Mesquite EBITDA represents AMID earnings defined as 70% of gross margins less 50% of operating expenses 19 Preliminary Draft Subject to Change Asset Overview A Gathering & Processing – East Texas Asset Overview Asset Map Longview Gathering & Processing System The Longview Gathering and Processing System (“Longview”) in Gregg, Rusk and Smith Counties consists of 643 miles of high- and low-pressure gathering lines, two cryogenic processing plants with a design capacity of 50.0 MMcfd, one fractionation unit with 8,500 Bpd of capacity, a stabilization unit with 6,000 Bpd of off-spec condensate and NGL treating capacity, product storage tanks, NGL sales pipelines and a two-bay, semi-automated truck rack equipped to receive on- and off-spec NGLs and condensate Highly profitable legacy contracts providing for retention of a high percentage of liquids AMID Currently providing economic incentives to spur workover activity Chapel Hill Plant Competes with Midcoast Operating L.P. (“Midcoast”) in the area Longview Plant Exxon E. Texas Plant In April 2016, AMID announced the commencement of operations at the Rig (12/11/18) East Texas Rail Facility, allowing for receipt and delivery of NGLs and Rail condensate by rail to the Longview Processing Plant System Utilization (MMcfd) Includes more than 8,900 feet of lead track with current capacity for more than 50 general purpose or pressure railcars 80.0 Includes slight volume gains from workovers and 1-2 wells per Ability to receive and deliver up to 4,500 Bpd of NGLs, including year on Longview and 1 well per year on Chapel Hill purity products and condensate, with similar capabilities for rail-to-truck 60.0 70.0 transloading Chapel Hill Gathering & Processing System 42.3 43.6 42.1 42.8 42.7 43.0 43.5 44.0 44.4 40.0 Located near Smith County, Texas, the Chapel Hill Gathering and Processing System (“Chapel Hill”) consists of 100 miles of gathering lines 20.0 with a combined compression capacity of 2,540 HP, a 20.0 MMcfd cryogenic processing plant, a 1,250 Bpd fractionation unit, 190,000 gallons of product storage capacity and truck racks to deliver propane, butane and --natural gasoline Gathers casinghead gas and wet gas production from the Paluxy, Petit and Cotton Valley formations Throughput (MMcfd) Capacity (MMcfd) Source: AMID management, public filings 20
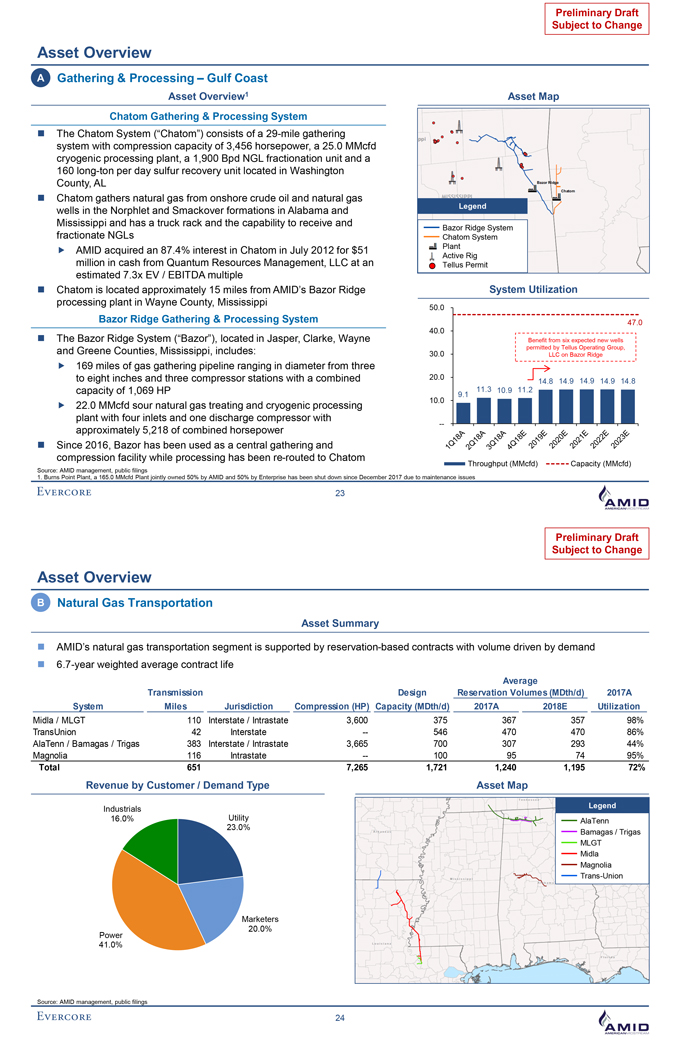
Preliminary Draft Subject to Change Asset Overview A Gathering & Processing – Eagle Ford Asset Overview Asset Map The Lavaca System (“Lavaca”) consists of 203 miles of high- Legend pressure and low-pressure pipelines located in Gonzales and PVAC Acreage Lavaca Counties, Texas PVAC Rig Lavaca System 218.0 MMcfd of gas gathering design capacity, 24,960 horsepower of leased compression and 3,215 horsepower of owned compression 70,000 dedicated acres; key customers include Penn Virginia Corporation (“PVAC”) and Devon Energy (“Devon”) In January 2014, AMID acquired 120 miles of the system from PVAC for $100.0 million at an implied 12.5x EV / EBITDA multiple PVAC entered into a fee-based gathering agreement covering a 70,000-acre dedication for 25 years System Utilization (MMcfd) In August 2014, AMID exercised its right-of-first-offer to 300.0 273.0 Assumes 55 wells connected 262.7 acquire the Gonzales County full-well-stream gathering annually (3 rigs pace) 245.1 250.0 225.7 system from ArcLight 203.3 AMID entered into a fee-based agreement with Forest Oil 200.0 218.0 173.9 Corporation 148.2 150.0 137.1 128.2 On December 13, 2018, AMID’s sale process for Lavaca 118.7 100.0 ended with no definitive bids being received Oil price decline 50.0 Uncertainty regarding closing of Denbury Resources -- Inc.’s (“Denbury” or “DNR”) announced acquisition of PVAC Throughput (MMcfd) Capacity (MMcfd) Source: AMID management, public filings, Wall Street research 21 Preliminary Draft Subject to Change Asset Overview A Gathering & Processing – Eagle Ford – PVAC Transaction The future of producer-driven volumes near AMID’s Eagle Ford positionis in flux as the outcome of Denbury’s announced acquisition of PVAC remains unclear Transaction Overview Post-Announcement Share Price Performance On October 28, 2018, Denbury announced it had entered a 120.0% definitive merger agreement to acquire PVAC in a transaction valued at approximately $1.7 billion 100.0% The proposed consideration includes: 86.7% 12.4 shares of Denbury per share of PVAC and cash 80.0% 84.1% of $25.86 per PVAC share, representing consideration 75.2% to each shareholder of $79.80 per share based on the 60.0% closing price of Denbury common stock on October 26, 46.0% 2018 include: 40.0% PVAC’s assets 10/28/18 11/5/18 11/13/18 11/22/18 11/30/18 12/8/18 12/17/18 84,700 net acres in Gonzales, Lavaca and DeWitt DNR PVAC Counties 1 Proposed Consideration S&P Oil & Gas E&P Index >450 net locations and a 10-year drilling inventory with Post-Announcement Merger Arbitrage Spread upside from Austin Chalk and Upper Eagle Ford Described by Denbury as delivering “top tier operating 25.0% As of December 17, 2018, the merger arbitrage spread was -$6.03, or (10.6%), margins” 20.0% reflecting the high level of uncertainty PVAC is operating three rigs in Lavaca County as of surrounding the completion of the transaction 15.0% December 2018 and plans to drill 50 wells in 2019 Select PVAC shareholders are pressuring the acquisition 10.0% regarding the quality of Denbury’s existing asset base, 5.0% expected synergies with PVAC and Eagle Ford EOR --% potential (which EOG is currently pilot testing in close (5.0%) proximity to PVAC’s acreage) (10.6%) (10.0%) (15.0%) Source: AMID management, public filings, Wall Street research 10/28/18 11/5/18 11/13/18 11/22/18 11/30/18 12/8/18 12/17/18 1. Reflects shift in value of Proposed Consideration over time relative to PVAC’s share price as of the transaction announcement date of October 28, 2018 22
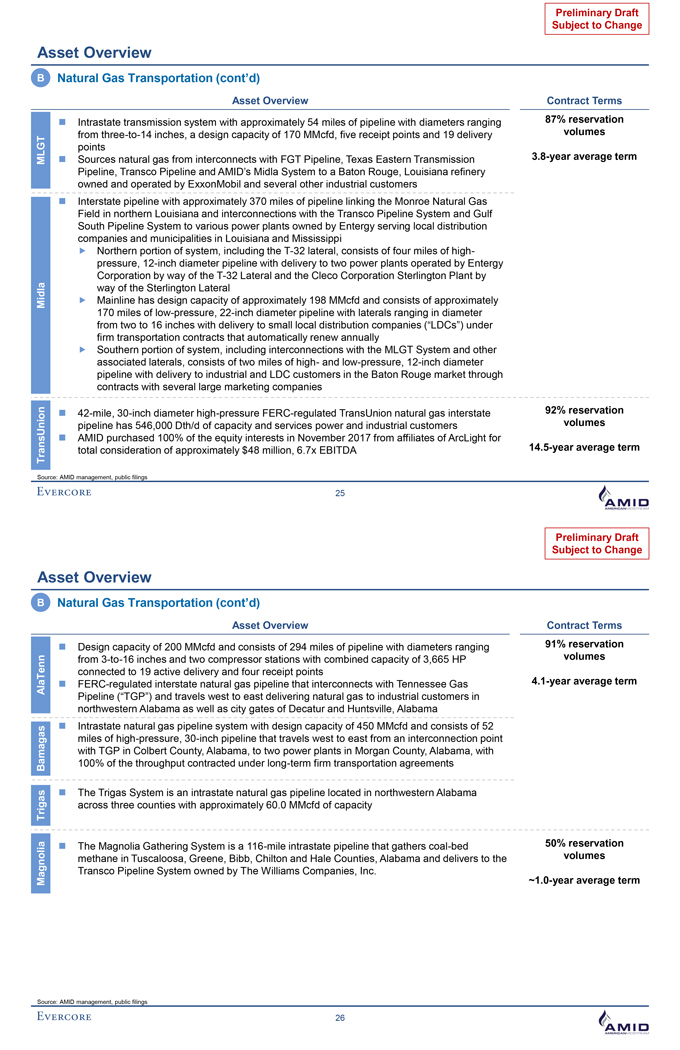
Preliminary Draft Subject to Change Asset Overview A Gathering & Processing – Gulf Coast Asset Overview1 Asset Map Chatom Gathering & Processing System The Chatom System (“Chatom”) consists of a 29-mile gathering system with compression capacity of 3,456 horsepower, a 25.0 MMcfd cryogenic processing plant, a 1,900 Bpd NGL fractionation unit and a 160 long-ton per day sulfur recovery unit located in Washington County, AL Chatom gathers natural gas from onshore crude oil and natural gas wells in the Norphlet and Smackover formations in Alabama and Legend Mississippi and has a truck rack and the capability to receive and Bazor Ridge System fractionate NGLs Chatom System AMID acquired an 87.4% interest in Chatom in July 2012 for $51 Plant Active Rig million in cash from Quantum Resources Management, LLC at an Tellus Permit estimated 7.3x EV / EBITDA multiple Chatom is located approximately 15 miles from AMID’s Bazor Ridge System Utilization processing plant in Wayne County, Mississippi 50.0 Bazor Ridge Gathering & Processing System 47.0 40.0 The Bazor Ridge System (“Bazor”), located in Jasper, Clarke, Wayne Benefit from six expected new wells and Greene Counties, Mississippi, includes: 30.0 permitted by Tellus Operating Group, LLC on Bazor Ridge 169 miles of gas gathering pipeline ranging in diameter from three to eight inches and three compressor stations with a combined 20.0 14.8 14.9 14.9 14.9 14.8 capacity of 1,069 HP 11.3 10.9 11.2 9.1 10.0 22.0 MMcfd sour natural gas treating and cryogenic processing plant with four inlets and one discharge compressor with -- approximately 5,218 of combined horsepower Since 2016, Bazor has been used as a central gathering and compression facility while processing has been re-routed to Chatom Throughput (MMcfd) Capacity (MMcfd) Source: AMID management, public filings 1. Burns Point Plant, a 165.0 MMcfd Plant jointly owned 50% by AMID and 50% by Enterprise has been shut down since December 2017 due to maintenance issues 23 Preliminary Draft Subject to Change Asset Overview B Natural Gas Transportation Asset Summary AMID’s natural gas transportation segment is supported by reservation-based contracts with volume driven by demand 6.7 -year weighted average contract life Average Transmission Design Reservation Volumes (MDth/d) 2017A System Miles Jurisdiction Compression (HP) Capacity (MDth/d) 2017A 2018E Utilization Midla / MLGT 110 Interstate / Intrastate 3,600 375 367 357 98% TransUnion 42 Interstate -- 546 470 470 86% AlaTenn / Bamagas / Trigas 383 Interstate / Intrastate 3,665 700 307 293 44% Magnolia 116 Intrastate -- 100 95 74 95% Total 651 7,265 1,721 1,240 1,195 72% Revenue by Customer / Demand Type Asset Map Industrials Legend 16.0% Utility AlaTenn 23.0% Bamagas / Trigas MLGT Midla Magnolia Trans-Union Marketers 20.0% Power 41.0% Source: AMID management, public filings 24
Preliminary Draft Subject to Change Asset Overview B Natural Gas Transportation (cont’d) Asset Overview Contract Terms Intrastate transmission system with approximately 54 miles of pipeline with diameters ranging 87% reservation from three-to-14 inches, a design capacity of 170 MMcfd, five receipt points and 19 delivery volumes points 3.8 -year average term MLGT Sources natural gas from interconnects with FGT Pipeline, Texas Eastern Transmission Pipeline, Transco Pipeline and AMID’s Midla System to a Baton Rouge, Louisiana refinery owned and operated by ExxonMobil and several other industrial customers Interstate pipeline with approximately 370 miles of pipeline linking the Monroe Natural Gas Field in northern Louisiana and interconnections with the Transco Pipeline System and Gulf South Pipeline System to various power plants owned by Entergy serving local distribution companies and municipalities in Louisiana and Mississippi Northern portion of system, including the T-32 lateral, consists of four miles of high-pressure, 12-inch diameter pipeline with delivery to two power plants operated by Entergy Corporation by way of the T-32 Lateral and the Cleco Corporation Sterlington Plant by way of the Sterlington Lateral Midla Mainline has design capacity of approximately 198 MMcfd and consists of approximately 170 miles of low-pressure, 22-inch diameter pipeline with laterals ranging in diameter from two to 16 inches with delivery to small local distribution companies (“LDCs”) under firm transportation contracts that automatically renew annually Southern portion of system, including interconnections with the MLGT System and other associated laterals, consists of two miles of high- and low-pressure, 12-inch diameter pipeline with delivery to industrial and LDC customers in the Baton Rouge market through contracts with several large marketing companies TransUnion 42-mile, 30-inch diameter high-pressure FERC-regulated TransUnion natural gas interstate 92% reservation pipeline has 546,000 Dth/d of capacity and services power and industrial customers volumes AMID purchased 100% of the equity interests in November 2017 from affiliates of ArcLight for 14.5 -year average term total consideration of approximately $48 million, 6.7x EBITDA Source: AMID management, public filings 25 Preliminary Draft Subject to Change Asset Overview B Natural Gas Transportation (cont’d) Asset Overview Contract Terms Design capacity of 200 MMcfd and consists of 294 miles of pipeline with diameters ranging 91% reservation AlaTenn from 3-to-16 inches and two compressor stations with combined capacity of 3,665 HP volumes connected to 19 active delivery and four receipt points 4.1 -year average term FERC-regulated interstate natural gas pipeline that interconnects with Tennessee Gas Pipeline (“TGP”) and travels west to east delivering natural gas to industrial customers in northwestern Alabama as well as city gates of Decatur and Huntsville, Alabama Intrastate natural gas pipeline system with design capacity of 450 MMcfd and consists of 52 Bamagas miles of high-pressure, 30-inch pipeline that travels west to east from an interconnection point with TGP in Colbert County, Alabama, to two power plants in Morgan County, Alabama, with 100% of the throughput contracted under long-term firm transportation agreements The Trigas System is an intrastate natural gas pipeline located in northwestern Alabama Trigas across three counties with approximately 60.0 MMcfd of capacity Magnolia The Magnolia Gathering System is a 116-mile intrastate pipeline that gathers coal-bed 50% reservation methane in Tuscaloosa, Greene, Bibb, Chilton and Hale Counties, Alabama and delivers to the volumes Transco Pipeline System owned by The Williams Companies, Inc. ~1.0 -year average term Source: AMID management, public filings 26
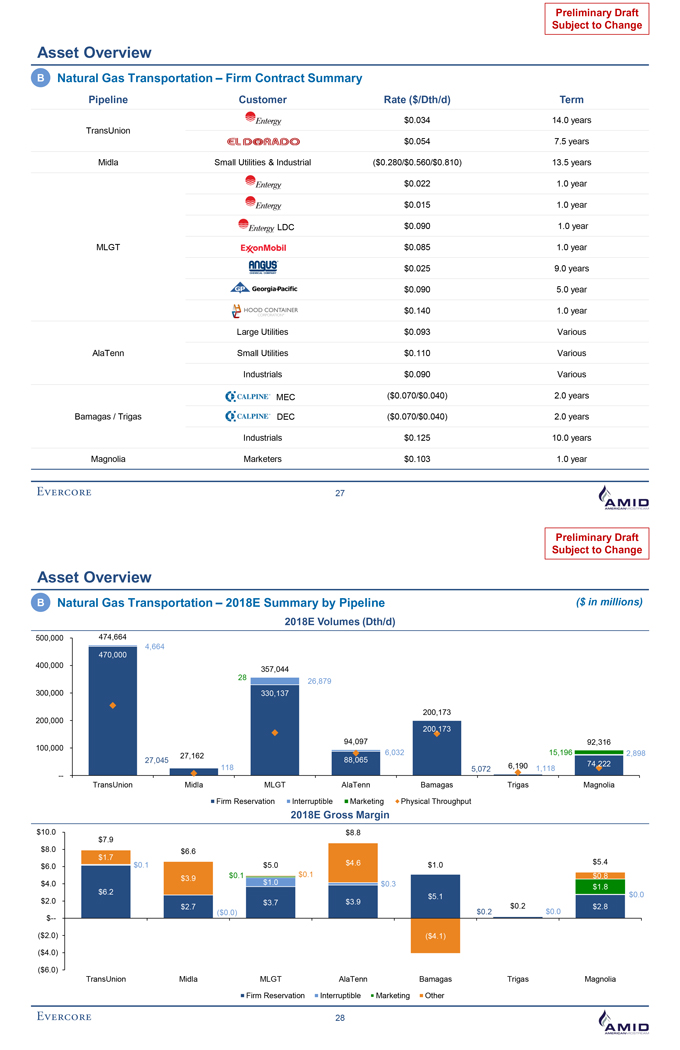
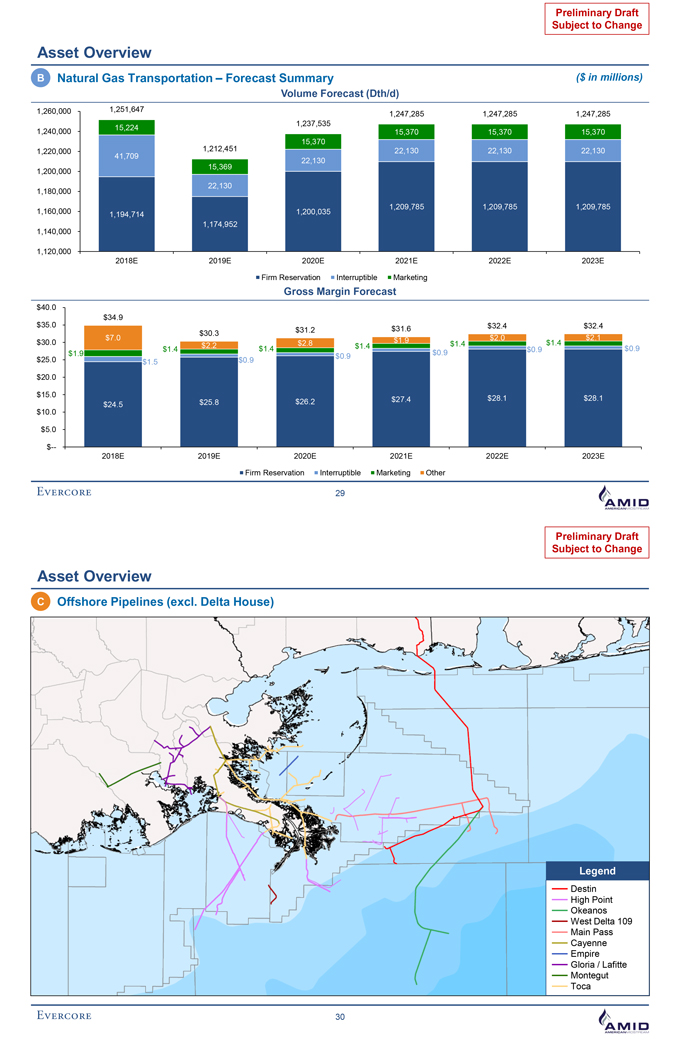
Preliminary Draft Subject to Change Asset Overview B Natural Gas Transportation – Firm Contract Summary Pipeline Customer Rate ($/Dth/d) Term $0.034 14.0 years TransUnion $0.054 7.5 years Midla Small Utilities & Industrial ($0.280/ $0.560/ $0.810) 13.5 years $0.022 1.0 year $0.015 1.0 year LDC $0.090 1.0 year MLGT $0.085 1.0 year $0.025 9.0 years $0.090 5.0 year $0.140 1.0 year Large Utilities $0.093 Various AlaTenn Small Utilities $0.110 Various Industrials $0.090 Various MEC ($0.070/ $0.040) 2.0 years Bamagas / Trigas DEC ($0.070/ $0.040) 2.0 years Industrials $0.125 10.0 years Magnolia Marketers $0.103 1.0 year 27 Preliminary Draft Subject to Change Asset Overview B Natural Gas Transportation – 2018E Summary by Pipeline ($ in millions) 2018E Volumes (Dth/d) 500,000 474,664 4,664 470,000 400,000 357,044 28 26,879 300,000 330,137 200,173 200,000 200,173 100,000 94,097 92,316 27,162 6,032 15,196 2,898 27,045 88,065 6,190 74,222 118 5,072 1,118 --TransUnion Midla MLGT AlaTenn Bamagas Trigas Magnolia Firm Reservation Interruptible Marketing Physical Throughput 2018E Gross Margin $10.0 $8.8 $7.9 $8.0 $6.6 $1.7 $0.1 $4.6 $1.0 $5.4 $6.0 $5.0 $0.1 $0.1 $0.8 $3.9 $4.0 $1.0 $0.3 $1.8 $6.2 $0.0 $5.1 $2.0 $3.7 $3.9 $2.7 $0.2 $2.8 $-- ($0.0) $0.2 $0.0 ($2.0) ($4.1) ($4.0) ($6.0) TransUnion Midla MLGT AlaTenn Bamagas Trigas Magnolia Firm Reservation Interruptible Marketing Other 28
Preliminary Draft Subject to Change Asset Overview B Natural Gas Transportation – Forecast Summary ($ in millions) Volume Forecast (Dth/d) 1,260,000 1,251,647 1,247,285 1,247,285 1,247,285 1,237,535 15,224 1,240,000 15,370 15,370 15,370 1,212,451 15,370 1,220,000 22,130 22,130 22,130 41,709 22,130 15,369 1,200,000 22,130 1,180,000 1,209,785 1,209,785 1,209,785 1,160,000 1,194,714 1,200,035 1,140,000 1,174,952 1,120,000 2018E 2019E 2020E 2021E 2022E 2023E Firm Reservation Interruptible Marketing Gross Margin Forecast $40.0 $34.9 $35.0 $32.4 $32.4 $31.2 $31.6 $30.3 $7.0 $1.9 $2.0 $2.1 $30.0 $2.2 $2.8 $1.4 $1.4 $1.4 $1.4 $1.4 $0.9 $0.9 $0.9 $25.0 $1.9 $0.9 $0.9 $1.5 $20.0 $15.0 $26.2 $27.4 $28.1 $28.1 $24.5 $25.8 $10.0 $5.0 $-- 2018E 2019E 2020E 2021E 2022E 2023E Firm Reservation Interruptible Marketing Other 29 Preliminary Draft I’------ jlSubjectto Change Asset Overview •C Offshore Pipelines (excl. Delta House) Legend Destin High Point Okeanos West Delta 109 Main Pass Cayenne Empire Gloria / Lafitte Montegut Toca EVERCORE 30 tt1_MID
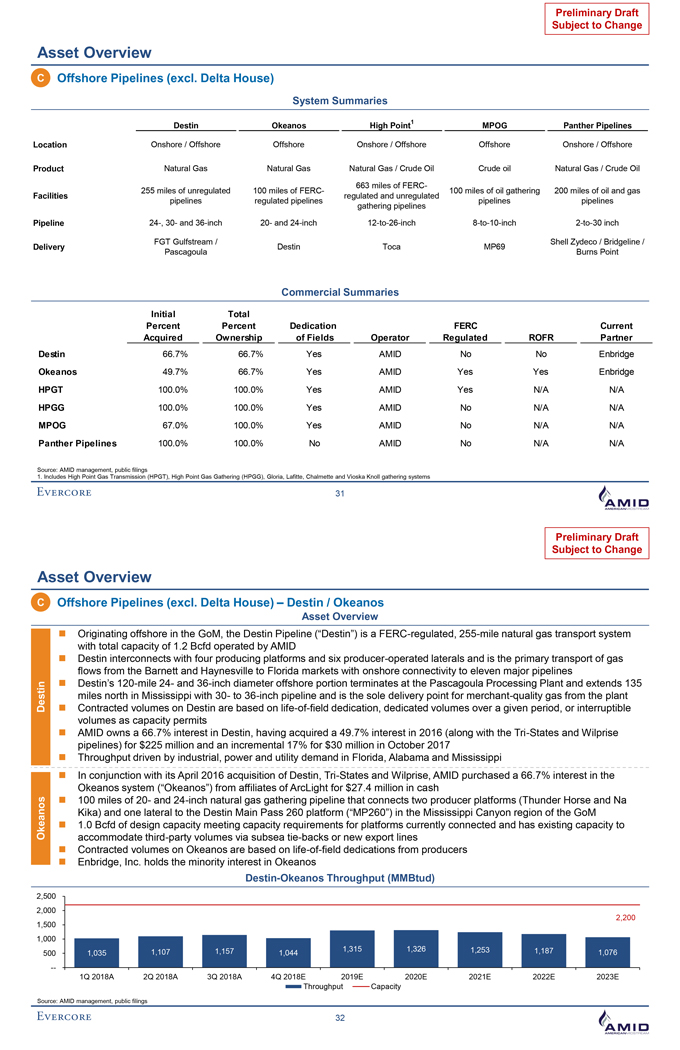
Preliminary Draft Subject to Change Asset Overview C Offshore Pipelines (excl. Delta House) System Summaries Destin Okeanos High Point1 MPOG Panther Pipelines Location Onshore / Offshore Offshore Onshore / Offshore Offshore Onshore / Offshore Product Natural Gas Natural Gas Natural Gas / Crude Oil Crude oil Natural Gas / Crude Oil 663 miles of FERC- 255 miles of unregulated 100 miles of FERC- 100 miles of oil gathering 200 miles of oil and gas Facilities regulated and unregulated pipelines regulated pipelines pipelines pipelines gathering pipelines Pipeline 24-, 30- and 36-inch 20- and 24-inch 12-to-26-inch 8-to-10-inch 2-to-30 inch FGT Gulfstream / Shell Zydeco / Bridgeline / Delivery Destin Toca MP69 Pascagoula Burns Point Commercial Summaries Initial Total Percent Percent Dedication FERC Current Acquired Ownership of Fields Operator Regulated ROFR Partner Destin 66.7% 66.7% Yes AMID No No Enbridge Okeanos 49.7% 66.7% Yes AMID Yes Yes Enbridge HPGT 100.0% 100.0% Yes AMID Yes N/A N/A HPGG 100.0% 100.0% Yes AMID No N/A N/A MPOG 67.0% 100.0% Yes AMID No N/A N/A Panther Pipelines 100.0% 100.0% No AMID No N/A N/A Source: AMID management, public filings 1. Includes High Point Gas Transmission (HPGT), High Point Gas Gathering (HPGG), Gloria, Lafitte, Chalmette and Vioska Knoll gathering systems 31 Preliminary Draft Subject to Change Asset Overview C Offshore Pipelines (excl. Delta House) – Destin / Okeanos Asset Overview Originating offshore in the GoM, the Destin Pipeline (“Destin”) is a FERC-regulated, 255-mile natural gas transport system with total capacity of 1.2 Bcfd operated by AMID Destin interconnects with four producing platforms and six producer-operated laterals and is the primary transport of gas flows from the Barnett and Haynesville to Florida markets with onshore connectivity to eleven major pipelines Destin Destin’s 120-mile 24- and 36-inch diameter offshore portion terminates at the Pascagoula Processing Plant and extends 135 miles north in Mississippi with 30- to 36-inch pipeline and is the sole delivery point for merchant-quality gas from the plant Contracted volumes on Destin are based on life-of-field dedication, dedicated volumes over a given period, or interruptible volumes as capacity permits AMID owns a 66.7% interest in Destin, having acquired a 49.7% interest in 2016 (along with the Tri-States and Wilprise pipelines) for $225 million and an incremental 17% for $30 million in October 2017 Throughput driven by industrial, power and utility demand in Florida, Alabama and Mississippi In conjunction with its April 2016 acquisition of Destin, Tri-States and Wilprise, AMID purchased a 66.7% interest in the Okeanos system (“Okeanos”) from affiliates of ArcLight for $27.4 million in cash Okeanos 100 miles of 20- and 24-inch natural gas gathering pipeline that connects two producer platforms (Thunder Horse and Na Kika) and one lateral to the Destin Main Pass 260 platform (“MP260”) in the Mississippi Canyon region of the GoM 1.0 Bcfd of design capacity meeting capacity requirements for platforms currently connected and has existing capacity to accommodate third-party volumes via subsea tie-backs or new export lines Contracted volumes on Okeanos are based on life-of-field dedications from producers Enbridge, Inc. holds the minority interest in Okeanos Destin-Okeanos Throughput (MMBtud) 2,500 2,000 1,500 2,200 1,000 1,107 1,157 1,315 1,326 1,253 1,187 500 1,035 1,044 1,076 --1Q 2018A 2Q 2018A 3Q 2018A 4Q 2018E 2019E 2020E 2021E 2022E 2023E Throughput Capacity Source: AMID management, public filings 32
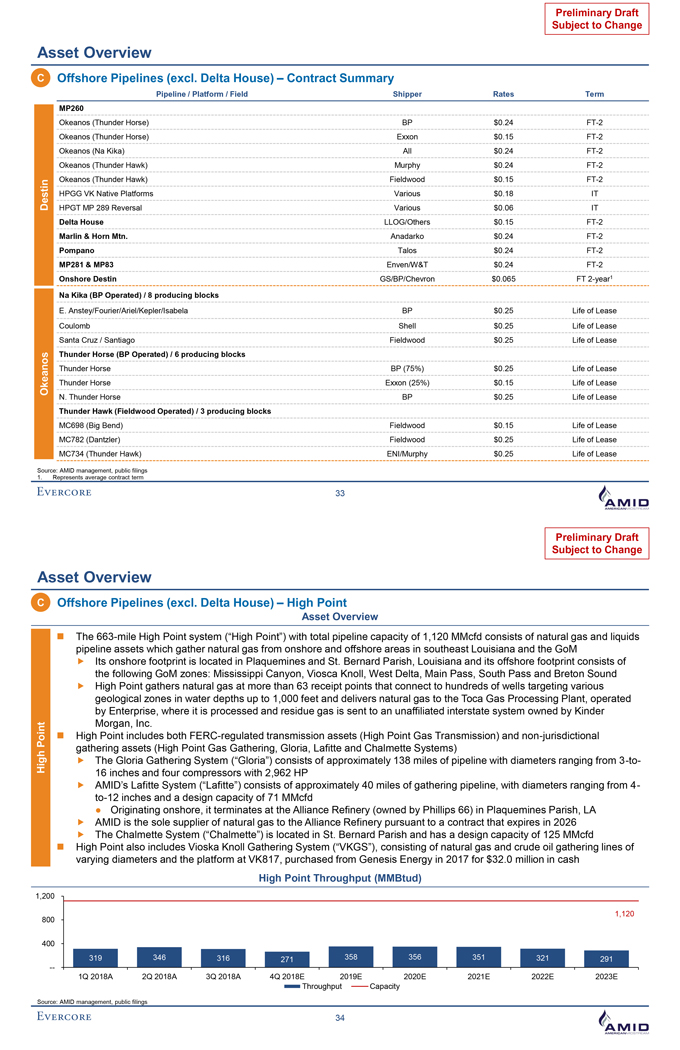
Preliminary Draft Subject to Change Asset Overview C Offshore Pipelines (excl. Delta House) – Contract Summary Pipeline / Platform / Field Shipper Rates Term MP260 Okeanos (Thunder Horse) BP $0.24 FT-2 Okeanos (Thunder Horse) Exxon $0.15 FT-2 Okeanos (Na Kika) All $0.24 FT-2 Okeanos (Thunder Hawk) Murphy $0.24 FT-2 Okeanos (Thunder Hawk) Fieldwood $0.15 FT-2 Destin HPGG VK Native Platforms Various $0.18 IT HPGT MP 289 Reversal Various $0.06 IT Delta House LLOG/Others $0.15 FT-2 Marlin & Horn Mtn. Anadarko $0.24 FT-2 Pompano Talos $0.24 FT-2 MP281 & MP83 Enven/W&T $0.24 FT-2 Onshore Destin GS/BP/Chevron $0.065 FT 2-year1 Na Kika (BP Operated) / 8 producing blocks E. Anstey/Fourier/Ariel/Kepler/Isabela BP $0.25 Life of Lease Coulomb Shell $0.25 Life of Lease Santa Cruz / Santiago Fieldwood $0.25 Life of Lease Okeanos Thunder Horse (BP Operated) / 6 producing blocks Thunder Horse BP (75%) $0.25 Life of Lease Thunder Horse Exxon (25%) $0.15 Life of Lease N. Thunder Horse BP $0.25 Life of Lease Thunder Hawk (Fieldwood Operated) / 3 producing blocks MC698 (Big Bend) Fieldwood $0.15 Life of Lease MC782 (Dantzler) Fieldwood $0.25 Life of Lease MC734 (Thunder Hawk) ENI/Murphy $0.25 Life of Lease Source: AMID management, public filings 1. Represents average contract term 33 Preliminary Draft Subject to Change Asset Overview C Offshore Pipelines (excl. Delta House) – High Point Asset Overview The 663-mile High Point system (“High Point”) with total pipeline capacity of 1,120 MMcfd consists of natural gas and liquids pipeline assets which gather natural gas from onshore and offshore areas in southeast Louisiana and the GoM Its onshore footprint is located in Plaquemines and St. Bernard Parish, Louisiana and its offshore footprint consists of the following GoM zones: Mississippi Canyon, Viosca Knoll, West Delta, Main Pass, South Pass and Breton Sound High Point gathers natural gas at more than 63 receipt points that connect to hundreds of wells targeting various geological zones in water depths up to 1,000 feet and delivers natural gas to the Toca Gas Processing Plant, operated by Enterprise, where it is processed and residue gas is sent to an unaffiliated interstate system owned by Kinder Morgan, Inc. High Point includes both FERC-regulated transmission assets (High Point Gas Transmission) and non-jurisdictional gathering assets (High Point Gas Gathering, Gloria, Lafitte and Chalmette Systems) High Point The Gloria Gathering System (“Gloria”) consists of approximately 138 miles of pipeline with diameters ranging from 3-to- 16 inches and four compressors with 2,962 HP AMID’s Lafitte System (“Lafitte”) consists of approximately 40 miles of gathering pipeline, with diameters ranging from 4-to-12 inches and a design capacity of 71 MMcfd Originating onshore, it terminates at the Alliance Refinery (owned by Phillips 66) in Plaquemines Parish, LA AMID is the sole supplier of natural gas to the Alliance Refinery pursuant to a contract that expires in 2026 The Chalmette System (“Chalmette”) is located in St. Bernard Parish and has a design capacity of 125 MMcfd High Point also includes Vioska Knoll Gathering System (“VKGS”), consisting of natural gas and crude oil gathering lines of varying diameters and the platform at VK817, purchased from Genesis Energy in 2017 for $32.0 million in cash High Point Throughput (MMBtud) 1,200 1,120 800 400 319 346 316 271 358 356 351 321 291 --1Q 2018A 2Q 2018A 3Q 2018A 4Q 2018E 2019E 2020E 2021E 2022E 2023E Throughput Capacity Source: AMID management, public filings 34
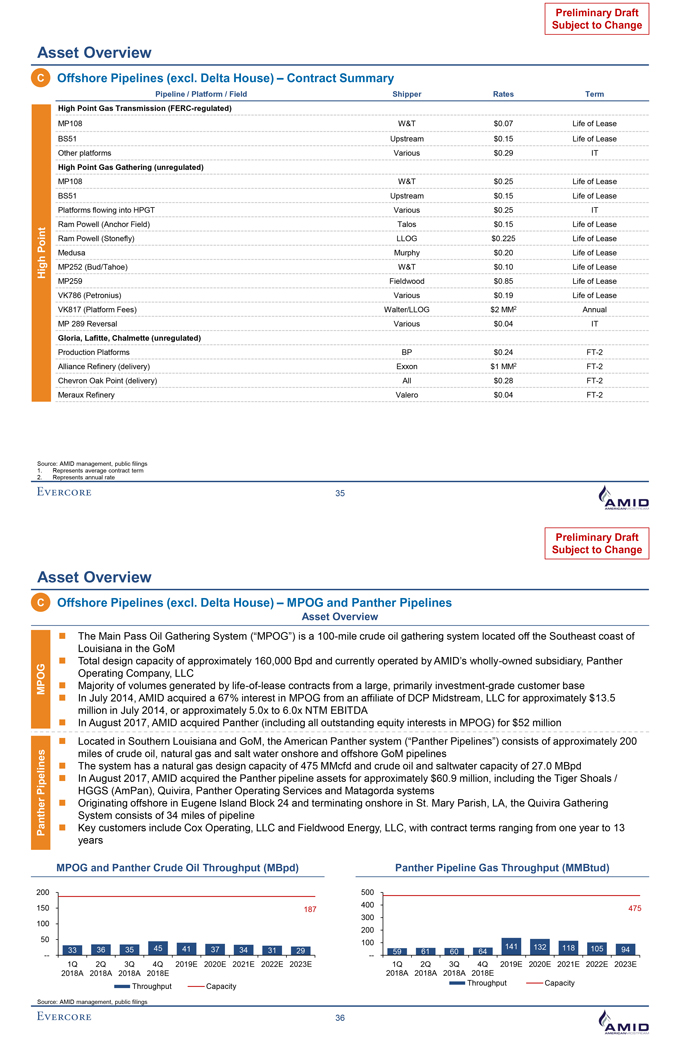
Preliminary Draft Subject to Change Asset Overview C Offshore Pipelines (excl. Delta House) – Contract Summary Pipeline / Platform / Field Shipper Rates Term High Point Gas Transmission (FERC-regulated) MP108 W&T $0.07 Life of Lease BS51 Upstream $0.15 Life of Lease Other platforms Various $0.29 IT High Point Gas Gathering (unregulated) MP108 W&T $0.25 Life of Lease BS51 Upstream $0.15 Life of Lease Platforms flowing into HPGT Various $0.25 IT Point Ram Powell (Anchor Field) Talos $0.15 Life of Lease Ram Powell (Stonefly) LLOG $0.225 Life of Lease Medusa Murphy $0.20 Life of Lease High MP252 (Bud/Tahoe) W&T $0.10 Life of Lease MP259 Fieldwood $0.85 Life of Lease VK786 (Petronius) Various $0.19 Life of Lease VK817 (Platform Fees) Walter/LLOG $2 MM2 Annual MP 289 Reversal Various $0.04 IT Gloria, Lafitte, Chalmette (unregulated) Production Platforms BP $0.24 FT-2 Alliance Refinery (delivery) Exxon $1 MM2 FT-2 Chevron Oak Point (delivery) All $0.28 FT-2 Meraux Refinery Valero $0.04 FT-2 Source: AMID management, public filings 1. Represents average contract term 2. Represents annual rate 35 Preliminary Draft Subject to Change Asset Overview C Offshore Pipelines (excl. Delta House) – MPOG and Panther Pipelines Asset Overview The Main Pass Oil Gathering System (“MPOG”) is a 100-mile crude oil gathering system located off the Southeast coast of Louisiana in the GoM Total design capacity of approximately 160,000 Bpd and currently operated by AMID’s wholly-owned subsidiary, Panther MPOG Operating Company, LLC Majority of volumes generated by life-of-lease contracts from a large, primarily investment-grade customer base In July 2014, AMID acquired a 67% interest in MPOG from an affiliate of DCP Midstream, LLC for approximately $13.5 million in July 2014, or approximately 5.0x to 6.0x NTM EBITDA In August 2017, AMID acquired Panther (including all outstanding equity interests in MPOG) for $52 million Located in Southern Louisiana and GoM, the American Panther system (“Panther Pipelines”) consists of approximately 200 Pipelines miles of crude oil, natural gas and salt water onshore and offshore GoM pipelines The system has a natural gas design capacity of 475 MMcfd and crude oil and saltwater capacity of 27.0 MBpd In August 2017, AMID acquired the Panther pipeline assets for approximately $60.9 million, including the Tiger Shoals / HGGS (AmPan), Quivira, Panther Operating Services and Matagorda systems Panther Originating offshore in Eugene Island Block 24 and terminating onshore in St. Mary Parish, LA, the Quivira Gathering System consists of 34 miles of pipeline Key customers include Cox Operating, LLC and Fieldwood Energy, LLC, with contract terms ranging from one year to 13 years MPOG and Panther Crude Oil Throughput (MBpd) Panther Pipeline Gas Throughput (MMBtud) 200 500 150 400 187 475 300 100 200 50 100 141 33 36 35 45 41 37 34 132 118 105 94 31 29 59 61 60 64 -- -- 1Q 2Q 3Q 4Q 2019E 2020E 2021E 2022E 2023E 1Q 2Q 3Q 4Q 2019E 2020E 2021E 2022E 2023E 2018A 2018A 2018A 2018E 2018A 2018A 2018A 2018E Throughput Capacity Throughput Capacity Source: AMID management, public filings 36
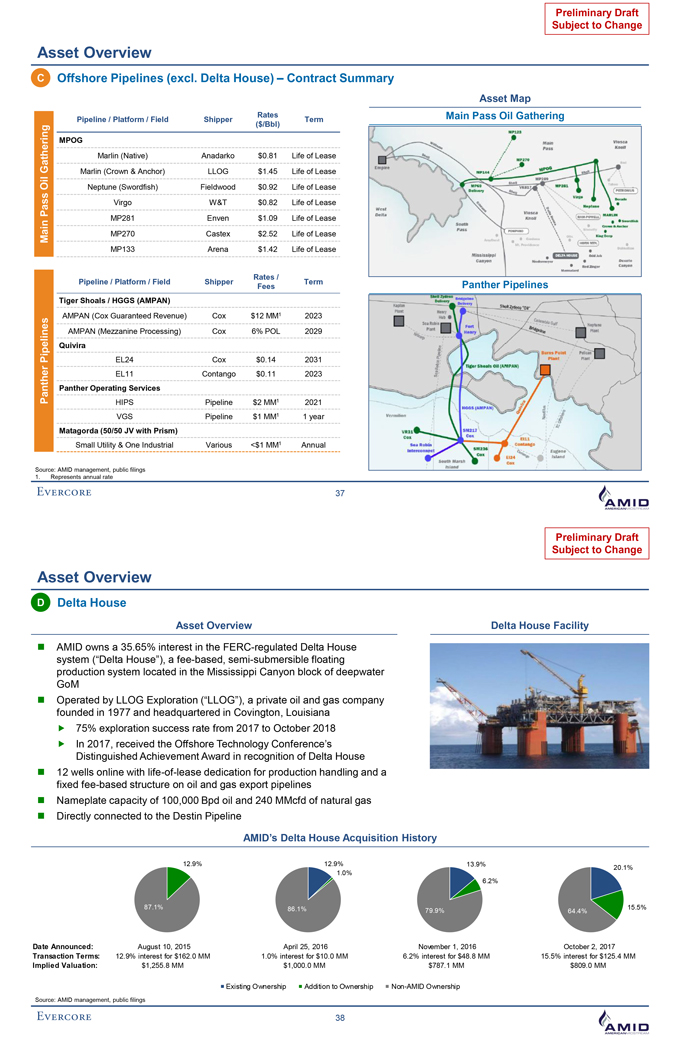
Preliminary Draft Subject to Change Asset Overview C Offshore Pipelines (excl. Delta House) – Contract Summary Asset Map Rates Main Pass Oil Gathering Pipeline / Platform / Field Shipper Term ($/Bbl) Gathering MPOG Marlin (Native) Anadarko $0.81 Life of Lease Marlin (Crown & Anchor) LLOG $1.45 Life of Lease Oil Neptune (Swordfish) Fieldwood $0.92 Life of Lease Pass Virgo W&T $0.82 Life of Lease Main MP281 Enven $1.09 Life of Lease MP270 Castex $2.52 Life of Lease MP133 Arena $1.42 Life of Lease Rates / Pipeline / Platform / Field Shipper Term Panther Pipelines Fees Tiger Shoals / HGGS (AMPAN) AMPAN (Cox Guaranteed Revenue) Cox $12 MM1 2023 Pipelines AMPAN (Mezzanine Processing) Cox 6% POL 2029 Quivira EL24 Cox $0.14 2031 Panther EL11 Contango $0.11 2023 Panther Operating Services HIPS Pipeline $2 MM1 2021 VGS Pipeline $1 MM1 1 year Matagorda (50/50 JV with Prism) Small Utility & One Industrial Various <$1 MM1 Annual Source: AMID management, public filings 1. Represents annual rate 37 Preliminary Draft Subject to Change Asset Overview D Delta House Asset Overview Delta House Facility AMID owns a 35.65% interest in the FERC-regulated Delta House system (“Delta House”), a fee-based, semi-submersible floating production system located in the Mississippi Canyon block of deepwater GoM Operated by LLOG Exploration (“LLOG”), a private oil and gas company founded in 1977 and headquartered in Covington, Louisiana 75% exploration success rate from 2017 to October 2018 In 2017, received the Offshore Technology Conference’s Distinguished Achievement Award in recognition of Delta House 12 wells online with life-of-lease dedication for production handling and a fixed fee-based structure on oil and gas export pipelines Nameplate capacity of 100,000 Bpd oil and 240 MMcfd of natural gas Directly connected to the Destin Pipeline AMID’s Delta House Acquisition History 12.9% 12.9% 13.9% 20.1% 1.0% 6.2% 87.1% 86.1% 15.5% 79.9% 64.4% Date Announced: August 10, 2015 April 25, 2016 November 1, 2016 October 2, 2017 Transaction Terms: 12.9% interest for $162.0 MM 1.0% interest for $10.0 MM 6.2% interest for $48.8 MM 15.5% interest for $125.4 MM Implied Valuation: $1,255.8 MM $1,000.0 MM $787.1 MM $809.0 MM Existing Ownership Addition to Ownership Non-AMID Ownership Source: AMID management, public filings 38
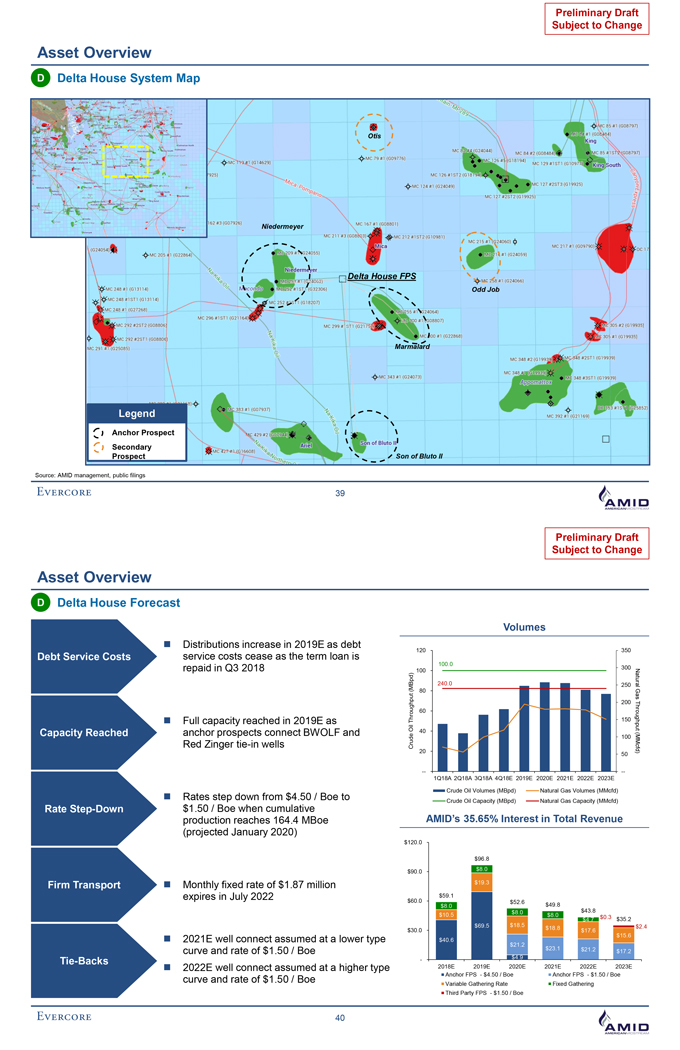
Preliminary Draft Subject to Change Asset Overview D Delta House System Map Otis Niedermeyer Delta House FPS Odd Job Marmalard Legend Anchor Prospect Secondary Prospect Son of Bluto II Source: AMID management, public filings 39 Preliminary Draft Subject to Change Asset Overview D Delta House Forecast Volumes Distributions increase in 2019E as debt 120 350 Debt Service Costs service costs cease as the term loan is 100.0 repaid in Q3 2018 300 100 240.0 250 Natural 80 Gas 200 60 Full capacity reached in 2019E as Oil Throughput (MBpd) 150 Capacity Reached anchor prospects connect BWOLF and 40 Red Zinger tie-in wells Crude 100 20 Throughput (MMcfd) 50 -- --1Q18A 2Q18A 3Q18A 4Q18E 2019E 2020E 2021E 2022E 2023E Crude Oil Volumes (MBpd) Natural Gas Volumes (MMcfd) Rates step down from $4.50 / Boe to Rate Step-Down $1.50 / Boe when cumulative Crude Oil Capacity (MBpd) Natural Gas Capacity (MMcfd) production reaches 164.4 MBoe AMID’s 35.65% Interest in Total Revenue (projected January 2020) $120.0 $96.8 $90.0 $8.0 Firm Transport Monthly fixed rate of $1.87 million $19.3 expires in July 2022 $60.0 $59.1 $52.6 $8.0 $49.8 $8.0 $43.8 $10.5 $8.0 $0.3 $4.7 $35.2 $69.5 $18.5 $2.4 $30.0 $18.8 $17.6 $15.6 2021E well connect assumed at a lower type $40.6 $21.2 $23.1 $21.2 curve and rate of $1.50 / Boe $17.2 Tie-Backs - $4.9 - - - 2022E well connect assumed at a higher type 2018E 2019E 2020E 2021E 2022E 2023E curve and rate of $1.50 / Boe Anchor FPS - $4.50 / Boe Anchor FPS - $1.50 / Boe Variable Gathering Rate Fixed Gathering Third Party FPS - $1.50 / Boe 40
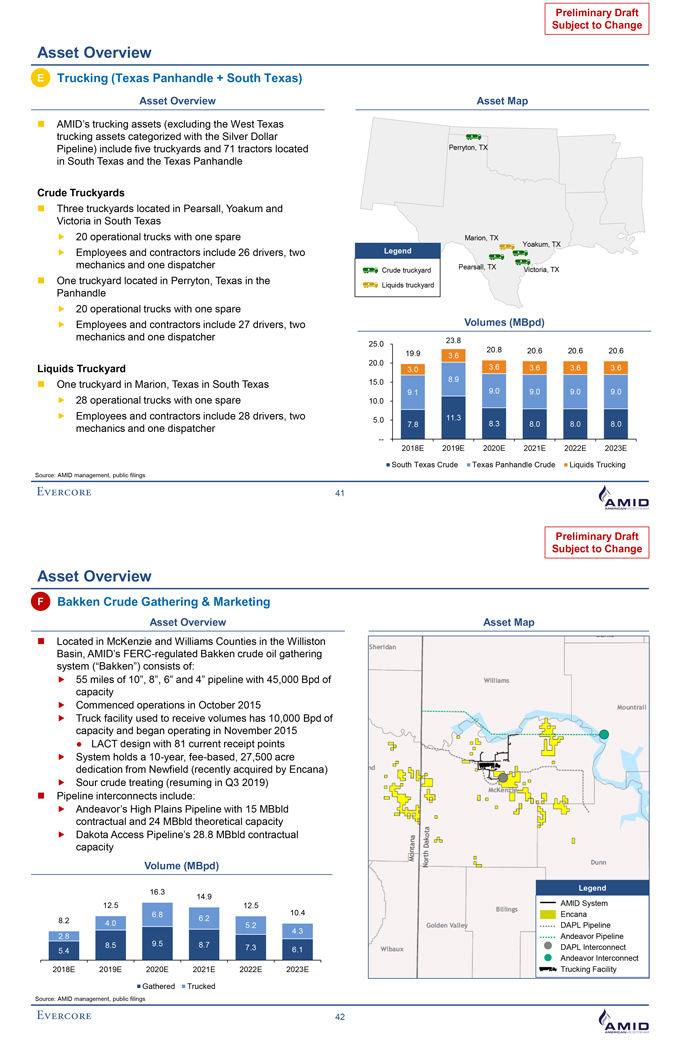
Preliminary Draft Subject to Change Asset Overview E Trucking (Texas Panhandle + South Texas) Asset Overview Asset Map AMID’s trucking assets (excluding the West Texas trucking assets categorized with the Silver Dollar Pipeline) include five truckyards and 71 tractors located Perryton, TX in South Texas and the Texas Panhandle Crude Truckyards Three truckyards located in Pearsall, Yoakum and Victoria in South Texas 20 operational trucks with one spare Marion, TX Employees and contractors include 26 drivers, two Legend Yoakum, TX mechanics and one dispatcher Pearsall, TX Crude truckyard Victoria, TX One truckyard located in Perryton, Texas in the Panhandle Liquids truckyard 20 operational trucks with one spare Employees and contractors include 27 drivers, two Volumes (MBpd) mechanics and one dispatcher 23.8 25.0 20.8 20.6 20.6 20.6 19.9 3.6 20.0 Liquids Truckyard 3.0 3.6 3.6 3.6 3.6 15.0 8.9 One truckyard in Marion, Texas in South Texas 9.1 9.0 9.0 9.0 9.0 28 operational trucks with one spare 10.0 Employees and contractors include 28 drivers, two 5.0 11.3 8.3 mechanics and one dispatcher 7.8 8.0 8.0 8.0 -- 2018E 2019E 2020E 2021E 2022E 2023E South Texas Crude Texas Panhandle Crude Liquids Trucking Source: AMID management, public filings 41 Preliminary Draft Subject to Change Asset Overview F Bakken Crude Gathering & Marketing Asset Overview Asset Map Located in McKenzie and Williams Counties in the Williston Basin, AMID’s FERC-regulated Bakken crude oil gathering system (“Bakken”) consists of: 55 miles of 10”, 8”, 6” and 4” pipeline with 45,000 Bpd of capacity Commenced operations in October 2015 Truck facility used to receive volumes has 10,000 Bpd of capacity and began operating in November 2015 LACT design with 81 current receipt points System holds a 10-year, fee-based, 27,500 acre dedication from Newfield (recently acquired by Encana) Sour crude treating (resuming in Q3 2019) Pipeline interconnects include: Andeavor’s High Plains Pipeline with 15 MBbld contractual and 24 MBbld theoretical capacity Dakota Access Pipeline’s 28.8 MBbld contractual capacity Volume (MBpd) Legend 16.3 14.9 AMID System 12.5 12.5 6.8 10.4 Encana 8.2 6.2 4.0 5.2 DAPL Pipeline 4.3 2.8 Andeavor Pipeline 8.5 9.5 8.7 7.3 6.1 DAPL Interconnect 5.4 Andeavor Interconnect 2018E 2019E 2020E 2021E 2022E 2023E Trucking Facility Gathered Trucked Source: AMID management, public filings 42
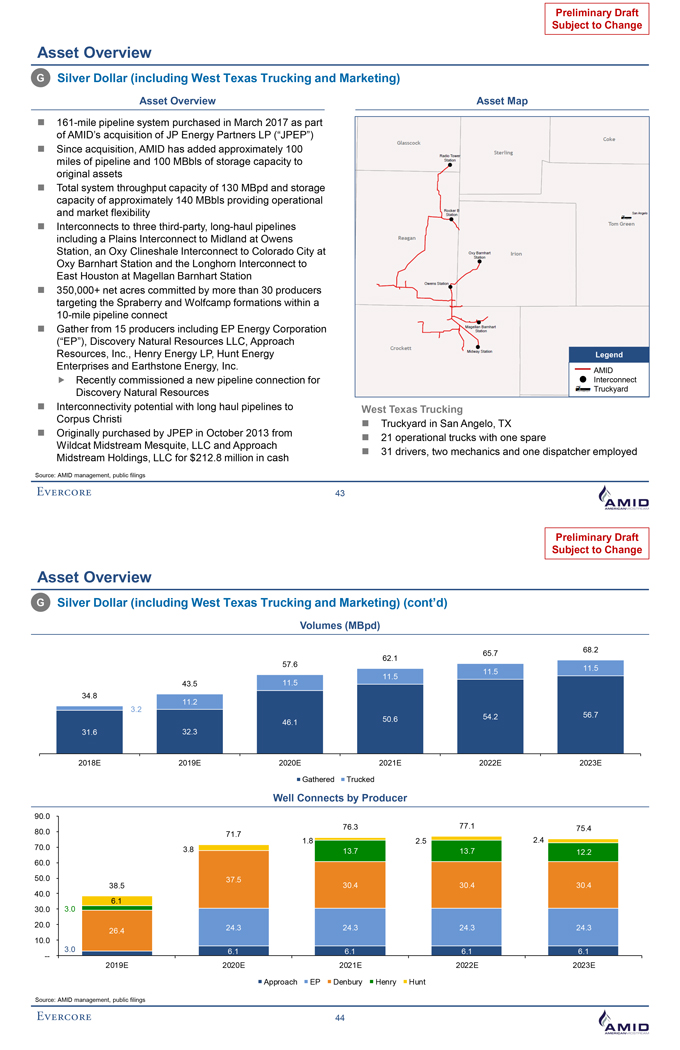
Preliminary Draft Subject to Change Asset Overview G Silver Dollar (including West Texas Trucking and Marketing) Asset Overview Asset Map 161-mile pipeline system purchased in March 2017 as part of AMID’s acquisition of JP Energy Partners LP (“JPEP”) Since acquisition, AMID has added approximately 100 miles of pipeline and 100 MBbls of storage capacity to original assets Total system throughput capacity of 130 MBpd and storage capacity of approximately 140 MBbls providing operational and market flexibility Interconnects to three third-party, long-haul pipelines including a Plains Interconnect to Midland at Owens Station, an Oxy Clineshale Interconnect to Colorado City at Oxy Barnhart Station and the Longhorn Interconnect to East Houston at Magellan Barnhart Station 350,000+ net acres committed by more than 30 producers targeting the Spraberry and Wolfcamp formations within a 10-mile pipeline connect Gather from 15 producers including EP Energy Corporation (“EP”), Discovery Natural Resources LLC, Approach Resources, Inc., Henry Energy LP, Hunt Energy Legend Enterprises and Earthstone Energy, Inc. AMID Recently commissioned a new pipeline connection for Interconnect Discovery Natural Resources Truckyard Interconnectivity potential with long haul pipelines to West Texas Trucking Corpus Christi Truckyard in San Angelo, TX Originally purchased by JPEP in October 2013 from 21 operational trucks with one spare Wildcat Midstream Mesquite, LLC and Approach 31 drivers, two mechanics and one dispatcher employed Midstream Holdings, LLC for $212.8 million in cash Source: AMID management, public filings 43 Preliminary Draft Subject to Change Asset Overview G Silver Dollar (including West Texas Trucking and Marketing) (cont’d) Volumes (MBpd) 68.2 65.7 62.1 57.6 11.5 11.5 11.5 43.5 11.5 34.8 11.2 3.2 54.2 56.7 46.1 50.6 31.6 32.3 2018E 2019E 2020E 2021E 2022E 2023E Gathered Trucked Well Connects by Producer 90.0 76.3 77.1 75.4 80.0 71.7 1.8 2.5 2.4 70.0 3.8 13.7 13.7 12.2 60.0 50.0 37.5 30.4 30.4 30.4 38.5 40.0 6.1 30.0 3.0 20.0 24.3 24.3 24.3 24.3 26.4 10.0 -- 3.0 6.1 6.1 6.1 6.1 2019E 2020E 2021E 2022E 2023E Approach EP Denbury Henry Hunt Source: AMID management, public filings 44
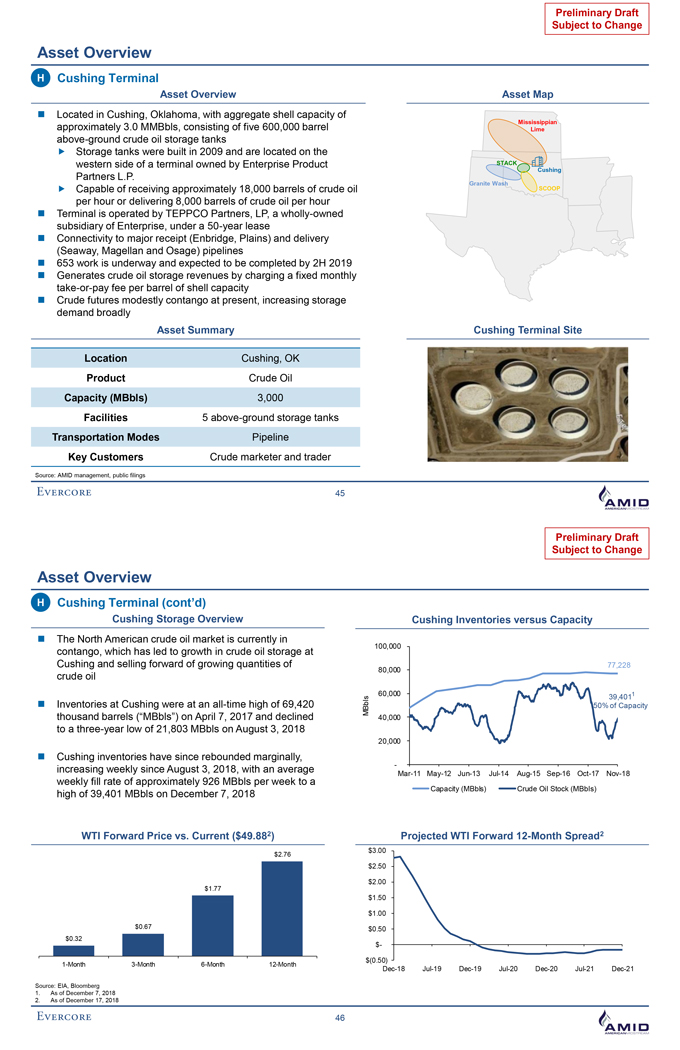
Preliminary Draft Subject to Change Asset Overview H Cushing Terminal Asset Overview Asset Map Located in Cushing, Oklahoma, with aggregate shell capacity of approximately 3.0 MMBbls, consisting of five 600,000 barrel Mississippian Lime above-ground crude oil storage tanks Storage tanks were built in 2009 and are located on the western side of a terminal owned by Enterprise Product STACK Cushing Partners L.P. Granite Wash Capable of receiving approximately 18,000 barrels of crude oil SCOOP per hour or delivering 8,000 barrels of crude oil per hour Terminal is operated by TEPPCO Partners, LP, a wholly-owned subsidiary of Enterprise, under a 50-year lease Connectivity to major receipt (Enbridge, Plains) and delivery (Seaway, Magellan and Osage) pipelines 653 work is underway and expected to be completed by 2H 2019 Generates crude oil storage revenues by charging a fixed monthly take-or-pay fee per barrel of shell capacity Crude futures modestly contango at present, increasing storage demand broadly Asset Summary Cushing Terminal Site Location Cushing, OK Product Crude Oil Capacity (MBbls) 3,000 Facilities 5 above-ground storage tanks Transportation Modes Pipeline Key Customers Crude marketer and trader Source: AMID management, public filings 45
Preliminary Draft Subject to Change Asset Overview H Cushing Terminal (cont’d) Cushing Storage Overview Cushing Inventories versus Capacity The North American crude oil market is currently in 100,000 contango, which has led to growth in crude oil storage at Cushing and selling forward of growing quantities of 77,228 80,000 crude oil s 60,000 39,4011 Inventories at Cushing were at an all-time high of 69,420 l MBb 50% of Capacity thousand barrels (“MBbls”) on April 7, 2017 and declined 40,000 to a three-year low of 21,803 MBbls on August 3, 2018 20,000 Cushing inventories have since rebounded marginally, increasing weekly since August 3, 2018, with an average -weekly fill rate of approximately 926 MBbls per week to a Mar-11 May-12 Jun-13 Jul-14 Aug-15 Sep-16 Oct-17 Nov-18 Capacity (MBbls) Crude Oil Stock (MBbls) high of 39,401 MBbls on December 7, 2018 WTI Forward Price vs. Current ($49.88 2) Projected WTI Forward 12-Month Spread2 $3.00 $2.76 $2.50 $2.00 $1.77 $1.50 $1.00 $0.67 $0.50 $0.32 $- $(0.50) 1-Month 3-Month 6-Month 12-Month Dec-18 Jul-19 Dec-19 Jul-20 Dec-20 Jul-21 Dec-21 Source: EIA, Bloomberg 1. As of December 7, 2018 2. As of December 17, 2018 46
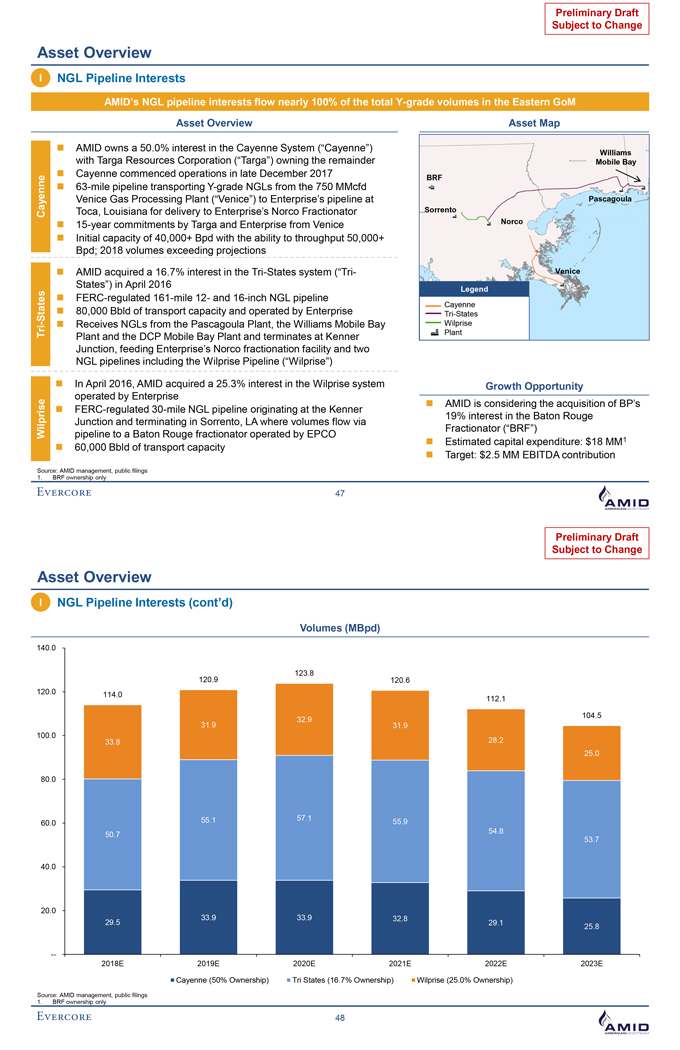
Preliminary Draft Subject to Change Asset Overview I NGL Pipeline Interests AMID’s NGL pipeline interests flow nearly 100% of the total Y-grade volumes in the Eastern GoM Asset Overview Asset Map AMID owns a 50.0% interest in the Cayenne System (“Cayenne”) Williams with Targa Resources Corporation (“Targa”) owning the remainder Mobile Bay Cayenne commenced operations in late December 2017 BRF Cayenne 63-mile pipeline transporting Y-grade NGLs from the 750 MMcfd Venice Gas Processing Plant (“Venice”) to Enterprise’s pipeline at Pascagoula Toca, Louisiana for delivery to Enterprise’s Norco Fractionator Sorrento 15-year commitments by Targa and Enterprise from Venice Norco Initial capacity of 40,000+ Bpd with the ability to throughput 50,000+ Bpd; 2018 volumes exceeding projections AMID acquired a 16.7% interest in the Tri-States system (“Tri- Venice States”) in April 2016 FERC-regulated 161-mile 12- and 16-inch NGL pipeline Legend Cayenne 80,000 Bbld of transport capacity and operated by Enterprise Tri-States Receives NGLs from the Pascagoula Plant, the Williams Mobile Bay Wilprise Tri-States Plant and the DCP Mobile Bay Plant and terminates at Kenner Plant Junction, feeding Enterprise’s Norco fractionation facility and two NGL pipelines including the Wilprise Pipeline (“Wilprise”) In April 2016, AMID acquired a 25.3% interest in the Wilprise system Growth Opportunity operated by Enterprise Wilprise AMID is considering the acquisition of BP’s FERC-regulated 30-mile NGL pipeline originating at the Kenner 19% interest in the Baton Rouge Junction and terminating in Sorrento, LA where volumes flow via Fractionator (“BRF”) pipeline to a Baton Rouge fractionator operated by EPCO 60,000 Bbld of transport capacity Estimated capital expenditure: $18 MM1 Target: $2.5 MM EBITDA contribution Source: AMID management, public filings 1. BRF ownership only 47
Preliminary Draft Subject to Change Asset Overview I NGL Pipeline Interests (cont’d) Volumes (MBpd) 140.0 120.9 123.8 120.6 120.0 114.0 112.1 104.5 32.9 31.9 31.9 100.0 33.8 28.2 25.0 80.0 55.1 57.1 60.0 55.9 54.8 50.7 53.7 40.0 20.0 33.9 33.9 32.8 29.5 29.1 25.8 -- 2018E 2019E 2020E 2021E 2022E 2023E Cayenne (50% Ownership) Tri States (16.7% Ownership) Wilprise (25.0% Ownership) Source: AMID management, public filings 1. BRF ownership only 48
Preliminary Draft Subject to Change Asset Overview Identified Growth Opportunities (Included in Base Case) ($ in millions) Implied Run-Incremental Incremental Rate EBITDA Project Description Growth Capex EBITDA Multiple Improve proportion of on-spec processing and rail volumes 2019 $57.0 $ - – Longview Build additional truck / rail sales outlets 2020 -- 11.6 4.9x 1 Expansion Secure Y-grade volumes via pipe and increase fractionation capacity and capabilities for purity products 2021 – 11.6 4.9x Acquisition of Potential to acquire BP’s approximately 19% share in Baton 2019 $18.0 $2.5 7.2x Interest in Rouge Fractionator 2 2020 – 2.5 7.2x Baton Rouge Fractionator 2021 – 2.5 7.2x In August 2018, AMID announced an agreement with 2019 $36.3 $8.8 4.1x Acquisition of Enterprise for a 25% stake in the Pascagoula gas plant Interest in Comprises three trains with approximately 1.5 Bcfd of 2020 0.2 8.7 4.2x 3 Pascagoula processing capacity Gas Plant Conditions include completion of modifications to certain 2021 – 8.0 4.6x facilities on the High Point system Potential to add incremental compression 2019 $6.5 $0.1 NM AlaTenn 4 2020 – 0.7 9.5x Compression 2021 – 1.0 6.5x Lateral pipeline connection to Ascend 2019 $0.7 $0.4 3.7x Bamagas – 5 Ascend 2020 – 0.6 2.6x Connection 2021 – 0.7 2.4x Source: AMID management, public filings 49 Preliminary Draft Subject to Change IV. AMID Financial Projections
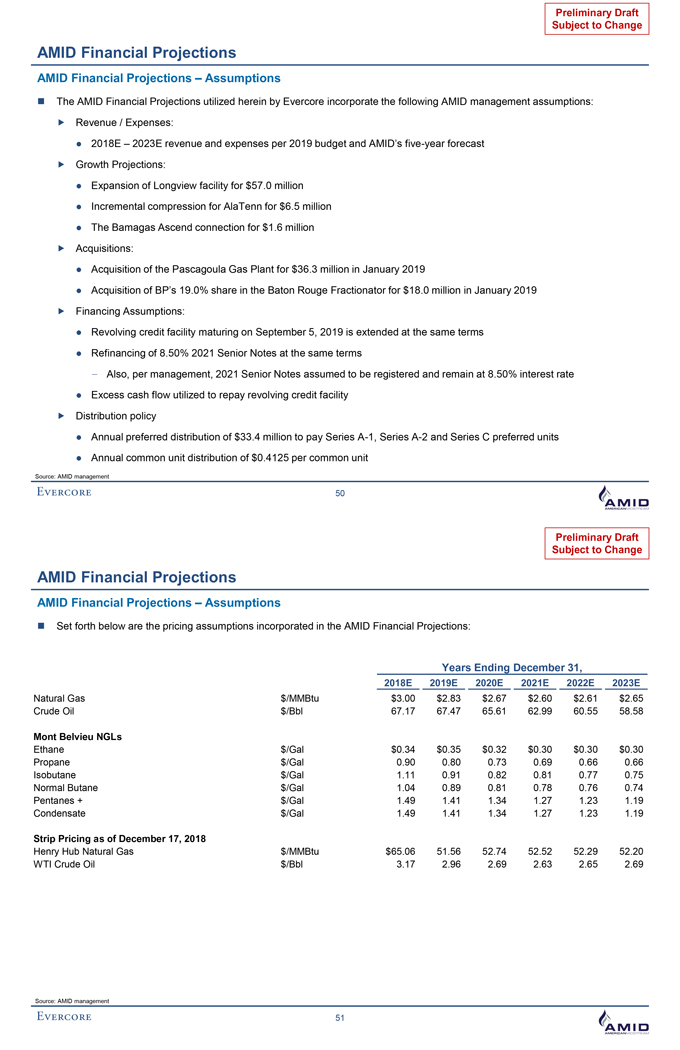
Preliminary Draft Subject to Change AMID Financial Projections AMID Financial Projections – Assumptions The AMID Financial Projections utilized herein by Evercore incorporate the following AMID management assumptions: Revenue / Expenses: 2018E –2023E revenue and expenses per 2019 budget and AMID’s five-year forecast Growth Projections: Expansion of Longview facility for $57.0 million Incremental compression for AlaTenn for $6.5 million The Bamagas Ascend connection for $1.6 million Acquisitions: Acquisition of the Pascagoula Gas Plant for $36.3 million in January 2019 Acquisition of BP’s 19.0% share in the Baton Rouge Fractionator for $18.0 million in January 2019 Financing Assumptions: Revolving credit facility maturing on September 5, 2019 is extended at the same terms Refinancing of 8.50% 2021 Senior Notes at the same terms - Also, per management, 2021 Senior Notes assumed to be registered and remain at 8.50% interest rate Excess cash flow utilized to repay revolving credit facility Distribution policy Annual preferred distribution of $33.4 million to pay Series A-1, Series A-2 and Series C preferred units Annual common unit distribution of $0.4125 per common unit Source: AMID management 50 Preliminary Draft Subject to Change AMID Financial Projections AMID Financial Projections – Assumptions Set forth below are the pricing assumptions incorporated in the AMID Financial Projections: Years Ending December 31, 2018E 2019E 2020E 2021E 2022E 2023E Natural Gas $/MMBtu $3.00 $2.83 $2.67 $2.60 $2.61 $2.65 Crude Oil $/Bbl 67.17 67.47 65.61 62.99 60.55 58.58 Mont Belvieu NGLs Ethane $/Gal $0.34 $0.35 $0.32 $0.30 $0.30 $0.30 Propane $/Gal 0.90 0.80 0.73 0.69 0.66 0.66 Isobutane $/Gal 1.11 0.91 0.82 0.81 0.77 0.75 Normal Butane $/Gal 1.04 0.89 0.81 0.78 0.76 0.74 Pentanes + $/Gal 1.49 1.41 1.34 1.27 1.23 1.19 Condensate $/Gal 1.49 1.41 1.34 1.27 1.23 1.19 Strip Pricing as of December 17, 2018 Henry Hub Natural Gas $/MMBtu $65.06 51.56 52.74 52.52 52.29 52.20 WTI Crude Oil $/Bbl 3.17 2.96 2.69 2.63 2.65 2.69 Source: AMID management 51
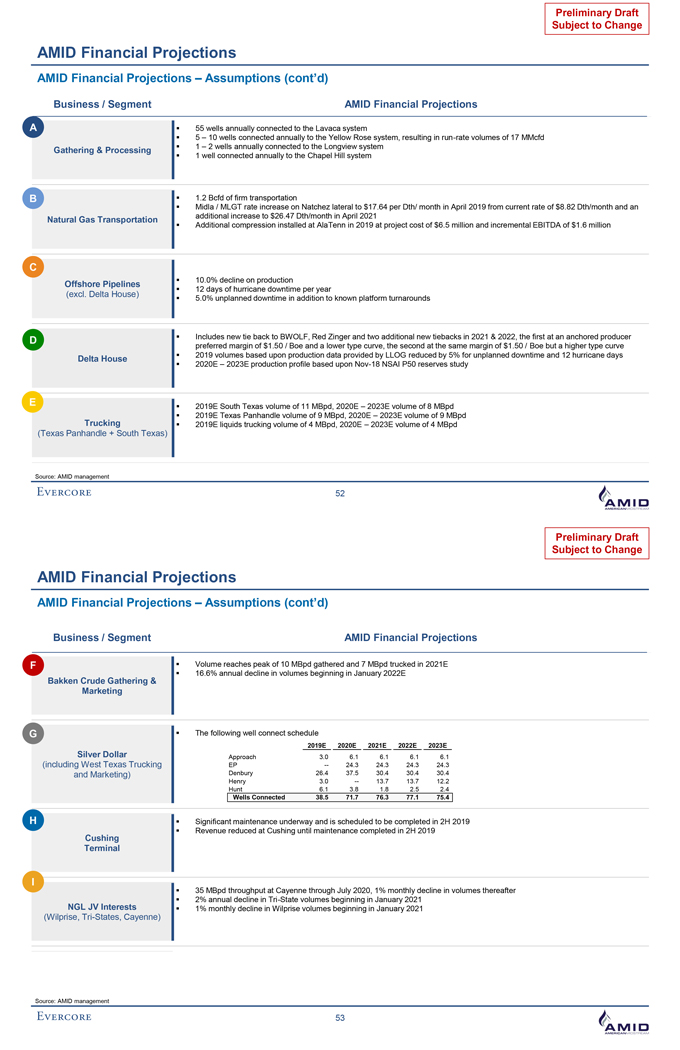
Preliminary Draft Subject to Change AMID Financial Projections AMID Financial Projections –Assumptions (cont’d) Business / Segment AMID Financial Projections A? 55 wells annually connected to the Lavaca system ? 5 – 10 wells connected annually to the Yellow Rose system, resulting in run-rate volumes of 17 MMcfd Gathering & Processing? 1 – 2 wells annually connected to the Longview system? 1 well connected annually to the Chapel Hill system B? 1.2 Bcfd of firm transportation ? Midla / MLGT rate increase on Natchez lateral to $17.64 per Dth/ month in April 2019 from current rate of $8.82 Dth/month and an Natural Gas Transportation additional increase to $26.47 Dth/month in April 2021? Additional compression installed at AlaTenn in 2019 at project cost of $6.5 million and incremental EBITDA of $1.6 million C ? 10.0% decline on production Offshore Pipelines ? 12 days of hurricane downtime per year (excl. Delta House) ? 5.0% unplanned downtime in addition to known platform turnarounds D? Includes new tie back to BWOLF, Red Zinger and two additional new tiebacks in 2021 & 2022, the first at an anchored producer preferred margin of $1.50 / Boe and a lower type curve, the second at the same margin of $1.50 / Boe but a higher type curve Delta House? 2019 volumes based upon production data provided by LLOG reduced by 5% for unplanned downtime and 12 hurricane days? 2020E – 2023E production profile based upon Nov-18 NSAI P50 reserves study E? 2019E South Texas volume of 11 MBpd, 2020E – 2023E volume of 8 MBpd? 2019E Texas Panhandle volume of 9 MBpd, 2020E – 2023E volume of 9 MBpd Trucking ? 2019E liquids trucking volume of 4 MBpd, 2020E – 2023E volume of 4 MBpd (Texas Panhandle + South Texas) Source: AMID management 52 Preliminary Draft Subject to Change AMID Financial Projections AMID Financial Projections –Assumptions (cont’d) Business / Segment AMID Financial Projections F? Volume reaches peak of 10 MBpd gathered and 7 MBpd trucked in 2021E Bakken Crude Gathering & ? 16.6% annual decline in volumes beginning in January 2022E Marketing G? The following well connect schedule 2019E 2020E 2021E 2022E 2023E Silver Dollar Approach 3.0 6.1 6.1 6.1 6.1 (including West Texas Trucking EP -- 24.3 24.3 24.3 24.3 and Marketing) Denbury 26.4 37.5 30.4 30.4 30.4 Henry 3.0 -- 13.7 13.7 12.2 Hunt 6.1 3.8 1.8 2.5 2.4 Wells Connected 38.5 71.7 76.3 77.1 75.4 H? Significant maintenance underway and is scheduled to be completed in 2H 2019 Cushing ? Revenue reduced at Cushing until maintenance completed in 2H 2019 Terminal I ? 35 MBpd throughput at Cayenne through July 2020, 1% monthly decline in volumes thereafter NGL JV Interests? 2% annual decline in Tri-State volumes beginning in January 2021? 1% monthly decline in Wilprise volumes beginning in January 2021 (Wilprise, Tri-States, Cayenne) Source: AMID management 53
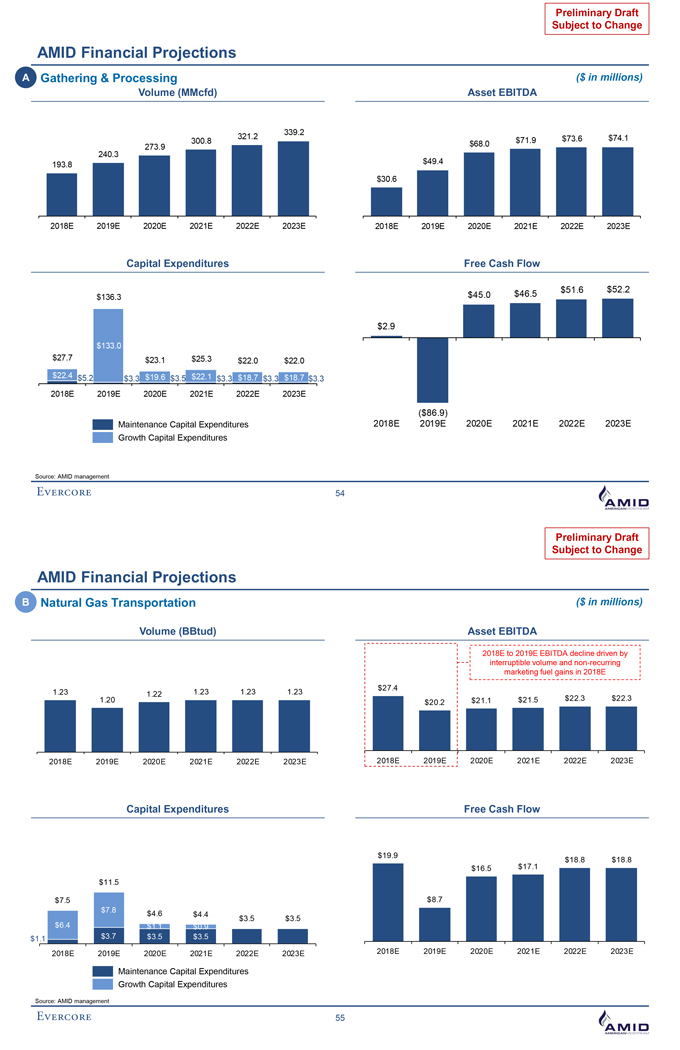
Preliminary Draft Subject to Change AMID Financial Projections A Gathering & Processing ($ in millions) Volume (MMcfd) Asset EBITDA 339.2 321.2 $73.6 $74.1 300.8 $68.0 $71.9 240.3 273.9 193.8 $49.4 $30.6 2018E 2019E 2020E 2021E 2022E 2023E 2018E 2019E 2020E 2021E 2022E 2023E Capital Expenditures Free Cash Flow $51.6 $52.2 $136.3 $45.0 $46.5 $2.9 $133.0 $27.7 $23.1 $25.3 $22.0 $22.0 $22.4 $5.2 $3.3 $19.6 $3.5 $22.1 $3.3 $18.7 $3.3 $18.7 $3.3 2018E 2019E 2020E 2021E 2022E 2023E ($86.9) Maintenance Capital Expenditures 2018E 2019E 2020E 2021E 2022E 2023E Growth Capital Expenditures Source: AMID management 54 Preliminary Draft Subject to Change AMID Financial Projections B Natural Gas Transportation ($ in millions) Volume (BBtud) Asset EBITDA 2018E to 2019E EBITDA decline driven by interruptible volume and non-recurring marketing fuel gains in 2018E $27.4 1.23 1.22 1.23 1.23 1.23 1.20 $21.1 $21.5 $22.3 $22.3 $20.2 2018E 2019E 2020E 2021E 2022E 2023E 2018E 2019E 2020E 2021E 2022E 2023E Capital Expenditures Free Cash Flow $19.9 $17.1 $18.8 $18.8 $16.5 $11.5 $7.5 $8.7 $7.8 $4.6 $4.4 $6.4 $3.5 $3.5 $1.1 $0.9 $1.1 $3.7 $3.5 $3.5 2018E 2019E 2020E 2021E 2022E 2023E 2018E 2019E 2020E 2021E 2022E 2023E Maintenance Capital Expenditures Growth Capital Expenditures Source: AMID management 55
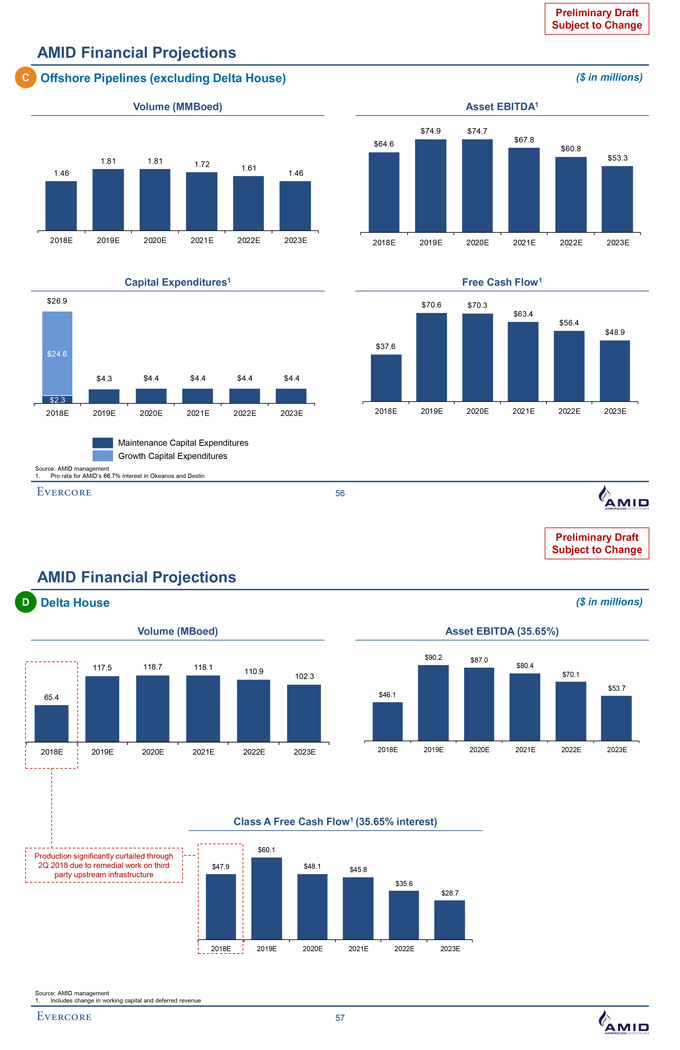
Preliminary Draft Subject to Change AMID Financial Projections C Offshore Pipelines (excluding Delta House) ($ in millions) Volume (MMBoed) Asset EBITDA1 $74.9 $74.7 $67.8 $64.6 $60.8 1.81 1.81 1.72 $53.3 1.61 1.46 1.46 2018E 2019E 2020E 2021E 2022E 2023E 2018E 2019E 2020E 2021E 2022E 2023E Capital Expenditures1 Free Cash Flow1 $26.9 $70.6 $70.3 $63.4 $56.4 $48.9 $37.6 $24.6 $4.3 $4.4 $4.4 $4.4 $4.4 $2.3 2018E 2019E 2020E 2021E 2022E 2023E 2018E 2019E 2020E 2021E 2022E 2023E Maintenance Capital Expenditures Growth Capital Expenditures Source: AMID management 1. Pro rata for AMID’s 66.7% interest in Okeanos and Destin 56 Preliminary Draft Subject to Change AMID Financial Projections D Delta House ($ in millions) Volume (MBoed) Asset EBITDA (35.65%) $90.2 $87.0 117.5 118.7 118.1 $80.4 110.9 $70.1 102.3 $46.1 $53.7 65.4 2018E 2019E 2020E 2021E 2022E 2023E 2018E 2019E 2020E 2021E 2022E 2023E Class A Free Cash Flow1 (35.65% interest) Production significantly curtailed through $60.1 2Q 2018 due to remedial work on third $47.9 $48.1 $45.8 party upstream infrastructure $35.6 $28.7 2018E 2019E 2020E 2021E 2022E 2023E Source: AMID management 1. Includes change in working capital and deferred revenue 57
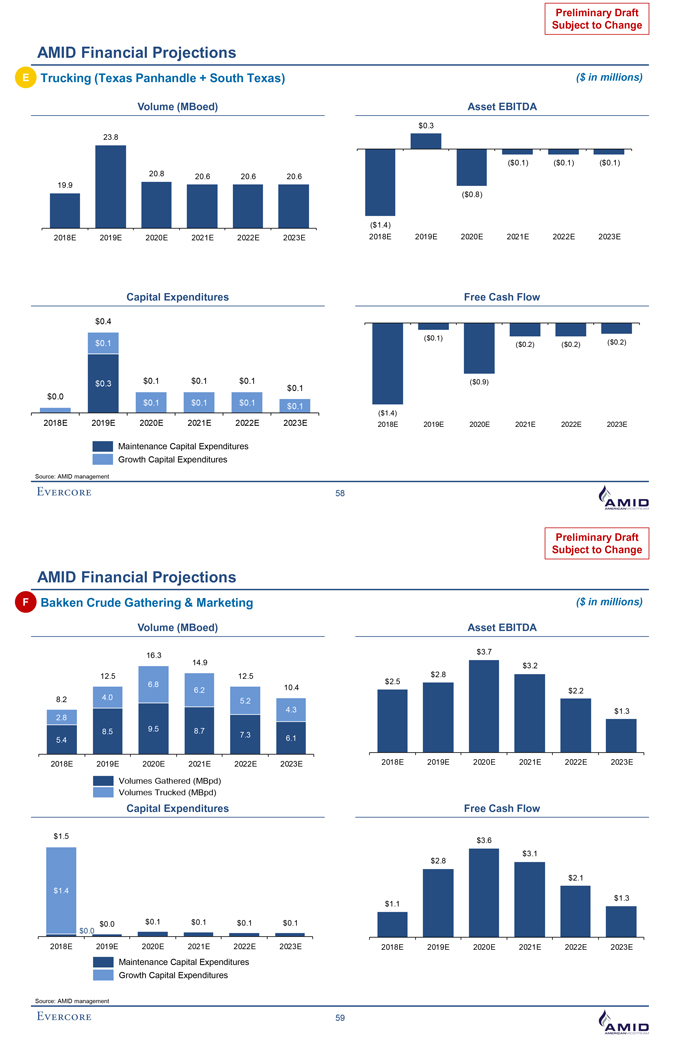
Preliminary Draft Subject to Change AMID Financial Projections E Trucking (Texas Panhandle + South Texas) ($ in millions) Volume (MBoed) Asset EBITDA $0.3 23.8 ($0.1) ($0.1) ($0.1) 20.8 20.6 20.6 20.6 19.9 ($0.8) ($1.4) 2018E 2019E 2020E 2021E 2022E 2023E 2018E 2019E 2020E 2021E 2022E 2023E Capital Expenditures Free Cash Flow $0.4 ($0.1) $0.1 ($0.2) ($0.2) ($0.2) $0.3 $0.1 $0.1 $0.1 $0.1 ($0.9) $0.0 $0.1 $0.1 $0.1 $0.1 ($1.4) 2018E 2019E 2020E 2021E 2022E 2023E 2018E 2019E 2020E 2021E 2022E 2023E Maintenance Capital Expenditures Growth Capital Expenditures Source: AMID management 58 Preliminary Draft Subject to Ch ange AMID Financial Projections F Bakken Crude Gathering & Marketing ($ in millions) Volume (MBoed) Asset EBITDA $3.7 16.3 14.9 $3.2 12.5 12.5 $2.5 $2.8 6.8 10.4 6.2 $2.2 8.2 4.0 5.2 4.3 $1.3 2.8 8.5 9.5 8.7 7.3 6.1 5.4 2018E 2019E 2020E 2021E 2022E 2023E 2018E 2019E 2020E 2021E 2022E 2023E Volumes Gathered (MBpd) Volumes Trucked (MBpd) Capital Expenditures Free Cash Flow $1.5 $3.6 $2.8 $3.1 $2.1 $1.4 $1.3 $1.1 $0.0 $0.1 $0.1 $0.1 $0.1 $0.0 2018E 2019E 2020E 2021E 2022E 2023E 2018E 2019E 2020E 2021E 2022E 2023E Maintenance Capital Expenditures Growth Capital Expenditures Source: AMID management 59
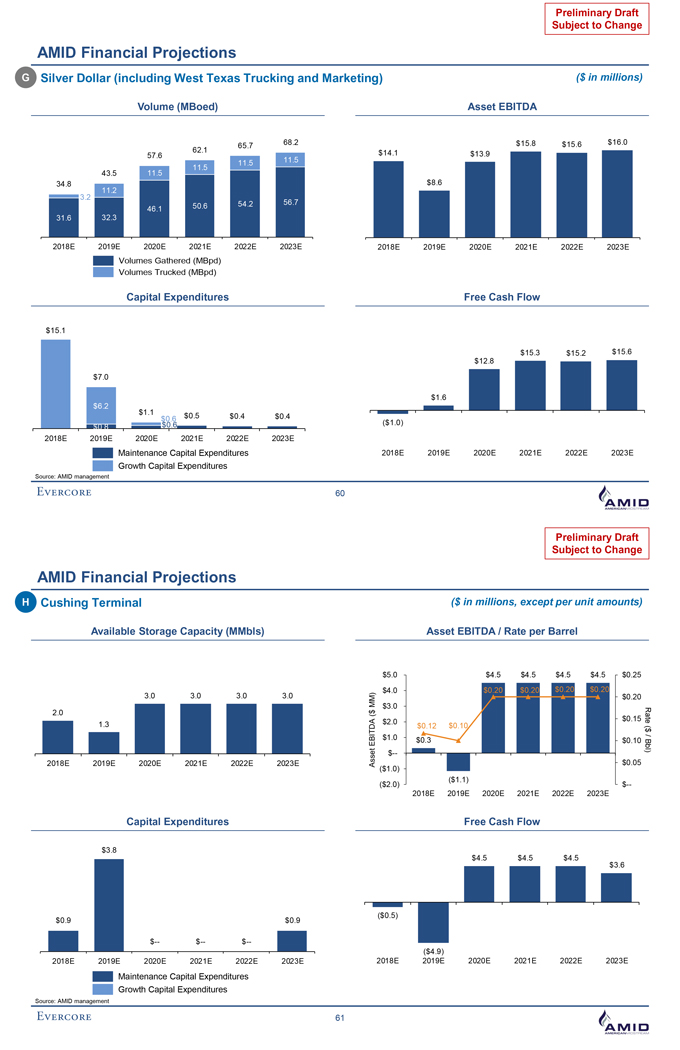
Preliminary Draft Subject to Change AMID Financial Projections G Silver Dollar (including West Texas Trucking and Marketing) ($ in millions) Volume (MBoed) Asset EBITDA 68.2 $15.8 $15.6 $16.0 65.7 62.1 $14.1 57.6 $13.9 11.5 11.5 11.5 43.5 11.5 34.8 $8.6 3.2 11.2 54.2 56.7 46.1 50.6 31.6 32.3 2018E 2019E 2020E 2021E 2022E 2023E 2018E 2019E 2020E 2021E 2022E 2023E Volumes Gathered (MBpd) Volumes Trucked (MBpd) Capital Expenditures Free Cash Flow $15.1 $15.3 $15.2 $15.6 $12.8 $7.0 $1.6 $6.2 $1.1 $0.6 $0.5 $0.4 $0.4 ($1.0) $0.8 $0.6 2018E 2019E 2020E 2021E 2022E 2023E Maintenance Capital Expenditures 2018E 2019E 2020E 2021E 2022E 2023E Growth Capital Expenditures Source: AMID management 60 Preliminary Draft Subject to Change AMID Financial Projections H Cushing Terminal ($ in millions, except per unit amounts) Available Storage Capacity (MMbls) Asset EBITDA / Rate per Barrel $5.0 $4.5 $4.5 $4.5 $4.5 $0.25 3.0 3.0 3.0 3.0 $4.0 $0.20 $0.20 $0.20 $0.20 $0.20 2.0 ($ MM) $3.0 $2.0 $0.15 Rate 1.3 EBITDA $0.12 $0.10 ($ / $1.0 $0.3 $0.10Bbl) $--2018E 2019E 2020E 2021E 2022E 2023E Asset ($1.0) $0.05 ($1.1) ($2.0) $--2018E 2019E 2020E 2021E 2022E 2023E Capital Expenditures Free Cash Flow $3.8 $4.5 $4.5 $4.5 $3.6 ($0.5) $0.9 $0.9 $-- $-- $-- ($4.9) 2018E 2019E 2020E 2021E 2022E 2023E 2018E 2019E 2020E 2021E 2022E 2023E Maintenance Capital Expenditures Growth Capital Expenditures Source: AMID management 61
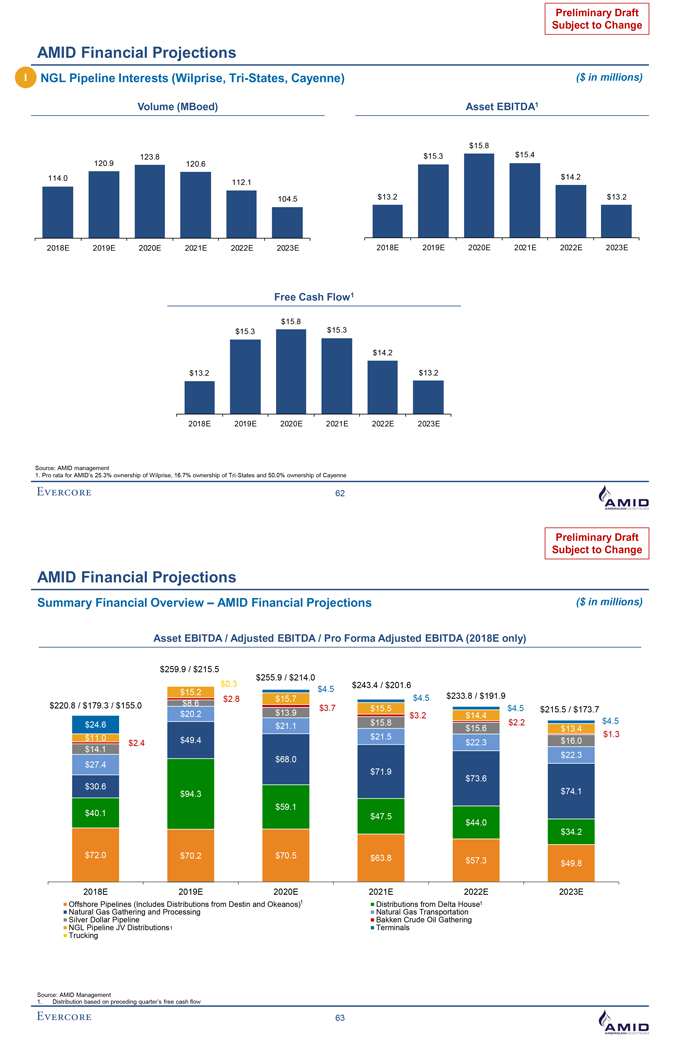
Preliminary Draft Subject to Change AMID Financial Projections I NGL Pipeline Interests (Wilprise, Tri-States, Cayenne) ($ in millions) Volume (MBoed) Asset EBITDA1 $15.8 123.8 $15.3 $15.4 120.9 120.6 114.0 $14.2 112.1 104.5 $13.2 $13.2 2018E 2019E 2020E 2021E 2022E 2023E 2018E 2019E 2020E 2021E 2022E 2023E Free Cash Flow1 $15.8 $15.3 $15.3 $14.2 $13.2 $13.2 2018E 2019E 2020E 2021E 2022E 2023E Source: AMID management 1. Pro rata for AMID’s 25.3% ownership of Wilprise, 16.7% ownership of Tri-States and 50.0% ownership of Cayenne 62 Preliminary Draft Subject to Change AMID Financial Projections Summary Financial Overview – AMID Financial Projections ($ in millions) Asset EBITDA / Adjusted EBITDA / Pro Forma Adjusted EBITDA (2018E only) $259.9 / $215.5 $255.9 / $214.0 $0.3 $243.4 / $201.6 $15.2 $4.5 $8.6 $2.8 $15.7 $4.5 $233.8 / $191.9 $220.8 / $179.3 / $155.0 $3.7 $15.5 $4.5 $13.9 $215.5 / $173.7 $20.2 $3.2 $14.4 $15.8 $2.2 $4.5 $24.6 $21.1 $15.6 $13.4 $21.5 $1.3 $11.0 $49.4 $16.0 $2.4 $22.3 $14.1 $22.3 $68.0 $27.4 $71.9 $73.6 $30.6 $94.3 $74.1 $59.1 $40.1 $47.5 $44.0 $34.2 $72.0 $70.2 $70.5 $63.8 $57.3 $49.8 2018E 2019E 2020E 2021E 2022E 2023E Offshore Pipelines (Includes Distributions from Destin and Okeanos)1 Distributions from Delta House1 Natural Gas Gathering and Processing Natural Gas Transportation Silver Dollar Pipeline Bakken Crude Oil Gathering NGL Pipeline JV Distributions1 Terminals Trucking Source: AMID Management 1. Distribution based on preceding quarter’s free cash flow 63
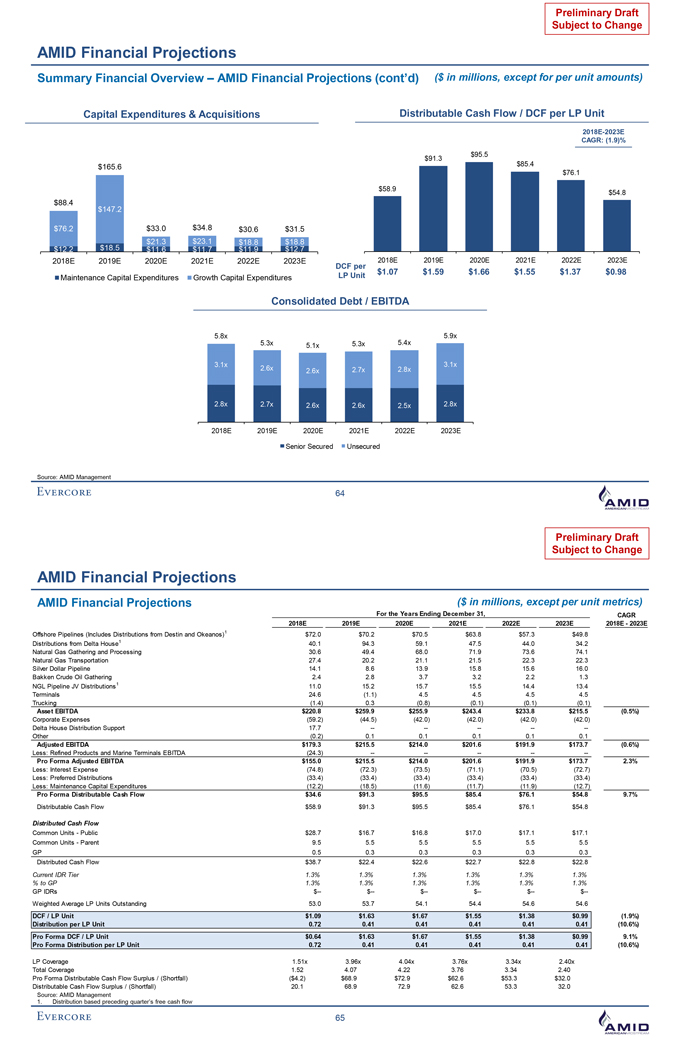
Preliminary Draft Subject to Change AMID Financial Projections Summary Financial Overview –AMID Financial Projections (cont’d) ($ in millions, except for per unit amounts) Capital Expenditures & Acquisitions Distributable Cash Flow / DCF per LP Unit 2018E-2023E CAGR: (1.9)% $95.5 $91.3 $165.6 $85.4 $76.1 $58.9 $54.8 $88.4 $147.2 $76.2 $33.0 $34.8 $30.6 $31.5 $18.5 $21.3 $23.1 $18.8 $18.8 $12.2 $11.6 $11.7 $11.9 $12.7 2018E 2019E 2020E 2021E 2022E 2023E DCF per 2018E 2019E 2020E 2021E 2022E 2023E $1.07 $1.59 $1.66 $1.55 $1.37 $0.98 Maintenance Capital Expenditures Growth Capital Expenditures LP Unit Consolidated Debt / EBITDA 5.8x 5.9x 5.3x 5.1x 5.3x 5.4x 3.1x 3.1x 2.6x 2.6x 2.7x 2.8x 2.8x 2.7x 2.6x 2.6x 2.5x 2.8x 2018E 2019E 2020E 2021E 2022E 2023E Senior Secured Unsecured Source: AMID Management 64 Preliminary Draft Subject to Change AMID Financial Projections AMID Financial Projections ($ in millions, except per unit metrics) For the Years Ending December 31, CAGR 2018E 2019E 2020E 2021E 2022E 2023E 2018E - 2023E Offshore Pipelines (Includes Distributions from Destin and Okeanos)1 $72.0 $70.2 $70.5 $63.8 $57.3 $49.8 Distributions from Delta House1 40.1 94.3 59.1 47.5 44.0 34.2 Natural Gas Gathering and Processing 30.6 49.4 68.0 71.9 73.6 74.1 Natural Gas Transportation 27.4 20.2 21.1 21.5 22.3 22.3 Silver Dollar Pipeline 14.1 8.6 13.9 15.8 15.6 16.0 Bakken Crude Oil Gathering 2.4 2.8 3.7 3.2 2.2 1.3 NGL Pipeline JV Distributions1 11.0 15.2 15.7 15.5 14.4 13.4 Terminals 24.6 (1.1) 4.5 4.5 4.5 4.5 Trucking (1.4) 0.3 (0.8) (0.1) (0.1) (0.1) Asset EBITDA $220.8 $259.9 $255.9 $243.4 $233.8 $215.5 (0.5%) Corporate Expenses (59.2) (44.5) (42.0) (42.0) (42.0) (42.0) Delta House Distribution Support 17.7 -- -- -- -- -- Other (0.2) 0.1 0.1 0.1 0.1 0.1 Adjusted EBITDA $179.3 $215.5 $214.0 $201.6 $191.9 $173.7 (0.6%) Less: Refined Products and Marine Terminals EBITDA (24.3) -- -- -- -- -- Pro Forma Adjusted EBITDA $155.0 $215.5 $214.0 $201.6 $191.9 $173.7 2.3% Less: Interest Expense (74.8) (72.3) (73.5) (71.1) (70.5) (72.7) Less: Preferred Distributions (33.4) (33.4) (33.4) (33.4) (33.4) (33.4) Less: Maintenance Capital Expenditures (12.2) (18.5) (11.6) (11.7) (11.9) (12.7) Pro Forma Distributable Cash Flow $34.6 $91.3 $95.5 $85.4 $76.1 $54.8 9.7% Distributable Cash Flow $58.9 $91.3 $95.5 $85.4 $76.1 $54.8 Distributed Cash Flow Common Units - Public $28.7 $16.7 $16.8 $17.0 $17.1 $17.1 Common Units - Parent 9.5 5.5 5.5 5.5 5.5 5.5 GP 0.5 0.3 0.3 0.3 0.3 0.3 Distributed Cash Flow $38.7 $22.4 $22.6 $22.7 $22.8 $22.8 Current IDR Tier 1.3% 1.3% 1.3% 1.3% 1.3% 1.3% % to GP 1.3% 1.3% 1.3% 1.3% 1.3% 1.3% GP IDRs $-- $-- $-- $-- $-- $--Weighted Average LP Units Outstanding 53.0 53.7 54.1 54.4 54.6 54.6 DCF / LP Unit $1.09 $1.63 $1.67 $1.55 $1.38 $0.99 (1.9%) Distribution per LP Unit 0.72 0.41 0.41 0.41 0.41 0.41 (10.6%) Pro Forma DCF / LP Unit $0.64 $1.63 $1.67 $1.55 $1.38 $0.99 9.1% Pro Forma Distribution per LP Unit 0.72 0.41 0.41 0.41 0.41 0.41 (10.6%) LP Coverage 1.51x 3.96x 4.04x 3.76x 3.34x 2.40x Total Coverage 1.52 4.07 4.22 3.76 3.34 2.40 Pro Forma Distributable Cash Flow Surplus / (Shortfall) ($4.2) $68.9 $72.9 $62.6 $53.3 $32.0 Distributable Cash Flow Surplus / (Shortfall) 20.1 68.9 72.9 62.6 53.3 32.0 Source: AMID Management 1. Distribution based preceding quarter’s free cash flow 65
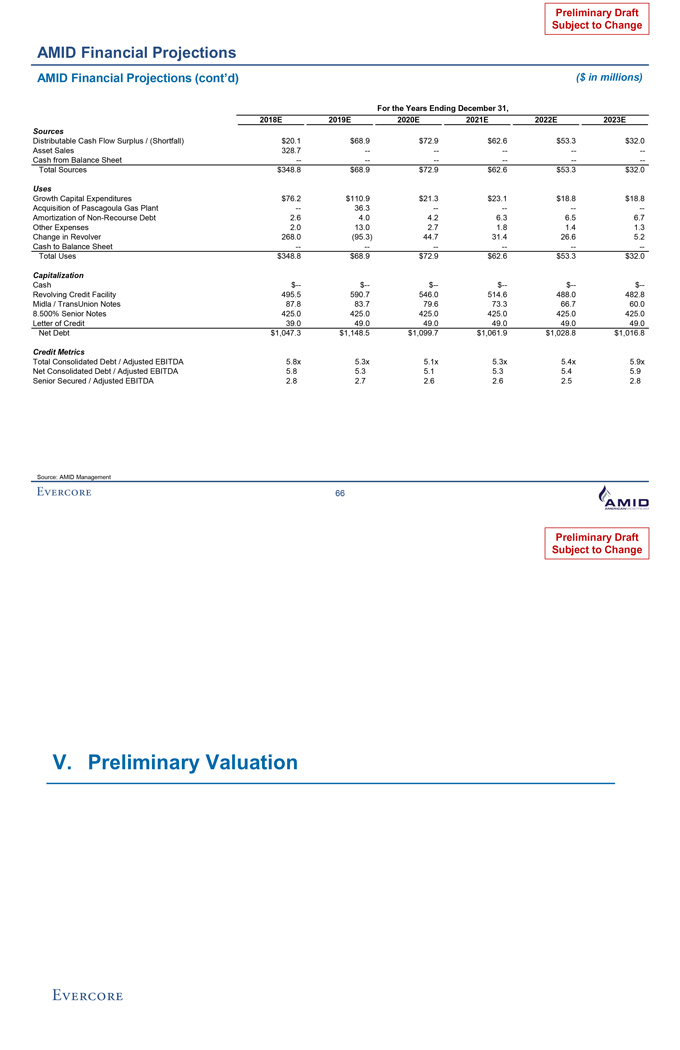
Preliminary Draft Subject to Change AMID Financial Projections AMID Financial Projections (cont’d) ($ in millions) For the Years Ending December 31, 2018E 2019E 2020E 2021E 2022E 2023E Sources Distributable Cash Flow Surplus / (Shortfall) $20.1 $68.9 $72.9 $62.6 $53.3 $32.0 Asset Sales 328.7 -- -- -- -- -- Cash from Balance Sheet -- -- -- -- -- -- Total Sources $348.8 $68.9 $72.9 $62.6 $53.3 $32.0 Uses Growth Capital Expenditures $76.2 $110.9 $21.3 $23.1 $18.8 $18.8 Acquisition of Pascagoula Gas Plant -- 36.3 -- -- -- --Amortization of Non-Recourse Debt 2.6 4.0 4.2 6.3 6.5 6.7 Other Expenses 2.0 13.0 2.7 1.8 1.4 1.3 Change in Revolver 268.0 (95.3) 44.7 31.4 26.6 5.2 Cash to Balance Sheet -- -- -- -- -- --Total Uses $348.8 $68.9 $72.9 $62.6 $53.3 $32.0 Capitalization Cash $-- $-- $-- $-- $-- $--Revolving Credit Facility 495.5 590.7 546.0 514.6 488.0 482.8 Midla / TransUnion Notes 87.8 83.7 79.6 73.3 66.7 60.0 8.500% Senior Notes 425.0 425.0 425.0 425.0 425.0 425.0 Letter of Credit 39.0 49.0 49.0 49.0 49.0 49.0 Net Debt $1,047.3 $1,148.5 $1,099.7 $1,061.9 $1,028.8 $1,016.8 Credit Metrics Total Consolidated Debt / Adjusted EBITDA 5.8x 5.3x 5.1x 5.3x 5.4x 5.9x Net Consolidated Debt / Adjusted EBITDA 5.8 5.3 5.1 5.3 5.4 5.9 Senior Secured / Adjusted EBITDA 2.8 2.7 2.6 2.6 2.5 2.8 Source: AMID Management 66 Preliminary Draft Subject to Change V. Preliminary Valuation
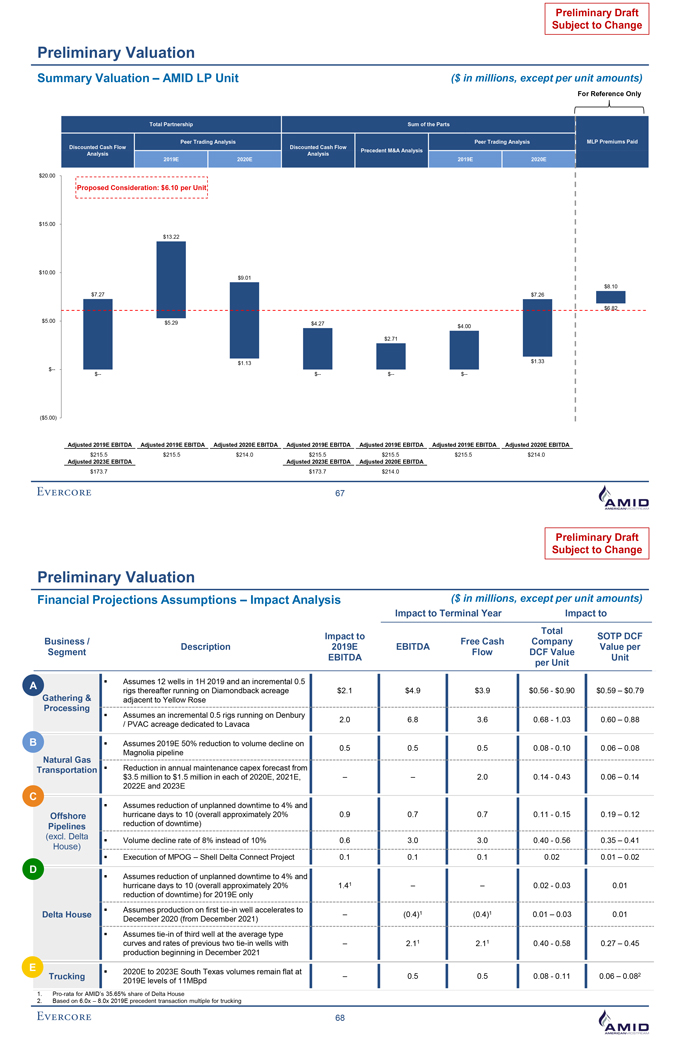
Preliminary Draft Subject to Change Preliminary Valuation Summary Valuation – AMID LP Unit ($ in millions, except per unit amounts) For Reference Only Total Partnership Sum of the Parts Peer Trading Analysis Peer Trading Analysis MLP Premiums Paid Discounted Cash Flow Discounted Cash Flow Precedent M&A Analysis Analysis Analysis 2019E 2020E 2019E 2020E $20.00 Proposed Consideration: $6.10 per Unit $15.00 $13.22 $10.00 $9.01 $8.10 $7.27 $7.26 $6.82 $5.00 $5.29 $4.27 $4.00 $2.71 $1.13 $1.33 $-- $-- $-- $-- $-- ($5.00) Adjusted 2019E EBITDA Adjusted 2019E EBITDA Adjusted 2020E EBITDA Adjusted 2019E EBITDA Adjusted 2019E EBITDA Adjusted 2019E EBITDA Adjusted 2020E EBITDA $215.5 $215.5 $214.0 $215.5 $215.5 $215.5 $214.0 Adjusted 2023E EBITDA Adjusted 2023E EBITDA Adjusted 2020E EBITDA $173.7 $173.7 $214.0 67 Preliminary Draft Subject to Change Preliminary Valuation Financial Projections Assumptions – Impact Analysis ($ in millions, except per unit amounts) Impact to Terminal Year Impact to Total Impact to SOTP DCF Business / Free Cash Company Description 2019E EBITDA Value per Segment Flow DCF Value EBITDA Unit per Unit A? Assumes 12 wells in 1H 2019 and an incremental 0.5 Gathering & rigs thereafter running on Diamondback acreage $2.1 $4.9 $3.9 $0.56 - $0.90 $0.59 – $0.79 adjacent to Yellow Rose Processing? Assumes an incremental 0.5 rigs running on Denbury 2.0 6.8 3.6 0.68 - 1.03 0.60 – 0.88 / PVAC acreage dedicated to Lavaca B? Assumes 2019E 50% reduction to volume decline on 0.5 0.5 0.5 0.08 - 0.10 0.06 – 0.08 Natural Gas Magnolia pipeline Transportation? Reduction in annual maintenance capex forecast from $3.5 million to $1.5 million in each of 2020E, 2021E, – – 2.0 0.14 - 0.43 0.06 – 0.14 2022E and 2023E C ? Assumes reduction of unplanned downtime to 4% and Offshore hurricane days to 10 (overall approximately 20% 0.9 0.7 0.7 0.11 - 0.15 0.19 – 0.12 Pipelines reduction of downtime) (excl. Delta ? Volume decline rate of 8% instead of 10% 0.6 3.0 3.0 0.40 - 0.56 0.35 – 0.41 House) ? Execution of MPOG – Shell Delta Connect Project 0.1 0.1 0.1 0.02 0.01 – 0.02 D ? Assumes reduction of unplanned downtime to 4% and hurricane days to 10 (overall approximately 20% 1.4 1 – – 0.02 - 0.03 0.01 reduction of downtime) for 2019E only? Assumes production on first tie-in well accelerates to 1 1 Delta House – (0.4) (0.4) 0.01 – 0.03 0.01 December 2020 (from December 2021)? Assumes tie-in of third well at the average type curves and rates of previous two tie-in wells with – 2.1 1 2.1 1 0.40 - 0.58 0.27 – 0.45 production beginning in December 2021 E? 2020E to 2023E South Texas volumes remain flat at 2 Trucking – 0.5 0.5 0.08 - 0.11 0.06 – 0.08 2019E levels of 11MBpd 1. Pro-rata for AMID’s 35.65% share of Delta House 2. Based on 6.0x – 8.0x 2019E precedent transaction multiple for trucking 68
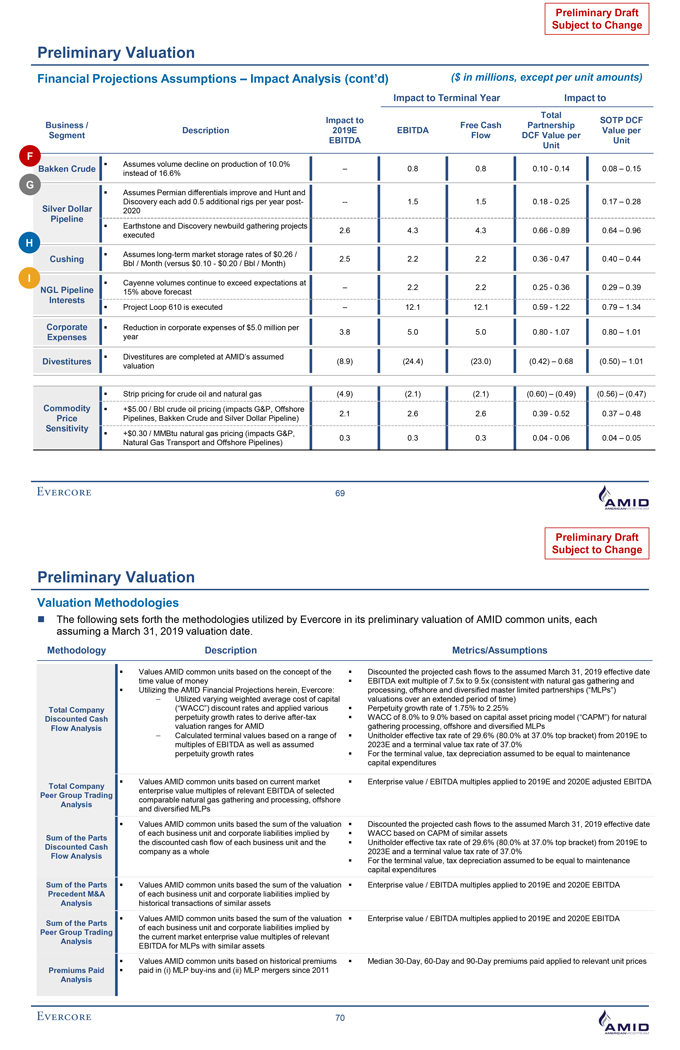
Preliminary Draft Subject to Change Preliminary Valuation Financial Projections Assumptions – Impact Analysis (cont’d) ($ in millions, except per unit amounts) Impact to Terminal Year Impact to Total Impact to SOTP DCF Business / Free Cash Partnership Description 2019E EBITDA Value per Segment Flow DCF Value per EBITDA Unit Unit F? Assumes volume decline on production of 10.0% Bakken Crude – 0.8 0.8 0.10 - 0.14 0.08 – 0.15 instead of 16.6% G? Assumes Permian differentials improve and Hunt and Silver Dollar Discovery each add 0.5 additional rigs per year post- -- 1.5 1.5 0.18 - 0.25 0.17 – 0.28 2020 Pipeline? Earthstone and Discovery newbuild gathering projects 2.6 4.3 4.3 0.66 - 0.89 0.64 – 0.96 H executed? Assumes long-term market storage rates of $0.26 / Cushing 2.5 2.2 2.2 0.36 - 0.47 0.40 – 0.44 Bbl / Month (versus $0.10 - $0.20 / Bbl / Month) I ? Cayenne volumes continue to exceed expectations at NGL Pipeline – 2.2 2.2 0.25 - 0.36 0.29 – 0.39 15% above forecast Interests? Project Loop 610 is executed – 12.1 12.1 0.59 - 1.22 0.79 – 1.34 Corporate ? Reduction in corporate expenses of $5.0 million per 3.8 5.0 5.0 0.80 - 1.07 0.80 – 1.01 Expenses year ? Divestitures are completed at AMID’s assumed Divestitures (8.9) (24.4) (23.0) (0.42) – 0.68 (0.50) – 1.01 valuation ? Strip pricing for crude oil and natural gas (4.9) (2.1) (2.1) (0.60) – (0.49) (0.56) – (0.47) Commodity ? +$5.00 / Bbl crude oil pricing (impacts G&P, Offshore 2.1 2.6 2.6 0.39 - 0.52 0.37 – 0.48 Price Pipelines, Bakken Crude and Silver Dollar Pipeline) Sensitivity ? +$0.30 / MMBtu natural gas pricing (impacts G&P, 0.3 0.3 0.3 0.04 - 0.06 0.04 – 0.05 Natural Gas Transport and Offshore Pipelines) 69Preliminary Draft Subject to Change Preliminary Valuation Valuation Methodologies The following sets forth the methodologies utilized by Evercore in its preliminary valuation of AMID common units, each assuming a March 31, 2019 valuation date. Methodology Description Metrics/Assumptions ? Values AMID common units based on the concept of the ? Discounted the projected cash flows to the assumed March 31, 2019 effective date time value of money? EBITDA exit multiple of 7.5x to 9.5x (consistent with natural gas gathering and ? Utilizing the AMID Financial Projections herein, Evercore: processing, offshore and diversified master limited partnerships (“MLPs”) ? Utilized varying weighted average cost of capital valuations over an extended period of time) Total Company (“WACC”) discount rates and applied various ? Perpetuity growth rate of 1.75% to 2.25% Discounted Cash perpetuity growth rates to derive after-tax ? WACC of 8.0% to 9.0% based on capital asset pricing model (“CAPM”) for natural Flow Analysis valuation ranges for AMID gathering processing, offshore and diversified MLPs ? Calculated terminal values based on a range of ? Unitholder effective tax rate of 29.6% (80.0% at 37.0% top bracket) from 2019E to multiples of EBITDA as well as assumed 2023E and a terminal value tax rate of 37.0% perpetuity growth rates? For the terminal value, tax depreciation assumed to be equal to maintenance capital expenditures ? Values AMID common units based on current market ? Enterprise value / EBITDA multiples applied to 2019E and 2020E adjusted EBITDA Total Company enterprise value multiples of relevant EBITDA of selected Peer Group Trading comparable natural gas gathering and processing, offshore Analysis and diversified MLPs ? Values AMID common units based the sum of the valuation ? Discounted the projected cash flows to the assumed March 31, 2019 effective date of each business unit and corporate liabilities implied by ? WACC based on CAPM of similar assets Sum of the Parts the discounted cash flow of each business unit and the ? Unitholder effective tax rate of 29.6% (80.0% at 37.0% top bracket) from 2019E to Discounted Cash company as a whole 2023E and a terminal value tax rate of 37.0% Flow Analysis ? For the terminal value, tax depreciation assumed to be equal to maintenance capital expenditures Sum of the Parts? Values AMID common units based the sum of the valuation ? Enterprise value / EBITDA multiples applied to 2019E and 2020E EBITDA Precedent M&A of each business unit and corporate liabilities implied by Analysis historical transactions of similar assets? Values AMID common units based the sum of the valuation ? Enterprise value / EBITDA multiples applied to 2019E and 2020E EBITDA Sum of the Parts of each business unit and corporate liabilities implied by Peer Group Trading the current market enterprise value multiples of relevant Analysis EBITDA for MLPs with similar assets ? Values AMID common units based on historical premiums? Median 30-Day, 60-Day and 90-Day premiums paid applied to relevant unit prices Premiums Paid ? paid in (i) MLP buy-ins and (ii) MLP mergers since 2011 Analysis 70
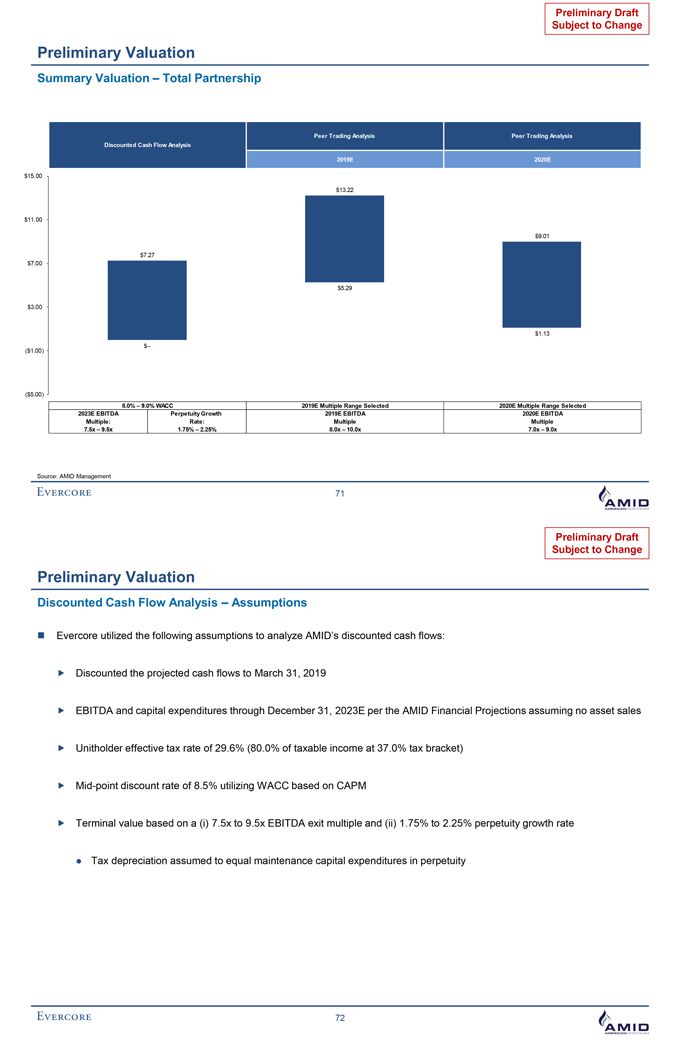
Preliminary Draft Subject to Change Preliminary Valuation Summary Valuation – Total Partnership Peer Trading Analysis Peer Trading Analysis Discounted Cash Flow Analysis 2019E 2020E $15.00 $13.22 $11.00 $9.01 $7.27 $7.00 $5.29 $3.00 $1.13 ($1.00) $-- ($5.00) 8.0% – 9.0% WACC 2019E Multiple Range Selected 2020E Multiple Range Selected 2023E EBITDA Perpetuity Growth 2019E EBITDA 2020E EBITDA Multiple: Rate: Multiple Multiple 7.5x – 9.5x 1.75% – 2.25% 8.0x – 10.0x 7.0x – 9.0x Source: AMID Management 71 Preliminary Draft Subject to Change Preliminary Valuation Discounted Cash Flow Analysis – Assumptions Evercore utilized the following assumptions to analyze AMID’s discounted cash flows: Discounted the projected cash flows to March 31, 2019 EBITDA and capital expenditures through December 31, 2023E per the AMID Financial Projections assuming no asset sales Unitholder effective tax rate of 29.6% (80.0% of taxable income at 37.0% tax bracket) Mid-point discount rate of 8.5% utilizing WACC based on CAPM Terminal value based on a (i) 7.5x to 9.5x EBITDA exit multiple and (ii) 1.75% to 2.25% perpetuity growth rate Tax depreciation assumed to equal maintenance capital expenditures in perpetuity 72
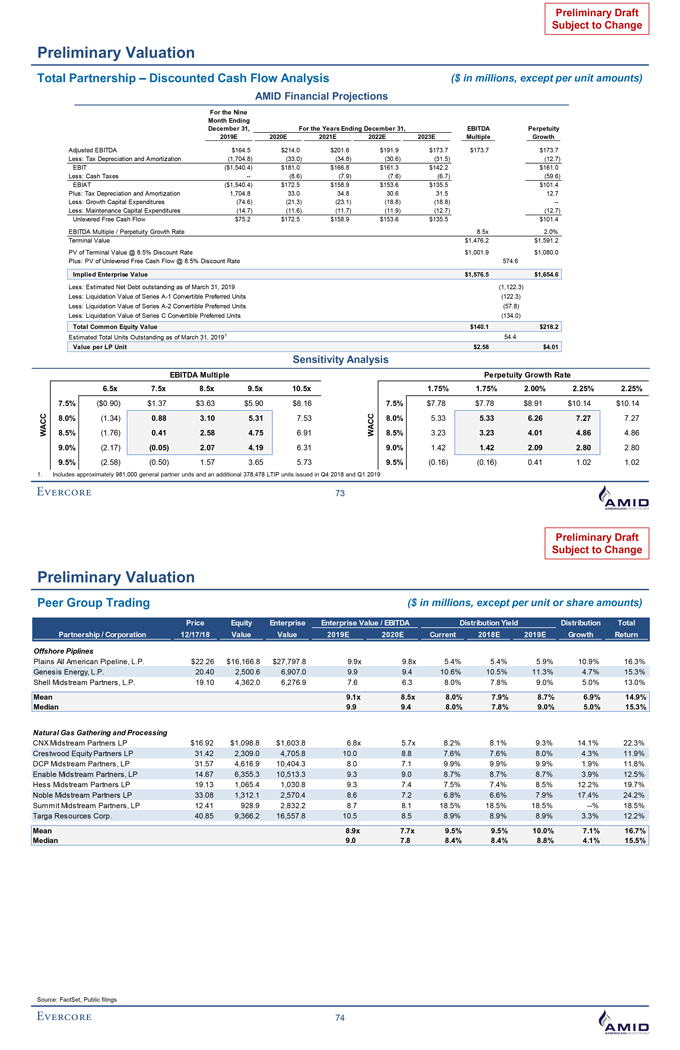
Preliminary Draft Subject to Change Preliminary Valuation Total Partnership – Discounted Cash Flow Analysis ($ in millions, except per unit amounts) AMID Financial Projections For the Nine Month Ending December 31, For the Years Ending December 31, EBITDA Perpetuity 2019E 2020E 2021E 2022E 2023E Multiple Growth Adjusted EBITDA $164.5 $214.0 $201.6 $191.9 $173.7 $173.7 $173.7 Less: Tax Depreciation and Amortization (1,704.8) (33.0) (34.8) (30.6) (31.5) (12.7) EBIT ($1,540.4) $181.0 $166.8 $161.3 $142.2 $161.0 Less: Cash Taxes -- (8.6) (7.9) (7.6) (6.7) (59.6) EBIAT ($1,540.4) $172.5 $158.9 $153.6 $135.5 $101.4 Plus: Tax Depreciation and Amortization 1,704.8 33.0 34.8 30.6 31.5 12.7 Less: Growth Capital Expenditures (74.6) (21.3) (23.1) (18.8) (18.8) --Less: Maintenance Capital Expenditures (14.7) (11.6) (11.7) (11.9) (12.7) (12.7) Unlevered Free Cash Flow $75.2 $172.5 $158.9 $153.6 $135.5 $101.4 EBITDA Multiple / Perpetuity Growth Rate 8.5x 2.0% Terminal Value $1,476.2 $1,591.2 PV of Terminal Value @ 8.5% Discount Rate $1,001.9 $1,080.0 Plus: PV of Unlevered Free Cash Flow @ 8.5% Discount Rate 574.6 Implied Enterprise Value $1,576.5 $1,654.6 Less: Estimated Net Debt outstanding as of March 31, 2019 (1,122.3) Less: Liquidation Value of Series A-1 Convertible Preferred Units (122.3) Less: Liquidation Value of Series A-2 Convertible Preferred Units (57.8) Less: Liquidation Value of Series C Convertible Preferred Units (134.0) Total Common Equity Value $140.1 $218.2 Estimated Total Units Outstanding as of March 31, 20191 54.4 Value per LP Unit $2.58 $4.01 Sensitivity Analysis EBITDA Multiple Perpetuity Growth Rate 6.5x 7.5x 8.5x 9.5x 10.5x 1.75% 1.75% 2.00% 2.25% 2.25% 7.5% ($0.90) $1.37 $3.63 $5.90 $8.16 7.5% $7.78 $7.78 $8.91 $10.14 $10.14 ACC 8.0% (1.34) 0.88 3.10 5.31 7.53 ACC 8.0% 5.33 5.33 6.26 7.27 7.27 W 8.5% (1.76) 0.41 2.58 4.75 6.91 W 8.5% 3.23 3.23 4.01 4.86 4.86 9.0% (2.17) (0.05) 2.07 4.19 6.31 9.0% 1.42 1.42 2.09 2.80 2.80 9.5% (2.58) (0.50) 1.57 3.65 5.73 9.5% (0.16) (0.16) 0.41 1.02 1.02 1. Includes approximately 981,000 general partner units and an additional 378,478 LTIP units issued in Q4 2018 and Q1 2019 73 Preliminary Draft Subject to Change Preliminary Valuation Peer Group Trading ($ in millions, except per unit or share amounts) Price Equity Enterprise Enterprise Value / EBITDA Distribution Yield Distribution Total Partnership / Corporation 12/17/18 Value Value 2019E 2020E Current 2018E 2019E Growth Return Offshore Piplines Plains All American Pipeline, L.P. $22.26 $16,166.8 $27,797.8 9.9x 9.8x 5.4% 5.4% 5.9% 10.9% 16.3% Genesis Energy, L.P. 20.40 2,500.6 6,907.0 9.9 9.4 10.6% 10.5% 11.3% 4.7% 15.3% Shell Midstream Partners, L.P. 19.10 4,362.0 6,276.9 7.6 6.3 8.0% 7.8% 9.0% 5.0% 13.0% Mean 9.1x 8.5x 8.0% 7.9% 8.7% 6.9% 14.9% Median 9.9 9.4 8.0% 7.8% 9.0% 5.0% 15.3% Natural Gas Gathering and Processing CNX Midstream Partners LP $16.92 $1,098.8 $1,603.8 6.8x 5.7x 8.2% 8.1% 9.3% 14.1% 22.3% Crestwood Equity Partners LP 31.42 2,309.0 4,705.8 10.0 8.8 7.6% 7.6% 8.0% 4.3% 11.9% DCP Midstream Partners, LP 31.57 4,616.9 10,404.3 8.0 7.1 9.9% 9.9% 9.9% 1.9% 11.8% Enable Midstream Partners, LP 14.67 6,355.3 10,513.3 9.3 9.0 8.7% 8.7% 8.7% 3.9% 12.5% Hess Midstream Partners LP 19.13 1,065.4 1,030.8 9.3 7.4 7.5% 7.4% 8.5% 12.2% 19.7% Noble Midstream Partners LP 33.08 1,312.1 2,570.4 8.6 7.2 6.8% 6.6% 7.9% 17.4% 24.2% Summit Midstream Partners, LP 12.41 928.9 2,832.2 8.7 8.1 18.5% 18.5% 18.5% --% 18.5% Targa Resources Corp. 40.85 9,366.2 16,557.8 10.5 8.5 8.9% 8.9% 8.9% 3.3% 12.2% Mean 8.9x 7.7x 9.5% 9.5% 10.0% 7.1% 16.7% Median 9.0 7.8 8.4% 8.4% 8.8% 4.1% 15.5% Source: FactSet, Public filings 74
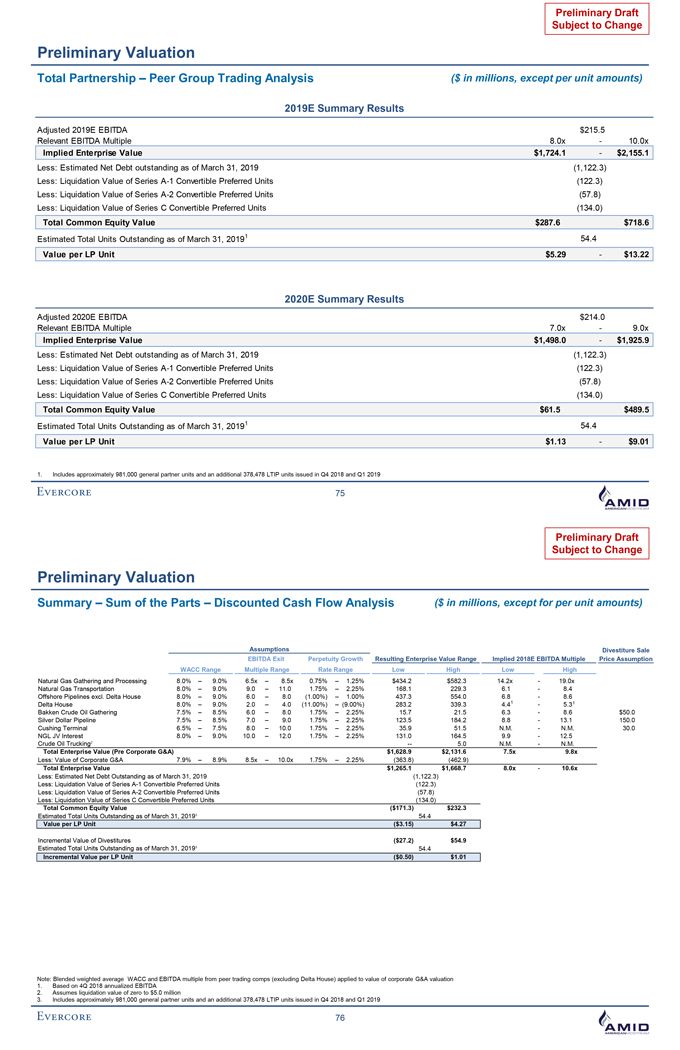
Preliminary Draft Subject to Change Preliminary Valuation Total Partnership – Peer Group Trading Analysis ($ in millions, except per unit amounts) 2019E Summary Results Adjusted 2019E EBITDA $215.5 Relevant EBITDA Multiple 8.0x - 10.0x Implied Enterprise Value $1,724.1 - $2,155.1 Less: Estimated Net Debt outstanding as of March 31, 2019 (1,122.3) Less: Liquidation Value of Series A-1 Convertible Preferred Units (122.3) Less: Liquidation Value of Series A-2 Convertible Preferred Units (57.8) Less: Liquidation Value of Series C Convertible Preferred Units (134.0) Total Common Equity Value $287.6 $718.6 Estimated Total Units Outstanding as of March 31, 20191 54.4 Value per LP Unit $5.29 - $13.22 2020E Summary Results Adjusted 2020E EBITDA $214.0 Relevant EBITDA Multiple 7.0x - 9.0x Implied Enterprise Value $1,498.0 - $1,925.9 Less: Estimated Net Debt outstanding as of March 31, 2019 (1,122.3) Less: Liquidation Value of Series A-1 Convertible Preferred Units (122.3) Less: Liquidation Value of Series A-2 Convertible Preferred Units (57.8) Less: Liquidation Value of Series C Convertible Preferred Units (134.0) Total Common Equity Value $61.5 $489.5 Estimated Total Units Outstanding as of March 31, 20191 54.4 Value per LP Unit $1.13 - $9.01 1. Includes approximately 981,000 general partner units and an additional 378,478 LTIP units issued in Q4 2018 and Q1 2019 75 Preliminary Draft Subject to Change Preliminary Valuation Summary – Sum of the Parts – Discounted Cash Flow Analysis ($ in millions, except for per unit amounts) Assumptions Divestiture Sale EBITDA Exit Perpetuity Growth Resulting Enterprise Value Range Implied 2018E EBITDA Multiple Price Assumption WACC Range Multiple Range Rate Range Low High Low High Natural Gas Gathering and Processing 8.0% – 9.0% 6.5x – 8.5x 0.75% – 1.25% $434.2 $582.3 14.2x - 19.0x Natural Gas Transportation 8.0% – 9.0% 9.0 – 11.0 1.75% – 2.25% 168.1 229.3 6.1 - 8.4 Offshore Pipelines excl. Delta House 8.0% – 9.0% 6.0 – 8.0 (1.00%) – 1.00% 437.3 554.0 6.8 - 8.6 Delta House 8.0% – 9.0% 2.0 – 4.0 (11.00%) – (9.00%) 283.2 339.3 4.4 1 - 5.3 1 Bakken Crude Oil Gathering 7.5% – 8.5% 6.0 – 8.0 1.75% – 2.25% 15.7 21.5 6.3 - 8.6 $50.0 Silver Dollar Pipeline 7.5% – 8.5% 7.0 – 9.0 1.75% – 2.25% 123.5 184.2 8.8 - 13.1 150.0 Cushing Terminal 6.5% – 7.5% 8.0 – 10.0 1.75% – 2.25% 35.9 51.5 N.M. - N.M. 30.0 NGL JV Interest 8.0% – 9.0% 10.0 – 12.0 1.75% – 2.25% 131.0 164.5 9.9 - 12.5 Crude Oil Trucking2 -- 5.0 N.M. - N.M. Total Enterprise Value (Pre Corporate G&A) $1,628.9 $2,131.6 7.5x 9.8x Less: Value of Corporate G&A 7.9% – 8.9% 8.5x – 10.0x 1.75% – 2.25% (363.8) (462.9) Total Enterprise Value $1,265.1 $1,668.7 8.0x - 10.6x Less: Estimated Net Debt Outstanding as of March 31, 2019 (1,122.3) Less: Liquidation Value of Series A-1 Convertible Preferred Units (122.3) Less: Liquidation Value of Series A-2 Convertible Preferred Units (57.8) Less: Liquidation Value of Series C Convertible Preferred Units (134.0) Total Common Equity Value ($171.3) $232.3 Estimated Total Units Outstanding as of March 31, 20193 54.4 Value per LP Unit ($3.15) $4.27 Incremental Value of Divestitures ($27.2) $54.9 Estimated Total Units Outstanding as of March 31, 20193 54.4 Incremental Value per LP Unit ($0.50) $1.01 Note: Blended weighted average WACC and EBITDA multiple from peer trading comps (excluding Delta House) applied to value of corporate G&A valuation 1. Based on 4Q 2018 annualized EBITDA 2. Assumes liquidation value of zero to $5.0 million 3. Includes approximately 981,000 general partner units and an additional 378,478 LTIP units issued in Q4 2018 and Q1 2019 76
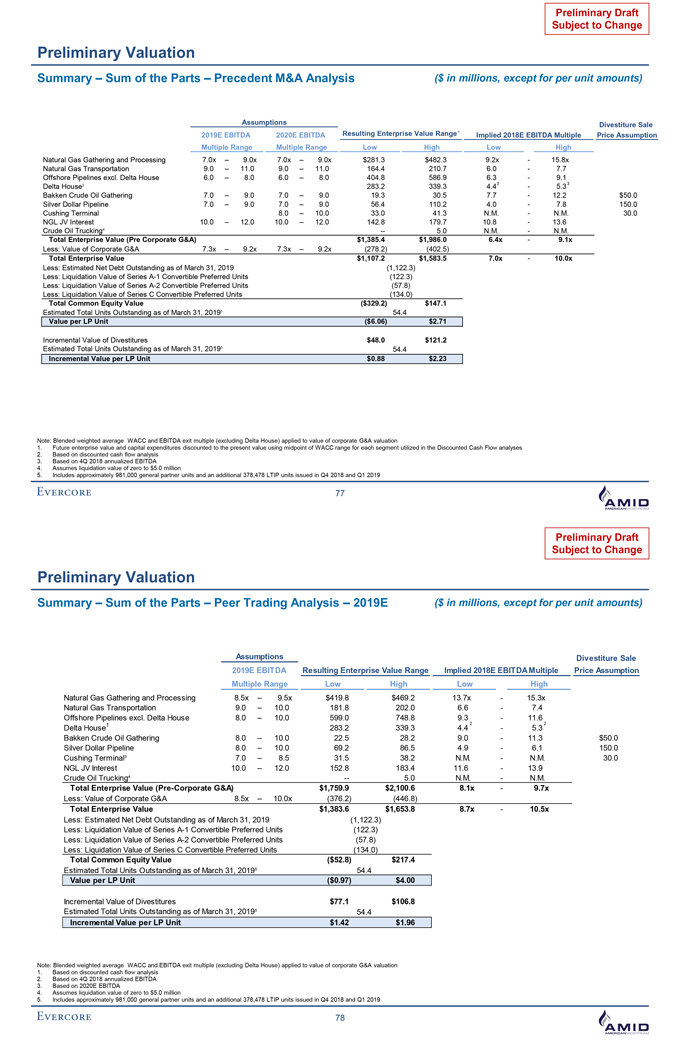
Preliminary Draft Subject to Change Preliminary Valuation Summary – Sum of the Parts – Precedent M&A Analysis ($ in millions, except for per unit amounts) Assumptions Divestiture Sale 2019E EBITDA 2020E EBITDA Resulting Enterprise Value Range Implied 2018E EBITDA Multiple Price Assumption Multiple Range Multiple Range Low High Low High Natural Gas Gathering and Processing 7.0x – 9.0x 7.0x – 9.0x $281.3 $482.3 9.2x - 15.8x Natural Gas Transportation 9.0 – 11.0 9.0 – 11.0 164.4 210.7 6.0 - 7.7 Offshore Pipelines excl. Delta House 6.0 – 8.0 6.0 – 8.0 404.8 586.9 6.3 - 9.1 Delta House2 283.2 339.3 4.4 3 - 5.3 3 Bakken Crude Oil Gathering 7.0 – 9.0 7.0 – 9.0 19.3 30.5 7.7 - 12.2 $50.0 Silver Dollar Pipeline 7.0 – 9.0 7.0 – 9.0 56.4 110.2 4.0 - 7.8 150.0 Cushing Terminal 8.0 – 10.0 33.0 41.3 N.M. - N.M. 30.0 NGL JV Interest 10.0 – 12.0 10.0 – 12.0 142.8 179.7 10.8 - 13.6 Crude Oil Trucking4 -- 5.0 N.M. - N.M. Total Enterprise Value (Pre Corporate G&A) $1,385.4 $1,986.0 6.4x - 9.1x Less: Value of Corporate G&A 7.3x – 9.2x 7.3x – 9.2x (278.2) (402.5) Total Enterprise Value $1,107.2 $1,583.5 7.0x - 10.0x Less: Estimated Net Debt Outstanding as of March 31, 2019 (1,122.3) Less: Liquidation Value of Series A-1 Convertible Preferred Units (122.3) Less: Liquidation Value of Series A-2 Convertible Preferred Units (57.8) Less: Liquidation Value of Series C Convertible Preferred Units (134.0) Total Common Equity Value ($329.2) $147.1 Estimated Total Units Outstanding as of March 31, 20195 54.4 Value per LP Unit ($6.06) $2.71 Incremental Value of Divestitures $48.0 $121.2 Estimated Total Units Outstanding as of March 31, 20195 54.4 Incremental Value per LP Unit $0.88 $2.23 Note: Blended weighted average WACC and EBITDA exit multiple (excluding Delta House) applied to value of corporate G&A valuation 1. Future enterprise value and capital expenditures discounted to the present value using midpoint of WACC range for each segment utilized in the Discounted Cash Flow analyses 2. Based on discounted cash flow analysis 3. Based on 4Q 2018 annualized EBITDA 4. Assumes liquidation value of zero to $5.0 million 5. Includes approximately 981,000 general partner units and an additional 378,478 LTIP units issued in Q4 2018 and Q1 2019 77 Preliminary Draft Subject to Change Preliminary Valuation Summary – Sum of the Parts – Peer Trading Analysis – 2019E ($ in millions, except for per unit amounts) Assumptions Divestiture Sale 2019E EBITDA Resulting Enterprise Value Range Implied 2018E EBITDA Multiple Price Assumption Multiple Range Low High Low High Natural Gas Gathering and Processing 8.5x – 9.5x $419.8 $469.2 13.7x - 15.3x Natural Gas Transportation 9.0 – 10.0 181.8 202.0 6.6 - 7.4 Offshore Pipelines excl. Delta House 8.0 – 10.0 599.0 748.8 9.3 - 11.6 1 2 2 Delta House 283.2 339.3 4.4 - 5.3 Bakken Crude Oil Gathering 8.0 – 10.0 22.5 28.2 9.0 - 11.3 $50.0 Silver Dollar Pipeline 8.0 – 10.0 69.2 86.5 4.9 - 6.1 150.0 Cushing Terminal3 7.0 – 8.5 31.5 38.2 N.M. - N.M. 30.0 NGL JV Interest 10.0 – 12.0 152.8 183.4 11.6 - 13.9 Crude Oil Trucking4 -- 5.0 N.M. - N.M. Total Enterprise Value (Pre-Corporate G&A) $1,759.9 $2,100.6 8.1x - 9.7x Less: Value of Corporate G&A 8.5x – 10.0x (376.2) (446.8) Total Enterprise Value $1,383.6 $1,653.8 8.7x - 10.5x Less: Estimated Net Debt Outstanding as of March 31, 2019 (1,122.3) Less: Liquidation Value of Series A-1 Convertible Preferred Units (122.3) Less: Liquidation Value of Series A-2 Convertible Preferred Units (57.8) Less: Liquidation Value of Series C Convertible Preferred Units (134.0) Total Common Equity Value ($52.8) $217.4 Estimated Total Units Outstanding as of March 31, 20195 54.4 Value per LP Unit ($0.97) $4.00 Incremental Value of Divestitures $77.1 $106.8 Estimated Total Units Outstanding as of March 31, 20195 54.4 Incremental Value per LP Unit $1.42 $1.96 Note: Blended weighted average WACC and EBITDA exit multiple (excluding Delta House) applied to value of corporate G&A valuation 1. Based on discounted cash flow analysis 2. Based on 4Q 2018 annualized EBITDA 3. Based on 2020E EBITDA 4. Assumes liquidation value of zero to $5.0 million 5. Includes approximately 981,000 general partner units and an additional 378,478 LTIP units issued in Q4 2018 and Q1 2019 78
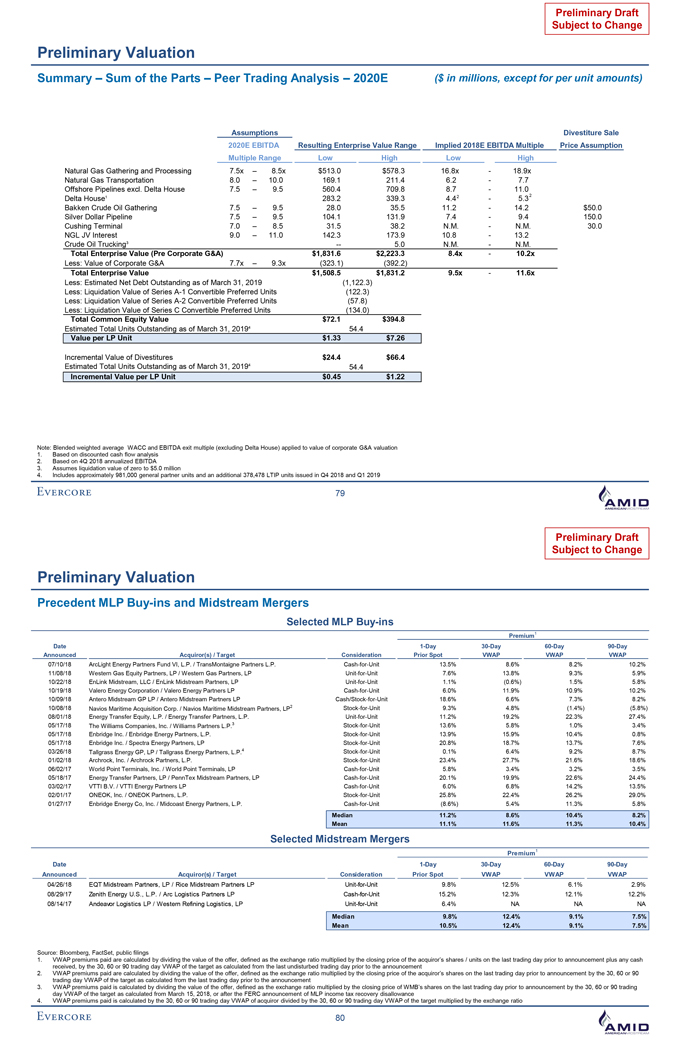
Preliminary Draft Subject to Change Preliminary Valuation Summary – Sum of the Parts – Peer Trading Analysis – 2020E ($ in millions, except for per unit amounts) Assumptions Divestiture Sale 2020E EBITDA Resulting Enterprise Value Range Implied 2018E EBITDA Multiple Price Assumption Multiple Range Low High Low High Natural Gas Gathering and Processing 7.5x – 8.5x $513.0 $578.3 16.8x - 18.9x Natural Gas Transportation 8.0 – 10.0 169.1 211.4 6.2 - 7.7 Offshore Pipelines excl. Delta House 7.5 – 9.5 560.4 709.8 8.7 - 11.0 Delta House1 283.2 339.3 4.4 2 - 5.3 2 Bakken Crude Oil Gathering 7.5 – 9.5 28.0 35.5 11.2 - 14.2 $50.0 Silver Dollar Pipeline 7.5 – 9.5 104.1 131.9 7.4 - 9.4 150.0 Cushing Terminal 7.0 – 8.5 31.5 38.2 N.M. - N.M. 30.0 NGL JV Interest 9.0 – 11.0 142.3 173.9 10.8 - 13.2 Crude Oil Trucking3 -- 5.0 N.M. - N.M. Total Enterprise Value (Pre Corporate G&A) $1,831.6 $2,223.3 8.4x - 10.2x Less: Value of Corporate G&A 7.7x – 9.3x (323.1) (392.2) Total Enterprise Value $1,508.5 $1,831.2 9.5x - 11.6x Less: Estimated Net Debt Outstanding as of March 31, 2019 (1,122.3) Less: Liquidation Value of Series A-1 Convertible Preferred Units (122.3) Less: Liquidation Value of Series A-2 Convertible Preferred Units (57.8) Less: Liquidation Value of Series C Convertible Preferred Units (134.0) Total Common Equity Value $72.1 $394.8 Estimated Total Units Outstanding as of March 31, 20194 54.4 Value per LP Unit $1.33 $7.26 Incremental Value of Divestitures $24.4 $66.4 Estimated Total Units Outstanding as of March 31, 20194 54.4 Incremental Value per LP Unit $0.45 $1.22 Note: Blended weighted average WACC and EBITDA exit multiple (excluding Delta House) applied to value of corporate G&A valuation 1. Based on discounted cash flow analysis 2. Based on 4Q 2018 annualized EBITDA 3. Assumes liquidation value of zero to $5.0 million 4. Includes approximately 981,000 general partner units and an additional 378,478 LTIP units issued in Q4 2018 and Q1 2019 79 Preliminary Draft Subject to Change Preliminary Valuation Precedent MLP Buy-ins and Midstream Mergers Selected MLP Buy-ins Premium1 Date 1-Day 30-Day 60-Day 90-Day Announced Acquiror(s) / Target Consideration Prior Spot VWAP VWAP VWAP 07/10/18 ArcLight Energy Partners Fund VI, L.P. / TransMontaigne Partners L.P. Cash-for-Unit 13.5% 8.6% 8.2% 10.2% 11/08/18 Western Gas Equity Partners, LP / Western Gas Partners, LP Unit-for-Unit 7.6% 13.8% 9.3% 5.9% 10/22/18 EnLink Midstream, LLC / EnLink Midstream Partners, LP Unit-for-Unit 1.1% (0.6%) 1.5% 5.8% 10/19/18 Valero Energy Corporation / Valero Energy Partners LP Cash-for-Unit 6.0% 11.9% 10.9% 10.2% 10/09/18 Antero Midstream GP LP / Antero Midstream Partners LP Cash/Stock-for-Unit 18.6% 6.6% 7.3% 8.2% 10/08/18 Navios Maritime Acquisition Corp. / Navios Maritime Midstream Partners, LP2 Stock-for-Unit 9.3% 4.8% (1.4%) (5.8%) 08/01/18 Energy Transfer Equity, L.P. / Energy Transfer Partners, L.P. Unit-for-Unit 11.2% 19.2% 22.3% 27.4% 05/17/18 The Williams Companies, Inc. / Williams Partners L.P.3 Stock-for-Unit 13.6% 5.8% 1.0% 3.4% 05/17/18 Enbridge Inc. / Enbridge Energy Partners, L.P. Stock-for-Unit 13.9% 15.9% 10.4% 0.8% 05/17/18 Enbridge Inc. / Spectra Energy Partners, LP Stock-for-Unit 20.8% 18.7% 13.7% 7.6% 03/26/18 Tallgrass Energy GP, LP / Tallgrass Energy Partners, L.P.4 Stock-for-Unit 0.1% 6.4% 9.2% 8.7% 01/02/18 Archrock, Inc. / Archrock Partners, L.P. Stock-for-Unit 23.4% 27.7% 21.6% 18.6% 06/02/17 World Point Terminals, Inc. / World Point Terminals, LP Cash-for-Unit 5.8% 3.4% 3.2% 3.5% 05/18/17 Energy Transfer Partners, LP / PennTex Midstream Partners, LP Cash-for-Unit 20.1% 19.9% 22.6% 24.4% 03/02/17 VTTI B.V. / VTTI Energy Partners LP Cash-for-Unit 6.0% 6.8% 14.2% 13.5% 02/01/17 ONEOK, Inc. / ONEOK Partners, L.P. Stock-for-Unit 25.8% 22.4% 26.2% 29.0% 01/27/17 Enbridge Energy Co, Inc. / Midcoast Energy Partners, L.P. Cash-for-Unit (8.6%) 5.4% 11.3% 5.8% Median 11.2% 8.6% 10.4% 8.2% Mean 11.1% 11.6% 11.3% 10.4% Selected Midstream Mergers Premium1 Date 1-Day 30-Day 60-Day 90-Day Announced Acquiror(s) / Target Consideration Prior Spot VWAP VWAP VWAP 04/26/18 EQT Midstream Partners, LP / Rice Midstream Partners LP Unit-for-Unit 9.8% 12.5% 6.1% 2.9% 08/29/17 Zenith Energy U.S., L.P. / Arc Logistics Partners LP Cash-for-Unit 15.2% 12.3% 12.1% 12.2% 08/14/17 Andeavor Logistics LP / Western Refining Logistics, LP Unit-for-Unit 6.4% NA NA NA Median 9.8% 12.4% 9.1% 7.5% Mean 10.5% 12.4% 9.1% 7.5% Source: Bloomberg, FactSet, public filings 1. VWAP premiums paid are calculated by dividing the value of the offer, defined as the exchange ratio multiplied by the closing price of the acquiror’s shares / units on the last trading day prior to announcement plus any cash received, by the 30, 60 or 90 trading day VWAP of the target as calculated from the last undisturbed trading day prior to the announcement 2. VWAP premiums paid are calculated by dividing the value of the offer, defined as the exchange ratio multiplied by the closing price of the acquiror’s shares on the last trading day prior to announcement by the 30, 60 or 90 trading day VWAP of the target as calculated from the last trading day prior to the announcement 3. VWAP premiums paid is calculated by dividing the value of the offer, defined as the exchange ratio multiplied by the closing price of WMB’s shares on the last trading day prior to announcement by the 30, 60 or 90 trading day VWAP of the target as calculated from March 15, 2018, or after the FERC announcement of MLP income tax recovery disallowance 4. VWAP premiums paid is calculated by the 30, 60 or 90 trading day VWAP of acquiror divided by the 30, 60 or 90 trading day VWAP of the target multiplied by the exchange ratio 80
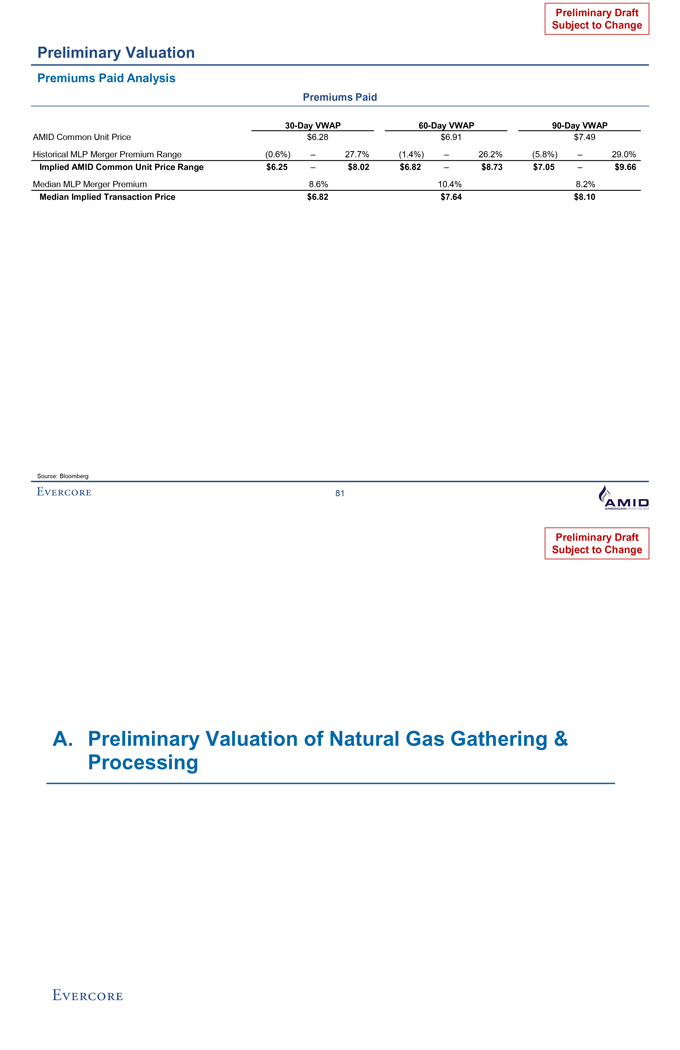
Preliminary Draft Subject to Change Preliminary Valuation Premiums Paid Analysis Premiums Paid 30-Day VWAP 60-Day VWAP 90-Day VWAP AMID Common Unit Price $6.28 $6.91 $7.49 Historical MLP Merger Premium Range (0.6%) – 27.7% (1.4%) – 26.2% (5.8%) – 29.0% Implied AMID Common Unit Price Range $6.25 – $8.02 $6.82 – $8.73 $7.05 – $9.66 Median MLP Merger Premium 8.6% 10.4% 8.2% Median Implied Transaction Price $6.82 $7.64 $8.10 Source: Bloomberg 81 Preliminary Draft Subject to Change A. Preliminary Valuation of Natural Gas Gathering & Processing
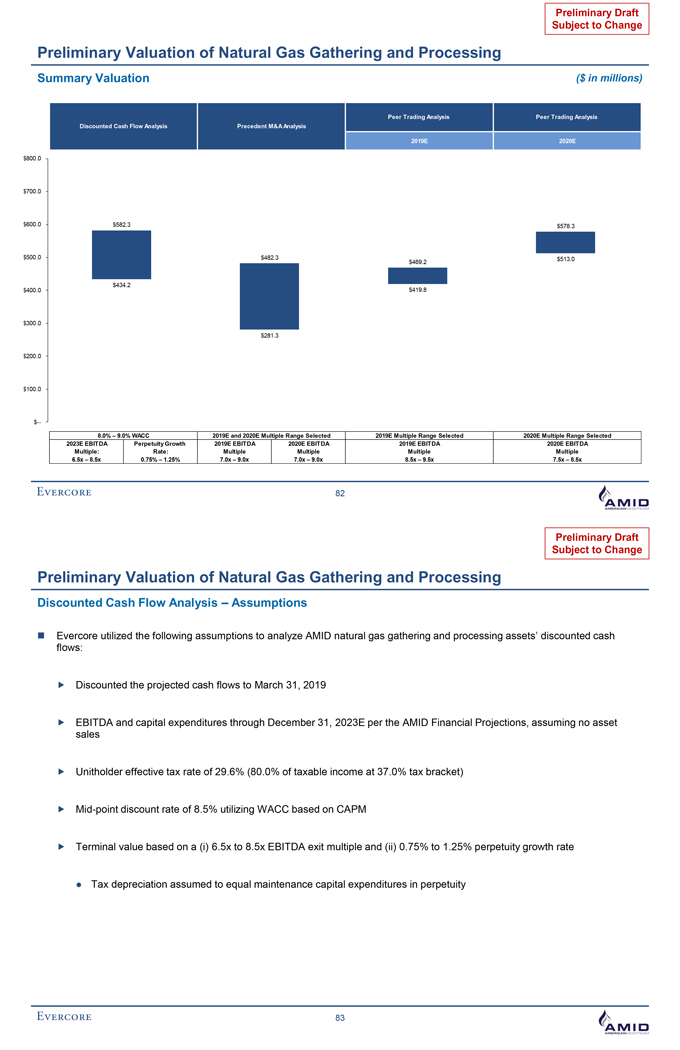
Preliminary Draft Subject to Change Preliminary Valuation of Natural Gas Gathering and Processing Summary Valuation ($ in millions) Peer Trading Analysis Peer Trading Analysis Discounted Cash Flow Analysis Precedent M&A Analysis 2019E 2020E $800.0 $700.0 $600.0 $582.3 $578.3 $500.0 $482.3 $469.2 $513.0 $434.2 $400.0 $419.8 $300.0 $281.3 $200.0 $100.0 $-- 8.0% – 9.0% WACC 2019E and 2020E Multiple Range Selected 2019E Multiple Range Selected 2020E Multiple Range Selected 2023E EBITDA Perpetuity Growth 2019E EBITDA 2020E EBITDA 2019E EBITDA 2020E EBITDA Multiple: Rate: Multiple Multiple Multiple Multiple 6.5x – 8.5x 0.75% – 1.25% 7.0x – 9.0x 7.0x – 9.0x 8.5x – 9.5x 7.5x – 8.5x 82 Preliminary Draft Subject to Change Preliminary Valuation of Natural Gas Gathering and Processing Discounted Cash Flow Analysis – Assumptions Evercore utilized the following assumptions to analyze AMID natural gas gathering and processing assets’ discounted cash flows: Discounted the projected cash flows to March 31, 2019 EBITDA and capital expenditures through December 31, 2023E per the AMID Financial Projections, assuming no asset sales Unitholder effective tax rate of 29.6% (80.0% of taxable income at 37.0% tax bracket) Mid-point discount rate of 8.5% utilizing WACC based on CAPM Terminal value based on a (i) 6.5x to 8.5x EBITDA exit multiple and (ii) 0.75% to 1.25% perpetuity growth rate Tax depreciation assumed to equal maintenance capital expenditures in perpetuity 83
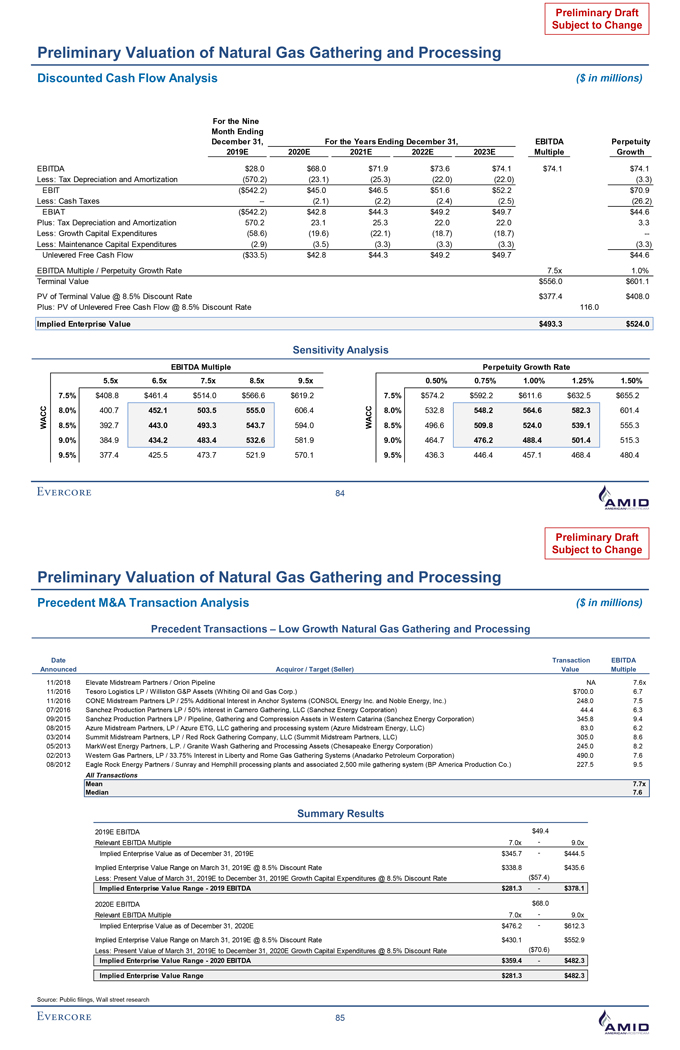
Preliminary Draft Subject to Change Preliminary Valuation of Natural Gas Gathering and Processing Discounted Cash Flow Analysis ($ in millions) For the Nine Month Ending December 31, For the Years Ending December 31, EBITDA Perpetuity 2019E 2020E 2021E 2022E 2023E Multiple Growth EBITDA $28.0 $68.0 $71.9 $73.6 $74.1 $74.1 $74.1 Less: Tax Depreciation and Amortization (570.2) (23.1) (25.3) (22.0) (22.0) (3.3) EBIT ($542.2) $45.0 $46.5 $51.6 $52.2 $70.9 Less: Cash Taxes -- (2.1) (2.2) (2.4) (2.5) (26.2) EBIAT ($542.2) $42.8 $44.3 $49.2 $49.7 $44.6 Plus: Tax Depreciation and Amortization 570.2 23.1 25.3 22.0 22.0 3.3 Less: Growth Capital Expenditures (58.6) (19.6) (22.1) (18.7) (18.7) --Less: Maintenance Capital Expenditures (2.9) (3.5) (3.3) (3.3) (3.3) (3.3) Unlevered Free Cash Flow ($33.5) $42.8 $44.3 $49.2 $49.7 $44.6 EBITDA Multiple / Perpetuity Growth Rate 7.5x 1.0% Terminal Value $556.0 $601.1 PV of Terminal Value @ 8.5% Discount Rate $377.4 $408.0 Plus: PV of Unlevered Free Cash Flow @ 8.5% Discount Rate 116.0 Implied Enterprise Value $493.3 $524.0 Sensitivity Analysis EBITDA Multiple Perpetuity Growth Rate 5.5x 6.5x 7.5x 8.5x 9.5x 0.50% 0.75% 1.00% 1.25% 1.50% 7.5% $408.8 $461.4 $514.0 $566.6 $619.2 7.5% $574.2 $592.2 $611.6 $632.5 $655.2 CC 8.0% 400.7 452.1 503.5 555.0 606.4 CC 8.0% 532.8 548.2 564.6 582.3 601.4 A A W 8.5% 392.7 443.0 493.3 543.7 594.0 W 8.5% 496.6 509.8 524.0 539.1 555.3 9.0% 384.9 434.2 483.4 532.6 581.9 9.0% 464.7 476.2 488.4 501.4 515.3 9.5% 377.4 425.5 473.7 521.9 570.1 9.5% 436.3 446.4 457.1 468.4 480.4 84 Preliminary Draft Subject to Change Preliminary Valuation of Natural Gas Gathering and Processing Precedent M&A Transaction Analysis ($ in millions) Precedent Transactions – Low Growth Natural Gas Gathering and Processing Date Transaction EBITDA Announced Acquiror / Target (Seller) Value Multiple 11/2018 Elevate Midstream Partners / Orion Pipeline NA 7.6x 11/2016 Tesoro Logistics LP / Williston G&P Assets (Whiting Oil and Gas Corp.) $700.0 6.7 11/2016 CONE Midstream Partners LP / 25% Additional Interest in Anchor Systems (CONSOL Energy Inc. and Noble Energy, Inc.) 248.0 7.5 07/2016 Sanchez Production Partners LP / 50% interest in Carnero Gathering, LLC (Sanchez Energy Corporation) 44.4 6.3 09/2015 Sanchez Production Partners LP / Pipeline, Gathering and Compression Assets in Western Catarina (Sanchez Energy Corporation) 345.8 9.4 08/2015 Azure Midstream Partners, LP / Azure ETG, LLC gathering and processing system (Azure Midstream Energy, LLC) 83.0 6.2 03/2014 Summit Midstream Partners, LP / Red Rock Gathering Company, LLC (Summit Midstream Partners, LLC) 305.0 8.6 05/2013 MarkWest Energy Partners, L.P. / Granite Wash Gathering and Processing Assets (Chesapeake Energy Corporation) 245.0 8.2 02/2013 Western Gas Partners, LP / 33.75% Interest in Liberty and Rome Gas Gathering Systems (Anadarko Petroleum Corporation) 490.0 7.6 08/2012 Eagle Rock Energy Partners / Sunray and Hemphill processing plants and associated 2,500 mile gathering system (BP America Production Co.) 227.5 9.5 All Transactions Mean 7.7x Median 7.6 Summary Results 2019E EBITDA $49.4 Relevant EBITDA Multiple 7.0x - 9.0x Implied Enterprise Value as of December 31, 2019E $345.7 - $444.5 Implied Enterprise Value Range on March 31, 2019E @ 8.5% Discount Rate $338.8 $435.6 Less: Present Value of March 31, 2019E to December 31, 2019E Growth Capital Expenditures @ 8.5% Discount Rate ($57.4) Implied Enterprise Value Range - 2019 EBITDA $281.3 - $378.1 2020E EBITDA $68.0 Relevant EBITDA Multiple 7.0x - 9.0x Implied Enterprise Value as of December 31, 2020E $476.2 - $612.3 Implied Enterprise Value Range on March 31, 2019E @ 8.5% Discount Rate $430.1 $552.9 Less: Present Value of March 31, 2019E to December 31, 2020E Growth Capital Expenditures @ 8.5% Discount Rate ($70.6) Implied Enterprise Value Range - 2020 EBITDA $359.4 - $482.3 Implied Enterprise Value Range $281.3 $482.3 Source: Public filings, Wall street research 85
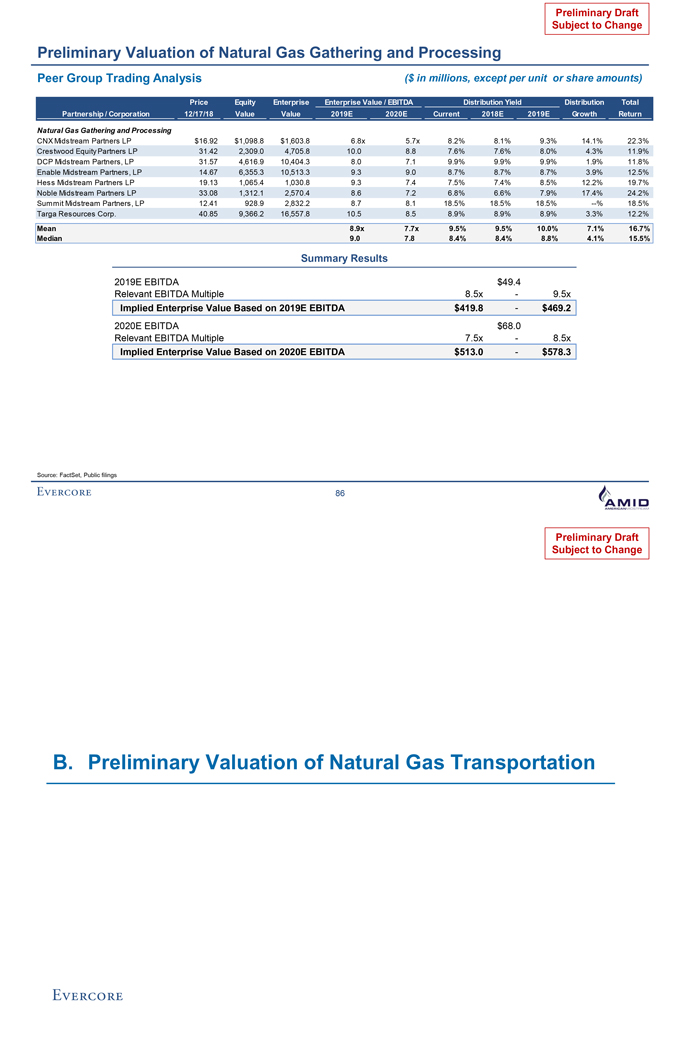
Preliminary Draft Subject to Change Preliminary Valuation of Natural Gas Gathering and Processing Peer Group Trading Analysis ($ in millions, except per unit or share amounts) Price Equity Enterprise Enterprise Value / EBITDA Distribution Yield Distribution Total Partnership / Corporation 12/17/18 Value Value 2019E 2020E Current 2018E 2019E Growth Return Natural Gas Gathering and Processing CNX Midstream Partners LP $16.92 $1,098.8 $1,603.8 6.8x 5.7x 8.2% 8.1% 9.3% 14.1% 22.3% Crestwood Equity Partners LP 31.42 2,309.0 4,705.8 10.0 8.8 7.6% 7.6% 8.0% 4.3% 11.9% DCP Midstream Partners, LP 31.57 4,616.9 10,404.3 8.0 7.1 9.9% 9.9% 9.9% 1.9% 11.8% Enable Midstream Partners, LP 14.67 6,355.3 10,513.3 9.3 9.0 8.7% 8.7% 8.7% 3.9% 12.5% Hess Midstream Partners LP 19.13 1,065.4 1,030.8 9.3 7.4 7.5% 7.4% 8.5% 12.2% 19.7% Noble Midstream Partners LP 33.08 1,312.1 2,570.4 8.6 7.2 6.8% 6.6% 7.9% 17.4% 24.2% Summit Midstream Partners, LP 12.41 928.9 2,832.2 8.7 8.1 18.5% 18.5% 18.5% --% 18.5% Targa Resources Corp. 40.85 9,366.2 16,557.8 10.5 8.5 8.9% 8.9% 8.9% 3.3% 12.2% Mean 8.9x 7.7x 9.5% 9.5% 10.0% 7.1% 16.7% Median 9.0 7.8 8.4% 8.4% 8.8% 4.1% 15.5% Summary Results 2019E EBITDA $49.4 Relevant EBITDA Multiple 8.5x - 9.5x Implied Enterprise Value Based on 2019E EBITDA $419.8 - $469.2 2020E EBITDA $68.0 Relevant EBITDA Multiple 7.5x - 8.5x Implied Enterprise Value Based on 2020E EBITDA $513.0 - $578.3 Source: FactSet, Public filings 86 Preliminary Draft Subject to Change B. Preliminary Valuation of Natural Gas Transportation
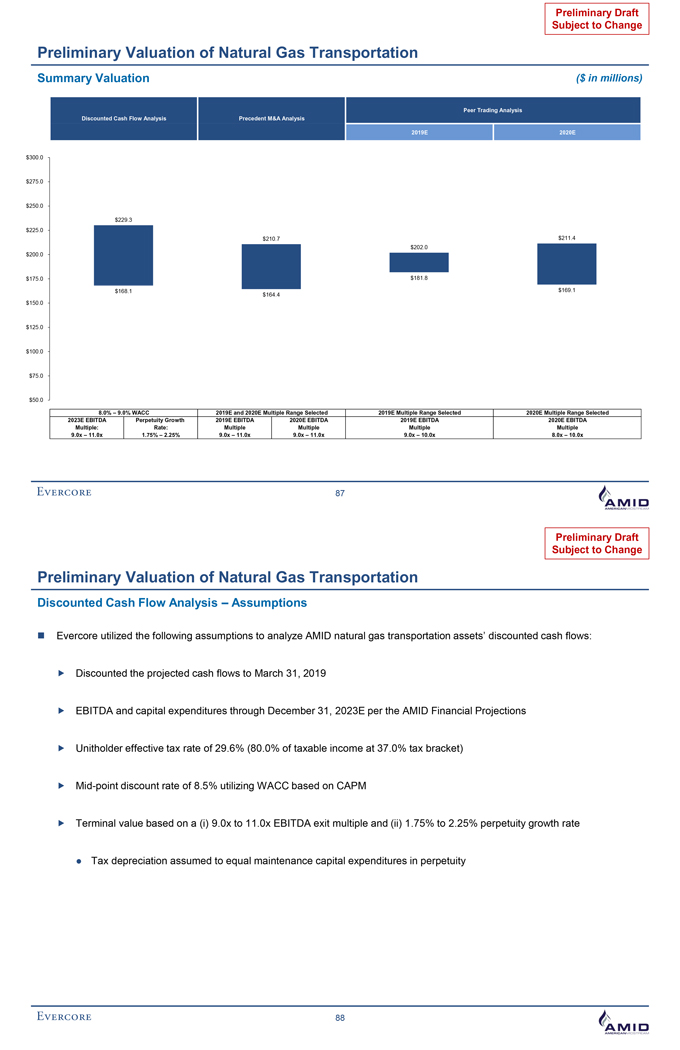
Preliminary Draft Subject to Change Preliminary Valuation of Natural Gas Transportation Summary Valuation ($ in millions) Peer Trading Analysis Discounted Cash Flow Analysis Precedent M&A Analysis 2019E 2020E $300.0 $275.0 $250.0 $229.3 $225.0 $210.7 $211.4 $202.0 $200.0 $175.0 $181.8 $168.1 $164.4 $169.1 $150.0 $125.0 $100.0 $75.0 $50.0 8.0% – 9.0% WACC 2019E and 2020E Multiple Range Selected 2019E Multiple Range Selected 2020E Multiple Range Selected 2023E EBITDA Perpetuity Growth 2019E EBITDA 2020E EBITDA 2019E EBITDA 2020E EBITDA Multiple: Rate: Multiple Multiple Multiple Multiple 9.0 x – 11.0x 1.75% – 2.25% 9.0 x – 11.0x 9.0 x – 11.0x 9.0 x – 10.0x 8.0 x – 10.0x 87 Preliminary Draft Subject to Change Preliminary Valuation of Natural Gas Transportation Discounted Cash Flow Analysis – Assumptions Evercore utilized the following assumptions to analyze AMID natural gas transportation assets’ discounted cash flows: Discounted the projected cash flows to March 31, 2019 EBITDA and capital expenditures through December 31, 2023E per the AMID Financial Projections Unitholder effective tax rate of 29.6% (80.0% of taxable income at 37.0% tax bracket) Mid-point discount rate of 8.5% utilizing WACC based on CAPM Terminal value based on a (i) 9.0x to 11.0x EBITDA exit multiple and (ii) 1.75% to 2.25% perpetuity growth rate Tax depreciation assumed to equal maintenance capital expenditures in perpetuity 88
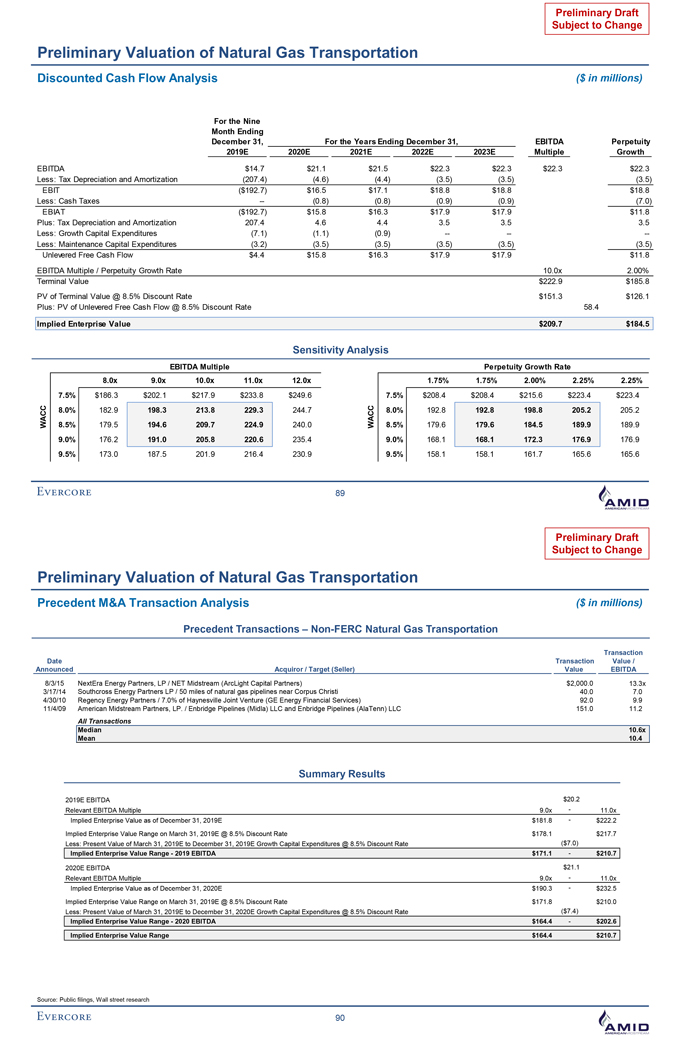
Preliminary Draft Subject to Change Preliminary Valuation of Natural Gas Transportation Discounted Cash Flow Analysis ($ in millions) For the Nine Month Ending December 31, For the Years Ending December 31, EBITDA Perpetuity 2019E 2020E 2021E 2022E 2023E Multiple Growth EBITDA $14.7 $21.1 $21.5 $22.3 $22.3 $22.3 $22.3 Less: Tax Depreciation and Amortization (207.4) (4.6) (4.4) (3.5) (3.5) (3.5) EBIT ($192.7) $16.5 $17.1 $18.8 $18.8 $18.8 Less: Cash Taxes -- (0.8) (0.8) (0.9) (0.9) (7.0) EBIAT ($192.7) $15.8 $16.3 $17.9 $17.9 $11.8 Plus: Tax Depreciation and Amortization 207.4 4.6 4.4 3.5 3.5 3.5 Less: Growth Capital Expenditures (7.1) (1.1) (0.9) -- -- --Less: Maintenance Capital Expenditures (3.2) (3.5) (3.5) (3.5) (3.5) (3.5) Unlevered Free Cash Flow $4.4 $15.8 $16.3 $17.9 $17.9 $11.8 EBITDA Multiple / Perpetuity Growth Rate 10.0x 2.00% Terminal Value $222.9 $185.8 PV of Terminal Value @ 8.5% Discount Rate $151.3 $126.1 Plus: PV of Unlevered Free Cash Flow @ 8.5% Discount Rate 58.4 Implied Enterprise Value $209.7 $184.5 Sensitivity Analysis EBITDA Multiple Perpetuity Growth Rate 8.0x 9.0x 10.0x 11.0x 12.0x 1.75% 1.75% 2.00% 2.25% 2.25% 7.5% $186.3 $202.1 $217.9 $233.8 $249.6 7.5% $208.4 $208.4 $215.6 $223.4 $223.4 ACC 8.0% 182.9 198.3 213.8 229.3 244.7 ACC 8.0% 192.8 192.8 198.8 205.2 205.2 W 8.5% 179.5 194.6 209.7 224.9 240.0 W 8.5% 179.6 179.6 184.5 189.9 189.9 9.0% 176.2 191.0 205.8 220.6 235.4 9.0% 168.1 168.1 172.3 176.9 176.9 9.5% 173.0 187.5 201.9 216.4 230.9 9.5% 158.1 158.1 161.7 165.6 165.6 89 Preliminary Draft Subject to Change Preliminary Valuation of Natural Gas Transportation Precedent M&A Transaction Analysis ($ in millions) Precedent Transactions – Non-FERC Natural Gas Transportation Transaction Date Transaction Value / Announced Acquiror / Target (Seller) Value EBITDA 8/3/15 NextEra Energy Partners, LP / NET Midstream (ArcLight Capital Partners) $2,000.0 13.3x 3/17/14 Southcross Energy Partners LP / 50 miles of natural gas pipelines near Corpus Christi 40.0 7.0 4/30/10 Regency Energy Partners / 7.0% of Haynesville Joint Venture (GE Energy Financial Services) 92.0 9.9 11/4/09 American Midstream Partners, LP. / Enbridge Pipelines (Midla) LLC and Enbridge Pipelines (AlaTenn) LLC 151.0 11.2 All Transactions Median 10.6x Mean 10.4 Summary Results 2019E EBITDA $20.2 Relevant EBITDA Multiple 9.0x - 11.0x Implied Enterprise Value as of December 31, 2019E $181.8 - $222.2 Implied Enterprise Value Range on March 31, 2019E @ 8.5% Discount Rate $178.1 $217.7 Less: Present Value of March 31, 2019E to December 31, 2019E Growth Capital Expenditures @ 8.5% Discount Rate ($7.0) Implied Enterprise Value Range - 2019 EBITDA $171.1 - $210.7 2020E EBITDA $21.1 Relevant EBITDA Multiple 9.0x - 11.0x Implied Enterprise Value as of December 31, 2020E $190.3 - $232.5 Implied Enterprise Value Range on March 31, 2019E @ 8.5% Discount Rate $171.8 $210.0 Less: Present Value of March 31, 2019E to December 31, 2020E Growth Capital Expenditures @ 8.5% Discount Rate ($7.4) Implied Enterprise Value Range - 2020 EBITDA $164.4 - $202.6 Implied Enterprise Value Range $164.4 $210.7 Source: Public filings, Wall street research 90
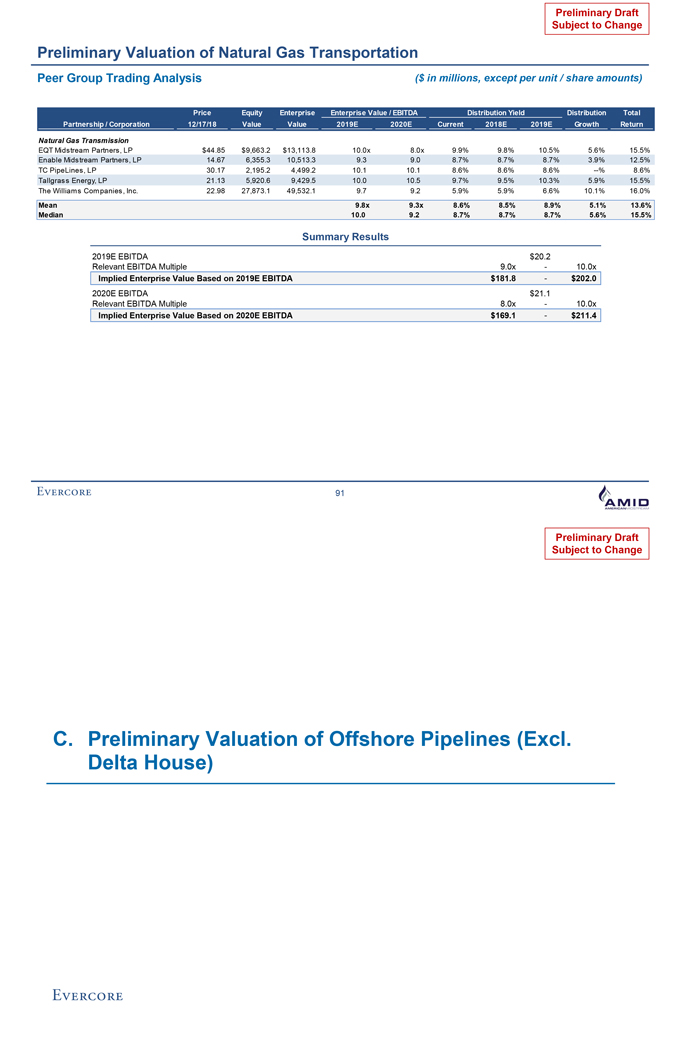
Preliminary Draft Subject to Change Preliminary Valuation of Natural Gas Transportation Peer Group Trading Analysis ($ in millions, except per unit / share amounts) Price Equity Enterprise Enterprise Value / EBITDA Distribution Yield Distribution Total Partnership / Corporation 12/17/18 Value Value 2019E 2020E Current 2018E 2019E Growth Return Natural Gas Transmission EQT Midstream Partners, LP $44.85 $9,663.2 $13,113.8 10.0x 8.0x 9.9% 9.8% 10.5% 5.6% 15.5% Enable Midstream Partners, LP 14.67 6,355.3 10,513.3 9.3 9.0 8.7% 8.7% 8.7% 3.9% 12.5% TC PipeLines, LP 30.17 2,195.2 4,499.2 10.1 10.1 8.6% 8.6% 8.6% --% 8.6% Tallgrass Energy, LP 21.13 5,920.6 9,429.5 10.0 10.5 9.7% 9.5% 10.3% 5.9% 15.5% The Williams Companies, Inc. 22.98 27,873.1 49,532.1 9.7 9.2 5.9% 5.9% 6.6% 10.1% 16.0% Mean 9.8x 9.3x 8.6% 8.5% 8.9% 5.1% 13.6% Median 10.0 9.2 8.7% 8.7% 8.7% 5.6% 15.5% Summary Results 2019E EBITDA $20.2 Relevant EBITDA Multiple 9.0x - 10.0x Implied Enterprise Value Based on 2019E EBITDA $181.8 - $202.0 2020E EBITDA $21.1 Relevant EBITDA Multiple 8.0x - 10.0x Implied Enterprise Value Based on 2020E EBITDA $169.1 - $211.4 91 Preliminary Draft Subject to Change C. Preliminary Valuation of Offshore Pipelines (Excl. Delta House)
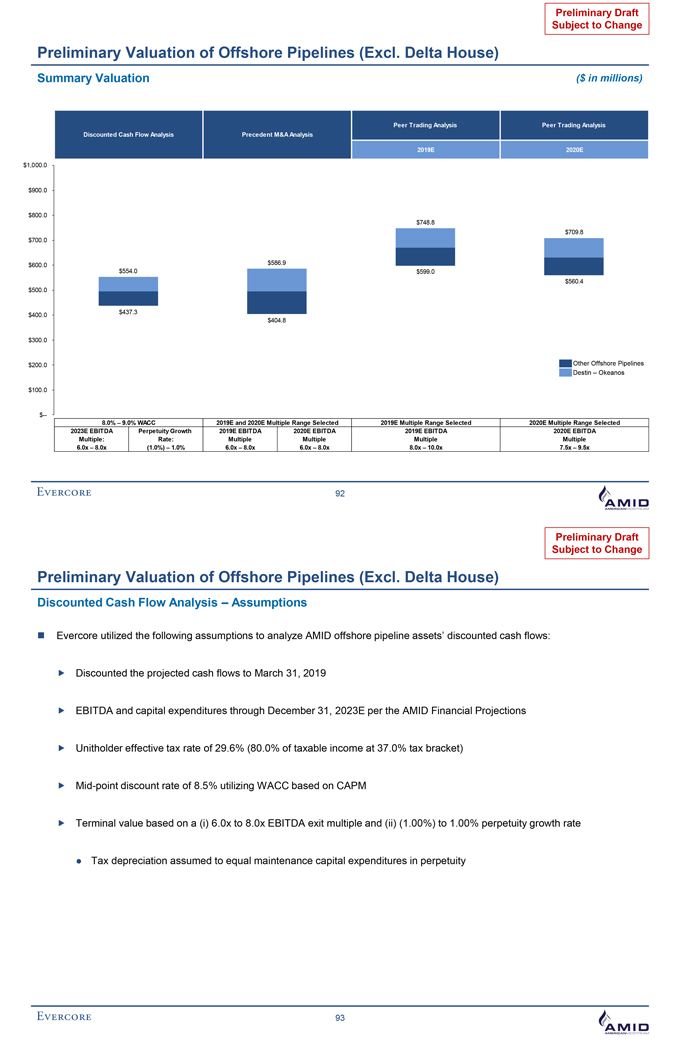
Preliminary Draft Subject to Change Preliminary Valuation of Offshore Pipelines (Excl. Delta House) Summary Valuation ($ in millions) Peer Trading Analysis Peer Trading Analysis Discounted Cash Flow Analysis Precedent M&A Analysis 2019E 2020E $1,000.0 $900.0 $800.0 $748.8 $709.8 $700.0 $600.0 $586.9 $554.0 $599.0 $560.4 $500.0 $437.3 $400.0 $404.8 $300.0 $200.0 Other Offshore Pipelines Destin – Okeanos $100.0 $-- 8.0% – 9.0% WACC 2019E and 2020E Multiple Range Selected 2019E Multiple Range Selected 2020E Multiple Range Selected 2023E EBITDA Perpetuity Growth 2019E EBITDA 2020E EBITDA 2019E EBITDA 2020E EBITDA Multiple: Rate: Multiple Multiple Multiple Multiple 6.0x – 8.0x (1.0%) – 1.0% 6.0x – 8.0x 6.0x – 8.0x 8.0x – 10.0x 7.5x – 9.5x 92 Preliminary Draft Subject to Change Preliminary Valuation of Offshore Pipelines (Excl. Delta House) Discounted Cash Flow Analysis – Assumptions Evercore utilized the following assumptions to analyze AMID offshore pipeline assets’ discounted cash flows: Discounted the projected cash flows to March 31, 2019 EBITDA and capital expenditures through December 31, 2023E per the AMID Financial Projections Unitholder effective tax rate of 29.6% (80.0% of taxable income at 37.0% tax bracket) Mid-point discount rate of 8.5% utilizing WACC based on CAPM Terminal value based on a (i) 6.0x to 8.0x EBITDA exit multiple and (ii) (1.00%) to 1.00% perpetuity growth rate Tax depreciation assumed to equal maintenance capital expenditures in perpetuity 93
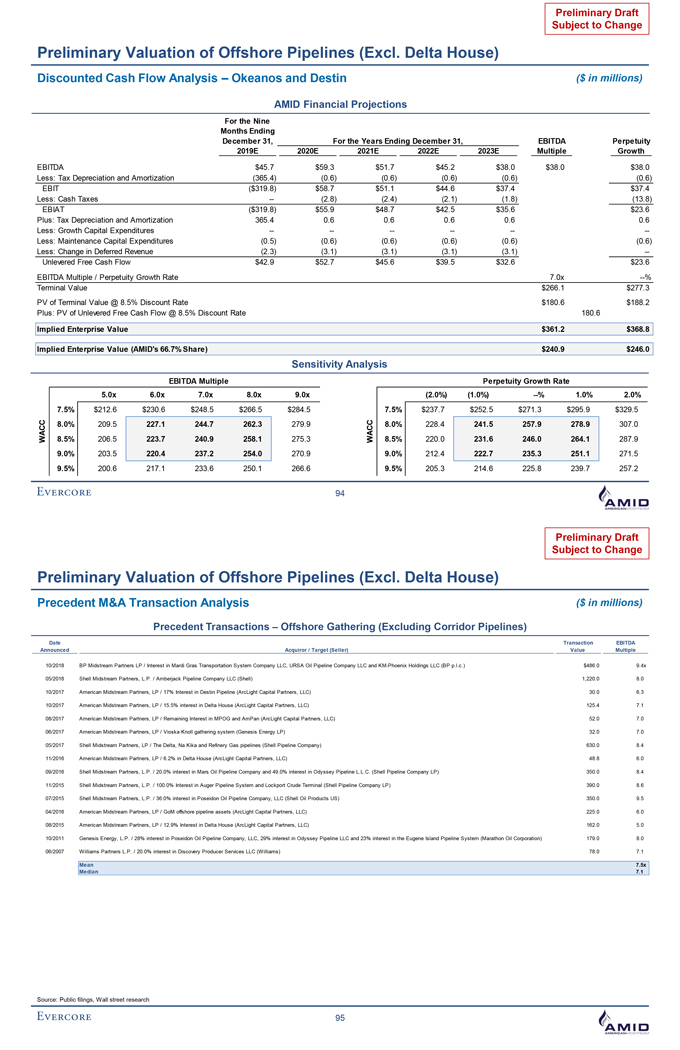
Preliminary Draft Subject to Change Preliminary Valuation of Offshore Pipelines (Excl. Delta House) Discounted Cash Flow Analysis – Okeanos and Destin ($ in millions) AMID Financial Projections For the Nine Months Ending December 31, For the Years Ending December 31, EBITDA Perpetuity 2019E 2020E 2021E 2022E 2023E Multiple Growth EBITDA $45.7 $59.3 $51.7 $45.2 $38.0 $38.0 $38.0 Less: Tax Depreciation and Amortization (365.4) (0.6) (0.6) (0.6) (0.6) (0.6) EBIT ($319.8) $58.7 $51.1 $44.6 $37.4 $37.4 Less: Cash Taxes -- (2.8) (2.4) (2.1) (1.8) (13.8) EBIAT ($319.8) $55.9 $48.7 $42.5 $35.6 $23.6 Plus: Tax Depreciation and Amortization 365.4 0.6 0.6 0.6 0.6 0.6 Less: Growth Capital Expenditures -- -- -- -- -- --Less: Maintenance Capital Expenditures (0.5) (0.6) (0.6) (0.6) (0.6) (0.6) Less: Change in Deferred Revenue (2.3) (3.1) (3.1) (3.1) (3.1) --Unlevered Free Cash Flow $42.9 $52.7 $45.6 $39.5 $32.6 $23.6 EBITDA Multiple / Perpetuity Growth Rate 7.0x --% Terminal Value $266.1 $277.3 PV of Terminal Value @ 8.5% Discount Rate $180.6 $188.2 Plus: PV of Unlevered Free Cash Flow @ 8.5% Discount Rate 180.6 Implied Enterprise Value $361.2 $368.8 Implied Enterprise Value (AMID’s 66.7% Share) $240.9 $246.0 Sensitivity Analysis EBITDA Multiple Perpetuity Growth Rate 5.0x 6.0x 7.0x 8.0x 9.0x (2.0%) (1.0%) --% 1.0% 2.0% 7.5% $212.6 $230.6 $248.5 $266.5 $284.5 7.5% $237.7 $252.5 $271.3 $295.9 $329.5 8.0% 209.5 227.1 244.7 262.3 279.9 WACC 8.0% 228.4 241.5 257.9 278.9 307.0 WACC 8.5% 206.5 223.7 240.9 258.1 275.3 8.5% 220.0 231.6 246.0 264.1 287.9 9.0% 203.5 220.4 237.2 254.0 270.9 9.0% 212.4 222.7 235.3 251.1 271.5 9.5% 200.6 217.1 233.6 250.1 266.6 9.5% 205.3 214.6 225.8 239.7 257.2 94 Preliminary Draft Subject to Change Preliminary Valuation of Offshore Pipelines (Excl. Delta House) Precedent M&A Transaction Analysis ($ in millions) Precedent Transactions – Offshore Gathering (Excluding Corridor Pipelines) Date Transaction EBITDA Announced Acquiror / Target (Seller) Value Multiple 10/2018 BP Midstream Partners LP / Interest in Mardi Gras Transportation System Company LLC, URSA Oil Pipeline Company LLC and KM-Phoenix Holdings LLC (BP p.l.c.) $486.0 9.4x 05/2018 Shell Midstream Partners, L.P. / Amberjack Pipeline Company LLC (Shell) 1,220.0 8.0 10/2017 American Midstream Partners, LP / 17% Interest in Destin Pipeline (ArcLight Capital Partners, LLC) 30.0 6.3 10/2017 American Midstream Partners, LP / 15.5% interest in Delta House (ArcLight Capital Partners, LLC) 125.4 7.1 08/2017 American Midstream Partners, LP / Remaining Interest in MPOG and AmPan (ArcLight Capital Partners, LLC) 52.0 7.0 06/2017 American Midstream Partners, LP / Vioska Knoll gathering system (Genesis Energy LP) 32.0 7.0 05/2017 Shell Midstream Partners, LP / The Delta, Na Kika and Refinery Gas pipelines (Shell Pipeline Company) 630.0 8.4 11/2016 American Midstream Partners, LP / 6.2% in Delta House (ArcLight Capital Partners, LLC) 48.8 6.0 09/2016 Shell Midstream Partners, L.P. / 20.0% interest in Mars Oil Pipeline Company and 49.0% interest in Odyssey Pipeline L.L.C. (Shell Pipeline Company LP) 350.0 8.4 11/2015 Shell Midstream Partners, L.P. / 100.0% Interest in Auger Pipeline System and Lockport Crude Terminal (Shell Pipeline Company LP) 390.0 8.6 07/2015 Shell Midstream Partners, L.P. / 36.0% interest in Poseidon Oil Pipeline Company, LLC (Shell Oil Products US) 350.0 9.5 04/2016 American Midstream Partners, LP / GoM offshore pipeline assets (ArcLight Capital Partners, LLC) 225.0 6.0 08/2015 American Midstream Partners, LP / 12.9% Interest in Delta House (ArcLight Capital Partners, LLC) 162.0 5.0 10/2011 Genesis Energy, L.P. / 28% interest in Poseidon Oil Pipeline Company, LLC, 29% interest in Odyssey Pipeline LLC and 23% interest in the Eugene Island Pipeline System (Marathon Oil Corporation) 179.0 8.0 06/2007 Williams Partners L.P. / 20.0% interest in Discovery Producer Services LLC (Williams) 78.0 7.1 Mean 7.5x Median 7.1 Source: Public filings, Wall street research 95
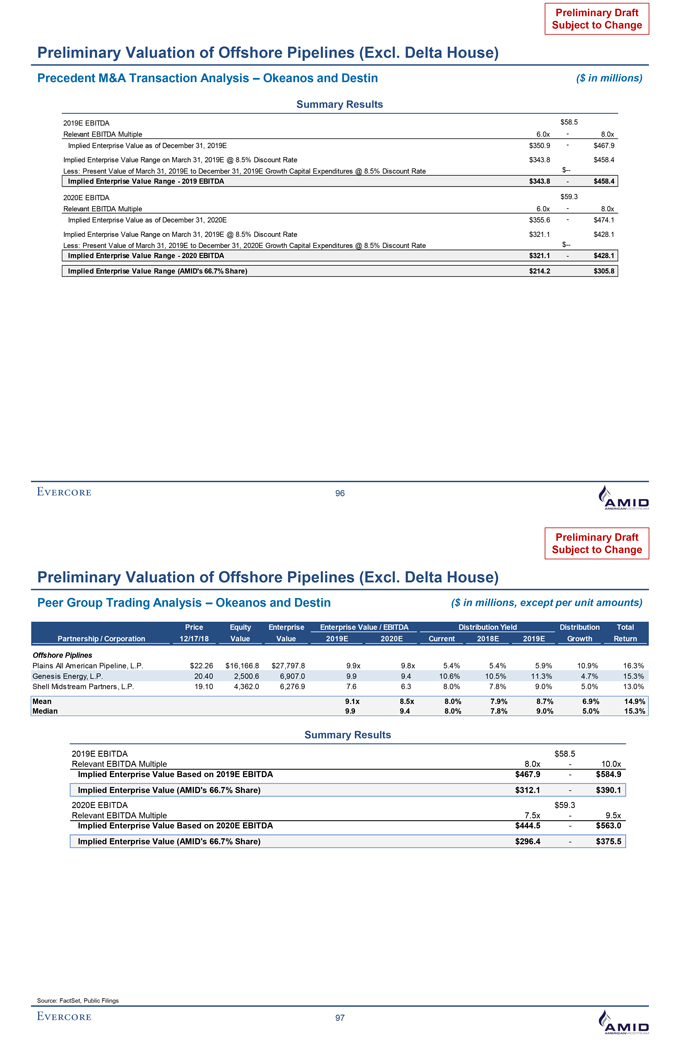
Preliminary Draft Subject to Change Preliminary Valuation of Offshore Pipelines (Excl. Delta House) Precedent M&A Transaction Analysis – Okeanos and Destin ($ in millions) Summary Results 2019E EBITDA $58.5 Relevant EBITDA Multiple 6.0x - 8.0x Implied Enterprise Value as of December 31, 2019E $350.9 - $467.9 Implied Enterprise Value Range on March 31, 2019E @ 8.5% Discount Rate $343.8 $458.4 Less: Present Value of March 31, 2019E to December 31, 2019E Growth Capital Expenditures @ 8.5% Discount Rate $-- Implied Enterprise Value Range - 2019 EBITDA $343.8 - $458.4 2020E EBITDA $59.3 Relevant EBITDA Multiple 6.0x - 8.0x Implied Enterprise Value as of December 31, 2020E $355.6 - $474.1 Implied Enterprise Value Range on March 31, 2019E @ 8.5% Discount Rate $321.1 $428.1 Less: Present Value of March 31, 2019E to December 31, 2020E Growth Capital Expenditures @ 8.5% Discount Rate $-- Implied Enterprise Value Range - 2020 EBITDA $321.1 - $428.1 Implied Enterprise Value Range (AMID’s 66.7% Share) $214.2 $305.8 96 Preliminary Draft Subject to Change Preliminary Valuation of Offshore Pipelines (Excl. Delta House) Peer Group Trading Analysis – Okeanos and Destin ($ in millions, except per unit amounts) Price Equity Enterprise Enterprise Value / EBITDA Distribution Yield Distribution Total Partnership / Corporation 12/17/18 Value Value 2019E 2020E Current 2018E 2019E Growth Return Offshore Piplines Plains All American Pipeline, L.P. $22.26 $16,166.8 $27,797.8 9.9x 9.8x 5.4% 5.4% 5.9% 10.9% 16.3% Genesis Energy, L.P. 20.40 2,500.6 6,907.0 9.9 9.4 10.6% 10.5% 11.3% 4.7% 15.3% Shell Midstream Partners, L.P. 19.10 4,362.0 6,276.9 7.6 6.3 8.0% 7.8% 9.0% 5.0% 13.0% Mean 9.1x 8.5x 8.0% 7.9% 8.7% 6.9% 14.9% Median 9.9 9.4 8.0% 7.8% 9.0% 5.0% 15.3% Summary Results 2019E EBITDA $58.5 Relevant EBITDA Multiple 8.0x - 10.0x Implied Enterprise Value Based on 2019E EBITDA $467.9 - $584.9 Implied Enterprise Value (AMID’s 66.7% Share) $312.1 - $390.1 2020E EBITDA $59.3 Relevant EBITDA Multiple 7.5x - 9.5x Implied Enterprise Value Based on 2020E EBITDA $444.5 - $563.0 Implied Enterprise Value (AMID’s 66.7% Share) $296.4 - $375.5 Source: FactSet, Public Filings 97
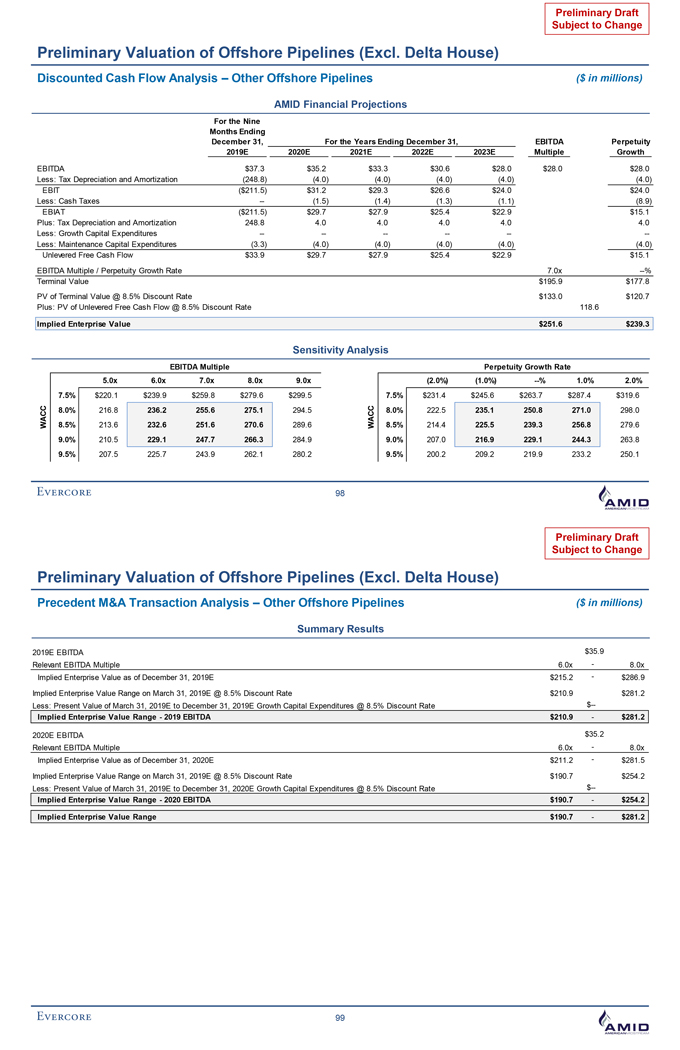
Preliminary Draft Subject to Change Preliminary Valuation of Offshore Pipelines (Excl. Delta House) Discounted Cash Flow Analysis – Other Offshore Pipelines ($ in millions) AMID Financial Projections For the Nine Months Ending December 31, For the Years Ending December 31, EBITDA Perpetuity 2019E 2020E 2021E 2022E 2023E Multiple Growth EBITDA $37.3 $35.2 $33.3 $30.6 $28.0 $28.0 $28.0 Less: Tax Depreciation and Amortization (248.8) (4.0) (4.0) (4.0) (4.0) (4.0) EBIT ($211.5) $31.2 $29.3 $26.6 $24.0 $24.0 Less: Cash Taxes -- (1.5) (1.4) (1.3) (1.1) (8.9) EBIAT ($211.5) $29.7 $27.9 $25.4 $22.9 $15.1 Plus: Tax Depreciation and Amortization 248.8 4.0 4.0 4.0 4.0 4.0 Less: Growth Capital Expenditures -- -- -- -- -- --Less: Maintenance Capital Expenditures (3.3) (4.0) (4.0) (4.0) (4.0) (4.0) Unlevered Free Cash Flow $33.9 $29.7 $27.9 $25.4 $22.9 $15.1 EBITDA Multiple / Perpetuity Growth Rate 7.0x --% Terminal Value $195.9 $177.8 PV of Terminal Value @ 8.5% Discount Rate $133.0 $120.7 Plus: PV of Unlevered Free Cash Flow @ 8.5% Discount Rate 118.6 Implied Enterprise Value $251.6 $239.3 Sensitivity Analysis EBITDA Multiple Perpetuity Growth Rate 5.0x 6.0x 7.0x 8.0x 9.0x (2.0%) (1.0%) --% 1.0% 2.0% 7.5% $220.1 $239.9 $259.8 $279.6 $299.5 7.5% $231.4 $245.6 $263.7 $287.4 $319.6 ACC 8.0% 216.8 236.2 255.6 275.1 294.5 ACC 8.0% 222.5 235.1 250.8 271.0 298.0 W 8.5% 213.6 232.6 251.6 270.6 289.6 W 8.5% 214.4 225.5 239.3 256.8 279.6 9.0% 210.5 229.1 247.7 266.3 284.9 9.0% 207.0 216.9 229.1 244.3 263.8 9.5% 207.5 225.7 243.9 262.1 280.2 9.5% 200.2 209.2 219.9 233.2 250.1 98 Preliminary Draft Subject to Change Preliminary Valuation of Offshore Pipelines (Excl. Delta House) Precedent M&A Transaction Analysis – Other Offshore Pipelines ($ in millions) Summary Results 2019E EBITDA $35.9 Relevant EBITDA Multiple 6.0x - 8.0x Implied Enterprise Value as of December 31, 2019E $215.2 - $286.9 Implied Enterprise Value Range on March 31, 2019E @ 8.5% Discount Rate $210.9 $281.2 Less: Present Value of March 31, 2019E to December 31, 2019E Growth Capital Expenditures @ 8.5% Discount Rate $-- Implied Enterprise Value Range - 2019 EBITDA $210.9 - $281.2 2020E EBITDA $35.2 Relevant EBITDA Multiple 6.0x - 8.0x Implied Enterprise Value as of December 31, 2020E $211.2 - $281.5 Implied Enterprise Value Range on March 31, 2019E @ 8.5% Discount Rate $190.7 $254.2 Less: Present Value of March 31, 2019E to December 31, 2020E Growth Capital Expenditures @ 8.5% Discount Rate $-- Implied Enterprise Value Range - 2020 EBITDA $190.7 - $254.2 Implied Enterprise Value Range $190.7 - $281.2 99
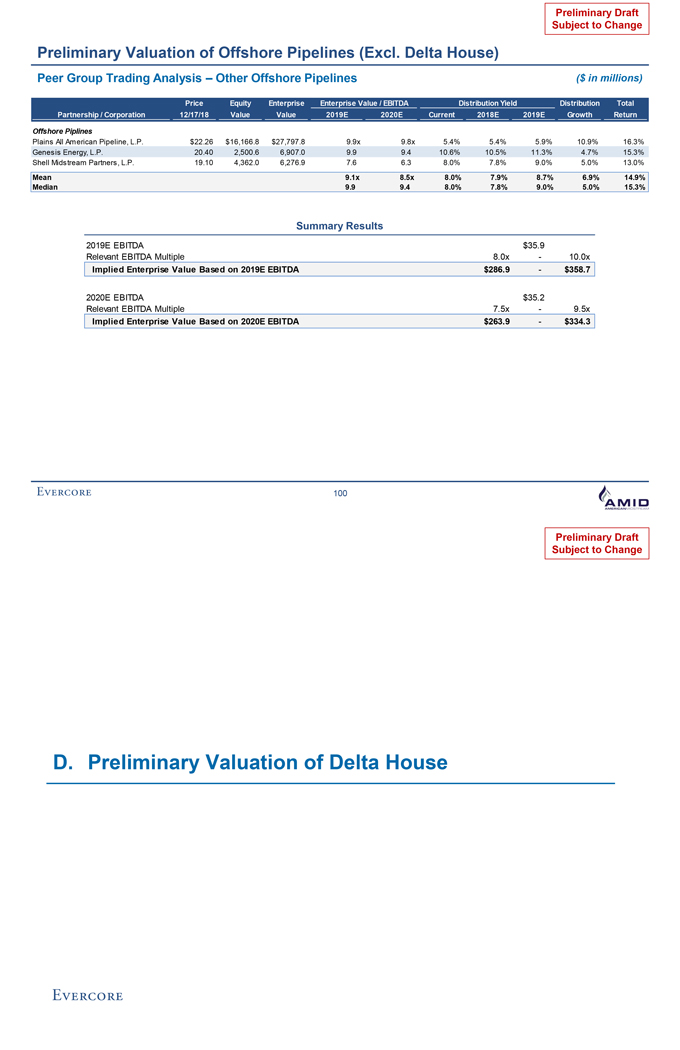
Preliminary Draft Subject to Change Preliminary Valuation of Offshore Pipelines (Excl. Delta House) Peer Group Trading Analysis – Other Offshore Pipelines ($ in millions) Price Equity Enterprise Enterprise Value / EBITDA Distribution Yield Distribution Total Partnership / Corporation 12/17/18 Value Value 2019E 2020E Current 2018E 2019E Growth Return Offshore Piplines Plains All American Pipeline, L.P. $22.26 $16,166.8 $27,797.8 9.9x 9.8x 5.4% 5.4% 5.9% 10.9% 16.3% Genesis Energy, L.P. 20.40 2,500.6 6,907.0 9.9 9.4 10.6% 10.5% 11.3% 4.7% 15.3% Shell Midstream Partners, L.P. 19.10 4,362.0 6,276.9 7.6 6.3 8.0% 7.8% 9.0% 5.0% 13.0% Mean 9.1x 8.5x 8.0% 7.9% 8.7% 6.9% 14.9% Median 9.9 9.4 8.0% 7.8% 9.0% 5.0% 15.3% Summary Results 2019E EBITDA $35.9 Relevant EBITDA Multiple 8.0x - 10.0x Implied Enterprise Value Based on 2019E EBITDA $286.9 - $358.7 2020E EBITDA $35.2 Relevant EBITDA Multiple 7.5x - 9.5x Implied Enterprise Value Based on 2020E EBITDA $263.9 - $334.3 100 Preliminary Draft Subject to Change D. Preliminary Valuation of Delta House
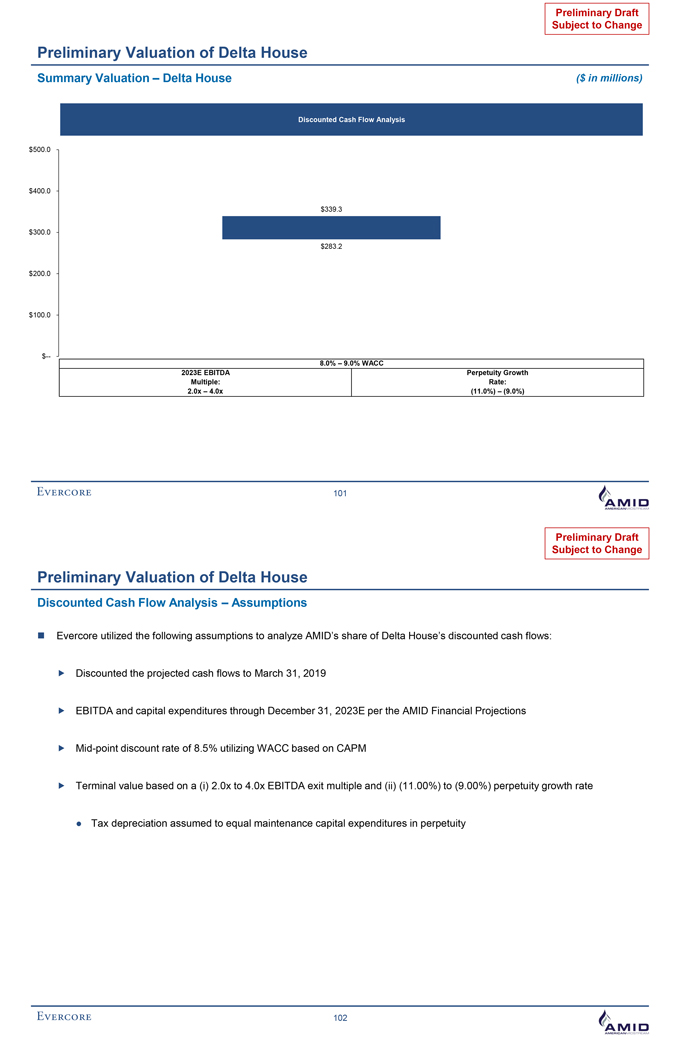
Preliminary Draft Subject to Change Preliminary Valuation of Delta House Summary Valuation – Delta House ($ in millions) Discounted Cash Flow Analysis $500.0 $400.0 $339.3 $300.0 $283.2 $200.0 $100.0 $-- 8.0% – 9.0% WACC 2023E EBITDA Perpetuity Growth Multiple: Rate: 2.0x – 4.0x (11.0%) – (9.0%) 101 Preliminary Draft Subject to Change Preliminary Valuation of Delta House Discounted Cash Flow Analysis – Assumptions Evercore utilized the following assumptions to analyze AMID’s share of Delta House’s discounted cash flows: Discounted the projected cash flows to March 31, 2019 EBITDA and capital expenditures through December 31, 2023E per the AMID Financial Projections Mid-point discount rate of 8.5% utilizing WACC based on CAPM Terminal value based on a (i) 2.0x to 4.0x EBITDA exit multiple and (ii) (11.00%) to (9.00%) perpetuity growth rate Tax depreciation assumed to equal maintenance capital expenditures in perpetuity 102
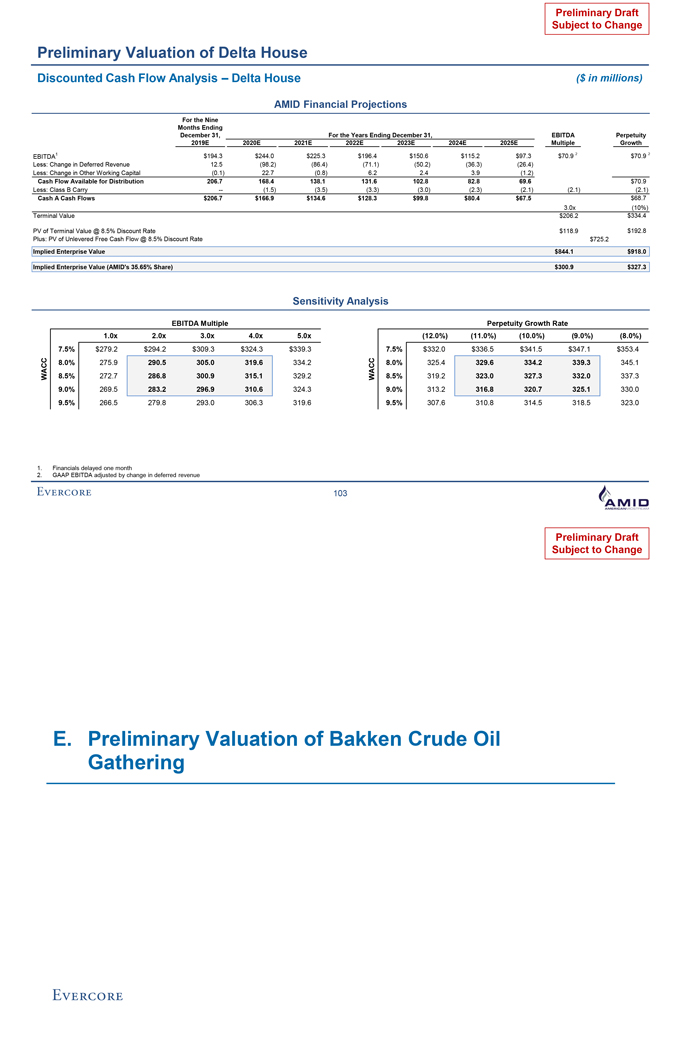
Preliminary Draft Subject to Change Preliminary Valuation of Delta House Discounted Cash Flow Analysis – Delta House ($ in millions) AMID Financial Projections For the Nine Months Ending December 31, For the Years Ending December 31, EBITDA Perpetuity 2019E 2020E 2021E 2022E 2023E 2024E 2025E Multiple Growth EBITDA1 $194.3 $244.0 $225.3 $196.4 $150.6 $115.2 $97.3 $70.9 2 $70.9 2 Less: Change in Deferred Revenue 12.5 (98.2) (86.4) (71.1) (50.2) (36.3) (26.4) Less: Change in Other Working Capital (0.1) 22.7 (0.8) 6.2 2.4 3.9 (1.2) Cash Flow Available for Distribution 206.7 168.4 138.1 131.6 102.8 82.8 69.6 $70.9 Less: Class B Carry -- (1.5) (3.5) (3.3) (3.0) (2.3) (2.1) (2.1) (2.1) Cash A Cash Flows $206.7 $166.9 $134.6 $128.3 $99.8 $80.4 $67.5 $68.7 3.0x (10%) Terminal Value $206.2 $334.4 PV of Terminal Value @ 8.5% Discount Rate $118.9 $192.8 Plus: PV of Unlevered Free Cash Flow @ 8.5% Discount Rate $725.2 Implied Enterprise Value $844.1 $918.0 Implied Enterprise Value (AMID’s 35.65% Share) $300.9 $327.3 Sensitivity Analysis EBITDA Multiple Perpetuity Growth Rate 1.0x 2.0x 3.0x 4.0x 5.0x (12.0%) (11.0%) (10.0%) (9.0%) (8.0%) 7.5% $279.2 $294.2 $309.3 $324.3 $339.3 7.5% $332.0 $336.5 $341.5 $347.1 $353.4 WACC 8.0% 275.9 290.5 305.0 319.6 334.2 WACC 8.0% 325.4 329.6 334.2 339.3 345.1 8.5% 272.7 286.8 300.9 315.1 329.2 8.5% 319.2 323.0 327.3 332.0 337.3 9.0% 269.5 283.2 296.9 310.6 324.3 9.0% 313.2 316.8 320.7 325.1 330.0 9.5% 266.5 279.8 293.0 306.3 319.6 9.5% 307.6 310.8 314.5 318.5 323.0 1. Financials delayed one month 2. GAAP EBITDA adjusted by change in deferred revenue 103 Preliminary Draft Subject to Change E. Preliminary Valuation of Bakken Crude Oil Gathering
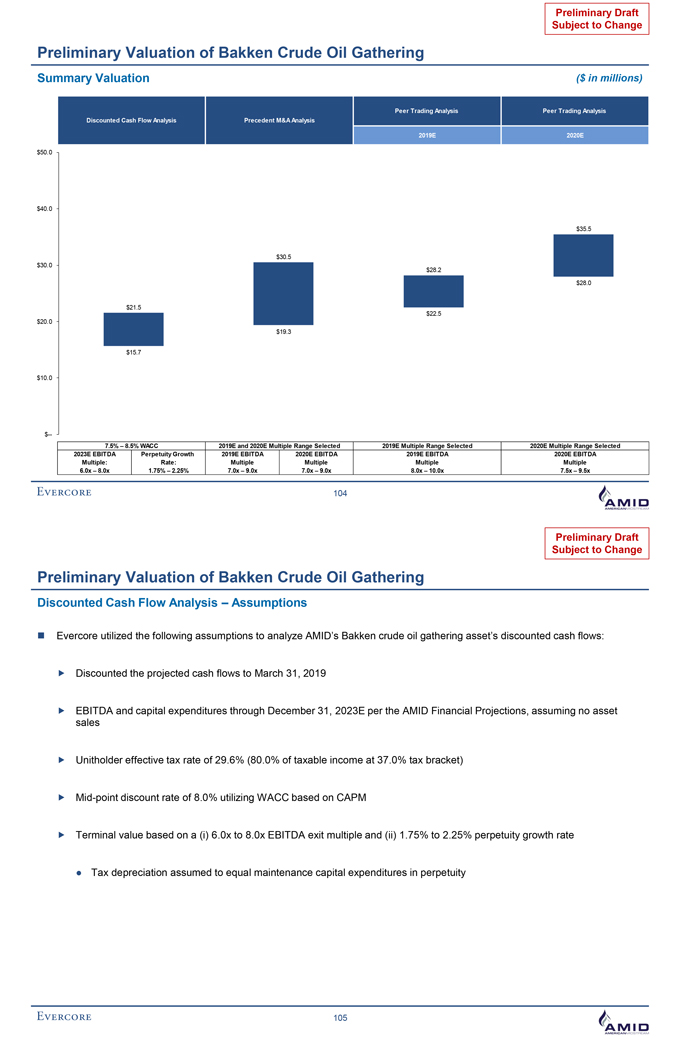
Preliminary Draft Subject to Change Preliminary Valuation of Bakken Crude Oil Gathering Summary Valuation ($ in millions) Peer Trading Analysis Peer Trading Analysis Discounted Cash Flow Analysis Precedent M&A Analysis 2019E 2020E $50.0 $40.0 $35.5 $30.5 $30.0 $28.2 $28.0 $21.5 $22.5 $20.0 $19.3 $15.7 $10.0 $-- 7.5% – 8.5% WACC 2019E and 2020E Multiple Range Selected 2019E Multiple Range Selected 2020E Multiple Range Selected 2023E EBITDA Perpetuity Growth 2019E EBITDA 2020E EBITDA 2019E EBITDA 2020E EBITDA Multiple: Rate: Multiple Multiple Multiple Multiple 6.0 x – 8.0x 1.75% – 2.25% 7.0 x – 9.0x 7.0 x – 9.0x 8.0 x – 10.0x 7.5 x – 9.5x 10⁴ Preliminary Draft Subject to Change Preliminary Valuation of Bakken Crude Oil Gathering Discounted Cash Flow Analysis – Assumptions Evercore utilized the following assumptions to analyze AMID’s Bakken crude oil gathering asset’s discounted cash flows: Discounted the projected cash flows to March 31, 2019 EBITDA and capital expenditures through December 31, 2023E per the AMID Financial Projections, assuming no asset sales Unitholder effective tax rate of 29.6% (80.0% of taxable income at 37.0% tax bracket) Mid-point discount rate of 8.0% utilizing WACC based on CAPM Terminal value based on a (i) 6.0x to 8.0x EBITDA exit multiple and (ii) 1.75% to 2.25% perpetuity growth rate Tax depreciation assumed to equal maintenance capital expenditures in perpetuity 105
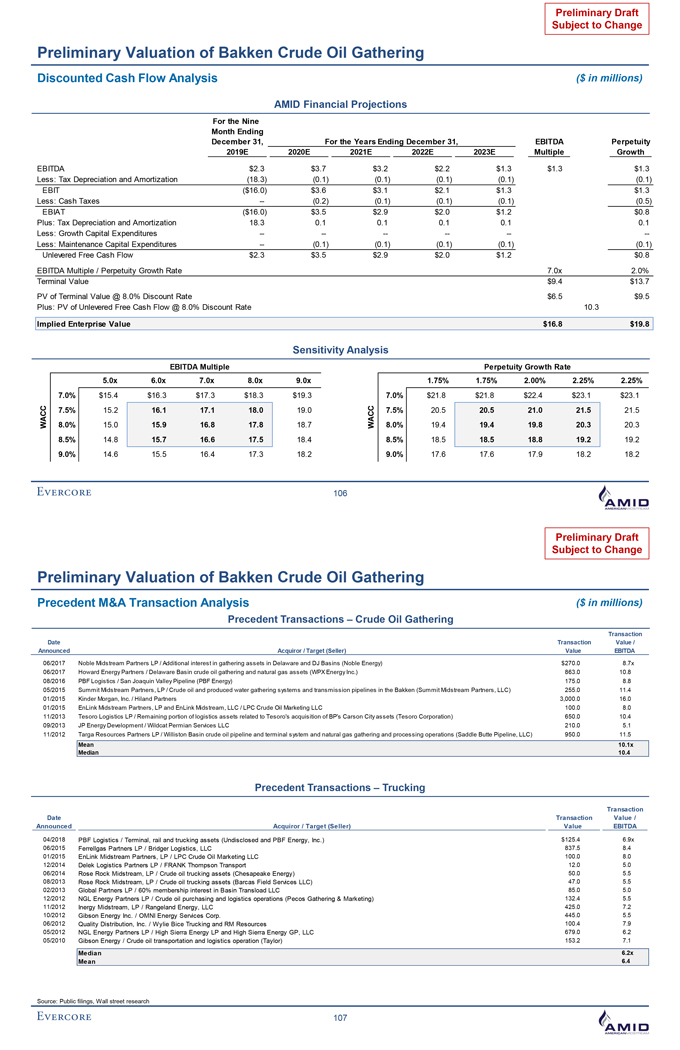
Preliminary Draft Subject to Change Preliminary Valuation of Bakken Crude Oil Gathering Discounted Cash Flow Analysis ($ in millions) AMID Financial Projections For the Nine Month Ending December 31, For the Years Ending December 31, EBITDA Perpetuity 2019E 2020E 2021E 2022E 2023E Multiple Growth EBITDA $2.3 $3.7 $3.2 $2.2 $1.3 $1.3 $1.3 Less: Tax Depreciation and Amortization (18.3) (0.1) (0.1) (0.1) (0.1) (0.1) EBIT ($16.0) $3.6 $3.1 $2.1 $1.3 $1.3 Less: Cash Taxes -- (0.2) (0.1) (0.1) (0.1) (0.5) EBIAT ($16.0) $3.5 $2.9 $2.0 $1.2 $0.8 Plus: Tax Depreciation and Amortization 18.3 0.1 0.1 0.1 0.1 0.1 Less: Growth Capital Expenditures -- -- -- -- -- --Less: Maintenance Capital Expenditures -- (0.1) (0.1) (0.1) (0.1) (0.1) Unlevered Free Cash Flow $2.3 $3.5 $2.9 $2.0 $1.2 $0.8 EBITDA Multiple / Perpetuity Growth Rate 7.0x 2.0% Terminal Value $9.4 $13.7 PV of Terminal Value @ 8.0% Discount Rate $6.5 $9.5 Plus: PV of Unlevered Free Cash Flow @ 8.0% Discount Rate 10.3 Implied Enterprise Value $16.8 $19.8 Sensitivity Analysis EBITDA Multiple Perpetuity Growth Rate 5.0x 6.0x 7.0x 8.0x 9.0x 1.75% 1.75% 2.00% 2.25% 2.25% 7.0% $15.4 $16.3 $17.3 $18.3 $19.3 7.0% $21.8 $21.8 $22.4 $23.1 $23.1 ACC 7.5% 15.2 16.1 17.1 18.0 19.0 ACC 7.5% 20.5 20.5 21.0 21.5 21.5 W 8.0% 15.0 15.9 16.8 17.8 18.7 W 8.0% 19.4 19.4 19.8 20.3 20.3 8.5% 14.8 15.7 16.6 17.5 18.4 8.5% 18.5 18.5 18.8 19.2 19.2 9.0% 14.6 15.5 16.4 17.3 18.2 9.0% 17.6 17.6 17.9 18.2 18.2 106 Preliminary Draft Subject to Change Preliminary Valuation of Bakken Crude Oil Gathering Precedent M&A Transaction Analysis ($ in millions) Precedent Transactions – Crude Oil Gathering Transaction Date Transaction Value / Announced Acquiror / Target (Seller) Value EBITDA 06/2017 Noble Midstream Partners LP / Additional interest in gathering assets in Delaware and DJ Basins (Noble Energy) $270.0 8.7x 06/2017 Howard Energy Partners / Delaware Basin crude oil gathering and natural gas assets (WPX Energy Inc.) 863.0 10.8 08/2016 PBF Logistics / San Joaquin Valley Pipeline (PBF Energy) 175.0 8.8 05/2015 Summit Midstream Partners, LP / Crude oil and produced water gathering systems and transmission pipelines in the Bakken (Summit Midstream Partners, LLC) 255.0 11.4 01/2015 Kinder Morgan, Inc. / Hiland Partners 3,000.0 16.0 01/2015 EnLink Midstream Partners, LP and EnLink Midstream, LLC / LPC Crude Oil Marketing LLC 100.0 8.0 11/2013 Tesoro Logistics LP / Remaining portion of logistics assets related to Tesoro’s acquisition of BP’s Carson City assets (Tesoro Corporation) 650.0 10.4 09/2013 JP Energy Development / Wildcat Permian Services LLC 210.0 5.1 11/2012 Targa Resources Partners LP / Williston Basin crude oil pipeline and terminal system and natural gas gathering and processing operations (Saddle Butte Pipeline, LLC) 950.0 11.5 Mean 10.1x Median 10.4 Precedent Transactions – Trucking Transaction Date Transaction Value / Announced Acquiror / Target (Seller) Value EBITDA 04/2018 PBF Logistics / Terminal, rail and trucking assets (Undisclosed and PBF Energy, Inc.) $125.4 6.9x 06/2015 Ferrellgas Partners LP / Bridger Logistics, LLC 837.5 8.4 01/2015 EnLink Midstream Partners, LP / LPC Crude Oil Marketing LLC 100.0 8.0 12/2014 Delek Logistics Partners LP / FRANK Thompson Transport 12.0 5.0 06/2014 Rose Rock Midstream, LP / Crude oil trucking assets (Chesapeake Energy) 50.0 5.5 08/2013 Rose Rock Midstream, LP / Crude oil trucking assets (Barcas Field Services LLC) 47.0 5.5 02/2013 Global Partners LP / 60% membership interest in Basin Transload LLC 85.0 5.0 12/2012 NGL Energy Partners LP / Crude oil purchasing and logistics operations (Pecos Gathering & Marketing) 132.4 5.5 11/2012 Inergy Midstream, LP / Rangeland Energy, LLC 425.0 7.2 10/2012 Gibson Energy Inc. / OMNI Energy Services Corp. 445.0 5.5 06/2012 Quality Distribution, Inc. / Wylie Bice Trucking and RM Resources 100.4 7.9 05/2012 NGL Energy Partners LP / High Sierra Energy LP and High Sierra Energy GP, LLC 679.0 6.2 05/2010 Gibson Energy / Crude oil transportation and logistics operation (Taylor) 153.2 7.1 Median 6.2x Mean 6.4 Source: Public filings, Wall street research 107
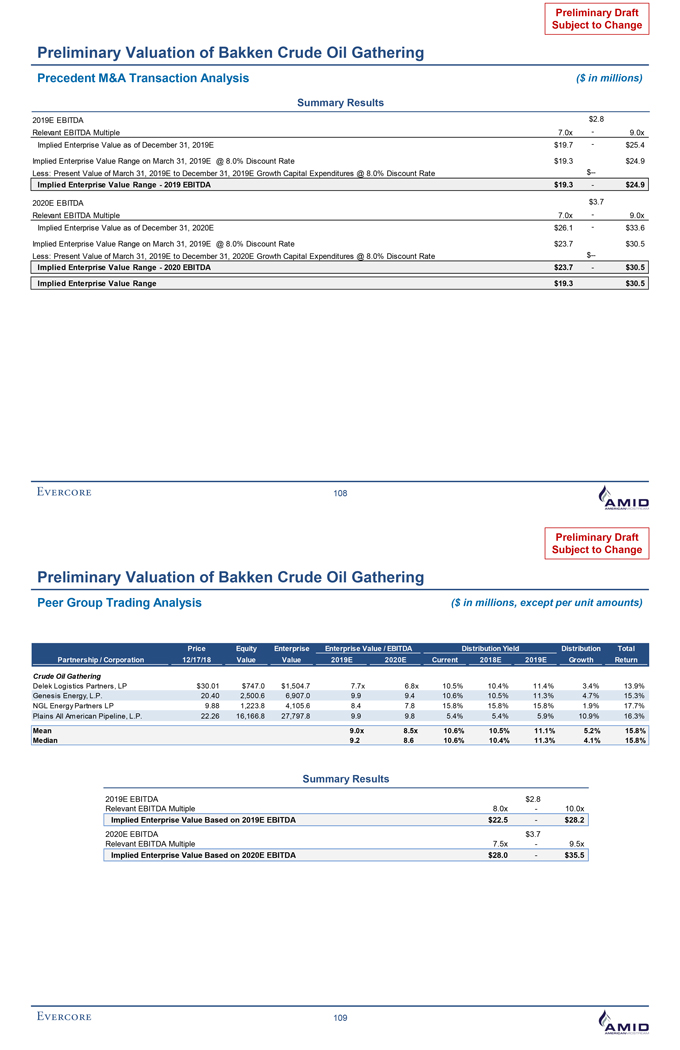
Preliminary Draft Subject to Change Preliminary Valuation of Bakken Crude Oil Gathering Precedent M&A Transaction Analysis ($ in millions) Summary Results 2019E EBITDA $2.8 Relevant EBITDA Multiple 7.0x - 9.0x Implied Enterprise Value as of December 31, 2019E $19.7 - $25.4 Implied Enterprise Value Range on March 31, 2019E @ 8.0% Discount Rate $19.3 $24.9 Less: Present Value of March 31, 2019E to December 31, 2019E Growth Capital Expenditures @ 8.0% Discount Rate $-- Implied Enterprise Value Range - 2019 EBITDA $19.3 - $24.9 2020E EBITDA $3.7 Relevant EBITDA Multiple 7.0x - 9.0x Implied Enterprise Value as of December 31, 2020E $26.1 - $33.6 Implied Enterprise Value Range on March 31, 2019E @ 8.0% Discount Rate $23.7 $30.5 Less: Present Value of March 31, 2019E to December 31, 2020E Growth Capital Expenditures @ 8.0% Discount Rate $-- Implied Enterprise Value Range - 2020 EBITDA $23.7 - $30.5 Implied Enterprise Value Range $19.3 $30.5 108 Preliminary Draft Subject to Change Preliminary Valuation of Bakken Crude Oil Gathering Peer Group Trading Analysis ($ in millions, except per unit amounts) Price Equity Enterprise Enterprise Value / EBITDA Distribution Yield Distribution Total Partnership / Corporation 12/17/18 Value Value 2019E 2020E Current 2018E 2019E Growth Return Crude Oil Gathering Delek Logistics Partners, LP $30.01 $747.0 $1,504.7 7.7x 6.8x 10.5% 10.4% 11.4% 3.4% 13.9% Genesis Energy, L.P. 20.40 2,500.6 6,907.0 9.9 9.4 10.6% 10.5% 11.3% 4.7% 15.3% NGL Energy Partners LP 9.88 1,223.8 4,105.6 8.4 7.8 15.8% 15.8% 15.8% 1.9% 17.7% Plains All American Pipeline, L.P. 22.26 16,166.8 27,797.8 9.9 9.8 5.4% 5.4% 5.9% 10.9% 16.3% Mean 9.0x 8.5x 10.6% 10.5% 11.1% 5.2% 15.8% Median 9.2 8.6 10.6% 10.4% 11.3% 4.1% 15.8% Summary Results 2019E EBITDA $2.8 Relevant EBITDA Multiple 8.0x - 10.0x Implied Enterprise Value Based on 2019E EBITDA $22.5 - $28.2 2020E EBITDA $3.7 Relevant EBITDA Multiple 7.5x - 9.5x Implied Enterprise Value Based on 2020E EBITDA $28.0 - $35.5 109
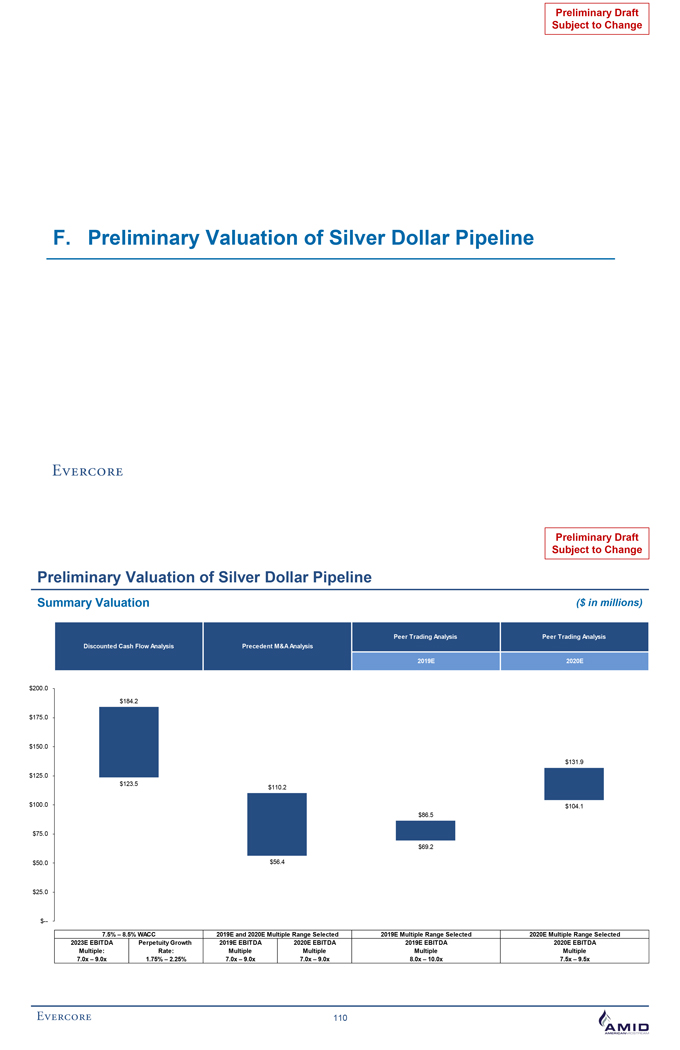
Preliminary Draft Subject to Change F. Preliminary Valuation of Silver Dollar Pipeline Preliminary Draft Subject to Change Preliminary Valuation of Silver Dollar Pipeline Summary Valuation ($ in millions) Peer Trading Analysis Peer Trading Analysis Discounted Cash Flow Analysis Precedent M&A Analysis 2019E 2020E $200.0 $184.2 $175.0 $150.0 $131.9 $125.0 $123.5 $110.2 $100.0 $104.1 $86.5 $75.0 $69.2 $50.0 $56.4 $25.0 $-- 7.5% – 8.5% WACC 2019E and 2020E Multiple Range Selected 2019E Multiple Range Selected 2020E Multiple Range Selected 2023E EBITDA Perpetuity Growth 2019E EBITDA 2020E EBITDA 2019E EBITDA 2020E EBITDA Multiple: Rate: Multiple Multiple Multiple Multiple 7.0 x – 9.0x 1.75% – 2.25% 7.0 x – 9.0x 7.0 x – 9.0x 8.0 x – 10.0x 7.5 x – 9.5x 110
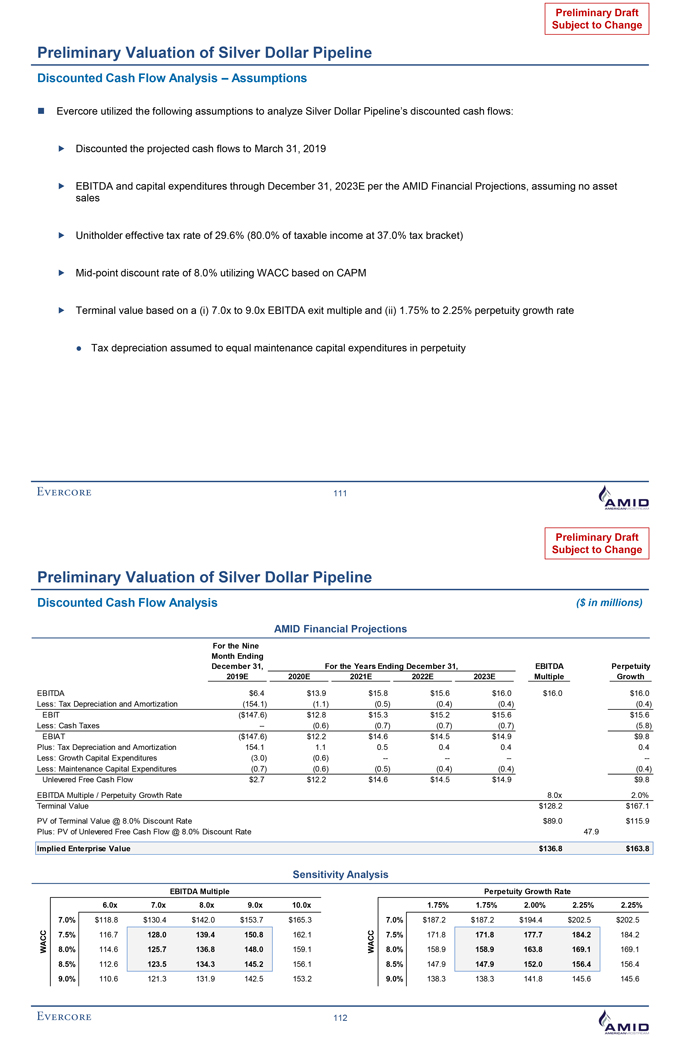
Preliminary Draft Subject to Change Preliminary Valuation of Silver Dollar Pipeline Discounted Cash Flow Analysis – Assumptions Evercore utilized the following assumptions to analyze Silver Dollar Pipeline’s discounted cash flows: Discounted the projected cash flows to March 31, 2019 EBITDA and capital expenditures through December 31, 2023E per the AMID Financial Projections, assuming no asset sales Unitholder effective tax rate of 29.6% (80.0% of taxable income at 37.0% tax bracket) Mid-point discount rate of 8.0% utilizing WACC based on CAPM Terminal value based on a (i) 7.0x to 9.0x EBITDA exit multiple and (ii) 1.75% to 2.25% perpetuity growth rate Tax depreciation assumed to equal maintenance capital expenditures in perpetuity 111 Preliminary Draft Subject to Change Preliminary Valuation of Silver Dollar Pipeline Discounted Cash Flow Analysis ($ in millions) AMID Financial Projections For the Nine Month Ending December 31, For the Years Ending December 31, EBITDA Perpetuity 2019E 2020E 2021E 2022E 2023E Multiple Growth EBITDA $6.4 $13.9 $15.8 $15.6 $16.0 $16.0 $16.0 Less: Tax Depreciation and Amortization (154.1) (1.1) (0.5) (0.4) (0.4) (0.4) EBIT ($147.6) $12.8 $15.3 $15.2 $15.6 $15.6 Less: Cash Taxes -- (0.6) (0.7) (0.7) (0.7) (5.8) EBIAT ($147.6) $12.2 $14.6 $14.5 $14.9 $9.8 Plus: Tax Depreciation and Amortization 154.1 1.1 0.5 0.4 0.4 0.4 Less: Growth Capital Expenditures (3.0) (0.6) -- -- -- --Less: Maintenance Capital Expenditures (0.7) (0.6) (0.5) (0.4) (0.4) (0.4) Unlevered Free Cash Flow $2.7 $12.2 $14.6 $14.5 $14.9 $9.8 EBITDA Multiple / Perpetuity Growth Rate 8.0x 2.0% Terminal Value $128.2 $167.1 PV of Terminal Value @ 8.0% Discount Rate $89.0 $115.9 Plus: PV of Unlevered Free Cash Flow @ 8.0% Discount Rate 47.9 Implied Enterprise Value $136.8 $163.8 Sensitivity Analysis EBITDA Multiple Perpetuity Growth Rate 6.0x 7.0x 8.0x 9.0x 10.0x 1.75% 1.75% 2.00% 2.25% 2.25% 7.0% $118.8 $130.4 $142.0 $153.7 $165.3 7.0% $187.2 $187.2 $194.4 $202.5 $202.5 ACC 7.5% 116.7 128.0 139.4 150.8 162.1 ACC 7.5% 171.8 171.8 177.7 184.2 184.2 W 8.0% 114.6 125.7 136.8 148.0 159.1 W 8.0% 158.9 158.9 163.8 169.1 169.1 8.5% 112.6 123.5 134.3 145.2 156.1 8.5% 147.9 147.9 152.0 156.4 156.4 9.0% 110.6 121.3 131.9 142.5 153.2 9.0% 138.3 138.3 141.8 145.6 145.6 112
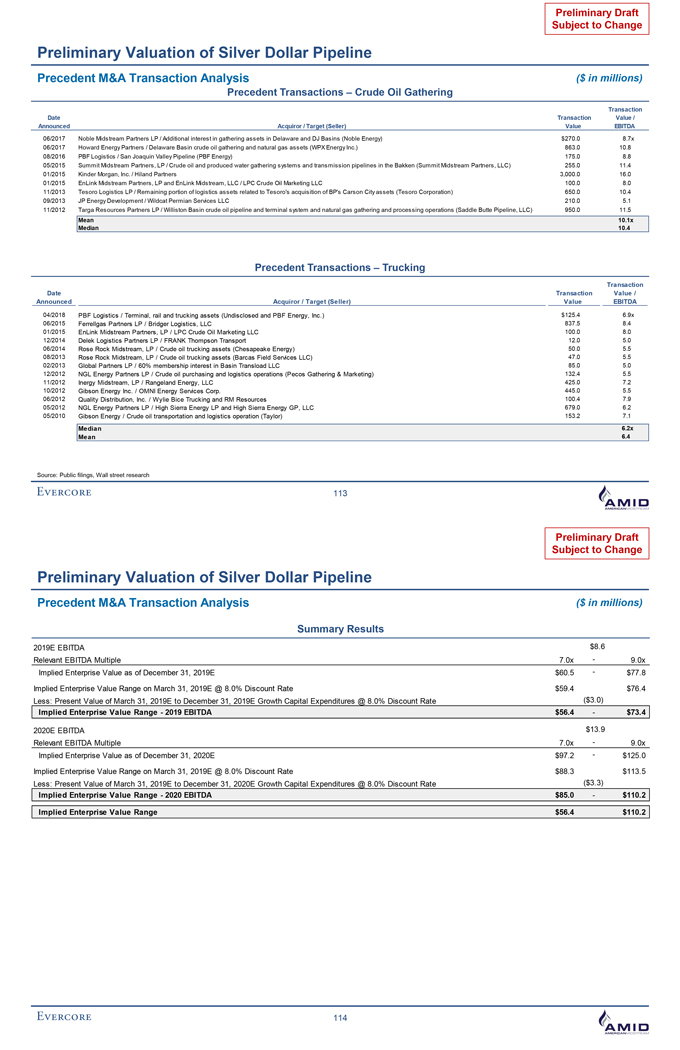
Preliminary Draft Subject to Change Preliminary Valuation of Silver Dollar Pipeline Precedent M&A Transaction Analysis ($ in millions) Precedent Transactions – Crude Oil Gathering Transaction Date Transaction Value / Announced Acquiror / Target (Seller) Value EBITDA 06/2017 Noble Midstream Partners LP / Additional interest in gathering assets in Delaware and DJ Basins (Noble Energy) $270.0 8.7x 06/2017 Howard Energy Partners / Delaware Basin crude oil gathering and natural gas assets (WPX Energy Inc.) 863.0 10.8 08/2016 PBF Logistics / San Joaquin Valley Pipeline (PBF Energy) 175.0 8.8 05/2015 Summit Midstream Partners, LP / Crude oil and produced water gathering systems and transmission pipelines in the Bakken (Summit Midstream Partners, LLC) 255.0 11.4 01/2015 Kinder Morgan, Inc. / Hiland Partners 3,000.0 16.0 01/2015 EnLink Midstream Partners, LP and EnLink Midstream, LLC / LPC Crude Oil Marketing LLC 100.0 8.0 11/2013 Tesoro Logistics LP / Remaining portion of logistics assets related to Tesoro’s acquisition of BP’s Carson City assets (Tesoro Corporation) 650.0 10.4 09/2013 JP Energy Development / Wildcat Permian Services LLC 210.0 5.1 11/2012 Targa Resources Partners LP / Williston Basin crude oil pipeline and terminal system and natural gas gathering and processing operations (Saddle Butte Pipeline, LLC) 950.0 11.5 Mean 10.1x Median 10.4 Precedent Transactions – Trucking Transaction Date Transaction Value / Announced Acquiror / Target (Seller) Value EBITDA 04/2018 PBF Logistics / Terminal, rail and trucking assets (Undisclosed and PBF Energy, Inc.) $125.4 6.9x 06/2015 Ferrellgas Partners LP / Bridger Logistics, LLC 837.5 8.4 01/2015 EnLink Midstream Partners, LP / LPC Crude Oil Marketing LLC 100.0 8.0 12/2014 Delek Logistics Partners LP / FRANK Thompson Transport 12.0 5.0 06/2014 Rose Rock Midstream, LP / Crude oil trucking assets (Chesapeake Energy) 50.0 5.5 08/2013 Rose Rock Midstream, LP / Crude oil trucking assets (Barcas Field Services LLC) 47.0 5.5 02/2013 Global Partners LP / 60% membership interest in Basin Transload LLC 85.0 5.0 12/2012 NGL Energy Partners LP / Crude oil purchasing and logistics operations (Pecos Gathering & Marketing) 132.4 5.5 11/2012 Inergy Midstream, LP / Rangeland Energy, LLC 425.0 7.2 10/2012 Gibson Energy Inc. / OMNI Energy Services Corp. 445.0 5.5 06/2012 Quality Distribution, Inc. / Wylie Bice Trucking and RM Resources 100.4 7.9 05/2012 NGL Energy Partners LP / High Sierra Energy LP and High Sierra Energy GP, LLC 679.0 6.2 05/2010 Gibson Energy / Crude oil transportation and logistics operation (Taylor) 153.2 7.1 Median 6.2x Mean 6.4 Source: Public filings, Wall street research 113 Preliminary Draft Subject to Change Preliminary Valuation of Silver Dollar Pipeline Precedent M&A Transaction Analysis ($ in millions) Summary Results 2019E EBITDA $8.6 Relevant EBITDA Multiple 7.0x - 9.0x Implied Enterprise Value as of December 31, 2019E $60.5 - $77.8 Implied Enterprise Value Range on March 31, 2019E @ 8.0% Discount Rate $59.4 $76.4 Less: Present Value of March 31, 2019E to December 31, 2019E Growth Capital Expenditures @ 8.0% Discount Rate ($3.0) Implied Enterprise Value Range - 2019 EBITDA $56.4 - $73.4 2020E EBITDA $13.9 Relevant EBITDA Multiple 7.0x - 9.0x Implied Enterprise Value as of December 31, 2020E $97.2 - $125.0 Implied Enterprise Value Range on March 31, 2019E @ 8.0% Discount Rate $88.3 $113.5 Less: Present Value of March 31, 2019E to December 31, 2020E Growth Capital Expenditures @ 8.0% Discount Rate ($3.3) Implied Enterprise Value Range - 2020 EBITDA $85.0 - $110.2 Implied Enterprise Value Range $56.4 $110.2 114
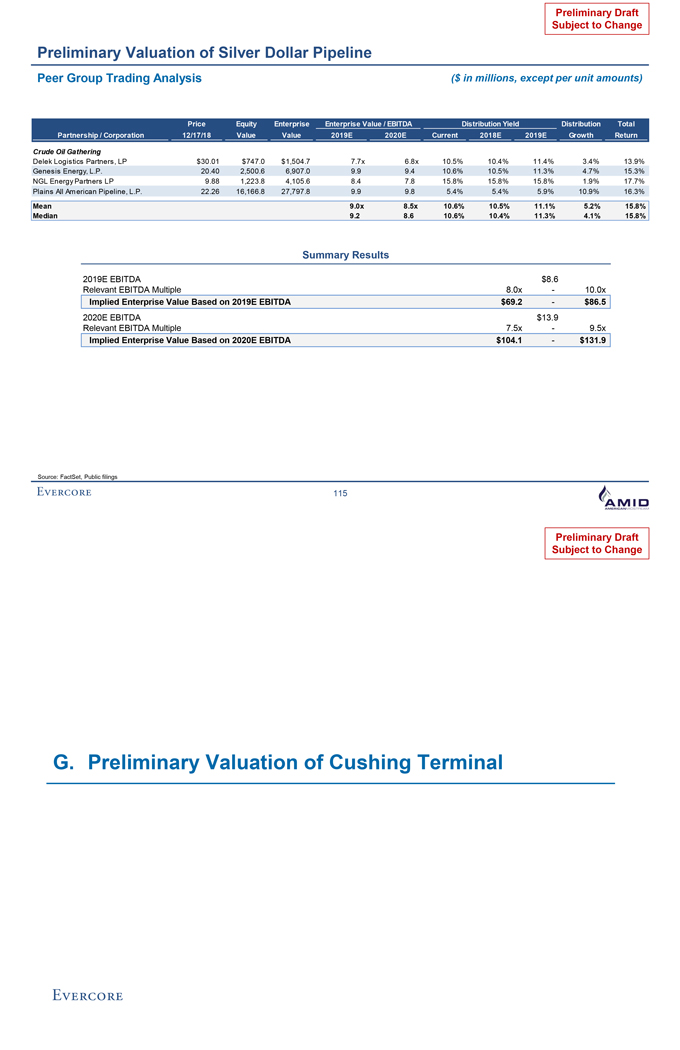
Preliminary Draft Subject to Change Preliminary Valuation of Silver Dollar Pipeline Peer Group Trading Analysis ($ in millions, except per unit amounts) Price Equity Enterprise Enterprise Value / EBITDA Distribution Yield Distribution Total Partnership / Corporation 12/17/18 Value Value 2019E 2020E Current 2018E 2019E Growth Return Crude Oil Gathering Delek Logistics Partners, LP $30.01 $747.0 $1,504.7 7.7x 6.8x 10.5% 10.4% 11.4% 3.4% 13.9% Genesis Energy, L.P. 20.40 2,500.6 6,907.0 9.9 9.4 10.6% 10.5% 11.3% 4.7% 15.3% NGL Energy Partners LP 9.88 1,223.8 4,105.6 8.4 7.8 15.8% 15.8% 15.8% 1.9% 17.7% Plains All American Pipeline, L.P. 22.26 16,166.8 27,797.8 9.9 9.8 5.4% 5.4% 5.9% 10.9% 16.3% Mean 9.0x 8.5x 10.6% 10.5% 11.1% 5.2% 15.8% Median 9.2 8.6 10.6% 10.4% 11.3% 4.1% 15.8% Summary Results 2019E EBITDA $8.6 Relevant EBITDA Multiple 8.0x - 10.0x Implied Enterprise Value Based on 2019E EBITDA $69.2 - $86.5 2020E EBITDA $13.9 Relevant EBITDA Multiple 7.5x - 9.5x Implied Enterprise Value Based on 2020E EBITDA $104.1 - $131.9 Source: FactSet, Public filings 115 Preliminary Draft Subject to Change G. Preliminary Valuation of Cushing Terminal
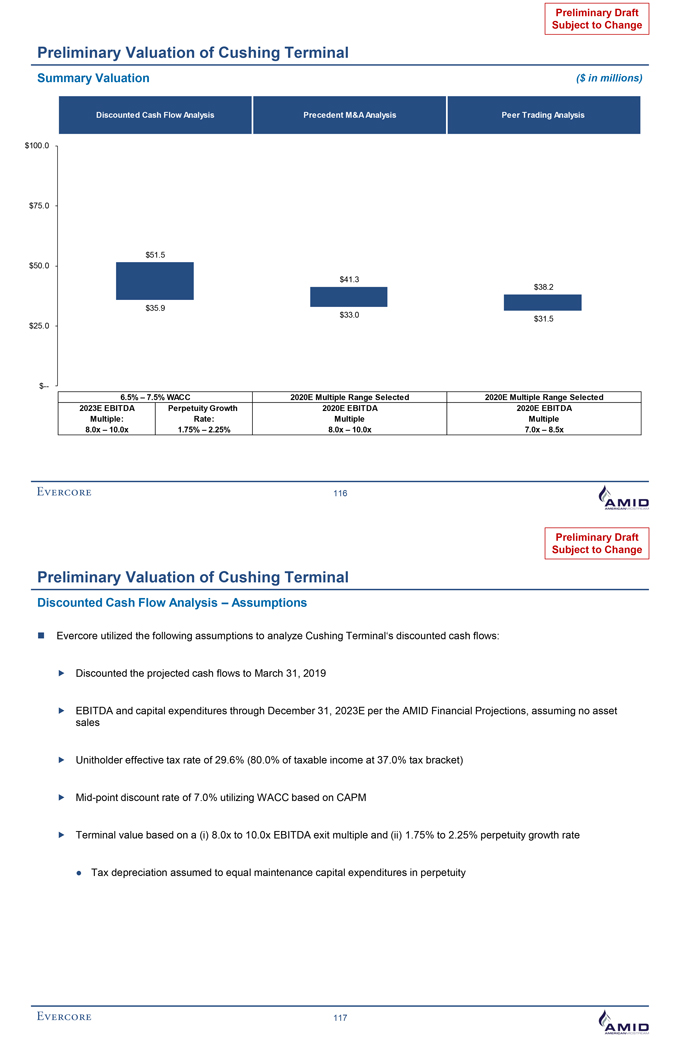
Preliminary Draft Subject to Change Preliminary Valuation of Cushing Terminal Summary Valuation ($ in millions) Discounted Cash Flow Analysis Precedent M&A Analysis Peer Trading Analysis $100.0 $75.0 $51.5 $50.0 $41.3 $38.2 $35.9 $33.0 $25.0 $31.5 $-- 6.5% – 7.5% WACC 2020E Multiple Range Selected 2020E Multiple Range Selected 2023E EBITDA Perpetuity Growth 2020E EBITDA 2020E EBITDA Multiple: Rate: Multiple Multiple 8.0x – 10.0x 1.75% – 2.25% 8.0x – 10.0x 7.0x – 8.5x 116 Preliminary Draft Subject to Change Preliminary Valuation of Cushing Terminal Discounted Cash Flow Analysis – Assumptions Evercore utilized the following assumptions to analyze Cushing Terminal‘s discounted cash flows: Discounted the projected cash flows to March 31, 2019 EBITDA and capital expenditures through December 31, 2023E per the AMID Financial Projections, assuming no asset sales Unitholder effective tax rate of 29.6% (80.0% of taxable income at 37.0% tax bracket) Mid-point discount rate of 7.0% utilizing WACC based on CAPM Terminal value based on a (i) 8.0x to 10.0x EBITDA exit multiple and (ii) 1.75% to 2.25% perpetuity growth rate Tax depreciation assumed to equal maintenance capital expenditures in perpetuity 117
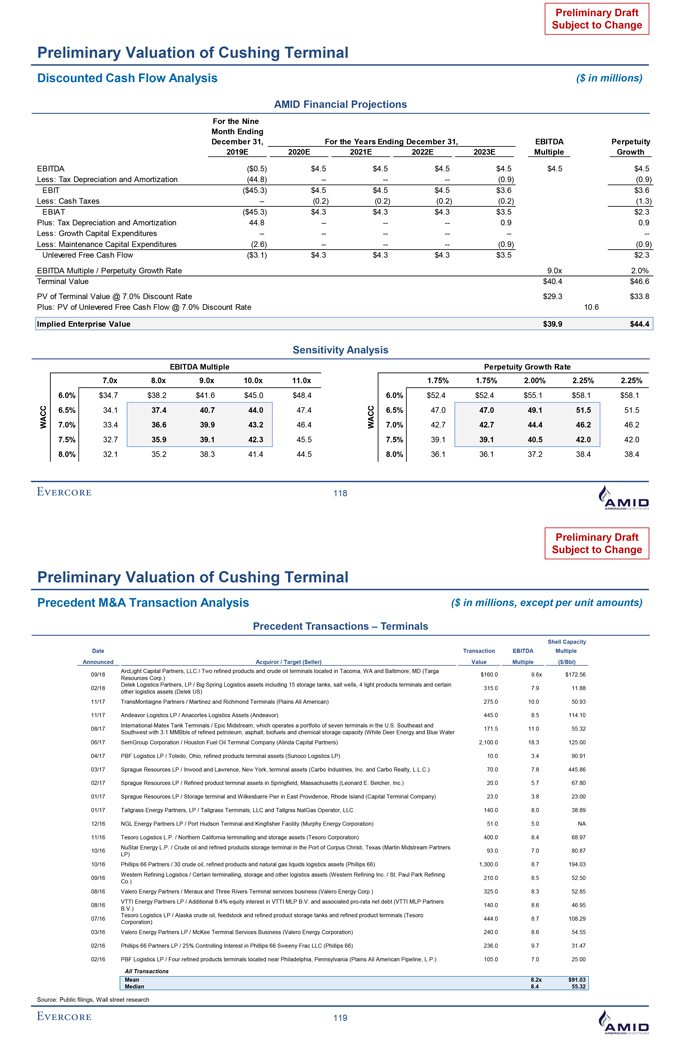
Preliminary Draft Subject to Change Preliminary Valuation of Cushing Terminal Discounted Cash Flow Analysis ($ in millions) AMID Financial Projections For the Nine Month Ending December 31, For the Years Ending December 31, EBITDA Perpetuity 2019E 2020E 2021E 2022E 2023E Multiple Growth EBITDA ($0.5) $4.5 $4.5 $4.5 $4.5 $4.5 $4.5 Less: Tax Depreciation and Amortization (44.8) -- -- -- (0.9) (0.9) EBIT ($45.3) $4.5 $4.5 $4.5 $3.6 $3.6 Less: Cash Taxes -- (0.2) (0.2) (0.2) (0.2) (1.3) EBIAT ($45.3) $4.3 $4.3 $4.3 $3.5 $2.3 Plus: Tax Depreciation and Amortization 44.8 -- -- -- 0.9 0.9 Less: Growth Capital Expenditures -- -- -- -- -- --Less: Maintenance Capital Expenditures (2.6) -- -- -- (0.9) (0.9) Unlevered Free Cash Flow ($3.1) $4.3 $4.3 $4.3 $3.5 $2.3 EBITDA Multiple / Perpetuity Growth Rate 9.0x 2.0% Terminal Value $40.4 $46.6 PV of Terminal Value @ 7.0% Discount Rate $29.3 $33.8 Plus: PV of Unlevered Free Cash Flow @ 7.0% Discount Rate 10.6 Implied Enterprise Value $39.9 $44.4 Sensitivity Analysis EBITDA Multiple Perpetuity Growth Rate 7.0x 8.0x 9.0x 10.0x 11.0x 1.75% 1.75% 2.00% 2.25% 2.25% 6.0% $34.7 $38.2 $41.6 $45.0 $48.4 6.0% $52.4 $52.4 $55.1 $58.1 $58.1 ACC 6.5% 34.1 37.4 40.7 44.0 47.4 ACC 6.5% 47.0 47.0 49.1 51.5 51.5 W 7.0% 33.4 36.6 39.9 43.2 46.4 W 7.0% 42.7 42.7 44.4 46.2 46.2 7.5% 32.7 35.9 39.1 42.3 45.5 7.5% 39.1 39.1 40.5 42.0 42.0 8.0% 32.1 35.2 38.3 41.4 44.5 8.0% 36.1 36.1 37.2 38.4 38.4 118 Preliminary Draft Subject to Change Preliminary Valuation of Cushing Terminal Precedent M&A Transaction Analysis ($ in millions, except per unit amounts) Precedent Transactions – Terminals Shell Capacity Date Transaction EBITDA Multiple Announced Acquiror / Target (Seller) Value Multiple ($/Bbl) ArcLight Capital Partners, LLC / Two refined products and crude oil terminals located in Tacoma, WA and Baltimore, MD (Targa 09/18 $160.0 9.6x $172.56 Resources Corp.) Delek Logistics Partners, LP / Big Spring Logistics assets including 15 storage tanks, salt wells, 4 light products terminals and certain 02/18 315.0 7.9 11.88 other logistics assets (Delek US) 11/17 TransMontaigne Partners / Martinez and Richmond Terminals (Plains All American) 275.0 10.0 50.93 11/17 Andeavor Logistics LP / Anacortes Logistics Assets (Andeavor) 445.0 8.5 114.10 International-Matex Tank Terminals / Epic Midstream, which operates a portfolio of seven terminals in the U.S. Southeast and 08/17 171.5 11.0 55.32 Southwest with 3.1 MMBbls of refined petroleum, asphalt, biofuels and chemical storage capacity (White Deer Energy and Blue Water 06/17 SemGroup Corporation / Houston Fuel Oil Terminal Company (Alinda Capital Partners) 2,100.0 18.3 125.00 04/17 PBF Logistics LP / Toledo, Ohio, refined products terminal assets (Sunoco Logistics LP) 10.0 3.4 90.91 03/17 Sprague Resources LP / Inwood and Lawrence, New York, terminal assets (Carbo Industries, Inc. and Carbo Realty, L.L.C.) 70.0 7.8 445.86 02/17 Sprague Resources LP / Refined product terminal assets in Springfield, Massachusetts (Leonard E. Belcher, Inc.) 20.0 5.7 67.80 01/17 Sprague Resources LP / Storage terminal and Wilkesbarre Pier in East Providence, Rhode Island (Capital Terminal Company) 23.0 3.8 23.00 01/17 Tallgrass Energy Partners, LP / Tallgrass Terminals, LLC and Tallgrss NatGas Operator, LLC 140.0 8.0 38.89 12/16 NGL Energy Partners LP / Port Hudson Terminal and Kingfisher Facility (Murphy Energy Corporation) 51.0 5.0 NA 11/16 Tesoro Logistics L.P. / Northern California terminalling and storage assets (Tesoro Corporation) 400.0 8.4 68.97 NuStar Energy L.P. / Crude oil and refined products storage terminal in the Port of Corpus Christi, Texas (Martin Midstream Partners 10/16 93.0 7.0 80.87 LP) 10/16 Phillips 66 Partners / 30 crude oil, refined products and natural gas liquids logistics assets (Phillips 66) 1,300.0 8.7 194.03 Western Refining Logistics / Certain terminalling, storage and other logistics assets (Western Refining Inc. / St. Paul Park Refining 09/16 210.0 8.5 52.50 Co.) 08/16 Valero Energy Partners / Meraux and Three Rivers Terminal services business (Valero Energy Corp.) 325.0 8.3 52.85 VTTI Energy Partners LP / Additional 8.4% equity interest in VTTI MLP B.V. and associated pro-rata net debt (VTTI MLP Partners 08/16 140.0 8.6 46.95 B.V.) Tesoro Logistics LP / Alaska crude oil, feedstock and refined product storage tanks and refined product terminals (Tesoro 07/16 444.0 8.7 108.29 Corporation) 03/16 Valero Energy Partners LP / McKee Terminal Services Business (Valero Energy Corporation) 240.0 8.6 54.55 02/16 Phillips 66 Partners LP / 25% Controlling Interest in Phillips 66 Sweeny Frac LLC (Phillips 66) 236.0 9.7 31.47 02/16 PBF Logistics LP / Four refined products terminals located near Philadelphia, Pennsylvania (Plains All American Pipeline, L.P.) 105.0 7.0 25.00 All Transactions Mean 8.2x $91.03 Median 8.4 55.32 Source: Public filings, Wall street research 119
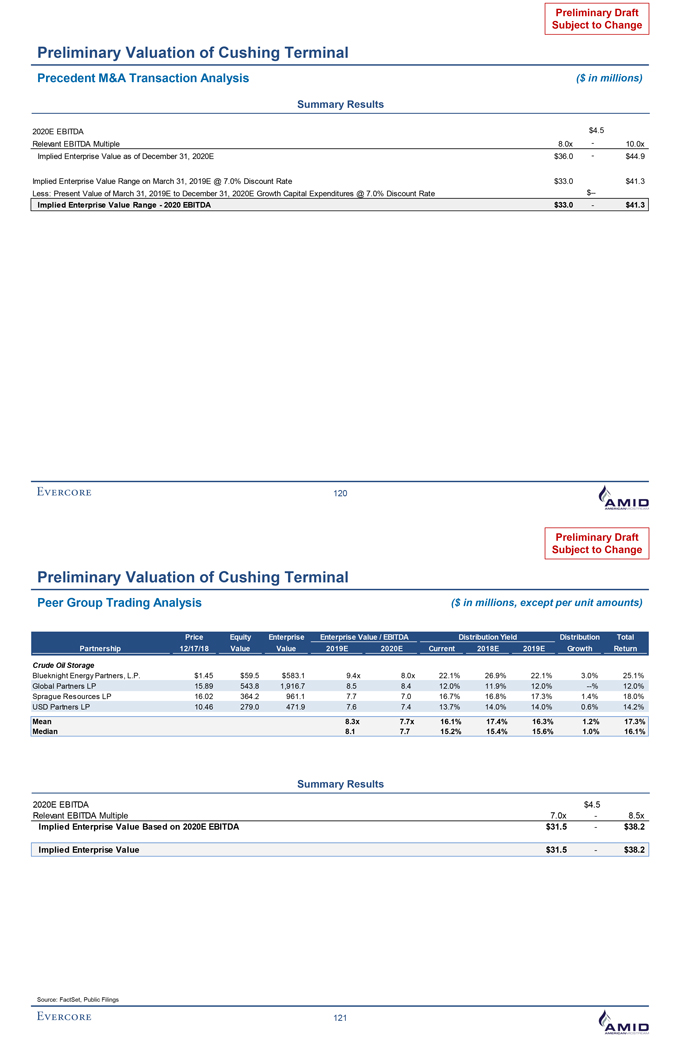
Preliminary Draft Subject to Change Preliminary Valuation of Cushing Terminal Precedent M&A Transaction Analysis ($ in millions) Summary Results 2020E EBITDA $4.5 Relevant EBITDA Multiple 8.0x - 10.0x Implied Enterprise Value as of December 31, 2020E $36.0 - $44.9 Implied Enterprise Value Range on March 31, 2019E @ 7.0% Discount Rate $33.0 $41.3 Less: Present Value of March 31, 2019E to December 31, 2020E Growth Capital Expenditures @ 7.0% Discount Rate $-- Implied Enterprise Value Range - 2020 EBITDA $33.0 - $41.3 120 Preliminary Draft Subject to Change Preliminary Valuation of Cushing Terminal Peer Group Trading Analysis ($ in millions, except per unit amounts) Price Equity Enterprise Enterprise Value / EBITDA Distribution Yield Distribution Total Partnership 12/17/18 Value Value 2019E 2020E Current 2018E 2019E Growth Return Crude Oil Storage Blueknight Energy Partners, L.P. $1.45 $59.5 $583.1 9.4x 8.0x 22.1% 26.9% 22.1% 3.0% 25.1% Global Partners LP 15.89 543.8 1,916.7 8.5 8.4 12.0% 11.9% 12.0% --% 12.0% Sprague Resources LP 16.02 364.2 961.1 7.7 7.0 16.7% 16.8% 17.3% 1.4% 18.0% USD Partners LP 10.46 279.0 471.9 7.6 7.4 13.7% 14.0% 14.0% 0.6% 14.2% Mean 8.3x 7.7x 16.1% 17.4% 16.3% 1.2% 17.3% Median 8.1 7.7 15.2% 15.4% 15.6% 1.0% 16.1% Summary Results 2020E EBITDA $4.5 Relevant EBITDA Multiple 7.0x - 8.5x Implied Enterprise Value Based on 2020E EBITDA $31.5 - $38.2 Implied Enterprise Value $31.5 - $38.2 Source: FactSet, Public Filings 121

Preliminary Draft Subject to Change H. Preliminary Valuation of NGL JV Interests Preliminary Draft Subject to Change Preliminary Valuation of NGL JV Interests Summary Valuation ($ in millions) Peer Trading Analysis Peer Trading Analysis Discounted Cash Flow Analysis Precedent M&A Analysis 2019E 2020E $200.0 $179.7 $183.4 $173.9 $164.5 $150.0 $152.8 $142.8 $142.3 $131.0 $100.0 $50.0 8.0% – 9.0% WACC 2019E and 2020E Multiple Range Selected 2019E Multiple Range Selected 2020E Multiple Range Selected 2023E EBITDA Perpetuity Growth 2019E EBITDA 2020E EBITDA 2019E EBITDA 2020E EBITDA Multiple: Rate: Multiple Multiple Multiple Multiple 10.0x – 12.0x 1.75% – 2.25% 10.0x – 12.0x 10.0x – 12.0x 10.0x – 12.0x 9.0x – 11.0x 122
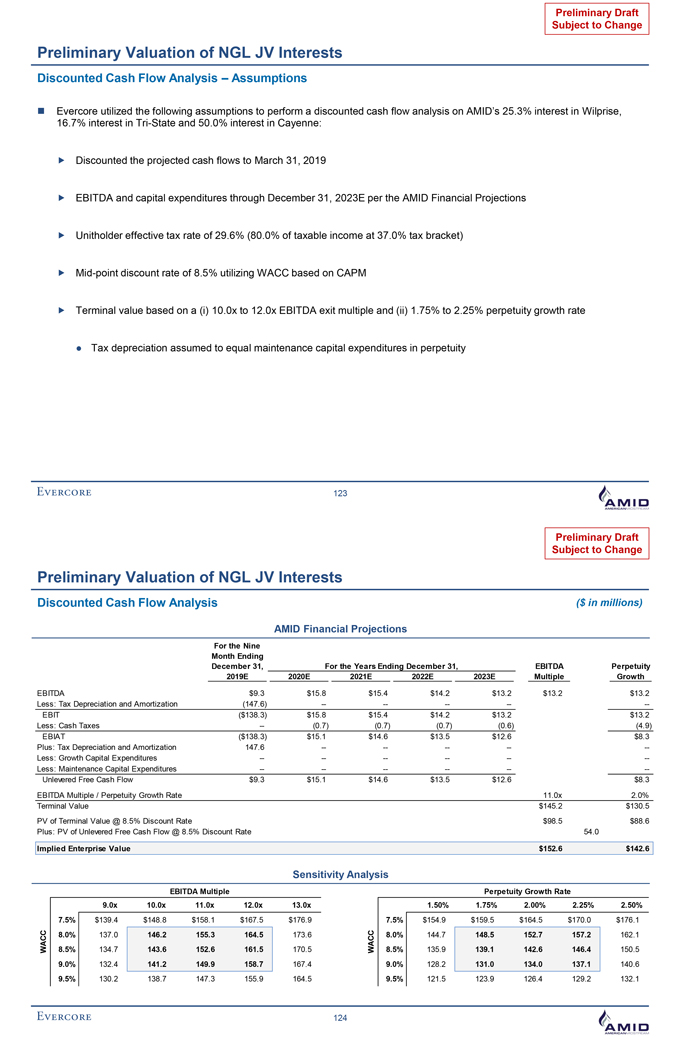
Preliminary Draft Subject to Change Preliminary Valuation of NGL JV Interests Discounted Cash Flow Analysis – Assumptions Evercore utilized the following assumptions to perform a discounted cash flow analysis on AMID’s 25.3% interest in Wilprise, 16.7% interest in Tri-State and 50.0% interest in Cayenne: Discounted the projected cash flows to March 31, 2019 EBITDA and capital expenditures through December 31, 2023E per the AMID Financial Projections Unitholder effective tax rate of 29.6% (80.0% of taxable income at 37.0% tax bracket) Mid-point discount rate of 8.5% utilizing WACC based on CAPM Terminal value based on a (i) 10.0x to 12.0x EBITDA exit multiple and (ii) 1.75% to 2.25% perpetuity growth rate Tax depreciation assumed to equal maintenance capital expenditures in perpetuity 123 Preliminary Draft Subject to Change Preliminary Valuation of NGL JV Interests Discounted Cash Flow Analysis ($ in millions) AMID Financial Projections For the Nine Month Ending December 31, For the Years Ending December 31, EBITDA Perpetuity 2019E 2020E 2021E 2022E 2023E Multiple Growth EBITDA $9.3 $15.8 $15.4 $14.2 $13.2 $13.2 $13.2 Less: Tax Depreciation and Amortization (147.6) -- -- -- -- --EBIT ($138.3) $15.8 $15.4 $14.2 $13.2 $13.2 Less: Cash Taxes -- (0.7) (0.7) (0.7) (0.6) (4.9) EBIAT ($138.3) $15.1 $14.6 $13.5 $12.6 $8.3 Plus: Tax Depreciation and Amortization 147.6 -- -- -- -- --Less: Growth Capital Expenditures -- -- -- -- -- --Less: Maintenance Capital Expenditures -- -- -- -- -- --Unlevered Free Cash Flow $9.3 $15.1 $14.6 $13.5 $12.6 $8.3 EBITDA Multiple / Perpetuity Growth Rate 11.0x 2.0% Terminal Value $145.2 $130.5 PV of Terminal Value @ 8.5% Discount Rate $98.5 $88.6 Plus: PV of Unlevered Free Cash Flow @ 8.5% Discount Rate 54.0 Implied Enterprise Value $152.6 $142.6 Sensitivity Analysis EBITDA Multiple Perpetuity Growth Rate 9.0x 10.0x 11.0x 12.0x 13.0x 1.50% 1.75% 2.00% 2.25% 2.50% 7.5% $139.4 $148.8 $158.1 $167.5 $176.9 7.5% $154.9 $159.5 $164.5 $170.0 $176.1 ACC 8.0% 137.0 146.2 155.3 164.5 173.6 ACC 8.0% 144.7 148.5 152.7 157.2 162.1 W 8.5% 134.7 143.6 152.6 161.5 170.5 W 8.5% 135.9 139.1 142.6 146.4 150.5 9.0% 132.4 141.2 149.9 158.7 167.4 9.0% 128.2 131.0 134.0 137.1 140.6 9.5% 130.2 138.7 147.3 155.9 164.5 9.5% 121.5 123.9 126.4 129.2 132.1 124
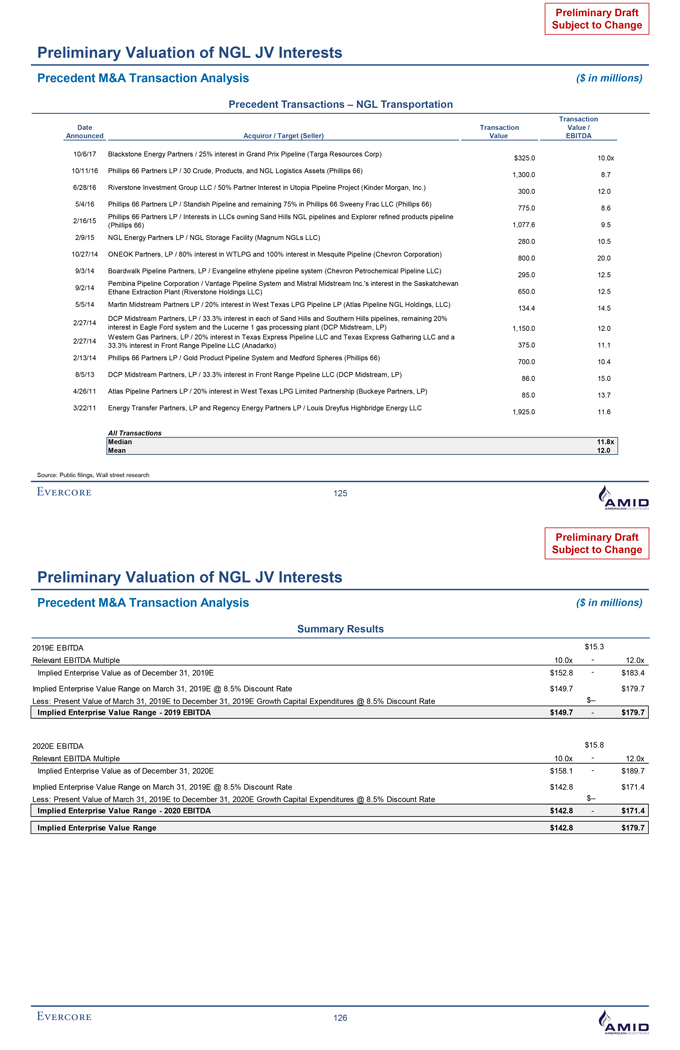
Preliminary Draft Subject to Change Preliminary Valuation of NGL JV Interests Precedent M&A Transaction Analysis ($ in millions) Precedent Transactions – NGL Transportation Transaction Date Transaction Value / Announced Acquiror / Target (Seller) Value EBITDA 10/6/17 Blackstone Energy Partners / 25% interest in Grand Prix Pipeline (Targa Resources Corp) $325.0 10.0x 10/11/16 Phillips 66 Partners LP / 30 Crude, Products, and NGL Logistics Assets (Phillips 66) 1,300.0 8.7 6/28/16 Riverstone Investment Group LLC / 50% Partner Interest in Utopia Pipeline Project (Kinder Morgan, Inc.) 300.0 12.0 5/4/16 Phillips 66 Partners LP / Standish Pipeline and remaining 75% in Phillips 66 Sweeny Frac LLC (Phillips 66) 775.0 8.6 Phillips 66 Partners LP / Interests in LLCs owning Sand Hills NGL pipelines and Explorer refined products pipeline 2/16/15 (Phillips 66) 1,077.6 9.5 2/9/15 NGL Energy Partners LP / NGL Storage Facility (Magnum NGLs LLC) 280.0 10.5 10/27/14 ONEOK Partners, LP / 80% interest in WTLPG and 100% interest in Mesquite Pipeline (Chevron Corporation) 800.0 20.0 9/3/14 Boardwalk Pipeline Partners, LP / Evangeline ethylene pipeline system (Chevron Petrochemical Pipeline LLC) 295.0 12.5 Pembina Pipeline Corporation / Vantage Pipeline System and Mistral Midstream Inc.‘s interest in the Saskatchewan 9/2/14 Ethane Extraction Plant (Riverstone Holdings LLC) 650.0 12.5 5/5/14 Martin Midstream Partners LP / 20% interest in West Texas LPG Pipeline LP (Atlas Pipeline NGL Holdings, LLC) 134.4 14.5 DCP Midstream Partners, LP / 33.3% interest in each of Sand Hills and Southern Hills pipelines, remaining 20% 2/27/14 interest in Eagle Ford system and the Lucerne 1 gas processing plant (DCP Midstream, LP) 1,150.0 12.0 Western Gas Partners, LP / 20% interest in Texas Express Pipeline LLC and Texas Express Gathering LLC and a 2/27/14 33.3% interest in Front Range Pipeline LLC (Anadarko) 375.0 11.1 2/13/14 Phillips 66 Partners LP / Gold Product Pipeline System and Medford Spheres (Phillips 66) 700.0 10.4 8/5/13 DCP Midstream Partners, LP / 33.3% interest in Front Range Pipeline LLC (DCP Midstream, LP) 86.0 15.0 4/26/11 Atlas Pipeline Partners LP / 20% interest in West Texas LPG Limited Partnership (Buckeye Partners, LP) 85.0 13.7 3/22/11 Energy Transfer Partners, LP and Regency Energy Partners LP / Louis Dreyfus Highbridge Energy LLC 1,925.0 11.6 All Transactions Median 11.8x Mean 12.0 Source: Public filings, Wall street research 125Preliminary Draft Subject to Change Preliminary Valuation of NGL JV Interests Precedent M&A Transaction Analysis ($ in millions) Summary Results 2019E EBITDA $15.3 Relevant EBITDA Multiple 10.0x - 12.0x Implied Enterprise Value as of December 31, 2019E $152.8 - $183.4 Implied Enterprise Value Range on March 31, 2019E @ 8.5% Discount Rate $149.7 $179.7 Less: Present Value of March 31, 2019E to December 31, 2019E Growth Capital Expenditures @ 8.5% Discount Rate $-- Implied Enterprise Value Range - 2019 EBITDA $149.7 - $179.7 2020E EBITDA $15.8 Relevant EBITDA Multiple 10.0x - 12.0x Implied Enterprise Value as of December 31, 2020E $158.1 - $189.7 Implied Enterprise Value Range on March 31, 2019E @ 8.5% Discount Rate $142.8 $171.4 Less: Present Value of March 31, 2019E to December 31, 2020E Growth Capital Expenditures @ 8.5% Discount Rate $-- Implied Enterprise Value Range - 2020 EBITDA $142.8 - $171.4 Implied Enterprise Value Range $142.8 $179.7 126
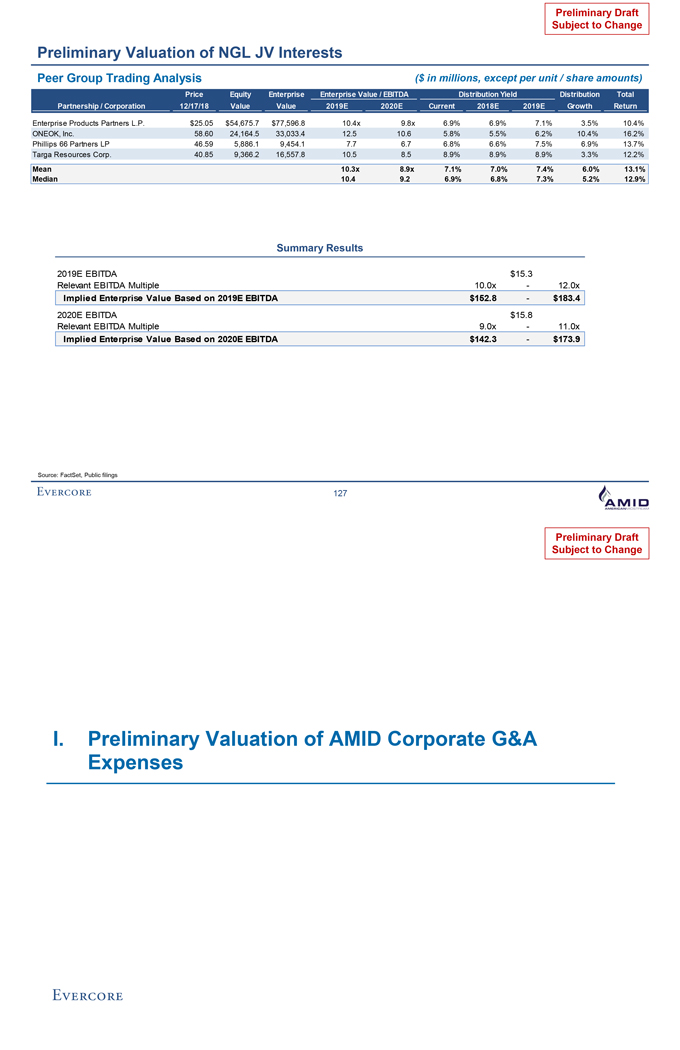
Preliminary Draft Subject to Change Preliminary Valuation of NGL JV Interests Peer Group Trading Analysis ($ in millions, except per unit / share amounts) Price Equity Enterprise Enterprise Value / EBITDA Distribution Yield Distribution Total Partnership / Corporation 12/17/18 Value Value 2019E 2020E Current 2018E 2019E Growth Return Enterprise Products Partners L.P. $25.05 $54,675.7 $77,596.8 10.4x 9.8x 6.9% 6.9% 7.1% 3.5% 10.4% ONEOK, Inc. 58.60 24,164.5 33,033.4 12.5 10.6 5.8% 5.5% 6.2% 10.4% 16.2% Phillips 66 Partners LP 46.59 5,886.1 9,454.1 7.7 6.7 6.8% 6.6% 7.5% 6.9% 13.7% Targa Resources Corp. 40.85 9,366.2 16,557.8 10.5 8.5 8.9% 8.9% 8.9% 3.3% 12.2% Mean 10.3x 8.9x 7.1% 7.0% 7.4% 6.0% 13.1% Median 10.4 9.2 6.9% 6.8% 7.3% 5.2% 12.9% Summary Results 2019E EBITDA $15.3 Relevant EBITDA Multiple 10.0x - 12.0x Implied Enterprise Value Based on 2019E EBITDA $152.8 - $183.4 2020E EBITDA $15.8 Relevant EBITDA Multiple 9.0x - 11.0x Implied Enterprise Value Based on 2020E EBITDA $142.3 - $173.9 Source: FactSet, Public filings 127 Preliminary Draft Subject to Change I. Preliminary Valuation of AMID Corporate G&A Expenses
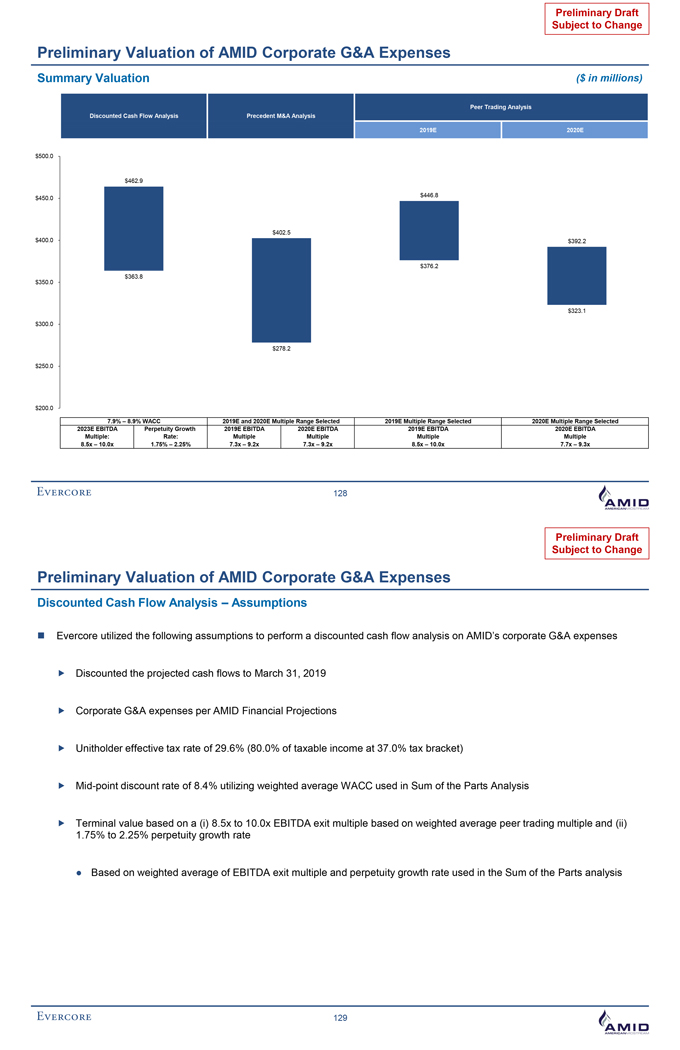
Preliminary Draft Subject to Change Preliminary Valuation of AMID Corporate G&A Expenses Summary Valuation ($ in millions) Peer Trading Analysis Discounted Cash Flow Analysis Precedent M&A Analysis 2019E 2020E $500.0 $462.9 $446.8 $450.0 $402.5 $400.0 $392.2 $376.2 $350.0 $363.8 $323.1 $300.0 $278.2 $250.0 $200.0 7.9% – 8.9% WACC 2019E and 2020E Multiple Range Selected 2019E Multiple Range Selected 2020E Multiple Range Selected 2023E EBITDA Perpetuity Growth 2019E EBITDA 2020E EBITDA 2019E EBITDA 2020E EBITDA Multiple: Rate: Multiple Multiple Multiple Multiple 8.5 x – 10.0x 1.75% – 2.25% 7.3 x – 9.2x 7.3 x – 9.2x 8.5 x – 10.0x 7.7 x – 9.3x 128 Preliminary Draft Subject to Change Preliminary Valuation of AMID Corporate G&A Expenses Discounted Cash Flow Analysis – Assumptions Evercore utilized the following assumptions to perform a discounted cash flow analysis on AMID’s corporate G&A expenses Discounted the projected cash flows to March 31, 2019 Corporate G&A expenses per AMID Financial Projections Unitholder effective tax rate of 29.6% (80.0% of taxable income at 37.0% tax bracket) Mid-point discount rate of 8.4% utilizing weighted average WACC used in Sum of the Parts Analysis Terminal value based on a (i) 8.5x to 10.0x EBITDA exit multiple based on weighted average peer trading multiple and (ii) 1.75% to 2.25% perpetuity growth rate Based on weighted average of EBITDA exit multiple and perpetuity growth rate used in the Sum of the Parts analysis 129
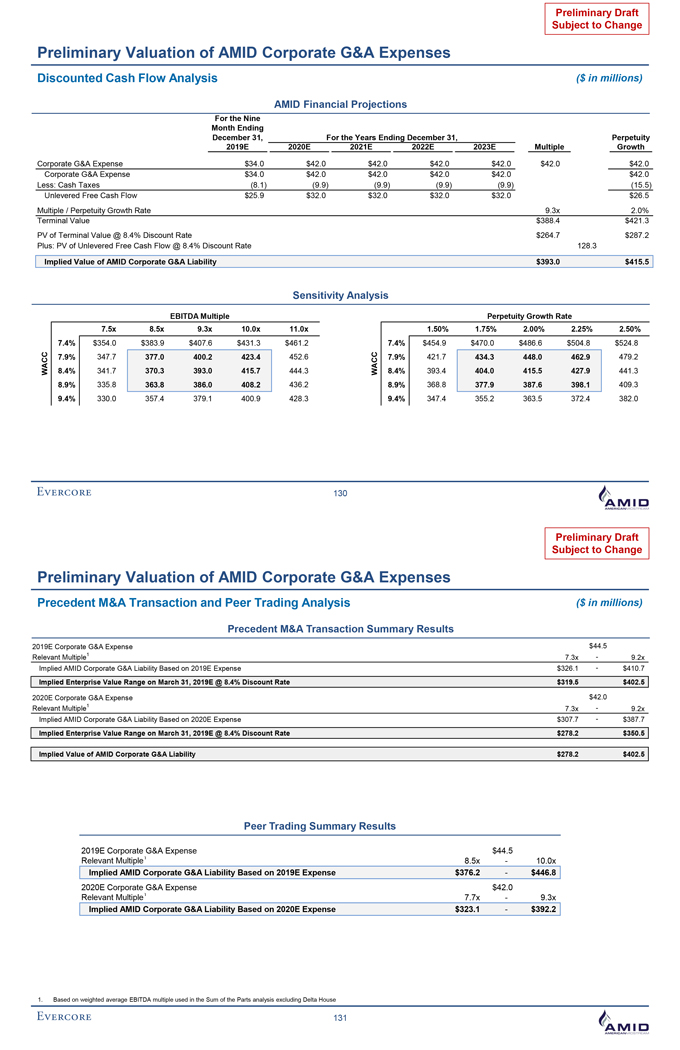
Preliminary Draft Subject to Change Preliminary Valuation of AMID Corporate G&A Expenses Discounted Cash Flow Analysis ($ in millions) AMID Financial Projections For the Nine Month Ending December 31, For the Years Ending December 31, Perpetuity 2019E 2020E 2021E 2022E 2023E Multiple Growth Corporate G&A Expense $34.0 $42.0 $42.0 $42.0 $42.0 $42.0 $42.0 Corporate G&A Expense $34.0 $42.0 $42.0 $42.0 $42.0 $42.0 Less: Cash Taxes (8.1) (9.9) (9.9) (9.9) (9.9) (15.5) Unlevered Free Cash Flow $25.9 $32.0 $32.0 $32.0 $32.0 $26.5 Multiple / Perpetuity Growth Rate 9.3x 2.0% Terminal Value $388.4 $421.3 PV of Terminal Value @ 8.4% Discount Rate $264.7 $287.2 Plus: PV of Unlevered Free Cash Flow @ 8.4% Discount Rate 128.3 Implied Value of AMID Corporate G&A Liability $393.0 $415.5 Sensitivity Analysis EBITDA Multiple Perpetuity Growth Rate 7.5x 8.5x 9.3x 10.0x 11.0x 1.50% 1.75% 2.00% 2.25% 2.50% 7.4% $354.0 $383.9 $407.6 $431.3 $461.2 7.4% $454.9 $470.0 $486.6 $504.8 $524.8 WACC 7.9% 347.7 377.0 400.2 423.4 452.6 WACC 7.9% 421.7 434.3 448.0 462.9 479.2 8.4% 341.7 370.3 393.0 415.7 444.3 8.4% 393.4 404.0 415.5 427.9 441.3 8.9% 335.8 363.8 386.0 408.2 436.2 8.9% 368.8 377.9 387.6 398.1 409.3 9.4% 330.0 357.4 379.1 400.9 428.3 9.4% 347.4 355.2 363.5 372.4 382.0 130 Preliminary Draft Subject to Change Preliminary Valuation of AMID Corporate G&A Expenses Precedent M&A Transaction and Peer Trading Analysis ($ in millions) Precedent M&A Transaction Summary Results 2019E Corporate G&A Expense $44.5 Relevant Multiple1 7.3x - 9.2x Implied AMID Corporate G&A Liability Based on 2019E Expense $326.1 - $410.7 Implied Enterprise Value Range on March 31, 2019E @ 8.4% Discount Rate $319.5 $402.5 2020E Corporate G&A Expense $42.0 Relevant Multiple1 7.3x - 9.2x Implied AMID Corporate G&A Liability Based on 2020E Expense $307.7 - $387.7 Implied Enterprise Value Range on March 31, 2019E @ 8.4% Discount Rate $278.2 $350.5 Implied Value of AMID Corporate G&A Liability $278.2 $402.5 Peer Trading Summary Results 2019E Corporate G&A Expense $44.5 Relevant Multiple1 8.5x - 10.0x Implied AMID Corporate G&A Liability Based on 2019E Expense $376.2 - $446.8 2020E Corporate G&A Expense $42.0 Relevant Multiple1 7.7x - 9.3x Implied AMID Corporate G&A Liability Based on 2020E Expense $323.1 - $392.2 1. Based on weighted average EBITDA multiple used in the Sum of the Parts analysis excluding Delta House 131
Preliminary Draft Subject to Change VI. Illustrative AMID Unitholder Tax AnalysisPreliminary Draft Subject to Change Illustrative AMID Unitholder Tax Analysis AMID Unitholder Tax Analysis @ Illustrative Offer Price ($6.10 / unit) – Assumptions PricewaterhouseCoopers LLP (“PwC”) provided the AMID unaffiliated unitholders tax liability by unit acquisition date information, which included the following: Adjusted Basis – Represents the weighted average price acquired, plus cumulative income, less cumulative distributions and DD&A from the acquisition date to January 2018 §751 Gain – Recharacterization of gain or loss on the sale of a partnership interest from capital to ordinary on §751 property owned by the partnership Net Ordinary Gain / (Loss) per Unit – Calculated as §751 Gain less Passive Loss Carryover assuming Passive Loss Carryover amounts are 100% available to offset Ordinary Gains Net Capital Gain / (Loss) per Unit – Calculated as Total Gain / (Loss) per Unit less §751 Gain Estimated Taxes – Calculated based on the Net Ordinary Gain / Loss per Unit and Net Capital Gain / (Loss) per Unit assuming the unitholder tax rates as set forth in table below Type Ordinary Gain Tax Rate (T1) Capital Gain Tax Rate (T2) Individual 29.6% 20.0% Corporation 21.0% 21.0% Partnership 29.6% 20.0% Estate 29.6% 20.0% Trust 29.6% 20.0% Foreign 21.0% 21.0% UBTI 21.0% 21.0% Other 29.6% 20.0% Considered total taxes assuming both (i) Net Ordinary Loss cannot be utilized to offset other passive income and (ii) Net Ordinary Loss can be utilized to offset passive income 132
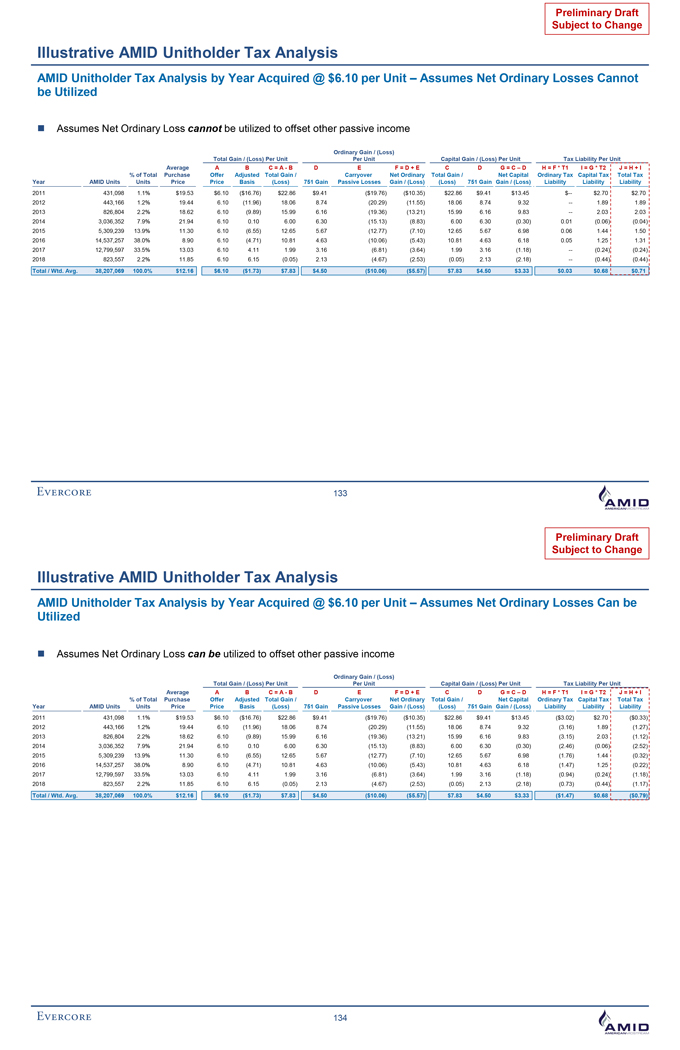
Preliminary Draft Subject to Change Illustrative AMID Unitholder Tax Analysis AMID Unitholder Tax Analysis by Year Acquired @ $6.10 per Unit – Assumes Net Ordinary Losses Cannot be Utilized Assumes Net Ordinary Loss cannot be utilized to offset other passive income Ordinary Gain / (Loss) Total Gain / (Loss) Per Unit Per Unit Capital Gain / (Loss) Per Unit Tax Liability Per Unit Average A B C = A - B D E F = D + E C D G = C – D H = F * T1 I = G * T2 J = H + I % of Total Purchase Offer Adjusted Total Gain / Carryover Net Ordinary Total Gain / Net Capital Ordinary Tax Capital Tax Total Tax Year AMID Units Units Price Price Basis (Loss) 751 Gain Passive Losses Gain / (Loss) (Loss) 751 Gain Gain / (Loss) Liability Liability Liability 2011 431,098 1.1% $19.53 $6.10 ($16.76) $22.86 $9.41 ($19.76) ($10.35) $22.86 $9.41 $13.45 $-- $2.70 $2.70 2012 443,166 1.2% 19.44 6.10 (11.96) 18.06 8.74 (20.29) (11.55) 18.06 8.74 9.32 -- 1.89 1.89 2013 826,804 2.2% 18.62 6.10 (9.89) 15.99 6.16 (19.36) (13.21) 15.99 6.16 9.83 -- 2.03 2.03 2014 3,036,352 7.9% 21.94 6.10 0.10 6.00 6.30 (15.13) (8.83) 6.00 6.30 (0.30) 0.01 (0.06) (0.04) 2015 5,309,239 13.9% 11.30 6.10 (6.55) 12.65 5.67 (12.77) (7.10) 12.65 5.67 6.98 0.06 1.44 1.50 2016 14,537,257 38.0% 8.90 6.10 (4.71) 10.81 4.63 (10.06) (5.43) 10.81 4.63 6.18 0.05 1.25 1.31 2017 12,799,597 33.5% 13.03 6.10 4.11 1.99 3.16 (6.81) (3.64) 1.99 3.16 (1.18) -- (0.24) (0.24) 2018 823,557 2.2% 11.85 6.10 6.15 (0.05) 2.13 (4.67) (2.53) (0.05) 2.13 (2.18) -- (0.44) (0.44) Total / Wtd. Avg. 38,207,069 100.0% $12.16 $6.10 ($1.73) $7.83 $4.50 ($10.06) ($5.57) $7.83 $4.50 $3.33 $0.03 $0.68 $0.71 133 Preliminary Draft Subject to Change Illustrative AMID Unitholder Tax Analysis AMID Unitholder Tax Analysis by Year Acquired @ $6.10 per Unit – Assumes Net Ordinary Losses Can be Utilized Assumes Net Ordinary Loss can be utilized to offset other passive income Ordinary Gain / (Loss) Total Gain / (Loss) Per Unit Per Unit Capital Gain / (Loss) Per Unit Tax Liability Per Unit Average A B C = A - B D E F = D + E C D G = C – D H = F * T1 I = G * T2 J = H + I % of Total Purchase Offer Adjusted Total Gain / Carryover Net Ordinary Total Gain / Net Capital Ordinary Tax Capital Tax Total Tax Year AMID Units Units Price Price Basis (Loss) 751 Gain Passive Losses Gain / (Loss) (Loss) 751 Gain Gain / (Loss) Liability Liability Liability 2011 431,098 1.1% $19.53 $6.10 ($16.76) $22.86 $9.41 ($19.76) ($10.35) $22.86 $9.41 $13.45 ($3.02) $2.70 ($0.33) 2012 443,166 1.2% 19.44 6.10 (11.96) 18.06 8.74 (20.29) (11.55) 18.06 8.74 9.32 (3.16) 1.89 (1.27) 2013 826,804 2.2% 18.62 6.10 (9.89) 15.99 6.16 (19.36) (13.21) 15.99 6.16 9.83 (3.15) 2.03 (1.12) 2014 3,036,352 7.9% 21.94 6.10 0.10 6.00 6.30 (15.13) (8.83) 6.00 6.30 (0.30) (2.46) (0.06) (2.52) 2015 5,309,239 13.9% 11.30 6.10 (6.55) 12.65 5.67 (12.77) (7.10) 12.65 5.67 6.98 (1.76) 1.44 (0.32) 2016 14,537,257 38.0% 8.90 6.10 (4.71) 10.81 4.63 (10.06) (5.43) 10.81 4.63 6.18 (1.47) 1.25 (0.22) 2017 12,799,597 33.5% 13.03 6.10 4.11 1.99 3.16 (6.81) (3.64) 1.99 3.16 (1.18) (0.94) (0.24) (1.18) 2018 823,557 2.2% 11.85 6.10 6.15 (0.05) 2.13 (4.67) (2.53) (0.05) 2.13 (2.18) (0.73) (0.44) (1.17) Total / Wtd. Avg. 38,207,069 100.0% $12.16 $6.10 ($1.73) $7.83 $4.50 ($10.06) ($5.57) $7.83 $4.50 $3.33 ($1.47) $0.68 ($0.79) 134
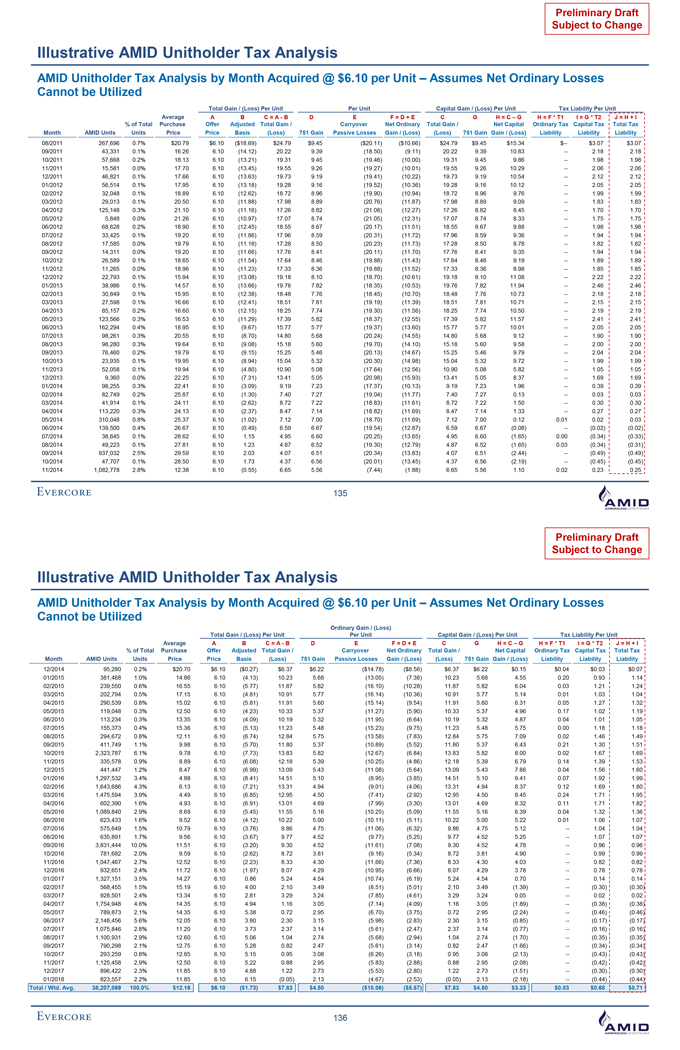
Preliminary Draft Subject to Change Illustrative AMID Unitholder Tax Analysis AMID Unitholder Tax Analysis by Month Acquired @ $6.10 per Unit – Assumes Net Ordinary Losses Cannot be Utilized Total Gain / (Loss) Per Unit Per Unit Capital Gain / (Loss) Per Unit Tax Liability Per Unit Average A B C = A - B D E F = D + E C G H = C – G H = F * T1 I = G * T2 J = H + I % of Total Purchase Offer Adjusted Total Gain / Carryover Net Ordinary Total Gain / Net Capital Ordinary Tax Capital Tax Total Tax Month AMID Units Units Price Price Basis (Loss) 751 Gain Passive Losses Gain / (Loss) (Loss) 751 Gain Gain / (Loss) Liability Liability Liability 08/2011 267,696 0.7% $20.79 $6.10 ($18.69) $24.79 $9.45 ($20.11) ($10.66) $24.79 $9.45 $15.34 $-- $3.07 $3.07 09/2011 43,331 0.1% 16.26 6.10 (14.12) 20.22 9.39 (18.50) (9.11) 20.22 9.39 10.83 -- 2.18 2.18 10/2011 57,668 0.2% 18.13 6.10 (13.21) 19.31 9.45 (19.46) (10.00) 19.31 9.45 9.86 -- 1.98 1.98 11/2011 15,581 0.0% 17.70 6.10 (13.45) 19.55 9.26 (19.27) (10.01) 19.55 9.26 10.29 -- 2.06 2.06 12/2011 46,821 0.1% 17.66 6.10 (13.63) 19.73 9.19 (19.41) (10.22) 19.73 9.19 10.54 -- 2.12 2.12 01/2012 56,514 0.1% 17.95 6.10 (13.18) 19.28 9.16 (19.52) (10.36) 19.28 9.16 10.12 -- 2.05 2.05 02/2012 32,048 0.1% 18.89 6.10 (12.62) 18.72 8.96 (19.90) (10.94) 18.72 8.96 9.76 -- 1.99 1.99 03/2012 29,013 0.1% 20.50 6.10 (11.88) 17.98 8.89 (20.76) (11.87) 17.98 8.89 9.09 -- 1.83 1.83 04/2012 125,148 0.3% 21.10 6.10 (11.16) 17.26 8.82 (21.08) (12.27) 17.26 8.82 8.45 -- 1.70 1.70 05/2012 5,848 0.0% 21.26 6.10 (10.97) 17.07 8.74 (21.05) (12.31) 17.07 8.74 8.33 -- 1.75 1.75 06/2012 68,628 0.2% 18.90 6.10 (12.45) 18.55 8.67 (20.17) (11.51) 18.55 8.67 9.88 -- 1.98 1.98 07/2012 33,425 0.1% 19.20 6.10 (11.86) 17.96 8.59 (20.31) (11.72) 17.96 8.59 9.36 -- 1.94 1.94 08/2012 17,585 0.0% 19.79 6.10 (11.18) 17.28 8.50 (20.23) (11.73) 17.28 8.50 8.78 -- 1.82 1.82 09/2012 14,311 0.0% 19.20 6.10 (11.66) 17.76 8.41 (20.11) (11.70) 17.76 8.41 9.35 -- 1.94 1.94 10/2012 26,589 0.1% 18.65 6.10 (11.54) 17.64 8.46 (19.88) (11.43) 17.64 8.46 9.19 -- 1.89 1.89 11/2012 11,265 0.0% 18.96 6.10 (11.23) 17.33 8.36 (19.88) (11.52) 17.33 8.36 8.98 -- 1.85 1.85 12/2012 22,793 0.1% 15.94 6.10 (13.08) 19.18 8.10 (18.70) (10.61) 19.18 8.10 11.08 -- 2.22 2.22 01/2013 38,986 0.1% 14.57 6.10 (13.66) 19.76 7.82 (18.35) (10.53) 19.76 7.82 11.94 -- 2.46 2.46 02/2013 30,849 0.1% 15.95 6.10 (12.38) 18.48 7.76 (18.45) (10.70) 18.48 7.76 10.73 -- 2.18 2.18 03/2013 27,598 0.1% 16.66 6.10 (12.41) 18.51 7.81 (19.19) (11.39) 18.51 7.81 10.71 -- 2.15 2.15 04/2013 85,157 0.2% 16.60 6.10 (12.15) 18.25 7.74 (19.30) (11.56) 18.25 7.74 10.50 -- 2.19 2.19 05/2013 123,566 0.3% 16.53 6.10 (11.29) 17.39 5.82 (18.37) (12.55) 17.39 5.82 11.57 -- 2.41 2.41 06/2013 162,294 0.4% 18.95 6.10 (9.67) 15.77 5.77 (19.37) (13.60) 15.77 5.77 10.01 -- 2.05 2.05 07/2013 98,261 0.3% 20.55 6.10 (8.70) 14.80 5.68 (20.24) (14.55) 14.80 5.68 9.12 -- 1.90 1.90 08/2013 98,280 0.3% 19.64 6.10 (9.08) 15.18 5.60 (19.70) (14.10) 15.18 5.60 9.58 -- 2.00 2.00 09/2013 76,460 0.2% 19.79 6.10 (9.15) 15.25 5.46 (20.13) (14.67) 15.25 5.46 9.79 -- 2.04 2.04 10/2013 23,935 0.1% 19.95 6.10 (8.94) 15.04 5.32 (20.30) (14.98) 15.04 5.32 9.72 -- 1.99 1.99 11/2013 52,058 0.1% 19.94 6.10 (4.80) 10.90 5.08 (17.64) (12.56) 10.90 5.08 5.82 -- 1.05 1.05 12/2013 9,360 0.0% 22.25 6.10 (7.31) 13.41 5.05 (20.98) (15.93) 13.41 5.05 8.37 -- 1.69 1.69 01/2014 98,255 0.3% 22.41 6.10 (3.09) 9.19 7.23 (17.37) (10.13) 9.19 7.23 1.96 -- 0.39 0.39 02/2014 82,749 0.2% 25.87 6.10 (1.30) 7.40 7.27 (19.04) (11.77) 7.40 7.27 0.13 -- 0.03 0.03 03/2014 41,914 0.1% 24.11 6.10 (2.62) 8.72 7.22 (18.83) (11.61) 8.72 7.22 1.50 -- 0.30 0.30 04/2014 113,220 0.3% 24.13 6.10 (2.37) 8.47 7.14 (18.82) (11.69) 8.47 7.14 1.33 -- 0.27 0.27 05/2014 310,048 0.8% 25.37 6.10 (1.02) 7.12 7.00 (18.70) (11.69) 7.12 7.00 0.12 0.01 0.02 0.03 06/2014 139,500 0.4% 26.67 6.10 (0.49) 6.59 6.67 (19.54) (12.87) 6.59 6.67 (0.08) -- (0.02) (0.02) 07/2014 38,645 0.1% 28.62 6.10 1.15 4.95 6.60 (20.25) (13.65) 4.95 6.60 (1.65) 0.00 (0.34) (0.33) 08/2014 49,223 0.1% 27.81 6.10 1.23 4.87 6.52 (19.30) (12.79) 4.87 6.52 (1.65) 0.03 (0.34) (0.31) 09/2014 937,032 2.5% 29.59 6.10 2.03 4.07 6.51 (20.34) (13.83) 4.07 6.51 (2.44) -- (0.49) (0.49) 10/2014 47,707 0.1% 28.50 6.10 1.73 4.37 6.56 (20.01) (13.45) 4.37 6.56 (2.19) -- (0.45) (0.45) 11/2014 1,082,778 2.8% 12.38 6.10 (0.55) 6.65 5.56 (7.44) (1.88) 6.65 5.56 1.10 0.02 0.23 0.25 135Preliminary Draft Subject to Change Illustrative AMID Unitholder Tax Analysis AMID Unitholder Tax Analysis by Month Acquired @ $6.10 per Unit – Assumes Net Ordinary Losses Cannot be Utilized Ordinary Gain / (Loss) Total Gain / (Loss) Per Unit Per Unit Capital Gain / (Loss) Per Unit Tax Liability Per Unit Average A B C = A - B D E F = D + E C G H = C – G H = F * T1 I = G * T2 J = H + I % of Total Purchase Offer Adjusted Total Gain / Carryover Net Ordinary Total Gain / Net Capital Ordinary Tax Capital Tax Total Tax Month AMID Units Units Price Price Basis (Loss) 751 Gain Passive Losses Gain / (Loss) (Loss) 751 Gain Gain / (Loss) Liability Liability Liability 12/2014 95,280 0.2% $20.70 $6.10 ($0.27) $6.37 $6.22 ($14.78) ($8.56) $6.37 $6.22 $0.15 $0.04 $0.03 $0.07 01/2015 381,468 1.0% 14.86 6.10 (4.13) 10.23 5.68 (13.05) (7.38) 10.23 5.68 4.55 0.20 0.93 1.14 02/2015 239,550 0.6% 16.55 6.10 (5.77) 11.87 5.82 (16.10) (10.28) 11.87 5.82 6.04 0.03 1.21 1.24 03/2015 202,794 0.5% 17.15 6.10 (4.81) 10.91 5.77 (16.14) (10.36) 10.91 5.77 5.14 0.01 1.03 1.04 04/2015 290,539 0.8% 15.02 6.10 (5.81) 11.91 5.60 (15.14) (9.54) 11.91 5.60 6.31 0.05 1.27 1.32 05/2015 119,048 0.3% 12.50 6.10 (4.23) 10.33 5.37 (11.27) (5.90) 10.33 5.37 4.96 0.17 1.02 1.19 06/2015 113,234 0.3% 13.35 6.10 (4.09) 10.19 5.32 (11.95) (6.64) 10.19 5.32 4.87 0.04 1.01 1.05 07/2015 155,373 0.4% 15.36 6.10 (5.13) 11.23 5.48 (15.23) (9.75) 11.23 5.48 5.75 0.00 1.18 1.18 08/2015 294,672 0.8% 12.11 6.10 (6.74) 12.84 5.75 (13.58) (7.83) 12.84 5.75 7.09 0.02 1.46 1.49 09/2015 411,749 1.1% 9.98 6.10 (5.70) 11.80 5.37 (10.89) (5.52) 11.80 5.37 6.43 0.21 1.30 1.51 10/2015 2,323,787 6.1% 9.78 6.10 (7.73) 13.83 5.82 (12.67) (6.84) 13.83 5.82 8.00 0.02 1.67 1.69 11/2015 335,578 0.9% 8.89 6.10 (6.08) 12.18 5.39 (10.25) (4.86) 12.18 5.39 6.79 0.14 1.39 1.53 12/2015 441,447 1.2% 8.47 6.10 (6.99) 13.09 5.43 (11.08) (5.64) 13.09 5.43 7.66 0.04 1.56 1.60 01/2016 1,297,532 3.4% 4.88 6.10 (8.41) 14.51 5.10 (8.95) (3.85) 14.51 5.10 9.41 0.07 1.92 1.99 02/2016 1,643,686 4.3% 6.13 6.10 (7.21) 13.31 4.94 (9.01) (4.06) 13.31 4.94 8.37 0.12 1.69 1.80 03/2016 1,475,594 3.9% 4.49 6.10 (6.85) 12.95 4.50 (7.41) (2.92) 12.95 4.50 8.45 0.24 1.71 1.95 04/2016 602,390 1.6% 4.93 6.10 (6.91) 13.01 4.69 (7.99) (3.30) 13.01 4.69 8.32 0.11 1.71 1.82 05/2016 1,089,840 2.9% 8.69 6.10 (5.45) 11.55 5.16 (10.25) (5.09) 11.55 5.16 6.39 0.04 1.32 1.36 06/2016 623,433 1.6% 9.52 6.10 (4.12) 10.22 5.00 (10.11) (5.11) 10.22 5.00 5.22 0.01 1.06 1.07 07/2016 575,649 1.5% 10.79 6.10 (3.76) 9.86 4.75 (11.06) (6.32) 9.86 4.75 5.12 -- 1.04 1.04 08/2016 635,891 1.7% 9.56 6.10 (3.67) 9.77 4.52 (9.77) (5.25) 9.77 4.52 5.25 -- 1.07 1.07 09/2016 3,831,444 10.0% 11.51 6.10 (3.20) 9.30 4.52 (11.61) (7.08) 9.30 4.52 4.78 -- 0.96 0.96 10/2016 781,682 2.0% 9.59 6.10 (2.62) 8.72 3.81 (9.16) (5.34) 8.72 3.81 4.90 -- 0.99 0.99 11/2016 1,047,467 2.7% 12.52 6.10 (2.23) 8.33 4.30 (11.66) (7.36) 8.33 4.30 4.03 -- 0.82 0.82 12/2016 932,651 2.4% 11.72 6.10 (1.97) 8.07 4.29 (10.95) (6.66) 8.07 4.29 3.78 -- 0.78 0.78 01/2017 1,327,151 3.5% 14.27 6.10 0.86 5.24 4.54 (10.74) (6.19) 5.24 4.54 0.70 -- 0.14 0.14 02/2017 568,455 1.5% 15.19 6.10 4.00 2.10 3.49 (8.51) (5.01) 2.10 3.49 (1.39) -- (0.30) (0.30) 03/2017 928,501 2.4% 13.34 6.10 2.81 3.29 3.24 (7.85) (4.61) 3.29 3.24 0.05 -- 0.02 0.02 04/2017 1,754,948 4.6% 14.35 6.10 4.94 1.16 3.05 (7.14) (4.09) 1.16 3.05 (1.89) -- (0.38) (0.38) 05/2017 789,873 2.1% 14.35 6.10 5.38 0.72 2.95 (6.70) (3.75) 0.72 2.95 (2.24) -- (0.46) (0.46) 06/2017 2,148,456 5.6% 12.05 6.10 3.80 2.30 3.15 (5.98) (2.83) 2.30 3.15 (0.85) -- (0.17) (0.17) 07/2017 1,075,846 2.8% 11.20 6.10 3.73 2.37 3.14 (5.61) (2.47) 2.37 3.14 (0.77) -- (0.16) (0.16) 08/2017 1,100,931 2.9% 12.60 6.10 5.06 1.04 2.74 (5.68) (2.94) 1.04 2.74 (1.70) -- (0.35) (0.35) 09/2017 790,298 2.1% 12.75 6.10 5.28 0.82 2.47 (5.61) (3.14) 0.82 2.47 (1.66) -- (0.34) (0.34) 10/2017 293,259 0.8% 12.85 6.10 5.15 0.95 3.08 (6.26) (3.18) 0.95 3.08 (2.13) -- (0.43) (0.43) 11/2017 1,125,458 2.9% 12.50 6.10 5.22 0.88 2.95 (5.83) (2.88) 0.88 2.95 (2.08) -- (0.42) (0.42) 12/2017 896,422 2.3% 11.85 6.10 4.88 1.22 2.73 (5.53) (2.80) 1.22 2.73 (1.51) -- (0.30) (0.30) 01/2018 823,557 2.2% 11.85 6.10 6.15 (0.05) 2.13 (4.67) (2.53) (0.05) 2.13 (2.18) -- (0.44) (0.44) Total / Wtd. Avg. 38,207,069 100.0% $12.16 $6.10 ($1.73) $7.83 $4.50 ($10.06) ($5.57) $7.83 $4.50 $3.33 $0.03 $0.68 $0.71 136
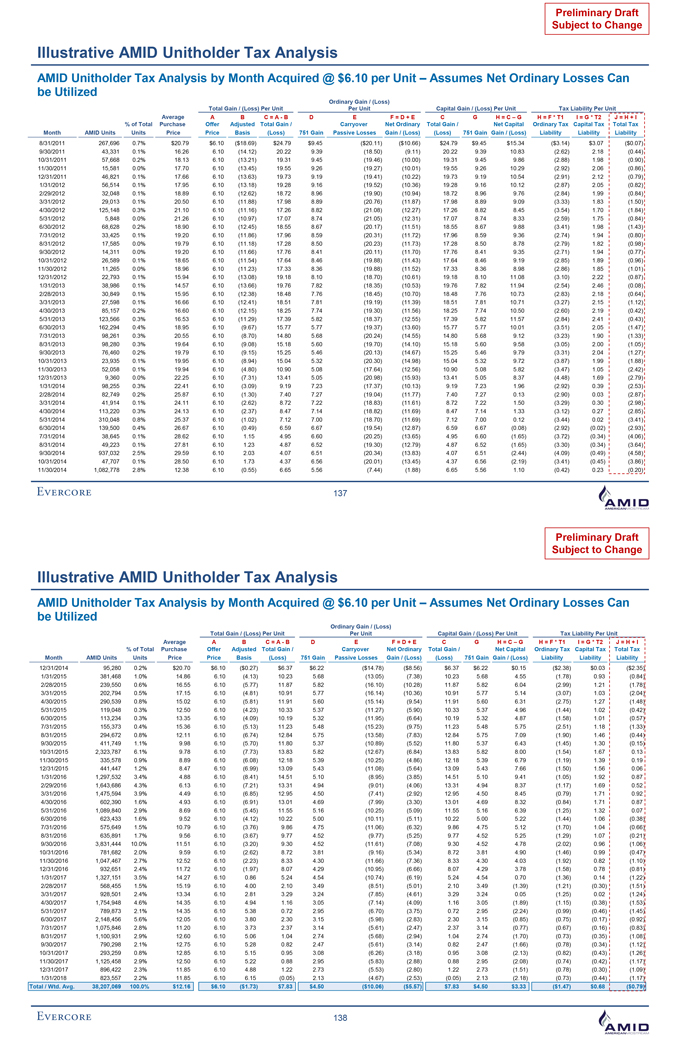
Preliminary Draft Subject to Change Illustrative AMID Unitholder Tax Analysis AMID Unitholder Tax Analysis by Month Acquired @ $6.10 per Unit – Assumes Net Ordinary Losses Can be Utilized Ordinary Gain / (Loss) Total Gain / (Loss) Per Unit Per Unit Capital Gain / (Loss) Per Unit Tax Liability Per Unit Average A B C = A - B D E F = D + E C G H = C – G H = F * T1 I = G * T2 J = H + I % of Total Purchase Offer Adjusted Total Gain / Carryover Net Ordinary Total Gain / Net Capital Ordinary Tax Capital Tax Total Tax Month AMID Units Units Price Price Basis (Loss) 751 Gain Passive Losses Gain / (Loss) (Loss) 751 Gain Gain / (Loss) Liability Liability Liability 8/31/2011 267,696 0.7% $20.79 $6.10 ($18.69) $24.79 $9.45 ($20.11) ($10.66) $24.79 $9.45 $15.34 ($3.14) $3.07 ($0.07) 9/30/2011 43,331 0.1% 16.26 6.10 (14.12) 20.22 9.39 (18.50) (9.11) 20.22 9.39 10.83 (2.62) 2.18 (0.44) 10/31/2011 57,668 0.2% 18.13 6.10 (13.21) 19.31 9.45 (19.46) (10.00) 19.31 9.45 9.86 (2.88) 1.98 (0.90) 11/30/2011 15,581 0.0% 17.70 6.10 (13.45) 19.55 9.26 (19.27) (10.01) 19.55 9.26 10.29 (2.92) 2.06 (0.86) 12/31/2011 46,821 0.1% 17.66 6.10 (13.63) 19.73 9.19 (19.41) (10.22) 19.73 9.19 10.54 (2.91) 2.12 (0.79) 1/31/2012 56,514 0.1% 17.95 6.10 (13.18) 19.28 9.16 (19.52) (10.36) 19.28 9.16 10.12 (2.87) 2.05 (0.82) 2/29/2012 32,048 0.1% 18.89 6.10 (12.62) 18.72 8.96 (19.90) (10.94) 18.72 8.96 9.76 (2.84) 1.99 (0.84) 3/31/2012 29,013 0.1% 20.50 6.10 (11.88) 17.98 8.89 (20.76) (11.87) 17.98 8.89 9.09 (3.33) 1.83 (1.50) 4/30/2012 125,148 0.3% 21.10 6.10 (11.16) 17.26 8.82 (21.08) (12.27) 17.26 8.82 8.45 (3.54) 1.70 (1.84) 5/31/2012 5,848 0.0% 21.26 6.10 (10.97) 17.07 8.74 (21.05) (12.31) 17.07 8.74 8.33 (2.59) 1.75 (0.84) 6/30/2012 68,628 0.2% 18.90 6.10 (12.45) 18.55 8.67 (20.17) (11.51) 18.55 8.67 9.88 (3.41) 1.98 (1.43) 7/31/2012 33,425 0.1% 19.20 6.10 (11.86) 17.96 8.59 (20.31) (11.72) 17.96 8.59 9.36 (2.74) 1.94 (0.80) 8/31/2012 17,585 0.0% 19.79 6.10 (11.18) 17.28 8.50 (20.23) (11.73) 17.28 8.50 8.78 (2.79) 1.82 (0.98) 9/30/2012 14,311 0.0% 19.20 6.10 (11.66) 17.76 8.41 (20.11) (11.70) 17.76 8.41 9.35 (2.71) 1.94 (0.77) 10/31/2012 26,589 0.1% 18.65 6.10 (11.54) 17.64 8.46 (19.88) (11.43) 17.64 8.46 9.19 (2.85) 1.89 (0.96) 11/30/2012 11,265 0.0% 18.96 6.10 (11.23) 17.33 8.36 (19.88) (11.52) 17.33 8.36 8.98 (2.86) 1.85 (1.01) 12/31/2012 22,793 0.1% 15.94 6.10 (13.08) 19.18 8.10 (18.70) (10.61) 19.18 8.10 11.08 (3.10) 2.22 (0.87) 1/31/2013 38,986 0.1% 14.57 6.10 (13.66) 19.76 7.82 (18.35) (10.53) 19.76 7.82 11.94 (2.54) 2.46 (0.08) 2/28/2013 30,849 0.1% 15.95 6.10 (12.38) 18.48 7.76 (18.45) (10.70) 18.48 7.76 10.73 (2.83) 2.18 (0.64) 3/31/2013 27,598 0.1% 16.66 6.10 (12.41) 18.51 7.81 (19.19) (11.39) 18.51 7.81 10.71 (3.27) 2.15 (1.12) 4/30/2013 85,157 0.2% 16.60 6.10 (12.15) 18.25 7.74 (19.30) (11.56) 18.25 7.74 10.50 (2.60) 2.19 (0.42) 5/31/2013 123,566 0.3% 16.53 6.10 (11.29) 17.39 5.82 (18.37) (12.55) 17.39 5.82 11.57 (2.84) 2.41 (0.43) 6/30/2013 162,294 0.4% 18.95 6.10 (9.67) 15.77 5.77 (19.37) (13.60) 15.77 5.77 10.01 (3.51) 2.05 (1.47) 7/31/2013 98,261 0.3% 20.55 6.10 (8.70) 14.80 5.68 (20.24) (14.55) 14.80 5.68 9.12 (3.23) 1.90 (1.33) 8/31/2013 98,280 0.3% 19.64 6.10 (9.08) 15.18 5.60 (19.70) (14.10) 15.18 5.60 9.58 (3.05) 2.00 (1.05) 9/30/2013 76,460 0.2% 19.79 6.10 (9.15) 15.25 5.46 (20.13) (14.67) 15.25 5.46 9.79 (3.31) 2.04 (1.27) 10/31/2013 23,935 0.1% 19.95 6.10 (8.94) 15.04 5.32 (20.30) (14.98) 15.04 5.32 9.72 (3.87) 1.99 (1.88) 11/30/2013 52,058 0.1% 19.94 6.10 (4.80) 10.90 5.08 (17.64) (12.56) 10.90 5.08 5.82 (3.47) 1.05 (2.42) 12/31/2013 9,360 0.0% 22.25 6.10 (7.31) 13.41 5.05 (20.98) (15.93) 13.41 5.05 8.37 (4.48) 1.69 (2.79) 1/31/2014 98,255 0.3% 22.41 6.10 (3.09) 9.19 7.23 (17.37) (10.13) 9.19 7.23 1.96 (2.92) 0.39 (2.53) 2/28/2014 82,749 0.2% 25.87 6.10 (1.30) 7.40 7.27 (19.04) (11.77) 7.40 7.27 0.13 (2.90) 0.03 (2.87) 3/31/2014 41,914 0.1% 24.11 6.10 (2.62) 8.72 7.22 (18.83) (11.61) 8.72 7.22 1.50 (3.29) 0.30 (2.98) 4/30/2014 113,220 0.3% 24.13 6.10 (2.37) 8.47 7.14 (18.82) (11.69) 8.47 7.14 1.33 (3.12) 0.27 (2.85) 5/31/2014 310,048 0.8% 25.37 6.10 (1.02) 7.12 7.00 (18.70) (11.69) 7.12 7.00 0.12 (3.44) 0.02 (3.41) 6/30/2014 139,500 0.4% 26.67 6.10 (0.49) 6.59 6.67 (19.54) (12.87) 6.59 6.67 (0.08) (2.92) (0.02) (2.93) 7/31/2014 38,645 0.1% 28.62 6.10 1.15 4.95 6.60 (20.25) (13.65) 4.95 6.60 (1.65) (3.72) (0.34) (4.06) 8/31/2014 49,223 0.1% 27.81 6.10 1.23 4.87 6.52 (19.30) (12.79) 4.87 6.52 (1.65) (3.30) (0.34) (3.64) 9/30/2014 937,032 2.5% 29.59 6.10 2.03 4.07 6.51 (20.34) (13.83) 4.07 6.51 (2.44) (4.09) (0.49) (4.58) 10/31/2014 47,707 0.1% 28.50 6.10 1.73 4.37 6.56 (20.01) (13.45) 4.37 6.56 (2.19) (3.41) (0.45) (3.86) 11/30/2014 1,082,778 2.8% 12.38 6.10 (0.55) 6.65 5.56 (7.44) (1.88) 6.65 5.56 1.10 (0.42) 0.23 (0.20) 137 Preliminary Draft Subject to Change Illustrative AMID Unitholder Tax Analysis AMID Unitholder Tax Analysis by Month Acquired @ $6.10 per Unit – Assumes Net Ordinary Losses Can be Utilized Ordinary Gain / (Loss) Total Gain / (Loss) Per Unit Per Unit Capital Gain / (Loss) Per Unit Tax Liability Per Unit Average A B C = A - B D E F = D + E C G H = C – G H = F * T1 I = G * T2 J = H + I % of Total Purchase Offer Adjusted Total Gain / Carryover Net Ordinary Total Gain / Net Capital Ordinary Tax Capital Tax Total Tax Month AMID Units Units Price Price Basis (Loss) 751 Gain Passive Losses Gain / (Loss) (Loss) 751 Gain Gain / (Loss) Liability Liability Liability 12/31/2014 95,280 0.2% $20.70 $6.10 ($0.27) $6.37 $6.22 ($14.78) ($8.56) $6.37 $6.22 $0.15 ($2.38) $0.03 ($2.35) 1/31/2015 381,468 1.0% 14.86 6.10 (4.13) 10.23 5.68 (13.05) (7.38) 10.23 5.68 4.55 (1.78) 0.93 (0.84) 2/28/2015 239,550 0.6% 16.55 6.10 (5.77) 11.87 5.82 (16.10) (10.28) 11.87 5.82 6.04 (2.99) 1.21 (1.78) 3/31/2015 202,794 0.5% 17.15 6.10 (4.81) 10.91 5.77 (16.14) (10.36) 10.91 5.77 5.14 (3.07) 1.03 (2.04) 4/30/2015 290,539 0.8% 15.02 6.10 (5.81) 11.91 5.60 (15.14) (9.54) 11.91 5.60 6.31 (2.75) 1.27 (1.48) 5/31/2015 119,048 0.3% 12.50 6.10 (4.23) 10.33 5.37 (11.27) (5.90) 10.33 5.37 4.96 (1.44) 1.02 (0.42) 6/30/2015 113,234 0.3% 13.35 6.10 (4.09) 10.19 5.32 (11.95) (6.64) 10.19 5.32 4.87 (1.58) 1.01 (0.57) 7/31/2015 155,373 0.4% 15.36 6.10 (5.13) 11.23 5.48 (15.23) (9.75) 11.23 5.48 5.75 (2.51) 1.18 (1.33) 8/31/2015 294,672 0.8% 12.11 6.10 (6.74) 12.84 5.75 (13.58) (7.83) 12.84 5.75 7.09 (1.90) 1.46 (0.44) 9/30/2015 411,749 1.1% 9.98 6.10 (5.70) 11.80 5.37 (10.89) (5.52) 11.80 5.37 6.43 (1.45) 1.30 (0.15) 10/31/2015 2,323,787 6.1% 9.78 6.10 (7.73) 13.83 5.82 (12.67) (6.84) 13.83 5.82 8.00 (1.54) 1.67 0.13 11/30/2015 335,578 0.9% 8.89 6.10 (6.08) 12.18 5.39 (10.25) (4.86) 12.18 5.39 6.79 (1.19) 1.39 0.19 12/31/2015 441,447 1.2% 8.47 6.10 (6.99) 13.09 5.43 (11.08) (5.64) 13.09 5.43 7.66 (1.50) 1.56 0.06 1/31/2016 1,297,532 3.4% 4.88 6.10 (8.41) 14.51 5.10 (8.95) (3.85) 14.51 5.10 9.41 (1.05) 1.92 0.87 2/29/2016 1,643,686 4.3% 6.13 6.10 (7.21) 13.31 4.94 (9.01) (4.06) 13.31 4.94 8.37 (1.17) 1.69 0.52 3/31/2016 1,475,594 3.9% 4.49 6.10 (6.85) 12.95 4.50 (7.41) (2.92) 12.95 4.50 8.45 (0.79) 1.71 0.92 4/30/2016 602,390 1.6% 4.93 6.10 (6.91) 13.01 4.69 (7.99) (3.30) 13.01 4.69 8.32 (0.84) 1.71 0.87 5/31/2016 1,089,840 2.9% 8.69 6.10 (5.45) 11.55 5.16 (10.25) (5.09) 11.55 5.16 6.39 (1.25) 1.32 0.07 6/30/2016 623,433 1.6% 9.52 6.10 (4.12) 10.22 5.00 (10.11) (5.11) 10.22 5.00 5.22 (1.44) 1.06 (0.38) 7/31/2016 575,649 1.5% 10.79 6.10 (3.76) 9.86 4.75 (11.06) (6.32) 9.86 4.75 5.12 (1.70) 1.04 (0.66) 8/31/2016 635,891 1.7% 9.56 6.10 (3.67) 9.77 4.52 (9.77) (5.25) 9.77 4.52 5.25 (1.29) 1.07 (0.21) 9/30/2016 3,831,444 10.0% 11.51 6.10 (3.20) 9.30 4.52 (11.61) (7.08) 9.30 4.52 4.78 (2.02) 0.96 (1.06) 10/31/2016 781,682 2.0% 9.59 6.10 (2.62) 8.72 3.81 (9.16) (5.34) 8.72 3.81 4.90 (1.46) 0.99 (0.47) 11/30/2016 1,047,467 2.7% 12.52 6.10 (2.23) 8.33 4.30 (11.66) (7.36) 8.33 4.30 4.03 (1.92) 0.82 (1.10) 12/31/2016 932,651 2.4% 11.72 6.10 (1.97) 8.07 4.29 (10.95) (6.66) 8.07 4.29 3.78 (1.58) 0.78 (0.81) 1/31/2017 1,327,151 3.5% 14.27 6.10 0.86 5.24 4.54 (10.74) (6.19) 5.24 4.54 0.70 (1.36) 0.14 (1.22) 2/28/2017 568,455 1.5% 15.19 6.10 4.00 2.10 3.49 (8.51) (5.01) 2.10 3.49 (1.39) (1.21) (0.30) (1.51) 3/31/2017 928,501 2.4% 13.34 6.10 2.81 3.29 3.24 (7.85) (4.61) 3.29 3.24 0.05 (1.25) 0.02 (1.24) 4/30/2017 1,754,948 4.6% 14.35 6.10 4.94 1.16 3.05 (7.14) (4.09) 1.16 3.05 (1.89) (1.15) (0.38) (1.53) 5/31/2017 789,873 2.1% 14.35 6.10 5.38 0.72 2.95 (6.70) (3.75) 0.72 2.95 (2.24) (0.99) (0.46) (1.45) 6/30/2017 2,148,456 5.6% 12.05 6.10 3.80 2.30 3.15 (5.98) (2.83) 2.30 3.15 (0.85) (0.75) (0.17) (0.92) 7/31/2017 1,075,846 2.8% 11.20 6.10 3.73 2.37 3.14 (5.61) (2.47) 2.37 3.14 (0.77) (0.67) (0.16) (0.83) 8/31/2017 1,100,931 2.9% 12.60 6.10 5.06 1.04 2.74 (5.68) (2.94) 1.04 2.74 (1.70) (0.73) (0.35) (1.08) 9/30/2017 790,298 2.1% 12.75 6.10 5.28 0.82 2.47 (5.61) (3.14) 0.82 2.47 (1.66) (0.78) (0.34) (1.12) 10/31/2017 293,259 0.8% 12.85 6.10 5.15 0.95 3.08 (6.26) (3.18) 0.95 3.08 (2.13) (0.82) (0.43) (1.26) 11/30/2017 1,125,458 2.9% 12.50 6.10 5.22 0.88 2.95 (5.83) (2.88) 0.88 2.95 (2.08) (0.74) (0.42) (1.17) 12/31/2017 896,422 2.3% 11.85 6.10 4.88 1.22 2.73 (5.53) (2.80) 1.22 2.73 (1.51) (0.78) (0.30) (1.09) 1/31/2018 823,557 2.2% 11.85 6.10 6.15 (0.05) 2.13 (4.67) (2.53) (0.05) 2.13 (2.18) (0.73) (0.44) (1.17) Total / Wtd. Avg. 38,207,069 100.0% $12.16 $6.10 ($1.73) $7.83 $4.50 ($10.06) ($5.57) $7.83 $4.50 $3.33 ($1.47) $0.68 ($0.79) 138
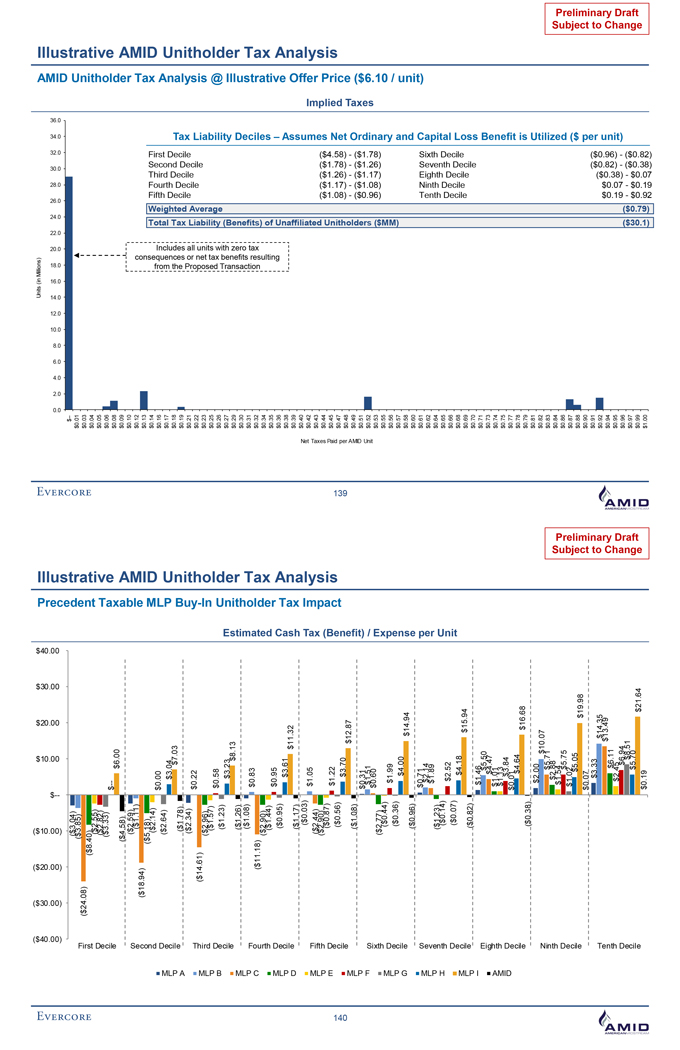
Preliminary Draft Subject to Change Illustrative AMID Unitholder Tax Analysis AMID Unitholder Tax Analysis @ Illustrative Offer Price ($6.10 / unit) Implied Taxes 36.0 34.0 Tax Liability Deciles – Assumes Net Ordinary and Capital Loss Benefit is Utilized ($ per unit) 32.0 First Decile ($4.58) - ($1.78) Sixth Decile ($0.96) - ($0.82) Second Decile ($1.78) - ($1.26) Seventh Decile ($0.82) - ($0.38) 30.0 Third Decile ($1.26) - ($1.17) Eighth Decile ($0.38) - $0.07 28.0 Fourth Decile ($1.17) - ($1.08) Ninth Decile $0.07 - $0.19 26.0 Fifth Decile ($1.08) - ($0.96) Tenth Decile $0.19 - $0.92 Weighted Average ($0.79) 24.0 Total Tax Liability (Benefits) of Unaffiliated Unitholders ($MM) ($30.1) 22.0 20.0 Includes all units with zero tax consequences or net tax benefits resulting o ns) 18.0 from the Proposed Transaction l li Mi (i n 16.0 s n it U 14.0 12.0 10.0 8.0 6.0 4.0 2.0 0.0 05 $-- 0. 0. 0. 0. 0. 0. 0. 0. 0. 0. 0. 0. 0. 0. $01 $0.03 $0.04 0. $ $0.06 $0.08 $0.09 $0.10 $12 $0.13 $0.14 $0.16 $0.17 $18 $0.19 $0.21 $0.22 $0.23 $25 $0.26 $0.27 $0.29 $0.30 $31 $0.32 $0.34 $35 $0.36 $38 $0.39 $0.40 $42 $0.43 0. $44 $0.45 $0.47 $48 $0.49 $0.51 $0.52 $0.53 $55 $0.56 $0.57 $0.58 $0.60 $61 $0.62 $0.64 $0.65 $0.66 $68 $0.69 $0.70 $0.71 $0.73 $74 $0.75 $0.77 $0.78 $0.79 0. $81 $0.82 $0.83 $84 0. $0.86 0. $87 $0.88 $0.90 0. $91 $0.92 $0.94 $0.95 $0.96 $97 $0.99 $1.00 Net Taxes Paid per AMID Unit 139 ( $ $ ( ( $ $ ( 40 30 20 10 $ 10 $ 20 30 $ $ 40 . . . . . . . . 00) 00) 00) 00) -- $ 00 00 00 00 3. 04) ($ ($3.85) 4.0) 82 ($ 8.4 ) 0 First ($ 2 .55) ($ Precedent ($2.82) ) 33.3 ($ Decile $--Illustrative .6 00 $ 4 ..58) ($ 2.5 ) 9 ($ 11) 1. ($ Taxable ) 49.81 ($ 1.5 8) ($ Second .14) 2 ($ AMID 00 0 . $ ) 2.6 4 ($ 04 3. $ MLP MLP Decile 7 .03 $ A 8) 1.7 ($ ) 2. 34 ($ 0. 2 2 $ Buy ($14.61) -Third 62.9 )($ In MLP 1. 7) 5 ($ B $0.58 ($ 1. 3) 2 Decile 3 .23 $ $8.13 Unitholder ($1.26) MLP ($1 8).0 C ($11 ) 83 0. .18 $ Fourth ($2.9 )0 Tax ($1 ).44 Estimated $0.95 Unitholder ($0. )59 MLP $3.61 D Decile 11.3 2$ ($1. 7)1 Cash Tax ($0. 3)0 $1.05 ($2 4)4. Tax MLP Fifth ($2.90) E ($0.87) $1. 2 2 Analysis ($0.56) Impact 140 Decile $3 0 7. $1 7 2.8 MLP ($1.0 8) (Benefit) F $0.3 1 $1.51 / $0 0 .6 Sixth ($2.77) ($0. 4)4 $1. 9 9 MLP ($0 6).3 G Decile $4. 0 0 $14 4 .9 ($0 96)Expense . $0.71 $2 4 .1 MLP $1. 9 per 8 ($1 ) .23 H Seventh ($0.1 )4 ($0 07) $2 52 Unit . . $4.1 8 Decile $15.9 4 MLP ($0. 2)8 I $1. 46 $5.5 0 $4 47 . Eighth $1 1 .0 $1. 3 1 AMID $3 .84 $0 1 0. $4 4 .6 Decile $1 8 6.6 ($0. )38 $2.00 $1 7 0.0 $5.71 Ninth $2 .88 $1 54 . $5.7 5 $1.0 2 Decile $5. 5 0 $1 .98 9 $0 7 Subject .0 $3.33 to $1 4.35 $1 .49 Preliminary 3 Tenth $6.11 $2.45 $6 4 .9 $8.51 Decile $5 0 Draft 7. $21.64 Change $0 9 .1
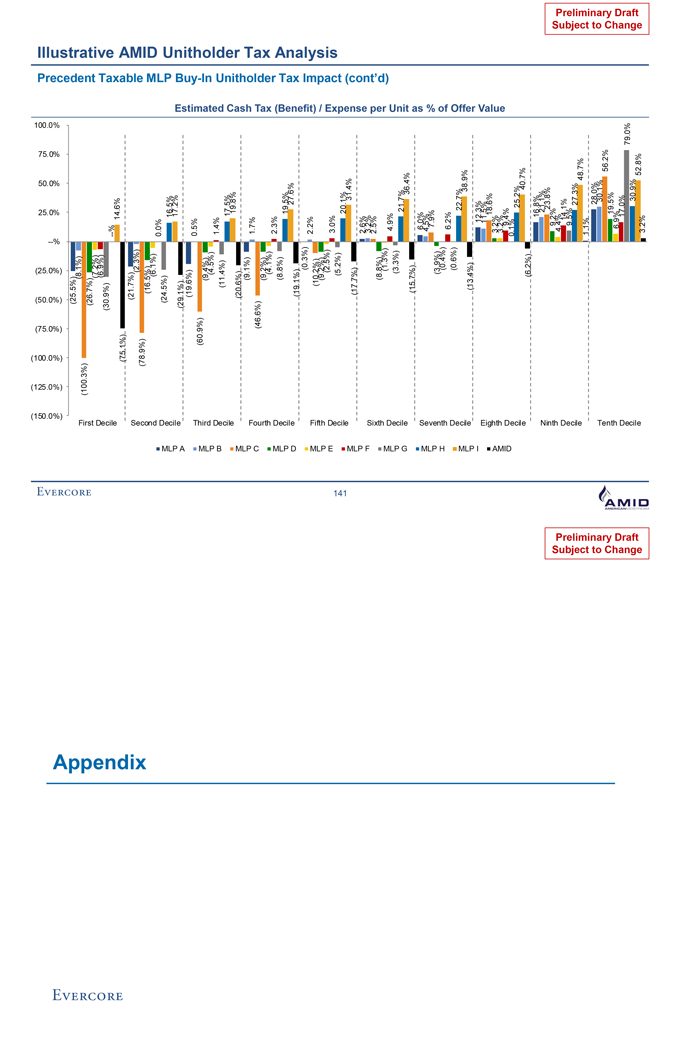
(150 . (125 . . (100 . (75 . (50 . (25 25 . . 50 75 . 100 . 0%) 0%) 0%) 0%) 0%) 0%) -- % 0% 0% 0% 0% .5%) (25 (8.1%) %) 00.3(1 %) (26.7 First Precedent 2% (7. ) (6.9%) 0.9%) (3 Illustrative Decile --% 61 % 4 . 5% .1(7 ) (21.7%) .(2 3%) Taxable % (78.9 ) 5%) (16 . Second 1%) .(6 AMID 0% .0 (24 %) .5 MLP MLP 1 56.% Decile 17.2 % A %) (29.1 19.6 %) ( 0.5 % - Buy (609%) . Third (9.4%) In MLP %) 5 (4. B 4% 1. Estimated (1 1.%) 4 Decile 7% 1 .5 819. % Unitholder (20.6%) MLP (9.1%) Cash C (46.6 %) % .71 Fourth (9.2%) Tax (4.1%)Tax .3% 2 Unitholder (8. 8%) MLP % 519. D Decile 7.6% 2 (19.1%) Tax (0 3%). 2. % 2 (Benefit) (1 2% ) 0. MLP Fifth (9.2%)/ (2 % ) 5. E (5. 2%) 3.0 % Impact Analysis 141 Decile 20.1 31 % 4% . MLP (1 %).77 F 2.6% Expense 3. % 2 2.5% Sixth (8.8%) per (1.3% ) (cont’d) 4 9% . MLP (3 % ) .3 G Decile 2 1.7% Unit 3 6.4% (1 %).75 6. % as 0 4. % 5 MLP 7.9 % % (3. %) 9 H Seventh (0 4%) of . (0. %) 6.2 % 6 2 2.7% Decile 3 9% 8. MLP (13.4%) Offer I 12 % .3 11. % 5 18.6% Eighth 3 % .2 3 % .2 AMID 9.4% Value 0 % .1 25 % .2 Decile 40 7% . (6.2% ) 16. % 8 21 1% . 23.8% Ninth 9 % .2 4.4 % 14.1% 9.5% Decile 2 % 37. 4 .7% 8 1.1% Subject 28.0% to 3 0 .1 % 5 % Preliminary 6.2 Tenth 19 5% . 6.9% 17. % 0 79 .0% 3 9% Draft 0. Decile 52.8% Change 3.2 % Preliminary Draft Subject to Change Appendix
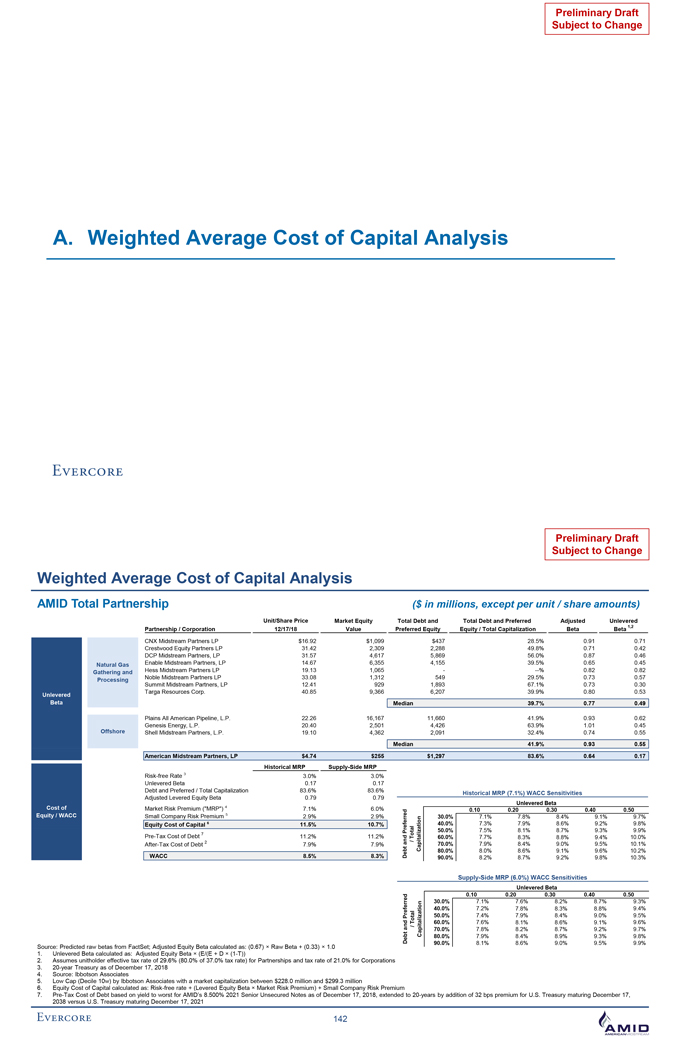
Preliminary Draft Subject to Change A. Weighted Average Cost of Capital Analysis Preliminary Draft Subject to Change Weighted Average Cost of Capital Analysis AMID Total Partnership ($ in millions, except per unit / share amounts) Unit/Share Price Market Equity Total Debt and Total Debt and Preferred Adjusted Unlevered Partnership / Corporation 12/17/18 Value Preferred Equity Equity / Total Capitalization Beta Beta 1,2 CNX Midstream Partners LP $16.92 $1,099 $437 28.5% 0.91 0.71 Crestwood Equity Partners LP 31.42 2,309 2,288 49.8% 0.71 0.42 DCP Midstream Partners, LP 31.57 4,617 5,869 56.0% 0.87 0.46 Natural Gas Enable Midstream Partners, LP 14.67 6,355 4,155 39.5% 0.65 0.45 Gathering and Hess Midstream Partners LP 19.13 1,065 - --% 0.82 0.82 Processing Noble Midstream Partners LP 33.08 1,312 549 29.5% 0.73 0.57 Summit Midstream Partners, LP 12.41 929 1,893 67.1% 0.73 0.30 Targa Resources Corp. 40.85 9,366 6,207 39.9% 0.80 0.53 Unlevered Beta Median 39.7% 0.77 0.49 Plains All American Pipeline, L.P. 22.26 16,167 11,660 41.9% 0.93 0.62 Genesis Energy, L.P. 20.40 2,501 4,426 63.9% 1.01 0.45 Offshore Shell Midstream Partners, L.P. 19.10 4,362 2,091 32.4% 0.74 0.55 Median 41.9% 0.93 0.55 American Midstream Partners, LP $4.74 $255 $1,297 83.6% 0.64 0.17 Historical MRP Supply-Side MRP Risk-free Rate 3 3.0% 3.0% Unlevered Beta 0.17 0.17 Debt and Preferred / Total Capitalization 83.6% 83.6% Historical MRP (7.1%) WACC Sensitivities Adjusted Levered Equity Beta 0.79 0.79 Cost of 4 Unlevered Beta Market Risk Premium (“MRP”) 7.1% 6.0% ed 0.10 0.20 0.30 0.40 0.50 Equity / WACC Small Company Risk Premium 5 2.9% 2.9% 30.0% 7.1% 7.8% 8.4% 9.1% 9.7% Equity Cost of Capital 6 11.5% 10.7% referr al ation 40.0% 7.3% 7.9% 8.6% 9.2% 9.8% 7 P z ali 50.0% 7.5% 8.1% 8.7% 9.3% 9.9% Pre-Tax Cost of Debt 11.2% 11.2% / Tot 60.0% 7.7% 8.3% 8.8% 9.4% 10.0% After-Tax Cost of Debt 2 7.9% 7.9% Capit 70.0% 7.9% 8.4% 9.0% 9.5% 10.1% WACC 8.5% 8.3% Debt and 80.0% 8.0% 8.6% 9.1% 9.6% 10.2% 90.0% 8.2% 8.7% 9.2% 9.8% 10.3% Supply-Side MRP (6.0%) WACC Sensitivities Unlevered Beta Preferred 0.10 0.20 0.30 0.40 0.50 30.0% 7.1% 7.6% 8.2% 8.7% 9.3% 40.0% 7.2% 7.8% 8.3% 8.8% 9.4% 50.0% 7.4% 7.9% 8.4% 9.0% 9.5% / Total 60.0% 7.6% 8.1% 8.6% 9.1% 9.6% Capitalization 70.0% 7.8% 8.2% 8.7% 9.2% 9.7% Debt and 80.0% 7.9% 8.4% 8.9% 9.3% 9.8% 90.0% 8.1% 8.6% 9.0% 9.5% 9.9% Source: Predicted raw betas from FactSet; Adjusted Equity Beta calculated as: (0.67) × Raw Beta + (0.33) × 1.0 1. Unlevered Beta calculated as: Adjusted Equity Beta × (E/(E + D × (1-T)) 2. Assumes unitholder effective tax rate of 29.6% (80.0% of 37.0% tax rate) for Partnerships and tax rate of 21.0% for Corporations 3. 20-year Treasury as of December 17, 2018 4. Source: Ibbotson Associates 5. Low Cap (Decile 10w) by Ibbotson Associates with a market capitalization between $228.0 million and $299.3 million 6. Equity Cost of Capital calculated as: Risk-free rate + (Levered Equity Beta × Market Risk Premium) + Small Company Risk Premium 7. Pre-Tax Cost of Debt based on yield to worst for AMID’s 8.500% 2021 Senior Unsecured Notes as of December 17, 2018, extended to 20-years by addition of 32 bps premium for U.S. Treasury maturing December 17, 2038 versus U.S. Treasury maturing December 17, 2021 142
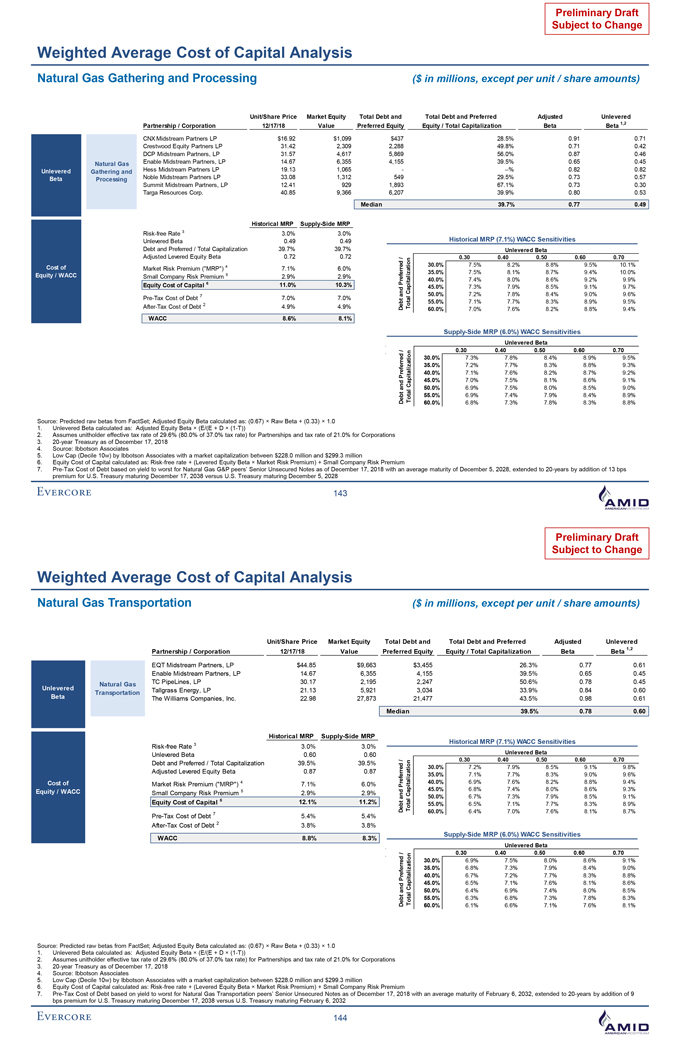
Preliminary Draft Subject to Change Weighted Average Cost of Capital Analysis Natural Gas Gathering and Processing ($ in millions, except per unit / share amounts) Unit/Share Price Market Equity Total Debt and Total Debt and Preferred Adjusted Unlevered Corporation 12/17/18 Value Preferred Equity Equity / Total Capitalization Beta Beta 1,2 Partnership / CNX Midstream Partners LP $16.92 $1,099 $437 28.5% 0.91 0.71 Crestwood Equity Partners LP 31.42 2,309 2,288 49.8% 0.71 0.42 DCP Midstream Partners, LP 31.57 4,617 5,869 56.0% 0.87 0.46 Natural Gas Enable Midstream Partners, LP 14.67 6,355 4,155 39.5% 0.65 0.45 Unlevered Gathering and Hess Midstream Partners LP 19.13 1,065 - --% 0.82 0.82 Beta Processing Noble Midstream Partners LP 33.08 1,312 549 29.5% 0.73 0.57 Summit Midstream Partners, LP 12.41 929 1,893 67.1% 0.73 0.30 Targa Resources Corp. 40.85 9,366 6,207 39.9% 0.80 0.53 Median 39.7% 0.77 0.49 Historical MRP Supply-Side MRP Risk-free Rate 3 3.0% 3.0% Unlevered Beta 0.49 0.49 Historical MRP (7.1%) WACC Sensitivities Debt and Preferred / Total Capitalization 39.7% 39.7% Unlevered Beta Adjusted Levered Equity Beta 0.72 0.72/ 0.30 0.40 0.50 0.60 0.70 Cost of 4 red ti on 30.0% 7.5% 8.2% 8.8% 9.5% 10.1% Market Risk Premium (“MRP”) 7.1% 6.0% r a e iz 35.0% 7.5% 8.1% 8.7% 9.4% 10.0% Equity / WACC Small Company Risk Premium 5 2.9% 2.9% ref al 6 11.0% 10.3% t 40.0% 7.4% 8.0% 8.6% 9.2% 9.9% Equity Cost of Capital api 45.0% 7.3% 7.9% 8.5% 9.1% 9.7% 7 and PC 50.0% 7.2% 7.8% 8.4% 9.0% 9.6% Pre-Tax Cost of Debt 7.0% 7.0%bt al 55.0% 7.1% 7.7% 8.3% 8.9% 9.5% After-Tax Cost of Debt 2 4.9% 4.9% e Tot D 60.0% 7.0% 7.6% 8.2% 8.8% 9.4% WACC 8.6% 8.1% Supply-Side MRP (6.0%) WACC Sensitivities Unlevered Beta / 0.30 0.40 0.50 0.60 0.70 d Capitalization rre 30.0% 7.3% 7.8% 8.4% 8.9% 9.5% e 35.0% 7.2% 7.7% 8.3% 8.8% 9.3% 40.0% 7.1% 7.6% 8.2% 8.7% 9.2% 45.0% 7.0% 7.5% 8.1% 8.6% 9.1% and Pref 50.0% 6.9% 7.5% 8.0% 8.5% 9.0% ebt Total 55.0% 6.9% 7.4% 7.9% 8.4% 8.9% D 60.0% 6.8% 7.3% 7.8% 8.3% 8.8% Source: Predicted raw betas from FactSet; Adjusted Equity Beta calculated as: (0.67) × Raw Beta + (0.33) × 1.0 1. Unlevered Beta calculated as: Adjusted Equity Beta × (E/(E + D × (1-T)) 2. Assumes unitholder effective tax rate of 29.6% (80.0% of 37.0% tax rate) for Partnerships and tax rate of 21.0% for Corporations 3. 20-year Treasury as of December 17, 2018 4. Source: Ibbotson Associates 5. Low Cap (Decile 10w) by Ibbotson Associates with a market capitalization between $228.0 million and $299.3 million 6. Equity Cost of Capital calculated as: Risk-free rate + (Levered Equity Beta × Market Risk Premium) + Small Company Risk Premium 7. Pre-Tax Cost of Debt based on yield to worst for Natural Gas G&P peers’ Senior Unsecured Notes as of December 17, 2018 with an average maturity of December 5, 2028, extended to 20-years by addition of 13 bps premium for U.S. Treasury maturing December 17, 2038 versus U.S. Treasury maturing December 5, 2028 143 Preliminary Draft Subject to Change Weighted Average Cost of Capital Analysis Natural Gas Transportation ($ in millions, except per unit / share amounts) Unit/Share Price Market Equity Total Debt and Total Debt and Preferred Adjusted Unlevered Partnership / Corporation 12/17/18 Value Preferred Equity Equity / Total Capitalization Beta Beta 1,2 EQT Midstream Partners, LP $44.85 $9,663 $3,455 26.3% 0.77 0.61 Enable Midstream Partners, LP 14.67 6,355 4,155 39.5% 0.65 0.45 Natural Gas TC PipeLines, LP 30.17 2,195 2,247 50.6% 0.78 0.45 Unlevered Tallgrass Energy, LP 21.13 5,921 3,034 33.9% 0.84 0.60 Transportation Beta The Williams Companies, Inc. 22.98 27,873 21,477 43.5% 0.98 0.61 Median 39.5% 0.78 0.60 Historical MRP Supply-Side MRP Historical MRP (7.1%) WACC Sensitivities Risk-free Rate 3 3.0% 3.0% Unlevered Beta 0.60 0.60 Unlevered Beta Debt and Preferred / Total Capitalization 39.5% 39.5% 0.30 0.40 0.50 0.60 0.70 ed / i on 30.0% 7.2% 7.9% 8.5% 9.1% 9.8% t Adjusted Levered Equity Beta 0.87 0.87 rr za fe ali 35.0% 7.1% 7.7% 8.3% 9.0% 9.6% 4 re 40.0% 6.9% 7.6% 8.2% 8.8% 9.4% Cost of Market Risk Premium (“MRP”) 7.1% 6.0% t Equity / WACC 5 45.0% 6.8% 7.4% 8.0% 8.6% 9.3% Small Company Risk Premium 2.9% 2.9% nd P Capi a 50.0% 6.7% 7.3% 7.9% 8.5% 9.1% Equity Cost of Capital 6 12.1% 11.2%bt Total 55.0% 6.5% 7.1% 7.7% 8.3% 8.9% De 60.0% 6.4% 7.0% 7.6% 8.1% 8.7% Pre-Tax Cost of Debt 7 5.4% 5.4% After-Tax Cost of Debt 2 3.8% 3.8% Supply-Side MRP (6.0%) WACC Sensitivities WACC 8.8% 8.3% Unlevered Beta 0.30 0.40 0.50 0.60 0.70 ed / on 30.0% 6.9% 7.5% 8.0% 8.6% 9.1% r ati 35.0% 6.8% 7.3% 7.9% 8.4% 9.0% iz 40.0% 6.7% 7.2% 7.7% 8.3% 8.8% apital 45.0% 6.5% 7.1% 7.6% 8.1% 8.6% and PreferC 50.0% 6.4% 6.9% 7.4% 8.0% 8.5% l a 55.0% 6.3% 6.8% 7.3% 7.8% 8.3% Debt Tot 60.0% 6.1% 6.6% 7.1% 7.6% 8.1% Source: Predicted raw betas from FactSet; Adjusted Equity Beta calculated as: (0.67) × Raw Beta + (0.33) × 1.0 1. Unlevered Beta calculated as: Adjusted Equity Beta × (E/(E + D × (1-T)) 2. Assumes unitholder effective tax rate of 29.6% (80.0% of 37.0% tax rate) for Partnerships and tax rate of 21.0% for Corporations 3. 20-year Treasury as of December 17, 2018 4. Source: Ibbotson Associates 5. Low Cap (Decile 10w) by Ibbotson Associates with a market capitalization between $228.0 million and $299.3 million 6. Equity Cost of Capital calculated as: Risk-free rate + (Levered Equity Beta × Market Risk Premium) + Small Company Risk Premium 7. Pre-Tax Cost of Debt based on yield to worst for Natural Gas Transportation peers’ Senior Unsecured Notes as of December 17, 2018 with an average maturity of February 6, 2032, extended to 20-years by addition of 9 bps premium for U.S. Treasury maturing December 17, 2038 versus U.S. Treasury maturing February 6, 2032 144
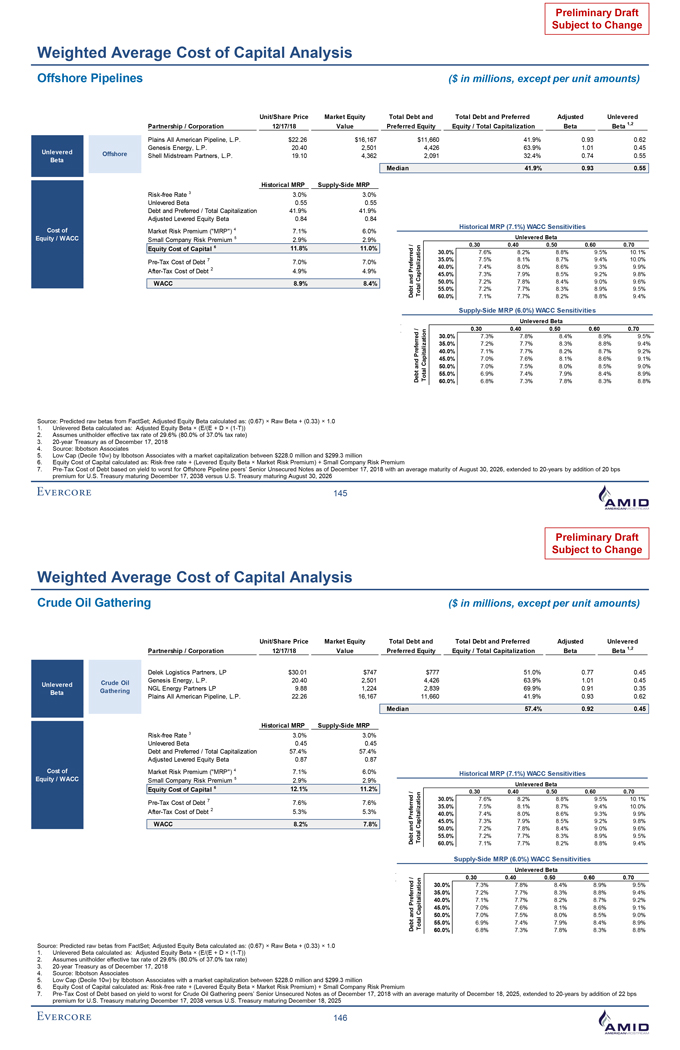
Preliminary Draft Subject to Change Weighted Average Cost of Capital Analysis Offshore Pipelines ($ in millions, except per unit amounts) Unit/Share Price Market Equity Total Debt and Total Debt and Preferred Adjusted Unlevered 1,2 Partnership / Corporation 12/17/18 Value Preferred Equity Equity / Total Capitalization Beta Beta Plains All American Pipeline, L.P. $22.26 $16,167 $11,660 41.9% 0.93 0.62 Genesis Energy, L.P. 20.40 2,501 4,426 63.9% 1.01 0.45 Unlevered Offshore Shell Midstream Partners, L.P. 19.10 4,362 2,091 32.4% 0.74 0.55 Beta Median 41.9% 0.93 0.55 Historical MRP Supply-Side MRP Risk-free Rate 3 3.0% 3.0% Unlevered Beta 0.55 0.55 Debt and Preferred / Total Capitalization 41.9% 41.9% Adjusted Levered Equity Beta 0.84 0.84 4 Historical MRP (7.1%) WACC Sensitivities Cost of Market Risk Premium (“MRP”) 7.1% 6.0% Equity / WACC Small Company Risk Premium 5 2.9% 2.9% Unlevered Beta 6 / 0.30 0.40 0.50 0.60 0.70 Equity Cost of Capital 11.8% 11.0% d on e i 30.0% 7.6% 8.2% 8.8% 9.5% 10.1% Pre-Tax Cost of Debt 7 7.0% 7.0% izat 35.0% 7.5% 8.1% 8.7% 9.4% 10.0% referr al t 40.0% 7.4% 8.0% 8.6% 9.3% 9.9% After-Tax Cost of Debt 2 4.9% 4.9% api 45.0% 7.3% 7.9% 8.5% 9.2% 9.8% and PC 50.0% 7.2% 7.8% 8.4% 9.0% 9.6% WACC 8.9% 8.4%ebt 55.0% 7.2% 7.7% 8.3% 8.9% 9.5% D Total 60.0% 7.1% 7.7% 8.2% 8.8% 9.4% Supply-Side MRP (6.0%) WACC Sensitivities Unlevered Beta / 0.30 0.40 0.50 0.60 0.70 d Capitalization rre 30.0% 7.3% 7.8% 8.4% 8.9% 9.5% e 35.0% 7.2% 7.7% 8.3% 8.8% 9.4% 40.0% 7.1% 7.7% 8.2% 8.7% 9.2% 45.0% 7.0% 7.6% 8.1% 8.6% 9.1% and Pref 50.0% 7.0% 7.5% 8.0% 8.5% 9.0% ebt Total 55.0% 6.9% 7.4% 7.9% 8.4% 8.9% D 60.0% 6.8% 7.3% 7.8% 8.3% 8.8% Source: Predicted raw betas from FactSet; Adjusted Equity Beta calculated as: (0.67) × Raw Beta + (0.33) × 1.0 1. Unlevered Beta calculated as: Adjusted Equity Beta × (E/(E + D × (1-T)) 2. Assumes unitholder effective tax rate of 29.6% (80.0% of 37.0% tax rate) 3. 20-year Treasury as of December 17, 2018 4. Source: Ibbotson Associates 5. Low Cap (Decile 10w) by Ibbotson Associates with a market capitalization between $228.0 million and $299.3 million 6. Equity Cost of Capital calculated as: Risk-free rate + (Levered Equity Beta × Market Risk Premium) + Small Company Risk Premium 7. Pre-Tax Cost of Debt based on yield to worst for Offshore Pipeline peers’ Senior Unsecured Notes as of December 17, 2018 with an average maturity of August 30, 2026, extended to 20-years by addition of 20 bps premium for U.S. Treasury maturing December 17, 2038 versus U.S. Treasury maturing August 30, 2026 145Preliminary Draft Subject to Change Weighted Average Cost of Capital Analysis Crude Oil Gathering ($ in millions, except per unit amounts) Unit/Share Price Market Equity Total Debt and Total Debt and Preferred Adjusted Unlevered 1,2 Partnership / Corporation 12/17/18 Value Preferred Equity Equity / Total Capitalization Beta Beta Delek Logistics Partners, LP $30.01 $747 $777 51.0% 0.77 0.45 Crude Oil Genesis Energy, L.P. 20.40 2,501 4,426 63.9% 1.01 0.45 Unlevered Gathering NGL Energy Partners LP 9.88 1,224 2,839 69.9% 0.91 0.35 Beta Plains All American Pipeline, L.P. 22.26 16,167 11,660 41.9% 0.93 0.62 Median 57.4% 0.92 0.45 Historical MRP Supply-Side MRP Risk-free Rate 3 3.0% 3.0% Unlevered Beta 0.45 0.45 Debt and Preferred / Total Capitalization 57.4% 57.4% Adjusted Levered Equity Beta 0.87 0.87 Cost of Market Risk Premium (“MRP”) 4 7.1% 6.0% Historical MRP (7.1%) WACC Sensitivities Equity / WACC Small Company Risk Premium 5 2.9% 2.9% Unlevered Beta 6 12.1% 11.2% Equity Cost of Capital / 0.30 0.40 0.50 0.60 0.70 d on Pre-Tax Cost of Debt 7 7.6% 7.6% re i at 30.0% 7.6% 8.2% 8.8% 9.5% 10.1% er f z 35.0% 7.5% 8.1% 8.7% 9.4% 10.0% After-Tax Cost of Debt 2 5.3% 5.3% Capitali 40.0% 7.4% 8.0% 8.6% 9.3% 9.9% 45.0% 7.3% 7.9% 8.5% 9.2% 9.8% WACC 8.2% 7.8% nd Pre a 50.0% 7.2% 7.8% 8.4% 9.0% 9.6% bt al 55.0% 7.2% 7.7% 8.3% 8.9% 9.5% D e Tot 60.0% 7.1% 7.7% 8.2% 8.8% 9.4% Supply-Side MRP (6.0%) WACC Sensitivities Unlevered Beta 0.30 0.40 0.50 0.60 0.70 ed / on 30.0% 7.3% 7.8% 8.4% 8.9% 9.5% r ati 35.0% 7.2% 7.7% 8.3% 8.8% 9.4% iz 40.0% 7.1% 7.7% 8.2% 8.7% 9.2% apital 45.0% 7.0% 7.6% 8.1% 8.6% 9.1% and PreferC 50.0% 7.0% 7.5% 8.0% 8.5% 9.0% l a 55.0% 6.9% 7.4% 7.9% 8.4% 8.9% Debt Tot 60.0% 6.8% 7.3% 7.8% 8.3% 8.8% Source: Predicted raw betas from FactSet; Adjusted Equity Beta calculated as: (0.67) × Raw Beta + (0.33) × 1.0 1. Unlevered Beta calculated as: Adjusted Equity Beta × (E/(E + D × (1-T)) 2. Assumes unitholder effective tax rate of 29.6% (80.0% of 37.0% tax rate) 3. 20-year Treasury as of December 17, 2018 4. Source: Ibbotson Associates 5. Low Cap (Decile 10w) by Ibbotson Associates with a market capitalization between $228.0 million and $299.3 million 6. Equity Cost of Capital calculated as: Risk-free rate + (Levered Equity Beta × Market Risk Premium) + Small Company Risk Premium 7. Pre-Tax Cost of Debt based on yield to worst for Crude Oil Gathering peers’ Senior Unsecured Notes as of December 17, 2018 with an average maturity of December 18, 2025, extended to 20-years by addition of 22 bps premium for U.S. Treasury maturing December 17, 2038 versus U.S. Treasury maturing December 18, 2025 146
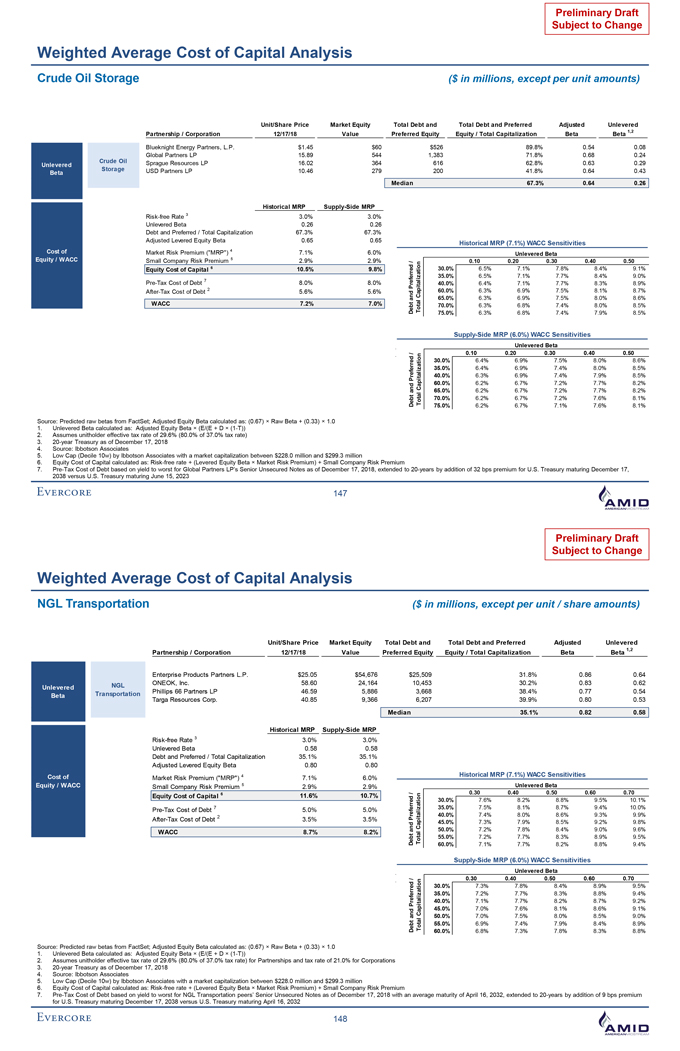
Preliminary Draft Subject to Change Weighted Average Cost of Capital Analysis Crude Oil Storage ($ in millions, except per unit amounts) Unit/Share Price Market Equity Total Debt and Total Debt and Preferred Adjusted Unlevered 1,2 Partnership / Corporation 12/17/18 Value Preferred Equity Equity / Total Capitalization Beta Beta Blueknight Energy Partners, L.P. $1.45 $60 $526 89.8% 0.54 0.08 Global Partners LP 15.89 544 1,383 71.8% 0.68 0.24 Crude Oil Sprague Resources LP 16.02 364 616 62.8% 0.63 0.29 Unlevered Storage USD Partners LP 10.46 279 200 41.8% 0.64 0.43 Beta Median 67.3% 0.64 0.26 Historical MRP Supply-Side MRP Risk-free Rate 3 3.0% 3.0% Unlevered Beta 0.26 0.26 Debt and Preferred / Total Capitalization 67.3% 67.3% Adjusted Levered Equity Beta 0.65 0.65 Historical MRP (7.1%) WACC Sensitivities Cost of Market Risk Premium (“MRP”) 4 7.1% 6.0% Unlevered Beta Equity / WACC Small Company Risk Premium 5 2.9% 2.9% 0.10 0.20 0.30 0.40 0.50 6 ed / i on 30.0% 6.5% 7.1% 7.8% 8.4% 9.1% Equity Cost of Capital 10.5% 9.8% t rr za fe 35.0% 6.5% 7.1% 7.7% 8.4% 9.0% Pre-Tax Cost of Debt 7 8.0% 8.0% re ali t 40.0% 6.4% 7.1% 7.7% 8.3% 8.9% After-Tax Cost of Debt 2 5.6% 5.6% nd P Capi 60.0% 6.3% 6.9% 7.5% 8.1% 8.7% a 65.0% 6.3% 6.9% 7.5% 8.0% 8.6% WACC 7.2% 7.0% bt Total 70.0% 6.3% 6.8% 7.4% 8.0% 8.5% De 75.0% 6.3% 6.8% 7.4% 7.9% 8.5% Supply-Side MRP (6.0%) WACC Sensitivities Unlevered Beta 0.10 0.20 0.30 0.40 0.50 ed / on 30.0% 6.4% 6.9% 7.5% 8.0% 8.6% r ati 35.0% 6.4% 6.9% 7.4% 8.0% 8.5% iz 40.0% 6.3% 6.9% 7.4% 7.9% 8.5% apital 60.0% 6.2% 6.7% 7.2% 7.7% 8.2% and PreferC 65.0% 6.2% 6.7% 7.2% 7.7% 8.2% l a 70.0% 6.2% 6.7% 7.2% 7.6% 8.1% Debt Tot 75.0% 6.2% 6.7% 7.1% 7.6% 8.1% Source: Predicted raw betas from FactSet; Adjusted Equity Beta calculated as: (0.67) × Raw Beta + (0.33) × 1.0 1. Unlevered Beta calculated as: Adjusted Equity Beta × (E/(E + D × (1-T)) 2. Assumes unitholder effective tax rate of 29.6% (80.0% of 37.0% tax rate) 3. 20-year Treasury as of December 17, 2018 4. Source: Ibbotson Associates 5. Low Cap (Decile 10w) by Ibbotson Associates with a market capitalization between $228.0 million and $299.3 million 6. Equity Cost of Capital calculated as: Risk-free rate + (Levered Equity Beta × Market Risk Premium) + Small Company Risk Premium 7. Pre-Tax Cost of Debt based on yield to worst for Global Partners LP’s Senior Unsecured Notes as of December 17, 2018, extended to 20-years by addition of 32 bps premium for U.S. Treasury maturing December 17, 2038 versus U.S. Treasury maturing June 15, 2023 147 Preliminary Draft Subject to Change Weighted Average Cost of Capital Analysis NGL Transportation ($ in millions, except per unit / share amounts) Unit/Share Price Market Equity Total Debt and Total Debt and Preferred Adjusted Unlevered 1,2 Partnership / Corporation 12/17/18 Value Preferred Equity Equity / Total Capitalization Beta Beta Enterprise Products Partners L.P. $25.05 $54,676 $25,509 31.8% 0.86 0.64 NGL ONEOK, Inc. 58.60 24,164 10,453 30.2% 0.83 0.62 Unlevered Transportation Phillips 66 Partners LP 46.59 5,886 3,668 38.4% 0.77 0.54 Beta Targa Resources Corp. 40.85 9,366 6,207 39.9% 0.80 0.53 Median 35.1% 0.82 0.58 Historical MRP Supply-Side MRP Risk-free Rate 3 3.0% 3.0% Unlevered Beta 0.58 0.58 Debt and Preferred / Total Capitalization 35.1% 35.1% Adjusted Levered Equity Beta 0.80 0.80 Cost of 4 Historical MRP (7.1%) WACC Sensitivities Market Risk Premium (“MRP”) 7.1% 6.0% Equity / WACC Small Company Risk Premium 5 2.9% 2.9% Unlevered Beta Equity Cost of Capital 6 11.6% 10.7% / 0.30 0.40 0.50 0.60 0.70 d on re i at 30.0% 7.6% 8.2% 8.8% 9.5% 10.1% Pre-Tax Cost of Debt 7 5.0% 5.0% f er Capitali z 35.0% 7.5% 8.1% 8.7% 9.4% 10.0% 2 40.0% 7.4% 8.0% 8.6% 9.3% 9.9% After-Tax Cost of Debt 3.5% 3.5% nd Pre 45.0% 7.3% 7.9% 8.5% 9.2% 9.8% a 50.0% 7.2% 7.8% 8.4% 9.0% 9.6% WACC 8.7% 8.2%bt al 55.0% 7.2% 7.7% 8.3% 8.9% 9.5% D e Tot 60.0% 7.1% 7.7% 8.2% 8.8% 9.4% Supply-Side MRP (6.0%) WACC Sensitivities Unlevered Beta 0.30 0.40 0.50 0.60 0.70 ed / on 30.0% 7.3% 7.8% 8.4% 8.9% 9.5% r ati 35.0% 7.2% 7.7% 8.3% 8.8% 9.4% iz 40.0% 7.1% 7.7% 8.2% 8.7% 9.2% apital 45.0% 7.0% 7.6% 8.1% 8.6% 9.1% and PreferC 50.0% 7.0% 7.5% 8.0% 8.5% 9.0% l a 55.0% 6.9% 7.4% 7.9% 8.4% 8.9% Debt Tot 60.0% 6.8% 7.3% 7.8% 8.3% 8.8% Source: Predicted raw betas from FactSet; Adjusted Equity Beta calculated as: (0.67) × Raw Beta + (0.33) × 1.0 1. Unlevered Beta calculated as: Adjusted Equity Beta × (E/(E + D × (1-T)) 2. Assumes unitholder effective tax rate of 29.6% (80.0% of 37.0% tax rate) for Partnerships and tax rate of 21.0% for Corporations 3. 20-year Treasury as of December 17, 2018 4. Source: Ibbotson Associates 5. Low Cap (Decile 10w) by Ibbotson Associates with a market capitalization between $228.0 million and $299.3 million 6. Equity Cost of Capital calculated as: Risk-free rate + (Levered Equity Beta × Market Risk Premium) + Small Company Risk Premium 7. Pre-Tax Cost of Debt based on yield to worst for NGL Transportation peers’ Senior Unsecured Notes as of December 17, 2018 with an average maturity of April 16, 2032, extended to 20-years by addition of 9 bps premium for U.S. Treasury maturing December 17, 2038 versus U.S. Treasury maturing April 16, 2032 148
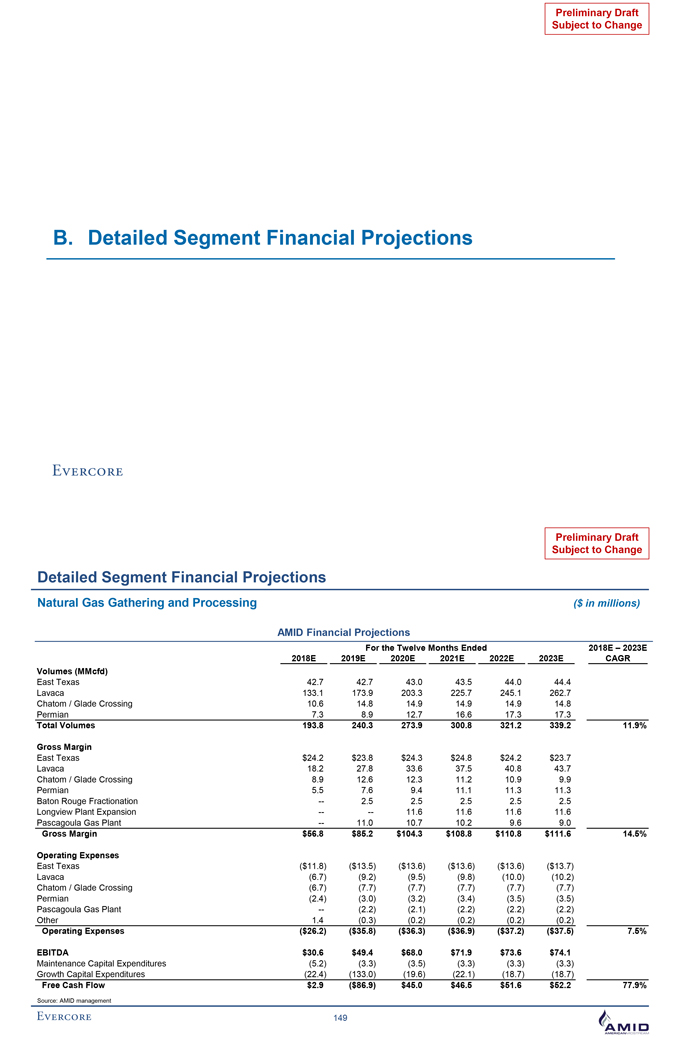
Preliminary Draft Subject to Change B. Detailed Segment Financial Projections Preliminary Draft Subject to Change Detailed Segment Financial Projections Natural Gas Gathering and Processing ($ in millions) AMID Financial Projections For the Twelve Months Ended 2018E – 2023E 2018E 2019E 2020E 2021E 2022E 2023E CAGR Volumes (MMcfd) East Texas 42.7 42.7 43.0 43.5 44.0 44.4 Lavaca 133.1 173.9 203.3 225.7 245.1 262.7 Chatom / Glade Crossing 10.6 14.8 14.9 14.9 14.9 14.8 Permian 7.3 8.9 12.7 16.6 17.3 17.3 Total Volumes 193.8 240.3 273.9 300.8 321.2 339.2 11.9% Gross Margin East Texas $24.2 $23.8 $24.3 $24.8 $24.2 $23.7 Lavaca 18.2 27.8 33.6 37.5 40.8 43.7 Chatom / Glade Crossing 8.9 12.6 12.3 11.2 10.9 9.9 Permian 5.5 7.6 9.4 11.1 11.3 11.3 Baton Rouge Fractionation -- 2.5 2.5 2.5 2.5 2.5 Longview Plant Expansion -- -- 11.6 11.6 11.6 11.6 Pascagoula Gas Plant -- 11.0 10.7 10.2 9.6 9.0 Gross Margin $56.8 $85.2 $104.3 $108.8 $110.8 $111.6 14.5% Operating Expenses East Texas ($11.8) ($13.5) ($13.6) ($13.6) ($13.6) ($13.7) Lavaca (6.7) (9.2) (9.5) (9.8) (10.0) (10.2) Chatom / Glade Crossing (6.7) (7.7) (7.7) (7.7) (7.7) (7.7) Permian (2.4) (3.0) (3.2) (3.4) (3.5) (3.5) Pascagoula Gas Plant -- (2.2) (2.1) (2.2) (2.2) (2.2) Other 1.4 (0.3) (0.2) (0.2) (0.2) (0.2) Operating Expenses ($26.2) ($35.8) ($36.3) ($36.9) ($37.2) ($37.5) 7.5% EBITDA $30.6 $49.4 $68.0 $71.9 $73.6 $74.1 Maintenance Capital Expenditures (5.2) (3.3) (3.5) (3.3) (3.3) (3.3) Growth Capital Expenditures (22.4) (133.0) (19.6) (22.1) (18.7) (18.7) Free Cash Flow $2.9 ($86.9) $45.0 $46.5 $51.6 $52.2 77.9% Source: AMID management 149
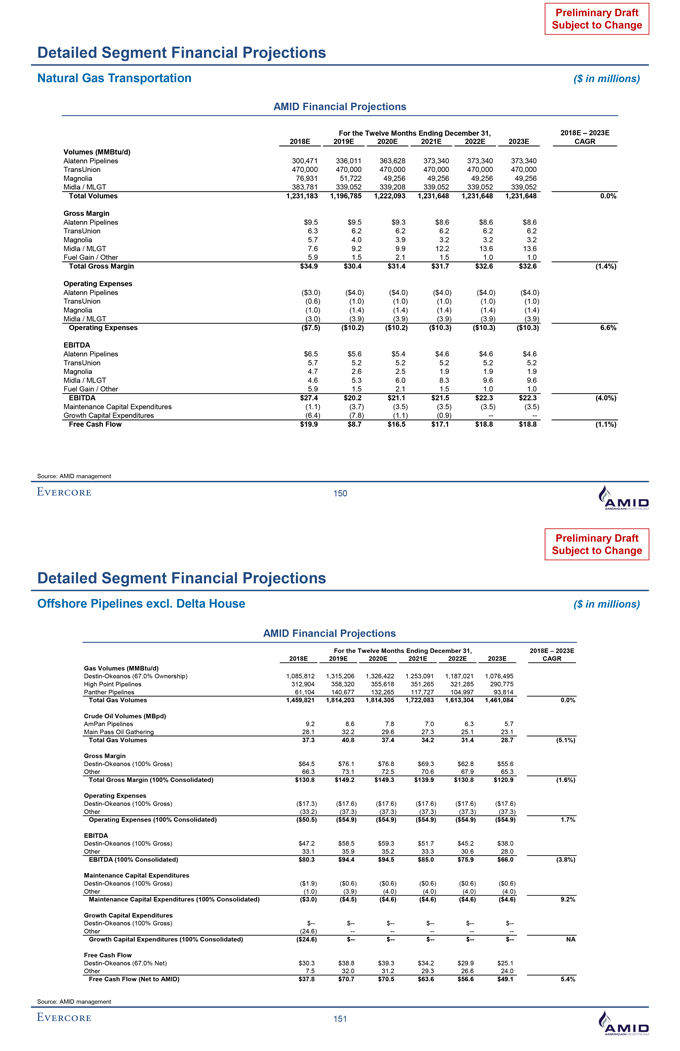
Preliminary Draft Subject to Change Detailed Segment Financial Projections Natural Gas Transportation ($ in millions) AMID Financial Projections For the Twelve Months Ending December 31, 2018E – 2023E 2018E 2019E 2020E 2021E 2022E 2023E CAGR Volumes (MMBtu/d) Alatenn Pipelines 300,471 336,011 363,628 373,340 373,340 373,340 TransUnion 470,000 470,000 470,000 470,000 470,000 470,000 Magnolia 76,931 51,722 49,256 49,256 49,256 49,256 Midla / MLGT 383,781 339,052 339,208 339,052 339,052 339,052 Total Volumes 1,231,183 1,196,785 1,222,093 1,231,648 1,231,648 1,231,648 0.0% Gross Margin Alatenn Pipelines $9.5 $9.5 $9.3 $8.6 $8.6 $8.6 TransUnion 6.3 6.2 6.2 6.2 6.2 6.2 Magnolia 5.7 4.0 3.9 3.2 3.2 3.2 Midla / MLGT 7.6 9.2 9.9 12.2 13.6 13.6 Fuel Gain / Other 5.9 1.5 2.1 1.5 1.0 1.0 Total Gross Margin $34.9 $30.4 $31.4 $31.7 $32.6 $32.6 (1.4%) Operating Expenses Alatenn Pipelines ($3.0) ($4.0) ($4.0) ($4.0) ($4.0) ($4.0) TransUnion (0.6) (1.0) (1.0) (1.0) (1.0) (1.0) Magnolia (1.0) (1.4) (1.4) (1.4) (1.4) (1.4) Midla / MLGT (3.0) (3.9) (3.9) (3.9) (3.9) (3.9) Operating Expenses ($7.5) ($10.2) ($10.2) ($10.3) ($10.3) ($10.3) 6.6% EBITDA Alatenn Pipelines $6.5 $5.6 $5.4 $4.6 $4.6 $4.6 TransUnion 5.7 5.2 5.2 5.2 5.2 5.2 Magnolia 4.7 2.6 2.5 1.9 1.9 1.9 Midla / MLGT 4.6 5.3 6.0 8.3 9.6 9.6 Fuel Gain / Other 5.9 1.5 2.1 1.5 1.0 1.0 EBITDA $27.4 $20.2 $21.1 $21.5 $22.3 $22.3 (4.0%) Maintenance Capital Expenditures (1.1) (3.7) (3.5) (3.5) (3.5) (3.5) Growth Capital Expenditures (6.4) (7.8) (1.1) (0.9) -- -- Free Cash Flow $19.9 $8.7 $16.5 $17.1 $18.8 $18.8 (1.1%) Source: AMID management 150 Preliminary Draft Subject to Change Detailed Segment Financial Projections Offshore Pipelines excl. Delta House ($ in millions) AMID Financial Projections For the Twelve Months Ending December 31, 2018E – 2023E 2018E 2019E 2020E 2021E 2022E 2023E CAGR Gas Volumes (MMBtu/d) Destin-Okeanos (67.0% Ownership) 1,085,812 1,315,206 1,326,422 1,253,091 1,187,021 1,076,495 High Point Pipelines 312,904 358,320 355,618 351,265 321,285 290,775 Panther Pipelines 61,104 140,677 132,265 117,727 104,997 93,814 Total Gas Volumes 1,459,821 1,814,203 1,814,305 1,722,083 1,613,304 1,461,084 0.0% Crude Oil Volumes (MBpd) AmPan Pipelines 9.2 8.6 7.8 7.0 6.3 5.7 Main Pass Oil Gathering 28.1 32.2 29.6 27.3 25.1 23.1 Total Gas Volumes 37.3 40.8 37.4 34.2 31.4 28.7 (5.1%) Gross Margin Destin-Okeanos (100% Gross) $64.5 $76.1 $76.8 $69.3 $62.8 $55.6 Other 66.3 73.1 72.5 70.6 67.9 65.3 Total Gross Margin (100% Consolidated) $130.8 $149.2 $149.3 $139.9 $130.8 $120.9 (1.6%) Operating Expenses Destin-Okeanos (100% Gross) ($17.3) ($17.6) ($17.6) ($17.6) ($17.6) ($17.6) Other (33.2) (37.3) (37.3) (37.3) (37.3) (37.3) Operating Expenses (100% Consolidated) ($50.5) ($54.9) ($54.9) ($54.9) ($54.9) ($54.9) 1.7% EBITDA Destin-Okeanos (100% Gross) $47.2 $58.5 $59.3 $51.7 $45.2 $38.0 Other 33.1 35.9 35.2 33.3 30.6 28.0 EBITDA (100% Consolidated) $80.3 $94.4 $94.5 $85.0 $75.9 $66.0 (3.8%) Maintenance Capital Expenditures Destin-Okeanos (100% Gross) ($1.9) ($0.6) ($0.6) ($0.6) ($0.6) ($0.6) Other (1.0) (3.9) (4.0) (4.0) (4.0) (4.0) Maintenance Capital Expenditures (100% Consolidated) ($3.0) ($4.5) ($4.6) ($4.6) ($4.6) ($4.6) 9.2% Growth Capital Expenditures Destin-Okeanos (100% Gross) $-- $-- $-- $-- $-- $-- Other (24.6) -- -- -- -- -- Growth Capital Expenditures (100% Consolidated) ($24.6) $-- $-- $-- $-- $-- NA Free Cash Flow Destin-Okeanos (67.0% Net) $30.3 $38.8 $39.3 $34.2 $29.9 $25.1 Other 7.5 32.0 31.2 29.3 26.6 24.0 Free Cash Flow (Net to AMID) $37.8 $70.7 $70.5 $63.6 $56.6 $49.1 5.4% Source: AMID management 151
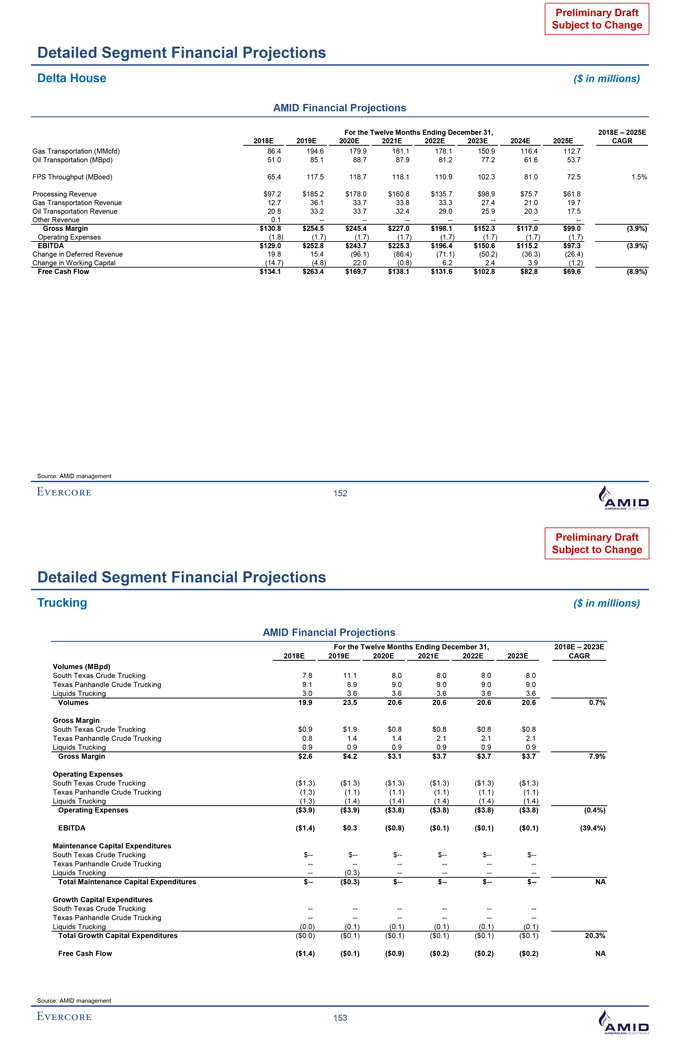
Preliminary Draft Subject to Change Detailed Segment Financial Projections Delta House ($ in millions) AMID Financial Projections For the Twelve Months Ending December 31, 2018E – 2025E 2018E 2019E 2020E 2021E 2022E 2023E 2024E 2025E CAGR Gas Transportation (MMcfd) 86.4 194.6 179.9 181.1 178.1 150.9 116.4 112.7 Oil Transportation (MBpd) 51.0 85.1 88.7 87.9 81.2 77.2 61.6 53.7 FPS Throughput (MBoed) 65.4 117.5 118.7 118.1 110.9 102.3 81.0 72.5 1.5% Processing Revenue $97.2 $185.2 $178.0 $160.8 $135.7 $98.9 $75.7 $61.8 Gas Transportation Revenue 12.7 36.1 33.7 33.8 33.3 27.4 21.0 19.7 Oil Transportation Revenue 20.8 33.2 33.7 32.4 29.0 25.9 20.3 17.5 Other Revenue 0.1 -- -- -- -- -- -- -- Gross Margin $130.8 $254.5 $245.4 $227.0 $198.1 $152.3 $117.0 $99.0 (3.9%) Operating Expenses (1.8) (1.7) (1.7) (1.7) (1.7) (1.7) (1.7) (1.7) EBITDA $129.0 $252.8 $243.7 $225.3 $196.4 $150.6 $115.2 $97.3 (3.9%) Change in Deferred Revenue 19.8 15.4 (96.1) (86.4) (71.1) (50.2) (36.3) (26.4) Change in Working Capital (14.7) (4.8) 22.0 (0.8) 6.2 2.4 3.9 (1.2) Free Cash Flow $134.1 $263.4 $169.7 $138.1 $131.6 $102.8 $82.8 $69.6 (8.9%) Source: AMID management 152 Preliminary Draft Subject to Change Detailed Segment Financial Projections Trucking ($ in millions) AMID Financial Projections For the Twelve Months Ending December 31, 2018E – 2023E 2018E 2019E 2020E 2021E 2022E 2023E CAGR Volumes (MBpd) South Texas Crude Trucking 7.8 11.1 8.0 8.0 8.0 8.0 Texas Panhandle Crude Trucking 9.1 8.9 9.0 9.0 9.0 9.0 Liquids Trucking 3.0 3.6 3.6 3.6 3.6 3.6 Volumes 19.9 23.5 20.6 20.6 20.6 20.6 0.7% Gross Margin South Texas Crude Trucking $0.9 $1.9 $0.8 $0.8 $0.8 $0.8 Texas Panhandle Crude Trucking 0.8 1.4 1.4 2.1 2.1 2.1 Liquids Trucking 0.9 0.9 0.9 0.9 0.9 0.9 Gross Margin $2.6 $4.2 $3.1 $3.7 $3.7 $3.7 7.9% Operating Expenses South Texas Crude Trucking ($1.3) ($1.3) ($1.3) ($1.3) ($1.3) ($1.3) Texas Panhandle Crude Trucking (1.3) (1.1) (1.1) (1.1) (1.1) (1.1) Liquids Trucking (1.3) (1.4) (1.4) (1.4) (1.4) (1.4) Operating Expenses ($3.9) ($3.9) ($3.8) ($3.8) ($3.8) ($3.8) (0.4%) EBITDA ($1.4) $0.3 ($0.8) ($0.1) ($0.1) ($0.1) (39.4%) Maintenance Capital Expenditures South Texas Crude Trucking $-- $-- $-- $-- $-- $-- Texas Panhandle Crude Trucking -- -- -- -- -- -- Liquids Trucking -- (0.3) -- -- -- -- Total Maintenance Capital Expenditures $-- ($0.3) $-- $-- $-- $-- NA Growth Capital Expenditures South Texas Crude Trucking -- -- -- -- -- -- Texas Panhandle Crude Trucking -- -- -- -- -- -- Liquids Trucking (0.0) (0.1) (0.1) (0.1) (0.1) (0.1) Total Growth Capital Expenditures ($0.0) ($0.1) ($0.1) ($0.1) ($0.1) ($0.1) 20.3% Free Cash Flow ($1.4) ($0.1) ($0.9) ($0.2) ($0.2) ($0.2) NA Source: AMID management 153
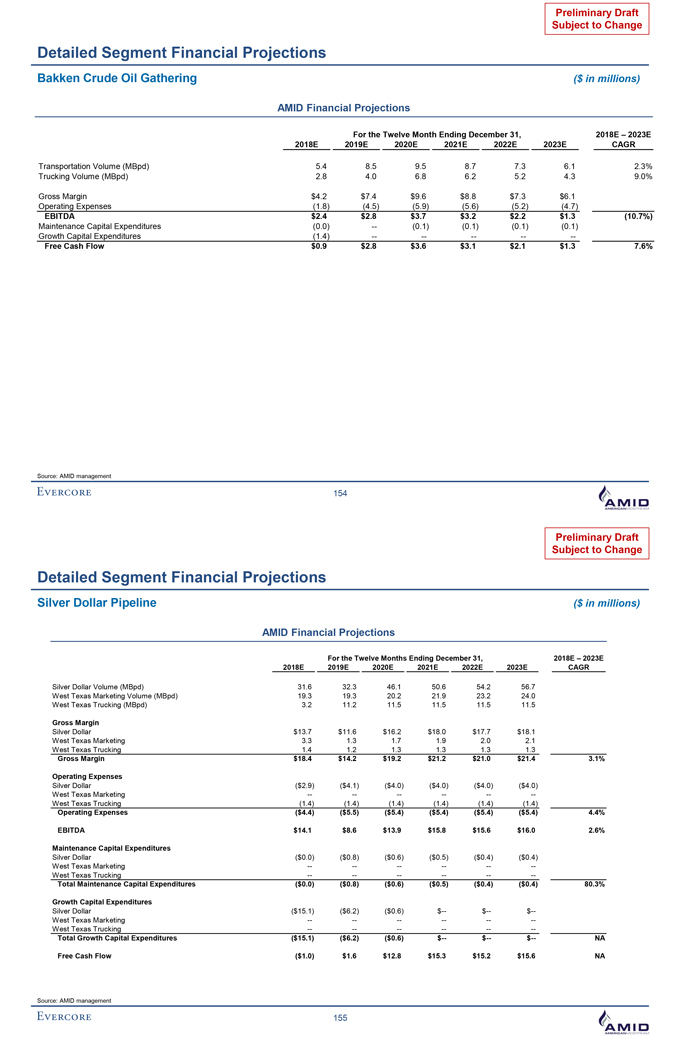
Preliminary Draft Subject to Change Detailed Segment Financial Projections Bakken Crude Oil Gathering ($ in millions) AMID Financial Projections For the Twelve Month Ending December 31, 2018E – 2023E 2018E 2019E 2020E 2021E 2022E 2023E CAGR Transportation Volume (MBpd) 5.4 8.5 9.5 8.7 7.3 6.1 2.3% Trucking Volume (MBpd) 2.8 4.0 6.8 6.2 5.2 4.3 9.0% Gross Margin $4.2 $7.4 $9.6 $8.8 $7.3 $6.1 Operating Expenses (1.8) (4.5) (5.9) (5.6) (5.2) (4.7) EBITDA $2.4 $2.8 $3.7 $3.2 $2.2 $1.3 (10.7%) Maintenance Capital Expenditures (0.0) -- (0.1) (0.1) (0.1) (0.1) Growth Capital Expenditures (1.4) -- -- -- -- -- Free Cash Flow $0.9 $2.8 $3.6 $3.1 $2.1 $1.3 7.6% Source: AMID management 154 Preliminary Draft Subject to Change Detailed Segment Financial Projections Silver Dollar Pipeline ($ in millions) AMID Financial Projections For the Twelve Months Ending December 31, 2018E – 2023E 2018E 2019E 2020E 2021E 2022E 2023E CAGR Silver Dollar Volume (MBpd) 31.6 32.3 46.1 50.6 54.2 56.7 West Texas Marketing Volume (MBpd) 19.3 19.3 20.2 21.9 23.2 24.0 West Texas Trucking (MBpd) 3.2 11.2 11.5 11.5 11.5 11.5 Gross Margin Silver Dollar $13.7 $11.6 $16.2 $18.0 $17.7 $18.1 West Texas Marketing 3.3 1.3 1.7 1.9 2.0 2.1 West Texas Trucking 1.4 1.2 1.3 1.3 1.3 1.3 Gross Margin $18.4 $14.2 $19.2 $21.2 $21.0 $21.4 3.1% Operating Expenses Silver Dollar ($2.9) ($4.1) ($4.0) ($4.0) ($4.0) ($4.0) West Texas Marketing -- -- -- -- -- -- West Texas Trucking (1.4) (1.4) (1.4) (1.4) (1.4) (1.4) Operating Expenses ($4.4) ($5.5) ($5.4) ($5.4) ($5.4) ($5.4) 4.4% EBITDA $14.1 $8.6 $13.9 $15.8 $15.6 $16.0 2.6% Maintenance Capital Expenditures Silver Dollar ($0.0) ($0.8) ($0.6) ($0.5) ($0.4) ($0.4) West Texas Marketing -- -- -- -- -- -- West Texas Trucking -- -- -- -- -- -- Total Maintenance Capital Expenditures ($0.0) ($0.8) ($0.6) ($0.5) ($0.4) ($0.4) 80.3% Growth Capital Expenditures Silver Dollar ($15.1) ($6.2) ($0.6) $-- $-- $-- West Texas Marketing -- -- -- -- -- -- West Texas Trucking -- -- -- -- -- -- Total Growth Capital Expenditures ($15.1) ($6.2) ($0.6) $-- $-- $-- NA Free Cash Flow ($1.0) $1.6 $12.8 $15.3 $15.2 $15.6 NA Source: AMID management 155
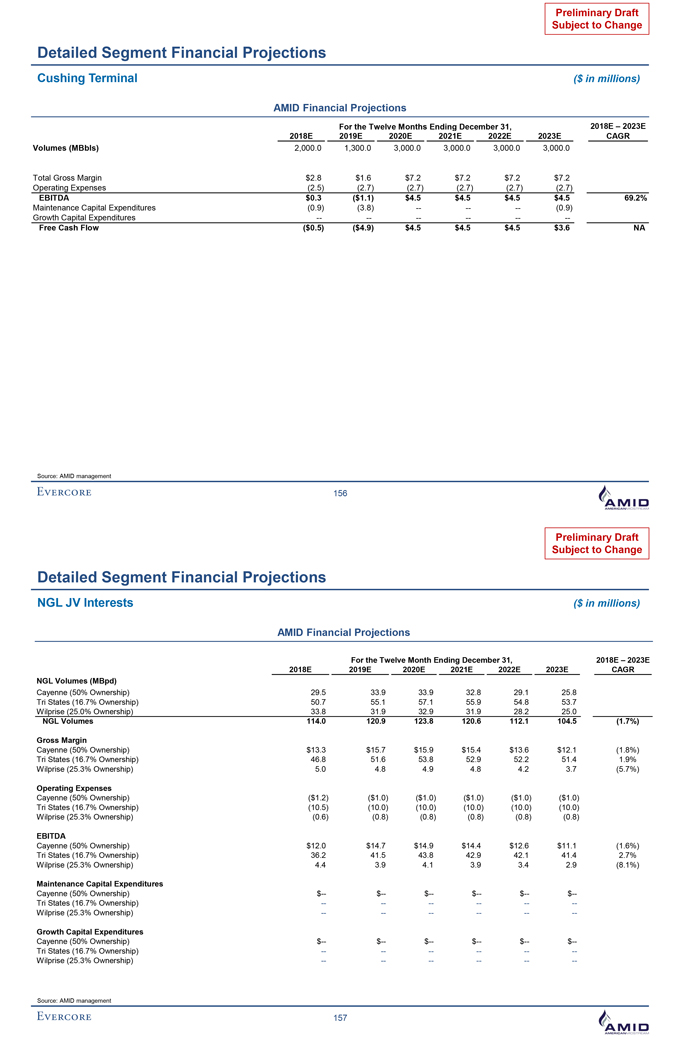
Preliminary Draft Subject to Change Detailed Segment Financial Projections Cushing Terminal ($ in millions) AMID Financial Projections For the Twelve Months Ending December 31, 2018E – 2023E 2018E 2019E 2020E 2021E 2022E 2023E CAGR Volumes (MBbls) 2,000.0 1,300.0 3,000.0 3,000.0 3,000.0 3,000.0 Total Gross Margin $2.8 $1.6 $7.2 $7.2 $7.2 $7.2 Operating Expenses (2.5) (2.7) (2.7) (2.7) (2.7) (2.7) EBITDA $0.3 ($1.1) $4.5 $4.5 $4.5 $4.5 69.2% Maintenance Capital Expenditures (0.9) (3.8) -- -- -- (0.9) Growth Capital Expenditures -- -- -- -- -- -- Free Cash Flow ($0.5) ($4.9) $4.5 $4.5 $4.5 $3.6 NA Source: AMID management 156 Preliminary Draft Subject to Change Detailed Segment Financial Projections NGL JV Interests ($ in millions) AMID Financial Projections For the Twelve Month Ending December 31, 2018E – 2023E 2018E 2019E 2020E 2021E 2022E 2023E CAGR NGL Volumes (MBpd) Cayenne (50% Ownership) 29.5 33.9 33.9 32.8 29.1 25.8 Tri States (16.7% Ownership) 50.7 55.1 57.1 55.9 54.8 53.7 Wilprise (25.0% Ownership) 33.8 31.9 32.9 31.9 28.2 25.0 NGL Volumes 114.0 120.9 123.8 120.6 112.1 104.5 (1.7%) Gross Margin Cayenne (50% Ownership) $13.3 $15.7 $15.9 $15.4 $13.6 $12.1 (1.8%) Tri States (16.7% Ownership) 46.8 51.6 53.8 52.9 52.2 51.4 1.9% Wilprise (25.3% Ownership) 5.0 4.8 4.9 4.8 4.2 3.7 (5.7%) Operating Expenses Cayenne (50% Ownership) ($1.2) ($1.0) ($1.0) ($1.0) ($1.0) ($1.0) Tri States (16.7% Ownership) (10.5) (10.0) (10.0) (10.0) (10.0) (10.0) Wilprise (25.3% Ownership) (0.6) (0.8) (0.8) (0.8) (0.8) (0.8) EBITDA Cayenne (50% Ownership) $12.0 $14.7 $14.9 $14.4 $12.6 $11.1 (1.6%) Tri States (16.7% Ownership) 36.2 41.5 43.8 42.9 42.1 41.4 2.7% Wilprise (25.3% Ownership) 4.4 3.9 4.1 3.9 3.4 2.9 (8.1%) Maintenance Capital Expenditures Cayenne (50% Ownership) $-- $-- $-- $-- $-- $-- Tri States (16.7% Ownership) -- -- -- -- -- -- Wilprise (25.3% Ownership) -- -- -- -- -- -- Growth Capital Expenditures Cayenne (50% Ownership) $-- $-- $-- $-- $-- $-- Tri States (16.7% Ownership) -- -- -- -- -- -- Wilprise (25.3% Ownership) -- -- -- -- -- -- Source: AMID management 157