UNITED STATES
SECURITIES AND EXCHANGE COMMISSION
Washington, D.C. 20549
FORM N-CSR
CERTIFIED SHAREHOLDER REPORT OF REGISTERED
MANAGEMENT INVESTMENT COMPANIES
Investment Company Act file number | 811-22558 |
|
BROOKFIELD INVESTMENT FUNDS |
(Exact name of registrant as specified in charter) |
|
THREE WORLD FINANCIAL CENTER 200 VESEY STREET NEW YORK, NEW YORK | | 10281-1010 |
(Address of principal executive offices) | | (Zip code) |
|
KIM G. REDDING, PRESIDENT BROOKFIELD INVESTMENT FUNDS THREE WORLD FINANCIAL CENTER 200 VESEY STREET NEW YORK, NEW YORK 10281-1010 |
(Name and address of agent for service) |
|
Registrant’s telephone number, including area code: | (800) 497-3746 | |
|
Date of fiscal year end: | December 31 | |
|
Date of reporting period: | December 31, 2011 | |
| | | | | | | | |
Item 1. Reports to Shareholders.
Brookfield Investment Management
2011
ANNUAL REPORT
Brookfield Global Listed Real Estate Fund
Brookfield Global Listed Infrastructure Fund
Brookfield High Yield Fund


IN PROFILE
Brookfield Investment Management Inc. is a global investment manager focused on specialized equity and fixed income securities investments. The firm is a subsidiary of Brookfield Asset Management Inc., a global alternative asset manager with approximately $150 billion of assets under management as of December 31, 2011 and over 100 years of history in owning and operating assets with a focus on real estate, infrastructure, power and private equity.
Brookfield Investment Management Inc. is a Registered Investment Adviser, and with its affiliates, had approximately $21 billion in assets under management as of December 31, 2011. Headquartered in New York, the firm maintains offices and investment teams in Chicago, Boston, London, Hong Kong, Sydney, and Toronto.
TABLE OF CONTENTS
| Letter to Shareholders | | | 1 | | |
|
| About your Fund's Expenses | | | 3 | | |
|
| Management Discussion of Fund Performance | | | 4 | | |
|
| Brookfield Global Listed Real Estate Fund | | | 4 | | |
|
| Management Discussion of Fund Performance Commentary | | | 4 | | |
|
| Portfolio Characteristics | | | 8 | | |
|
| Brookfield Global Listed Infrastructure Fund | | | 9 | | |
|
| Management Discussion of Fund Performance Commentary | | | 9 | | |
|
| Portfolio Characteristics | | | 14 | | |
|
| Brookfield High Yield Fund | | | 15 | | |
|
| Management Discussion of Fund Performance Commentary | | | 15 | | |
|
| Portfolio Characteristics | | | 18 | | |
|
| Portfolio of Investments, Notes to Portfolios of Investments | | | 19 | | |
|
| Brookfield Global Listed Real Estate Fund | | | 19 | | |
|
| Brookfield Global Listed Infrastructure Fund | | | 24 | | |
|
| Brookfield High Yield Fund | | | 29 | | |
|
| Statements of Assets and Liabilities | | | 33 | | |
|
| Statements of Operations | | | 34 | | |
|
| Statements of Changes in Net Assets | | | 35 | | |
|
| Financial Highlights | | | 37 | | |
|
| Brookfield Global Listed Real Estate Fund | | | 37 | | |
|
| Class Y | | | 37 | | |
|
| Class I | | | 38 | | |
|
| Brookfield Global Listed Infrastructure Fund | | | 39 | | |
|
| Class A | | | 39 | | |
|
| Class Y | | | 40 | | |
|
| Class I | | | 41 | | |
|
| Brookfield High Yield Fund | | | 42 | | |
|
| Class Y | | | 42 | | |
|
| Class I | | | 43 | | |
|
| Notes to Financial Statements | | | 44 | | |
|
| Report of Independent Registered Public Accounting Firm | | | 56 | | |
|
| Tax Information | | | 57 | | |
|
| Board Considerations Relating to the Investment Advisory Agreements | | | 58 | | |
|
| Information Concerning Trustees and Officers | | | 60 | | |
|
This report is for shareholder information. This is not a prospectus intended for the use in the purchase or sale of Fund shares.
NOT FDIC INSURED MAY LOSE VALUE NOT BANK GUARANTEED
© Copyright 2011. Brookfield Investment Management Inc.
LETTER TO SHAREHOLDERS
Dear Shareholders,
I am pleased to provide the first Annual Report for Brookfield Global Listed Infrastructure Fund, Brookfield Global Listed Real Estate Fund and Brookfield High Yield Fund (each a "Fund" and, collectively, the "Funds") covering the period from the commencement of investment operations on December 1, 2011 through the end of the Funds' fiscal year.
The capital markets continued to face significant challenges throughout much of 2011, as investors remained concerned over the health of the global economy, sovereign debt issues in Europe, and enhanced regulation in the U.S. and abroad. Investor confidence shifted regularly in response to economic data releases and financial headlines, resulting in a volatile and highly correlated market. Accordingly, the appetite for risk diminished and investor focus tended towards safety.
However, as 2011 drew to a close, the capital markets began to regain some footing due to early signs of economic stabilization and recovery in the U.S. While this rally in performance could not offset the challenges experienced earlier in the year for all facets of the investment market, it did provide improved confidence heading into the new year.
Within this volatile environment, the fixed income and equities markets produced mixed results. Against the backdrop of sound corporate credit and improving confidence in an early economic recovery, high yield bonds recovered strongly in the fourth quarter to produce modestly positive returns for the full year. Similarly, infrastructure equity securities provided attractive returns, as investors sought perceived safety in the historically steady and potentially growing cash flows and appealing yield profiles offered by these companies. However, the diminished appetite for risk and concern over the impact of lingering global economic weakness on demand for commercial space led to more challenging performance for real estate securities.
As we move forward, we expect all three asset classes should continue to offer investors an appealing level of current income, particularly in a low interest rate environment. An attractive climate for corporate credit, including strong liquidity and low average debt levels, supports our positive view on the high yield market and our expectation that yield spreads may narrow in the coming year. Furthermore, investor demand for income-producing securities and investment in hard assets should benefit both global infrastructure and real estate securities in the year ahead, particularly if the underlying fundamentals in these asset classes remain relatively stable. We acknowledge that challenges to future performance remain, with ongoing concerns over the Eurozone crisis, softening economic activity in Asia, and the fragile U.S. recovery continuing to dominate headlines. However, we believe these risks have been incorporated into current valuation levels and that investor expectations for the coming year may be surpassed.
In addition to performance information, this report provides an overview of market conditions and a discussion of factors affecting the Funds' investment performance, together with the Funds' audited financial statements and portfolio of investments as of December 31, 2011.
We welcome your questions and comments, and encourage you to contact our Investor Relations team at (800) 497-3746 or visit us at www.brookfieldim.com for more information. Thank you for your support.
Sincerely,

Kim G. Redding
President
2011 Annual Report
1
LETTER TO SHAREHOLDERS (continued)
These views represent the opinions of Brookfield Investment Management Inc. and are not intended to predict or depict the performance of any investment. These views are as of the close of business on December 31, 2011 and subject to change based on subsequent developments.
Must be preceded or accompanied by a prospectus.
Mutual fund investing involves risk. Principal loss is possible. Investors should be aware of the risks involved with investing in a fund concentrating in REITs and real estate securities, such as declines in the value of real estate and increased susceptibility to adverse economic or regulatory developments. Investments in infrastructure entities involve greater exposure to the potential adverse economic, regulatory, political and other changes affecting such entities. Investment in lower-rated and non-rated securities presents a greater risk of loss to principal and interest than higher-rated securities. Investments in asset-backed and mortgage-backed securities include additional risks that investors should be aware of, such as credit risk, prepayment risk, possible illiquidity and default, as well as increased susceptibility to adverse economic developments. Investments in debt securities typically decrease in value when interest rates rise. This risk is usually greater for longer-term debt securities. Investments in foreign securities involve greater volatility and political, economic and currency risks and differences in accounting methods.
Correlation is a statistical measure of how two securities move in relation to each other.
Quasar Distributors, LLC is the distributor of Brookfield Investment Funds.
Brookfield Investment Management Inc.
2
ABOUT YOUR FUND'S EXPENSES (Unaudited)
As a shareholder of a fund, you may incur two types of costs: (1) transaction costs, including sales charges (loads) on purchase payments, reinvested dividends or other distributions, redemption fees and exchange fees; and (2) ongoing costs, including management fees, distribution (12b-1) fees and other Fund expenses. This example is intended to help you understand your ongoing costs (in dollars) of investing in the Fund and to compare these costs with the ongoing costs of investing in other mutual funds. The example is based on an investment of $1,000 invested at the beginning of the period and held for the entire period as indicated below.
Actual Fund Return
The table below provides information about actual account values and actual expenses. You may use the information on this line, together with the amount you invested, to estimate the expense that you paid over the period. Simply divide your account value by $1,000 (for example, an $8,600 account value divided by $1,000 = 8.6), then multiply the result by the number in the first line under the heading entitles "Expenses Paid During Period" to estimate the expenses you paid on your account during this period.
Hypothetical Example for Comparison Purposes
The table below also provides information about hypothetical account values and hypothetical expenses, which is not the Fund's actual expense ratio and an assumed rate of return of 5% per year before expenses, which is not the Fund's actual return. The hypothetical account values and expenses may not be used to estimate the actual ending account balance or expenses you paid for the period. You may use this information to compare the ongoing costs of investing in the Fund and the other funds. To do so, compare this 5% hypothetical example with hypothetical examples that appear in stockholders' reports of other funds.
Please note that the expenses shown in the table are meant to highlight your ongoing costs only and do not reflect any transactional costs, such as sales charges (loads), redemption fees or exchange fees. Therefore, the hypothetical account values and expenses in the table are useful in comparing ongoing costs only, and will not help you determine the relative total costs of owning different funds. In addition, if these transactional costs were included, your costs overall would have been higher.
SHAREHOLDER AND FUND EXPENSES
| | | Annualized
Expense
Ratio | | Beginning
Account Value(1) | | Ending
Account Value
December 31, 2011 | | Expenses
Paid During
Period | |
| GLOBAL LISTED REAL ESTATE FUND | |
| Actual | |
| Class Y Shares | | | 1.25 | % | | $ | 1,000 | | | $ | 1,006 | | | $ | 1.06 | (2) | |
| Class I Shares | | | 1.25 | % | | | 1,000 | | | | 1,006 | | | | 1.06 | (2) | |
| Hypothetical (assuming a 5% return before expenses) | |
| Class Y Shares | | | 1.25 | % | | | 1,000 | | | | 1,019 | | | | 6.36 | (3) | |
| Class I Shares | | | 1.25 | % | | | 1,000 | | | | 1,019 | | | | 6.36 | (3) | |
| GLOBAL LISTED INFRASTRUCTURE FUND | |
| Actual | |
| Class A Shares | | | 1.60 | % | | | 1,000 | | | | 1,002 | | | | 0.09 | (2) | |
| Class Y Shares | | | 1.35 | % | | | 1,000 | | | | 1,016 | | | | 1.16 | (2) | |
| Class I Shares | | | 1.35 | % | | | 1,000 | | | | 1,016 | | | | 1.16 | (2) | |
| Hypothetical (assuming a 5% return before expenses) | |
| Class A Shares | | | 1.60 | % | | | 1,000 | | | | 1,017 | | | | 8.13 | (3) | |
| Class Y Shares | | | 1.35 | % | | | 1,000 | | | | 1,018 | | | | 6.87 | (3) | |
| Class I Shares | | | 1.35 | % | | | 1,000 | | | | 1,018 | | | | 6.87 | (3) | |
| HIGH YIELD FUND | |
| Actual | |
| Class Y Shares | | | 1.15 | % | | | 1,000 | | | | 1,008 | | | | 0.98 | (2) | |
| Class I Shares | | | 1.15 | % | | | 1,000 | | | | 1,008 | | | | 0.98 | (2) | |
| Hypothetical (assuming a 5% return before expenses) | |
| Class Y Shares | | | 1.15 | % | | | 1,000 | | | | 1,019 | | | | 5.85 | (3) | |
| Class I Shares | | | 1.15 | % | | | 1,000 | | | | 1,019 | | | | 5.85 | (3) | |
(1) Commencement of operations for Class A shares December 29, 2011; Class Y and I shares December 1, 2011.
(2) Expenses are equal to the portfolio's annualized expense ratio multiplied by the average account value over the period, multiplied by 2 days for Class A and 31 days for Class Y and Class I and divided by 365 to reflect the period of December 29, 2011 through December 31, 2011 for Class A and December 1, 2011 through December 31, 2011 for Class Y and Class I.
(3) Expenses are equal to the portfolio's annualized expense ratio multiplied by the average account value over the period, multiplied by 184/365 (to reflect a six-month period).
2011 Annual Report
3
BROOKFIELD GLOBAL LISTED REAL ESTATE FUND
PORTFOLIO STRATEGY
Individual contributors of performance included Brookdale Senior Living Inc., a U.S. based Healthcare Operator. We believe that Brookdale is a high quality healthcare operator with strong fundamentals as well as attractive growth potential resulting from demographic trends in senior housing. We believe we may be at the beginning of the up-cycle in senior housing and that the security represents a long-term value opportunity.
Rayonier Inc. REIT, a U.S.-based Timber company is a non-benchmark REIT ("Real Estate Investment Trust") specializing in timber, which has historically been more levered to economic improvement than lower beta securities. The stock has performed well on improving housing data releases in the U.S. (timber can be correlated to housing) as well as improving economic sentiment throughout the country.
Camden Property Trust, a U.S.-based REIT also contributed to performance. Residential REITs in the U.S. performed well in recent periods due to strong fundamentals; declining home ownership has buoyed occupancy and rental rates. Camden represents an attractive relative value opportunity coupled with a strong management team and balance sheet.
Detractors of performance included primarily non-U.S. based companies. CapitaLand Ltd., a Singapore-based high-quality diversified REIT, has underperformed its peers primarily due to macroeconomic news in recent periods. Specifically, the stock has come under pressure as a result of its exposure to Singapore's residential market due to a continuation of Singaporean government tightening measures aimed at cooling the residential property market.
Hammerson PLC, a UK-based retail operator owns several high quality shopping centers in London, which we expected to outperform in the current market environment. However, the UK retail market was weak during December 2011, which was likely affected by the relatively poor retail sentiment throughout the Christmas season which resulted in underperformance by Hammerson.
Norwegian Property ASA also detracted from Fund performance. However, the company has a strong management team and an attractive central business district office portfolio in Oslo, Norway. The security trades at an attractive discount to private market asset valuation based on our analysis. In addition, continued strong oil prices, non-Euro currency and strong fiscal position of Norway provide an attractive backdrop.
GLOBAL REAL ESTATE MARKET OVERVIEW AND OUTLOOK
After a challenging third quarter, markets regained some footing in the fourth quarter of 2011. Early signs of economic improvement have been emerging in the U.S. and the Chinese government has shifted to an increasingly accommodative approach. Nevertheless, it cannot be disputed that 2011 was a challenging year for global real estate securities. Global investors grew concerned about the impact of Europe's debt crisis on the global economy and on the demand for commercial space. Global real estate securities closed the year down 5.8%, as measured by the FTSE EPRA/NAREIT Developed Index, modestly underperforming global equities which were down 5.0% as measured by the MSCI World Index.
Amid continued uncertainty in global equity markets, we believe REITs should be well positioned to capitalize on current conditions in the coming year. We believe historically low supply growth should support property fundamentals and attractive dividend yields may benefit the asset class in a long-term low rate market. With a current dividend yield over 4.0% as of December 31, 2011 as measured by the FTSE EPRA /NAREIT Developed Index, we expect investors may increasingly look to REITs and other dividend paying equities to generate income.
There were two key emergent themes among real estate securities during 2011: highly attractive financing terms and the continued bifurcation of high quality versus low quality assets.
Throughout 2011, REITs continually issued equity, thereby, strengthening balance sheets against deteriorating market conditions. As an example, U.S. REITs raised over $30 billion in common stock in 2011.
Brookfield Investment Management Inc.
4
BROOKFIELD GLOBAL LISTED REAL ESTATE FUND
In addition, well-capitalized REITs accessed debt markets, exploiting the current low interest rate environment and illustrating that publicly listed real estate companies maintain a competitive advantage in access to and the cost of credit. U.S. REITs raised approximately $14 billion in unsecured debt transactions in 2011, almost a third of which was raised as global credit markets became more selective in the second half of 2011.
Importantly, we are monitoring sectors more reliant on Collateralized Mortgage Backed Securities ("CMBS") financing, including the hotel sector as well as secondary retail markets, as CMBS can be more vulnerable to market movements.
OUTLOOK
Looking ahead, real estate securities appear to be well-positioned for future growth despite ongoing volatility and uncertainty within capital markets. Listed real estate securities companies have maintained a competitive advantage over private market peers in their ability to access capital and exploit the current historically attractive interest rate levels. A confluence of demand for income producing securities and real assets coupled with widening yield spreads and expectations of a continued low rate environment should further benefit the real estate securities asset class. Underlying fundamentals have remained relatively stable and we believe fundamentals will likely continue to recover at a slow pace over the medium-term. However, we acknowledge the possible risk of a worsened Eurozone crisis, which would threaten commercial real estate fundamentals going forward.
Moreover, we see attractive value opportunities beginning to emerge across the globe. In the U.S., we believe the recent flight to quality has led the pricing spread between high quality and lower quality companies to become too wide. As such, we are strategically identifying companies operating in secondary markets that offer attractive growth opportunities. In Asia and Europe, indiscriminate market selling has impacted high quality companies with premium assets and above-average growth profiles, creating, in our view, attractive entry points in select companies.
AVERAGE ANNUAL TOTAL RETURNS
| As of December 31, 2011 | | Since Inception* | |
| Average Annual Total Returns | |
| Class Y Shares | | | 0.59 | % | |
| Class I Shares | | | 0.59 | % | |
| FTSE EPRA/NAREIT Developed Index | | | 0.94 | % | |
* Classes Y and I were incepted on December 1, 2011.
Disclosure
Performance data quoted represents past performance results and does not guarantee future results. Current performance may be lower or higher than the performance data quoted.
All returns shown in USD.
The Fund's portfolio holdings are subject to change without notice. The mention of specific securities is not a recommendation or solicitation for any person to buy, sell or hold any particular security. There is no assurance that the Fund currently holds these securities. Please refer to the Schedule of Investments contained in this report for a full listing of fund holdings.
Mutual fund investing involves risk. Principal loss is possible.
The FTSE EPRA/NAREIT Developed Index is calculated by the FTSE Group. Performance is calculated by price, total return and net total return and the index is calculated daily. Constituents must meet minimum market capitalization, liquidity requirements, and real estate activity requirements in order to be included within the index. North American and Asian companies must be of a minimum of US$200 million in market capitalization with liquidity
2011 Annual Report
5
BROOKFIELD GLOBAL LISTED REAL ESTATE FUND
of US$100 million. European companies are bound by $50 million market cap minimum and liquidity of $25 million. The index is unmanaged and, unlike the Fund, is not affected by cash flows or trading and other expenses. It is not possible to invest directly in an index. Index performance is shown for illustrative purposes only and does not predict or depict the performance of the Fund.
The MSCI World Index is a free float-adjusted market capitalization weighted index that is designed to measure the equity market performance of developed markets. The MSCI World Index consists of the following 24 developed market country indices: Australia, Austria, Belgium, Canada, Denmark, Finland, France, Germany, Greece, Hong Kong, Ireland, Israel, Italy, Japan, Netherlands, New Zealand, Norway, Portugal, Singapore, Spain, Sweden, Switzerland, the United Kingdom, and the United States.
Beta is a measure of volatility, or systematic risk, of a security or portfolio in comparison to the market as a whole. A basis point is one hundredth of one percent (0.01%). Correlation is a statistical measure of how two securities move in relation to each other.
These views represent the opinions of Brookfield Investment Management Inc. and are not intended to predict or depict the performance of any investment. These views are as of the close of business on December 31, 2011 and subject to change based on subsequent developments.
Brookfield Investment Management Inc.
6
BROOKFIELD GLOBAL LISTED REAL ESTATE FUND
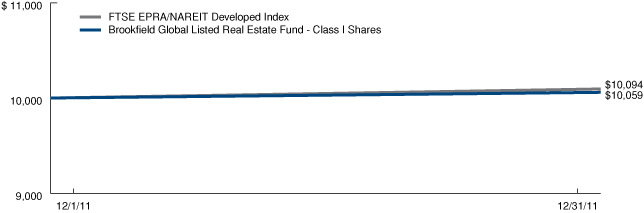
Growth of a $10,000 Investment (Unaudited)
Class Y Shares
The graph below illustrates a hypothetical investment of $10,000 in Global Listed Real Estate Fund—Class Y Shares from the commencement of investment operations on December 1, 2011 to December 31, 2011 compared to the FTSE EPRA/NAREIT Developed Index.

Class I Shares
The graph below illustrates a hypothetical investment of $10,000 in Global Listed Real Estate Fund—Class I Shares from the commencement of investment operations on December 1, 2011 to December 31, 2011 compared to the FTSE EPRA/NAREIT Developed Index.
2011 Annual Report
7
BROOKFIELD GLOBAL LISTED REAL ESTATE FUND
Portfolio Characteristics (Unaudited)
December 31, 2011
| ASSET ALLOCATION BY GEOGRAPHY | | Percent of
Net Assets | |
| United States | | | 49 | % | |
| Hong Kong | | | 14 | % | |
| Australia | | | 10 | % | |
| Japan | | | 8 | % | |
| United Kingdom | | | 6 | % | |
| France | | | 3 | % | |
| Canada | | | 2 | % | |
| Singapore | | | 2 | % | |
| Germany | | | 2 | % | |
| Sweden | | | 1 | % | |
| Norway | | | 1 | % | |
| Other Assets in Excess of Liabilities | | | 2 | % | |
| Total | | | 100 | % | |
ASSET ALLOCATION BY SECTOR
| Diversified | | | 17 | % | |
| Office | | | 27 | % | |
| Retail | | | 17 | % | |
| Residential | | | 8 | % | |
| Hotel | | | 2 | % | |
| Healthcare | | | 9 | % | |
| Home Builders | | | 3 | % | |
| Industrial | | | 3 | % | |
| Regional Malls | | | 6 | % | |
| Self Storage | | | 4 | % | |
| Strip Centers | | | 2 | % | |
| Other Assets in Excess of Liabilities | | | 2 | % | |
| Total | | | 100 | % | |
TOP TEN HOLDINGS
| Simon Property Group, Inc. | | | 6 | % | |
| Sun Hung Kai Properties Ltd. | | | 5 | % | |
| Westfield Group | | | 5 | % | |
| Brookdale Senior Living, Inc. | | | 4 | % | |
| Health Care REIT, Inc. | | | 4 | % | |
| Boston Properties, Inc. | | | 4 | % | |
| Public Storage | | | 4 | % | |
| Hang Lung Properties Ltd. | | | 4 | % | |
| Mitsubishi Estate Co. Ltd. | | | 4 | % | |
| Camden Property Trust | | | 3 | % | |
Brookfield Investment Management Inc.
8
BROOKFIELD GLOBAL LISTED INFRASTRUCTURE FUND
PORTFOLIO STRATEGY
Individual contributors of performance included three U.S. based Oil & Gas Storage & Transmission companies. Tesoro Logistics LP, benefitted from the increased quantity of oil rigs located in the Bakken formation in the Midwest region of the U.S., which has provided additional growth opportunities for the company.
Targa Resources Corp. performed well due to continued strengthening of natural gas liquids ("NGLs") prices. Higher prices have allowed for more liquids rich drilling and therefore additional demand for Targa's assets, which gather, process, store and transport NGLs.
Energy Transfer Equity LP's acquisition of Southern Union also contributed to performance as it will allow for the new company to sell its natural gas pipeline assets to both of Energy Transfer's associated master limited partnerships ("MLPS"), Energy Transfer Partners and Regency Gas Partners. The transaction has been viewed favorably by investors as these asset sales could potentially generate profits for Energy Transfer Equity and earnings accretion for the acquiring MLP. Further, we believe investors are attracted to the historically steady and potentially growing cash flows and attractive yield profiles offered by U.S. energy companies.
Detractors of performance included primarily non-U.S. based companies. Fraport AG, a German airport was weak in the current "risk-off" market environment amid significant macroeconomic headwinds through Europe. In addition, the company underperformed within the higher-beta transportation infrastructure sector. Nonetheless, we believe the company offers a compelling valuation and strong growth potential.
Group Eurotunnel SA, a French operator of Toll Roads, holds the concession to operate the tunnel beneath the English Channel. We believe the security has been disproportionately weakened by continued vulnerability throughout Europe as well as the higher-beta transportation infrastructure sector. We like the company's insulation from competition characteristics of the company and believe it should be poised to perform well in the coming months, even in a downside risk scenario.
DP World Ltd, UK-based operator of Ports is one of the largest and highest quality listed seaport operators in the world. The company owns and operates several ports in emerging markets, including many in the Middle East. Accordingly, DP World Ltd has been out of favor amid the recent flight to safety.
INFRASTRUCTURE MARKET OVERVIEW AND OUTLOOK
Macroeconomic events led the day throughout much of 2011, impacting infrastructure securities which often rose and fell along with broader equity markets. However, while global infrastructure securities have not been immune to excess volatility in the "risk-on/risk-off" market environment, we believe investors sought the perceived safety in the historically steady and potentially growing cash flows and attractive yield profiles offered by listed infrastructure companies.
During 2011, indebted governments began seeking infrastructure asset sales in an effort to improve sovereign balance sheets. Portugal requested a bailout from the International Monetary Fund (IMF), and part of the aid package will include the sale of its stakes in Portuguese energy companies. In December it was announced that this will include the sale of up to 40% of the €1 billion energy company Redes Energeticas Nacionais SA (REN), which operates Portugal's electricity and gas grids.
REGULATORY FRAMEWORKS UNDER WATCH
We continue to closely monitor the various regulatory frameworks globally that impact our investment universe, particularly pending regulatory announcements that could impact future cash flow expectations, either positively or negatively. This was especially important in 2011 as significant macroeconomic events unfolded.
2011 Annual Report
9
BROOKFIELD GLOBAL LISTED INFRASTRUCTURE FUND
At the outset of 2011, the Chinese government continued the prior year's policies, implementing cooling measures aimed at controlling inflation. In January, China's central bank ordered banks to set aside additional cash reserves, lifting required ratios by 50 basis points in another attempt to tighten monetary policy. Chinese securities dropped sharply as a result. The Chinese Ministry of Communications also announced a potential reduction in toll rates in exchange for increasing operators' concession periods by 20 years or more. This negatively impacted Chinese toll road equity prices, as it introduced uncertainty into the sector, and could result in lower earnings in the short-term. However, the expected impact on the overall value of the companies is limited. Chinese equity markets were impacted further as the year progressed driven by investors' preference for less risky investments.
European infrastructure securities, already down on concerns about Europe, were impacted further as regulatory changes led to selloffs in the space, particularly in Italy and Spain. New austerity measures announced by the Italian government in the second half of 2011 to cut its fiscal deficit included a 4% tax increase on corporate utilities, with the express provision that the additional tax cannot be passed through to the end consumer. Italian energy companies in the benchmark were affected following the announcement.
OUTLOOK
We believe infrastructure assets should be well positioned to offer attractive current income as well as predictable growth and the potential for capital appreciation in the coming year. We continue to see growing demand coupled with an expanding investable universe. Further, we believe Gross Domestic Product (GDP) growth may remain moderate and therefore interest rates benign into 2012, which should benefit asset classes like infrastructure as investors may turn to higher yielding equities as an alternative to bonds.
The economic outlook for North America has continued to advance with improving consumer confidence, housing and jobs data. The region has benefitted from the "risk-off" trade in recent months and is therefore more fully valued on a relative basis than Europe and the Asia Pacific regions. Conversely, the selloff that occurred in 2011 has created attractive entry points throughout Europe, and we are strategically monitoring opportunities to potentially capitalize on deep discounts throughout the region in high quality, well capitalized companies. We acknowledge that the threat of recession remains greatest in the European region and a quality bias is paramount. However, we believe the regulatory environment in many European countries may provide a greater degree of certainty than many emerging market economies, creating attractive opportunities to invest.
AVERAGE ANNUAL TOTAL RETURNS
| As of December 31, 2011 | | Since Inception* | |
| Average Annual Total Returns | |
| Class A Shares | | | -4.61 | % | |
| (excluding sales load) | | | 0.20 | % | |
| Dow Jones Brookfield Global Infrastructure Composite Index | | | 0.24 | % | |
| Class Y Shares | | | 1.58 | % | |
| Class I Shares | | | 1.58 | % | |
| Dow Jones Brookfield Global Infrastructure Composite Index | | | 3.01 | % | |
* Classes Y and I were incepted on December 1, 2011. Class A was incepted on December 29, 2011.
Disclosure
Performance data quoted represents past performance results and does not guarantee future results. Current performance may be lower or higher than the performance data quoted.
All returns shown in USD.
The Fund's portfolio holdings are subject to change without notice. The mention of specific securities is not a recommendation or solicitation for any person to buy, sell or hold any particular security. There is no assurance that
Brookfield Investment Management Inc.
10
BROOKFIELD GLOBAL LISTED INFRASTRUCTURE FUND
the Brookfield Global Listed Infrastructure Fund currently holds these securities. Please refer to the Schedule of Investments contained in this report for a full listing of Fund holdings.
Mutual fund investing involves risk. Principal loss is possible.
The Dow Jones Brookfield Global Infrastructure Composite Index was created on July 1, 2008 and is comprised of infrastructure companies with at least 70% of its annual cash flows derived from owning and operating infrastructure assets. The Index is maintained by Dow Jones Indexes. The Index is unmanaged and, unlike the Fund, is not affected by cash flows or trading and other expenses. It is not possible to invest directly in an index. Index performance is shown for illustrative purposes only and does not predict or depict the performance of the Fund.
MSCI World Index is a free float-adjusted market capitalization weighted index that is designed to measure the equity market performance of developed markets. The MSCI World Index consists of the following 24 developed market country indices: Australia, Austria, Belgium, Canada, Denmark, Finland, France, Germany, Greece, Hong Kong, Ireland, Israel, Italy, Japan, Netherlands, New Zealand, Norway, Portugal, Singapore, Spain, Sweden, Switzerland, the United Kingdom, and the United States.
Beta is a measure of volatility, or systematic risk, of a security or portfolio in comparison to the market as a whole. A basis point is one hundredth of one percent (0.01%).
These views represent the opinions of Brookfield Investment Management Inc. and are not intended to predict or depict the performance of any investment. These views are as of the close of business on December 31, 2011 and subject to change based on subsequent developments.
2011 Annual Report
11
BROOKFIELD GLOBAL LISTED INFRASTRUCTURE FUND
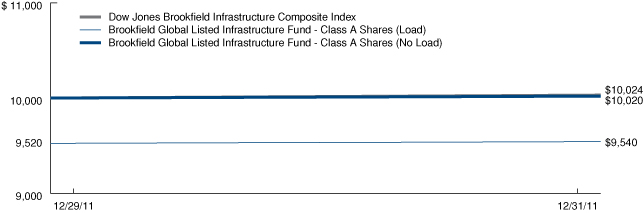
Growth of a $10,000 Investment (Unaudited)
Class A Shares
The graph below illustrates a hypothetical investment of $10,000 in Global Listed Infrastructure Fund—Class A Shares from the commencement of investment operations on December 29, 2011 to December 31, 2011 compared to the Dow Jones Brookfield Global Infrastructure Composite Index.
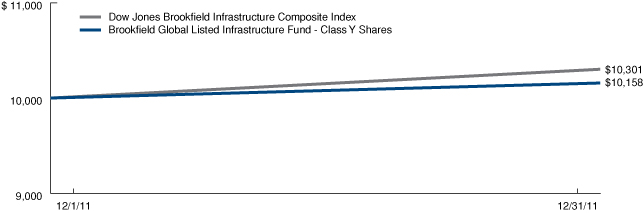
Class Y Shares
The graph below illustrates a hypothetical investment of $10,000 in Global Listed Infrastructure Fund—Class Y Shares from the commencement of investment operations on December 1, 2011 to December 31, 2011 compared to the Dow Jones Brookfield Global Infrastructure Composite Index.
Brookfield Investment Management Inc.
12
BROOKFIELD GLOBAL LISTED INFRASTRUCTURE FUND
Growth of a $10,000 Investment (Unaudited)
Class I Shares
The graph below illustrates a hypothetical investment of $10,000 in Global Listed Infrastructure Fund—Class I Shares from the commencement of investment operations on December 1, 2011 to December 31, 2011 compared to the Dow Jones Brookfield Global Infrastructure Composite Index.

2011 Annual Report
13
BROOKFIELD GLOBAL LISTED INFRASTRUCTURE FUND
Portfolio Characteristics (Unaudited)
December 31, 2011
| ASSET ALLOCATION BY GEOGRAPHY | | Percent of
Net Assets | |
| United States | | | 49 | % | |
| United Kingdom | | | 12 | % | |
| Canada | | | 11 | % | |
| Australia | | | 4 | % | |
| France | | | 4 | % | |
| Spain | | | 4 | % | |
| Brazil | | | 3 | % | |
| China | | | 2 | % | |
| Luxembourg | | | 2 | % | |
| Italy | | | 2 | % | |
| Germany | | | 1 | % | |
| Switzerland | | | 1 | % | |
| United Arab Emirates | | | 1 | % | |
| Other Assets in Excess of Liabilities | | | 4 | % | |
| Total | | | 100 | % | |
ASSET ALLOCATION BY SECTOR
| Infrastructure | | | 20 | % | |
| Toll Roads | | | 9 | % | |
| Rail | | | 1 | % | |
| Transmission & Distribution | | | 13 | % | |
| Oil & Gas Storage and Transportation | | | 44 | % | |
| Airports | | | 2 | % | |
| Ports | | | 1 | % | |
| Water | | | 6 | % | |
| Other Assets in Excess of Liabilities | | | 4 | % | |
| Total | | | 100 | % | |
TOP TEN HOLDINGS
| National Grid PLC | | | 7 | % | |
| Enbridge, Inc. | | | 7 | % | |
| American Tower Corp. | | | 6 | % | |
| TransCanada Corp. | | | 5 | % | |
| Spectra Energy Corp. | | | 5 | % | |
| Enterprise Products Partners LP | | | 4 | % | |
| Group Eurotunnel SA | | | 3 | % | |
| El Paso Corp. | | | 3 | % | |
| Energy Transfer Equity LP | | | 3 | % | |
| Chesapeake Midstream Partners LP | | | 3 | % | |
Brookfield Investment Management Inc.
14
BROOKFIELD HIGH YIELD FUND
PORTFOLIO STRATEGY
Individual contributors of performance included Cablevision Corp., whose bonds benefitted from an improved outlook for the economy and the high yield market. The improved outlook for the economy also helped more cyclical industries like Automotives and Chemicals, benefitting the bonds of Visteon and Huntsman.
Detractors of performance included United Rentals, whose bonds fell after the company announced an acquisition. As the Fund only recently commenced investment operations, the Fund's cash position as of the end of the fiscal year also detracted from the Fund's performance.
HIGH YIELD MARKET OVERVIEW AND OUTLOOK
After a challenging third quarter, markets regained their footing in the fourth. Europe continued to dominate investors' thinking and the on-again, off-again enthusiasm for the European Union's plan to shore up the Euro was on-again. Risk markets responded with the Russell 2000 Index up 15.5% and the high yield market, as measured by the BofA Merrill Lynch US High Yield Master II Index, up 6.2% in the fourth quarter ending December 31, 2011.
The economic news out of Europe was overwhelmingly negative over the last three months. Fears of bank insolvency led to tighter credit but some hope came with more expansionary policies in the fourth quarter. However, they were possibly too late to avoid a general recession in Europe. The question is whether that recession will migrate to North America. Positive numbers from automotive manufacturers and strong rail traffic lead Brookfield to believe that economic growth in the U.S. is on a strengthening, not weakening, path.
Fears of a double-dip recession were also at the forefront throughout the year. Brookfield noted that high yield spreads, as measured by the Bank of America Merrill Lynch U.S. High Yield Master Index in June and September were almost fully discounting a recession. As confidence began to return and investors noted the year-end signs of strength, spreads between U.S. Treasuries narrowed substantially. However, at 737 basis points as of December 31, 2011, they remained much wider than the 400-500 basis points typically expected at this point in the credit cycle. As such, we believe the market continued to represent significantly attractive value. As investors returned to high yield, the more volatile CCC-rated bonds outperformed BB-rated bonds, returning 8.1% in the fourth quarter, compared with 5.5% from the more conservative BB-rated bonds.
Corporate credit has been sound for the past couple of years, however we saw continued modest deterioration in the fourth quarter with defaults rising from less than 1.2% at the end of the third quarter to 1.7%.1 Note that 2011's default rate of 1.7% remained well below the market's 25-year average default rate of 4.2%.1
The fourth quarter also saw continued deterioration in rating agency activity first noted in the third quarter when slightly more ratings downgrades than upgrades occurred. Brookfield noted that companies reported generally good earnings through the third quarter, although management remained cautious regarding forward guidance.
We expect continued modest economic growth in 2012, although note that many economists are on the verge of raising their growth estimates. Consequently, while we believe that in general high yield balance sheets are strong, with adequate liquidity, modest debt, and manageable maturities, there remains a cohort of credit that will not survive a period of modest economic growth. Additionally there are always companies with faulty or outmoded business models that will need to restructure. Some of these companies are quite large and as they fail, investors should be prepared for bumps in the default rate along with some headline risk.
Supply and demand turned strongly positive in the fourth quarter with high yield mutual funds seeing a reversal from modest outflows to strong inflows.2 New issues, which went dry in the third quarter, picked up in the fourth, but at $35.5 billion remained well below the $81.8 billion posted in the second quarter. Overall with money flooding into mutual funds and a relatively light new issue calendar, the deals came oversubscribed and traded higher in the
1 JP Morgan, High Yield Default Monitor, January 3, 2012 p. 2
2 Credit Suisse "Leveraged Finance Strategy Update" January 4, 2012, p. 2.
2011 Annual Report
15
BROOKFIELD HIGH YIELD FUND
aftermarket. Traders report that there seems to be ample cash available for reasonably creditworthy names and report some challenges buying good quality paper in the secondary market.
We believe that corporate credit quality is quite sound. Typically, we enter recessions with stressed balance sheets from acquisitions, capital spending, and leveraged buyouts. Currently balance sheets are near cyclical lows in debt and very high corporate cash simply because companies never had to invest in their business this cycle. Therefore the risk to our generally bullish posture on high yield may be mitigated by the probability that if the U.S. should slide into recession the impact on high yield investors, while not negligible, would likely be muted.
Given our expectation of modest economic growth, modestly increasing defaults, but no general recession, we believe that high yield investors are generously compensated at current spread levels. We believe the risk of further turmoil in Europe remains high, and we note the decline in secondary trading liquidity in the U.S., for which investors should rightly demand richer-than-normal spreads.
Disclosure
Performance data quoted represents past performance results and does not guarantee future results. Current performance may be lower or higher than the performance data quoted.
All returns shown in USD.
The Fund's portfolio holdings are subject to change without notice. The mention of specific securities is not a recommendation or solicitation for any person to buy, sell or hold any particular security. There is no assurance that the Brookfield High Yield Fund currently holds these securities. Please refer to the Portfolio of Investments contained in this report for a full listing of fund holdings.
Mutual fund investing involves risk. Principal loss is possible.
The BofA Merrill Lynch High Yield Master II Index is an unmanaged index that tracks the performance of below investment grade U.S. dollar-denominated corporate bonds publicly issued in the U.S. domestic market. The index is unmanaged and, unlike the Fund, is not affected by cash flows or trading and other expenses. It is not possible to invest directly in an index. Index performance is shown for illustrative purposes only and does not predict or depict the performance of the Fund.
The Russell 2000 Index measures the performance of the small-cap segment of the U.S. equity universe. The Russell 2000 is a subset of the Russell 3000® Index representing approximately 10% of the total market capitalization of that index. It includes approximately 2000 of the smallest securities based on a combination of their market cap and current index membership.
A basis point is one hundredth of one percent (0.01%). Ratings are provided by ratings agencies such as Standard & Poor's or Moody's, who assign a rating based on their analysis of the issuer's credit worthiness. The highest rating given is AAA and the lowest is C.
These views represent the opinions of Brookfield Investment Management Inc. and are not intended to predict or depict the performance of any investment. These views are as of the close of business on December 31, 2011 and subject to change based on subsequent developments.
AVERAGE ANNUAL TOTAL RETURNS
| As of December 31, 2011 | | Since Inception* | |
| Average Annual Total Returns | |
| Class Y Shares | | | 0.77 | % | |
| Class I Shares | | | 0.77 | % | |
| BofA Merrill Lynch U.S. High Yield Master II Index | | | 2.48 | % | |
* Classes Y and I were incepted on December 1, 2011.
Brookfield Investment Management Inc.
16
BROOKFIELD HIGH YIELD FUND
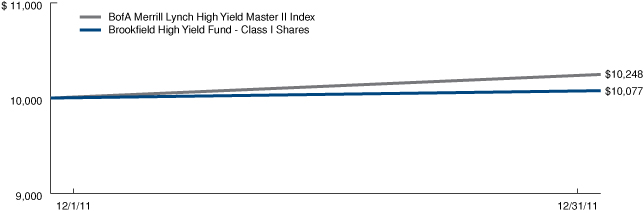
Growth of a $10,000 Investment (Unaudited)
Class Y Shares
The graph below illustrates a hypothetical investment of $10,000 in High Yield Fund—Class Y Shares from the commencement of investment operations on December 1, 2011 to December 31, 2011 compared to the BofA Merrill Lynch U.S. High Yield Master II Index.

Class I Shares
The graph below illustrates a hypothetical investment of $10,000 in High Yield Fund—Class I Shares from the commencement of investment operations on December 1, 2011 to December 31, 2011 compared to the BofA Merrill Lynch U.S. High Yield Master II Index.
2011 Annual Report
17
BROOKFIELD HIGH YIELD FUND
Portfolio Characteristics (Unaudited)
December 31, 2011
| CREDIT QUALITY | | Percent of
Net Assets | |
| BB | | | 23 | % | |
| B | | | 41 | % | |
| CCC | | | 5 | % | |
| CC | | | 1 | % | |
| Cash | | | 30 | % | |
| Total | | | 100 | % | |
ASSET ALLOCATION BY SECTOR
| Energy | | | 11 | % | |
| Consumer Cyclical | | | 10 | % | |
| Consumer Non-Cyclical | | | 10 | % | |
| Basic Industry | | | 9 | % | |
| Telecommunications | | | 7 | % | |
| Services Cyclical | | | 5 | % | |
| Capital Goods | | | 5 | % | |
| Technology & Electronics | | | 4 | % | |
| Media | | | 3 | % | |
| Services Non-Cyclical | | | 2 | % | |
| Finance & Investment | | | 2 | % | |
| Utility | | | 1 | % | |
| Real Estate | | | 1 | % | |
| Other Assets in Excess of Liabilities | | | 30 | % | |
| Total | | | 100 | % | |
TOP TEN HOLDINGS
| Owens-Illinois, Inc. | | | 1 | % | |
| B&G Foods, Inc. | | | 1 | % | |
| AMC Entertainment, Inc. | | | 1 | % | |
| Key Energy Services, Inc. | | | 1 | % | |
| Terex Corp. | | | 1 | % | |
| Service Corp. International | | | 1 | % | |
| Cablevision Systems Corp. | | | 1 | % | |
| Consol Energy, Inc. | | | 1 | % | |
| CCO Holdings LLC/Cap Corp. | | | 1 | % | |
| Crosstex Energy LP/Crosstex Energy Finance Corp. | | | 1 | % | |
Brookfield Investment Management Inc.
18
BROOKFIELD GLOBAL LISTED REAL ESTATE FUND
Portfolio of Investments
December 31, 2011
| | | Shares | | Value
(Note 2) | |
| COMMON STOCKS – 97.9% | |
| AUSTRALIA – 10.5% | |
| Diversified – Sector – 1.9% | |
Dexus Property Group 1
(Cost – $101,035) | | | 113,200 | | | $ | 95,932 | | |
| Office – 2.0% | |
Commonwealth Property Office Fund 1
(Cost – $99,610) | | | 101,400 | | | | 99,001 | | |
| Retail – 6.6% | |
| Westfield Group 1 | | | 29,700 | | | | 236,959 | | |
| Westfield Retail Trust 1 | | | 38,200 | | | | 97,352 | | |
Total Retail
(Cost – $349,969) | | | | | 334,311 | | |
Total AUSTRALIA
(Cost – $550,614) | | | | | 529,244 | | |
| CANADA – 2.0% | |
| Residential – 2.0% | |
Boardwalk Real Estate Investment Trust 1
(Cost – $102,637) | | | 2,000 | | | | 99,023 | | |
Total CANADA
(Cost – $102,637) | | | | | 99,023 | | |
| FRANCE – 2.8% | |
| Diversified – Sector – 2.8% | |
Unibail-Rodamco SE 1
(Cost – $148,870) | | | 800 | | | | 143,178 | | |
Total FRANCE
(Cost – $148,870) | | | | | 143,178 | | |
| GERMANY – 1.6% | |
| Office – 1.6% | |
Alstria Office REIT-AG 1
(Cost – $75,266) | | | 6,700 | | | | 79,669 | | |
Total GERMANY
(Cost – $75,266) | | | | | 79,669 | | |
| HONG KONG – 14.3% | |
| Diversified – Sector – 5.1% | |
Sun Hung Kai Properties Ltd. 1
(Cost – $260,447) | | | 20,751 | | | | 259,324 | | |
| Hotel – 2.4% | |
The Hongkong & Shanghai Hotels 1
(Cost – $120,804) | | | 111,002 | | | | 122,799 | | |
| Office – 3.0% | |
Hongkong Land Holdings Ltd. 1
(Cost – $157,054) | | | 33,052 | | | | 150,056 | | |
See Notes to Portfolios of Investments and Notes to Financial Statements.
2011 Annual Report
19
BROOKFIELD GLOBAL LISTED REAL ESTATE FUND
Portfolio of Investments
December 31, 2011
| | | Shares | | Value
(Note 2) | |
| COMMON STOCKS (continued) | |
| Retail – 3.8% | |
Hang Lung Properties Ltd. 1
(Cost – $213,954) | | | 68,101 | | | $ | 193,310 | | |
Total HONG KONG
(Cost – $752,259) | | | | | 725,489 | | |
| JAPAN – 7.6% | |
| Office – 5.3% | |
| Japan Real Estate Investment Corp. 1 | | | 12 | | | | 93,428 | | |
| Mitsubishi Estate Co. Ltd. 1 | | | 11,855 | | | | 176,775 | | |
Total Office
(Cost – $297,517) | | | | | 270,203 | | |
| Retail – 2.3% | |
United Urban Investment Corp. 1
(Cost – $104,944) | | | 100 | | | | 113,791 | | |
Total JAPAN
(Cost – $402,461) | | | | | 383,994 | | |
| NORWAY – 1.3% | |
| Diversified – Sector – 1.3% | |
Norwegian Property ASA 1
(Cost – $74,061) | | | 55,500 | | | | 68,136 | | |
Total NORWAY
(Cost – $74,061) | | | | | 68,136 | | |
| SINGAPORE – 1.7% | |
| Diversified – Sector – 1.7% | |
CapitaLand Ltd. 1
(Cost – $103,087) | | | 50,800 | | | | 86,454 | | |
Total SINGAPORE
(Cost – $103,087) | | | | | 86,454 | | |
| SWEDEN – 1.5% | |
| Diversified – Sector – 1.5% | |
Hufvudstaden AB 1
(Cost – $75,126) | | | 7,500 | | | | 76,240 | | |
Total SWEDEN
(Cost – $75,126) | | | | | 76,240 | | |
| UNITED KINGDOM – 6.0% | |
| Office – 1.9% | |
Derwent London PLC 1
(Cost – $101,944) | | | 4,000 | | | | 96,944 | | |
See Notes to Portfolios of Investments and Notes to Financial Statements.
Brookfield Investment Management Inc.
20
BROOKFIELD GLOBAL LISTED REAL ESTATE FUND
Portfolio of Investments
December 31, 2011
| | | Shares | | Value
(Note 2) | |
| COMMON STOCKS (continued) | |
| Retail – 4.1% | |
| Hammerson PLC 1 | | | 24,400 | | | $ | 136,252 | | |
| Shaftesbury PLC 1 | | | 9,500 | | | | 68,906 | | |
Total Retail
(Cost – $225,401) | | | | | 205,158 | | |
Total UNITED KINGDOM
(Cost – $327,345) | | | | | 302,102 | | |
| UNITED STATES – 48.6% | |
| Healthcare – 8.7% | |
| Brookdale Senior Living, Inc. 2 | | | 12,600 | | | | 219,114 | | |
| Health Care REIT, Inc. | | | 4,000 | | | | 218,120 | | |
Total Healthcare
(Cost – $396,223) | | | | | 437,234 | | |
| Homebuilders – 3.1% | |
Lennar Corp. – Class A
(Cost – $149,998) | | | 8,100 | | | | 159,165 | | |
| Industrial – 3.1% | |
ProLogis, Inc.
(Cost – $149,192) | | | 5,400 | | | | 154,386 | | |
| Infrastructure – 2.1% | |
Rayonier, Inc.
(Cost – $97,260) | | | 2,400 | | | | 107,112 | | |
| Office – 13.2% | |
| Boston Properties, Inc. | | | 2,100 | | | | 209,159 | | |
| Corporate Office Properties Trust | | | 7,200 | | | | 153,072 | | |
| Douglas Emmett, Inc. | | | 8,300 | | | | 151,392 | | |
| SL Green Realty Corp. | | | 2,300 | | | | 153,272 | | |
Total Office
(Cost – $645,799) | | | | | 666,895 | | |
| Regional Malls – 6.1% | |
Simon Property Group, Inc.
(Cost – $295,535) | | | 2,400 | | | | 309,456 | | |
| Residential – 6.3% | |
| Camden Property Trust | | | 2,600 | | | | 161,824 | | |
| Essex Property Trust, Inc. | | | 1,100 | | | | 154,561 | | |
Total Residential
(Cost – $295,543) | | | | | 316,385 | | |
| Self Storage – 4.0% | |
Public Storage
(Cost – $194,778) | | | 1,500 | | | | 201,690 | | |
See Notes to Portfolios of Investments and Notes to Financial Statements.
2011 Annual Report
21
BROOKFIELD GLOBAL LISTED REAL ESTATE FUND
Portfolio of Investments
December 31, 2011
| | | Shares | | Value
(Note 2) | |
| COMMON STOCKS (continued) | |
| Strip Centers – 2.0% | |
DDR Corp.
(Cost – $98,318) | | | 8,500 | | | $ | 103,445 | | |
Total UNITED STATES
(Cost – $2,322,646) | | | | | 2,455,768 | | |
Total COMMON STOCK
(Cost – $4,934,372) | | | | | 4,949,297 | | |
Total Investments – 97.9%
(Cost – $4,934,372) | | | | | 4,949,297 | | |
| Other Assets in Excess of Liabilities – 2.1% | | | | | 103,819 | | |
| TOTAL NET ASSETS – 100.0% | | | | $ | 5,053,116 | | |
See Notes to Portfolios of Investments and Notes to Financial Statements.
Brookfield Investment Management Inc.
22
BROOKFIELD GLOBAL LISTED REAL ESTATE FUND
Notes to Portfolio of Investments
December 31, 2011
The following notes should be read in conjunction with the accompanying Portfolio of Investments.
1 — Foreign security or a U.S. security of a foreign company
2 — Non-income producing security.
See Notes to Financial Statements.
2011 Annual Report
23
BROOKFIELD GLOBAL LISTED INFRASTRUCTURE FUND
Portfolio of Investments
December 31, 2011
| | | Shares | | Value
(Note 2) | |
| COMMON STOCKS – 96.2% | |
| AUSTRALIA – 4.5% | |
| Infrastructure – Diversified – 2.0% | |
| Challenger Infrastructure Fund – Class A 2 | | | 2,457 | | | $ | 2,819 | | |
| DUET Group 2 | | | 138,900 | | | | 249,364 | | |
Total Infrastructure – Diversified
(Cost – $253,222) | | | | | 252,183 | | |
| Toll Roads – 1.5% | |
Transurban Group 2
(Cost – $186,802) | | | 32,500 | | | | 186,662 | | |
| Transmission & Distribution – 1.0% | |
Spark Infrastructure Group 1,2,5
(Cost – $122,190) | | | 87,500 | | | | 122,927 | | |
Total AUSTRALIA
(Cost – $562,214) | | | | | 561,772 | | |
| BRAZIL – 3.0% | |
| Rail – 1.0% | |
All America Latina Logistica SA 2
(Cost – $123,470) | | | 24,800 | | | | 123,651 | | |
| Toll Roads – 1.0% | |
CCR SA 2
(Cost – $122,924) | | | 19,000 | | | | 124,477 | | |
| Transmission & Distribution – 1.0% | |
Eletropaulo Metropolitana Eletricidade de Sao Paulo SA 2
(Cost – $120,684) | | | 6,400 | | | | 125,238 | | |
Total BRAZIL
(Cost – $367,078) | | | | | 373,366 | | |
| CANADA – 11.5% | |
| Oil & Gas Storage & Transportation – 11.5% | |
| Enbridge, Inc. 2 | | | 21,800 | | | | 815,079 | | |
| TransCanada Corp. 2 | | | 14,000 | | | | 611,946 | | |
Total Oil & Gas Storage & Transportation
(Cost – $1,393,175) | | | | | 1,427,025 | | |
Total CANADA
(Cost – $1,393,175) | | | | | 1,427,025 | | |
| CHINA – 2.1% | |
| Infrastructure – Diversified – 1.1% | |
Shenzhen International Holdings Ltd. 2
(Cost – $125,115) | | | 1,991,018 | | | | 130,451 | | |
| Toll Roads – 1.0% | |
Sichuan Expressway Co. Ltd. 2
(Cost – $125,887) | | | 319,572 | | | | 128,127 | | |
Total CHINA
(Cost – $251,002) | | | | | 258,578 | | |
See Notes to Portfolios of Investments and Notes to Financial Statements.
Brookfield Investment Management Inc.
24
BROOKFIELD GLOBAL LISTED INFRASTRUCTURE FUND
Portfolio of Investments
December 31, 2011
| | | Shares | | Value
(Note 2) | |
| COMMON STOCKS (continued) | |
| FRANCE – 4.1% | |
| Infrastructure – Communications – 1.0% | |
Eutelsat Communications SA 2
(Cost – $124,537) | | | 3,200 | | | $ | 124,643 | | |
| Toll Roads – 3.1% | |
Group Eurotunnel SA 2
(Cost – $401,344) | | | 56,689 | | | | 384,595 | | |
Total FRANCE
(Cost – $525,881) | | | | | 509,238 | | |
| GERMANY – 1.0% | |
| Airports – 1.0% | |
Fraport AG 2
(Cost – $130,143) | | | 2,500 | | | | 122,863 | | |
Total GERMANY
(Cost – $130,143) | | | | | 122,863 | | |
| ITALY – 1.7% | |
| Oil & Gas Storage & Transportation – 1.7% | |
Snam Rete Gas SpA 2
(Cost – $220,011) | | | 49,200 | | | | 216,703 | | |
Total ITALY
(Cost – $220,011) | | | | | 216,703 | | |
| LUXEMBOURG – 2.0% | |
| Infrastructure – Communications – 2.0% | |
SES SA 2
(Cost – $250,385) | | | 10,400 | | | | 249,148 | | |
Total LUXEMBOURG
(Cost – $250,385) | | | | | 249,148 | | |
| SPAIN – 4.0% | |
| Toll Roads – 2.0% | |
Abertis Infraestructuras SA 2
(Cost – $248,347) | | | 15,600 | | | | 247,910 | | |
| Transmission & Distribution – 2.0% | |
Red Electrica Corp. SA 2
(Cost – $252,273) | | | 5,800 | | | | 247,673 | | |
Total SPAIN
(Cost – $500,620) | | | | | 495,583 | | |
| SWITZERLAND – 1.0% | |
| Airports – 1.0% | |
Flughafen Zurich AG 2
(Cost – $121,602) | | | 347 | | | | 120,358 | | |
Total SWITZERLAND
(Cost – $121,602) | | | | | 120,358 | | |
See Notes to Portfolios of Investments and Notes to Financial Statements.
2011 Annual Report
25
BROOKFIELD GLOBAL LISTED INFRASTRUCTURE FUND
Portfolio of Investments
December 31, 2011
| | | Shares | | Value
(Note 2) | |
| COMMON STOCKS (continued) | |
| UNITED ARAB EMIRATES – 0.4% | |
| Ports – 0.4% | |
DP World Ltd. 2
(Cost – $50,131) | | | 4,800 | | | $ | 46,962 | | |
Total UNITED ARAB EMIRATES
(Cost – $50,131) | | | | | 46,962 | | |
| UNITED KINGDOM – 11.9% | |
| Infrastructure – Diversified – 1.0% | |
| Bilfinger Berger Global Infrastructure SICAV SA 2,3,4 | | | 38,400 | | | | 62,020 | | |
| John Laing Infrastructure Fund Ltd. 2,4 | | | 36,600 | | | | 61,671 | | |
Total Infrastructure – Diversified
(Cost – $123,544) | | | | | 123,691 | | |
| Transmission & Distribution – 6.9% | |
National Grid PLC 2
(Cost – $876,438) | | | 89,500 | | | | 865,081 | | |
| Water – 4.0% | |
| Severn Trent PLC 2 | | | 10,700 | | | | 248,300 | | |
| United Utilities Group PLC 2 | | | 26,400 | | | | 248,239 | | |
Total Water
(Cost – $507,107) | | | | | 496,539 | | |
Total UNITED KINGDOM
(Cost – $1,507,089) | | | | | 1,485,311 | | |
| UNITED STATES – 49.0% | |
| Infrastructure – Communications – 10.4% | |
| American Tower Corp. | | | 12,200 | | | | 732,122 | | |
| Crown Castle International Corp. 3 | | | 7,000 | | | | 313,600 | | |
| SBA Communications Corp. 3 | | | 5,700 | | | | 244,872 | | |
Total Infrastructure – Communications
(Cost – $1,275,110) | | | | | 1,290,594 | | |
| Infrastructure – Diversified – 1.9% | |
CenterPoint Energy, Inc.
(Cost – $245,748) | | | 12,200 | | | | 245,098 | | |
| Oil & Gas Storage & Transportation – 31.0% | |
| Chesapeake Midstream Partners LP | | | 10,900 | | | | 316,100 | | |
| Crosstex Energy, Inc. | | | 5,000 | | | | 63,200 | | |
| El Paso Corp. | | | 14,100 | | | | 374,637 | | |
| Energy Transfer Equity LP | | | 9,100 | | | | 369,278 | | |
| Enterprise Products Partners LP | | | 10,800 | | | | 500,904 | | |
| MarkWest Energy Partners LP | | | 5,700 | | | | 313,842 | | |
| NuStar Energy LP | | | 2,200 | | | | 124,652 | | |
| ONEOK, Inc. | | | 3,600 | | | | 312,084 | | |
| Plains All American Pipeline LP | | | 4,200 | | | | 308,490 | | |
See Notes to Portfolios of Investments and Notes to Financial Statements.
Brookfield Investment Management Inc.
26
BROOKFIELD GLOBAL LISTED INFRASTRUCTURE FUND
Portfolio of Investments
December 31, 2011
| | | Shares | | Value
(Note 2) | |
| COMMON STOCKS (continued) | |
| Regency Energy Partners LP | | | 5,000 | | | $ | 124,300 | | |
| Sempra Energy | | | 4,500 | | | | 247,500 | | |
| Spectra Energy Corp. | | | 18,100 | | | | 556,575 | | |
| Targa Resources Corp. | | | 3,000 | | | | 122,070 | | |
| Tesoro Logistics LP | | | 3,700 | | | | 121,730 | | |
Total Oil & Gas Storage & Transportation
(Cost – $3,749,521) | | | | | 3,855,362 | | |
| Transmission & Distribution – 3.7% | |
| ITC Holdings Corp. | | | 3,200 | | | | 242,816 | | |
| Northeast Utilities | | | 2,600 | | | | 93,782 | | |
| NorthWestern Corp. | | | 3,400 | | | | 121,686 | | |
Total Transmission & Distribution
(Cost – $457,488) | | | | | 458,284 | | |
| Water – 2.0% | |
American Water Works Co., Inc.
(Cost – $245,077) | | | 7,700 | | | | 245,322 | | |
Total UNITED STATES
(Cost – $5,972,944) | | | | | 6,094,660 | | |
Total COMMON STOCK – 96.2%
(Cost – $11,852,275) | | | | | 11,961,567 | | |
Total Investments – 96.2%
(Cost – $11,852,275) | | | | | 11,961,567 | | |
| Other Assets in Excess of Liabilities – 3.8% | | | | | 470,438 | | |
| TOTAL NET ASSETS – 100.0% | | | | $ | 12,432,005 | | |
See Notes to Portfolios of Investments and Notes to Financial Statements.
2011 Annual Report
27
BROOKFIELD GLOBAL LISTED INFRASTRUCTURE FUND
Notes to Portfolio of Investments
December 31, 2011
The following notes should be read in conjunction with the accompanying Portfolio of Investments.
1 — Security exempt from registration under Rule 144A of the Securities Act of 1933. These securities may only be resold in transactions exempt from registration, normally to qualified institutional buyers. As of December 31, 2011, the total values of all such investments was $122,927 or 1.0% of net assets.
2 — Foreign security or a U.S. security of a foreign company.
3 — Non-income producing security.
4 — ETFs – Exchange Traded Funds.
5 — Private Placement.
See Notes to Financial Statements.
Brookfield Investment Management Inc.
28
BROOKFIELD HIGH YIELD FUND
Portfolio of Investments
December 31, 2011
| | | Interest
Rate | | Maturity | | Principal
Amount
(000s) | | Value
(Note 2) | |
| HIGH YIELD CORPORATE BONDS – 70.0% | |
| Basic Industry – 8.7% | |
| AK Steel Corp. | | | 7.63 | % | | 05/15/20 | | $ | 200 | | | $ | 188,000 | | |
| Associated Materials LLC | | | 9.13 | | | 11/01/17 | | | 200 | | | | 174,500 | | |
| Cascades, Inc. 2 | | | 7.88 | | | 01/15/20 | | | 200 | | | | 194,000 | | |
| Huntsman International LLC | | | 8.63 | | | 03/15/21 | | | 200 | | | | 212,000 | | |
| Momentive Performance Materials, Inc. | | | 9.00 | | | 01/15/21 | | | 200 | | | | 152,000 | | |
| Polymer Group, Inc. 1,3 | | | 7.75 | | | 02/01/19 | | | 200 | | | | 207,000 | | |
| Steel Dynamics, Inc. | | | 7.63 | | | 03/15/20 | | | 200 | | | | 211,000 | | |
| Trimas Corp. | | | 9.75 | | | 12/15/17 | | | 200 | | | | 217,000 | | |
| United States Steel Corp. | | | 7.00 | | | 02/01/18 | | | 200 | | | | 198,000 | | |
Total Basic Industry
(Cost – $1,738,856) | | | | | | | | | 1,753,500 | | |
| Capital Goods – 4.6% | |
| Berry Plastics Corp. | | | 9.50 | | | 05/15/18 | | | 200 | | | | 201,000 | | |
| Building Materials Corp. of America 1,3 | | | 6.75 | | | 05/01/21 | | | 200 | | | | 210,000 | | |
| Owens-Illinois, Inc. | | | 7.80 | | | 05/15/18 | | | 250 | | | | 276,250 | | |
| Terex Corp. | | | 8.00 | | | 11/15/17 | | | 250 | | | | 245,000 | | |
Total Capital Goods
(Cost – $924,683) | | | | | | | | | 932,250 | | |
| Consumer Cyclical – 9.9% | |
| American Axle & Manufacturing, Inc. | | | 7.88 | | | 03/01/17 | | | 200 | | | | 198,000 | | |
| Levi Strauss & Co. 1,3 | | | 7.63 | | | 05/15/20 | | | 200 | | | | 204,250 | | |
| Limited Brands, Inc. | | | 7.60 | | | 07/15/37 | | | 200 | | | | 199,000 | | |
| McJunkin Red Man Corp. | | | 9.50 | | | 12/15/16 | | | 200 | | | | 203,000 | | |
| MGM Mirage, Inc. | | | 7.63 | | | 01/15/17 | | | 200 | | | | 190,500 | | |
| Niska Gas Storage US LLC/Niska Gas Storage Canada ULC | | | 8.88 | | | 03/15/18 | | | 200 | | | | 195,500 | | |
| Phillips-Van Heusen Corp. | | | 7.38 | | | 05/15/20 | | | 200 | | | | 217,000 | | |
| Pittsburgh Glass Works LLC 1,3 | | | 8.50 | | | 04/15/16 | | | 200 | | | | 192,500 | | |
| Tenneco, Inc. | | | 6.88 | | | 12/15/20 | | | 200 | | | | 205,000 | | |
| Visteon Corp. 1,3 | | | 6.75 | | | 04/15/19 | | | 200 | | | | 199,500 | | |
Total Consumer Cyclical
(Cost – $1,989,399) | | | | | | | | | 2,004,250 | | |
| Consumer Non-Cyclical – 9.9% | |
| Avis Budget Car Rental LLC/Avis Budget Finance, Inc. 1,3 | | | 8.25 | | | 01/15/19 | | | 200 | | | | 198,500 | | |
| Avis Budget Car Rental LLC/Avis Budget Finance, Inc. | | | 9.75 | | | 03/15/20 | | | 100 | | | | 102,750 | | |
| B&G Foods, Inc. | | | 7.63 | | | 01/15/18 | | | 250 | | | | 265,625 | | |
| C&S Group Enterprises LLC 1,3 | | | 8.38 | | | 05/01/17 | | | 200 | | | | 211,000 | | |
| Iron Mountain, Inc. | | | 8.38 | | | 08/15/21 | | | 200 | | | | 213,000 | | |
| Reynolds Group Issuer LLC 1,3 | | | 9.00 | | | 04/15/19 | | | 200 | | | | 190,000 | | |
| Rite-Aid Corp. | | | 8.63 | | | 03/01/15 | | | 200 | | | | 193,000 | | |
| RSC Equipment Rental Inc./RSC Holdings III, LLC | | | 8.25 | | | 02/01/21 | | | 200 | | | | 202,500 | | |
| Service Corp. International | | | 8.00 | | | 11/15/21 | | | 200 | | | | 223,000 | | |
See Notes to Portfolios of Investments and Notes to Financial Statements.
2011 Annual Report
29
BROOKFIELD HIGH YIELD FUND
Portfolio of Investments
December 31, 2011
| | | Interest
Rate | | Maturity | | Principal
Amount
(000s) | | Value
(Note 2) | |
| HIGH YIELD CORPORATE BONDS (continued) | |
| United Rentals North America, Inc. | | | 8.38 | % | | 09/15/20 | | $ | 200 | | | $ | 195,000 | | |
Total Consumer Non-Cyclical
(Cost – $1,997,806) | | | | | | | | | 1,994,375 | | |
| Energy – 11.6% | |
| BreitBurn Energy Partners LP/BreitBurn Finance Corp. | | | 8.63 | | | 10/15/20 | | | 200 | | | | 209,250 | | |
| Calfrac Holdings LP 1,3 | | | 7.50 | | | 12/01/20 | | | 200 | | | | 195,000 | | |
| Chaparral Energy, Inc. | | | 8.88 | | | 02/01/17 | | | 200 | | | | 207,000 | | |
| Consol Energy, Inc. | | | 8.25 | | | 04/01/20 | | | 200 | | | | 221,000 | | |
| Crosstex Energy LP/Crosstex Energy Finance Corp. | | | 8.88 | | | 02/15/18 | | | 200 | | | | 218,500 | | |
| Frac Tech Services LLC/Frac Tech Finance, Inc. 1,3 | | | 7.13 | | | 11/15/18 | | | 200 | | | | 209,500 | | |
| Hercules Offshore, Inc. 1,3 | | | 10.50 | | | 10/15/17 | | | 200 | | | | 194,500 | | |
| Key Energy Services, Inc. | | | 6.75 | | | 03/01/21 | | | 250 | | | | 250,000 | | |
| Linn Energy LLC/Linn Energy Finance Corp. | | | 8.63 | | | 04/15/20 | | | 200 | | | | 217,000 | | |
| Precision Drilling Corp. 2 | | | 6.63 | | | 11/15/20 | | | 200 | | | | 204,500 | | |
| Trinidad Drilling LTD 1,2,3 | | | 7.88 | | | 01/15/19 | | | 200 | | | | 206,000 | | |
Total Energy
(Cost – $2,318,123) | | | | | | | | | 2,332,250 | | |
| Finance & Investment – 1.9% | |
| Marina District Finance Co., Inc. | | | 9.88 | | | 08/15/18 | | | 200 | | | | 182,500 | | |
| Masonite International Corp. 1,2,3 | | | 8.25 | | | 04/15/21 | | | 200 | | | | 196,000 | | |
Total Finance & Investment
(Cost – $372,225) | | | | | | | | | 378,500 | | |
| Media – 3.2% | |
| Cablevision Systems Corp. | | | 8.63 | | | 09/15/17 | | | 200 | | | | 221,500 | | |
| CCO Holdings LLC/Cap Corp. | | | 8.13 | | | 04/30/20 | | | 200 | | | | 219,000 | | |
| Mediacom LLC/Mediacom Capital Corp. | | | 9.13 | | | 08/15/19 | | | 200 | | | | 212,250 | | |
Total Media
(Cost – $635,280) | | | | | | | | | 652,750 | | |
| Real Estate – 0.9% | |
Realogy Corp. 1,3
(Cost – $175,184) | | | 7.88 | | | 02/15/19 | | | 200 | | | | 174,000 | | |
| Services Cyclical – 5.5% | |
| AMC Entertainment, Inc. | | | 8.75 | | | 06/01/19 | | | 250 | | | | 258,750 | | |
| Cedar Fair LP/Canada's Wonderland Co/Magnum Management Corp. | | | 9.13 | | | 08/01/18 | | | 200 | | | | 217,500 | | |
| CityCenter Holdings LLC/CityCenter Finance Corp. 1,3 | | | 7.63 | | | 01/15/16 | | | 200 | | | | 205,000 | | |
| Harrahs Operating Escrow LLC/Harrah Escrow Corp. | | | 11.25 | | | 06/01/17 | | | 200 | | | | 212,250 | | |
| Royal Caribbean Cruises Limited 2 | | | 7.25 | | | 06/15/16 | | | 200 | | | | 215,000 | | |
Total Services Cyclical
(Cost – $1,103,977) | | | | | | | | | 1,108,500 | | |
See Notes to Portfolios of Investments and Notes to Financial Statements.
Brookfield Investment Management Inc.
30
BROOKFIELD HIGH YIELD FUND
Portfolio of Investments
December 31, 2011
| | | Interest
Rate | | Maturity | | Principal
Amount
(000s) | | Value
(Note 2) | |
| HIGH YIELD CORPORATE BONDS (continued) | |
| Services Non-Cyclical – 2.1% | |
| HCA, Inc. | | | 8.00 | % | | 10/01/18 | | $ | 200 | | | $ | 211,500 | | |
| Health Management Associates, Inc. 1,3 | | | 7.38 | | | 01/15/20 | | | 200 | | | | 208,000 | | |
Total Services Non-Cyclical
(Cost – $410,434) | | | | | | | | | 419,500 | | |
| Technology & Electronics – 3.9% | |
| Coleman Cable, Inc. | | | 9.00 | | | 02/15/18 | | | 200 | | | | 198,250 | | |
| First Data Corp. 1,3 | | | 7.38 | | | 06/15/19 | | | 200 | | | | 188,000 | | |
| First Data Corp. 1,3 | | | 8.25 | | | 01/15/21 | | | 200 | | | | 179,000 | | |
| Freescale Semiconductor, Inc. 1,3 | | | 9.25 | | | 04/15/18 | | | 200 | | | | 213,750 | | |
Total Technology & Electronics
(Cost – $779,068) | | | | | | | | | 779,000 | | |
| Telecommunications – 6.8% | |
| CenturyLink, Inc. | | | 6.45 | | | 06/15/21 | | | 200 | | | | 200,368 | | |
| Cincinnati Bell, Inc. | | | 8.38 | | | 10/15/20 | | | 200 | | | | 199,500 | | |
| Citizens Communications Corp. | | | 7.13 | | | 03/15/19 | | | 200 | | | | 195,000 | | |
| inVentiv Health, Inc. 1,3 | | | 10.00 | | | 08/15/18 | | | 200 | | | | 183,000 | | |
| Lamar Media Corp. | | | 7.88 | | | 04/15/18 | | | 200 | | | | 212,000 | | |
| Sprint Nextel Corp. | | | 8.38 | | | 08/15/17 | | | 200 | | | | 179,250 | | |
| Windstream Corp. | | | 7.00 | | | 03/15/19 | | | 200 | | | | 202,000 | | |
Total Telecommunications
(Cost – $1,364,515) | | | | | | | | | 1,371,118 | | |
| Utility – 1.0% | |
Calpine Corp. 1,3
(Cost – $206,916) | | | 7.25 | | | 10/15/17 | | | 200 | | | | 210,000 | | |
Total HIGH YIELD CORPORATE BONDS
(Cost – $14,016,466) | | | | | | | | | 14,109,993 | | |
Total Investments – 70.0%
(Cost – $14,016,466) | | | | | | | | | 14,109,993 | | |
| Other Assets in Excess of Liabilities – 30.0% | | | | | | | | | 6,046,069 | | |
| TOTAL NET ASSETS – 100.0% | | | | | | | | $ | 20,156,062 | | |
See Notes to Portfolios of Investments and Notes to Financial Statements.
2011 Annual Report
31
BROOKFIELD HIGH YIELD FUND
Notes to Portfolio of Investments
December 31, 2011
The following notes should be read in conjunction with the accompanying Portfolio of Investments.
1 — Security exempt from registration under Rule 144A of the Securities Act of 1933. These securities may only be resold in transactions exempt from registration, normally to qualified institutional buyers. As of December 31, 2011, the total value of all such investments was $4,174,500 or 20.7% of net assets.
2 — Foreign security or a U.S. security of a foreign company.
3 — Private Placement.
See Notes to Financial Statements.
Brookfield Investment Management Inc.
32
BROOKFIELD INVESTMENT FUNDS
Statements of Assets and Liabilities
December 31, 2011
| | | Brookfield
Global Listed
Real Estate
Fund | | Brookfield
Global Listed
Infrastructure
Fund | | Brookfield
High Yield
Fund | |
| Assets: | |
| Investments in securities, at value (Note 2) | | $ | 4,949,297 | | | $ | 11,961,567 | | | $ | 14,109,993 | | |
| Cash | | | 20,149 | | | | 7,378,160 | | | | 5,980,928 | | |
| Foreign currency | | | — | | | | 79,278 | | | | — | | |
| Net receivable from advisor (Note 4) | | | 100,941 | | | | 81,904 | | | | 77,979 | | |
| Interest and dividends receivable | | | 21,628 | | | | 11,636 | | | | 298,054 | | |
| Receivable for investments sold | | | — | | | | 107,484 | | | | — | | |
| Deferred offering costs | | | 53,251 | | | | 53,251 | | | | 52,537 | | |
| Prepaid expenses | | | 59,217 | | | | 59,217 | | | | 59,217 | | |
| Total assets | | | 5,204,483 | | | | 19,732,497 | | | | 20,578,708 | | |
| Liabilities: | |
| Payable for investments purchased | | | — | | | | 7,167,137 | | | | 281,350 | | |
| Distribution fee payable | | | — | | | | 31 | | | | — | | |
| Accrued organizational costs | | | 13,750 | | | | 13,750 | | | | 13,750 | | |
| Deferred offering costs | | | 55,609 | | | | 55,610 | | | | 54,895 | | |
| Accrued expenses | | | 82,008 | | | | 63,964 | | | | 72,651 | | |
| Total liabilities | | | 151,367 | | | | 7,300,492 | | | | 422,646 | | |
| Net Assets | | $ | 5,053,116 | | | $ | 12,432,005 | | | $ | 20,156,062 | | |
| Composition of Net Assets: | |
| Paid in capital (Note 6) | | $ | 5,042,232 | | | $ | 12,325,731 | | | $ | 20,062,535 | | |
| Distributions in excess of net investment income | | | (4,135 | ) | | | (80 | ) | | | — | | |
Acumulated net realized gain on investment transactions and foreign
currency translations | | | — | | | | 3,926 | | | | — | | |
Net unrealized appreciation on investment transactions and foreign currency
translations | | | 15,019 | | | | 102,428 | | | | 93,527 | | |
| Net assets applicable to capital stock outstanding | | $ | 5,053,116 | | | $ | 12,432,005 | | | $ | 20,156,062 | | |
| Total investments at cost | | $ | 4,934,372 | | | $ | 11,852,275 | | | $ | 14,016,466 | | |
| Foreign currency at cost | | $ | — | | | $ | 79,330 | | | $ | — | | |
| Net Assets | |
| Class A Shares – Net Assets | | | | | | $ | 2,302,479 | | |
| Shares outstanding | | | N/A | | | | 226,925 | | | | N/A | | |
| Net asset value and redemption price per share | | | N/A | | | $ | 10.15 | | | | N/A | | |
| Offering price per share based on a maximum sales charge of 4.75% | | | N/A | | | $ | 10.65 | | | | N/A | | |
| Class Y Shares – Net Assets | | $ | 12,570 | | | $ | 12,694 | | | $ | 12,592 | | |
| Shares outstanding | | | 1,255 | | | | 1,251 | | | | 1,253 | | |
| Net asset value and redemption price per share | | $ | 10.02 | | | $ | 10.15 | | | $ | 10.05 | | |
| Class I Shares – Net Assets | | $ | 5,040,546 | | | $ | 10,116,832 | | | $ | 20,143,470 | | |
| Shares outstanding | | | 503,188 | | | | 996,985 | | | | 2,004,989 | | |
| Net asset value and redemption price per share | | $ | 10.02 | | | $ | 10.15 | | | $ | 10.05 | | |
See Notes to Financial Statements.
2011 Annual Report
33
BROOKFIELD INVESTMENT FUNDS
Statements of Operations
For the Period December 1, 20111 through December 31, 2011
| | | Brookfield
Global Listed
Real Estate
Fund | | Brookfield
Global Listed
Infrastructure
Fund | | Brookfield
High Yield
Fund | |
| Investment Income (Note 2): | |
| Interest | | $ | — | | | $ | — | | | $ | 73,214 | | |
| Dividends | | | 19,558 | | | | 14,489 | | | | — | | |
| Foreign withholding tax | | | (44 | ) | | | (835 | ) | | | — | | |
| Total investment income | | | 19,514 | | | | 13,654 | | | | 73,214 | | |
| Expenses: | |
| Investment advisory fees (Note 4) | | | 3,182 | | | | 3,961 | | | | 11,059 | | |
| Administration fees (Note 4) | | | 636 | | | | 699 | | | | 2,552 | | |
| Distribution fees – Class A | | | — | | | | 31 | | | | — | | |
| Audit and tax services | | | 28,000 | | | | 28,000 | | | | 33,000 | | |
| Organizational fees | | | 13,750 | | | | 13,750 | | | | 13,750 | | |
| Registration fees | | | 11,143 | | | | 11,143 | | | | 11,143 | | |
| Reports to shareholders | | | 10,500 | | | | 10,500 | | | | 10,500 | | |
| Fund accounting fees | | | 8,423 | | | | 6,890 | | | | 10,416 | | |
| Offering fees | | | 4,299 | | | | 4,299 | | | | 5,013 | | |
| Custodian fees | | | 20,035 | | | | 4,155 | | | | 4,322 | | |
| Transfer agent fees | | | 4,200 | | | | 4,200 | | | | 4,200 | | |
| Trustees' fees | | | 2,917 | | | | 2,917 | | | | 2,917 | | |
| Legal fees | | | 1,052 | | | | 1,052 | | | | 1,052 | | |
| Miscellaneous | | | 794 | | | | 794 | | | | 794 | | |
| Insurance | | | 494 | | | | 494 | | | | 494 | | |
| Total operating expenses | | | 109,425 | | | | 92,885 | | | | 111,212 | | |
| Less expenses waived and reimbursed by the investment advisor (Note 4) | | | (104,122 | ) | | | (86,563 | ) | | | (91,591 | ) | |
| Net expenses | | | 5,303 | | | | 6,322 | | | | 19,621 | | |
| Net investment income | | | 14,211 | | | | 7,332 | | | | 53,593 | | |
Net Realized and Unrealized Gain (Loss) on Investments, Foreign Currency
and Foreign Currency Translations (Note 2): | |
| Net realized gain (loss) on: | |
| Investments | | | — | | | | 4,756 | | | | — | | |
| Foreign currency and foreign currency translations | | | (1,114 | ) | | | (11 | ) | | | — | | |
Net realized gain (loss) on investments, foreign currency and foreign currency
translations: | | | (1,114 | ) | | | 4,745 | | | | — | | |
| Net change in unrealized appreciation (depreciation) on: | |
| Investments | | | 14,925 | | | | 109,292 | | | | 93,527 | | |
| Foreign currency and foreign currency translations | | | 94 | | | | (6,864 | ) | | | — | | |
Net change in unrealized appreciation on investments, foreign currency and
foreign currency translations | | | 15,019 | | | | 102,428 | | | | 93,527 | | |
| Net increase in net assets resulting from operations | | $ | 28,116 | | | $ | 114,505 | | | $ | 147,120 | | |
1 Commencement of Operation.
See Notes to Financial Statements.
Brookfield Investment Management Inc.
34
BROOKFIELD INVESTMENT FUNDS
Statements of Changes in Net Assets
For the Period December 1, 20111 through December 31, 2011
| | | Brookfield
Global Listed
Real Estate
Fund | | Brookfield
Global Listed
Infrastructure
Fund | | Brookfield
High Yield
Fund | |
| Increase (Decrease) in Net Assets Resulting from Operations: | |
| Net investment income | | $ | 14,211 | | | $ | 7,332 | | | $ | 53,593 | | |
Net realized gain (loss) on investments, foreign
currency and foreign currency translations | | | (1,114 | ) | | | 4,745 | | | | — | | |
Net change in unrealized appreciation on investments, foreign
currency and foreign currency translation | | | 15,019 | | | | 102,428 | | | | 93,527 | | |
| Net increase in net assets resulting from operations | | | 28,116 | | | | 114,505 | | | | 147,120 | | |
| Distributions to Shareholders (Note 2): | |
| Distributions from net investment income: | |
| Class Y shares | | | (48 | ) | | | (11 | ) | | | (33 | ) | |
| Class I shares | | | (19,420 | ) | | | (8,220 | ) | | | (53,562 | ) | |
| Total distributions paid | | | (19,468 | ) | | | (8,231 | ) | | | (53,595 | ) | |
| Capital Stock Transactions (Note 6): | |
| Class A2 | |
| Proceeds from shares sold | | | — | | | | 2,298,751 | | | | — | | |
| Net change resulting from Class A transactions | | | — | | | | 2,298,751 | | | | — | | |
| Class Y | |
| Proceeds from shares sold | | | 12,500 | | | | 12,500 | | | | 12,500 | | |
| Reinvestment of dividends | | | 48 | | | | 10 | | | | 33 | | |
| | | | 12,548 | | | | 12,510 | | | | 12,533 | | |
| Class I | |
| Proceeds from shares sold | | | 5,012,500 | | | | 10,006,250 | | | | 20,012,500 | | |
| Reinvestment of dividends | | | 19,420 | | | | 8,220 | | | | 37,504 | | |
| | | | 5,031,920 | | | | 10,014,470 | | | | 20,050,004 | | |
| Total increase in net assets | | | 5,053,116 | | | | 12,432,005 | | | | 20,156,062 | | |
| Net Assets: | |
| Beginning of period | | | 0 | | | | 0 | | | | 0 | | |
| End of period | | $ | 5,053,116 | | | $ | 12,432,005 | | | $ | 20,156,062 | | |
(including distributions in excess of net investment
income of) | | $ | (4,135 | ) | | $ | (80 | ) | | $ | — | | |
| Share Transactions (Note 6): | |
| Class A shares | |
| Shares sold | | | — | | | | 226,925 | | | | — | | |
| Net increase in shares | | | — | | | | 226,925 | | | | — | | |
1 Commencement of Operations.
2 Commencement of Operations for Class A shares was December 29, 2011.
See Notes to Financial Statements.
2011 Annual Report
35
BROOKFIELD INVESTMENT FUNDS
Statements of Changes in Net Assets (continued)
For the Period December 1, 20111 through December 31, 2011
| | | Brookfield
Global Listed
Real Estate
Fund | | Brookfield
Global Listed
Infrastructure
Fund | | Brookfield
High Yield
Fund | |
| Class Y shares | |
| Shares sold | | | 1,250 | | | | 1,250 | | | | 1,250 | | |
| Reinvestment of dividends and distributions | | | 5 | | | | 1 | | | | 3 | | |
| Net increase in shares | | | 1,255 | | | | 1,251 | | | | 1,253 | | |
| Class I shares | |
| Shares sold | | | 501,250 | | | | 996,790 | | | | 2,001,250 | | |
| Reinvestment of dividends and distributions | | | 1,938 | | | | 195 | | | | 3,739 | | |
| Net increase in shares | | | 503,188 | | | | 996,985 | | | | 2,004,989 | | |
1 Commencement of Operations.
See Notes to Financial Statements.
Brookfield Investment Management Inc.
36
BROOKFIELD GLOBAL LISTED REAL ESTATE FUND
Financial Highlights
| Class Y | | For the period
December 1, 20111
through
December 31, 2011 | |
| Per Share Operating Performance: | |
| Net asset value, beginning of period | | $ | 10.00 | | |
| Net investment income | | | 0.042 | | |
| Net realized and unrealized gain on investment transactions | | | 0.02 | | |
| Net increase in net asset value resulting from operations | | | 0.06 | | |
| Dividends from net investment income | | | (0.04 | ) | |
| Total dividends and distributions paid | | | (0.04 | ) | |
| Net asset value, end of period | | $ | 10.02 | | |
| Total Investment Return† | | | 0.59 | % | |
| Ratios to Average Net Assets/Supplementary Data: | |
| Net assets, end of period (000s) | | $ | 13 | | |
| Gross operating expenses | | | 25.79 | %3 | |
| Total expenses | | | 1.25 | %3 | |
| Net investment income | | | 3.35 | %3 | |
| Net investment income, excluding the effect of waivers and reimbursement | | | -21.19 | %3 | |
| Portfolio turnover rate | | | 0 | % | |
† Total investment return is computed based upon the net asset value of the Fund's shares and excludes the effects of sales charges or contingent deferred sales charges, if applicable.
1 From the commencement of investment operations on December 1, 2011.
2 Per share amounts presented are based on average shares outstanding throughout the period indicated.
3 Annualized.
See Notes to Financial Statements.
2011 Annual Report
37
BROOKFIELD GLOBAL LISTED REAL ESTATE FUND
Financial Highlights
| Class I | | For the period
December 1, 20111
through
December 31, 2011 | |
| Per Share Operating Performance: | |
| Net asset value, beginning of period | | $ | 10.00 | | |
| Net investment income | | | 0.042 | | |
| Net realized and unrealized gain on investment transactions | | | 0.02 | | |
| Net increase in net asset value resulting from operations | | | 0.06 | | |
| Dividends from net investment income | | | (0.04 | ) | |
| Total dividends and distributions paid | | | (0.04 | ) | |
| Net asset value, end of period | | $ | 10.02 | | |
| Total Investment Return† | | | 0.59 | % | |
| Ratios to Average Net Assets/Supplementary Data: | |
| Net assets, end of period (000s) | | $ | 5,041 | | |
| Gross operating expenses | | | 25.79 | %3 | |
| Total expenses | | | 1.25 | %3 | |
| Net investment income | | | 3.35 | %3 | |
| Net investment income, excluding the effect of waivers and reimbursement | | | -21.19 | %3 | |
| Portfolio turnover rate | | | 0 | % | |
† Total investment return is computed based upon the net asset value of the Fund's shares and excludes the effects of sales charges or contingent deferred sales charges, if applicable.
1 From the commencement of investment operations on December 1, 2011.
2 Per share amounts presented are based on average shares outstanding throughout the period indicated.
3 Annualized.
See Notes to Financial Statements.
Brookfield Investment Management Inc.
38
BROOKFIELD GLOBAL LISTED INFRASTRUCTURE FUND
Financial Highlights
| Class A | | For the period
December 29, 20111
through
December 31, 2011 | |
| Per Share Operating Performance: | |
| Net asset value, beginning of period | | $ | 10.13 | | |
| Net investment income | | | 0.002,4 | | |
| Net realized and unrealized gain on investment transactions | | | 0.02 | | |
| Net increase in net asset value resulting from operations | | | 0.02 | | |
| Dividends from net investment income | | | (0.00 | )4 | |
| Total dividends and distributions paid | | | (0.00 | )4 | |
| Net asset value, end of period | | $ | 10.15 | | |
| Total Investment Return† | | | 0.20 | % | |
| Ratios to Average Net Assets/Supplementary Data: | |
| Net assets, end of period (000s) | | $ | 2,302 | | |
| Gross operating expenses | | | 34.45 | %3 | |
| Total expenses | | | 1.60 | %3 | |
| Net investment income | | | -1.60 | %3 | |
| Net investment income, excluding the effect of waivers and reimbursement | | | -34.45 | %3 | |
| Portfolio turnover rate | | | 1 | % | |
† Total investment return is computed based upon the net asset value of the Fund's shares and excludes the effects of sales charges or contingent deferred sales charges, if applicable.
1 From the commencement of investment operations on December 29, 2011.
2 Per share amounts presented are based on average shares outstanding throughout the period indicated.
3 Annualized.
4 Rounds to less than $0.005.
See Notes to Financial Statements.
2011 Annual Report
39
BROOKFIELD GLOBAL LISTED INFRASTRUCTURE FUND
Financial Highlights
| Class Y | | For the period
December 1, 20111
through
December 31, 2011 | |
| Per Share Operating Performance: | |
| Net asset value, beginning of period | | $ | 10.00 | | |
| Net investment income | | | 0.032 | | |
| Net realized and unrealized gain on investment transactions | | | 0.13 | | |
| Net increase in net asset value resulting from operations | | | 0.16 | | |
| Dividends from net investment income | | | (0.01 | ) | |
| Total dividends and distributions paid | | | (0.01 | ) | |
| Net asset value, end of period | | $ | 10.15 | | |
| Total Investment Return† | | | 1.58 | % | |
| Ratios to Average Net Assets/Supplementary Data: | |
| Net assets, end of period (000s) | | $ | 13 | | |
| Gross operating expenses | | | 18.59 | %3 | |
| Total expenses | | | 1.35 | %3 | |
| Net investment income | | | 1.66 | %3 | |
| Net investment income, excluding the effect of waivers and reimbursement | | | -15.39 | %3 | |
| Portfolio turnover rate | | | 1 | % | |
† Total investment return is computed based upon the net asset value of the Fund's shares and excludes the effects of sales charges or contingent deferred sales charges, if applicable.
1 From the commencement of investment operations on December 1, 2011.
2 Per share amounts presented are based on average shares outstanding throughout the period indicated.
3 Annualized.
See Notes to Financial Statements.
Brookfield Investment Management Inc.
40
BROOKFIELD GLOBAL LISTED INFRASTRUCTURE FUND
Financial Highlights
| Class I | | For the period
December 1, 20111
through
December 31, 2011 | |
| Per Share Operating Performance: | |
| Net asset value, beginning of period | | $ | 10.00 | | |
| Net investment income | | | 0.022 | | |
| Net realized and unrealized gain on investment transactions | | | 0.14 | | |
| Net increase in net asset value resulting from operations | | | 0.16 | | |
| Dividends from net investment income | | | (0.01 | ) | |
| Total dividends and distributions paid | | | (0.01 | ) | |
| Net asset value, end of period | | $ | 10.15 | | |
| Total Investment Return† | | | 1.58 | % | |
| Ratios to Average Net Assets/Supplementary Data: | |
| Net assets, end of period (000s) | | $ | 10,117 | | |
| Gross operating expenses | | | 19.53 | %3 | |
| Total expenses | | | 1.35 | %3 | |
| Net investment income | | | 1.66 | %3 | |
| Net investment income, excluding the effect of waivers and reimbursement | | | -16.34 | %3 | |
| Portfolio turnover rate | | | 1 | % | |
† Total investment return is computed based upon the net asset value of the Fund's shares and excludes the effects of sales charges or contingent deferred sales charges, if applicable.
1 From the commencement of investment operations on December 1, 2011.
2 Per share amounts presented are based on average shares outstanding throughout the period indicated.
3 Annualized.
See Notes to Financial Statements.
2011 Annual Report
41
BROOKFIELD HIGH YIELD FUND
Financial Highlights
| Class Y | | For the period
December 1, 20111
through
December 31, 2011 | |
| Per Share Operating Performance: | |
| Net asset value, beginning of period | | $ | 10.00 | | |
| Net investment income | | | 0.032 | | |
| Net realized and unrealized gain on investment transactions | | | 0.05 | | |
| Net increase in net asset value resulting from operations | | | 0.08 | | |
| Dividends from net investment income | | | (0.03 | ) | |
| Total dividends and distributions paid | | | (0.03 | ) | |
| Net asset value, end of period | | $ | 10.05 | | |
| Total Investment Return† | | | 0.77 | % | |
| Ratios to Average Net Assets/Supplementary Data: | |
| Net assets, end of period (000s) | | $ | 13 | | |
| Gross operating expenses | | | 6.53 | %3 | |
| Total expenses | | | 1.15 | %3 | |
| Net investment income | | | 3.15 | %3 | |
| Net investment income, excluding the effect of waivers and reimbursement | | | -2.23 | %3 | |
| Portfolio turnover rate | | | 0 | % | |
† Total investment return is computed based upon the net asset value of the Fund's shares and excludes the effects of sales charges or contingent deferred sales charges, if applicable.
1 From the commencement of investment operations on December 1, 2011.
2 Per share amounts presented are based on average shares outstanding throughout the period indicated.
3 Annualized.
See Notes to Financial Statements.
Brookfield Investment Management Inc.
42
BROOKFIELD HIGH YIELD FUND
Financial Highlights
| Class I | | For the period
December 1, 20111
through
December 31, 2011 | |
| Per Share Operating Performance: | |
| Net asset value, beginning of period | | $ | 10.00 | | |
| Net investment income | | | 0.032 | | |
| Net realized and unrealized gain on investment transactions | | | 0.05 | | |
| Net increase in net asset value resulting from operations | | | 0.08 | | |
| Dividends from net investment income | | | (0.03 | ) | |
| Total dividends and distributions paid | | | (0.03 | ) | |
| Net asset value, end of period | | $ | 10.05 | | |
| Total Investment Return† | | | 0.77 | % | |
| Ratios to Average Net Assets/Supplementary Data: | |
| Net assets, end of period (000s) | | $ | 20,143 | | |
| Gross operating expenses | | | 6.53 | %3 | |
| Total expenses | | | 1.15 | %3 | |
| Net investment income | | | 3.15 | %3 | |
| Net investment income, excluding the effect of waivers and reimbursement | | | -2.23 | %3 | |
| Portfolio turnover rate | | | 0 | % | |
† Total investment return is computed based upon the net asset value of the Fund's shares and excludes the effects of sales charges or contingent deferred sales charges, if applicable.
1 From the commencement of investment operations on December 1, 2011.
2 Per share amounts presented are based on average shares outstanding throughout the period indicated.
3 Annualized.
See Notes to Financial Statements.
2011 Annual Report
43
BROOKFIELD INVESTMENT FUNDS
Notes to Financial Statements
December 31, 2011
1. Organization
Brookfield Investment Funds (the "Trust") was organized as a statutory trust under the laws of the State of Delaware on May 12, 2011. The Trust is registered under the Investment Company Act of 1940, as amended (the "1940 Act"), as a diversified, open-end management investment company. The Trust consists of four series of underlying portfolios including the Brookfield Global Listed Real Estate Fund (the "Real Estate Fund"), the Brookfield Global Listed Infrastructure Fund (the "Infrastructure Fund"), the Brookfield Global High Yield Fund (the "Global High Yield Fund"), and the Brookfield High Yield Fund (the "High Yield Fund") (each, a "Fund," and collectively, the "Funds").
The Funds currently have four classes of shares: Class A, Class C, Class Y and Class I shares. Each of the Class A shares, Class C shares, Class Y shares and Class I shares represents an interest in the same portfolio of assets and have identical voting, dividend, liquidation and other rights. The assets belonging to a particular Fund belong to that Fund for all purposes, and to no other Fund, subject only to the rights of creditors of that Fund. The assets belonging to each Fund are further allocated to each Class in the proportion that the "assets belonging to" the Class (calculated in the same manner as with determination of "assets belonging to" the Fund) bears to the assets of all Classes within the Fund, has the same rights and is identical in all material respects except that: (i) Class A shares have a maximum front end sales load of 4.75% and Class C shares have a maximum deferred sales charge of 1.00%; (ii) Class A shares have a 12b-1 fee of 0.25% and Class C shares have a 12b-1 fee of 1.00%; and (iii) each Class has exclusive voting rights with respect to matters relating to its own distribution arrangements.
Brookfield Investment Management Inc. (the "Adviser"), a Delaware corporation and a wholly-owned subsidiary of Brookfield Asset Management Inc., is registered as an investment adviser under the Investment Advisers Act of 1940, as amended (the "Advisers Act"), and serves as investment adviser to the Funds. AMP Capital Brookfield (US) LLC (the "Sub-Adviser"), a Delaware limited liability company and a registered investment adviser under the Advisers Act, serves as investment sub-adviser to the Real Estate Fund and the Infrastructure Fund. The Sub-Adviser is indirectly jointly owned by the Adviser and AMP Capital Investors, an Australian investment manager affiliate.
The Real Estate Fund and the Infrastructure Fund each seek total return through growth of capital and current income. The Global High Yield Fund and the High Yield Fund each seek total return, consisting of a high level of current income and capital appreciation. There can be no assurance that each Fund will achieve its investment objective.
The Real Estate Fund, the Infrastructure Fund and the High Yield Fund each commenced operations on December 1, 2011. Although the Global High Yield Fund has not commenced operations as of December 31, 2011, on October 25, 2011, the Funds, including the Global High Yield Fund, sold 625 shares of each of the Class A, Class C, Class Y and Class I shares of each Fund to the Adviser, which represented the initial capital at $10.00 per share for each Fund.
2. Significant Accounting Policies
The preparation of financial statements in conformity with accounting principles generally accepted in the United States of America ("GAAP") requires management to make estimates and assumptions that affect the reported amounts of assets and liabilities and disclosure of contingent assets and liabilities at the date of the financial statements and the reported amounts of revenues and expenses during the reporting period. Actual results could differ from those estimates.
Valuation of Investments: Debt securities, including U.S. government securities, listed corporate bonds, other fixed income and asset-backed securities, and unlisted securities and private placement securities, are generally valued at the latest price furnished by an independent pricing service or, if not valued by an independent pricing service, using prices obtained from at least two active and reliable market makers in any such security, or a broker-dealer. Short-term debt securities with remaining maturities of sixty days or less are valued at cost with interest accrued or
Brookfield Investment Management Inc.
44
BROOKFIELD INVESTMENT FUNDS
Notes to Financial Statements
December 31, 2011
discount accreted to the date of maturity, unless such valuation, in the judgment of the Adviser's Valuation Committee, does not represent market value.
Investments in equity securities listed or traded on any securities exchange or traded in the over-the-counter market are valued at the last quoted price as of the close of business on the valuation date. Equity securities for which no sales were reported for that date are valued at "fair value" as determined in good faith by the Adviser's Valuation Committee. Investments in open-end registered investment companies, if any, are valued at the net asset value ("NAV") as reported by those investment companies.
When price quotations for certain securities are not readily available, or if the available quotations are not believed to be reflective of market value by the Adviser, those securities will be valued at "fair value" as determined in good faith by the Adviser's Valuation Committee using procedures adopted by and under the supervision of the Trust's Board of Trustees (the "Board" or "Trustees"). There can be no assurance that a Fund could purchase or sell a portfolio security at the price used to calculate a Fund's NAV.
Fair valuation procedures may be used to value a substantial portion of the assets of each Fund. A Fund may use the fair value of a security to calculate its NAV when, for example, (1) a portfolio security is not traded in a public market or the principal market in which the security trades is closed, (2) trading in a portfolio security is suspended and not resumed prior to the normal market close, (3) a portfolio security is not traded in significant volume for a substantial period, or (4) the Adviser determines that the quotation or price for a portfolio security provided by a broker-dealer or an independent pricing service is inaccurate.
The "fair value" of securities may be difficult to determine and thus judgment plays a greater role in the valuation process. The fair valuation methodology may include or consider the following guidelines, as appropriate: (1) evaluation of all relevant factors, including but not limited to, pricing history, current market level, supply and demand of the respective security; (2) comparison to the values and current pricing of securities that have comparable characteristics; (3) knowledge of historical market information with respect to the security; (4) other factors relevant to the security which would include, but not be limited to, duration, yield, fundamental analytical data, the Treasury yield curve, and credit quality.
In addition, whenever developments in one or more securities markets after the close of the principal markets and before the time the Fund determines its net asset value would, if such developments had been reflected in such principal markets, likely have more than a minimal effect on the Fund's net asset value per share, the Fund may fair value such portfolio securities based on available market information as of the time the Fund determines its net asset value.
The values assigned to fair valued investments are based on available information and do not necessarily represent amounts that might ultimately be realized, since such amounts depend on future developments inherent in long-term investments. Changes in the fair valuation of portfolio securities may be less frequent and of greater magnitude than changes in the price of portfolio securities valued at their last sale price, by an independent pricing service, or based on market quotations. Imprecision in estimating fair value can also impact the amount of unrealized appreciation or depreciation recorded for a particular portfolio security and differences in the assumptions used could result in a different determination of fair value, and those differences could be material.
The Funds have established methods of fair value measurements in accordance with GAAP. Fair value denotes the price that a Fund would receive upon selling an investment in a timely transaction to an independent buyer in the principal or most advantageous market of the investment. A three-tier hierarchy has been established to maximize the use of observable market data and minimize the use of unobservable inputs and to establish classification of fair value measurements for disclosure purposes. Inputs refer broadly to the assumptions that market participants would use in pricing the asset or liability, including assumptions about risk, for example, the risk inherent in a particular
2011 Annual Report
45
BROOKFIELD INVESTMENT FUNDS
Notes to Financial Statements
December 31, 2011
valuation technique used to measure fair value including such a pricing model and/or the risk inherent in the inputs to the valuation technique. Inputs may be observable or unobservable. Observable inputs are inputs that reflect the assumptions market participants would use in pricing the asset or liability developed based on market data obtained from sources independent of the reporting entity. Unobservable inputs are inputs that reflect the reporting entity's own assumptions about the assumptions market participants would use in pricing the asset or liability developed based on the best information available in the circumstances. The three-tier hierarchy of inputs is summarized in the three broad levels listed below.
• Level 1 - quoted prices in active markets for identical investments
• Level 2 - quoted prices in markets that are not active or other significant observable inputs (including quoted prices for similar investments, interest rates, prepayment speeds, credit risk, etc.)
• Level 3 - significant unobservable inputs (including each Fund's own assumptions in determining the fair value of investments)
The inputs or methodology used for valuing investments are not necessarily an indication of the risk associated with investing in those securities.
The following is a summary of the inputs used as of December 31, 2011 in valuing the Funds' investments carried at fair value:
Brookfield Global Listed Real Estate Fund
| Valuation Inputs | | Common
Stocks | | Total | |
| Level 1 — Quoted Prices | | $ | 2,704,847 | | | $ | 2,704,847 | | |
| Level 2 — Quoted Prices in Inactive Markets or Other Significant Observable Inputs | | | 2,244,450 | | | | 2,244,450 | | |
| Level 3 — Significant Unobservable Inputs | | | — | | | | — | | |
| Total | | $ | 4,949,297 | | | $ | 4,949,297 | | |
Brookfield Global Listed Infrastructure Fund
| Valuation Inputs | | Common
Stocks | | Total | |
| Level 1 — Quoted Prices | | $ | 8,065,704 | | | $ | 8,065,704 | | |
| Level 2 — Quoted Prices in Inactive Markets or Other Significant Observable Inputs | | | 3,895,863 | | | | 3,895,863 | | |
| Level 3 — Significant Unobservable Inputs | | | — | | | | — | | |
| Total | | $ | 11,961,567 | | | $ | 11,961,567 | | |
Brookfield High Yield Fund
| Valuation Inputs | | High Yield
Corporate
Bonds | | Total | |
| Level 1 — Quoted Prices | | $ | — | | | $ | — | | |
| Level 2 — Quoted Prices in Inactive Markets or Other Significant Observable Inputs | | | 9,792,243 | | | | 9,792,243 | | |
| Level 3 — Significant Unobservable Inputs | | | 4,317,750 | | | | 4,317,750 | | |
| Total | | $ | 14,109,993 | | | $ | 14,109,993 | | |
Brookfield Investment Management Inc.
46
BROOKFIELD INVESTMENT FUNDS
Notes to Financial Statements
December 31, 2011
The following is a reconciliation of assets in which significant unobservable inputs (Level 3) were used in determining fair value:
| Investments in Securities | | High Yield
Corporate
Bonds | | Total | |
| Balance at December 1, 2011 | | $ | — | | | $ | — | | |
| Accrued Discounts (Premiums) | | | 695 | | | | 695 | | |
| Realized Gain/(Loss) | | | — | | | | — | | |
| Change in Unrealized Appreciation | | | 25,865 | | | | 25,865 | | |
| Purchases at cost | | | 4,291,190 | | | | 4,291,190 | | |
| Sales proceeds | | | — | | | | — | | |
| Transfers into Level 3 | | | — | | | | — | | |
| Transfers out of Level 3 | | | — | | | | — | | |
| Balance at December 31, 2011 | | $ | 4,317,750 | | | $ | 4,317,750 | | |
| Change in unrealized gains or losses relating to assets still held at reporting date | | $ | 25,865 | | | $ | 25,865 | | |
For the period December 1, 2011 (commencement of operations) to December 31, 2011, there was no significant security transfer activity between Level 1 and Level 2.
Investment Transactions and Investment Income: Securities transactions are recorded on the trade date. Realized gains and losses from securities transactions are calculated on the identified cost basis. Interest income is recorded on the accrual basis. Discounts and premiums on securities are accreted and amortized, respectively on a daily basis, using the effective yield to maturity method adjusted based on management's assessment of the collectability of such interest. Dividend income is recorded on the ex-dividend date.
Taxes: Each Fund intends to continue to meet the requirements of the Internal Revenue Code of 1986, as amended, applicable to regulated investment companies and to distribute substantially all of its taxable income to its shareholders. Therefore, no federal income or excise tax provision is required. Each Fund may incur an excise tax to the extent it has not distributed all of its taxable income on a calendar year basis.
GAAP provides guidance for how uncertain tax positions should be recognized, measured, presented and disclosed in the financial statements. An evaluation of tax positions taken in the course of preparing the Funds' tax returns to determine whether the tax positions are "more-likely-than-not" of being sustained by the taxing authority is required. Tax benefits of positions not deemed to meet the more-likely-than-not threshold would be booked as a tax expense in the current year and recognized as: a liability for unrecognized tax benefits; a reduction of an income tax refund receivable; a reduction of a deferred tax asset; an increase in deferred tax liability; or a combination thereof. As of December 31, 2011, the Funds have determined that there are no uncertain tax positions or tax liabilities required to be accrued.
Expenses: Expenses directly attributable to a Fund are charged directly to that Fund, while expenses which are attributable to more than one Fund are allocated among the respective Funds based upon relative net assets.
Dividends and Distributions: Each Fund declares and pays dividends at least annually from net investment income. To the extent these distributions exceed net investment income, they may be classified as return of capital. Each Fund also pays distributions at least annually from its net realized capital gains, if any. Dividends and distributions are recorded on the ex-dividend date. All common shares have equal dividend and other distribution rights. A notice disclosing the source(s) of a distribution will be provided if payment is made from any source other than net investment income. Any such notice would be provided only for informational purposes in order to comply with the requirements of Section 19(a) of the 1940 Act and not for tax reporting purposes. The tax composition of each Fund's distributions for each calendar year is reported on IRS Form 1099-DIV.
2011 Annual Report
47
BROOKFIELD INVESTMENT FUNDS
Notes to Financial Statements
December 31, 2011
Dividends from net investment income and distributions from realized gains from investment transactions have been determined in accordance with Federal income tax regulations and may differ from net investment income and realized gains recorded by each Fund for financial reporting purposes. These differences, which could be temporary or permanent in nature, may result in reclassification of distributions; however, net investment income, net realized gains and losses and net assets are not affected.
Covered Calls and Other Option Transactions: A Fund may write call options with the purpose of generating realized gains or reducing the Fund's ownership of certain securities. The Fund may write call options on equity securities in its portfolio ("covered calls"), in amounts up to 15% of the Fund's net assets (plus the amount of any borrowing for investment purposes). At the time the call option is sold, the writer of the call option receives a premium from the buyer of such call option. Any premiums received by the Fund from writing options may result in short-term capital gains. Writing a covered call is the selling of an option contract entitling the buyer to purchase an underlying security that the Fund owns. When the Fund sells a call option, it generates short-term gains in the form of the premium paid by the buyer of the call option, but the Fund forgoes the opportunity to participate in any increase in the value of the underlying equity security above the exercise price of the option and retains the risk of loss if the underlying security declines in value. The writer of the call option has the obligation, upon exercise of the option, to deliver the underlying security upon payment of the exercise price during the option period. A call option whose strike price is above the current price of the underlying stock is called "out-of-the-money." A call option whose strike price is below the current price of the underlying stock is called "in-the-money."
If the Fund has written a call option, it may terminate its obligation by effecting a closing purchase transaction. This is accomplished by purchasing a call option with the same terms as the option previously written. However, once the Fund has been assigned an exercise notice, the Fund will be unable to effect a closing purchase transaction. There can be no assurance that a closing purchase transaction can be effected when the Fund so desires.
The Fund will realize a profit from a closing transaction if the price of the transaction is less than the premium it received from writing the option; the Fund will realize a loss from a closing transaction if the price of the transaction is more than the premium it received from writing the option. Since call option prices generally reflect increases in the price of the underlying security, any loss resulting from the repurchase of a call option may also be wholly or partially offset by unrealized appreciation of the underlying security. Other principal factors affecting the market value of a call option include supply and demand, interest rates, the current market price and price volatility of the underlying security and the time remaining until the expiration date of the option. Gains and losses on transactions in options depend, in part, on the ability of the Adviser or Sub-Adviser, as the case may be, to predict correctly the effect of these factors. The use of options cannot serve as a complete hedge since the price movement of securities underlying the options will not necessarily follow the price movements of the portfolio securities subject to the hedge.
An option position may be closed out on an exchange that provides a secondary market for an option with the same terms or in a private transaction. Although the Fund will generally write options for which there appears to be an active secondary market, there is no assurance that a liquid secondary market on an exchange will exist for any particular option. In such event, it might not be possible to effect closing purchase transactions in particular options.
When Issued, Delayed Delivery Securities and Forward Commitments: A Fund may enter into forward commitments for the purchase or sale of securities, including on a "when issued" or "delayed delivery" basis, in excess of customary settlement periods for the type of security involved. In some cases, a forward commitment may be conditioned upon the occurrence of a subsequent event, such as approval and consummation of a merger, corporate reorganization or debt restructuring. When such transactions are negotiated, the price is fixed at the time of the commitment, with payment and delivery taking place in the future, generally a month or more after the date of the commitment. While it will only enter into a forward commitment with the intention of actually acquiring the security, the Fund may sell the security before the settlement date if it is deemed advisable.
Brookfield Investment Management Inc.
48
BROOKFIELD INVESTMENT FUNDS
Notes to Financial Statements
December 31, 2011
Securities purchased under a forward commitment are subject to market fluctuation, and no interest (or dividends) accrues to the Fund prior to the settlement date. The Fund will segregate with its custodian cash or liquid securities in an aggregate amount at least equal to the amount of its outstanding forward commitments.
3. Risks of Investing in Below-Investment Grade Securities
The High Yield Fund has investments in below-investment grade debt securities. Below-investment grade securities involve a higher degree of credit risk than investment grade debt securities. In the event of an unanticipated default, the Funds would experience a reduction in its income, a decline in the market value of the securities so affected and a decline in the NAV of its shares. During an economic downturn or period of rising interest rates, highly leveraged and other below-investment grade issuers frequently experience financial stress that could adversely affect their ability to service principal and interest payment obligations, to meet projected business goals and to obtain additional financing. The market prices of below-investment grade debt securities are generally less sensitive to interest rate changes than higher-rated investments but are more sensitive to adverse economic or political changes or individual developments specific to the issuer than higher-rated investments. Periods of economic or political uncertainty and change can be expected to result in significant volatility of prices for these securities. Rating services consider these securities to be speculative in nature.
Below-investment grade securities may be subject to market conditions, events of default or other circumstances which cause them to be considered "distressed securities." Distressed securities frequently do not produce income while they are outstanding. The Fund may be required to bear certain extraordinary expenses in order to protect and recover its investments in certain distressed securities. Therefore, to the extent the Fund seeks capital growth through investment in such securities, the Fund's ability to achieve current income for its shareholders may be diminished. The Fund is also subject to significant uncertainty as to when and in what manner and for what value the obligations evidenced by distressed securities will eventually be satisfied (e.g., through a liquidation of the obligor's assets, an exchange offer or plan of reorganization involving the securities or a payment of some amount in satisfaction of the obligation). In addition, even if an exchange offer is made or a plan of reorganization is adopted with respect to distressed securities held by the Funds, there can be no assurance that the securities or other assets received by the Fund in connection with such exchange offer or plan of reorganization will not have a lower value or income potential than may have been anticipated when the investment was made. Moreover, any securities received by the Fund upon completion of an exchange offer or plan of reorganization may be restricted as to resale. As a result of the Fund's participation in negotiations with respect to any exchange offer or plan of reorganization with respect to an issuer of such securities, the Fund may be restricted from disposing of distressed securities.
4. Investment Advisory and Other Agreements
The Adviser currently serves as the investment adviser to all the Funds pursuant to separate investment advisory agreements (the "Advisory Agreements"). Pursuant to the Advisory Agreements, the Adviser shall: (i) furnish continuously an investment program for the Funds; (ii) determine (subject to the overall supervision and review of the Trust's Board of Trustees) the investments to be purchased, held, sold or exchanged by the Funds and the portion, if any, of the assets of the Funds to be held uninvested; (iii) make changes in the investments of the Funds; and (iv) vote, exercise consents and exercise all other rights pertaining to such investments. The Adviser may engage one or more investment sub-advisers to perform any of the services contemplated to be performed by the Adviser under the Advisory Agreements. The Sub-Adviser serves as investment sub-adviser to the Real Estate Fund and the Infrastructure Fund. Pursuant to separate sub-advisory agreements between the Adviser, the Trust, on behalf of the Infrastructure Fund and the Real Estate Fund, and the Sub-Adviser (the "Sub-Advisory Agreements"), the Sub-Adviser manages each applicable Fund's portfolio of investments in accordance with the stated policies of each applicable Fund, subject to the supervision of the Board. The Sub-Adviser is responsible for investment decisions, and provides each applicable Fund with investment officers who are authorized by the Board to execute purchases and sales of securities.
2011 Annual Report
49
BROOKFIELD INVESTMENT FUNDS
Notes to Financial Statements
December 31, 2011
After initial two year terms, the Advisory Agreements and the Sub-Advisory Agreements will each continue in effect for successive annual periods so long as such continuation is specifically approved at least annually by the vote of (i) the Board of Trustees or a (ii) a vote of a majority (as defined in the 1940 Act) of the outstanding voting securities of each applicable Fund, provided that in either event the continuance also is approved by a majority of the Trustees who are not "interested persons" (as defined pursuant to the 1940 Act) of the applicable Funds, the Adviser or Sub-Adviser, as applicable by vote cast in person at a meeting called for the purpose of voting on such approval. The Advisory Agreements are terminable at any time, without payment of any penalty, by vote of the Trust's Board of Trustees, or by a vote of a majority (as defined in the 1940 Act) of the outstanding voting securities of each applicable Fund, or by the Adviser, in each case on not more than 60 days' nor less than 30 days' prior written notice to the other party. The Sub-Advisory Agreements are terminable (i) at any time, without payment of any penalty, by vote of the Trust's Board of Trustees, or by a vote of a majority (as defined in the 1940 Act) of the outstanding voting securities of each applicable Fund, (ii) at any time, without payment of a penalty, by the Adviser (1) upon no less than 60 days' prior written notice to the Sub-Adviser; (2) upon material breach by the Sub-Adviser of any of the representations and warranties set forth in the Sub-Advisory Agreements; or (3) if the Sub-Adviser becomes unable to discharge its duties and obligations under the Sub-Advisory Agreements, including circumstances such as financial insolvency of the Sub-Adviser or other circumstances that could adversely affect each applicable Fund, or (iii) by the Sub-Adviser, upon no less than 60 days' prior written notice to the Adviser. The Advisory Agreements and the Sub-Advisory Agreements will terminate automatically in the event of their assignment (as defined in the 1940 Act). The Funds shall compensate the Adviser for its services and its related expenses at the annual rates presented below as applied to each Fund's average daily net assets, payable monthly in arrears. The Adviser is responsible for payment to the Sub-Adviser out of its advisory fees. Pursuant to an operating expenses limitation agreement (the "Expense Limitation Agreement"), the Adviser has contractually agreed to waive all or a portion of its investment advisory or administration fees, as presented below, and/or to reimburse certain expenses of each Fund to the extent necessary to maintain each Fund's total annual operating expenses (excluding any front-end or contingent deferred loads, brokerage commissions and other transactional expenses, acquired fund fees and expenses, interest, taxes, and extraordinary expenses, such as litigation; and other expenses not incurred in the ordinary course of a Fund's business). The Expense Limitation Agreement will continue until at least May 1, 2013 and may not be terminated by the Funds or the Adviser before such time. Thereafter, the Expense Limitation Agreement may only be terminated or amended to increase the expense cap as of May 1st of each calendar year, provided that in the case of a termination by the Adviser, the Adviser will provide the Board of Trustees with written notice of its intention to terminate the arrangement prior to the expiration of its then current term.
| | | Real Estate Fund | | Infrastructure Fund | | High Yield Fund | |
| Annual Advisory Fee Rate | | | 0.75 | % | | | 0.85 | % | | | 0.65 | % | |
| Annual cap on expenses — Class A | | | 1.50 | % | | | 1.60 | % | | | 1.40 | % | |
| Annual cap on expenses — Class C | | | 2.25 | % | | | 2.35 | % | | | 2.15 | % | |
| Annual cap on expenses — Class Y | | | 1.25 | % | | | 1.35 | % | | | 1.15 | % | |
| Annual cap on expenses — Class I | | | 1.25 | % | | | 1.35 | % | | | 1.15 | % | |
The amount of investment advisory fees waived and expenses reimbursed available to be recouped and the year of expiration of each Fund are listed in the table below:
| Fund | | December 31, 2014 | |
| Real Estate Fund | | $ | 104,122 | | |
| Infrastructure Fund | | | 86,563 | | |
| High Yield Fund | | | 91,591 | | |
During the period December 1, 2011 (commencement of operations) to December 31, 2011, the Adviser earned the following in investment advisory fees under the Advisory Agreements. Further, under the Expense Limitation
Brookfield Investment Management Inc.
50
BROOKFIELD INVESTMENT FUNDS
Notes to Financial Statements
December 31, 2011
Agreement, the Adviser was required to waive its investment advisory fees and/or reimburse the following costs to the Funds:
| Fund | | Investment
Advisory Fees | | Waiver and/or
Expense
Reimbursement | |
| Real Estate Fund | | $ | 3,182 | | | $ | 104,122 | | |
| Infrastructure Fund | | | 3,961 | | | | 86,563 | | |
| High Yield Fund | | | 11,059 | | | | 91,591 | | |
Pursuant to separate administration agreements with the Funds (the "Administration Agreements"), the Adviser also performs various administrative services to the Funds, including, among other responsibilities, the preparation and coordination of reports and other materials to be supplied to the Board of Trustees; prepare and/or supervise the preparation and filing with the applicable regulatory authority of all securities filings, periodic financial reports, prospectuses, statements of additional information, marketing materials, tax returns, shareholder reports and other regulatory reports and filings required of the Funds; supervise and monitor the preparation of all required filings necessary to maintain the Funds' qualification and/or registration to sell shares in all states where the Funds currently do, or intend to do business; coordinate the preparation, printing and mailing of all materials required to be sent to shareholders; coordinate the preparation and payment of Fund-related expenses; monitor and oversee the activities of the Funds' other service providers; review and adjust as necessary the Funds' daily expense accruals; monitor daily, monthly and periodic compliance with respect to the federal and state securities laws; send performance information to service organizations that track investment company information; and perform such additional services as may be agreed upon by the Funds and the Adviser.
For its services under the Administration Agreements, the Adviser receives from each Fund, respectively, an annual fee equal to 0.15% of its average daily net assets, payable monthly in arrears.
During the period December 1, 2011 (commencement of operations) to December 31, 2011, the Adviser earned the following in Administration fees:
| Fund | | Administration Fee | |
| Real Estate Fund | | $ | 636 | | |
| Infrastructure Fund | | | 699 | | |
| High Yield Fund | | | 2,552 | | |
Pursuant to a sub-administration agreement (the "Sub-Administration Agreement"), U.S. Bancorp Fund Services, LLC, ("USBFS" or the "Sub-Administrator") acts as the Sub-Administrator to the Funds. USBFS provides certain services to the Funds including, among other responsibilities, preparation for signature by an officer of the Trust of all documents required to be filed for compliance by the Trust and the Funds with applicable laws and regulations, excluding those of the securities laws of various states; arranging for the computation of performance data, including NAV per share and yield; responding to shareholder inquiries; and arranging for the maintenance of books and records of the Funds, and providing, at its own expense, office facilities, equipment and personnel necessary to carry out its duties. In this capacity, USBFS does not have any responsibility or authority for the management of the Fund, the determination of investment policy, or for any matter pertaining to the distribution of Fund shares.
Pursuant to a custody agreement between the Trust and U.S. Bank National Association, (the "Custodian"), the Custodian serves as the custodian of the Funds' assets, holds the Funds' portfolio securities in safekeeping, and keeps all necessary records and documents relating to its duties. The Custodian is compensated with an asset-based fee plus transaction fees and is reimbursed for out-of-pocket expenses.
2011 Annual Report
51
BROOKFIELD INVESTMENT FUNDS
Notes to Financial Statements
December 31, 2011
During the period December 1, 2011 (commencement of operations) to December 31, 2011, the Custodian earned the following in Custodian fees:
| Fund | | Custody Fee | |
| Real Estate Fund | | $ | 20,035 | | |
| Infrastructure Fund | | | 4,155 | | |
| High Yield Fund | | | 4,322 | | |
Certain officers and/or Trustees of the Trust are officers and/or directors of the Adviser.
5. Purchases and Sales of Investments
Purchases and sales of investments, excluding short-term securities and U.S. Government securities, for the period December 1, 2011 (commencement of operations) to December 31, 2011 were as follows:
| Fund | | Purchases | | Sales | |
| Real Estate Fund | | $ | 4,937,749 | | | $ | — | | |
| Infrastructure Fund | | | 11,974,987 | | | | 127,467 | | |
| High Yield Fund | | | 14,016,395 | | | | — | | |
For the period December 1, 2011 (commencement of operations) to December 31, 2011, there were no transactions in U.S. Government Securities.
6. Shares of Beneficial Interest
The Trust's Amended and Restated Agreement and Declaration of Trust dated as of September 27, 2011 (the "Declaration of Trust") permits the Trustees to issue an unlimited number of full and fractional shares of beneficial interest and to divide or combine the shares into a greater or lesser number of shares without thereby materially changing the proportionate beneficial interest in a series or any class thereof. Upon a series' liquidation, all shareholders would share pro rata in the net assets of such series available for distribution to shareholders unless otherwise determined by the Trustees or otherwise provided by the Declaration of Trust.
With respect to each series, the Trust may offer more than one class of shares. The Trust reserves the right to create and issue additional series or classes. Each share of a series or class represents an equal proportionate interest in that series or class with each other share of that series or class. Currently, each series offers four classes of shares of beneficial interest – "Class A" Shares, "Class C" Shares, "Class Y" Shares, and "Class I" Shares.
The shares of each series or class participate equally in the earnings, dividends and assets of the particular series or class. General liabilities of the Trust which are not readily identifiable as belonging to a specific series are allocated among any one or more series in a manner believed by the Trustees of the Trust to be fair and equitable. Shares have no pre-emptive or conversion rights. Shares, when issued, are fully paid and non-assessable, except as set forth below. On each matter submitted to a vote of shareholders, unless the Trustees determine otherwise, all shares of all series and classes shall vote together as a single class; provided, however, that: (i) as to any matter with respect to which a separate vote of any series or class is required by the 1940 Act or other applicable law or is required by attributes applicable to any series or class, such requirements as to a separate vote by that series or class shall apply; (ii) unless the Trustees determine that this clause (ii) shall not apply in a particular case, to the extent that a matter referred to in clause (i) above affects more than one series or class and the interests of each such series or class in the matter are identical, then the shares of all such affected series or classes shall vote together as a single class; and (iii) as to any matter which does not affect the interests of a particular series or class, only the holders of shares of the one or more affected series or classes shall be entitled to vote. As determined by the Trustees, in their sole discretion, without the vote or consent of shareholders, (except as required by the 1940 Act)
Brookfield Investment Management Inc.
52
BROOKFIELD INVESTMENT FUNDS
Notes to Financial Statements
December 31, 2011
on any matter submitted to a vote of shareholders either (x) each whole share shall be entitled to one vote as to any matter on which it is entitled to vote and each fractional share shall be entitled to a proportionate fractional vote or (y) each dollar of NAV (number of shares owned times NAV per share of the Trust, if no series shall have been established, or of such series or class, as applicable) shall be entitled to one vote on any matter on which such shares are entitled to vote and each fractional dollar amount shall be entitled to a proportionate fractional vote. Without limiting the power of the Trustees in any way to designate otherwise in accordance with the preceding sentence, the Trustees established that each whole share shall be entitled to one vote as to any matter on which it is entitled to vote and each fractional share shall be entitled to a proportionate fractional vote. There is no cumulative voting in the election of Trustees. Shares may be voted in person or by proxy or in any manner provided for in the Trust's By-Laws or as determined by the Trustees. A proxy may be given in writing, electronically, by telefax, or in any other manner provided for in the By-Laws or as determined by the Trustees.
7. Federal Income Tax Information
Income and capital gain distributions are determined in accordance with federal income tax regulations, which may differ from GAAP.
The tax character of distributions paid for the period December 1, 2011 (commencement of operations) to December 31, 2011 were as follows:
| | | Real Estate Fund | | Infrastructure Fund | | High Yield Fund | |
| Ordinary income | | $ | 17,232 | | | $ | 8,231 | | | $ | 53,593 | | |
| Return of capital | | | 2,236 | | | | — | | | | 2 | | |
| Total distributions | | | 19,468 | | | | 8,231 | | | | 53,595 | | |
At December 31, 2011, each Fund's most recently completed tax year-end, the components of net assets (excluding paid-in capital) on a tax basis were as follows:
| | | Real Estate Fund | | Infrastructure Fund | | High Yield Fund | |
| Post-October Loss | | $ | (4,135 | ) | | $ | (11 | ) | | $ | — | | |
| Accumulated gains | | | — | | | | 3,926 | | | | — | | |
| Book basis unrealized appreciation | | | 15,019 | | | | 102,428 | | | | 93,527 | | |
| Plus: Cumulative timing difference | | | — | | | | (69 | ) | | | — | | |
| Tax basis unrealized appreciation on investments | | | 15,019 | | | | 102,359 | | | | 93,527 | | |
| Total tax basis net accumulated gains | | | 10,884 | | | | 106,274 | | | | 93,527 | | |
As of December 31, 2011, the Funds' had no capital loss carryforwards.
Federal Income Tax Basis: The federal income tax basis of the Funds' investments at December 31, 2011 was as follows:
| Fund | | Cost of
Investments | | Gross Unrealized
Appreciation | | Gross Unrealized
Depreciation | | Net Unrealized
Appreciation | |
| Real Estate Fund | | $ | 4,934,372 | | | $ | 149,885 | | | $ | (134,960 | ) | | $ | 14,925 | | |
| Infrastructure Fund | | | 11,852,344 | | | | 185,911 | | | | (76,688 | ) | | | 109,223 | | |
| High Yield Fund | | | 14,016,466 | | | | 137,293 | | | | (43,766 | ) | | | 93,527 | | |
2011 Annual Report
53
BROOKFIELD INVESTMENT FUNDS
Notes to Financial Statements
December 31, 2011
Capital Account Reclassifications: Because federal income tax regulations differ in certain respects from GAAP, income and capital gain distributions, if any, determined in accordance with tax regulations may differ from net investment income and realized gains recognized for financial reporting purposes. These differences are primarily due to differing treatments for wash sales and return of capital. Permanent book and tax differences, if any, relating to shareholder distributions will result in reclassifications to paid-in-capital or to undistributed capital gains. These reclassifications have no effect on net assets or NAV per share.
GAAP requires that certain components of net assets relating to permanent differences be reclassified between financial and tax reporting. These reclassifications have no effect on net assets or net asset value per share. For the year ended December 31, 2011, the following table shows the reclassifications made:
| | | Undistributed
Net Investment
Income (Loss) | | Accumulated Net
Realized
Gain(Loss) | | Paid in
Capital | |
| Real Estate Fund | | $ | 1,122 | | | $ | 1,114 | | | $ | (2,236 | ) | |
| Infrastructure Fund | | | 819 | | | | (819 | ) | | | — | | |
| High Yield Fund | | | 2 | | | | — | | | | (2 | ) | |
The Regulated Investment Company Modernization Act: On December 22, 2010, President Obama signed into law the Regulated Investment Company Modernization Act of 2010 (the "Modernization Act"). The Modernization Act is the first major piece of legislation affecting Regulated Investment Companies ("RICs") since 1986 and it modernizes several of the federal income and excise tax provisions related to RICs. Some highlights of the Modernization Act are as follows:
New capital losses may now be carried forward indefinitely, and retain their character as long-term or short-term capital losses. Prior to the Modernization Act, capital losses could be carried forward for eight years, and carried forward as short-term capital losses, irrespective of the character of the original loss. The Modernization Act contains simplification provisions, which are aimed at preventing disqualification of a RIC for "inadvertent" failures of the asset diversification and/or gross income tests. Additionally, the Modernization Act exempts publicly-offered RICs with at least 500 shareholders from the preferential dividend rule, and repealed the requirement that a RIC send designation notices to shareholders within 60 days of the end of the RIC's tax year regarding the designation of capital gain dividends, exempt-interest dividend, and certain other designations. The Modernization Act provides simplified reporting for such information, typically on the Form 1099 provided by the RIC to its shareholders.
Except for the simplification provisions related to RIC qualification, the Modernization Act is effective for taxable years beginning after December 22, 2010. The provisions related to RIC qualification are effective for taxable years for which the extended due date of the tax return is after December 22, 2010.
8. Indemnification
Under each Fund's organizational documents, its officers and Trustees are indemnified against certain liabilities arising out of the performance of their duties to each Fund.
In addition, in the normal course of business, the Trust, on behalf of the Funds, enters into contracts with vendors and others that provide for indemnification. The Funds' maximum exposure under these arrangements is unknown, since this would involve the resolution of certain claims, as well as future claims that may be made, against the Funds. Thus, an estimate of the financial impact, if any, of these arrangements cannot be made at this time.
9. New Accounting Pronouncements
In May 2011, the Financial Accounting Standard Board issued ASU No. 2011-04 "Amendments to Achieve Common Fair Value Measurement and Disclosure Requirements in U.S. GAAP and International Financial Reporting
Brookfield Investment Management Inc.
54
BROOKFIELD INVESTMENT FUNDS
Notes to Financial Statements
December 31, 2011
Standards." ASU No. 2011-04 requires additional disclosures regarding fair value measurements. Effective for fiscal years beginning after December 15, 2011, and for interim periods within those fiscal years, entities will need to disclose the following:
1) the amounts of any transfers between Level 1 and Level 2 and the reasons for those transfers, and
2) for Level 3 fair value measurements, quantitative information about the significant unobservable inputs used, a description of the entity's valuation processes, and a narrative description of the sensitivity of the fair value measurement to changes in the unobservable inputs and the interrelationship between inputs.
Management is currently evaluating the impact these disclosures will have on the Funds' financial statement disclosures.
10. Subsequent Events
GAAP requires recognition in the financial statements of the effects of all subsequent events that provide additional evidence about conditions that existed at the date of the Statement of Assets and Liabilities. For non-recognized subsequent events that must be disclosed to keep the financial statements from being misleading, the Funds' are required to disclose the nature of the event as well as an estimate of their financial effect, or a statement that such an estimate cannot be made.
Dividends: The High Yield Fund declared and paid dividends in January and February of 2012 from net investment income.
Management has evaluated subsequent events in the preparation of the Funds' financial statements and has determined that other than the items listed herein, there are no events that require recognition or disclosure in the financial statements.
2011 Annual Report
55
BROOKFIELD INVESTMENT FUNDS
Report of Independent Registered Public Accounting Firm
December 31, 2011
To the Shareholders of Brookfield Global Listed Real Estate Fund, Brookfield Global Listed Infrastructure Fund and Brookfield High Yield Fund and Board of Trustees of Brookfield Investment Funds:
We have audited the accompanying statements of assets and liabilities, including the portfolios of investments, of Brookfield Global Listed Real Estate Fund, Brookfield Global Listed Infrastructure Fund and Brookfield High Yield Fund, three of the four series constituting Brookfield Investment Funds (the "Trust"), as of December 31, 2011, and the related statements of operations, the statements of changes in net assets and the financial highlights for the period December 1, 2011 (commencement of operations) through December 31, 2011. These financial statements and financial highlights are the responsibility of management of the Trust. Our responsibility is to express an opinion on these financial statements and financial highlights based on our audits.
We conducted our audits in accordance with the standards of the Public Company Accounting Oversight Board (United States). Those standards require that we plan and perform the audit to obtain reasonable assurance about whether the financial statements and financial highlights are free of material misstatement. The Trust is not required to have, nor were we engaged to perform, an audit of its internal control over financial reporting. Our audits included consideration of internal control over financial reporting as a basis for designing audit procedures that are appropriate in the circumstances, but not for the purpose of expressing an opinion on the effectiveness of the Trust's internal control over financial reporting. Accordingly, we express no such opinion. An audit also includes examining, on a test basis, evidence supporting the amounts and disclosures in the financial statements, assessing the accounting principles used and significant estimates made by management, as well as evaluating the overall financial statement presentation. Our procedures included confirmation of securities owned as of December 31, 2011, by correspondence with the custodian and brokers. We believe that our audits provide a reasonable basis for our opinion.
In our opinion, the financial statements and financial highlights referred to above present fairly, in all material respects, the financial position of Brookfield Global Listed Real Estate Fund, Brookfield Global Listed Infrastructure Fund and Brookfield High Yield Fund of the Brookfield Investment Funds as of December 31, 2011, the results of their operations, the changes in their net assets, and the financial highlights for the period presented, in conformity with accounting principles generally accepted in the United States of America.
DELOITTE & TOUCHE LLP
Philadelphia, Pennsylvania
February 28, 2012
Brookfield Investment Management Inc.
56
BROOKFIELD INVESTMENT FUNDS
Tax Information (Unaudited)
December 31, 2011
For the fiscal year ended December 31, 2011, certain dividends paid by the Funds may be subject to a maximum tax rate of 15%, as provided for by the Jobs and Growth Tax Relief Reconciliation Act of 2003. The percentage of dividends declared from ordinary income designated as qualified dividend income was as follows:
| Brookfield Global Listed Real Estate Fund | | | 38.97 | % | |
| Brookfield Global Listed Infrastructure Fund | | | 100.00 | % | |
| Brookfield High Yield Fund | | | 0.00 | % | |
For corporate shareholders, the percent of ordinary income distributions qualifying for the corporate dividends received deductions for the fiscal year ended December 31, 2011, was as follows:
| Brookfield Global Listed Real Estate Fund | | | 15.40 | % | |
| Brookfield Global Listed Infrastructure Fund | | | 44.50 | % | |
| Brookfield High Yield Fund | | | 0.00 | % | |
The percentage of taxable ordinary income distributions that are designated as short-term capital gain distributions under the Internal Revenue Section 871(k)(2)(C) for each Fund was as follows:
| Brookfield Global Listed Real Estate Fund | | | 0.00 | % | |
| Brookfield Global Listed Infrastructure Fund | | | 0.00 | % | |
| Brookfield High Yield Fund | | | 0.00 | % | |
2011 Annual Report
57
BROOKFIELD INVESTMENT FUNDS
Board Considerations Relating to the Investment Advisory Agreements (Unaudited)
December 31, 2011
In determining whether to approve the Investment Advisory Agreements and Sub-Investment Advisory Agreements (the "Agreements"), the Board considered the following information and made the conclusions as described below:
(i) The nature, extent and quality of the services to be provided by the Adviser and the Sub-Adviser.
The Board reviewed in detail the nature, extent and quality of services to be provided by the Adviser and the Sub-Adviser under the Agreements. The Board noted that these services include, among other things, furnishing a continuous investment program for the Funds, including arranging for, or implementing, the purchase and sale of portfolio securities, the provision of general corporate services such as portfolio management compliance services and the preparation and filing of certain reports on behalf of the Funds. The Board also considered, among other things, the professional experience and qualifications of the senior management and key professional personnel of the Adviser and Sub-Adviser, including those individuals responsible for portfolio management. It was noted that, pursuant to the Investment Advisory Agreements, the Adviser is authorized to engage one or more investment sub-advisers, such as the Sub-Adviser, for the performance of any of the services to be provided by the Adviser under the Investment Advisory Agreements. The Board considered that the Adviser provides, at its own expense, office facilities and equipment for use by the Funds and supervisory persons responsible for supervising and monitoring the Funds' service providers, including the Sub-Adviser for its services to the Infrastructure Fund and the Real Estate Fund. The Board also considered that the Adviser pays for the compensation of officers of the Funds who are also officers or employees of the Adviser, except as may otherwise be determined by the Board.
The Board also considered the Adviser's and the Sub-Adviser's operational capabilities and resources. The Board considered that the Adviser is a wholly-owned subsidiary of Brookfield Asset Management Inc. ("BAM"), a global asset manager focusing on property, renewable power and infrastructure assets. It was noted that the Adviser's equity investment strategies are managed by AMP Capital Brookfield Pty Ltd., which is jointly owned by the Adviser and AMP Capital Investors. It was then noted that the Sub-Adviser is a subsidiary of AMP Capital Brookfield Pty Ltd., a specialist investment manager with licensed investment management businesses operating in the United States, Australia, Hong Kong and the United Kingdom. It was further noted that the Sub-Adviser's parent companies, BAM and AMP Capital Investors are two highly regarded global investment managers with capability, presence and experience in real estate and infrastructure investment and operation. The Board then considered that the Adviser and AMP Capital Brookfield Pty Ltd. (together, the "Manager") have worked together since 2001 and have significant experience in managing global REITs and listed infrastructure securities on behalf of clients in Asia, Australia, Europe and North America and successfully developed a number of core and opportunistic equity strategies which invest across a broad universe of global listed real estate and infrastructure securities. The Board considered the Sub-Adviser's robust operational capabilities and resources, noting that the Sub-Adviser is generally responsible for managing North American portfolios as well as global portfolios of 1940 Act clients of the Manager. It was then noted that the Manager's institutional clients include insurance companies, pension funds, registered investment companies, private investment vehicles, Taft-Hartley investors, sovereign wealth funds, and mutual funds as well as foundations and endowments.
The Board evaluated these factors in consultation with Paul Hastings. Based on its review, the Board concluded that the nature, extent, and quality of services provided by the Adviser and the Sub-Adviser, respectively, in view of the Funds under the Agreements were reasonable and appropriate (i) in relation to the Adviser advisory fee, and (ii) in relation to the fees paid to the Sub-Adviser in connection with the Infrastructure Fund and the Real Estate Fund, taking special consideration of the fact that the fees to be paid to the Sub-Adviser under the Investment Sub-Advisory Agreements are payable by the Adviser, and not by the Infrastructure Fund or Real Estate Fund, respectively.
(ii) The performance of the Funds and the Adviser and the Sub-Adviser.
Since the Funds have not yet commenced operations, it was not possible for the Board to consider the performance of the Funds, the Adviser and the Sub-Adviser. In connection with its assessment of the ability of the Adviser and the Sub-Adviser to perform their duties under the Agreements, the Board considered the Adviser's and the
Brookfield Investment Management Inc.
58
BROOKFIELD INVESTMENT FUNDS
Board Considerations Relating to the Investment Advisory Agreements (Unaudited) (continued)
December 31, 2011
Sub-Adviser's financial condition and whether they had the resources necessary to carry out their functions under the Agreements. The Board concluded that the Adviser and the Sub-Adviser had the financial resources necessary to perform their obligations under the Agreements.
(iii) The cost of the advisory services and the profits to the Adviser and the Sub-Adviser and their affiliates from their relationship with the Funds.
The Board considered the proposed level of the advisory fees for each Fund and discussed comparative advisory and administrative fees of other comparable open-end funds, including private accounts, and discussed the differences in the fees charged and services provided to the different accounts and each Fund. The Board considered that this type of information would be useful in assessing whether the Adviser and the Sub-Adviser would be providing services at a cost that was competitive with other similarly managed open-end funds.
In addition, the Board reviewed the fee structure and services provided to private accounts by the Adviser. The Board noted that the service level for those private accounts is materially different than the services provided to its mutual fund clients. The Board considered that the private account fees only relate to managing the account's portfolio of securities and is exclusive of custodial and administrative fees. The Board further considered that the private accounts do not require, and therefore the fees do not relate to, regulatory filings, tax reporting or filings, calculation of investment gains and the management of year-end distributions, and the performance of legally required diversification testing. The Board concluded that the contract rate advisory fee and total fund expenses for each Fund were reasonable, noting that the advisory fees charged by each Fund were consistent with the advisory fees charged by the similarly managed open-end funds in the peer group. In concluding that the advisory fees and fund expenses were reasonable, the Board considered each Fund's innovative and unique investment process. In assessing this information, the Board considered both the gross fees as well as the level of fees after waivers and/or reimbursements.
Since the Funds had not yet commenced operations, the Board did not consider the overall profitability of the Adviser or the Sub-Adviser in connection with the operation of the Funds. In this regard, the Adviser agreed to provide the Board a profitability analysis for each Fund addressing the overall profitability of the Adviser for its management of each Fund, as well as its expected profits and that of its affiliates, including the Sub-Adviser, for providing investment advisory or administrative support for the respective Funds at the first renewal of the Agreements, and annually thereafter.
(iv) The extent to which economies of scale will be realized as the Funds grow and whether fee levels reflect those economies of scale.
The Board considered whether economies of scale would be realized by the Funds at higher asset levels. The Board also assessed whether certain costs would increase if asset levels rise. The Board concluded that under foreseeable conditions, the Board was unable to assess at this time whether economies of scale would be realized if the Funds were to experience significant growth. In the event there were to be significant asset growth in the Funds, the Board determined to reassess whether the advisory fees appropriately took into account any economies of scale that had been realized as a result of that growth.
(v) Other factors.
The Board also considered whether the Adviser or the Sub-Adviser would benefit in other ways from its relationship with the respective Funds, noting that the Adviser and the Sub-Adviser expect to participate in third party soft-dollar practices and commission sharing agreements, in which the Adviser and the Sub-Adviser each receive brokerage and research products and services in exchange for the direction of brokerage business to a particular broker or brokers. It was further noted that the Adviser and the Sub-Adviser analyze their use of client brokerage commissions annually to ensure that their use of soft dollars falls within the safe harbor provided by Section 28(e) of the Securities Exchange Act of 1934, as amended. Finally, it was noted that the Adviser will serve as Administrator (as defined below) of each Fund, and the Board discussed the concomitant benefits that would accrue to the Adviser for that arrangement.
2011 Annual Report
59
BROOKFIELD INVESTMENT FUNDS
Information Concerning Trustees and Officers (Unaudited)
Trustees of the Funds
| Name, Address and Age | | Position(s) Held with
Funds and Term of Office
and Length of Time Served | | Principal Occupation(s) During Past 5 Years and
Other Directorships Held by Director | | Number of Portfolios
in Fund Complex
Overseen by Director | |
Disinterested Trustee
Class I Trustee to serve until 2012 Annual Meeting of Shareholders: | |
|
Rodman L. Drake c/o Three World Financial Center, 200 Vesey Street, New York, New York 10281-1010
Age 69 | | Chairman Elected Sept 2011
Director since Sept 2011, Member of the Audit Committee, Chairman of the Nominating and Compensation Committee
Elected for Three Year Term | | Chairman (since 2003) and Director/Trustee of several investment companies advised by the Advisor (1989-Present); Director and/or Lead Director of Crystal River Capital, Inc. (2005- 2010); Chairman of Board (2005-2010), Interim President and Chief Executive Officer of Crystal River Capital, Inc. (2009-2010); Director of Celgene Corporation (2006-Present); Director of Student Loan Corporation (2005-2010); Director of Apex Silver Mines Limited (2007-2009); Co-founder, Baringo Capital LLC (2002-Present); Director of Jackson Hewitt Tax Services Inc. (2004-2011); Director of Animal Medical Center (2002-Present); Director and/or Lead Director of Parsons Brinckerhoff, Inc. (1995-2008); Trustee and Chairman of Excelsior Funds (1994-2007); Trustee of Columbia Atlantic Funds (2007-2009); Chairman of Columbia Atlantic Funds (2009-Present). | | | 12 | | |
|
Disinterested Trustee
Class II Trustee to serve until 2013 Annual Meeting of Shareholders: | |
|
Edward A. Kuczmarski c/o Three World Financial Center, 200 Vesey Street, New York, New York 10281-1010
Age 62 | | Director since Sept 2011, Member of the Audit Committee, Member of the Nominating and Compensation Committee
Elected for Three Year Term | | Certified Public Accountant and Partner of Crowe Horwath LLP (formerly Hays & Company before merger in 2009) (1980-Present); Trustee of the Empire Builder Tax Free Bond Fund (1984-Present); Director of ISI Funds (2007-Present); Trustee of the Daily Income Fund (2006-Present); Director of the California Daily Tax Free Income Fund, Inc. (2006-Present); Director of the New York Tax Free Income Fund, Inc. (1984-Present) | | | 5 | | |
|
Brookfield Investment Management Inc.
60
BROOKFIELD INVESTMENT FUNDS
Information Concerning Trustees and Officers (Unaudited)
Trustees Table (continued)
| Name, Address and Age | | Position(s) Held with
Funds and Term of Office
and Length of Time Served | | Principal Occupation(s) During Past 5 Years and
Other Directorships Held by Director | | Number of Portfolios
in Fund Complex
Overseen by Director | |
Disinterested Trustee
Class III Trustee to serve until 2014 Annual Meeting of Shareholders | |
|
Louis P. Salvatore c/o Three World Financial Center, 200 Vesey Street, New York, New York 10281-1010
Age 65 | | Director since Sept 2011, Chairman of the Audit Committee, Member of the Nominating and Compensation Committee
Elected for Three Year Term | | Director/Trustee of several investment companies advised by the Advisor (2005-Present); Director of Crystal River Capital, Inc. (2005-2010); Director of Turner Corp. (2003-Present); Director of Jackson Hewitt Tax Services, Inc. (2004-2011); Employee of Arthur Andersen LLP (2002-Present). | | | 12 | | |
|
Interested Trustee
Class III Trustee to serve until 2014 Annual Meeting of Shareholders | |
|
Kim G. Redding c/o Three World Financial Center, 200 Vesey Street, New York, New York 10281-1010
Age 56 | | Director since Sept 2011 | | President of several investment companies advised by the Advisor (2010-Present); Chief Executive Officer and Chief Investment Officer of the Advisor (2010-Present); Director, Brookfield Investment Management (UK) Limited (March 2011-Present); Director and Chairman of the Board of Directors, Brookfield Investment Management (Canada) Inc. (January 2011-Present); Co-Chief Executive Officer and Chief Investment Officer of the Advisor (2009-2010); Director, Brookfield Investment Funds (UCITS) plc (2011-Present); Founder and Chief Executive Officer of Brookfield Redding LLC (2001-2009). | | | 12 | | |
|
2011 Annual Report
61
BROOKFIELD INVESTMENT FUNDS
Information Concerning Trustees and Officers (Unaudited)
Officers of the Funds
| Name, Address and Age | | Position(s)
Held with Funds | | Term of Office and
Length of Time Served | | Principal Occupation(s) During Past 5 Years | |
Kim G. Redding* c/o Three World Financial Center, 200 Vesey Street, New York, New York 10281-1010
Age 56 | | President | | Elected Annually Since Sept 2011 | | President of several investment companies advised by the Advisor (2010-Present); Chief Executive Officer and Chief Investment Officer of the Advisor (2010-Present); Director, Brookfield Investment Management (UK) Limited (March 2011-Present); Director and Chairman of the Board of Directors, Brookfield Investment Management (Canada) Inc. (2011-Present); Co-Chief Executive Officer and Chief Investment Officer of the Advisor (2009-2010); Director, Brookfield Investment Funds (UCITS) plc (2011-Present); Founder and Chief Executive Officer of Brookfield Redding LLC (2001-2009). | |
|
Jonathan C. Tyras* c/o Three World Financial Center, 200 Vesey Street, New York, New York 10281-1010
Age 43 | | Vice President | | Elected Annually Since Sept 2011 | | Managing Director and Chief Financial Officer of the Advisor (2010-Present); Director of the Advisor (2006-2010); General Counsel and Secretary of the Advisor (2006-Present); Vice President and General Counsel (2006-2010) and Secretary (2007-2010) of Crystal River Capital, Inc.; Secretary of several investment companies advised by the Advisor (2006-Present); Chief Financial Officer of Brookfield Investment Management (UK) Limited (March 2011-Present); Chief Financial Officer of Brookfield Investment Management (Canada) Inc. (2011-Present).Chief Executive Officer, AMP Capital Brookfield (US) LLC (2011-Present); Managing Director, AMP Capital Brookfield Pty Limited (2011-Present). | |
|
Steven M. Pires* c/o Three World Financial Center, 200 Vesey Street, New York, New York 10281-1010
Age 55 | | Treasurer | | Elected Annually Since Sept 2011 | | Treasurer of several investment companies advised by the Advisor (2009-Present); Vice President of the Advisor (2011-Present); Vice President of Brookfield Operations and Management Services LLC (2008-2010); Assistant Vice President of Managers Investment Group LLC (2004-2008). | |
|
Brian F. Hurley* c/o Three World Financial Center, 200 Vesey Street, New York, New York 10281-1010
Age 34 | | Secretary | | Elected Annually Since Sept 2011 | | Director and Assistant General Counsel of the Adviser (2010-Present); Attorney at Paul Hastings LLP (2002-2010). | |
|
Brookfield Investment Management Inc.
62
BROOKFIELD INVESTMENT FUNDS
Information Concerning Trustees and Officers (Unaudited)
Officers of the Funds (continued)
| Name, Address and Age | | Position(s)
Held with Funds | | Term of Office and
Length of Time Served | | Principal Occupation(s) During Past 5 Years | |
Seth Gelman* c/o Three World Financial Center, 200 Vesey Street, New York, New York 10281-1010
Age 36 | | Chief Compliance Officer ("CCO") | | Elected Annually Since Sept 2011 | | CCO of several investment companies advised by the Advisor (2009-Present); Director and CCO of the Advisor (2009-Present); Vice President, Oppenheimer Funds, Inc. (2004-2009). | |
|
* Interested person as defined by the Investment Company Act of 1940, as amended (the "1940 Act") because of affiliations with Brookfield Investment Management Inc., Advisor of the INF and OEF
The Funds' Statement of Additional Information includes additional information about the directors and is available, without charge, upon request by calling 1-800-497-3746.
2011 Annual Report
63
CORPORATE INFORMATION
Investment Advisor and Administrator
Brookfield Investment Management Inc.
Three World Financial Center
200 Vesey Street, 24th Floor
New York, New York 10281-1010
www.brookfieldim.com
Please direct your inquiries to:
Investor Relations
Phone: 1-800-497-3746
E-mail: funds@brookfield.com
Transfer Agent
Shareholder inquiries relating to distributions, address changes and shareholder account information should be directed to the Funds' transfer agent:
U.S. Bancorp Fund Services LLC
615 East Michigan Street
Milwaukee, Wisconsin 53202
1-855-244-4859
Sub-Administrator and Fund Accounting Agent
U.S. Bancorp Fund Services LLC
615 East Michigan Street
Milwaukee, Wisconsin 53202
Independent Registered Public Accounting Firm
Deloitte & Touche LLP
1700 Market Street
Philadelphia, Pennsylvania 19103
Legal Counsel
Paul Hastings LLP
75 East 55th Street
New York, New York, 10022
Custodian
U.S. Bank National Association
1555 North River Center Drive, Suite 302
Milwaukee, Wisconsin 53212
The Funds file their complete schedules of portfolio holdings with the SEC for the first and third quarters of each fiscal year on Form N-Q. The Funds' Forms N-Q are available on the SEC's website at http://www.sec.gov. In addition, the Funds' Forms N-Q may be reviewed and copied at the SEC's Public Reference Room in Washington, D.C. Information on the operation of the Public Reference Room may be obtained by calling 1-800-SEC-0330.
You may obtain a description of the Funds' proxy voting policies and procedures, information regarding how the Funds voted proxies relating to portfolio securities during the most recent 12-month period ended June 30, without charge, upon request by calling 1-800-497-3746, or go to SEC's website at www.sec.gov.
Brookfield Investment Management Inc.
Three World Financial Center
200 Vesey Street 24th Floor
New York, New York 10281
1-800-497-3746
www.brookfieldim.com


Item 2. Code of Ethics.
As of the end of the period covered by this report, the Registrant had adopted a Code of Ethics for Principal Executive and Principal Financial Officers (the “Code”). There were no amendments to or waivers from the Code during the period covered by this report. A copy of the Registrant’s Code will be provided upon request to any person without charge by contacting Investor Relations at (800) 497-3746 or by writing to Secretary, Brookfield Investment Funds, Three World Financial Center, 200 Vesey Street, 24th Floor, New York, NY 10281-1010.
Item 3. Audit Committee Financial Expert.
The Registrant’s Board of Directors has determined that three members serving on the Registrant’s audit committee are audit committee financial experts and they are Messrs. Rodman L. Drake, Edward A. Kuczmarski and Louis P. Salvatore.
Item 4. Principal Accountant Fees and Services.
Audit Fees
For the fiscal year ended December 31, 2011, the first fiscal year end since the Registrant’s launch, Deloitte & Touche LLP billed the Registrant aggregate fees of $113,000 for professional services rendered for the audit of the Registrant’s annual financial statements and review of financial statements included in the Registrant’s annual report to shareholders.
Tax Fees
For the fiscal year ended December 31, 2011, Deloitte & Touche LLP billed the Registrant aggregate fees of $18,000 for professional services rendered for tax compliance, tax advice and tax planning. The nature of the services comprising the Tax Fees was the review of the Registrant’s income tax returns and tax distribution requirements.
Audit-Related Fees
For the fiscal year ended December 31, 2011, there were no Audit-Related Fees.
All Other Fees
For the fiscal year ended December 31, 2011, there were no Other Fees.
Item 5. Audit Committee of Listed Registrants.
Not applicable
Item 6. Schedule of Investments.
Please see Item 1.
Item 7. Disclosure of Proxy Voting Policies and Procedures for Closed-End Management Investment Companies.
Not applicable
Item 8. Portfolio Managers of Closed-End Management Investment Companies.
Not applicable
Item 9. Purchases of Equity Securities by Closed-End Management Investment Company and Affiliated Purchasers.
None.
Item 10. Submission of Matters to a Vote of Security Holders.
Not applicable.
Item 11. Controls and Procedures.
(a) The Registrant’s principal executive officer and principal financial officer have concluded that the Registrant’s Disclosure Controls and Procedures are effective, based on their evaluation of such Disclosure Controls and Procedures as of a date within 90 days of the filing of this report on Form N-CSR.
(b) As of the date of filing this Form N-CSR, the Registrant’s principal executive officer and principal financial officer are aware of no changes in the Registrant’s internal control over financial reporting that occurred during the Registrant’s second fiscal quarter of the period covered by this report that has materially affected or is reasonably likely to materially affect the Registrant’s internal control over financial reporting.
Item 12. Exhibits.
(a)(1) None.
(2) A separate certification for each principal executive officer and principal financial officer of the Registrant as required by Rule 30a-2(a) under the Investment Company Act of 1940 is attached as an exhibit to this Form N-CSR.
(3) None.
(b) A separate certification for each principal executive officer and principal financial officer of the Registrant as required by Rule 30a-2(b) under the Investment Company Act of 1940 is attached as an exhibit to this Form N-CSR.
SIGNATURES
Pursuant to the requirements of the Securities Exchange Act of 1934 and the Investment Company Act of 1940, the Registrant has duly caused this report to be signed on its behalf by the undersigned, thereunto duly authorized.
BROOKFIELD INVESTMENT FUNDS
By: | /s/ Kim G. Redding | |
| Kim G. Redding | |
| Principal Executive Officer | |
| | |
Date: March 7, 2012 | |
Pursuant to the requirements of the Securities Exchange Act of 1934 and the Investment Company Act of 1940, this report has been signed below by the following persons on behalf of the Registrant and in the capacities and on the dates indicated.
By: | /s/ Kim G. Redding | |
| Kim G. Redding | |
| Principal Executive Officer | |
| | |
Date: March 7, 2012 | |
| |
| |
By: | /s/ Steven M. Pires | |
| Steven M. Pires | |
| Treasurer and Principal Financial Officer | |
| | |
Date: March 7, 2012 | |