UNITED STATES
SECURITIES AND EXCHANGE COMMISSION
WASHINGTON, D.C. 20549
FORM N-CSR
CERTIFIED SHAREHOLDER REPORT OF REGISTERED
MANAGEMENT INVESTMENT COMPANIES
Investment Company Act file number 811-22558
BROOKFIELD INVESTMENT FUNDS
(Exact name of registrant as specified in charter)
BROOKFIELD PLACE
250 VESEY STREET, 15th Floor
NEW YORK, NEW YORK 10281-1023
(Address of principal executive offices) (Zip code)
BRIAN F. HURLEY, PRESIDENT
BROOKFIELD INVESTMENT FUNDS
BROOKFIELD PLACE
250 VESEY STREET 15th Floor
NEW YORK, NEW YORK 10281-1023
(Name and address of agent for service)
Registrant’s telephone number, including area code: (855) 777-8001
Date of fiscal year end: December 31, 2014
Date of reporting period: December 31, 2014
Item 1. Reports to Stockholders.
Brookfield Investment Management
ANNUAL REPORT
December 31, 2014
Brookfield Global Listed Infrastructure Fund
Brookfield Global Listed Real Estate Fund
Brookfield U.S. Listed Real Estate Fund
Brookfield Real Assets Securities Fund
Brookfield Asset Management Inc. is a global alternative asset manager with over $200 billion in assets under management as of December 31, 2014. Brookfield has over a 100-year history of owning and operating assets with a focus on property, renewable power, infrastructure and private equity. The company offers a range of public and private investment products and services, which leverage its expertise and experience and provide it with a competitive advantage in the markets where it operates. On behalf of its clients, Brookfield is also an active investor in the public securities markets, where its experience extends over 30 years. Over this time, the company has successfully developed several investment operations and built expertise in the management of institutional portfolios, retail mutual funds and various commingled vehicles.
Brookfield’s public market activities are conducted by Brookfield Investment Management, a registered investment adviser. These activities complement Brookfield’s core competencies and include global listed real estate and infrastructure equities, corporate credit and securitized credit strategies. Headquartered in New York, NY, Brookfield Investment Management also maintains offices and investment teams in Toronto, Chicago and Boston and has over $18 billion of assets under management as of December 31, 2014.
This report is for shareholder information. This is not a prospectus intended for the use in the purchase or sale of Fund shares.
| NOT FDIC INSURED | MAY LOSE VALUE | NOT BANK GUARANTEED |
© Copyright 2014. Brookfield Investment Management Inc.
[THIS PAGE IS INTENTIONALLY LEFT BLANK]
Dear Shareholders,
I am pleased to provide the Annual Report for Brookfield Global Listed Infrastructure Fund (the “Infrastructure Fund”), Brookfield Global Listed Real Estate Fund (the “Global Real Estate Fund”), Brookfield U.S. Listed Real Estate Fund (the “U.S. Real Estate Fund”) for the year ended December 31, 2014 and the Brookfield Real Assets Securities Fund (the “Real Assets Fund”) (each a “Fund” and, collectively, the “Funds”) for the period from November 19, 2014 (commencement of operations) to December 31, 2014.
Volatility returned to capital markets during 2014, driven by concerns over slowing global economic growth and a dramatic fall in the price of crude oil, which declined by nearly 50% in the latter half of the year. Signs of anemic growth in Europe and a continued deceleration in China weighed on investor sentiment over the period and led to negative revisions to future economic growth forecasts. Slowing demand also led the Organization of the Petroleum Exporting Countries (OPEC) to raise production levels sharply in order to protect market share in an increasingly competitive oil market. Although lower oil prices should prove beneficial for consumers in oil-importing countries and regions, the pronounced decline in commodity prices served to reinforce concerns over the health of the global economy.
The U.S. remained a bright spot amid challenging global market conditions. Economic data points in the U.S. reflected healthy levels of growth, including continued expansion of the labor market as well as manufacturing production and services. While the implications of lower oil prices on the U.S. oil and gas industry and the economy as a whole have yet to be seen, the U.S. appears to be advancing more quickly through the economic recovery cycle than many other developed markets.
Against this backdrop, the 10-year U.S. Treasury rate declined by 87 basis points over the period, ending the year at 2.17%. Within a volatile market environment, investors sought the safety of yield, which led the 10-year Treasury to briefly move below 2.0% during intraday trading in October, a level that had not been observed since June 2013. Looking ahead, the divergence of growth among developed economies will likely continue to foster varying levels of accommodative monetary policy across the globe. In the U.S., the Federal Reserve officially announced the end of its quantitative easing program during the latter half of 2014, leading market participants to anticipate a modest increase in the federal funds rate at some point in 2015. Conversely, the Bank of Japan announced plans to undertake additional asset purchases in order to stimulate growth, the European Central Bank is expected to implement further quantitative easing initiatives in 2015 and anticipation remains high for further stimulus activity in China. Given this recent activity, we expect interest rates to remain low in the near term.
In addition to performance information, this report provides the Funds’ audited financial statements as of December 31, 2014.
We welcome your questions and comments, and encourage you to contact our Investor Relations team at (855) 777-8001 or visit us at www.brookfieldim.com for more information. Thank you for your support.
Sincerely,
Brian F. Hurley
President
Letter to Shareholders (continued)
These views represent the opinions of Brookfield Investment Management Inc. and are not intended to predict or depict the performance of any investment. These views are as of the close of business on December 31, 2014 and subject to change based on subsequent developments. Must be preceded or accompanied by a prospectus. Quasar Distributors, LLC is the distributor of Brookfield Investment Funds.
Mutual fund investing involves risk. Principal loss is possible. Investors should be aware of the risks involved with investing in a fund concentrating in REITs and real estate securities, such as declines in the value of real estate and increased susceptibility to adverse economic or regulatory developments. Investments in infrastructure entities involve greater exposure to the potential adverse economic, regulatory, political and other changes affecting such entities.
2Brookfield Investment Management Inc.
About Your Fund’s Expenses
As a shareholder of a fund, you may incur two types of costs: (1) transaction costs, including sales charges (loads) on purchase payments, reinvested dividends or other distributions, redemption fees and exchange fees; and (2) ongoing costs, including management fees, distribution (12b-1) fees and other Fund expenses. This example is intended to help you understand your ongoing costs (in dollars) of investing in the Fund and to compare these costs with the ongoing costs of investing in other mutual funds. The example is based on an investment of $1,000 invested at the beginning of the period and held for the entire period as indicated below.
Actual Fund Return
The table below provides information about actual account values and actual expenses. You may use the information on this line, together with the amount you invested, to estimate the expense that you paid over the period. Simply divide your account value by $1,000 (for example, an $8,600 account value divided by $1,000 = 8.6), then multiply the result by the number in the first line under the heading entitled “Expenses Paid During Period” to estimate the expenses you paid on your account during this period.
Hypothetical Example for Comparison Purposes
The table below also provides information about hypothetical account values and hypothetical expenses, which is not the Fund’s actual expense ratio and an assumed rate of return of 5% per year before expenses, which is not the Fund’s actual return. The hypothetical account values and expenses may not be used to estimate the actual ending account balance or expenses you paid for the period. You may use this information to compare the ongoing costs of investing in the Fund and the other funds. To do so, compare this 5% hypothetical example with hypothetical examples that appear in shareholders’ reports of other funds.
Please note that the expenses shown in the table are meant to highlight your ongoing costs only and do not reflect any transactional costs, such as sales charges (loads), redemption fees or exchange fees. Therefore, the hypothetical account values and expenses in the table are useful in comparing ongoing costs only, and will not help you determine the relative total costs of owning different funds. In addition, if these transactional costs were included, your costs overall would have been higher.
| | Annualized Expense Ratio | Beginning Account Value
(07/01/14) | Ending Account Value
(12/31/14) | Expenses Paid During Period
(07/01/14–
12/31/14) (1) |
| INFRASTRUCTURE FUND | | | | |
| Actual | | | | |
Class A Shares
| 1.35% | $1,000.00 | $ 928.90 | $ 6.56 |
Class C Shares
| 2.10% | 1,000.00 | 924.90 | 10.19 |
Class Y Shares
| 1.10% | 1,000.00 | 929.80 | 5.35 |
Class I Shares
| 1.10% | 1,000.00 | 929.80 | 5.35 |
| Hypothetical (assuming a 5% return before expenses) | | | | |
Class A Shares
| 1.35% | 1,000.00 | 1,018.40 | 6.87 |
Class C Shares
| 2.10% | 1,000.00 | 1,014.62 | 10.66 |
Class Y Shares
| 1.10% | 1,000.00 | 1,019.66 | 5.60 |
Class I Shares
| 1.10% | 1,000.00 | 1,019.66 | 5.60 |
About Your Fund’s Expenses
| | Annualized Expense Ratio | Beginning Account Value
(07/01/14) | Ending Account Value
(12/31/14) | Expenses Paid During Period
(07/01/14–
12/31/14) (1) |
| GLOBAL REAL ESTATE FUND | | | | |
| Actual | | | | |
Class A Shares
| 1.20% | $1,000.00 | $1,036.10 | $ 6.16 |
Class C Shares
| 1.95% | 1,000.00 | 1,031.50 | 9.98 |
Class Y Shares
| 0.95% | 1,000.00 | 1,036.70 | 4.88 |
Class I Shares
| 0.95% | 1,000.00 | 1,037.50 | 4.88 |
| Hypothetical (assuming a 5% return before expenses) | | | | |
Class A Shares
| 1.20% | 1,000.00 | 1,019.16 | 6.11 |
Class C Shares
| 1.95% | 1,000.00 | 1,015.38 | 9.91 |
Class Y Shares
| 0.95% | 1,000.00 | 1,020.42 | 4.84 |
Class I Shares
| 0.95% | 1,000.00 | 1,020.42 | 4.84 |
| U.S. REAL ESTATE FUND | | | | |
| Actual | | | | |
Class A Shares
| 1.20% | $1,000.00 | $1,091.50 | $ 6.33 |
Class C Shares
| 1.95% | 1,000.00 | 1,087.40 | 10.26 |
Class Y Shares
| 0.95% | 1,000.00 | 1,092.50 | 5.01 |
Class I Shares
| 0.95% | 1,000.00 | 1,092.50 | 5.01 |
| Hypothetical (assuming a 5% return before expenses) | | | | |
Class A Shares
| 1.20% | 1,000.00 | 1,019.16 | 6.11 |
Class C Shares
| 1.95% | 1,000.00 | 1,015.38 | 9.91 |
Class Y Shares
| 0.95% | 1,000.00 | 1,020.42 | 4.84 |
Class I Shares
| 0.95% | 1,000.00 | 1,020.42 | 4.84 |
| | Annualized Expense Ratio | Beginning Account Value
(11/19/14) | Ending Account Value
(12/31/14) | Expenses Paid During Period
(11/19/14–
12/31/14) (2) |
| REAL ASSETS FUND | | | | |
| Actual | | | | |
Class A Shares
| 1.35% | $1,000.00 | $974.50 | $1.53 |
Class C Shares
| 2.10% | 1,000.00 | 973.70 | 2.38 |
Class Y Shares
| 1.10% | 1,000.00 | 974.90 | 1.25 |
Class I Shares
| 1.10% | 1,000.00 | 973.90 | 1.25 |
| | Annualized Expense Ratio | Beginning Account Value
(07/01/14) | Ending Account Value
(12/31/14) | Expenses Paid During Period
(07/01/14–
12/31/14) (1) |
| Hypothetical (assuming a 5% return before expenses) | | | | |
Class A Shares
| 1.35% | $1,000.00 | 1,018.40 | $ 6.87 |
Class C Shares
| 2.10% | 1,000.00 | 1,014.62 | 10.66 |
Class Y Shares
| 1.10% | 1,000.00 | 1,019.66 | 5.60 |
Class I Shares
| 1.10% | 1,000.00 | 1,019.66 | 5.60 |
| (1) | Expenses are equal to the Funds’ annualized expense ratio multiplied by the average account value over the period, multiplied by 184/365 (to reflect a six-month period). |
| (2) | Expenses are equal to the Funds’ annualized expense ratio multiplied by the average account value over the period, multiplied by 42/365 (to reflect a 42 day period). The Fund commenced operations on November 19, 2014. |
4Brookfield Investment Management Inc.
Brookfield Global Listed Infrastructure Fund
MANAGEMENT DISCUSSION OF FUND PERFORMANCE
By sector, pipelines and toll roads were the leading detractors relative to the Dow Jones Brookfield Global Infrastructure Composite Index1 (the “Benchmark”) due to stock selection.2 Our underweight position in the electricity transmission & distribution sector, the Benchmark’s strongest-performing sector for the year, was also a meaningful detractor from relative performance. In anticipation of rising interest rates, the portfolio maintained a significant underweight to slower-growing, higher-yielding “bond proxies,” including companies in the electricity transmission & distribution sector. Slowing global growth and falling interest rates led bond proxies to outperform. The Fund’s strongest relative contributor was an allocation to the non-Benchmark rail sector, as rail companies benefitted from the strengthening U.S. economy. In addition, stock selection within the midstream sector provided positive performance versus the Benchmark.
By region, Asia Pacific and Continental Europe were the largest detractors from relative performance as a result of stock selection. In terms of individual countries, China was the weakest performer relative to the Benchmark due to stock selection and an overweight allocation to the underperforming country. Brazil was also a meaningful detractor from relative performance. The country struggled throughout the year with slowing growth, increasing inflation, droughts and uncertainty around their presidential election in October. Canada was the leading contributor by country due to stock selection and an overweight allocation to the outperforming country. Hong Kong also contributed to relative performance, driven by an underweight allocation to the underperforming country.
In terms of individual securities, non-Benchmark holding KunLun Energy Co. Ltd. (HKG: 0135) (China, pipelines) was the largest detractor from relative performance. In September, KunLun announced a reduction in the tariff that the company can charge, triggering a decline in its share price. The second-largest detractor, Beijing Enterprises Holdings Limited (HKG: 0392) (China, pipelines), underperformed due to general weakness in China. The third-largest detractor, non-Benchmark holding Abengoa S.A. (BME: ABG) (Spain, diversified), disclosed balance sheet issues in November that had not been anticipated by the market, leading to a sell-off. The Fund’s largest relative contributor for the year was U.S. Master Limited Partnership (“MLP”) Kinder Morgan Energy Partners, L.P. (U.S., MLP), which was acquired by Kinder Morgan Inc. (NYSE: KMI) (U.S., pipelines) in November. An overweight position in company EQT Midstream Partners LP (NYSE: EQM) (U.S., pipelines) and non-Benchmark holding Union Pacific Corporation (NYSE: UNP) (U.S., rail) also provided strong relative performance for the year.
INFRASTRUCTURE MARKET OVERVIEW AND OUTLOOK
Positive performance for the year, but results vary across regions
Overall, 2014 was a strong year for infrastructure securities, despite the effects of falling oil and natural gas prices on energy infrastructure companies during the second half of the year. For the year ending December 31, 2014, the Dow Jones Brookfield Global Infrastructure Composite Index returned 15.6%, outperforming the MSCI World Index3 by more than 1,000 basis points (bps). All infrastructure sectors were positive for the year, led by electricity transmission & distribution (+22.3%), water (+17.9) and communications (+17.7%), all of which outperformed the broader index. Relative laggards included toll roads (+9.9%), diversified (+5.7%) and ports (+3.4%). MLPs finished up 4.8% for the year, as measured by the Alerian MLP Total Return Index.4However, the MLP sector experienced significant volatility later in the year, finishing the fourth quarter down 12.3%.
Declining crude oil prices dominate headlines
Crude oil prices plunged by almost 50% in 2014, with the price of Brent crude oil ending the year at approximately $55 per barrel, compared with approximately $108 per barrel as of December 31, 2013.5 Amidst declining prices, it was widely hoped that the Organization of Petroleum Exporting Countries (OPEC) would announce explicit production cuts at its meeting in late November in an attempt to stabilize prices. However, OPEC decided not to cut production and changed its stance from defending price to protecting market share against North American producers. As a result of the decision, oil prices plunged, and have since remained volatile. During the fourth quarter, natural gas prices also fell by almost 30%.6 These significant declines in commodity prices led to weak
Brookfield Global Listed Infrastructure Fund
performance and a lower outlook for energy exploration & production (E&P) companies, which are the customers of energy infrastructure companies.
Corporate merger and acquisition news
There was a broad range of activity during the year, although deals and IPOs tapered off in December amidst the continuing decline in oil and natural gas prices. A few highlights of the year include Exelon Corporation’s (NYSE: EXC) (U.S., utilities) agreement in the second quarter to buy Pepco Holdings Inc. (NYSE: POM) (U.S., utilities) for $6.8 billion, creating one of the largest electric and natural gas utility companies in the U.S. The combined company will serve approximately 10 million customers and maintain a rate base of $26.0 billion. The transaction is expected to close during the second or third quarter of 2015. In October, Williams Partners L.P. (NYSE: WPZ), (U.S., MLP), a diversified MLP focused on natural gas pipelines and processing, announced it had entered into a merger agreement with Access Midstream Partners, L.P. (NYSE: ACMP) (U.S., MLP). The Williams Companies, Inc. (NYSE: WMB) (U.S., midstream) owns a controlling interest in both entities. The $50 billion transaction is expected to close in early 2015 and will create one of the largest MLPs. In November, Kinder Morgan Inc. (NYSE: KMI) (U.S., pipelines) completed its successful consolidation of several of its affiliated MLPs. The completed deal was the largest in the energy sector since Exxon’s merger with Mobil in 1999, and made KMI a single, publically listed company on the NYSE. In December, market activity slowed considerably, but a notable development was an announcement that Veresen Inc. (TSE: VSN) (Canada, pipelines) and private equity firm KKR & Co. have formed a CAD $5 billion pipeline and natural gas gathering joint venture to serve natural gas producers in northern British Columbia.
OUTLOOK
The outlook for most infrastructure sectors is generally positive. We believe that low oil prices will keep inflation under control, allowing central banks to keep interest rates lower for longer. These low rates should be supportive of infrastructure valuations. From a regional perspective, lower oil prices should be positive for GDP growth for oil-importing countries, but negative for countries that rely heavily on oil exports. From a sector perspective, we continue to monitor the potential impact of sustained lower oil prices on our energy infrastructure holdings. Energy infrastructure companies generally do not have significant direct commodity sensitivity, but we remain cognizant that prolonged lower oil prices will likely reduce the growth outlooks and capital expenditures of E&P companies, which in turn will reduce the growth rate of energy infrastructure companies. We believe the portfolio’s energy infrastructure holdings are attractively valued and will realize growth in an environment of lower oil prices. We continue to favor securities that offer a reasonable combination of yield and growth.
| 1 | Attribution reflects returns in local currencies. |
| 2 | As measured by the MSCI World Index, a free float-adjusted market capitalization weighted index that is designed to measure the equity market performance of developed markets. |
| 3 | The Dow Jones Brookfield Global Infrastructure Composite Index is calculated and maintained by S&P Dow Jones Indices and comprises infrastructure companies with at least 70% of their annual cash flows derived from owning and operating infrastructure assets, including Master Limited Partnerships. You cannot invest directly in an index. |
| 4 | The Alerian MLP Total Return Index is a composite of the 50 most prominent energy Master Limited Partnerships (MLPs) and is calculated using a float-adjusted, capitalization-weighted methodology. You cannot invest directly in an index. |
| 5 | Source: U.S. Energy Information Administration. |
| 6 | Source: U.S. Energy Information Administration. |
6Brookfield Investment Management Inc.
Brookfield Global Listed Infrastructure Fund
AVERAGE ANNUAL TOTAL RETURNS
| As of December 31, 2014 | 1 Year | Since Inception* |
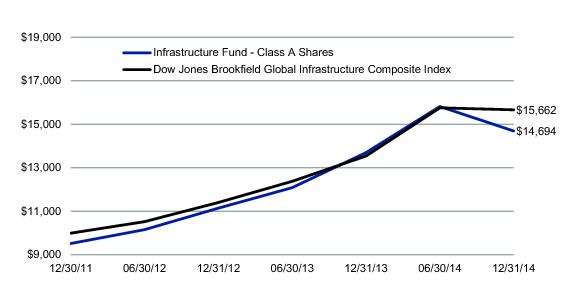
| Class A Shares (excluding sales charge) | 7.27% | 15.53% |
| Class A Shares (including sales charge) | 2.21% | 13.66% |
| Class C Shares (excluding sales charge) | 6.41% | 13.12% |
| Class C Shares (including sales charge) | 5.41% | 13.12% |
| Class Y Shares | 7.54% | 15.85% |
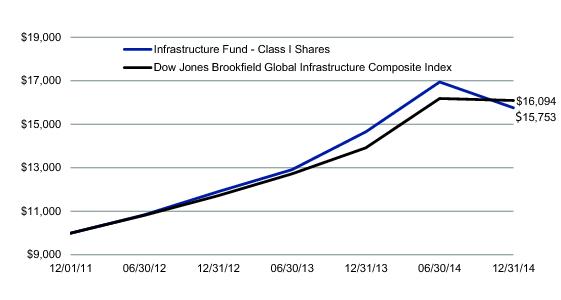
| Class I Shares | 7.53% | 15.87% |
| Dow Jones Brookfield Global Infrastructure Composite Index | 15.63% | 16.61% |
* Class A was incepted on December 29, 2011, Class C was incepted on May 1, 2012 and Classes Y and I were incepted on December 1, 2011. The Dow Jones Brookfield Global Infrastructure Composite Index references Class I’s inception date.
Performance data quoted represents past performance; past performance does not guarantee future results. The investment return and principal value of an investment will fluctuate so that an investor’s shares, when redeemed, may be worth more or less than their original cost. Current performance of the Fund may be lower or higher than the performance quoted. Performance data current to the most recent month end may be obtained by calling 855.244.4859. The Fund imposes a 2.00% redemption fee on shares redeemed within 60 days. Performance data does not reflect the imposition of the redemption fee and if it had, performance would have been lower. Performance shown including sales charge reflects the Class A maximum sales charge of 4.75% and the Class C Contingent Deferred Sales Charge (CDSC) of 1.00%. Performance data excluding sales charge does not reflect the deduction of the sales charge or CDSC and if reflected, the sales charge or fee would reduce the performance quoted.
As per the prospectus dated April 30, 2014, the Fund’s gross and net expense ratios for Class A is 1.51% and 1.35%, Class C is 2.26% and 2.10%, Class Y is 1.26% and 1.10% and Class I is 1.26% and 1.10%, respectively for the year ended December 31, 2013.
The Adviser has contractually agreed to reimburse the Fund's expenses through May 1, 2015. There is no guarantee that such reimbursement will be continued after that date.
Brookfield Global Listed Infrastructure Fund
The graphs below illustrate a hypothetical investment of $10,000 in the Infrastructure Fund—Class A Shares from the commencement of investment operations on December 29, 2011 to December 31, 2014 compared to the Dow Jones Brookfield Global Infrastructure Composite Index and Class I Shares from the commencement of investment operations on December 1, 2011 to December 31, 2014 compared to the Dow Jones Brookfield Global Infrastructure Composite Index.
Class A Shares
Class I Shares
8Brookfield Investment Management Inc.
Brookfield Global Listed Infrastructure Fund
Disclosure
Performance data quoted represents past performance results and does not guarantee future results. Current performance may be lower or higher than the performance data quoted.
All returns shown in USD.
The Fund’s portfolio holdings are subject to change without notice. The mention of specific securities is not a recommendation or solicitation for any person to buy, sell or hold any particular security. There is no assurance that the Brookfield Global Listed Infrastructure Fund currently holds these securities. Please refer to the Schedule of Investments contained in this report for a full listing of fund holdings.
Mutual fund investing involves risk. Principal loss is possible.
A basis point (bps) is a unit that is equal to 1/100th of 1%.
These views represent the opinions of Brookfield Investment Management Inc. and are not intended to predict or depict the performance of any investment. These views are as of the close of business on December 31, 2014 and subject to change based on subsequent developments.
Brookfield Global Listed Infrastructure Fund
Portfolio Characteristics (Unaudited)
December 31, 2014
| ASSET ALLOCATION BY GEOGRAPHY | Percent of Net Assets |
| United States | 51.9% |
| Canada | 12.4% |
| United Kingdom | 8.8% |
| Italy | 4.5% |
| Australia | 4.2% |
| China | 3.9% |
| France | 3.8% |
| Spain | 2.3% |
| Japan | 2.1% |
| Brazil | 2.0% |
| Bermuda | 1.7% |
| Netherlands | 1.0% |
| Switzerland | 1.0% |
| Mexico | 0.4% |
| Liabilities in Excess of Other Assets | (0.0)% |
| Total | 100.0% |
| ASSET ALLOCATION BY SECTOR | Percentage of Net Assets |
| Pipelines | 29.4% |
| Midstream | 12.7% |
| Toll Roads | 10.0% |
| Telecommunications | 9.4% |
| Electricity Transmission & Distribution | 8.3% |
| Water | 6.8% |
| Gas Utilities | 5.9% |
| Communications | 3.7% |
| Rail | 3.2% |
| Electric Utilities & Generation | 2.6% |
| Infrastructure - Diversified | 2.1% |
| Transportation | 1.7% |
| Ports | 1.3% |
| Transmission & Distribution | 1.1% |
| Airports | 1.0% |
| Other | 0.8% |
| Liabilities in Excess of Other Assets | (0.0)% |
| Total | 100.0% |
| TOP TEN HOLDINGS | Percentage of Net Assets |
| American Tower Corp. | 5.9% |
| Enbridge, Inc. | 5.8% |
| National Grid PLC | 5.0% |
| Crown Castle International Corp. | 3.5% |
| Enterprise Products Partners LP | 3.0% |
| The Williams Companies, Inc. | 2.9% |
| Kinder Morgan, Inc. | 2.7% |
| Transurban Group | 2.6% |
| SBA Communications Corp. | 2.6% |
| Atlantia SpA | 2.5% |
10Brookfield Investment Management Inc.
Brookfield Global Listed Infrastructure Fund
Schedule of Investments
December 31, 2014
| | | | Shares | Value |
| COMMON STOCKS – 100.0% | | | | |
| AUSTRALIA – 4.2% | | | | |
| Electric Utilities & Generation – 1.6% | | | | |
Origin Energy Limited
| | | 793,900 | $ 7,511,443 |
| Toll Roads – 2.6% | | | | |
Transurban Group
| | | 1,813,460 | 12,637,502 |
| Total AUSTRALIA | | | | 20,148,945 |
| BERMUDA – 1.7% | | | | |
| Transportation – 1.7% | | | | |
Teekay Corp.
| | | 157,500 | 8,015,175 |
| Total BERMUDA | | | | 8,015,175 |
| BRAZIL – 2.0% | | | | |
| Toll Roads – 0.9% | | | | |
CCR SA
| | | 766,650 | 4,444,390 |
| Water – 1.1% | | | | |
Cia de Saneamento Basico do Estado de Sao Paulo
| | | 848,200 | 5,335,178 |
| Total BRAZIL | | | | 9,779,568 |
| CANADA – 12.4% | | | | |
| Pipelines – 12.4% | | | | |
Enbridge, Inc.
| | | 538,900 | 27,710,351 |
Inter Pipeline Ltd.
| | | 313,900 | 9,710,420 |
Pembina Pipeline Corp.
| | | 185,200 | 6,749,327 |
TransCanada Corp.
| | | 207,900 | 10,217,843 |
Veresen, Inc.
| | | 331,400 | 5,237,135 |
| Total Pipelines | | | | 59,625,076 |
| Total CANADA | | | | 59,625,076 |
| CHINA – 3.9% | | | | |
| Gas Utilities – 1.4% | | | | |
ENN Energy Holdings Ltd.
| | | 1,183,800 | 6,697,128 |
| Pipelines – 1.2% | | | | |
Beijing Enterprises Holdings Ltd.
| | | 745,100 | 5,827,211 |
| Ports – 1.3% | | | | |
COSCO Pacific Ltd.
| | | 4,487,400 | 6,355,369 |
| Total CHINA | | | | 18,879,708 |
| FRANCE – 3.8% | | | | |
| Communications – 1.1% | | | | |
Eutelsat Communications SA
| | | 159,489 | 5,157,831 |
| Electric Utilities & Generation – 1.0% | | | | |
GDF Suez
| | | 206,400 | 4,813,062 |
| Toll Roads – 1.7% | | | | |
Group Eurotunnel SA
| | | 635,200 | 8,200,565 |
| Total FRANCE | | | | 18,171,458 |
| ITALY – 4.5% | | | | |
| Pipelines – 2.0% | | | | |
Snam Rete Gas SpA
| | | 1,883,234 | 9,320,564 |
See Notes to Financial Statements.
Brookfield Global Listed Infrastructure Fund
Schedule of Investments (continued)
December 31, 2014
| | | | Shares | Value |
| COMMON STOCKS (continued) | | | | |
| Toll Roads – 2.5% | | | | |
Atlantia SpA
| | | 524,300 | $ 12,185,794 |
| Total ITALY | | | | 21,506,358 |
| JAPAN – 2.1% | | | | |
| Gas Utilities – 2.1% | | | | |
Tokyo Gas Company Ltd.
| | | 1,819,300 | 9,816,333 |
| Total JAPAN | | | | 9,816,333 |
| MEXICO – 0.4% | | | | |
| Pipelines – 0.4% | | | | |
Infraestructura Energetica Nova SAB de CV
| | | 360,100 | 1,801,263 |
| Total MEXICO | | | | 1,801,263 |
| NETHERLANDS – 1.0% | | | | |
| Midstream – 1.0% | | | | |
VOPAK
| | | 95,800 | 4,970,306 |
| Total NETHERLANDS | | | | 4,970,306 |
| SPAIN – 2.3% | | | | |
| Toll Roads – 2.3% | | | | |
Ferrovial SA
| | | 545,614 | 10,785,816 |
| Total SPAIN | | | | 10,785,816 |
| SWITZERLAND – 1.0% | | | | |
| Airports – 1.0% | | | | |
Flughafen Zuerich AG
| | | 7,487 | 5,007,018 |
| Total SWITZERLAND | | | | 5,007,018 |
| UNITED KINGDOM – 8.8% | | | | |
| Electricity Transmission & Distribution – 5.0% | | | | |
National Grid PLC
| | | 1,699,900 | 24,120,415 |
| Water – 3.8% | | | | |
Pennon Group PLC
| | | 524,700 | 7,496,234 |
Severn Trent PLC
| | | 155,500 | 4,849,939 |
United Utilities Group PLC
| | | 417,900 | 5,935,831 |
| Total Water | | | | 18,282,004 |
| Total UNITED KINGDOM | | | | 42,402,419 |
| UNITED STATES – 51.9% | | | | |
| Communications – 2.6% | | | | |
SBA Communications Corp. 1
| | | 112,000 | 12,405,120 |
| Electricity Transmission & Distribution – 3.3% | | | | |
ITC Holdings Corp.
| | | 131,300 | 5,308,459 |
Northeast Utilities
| | | 147,200 | 7,878,144 |
UIL Holdings Corp.
| | | 60,500 | 2,634,170 |
| Total Electricity Transmission & Distribution | | | | 15,820,773 |
| Gas Utilities – 2.4% | | | | |
AGL Resources, Inc.
| | | 95,000 | 5,178,450 |
NiSource, Inc.
| | | 143,800 | 6,099,996 |
| Total Gas Utilities | | | | 11,278,446 |
See Notes to Financial Statements.
12Brookfield Investment Management Inc.
Brookfield Global Listed Infrastructure Fund
Schedule of Investments (continued)
December 31, 2014
| | | | Shares | Value |
| COMMON STOCKS (continued) | | | | |
| Infrastructure - Diversified – 2.1% | | | | |
CenterPoint Energy, Inc.
| | | 423,500 | $ 9,922,605 |
| Midstream – 11.7% | | | | |
Access Midstream Partners LP
| | | 165,400 | 8,964,680 |
Atlas Pipeline Partners LP
| | | 128,500 | 3,502,910 |
Crestwood Equity Partners LP
| | | 758,700 | 6,145,470 |
EQT Midstream Partners LP
| | | 59,500 | 5,236,000 |
MarkWest Energy Partners LP
| | | 116,744 | 7,844,029 |
ONEOK Inc.
| | | 106,500 | 5,302,635 |
Targa Resources Corp.
| | | 52,000 | 5,514,600 |
The Williams Companies, Inc.
| | | 307,600 | 13,823,544 |
| Total Midstream | | | | 56,333,868 |
| Other – 0.8% | | | | |
EV Energy Partners LP
| | | 187,500 | 3,613,125 |
| Pipelines – 13.4% | | | | |
Boardwalk Pipeline Partners LP
| | | 422,300 | 7,504,271 |
Energy Transfer Equity LP
| | | 174,600 | 10,018,548 |
Enterprise Products Partners LP
| | | 397,400 | 14,354,088 |
Kinder Morgan, Inc.
| | | 306,000 | 12,946,860 |
Sempra Energy
| | | 109,300 | 12,171,648 |
Spectra Energy Corp.
| | | 206,200 | 7,485,060 |
| Total Pipelines | | | | 64,480,475 |
| Rail – 3.2% | | | | |
Kansas City Southern
| | | 43,200 | 5,271,696 |
Union Pacific Corp.
| | | 84,800 | 10,102,224 |
| Total Rail | | | | 15,373,920 |
| Telecommunications – 9.4% | | | | |
American Tower Corp.
| | | 288,523 | 28,520,433 |
Crown Castle International Corp.
| | | 211,700 | 16,660,790 |
| Total Telecommunications | | | | 45,181,223 |
| Transmission & Distribution – 1.1% | | | | |
PG&E Corp.
| | | 98,300 | 5,233,492 |
| Water – 1.9% | | | | |
American Water Works Company Inc.
| | | 171,300 | 9,130,290 |
| Total UNITED STATES | | | | 248,773,337 |
Total COMMON STOCKS
(Cost $427,026,952)
| | | | 479,682,780 |
Total Investments – 100.0%
(Cost $427,026,952)
| | | | 479,682,780 |
Liabilities in Excess of Other Assets – (0.0)%
| | | | (25,044) |
TOTAL NET ASSETS – 100.0%
| | | | $479,657,736 |
| The following notes should be read in conjunction with the accompanying Schedule of Investments. | |
| 1 | — Non-income producing security. |
See Notes to Financial Statements.
Brookfield Global Listed Real Estate Fund
MANAGEMENT DISCUSSION OF FUND PERFORMANCE
Over the 12 months ending December 31, 2014, the diversified and residential sectors were the greatest relative contributors to performance driven by stock selection. The largest individual contributors to performance by security included a zero weight to Sumitomo Realty & Development (8830.JP) (Japan, residential) and an underweight position in Mitsui Fudosan Co., Ltd. (8801.JP) (Japan, diversified). These companies were trading at expensive valuations and were also held back by the general weakness across Japanese real estate companies over the course of the year. Mitsubishi Estate Company, Limited (Japan, office) was the largest relative detractor by security. The Fund had an overweight position in the underperforming company. The Fund’s underweight position towards Japan over the course of the year was beneficial to relative performance, as it was the worst performing country in the Benchmark for the 12 months.
The retail sector was the largest detractor from relative performance driven by stock selection. Non-benchmark holding Atrium European Real Estate Limited (ATRS.AV) (Poland, retail) was one of the top detractors from relative performance as the company was impacted by tensions between the Ukraine and Russia. Another key relative detractor in the retail space was non-Benchmark holding Multiplan Empreendimentos Imobiliarios SA (Brazil), which was affected by weakness in the country’s recovering economy. A zero weight to the manufactured homes sector also modestly detracted from relative performance.
On a regional basis, Asia Pacific was the largest contributor to relative performance driven by the Fund’s underweight allocation to Japan. Stock selection in the U.S. also contributed to relative performance. Europe contributed to relative performance while a non-Benchmark position in Brazil was a detractor.
By security, non-Benchmark exposure to Iron Mountain Incorporated (NYSE: IRM) (U.S., self storage), was a leading relative contributor. The company performed well after achieving REIT status in 2014. Health Care REIT, Inc (NYSE: HCN) (health care) was a leading relative detractor. The Fund did not own this security which delivered strong performance during the year.
GLOBAL REAL ESTATE MARKET OVERVIEW
Positive performance for the year, but results vary across regions
For 2014, the MSCI World Index returned 5.5%1, although there was broad divergence in performance across regions and sectors. North America provided the strongest regional performance, returning 12.6% for the year, while Europe returned -5.7% and Asia Pacific returned -2.5%. Among developed markets, the U.S. was clearly the bright spot, marked by 5.0% annualized GDP growth rate in the third quarter of 2014 and a significant decrease in the unemployment rate from 6.7% at the end of 2013 to 5.6% at the end of the 2014.2 In contrast, Japan entered into a recession in April, and the Eurozone continued to struggle with both slow growth and the risk of deflation. Acknowledging the ongoing weakness, the International Monetary Fund (IMF) lowered its global growth projections for 2014 in October to 3.4% from 3.8% earlier in the year.3
Falling crude oil prices - and a broader decline of most commodity prices – emerged as one of the most significant macroeconomic stories of the year. The price per barrel of global benchmark Brent crude oil declined by almost 50% from the beginning of the year.4 Lower energy prices should benefit oil-importing countries and hurt countries with heavy reliance on oil exports, as the IMF predicts that lower oil prices will lead to a 0.3% to 0.7% stimulus for the global economy in 2015.5 However, during late 2014, the volatility of oil prices led to investor caution.
Central banks continued to exert an outsized influence on global markets. The U.S. Federal Reserve (Fed) ended its final quantitative easing (QE) program in October. The yield on the 10-Year U.S. Treasury note ended the year at 2.2%, after beginning the year at 3.0%6. The decline in U.S. interest rates defied consensus expectations, particularly as many market participants had assumed that interest rates would rise following the conclusion of QE, but rates continued to remain low through the end of the year. Amidst slow growth and a failure to reach inflation targets, the Bank of Japan (BoJ) embarked on historic accommodative monetary policies throughout 2014. The asset purchases aimed to offset a marked decline in GDP of 6.8% in the second quarter after the
14Brookfield Investment Management Inc.
Brookfield Global Listed Real Estate Fund
Japanese consumption tax was increased to 8% in April. In December, Japanese Prime Minister Shinzo Abe’s party won elections in a landslide, signaling that more QE could be in store in 2015. In Europe, sluggish growth and a risk of deflation led to European Central Bank President Mario Draghi to suggest that the Eurozone could embark on QE in 2015. As a result, European shares rallied in November, but nonetheless ended the year down.
Real estate securities performed well with the FTSE EPRA/NAREIT Developed Index (the “Benchmark”)8 up 15.9% for the year ending December 31, 2014, outperforming the broader equity market9. North America led the way, up 28.2%, followed by Europe, up 18.8%, and Asia Pacific, up 15.0%. Developed real estate markets showed more resilience over the year, despite volatility month to month as market sentiment was impacted by macroeconomic indicators and political unrest, such as the Russia/Ukraine crisis which impacted some European names. A number of REIT markets and sectors ended the year trading at premiums to NAV. Conversely, emerging markets remained weak over the year, with country specific issues impacting local economies and security markets.
Capital markets and transaction activity continued throughout the year including the following:
| • | One of the highest profile transactions was the sale by Hilton Worldwide Holdings Inc. (NYSE: HLT) of the landmark Waldorf Astoria hotel in Manhattan to Chinese-based Anbang Insurance Group Co. for $1.95 billion. The transaction marked the largest ever for a U.S. hotel, according to research firm Lodging Econometrics. |
| • | Simon Property Group (NYSE: SPG) (U.S., regional malls), one of the largest owners of retail real estate in the U.S., completed the spin-off of a portfolio of assets through the listing of a new retail-focused REIT, Washington Prime Group (NYSE: WPG) (U.S., regional malls). |
| • | Westfield Group (WDC) (Australia, retail), one of the world’s largest owners of retail assets, announced shareholder approval of a reorganization plan to separate its assets geographically into two separate entities. Scentre Group (SCG) owns and manages assets formerly held by WDC in Australia and New Zealand, totaling $36 billion in value. Following the shareholder vote, WDC announced that 76 percent of votes cast were in favor of the reorganization, allowing the plan to proceed. The approval removed a significant overhang from the shares of WDC. |
| • | In one of the largest IPOs in U.S. REIT history; Paramount Group Inc (NYSE: PGRE) (U.S., office) raised approximately $2.3 billion in its IPO. Underpinned by a 10.4 million square foot office portfolio across New York City, Washington, D.C. and San Francisco, the offering was multiple times oversubscribed. |
| • | In other corporate activity, Deutsche Annington Immobilien SE, (Germany, residential) announced a $4.9 billion offer to acquire a rival German company, Gagfah SA (residential). If successful, it will mark one of Germany’s largest ever real estate acquisitions. |
OUTLOOK
As we look ahead to 2015, the Fund’s portfolio remains positioned for an environment of improving economic growth and modestly rising interest rates, which we expect over the medium term. The portfolio consequently has limited exposure to those sectors with greater sensitivity to interest rates and/or lower prospects for growth, such as triple net lease. We are monitoring exposure to markets which could be affected by falling oil prices. Following strong performance in 2014, we view U.S. REIT valuations as no longer cheap, however we see potential value opportunities in certain sectors, such as secondary-quality malls, as well as opportunities that may arise from anticipated REIT conversion activity.
Brookfield Global Listed Real Estate Fund
We believe valuations remain rich in the UK and, accordingly, have an underweight position in the country. We anticipate interest rates will remain low on the Continent, which should be beneficial for real estate asset valuations. Additionally, we see opportunities in emerging markets, most of which are at an earlier stage of the growth cycle relative to the U.S. and offer attractive valuations. Furthermore, we anticipate some emerging market governments will announce supportive monetary policy measures in 2015.
| 1 | As measured by the MSCI World Index, a free float-adjusted market capitalization weighted index that is designed to measure the equity market performance of developed markets. You cannot invest directly in an index. |
| 2 | Sources: U.S. Department of Commerce Bureau of Economic Analysis and U.S. Department of Labor Bureau of Labor Statistics. |
| 3 | http://www.imf.org/external/pubs/ft/weo/2014/02/index.htm. |
| 4 | Source: U.S. Energy Information Administration. |
| 5 | http://blog-imfdirect.imf.org/2014/12/22/seven-questions-about-the-recent-oil-price-slump/ |
| 6 | Source: U.S. Department of Treasury. |
| 7 | http://money.cnn.com/2014/08/12/news/economy/japan-gdp. |
| 8 | The FTSE EPRA/NAREIT Developed Index is a free-float adjusted, liquidity, size and revenue screened index designed to track the performance of listed real estate companies and REITS worldwide. You cannot invest directly in an index. |
| 9 | As measured by the MSCI World Index. |
AVERAGE ANNUAL TOTAL RETURNS
| As of December 31, 2014 | 1 Year | Since Inception* |
| Class A Shares (excluding sales charge) | 19.25% | 14.58% |
| Class A Shares (including sales charge) | 13.60% | 12.50% |
| Class C Shares (excluding sales charge) | 18.27% | 13.71% |
| Class C Shares (including sales charge) | 17.27% | 13.71% |
| Class Y Shares | 19.51% | 18.34% |
| Class I Shares | 19.61% | 18.34% |
| FTSE EPRA/NAREIT Developed Index | 15.89% | 15.77% |
* Classes A and C were incepted on May 1, 2012 and Classes Y and I were incepted on December 1, 2011. The FTSE/EPRA NAREIT Developed Index references Class I's inception date.
Performance data quoted represents past performance; past performance does not guarantee future results. The investment return and principal value of an investment will fluctuate so that an investor’s shares, when redeemed, may be worth more or less than their original cost. Current performance of the Fund may be lower or higher than the performance quoted. Performance data current to the most recent month end may be obtained by calling 855.244.4859. The Fund imposes a 2.00% redemption fee on shares redeemed within 60 days. Performance data does not reflect the imposition of the redemption fee and if it had, performance would have been lower. Performance shown including sales charge reflects the Class A maximum sales charge of 4.75% and the Class C Contingent Deferred Sales Charge (CDSC) of 1.00%. Performance data excluding sales charge does not reflect the deduction of the sales charge or CDSC and if reflected, the sales charge or fee would reduce the performance quoted.
As per the prospectus dated April 30, 2014, the Fund’s gross and net expense ratios for Class A is 1.66% and 1.20%, Class C is 2.41% and 1.95%, Class Y is 1.41% and 0.95% and Class I is 1.41% and 0.95%, respectively for the year ended December 31, 2013.
The Adviser has contractually agreed to reimburse the Fund's expenses through May 1, 2015. There is no guarantee that such reimbursement will be continued after that date.
16Brookfield Investment Management Inc.
Brookfield Global Listed Real Estate Fund
The graphs below illustrate a hypothetical investment of $10,000 in the Global Real Estate Fund—Class A Shares from the commencement of investment operations on May 1, 2012 to December 31, 2014 compared to the FTSE EPRA/NAREIT Developed Index and Class I Shares from the commencement of investment operations on December 1, 2011 to December 31, 2014 compared to the FTSE EPRA/NAREIT Developed Index.
Class A Shares
Class I Shares
Brookfield Global Listed Real Estate Fund
Disclosure
Performance data quoted represents past performance results and does not guarantee future results. Current performance may be lower or higher than the performance data quoted.
All returns shown in USD.
The Fund’s portfolio holdings are subject to change without notice. The mention of specific securities is not a recommendation or solicitation for any person to buy, sell or hold any particular security. There is no assurance that the Brookfield Global Listed Real Estate Fund currently holds these securities. Please refer to the Schedule of Investments contained in this report for a full listing of fund holdings.
Mutual fund investing involves risk. Principal loss is possible.
A capitalization rate is a rate of return on a real estate investment property which is based on the anticipated income that the property will generate.
These views represent the opinions of Brookfield Investment Management Inc. and are not intended to predict or depict the performance of any investment. These views are as of the close of business on December 31, 2014 and subject to change based on subsequent developments.
18Brookfield Investment Management Inc.
Brookfield Global Listed Real Estate Fund
Portfolio Characteristics (Unaudited)
December 31, 2014
| ASSET ALLOCATION BY GEOGRAPHY | Percent of Net Assets |
| United States | 48.4% |
| Australia | 8.5% |
| Japan | 8.1% |
| Hong Kong | 7.8% |
| Germany | 5.6% |
| France | 4.8% |
| Singapore | 3.8% |
| United Kingdom | 2.4% |
| Netherlands | 1.8% |
| Brazil | 0.9% |
| New Zealand | 0.9% |
| Austria | 0.7% |
| Other Assets in Excess of Liabilities | 6.3% |
| Total | 100.0% |
| ASSET ALLOCATION BY SECTOR | Percentage of Net Assets |
| Office | 18.5% |
| Real Estate - Diversified | 17.0% |
| Retail | 13.8% |
| Residential | 7.7% |
| Regional Malls | 7.4% |
| Healthcare | 6.0% |
| Strip Centers | 3.4% |
| Specialty | 3.3% |
| Mixed | 2.8% |
| Telecommunications | 2.4% |
| Real Estate Management/Service | 2.3% |
| Developer - Office | 2.0% |
| Hotel | 1.9% |
| Industrial | 1.9% |
| Homebuilders | 1.4% |
| Self Storage | 1.0% |
| Real Estate Operator/Developer | 0.9% |
| Other Assets in Excess of Liabilities | 6.3% |
| Total | 100.0% |
| TOP TEN HOLDINGS | Percentage of Net Assets |
| Unibail-Rodamco SE | 4.8% |
| Simon Property Group, Inc. | 4.5% |
| Vornado Realty Trust | 4.2% |
| Mitsubishi Estate Company Ltd. | 3.6% |
| Outfront Media, Inc. | 3.3% |
| Ventas, Inc. | 3.2% |
| Westfield Corp. | 3.1% |
| CBL & Associates Properties, Inc. | 2.9% |
| AvalonBay Communities, Inc. | 2.4% |
| Douglas Emmett, Inc. | 2.4% |
Brookfield Global Listed Real Estate Fund
Schedule of Investments
December 31, 2014
| | | | Shares | Value |
| COMMON STOCKS – 93.7% | | | | |
| AUSTRALIA – 8.5% | | | | |
| Industrial – 0.9% | | | | |
Goodman Group
| | | 687,600 | $ 3,175,946 |
| Real Estate - Diversified – 2.3% | | | | |
Dexus Property Group
| | | 1,417,300 | 8,023,123 |
| Retail – 5.3% | | | | |
Scentre Group 1
| | | 2,551,173 | 7,227,916 |
Westfield Corp. 1
| | | 1,476,000 | 10,819,619 |
| Total Retail | | | | 18,047,535 |
| Total AUSTRALIA | | | | 29,246,604 |
| AUSTRIA – 0.7% | | | | |
| Residential – 0.7% | | | | |
Conwert Immobilien Invest SE
| | | 212,000 | 2,503,306 |
| Total AUSTRIA | | | | 2,503,306 |
| BRAZIL – 0.9% | | | | |
| Retail – 0.9% | | | | |
Multiplan Empreendimentos Imobiliarios SA
| | | 181,300 | 3,235,600 |
| Total BRAZIL | | | | 3,235,600 |
| FRANCE – 4.8% | | | | |
| Real Estate - Diversified – 4.8% | | | | |
Unibail-Rodamco SE
| | | 64,200 | 16,469,630 |
| Total FRANCE | | | | 16,469,630 |
| GERMANY – 5.6% | | | | |
| Mixed – 0.9% | | | | |
DIC Asset AG
| | | 364,574 | 3,251,639 |
| Office – 1.9% | | | | |
Alstria Office REIT - AG
| | | 521,300 | 6,472,802 |
| Real Estate Management/Service – 2.3% | | | | |
Deutsche Annington Immobilien SE
| | | 228,100 | 7,744,394 |
| Residential – 0.5% | | | | |
Grand City Properties SA 1
| | | 112,800 | 1,663,255 |
| Total GERMANY | | | | 19,132,090 |
| HONG KONG – 7.8% | | | | |
| Office – 2.4% | | | | |
Hongkong Land Holdings Ltd.
| | | 1,217,600 | 8,203,614 |
| Real Estate - Diversified – 2.0% | | | | |
Sun Hung Kai Properties Ltd.
| | | 449,051 | 6,803,325 |
| Retail – 3.4% | | | | |
Hang Lung Properties Ltd.
| | | 1,808,800 | 5,046,022 |
Wharf Holdings Ltd.
| | | 939,700 | 6,746,192 |
| Total Retail | | | | 11,792,214 |
| Total HONG KONG | | | | 26,799,153 |
See Notes to Financial Statements.
20Brookfield Investment Management Inc.
Brookfield Global Listed Real Estate Fund
Schedule of Investments (continued)
December 31, 2014
| | | | Shares | Value |
| COMMON STOCKS (continued) | | | | |
| JAPAN – 8.1% | | | | |
| Homebuilders – 1.4% | | | | |
Sekisui House Ltd.
| | | 379,200 | $ 4,989,506 |
| Office – 4.8% | | | | |
Mitsubishi Estate Company Ltd.
| | | 582,755 | 12,279,159 |
Nippon Building Fund, Inc.
| | | 810 | 4,066,289 |
| Total Office | | | | 16,345,448 |
| Real Estate - Diversified – 1.9% | | | | |
Mitsui Fudosan Company Ltd.
| | | 241,300 | 6,470,594 |
| Total JAPAN | | | | 27,805,548 |
| NETHERLANDS – 1.8% | | | | |
| Retail – 1.8% | | | | |
Atrium European Real Estate Ltd.
| | | 1,217,750 | 6,026,787 |
| Total NETHERLANDS | | | | 6,026,787 |
| NEW ZEALAND – 0.9% | | | | |
| Real Estate Operator/Developer – 0.9% | | | | |
Precinct Properties New Zealand Ltd.
| | | 3,409,300 | 3,156,873 |
| Total NEW ZEALAND | | | | 3,156,873 |
| SINGAPORE – 3.8% | | | | |
| Developer - Office – 2.0% | | | | |
Keppel Land Ltd.
| | | 2,623,900 | 6,759,496 |
| Real Estate - Diversified – 1.8% | | | | |
CapitaLand Ltd.
| | | 2,416,000 | 6,007,024 |
Suntec Real Estate Investment Trust
| | | 161,600 | 239,058 |
| Total Real Estate - Diversified | | | | 6,246,082 |
| Total SINGAPORE | | | | 13,005,578 |
| UNITED KINGDOM – 2.4% | | | | |
| Retail – 2.4% | | | | |
Hammerson PLC
| | | 874,200 | 8,186,823 |
| Total UNITED KINGDOM | | | | 8,186,823 |
| UNITED STATES – 48.4% | | | | |
| Healthcare – 6.0% | | | | |
Brookdale Senior Living, Inc. 1
| | | 138,800 | 5,089,796 |
HCP, Inc.
| | | 76,056 | 3,348,746 |
Sabra Health Care REIT, Inc.
| | | 39,800 | 1,208,726 |
Ventas, Inc.
| | | 151,800 | 10,884,060 |
| Total Healthcare | | | | 20,531,328 |
| Hotel – 1.9% | | | | |
Host Hotels & Resorts, Inc.
| | | 277,800 | 6,603,306 |
| Industrial – 1.0% | | | | |
DCT Industrial Trust, Inc.
| | | 95,325 | 3,399,290 |
| Mixed – 1.9% | | | | |
Liberty Property Trust
| | | 176,700 | 6,649,221 |
See Notes to Financial Statements.
Brookfield Global Listed Real Estate Fund
Schedule of Investments (continued)
December 31, 2014
| | | | Shares | Value |
| COMMON STOCKS (continued) | | | | |
| Office – 9.4% | | | | |
Brandywine Realty Trust
| | | 210,500 | $ 3,363,790 |
Douglas Emmett, Inc.
| | | 294,250 | 8,356,700 |
DuPont Fabros Technology, Inc.
| | | 60,400 | 2,007,696 |
Highwoods Properties, Inc.
| | | 149,800 | 6,633,144 |
Parkway Properties, Inc.
| | | 216,200 | 3,975,918 |
SL Green Realty Corp.
| | | 67,400 | 8,021,948 |
| Total Office | | | | 32,359,196 |
| Real Estate - Diversified – 4.2% | | | | |
Vornado Realty Trust
| | | 121,400 | 14,289,994 |
| Regional Malls – 7.4% | | | | |
CBL & Associates Properties, Inc.
| | | 509,700 | 9,898,374 |
Simon Property Group, Inc.
| | | 85,400 | 15,552,194 |
| Total Regional Malls | | | | 25,450,568 |
| Residential – 6.5% | | | | |
AvalonBay Communities, Inc.
| | | 51,400 | 8,398,246 |
Camden Property Trust
| | | 77,400 | 5,715,216 |
Mid-America Apartment Communities, Inc.
| | | 110,800 | 8,274,544 |
| Total Residential | | | | 22,388,006 |
| Self Storage – 1.0% | | | | |
Iron Mountain, Inc.
| | | 85,223 | 3,294,721 |
| Specialty – 3.3% | | | | |
Outfront Media, Inc.
| | | 415,494 | 11,151,848 |
| Strip Centers – 3.4% | | | | |
Brixmor Property Group, Inc.
| | | 268,400 | 6,667,056 |
Washington Prime Group, Inc.
| | | 290,500 | 5,002,410 |
| Total Strip Centers | | | | 11,669,466 |
| Telecommunications – 2.4% | | | | |
American Tower Corp.
| | | 84,300 | 8,333,055 |
| Total UNITED STATES | | | | 166,119,999 |
Total COMMON STOCKS
(Cost $305,633,462)
| | | | 321,687,991 |
Total Investments – 93.7%
(Cost $305,633,462)
| | | | 321,687,991 |
Other Assets in Excess of Liabilities – 6.3%
| | | | 21,520,129 |
TOTAL NET ASSETS – 100.0%
| | | | $343,208,120 |
| The following notes should be read in conjunction with the accompanying Schedule of Investments. | |
| 1 | — Non-income producing security. |
See Notes to Financial Statements.
22Brookfield Investment Management Inc.
Brookfield U.S. Listed Real Estate Fund
MANAGEMENT DISCUSSION OF FUND PERFORMANCE
During the 12 month period ending December 31, 2014, the triple net lease sector was the leading relative contributor to performance driven by underweight exposure to the sector. The Fund’s largest individual contributor to performance was American Realty Capital Properties, Inc. (NYSE: ARCP) (triple net lease). We trimmed our overweight position in this company to zero over the course of the year based on our concerns for its medium term growth prospects. During the fourth quarter, ARCP sold off significantly amid news of possible accounting irregularities. The residential sector was also a meaningful contributor to relative performance. AvalonBay Communities, Inc. (NYSE: AVB), Equity Residential (NYSE: EQR) and Essex Property Trust, Inc. (NYSE: ESS) were among the top relative contributors by security during the year.
Regional malls and strip centers were the leading relative detractors by sector during the year. CBL & Associates Properties, Inc. (NYSE: CBL) (regional malls), which sold off due to investor concern over plans to sell some of its assets, was the Fund’s top relative detractor by security during the year. In addition, Washington Prime Group was also a leading relative detractor by security. The company was negatively impacted by concerns over future prospects for Sears and JC Penney.
By security, other standouts included non-Benchmark exposure to Iron Mountain Incorporated (NYSE: IRM) (self storage), which performed well after achieving REIT status in 2014. This was one the Fund’s largest relative contributors to annual performance.
Among the Fund’s leading detractors was OUTFRONT Media Inc (NYSE:OUT) (specialty), formerly known as CBS Outdoor Americas. The company’s share price declined after reporting lower than-expected earnings for the third quarter 2014. Zero exposure to Health Care REIT (NYSE: HCN) (health care) also detracted from relative performance as the company outperformed during the year amid low interest rates.
U.S. REAL ESTATE MARKET OVERVIEW
For the period from January 1, 2014 through December 31, 2014, the S&P 500 Total Return Index1 was up 13.7%. Among international developed markets, the U.S. was clearly the bright spot, marked by 5.0% annualized GDP growth rate in the third quarter of 2014 and a significant decrease in the unemployment rate from 6.7% at the end of 2013 to 5.6% at the end of the 2014.2
Falling crude oil prices - and a broader decline of most commodity prices – emerged as one of the most significant macroeconomic stories of the year. The price per barrel of global benchmark Brent crude oil declined by almost 50% from the beginning of the year.3 Lower energy prices should benefit oil-importing countries and hurt countries with heavy reliance on oil exports, as the IMF predicts that lower oil prices will lead to a 0.3% to 0.7% stimulus for the global economy in 2015.4
The U.S. Federal Reserve (Fed) ended its final quantitative easing (QE) program in October. The yield on the 10-Year U.S. Treasury note ended the year at 2.2%, after beginning the year at 3.0%5. The decline in U.S. interest rates defied consensus expectations, particularly as many market participants had assumed that interest rates would rise following the conclusion of QE, but rates continued to remain low through the end of the year.
U.S. real estate securities were up 30.4% for the 12 months ending December 31, 2014, as measured by the MSCI US REIT Total Return Index6 (the “Benchmark”). Residential was the strongest performer, up 36.7%, followed by health care, up 32.4%,7 driven by continued low interest rates. U.S. real estate markets showed resilience over the year, despite a level of volatility month to month as market sentiment was impacted by macroeconomic indicators, such as shifts in interest rate expectations. However, by the close of the year, a number of U.S. REIT sectors were trading at premiums to NAV.
Brookfield U.S. Listed Real Estate Fund
Capital markets and transaction activity continued throughout the period including:
| • | Simon Property Group (NYSE: SPG) (regional malls), one of the largest owners of retail real estate in the U.S., completed the spin-off of a portfolio of assets through the listing of a new retail-focused REIT, Washington Prime Group (NYSE: WPG) (regional malls). |
| • | The IRS issued a favorable ruling to Iron Mountain Inc. (NYSE: IRM) (self storage), a leading provider of storage and information management services, which led to a rally in the company’s share price. |
| • | CBS Outdoor Americas (specialty), one of the largest owners of outdoor advertising and billboard media space in the U.S., received approval to convert to a REIT and completed its separation from CBS Corporation. The company subsequently changed its name to OUTFRONT Media (NYSE: OUT). |
| • | In one of the largest IPOs in U.S. REIT history; Paramount Group Inc (NYSE: PGRE) (office) raised approximately $2.3 billion in its IPO. Underpinned by a 10.4 million square foot office portfolio across New York City, Washington, D.C. and San Francisco, the offering was multiple times oversubscribed. |
Interest in U.S. real estate extended beyond North American investors, with capital from the Asia Pacific and Middle East continuing to seek high quality assets in gateway markets in 2014. Over the year, one of the most significant transactions was the sale by Hilton Worldwide Holdings Inc. (NYSE: HLT) (hotels) of the landmark Waldorf Astoria hotel in Manhattan to Chinese-based Anbang Insurance Group Co. for $1.95 billion in October. The transaction marked the largest ever for a U.S. hotel, according to research firm Lodging Econometrics.
OUTLOOK
As we look ahead to 2015, the Fund’s portfolio remains positioned for an environment of improving economic growth and modestly rising interest rates, which we expect over the medium term. The portfolio consequently has limited exposure to those sectors with greater sensitivity to interest rates and/or lower prospects for growth, such as triple net lease. We are also monitoring exposure to markets which could be affected by falling oil prices. Following strong performance in 2014, we are monitoring U.S. REIT valuations and see potential value opportunities in certain sectors, such as secondary-quality malls, as well as anticipated REIT conversion activity.
| 1 | The S&P 500 Total Return Index is a broad based unmanaged index of 500 stocks, which is widely recognized as representative of the U.S. equity market in general. You cannot invest directly in an index. |
| 2 | Sources: U.S. Department of Commerce Bureau of Economic Analysis and U.S. Department of Labor Bureau of Labor Statistics |
| 3 | Source: U.S. Energy Information Administration |
| 4 | http://blog-imfdirect.imf.org/2014/12/22/seven-questions-about-the-recent-oil-price-slump/ |
| 5 | Source: U.S. Department of Treasury. |
| 6 | The MSCI US REIT Total Return Index (RMS) is a total return market capitalization-weighted index which prices once per day after market close. It is calculated by MSCI and is composed of equity REITs that are included in the MSCI US Investable Market 2500 Index. You cannot invest directly in an index. |
| 7 | Source: The FTSE EPRA/NAREIT Developed Sector Index, a free-float adjusted, liquidity, size and revenue screened index designed to track the performance of listed real estate companies and REITS worldwide. |
24Brookfield Investment Management Inc.
Brookfield U.S. Listed Real Estate Fund
AVERAGE ANNUAL TOTAL RETURNS
| As of December 31, 2014 | 1 Year | Since Inception* |
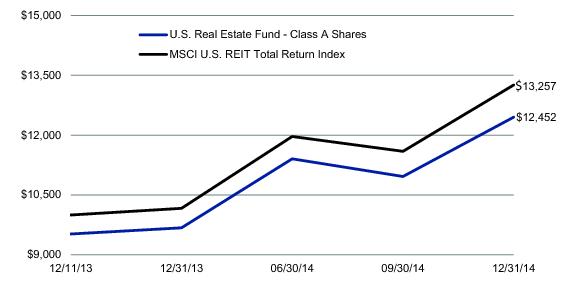
| Class A Shares (excluding sales charge) | 28.66% | 28.94% |
| Class A Shares (including sales charge) | 22.60% | 23.11% |
| Class C Shares (excluding sales charge) | 27.78% | 28.06% |
| Class C Shares (including sales charge) | 26.78% | 28.06% |
| Class Y Shares | 28.98% | 29.27% |
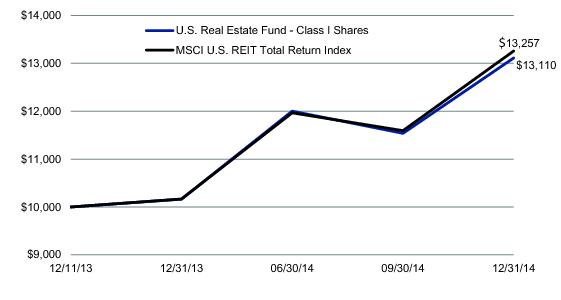
| Class I Shares | 28.98% | 29.27% |
| MSCI U.S. REIT Total Return Index | 30.38% | 30.64% |
* Classes A, C , Y and I were incepted on December 11, 2013.
Performance data quoted represents past performance; past performance does not guarantee future results. The investment return and principal value of an investment will fluctuate so that an investor’s shares, when redeemed, may be worth more or less than their original cost. Current performance of the Fund may be lower or higher than the performance quoted. Performance data current to the most recent month end may be obtained by calling 855.244.4859. The Fund imposes a 2.00% redemption fee on shares redeemed within 60 days. Performance data does not reflect the imposition of the redemption fee and if it had, performance would have been lower. Performance shown including sales charge reflects the Class A maximum sales charge of 4.75% and the Class C Contingent Deferred Sales Charge (CDSC) of 1.00%. Performance data excluding sales charge does not reflect the deduction of the sales charge or CDSC and if reflected, the sales charge or fee would reduce the performance quoted.
As per the prospectus dated April 30, 2014, the Fund’s gross and net expense ratios for Class A is 2.52% and 1.20%, Class C is 3.27% and 1.95%, Class Y is 2.27% and 0.95% and Class I is 2.27% and 0.95%, respectively for the year ended December 31, 2013.
The Adviser has contractually agreed to reimburse the Fund's expenses through May 1, 2015. There is no guarantee that such reimbursement will be continued after that date.
Brookfield U.S. Listed Real Estate Fund
The graphs below illustrate a hypothetical investment of $10,000 in the U.S Real Estate Fund—Class A Shares from the commencement of investment operations on December 11, 2013 to December 31, 2014 compared to the MSCI U.S. REIT Total Return Index and Class I Shares from the commencement of investment operations on December 11, 2013 to December 31, 2014 compared to the MSCI U.S. REIT Total Return Index.
Class A Shares
Class I Shares
26Brookfield Investment Management Inc.
Brookfield U.S. Listed Real Estate Fund
Disclosure
Performance data quoted represents past performance results and does not guarantee future results. Current performance may be lower or higher than the performance data quoted.
All returns shown in USD.
The Fund’s portfolio holdings are subject to change without notice. The mention of specific securities is not a recommendation or solicitation for any person to buy, sell or hold any particular security. There is no assurance that the Brookfield U.S. Listed Real Estate Fund currently holds these securities. Please refer to the Schedule of Investments contained in this report for a full listing of fund holdings.
Mutual fund investing involves risk. Principal loss is possible.
A capitalization rate is a rate of return on a real estate investment property which is based on the anticipated income that the property will generate.
These views represent the opinions of Brookfield Investment Management Inc. and are not intended to predict or depict the performance of any investment. These views are as of the close of business on December 31, 2014 and subject to change based on subsequent developments.
Brookfield U.S. Listed Real Estate Fund
Portfolio Characteristics (Unaudited)
December 31, 2014
| ASSET ALLOCATION BY SECTOR | Percentage of Net Assets |
| Office | 18.0% |
| Regional Malls | 16.4% |
| Healthcare | 12.5% |
| Residential | 11.3% |
| Real Estate - Diversified | 6.2% |
| Specialty | 6.2% |
| Strip Centers | 6.1% |
| Telecommunications | 5.6% |
| Mixed | 4.1% |
| Hotel | 2.9% |
| Industrial | 2.1% |
| Triple Net Lease | 2.0% |
| Self Storage | 1.9% |
| Other Assets in Excess of Liabilities | 4.7% |
| Total | 100.0% |
| TOP TEN HOLDINGS | Percentage of Net Assets |
| Simon Property Group, Inc. | 10.5% |
| Outfront Media, Inc. | 6.2% |
| Vornado Realty Trust | 6.2% |
| CBL & Associates Properties, Inc. | 5.9% |
| Ventas, Inc. | 5.8% |
| SL Green Realty Corp. | 4.9% |
| Douglas Emmett, Inc. | 4.3% |
| Liberty Property Trust | 4.1% |
| Highwoods Properties, Inc. | 4.1% |
| Mid-America Apartment Communities, Inc. | 3.9% |
28Brookfield Investment Management Inc.
Brookfield U.S. Listed Real Estate Fund
Schedule of Investments
December 31, 2014
| | | | Shares | Value |
| COMMON STOCKS – 95.3% | | | | |
| Healthcare – 12.5% | | | | |
Brookdale Senior Living, Inc. 1
| | | 18,400 | $ 674,728 |
HCP, Inc.
| | | 15,013 | 661,023 |
National Health Investors, Inc.
| | | 10,100 | 706,596 |
Sabra Health Care REIT, Inc.
| | | 6,200 | 188,294 |
Ventas, Inc.
| | | 26,500 | 1,900,050 |
| Total Healthcare | | | | 4,130,691 |
| Hotel – 2.9% | | | | |
Host Hotels & Resorts, Inc.
| | | 39,700 | 943,669 |
| Industrial – 2.1% | | | | |
DCT Industrial Trust, Inc.
| | | 19,350 | 690,021 |
| Mixed – 4.1% | | | | |
Liberty Property Trust
| | | 35,700 | 1,343,391 |
| Office – 18.0% | | | | |
Brandywine Realty Trust
| | | 40,600 | 648,788 |
Douglas Emmett, Inc.
| | | 50,300 | 1,428,520 |
DuPont Fabros Technology, Inc.
| | | 9,900 | 329,076 |
Highwoods Properties, Inc.
| | | 30,300 | 1,341,684 |
Parkway Properties, Inc.
| | | 31,500 | 579,285 |
SL Green Realty Corp.
| | | 13,600 | 1,618,672 |
| Total Office | | | | 5,946,025 |
| Real Estate - Diversified – 6.2% | | | | |
Vornado Realty Trust
| | | 17,300 | 2,036,383 |
| Regional Malls – 16.4% | | | | |
CBL & Associates Properties, Inc.
| | | 100,300 | 1,947,826 |
Simon Property Group, Inc.
| | | 19,100 | 3,478,301 |
| Total Regional Malls | | | | 5,426,127 |
| Residential – 11.3% | | | | |
AvalonBay Communities, Inc.
| | | 7,900 | 1,290,781 |
Camden Property Trust
| | | 15,700 | 1,159,288 |
Mid-America Apartment Communities, Inc.
| | | 17,400 | 1,299,432 |
| Total Residential | | | | 3,749,501 |
| Self Storage – 1.9% | | | | |
Iron Mountain, Inc.
| | | 16,612 | 642,220 |
| Specialty – 6.2% | | | | |
Outfront Media, Inc.
| | | 76,627 | 2,056,667 |
| Strip Centers – 6.1% | | | | |
Brixmor Property Group, Inc.
| | | 41,400 | 1,028,376 |
Washington Prime Group, Inc.
| | | 58,100 | 1,000,482 |
| Total Strip Centers | | | | 2,028,858 |
| Telecommunications – 5.6% | | | | |
American Tower Corp.
| | | 10,000 | 988,500 |
Crown Castle International Corp.
| | | 10,800 | 849,960 |
| Total Telecommunications | | | | 1,838,460 |
See Notes to Financial Statements.
Brookfield U.S. Listed Real Estate Fund
Schedule of Investments (continued)
December 31, 2014
| | | | Shares | Value |
| COMMON STOCKS (continued) | | | | |
| Triple Net Lease – 2.0% | | | | |
Lexington Realty Trust
| | | 58,900 | $ 646,722 |
Total COMMON STOCKS
(Cost $27,751,668)
| | | | 31,478,735 |
Total Investments – 95.3%
(Cost $27,751,668)
| | | | 31,478,735 |
Other Assets in Excess of Liabilities – 4.7%
| | | | 1,539,860 |
TOTAL NET ASSETS – 100.0%
| | | | $ 33,018,595 |
| The following notes should be read in conjunction with the accompanying Schedule of Investments. | |
| 1 | — Non-income producing security. |
See Notes to Financial Statements.
30Brookfield Investment Management Inc.
Brookfield Real Assets Securities Fund
INVESTMENT OBJECTIVE
The Real Assets Fund seeks total return, which is targeted to be in excess of inflation, through growth of capital and current income.
The Real Assets Fund commenced operations on November 19, 2014. The following pages show the portfolio characteristics and the schedule of investments for the Fund as of December 31, 2014.
Brookfield Real Assets Securities Fund
Portfolio Characteristics (Unaudited)
December 31, 2014
| ASSET ALLOCATION BY SECURITY TYPE | Percent of Net Assets |
| Common Stocks | 65.9% |
| Corporate Bonds | 24.5% |
| Preferred Stocks | 5.0% |
| Other Assets in Excess of Liabilities | 4.6% |
| Total | 100.0% |
| ASSET ALLOCATION BY GEOGRAPHY | Percentage of Net Assets |
| United States | 61.4% |
| Canada | 6.7% |
| United Kingdom | 3.5% |
| Australia | 3.4% |
| Japan | 2.3% |
| France | 2.1% |
| Hong Kong | 2.1% |
| Singapore | 2.1% |
| Bermuda | 1.7% |
| Germany | 1.7% |
| Italy | 1.2% |
| Belgium | 1.0% |
| Luxembourg | 1.0% |
| Spain | 1.0% |
| Greece | 1.0% |
| China | 0.8% |
| Netherlands | 0.7% |
| Mexico | 0.4% |
| Switzerland | 0.3% |
| New Zealand | 0.3% |
| Brazil | 0.2% |
| Ireland | 0.2% |
| Portugal | 0.2% |
| Norway | 0.1% |
| Other Assets in Excess of Liabilities | 4.6% |
| Total | 100.0% |
| TOP TEN HOLDINGS | Percentage of Net Assets |
| American Tower Corp. | 2.4% |
| Enbridge, Inc. | 2.2% |
| The Williams Companies, Inc. | 1.6% |
| Simon Property Group, Inc. | 1.3% |
| Unibail-Rodamco SE | 1.3% |
| National Grid PLC | 1.2% |
| Vornado Realty Trust | 1.2% |
| United Rentals North America, Inc. | 1.1% |
| Calpine Corp. | 1.1% |
| CCO Holdings LLC | 1.1% |
32Brookfield Investment Management Inc.
Brookfield Real Assets Securities Fund
Schedule of Investments
December 31, 2014
| | | | Shares | Value |
| COMMON STOCKS – 65.9% | | | | |
| AUSTRALIA – 3.4% | | | | |
| Electric Utilities & Generation – 0.4% | | | | |
Origin Energy Limited
| | | 10,900 | $ 103,130 |
| Industrial – 0.3% | | | | |
Goodman Group
| | | 13,100 | 60,507 |
| Real Estate - Diversified – 0.6% | | | | |
Dexus Property Group
| | | 27,400 | 155,107 |
| Retail – 1.5% | | | | |
Scentre Group 1
| | | 47,500 | 134,576 |
Westfield Corp. 1
| | | 29,400 | 215,513 |
| Total Retail | | | | 350,089 |
| Toll Roads – 0.6% | | | | |
Transurban Group
| | | 21,900 | 152,615 |
| Total AUSTRALIA | | | | 821,448 |
| BERMUDA – 0.7% | | | | |
| Transportation – 0.7% | | | | |
Teekay Corp.
| | | 3,500 | 178,115 |
| Total BERMUDA | | | | 178,115 |
| BRAZIL – 0.2% | | | | |
| Water – 0.2% | | | | |
Cia de Saneamento Basico do Estado de Sao Paulo
| | | 8,000 | 50,320 |
| Total BRAZIL | | | | 50,320 |
| CANADA – 6.7% | | | | |
| Basic Materials – 0.6% | | | | |
Agrium, Inc.
| | | 500 | 47,360 |
Dominion Diamond Corp. 1
| | | 2,900 | 52,084 |
Franco-Nevada Corp.
| | | 1,000 | 49,190 |
| Total Basic Materials | | | | 148,634 |
| Chemicals – 0.2% | | | | |
Methanex Corp.
| | | 900 | 41,247 |
| Electric Utilities & Generation – 0.4% | | | | |
Algonquin Power & Utilities Corp.
| | | 5,600 | 46,466 |
TransAlta Renewables, Inc.
| | | 5,700 | 56,323 |
| Total Electric Utilities & Generation | | | | 102,789 |
| Exploration & Production – 0.5% | | | | |
Africa Oil Corp. 1
| | | 5,500 | 11,409 |
MEG Energy Corp. 1
| | | 900 | 15,145 |
Peyto Exploration & Development Corp.
| | | 1,700 | 48,975 |
Seven Generations Energy Ltd. 1
| | | 2,700 | 40,646 |
| Total Exploration & Production | | | | 116,175 |
| Oilfield Services & Equipment – 0.1% | | | | |
Xtreme Drilling & Coil Services Corp.
| | | 19,700 | 37,982 |
| Pipelines – 4.4% | | | | |
Enbridge, Inc.
| | | 10,200 | 524,486 |
See Notes to Financial Statements.
Brookfield Real Assets Securities Fund
Schedule of Investments (continued)
December 31, 2014
| | | | Shares | Value |
| COMMON STOCKS (continued) | | | | |
Inter Pipeline Ltd.
| | | 5,100 | $ 157,767 |
Pembina Pipeline Corp.
| | | 3,300 | 120,153 |
TransCanada Corp.
| | | 4,300 | 211,336 |
Veresen, Inc.
| | | 3,700 | 58,472 |
| Total Pipelines | | | | 1,072,214 |
| Ports – 0.3% | | | | |
Westshore Terminals Investment Corp.
| | | 2,300 | 62,617 |
| Rail – 0.2% | | | | |
Canadian Pacific Railway Ltd.
| | | 300 | 57,807 |
| Total CANADA | | | | 1,639,465 |
| CHINA – 0.8% | | | | |
| Electric Utilities & Generation – 0.1% | | | | |
Huaneng Renewables Corporation Ltd.
| | | 41,300 | 13,248 |
| Gas Utilities – 0.2% | | | | |
ENN Energy Holdings Ltd.
| | | 10,300 | 58,270 |
| Pipelines – 0.2% | | | | |
Beijing Enterprises Holdings Ltd.
| | | 7,900 | 61,784 |
| Ports – 0.3% | | | | |
COSCO Pacific Ltd.
| | | 45,900 | 65,007 |
| Total CHINA | | | | 198,309 |
| FRANCE – 2.1% | | | | |
| Communications – 0.2% | | | | |
Eutelsat Communications SA
| | | 1,900 | 61,445 |
| Electric Utilities & Generation – 0.2% | | | | |
GDF Suez
| | | 2,600 | 60,630 |
| Real Estate - Diversified – 1.3% | | | | |
Unibail-Rodamco SE
| | | 1,200 | 307,844 |
| Toll Roads – 0.4% | | | | |
Group Eurotunnel SA
| | | 7,100 | 91,662 |
| Total FRANCE | | | | 521,581 |
| GERMANY – 1.7% | | | | |
| Mixed – 0.3% | | | | |
DIC Asset AG
| | | 7,100 | 63,325 |
| Office – 0.5% | | | | |
Alstria Office REIT - AG
| | | 10,100 | 125,408 |
| Real Estate Management/Service – 0.6% | | | | |
Deutsche Annington Immobilien SE
| | | 4,500 | 152,783 |
| Residential – 0.3% | | | | |
Grand City Properties SA 1
| | | 4,500 | 66,353 |
| Total GERMANY | | | | 407,869 |
| HONG KONG – 2.1% | | | | |
| Electric Utilities & Generation – 0.0% | | | | |
United Photovoltaics Group Ltd. 1
| | | 62,000 | 8,281 |
See Notes to Financial Statements.
34Brookfield Investment Management Inc.
Brookfield Real Assets Securities Fund
Schedule of Investments (continued)
December 31, 2014
| | | | Shares | Value |
| COMMON STOCKS (continued) | | | | |
| Office – 0.6% | | | | |
Hongkong Land Holdings Ltd.
| | | 22,000 | $ 148,226 |
| Real Estate - Diversified – 0.6% | | | | |
Sun Hung Kai Properties Ltd.
| | | 8,600 | 130,294 |
| Retail – 0.9% | | | | |
Hang Lung Properties Ltd.
| | | 34,000 | 94,850 |
Wharf Holdings Ltd.
| | | 17,500 | 125,634 |
| Total Retail | | | | 220,484 |
| Total HONG KONG | | | | 507,285 |
| IRELAND – 0.2% | | | | |
| Basic Materials – 0.2% | | | | |
CRH PLC
| | | 2,050 | 49,221 |
| Total IRELAND | | | | 49,221 |
| ITALY – 1.2% | | | | |
| Pipelines – 0.6% | | | | |
Snam Rete Gas SpA
| | | 29,900 | 147,982 |
| Toll Roads – 0.6% | | | | |
Atlantia SpA
| | | 6,100 | 141,777 |
| Total ITALY | | | | 289,759 |
| JAPAN – 2.3% | | | | |
| Gas Utilities – 0.5% | | | | |
Tokyo Gas Company Ltd.
| | | 22,800 | 123,021 |
| Homebuilders – 0.4% | | | | |
Sekisui House Ltd.
| | | 7,000 | 92,106 |
| Office – 0.9% | | | | |
Mitsubishi Estate Company Ltd.
| | | 10,900 | 229,672 |
| Real Estate - Diversified – 0.5% | | | | |
Mitsui Fudosan Company Ltd.
| | | 4,100 | 109,944 |
| Total JAPAN | | | | 554,743 |
| MEXICO – 0.4% | | | | |
| Chemicals – 0.2% | | | | |
Mexichem SAB de CV 1
| | | 13,900 | 42,217 |
| Other – 0.2% | | | | |
Cemex SAB de CV 1
| | | 4,450 | 45,346 |
| Total MEXICO | | | | 87,563 |
| NETHERLANDS – 0.7% | | | | |
| Midstream – 0.2% | | | | |
VOPAK
| | | 1,200 | 62,259 |
| Retail – 0.5% | | | | |
Atrium European Real Estate Ltd.
| | | 22,421 | 110,964 |
| Total NETHERLANDS | | | | 173,223 |
See Notes to Financial Statements.
Brookfield Real Assets Securities Fund
Schedule of Investments (continued)
December 31, 2014
| | | | Shares | Value |
| COMMON STOCKS (continued) | | | | |
| NEW ZEALAND – 0.3% | | | | |
| Real Estate Operator/Developer – 0.3% | | | | |
Precinct Properties New Zealand Ltd.
| | | 70,300 | $ 65,095 |
| Total NEW ZEALAND | | | | 65,095 |
| NORWAY – 0.1% | | | | |
| Exploration & Production – 0.1% | | | | |
Rocksource ASA 1
| | | 39,000 | 31,254 |
| Total NORWAY | | | | 31,254 |
| PORTUGAL – 0.2% | | | | |
| Electric Utilities & Generation – 0.2% | | | | |
EDP Renovaveis SA
| | | 6,700 | 43,601 |
| Total PORTUGAL | | | | 43,601 |
| SINGAPORE – 1.1% | | | | |
| Developer - Office – 0.5% | | | | |
Keppel Land Ltd.
| | | 49,000 | 126,230 |
| Real Estate - Diversified – 0.6% | | | | |
CapitaLand Ltd.
| | | 53,700 | 133,517 |
Suntec Real Estate Investment Trust
| | | 3,000 | 4,438 |
| Total Real Estate - Diversified | | | | 137,955 |
| Total SINGAPORE | | | | 264,185 |
| SPAIN – 1.0% | | | | |
| Building & Construction – 0.2% | | | | |
Acciona SA 1
| | | 600 | 40,488 |
| Electric Utilities & Generation – 0.2% | | | | |
Endesa SA
| | | 2,200 | 44,042 |
| Toll Roads – 0.6% | | | | |
Ferrovial SA
| | | 7,500 | 148,262 |
| Total SPAIN | | | | 232,792 |
| SWITZERLAND – 0.3% | | | | |
| Airports – 0.3% | | | | |
Flughafen Zuerich AG
| | | 100 | 66,876 |
| Total SWITZERLAND | | | | 66,876 |
| UNITED KINGDOM – 3.5% | | | | |
| Basic Materials – 0.3% | | | | |
Antofagasta PLC
| | | 6,500 | 75,738 |
| Electric Utilities & Generation – 0.4% | | | | |
Drax Group PLC
| | | 6,400 | 45,830 |
Infinis Energy PLC
| | | 14,400 | 49,376 |
| Total Electric Utilities & Generation | | | | 95,206 |
| Electricity Transmission & Distribution – 1.2% | | | | |
National Grid PLC
| | | 20,900 | 296,557 |
| Industrial – 0.1% | | | | |
CNH Industrial NV
| | | 3,110 | 25,066 |
See Notes to Financial Statements.
36Brookfield Investment Management Inc.
Brookfield Real Assets Securities Fund
Schedule of Investments (continued)
December 31, 2014
| | | | Shares | Value |
| COMMON STOCKS (continued) | | | | |
| Retail – 0.6% | | | | |
Hammerson PLC
| | | 16,000 | $ 149,839 |
| Water – 0.9% | | | | |
Pennon Group PLC
| | | 7,000 | 100,007 |
Severn Trent PLC
| | | 1,900 | 59,260 |
United Utilities Group PLC
| | | 4,300 | 61,077 |
| Total Water | | | | 220,344 |
| Total UNITED KINGDOM | | | | 862,750 |
| UNITED STATES – 36.9% | | | | |
| Basic Materials – 2.0% | | | | |
Allegheny Technologies, Inc.
| | | 1,060 | 36,856 |
Boise Cascade Co. 1
| | | 1,600 | 59,440 |
CVR Partners LP
| | | 3,900 | 37,986 |
Horsehead Holding Corp. 1
| | | 3,300 | 52,239 |
International Paper Co.
| | | 630 | 33,755 |
Intrepid Potash, Inc. 1
| | | 3,500 | 48,580 |
Monsanto Co.
| | | 400 | 47,788 |
Nucor Corp.
| | | 790 | 38,750 |
Packaging Corporation of America
| | | 440 | 34,342 |
PBF Logistics LP
| | | 1,600 | 34,160 |
Stillwater Mining Co. 1
| | | 3,750 | 55,275 |
| Total Basic Materials | | | | 479,171 |
| Building Materials – 0.2% | | | | |
Martin Marietta Materials, Inc.
| | | 430 | 47,438 |
| Chemicals – 0.2% | | | | |
Axiall Corp.
| | | 1,200 | 50,964 |
| Communications – 0.7% | | | | |
SBA Communications Corp. 1
| | | 1,500 | 166,140 |
| Consumer Cyclical – 0.2% | | | | |
Sanderson Farms, Inc.
| | | 500 | 42,013 |
| Consumer Non-Cyclical – 0.1% | | | | |
Bunge Ltd.
| | | 300 | 27,273 |
| Electric Utilities & Generation – 1.1% | | | | |
NextEra Energy, Inc.
| | | 600 | 63,774 |
NRG Yield, Inc.
| | | 1,300 | 61,282 |
Pattern Energy Group, Inc.
| | | 2,900 | 71,514 |
TerraForm Power, Inc.
| | | 1,600 | 49,408 |
Vivint Solar, Inc. 1
| | | 3,400 | 31,348 |
| Total Electric Utilities & Generation | | | | 277,326 |
| Electricity Transmission & Distribution – 1.1% | | | | |
ITC Holdings Corp.
| | | 3,500 | 141,505 |
Northeast Utilities
| | | 1,800 | 96,336 |
UIL Holdings Corp.
| | | 800 | 34,832 |
| Total Electricity Transmission & Distribution | | | | 272,673 |
| Energy – 0.4% | | | | |
Chesapeake Energy Corp.
| | | 4,500 | 88,065 |
See Notes to Financial Statements.
Brookfield Real Assets Securities Fund
Schedule of Investments (continued)
December 31, 2014
| | | | Shares | Value |
| COMMON STOCKS (continued) | | | | |
| Exploration & Production – 1.9% | | | | |
Cabot Oil & Gas Corp.
| | | 2,500 | $ 74,025 |
Cimarex Energy Co.
| | | 600 | 63,600 |
Concho Resources, Inc. 1
| | | 700 | 69,825 |
Laredo Petroleum, Inc. 1
| | | 6,600 | 68,310 |
Noble Energy, Inc.
| | | 1,600 | 75,888 |
SM Energy Co.
| | | 1,800 | 69,444 |
WPX Energy, Inc. 1
| | | 4,300 | 50,009 |
| Total Exploration & Production | | | | 471,101 |
| Gas Utilities – 0.8% | | | | |
AGL Resources, Inc.
| | | 1,200 | 65,412 |
NiSource, Inc.
| | | 2,900 | 123,018 |
| Total Gas Utilities | | | | 188,430 |
| Healthcare – 1.7% | | | | |
Brookdale Senior Living, Inc. 1
| | | 2,600 | 95,342 |
HCP, Inc.
| | | 1,449 | 63,799 |
Sabra Health Care REIT, Inc.
| | | 1,600 | 48,592 |
Ventas, Inc.
| | | 2,900 | 207,930 |
| Total Healthcare | | | | 415,663 |
| Hotel – 0.5% | | | | |
Host Hotels & Resorts, Inc.
| | | 5,500 | 130,735 |
| Industrial – 0.6% | | | | |
DCT Industrial Trust, Inc.
| | | 1,900 | 67,754 |
Deere & Co.
| | | 330 | 29,195 |
Eagle Materials, Inc.
| | | 520 | 39,536 |
| Total Industrial | | | | 136,485 |
| Infrastructure - Diversified – 0.5% | | | | |
CenterPoint Energy, Inc.
| | | 5,200 | 121,836 |
| Midstream – 3.8% | | | | |
Access Midstream Partners LP
| | | 900 | 48,780 |
Crestwood Equity Partners LP
| | | 9,000 | 72,900 |
EQT Midstream Partners LP
| | | 900 | 79,200 |
MarkWest Energy Partners LP
| | | 497 | 33,393 |
ONEOK Inc.
| | | 2,000 | 99,580 |
Sunoco Logistics Partners LP
| | | 2,300 | 96,094 |
Targa Resources Corp.
| | | 1,000 | 106,050 |
The Williams Companies, Inc.
| | | 8,500 | 381,990 |
| Total Midstream | | | | 917,987 |
| Mixed – 0.5% | | | | |
Liberty Property Trust
| | | 3,500 | 131,705 |
| Office – 2.5% | | | | |
Brandywine Realty Trust
| | | 4,100 | 65,518 |
Douglas Emmett, Inc.
| | | 5,700 | 161,880 |
Highwoods Properties, Inc.
| | | 3,000 | 132,840 |
Parkway Properties, Inc.
| | | 5,200 | 95,628 |
See Notes to Financial Statements.
38Brookfield Investment Management Inc.
Brookfield Real Assets Securities Fund
Schedule of Investments (continued)
December 31, 2014
| | | | Shares | Value |
| COMMON STOCKS (continued) | | | | |
SL Green Realty Corp.
| | | 1,300 | $ 154,726 |
| Total Office | | | | 610,592 |
| Oilfield Services & Equipment – 0.7% | | | | |
Cameron International Corp. 1
| | | 900 | 44,955 |
Oceaneering International, Inc.
| | | 800 | 47,048 |
Schlumberger Ltd.
| | | 900 | 76,869 |
| Total Oilfield Services & Equipment | | | | 168,872 |
| Other – 1.0% | | | | |
AK Steel Holding Corp. 1
| | | 7,400 | 43,956 |
Emerge Energy Services LP
| | | 1,200 | 64,800 |
EV Energy Partners LP
| | | 3,200 | 61,664 |
Rice Energy, Inc. 1
| | | 3,300 | 69,201 |
| Total Other | | | | 239,621 |
| Pipelines – 3.7% | | | | |
Boardwalk Pipeline Partners LP
| | | 6,400 | 113,728 |
Enterprise Products Partners LP
| | | 4,300 | 155,316 |
Kinder Morgan, Inc.
| | | 3,800 | 160,778 |
SemGroup Corp.
| | | 700 | 47,873 |
Sempra Energy
| | | 2,200 | 244,992 |
Spectra Energy Corp.
| | | 4,800 | 174,240 |
| Total Pipelines | | | | 896,927 |
| Rail – 0.8% | | | | |
Kansas City Southern
| | | 600 | 73,218 |
Union Pacific Corp.
| | | 1,000 | 119,130 |
| Total Rail | | | | 192,348 |
| Real Estate - Diversified – 1.2% | | | | |
Vornado Realty Trust
| | | 2,400 | 282,504 |
| Refineries – 0.5% | | | | |
Valero Energy Corp.
| | | 1,400 | 69,300 |
Western Refinancing, Inc.
| | | 1,700 | 64,226 |
| Total Refineries | | | | 133,526 |
| Regional Malls – 2.0% | | | | |
CBL & Associates Properties, Inc.
| | | 9,800 | 190,316 |
Simon Property Group, Inc.
| | | 1,700 | 309,587 |
| Total Regional Malls | | | | 499,903 |
| Residential – 1.7% | | | | |
AvalonBay Communities, Inc.
| | | 1,000 | 163,390 |
Camden Property Trust
| | | 1,400 | 103,376 |
Mid-America Apartment Communities, Inc.
| | | 2,100 | 156,828 |
| Total Residential | | | | 423,594 |
| Self Storage – 0.3% | | | | |
Iron Mountain, Inc.
| | | 1,700 | 65,722 |
| Specialty – 0.8% | | | | |
Outfront Media, Inc.
| | | 7,500 | 201,300 |
See Notes to Financial Statements.
Brookfield Real Assets Securities Fund
Schedule of Investments (continued)
December 31, 2014
| | | | Shares | Value |
| COMMON STOCKS (continued) | | | | |
| Strip Centers – 0.9% | | | | |
Brixmor Property Group, Inc.
| | | 5,200 | $ 129,168 |
Washington Prime Group, Inc.
| | | 5,400 | 92,988 |
| Total Strip Centers | | | | 222,156 |
| Telecommunications – 3.3% | | | | |
American Tower Corp.
| | | 5,800 | 573,330 |
Crown Castle International Corp.
| | | 3,000 | 236,100 |
| Total Telecommunications | | | | 809,430 |
| Timber – 0.2% | | | | |
Plum Creek Timber Company, Inc.
| | | 1,200 | 51,348 |
| Transmission & Distribution – 0.3% | | | | |
PG&E Corp.
| | | 1,200 | 63,888 |
| Utility – 0.2% | | | | |
Tallgrass Energy Partners LP
| | | 900 | 40,230 |
| Water – 0.5% | | | | |
American Water Works Company Inc.
| | | 2,300 | 122,590 |
| Total UNITED STATES | | | | 8,989,556 |
Total COMMON STOCKS
(Cost $16,468,620)
| | | | 16,035,010 |
| | Interest
Rate | Maturity | Principal
Amount
(000s) | Value |
| CORPORATE BONDS – 24.5% | | | | |
| BELGIUM – 1.0% | | | | |
| Energy – 1.0% | | | | |
LBC Tank Terminals Holding Netherlands BV
| 6.88% | 05/15/23 | $ 250 | $ 251,250 |
| Total BELGIUM | | | | 251,250 |
| BERMUDA – 1.0% | | | | |
| Transportation – 1.0% | | | | |
Teekay Offshore Partners LP
| 6.00 | 07/30/19 | 250 | 230,000 |
| Total BERMUDA | | | | 230,000 |
| GREECE – 1.0% | | | | |
| Services – 1.0% | | | | |
Dynagas LNG Partners LP
| 6.25 | 10/30/19 | 250 | 232,500 |
| Total GREECE | | | | 232,500 |
| LUXEMBOURG – 1.0% | | | | |
| Telecommunications – 1.0% | | | | |
Intelsat Luxembourg SA
| 7.75 | 06/01/21 | 250 | 250,625 |
| Total LUXEMBOURG | | | | 250,625 |
| SINGAPORE – 1.0% | | | | |
| Financial Services – 1.0% | | | | |
Puma International Financing SA
| 6.75 | 02/01/21 | 250 | 242,250 |
| Total SINGAPORE | | | | 242,250 |
See Notes to Financial Statements.
40Brookfield Investment Management Inc.
Brookfield Real Assets Securities Fund
Schedule of Investments (continued)
December 31, 2014
| | Interest
Rate | Maturity | Principal
Amount
(000s) | Value |
| CORPORATE BONDS (continued) | | | | |
| UNITED STATES – 19.5% | | | | |
| Energy – 5.9% | | | | |
Blue Racer Midstream LLC 2
| 6.13% | 11/15/22 | $ 250 | $ 241,250 |
Chesapeake Energy Corp.
| 4.88 | 04/15/22 | 250 | 243,125 |
EV Energy Partners LP
| 8.00 | 04/15/19 | 250 | 212,500 |
Ferrellgas LP
| 6.75 | 01/15/22 | 250 | 244,375 |
Holly Energy Partners LP
| 6.50 | 03/01/20 | 250 | 247,500 |
Tesoro Logistics LP
| 5.88 | 10/01/20 | 250 | 250,625 |
| Total Energy | | | | 1,439,375 |
| Media – 3.2% | | | | |
CCO Holdings LLC
| 6.63 | 01/31/22 | 250 | 265,625 |
Lamar Media Corp.
| 5.38 | 01/15/24 | 250 | 257,500 |
Mediacom Broadband LLC
| 6.38 | 04/01/23 | 250 | 256,250 |
| Total Media | | | | 779,375 |
| Services – 4.0% | | | | |
Casella Waste Systems, Inc.
| 7.75 | 02/15/19 | 250 | 253,750 |
Iron Mountain, Inc.
| 6.00 | 08/15/23 | 250 | 260,000 |
MasTec, Inc.
| 4.88 | 03/15/23 | 200 | 188,000 |
United Rentals North America, Inc.
| 7.63 | 04/15/22 | 250 | 274,875 |
| Total Services | | | | 976,625 |
| Healthcare – 1.1% | | | | |
HCA, Inc.
| 5.88 | 05/01/23 | 250 | 263,437 |
| Telecommunications – 4.2% | | | | |
Crown Castle International Corp.
| 5.25 | 01/15/23 | 250 | 255,000 |
Fairpoint Communications, Inc. 2
| 8.75 | 08/15/19 | 250 | 251,250 |
Frontier Communications Corp.
| 7.63 | 04/15/24 | 250 | 257,500 |
Level 3 Financing, Inc.
| 6.13 | 01/15/21 | 250 | 258,750 |
| Total Telecommunications | | | | 1,022,500 |
| Utility – 1.1% | | | | |
Calpine Corp. 2
| 5.88 | 01/15/24 | 250 | 266,250 |
| Total UNITED STATES | | | | 4,747,562 |
Total CORPORATE BONDS
(Cost $6,110,446)
| | | | 5,954,187 |
| | | | Shares | Value |
| PREFERRED STOCKS – 5.0% | | | | |
| UNITED STATES – 5.0% | | | | |
| Office – 2.2% | | | | |
CoreSite Realty Corp., Series A, 7.25%
| | | 9,700 | $ 248,417 |
Equity Commonwealth, 6.50%
| | | 9,600 | 230,592 |
Kilroy Realty Corp., 6.38%
| | | 2,500 | 62,500 |
| Total Office | | | | 541,509 |
| Residential – 0.8% | | | | |
American Homes 4 Rent, 5.00%
| | | 7,700 | 190,036 |
See Notes to Financial Statements.
Brookfield Real Assets Securities Fund
Schedule of Investments (continued)
December 31, 2014
| | | | Shares | Value |
| PREFERRED STOCKS (continued) | | | | |
| Self Storage – 1.0% | | | | |
Public Storage, 5.63%
| | | 10,000 | $ 245,300 |
| Strip Centers – 0.2% | | | | |
DDR Corp., 6.25%
| | | 2,500 | 62,550 |
| Triple Net Lease – 0.8% | | | | |
EPR Properties, 6.63%
| | | 2,500 | 63,000 |
Gramercy Property Trust, Inc., 7.13%
| | | 4,826 | 124,270 |
| Total Triple Net Lease | | | | 187,270 |
| Total UNITED STATES | | | | 1,226,665 |
Total PREFERRED STOCKS
(Cost $1,237,469)
| | | | 1,226,665 |
Total Investments – 95.4%
(Cost $23,816,535)
| | | | 23,215,862 |
Other Assets in Excess of Liabilities – 4.6%
| | | | 1,132,132 |
TOTAL NET ASSETS – 100.0%
| | | | $ 24,347,994 |
| The following notes should be read in conjunction with the accompanying Schedule of Investments. | |
| 1 | — Non-income producing security. |
| 2 | — Security exempt from registration under Rule 144A of the Securities Act of 1933. These securities may only be resold in transactions exempt from registration, normally to qualified institutional buyers. As of December 31, 2014, the total value of all such securities was $758,750 or 3.1% of net assets. |
See Notes to Financial Statements.
42Brookfield Investment Management Inc.
BROOKFIELD INVESTMENT FUNDS
Statements of Assets and Liabilities
December 31, 2014
| | | Infrastructure Fund | | Global Real Estate Fund | | U.S. Real Estate Fund | | Real Assets Fund | |
| Assets: | | | | | | | | | |
Investments in securities, at value (Note 2)
| | $479,682,780 | | $321,687,991 | | $31,478,735 | | $23,215,862 | |
Cash
| | 173,964 | | 9,633,376 | | 1,336,919 | | 877,205 | |
Dividends receivable, net
| | 1,022,357 | | 948,165 | | 120,846 | | 149,502 | |
Receivable for investments sold
| | 4,877,399 | | 3,231,129 | | 467,713 | | 101,407 | |
Receivable for fund shares sold
| | 645,353 | | 9,794,598 | | — | | — | |
Net receivable from Adviser
| | — | | — | | 14,541 | | 24,618 | |
Deferred offering costs
| | — | | — | | — | | 107,741 | |
Prepaid expenses
| | 56,449 | | 34,452 | | 7,078 | | 500 | |
Total assets
| | 486,458,302 | | 345,329,711 | | 33,425,832 | | 24,476,835 | |
| Liabilities: | | | | | | | | | |
Payable for investments purchased
| | 1,159,053 | | 1,810,626 | | 325,932 | | 83,976 | |
Payable for fund shares purchased
| | 2,054,740 | | 40,352 | | 8,083 | | — | |
Short term loan payable (Note 6)
| | 2,917,000 | | — | | — | | — | |
Short term loan payable interest
| | 369 | | — | | — | | — | |
Distribution fee payable
| | 221,539 | | 9,652 | | — | | 2 | |
Investment advisory fee payable
| | 187,829 | | 94,344 | | — | | — | |
Administration fee payable
| | 61,904 | | 40,617 | | — | | — | |
Trustees' fee payable
| | 6,543 | | 4,445 | | 1,780 | | 1,715 | |
Accrued expenses
| | 191,589 | | 121,555 | | 71,442 | | 43,148 | |
Total liabilities
| | 6,800,566 | | 2,121,591 | | 407,237 | | 128,841 | |
Commitments and contingencies (Note 8)
| | | | | | | | | |
Net Assets
| | $479,657,736 | | $343,208,120 | | $33,018,595 | | $24,347,994 | |
| Composition of Net Assets: | | | | | | | | | |
Paid-in capital (Note 5)
| | $436,036,273 | | $331,774,480 | | $28,580,234 | | $25,058,077 | |
Distributions in excess of net investment income
| | (2,137,031) | | (3,536,301) | | — | | (19,720) | |
Accumulated net realized gain (loss) on investment transactions and foreign currency transactions
| | (6,879,354) | | (1,078,820) | | 711,294 | | (89,841) | |
Net unrealized appreciation (depreciation) on investments and foreign currency translations
| | 52,637,848 | | 16,048,761 | | 3,727,067 | | (600,522) | |
Net assets applicable to capital shares outstanding
| | $479,657,736 | | $343,208,120 | | $33,018,595 | | $24,347,994 | |
Total investments at cost
| | $427,026,952 | | $305,633,462 | | $27,751,668 | | $23,816,535 | |
| Net Assets | | | | | | | | | |
Class A Shares — Net Assets
| | $ 74,164,351 | | $ 5,811,825 | | $ 122,894 | | $ 974 | |
Shares outstanding
| | 5,241,787 | | 436,928 | | 10,440 | | 100 | |
Net asset value and redemption price per share
| | $ 14.15 | | $ 13.30 | | $ 11.77 | | $ 9.72* | |
Offering price per share based on a maximum sales charge of 4.75%
| | $ 14.86 | | $ 13.96 | | $ 12.36 | | $ 10.20 | |
Class C Shares — Net Assets
| | $ 33,469,824 | | $ 4,187,616 | | $ 1,298 | | $ 973 | |
Shares outstanding
| | 2,393,503 | | 316,173 | | 110 | | 100 | |
Net asset value and redemption price per share
| | $ 13.98 | | $ 13.24 | | $ 11.77* | | $ 9.72* | |
Class Y Shares — Net Assets
| | $199,436,278 | | $120,366,560 | | $ 118,397 | | $ 975 | |
Shares outstanding
| | 14,067,462 | | 9,033,293 | | 10,061 | | 100 | |
Net asset value and redemption price per share
| | $ 14.18 | | $ 13.32 | | $ 11.77 | | $ 9.72* | |
Class I Shares — Net Assets
| | $172,587,283 | | $212,842,119 | | $32,776,006 | | $24,345,072 | |
Shares outstanding
| | 12,162,343 | | 15,982,152 | | 2,784,755 | | 2,506,394 | |
Net asset value and redemption price per share
| | $ 14.19 | | $ 13.32 | | $ 11.77 | | $ 9.71 | |
| * | Net asset value does not calculate due to fractional shares outstanding. |
See Notes to Financial Statements.
BROOKFIELD INVESTMENT FUNDS
Statements of Operations
For the Year Ended December 31, 2014
| | | Infrastructure Fund | | Global Real Estate Fund | | U.S. Real Estate Fund | | Real Assets Fund1 | |
| Investment Income: | | | | | | | | | |
Dividends (net of foreign withholding tax of $889,984, $225,664, $0 and $2,977)
| | $10,513,586 | | $ 7,102,123 | | $1,248,741 | | $ 60,497 | |
Interest
| | — | | — | | — | | 35,396 | |
Total investment income
| | 10,513,586 | | 7,102,123 | | 1,248,741 | | 95,893 | |
| Expenses: | | | | | | | | | |
Investment advisory fees (Note 3)
| | 3,834,812 | | 1,393,505 | | 219,778 | | 23,926 | |
Administration fees (Note 3)
| | 676,732 | | 278,701 | | 43,956 | | 4,222 | |
Distribution fees — Class A
| | 251,495 | | 15,037 | | 126 | | 1 | |
Distribution fees — Class C
| | 258,072 | | 25,292 | | 11 | | 1 | |
Fund accounting fees
| | 195,186 | | 100,652 | | 68,693 | | 12,818 | |
Transfer agent fees
| | 139,456 | | 62,430 | | 52,435 | | 5,824 | |
Custodian fees
| | 137,043 | | 95,931 | | 7,822 | | 2,653 | |
Legal fees
| | 102,032 | | 40,548 | | 11,898 | | 527 | |
Registration fees
| | 72,854 | | 66,661 | | 98,985 | | 2,837 | |
Reports to shareholders
| | 68,359 | | 21,771 | | 5,293 | | 1,956 | |
Trustees' fees
| | 54,328 | | 45,685 | | 37,358 | | 1,715 | |
Insurance
| | 48,426 | | 15,170 | | 1,038 | | — | |
Audit and tax services
| | 41,778 | | 35,977 | | 46,141 | | 20,511 | |
Miscellaneous
| | 15,210 | | 7,159 | | 5,568 | | 903 | |
Interest expense
| | 369 | | — | | — | | — | |
Offering fees
| | — | | — | | 32,278 | | 14,010 | |
Total operating expenses
| | 5,896,152 | | 2,204,519 | | 631,380 | | 91,904 | |
Less expenses reimbursed by the investment adviser (Note 3)
| | (423,903) | | (399,082) | | (352,858) | | (60,940) | |
Net expenses
| | 5,472,249 | | 1,805,437 | | 278,522 | | 30,964 | |
Net investment income
| | 5,041,337 | | 5,296,686 | | 970,219 | | 64,929 | |
| Realized and Unrealized Gain (Loss) on Investments and Foreign Currency Translations: | | | | | | | | | |
| Net realized gain (loss) on: | | | | | | | | | |
Investments
| | $17,070,258 | | $11,243,848 | | $2,983,070 | | $ (89,676) | |
Foreign currency transactions
| | (687,605) | | (443,700) | | — | | (19,886) | |
Net realized gain (loss)
| | $16,382,653 | | $10,800,148 | | $2,983,070 | | $(109,562) | |
| Net change in unrealized appreciation (depreciation) on: | | | | | | | | | |
Investments
| | $ 4,269,908 | | $15,495,608 | | $3,431,648 | | $(600,673) | |
Foreign currency translations
| | (24,401) | | (5,613) | | — | | 151 | |
Net change in unrealized appreciation (depreciation)
| | $ 4,245,507 | | $15,489,995 | | $3,431,648 | | $(600,522) | |
Net realized and unrealized gain (loss)
| | 20,628,160 | | 26,290,143 | | 6,414,718 | | (710,084) | |
Net increase (decrease) in net assets resulting from operations
| | $25,669,497 | | $31,586,829 | | $7,384,937 | | $(645,155) | |
| 1 | For the period November 19, 2014 (commencement of operations) through December 31, 2014. |
See Notes to Financial Statements.
44Brookfield Investment Management Inc.
BROOKFIELD INVESTMENT FUNDS
Statements of Changes in Net Assets
| | Infrastructure Fund | | Global Real Estate Fund |
| | For the Year Ended December 31, 2014 | | For the Year Ended December 31, 2013 | | For the Year Ended December 31, 2014 | | For the Year Ended
December 31, 2013 |
| Increase in Net Assets Resulting from Operations: | | | | | | | |
Net investment income
| $ 5,041,337 | | $ 3,779,084 | | $ 5,296,686 | | $ 1,484,707 |
Net realized gain on investments and foreign currency transactions
| 16,382,653 | | 6,409,677 | | 10,800,148 | | 3,622,176 |
Net unrealized appreciation (depreciation) on investments and foreign currency translations
| 4,245,507 | | 41,563,851 | | 15,489,995 | | (2,827,513) |
Net increase in net assets resulting from operations
| 25,669,497 | | 51,752,612 | | 31,586,829 | | 2,279,370 |
| Distributions to Shareholders: | | | | | | | |
| From net investment income: | | | | | | | |
Class A shares
| (1,545,898) | | (1,182,363) | | (213,325) | | (68,747) |
Class C shares
| (247,600) | | (104,963) | | (107,792) | | (7,457) |
Class Y shares
| (2,383,478) | | (808,000) | | (3,765,253) | | (535,110) |
Class I shares
| (2,603,342) | | (2,757,379) | | (5,748,154) | | (1,425,136) |
| From net realized gain on investments: | | | | | | | |
Class A shares
| (2,893,157) | | (799,350) | | (146,615) | | (176,957) |
Class C shares
| (1,309,663) | | (118,438) | | (106,536) | | (32,633) |
Class Y shares
| (7,844,321) | | (577,619) | | (3,014,847) | | (1,666,498) |
Class I shares
| (6,626,031) | | (1,416,412) | | (5,243,265) | | (2,711,697) |
Total distributions paid
| (25,453,490) | | (7,764,524) | | (18,345,787) | | (6,624,235) |
| Capital Share Transactions (Note 5): | | | | | | | |
Proceeds from shares sold
| 330,468,112 | | 280,609,570 | | 273,420,839 | | 120,730,845 |
Reinvestment of distributions
| 21,926,742 | | 7,099,249 | | 14,280,837 | | 6,408,539 |
Cost of shares redeemed
| (253,824,916) | | (71,662,604) | | (85,114,013) | | (33,219,288) |
Redemption fees
| 45,535 | | 28,172 | | 63,661 | | 7,213 |
Net increase in capital share transactions
| 98,615,473 | | 216,074,387 | | 202,651,324 | | 93,927,309 |
Total increase in net assets
| 98,831,480 | | 260,062,475 | | 215,892,366 | | 89,582,444 |
| Net Assets: | | | | | | | |
Beginning of year
| 380,826,256 | | 120,763,781 | | 127,315,754 | | 37,733,310 |
End of year
| $ 479,657,736 | | $380,826,256 | | $343,208,120 | | $127,315,754 |
(including undistributed (distributions in excess of) net investment income)
| $ (2,137,031) | | $ 4,782 | | $ (3,536,301) | | $ (773,886) |
See Notes to Financial Statements.
BROOKFIELD INVESTMENT FUNDS
Statements of Changes in Net Assets (continued)
| U.S. Real Estate Fund | | Real Assets Fund |
| | For the Year Ended December 31, 2014 | | For the Period
December 11, 20131
through
December 31, 2013 | | For the Period
November 19, 20141
through
December 31, 2014 |
| Increase in Net Assets Resulting from Operations: | | | | | |
Net investment income
| $ 970,219 | | $ 100,071 | | $ 64,929 |
Net realized gain (loss) on investments and foreign currency transactions
| 2,983,070 | | 12,003 | | (109,562) |
Net unrealized appreciation (depreciation) on investments and foreign currency translations
| 3,431,648 | | 295,419 | | (600,522) |
Net increase (decrease) in net assets resulting from operations
| 7,384,937 | | 407,493 | | (645,155) |
| Distributions to Shareholders: | | | | | |
| From net investment income: | | | | | |
Class A shares
| (2,745) | | (5) | | (2) |
Class C shares
| (28) | | (5) | | (2) |
Class Y shares
| (2,413) | | (5) | | (3) |
Class I shares
| (978,320) | | (136,870) | | (72,345) |
| From net realized gain on investments: | | | | | |
Class A shares
| (8,924) | | — | | — |
Class C shares
| (89) | | — | | — |
Class Y shares
| (8,344) | | — | | — |
Class I shares
| (2,233,975) | | — | | — |
Total distributions paid
| (3,234,838) | | (136,885) | | (72,352) |
| Capital Share Transactions (Note 5): | | | | | |
Proceeds from shares sold
| 248,364 | | 25,004,000 | | 25,004,000 |
Reinvestment of distributions
| 3,234,839 | | 136,885 | | 61,501 |
Cost of shares redeemed
| (26,200) | | — | | — |
Net increase in capital share transactions
| 3,457,003 | | 25,140,885 | | 25,065,501 |
Total increase in net assets
| 7,607,102 | | 25,411,493 | | 24,347,994 |
| Net Assets: | | | | | |
Beginning of period
| 25,411,493 | | — | | — |
End of period
| $33,018,595 | | $25,411,493 | | $24,347,994 |
(including distributions in excess of net investment income)
| $ — | | $ — | | $ (19,720) |
| 1 | Commencement of operations. |
See Notes to Financial Statements.
46Brookfield Investment Management Inc.
Brookfield Global Listed Infrastructure Fund
Financial Highlights
| Class A | For the Year Ended December 31, 2014 | | For the Year Ended December 31, 2013 | | For the Year Ended December 31, 2012 | | For the Period December 29, 20111 through December 31, 2011 |
| Per Share Operating Performance: | | | | | | | |
Net asset value, beginning of period
| $ 13.91 | | $ 11.61 | | $ 10.15 | | $ 10.13 |
Net investment income2
| 0.15 | | 0.17 | | 0.21 | | 0.00 3 |
Net realized and unrealized gain on investment transactions
| 0.88 | | 2.46 | | 1.50 | | 0.02 |
Net increase in net asset value resulting from operations
| 1.03 | | 2.63 | | 1.71 | | 0.02 |
Distributions from net investment income
| (0.22) | | (0.22) | | (0.11) | | (0.00) 3 |
Distributions from net realized capital gain
| (0.57) | | (0.11) | | (0.14) | | — |
Total distributions paid
| (0.79) | | (0.33) | | (0.25) | | (0.00) 3 |
Redemption fees
| 0.00 3 | | 0.00 3 | | 0.00 3 | | — |
Net asset value, end of period
| $ 14.15 | | $ 13.91 | | $ 11.61 | | $ 10.15 |
Total Investment Return†
| 7.27% | | 22.86% | | 16.87% | | 0.20% 4 |
| Ratios to Average Net Assets/Supplementary Data: | | | | | | | |
Net assets, end of period (000s)
| $74,164 | | $104,349 | | $16,547 | | $ 2,302 |
Gross operating expenses
| 1.44% | | 1.51% | | 2.16% | | 34.45% 5 |
Net expenses, including fee waivers and reimbursement
| 1.35% | | 1.35% | | 1.42% | | 1.60% 5 |
Net investment income (loss)
| 1.01% | | 1.30% | | 1.85% | | (1.60)% 5 |
Net investment income (loss), excluding the effect of fee waivers and reimbursement
| 0.92% | | 1.14% | | 1.11% | | (34.45)% 5 |
Portfolio turnover rate
| 85% | | 64% | | 88% | | 1% 4 |
| † | Total investment return is computed based upon the net asset value of the Fund’s shares and excludes the effects of sales charges or contingent deferred sales charges, if applicable. Distributions are assumed to be reinvested at the net asset value of the Class on the ex-date of the distribution. |
| 1 | Commencement of operations. |
| 2 | Per share amounts presented are based on average shares outstanding throughout the period indicated. |
| 3 | Rounds to less than $0.005. |
| 4 | Not annualized. |
| 5 | Annualized. |
| Class C | For the Year Ended December 31, 2014 | | For the Year Ended December 31, 2013 | | For the Period May 1, 20121 through December 31, 2012 |
| Per Share Operating Performance: | | | | | |
Net asset value, beginning of period
| $ 13.80 | | $ 11.57 | | $11.02 |
Net investment income2
| 0.04 | | 0.08 | | 0.10 |
Net realized and unrealized gain on investment transactions
| 0.86 | | 2.43 | | 0.69 |
Net increase in net asset value resulting from operations
| 0.90 | | 2.51 | | 0.79 |
Distributions from net investment income
| (0.15) | | (0.17) | | (0.10) |
Distributions from net realized capital gain
| (0.57) | | (0.11) | | (0.14) |
Total distributions paid
| (0.72) | | (0.28) | | (0.24) |
Redemption fees
| 0.00 3 | | 0.00 3 | | — |
Net asset value, end of period
| $ 13.98 | | $ 13.80 | | $11.57 |
Total Investment Return†
| 6.41% | | 21.85% | | 7.19% 4 |
| Ratios to Average Net Assets/Supplementary Data: | | | | | |
Net assets, end of period (000s)
| $33,470 | | $15,378 | | $ 829 |
Gross operating expenses
| 2.19% | | 2.26% | | 2.63% 5 |
Net expenses, including fee waivers and reimbursement
| 2.10% | | 2.10% | | 2.13% 5 |
Net investment income
| 0.24% | | 0.58% | | 1.67% 5 |
Net investment income, excluding the effect of fee waivers and reimbursement
| 0.15% | | 0.42% | | 0.17% 5 |
Portfolio turnover rate
| 85% | | 64% | | 88% 4 |
| † | Total investment return is computed based upon the net asset value of the Fund’s shares and excludes the effects of sales charges or contingent deferred sales charges, if applicable. Distributions are assumed to be reinvested at the net asset value of the Class on the ex-date of the distribution. |
| 1 | Commencement of operations. |
| 2 | Per share amounts presented are based on average shares outstanding throughout the period indicated. |
| 3 | Rounds to less than $0.005. |
| 4 | Not annualized. |
| 5 | Annualized. |
See Notes to Financial Statements.
Brookfield Global Listed Infrastructure Fund
Financial Highlights
| Class Y | For the Year Ended December 31, 2014 | | For the Year Ended December 31, 2013 | | For the Year Ended December 31, 2012 | | For the Period December 1, 20111 through December 31, 2011 |
| Per Share Operating Performance: | | | | | | | |
Net asset value, beginning of period
| $ 13.93 | | $ 11.62 | | $ 10.15 | | $ 10.00 |
Net investment income2
| 0.19 | | 0.19 | | 0.24 | | 0.03 |
Net realized and unrealized gain on investment transactions
| 0.88 | | 2.47 | | 1.49 | | 0.13 |
Net increase in net asset value resulting from operations
| 1.07 | | 2.66 | | 1.73 | | 0.16 |
Distributions from net investment income
| (0.25) | | (0.24) | | (0.12) | | (0.01) |
Distributions from net realized capital gain
| (0.57) | | (0.11) | | (0.14) | | — |
Total distributions paid
| (0.82) | | (0.35) | | (0.26) | | (0.01) |
Redemption fees
| 0.00 3 | | 0.00 3 | | — | | — |
Net asset value, end of period
| $ 14.18 | | $ 13.93 | | $ 11.62 | | $ 10.15 |
Total Investment Return†
| 7.54% | | 23.11% | | 17.06% | | 1.58% 4 |
| Ratios to Average Net Assets/Supplementary Data: | | | | | | | |
Net assets, end of period (000s)
| $199,436 | | $76,014 | | $20,300 | | $ 13 |
Gross operating expenses
| 1.19% | | 1.26% | | 1.67% | | 18.59% 5 |
Net expenses, including fee waivers and reimbursement
| 1.10% | | 1.10% | | 1.13% | | 1.35% 5 |
Net investment income
| 1.22% | | 1.49% | | 2.86% | | 1.66% 5 |
Net investment income (loss), excluding the effect of fee waivers and reimbursement
| 1.13% | | 1.33% | | 2.32% | | (15.39)% 5 |
Portfolio turnover rate
| 85% | | 64% | | 88% | | 1% 4 |
| † | Total investment return is computed based upon the net asset value of the Fund’s shares and excludes the effects of sales charges or contingent deferred sales charges, if applicable. Distributions are assumed to be reinvested at the net asset value of the Class on the ex-date of the distribution. |
| 1 | Commencement of operations. |
| 2 | Per share amounts presented are based on average shares outstanding throughout the period indicated. |
| 3 | Rounds to less than $0.005. |
| 4 | Not annualized. |
| 5 | Annualized. |
| Class I | For the Year Ended December 31, 2014 | | For the Year Ended December 31, 2013 | | For the Year Ended December 31, 2012 | | For the Period December 1, 20111 through December 31, 2011 |
| Per Share Operating Performance: | | | | | | | |
Net asset value, beginning of period
| $ 13.94 | | $ 11.63 | | $ 10.15 | | $ 10.00 |
Net investment income2
| 0.18 | | 0.19 | | 0.24 | | 0.02 |
Net realized and unrealized gain on investment transactions
| 0.89 | | 2.47 | | 1.50 | | 0.14 |
Net increase in net asset value resulting from operations
| 1.07 | | 2.66 | | 1.74 | | 0.16 |
Distributions from net investment income
| (0.25) | | (0.24) | | (0.12) | | (0.01) |
Distributions from net realized capital gain
| (0.57) | | (0.11) | | (0.14) | | — |
Total distributions paid
| (0.82) | | (0.35) | | (0.26) | | (0.01) |
Redemption fees
| 0.00 3 | | 0.00 3 | | — | | — |
Net asset value, end of period
| $ 14.19 | | $ 13.94 | | $ 11.63 | | $ 10.15 |
Total Investment Return†
| 7.53% | | 23.09% | | 17.16% | | 1.58% 4 |
| Ratios to Average Net Assets/Supplementary Data: | | | | | | | |
Net assets, end of period (000s)
| $172,587 | | $185,085 | | $83,088 | | $10,117 |
Gross operating expenses
| 1.19% | | 1.26% | | 1.78% | | 19.53% 5 |
Net expenses, including fee waivers and reimbursement
| 1.10% | | 1.10% | | 1.17% | | 1.35% 5 |
Net investment income
| 1.21% | | 1.49% | | 2.06% | | 1.66% 5 |
Net investment income (loss), excluding the effect of fee waivers and reimbursement
| 1.12% | | 1.33% | | 1.45% | | (16.34)% 5 |
Portfolio turnover rate
| 85% | | 64% | | 88% | | 1% 4 |
| † | Total investment return is computed based upon the net asset value of the Fund’s shares and excludes the effects of sales charges or contingent deferred sales charges, if applicable. Distributions are assumed to be reinvested at the net asset value of the Class on the ex-date of the distribution. |
| 1 | Commencement of operations. |
| 2 | Per share amounts presented are based on average shares outstanding throughout the period indicated. |
| 3 | Rounds to less than $0.005. |
| 4 | Not annualized. |
| 5 | Annualized. |
See Notes to Financial Statements.
48Brookfield Investment Management Inc.
Brookfield Global Listed Real Estate Fund
Financial Highlights
| Class A | For the Year Ended December 31, 2014 | | For the Year Ended December 31, 2013 | | For the Period May 1, 20121 through December 31, 2012 |
| Per Share Operating Performance: | | | | | |
Net asset value, beginning of period
| $11.85 | | $11.99 | | $11.57 |
Net investment income2
| 0.35 | | 0.21 | | 0.14 |
Net realized and unrealized gain on investment transactions
| 1.92 | | 0.38 | | 1.50 |
Net increase in net asset value resulting from operations
| 2.27 | | 0.59 | | 1.64 |
Distributions from net investment income
| (0.47) | | (0.25) | | (0.55) |
Distributions from net realized capital gain
| (0.35) | | (0.48) | | (0.67) |
Total distributions paid
| (0.82) | | (0.73) | | (1.22) |
Redemption fees
| 0.00 3 | | 0.00 3 | | — |
Net asset value, end of period
| $13.30 | | $11.85 | | $11.99 |
Total Investment Return†
| 19.25% | | 4.99% | | 14.89% 4 |
| Ratios to Average Net Assets/Supplementary Data: | | | | | |
Net assets, end of period (000s)
| $5,812 | | $4,942 | | $ 639 |
Gross operating expenses
| 1.41% | | 1.66% | | 2.54% 5 |
Net expenses, including fee waivers and reimbursement
| 1.20% | | 1.20% | | 1.23% 5 |
Net investment income
| 2.64% | | 1.69% | | 2.08% 5 |
Net investment income, excluding the effect of fee waivers and reimbursement
| 2.43% | | 1.23% | | 0.77% 5 |
Portfolio turnover rate
| 108% | | 147% | | 106% 4 |
| † | Total investment return is computed based upon the net asset value of the Fund’s shares and excludes the effects of sales charges or contingent deferred sales charges, if applicable. Distributions are assumed to be reinvested at the net asset value of the Class on the ex-date of the distribution. |
| 1 | Commencement of operations. |
| 2 | Per share amounts presented are based on average shares outstanding throughout the period indicated. |
| 3 | Rounds to less than $0.005. |
| 4 | Not annualized. |
| 5 | Annualized. |
| Class C | For the Year Ended December 31, 2014 | | For the Year Ended December 31, 2013 | | For the Period May 1, 20121 through December 31, 2012 |
| Per Share Operating Performance: | | | | | |
Net asset value, beginning of period
| $11.83 | | $12.00 | | $11.57 |
Net investment income2
| 0.31 | | 0.11 | | 0.07 |
Net realized and unrealized gain on investment transactions
| 1.85 | | 0.39 | | 1.52 |
Net increase in net asset value resulting from operations
| 2.16 | | 0.50 | | 1.59 |
Distributions from net investment income
| (0.40) | | (0.19) | | (0.49) |
Distributions from net realized capital gain
| (0.35) | | (0.48) | | (0.67) |
Total distributions paid
| (0.75) | | (0.67) | | (1.16) |
Net asset value, end of period
| $13.24 | | $11.83 | | $12.00 |
Total Investment Return†
| 18.27% | | 4.18% | | 14.39% 4 |
| Ratios to Average Net Assets/Supplementary Data: | | | | | |
Net assets, end of period (000s)
| $4,188 | | $ 833 | | $ 67 |
Gross operating expenses
| 2.16% | | 2.41% | | 3.55% 5 |
Net expenses, including fee waivers and reimbursement
| 1.95% | | 1.95% | | 2.04% 5 |
Net investment income
| 2.31% | | 0.91% | | 1.29% 5 |
Net investment income (loss), excluding the effect of fee waivers and reimbursement
| 2.10% | | 0.45% | | (0.22)% 5 |
Portfolio turnover rate
| 108% | | 147% | | 106% 4 |
| † | Total investment return is computed based upon the net asset value of the Fund’s shares and excludes the effects of sales charges or contingent deferred sales charges, if applicable. Distributions are assumed to be reinvested at the net asset value of the Class on the ex-date of the distribution. |
| 1 | Commencement of operations. |
| 2 | Per share amounts presented are based on average shares outstanding throughout the period indicated. |
| 3 | Rounds to less than $0.005. |
| 4 | Not annualized. |
| 5 | Annualized. |
See Notes to Financial Statements.
Brookfield Global Listed Real Estate Fund
Financial Highlights
| Class Y | For the Year Ended December 31, 2014 | | For the Year Ended December 31, 2013 | | For the Year Ended December 31, 2012 | | For the Period December 1, 20111 through December 31, 2011 |
| Per Share Operating Performance: | | | | | | | |
Net asset value, beginning of period
| $ 11.87 | | $ 12.01 | | $10.02 | | $ 10.00 |
Net investment income2
| 0.41 | | 0.25 | | 0.22 | | 0.04 |
Net realized and unrealized gain on investment transactions
| 1.90 | | 0.37 | | 3.00 | | 0.02 |
Net increase in net asset value resulting from operations
| 2.31 | | 0.62 | | 3.22 | | 0.06 |
Distributions from net investment income
| (0.51) | | (0.28) | | (0.56) | | (0.04) |
Distributions from net realized capital gain
| (0.35) | | (0.48) | | (0.67) | | — |
Total distributions paid
| (0.86) | | (0.76) | | (1.23) | | (0.04) |
Redemption fees
| 0.00 3 | | 0.00 3 | | — | | — |
Net asset value, end of period
| $ 13.32 | | $ 11.87 | | $12.01 | | $ 10.02 |
Total Investment Return†
| 19.51% | | 5.20% | | 32.93% | | 0.59% 4 |
| Ratios to Average Net Assets/Supplementary Data: | | | | | | | |
Net assets, end of period (000s)
| $120,367 | | $51,694 | | $9,101 | | $ 13 |
Gross operating expenses
| 1.16% | | 1.41% | | 3.24% | | 25.79% 5 |
Net expenses, including fee waivers and reimbursement
| 0.95% | | 0.95% | | 1.11% | | 1.25% 5 |
Net investment income
| 3.09% | | 1.98% | | 3.64% | | 3.35% 5 |
Net investment income (loss), excluding the effect of fee waivers and reimbursement
| 2.88% | | 1.52% | | 1.51% | | (21.19)% 5 |
Portfolio turnover rate
| 108% | | 147% | | 106% | | 0% 4 |
| † | Total investment return is computed based upon the net asset value of the Fund’s shares and excludes the effects of sales charges or contingent deferred sales charges, if applicable. Distributions are assumed to be reinvested at the net asset value of the Class on the ex-date of the distribution. |
| 1 | Commencement of operations. |
| 2 | Per share amounts presented are based on average shares outstanding throughout the period indicated. |
| 3 | Rounds to less than $0.005. |
| 4 | Not annualized. |
| 5 | Annualized. |
| Class I | For the Year Ended December 31, 2014 | | For the Year Ended December 31, 2013 | | For the Year Ended December 31, 2012 | | For the Period December 1, 20111 through December 31, 2011 |
| Per Share Operating Performance: | | | | | | | |
Net asset value, beginning of period
| $ 11.86 | | $ 12.00 | | $ 10.02 | | $ 10.00 |
Net investment income2
| 0.36 | | 0.23 | | 0.21 | | 0.04 |
Net realized and unrealized gain on investment transactions
| 1.96 | | 0.39 | | 3.00 | | 0.02 |
Net increase in net asset value resulting from operations
| 2.32 | | 0.62 | | 3.21 | | 0.06 |
Distributions from net investment income
| (0.51) | | (0.28) | | (0.56) | | (0.04) |
Distributions from net realized capital gain
| (0.35) | | (0.48) | | (0.67) | | — |
Total distributions paid
| (0.86) | | (0.76) | | (1.23) | | (0.04) |
Redemption fees
| 0.00 3 | | 0.00 3 | | — | | — |
Net asset value, end of period
| $ 13.32 | | $ 11.86 | | $ 12.00 | | $ 10.02 |
Total Investment Return†
| 19.61% | | 5.20% | | 32.83% | | 0.59% 4 |
| Ratios to Average Net Assets/Supplementary Data: | | | | | | | |
Net assets, end of period (000s)
| $212,842 | | $69,846 | | $27,926 | | $ 5,041 |
Gross operating expenses
| 1.16% | | 1.41% | | 2.65% | | 25.79% 5 |
Net expenses, including fee waivers and reimbursement
| 0.95% | | 0.95% | | 1.05% | | 1.25% 5 |
Net investment income
| 2.69% | | 1.86% | | 1.81% | | 3.35% 5 |
Net investment income (loss), excluding the effect of fee waivers and reimbursement
| 2.48% | | 1.40% | | 0.21% | | (21.19)% 5 |
Portfolio turnover rate
| 108% | | 147% | | 106% | | 0% 4 |
| † | Total investment return is computed based upon the net asset value of the Fund’s shares and excludes the effects of sales charges or contingent deferred sales charges, if applicable. Distributions are assumed to be reinvested at the net asset value of the Class on the ex-date of the distribution. |
| 1 | Commencement of operations. |
| 2 | Per share amounts presented are based on average shares outstanding throughout the period indicated. |
| 3 | Rounds to less than $0.005. |
| 4 | Not annualized. |
| 5 | Annualized. |
See Notes to Financial Statements.
50Brookfield Investment Management Inc.
Brookfield U.S. Listed Real Estate Fund
Financial Highlights
| Class A | For the Year Ended December 31, 2014 | | For the Period December 11, 20131 through December 31, 2013 |
| Per Share Operating Performance: | | | |
Net asset value, beginning of period
| $10.11 | | $10.00 |
Net investment income3
| 0.68 | | 0.04 |
Net realized and unrealized gain on investment transactions
| 2.22 | | 0.12 |
Net increase in net asset value resulting from operations
| 2.90 | | 0.16 |
Distributions from net investment income
| (0.36) | | (0.05) |
Distributions from net realized capital gain
| (0.88) | | — |
Total distributions paid
| (1.24) | | (0.05) |
Net asset value, end of period
| $11.77 | | $10.11 |
Total Investment Return†
| 28.66% | | 1.62% 4 |
| Ratios to Average Net Assets/Supplementary Data: | | | |
Net assets, end of period (000s)
| $ 123 | | $ 1 |
Gross operating expenses
| 2.40% | | 3.82% 2,5 |
Net expenses, including fee waivers and reimbursement
| 1.20% | | 0.80% 2,5 |
Net investment income
| 5.61% | | 8.17% 2,5 |
Net investment income, excluding the effect of fee waivers and reimbursement
| 4.41% | | 5.15% 2,5 |
Portfolio turnover rate
| 86% | | 4% 4 |
| † | Total investment return is computed based upon the net asset value of the Fund’s shares and excludes the effects of sales charges or contingent deferred sales charges, if applicable. Distributions are assumed to be reinvested at the net asset value of the Class on the ex-date of the distribution. |
| 1 | Commencement of operations. |
| 2 | Organization costs were not annualized in the calculation of the income and expense ratios. If these expenses were annualized, the gross and net expense ratios would have been 4.16% and 1.20%, respectively. |
| 3 | Per share amounts presented are based on average shares outstanding throughout the period indicated. |
| 4 | Not annualized. |
| 5 | Annualized. |
| Class C | For the Year Ended December 31, 2014 | | For the Period December 11, 20131 through December 31, 2013 |
| Per Share Operating Performance: | | | |
Net asset value, beginning of period
| $10.11 | | $10.00 |
Net investment income3
| 0.26 | | 0.04 |
Net realized and unrealized gain on investment transactions
| 2.56 | | 0.12 |
Net increase in net asset value resulting from operations
| 2.82 | | 0.16 |
Distributions from net investment income
| (0.28) | | (0.05) |
Distributions from net realized capital gain
| (0.88) | | — |
Total distributions paid
| (1.16) | | (0.05) |
Net asset value, end of period
| $11.77 | | $10.11 |
Total Investment Return†
| 27.78% | | 1.58% 4 |
| Ratios to Average Net Assets/Supplementary Data: | | | |
Net assets, end of period (000s)
| $ 1 | | $ 1 |
Gross operating expenses
| 3.15% | | 4.54% 2,5 |
Net expenses, including fee waivers and reimbursement
| 1.95% | | 1.52% 2,5 |
Net investment income
| 2.27% | | 7.45% 2,5 |
Net investment income, excluding the effect of fee waivers and reimbursement
| 1.07% | | 4.43% 2,5 |
Portfolio turnover rate
| 86% | | 4% 4 |
| † | Total investment return is computed based upon the net asset value of the Fund’s shares and excludes the effects of sales charges or contingent deferred sales charges, if applicable. Distributions are assumed to be reinvested at the net asset value of the Class on the ex-date of the distribution. |
| 1 | Commencement of operations. |
| 2 | Organization costs were not annualized in the calculation of the income and expense ratios. If these expenses were annualized, the gross and net expense ratios would have been 4.89% and 1.95%, respectively. |
| 3 | Per share amounts presented are based on average shares outstanding throughout the period indicated. |
| 4 | Not annualized. |
| 5 | Annualized. |
See Notes to Financial Statements.
Brookfield U.S. Listed Real Estate Fund
Financial Highlights
| Class Y | For the Year Ended December 31, 2014 | | For the Period December 11, 20131 through December 31, 2013 |
| Per Share Operating Performance: | | | |
Net asset value, beginning of period
| $10.11 | | $10.00 |
Net investment income3
| 0.83 | | 0.04 |
Net realized and unrealized gain on investment transactions
| 2.10 | | 0.12 |
Net increase in net asset value resulting from operations
| 2.93 | | 0.16 |
Distributions from net investment income
| (0.39) | | (0.05) |
Distributions from net realized capital gain
| (0.88) | | — |
Total distributions paid
| (1.27) | | (0.05) |
Net asset value, end of period
| $11.77 | | $10.11 |
Total Investment Return†
| 28.98% | | 1.64% 4 |
| Ratios to Average Net Assets/Supplementary Data: | | | |
Net assets, end of period (000s)
| $ 118 | | $ 1 |
Gross operating expenses
| 2.15% | | 3.46% 2,5 |
Net expenses, including fee waivers and reimbursement
| 0.95% | | 0.44% 2,5 |
Net investment income
| 6.78% | | 8.54% 2,5 |
Net investment income, excluding the effect of fee waivers and reimbursement
| 5.58% | | 5.52% 2,5 |
Portfolio turnover rate
| 86% | | 4% 4 |
| † | Total investment return is computed based upon the net asset value of the Fund’s shares and excludes the effects of sales charges or contingent deferred sales charges, if applicable. Distributions are assumed to be reinvested at the net asset value of the Class on the ex-date of the distribution. |
| 1 | Commencement of operations. |
| 2 | Organization costs were not annualized in the calculation of the income and expense ratios. If these expenses were annualized, the gross and net expense ratios would have been 3.80% and 0.95%, respectively. |
| 3 | Per share amounts presented are based on average shares outstanding throughout the period indicated. |
| 4 | Not annualized. |
| 5 | Annualized. |
| Class I | For the Year Ended December 31, 2014 | | For the Period December 11, 20131 through December 31, 2013 |
| Per Share Operating Performance: | | | |
Net asset value, beginning of period
| $ 10.11 | | $ 10.00 |
Net investment income3
| 0.38 | | 0.04 |
Net realized and unrealized gain on investment transactions
| 2.55 | | 0.12 |
Net increase in net asset value resulting from operations
| 2.93 | | 0.16 |
Distributions from net investment income
| (0.39) | | (0.05) |
Distributions from net realized capital gain
| (0.88) | | — |
Total distributions paid
| (1.27) | | (0.05) |
Net asset value, end of period
| $ 11.77 | | $ 10.11 |
Total Investment Return†
| 28.98% | | 1.64% 4 |
| Ratios to Average Net Assets/Supplementary Data: | | | |
Net assets, end of period (000s)
| $32,776 | | $25,408 |
Gross operating expenses
| 2.15% | | 3.59% 2,5 |
Net expenses, including fee waivers and reimbursement
| 0.95% | | 0.61% 2,5 |
Net investment income
| 3.30% | | 7.58% 2,5 |
Net investment income, excluding the effect of fee waivers and reimbursement
| 2.10% | | 4.60% 2,5 |
Portfolio turnover rate
| 86% | | 4% 4 |
| † | Total investment return is computed based upon the net asset value of the Fund’s shares and excludes the effects of sales charges or contingent deferred sales charges, if applicable. Distributions are assumed to be reinvested at the net asset value of the Class on the ex-date of the distribution. |
| 1 | Commencement of operations. |
| 2 | Organization costs were not annualized in the calculation of the income and expense ratios. If these expenses were annualized, the gross and net expense ratios would have been 3.93% and 0.95%, respectively. |
| 3 | Per share amounts presented are based on average shares outstanding throughout the period indicated. |
| 4 | Not annualized. |
| 5 | Annualized. |
See Notes to Financial Statements.
52Brookfield Investment Management Inc.
Brookfield Real Assets Securities Fund
Financial Highlights
| Class A | For the Period November 19, 20141 through December 31, 2014 |
| Per Share Operating Performance: | |
Net asset value, beginning of period
| $10.00 |
Net investment income2
| 0.03 |
Net realized and unrealized loss on investment transactions
| (0.29) |
Net decrease in net asset value resulting from operations
| (0.26) |
Distributions from net investment income
| (0.02) |
Net asset value, end of period
| $ 9.72 |
Total Investment Return†
| -2.55% 3 |
| Ratios to Average Net Assets/Supplementary Data: | |
Net assets, end of period (000s)
| $ 1 |
Gross operating expenses
| 3.56% 4 |
Net expenses, including fee waivers and reimbursement
| 1.35% 4 |
Net investment income
| 2.33% 4 |
Net investment income, excluding the effect of fee waivers and reimbursement
| 0.12% 4 |
Portfolio turnover rate
| 7% 3 |
| † | Total investment return is computed based upon the net asset value of the Fund’s shares and excludes the effects of sales charges or contingent deferred sales charges, if applicable. Distributions are assumed to be reinvested at the net asset value of the Class on the ex-date of the distribution. |
| 1 | Commencement of operations. |
| 2 | Per share amounts presented are based on average shares outstanding throughout the period indicated. |
| 3 | Not annualized. |
| 4 | Annualized. |
| Class C | For the Period November 19, 20141 through December 31, 2014 |
| Per Share Operating Performance: | |
Net asset value, beginning of period
| $10.00 |
Net investment income2
| 0.03 |
Net realized and unrealized loss on investment transactions
| (0.29) |
Net decrease in net asset value resulting from operations
| (0.26) |
Distributions from net investment income
| (0.02) |
Net asset value, end of period
| $ 9.72 |
Total Investment Return†
| -2.63% 3 |
| Ratios to Average Net Assets/Supplementary Data: | |
Net assets, end of period (000s)
| $ 1 |
Gross operating expenses
| 4.31% 4 |
Net expenses, including fee waivers and reimbursement
| 2.10% 4 |
Net investment income
| 2.25% 4 |
Net investment income, excluding the effect of fee waivers and reimbursement
| 0.04% 4 |
Portfolio turnover rate
| 7% 3 |
| † | Total investment return is computed based upon the net asset value of the Fund’s shares and excludes the effects of sales charges or contingent deferred sales charges, if applicable. Distributions are assumed to be reinvested at the net asset value of the Class on the ex-date of the distribution. |
| 1 | Commencement of operations. |
| 2 | Per share amounts presented are based on average shares outstanding throughout the period indicated. |
| 3 | Not annualized. |
| 4 | Annualized. |
See Notes to Financial Statements.
Brookfield Real Assets Securities Fund
Financial Highlights
| Class Y | For the Period November 19, 20141 through December 31, 2014 |
| Per Share Operating Performance: | |
Net asset value, beginning of period
| $10.00 |
Net investment income2
| 0.03 |
Net realized and unrealized loss on investment transactions
| (0.28) |
Net decrease in net asset value resulting from operations
| (0.25) |
Distributions from net investment income
| (0.03) |
Net asset value, end of period
| $ 9.72 |
Total Investment Return†
| -2.51% 3 |
| Ratios to Average Net Assets/Supplementary Data: | |
Net assets, end of period (000s)
| $ 1 |
Gross operating expenses
| 3.31% 4 |
Net expenses, including fee waivers and reimbursement
| 1.10% 4 |
Net investment income
| 2.36% 4 |
Net investment income, excluding the effect of fee waivers and reimbursement
| 0.15% 4 |
Portfolio turnover rate
| 7% 3 |
| † | Total investment return is computed based upon the net asset value of the Fund’s shares and excludes the effects of sales charges or contingent deferred sales charges, if applicable. Distributions are assumed to be reinvested at the net asset value of the Class on the ex-date of the distribution. |
| 1 | Commencement of operations. |
| 2 | Per share amounts presented are based on average shares outstanding throughout the period indicated. |
| 3 | Not annualized. |
| 4 | Annualized. |
| Class I | For the Period November 19, 20141 through December 31, 2014 |
| Per Share Operating Performance: | |
Net asset value, beginning of period
| $ 10.00 |
Net investment income2
| 0.03 |
Net realized and unrealized loss on investment transactions
| (0.29) |
Net decrease in net asset value resulting from operations
| (0.26) |
Distributions from net investment income
| (0.03) |
Net asset value, end of period
| $ 9.71 |
Total Investment Return†
| -2.61% 3 |
| Ratios to Average Net Assets/Supplementary Data: | |
Net assets, end of period (000s)
| $24,345 |
Gross operating expenses
| 3.31% 4 |
Net expenses, including fee waivers and reimbursement
| 1.10% 4 |
Net investment income
| 2.31% 4 |
Net investment income, excluding the effect of fee waivers and reimbursement
| 0.10% 4 |
Portfolio turnover rate
| 7% 3 |
| † | Total investment return is computed based upon the net asset value of the Fund’s shares and excludes the effects of sales charges or contingent deferred sales charges, if applicable. Distributions are assumed to be reinvested at the net asset value of the Class on the ex-date of the distribution. |
| 1 | Commencement of operations. |
| 2 | Per share amounts presented are based on average shares outstanding throughout the period indicated. |
| 3 | Not annualized. |
| 4 | Annualized. |
See Notes to Financial Statements.
54Brookfield Investment Management Inc.
BROOKFIELD INVESTMENT FUNDS
Notes to Financial Statements
December 31, 2014
1.Organization
Brookfield Investment Funds (the “Trust”) was organized as a statutory trust under the laws of the State of Delaware on May 12, 2011. The Trust is registered under the Investment Company Act of 1940, as amended (the “1940 Act”), as an open-end management investment company. The Trust currently consists of four series portfolios: the Brookfield Global Listed Infrastructure Fund (the “Infrastructure Fund”), the Brookfield Global Listed Real Estate Fund (the “Global Real Estate Fund”), the Brookfield U.S. Listed Real Estate Fund (the “U.S. Real Estate Fund”) and the Brookfield Real Assets Securities Fund (the “Real Assets Fund”) (each, a “Fund,” and collectively, the “Funds”). The Infrastructure Fund, Global Real Estate Fund and Real Assets Fund are each a diversified open-end management investment company and the U.S. Real Estate Fund is a non-diversified open-end management investment company.
Each Fund currently has four classes of shares: Class A, Class C, Class Y and Class I shares. Each class represents an interest in the same portfolio of assets and has identical voting, dividend, liquidation and other rights except that: (i) Class A shares have a maximum front end sales charge of 4.75% and Class C shares have a maximum deferred sales charge of 1.00%; (ii) Class A shares have a 12b-1 fee of 0.25% and Class C shares have a 12b-1 fee of 1.00%; and (iii) each class has exclusive voting rights with respect to matters relating to its own distribution arrangements. The assets belonging to a particular Fund belong to that Fund for all purposes, and to no other Fund, subject only to the rights of creditors of that Fund.
Brookfield Investment Management Inc. (the “Adviser”), a wholly-owned subsidiary of Brookfield Asset Management Inc., is registered as an investment adviser under the Investment Advisers Act of 1940, as amended (the “Advisers Act”), and serves as investment adviser to the Funds.
The investment objective of each Fund is to seek total return through growth of capital and current income. Each Fund's investment objective is not fundamental and may be changed by the Board of Trustees (the “Board”) without shareholder approval, upon not less than 60 days prior written notice to shareholders. There can be no assurance that each Fund will achieve it's investment objective.
2.Significant Accounting Policies
The preparation of financial statements in conformity with accounting principles generally accepted in the United States of America (“GAAP”) requires management to make estimates and assumptions that affect the reported amounts of assets and liabilities and disclosure of contingent assets and liabilities at the date of the financial statements and the reported amounts of increases and decreases in net assets from operations during the reporting period. Actual results could differ from those estimates. Each Fund is an investment company under GAAP and follows the accounting and reporting guidance applicable to investment companies.
Valuation of Investments: Debt securities, including U.S. government securities, listed corporate bonds, other fixed income and asset-backed securities, and unlisted securities and private placement securities, are generally valued at the bid prices furnished by an independent pricing service or, if not valued by an independent pricing service, using bid prices obtained from active and reliable market makers in any such security or a broker-dealer. The broker-dealers or pricing services use multiple valuation techniques to determine fair value. In instances where sufficient market activity exists, the broker-dealers or pricing services may utilize a market-based approach through which quotes from market makers are used to determine fair value. In instances where sufficient market activity may not exist or is limited, the broker-dealers or pricing services utilize proprietary valuation models which may consider market transactions in comparable securities and the various relationships between securities in determining fair value and/or market characteristics such as benchmark yield curves, option-adjusted spreads, credit spreads, estimated default rates, coupon-rates, anticipated timing of principal repayments, underlying collateral, and other unique security features in order to estimate the relevant cash flows, which are then discounted to calculate the fair values. Short-term debt securities with remaining maturities of sixty days or less are valued at amortized cost with interest accrued or discount accreted to the date of maturity, unless such valuation, in the judgment of the Adviser’s Valuation Committee, does not represent market value.
BROOKFIELD INVESTMENT FUNDS
Notes to Financial Statements (continued)
December 31, 2014
Investments in equity securities listed or traded on any securities exchange or traded in the over-the-counter market are valued at the last quoted price as of the close of business on the valuation date. Investments in open-end registered investment companies, if any, are valued at the net asset value (“NAV”) as reported by those investment companies.
Fair valuation procedures may be used to value a substantial portion of the assets of each Fund. A Fund may use the fair value of a security to calculate its NAV when, for example, (1) a portfolio security is not traded in a public market or the principal market in which the security trades is closed, (2) trading in a portfolio security is suspended and not resumed prior to the normal market close, (3) a portfolio security is not traded in significant volume for a substantial period, or (4) the Adviser determines that the quotation or price for a portfolio security provided by a broker-dealer or an independent pricing service is inaccurate.
The fair value of securities may be difficult to determine and thus judgment plays a greater role in the valuation process. The fair valuation methodology may include or consider the following guidelines, as appropriate: (1) evaluation of all relevant factors, including but not limited to, pricing history, current market level, supply and demand of the respective security; (2) comparison to the values and current pricing of securities that have comparable characteristics; (3) knowledge of historical market information with respect to the security; (4) other factors relevant to the security which would include, but not be limited to, duration, yield, fundamental analytical data, the Treasury yield curve, and credit quality.
The values assigned to fair valued investments are based on available information and do not necessarily represent amounts that might ultimately be realized, since such amounts depend on future developments inherent in long-term investments. Changes in the fair valuation of portfolio securities may be less frequent and of greater magnitude than changes in the price of portfolio securities valued at their last sale price, by an independent pricing service, or based on market quotations. Imprecision in estimating fair value can also impact the amount of unrealized appreciation or depreciation recorded for a particular portfolio security and differences in the assumptions used could result in a different determination of fair value, and those differences could be material.
The Trust’s Board has adopted procedures for the valuation of each Fund’s securities. The Adviser oversees the day to day responsibilities for valuation determinations under these procedures. The Board regularly reviews the application of these procedures to the securities in a Fund’s portfolio. Pursuant to the procedures, securities in a Fund are valued using unadjusted quoted market prices, when available, as supplied primarily by third party pricing services or dealers. However, if (i) a market value or price is not readily available, (ii) the available quotations are not believed to be reflective of market value by the Adviser, or (iii) a significant event has occurred that would materially affect the value of the security, the security is fair valued, as determined in good faith, by the Adviser’s Valuation Committee. The Adviser’s Valuation Committee is comprised of senior members of the Adviser’s management team. There can be no assurance that a Fund could purchase or sell a portfolio security at the price used to calculate the Fund’s NAV. As of December 31, 2014, there were no Fund securities that were fair valued by the Adviser’s Valuation Committee.
The Funds have established methods of fair value measurements in accordance with GAAP. Fair value denotes the price that a Fund would receive upon selling an investment in a timely transaction to an independent buyer in the principal or most advantageous market of the investment. A three-tier hierarchy has been established to maximize the use of observable market data and minimize the use of unobservable inputs and to establish classification of fair value measurements for disclosure purposes. Inputs refer broadly to the assumptions that market participants would use in pricing the asset or liability, including assumptions about risk, for example, the risk inherent in a particular valuation technique used to measure fair value including such a pricing model and/or the risk inherent in the inputs to the valuation technique. Inputs may be observable or unobservable. Observable inputs are inputs that reflect the assumptions market participants would use in pricing the asset or liability developed based on market data obtained from sources independent of the reporting entity. Unobservable inputs are inputs that reflect the reporting entity’s own assumptions about the assumptions market participants would use in pricing the asset or liability developed based on the best information available in the circumstances. The three-tier hierarchy of inputs is summarized in the three broad levels listed below.
56Brookfield Investment Management Inc.
BROOKFIELD INVESTMENT FUNDS
Notes to Financial Statements (continued)
December 31, 2014
| Level 1 - | quoted prices in active markets for identical assets or liabilities
|
| Level 2 - | quoted prices in markets that are not active or other significant observable inputs (including, but not limited to: quoted prices for similar assets or liabilities, quoted prices based on recently executed transactions, interest rates, credit risk, etc.)
|
| Level 3 - | significant unobservable inputs (including each Fund’s own assumptions in determining the fair value of assets or liabilities) |
The Adviser’s valuation policy, as previously stated, establishes parameters for the sources and types of valuation analysis, as well as, the methodologies and inputs the Adviser uses in determining fair value, including the use of the Adviser’s Valuation Committee. If the Adviser’s Valuation Committee determines that additional techniques, sources or inputs are appropriate or necessary in a given situation, such additional work will be undertaken.
Significant increases or decreases in any of the unobservable inputs in isolation may result in a lower or higher fair value measurement.
To assess the continuing appropriateness of security valuations, the Adviser (or its third party service providers, who are subject to oversight by the Adviser), regularly compares one of its prior day prices, prices on comparable securities and sale prices to the current day prices and challenges those prices that exceed certain tolerance levels with the third party pricing service or broker source. For those securities valued by fair valuations, the Adviser’s Valuation Committee reviews and affirms the reasonableness of the valuations based on such methodologies and fair valuation determinations on a regular basis after considering all relevant information that is reasonably available.
The inputs or methodology used for valuing investments are not necessarily an indication of the risk associated with investing in those securities.
Infrastructure Fund
The following table summarizes the Infrastructure Fund's investments categorized in the disclosure hierarchy as of December 31, 2014:
| Valuation Inputs | Level 1 | | Level 2 | | Level 3 | | Total |
| Common Stocks: |
Australia
| $ — | | $ 20,148,945 | | $ — | | $ 20,148,945 |
Bermuda
| 8,015,175 | | — | | — | | 8,015,175 |
Brazil
| 9,779,568 | | — | | — | | 9,779,568 |
Canada
| 59,625,076 | | — | | — | | 59,625,076 |
China
| — | | 18,879,708 | | — | | 18,879,708 |
France
| — | | 18,171,458 | | — | | 18,171,458 |
Italy
| — | | 21,506,358 | | — | | 21,506,358 |
Japan
| — | | 9,816,333 | | — | | 9,816,333 |
Mexico
| 1,801,263 | | — | | — | | 1,801,263 |
Netherlands
| — | | 4,970,306 | | — | | 4,970,306 |
Spain
| — | | 10,785,816 | | — | | 10,785,816 |
Switzerland
| — | | 5,007,018 | | — | | 5,007,018 |
United Kingdom
| — | | 42,402,419 | | — | | 42,402,419 |
United States
| 248,773,337 | | — | | — | | 248,773,337 |
Total
| $ 327,994,419 | | $ 151,688,361 | | $ — | | $ 479,682,780 |
For further information regarding security characteristics, see the Schedule of Investments.
BROOKFIELD INVESTMENT FUNDS
Notes to Financial Statements (continued)
December 31, 2014
Level 2 securities are fair valued as a result of foreign market movements following the close of local trading. During the year ended December 31, 2014, transfers from Level 2 to Level 1 were $4,444,390 due to these market movements. There were no additional transfers between Levels. The basis for recognizing and valuing transfers is as of the end of the period in which transfers occur. During the year ended December 31, 2014, the Infrastructure Fund did not invest in any level 3 securities.
Global Real Estate Fund
The following table summarizes the Global Real Estate Fund's investments categorized in the disclosure hierarchy as of December 31, 2014:
| Valuation Inputs | Level 1 | | Level 2 | | Level 3 | | Total |
| Common Stocks: |
Australia
| $ — | | $ 29,246,604 | | $ — | | $ 29,246,604 |
Austria
| — | | 2,503,306 | | — | | 2,503,306 |
Brazil
| 3,235,600 | | — | | — | | 3,235,600 |
France
| — | | 16,469,630 | | — | | 16,469,630 |
Germany
| — | | 19,132,090 | | — | | 19,132,090 |
Hong Kong
| — | | 26,799,153 | | — | | 26,799,153 |
Japan
| — | | 27,805,548 | | — | | 27,805,548 |
Netherlands
| 6,026,787 | | — | | — | | 6,026,787 |
New Zealand
| — | | 3,156,873 | | — | | 3,156,873 |
Singapore
| — | | 13,005,578 | | — | | 13,005,578 |
United Kingdom
| — | | 8,186,823 | | — | | 8,186,823 |
United States
| 166,119,999 | | — | | — | | 166,119,999 |
Total
| $ 175,382,386 | | $ 146,305,605 | | $ — | | $ 321,687,991 |
For further information regarding security characteristics, see the Schedule of Investments.
Level 2 securities are fair valued as a result of foreign market movements following the close of local trading. During the year ended December 31, 2014, transfers from Level 2 to Level 1 were $9,262,387 and transfers from Level 1 to Level 2 were $6,472,802 due to these market movements. There were no additional transfers between Levels. The basis for recognizing and valuing transfers is as of the end of the period in which transfers occur. During the year ended December 31, 2014, the Global Real Estate Fund did not invest in any Level 3 securities.
58Brookfield Investment Management Inc.
BROOKFIELD INVESTMENT FUNDS
Notes to Financial Statements (continued)
December 31, 2014
U.S. Real Estate Fund
The following table summarizes the Real Assets Fund's investments categorized in the disclosure hierarchy as of December 31, 2014:
| Valuation Inputs | Level 1 | | Level 2 | | Level 3 | | Total |
| Common Stocks: |
Healthcare
| $ 4,130,691 | | $ — | | $ — | | $ 4,130,691 |
Hotel
| 943,669 | | — | | — | | 943,669 |
Industrial
| 690,021 | | — | | — | | 690,021 |
Mixed
| 1,343,391 | | — | | — | | 1,343,391 |
Office
| 5,946,025 | | — | | — | | 5,946,025 |
Real Estate - Diversified
| 2,036,383 | | — | | — | | 2,036,383 |
Regional Malls
| 5,426,127 | | — | | — | | 5,426,127 |
Residential
| 3,749,501 | | — | | — | | 3,749,501 |
Self Storage
| 642,220 | | — | | — | | 642,220 |
Specialty
| 2,056,667 | | — | | — | | 2,056,667 |
Strip Centers
| 2,028,858 | | — | | — | | 2,028,858 |
Telecommunications
| 1,838,460 | | — | | — | | 1,838,460 |
Triple Net Lease
| 646,722 | | — | | — | | 646,722 |
Total
| $ 31,478,735 | | $ — | | $ — | | $ 31,478,735 |
For further information regarding security characteristics, see the Schedule of Investments.
During the year ended December 31, 2014, there were no transfers between Levels. The basis for recognizing and valuing transfers is as of the end of the period in which transfers occur. During the year ended December 31, 2014, the U.S. Real Estate Fund did not invest in any Level 2 or Level 3 securities.
BROOKFIELD INVESTMENT FUNDS
Notes to Financial Statements (continued)
December 31, 2014
Real Assets Fund
The following table summarizes the Real Asset Fund's investments categorized in the disclosure hierarchy as of December 31, 2014:
| Valuation Inputs | Level 1 | | Level 2 | | Level 3 | | Total |
| Common Stocks: |
Australia
| $ — | | $ 821,448 | | $ — | | $ 821,448 |
Bermuda
| 178,115 | | — | | — | | 178,115 |
Brazil
| 50,320 | | — | | — | | 50,320 |
Canada
| 1,639,465 | | — | | — | | 1,639,465 |
China
| — | | 198,309 | | — | | 198,309 |
France
| — | | 521,581 | | — | | 521,581 |
Germany
| — | | 407,869 | | — | | 407,869 |
Hong Kong
| — | | 507,285 | | — | | 507,285 |
Ireland
| 49,221 | | — | | — | | 49,221 |
Italy
| — | | 289,759 | | — | | 289,759 |
Japan
| — | | 554,743 | | — | | 554,743 |
Mexico
| 87,563 | | — | | — | | 87,563 |
Netherlands
| 110,964 | | 62,259 | | — | | 173,223 |
New Zealand
| — | | 65,095 | | — | | 65,095 |
Norway
| — | | 31,254 | | — | | 31,254 |
Portugal
| — | | 43,601 | | — | | 43,601 |
Singapore
| — | | 264,185 | | — | | 264,185 |
Spain
| — | | 232,792 | | — | | 232,792 |
Switzerland
| — | | 66,876 | | — | | 66,876 |
United Kingdom
| 74,442 | | 788,308 | | — | | 862,750 |
United States
| 8,989,556 | | — | | — | | 8,989,556 |
Total Common Stocks
| 11,179,646 | | 4,855,364 | | — | | 16,035,010 |
| Corporate Bonds: |
Belgium
| — | | 251,250 | | — | | 251,250 |
Bermuda
| — | | 230,000 | | — | | 230,000 |
Greece
| — | | 232,500 | | — | | 232,500 |
Luxembourg
| — | | 250,625 | | — | | 250,625 |
Singapore
| — | | 242,250 | | — | | 242,250 |
United States
| — | | 4,747,562 | | — | | 4,747,562 |
Total Corporate Bonds
| — | | 5,954,187 | | — | | 5,954,187 |
| Preferred Stocks |
United States
| 853,978 | | 372,687 | | — | | 1,226,665 |
Total
| $ 12,033,624 | | $ 11,182,238 | | $ — | | $ 23,215,862 |
For further information regarding security characteristics, see the Schedule of Investments.
During the period ended December 31, 2014, there were no transfers between Levels. The basis for recognizing and valuing transfers is as of the end of the period in which transfers occur. During the period ended December 31, 2014, the Real Assets Fund did not invest in any Level 3 securities.
Investment Transactions and Investment Income: Securities transactions are recorded on the trade date. Realized gains and losses from securities transactions are calculated on the identified cost basis. Interest income is recorded on the accrual basis. Discounts and premiums on securities are accreted and amortized, respectively, on
60Brookfield Investment Management Inc.
BROOKFIELD INVESTMENT FUNDS
Notes to Financial Statements (continued)
December 31, 2014
a daily basis, using the effective yield to maturity method adjusted based on management’s assessment of the collectability of such interest. Dividend income is recorded on the ex-dividend date.
Foreign Currency Transactions: Securities and other assets and liabilities denominated in foreign currencies are translated into U.S. dollar amounts at the date of valuation. Purchases and sales of securities and income and expense items denominated in foreign currencies are translated into U.S. dollar amounts on the respective dates of such transactions. The Funds isolate the portion of realized gains or losses resulting from changes in foreign exchange rates on securities from the fluctuations arising from changes in market prices of securities held. The Funds do not isolate the portion of unrealized gains or losses resulting from changes in foreign exchange rates on securities from the fluctuations arising from changes in market prices of securities held.
Reported net realized foreign exchange gains or losses arise from sales of securities, currency gains or losses realized between the trade and settlement dates on securities transactions and the difference between the amounts of dividends, interest and foreign withholding taxes recorded on a Fund's books and the U.S. dollar equivalent of the amounts actually received or paid.
Taxes: Each Fund intends to continue to meet the requirements of the Internal Revenue Code of 1986, as amended, applicable to regulated investment companies and to distribute substantially all of its taxable income to its shareholders. Therefore, no federal income or excise tax provision is required. Each Fund may incur an excise tax to the extent it has not distributed all of its taxable income on a calendar year basis.
GAAP provides guidance for how uncertain tax positions should be recognized, measured, presented and disclosed in the financial statements. An evaluation of tax positions taken in the course of preparing the Funds’ tax returns to determine whether the tax positions are “more-likely-than-not” of being sustained by the taxing authority is required. Tax benefits of positions not deemed to meet the more-likely-than-not threshold would be booked as a tax expense in the current year and recognized as: a liability for unrecognized tax benefits; a reduction of an income tax refund receivable; a reduction of a deferred tax asset; an increase in a deferred tax liability; or a combination thereof. As of December 31, 2014, each Fund has determined that there are no uncertain tax positions or tax liabilities required to be accrued.
The Funds have reviewed the taxable years open for examination (i.e. not barred by the applicable statute of limitations) by taxing authorities of all major jurisdictions, including the Internal Revenue Service. As of December 31, 2014, open taxable periods consisted of the taxable years ended December 31, 2012 through December 31, 2014 for the Infrastructure Fund and Global Real Estate Fund, the period December 11, 2013 (commencement of operations) through December 31, 2014 for the U.S. Real Estate Fund and for the period November 19, 2014 (commencement of operations) through December 31, 2014 for the Real Assets Fund. No examination of the Funds’ tax returns is currently in progress.
Expenses: Expenses directly attributable to a Fund are charged directly to that Fund, while expenses which are attributable to more than one Fund are allocated among the respective Funds based upon relative average net assets, evenly or a combination of both. Income and expenses of a Fund are allocated on a pro rata basis to each class of shares, except for distribution fees, which are unique to each class of shares.
Distributions: Each Fund declares and pays dividends quarterly from net investment income. Distributions of realized capital gains in excess of capital loss carryforwards are distributed at least annually. Dividends and distributions are recorded on the ex-dividend date. All common shares have equal dividend and other distribution rights. A notice disclosing the source(s) of a distribution will be provided after a payment is made from any source other than net investment income.
Dividends from net investment income and distributions from realized gains from investment transactions have been determined in accordance with Federal income tax regulations and may differ from net investment income and realized gains recorded by each Fund for financial reporting purposes. These differences, which could be
BROOKFIELD INVESTMENT FUNDS
Notes to Financial Statements (continued)
December 31, 2014
temporary or permanent in nature, may result in reclassification of distributions; however, net investment income, net realized gains and losses and net assets are not affected.
3.Investment Advisory Agreements and Related Party Transactions
The Adviser currently serves as the investment adviser to each Fund pursuant to separate investment advisory agreements (the “Advisory Agreements”) under which the Adviser is responsible for the management of each Fund’s portfolio and provides the necessary personnel, facilities, equipment and certain other services necessary to the operations of each Fund.
Pursuant to operating expenses limitation agreements (the “Expense Limitation Agreements”), the Adviser has contractually agreed to waive all or a portion of its investment advisory or administration fees, as presented below, and/or to reimburse certain expenses of each Fund to the extent necessary to maintain each Fund’s total annual operating expenses (excluding any front-end or contingent deferred charges, brokerage commissions and other transactional expenses, acquired fund fees and expenses, interest, taxes, and extraordinary expenses, such as litigation; and other expenses not incurred in the ordinary course of a Fund’s business). The Expense Limitation Agreements will continue until at least May 1, 2015 (May 1, 2016 for the Real Assets Fund) and may not be terminated by the Funds or the Adviser before such time. Thereafter, the Expense Limitation Agreements may only be terminated or amended to increase the expense cap as of May 1st of each calendar year, provided that in the case of a termination by the Adviser, the Adviser will provide the Board with written notice of its intention to terminate the arrangement prior to the expiration of its then current term. Pursuant to the Expense Limitation Agreements, the Adviser retains its right to receive reimbursement of any payments made by it, or to recoup any fees waived by it during the prior three years, provided that after giving effect to such repayment or recoupment, such adjusted total annual operating expenses (expressed as a percentage of average net assets) for each Fund would not exceed the percentage limitations listed below.
62Brookfield Investment Management Inc.
BROOKFIELD INVESTMENT FUNDS
Notes to Financial Statements (continued)
December 31, 2014
The Advisory Agreements provide that each Fund shall pay the Adviser a monthly fee at the annual rates stated below of each Fund’s average daily net assets:
| | Annual Advisory Fee Rate | Annual Expense Cap from July 1, 2012 | Annual Expense Cap through June 30, 2012 |
| Infrastructure Fund | | | |
Class A
| 0.85% | 1.35% | 1.60% |
Class C
| 0.85% | 2.10% | 2.35% |
Class Y
| 0.85% | 1.10% | 1.35% |
Class I
| 0.85% | 1.10% | 1.35% |
| Global Real Estate Fund | | | |
Class A
| 0.75% | 1.20% | 1.50% |
Class C
| 0.75% | 1.95% | 2.25% |
Class Y
| 0.75% | 0.95% | 1.25% |
Class I
| 0.75% | 0.95% | 1.25% |
| U.S. Real Estate Fund | | | |
Class A
| 0.75% | 1.20% 1 | N/A |
Class C
| 0.75% | 1.95% 1 | N/A |
Class Y
| 0.75% | 0.95% 1 | N/A |
Class I
| 0.75% | 0.95% 1 | N/A |
| Real Assets Fund | | | |
Class A
| 0.85% | 1.35% 2 | N/A |
Class C
| 0.85% | 2.10% 2 | N/A |
Class Y
| 0.85% | 1.10% 2 | N/A |
Class I
| 0.85% | 1.10% 2 | N/A |
1 Annual Expense Cap was effective December 11, 2013 (commencement of operations).
2 Annual Expense Cap was effective November 19, 2014 (commencement of operations).
The amount of investment advisory fees waived and/or expenses reimbursed available to be recouped are listed in the table below:
| Fund | December 31, 2015 | December 31, 2016 | December 31, 2017 |
Infrastructure Fund
| $380,615 | $435,670 | $423,903 |
Global Real Estate Fund
| 336,765 | 369,168 | 399,082 |
U.S. Real Estate Fund
| — | 41,257 | 352,858 |
Real Assets Fund1
| — | — | 60,940 |
1 From the commencement of operations on November 19, 2014.
For the year ended December 31, 2014, the Adviser did not recoup any expenses.
Each Fund has entered into separate Administration Agreements with the Adviser. The Adviser has entered into a sub-administration agreement with U.S. Bancorp Fund Services, LLC. The Adviser and the sub-administrator perform administrative services necessary for the operation of the Funds, including maintaining certain books and records of the Funds and preparing reports and other documents required by federal, state and other applicable laws and regulations, and providing the Funds with administrative office facilities. For its services under the Administration Agreements, the Adviser receives from each Fund, respectively, an annual fee equal to 0.15% of its average daily net assets, payable monthly in arrears.
Certain officers and/or Trustees of the Trust are officers and/or directors of the Adviser.
BROOKFIELD INVESTMENT FUNDS
Notes to Financial Statements (continued)
December 31, 2014
4.Purchases and Sales of Investments
Purchases and sales of investments, excluding U.S. Government securities, for the year ended December 31, 2014 were as follows:
| Fund | Purchases | Sales |
Infrastructure Fund
| $458,831,195 | $370,752,036 |
Global Real Estate Fund
| 382,397,576 | 197,753,502 |
U.S. Real Estate Fund
| 25,043,881 | 24,789,652 |
Real Assets Fund1
| 25,631,687 | 1,714,776 |
1 From the commencement of operations on November 19, 2014.
During the year ended December 31, 2014, there were no transactions in U.S. Government securities in any Fund.
5.Shares of Beneficial Interest
The Trust’s Declaration of Trust authorizes the issuance of an unlimited number of full and fractional shares of beneficial interest. With respect to each series, the Trust may offer more than one class of shares. The Trust reserves the right to create and issue additional series or classes. Each share of a series or class represents an equal proportionate interest in that series or class with each other share of that series or class. Currently, each series offers four classes of shares of beneficial interest — “Class A” Shares, “Class C” Shares, “Class Y” Shares, and “Class I” Shares.
The shares of each series or class participate equally in the earnings, dividends and assets of the particular series or class.
| | Infrastructure Fund |
| | 2014 | | 2013 |
| Class A | Shares | | Amount | | Shares | | Amount |
Proceeds from shares sold
| 3,559,368 | | $ 52,700,999 | | 6,941,185 | | $ 88,870,491 |
Reinvestment of dividends
| 252,767 | | 3,682,851 | | 122,407 | | 1,610,457 |
Cost of shares redeemed
| (6,072,852) | | (93,265,504) | | (985,809) | | (12,871,007) |
Redemption fees
| — | | 13,307 | | — | | 20,738 |
Net Increase (Decrease) — Class A
| (2,260,717) | | $(36,868,347) | | 6,077,783 | | $ 77,630,679 |
| | Infrastructure Fund |
| | 2014 | | 2013 |
| Class C | Shares | | Amount | | Shares | | Amount |
Proceeds from shares sold
| 1,524,929 | | $23,010,630 | | 1,069,393 | | $13,615,850 |
Reinvestment of dividends
| 69,875 | | 995,294 | | 12,080 | | 159,183 |
Cost of shares redeemed
| (315,984) | | (4,677,798) | | (38,467) | | (504,709) |
Redemption fees
| — | | 1,907 | | — | | 596 |
Net Increase — Class C
| 1,278,820 | | $19,330,033 | | 1,043,006 | | $13,270,920 |
64Brookfield Investment Management Inc.
BROOKFIELD INVESTMENT FUNDS
Notes to Financial Statements (continued)
December 31, 2014
| | Infrastructure Fund |
| | 2014 | | 2013 |
| Class Y | Shares | | Amount | | Shares | | Amount |
Proceeds from shares sold
| 12,347,763 | | $189,546,259 | | 4,409,818 | | $ 56,807,091 |
Reinvestment of dividends
| 561,024 | | 8,138,316 | | 87,999 | | 1,155,818 |
Cost of shares redeemed
| (4,299,535) | | (63,998,704) | | (786,599) | | (10,386,243) |
Redemption fees
| — | | 29,981 | | — | | 2,639 |
Net Increase — Class Y
| 8,609,252 | | $133,715,852 | | 3,711,218 | | $ 47,579,305 |
| | Infrastructure Fund |
| | 2014 | | 2013 |
| Class I | Shares | | Amount | | Shares | | Amount |
Proceeds from shares sold
| 4,235,054 | | $ 65,210,224 | | 9,690,755 | | $121,316,138 |
Reinvestment of dividends
| 626,558 | | 9,110,281 | | 319,389 | | 4,173,791 |
Cost of shares redeemed
| (5,975,622) | | (91,882,910) | | (3,876,351) | | (47,900,645) |
Redemption fees
| — | | 340 | | — | | 4,199 |
Net Increase (Decrease) — Class I
| (1,114,010) | | $(17,562,065) | | 6,133,793 | | $ 77,593,483 |
| | Global Real Estate Fund |
| | 2014 | | 2013 |
| Class A | Shares | | Amount | | Shares | | Amount |
Proceeds from shares sold
| 505,857 | | $ 6,626,556 | | 422,265 | | $5,238,830 |
Reinvestment of dividends
| 18,403 | | 245,449 | | 16,226 | | 193,549 |
Cost of shares redeemed
| (504,472) | | (6,794,291) | | (74,647) | | (923,703) |
Redemption fees
| — | | 2,471 | | — | | 611 |
Net Increase — Class A
| 19,788 | | $ 80,185 | | 363,844 | | $4,509,287 |
| | Global Real Estate Fund |
| | 2014 | | 2013 |
| Class C | Shares | | Amount | | Shares | | Amount |
Proceeds from shares sold
| 272,518 | | $3,583,822 | | 64,192 | | $801,834 |
Reinvestment of dividends
| 7,897 | | 105,369 | | 2,928 | | 34,794 |
Cost of shares redeemed
| (34,720) | | (451,696) | | (2,244) | | (29,583) |
Net Increase — Class C
| 245,695 | | $3,237,495 | | 64,876 | | $807,045 |
| | Global Real Estate Fund |
| | 2014 | | 2013 |
| Class Y | Shares | | Amount | | Shares | | Amount |
Proceeds from shares sold
| 5,161,077 | | $ 69,512,130 | | 3,670,381 | | $45,001,209 |
Reinvestment of dividends
| 466,004 | | 6,240,880 | | 172,456 | | 2,057,373 |
Cost of shares redeemed
| (949,090) | | (12,546,450) | | (245,430) | | (3,013,058) |
Redemption fees
| — | | 6,142 | | — | | 590 |
Net Increase — Class Y
| 4,677,991 | | $ 63,212,702 | | 3,597,407 | | $44,046,114 |
BROOKFIELD INVESTMENT FUNDS
Notes to Financial Statements (continued)
December 31, 2014
| | Global Real Estate Fund |
| | 2014 | | 2013 |
| Class I | Shares | | Amount | | Shares | | Amount |
Proceeds from shares sold
| 14,385,453 | | $193,698,331 | | 5,555,495 | | $ 69,688,972 |
Reinvestment of dividends
| 574,414 | | 7,689,139 | | 344,270 | | 4,122,823 |
Cost of shares redeemed
| (4,865,419) | | (65,321,576) | | (2,338,489) | | (29,252,944) |
Redemption fees
| — | | 55,048 | | — | | 6,012 |
Net Increase — Class I
| 10,094,448 | | $136,120,942 | | 3,561,276 | | $ 44,564,863 |
| | U.S. Real Estate Fund |
| | 2014 | | 2013 1 |
| Class A | Shares | | Amount | | Shares | | Amount |
Proceeds from shares sold
| 11,112 | | $134,450 | | 100 | | $1,000 |
Reinvestment of dividends
| 981 | | 11,670 | | 1 | | 5 |
Cost of shares redeemed
| (1,754) | | (21,645) | | — | | — |
Net Increase — Class A
| 10,339 | | $124,475 | | 101 | | $1,005 |
| | U.S. Real Estate Fund |
| | 2014 | | 2013 1 |
| Class C | Shares | | Amount | | Shares | | Amount |
Proceeds from shares sold
| — | | $ — | | 100 | | $1,000 |
Reinvestment of dividends
| 10 | | 117 | | 0 3 | | 5 |
Cost of shares redeemed
| — | | — | | — | | — |
Net Increase — Class C
| 10 | | $117 | | 100 | | $1,005 |
| | U.S. Real Estate Fund |
| | 2014 | | 2013 1 |
| Class Y | Shares | | Amount | | Shares | | Amount |
Proceeds from shares sold
| 9,439 | | $113,914 | | 100 | | $1,000 |
Reinvestment of dividends
| 903 | | 10,757 | | 1 | | 5 |
Cost of shares redeemed
| (382) | | (4,555) | | — | | — |
Net Increase — Class Y
| 9,960 | | $120,116 | | 101 | | $1,005 |
| | U.S. Real Estate Fund |
| | 2014 | | 2013 1 |
| Class I | Shares | | Amount | | Shares | | Amount |
Proceeds from shares sold
| — | | $ — | | 2,500,100 | | $25,001,000 |
Reinvestment of dividends
| 271,184 | | 3,212,295 | | 13,471 | | 136,870 |
Cost of shares redeemed
| — | | — | | — | | — |
Net Increase — Class I
| 271,184 | | $3,212,295 | | 2,513,571 | | $25,137,870 |
66Brookfield Investment Management Inc.
BROOKFIELD INVESTMENT FUNDS
Notes to Financial Statements (continued)
December 31, 2014
| | Real Assets Fund |
| | 2014 2 |
| Class A | Shares | | Amount |
Proceeds from shares sold
| 100 | | $1,000 |
Reinvestment of dividends
| 0 3 | | 2 |
Cost of shares redeemed
| — | | — |
Net Increase — Class A
| 100 | | $1,002 |
| | Real Assets Fund |
| | 2014 2 |
| Class C | Shares | | Amount |
Proceeds from shares sold
| 100 | | $1,000 |
Reinvestment of dividends
| 0 3 | | 2 |
Cost of shares redeemed
| — | | — |
Net Increase — Class C
| 100 | | $1,002 |
| | Real Assets Fund |
| | 2014 2 |
| Class Y | Shares | | Amount |
Proceeds from shares sold
| 100 | | $1,000 |
Reinvestment of dividends
| 0 3 | | 3 |
Cost of shares redeemed
| — | | — |
Net Increase — Class Y
| 100 | | $1,003 |
| | Real Assets Fund |
| | 2014 2 |
| Class I | Shares | | Amount |
Proceeds from shares sold
| 2,500,100 | | $25,001,000 |
Reinvestment of dividends
| 6,294 | | 61,494 |
Cost of shares redeemed
| — | | — |
Net Increase — Class I
| 2,506,394 | | $25,062,494 |
1 Commencement of operations was December 11, 2013.
2 Commencement of operations was November 19, 2014.
3 Rounds to less than 1 share.
6.Credit Facility
Effective September 11, 2014, U.S. Bank, N.A. (the “Bank”) has made available to the Trust excluding the Real Assets Fund, a credit facility, pursuant to a separate Loan and Security Agreement, for temporary or extraordinary purposes. The maximum line of credit as of December 31, 2014 for the Trust is $75,000,000. For the year ended December 31, 2014, the average interest rate on the outstanding principal amount was 3.00%. Advances are not collateralized by a first lien against a Fund’s assets.
During the year ended December 31, 2014, the Infrastructure Fund utilized the credit facility on two days and had an outstanding average daily loan balance of $2,213,000, the maximum amount outstanding during the year was
BROOKFIELD INVESTMENT FUNDS
Notes to Financial Statements (continued)
December 31, 2014
$2,917,000 and the interest expense amounted to $369. The Global Real Estate Fund and U.S. Real Estate Fund did not utilize the line of credit during the year. At December 31, 2014, the Infrastructure Fund, Global Real Estate Fund and U.S. Real Estate Fund had a loan payable of $2,917,000, $0 and $0, respectively.
7.Federal Income Tax Information
Income and capital gain distributions are determined in accordance with federal income tax regulations, which may differ from GAAP.
The tax character of distributions paid for the year ended December 31, 2014 were as follows:
| | Infrastructure Fund | | Global Real Estate Fund | | U.S. Real Estate Fund | | Real Assets Fund1 |
Ordinary income (including short-term capital gains)
| $19,713,037 | | $15,758,584 | | $3,113,163 | | $72,352 |
Long-term capital gains
| 5,740,453 | | 2,587,203 | | 121,675 | | — |
Total distributions
| $25,453,490 | | $18,345,787 | | $3,234,838 | | $72,352 |
1 From the commencement of operations on November 19, 2014.
The tax character of distributions paid for the year ended December 31, 2013 were as follows:
| | Infrastructure Fund | | Global Real Estate Fund | | U.S. Real Estate Fund |
Ordinary income (including any short-term capital gains)
| $7,453,056 | | $5,730,008 | | $136,885* |
Long-term capital gains
| 311,468 | | 894,227 | | — |
Total distributions
| $7,764,524 | | $6,624,235 | | $ 136,885 |
* A portion of this amount (22,859) relates to a return of capital.
A notice disclosing the source(s) of a distribution is provided after a payment is made from any source other than net investment income. Any such notice is provided only for informational purposes in order to comply with the requirements of Section 19(a) of the 1940 Act and not for tax reporting purposes. The tax composition of each Funds’ distributions for each calendar year is reported on IRS Form 1099-DIV.
At December 31, 2014, each Fund's most recently completed tax year-end, the components of net assets (excluding paid-in capital) on a tax basis were as follows:
| | Infrastructure Fund | | Global Real Estate Fund | | U.S. Real Estate Fund | | Real Assets Fund1 |
Post-October Loss
| $(5,312,787) | | $ (118,672) | | $ — | | $ (5,709) |
Undistributed net investment income
| — | | 1,527,403 | | 398,900 | | — |
Undistributed Long-term capital gains
| — | | — | | 313,189 | | — |
Other accumulated losses
| (1,226,313) | | (16,051) | | — | | (84,346) |
Book basis unrealized appreciation
| 50,160,563 | | 10,040,960 | | 3,726,272 | | (620,028) |
Plus: Cumulative timing difference
| — | | — | | — | | — |
Tax basis unrealized appreciation on investments
| 50,160,563 | | 10,040,960 | | 3,726,272 | | (620,028) |
Total tax basis net accumulated gains (losses)
| $ 43,621,463 | | $11,433,640 | | $4,438,361 | | $(710,083) |
1 From the commencement of operations on November 19, 2014.
68Brookfield Investment Management Inc.
BROOKFIELD INVESTMENT FUNDS
Notes to Financial Statements (continued)
December 31, 2014
As of December 31, 2014, the Real Assets Fund's capital loss carryforward was $84,497 which will not expire. As of December 31, 2014, the Infrastructure Fund, Global Real Estate Fund and U.S. Real Estate Fund had no capital loss carryforwards.
Federal Income Tax Basis: The Federal income tax basis of each Fund's investments, not including foreign currency translation, at December 31, 2014 was as follows:
| Fund | Cost of Investments | Gross Unrealized Appreciation | Gross Unrealized Depreciation | Net Unrealized Appreciation (Depreciation) |
Infrastructure Fund
| $429,522,217 | $67,683,657 | $(17,523,094) | $50,160,563 |
Global Real Estate Fund
| 311,647,031 | 19,266,637 | (9,225,677) | 10,040,960 |
U.S. Real Estate Fund
| 27,752,463 | 4,126,162 | (399,890) | 3,726,272 |
Real Assets Fund
| 23,835,890 | 325,804 | (945,832) | (620,028) |
Capital Account Reclassifications: Because federal income tax regulations differ in certain respects from GAAP, income and capital gain distributions, if any, determined in accordance with tax regulations may differ from net investment income and realized gains recognized for financial reporting purposes. These differences are primarily due to differing treatments for wash sales, partnership income/expense and return of capital. Permanent book and tax differences, if any, relating to shareholder distributions will result in reclassifications to paid-in-capital or to undistributed capital gains. These reclassifications have no effect on net assets or NAV per share.
At December 31, 2014, the Funds' most recently completed tax year-end, each Fund's components of net assets were increased or (decreased) by the amounts shown in the table below:
| | Paid-in capital | Distributions in Excess of Net Investment Income | Accumulated Net Realized Gain |
Infrastructure Fund
| $7,747,274 | $ (402,832) | $(7,344,442) |
Global Real Estate Fund
| 442,181 | 1,775,423 | (2,217,604) |
U.S. Real Estate Fund
| 5,205 | 13,287 | (18,492) |
Real Assets Fund
| (7,424) | (12,297) | 19,721 |
8.Indemnification
Under the Funds’ organizational documents, its officers and trustees are indemnified against certain liabilities arising out of the performance of their duties to the Funds. In addition, in the normal course of business, the Trust, on behalf of the Funds, enters into contracts with vendors and others that provide for indemnification. The Funds’ maximum exposure under these arrangements is unknown, since this would involve the resolution of certain claims, as well as future claims that may be made, against the Funds. Thus an estimate of the financial impact, if any, of these arrangements cannot be made at this time. However, based on experience, the Funds expect the risk of loss due to these warranties and indemnities to be unlikely.
9.New Accounting Pronouncements
In June 2014, the FASB issued ASU No. 2014-11 “Repurchase-to-Maturity Transactions, Repurchase Financings, and Disclosures.” ASU No. 2014-11 makes limited changes to the accounting for repurchase agreements, clarifies when repurchase agreements and securities lending transactions should be accounted for as secured borrowings, and requires additional disclosures regarding these types of transactions. The effective date of this ASU is for fiscal years beginning on or after December 15, 2014, and for interim periods within those fiscal years. Management has determined that this guidance will not have an impact on the Funds’ financial statements disclosure.
BROOKFIELD INVESTMENT FUNDS
Notes to Financial Statements (concluded)
December 31, 2014
10.Subsequent Events
GAAP requires recognition in the financial statements of the effects of all subsequent events that provide additional evidence about conditions that existed at the date of the Statements of Assets and Liabilities. For non-recognized subsequent events that must be disclosed to keep the financial statements from being misleading, the Funds are required to disclose the nature of the event as well as an estimate of their financial effect, or a statement that such an estimate cannot be made.
Management has evaluated subsequent events in the preparation of the Funds' financial statements and has determined that herein, there are no events that require recognition or disclosure in the financial statements.
70Brookfield Investment Management Inc.
BROOKFIELD INVESTMENT FUNDS
Report of Independent Registered Public Accounting Firm
December 31, 2014
To the Board of Trustees of Brookfield Investment Funds and Shareholders of:
Brookfield Global Listed Infrastructure Fund
Brookfield Global Listed Real Estate Fund
Brookfield U.S. Listed Real Estate Fund
Brookfield Real Assets Securities Fund
We have audited the accompanying statements of assets and liabilities, including the schedules of investments, of Brookfield Global Listed Infrastructure Fund, Brookfield Global Listed Real Estate Fund, Brookfield U.S. Listed Real Estate Fund, and Brookfield Real Assets Securities Fund (collectively, the “Funds”), each a series comprising the Brookfield Investment Funds as of December 31, 2014, and the related statements of operations for the year then ended (as to Brookfield Real Assets Securities Fund, for the period November 19, 2014 (commencement of operations) through December 31, 2014), the statements of changes in net assets for each of the two years in the period then ended (as to Brookfield Real Assets Securities Fund, for the period November 19, 2014 (commencement of operations) through December 31, 2014), and the financial highlights for each of the periods presented. These financial statements and financial highlights are the responsibility of the Funds' management. Our responsibility is to express an opinion on these financial statements and financial highlights based on our audits.
We conducted our audits in accordance with the standards of the Public Company Accounting Oversight Board (United States). Those standards require that we plan and perform the audit to obtain reasonable assurance about whether the financial statements and financial highlights are free of material misstatement. The Funds are not required to have, nor were we engaged to perform, an audit of their internal control over financial reporting. Our audits included consideration of internal control over financial reporting as a basis for designing audit procedures that are appropriate in the circumstances, but not for the purpose of expressing an opinion on the effectiveness of the Funds' internal control over financial reporting. Accordingly, we express no such opinion. An audit also includes examining, on a test basis, evidence supporting the amounts and disclosures in the financial statements, assessing the accounting principles used and significant estimates made by management, as well as evaluating the overall financial statement presentation. Our procedures included confirmation of securities owned as of December 31, 2014, by correspondence with the custodian and brokers; where replies were not received from brokers, we performed other auditing procedures. We believe that our audits provide a reasonable basis for our opinion.
In our opinion, the financial statements and financial highlights referred to above present fairly, in all material respects, the financial position of Brookfield Global Listed Infrastructure Fund, Brookfield Global Listed Real Estate Fund, Brookfield U.S. Listed Real Estate Fund, and Brookfield Real Assets Securities Fund, each a series comprising the Brookfield Investment Funds as of December 31, 2014, and the results of their operations for the period then ended, the changes in their net assets and the financial highlights for each of the periods presented, in conformity with accounting principles generally accepted in the United States of America.
DELOITTE & TOUCHE LLP
Philadelphia, Pennsylvania
February 26, 2015
BROOKFIELD INVESTMENT FUNDS
Tax Information (Unaudited)
December 31, 2014
QUALIFIED DIVIDEND INCOME/DIVIDENDS RECEIVED DEDUCTION
For the fiscal year ended December 31, 2014, certain dividends paid by the Funds may be subject to a maximum tax rate of 15%, as provided for by the Jobs and Growth Tax Relief Reconciliation Act of 2003. The percentage of dividends declared from ordinary income designated as qualified dividend income was as follows:
Infrastructure Fund
| 57.90% |
Global Real Estate Fund
| 26.24% |
U.S. Real Estate Fund
| 17.25% |
Real Assets Fund
| 59.76% |
For corporate shareholders, the percentage of ordinary distributions qualifying for the corporate dividends received deductions for the year ended December 31, 2014, was as follows:
Infrastructure Fund
| 52.00% |
Global Real Estate Fund
| 23.20% |
U.S. Real Estate Fund
| 15.30% |
Real Assets Fund
| 65.60% |
The percentage of taxable ordinary income distributions that are designated as short-term capital gain distributions under the Internal Revenue Section 871(k)(2)(C) for each Fund was as follows:
Infrastructure Fund
| 85.39% |
Global Real Estate Fund
| 41.70% |
U.S. Real Estate Fund
| 68.41% |
Real Assets Fund
| 0.00% |
72Brookfield Investment Management Inc.
BROOKFIELD INVESTMENT FUNDS
Information Concerning Trustees and Officers (Unaudited)
The following tables provide information concerning the trustees and officers of the Funds.
Trustees of the Fund
| Name, Address and Age | Position(s) Held with Funds and Term of Office and Length of Time Served | Principal Occupation(s) During Past 5 Years and Other Directorships Held by Trustee | Number of Portfolios in Fund Complex |
| Independent Trustees | | | |
Edward A. Kuczmarski
c/o Brookfield Place,
250 Vesey Street,
New York, New York
10281-1023
Born: 1949 | Trustee, Chairman of the Board, Member of the Audit Committee, Chairman of the Nominating and Compensation Committee
Served Since 2011 | Director/Trustee of several investment companies advised by the Adviser (2011-Present); Certified Public Accountant and Retired Partner of Crowe Horwath LLP (formerly Hays & Company LLP before merger in 2009) (1980-2013); Director of ISI Funds (2007-Present); Trustee of the Daily Income Fund (2006-Present); Director of the California Daily Tax Free Income Fund, Inc. (2006-Present); Trustee of the Stralem Funds (2014-Present). | 8 |
Louis P. Salvatore
c/o Brookfield Place,
250 Vesey Street,
New York, New York
10281-1023
Born: 1946 | Trustee, Chairman of the Audit Committee, Member of the Nominating and Compensation Committee
Served Since 2011 | Director/Trustee of several investment companies advised by the Adviser (2005-Present); Director of SP Fiber Technologies, Inc. (2012-Present); Director of Chambers Street Properties (2012-Present); Director of Crystal River Capital, Inc. (2005-2010); Director of Turner Corp. (2003-Present); Director of Jackson Hewitt Tax Services, Inc. (2004-2011); Employee of Arthur Andersen LLP (2002-Present). | 8 |
Stuart A. McFarland
c/o Brookfield Place,
250 Vesey Street,
New York, New York
10281-1023
Born: 1947 | Trustee, Member of the Audit Committee, Member of the Nominating and Compensation Committee
Served Since 2013 | Director/Trustee of several investment companies advised by the Adviser (2006-Present); Director of New America High Income Fund (2013-Present); Director of United Guaranty Corporation (2011-Present); Director of Brandywine Funds (2003-2013); Director of New Castle Investment Corp. (2000-Present); Managing Partner of Federal City Capital Advisors (1997-Present); Director of New Senior Investment Group, Inc. (2014-Present). | 8 |
BROOKFIELD INVESTMENT FUNDS
Information Concerning Trustees and Officers (Unaudited) (continued)
Trustees of the Fund (continued)
| Name, Address and Age | Position(s) Held with Funds and Term of Office and Length of Time Served | Principal Occupation(s) During Past 5 Years and Other Directorships Held by Trustee | Number of Portfolios in Fund Complex |
| Interested Trustees | | | |
Jonathan C. Tyras
c/o Brookfield Place,
250 Vesey Street,
New York, New York
10281-1023
Born: 1968 | Trustee
Served Since 2014 | Managing Director and Chief Financial Officer of the Adviser (2010-Present); General Counsel and Secretary of the Adviser (2006-Present); Director/Trustee of several investment companies advised by the Adviser (2014-Present); Secretary of several investment companies advised by the Adviser (2006-2014); Vice President of Brookfield Investment Funds (2011-2014); Vice President and General Counsel (2006-2010) and Secretary (2007-2010) of Crystal River Capital, Inc.; Chief Financial Officer of Brookfield Investment Management (UK) Limited (2011-Present); Director of Brookfield Investment Management (UK) Limited (2013-Present); Chief Financial Officer of Brookfield Investment Management (Canada) Inc. (2011-Present); Chief Executive Officer of Brookfield Investment Management (US) LLC (2011-Present); Managing Director of AMP Capital Brookfield Pty Limited (2011-2012). | 8 |
Heather S. Goldman
c/o Brookfield Place,
250 Vesey Street,
New York, New York
10281-1023
Born: 1967 | Trustee
Served Since 2013 | Director/Trustee of several investment companies advised by the Adviser (2013-Present); Global Head of Marketing and Business Development of the Adviser (2011-2013); Managing Partner of Brookfield Financial (2009-2011); Head of Investor Relations of Starwood Capital Group Global (2007-2009); Director and immediate past Board Chair of University Settlement House (2003-2013); Member of the Honorary Board of University Settlement House (2014-Present). | 8 |
74Brookfield Investment Management Inc.
BROOKFIELD INVESTMENT FUNDS
Information Concerning Trustees and Officers (Unaudited) (continued)
Officers of the Fund
| Name, Address and Year of Birth | Position(s) Held with Funds | Term of Office and Length of Time Served | Principal Occupation(s) During Past 5 Years |
Brian F. Hurley*
c/o Brookfield Place,
250 Vesey Street,
New York, New York
10281-1023
Born: 1977 | President | Since 2014 | Managing Director (2014-Present) and Assistant General Counsel (2010-Present) of the Adviser; Director of the Adviser (2010-2014); Secretary of Brookfield Investment Funds (2011-2014); Associate at Paul Hastings LLP (2002-2010). |
Angela W. Ghantous*
c/o Brookfield Place,
250 Vesey Street,
New York, New York
10281-1023
Born: 1975 | Treasurer | Since 2012 | Treasurer of several investment companies advised by the Adviser (2012-Present); Director of the Adviser (2012-Present); Vice President of the Adviser (2009-2012); Controller of Brookfield Redding LLC (2006-2009). |
Alexis I. Rieger*
c/o Brookfield Place,
250 Vesey Street,
New York, New York
10281-1023
Born: 1980 | Secretary | Since 2014 | Vice President and Associate General Counsel of the Adviser (2011-Present); Associate at Kleinberg, Kaplan, Wolff & Cohen P.C. (2009-2011); Associate at Alston & Bird LLP (2007-2009). |
Seth Gelman*
c/o Brookfield Place,
250 Vesey Street,
New York, New York
10281-1023
Born: 1975 | Chief Compliance Officer (“CCO”) | Since 2011 | CCO of several investment companies advised by the Adviser (2009-Present); CCO of the Adviser (2009-Present); Vice President of Oppenheimer Funds, Inc. (2004-2009). |
* Interested person as defined by the Investment Company Act of 1940, as amended (the “1940 Act”) because of affiliations with Brookfield Investment Management Inc., Adviser of the Fund.
The Fund’s Statement of Additional Information includes additional information about the trustees, and is available, without charge, upon request by calling 1-855-777-8001.
BROOKFIELD INVESTMENT FUNDS
Board Considerations Relating to the Investment Advisory Agreement (Unaudited)
December 31, 2014
At an in-person meeting held on August 27, 2014, the Board, including a majority of the Trustees who are not considered to be “interested persons” of the Trust (the “Independent Trustees”) under the Investment Company Act of 1940 (the “1940 Act”), initially approved the Trust’s advisory agreement (the “Advisory Agreement”) with Brookfield Investment Management Inc. (the “Adviser”) for the Real Assets Securities Fund, a new series of the Trust (the “Fund”).
In considering the Advisory Agreement, the Board reviewed information provided by the Adviser relating to the Fund and the Adviser, and other information regarding the nature, extent and quality of services to be provided by the Adviser under the Advisory Agreement, as more fully discussed below.
In considering whether to approve the Advisory Agreement for the Brookfield Real Assets Securities Fund. the Board reviewed and analyzed the factors it deemed relevant, including: (1) the nature, extent and quality of the services to be provided to the Fund by the Adviser; (2) the Adviser's personnel and operations; (3) the level and method of computing the Fund's proposed advisory fees; (4) any "fall-out" benefits to the Adviser and its affiliates (i.e., ancillary benefits realized by the Adviser or its affiliates from the Adviser's relationship with the Trust); and (5) the anticipated effect of growth in size on the Fund's performance and expenses..
NATURE, EXTENT AND QUALITY OF SERVICES. In considering the nature, extent and quality of the services to be provided by the Adviser to the Fund, the Board took into account the extensive responsibilities that the Adviser would have as investment adviser to the Fund, including the provision of investment advisory services to the Fund, compliance with the Fund's policies and objective, review of brokerage matters including with respect to trade allocation and best execution, oversight of general fund compliance with federal and state laws, and the implementation of Board directives as they relate to the Fund. The Board also considered the Adviser's risk management processes and the Adviser's role in coordinating the activities of the Fund's other service providers. The Board considered the Adviser's current level of staffing and its overall resources. The Board reviewed the Adviser's history and investment experience, as well as information regarding the Adviser's investment personnel who would be providing services to the Fund. The Board also evaluated the expertise and performance of the personnel who would be overseeing the compliance with the Fund's investment restrictions, tax and other requirements. The Board further took into account its knowledge of the Adviser's management and the quality of services the Adviser provided to other funds of the Trust, through Board meetings, discussions and reports during the preceding year.
The Board also recognized the Adviser's reputation and experience in serving as an investment adviser to the Trust. The Board considered the Adviser's investment process and philosophy. The Board took into account that the Adviser's responsibilities would include the development and maintenance of an investment program for the Fund which would be consistent with the Fund's investment objective, the selection of investment securities and the placement of orders for the purchase and sale of such securities, as well as the implementation of compliance controls related to performance of these services.
Based on its consideration and review of the foregoing information, the Board concluded that the nature, extent and quality of services to be provided by the Adviser were satisfactory and that there was a reasonable basis on which to conclude that it would provide a high quality of investment services to the Fund.
PERFORMANCE. While the Fund had not yet commenced operations, the Board did consider the Fund's investment policies and strategy. In addition, the Board considered the performance of other funds managed by the Fund's portfolio managers.
FEES AND EXPNENSES. The Board considered the proposed management fee payable under the Advisory Agreement, and took into account that the proposed fee was consistent with the management fee charged by the Adviser to the other comparable series of the Trust and were in line with relevant peers. The Board noted that the Fund's proposed management fee included both advisory and administrative fees.
The Board also considered that the Adviser had agreed to enter into an expense limitation agreement with the
76Brookfield Investment Management Inc.
BROOKFIELD INVESTMENT FUNDS
Board Considerations Relating to the Investment Advisory Agreement (Unaudited) (continued)
December 31, 2014
Fund, pursuant to which the Adviser would agree to waive a portion of its management fee and/or reimburse certain expenses as a means of limiting the Fund's total annual operating expenses. The Board concluded that the contract rate advisory fee and total fund expenses for the Fund were reasonable.
PROFITABILITY. As the Fund had not commenced operation, the Board did not consider the anticipated profitability of the Adviser with respect to the Fund. However, the Board specifically noted that the Adviser agreed to enter into a contractual expense waiver for the Fund, in order to limit the Fund's net operating expenses.
ECONOMIES OF SCALE. The Board also considered the probable effect of the Fund's growth in size on its performance and fees. The Board also noted that if the Fund's assets increase over time, the Fund may realize other economies of scale if assets increase proportionally more than certain other fixed expenses. The Board noted the Fund's expense limitation agreement with the Adviser served to limit the Fund's expenses until the Fund had the opportunity to grow its assets. The Board concluded that the proposed advisory fee structure for the Fund was reasonable at this time.
OTHER FACTORS. As part of its evaluation of the Adviser's compensation, the Board considered other benefits that may be realized by the Adviser and its affiliates from their relationship with the Trust. Among them, the Board recognized the opportunity to provide advisory services to additional portfolios of the Trust and reputational benefits. The Board concluded that the benefits that may accrue to the Adviser and its affiliates by virtue of the Adviser's relationship to the Fund were fair and reasonable in light of the anticipated costs of providing investment advisory services to the Fund and the ongoing commitment of the Adviser to the Fund.
CONCLUSION. In considering the initial approval of the Advisory Agreement, the Board, including the Independent Trustees, did not identify any single factor as controlling, and each Trustee may have attributed different weights to various factors. Based on all of the above-mentioned considerations, and the recommendations of management, the Board, including a majority of the Independent Trustees, determined that approval of the Advisory Agreement was in the best interests of the Fund. After full consideration of these and other factors, the Board, including a majority of the Independent Trustees, with the assistance of independent legal counsel, approved the Advisory Agreement with respect to the Fund.
BROOKFIELD INVESTMENT FUNDS
Joint Notice of Privacy Policy (Unaudited)
Brookfield Investment Management Inc. (“BIM”), on its own behalf and on behalf of the funds managed by BIM and its affiliates, recognizes and appreciates the importance of respecting the privacy of our clients and shareholders. Our relationships are based on integrity and trust and we maintain high standards to safeguard your non-public personal information (“Personal Information”) at all times. This privacy policy (“Policy”) describes the types of Personal Information we collect about you, the steps we take to safeguard that information and the circumstances in which it may be disclosed.
If you hold shares of a Fund through a financial intermediary, such as a broker, investment adviser, bank or trust company, the privacy policy of your financial intermediary will also govern how your Personal Information will be shared with other parties.
WHAT INFORMATION DO WE COLLECT?
We collect the following Personal Information about you:
| • | Information we receive from you in applications or other forms, correspondence or conversations, including but not limited to name, address, phone number, social security number, assets, income and date of birth. |
| • | Information about transactions with us, our affiliates, or others, including but not limited to account number, balance and payment history, parties to transactions, cost basis information, and other financial information. |
| • | Information we may receive from our due diligence, such as your creditworthiness and your credit history. |
WHAT IS OUR PRIVACY POLICY?
We may share your Personal Information with our affiliates in order to provide products or services to you or to support our business needs. We will not disclose your Personal Information to nonaffiliated third parties unless 1) we have received proper consent from you; 2) we are legally permitted to do so; or 3) we reasonably believe, in good faith, that we are legally required to do so. For example, we may disclose your Personal Information with the following in order to assist us with various aspects of conducting our business, to comply with laws or industry regulations, and/or to effect any transaction on your behalf;
| • | Unaffiliated service providers (e.g. transfer agents, securities broker-dealers, administrators, investment advisors or other firms that assist us in maintaining and supporting financial products and services provided to you); |
| • | Government agencies, other regulatory bodies and law enforcement officials (e.g. for reporting suspicious transactions); |
| • | Other organizations, with your consent or as directed by you; and |
| • | Other organizations, as permitted or required by law (e.g. for fraud protection) |
When we share your Personal Information, the information is made available for limited purposes and under controlled circumstances designed to protect your privacy. We require third parties to comply with our standards for security and confidentiality.
HOW DO WE PROTECT CLIENT INFORMATION?
We restrict access to your Personal Information to those persons who require such information to assist us with providing products or services to you. It is our practice to maintain and monitor physical, electronic, and procedural safeguards that comply with federal standards to guard client nonpublic personal information. We regularly train our employees on privacy and information security and on their obligations to protect client information.
CONTACT INFORMATION
For questions concerning our Privacy Policy, please contact our client services representative at 1-855-777-8001.
78Brookfield Investment Management Inc.
Investment Adviser and Administrator
Brookfield Investment Management Inc.
Brookfield Place
250 Vesey Street, 15th Floor
New York, New York 10281-1023
www.brookfieldim.com
Please direct your inquiries to:
Investor Relations
Phone: 1-855-777-8001
E-mail: funds@brookfield.com
Transfer Agent
Shareholder inquiries relating to distributions, address changes and shareholder account information should be directed to the Funds’ transfer agent:
U.S. Bancorp Fund Services, LLC
615 East Michigan Street
Milwaukee, Wisconsin 53202
1-855-244-4859
Fund Accounting Agent
U.S. Bancorp Fund Services, LLC
615 East Michigan Street
Milwaukee, Wisconsin 53202
Sub-Administrator
U.S. Bancorp Fund Services, LLC
1201 South Alma School Road, Suite 3000
Mesa, Arizona 85210
Independent Registered Public Accounting Firm
Deloitte & Touche LLP
1700 Market Street
Philadelphia, Pennsylvania 19103
Legal Counsel
Paul Hastings LLP
75 East 55th Street
New York, New York 10022
Custodian
U.S. Bank National Association
1555 North River Center Drive, Suite 302
Milwaukee, Wisconsin 53212
Distributor
Quasar Distributors, LLC
615 East Michigan Street
Milwaukee, Wisconsin 53202
The Funds file their complete schedule of portfolio holdings with the SEC for the first and third quarters of each fiscal year on Form N-Q. The Funds' Form N-Q will be available on the SEC's website at www.sec.gov. In addition, the Funds' Form N-Q may be reviewed and copied at the SEC's Public Reference Room in Washington, D.C. Information on the operation of the Public Reference Room may be obtained by calling 1-800-SEC-0330.
You may obtain a description of the Funds' proxy voting policies and procedures, and information regarding how the Funds voted proxies relating to portfolio securities during the most recent 12-month period ended June 30, without charge, upon request by calling 1-855-777-8001, or go to the SEC's website at www.sec.gov.
Brookfield Investment Management Inc.
Brookfield Place
250 Vesey Street, 15th Floor
New York, New York 10281-1023
1-855-777-8001
www.brookfieldim.com
Item 2. Code of Ethics.
As of the end of the period covered by this report, the Registrant had adopted a Code of Ethics for Principal Executive and Principal Financial Officers (the “Code”). There were no amendments to or waivers from the Code during the period covered by this report. A copy of the Registrant’s Code will be provided upon request to any person without charge by contacting Investor Relations at (855) 777-8001 or by writing to Secretary, Brookfield Investment Funds, Brookfield Place, 250 Vesey Street, 15th Floor, New York, NY 10281-1023.
Item 3. Audit Committee Financial Expert.
The Registrant’s Board of Directors has determined that three members serving on the Registrant’s audit committee are audit committee financial experts. Their names are Edward A. Kuczmarski, Stuart A. McFarland and Louis P. Salvatore. Messrs. Kuczmarski, McFarland and Salvatore are each independent.
Item 4. Principal Accountant Fees and Services.
(a) Audit Fees
The aggregate fees billed by the Funds’ independent registered public accounting firm, Deloitte &Touche LLP (“Deloitte”), to the Funds for the Funds’ two most recent fiscal years for professional services rendered for the audit of the Registrant’s annual financial statements and the review of financial statements that are included in the Registrant’s annual and semi-annual reports to shareholders (“Audit Fees”) were $148,000 and $107,000 for the fiscal years ended December 31, 2014 and December 31, 2013, respectively.
(b) Audit-Related Fees
There were no fees billed by Deloitte to theFunds in its two recent fiscal years for services rendered for assurance and related services that are reasonably related to the performance of the audit or review of the Fund’s financial statements, but are not reported as Audit Fees (“Audit-Related Fees”).
For the Funds’ two most recent fiscal years, there were no Audit-Related Fees billed by Deloitte for engagements related directly to the operations and financial reporting of one or more Funds by a Fund Service Provider. A Fund Service Provider is (a) any investment adviser to the Fund (not including any Subadvisor whose role is primarily portfolio management and is subcontracted with or overseen by another investment adviser) or (b) any entity that provides ongoing services to the Fund and is controlling, controlled by or under common control with a Fund investment adviser described in (a).
(c) Tax Fees
For the fiscal years ended December 31, 2014 and December 31, 2013, Deloitte billed the Registrant aggregate fees of $24,000 and $13,000, respectively. Each bill is for professional services rendered for tax compliance, tax advice and tax planning. The nature of the services comprising the Tax Fees was the review of the Registrant’s income tax returns and tax distribution requirements.
For the Funds’ two most recent fiscal years, Tax Fees billed by Deloitte for engagements by Fund Service Providers that related directly to the operations and financial reporting of the Funds were $0 for fiscal 2014 and $0 for fiscal 2013, respectively.
The services for which Tax Fees were charged comprise all services performed by professional staff in Deloitte’s tax division except those services related to the audit. Typically, this category would include fees for tax compliance, tax planning, and tax advice. Tax compliance, tax advice, and tax planning services include preparation of original and amended tax returns, claims for refund and tax payment-planning services, assistance with tax audits and appeals, tax advice related to mergers and acquisitions and requests for rulings or technical advice from taxing authorities.
(d) All Other Fees
There were no other fees billed by Deloitte to the Funds for all other non-audit services (“Other Fees”) for the fiscal years ended December 31, 2014 and December 31, 2013. During the same period, there were no Other Fees billed by Deloitte for engagements by Fund Service Providers that related directly to the operations and financial reporting of the Funds.
(e) (1) According to policies adopted by the Audit Committee, services provided by Deloitte to the Funds must be pre-approved by the Audit Committee. On an annual basis, the Audit Committee reviews and pre-approves various types of services that Deloitte may perform for the Funds without specific approval of each engagement, subject to specified budget limitations. As contemplated by the Sarbanes-Oxley Act of 2002 and related SEC rules, the Audit Committee also pre-approves non-audit services provided by Deloitte to any Fund Service Provider for any engagement that relates directly to the operations and financial reporting of the Funds. Any engagement that is not already pre-approved or that will exceed a pre-approved budget must be submitted to the Audit Committee for pre-approval.
(e) (2) None.
(f) Not applicable.
(g) The aggregate fees billed by Deloitte in 2014 and 2013 for non-audit services rendered to the Funds and Fund Service Providers were $274,000 and $168,000, respectively. For the fiscal year ended December 31, 2014, this amount reflects the amounts disclosed above in Item 4(b),(c),(d), plus $250,000 in fees billed to the Fund Service Providers for non-audit services that did not relate directly to the operations and financial reporting of the Funds. For the fiscal year ended December 31, 2013, this amount reflects the amounts disclosed above in Item 4(b),(c),(d), plus $155,000 in fees billed to the Fund Service Providers for non-audit services that did not relate directly to the operations and financial reporting of the Funds.
(h) The Trust’s Audit Committee has considered whether the provision of non-audit services by registrant’s independent registered public accounting firm to the registrant’s investment advisor, and any entity controlling, controlled, or under common control with the investment advisor that provided ongoing services to the registrant that were not pre-approved by the Committee (because such services did not relate directly to the operations and financial reporting of the registrant) was compatible with maintaining the independence of the independent registered public accounting firm.
Item 5. Audit Committee of Listed Registrants.
Not applicable.
Item 6. Investments.
Schedule of Investments is included as part of the report to shareholders filed under Item 1 of this Form.
Item 7. Disclosure of Proxy Voting Policies and Procedures for Closed-End Management Investment Companies.
Not applicable.
Item 8. Portfolio Managers of Closed-End Management Investment Companies.
Not applicable.
Item 9. Purchases of Equity Securities by Closed-End Management Investment Company and Affiliated Purchasers.
Not applicable.
Item 10. Submission of Matters to a Vote of Security Holders.
The registrant’s nominating committee charter does not contain any procedures by which shareholders may recommend nominees to the registrant’s board of trustees.
Item 11. Controls and Procedures.
(a) The Registrant’s principal executive officer and principal financial officer have concluded that the Registrant’s Disclosure Controls and Procedures are effective, based on their evaluation of such Disclosure Controls and Procedures as of a date within 90 days of the filing of this report on Form N-CSR.
(b) As of the date of filing this Form N-CSR, the Registrant’s principal executive officer and principal financial officer are aware of no changes in the Registrant’s internal control over financial reporting that occurred during the Registrant’s second fiscal quarter of the period covered by this report that has materially affected or is reasonably likely to materially affect the Registrant’s internal control over financial reporting.
Item 12. Exhibits.
(a)(1) None.
(2) A separate certification for each principal executive officer and principal financial officer of the Registrant as required by Rule 30a-2(a) under the Investment Company Act of 1940 is attached as an exhibit to this Form N-CSR.
(3) Not Applicable.
(b) A separate certification for each principal executive officer and principal financial officer of the Registrant as required by Rule 30a-2(b) under the Investment Company Act of 1940 is attached as an exhibit to this Form N-CSR.
SIGNATURES
Pursuant to the requirements of the Securities Exchange Act of 1934 and the Investment Company Act of 1940, the Registrant has duly caused this report to be signed on its behalf by the undersigned, thereunto duly authorized.
BROOKFIELD INVESTMENT FUNDS
| | |
| By: | | /s/ Brian F. Hurley |
| | Brian F. Hurley |
| | President and Principal Executive Officer |
| |
| Date: | | March 5, 2015 |
Pursuant to the requirements of the Securities Exchange Act of 1934 and the Investment Company Act of 1940, this report has been signed below by the following persons on behalf of the Registrant and in the capacities and on the dates indicated.
| | |
| By: | | /s/ Brian F. Hurley |
| | Brian F. Hurley |
| | President and Principal Executive Officer |
| |
| Date: | | March 5, 2015 |
| | |
| By: | | /s/ Angela W. Ghantous |
| | Angela W. Ghantous |
| | Treasurer and Principal Financial Officer |
| |
| Date: | | March 5, 2015 |