UNITED STATES
SECURITIES AND EXCHANGE COMMISSION
WASHINGTON, D.C. 20549
FORM N-CSR
CERTIFIED SHAREHOLDER REPORT OF REGISTERED
MANAGEMENT INVESTMENT COMPANIES
Investment Company Act file number 811-22558
BROOKFIELD INVESTMENT FUNDS
(Exact name of registrant as specified in charter)
BROOKFIELD PLACE
250 VESEY STREET, 15th Floor
NEW YORK, NEW YORK 10281-1023
(Address of principal executive offices) (Zip code)
BRIAN F. HURLEY, PRESIDENT
BROOKFIELD INVESTMENT FUNDS
BROOKFIELD PLACE
250 VESEY STREET 15th Floor
NEW YORK, NEW YORK 10281-1023
(Name and address of agent for service)
Registrant’s telephone number, including area code: (855) 777-8001
Date of fiscal year end: December 31, 2017
Date of reporting period: December 31, 2017
Item 1. Reports to Shareholders.
Brookfield Investment Management
ANNUAL REPORT
December 31, 2017
Brookfield Global Listed Infrastructure Fund
Brookfield Global Listed Real Estate Fund
Brookfield U.S. Listed Real Estate Fund
Brookfield Real Assets Securities Fund
Brookfield Investment Management (the “Firm”) is an SEC-registered investment adviser and represents the Public Securities platform of Brookfield Asset Management. The Firm provides global listed real assets strategies including real estate equities, infrastructure equities, real asset debt and diversified real assets. With more than $16 billion of assets under management as of December 31, 2017, the Firm manages separate accounts, registered funds and opportunistic strategies for institutional and individual clients, including financial institutions, public and private pension plans, insurance companies, endowments and foundations, sovereign wealth funds and high net worth investors. The Firm is a wholly owned subsidiary of Brookfield Asset Management, a leading global alternative asset manager with approximately $285 billion of assets under management as of December 31, 2017. For more information, go to www.brookfield.com.
Brookfield Investment Funds is managed by Brookfield Investment Management, and uses its website as a channel of distribution of material company information. Financial and other material information regarding the Fund is routinely posted on and accessible at www.brookfield.com.
This report is for shareholder information. This is not a prospectus intended for the use in the purchase or sale of Fund shares.
| NOT FDIC INSURED | MAY LOSE VALUE | NOT BANK GUARANTEED |
[THIS PAGE IS INTENTIONALLY LEFT BLANK]
Dear Shareholders,
We are pleased to provide the Annual Report for Brookfield Global Listed Infrastructure Fund (the “Infrastructure Fund”), Brookfield Global Listed Real Estate Fund (the “Global Real Estate Fund”), Brookfield U.S. Listed Real Estate Fund (the “U.S. Real Estate Fund”) and Brookfield Real Assets Securities Fund (the “Real Assets Securities Fund”) (each, a “Fund”, and collectively, the “Funds”) for the year ended December 31, 2017.
The MSCI World1 and S&P 500 Total Return2 Indexes reached record highs in 2017 amid accelerating economic growth, strong corporate earnings and investor optimism. For the year, the MSCI World and the S&P 500 Indexes returned 23.1% and 21.8%, respectively. It was the first time in the history of both indexes (going back to 1970 for the MSCI World and 1928 for the S&P 500) where total returns were positive in every calendar month over the course of a year.
Global economic expansion continued in 2017 and was remarkably synchronized across the globe. In fact, it was the first year since 2007 that no Organization for Economic Cooperation and Development economy showed signs of contraction. Across developed market economies, the European recovery witnessed the strongest acceleration in recent quarters, with economic and policy surprise indexes in Europe generally outpacing those in Asia and the Americas over the last 12 months. Adding to this global optimism, the U.S. Tax Cuts and Jobs Act of 2017—which lowers federal tax rates for U.S. companies and individuals—was signed into law in the final days of December.
The Federal Open Market Committee (“FOMC”) increased the federal funds rate by 25 basis points on three occasions in 2017 (in March, June and December), to a target range from 1.25% to 1.5% at the end of the year. The FOMC also began to reduce the size of its $4.4 trillion balance sheet.
The spot price of West Texas Intermediate Crude Oil rose 12.5% during the year, closing at $60.46 per barrel. In November, the Organization of the Petroleum Exporting Countries (“OPEC”) and Russia agreed to extend oil production cuts until the end of 2018. OPEC members Libya and Nigeria, which were exempt from the initial deal in 2016 to curb output, agreed not to increase their production in 2018 above current levels.
Global real assets also performed well during the year. With the exception of Master Limited Partnerships, all real asset sectors delivered positive performance. Global real estate, infrastructure and natural resource indexes all posted double-digit returns; however, none managed to outpace global equities more broadly. Real asset high-yield and investment grade debt also posted strong returns and performed on par with their respective broad market high-yield and investment-grade indexes.
In addition to performance information and additional discussion on factors impacting the Funds, this report provides the Funds’ audited financial statements and schedule of investments as of December 31, 2017.
We welcome your questions and comments, and encourage you to contact our Investor Relations team at (855) 777-8001 or visit us at www.brookfieldim.com for more information. Thank you for your support.
Brian F. Hurley
President
Brookfield Investment Funds
Craig Noble, CFA
CEO, Chief Investment Officer and Portfolio Manager
Brookfield Investment Management Inc.
Letter to Shareholders (continued)
Must be preceded or accompanied by a prospectus.
Quasar Distributors, LLC is the distributor of Brookfield Investment Funds.
1 The MSCI World Index is a free float-adjusted market capitalization weighted index that is designed to measure the equity market performance of developed markets.
2 The S&P 500 Total Return Index is the total return version of S&P 500 Index. Dividends are reinvested on a daily basis and the base date for the index is January 1, 1988. All regular cash dividends are assumed reinvested in the S&P 500 Index on the ex-date. Special cash dividends trigger a price adjustment in the price return index.
Indices are not managed and an investor cannot invest directly in an index.
These views represent the opinions of Brookfield Investment Management Inc. and are not intended to predict or depict the performance of any investment. These views are as of the close of business on December 31, 2017 and subject to change based on subsequent developments.
The Funds’ portfolio holdings are subject to change without notice. The mention of specific securities is not a recommendation or solicitation for any person to buy, sell or hold any particular security. There is no assurance that the Funds currently hold these securities. Please refer to the Schedules of Investments contained in this report for a full listing of Funds’ holdings.
Past performance is no guarantee of future results.
Mutual fund investing involves risk. Principal loss is possible.
A basis point (bps) is a unit that is equal to 1/100 of 1%, and is used to denote the change in a financial instrument.
The Securities and Exchange Commission (SEC) does not approve, endorse, nor indemnify any security.
Earnings growth is not representative of the Fund’s future performance.
Diversification does not assure a profit, nor does it protect against a loss in a declining market.
2Brookfield Investment Management Inc.
About Your Fund’s Expenses
As a shareholder of a Fund, you may incur two types of costs: (1) transaction costs, including sales charges (loads) on purchase payments and contingent deferred sales charges and redemption fees on redemptions; and (2) ongoing costs, including management fees, distribution (12b-1) fees and other fund expenses. This example is intended to help you understand your ongoing costs (in dollars) of investing in the Funds and to compare these costs with the ongoing costs of investing in other mutual funds. The example is based on an investment of $1,000 invested at the beginning of the period and held for the entire period as indicated below.
Actual Fund Return
The table below provides information about actual account values and actual expenses. You may use the information on this line, together with the amount you invested, to estimate the expenses that you paid over the period. Simply divide your account value by $1,000 (for example, an $8,600 account value divided by $1,000 = 8.6), then multiply the result by the number in the first line under the heading entitled “Expenses Paid During Period” to estimate the expenses you paid on your account during this period.
Hypothetical Example for Comparison Purposes
The table below also provides information about hypothetical account values and hypothetical expenses based on the Funds’ actual expense ratio and an assumed rate of return of 5% per year before expenses, which is not the Funds’ actual return. The hypothetical account values and expenses may not be used to estimate the actual ending account balance or expenses you paid for the period. You may use this information to compare the ongoing costs of investing in the Funds and other funds. To do so, compare this 5% hypothetical example with hypothetical examples that appear in shareholders’ reports of other funds.
Please note that the expenses shown in the table are meant to highlight your ongoing costs only and do not reflect any transactional costs, such as sales charges (loads) and redemption fees. Therefore, the hypothetical account values and expenses in the table are useful in comparing ongoing costs only, and will not help you determine the relative total costs of owning different funds. In addition, if these transactional costs were included, your costs overall would have been higher.
| | Annualized Expense Ratio | Beginning Account Value
(07/01/17) | Ending Account Value
(12/31/17) | Expenses Paid During Period
(07/01/17–
12/31/17) (1) |
| INFRASTRUCTURE FUND | | | | |
| Actual | | | | |
Class A Shares
| 1.35% | $1,000.00 | $1,015.00 | $ 6.86 |
Class C Shares
| 2.10% | 1,000.00 | 1,011.00 | 10.64 |
Class Y Shares
| 1.10% | 1,000.00 | 1,016.40 | 5.59 |
Class I Shares
| 1.10% | 1,000.00 | 1,015.60 | 5.59 |
| Hypothetical (assuming a 5% return before expenses) | | | | |
Class A Shares
| 1.35% | 1,000.00 | 1,018.40 | 6.87 |
Class C Shares
| 2.10% | 1,000.00 | 1,014.62 | 10.66 |
Class Y Shares
| 1.10% | 1,000.00 | 1,019.66 | 5.60 |
Class I Shares
| 1.10% | 1,000.00 | 1,019.66 | 5.60 |
About Your Fund’s Expenses (continued)
| | Annualized Expense Ratio | Beginning Account Value
(07/01/17) | Ending Account Value
(12/31/17) | Expenses Paid During Period
(07/01/17–
12/31/17) (1) |
| GLOBAL REAL ESTATE FUND | | | | |
| Actual | | | | |
Class A Shares
| 1.20% | $1,000.00 | $1,047.10 | $ 6.19 |
Class C Shares
| 1.95% | 1,000.00 | 1,043.30 | 10.04 |
Class Y Shares
| 0.95% | 1,000.00 | 1,049.30 | 4.91 |
Class I Shares
| 0.95% | 1,000.00 | 1,048.60 | 4.91 |
| Hypothetical (assuming a 5% return before expenses) | | | | |
Class A Shares
| 1.20% | 1,000.00 | 1,019.16 | 6.11 |
Class C Shares
| 1.95% | 1,000.00 | 1,015.38 | 9.91 |
Class Y Shares
| 0.95% | 1,000.00 | 1,020.42 | 4.84 |
Class I Shares
| 0.95% | 1,000.00 | 1,020.42 | 4.84 |
| U.S. REAL ESTATE FUND | | | | |
| Actual | | | | |
Class A Shares
| 1.20% | $1,000.00 | $1,005.20 | $ 6.07 |
Class C Shares
| 1.95% | 1,000.00 | 1,002.10 | 9.84 |
Class Y Shares
| 0.95% | 1,000.00 | 1,007.50 | 4.81 |
Class I Shares
| 0.95% | 1,000.00 | 1,006.50 | 4.80 |
| Hypothetical (assuming a 5% return before expenses) | | | | |
Class A Shares
| 1.20% | 1,000.00 | 1,019.16 | 6.11 |
Class C Shares
| 1.95% | 1,000.00 | 1,015.38 | 9.91 |
Class Y Shares
| 0.95% | 1,000.00 | 1,020.42 | 4.84 |
Class I Shares
| 0.95% | 1,000.00 | 1,020.42 | 4.84 |
| REAL ASSETS SECURITIES FUND | | | | |
| Actual | | | | |
Class A Shares
| 1.35% | $1,000.00 | $1,025.60 | $ 6.89 |
Class C Shares
| 2.10% | 1,000.00 | 1,023.00 | 10.71 |
Class Y Shares
| 1.10% | 1,000.00 | 1,024.70 | 5.61 |
Class I Shares
| 1.10% | 1,000.00 | 1,025.90 | 5.62 |
| Hypothetical (assuming a 5% return before expenses) | | | | |
Class A Shares
| 1.35% | 1,000.00 | 1,018.40 | 6.87 |
Class C Shares
| 2.10% | 1,000.00 | 1,014.62 | 10.66 |
Class Y Shares
| 1.10% | 1,000.00 | 1,019.66 | 5.60 |
Class I Shares
| 1.10% | 1,000.00 | 1,019.66 | 5.60 |
| (1) | Expenses are equal to the Funds’ annualized expense ratio by class multiplied by the average account value over the period, multiplied by 184/365 (to reflect a six-month period). |
4Brookfield Investment Management Inc.
Brookfield Global Listed Infrastructure Fund
MANAGEMENT DISCUSSION OF FUND PERFORMANCE
For the year ended December 31, 2017, the Infrastructure Fund, Class I had a total return of 10.7%, which assumes the reinvestment of dividends and is exclusive of brokerage commissions, underperforming the Dow Jones Brookfield Global Infrastructure Composite Index1, which returned 12.7%. During the 12-month period ended December 31, 2017, the leading contributor to relative performance was the non-index Renewables/Electric Generation sector. Stock selection within the Pipelines sector also contributed, largely driven by underweight exposure to a number of Canadian pipeline operators. Stock selection within the Communications sector also contributed. Overweight positions in select U.S. tower companies meaningfully contributed as the sector performed well in 2017.
In contrast, MLPs were the leading sector detractor in 2017 due to a combination of stock selection and overweight exposure to the underperforming sector. Investor sentiment for MLPs failed to keep pace with energy infrastructure fundamentals, which continued to be positive in 2017.
The Airports sector was also a significant detractor (underweight allocation and stock selection). Underperformance was primarily driven by underweight positions in European airports, which experienced meaningful multiple expansion as capital flowed into the region following the outcome of regional elections in the spring.
The Electricity Transmission & Distribution sector was the third largest detractor in 2017. Positive allocation effect from our underweight exposure was offset by negative security selection. We maintained zero exposure to select T&D utilities, which performed well over the period. Our positioning in these sectors was driven by our view that valuations were elevated, particularly relative to stocks in the Renewables/Electric Generation sector.
By region, Continental Europe was the leading contributor to relative performance due to stock selection. Canada also contributed due to a combination of stock selection and underweight exposure. The U.S. was the leading detractor due to stock selection. Asia Pacific (underweight exposure and stock selection) was also a leading regional detractor.
By security, overweight positions in SBA Communications Corp. (SBAC, Communications, U.S.) and American Tower Corporation (AMT, Communications, U.S.) were among the leading contributors to relative performance in 2017. Tower assets performed well amid positive trends for data usage, deployment of new technologies and the pending rollout of The First Responder Network Authority (FirstNet). Not owning SES SA (SESG.FP, Communications, Continental Europe) was also a leading contributor, as the stock declined nearly 35% during the year.
Conversely, underweight exposure to Crown Castle International Corp. (CCI, Communications, U.S.) was the leading detractor from relative performance. We maintained overweight positions to SBA Communications and American Tower over Crown Castle based on our view of relative valuation. Overweight positions in Enbridge Energy Partners, L.P. (EEP, MLP, U.S.) and Energy Transfer Partners, L.P. (ETP, MLP, U.S.) were also leading detractors as the MLP sector underperformed in 2017.
INFRASTRUCTURE MARKET OVERVIEW AND OUTLOOK
Listed infrastructure returns were positive in 2017, with the Dow Jones Brookfield Global Infrastructure Composite Index posting a gain of 12.7%.1 Regional returns were particularly strong in Europe, where listed infrastructure stocks rose 27.2%. The Asia Pacific and Americas regions of the Dow Jones Brookfield Global Infrastructure Index returned 24.0% and 10.0%, respectively. By sector, Toll Roads gained 43.1%, followed by Airports (39.5%), Diversified (36.8%), Communications (33.9%), Water (20.0%), Ports (7.7%), Oil & Gas Storage & Transportation (6.4%) and Electricity Transmission & Distribution (4.4%). Conversely, the Alerian MLP Index declined 6.5%.2
U.S. communication tower stocks performed very well in 2017. Again, positive demand drivers including increased data usage, deployment of new technologies and the pending rollout of FirstNet provided tailwinds for the sector during the year. Transport stocks also performed well in 2017. Notably, European airports and toll roads benefitted
Brookfield Global Listed Infrastructure Fund
from an expanding economy, as well as capital flows into the region following the outcome of regional elections in which several populist candidates were defeated.
Performance among utilities was mixed in 2017. U.K. water and electric utilities underperformed amid uncertainties related to Brexit, currency and in some cases possible nationalization of assets if the labor party gains control of the government. Gas utilities in China/Hong Kong performed well as regulation around their allowed returns became more transparent. And in the U.S., while some transmission & distribution operators produced double-digit returns, wildfires in California had a significantly negative impact on two public utilities in the state.
Lastly, energy infrastructure lagged the broader asset class in 2017 as investor sentiment failed to keep pace with positive fundamentals. However, that trend began to reverse in the final weeks of the year, with Master Limited Partnerships ("MLPs") outperforming broader listed infrastructure in December.
1 The Dow Jones Brookfield Global Infrastructure Composite Index is calculated and maintained by S&P Dow Jones Indices and comprises infrastructure companies with at least 70% of its annual cash flows derived from owning and operating infrastructure assets, including MLPs.
2 The Alerian MLP Index is a composite of the 50 most prominent energy MLPs calculated by Standard & Poor's using a float-adjusted market-capitalization methodology. The index is disseminated by the New York Stock Exchange real-time on a price return basis (NYSE: AMZ) and on a total-return basis (NYSE: AMZX).
Indices are not managed and an investor cannot invest directly in an index.
OUTLOOK
In our view, the fundamental picture for the North American energy infrastructure sector continues to be strong. Monthly crude oil production in the U.S. recently hit its highest level since 1971, and U.S. natural gas gross monthly withdrawals are at record highs. Additionally, we believe the widening spread between West Texas Intermediate and Brent Crude oil could be a positive sign for exports of U.S. oil, which could boost midstream throughput volumes further. The recent cooperation between OPEC and Russia to extend production cuts through 2018 may further support balanced markets. We are encouraged by the recent change in market sentiment for midstream energy infrastructure and believe there is more room for investor sentiment to catch up with fundamentals; we therefore remain overweight.
Fundamentally, we believe that transmission and distribution utility companies in North America and Europe are performing well amid low financing costs and (generally) healthy growth rates. However, valuations appear to be elevated and investors are having to pay very high multiples for exposure to these businesses. We maintain our preference for utilities exposed to low-cost renewables generation. California—a market where we previously saw regulatory support—is now contending with the potential liabilities from widespread fires, making the region less attractive for investors. Underperformance among U.K. utilities amid uncertainties related to Brexit, currency and regulations created more attractive valuations. Recently we added exposure opportunistically, but will continue to monitor the risks—particularly those regarding regulations.
Traffic and cash flow growth has been positive for toll roads globally. We continue to prefer companies with European exposure, where growth has been steady. However, we are monitoring the political environment as some risks have re-emerged in the region. We remain optimistic for the prospect of passenger traffic in certain markets within Latin America, particularly Mexican toll road operators. The political situation in Mexico, specifically as it pertains to the North American Free Trade Agreement (NAFTA) negotiations, continues to be a risk factor we are considering.
Our outlook for the communications sector is unchanged as we continue to see long-term growth prospects. However, amid very strong performance for U.S. tower companies this year we have decreased our exposure recently.
If infrastructure stocks trade more in-line with our estimation of appropriate risk-adjusted cost of capital (which varies by sector), we see the potential for double-digit upside in some groups. However, we also see equal downside risk among sectors most exposed to certain factors, notably rising interest rates or adverse regulatory
6Brookfield Investment Management Inc.
Brookfield Global Listed Infrastructure Fund
changes. We are being particularly selective within rate-sensitive sectors, as we do not believe the prospect for higher interest rates is appropriately discounted at current levels.
AVERAGE ANNUAL TOTAL RETURNS
| As of December 31, 2017 | One Year | Five Years | Since Inception* |
| Class A Shares (excluding sales charge) | 10.52% | 5.73% | 7.54% |
| Class A Shares (including sales charge) | 5.24% | 4.71% | 6.66% |
| Class C Shares (excluding sales charge) | 9.62% | 4.94% | 5.61% |
| Class C Shares (including sales charge) | 8.62% | 4.94% | 5.61% |
| Class Y Shares | 10.79% | 6.00% | 7.93% |
| Class I Shares | 10.70% | 5.98% | 7.93% |
| Dow Jones Brookfield Global Infrastructure Composite Total Return Index | 12.73% | 8.12% | 9.45% |
* Class A was incepted on December 29, 2011, Class C was incepted on May 1, 2012 and Classes Y and I were incepted on December 1, 2011. The Dow Jones Brookfield Global Infrastructure Composite Total Return Index references Class I’s inception date. All returns shown in USD.
The table and graphs do not reflect the deductions of taxes that a shareholder would pay on fund distributions or the redemption of fund shares.
Performance data quoted represents past performance; past performance does not guarantee future results. The investment return and principal value of an investment will fluctuate so that an investor’s shares, when redeemed, may be worth more or less than their original cost. Current performance of the Fund may be lower or higher than the performance quoted. Performance data current to the most recent month end may be obtained by calling 855.244.4859. Performance shown including sales charge reflects the Class A maximum sales charge of 4.75% and the Class C Contingent Deferred Sales Charge (CDSC) of 1.00%. Performance data excluding sales charge does not reflect the deduction of the sales charge or CDSC and if reflected, the sales charge or fee would reduce the performance quoted.
The Fund’s gross and net expense ratios for Class A is 1.50% and 1.35%, Class C is 2.25% and 2.10%, Class Y is 1.25% and 1.10% and Class I is 1.25% and 1.10%, respectively for the year ended December 31, 2017.
The Adviser has contractually agreed to reimburse the Fund's expenses through May 1, 2018. There is no guarantee that such reimbursement will be continued after that date.
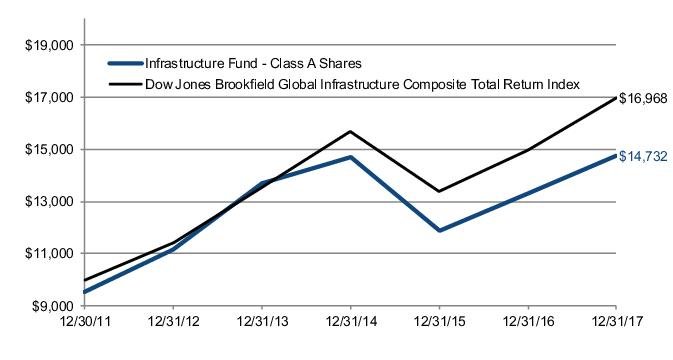
The graphs below illustrate a hypothetical investment of $10,000 in the Infrastructure Fund—Class A Shares (including sales charge) from the commencement of investment operations on December 29, 2011 to December 31, 2017 compared to the Dow Jones Brookfield Global Infrastructure Composite Total Return Index, and Class I Shares from the commencement of investment operations on December 1, 2011 to December 31, 2017 compared to the Dow Jones Brookfield Global Infrastructure Composite Total Return Index.
Brookfield Global Listed Infrastructure Fund
Class A Shares
Class I Shares
Disclosure
The Fund’s portfolio holdings are subject to change without notice. The mention of specific securities is not a recommendation or solicitation for any person to buy, sell or hold any particular security. There is no assurance
8Brookfield Investment Management Inc.
Brookfield Global Listed Infrastructure Fund
that the Brookfield Global Listed Infrastructure Fund currently holds these securities. Please refer to the Schedule of Investments contained in this report for a full listing of fund holdings.
Infrastructure companies may be subject to a variety of factors that may adversely affect their business, including high interest costs, high leverage, regulation costs, economic slowdown, surplus capacity, increased competition, lack of fuel availability and energy conversation policies. The Fund invests in small and mid-cap companies, which involve additional risks such as limited liquidity and greater volatility. The Fund invests in foreign securities which involve greater volatility and political, economic and currency risks and differences in accounting methods. Investing in emerging markets may entail special risks relating to potential economic, political or social instability and the risks of nationalization, confiscation or the imposition of restrictions on foreign investment. Investments in debt securities typically decrease in value when interest rates rise. This risk is usually greater for longer-term debt securities. Investment by the Fund in lower-rated and non-rated securities presents a greater risk of loss to principal and interest than higher-rated securities. Some securities held may be difficult to sell, particularly during times of market turmoil. If the Fund is forced to sell an illiquid asset to meet redemption, it may be forced to sell at a loss. Investing in MLPs involves certain risks related to investing in the underlying assets of the MLPs and risks associated with pooled investment vehicles. Using derivatives exposes the Fund to additional risks, may increase the volatility of the Fund’s net asset value and may not provide the result intended. Since the Fund will invest more than 25% of its total assets in securities in the Infrastructure industry, the Fund may be subject to greater volatility than a fund that is more broadly diversified.
A Basis Point is one hundredth of one percent (0.01%). Cash flow refers to the amount of cash generated and used by a company over a given period.
Earnings growth is not a measure of the Fund’s future performance.
These views represent the opinions of Brookfield Investment Management Inc. and are not intended to predict or depict the performance of any investment. These views are as of the close of business on December 31, 2017 and subject to change based on subsequent developments.
Brookfield Global Listed Infrastructure Fund
Portfolio Characteristics (Unaudited)
December 31, 2017
| ASSET ALLOCATION BY GEOGRAPHY | Percent of Net Assets |
| United States | 50.2% |
| Canada | 14.1% |
| United Kingdom | 7.3% |
| France | 7.3% |
| Spain | 4.4% |
| Italy | 3.0% |
| China | 2.4% |
| Denmark | 2.3% |
| Australia | 2.1% |
| Mexico | 1.4% |
| Brazil | 1.2% |
| New Zealand | 1.1% |
| Switzerland | 1.0% |
| Hong Kong | 0.7% |
| Other Assets in Excess of Liabilities | 1.5% |
| Total | 100.0% |
| ASSET ALLOCATION BY SECTOR | |
| Pipelines | 20.6% |
| Master Limited Partnerships | 15.1% |
| Toll Roads | 13.7% |
| Communications | 11.3% |
| Electricity Transmission & Distribution | 10.2% |
| Renewables/Electric Generation | 10.1% |
| Midstream | 6.7% |
| Water | 4.7% |
| Gas Utilities | 3.2% |
| Airports | 2.9% |
| Other Assets in Excess of Liabilities | 1.5% |
| Total | 100.0% |
| TOP TEN HOLDINGS | |
| American Tower Corp. | 6.6% |
| TransCanada Corp. | 5.0% |
| Enbridge, Inc. | 4.6% |
| National Grid PLC | 4.3% |
| Kinder Morgan, Inc. | 4.2% |
| Enterprise Products Partners LP | 4.2% |
| Vinci SA | 3.6% |
| SBA Communications Corp. | 3.5% |
| Energy Transfer Partners LP | 3.5% |
| The Williams Companies, Inc. | 3.3% |
10Brookfield Investment Management Inc.
Brookfield Global Listed Infrastructure Fund
Schedule of Investments
December 31, 2017
| | | | Shares | Value |
| COMMON STOCKS – 98.5% | | | |
| AUSTRALIA – 2.1% | | | |
| Pipelines – 1.3% | | | |
APA Group
| | | 500,100 | $ 3,242,881 |
| Toll Roads – 0.8% | | | |
Macquarie Atlas Roads Group
| | | 369,300 | 1,805,723 |
| Total AUSTRALIA | | | | 5,048,604 |
| BRAZIL – 1.2% | | | |
| Water – 1.2% | | | |
Cia de Saneamento Basico do Estado de Sao Paulo - ADR
| | | 287,600 | 3,005,420 |
| Total BRAZIL | | | | 3,005,420 |
| CANADA – 14.1% | | | |
| Pipelines – 14.1% | | | |
Enbridge, Inc.
| | | 288,200 | 11,271,211 |
Inter Pipeline Ltd.
| | | 170,700 | 3,534,862 |
Pembina Pipeline Corp.
| | | 206,500 | 7,476,384 |
TransCanada Corp.
| | | 250,635 | 12,198,766 |
| Total Pipelines | | | | 34,481,223 |
| Total CANADA | | | | 34,481,223 |
| CHINA – 2.4% | | | |
| Airports – 0.4% | | | |
Beijing Capital International Airport Company Ltd.
| | | 718,300 | 1,081,165 |
| Gas Utilities – 0.5% | | | |
ENN Energy Holdings Ltd.
| | | 166,000 | 1,180,669 |
| Pipelines – 1.0% | | | |
Beijing Enterprises Holdings Ltd.
| | | 205,700 | 1,217,551 |
Kunlun Energy Company Ltd.
| | | 1,185,300 | 1,231,928 |
| Total Pipelines | | | | 2,449,479 |
| Water – 0.5% | | | |
Guangdong Investment Ltd.
| | | 837,600 | 1,119,874 |
| Total CHINA | | | | 5,831,187 |
| DENMARK – 2.3% | | | |
| Renewables/Electric Generation – 2.3% | | | |
Orsted A/S 1
| | | 103,000 | 5,614,408 |
| Total DENMARK | | | | 5,614,408 |
| FRANCE – 7.3% | | | |
| Communications – 0.7% | | | |
Eutelsat Communications SA
| | | 75,200 | 1,741,067 |
| Toll Roads – 6.6% | | | |
Eiffage SA
| | | 31,900 | 3,491,174 |
Getlink SE
| | | 298,500 | 3,839,413 |
Vinci SA
| | | 85,700 | 8,749,230 |
| Total Toll Roads | | | | 16,079,817 |
| Total FRANCE | | | | 17,820,884 |
See Notes to Financial Statements.
Brookfield Global Listed Infrastructure Fund
Schedule of Investments (continued)
December 31, 2017
| | | | Shares | Value |
| COMMON STOCKS (continued) | | | |
| HONG KONG – 0.7% | | | |
| Gas Utilities – 0.7% | | | |
China Resources Gas Group Ltd.
| | | 452,100 | $ 1,636,413 |
| Total HONG KONG | | | | 1,636,413 |
| ITALY – 3.0% | | | |
| Gas Utilities – 0.6% | | | |
Italgas SpA
| | | 262,824 | 1,603,686 |
| Renewables/Electric Generation – 1.0% | | | |
Enel SpA
| | | 387,300 | 2,381,606 |
| Toll Roads – 1.4% | | | |
Atlantia SpA
| | | 108,400 | 3,417,452 |
| Total ITALY | | | | 7,402,744 |
| MEXICO – 1.4% | | | |
| Airports – 0.4% | | | |
Grupo Aeroportuario del Pacifico SAB de CV
| | | 89,200 | 916,384 |
| Toll Roads – 1.0% | | | |
Promotora y Operadora de Infraestructura SAB de CV
| | | 247,677 | 2,447,105 |
| Total MEXICO | | | | 3,363,489 |
| NEW ZEALAND – 1.1% | | | |
| Airports – 1.1% | | | |
Auckland International Airport Ltd.
| | | 602,700 | 2,766,571 |
| Total NEW ZEALAND | | | | 2,766,571 |
| SPAIN – 4.4% | | | |
| Communications – 0.5% | | | |
Cellnex Telecom SA 1
| | | 49,000 | 1,253,683 |
| Toll Roads – 3.9% | | | |
Abertis Infraestructuras SA
| | | 157,400 | 3,502,088 |
Ferrovial SA
| | | 184,383 | 4,184,222 |
Obrascon Huarte Lain SA 2
| | | 296,300 | 1,768,263 |
| Total Toll Roads | | | | 9,454,573 |
| Total SPAIN | | | | 10,708,256 |
| SWITZERLAND – 1.0% | | | |
| Airports – 1.0% | | | |
Flughafen Zurich AG
| | | 10,735 | 2,453,665 |
| Total SWITZERLAND | | | | 2,453,665 |
| UNITED KINGDOM – 7.3% | | | |
| Electricity Transmission & Distribution – 4.3% | | | |
National Grid PLC
| | | 901,132 | 10,622,994 |
| Water – 3.0% | | | |
Pennon Group PLC
| | | 247,400 | 2,611,861 |
Severn Trent PLC
| | | 162,500 | 4,735,009 |
| Total Water | | | | 7,346,870 |
| Total UNITED KINGDOM | | | | 17,969,864 |
See Notes to Financial Statements.
12Brookfield Investment Management Inc.
Brookfield Global Listed Infrastructure Fund
Schedule of Investments (continued)
December 31, 2017
| | | | Shares | Value |
| COMMON STOCKS (continued) | | | |
| UNITED STATES – 50.2% | | | |
| Communications – 10.1% | | | |
American Tower Corp.
| | | 113,533 | $ 16,197,753 |
SBA Communications Corp. 2
| | | 52,200 | 8,527,392 |
| Total Communications | | | | 24,725,145 |
| Electricity Transmission & Distribution – 5.9% | | | |
Edison International
| | | 68,900 | 4,357,236 |
PG&E Corp. 2
| | | 98,734 | 4,426,245 |
Sempra Energy
| | | 51,600 | 5,517,072 |
| Total Electricity Transmission & Distribution | | | | 14,300,553 |
| Gas Utilities – 1.4% | | | |
Atmos Energy Corp.
| | | 20,600 | 1,769,334 |
Southwest Gas Holdings, Inc.
| | | 20,400 | 1,641,792 |
| Total Gas Utilities | | | | 3,411,126 |
| Master Limited Partnerships – 15.1% | | | |
Boardwalk Pipeline Partners LP
| | | 149,300 | 1,927,463 |
Cone Midstream Partners LP
| | | 19,400 | 325,338 |
Energy Transfer Equity LP
| | | 137,200 | 2,368,072 |
Energy Transfer Partners LP
| | | 472,600 | 8,468,992 |
EnLink Midstream Partners LP
| | | 158,500 | 2,436,145 |
Enterprise Products Partners LP
| | | 388,269 | 10,293,011 |
MPLX LP
| | | 166,976 | 5,922,639 |
Plains All American Pipeline LP
| | | 159,200 | 3,285,888 |
Rice Midstream Partners LP
| | | 89,920 | 1,930,583 |
| Total Master Limited Partnerships | | | | 36,958,131 |
| Midstream – 6.7% | | | |
Cheniere Energy, Inc. 2
| | | 32,600 | 1,755,184 |
Targa Resources Corp.
| | | 132,900 | 6,435,018 |
The Williams Companies, Inc.
| | | 268,000 | 8,171,320 |
| Total Midstream | | | | 16,361,522 |
| Pipelines – 4.2% | | | |
Kinder Morgan, Inc.
| | | 574,600 | 10,383,022 |
| Renewables/Electric Generation – 6.8% | | | |
American Electric Power Company, Inc.
| | | 39,400 | 2,898,658 |
CMS Energy Corp.
| | | 49,800 | 2,355,540 |
Entergy Corp.
| | | 60,100 | 4,891,539 |
FirstEnergy Corp.
| | | 52,100 | 1,595,302 |
Great Plains Energy, Inc.
| | | 51,700 | 1,666,808 |
NRG Energy, Inc.
| | | 31,100 | 885,728 |
See Notes to Financial Statements.
Brookfield Global Listed Infrastructure Fund
Schedule of Investments (continued)
December 31, 2017
| | | | Shares | Value |
| COMMON STOCKS (continued) | | | |
Pattern Energy Group, Inc.
| | | 110,600 | $ 2,376,794 |
| Total Renewables/Electric Generation | | | | 16,670,369 |
| Total UNITED STATES | | | | 122,809,868 |
Total COMMON STOCKS
(Cost $204,564,714)
| | | | 240,912,596 |
Total Investments – 98.5%
(Cost $204,564,714)
| | | | 240,912,596 |
Other Assets in Excess of Liabilities – 1.5%
| | | | 3,699,989 |
TOTAL NET ASSETS – 100.0%
| | | | $244,612,585 |
| ADR— American Depositary Receipt |
| 1 | — Security exempt from registration under Rule 144A of the Securities Act of 1933. These securities may only be resold in transactions exempt from registration, normally to qualified institutional buyers. As of December 31, 2017, the total value of all such securities was $6,868,091 or 2.8% of net assets. |
| 2 | — Non-income producing security. |
See Notes to Financial Statements.
14Brookfield Investment Management Inc.
Brookfield Global Listed Real Estate Fund
MANAGEMENT DISCUSSION OF FUND PERFORMANCE
For the year ended December 31, 2017, the Global Real Estate Fund had a total return 10.1%, which assumes the reinvestment of dividends and is exclusive of brokerage commissions, underperforming the FTSE EPRA/NAREIT Developed Index1, which returned 11.4% During the 12-month period ended December 31, 2017, the Industrial sector was the leading contributor to relative performance, driven by positive stock selection and underweight exposure. The Diversified and Specialty sectors were also leading contributors, both due to stock selection. Conversely, Retail was the leading sector detractor due to stock selection and overweight exposure. Stock selection within the Self Storage sector also detracted, and overweight exposures within Datacenters detracted as well.
By region, Singapore was the leading contributor to relative performance due to stock selection and an overweight allocation. Stock selection and underweight exposure in China/Hong Kong contributed as well. The U.S. was the leading detractor due to stock selection, while overweight exposure in the U.K. detracted as well.
By security, non-index holding SOHO China Ltd. (410.HK, Office, China/Hong Kong) was the leading contributor during the year. The company executed several successful asset sales, helping to illustrate the size of the disconnect between public market and private market valuations. It also announced two special dividends during the year. The timing of our overweight allocation to Wharf (Holdings) Ltd. (4 HK, Diversified, Hong Kong) also contributed, as Hong Kong stocks rallied following a period of underperformance after the U.S. elections in 2016. An overweight position in City Developments Limited (CIT.SP, Diversified, Singapore) contributed as well.
By security, an overweight position in CBL & Associates Properties, Inc. (CBL, Retail, U.S.) was the leading detractor from performance during the year. The stock declined meaningfully after reporting disappointing quarterly results in November. Rent spreads declined from prior-quarter levels due to the company using more aggressive rental rates to maintain occupancy. This decline in rent spreads was greater than for any of the company’s mall peers. Additionally, class A mall operators continued to report positive rent spreads during the period.
Overweight exposure to Mitsubishi Estate Company, Limited (8802.JP, Office, Japan) detracted as well as Japanese developers declined amid a strengthening Yen. An overweight position in Brixmor Property Group, Inc. (BRX, Retail, U.S.) also detracted. The stock declined on weakness within the sector in 2017.
GLOBAL REAL ESTATE MARKET OVERVIEW
Global real estate securities, as measured by the FTSE EPRA/NAREIT Developed Index (the “Benchmark”)1 returned 11.4%. By region, Europe returned 29.1%, followed by Asia Pacific (up 16.1%) and North America (up 4.6%).
European real estate equities benefitted from an expanding economy, as well as capital flows into the region following the outcome of regional elections in which a number of populist candidates were defeated. In the Asia Pacific region, real estate stocks performed particularly well in China and Hong Kong, following a period of underperformance immediately following the U.S. presidential election in 2016. Returns were also strong across all property types in Singapore. Fundamentals in the region have improved – particularly within the residential sector where supply has moderated, and affordability is better compared to the recent past.
By U.S. property type, Industrial gained 23.3%, followed by Diversified (9.6%), Hotels (7.4%), Residential (6.2%), Mixed (5.2%), Office (5.1%), Self Storage (3.6%) and Healthcare (0.7%). Retail was the only property type to post negative returns (down 4.8%) during the year.
The Industrial sector benefitted from strong fundamentals as e-commerce continues to be a major demand driver. Datacenters and communication tower stocks also performed very well in 2017, benefiting from increased demand for data consumption and transmission. Hotels benefitted from the improving economic outlook throughout the global economy. Conversely, the Retail sector declined amid concerns around the prospect for tenant
Brookfield Global Listed Real Estate Fund
bankruptcies, store closures and the perceived threat from e-commerce. Healthcare stocks, while slightly positive for the year, struggled amid sector-specific fundamental headwinds, as well as the prospect for higher interest rates.
1The FTSE EPRA/NAREIT Developed Index is a free-float adjusted, liquidity, size and revenue screened index designed to track the performance of listed real estate companies and REITs worldwide.
Indices are not managed and an investor cannot invest directly in an index.
OUTLOOK
In our view, the U.S. economy remains healthy as we continue to see job growth and improving GDP—both of which are positive for real estate. We believe the recent tax bill may help stimulate the economy further and help accelerate or extend the current business cycle. Despite these positives for the overall economy, we continue to view the real estate market with a cautious eye. Interest rates have likely reached their cyclical low and are likely to drift higher over time, which could potentially present a risk to real estate values. We therefore maintain a cautious approach to investing in assets with limited growth potential. We favor companies trading at discounts to NAV or companies we believe are positioned for growth.
Two real estate sectors that are currently experiencing a long-term cyclical demand shift are Datacenters and Towers. Both sectors are benefiting from increased demand for data consumption and transmission. This trend may continue for several more years and should lead to outsized revenue growth relative to more traditional real estate sectors.
The current real estate cycle has had much more limited supply growth than prior cycles, which has helped to keep supply and demand relatively well balanced. We will continue to closely monitor the supply pipeline.
Outside the U.S., we continue to see better value opportunities in the U.K. compared to Continental Europe and are encouraged by the progress made so far in the Brexit negotiations. We favor exposure to London office properties, where we believe the public market discount is widest and where we believe market sentiment has created the greatest opportunity. In continental Europe, we believe interest rates have likely bottomed, as the region continues to see economic growth. Should interest rates rise incrementally from current levels, this could create downward pressure on property prices, putting equity values at risk as many companies trade above NAV.
In the Asia Pacific region, we have seen reflationary government policy in China through relaxed credit standards and housing policies, as well as increased infrastructure spending. We believe some of the inflationary policies in China could be reversed, which would likely lead to a slowdown in economic growth. There is also a risk of tightening housing and credit policies that would also put downward pressure on stocks in the region. We continue to see attractive opportunities in the Singapore market as the government begins to ease or reverse many measures designed to cool the property market over the last several years. We see the potential for a recovery in the country’s property market as these measures are reversed and growth returns. In Japan, developers continue to trade at large discounts to NAV and we believe there is potential for this discount to close as demand remains positive. Japanese REITs on the other hand continue to trade at large premiums to NAV and we believe may be more negatively affected by new supply in 2018. However, recent underperformance for the REITs has improved valuation.
Global economic growth trends continue to be positive. However, we believe global interest rates have reached—or are near a bottom—and we expect rates to drift higher from here. Our view on interest rates, combined with our position in the property cycle, leads us to invest somewhat cautiously. We are seeking investment opportunities in companies that provide exposure to outsized growth at a reasonable price and companies that represent attractive value opportunities. We are encouraged by the wide variations in valuation between companies and sectors, which we believe presents attractive opportunities for active management.
16Brookfield Investment Management Inc.
Brookfield Global Listed Real Estate Fund
AVERAGE ANNUAL TOTAL RETURNS
| As of December 31, 2017 | One Year | Five Years | Since Inception* |
| Class A Shares (excluding sales charge) | 9.84% | 7.49% | 9.22% |
| Class A Shares (including sales charge) | 4.61% | 6.45% | 8.28% |
| Class C Shares (excluding sales charge) | 9.08% | 6.68% | 8.41% |
| Class C Shares (including sales charge) | 8.08% | 6.68% | 8.41% |
| Class Y Shares | 10.20% | 7.76% | 11.53% |
| Class I Shares | 10.13% | 7.74% | 11.51% |
| FTSE EPRA/NAREIT Developed Total Return Index | 11.42% | 7.20% | 10.53% |
* Classes A and C were incepted on May 1, 2012 and Classes Y and I were incepted on December 1, 2011. The FTSE/EPRA NAREIT Developed Total Return Index references Class I's inception date. All returns shown in USD.
The table and graphs do not reflect the deductions of taxes that a shareholder would pay on fund distributions or the redemption of fund shares.
Performance data quoted represents past performance; past performance does not guarantee future results. The investment return and principal value of an investment will fluctuate so that an investor’s shares, when redeemed, may be worth more or less than their original cost. Current performance of the Fund may be lower or higher than the performance quoted. Performance data current to the most recent month end may be obtained by calling 855.244.4859. Performance shown including sales charge reflects the Class A maximum sales charge of 4.75% and the Class C Contingent Deferred Sales Charge (CDSC) of 1.00%. Performance data excluding sales charge does not reflect the deduction of the sales charge or CDSC and if reflected, the sales charge or fee would reduce the performance quoted.
The Fund’s gross and net expense ratios for Class A is 1.24% and 1.20%, Class C is 1.99% and 1.95%, Class Y is 0.99% and 0.95% and Class I is 0.99% and 0.95%, respectively for the year ended December 31, 2017.
The Adviser has contractually agreed to reimburse the Fund's expenses through May 1, 2018. There is no guarantee that such reimbursement will be continued after that date.
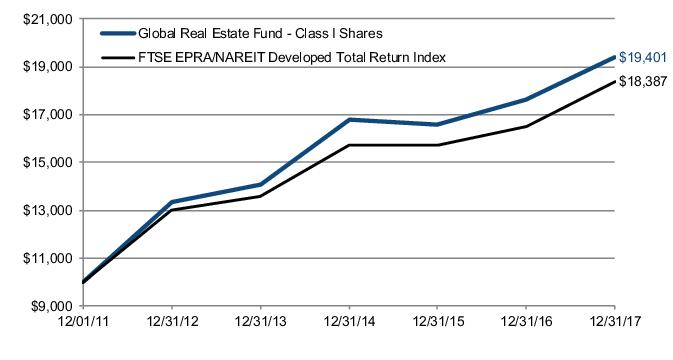
The graphs below illustrate a hypothetical investment of $10,000 in the Global Real Estate Fund—Class A Shares (including sales charge) from the commencement of investment operations on May 1, 2012 to December 31, 2017 compared to the FTSE EPRA/NAREIT Developed Total Return Index, and Class I Shares from the commencement of investment operations on December 1, 2011 to December 31, 2017 compared to the FTSE EPRA/NAREIT Developed Total Return Index.
Brookfield Global Listed Real Estate Fund
Class A Shares
Class I Shares
Disclosure
The Fund’s portfolio holdings are subject to change without notice. The mention of specific securities is not a recommendation or solicitation for any person to buy, sell or hold any particular security. There is no assurance
18Brookfield Investment Management Inc.
Brookfield Global Listed Real Estate Fund
that the Brookfield Global Listed Real Estate Fund currently holds these securities. Please refer to the Schedule of Investments contained in this report for a full listing of fund holdings.
Investors should be aware of the risks involved with investing in a fund concentrating in REITs and real estate securities, such as declines in the value of real estate and increased susceptibility to adverse economic or regulatory developments. Investments in foreign securities involve political, economic and currency risks, greater volatility and differences in accounting methods. Investing in emerging markets may entail special risks relating to potential economic, political or social instability and the risks of nationalization, confiscation or the imposition of restrictions on foreign investment. The Fund invests in small and mid-cap companies, which involve additional risks such as limited liquidity and greater volatility. Investments in debt securities typically decrease in value when interest rates rise. This risk is usually greater for longer-term debt securities. Investment by the Fund in lower-rated and non-rated securities presents a greater risk of loss to principal and interest than higher-rated securities. Some securities held may be difficult to sell, particularly during times of market turmoil. If the Fund is forced to sell an illiquid asset to meet redemption, the Fund may be forced to sell at a loss. Using derivatives exposes the Fund to additional risks, may increase the volatility of the Fund’s net asset value and may not provide the result intended. Since the Fund will invest more than 25% of its total assets in securities in the Real Estate industry, the Fund may be subject to greater volatility than a fund that is more broadly diversified.
A basis point (bps) is a unit that is equal to 1/100th of 1% and is used to denote a change in a financial statement.
Earnings growth is not a measure of the Fund’s future performance.
These views represent the opinions of Brookfield Investment Management Inc. and are not intended to predict or depict the performance of any investment. These views are as of the close of business on December 31, 2017 and subject to change based on subsequent developments.
Brookfield Global Listed Real Estate Fund
Portfolio Characteristics (Unaudited)
December 31, 2017
| ASSET ALLOCATION BY GEOGRAPHY | Percent of Net Assets |
| United States | 49.4% |
| United Kingdom | 13.5% |
| Japan | 9.4% |
| Germany | 5.7% |
| Singapore | 4.8% |
| Hong Kong | 3.8% |
| Australia | 3.4% |
| Spain | 3.0% |
| France | 2.7% |
| China | 1.4% |
| Other Assets in Excess of Liabilities | 2.9% |
| Total | 100.0% |
| ASSET ALLOCATION BY SECTOR | |
| Office | 27.2% |
| Retail | 19.6% |
| Diversified | 14.4% |
| Residential | 12.6% |
| Healthcare | 4.9% |
| Industrial | 3.9% |
| Datacenters | 3.9% |
| Specialty | 3.1% |
| Net Lease | 2.9% |
| Hotel | 2.6% |
| Self Storage | 2.0% |
| Other Assets in Excess of Liabilities | 2.9% |
| Total | 100.0% |
| TOP TEN HOLDINGS | |
| Simon Property Group, Inc. | 8.3% |
| Mitsubishi Estate Company Ltd. | 4.3% |
| Land Securities Group PLC | 4.1% |
| Great Portland Estates PLC | 3.7% |
| Mitsui Fudosan Company Ltd. | 3.6% |
| Merlin Properties Socimi SA | 3.0% |
| Hammerson PLC | 2.7% |
| American Homes 4 Rent | 2.5% |
| Dexus | 2.4% |
| City Developments Ltd. | 2.3% |
20Brookfield Investment Management Inc.
Brookfield Global Listed Real Estate Fund
Schedule of Investments
December 31, 2017
| | | | Shares | Value |
| COMMON STOCKS – 97.1% | | | |
| AUSTRALIA – 3.4% | | | |
| Diversified – 3.4% | | | |
Dexus
| | | 6,483,900 | $ 49,203,525 |
The GPT Group
| | | 4,664,500 | 18,554,573 |
| Total Diversified | | | | 67,758,098 |
| Total AUSTRALIA | | | | 67,758,098 |
| CHINA – 1.4% | | | |
| Office – 1.4% | | | |
SOHO China Ltd.
| | | 50,071,200 | 29,235,336 |
| Total CHINA | | | | 29,235,336 |
| FRANCE – 2.7% | | | |
| Office – 2.0% | | | |
Gecina SA
| | | 212,303 | 39,201,105 |
| Retail – 0.7% | | | |
Eurocommercial Properties NV
| | | 334,000 | 14,565,489 |
| Total FRANCE | | | | 53,766,594 |
| GERMANY – 5.7% | | | |
| Office – 2.0% | | | |
alstria office REIT-AG
| | | 2,580,678 | 39,881,514 |
| Residential – 3.7% | | | |
Grand City Properties SA
| | | 1,335,187 | 31,428,931 |
Vonovia SE
| | | 866,055 | 42,910,565 |
| Total Residential | | | | 74,339,496 |
| Total GERMANY | | | | 114,221,010 |
| HONG KONG – 3.8% | | | |
| Diversified – 1.6% | | | |
Wharf Real Estate Investment Company Ltd. 1
| | | 4,718,012 | 31,401,681 |
| Office – 2.2% | | | |
Hongkong Land Holdings Ltd.
| | | 6,418,300 | 45,145,250 |
| Total HONG KONG | | | | 76,546,931 |
| JAPAN – 9.4% | | | |
| Office – 8.3% | | | |
Hulic REIT, Inc.
| | | 5,505 | 8,008,793 |
Mitsubishi Estate Company Ltd.
| | | 4,970,255 | 86,298,742 |
Mitsui Fudosan Company Ltd.
| | | 3,207,500 | 71,737,272 |
| Total Office | | | | 166,044,807 |
| Residential – 1.1% | | | |
Leopalace21 Corp.
| | | 2,552,525 | 19,821,895 |
Nippon Accommodations Fund, Inc.
| | | 442 | 1,824,096 |
| Total Residential | | | | 21,645,991 |
| Total JAPAN | | | | 187,690,798 |
| SINGAPORE – 4.8% | | | |
| Diversified – 2.3% | | | |
City Developments Ltd.
| | | 5,027,700 | 46,758,230 |
See Notes to Financial Statements.
Brookfield Global Listed Real Estate Fund
Schedule of Investments (continued)
December 31, 2017
| | | | Shares | Value |
| COMMON STOCKS (continued) | | | |
| Office – 1.1% | | | |
CapitaLand Commercial Trust
| | | 15,333,200 | $ 22,086,217 |
| Retail – 1.4% | | | |
CapitaLand Mall Trust
| | | 17,144,500 | 27,275,733 |
| Total SINGAPORE | | | | 96,120,180 |
| SPAIN – 3.0% | | | |
| Diversified – 3.0% | | | |
Merlin Properties Socimi SA
| | | 4,429,400 | 59,991,994 |
| Total SPAIN | | | | 59,991,994 |
| UNITED KINGDOM – 13.5% | | | |
| Diversified – 4.1% | | | |
Land Securities Group PLC
| | | 6,037,913 | 82,035,332 |
| Industrial – 0.7% | | | |
Tritax Big Box REIT PLC
| | | 7,259,657 | 14,594,590 |
| Office – 4.9% | | | |
Derwent London PLC
| | | 577,017 | 24,291,024 |
Great Portland Estates PLC
| | | 8,040,411 | 74,620,679 |
| Total Office | | | | 98,911,703 |
| Retail – 3.8% | | | |
Capital & Counties Properties PLC
| | | 5,202,617 | 22,430,854 |
Hammerson PLC
| | | 7,233,837 | 53,370,630 |
| Total Retail | | | | 75,801,484 |
| Total UNITED KINGDOM | | | | 271,343,109 |
| UNITED STATES – 49.4% | | | |
| Datacenters – 3.9% | | | |
Equinix, Inc.
| | | 95,333 | 43,206,822 |
QTS Realty Trust, Inc.
| | | 646,047 | 34,989,906 |
| Total Datacenters | | | | 78,196,728 |
| Healthcare – 4.9% | | | |
HCP, Inc.
| | | 1,421,625 | 37,075,980 |
Physicians Realty Trust
| | | 1,072,000 | 19,285,280 |
Ventas, Inc.
| | | 682,025 | 40,928,320 |
| Total Healthcare | | | | 97,289,580 |
| Hotel – 2.6% | | | |
LaSalle Hotel Properties
| | | 646,300 | 18,141,641 |
Park Hotels & Resorts, Inc.
| | | 1,184,722 | 34,060,757 |
| Total Hotel | | | | 52,202,398 |
| Industrial – 3.2% | | | |
Duke Realty Corp.
| | | 1,519,077 | 41,334,085 |
Prologis, Inc.
| | | 364,600 | 23,520,346 |
| Total Industrial | | | | 64,854,431 |
| Net Lease – 2.9% | | | |
Gramercy Property Trust
| | | 1,079,668 | 28,783,949 |
See Notes to Financial Statements.
22Brookfield Investment Management Inc.
Brookfield Global Listed Real Estate Fund
Schedule of Investments (continued)
December 31, 2017
| | | | Shares | Value |
| COMMON STOCKS (continued) | | | |
MGM Growth Properties LLC
| | | 967,021 | $ 28,188,662 |
| Total Net Lease | | | | 56,972,611 |
| Office – 5.3% | | | |
Hudson Pacific Properties, Inc.
| | | 982,951 | 33,666,072 |
Kilroy Realty Corp.
| | | 382,984 | 28,589,755 |
SL Green Realty Corp.
| | | 430,700 | 43,470,551 |
| Total Office | | | | 105,726,378 |
| Residential – 7.8% | | | |
American Campus Communities, Inc.
| | | 631,600 | 25,914,548 |
American Homes 4 Rent
| | | 2,266,703 | 49,504,793 |
Essex Property Trust, Inc.
| | | 142,611 | 34,422,017 |
Mid-America Apartment Communities, Inc.
| | | 454,128 | 45,667,112 |
| Total Residential | | | | 155,508,470 |
| Retail – 13.7% | | | |
Brixmor Property Group, Inc.
| | | 1,251,726 | 23,357,207 |
DDR Corp.
| | | 3,878,000 | 34,746,880 |
Federal Realty Investment Trust
| | | 221,500 | 29,417,415 |
Simon Property Group, Inc.
| | | 963,133 | 165,408,462 |
Taubman Centers, Inc.
| | | 330,500 | 21,624,615 |
| Total Retail | | | | 274,554,579 |
| Self Storage – 2.0% | | | |
Public Storage
| | | 194,600 | 40,671,400 |
| Specialty – 3.1% | | | |
American Tower Corp.
| | | 135,400 | 19,317,518 |
Crown Castle International Corp.
| | | 392,855 | 43,610,834 |
| Total Specialty | | | | 62,928,352 |
| Total UNITED STATES | | | | 988,904,927 |
Total COMMON STOCKS
(Cost $1,841,571,832)
| | | | 1,945,578,977 |
Total Investments – 97.1%
(Cost $1,841,571,832)
| | | | 1,945,578,977 |
Other Assets in Excess of Liabilities – 2.9%
| | | | 57,103,513 |
TOTAL NET ASSETS – 100.0%
| | | | $2,002,682,490 |
| 1 | — Non-income producing security. |
See Notes to Financial Statements.
Brookfield U.S. Listed Real Estate Fund
MANAGEMENT DISCUSSION OF FUND PERFORMANCE
For the year ended December 31, 2017, the U.S. Real Estate Fund had a total return 3.0%, which assumes the reinvestment of dividends and is exclusive of brokerage commissions, underperforming the MSCI U.S. REIT Total Return Index1, which returned 5.1%. During the 12-month period ended December 31, 2017, the Industrial sector was the leading contributor to relative performance due to an overweight allocation to the outperforming sector. Industrial real estate stocks performed well in 2017 amid positive fundamentals as e-commerce continues to be a major demand driver for the sector. Stock selection and overweight exposure within the Specialty sector also contributed, largely driven by non-index exposure to communication tower operators, which performed well in 2017. Underweight exposure with Healthcare also contributed. Conversely, Retail was the leading detractor from relative performance due to stock selection and overweight exposure. The sector performed poorly in 2017 amid continued concerns around retailer bankruptcies, store closures and the threat from e-commerce. Underweight exposure and stock selection in the Datacenters sector also detracted, as did stock selection and an underweight allocation within Self Storage.
By security, overweight exposure to Prologis, Inc. (PLD, Industrial) was the leading contributor to relative performance as the stock returned more than 25% during the year. Non-index holding Crown Castle International Corp. (CCI, Specialty) also contributed as communication towers performed very well in 2017. The timing of our overweight exposure to Taubman Centers, Inc. (TCO, Retail) contributed as well. We added exposure to Taubman later in the period to upgrade the quality of our retail holdings and the stock subsequently performed well as the retail sector rebounded during the fourth quarter.
By security, an overweight position in CBL & Associates Properties, Inc. (CBL, Retail) was the leading detractor from performance during the year. The stock declined meaningfully after reporting disappointing quarterly results in November. Rent spreads declined from prior-quarter levels due to the company using more aggressive rental rates to maintain occupancy. This decline in rent spreads was greater than for any of the company’s mall peers. Additionally, class A mall operators continued to report positive rent spreads during the period. The timing of our underweight exposure to Equinix, Inc. (EQIX, Datacenters) was the second largest detractor from relative performance. An overweight position in Brixmor Property Group, Inc. (BRX, Retail) also detracted. The stock declined on weakness within the sector in 2017.
U.S. REAL ESTATE MARKET OVERVIEW
U.S. real estate securities were up 5.1% for the year, as measured by the MSCI US REIT Total Return Index1 (the “Benchmark”). By property type, Industrial gained 23.3%, followed by Diversified (9.6%), Hotels (7.4%), Residential (6.2%), Mixed (5.2%), Office (5.1%), Self Storage (3.6%) and Healthcare (0.7%). Retail was the only property type to post negative returns (down 4.8%) during the year.2
The Industrial sector benefitted from strong fundamentals as e-commerce continues to be a major demand driver for the sector. Datacenters and communication tower stocks also performed very well in 2017, benefiting from increased demand for data consumption and transmission. Hotels benefitted from the improving economic outlook throughout the global economy.
Conversely, the Retail sector declined amid concerns around the prospect for tenant bankruptcies, store closures and the perceived threat from e-commerce. Healthcare stocks, while slightly positive for the year, struggled amid sector-specific fundamental headwinds, as well as the prospect for higher interest rates.
1 The MSCI US REIT Total Return Index (RMS) is a total return market capitalization-weighted index which prices once per day after market close. It is calculated by MSCI and is composed of equity REITs that are included in the MSCI US Investable Market 2500 Index. You cannot invest directly in an index.
2 Sector returns represented by the U.S. portion of the FTSE EPRA/NAREIT Developed North America Index. The FTSE EPRA/NAREIT Developed Index is calculated by the FTSE Group. Performance is calculated by price, total return and net total return and the Index is calculated daily. Constituents must meet minimum market capitalization, liquidity requirements, and real estate activity requirements in order to be included within the Index. North American and Asian companies must be of a minimum of US$200 million in market capitalization with liquidity of US$100 million. European companies are bound by €50 million (approximately $60 million) market cap minimum and liquidity of €25 million (approximately $30 million).
24Brookfield Investment Management Inc.
Brookfield U.S. Listed Real Estate Fund
Indices are not managed and an investor cannot invest directly in an index.
OUTLOOK
In our view, the U.S. economy remains healthy as we continue to see job growth and improving GDP—both of which are positive for real estate. We believe the recent tax bill may help stimulate the economy further and help accelerate or extend the current business cycle. Despite these positives for the overall economy, we continue to view the real estate market with a cautious eye. Interest rates have likely reached their cyclical low and are likely to drift higher over time, which could potentially present a risk to real estate values. We therefore maintain a cautious approach to investing in assets with limited growth potential. We favor companies trading at discounts to net asset value (NAV) or companies we believe are positioned for growth.
Two real estate sectors which are currently experiencing a long-term cyclical demand shift are Datacenters and Towers. Both sectors are benefiting from increased demand for data consumption and transmission. This trend may continue for several more years and should lead to outsized revenue growth relative to more traditional real estate sectors.
The current real estate cycle has had much more limited supply growth than prior cycles, which has helped to keep supply and demand relatively well balanced. We will continue to closely monitor the supply pipeline.
We believe the U.S. REIT market overall continues to trade near fair value. However, we see a wide variation in valuation between companies and sectors which presents an attractive opportunity for active management.
AVERAGE ANNUAL TOTAL RETURNS
| As of December 31, 2017 | One Year | Since Inception* |
| Class A Shares (excluding sales charge) | 2.73% | 8.23% |
| Class A Shares (including sales charge) | -2.17% | 6.93% |
| Class C Shares (excluding sales charge) | 1.95% | 7.48% |
| Class C Shares (including sales charge) | 0.96% | 7.48% |
| Class Y Shares | 3.19% | 8.60% |
| Class I Shares | 3.00% | 8.51% |
| MSCI US REIT Total Return Index | 5.07% | 10.76% |
* Classes A, C , Y and I were incepted on December 11, 2013. All returns shown in USD.
The table and graphs do not reflect the deductions of taxes that a shareholder would pay on fund distributions or the redemption of fund shares.
Performance data quoted represents past performance; past performance does not guarantee future results. The investment return and principal value of an investment will fluctuate so that an investor’s shares, when redeemed, may be worth more or less than their original cost. Current performance of the Fund may be lower or higher than the performance quoted. Performance data current to the most recent month end may be obtained by calling 855.244.4859. Performance shown including sales charge reflects the Class A maximum sales charge of 4.75% and the Class C Contingent Deferred Sales Charge (CDSC) of 1.00%. Performance data excluding sales charge does not reflect the deduction of the sales charge or CDSC and if reflected, the sales charge or fee would reduce the performance quoted.
The Fund’s gross and net expense ratios for Class A is 2.22% and 1.20%, Class C is 2.97% and 1.95%, Class Y is 1.97% and 0.95% and Class I is 1.97% and 0.95%, respectively for the year ended December 31, 2017.
The Adviser has contractually agreed to reimburse the Fund's expenses through May 1, 2018. There is no guarantee that such reimbursement will be continued after that date.
The graphs below illustrate a hypothetical investment of $10,000 in the U.S Real Estate Fund—Class A Shares
Brookfield U.S. Listed Real Estate Fund
(including sales charge) from the commencement of investment operations on December 11, 2013 to December 31, 2017 compared to the MSCI U.S. REIT Total Return Index, and Class I Shares from the commencement of investment operations on December 11, 2013 to December 31, 2017 compared to the MSCI U.S. REIT Total Return Index.
Class A Shares
Class I Shares
26Brookfield Investment Management Inc.
Brookfield U.S. Listed Real Estate Fund
Disclosure
The Fund’s portfolio holdings are subject to change without notice. The mention of specific securities is not a recommendation or solicitation for any person to buy, sell or hold any particular security. There is no assurance that the Brookfield U.S. Listed Real Estate Fund currently holds these securities. Please refer to the Schedule of Investments contained in this report for a full listing of fund holdings.
Investors should be aware of the risks involved with investing in a fund concentrating in REITs and real estate securities, such as declines in the value of real estate and increased susceptibility to adverse economic or regulatory developments. Investments in foreign securities involve political, economic and currency risks, greater volatility and differences in accounting methods. Investing in emerging markets may entail special risks relating to potential economic, political or social instability and the risks of nationalization, confiscation or the imposition of restrictions on foreign investment. The Fund invests in small and mid-cap companies, which involve additional risks such as limited liquidity and greater volatility. Investments in debt securities typically decrease in value when interest rates rise. This risk is usually greater for longer-term debt securities. Investment by the Fund in lower-rated and non-rated securities presents a greater risk of loss to principal and interest than higher-rated securities. Some securities held may be difficult to sell, particularly during times of market turmoil. If the Fund is forced to sell an illiquid asset to meet redemption, the Fund may be forced to sell at a loss. Using derivatives exposes the Fund to additional risks, may increase the volatility of the Fund’s net asset value and may not provide the result intended. Since the Fund will invest more than 25% of its total assets in securities in the Real Estate industry, the Fund may be subject to greater volatility than a fund that is more broadly diversified. Using derivatives exposes the Fund to additional risks, may increase the volatility of the Fund’s net asset value and may not provide the result intended.
Earnings growth is not a measure of the Fund’s future performance.
These views represent the opinions of Brookfield Investment Management Inc. and are not intended to predict or depict the performance of any investment. These views are as of the close of business on December 31, 2017 and subject to change based on subsequent developments.
Brookfield U.S. Listed Real Estate Fund
Portfolio Characteristics (Unaudited)
December 31, 2017
| ASSET ALLOCATION BY SECTOR | Percent of Net Assets |
| Retail | 23.7% |
| Residential | 13.4% |
| Office | 11.1% |
| Healthcare | 11.0% |
| Datacenters | 10.1% |
| Industrial | 7.3% |
| Specialty | 6.5% |
| Net Lease | 6.0% |
| Hotel | 5.8% |
| Self Storage | 3.7% |
| Other Assets in Excess of Liabilities | 1.4% |
| Total | 100.0% |
| TOP TEN HOLDINGS | |
| Simon Property Group, Inc. | 14.0% |
| SL Green Realty Corp. | 5.6% |
| QTS Realty Trust, Inc. | 5.1% |
| Equinix, Inc. | 5.0% |
| American Homes 4 Rent | 4.8% |
| Ventas, Inc. | 4.5% |
| Prologis, Inc. | 4.5% |
| HCP, Inc. | 4.5% |
| Crown Castle International Corp. | 4.5% |
| Park Hotels & Resorts, Inc. | 4.0% |
28Brookfield Investment Management Inc.
Brookfield U.S. Listed Real Estate Fund
Schedule of Investments
December 31, 2017
| | | | Shares | Value |
| COMMON STOCKS – 98.6% | | | |
| Datacenters – 10.1% | | | |
Equinix, Inc.
| | | 2,700 | $ 1,223,694 |
QTS Realty Trust, Inc.
| | | 23,200 | 1,256,512 |
| Total Datacenters | | | | 2,480,206 |
| Healthcare – 11.0% | | | |
HCP, Inc.
| | | 42,200 | 1,100,576 |
Physicians Realty Trust
| | | 27,000 | 485,730 |
Ventas, Inc.
| | | 18,400 | 1,104,184 |
| Total Healthcare | | | | 2,690,490 |
| Hotel – 5.8% | | | |
LaSalle Hotel Properties
| | | 15,900 | 446,313 |
Park Hotels & Resorts, Inc.
| | | 33,936 | 975,660 |
| Total Hotel | | | | 1,421,973 |
| Industrial – 7.3% | | | |
Duke Realty Corp.
| | | 25,400 | 691,134 |
Prologis, Inc.
| | | 17,100 | 1,103,122 |
| Total Industrial | | | | 1,794,256 |
| Net Lease – 6.0% | | | |
Gramercy Property Trust
| | | 28,066 | 748,240 |
MGM Growth Properties LLC
| | | 24,600 | 717,090 |
| Total Net Lease | | | | 1,465,330 |
| Office – 11.1% | | | |
Hudson Pacific Properties, Inc.
| | | 22,200 | 760,350 |
Kilroy Realty Corp.
| | | 8,000 | 597,200 |
SL Green Realty Corp.
| | | 13,500 | 1,362,555 |
| Total Office | | | | 2,720,105 |
| Residential – 13.4% | | | |
American Campus Communities, Inc.
| | | 10,100 | 414,403 |
American Homes 4 Rent
| | | 53,800 | 1,174,992 |
Essex Property Trust, Inc.
| | | 3,450 | 832,727 |
Mid-America Apartment Communities, Inc.
| | | 8,500 | 854,760 |
| Total Residential | | | | 3,276,882 |
| Retail – 23.7% | | | |
Brixmor Property Group, Inc.
| | | 23,500 | 438,510 |
DDR Corp.
| | | 54,700 | 490,112 |
Federal Realty Investment Trust
| | | 6,800 | 903,108 |
Simon Property Group, Inc.
| | | 19,949 | 3,426,041 |
Taubman Centers, Inc.
| | | 8,300 | 543,069 |
| Total Retail | | | | 5,800,840 |
| Self Storage – 3.7% | | | |
Public Storage
| | | 4,400 | 919,600 |
| Specialty – 6.5% | | | |
American Tower Corp.
| | | 3,400 | 485,078 |
See Notes to Financial Statements.
Brookfield U.S. Listed Real Estate Fund
Schedule of Investments (continued)
December 31, 2017
| | | | Shares | Value |
| COMMON STOCKS (continued) | | | |
Crown Castle International Corp.
| | | 9,900 | $ 1,098,999 |
| Total Specialty | | | | 1,584,077 |
Total COMMON STOCKS
(Cost $23,024,281)
| | | | 24,153,759 |
Total Investments – 98.6%
(Cost $23,024,281)
| | | | 24,153,759 |
Other Assets in Excess of Liabilities – 1.4%
| | | | 340,006 |
TOTAL NET ASSETS – 100.0%
| | | | $ 24,493,765 |
See Notes to Financial Statements.
30Brookfield Investment Management Inc.
Brookfield Real Assets Securities Fund
MANAGEMENT DISCUSSION OF FUND PERFORMANCE
For the year ended December 31, 2017, the Real Assets Securities Fund, Class I had a total return 9.7%, which assumes the reinvestment of dividends and is exclusive of brokerage commissions, underperforming the Fund’s Blended Index1, which returned 12.1%.
On an absolute performance basis, all asset class components of the strategy except Master Limited Partnerships ("MLPs") contributed positively to performance during the period.
On a relative performance basis, Global Real Estate was the leading contributor, driven by security selection within the sector, as well as an underweight allocation. Real Asset Debt was the second largest contributor to relative performance, also driven by security selection within the sector and an underweight allocation.
In the next section, we provide further detail on the performance of each asset class, along with our outlook for investing in real asset-related securities.
1 The Blended Index for the period from October 1, 2016 forward consists of 35% FTSE EPRA/NAREIT Developed Index, 5% BofA Merrill Lynch Preferred Stock REITs 7% Constrained Index, 40% Dow Jones Brookfield Global Infrastructure Index, 5% Alerian MLP Index, and 15% the ICE BofA Merrill Lynch Global High Yield Index and ICE BofA Merrill Lynch Global Corporate Index, weighted 70% and 30%, respectively. For the period from November 19, 2014 through September 30, 2016, the Blended Index consisted of 33.33% Dow Jones Brookfield Global Infrastructure Composite Index, 33.33% FTSE EPRA/NAREIT Developed Index, 13.33% the BofA Merrill Lynch Global High Yield Index and BofA Merrill Lynch Global Corporate Index, weighted 70% and 30%, respectively, 10% S&P Global Natural Resources Index, 6.66% Bloomberg Commodity Index and 3.33% Barclays Global Inflation-Linked Index.
GLOBAL INFRASTRUCTURE SECURITIES
Listed infrastructure returns were positive in 2017, with the Dow Jones Brookfield Global Infrastructure Composite Index posting a gain of 12.7%.2 Regional returns were particularly strong in Europe, where listed infrastructure stocks rose 27.2%. The Asia Pacific and Americas regions of the Dow Jones Brookfield Global Infrastructure Index returned 24.0% and 10.0%, respectively. By sector, Toll Roads gained 43.1%, followed by Airports (39.5%), Diversified (36.8%), Communications (33.9%), Water (20.0%), Ports (7.7%), Oil & Gas Storage & Transportation (6.4%) and Electricity Transmission & Distribution (4.4%). Conversely, the Alerian MLP Index declined 6.5%.3
U.S. communication tower stocks performed very well in 2017. Again, positive demand drivers including increased data usage, deployment of new technologies and the pending rollout of The First Responder Network Authority (FirstNet) provided tailwinds for the sector during the year. Transport stocks also performed well in 2017. Notably, European airports and toll roads benefitted from an expanding economy, as well as capital flows into the region following the outcome of regional elections in which several populist candidates were defeated.
Performance among utilities was mixed in 2017. U.K. water and electric utilities underperformed amid uncertainties related to Brexit, currency and in some cases possible nationalization of assets if the labor party gains control of the government. Gas utilities in China/Hong Kong performed well as regulation around their allowed returns became more transparent. In the U.S., while some transmission & distribution operators produced double-digit returns, wildfires in California had a significantly negative impact on two public utilities in the state.
Lastly, energy infrastructure lagged the broader asset class in 2017 as investor sentiment failed to keep pace with positive fundamentals. However, that trend began to reverse in the final weeks of the year, with MLPs outperforming broader listed infrastructure in December.
If infrastructure stocks trade more in-line with our estimation of appropriate risk-adjusted cost of capital (which varies by sector), we see the potential for double-digit upside in some groups. However, we also see equal downside risk among sectors most exposed to certain factors, notably rising interest rates or adverse regulatory changes. We are being particularly selective within rate-sensitive sectors, as we do not believe the prospect for higher interest rates is appropriately discounted at current levels.
2 The Dow Jones Brookfield Global Infrastructure Composite Index is calculated and maintained by S&P Dow Jones Indices and comprises
Brookfield Real Assets Securities Fund
infrastructure companies with at least 70% of its annual cash flows derived from owning and operating infrastructure assets, including MLPs.
3 The Alerian MLP Index is a composite of the 50 most prominent energy MLPs calculated by Standard & Poor's using a float-adjusted market-capitalization methodology. The index is disseminated by the New York Stock Exchange real-time on a price return basis (NYSE: AMZ) and on a total-return basis (NYSE: AMZX).
GLOBAL REAL ESTATE SECURITIES
Global real estate securities, as measured by the FTSE EPRA/NAREIT Developed Index4 returned 11.4%. By region, Europe returned 29.1%, followed by Asia Pacific (up 16.1%) and North America (up 4.6%).
European real estate equities benefitted from an expanding economy, as well as capital flows into the region following the outcome of regional elections in which a number of populist candidates were defeated. In the Asia Pacific region, real estate stocks performed particularly well in China and Hong Kong, following a period of underperformance immediately following the U.S. presidential election in 2016. Returns were also strong across all property types in Singapore. Fundamentals in the region have improved – particularly within the residential sector where supply has moderated, and affordability has improved relative to the recent past.
By U.S. property type, Industrial gained 23.3%, followed by Diversified (9.6%), Hotels (7.4%), Residential (6.2%), Mixed (5.2%), Office (5.1%), Self Storage (3.6%) and Healthcare (0.7%). Retail was the only property type to post negative returns (down 4.8%) during the year.
The Industrial sector benefitted from strong fundamentals as e-commerce continues to be a major demand driver. Datacenters and communication tower stocks also performed very well in 2017, benefiting from increased demand for data consumption and transmission. Hotels benefitted from the improving economic outlook throughout the global economy. Conversely, the Retail sector declined amid concerns around the prospect for tenant bankruptcies, store closures and the perceived threat from e-commerce. Healthcare stocks, while slightly positive for the year, struggled amid sector-specific fundamental headwinds, as well as the prospect for higher interest rates.
In our view, the U.S. economy remains healthy as we continue to see job growth and improving GDP—both of which are positive for real estate. We believe the recent tax bill could help stimulate the economy further and help accelerate or extend the current business cycle. Despite these positives for the overall economy, we continue to view the real estate market with a cautious eye. Interest rates have likely reached their cyclical low and are likely to drift higher over time, which could potentially present a risk to real estate values.
Outside the U.S., we continue to see better value opportunities in the U.K. compared to Continental Europe and are encouraged by the progress made so far in the Brexit negotiations. We favor exposure to London office properties, where we believe the public market discount is widest and where we believe market sentiment has created the greatest opportunity. In the Asia Pacific region, we have seen reflationary government policy in China through relaxed credit standards and housing policies, as well as increased infrastructure spending. We believe some of the inflationary policies in China could be reversed which would likely lead to a slowdown in economic growth. We continue to see attractive opportunities in the Singapore market as the government begins to ease or reverse many measures designed to cool the property market over the last several years. We see the potential for a recovery in the country’s property market as these measures are reversed and growth returns.
4 The FTSE EPRA/NAREIT Developed Index is calculated by the FTSE Group. Performance is calculated by price, total return and net total return and the Index is calculated daily. Constituents must meet minimum market capitalization, liquidity requirements, and real estate activity requirements in order to be included within the Index. North American and Asian companies must be of a minimum of US$200 million in market capitalization with liquidity of US$100 million. European companies are bound by €50 million (approximately $60 million) market cap minimum and liquidity of €25 million (approximately $30 million).
FIXED INCOME
The ICE BofA Merrill Lynch Global High Yield Index rose 10.2%5 in 2017. Investment grade securities advanced 9.3%, as measured by the ICE BofA Merrill Lynch Global Corporate Index.6
32Brookfield Investment Management Inc.
Brookfield Real Assets Securities Fund
During most of 2017, strong equity market returns, benign interest rates and strong commodity prices were all positive for real asset debt. Any global political and markets risks were largely shrugged off by markets, which instead preferred to focus on corporate tax cuts, deregulation in the United States and strong corporate earnings. Earnings were boosted further by the weakening of the dollar after a very strong post-election rally.
In general, we find it hard to be enthusiastic about investment-grade markets at these levels, given the low quality of the indexes, near-record long duration and tight spreads in an environment where interest rates are rising. On the other hand, the spreads of high-yield corporates, while narrow, continue to reap the benefits of very good credit quality, few debt maturity hammers and low default levels. Despite narrow spreads, the market has seen tighter spreads historically, suggesting that there may be room to absorb any increases in interest rates.
5 The ICE BofA Merrill Lynch Global High Yield Index tracks the performance of below investment-grade but not in default U.S. dollar denominated corporate bonds publicly issued in the U.S. domestic market, and includes issues with a credit rating of BBB or below as rated by Moody's and S&P.
6 The ICE BofA Merrill Lynch Global Corporate Index is an unmanaged, commonly accepted measure of the performance of global investment grade corporate securities. Index returns are calculated monthly, assume reinvestment of dividends.
Indices are not managed and an investor cannot invest directly in an index.
OUTLOOK
We believe the current economic and market environments are positive for real assets. Our view is that global economic growth, inflation and interest rates should all move modestly higher. U.S. tax reform may be powerful fiscal stimulus as corporate tax rates are reduced from a maximum of 35% to a flat rate of 21%; and as U.S. corporations can fully expense capital investments made through 2022. We are seeing moderate amounts of wage inflation beginning to materialize. We believe that real assets are well positioned if inflation begins to move higher from current levels.
From an asset allocation perspective, we maintain a keen eye on economic trends and central bank actions around the globe. While these uncertainties can increase volatility, they afford allocators, like ourselves, the opportunity to add value by adjusting allocations across the real asset landscape where we see particular opportunities.
AVERAGE ANNUAL TOTAL RETURNS
| As of December 31, 2017 | One Year | Since Inception* |
| Class A Shares (excluding sales charge) | 9.74% | 1.25% |
| Class A Shares (including sales charge) | 4.56% | -0.33% |
| Class C Shares (excluding sales charge) | 8.94% | 0.60% |
| Class C Shares (including sales charge) | 7.94% | 0.60% |
| Class Y Shares | 9.64% | 1.32% |
| Class I Shares | 9.65% | 1.29% |
| MSCI World Total Return Index | 23.07% | 9.18% |
| S&P Real Assets Total Return Index | 11.16% | N/A |
| Blended Index** | 12.12% | 2.90% |
* Classes A, C , Y and I were incepted on November 19, 2014. All returns shown in USD.
** The Blended Index for the period from October 1, 2016 forward consists of 35% FTSE EPRA/NAREIT Developed Index, 5% BofA Merrill Lynch Preferred Stock REITs 7% Constrained Index, 40% Dow Jones Brookfield Global Infrastructure Index, 5% Alerian MLP Index, and 15% the ICE BofA Merrill Lynch Global High Yield Index and ICE BofA Merrill Lynch Global Corporate Index, weighted 70% and 30%, respectively. For the period from November 19, 2014 through September 30, 2016, the Blended Index consisted of 33.33% Dow Jones Brookfield Global Infrastructure Composite Index, 33.33% FTSE EPRA/NAREIT Developed Index, 13.33% the BofA Merrill Lynch Global High Yield Index and BofA Merrill Lynch Global Corporate Index, weighted 70% and 30%, respectively, 10% S&P Global Natural Resources Index, 6.66% Bloomberg Commodity Index and 3.33% Barclays Global Inflation-Linked Index.
The table and graphs do not reflect the deductions of taxes that a shareholder would pay on fund distributions or the redemption of fund shares.
Brookfield Real Assets Securities Fund
Performance data quoted represents past performance; past performance does not guarantee future results. The investment return and principal value of an investment will fluctuate so that an investor’s shares, when redeemed, may be worth more or less than their original cost. Current performance of the Fund may be lower or higher than the performance quoted. Performance data current to the most recent month end may be obtained by calling 855.244.4859. Performance shown including sales charge reflects the Class A maximum sales charge of 4.75% and the Class C Contingent Deferred Sales Charge (CDSC) of 1.00%. Performance data excluding sales charge does not reflect the deduction of the sales charge or CDSC and if reflected, the sales charge or fee would reduce the performance quoted.
The Fund’s gross and net expense ratios for Class A is 1.82% and 1.35%, Class C is 2.57% and 2.10%, Class Y is 1.57% and 1.10% and Class I is 1.57% and 1.10%, respectively for the year ended December 31, 2017.
The Adviser has contractually agreed to reimburse the Fund's expenses through May 1, 2018. There is no guarantee that such reimbursement will be continued after that date.
The graphs below illustrate a hypothetical investment of $10,000 in the Real Assets Securities Fund—Class A Shares (including sales charge) from the commencement of investment operations on November 19, 2014 to December 31, 2017 compared to the MSCI World Total Return Index, and Class I Shares from the commencement of investment operations on November 19, 2014 to December 31, 2017 compared to the MSCI World Total Return Index.
Class A Shares
34Brookfield Investment Management Inc.
Brookfield Real Assets Securities Fund
Class I Shares
Disclosure
The Fund’s portfolio holdings are subject to change without notice. The mention of specific securities is not a recommendation or solicitation for any person to buy, sell or hold any particular security. There is no assurance that the Brookfield Global Listed Infrastructure Fund currently holds these securities. Please refer to the Schedule of Investments contained in this report for a full listing of fund holdings.
Infrastructure companies may be subject to a variety of factors that may adversely affect their business, including high interest costs, high leverage, regulation costs, economic slowdown, surplus capacity, increased competition, lack of fuel availability and energy conversation policies. The Fund invests in small and mid-cap companies, which involve additional risks such as limited liquidity and greater volatility. The Fund invests in foreign securities which involve greater volatility and political, economic and currency risks and differences in accounting methods. Investing in emerging markets may entail special risks relating to potential economic, political or social instability and the risks of nationalization, confiscation or the imposition of restrictions on foreign investment. Investments in debt securities typically decrease in value when interest rates rise. This risk is usually greater for longer-term debt securities. Investment by the Fund in lower-rated and non-rated securities presents a greater risk of loss to principal and interest than higher-rated securities. Some securities held may be difficult to sell, particularly during times of market turmoil. If the Fund is forced to sell an illiquid asset to meet redemption, it may be forced to sell at a loss. Investing in MLPs involves certain risks related to investing in the underlying assets of the MLPs and risks associated with pooled investment vehicles. Using derivatives exposes the Fund to additional risks, may increase the volatility of the Fund’s net asset value and may not provide the result intended. Since the Fund will invest more than 25% of its total assets in securities in the Infrastructure industry, the Fund may be subject to greater volatility than a fund that is more broadly diversified.
A Basis Point is one hundredth of one percent (0.01%). Cash flow refers to the amount of cash generated and used by a company over a given period.
Earnings growth is not a measure of the Fund’s future performance.
Brookfield Real Assets Securities Fund
These views represent the opinions of Brookfield Investment Management Inc. and are not intended to predict or depict the performance of any investment. These views are as of the close of business on December 31, 2017 and subject to change based on subsequent developments.
36Brookfield Investment Management Inc.
Brookfield Real Assets Securities Fund
Portfolio Characteristics (Unaudited)
December 31, 2017
| ASSET ALLOCATION BY SECTOR | Percent of
Net Assets |
| Infrastructure Equities | |
| — Global Infrastructure | 40.6% |
| — Master Limited Partnerships | 7.8% |
| Total Infrastructure Equities | 48.4% |
| Real Estate Equities | |
| — Global Real Estate Equities | 35.6% |
| — REIT Preferreds | 2.9% |
| Total Real Estate Equities | 38.5% |
| Real Asset Debt | 9.4% |
| Other Assets in Excess of Liabilities | 3.7% |
| Total | 100.0% |
| ASSET ALLOCATION BY GEOGRAPHY | Percent of Net Assets |
| United States | 55.4% |
| United Kingdom | 8.4% |
| Canada | 7.3% |
| France | 4.5% |
| Japan | 3.6% |
| Spain | 3.3% |
| Australia | 2.1% |
| Germany | 2.1% |
| Singapore | 1.8% |
| Hong Kong | 1.7% |
| China | 1.6% |
| Italy | 1.4% |
| Denmark | 0.8% |
| Mexico | 0.6% |
| Brazil | 0.5% |
| New Zealand | 0.5% |
| Switzerland | 0.5% |
| Luxembourg | 0.2% |
| Other Assets in Excess of Liabilities | 3.7% |
| Total | 100.0% |
| ASSET ALLOCATION BY SECURITY TYPE | Percent of Net Assets |
| Common Stocks | 84.0% |
| Convertible Preferred Stocks | 0.5% |
| Real Asset Debt | 9.4% |
| Preferred Stocks | 2.4% |
| Other Assets in Excess of Liabilities | 3.7% |
| Total | 100.0% |
Brookfield Real Assets Securities Fund
Portfolio Characteristics (Unaudited)(continued)
December 31, 2017
| TOP TEN HOLDINGS | Percent of Net Assets |
| American Tower Corp. | 3.7% |
| Simon Property Group, Inc. | 2.9% |
| TransCanada Corp. | 2.3% |
| Enbridge, Inc. | 2.3% |
| Kinder Morgan, Inc. | 2.2% |
| National Grid PLC | 2.0% |
| The Williams Companies, Inc. | 1.8% |
| Vinci SA | 1.8% |
| SBA Communications Corp. | 1.7% |
| Mitsubishi Estate Company Ltd. | 1.7% |
38Brookfield Investment Management Inc.
Brookfield Real Assets Securities Fund
Schedule of Investments
December 31, 2017
| | | | Shares | Value |
| COMMON STOCKS – 84.0% | | | |
| AUSTRALIA – 2.1% | | | |
| Diversified – 1.2% | | | |
Dexus
| | | 92,800 | $ 704,219 |
The GPT Group
| | | 68,700 | 273,277 |
| Total Diversified | | | | 977,496 |
| Pipelines – 0.6% | | | |
APA Group
| | | 68,200 | 442,241 |
| Toll Roads – 0.3% | | | |
Macquarie Atlas Roads Group
| | | 50,100 | 244,968 |
| Total AUSTRALIA | | | | 1,664,705 |
| BRAZIL – 0.5% | | | |
| Water – 0.5% | | | |
Cia de Saneamento Basico do Estado de Sao Paulo - ADR
| | | 36,400 | 380,380 |
| Total BRAZIL | | | | 380,380 |
| CANADA – 6.5% | | | |
| Pipelines – 6.5% | | | |
Enbridge, Inc.
| | | 44,904 | 1,756,150 |
Inter Pipeline Ltd.
| | | 23,300 | 482,497 |
Pembina Pipeline Corp.
| | | 28,600 | 1,035,470 |
TransCanada Corp.
| | | 37,071 | 1,804,299 |
| Total Pipelines | | | | 5,078,416 |
| Total CANADA | | | | 5,078,416 |
| CHINA – 1.6% | | | |
| Airports – 0.2% | | | |
Beijing Capital International Airport Company Ltd.
| | | 102,100 | 153,678 |
| Gas Utilities – 0.2% | | | |
ENN Energy Holdings Ltd.
| | | 23,900 | 169,988 |
| Office – 0.5% | | | |
SOHO China Ltd.
| | | 685,400 | 400,188 |
| Pipelines – 0.5% | | | |
Beijing Enterprises Holdings Ltd.
| | | 28,000 | 165,734 |
Kunlun Energy Company Ltd.
| | | 160,800 | 167,125 |
| Total Pipelines | | | | 332,859 |
| Water – 0.2% | | | |
Guangdong Investment Ltd.
| | | 111,800 | 149,477 |
| Total CHINA | | | | 1,206,190 |
| DENMARK – 0.8% | | | |
| Renewables/Electric Generation – 0.8% | | | |
Orsted A/S 1
| | | 11,700 | 637,753 |
| Total DENMARK | | | | 637,753 |
| FRANCE – 4.5% | | | |
| Communications – 0.3% | | | |
Eutelsat Communications SA
| | | 9,800 | 226,894 |
See Notes to Financial Statements.
Brookfield Real Assets Securities Fund
Schedule of Investments (continued)
December 31, 2017
| | | | Shares | Value |
| COMMON STOCKS (continued) | | | |
| Office – 0.7% | | | |
Gecina SA
| | | 3,000 | $ 553,941 |
| Retail – 0.3% | | | |
Eurocommercial Properties NV
| | | 4,700 | 204,963 |
| Toll Roads – 3.2% | | | |
Eiffage SA
| | | 4,500 | 492,485 |
Getlink SE
| | | 44,800 | 576,234 |
Vinci SA
| | | 13,800 | 1,408,861 |
| Total Toll Roads | | | | 2,477,580 |
| Total FRANCE | | | | 3,463,378 |
| GERMANY – 2.1% | | | |
| Office – 0.7% | | | |
alstria office REIT-AG
| | | 35,986 | 556,124 |
| Residential – 1.4% | | | |
Grand City Properties SA
| | | 18,510 | 435,707 |
Vonovia SE
| | | 12,816 | 634,996 |
| Total Residential | | | | 1,070,703 |
| Total GERMANY | | | | 1,626,827 |
| HONG KONG – 1.7% | | | |
| Diversified – 0.6% | | | |
Wharf Real Estate Investment Company Ltd. 2
| | | 67,487 | 449,173 |
| Gas Utilities – 0.3% | | | |
China Resources Gas Group Ltd.
| | | 65,400 | 236,721 |
| Office – 0.8% | | | |
Hongkong Land Holdings Ltd.
| | | 90,743 | 638,271 |
| Total HONG KONG | | | | 1,324,165 |
| ITALY – 1.4% | | | |
| Gas Utilities – 0.3% | | | |
Italgas SpA
| | | 37,473 | 228,652 |
| Renewables/Electric Generation – 0.5% | | | |
Enel SpA
| | | 63,000 | 387,403 |
| Toll Roads – 0.6% | | | |
Atlantia SpA
| | | 14,800 | 466,590 |
| Total ITALY | | | | 1,082,645 |
| JAPAN – 3.6% | | | |
| Office – 3.2% | | | |
Hulic REIT, Inc.
| | | 66 | 96,018 |
Mitsubishi Estate Company Ltd.
| | | 74,050 | 1,285,733 |
Mitsui Fudosan Company Ltd.
| | | 50,200 | 1,122,747 |
| Total Office | | | | 2,504,498 |
| Residential – 0.4% | | | |
Leopalace21 Corp.
| | | 35,304 | 274,157 |
| Total JAPAN | | | | 2,778,655 |
See Notes to Financial Statements.
40Brookfield Investment Management Inc.
Brookfield Real Assets Securities Fund
Schedule of Investments (continued)
December 31, 2017
| | | | Shares | Value |
| COMMON STOCKS (continued) | | | |
| MEXICO – 0.6% | | | |
| Airports – 0.2% | | | |
Grupo Aeroportuario del Pacifico SAB de CV
| | | 14,500 | $ 148,964 |
| Toll Roads – 0.4% | | | |
Promotora y Operadora de Infraestructura SAB de CV
| | | 33,293 | 328,942 |
| Total MEXICO | | | | 477,906 |
| NEW ZEALAND – 0.5% | | | |
| Airports – 0.5% | | | |
Auckland International Airport Ltd.
| | | 81,000 | 371,814 |
| Total NEW ZEALAND | | | | 371,814 |
| SINGAPORE – 1.8% | | | |
| Diversified – 0.9% | | | |
City Developments Ltd.
| | | 77,500 | 720,760 |
| Office – 0.4% | | | |
CapitaLand Commercial Trust
| | | 217,000 | 312,571 |
| Retail – 0.5% | | | |
CapitaLand Mall Trust
| | | 221,600 | 352,550 |
| Total SINGAPORE | | | | 1,385,881 |
| SPAIN – 3.3% | | | |
| Communications – 0.2% | | | |
Cellnex Telecom SA 1
| | | 6,900 | 176,539 |
| Diversified – 1.1% | | | |
Merlin Properties Socimi SA
| | | 63,200 | 855,984 |
| Toll Roads – 2.0% | | | |
Abertis Infraestructuras SA
| | | 24,700 | 549,565 |
Ferrovial SA
| | | 33,019 | 749,303 |
Obrascon Huarte Lain SA 2
| | | 39,900 | 238,116 |
| Total Toll Roads | | | | 1,536,984 |
| Total SPAIN | | | | 2,569,507 |
| SWITZERLAND – 0.5% | | | |
| Airports – 0.5% | | | |
Flughafen Zurich AG
| | | 1,550 | 354,279 |
| Total SWITZERLAND | | | | 354,279 |
| UNITED KINGDOM – 8.4% | | | |
| Diversified – 1.5% | | | |
Land Securities Group PLC
| | | 83,957 | 1,140,701 |
| Electricity Transmission & Distribution – 2.0% | | | |
National Grid PLC
| | | 130,833 | 1,542,325 |
| Industrial – 0.3% | | | |
Tritax Big Box REIT PLC
| | | 109,400 | 219,935 |
| Office – 2.1% | | | |
Derwent London PLC
| | | 8,600 | 362,039 |
Great Portland Estates PLC
| | | 137,868 | 1,279,515 |
| Total Office | | | | 1,641,554 |
See Notes to Financial Statements.
Brookfield Real Assets Securities Fund
Schedule of Investments (continued)
December 31, 2017
| | | | Shares | Value |
| COMMON STOCKS (continued) | | | |
| Retail – 1.3% | | | |
Capital & Counties Properties PLC
| | | 77,000 | $ 331,982 |
Hammerson PLC
| | | 93,526 | 690,027 |
| Total Retail | | | | 1,022,009 |
| Water – 1.2% | | | |
Pennon Group PLC
| | | 32,400 | 342,055 |
Severn Trent PLC
| | | 20,800 | 606,081 |
| Total Water | | | | 948,136 |
| Total UNITED KINGDOM | | | | 6,514,660 |
| UNITED STATES – 44.1% | | | |
| Communications – 6.3% | | | |
American Tower Corp.
| | | 20,300 | 2,896,201 |
Crown Castle International Corp.
| | | 5,600 | 621,656 |
SBA Communications Corp. 2
| | | 8,200 | 1,339,552 |
| Total Communications | | | | 4,857,409 |
| Datacenters – 1.5% | | | |
Equinix, Inc.
| | | 1,400 | 634,508 |
QTS Realty Trust, Inc.
| | | 10,000 | 541,600 |
| Total Datacenters | | | | 1,176,108 |
| Electricity Transmission & Distribution – 2.9% | | | |
Edison International
| | | 10,500 | 664,020 |
PG&E Corp. 2
| | | 16,584 | 743,461 |
Sempra Energy
| | | 8,100 | 866,052 |
| Total Electricity Transmission & Distribution | | | | 2,273,533 |
| Gas Utilities – 0.8% | | | |
Atmos Energy Corp.
| | | 3,500 | 300,615 |
Southwest Gas Holdings, Inc.
| | | 4,400 | 354,112 |
| Total Gas Utilities | | | | 654,727 |
| Healthcare – 1.8% | | | |
HCP, Inc.
| | | 20,300 | 529,424 |
Physicians Realty Trust
| | | 15,300 | 275,247 |
Ventas, Inc.
| | | 9,800 | 588,178 |
| Total Healthcare | | | | 1,392,849 |
| Hotel – 1.0% | | | |
LaSalle Hotel Properties
| | | 9,200 | 258,244 |
Park Hotels & Resorts, Inc.
| | | 16,930 | 486,737 |
| Total Hotel | | | | 744,981 |
| Industrial – 1.1% | | | |
Duke Realty Corp.
| | | 20,500 | 557,805 |
Prologis, Inc.
| | | 5,200 | 335,452 |
| Total Industrial | | | | 893,257 |
| Master Limited Partnerships – 7.8% | | | |
Archrock Partners LP
| | | 5,500 | 65,505 |
Boardwalk Pipeline Partners LP
| | | 38,500 | 497,035 |
Cone Midstream Partners LP
| | | 1,800 | 30,186 |
See Notes to Financial Statements.
42Brookfield Investment Management Inc.
Brookfield Real Assets Securities Fund
Schedule of Investments (continued)
December 31, 2017
| | | | Shares | Value |
| COMMON STOCKS (continued) | | | |
Enable Midstream Partners LP
| | | 7,900 | $ 112,338 |
Energy Transfer Partners LP
| | | 59,105 | 1,059,162 |
EnLink Midstream Partners LP
| | | 24,100 | 370,417 |
Enterprise Products Partners LP
| | | 34,295 | 909,160 |
EQT Midstream Partners LP
| | | 6,320 | 461,992 |
MPLX LP
| | | 20,700 | 734,229 |
Oasis Midstream Partners LP 2
| | | 5,500 | 95,920 |
Plains All American Pipeline LP
| | | 29,600 | 610,944 |
Rice Midstream Partners LP
| | | 17,464 | 374,952 |
Western Gas Partners LP
| | | 4,120 | 198,131 |
Williams Partners LP
| | | 12,679 | 491,692 |
| Total Master Limited Partnerships | | | | 6,011,663 |
| Midstream – 3.6% | | | |
Cheniere Energy, Inc. 2
| | | 6,000 | 323,040 |
Targa Resources Corp.
| | | 22,610 | 1,094,776 |
The Williams Companies, Inc.
| | | 46,300 | 1,411,687 |
| Total Midstream | | | | 2,829,503 |
| Net Lease – 1.0% | | | |
Gramercy Property Trust
| | | 15,422 | 411,150 |
MGM Growth Properties LLC
| | | 13,498 | 393,467 |
| Total Net Lease | | | | 804,617 |
| Office – 2.0% | | | |
Hudson Pacific Properties, Inc.
| | | 14,210 | 486,692 |
Kilroy Realty Corp.
| | | 5,500 | 410,575 |
SL Green Realty Corp.
| | | 6,300 | 635,859 |
| Total Office | | | | 1,533,126 |
| Pipelines – 2.2% | | | |
Kinder Morgan, Inc.
| | | 96,200 | 1,738,334 |
| Renewables/Electric Generation – 3.6% | | | |
American Electric Power Company, Inc.
| | | 7,400 | 544,418 |
CMS Energy Corp.
| | | 9,800 | 463,540 |
Entergy Corp.
| | | 7,600 | 618,564 |
FirstEnergy Corp.
| | | 11,200 | 342,944 |
Great Plains Energy, Inc.
| | | 9,500 | 306,280 |
NRG Energy, Inc.
| | | 5,700 | 162,336 |
Pattern Energy Group, Inc.
| | | 15,200 | 326,648 |
| Total Renewables/Electric Generation | | | | 2,764,730 |
| Residential – 2.7% | | | |
American Campus Communities, Inc.
| | | 8,300 | 340,549 |
American Homes 4 Rent
| | | 30,373 | 663,347 |
Essex Property Trust, Inc.
| | | 1,963 | 473,809 |
Mid-America Apartment Communities, Inc.
| | | 6,200 | 623,472 |
| Total Residential | | | | 2,101,177 |
| Retail – 5.0% | | | |
Brixmor Property Group, Inc.
| | | 17,953 | 335,003 |
DDR Corp.
| | | 55,500 | 497,280 |
See Notes to Financial Statements.
Brookfield Real Assets Securities Fund
Schedule of Investments (continued)
December 31, 2017
| | | | Shares | Value |
| COMMON STOCKS (continued) | | | |
Federal Realty Investment Trust
| | | 3,200 | $ 424,992 |
Simon Property Group, Inc.
| | | 13,265 | 2,278,131 |
Taubman Centers, Inc.
| | | 4,700 | 307,521 |
| Total Retail | | | | 3,842,927 |
| Self Storage – 0.8% | | | |
Public Storage
| | | 2,800 | 585,200 |
| Total UNITED STATES | | | | 34,204,141 |
Total COMMON STOCKS
(Cost $60,713,426)
| | | | 65,121,302 |
| CONVERTIBLE PREFERRED STOCKS – 0.5% | | | |
| UNITED STATES – 0.5% | | | |
| Net Lease – 0.1% | | | |
Lexington Realty Trust, Series C, 6.50%
| | | 1,759 | 90,754 |
| Office – 0.4% | | | |
Equity Commonwealth, Series D, 6.50%
| | | 12,524 | 333,827 |
| Total UNITED STATES | | | | 424,581 |
Total CONVERTIBLE PREFERRED STOCKS
(Cost $400,845)
| | | | 424,581 |
| | | | Principal
Amount
(000s) | Value |
| REAL ASSET DEBT – 9.4% | | | |
| CANADA – 0.8% | | | |
| Energy – 0.4% | | | |
MEG Energy Corp., 6.50%, 01/15/25 1
| | | $ 175 | $ 172,812 |
Trinidad Drilling Ltd., 6.63%, 02/15/25 1
| | | 125 | 118,750 |
| Total Energy | | | | 291,562 |
| Metals & Mining – 0.4% | | | |
Hudbay Minerals, Inc., 7.63%, 01/15/25 1
| | | 175 | 191,625 |
Kinross Gold Corp., 5.95%, 03/15/24
| | | 100 | 109,625 |
| Total Metals & Mining | | | | 301,250 |
| Total CANADA | | | | 592,812 |
| LUXEMBOURG – 0.2% | | | |
| Metals & Mining – 0.2% | | | |
ArcelorMittal, 6.13%, 06/01/25
| | | 150 | 172,688 |
| Total LUXEMBOURG | | | | 172,688 |
| UNITED STATES – 8.4% | | | |
| Construction & Building Materials – 0.4% | | | |
PulteGroup, Inc., 6.38%, 05/15/33
| | | 125 | 140,000 |
Toll Brothers Finance Corp., 4.88%, 11/15/25
| | | 175 | 182,875 |
| Total Construction & Building Materials | | | | 322,875 |
| Energy – 0.9% | | | |
Concho Resources, Inc., 4.38%, 01/15/25
| | | 175 | 182,000 |
EP Energy LLC, 8.00%, 11/29/24 1
| | | 175 | 180,688 |
Pattern Energy Group, Inc., 5.88%, 02/01/24 1
| | | 125 | 131,250 |
See Notes to Financial Statements.
44Brookfield Investment Management Inc.
Brookfield Real Assets Securities Fund
Schedule of Investments (continued)
December 31, 2017
| | | | Principal
Amount
(000s) | Value |
| REAL ASSET DEBT (continued) | | | |
Range Resources Corp., 5.75%, 06/01/21
| | | $ 175 | $ 181,562 |
| Total Energy | | | | 675,500 |
| Health Facilities – 0.5% | | | |
HCA, Inc., 5.25%, 06/15/26
| | | 275 | 291,500 |
Tenet Healthcare Corp., 8.13%, 04/01/22
| | | 125 | 127,187 |
| Total Health Facilities | | | | 418,687 |
| Infrastructure Services – 0.4% | | | |
Terex Corp., 5.63%, 02/01/25 1
| | | 125 | 130,625 |
United Rentals North America, Inc., 5.75%, 11/15/24
| | | 175 | 184,188 |
| Total Infrastructure Services | | | | 314,813 |
| Leisure – 0.6% | | | |
Boyd Gaming Corp., 6.38%, 04/01/26
| | | 150 | 161,625 |
GLP Capital LP, 5.38%, 04/15/26
| | | 125 | 134,062 |
MGM Growth Properties Operating Partnership LP, 5.63%, 05/01/24
| | | 175 | 186,375 |
| Total Leisure | | | | 482,062 |
| Media – 1.0% | | | |
CCO Holdings LLC, 5.88%, 05/01/27 1
| | | 175 | 180,250 |
Comcast Corp., 3.15%, 02/15/28
| | | 225 | 225,719 |
CSC Holdings LLC, 5.25%, 06/01/24
| | | 175 | 172,375 |
Mediacom Broadband LLC, 6.38%, 04/01/23
| | | 150 | 154,125 |
| Total Media | | | | 732,469 |
| Metals & Mining – 0.2% | | | |
AK Steel Corp., 7.63%, 10/01/21
| | | 175 | 181,563 |
| Oil Gas Transportation & Distribution – 1.2% | | | |
AmeriGas Partners LP, 5.50%, 05/20/25
| | | 150 | 151,500 |
Antero Midstream Partners LP, 5.38%, 09/15/24
| | | 100 | 103,000 |
Blue Racer Midstream LLC, 6.13%, 11/15/22 1
| | | 150 | 156,375 |
Crestwood Midstream Partners LP, 6.25%, 04/01/23
| | | 100 | 103,920 |
Holly Energy Partners LP, 6.00%, 08/01/24 1
| | | 100 | 104,250 |
MPLX LP, 4.88%, 12/01/24
| | | 125 | 134,737 |
Targa Resources Partners LP, 5.25%, 05/01/23
| | | 175 | 178,938 |
| Total Oil Gas Transportation & Distribution | | | | 932,720 |
| Real Estate – 0.3% | | | |
Hospitality Properties Trust, 4.95%, 02/15/27
| | | 100 | 105,462 |
Lamar Media Corp., 5.38%, 01/15/24
| | | 125 | 130,625 |
| Total Real Estate | | | | 236,087 |
| Telecommunication Services – 2.0% | | | |
CenturyLink, Inc., 7.65%, 03/15/42
| | | 200 | 176,250 |
Crown Castle International Corp., 4.75%, 05/15/47
| | | 150 | 157,905 |
CyrusOne LP, 5.38%, 03/15/27 1
| | | 175 | 183,750 |
Frontier Communications Corp., 11.00%, 09/15/25
| | | 175 | 128,625 |
Level 3 Financing, Inc., 5.38%, 05/01/25
| | | 175 | 174,781 |
SBA Communications Corp., 4.88%, 09/01/24
| | | 150 | 154,125 |
Sprint Capital Corp., 6.88%, 11/15/28
| | | 100 | 100,625 |
See Notes to Financial Statements.
Brookfield Real Assets Securities Fund
Schedule of Investments (continued)
December 31, 2017
| | | | Principal
Amount
(000s) | Value |
| REAL ASSET DEBT (continued) | | | |
T-Mobile USA, Inc., 6.50%, 01/15/26
| | | $ 100 | $ 109,125 |
Windstream Services LLC, 6.38%, 08/01/23 1
| | | 216 | 129,600 |
Zayo Group LLC, 6.00%, 04/01/23
| | | 150 | 156,233 |
Zayo Group LLC, 5.75%, 01/15/27 1
| | | 100 | 102,000 |
| Total Telecommunication Services | | | | 1,573,019 |
| Transportation – 0.3% | | | |
Teekay Offshore Partners LP, 6.00%, 07/30/19
| | | 100 | 99,500 |
Watco Companies LLC, 6.38%, 04/01/23 1
| | | 100 | 103,500 |
| Total Transportation | | | | 203,000 |
| Utility – 0.6% | | | |
AES Corp., 4.88%, 05/15/23
| | | 100 | 101,875 |
Calpine Corp., 5.75%, 01/15/25
| | | 100 | 94,500 |
Dynegy, Inc., 6.75%, 11/01/19
| | | 76 | 78,090 |
NRG Energy, Inc., 6.25%, 07/15/22
| | | 100 | 104,000 |
NRG Yield Operating LLC, 5.38%, 08/15/24
| | | 100 | 103,500 |
| Total Utility | | | | 481,965 |
| Total UNITED STATES | | | | 6,554,760 |
Total REAL ASSET DEBT
(Cost $7,338,317)
| | | | 7,320,260 |
| | | | Shares | Value |
| PREFERRED STOCKS – 2.4% | | | |
| UNITED STATES – 2.4% | | | |
| Datacenters – 0.2% | | | |
Digital Realty Trust, Inc., Series G, 5.88%
| | | 1,389 | $ 35,406 |
Digital Realty Trust, Inc., Series J, 5.25%
| | | 4,500 | 112,950 |
| Total Datacenters | | | | 148,356 |
| Diversified – 0.1% | | | |
PS Business Parks, Inc., Series W, 5.20%
| | | 3,400 | 85,850 |
| Industrial – 0.2% | | | |
Rexford Industrial Realty, Inc., Series A, 5.88%
| | | 5,400 | 137,430 |
Rexford Industrial Realty, Inc., Series B, 5.88%
| | | 1,400 | 35,616 |
| Total Industrial | | | | 173,046 |
| Midstream – 0.1% | | | |
CorEnergy Infrastructure Trust, Inc., Series A, 7.38%
| | | 3,000 | 77,220 |
| Net Lease – 0.4% | | | |
Gramercy Property Trust, Series A, 7.13%
| | | 7,058 | 188,943 |
National Retail Properties, Inc., Series F, 5.20%
| | | 2,800 | 70,252 |
| Total Net Lease | | | | 259,195 |
| Residential – 0.3% | | | |
American Homes 4 Rent, Series C, 5.50% 3
| | | 3,400 | 96,730 |
American Homes 4 Rent, Series E, 6.35%
| | | 3,800 | 101,802 |
American Homes 4 Rent, Series F, 5.88%
| | | 2,200 | 56,232 |
| Total Residential | | | | 254,764 |
See Notes to Financial Statements.
46Brookfield Investment Management Inc.
Brookfield Real Assets Securities Fund
Schedule of Investments (continued)
December 31, 2017
| | | | Shares | Value |
| PREFERRED STOCKS (continued) | | | |
| Retail – 0.2% | | | |
DDR Corp., Series K, 6.25%
| | | 3,432 | $ 88,099 |
Federal Realty Investment Trust, Series C, 5.00%
| | | 3,500 | 88,095 |
| Total Retail | | | | 176,194 |
| Self Storage – 0.9% | | | |
Public Storage, Series D, 4.95%
| | | 14,200 | 355,284 |
Public Storage, Series F, 5.15%
| | | 2,600 | 65,052 |
Public Storage, Series G, 5.05%
| | | 9,700 | 242,015 |
| Total Self Storage | | | | 662,351 |
| Total UNITED STATES | | | | 1,836,976 |
Total PREFERRED STOCKS
(Cost $1,821,711)
| | | | 1,836,976 |
Total Investments – 96.3%
(Cost $70,274,299)
| | | | 74,703,119 |
Other Assets in Excess of Liabilities – 3.7%
| | | | 2,846,310 |
TOTAL NET ASSETS – 100.0%
| | | | $ 77,549,429 |
| ADR— American Depositary Receipt |
| 1 | — Security exempt from registration under Rule 144A of the Securities Act of 1933. These securities may only be resold in transactions exempt from registration, normally to qualified institutional buyers. As of December 31, 2017, the total value of all such securities was $2,699,767 or 3.5% of net assets. |
| 2 | — Non-income producing security. |
| 3 | — Security is a “step up” holding where the coupon increases or steps up at a predetermined date. Interest rate shown is the rate in effect as of December 31, 2017. |
See Notes to Financial Statements.
BROOKFIELD INVESTMENT FUNDS
Statements of Assets and Liabilities
December 31, 2017
| | Infrastructure Fund | | Global Real Estate Fund | | U.S. Real Estate Fund | | Real Assets Securities Fund |
| Assets: | | | | | | | |
Investments in securities, at value (Note 2)
| $240,912,596 | | $1,945,578,977 | | $24,153,759 | | $74,703,119 |
Cash
| 2,702,528 | | 32,163,572 | | 221,899 | | 2,514,693 |
Dividends and interest receivable
| 793,071 | | 7,754,468 | | 110,606 | | 326,547 |
Receivable for fund shares sold
| 845,129 | | 23,030,026 | | 46 | | 12,000 |
Receivable for investments sold
| 411,837 | | 2,249,311 | | 227,825 | | 195,507 |
Net receivable from Adviser (Note 3)
| — | | — | | 10,227 | | — |
Prepaid expenses
| 39,080 | | 53,141 | | 43,639 | | 40,451 |
Total assets
| 245,704,241 | | 2,010,829,495 | | 24,768,001 | | 77,792,317 |
| Liabilities: | | | | | | | |
Payable for investments purchased
| 513,592 | | 5,838,007 | | 212,527 | | 128,289 |
Payable for fund shares purchased
| 187,007 | | 553,172 | | 5,000 | | — |
Distribution fee payable
| 203,427 | | 38,462 | | 4,462 | | 44 |
Investment advisory fee payable, net (Note 3)
| 70,368 | | 1,160,592 | | — | | 33,108 |
Administration fee payable, net (Note 3)
| 30,431 | | 248,962 | | — | | 9,806 |
Trustees' fee payable
| 4,504 | | 18,644 | | 2,618 | | 3,043 |
Accrued expenses
| 82,327 | | 289,166 | | 49,629 | | 68,598 |
Total liabilities
| 1,091,656 | | 8,147,005 | | 274,236 | | 242,888 |
Commitments and contingencies (Note 9)
| | | | | | | |
Net Assets
| $244,612,585 | | $2,002,682,490 | | $24,493,765 | | $77,549,429 |
| Composition of Net Assets: | | | | | | | |
Paid-in capital (Note 6)
| $237,377,004 | | $1,944,573,357 | | $24,112,618 | | $78,558,269 |
Distributions in excess of net investment income
| (5,816,287) | | (16,637,113) | | — | | (526,964) |
Accumulated net realized loss on investments, and foreign currency transactions
| (23,296,731) | | (29,311,332) | | (748,331) | | (4,912,551) |
Net unrealized appreciation on investments, and foreign currency
| 36,348,599 | | 104,057,578 | | 1,129,478 | | 4,430,675 |
Net assets applicable to capital shares outstanding
| $244,612,585 | | $2,002,682,490 | | $24,493,765 | | $77,549,429 |
Total investments at cost
| $204,564,714 | | $1,841,571,832 | | $23,024,281 | | $70,274,299 |
| Net Assets | | | | | | | |
| Class A Shares — Net Assets | $ 12,571,144 | | $ 7,105,596 | | $ 105,920 | | $ 3,405 |
Shares outstanding
| 987,470 | | 532,467 | | 10,309 | | 363 |
Net asset value and redemption price per share
| $ 12.73 | | $ 13.34 | | $ 10.27 | | $ 9.39* |
Offering price per share based on a maximum sales charge of 4.75%
| $ 13.36 | | $ 14.01 | | $ 10.78 | | $ 9.86 |
| Class C Shares — Net Assets | $ 10,686,100 | | $ 6,245,278 | | $ 483,872 | | $ 1,019 |
Shares outstanding
| 849,456 | | 470,340 | | 47,211 | | 108 |
Net asset value and redemption price per share
| $ 12.58 | | $ 13.28 | | $ 10.25 | | $ 9.41* |
| Class Y Shares — Net Assets | $ 55,317,936 | | $1,502,251,982 | | $ 26,372 | | $12,262,469 |
Shares outstanding
| 4,336,517 | | 112,393,266 | | 2,574 | | 1,318,786 |
Net asset value and redemption price per share
| $ 12.76 | | $ 13.37 | | $ 10.25 | | $ 9.30 |
| Class I Shares — Net Assets | $166,037,405 | | $ 487,079,634 | | $23,877,601 | | $65,282,536 |
Shares outstanding
| 13,009,509 | | 36,476,629 | | 2,338,006 | | 7,030,751 |
Net asset value and redemption price per share
| $ 12.76 | | $ 13.35 | | $ 10.21 | | $ 9.29 |
| * | Net asset value does not calculate due to fractional shares outstanding. |
See Notes to Financial Statements.
48Brookfield Investment Management Inc.
BROOKFIELD INVESTMENT FUNDS
Statements of Operations
For the Year Ended December 31, 2017
| | Infrastructure Fund | | Global Real Estate Fund | | U.S. Real Estate Fund | | Real Assets Securities Fund |
| Investment Income: | | | | | | | |
Dividends (net of foreign withholding tax of $466,285, $2,516,273, $0 and $100,676)
| $ 6,999,169 | | $ 63,367,610 | | $ 956,134 | | $1,837,278 |
Interest
| — | | — | | — | | 416,800 |
Total investment income
| 6,999,169 | | 63,367,610 | | 956,134 | | 2,254,078 |
| Expenses: | | | | | | | |
Investment advisory fees (Note 3)
| 2,197,367 | | 13,919,969 | | 226,484 | | 590,839 |
Administration fees (Note 3)
| 387,771 | | 2,783,994 | | 45,297 | | 104,266 |
Distribution fees — Class A
| 43,481 | | 25,765 | | 240 | | 5 |
Distribution fees — Class C
| 127,223 | | 64,002 | | 5,144 | | 11 |
Audit and tax services
| 120,831 | | 38,679 | | 40,365 | | 44,956 |
Fund accounting fees
| 109,107 | | 286,864 | | 64,108 | | 90,062 |
Registration fees
| 86,265 | | 122,967 | | 80,664 | | 76,732 |
Transfer agent fees
| 80,052 | | 168,438 | | 52,248 | | 54,756 |
Custodian fees
| 64,952 | | 236,637 | | 8,987 | | 45,813 |
Trustees' fees
| 53,954 | | 217,052 | | 31,368 | | 35,372 |
Miscellaneous
| 44,677 | | 82,575 | | 9,963 | | 10,367 |
Legal fees
| 41,865 | | 167,921 | | 24,151 | | 27,203 |
Insurance
| 23,076 | | 134,685 | | 4,365 | | 5,421 |
Reports to shareholders
| 13,590 | | 191,262 | | 5,972 | | 6,922 |
Interest expense
| 5,286 | | 1,648 | | 58 | | — |
Total operating expenses
| 3,399,497 | | 18,442,458 | | 599,414 | | 1,092,725 |
Less expenses reimbursed by the investment adviser (Note 3)
| (385,142) | | (720,729) | | (307,149) | | (328,094) |
Net expenses
| 3,014,355 | | 17,721,729 | | 292,265 | | 764,631 |
Net investment income
| 3,984,814 | | 45,645,881 | | 663,869 | | 1,489,447 |
| Realized and Unrealized Gain (Loss) on Investments, Foreign Currency and Foreign Currency Translations: | | | | | | | |
Net realized gain (loss) on:
| | | | | | | |
Investments
| 24,216,512 | | 8,198,570 | | 16,080 | | 887,357 |
Foreign currency transactions
| (12,605) | | (198,561) | | — | | (6,742) |
Net realized gain (loss)
| 24,203,907 | | 8,000,009 | | 16,080 | | 880,615 |
Net change in unrealized appreciation (depreciation) on:
| | | | | | | |
Investments
| (1,131,035) | | 119,633,811 | | 103,935 | | 3,684,484 |
Foreign currency translations
| 17,316 | | 73,147 | | — | | 2,099 |
Net change in unrealized appreciation (depreciation)
| (1,113,719) | | 119,706,958 | | 103,935 | | 3,686,583 |
Net realized and unrealized gain
| 23,090,188 | | 127,706,967 | | 120,015 | | 4,567,198 |
Net increase in net assets resulting from operations
| $27,075,002 | | $173,352,848 | | $ 783,884 | | $6,056,645 |
See Notes to Financial Statements.
BROOKFIELD INVESTMENT FUNDS
Statements of Changes in Net Assets
| | Infrastructure Fund | | Global Real Estate Fund |
| | For the Year Ended December 31, 2017 | | For the Year Ended December 31, 2016 | | For the Year Ended December 31, 2017 | | For the Year Ended December 31, 2016 |
| Increase (Decrease) in Net Assets Resulting from Operations: | | | | | | | |
Net investment income
| $ 3,984,814 | | $ 4,346,875 | | $ 45,645,881 | | $ 25,259,394 |
Net realized gain (loss) on investments and foreign currency transactions
| 24,203,907 | | (8,542,069) | | 8,000,009 | | 49,216,970 |
Net unrealized appreciation (depreciation) on investments and foreign currency translations
| (1,113,719) | | 41,483,355 | | 119,706,958 | | 6,506,160 |
Net increase in net assets resulting from operations
| 27,075,002 | | 37,288,161 | | 173,352,848 | | 80,982,524 |
| Distributions to Shareholders: | | | | | | | |
| From net investment income: | | | | | | | |
Class A shares
| (395,580) | | (365,323) | | (358,082) | | (673,700) |
Class C shares
| (239,956) | | (196,207) | | (191,056) | | (201,059) |
Class Y shares
| (1,328,308) | | (1,319,060) | | (56,872,227) | | (33,139,091) |
Class I shares
| (4,511,761) | | (3,484,368) | | (17,892,628) | | (15,178,517) |
| From net realized gain on investments: | | | | | | | |
Class A shares
| — | | — | | — | | (342,999) |
Class C shares
| — | | — | | — | | (160,290) |
Class Y shares
| — | | — | | — | | (22,344,289) |
Class I shares
| — | | — | | — | | (9,163,040) |
| From return of capital: | | | | | | | |
Class A shares
| (219,244) | | (534,766) | | — | | (21,199) |
Class C shares
| (132,992) | | (287,210) | | — | | (6,327) |
Class Y shares
| (736,192) | | (1,930,857) | | — | | (1,042,786) |
Class I shares
| (2,500,570) | | (5,100,464) | | — | | (477,622) |
Total distributions paid
| (10,064,603) | | (13,218,255) | | (75,313,993) | | (82,750,919) |
| Capital Share Transactions (Note 6): | | | | | | | |
Subscriptions
| 47,278,421 | | 75,793,676 | | 1,029,453,076 | | 582,722,316 |
Reinvestment of distributions
| 9,215,399 | | 12,417,373 | | 54,731,784 | | 72,415,018 |
Redemptions
| (81,097,810) | | (174,590,212) | | (643,512,980) | | (395,728,822) |
Redemption fees1
| — | | 13,485 | | — | | 33,297 |
Net increase (decrease) in capital share transactions
| (24,603,990) | | (86,365,678) | | 440,671,880 | | 259,441,809 |
Total increase (decrease) in net assets
| (7,593,591) | | (62,295,772) | | 538,710,735 | | 257,673,414 |
| Net Assets: | | | | | | | |
Beginning of year
| 252,206,176 | | 314,501,948 | | 1,463,971,755 | | 1,206,298,341 |
End of year
| $244,612,585 | | $ 252,206,176 | | $2,002,682,490 | | $1,463,971,755 |
Distributions in excess of net investment income
| $ (5,816,287) | | $ (5,340,810) | | $ (16,637,113) | | $ (9,439,297) |
| 1 | Redemption fees were eliminated effective September 1, 2016. |
See Notes to Financial Statements.
50Brookfield Investment Management Inc.
BROOKFIELD INVESTMENT FUNDS
Statements of Changes in Net Assets (continued)
| | U.S. Real Estate Fund | | Real Assets Securities Fund |
| | For the Year Ended December 31, 2017 | | For the Year Ended December 31, 2016 | | For the Year Ended December 31, 2017 | | For the Year Ended December 31, 2016 |
| Increase (Decrease) in Net Assets Resulting from Operations: | | | | | | | |
Net investment income
| $ 663,869 | | $ 804,775 | | $ 1,489,447 | | $ 1,325,010 |
Net realized gain (loss) on investments, swap contracts, and foreign currency transactions
| 16,080 | | 2,383,574 | | 880,615 | | (2,301,151) |
Net unrealized appreciation (depreciation) on investments, swap contracts, and foreign currency translations
| 103,935 | | 565,222 | | 3,686,583 | | 6,894,259 |
Net increase in net assets resulting from operations
| 783,884 | | 3,753,571 | | 6,056,645 | | 5,918,118 |
| Distributions to Shareholders: | | | | | | | |
| From net investment income: | | | | | | | |
Class A shares
| (2,724) | | (2,743) | | (58) | | (23) |
Class C shares
| (10,936) | | (10,092) | | (21) | | (19) |
Class Y shares
| (3,498) | | (15,980) | | (232,828) | | (105,696) |
Class I shares
| (833,905) | | (1,416,910) | | (1,761,209) | | (1,513,666) |
| From net realized gain on investments: | | | | | | | |
Class A shares
| (774) | | (3,672) | | — | | — |
Class C shares
| (3,108) | | (23,273) | | — | | — |
Class Y shares
| (995) | | (38,759) | | — | | — |
Class I shares
| (237,035) | | (2,360,667) | | — | | — |
| From return of capital: | | | | | | | |
Class A shares
| (290) | | (46) | | (24) | | (11) |
Class C shares
| (1,165) | | (170) | | (8) | | (9) |
Class Y shares
| (373) | | (270) | | (98,717) | | (48,963) |
Class I shares
| (88,820) | | (23,934) | | (746,739) | | (701,198) |
Total distributions paid
| (1,183,623) | | (3,896,516) | | (2,839,604) | | (2,369,585) |
| Capital Share Transactions (Note 6): | | | | | | | |
Subscriptions
| 327,760 | | 917,530 | | 12,197,625 | | 2,526,247 |
Reinvestment of distributions
| 1,039,664 | | 3,820,578 | | 2,572,060 | | 2,229,810 |
Redemptions
| (23,270,960) | | (10,319,230) | | (996,565) | | (210,514) |
Net increase (decrease) in capital share transactions
| (21,903,536) | | (5,581,122) | | 13,773,120 | | 4,545,543 |
Total increase (decrease) in net assets
| (22,303,275) | | (5,724,067) | | 16,990,161 | | 8,094,076 |
| Net Assets: | | | | | | | |
Beginning of year
| 46,797,040 | | 52,521,107 | | 60,559,268 | | 52,465,192 |
End of year
| $ 24,493,765 | | $ 46,797,040 | | $77,549,429 | | $60,559,268 |
Distributions in excess of net investment income
| $ — | | $ (276,231) | | $ (526,964) | | $ 410,915 |
See Notes to Financial Statements.
Brookfield Global Listed Infrastructure Fund
Financial Highlights
| | Per Share Operating Performance: | | Ratios to Average Net Assets/Supplementary Data: |
| | Net asset
value,
beginning
of year | Net
investment
income(1) | Net
realized and
unrealized
gain (loss) on
investment
transactions | Net
increase
(decrease)
in net
asset value
resulting from
operations | Distributions
from net
investment
income | Distributions
from net
realized
gains | Return
of capital
distributions | Total
distributions
paid | Redemption
fees(3) | Net asset
value, end
of year | Total
Investment
Return† | Net assets,
end of year
(000s) | Gross
operating
expenses | Net expenses,
including fee
waivers and
reimbursement
and excluding
interest
expense | Net
investment
income | Net
investment
income,
excluding the
effect of fee
waivers and
reimbursement | Portfolio
turnover
rate |
| Class A: | | | | | | | | | | | | | | | | | |
| December 31, 2017 | $11.97 | 0.17 | 1.07 | 1.24 | (0.31) | — | (0.17) | (0.48) | — | $12.73 | 10.52% | $ 12,571 | 1.50% | 1.35% | 1.37% | 1.22% | 93% |
| December 31, 2016 | $11.06 | 0.12 | 1.25 | 1.37 | (0.19) | — | (0.27) | (0.46) | 0.00 (2) | $11.97 | 12.38% | $ 20,006 | 1.43% | 1.35% | 1.05% | 0.97% | 100% |
| December 31, 2015 | $14.15 | 0.15 | (2.83) | (2.68) | (0.10) | — | (0.31) | (0.41) | 0.00 (2) | $11.06 | -19.28% | $ 31,989 | 1.41% | 1.35% | 1.13% | 1.07% | 98% |
| December 31, 2014 | $13.91 | 0.15 | 0.88 | 1.03 | (0.22) | (0.57) | — | (0.79) | 0.00 (2) | $14.15 | 7.27% | $ 74,164 | 1.44% | 1.35% | 1.01% | 0.92% | 85% |
| December 31, 2013 | $11.61 | 0.17 | 2.46 | 2.63 | (0.22) | (0.11) | — | (0.33) | 0.00 (2) | $13.91 | 22.86% | $104,349 | 1.51% | 1.35% | 1.30% | 1.14% | 64% |
| Class C: | | | | | | | | | | | | | | | | | |
| December 31, 2017 | $11.83 | 0.07 | 1.06 | 1.13 | (0.24) | — | (0.14) | (0.38) | — | $12.58 | 9.62% | $ 10,686 | 2.25% | 2.10% | 0.59% | 0.44% | 93% |
| December 31, 2016 | $10.93 | 0.04 | 1.23 | 1.27 | (0.15) | — | (0.22) | (0.37) | — | $11.83 | 11.60% | $ 13,935 | 2.18% | 2.10% | 0.32% | 0.24% | 100% |
| December 31, 2015 | $13.98 | 0.05 | (2.79) | (2.74) | (0.08) | — | (0.23) | (0.31) | 0.00 (2) | $10.93 | -19.91% | $ 18,026 | 2.16% | 2.10% | 0.41% | 0.35% | 98% |
| December 31, 2014 | $13.80 | 0.04 | 0.86 | 0.90 | (0.15) | (0.57) | — | (0.72) | 0.00 (2) | $13.98 | 6.41% | $ 33,470 | 2.19% | 2.10% | 0.24% | 0.15% | 85% |
| December 31, 2013 | $11.57 | 0.08 | 2.43 | 2.51 | (0.17) | (0.11) | — | (0.28) | 0.00 (2) | $13.80 | 21.85% | $ 15,378 | 2.26% | 2.10% | 0.58% | 0.42% | 64% |
| Class Y: | | | | | | | | | | | | | | | | | |
| December 31, 2017 | $11.99 | 0.20 | 1.08 | 1.28 | (0.33) | — | (0.18) | (0.51) | — | $12.76 | 10.79% | $ 55,318 | 1.25% | 1.10% | 1.57% | 1.42% | 93% |
| December 31, 2016 | $11.08 | 0.16 | 1.24 | 1.40 | (0.20) | — | (0.29) | (0.49) | 0.00 (2) | $11.99 | 12.64% | $ 62,515 | 1.18% | 1.10% | 1.33% | 1.25% | 100% |
| December 31, 2015 | $14.18 | 0.18 | (2.84) | (2.66) | (0.12) | — | (0.33) | (0.45) | 0.01 | $11.08 | -19.01% | $ 77,826 | 1.16% | 1.10% | 1.37% | 1.31% | 98% |
| December 31, 2014 | $13.93 | 0.19 | 0.88 | 1.07 | (0.25) | (0.57) | — | (0.82) | 0.00 (2) | $14.18 | 7.54% | $199,436 | 1.19% | 1.10% | 1.22% | 1.13% | 85% |
| December 31, 2013 | $11.62 | 0.19 | 2.47 | 2.66 | (0.24) | (0.11) | — | (0.35) | 0.00 (2) | $13.93 | 23.11% | $ 76,014 | 1.26% | 1.10% | 1.49% | 1.33% | 64% |
| Class I: | | | | | | | | | | | | | | | | | |
| December 31, 2017 | $12.00 | 0.21 | 1.06 | 1.27 | (0.33) | — | (0.18) | (0.51) | — | $12.76 | 10.70% | $166,037 | 1.25% | 1.10% | 1.62% | 1.47% | 93% |
| December 31, 2016 | $11.08 | 0.16 | 1.25 | 1.41 | (0.20) | — | (0.29) | (0.49) | 0.00 (2) | $12.00 | 12.74% | $155,750 | 1.18% | 1.10% | 1.33% | 1.25% | 100% |
| December 31, 2015 | $14.19 | 0.20 | (2.86) | (2.66) | (0.07) | — | (0.38) | (0.45) | 0.00 (2) | $11.08 | -19.06% | $186,661 | 1.16% | 1.10% | 1.56% | 1.50% | 98% |
| December 31, 2014 | $13.94 | 0.18 | 0.89 | 1.07 | (0.25) | (0.57) | — | (0.82) | 0.00 (2) | $14.19 | 7.53% | $172,587 | 1.19% | 1.10% | 1.21% | 1.12% | 85% |
| December 31, 2013 | $11.63 | 0.19 | 2.47 | 2.66 | (0.24) | (0.11) | — | (0.35) | 0.00 (2) | $13.94 | 23.09% | $185,085 | 1.26% | 1.10% | 1.49% | 1.33% | 64% |
| † | Total investment return is computed based upon the net asset value of the Fund’s shares and excludes the effects of sales charges or contingent deferred sales charges, if applicable. Distributions are assumed to be reinvested at the net asset value of the Class on the ex-date of the distribution. |
| (1) | Per share amounts presented are based on average shares outstanding throughout the period indicated. |
| (2) | Rounds to less than $0.005. |
| (3) | Redemption fees were eliminated effective September 1, 2016. |
See Notes to Financial Statements.
52Brookfield Investment Management Inc.
Brookfield Global Listed Real Estate Fund
Financial Highlights
| | Per Share Operating Performance: | | Ratios to Average Net Assets/Supplementary Data: |
| | Net asset
value,
beginning
of year | Net
investment
income(1) | Net
realized and
unrealized
gain (loss) on
investment
transactions | Net
increase
(decrease)
in net
asset value
resulting from
operations | Distributions
from net
investment
income | Distributions
from net
realized
gains | Return
of capital
distributions | Total
distributions
paid | Redemption
fees(3) | Net asset
value, end
of year | Total
Investment
Return† | Net assets,
end of year
(000s) | Gross
operating
expenses | Net expenses,
including fee
waivers and
reimbursement
and excluding
interest
expense | Net
investment
income | Net
investment
income,
excluding the
effect of fee
waivers and
reimbursement | Portfolio
turnover
rate |
| Class A: | | | | | | | | | | | | | | | | | |
| December 31, 2017 | $12.61 | 0.28 | 0.94 | 1.22 | (0.49) | — | — | (0.49) | — | $13.34 | 9.84% | $ 7,106 | 1.24% | 1.20% | 2.13% | 2.09% | 89% |
| December 31, 2016 | $12.61 | 0.22 | 0.53 | 0.75 | (0.45) | (0.29) | (0.01) | (0.75) | 0.00 (2) | $12.61 | 6.00% | $ 14,953 | 1.27% | 1.20% | 1.68% | 1.61% | 88% |
| December 31, 2015 | $13.30 | 0.23 | (0.43) | (0.20) | (0.40) | (0.07) | (0.02) | (0.49) | 0.00 (2) | $12.61 | -1.55% | $ 30,280 | 1.31% | 1.20% | 1.75% | 1.64% | 60% |
| December 31, 2014 | $11.85 | 0.35 | 1.92 | 2.27 | (0.47) | (0.35) | — | (0.82) | 0.00 (2) | $13.30 | 19.25% | $ 5,812 | 1.41% | 1.20% | 2.64% | 2.43% | 108% |
| December 31, 2013 | $11.99 | 0.21 | 0.38 | 0.59 | (0.25) | (0.48) | — | (0.73) | 0.00 (2) | $11.85 | 4.99% | $ 4,942 | 1.66% | 1.20% | 1.69% | 1.23% | 147% |
| Class C: | | | | | | | | | | | | | | | | | |
| December 31, 2017 | $12.55 | 0.19 | 0.93 | 1.12 | (0.39) | — | — | (0.39) | — | $13.28 | 9.08% | $ 6,245 | 1.99% | 1.95% | 1.45% | 1.41% | 89% |
| December 31, 2016 | $12.55 | 0.12 | 0.54 | 0.66 | (0.36) | (0.29) | (0.01) | (0.66) | 0.00 (2) | $12.55 | 5.26% | $ 6,919 | 2.02% | 1.95% | 0.90% | 0.83% | 88% |
| December 31, 2015 | $13.24 | 0.12 | (0.43) | (0.31) | (0.30) | (0.07) | (0.02) | (0.39) | 0.01 | $12.55 | -2.31% | $ 7,050 | 2.06% | 1.95% | 0.90% | 0.79% | 60% |
| December 31, 2014 | $11.83 | 0.31 | 1.85 | 2.16 | (0.40) | (0.35) | — | (0.75) | — | $13.24 | 18.27% | $ 4,188 | 2.16% | 1.95% | 2.31% | 2.10% | 108% |
| December 31, 2013 | $12.00 | 0.11 | 0.39 | 0.50 | (0.19) | (0.48) | — | (0.67) | — | $11.83 | 4.18% | $ 833 | 2.41% | 1.95% | 0.91% | 0.45% | 147% |
| Class Y: | | | | | | | | | | | | | | | | | |
| December 31, 2017 | $12.63 | 0.32 | 0.94 | 1.26 | (0.52) | — | — | (0.52) | — | $13.37 | 10.20% | $1,502,252 | 0.99% | 0.95% | 2.46% | 2.42% | 89% |
| December 31, 2016 | $12.63 | 0.25 | 0.54 | 0.79 | (0.48) | (0.29) | (0.02) | (0.79) | 0.00 (2) | $12.63 | 6.27% | $1,060,627 | 1.02% | 0.95% | 1.94% | 1.87% | 88% |
| December 31, 2015 | $13.32 | 0.28 | (0.45) | (0.17) | (0.42) | (0.07) | (0.03) | (0.52) | 0.00 (2) | $12.63 | -1.33% | $ 779,226 | 1.06% | 0.95% | 2.11% | 2.00% | 60% |
| December 31, 2014 | $11.87 | 0.41 | 1.90 | 2.31 | (0.51) | (0.35) | — | (0.86) | 0.00 (2) | $13.32 | 19.51% | $ 120,367 | 1.16% | 0.95% | 3.09% | 2.88% | 108% |
| December 31, 2013 | $12.01 | 0.25 | 0.37 | 0.62 | (0.28) | (0.48) | — | (0.76) | 0.00 (2) | $11.87 | 5.20% | $ 51,694 | 1.41% | 0.95% | 1.98% | 1.52% | 147% |
| Class I: | | | | | | | | | | | | | | | | | |
| December 31, 2017 | $12.62 | 0.32 | 0.93 | 1.25 | (0.52) | — | — | (0.52) | — | $13.35 | 10.13% | $ 487,080 | 0.99% | 0.95% | 2.48% | 2.44% | 89% |
| December 31, 2016 | $12.62 | 0.25 | 0.54 | 0.79 | (0.48) | (0.29) | (0.02) | (0.79) | 0.00 (2) | $12.62 | 6.27% | $ 381,472 | 1.02% | 0.95% | 1.91% | 1.84% | 88% |
| December 31, 2015 | $13.32 | 0.25 | (0.43) | (0.18) | (0.43) | (0.07) | (0.02) | (0.52) | 0.00 (2) | $12.62 | -1.40% | $ 389,743 | 1.06% | 0.95% | 1.88% | 1.77% | 60% |
| December 31, 2014 | $11.86 | 0.36 | 1.96 | 2.32 | (0.51) | (0.35) | — | (0.86) | 0.00 (2) | $13.32 | 19.61% | $ 212,842 | 1.16% | 0.95% | 2.69% | 2.48% | 108% |
| December 31, 2013 | $12.00 | 0.23 | 0.39 | 0.62 | (0.28) | (0.48) | — | (0.76) | 0.00 (2) | $11.86 | 5.20% | $ 69,846 | 1.41% | 0.95% | 1.86% | 1.40% | 147% |
| † | Total investment return is computed based upon the net asset value of the Fund’s shares and excludes the effects of sales charges or contingent deferred sales charges, if applicable. Distributions are assumed to be reinvested at the net asset value of the Class on the ex-date of the distribution. |
| (1) | Per share amounts presented are based on average shares outstanding throughout the period indicated. |
| (2) | Rounds to less than $0.005. |
| (3) | Redemption fees were eliminated effective September 1, 2016. |
See Notes to Financial Statements.
Brookfield U.S. Listed Real Estate Fund
Financial Highlights
| | Per Share Operating Performance: | | Ratios to Average Net Assets/Supplementary Data: |
| | Net asset
value,
beginning
of period | Net
investment
income(3) | Net
realized and
unrealized
gain (loss) on
investment
transactions | Net
increase
(decrease)
in net
asset value
resulting from
operations | Distributions
from net
investment
income | Distributions
from net
realized
gains | Return
of capital
distributions | Total
distributions
paid | Redemption
fees(7) | Net asset
value, end
of period | Total
Investment
Return† | Net assets,
end of period
(000s) | Gross
operating
expenses | Net expenses,
including fee
waivers and
reimbursement
and excluding
interest
expense | Net
investment
income | Net
investment
income,
excluding the
effect of fee
waivers and
reimbursement | Portfolio
turnover
rate |
| Class A: | | | | | | | | | | | | | | | | | |
| December 31, 2017 | $10.38 | 0.20 | 0.08 | 0.28 | (0.27) | (0.08) | (0.04) | (0.39) | — | $10.27 | 2.73% | $ 106 | 2.22% | 1.20% | 1.87% | 0.85% | 102% |
| December 31, 2016 | $10.47 | 0.15 | 0.64 | 0.79 | (0.30) | (0.57) | (0.01) | (0.88) | — | $10.38 | 7.63% | $ 90 | 1.74% | 1.20% | 1.43% | 0.89% | 111% |
| December 31, 2015 | $11.77 | 0.27 | (0.87) | (0.60) | (0.29) | (0.45) | — | (0.74) | 0.04 | $10.47 | -4.69% | $ 85 | 1.78% | 1.20% | 2.33% | 1.75% | 78% |
| December 31, 2014 | $10.11 | 0.68 | 2.22 | 2.90 | (0.36) | (0.88) | — | (1.24) | — | $11.77 | 28.66% | $ 123 | 2.40% | 1.20% | 5.61% | 4.41% | 86% |
| December 31, 2013(1) | $10.00 | 0.04 | 0.12 | 0.16 | (0.05) | — | — | (0.05) | — | $10.11 | 1.62% (4) | $ 1 | 3.82% (2),(5) | 0.80% (2),(5) | 8.17% (2),(5) | 5.15% (2),(5) | 4% (4) |
| Class C: | | | | | | | | | | | | | | | | | |
| December 31, 2017 | $10.36 | 0.11 | 0.09 | 0.20 | (0.22) | (0.06) | (0.03) | (0.31) | — | $10.25 | 1.95% | $ 484 | 2.97% | 1.95% | 1.06% | 0.04% | 102% |
| December 31, 2016 | $10.47 | 0.08 | 0.63 | 0.71 | (0.25) | (0.57) | (0.00) (6) | (0.82) | — | $10.36 | 6.87% | $ 546 | 2.49% | 1.95% | 0.71% | 0.17% | 111% |
| December 31, 2015 | $11.77 | 0.17 | (0.80) | (0.63) | (0.22) | (0.45) | — | (0.67) | — | $10.47 | -5.18% | $ 360 | 2.53% | 1.95% | 1.58% | 1.00% | 78% |
| December 31, 2014 | $10.11 | 0.26 | 2.56 | 2.82 | (0.28) | (0.88) | — | (1.16) | — | $11.77 | 27.78% | $ 1 | 3.15% | 1.95% | 2.27% | 1.07% | 86% |
| December 31, 2013(1) | $10.00 | 0.04 | 0.12 | 0.16 | (0.05) | — | — | (0.05) | — | $10.11 | 1.58% (4) | $ 1 | 4.54% (2),(5) | 1.52% (2),(5) | 7.45% (2),(5) | 4.43% (2),(5) | 4% (4) |
| Class Y: | | | | | | | | | | | | | | | | | |
| December 31, 2017 | $10.34 | 0.22 | 0.10 | 0.32 | (0.33) | (0.04) | (0.04) | (0.41) | — | $10.25 | 3.19% | $ 26 | 1.97% | 0.95% | 2.12% | 1.10% | 102% |
| December 31, 2016 | $10.42 | 0.19 | 0.63 | 0.82 | (0.32) | (0.57) | (0.01) | (0.90) | — | $10.34 | 7.95% | $ 749 | 1.49% | 0.95% | 1.81% | 1.27% | 111% |
| December 31, 2015 | $11.77 | 0.29 | (0.83) | (0.54) | (0.38) | (0.45) | — | (0.83) | 0.02 | $10.42 | -4.30% | $ 284 | 1.53% | 0.95% | 2.58% | 2.00% | 78% |
| December 31, 2014 | $10.11 | 0.83 | 2.10 | 2.93 | (0.39) | (0.88) | — | (1.27) | — | $11.77 | 28.98% | $ 118 | 2.15% | 0.95% | 6.78% | 5.58% | 86% |
| December 31, 2013(1) | $10.00 | 0.04 | 0.12 | 0.16 | (0.05) | — | — | (0.05) | — | $10.11 | 1.64% (4) | $ 1 | 3.46% (2),(5) | 0.44% (2),(5) | 8.54% (2),(5) | 5.52% (2),(5) | 4% (4) |
| Class I: | | | | | | | | | | | | | | | | | |
| December 31, 2017 | $10.32 | 0.23 | 0.07 | 0.30 | (0.29) | (0.08) | (0.04) | (0.41) | — | $10.21 | 3.00% | $23,878 | 1.97% | 0.95% | 2.22% | 1.20% | 102% |
| December 31, 2016 | $10.41 | 0.18 | 0.63 | 0.81 | (0.32) | (0.57) | (0.01) | (0.90) | — | $10.32 | 7.86% | $45,412 | 1.49% | 0.95% | 1.65% | 1.11% | 111% |
| December 31, 2015 | $11.77 | 0.29 | (0.82) | (0.53) | (0.38) | (0.45) | — | (0.83) | 0.00 (6) | $10.41 | -4.38% | $51,792 | 1.53% | 0.95% | 2.58% | 2.00% | 78% |
| December 31, 2014 | $10.11 | 0.38 | 2.55 | 2.93 | (0.39) | (0.88) | — | (1.27) | — | $11.77 | 28.98% | $32,776 | 2.15% | 0.95% | 3.30% | 2.10% | 86% |
| December 31, 2013(1) | $10.00 | 0.04 | 0.12 | 0.16 | (0.05) | — | — | (0.05) | — | $10.11 | 1.64% (4) | $25,408 | 3.59% (2),(5) | 0.61% (2),(5) | 7.58% (2),(5) | 4.60% (2),(5) | 4% (4) |
| † | Total investment return is computed based upon the net asset value of the Fund’s shares and excludes the effects of sales charges or contingent deferred sales charges, if applicable. Distributions are assumed to be reinvested at the net asset value of the Class on the ex-date of the distribution. |
| (1) | Classes A, C, Y and I were incepted on December 11, 2013. |
| (2) | Organization costs were not annualized in the calculation of the income and expense ratios. If these expenses were annualized, the gross and net expense ratios would have been 4.16% and 1.20% for Class A, 4.89% and 1.95% for Class C, 3.80% and 0.95% for Class Y and 3.93% and 0.95% for Class I, respectively. |
| (3) | Per share amounts presented are based on average shares outstanding throughout the period indicated. |
| (4) | Not annualized. |
| (5) | Annualized. |
| (6) | Rounds to less than $0.005. |
| (7) | Redemption fees were eliminated effective September 1, 2016. |
See Notes to Financial Statements.
54Brookfield Investment Management Inc.
Brookfield Real Assets Securities Fund
Financial Highlights
| | Per Share Operating Performance: | | Ratios to Average Net Assets/Supplementary Data: |
| | Net asset
value,
beginning
of period | Net
investment
income(2) | Net
realized and
unrealized
gain (loss) on
investment
transactions | Net
increase
(decrease)
in net
asset value
resulting from
operations | Distributions
from net
investment
income | Distributions
from net
realized
gains | Return
of capital
distributions | Total
distributions
paid | Redemption
fees(5) | Net asset
value, end
of period | Total
Investment
Return† | Net assets,
end of period
(000s) | Gross
operating
expenses | Net expenses,
including fee
waivers and
reimbursement
and excluding
interest
expense | Net
investment
income | Net
investment
income,
excluding the
effect of fee
waivers and
reimbursement | Portfolio
turnover
rate |
| Class A: | | | | | | | | | | | | | | | | | |
| December 31, 2017 | $ 8.88 | 0.17 | 0.69 | 0.86 | (0.25) | — | (0.10) | (0.35) | — | $9.39 | 9.74% | $ 3 | 1.82% | 1.35% | 1.77% | 1.30% | 81% |
| December 31, 2016 | $ 8.28 | 0.18 | 0.74 | 0.92 | (0.22) | — | (0.10) | (0.32) | — | $8.88 | 11.04% | $ 1 | 1.97% | 1.35% | 2.02% | 1.40% | 119% |
| December 31, 2015 | $ 9.72 | 0.19 | (1.40) | (1.21) | (0.18) | — | (0.05) | (0.23) | — | $8.28 | -12.58% | $ 1 | 2.12% | 1.35% | 2.07% | 1.30% | 76% |
| December 31, 2014(1) | $10.00 | 0.03 | (0.29) | (0.26) | (0.02) | — | — | (0.02) | — | $9.72 | -2.55% (3) | $ 1 | 3.56% (4) | 1.35% (4) | 2.33% (4) | 0.12% (4) | 7% (3) |
| Class C: | | | | | | | | | | | | | | | | | |
| December 31, 2017 | $ 8.89 | 0.11 | 0.68 | 0.79 | (0.20) | — | (0.07) | (0.27) | — | $9.41 | 8.94% | $ 1 | 2.57% | 2.10% | 1.18% | 0.71% | 81% |
| December 31, 2016 | $ 8.29 | 0.16 | 0.71 | 0.87 | (0.18) | — | (0.09) | (0.27) | — | $8.89 | 10.49% | $ 1 | 2.72% | 2.10% | 1.28% | 0.66% | 119% |
| December 31, 2015 | $ 9.72 | 0.12 | (1.38) | (1.26) | (0.13) | — | (0.04) | (0.17) | — | $8.29 | -13.08% | $ 1 | 2.87% | 2.10% | 1.33% | 0.56% | 76% |
| December 31, 2014(1) | $10.00 | 0.03 | (0.29) | (0.26) | (0.02) | — | — | (0.02) | — | $9.72 | -2.63% (3) | $ 1 | 4.31% (4) | 2.10% (4) | 2.25% (4) | 0.04% (4) | 7% (3) |
| Class Y: | | | | | | | | | | | | | | | | | |
| December 31, 2017 | $ 8.83 | 0.20 | 0.64 | 0.84 | (0.26) | — | (0.11) | (0.37) | — | $9.30 | 9.64% | $12,262 | 1.57% | 1.10% | 2.11% | 1.64% | 81% |
| December 31, 2016 | $ 8.27 | 0.20 | 0.72 | 0.92 | (0.25) | — | (0.11) | (0.36) | — | $8.83 | 11.14% | $ 4,675 | 1.72% | 1.10% | 2.30% | 1.68% | 119% |
| December 31, 2015 | $ 9.72 | 0.24 | (1.42) | (1.18) | (0.18) | — | (0.09) | (0.27) | — | $8.27 | -12.32% | $ 2,058 | 1.87% | 1.10% | 2.58% | 1.81% | 76% |
| December 31, 2014(1) | $10.00 | 0.03 | (0.28) | (0.25) | (0.03) | — | — | (0.03) | — | $9.72 | -2.51% (3) | $ 1 | 3.31% (4) | 1.10% (4) | 2.36% (4) | 0.15% (4) | 7% (3) |
| Class I: | | | | | | | | | | | | | | | | | |
| December 31, 2017 | $ 8.82 | 0.20 | 0.64 | 0.84 | (0.26) | — | (0.11) | (0.37) | — | $9.29 | 9.65% | $65,283 | 1.57% | 1.10% | 2.15% | 1.67% | 81% |
| December 31, 2016 | $ 8.26 | 0.20 | 0.72 | 0.92 | (0.25) | — | (0.11) | (0.36) | — | $8.82 | 11.15% | $55,882 | 1.72% | 1.10% | 2.30% | 1.68% | 119% |
| December 31, 2015 | $ 9.71 | 0.22 | (1.40) | (1.18) | (0.20) | — | (0.07) | (0.27) | — | $8.26 | -12.33% | $50,405 | 1.87% | 1.10% | 2.41% | 1.64% | 76% |
| December 31, 2014(1) | $10.00 | 0.03 | (0.29) | (0.26) | (0.03) | — | — | (0.03) | — | $9.71 | -2.61% (3) | $24,345 | 3.31% (4) | 1.10% (4) | 2.31% (4) | 0.10% (4) | 7% (3) |
| † | Total investment return is computed based upon the net asset value of the Fund’s shares and excludes the effects of sales charges or contingent deferred sales charges, if applicable. Distributions are assumed to be reinvested at the net asset value of the Class on the ex-date of the distribution. |
| (1) | Classes A, C, Y and I were incepted on November 19, 2014. |
| (2) | Per share amounts presented are based on average shares outstanding throughout the period indicated. |
| (3) | Not annualized. |
| (4) | Annualized. |
| (5) | Redemption fees were eliminated effective September 1, 2016. |
See Notes to Financial Statements.
BROOKFIELD INVESTMENT FUNDS
Notes to Financial Statements
December 31, 2017
1.Organization
Brookfield Investment Funds (the “Trust”) was organized as a statutory trust under the laws of the State of Delaware on May 12, 2011. The Trust is registered under the Investment Company Act of 1940, as amended (the “1940 Act”), as an open-end management investment company. As of December 31, 2017, the Trust consisted of five series portfolios: the Brookfield Global Listed Infrastructure Fund (the “Infrastructure Fund”), the Brookfield Global Listed Real Estate Fund (the “Global Real Estate Fund”), the Brookfield U.S. Listed Real Estate Fund (the “U.S. Real Estate Fund”), the Brookfield Real Assets Securities Fund (the “Real Assets Securities Fund”) and the Brookfield Real Assets Debt Fund (each, a “Fund,” and collectively, the “Funds”). The Infrastructure Fund, Global Real Estate Fund and Real Assets Securities Fund are each a diversified open-end management investment company and the U.S. Real Estate Fund is a non-diversified open-end management investment company. The Brookfield Real Assets Debt Fund is not currently available for purchase.
Each Fund currently has four classes of shares: Class A, Class C, Class Y and Class I shares. Each class represents an interest in the same portfolio of assets and has identical voting, dividend, liquidation and other rights except that: (i) Class A shares have a maximum front end sales charge of 4.75% and Class C shares have a maximum deferred sales charge of 1.00%; (ii) Class A shares have a 12b-1 fee of 0.25% and Class C shares have a 12b-1 fee of 1.00%; and (iii) each class has exclusive voting rights with respect to matters relating to its own distribution arrangements. The assets belonging to a particular Fund belong to that Fund for all purposes, and to no other Fund, subject only to the rights of creditors of that Fund.
Brookfield Investment Management Inc. (the “Adviser”), a wholly-owned subsidiary of Brookfield Asset Management Inc., is registered as an investment adviser under the Investment Advisers Act of 1940, as amended, and serves as investment adviser to the Funds.
The investment objective of each Fund is to seek total return through growth of capital and current income. Each Fund's investment objective is not fundamental and may be changed by the Trust's Board of Trustees (the “Board”) without shareholder approval, upon not less than 60 days prior written notice to shareholders. There can be no assurance that each Fund will achieve its investment objective.
2.Significant Accounting Policies
The preparation of financial statements in conformity with accounting principles generally accepted in the United States of America (“GAAP”) requires management to make estimates and assumptions that affect the reported amounts of assets and liabilities and disclosure of contingent assets and liabilities at the date of the financial statements and the reported amounts of increases and decreases in net assets from operations during the reporting period. Actual results could differ from those estimates. Each Fund is an investment company within the scope of Financial Accounting Standards Board (“FASB”) Accounting Standards Update (“ASU”) 2013-08 and follows accounting and reporting guidance under FASB Accounting Standards Codification (“ASC”) Topic 946 Financial Services-Investment Companies.
Valuation of Investments: The Board has adopted procedures for the valuation of each Fund’s securities. The Adviser oversees the day to day responsibilities for valuation determinations under these procedures. The Board regularly reviews the application of these procedures to the securities in each Fund’s portfolio. The Adviser’s Valuation Committee is comprised of senior members of the Adviser’s management team. There can be no assurance that each Fund could purchase or sell a portfolio security at the price used to calculate each Fund’s NAV.
Debt securities, including U.S. government securities, listed corporate bonds, other fixed income and asset-backed securities, and unlisted securities and private placement securities, are generally valued at the bid prices furnished by an independent pricing service or, if not valued by an independent pricing service, using bid prices obtained from active and reliable market makers in any such security or a broker-dealer. The broker-dealers or pricing services use multiple valuation techniques to determine fair value. In instances where sufficient market activity
56Brookfield Investment Management Inc.
BROOKFIELD INVESTMENT FUNDS
Notes to Financial Statements (continued)
December 31, 2017
exists, the broker-dealers or pricing services may utilize a market-based approach through which quotes from market makers are used to determine fair value. In instances where sufficient market activity may not exist or is limited, the broker-dealers or pricing services also utilize proprietary valuation models which may consider market transactions in comparable securities and the various relationships between securities in determining fair value and/or market characteristics such as benchmark yield curves, option-adjusted spreads, credit spreads, estimated default rates, coupon-rates, anticipated timing of principal repayments, underlying collateral, and other unique security features in order to estimate the relevant cash flows, which are then discounted to calculate the fair values. Short-term debt securities with remaining maturities of sixty days or less are valued at amortized cost of discount or premium to maturity, unless such valuation, in the judgment of the Adviser’s Valuation Committee, does not represent fair value.
Investments in equity securities listed or traded on any securities exchange or traded in the over-the-counter market are valued at the last trade price as of the close of business on the valuation date. Prices of foreign equities that are principally traded on certain foreign markets will generally be adjusted daily pursuant to a fair value pricing service approved by the Board in order to reflect an adjustment for the factors occurring after the close of certain foreign markets but before the NYSE Close. When fair value pricing is employed, the value of the portfolio securities used to calculate the Funds’ net asset values may differ from quoted or official closing prices. Investments in open-end registered investment companies, if any, are valued at the net asset value (“NAV”) as reported by those investment companies.
Securities for which market prices are not readily available or which cannot be valued using the sources described above will be valued using an internal proprietary fair value methodology. For any security warranting such fair value measurement, a memorandum, including the specific methodology and supporting information, will be provided to the Valuation Committee by a portfolio manager or analyst looking to fair value a particular security utilizing the internal proprietary fair value methodology. A portfolio manager or analyst shall use their best efforts to maximize the use of relevant observable inputs and minimize the use of unobservable inputs within their valuation technique. The Valuation Committee shall review the memorandum and supporting information provided by a portfolio manager or analyst and consider all relevant factors as it deems appropriate before approving the fair value recommendation.
Each Fund may use the fair value of a security to calculate its NAV when, for example, (1) a portfolio security is not traded in a public market or the principal market in which the security trades is closed, (2) trading in a portfolio security is suspended and not resumed prior to the normal market close, (3) a portfolio security is not traded in significant volume for a substantial period, or (4) the Adviser determines that the quotation or price for a portfolio security provided by a broker-dealer or an independent pricing service is inaccurate.
The fair value of securities may be difficult to determine and thus judgment plays a greater role in the valuation process. The fair valuation methodology may include or consider the following guidelines, as appropriate: (1) evaluation of all relevant factors, including but not limited to, pricing history, current market level, supply and demand of the respective security; (2) comparison to the values and current pricing of securities that have comparable characteristics; (3) knowledge of historical market information with respect to the security; (4) other factors relevant to the security which would include, but not be limited to, duration, yield, fundamental analytical data, the Treasury yield curve, and credit quality.
The values assigned to fair valued investments are based on available information and do not necessarily represent amounts that might ultimately be realized, since such amounts depend on future developments inherent in investments. Changes in the fair valuation of portfolio securities may be less frequent and of greater magnitude than changes in the price of portfolio securities valued at their last sale price, by an independent pricing service, or based on market quotations. Imprecision in estimating fair value can also impact the amount of unrealized appreciation or depreciation recorded for a particular portfolio security and differences in the assumptions used could result in a different determination of fair value, and those differences could be material.
BROOKFIELD INVESTMENT FUNDS
Notes to Financial Statements (continued)
December 31, 2017
The Funds have established methods of fair value measurements in accordance with GAAP. Fair value denotes the price that a Fund would receive upon selling an investment in a timely transaction to an independent buyer in the principal or most advantageous market of the investment. A three-tier hierarchy has been established to maximize the use of observable market data and minimize the use of unobservable inputs and to establish classification of fair value measurements for disclosure purposes. Inputs refer broadly to the assumptions that market participants would use in pricing the asset or liability, including assumptions about risk, for example, the risk inherent in a particular valuation technique used to measure fair value including such a pricing model and/or the risk inherent in the inputs to the valuation technique. Inputs may be observable or unobservable. Observable inputs are inputs that reflect the assumptions market participants would use in pricing the asset or liability developed based on market data obtained from sources independent of the reporting entity. Unobservable inputs are inputs that reflect the reporting entity’s own assumptions about the assumptions market participants would use in pricing the asset or liability developed based on the best information available in the circumstances. The three-tier hierarchy of inputs is summarized in the three broad levels listed below.
| Level 1 - | quoted prices in active markets for identical assets or liabilities |
| Level 2 - | quoted prices in markets that are not active or other significant observable inputs (including, but not limited to: quoted prices for similar assets or liabilities, quoted prices based on recently executed transactions, interest rates, credit risk, etc.)
|
| Level 3 - | significant unobservable inputs (including each Fund’s own assumptions in determining the fair value of assets or liabilities) |
The Adviser’s valuation policy, as previously stated, establishes parameters for the sources and types of valuation analysis, as well as, the methodologies and inputs the Adviser uses in determining fair value. If the Valuation Committee determines that additional techniques, sources or inputs are appropriate or necessary in a given situation, such additional work will be undertaken.
Significant increases or decreases in any of the unobservable inputs in isolation may result in a lower or higher fair value measurement.
To assess the continuing appropriateness of security valuations, the Adviser (or its third party service providers, who are subject to oversight by the Adviser), regularly compares its prior day prices, prices on comparable securities and sale prices to the current day prices and challenges those prices that exceed certain tolerance levels with the third party pricing service or broker source. For those securities valued by fair valuations, the Adviser’s Valuation Committee reviews and affirms the reasonableness of the valuations based on such methodologies and fair valuation determinations on a regular basis after considering all relevant information that is reasonably available.
58Brookfield Investment Management Inc.
BROOKFIELD INVESTMENT FUNDS
Notes to Financial Statements (continued)
December 31, 2017
The inputs or methodology used for valuing investments are not necessarily an indication of the risk associated with investing in those securities.
Infrastructure Fund
The following table summarizes the Infrastructure Fund’s investments valuation inputs categorized in the disclosure hierarchy as of December 31, 2017:
| Description | Level 1 | | Level 2 | | Level 3 | | Total |
| Common Stocks: | | | | | | | |
Australia
| $ — | | $ 5,048,604 | | $ — | | $ 5,048,604 |
Brazil
| 3,005,420 | | — | | — | | 3,005,420 |
Canada
| 34,481,223 | | — | | — | | 34,481,223 |
China
| — | | 5,831,187 | | — | | 5,831,187 |
Denmark
| — | | 5,614,408 | | — | | 5,614,408 |
France
| 3,839,413 | | 13,981,471 | | — | | 17,820,884 |
Hong Kong
| — | | 1,636,413 | | — | | 1,636,413 |
Italy
| — | | 7,402,744 | | — | | 7,402,744 |
Mexico
| 3,363,489 | | — | | — | | 3,363,489 |
New Zealand
| — | | 2,766,571 | | — | | 2,766,571 |
Spain
| — | | 10,708,256 | | — | | 10,708,256 |
Switzerland
| — | | 2,453,665 | | — | | 2,453,665 |
United Kingdom
| — | | 17,969,864 | | — | | 17,969,864 |
United States
| 122,809,868 | | — | | — | | 122,809,868 |
Total
| $ 167,499,413 | | $ 74,413,183 | | $ — | | $ 240,912,596 |
For further information regarding security characteristics, see the Schedule of Investments.
During the year ended December 31, 2017, there was a transfer from Level 2 to Level 1 of $3,839,413, which represents a common stock that was previously priced using the factor adjusted price and is currently priced using the market close price. There was also a transfer from Level 1 to Level 2 of $1,603,686, which represents a common stock that was previously priced using the market close price and is currently priced using the factor adjusted price. There were no additional transfers between Levels. The basis for recognizing and valuing transfers is as of the end of the period in which transfers occur.
BROOKFIELD INVESTMENT FUNDS
Notes to Financial Statements (continued)
December 31, 2017
Global Real Estate Fund
The following table summarizes the Global Real Estate Fund’s investments valuation inputs categorized in the disclosure hierarchy as of December 31, 2017:
| Description | Level 1 | | Level 2 | | Level 3 | | Total |
| Common Stocks: | | | | | | | |
Australia
| $ — | | $ 67,758,098 | | $ — | | $ 67,758,098 |
China
| — | | 29,235,336 | | — | | 29,235,336 |
France
| — | | 53,766,594 | | — | | 53,766,594 |
Germany
| — | | 114,221,010 | | — | | 114,221,010 |
Hong Kong
| 31,401,681 | | 45,145,250 | | — | | 76,546,931 |
Japan
| 1,824,096 | | 185,866,702 | | — | | 187,690,798 |
Singapore
| — | | 96,120,180 | | — | | 96,120,180 |
Spain
| — | | 59,991,994 | | — | | 59,991,994 |
United Kingdom
| 38,885,615 | | 232,457,494 | | — | | 271,343,109 |
United States
| 988,904,927 | | — | | — | | 988,904,927 |
Total
| $1,061,016,318 | | $ 884,562,659 | | $ — | | $1,945,578,977 |
For further information regarding security characteristics, see the Schedule of Investments.
During the year ended December 31, 2017, there was a transfer from Level 2 to Level 1 of $1,824,096, which represents a common stock that was previously priced using the factor adjusted price and is currently priced using the market close price. There were no additional transfers between Levels. The basis for recognizing and valuing transfers is as of the end of the period in which transfers occur.
U.S. Real Estate Fund
The following table summarizes the U.S. Real Estate Fund’s investments valuation inputs categorized in the disclosure hierarchy as of December 31, 2017:
| Valuation Inputs | Level 1 | | Level 2 | | Level 3 | | Total |
Common Stocks
| $ 24,153,759 | | $ — | | $ — | | $ 24,153,759 |
Total
| $ 24,153,759 | | $ — | | $ — | | $ 24,153,759 |
For further information regarding security characteristics, see the Schedule of Investments.
During the year ended December 31, 2017, there were no transfers between Levels. The basis for recognizing and valuing transfers is as of the end of the period in which transfers occur.
60Brookfield Investment Management Inc.
BROOKFIELD INVESTMENT FUNDS
Notes to Financial Statements (continued)
December 31, 2017
Real Assets Securities Fund
The following table summarizes the Real Assets Securities Fund’s investments valuation inputs categorized in the disclosure hierarchy as of December 31, 2017:
| Description | Level 1 | | Level 2 | | Level 3 | | Total |
| Common Stocks: | | | | | | | |
Australia
| $ — | | $ 1,664,705 | | $ — | | $ 1,664,705 |
Brazil
| 380,380 | | — | | — | | 380,380 |
Canada
| 5,078,416 | | — | | — | | 5,078,416 |
China
| — | | 1,206,190 | | — | | 1,206,190 |
Denmark
| — | | 637,753 | | — | | 637,753 |
France
| 576,234 | | 2,887,144 | | — | | 3,463,378 |
Germany
| — | | 1,626,827 | | — | | 1,626,827 |
Hong Kong
| 449,173 | | 874,992 | | — | | 1,324,165 |
Italy
| — | | 1,082,645 | | — | | 1,082,645 |
Japan
| — | | 2,778,655 | | — | | 2,778,655 |
Mexico
| 477,906 | | — | | — | | 477,906 |
New Zealand
| — | | 371,814 | | — | | 371,814 |
Singapore
| — | | 1,385,881 | | — | | 1,385,881 |
Spain
| — | | 2,569,507 | | — | | 2,569,507 |
Switzerland
| — | | 354,279 | | — | | 354,279 |
United Kingdom
| 581,974 | | 5,932,686 | | — | | 6,514,660 |
United States
| 34,204,141 | | — | | — | | 34,204,141 |
Total Common Stocks
| 41,748,224 | | 23,373,078 | | — | | 65,121,302 |
| Convertible Preferred Stocks: | | | | | | | |
United States
| — | | 424,581 | | — | | 424,581 |
| Real Asset Debt | | | | | | | |
Canada
| — | | 592,812 | | — | | 592,812 |
Luxembourg
| — | | 172,688 | | — | | 172,688 |
United States
| — | | 6,554,760 | | — | | 6,554,760 |
Total Real Asset Debt
| — | | 7,320,260 | | — | | 7,320,260 |
| Preferred Stocks: | | | | | | | |
United States
| 1,474,987 | | 361,989 | | — | | 1,836,976 |
Total
| $ 43,223,211 | | $ 31,479,908 | | $ — | | $ 74,703,119 |
For further information regarding security characteristics, see the Schedule of Investments.
During the year ended December 31, 2017, there were transfers from Level 1 to Level 2 of $228,652, which represents a common stock that was previously priced using the market close price and is currently priced using the factor adjusted price and $424,581 which represents convertible preferred stocks that were previously priced using market close prices and are currently priced using the mean of the bid and ask prices. There were also transfers from Level 2 to Level 1 of $576,234, which represents a common stock that was previously priced using the factor adjusted price and is currently priced using the market close price. There were no additional transfers between Levels. The basis for recognizing and valuing transfers is as of the end of the period in which transfers occur.
Investment Transactions and Investment Income: Securities transactions are recorded on the trade date. Realized gains and losses from securities transactions are calculated on the identified cost basis. Interest income is recorded on the accrual basis. Discounts and premiums on securities are accreted and amortized, respectively, on a daily basis, using the effective yield to maturity method adjusted based on management’s assessment of the collectability of such interest. Dividend income is recorded on the ex-dividend date. Net realized gain (loss) on
BROOKFIELD INVESTMENT FUNDS
Notes to Financial Statements (continued)
December 31, 2017
Statement of Operations may also include realized gain distributions received from real estate investment trusts (“REITS”). Distributions of net realized gains are recorded on the REIT's ex-dividend date.
Foreign Currency Transactions: Securities and other assets and liabilities denominated in foreign currencies are translated into U.S. dollar amounts at the date of valuation. Purchases and sales of securities and income and expense items denominated in foreign currencies are translated into U.S. dollar amounts on the respective dates of such transactions. The Funds isolate the portion of realized gains or losses resulting from changes in foreign exchange rates on securities from the fluctuations arising from changes in market prices of securities held. The Funds do not isolate the portion of unrealized gains or losses resulting from changes in foreign exchange rates on securities from the fluctuations arising from changes in market prices of securities held.
Reported net realized foreign exchange gains or losses arise from sales of securities, currency gains or losses realized between the trade and settlement dates on securities transactions and the difference between the amounts of dividends, interest and foreign withholding taxes recorded on a Fund's books and the U.S. dollar equivalent of the amounts actually received or paid.
Taxes: Each Fund intends to continue to meet the requirements of the Internal Revenue Code of 1986, as amended, applicable to regulated investment companies and to distribute substantially all of its taxable income to its shareholders. Therefore, no federal income or excise tax provision is required. Each Fund may incur an excise tax to the extent it has not distributed all of its taxable income on a calendar year basis.
GAAP provides guidance for how uncertain tax positions should be recognized, measured, presented and disclosed in the financial statements. An evaluation of tax positions taken in the course of preparing the Funds’ tax returns to determine whether the tax positions are “more-likely-than-not” of being sustained by the taxing authority is required. Tax benefits of positions not deemed to meet the more-likely-than-not threshold would be booked as a tax expense in the current year and recognized as: a liability for unrecognized tax benefits; a reduction of an income tax refund receivable; a reduction of a deferred tax asset; an increase in a deferred tax liability; or a combination thereof. As of December 31, 2017, each Fund has determined that there are no uncertain tax positions or tax liabilities required to be accrued.
The Funds have reviewed the taxable years open for examination (i.e. not barred by the applicable statute of limitations) by taxing authorities of all major jurisdictions, including the Internal Revenue Service. As of December 31, 2017, open taxable periods consisted of the taxable years ended December 31, 2015 through December 31, 2017. No examination of the Funds’ tax returns is currently in progress.
Expenses: Expenses directly attributable to a Fund are charged directly to that Fund, while expenses which are attributable to more than one Fund in the Trust and other investment companies advised by the Adviser are allocated among the respective investment companies, including the Funds, based upon relative average net assets, evenly or a combination of average net assets and evenly. Income and expenses of a Fund are allocated on a pro rata basis to each class of shares, except for distribution fees, which are unique to each class of shares.
Distributions: Each Fund declares and pays dividends quarterly from net investment income. To the extent these distributions exceed net investment income, they may be classified as return of capital. Each Fund also pays distributions at least annually from their realized capital gains, if any. Dividends and distributions are recorded on the ex-dividend date. All common shares have equal dividend and other distribution rights. A notice disclosing the source(s) of a distribution is provided after a payment is made from any source other than net investment income. Any such notice is provided only for informational purposes in order to comply with the requirements of Section 19(a) of the 1940 Act and not for tax reporting purposes. The tax composition of the Fund’s distributions for each calendar year is reported on IRS Form 1099-DIV.
Dividends from net investment income and distributions from realized gains from investment transactions have been determined in accordance with federal income tax regulations and may differ from net investment income and realized gains recorded by each Fund for financial reporting purposes. These differences, which could be
62Brookfield Investment Management Inc.
BROOKFIELD INVESTMENT FUNDS
Notes to Financial Statements (continued)
December 31, 2017
temporary or permanent in nature, may result in reclassification of distributions; however, net investment income, net realized gains and losses and net assets are not affected.
New Accounting Pronouncements and Upcoming Regulatory Changes: In March 2017, the FASB issued ASU 2017-08, Receivables—Nonrefundable Fees and Other Costs (Subtopic 310-20): Premium Amortization on Purchased Callable Debt Securities. The amendments in the ASU shorten the amortization period for certain callable debt securities, held at a premium, to be amortized to the earliest call date. The ASU does not require an accounting change for securities held at a discount; which continues to be amortized to maturity. The ASU is effective for fiscal years and interim periods within those fiscal years beginning after December 15, 2018. Management is currently evaluating the impact, if any, of applying this provision.
3.Investment Advisory Agreements and Related Party Transactions
The Adviser currently serves as the investment adviser to each Fund pursuant to separate investment advisory agreements (the “Advisory Agreements”) under which the Adviser is responsible for the management of each Fund’s portfolio and provides the necessary personnel, facilities, equipment and certain other services necessary to the operations of each Fund.
Pursuant to operating expense limitation agreements (the “Expense Limitation Agreements”), the Adviser has contractually agreed to waive all or a portion of its investment advisory or administration fees, as presented below, and/or to reimburse certain expenses of each Fund to the extent necessary to maintain each Fund’s total annual operating expenses (excluding any front-end or contingent deferred charges, brokerage commissions and other transactional expenses, acquired fund fees and expenses, interest, taxes, and extraordinary expenses, such as litigation; and other expenses not incurred in the ordinary course of a Fund’s business) at certain levels. The Expense Limitation Agreements will continue until at least May 1, 2018 and may not be terminated by the Funds or the Adviser before such time. Thereafter, the Expense Limitation Agreements may only be terminated or amended to increase the expense cap as of May 1st of each calendar year, provided that in the case of a termination by the Adviser, the Adviser will provide the Board with written notice of its intention to terminate the arrangement prior to the expiration of its then current term. Pursuant to the Expense Limitation Agreements, the Adviser retains the right to receive reimbursement of any payments made by it, or to recoup any fees waived by it during the three year period following any waiver or reimbursement, provided that after giving effect to such repayment or recoupment, such adjusted total annual operating expenses (expressed as a percentage of average net assets) for each Fund would not exceed the percentage limitations listed below.
The Advisory Agreements provide that each Fund shall pay the Adviser a monthly fee at the annual rates stated below of each Fund’s average daily net assets:
BROOKFIELD INVESTMENT FUNDS
Notes to Financial Statements (continued)
December 31, 2017
| | Annual
Advisory Fee
Rate | Annual
Expense Cap |
| Infrastructure Fund | | |
Class A
| 0.85% | 1.35% |
Class C
| 0.85% | 2.10% |
Class Y
| 0.85% | 1.10% |
Class I
| 0.85% | 1.10% |
| Global Real Estate Fund | | |
Class A
| 0.75% | 1.20% |
Class C
| 0.75% | 1.95% |
Class Y
| 0.75% | 0.95% |
Class I
| 0.75% | 0.95% |
| U.S. Real Estate Fund | | |
Class A
| 0.75% | 1.20% |
Class C
| 0.75% | 1.95% |
Class Y
| 0.75% | 0.95% |
Class I
| 0.75% | 0.95% |
| Real Assets Securities Fund | | |
Class A
| 0.85% | 1.35% |
Class C
| 0.85% | 2.10% |
Class Y
| 0.85% | 1.10% |
Class I
| 0.85% | 1.10% |
The amount of investment advisory fees waived and/or expenses reimbursed available to be recouped before expiration are listed in the table below:
| Expiration Period | Infrastructure Fund | | Global Real Estate Fund | | U.S. Real Estate Fund | | Real Assets Securities Fund |
Less than 1 year
| $260,292 | | $ 874,307 | | $227,118 | | $ 405,998 |
Within 1 to 2 years
| 255,544 | | 908,130 | | 264,318 | | 355,840 |
Within 2 to 3 years
| 385,142 | | 720,729 | | 307,149 | | 328,094 |
| Total amount subject to recoupment | $900,978 | | $2,503,166 | | $798,585 | | $1,089,932 |
For the year ended December 31, 2017, the Adviser did not recoup any expenses.
Each Fund has entered into separate Administration Agreements with the Adviser and the Adviser has entered into a sub-administration agreement with U.S. Bancorp Fund Services, LLC (the “Sub-Administrator”). The Adviser and the Sub-Administrator perform administrative services necessary for the operation of the Funds, including maintaining certain books and records of the Funds and preparing reports and other documents required by federal, state and other applicable laws and regulations, and providing the Funds with administrative office facilities. For its services under the Administration Agreements, the Adviser receives from each Fund, respectively, an annual fee equal to 0.15% of its average daily net assets, payable monthly in arrears. The Adviser is responsible for any fees due to the Sub-Administrator.
Certain officers and/or trustees of the Trust are officers and/or employees of the Adviser.
64Brookfield Investment Management Inc.
BROOKFIELD INVESTMENT FUNDS
Notes to Financial Statements (continued)
December 31, 2017
4.Purchases and Sales of Investments
Purchases and sales of investments, excluding U.S. Government securities, for the year ended December 31, 2017 were as follows:
| Fund | Purchases | Sales |
Infrastructure Fund
| $ 235,755,423 | $ 265,816,683 |
Global Real Estate Fund
| 2,005,340,460 | 1,601,831,183 |
U.S. Real Estate Fund
| 31,208,799 | 51,774,920 |
Real Assets Securities Fund
| 66,526,100 | 54,422,466 |
During the year ended December 31, 2017, there were no transactions in U.S. Government securities.
5.Derivative Financial Instruments
Swap Contracts:
Each Fund may enter into total rate of return, credit default or other types of swaps and related derivatives for the purpose of hedging and risk management. These transactions generally provide for the transfer from one counterparty to another of certain risks inherent in the ownership of a financial asset such as a debt instrument or common stock. Such risks include, among other things, the risk of default and insolvency of the obligor of such asset, the risk that the credit of the obligor or the underlying collateral will decline or the risk that the common stock of the underlying issuers will decline in value. The transfer of risk pursuant to a derivative of this type may be complete or partial, and may be for the life of the related asset or for a shorter period. These derivatives may be used as a risk management tool for a pool of financial assets, providing a Fund with the opportunity to gain or reduce exposure to one or more reference securities or other financial assets (each, a “Reference Asset”) without actually owning or selling such assets in order, for example, to increase or reduce a concentration risk or to diversify a portfolio. Conversely, these derivatives may be used by a Fund to reduce exposure to an owned asset without selling it.
Because a Fund would not own the Reference Assets, the Fund may not have any voting rights with respect to the Reference Assets, and in such cases all decisions related to the obligors or issuers of the Reference Assets, including whether to exercise certain remedies, will be controlled by the swap counterparties.
The Funds did not have any swap contracts outstanding during the year ended December 31, 2017.
6.Shares of Beneficial Interest
The Trust’s Declaration of Trust authorizes the issuance of an unlimited number of full and fractional shares of beneficial interest. With respect to each series, the Trust may offer more than one class of shares. The Trust reserves the right to create and issue additional series or classes. Each share of a series or class represents an equal proportionate interest in that series or class with each other share of that series or class. Currently, each series offers four classes of shares of beneficial interest — “Class A” Shares, “Class C” Shares, “Class Y” Shares, and “Class I” Shares.
The shares of each series or class participate equally in the earnings, dividends and assets of the particular series or class.
BROOKFIELD INVESTMENT FUNDS
Notes to Financial Statements (continued)
December 31, 2017
| | Brookfield Global Listed Infrastructure Fund |
| | 2017 | | 2016 |
| Class A | Shares | | Amount | | Shares | | Amount |
Subscriptions
| 86,011 | | $ 1,091,641 | | 175,795 | | $ 2,091,020 |
Reinvestment of distributions
| 38,908 | | 492,917 | | 58,627 | | 708,153 |
Redemptions
| (808,956) | | (10,312,807) | | (1,456,477) | | (16,809,810) |
Redemption fees
| — | | — | | — | | 2,450 |
Net Decrease
| (684,037) | | $ (8,728,249) | | (1,222,055) | | $ (14,008,187) |
| Class C | Shares | | Amount | | Shares | | Amount |
Subscriptions
| 36,948 | | $ 454,176 | | 69,035 | | $ 798,295 |
Reinvestment of distributions
| 21,487 | | 269,102 | | 29,124 | | 348,570 |
Redemptions
| (386,961) | | (4,876,030) | | (568,921) | | (6,471,254) |
Redemption fees
| — | | — | | — | | — |
Net Decrease
| (328,526) | | $ (4,152,752) | | (470,762) | | $ (5,324,389) |
| Class Y | Shares | | Amount | | Shares | | Amount |
Subscriptions
| 1,646,743 | | $ 20,945,129 | | 1,876,326 | | $ 21,515,072 |
Reinvestment of distributions
| 141,443 | | 1,796,029 | | 240,410 | | 2,926,378 |
Redemptions
| (2,663,705) | | (33,815,660) | | (3,929,257) | | (46,442,803) |
Redemption fees
| — | | — | | — | | 2,203 |
Net Decrease
| (875,519) | | $(11,074,502) | | (1,812,521) | | $ (21,999,150) |
| Class I | Shares | | Amount | | Shares | | Amount |
Subscriptions
| 1,994,642 | | $ 24,787,475 | | 4,441,289 | | $ 51,389,289 |
Reinvestment of distributions
| 523,553 | | 6,657,351 | | 691,552 | | 8,434,272 |
Redemptions
| (2,487,101) | | (32,093,313) | | (8,997,332) | | (104,866,345) |
Redemption fees
| — | | — | | — | | 8,832 |
Net Increase (Decrease)
| 31,094 | | $ (648,487) | | (3,864,491) | | $ (45,033,952) |
| | Brookfield Global Listed Real Estate Fund |
| | 2017 | | 2016 |
| Class A | Shares | | Amount | | Shares | | Amount |
Subscriptions
| 180,537 | | $ 2,352,612 | | 332,590 | | $ 4,537,562 |
Reinvestment of distributions
| 23,441 | | 302,565 | | 59,594 | | 764,017 |
Redemptions
| (857,587) | | (11,139,645) | | (1,608,042) | | (20,540,471) |
Redemption fees
| — | | — | | — | | 3,439 |
Net Decrease
| (653,609) | | $ (8,484,468) | | (1,215,858) | | $(15,235,453) |
| Class C | Shares | | Amount | | Shares | | Amount |
Subscriptions
| 67,507 | | $ 873,756 | | 195,677 | | $ 2,562,900 |
Reinvestment of distributions
| 8,647 | | 111,258 | | 17,829 | | 227,637 |
Redemptions
| (157,256) | | (2,028,212) | | (223,614) | | (2,875,751) |
Redemption fees
| — | | — | | — | | 526 |
Net Decrease
| (81,102) | | $ (1,043,198) | | (10,108) | | $ (84,688) |
66Brookfield Investment Management Inc.
BROOKFIELD INVESTMENT FUNDS
Notes to Financial Statements (continued)
December 31, 2017
| | Brookfield Global Listed Real Estate Fund |
| | 2017 | | 2016 |
| Class Y | Shares | | Amount | | Shares | | Amount |
Subscriptions
| 64,296,338 | | $ 836,275,079 | | 40,327,550 | | $ 519,177,885 |
Reinvestment of distributions
| 3,052,531 | | 39,559,599 | | 3,901,094 | | 50,073,482 |
Redemptions
| (38,942,832) | | (507,450,452) | | (21,939,590) | | (286,392,703) |
Redemption fees
| — | | — | | — | | 23,766 |
Net Increase
| 28,406,037 | | $ 368,384,226 | | 22,289,054 | | $ 282,882,430 |
| Class I | Shares | | Amount | | Shares | | Amount |
Subscriptions
| 14,512,360 | | $ 189,951,629 | | 4,443,676 | | $ 56,443,969 |
Reinvestment of distributions
| 1,139,083 | | 14,758,362 | | 1,664,721 | | 21,349,882 |
Redemptions
| (9,409,180) | | (122,894,671) 1 | | (6,759,510) | | (85,919,897) |
Redemption fees
| — | | — | | — | | 5,566 |
Net Increase (Decrease)
| 6,242,263 | | $ 81,815,320 | | (651,113) | | $ (8,120,480) |
| | Brookfield U.S. Listed Real Estate Fund |
| | 2017 | | 2016 |
| Class A | Shares | | Amount | | Shares | | Amount |
Subscriptions
| 5,576 | | $ 57,721 | | 5,392 | | $ 58,771 |
Reinvestment of distributions
| 107 | | 1,102 | | 168 | | 1,730 |
Redemptions
| (4,056) | | (41,831) | | (4,958) | | (52,845) |
Net Increase
| 1,627 | | $ 16,992 | | 602 | | $ 7,656 |
| Class C | Shares | | Amount | | Shares | | Amount |
Subscriptions
| 593 | | $ 6,065 | | 20,210 | | $ 210,937 |
Reinvestment of distributions
| 1,484 | | 15,152 | | 3,219 | | 33,535 |
Redemptions
| (7,604) | | (79,765) | | (5,089) | | (54,574) |
Net Increase (Decrease)
| (5,527) | | $ (58,548) | | 18,340 | | $ 189,898 |
| Class Y | Shares | | Amount | | Shares | | Amount |
Subscriptions
| 25,256 | | $ 263,974 | | 59,690 | | $ 647,822 |
Reinvestment of distributions
| 481 | | 4,866 | | 5,282 | | 54,956 |
Redemptions
| (95,533) | | (972,617) | | (19,879) | | (211,781) |
Net Increase (Decrease)
| (69,796) | | $ (703,777) | | 45,093 | | $ 490,997 |
| Class I | Shares | | Amount | | Shares | | Amount |
Subscriptions
| — | | $ — | | — | | $ — |
Reinvestment of distributions
| 100,310 | | 1,018,544 | | 358,895 | | 3,730,357 |
Redemptions
| (2,161,476) | | (22,176,747) 2 | | (937,210) | | (10,000,030) |
Net Decrease
| (2,061,166) | | $(21,158,203) | | (578,315) | | $ (6,269,673) |
BROOKFIELD INVESTMENT FUNDS
Notes to Financial Statements (continued)
December 31, 2017
| | Brookfield Real Assets Securities Fund |
| | 2017 | | 2016 |
| Class A | Shares | | Amount | | Shares | | Amount |
Subscriptions
| 252 | | $ 2,394 | | — | | $ — |
Reinvestment of distributions
| 4 | | 37 | | 4 | | 34 |
Redemptions
| — | | — | | — | | — |
Net Increase
| 256 | | $ 2,431 | | 4 | | $ 34 |
| Class C | Shares | | Amount | | Shares | | Amount |
Subscriptions
| — | | $ — | | — | | $ — |
Reinvestment of distributions
| 3 | | 29 | | 3 | | 28 |
Redemptions
| — | | — | | — | | — |
Net Increase
| 3 | | $ 29 | | 3 | | $ 28 |
| Class Y | Shares | | Amount | | Shares | | Amount |
Subscriptions
| 860,716 | | $8,015,536 | | 287,767 | | $2,526,247 |
Reinvestment of distributions
| 35,976 | | 331,366 | | 17,319 | | 154,659 |
Redemptions
| (107,361) | | (996,565) | | (24,560) | | (210,514) |
Net Increase
| 789,331 | | $7,350,337 | | 280,526 | | $2,470,392 |
| Class I | Shares | | Amount | | Shares | | Amount |
Subscriptions
| 448,982 | | $4,179,695 | | — | | $ — |
Reinvestment of distributions
| 244,057 | | 2,240,628 | | 233,794 | | 2,075,089 |
Redemptions
| — | | — | | — | | — |
Net Increase
| 693,039 | | $6,420,323 | | 233,794 | | $2,075,089 |
1 Includes an in-kind redemption which resulted in a realized loss of $(5,108,418).
2 Includes an in-kind redemption which resulted in a realized loss of $(1,077,082).
On August 23, 2016, the Board approved the elimination of each Fund's redemption fees effective September 1, 2016.
7.Credit Facility
U.S. Bank, N.A. (the “Bank”) has made available to the Trust, a credit facility, pursuant to a separate Loan and Security Agreement, for temporary or extraordinary purposes. The maximum line of credit as of December 31, 2017 for the Trust is $75,000,000. For the year ended December 31, 2017, the average interest rate on the outstanding principal amount for the Infrastructure Fund, Global Real Estate Fund and U.S. Real Estate Fund was 3.64%, 4.00% and 3.63%, respectively. Advances are not collateralized by a first lien against a Fund’s assets.
During the year ended December 31, 2017, the Infrastructure Fund, Global Real Estate Fund and U.S. Real Estate Fund utilized the credit facility for 31 days, 8 days and 5 days, respectively, and had an outstanding average daily loan balance of $1,688,323, $1,853,500 and $114,800, respectively. The maximum amount outstanding during the year was $4,384,000, $2,860,000 and $152,000, respectively, and the interest expense amounted to $5,286, $1,648 and $58, respectively. The Real Assets Securities Fund did not utilize the credit facility during the year. At December 31, 2017, the Funds did not have an amount outstanding on the credit facility.
68Brookfield Investment Management Inc.
BROOKFIELD INVESTMENT FUNDS
Notes to Financial Statements (continued)
December 31, 2017
8.Federal Income Tax Information
Income and capital gain distributions are determined in accordance with federal income tax regulations, which may differ from GAAP.
The tax character of distributions paid for the year ended December 31, 2017 were as follows:
| | Infrastructure Fund | | Global Real Estate Fund | | U.S. Real Estate Fund | | Real Assets Securities Fund |
Ordinary income (including short-term capital gains)
| $ 6,475,605 | | $75,313,993 | | $ 851,063 | | $1,994,116 |
Long-term capital gains
| — | | — | | 241,912 | | — |
Return of capital
| 3,588,998 | | — | | 90,648 | | 845,488 |
Total distributions
| $10,064,603 | | $75,313,993 | | $1,183,623 | | $2,839,604 |
The tax character of distributions paid for the year ended December 31, 2016 were as follows:
| | Infrastructure Fund | | Global Real Estate Fund | | U.S. Real Estate Fund | | Real Assets Securities Fund |
Ordinary income (including short-term capital gains)
| $ 5,364,958 | | $72,145,638 | | $3,273,371 | | $1,619,404 |
Long-term capital gains
| — | | 9,057,347 | | 598,725 | | — |
Return of capital
| 7,853,297 | | 1,547,934 | | 24,420 | | 750,181 |
Total distributions
| $13,218,255 | | $82,750,919 | | $3,896,516 | | $2,369,585 |
At December 31, 2017, the Funds' most recently completed tax year-end, the components of net assets (excluding paid-in capital) on a tax basis were as follows:
| | Infrastructure Fund | | Global Real Estate Fund | | U.S. Real Estate Fund | | Real Assets Securities Fund |
Post-October loss
| $ (401,998) | | $(8,353,612) | | $(598,216) | | $ — |
Capital loss carryforward(1)
| (27,030,767) | | — | | — | | (5,031,957) |
Other accumulated losses
| (5,414,289) | | — | | — | | (301,752) |
Tax basis unrealized appreciation on
investments and foreign currency
| 40,082,635 | | 66,462,745 | | 979,363 | | 4,324,869 |
Total tax basis net accumulated gains
(losses)
| $ 7,235,581 | | $ 58,109,133 | | $ 381,147 | | $(1,008,840) |
(1) To the extent that future capital gains are offset by capital loss carryforwards, such gains will not be distributed.
As of December 31, 2017, the Infrastructure Fund's capital loss carryforwards was $27,030,767 from short-term capital gains, the Real Assets Securities Fund's capital loss carryforwards were $3,069,441 from short-term capital gains and $1,962,516 from long-term capital gains which will not expire. As of December 31, 2017, the Global Real Estate Fund and U.S. Real Estate Fund had no capital loss carryforwards.
BROOKFIELD INVESTMENT FUNDS
Notes to Financial Statements (concluded)
December 31, 2017
Federal Income Tax Basis: The federal income tax basis of each Fund's investments, not including foreign currency translation, at December 31, 2017 was as follows:
| Fund | Cost of Investments | Gross Unrealized Appreciation | Gross Unrealized Depreciation | Net Unrealized Appreciation |
Infrastructure Fund
| $ 200,830,678 | $ 48,665,127 | $ (8,583,209) | $40,081,918 |
Global Real Estate Fund
| 1,879,166,665 | 160,823,200 | (94,410,888) | 66,412,312 |
U.S. Real Estate Fund
| 23,174,396 | 1,826,350 | (846,987) | 979,363 |
Real Assets Securities Fund
| 70,380,105 | 7,580,835 | (3,257,821) | 4,323,014 |
Capital Account Reclassifications: Because federal income tax regulations differ in certain respects from GAAP, income and capital gain distributions, if any, determined in accordance with tax regulations may differ from net investment income and realized gains recognized for financial reporting purposes. These differences are primarily due to differing treatments for wash sales, partnership income/expense and return of capital. Permanent book and tax differences, if any, relating to shareholder distributions will result in reclassifications to paid-in-capital or to undistributed capital gains. These reclassifications have no effect on net assets or NAV per share.
| | Paid-in capital | Distributions in excess of net investment income | Accumulated net realized loss |
Infrastructure Fund
| $(2,958,047) | $ 2,015,315 | $ 942,732 |
Global Real Estate Fund
| 221,503 | 22,470,296 | (22,691,799) |
U.S. Real Estate Fund
| 24,095 | 187,194 | (211,289) |
Real Assets Securities Fund
| (266,690) | 253,936 | 12,754 |
9.Indemnification
Under the Funds’ organizational documents, its officers and trustees are indemnified against certain liabilities arising out of the performance of their duties to the Funds. In addition, in the normal course of business, the Trust, on behalf of the Funds, enters into contracts with vendors and others that provide for indemnification. The Funds’ maximum exposure under these arrangements is unknown, since this would involve the resolution of certain claims, as well as future claims that may be made, against the Funds. Thus an estimate of the financial impact, if any, of these arrangements cannot be made at this time. However, based on experience, the Funds expect the risk of loss due to these warranties and indemnities to be unlikely.
10.Subsequent Events
GAAP requires recognition in the financial statements of the effects of all subsequent events that provide additional evidence about conditions that existed at the date of the Statements of Assets and Liabilities. For non-recognized subsequent events that must be disclosed to keep the financial statements from being misleading, the Funds are required to disclose the nature of the event as well as an estimate of their financial effect, or a statement that such an estimate cannot be made.
Management has evaluated subsequent events in the preparation of the Funds' financial statements and has determined that herein, there are no additional events that require recognition or disclosure in the financial statements.
70Brookfield Investment Management Inc.
BROOKFIELD INVESTMENT FUNDS
Report of Independent Registered Public Accounting Firm (Unaudited)
December 31, 2017
To the Board of Trustees of Brookfield Investment Funds and Shareholders of:
Brookfield Global Listed Infrastructure Fund
Brookfield Global Listed Real Estate Fund
Brookfield U.S. Listed Real Estate Fund
Brookfield Real Assets Securities Fund
Opinion on the Financial Statements and Financial Highlights
We have audited the accompanying statements of assets and liabilities of Brookfield Global Listed Infrastructure Fund, Brookfield Global Listed Real Estate Fund, Brookfield U.S. Listed Real Estate Fund, and Brookfield Real Assets Securities Fund (the “Funds”) each a series comprising the Brookfield Investment Funds, including the schedules of investments as of December 31, 2017, the related statements of operations for the year then ended, the statements of changes in net assets for each of the two years in the period then ended, the financial highlights for each of the five years in the period then ended, and the related notes. In our opinion, the financial statements and financial highlights present fairly, in all material respects, the financial position of each of the portfolios constituting the Brookfield Investment Funds as of December 31, 2017, and the results of their operations for the year then ended, the changes in their net assets for each of the two years in the period then ended, and the financial highlights for each of the five years in the period then ended, in conformity with accounting principles generally accepted in the United States of America.
Basis for Opinion
These financial statements and financial highlights are the responsibility of the Funds’ management. Our responsibility is to express an opinion on the Funds’ financial statements and financial highlights based on our audits. We are a public accounting firm registered with the Public Company Accounting Oversight Board (United States) (PCAOB) and are required to be independent with respect to the Funds in accordance with the U.S. federal securities laws and the applicable rules and regulations of the Securities and Exchange Commission and the PCAOB.
We conducted our audits in accordance with the standards of the PCAOB. Those standards require that we plan and perform the audit to obtain reasonable assurance about whether the financial statements and financial highlights are free of material misstatement, whether due to error or fraud. The Funds are not required to have, nor were we engaged to perform, an audit of their internal control over financial reporting. As part of our audits we are required to obtain an understanding of internal control over financial reporting but not for the purpose of expressing an opinion on the effectiveness of the Funds’ internal control over financial reporting. Accordingly, we express no such opinion.
Our audits included performing procedures to assess the risks of material misstatement of the financial statements and financial highlights, whether due to error or fraud, and performing procedures that respond to those risks. Such procedures included examining, on a test basis, evidence regarding the amounts and disclosures in the financial statements and financial highlights. Our audits also included evaluating the accounting principles used and significant estimates made by management, as well as evaluating the overall presentation of the financial statements and financial highlights. Our procedures included confirmation of securities owned as of December 31, 2017, by correspondence with the custodian and brokers; when replies were not received from brokers, we performed other auditing procedures. We believe that our audits provide a reasonable basis for our opinion.
DELOITTE & TOUCHE LLP
Chicago, Illinois
March 1, 2018
We have served as the auditor of one or more Brookfield Investment Management investment companies since 2011.
BROOKFIELD INVESTMENT FUNDS
Tax Information (Unaudited)
December 31, 2017
QUALIFIED DIVIDEND INCOME/DIVIDENDS RECEIVED DEDUCTION
For the fiscal year ended December 31, 2017, certain dividends paid by the Funds may be subject to a maximum tax rate of 15%, as provided for by the Jobs and Growth Tax Relief Reconciliation Act of 2003. The percentage of dividends declared from ordinary income designated as qualified dividend income was as follows:
Infrastructure Fund
| 100.00% |
Global Real Estate Fund
| 39.85% |
U.S. Real Estate Fund
| 39.08% |
Real Assets Securities Fund
| 63.77% |
For corporate shareholders, the percentage of ordinary distributions qualifying for the corporate dividends received deductions for the year ended December 31, 2017, was as follows:
Infrastructure Fund
| 33.20% |
Global Real Estate Fund
| 9.90% |
U.S. Real Estate Fund
| 38.40% |
Real Assets Securities Fund
| 21.50% |
The percentage of taxable ordinary income distributions that are designated as short-term capital gain distributions under the Internal Revenue Section 871(k)(2)(C) for each Fund was as follows:
Infrastructure Fund
| 0.00% |
Global Real Estate Fund
| 12.24% |
U.S. Real Estate Fund
| 0.00% |
Real Assets Securities Fund
| 0.00% |
72Brookfield Investment Management Inc.
BROOKFIELD INVESTMENT FUNDS
Information Concerning Trustees and Officers (Unaudited)
The following tables provide information concerning the trustees and officers of the Funds.
Trustees of the Fund
| Name, Address and Year of Birth | Position(s) Held with Funds and Term of Office and Length of Time Served | Principal Occupation(s) During Past 5 Years and Other Directorships Held by Trustee | Number of Portfolios in Fund Complex Overseen by Trustee |
| Independent Trustees | | | |
Edward A. Kuczmarski
c/o Brookfield Place,
250 Vesey Street,
New York, New York
10281-1023
Born: 1949 | Director, Chairman of the Board, Member of the Audit Committee, Chairman of the Nominating and Compensation Committee Since 2011 | Director/Trustee of several investment companies advised by the Adviser (2011-Present); Certified Public Accountant and Retired Partner of Crowe Horwath LLP (1980-2013); Trustee of the Empire Builder Tax Free Bond Fund (1984-2013); Director of ISI Funds (2007-2015); Trustee of the Daily Income Fund (2006-2015), Director of the California Daily Tax Free Income Fund, Inc. (2006-2015); Trustee of the Stralem Funds (2014-2016). | 7 |
Louis P. Salvatore
c/o Brookfield Place,
250 Vesey Street,
New York, New York
10281-1023
Born: 1946 | Director, Chairman of the Audit Committee, Member of the Nominating and Compensation Committee Since 2011 | Director/Trustee of several investment companies advised by the Adviser (2005-Present); Director of SP Fiber Technologies, Inc. (2012-2015); Director of Gramercy Property Trust (2012-Present); Director of Turner Corp. (2003-Present); Director of Jackson Hewitt Tax Services, Inc. (2004-2011); Employee of Arthur Andersen LLP (2002-Present). | 7 |
Stuart A. McFarland
c/o Brookfield Place,
250 Vesey Street,
New York, New York
10281-1023
Born: 1947 | Director, Member of the Audit Committee, Member of the Nominating and Compensation Committee Since 2013 | Director/ Trustee of several investment companies advised by the Adviser (2006-Present); Director of United Guaranty Corporation (2011-2016); Director of Brandywine Funds (2003-2013); Director of Drive Shack Inc. (formerly, Newcastle Investment Corp.) (2000-Present); Managing Partner of Federal City Capital Advisors (1997-Present); Director of New America High Income Fund (2013-Present); Director of New Senior Investment Group, Inc. (2014-Present). | 7 |
Heather S. Goldman
c/o Brookfield Place,
250 Vesey Street,
New York, New York
10281-1023
Born: 1967 | Director, Member of the Audit Committee, Member of the Nominating and Compensation Committee Since 2013 | Director/ Trustee of several investment companies advised by the Adviser (2013-Present); Global Head of Marketing and Business Development of the Adviser (2011-2013); Managing Partner of Brookfield Financial (2009-2011); Director and Board Chair of University Settlement House (2003-2013); Member of the Honorary Board of University Settlement House (2014-Present); Co-Founder & CEO of Capstak, Inc. (2014-Present); Chairman of Capstak, Inc. (2016-Present). | 7 |
BROOKFIELD INVESTMENT FUNDS
Information Concerning Trustees and Officers (Unaudited) (continued)
Trustees of the Fund (continued)
| Name, Address and Year of Birth | Position(s) Held with Funds and Term of Office and Length of Time Served | Principal Occupation(s) During Past 5 Years and Other Directorships Held by Trustee | Number of Portfolios in Fund Complex Overseen by Trustee |
| Interested Trustees | | | |
David Levi
c/o Brookfield Place,
250 Vesey Street,
New York, New York
10281-1023
Born: 1971 | Director Since April 26, 2017 | Director/Trustee of several investment companies advised by the Adviser (2017 - Present); Director of Brookfield Investment Management UK Ltd. (2017-Present); Director of Brookfield Investment Management (Canada) Inc. (2017-Present); President of the Adviser (2016-Present); Managing Director and Head of Distribution of the Adviser (2014-2016); Managing Partner of Brookfield Asset Management Inc. (2015-Present); Managing Director and Head of Global Business Development at Nuveen Investments (2009-2014). | 7 |
74Brookfield Investment Management Inc.
BROOKFIELD INVESTMENT FUNDS
Information Concerning Trustees and Officers (Unaudited) (continued)
Officers of the Fund
| Name, Address and Year of Birth | Position(s) Held with Funds | Term of Office and Length of Time Served | Principal Occupation(s) During Past 5 Years |
Brian F. Hurley*
c/o Brookfield Place,
250 Vesey Street,
New York, New York
10281-1023
Born: 1977 | President | Served since 2013 | President of several investment companies advised by the Adviser (2014-Present); General Counsel of the Adviser (October 2017 - Present); Managing Director (2014-Present), Assistant General Counsel (2010-Present) and Head of Legal and Funds (April 2017-October 2017) of the Adviser; Director of the Adviser (2010-2014); Corporate Secretary of Brookfield Investment Management Inc. (2017-Present); Corporate Secretary of Brookfield Investment Management UK Ltd. (2017-Present); Corporate Secretary of Brookfield Investment Management (Canada) Inc. (2017-Present); Managing Partner of Brookfield Asset Management Inc. (2016-Present); Secretary of Brookfield Investment Funds (2011-2014); Director of Brookfield Soundvest Capital Management (2015-Present). |
Angela W. Ghantous*
c/o Brookfield Place,
250 Vesey Street,
New York, New York
10281-1023
Born: 1975 | Treasurer | Served since 2014 | Treasurer of several investment companies advised by the Adviser (2012-Present); Director and Head of Fund Administration and Accounting of the Adviser (2012-Present); Vice President of the Adviser (2009-2012). |
Adam R. Sachs*
c/o Brookfield Place,
250 Vesey Street,
New York, New York
10281-1023
Born: 1984 | Chief Compliance Officer (“CCO”) | Served since 2017 | Chief Compliance Officer of several investment companies advised by the Advisor (2017-Present); Director of Corporate Legal and Compliance at the Adviser (2017-Present); Chief Compliance Officer of Brookfield Investment Management (Canada) Inc. (2017-Present); Chief Compliance Officer of Brookfield Investment Management UK Ltd. (2017-Present); Senior Compliance Officer of Corporate Legal and Compliance at the Adviser (2011-2017). |
Alexis I. Rieger*
c/o Brookfield Place,
250 Vesey Street,
New York, New York
10281-1023
Born: 1980 | Secretary | Served since 2014 | Secretary of several investment companies advised by the Adviser (2014-Present); Vice President and Associate General Counsel of the Adviser (2011-Present). |
Casey Tushaus*
c/o Brookfield Place,
250 Vesey Street,
New York, New York
10281-1023
Born: 1982 | Assistant Treasurer | Served since 2016 | CCO of several investment companies advised by the Advisor (2009-Present); Director and CCO of the Advisor (2009-Present); Vice President, Oppenheimer Funds, Inc. (2004-2009). |
BROOKFIELD INVESTMENT FUNDS
Information Concerning Trustees and Officers (Unaudited) (continued)
Officers of the Fund (continued)
| Name, Address and Year of Birth | Position(s) Held with Funds | Term of Office and Length of Time Served | Principal Occupation(s) During Past 5 Years |
Mohamed Rasul*
c/o Brookfield Place,
250 Vesey Street,
New York, New York
10281-1023
Born: 1981 | Assistant Treasurer | Served since 2016 | Assistant Treasurer of several investment companies advised by the Adviser (2016-Present); Assistant Vice President of the Adviser (2014 -Present); Senior Accountant of the Adviser (2012 - 2014). |
* Interested person as defined by the Investment Company Act of 1940, as amended (the “1940 Act”) because of affiliations with Brookfield Investment Management Inc., Adviser of the Fund.
The Fund’s Statement of Additional Information includes additional information about the directors, and is available, without charge, upon request by calling 1-855-777-8001.
76Brookfield Investment Management Inc.
BROOKFIELD INVESTMENT FUNDS
Joint Notice of Privacy Policy (Unaudited)
Brookfield Investment Management Inc. (“BIM”), on its own behalf and on behalf of the funds managed by BIM and its affiliates, recognizes and appreciates the importance of respecting the privacy of our clients and shareholders. Our relationships are based on integrity and trust and we maintain high standards to safeguard your non-public personal information (“Personal Information”) at all times. This privacy policy (“Policy”) describes the types of Personal Information we collect about you, the steps we take to safeguard that information and the circumstances in which it may be disclosed.
If you hold shares of a Fund through a financial intermediary, such as a broker, investment adviser, bank or trust company, the privacy policy of your financial intermediary will also govern how your Personal Information will be shared with other parties.
WHAT INFORMATION DO WE COLLECT?
We collect the following Personal Information about you:
| • | Information we receive from you in applications or other forms, correspondence or conversations, including but not limited to name, address, phone number, social security number, assets, income and date of birth. |
| • | Information about transactions with us, our affiliates, or others, including but not limited to account number, balance and payment history, parties to transactions, cost basis information, and other financial information. |
| • | Information we may receive from our due diligence, such as your creditworthiness and your credit history. |
WHAT IS OUR PRIVACY POLICY?
We may share your Personal Information with our affiliates in order to provide products or services to you or to support our business needs. We will not disclose your Personal Information to nonaffiliated third parties unless 1) we have received proper consent from you; 2) we are legally permitted to do so; or 3) we reasonably believe, in good faith, that we are legally required to do so. For example, we may disclose your Personal Information with the following in order to assist us with various aspects of conducting our business, to comply with laws or industry regulations, and/or to effect any transaction on your behalf;
| • | Unaffiliated service providers (e.g. transfer agents, securities broker-dealers, administrators, investment advisors or other firms that assist us in maintaining and supporting financial products and services provided to you); |
| • | Government agencies, other regulatory bodies and law enforcement officials (e.g. for reporting suspicious transactions); |
| • | Other organizations, with your consent or as directed by you; and |
| • | Other organizations, as permitted or required by law (e.g. for fraud protection) |
When we share your Personal Information, the information is made available for limited purposes and under controlled circumstances designed to protect your privacy. We require third parties to comply with our standards for security and confidentiality.
HOW DO WE PROTECT CLIENT INFORMATION?
We restrict access to your Personal Information to those persons who require such information to assist us with providing products or services to you. It is our practice to maintain and monitor physical, electronic, and procedural safeguards that comply with federal standards to guard client nonpublic personal information. We regularly train our employees on privacy and information security and on their obligations to protect client information.
CONTACT INFORMATION
For questions concerning our Privacy Policy, please contact our client services representative at 1-855-777-8001.
[THIS PAGE IS INTENTIONALLY LEFT BLANK]
Investment Adviser and Administrator
Brookfield Investment Management Inc.
Brookfield Place
250 Vesey Street, 15th Floor
New York, New York 10281-1023
www.brookfieldim.com
Please direct your inquiries to:
Investor Relations
Phone: 1-855-777-8001
E-mail: funds@brookfield.com
Transfer Agent
Shareholder inquiries relating to distributions, address changes and shareholder account information should be directed to the Funds’ transfer agent:
U.S. Bancorp Fund Services, LLC
615 East Michigan Street
Milwaukee, Wisconsin 53202
1-855-244-4859
Fund Accounting Agent
U.S. Bancorp Fund Services, LLC
615 East Michigan Street
Milwaukee, Wisconsin 53202
Sub-Administrator
U.S. Bancorp Fund Services, LLC
1201 South Alma School Road, Suite 3000
Mesa, Arizona 85210
Independent Registered Public Accounting Firm
Deloitte & Touche LLP
111 South Wacker Drive
Chicago, Illinois 60606
Legal Counsel
Paul Hastings LLP
200 Park Avenue
New York, New York 10166
Custodian
U.S. Bank National Association
1555 North Rivercenter Drive, Suite 302
Milwaukee, Wisconsin 53212
Distributor
Quasar Distributors, LLC
615 East Michigan Street
Milwaukee, Wisconsin 53202
The Funds file their complete schedule of portfolio holdings with the SEC for the first and third quarters of each fiscal year on Form N-Q. The Funds' Form N-Q will be available on the SEC's website at www.sec.gov. In addition, the Funds' Form N-Q may be reviewed and copied at the SEC's Public Reference Room in Washington, D.C. Information on the operation of the Public Reference Room may be obtained by calling 1-800-SEC-0330.
You may obtain a description of the Funds' proxy voting policies and procedures, and information regarding how the Funds voted proxies relating to portfolio securities during the most recent 12-month period ended June 30, without charge, upon request by calling 1-855-777-8001, or go to the SEC's website at www.sec.gov.
Brookfield Investment Management Inc.
Brookfield Place
250 Vesey Street, 15th Floor
New York, New York 10281-1023
1-855-777-8001
www.brookfield.com
Item 2. Code of Ethics.
As of the end of the period covered by this report, the Registrant had adopted a Code of Ethics for Principal Executive and Principal Financial Officers (the “Code”). There were no amendments to or waivers from the Code during the period covered by this report. A copy of the Registrant’s Code will be provided upon request to any person without charge by contacting Investor Relations at (855) 777-8001 or by writing to Secretary, Brookfield Investment Funds, Brookfield Place, 250 Vesey Street, 15th Floor, New York, NY 10281-1023.
Item 3. Audit Committee Financial Expert.
The Registrant’s Board of Trustees has determined that Stuart A. McFarland, Edward A. Kuczmarski and Louis P. Salvatore each qualify as audit committee financial experts, as defined in Item 3(b) of Form N-CSR. Messrs. McFarland, Kuczmarski and Salvatore are considered “independent” for purposes of Item 3(a)(2) of Form N-CSR.
Item 4. Principal Accountant Fees and Services.
The aggregate fees billed by the Funds’ independent registered public accounting firm, Deloitte & Touche LLP (“Deloitte”), to the Funds for the Funds’ two most recent fiscal years for professional services rendered for the audit of the Registrant’s annual financial statements and the review of financial statements that are included in the Registrant’s annual and semi-annual reports to shareholders (“Audit Fees”) were $134,000 and $131,250 for the fiscal years ended December 31, 2017 and December 31, 2016, respectively.
There were no fees billed by Deloitte to the Funds in its two recent fiscal years for services rendered for assurance and related services that are reasonably related to the performance of the audit or review of the Fund’s financial statements, but are not reported as Audit Fees (“Audit-Related Fees”).
For the Funds’ two most recent fiscal years, there were no Audit-Related Fees billed by Deloitte for engagements related directly to the operations and financial reporting of one or more Funds by a Fund Service Provider. A Fund Service Provider is (a) any investment adviser to the Fund (not including any Subadvisor whose role is primarily portfolio management and is subcontracted with or overseen by another investment adviser) or (b) any entity that provides ongoing services to the Fund and is controlling, controlled by or under common control with a Fund investment adviser described in (a).
For the fiscal years ended December 31, 2017 and December 31, 2016, Deloitte billed the Registrant aggregate fees of $33,200 and $33,200, respectively. Each bill is for professional services rendered for tax compliance, tax advice and tax planning. The nature of the services comprising the Tax Fees was the review of the Registrant’s income tax returns and tax distribution requirements.
For the Funds’ two most recent fiscal years, Tax Fees billed by Deloitte for engagements by Fund Service Providers that related directly to the operations and financial reporting of the Funds were $0 for fiscal 2017 and $0 for fiscal 2016, respectively.
The services for which Tax Fees were charged comprise all services performed by professional staff in Deloitte’s tax division except those services related to the audit. Typically, this category would include fees for tax compliance, tax planning, and tax advice. Tax compliance, tax advice, and tax planning services include preparation of original and amended tax returns, claims for refund and tax payment-planning services, assistance with tax audits and appeals, tax advice related to mergers and acquisitions and requests for rulings or technical advice from taxing authorities.
For the fiscal years ended December 31, 2017 and December 31, 2016, Deloitte billed the Registrant aggregate fees of $79,427 and $0, respectively, for all other non-audit services (“Other Fees”), including tax reclaim services. During the same period, there were no Other Fees billed by Deloitte for engagements by Fund Service Providers that related directly to the operations and financial reporting of the Funds.
(e) (1) According to policies adopted by the Audit Committee, services provided by Deloitte to the Funds must be pre-approved by the Audit Committee. On an annual basis, the Audit Committee reviews and pre-approves various types of services that Deloitte may perform for the Funds without specific approval of each engagement, subject to specified budget limitations. As contemplated by the Sarbanes-Oxley Act of 2002 and related SEC rules, the Audit Committee also pre-approves non-audit services provided by Deloitte to any Fund Service Provider for any engagement that relates directly to the operations and financial reporting of the Funds. Any engagement that is not already pre-approved or that will exceed a pre-approved budget must be submitted to the Audit Committee for pre-approval.
(e) (2) None.
(f) Not applicable.
(g) The aggregate fees billed by Deloitte in 2017 and 2016 for non-audit services rendered to the Funds and Fund Service Providers were $267,627 and $178,200, respectively. For the fiscal years ended December 31, 2017 and December 31, 2016, this amount reflects the amounts disclosed above in Item 4(b),(c),(d), plus $155,000 and $145,000, respectively, in fees billed to the Fund Service Providers for non-audit services that did not relate directly to the operations and financial reporting of the Funds, including fees billed by Deloitte to Brookfield Investment Management Inc. that were associated with Deloitte’s SSAE 16 Review (formerly, SAS No. 70).
(h) The Trust’s Audit Committee has considered whether the provision of non-audit services by registrant’s independent registered public accounting firm to the registrant’s investment advisor, and any entity controlling, controlled, or under common control with the investment adviser that provided ongoing services to the registrant that were not pre-approved by the Committee (because such services did not relate directly to the operations and financial reporting of the registrant) was compatible with maintaining the independence of the independent registered public accounting firm.
Item 5. Audit Committee of Listed Registrants.
Not applicable.
Item 6. Schedule of Investments.
Schedule of Investments is included as part of the report to shareholders filed under Item 1 of this Form.
Item 7. Disclosure of Proxy Voting Policies and Procedures for Closed-End Management Investment Companies.
Not applicable.
Item 8. Portfolio Managers of Closed-End Management Investment Companies.
Not applicable.
Item 9. Purchases of Equity Securities by Closed-End Management Investment Company and Affiliated Purchasers.
Not applicable.
Item 10. Submission of Matters to a Vote of Security Holders.
There were no material changes to the procedures by which shareholders may recommend nominees to the Registrant’s Board of Trustees that were implemented after the Registrant last provided disclosure in response to the requirements of Item 407(c)(2)(iv) of Regulation S-K (17 CFR 229.407) (as required by 22(b)(15)) of Schedule 14A (17 CFR 240.14a- 101), or this Item 10.
Item 11. Controls and Procedures.
(a) The Registrant’s principal executive officer and principal financial officer have concluded that the Registrant’s Disclosure Controls and Procedures are effective, based on their evaluation of such Disclosure Controls and Procedures as of a date within 90 days of the filing of this report on Form N-CSR.
(b) As of the date of filing this Form N-CSR, the Registrant’s principal executive officer and principal financial officer are aware of no changes in the Registrant’s internal control over financial reporting that occurred during the Registrant’s second fiscal quarter of the period covered by this report that has materially affected or is reasonably likely to materially affect the Registrant’s internal control over financial reporting.
Item 12. Disclosure of Securities Lending Activities for Closed-End Management Investment Companies
Not applicable.
Item 13. Exhibits.
(a)(1) None.
(2) A separate certification for each principal executive officer and principal financial officer of the Registrant as required by Rule 30a-2(a) under the Investment Company Act of 1940 is attached as an exhibit to this Form N-CSR.
(3) Not applicable.
(b) A separate certification for each principal executive officer and principal financial officer of the Registrant as required by Rule 30a-2(b) under the Investment Company Act of 1940 is attached as an exhibit to this Form N-CSR.
(4) Not applicable.
SIGNATURES
Pursuant to the requirements of the Securities Exchange Act of 1934 and the Investment Company Act of 1940, the Registrant has duly caused this report to be signed on its behalf by the undersigned, thereunto duly authorized.
| | | | |
| BROOKFIELD INVESTMENT FUNDS |
| | |
| By: | | /s/ Brian F. Hurley | | |
| | Brian F. Hurley President and Principal Executive Officer |
Date: March 9, 2018
Pursuant to the requirements of the Securities Exchange Act of 1934 and the Investment Company Act of 1940, this report has been signed below by the following persons on behalf of the Registrant and in the capacities and on the dates indicated.
| | | | |
| By: | | /s/ Brian F. Hurley | | |
| | Brian F. Hurley President and Principal Executive Officer |
Date: March 9, 2018
| | | | |
| By: | | /s/ Angela W. Ghantous | | |
| | Angela W. Ghantous Treasurer and Principal Financial Officer |
Date: March 9, 2018