UNITED STATES
SECURITIES AND EXCHANGE COMMISSION
WASHINGTON, D.C. 20549
FORMN-CSR
CERTIFIED SHAREHOLDER REPORT OF REGISTERED
MANAGEMENT INVESTMENT COMPANIES
Investment Company Act file number811-22558
BROOKFIELD INVESTMENT FUNDS
(Exact name of registrant as specified in charter)
BROOKFIELD PLACE
250 VESEY STREET, 15th Floor
NEW YORK, NEW YORK 10281-1023
(Address of principal executive offices) (Zip code)
BRIAN F. HURLEY, PRESIDENT
BROOKFIELD INVESTMENT FUNDS
BROOKFIELD PLACE
250 VESEY STREET 15th Floor
NEW YORK, NEW YORK 10281-1023
(Name and address of agent for service)
Registrant’s telephone number, including area code: (855)777-8001
Date of fiscal year end: September 30
Date of reporting period: September 30, 2019
Item 1. Reports to Shareholders.

Brookfield
20
19
ANNUAL REPORT
SEPTEMBER 30, 2019
Center Coast Brookfield
Energy Infrastructure Fund
* Please see inside front cover of the report for important information regarding future delivery of shareholder reports.
Brookfield Public Securities Group LLC (the “Firm”) is an SEC-registered investment adviser and represents the Public Securities platform of Brookfield Asset Management. The Firm provides global listed real assets strategies including real estate equities, infrastructure and energy infrastructure equities, multi-real-asset-class strategies and real asset debt. With over $19 billion of assets under management as of September 30, 2019, the Firm manages separate accounts, registered funds and opportunistic strategies for institutional and individual clients, including financial institutions, public and private pension plans, insurance companies, endowments and foundations, sovereign wealth funds and high net worth investors. The Firm is a wholly owned subsidiary of Brookfield Asset Management, a leading global alternative asset manager with over $500 billion of assets under management as of September 30, 2019. For more information, go to www.brookfield.com.
Center Coast Brookfield Energy Infrastructure Fund (the “Fund”) is managed by Brookfield Public Securities Group LLC. The Fund uses its website as a channel of distribution of material company information. Financial and other material information regarding the Fund is routinely posted on and accessible at https://publicsecurities.brookfield.com/en.
Beginning on January 1, 2021, as permitted by regulations adopted by the Securities and Exchange Commission, paper copies of the Fund’s annual and semi-annual shareholder reports will no longer be sent by mail, unless you specifically request paper copies of the reports. Instead, the reports will be made available on the Fund’s website (https://publicsecurities.brookfield.com/en), and you will be notified by mail each time a report is posted and provided with a website link to access the report.
If you already elected to receive shareholder reports electronically, you will not be affected by this change and you need not take any action. You may elect to receive shareholder reports and other communications from the Fund electronically anytime by contacting your financial intermediary (such as a broker, investment adviser, bank or trust company) or, if you are a direct investor, by calling the Fund (toll-free) at 1-855-777-8001 or by sending an e-mail request to the Fund atpublicsecurities.enquiries@brookfield.com.
Beginning on January 1, 2019, you may elect to receive all future reports in paper free of charge. If you invest through a financial intermediary, you may contact your financial intermediary to request that you continue to receive paper copies of your shareholder reports. If you invest directly with the Fund, you may call 1-855-777-8001 or send an email request topublicsecurities.enquiries@brookfield.com to let the Fund know you wish to continue receiving paper copies of your shareholder reports. Your election to receive reports in paper will apply to all funds held in your account if you invest through your financial intermediary or all funds held within the fund complex if you invest directly with the Fund.
This report is for shareholder information. This is not a prospectus intended for use in the purchase or sale of Fund shares.
| NOT FDIC INSURED | MAY LOSE VALUE | NOT BANK GUARANTEED |
[THIS PAGE IS INTENTIONALLY LEFT BLANK]
Dear Shareholders,
We are pleased to provide the Annual Report for Center Coast Brookfield Energy Infrastructure Fund (the “Fund”) for the fiscal year ended September 30, 2019.
Broader equity and fixed-income markets posted gains during the period with the MSCI World1, S&P 5002 and Bloomberg Barclays Global Aggregate Bond3 Indexes returning +2.42%, +4.25% and +7.60%, respectively. Energy infrastructure lagged broader markets returning -8.13%, as measured by the Alerian MLP Index4, as commodity price volatility and technical selling in late 2018 heavily contributed to the sector’s underperformance during the fiscal year.
From a macroeconomic perspective, the period was marked by slowing economic growth and falling interest rates amid dovish monetary policy. Domestically, the U.S. continued to lead the developed world in terms of economic growth, although the pace of that growth moderated somewhat throughout the period. The ongoing U.S.-China trade dispute continued to gain steam, with additional tariffs levied throughout the period and no clear resolution expected in the near future.
In response to slowing economic growth and the perceived increased risks to economic growth, the U.S. Federal Reserve’s Federal Open Market Committee (“the FOMC”) reversed course during the period. After raising the target for the federal funds rate at its meeting in December 2018, the FOMC then cut its benchmark rate twice by 25 basis points at both of the August and September 2019 meetings.
Globally, the Eurozone continued to lag the U.S. in terms of economic growth and in response, the European Central Bank resumed stimulus measures in an attempt to combat the region’s economic malaise. The People’s Bank of China also increased its stimulus measures to combat a slowing Chinese economy, some of which can be attributed to the U.S-China trade dispute.
Looking ahead we expect modest, albeit slowing, global economic growth. We do, however, acknowledge heightened market and economic risks related to ongoing geopolitical uncertainty, including trade disputes, Brexit and the upcoming U.S. presidential election, among others. Given the wholesale measures (discussed in greater detail in the Management Discussion of Fund Performance) the asset class has undertaken over the last several years coupled with the sector’s historical relative cash flow stability versus the broader energy industry, we believe energy infrastructure has the ability to show defensiveness in an uncertain environment.
In addition to performance information, this report provides an overview of market conditions and a discussion of factors affecting the Fund’s investment performance, together with the Fund’s audited financial statements as of September 30, 2019.
We welcome your questions and comments, and encourage you to contact our Investor Relations team at (855) 777-8001 or visit us at www.brookfield.com for more information. Thank you for your support.
Sincerely,
Brian F. Hurley
President
Center Coast Brookfield Energy Infrastructure Fund
David W. Levi, CFA
Chief Executive Officer
Brookfield Public Securities Group LLC
Past performance is no guarantee of future results.
1 The MSCI World Index is a free float-adjusted market capitalization weighted index that is designed to measure the equity market performance of developed markets.
Letter to Shareholders(continued)
2 The S&P 500 Index is an unmanaged weighted index of 500 large company stocks that is widely-recognized as representative of the performance of the U.S. stock market. Indexes are not managed and an investor cannot invest directly in an index.
3 The Bloomberg Barclays Global Aggregate Bond Index tracks the performance of investment grade public debt issued in the major domestic and eurobond markets, including global bonds.
4 The Alerian MLP Index is the leading gauge of energy infrastructure Master Limited Partnerships (MLPs). The capped, float-adjusted, capitalization-weighted index, whose constituents earn the majority of their cash flow from midstream activities involving energy commodities, is disseminated real-time on a price-return basis (AMZ) and on a total-return basis (AMZX).
Indices are not managed and an investor cannot invest directly in an index.
These views represent the opinions of Brookfield Public Securities Group LLC and are not intended to predict or depict the performance of any investment. These views are primarily as of the close of business on September 30, 2019 and subject to change based on subsequent developments.
The Fund’s portfolio holdings are subject to change without notice. The mention of specific securities is not a recommendation or solicitation for any person to buy, sell or hold any particular security. There is no assurance that the Fund currently holds these securities. Please refer to the Schedule of Investments contained in this report for a full listing of Fund’s holdings.
Mutual fund investing involves risk. Principal loss is possible.
Quasar Distributors, LLC is the distributor of Brookfield Investment Funds.
Diversification does not assure a profit, nor does it protect against a loss in a declining market.
Must be preceded or accompanied by a prospectus.
2Brookfield Public Securities Group LLC
About Your Fund’s Expenses
As a shareholder of the Fund, you may incur two types of costs: (1) transaction costs, including sales charges (loads) on purchase payments and contingent deferred sales charges and redemption fees on redemptions; and (2) ongoing costs, including management fees, distribution (12b-1) fees and other fund expenses. This example is intended to help you understand your ongoing costs (in dollars) of investing in the Fund and to compare these costs with the ongoing costs of investing in other mutual funds. The example is based on an investment of $1,000 invested at the beginning of the period and held for the entire period as indicated below.
Actual Fund Return
The table below provides information about actual account values and actual expenses. You may use the information on this line, together with the amount you invested, to estimate the expenses that you paid over the period. Simply divide your account value by $1,000 (for example, an $8,600 account value divided by $1,000 = 8.6), then multiply the result by the number in the first line under the heading entitled “Expenses Paid During Period” to estimate the expenses you paid on your account during this period.
Hypothetical Example for Comparison Purposes
The table below also provides information about hypothetical account values and hypothetical expenses based on the Fund’s actual expense ratio and an assumed rate of return of 5% per year before expenses, which is not the Fund’s actual return. The hypothetical account values and expenses may not be used to estimate the actual ending account balance or expenses you paid for the period. You may use this information to compare the ongoing costs of investing in the Fund and other funds. To do so, compare this 5% hypothetical example with hypothetical examples that appear in shareholders’ reports of other funds.
Please note that the expenses shown in the table are meant to highlight your ongoing costs only and do not reflect any transactional costs, such as sales charges (loads) and redemption fees. Therefore, the hypothetical account values and expenses in the table are useful in comparing ongoing costs only, and will not help you determine the relative total costs of owning different funds. In addition, if these transactional costs were included, your costs overall would have been higher.
| | Annualized Expense Ratio | Beginning Account Value
(04/01/19) | Ending Account Value
(09/30/19) | Expenses Paid During Period
(04/01/19–
09/30/19)(1) |
| Actual | | | | |
Class Y Shares
| 1.25% | $1,000.00 | $937.60 | $6.07 |
| Hypothetical (assuming a 5% return before expenses) | | | | |
Class Y Shares
| 1.25% | $1,000.00 | 1,018.80 | 6.33 |
| (1) | Expenses are equal to the Fund’s annualized expense ratio by class multiplied by the average account value over the period, multiplied by 183/365 (to reflect a six-month period). |
Center Coast Brookfield Energy Infrastructure Fund
Management Discussion of Fund Performance
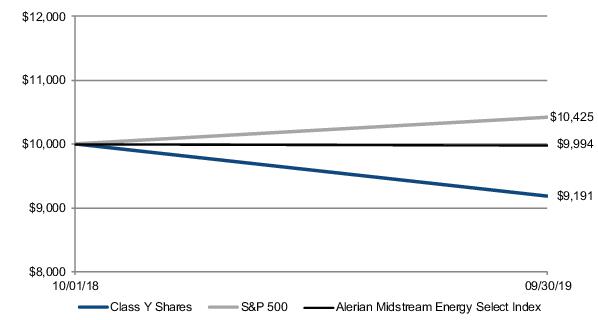
For the fiscal year ended September 30, 2019, the Fund's Class Y had a total return of -8.09%, which assumes the reinvestment of dividends and is exclusive of brokerage commissions, underperforming the S&P 5001 and Alerian Midstream Energy Select Index2, which returned 4.25% and -0.06%, respectively.
MARKET OVERVIEW
Introduction
Fiscal First Quarter (October – December 2018) (-18.83% NAV total return by the Fund's Y share class)
The Fund’s fiscal first quarter came to a disappointing end due to a combination of broader market volatility, crude oil price weakness and year-end tax loss selling. Over the same time period, the Fund’s benchmark, the Alerian MLP Index3 (“AMZ”) posted a -17.30% return for the third worst quarterly performance for the index on record.
The asset class was defined by uncertainty over much of the calendar year. Numerous midstream companies engaged in “simplification” transactions during the first half of the fiscal year, which contributed to the volatility. Simplifications are transactions in which incentive distribution rights are retired in exchange for various financial considerations, and/or two or more affiliated public entities merge in a corporate transaction or series of corporate transactions. However, each transaction and transition itself is difficult to predict (i.e., uncertain) and sometimes results in a distribution cut and/or unexpected tax bill. Even the most seasoned industry vets were caught off guard and surprised by many of the announced simplification transactions and distribution cuts.
In addition to simplification, most midstream companies took steps to eliminate the ongoing need for equity capital markets to fund growth (the transition to “self-funding”). This too can involve a corporate action or corporate finance decision that is difficult to predict and often impacts growth projections and/or distributions, making it difficult to value and invest in the equity of a company.
Despite the disappointing ending, we headed into 2019 optimistic given fundamentals remained constructive while the often-painful process of simplification was largely over. The industry exited the calendar year with both record levels of supply and demand while midstream companies positioned themselves with little need for external equity, distribution coverage levels higher than they were at the peak of the market and leverage levels lower than they had been in years.
Fiscal Second Quarter (January – March 2019) (20.32% NAV total return by the Fund's Y share class)
The Fund outperformed the AMZ for the three months ended March 31, 2019 and beat the Index’s strongest-ever quarterly return in its 23 year history (+19.74% in Q1 of 2013). Other than the quarterly return, it was a fairly boring quarter. There were some project announcements, modest earnings surprises, some Mergers & Acquisitions here and there, ongoing regulatory battles, and a few small equity offerings, but nothing extraordinary or shocking. The level of activity felt normal, like what you would expect in any given quarter—no major surprises, no Federal Energy Regulatory Commission policy change, no unexpected distribution cuts, no Exploration & Production bankruptcy fears, no unwanted tax bills, no game-changers. And this is exactly what we want! Boring, in our opinion, is better.
Conversely, underperformance during the period, and beyond, tracked names that: announced project delays, revised guidance, have complicated balance sheets, and generally just over-promised the market and under-delivered results. It helps to have scale, integration, balance sheet flexibility, and management experience, which is where our portfolios remained biased.
As previously discussed, the corporate and financing maturation process was largely behind us – at the end of the Fund’s fiscal second quarter, just 7% of the midstream market cap remained in an IDR-paying structure. In addition, public equity issuance virtually evaporated, from $50+ billion over a three year-span from 2014-2016 to ~$5bn expected from 2019-2021 by some sell-side estimates. The transition allowed companies to actually be “boring” and execute the plan with a cleaner, more mature structure built for stability in a lower-for-longer,
4Brookfield Public Securities Group LLC
Center Coast Brookfield Energy Infrastructure Fund
post-shale world. With all of that said, and as odd as it may sound, our hope was for the trend of “boring is better” to continue for the rest of the year.
Fiscal Third Quarter (April – June 2019) (-2.35% NAV total return by the Fund's Y share class)
The fund’s fiscal third quarter was largely a continuation of the “boring is better” trend, outside of the broader market and commodities volatility. Industry bellwethers outperformed as energy investors continued showing very little patience for the old investment paradigm: for midstream, using equity capital markets to fund growth (“Midstream 1.0”), while for oil & gas producers, growing production for growth’s sake (instead of focusing on free cash flow).
During the Fund’s fiscal third quarter, midstream outperformed broader energy indices and energy commodities, potentially showing that the measures the sector had taken to adjust its corporate finance model could be starting to pay off for investors. From April to June, the AMZ outperformed:
| • | Broader energy by 3% |
| • | Oil & gas producers by 11% |
| • | Oilfield services by 14% |
| • | U.S. crude oil by 3% |
| • | U.S. natural gas by 11% |
| • | U.S. natural gas liquids (NGLs) by 21%4 |
Energy commodities went on a wild ride yet again in the second calendar quarter, driven by changing supply/demand fundamentals, up-and-down trade war news, and other geopolitical tensions. U.S. crude rallied 10% from the end of the first quarter to late April but had trekked down 15% by mid-June before finally finishing the quarter down only 3%. U.S. gas prices were under pressure virtually the entire quarter, and U.S. NGL prices had their lowest quarterly average since the third quarter of 2016 despite wide pricing spreads to Europe and Asia, signaling the need for more export capacity to get high-demand liquids to market. Amidst this choppiness, midstream equities continued to be “boring.”
Fiscal Fourth Quarter (July – September 2019) (-3.98% NAV total return by the Fund's Y share class)
While the prior quarters saw a continuation of “boring is better”, the end of the fund’s fiscal year delivered a handful of surprises, a bit of drama, and a noticeable increase in volatility. Some of this volatility showed up in response to continued weakness in natural gas and natural gas liquids (“NGL”) prices. Importantly, the primary cause of this commodity price weakness is record supply, which is what moves through midstream assets to create cash flow (record cash flow, we might add).
The challenge, however, is that the extreme success of some basins is starting to impact other basins halfway across the country, and even halfway across the world. The Permian Basin—largely viewed as the “best” basin in North America—is taking absolutely no prisoners as it continues to produce record levels of crude oil that comes out of the ground along with “associated” natural gas and NGLs. Producers view these associated hydrocarbons as a byproduct and, in our opinion, it’s hard to compete with byproduct economics. As long as crude prices incentivize drilling in the Permian (and the Bakken and Rockies, to a lesser extent), associated gas and NGLs will most likely make it incrementally more difficult for basins relying on dry or wet gas economics to compete.
Further, with the ongoing completion of export facilities, North America’s excess natural gas and NGLs started to pressure prices abroad. Despite the interim volatility this has created, cheap natural gas prices have tended to stimulate demand which could result in long-term tailwinds for the industry as a whole. Cheap natural gas import
Center Coast Brookfield Energy Infrastructure Fund
prices abroad should accelerate the transition away from “dirtier” fuels such as coal and heating oil, helping reduce global carbon emissions.
Perhaps the most dramatic event of the quarter, however, was the brazen attack on Saudi Arabia’s Abqaiq and Khurais oil facilities on September 14th. Although Saudi Arabia has been able to return production back to pre-attack levels as of the writing of this letter, crude oil prices jumped more than 10% the following Monday morning (September 16, 2019), and many believed that a geopolitical risk premium would be embedded in crude oil prices—and energy equities—for the foreseeable future. Yet, shockingly, global crude oil prices erased all their gains in two weeks, and the near-term portion of the Brent futures curve is actually lower as of this writing than it was before the attack.5
The end of the Fund’s fiscal year felt like a common refrain: any major news had little or no impact due to overwhelming negative energy sentiment and broader market jitters. So, what continues to make us excited about this asset class? The cash flow. It’s sustainable, in our view, and we believe with simplification mostly behind us, balance sheets healthier, and financing less equity dependent, it should finally start accruing to the benefit of equity investors in a sustainable way. In the current sub 2% interest rate world, we think this can matter. At a minimum we think it will provide attractive income—an important component of total return—and could mitigate risk to the extent volatility picks up meaningfully. In the meantime, we’ll continue to celebrate the fundamentals, point out the myriad valuation disconnects, and hope that someone eventually listens even if, for now, it feels like we’re shouting into the void.
1The S&P 500 Index is an unmanaged weighted index of 500 large company stocks that is widely-recognized as representative of the performance of the U.S. stock market. Indexes are not managed and an investor cannot invest directly in an index.
2The Alerian Midstream Energy Select Index is a composite of North American energy infrastructure companies. The capped, float-adjusted, capitalization-weighted index, whose constituents are engaged in midstream activities involving energy commodities, is disseminated real-time on a price-return basis (AMEI) and on a total-return basis (AMEIX).
3The Alerian MLP Index is the leading gauge of energy infrastructure Master Limited Partnerships (MLPs). The capped, float-adjusted, capitalization-weighted index, whose constituents earn the majority of their cash flow from midstream activities involving energy commodities, is disseminated real-time on a price-return basis (AMZ) and on a total-return basis (AMZX).
4Broader energy is represented by the IXE Index, Oil & gas producers by the SPSIOP Index, Oilfield services by the OSX Index, U.S. crude oil by West Texas Intermediate (WTI), U.S. natural gas by Henry Hub, and U.S. NGLs by Mont Belvieu is the U.S. benchmark for NGL prices. The Energy Select Sector (“IXE”) Index is one of the eleven Select Sector Indices that seeks to track their respective Global Industry Classification Standard (GICS®) sectors. The IXE tracks companies within the Energy GICS® sector, which is comprised of companies that are engaged in exploration & production, refining & marketing and storage & transportation of oil & gas and coal & consumable fuels. The sector also includes companies that offer oil & gas equipment and services. The S&P Oil & Gas Exploration & Production Select Industry (“SPSIOP”) Index is a sub-index of the Energy Select Sector Index. The index comprises stocks in the S&P Total Market Index that are classified in the GICS oil & gas exploration & production sub-industry. The PHLX Oil Service Sector (“OSX”) Index is designed to track the performance of a set of companies involved in the oil services sector. Henry Hub is the U.S. benchmark for natural gas spot and futures pricing. West Texas Intermediate (“WTI”) is the U.S. benchmark for crude oil prices.
5Bloomberg Brent Spot Prices and 10/4/2019 Brent Futures Curve vs. 9/13/2019 Brent Futures Curve.
Indices are not managed and an investor cannot invest directly in an index.
6Brookfield Public Securities Group LLC
Center Coast Brookfield Energy Infrastructure Fund
AVERAGE ANNUAL TOTAL RETURNS
| Average Annual Total Returns for fiscal year ended September 30, 2019 | One Year† | Since Inception1 |
| Class Y Shares | -8.09% | -8.09% |
| S&P 500 Index2 | 4.25% | 4.25% |
| Alerian Midstream Energy Select Index3 | -0.06% | -0.06% |
† Returns for less than one year are not annualized.
1 Class Y Shares commenced operations on October 1, 2018.
2 The S&P 500 Index references Class Y's inception date.
3 The Alerian Midstream Energy Select Index references Class Y's inception date.
Performance data quoted represents past performance; past performance does not guarantee future results. The investment return and principal value of an investment will fluctuate so that an investor’s shares, when redeemed, may be worth more or less than their original cost. Current performance of the Funds may be lower or higher than the performance quoted. Performance data current to the most recent month end may be obtained by calling 855.244.4859.
Investment performance reflects fee waivers, expenses and reimbursements in effect. In the absence of such waivers, total return and NAV would be reduced.
The gross expense ratio in the prospectus dated January 28, 2019 is 4.00% for Class Y Shares, as applicable to investors.
The Fund’s gross and net expense ratios in the financial highlights of this report are as follows: Class Y is 6.17% and 1.25% for the fiscal year ended September 30, 2019.
The Adviser has contractually agreed to reimburse the Fund's expenses through October 1, 2020. There is no guarantee that such reimbursement will be continued after that date.
The graph below illustrates a hypothetical investment of $10,000 in the Fund—Class Y Shares from the commencement of investment operations on October 1, 2018 to September 30, 2019 compared to the Alerian Midstream Energy Select Index.
Center Coast Brookfield Energy Infrastructure Fund
Disclosure
The Fund’s portfolio holdings are subject to change without notice. The mention of specific securities is not a recommendation or solicitation for any person to buy, sell or hold any particular security. There is no assurance that the Fund currently holds these securities. Please refer to the Schedule of Investments contained in this report for a full listing of fund holdings.
Earnings growth is not a measure of the Fund’s future performance.
A Basis Point is one hundredth of one percent (0.01%). Cash flow refers to the amount of cash generated and used by a company over a given period.
Mutual fund investing involves risk. Principal loss is possible. Investing in Master Limited Partnerships (“MLPs”) involves additional risks as compared to the risks of investing in common stock, including risks related to cash flow, dilution and voting rights. The Fund’s investments are concentrated in the energy infrastructure industry with an emphasis on securities issued by MLPs, which may increase volatility. Energy infrastructure companies are subject to risks specific to the industry such as fluctuations in commodity prices, reduced volumes of natural gas or other energy commodities, environmental hazards, changes in the macroeconomic or the regulatory environment or extreme weather. MLPs may trade less frequently than larger companies due to their smaller capitalizations which may result in erratic price movement or difficulty in buying or selling. The Fund invests in small and mid-cap companies, which involve additional risks such as limited liquidity and greater volatility. Additional management fees and other expenses are associated with investing in MLPs. Additionally, investing in MLPs involves material income tax risks and certain other risks. Actual results, performance or events may be affected by, without limitation, (1) general economic conditions, (2) performance of financial markets, (3) interest rate levels, (4) changes in laws and regulations and (5) changes in the policies of governments and/or regulatory authorities. An investment in the Fund may not receive the same tax advantages as a direct investment in the MLP. This material is provided for general and educational purposes only, and is not intended to provide legal, tax or investment advice or to avoid legal penalties that may be imposed under U.S. federal tax laws. Investors should contact their own legal or tax advisors to learn more about the rules that may affect individual situations.
These views represent the opinions of Brookfield Public Securities Group LLC and are not intended to predict or depict the performance of any investment. These views are as of the close of business on September 30, 2019 and subject to change based on subsequent developments.
8Brookfield Public Securities Group LLC
Center Coast Brookfield Energy Infrastructure Fund
Portfolio Characteristics (Unaudited)
September 30, 2019
| Asset Allocation by Sector | Percent of
Total Investments |
| Master Limited Partnerships | |
| Pipeline Transportation | Natural Gas | 10.3% |
| Pipeline Transportation | Petroleum | 8.5% |
| Gathering + Processing | 6.1% |
| Total Master Limited Partnerships | 24.9% |
| Common Stocks | |
| Gathering + Processing | 36.6% |
| Pipeline Transportation | Petroleum | 17.3% |
| Pipeline Transportation | Natural Gas | 13.1% |
| Other | Liquefaction | 8.1% |
| Total Common Stocks | 75.1% |
| Total | 100.0% |
| TOP TEN HOLDINGS | Percent of
Net Assets |
| Williams Companies, Inc. | 9.0% |
| Targa Resources Corp. | 8.9% |
| Cheniere Energy, Inc. | 8.0% |
| Pembina Pipeline Corp. | 6.3% |
| ONEOK, Inc. | 6.1% |
| Enterprise Products Partners LP | 5.1% |
| Energy Transfer LP | 5.1% |
| Plains GP Holdings LP | 4.7% |
| MPLX LP | 4.6% |
| Equitrans Midstream Corp. | 4.5% |
Center Coast Brookfield Energy Infrastructure Fund
Schedule of Investments
September 30, 2019
| | | | Shares | Value |
| MASTER LIMITED PARTNERSHIPS – 24.8% | | | |
| Gathering + Processing – 6.1% | | | |
MPLX LP
| | | 7,482 | $209,571 |
Western Midstream Partners LP
| | | 2,772 | 68,995 |
| Total Gathering + Processing | | | | 278,566 |
| Pipeline Transportation | Natural Gas – 10.2% | | | |
Energy Transfer LP
| | | 18,000 | 235,440 |
Enterprise Products Partners LP
| | | 8,247 | 235,699 |
| Total Pipeline Transportation | Natural Gas | | | | 471,139 |
| Pipeline Transportation | Petroleum – 8.5% | | | |
Magellan Midstream Partners LP
| | | 2,176 | 144,204 |
Phillips 66 Partners LP
| | | 1,282 | 72,587 |
Plains All American Pipeline LP
| | | 8,319 | 172,619 |
| Total Pipeline Transportation | Petroleum | | | | 389,410 |
Total MASTER LIMITED PARTNERSHIPS
(Cost $1,188,630)
| | | | 1,139,115 |
| COMMON STOCKS – 74.4% | | | |
| Gathering + Processing – 36.3% | | | |
Altus Midstream Co. (n)
| | | 46,395 | 131,298 |
Antero Midstream Corp.
| | | 18,699 | 138,373 |
EnLink Midstream LLC
| | | 18,435 | 156,698 |
ONEOK, Inc.
| | | 3,818 | 281,348 |
Rattler Midstream LP (n)
| | | 7,637 | 136,091 |
Targa Resources Corp.
| | | 10,234 | 411,100 |
Williams Companies, Inc.
| | | 17,139 | 412,364 |
| Total Gathering + Processing | | | | 1,667,272 |
| Other | Liquefaction – 8.0% | | | |
Cheniere Energy, Inc. (n)
| | | 5,837 | 368,081 |
| Pipeline Transportation | Natural Gas – 13.0% | | | |
Equitrans Midstream Corp.
| | | 14,252 | 207,367 |
Kinder Morgan, Inc.
| | | 9,379 | 193,301 |
TC Energy Corp. (u)
| | | 3,793 | 196,439 |
| Total Pipeline Transportation | Natural Gas | | | | 597,107 |
| Pipeline Transportation | Petroleum – 17.1% | | | |
Enbridge, Inc. (u)
| | | 3,993 | 140,074 |
Pembina Pipeline Corp. (u)
| | | 7,784 | 288,553 |
Plains GP Holdings LP
| | | 10,181 | 216,143 |
Tallgrass Energy LP
| | | 7,041 | 141,806 |
| Total Pipeline Transportation | Petroleum | | | | 786,576 |
Total COMMON STOCKS
(Cost $3,643,749)
| | | | 3,419,036 |
Total Investments – 99.2%
(Cost $4,832,379)
| | | | 4,558,151 |
Other Assets in Excess of Liabilities – 0.8%
| | | | 38,716 |
TOTAL NET ASSETS – 100.0%
| | | | $4,596,867 |
See Notes to Financial Statements.
10Brookfield Public Securities Group LLC
Center Coast Brookfield Energy Infrastructure Fund
Schedule of Investments (continued)
September 30, 2019
| The following notes should be read in conjunction with the accompanying Schedule of Investments. |
| LP— Limited Partnership |
| LLC— Limited Liability Company |
| (n) | — Non-income producing security. |
| (u) | — Foreign security or a U.S. security of a foreign company. |
See Notes to Financial Statements.
CENTER COAST BROOKFIELD ENERGY INFRASTRUCTURE FUND
Statement of Assets and Liabilities
September 30, 2019
| Assets: | |
Investments in securities, at value (cost $4,832,379)
| $4,558,151 |
Cash
| 49,250 |
Dividends receivable
| 5,824 |
Net receivable from Adviser
| 21,491 |
Receivable for investments sold
| 3,983 |
Prepaid expenses
| 74 |
Total assets
| 4,638,773 |
| Liabilities: | |
Trustees' fee payable
| 1,368 |
Accrued expenses
| 40,538 |
Total liabilities
| 41,906 |
Commitments and contingencies (Note 8)
| |
Net Assets
| $4,596,867 |
| Composition of Net Assets: | |
Paid-in capital
| $5,013,542 |
Accumulated losses
| (416,675) |
Net assets applicable to capital shares outstanding
| $4,596,867 |
| Net Assets | |
| Class Y Shares — Net Assets | $4,596,867 |
Shares outstanding
| 501,693 |
Net asset value and redemption price per share
| $9.16 |
See Notes to Financial Statements.
12Brookfield Public Securities Group LLC
CENTER COAST BROOKFIELD ENERGY INFRASTRUCTURE FUND
Statement of Operations
For the Fiscal Year Ended September 30, 2019
| Investment Income: | |
Dividends and distributions from common stocks (net of foreign withholding tax of $6,143)
| $163,637 |
Distributions from master limited partnerships
| 121,691 |
Total dividends and distributions
| 285,328 |
Less return of capital distributions
| (194,228) |
Total investment income
| 91,100 |
| Expenses: | |
Investment advisory fees (Note 3)
| 46,494 |
Administration fees (Note 3)
| 6,974 |
Organizational fees
| 138,112 |
Audit and tax services
| 33,216 |
Trustees' fees
| 17,932 |
Reports to shareholders
| 15,483 |
Legal fees
| 11,200 |
Custodian fees
| 6,581 |
Miscellaneous
| 4,389 |
Transfer agent fees
| 3,594 |
Fund accounting fees
| 2,276 |
Registration fees
| 650 |
Insurance
| 187 |
Interest expense
| 7 |
Total operating expenses
| 287,095 |
Less expenses reimbursed by the investment adviser (Note 3)
| (228,978) |
Net expenses
| 58,117 |
Net investment income
| 32,983 |
| Realized and Unrealized Gain (Loss): | |
Net realized gain (loss) on:
| |
Investments
| (161,941) |
Foreign currency transactions
| 37 |
Net realized loss
| (161,904) |
Net change in unrealized (appreciation) depreciation on:
| |
Investments
| (274,228) |
Foreign currency translations
| 16 |
Net change in unrealized depreciation
| (274,212) |
Net realized and unrealized loss
| (436,116) |
Net decrease in net assets resulting from operations
| $(403,133) |
See Notes to Financial Statements.
CENTER COAST BROOKFIELD ENERGY INFRASTRUCTURE FUND
Statements of Changes in Net Assets
| | For the
Fiscal Year
Ended
September 30,
2019 |
| Increase (Decrease) in Net Assets Resulting from Operations: | |
Net investment income
| $32,983 |
Net realized loss
| (161,904) |
Net unrealized depreciation
| (274,212) |
Net decrease in net assets resulting from operations
| (403,133) |
| Distributions to Shareholders: | |
| From distributable earnings: | |
Class Y shares
| (13,542) |
Total distributions paid
| (13,542) |
| Capital Share Transactions (Note 6): | |
Subscriptions
| 5,000,000 |
Reinvestment of distributions
| 13,542 |
Net increase in capital share transactions
| 5,013,542 |
Total increase in net assets
| 4,596,867 |
| Net Assets: | |
Beginning of year
| — |
End of year
| $4,596,867 |
See Notes to Financial Statements.
14Brookfield Public Securities Group LLC
Center Coast Brookfield Energy Infrastructure Fund
Financial Highlights
| Class Y | For the
Fiscal Year
Ended
September 30,
2019 |
| Per Share Operating Performance: | |
Net asset value, beginning of period
| $10.00 |
Net investment income1
| 0.07 |
Net realized and unrealized gain (loss)1
| (0.88) |
Net increase (decrease) in net asset value resulting from operations
| (0.81) |
Distributions from distributable earnings
| (0.03) |
Net asset value, end of period
| $9.16 |
| Total Investment Return† | -8.09% |
| Ratios to Average Net Assets/Supplementary Data: | |
Net assets, end of period (000s)
| $4,597 |
Gross operating expenses
| 6.17% |
| Net expenses, including fee waivers and reimbursement and exlcuding organizational fees | 3.20% |
Net expenses, including fee waivers and reimbursement
| 1.25% |
Net investment income
| (4.21)% |
Net investment income, excluding the effect of fee waivers and reimbursement
| 0.71% |
Portfolio turnover rate
| 96% |
| † | Total investment return is computed based upon the net asset value of the Fund’s shares and excludes the effects of sales charges or contingent deferred sales charges, if applicable. Distributions are assumed to be reinvested at the net asset value of the Class on the ex-date of the distribution. |
| 1 | Per share amounts presented are based on average shares outstanding throughout the period indicated. |
See Notes to Financial Statements.
CENTER COAST BROOKFIELD ENERGY INFRASTRUCTURE FUND
Notes to Financial Statements
September 30, 2019
1.Organization
Brookfield Investment Funds, a Delaware statutory trust (the “Trust”), is registered as an open-end management investment company under the under the Investment Company Act of 1940, as amended (the “1940 Act”). The Trust consists of seven different series of underlying portfolios as of September 30, 2019. Center Coast Brookfield Energy Infrastructure Fund (the “Fund”), a series of the Trust, is non-diversified as the term is defined in the 1940 Act. The Fund's Class Y Shares commenced operations on October 1, 2018. Shares of the Fund are not offered for sale as of the date of this report. As of September 30, 2019, Brookfield Public Securities Group LLC (the “Adviser”) owns Class Y shares in the Fund.
The Fund currently has four classes of shares: Class A, Class C, Class Y and Class I shares. Each class represents an interest in the same portfolio of assets and has identical voting, dividend, liquidation and other rights except that: (i) Class A shares have a maximum front end sales charge of 4.75% and Class C shares have a maximum deferred sales charge of 1.00%; (ii) Class A shares have a 12b-1 fee of 0.25% and Class C shares have a 12b-1 fee of 1.00%; and (iii) each class has exclusive voting rights with respect to matters relating to its own distribution arrangements. Currently, the Fund is not publicly offering any share class to investors.
The Adviser, a wholly-owned subsidiary of Brookfield Asset Management Inc., is registered as an investment adviser under the Investment Advisers Act of 1940, as amended, and serves as investment adviser to the Fund.
The Fund’s primary investment objective is to seek total return through growth of capital and current income. The Fund's investment objective is not fundamental and may be changed by the Trust's Board of Trustees (the “Board”) without shareholder approval, upon not less than 60 days prior written notice to shareholders. There can be no assurance that the Fund will achieve its investment objective.
2.Significant Accounting Policies
The preparation of financial statements in conformity with accounting principles generally accepted in the United States of America (“GAAP”) requires management to make estimates and assumptions that affect the reported amounts of assets and liabilities and disclosure of contingent assets and liabilities at the date of the financial statements and the reported amounts of increases and decreases in net assets from operations during the reporting period. Actual results could differ from those estimates. The Fund is an investment company within the scope of Financial Accounting Standards Board (“FASB”) Accounting Standards Update (“ASU”) 2013-08 and follows accounting and reporting guidance under FASB Accounting Standards Codification (“ASC”) Topic 946,Financial Services-Investment Companies.
Valuation of Investments:The Fund’s Board has adopted procedures for the valuation of the Fund’s securities. The Adviser oversees the day to day responsibilities for valuation determinations under these procedures. The Board regularly reviews the application of these procedures to the securities in the Fund’s portfolio. The Adviser’s Valuation Committee is comprised of senior members of the Adviser’s management team. There can be no assurance that the Fund could purchase or sell a portfolio security at the price used to calculate the Fund’s net asset value (“NAV”).
Investments in equity securities listed or traded on any securities exchange or traded in the over-the-counter market are valued at the last trade price as of the close of business on the valuation date. Prices of foreign equities that are principally traded on certain foreign markets will generally be adjusted daily pursuant to a fair value pricing service approved by the Board in order to reflect an adjustment for the factors occurring after the close of certain foreign markets but before the NYSE Close. When fair value pricing is employed, the value of the portfolio securities used to calculate the Fund’s NAV may differ from quoted or official closing prices. Investments in open-end registered investment companies, if any, are valued at the NAV as reported by those investment companies.
16Brookfield Public Securities Group LLC
CENTER COAST BROOKFIELD ENERGY INFRASTRUCTURE FUND
Notes to Financial Statements (continued)
September 30, 2019
Debt securities, including U.S. government securities, listed corporate bonds, other fixed income and asset-backed securities, and unlisted securities and private placement securities, are generally valued at the bid prices furnished by an independent pricing service or, if not valued by an independent pricing service, using bid prices obtained from active and reliable market makers in any such security or a broker-dealer. The broker-dealers or pricing services use multiple valuation techniques to determine fair value. In instances where sufficient market activity exists, the broker-dealers or pricing services may utilize a market-based approach through which quotes from market makers are used to determine fair value. In instances where sufficient market activity may not exist or is limited, the broker-dealers or pricing services may also utilize proprietary valuation models which may consider market transactions in comparable securities and the various relationships between securities in determining fair value and/or market characteristics such as benchmark yield curves, option-adjusted spreads, credit spreads, estimated default rates, coupon-rates, anticipated timing of principal repayments, underlying collateral, and other unique security features in order to estimate the relevant cash flows, which are then discounted to calculate the fair values. Short-term debt securities with remaining maturities of sixty days or less are valued at amortized cost of discount or premium to maturity, unless such valuation, in the judgment of the Adviser's Valuation Committee, does not represent fair value.
Securities for which market prices are not readily available or which cannot be valued using the sources described above will be valued using an internal proprietary fair value methodology. For any security warranting such fair value measurement, a memorandum, including the specific methodology and supporting information, will be provided to the Valuation Committee by a portfolio manager or analyst looking to fair value a particular security utilizing the internal proprietary fair value methodology. A portfolio manager or analyst shall use their best efforts to maximize the use of relevant observable inputs and minimize the use of unobservable inputs within their valuation technique. The Valuation Committee shall review the memorandum and supporting information provided by a portfolio manager or analyst and consider all relevant factors as it deems appropriate before approving the fair value recommendation.
The Fund may use the internally determined fair value of a security to calculate its NAV when, for example, (1) a portfolio security is not traded in a public market or the principal market in which the security trades is closed, (2) trading in a portfolio security is suspended and not resumed prior to the normal market close, (3) a portfolio security is not traded in significant volume for a substantial period, or (4) the Adviser determines that the quotation or price for a portfolio security provided by a broker-dealer or an independent pricing service is inaccurate.
The internally determined fair value of securities may be difficult to determine and thus judgment plays a greater role in the valuation process. The fair valuation methodology may include or consider the following guidelines, as appropriate: (1) evaluation of all relevant factors, including, but not limited to, pricing history, current market level, supply and demand of the respective security; (2) comparison to the values and current pricing of securities that have comparable characteristics; (3) knowledge of historical market information with respect to the security; (4) other factors relevant to the security which would include, but not be limited to, duration, yield, fundamental analytical data, the Treasury yield curve, and credit quality.
The values assigned to internally fair valued investments are based on available information and do not necessarily represent amounts that might ultimately be realized, since such amounts depend on future developments inherent in investments. Changes in the fair valuation of portfolio securities may be less frequent and of greater magnitude than changes in the price of portfolio securities valued at their last sale price, by an independent pricing service, or based on market quotations. Imprecision in estimating fair value can also impact the amount of unrealized appreciation or depreciation recorded for a particular portfolio security and differences in the assumptions used could result in a different determination of fair value, and those differences could be material.
The Fund has established methods of fair value measurements in accordance with GAAP. Fair value denotes the price that the Fund would receive upon selling an investment in a timely transaction to an independent buyer in the principal or most advantageous market of the investment. A three-tier hierarchy has been established to maximize the use of observable market data and minimize the use of unobservable inputs and to establish classification of
CENTER COAST BROOKFIELD ENERGY INFRASTRUCTURE FUND
Notes to Financial Statements (continued)
September 30, 2019
fair value measurements for disclosure purposes. Inputs refer broadly to the assumptions that market participants would use in pricing the asset or liability, including assumptions about risk, for example, the risk inherent in a particular valuation technique used to measure fair value including such a pricing model and/or the risk inherent in the inputs to the valuation technique. Inputs may be observable or unobservable. Observable inputs are inputs that reflect the assumptions market participants would use in pricing the asset or liability developed based on market data obtained from sources independent of the reporting entity. Unobservable inputs are inputs that reflect the reporting entity’s own assumptions about the assumptions market participants would use in pricing the asset or liability developed based on the best information available in the circumstances. The three-tier hierarchy of inputs is summarized in the three broad levels listed below.
| Level 1 - | quoted prices in active markets for identical assets or liabilities |
| Level 2 - | quoted prices in markets that are not active or other significant observable inputs (including, but not limited to: quoted prices for similar assets or liabilities, quoted prices based on recently executed transactions, interest rates, credit risk, etc.)
|
| Level 3 - | significant unobservable inputs (including the Fund’s own assumptions in determining the fair value of assets or liabilities) |
The Adviser’s valuation policy, as previously stated, establishes parameters for the sources and types of valuation analysis, as well as, the methodologies and inputs the Valuation Committee uses in determining fair value. If the Valuation Committee determines that additional techniques, sources or inputs are appropriate or necessary in a given situation, such additional work will be undertaken.
To assess the continuing appropriateness of security valuations, the Adviser (or its third party service provider, who is subject to oversight by the Adviser), regularly compares its prior day prices, prices on comparable securities and sale prices to the current day prices and challenges those prices that exceed certain tolerance levels with the third party pricing service or broker source. For those securities valued by fair valuations, the Adviser’s Valuation Committee reviews and affirms the reasonableness of the valuations based on such methodologies and fair valuation determinations on a regular basis after considering all relevant information that is reasonably available.
The inputs or methodology used for valuing investments are not necessarily an indication of the risk associated with investing in those securities.
The following table summarizes the Fund’s investments valuation inputs categorized in the disclosure hierarchy as of September 30, 2019:
| Valuation Inputs | Level 1 | | Level 2 | | Level 3 | | Total |
Common Stocks
| $3,419,036 | | $— | | $— | | $3,419,036 |
Master Limited Partnerships
| 1,139,115 | | — | | — | | 1,139,115 |
Total Investments
| $4,558,151 | | $— | | $— | | $4,558,151 |
For further information regarding security characteristics, see the Schedule of Investments.
Investment Transactions and Investment Income: Securities transactions are recorded on the trade date. Realized gains and losses from securities transactions are calculated on the identified cost basis. Interest income is recorded on the accrual basis. Discounts and premiums on securities are accreted and amortized, respectively, on a daily basis, using the effective yield to maturity method adjusted based on management’s assessment of the collectability of such interest. Dividend income is recorded on the ex-dividend date.
Master Limited Partnerships: A master limited partnership (“MLP”) is an entity receiving partnership taxation treatment under the U.S. Internal Revenue Code of 1986 (the “Code”), the partnership interests or “units” of which
18Brookfield Public Securities Group LLC
CENTER COAST BROOKFIELD ENERGY INFRASTRUCTURE FUND
Notes to Financial Statements (continued)
September 30, 2019
are traded on securities exchanges like shares of corporate stock. Holders of MLP units generally have limited control and voting rights on matters affecting the partnership.
The Fund invests in MLPs, which generally are treated as partnerships for federal income tax purposes. If an MLP does not meet current legal requirements to maintain partnership status, or if it is unable to do so because of tax law changes, it would be taxed as a corporation or other form of taxable entity and there could be a material decrease in the value of its securities. Additionally, if tax law changes to eliminate or reduce tax deductions such as depletion, depreciation and amortization expense deductions that MLPs have been able to use to offset a significant portion of their taxable income, it could significantly reduce the value of the MLPs held by the Fund and could cause a greater portion of the income and gain allocated to the Fund to be subject to U.S. federal, state and local corporate income taxes, which would reduce the amount the Fund can distribute to shareholders and could increase the percentage of Fund distributions treated as dividends instead of tax-deferred return of capital.
Depreciation or other cost recovery deductions passed through to the Fund from investments in MLPs in a given year generally will reduce the Fund’s taxable income (and earnings and profits), but those deductions may be recaptured in the Fund’s taxable income (and earnings and profits) in subsequent years when the MLPs dispose of their assets or when the Fund disposes of its interests in the MLPs. When deductions are recaptured, distributions to the Fund’s shareholders may be taxable.
Return of Capital Estimates:A distribution received from the Fund’s investments in MLPs generally is comprised of income and return of capital. The Fund records investment income and return of capital based on estimates made at the time such distributions are received. Such estimates are based on historical information available from each MLP and other industry sources. These estimates may subsequently be revised based on information received from MLPs after their tax reporting periods are concluded. For the fiscal year ended September 30, 2019, the Fund estimated that 100% of the MLP distributions received would be treated as return of capital.
Expenses: Expenses directly attributable to the Fund are charged directly to the Fund, while expenses which are attributable to the Fund and other investment companies advised by the Adviser are allocated among the respective investment companies, including the Fund, based upon relative average net assets, evenly or a combination of average net assets and evenly.
Distributions to Shareholders: The Fund’s dividend distribution policy is intended to provide monthly distributions to its common shareholders at a rate that over time is similar to the distribution rate the Fund receives from the MLPs in which it invests, without offset for the expenses of the Fund. The Fund is not required to make such distributions and therefore the amount, if any, and/or the frequency of payment is subject to change. The amount of the Fund’s distributions is based on, among other considerations, distributions the Fund actually receives from portfolio investments, including returns of capital, and estimated future cash flows. Because the Fund’s distribution policy takes into consideration estimated future cash flows from its underlying holdings, and to permit the Fund to maintain a stable distribution rate, the Fund’s distributions may exceed, or be below the amount the Fund actually receives from its portfolio investments. Additionally, since the Fund’s distribution rate is not derived from the Fund’s investment income or loss, the Fund’s distributions may not represent yield or investment return on the Fund’s portfolio. To the extent that the distributions paid exceed the distributions the Fund has received, the distributions will reduce the Fund’s net assets. Consequently, the Fund may maintain cash reserves, borrow or may be required to sell certain investments at times when it would not otherwise be desirable to do so in order to pay the expenses of the Fund. The Fund is not required to make such distributions and, as a result, the Fund could in the future decide not to make such distributions or not to make distributions at a rate that over time is similar to the distribution rate that it receives from the MLPs in which it invests. Furthermore, unlike the MLPs in which it invests, the Fund is not a pass through entity. Consequently, the tax characterization of the distributions paid by the Fund, as dividend income or return of capital, may differ greatly from those of the underlying MLPs.
Distributions, if any, are declared and distributed monthly. The estimated characterization of the distributions paid will be either a dividend (ordinary or qualified income) or distribution (return of capital). This estimate is based on the Fund’s operating results during the period. It is anticipated that a portion of its distributions will be comprised of
CENTER COAST BROOKFIELD ENERGY INFRASTRUCTURE FUND
Notes to Financial Statements (continued)
September 30, 2019
return of capital as a result of the tax character of cash distributions made by the Fund’s investments. The actual characterization of the distributions made during the period will not be determined until after the end of the fiscal year. For the fiscal year ended September 30, 2019, the Fund estimates that its distributions will be largely characterized as return of capital. The Fund will inform shareholders of the final tax character of the distributions on IRS Form DIV in February 2020.
The portion of the Fund’s distributions that may be classified as return of capital is uncertain and can be materially impacted by events that are not subject to the control of the Fund’s Adviser (e.g., mergers, acquisitions, reorganizations and other capital transactions occurring at the individual MLP level, changes in the tax characterization of distributions received from the MLP investments held by the Fund, changes in tax laws, etc.). The return of capital portion may also be impacted by the Fund’s strategy, which may recognize gains on its holdings. Because of these factors, the portion of the Fund’s distributions that are classified as return of capital may vary materially from year to year. Accordingly, there is no guarantee that future distributions will maintain the same classification for tax purposes as past distributions.
The distributions are determined in accordance with federal income tax regulations and are recorded on the ex-dividend date. The character may differ from GAAP. These differences between book-basis and tax-basis are either considered temporary or permanent in nature. To the extent these differences are permanent in nature, such amounts are reclassified within the composition of net assets based on their federal tax-basis treatment; temporary differences do not require reclassification.
Energy Industry Concentration Risk: A substantial portion of the MLPs in which the Fund invests are engaged primarily in the energy industry. As a result, the Fund will be concentrated in the energy industry, and will therefore be susceptible to adverse economic, environmental or regulatory occurrences effecting the energy industry.
New Accounting Pronouncements: In August 2018, FASB issued ASU 2018-13, Fair Value Measurement (Topic 820): Disclosure Framework — Changes to the Disclosure Requirements for Fair Value Measurement. The primary focus of ASU 2018-13 is to improve the effectiveness of the disclosure requirements for fair value measurements. In general, the amendments in ASU 2018-13 are effective for all entities for fiscal years and interim periods within those fiscal years, beginning after December 15, 2019. An entity is permitted to early adopt upon the issuance of ASU 2018-13. Management has implemented the amendments and there was no material impact on the Fund’s financial statements.
3.Investment Advisory Agreement and Related Party Transactions
The Fund has entered into an investment advisory agreement (the “Advisory Agreement”) with the Adviser under which the Adviser is responsible for the management of the Fund’s portfolio and provides the necessary personnel, facilities, equipment and certain other services necessary to the operations of the Fund. The Advisory Agreement provides that the Fund shall pay the Adviser a fee, computed daily and payable monthly, at an annual rate of 1.00% of the Fund’s average daily net assets.
Pursuant to operating expense limitation agreement (the “Expense Limitation Agreement”), the Adviser has contractually agreed to waive all or a portion of its investment advisory or administration fees, as presented above, and/or to reimburse certain expenses of the Fund to the extent necessary to maintain the Fund’s total annual operating expenses after fee waiver and/or expense reimbursement (excluding any front-end or contingent deferred charges, brokerage commissions and other transactional expenses, acquired fund fees and expenses, interest, taxes, and extraordinary expenses, such as litigation; and other expenses not incurred in the ordinary course of a Fund’s business) at no more than 1.50% for Class A Shares, 2.25% for Class C Shares, 1.25% for Class I Shares and 1.25% for Class Y Shares. The Expense Limitation Agreement will continue until at least October 1, 2020 and may not be terminated by the Fund or the Adviser before such time. Thereafter, the Expense Limitation Agreement may only be terminated or amended to increase the expense cap as of October 1st of each calendar year, provided that in the case of a termination by the Adviser, the Adviser will provide the Board with written notice of its intention to terminate the arrangement prior to the expiration of its then current term. Pursuant
20Brookfield Public Securities Group LLC
CENTER COAST BROOKFIELD ENERGY INFRASTRUCTURE FUND
Notes to Financial Statements (continued)
September 30, 2019
to the Expense Limitation Agreement, any waivers and/or reimbursements made by the Adviser are subject to recoupment from the Fund for a period not to exceed three years after the occurrence of the waiver and/or reimbursement, provided that the Fund is able to effect such payment to the Adviser and remain in compliance with the expense cap in effect at the time the waivers and/or reimbursements occurred.
The amount of investment advisory fees waived and/or expenses reimbursed available to be recouped before expiration is $228,978 for fiscal year ended September 30, 2019. For the fiscal year ended September 30, 2019, the Adviser did not recoup any expenses.
The Fund has entered into an Administration Agreement with the Adviser and the Adviser has entered into a sub-administration agreement with U.S. Bancorp Fund Services, LLC (“Sub-Administrator”). The Adviser and Sub-Administrator perform administrative services necessary for the operation of the Fund, including maintaining certain books and records of the Fund and preparing reports and other documents required by federal, state, and other applicable laws and regulations, and providing the Fund with administrative office facilities. For these services, the Fund pays to the Adviser a monthly fee at an annual rate of 0.15% of the Fund’s average daily net Assets. The Adviser is responsible for any fees due to the Sub-Administrator.
Certain officers and/or trustees of the Trust are officers and/or employees of the Adviser.
4.Purchases and Sales of Investments
For the fiscal year ended September 30, 2019, purchases and sales of investments, excluding short-term investments were $9,505,951 and $4,317,071, respectively.
5.Shares of Beneficial Interest
The Trust’s Declaration of Trust authorizes the issuance of an unlimited number of full and fractional shares of beneficial interest. With respect to each series, the Trust may offer more than one class of shares. The Trust reserves the right to create and issue additional series or classes. Each share of a series or class represents an equal proportionate interest in that series or class with each other share of that series or class.
The shares of each series or class participate equally in the earnings, dividends and assets of the particular series or class.
| | 20191 |
| Class Y | Shares | | Amount |
Subscriptions
| 500,000 | | $5,000,000 |
Reinvestment of distributions
| 1,693 | | 13,542 |
Redemptions
| — | | — |
Net Increase
| 501,693 | | $5,013,542 |
1 For the Fiscal Year Ended September 30, 2019.
6.Credit Facility
U.S. Bank, N.A. (the “Bank”) has made available to the Trust, a credit facility, pursuant to a separate Loan and Security Agreement, for temporary or extraordinary purposes. The maximum line of credit as of September 30, 2019 for the Trust is $75,000,000. Advances are not collateralized by a first lien against the Fund’s assets. For fiscal year ended September 30, 2019, the average interest rate on the outstanding principal amount for the Fund was 5.00%.
CENTER COAST BROOKFIELD ENERGY INFRASTRUCTURE FUND
Notes to Financial Statements (continued)
September 30, 2019
During the fiscal year ended September 30, 2019, the Fund utilized the credit facility for 1 day and had an outstanding average daily loan balance of $16,000. The maximum amount outstanding during the period was $16,000 and the interest expense amounted to $7. At of September 30, 2019, the Fund did not have an amount outstanding on the credit facility.
7.Federal Income Tax Information
The Fund intends to continue to meet the requirements of the Internal Revenue Code of 1986, as amended, applicable to regulated investment companies and to distribute substantially all of its taxable income to its shareholders. Therefore, no federal income or excise tax provision is required. The Fund may incur an excise tax to the extent it has not distributed all of its taxable income on a calendar year basis.
GAAP provides guidance for how uncertain tax positions should be recognized, measured, presented and disclosed in the financial statements. An evaluation of tax positions taken in the course of preparing the Funds’ tax returns to determine whether the tax positions are “more-likely-than-not” of being sustained by the taxing authority is required. Tax benefits of positions not deemed to meet the more-likely-than-not threshold would be booked as a tax expense in the current year and recognized as: a liability for unrecognized tax benefits; a reduction of an income tax refund receivable; a reduction of a deferred tax asset; an increase in a deferred tax liability; or a combination thereof. As of September 30, 2019, The Fund has determined that there are no uncertain tax positions or tax liabilities required to be accrued.
The Fund has reviewed the taxable year open for examination (i.e. not barred by the applicable statute of limitations) by taxing authorities of all major jurisdictions, including the Internal Revenue Service. As of September 30, 2019, open taxable year consisted of the taxable period from October 1, 2018 (commencement of operations) to September 30, 2019. No examination of the Funds’ tax returns is currently in progress.
Income and capital gain distributions are determined in accordance with federal income tax regulations, which may differ from GAAP.
The tax character of distribution paid of $13,542 for the year ended September 30, 2019 was from ordinary income (including short-term capital gains).
At September 30, 2019, the Fund’s most recently completed tax year-end, the components of net assets (excluding paid-in capital) on a tax basis were as follows:
Capital loss carryforward(1)
| $(11,947) |
Undistributed ordinary income
| 51,024 |
Other accumulated losses
| (61,055) |
Tax basis unrealized depreciation on investments and foreign currency
| (394,697) |
Total Tax basis net accumulated losses
| $(416,675) |
(1) To the extent that future capital gains are offset by capital loss carryforwards, such gains will not be distributed.
As of September 30, 2019, the Fund’s capital loss carryforwards was $11,947 from short-term capital gains which will not expire.
Federal Income Tax Basis: The federal income tax basis of the Fund’s investments, not including foreign currency translation, at September 30, 2019 was as follows:
| Cost of Investments | Gross Unrealized Appreciation | Gross Unrealized Depreciation | Net Unrealized Appreciation |
$4,952,848
| $206,978 | $(601,675) | $(394,697) |
22Brookfield Public Securities Group LLC
CENTER COAST BROOKFIELD ENERGY INFRASTRUCTURE FUND
Notes to Financial Statements (continued)
September 30, 2019
Capital Account Reclassifications: Because federal income tax regulations differ in certain respects from GAAP, income and capital gain distributions, if any, determined in accordance with tax regulations may differ from net investment income and realized gains recognized for financial reporting purposes. These differences are primarily due to differing treatments for wash sales, partnership income/expense and return of capital. Permanent book and tax differences, if any, relating to shareholder distributions will result in reclassifications to paid-in-capital or to undistributed capital gains. These reclassifications have no effect on net assets or NAV per share.
At September 30, 2019, the Fund’s most recently completed tax year-end, the Fund’s components of net assets were increased or (decreased) by (29,472) and 29,472 for distributions in excess of net investment income and accumulated net realized loss, respectively.
8.Indemnification
Under the Fund’s organizational documents, its officers and directors are indemnified against certain liabilities arising out of the performance of their duties to the Fund. In addition, in the normal course of business, the Fund enters into contracts with its vendors and others that provide for indemnification. The Fund’s maximum exposure under these arrangements is unknown, since this would involve the resolution of certain claims, as well as future claims that may be made, against the Fund. Thus, an estimate of the financial impact, if any, of these arrangements cannot be made at this time. However, based on experience, the Fund expects the risk of loss due to these warranties and indemnities to be unlikely.
9.Subsequent Events
GAAP requires recognition in the financial statements of the effects of all subsequent events that provide additional evidence about conditions that existed at the date of the Statement of Assets and Liabilities. For non-recognized subsequent events that must be disclosed to keep the financial statements from being misleading, the Fund is required to disclose the nature of the event as well as an estimate of its financial effect, or a statement that such an estimate cannot be made.
Management has evaluated subsequent events in the preparation of the Fund’s financial statements and has determined that herein, there are no additional events that require recognition or disclosure in the financial statements.
CENTER COAST BROOKFIELD ENERGY INFRASTRUCTURE FUND
Report of Independent Registered Public Accounting Firm
September 30, 2019
To the shareholders of Center Coast Brookfield Energy Infrastructure Fund and the Board of Trustees of Brookfield Investment Funds
Opinion on the Financial Statements and Financial Highlights
We have audited the accompanying statement of assets and liabilities of Center Coast Brookfield Energy Infrastructure Fund (the “Fund”), a series of the Brookfield Investment Trust, including the schedule of investments, as of September 30, 2019, the related statements of operations and changes in net assets and the financial highlights for the year then ended, and the related notes. In our opinion, the financial statements and financial highlights present fairly, in all material respects, the financial position of the Fund as of September 30, 2019, and the results of its operations, changes in its net assets, and the financial highlights for the year ended September 30, 2019, in conformity with accounting principles generally accepted in the United States of America.
Basis for Opinion
These financial statements and financial highlights are the responsibility of the Fund’s management. Our responsibility is to express an opinion on the Fund’s financial statements and financial highlights based on our audit. We are a public accounting firm registered with the Public Company Accounting Oversight Board (United States) (PCAOB) and are required to be independent with respect to the Fund in accordance with the U.S. federal securities laws and the applicable rules and regulations of the Securities and Exchange Commission and the PCAOB.
We conducted our audit in accordance with the standards of the PCAOB. Those standards require that we plan and perform the audit to obtain reasonable assurance about whether the financial statements and financial highlights are free of material misstatement, whether due to error or fraud. The Fund is not required to have, nor were we engaged to perform, an audit of its internal control over financial reporting. As part of our audit we are required to obtain an understanding of internal control over financial reporting but not for the purpose of expressing an opinion on the effectiveness of the Fund’s internal control over financial reporting. Accordingly, we express no such opinion.
Our audit included performing procedures to assess the risks of material misstatement of the financial statements and financial highlights, whether due to error or fraud, and performing procedures that respond to those risks. Such procedures included examining, on a test basis, evidence regarding the amounts and disclosures in the financial statements and financial highlights. Our audit also included evaluating the accounting principles used and significant estimates made by management, as well as evaluating the overall presentation of the financial statements and financial highlights. Our procedures included confirmation of securities owned as of September 30, 2019, by correspondence with the custodian and brokers. We believe that our audit provides a reasonable basis for our opinion.
DELOITTE & TOUCHE LLP
Chicago, Illinois
November 27, 2019
We have served as the auditor of one or more of Brookfield Public Securities Group LLC's investment companies since 2011.
24Brookfield Public Securities Group LLC
CENTER COAST BROOKFIELD ENERGY INFRASTRUCTURE FUND
Tax Information
September 30, 2019
QUALIFIED DIVIDEND INCOME/DIVIDENDS RECEIVED DEDUCTION
For the fiscal year ended September 30, 2019, certain dividends paid by the Funds may be subject to a maximum tax rate of 15%, as provided for by the Jobs and Growth Tax Relief Reconciliation Act of 2003. The percentage of dividends declared from ordinary income designated as qualified dividend income was 100.00%.
For corporate shareholders, the percentage of ordinary distributions qualifying for the corporate dividends received deductions for the year ended September 30, 2019 was 100.00%.
The percentage of taxable ordinary income distributions that are designated as short-term capital gain distributions under the Internal Revenue Section 871(k)(2)(C) for each Fund was 0.00%.
CENTER COAST BROOKFIELD ENERGY INFRASTRUCTURE FUND
Information Concerning Trustees and Officers (Unaudited)
September 30, 2019
The following tables provide information concerning the trustees and officers of the Fund.
Trustees of the Fund
| Name, Address and Year of Birth | Position(s) Held with Funds | Principal Occupation(s) During Past 5 Years and Other Directorships Held by Director | Number of Portfolios in Fund Complex |
| Independent Trustees | | | |
Edward A. Kuczmarski
c/o Brookfield Place,
250 Vesey Street,
New York, New York
10281-1023
Born: 1949 | Trustee and Independent Chairman of the Board, Member of the Audit Committee, Chairman of the Nominating and Compensation Committee
Served Since 2018 | Director/Trustee of several investment companies advised by the Adviser (2011-Present); Certified Public Accountant and Retired Partner of Crowe Horwath LLP (1980-2013); Trustee of the Empire Builder Tax Free Bond Fund (1984-2013); Director of ISI Funds (2007-2015); Trustee of the Daily Income Fund (2006-2015), Director of the California Daily Tax Free Income Fund, Inc. (2006-2015); Trustee of the Stralem Funds (2014-2016). | 10 |
Stuart A. McFarland
c/o Brookfield Place,
250 Vesey Street,
New York, New York
10281-1023
Born: 1947 | Trustee, Member of the Audit Committee, Member of the Nominating and Compensation Committee
Served Since 2018 | Director/Trustee of several investment companies advised by the Adviser (2006-Present); Director of United Guaranty Corporation (2011-2016); Director of Brandywine Funds (2003-2013); Director of Drive Shack Inc. (formerly, Newcastle Investment Corp.) (2000-Present); Managing Partner of Federal City Capital Advisors (1997-Present); Director of New America High Income Fund (2013-Present); Director of New Senior Investment Group, Inc. (2014-Present). | 10 |
Louis P. Salvatore
c/o Brookfield Place,
250 Vesey Street,
New York, New York
10281-1023
Born: 1946 | Trustee, Chairman of the Audit Committee, Member of the Nominating and Compensation Committee
Served Since 2018 | Director/Trustee of several investment companies advised by the Adviser (2005-Present); Director of SP Fiber Technologies, Inc. (2012-2015); Director of Gramercy Property Trust (2012-2018); Director of Turner Corp. (2003-Present); Employee of Arthur Andersen LLP (2002-Present). | 10 |
Heather S. Goldman
c/o Brookfield Place,
250 Vesey Street,
New York, New York
10281-1023
Born: 1967 | Trustee, Member of the Audit Committee, Member of the Nominating and Compensation Committee
Served Since 2018 | Director/Trustee of several investment companies advised by the Adviser (2013-Present); Global Head of Marketing and Business Development of the Adviser (2011-2013); Director and Board Chair of University Settlement House (2003-2013); Member of the Honorary Board of University Settlement House (2014-Present); Co-Founder & CEO of Capstak, Inc. (2014-2018); Chairman of Capstak, Inc. (2016-2018). | 10 |
26Brookfield Public Securities Group LLC
CENTER COAST BROOKFIELD ENERGY INFRASTRUCTURE FUND
Information Concerning Trustees and Officers (Unaudited) (continued)
September 30, 2019
| Name, Address and Year of Birth | Position(s) Held with Funds | Principal Occupation(s) During Past 5 Years and Other Directorships Held by Director | Number of Portfolios in Fund Complex |
| Interested Trustee | | | |
David Levi
c/o Brookfield Place,
250 Vesey Street,
New York, New York
10281-1023
Born: 1971 | Trustee
Served since 2018 | Director/Trustee of several investment companies advised by the Adviser (2017-Present); Chief Executive Officer of the Adviser (2019-Present); President of the Adviser (2016-2019); Managing Director and Head of Distribution of the Adviser (2014-2016); Managing Partner of Brookfield Asset Management Inc. (2015-Present); Managing Director and Head of Global Business Development at Nuveen Investments (2009-2014). | 10 |
CENTER COAST BROOKFIELD ENERGY INFRASTRUCTURE FUND
Information Concerning Trustees and Officers (Unaudited) (continued)
September 30, 2019
Officers of the Fund
| Name, Address and Year of Birth | Position(s) Held with Funds | Term of Office and Length of Time Served | Principal Occupation(s) During Past 5 Years |
Brian F. Hurley*
c/o Brookfield Place,
250 Vesey Street,
New York, New York
10281-1023
Born: 1977 | President | Served since 2018 | President of several investment companies advised by the Adviser (2014-Present); General Counsel of the Adviser (2017-Present); Managing Director (2014-Present), Assistant General Counsel (2010-2017) and Head of Legal and Funds (April 2017-October 2017) of the Adviser; Director of the Adviser (2010-2014); Corporate Secretary of Brookfield Investment Management Inc. (2017-Present); Corporate Secretary of Brookfield Investment Management UK Ltd. (2017-Present); Corporate Secretary of Brookfield Investment Management (Canada) Inc. (2017-Present); Managing Partner of Brookfield Asset Management Inc. (2016-Present); Secretary of Brookfield Investment Funds (2011-2014); Director of Brookfield Soundvest Capital Management (2015-Present). |
Angela W. Ghantous*
c/o Brookfield Place,
250 Vesey Street,
New York, New York
10281-1023
Born: 1975 | Treasurer | Served since 2018 | Treasurer of several investment companies advised by the Adviser (2012-Present); Director and Head of Fund Accounting and Administration of the Adviser (2012-Present); Vice President of the Adviser (2009-2012). |
Thomas D. Peeney*
c/o Brookfield Place,
250 Vesey Street,
New York, New York
10281-1023
Born: 1973 | Secretary | Served since 2018 | Secretary of several investment companies advised by the Adviser (2018-Present); Director of the Adviser (2018-Present); Vice President of the Adviser (2017-2018); Vice President and Assistant General Counsel of SunAmerica Asset Management, LLC (2013-2017); Associate, Corporate Department at Paul Hastings LLP (2006-2013). |
Adam R. Sachs*
c/o Brookfield Place,
250 Vesey Street,
New York, New York
10281-1023
Born: 1984 | Chief Compliance Officer (“CCO”) | Served since 2018 | Chief Compliance Officer of several investment companies advised by the Advisor (2017-Present); Director of Corporate Legal and Compliance at the Adviser (2017-Present); Chief Compliance Officer of Brookfield Investment Management (Canada) Inc. (2017-Present); Chief Compliance Officer of Brookfield Investment Management UK Ltd. (2017-Present); Senior Compliance Officer of Corporate Legal and Compliance at the Adviser (2011-2017). |
Casey Tushaus*
c/o Brookfield Place,
250 Vesey Street,
New York, New York
10281-1023
Born: 1982 | Assistant Treasurer | Served since 2018 | Assistant Treasurer of several investment companies advised by the Adviser (2016-Present); Vice President of the Adviser (2014-Present); Assistant Fund Controller at Walton Street Capital (2007-2014). |
28Brookfield Public Securities Group LLC
CENTER COAST BROOKFIELD ENERGY INFRASTRUCTURE FUND
Information Concerning Trustees and Officers (Unaudited) (continued)
September 30, 2019
| Name, Address and Year of Birth | Position(s) Held with Funds | Term of Office and Length of Time Served | Principal Occupation(s) During Past 5 Years |
Mohamed Rasul*
c/o Brookfield Place,
250 Vesey Street,
New York, New York
10281-1023
Born: 1981 | Assistant Treasurer | Served since 2018 | Assistant Treasurer of several investment companies advised by the Adviser (2016-Present); Assistant Vice President of the Adviser (2014 -Present); Senior Accountant of the Adviser (2012-2014). |
* Interested person as defined by the Investment Company Act of 1940, as amended, because of affiliations with Brookfield Public Securities Group LLC, investment adviser of the Fund.
The Fund’s Statement of Additional Information includes additional information about the trustees, and is available, without charge, upon request by calling 1-855-777-8001.
CENTER COAST BROOKFIELD ENERGY INFRASTRUCTURE FUND
Joint Notice of Privacy Policy (Unaudited)
Brookfield Public Securities Group LLC (“PSG”), on its own behalf and on behalf of the funds managed by PSG and its affiliates, recognizes and appreciates the importance of respecting the privacy of our clients and shareholders. Our relationships are based on integrity and trust and we maintain high standards to safeguard your non-public personal information (“Personal Information”) at all times. This privacy policy (“Policy”) describes the types of Personal Information we collect about you, the steps we take to safeguard that information and the circumstances in which it may be disclosed.
If you hold shares of a Fund through a financial intermediary, such as a broker, investment adviser, bank or trust company, the privacy policy of your financial intermediary will also govern how your Personal Information will be shared with other parties.
WHAT INFORMATION DO WE COLLECT?
We collect the following Personal Information about you:
| • | Information we receive from you in applications or other forms, correspondence or conversations, including but not limited to name, address, phone number, social security number, assets, income and date of birth. |
| • | Information about transactions with us, our affiliates, or others, including but not limited to account number, balance and payment history, parties to transactions, cost basis information, and other financial information. |
| • | Information we may receive from our due diligence, such as your creditworthiness and your credit history. |
WHAT IS OUR PRIVACY POLICY?
We may share your Personal Information with our affiliates in order to provide products or services to you or to support our business needs. We will not disclose your Personal Information to nonaffiliated third parties unless 1) we have received proper consent from you; 2) we are legally permitted to do so; or 3) we reasonably believe, in good faith, that we are legally required to do so. For example, we may disclose your Personal Information with the following in order to assist us with various aspects of conducting our business, to comply with laws or industry regulations, and/or to effect any transaction on your behalf;
| • | Unaffiliated service providers (e.g. transfer agents, securities broker-dealers, administrators, investment advisors or other firms that assist us in maintaining and supporting financial products and services provided to you); |
| • | Government agencies, other regulatory bodies and law enforcement officials (e.g. for reporting suspicious transactions); |
| • | Other organizations, with your consent or as directed by you; and |
| • | Other organizations, as permitted or required by law (e.g. for fraud protection) |
When we share your Personal Information, the information is made available for limited purposes and under controlled circumstances designed to protect your privacy. We require third parties to comply with our standards for security and confidentiality.
HOW DO WE PROTECT CLIENT INFORMATION?
We restrict access to your Personal Information to those persons who require such information to assist us with providing products or services to you. It is our practice to maintain and monitor physical, electronic, and procedural safeguards that comply with federal standards to guard client nonpublic personal information. We regularly train our employees on privacy and information security and on their obligations to protect client information.
CONTACT INFORMATION
For questions concerning our Privacy Policy, please contact our client services representative at 1-855-777-8001.
30Brookfield Public Securities Group LLC
Investment Adviser and Administrator
Brookfield Public Securities Group LLC
Brookfield Place
250 Vesey Street, 15th Floor
New York, New York 10281-1023
www.brookfield.com
Please direct your inquiries to:
Investor Relations
Phone: 1-855-777-8001
E-mail: funds@brookfield.com
Transfer Agent
Shareholder inquiries relating to distributions, address changes and shareholder account information should be directed to the Funds’ transfer agent:
U.S. Bancorp Fund Services, LLC
615 East Michigan Street
Milwaukee, Wisconsin 53202
1-855-244-4859
Fund Accounting Agent
U.S. Bancorp Fund Services, LLC
615 East Michigan Street
Milwaukee, Wisconsin 53202
Sub-Administrator
U.S. Bancorp Fund Services, LLC
1201 South Alma School Road, Suite 3000
Mesa, Arizona 85210
Independent Registered Public Accounting Firm
Deloitte & Touche LLP
111 South Wacker Drive
Chicago, Illinois 60606
Legal Counsel
Paul Hastings LLP
200 Park Avenue
New York, New York 10166
Custodian
U.S. Bank National Association
1555 North Rivercenter Drive, Suite 302
Milwaukee, Wisconsin 53212
Distributor
Quasar Distributors, LLC
777 East Wisconsin Avenue
Milwaukee, Wisconsin 53202
The Fund files its complete schedule of portfolio holdings with the SEC for the first and third quarters of each fiscal year on Form N-PORT. The Fund's Form N-PORT will be available on the SEC's website at www.sec.gov.
You may obtain a description of the Fund's proxy voting policies and procedures, and information regarding how the Fund voted proxies relating to portfolio securities during the most recent 12-month period ended June 30, without charge, upon request by calling 1-855-777-8001, or go to the SEC's website at www.sec.gov.
Other Compliance Matters
Dan C. Tutcher is a Managing Director of the Adviser on the Energy Infrastructure Securities team. Mr. Tutcher also serves on the Board of Enbridge, Inc. The Adviser has adopted policies and procedures reasonably designed to address potential conflicts of interest while allowing the Adviser to continue to invest in Enbridge Inc. However, from time to time, the Adviser may restrict any fund or account managed by the Adviser from acquiring or disposing of securities of Enbridge Inc. at any time. As of September 30, 2019, the Fund's ownership of Enbridge, Inc. was $140,074 or 3.05% of net assets.
Brookfield Public Securities Group LLC
Brookfield Place
250 Vesey Street, 15th Floor
New York, New York 10281-1023
1-855-777-8001
www.brookfield.com

Brookfield
20
19
ANNUAL REPORT
SEPTEMBER 30, 2019
Center Coast Brookfield MLP Focus Fund
* Please see inside front cover of the report for important information regarding future delivery of shareholder reports.
Brookfield Public Securities Group LLC (the “Firm”) is an SEC-registered investment adviser and represents the Public Securities platform of Brookfield Asset Management. The Firm provides global listed real assets strategies including real estate equities, infrastructure and energy infrastructure equities, multi-real-asset-class strategies and real asset debt. With over $19 billion of assets under management as of September 30, 2019, the Firm manages separate accounts, registered funds and opportunistic strategies for institutional and individual clients, including financial institutions, public and private pension plans, insurance companies, endowments and foundations, sovereign wealth funds and high net worth investors. The Firm is a wholly owned subsidiary of Brookfield Asset Management, a leading global alternative asset manager with over $500 billion of assets under management as of September 30, 2019. For more information, go to www.brookfield.com.
Center Coast Brookfield MLP Focus Fund (the “Fund”) is managed by Brookfield Public Securities Group LLC. The Fund uses its website as a channel of distribution of material company information. Financial and other material information regarding the Fund is routinely posted on and accessible at https://publicsecurities.brookfield.com/en.
Beginning on January 1, 2021, as permitted by regulations adopted by the Securities and Exchange Commission, paper copies of the Fund’s annual and semi-annual shareholder reports will no longer be sent by mail, unless you specifically request paper copies of the reports. Instead, the reports will be made available on the Fund’s website (https://publicsecurities.brookfield.com/en), and you will be notified by mail each time a report is posted and provided with a website link to access the report.
If you already elected to receive shareholder reports electronically, you will not be affected by this change and you need not take any action. You may elect to receive shareholder reports and other communications from the Fund electronically anytime by contacting your financial intermediary (such as a broker, investment adviser, bank or trust company) or, if you are a direct investor, by calling the Fund (toll-free) at 1-855-777-8001 or by sending an e-mail request to the Fund atpublicsecurities.enquiries@brookfield.com.
Beginning on January 1, 2019, you may elect to receive all future reports in paper free of charge. If you invest through a financial intermediary, you may contact your financial intermediary to request that you continue to receive paper copies of your shareholder reports. If you invest directly with the Fund, you may call 1-855-777-8001 or send an email request topublicsecurities.enquiries@brookfield.com to let the Fund know you wish to continue receiving paper copies of your shareholder reports. Your election to receive reports in paper will apply to all funds held in your account if you invest through your financial intermediary or all funds held within the fund complex if you invest directly with the Fund.
This report is for shareholder information. This is not a prospectus intended for the use in the purchase or sale of Fund shares.
| NOT FDIC INSURED | MAY LOSE VALUE | NOT BANK GUARANTEED |
[THIS PAGE IS INTENTIONALLY LEFT BLANK]
Dear Shareholders,
We are pleased to provide the Annual Report for Center Coast Brookfield MLP Focus Fund (the “Fund”) for the fiscal year ended September 30, 2019.
Broader equity and fixed-income markets posted gains during the period with the MSCI World1, S&P 5002 and Bloomberg Barclays Global Aggregate Bond3 Indexes returning +2.42%, +4.25% and +7.60%, respectively. Energy infrastructure lagged broader markets returning -8.13%, as measured by the Alerian MLP Index4, as commodity price volatility and technical selling in late 2018 heavily contributed to the sector’s underperformance during the fiscal year.
From a macroeconomic perspective, the period was marked by slowing economic growth and falling interest rates amid dovish monetary policy. Domestically, the U.S. continued to lead the developed world in terms of economic growth, although the pace of that growth moderated somewhat throughout the period. The ongoing U.S.-China trade dispute continued to gain steam, with additional tariffs levied throughout the period and no clear resolution expected in the near future.
In response to slowing economic growth and the perceived increased risks to economic growth, the U.S. Federal Reserve’s Federal Open Market Committee (“the FOMC”) reversed course during the period. After raising the target for the federal funds rate at its meeting in December 2018, the FOMC then cut its benchmark rate twice by 25 basis points at both of the August and September 2019 meetings.
Globally, the Eurozone continued to lag the U.S. in terms of economic growth and in response, the European Central Bank resumed stimulus measures in an attempt to combat the region’s economic malaise. The People’s Bank of China also increased its stimulus measures to combat a slowing Chinese economy, some of which can be attributed to the U.S-China trade dispute.
Looking ahead we expect modest, albeit slowing, global economic growth. We do, however, acknowledge heightened market and economic risks related to ongoing geopolitical uncertainty, including trade disputes, Brexit and the upcoming U.S. presidential election, among others. Given the wholesale measures (discussed in greater detail in the Management Discussion of Fund Performance) the asset class has undertaken over the last several years coupled with the sector’s historical relative cash flow stability versus the broader energy industry, we believe energy infrastructure has the ability to show defensiveness in an uncertain environment.
In addition to performance information, this report provides the Fund’s audited financial statements as of September 30, 2019.
We welcome your questions and comments, and encourage you to contact our Investor Relations team at (855) 777-8001 or to visit us at www.brookfield.com for more information. Thank you for your support.
Sincerely,
Brian F. Hurley
President
Center Coast Brookfield MLP Focus Fund
David W. Levi, CFA
Chief Executive Officer
Brookfield Public Securities Group LLC
Past performance is no guarantee of future results.
1 The MSCI World Index is a free float-adjusted market capitalization weighted index that is designed to measure the equity market performance of developed markets.
2 The S&P 500 Index is an unmanaged weighted index of 500 large company stocks that is widely-recognized as
Letter to Shareholders(continued)
representative of the performance of the U.S. stock market. Indexes are not managed and an investor cannot invest directly in an index.
3The Bloomberg Barclays Global Aggregate Bond Index tracks the performance of investment grade public debt issued in the major domestic and eurobond markets, including global bonds.
4 The Alerian MLP Index is the leading gauge of energy infrastructure Master Limited Partnerships (MLPs). The capped, float-adjusted, capitalization-weighted index, whose constituents earn the majority of their cash flow from midstream activities involving energy commodities, is disseminated real-time on a price-return basis (AMZ) and on a total-return basis (AMZX).
Indices are not managed and an investor cannot invest directly in an index.
These views represent the opinions of Brookfield Public Securities Group LLC and are not intended to predict or depict the performance of any investment. These views are primarily as of the close of business on September 30, 2019 and subject to change based on subsequent developments.
Mutual fund investing involves risk. Principal loss is possible.
Quasar Distributors, LLC is the distributor of Brookfield Investment Funds.
A basis point (bps) is a unit that is equal to 1/100 of 1%, and is used to denote the change in a financial instrument.
Must be preceded or accompanied by a prospectus.
2Brookfield Public Securities Group LLC
About Your Fund’s Expenses
As a shareholder of the Fund, you may incur two types of costs: (1) transaction costs, including sales charges (loads) on purchase payments and contingent deferred sales charges and redemption fees on redemptions; and (2) ongoing costs, including management fees, distribution (12b-1) fees and other fund expenses. This example is intended to help you understand your ongoing costs (in dollars) of investing in the Fund and to compare these costs with the ongoing costs of investing in other mutual funds. The example is based on an investment of $1,000 invested at the beginning of the period and held for the entire period as indicated below.
Actual Fund Return
The table below provides information about actual account values and actual expenses. You may use the information on this line, together with the amount you invested, to estimate the expenses that you paid over the period. Simply divide your account value by $1,000 (for example, an $8,600 account value divided by $1,000 = 8.6), then multiply the result by the number in the first line under the heading entitled “Expenses Paid During Period” to estimate the expenses you paid on your account during this period.
Hypothetical Example for Comparison Purposes
The table below also provides information about hypothetical account values and hypothetical expenses based on the Fund’s actual expense ratio and an assumed rate of return of 5% per year before expenses, which is not the Fund’s actual return. The hypothetical account values and expenses may not be used to estimate the actual ending account balance or expenses you paid for the period. You may use this information to compare the ongoing costs of investing in the Fund and other funds. To do so, compare this 5% hypothetical example with hypothetical examples that appear in shareholders’ reports of other funds.
Please note that the expenses shown in the table are meant to highlight your ongoing costs only and do not reflect any transactional costs, such as sales charges (loads) and redemption fees. Therefore, the hypothetical account values and expenses in the table are useful in comparing ongoing costs only, and will not help you determine the relative total costs of owning different funds. In addition, if these transactional costs were included, your costs overall would have been higher.
| | Annualized Expense Ratio | Beginning Account Value
(04/01/19) | Ending Account Value
(09/30/19) | Expenses Paid During Period
(04/01/19–
09/30/19)(2) |
| Actual | | | | |
Class A Shares
| 1.46% | $1,000.00 | $939.10 | $7.10 |
Class C Shares
| 2.21% | 1,000.00 | 936.20 | 10.73 |
Class I Shares
| 1.21% | 1,000.00 | 941.90 | 5.89 |
Class Y Shares
| 1.21% | 1,000.00 | 940.50 | 5.89 |
| Hypothetical (assuming a 5% return before expenses) | | | | |
Class A Shares
| 1.46% | 1,000.00 | 1,017.75 | 7.38 |
Class C Shares
| 2.21% | 1,000.00 | 1,013.99 | 11.16 |
Class I Shares
| 1.21% | 1,000.00 | 1,019.00 | 6.12 |
Class Y Shares
| 1.21% | 1,000.00 | 1,000.00 | 6.07 |
| (1) | Expenses are equal to the Fund’s annualized expense ratio by class multiplied by the average account value over the period, multiplied by 183/365 (to reflect a six-month period). |
Center Coast Brookfield MLP Focus Fund
Management Discussion of Fund Performance
For the fiscal year ended September 30, 2019, the Fund's Class Y had a total return of -7.70%, which assumes the reinvestment of dividends and is exclusive of brokerage commissions, underperforming the S&P 5001 and outperforming the Alerian MLP Index2, which returned 4.25% and -8.13%, respectively.
MARKET OVERVIEW
Introduction
Fiscal First Quarter (October – December 2018) (-18.68% NAV total return by the Fund's Y share class)
The Fund’s fiscal first quarter came to a disappointing end due to a combination of broader market volatility, crude oil price weakness and year-end tax loss selling. Over the same time period, the Fund’s benchmark, the Alerian MLP Index (“AMZ”) posted a -17.30% return for the third worst quarterly performance for the index on record.
The asset class was defined by uncertainty over much of the calendar year. Numerous midstream companies engaged in “simplification” transactions during the first half of the fiscal year, which contributed to the volatility. Simplifications are transactions in which incentive distribution rights are retired in exchange for various financial considerations, and/or two or more affiliated public entities merge in a corporate transaction or series of corporate transactions. However, each transaction and transition itself is difficult to predict (i.e., uncertain) and sometimes results in a distribution cut and/or unexpected tax bill. Even the most seasoned industry vets were caught off guard and surprised by many of the announced simplification transactions and distribution cuts.
In addition to simplification, most midstream companies took steps to eliminate the ongoing need for equity capital markets to fund growth (the transition to “self-funding”). This too can involve a corporate action or corporate finance decision that is difficult to predict and often impacts growth projections and/or distributions, making it difficult to value and invest in the equity of a company.
Despite the disappointing ending, we headed into 2019 optimistic given fundamentals remained constructive while the often-painful process of simplification was largely over. The industry exited the calendar year with both record levels of supply and demand while midstream companies positioned themselves with little need for external equity, distribution coverage levels higher than they were at the peak of the market and leverage levels lower than they had been in years.
Fiscal Second Quarter (January – March 2019) (20.49% NAV total return by the Fund's Y share class)
The Fund outperformed the AMZ for the three months ended March 31, 2019 and beat the Index’s strongest-ever quarterly return in its 23 year history (+19.74% in Q1 of 2013). Other than the quarterly return, it was a fairly boring quarter. There were some project announcements, modest earnings surprises, some Mergers & Acquisitions here and there, ongoing regulatory battles, and a few small equity offerings, but nothing extraordinary or shocking. The level of activity felt normal, like what you would expect in any given quarter—no major surprises, no Federal Energy Regulatory Commission policy change, no unexpected distribution cuts, no Exploration & Production bankruptcy fears, no unwanted tax bills, no game-changers. And this is exactly what we want! Boring, in our opinion, is better.
Conversely, underperformance during the period, and beyond, tracked names that: announced project delays, revised guidance, have complicated balance sheets, and generally just over-promised the market and under-delivered results. It helps to have scale, integration, balance sheet flexibility, and management experience, which is where our portfolios remained biased.
As previously discussed, the corporate and financing maturation process was largely behind us – at the end of the Fund’s fiscal second quarter, just 7% of the midstream market cap remained in an IDR-paying structure. In addition, public equity issuance virtually evaporated, from $50+ billion over a three year-span from 2014-2016 to ~$5bn expected from 2019-2021 by some sell-side estimates. The transition allowed companies to actually be
4Brookfield Public Securities Group LLC
Center Coast Brookfield MLP Focus Fund
“boring” and execute the plan with a cleaner, more mature structure built for stability in a lower-for-longer, post-shale world. With all of that said, and as odd as it may sound, our hope was for the trend of “boring is better” to continue for the rest of the year.
Fiscal Third Quarter (April – June 2019) (-1.60% NAV total return by the Fund's Y share class)
The fund’s fiscal third quarter was largely a continuation of the “boring is better” trend, outside of the broader market and commodities volatility. Industry bellwethers outperformed as energy investors continued showing very little patience for the old investment paradigm: for midstream, using equity capital markets to fund growth (“Midstream 1.0”), while for oil & gas producers, growing production for growth’s sake (instead of focusing on free cash flow).
During the Fund’s fiscal third quarter, midstream outperformed broader energy indices and energy commodities, potentially showing that the measures the sector had taken to adjust its corporate finance model could be starting to pay off for investors. From April to June, the AMZ outperformed:
| • | Broader energy by 3% |
| • | Oil & gas producers by 11% |
| • | Oilfield services by 14% |
| • | U.S. crude oil by 3% |
| • | U.S. natural gas by 11% |
| • | U.S. natural gas liquids (NGLs) by 21%3 |
Energy commodities went on a wild ride yet again in the second calendar quarter, driven by changing supply/demand fundamentals, up-and-down trade war news, and other geopolitical tensions. U.S. crude rallied 10% from the end of the first quarter to late April but had trekked down 15% by mid-June before finally finishing the quarter down only 3%. U.S. gas prices were under pressure virtually the entire quarter, and U.S. NGL prices had their lowest quarterly average since the third quarter of 2016 despite wide pricing spreads to Europe and Asia, signaling the need for more export capacity to get high-demand liquids to market. Amidst this choppiness, midstream equities continued to be “boring.”
Fiscal Fourth Quarter (July – September 2019) (-4.28% NAV total return by the Fund's Y share class)
While the prior quarters saw a continuation of “boring is better”, the end of the fund’s fiscal year delivered a handful of surprises, a bit of drama, and a noticeable increase in volatility. Some of this volatility showed up in response to continued weakness in natural gas and natural gas liquids (“NGL”) prices. Importantly, the primary cause of this commodity price weakness is record supply, which is what moves through midstream assets to create cash flow (record cash flow, we might add).
The challenge, however, is that the extreme success of some basins is starting to impact other basins halfway across the country, and even halfway across the world. The Permian Basin—largely viewed as the “best” basin in North America—is taking absolutely no prisoners as it continues to produce record levels of crude oil that comes out of the ground along with “associated” natural gas and NGLs. Producers view these associated hydrocarbons as a byproduct and, in our opinion, it’s hard to compete with byproduct economics. As long as crude prices incentivize drilling in the Permian (and the Bakken and Rockies, to a lesser extent), associated gas and NGLs will most likely make it incrementally more difficult for basins relying on dry or wet gas economics to compete.
Further, with the ongoing completion of export facilities, North America’s excess natural gas and NGLs started to pressure prices abroad. Despite the interim volatility this has created, cheap natural gas prices have tended to stimulate demand which could result in long-term tailwinds for the industry as a whole. Cheap natural gas import
Center Coast Brookfield MLP Focus Fund
prices abroad should accelerate the transition away from “dirtier” fuels such as coal and heating oil, helping reduce global carbon emissions.
Perhaps the most dramatic event of the quarter, however, was the brazen attack on Saudi Arabia’s Abqaiq and Khurais oil facilities on September 14th. Although Saudi Arabia has been able to return production back to pre-attack levels as of the writing of this letter, crude oil prices jumped more than 10% the following Monday morning (September 16, 2019), and many believed that a geopolitical risk premium would be embedded in crude oil prices—and energy equities—for the foreseeable future. Yet, shockingly, global crude oil prices erased all their gains in two weeks, and the near-term portion of the Brent futures curve is actually lower as of this writing than it was before the attack.4
The end of the Fund’s fiscal year felt like a common refrain: any major news had little or no impact due to overwhelming negative energy sentiment and broader market jitters. So, what continues to make us excited about this asset class? The cash flow. It’s sustainable, in our view, and we believe with simplification mostly behind us, balance sheets healthier, and financing less equity dependent, it should finally start accruing to the benefit of equity investors in a sustainable way. In the current sub 2% interest rate world, we think this can matter. At a minimum we think it will provide attractive income—an important component of total return—and could mitigate risk to the extent volatility picks up meaningfully. In the meantime, we’ll continue to celebrate the fundamentals, point out the myriad valuation disconnects, and hope that someone eventually listens even if, for now, it feels like we’re shouting into the void.
1 The S&P 500 Index is an unmanaged weighted index of 500 large company stocks that is widely-recognized as representative of the performance of the U.S. stock market. Indexes are not managed and an investor cannot invest directly in an index.
2 The Alerian MLP Index is the leading gauge of energy infrastructure Master Limited Partnerships (MLPs). The capped, float-adjusted, capitalization-weighted index, whose constituents earn the majority of their cash flow from midstream activities involving energy commodities, is disseminated real-time on a price-return basis (AMZ) and on a total-return basis (AMZX).
3 Broader energy is represented by the IXE Index, Oil & gas producers by the SPSIOP Index, Oilfield services by the OSX Index, U.S. crude oil by West Texas Intermediate (WTI), U.S. natural gas by Henry Hub, and U.S. NGLs by Mont Belvieu is the U.S. benchmark for NGL prices. The Energy Select Sector (“IXE”) Index is one of the eleven Select Sector Indices that seeks to track their respective Global Industry Classification Standard (GICS®) sectors. The IXE tracks companies within the Energy GICS® sector, which is comprised of companies that are engaged in exploration & production, refining & marketing and storage & transportation of oil & gas and coal & consumable fuels. The sector also includes companies that offer oil & gas equipment and services. The S&P Oil & Gas Exploration & Production Select Industry (“SPSIOP”) Index is a sub-index of the Energy Select Sector Index. The index comprises stocks in the S&P Total Market Index that are classified in the GICS oil & gas exploration & production sub-industry. The PHLX Oil Service Sector (“OSX”) Index is designed to track the performance of a set of companies involved in the oil services sector. Henry Hub is the U.S. benchmark for natural gas spot and futures pricing. West Texas Intermediate (“WTI”) is the U.S. benchmark for crude oil prices.
4 Bloomberg Brent Spot Prices and 10/4/2019 Brent Futures Curve vs. 9/13/2019 Brent Futures Curve.
Indices are not managed and an investor cannot invest directly in an index.
6Brookfield Public Securities Group LLC
Center Coast Brookfield MLP Focus Fund
AVERAGE ANNUAL TOTAL RETURNS
| As of September 30, 2019 | 1 Year | 5 Years | Since Inception* |
| Class A (Excluding Sales Charge) | -8.02% | -5.21% | 1.71% |
| Class A (Including Sales Charge) | -12.40% | -6.33% | 1.02% |
| Class C (Excluding Sales Charge) | -8.63% | -5.92% | 0.91% |
| Class I Shares | -7.72% | N/A | -3.29% |
| Class Y Shares | -7.70% | -4.95% | 1.93% |
| S&P 500 Index | 4.25% | 10.84% | 12.68%1 |
| Alerian MLP Index | -8.13% | -8.65% | 1.68%2 |
* Class A, Class C and Class Y Shares were incepted on December 31, 2010 and Class I Shares commenced operations on February 5, 2018.
The Alerian MLP Index references Class Y’s inception date. All returns shown in USD.
1 The S&P 500 Index references Class Y's inception date.
2 The Alerian MLP Index references Class Y's inception date.
The table and graphs do not reflect the deductions of taxes that a shareholder would pay on fund distributions or the redemption of fund shares.
Performance data quoted represents past performance and is no guarantee of future results. Total return figures include the reinvestment of dividends and capital gains, and as the fund is taxable as a “C” corporation performance is net of federal, state and local taxes paid by the Fund. Current performance may be lower or higher than the performance data quoted. Investment return and principal value will fluctuate so that an investor’s shares, when redeemed, may be worth more or less than original cost. For the most recent month end performance, please call (855) 244-4859.
For periods prior to the Reorganization, performance shown including sales charge reflects the Class A maximum sales charge of 5.75% of the Predecessor Fund. For periods following the Reorganization, performance shown including sale charge reflects the Class A maximum sales charge of 4.75%. Performance data excluding sales charge does not reflect the deduction of the sales charge and if reflected, the sales charge or fee would reduce the performance quoted. Investment performance reflects fee waivers, expenses and reimbursements in effect. In the absence of such waivers, total return and NAV would be reduced. On purchases of Class A Shares, no sales charge is payable at the time of purchase on investments of $1 million or more, although for such investments the Fund will impose a CDSC of 1.00% on redemptions made within 18 months of the purchase. If imposed, the CDSC is based on the original cost of the shares redeemed. Class C Shares are subject to a CDSC of 1.00% when redeemed within 12 months of the purchase.
The gross expense ratio in the prospectus dated January 28, 2019 is 1.47% for Class A Shares, 2.22% for Class C Shares, 1.22% for Class I Shares and 1.22% for Class Y Shares, as applicable to investors respectively.
The Fund’s gross and net expense ratios in the financial highlights of this report are as follows: Class A is 1.47% and 1.46%, Class C is 2.22% and 2.21%, Class I is 1.22% and 1.21% and Class Y is 1.22% and 1.21%, respectively for the fiscal year ended September 30, 2019.
The Adviser has contractually agreed to waive and/or reimburse the Fund's expenses through February 1, 2020. There is no guarantee that such reimbursement will be continued after that date.
Center Coast Brookfield MLP Focus Fund
The graph below illustrates a hypothetical investment of $10,000 in the Fund—Class A Shares (with load) from the commencement of investment operations on December 31, 2010 to September 30, 2019 compared to the Alerian MLP Index.
Disclosure
Following the close of business on February 2, 2018, the Fund acquired all of the assets, subject to liabilities, of the Center Coast MLP Focus Fund (the “Predecessor Fund”) through a tax-free reorganization (the “Reorganization”). The Fund is a newly created series of Brookfield Investment Funds, which has the same investment objective and substantially similar investment strategies and policies as the Predecessor Fund. As a result of the Reorganization, shareholders of the Predecessor Fund’s Class A and Class C Shares received Class A and Class C Shares of the Fund, respectively, and shareholders of the Predecessor Fund's Institutional Class Shares received Class Y Shares of the Fund. In addition, as a result of the Reorganization, the Fund’s Class A and Class C Shares adopted the Predecessor Fund’s Class A and Class C Shares’ performance and accounting history, and the Fund’s Class Y Shares adopted the Predecessor Fund’s Institutional Class Shares’ performance and accounting history. Figures shown reflect the performance history of the Predecessor Fund’s Institutional Class Shares and do not reflect sales charges. If sales charges were reflected, returns would be less than these shown. The Fund’s Class A and Class C Shares would have substantially similar returns because the shares are invested in the same portfolio of securities, and the returns would differ only to the extent that the classes do not have the same expenses. The Fund’s Class I Shares adopted the performance history of the Predecessor Fund’s Institutional Class Shares. The Predecessor Fund's past performance (before and after taxes) is not an indication of how the Fund will perform in the future.
The Fund’s portfolio holdings are subject to change without notice. The mention of specific securities is not a recommendation or solicitation for any person to buy, sell or hold any particular security. There is no assurance that the Center Coast Brookfield MLP Focus Fund currently holds these securities. Please refer to the Schedule of Investments contained in this report for a full listing of fund holdings.
Brookfield Public Securities Group LLC, the Fund’s investment adviser (the “Adviser”), has contractually agreed to waive all or a portion of its investment advisory or administration fees and/or to reimburse certain expenses of the Fund to the extent necessary to maintain the Fund’s total annual fund operating expenses after Fee Waiver and/or Expense Reimbursement (excluding any front-end or contingent deferred sales loads, brokerage commissions and other transactional expenses, acquired fund fees and expenses, interest, taxes, such as deferred income tax
8Brookfield Public Securities Group LLC
Center Coast Brookfield MLP Focus Fund
expenses, and extraordinary expenses, such as litigation; and other expenses not incurred in the ordinary course of the Fund’s business), at no more than 1.46% for Class A Shares, 2.21% for Class C Shares, and 1.21% for Class Y Shares. These are the net expense ratios as of the most recent prospectus and are applicable to investors. The fee waiver and expense reimbursement arrangement will continue until at least February 1, 2020 and may not be terminated by the Fund or the Adviser before such time.
The Fund is not required to make distributions and in the future could decide not to make such distributions or not to make distributions at a rate that over time is similar to the distribution rate it receives from the MLPs in which it invests. It is expected that a portion of the distributions will be considered tax deferred return of capital (ROC). ROC is tax deferred and reduces the shareholder’s cost basis (until the cost basis reaches zero); and when the Fund shares are sold, if the result is a gain, it would then be taxable to the shareholder at the capital gains rate. Any portion of distributions that are not considered ROC are expected to be characterized as qualified dividends for tax purposes. Qualified dividends are taxable in the year received and do not serve to reduce the shareholder’s cost basis. The portion of the Fund’s distributions that are considered ROC may vary materially from year to year. Accordingly, there is no guarantee that future distributions will maintain the same classification for tax purposes as past distributions. An investment in the Fund may not receive the same tax advantages as a direct investment in the MLP. Because deferred tax liability is reflected in the daily NAV, the MLP Fund’s after-tax performance could differ significantly from the underlying assets even if the pre-tax performance is closely tracked.
Earnings growth is not a measure of the Fund’s future performance.
Mutual fund investing involves risk. Principal loss is possible. Investing in Master Limited Partnerships (“MLPs”) involves additional risks as compared to the risks of investing in common stock, including risks related to cash flow, dilution and voting rights. The Fund’s investments are concentrated in the energy infrastructure industry with an emphasis on securities issued by MLPs, which may increase volatility. Energy infrastructure companies are subject to risks specific to the industry such as fluctuations in commodity prices, reduced volumes of natural gas or other energy commodities, environmental hazards, changes in the macroeconomic or the regulatory environment or extreme weather. MLPs may trade less frequently than larger companies due to their smaller capitalizations which may result in erratic price movement or difficulty in buying or selling. The Fund invests in small and mid-cap companies, which involve additional risks such as limited liquidity and greater volatility. Additional management fees and other expenses are associated with investing in MLPs. Additionally, investing in MLPs involves material income tax risks and certain other risks. Actual results, performance or events may be affected by, without limitation, (1) general economic conditions, (2) performance of financial markets, (3) interest rate levels, (4) changes in laws and regulations and (5) changes in the policies of governments and/or regulatory authorities. Unlike most other open-end mutual funds, the Fund will be taxable as a regular corporation, or “C” corporation. Consequently, the Fund will accrue and pay federal, state and local income taxes on its taxable income, if any, at the Fund level, which will ultimately reduce the returns that the shareholder would have otherwise received. Additionally, on a daily basis the Fund’s net asset value per share (“NAV”) will include a deferred tax expense (which reduces the Fund’s NAV) or asset (which increases the Fund’s NAV, unless offset by a valuation allowance). To the extent the Fund has a deferred tax asset, consideration is given as to whether or not a valuation allowance is required. The Fund’s deferred tax expense or asset is based on estimates that could vary dramatically from the Fund’s actual tax liability/benefit and, therefore, could have a material impact on the Fund’s NAV. This material is provided for general and educational purposes only, and is not intended to provide legal, tax or investment advice or to avoid legal penalties that may be imposed under U.S. federal tax laws. Investors should contact their own legal or tax advisors to learn more about the rules that may affect individual situations.
Center Coast Brookfield MLP Focus Fund
Total return figures include the reinvestment of dividends and capital gains, and as the fund is taxable as a “C” corporation performance is net of federal, state and local taxes paid by the Fund.
These views represent the opinions of Brookfield Public Securities Group LLC and are not intended to predict or depict the performance of any investment. These views are as of the close of business on September 30, 2019 and subject to change based on subsequent developments.
10Brookfield Public Securities Group LLC
Center Coast Brookfield MLP Focus Fund
Portfolio Characteristics (Unaudited)
September 30, 2019
| Asset Allocation by Sector | Percent of
Total Investments |
| Master Limited Partnerships | |
| Pipeline Transportation | Natural Gas | 24.8% |
| Pipeline Transportation | Petroleum | 18.2% |
| Gathering + Processing | 17.4% |
| Total Master Limited Partnerships | 60.4% |
| Common Stocks | |
| Gathering + Processing | 27.6% |
| Pipeline Transportation | Petroleum | 6.5% |
| Pipeline Transportation | Natural Gas | 3.9% |
| Total Common Stocks | 38.0% |
| Money Market Fund | 1.6% |
| Total | 100.0% |
| TOP TEN HOLDINGS | Percent of
Net Assets |
| Enterprise Products Partners LP | 9.9% |
| Energy Transfer LP | 9.5% |
| MPLX LP | 9.0% |
| Williams Companies, Inc. | 8.3% |
| Targa Resources Corp. | 8.2% |
| Plains All American Pipeline LP | 8.2% |
| EnLink Midstream LLC | 5.4% |
| Magellan Midstream Partners LP | 4.9% |
| ONEOK, Inc. | 4.8% |
| EQM Midstream Partners LP | 3.8% |
Center Coast Brookfield MLP Focus Fund
Schedule of Investments
September 30, 2019
| | | | Shares | Value |
| MASTER LIMITED PARTNERSHIPS – 60.8% | | | |
| Gathering + Processing – 19.1% | | | |
Crestwood Equity Partners LP
| | | 867,326 | $31,666,072 |
DCP Midstream LP
| | | 1,290,801 | 33,831,894 |
Enable Midstream Partners LP
| | | 3,553,593 | 42,749,724 |
MPLX LP
| | | 7,381,748 | 206,762,762 |
Summit Midstream Partners LP
| | | 2,761,756 | 13,422,134 |
TC Pipelines LP
| | | 946,565 | 38,496,799 |
Western Midstream Partners LP
| | | 2,954,263 | 73,531,606 |
| Total Gathering + Processing | | | | 440,460,991 |
| Pipeline Transportation | Natural Gas – 23.3% | | | |
Energy Transfer LP
| | | 16,811,119 | 219,889,436 |
Enterprise Products Partners LP
| | | 7,965,298 | 227,648,217 |
EQM Midstream Partners LP
| | | 2,705,931 | 88,483,944 |
| Total Pipeline Transportation | Natural Gas | | | | 536,021,597 |
| Pipeline Transportation | Petroleum – 18.4% | | | |
Holly Energy Partners LP
| | | 953,833 | 24,103,360 |
Magellan Midstream Partners LP
| | | 1,699,295 | 112,612,280 |
NuStar Energy LP
| | | 2,679,572 | 75,885,479 |
Phillips 66 Partners LP
| | | 393,880 | 22,301,485 |
Plains All American Pipeline LP
| | | 9,050,943 | 187,807,067 |
| Total Pipeline Transportation | Petroleum | | | | 422,709,671 |
Total MASTER LIMITED PARTNERSHIPS
(Cost $1,407,341,916)
| | | | 1,399,192,259 |
| COMMON STOCKS – 38.2% | | | |
| Gathering + Processing – 27.8% | | | |
Antero Midstream Corp.
| | | 3,105,464 | 22,980,434 |
EnLink Midstream LLC
| | | 14,698,827 | 124,940,030 |
ONEOK, Inc.
| | | 1,498,647 | 110,435,297 |
Targa Resources Corp.
| | | 4,704,410 | 188,976,150 |
Williams Companies, Inc.
| | | 7,955,488 | 191,409,041 |
| Total Gathering + Processing | | | | 638,740,952 |
| Pipeline Transportation | Natural Gas – 3.9% | | | |
Equitrans Midstream Corp.
| | | 878,281 | 12,778,988 |
Kinder Morgan, Inc.
| | | 3,773,106 | 77,763,715 |
| Total Pipeline Transportation | Natural Gas | | | | 90,542,703 |
| Pipeline Transportation | Petroleum – 6.5% | | | |
Pembina Pipeline Corp. (u)
| | | 615,704 | 22,824,147 |
SemGroup Corp. (a)
| | | 4,305,887 | 70,358,194 |
Tallgrass Energy LP
| | | 2,823,008 | 56,855,381 |
| Total Pipeline Transportation | Petroleum | | | | 150,037,722 |
Total COMMON STOCKS
(Cost $823,347,982)
| | | | 879,321,377 |
See Notes to Financial Statements.
12Brookfield Public Securities Group LLC
Center Coast Brookfield MLP Focus Fund
Schedule of Investments (continued)
September 30, 2019
| | | | Shares | Value |
| SHORT-TERM INVESTMENT – 1.6% | | | |
| Money Market Fund – 1.6% | | | |
First American Treasury Obligations Fund, Class X, 1.89% (y)
| | | 37,792,946 | $37,792,946 |
Total SHORT-TERM INVESTMENT
(Cost $37,792,946)
| | | | 37,792,946 |
Total Investments – 100.6%
(Cost $2,268,482,844)
| | | | 2,316,306,582 |
Liabilities in Excess of Other Assets – (0.6)%
| | | | (14,130,537) |
TOTAL NET ASSETS – 100.0%
| | | | $2,302,176,045 |
| The following notes should be read in conjunction with the accompanying Schedule of Investments. |
| LP— Limited Partnership |
| LLC— Limited Liability Company |
| (a) | — Affiliate issuer. (Note 8) |
| (u) | — Foreign security or a U.S. security of a foreign company. |
| (y) | — The rate quoted is the annualized seven-day yield as of September 30, 2019. |
See Notes to Financial Statements.
CENTER COAST BROOKFIELD MLP FOCUS FUND
Statement of Assets and Liabilities
September 30, 2019
| Assets: | |
Investments in unaffiliated securities at value (cost $2,194,352,805)
| $2,245,948,388 |
Investments in affiliated securities at value (cost $74,130,039)
| 70,358,194 |
Total Investments (cost $2,268,482,844)
| 2,316,306,582 |
Receivable for fund shares sold
| 6,345,612 |
Receivable for investments sold
| 3,532,428 |
Interest and dividends receivable
| 318,023 |
Prepaid expenses
| 130,103 |
Total assets
| 2,326,632,748 |
| Liabilities: | |
Payable for investments purchased
| 17,837,810 |
Payable for fund shares redeemed
| 2,550,100 |
Distribution fee payable
| 1,435,499 |
Investment advisory fee payable (Note 4)
| 1,846,899 |
Administration fee payable (Note 4)
| 282,280 |
Trustees' fees payable
| 15,488 |
Accrued expenses
| 488,627 |
Total liabilities
| 24,456,703 |
Commitments and contingencies (Note 9)
| |
Net Assets
| $2,302,176,045 |
| Composition of Net Assets: | |
Paid-in capital
| 2,703,382,558 |
Accumulated losses
| (401,206,513) |
Net assets applicable to capital stock outstanding
| $2,302,176,045 |
| Net Assets | |
Class A Shares - Net Assets
| $362,375,425 |
Shares outstanding
| 60,800,516 |
Net asset value and redemption price per share
| $5.96 |
Offering price per share based on a maximum sales charge of
| $6.26 |
Class C Shares - Net Assets
| $470,088,210 |
Shares outstanding
| 87,541,269 |
Net asset value and redemption price per share
| $5.37 |
Class I Shares - Net Assets
| $237 |
Shares outstanding
| 39 |
Net asset value and redemption price per share
| $6.11* |
Class Y Shares - Net Assets
| $1,469,712,173 |
Shares outstanding
| 240,305,373 |
Net asset value and redemption price per share
| $6.12 |
| * | Net asset value does not recalculate due to fractional shares outstanding. |
See Notes to Financial Statements.
14Brookfield Public Securities Group LLC
CENTER COAST BROOKFIELD MLP FOCUS FUND
Statement of Operations
For the Fiscal Year Ended September 30, 2019
| Investment Income: | |
Distributions from unaffiliated master limited partnerships
| $134,805,654 |
Distributions from affiliated master limited partnerships
| 9,902,050 |
Dividends and distributions from unaffiliated common stocks (net of foreign witholding tax of $587,868)
| 41,257,980 |
Dividends and distributions from affiliated common stocks
| 7,306,154 |
Dividends from money market fund
| 398,839 |
Total dividends and distributions
| 193,670,677 |
Less return of capital on distributions from unaffliated investments
| (155,845,342) |
Less return of capital on distributions from affliated investments
| (17,208,204) |
Total investment income
| 20,617,131 |
| Expenses: | |
Investment advisory fees (Note 4)
| 24,118,335 |
Administration fees (Note 4)
| 3,617,750 |
Distribution fees — Class A
| 893,110 |
Distribution fees — Class C
| 5,329,568 |
Transfer agency fees
| 280,566 |
Fund accounting fees
| 240,313 |
Reports to shareholders
| 193,430 |
Trustees' fees
| 181,186 |
Audit and tax services
| 147,648 |
Registration fees
| 147,487 |
Insurance
| 135,764 |
Legal fees
| 122,669 |
Franchise tax
| 120,844 |
Custodian fees
| 106,170 |
Miscellaneous
| 93,922 |
Interest expense
| 8,687 |
Total operating expenses
| 35,737,449 |
Less expenses waived by the investment adviser (Note 4)
| (210,741) |
Net expenses
| 35,526,708 |
Net investment loss
| (14,909,577) |
| Net Realized and Unrealized Gain (Loss): | |
| Net realized gain (loss) on: | |
Investments in unaffiliated companies
| 19,969,288 |
Investments in affiliated companies
| (2,068,285) |
Foreign currency transactions
| (6,699) |
Net realized gain
| 17,894,304 |
| Net change in unrealized appreciation (depreciation) on: | |
Investments in unaffiliated companies
| (216,510,615) |
Investments in affiliated companies
| 7,609,673 |
Foreign currency translations
| 136 |
Net change in unrealized depreciation
| (208,900,806) |
Net realized and unrealized loss
| (191,006,502) |
Net decrease in net assets resulting from operations
| $(205,916,079) |
See Notes to Financial Statements.
CENTER COAST BROOKFIELD MLP FOCUS FUND
Statements of Changes in Net Assets
| | For the
Fiscal Year
Ended
September 30
2019 | | For the
Ten Months
Ended
September 30,
20181 | | For the
Fiscal Year
Ended
November 30
2017 |
| Increase (Decrease) in Net Assets Resulting from Operations: | | | | | |
Net investment loss
| $(14,909,577) | | $(18,810,721) | | $(37,667,955) |
Net realized gain
| 17,894,304 | | 101,811,979 | | 24,353,399 |
Net unrealized appreciation (depreciation)
| (208,900,806) | | 144,650,896 | | (190,655,524) |
Net increase (decrease) in net assets resulting from operations
| (205,916,079) | | 227,652,154 | | (203,970,080) |
| Distributions to Shareholders: | | | | | |
From distributable earnings
| | | | | |
Class A shares
| (8,279,960) | | (8,527,635) | | — |
Class C shares
| (13,508,110) | | (15,503,812) | | — |
Class I shares
| (5) | | (5) | | — |
Class Y shares
| (34,524,594) | | (35,029,697) | | — |
From return of capital
| | | | | |
Class A shares
| (29,803,760) | | (18,778,273) | | (36,826,259) |
Class C shares
| (48,622,514) | | (34,140,157) | | (70,244,807) |
Class I shares
| (19) | | (10) | | — |
Class Y shares
| (124,271,455) | | (77,137,121) | | (131,027,418) |
Total distributions
| (259,010,417) | | (189,116,710) | | (238,098,484) |
| Capital Share Transactions: | | | | | |
Subscriptions
| 1,078,455,226 | | 885,813,665 | | 1,100,942,631 |
Reinvestment of distributions
| 250,211,109 | | 180,614,093 | | 228,728,796 |
Redemption
| (1,155,732,216) | | (1,031,270,834) | | (969,472,726) |
Net increase in net assets from capital share transactions
| 172,934,119 | | 35,156,924 | | 360,198,701 |
Total increase (decrease) in net assets
| (291,992,377) | | 73,692,368 | | (81,869,863) |
| Net Assets: | | | | | |
Beginning of period
| 2,594,168,422 | | 2,520,476,054 | | 2,602,345,917 |
End of period
| $2,302,176,045 | | $2,594,168,422 | | $2,520,476,0542 |
| 1 | The Fund changed its fiscal year end from November 30 to September 30. |
| 2 | The Securities and Exchange Commission (“SEC”) eliminated the requirement to disclose undistributed (distributions in excess of) net investment income in 2018. For the fiscal year ended November 30, 2017, distributions in excess of net investment income were $(196,900,682). |
See Notes to Financial Statements.
16Brookfield Public Securities Group LLC
Center Coast Brookfield MLP Focus Fund
Financial Highlights
| | For the
Year Ended
September 30, | For the Ten
Month Period
Ended
September 30, | | For the Year Ended November 30, |
| Class A | 2019 | 20182 | | 2017 | 2016 | 2015 | 2014 |
| Per Share Operating Performance: | | | | | | | |
Net asset value, beginning of period
| $7.21 | $7.03 | | $8.23 | $8.30 | $11.49 | $11.02 |
Income from investment Operations:
| | | | | | | |
Net investment loss1
| (0.04) | (0.07) | | (0.11) | (0.05) | (0.04) | (0.08) |
Return of capital1
| 0.46 | 0.33 | | 0.38 | 0.37 | 0.34 | 0.33 |
Net realized and unrealized gain (loss)1,3
| (0.99) | 0.43 | | (0.79) | 0.29 | (2.77) | 0.90 |
Total from investment operations
| (0.57) | 0.69 | | (0.52) | 0.61 | (2.47) | 1.15 |
| Distributions to Shareholders: | | | | | | | |
From distributable earnings
| (0.14) | (0.16) | | — | — | — | (0.30) |
From return of capital
| (0.54) | (0.35) | | (0.68) | (0.68) | (0.72) | (0.38) |
Total distributions to shareholders
| (0.68) | (0.51) | | (0.68) | (0.68) | (0.72) | (0.68) |
Net asset value, end of period
| $5.96 | $7.21 | | $7.03 | $8.23 | $8.30 | $11.49 |
Total Return†
| -8.02% | 10.26%7 | | -6.88% | 8.17% | -22.27% | 10.62% |
| Ratios and Supplemental Data: | | | | | | | |
Net assets, end of period (in thousands)
| $362,375 | $388,010 | | $369,684 | $451,900 | $416,593 | $566,018 |
Ratio of Expenses to Average Net Assets:
| | | | | | | |
Before expense recoupment/(waivers) and deferred tax expense
| 1.47% | 1.47%8 | | 1.44% | 1.46% | 1.47% | 1.44% |
Expense recoupment/(waivers)
| (0.01)% | (0.01)%8 | | —% | —% | —% | —% |
Net of expense recoupment/(waivers) and before deferred tax expense
| 1.46% | 1.46%8 | | 1.44% | 1.46% | 1.47% | 1.44% |
Deferred tax expense/(benefit)4,5
| —% | —%8 | | —% | 5.61% | -14.59% | 5.62% |
Total expenses/(benefit)
| 1.46% | 1.46%8 | | 1.44% | 7.07% | -13.12% | 7.06% |
Ratio of Net Investment Income (Loss) to Average Net Assets:
| | | | | | | |
Before expense recovery/(reimbursement) and deferred tax benefit
| (0.62)% | (1.13)%8 | | (1.39)% | (1.10)% | 0.95% | (1.20)% |
Expense recoupment/(waivers)
| 0.01% | 0.01%8 | | —% | —% | —% | —% |
Net of expense recoupment/(waivers) and before deferred tax benefit
| (0.61)% | (1.12)%8 | | (1.39)% | (1.10)% | 0.95% | (1.20)% |
Deferred tax benefit5,6
| —% | —%8 | | 0.09% | 0.41% | 0.59% | 0.50% |
Net investment loss
| (0.61)% | (1.12)%8 | | (1.30)% | (0.69)% | (0.36)% | (0.70)% |
Portfolio turnover rate
| 57% | 35%7 | | 32% | 60% | 51% | 55% |
| † | Total investment return is computed based upon the net asset value of the Fund’s shares and excludes the effects of sales charges or contingent deferred sales charges, if applicable. Distributions are assumed to be reinvested at the net asset value of the Class on the ex-date of the distribution. |
| 1 | Per share amounts presented are based on average shares outstanding throughout the period indicated. |
| 2 | Amounts shown are for the period ended September 30, 2018 and are not necessarily indicative of a full year of operations. The Fund changed its fiscal year end from November 30 to September 30. |
| 3 | Realized and unrealized gains and losses per share in this caption are balancing amounts necessary to reconcile the change in net asset value per share in the period. It may not agree to the aggregate gains and losses in the Statement of Operations due to the fluctuation in share transactions this period. |
| 4 | Deferred tax expense (benefit) estimate for the ratio calculation is derived from net investment income (loss), and realized and unrealized gains (losses). |
| 5 | Effective December 1, 2012 the deferred tax expense and deferred tax benefit are allocated based on average net assets. |
| 6 | Deferred tax benefit (expense) estimate for the ratio calculation is derived from net investment income (loss) only. |
| 7 | Not annualized. |
| 8 | Annualized. |
See Notes to Financial Statements.
Center Coast Brookfield MLP Focus Fund
Financial Highlights
| | For the
Year Ended
September 30, | For the Ten
Month Period
Ended
September 30, | | For the Year Ended November 30, |
| Class C | 2019 | 20182 | | 2017 | 2016 | 2015 | 2014 |
Per Share Operating Performance:
| | | | | | | |
Net asset value, beginning of period
| $6.61 | $6.54 | | $7.75 | $7.91 | $11.08 | $10.72 |
| Income from investment Operations: | | | | | | | |
Net investment loss1
| (0.08) | (0.10) | | (0.16) | (0.11) | (0.11) | (0.16) |
Return of capital1
| 0.42 | 0.30 | | 0.36 | 0.35 | 0.32 | 0.32 |
Net realized and unrealized gain (loss)1,3
| (0.90) | 0.38 | | (0.73) | 0.28 | (2.66) | 0.88 |
Total from investment operations
| (0.56) | 0.58 | | (0.53) | 0.52 | (2.45) | 1.04 |
| Distributions to Shareholders: | | | | | | | |
From distributable earnings
| (0.14) | (0.16) | | — | — | — | (0.30) |
From return of capital
| (0.54) | (0.35) | | (0.68) | (0.68) | (0.72) | (0.38) |
Total distributions to shareholders
| (0.68) | (0.51) | | (0.68) | (0.68) | (0.72) | (0.68) |
Net asset value, end of period
| $5.37 | $6.61 | | $6.54 | $7.75 | $7.91 | $11.08 |
Total Return†
| -8.63% | 9.31%7 | | -7.44% | 7.40% | -22.93% | 9.87% |
| Ratios and Supplemental Data: | | | | | | | |
Net assets, end of period (in thousands)
| $470,088 | $637,182 | | $660,663 | $796,542 | $841,555 | $1,056,466 |
Ratio of Expenses to Average Net Assets:
| | | | | | | |
Before expense recoupment/(waivers) and deferred tax expense
| 2.22% | 2.22%8 | | 2.19% | 2.21% | 2.22% | 2.19% |
Expense recoupment/(waivers)
| (0.01)% | (0.01)%8 | | —% | —% | —% | —% |
Net of expense recoupment/(waivers) and before deferred tax expense
| 2.21% | 2.21%8 | | 2.19% | 2.21% | 2.22% | 2.19% |
Deferred tax expense/(benefit)4,5
| —% | —%8 | | —% | 5.61% | (14.59)% | 5.62% |
Total expenses/(benefit)
| 2.21% | 2.21%8 | | 2.19% | 7.82% | (12.37)% | 7.81% |
Ratio of Net Investment Income (Loss) to Average Net Assets:
| | | | | | | |
Before expense recovery/(reimbursement) and deferred tax benefit
| (1.37)% | (1.88)%8 | | (2.14)% | (1.85)% | (1.70)% | (1.95)% |
Expense recoupment/(waivers)
| 0.01% | 0.01%8 | | —% | —% | —% | —% |
Net of expense recoupment/(waivers) and before deferred tax benefit
| (1.36)% | (1.87)%8 | | (2.14)% | (1.85)% | (1.70)% | (1.95)% |
Deferred tax benefit5,6
| —% | —%8 | | 0.09% | 0.41% | 0.59% | 0.50% |
Net investment loss
| (1.36)% | (1.87)%8 | | (2.05)% | (1.44)% | (1.11)% | (1.45)% |
Portfolio turnover rate
| 57% | 35%7 | | 32% | 60% | 51% | 55% |
| † | Total investment return is computed based upon the net asset value of the Fund’s shares and excludes the effects of sales charges or contingent deferred sales charges, if applicable. Distributions are assumed to be reinvested at the net asset value of the Class on the ex-date of the distribution. |
| 1 | Per share amounts presented are based on average shares outstanding throughout the period indicated. |
| 2 | Amounts shown are for the period ended September 30, 2018 and are not necessarily indicative of a full year of operations. The Fund changed its fiscal year end from November 30 to September 30. |
| 3 | Realized and unrealized gains and losses per share in this caption are balancing amounts necessary to reconcile the change in net asset value per share in the period. It may not agree to the aggregate gains and losses in the Statement of Operations due to the fluctuation in share transactions this period. |
| 4 | Deferred tax expense (benefit) estimate for the ratio calculation is derived from net investment income (loss), and realized and unrealized gains (losses). |
| 5 | Effective December 1, 2012 the deferred tax expense and deferred tax benefit are allocated based on average net assets. |
| 6 | Deferred tax benefit (expense) estimate for the ratio calculation is derived from net investment income (loss) only. |
| 7 | Not annualized. |
| 8 | Annualized. |
See Notes to Financial Statements.
18Brookfield Public Securities Group LLC
Center Coast Brookfield MLP Focus Fund
Financial Highlights
| | For the
Year Ended
September 30, | For the Period
February 5,
2018 to
September 30, |
| Class I | 2019 | 20182,3 |
Per Share Operating Performance:
| | |
Net asset value, beginning of period
| $7.35 | $7.64 |
| Income from investment Operations: | | |
Net investment income1
| (0.02) | (0.04) |
Return of capital1
| 0.46 | 0.32 |
Net realized and unrealized gain (loss)1,2
| (1.00) | (0.11) |
Total from investment operations
| (0.56) | 0.17 |
| Distributions to Shareholders: | | |
From distributable earnings
| (0.14) | (0.14) |
From return of capital
| (0.54) | (0.32) |
Total distributions to shareholders
| (0.68) | (0.46) |
Net asset value, end of period
| $6.11 | $7.35 |
Total Return†
| -7.72% | 2.55%4 |
| Ratios and Supplemental Data: | | |
Net assets, end of period
| $237 | $257 |
Ratio of Expenses to Average Net Assets:
| | |
Before expense recoupment/(waivers) and deferred tax expense
| 1.22% | 1.22%5 |
Expense recoupment/(waivers)
| (0.01)% | (0.01)%5 |
Net of expense recoupment/(waivers) and before deferred tax expense
| 1.21% | 1.21%5 |
Deferred tax expense/(benefit)
| — | — |
Total expenses/(benefit)
| 1.21% | 1.21%5 |
| Ratio of Net Investment Income (Loss) to Average Net Assets: | | |
Before expense recovery/(reimbursement) and deferred tax benefit
| (0.37)% | (0.80)%5 |
Expense recoupment/(waivers)
| 0.01% | 0.01%5 |
Net of expense recoupment/(waivers) and before deferred tax benefit
| (0.36)% | (0.79)%5 |
Deferred tax benefit
| —% | —%5 |
Net investment income
| (0.36)% | (0.79)%5 |
Portfolio turnover rate
| 57% | 35%4 |
| † | Total investment return is computed based upon the net asset value of the Fund’s shares and excludes the effects of sales charges or contingent deferred sales charges, if applicable. Distributions are assumed to be reinvested at the net asset value of the Class on the ex-date of the distribution. |
| 1 | Per share amounts presented are based on average shares outstanding throughout the period indicated. |
| 2 | Amounts shown are for the period ended September 30, 2018 and are not necessarily indicative of a full year of operations. The Fund changed its fiscal year end from November 30 to September 30. |
| 3 | Class I Shares commenced operations on February 5, 2018. |
| 4 | Not Annualized. |
| 5 | Annualized. |
See Notes to Financial Statements.
Center Coast Brookfield MLP Focus Fund
Financial Highlights
| | For the
Year Ended
September 30, | For the Ten
Month Period
Ended
September 30, | | For the Year Ended November 30, |
| Class Y | 2019 | 20182 | | 2017 | 2016 | 2015 | 2014 |
Per Share Operating Performance:
| | | | | | | |
Net asset value, beginning of period
| $7.36 | $7.16 | | $8.34 | $8.38 | $11.57 | $11.06 |
| Income from investment Operations: | | | | | | | |
Net investment loss1
| (0.02) | (0.05) | | (0.09) | (0.03) | (0.01) | (0.05) |
Return of capital1
| 0.47 | 0.33 | | 0.39 | 0.38 | 0.34 | 0.32 |
Net realized and unrealized gain (loss)1,3
| (1.01) | 0.43 | | (0.80) | 0.29 | (2.80) | 0.91 |
Total from investment operations
| (0.56) | 0.71 | | (0.50) | 0.64 | (2.47) | 1.19 |
| Distributions to Shareholders: | | | | | | | |
From distributable earnings
| (0.14) | (0.16) | | — | — | — | (0.30) |
From return of capital
| (0.54) | (0.35) | | (0.68) | (0.68) | (0.72) | (0.38) |
Total distributions to shareholders
| (0.68) | (0.51) | | (0.68) | (0.68) | (0.72) | (0.68) |
Net asset value, end of period
| $6.12 | $7.36 | | $7.16 | $8.34 | $8.38 | $11.57 |
Total Return†
| -7.70% | 10.35%7 | | -6.53% | 8.46% | -22.11% | 10.95% |
| Ratios and Supplemental Data: | | | | | | | |
Net assets, end of period (in thousands)
| $1,469,712 | $1,568,976 | | $1,490,129 | $1,353,904 | $1,144,976 | $1,568,738 |
Ratio of Expenses to Average Net Assets:
| | | | | | | |
Before expense recoupment/(waivers) and deferred tax expense
| 1.22% | 1.22%8 | | 1.19% | 1.21% | 1.22% | 1.19% |
Expense recoupment/(waivers)
| (0.01)% | (0.01)%8 | | —% | —% | —% | —% |
Net of expense recoupment/(waivers) and before deferred tax expense
| 1.21% | 1.21%8 | | 1.19% | 1.21% | 1.22% | 1.19% |
Deferred tax expense/(benefit)4,5
| —% | —%8 | | —% | 5.61% | (14.59)% | 5.62% |
Total expenses/(benefit)
| 1.21% | 1.21%8 | | 1.19% | 6.82% | (13.37)% | 6.81% |
Ratio of Net Investment Income (Loss) to Average Net Assets:
| | | | | | | |
Before expense recovery/(reimbursement) and deferred tax benefit
| (0.37)% | (0.88)%8 | | (1.14)% | (0.85)% | (0.70)% | (0.95)% |
Expense recoupment/(waivers)
| 0.01% | 0.01%8 | | —% | —% | —% | —% |
Net of expense recoupment/(waivers) and before deferred tax benefit
| (0.36)% | (0.87)%8 | | (1.14)% | (0.85)% | (0.70)% | (0.95)% |
Deferred tax benefit5,6
| —% | —%8 | | 0.09% | 0.41% | 0.59% | 0.50% |
Net investment loss
| (0.36)% | (0.87)%8 | | (1.05)% | (0.44)% | (0.11)% | (0.45)% |
Portfolio turnover rate
| 57% | 35%10 | | 32% | 60% | 51% | 55% |
| † | Total investment return is computed based upon the net asset value of the Fund’s shares and excludes the effects of sales charges or contingent deferred sales charges, if applicable. Distributions are assumed to be reinvested at the net asset value of the Class on the ex-date of the distribution. |
| 1 | Per share amounts presented are based on average shares outstanding throughout the period indicated. |
| 2 | Amounts shown are for the period ended September 30, 2018 and are not necessarily indicative of a full year of operations. The Fund changed its fiscal year end from November 30 to September 30. |
| 3 | Realized and unrealized gains and losses per share in this caption are balancing amounts necessary to reconcile the change in net asset value per share in the period. It may not agree to the aggregate gains and losses in the Statement of Operations due to the fluctuation in share transactions this period. |
| 4 | Deferred tax expense (benefit) estimate for the ratio calculation is derived from net investment income (loss), and realized and unrealized gains (losses). |
| 5 | Effective December 1, 2012 the deferred tax expense and deferred tax benefit are allocated based on average net assets. |
| 6 | Deferred tax benefit (expense) estimate for the ratio calculation is derived from net investment income (loss) only. |
| 7 | Not annualized. |
| 8 | Annualized. |
See Notes to Financial Statements.
20Brookfield Public Securities Group LLC
CENTER COAST BROOKFIELD MLP FOCUS FUND
Notes to Financial Statements
September 30, 2019
1.Organization
Brookfield Investment Funds, a Delaware statutory trust (the "Trust"), is registered as an open-end management investment company under the Investment Company Act of 1940, as amended (the "1940 Act"). The Trust consists of seven different series of underlying portfolios as of September 30, 2019. Center Coast Brookfield MLP Focus Fund (the ‘‘Fund’’), a series of the Trust, is non-diversified as the term is defined in the 1940 Act. The Fund’s primary investment objective is to seek maximum total return with an emphasis on providing cash distributions to shareholders. The Fund currently offers four classes of shares: Class A Shares, Class C Shares, Class I Shares, and Class Y Shares.
Following the close of business on February 2, 2018, the Fund acquired all of the assets, subject to liabilities, of the Center Coast MLP Focus Fund (the “Predecessor Fund”) through a tax-free reorganization (the “Reorganization”). The Fund has the same investment objective and substantially similar investment strategies and policies as the Predecessor Fund. As a result of the Reorganization, shareholders of the Predecessor Fund’s Class A and Class C Shares received Class A and Class C Shares of the Fund, respectively, and shareholders of the Predecessor Fund’s Institutional Class Shares received Class Y Shares of the Fund. In addition, as a result of the Reorganization, the Fund’s Class A and Class C Shares adopted the Predecessor Fund’s Class A and Class C Shares’ performance and accounting history, and the Fund’s Class Y Shares adopted the Predecessor Fund’s Institutional Class Shares’ performance and accounting history. The Predecessor Fund commenced operations on December 31, 2010. The Fund's Class I Shares commenced operations on February 5, 2018.
Each class represents an interest in the same portfolio of assets and has identical voting, dividend, liquidation and other rights except that: (i) Class A Shares have a maximum front end sales charge of 4.75% and Class C shares have a maximum deferred sales charge of 1.00%; (ii) Class A shares have a 12b-1 fee of 0.25% and Class C shares have a 12b-1 fee of 1.00%; and (iii) each class has exclusive voting rights with respect to matters relating to its own distribution arrangements.
Brookfield Public Securities Group LLC (the “Adviser”), a wholly-owned subsidiary of Brookfield Asset Management Inc., is registered as an investment adviser under the Investment Advisers Act of 1940, as amended, and serves as investment adviser to the Fund.
2.Significant Accounting Policies
The preparation of financial statements in conformity with accounting principles generally accepted in the United States of America (“GAAP”) requires management to make estimates and assumptions that affect the reported amounts of assets and liabilities and disclosure of contingent assets and liabilities at the date of the financial statements and the reported amounts of increases and decreases in net assets from operations during the reporting period. Actual results could differ from those estimates. The Fund is an investment company within the scope of Financial Accounting Standards Board (“FASB”) Accounting Standards Update (“ASU”) 2013-08 and follows accounting and reporting guidance under FASB Accounting Standards Codification (“ASC”) Topic 946,Financial Services-Investment Companies.
Valuation of Investments: The Fund’s Board of Trustees (the “Board”) has adopted procedures for the valuation of the Fund’s securities. The Adviser oversees the day to day responsibilities for valuation determinations under these procedures. The Board regularly reviews the application of these procedures to the securities in the Fund’s portfolio. The Adviser’s Valuation Committee is comprised of senior members of the Adviser’s management team. There can be no assurance that the Fund could purchase or sell a portfolio security at the price used to calculate the Fund’s net asset value (“NAV”).
Investments in equity securities listed or traded on any securities exchange or traded in the over-the-counter market are valued at the last trade price as of the close of business on the valuation date. Prices of foreign equities that are principally traded on certain foreign markets will generally be adjusted daily pursuant to a fair value pricing service approved by the Board in order to reflect an adjustment for the factors occurring after the
CENTER COAST BROOKFIELD MLP FOCUS FUND
Notes to Financial Statements (continued)
September 30, 2019
close of certain foreign markets but before the NYSE close. When fair value pricing is employed, the value of the portfolio securities used to calculate the Fund’s net asset values may differ from quoted or official closing prices. Investments in open-end registered investment companies, if any, are valued at the NAV as reported by those investment companies.
Debt securities, including U.S. government securities, listed corporate bonds, other fixed income and asset-backed securities, and unlisted securities and private placement securities, are generally valued at the bid prices furnished by an independent pricing service or, if not valued by an independent pricing service, using bid prices obtained from active and reliable market makers in any such security or a broker-dealer. The broker-dealers or pricing services use multiple valuation techniques to determine fair value. In instances where sufficient market activity exists, the broker-dealers or pricing services may utilize a market-based approach through which quotes from market makers are used to determine fair value. In instances where sufficient market activity may not exist or is limited, the broker-dealers or pricing services may also utilize proprietary valuation models which may consider market transactions in comparable securities and the various relationships between securities in determining fair value and/or market characteristics such as benchmark yield curves, option-adjusted spreads, credit spreads, estimated default rates, coupon-rates, anticipated timing of principal repayments, underlying collateral, and other unique security features in order to estimate the relevant cash flows, which are then discounted to calculate the fair values. Short-term debt securities with remaining maturities of sixty days or less are valued at amortized cost of discount or premium to maturity, unless such valuation, in the judgment of the Adviser’s Valuation Committee, does not represent fair value.
Securities for which market prices are not readily available or which cannot be valued using the sources described above will be valued using an internal proprietary fair value methodology. For any security warranting such fair value measurement, a memorandum, including the specific methodology and supporting information, will be provided to the Valuation Committee by a portfolio manager or analyst looking to fair value a particular security utilizing the internal proprietary fair value methodology. A portfolio manager or analyst shall use their best efforts to maximize the use of relevant observable inputs and minimize the use of unobservable inputs within their valuation technique. The Valuation Committee shall review the memorandum and supporting information provided by a portfolio manager or analyst and consider all relevant factors as it deems appropriate before approving the fair value recommendation.
The Fund may use the internally determined fair value of a security to calculate its NAV when, for example, (1) a portfolio security is not traded in a public market or the principal market in which the security trades is closed, (2) trading in a portfolio security is suspended and not resumed prior to the normal market close, (3) a portfolio security is not traded in significant volume for a substantial period, or (4) the Adviser determines that the quotation or price for a portfolio security provided by a broker-dealer or an independent pricing service is inaccurate.
The internally determined fair value of securities may be difficult to determine and thus judgment plays a greater role in the valuation process. The fair valuation methodology may include or consider the following guidelines, as appropriate: (1) evaluation of all relevant factors, including, but not limited to, pricing history, current market level, supply and demand of the respective security; (2) comparison to the values and current pricing of securities that have comparable characteristics; (3) knowledge of historical market information with respect to the security; (4) other factors relevant to the security which would include, but not be limited to, duration, yield, fundamental analytical data, the Treasury yield curve, and credit quality.
The values assigned to internally fair valued investments are based on available information and do not necessarily represent amounts that might ultimately be realized, since such amounts depend on future developments inherent in investments. Changes in the fair valuation of portfolio securities may be less frequent and of greater magnitude than changes in the price of portfolio securities valued at their last sale price, by an independent pricing service, or based on market quotations. Imprecision in estimating fair value can also impact the amount of unrealized appreciation or depreciation recorded for a particular portfolio security and differences in the assumptions used could result in a different determination of fair value, and those differences could be material.
22Brookfield Public Securities Group LLC
CENTER COAST BROOKFIELD MLP FOCUS FUND
Notes to Financial Statements (continued)
September 30, 2019
The Fund has established methods of fair value measurements in accordance with GAAP. Fair value denotes the price that the Fund would receive upon selling an investment in a timely transaction to an independent buyer in the principal or most advantageous market of the investment. A three-tier hierarchy has been established to maximize the use of observable market data and minimize the use of unobservable inputs and to establish classification of fair value measurements for disclosure purposes. Inputs refer broadly to the assumptions that market participants would use in pricing the asset or liability, including assumptions about risk, for example, the risk inherent in a particular valuation technique used to measure fair value including such a pricing model and/or the risk inherent in the inputs to the valuation technique. Inputs may be observable or unobservable. Observable inputs are inputs that reflect the assumptions market participants would use in pricing the asset or liability developed based on market data obtained from sources independent of the reporting entity. Unobservable inputs are inputs that reflect the reporting entity’s own assumptions about the assumptions market participants would use in pricing the asset or liability developed based on the best information available in the circumstances. The three-tier hierarchy of inputs is summarized in the three broad levels listed below.
| Level 1 - | quoted prices in active markets for identical assets or liabilities |
| Level 2 - | quoted prices in markets that are not active or other significant observable inputs (including, but not limited to: quoted prices for similar assets or liabilities, quoted prices based on recently executed transactions, interest rates, credit risk, etc.)
|
| Level 3 - | significant unobservable inputs (including the Fund’s own assumptions in determining the fair value of assets or liabilities) |
The Adviser’s valuation policy, as previously stated, establishes parameters for the sources and types of valuation analysis, as well as, the methodologies and inputs the Valuation Committee uses in determining fair value. If the Valuation Committee determines that additional techniques, sources or inputs are appropriate or necessary in a given situation, such additional work will be undertaken.
To assess the continuing appropriateness of security valuations, the Adviser (or its third party service provider, who is subject to oversight by the Adviser), regularly compares its prior day prices, prices on comparable securities and sale prices to the current day prices and challenges those prices that exceed certain tolerance levels with the third party pricing service or broker source. For those securities valued by fair valuations, the Adviser’s Valuation Committee reviews and affirms the reasonableness of the valuations based on such methodologies and fair valuation determinations on a regular basis after considering all relevant information that is reasonably available.
The inputs or methodology used for valuing investments are not necessarily an indication of the risk associated with investing in those securities.
The following table summarizes the Fund’s investments valuation inputs categorized in the disclosure hierarchy as of September 30, 2019:
| Valuation Inputs | Level 1 | | Level 2 | | Level 3 | | Total |
Master Limited Partnerships
| 1,399,192,259 | | $— | | $— | | 1,399,192,259 |
Common Stocks
| 879,321,377 | | — | | — | | 879,321,377 |
Money Market Fund
| 37,792,946 | | — | | — | | 37,792,946 |
Total Investments
| $2,316,306,582 | | $— | | $— | | $2,316,306,582 |
For further information regarding security characteristics, see the Schedule of Investments.
Investment Transactions and Investment Income: Securities transactions are recorded on the trade date. Realized gains and losses from securities transactions are calculated on the identified cost basis. Interest income is recorded on the accrual basis. Discounts and premiums on securities are accreted and amortized, respectively, on
CENTER COAST BROOKFIELD MLP FOCUS FUND
Notes to Financial Statements (continued)
September 30, 2019
a daily basis, using the effective yield to maturity method adjusted based on management’s assessment of the collectability of such interest. Dividend income is recorded on the ex-dividend date.
Master Limited Partnerships: A master limited partnership (“MLP”) is an entity receiving partnership taxation treatment under the U.S. Internal Revenue Code of 1986 (the “Code”), the partnership interests or “units” of which are traded on securities exchanges like shares of corporate stock. Holders of MLP units generally have limited control and voting rights on matters affecting the partnership.
The Fund primarily invests in MLPs, which generally are treated as partnerships for federal income tax purposes. If an MLP does not meet current legal requirements to maintain partnership status, or if it is unable to do so because of tax law changes, it would be taxed as a corporation or other form of taxable entity and there could be a material decrease in the value of its securities. Additionally, if tax law changes to eliminate or reduce tax deductions such as depletion, depreciation and amortization expense deductions that MLPs have been able to use to offset a significant portion of their taxable income, it could significantly reduce the value of the MLPs held by the Fund and could cause a greater portion of the income and gain allocated to the Fund to be subject to U.S. federal, state and local corporate income taxes, which would reduce the amount the Fund can distribute to shareholders and could increase the percentage of Fund distributions treated as dividends instead of tax-deferred return of capital.
Depreciation or other cost recovery deductions passed through to the Fund from investments in MLPs in a given year generally will reduce the Fund’s taxable income (and earnings and profits), but those deductions may be recaptured in the Fund’s taxable income (and earnings and profits) in subsequent years when the MLPs dispose of their assets or when the Fund disposes of its interests in the MLPs. When deductions are recaptured, distributions to the Fund’s shareholders may be taxable.
Return of Capital Estimates:A distribution received from the Fund’s investments in MLPs generally is comprised of income and return of capital. The Fund records investment income and return of capital based on estimates made at the time such distributions are received. Such estimates are based on historical information available from each MLP and other industry sources. These estimates may subsequently be revised based on information received from MLPs after their tax reporting periods are concluded. For the fiscal year ended September 30, 2019, the Fund estimated that 100% of the MLP distributions received would be treated as return of capital.
Expenses: Expenses directly attributable to the Fund are charged directly to the Fund, while expenses which are attributable to the Fund and other investment companies advised by the Adviser are allocated among the respective investment companies, including the Fund, based upon relative average net assets, evenly or a combination of average net assets and evenly.
Distributions to Shareholders: The Fund’s dividend distribution policy is intended to provide monthly distributions to its common shareholders at a rate that over time is similar to the distribution rate the Fund receives from the MLPs in which it invests, without offset for the expenses of the Fund. The Fund is not required to make such distributions and therefore the amount, if any, and/or the frequency of payment is subject to change. The amount of the Fund’s distributions is based on, among other considerations, distributions the Fund actually receives from portfolio investments, including returns of capital, and estimated future cash flows. Because the Fund’s distribution policy takes into consideration estimated future cash flows from its underlying holdings, and to permit the Fund to maintain a stable distribution rate, the Fund’s distributions may exceed, or be below the amount the Fund actually receives from its portfolio investments. Additionally, since the Fund’s distribution rate is not derived from the Fund’s investment income or loss, the Fund’s distributions may not represent yield or investment return on the Fund’s portfolio. To the extent that the distributions paid exceed the distributions the Fund has received, the distributions will reduce the Fund’s net assets. Consequently, the Fund may maintain cash reserves, borrow or may be required to sell certain investments at times when it would not otherwise be desirable to do so in order to pay the expenses of the Fund. The Fund is not required to make such distributions and, as a result, the Fund could in the future decide not to make such distributions or not to make distributions at a rate that over time is similar to the distribution rate that it receives from the MLPs in which it invests. Furthermore, unlike the MLPs in which it invests,
24Brookfield Public Securities Group LLC
CENTER COAST BROOKFIELD MLP FOCUS FUND
Notes to Financial Statements (continued)
September 30, 2019
the Fund is not a pass through entity. Consequently, the tax characterization of the distributions paid by the Fund, as dividend income or return of capital, may differ greatly from those of the underlying MLPs.
Distributions, if any, are declared and distributed monthly. The estimated characterization of the distributions paid will be either a dividend (ordinary or qualified income) or distribution (return of capital). This estimate is based on the Fund’s operating results during the period. It is anticipated that a portion of its distributions will be comprised of return of capital as a result of the tax character of cash distributions made by the Fund’s investments. The actual characterization of the distributions made during the period will not be determined until after the end of the fiscal year. For the fiscal year ended September 30, 2019, the Fund estimates that its distributions will be largely characterized as return of capital. The Fund will inform shareholders of the final tax character of the distributions on IRS Form DIV in February 2020.
The portion of the Fund’s distributions that may be classified as return of capital is uncertain and can be materially impacted by events that are not subject to the control of the Fund’s Adviser (e.g., mergers, acquisitions, reorganizations and other capital transactions occurring at the individual MLP level, changes in the tax characterization of distributions received from the MLP investments held by the Fund, changes in tax laws, etc.). The return of capital portion may also be impacted by the Fund’s strategy, which may recognize gains on its holdings. Because of these factors, the portion of the Fund’s distributions that are classified as return of capital may vary materially from year to year. Accordingly, there is no guarantee that future distributions will maintain the same classification for tax purposes as past distributions.
The distributions are determined in accordance with federal income tax regulations and are recorded on the ex-dividend date. The character may differ from GAAP. These differences between book-basis and tax-basis are either considered temporary or permanent in nature. To the extent these differences are permanent in nature, such amounts are reclassified within the composition of net assets based on their federal tax-basis treatment; temporary differences do not require reclassification.
Energy Industry Concentration Risk: A substantial portion of the MLPs in which the Fund invests are engaged primarily in the energy industry. As a result, the Fund will be concentrated in the energy industry, and will therefore be susceptible to adverse economic, environmental or regulatory occurrences effecting the energy industry.
New Accounting Pronouncements: In August 2018, FASB issued ASU 2018-13,Fair Value Measurement (Topic 820): Disclosure Framework — Changes to the Disclosure Requirements for Fair Value Measurement. The primary focus of ASU 2018-13 is to improve the effectiveness of the disclosure requirements for fair value measurements. In general, the amendments in ASU 2018-13 are effective for all entities for fiscal years and interim periods within those fiscal years, beginning after December 15, 2019. An entity is permitted to early adopt upon the issuance of ASU 2018-13. Management has implemented the amendments and there was no material impact on the Fund’s financial statements.
3.Federal Income Tax Information
The Fund does not intend to qualify as a regulated investment company pursuant to Subchapter M of the Internal Revenue Code, therefore it is taxed as a corporation. As a corporation, the Fund is obligated to pay federal, state and local income tax on taxable income. The Fund’s net deferred tax asset balance is continued to be completely offset by a full valuation allowance. The Fund is currently using an estimated tax rate of 1.22% for state and local tax.
CENTER COAST BROOKFIELD MLP FOCUS FUND
Notes to Financial Statements (continued)
September 30, 2019
The Fund's income tax provision consists of the following for the fiscal year ended September 30, 2019:
Deferred tax expense (benefit)
| |
Federal
| $(46,385,799) |
State
| (1,697,250) |
Change in valuation allowance
| 48,083,049 |
Total deferred tax expense
| $— |
Total income tax expense (benefit) for the Fund differs from the amount computed by applying the federal statutory income tax rate of 21% net investment income (loss) and realized and unrealized gain (loss) on investments for the year ended September 30, 2019, as follows:
| | Amount |
Application of statutory income tax rate
| $(43,242,376) |
State income taxes net of federal benefit
| (2,504,936) |
Effect of permanent & temporary differences
| (2,335,737) |
Change in valuation allowance
| 48,083,049 |
Total income tax expense
| $— |
For the fiscal year ended September 30, 2019, the Fund’s effective tax rate of 0.00% differed from the combined federal and state statutory tax rate of 22.22% mainly due to the change in valuation allowance primarily as a result of the change in unrealized appreciation.
The Fund intends to invest its assets primarily in MLPs, which generally are treated as partnerships for federal income tax purposes. As a limited partner in the MLPs, the Fund reports its allocable share of the MLP's taxable income in computing its own taxable income. Deferred income taxes reflect the net tax effects of temporary difference between the carrying amounts of assets and liabilities for financial reporting purposes and the amounts used for income tax purposes. Such temporary differences are principally: (i) taxes on unrealized gains/(losses), which are attributable to the temporary difference between fair market value and tax basis, (ii) the net tax effects of temporary differences between the carrying amounts of assets and liabilities for financial reporting and income tax purposes and (iii) the net tax benefit of accumulated net operating losses and capital loss carryforwards. Deferred tax assets and liabilities are measured using effective tax rates expected to apply to taxable income in the years such temporary differences are realized or otherwise settled.
Components of the Fund's deferred tax assets and liabilities as of September 30, 2019 are as follows:
| | Amount |
Deferred tax assets:
| |
Net operating loss carryforward (tax basis)
| $56,929,129 |
Capital loss carryforward (tax basis)
| 70,378,579 |
Valuation Allowance
| (54,518,165) |
Total deferred tax assets
| 72,789,543 |
Deferred tax liabilities:
| |
Net unrealized gains on investment securities (tax basis)
| (72,789,543) |
Total net deferred tax liability
| $— |
To the extent the Fund has a deferred tax asset or if a portion of the deferred tax liability is offset by a tax asset resulting from net operating losses, consideration is given to whether or not a valuation allowance is required against the deferred tax asset amount. A valuation allowance is required if, based on the evaluation criterion provided by ASC 740,Income Taxes (ASC 740), it is more-likely-than-not that some portion or all of the deferred tax asset will not be realized. Among the factors considered in assessing the Fund's valuation allowance are: the
26Brookfield Public Securities Group LLC
CENTER COAST BROOKFIELD MLP FOCUS FUND
Notes to Financial Statements (continued)
September 30, 2019
nature, frequency and severity of current and cumulative losses, forecasts of future profitability, forecasts of future MLP distributions, the duration of the statutory carryforward periods and the associated risks that operating and capital loss carryforwards may expire unused. Based on the Fund’s assessment, it has determined that in the future it is more likely than not that the fund will not generate the necessary appropriate character of income within the relevant carryforward periods to realize its deferred tax assets. As of Septmber 30, 2019, the Fund has determined that a valuation allowance of $54,518,165 was required as stated in the table above.
In making this assessment, significant reliance was placed on forecasts and estimates as to the Fund’s MLP investments. In conjunction with work performed by qualified independent tax consultants, the Fund utilized historical information and other information about the specific MLP fund holdings to project and forecast future distributions and related tax implications.
The Fund may rely, to some extent, on information provided by the MLPs, which may not necessarily be timely, to estimate taxable income allocable to MLP units held in their portfolios, and to estimate their associated deferred tax asset/(liability). Such estimates as well as estimates made in connection with MLP distribution forecasts are made in good faith.
From time to time, and as new information becomes available, the Fund will modify its forecasts, estimates or assumptions regarding its deferred tax liability or asset.
Modifications of the Fund’s estimates or assumptions regarding its deferred tax liability and/or asset balances and any applicable valuation allowance, changes in generally accepted accounting principles or related guidance or interpretations thereof, limitations imposed on net operating losses (if any) and changes in applicable tax law could result in increases or decreases in the Fund’s NAV, which could be material. Such changes could have a material impact on the Fund’s NAV and results of operations with respect to the Fund’s shareholders in the period it is recorded, even though the shareholders at such time might not have held shares in the Fund at the time the deferred tax asset or liability had been established.
The Fund's policy is to classify interest and penalties associated with underpayment of federal and state income taxes, if any, as income tax expense on their Statement of Operations. As of September 30, 2019, the Fund did not have any interest or penalties associated with the underpayment of any income taxes.
The Fund files income tax returns in the U.S. federal jurisdiction and various states. The Fund has reviewed all major jurisdictions and concluded that there is no significant impact on the Fund's net assets and no tax liability resulting from unrecognized tax benefits relating to uncertain tax positions expected to be taken on their tax returns. Furthermore, management of the Fund is not aware of any tax positions for which it is reasonably possible that the total amounts of unrecognized tax benefits will significantly change in the next 12 months.
As of September 30, 2019, the Fund had net operating loss carryforwards for federal income tax purposes, which may be carried forward for 20 years, as follows:
| | Amount |
Expiration Date:
| |
| 9/30/2035 | $92,716,151 |
| 9/30/2036 | 57,346,506 |
| 9/30/2037 | 89,523,820 |
| Unlimited | 16,660,771 |
Total
| $256,247,248 |
CENTER COAST BROOKFIELD MLP FOCUS FUND
Notes to Financial Statements (continued)
September 30, 2019
As of September 30, 2019, the Fund had net capital loss carryforwards for federal income tax purposes, which may be carried forward for 5 years, as follows:
| | Amount |
Expiration Date:
| |
| 9/30/2021 | $316,785,409 |
Total
| $316,785,409 |
As of September 30, 2019, gross unrealized appreciation and depreciation of investments, based on cost for federal income tax purposes, were as follows:
| Cost of Investments | Gross Unrealized Appreciation | Gross Unrealized Depreciation | Net Unrealized Appreciation |
| $1,997,650,330 | $438,673,882 | $(120,017,630) | $318,656,252 |
The difference between cost amounts for financial statement and federal income tax purposes is due primarily to income/(loss) from MLP K-1s, which is treated as an increase/(decrease) in cost basis of the MLP shares held, and timing differences in recognizing certain gains and losses in security transactions.
4.Investment Advisory Agreement and Related Party Transactions
The Fund has entered into an investment advisory agreement (the “Advisory Agreement”) with the Adviser under which the Adviser is responsible for the management of the Fund’s portfolio and provides the necessary personnel, facilities, equipment and certain other services necessary to the operations of the Fund. The Advisory Agreement provides that the Fund shall pay the Adviser a fee, computed daily and payable monthly, at an annual rate of 1.00% of the Fund’s average daily net assets.
The Adviser has contractually agreed to waive all or a portion of its investment advisory or administration fees and/or to reimburse certain expenses of the Fund to the extent necessary to maintain the Total Annual Fund Operating Expenses After Fee Waiver and/or Expense Reimbursement (excluding any front-end or contingent deferred sales loads, brokerage commissions and other transactional expenses, acquired fund fees and expenses, interest, taxes, such as deferred income tax expenses, and extraordinary expenses, such as litigation; and other expenses not incurred in the ordinary course of the Fund’s business) at no more than 1.46% for Class A Shares, 2.21% for Class C Shares, 1.21% for Class I Shares and 1.21% for Class Y Shares. The fee waiver and expense reimbursement arrangement will continue until at least February 1, 2020 and may not be terminated by the Fund or the Adviser before such time. Thereafter, this arrangement may only be terminated or amended to increase the expense cap as of February 2nd of each calendar year, provided that in the case of a termination by the Adviser, the Adviser will provide the Board of Trustees with written notice of its intention to terminate the arrangement prior to the expiration of its then current term. Any waivers and/or reimbursements made by the Adviser are subject to recoupment from the Fund for a period not to exceed three years after the occurrence of the waiver and/or reimbursement, provided that the Fund is able to effect such payment to the Adviser and remain in compliance with the expense cap in effect at the time the waivers and/or reimbursements occurred.
The amount of investment advisory fees waived and/or expenses reimbursed available to be recouped before expiration is $210,741 for the fiscal year ended September 30, 2019, $251,919 for the ten months ended September 30, 2018 and $0 for the fiscal year ended November 30, 2017. For the fiscal year ended September 30, 2019, the ten months ended September 30, 2018 and the fiscal year ended November 30, 2017, the Adviser did not recoup any expenses.
The Fund has entered into an Administration Agreement with the Adviser and the Adviser has entered into a sub-administration agreement with U.S. Bancorp Fund Services, LLC, doing business as U.S. Bank Global Fund Services (“Sub-Administrator”). The Adviser and Sub-Administrator perform administrative services necessary for the operation of the Fund, including maintaining certain books and records of the Fund and preparing reports and other documents required by federal, state, and other applicable laws and regulations, and providing the Fund with
28Brookfield Public Securities Group LLC
CENTER COAST BROOKFIELD MLP FOCUS FUND
Notes to Financial Statements (continued)
September 30, 2019
administrative office facilities. For these services, the Fund pays to the Adviser a monthly fee at an annual rate of 0.15% of the Fund’s average daily net Assets. The Adviser is responsible for any fees due to the Sub-Administrator.
Certain officers and/or trustees of the Trust are officers and/or employees of the Adviser.
5.Purchases and Sales of Investments
For the fiscal year ended September 30, 2019, purchases and sales of investments, excluding short-term investments were $1,420,716,090 and $1,349,673,898, respectively.
6.Shares of Beneficial Interest
The Trust’s Declaration of Trust authorizes the issuance of an unlimited number of full and fractional shares of beneficial interest. With respect to each series, the Trust may offer more than one class of shares. The Trust reserves the right to create and issue additional series or classes. Each share of a series or class represents an equal proportionate interest in that series or class with each other share of that series or class. Currently, each series offers four classes of shares of beneficial interest — “Class A” Shares, “Class C” Shares, “Class I” Shares, and “Class Y” Shares.
The shares of each series or class participate equally in the earnings, distributions and assets of the particular series or class.
| | 20191 | | 20182 | | 20173 |
| Class A | Shares | | Amount | | Shares | | Amount | | Shares | | Amount |
Subscriptions
| 19,036,164 | | $121,246,563 | | 12,838,115 | | $92,996,245 | | 13,889,680 | | $112,959,556 |
Reinvestment of distributions
| 5,457,114 | | 34,749,294 | | 3,409,802 | | 24,085,760 | | 4,129,810 | | 32,681,291 |
Redemptions
| (17,535,409) | | (111,722,243) | | (14,965,335) | | (107,020,013) | | (20,350,725) | | (164,184,604) |
Net Increase (Decrease)
| 6,957,869 | | $44,273,614 | | 1,282,582 | | $10,061,992 | | (2,331,235) | | $(18,543,757) |
| Class C | Shares | | Amount | | Shares | | Amount | | Shares | | Amount |
Subscriptions
| 13,119,943 | | $75,747,876 | | 11,698,214 | | $78,728,997 | | 16,109,846 | | $123,016,368 |
Reinvestment of distributions
| 10,337,129 | | 59,950,608 | | 7,238,114 | | 47,178,388 | | 9,145,807 | | 67,438,747 |
Redemptions
| (32,286,918) | | (184,779,259) | | (23,653,945) | | (155,684,637) | | (26,889,996) | | (199,335,773) |
Net Decrease
| (8,829,846) | | $(49,080,775) | | (4,717,617) | | $(29,777,252) | | (1,634,343) | | $(8,880,658) |
| Class I4 | Shares | | Amount | | Shares | | Amount | | Shares | | Amount |
Subscriptions
| — | | $— | | 33 | | $250 | | — | | $— |
Reinvestment of distributions
| 4 | | 25 | | 2 | | 16 | | — | | — |
Redemptions
| — | | — | | — | | — | | — | | — |
Net Increase
| 4 | | $25 | | 35 | | $266 | | — | | $— |
CENTER COAST BROOKFIELD MLP FOCUS FUND
Notes to Financial Statements (continued)
September 30, 2019
| | 20191 | | 20182 | | 20173 |
| Class Y | Shares | | Amount | | Shares | | Amount | | Shares | | Amount |
Subscriptions
| 136,218,109 | | $881,460,787 | | 97,184,868 | | $714,088,173 | | 105,955,557 | | $864,966,707 |
Reinvestment of distributions
| 23,834,684 | | 155,511,182 | | 15,206,959 | | 109,349,929 | | 16,170,128 | | 128,608,758 |
Redemptions
| (132,981,088) | | (859,230,714) | | (107,378,836) | | (768,566,184) | | (76,149,722) | | (605,952,349) |
Net Increase
| 27,071,705 | | $177,741,255 | | 5,012,991 | | $54,871,918 | | 45,975,963 | | $387,623,116 |
1 For the Fiscal Year Ended September 30, 2019.
2 For Ten Month Period Ended September 30, 2018.
3For the Fiscal Year Ended November 30, 2017.
4 Class I Shares commenced operations on February 5, 2018.
7.Credit Facility
U.S. Bank, N.A. (the “Bank”) has made available to the Trust, a credit facility, pursuant to a separate Loan and Security Agreement, for temporary or extraordinary purposes. The maximum line of credit as of September 30, 2019 for the Trust is $75,000,000. Advances are not collateralized by a first lien against the Fund’s assets. For fiscal year ended September 30, 2019, the average interest rate on the outstanding principal amount for the Fund was 5.25%.
During the fiscal year ended September 30, 2019, the Fund utilized the credit facility for 5 days and had an outstanding average daily loan balance of $11,913,400. The maximum amount outstanding during the period was $15,941,000 and the interest expense amounted to $8,687. At of September 30, 2019, the Fund did not have an amount outstanding on the credit facility.
8.Investments in Affiliated Issuers
An affiliated issuer is an entity in which the Fund has ownership of at least 5% of the outstanding voting securities. Issuers that are affiliates of the Fund at period-end are noted in the Fund’s Schedule of Investments (if any). A schedule of the Fund's investments in securities of affiliated issuers held during the fiscal year ended September 30, 2019, is set forth below.
| Security Description | Value Beginning of Year | | Purchases | | Sales Proceeds | | Net Realized Gain (Loss) | | Change in Unrealized Depreciation while Affiliated | | Return of Capital Distributions | | Value End of Period1/Year |
NuStar Energy LP1
| $153,393,895 | | $5,026,822 | | $(8,348,375) | | $1,210,153 | | $3,948,431 | | $(9,902,050) | | $145,328,876 |
SemGroup Corp.
| 24,327,897 | | 58,372,421 | | (5,418,774) | | (3,278,438) | | 3,661,242 | | (7,306,154) | | 70,358,194 |
Total
| $177,721,792 | | $63,399,243 | | $(13,767,149) | | $(2,068,285) | | $7,609,673 | | $(17,208,204) | | $215,687,070 |
| Security Description | Shares Beginning of Year | | Purchases | | Sales | | Shares End of Period1/Year |
NuStar Energy LP1
| 5,517,766 | | 188,998 | | (306,397) | | 5,400,367 |
SemGroup Corp.
| 1,103,306 | | 3,737,446 | | (534,864) | | 4,305,887 |
Total
| 6,621,072 | | 3,926,444 | | (841,261) | | 9,706,254 |
1 This security was considered an affiliate during the period from October 1, 2018 to June 11, 2019, but is no longer an affiliate at September 30, 2019.
As of September 30, 2019, the Fund owned 5.47% of the total oustanding shares of SemGroup Corp.
30Brookfield Public Securities Group LLC
CENTER COAST BROOKFIELD MLP FOCUS FUND
Notes to Financial Statements (continued)
September 30, 2019
9.Indemnification
Under the Fund’s organizational documents, its officers and directors are indemnified against certain liabilities arising out of the performance of their duties to the Fund. In addition, in the normal course of business, the Fund enters into contracts with its vendors and others that provide for indemnification. The Fund’s maximum exposure under these arrangements is unknown, since this would involve the resolution of certain claims, as well as future claims that may be made, against the Fund. Thus, an estimate of the financial impact, if any, of these arrangements cannot be made at this time. However, based on experience, the Fund expects the risk of loss due to these warranties and indemnities to be unlikely.
10.Subsequent Events
On October 17, 2019 and November 21, 2019, the Fund paid a distribution in the amount of $0.057 per common share and $0.057 per common share, respectively.
GAAP requires recognition in the financial statements of the effects of all subsequent events that provide additional evidence about conditions that existed at the date of the Statement of Assets and Liabilities. For non-recognized subsequent events that must be disclosed to keep the financial statements from being misleading, the Fund is required to disclose the nature of the event as well as an estimate of its financial effect, or a statement that such an estimate cannot be made.
Management has evaluated subsequent events in the preparation of the Fund’s financial statements and has determined that other than the items listed herein, there are no events that require recognition or disclosure in the financial statements.
CENTER COAST BROOKFIELD MLP FOCUS FUND
Report of Independent Registered Public Accounting Firm
September 30, 2019
To the shareholders of Center Coast Brookfield MLP Focus Fund and the Board of Trustees of Brookfield Investment Funds
Opinion on the Financial Statements and Financial Highlights
We have audited the accompanying statement of assets and liabilities of Center Coast Brookfield MLP Focus Fund (the “Fund”), a series of the Brookfield Investment Trust, including the schedule of investments, as of September 30, 2019, the related statement of operations for the year then ended, the statements of changes in net assets and the financial highlights for the period from December 1, 2017 through September 30, 2018 and for the year ended September 30, 2019, and the related notes. In our opinion, the financial statements and financial highlights present fairly, in all material respects, the financial position of the Fund as of September 30, 2019, and the results of its operations for the year then ended, the changes in its net assets, and the financial highlights for the period from December 1, 2017 through September 30, 2018 and for the year ended September 30, 2019, in conformity with accounting principles generally accepted in the United States of America.
The statement of changes in net assets for the year ended November 30, 2017, and the financial highlights for each of the four years in the period ended November 30, 2017 were audited by other auditors whose report dated January 29, 2018, expressed an unqualified opinion on those financial statements and financial highlights.
Basis for Opinion
These financial statements and financial highlights are the responsibility of the Fund’s management. Our responsibility is to express an opinion on the Fund’s financial statements and financial highlights based on our audit. We are a public accounting firm registered with the Public Company Accounting Oversight Board (United States) (PCAOB) and are required to be independent with respect to the Fund in accordance with the U.S. federal securities laws and the applicable rules and regulations of the Securities and Exchange Commission and the PCAOB.
We conducted our audit in accordance with the standards of the PCAOB. Those standards require that we plan and perform the audit to obtain reasonable assurance about whether the financial statements and financial highlights are free of material misstatement, whether due to error or fraud. The Fund is not required to have, nor were we engaged to perform, an audit of its internal control over financial reporting. As part of our audit we are required to obtain an understanding of internal control over financial reporting but not for the purpose of expressing an opinion on the effectiveness of the Fund’s internal control over financial reporting. Accordingly, we express no such opinion.
Our audit included performing procedures to assess the risks of material misstatement of the financial statements and financial highlights, whether due to error or fraud, and performing procedures that respond to those risks. Such procedures included examining, on a test basis, evidence regarding the amounts and disclosures in the financial statements and financial highlights. Our audit also included evaluating the accounting principles used and significant estimates made by management, as well as evaluating the overall presentation of the financial statements and financial highlights. Our procedures included confirmation of securities owned as of September 30, 2019, by correspondence with the custodian and brokers. We believe that our audit provides a reasonable basis for our opinion.
DELOITTE & TOUCHE LLP
Chicago, Illinois
November 27, 2019
We have served as the auditor of one or more of Brookfield Public Securities Group LLC's investment companies since 2011.
32Brookfield Public Securities Group LLC
CENTER COAST BROOKFIELD MLP FOCUS FUND
Board Considerations Relating to the Investment Advisory Agreement (Unaudited)
September 30, 2019
The Board of Trustees (the “Board,” the members of which are referred to as “Trustees”) of Brookfield Investment Funds (the “Trust”), including the Trustees who are not “interested persons,” as defined in Section 2(a)(19) of the Investment Company Act of 1940, as amended (the “1940 Act”) (the “Independent Trustees”), of the Trust, considered and approved the continuation of the Investment Advisory Agreement (the “Advisory Agreement”) between the Trust, on behalf of its series, Center Coast Brookfield MLP Focus Fund (the “Fund”), and Brookfield Public Securities Group LLC (the “Adviser” or “Brookfield”) for a successive one-year period at an in-person meeting held on May 22-23, 2019 (the “Meeting”).
In accordance with Section 15(c) of the 1940 Act, the Board requested, and Brookfield provided, materials relating to the Board’s consideration of whether to approve the continuation of the Advisory Agreement. These materials included, among other things: (a) a summary of the services provided to the Fund by Brookfield; (b) information independently compiled and prepared by Broadridge Financial Solutions, Inc. (“Broadridge”), an independent third-party provider of mutual fund data, on fees and expenses of the Fund, and the investment performance of the Fund as compared with a peer group and/or peer universe of funds, as applicable, including supplemental data independently prepared by Brookfield; (c) information on the profitability of Brookfield; (d) information relating to economies of scale; (e) information about Brookfield’s general compliance policies and procedures and the services that it provides; (f) information on Brookfield’s risk management processes; (g) information regarding brokerage and soft dollar practices; and (h) information about the key personnel of Brookfield that are involved in the investment management, administration, compliance and risk management activities with respect to the Fund, as well as current and projected staffing levels and compensation practices.
In determining whether to approve the continuation of the Advisory Agreement, the Board, including the Independent Trustees, considered at the Meeting, and from time to time, as appropriate, factors that it deemed relevant. The following discusses the primary factors relevant to the Board’s decision.
THE NATURE, EXTENT AND QUALITY OF THE SERVICES TO BE PROVIDED BY THE ADVISER. The Board, including the Independent Trustees, considered the nature, extent and quality of services provided by Brookfield. The Board noted that such services include acting as investment manager and adviser to the Fund, managing the daily business affairs of the Fund, and obtaining and evaluating economic, statistical and financial information to formulate and implement investment policies. Additionally, the Board observed that Brookfield provides office space, bookkeeping, accounting, legal and compliance services, clerical and administrative services and has authorized its officers and employees, if elected, to serve as officers or Trustees of the Fund without compensation. The Board also noted that Brookfield is also responsible for the coordination and oversight of the Fund’s third-party service providers. In addition to the quality of the advisory services provided by Brookfield, the Board considered the quality of the administrative and other services provided by Brookfield to the Fund pursuant to the Advisory Agreement.
In connection with the services provided by Brookfield, the Board analyzed the structure and duties of Brookfield’s fund administration and accounting, operations and its legal and compliance departments to determine whether they are adequate to meet the needs of the Fund. The Board also considered the personnel responsible for providing advisory services to the Fund and other key personnel of Brookfield, in addition to the current and projected staffing levels and compensation practices. The Board concluded, based on the Trustees’ experience and interaction with Brookfield, that: (i) Brookfield would continue to be able to retain high quality personnel; (ii) Brookfield has exhibited a high level of diligence and attention to detail in carrying out its advisory and other responsibilities under the Advisory Agreement; (iii) Brookfield has been responsive to requests of the Board; and (iv) Brookfield has kept the Board apprised of developments relating to the Fund and the industry in general.
The Board’s conclusion was based, in part, upon the following: (i) a comprehensive description of the investment advisory and other services provided to the Fund; (ii) a list of personnel who furnish such services and a description of their duties and qualifications; (iii) performance data with respect to the Fund, including comparable investment companies and accounts managed by Brookfield; (iv) standardized industry performance data with respect to comparable investment companies and the performance of appropriate recognized indices; (v) recent financial statements of Brookfield; (vi) Brookfield’s culture of compliance and its commitment to compliance generally, as well as its risk management processes and attention to regulatory matters; and (vii) Brookfield’s reputation and its experience serving as an investment adviser and the experience of the team of portfolio managers that manage the Fund, as well as its experience serving as an investment adviser to other investment funds and institutional clients. The Board also reviewed Brookfield’s compliance and regulatory history and noted that there were no material regulatory or compliance issues that would potentially impact Brookfield from
CENTER COAST BROOKFIELD MLP FOCUS FUND
Board Considerations Relating to the Investment Advisory Agreement (Unaudited) (continued)
September 30, 2019
effectively serving as the investment adviser to the Fund. The Board concluded that the nature, extent and quality of the overall services provided under the Advisory Agreement were reasonable and appropriate in relation to the management fees and that the quality of services continues to be high.
THE PERFORMANCE OF THE FUND AND THE ADVISER. The Board, including the Independent Trustees, also considered the investment performance of the Adviser. The Board noted that it regularly reviews the performance of the Fund throughout the year. The Board further noted that, while it monitors performance of the Fund closely, it generally attaches more importance to performance over relatively long periods of time, typically three to five years. The Board observed that the Fund’s performance included the prior performance of its predecessor fund, Center Coast MLP Focus Fund (the “Predecessor Fund”). The Board considered the investment performance of the Fund in view of its importance to shareholders. In connection with this review, the Board received information regarding the investment performance of the Fund as compared to a group of funds with investment classifications and/or objectives comparable to those of the Fund and to an appropriate index or combination of indices identified by Broadridge (“Peer Universe”), as well as a focused peer group identified by Brookfield (“Peer Group”). In addition, the Board considered supplemental performance information that provided strategy level performance returns over longer periods as compared to the Fund’s performance information since inception, including the Predecessor Fund’s performance. The Board was provided with a description of the methodology used by Broadridge to select the funds included in the Peer Universe. At the Meeting, management discussed the methodology used by Brookfield to select the funds included in the Peer Group. The performance information was presented for the periods ended March 31, 2019. The Board noted that the Fund’s performance was above the median of its Peer Universe for the one-year period. The Board also noted that the Fund outperformed its Broadridge Index and was in the first quintile of its Peer Universe for the one-year period. The Board further noted that the Fund’s performance was above the median of its Peer Group for the quarter ended March 31, 2019 and one-, two- and five-year periods and since inception and below the median of its Peer Group for the three-year period. The Board then noted that the Fund outperformed its index for the quarter ended March 31, 2019 and for the one-, two-, three- and five-year periods and since inception. The Board concluded that the Fund’s performance was satisfactory.
THE COST OF THE ADVISORY SERVICES, AND THE PROFITABILITY TO THE ADVISER AND ITS AFFILIATES FROM THEIR RELATIONSHIP WITH THE FUND. The Board also received information regarding the management fees to be paid by the Fund to Brookfield pursuant to the Advisory Agreement. The Board examined this information in order to determine the reasonableness of the fees in light of the nature and quality of services to be provided and any potential additional benefits to be received by Brookfield or its affiliates in connection with providing such services to the Fund.
To assist in analyzing the reasonableness of the management fees for the Fund, the Board received reports independently prepared by Broadridge. The reports showed comparative fee and expense information for the Fund’s expense group (“Expense Group”) and expense universe (“Expense Universe”), including rankings within each category, as determined by Broadridge. Brookfield identified the funds eligible for inclusion in the Expense Group. In considering the reasonableness of the management fees to be paid by the Fund to Brookfield, the Board was presented with a number of expense comparisons, including: (i) contractual and actual management fees; and (ii) actual total operating expenses. In considering the Fund’s total operating expenses, the Board also considered the level of fee waivers and expense reimbursements, as applicable, and the net expense caps contractually agreed upon by Brookfield with respect to the Fund. The Board acknowledged that it was difficult to make precise comparisons with other funds in the Expense Group and Expense Universe since the exact nature of services provided under the various fund agreements is often not apparent. The Board noted, however, that the comparative fee information provided by Broadridge as a whole was useful in assessing whether Brookfield was providing services at a cost that was competitive with other, similar funds. The Fund’s fee and expense rankings are discussed below relative to the median of the applicable expense grouping. The Board considered that the Fund’s actual management fees were above the median of its Expense Group (ranked 10/12) and Expense Universe (ranked 33/41). The Board also considered that the Fund’s actual total expenses were above the median of its Expense Group (ranked 8/12) and Expense Universe (ranked 26/41). The Board noted management’s discussion regarding the Fund’s expenses.
The Board was also asked to consider the management fees received by Brookfield with respect to other funds and accounts with similar investment strategies to the Fund, which include institutional and separately managed accounts. In comparing these fees, the Board considered certain differences between these accounts and the Fund, as applicable, including the broader and more extensive scope of services provided to the Fund in
34Brookfield Public Securities Group LLC
CENTER COAST BROOKFIELD MLP FOCUS FUND
Board Considerations Relating to the Investment Advisory Agreement (Unaudited) (continued)
September 30, 2019
comparison to institutional or separately managed accounts; the greater financial, regulatory and reputational risks in managing the Fund; and the impact on Brookfield and expenses associated with the more extensive regulatory regime to which the Fund is subject as compared to institutional or separately managed accounts.
The Board also considered Brookfield’s profitability and the benefits Brookfield and its affiliates received from their relationship with the Fund. The Board received and reviewed financial statements relating to Brookfield’s financial condition and profitability with respect to the services it provided to the Fund and considered how profit margins could affect Brookfield’s ability to attract and retain high quality investment professionals and other key personnel. In this regard, the Board reviewed the Fund’s profitability analysis addressing the overall profitability of Brookfield in connection with its management of the Brookfield Fund Complex,1 as well as its expected profits and that of its affiliates for providing administrative support for the Fund. In analyzing Brookfield’s profitability, particular attention was given to the allocation of the direct and indirect costs of the resources and expenses in managing the Fund, as well as the non-Fund and non-advisory business activities. The Board further noted that the methodology followed in allocating costs to the Fund appeared reasonable, while also recognizing that allocation methodologies are inherently subjective. The Board also specifically noted that Brookfield had agreed to extend its contractual expense waiver for the Fund, in order to limit the Fund’s net operating expenses. The Board concluded that the expected profitability to the Adviser from the Fund was reasonable.
The Board concluded that Brookfield had the financial resources necessary to perform its obligations under the Advisory Agreement and to continue to provide the Fund with the high quality services that it had provided in the past. The Board also concluded that the management fees were reasonable in light of the factors discussed above.
THE EXTENT TO WHICH ECONOMIES OF SCALE WILL BE REALIZED AS THE FUND GROWS AND WHETHER FEE LEVELS REFLECT THOSE ECONOMIES OF SCALE. The Board, including the Independent Trustees, considered whether shareholders would benefit from economies of scale and whether there was potential for future realization of economies with respect to the Fund. The Board considered that as a result of being part of the Brookfield Fund Complex, the constituent funds, including the Fund, share common resources and may share certain expenses, and if the size of the complex increases, each fund could incur lower expenses than they otherwise would achieve as stand-alone entities. The Board noted, however, that although shareholders might benefit from lower operating expenses as a result of an increasing amount of assets spread over the fixed expenses of the Fund, the Fund’s expense limitation agreement with the Adviser served to limit the Fund’s expenses until the Fund had the opportunity to grow its assets. The Board concluded that the management fee structure was reasonable in light of the factors discussed above.
OTHER FACTORS. In consideration of the Advisory Agreement, the Board also received information regarding Brookfield’s brokerage and soft dollar practices. The Board considered that Brookfield is responsible for decisions to buy and sell securities for the Fund, selection of broker-dealers and negotiation of commission rates. The Board noted that it receives reports from Brookfield that include information on brokerage commissions and execution throughout the year. The Board also considered the benefits Brookfield derives from its soft dollar arrangements, including arrangements under which brokers provide brokerage and/or research services to Brookfield in return for allocating brokerage. The Board then considered other benefits that may be realized by Brookfield and its affiliates from their relationship with the Fund. Among them, the Board recognized the opportunity to provide advisory services to additional funds and accounts and reputational benefits. The Board concluded that the benefits that may accrue to Brookfield and its affiliates by virtue of the advisory relationship to the Fund were fair and reasonable in light of the costs of providing investment advisory services to the Fund and the ongoing commitment of Brookfield to the Fund.
CONCLUSION.After a full and complete discussion, the Board approved the Advisory Agreement for a successive one-year period. Based upon their evaluation of all these factors in their totality, the Board, including the Independent Trustees, was satisfied that the terms of the Advisory Agreement were fair and reasonable and in the best interests of the Fund and the Fund’s shareholders. In arriving at a decision to approve the Advisory Agreement, the Board did not identify any single factor or group of factors as all-important or controlling, but considered all factors together, and each Independent Trustee may have attributed different weights to different factors. The Independent Trustees were also assisted by the advice of independent legal counsel in making this determination.
1 The Brookfield Fund Complex is comprised of Brookfield Investment Funds (7 series of underlying portfolios),
CENTER COAST BROOKFIELD MLP FOCUS FUND
Board Considerations Relating to the Investment Advisory Agreement (Unaudited) (continued)
September 30, 2019
Brookfield Global Listed Infrastructure Income Fund Inc. (NYSE: INF), Brookfield Real Assets Income Fund Inc. (NYSE: RA), and Center Coast Brookfield MLP & Energy Infrastructure Fund (NYSE: CEN) (the “Brookfield Fund Complex”).
36Brookfield Public Securities Group LLC
CENTER COAST BROOKFIELD MLP FOCUS FUND
Information Concerning Trustees and Officers (Unaudited)
September 30, 2019
The following tables provide information concerning the trustees and officers of the Fund.
Trustees of the Fund
| Name, Address and Year of Birth | Position(s) Held with Funds | Principal Occupation(s) During Past 5 Years and Other Directorships Held by Director | Number of Portfolios in Fund Complex |
| Independent Trustees | | | |
Edward A. Kuczmarski
c/o Brookfield Place,
250 Vesey Street,
New York, New York
10281-1023
Born: 1949 | Trustee and Independent Chairman of the Board, Member of the Audit Committee, Chairman of the Nominating and Compensation Committee
Served Since 2018 | Director/Trustee of several investment companies advised by the Adviser (2011-Present); Certified Public Accountant and Retired Partner of Crowe Horwath LLP (1980-2013); Trustee of the Empire Builder Tax Free Bond Fund (1984-2013); Director of ISI Funds (2007-2015); Trustee of the Daily Income Fund (2006-2015), Director of the California Daily Tax Free Income Fund, Inc. (2006-2015); Trustee of the Stralem Funds (2014-2016). | 10 |
Stuart A. McFarland
c/o Brookfield Place,
250 Vesey Street,
New York, New York
10281-1023
Born: 1947 | Trustee, Member of the Audit Committee, Member of the Nominating and Compensation Committee
Served Since 2018 | Director/Trustee of several investment companies advised by the Adviser (2006-Present); Director of United Guaranty Corporation (2011-2016); Director of Brandywine Funds (2003-2013); Director of Drive Shack Inc. (formerly, Newcastle Investment Corp.) (2000-Present); Managing Partner of Federal City Capital Advisors (1997-Present); Director of New America High Income Fund (2013-Present); Director of New Senior Investment Group, Inc. (2014-Present). | 10 |
Louis P. Salvatore
c/o Brookfield Place,
250 Vesey Street,
New York, New York
10281-1023
Born: 1946 | Trustee, Chairman of the Audit Committee, Member of the Nominating and Compensation Committee
Served Since 2018 | Director/Trustee of several investment companies advised by the Adviser (2005-Present); Director of SP Fiber Technologies, Inc. (2012-2015); Director of Gramercy Property Trust (2012-2018); Director of Turner Corp. (2003-Present); Employee of Arthur Andersen LLP (2002-Present). | 10 |
Heather S. Goldman
c/o Brookfield Place,
250 Vesey Street,
New York, New York
10281-1023
Born: 1967 | Trustee, Member of the Audit Committee, Member of the Nominating and Compensation Committee
Served Since 2018 | Director/Trustee of several investment companies advised by the Adviser (2013-Present); Global Head of Marketing and Business Development of the Adviser (2011-2013); Director and Board Chair of University Settlement House (2003-2013); Member of the Honorary Board of University Settlement House (2014-Present); Co-Founder & CEO of Capstak, Inc. (2014-2018); Chairman of Capstak, Inc. (2016-2018). | 10 |
CENTER COAST BROOKFIELD MLP FOCUS FUND
Information Concerning Trustees and Officers (Unaudited) (continued)
September 30, 2019
| Name, Address and Year of Birth | Position(s) Held with Funds | Principal Occupation(s) During Past 5 Years and Other Directorships Held by Director | Number of Portfolios in Fund Complex |
| Interested Trustee | | | |
David Levi
c/o Brookfield Place,
250 Vesey Street,
New York, New York
10281-1023
Born: 1971 | Trustee
Served since 2018 | Director/Trustee of several investment companies advised by the Adviser (2017-Present); Chief Executive Officer of the Adviser (2019-Present); President of the Adviser (2016-2019); Managing Director and Head of Distribution of the Adviser (2014-2016); Managing Partner of Brookfield Asset Management Inc. (2015-Present); Managing Director and Head of Global Business Development at Nuveen Investments (2009-2014). | 10 |
38Brookfield Public Securities Group LLC
CENTER COAST BROOKFIELD MLP FOCUS FUND
Information Concerning Trustees and Officers (Unaudited) (continued)
September 30, 2019
Officers of the Fund
| Name, Address and Year of Birth | Position(s) Held with Funds | Term of Office and Length of Time Served | Principal Occupation(s) During Past 5 Years |
Brian F. Hurley*
c/o Brookfield Place,
250 Vesey Street,
New York, New York
10281-1023
Born: 1977 | President | Served since 2018 | President of several investment companies advised by the Adviser (2014-Present); General Counsel of the Adviser (2017-Present); Managing Director (2014-Present), Assistant General Counsel (2010-2017) and Head of Legal and Funds (April 2017-October 2017) of the Adviser; Director of the Adviser (2010-2014); Corporate Secretary of Brookfield Investment Management Inc. (2017-Present); Corporate Secretary of Brookfield Investment Management UK Ltd. (2017-Present); Corporate Secretary of Brookfield Investment Management (Canada) Inc. (2017-Present); Managing Partner of Brookfield Asset Management Inc. (2016-Present); Secretary of Brookfield Investment Funds (2011-2014); Director of Brookfield Soundvest Capital Management (2015-Present). |
Angela W. Ghantous*
c/o Brookfield Place,
250 Vesey Street,
New York, New York
10281-1023
Born: 1975 | Treasurer | Served since 2018 | Treasurer of several investment companies advised by the Adviser (2012-Present); Director and Head of Fund Accounting and Administration of the Adviser (2012-Present); Vice President of the Adviser (2009-2012). |
Thomas D. Peeney*
c/o Brookfield Place,
250 Vesey Street,
New York, New York
10281-1023
Born: 1973 | Secretary | Served since 2018 | Secretary of several investment companies advised by the Adviser (2018-Present); Director of the Adviser (2018-Present); Vice President of the Adviser (2017-2018); Vice President and Assistant General Counsel of SunAmerica Asset Management, LLC (2013-2017); Associate, Corporate Department at Paul Hastings LLP (2006-2013). |
Adam R. Sachs*
c/o Brookfield Place,
250 Vesey Street,
New York, New York
10281-1023
Born: 1984 | Chief Compliance Officer (“CCO”) | Served since 2018 | Chief Compliance Officer of several investment companies advised by the Advisor (2017-Present); Director of Corporate Legal and Compliance at the Adviser (2017-Present); Chief Compliance Officer of Brookfield Investment Management (Canada) Inc. (2017-Present); Chief Compliance Officer of Brookfield Investment Management UK Ltd. (2017-Present); Senior Compliance Officer of Corporate Legal and Compliance at the Adviser (2011-2017). |
Casey Tushaus*
c/o Brookfield Place,
250 Vesey Street,
New York, New York
10281-1023
Born: 1982 | Assistant Treasurer | Served since 2018 | Assistant Treasurer of several investment companies advised by the Adviser (2016-Present); Vice President of the Adviser (2014-Present); Assistant Fund Controller at Walton Street Capital (2007-2014). |
CENTER COAST BROOKFIELD MLP FOCUS FUND
Information Concerning Trustees and Officers (Unaudited) (continued)
September 30, 2019
| Name, Address and Year of Birth | Position(s) Held with Funds | Term of Office and Length of Time Served | Principal Occupation(s) During Past 5 Years |
Mohamed Rasul*
c/o Brookfield Place,
250 Vesey Street,
New York, New York
10281-1023
Born: 1981 | Assistant Treasurer | Served since 2018 | Assistant Treasurer of several investment companies advised by the Adviser (2016-Present); Assistant Vice President of the Adviser (2014 -Present); Senior Accountant of the Adviser (2012-2014). |
* Interested person as defined by the Investment Company Act of 1940, as amended, because of affiliations with Brookfield Public Securities Group LLC, investment adviser of the Fund.
The Fund’s Statement of Additional Information includes additional information about the trustees, and is available, without charge, upon request by calling 1-855-777-8001.
40Brookfield Public Securities Group LLC
[THIS PAGE IS INTENTIONALLY LEFT BLANK]
CENTER COAST BROOKFIELD MLP FOCUS FUND
Joint Notice of Privacy Policy (Unaudited)
Brookfield Public Securities Group LLC (“PSG”), on its own behalf and on behalf of the funds managed by PSG and its affiliates, recognizes and appreciates the importance of respecting the privacy of our clients and shareholders. Our relationships are based on integrity and trust and we maintain high standards to safeguard your non-public personal information (“Personal Information”) at all times. This privacy policy (“Policy”) describes the types of Personal Information we collect about you, the steps we take to safeguard that information and the circumstances in which it may be disclosed.
If you hold shares of a Fund through a financial intermediary, such as a broker, investment adviser, bank or trust company, the privacy policy of your financial intermediary will also govern how your Personal Information will be shared with other parties.
WHAT INFORMATION DO WE COLLECT?
We collect the following Personal Information about you:
| • | Information we receive from you in applications or other forms, correspondence or conversations, including but not limited to name, address, phone number, social security number, assets, income and date of birth. |
| • | Information about transactions with us, our affiliates, or others, including but not limited to account number, balance and payment history, parties to transactions, cost basis information, and other financial information. |
| • | Information we may receive from our due diligence, such as your creditworthiness and your credit history. |
WHAT IS OUR PRIVACY POLICY?
We may share your Personal Information with our affiliates in order to provide products or services to you or to support our business needs. We will not disclose your Personal Information to nonaffiliated third parties unless 1) we have received proper consent from you; 2) we are legally permitted to do so; or 3) we reasonably believe, in good faith, that we are legally required to do so. For example, we may disclose your Personal Information with the following in order to assist us with various aspects of conducting our business, to comply with laws or industry regulations, and/or to effect any transaction on your behalf;
| • | Unaffiliated service providers (e.g. transfer agents, securities broker-dealers, administrators, investment advisors or other firms that assist us in maintaining and supporting financial products and services provided to you); |
| • | Government agencies, other regulatory bodies and law enforcement officials (e.g. for reporting suspicious transactions); |
| • | Other organizations, with your consent or as directed by you; and |
| • | Other organizations, as permitted or required by law (e.g. for fraud protection) |
When we share your Personal Information, the information is made available for limited purposes and under controlled circumstances designed to protect your privacy. We require third parties to comply with our standards for security and confidentiality.
HOW DO WE PROTECT CLIENT INFORMATION?
We restrict access to your Personal Information to those persons who require such information to assist us with providing products or services to you. It is our practice to maintain and monitor physical, electronic, and procedural safeguards that comply with federal standards to guard client nonpublic personal information. We regularly train our employees on privacy and information security and on their obligations to protect client information.
CONTACT INFORMATION
For questions concerning our Privacy Policy, please contact our client services representative at 1-855-777-8001.
42Brookfield Public Securities Group LLC
Investment Adviser and Administrator
Brookfield Public Securities Group LLC
Brookfield Place
250 Vesey Street, 15th Floor
New York, New York 10281-1023
www.brookfield.com
Please direct your inquiries to:
Investor Relations
Phone: 1-855-777-8001
E-mail: funds@brookfield.com
Transfer Agent
Shareholder inquiries relating to distributions, address changes and shareholder account information should be directed to the Funds’ transfer agent:
U.S. Bancorp Fund Services, LLC
615 East Michigan Street
Milwaukee, Wisconsin 53202
1-855-244-4859
Fund Accounting Agent
U.S. Bancorp Fund Services, LLC
615 East Michigan Street
Milwaukee, Wisconsin 53202
Sub-Administrator
U.S. Bancorp Fund Services, LLC
1201 South Alma School Road, Suite 3000
Mesa, Arizona 85210
Independent Registered Public Accounting Firm
Deloitte & Touche LLP
111 South Wacker Drive
Chicago, Illinois 60606
Legal Counsel
Paul Hastings LLP
200 Park Avenue
New York, New York 10166
Custodian
U.S. Bank National Association
1555 North Rivercenter Drive, Suite 302
Milwaukee, Wisconsin 53212
Distributor
Quasar Distributors, LLC
777 East Wisconsin Avenue
Milwaukee, Wisconsin 53202
The Fund files its complete schedule of portfolio holdings with the SEC for the first and third quarters of each fiscal year on Form N-PORT. The Fund's Form N-PORT will be available on the SEC's website at www.sec.gov.
You may obtain a description of the Fund's proxy voting policies and procedures, and information regarding how the Fund voted proxies relating to portfolio securities during the most recent 12-month period ended June 30, without charge, upon request by calling 1-855-777-8001, or go to the SEC's website at www.sec.gov.
Other Compliance Matters
Dan C. Tutcher is a Managing Director of the Adviser on the Energy Infrastructure Securities team. Mr. Tutcher also serves on the Board of Enbridge, Inc. The Adviser has adopted policies and procedures reasonably designed to address potential conflicts of interest while allowing the Adviser to continue to invest in Enbridge Inc. However, from time to time, the Adviser may restrict any fund or account managed by the Adviser from acquiring or disposing of securities of Enbridge Inc. at any time. As of September 30, 2019, the Fund did not own Enbridge, Inc.
Brookfield Public Securities Group LLC
Brookfield Place
250 Vesey Street, 15th Floor
New York, New York 10281-1023
1-855-777-8001
www.brookfield.com
Item 2. Code of Ethics.
As of the end of the period covered by this report, the Registrant had adopted a Code of Ethics for Principal Executive and Principal Financial Officers (the “Code”). There were no amendments to or waivers from the Code during the period covered by this report. A copy of the Registrant’s Code will be provided upon request to any person without charge by contacting Investor Relations at (855)777-8001 or by writing to Secretary, Brookfield Investment Funds, Brookfield Place, 250 Vesey Street, 15th Floor, New York, NY 10281-1023.
Item 3. Audit Committee Financial Expert.
The Registrant’s Board of Trustees has determined that Stuart A. McFarland, Edward A. Kuczmarski and Louis P. Salvatore each qualify as audit committee financial experts, as defined in Item 3(b) of FormN-CSR. Messrs. McFarland, Kuczmarski and Salvatore are considered “independent” for purposes of Item 3(a)(2) of FormN-CSR.
Item 4. Principal Accountant Fees and Services.
The aggregate fees billed by the Registrant’s independent registered public accounting firm, Deloitte & Touche LLP (“Deloitte”), for the most recent fiscal year for professional services rendered for the audit of the Registrant’s annual financial statements and the review of financial statements that are included in the Registrant’s annual and semi-annual reports to shareholders (“Audit Fees”) were $86,000 and $70,000 for the fiscal years ended September 30, 2019 and September 30, 2018, respectively..
There were no fees billed by Deloitte to the Funds in its two recent fiscal years for services rendered for assurance and related services that are reasonably related to the performance of the audit or review of the Fund’s financial statements, but are not reported as Audit Fees (“Audit-Related Fees”).
For the Funds’ two most recent fiscal years, there were no Audit-Related Fees billed by Deloitte for engagements related directly to the operations and financial reporting of one or more Funds by a Fund Service Provider. A Fund Service Provider is (a) any investment adviser to the Fund (not including any Subadvisor whose role is primarily portfolio management and is subcontracted with or overseen by another investment adviser) or (b) any entity that provides ongoing services to the Fund and is controlling, controlled by or under common control with a Fund investment adviser described in (a).
For the fiscal years ended September 30, 2019 and September 30, 2018, the aggregate fees billed by Deloitte to the Registrant for tax compliance, tax advice and tax planning (“Tax Fees”) were $87,600 and $84,000, respectively. The nature of the services comprising the Tax Fees was the review of the Registrant’s income tax returns and tax distribution requirements.
The Tax Fees billed by Deloitte for engagements by Fund Service Providers that related directly to the operations and financial reporting of the Registrant were $0 for the Registrant’s fiscal years ended September 30, 2019 and September 30, 2018.
The services for which Tax Fees were charged comprise all services performed by professional staff in Deloitte’s respective tax divisions except those services related to the audits. Typically, this category would include fees for tax compliance, tax advice, and tax planning services, which include, among other things, preparation of original and amended tax returns, claims for refund and tax payment-planning services, assistance with tax audits and appeals, tax advice related to mergers and acquisitions and requests for rulings or technical advice from taxing authorities.
All other fees billed by Deloitte for engagements by Fund Service Providers that related directly to the operations and financial reporting of the Registrant were $0 for the Registrant’s fiscal years ended September 30, 2019 and September 30, 2018.
(e) (1) According to policies adopted by the Audit Committee, services provided by Deloitte to the Registrant must bepre-approved by the Audit Committee. On an annual basis, the Audit Committee reviews andpre-approves various types of services that Deloitte may perform for the Registrant without specific approval of each engagement, subject to specified budget limitations. As contemplated by the Sarbanes-Oxley Act of 2002 and related SEC rules, the Audit Committee alsopre-approvesnon-audit services provided by Deloitte to any Fund Service Provider for any engagement that relates directly to the operations and financial reporting of the Registrant. Any engagement that is not alreadypre-approved or that will exceed apre-approved budget must be submitted to the Audit Committee forpre-approval.
(e) (2) None.
(f) Not applicable.
(g) The aggregate fees billed by Deloitte for the fiscal years ended September 30, 2019 and September 30, 2018, fornon-audit services rendered to the Registrant and Fund Service Providers were $318,600 and $294,000, respectively. For the fiscal years ended September 30, 2019 and September 30, 2018, these amount reflect the amounts disclosed above in Item 4(b),(c),(d), plus $145,000 and $140,000, respectively, in fees billed to the Fund Service Providers fornon-audit services that did not relate directly to the operations and financial reporting of the Registrant, including fees billed by Deloitte to Brookfield Public Securities Group LLC that were associated with Deloitte’s SSAE 16 Review (formerly, SAS No. 70).
(h) The Registrant’s Audit Committee has considered whether the provision ofnon-audit services by the Registrant’s independent registered public accounting firm to the Registrant’s investment adviser, and any entity controlling, controlled, or under common control with the investment adviser that provided ongoing services to the Registrant that were notpre-approved by the Audit Committee (because such services did not relate directly to the operations and financial reporting of the Registrant) were compatible with maintaining the independence of the independent registered public accounting firm.
Item 5. Audit Committee of Listed Registrants.
Not applicable.
Item 6. Schedule of Investments.
Schedule of Investments is included as part of the report to shareholders filed under Item 1 of this Form.
Item 7. Disclosure of Proxy Voting Policies and Procedures forClosed-End Management Investment Companies.
Not applicable.
Item 8. Portfolio Managers ofClosed-End Management Investment Companies.
Not applicable.
Item 9. Purchases of Equity Securities byClosed-End Management Investment Company and Affiliated Purchasers.
Not applicable.
Item 10. Submission of Matters to a Vote of Security Holders.
There were no material changes to the procedures by which shareholders may recommend nominees to the Registrant’s Board of Trustees that were implemented after the Registrant last provided disclosure in response to the requirements of Item 407(c)(2)(iv) of RegulationS-K (17 CFR 229.407) (as required by 22(b)(15)) of Schedule 14A (17 CFR240.14a- 101), or this Item 10.
Item 11. Controls and Procedures.
(a) The Registrant’s principal executive officer and principal financial officer have concluded that the Registrant’s Disclosure Controls and Procedures are effective, based on their evaluation of such Disclosure Controls and Procedures as of a date within 90 days of the filing of this report on FormN-CSR.
(b) As of the date of filing this FormN-CSR, the Registrant’s principal executive officer and principal financial officer are aware of no changes in the Registrant’s internal control over financial reporting that occurred during the Registrant’s second fiscal quarter of the period covered by this report that has materially affected or is reasonably likely to materially affect the Registrant’s internal control over financial reporting.
Item 12. Disclosure of Securities Lending Activities forClosed-End Management Investment Companies
Not applicable.
Item 13. Exhibits.
(a)(1) None.
(2) A separate certification for each principal executive officer and principal financial officer of the Registrant as required byRule 30a-2(a) under the Investment Company Act of 1940 is attached as an exhibit to this FormN-CSR.
(3) Not applicable.
(b) A separate certification for each principal executive officer and principal financial officer of the Registrant as required byRule 30a-2(b) under the Investment Company Act of 1940 is attached as an exhibit to this FormN-CSR.
(4) Not applicable.
SIGNATURES
Pursuant to the requirements of the Securities Exchange Act of 1934 and the Investment Company Act of 1940, the Registrant has duly caused this report to be signed on its behalf by the undersigned, thereunto duly authorized.
| | |
| BROOKFIELD INVESTMENT FUNDS |
| |
| By: | | /s/ Brian F. Hurley |
| | Brian F. Hurley President and Principal Executive Officer |
Date: December 6, 2019
Pursuant to the requirements of the Securities Exchange Act of 1934 and the Investment Company Act of 1940, this report has been signed below by the following persons on behalf of the Registrant and in the capacities and on the dates indicated.
| | |
| By: | | /s/ Brian F. Hurley |
| | Brian F. Hurley President and Principal Executive Officer |
Date: December 6, 2019
| | |
| By: | | /s/ Angela W. Ghantous |
| | Angela W. Ghantous Treasurer and Principal Financial Officer |
Date: December 6, 2019