UNITED STATES
SECURITIES AND EXCHANGE COMMISSION
WASHINGTON, D.C. 20549
FORM N-CSR
CERTIFIED SHAREHOLDER REPORT OF REGISTERED
MANAGEMENT INVESTMENT COMPANIES
Investment Company Act file number 811-22558
BROOKFIELD INVESTMENT FUNDS
(Exact name of registrant as specified in charter)
BROOKFIELD PLACE
250 VESEY STREET, 15th Floor
NEW YORK, NEW YORK 10281-1023
(Address of principal executive offices) (Zip code)
BRIAN F. HURLEY, PRESIDENT
BROOKFIELD INVESTMENT FUNDS
BROOKFIELD PLACE
250 VESEY STREET 15th Floor
NEW YORK, NEW YORK 10281-1023
(Name and address of agent for service)
Registrant’s telephone number, including area code: (855) 777-8001
Date of fiscal year end: September 30
Date of reporting period: September 30, 2018
Item 1. Reports to Shareholders.
Brookfield Investment Management
ANNUAL REPORT
September 30, 2018
Center Coast Brookfield MLP Focus Fund
Brookfield Investment Management (the “Firm”) is an SEC-registered investment adviser and represents the Public Securities platform of Brookfield Asset Management. The Firm provides global listed real assets strategies including real estate equities, infrastructure equities, energy infrastructure equities, real asset debt and diversified real assets. With over $19 billion of assets under management as of September 30, 2018, the Firm manages separate accounts, registered funds and opportunistic strategies for institutional and individual clients, including financial institutions, public and private pension plans, insurance companies, endowments and foundations, sovereign wealth funds and high net worth investors. The Firm is a wholly owned subsidiary of Brookfield Asset Management, a leading global alternative asset manager with more than $330 billion of assets under management as of September 30, 2018. For more information, go to www.brookfield.com.
Brookfield Investment Funds is managed by Brookfield Investment Management. The Trust uses its website as a channel of distribution of material company information. Financial and other material information regarding the Fund is routinely posted on and accessible at www.brookfield.com.
This report is for shareholder information. This is not a prospectus intended for the use in the purchase or sale of Fund shares.
| NOT FDIC INSURED | MAY LOSE VALUE | NOT BANK GUARANTEED |
[THIS PAGE IS INTENTIONALLY LEFT BLANK]
Dear Shareholders,
We are pleased to provide the Annual Report for Center Coast Brookfield MLP Focus Fund (the “Fund”) for the period from December 1, 2017 to September 30, 2018 (the “Period”). The Fund changed its fiscal year end from November 30 to September 30.
After a pullback during the first quarter of 2018, the MSCI World1 and S&P 500®2 Indexes hit yet another record high, returning 7.37% and 11.79% respectively over the period. The synchronized global economic expansion of 2017 continued throughout the first nine months of this year, with the U.S. firmly leading the world in terms of economic growth. U.S. small business optimism has reached its highest level in nearly a decade, while U.S. consumer sentiment still hovers near 10-year highs.3 For the calendar third quarter of 2018, U.S. GDP growth posted 3.5% year-over-year growth rate, while corporate profits grew by approximately 16% over the same period (the largest in six years)4. However, markets continued to contend with a number of headwinds including rising interest rates, the specter of higher inflation and escalating trade tensions with China.
In response to U.S. economic strength, the U.S. Federal Open Market Committee (FOMC) raised the federal funds rate on four occasions throughout the period (December, March, June, and September) to a target range of 2.0%-2.25%5. A fourth increase is expected by the end of 2018—not surprising given the notable removal of the word “accommodative” from the FOMC notes in the September 2018 press release. Meanwhile, monetary policy outside of the U.S. remains much more accommodative amid more muted consumer sentiment and softer economic data.
The spot price of West Texas Intermediate Crude Oil rose over 25% throughout the period closing at $73.16 per barrel. While U.S. crude oil production hit record levels, U.S. infrastructure bottlenecks, concerns around global supply shocks from Iran sanctions and economic turmoil in Venezuela have led to an increase in prices. Subsequent to period end, crude oil prices fell 30% in response to sanction waivers and fears that crude oil demand would slow with trade uncertainty, protectionism, and macro-economic malaise.
Global real asset returns were mixed throughout the period. Master limited partnerships were the best-performing real asset sector for the period. Global and U.S. real estate posted modest returns for the period while global infrastructure declined. Real asset debt posted positive returns for the period, outperforming broader-based high yield and investment grade indexes. Master limited partnerships were the best-performing real asset sector for the period but have given up some of that performance amid the recent crude oil price decline.
In addition to performance information, this report provides the Fund’s audited financial statements as of September 30, 2018.
We welcome your questions and comments, and encourage you to contact our Investor Relations team at (855) 777-8001 or to visit us at www.brookfield.com for more information. Thank you for your support.
Sincerely,
Brian F. Hurley
President
Center Coast Brookfield MLP Focus Fund
Craig Noble, CFA
CEO, Chief Investment Officer and Portfolio Manager
Brookfield Investment Management Inc.
Letter to Shareholders (continued)
Past performance is no guarantee of future results.
Must be preceded or accompanied by a prospectus.
1 The MSCI World Index is a free float-adjusted market capitalization weighted index that is designed to measure the equity market performance of developed markets.
2 The S&P 500® Index is an equity index of 500 widely held, large-capitalization U.S. companies. Special cash dividends trigger a price adjustment in the price return index. Indices are not managed and an investor cannot invest directly in an index.
3 Source: Source: The National Federation of Independent Business Research Foundation and the University of Michigan Survey of Consumers.
4 Source: Source: Bureau of Economic of Economic Analysis, U.S. Department of Commerce.
5 Source: Source: The U.S. Federal Reserve.
Indices are not managed and an investor cannot invest directly in an index.
These views represent the opinions of Brookfield Investment Management Inc. and are not intended to predict or depict the performance of any investment. These views are as of the close of business on September 30, 2018 and subject to change based on subsequent developments.
The Funds’ portfolio holdings are subject to change without notice. The mention of specific securities is not a recommendation or solicitation for any person to buy, sell or hold any particular security. There is no assurance that the Funds currently hold these securities. Please refer to the Schedules of Investments contained in this report for a full listing of Funds’ holdings.
Mutual fund investing involves risk. Principal loss is possible.
Quasar Distributors, LLC is the distributor of Brookfield Investment Funds.
A basis point (bps) is a unit that is equal to 1/100 of 1%, and is used to denote the change in a financial instrument.
Diversification does not assure a profit, nor does it protect against a loss in a declining market.
2Brookfield Investment Management Inc.
About Your Fund’s Expenses
As a shareholder of a Fund, you may incur two types of costs: (1) transaction costs, including sales charges (loads) on purchase payments and contingent deferred sales charges and redemption fees on redemptions; and (2) ongoing costs, including management fees, distribution (12b-1) fees and other fund expenses. This example is intended to help you understand your ongoing costs (in dollars) of investing in the Funds and to compare these costs with the ongoing costs of investing in other mutual funds. The example is based on an investment of $1,000 invested at the beginning of the period and held for the entire period as indicated below.
Actual Fund Return
The table below provides information about actual account values and actual expenses. You may use the information on this line, together with the amount you invested, to estimate the expenses that you paid over the period. Simply divide your account value by $1,000 (for example, an $8,600 account value divided by $1,000 = 8.6), then multiply the result by the number in the first line under the heading entitled “Expenses Paid During Period” to estimate the expenses you paid on your account during this period.
Hypothetical Example for Comparison Purposes
The table below also provides information about hypothetical account values and hypothetical expenses based on the Funds’ actual expense ratio and an assumed rate of return of 5% per year before expenses, which is not the Funds’ actual return. The hypothetical account values and expenses may not be used to estimate the actual ending account balance or expenses you paid for the period. You may use this information to compare the ongoing costs of investing in the Funds and other funds. To do so, compare this 5% hypothetical example with hypothetical examples that appear in shareholders’ reports of other funds.
Please note that the expenses shown in the table are meant to highlight your ongoing costs only and do not reflect any transactional costs, such as sales charges (loads) and redemption fees. Therefore, the hypothetical account values and expenses in the table are useful in comparing ongoing costs only, and will not help you determine the relative total costs of owning different funds. In addition, if these transactional costs were included, your costs overall would have been higher.
| | Annualized Expense Ratio | Beginning Account Value
(04/01/18) | Ending Account Value
(09/30/18) | Expenses Paid During Period
(04/01/18–
09/30/18)(1) |
| Actual | | | | |
Class A Shares
| 1.46% | $1,000.00 | $1,187.80 | $ 8.01 |
Class C Shares
| 2.21% | 1,000.00 | 1,182.60 | 12.09 |
Class I Shares
| 1.21% | 1,000.00 | 1,189.30 | 6.64 |
Class Y Shares
| 1.21% | 1,000.00 | 1,189.00 | 6.64 |
| Hypothetical (assuming a 5% return before expenses) | | | | |
Class A Shares
| 1.46% | 1,000.00 | 1,017.75 | 7.38 |
Class C Shares
| 2.21% | 1,000.00 | 1,013.99 | 11.16 |
Class I Shares
| 1.21% | 1,000.00 | 1,019.00 | 6.12 |
Class Y Shares
| 1.21% | 1,000.00 | 1,019.99 | 6.12 |
| (1) | Expenses are equal to the Funds’ annualized expense ratio by class multiplied by the average account value over the period, multiplied by 183/365 (to reflect a six-month period). |
Center Coast Brookfield MLP Focus Fund
Management Discussion of Fund Performance
For the ten month period ended September 30, 2018, the Fund's Class Y had a total return of 10.35%, which assumes the reinvestment of dividends and is exclusive of brokerage commissions, underperforming the S&P 500®1 and Alerian MLP Index2, which returned 11.79% and 10.92%, respectively.
MARKET OVERVIEW
Introduction
A positive fundamental backdrop supported the midstream market in late 2017 but was ultimately overpowered by corporate finance announcements, capital markets fatigue, and other technical factors such as tax harvesting. Year-end tax harvesting has occurred consistently throughout the energy downturn, particularly in years with an absence of widespread losses in other market sectors. This appeared to cause indiscriminate selling across the board, but likely affected some names more than others. Despite this technical headwind, we thought that late-year federal tax reform could serve to boost sentiment for midstream products. Broadly speaking, we expected significant benefits for most investors of MLPs or MLP investment funds structured as C corporations from the new tax code, including the 20% pass-through income deduction and the lowering of the corporate tax rate.
So, heading into 2018, we were optimistic that the abatement of technical pressures would allow strong industry fundamentals to start to shine through—and that record production and midstream throughput, increasing commodity prices, cheap valuations, and the market’s recognition of a healthier, transitioning midstream sector would lift the figurative clouds that had been pervasive for the better part of four years.
January 2018-March 2018 Fund Summary Observations (-10.68% NAV total return by the Fund's Y share class)
Unfortunately, the market wasn’t ready to buy this turnaround story—early 2018 performance started off well then reversed quickly in February before accelerating downward from mid-March to quarter-end. This acceleration into quarter-end came after the FERC3 announced that regulated interstate gas and oil pipelines within the Master Limited Partnership (“MLP”) structure would no longer be able to recover an income tax allowance in cost-of-service rate-making. This was an unexpected policy change that caused a sell-off across all midstream equities, although we believed that most companies would ultimately experience little or no cash flow impact (more on that below).
Back in February, however, a handful of announcements like the NuStar and Macquarie Infrastructure Corporation distribution cuts took attention away from other positive developments prior to the unexpected FERC announcement that surprised an already wary investor base. Like many other times in this prolonged downturn, just as things started to recover, an unexpected issue popped up and disrupted the fragile recovery that had started to find traction—another tail started wagging the dog. We believe these company-specific events do not define the midstream story and do not fundamentally change its long-term trajectory, yet they continue to be a source of stress and confusion for investors looking for sustainable and drama-free market recovery.
March’s performance was mostly driven by the unexpected FERC announcement. Although we knew the FERC was looking at this issue, the announcement was surprising for several reasons. The prior FERC policy survived a legal challenge in 2007 and had been vetted through the court system. Most of the FERC commissioners were appointed by a pro-infrastructure, pro-energy administration. Also, the FERC failed to consider the complexities involved with this abrupt policy change and ended up creating more questions than answers.
The Alerian MLP Index traded down almost 8% in the seven days following the FERC announcement, and once again the entire midstream universe (C-Corps included) got painted with a broad brush. The types of assets that could be materially affected by this FERC ruling do not represent the entirety of the midstream value chain. We estimated that the March FERC ruling, at that time, could affect 1-2% of our universe’s cash flow in the aggregate. Yet the ultimate impact and timing is still unknown given the complexity and nuances involved in pipeline rate-making and the amount of analysis FERC needs to undertake. With minimal expected cash flow impairment
4Brookfield Investment Management Inc.
Center Coast Brookfield MLP Focus Fund
and a prolonged timeline, we believe the magnitude of the market sell-off was most definitely overdone in the short time after the mid-March announcement.
For the few companies that did have moderate cash flow impact expectations, the market immediately priced in a worst-case scenario while also failing to recognize some of the potential mitigating factors. First, negotiated rates, which make up a substantial portion of cash flows on interstate pipelines, are not affected by the ruling. Second, rate cases are all encompassing and have many moving parts—income tax allowance is just one part of a larger equation (the FERC’s July update gave midstream companies a win by allowing for the removal of accumulated deferred income taxes from rate base). Lastly, all the companies that are facing cash flow headwinds due to the removal of the income tax allowance have an easy out—they are all owned by a C-Corp parent and could be bought out or restructured before cash flow degradation materializes. We have seen these announcements for nearly all of the MLPs that expected a moderate cash flow impact from the initial March FERC ruling.
Outside of the FERC policy reversal impacting a few names, not much changed from a fundamental perspective during this time period. We anticipated attractive cash flow growth in 2018 and that started to materialize in the weeks that followed as first quarter earnings were reported. Thus, valuation levels at the time suggested that the first quarter’s energy market was like the energy market of the 2008-2009 financial crisis or the sub-$30 crude oil market of early 2016. Sentiment continued to be extremely low; energy equities, and particularly MLPs, struggled to attract new investors. We hoped that the second quarter and a strong reporting period would start to turn the tide for midstream equities.
April 2018-June 2018 Fund Summary Observations (+10.22% NAV total return by the Fund's Y share class)
Midstream equities did indeed snap back in the second quarter, generating outperformance after the difficult first quarter that ended with a tremendous amount of investor frustration. While the handful of companies impacted by the FERC’s revised policies continued to underperform during the second quarter, the ability of the unimpacted companies to perform well suggested that investors were willing to ignore some of the noise. This was in stark contrast to other disruptive events over the past few years in which we saw midstream companies sold indiscriminately as a group regardless of fundamentals, including whether these events had any meaningful impact on midstream companies otherwise.
We presume that this dispersion and performance was the result of the positive industry fundamentals that were on display during the April-May earnings season. Growing production, demand, and exports filled many existing midstream assets to max capacity. As a result, the industry still needs to build new assets in key growth regions, and existing assets are being marketed to find new revenue opportunities. Further, regions with underutilized assets like the Eagle Ford, Haynesville, and Oklahoma received renewed attention and highlighted an opportunity for midstream companies to increase cash flow through operating leverage.
While we’ve spoken about industry fundamentals constantly over the last few years, first quarter earnings results provided the most tangible reflection of those fundamentals we could recall. The Fund’s holdings reported impressive year-over-year eanings before interest, tax, depreciation and amortization (“EBITDA”) growth by 25%, and we expected similarly impressive results to continue throughout the year. Continued earnings strength is a result of myriad factors, including: (i) record production of crude oil, natural gas, and natural gas liquids (“NGLs”); (ii) record exports of U.S. produced hydrocarbons and products; (iii) the completion of long-dated pipeline projects like EPD’s Midland-to-Sealy pipeline; (iv) record seasonal natural gas demand, and; (v) start-ups of the first few world-scale ethane crackers being built along the Gulf Coast.
However, as mentioned above, not every midstream equity performed well during the second quarter. Those few names impacted by the mid-March FERC policy change sold off with uncertainty, reduced growth estimates, and as many general partners waved the white flag to avoid rate degradation on cost-of-service interstate pipelines.
Unfortunately, in a few instances, historically strong and supportive sponsors demonstrated very little patience and either made statements or announced decisions that were severely detrimental to the limited partners. Instead of support and patience, certain sponsors/general partners appeared reactionary and almost adversarial to the
Center Coast Brookfield MLP Focus Fund
limited partners. Because of this, and in response to the associated uncertainty, certain partnerships experienced disproportionate equity price moves (losses of up to 50% for some) that far exceeded the potential FERC-related cash flow degradation (5%-15% of EBITDA by our estimates for those names). While we could not go back in time to avoid those situations, we moved forward with heightened awareness of sponsor alignment and management incentives. We believe these situations highlighted how the ongoing and accelerating “simplification” trend should benefit investors over the long term by better aligning general partners with limited partners and management teams with common equity investors. And that simplification trend continued with fervor during the second quarter.
There were a total of six limited partner acquisitions and one incentive distribution right (“IDR”) buy-out transaction in the second quarter, and a large portion of these were in response to the FERC announcement. We believe MLPs that were not impacted by the FERC policy change will look at their own fact patterns and circumstances to determine the best and most tax-efficient way of simplifying their corporate structure. Seeing that many midstream companies and investors prefer the tax-advantaged status of the MLP structure, and considering the potential tax consequences of a C-Corp conversion, we expect a large handful of companies to remain in a partnership structure. Others may indeed end up converting to a C-Corp structure, particularly if there is a pre-existing public C-Corp parent vehicle that might be able to utilize a basis step-up upon acquisition. When the dust settles, however, the underlying entities should be stronger and better aligned than they were previously—regardless of the corporate structure.
As the second quarter came to a close, crude oil price correlation was down, fundamentals stayed up, and the industry remained “under-built.” Further, the ability of many pipeline MLPs to outperform shortly after the unexpected FERC policy change felt like a reversal of some of the extreme bearishness that sold the group indiscriminately in the three years prior. As we entered July, there were still some simplifications and FERC issues to sort out while the asset class continued to make progress in its evolution—a process we like to call the transition from “Midstream 1.0” to “Midstream 2.0.”4
July 2018-September 2018 Fund Summary Observations (+7.87% NAV total return by the Fund's Y share class)
A strong mid-summer run overpowered a soft final few weeks to keep us squarely in the green during the third quarter. Looking back, most of the market strength occurred in the middle of earnings season. From the first earnings report on July 18th to the final one on August 9th, the AMZ returned nearly 11%, ending with its peak value for the quarter. Since this was one of the most fundamentally bullish earnings seasons we can recall, this feels like more than just coincidence.
There were, however, other notable events that also affected sector performance during the quarter. The FERC clarified its mid-March ruling on July 18th in a way that was viewed as incrementally positive to the handful of partnerships impacted by the initial ruling. The simplification wave also continued, with the highly-anticipated Energy Transfer announcement coming much sooner than projected and with more favorable terms than many had expected. The Enbridge MLP subsidiaries received revised takeout offers at higher premiums, and Dominion announced an offer to buy-out its MLP.
The weakness seen in the last few weeks of the third quarter was frustrating to many, particularly since crude oil prices rose higher at the end of the quarter. While it’s impossible to identify the exact cause with 100% certainty, we would highlight heightened regulatory concerns as a potential culprit. Currently there’s a ballot initiative that threatens future oil and gas production growth in Colorado, an important state for four or five companies in our investable universe. A couple of large pipeline projects also experienced delays and cost overruns due to state-level opposition. With the risk of these headwinds isolated and likely already priced into the market, we exited the quarter optimistic about another solid earnings season and an asset class that is well on its way to becoming more mature, simplified, self-funding, and incrementally investable. With more progress and continued execution at the operational level, we are cautiously optimistic that fund flows could improve, generalist investors could rotate, retail investors could return, and valuations could re-rate to a level more commensurate with the
6Brookfield Investment Management Inc.
Center Coast Brookfield MLP Focus Fund
top-tier fundamental backdrop. In the meantime, we’ll take another solid quarter as a positive sign that things are heading in the right direction.
1 The S&P 500® Total Return Index is the total return version of S&P 500® Index. Dividends are reinvested on a daily basis and the base date for the index is January 1, 1988. All regular cash dividends are assumed reinvested in the S&P 500® Index on the ex-date. Special cash dividends trigger a price adjustment in the price return index.
2 The Alerian MLP Index is a composite of the 50 most prominent energy MLPs calculated by Standard & Poor’s using a float-adjusted market-capitalization methodology. The index is disseminated by the New York Stock Exchange real-time on a price return basis (NYSE: AMZ) and on a total-return basis (NYSE: AMZX).
3 Federal Energy Regulatory Commission.
4 A term used to illustrate the evolution of the midstream sector from one that was previously characterized by capital funding from external sources, lower distribution coverage, and the presence of incentive distribution rights “IDRs,” to one that places a greater emphasis on self-funding of capital projects with excess cash flow (higher distribution coverage) and corporate governance simplification through the elimination of IDRs and/or structural combination of multiple affiliated public securities.
Indices are not managed and an investor cannot invest directly in an index.
CONCLUSION
Even though the fiscal 2018 ended with a whimper in September, it wasn’t a bad one in the end—a positive 10.35% NAV return by the Fund's Y share class; FERC clarification after March uncertainty; impressive earnings; bullish company guidance; improved LP premiums, and; continued progress on the structural evolution and progression to “Midstream 2.0.” This was accomplished even as the 10-year Treasury rate climbed above 3%, trade tensions escalated, and tariff talk increased the risk of a broader economic slowdown and reduced hydrocarbon exports out of the U.S. These macro factors are top of mind and increasingly important should the U.S. oil and gas market continue to gain global market share.
Yet domestic progress—supply, demand, and the critical need for more midstream assets—keeps us optimistic about the earnings and cash flow potential of our midstream investments. Coupled with an ongoing maturation of the asset class through simplification and self-funding, we believe the sector continues to improve and become more appealing to a broader set of investors. The catalyst for continued performance, in our opinion, is continued execution with fewer surprises. The outlook is exciting, and the plan ahead is a good one; if companies are able to execute the plan and deliver on stated objectives, we believe the future will be bright.
AVERAGE ANNUAL TOTAL RETURNS
| As of September 30, 2018 | | | |
| | One Year | Five Years | Since Inception* |
| Class A Shares (Excluding Sales Charge) | 3.12% | -0.50% | 3.03% |
| Class A Shares (Including Sales Charge) | -2.81% | -1.68% | 2.25% |
| Class C Shares (Excluding Sales Charge) | 2.19% | -1.27% | 2.21% |
| Class I Shares | 3.20% | -0.29% | 3.23% |
| Class Y Shares | 3.33% | -0.26% | 3.24% |
| S&P 500® Index | 17.91% | 13.95% | 13.82% |
| Alerian MLP Index | 4.89% | -2.72% | 3.03% |
* Class A, Class C and Class Y were incepted on December 31, 2010 and Class I was was incepted on February 5, 2018. The Alerian MLP Index references Class Y’s inception date. All returns shown in USD.
The table and graphs do not reflect the deductions of taxes that a shareholder would pay on fund distributions or the redemption of fund shares.
Performance data quoted represents past performance; past performance does not guarantee future results. The investment return and principal value of an investment will fluctuate so that an investor’s shares, when redeemed, may be worth more or less than their original cost. Current performance of the Fund may be lower or higher than the performance quoted. Performance data current to the most recent month end may be obtained by calling 855.244.4859. Performance shown including sales charge reflects the Class A maximum sales charge of 4.75%
Center Coast Brookfield MLP Focus Fund
and the Class C Contingent Deferred Sales Charge (CDSC) of 1.00%. Performance data excluding sales charge does not reflect the deduction of the sales charge or CDSC and if reflected, the sales charge or fee would reduce the performance quoted.
The gross expense ratio in the prospectus dated February 5, 2018 is 1.46% for Class A Shares, 2.21% for Class C Shares, 1.21% for Class I Shares and 1.21% for Class Y Shares, as applicable to investors respectively.
The Fund’s gross and net expense ratios in the financial highlights of this report are as follows: Class A is 1.47% and 1.46%, Class C is 2.22% and 2.21%, Class I is 1.22% and 1.21% and Class Y is 1.22% and 1.21%, respectively for the fiscal year ended September 30, 2018.
The Adviser has contractually agreed to reimburse the Fund's expenses through February 5, 2020. There is no guarantee that such reimbursement will be continued after that date.
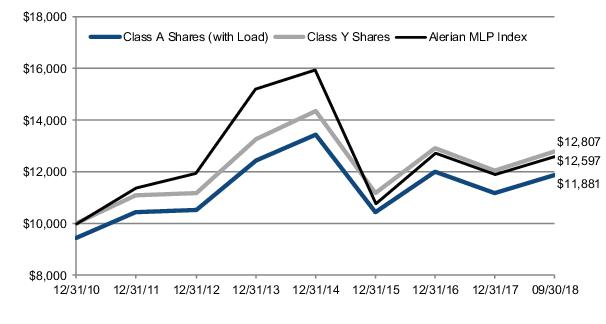
The graphs below illustrate a hypothetical investment of $10,000 in the Fund's Class A Shares (including sales charge) and Class Y Shares the from the commencement of investment operations on December 31, 2010 to September 30, 2018 compared to the Alerian MLP Index.
Disclosure
The Fund’s portfolio holdings are subject to change without notice. The mention of specific securities is not a recommendation or solicitation for any person to buy, sell or hold any particular security. There is no assurance that the Center Coast Brookfield MLP Focus Fund currently holds these securities. Please refer to the Schedule of Investments contained in this report for a full listing of fund holdings.
Performance data quoted represents past performance and is no guarantee of future results. S&P 500 Index and Alerian MLP Index references Class A’s inception date. Total return figures include the reinvestment of dividends and capital gains, and as the Fund is taxable as a “C” corporation, performance is net of federal, state and local taxes paid by the Fund. Current performance may be lower or higher than the performance data quoted. Investment return and principal value will fluctuate so that an investor’s shares, when redeemed, may be worth more or less than original cost. For the most recent month end performance, please call (855) 244-4859.
8Brookfield Investment Management Inc.
Center Coast Brookfield MLP Focus Fund
Following the close of business on February 2, 2018, the Fund acquired all of the assets, subject to liabilities, of the Center Coast MLP Focus Fund (the “Predecessor Fund”) through a tax-free reorganization (the “Reorganization”). The Fund is a newly created series of Brookfield Investment Funds, which has the same investment objective and substantially similar investment strategies and policies as the Predecessor Fund. The Fund offers multiple share classes, which are subject to different sales charges and distribution and servicing fees. As a result of the Reorganization, shareholders of the Predecessor Fund’s Class A and Class C Shares received Class A and Class C Shares of the Fund, respectively, and shareholders of the Predecessor Fund’s Institutional Class Shares received Class Y Shares of the Fund. In addition, as a result of the Reorganization, the Fund’s Class A and Class C Shares adopted the Predecessor Fund’s Class A and Class C Shares’ performance and accounting history, and the Fund’s Class Y Shares adopted the Predecessor Fund’s Institutional Class Shares’ performance and accounting history.
Brookfield Investment Management Inc., the Fund’s investment adviser (the “Adviser”), has contractually agreed to waive all or a portion of its investment advisory or administration fees and/or to reimburse certain expenses of the Fund to the extent necessary to maintain the Fund’s total annual fund operating expenses (i.e., the Fund’s gross expense ratios) (excluding any front-end or contingent deferred sales loads, brokerage commissions and other transactional expenses, acquired fund fees and expenses, interest, taxes, such as deferred income tax expenses, and extraordinary expenses, such as litigation; and other expenses not incurred in the ordinary course of the Fund’s business), at no more than 1.46% for Class A Shares, 2.21% for Class C Shares, 1.46% for Class T Shares, 1.21% for Class I Shares and 1.21% for Class Y Shares, as applicable to investors respectively. The fee waiver and expense reimbursement arrangement will continue for two years following the Fund’s Reorganization and may not be terminated by the Fund or the Adviser before such time. Current performance of the Fund may be lower or higher than the performance quoted. Performance shown including sales charge reflects the Class A maximum sales charge of 5.75% of the Predecessor Fund. Performance data excluding sales charge does not reflect the deduction of the sales charge and if reflected, the sales charge or fee would reduce the performance quoted. Investment performance reflects fee waivers, expenses and reimbursements in effect. In the absence of such waivers, total return and NAV would be reduced. On purchases of Class A Shares, no sales charge is payable at the time of purchase on investments of $1 million or more, although for such investments the Fund will impose a CDSC of 1.00% on redemptions made within 18 months of the purchase. If imposed, the CDSC is based on the original cost of the shares redeemed. Class C Shares are subject to a CDSC of 1.00% when redeemed within 12 months of the purchase.
The Fund is not required to make distributions and in the future could decide not to make such distributions or not to make distributions at a rate that over time is similar to the distribution rate it receives from the MLPs in which it invests. It is expected that a portion of the distributions will be considered tax deferred return of capital (ROC). ROC is tax deferred and reduces the shareholder’s cost basis (until the cost basis reaches zero); and when the Fund shares are sold, if the result is a gain, it would then be taxable to the shareholder at the capital gains rate. Any portion of distributions that are not considered ROC are expected to be characterized as qualified dividends for tax purposes. Qualified dividends are taxable in the year received and do not serve to reduce the shareholder’s cost basis. The portion of the Fund’s distributions that are considered ROC may vary materially from year to year. Accordingly, there is no guarantee that future distributions will maintain the same classification for tax purposes as past distributions. An investment in the Fund may not receive the same tax treatment as a direct investment in the MLP. Because deferred tax liability may be reflected in the daily NAV, the MLP Fund’s after-tax performance could differ significantly from the underlying assets even if the pre-tax performance is closely tracked.
A Basis Point is one hundredth of one percent (0.01%). Cash flow refers to the amount of cash generated and used by a company over a given period.
Earnings growth is not a measure of the Fund’s future performance.
Investing in Master Limited Partnerships (“MLPs”) involves additional risks as compared to the risks of investing in common stock, including risks related to cash flow, dilution and voting rights. The Fund’s investments are concentrated in the energy infrastructure industry with an emphasis on securities issued by MLPs, which may increase volatility. Energy infrastructure companies are subject to risks specific to
Center Coast Brookfield MLP Focus Fund
the industry such as fluctuations in commodity prices, reduced volumes of natural gas or other energy commodities, environmental hazards, changes in the macroeconomic or the regulatory environment or extreme weather. MLPs may trade less frequently than larger companies due to their smaller capitalizations which may result in erratic price movement or difficulty in buying or selling. The Fund invests in small and mid-cap companies, which involve additional risks such as limited liquidity and greater volatility. Additional management fees and other expenses are associated with investing in MLPs. Additionally, investing in MLPs involves material income tax risks and certain other risks. Actual results, performance or events may be affected by, without limitation, (1) general economic conditions, (2) performance of financial markets, (3) interest rate levels, (4) changes in laws and regulations and (5) changes in the policies of governments and/or regulatory authorities. Unlike most other open-end mutual funds, the Fund will be taxable as a regular corporation, or “C” corporation. Consequently, the Fund will accrue and pay federal, state and local income taxes on its taxable income, if any, at the Fund level, which will ultimately reduce the returns that the shareholder would have otherwise received. Additionally, on a daily basis the Fund’s net asset value per share (“NAV”) will include a deferred tax expense (which reduces the Fund’s NAV) or asset (which increases the Fund’s NAV, unless offset by a valuation allowance). To the extent the Fund has a deferred tax asset, consideration is given as to whether or not a valuation allowance is required. The Fund’s deferred tax expense or asset is based on estimates that could vary dramatically from the Fund’s actual tax liability/benefit and, therefore, could have a material impact on the Fund’s NAV. This material is provided for general and educational purposes only, and is not intended to provide legal, tax or investment advice or to avoid legal penalties that may be imposed under U.S. federal tax laws. Investors should contact their own legal or tax advisors to learn more about the rules that may affect individual situations.
These views represent the opinions of Brookfield Investment Management Inc. and are not intended to predict or depict the performance of any investment. These views are as of the close of business on September 30, 2018 and subject to change based on subsequent developments.
10Brookfield Investment Management Inc.
Center Coast Brookfield MLP Focus Fund
Portfolio Characteristics (Unaudited)
September 30, 2018
| Asset Allocation by Sector | Percent of
Net Assets |
| Master Limited Partnerships | |
| Diversified Midstream | 26.5% |
| Petroleum Transportation & Storage | 23.1% |
| Gathering & Processing | 15.2% |
| Natural Gas Transportation & Storage | 11.0% |
| Total Master Limited Partnerships | 75.8% |
| Common Stocks | |
| Midstream C-corps | 22.7% |
| Petroleum Transportation & Storage | 0.5% |
| Total Common Stocks | 23.2% |
| Other Assets in Excess of Liabilities | 1.0% |
| Net Assets | 100.0% |
| TOP TEN HOLDINGS | |
| Energy Transfer Partners LP | 8.6% |
| Enterprise Products Partners LP | 8.4% |
| Williams Companies, Inc. | 7.6% |
| Targa Resources Corp. | 7.3% |
| NuStar Energy LP | 5.9% |
| Enlink Midstream Partners LP | 5.8% |
| MPLX LP | 5.2% |
| Plains All American Pipeline LP | 5.2% |
| Spectra Energy Partners LP | 5.0% |
| Western Gas Partners LP | 4.9% |
Center Coast Brookfield MLP Focus Fund
Schedule of Investments
September 30, 2018
| | | | Shares | Value |
| MASTER LIMITED PARTNERSHIPS – 75.8% | | | |
| Diversified Midstream – 26.5% | | | |
Andeavor Logistics LP
| | | 2,299,950 | $ 111,685,572 |
Energy Transfer Partners LP
| | | 10,007,043 | 222,756,775 |
Enterprise Products Partners LP
| | | 7,546,444 | 216,809,336 |
MPLX LP
| | | 3,909,375 | 135,577,125 |
| Total Diversified Midstream | | | | 686,828,808 |
| Gathering & Processing – 15.2% | | | |
Crestwood Equity Partners LP
| | | 698,860 | 25,683,105 |
DCP Midstream LP
| | | 1,721,902 | 68,170,100 |
Enlink Midstream Partners LP
| | | 8,112,994 | 151,226,208 |
Summit Midstream Partners LP
| | | 1,623,249 | 23,212,461 |
Western Gas Partners LP
| | | 2,877,402 | 125,684,920 |
| Total Gathering & Processing | | | | 393,976,794 |
| Natural Gas Transportation & Storage – 11.0% | | | |
EQT Midstream Partners LP
| | | 1,190,729 | 62,846,675 |
Spectra Energy Partners LP
| | | 3,610,302 | 128,923,884 |
TC Pipelines LP
| | | 3,096,530 | 93,917,755 |
| Total Natural Gas Transportation & Storage | | | | 285,688,314 |
| Petroleum Transportation & Storage – 23.1% | | | |
Buckeye Partners LP
| | | 3,052,597 | 109,008,239 |
Enbridge Energy Partners LP
| | | 6,649,008 | 73,072,598 |
Magellan Midstream Partners LP
| | | 1,529,569 | 103,582,413 |
NuStar Energy LP 1
| | | 5,517,766 | 153,393,895 |
Phillips 66 Partners LP
| | | 506,333 | 25,893,869 |
Plains All American Pipeline LP
| | | 5,393,728 | 134,897,137 |
| Total Petroleum Transportation & Storage | | | | 599,848,151 |
Total MASTER LIMITED PARTNERSHIPS
(Cost $1,834,292,201)
| | | | 1,966,342,067 |
| COMMON STOCKS – 23.2% | | | |
| Midstream C-corps – 22.8% | | | |
Kinder Morgan Inc.
| | | 3,942,520 | 69,900,880 |
ONEOK, Inc
| | | 1,612,699 | 109,324,865 |
SemGroup Corp
| | | 1,103,306 | 24,327,897 |
Targa Resources Corp.
| | | 3,353,852 | 188,855,406 |
Williams Companies, Inc.
| | | 7,285,441 | 198,091,141 |
| Total Midstream C-corps | | | | 590,500,189 |
| Petroleum Transportation & Storage – 0.4% | | | |
Enbridge Energy Management LLC 2
| | | 1,072,160 | 11,707,987 |
Total COMMON STOCKS
(Cost $477,533,362)
| | | | 602,208,176 |
Total Investments – 99.0%
(Cost $2,311,825,563)
| | | | 2,568,550,243 |
Other Assets in Excess of Liabilities – 1.0%
| | | | 25,618,179 |
TOTAL NET ASSETS – 100.0%
| | | | $2,594,168,422 |
See Notes to Financial Statements.
12Brookfield Investment Management Inc.
Center Coast Brookfield MLP Focus Fund
Schedule of Investments (continued)
September 30, 2018
| The following notes should be read in conjunction with the accompanying Schedule of Investments. |
| LP— Limited Partnership |
| LLC— Limited Liability Company |
| 1 | — Affiliate issuer. (Note 8) |
| 2 | — Non-income producing security. |
See Notes to Financial Statements.
CENTER COAST BROOKFIELD MLP FOCUS FUND
Statement of Assets and Liabilities
September 30, 2018
| Assets: | |
Investments in securities, at value:
| |
| Unaffiliated securities (cost $2,136,286,334) | $2,415,156,348 |
| Affiliated securities (cost $175,539,229) | 153,393,895 |
| Total investments (cost $2,311,825,563) | 2,568,550,243 |
Cash
| 28,554,266 |
Receivable for fund shares sold
| 4,675,868 |
Prepaid expenses
| 127,333 |
Total assets
| 2,601,907,710 |
| Liabilities: | |
Payable for fund shares purchased
| 3,032,889 |
Distribution fee payable (Note 4)
| 1,799,435 |
Investment advisory fee payable (Note 4)
| 1,952,698 |
Administration fee payable (Note 4)
| 332,638 |
Trustees' fees payable
| 14,619 |
Accrued expenses
| 607,009 |
Total liabilities
| 7,739,288 |
Commitments and contingencies (Note 10)
| |
Net Assets
| $2,594,168,422 |
| Composition of Net Assets: | |
Paid-in capital
| 2,733,146,187 |
Accumulated distributable earnings
| (138,977,765) |
Net Assets
| $2,594,168,422 |
| Net Assets | |
Class A Shares - Net Assets
| $ 388,010,479 |
Shares outstanding
| 53,842,647 |
Net asset value and redemption price per share
| $ 7.21 |
Offering price per share based on a maximum sales charge of 4.75%
| $ 7.57 |
Class C Shares - Net Assets
| $ 637,181,644 |
Shares outstanding
| 96,371,115 |
Net asset value and redemption price per share
| $ 6.61 |
Class I Shares - Net Assets
| $ 257 |
Shares outstanding
| 35 |
Net asset value and redemption price per share
| $ 7.35* |
Class Y Shares - Net Assets
| $1,568,976,042 |
Shares outstanding
| 213,233,668 |
Net asset value and redemption price per share
| $ 7.36 |
| * | Net asset value does not recalculate due to fractional shares outstanding. |
See Notes to Financial Statements.
14Brookfield Investment Management Inc.
CENTER COAST BROOKFIELD MLP FOCUS FUND
Statements of Operations
For the Period Ended September 30, 2018
| | For the Ten
Months Ended
September 30,
2018* | | For the Fiscal
Year Ended
November 30,
2017 |
| Investment Income (Note 2): | | | |
Distributions from:
| | | |
Unaffiliated master limited partnerships
| $ 133,109,561 | | $ 170,231,126 |
Affiliated master limited partnerships
| 12,878,760 | | 20,048,836 |
Less return of capital on distributions from:
| | | |
Unaffiliated master limited partnerships
| (133,109,561) | | (170,231,126) |
Affiliated master limited partnerships
| (12,878,760) | | (20,048,836) |
Distributions from corporations
| 16,285,196 | | 16,162,742 |
Less return of capital distributions from corporations
| (9,037,015) | | (14,714,064) |
Interest
| 499 | | 3,252 |
Total investment income
| 7,248,680 | | 1,451,930 |
| Expenses: | | | |
Investment advisory fees (Note 4)
| 21,702,614 | | 27,464,343 |
Administration fees (Note 4)
| 2,795,153 | | — |
Shareholder servicing fees (Note 4)
| 99,001 | | 2,031,770 |
Distribution fees — Class A
| 788,600 | | 1,102,866 |
Distribution fees — Class C
| 5,335,793 | | 7,818,484 |
Fund administration fees
| — | | 1,458,397 |
Transfer agency fees
| 394,616 | | 497,536 |
Reports to stockholders
| 230,929 | | 233,786 |
Audit and tax services
| 222,076 | | 135,999 |
Fund accounting fees
| 217,269 | | 359,778 |
Registration fees
| 187,685 | | 169,956 |
Trustees' fees
| 109,891 | | 16,100 |
Legal fees
| 100,711 | | 31,666 |
Franchise tax
| 100,317 | | 41,784 |
Custodian fees
| 89,921 | | 145,799 |
Insurance
| 85,984 | | 8,079 |
Chief compliance officer fees
| — | | 15,549 |
Miscellaneous
| 36,479 | | 84,100 |
Total operating expenses
| 32,497,039 | | 41,615,992 |
Less expenses waived by the investment adviser (Note 4)
| (251,919) | | — |
Net expenses
| 32,245,120 | | 41,615,992 |
Net investment loss, before taxes
| (24,996,440) | | (40,164,062) |
Deferred tax benefit
| 6,185,719 | | 2,496,107 |
Net investment loss, net of deferred taxes
| (18,810,721) | | (37,667,955) |
| Net Realized and Unrealized Gain (Loss): | | | |
| Net realized gain (loss) on: | | | |
Investments in unaffiliated companies
| 124,581,072 | | 40,642,768 |
Investments in affiliated companies
| 10,710,766 | | (2,047,841) |
Deferred tax expense
| (33,479,859) | | (14,241,528) |
Net realized gain on investments, net of deferred taxes
| 101,811,979 | | 24,353,399 |
| Net change in unrealized appreciation (depreciation) on: | | | |
Investments in unaffiliated companies
| 110,805,710 | | (176,417,685) |
Investments in affiliated companies
| 6,551,046 | | (25,983,260) |
Deferred tax benefit
| 27,294,140 | | 11,745,721 |
Net change in unrealized appreciation (depreciation), net of deferred taxes
| 144,650,896 | | (190,655,524) |
Net realized and unrealized gain (loss) on investments, net of deferred taxes
| 246,462,875 | | (166,302,125) |
Net increase (decrease) in net assets resulting from operations
| $ 227,652,154 | | $(203,970,080) |
| * | The Fund changed its fiscal year end from November 30 to September 30. |
See Notes to Financial Statements.
CENTER COAST BROOKFIELD MLP FOCUS FUND
Statements of Changes in Net Assets
| | For the
Ten Months
Ended
September 30,
2018* | | For the
Fiscal Year
Ended
November 30,
2017 | | For the
Fiscal Year
Ended
November 30,
2016 |
| Increase (Decrease) in Net Assets Resulting from Operations: | | | | | |
Net investment loss
| $ (18,810,721) | | $ (37,667,955) | | $ (18,457,731) |
Net realized gain (loss) on investments, net of deferred taxes
| 101,811,979 | | 24,353,399 | | (217,090,150) |
Net unrealized appreciation (depreciation) on investments, net of deferred taxes
| 144,650,896 | | (190,655,524) | | 414,340,744 |
Net increase (decrease) in net assets resulting from operations, net of deferred taxes
| 227,652,154 | | (203,970,080) | | 178,792,863 |
| Distributions to Shareholders (Note 2): | | | | | |
From distributable earnings
| (59,061,149) | | — | | — |
From return of capital
| (130,055,561) | | (238,098,484) | | (204,222,812) |
Total distributions paid
| (189,116,710) | | (238,098,484) | | (204,222,812) |
| Capital Share Transactions (Note 6): | | | | | |
Subscriptions
| 885,813,665 | | 1,100,942,631 | | 1,086,360,954 |
Reinvestment of distributions
| 180,614,093 | | 228,728,796 | | 199,614,680 |
Redemption
| (1,031,270,834) | | (969,472,726) | | (1,061,323,973) |
Net increase in net assets from capital share transactions
| 35,156,924 | | 360,198,701 | | 224,651,661 |
Total increase (decrease) in net assets
| 73,692,368 | | (81,869,863) | | 199,221,712 |
| Net Assets: | | | | | |
Beginning of period
| 2,520,476,054 | | 2,602,345,917 | | 2,403,124,205 |
End of period
| $ 2,594,168,422 | | $2,520,476,054 | | $ 2,602,345,917 |
| * | The Fund changed its fiscal year end from November 30 to September 30. |
See Notes to Financial Statements.
16Brookfield Investment Management Inc.
Center Coast Brookfield MLP Focus Fund
Financial Highlights
| | For the Ten Month Period Ended September 30, | For the Year Ended November 30, |
| Class A | 2018 2 | 2017 | 2016 | 2015 | 2014 | 2013 |
| Per Share Operating Performance: | | | | | | |
Net asset value, beginning of period
| $ 7.03 | $ 8.23 | $ 8.30 | $ 11.49 | $ 11.02 | $ 10.13 |
Income from investment Operations:
| | | | | | |
Net investment loss1
| (0.07) | (0.11) | (0.05) | (0.04) | (0.08) | (0.10) |
Return of capital1
| 0.33 | 0.38 | 0.37 | 0.34 | 0.33 | 0.39 |
Net realized and unrealized gain (loss) on investments1,3
| 0.43 | (0.79) | 0.29 | (2.77) | 0.90 | 1.27 |
Total from investment operations
| 0.69 | (0.52) | 0.61 | (2.47) | 1.15 | 1.56 |
| Distributions to Shareholders: | | | | | | |
From net investment income/distributable earnings
| (0.16) | — | — | — | (0.30) | — |
From return of capital
| (0.35) | (0.68) | (0.68) | (0.72) | (0.38) | (0.67) |
Total distributions to shareholders
| (0.51) | (0.68) | (0.68) | (0.72) | (0.68) | (0.67) |
Net asset value, end of period
| $ 7.21 | $ 7.03 | $ 8.23 | $ 8.30 | $ 11.49 | $ 11.02 |
Total Return†
| 10.26% 9 | -6.88% | 8.17% | -22.27% | 10.62% | 15.67% 4 |
| Ratios and Supplemental Data: | | | | | | |
Net assets, end of period (in thousands)
| $388,010 | $369,684 | $451,900 | $416,593 | $566,018 | $798,021 |
Ratio of Expenses to Average Net Assets:
| | | | | | |
Before expense recoupment/(waivers) and deferred tax expense
| 1.47% 10 | 1.44% | 1.46% | 1.47% | 1.44% | 1.46% |
Expense recoupment/(waivers)
| (0.01)% 10 | —% | —% | —% | —% | 0.03% |
Net of expense recoupment/(waivers) and before deferred tax expense
| 1.46% 10 | 1.44% | 1.46% | 1.47% | 1.44% | 1.49% |
Deferred tax expense/(benefit)5,6
| —% 10 | —% | 5.61% | (14.59)% | 5.62% | 7.49% 7 |
Total expenses/(benefit)
| 1.46% 10 | 1.44% | 7.07% | (13.12)% | 7.06% | 8.98% 7 |
Ratio of Net Investment Income (Loss) to Average Net Assets:
| | | | | | |
Before expense recovery/(reimbursement) and deferred tax benefit
| (1.13)% 10 | (1.39)% | (1.10)% | 0.95% | (1.20)% | (1.46)% |
Expense recoupment/(waivers)
| 0.01% 10 | —% | —% | —% | —% | 0.03% |
Net of expense recoupment/(waivers) and before deferred tax benefit
| (1.12)% 10 | (1.39)% | (1.10)% | 0.95% | (1.20)% | (1.49)% |
Deferred tax benefit6,8
| —% 10 | 0.09% | 0.41% | 0.59% | 0.50% | 0.61% 7 |
Net investment loss
| (1.12)% 10 | (1.30)% | (0.69)% | (0.36)% | (0.70)% | (0.88)% 7 |
Portfolio turnover rate
| 35% 9 | 32% | 60% | 51% | 55% | 9% |
| † | Total investment return is computed based upon the net asset value of the Fund’s shares and excludes the effects of sales charges or contingent deferred sales charges, if applicable. Distributions are assumed to be reinvested at the net asset value of the Class on the ex-date of the distribution. |
| 1 | Per share amounts presented are based on average shares outstanding throughout the period indicated. |
| 2 | Amounts shown are for the ten month period ended September 30, 2018 and are not necessarily indicative of a full year of operations. The Fund changed its fiscal year end from November 30 to September 30. |
| 3 | Realized and unrealized gains and losses per share in this caption are balancing amounts necessary to reconcile the change in net asset value per share in the period. It may not agree to the aggregate gains and losses in the Statement of Operations due to the fluctuation in share transactions this period. |
| 4 | For the fiscal year ended November 30, 2013, total returns would have been lower had expenses not been waived or absorbed by the Adviser. Returns shown do not include payment of sales load of 5.75% of offering price which is reduced on sales of $50,000 or more. Returns do not include a Contingent Deferred Sales Charge (“CDSC”) of 1.00% on certain purchases of $1 million or more that are redeemed in whole or in part within 12 months of purchase. If sales charges and CDSC were included total return would be lower. The return includes Rule 12b-1 fees of 0.25% and does not reflect the deduction of taxes that a shareholder would pay on the redemption of Fund shares. |
| 5 | Deferred tax expense (benefit) estimate for the ratio calculation is derived from net investment income (loss), and realized and unrealized gains (losses). |
| 6 | Effective December 1, 2012 the deferred tax expense and deferred tax benefit are allocated based on average net assets. |
| 7 | Ratios have been restated due to a change in accounting methodology. |
| 8 | Deferred tax benefit (expense) estimate for the ratio calculation is derived from net investment income (loss) only. |
| 9 | Not annualized. |
| 10 | Annualized. |
See Notes to Financial Statements.
Center Coast Brookfield MLP Focus Fund
Financial Highlights
| | For the Ten Month Period Ended September 30, | For the Year Ended November 30, |
| Class C | 2018 | 2017 | 2016 | 2015 | 2014 | 2013 |
Per Share Operating Performance:
| | | | | | |
Net asset value, beginning of period
| $ 6.54 | $ 7.75 | $ 7.91 | $ 11.08 | $ 10.72 | $ 9.94 |
| Income from investment Operations: | | | | | | |
Net investment loss1
| (0.10) | (0.16) | (0.11) | (0.11) | (0.16) | (0.15) |
Return of capital1
| 0.30 | 0.36 | 0.35 | 0.32 | 0.32 | 0.38 |
Net realized and unrealized gain (loss) on investments1,3
| 0.38 | (0.73) | 0.28 | (2.66) | 0.88 | 1.22 |
Total from investment operations
| 0.58 | (0.53) | 0.52 | (2.45) | 1.04 | 1.45 |
| Distributions to Shareholders: | | | | | | |
From net investment income/distributable earnings
| (0.16) | — | — | — | (0.30) | — |
From return of capital
| (0.35) | (0.68) | (0.68) | (0.72) | (0.38) | (0.67) |
Total distributions to shareholders
| (0.51) | (0.68) | (0.68) | (0.72) | (0.68) | (0.67) |
Net asset value, end of period
| $ 6.61 | $ 6.54 | $ 7.75 | $ 7.91 | $ 11.08 | $ 10.72 |
Total Return†
| 9.31% 9 | -7.44% | 7.40% | -22.93% | 9.87% | 14.84% 4 |
| Ratios and Supplemental Data: | | | | | | |
Net assets, end of period (in thousands)
| $637,182 | $660,663 | $796,542 | $841,555 | $1,056,466 | $762,945 |
Ratio of Expenses to Average Net Assets:
| | | | | | |
Before expense recoupment/(waivers) and deferred tax expense
| 2.22% 10 | 2.19% | 2.21% | 2.22% | 2.19% | 2.21% |
Expense recoupment/(waivers)
| (0.01)% 10 | —% | —% | —% | —% | 0.03% |
Net of expense recoupment/(waivers) and before deferred tax expense
| 2.21% 10 | 2.19% | 2.21% | 2.22% | 2.19% | 2.24% |
Deferred tax expense/(benefit)5,6
| —% 10 | —% | 5.61% | (14.59)% | 5.62% | 7.49% 7 |
Total expenses/(benefit)
| 2.21% 10 | 2.19% | 7.82% | (12.37)% | 7.81% | 9.72% 7 |
Ratio of Net Investment Income (Loss) to Average Net Assets:
| | | | | | |
Before expense recovery/(reimbursement) and deferred tax benefit
| (1.88)% 10 | (2.14)% | (1.85)% | (1.70)% | (1.95)% | (2.21)% |
Expense recoupment/(waivers)
| 0.01% 10 | —% | —% | —% | —% | 0.03% |
Net of expense recoupment/(waivers) and before deferred tax benefit
| (1.87)% 10 | (2.14)% | (1.85)% | (1.70)% | (1.95)% | (2.24)% |
Deferred tax benefit6,8
| —% 10 | 0.09% | 0.41% | 0.59% | 0.50% | 0.61% 7 |
Net investment loss
| (1.87)% 10 | (2.05)% | (1.44)% | (1.11)% | (1.45)% | (1.62)% 7 |
Portfolio turnover rate
| 35% 9 | 32% | 60% | 51% | 55% | 9% |
| † | Total investment return is computed based upon the net asset value of the Fund’s shares and excludes the effects of sales charges or contingent deferred sales charges, if applicable. Distributions are assumed to be reinvested at the net asset value of the Class on the ex-date of the distribution. |
| 1 | Per share amounts presented are based on average shares outstanding throughout the period indicated. |
| 2 | Amounts shown are for the ten month period ended September 30, 2018 and are not necessarily indicative of a full year of operations. The Fund changed its fiscal year end from November 30 to September 30. |
| 3 | Realized and unrealized gains and losses per share in this caption are balancing amounts necessary to reconcile the change in net asset value per share in the period. It may not agree to the aggregate gains and losses in the Statement of Operations due to the fluctuation in share transactions this period. |
| 4 | For the fiscal year ended November 30, 2013, total returns would have been lower had expenses not been waived or absorbed by the Adviser. Returns shown do not include payment of sales load of 5.75% of offering price which is reduced on sales of $50,000 or more. Returns do not include a Contingent Deferred Sales Charge (“CDSC”) of 1.00% on certain purchases of $1 million or more that are redeemed in whole or in part within 12 months of purchase. If sales charges and CDSC were included total return would be lower. The return includes Rule 12b-1 fees of 0.25% and does not reflect the deduction of taxes that a shareholder would pay on the redemption of Fund shares. |
| 5 | Deferred tax expense (benefit) estimate for the ratio calculation is derived from net investment income (loss), and realized and unrealized gains (losses). |
| 6 | Effective December 1, 2012 the deferred tax expense and deferred tax benefit are allocated based on average net assets. |
| 7 | Ratios have been restated due to a change in accounting methodology. |
| 8 | Deferred tax benefit (expense) estimate for the ratio calculation is derived from net investment income (loss) only. |
| 9 | Not Annualized. |
| 10 | Annualized. |
See Notes to Financial Statements.
18Brookfield Investment Management Inc.
Center Coast Brookfield MLP Focus Fund
Financial Highlights
| | For the Period
February 5,
2018 to
September 30, |
| Class I | 2018 2,3 |
Per Share Operating Performance:
| |
Net asset value, beginning of period
| $ 7.64 |
| Income from investment Operations: | |
Net investment income1
| (0.04) |
Return of capital1
| 0.32 |
Net realized and unrealized gain (loss) on investments1,2
| (0.11) |
Total from investment operations
| 0.17 |
| Distributions to Shareholders: | |
From net investment income/distributable earnings
| (0.14) |
From return of capital
| (0.32) |
Total distributions to shareholders
| (0.46) |
Net asset value, end of period
| $ 7.35 |
Total Return†
| 2.55% 4 |
| Ratios and Supplemental Data: | |
Net assets, end of period
| $ 257 |
Ratio of Expenses to Average Net Assets:
| |
Before expense recoupment/(waivers) and deferred tax expense
| 1.22% 5 |
Expense recoupment/(waivers)
| (0.01)% 5 |
Net of expense recoupment/(waivers) and before deferred tax expense
| 1.21% 5 |
Deferred tax expense/(benefit)
| —% 5 |
Total expenses/(benefit)
| 1.21% 5 |
| Ratio of Net Investment Income (Loss) to Average Net Assets: | |
Before expense recovery/(reimbursement) and deferred tax benefit
| (0.80)% 5 |
Expense recoupment/(waivers)
| 0.01% 5 |
Net of expense recoupment/(waivers) and before deferred tax benefit
| (0.79)% 5 |
Deferred tax benefit
| —% 5 |
Net investment income
| (0.79)% 5 |
Portfolio turnover rate
| 35% 4 |
| † | Total investment return is computed based upon the net asset value of the Fund’s shares and excludes the effects of sales charges or contingent deferred sales charges, if applicable. Distributions are assumed to be reinvested at the net asset value of the Class on the ex-date of the distribution. |
| 1 | Per share amounts presented are based on average shares outstanding throughout the period indicated. |
| 2 | Amounts shown are for the period February 5, 2018 to September 30, 2018 and are not necessarily indicative of a full year of operations. The Fund changed its fiscal year end from November 30 to September 30. |
| 3 | Class I was incepted on February 5, 2018. |
| 4 | Not Annualized. |
| 5 | Annualized. |
See Notes to Financial Statements.
Center Coast Brookfield MLP Focus Fund
Financial Highlights
| | For the Ten Month Period Ended September 30, | For the Year Ended November 30, |
| Class Y | 2018 | 2017 | 2016 | 2015 | 2014 | 2013 |
Per Share Operating Performance:
| | | | | | |
Net asset value, beginning of period
| $ 7.16 | $ 8.34 | $ 8.38 | $ 11.57 | $ 11.06 | $ 10.14 |
| Income from investment Operations: | | | | | | |
Net investment loss1
| (0.05) | (0.09) | (0.03) | (0.01) | (0.05) | (0.09) |
Return of capital1
| 0.33 | 0.39 | 0.38 | 0.34 | 0.32 | 0.39 |
Net realized and unrealized gain (loss) on investments1,3
| 0.43 | (0.80) | 0.29 | (2.80) | 0.91 | 1.29 |
Total from investment operations
| 0.71 | (0.50) | 0.64 | (2.47) | 1.19 | 1.59 |
| Distributions to Shareholders: | | | | | | |
From net investment income/distributable earnings
| (0.16) | — | — | — | (0.30) | — |
From return of capital
| (0.35) | (0.68) | (0.68) | (0.72) | (0.38) | (0.67) |
Total distributions to shareholders
| (0.51) | (0.68) | (0.68) | (0.72) | (0.68) | (0.67) |
Net asset value, end of period
| $ 7.36 | $ 7.16 | $ 8.34 | $ 8.38 | $ 11.57 | $ 11.06 |
Total Return†
| 10.35% 10 | -6.53% | 8.46% | -22.11% | 10.95% | 15.96% 5 |
| Ratios and Supplemental Data: | | | | | | |
Net assets, end of period (in thousands)
| $1,568,976 | $1,490,129 | $1,353,904 | $1,144,976 | $1,568,738 | $642,660 |
Ratio of Expenses to Average Net Assets:
| | | | | | |
Before expense recoupment/(waivers) and deferred tax expense
| 1.22% 9 | 1.19% | 1.21% | 1.22% | 1.19% | 1.21% |
Expense recoupment/(waivers)
| (0.01)% 9 | —% | —% | —% | —% | 0.03% |
Net of expense recoupment/(waivers) and before deferred tax expense
| 1.21% 9 | 1.19% | 1.21% | 1.22% | 1.19% | 1.24% |
Deferred tax expense/(benefit)6,7
| —% 9 | —% | 5.61% | (14.59)% | 5.62% | 7.49% 8 |
Total expenses/(benefit)
| 1.21% 9 | 1.19% | 6.82% | (13.37)% | 6.81% | 8.73% 8 |
Ratio of Net Investment Income (Loss) to Average Net Assets:
| | | | | | |
Before expense recovery/(reimbursement) and deferred tax benefit
| (0.88)% 9 | (1.14)% | (0.85)% | (0.70)% | (0.95)% | (1.21)% |
Expense recoupment/(waivers)
| 0.01% 9 | —% | —% | —% | —% | 0.03% |
Net of expense recoupment/(waivers) and before deferred tax benefit
| (0.87)% 9 | (1.14)% | (0.85)% | (0.70)% | (0.95)% | (1.24)% |
Deferred tax benefit7,9
| —% 9 | 0.09% | 0.41% | 0.59% | 0.50% | 0.62% 8 |
Net investment loss
| (0.87)% 9 | (1.05)% | (0.44)% | (0.11)% | (0.45)% | (0.62)% 8 |
Portfolio turnover rate
| 35% 10 | 32% | 60% | 51% | 55% | 9% |
| † | Total investment return is computed based upon the net asset value of the Fund’s shares and excludes the effects of sales charges or contingent deferred sales charges, if applicable. Distributions are assumed to be reinvested at the net asset value of the Class on the ex-date of the distribution. |
| 1 | Per share amounts presented are based on average shares outstanding throughout the period indicated. |
| 2 | Amounts shown are for the ten month period ended September 30, 2018 and are not necessarily indicative of a full year of operations. The Fund changed its fiscal year end from November 30 to September 30. |
| 3 | Realized and unrealized gains and losses per share in this caption are balancing amounts necessary to reconcile the change in net asset value per share in the period. It may not agree to the aggregate gains and losses in the Statement of Operations due to the fluctuation in share transactions this period. |
| 4 | Prior to February 3, 2018 this Fund operated under a different name. Please see Note 1 of the Notes to Financial Statements for details of this name change. Effective before the opening of business on February 5, 2018, the Institutional share classe was redesignated as Y. See Note 1 for further information. |
| 5 | For the fiscal year ended November 30, 2013, total returns would have been lower had expenses not been waived or absorbed by the Adviser. Returns shown do not include payment of sales load of 5.75% of offering price which is reduced on sales of $50,000 or more. Returns do not include a Contingent Deferred Sales Charge (“CDSC”) of 1.00% on certain purchases of $1 million or more that are redeemed in whole or in part within 12 months of purchase. If sales charges and CDSC were included total return would be lower. The return includes Rule 12b-1 fees of 0.25% and does not reflect the deduction of taxes that a shareholder would pay on the redemption of Fund shares. |
| 6 | Deferred tax expense (benefit) estimate for the ratio calculation is derived from net investment income (loss), and realized and unrealized gains (losses). |
| 7 | Effective December 1, 2012 the deferred tax expense and deferred tax benefit are allocated based on average net assets. |
| 8 | Ratios have been restated due to a change in accounting methodology. |
| 9 | Deferred tax benefit (expense) estimate for the ratio calculation is derived from net investment income (loss) only. |
| 10 | Not annualized. |
| 11 | Annualized. |
See Notes to Financial Statements.
20Brookfield Investment Management Inc.
CENTER COAST BROOKFIELD MLP FOCUS FUND
Notes to Financial Statements
September 30, 2018
1.Organization
Brookfield Investment Funds, a Delaware statutory trust (the "Trust"), is registered as an open-end management investment company under the Investment Company Act of 1940, as amended (the "1940 Act"). The Trust consists of six different series of underlying portfolios as of September 30, 2018. Center Coast Brookfield MLP Focus Fund (the ‘‘Fund’’), a series of the Trust, is non-diversified as that term is defined in the 1940 Act. The Fund’s primary investment objective is to seek maximum total return with an emphasis on providing cash distributions to shareholders. The Fund currently offers four classes of shares: Class A Shares, Class C Shares, Class I Shares, and Class Y Shares.
Following the close of business on February 2, 2018, the Fund acquired all of the assets, subject to liabilities, of the Center Coast MLP Focus Fund (the “Predecessor Fund”) through a tax-free reorganization (the “Reorganization”). The Fund is a newly created series of the Trust, which has the same investment objective and substantially similar investment strategies and policies as the Predecessor Fund. As a result of the Reorganization, shareholders of the Predecessor Fund’s Class A and Class C Shares received Class A and Class C Shares of the Fund, respectively, and shareholders of the Predecessor Fund’s Institutional Class Shares received Class Y Shares of the Fund. In addition, as a result of the Reorganization, the Fund’s Class A and Class C Shares adopted the Predecessor Fund’s Class A and Class C Shares’ performance and accounting history, and the Fund’s Class Y Shares adopted the Predecessor Fund’s Institutional Class Shares’ performance and accounting history. The Predecessor Fund commenced operations on December 31, 2010. The Fund's Class I Shares commenced operations on February 5, 2018.
Each class represents an interest in the same portfolio of assets and has identical voting, dividend, liquidation and other rights except that: (i) Class A Shares have a maximum front end sales charge of 4.75% and Class C shares have a maximum deferred sales charge of 1.00%; (ii) Class A shares have a 12b-1 fee of 0.25% and Class C shares have a 12b-1 fee of 1.00%; and (iii) each class has exclusive voting rights with respect to matters relating to its own distribution arrangements.
Brookfield Investment Management Inc. (the “Adviser”), a wholly-owned subsidiary of Brookfield Asset Management Inc., is registered as an investment adviser under the Investment Advisers Act of 1940, as amended, and serves as investment adviser to the Fund.
2.Significant Accounting Policies
The preparation of financial statements in conformity with accounting principles generally accepted in the United States of America (“GAAP”) requires management to make estimates and assumptions that affect the reported amounts of assets and liabilities and disclosure of contingent assets and liabilities at the date of the financial statements and the reported amounts of increases and decreases in net assets from operations during the reporting period. Actual results could differ from those estimates. The Fund is an investment company within the scope of Financial Accounting Standards Board (“FASB”) Accounting Standards Update (“ASU”) 2013-08 and follows accounting and reporting guidance under FASB Accounting Standards Codification (“ASC”) Topic 946 Financial Services-Investment Companies.
Valuation of Investments: The Fund’s Board of Trustees (the “Board”) has adopted procedures for the valuation of the Fund’s securities. The Adviser oversees the day to day responsibilities for valuation determinations under these procedures. The Board regularly reviews the application of these procedures to the securities in the Fund’s portfolio. The Adviser’s Valuation Committee is comprised of senior members of the Adviser’s management team.
Investments in equity securities listed or traded on any securities exchange or traded in the over-the-counter market are valued at the last trade price as of the close of business on the valuation date. Prices of foreign equities that are principally traded on certain foreign markets will generally be adjusted daily pursuant to a fair value pricing service approved by the Board in order to reflect an adjustment for the factors occurring after the close of certain foreign markets but before the NYSE close. When fair value pricing is employed, the value of the
CENTER COAST BROOKFIELD MLP FOCUS FUND
Notes to Financial Statements (continued)
September 30, 2018
portfolio securities used to calculate the Fund’s net asset values may differ from quoted or official closing prices. Investments in open-end registered investment companies, if any, are valued at the NAV as reported by those investment companies.
Debt securities, including U.S. government securities, listed corporate bonds, other fixed income and asset-backed securities, and unlisted securities and private placement securities, are generally valued at the bid prices furnished by an independent pricing service or, if not valued by an independent pricing service, using bid prices obtained from active and reliable market makers in any such security or a broker-dealer. The broker-dealers or pricing services use multiple valuation techniques to determine fair value. In instances where sufficient market activity exists, the broker-dealers or pricing services may utilize a market-based approach through which quotes from market makers are used to determine fair value. In instances where sufficient market activity may not exist or is limited, the broker-dealers or pricing services may also utilize proprietary valuation models which may consider market transactions in comparable securities and the various relationships between securities in determining fair value and/or market characteristics such as benchmark yield curves, option-adjusted spreads, credit spreads, estimated default rates, coupon-rates, anticipated timing of principal repayments, underlying collateral, and other unique security features in order to estimate the relevant cash flows, which are then discounted to calculate the fair values. Short-term debt securities with remaining maturities of sixty days or less are valued at amortized cost of discount or premium to maturity, unless such valuation, in the judgment of the Adviser’s Valuation Committee, does not represent fair value.
Securities for which market prices are not readily available or which cannot be valued using the sources described above will be valued using an internal proprietary fair value methodology. For any security warranting such fair value measurement, a memorandum, including the specific methodology and supporting information, will be provided to the Valuation Committee by a portfolio manager or analyst looking to fair value a particular security utilizing the internal proprietary fair value methodology. A portfolio manager or analyst shall use their best efforts to maximize the use of relevant observable inputs and minimize the use of unobservable inputs within their valuation technique. The Valuation Committee shall review the memorandum and supporting information provided by a portfolio manager or analyst and consider all relevant factors as it deems appropriate before approving the fair value recommendation.
The Fund may use the fair value of a security to calculate its NAV when, for example, (1) a portfolio security is not traded in a public market or the principal market in which the security trades is closed, (2) trading in a portfolio security is suspended and not resumed prior to the normal market close, (3) a portfolio security is not traded in significant volume for a substantial period, or (4) the Adviser determines that the quotation or price for a portfolio security provided by a broker-dealer or an independent pricing service is inaccurate.
The fair value of securities may be difficult to determine and thus judgment plays a greater role in the valuation process. The fair valuation methodology may include or consider the following guidelines, as appropriate: (1) evaluation of all relevant factors, including, but not limited to, pricing history, current market level, supply and demand of the respective security; (2) comparison to the values and current pricing of securities that have comparable characteristics; (3) knowledge of historical market information with respect to the security; (4) other factors relevant to the security which would include, but not be limited to, duration, yield, fundamental analytical data, the Treasury yield curve, and credit quality.
The values assigned to fair valued investments are based on available information and do not necessarily represent amounts that might ultimately be realized, since such amounts depend on future developments inherent in investments. Changes in the fair valuation of portfolio securities may be less frequent and of greater magnitude than changes in the price of portfolio securities valued at their last sale price, by an independent pricing service, or based on market quotations. Imprecision in estimating fair value can also impact the amount of unrealized appreciation or depreciation recorded for a particular portfolio security and differences in the assumptions used could result in a different determination of fair value, and those differences could be material.
22Brookfield Investment Management Inc.
CENTER COAST BROOKFIELD MLP FOCUS FUND
Notes to Financial Statements (continued)
September 30, 2018
The Fund has established methods of fair value measurements in accordance with GAAP. Fair value denotes the price that the Fund would receive upon selling an investment in a timely transaction to an independent buyer in the principal or most advantageous market of the investment. A three-tier hierarchy has been established to maximize the use of observable market data and minimize the use of unobservable inputs and to establish classification of fair value measurements for disclosure purposes. Inputs refer broadly to the assumptions that market participants would use in pricing the asset or liability, including assumptions about risk, for example, the risk inherent in a particular valuation technique used to measure fair value including such a pricing model and/or the risk inherent in the inputs to the valuation technique. Inputs may be observable or unobservable. Observable inputs are inputs that reflect the assumptions market participants would use in pricing the asset or liability developed based on market data obtained from sources independent of the reporting entity. Unobservable inputs are inputs that reflect the reporting entity’s own assumptions about the assumptions market participants would use in pricing the asset or liability developed based on the best information available in the circumstances. The three-tier hierarchy of inputs is summarized in the three broad levels listed below.
| Level 1 - | quoted prices in active markets for identical assets or liabilities |
| Level 2 - | quoted prices in markets that are not active or other significant observable inputs (including, but not limited to: quoted prices for similar assets or liabilities, quoted prices based on recently executed transactions, interest rates, credit risk, etc.)
|
| Level 3 - | significant unobservable inputs (including the Fund’s own assumptions in determining the fair value of assets or liabilities) |
The Adviser’s valuation policy, as previously stated, establishes parameters for the sources and types of valuation analysis, as well as, the methodologies and inputs the Valuation Committee uses in determining fair value. If the Valuation Committee determines that additional techniques, sources or inputs are appropriate or necessary in a given situation, such additional work will be undertaken.
Significant increases or decreases in any of the unobservable inputs in isolation may result in a lower or higher fair value measurement.
To assess the continuing appropriateness of security valuations, the Adviser (or its third party service provider, who is subject to oversight by the Adviser), regularly compares its prior day prices, prices on comparable securities and sale prices to the current day prices and challenges those prices that exceed certain tolerance levels with the third party pricing service or broker source. For those securities valued by fair valuations, the Adviser’s Valuation Committee reviews and affirms the reasonableness of the valuations based on such methodologies and fair valuation determinations on a regular basis after considering all relevant information that is reasonably available.
The inputs or methodology used for valuing investments are not necessarily an indication of the risk associated with investing in those securities.
The following table summarizes the Fund’s investments valuation inputs categorized in the disclosure hierarchy as of September 30, 2018:
| Valuation Inputs | Level 1 | | Level 2 | | Level 3 | | Total |
Master Limited Partnerships
| $1,966,342,067 | | $ — | | $ — | | $1,966,342,067 |
Common Stocks
| 602,208,176 | | — | | — | | 602,208,176 |
Total Investments
| $2,568,550,243 | | $ — | | $ — | | $2,568,550,243 |
For further information regarding security characteristics, see the Schedule of Investments.
CENTER COAST BROOKFIELD MLP FOCUS FUND
Notes to Financial Statements (continued)
September 30, 2018
Master Limited Partnerships: A master limited partnership (“MLP”) is an entity receiving partnership taxation treatment under the U.S. Internal Revenue Code of 1986 (the “Code”), the partnership interests or “units” of which are traded on securities exchanges like shares of corporate stock. Holders of MLP units generally have limited control and voting rights on matters affecting the partnership.
The Fund invests in MLPs, which generally are treated as partnerships for federal income tax purposes. If an MLP does not meet current legal requirements to maintain partnership status, or if it is unable to do so because of tax law changes, it would be taxed as a corporation or other form of taxable entity and there could be a material decrease in the value of its securities. Additionally, if tax law changes to eliminate or reduce tax deductions such as depletion, depreciation and amortization expense deductions that MLPs have been able to use to offset a significant portion of their taxable income, it could significantly reduce the value of the MLPs held by the Fund and could cause a greater portion of the income and gain allocated to the Fund to be subject to U.S. federal, state and local corporate income taxes, which would reduce the amount the Fund can distribute to shareholders and could increase the percentage of Fund distributions treated as dividends instead of tax-deferred return of capital.
Depreciation or other cost recovery deductions passed through to the Fund from investments in MLPs in a given year generally will reduce the Fund’s taxable income (and earnings and profits), but those deductions may be recaptured in the Fund’s taxable income (and earnings and profits) in subsequent years when the MLPs dispose of their assets or when the Fund disposes of its interests in the MLPs. When deductions are recaptured, distributions to the Fund’s shareholders may be taxable.
Investment Transactions and Investment Income: Securities transactions are recorded on the trade date. Realized gains and losses from securities transactions are calculated on the identified cost basis. Interest income is recorded on the accrual basis. Discounts and premiums on securities are accreted and amortized, respectively, on a daily basis, using the effective yield to maturity method adjusted based on management’s assessment of the collectability of such interest. Dividend income is recorded on the ex-dividend date.
Return of Capital Estimates: A distribution received from the Fund’s investments in MLPs generally are comprised of income and return of capital. The Fund records investment income and return of capital based on estimates made at the time such distributions are received. Such estimates are based on historical information available from each MLP and other industry sources. These estimates may subsequently be revised based on information received from MLPs after their tax reporting periods are concluded. For the ten months ended September 30, 2018, the Fund estimated that 100% of the MLP distributions received would be treated as return of capital.
Expenses: Expenses directly attributable to the Fund are charged directly to the Fund, while expenses which are attributable to the Fund and other investment companies advised by the Adviser are allocated among the respective investment companies, including the Fund, based upon relative average net assets, evenly or a combination of average net assets and evenly.
Distributions to Shareholders: The Fund’s dividend distribution policy is intended to provide monthly distributions to its common shareholders at a rate that over time is similar to the distribution rate the Fund receives from the MLPs in which it invests, without offset for the expenses of the Fund. The Fund is not required to make such distributions and therefore the amount, if any, and/or the frequency of payment is subject to change. The amount of the Fund’s distributions is based on, among other considerations, distributions the Fund actually receives from portfolio investments, including returns of capital, and estimated future cash flows. Because the Fund’s distribution policy takes into consideration estimated future cash flows from its underlying holdings, and to permit the Fund to maintain a stable distribution rate, the Fund’s distributions may exceed, or be below the amount the Fund actually receives from its portfolio investments. Additionally, since the Fund’s distribution rate is not derived from the Fund’s investment income or loss, the Fund’s distributions may not represent yield or investment return on the Fund’s portfolio. To the extent that the distributions paid exceed the distributions the Fund has received, the distributions will reduce the Fund’s net assets. Consequently, the Fund may maintain cash reserves, borrow or may be required to sell certain investments at times when it would not otherwise be desirable to do so in order to pay the expenses of the Fund. The Fund is not required to make such distributions and, as a result, the Fund could in the future
24Brookfield Investment Management Inc.
CENTER COAST BROOKFIELD MLP FOCUS FUND
Notes to Financial Statements (continued)
September 30, 2018
decide not to make such distributions or not to make distributions at a rate that over time is similar to the distribution rate that it receives from the MLPs in which it invests. Furthermore, unlike the MLPs in which it invests, the Fund is not a pass through entity. Consequently, the tax characterization of the distributions paid by the Fund, as dividend income or return of capital, may differ greatly from those of the underlying MLPs.
Distributions, if any, are declared and distributed monthly. The estimated characterization of the distributions paid will be either a dividend (ordinary income) or distribution (return of capital). This estimate is based on the Fund’s operating results during the period. It is anticipated that a portion of its distributions will be comprised of return of capital as a result of the tax character of cash distributions made by the Fund’s investments. The actual characterization of the distributions made during the period will not be determined until after the end of the fiscal year. For the ten months ended September 30, 2018, the Fund estimates that its distributions will be largely characterized as return of capital. The Fund will inform shareholders of the final tax character of the distributions on IRS Form DIV in February 2019.
The portion of the Fund’s distributions that may be classified as return of capital is uncertain and can be materially impacted by events that are not subject to the control of the Fund’s Adviser (e.g., mergers, acquisitions, reorganizations and other capital transactions occurring at the individual MLP level, changes in the tax characterization of distributions received from the MLP investments held by the Fund, changes in tax laws, etc.). The return of capital portion may also be impacted by the Fund’s strategy, which may recognize gains on its holdings. Because of these factors, the portion of the Fund’s distributions that are classified as return of capital may vary materially from year to year. Accordingly, there is no guarantee that future distributions will maintain the same classification for tax purposes as past distributions.
The distributions are determined in accordance with federal income tax regulations and are recorded on the ex-dividend date. The character may differ from GAAP. These differences between book-basis and tax-basis are either considered temporary or permanent in nature. To the extent these differences are permanent in nature, such amounts are reclassified within the composition of net assets based on their federal tax-basis treatment; temporary differences do not require reclassification.
Energy Industry Concentration Risk: A substantial portion of the MLPs in which the Fund invests are engaged primarily in the energy industry. As a result, the Fund will be concentrated in the energy industry, and will therefore be susceptible to adverse economic, environmental or regulatory occurrences effecting the energy industry.
3.Federal Income Tax Information
The Fund does not intend to qualify as a regulated investment company pursuant to Subchapter M of the Internal Revenue Code, therefore it is taxed as a corporation. As a corporation, the Fund is obligated to pay federal, state and local income tax on taxable income. On December 22, 2017 ("Date of Enactment"), President Trump signed tax reform legislation, which includes a broad range of tax reform provisions. The federal income tax rate for corporations changed to 21% for taxable years beginning after December 31, 2017. The change in federal income tax rate is recorded on the Date of Enactment. As a result of the tax legislation enacted on December 22, 2017, the Fund adjusted its estimates of its net deferred tax asset balance to reflect the reduction in the corporate rate from 35% to 21%. The Fund’s net deferred tax asset balance was reduced, and continued to be completely offset by a full valuation allowance. The Fund is currently using an estimated tax rate of 2.35% for state and local tax.
CENTER COAST BROOKFIELD MLP FOCUS FUND
Notes to Financial Statements (continued)
September 30, 2018
The Fund's income tax provision consists of the following as of September 30, 2018:
Deferred tax expense (benefit)
| |
Federal
| $ 50,346,881 |
State
| 5,139,235 |
Change in valuation allowance
| (55,486,116) |
Total deferred tax expense
| $ — |
The reconciliation between the federal statutory income tax rate of 21% and the effective tax rate on net investment income (loss) and realized and unrealized gain (loss) follows:
| | Amount | | Rate |
Application of statutory income tax rate
| $ 50,994,081 | | 22.40% |
State income taxes net of federal benefit
| 5,341,711 | | 2.35% |
Effect of permanent & temporary differences
| (849,676) | | (0.37)% |
Change in federal rate due to tax reform
| 32,476,222 | | 14.26% |
Change in valution allowance
| (87,962,338) | | (38.64)% |
Total income tax expense
| $ — | | —% |
For the ten months ended September 30, 2018, the Fund’s effective tax rate of 0.00% differed from the combined federal and state statutory tax rate of 24.75% mainly due to the change in valuation allowance primarily as a result of the change in unrealized appreciation.
The Fund intends to invest its assets primarily in MLPs, which generally are treated as partnerships for federal income tax purposes. As a limited partner in the MLPs, the Fund reports its allocable share of the MLP's taxable income in computing its own taxable income. Deferred income taxes reflect the net tax effects of temporary difference between the carrying amounts of assets and liabilities for financial reporting purposes and the amounts used for income tax purposes. Such temporary differences are principally: (i) taxes on unrealized gains/(losses), which are attributable to the temporary difference between fair market value and tax basis, (ii) the net tax effects of temporary differences between the carrying amounts of assets and liabilities for financial reporting and income tax purposes and (iii) the net tax benefit of accumulated net operating losses and capital loss carryforwards. Deferred tax assets and liabilities are measured using effective tax rates expected to apply to taxable income in the years such temporary differences are realized or otherwise settled.
Components of the Fund's deferred tax assets and liabilities as of September 30, 2018 are as follows:
| | Amount |
Deferred tax assets:
| |
Net operating loss carryforward (tax basis)
| $ 92,075,346 |
Capital loss carryforward (tax basis)
| 69,949,589 |
Valuation Allowance
| (6,435,116) |
Total deferred tax assets
| 155,589,819 |
Deferred tax liabilities:
| |
Net unrealized gains on investment securities (tax basis)
| (155,589,819) |
Total net deferred tax liability
| $ — |
To the extent the Fund has a deferred tax asset or if a portion of the deferred tax liability is offset by a tax asset resulting from net operating losses, consideration is given to whether or not a valuation allowance is required against the deferred tax asset amount. A valuation allowance is required if, based on the evaluation criterion provided by Accounting Standard Codification (“ASC”) 740, Income Taxes (ASC 740), it is more-likely-than-not that some portion or all of the deferred tax asset will not be realized. Among the factors considered in assessing the
26Brookfield Investment Management Inc.
CENTER COAST BROOKFIELD MLP FOCUS FUND
Notes to Financial Statements (continued)
September 30, 2018
Fund's valuation allowance are: the nature, frequency and severity of current and cumulative losses, forecasts of future profitability, forecasts of future MLP distributions, the duration of the statutory carryforward periods and the associated risks that operating and capital loss carryforwards may expire unused. Based on the Fund’s assessment, it has determined that in the future it is more likely than not that the fund will not generate the necessary appropriate character of income within the relevant carryforward periods to realize its deferred tax assets. As of September 30, 2018, the Fund has determined that a valuation allowance of $6,435,116 was required as stated in the table above.
In making this assessment, significant reliance was placed on forecasts and estimates as to the Fund’s MLP investments. In conjunction with work performed by qualified independent tax consultants, the Fund utilized historical information and other information about the specific MLP fund holdings to project and forecast future distributions and related tax implications.
The Fund may rely, to some extent, on information provided by the MLPs, which may not necessarily be timely, to estimate taxable income allocable to MLP units held in their portfolios, and to estimate their associated deferred tax asset/(liability). Such estimates as well as estimates made in connection with MLP distribution forecasts are made in good faith.
From time to time, and as new information becomes available, the Fund will modify its forecasts, estimates or assumptions regarding its deferred tax liability or asset.
Modifications of the Fund’s estimates or assumptions regarding its deferred tax liability and/or asset balances and any applicable valuation allowance, changes in generally accepted accounting principles or related guidance or interpretations thereof, limitations imposed on net operating losses (if any) and changes in applicable tax law could result in increases or decreases in the Fund’s NAV, which could be material. Such changes could have a material impact on the Fund’s NAV and results of operations with respect to the Fund’s shareholders in the period it is recorded, even though the shareholders at such time might not have held shares in the Fund at the time the deferred tax asset or liability had been established.
The Fund's policy is to classify interest and penalties associated with underpayment of federal and state income taxes, if any, as income tax expense on their Statement of Operations. As of September 30, 2018, the Fund did not have any interest or penalties associated with the underpayment of any income taxes.
The Fund files income tax returns in the U.S. federal jurisdiction and various states. The Fund has reviewed all major jurisdictions and concluded that there is no significant impact on the Fund's net assets and no tax liability resulting from unrecognized tax benefits relating to uncertain tax positions expected to be taken on their tax returns. Furthermore, management of the Fund is not aware of any tax positions for which it is reasonably possible that the total amounts of unrecognized tax benefits will significantly change in the next 12 months.
As of September 30, 2018, the Fund had net operating loss carryforwards for federal income tax purposes, which may be carried forward for 20 years, as follows:
| | Amount |
Expiration Date:
| |
| 09/30/2033 | $ 12,066,929 |
| 09/30/2035 | 126,671,855 |
| 09/30/2036 | 57,346,506 |
| 09/30/2037 | 89,523,821 |
| 09/30/2038 | 108,064,239 |
Total
| $393,673,350 |
CENTER COAST BROOKFIELD MLP FOCUS FUND
Notes to Financial Statements (continued)
September 30, 2018
As of September 30, 2018, the Fund had net capital loss carryforwards for federal income tax purposes, which may be carried forward for 5 years, as follows:
| | Amount |
Expiration Date:
| |
| 09/30/2021 | $299,073,426 |
Total
| $299,073,426 |
As of September 30, 2018, gross unrealized appreciation and depreciation of investments, based on cost for federal income tax purposes were as follows:
| Cost of Investments | Gross Unrealized Appreciation | Gross Unrealized Depreciation | Net Unrealized Appreciation |
| $1,903,317,168 | $713,841,026 | $(48,607,951) | $665,233,075 |
The difference between cost amounts for financial statement and federal income tax purposes is due primarily to income/(loss) from MLP K-1s, which is treated as an increase/(decrease) in cost basis of the MLP shares held, and timing differences in recognizing certain gains and losses in security transactions.
4.Investment Advisory Agreements and Related Party Transactions
The Fund has entered into an investment advisory agreement (the “Advisory Agreement”) with the Adviser under which the Adviser is responsible for the management of the Fund’s portfolio and provides the necessary personnel, facilities, equipment and certain other services necessary to the operations of the Fund. The Advisory Agreement provides that the Fund shall pay the Adviser a fee, computed daily and payable monthly, at an annual rate of 1.00% of the Fund’s average daily net assets. The rate was effective for the ten months ended September 30, 2018.
Effective February 5, 2018, the Adviser has contractually agreed to waive all or a portion of its investment advisory or administration fees and/or to reimburse certain expenses of the Fund to the extent necessary to maintain the Total Annual Fund Operating Expenses After Fee Waiver and/or Expense Reimbursement (excluding any front-end or contingent deferred sales loads, brokerage commissions and other transactional expenses, acquired fund fees and expenses, interest, taxes, such as deferred income tax expenses, and extraordinary expenses, such as litigation; and other expenses not incurred in the ordinary course of the Fund’s business) at no more than 1.46% for Class A Shares, 2.21% for Class C Shares, 1.21% for Class I Shares and 1.21% for Class Y Shares. The fee waiver and expense reimbursement arrangement will continue for two years following the Fund’s Reorganization and may not be terminated by the Fund or the Adviser before such time. Thereafter, this arrangement may only be terminated or amended to either reduce or increase the expense cap, provided that in the case of a termination by the Adviser, the Adviser will provide the Board of Trustees with written notice of its intention to terminate the arrangement prior to the expiration of its then current term. The Fund will carry forward, for a period not to exceed three years from the date that an amount is waived, any fees in excess of the expense limitation and repay the Adviser such amount provided the Fund is able to do so without exceeding the lesser of (1) the expense limit in effect at the time of the waiver or reimbursement, as applicable, or (2) the expense limit in effect at the time of recoupment. Furthermore, following the closing of the Reorganization, the Adviser will not be able to seek reimbursement for amounts waived by the Predecessor Fund’s investment adviser prior to the Reorganization. Prior to February 5, 2018, the predecessor Fund's investment adviser had contractually agreed to waive its fees and/or reimburse operating expenses of the Acquired Fund to ensure that total annual fund operating expenses (excluding front end or contingent deferred sales loads, taxes such as deferred income tax expenses, leverage interest, brokerage commissions, or extraordinary expenses) do not exceed 1.50%, 2.25% and 1.25% of average daily net assets of the Class A shares, Class C shares, and Institutional shares.
The amount of investment advisory fees waived and/or expenses reimbursed available to be recouped before expiration is $251,919 for the ten months ended September 30, 2018 and $0 for the fiscal year ended
28Brookfield Investment Management Inc.
CENTER COAST BROOKFIELD MLP FOCUS FUND
Notes to Financial Statements (continued)
September 30, 2018
November 30, 2018. For the ten months ended September 30, 2018 and the fiscal year ended November 30, 2018, the Adviser did not recoup any expenses.
Effective February 5, 2018, the Fund has entered into an Administration Agreement with the Adviser and the Adviser has entered into a sub-administration agreement with U.S. Bancorp Fund Services, LLC (“Sub-Administrator”). The Adviser and Sub-Administrator perform administrative services necessary for the operation of the Fund, including maintaining certain books and records of the Fund and preparing reports and other documents required by federal, state, and other applicable laws and regulations, and providing the Fund with administrative office facilities. For these services, the Fund pays to the Adviser a monthly fee at an annual rate of 0.15% of the Fund’s average daily net Assets. The Adviser is responsible for any fees due to the Sub-Administrator.
Prior to the Reorganization, the Fund had adopted a Shareholder Servicing Plan to pay a fee at an annual rate of up to 0.15% of average daily net assets of shares serviced by shareholder servicing agents who provide administrative and support services to their customers. In conjunction with the Reorganization, the Shareholder Servicing Plan was terminated following the close of business on February 2, 2018.
Certain officers and/or trustees of the Trust are officers and/or employees of the Adviser.
5.Purchases and Sales of Investments
For the ten months ended September 30, 2018, purchases and sales of investments, excluding short-term investments were $901,307,137 and $955,993,549, respectively.
6.Shares of Beneficial Interest
The Trust’s Declaration of Trust authorizes the issuance of an unlimited number of full and fractional shares of beneficial interest. With respect to each series, the Trust may offer more than one class of shares. The Trust reserves the right to create and issue additional series or classes. Each share of a series or class represents an equal proportionate interest in that series or class with each other share of that series or class. Currently, each series offers four classes of shares of beneficial interest — “Class A” Shares, “Class C” Shares, “Class I” Shares, and “Class Y” Shares.
The shares of each series or class participate equally in the earnings, distributions and assets of the particular series or class.
| | Center Coast Brookfield MLP Focus Fund |
| | 2018 1 | | 2017 2 | | 2016 3 |
| Class A | Shares | | Amount | | Shares | | Amount | | Shares | | Amount |
Subscriptions
| 12,838,115 | | $ 92,996,245 | | 13,889,680 | | $ 112,959,556 | | 21,301,102 | | $ 164,411,178 |
Reinvestment of distributions
| 3,409,802 | | 24,085,760 | | 4,129,810 | | 32,681,291 | | 4,233,922 | | 33,283,938 |
Redemptions
| (14,965,335) | | (107,020,013) | | (20,350,725) | | (164,184,604) | | (20,865,493) | | (159,537,865) |
Net Increase (Decrease)
| 1,282,582 | | $ 10,061,992 | | (2,331,235) | | $ (18,543,757) | | 4,669,531 | | $ 38,157,251 |
| Class C | Shares | | Amount | | Shares | | Amount | | Shares | | Amount |
Subscriptions
| 11,698,214 | | $ 78,728,997 | | 16,109,846 | | $ 123,016,368 | | 16,357,798 | | $ 120,726,811 |
Reinvestment of distributions
| 7,238,114 | | 47,178,388 | | 9,145,807 | | 67,438,747 | | 9,043,774 | | 67,141,098 |
Redemptions
| (23,653,945) | | (155,684,637) | | (26,889,996) | | (199,335,773) | | (29,066,245) | | (211,813,798) |
Net Decrease
| (4,717,617) | | $ (29,777,252) | | (1,634,343) | | $ (8,880,658) | | (3,664,673) | | $ (23,945,889) |
CENTER COAST BROOKFIELD MLP FOCUS FUND
Notes to Financial Statements (continued)
September 30, 2018
| | Center Coast Brookfield MLP Focus Fund |
| | 2018 1 | | 2017 2 | | 2016 3 |
| Class I4 | Shares | | Amount | | Shares | | Amount | | Shares | | Amount |
Subscriptions
| 33 | | $ 250 | | — | | $ — | | — | | $ — |
Reinvestment of distributions
| 2 | | 16 | | — | | — | | — | | — |
Redemptions
| — | | — | | — | | — | | — | | — |
Net Increase
| 35 | | $ 266 | | — | | $ — | | — | | $ — |
| Class Y | Shares | | Amount | | Shares | | Amount | | Shares | | Amount |
Subscriptions
| 97,184,868 | | $ 714,088,173 | | 105,955,557 | | $ 864,966,707 | | 102,845,509 | | $ 801,222,965 |
Reinvestment of distributions
| 15,206,959 | | 109,349,929 | | 16,170,128 | | 128,608,758 | | 12,466,128 | | 99,189,644 |
Redemptions
| (107,378,836) | | (768,566,184) | | (76,149,722) | | (605,952,349) | | (89,713,596) | | (689,972,310) |
Net Increase
| 5,012,991 | | $ 54,871,918 | | 45,975,963 | | $ 387,623,116 | | 25,598,041 | | $ 210,440,299 |
1 For Ten Month Period Ended September 30, 2018.
2 For the Fiscal Year Ended November 30, 2017.
3 For the Fiscal Year Ended November 30, 2016.
4 Class I was incepted on February 5, 2018.
7.Credit Facility
U.S. Bank, N.A. (the “Bank”) has made available to the Trust, a credit facility, pursuant to a separate Loan and Security Agreement, for temporary or extraordinary purposes. The maximum line of credit as of September 30, 2018 for the Trust is $75,000,000. Advances are not collateralized by a first lien against a Fund’s assets. As of September 30, 2018, the Fund did not have an amount outstanding on the credit facility, and did not use the credit facility during the ten month period ended September 30, 2018.
8.Investments in Affiliated Issuers
An affiliated issuer is an entity in which the Fund has ownership of at least 5% of the voting securities. Issuers that are affiliates of the Fund at period-end are noted in the Fund’s Schedule of Investments (if any). Additional security purchases and the reduction of certain securities shares outstanding of existing portfolio holdings that were not considered affiliated in prior years may result in the Fund owning in excess of 5% of the outstanding shares at period-end. The table below reflects transactions during the period with entities that are affiliates as of September 30, 2018 and may include acquisitions of new investments, prior year holdings that became affiliated during the period and prior period affiliated holdings that are no longer affiliated as of period-end.
| Security Description | Value
Beginning
of Period | Purchases 1 | Sales Proceeds | Net
Realized
Gain (Loss) | Change in
Unrealized
Depreciation
while Affiliated | Value
End of
Period | Return of
Capital
Distributions |
NuStar Energy LP
| $112,756,462 | $77,453,358 | $(41,198,977) | $10,710,766 | $6,551,046 | $153,393,895 | $(12,878,760) |
| Security Description | Shares Beginning of Period | Purchases | Sales | Shares End of Period |
NuStar Energy LP
| 3,880,126 | 3,136,563 | (1,498,923) | 5,517,766 |
30Brookfield Investment Management Inc.
CENTER COAST BROOKFIELD MLP FOCUS FUND
Notes to Financial Statements (continued)
September 30, 2018
1 Additions due to purchases and corporate actions.
As of September 30, 2018, the Fund owned 5.15% of the total outstanding shares of the issuer.
9.Other Risks
Liquidity Risk: The Fund may make investments that are illiquid or that may become less liquid in response to market developments or adverse investor perceptions. Illiquid investments may be more difficult to value. Liquidity risk may also refer to the risk that the Fund will not be able to pay redemption proceeds within the allowable time period because of unusual market conditions, an unusually high volume of redemption requests, or other reasons. To meet redemption requests, the Fund may be forced to sell investments at an unfavorable time and/or under unfavorable conditions.
Market and Credit Risks: In the normal course of business, the Fund trades financial instruments and enters into financial transactions where risk of potential loss exists due to changes in the market (market risk). Additionally, the Fund may also be exposed to credit risk in the event that an issuer fails to perform or that an institution or entity with which the Fund has unsettled or open transactions defaults.
Master Limited Partnership Risk: Investments in securities of MLPs involve risks that differ from investments in common stock, including risks related to limited control and limited rights to vote on matters affecting the MLP, risks related to potential conflicts of interest between the MLP and the MLP’s general partner, cash flow risks, dilution risks, limited liquidity and risks related to the general partner’s right to require unit-holders to sell their common units at an undesirable time or price.
Non-Diversification Risk: The Fund is non-diversified, meaning that it is permitted to invest a larger percentage of its assets in fewer issuers than diversified mutual funds. Thus, the Fund may be more susceptible to adverse developments affecting any single issuer held in its portfolio, and may be more susceptible to greater losses because of these developments.
Private Investment Risk: The Fund may invest in unregistered or restricted securities, including private investment in public equities (“PIPE”). Unregistered or restricted securities may not be readily marketable and are often more difficult to value. Further, the Advisor may not have timely or accurate information about the business, financial condition and results of operations which may adversely affect the Advisor’s ability to value those investments. PIPE investors may purchase securities directly from a publicly traded company in a private placement transaction, typically at a discount to the market price of the company’s common stock. In a PIPE transaction, the Fund may bear the price risk from the time of pricing until the time of closing. In addition, the Fund may have to commit to purchase a specified number of shares at a fixed price, with the closing conditioned upon, among other things, the SEC’s preparedness to declare effective a resale registration statement covering the resale, from time to time, of the shares sold in the private financing. Because the sale of the securities is not registered under the 1933 Act, the securities are “restricted” and cannot be immediately resold by the investors into the public markets. Accordingly, PIPE securities may be deemed illiquid.
Portfolio Concentration Risk: The Fund concentrates its investments in the energy sector, and therefore is susceptible to adverse economic, environmental, business, regulatory or other occurrences affecting that sector. The energy sector has historically experienced substantial price volatility. MLPs and other companies operating in the energy sector are subject to specific risks, including, among others, fluctuations in commodity prices; reduced consumer demand for commodities such as oil, natural gas or petroleum products; reduced availability of natural gas or other commodities for transporting, processing, storing or delivering; slowdowns in new construction; extreme weather or other natural disasters; and threats of attack by terrorists on energy assets. Additionally, changes in the regulatory environment for energy companies may adversely impact their profitability. Over time, depletion of natural gas reserves and other energy reserves may also affect the profitability of energy companies.
Leverage Risk: The Fund’s use of leverage creates the possibility of higher volatility for the Fund’s per share NAV, market price, distributions and returns. When the Fund uses leverage, the Fund will experience a greater increase
CENTER COAST BROOKFIELD MLP FOCUS FUND
Notes to Financial Statements (continued)
September 30, 2018
in its NAV if the securities acquired increase in value, but it will also experience a correspondingly larger decline in its NAV if the securities acquired decline in value, which will make the Fund’s NAV more volatile, and its total return performance more variable over time. There is no assurance that a Fund’s leveraging strategy will be successful.
Tax Risks: Tax risks associated with investments in the Fund include but are not limited to the following:
Fund Structure Risk: The Fund is taxable as a regular corporation, or “C” corporation, for U.S. federal income tax purposes. This means the Fund generally will be subject to U.S. federal income tax on its taxable income at the rates applicable to corporations (currently a maximum rate of 21%), and will also be subject to state and local income taxes.
MLP Tax Risk: MLPs are generally treated as partnerships for U.S. federal income tax purposes. Partnerships do not pay U.S. federal income tax at the partnership level. Rather, each partner is allocated a share of the partnership’s income, gains, losses, deductions and expenses. A change in current tax law or a change in the underlying business mix of a given MLP could result in an MLP being treated as a corporation for U.S. federal income tax purposes, which would result in the MLP being required to pay U.S. federal income tax (as well as state and local income taxes) on its taxable income. This would have the effect of reducing the amount of cash available for distribution by the MLP and could result in a reduction in the value of the Fund’s investment in the MLP and lower income to the Fund. To the extent a distribution received by the Fund from an MLP is treated as a return of capital, the Fund’s adjusted tax basis in the interests of the MLP will be reduced, which may increase the Fund’s tax liability upon the sale of the interests in the MLP or upon subsequent distributions in respect of such interests.
Tax Estimation/NAV Risk: In calculating the Fund’s NAV, the Fund is, among other things, include its current taxes and deferred tax liability and/or asset balances and related valuation balances, if any. The Fund may accrue a deferred income tax liability balance, at the currently effective statutory U.S. federal income tax rate (currently 21%) plus an estimated state and local income tax rate, for its future tax liability associated with the capital appreciation of its investments and the distributions received by the Fund on interests of MLPs considered to be return of capital and for any net operating gains. Any deferred tax liability balance reduces the Fund’s NAV. The Fund may also record a deferred tax asset balance, which reflects an estimate of the Fund’s future tax benefit associated with net operating losses and/or unrealized losses. Any deferred tax asset balance increases the Fund’s NAV to the extent it exceeds any valuation allowance. The Fund will rely to some extent on information provided by MLPs, which may not be provided to the Fund on a timely basis, to estimate current taxes and deferred tax liability and/or asset balances for purposes of financial statement reporting and determining its NAV to the extent it exceeds any valuation allowance. The estimate of the Fund’s current taxes and deferred tax liability and/or asset balances used to calculate the Fund’s NAV could vary significantly from the Fund’s actual tax liability or benefit, and, as a result, the determination of the Fund’s actual tax liability or benefit may have a material impact on the Fund’s NAV. From time to time, the Fund may modify its estimates or assumptions regarding its current taxes and deferred tax liability and/or asset balances as new information becomes available, which modifications in estimates or assumptions may have a material impact on the Fund’s NAV.
10.Indemnification
Under the Fund’s organizational documents, its officers and directors are indemnified against certain liabilities arising out of the performance of their duties to the Fund. In addition, in the normal course of business, the Fund enters into contracts with its vendors and others that provide for indemnification. The Fund’s maximum exposure under these arrangements is unknown, since this would involve the resolution of certain claims, as well as future claims that may be made, against the Fund. Thus, an estimate of the financial impact, if any, of these arrangements cannot be made at this time. However, based on experience, the Fund expects the risk of loss due to these warranties and indemnities to be unlikely.
32Brookfield Investment Management Inc.
CENTER COAST BROOKFIELD MLP FOCUS FUND
Notes to Financial Statements (continued)
September 30, 2018
11.Subsequent Events
On October 18, 2018 and November 22, 2018, the Fund paid a distribution in the amount of $0.057 per common share and $0.057 per common share, respectively.
GAAP requires recognition in the financial statements of the effects of all subsequent events that provide additional evidence about conditions that existed at the date of the Statement of Assets and Liabilities. For non-recognized subsequent events that must be disclosed to keep the financial statements from being misleading, the Fund is required to disclose the nature of the event as well as an estimate of its financial effect, or a statement that such an estimate cannot be made.
Management has evaluated subsequent events in the preparation of the Fund’s financial statements and has determined that other than the items listed herein, there are no events that require recognition or disclosure in the financial statements.
CENTER COAST BROOKFIELD MLP FOCUS FUND
Report of Independent Registered Public Accounting Firm
September 30, 2018
To the shareholders of Center Coast Brookfield MLP Focus Fund and the Board of Trustees of Brookfield Investment Funds
Opinion on the Financial Statements and Financial Highlights
We have audited the accompanying statement of assets and liabilities of Center Coast Brookfield MLP Focus Fund (the “Fund”), a series of the Brookfield Investment Trust, including the schedule of investments as of September 30, 2018, the related statements of operations and changes in net assets, and the financial highlights for the period from December 1, 2017 through September 30, 2018, and the related notes. In our opinion, the financial statements and financial highlights present fairly, in all material respects, the financial position of the Fund as of September 30, 2018, and the results of its operations, the changes in its net assets, and the financial highlights for the period from December 1, 2017 through September 30, 2018, in conformity with accounting principles generally accepted in the United States of America.
The statement of operations for the year ended November 30, 2017, statements of changes in net assets for each of the two years in the period ended November 30, 2017, and the financial highlights for each of the five years in the period ended November 30, 2017 were audited by other auditors whose report dated January 29, 2018, expressed an unqualified opinion on those financial statements and financial highlights.
Basis for Opinion
These financial statements and financial highlights are the responsibility of the Fund’s management. Our responsibility is to express an opinion on the Fund’s financial statements and financial highlights based on our audit. We are a public accounting firm registered with the Public Company Accounting Oversight Board (United States) (PCAOB) and are required to be independent with respect to the Fund in accordance with the U.S. federal securities laws and the applicable rules and regulations of the Securities and Exchange Commission and the PCAOB.
We conducted our audit in accordance with the standards of the PCAOB. Those standards require that we plan and perform the audit to obtain reasonable assurance about whether the financial statements and financial highlights are free of material misstatement, whether due to error or fraud. The Fund is not required to have, nor were we engaged to perform, an audit of its internal control over financial reporting. As part of our audit we are required to obtain an understanding of internal control over financial reporting but not for the purpose of expressing an opinion on the effectiveness of the Fund’s internal control over financial reporting. Accordingly, we express no such opinion.
Our audit included performing procedures to assess the risks of material misstatement of the financial statements and financial highlights, whether due to error or fraud, and performing procedures that respond to those risks. Such procedures included examining, on a test basis, evidence regarding the amounts and disclosures in the financial statements and financial highlights. Our audit also included evaluating the accounting principles used and significant estimates made by management, as well as evaluating the overall presentation of the financial statements and financial highlights. Our procedures included confirmation of securities owned as of September 30, 2018, by correspondence with the custodian and brokers. We believe that our audit provides a reasonable basis for our opinion.
DELOITTE & TOUCHE LLP
Chicago, Illinois
November 29, 2018
We have served as the auditor of one or more of Brookfield Investment Management investment companies since 2011.
34Brookfield Investment Management Inc.
CENTER COAST BROOKFIELD MLP FOCUS FUND
Information Concerning Trustees and Officers (Unaudited)
September 30, 2018
The following tables provide information concerning the trustees and officers of the Fund.
Trustees of the Fund
| Name, Address and Year of Birth | Position(s) Held with Funds | Principal Occupation(s) During Past 5 Years and Other Directorships Held by Director | Number of Portfolios in Fund Complex |
| Independent Trustees | | | |
Edward A. Kuczmarski
c/o Brookfield Place,
250 Vesey Street,
New York, New York
10281-1023
Born: 1949 | Trustee and Independent Chairman of the Board, Member of the Audit Committee, Chairman of the Nominating and Compensation Committee Served Since 2018 | Director/Trustee of several investment companies advised by the Adviser (2011-Present); Certified Public Accountant and Retired Partner of Crowe Horwath LLP (1980-2013); Trustee of the Empire Builder Tax Free Bond Fund (1984-2013); Director of ISI Funds (2007-2015); Trustee of the Daily Income Fund (2006-2015), Director of the California Daily Tax Free Income Fund, Inc. (2006-2015); Trustee of the Stralem Funds (2014-2016). | 10 |
Stuart A. McFarland
c/o Brookfield Place,
250 Vesey Street,
New York, New York
10281-1023
Born: 1947 | Trustee, Member of the Audit Committee, Member of the Nominating and Compensation Committee Served Since 2018 | Director/Trustee of several investment companies advised by the Adviser (2006-Present); Director of United Guaranty Corporation (2011-2016); Director of Brandywine Funds (2003-2013); Director of Drive Shack Inc. (formerly, Newcastle Investment Corp.) (2000-Present); Managing Partner of Federal City Capital Advisors (1997-Present); Director of New America High Income Fund (2013-Present); Director of New Senior Investment Group, Inc. (2014-Present). | 10 |
Louis P. Salvatore
c/o Brookfield Place,
250 Vesey Street,
New York, New York
10281-1023
Born: 1946 | Trustee, Chairman of the Audit Committee, Member of the Nominating and Compensation Committee Served Since 2018 | Director/Trustee of several investment companies advised by the Adviser (2005-Present); Director of SP Fiber Technologies, Inc. (2012-2015); Director of Gramercy Property Trust (2012-Present); Director of Turner Corp. (2003-Present); Director of Jackson Hewitt Tax Services, Inc. (2004-2011); Employee of Arthur Andersen LLP (2002-Present). | 10 |
Heather S. Goldman
c/o Brookfield Place,
250 Vesey Street,
New York, New York
10281-1023
Born: 1967 | Trustee, Member of the Audit Committee, Member of the Nominating and Compensation Committee Served Since 2018 | Director/Trustee of several investment companies advised by the Adviser (2013-Present); Global Head of Marketing and Business Development of the Adviser (2011-2013); Managing Partner of Brookfield Financial (2009-2011); Director and Board Chair of University Settlement House (2003-2013); Member of the Honorary Board of University Settlement House (2014-Present); Co-Founder & CEO of Capstak, Inc. (2014-Present); Chairman of Capstak, Inc. (2016-Present). | 10 |
CENTER COAST BROOKFIELD MLP FOCUS FUND
Information Concerning Trustees and Officers (Unaudited) (continued)
September 30, 2018
| Name, Address and Year of Birth | Position(s) Held with Funds | Principal Occupation(s) During Past 5 Years and Other Directorships Held by Director | Number of Portfolios in Fund Complex |
| Interested Trustee | | | |
David Levi
c/o Brookfield Place,
250 Vesey Street,
New York, New York
10281-1023
Born: 1971 | Trustee Served since 2018 | Director/Trustee of several investment companies advised by the Adviser (2017 - Present); Director of Brookfield Investment Management UK Ltd. (2017-Present); Director of Brookfield Investment Management (Canada) Inc. (2017-Present); President of the Adviser (2016-Present); Managing Director and Head of Distribution of the Adviser (2014-2016); Managing Partner of Brookfield Asset Management Inc. (2015-Present); Managing Director and Head of Global Business Development at Nuveen Investments (2009-2014). | 10 |
36Brookfield Investment Management Inc.
CENTER COAST BROOKFIELD MLP FOCUS FUND
Information Concerning Trustees and Officers (Unaudited) (continued)
September 30, 2018
Officers of the Fund
| Name, Address and Year of Birth | Position(s) Held with Funds | Term of Office and Length of Time Served | Principal Occupation(s) During Past 5 Years |
Brian F. Hurley*
c/o Brookfield Place,
250 Vesey Street,
New York, New York
10281-1023
Born: 1977 | President | Served since 2018 | President of several investment companies advised by the Adviser (2014-Present); General Counsel of the Adviser (October 2017 - Present); Managing Director (2014-Present), Assistant General Counsel (2010-Present) and Head of Legal and Funds (April 2017-October 2017) of the Adviser; Director of the Adviser (2010-2014); Corporate Secretary of Brookfield Investment Management Inc. (2017-Present); Corporate Secretary of Brookfield Investment Management UK Ltd. (2017-Present); Corporate Secretary of Brookfield Investment Management (Canada) Inc. (2017-Present); Managing Partner of Brookfield Asset Management Inc. (2016-Present); Secretary of Brookfield Investment Funds (2011-2014); Director of Brookfield Soundvest Capital Management (2015-Present). |
Angela W. Ghantous*
c/o Brookfield Place,
250 Vesey Street,
New York, New York
10281-1023
Born: 1975 | Treasurer | Served since 2018 | Treasurer of several investment companies advised by the Adviser (2012-Present); Director and Head of Fund Administration and Accounting of the Adviser (2012-Present); Vice President of the Adviser (2009-2012). |
Thomas D. Peeney*
c/o Brookfield Place,
250 Vesey Street,
New York, New York
10281-1023
Born: 1973 | Secretary | Served since 2018 | Secretary of several investment companies advised by the Adviser (2018-Present); Director of the Adviser (2018-Present); Vice President of the Adviser (2017-2018); Vice President and Assistant General Counsel of SunAmerica Asset Management, LLC (2013-2017); Associate, Corporate Department at Paul Hastings LLP (2006-2013). |
Adam R. Sachs*
c/o Brookfield Place,
250 Vesey Street,
New York, New York
10281-1023
Born: 1984 | Chief Compliance Officer (“CCO”) | Served since 2018 | Chief Compliance Officer of several investment companies advised by the Advisor (2017-Present); Director of Corporate Legal and Compliance at the Adviser (2017-Present); Chief Compliance Officer of Brookfield Investment Management (Canada) Inc. (2017-Present); Chief Compliance Officer of Brookfield Investment Management UK Ltd. (2017-Present); Senior Compliance Officer of Corporate Legal and Compliance at the Adviser (2011-2017). |
Casey Tushaus*
c/o Brookfield Place,
250 Vesey Street,
New York, New York
10281-1023
Born: 1982 | Assistant Treasurer | Served since 2018 | Assistant Treasurer of several investment companies advised by the Adviser (2016-Present); Vice President of the Adviser (2014-Present); Assistant Fund Controller at Walton Street Capital (2007-2014). |
CENTER COAST BROOKFIELD MLP FOCUS FUND
Information Concerning Trustees and Officers (Unaudited) (continued)
September 30, 2018
| Name, Address and Year of Birth | Position(s) Held with Funds | Term of Office and Length of Time Served | Principal Occupation(s) During Past 5 Years |
Mohamed Rasul*
c/o Brookfield Place,
250 Vesey Street,
New York, New York
10281-1023
Born: 1981 | Assistant Treasurer | Served since 2018 | Assistant Treasurer of several investment companies advised by the Adviser (2016-Present); Assistant Vice President of the Adviser (2014 -Present); Senior Accountant of the Adviser (2012-2014). |
* Interested person as defined by the Investment Company Act of 1940, as amended (the “1940 Act”) because of affiliations with Brookfield Investment Management Inc., Adviser of the Fund.
The Fund’s Statement of Additional Information includes additional information about the directors, and is available, without charge, upon request by calling 1-855-777-8001.
38Brookfield Investment Management Inc.
[THIS PAGE IS INTENTIONALLY LEFT BLANK]
CENTER COAST BROOKFIELD MLP FOCUS FUND
Joint Notice of Privacy Policy (Unaudited)
Brookfield Investment Management Inc. (“BIM”), on its own behalf and on behalf of the funds managed by BIM and its affiliates, recognizes and appreciates the importance of respecting the privacy of our clients and shareholders. Our relationships are based on integrity and trust and we maintain high standards to safeguard your non-public personal information (“Personal Information”) at all times. This privacy policy (“Policy”) describes the types of Personal Information we collect about you, the steps we take to safeguard that information and the circumstances in which it may be disclosed.
If you hold shares of a Fund through a financial intermediary, such as a broker, investment adviser, bank or trust company, the privacy policy of your financial intermediary will also govern how your Personal Information will be shared with other parties.
WHAT INFORMATION DO WE COLLECT?
We collect the following Personal Information about you:
| • | Information we receive from you in applications or other forms, correspondence or conversations, including but not limited to name, address, phone number, social security number, assets, income and date of birth. |
| • | Information about transactions with us, our affiliates, or others, including but not limited to account number, balance and payment history, parties to transactions, cost basis information, and other financial information. |
| • | Information we may receive from our due diligence, such as your creditworthiness and your credit history. |
WHAT IS OUR PRIVACY POLICY?
We may share your Personal Information with our affiliates in order to provide products or services to you or to support our business needs. We will not disclose your Personal Information to nonaffiliated third parties unless 1) we have received proper consent from you; 2) we are legally permitted to do so; or 3) we reasonably believe, in good faith, that we are legally required to do so. For example, we may disclose your Personal Information with the following in order to assist us with various aspects of conducting our business, to comply with laws or industry regulations, and/or to effect any transaction on your behalf;
| • | Unaffiliated service providers (e.g. transfer agents, securities broker-dealers, administrators, investment advisors or other firms that assist us in maintaining and supporting financial products and services provided to you); |
| • | Government agencies, other regulatory bodies and law enforcement officials (e.g. for reporting suspicious transactions); |
| • | Other organizations, with your consent or as directed by you; and |
| • | Other organizations, as permitted or required by law (e.g. for fraud protection) |
When we share your Personal Information, the information is made available for limited purposes and under controlled circumstances designed to protect your privacy. We require third parties to comply with our standards for security and confidentiality.
HOW DO WE PROTECT CLIENT INFORMATION?
We restrict access to your Personal Information to those persons who require such information to assist us with providing products or services to you. It is our practice to maintain and monitor physical, electronic, and procedural safeguards that comply with federal standards to guard client nonpublic personal information. We regularly train our employees on privacy and information security and on their obligations to protect client information.
CONTACT INFORMATION
For questions concerning our Privacy Policy, please contact our client services representative at 1-855-777-8001.
40Brookfield Investment Management Inc.
[THIS PAGE IS INTENTIONALLY LEFT BLANK]
[THIS PAGE IS INTENTIONALLY LEFT BLANK]
Investment Adviser and Administrator
Brookfield Investment Management Inc.
Brookfield Place
250 Vesey Street, 15th Floor
New York, New York 10281-1023
www.brookfield.com
Please direct your inquiries to:
Investor Relations
Phone: 1-855-777-8001
E-mail: funds@brookfield.com
Transfer Agent
Shareholder inquiries relating to distributions, address changes and shareholder account information should be directed to the Funds’ transfer agent:
U.S. Bancorp Fund Services, LLC
615 East Michigan Street
Milwaukee, Wisconsin 53202
1-855-244-4859
Fund Accounting Agent
U.S. Bancorp Fund Services, LLC
615 East Michigan Street
Milwaukee, Wisconsin 53202
Sub-Administrator
U.S. Bancorp Fund Services, LLC
1201 South Alma School Road, Suite 3000
Mesa, Arizona 85210
Independent Registered Public Accounting Firm
Deloitte & Touche LLP
111 South Wacker Drive
Chicago, Illinois 60606
Legal Counsel
Paul Hastings LLP
200 Park Avenue
New York, New York 10166
Custodian
U.S. Bank National Association
1555 North Rivercenter Drive, Suite 302
Milwaukee, Wisconsin 53212
Distributor
Quasar Distributors, LLC
777 E Wisconsin Avenue
Milwaukee, Wisconsin 53202
The Fund files its complete schedule of portfolio holdings with the SEC for the first and third quarters of each fiscal year on Form N-Q. The Fund's Form N-Q will be available on the SEC's website at www.sec.gov. In addition, the Fund's Form N-Q may be reviewed and copied at the SEC's Public Reference Room in Washington, D.C. Information on the operation of the Public Reference Room may be obtained by calling 1-800-SEC-0330.
You may obtain a description of the Fund's proxy voting policies and procedures, and information regarding how the Fund voted proxies relating to portfolio securities during the most recent 12-month period ended June 30, without charge, upon request by calling 1-855-777-8001, or go to the SEC's website at www.sec.gov.
Brookfield Investment Management Inc.
Brookfield Place
250 Vesey Street, 15th Floor
New York, New York 10281-1023
1-855-777-8001
www.brookfieldim.com
Item 2. Code of Ethics.
As of the end of the period covered by this report, the Registrant had adopted a Code of Ethics for Principal Executive and Principal Financial Officers (the “Code”). There were no amendments to or waivers from the Code during the period covered by this report. A copy of the Registrant’s Code will be provided upon request to any person without charge by contacting Investor Relations at (855) 777-8001 or by writing to Secretary, Center Coast Brookfield MLP Focus Fund, Brookfield Place, 250 Vesey Street, 15th Floor, New York, NY 10281-1023.
Item 3. Audit Committee Financial Expert.
The Registrant’s Board of Trustees has determined that Stuart A. McFarland, Edward A. Kuczmarski, and Louis P. Salvatore each qualify as audit committee financial experts, as defined in Item 3(b) of Form N-CSR. Messrs. McFarland, Kuczmarski and Salvatore are considered “independent” for purposes of Item 3(a)(2) of Form N-CSR.
Item 4. Principal Accountant Fees and Services.
The aggregate fees billed by the Registrant’s independent registered public accounting firm, Deloitte & Touche LLP (“Deloitte”), for professional services rendered for the audit of the Registrant’s annual financial statements and the review of financial statements that are included in the Registrant’s annual and semi-annual reports to shareholders (“Audit Fees”) were $70,000 for the fiscal year ended September 30, 2018.
The aggregate Audit Fees billed by the Registrant’s former independent registered public accounting firm, Tait, Weller & Baker LLP (“Tait Weller”), were $23,000 for the fiscal year ended November 30, 2017.
There were no fees billed by Deloitte to the Registrant in the fiscal year ended September 30, 2018 for services rendered for assurance and related services that are reasonably related to the performance of the audit or review of the Registrant’s financial statements but are not reported as Audit Fees (“Audit-Related Fees”).
There were no Audit-Related Fees billed by Tait Weller to the Registrant in the fiscal year ended November 30, 2017.
For the Registrant’s two most recent fiscal years, September 30, 2018 and November 30, 2017, respectively, there were no Audit-Related Fees billed either by Deloitte or Tait Weller for engagements related directly to the operations and financial reporting of the Registrant by a “Fund Service Provider.” A Fund Service Provider is any investment adviser to the Registrant, or any entity that provides ongoing services to the Registrant and is controlling, controlled by or under common control with such investment adviser.
For the fiscal year ended September 30, 2018, the aggregate fees billed by Deloitte to the Registrant for tax compliance, tax advice and tax planning (“Tax Fees”) were $85,000. The nature of the services comprising the Tax Fees was the review of the Registrant’s income tax returns and tax distribution requirements.
The aggregate Tax Fees billed by Tait Weller to the Registrant in the fiscal year ended November 30, 2017 were $5,000. The nature of the services comprising the Tax Fees was the review of the Registrant’s income tax returns and tax distribution requirements.
The Tax Fees billed by Deloitte and Tait Weller for engagements by Fund Service Providers that related directly to the operations and financial reporting of the Registrant were $0 for the Registrant’s fiscal years ended September 30, 2018 and November 30, 2017, respectively.
The services for which Tax Fees were charged comprise all services performed by professional staff in Deloitte’s and Tait Weller’s respective tax divisions except those services related to the audits. Typically, this category would include fees for tax compliance, tax advice, and tax planning services, which include, among other things, preparation of original and amended tax returns, claims for refund and tax payment-planning services, assistance with tax audits and appeals, tax advice related to mergers and acquisitions and requests for rulings or technical advice from taxing authorities.
All other fees billed by Deloitte and Tait Weller for engagements by Fund Service Providers that related directly to the operations and financial reporting of the Registrant were $0 for the Registrant’s fiscal years ended September 30, 2018 and November 30, 2017, respectively.
(e) (1) According to policies adopted by the Audit Committee, services provided by Deloitte to the Registrant must be pre-approved by the Audit Committee. On an annual basis, the Audit Committee reviews and pre-approves various types of services that Deloitte may perform for the Registrant without specific approval of each engagement, subject to specified budget limitations. As contemplated by the Sarbanes-Oxley Act of 2002 and related SEC rules, the Audit Committee also pre-approves non-audit services provided by Deloitte to any Fund Service Provider for any engagement that relates directly to the operations and financial reporting of the Registrant. Any engagement that is not already pre-approved or that will exceed a pre-approved budget must be submitted to the Audit Committee for pre-approval.
(e) (2) None.
(f) Not applicable.
(g) The aggregate fees billed by Deloitte for the fiscal year ended September 30, 2018, for non-audit services rendered to the Registrant and Fund Service Providers were $225,000. For the fiscal year ended September 30, 2018, this amount reflects the amounts disclosed above in Item 4(b),(c),(d), plus $140,000, in fees billed to the Fund Service Providers for non-audit services that did not relate directly to the operations and financial reporting of the Registrant, including fees billed by Deloitte to Brookfield Investment Management Inc. that were associated with Deloitte’s SSAE 16 Review (formerly, SAS No. 70).
There were no fees billed by Tait Weller to the Registrant in the fiscal year ended November 30, 2017 for non-audit services rendered to the Registrant and Fund Service Providers.
(h) The Registrant’s Audit Committee has considered whether the provision of non-audit services by the Registrant’s independent registered public accounting firm to the Registrant’s investment adviser, and any entity controlling, controlled, or under common control with the investment adviser that provided ongoing services to the Registrant that were not pre-approved by the Audit Committee (because such services did not relate directly to the operations and financial reporting of the Registrant) were compatible with maintaining the independence of the independent registered public accounting firm.
Item 5. Audit Committee of Listed Registrants.
Not applicable.
Item 6. Schedule of Investments.
Schedule of Investments is included as part of the report to shareholders filed under Item 1 of this Form.
Item 7. Disclosure of Proxy Voting Policies and Procedures for Closed-End Management Investment Companies.
Not applicable to open-end investment companies.
Item 8. Portfolio Managers of Closed-End Management Investment Companies.
Not applicable to open-end investment companies.
Item 9. Purchases of Equity Securities by Closed-End Management Investment Company and Affiliated Purchasers.
Not applicable to open-end investment companies.
Item 10. Submission of Matters to a Vote of Security Holders.
There were no material changes to the procedures by which shareholders may recommend nominees to the Registrant’s Board of Trustees that were implemented after the Registrant last provided disclosure in response to the requirements of Item 407(c)(2)(iv) of Regulation S-K (17 CFR 229.407) (as required by 22(b)(15)) of Schedule 14A (17 CFR 240.14a- 101), or this Item 10.
Item 11. Controls and Procedures.
(a) The Registrant’s principal executive officer and principal financial officer have concluded that the Registrant’s Disclosure Controls and Procedures are effective, based on their evaluation of such Disclosure Controls and Procedures as of a date within 90 days of the filing of this report on Form N-CSR.
(b) As of the date of filing this Form N-CSR, the Registrant’s principal executive officer and principal financial officer are aware of no changes in the Registrant’s internal control over financial reporting that occurred during the Registrant’s second fiscal quarter of the period covered by this report that has materially affected or is reasonably likely to materially affect the Registrant’s internal control over financial reporting.
Item 12. Disclosure of Securities Lending Activities for Closed-End Management Investment Companies
Not applicable.
Item 13. Exhibits.
(a)(1) None.
| | (2) | A separate certification for each principal executive officer and principal financial officer of the Registrant as required by Rule 30a-2(a) under the Investment Company Act of 1940 is attached as an exhibit to this Form N-CSR. |
| (b) | A separate certification for each principal executive officer and principal financial officer of the Registrant as required by Rule 30a-2(b) under the Investment Company Act of 1940 is attached as an exhibit to this Form N-CSR. |
SIGNATURES
Pursuant to the requirements of the Securities Exchange Act of 1934 and the Investment Company Act of 1940, the Registrant has duly caused this report to be signed on its behalf by the undersigned, thereunto duly authorized.
| | |
| BROOKFIELD INVESTMENT FUNDS |
| |
| By: | | /s/ Brian F. Hurley |
| | Brian F. Hurley President and Principal Executive Officer |
Date: December 6, 2018
Pursuant to the requirements of the Securities Exchange Act of 1934 and the Investment Company Act of 1940, this report has been signed below by the following persons on behalf of the Registrant and in the capacities and on the dates indicated.
| | |
| By: | | /s/ Brian F. Hurley |
| | Brian F. Hurley President and Principal Executive Officer |
Date: December 6, 2018
| | |
| By: | | /s/ Angela W. Ghantous |
| | Angela W. Ghantous Treasurer and Principal Financial Officer |
Date: December 6, 2018