UNITED STATES
SECURITIES AND EXCHANGE COMMISSION
WASHINGTON, D.C. 20549
FORM N-CSR
CERTIFIED SHAREHOLDER REPORT OF REGISTERED
MANAGEMENT INVESTMENT COMPANIES
Investment Company Act file number 811-22558
BROOKFIELD INVESTMENT FUNDS
(Exact name of registrant as specified in charter)
BROOKFIELD PLACE
250 VESEY STREET, 15th Floor
NEW YORK, NEW YORK 10281-1023
(Address of principal executive offices) (Zip code)
BRIAN F. HURLEY, PRESIDENT
BROOKFIELD INVESTMENT FUNDS
BROOKFIELD PLACE
250 VESEY STREET 15th Floor
NEW YORK, NEW YORK 10281-1023
(Name and address of agent for service)
Registrant’s telephone number, including area code: (855) 777-8001
Date of fiscal year end: December 31, 2015
Date of reporting period: December 31, 2015
Item 1. Reports to Stockholders.
Brookfield Investment Management
ANNUAL REPORT
December 31, 2015
Brookfield Global Listed Infrastructure Fund
Brookfield Global Listed Real Estate Fund
Brookfield U.S. Listed Real Estate Fund
Brookfield Real Assets Securities Fund
Brookfield Asset Management Inc. is a global alternative asset manager with over $225 billion in assets under management as of December 31, 2015. Brookfield has over a 100-year history of owning and operating assets with a focus on property, renewable power, infrastructure and private equity. The company offers a range of public and private investment products and services, which leverage its expertise and experience and provide it with a competitive advantage in the markets where it operates. On behalf of its clients, Brookfield is also an active investor in the public securities markets, where its experience extends over 30 years. Over this time, the company has successfully developed several investment operations and built expertise in the management of institutional portfolios, retail mutual funds and various commingled vehicles.
Brookfield’s public market activities are conducted by Brookfield Investment Management, a registered investment adviser. These activities complement Brookfield’s core competencies and include global listed real estate and infrastructure equities, corporate credit and securitized credit strategies. Headquartered in New York, NY, Brookfield Investment Management also maintains offices and investment teams in Toronto, Chicago and Boston and has nearly $17 billion of assets under management as of December 31, 2015.
This report is for shareholder information. This is not a prospectus intended for the use in the purchase or sale of Fund shares.
| NOT FDIC INSURED | MAY LOSE VALUE | NOT BANK GUARANTEED |
© Copyright 2015. Brookfield Investment Management Inc.
[THIS PAGE IS INTENTIONALLY LEFT BLANK]
Dear Shareholders,
I am pleased to provide the Annual Report for Brookfield Global Listed Infrastructure Fund (the “Infrastructure Fund”), Brookfield Global Listed Real Estate Fund (the “Global Real Estate Fund”), Brookfield U.S. Listed Real Estate Fund (the “U.S. Real Estate Fund”) and the Brookfield Real Assets Securities Fund (the “Real Assets Fund”) (each a “Fund” and, collectively, the “Funds”) for the year ended December 31, 2015.
Volatility in capital markets reached levels in 2015 not seen since the financial crisis. Market instability was driven by uncertainties over the strengthening U.S. dollar, slowing economic growth in China, rising interest rates in the U.S. and plummeting commodity prices. West Texas Intermediate crude oil fell by more than 30% in 2015, and by about 50% since members of the Organization of the Petroleum Exporting Countries (OPEC) decided to eliminate production curbs in November 2014.
A surprise announcement in August that China would devalue its currency drove concerns over China’s slow economic growth to a new level. The mounting uncertainty led to a massive sell off in Chinese stocks, which spread around the world and weighed on global equity indexes for much of the third quarter. We expect China’s economic slowdown will continue, but also recognize that the country’s growth rate still exceeds that of developed-market economies (assuming, of course, that the accuracy of the data can be relied upon). While the situation in the region remains fluid, we continue to believe that China will eventually work through its challenges as it gradually evolves from an investment-driven to consumer-led economy.
Economic data from the U.S. have been mixed. On the one hand, employment growth has been solid and consumer spending has held up pretty well overall. But on the other hand, we have been seeing a slowdown in industrial production and some weakness in corporate earnings. While a U.S. recession is not our expectation, it remains a risk, particularly if weakness in the industrial sector spills over into the much larger services sector.
In December, the Federal Reserve announced that the U.S. federal funds rate would be raised for the first time since 2006. Despite market concerns over this long-awaited liftoff, it is notable that the U.S. 10-Year Treasury note moved only 10 basis points in 2015 to close the year at 2.27%. In our view, U.S. interest rates will remain below historical levels for a protracted period of time. We are even more confident that rates will remain low in Europe, where accommodative monetary policy by the European Central Bank (ECB) is ongoing.
In the near term, however, markets are contending with extremely high volatility, which continued beyond the reporting period of this summary into January and February of 2016. We expect this trend to continue until there is more clarity on macroeconomic headwinds related to the economic slowdown in China, declining oil prices and the direction of central bank policy decisions; but, ultimately, we believe that the patience of the long-term investor should be rewarded.
In closing, periods of heightened volatility can be challenging, but they also present unique investment opportunities for long-term value investors—particularly those who remain disciplined, value driven and focused on the drivers of longer-term cash profits. We fundamentally believe this value approach serves the best interests of our investors over the long term.
Letter to Shareholders (continued)
In addition to performance information, this report provides the Funds’ audited financial statements as of December 31, 2015.
We welcome your questions and comments, and encourage you to contact our Investor Relations team at (855) 777-8001 or visit us at www.brookfieldim.com for more information. Thank you for your support.
Sincerely,
Brian F. Hurley
President
Must be preceded or accompanied by a prospectus.
Quasar Distributors, LLC is the distributor of Brookfield Investment Funds.
These views represent the opinions of Brookfield Investment Management Inc. and are not intended to predict or depict the performance of any investment. These views are as of the close of business on December 31, 2015 and subject to change based on subsequent developments.
Mutual fund investing involves risk. Principal loss is possible.
A basis point (bps) is a unit that is equal to 1/100 of 1%, and is used to denote the change in a financial instrument.
2Brookfield Investment Management Inc.
About Your Fund’s Expenses
As a shareholder of a fund, you may incur two types of costs: (1) transaction costs, including sales charges (loads) on purchase payments, reinvested dividends or other distributions, redemption fees and exchange fees; and (2) ongoing costs, including management fees, distribution (12b-1) fees and other Fund expenses. This example is intended to help you understand your ongoing costs (in dollars) of investing in the Fund and to compare these costs with the ongoing costs of investing in other mutual funds. The example is based on an investment of $1,000 invested at the beginning of the period and held for the entire period as indicated below.
Actual Fund Return
The table below provides information about actual account values and actual expenses. You may use the information on this line, together with the amount you invested, to estimate the expense that you paid over the period. Simply divide your account value by $1,000 (for example, an $8,600 account value divided by $1,000 = 8.6), then multiply the result by the number in the first line under the heading entitled “Expenses Paid During Period” to estimate the expenses you paid on your account during this period.
Hypothetical Example for Comparison Purposes
The table below also provides information about hypothetical account values and hypothetical expenses, which is not the Fund’s actual expense ratio and an assumed rate of return of 5% per year before expenses, which is not the Fund’s actual return. The hypothetical account values and expenses may not be used to estimate the actual ending account balance or expenses you paid for the period. You may use this information to compare the ongoing costs of investing in the Fund and the other funds. To do so, compare this 5% hypothetical example with hypothetical examples that appear in shareholders’ reports of other funds.
Please note that the expenses shown in the table are meant to highlight your ongoing costs only and do not reflect any transactional costs, such as sales charges (loads), redemption fees or exchange fees. Therefore, the hypothetical account values and expenses in the table are useful in comparing ongoing costs only, and will not help you determine the relative total costs of owning different funds. In addition, if these transactional costs were included, your costs overall would have been higher.
| | Annualized Expense Ratio | Beginning Account Value
(07/01/15) | Ending Account Value
(12/31/15) | Expenses Paid During Period
(07/01/15–
12/31/15) (1) |
| INFRASTRUCTURE FUND | | | | |
| Actual | | | | |
Class A Shares
| 1.35% | $1,000.00 | $ 859.90 | $ 6.33 |
Class C Shares
| 2.10% | 1,000.00 | 856.90 | 9.83 |
Class Y Shares
| 1.10% | 1,000.00 | 861.00 | 5.16 |
Class I Shares
| 1.10% | 1,000.00 | 861.00 | 5.16 |
| Hypothetical (assuming a 5% return before expenses) | | | | |
Class A Shares
| 1.35% | 1,000.00 | 1,018.40 | 6.87 |
Class C Shares
| 2.10% | 1,000.00 | 1,014.62 | 10.66 |
Class Y Shares
| 1.10% | 1,000.00 | 1,019.66 | 5.60 |
Class I Shares
| 1.10% | 1,000.00 | 1,019.66 | 5.60 |
About Your Fund’s Expenses
| | Annualized Expense Ratio | Beginning Account Value
(07/01/15) | Ending Account Value
(12/31/15) | Expenses Paid During Period
(07/01/15–
12/31/15) (1) |
| GLOBAL REAL ESTATE FUND | | | | |
| Actual | | | | |
Class A Shares
| 1.20% | $1,000.00 | $1,002.00 | $ 6.06 |
Class C Shares
| 1.95% | 1,000.00 | 998.30 | 9.82 |
Class Y Shares
| 0.95% | 1,000.00 | 1,003.50 | 4.84 |
Class I Shares
| 0.95% | 1,000.00 | 1,003.50 | 4.84 |
| Hypothetical (assuming a 5% return before expenses) | | | | |
Class A Shares
| 1.20% | 1,000.00 | 1,019.16 | 6.11 |
Class C Shares
| 1.95% | 1,000.00 | 1,029.70 | 9.91 |
Class Y Shares
| 0.95% | 1,000.00 | 1,020.42 | 4.80 |
Class I Shares
| 0.95% | 1,000.00 | 1,020.42 | 4.80 |
| U.S. REAL ESTATE FUND | | | | |
| Actual | | | | |
Class A Shares
| 1.20% | 1,000.00 | 1,029.80 | 6.14 |
Class C Shares
| 1.95% | 1,000.00 | 1,029.70 | 9.98 |
Class Y Shares
| 0.95% | 1,000.00 | 1,033.60 | 4.87 |
Class I Shares
| 0.95% | 1,000.00 | 1,034.60 | 4.87 |
| Hypothetical (assuming a 5% return before expenses) | | | | |
Class A Shares
| 1.20% | 1,000.00 | 1,019.16 | 6.11 |
Class C Shares
| 1.95% | 1,000.00 | 1,015.38 | 9.91 |
Class Y Shares
| 0.95% | 1,000.00 | 1,020.42 | 4.84 |
Class I Shares
| 0.95% | 1,000.00 | 1,020.42 | 4.84 |
| REAL ASSETS SECURITIES FUND | | | | |
| Actual | | | | |
Class A Shares
| 1.35% | 1,000.00 | 884.40 | 6.41 |
Class C Shares
| 2.10% | 1,000.00 | 881.40 | 9.96 |
Class Y Shares
| 1.10% | 1,000.00 | 885.50 | 5.23 |
Class I Shares
| 1.10% | 1,000.00 | 885.30 | 5.23 |
| Hypothetical (assuming a 5% return before expenses) | | | | |
Class A Shares
| 1.35% | 1,000.00 | 1,018.40 | 6.87 |
Class C Shares
| 2.10% | 1,000.00 | 1,014.62 | 10.66 |
Class Y Shares
| 1.10% | 1,000.00 | 1,019.66 | 5.60 |
Class I Shares
| 1.10% | 1,000.00 | 1,019.66 | 5.60 |
| (1) | Expenses are equal to the Funds’ annualized expense ratio multiplied by the average account value over the period, multiplied by 184/365 (to reflect a six-month period). |
4Brookfield Investment Management Inc.
Brookfield Global Listed Infrastructure Fund
MANAGEMENT DISCUSSION OF FUND PERFORMANCE
For the fiscal year ended December 31, 2015, the Brookfield Global Listed Infrastructure Fund ═ Class I had a total return -19.06%. By sector, Master Limited Partnerships (MLPs) were the leading detractor relative to the Dow Jones Brookfield Global Infrastructure Composite Index1 (“the Benchmark”) due to an overweight allocation and stock selection, as the space traded with sensitivity to oil prices throughout the year.2 Our underweight position and stock selection in the Electricity Transmission & Distribution sector also detracted as defensive stocks outperformed during a volatile period. Our allocation to the non-benchmark Rail sector underperformed mainly due to poorer than expected carload data, which was driven by a softer industrial economy and a strong U.S. Dollar. The Fund’s strongest relative contributor was an overweight allocation to the Toll Roads sector. Traffic on toll roads has been better than expected, which is indicative of the positive macroeconomic trends in countries where we are invested.
An underweight position in Pipelines contributed to relative performance during the year, as the sector declined alongside oil. An overweight allocation in Communications also contributed, due to strong fundamentals in the sector that are uncorrelated to overall macro environment.
By region, the U.S. and Asia Pacific were the largest detractors from relative performance as a result of stock selection. An overweight allocation in Continental Europe was the leading contributor by region. Stock selection in Latin America also contributed during the year.
In terms of individual securities, an overweight position in Crestwood Equity Partners (CEQP, MLP, U.S.) was the Fund’s worst detractor as the company was unable to find a strategic or new financial sponsor and “rolled-up” its MLP into its general partner. Overweight positions in SemGroup Corporation (SEMG, Pipelines, U.S.) and Targa Resources Corp (TRGP, Midstream, U.S.) also detracted from relative performance, as both underperformed on crude oil weakness.
In contrast, underweight positions in underperforming Kinder Morgan Inc. (KMI, Pipelines, U.S.) and Energy Transfer Equity, LP (ETE, MLP, U.S.) were the leading contributors to relative performance. KMI was forced to cut its distribution to both fund new projects and retain its investment-grade ratings. ETE performed poorly on investor concerns about funding needs and overall leverage. Not owning underperforming Cheniere Energy, Inc. (LNG, Midstream, U.S.) also contributed to relative performance as liquefied natural gas prices fell and the company’s efforts to contract new capacity stalled.
INFRASTRUCTURE MARKET OVERVIEW AND OUTLOOK
Global equity markets were flat in 2015, as the MSCI World Index3 returned -0.3% for the period. Returns in Asia Pacific were positive (+3.2%), while Europe (-2.3%) and North America (-0.3%) declined.
During the first half of the year, investors focused largely on a strengthening U.S. dollar, central bank activity around the world and geopolitical events (notably, the possibility of a Greek exit from the euro and the potential for a Puerto Rico debt default). The main investment themes during the second half of the year revolved around economic and market concerns in China, continued declines in commodity prices and the long-awaited announcement in December that the federal funds rate would increase for the first time since 2006. While the Federal Reserve’s move was highly anticipated and the initial intraday market reaction was muted, equities began to selloff in the days after the announcement, before recovering some losses the following week. The trading year ended on concerns that stress in some areas of the high-yield fixed income market would spread to equities.
The yield on the 10-Year U.S. Treasury note rose 10 basis points during the period, ending the year at 2.27%.
Challenging year for infrastructure securities
Global infrastructure securities underperformed the MSCI World Index in 2015, with the Dow Jones Brookfield Global Infrastructure Composite Index returning -14.5%.1 Regional returns were mixed, as Asia Pacific (+2.4%) generated positive performance, returns in Europe were flat (+0.5%) and the Americas (-22.6%) weighed on
Brookfield Global Listed Infrastructure Fund
overall benchmark results. Four of eight sectors generated positive returns in the period, led by Airports (+17.9%), Toll Roads (+4.4%), Water (+4.2%) and Electricity Transmission & Distribution (0.1%); while Oil & Gas Storage & Transportation (-30.3%), Ports (-19.9%), Diversified (-3.9%) and Communications (-0.4%) declined. The Alerian MLP Index4 had a total return of -32.6% in 2015, the worst performance for the index since 2008.
For much of 2015, the macro environment proved to be very challenging for investors in global infrastructure securities. Oil prices declined by 30.5% as the price of West Texas Intermediate Crude fell to $37.13 per barrel. The selloff accelerated in December after the Dec. 4 meeting of the Organization of the Petroleum Exporting Countries (OPEC), when the group abandoned its target output of 30 million barrels per day. Even though cash flows of most energy infrastructure companies haven't been affected by declines in oil yet, growth fundamentals going forward have taken a step down, which has led to a change in valuation. This valuation has served as a negative feedback loop for the energy infrastructure space given its reliance on access to capital markets to fund growth. However, if we look at other parts of infrastructure, fundamentals remained largely intact. In the Electricity Transmission & Distribution, Gas Utilities and Water sectors regulated growth was consistently strong; and valuations were supported by low bond yields.
OUTLOOK
We enter 2016 with a more cautious outlook on the global macroeconomic environment. While the employment numbers remain strong in the U.S., and consumer spending has been solid, both corporate profits and industrial production have been declining. We are also concerned about the continued decline in oil prices; notably, West Texas Intermediate Crude, which closed the year at $37.13 per barrel, well below its average price of ~$49 per barrel over the course of the year. Should prices remain below $40 for a protracted period of time or decline further, the ability for energy & production companies to invest in new drilling, service debt and return capital to investors could be severely impacted.
That said, we continue to see attractive opportunities across the diverse industry groups that comprise infrastructure equities as an asset class. In this environment of potentially slower economic growth, we see more attractive opportunities for infrastructure investment in Communications, which continues to benefit from growing data usage. We also see opportunities in Utilities, which tend to offer more defensive characteristics in an environment of slower growth. We are also positive on European transportation assets. Toll Roads continue to enjoy favorable traffic growth amid the region’s gradual recovery, and the region’s Airports offer attractive prospects for growth—more so than assets in markets with greater exposure to the travel patterns of the Chinese consumer, such as airports in Australia.
Although our stance on the global economy has become more cautious, there are inherently defensive characteristics in the business models of many infrastructure-related companies, as defined by relatively stable cash flows derived from contracted or regulated revenue streams. In our view, fundamentally based, bottom-up security selection is the best way to identify the most attractive opportunities for investment.
| 1 | The Dow Jones Brookfield Global Infrastructure Composite Index is calculated and maintained by S&P Dow Jones Indices and comprises infrastructure companies with at least 70% of their annual cash flows derived from owning and operating infrastructure assets, including Master Limited Partnerships. You cannot invest directly in an index. |
| 2 | Attribution reflects returns in local currencies. |
| 3 | The MSCI World Index is a free float-adjusted market capitalization weighted index that is designed to measure the equity performance of developed markets. |
| 4 | The Alerian MLP Index is a composite of the 50 most prominent energy master limited partnerships calculated by Standard & Poor’s using a float-adjusted market capitalization methodology. |
6Brookfield Investment Management Inc.
Brookfield Global Listed Infrastructure Fund
AVERAGE ANNUAL TOTAL RETURNS
| As of December 31, 2015 | 1 Year | 3 Years | Since inception* |
| Class A Shares (excluding sales charge) | -19.28% | 2.08% | 5.64% |
| Class A Shares (including sales charge) | -23.14% | 0.44% | 4.35% |
| Class C Shares (excluding sales charge) | -19.91% | 1.32% | 2.98% |
| Class C Shares (including sales charge) | -20.69% | 1.32% | 2.98% |
| Class Y Shares | -19.01% | 2.35% | 6.13% |
| Class I Shares | -19.06% | 2.32% | 6.13% |
| Dow Jones Brookfield Global Infrastructure Composite Index | -14.54% | 5.48% | 8.11% |
* Class A was incepted on December 29, 2011, Class C was incepted on May 1, 2012 and Classes Y and I were incepted on December 1, 2011. The Dow Jones Brookfield Global Infrastructure Composite Index references Class I’s inception date. All returns shown in USD.
Performance data quoted represents past performance; past performance does not guarantee future results. The investment return and principal value of an investment will fluctuate so that an investor’s shares, when redeemed, may be worth more or less than their original cost. Current performance of the Fund may be lower or higher than the performance quoted. Performance data current to the most recent month end may be obtained by calling 855.244.4859. The Fund imposes a 2.00% redemption fee on shares redeemed within 60 days. Performance data does not reflect the imposition of the redemption fee and if it had, performance would have been lower. Performance shown including sales charge reflects the Class A maximum sales charge of 4.75% and the Class C Contingent Deferred Sales Charge (CDSC) of 1.00%. Performance data excluding sales charge does not reflect the deduction of the sales charge or CDSC and if reflected, the sales charge or fee would reduce the performance quoted.
As per the prospectus dated April 30, 2015, the Fund’s gross and net expense ratios for Class A is 1.44% and 1.35%, Class C is 2.19% and 2.10%, Class Y is 1.19% and 1.10% and Class I is 1.19% and 1.10%, respectively for the year ended December 31, 2014.
The Adviser has contractually agreed to reimburse the Fund's expenses through May 1, 2016. There is no guarantee that such reimbursement will be continued after that date.
Brookfield Global Listed Infrastructure Fund
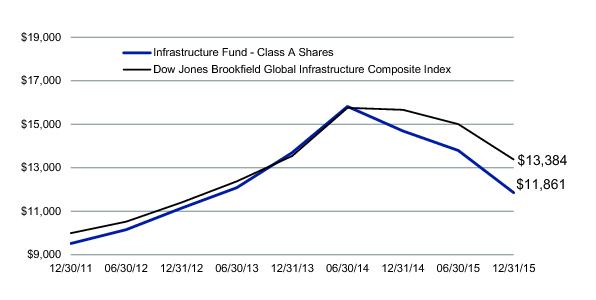
The graphs below illustrate a hypothetical investment of $10,000 in the Infrastructure Fund—Class A Shares (including sales charge) from the commencement of investment operations on December 29, 2011 to December 31, 2015 compared to the Dow Jones Brookfield Global Infrastructure Composite Index and Class I Shares from the commencement of investment operations on December 1, 2011 to December 31, 2015 compared to the Dow Jones Brookfield Global Infrastructure Composite Index.
Class A Shares
Class I Shares
8Brookfield Investment Management Inc.
Brookfield Global Listed Infrastructure Fund
Disclosure
The Fund’s portfolio holdings are subject to change without notice. The mention of specific securities is not a recommendation or solicitation for any person to buy, sell or hold any particular security. There is no assurance that the Brookfield Global Listed Infrastructure Fund currently holds these securities. Please refer to the Schedule of Investments contained in this report for a full listing of fund holdings.
Infrastructure companies may be subject to a variety of factors that may adversely affect their business, including high interest costs, high leverage, regulation costs, economic slowdown, surplus capacity, increased competition, lack of fuel availability and energy conversation policies. The Fund invests in small and mid-cap companies, which involve additional risks such as limited liquidity and greater volatility. The Fund invests in foreign securities which involve greater volatility and political, economic and currency risks and differences in accounting methods. Investing in emerging markets may entail special risks relating to potential economic, political or social instability and the risks of nationalization, confiscation or the imposition of restrictions on foreign investment. Investments in debt securities typically decrease in value when interest rates rise. This risk is usually greater for longer-term debt securities. Investment by the Fund in lower-rated and non-rated securities presents a greater risk of loss to principal and interest than higher-rated securities. Some securities held may be difficult to sell, particularly during times of market turmoil. If the Fund is forced to sell an illiquid asset to meet redemption, it may be forced to sell at a loss. Investing in MLPs involves certain risks related to investing in the underlying assets of the MLPs and risks associated with pooled investment vehicles. Using derivatives exposes the Fund to additional risks, may increase the volatility of the Fund’s net asset value and may not provide the result intended. Since the Fund will invest more than 25% of its total assets in securities in the Infrastructure industry, the Fund may be subject to greater volatility than a fund that is more broadly diversified.
A Basis Point is one hundredth of one percent (0.01%). Cash flow refers to the amount of cash generated and used by a company over a given period.
Earnings growth is not a measure of the Fund’s future performance.
These views represent the opinions of Brookfield Investment Management Inc. and are not intended to predict or depict the performance of any investment. These views are as of the close of business on December 31, 2015 and subject to change based on subsequent developments.
Brookfield Global Listed Infrastructure Fund
Portfolio Characteristics (Unaudited)
December 31, 2015
| ASSET ALLOCATION BY GEOGRAPHY | Percent of Net Assets |
| United States | 50.8% |
| Canada | 10.1% |
| United Kingdom | 7.8% |
| France | 5.0% |
| Spain | 4.6% |
| Australia | 4.5% |
| Italy | 3.8% |
| China | 3.0% |
| Hong Kong | 2.1% |
| Luxembourg | 1.6% |
| Switzerland | 1.5% |
| Mexico | 1.2% |
| Netherlands | 1.2% |
| Japan | 1.0% |
| Singapore | 0.5% |
| Other Assets in Excess of Liabilities | 1.3% |
| Total | 100.0% |
| ASSET ALLOCATION BY SECTOR | Percent of Net Assets |
| Pipelines | 27.2% |
| Toll Roads | 11.7% |
| Electricity Transmission & Distribution | 11.1% |
| Telecommunications | 8.6% |
| Midstream | 7.6% |
| Gas Utilities | 7.1% |
| Water | 5.4% |
| Communications | 4.7% |
| Airports | 4.4% |
| Transmission & Distribution | 4.1% |
| Rail | 4.1% |
| Ports | 1.6% |
| Diversified | 0.6% |
| Infrastructure - Diversified | 0.5% |
| Other Assets in Excess of Liabilities | 1.3% |
| Total | 100.0% |
| TOP TEN HOLDINGS | Percent of Net Assets |
| Enterprise Products Partners LP | 5.3% |
| American Tower Corp. | 5.2% |
| National Grid PLC | 5.0% |
| PG&E Corp. | 4.1% |
| Transurban Group | 3.9% |
| Enbridge, Inc. | 3.8% |
| Crown Castle International Corp. | 3.5% |
| Eversource Energy | 3.2% |
| Energy Transfer Partners LP | 3.2% |
| Groupe Eurotunnel SA | 3.1% |
10Brookfield Investment Management Inc.
Brookfield Global Listed Infrastructure Fund
Schedule of Investments
December 31, 2015
| | | | Shares | Value |
| COMMON STOCKS – 98.7% | | | |
| AUSTRALIA – 4.5% | | | |
| Diversified – 0.6% | | | |
Macquarie Atlas Roads Group
| | | 614,000 | $ 1,809,060 |
| Toll Roads – 3.9% | | | |
Transurban Group
| | | 1,634,841 | 12,392,003 |
| Total AUSTRALIA | | | | 14,201,063 |
| CANADA – 10.1% | | | |
| Electricity Transmission & Distribution – 0.4% | | | |
Hydro One Ltd. 1,2
| | | 81,400 | 1,311,271 |
| Pipelines – 9.7% | | | |
Enbridge, Inc.
| | | 362,700 | 12,057,671 |
Inter Pipeline Ltd.
| | | 319,200 | 5,123,533 |
Pembina Pipeline Corp.
| | | 220,600 | 4,806,743 |
TransCanada Corp.
| | | 93,700 | 3,060,131 |
Veresen, Inc.
| | | 830,700 | 5,319,073 |
| Total Pipelines | | | | 30,367,151 |
| Total CANADA | | | | 31,678,422 |
| CHINA – 3.0% | | | |
| Gas Utilities – 1.3% | | | |
ENN Energy Holdings Ltd.
| | | 783,200 | 4,154,574 |
| Pipelines – 0.6% | | | |
Beijing Capital Interanational Airport Company Ltd.
| | | 1,816,300 | 1,950,803 |
| Ports – 1.1% | | | |
China Merchants Holdings International Company Ltd.
| | | 1,025,242 | 3,242,708 |
| Total CHINA | | | | 9,348,085 |
| FRANCE – 5.0% | | | |
| Airports – 1.6% | | | |
Aeroports de Paris
| | | 43,446 | 5,055,775 |
| Communications – 0.3% | | | |
Eutelsat Communications SA
| | | 34,589 | 1,035,616 |
| Toll Roads – 3.1% | | | |
Groupe Eurotunnel SA
| | | 785,200 | 9,768,787 |
| Total FRANCE | | | | 15,860,178 |
| HONG KONG – 2.1% | | | |
| Gas Utilities – 2.1% | | | |
China Gas Holdings Ltd.
| | | 1,223,100 | 1,757,447 |
Hong Kong & China Gas Company Ltd.
| | | 2,508,680 | 4,909,589 |
| Total Gas Utilities | | | | 6,667,036 |
| Total HONG KONG | | | | 6,667,036 |
| ITALY – 3.8% | | | |
| Pipelines – 1.8% | | | |
Snam SpA
| | | 1,099,534 | 5,738,432 |
See Notes to Financial Statements.
Brookfield Global Listed Infrastructure Fund
Schedule of Investments (continued)
December 31, 2015
| | | | Shares | Value |
| COMMON STOCKS (continued) | | | |
| Toll Roads – 2.0% | | | |
Atlantia SpA
| | | 236,100 | $ 6,246,868 |
| Total ITALY | | | | 11,985,300 |
| JAPAN – 1.0% | | | |
| Rail – 1.0% | | | |
East Japan Railway Co.
| | | 33,100 | 3,116,893 |
| Total JAPAN | | | | 3,116,893 |
| LUXEMBOURG – 1.6% | | | |
| Communications – 1.6% | | | |
SES SA
| | | 179,800 | 4,982,233 |
| Total LUXEMBOURG | | | | 4,982,233 |
| MEXICO – 1.2% | | | |
| Airports – 0.8% | | | |
Grupo Aeroportuario del Centro Norte SAB de CV
| | | 277,700 | 1,352,528 |
Grupo Aeroportuario del Pacifico SAB de CV
| | | 132,900 | 1,173,965 |
| Total Airports | | | | 2,526,493 |
| Pipelines – 0.4% | | | |
Infraestructura Energetica Nova SAB de CV
| | | 306,300 | 1,279,797 |
| Total MEXICO | | | | 3,806,290 |
| NETHERLANDS – 1.2% | | | |
| Midstream – 1.2% | | | |
Koninklijke Vopak NV
| | | 85,400 | 3,677,756 |
| Total NETHERLANDS | | | | 3,677,756 |
| SINGAPORE – 0.5% | | | |
| Ports – 0.5% | | | |
Hutchison Port Holdings Trust
| | | 3,013,100 | 1,592,185 |
| Total SINGAPORE | | | | 1,592,185 |
| SPAIN – 4.6% | | | |
| Airports – 0.5% | | | |
Aena SA 1,2
| | | 12,600 | 1,442,824 |
| Electricity Transmission & Distribution – 1.4% | | | |
Red Electrica Corp. SA
| | | 54,300 | 4,535,684 |
| Toll Roads – 2.7% | | | |
Ferrovial SA
| | | 373,247 | 8,440,362 |
| Total SPAIN | | | | 14,418,870 |
| SWITZERLAND – 1.5% | | | |
| Airports – 1.5% | | | |
Flughafen Zuerich AG
| | | 6,287 | 4,717,212 |
| Total SWITZERLAND | | | | 4,717,212 |
| UNITED KINGDOM – 7.8% | | | |
| Electricity Transmission & Distribution – 5.0% | | | |
National Grid PLC
| | | 1,135,366 | 15,658,590 |
| Water – 2.8% | | | |
Severn Trent PLC
| | | 81,100 | 2,592,506 |
See Notes to Financial Statements.
12Brookfield Investment Management Inc.
Brookfield Global Listed Infrastructure Fund
Schedule of Investments (continued)
December 31, 2015
| | | | Shares | Value |
| COMMON STOCKS (continued) | | | |
United Utilities Group PLC
| | | 451,600 | $ 6,218,258 |
| Total Water | | | | 8,810,764 |
| Total UNITED KINGDOM | | | | 24,469,354 |
| UNITED STATES – 50.8% | | | |
| Communications – 2.8% | | | |
SBA Communications Corp. 2
| | | 84,600 | 8,888,922 |
| Electricity Transmission & Distribution – 4.3% | | | |
Eversource Energy
| | | 198,900 | 10,157,823 |
ITC Holdings Corp.
| | | 86,100 | 3,379,425 |
| Total Electricity Transmission & Distribution | | | | 13,537,248 |
| Gas Utilities – 3.7% | | | |
Columbia Pipeline Group, Inc.
| | | 159,600 | 3,192,000 |
NiSource, Inc.
| | | 213,800 | 4,171,238 |
One Gas, Inc.
| | | 52,200 | 2,618,874 |
Southwest Gas Corp.
| | | 27,605 | 1,522,692 |
| Total Gas Utilities | | | | 11,504,804 |
| Infrastructure - Diversified – 0.5% | | | |
CenterPoint Energy, Inc.
| | | 89,100 | 1,635,876 |
| Midstream – 6.4% | | | |
Crestwood Equity Partners LP
| | | 39,110 | 812,706 |
Enable Midstream Partners LP
| | | 41,800 | 384,560 |
EQT Midstream Partners LP
| | | 59,700 | 4,504,962 |
Rice Midstream Partners LP
| | | 68,700 | 926,763 |
Rice Midstream Partners LP 3,4
| | | 156,620 | 2,112,804 |
Sunoco Logistics Partners LP
| | | 141,200 | 3,628,840 |
Targa Resources Corp.
| | | 46,800 | 1,266,408 |
The Williams Companies, Inc.
| | | 246,200 | 6,327,340 |
| Total Midstream | | | | 19,964,383 |
| Pipelines – 14.7% | | | |
Boardwalk Pipeline Partners LP
| | | 220,800 | 2,865,984 |
Columbia Pipeline Partners LP
| | | 102,300 | 1,788,204 |
Energy Transfer Equity LP
| | | 138,500 | 1,902,990 |
Energy Transfer Partners LP
| | | 300,800 | 10,145,984 |
Enterprise Products Partners LP
| | | 657,300 | 16,813,734 |
MPLX LP
| | | 50,576 | 1,989,154 |
SemGroup Corp.
| | | 127,900 | 3,691,194 |
Sempra Energy
| | | 32,900 | 3,092,929 |
Williams Partners LP
| | | 142,851 | 3,978,391 |
| Total Pipelines | | | | 46,268,564 |
| Rail – 3.1% | | | |
CSX Corp.
| | | 61,600 | 1,598,520 |
Union Pacific Corp.
| | | 103,200 | 8,070,240 |
| Total Rail | | | | 9,668,760 |
| Telecommunications – 8.6% | | | |
American Tower Corp.
| | | 167,653 | 16,253,958 |
See Notes to Financial Statements.
Brookfield Global Listed Infrastructure Fund
Schedule of Investments (continued)
December 31, 2015
| | | | Shares | Value |
| COMMON STOCKS (continued) | | | |
Crown Castle International Corp.
| | | 126,200 | $ 10,909,990 |
| Total Telecommunications | | | | 27,163,948 |
| Transmission & Distribution – 4.1% | | | |
PG&E Corp.
| | | 243,800 | 12,967,722 |
| Water – 2.6% | | | |
American Water Works Company Inc.
| | | 138,574 | 8,279,797 |
| Total UNITED STATES | | | | 159,880,024 |
Total COMMON STOCKS
(Cost $314,381,805)
| | | | 310,400,901 |
Total Investments – 98.7%
(Cost $314,381,805)
| | | | 310,400,901 |
Other Assets in Excess of Liabilities – 1.3%
| | | | 4,101,047 |
TOTAL NET ASSETS – 100.0%
| | | | $314,501,948 |
| The following notes should be read in conjunction with the accompanying Schedule of Investments. |
| 1 | — Security exempt from registration under Rule 144A of the Securities Act of 1933. These securities may only be resold in transactions exempt from registration, normally to qualified institutional buyers. As of December 31, 2015, the total value of all such securities was $2,754,095 or 0.9% of net assets. |
| 2 | — Non-income producing security. |
| 3 | — Private Placement. |
| 4 | — Security fair valued in good faith pursuant to the fair value procedures adopted by the Board of Directors. As of December 31, 2015, the total value of all such securities was $2,112,804 or 0.7% of net assets. |
See Notes to Financial Statements.
14Brookfield Investment Management Inc.
Brookfield Global Listed Real Estate Fund
MANAGEMENT DISCUSSION OF FUND PERFORMANCE
For the fiscal year ended December 31, 2015, the Brookfield Global Listed Real Estate Fund — Class I had a total return -1.40%. Over the 12 months ending December 31, 2015, Self Storage was the largest detractor as the portfolio maintained zero exposure to the outperforming sector, having viewed the sector as overvalued. Stock selection in the “Other” sector also detracted from relative performance during the period, as did zero allocation to the outperforming Manufactured Homes sector. In contrast, positive stock selection in the Office sector was the leading contributor to relative performance during the year. Underweight allocations in the underperforming Healthcare and Diversified sectors also contributed to relative performance during the year.
By region, the U.S. was the largest detractor, driven by stock selection. The U.K. also detracted during the year, due to the combination of an underweight allocation to the outperforming region and negative stock selection. Japan was the leading contributor to relative performance, as the portfolio held an underweight position in the underperforming region. Stock selection in China/Hong Kong also contributed to relative performance during the year, as did positive stock selection in Singapore.
By position, zero exposure to Public Storage (PSA, Self Storage, U.S.) was the largest detractor from relative performance as the sector was a top performer. An overweight position in underperforming CBL & Associates Properties, Inc. (CBL, Retail, U.S.) also detracted from relative performance as secondary retail underperformed prime retail. A position in non-benchmark NorthStar Realty Finance Corp. (NRF, Diversified, U.S.) also detracted from performance during the year. The largest individual contributor to performance by security was a position in Sun Hung Kai Properties Limited (16.HK, Diversified, Hong Kong). An overweight position in Mid-America Apartment Communities, Inc. (MAA, Residential, U.S.) also contributed as the company outperformed on strong earnings growth. An overweight position in Alstria Office REIT-AG (AOX.GR, Office, Germany) was also a contributor during the year.
GLOBAL REAL ESTATE MARKET OVERVIEW
Global equity markets were flat in 2015, as the MSCI World Index1 returned -0.3% for the period. Returns in Asia Pacific were positive (+3.2%), while Europe (-2.3%) and North America (-0.3%) declined.
During the first half of the year, investors focused largely on a strengthening U.S. dollar, central bank activity and geopolitical events (notably, the possibility of a Greek exit from the euro and the potential for a Puerto Rico debt default). The main investment themes during the second half of the year revolved around economic and market concerns in China, major declines in commodity prices (driven by oil) and the long-awaited announcement in December that the federal funds rate would increase for the first time since 2006.
The Federal Reserve’s move was highly anticipated and thus the yield on the 10-Year U.S. Treasury note rose only 10 basis points during the period, ending the year at 2.27%.
Real estate securities were flat in 2015 with the FTSE EPRA/NAREIT Developed Index (the “Benchmark”)2 returning 0.1% for the year, outperforming the broader equity market.1 Europe led the way, up 6.7%, followed by North America, up 1.8%, while Asia Pacific was down 7.3%.
Over the course of 2015, the main focus for REIT investors was on the direction of interest rates and the timing of the Federal Open Market Committee’s (FOMC) decision to raise them. In addition to the focus on interest rates, we saw a flight to quality throughout the year, which led to owners of secondary assets in the U.S. significantly underperforming the market. By the end of the year, many of these companies were trading at discounts to Net Asset Value (NAV) of greater than 30%. We see similar valuation gaps between public and private market pricing among Hong Kong landlords, as well as Japanese developers.
| 1 | The MSCI World Index is a free float-adjusted market capitalization weighted index that is designed to measure the equity performance of developed markets. |
| 2 | The FTSE EPRA/NAREIT Developed Index is a free-float adjusted, liquidity, size and revenue screened index designed to track the performance of listed real estate companies and REITs worldwide. |
Brookfield Global Listed Real Estate Fund
OUTLOOK
Valuation gaps of this magnitude – as noted in the section above – are rare. If history is a guide, they tend to persist in the short-to-medium term but are not sustainable over long periods of time. With the liftoff in U.S. rates now behind us, buyers can have greater confidence in the direction of interest rates, and this may lead to an increase in mergers and acquisitions activity this year. An increase in Mergers & Acquisitions (M&A) could be one catalyst which would help to narrow the disparity between public and private market valuations. Another potential catalyst is the increase we are seeing in the number of REITs selling assets in order to de-lever their balance sheets or to buy back shares. In the near term, however, markets are contending with extremely high volatility, which continued beyond the reporting period of this summary into January and February of 2016. We expect this trend to continue until there is more clarity on macroeconomic headwinds related to the economic slowdown in China, declining oil prices and the direction of central bank policy decisions; but, ultimately, we believe that the patience of the long-term investor should be rewarded.
A portion of the portfolio is focused on secondary assets, which will benefit from a decrease in the valuation discount that the market currently ascribes to them. Additionally, the portfolio maintains exposure to many high-quality companies, which we expect to experience outsized revenue growth from the ownership of prime assets.
AVERAGE ANNUAL TOTAL RETURNS
| As of December 31, 2015 | 1 Year | 3 Years | Since Inception* |
| Class A Shares (excluding sales charge) | -1.55% | 7.22% | 9.94% |
| Class A Shares (including sales charge) | -6.20% | 5.49% | 8.49% |
| Class C Shares (excluding sales charge) | -2.31% | 6.37% | 9.10% |
| Class C Shares (including sales charge) | -3.26% | 6.37% | 9.10% |
| Class Y Shares | -1.33% | 7.45% | 13.19% |
| Class I Shares | -1.40% | 7.45% | 13.17% |
| FTSE EPRA/NAREIT Developed Index | 0.05% | 6.57% | 11.70% |
* Classes A and C were incepted on May 1, 2012 and Classes Y and I were incepted on December 1, 2011. The FTSE/EPRA NAREIT Developed Index references Class I's inception date. All returns shown in USD.
Performance data quoted represents past performance; past performance does not guarantee future results. The investment return and principal value of an investment will fluctuate so that an investor’s shares, when redeemed, may be worth more or less than their original cost. Current performance of the Fund may be lower or higher than the performance quoted. Performance data current to the most recent month end may be obtained by calling 855.244.4859. The Fund imposes a 2.00% redemption fee on shares redeemed within 60 days. Performance data does not reflect the imposition of the redemption fee and if it had, performance would have been lower. Performance shown including sales charge reflects the Class A maximum sales charge of 4.75% and the Class C Contingent Deferred Sales Charge (CDSC) of 1.00%. Performance data excluding sales charge does not reflect the deduction of the sales charge or CDSC and if reflected, the sales charge or fee would reduce the performance quoted.
As per the prospectus dated April 30, 2015, the Fund’s gross and net expense ratios for Class A is 1.41% and 1.20%, Class C is 2.16% and 1.95%, Class Y is 1.16% and 0.95% and Class I is 1.16% and 0.95%, respectively for the year ended December 31, 2014.
The Adviser has contractually agreed to reimburse the Fund's expenses through May 1, 2016. There is no guarantee that such reimbursement will be continued after that date.
16Brookfield Investment Management Inc.
Brookfield Global Listed Real Estate Fund
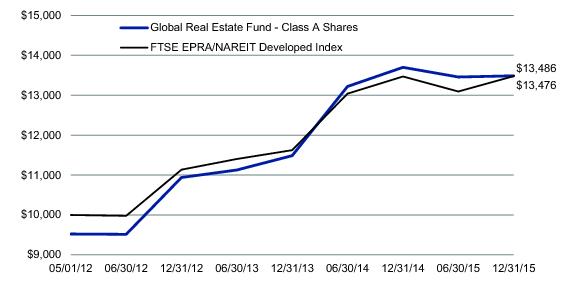
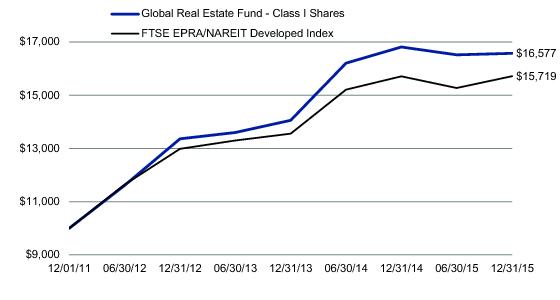
The graphs below illustrate a hypothetical investment of $10,000 in the Global Real Estate Fund—Class A Shares (including sales charge) from the commencement of investment operations on May 1, 2012 to December 31, 2015 compared to the FTSE EPRA/NAREIT Developed Index and Class I Shares from the commencement of investment operations on December 1, 2011 to December 31, 2015 compared to the FTSE EPRA/NAREIT Developed Index.
Class A Shares
Class I Shares
Disclosure
The Fund’s portfolio holdings are subject to change without notice. The mention of specific securities is not a recommendation or solicitation for any person to buy, sell or hold any particular security. There is no assurance
Brookfield Global Listed Real Estate Fund
that the Brookfield Global Listed Real Estate Fund currently holds these securities. Please refer to the Schedule of Investments contained in this report for a full listing of fund holdings.
Investors should be aware of the risks involved with investing in a fund concentrating in REITs and real estate securities, such as declines in the value of real estate and increased susceptibility to adverse economic or regulatory developments. Investments in foreign securities involve political, economic and currency risks, greater volatility and differences in accounting methods. Investing in emerging markets may entail special risks relating to potential economic, political or social instability and the risks of nationalization, confiscation or the imposition of restrictions on foreign investment. The Fund invests in small and mid-cap companies, which involve additional risks such as limited liquidity and greater volatility. Investments in debt securities typically decrease in value when interest rates rise. This risk is usually greater for longer-term debt securities. Investment by the Fund in lower-rated and non-rated securities presents a greater risk of loss to principal and interest than higher-rated securities. Some securities held may be difficult to sell, particularly during times of market turmoil. If the Fund is forced to sell an illiquid asset to meet redemption, the Fund may be forced to sell at a loss. Using derivatives exposes the Fund to additional risks, may increase the volatility of the Fund’s net asset value and may not provide the result intended. Since the Fund will invest more than 25% of its total assets in securities in the Real Estate industry, the Fund may be subject to greater volatility than a fund that is more broadly diversified.
A basis point (bps) is a unit that is equal to 1/100th of 1% and is used to denote a change in a financial statement.
A capitalization rate is a rate of return on a real estate investment property which is based on the anticipated income that the property will generate.
Earnings growth is not a measure of the Fund’s future performance.
These views represent the opinions of Brookfield Investment Management Inc. and are not intended to predict or depict the performance of any investment. These views are as of the close of business on December 31, 2015 and subject to change based on subsequent developments.
18Brookfield Investment Management Inc.
Brookfield Global Listed Real Estate Fund
Portfolio Characteristics (Unaudited)
December 31, 2015
| ASSET ALLOCATION BY GEOGRAPHY | Percent of Net Assets |
| United States | 53.2% |
| Germany | 9.5% |
| Hong Kong | 8.2% |
| Australia | 7.8% |
| Japan | 7.3% |
| France | 4.3% |
| United Kingdom | 3.9% |
| Singapore | 1.8% |
| Austria | 1.2% |
| Netherlands | 0.8% |
| New Zealand | 0.5% |
| Other Assets in Excess of Liabilities | 1.5% |
| Total | 100.0% |
| ASSET ALLOCATION BY SECTOR | Percent of Net Assets |
| Office | 24.5% |
| Real Estate - Diversified | 14.5% |
| Retail | 13.1% |
| Residential | 9.7% |
| Regional Malls | 7.9% |
| Industrial | 7.4% |
| Healthcare | 7.0% |
| Hotel | 4.2% |
| Real Estate Management/Service | 3.6% |
| Specialty | 2.6% |
| Mixed | 1.2% |
| Strip Centers | 1.0% |
| Other | 0.8% |
| Communications | 0.5% |
| Real Estate Operator/Developer | 0.5% |
| Other Assets in Excess of Liabilities | 1.5% |
| Total | 100.0% |
| TOP TEN HOLDINGS | Percent of Net Assets |
| Simon Property Group, Inc. | 7.1% |
| ProLogis, Inc. | 4.6% |
| SL Green Realty Corp. | 3.6% |
| Deutsche Annington Immobilien SE | 3.6% |
| Dexus Property Group | 3.4% |
| Mitsubishi Estate Company Ltd. | 3.2% |
| Hongkong Land Holdings Ltd. | 3.1% |
| Alstria Office REIT - AG | 3.1% |
| Ventas, Inc. | 3.0% |
| Hammerson PLC | 2.9% |
Brookfield Global Listed Real Estate Fund
Schedule of Investments
December 31, 2015
| | | | Shares | Value |
| COMMON STOCKS – 98.5% | | | |
| AUSTRALIA – 7.8% | | | |
| Real Estate - Diversified – 3.4% | | | |
Dexus Property Group
| | | 7,608,100 | $ 41,267,574 |
| Retail – 4.4% | | | |
Scentre Group
| | | 9,891,572 | 30,002,520 |
Westfield Corp. 1
| | | 3,339,144 | 22,972,985 |
| Total Retail | | | | 52,975,505 |
| Total AUSTRALIA | | | | 94,243,079 |
| AUSTRIA – 1.2% | | | |
| Office – 1.2% | | | |
CA Immobilien Anlagen AG
| | | 806,601 | 14,752,088 |
| Total AUSTRIA | | | | 14,752,088 |
| FRANCE – 4.3% | | | |
| Office – 1.9% | | | |
Gecina SA
| | | 189,800 | 23,074,394 |
| Real Estate - Diversified – 2.4% | | | |
Unibail-Rodamco SE
| | | 115,300 | 29,278,424 |
| Total FRANCE | | | | 52,352,818 |
| GERMANY – 9.5% | | | |
| Office – 3.0% | | | |
Alstria Office REIT - AG
| | | 2,767,647 | 36,869,535 |
| Real Estate Management/Service – 3.6% | | | |
Vonovia SE
| | | 1,389,820 | 42,936,056 |
| Residential – 1.5% | | | |
Deutsche Wohnen AG
| | | 656,227 | 18,145,965 |
| Retail – 1.4% | | | |
Deutsche Euroshop AG
| | | 385,103 | 16,869,280 |
| Total GERMANY | | | | 114,820,836 |
| HONG KONG – 8.2% | | | |
| Office – 3.1% | | | |
Hongkong Land Holdings Ltd.
| | | 5,310,500 | 37,082,085 |
| Real Estate - Diversified – 1.9% | | | |
Cheung Kong Property Holdings Ltd.
| | | 1,752,200 | 11,334,956 |
Swire Properties Ltd.
| | | 4,167,300 | 11,982,397 |
| Total Real Estate - Diversified | | | | 23,317,353 |
| Retail – 3.2% | | | |
Hang Lung Properties Ltd.
| | | 3,624,600 | 8,212,830 |
Wharf Holdings Ltd.
| | | 5,398,700 | 29,765,618 |
| Total Retail | | | | 37,978,448 |
| Total HONG KONG | | | | 98,377,886 |
| JAPAN – 7.3% | | | |
| Office – 4.4% | | | |
Mitsubishi Estate Company Ltd.
| | | 1,839,755 | 38,254,639 |
See Notes to Financial Statements.
20Brookfield Investment Management Inc.
Brookfield Global Listed Real Estate Fund
Schedule of Investments (continued)
December 31, 2015
| | | | Shares | Value |
| COMMON STOCKS (continued) | | | |
Nippon Building Fund, Inc.
| | | 3,212 | $ 15,348,702 |
| Total Office | | | | 53,603,341 |
| Real Estate - Diversified – 2.9% | | | |
GLP J-REIT
| | | 12,238 | 11,842,912 |
Mitsui Fudosan Company Ltd.
| | | 922,200 | 23,145,272 |
| Total Real Estate - Diversified | | | | 34,988,184 |
| Total JAPAN | | | | 88,591,525 |
| NETHERLANDS – 0.8% | | | |
| Retail – 0.8% | | | |
Atrium European Real Estate Ltd.
| | | 2,640,320 | 10,219,192 |
| Total NETHERLANDS | | | | 10,219,192 |
| NEW ZEALAND – 0.5% | | | |
| Real Estate Operator/Developer – 0.5% | | | |
Precinct Properties New Zealand Ltd.
| | | 6,830,347 | 5,831,994 |
| Total NEW ZEALAND | | | | 5,831,994 |
| SINGAPORE – 1.8% | | | |
| Industrial – 1.8% | | | |
Global Logistic Properties, Ltd.
| | | 14,017,400 | 21,168,528 |
| Total SINGAPORE | | | | 21,168,528 |
| UNITED KINGDOM – 3.9% | | | |
| Industrial – 1.0% | | | |
Hansteen Holdings PLC
| | | 6,883,580 | 11,667,756 |
| Retail – 2.9% | | | |
Hammerson PLC
| | | 3,950,900 | 34,927,591 |
| Total UNITED KINGDOM | | | | 46,595,347 |
| UNITED STATES – 53.2% | | | |
| Communications – 0.5% | | | |
SBA Communications Corp. 1
| | | 56,700 | 5,957,469 |
| Healthcare – 7.0% | | | |
Care Capital Properties, Inc.
| | | 576,950 | 17,637,361 |
Ventas, Inc.
| | | 634,000 | 35,776,620 |
Welltower, Inc.
| | | 452,600 | 30,790,378 |
| Total Healthcare | | | | 84,204,359 |
| Hotel – 4.2% | | | |
Hersha Hospitality Trust
| | | 505,617 | 11,002,226 |
Host Hotels & Resorts, Inc.
| | | 1,927,800 | 29,572,452 |
Sunstone Hotel Investors, Inc.
| | | 836,294 | 10,445,312 |
| Total Hotel | | | | 51,019,990 |
| Industrial – 4.6% | | | |
ProLogis, Inc.
| | | 1,288,400 | 55,298,128 |
| Mixed – 1.2% | | | |
Kilroy Realty Corp.
| | | 223,132 | 14,119,793 |
| Office – 10.9% | | | |
Brandywine Realty Trust
| | | 1,595,800 | 21,798,628 |
See Notes to Financial Statements.
Brookfield Global Listed Real Estate Fund
Schedule of Investments (continued)
December 31, 2015
| | | | Shares | Value |
| COMMON STOCKS (continued) | | | |
Corporate Office Properties Trust
| | | 942,100 | $ 20,566,043 |
Digital Realty Trust, Inc.
| | | 123,700 | 9,354,194 |
Highwoods Properties, Inc.
| | | 356,400 | 15,539,040 |
Hudson Pacific Properties, Inc.
| | | 727,894 | 20,482,937 |
SL Green Realty Corp.
| | | 384,458 | 43,436,065 |
| Total Office | | | | 131,176,907 |
| Other – 0.8% | | | |
CyrusOne, Inc.
| | | 240,835 | 9,019,271 |
| Real Estate - Diversified – 3.9% | | | |
NorthStar Realty Finance Corp.
| | | 750,450 | 12,780,163 |
Vornado Realty Trust
| | | 340,200 | 34,006,392 |
| Total Real Estate - Diversified | | | | 46,786,555 |
| Regional Malls – 7.9% | | | |
CBL & Associates Properties, Inc.
| | | 843,575 | 10,435,023 |
Simon Property Group, Inc.
| | | 437,960 | 85,156,942 |
| Total Regional Malls | | | | 95,591,965 |
| Residential – 8.2% | | | |
AvalonBay Communities, Inc.
| | | 174,000 | 32,038,620 |
Camden Property Trust
| | | 270,800 | 20,786,608 |
Equity Residential
| | | 311,500 | 25,415,285 |
Mid-America Apartment Communities, Inc.
| | | 232,000 | 21,067,920 |
| Total Residential | | | | 99,308,433 |
| Retail – 0.4% | | | |
WP GLIMCHER, Inc.
| | | 497,100 | 5,274,231 |
| Specialty – 2.6% | | | |
Outfront Media, Inc.
| | | 1,433,150 | 31,285,665 |
| Strip Centers – 1.0% | | | |
DDR Corp.
| | | 717,100 | 12,075,964 |
| Total UNITED STATES | | | | 641,118,730 |
Total COMMON STOCKS
(Cost $1,210,221,196)
| | | | 1,188,072,023 |
Total Investments – 98.5%
(Cost $1,210,221,196)
| | | | 1,188,072,023 |
Other Assets in Excess of Liabilities – 1.5%
| | | | 18,226,318 |
TOTAL NET ASSETS – 100.0%
| | | | $1,206,298,341 |
| The following notes should be read in conjunction with the accompanying Schedule of Investments. |
| 1 | — Non-income producing security. |
See Notes to Financial Statements.
22Brookfield Investment Management Inc.
Brookfield U.S. Listed Real Estate Fund
MANAGEMENT DISCUSSION OF FUND PERFORMANCE
For the fiscal year ended December 31, 2015, the Brookfield U.S. Listed Real Estate Fund ═ Class I had a total return -4.38%.1 During the 12-month period ending December 31, 2015, the Retail sector was the largest detractor from relative performance due to stock selection. A zero allocation to Self Storage was the second largest detractor as the sector outperformed during the year. The Office sector also detracted, due to stock selection and an overweight position.
Overweight allocations to CBL & Associates Properties, Inc. (NYSE: CBL) (Retail) and WP Glimcher, Inc. (NYSE: WPG) (Retail) were among the largest detractors during the period. CBL and WPG underperformed as the risk-off environment this year led to secondary regional malls meaningfully underperforming the market. An underweight allocation to Public Storage (NYSE: PSA) (Self Storage) also detracted from relative performance.
The Healthcare sector was the largest contributor to relative performance, driven by an underweight allocation. Stock selection in the Residential and Industrial sectors contributed during the period.
The largest contributor to relative performance during the period was an overweight position in Mid-America Apartment Communities, Inc. (NYSE: MAA) (Residential), as the company outperformed on strong earnings growth. An underweight allocation to Welltower, Inc. (NYSE: HCN) (Healthcare) also contributed to relative performance as the company underperformed substantially in the months of October and November, following a poor earnings report by peer Ventas (NYSE: VTR). An overweight allocation to Douglas Emmett, Inc. (NYSE: DEI) (Office) also contributed during the period.
U.S. REAL ESTATE MARKET OVERVIEW
For the period from January 1, 2015 through December 31, 2015 (the “Period”), the S&P 500 Total Return Index2 was up 1.4%. During the first half of the year, investors focused largely on a strengthening U.S. dollar, central bank activity and geopolitical events (notably, the possibility of a Greek exit from the euro and the potential for a Puerto Rico debt default). The main investment themes during the second half of the year revolved around economic and market concerns in China, major declines in commodity prices (driven by oil) and the long-awaited announcement in December that the federal funds rate would increase for the first time since 2006.
The U.S. Federal Reserve’s move was highly anticipated and thus the yield on the 10-Year U.S. Treasury note rose only 10 basis points during the period, ending the year at 2.27%. U.S. real estate securities were up 2.5% for the 12 months as measured by the MSCI U.S. REIT Total Return Index3 (the “Benchmark”). By sector, Self Storage led the way with a return of (+40.6%), followed by Residential (+16.6%), Retail (+4.7%), Industrial (2.7%) and Office (+0.3%); while the Hotels (-24.5%), Healthcare (-7.6%), Diversified (-2.5%) and Industrial/Office (-0.6%) sectors posted negative returns for the year.4
Over the course of 2015, the main focus for REIT investors was on the direction of interest rates and the timing of the FOMC’s decision to raise them. In addition to the focus on interest rates, we saw a flight to quality throughout the year, which led to owners of secondary assets in the significantly underperforming the market. By the end of the year, many of these companies were trading at discounts to Net Asset Value (NAV) of greater than 30%.
| 1 | The total return stated assumes the reinvestment of dividends and is exclusive of brokerage commissions. |
| 2 | The S&P 500 Total Return Index is a broad based unmanaged index of 500 stocks, which is widely recognized as representative of the U.S. equity market in general. You cannot invest directly in an index. |
| 3 | The MSCI U.S. REIT Total Return Index (RMS) is a total return market capitalization-weighted index which prices once per day after market close. It is calculated by MSCI and is composed of equity REITs that are included in the MSCI US Investable Market 2500 Index. You cannot invest directly in an index. |
| 4 | Source: The FTSE EPRA/NAREIT Developed Sector Index, a free-float adjusted, liquidity, size and revenue screened index designed to track the performance of listed real estate companies and REITs worldwide. |
Brookfield U.S. Listed Real Estate Fund
OUTLOOK
Valuation gaps of this magnitude – as noted in the section above – are rare. If history is a guide, they tend to persist in the short-to-medium term but are not sustainable over long periods of time. With the liftoff in U.S. rates now behind us, buyers can have greater confidence in the direction of interest rates, and this may lead to an increase in mergers and acquisitions activity this year. An increase in M&A could be one catalyst which would help to narrow the disparity between public and private market valuations. Another potential catalyst is the increase we are seeing in the number of REITs selling assets in order to de-lever their balance sheets or to buy back shares. In the near term, however, markets are contending with extremely high volatility, which continued beyond the reporting period for this summary into January and February of 2016. We expect this trend to continue until there is more clarity on macroeconomic headwinds related to the economic slowdown in China, declining oil prices and the direction of central bank policy decisions; but, ultimately, we believe that the patience of the long-term investor should be rewarded.
A portion of the portfolio is focused on secondary assets, which should benefit from a decrease in the valuation discount that the market currently ascribes to them. Additionally, the portfolio maintains exposure to many high-quality companies, which we expect to experience outsized revenue growth from the ownership of prime assets.
AVERAGE ANNUAL TOTAL RETURNS
| As of December 31, 2015 | 1 Year | Since Inception* |
| Class A Shares (excluding sales charge) | -4.69% | 11.30% |
| Class A Shares (including sales charge) | -9.24% | 8.69% |
| Class C Shares (excluding sales charge) | -5.18% | 10.59% |
| Class C Shares (including sales charge) | -6.07% | 10.59% |
| Class Y Shares | -4.30% | 11.67% |
| Class I Shares | -4.38% | 11.63% |
| MSCI U.S. REIT Total Return Index | 2.52% | 14.75% |
* Classes A, C , Y and I were incepted on December 11, 2013. All returns shown in USD.
Performance data quoted represents past performance; past performance does not guarantee future results. The investment return and principal value of an investment will fluctuate so that an investor’s shares, when redeemed, may be worth more or less than their original cost. Current performance of the Fund may be lower or higher than the performance quoted. Performance data current to the most recent month end may be obtained by calling 855.244.4859. The Fund imposes a 2.00% redemption fee on shares redeemed within 60 days. Performance data does not reflect the imposition of the redemption fee and if it had, performance would have been lower. Performance shown including sales charge reflects the Class A maximum sales charge of 4.75% and the Class C Contingent Deferred Sales Charge (CDSC) of 1.00%. Performance data excluding sales charge does not reflect the deduction of the sales charge or CDSC and if reflected, the sales charge or fee would reduce the performance quoted.
As per the prospectus dated April 30, 2015, the Fund’s gross and net expense ratios for Class A is 2.40% and 1.20%, Class C is 3.15% and 1.95%, Class Y is 2.15% and 0.95% and Class I is 2.15% and 0.95%, respectively for the year ended December 31, 2014.
The Adviser has contractually agreed to reimburse the Fund's expenses through May 1, 2016. There is no guarantee that such reimbursement will be continued after that date.
24Brookfield Investment Management Inc.
Brookfield U.S. Listed Real Estate Fund
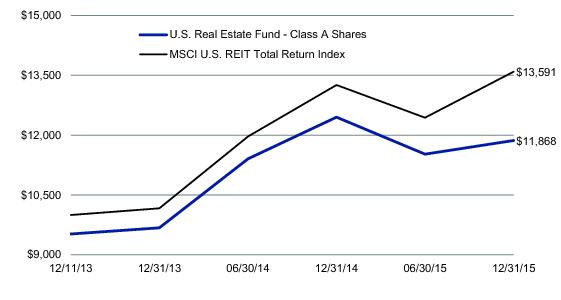
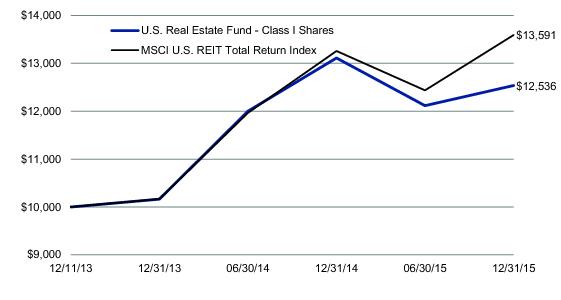
The graphs below illustrate a hypothetical investment of $10,000 in the U.S Real Estate Fund—Class A Shares (including sales charge) from the commencement of investment operations on December 11, 2013 to December 31, 2015 compared to the MSCI U.S. REIT Total Return Index and Class I Shares from the commencement of investment operations on December 11, 2013 to December 31, 2015 compared to the MSCI U.S. REIT Total Return Index.
Class A Shares
Class I Shares
Brookfield U.S. Listed Real Estate Fund
Disclosure
The Fund’s portfolio holdings are subject to change without notice. The mention of specific securities is not a recommendation or solicitation for any person to buy, sell or hold any particular security. There is no assurance that the Brookfield U.S. Listed Real Estate Fund currently holds these securities. Please refer to the Schedule of Investments contained in this report for a full listing of fund holdings.
Investors should be aware of the risks involved with investing in a fund concentrating in REITs and real estate securities, such as declines in the value of real estate and increased susceptibility to adverse economic or regulatory developments. Investments in foreign securities involve political, economic and currency risks, greater volatility and differences in accounting methods. Investing in emerging markets may entail special risks relating to potential economic, political or social instability and the risks of nationalization, confiscation or the imposition of restrictions on foreign investment. The Fund invests in small and mid-cap companies, which involve additional risks such as limited liquidity and greater volatility. Investments in debt securities typically decrease in value when interest rates rise. This risk is usually greater for longer-term debt securities. Investment by the Fund in lower-rated and non-rated securities presents a greater risk of loss to principal and interest than higher-rated securities. Some securities held may be difficult to sell, particularly during times of market turmoil. If the Fund is forced to sell an illiquid asset to meet redemption, the Fund may be forced to sell at a loss. Using derivatives exposes the Fund to additional risks, may increase the volatility of the Fund’s net asset value and may not provide the result intended. Since the Fund will invest more than 25% of its total assets in securities in the Real Estate industry, the Fund may be subject to greater volatility than a fund that is more broadly diversified. Using derivatives exposes the Fund to additional risks, may increase the volatility of the Fund’s net asset value and may not provide the result intended.
A capitalization rate is a rate of return on a real estate investment property which is based on the anticipated income that the property will generate.
Earnings growth is not a measure of the Fund’s future performance.
These views represent the opinions of Brookfield Investment Management Inc. and are not intended to predict or depict the performance of any investment. These views are as of the close of business on December 31, 2015 and subject to change based on subsequent developments.
26Brookfield Investment Management Inc.
Brookfield U.S. Listed Real Estate Fund
Portfolio Characteristics (Unaudited)
December 31, 2015
| ASSET ALLOCATION BY SECTOR | Percent of Net Assets |
| Office | 18.8% |
| Regional Malls | 16.0% |
| Healthcare | 15.7% |
| Residential | 14.9% |
| Industrial | 7.6% |
| Hotel | 7.0% |
| Real Estate - Diversified | 6.2% |
| Specialty | 3.8% |
| Retail | 2.3% |
| Mixed | 1.9% |
| Other | 1.5% |
| Communications | 1.0% |
| Other Assets in Excess of Liabilities | 3.3% |
| Total | 100.0% |
| TOP TEN HOLDINGS | Percent of Net Assets |
| Simon Property Group, Inc. | 12.1% |
| ProLogis, Inc. | 7.6% |
| SL Green Realty Corp. | 5.4% |
| AvalonBay Communities, Inc. | 5.2% |
| Welltower, Inc. | 5.1% |
| Ventas, Inc. | 4.7% |
| Equity Residential | 4.3% |
| Vornado Realty Trust | 4.1% |
| CBL & Associates Properties, Inc. | 3.9% |
| Outfront Media, Inc. | 3.8% |
Brookfield U.S. Listed Real Estate Fund
Schedule of Investments
December 31, 2015
| | | | Shares | Value |
| COMMON STOCKS – 96.7% | | | |
| Communications – 1.0% | | | |
SBA Communications Corp. 1
| | | 4,800 | $ 504,336 |
| Healthcare – 15.7% | | | |
Care Capital Properties, Inc.
| | | 50,028 | 1,529,356 |
HCP, Inc.
| | | 41,670 | 1,593,461 |
Ventas, Inc.
| | | 43,862 | 2,475,132 |
Welltower, Inc.
| | | 39,100 | 2,659,973 |
| Total Healthcare | | | | 8,257,922 |
| Hotel – 7.0% | | | |
Hersha Hospitality Trust
| | | 44,732 | 973,368 |
Host Hotels & Resorts, Inc.
| | | 118,431 | 1,816,732 |
Sunstone Hotel Investors, Inc.
| | | 72,340 | 903,527 |
| Total Hotel | | | | 3,693,627 |
| Industrial – 7.6% | | | |
ProLogis, Inc.
| | | 93,314 | 4,005,037 |
| Mixed – 1.9% | | | |
Kilroy Realty Corp.
| | | 15,700 | 993,496 |
| Office – 18.8% | | | |
Brandywine Realty Trust
| | | 142,465 | 1,946,072 |
Corporate Office Properties Trust
| | | 77,009 | 1,681,107 |
Digital Realty Trust, Inc.
| | | 10,700 | 809,134 |
Highwoods Properties, Inc.
| | | 30,225 | 1,317,810 |
Hudson Pacific Properties, Inc.
| | | 45,046 | 1,267,594 |
SL Green Realty Corp.
| | | 25,149 | 2,841,334 |
| Total Office | | | | 9,863,051 |
| Other – 1.5% | | | |
CyrusOne, Inc.
| | | 21,600 | 808,920 |
| Real Estate - Diversified – 6.2% | | | |
NorthStar Realty Finance Corp.
| | | 63,877 | 1,087,825 |
Vornado Realty Trust
| | | 21,398 | 2,138,944 |
| Total Real Estate - Diversified | | | | 3,226,769 |
| Regional Malls – 16.0% | | | |
CBL & Associates Properties, Inc.
| | | 164,087 | 2,029,756 |
Simon Property Group, Inc.
| | | 32,649 | 6,348,272 |
| Total Regional Malls | | | | 8,378,028 |
| Residential – 14.9% | | | |
AvalonBay Communities, Inc.
| | | 14,810 | 2,726,965 |
Camden Property Trust
| | | 23,363 | 1,793,344 |
Equity Residential
| | | 27,867 | 2,273,669 |
Mid-America Apartment Communities, Inc.
| | | 11,459 | 1,040,592 |
| Total Residential | | | | 7,834,570 |
| Retail – 2.3% | | | |
WP GLIMCHER, Inc.
| | | 114,394 | 1,213,720 |
See Notes to Financial Statements.
28Brookfield Investment Management Inc.
Brookfield U.S. Listed Real Estate Fund
Schedule of Investments (continued)
December 31, 2015
| | | | Shares | Value |
| COMMON STOCKS (continued) | | | |
| Specialty – 3.8% | | | |
Outfront Media, Inc.
| | | 92,228 | $ 2,013,337 |
Total COMMON STOCKS
(Cost $50,332,493)
| | | | 50,792,813 |
Total Investments – 96.7%
(Cost $50,332,493)
| | | | 50,792,813 |
Other Assets in Excess of Liabilities – 3.3%
| | | | 1,728,294 |
TOTAL NET ASSETS – 100.0%
| | | | $ 52,521,107 |
| The following notes should be read in conjunction with the accompanying Schedule of Investments. |
| 1 | — Non-income producing security. |
See Notes to Financial Statements.
Brookfield Real Assets Securities Fund
MANAGEMENT DISCUSSION OF FUND PERFORMANCE
For the fiscal year ended December 31, 2015, the Brookfield Diversified Real Assets Fund — Class I had a total return -12.33%.1 Real Estate Equities contributed positively to Fund performance, while investments in Infrastructure Equities, Natural Resource Equities, Commodities and Fixed Income detracted from Fund performance. By region, investments in Continental Europe contributed to performance and those in the following regions detracted from performance: Latin America, the United Kingdom, Asia Pacific, Canada and the United States. The three largest contributors to Fund performance were Simon Property Group, Inc. (SPG, Core Real Estate—Retail, U.S.), Unibail-Rodamco SE (UL.NA, Core Real Estate—Retail, France) and MPLX 4.875% 01-12-2024 (Real Asset Debt—Oil & Gas Storage & Transportation, U.S.). The three largest detractors from Fund performance were all in sectors impacted by the substantial decline in energy prices: the Fund’s investment in a total-return swap on the Bloomberg Commodity Index,2 Kinder Morgan Inc. (KMI, Core Infrastructure—Pipelines, U.S.) and Chesapeake Energy Corporation (CHK, Energy—Exploration & Production, U.S.).
The Fund’s diversification by geography and sector as of December 31, 2015 is summarized in the portfolio characteristics page.
In the next section, we provide further detail on the positioning and performance of each asset class, along with our outlook for investing in real asset-related securities. The Fund’s investments in the sectors presented in the portfolio characteristics page are grouped by Real Estate Equities, Infrastructure Equities, Natural Resource Equities & Commodities and Fixed Income. Total returns from these segments of the portfolio are shown after the deduction of fees and expenses.
REAL ESTATE EQUITIES
Real estate securities, as measured by the FTSE EPRA/NAREIT Developed Index,3 had a 0.1% total return for 2015, which outperformed global equities.4 By region, Europe led the way, up 6.7%, followed by North America, which rose 1.8%. Asia Pacific declined by 7.3%.
The Fund’s allocation to Real Estate Equities, including both Real Estate Equities—Core and Real Estate Equities—Preferreds, had a total return of 1.6%*. The bulk of the allocation was to Real Estate Equities—Core, which delivered a return of -0.9%* and detracted from fund performance. The allocation to Real Estate Equities—Preferreds had a 7.8%* total return for the year and contributed to Fund performance.
Within the Real Estate Equities—Core allocation, by region, the three largest contributors to performance were Continental Europe, Australia/N.Z, and Other Asia. China/Hong Kong, the U.S. and the United Kingdom were the three largest detractors from performance. By security, Simon Property Group, Inc. (SPG, Retail, U.S.), Unibail-Rodamco SE (UL NA, Retail, France) and Keppel Corporation Limited (KPLD.SP, Diversified, Singapore) contributed most significantly to Fund performance. Host Hotels & Resorts, Inc. (HST, Hotels, U.S.), CBL & Associates Properties, Inc., (CBL, Retail, U.S) and NorthStar Realty Finance Corp. (NRF, Diversified, U.S) were the most significant detractors from performance.
At year end, global real estate common equity, as a group, was trading at a discount to private-market valuations. The gap in valuations was driven by investor concerns over the direction of U.S. interest rates, magnified by a flight to quality during the period. Many owners of non-prime and secondary assets underperformed significantly in this environment, and as a result, several companies closed the year trading at discounts to net asset value (NAV) of 30% or more. We believe that this unusually wide gap will narrow in 2016, now that the liftoff in U.S. interest rates is behind us. One reason is that buyers can have greater confidence in the direction of interest rates, which should help to narrow the disparity between public and private market valuations. Another catalyst is the increase we are seeing in the number of REITs selling assets in order to buy back shares or improve the quality of their balance sheets. A portion of the Fund’s allocation to global real estate common equity is focused on secondary assets, which we expect should benefit from a decrease in the valuation discount that the market currently ascribes to these assets. Additionally, the portfolio maintains exposure to many high-quality companies, in prime assets with the potential to deliver outsized revenue growth.
30Brookfield Investment Management Inc.
Brookfield Real Assets Securities Fund
From a regional perspective, property-market fundamentals are particularly robust in the U.S., where economic growth appears sufficient to drive a modest increase in the demand for space. At the same time, construction has remained relatively low, and this has served to limit new supply. These dynamics should be positive for growth in property occupancies, rents and cash flows. We continue to limit exposure to the U.K. office market as we see meaningful new supply on the horizon, while both rents and property values are near all-time highs. Our views on continental Europe are more positive, based on muted supply growth and the expectation that GDP growth will pick up gradually, while property values receive a boost from the ECB's easy monetary policy. In the Asia Pacific region, we believe that valuations in the Japanese REIT sector are stretched, as they trade at sizeable premiums to NAV; accordingly, we are more positive on Japanese developers. We have a positive outlook on the Australian property market as the spread between property yields and local debt costs is attractive, but we are somewhat cautious on the Australian office market. We acknowledge that there are a number of risks to the Hong Kong market; however, we still view the market as attractively priced despite these risks.
INFRASTRUCTURE EQUITIES
Global infrastructure equities had a total return of -14.5%, as measured by the Dow Jones Brookfield Global Infrastructure Index,5 and underperformed global equities.4 Regional returns were mixed, as Asia Pacific (+2.4%) generated positive performance, returns in Europe were flat (+0.5%) and the Americas (-22.6%) weighed on the performance of the index. Four of eight sectors generated positive returns, led by Airports (+17.9%), Toll Roads (+4.4%), Water (+4.2%), Electricity Transmission & Distribution (0.1%). Negative total returns were generated by Oil & Gas Storage & Transportation (-30.3%), Ports (-19.9%), Diversified (-3.9%) and Communications (-0.4%). The Alerian MLP Index6 had a total return of -32.6% in 2015, which marks the worst performance for the index since 2008.
The Fund’s allocation to Infrastructure Equities, including Infrastructure Equities—Core, Infrastructure Equities—MLPs and Infrastructure Equities—Renewable Energy, had a total return of -19.6%* and detracted from Fund performance. Most of this allocation represented Infrastructure Equities—Core, which had a total return of -17.1%* and detracted from fund performance. The allocation to Infrastructure Equities—MLPs had a total return of -32.8%* during the period and had a negative contribution to Fund performance. The Fund's allocation to Infrastructure Equities—Renewable Energy had a total return of -11.2%* during 2015 and detracted from Fund performance.
As reflected in the above returns, the macro environment in 2015 proved to be very challenging for investors in global infrastructure securities. Particularly hard hit were energy-related sectors impacted by the year’s 30.5% decline in oil prices, as measured by West Texas Intermediate crude oil, which closed the year at $37.13 per barrel. This selloff accelerated at year end, following the December OPEC meeting when the group abandoned its target output of 30 million barrels per day.
Regionally within the Infrastructure—Core allocation, Continental Europe, the United Kingdom and Latin America contributed positively to returns. Returns from Asia Pacific were flat, while both Canada and the U.S. detracted from performance. By sector, the three largest contributors to 2015 returns included Toll Roads, Water and Airports. Pipelines, Midstream and Rail were the three largest detractors from performance. Securities with the three largest contributions to return were Transurban Group Ltd. (TCL.AU, Toll Roads, Australia), Atlantia S.p.A (ATL.IM, Toll Roads, Italy) and Crown Castle International Corp. (CCI, Communications, U.S.). The three largest detractors from performance were all energy infrastructure names impacted by the substantial decline in oil and gas prices - Kinder Morgan Inc. (KMI, Pipelines, U.S.), Targa Resources Corp (TRGP, Pipelines, U.S.) and Williams Companies, Inc. (WMB, Midstream, U.S.).
Despite a more cautious outlook on the global macroeconomic environment, we continue to see attractive opportunities across the diverse industry groups that comprise infrastructure equities. For example, there are inherently defensive characteristics in the business models of many infrastructure-related companies, as defined by relatively stable cash flows derived from contracted or regulated revenue streams. We are also positive on European transportation assets; Toll Roads continue to enjoy favorable traffic growth amid the region's gradual recovery, and European Airports offer attractive prospects for growth—more so than assets in markets with
Brookfield Real Assets Securities Fund
greater exposure to the travel patterns of the Chinese consumer, such as airports in Australia. We also have a favorable view of the Communications sector, which continues to benefit from growing data usage and the proliferation of tablets and cell phones.
NATURAL RESOURCE EQUITIES & COMMODITIES
During 2015, the S&P Global Natural Resources Index7 had a total return of -24.0%. The Agribusiness, Energy and Metals & Mining components of the index had total returns of -12.0%, -17.8% and -42.2%, respectively. Over the same period, the total return of the Bloomberg Commodity Index2 was -24.7%.
In comparison, the Fund's allocation to Natural Resource Equities & Commodities generated a combined total return of -24.4%* and detracted from Fund performance. The Fund’s allocation to Natural Resource Equities (including Agriculture & Timber, Energy and Metals & Mining) delivered a total return of -26.0%* and detracted from Fund performance. The Fund’s total return swap on the Bloomberg Commodity Index delivered a total return of -24.6%* and detracted from performance.
The sections below provides highlights of the three sectors that comprise Natural Resource Equities.
Natural Resource Equities—Agriculture & Timber: The past year’s crops for U.S. corn and soybeans proved to be fairly robust, dragging down corn and soybean prices. Planting progress for the current Latin American crop season points to ample production out of Brazil and Argentina; this should continue to weigh on corn and soybean prices. In our view, the Argentinian government’s move to devalue the peso and lower export taxes for major crops has dampened the backdrop for corn and soybean prices. Moreover, the weaker Brazilian real has provided an incentive for Brazilian farmers to export, which should also depress prices. With the likelihood that corn prices will remain subdued, the demand for discretionary items like fertilizers and tractors/combines will be lower. The potential impact of a robust El Nino season also bears watching, as it could affect the yields of soybeans, sugar and palm oil, among other crops.
During 2015, investments in the timber sector were impacted by a number of factors. For much of the year, timber REIT investors were focused on the prospects for U.S. interest rates to move higher, which finally took place in December. In addition, even though log demand has been buoyed by the slow U.S. housing recovery, these benefits have been more than offset by the combined effects of likely peaking prices in the timberlands transaction cycle and U.S.-dollar strength, which has made U.S. log exports less competitive. The strong U.S. dollar and ensuing increase in imports have also hurt U.S.-based paper product and paper packaging names. More attractive are the group’s European competitors, which have benefited from the region’s nascent demand recovery.
Natural Resource Equities—Energy: Exploration & Production (E&P) and integrated oil companies comprised more than half of the portfolio’s exposure to energy, with the remainder invested primarily in oilfield services and refiners.
U.S. production declined after peaking in 2015, while the U.S. rig count moved sharply lower as crude oil prices fell to levels not seen in more than a decade. West Texas Crude Oil closed the year at just over $37 per barrel, which represents a 30%+ decline over the course of the year. In our view, the path towards the rebalancing of global energy supply and demand will prove to be much slower than anticipated. Despite robust demand for crude and refined products, concerns have mounted over the visibility of longer-term demand growth, given signs of economic slowdown in emerging markets (China in particular).
Natural Resource Equities—Metals & Mining: Key investing themes in these groups have been focused on China’s slowdown in metals demand, general oversupply conditions in most commodity metals and the relative strength of the U.S. dollar. Accordingly, the Fund’s portfolio has been focused on producers with less exposure to China’s reduced demand growth and those with the best supply-demand fundamentals—palladium, copper and aggregates. At the same time, we have been avoiding those with the least favorable fundamentals; namely, steel, nickel and silver. Furthermore, we have invested in mining companies that have compelling company-specific cost-cutting, productivity-enhancing and portfolio improvement initiatives underway.
32Brookfield Investment Management Inc.
Brookfield Real Assets Securities Fund
The fund’s performance benefited from investments in aggregates, which are not strongly correlated to the broader metal commodity complex. The performance of this group has been driven by a construction recovery in the U.S., and to a lesser extent, in the Eurozone.
Due to persistently low metal prices, balance-sheet concerns have dominated trading, and further balance-sheet actions could be required should commodity-market malaise continue. Conversely, a turnaround for this beaten-up sector could be driven by a reversal in U.S. dollar strength, global growth acceleration and/or a pick-up in inflation.
FIXED INCOME
The Fund’s allocation to Fixed Income included Real Asset Debt that generated a 2015 total return of -9.8%*. In comparison, the BofA Merrill Lynch Global High Yield Index8 and BofA Merrill Lynch Global Broad Market Index9 had total returns of -4.2% and -3.9%, respectively. The bulk of the allocation’s underperformance, compared with these bond indexes, can be attributed to the focus on the real-asset sectors of the corporate bond market, which were negatively impacted by falling oil and natural resource pricing. Within Fixed Income—Real Asset Debt, the largest industry allocation was to energy–primarily natural gas distribution, but with some exposure to energy Exploration & Production. While energy infrastructure results typically are relatively insensitive to oil and gas prices, investors took all energy-related securities lower in the year-end selloff. Accordingly, the energy allocation had a negative contribution to fund performance. The allocation to telecommunications issues, the second-largest credit allocation, also had a negative contribution to performance, primarily driven by investor concerns over the acquisition-related integration issues of certain individual credits. The third-largest credit allocation was to the services sector, including companies related to infrastructure and real estate services. The fund’s holdings in this sector had a positive contribution to performance. The sleeve’s largest contribution to return came from the media sector, primarily attributable to price rallies seen in outdoor advertising (billboard) bonds and cable TV bonds.
Looking forward, we expect that continued weakness in commodity prices will lead to higher default rates in related sectors of the high-yield market, although overall, defaults are likely to remain in line with the long-term average. In our view, credit spreads are very attractive given current credit conditions, as the market seems to have more than discounted for the expected level of loss. Investment-grade companies, in general, have taken on more debt over the current cycle to make acquisitions and return capital to shareholders, which in turn has increased the level of credit risk in the investment-grade corporate bond market. By contrast, high-yield companies have taken on only modest levels of debt over the past five years, and this has helped to keep risk relatively low for companies in the high-yield universe. While there have been some signs that high-yield companies are issuing more debt for acquisitions than in the previous 12-month period, the increase is not significant enough, in our view, to raise investor concerns.
We believe that the performance of this year’s credit markets will be driven by the risk appetite of global investors, which can vary according to sentiment about central bank policy and global economic growth. Nevertheless, we continue to see upside potential, with limited increases in interest rates amid heighted volatility globally.
*Returns are net of fees and calculated by Brookfield Investment Management Inc.
| 1 | The total return stated assumes the reinvestment of dividends and is exclusive of brokerage commissions. |
| 2 | The Bloomberg Commodity Index (BCOM) is a broadly diversified commodity price index that tracks prices of futures contracts on physical commodities in the commodity markets. |
| 3 | The FTSE EPRA/NAREIT Developed Index is a free-float adjusted, liquidity, size and revenue screened index designed to track the performance of listed real estate companies and REITS worldwide. |
| 4 | As measured by the MSCI World Index. The MSCI World Index is a free float-adjusted market capitalization weighted index that is designed to measure the equity performance of developed markets. |
| 5 | The Dow Jones Brookfield Global Infrastructure Index is calculated and maintained by S&P Dow Jones Indices and comprises infrastructure companies with at least 70% of its annual cash flows derived from owning and operating infrastructure assets, including Master Limited Partnerships (“MLPs”). |
| 6 | The Alerian MLP Index is a composite of the 50 most prominent energy master limited partnerships calculated by Standard & Poor’s using a float-adjusted market capitalization methodology. |
| 7 | The S&P Global Natural Resources Index includes 90 of the largest publicly-traded companies in natural resources and commodities businesses that meet specific investability requirements, offering investors diversified and investable equity exposure across 3 primary |
Brookfield Real Assets Securities Fund
| commodity-related sectors: agribusiness, energy, and metals & mining. | |
| 8 | The BofA ML Global High-Yield Index tracks the performance of below investment-grade, U.S. dollar-denominated corporate bonds publicly issued in the U.S. domestic market, and includes issues with a credit rating of BBB or below, as rated by Moody's and S&P. |
| 9 | The BofA ML Global Broad Market Index tracks the performance of investment- grade public debt issued in the major domestic and eurobond markets, including global bonds. |
OUTLOOK
We enter 2016 with a somewhat cautious outlook on the global macroeconomic environment. In the U.S, employment data and consumer spending have been solid; however, both corporate profits and industrial production have been declining. The recent leg downward of energy prices is also of concern, given the impact on producers and the indirect impact on companies involved in energy gathering, processing and transportation. The Eurozone continues to recover gradually, buoyed by continuing quantitative easing initiatives. The outlook for Asia is mixed. While we currently are cautious on investment in China, given the deceleration in growth, our view is positive over the long term, as the nation transforms from an investment-led to consumer-based economy.
This global slow-growth environment provides a favorable backdrop for real asset investments in real estate and infrastructure but is less favorable for natural resources. The industry groups that comprise the global real assets universe offer broad sector and regional diversification, along with the potential for attractive income, capital appreciation and inflation protection. In the near term, however, markets are contending with extremely high volatility, which continued beyond the reporting period of this summary into January and February of 2016. We expect this trend to continue until there is more clarity on macroeconomic headwinds related to the economic slowdown in China, declining oil prices and the direction of central bank policy decisions; but, ultimately, we believe that the patience of the long-term investor should be rewarded.
Use of Derivatives: During 2015, the Fund invested in derivatives through a total return swap on the Bloomberg Commodities Index. This investment had a materially negative impact on the Fund’s performance.
Currency Impact: Although the Fund reports its NAV and pays dividends in U.S. dollars, the Fund’s investments denominated in foreign currencies are subject to foreign currency risk. The currency impact of the Fund’s investments in foreign securities, mainly a result of continued U.S.-dollar strength, significantly detracted from the Fund’s 2015 performance.
AVERAGE ANNUAL TOTAL RETURNS
| As of December 31, 2015 | 1 Year | Since Inception* |
| Class A Shares (excluding sales charge) | -12.48% | -13.30% |
| Class A Shares (including sales charge) | -16.60% | -17.01% |
| Class C Shares (including sales charge) | -13.08% | -13.90% |
| Class C Shares (including sales charge) | -13.93% | -13.90% |
| Class Y Shares | -12.32% | -13.12% |
| Class I Shares | -12.33% | -13.22% |
| MSCI World Index | -0.32% | -0.89% |
| Blended Index | -9.73% | -9.57% |
* Classes A, C , Y and I were incepted on November 19, 2014. All returns shown in USD.
Performance data quoted represents past performance; past performance does not guarantee future results. The investment return and principal value of an investment will fluctuate so that an investor’s shares, when redeemed, may be worth more or less than their original cost. Current performance of the Fund may be lower or higher than the performance quoted. Performance data current to the most recent month end may be obtained by calling 855.244.4859. The Fund imposes a 2.00% redemption fee on shares redeemed within 60 days. Performance data does not reflect the imposition of the redemption fee and if it had, performance would have been lower. Performance shown including sales charge reflects the Class A maximum sales charge of 4.75% and the Class C Contingent Deferred Sales Charge (CDSC) of 1.00%. Performance data excluding sales charge does not reflect
34Brookfield Investment Management Inc.
Brookfield Real Assets Securities Fund
the deduction of the sales charge or CDSC and if reflected, the sales charge or fee would reduce the performance quoted.
As per the prospectus dated April 30, 2015, the Fund’s gross and net expense ratios for Class A is 2.97% and 1.35%, Class C is 3.72% and 2.10%, Class Y is 2.72% and 1.10% and Class I is 2.72% and 1.10%, respectively for the year ended December 31, 2015.
The Adviser has contractually agreed to reimburse the Fund's expenses through May 1, 2016. There is no guarantee that such reimbursement will be continued after that date.
The graphs below illustrate a hypothetical investment of $10,000 in the U.S Real Estate Fund—Class A Shares (including sales charge) from the commencement of investment operations on November 19, 2014 to December 31, 2015 compared to the MSCI World Index and Class I Shares from the commencement of investment operations on November 19, 2014 to December 31, 2015 compared to the MSCI World Index.
Class A Shares
Brookfield Real Assets Securities Fund
Class I Shares
Disclosure
The Fund’s portfolio holdings are subject to change without notice. The mention of specific securities is not a recommendation or solicitation for any person to buy, sell or hold any particular security. There is no assurance that the Brookfield Global Listed Infrastructure Fund currently holds these securities. Please refer to the Schedule of Investments contained in this report for a full listing of fund holdings.
Investing in MLPs involves certain risks related to investing in the underlying assets of the MLPs and risks associated with pooled investment vehicles. Exposure to the commodities markets may subject the Fund to greater volatility than investments in traditional securities. Investors should be aware of the risks involved with investing in a fund concentrating in REITs and real estate securities, such as declines in the value of real estate and increased susceptibility to adverse economic or regulatory developments. Investments in foreign securities involve political, economic and currency risks, greater volatility and differences in accounting methods. Investing in emerging markets may entail special risks relating to potential economic, political or social instability and the risks of nationalization, confiscation or the imposition of restrictions on foreign investment. The Fund invests in small and mid-cap companies, which involve additional risks such as limited liquidity and greater volatility. Investments in debt securities typically decrease in value when interest rates rise. This risk is usually greater for longer-term debt securities. Investment by the Fund in lower-rated and non-rated securities presents a greater risk of loss to principal and interest than higher-rated securities. Some securities held may be difficult to sell, particularly during times of market turmoil. If the Fund is forced to sell an illiquid asset to meet redemption, the Fund may be forced to sell at a loss. Using derivatives exposes the Fund to additional risks, may increase the volatility of the Fund’s net asset value and may not provide the result intended. Since the Fund will invest more than 25% of its total assets in securities in the Real Assets industry, the Fund may be subject to greater volatility than a fund that is more broadly diversified.
Diversification does not assure a profit, nor does it profit against a loss in a declining market.
A Basis Point is one hundredth of one percent (0.01%). Cash flow refers to the amount of cash generated and used by a company over a given period.
Cash flow refers to the amount of cash generated and used by a company over a given period.
36Brookfield Investment Management Inc.
Brookfield Real Assets Securities Fund
Earnings growth is not a measure of the Fund’s future performance.
The Blended Index comprises 33.33% FTSE EPRA/NAREIT Developed Index, 33.33% Dow Jones Brookfield Global Infrastructure Composite Index, 10.00% S&P Global Natural Resources Index, 6.67% Bloomberg Commodity Index, 13.33% Custom Blend: BAML Global High Yield Index 70%/BAML Global Broad Market Corporate High Yield Index 30% and 3.34% Barclays Global Inflation Linked.
The BAML Global Broad Market Corporate High Yield Index is an unmanaged, commonly accepted measure of the performance of global investment grade corporate securities. Index returns are calculated monthly, assume reinvestment of dividends. The index does not reflect any fees, expenses or sales charges. It is not possible to invest directly in an index.
The BAML Global High Yield Index is an unmanaged, commonly accepted measure of the performance of global high yield corporate securities. Index returns are calculated monthly, assume reinvestment of dividends. The index does not reflect any fees, expenses or sales charges. It is not possible to invest directly in an index.
The Barclays Global Inflation-Linked Index includes securities which offer the potential for protection against inflation as their cash flows are linked to an underlying inflation index. All securities included in the index have to be issued by an investment-grade rated sovereign in its local currency.
These views represent the opinions of Brookfield Investment Management Inc. and are not intended to predict or depict the performance of any investment. These views are as of the close of business on December 31, 2015 and subject to change based on subsequent developments.
Brookfield Real Assets Securities Fund
Portfolio Characteristics (Unaudited)
December 31, 2015
| ASSET ALLOCATION BY SECTOR | Percent of Total Investments |
| Real Estate Equities | 32.3% |
| — Core | 26.9% |
| — Preferred Stocks | 5.4% |
| Infrastructure Equities | 27.0% |
| — Core | 18.8% |
| — MLPs | 4.6% |
| — Renewable Energy | 3.6% |
| Natural Resource Equities & Commodities | 16.0% |
| Natural Resource Equities | 12.7% |
| — Agriculture & Timber | 4.9% |
| — Energy | 3.9% |
| — Metals & Mining | 3.9% |
| Commodities | 3.3% |
| Fixed Income | 24.1% |
| — Real Asset Debt | 24.1% |
| Cash | 0.6% |
| Total | 100.0% |
| ASSET ALLOCATION BY GEOGRAPHY | Percent of Net Assets |
| United States | 59.9% |
| Canada | 4.3% |
| Australia | 3.3% |
| United Kingdom | 3.1% |
| Japan | 2.9% |
| Germany | 2.8% |
| Hong Kong | 2.6% |
| France | 2.0% |
| Spain | 1.8% |
| Switzerland | 1.4% |
| Singapore | 1.4% |
| Italy | 1.2% |
| Luxembourg | 1.0% |
| Belgium | 0.7% |
| Greece | 0.6% |
| China | 0.6% |
| Austria | 0.6% |
| Netherlands | 0.5% |
| Ireland | 0.5% |
| Bermuda | 0.4% |
| Finland | 0.4% |
| Mexico | 0.4% |
| South Africa | 0.3% |
| New Zealand | 0.3% |
| Brazil | 0.2% |
| Norway | 0.1% |
| Other Assets in Excess of Liabilities | 6.7% |
| Total | 100.0% |
38Brookfield Investment Management Inc.
Brookfield Real Assets Securities Fund
Portfolio Characteristics (Unaudited)(continued)
December 31, 2015
| ASSET ALLOCATION BY SECURITY TYPE | Percent of Net Assets |
| Common Stocks | 64.4% |
| Corporate Bonds | 22.4% |
| Convertible Preferred Stocks | 1.1% |
| Preferred Stocks | 4.1% |
| Term Loans | 1.3% |
| Other Assets in Excess of Liabilities | 6.7% |
| Total | 100.0% |
| TOP TEN HOLDINGS | Percent of Net Assets |
| Simon Property Group, Inc. | 1.9% |
| American Tower Corp. | 1.2% |
| ProLogis, Inc. | 1.2% |
| Enterprise Products Partners LP | 1.1% |
| MPLX LP | 1.0% |
| SL Green Realty Corp. | 1.0% |
| Deutsche Annington Immobilien SE | 0.9% |
| Dexus Property Group | 0.9% |
| National Grid PLC | 0.9% |
| PG&E Corp. | 0.9% |
Brookfield Real Assets Securities Fund
Schedule of Investments
December 31, 2015
| | | | Shares | Value |
| COMMON STOCKS – 64.4% | | | |
| AUSTRALIA – 3.3% | | | |
| Diversified – 0.1% | | | |
Macquarie Atlas Roads Group
| | | 20,300 | $ 59,811 |
| Electricity Transmission & Distribution – 0.1% | | | |
Spark Infrastructure Group
| | | 42,670 | 59,351 |
| Exploration & Production – 0.2% | | | |
Karoon Gas Australia Ltd. 1
| | | 48,000 | 61,338 |
Senex Energy Ltd.
| | | 103,200 | 10,433 |
| Total Exploration & Production | | | | 71,771 |
| Real Estate - Diversified – 0.9% | | | |
Dexus Property Group
| | | 89,100 | 483,293 |
| Refineries – 0.1% | | | |
Caltex Australia Ltd.
| | | 2,200 | 60,134 |
| Retail – 1.2% | | | |
Scentre Group
| | | 115,100 | 349,114 |
Westfield Corp. 1
| | | 39,500 | 271,756 |
| Total Retail | | | | 620,870 |
| Toll Roads – 0.7% | | | |
Transurban Group
| | | 48,667 | 368,893 |
| Total AUSTRALIA | | | | 1,724,123 |
| AUSTRIA – 0.6% | | | |
| Metals & Mining – 0.2% | | | |
voestalpine AG
| | | 2,360 | 72,189 |
| Office – 0.4% | | | |
CA Immobilien Anlagen AG
| | | 12,000 | 219,470 |
| Total AUSTRIA | | | | 291,659 |
| BELGIUM – 0.1% | | | |
| Shipping – 0.1% | | | |
Euronav NV
| | | 3,900 | 53,469 |
| Total BELGIUM | | | | 53,469 |
| BERMUDA – 0.2% | | | |
| Shipping – 0.2% | | | |
DHT Holdings, Inc.
| | | 9,900 | 80,091 |
| Total BERMUDA | | | | 80,091 |
| BRAZIL – 0.2% | | | |
| Basic Materials – 0.1% | | | |
Vale SA
| | | 14,735 | 48,478 |
| Paper & Forest Products – 0.1% | | | |
Fibria Celulose SA
| | | 6,400 | 81,216 |
| Total BRAZIL | | | | 129,694 |
| CANADA – 4.3% | | | |
| Basic Materials – 0.8% | | | |
Agrium, Inc.
| | | 2,260 | 201,908 |
Barrick Gold Corp.
| | | 11,565 | 85,350 |
See Notes to Financial Statements.
40Brookfield Investment Management Inc.
Brookfield Real Assets Securities Fund
Schedule of Investments (continued)
December 31, 2015
| | | | Shares | Value |
| COMMON STOCKS (continued) | | | |
Potash Corporation of Saskatchewan, Inc.
| | | 7,900 | $ 135,248 |
| Total Basic Materials | | | | 422,506 |
| Electric Utilities & Generation – 0.5% | | | |
Algonquin Power & Utilities Corp.
| | | 19,260 | 151,859 |
Boralex, Inc.
| | | 8,800 | 91,962 |
| Total Electric Utilities & Generation | | | | 243,821 |
| Electricity Transmission & Distribution – 0.1% | | | |
Hydro One Ltd. 1,2
| | | 3,400 | 54,770 |
| Exploration & Production – 0.7% | | | |
Advantage Oil & Gas Ltd. 1
| | | 24,000 | 121,934 |
Cenovus Energy, Inc.
| | | 11,600 | 146,708 |
Pengrowth Energy Corp.
| | | 12,600 | 9,288 |
Peyto Exploration & Development Corp.
| | | 2,020 | 36,306 |
Seven Generations Energy Ltd. 1
| | | 4,300 | 41,891 |
| Total Exploration & Production | | | | 356,127 |
| Metals & Mining – 0.0% | | | |
First Quantum Minerals Ltd.
| | | 6,865 | 25,700 |
| Oilfield Services & Equipment – 0.2% | | | |
Xtreme Drilling & Coil Services Corp. 1
| | | 101,230 | 125,102 |
| Pipelines – 2.0% | | | |
Enbridge, Inc.
| | | 11,900 | 395,606 |
Inter Pipeline Ltd.
| | | 10,400 | 166,932 |
Pembina Pipeline Corp.
| | | 8,900 | 193,664 |
TransCanada Corp.
| | | 3,700 | 120,838 |
Veresen, Inc.
| | | 25,300 | 161,999 |
| Total Pipelines | | | | 1,039,039 |
| Total CANADA | | | | 2,267,065 |
| CHINA – 0.6% | | | |
| Gas Utilities – 0.3% | | | |
ENN Energy Holdings Ltd.
| | | 27,600 | 146,408 |
| Pipelines – 0.1% | | | |
Beijing Capital Interanational Airport Company Ltd.
| | | 58,300 | 62,617 |
| Ports – 0.2% | | | |
China Merchants Holdings International Company Ltd.
| | | 31,769 | 100,481 |
| Total CHINA | | | | 309,506 |
| FINLAND – 0.4% | | | |
| Basic Materials – 0.4% | | | |
UPM-Kymmene OYJ
| | | 11,221 | 208,323 |
| Total FINLAND | | | | 208,323 |
| FRANCE – 2.0% | | | |
| Airports – 0.3% | | | |
Aeroports de Paris
| | | 1,200 | 139,643 |
| Office – 0.5% | | | |
Gecina SA
| | | 2,200 | 267,459 |
See Notes to Financial Statements.
Brookfield Real Assets Securities Fund
Schedule of Investments (continued)
December 31, 2015
| | | | Shares | Value |
| COMMON STOCKS (continued) | | | |
| Real Estate - Diversified – 0.6% | | | |
Unibail-Rodamco SE
| | | 1,300 | $ 330,112 |
| Toll Roads – 0.6% | | | |
Groupe Eurotunnel SA
| | | 23,300 | 289,879 |
| Total FRANCE | | | | 1,027,093 |
| GERMANY – 2.8% | | | |
| Metals & Mining – 0.3% | | | |
ThyssenKrupp AG
| | | 6,445 | 127,762 |
| Office – 0.8% | | | |
Alstria Office REIT - AG
| | | 32,200 | 428,956 |
| Real Estate Management/Service – 0.9% | | | |
Vonovia SE
| | | 15,970 | 493,365 |
| Residential – 0.4% | | | |
Deutsche Wohnen AG
| | | 7,800 | 215,685 |
| Retail – 0.4% | | | |
Deutsche Euroshop AG
| | | 4,900 | 214,643 |
| Total GERMANY | | | | 1,480,411 |
| HONG KONG – 2.6% | | | |
| Electric Utilities & Generation – 0.1% | | | |
United Photovoltaics Group Ltd. 1
| | | 156,000 | 14,991 |
| Gas Utilities – 0.4% | | | |
China Gas Holdings Ltd.
| | | 37,700 | 54,170 |
Hong Kong & China Gas Company Ltd.
| | | 84,700 | 165,761 |
| Total Gas Utilities | | | | 219,931 |
| Office – 0.8% | | | |
Hongkong Land Holdings Ltd.
| | | 62,100 | 433,631 |
| Real Estate - Diversified – 0.5% | | | |
Cheung Kong Property Holdings Ltd.
| | | 19,800 | 128,086 |
Swire Properties Ltd.
| | | 48,900 | 140,604 |
| Total Real Estate - Diversified | | | | 268,690 |
| Retail – 0.8% | | | |
Hang Lung Properties Ltd.
| | | 27,200 | 61,631 |
Wharf Holdings Ltd.
| | | 62,800 | 346,247 |
| Total Retail | | | | 407,878 |
| Total HONG KONG | | | | 1,345,121 |
| IRELAND – 0.4% | | | |
| Basic Materials – 0.2% | | | |
CRH PLC
| | | 3,244 | 93,492 |
| Containers & Packaging – 0.1% | | | |
Smurfit Kappa Group PLC
| | | 3,179 | 81,814 |
| Gas Utilities – 0.1% | | | |
Ardmore Shipping Corp.
| | | 4,000 | 50,880 |
| Total IRELAND | | | | 226,186 |
See Notes to Financial Statements.
42Brookfield Investment Management Inc.
Brookfield Real Assets Securities Fund
Schedule of Investments (continued)
December 31, 2015
| | | | Shares | Value |
| COMMON STOCKS (continued) | | | |
| ITALY – 1.2% | | | |
| Electric Utilities & Generation – 0.4% | | | |
Enel Green Power SpA
| | | 75,900 | $ 154,273 |
ERG SpA
| | | 6,200 | 83,829 |
| Total Electric Utilities & Generation | | | | 238,102 |
| Pipelines – 0.4% | | | |
Snam SpA
| | | 37,300 | 194,668 |
| Toll Roads – 0.4% | | | |
Atlantia SpA
| | | 7,500 | 198,439 |
| Total ITALY | | | | 631,209 |
| JAPAN – 2.9% | | | |
| Basic Materials – 0.2% | | | |
JFE Holdings, Inc.
| | | 7,900 | 124,049 |
| Metals & Mining – 0.4% | | | |
Nippon Steel & Sumitomo Metal Corp.
| | | 10,850 | 214,639 |
| Office – 1.2% | | | |
Mitsubishi Estate Company Ltd.
| | | 19,600 | 407,549 |
Nippon Building Fund, Inc.
| | | 42 | 200,699 |
| Total Office | | | | 608,248 |
| Paper & Forest Products – 0.1% | | | |
Oji Holdings Crop.
| | | 17,600 | 70,734 |
| Rail – 0.2% | | | |
East Japan Railway Co.
| | | 1,100 | 103,583 |
| Real Estate - Diversified – 0.8% | | | |
GLP J-REIT
| | | 151 | 146,125 |
Mitsui Fudosan Company Ltd.
| | | 10,700 | 268,548 |
| Total Real Estate - Diversified | | | | 414,673 |
| Total JAPAN | | | | 1,535,926 |
| LUXEMBOURG – 0.3% | | | |
| Communications – 0.3% | | | |
SES SA
| | | 5,800 | 160,717 |
| Total LUXEMBOURG | | | | 160,717 |
| MEXICO – 0.4% | | | |
| Airports – 0.2% | | | |
Grupo Aeroportuario del Centro Norte SAB de CV
| | | 8,100 | 39,451 |
Grupo Aeroportuario del Pacifico SAB de CV
| | | 300 | 26,484 |
| Total Airports | | | | 65,935 |
| Metals & Mining – 0.2% | | | |
Southern Copper Corp.
| | | 4,200 | 109,704 |
| Pipelines – 0.0% | | | |
Infraestructura Energetica Nova SAB de CV
| | | 2,500 | 10,445 |
| Total MEXICO | | | | 186,084 |
See Notes to Financial Statements.
Brookfield Real Assets Securities Fund
Schedule of Investments (continued)
December 31, 2015
| | | | Shares | Value |
| COMMON STOCKS (continued) | | | |
| NETHERLANDS – 0.5% | | | |
| Midstream – 0.2% | | | |
Koninklijke Vopak NV
| | | 2,600 | $ 111,969 |
| Retail – 0.3% | | | |
Atrium European Real Estate Ltd.
| | | 42,121 | 163,027 |
| Total NETHERLANDS | | | | 274,996 |
| NEW ZEALAND – 0.3% | | | |
| Electric Utilities & Generation – 0.2% | | | |
Mighty River Power Ltd.
| | | 44,600 | 84,626 |
| Real Estate Operator/Developer – 0.1% | | | |
Precinct Properties New Zealand Ltd.
| | | 68,814 | 58,756 |
| Total NEW ZEALAND | | | | 143,382 |
| NORWAY – 0.1% | | | |
| Chemicals – 0.1% | | | |
Yara International ASA
| | | 1,500 | 64,512 |
| Total NORWAY | | | | 64,512 |
| SINGAPORE – 0.8% | | | |
| Food Products – 0.2% | | | |
Golden Agri-Resources Ltd.
| | | 180,000 | 42,995 |
Wilmar Interantional Ltd.
| | | 29,900 | 61,694 |
| Total Food Products | | | | 104,689 |
| Industrial – 0.5% | | | |
Global Logistic Properties, Ltd.
| | | 164,000 | 247,666 |
| Ports – 0.1% | | | |
Hutchison Port Holdings Trust
| | | 99,500 | 52,578 |
| Total SINGAPORE | | | | 404,933 |
| SOUTH AFRICA – 0.3% | | | |
| Basic Materials – 0.3% | | | |
Mondi PLC
| | | 7,912 | 155,082 |
| Total SOUTH AFRICA | | | | 155,082 |
| SPAIN – 1.8% | | | |
| Airports – 0.1% | | | |
Aena SA 1,2
| | | 400 | 45,804 |
| Electric Utilities & Generation – 0.9% | | | |
EDP Renovaveis SA
| | | 27,730 | 218,115 |
Iberdrola SA
| | | 17,600 | 124,766 |
Saeta Yield SA
| | | 13,870 | 129,431 |
| Total Electric Utilities & Generation | | | | 472,312 |
| Electricity Transmission & Distribution – 0.3% | | | |
Red Electrica Corp. SA
| | | 2,100 | 175,413 |
| Toll Roads – 0.5% | | | |
Ferrovial SA
| | | 11,396 | 257,702 |
| Total SPAIN | | | | 951,231 |
See Notes to Financial Statements.
44Brookfield Investment Management Inc.
Brookfield Real Assets Securities Fund
Schedule of Investments (continued)
December 31, 2015
| | | | Shares | Value |
| COMMON STOCKS (continued) | | | |
| SWITZERLAND – 1.4% | | | |
| Airports – 0.3% | | | |
Flughafen Zuerich AG
| | | 200 | $ 150,063 |
| Basic Materials – 0.9% | | | |
Syngenta AG
| | | 6,077 | 478,442 |
| Metals & Mining – 0.2% | | | |
Glencore PLC
| | | 100,100 | 132,646 |
| Total SWITZERLAND | | | | 761,151 |
| UNITED KINGDOM – 3.1% | | | |
| Basic Materials – 0.1% | | | |
Antofagasta PLC
| | | 7,715 | 53,070 |
| Electricity Transmission & Distribution – 0.9% | | | |
National Grid PLC
| | | 34,778 | 479,647 |
| Exploration & Production – 0.2% | | | |
Genel Energy Plc 1
| | | 4,500 | 11,280 |
Tullow Oil PLC
| | | 31,800 | 77,893 |
| Total Exploration & Production | | | | 89,173 |
| Industrial – 0.2% | | | |
Hansteen Holdings PLC
| | | 67,300 | 114,074 |
| Metals & Mining – 0.4% | | | |
Anglo American PLC
| | | 9,922 | 43,530 |
Rio Tinto PLC
| | | 5,621 | 163,684 |
| Total Metals & Mining | | | | 207,214 |
| Retail – 0.8% | | | |
Hammerson PLC
| | | 45,400 | 401,355 |
| Water – 0.5% | | | |
Severn Trent PLC
| | | 2,300 | 73,523 |
United Utilities Group PLC
| | | 13,800 | 190,018 |
| Total Water | | | | 263,541 |
| Total UNITED KINGDOM | | | | 1,608,074 |
| UNITED STATES – 33.8% | | | |
| Basic Materials – 1.2% | | | |
Freeport-McMoRan, Inc.
| | | 10,891 | 73,732 |
International Paper Co.
| | | 3,200 | 120,640 |
Monsanto Co.
| | | 2,926 | 288,270 |
Newmont Mining Corp.
| | | 4,832 | 86,928 |
Stillwater Mining Co. 1
| | | 9,250 | 79,272 |
| Total Basic Materials | | | | 648,842 |
| Chemicals – 0.4% | | | |
Axiall Corp.
| | | 4,400 | 67,760 |
CF Industries Holdings, Inc.
| | | 2,950 | 120,390 |
| Total Chemicals | | | | 188,150 |
| Communications – 0.7% | | | |
SBA Communications Corp. 1
| | | 3,700 | 388,759 |
See Notes to Financial Statements.
Brookfield Real Assets Securities Fund
Schedule of Investments (continued)
December 31, 2015
| | | | Shares | Value |
| COMMON STOCKS (continued) | | | |
| Consumer Non-Cyclical – 0.1% | | | |
Bunge Ltd.
| | | 418 | $ 28,541 |
| Containers & Packaging – 0.1% | | | |
WestRock Co.
| | | 1,683 | 76,778 |
| Electric Utilities & Generation – 0.9% | | | |
NextEra Energy, Inc.
| | | 1,640 | 170,380 |
NRG Yield Operating, Inc. - Class A
| | | 3,440 | 47,850 |
NRG Yield Operating, Inc. - Class C
| | | 3,240 | 47,822 |
Pattern Energy Group, Inc.
| | | 9,590 | 200,527 |
| Total Electric Utilities & Generation | | | | 466,579 |
| Electricity Transmission & Distribution – 1.5% | | | |
Avangrid, Inc. 1
| | | 2,630 | 100,992 |
Eversource Energy
| | | 7,600 | 388,132 |
ITC Holdings Corp.
| | | 5,440 | 213,520 |
Northwestern Corp.
| | | 1,740 | 94,395 |
| Total Electricity Transmission & Distribution | | | | 797,039 |
| Exploration & Production – 1.1% | | | |
Anadarko Petroleum Corp.
| | | 800 | 38,864 |
BHP Billiton Ltd.
| | | 11,733 | 302,242 |
Cabot Oil & Gas Corp.
| | | 2,400 | 42,456 |
Cimarex Energy Co.
| | | 200 | 17,876 |
Concho Resources, Inc. 1
| | | 700 | 65,002 |
SM Energy Co.
| | | 6,900 | 135,654 |
| Total Exploration & Production | | | | 602,094 |
| Food Products – 0.2% | | | |
Archer-Daniels-Midland Co.
| | | 2,521 | 92,470 |
| Gas Utilities – 1.0% | | | |
Columbia Pipeline Group, Inc.
| | | 7,300 | 146,000 |
NiSource, Inc.
| | | 11,100 | 216,561 |
One Gas, Inc.
| | | 2,400 | 120,408 |
Southwest Gas Corp.
| | | 900 | 49,644 |
| Total Gas Utilities | | | | 532,613 |
| Healthcare – 1.8% | | | |
Care Capital Properties, Inc.
| | | 6,675 | 204,055 |
Ventas, Inc.
| | | 6,600 | 372,438 |
Welltower, Inc.
| | | 5,300 | 360,559 |
| Total Healthcare | | | | 937,052 |
| Hotel – 1.2% | | | |
Hersha Hospitality Trust
| | | 5,900 | 128,384 |
Host Hotels & Resorts, Inc.
| | | 23,500 | 360,490 |
Sunstone Hotel Investors, Inc.
| | | 9,700 | 121,153 |
| Total Hotel | | | | 610,027 |
| Industrial – 1.2% | | | |
ProLogis, Inc.
| | | 14,700 | 630,924 |
See Notes to Financial Statements.
46Brookfield Investment Management Inc.
Brookfield Real Assets Securities Fund
Schedule of Investments (continued)
December 31, 2015
| | | | Shares | Value |
| COMMON STOCKS (continued) | | | |
| Infrastructure - Diversified – 0.2% | | | |
CenterPoint Energy, Inc.
| | | 5,400 | $ 99,144 |
| Machinery – 0.1% | | | |
AGCO Corp.
| | | 561 | 25,464 |
| Metals & Mining – 0.3% | | | |
Alcoa, Inc.
| | | 14,100 | 139,167 |
| Midstream – 1.9% | | | |
Crestwood Equity Partners LP
| | | 2,859 | 59,410 |
EQT Midstream Partners LP
| | | 1,080 | 81,497 |
Gener8 Maritime, Inc. 1
| | | 3,200 | 30,240 |
Rice Midstream Partners LP 3,4
| | | 3,127 | 42,183 |
Rice Midstream Partners LP
| | | 7,820 | 105,492 |
Sunoco Logistics Partners LP
| | | 4,700 | 120,790 |
Targa Resources Corp.
| | | 2,000 | 54,120 |
Targa Resources Partners LP
| | | 3,420 | 56,533 |
Tesoro Logistics LP
| | | 2,020 | 101,646 |
The Williams Companies, Inc.
| | | 13,200 | 339,240 |
| Total Midstream | | | | 991,151 |
| Mixed – 0.3% | | | |
Kilroy Realty Corp.
| | | 2,600 | 164,528 |
| Office – 2.9% | | | |
Brandywine Realty Trust
| | | 17,900 | 244,514 |
Corporate Office Properties Trust
| | | 11,000 | 240,130 |
Digital Realty Trust, Inc.
| | | 1,400 | 105,868 |
Highwoods Properties, Inc.
| | | 4,100 | 178,760 |
Hudson Pacific Properties, Inc.
| | | 8,600 | 242,004 |
SL Green Realty Corp.
| | | 4,500 | 508,410 |
| Total Office | | | | 1,519,686 |
| Oil, Gas & Consumable Fuels – 0.3% | | | |
Exxon Mobil Corp.
| | | 1,200 | 93,540 |
Gulfport Energy Corp. 1
| | | 3,600 | 88,452 |
| Total Oil, Gas & Consumable Fuels | | | | 181,992 |
| Oilfield Services & Equipment – 0.5% | | | |
Aspen Technology, Inc.
| | | 2,160 | 81,562 |
C&J Energy Services Ltd. 1
| | | 5,850 | 27,846 |
National Oilwell Varco, Inc.
| | | 3,600 | 120,564 |
Schlumberger Ltd.
| | | 600 | 41,850 |
| Total Oilfield Services & Equipment | | | | 271,822 |
| Other – 0.4% | | | |
Alliance Resource Partners LP
| | | 1,260 | 16,997 |
CyrusOne, Inc.
| | | 2,900 | 108,605 |
Lowe's Companies, Inc.
| | | 400 | 30,416 |
Rice Energy, Inc. 1
| | | 4,700 | 51,230 |
Vulcan Materials Co.
| | | 234 | 22,223 |
| Total Other | | | | 229,471 |
See Notes to Financial Statements.
Brookfield Real Assets Securities Fund
Schedule of Investments (continued)
December 31, 2015
| | | | Shares | Value |
| COMMON STOCKS (continued) | | | |
| Paper & Forest Products – 0.1% | | | |
Louisiana-Pacific Corp.
| | | 1,500 | $ 27,015 |
| Pipelines – 4.3% | | | |
Boardwalk Pipeline Partners LP
| | | 12,720 | 165,105 |
Energy Transfer Equity LP
| | | 2,216 | 30,448 |
Energy Transfer Partners LP
| | | 11,570 | 390,256 |
Enterprise Products Partners LP
| | | 23,310 | 596,270 |
Kinder Morgan, Inc.
| | | 12,000 | 179,040 |
MPLX LP
| | | 6,051 | 237,986 |
NuStar Energy LP
| | | 1,070 | 42,907 |
NuStar GP Holdings LLC
| | | 1,840 | 38,916 |
SemGroup Corp.
| | | 5,200 | 150,072 |
Sempra Energy
| | | 2,000 | 188,020 |
Spectra Energy Corp.
| | | 4,100 | 98,154 |
Williams Partners LP
| | | 4,029 | 112,208 |
| Total Pipelines | | | | 2,229,382 |
| Rail – 0.6% | | | |
CSX Corp.
| | | 2,700 | 70,065 |
Union Pacific Corp.
| | | 3,400 | 265,880 |
| Total Rail | | | | 335,945 |
| Real Estate - Diversified – 1.0% | | | |
NorthStar Realty Finance Corp.
| | | 8,500 | 144,755 |
Vornado Realty Trust
| | | 4,000 | 399,840 |
| Total Real Estate - Diversified | | | | 544,595 |
| Refineries – 0.3% | | | |
Valero Energy Corp.
| | | 1,900 | 134,349 |
| Regional Malls – 2.1% | | | |
CBL & Associates Properties, Inc.
| | | 10,500 | 129,885 |
Simon Property Group, Inc.
| | | 5,120 | 995,533 |
| Total Regional Malls | | | | 1,125,418 |
| Residential – 2.1% | | | |
AvalonBay Communities, Inc.
| | | 1,900 | 349,847 |
Camden Property Trust
| | | 3,200 | 245,632 |
Equity Residential
| | | 3,500 | 285,565 |
Mid-America Apartment Communities, Inc.
| | | 2,700 | 245,187 |
| Total Residential | | | | 1,126,231 |
| Retail – 0.1% | | | |
WP GLIMCHER, Inc.
| | | 6,400 | 67,904 |
| Shipping – 0.1% | | | |
Scorpio Tankers, Inc.
| | | 6,900 | 55,338 |
| Specialty – 0.7% | | | |
Outfront Media, Inc.
| | | 16,600 | 362,378 |
| Strip Centers – 0.3% | | | |
DDR Corp.
| | | 8,200 | 138,088 |
See Notes to Financial Statements.
48Brookfield Investment Management Inc.
Brookfield Real Assets Securities Fund
Schedule of Investments (continued)
December 31, 2015
| | | | Shares | Value |
| COMMON STOCKS (continued) | | | |
| Telecommunications – 2.0% | | | |
American Tower Corp.
| | | 6,700 | $ 649,565 |
Crown Castle International Corp.
| | | 4,900 | 423,605 |
| Total Telecommunications | | | | 1,073,170 |
| Timber – 0.3% | | | |
Plum Creek Timber Company, Inc.
| | | 900 | 42,948 |
Weyerhaeuser Co.
| | | 3,200 | 95,936 |
| Total Timber | | | | 138,884 |
| Transmission & Distribution – 0.9% | | | |
PG&E Corp.
| | | 9,000 | 478,710 |
| Water – 0.6% | | | |
American Water Works Company Inc.
| | | 4,900 | 292,775 |
| Total UNITED STATES | | | | 17,752,475 |
Total COMMON STOCKS
(Cost $37,684,098)
| | | | 33,772,513 |
| CONVERTIBLE PREFERRED STOCKS – 1.1% | | | |
| UNITED STATES – 1.1% | | | |
| Office – 0.8% | | | |
Equity Commonwealth, 6.50%
| | | 17,600 | 435,424 |
| Triple Net Lease – 0.3% | | | |
Lexington Realty Trust, 6.50%
| | | 3,200 | 152,000 |
| Total UNITED STATES | | | | 587,424 |
Total CONVERTIBLE PREFERRED STOCKS
(Cost $593,304)
| | | | 587,424 |
| | Interest
Rate | Maturity | Principal
Amount
(000s) | Value |
| CORPORATE BONDS – 22.4% | | | |
| BELGIUM – 0.6% | | | |
| Energy – 0.6% | | | |
LBC Tank Terminals Holding Netherlands BV
| 6.88% | 05/15/23 | 300 | $ 297,000 |
| Total BELGIUM | | | | 297,000 |
| BERMUDA – 0.3% | | | |
| Transportation – 0.3% | | | |
Teekay Offshore Partners LP
| 6.00 | 07/30/19 | 250 | 142,500 |
| Total BERMUDA | | | | 142,500 |
| GREECE – 0.6% | | | |
| Services – 0.6% | | | |
Dynagas LNG Partners LP
| 6.25 | 10/30/19 | 475 | 330,125 |
| Total GREECE | | | | 330,125 |
| LUXEMBOURG – 0.7% | | | |
| Telecommunications – 0.7% | | | |
Intelsat Luxembourg SA 5
| 7.75 | 06/01/21 | 775 | 362,313 |
| Total LUXEMBOURG | | | | 362,313 |
See Notes to Financial Statements.
Brookfield Real Assets Securities Fund
Schedule of Investments (continued)
December 31, 2015
| | Interest
Rate | Maturity | Principal
Amount
(000s) | Value |
| CORPORATE BONDS (continued) | | | |
| SINGAPORE – 0.6% | | | |
| Financial Services – 0.6% | | | |
Puma International Financing SA
| 6.75% | 02/01/21 | 300 | $ 295,050 |
| Total SINGAPORE | | | | 295,050 |
| UNITED STATES – 19.6% | | | |
| Electric Utilities & Generation – 0.7% | | | |
TerraForm Power Operating LLC 2
| 5.88 | 02/01/23 | 425 | 351,687 |
| Energy – 4.4% | | | |
Blue Racer Midstream LLC 2
| 6.13 | 11/15/22 | 375 | 258,750 |
Chesapeake Energy Corp. 2
| 8.00 | 12/15/22 | 297 | 145,346 |
EP Energy LLC
| 6.38 | 06/15/23 | 325 | 162,500 |
EV Energy Partners LP
| 8.00 | 04/15/19 | 500 | 250,000 |
Ferrellgas LP
| 6.75 | 01/15/22 | 275 | 231,688 |
Global Partners LP
| 6.25 | 07/15/22 | 400 | 320,000 |
Holly Energy Partners LP
| 6.50 | 03/01/20 | 375 | 371,250 |
Suburban Propane Partners LP
| 5.50 | 06/01/24 | 275 | 221,375 |
Tesoro Logistics LP 2
| 6.25 | 10/15/22 | 375 | 355,312 |
| Total Energy | | | | 2,316,221 |
| Healthcare – 1.6% | | | |
CHS/Community Health Systems, Inc.
| 6.88 | 02/01/22 | 400 | 379,500 |
HCA, Inc.
| 5.88 | 05/01/23 | 450 | 461,250 |
| Total Healthcare | | | | 840,750 |
| Media – 2.8% | | | |
CCO Holdings LLC
| 5.75 | 01/15/24 | 450 | 462,375 |
Lamar Media Corp.
| 5.38 | 01/15/24 | 400 | 412,000 |
Mediacom Broadband LLC
| 6.38 | 04/01/23 | 250 | 244,375 |
Neptune Finco Corp. 2
| 10.88 | 10/15/25 | 350 | 366,625 |
| Total Media | | | | 1,485,375 |
| Pipelines – 1.0% | | | |
MPLX LP 2
| 4.88 | 12/01/24 | 600 | 538,500 |
| Services – 1.6% | | | |
Casella Waste Systems, Inc.
| 7.75 | 02/15/19 | 400 | 397,000 |
United Rentals North America, Inc.
| 5.75 | 11/15/24 | 450 | 445,500 |
| Total Services | | | | 842,500 |
| Telecommunications – 5.0% | | | |
CenturyLink, Inc.
| 7.65 | 03/15/42 | 500 | 382,500 |
Crown Castle International Corp.
| 5.25 | 01/15/23 | 375 | 394,219 |
CyrusOne LP
| 6.38 | 11/15/22 | 375 | 386,250 |
FairPoint Communications, Inc. 2
| 8.75 | 08/15/19 | 250 | 246,250 |
Frontier Communications Corp.
| 7.63 | 04/15/24 | 275 | 231,000 |
Frontier Communications Corp. 2
| 11.00 | 09/15/25 | 200 | 198,000 |
Level 3 Financing, Inc. 2
| 5.38 | 05/01/25 | 450 | 447,750 |
Zayo Group LLC
| 6.00 | 04/01/23 | 375 | 354,375 |
| Total Telecommunications | | | | 2,640,344 |
See Notes to Financial Statements.
50Brookfield Investment Management Inc.
Brookfield Real Assets Securities Fund
Schedule of Investments (continued)
December 31, 2015
| | Interest
Rate | Maturity | Principal
Amount
(000s) | Value |
| CORPORATE BONDS (continued) | | | |
| Transportation – 0.5% | | | |
Watco Companies LLC 2
| 6.38% | 04/01/23 | 250 | $ 246,250 |
| Utility – 2.0% | | | |
AES Corp.
| 4.88 | 05/15/23 | 425 | 371,875 |
NRG Energy, Inc.
| 6.25 | 07/15/22 | 400 | 340,800 |
NRG Yield Operating LLC
| 5.38 | 08/15/24 | 400 | 331,500 |
| Total Utility | | | | 1,044,175 |
| Total UNITED STATES | | | | 10,305,802 |
Total CORPORATE BONDS
(Cost $13,964,964)
| | | | 11,732,790 |
| | | | Shares | Value |
| PREFERRED STOCKS – 4.1% | | | |
| UNITED STATES – 4.1% | | | |
| Office – 1.7% | | | |
CoreSite Realty Corp., Series A, 7.25%
| | | 14,900 | $ 394,701 |
Kilroy Realty Corp., 6.38%
| | | 3,800 | 96,596 |
Vornado Realty Trust, 5.70%
| | | 16,000 | 404,160 |
| Total Office | | | | 895,457 |
| Other – 0.3% | | | |
Digital Realty Trust, Inc., 5.88%
| | | 6,600 | 164,604 |
| Residential – 0.6% | | | |
American Homes 4 Rent, 5.00%
| | | 11,900 | 305,830 |
| Self Storage – 0.7% | | | |
Public Storage, 5.63%
| | | 15,400 | 393,778 |
| Strip Centers – 0.4% | | | |
DDR Corp., 6.25%
| | | 8,100 | 202,500 |
| Triple Net Lease – 0.4% | | | |
EPR Properties, 6.63%
| | | 3,800 | 96,178 |
Gramercy Property Trust, Inc., 7.13%
| | | 4,826 | 120,650 |
| Total Triple Net Lease | | | | 216,828 |
| Total UNITED STATES | | | | 2,178,997 |
Total PREFERRED STOCKS
(Cost $2,159,710)
| | | | 2,178,997 |
| | Interest
Rate | Maturity | Principal
Amount
(000s) | Value |
| TERM LOANS – 1.3% | | | |
| UNITED STATES – 1.3% | | | |
Fairpoint Communications, Inc. 3,6
| 7.50% | 02/14/19 | $ 247 | $ 245,352 |
Fortescue Metals Group Ltd. 3,6
| 4.25 | 06/28/19 | 274 | 202,665 |
See Notes to Financial Statements.
Brookfield Real Assets Securities Fund
Schedule of Investments (continued)
December 31, 2015
| | Interest
Rate | Maturity | Principal
Amount
(000s) | Value |
| TERM LOANS (continued) | | | |
Four Seasons Holdings, Inc. 3,6
| 6.25% | 12/28/20 | $ 250 | $ 246,458 |
| Total UNITED STATES | | | | 694,475 |
Total TERM LOANS
(Cost $736,387)
| | | | 694,475 |
Total Investments – 93.3%
(Cost $55,138,463)
| | | | 48,966,199 |
Other Assets in Excess of Liabilities – 6.7%
| | | | 3,498,993 |
TOTAL NET ASSETS – 100.0%
| | | | $ 52,465,192 |
| The following notes should be read in conjunction with the accompanying Schedule of Investments. |
| 1 | — Non-income producing security. |
| 2 | — Security exempt from registration under Rule 144A of the Securities Act of 1933. These securities may only be resold in transactions exempt from registration, normally to qualified institutional buyers. As of December 31, 2015, the total value of all such securities was $3,255,044 or 6.2% of net assets. |
| 3 | — Private Placement. |
| 4 | — Security fair valued in good faith pursuant to the fair value procedures adopted by the Board of Directors. As of December 31, 2015, the total value of all such securities was $42,183 or 0.1% of net assets. |
| 5 | — Foreign security or a U.S. security of a foreign company. |
| 6 | — Variable rate security – Interest rate shown is the rate in effect as of December 31, 2015. |
See Notes to Financial Statements.
52Brookfield Investment Management Inc.
BROOKFIELD INVESTMENT FUNDS
Statements of Assets and Liabilities
December 31, 2015
| | Infrastructure Fund | | Global Real Estate Fund | | U.S. Real Estate Fund | | Real Assets Securities Fund |
| Assets: | | | | | | | |
Investments in securities, at value (Note 2)
| $310,400,901 | | $1,188,072,023 | | $50,792,813 | | $48,966,199 |
Cash
| 4,552,388 | | 15,574,161 | | 1,485,887 | | 3,131,908 |
Cash on deposit with brokers for swap contracts
| — | | — | | — | | 260,000 |
Dividends receivable
| 1,207,077 | | 4,556,593 | | 273,467 | | 350,899 |
Receivable for investments sold
| 1,725,853 | | — | | — | | 105,937 |
Receivable for fund shares sold
| 196,038 | | 2,126,536 | | 76,220 | | — |
Receivable for swap contracts
| — | | — | | — | | 22,148 |
Prepaid expenses
| 75,282 | | 120,677 | | 38,520 | | 38,089 |
Total assets
| 318,157,539 | | 1,210,449,990 | | 52,666,907 | | 52,875,180 |
| Liabilities: | | | | | | | |
Payable for investments purchased
| 1,551,729 | | 629,955 | | 53,058 | | 299,374 |
Payable for fund shares purchased
| 1,426,147 | | 2,385,956 | | — | | — |
Distribution fee payable
| 270,820 | | 12,606 | | 566 | | 15 |
Investment advisory fee payable
| 223,741 | | 628,407 | | 12,758 | | 12,334 |
Administration fee payable
| 42,145 | | 152,630 | | 6,552 | | 6,662 |
Trustees' fee payable
| 5,706 | | 13,162 | | 1,965 | | 2,023 |
Accrued expenses
| 135,303 | | 328,933 | | 70,901 | | 89,580 |
Total liabilities
| 3,655,591 | | 4,151,649 | | 145,800 | | 409,988 |
Commitments and contingencies (Note 9)
| | | | | | | |
Net Assets
| $314,501,948 | | $1,206,298,341 | | $52,521,107 | | $52,465,192 |
| Composition of Net Assets: | | | | | | | |
Paid-in capital (Note 5)
| $370,141,855 | | $1,246,253,470 | | $51,688,249 | | $63,063,142 |
Distributions in excess of net investment income
| (2,943,889) | | (8,030,429) | | — | | (92,414) |
Accumulated net realized gain (loss) on investment transactions, swap contracts and foreign currency translations
| (48,674,981) | | (9,769,160) | | 372,537 | | (4,355,369) |
Net unrealized appreciation (depreciation) on investments, swap contracts and foreign currency
| (4,021,037) | | (22,155,540) | | 460,321 | | (6,150,167) |
Net assets applicable to capital shares outstanding
| $314,501,948 | | $1,206,298,341 | | $52,521,107 | | $52,465,192 |
Total investments at cost
| $314,381,805 | | $1,210,221,196 | | $50,332,493 | | $55,138,463 |
| Net Assets | | | | | | | |
| Class A Shares — Net Assets | $ 31,988,514 | | $ 30,279,695 | | $ 84,601 | | $ 853 |
Shares outstanding
| 2,893,562 | | 2,401,934 | | 8,080 | | 103 |
Net asset value and redemption price per share
| $ 11.06 | | $ 12.61 | | $ 10.47 | | $ 8.28 |
Offering price per share based on a maximum sales charge of 4.75%
| $ 11.61 | | $ 13.24 | | $ 10.99 | | $ 8.69 |
| Class C Shares — Net Assets | $ 18,026,470 | | $ 7,049,811 | | $ 360,060 | | $ 846 |
Shares outstanding
| 1,648,744 | | 561,550 | | 34,398 | | 102 |
Net asset value and redemption price per share
| $ 10.93 | | $ 12.55 | | $ 10.47 | | $ 8.29 |
| Class Y Shares — Net Assets | $ 77,826,256 | | $ 779,226,163 | | $ 284,338 | | $ 2,058,291 |
Shares outstanding
| 7,024,557 | | 61,698,175 | | 27,277 | | 248,929 |
Net asset value and redemption price per share
| $ 11.08 | | $ 12.63 | | $ 10.42 | | $ 8.27 |
| Class I Shares — Net Assets | $186,660,708 | | $ 389,742,672 | | $51,792,108 | | $50,405,202 |
Shares outstanding
| 16,842,906 | | 30,885,479 | | 4,977,487 | | 6,103,918 |
Net asset value and redemption price per share
| $ 11.08 | | $ 12.62 | | $ 10.41 | | $ 8.26 |
See Notes to Financial Statements.
BROOKFIELD INVESTMENT FUNDS
Statements of Operations
For the Year Ended December 31, 2015
| | Infrastructure Fund | | Global Real Estate Fund | | U.S. Real Estate Fund | | Real Assets Securities Fund |
| Investment Income: | | | | | | | |
Dividends (net of foreign withholding tax of $912,830, $779,321, $0 and $44,964)
| $ 12,047,798 | | $ 22,373,135 | | $ 1,382,029 | | $ 1,004,530 |
Interest
| — | | — | | — | | 841,000 |
Total investment income
| 12,047,798 | | 22,373,135 | | 1,382,029 | | 1,845,530 |
| Expenses: | | | | | | | |
Investment advisory fees (Note 3)
| 3,994,658 | | 5,666,893 | | 293,484 | | 446,641 |
Administration fees (Note 3)
| 704,940 | | 1,133,379 | | 58,697 | | 78,819 |
Distribution fees — Class A
| 148,021 | | 54,178 | | 259 | | 3 |
Distribution fees — Class C
| 286,154 | | 61,963 | | 517 | | 10 |
Transfer agent fees
| 152,342 | | 428,459 | | 54,452 | | 61,521 |
Fund accounting fees
| 114,906 | | 174,974 | | 63,598 | | 96,907 |
Custodian fees
| 89,928 | | 121,618 | | 8,776 | | 61,593 |
Trustees' fees
| 77,469 | | 109,842 | | 20,755 | | 22,398 |
Registration fees
| 76,667 | | 162,317 | | 33,687 | | 29,503 |
Legal fees
| 56,463 | | 84,019 | | 15,931 | | 20,002 |
Audit and tax services
| 48,103 | | 45,576 | | 40,554 | | 41,923 |
Insurance
| 47,858 | | 40,247 | | 2,932 | | 1,643 |
Reports to shareholders
| 37,130 | | 74,144 | | 3,066 | | 9,260 |
Interest expense
| 15,777 | | 1,857 | | — | | 542 |
Miscellaneous
| 13,608 | | 9,047 | | 2,933 | | 6,063 |
Offering fees
| — | | — | | — | | 107,731 |
Total operating expenses
| 5,864,024 | | 8,168,513 | | 599,641 | | 984,559 |
Less expenses reimbursed by the investment adviser (Note 3)
| (260,292) | | (874,307) | | (227,118) | | (405,998) |
Net expenses
| 5,603,732 | | 7,294,206 | | 372,523 | | 578,561 |
Net investment income
| 6,444,066 | | 15,078,929 | | 1,009,506 | | 1,266,969 |
| Realized and Unrealized Gain (Loss) on Investments, Foreign Currency and Foreign Currency Translations: | | | | | | | |
Net realized gain (loss) on:
| | | | | | | |
Investments
| (44,784,605) | | 7,376,583 | | 2,296,691 | | (3,738,477) |
Swap contracts
| — | | — | | — | | (635,300) |
Foreign currency transactions
| (256,683) | | (370,186) | | — | | (3,883) |
Net realized gain (loss)
| (45,041,288) | | 7,006,397 | | 2,296,691 | | (4,377,660) |
Net change in unrealized depreciation on:
| | | | | | | |
Investments
| (56,636,732) | | (38,203,703) | | (3,266,746) | | (5,571,517) |
Swap contracts
| — | | — | | — | | 22,148 |
Foreign currency translations
| (22,153) | | (598) | | — | | (276) |
Net change in unrealized depreciation
| (56,658,885) | | (38,204,301) | | (3,266,746) | | (5,549,645) |
Net realized and unrealized loss
| (101,700,173) | | (31,197,904) | | (970,055) | | (9,927,305) |
Net increase (decrease) in net assets resulting from operations
| $ (95,256,107) | | $(16,118,975) | | $ 39,451 | | $(8,660,336) |
See Notes to Financial Statements.
54Brookfield Investment Management Inc.
BROOKFIELD INVESTMENT FUNDS
Statements of Changes in Net Assets
| | Infrastructure Fund | | Global Real Estate Fund |
| | For the Year Ended December 31, 2015 | | For the Year Ended December 31, 2014 | | For the Year Ended December 31, 2015 | | For the Year Ended December 31, 2014 |
| Increase (Decrease) in Net Assets Resulting from Operations: | | | | | | | |
Net investment income
| $ 6,444,066 | | $ 5,041,337 | | $ 15,078,929 | | $ 5,296,686 |
Net realized gain (loss) on investments, foreign currency and foreign currency translations
| (45,041,288) | | 16,382,653 | | 7,006,397 | | 10,800,148 |
Net unrealized appreciation (depreciation) on investments, foreign currency and foreign currency translations
| (56,658,885) | | 4,245,507 | | (38,204,301) | | 15,489,995 |
Net increase (decrease) in net assets resulting from operations
| (95,256,107) | | 25,669,497 | | (16,118,975) | | 31,586,829 |
| Distributions to Shareholders: | | | | | | | |
| From net investment income: | | | | | | | |
Class A shares
| (367,588) | | (1,545,898) | | (799,347) | | (213,325) |
Class C shares
| (135,522) | | (247,600) | | (158,625) | | (107,792) |
Class Y shares
| (986,233) | | (2,383,478) | | (16,903,504) | | (3,765,253) |
Class I shares
| (1,825,491) | | (2,603,342) | | (11,310,399) | | (5,748,154) |
| From net realized gain on investments: | | | | | | | |
Class A shares
| — | | (2,893,157) | | (154,127) | | (146,615) |
Class C shares
| — | | (1,309,663) | | (36,578) | | (106,536) |
Class Y shares
| — | | (7,844,321) | | (3,914,857) | | (3,014,847) |
Class I shares
| — | | (6,626,031) | | (1,992,357) | | (5,243,265) |
| From Return of capital: | | | | | | | |
Class A shares
| (1,394,631) | | — | | (40,462) | | — |
Class C shares
| (514,169) | | — | | (8,029) | | — |
Class Y shares
| (3,741,764) | | — | | (855,626) | | — |
Class I shares
| (6,925,909) | | — | | (572,512) | | — |
Total distributions paid
| (15,891,307) | | (25,453,490) | | (36,746,423) | | (18,345,787) |
| Capital Share Transactions (Note 6): | | | | | | | |
Subscriptions
| 233,127,321 | | 330,468,112 | | 1,063,318,099 | | 273,420,839 |
Reinvestments of distributions
| 14,514,467 | | 21,926,742 | | 33,146,395 | | 14,280,837 |
Redemptions
| (301,750,801) | | (253,824,916) | | (180,624,269) | | (85,114,013) |
Redemption fees
| 100,639 | | 45,535 | | 115,394 | | 63,661 |
Net increase (decrease) in capital share transactions
| (54,008,374) | | 98,615,473 | | 915,955,619 | | 202,651,324 |
Total increase (decrease) in net assets
| (165,155,788) | | 98,831,480 | | 863,090,221 | | 215,892,366 |
| Net Assets: | | | | | | | |
Beginning of year
| 479,657,736 | | 380,826,256 | | 343,208,120 | | 127,315,754 |
End of year
| $ 314,501,948 | | $ 479,657,736 | | $1,206,298,341 | | $343,208,120 |
(including distributions in excess of net investment income)
| $ (2,943,889) | | $ (2,137,031) | | $ (8,030,429) | | $ (3,536,301) |
See Notes to Financial Statements.
BROOKFIELD INVESTMENT FUNDS
Statements of Changes in Net Assets (continued)
| | U.S. Real Estate Fund | | Real Assets Securities Fund |
| | For the Year Ended December 31, 2015 | | For the Year Ended December 31, 2014 | | For the Year Ended December 31, 2015 | | For the Period
November 19, 20141
through
December 31, 2014 |
| Increase (Decrease) in Net Assets Resulting from Operations: | | | | | | | |
Net investment income
| $ 1,009,506 | | $ 970,219 | | $ 1,266,969 | | $ 64,929 |
Net realized gain (loss) on investments, foreign currency and foreign currency translations
| 2,296,691 | | 2,983,070 | | (4,377,660) | | (109,562) |
Net unrealized appreciation (depreciation) on investments, foreign currency and foreign currency translations
| (3,266,746) | | 3,431,648 | | (5,549,645) | | (600,522) |
Net increase (decrease) in net assets resulting from operations
| 39,451 | | 7,384,937 | | (8,660,336) | | (645,155) |
| Distributions to Shareholders: | | | | | | | |
| From net investment income: | | | | | | | |
Class A shares
| (2,245) | | (2,745) | | (18) | | (2) |
Class C shares
| (2,253) | | (28) | | (13) | | (2) |
Class Y shares
| (9,675) | | (2,413) | | (47,947) | | (3) |
Class I shares
| (1,480,494) | | (978,320) | | (1,265,129) | | (72,345) |
| From net realized gain on investments: | | | | | | | |
Class A shares
| (345) | | (8,924) | | — | | — |
Class C shares
| (6,805) | | (89) | | — | | — |
Class Y shares
| (11,769) | | (8,344) | | — | | — |
Class I shares
| (2,131,368) | | (2,233,975) | | — | | — |
| From Return of capital: | | | | | | | |
Class A shares
| — | | — | | (5) | | — |
Class C shares
| — | | — | | (4) | | — |
Class Y shares
| — | | — | | (14,845) | | — |
Class I shares
| — | | — | | (391,700) | | — |
Total distributions paid
| (3,644,954) | | (3,234,838) | | (1,719,661) | | (72,352) |
| Capital Share Transactions (Note 6): | | | | | | | |
Subscriptions
| 19,799,907 | | 248,364 | | 40,035,423 | | 25,004,000 |
Reinvestments of distributions
| 3,644,954 | | 3,234,839 | | 1,618,018 | | 61,501 |
Redemptions
| (337,974) | | (26,200) | | (3,156,246) | | — |
Redemption fees
| 1,128 | | — | | — | | — |
Net increase in capital share transactions
| 23,108,015 | | 3,457,003 | | 38,497,195 | | 25,065,501 |
Total increase in net assets
| 19,502,512 | | 7,607,102 | | 28,117,198 | | 24,347,994 |
| Net Assets: | | | | | | | |
Beginning of year
| 33,018,595 | | 25,411,493 | | 24,347,994 | | — |
End of year
| $52,521,107 | | $33,018,595 | | $52,465,192 | | $24,347,994 |
(including distributions in excess of net investment income)
| $ — | | $ — | | $ (92,414) | | $ (19,720) |
| 1 | Commencement of operations. |
See Notes to Financial Statements.
56Brookfield Investment Management Inc.
Brookfield Global Listed Infrastructure Fund
Financial Highlights
| | Per Share Operating Performance: | | Ratios to Average Net Assets/Supplementary Data: |
| | Net asset
value,
beginning
of period | Net
investment
income(2) | Net
realized and
unrealized
gain (loss) on
investment
transactions | Net
increase
(decrease)
in net
asset value
resulting from
operations | Distributions
from net
investment
income | Distributions
from net
realized
gains | Return
of capital
distributions | Total
distributions
paid | Redemption
fees | Net asset
value, end
of period | Total
Investment
Return† | Net assets,
end of period
(000s) | Gross
operating
expenses | Net expenses,
including fee
waivers and
reimbursement
and excluding
interest
expense | Net
investment
income | Net
investment
income,
excluding the
effect of fee
waivers and
reimbursement | Portfolio
turnover
rate |
| Class A: | | | | | | | | | | | | | | | | | |
| December 31, 2015 | $14.15 | 0.15 | (2.83) | (2.68) | (0.10) | — | (0.31) | (0.41) | 0.00 (3) | $11.06 | -19.28% | $ 31,989 | 1.41% | 1.35% | 1.13% | 1.07% | 98% |
| December 31, 2014 | $13.91 | 0.15 | 0.88 | 1.03 | (0.22) | (0.57) | — | (0.79) | 0.00 (3) | $14.15 | 7.27% | $ 74,164 | 1.44% | 1.35% | 1.01% | 0.92% | 85% |
| December 31, 2013 | $11.61 | 0.17 | 2.46 | 2.63 | (0.22) | (0.11) | — | (0.33) | 0.00 (3) | $13.91 | 22.86% | $104,349 | 1.51% | 1.35% | 1.30% | 1.14% | 64% |
| December 31, 2012 | $10.15 | 0.21 | 1.50 | 1.71 | (0.11) | (0.14) | — | (0.25) | 0.00 (3) | $11.61 | 16.87% | $ 16,547 | 2.16% | 1.42% | 1.85% | 1.11% | 88% |
| December 31, 2011(1) | $10.13 | 0.00 (3) | 0.02 | 0.02 | (0.00) (3) | — | — | (0.00) (3) | — | $10.15 | 0.20% | $ 2,302 | 34.45% (5) | 1.60% (5) | (1.60)% (5) | (34.45)% (5) | 1% (4) |
| Class C: | | | | | | | | | | | | | | | | | |
| December 31, 2015 | $13.98 | 0.05 | (2.79) | (2.74) | (0.08) | — | (0.23) | (0.31) | 0.00 (3) | $10.93 | -19.91% | $ 18,026 | 2.16% | 2.10% | 0.41% | 0.35% | 98% |
| December 31, 2014 | $13.80 | 0.04 | 0.86 | 0.90 | (0.15) | (0.57) | — | (0.72) | 0.00 (3) | $13.98 | 6.41% | $ 33,470 | 2.19% | 2.10% | 0.24% | 0.15% | 85% |
| December 31, 2013 | $11.57 | 0.08 | 2.43 | 2.51 | (0.17) | (0.11) | — | (0.28) | 0.00 (3) | $13.80 | 21.85% | $ 15,378 | 2.26% | 2.10% | 0.58% | 0.42% | 64% |
| December 31, 2012(1) | $11.02 | 0.10 | 0.69 | 0.79 | (0.10) | (0.14) | — | (0.24) | — | $11.57 | 7.19% | $ 829 | 2.63% (5) | 2.13% (5) | 1.67% (5) | 0.17% (5) | 88% (4) |
| Class Y: | | | | | | | | | | | | | | | | | |
| December 31, 2015 | $14.18 | 0.18 | (2.84) | (2.66) | (0.12) | — | (0.33) | (0.45) | 0.01 | $11.08 | -19.01% | $ 77,826 | 1.16% | 1.10% | 1.37% | 1.31% | 98% |
| December 31, 2014 | $13.93 | 0.19 | 0.88 | 1.07 | (0.25) | (0.57) | — | (0.82) | 0.00 (3) | $14.18 | 7.54% | $199,436 | 1.19% | 1.10% | 1.22% | 1.13% | 85% |
| December 31, 2013 | $11.62 | 0.19 | 2.47 | 2.66 | (0.24) | (0.11) | — | (0.35) | 0.00 (3) | $13.93 | 23.11% | $ 76,014 | 1.26% | 1.10% | 1.49% | 1.33% | 64% |
| December 31, 2012 | $10.15 | 0.24 | 1.49 | 1.73 | (0.12) | (0.14) | — | (0.26) | — | $11.62 | 17.06% | $ 20,300 | 1.67% | 1.13% | 2.86% | 2.32% | 88% |
| December 31, 2011(1) | $10.00 | 0.03 | 0.13 | 0.16 | (0.01) | — | — | (0.01) | — | $10.15 | 1.58% | $ 13 | 18.59% (5) | 1.35% (5) | 1.66% (5) | (15.39)% (5) | 1% (4) |
| Class I: | | | | | | | | | | | | | | | | | |
| December 31, 2015 | $14.19 | 0.20 | (2.86) | (2.66) | (0.07) | — | (0.38) | (0.45) | 0.00 (3) | $11.08 | -19.06% | $186,661 | 1.16% | 1.10% | 1.56% | 1.50% | 98% |
| December 31, 2014 | $13.94 | 0.18 | 0.89 | 1.07 | (0.25) | (0.57) | — | (0.82) | 0.00 (3) | $14.19 | 7.53% | $172,587 | 1.19% | 1.10% | 1.21% | 1.12% | 85% |
| December 31, 2013 | $11.63 | 0.19 | 2.47 | 2.66 | (0.24) | (0.11) | — | (0.35) | 0.00 (3) | $13.94 | 23.09% | $185,085 | 1.26% | 1.10% | 1.49% | 1.33% | 64% |
| December 31, 2012 | $10.15 | 0.24 | 1.50 | 1.74 | (0.12) | (0.14) | — | (0.26) | — | $11.63 | 17.16% | $ 83,088 | 1.78% | 1.17% | 2.06% | 1.45% | 88% |
| December 31, 2011(1) | $10.00 | 0.02 | 0.14 | 0.16 | (0.01) | — | — | (0.01) | — | $10.15 | 1.58% | $ 10,117 | 19.53% (5) | 1.35% (5) | 1.66% (5) | (16.34)% (5) | 1% (4) |
| † | Total investment return is computed based upon the net asset value of the Fund’s shares and excludes the effects of sales charges or contingent deferred sales charges, if applicable. Distributions are assumed to be reinvested at the net asset value of the Class on the ex-date of the distribution. |
| (1) | Class A was incepted on December 29, 2011, Class C was incepted on May 1, 2012 and Classes Y and I were incepted on December 1, 2011. |
| (2) | Per share amounts presented are based on average shares outstanding throughout the period indicated. |
| (3) | Rounds to less than $0.005. |
| (4) | Not annualized. |
| (5) | Annualized. |
See Notes to Financial Statements.
Brookfield Global Listed Real Estate Fund
Financial Highlights
| | Per Share Operating Performance: | | Ratios to Average Net Assets/Supplementary Data: |
| | Net asset
value,
beginning
of period | Net
investment
income(2) | Net
realized and
unrealized
gain (loss) on
investment
transactions | Net
increase
(decrease)
in net
asset value
resulting from
operations | Distributions
from net
investment
income | Distributions
from net
realized
gains | Return
of capital
distributions | Total
distributions
paid | Redemption
fees | Net asset
value, end
of period | Total
Investment
Return† | Net assets,
end of period
(000s) | Gross
operating
expenses | Net expenses,
including fee
waivers and
reimbursement
and excluding
interest
expense | Net
investment
income | Net
investment
income,
excluding the
effect of fee
waivers and
reimbursement | Portfolio
turnover
rate |
| Class A: | | | | | | | | | | | | | | | | | |
| December 31, 2015 | $13.30 | 0.23 | (0.43) | (0.20) | (0.40) | (0.07) | (0.02) | (0.49) | 0.00 (3) | $12.61 | -1.55% | $ 30,280 | 1.31% | 1.20% | 1.75% | 1.64% | 60% |
| December 31, 2014 | $11.85 | 0.35 | 1.92 | 2.27 | (0.47) | (0.35) | — | (0.82) | 0.00 (3) | $13.30 | 19.25% | $ 5,812 | 1.41% | 1.20% | 2.64% | 2.43% | 108% |
| December 31, 2013 | $11.99 | 0.21 | 0.38 | 0.59 | (0.25) | (0.48) | — | (0.73) | 0.00 (3) | $11.85 | 4.99% | $ 4,942 | 1.66% | 1.20% | 1.69% | 1.23% | 147% |
| December 31, 2012(1) | $11.57 | 0.14 | 1.50 | 1.64 | (0.55) | (0.67) | — | (1.22) | — | $11.99 | 14.89% (4) | $ 639 | 2.54% (5) | 1.23% (5) | 2.08% (5) | 0.77% (5) | 106% (4) |
| Class C: | | | | | | | | | | | | | | | | | |
| December 31, 2015 | $13.24 | 0.12 | (0.43) | (0.31) | (0.30) | (0.07) | (0.02) | (0.39) | 0.01 | $12.55 | -2.31% | $ 7,050 | 2.06% | 1.95% | 0.90% | 0.79% | 60% |
| December 31, 2014 | $11.83 | 0.31 | 1.85 | 2.16 | (0.40) | (0.35) | — | (0.75) | — | $13.24 | 18.27% | $ 4,188 | 2.16% | 1.95% | 2.31% | 2.10% | 108% |
| December 31, 2013 | $12.00 | 0.11 | 0.39 | 0.50 | (0.19) | (0.48) | — | (0.67) | — | $11.83 | 4.18% | $ 833 | 2.41% | 1.95% | 0.91% | 0.45% | 147% |
| December 31, 2012(1) | $11.57 | 0.07 | 1.52 | 1.59 | (0.49) | (0.67) | — | (1.16) | — | $12.00 | 14.39% (4) | $ 67 | 3.55% (5) | 2.04% (5) | 1.29% (5) | (0.22)% (5) | 106% (4) |
| Class Y: | | | | | | | | | | | | | | | | | |
| December 31, 2015 | $13.32 | 0.28 | (0.45) | (0.17) | (0.42) | (0.07) | (0.03) | (0.52) | 0.00 (3) | $12.63 | -1.33% | $779,226 | 1.06% | 0.95% | 2.11% | 2.00% | 60% |
| December 31, 2014 | $11.87 | 0.41 | 1.90 | 2.31 | (0.51) | (0.35) | — | (0.86) | 0.00 (3) | $13.32 | 19.51% | $120,367 | 1.16% | 0.95% | 3.09% | 2.88% | 108% |
| December 31, 2013 | $12.01 | 0.25 | 0.37 | 0.62 | (0.28) | (0.48) | — | (0.76) | 0.00 (3) | $11.87 | 5.20% | $ 51,694 | 1.41% | 0.95% | 1.98% | 1.52% | 147% |
| December 31, 2012 | $10.02 | 0.22 | 3.00 | 3.22 | (0.56) | (0.67) | — | (1.23) | — | $12.01 | 32.93% | $ 9,101 | 3.24% | 1.11% | 3.64% | 1.51% | 106% |
| December 31, 2011(1) | $10.00 | 0.04 | 0.02 | 0.06 | (0.04) | — | — | (0.04) | — | $10.02 | 0.59% (4) | $ 13 | 25.79% (5) | 1.25% (5) | 3.35% (5) | (21.19)% (5) | 0% (4) |
| Class I: | | | | | | | | | | | | | | | | | |
| December 31, 2015 | $13.32 | 0.25 | (0.43) | (0.18) | (0.43) | (0.07) | (0.02) | (0.52) | 0.00 (3) | $12.62 | -1.40% | $389,743 | 1.06% | 0.95% | 1.88% | 1.77% | 60% |
| December 31, 2014 | $11.86 | 0.36 | 1.96 | 2.32 | (0.51) | (0.35) | — | (0.86) | 0.00 (3) | $13.32 | 19.61% | $212,842 | 1.16% | 0.95% | 2.69% | 2.48% | 108% |
| December 31, 2013 | $12.00 | 0.23 | 0.39 | 0.62 | (0.28) | (0.48) | — | (0.76) | 0.00 (3) | $11.86 | 5.20% | $ 69,846 | 1.41% | 0.95% | 1.86% | 1.40% | 147% |
| December 31, 2012 | $10.02 | 0.21 | 3.00 | 3.21 | (0.56) | (0.67) | — | (1.23) | — | $12.00 | 32.83% | $ 27,926 | 2.65% | 1.05% | 1.81% | 0.21% | 106% |
| December 31, 2011(1) | $10.00 | 0.04 | 0.02 | 0.06 | (0.04) | — | — | (0.04) | — | $10.02 | 0.59% (4) | $ 5,041 | 25.79% (5) | 1.25% (5) | 3.35% (5) | (21.19)% (5) | 0% (4) |
| † | Total investment return is computed based upon the net asset value of the Fund’s shares and excludes the effects of sales charges or contingent deferred sales charges, if applicable. Distributions are assumed to be reinvested at the net asset value of the Class on the ex-date of the distribution. |
| (1) | Class A and C were incepted on December 1, 2011 and Classes Y and I were incepted on May 1, 2012. |
| (2) | Per share amounts presented are based on average shares outstanding throughout the period indicated. |
| (3) | Rounds to less than $0.005. |
| (4) | Not annualized. |
| (5) | Annualized. |
See Notes to Financial Statements.
58Brookfield Investment Management Inc.
Brookfield U.S. Listed Real Estate Fund
Financial Highlights
| | Per Share Operating Performance: | | Ratios to Average Net Assets/Supplementary Data: |
| | Net asset
value,
beginning
of period | Net
investment
income(3) | Net
realized and
unrealized
gain (loss) on
investment
transactions | Net
increase
(decrease)
in net
asset value
resulting from
operations | Distributions
from net
investment
income | Distributions
from net
realized
gains | Total
distributions
paid | Redemption
fees | Net asset
value, end
of period | Total
Investment
Return† | Net assets,
end of period
(000s) | Gross
operating
expenses | Net expenses,
including fee
waivers and
reimbursement
and excluding
interest
expense | Net
investment
income | Net
investment
income,
excluding the
effect of fee
waivers and
reimbursement | Portfolio
turnover
rate |
| Class A: | | | | | | | | | | | | | | | | |
| December 31, 2015 | $11.77 | 0.27 | (0.87) | (0.60) | (0.29) | (0.45) | (0.74) | 0.04 | $10.47 | -4.69% | $ 85 | 1.78% | 1.20% | 2.33% | 1.75% | 78% |
| December 31, 2014 | $10.11 | 0.68 | 2.22 | 2.90 | (0.36) | (0.88) | (1.24) | — | $11.77 | 28.66% | $ 123 | 2.40% | 1.20% | 5.61% | 4.41% | 86% |
| December 31, 2013(1) | $10.00 | 0.04 | 0.12 | 0.16 | (0.05) | — | (0.05) | — | $10.11 | 1.62% (4) | $ 1 | 3.82% (2),(5) | 0.80% (2),(5) | 8.17% (2),(5) | 5.15% (2),(5) | 4% (4) |
| Class C: | | | | | | | | | | | | | | | | |
| December 31, 2015 | $11.77 | 0.17 | (0.80) | (0.63) | (0.22) | (0.45) | (0.67) | — | $10.47 | -5.18% | $ 360 | 2.53% | 1.95% | 1.58% | 1.00% | 78% |
| December 31, 2014 | $10.11 | 0.26 | 2.56 | 2.82 | (0.28) | (0.88) | (1.16) | — | $11.77 | 27.78% | $ 1 | 3.15% | 1.95% | 2.27% | 1.07% | 86% |
| December 31, 2013(1) | $10.00 | 0.04 | 0.12 | 0.16 | (0.05) | — | (0.05) | — | $10.11 | 1.58% (4) | $ 1 | 4.54% (2),(5) | 1.52% (2),(5) | 7.45% (2),(5) | 4.43% (2),(5) | 4% (4) |
| Class Y: | | | | | | | | | | | | | | | | |
| December 31, 2015 | $11.77 | 0.29 | (0.83) | (0.54) | (0.38) | (0.45) | (0.83) | 0.02 | $10.42 | -4.30% | $ 284 | 1.53% | 0.95% | 2.58% | 2.00% | 78% |
| December 31, 2014 | $10.11 | 0.83 | 2.10 | 2.93 | (0.39) | (0.88) | (1.27) | — | $11.77 | 28.98% | $ 118 | 2.15% | 0.95% | 6.78% | 5.58% | 86% |
| December 31, 2013(1) | $10.00 | 0.04 | 0.12 | 0.16 | (0.05) | — | (0.05) | — | $10.11 | 1.64% (4) | $ 1 | 3.46% (2),(5) | 0.44% (2),(5) | 8.54% (2),(5) | 5.52% (2),(5) | 4% (4) |
| Class I: | | | | | | | | | | | | | | | | |
| December 31, 2015 | $11.77 | 0.29 | (0.82) | (0.53) | (0.38) | (0.45) | (0.83) | 0.00 (6) | $10.41 | -4.38% | $51,792 | 1.53% | 0.95% | 2.58% | 2.00% | 78% |
| December 31, 2014 | $10.11 | 0.38 | 2.55 | 2.93 | (0.39) | (0.88) | (1.27) | — | $11.77 | 28.98% | $32,776 | 2.15% | 0.95% | 3.30% | 2.10% | 86% |
| December 31, 2013(1) | $10.00 | 0.04 | 0.12 | 0.16 | (0.05) | — | (0.05) | — | $10.11 | 1.64% (4) | $25,408 | 3.59% (2),(5) | 0.61% (2),(5) | 7.58% (2),(5) | 4.6% (2),(5) | 4% (4) |
| † | Total investment return is computed based upon the net asset value of the Fund’s shares and excludes the effects of sales charges or contingent deferred sales charges, if applicable. Distributions are assumed to be reinvested at the net asset value of the Class on the ex-date of the distribution. |
| (1) | Classes A, C, Y and I were incepted on December 11, 2013. |
| (2) | Organization costs were not annualized in the calculation of the income and expense ratios. If these expenses were annualized, the gross and net expense ratios would have been 4.16% and 1.20% for Class A, 4.89% and 1.95% for Class C, 3.80% and 0.95% for Class Y and 3.93% and 0.95% for Class I, respectively. |
| (3) | Per share amounts presented are based on average shares outstanding throughout the period indicated. |
| (4) | Not annualized. |
| (5) | Annualized. |
| (6) | Rounds to less than $0.005. |
See Notes to Financial Statements.
Brookfield Real Assets Securities Fund
Financial Highlights
| | Per Share Operating Performance: | | Ratios to Average Net Assets/Supplementary Data: |
| | Net asset
value,
beginning
of period | Net
investment
income(2) | Net
realized and
unrealized
gain (loss) on
investment
transactions | Net
increase
(decrease)
in net
asset value
resulting from
operations | Distributions
from net
investment
income | Distributions
from net
realized
gains | Return
of capital
distributions | Total
distributions
paid | Redemption
fees | Net asset
value, end
of period† | Total
Investment
Return† | Net assets,
end of period
(000s) | Gross
operating
expenses | Net expenses,
including fee
waivers and
reimbursement
and excluding
interest
expense | Net
investment
income | Net
investment
income,
excluding the
effect of fee
waivers and
reimbursement | Portfolio
turnover
rate |
| Class A: | | | | | | | | | | | | | | | | | |
| December 31, 2015 | $ 9.72 | 0.19 | (1.40) | (1.21) | (0.18) | — | (0.05) | (0.23) | — | $8.28 | -12.58% | $ 1 | 2.12% | 1.35% | 2.07% | 1.30% | 76% |
| December 31, 2014(1) | $10.00 | 0.03 | (0.29) | (0.26) | (0.02) | — | — | (0.02) | — | $9.72 | -2.55% (3) | $ 1 | 3.56% (4) | 1.35% (4) | 2.33% (4) | 0.12% (4) | 7% (3) |
| Class C: | | | | | | | | | | | | | | | | | |
| December 31, 2015 | $ 9.72 | 0.12 | (1.38) | (1.26) | (0.13) | — | (0.04) | (0.17) | — | $8.29 | -13.08% | $ 1 | 2.87% | 2.10% | 1.33% | 0.56% | 76% |
| December 31, 2014(1) | $10.00 | 0.03 | (0.29) | (0.26) | (0.02) | — | — | (0.02) | — | $9.72 | -2.63% (3) | $ 1 | 4.31% (4) | 2.10% (4) | 2.25% (4) | 0.04% (4) | 7% (3) |
| Class Y: | | | | | | | | | | | | | | | | | |
| December 31, 2015 | $ 9.72 | 0.24 | (1.42) | (1.18) | (0.18) | — | (0.09) | (0.27) | — | $8.27 | -12.32% | $ 2,058 | 1.87% | 1.10% | 2.58% | 1.81% | 76% |
| December 31, 2014(1) | $10.00 | 0.03 | (0.28) | (0.25) | (0.03) | — | — | (0.03) | — | $9.72 | -2.51% (3) | $ 1 | 3.31% (4) | 1.10% (4) | 2.36% (4) | 0.15% (4) | 7% (3) |
| Class I: | | | | | | | | | | | | | | | | | |
| December 31, 2015 | $ 9.71 | 0.22 | (1.40) | (1.18) | (0.20) | — | (0.07) | (0.27) | — | $8.26 | -12.33% | $50,405 | 1.87% | 1.10% | 2.41% | 1.64% | 76% |
| December 31, 2014(1) | $10.00 | 0.03 | (0.29) | (0.26) | (0.03) | — | — | (0.03) | — | $9.71 | -2.61% (3) | $24,345 | 3.31% (4) | 1.10% (4) | 2.31% (4) | 0.1% (4) | 7% (3) |
| † | Total investment return is computed based upon the net asset value of the Fund’s shares and excludes the effects of sales charges or contingent deferred sales charges, if applicable. Distributions are assumed to be reinvested at the net asset value of the Class on the ex-date of the distribution. |
| (1) | Classes A, C, Y and I were incepted on November 19, 2014. |
| (2) | Per share amounts presented are based on average shares outstanding throughout the period indicated. |
| (3) | Not annualized. |
| (4) | Annualized. |
See Notes to Financial Statements.
60Brookfield Investment Management Inc.
BROOKFIELD INVESTMENT FUNDS
Notes to Financial Statements
December 31, 2015
1.Organization
Brookfield Investment Funds (the “Trust”) was organized as a statutory trust under the laws of the State of Delaware on May 12, 2011. The Trust is registered under the Investment Company Act of 1940, as amended (the “1940 Act”), as an open-end management investment company. The Trust currently consists of five series portfolios: the Brookfield Global Listed Infrastructure Fund (the “Infrastructure Fund”), the Brookfield Global Listed Real Estate Fund (the “Global Real Estate Fund”), the Brookfield U.S. Listed Real Estate Fund (the “U.S. Real Estate Fund”), the Brookfield Real Assets Securities Fund (the “Real Assets Securities Fund”) and the Brookfield Real Assets Debt Fund (each, a “Fund,” and collectively, the “Funds”). The Infrastructure Fund, Global Real Estate Fund and Real Assets Securities Fund are each a diversified open-end management investment company and the U.S. Real Estate Fund is a non-diversified open-end management investment company. The Brookfield Real Assets Debt Fund is not currently available for purchase.
Each Fund currently has four classes of shares: Class A, Class C, Class Y and Class I shares. Each class represents an interest in the same portfolio of assets and has identical voting, dividend, liquidation and other rights except that: (i) Class A shares have a maximum front end sales charge of 4.75% and Class C shares have a maximum deferred sales charge of 1.00%; (ii) Class A shares have a 12b-1 fee of 0.25% and Class C shares have a 12b-1 fee of 1.00%; and (iii) each class has exclusive voting rights with respect to matters relating to its own distribution arrangements. The assets belonging to a particular Fund belong to that Fund for all purposes, and to no other Fund, subject only to the rights of creditors of that Fund.
Brookfield Investment Management Inc. (the “Adviser”), a wholly-owned subsidiary of Brookfield Asset Management Inc., is registered as an investment adviser under the Investment Advisers Act of 1940, as amended (the “Advisers Act”), and serves as investment adviser to the Funds.
The investment objective of each Fund is to seek total return through growth of capital and current income. Each Fund's investment objective is not fundamental and may be changed by the Trust's Board of Trustees (the “Board”) without shareholder approval, upon not less than 60 days prior written notice to shareholders. There can be no assurance that each Fund will achieve its investment objective.
2.Significant Accounting Policies
The preparation of financial statements in conformity with accounting principles generally accepted in the United States of America (“GAAP”) requires management to make estimates and assumptions that affect the reported amounts of assets and liabilities and disclosure of contingent assets and liabilities at the date of the financial statements and the reported amounts of increases and decreases in net assets from operations during the reporting period. Actual results could differ from those estimates. Each Fund is an investment company under GAAP and follows the accounting and reporting guidance applicable to investment companies.
Valuation of Investments: Debt securities, including U.S. government securities, listed corporate bonds, other fixed income and asset-backed securities, and unlisted securities and private placement securities, are generally valued at the bid prices furnished by an independent pricing service or, if not valued by an independent pricing service, using bid prices obtained from active and reliable market makers in any such security or a broker-dealer. The broker-dealers or pricing services use multiple valuation techniques to determine fair value. In instances where sufficient market activity exists, the broker-dealers or pricing services may utilize a market-based approach through which quotes from market makers are used to determine fair value. In instances where sufficient market activity may not exist or is limited, the broker-dealers or pricing services utilize proprietary valuation models which may consider market transactions in comparable securities and the various relationships between securities in determining fair value and/or market characteristics such as benchmark yield curves, option-adjusted spreads, credit spreads, estimated default rates, coupon-rates, anticipated timing of principal repayments, underlying collateral, and other unique security features in order to estimate the relevant cash flows, which are then discounted to calculate the fair values. Short-term debt securities with remaining maturities of sixty days or less
BROOKFIELD INVESTMENT FUNDS
Notes to Financial Statements (continued)
December 31, 2015
are valued at amortized cost with interest accrued or discount accreted to the date of maturity, unless such valuation, in the judgment of the Adviser’s Valuation Committee, does not represent market value.
Investments in equity securities listed or traded on any securities exchange or traded in the over-the-counter market are valued at the last quoted price as of the close of business on the valuation date. Investments in open-end registered investment companies, if any, are valued at the net asset value (“NAV”) as reported by those investment companies.
Fair valuation procedures may be used to value a substantial portion of the assets of each Fund. A Fund may use the fair value of a security to calculate its NAV when, for example, (1) a portfolio security is not traded in a public market or the principal market in which the security trades is closed, (2) trading in a portfolio security is suspended and not resumed prior to the normal market close, (3) a portfolio security is not traded in significant volume for a substantial period, or (4) the Adviser determines that the quotation or price for a portfolio security provided by a broker-dealer or an independent pricing service is inaccurate.
The fair value of securities may be difficult to determine and thus judgment plays a greater role in the valuation process. The fair valuation methodology may include or consider the following guidelines, as appropriate: (1) evaluation of all relevant factors, including but not limited to, pricing history, current market level, supply and demand of the respective security; (2) comparison to the values and current pricing of securities that have comparable characteristics; (3) knowledge of historical market information with respect to the security; (4) other factors relevant to the security which would include, but not be limited to, duration, yield, fundamental analytical data, the Treasury yield curve, and credit quality.
The values assigned to fair valued investments are based on available information and do not necessarily represent amounts that might ultimately be realized, since such amounts depend on future developments inherent in long-term investments. Changes in the fair valuation of portfolio securities may be less frequent and of greater magnitude than changes in the price of portfolio securities valued at their last sale price, by an independent pricing service, or based on market quotations. Imprecision in estimating fair value can also impact the amount of unrealized appreciation or depreciation recorded for a particular portfolio security and differences in the assumptions used could result in a different determination of fair value, and those differences could be material.
The Trust’s Board has adopted procedures for the valuation of each Fund’s securities. The Adviser oversees the day to day responsibilities for valuation determinations under these procedures. The Board regularly reviews the application of these procedures to the securities in a Fund’s portfolio. Pursuant to the procedures, securities in a Fund are valued using unadjusted quoted market prices, when available, as supplied primarily by third party pricing services or dealers. However, if (i) a market value or price is not readily available, (ii) the available quotations are not believed to be reflective of market value by the Adviser, or (iii) a significant event has occurred that would materially affect the value of the security, the security is fair valued, as determined in good faith, by the Adviser’s Valuation Committee. The Adviser’s Valuation Committee is comprised of senior members of the Adviser’s management team. There can be no assurance that a Fund could purchase or sell a portfolio security at the price used to calculate the Fund’s NAV. As of December 31, 2015, the Global Real Estate Fund and U.S. Real Estate Fund did not have any securities that were fair valued by the Adviser’s Valuation Committee.
The Funds have established methods of fair value measurements in accordance with GAAP. Fair value denotes the price that a Fund would receive upon selling an investment in a timely transaction to an independent buyer in the principal or most advantageous market of the investment. A three-tier hierarchy has been established to maximize the use of observable market data and minimize the use of unobservable inputs and to establish classification of fair value measurements for disclosure purposes. Inputs refer broadly to the assumptions that market participants would use in pricing the asset or liability, including assumptions about risk, for example, the risk inherent in a particular valuation technique used to measure fair value including such a pricing model and/or the risk inherent in the inputs to the valuation technique. Inputs may be observable or unobservable. Observable inputs are inputs that reflect the assumptions market participants would use in pricing the asset or liability developed based on market data obtained from sources independent of the reporting entity. Unobservable inputs
62Brookfield Investment Management Inc.
BROOKFIELD INVESTMENT FUNDS
Notes to Financial Statements (continued)
December 31, 2015
are inputs that reflect the reporting entity’s own assumptions about the assumptions market participants would use in pricing the asset or liability developed based on the best information available in the circumstances. The three-tier hierarchy of inputs is summarized in the three broad levels listed below.
| Level 1 - | quoted prices in active markets for identical assets or liabilities |
| Level 2 - | quoted prices in markets that are not active or other significant observable inputs (including, but not limited to: quoted prices for similar assets or liabilities, quoted prices based on recently executed transactions, interest rates, credit risk, etc.)
|
| Level 3 - | significant unobservable inputs (including each Fund’s own assumptions in determining the fair value of assets or liabilities) |
The Adviser’s valuation policy, as previously stated, establishes parameters for the sources and types of valuation analysis, as well as, the methodologies and inputs the Adviser uses in determining fair value, including the use of the Adviser’s Valuation Committee. If the Adviser’s Valuation Committee determines that additional techniques, sources or inputs are appropriate or necessary in a given situation, such additional work will be undertaken.
Significant increases or decreases in any of the unobservable inputs in isolation may result in a lower or higher fair value measurement.
To assess the continuing appropriateness of security valuations, the Adviser (or its third party service providers, who are subject to oversight by the Adviser), regularly compares one of its prior day prices, prices on comparable securities and sale prices to the current day prices and challenges those prices that exceed certain tolerance levels with the third party pricing service or broker source. For those securities valued by fair valuations, the Adviser’s Valuation Committee reviews and affirms the reasonableness of the valuations based on such methodologies and fair valuation determinations on a regular basis after considering all relevant information that is reasonably available.
The inputs or methodology used for valuing investments are not necessarily an indication of the risk associated with investing in those securities.
BROOKFIELD INVESTMENT FUNDS
Notes to Financial Statements (continued)
December 31, 2015
Infrastructure Fund
The following table summarizes the Infrastructure Fund's investments categorized in the disclosure hierarchy as of December 31, 2015:
| Valuation Inputs | Level 1 | | Level 2 | | Level 3 | | Total |
| Common Stocks: |
Australia
| $ — | | $ 14,201,063 | | $ — | | $ 14,201,063 |
Canada
| 31,678,422 | | — | | — | | 31,678,422 |
China
| — | | 9,348,085 | | — | | 9,348,085 |
France
| — | | 15,860,178 | | — | | 15,860,178 |
Hong Kong
| — | | 6,667,036 | | — | | 6,667,036 |
Italy
| — | | 11,985,300 | | — | | 11,985,300 |
Japan
| — | | 3,116,893 | | — | | 3,116,893 |
Luxembourg
| — | | 4,982,233 | | — | | 4,982,233 |
Mexico
| 3,806,290 | | — | | — | | 3,806,290 |
Netherlands
| — | | 3,677,756 | | — | | 3,677,756 |
Singapore
| — | | 1,592,185 | | — | | 1,592,185 |
Spain
| — | | 14,418,870 | | — | | 14,418,870 |
Switzerland
| — | | 4,717,212 | | — | | 4,717,212 |
United Kingdom
| — | | 24,469,354 | | — | | 24,469,354 |
United States
| 157,767,220 | | 2,112,804 | | — | | 159,880,024 |
Total
| $ 193,251,932 | | $ 117,148,969 | | $ — | | $ 310,400,901 |
For further information regarding security characteristics, see the Schedule of Investments.
Level 2 securities are fair valued using a factor as a result of market movements following the close of local trading. During the year ended December 31, 2015, there were no transfers between Levels. The basis for recognizing and valuing transfers is as of the end of the period in which transfers occur. During the year ended December 31, 2015, the Infrastructure Fund did not invest in any level 3 securities.
64Brookfield Investment Management Inc.
BROOKFIELD INVESTMENT FUNDS
Notes to Financial Statements (continued)
December 31, 2015
Global Real Estate Fund
The following table summarizes the Global Real Estate Fund's investments categorized in the disclosure hierarchy as of December 31, 2015:
| Valuation Inputs | Level 1 | | Level 2 | | Level 3 | | Total |
| Common Stocks: |
Australia
| $ — | | $ 94,243,079 | | $ — | | $ 94,243,079 |
Austria
| — | | 14,752,088 | | — | | 14,752,088 |
France
| — | | 52,352,818 | | — | | 52,352,818 |
Germany
| — | | 114,820,836 | | — | | 114,820,836 |
Hong Kong
| — | | 98,377,886 | | — | | 98,377,886 |
Japan
| — | | 88,591,525 | | — | | 88,591,525 |
Netherlands
| — | | 10,219,192 | | — | | 10,219,192 |
New Zealand
| — | | 5,831,994 | | — | | 5,831,994 |
Singapore
| — | | 21,168,528 | | — | | 21,168,528 |
United Kingdom
| — | | 46,595,347 | | — | | 46,595,347 |
United States
| 641,118,730 | | — | | — | | 641,118,730 |
Total
| $ 641,118,730 | | $ 546,953,293 | | $ — | | $1,188,072,023 |
For further information regarding security characteristics, see the Schedule of Investments.
Level 2 securities are fair valued using a factor as a result of market movements following the close of local trading. During the year ended December 31, 2015, transfers from Level 1 to Level 2 was $10,219,192, which represents a security that was previously priced using the market close price and currently priced using the adjusted price. There were no additional transfers between Levels. The basis for recognizing and valuing transfers is as of the end of the period in which transfers occur. During the year ended December 31, 2015, the Global Real Estate Fund did not invest in any Level 3 securities.
U.S. Real Estate Fund
The following table summarizes the U.S. Real Estate Fund's investments categorized in the disclosure hierarchy as of December 31, 2015:
| Valuation Inputs | Level 1 | | Level 2 | | Level 3 | | Total |
| Common Stocks | $ 50,792,813 | | $ — | | $ — | | $ 50,792,813 |
Total
| $ 50,792,813 | | $ — | | $ — | | $ 50,792,813 |
For further information regarding security characteristics, see the Schedule of Investments.
During the year ended December 31, 2015, there were no transfers between Levels. The basis for recognizing and valuing transfers is as of the end of the period in which transfers occur. During the year ended December 31, 2015, the Brookfield U.S. Listed Real Estate Fund did not invest in any Level 2 or Level 3 securities.
BROOKFIELD INVESTMENT FUNDS
Notes to Financial Statements (continued)
December 31, 2015
Real Assets Securities Fund
The following table summarizes the Real Assets Securities Fund's investments categorized in the disclosure hierarchy as of December 31, 2015:
| Valuation Inputs | Level 1 | | Level 2 | | Level 3 | | Total |
| Common Stocks: |
Australia
| $ — | | $ 1,724,123 | | $ — | | $ 1,724,123 |
Austria
| — | | 291,659 | | — | | 291,659 |
Belgium
| 53,469 | | — | | — | | 53,469 |
Bermuda
| 80,091 | | — | | — | | 80,091 |
Brazil
| 129,694 | | — | | — | | 129,694 |
Canada
| 2,267,065 | | — | | — | | 2,267,065 |
China
| — | | 309,506 | | — | | 309,056 |
Finland
| — | | 208,323 | | — | | 208,323 |
France
| — | | 1,027,093 | | — | | 1,027,093 |
Germany
| — | | 1,480,411 | | — | | 1,480,411 |
Hong Kong
| — | | 1,345,121 | | — | | 1,345,121 |
Ireland
| 144,372 | | 81,814 | | — | | 226,186 |
Italy
| — | | 631,209 | | — | | 631,209 |
Japan
| — | | 1,535,926 | | — | | 1,535,926 |
Luxembourg
| — | | 160,717 | | — | | 160,717 |
Mexico
| 186,084 | | — | | — | | 186,084 |
Netherlands
| — | | 274,996 | | — | | 274,996 |
New Zealand
| — | | 143,382 | | — | | 143,382 |
Norway
| — | | 64,512 | | — | | 64,512 |
Singapore
| — | | 404,933 | | — | | 404,933 |
South Africa
| — | | 155,082 | | — | | 155,082 |
Spain
| — | | 951,231 | | — | | 951,231 |
Switzerland
| 478,442 | | 282,709 | | — | | 761,151 |
United Kingdom
| 163,684 | | 1,444,390 | | — | | 1,608,074 |
United States
| 17,710,292 | | 42,183 | | — | | 17,752,475 |
Total Common Stocks
| 21,213,193 | | 12,559,320 | | — | | 33,772,513 |
| Corporate Bonds: |
Belgium
| — | | 297,000 | | — | | 297,000 |
Bermuda
| — | | 142,500 | | — | | 142,500 |
Greece
| — | | 330,125 | | — | | 330,125 |
Luxembourg
| — | | 362,313 | | — | | 362,313 |
Singapore
| — | | 295,050 | | — | | 295,050 |
United States
| — | | 10,305,802 | | — | | 10,305,802 |
Total Corporate Bonds
| — | | 11,732,790 | | — | | 11,732,790 |
| Convertible Preferred Stocks: |
United States
| 587,424 | | — | | — | | 587,424 |
| Preferred Stocks: |
United States
| 2,058,347 | | 120,650 | | — | | 2,178,997 |
| Term Loans: |
United States
| — | | 694,475 | | — | | — |
Total
| $ 23,858,964 | | $ 25,107,235 | | $ — | | $ 48,966,199 |
66Brookfield Investment Management Inc.
BROOKFIELD INVESTMENT FUNDS
Notes to Financial Statements (continued)
December 31, 2015
| Assets: | Level 1 | | Level 2 | | Level 3 | | Total |
Other Financial Instruments*
| $ — | | $ 22,148 | | $ — | | $ 22,148 |
Total Liabilities - Other Financial Instruments
| $ — | | $ 22,148 | | $ — | | $ 22,148 |
* Other Financial Instruments includes swap contracts which are valued at the unrealized gain on the instrument.
For further information regarding security characteristics, see the Schedule of Investments.
Level 2 common stocks are fair valued using a factor as a result of market movements following the close of local trading. During the year ended December 31, 2015, transfers from Level 2 to Level 1 was $394,701, which represents preferred stocks that were previously priced using mean of the bid and ask price and currently priced using the market close price and transfers from Level 1 to Level 2 was $163,027, which represents a security that was previously priced using the market close price and currently priced using the adjusted price. There were no additional transfers between Levels. The basis for recognizing and valuing transfers is as of the end of the period in which transfers occur. During the year ended December 31, 2015, the Real Assets Securities Fund did not invest in any Level 3 securities.
Investment Transactions and Investment Income: Securities transactions are recorded on the trade date. Realized gains and losses from securities transactions are calculated on the identified cost basis. Interest income is recorded on the accrual basis. Discounts and premiums on securities are accreted and amortized, respectively, on a daily basis, using the effective yield to maturity method adjusted based on management’s assessment of the collectability of such interest. Dividend income is recorded on the ex-dividend date.
Foreign Currency Transactions: Securities and other assets and liabilities denominated in foreign currencies are translated into U.S. dollar amounts at the date of valuation. Purchases and sales of securities and income and expense items denominated in foreign currencies are translated into U.S. dollar amounts on the respective dates of such transactions. The Funds isolate the portion of realized gains or losses resulting from changes in foreign exchange rates on securities from the fluctuations arising from changes in market prices of securities held. The Funds do not isolate the portion of unrealized gains or losses resulting from changes in foreign exchange rates on securities from the fluctuations arising from changes in market prices of securities held.
Reported net realized foreign exchange gains or losses arise from sales of securities, currency gains or losses realized between the trade and settlement dates on securities transactions and the difference between the amounts of dividends, interest and foreign withholding taxes recorded on a Fund's books and the U.S. dollar equivalent of the amounts actually received or paid.
Taxes: Each Fund intends to continue to meet the requirements of the Internal Revenue Code of 1986, as amended, applicable to regulated investment companies and to distribute substantially all of its taxable income to its shareholders. Therefore, no federal income or excise tax provision is required. Each Fund may incur an excise tax to the extent it has not distributed all of its taxable income on a calendar year basis.
GAAP provides guidance for how uncertain tax positions should be recognized, measured, presented and disclosed in the financial statements. An evaluation of tax positions taken in the course of preparing the Funds’ tax returns to determine whether the tax positions are “more-likely-than-not” of being sustained by the taxing authority is required. Tax benefits of positions not deemed to meet the more-likely-than-not threshold would be booked as a tax expense in the current year and recognized as: a liability for unrecognized tax benefits; a reduction of an income tax refund receivable; a reduction of a deferred tax asset; an increase in a deferred tax liability; or a combination thereof. As of December 31, 2015, each Fund has determined that there are no uncertain tax positions or tax liabilities required to be accrued.
The Funds have reviewed the taxable years open for examination (i.e. not barred by the applicable statute of
BROOKFIELD INVESTMENT FUNDS
Notes to Financial Statements (continued)
December 31, 2015
limitations) by taxing authorities of all major jurisdictions, including the Internal Revenue Service. As of December 31, 2015, open taxable periods consisted of the taxable years ended December 31, 2013 through December 31, 2015 for the Infrastructure Fund and Global Real Estate Fund, the period December 11, 2013 (commencement of operations) through December 31, 2015 for the U.S. Real Estate Fund and the period November 19, 2014 (commencement of operations) through December 31, 2015 for the Real Assets Securities Fund. No examination of the Funds’ tax returns is currently in progress.
Expenses: Expenses directly attributable to a Fund are charged directly to that Fund, while expenses which are attributable to more than one Fund are allocated among the respective Funds based upon relative average net assets, evenly or a combination of both. Income and expenses of a Fund are allocated on a pro rata basis to each class of shares, except for distribution fees, which are unique to each class of shares.
Distributions: Each Fund declares and pays dividends quarterly from net investment income. Distributions of realized capital gains in excess of capital loss carryforwards are distributed at least annually. Dividends and distributions are recorded on the ex-dividend date. All common shares have equal dividend and other distribution rights. A notice disclosing the source(s) of a distribution will be provided after a payment is made from any source other than net investment income.
Dividends from net investment income and distributions from realized gains from investment transactions have been determined in accordance with federal income tax regulations and may differ from net investment income and realized gains recorded by each Fund for financial reporting purposes. These differences, which could be temporary or permanent in nature, may result in reclassification of distributions; however, net investment income, net realized gains and losses and net assets are not affected.
3.Investment Advisory Agreements and Related Party Transactions
The Adviser currently serves as the investment adviser to each Fund pursuant to separate investment advisory agreements (the “Advisory Agreements”) under which the Adviser is responsible for the management of each Fund’s portfolio and provides the necessary personnel, facilities, equipment and certain other services necessary to the operations of each Fund.
Pursuant to operating expenses limitation agreements (the “Expense Limitation Agreements”), the Adviser has contractually agreed to waive all or a portion of its investment advisory or administration fees, as presented below, and/or to reimburse certain expenses of each Fund to the extent necessary to maintain each Fund’s total annual operating expenses (excluding any front-end or contingent deferred charges, brokerage commissions and other transactional expenses, acquired fund fees and expenses, interest, taxes, and extraordinary expenses, such as litigation; and other expenses not incurred in the ordinary course of a Fund’s business). The Expense Limitation Agreements will continue until at least May 1, 2016 and may not be terminated by the Funds or the Adviser before such time. Thereafter, the Expense Limitation Agreements may only be terminated or amended to increase the expense cap as of May 1st of each calendar year, provided that in the case of a termination by the Adviser, the Adviser will provide the Board with written notice of its intention to terminate the arrangement prior to the expiration of its then current term. Pursuant to the Expense Limitation Agreements, the Adviser retains its right to receive reimbursement of any payments made by it, or to recoup any fees waived by it during the prior three years, provided that after giving effect to such repayment or recoupment, such adjusted total annual operating expenses (expressed as a percentage of average net assets) for each Fund would not exceed the percentage limitations listed below.
68Brookfield Investment Management Inc.
BROOKFIELD INVESTMENT FUNDS
Notes to Financial Statements (continued)
December 31, 2015
The Advisory Agreements provide that each Fund shall pay the Adviser a monthly fee at the annual rates stated below of each Fund’s average daily net assets:
| | Annual Advisory
Fee Rate | Annual Expense
Cap from
July 1, 2012 | Annual Expense
Cap through
June 30, 2012 |
| Infrastructure Fund | | | |
Class A
| 0.85% | 1.35% | 1.60% |
Class C
| 0.85% | 2.10% | 2.35% |
Class Y
| 0.85% | 1.10% | 1.35% |
Class I
| 0.85% | 1.10% | 1.35% |
| Global Real Estate Fund | | | |
Class A
| 0.75% | 1.20% | 1.50% |
Class C
| 0.75% | 1.95% | 2.25% |
Class Y
| 0.75% | 0.95% | 1.25% |
Class I
| 0.75% | 0.95% | 1.25% |
| U.S. Real Estate Fund | | | |
Class A
| 0.75% | 1.20% 1 | N/A |
Class C
| 0.75% | 1.95% 1 | N/A |
Class Y
| 0.75% | 0.95% 1 | N/A |
Class I
| 0.75% | 0.95% 1 | N/A |
| Real Assets Securities Fund | | | |
Class A
| 0.85% | 1.35% 2 | N/A |
Class C
| 0.85% | 2.10% 2 | N/A |
Class Y
| 0.85% | 1.10% 2 | N/A |
Class I
| 0.85% | 1.10% 2 | N/A |
1 Annual Expense Cap was effective December 11, 2013 (commencement of operations).
2 Annual Expense Cap was effective November 19, 2014 (commencement of operations).
The amount of investment advisory fees waived and/or expenses reimbursed available to be recouped are listed in the table below:
| Fund | December 31, 2016 | December 31, 2017 | December 31, 2018 |
Infrastructure Fund
| $435,670 | $423,903 | $260,292 |
Global Real Estate Fund
| 369,168 | 399,082 | 874,307 |
U.S. Real Estate Fund
| 41,257 | 352,858 | 227,118 |
Real Assets Securities Fund1
| — | 60,940 | 405,998 |
1 From the commencement of operations on November 19, 2014.
For the year ended December 31, 2015, the Adviser did not recoup any expenses.
Each Fund has entered into separate Administration Agreements with the Adviser and the Adviser has entered into a sub-administration agreement with U.S. Bancorp Fund Services, LLC. The Adviser and the sub-administrator perform administrative services necessary for the operation of the Funds, including maintaining certain books and records of the Funds and preparing reports and other documents required by federal, state and other applicable laws and regulations, and providing the Funds with administrative office facilities. For its services under the Administration Agreements, the Adviser receives from each Fund, respectively, an annual fee equal to 0.15% of its
BROOKFIELD INVESTMENT FUNDS
Notes to Financial Statements (continued)
December 31, 2015
average daily net assets, payable monthly in arrears. The Adviser is responsible for any fees due to the Sub-Administrator.
Certain officers and/or trustees of the Trust are officers and/or employees of the Adviser.
4.Purchases and Sales of Investments
Purchases and sales of investments, excluding U.S. Government securities, for the year ended December 31, 2015 were as follows:
| Fund | Purchases | Sales |
Infrastructure Fund
| $ 449,217,181 | $512,012,367 |
Global Real Estate Fund
| 1,345,020,462 | 440,797,879 |
U.S. Real Estate Fund
| 50,219,784 | 29,394,222 |
Real Assets Securities Fund
| 71,556,856 | 36,119,217 |
During the year ended December 31, 2015, there were no transactions in U.S. Government securities.
5.Swaps Agreements
Each Fund may enter into total rate of return, credit default or other types of swaps and related derivatives for the purpose of hedging and risk management. These transactions generally provide for the transfer from one counterparty to another of certain risks inherent in the ownership of a financial asset such as a debt instrument or common stock. Such risks include, among other things, the risk of default and insolvency of the obligor of such asset, the risk that the credit of the obligor or the underlying collateral will decline or the risk that the common stock of the underlying issuers will decline in value. The transfer of risk pursuant to a derivative of this type may be complete or partial, and may be for the life of the related asset or for a shorter period. These derivatives may be used as a risk management tool for a pool of financial assets, providing a Fund with the opportunity to gain or reduce exposure to one or more reference securities or other financial assets (each, a “Reference Asset”) without actually owning or selling such assets in order, for example, to increase or reduce a concentration risk or to diversify a portfolio. Conversely, these derivatives may be used by the Fund to reduce exposure to an owned asset without selling it.
Because a Fund would not own the Reference Assets, the Fund may not have any voting rights with respect to the Reference Assets, and in such cases all decisions related to the obligors or issuers of the Reference Assets, including whether to exercise certain remedies, will be controlled by the swap counterparties.
Total rate of return swaps and similar derivatives are subject to many risks, including the possibility that the market will move in a manner or direction that would have resulted in gain for a Fund had the swap or other derivative not been utilized (in which case it would have been better had the Fund not engaged in the interest rate hedging transactions), the risk of imperfect correlation between the risk sought to be hedged and the derivative transactions utilized, the possible inability of the counterparty to fulfill its obligations under the swap and potential illiquidity of the hedging instrument utilized, which may make it difficult for the Fund to close out or unwind one or more hedging transactions.
Total rate of return swaps and related derivatives present certain legal, tax and market uncertainties that present risks in entering into such arrangements. There is currently little or no case law or litigation characterizing total rate of return swaps or related derivatives, interpreting their positions, or characterizing their tax treatment. In addition, additional regulations and laws may apply to these types of derivatives that have not previously been applied. There can be no assurance that future decisions construing similar provisions to those in any swap agreement or other related documents or additional regulations and laws will not have an adverse effect on a Fund that utilizes these instruments.
70Brookfield Investment Management Inc.
BROOKFIELD INVESTMENT FUNDS
Notes to Financial Statements (continued)
December 31, 2015
At December 31, 2015, the Real Assets Securities Fund had the following swap agreement outstanding:
OVER THE COUNTER TOTAL RETURN SWAP CONTRACTS1
| Counterparty | Referenced
Obligation | Notional
Amount (000s) | Rate Received
(Paid) | Termination
Date | Unrealized
Appreciation2 |
Morgan Stanley
| Bloomberg Commodity Index | $2,103 | (0.15)% | 01/20/16 | $22,148 |
1 The Real Assets Securities Fund receives monthly payments based on any positive monthly return of the Referenced Obligation. The Real Assets Securities Fund makes payments on any negative monthly return of such Referenced Obligation.
2 There are no upfront payments on the swap contracts listed above, therefore the unrealized appreciation on the contract is equal to its market value.
The following table sets forth the fair value of the Real Assets Securities Fund’s derivative instruments:
| Derivatives | Statement of Assets and Liabilities | Value as of December 31, 2015 |
Swap contracts
(commodity related)
| Receivable for swap contracts (asset) | $22,148 |
The following table sets forth the effect of derivative instruments on the Statement of Operations for the year ended December 31, 2015:
| Derivatives | Location of Gains (Losses) on Derivatives Recognized in Income | Net Realized Loss on Swap contracts | Net Change in Unrealized Appreciation on Swap contracts |
Swap contracts
(commodity related)
| Swap contracts | $(635,300) | $22,148 |
Below is the gross and net information about instruments and transactions eligible for offset in the Statement of Assets and Liabilities as well as instruments and transactions subject to an agreement similar to a master netting arrangement:
| | | | | Gross Amounts not offset in the Statement of Assets and Liabilities | |
| | Gross Amounts of Recognized Assets | Gross Amounts Offset in the Statement of Assets and Liabilities | Net Amounts Presented in the Statement of Assets and Liabilities | Financial Instruments | Collateral Pledged (Received) | Net Amount |
| Description | | | | | | |
Swap contracts
| $22,148 | $— | $22,148 | $— | $— | $— |
6.Shares of Beneficial Interest
The Trust’s Declaration of Trust authorizes the issuance of an unlimited number of full and fractional shares of beneficial interest. With respect to each series, the Trust may offer more than one class of shares. The Trust reserves the right to create and issue additional series or classes. Each share of a series or class represents an equal proportionate interest in that series or class with each other share of that series or class. Currently, each series offers four classes of shares of beneficial interest — “Class A” Shares, “Class C” Shares, “Class Y” Shares, and “Class I” Shares.
BROOKFIELD INVESTMENT FUNDS
Notes to Financial Statements (continued)
December 31, 2015
The shares of each series or class participate equally in the earnings, dividends and assets of the particular series or class.
| | Infrastructure Fund |
| | 2015 3 | | 2014 4 |
| Class A | Shares | | Amount | | Shares | | Amount |
Shares sold
| 663,401 | | $ 8,834,220 | | 3,559,368 | | $ 52,700,999 |
Reinvestment of distributions
| 113,717 | | 1,432,424 | | 252,767 | | 3,682,851 |
Shares redeemed
| (3,125,343) | | (38,660,358) | | (6,072,852) | | (93,265,504) |
Redemption fees
| — | | 2,828 | | — | | 13,307 |
Net Decrease — Class A
| (2,348,225) | | $(28,390,886) | | (2,260,717) | | $(36,868,347) |
| | Infrastructure Fund |
| | 2015 3 | | 2014 4 |
| Class C | Shares | | Amount | | Shares | | Amount |
Shares sold
| 345,999 | | $ 4,571,290 | | 1,524,929 | | $23,010,630 |
Reinvestment of distributions
| 36,448 | | 451,151 | | 69,875 | | 995,294 |
Shares redeemed
| (1,127,206) | | (13,883,057) | | (315,984) | | (4,677,798) |
Redemption fees
| — | | 264 | | — | | 1,907 |
Net Increase (Decrease) — Class C
| (744,759) | | $ (8,860,352) | | 1,278,820 | | $19,330,033 |
| | Infrastructure Fund |
| | 2015 3 | | 2014 4 |
| Class Y | Shares | | Amount | | Shares | | Amount |
Shares sold
| 4,363,711 | | $ 58,280,556 | | 12,347,763 | | $189,546,259 |
Reinvestment of distributions
| 315,984 | | 3,947,985 | | 561,024 | | 8,138,316 |
Shares redeemed
| (11,722,600) | | (149,543,936) | | (4,299,535) | | (63,998,704) |
Redemption fees
| — | | 97,244 | | — | | 29,981 |
Net Increase (Decrease) — Class Y
| (7,042,905) | | $ (87,218,151) | | 8,609,252 | | $133,715,852 |
| | Infrastructure Fund |
| | 2015 3 | | 2014 4 |
| Class I | Shares | | Amount | | Shares | | Amount |
Shares sold
| 12,157,549 | | $161,441,255 | | 4,235,054 | | $ 65,210,224 |
Reinvestment of distributions
| 697,665 | | 8,682,907 | | 626,558 | | 9,110,281 |
Shares redeemed
| (8,174,651) | | (99,663,450) | | (5,975,622) | | (91,882,910) |
Redemption fees
| — | | 303 | | — | | 340 |
Net Increase (Decrease) — Class I
| 4,680,563 | | $ 70,461,015 | | (1,114,010) | | $(17,562,065) |
72Brookfield Investment Management Inc.
BROOKFIELD INVESTMENT FUNDS
Notes to Financial Statements (continued)
December 31, 2015
| | Global Real Estate Fund |
| | 2015 3 | | 2014 4 |
| Class A | Shares | | Amount | | Shares | | Amount |
Shares sold
| 2,216,238 | | $29,961,484 | | 505,857 | | $ 6,626,556 |
Reinvestment of distributions
| 42,828 | | 544,872 | | 18,403 | | 245,449 |
Shares redeemed
| (294,060) | | (3,843,243) | | (504,472) | | (6,794,291) |
Redemption fees
| — | | 4,969 | | — | | 2,471 |
Net Increase — Class A
| 1,965,006 | | $26,668,082 | | 19,788 | | $ 80,185 |
| | Global Real Estate Fund |
| | 2015 3 | | 2014 4 |
| Class C | Shares | | Amount | | Shares | | Amount |
Shares sold
| 356,920 | | $ 4,799,953 | | 272,518 | | $3,583,822 |
Reinvestment of distributions
| 10,219 | | 129,531 | | 7,897 | | 105,369 |
Shares redeemed
| (121,762) | | (1,578,523) | | (34,720) | | (451,696) |
Redemption fees
| — | | 2,683 | | — | | — |
Net Increase — Class C
| 245,377 | | $ 3,353,644 | | 245,695 | | $3,237,495 |
| | Global Real Estate Fund |
| | 2015 3 | | 2014 4 |
| Class Y | Shares | | Amount | | Shares | | Amount |
Shares sold
| 60,121,252 | | $ 784,004,762 | | 5,161,077 | | $ 69,512,130 |
Reinvestment of distributions
| 1,616,019 | | 20,369,419 | | 466,004 | | 6,240,880 |
Shares redeemed
| (9,072,389) | | (118,220,864) | | (949,090) | | (12,546,450) |
Redemption fees
| — | | 93,022 | | — | | 6,142 |
Net Increase — Class Y
| 52,664,882 | | $ 686,246,339 | | 4,677,991 | | $ 63,212,702 |
| | Global Real Estate Fund |
| | 2015 3 | | 2014 4 |
| Class I | Shares | | Amount | | Shares | | Amount |
Shares sold
| 18,324,946 | | $244,551,900 | | 14,385,453 | | $193,698,331 |
Reinvestment of distributions
| 950,314 | | 12,102,573 | | 574,414 | | 7,689,139 |
Shares redeemed
| (4,371,933) | | (56,981,639) | | (4,865,419) | | (65,321,576) |
Redemption fees
| — | | 14,720 | | — | | 55,048 |
Net Increase — Class I
| 14,903,327 | | $199,687,554 | | 10,094,448 | | $136,120,942 |
| | U.S. Real Estate Fund |
| | 2015 3 | | 2014 4 |
| Class A | Shares | | Amount | | Shares | | Amount |
Shares sold
| 11,339 | | $ 126,527 | | 11,112 | | $134,450 |
Reinvestment of distributions
| 235 | | 2,591 | | 981 | | 11,670 |
Shares redeemed
| (13,934) | | (157,833) | | (1,754) | | (21,645) |
Redemption fees
| — | | 394 | | — | | — |
Net Increase (Decrease) — Class A
| (2,360) | | $ (28,321) | | 10,339 | | $124,475 |
BROOKFIELD INVESTMENT FUNDS
Notes to Financial Statements (continued)
December 31, 2015
| | U.S. Real Estate Fund |
| | 2015 3 | | 2014 4 |
| Class C | Shares | | Amount | | Shares | | Amount |
Shares sold
| 34,974 | | $368,854 | | — | | $ — |
Reinvestment of distributions
| 876 | | 9,058 | | 10 | | 117 |
Shares redeemed
| (1,562) | | (18,534) | | — | | — |
Redemption fees
| — | | — | | — | | — |
Net Increase — Class C
| 34,288 | | $359,378 | | 10 | | $117 |
| | U.S. Real Estate Fund |
| | 2015 3 | | 2014 4 |
| Class Y | Shares | | Amount | | Shares | | Amount |
Shares sold
| 29,086 | | $ 346,610 | | 9,439 | | $113,914 |
Reinvestment of distributions
| 2,039 | | 21,443 | | 903 | | 10,757 |
Shares redeemed
| (13,909) | | (161,607) | | (382) | | (4,555) |
Redemption fees
| — | | 369 | | — | | — |
Net Increase — Class Y
| 17,216 | | $ 206,815 | | 9,960 | | $120,116 |
| | U.S. Real Estate Fund |
| | 2015 3 | | 2015 4 |
| Class I | Shares | | Amount | | Shares | | Amount |
Shares sold
| 1,845,951 | | $18,957,916 | | — | | $ — |
Reinvestment of distributions
| 346,781 | | 3,611,862 | | 271,184 | | 3,212,295 |
Shares redeemed
| — | | — | | — | | — |
Redemption fees
| — | | 365 | | — | | — |
Net Increase — Class I
| 2,192,732 | | $22,570,143 | | 271,184 | | $3,212,295 |
| | Real Assets Securities Fund |
| | 2015 3 | | 2014 1,5 |
| Class A | Shares | | Amount | | Shares | | Amount |
Shares sold
| — | | $ — | | 100 | | $1,000 |
Reinvestment of distributions
| 3 | | 23 | | 0 2 | | 2 |
Shares redeemed
| — | | — | | — | | — |
Redemption fees
| — | | — | | — | | — |
Net Increase — Class A
| 3 | | $23 | | 100 | | $1,002 |
| | Real Assets Securities Fund |
| | 2015 3 | | 2014 1,5 |
| Class C | Shares | | Amount | | Shares | | Amount |
Shares sold
| — | | $ — | | 100 | | $1,000 |
Reinvestment of distributions
| 2 | | 17 | | 0 2 | | 2 |
Shares redeemed
| — | | — | | — | | — |
Redemption fees
| — | | — | | — | | — |
Net Increase — Class C
| 2 | | $17 | | 100 | | $1,002 |
74Brookfield Investment Management Inc.
BROOKFIELD INVESTMENT FUNDS
Notes to Financial Statements (continued)
December 31, 2015
| | Real Assets Securities Fund |
| | 2015 3 | | 2014 1,5 |
| Class Y | Shares | | Amount | | Shares | | Amount |
Shares sold
| 241,720 | | $2,404,228 | | 100 | | $1,000 |
Reinvestment of distributions
| 7,109 | | 62,792 | | 0 2 | | 3 |
Shares redeemed
| — | | — | | — | | — |
Redemption fees
| — | | — | | — | | — |
Net Increase — Class Y
| 248,829 | | $2,467,020 | | 100 | | $1,003 |
| | Real Assets Securities Fund |
| | 2015 3 | | 2014 1,5 |
| Class I | Shares | | Amount | | Shares | | Amount |
Shares sold
| 3,776,348 | | $37,631,195 | | 2,500,100 | | $25,001,000 |
Reinvestment of distributions
| 175,627 | | 1,555,186 | | 6,294 | | 61,494 |
Shares redeemed
| (354,451) | | (3,156,246) | | — | | — |
Redemption fees
| — | | — | | — | | — |
Net Increase — Class I
| 3,597,524 | | $36,030,135 | | 2,506,394 | | $25,062,494 |
1 Commencement of operations was November 19, 2014.
2 Rounds to less than 1 share.
3 For the Year Ended December 31, 2015.
4 For the Year Ended December 31, 2014.
5 For the Period Ending December 31, 2014.
7.Credit Facility
U.S. Bank, N.A. (the “Bank”) has made available to the Trust, a credit facility, pursuant to a separate Loan and Security Agreement, for temporary or extraordinary purposes. The maximum line of credit as of December 31, 2015 for the Trust is $75,000,000. For the year ended December 31, 2015, the average interest rate on the outstanding principal amount for the Infrastructure Fund and Global Real Estate Fund was 3.03% and 3.11%, respectively. Advances are not collateralized by a first lien against a Fund’s assets.
During the year ended December 31, 2015, the Infrastructure Fund and Global Real Estate Fund utilized the credit facility for 60 days and 9 days, respectively, and had an outstanding average daily loan balance of $3,089,867 and $2,380,000, respectively. The maximum amount outstanding during the year was $9,754,000 and $3,975,000, respectively, and the interest expense amounted to $15,777 and $1,857, respectively. The U.S. Real Estate Fund and Real Assets Securities Fund did not utilize the credit facility during the year. At December 31, 2015, the Infrastructure Fund, Global Real Estate Fund, U.S. Real Estate Fund and Real Assets Securities Fund did not have a loan payable.
BROOKFIELD INVESTMENT FUNDS
Notes to Financial Statements (continued)
December 31, 2015
8.Federal Income Tax Information
Income and capital gain distributions are determined in accordance with federal income tax regulations, which may differ from GAAP.
The tax character of distributions paid for the year ended December 31, 2015 were as follows:
| | Infrastructure Fund | | Global Real Estate Fund | | U.S. Real Estate Fund | | Real Assets Securities Fund |
Ordinary income (including short-term capital gains)
| $ 3,314,834 | | $27,449,244 | | $1,663,264 | | $1,313,107 |
Long-term capital gains
| — | | 7,820,550 | | 1,981,690 | | — |
Return of capital
| 12,576,473 | | 1,476,629 | | — | | 406,554 |
Total distributions
| $15,891,307 | | $36,746,423 | | $3,644,954 | | $1,719,661 |
The tax character of distributions paid for the year ended December 31, 2014 were as follows:
| | Infrastructure Fund | | Global Real Estate Fund | | U.S. Real Estate Fund | | Real Assets Securities Fund1 |
Ordinary income (including short-term capital gains)
| $19,713,037 | | $15,758,584 | | $3,113,163 | | $72,352 |
Long-term capital gains
| 5,740,453 | | 2,587,203 | | 121,675 | | — |
Total distributions
| $25,453,490 | | $18,345,787 | | $3,234,838 | | $72,352 |
1 From the commencement of operations on November 19, 2014.
A notice disclosing the source(s) of a distribution is provided after a payment is made from any source other than net investment income. Any such notice is provided only for informational purposes in order to comply with the requirements of Section 19(a) of the 1940 Act and not for tax reporting purposes. The tax composition of the Fund’s distributions for each calendar year is reported on IRS Form 1099-DIV.
At December 31, 2015, the Fund's most recently completed tax year-end, the components of net assets (excluding paid-in capital) on a tax basis were as follows:
| | Infrastructure Fund | | Global Real Estate Fund | | U.S. Real Estate Fund | | Real Assets Securities Fund |
Post-October Loss
| $ — | | $ (1,926,953) | | $ — | | $ — |
Capital loss carryforward(1)
| (38,984,170) | | — | | — | | (3,944,779) |
Undistributed Long-term capital gains
| — | | — | | 375,486 | | — |
Other accumulated losses
| (2,984,022) | | (1,045,784) | | 1 | | 5,992 |
Book basis unrealized appreciation
(depreciation)
| (13,671,715) | | (36,982,392) | | 457,371 | | (6,659,163) |
Plus: Cumulative timing difference
| — | | — | | — | | — |
Tax basis unrealized appreciation
(depreciation) on investments
| (13,671,715) | | (36,982,392) | | 457,371 | | (6,659,163) |
Total tax basis net accumulated gains
(losses)
| $(55,639,907) | | $(39,955,129) | | $832,858 | | $(10,597,950) |
As of December 31, 2015, the Infrastructure Fund's capital loss carryforwards was $38,984,170 from long-term capital gains, the Real Assets Securities Fund's capital loss carryforwards was $3,865,841 for short-term gains and $78,938 for long-term capital gains which will not expire. As of December 31, 2015, the Global Real Estate Fund and U.S. Real Estate Fund had no capital loss carryforwards.
76Brookfield Investment Management Inc.
BROOKFIELD INVESTMENT FUNDS
Notes to Financial Statements (concluded)
December 31, 2015
Federal Income Tax Basis: The federal income tax basis of each Fund's investments, not including foreign currency translation, at December 31, 2015 was as follows:
| Fund | Cost of Investments | Gross Unrealized Appreciation | Gross Unrealized Depreciation | Net Unrealized Appreciation (Depreciation) |
Infrastructure Fund
| $ 324,072,616 | $30,052,455 | $(43,724,170) | $(13,671,715) |
Global Real Estate Fund
| 1,225,054,415 | 38,985,973 | (75,968,365) | (36,982,392) |
U.S. Real Estate Fund
| 50,335,442 | 4,054,353 | (3,596,982) | 457,371 |
Real Assets Securities Fund
| 55,625,362 | 972,884 | (7,632,047) | (6,659,163) |
Capital Account Reclassifications: Because federal income tax regulations differ in certain respects from GAAP, income and capital gain distributions, if any, determined in accordance with tax regulations may differ from net investment income and realized gains recognized for financial reporting purposes. These differences are primarily due to differing treatments for wash sales, partnership income/expense and return of capital. Permanent book and tax differences, if any, relating to shareholder distributions will result in reclassifications to paid-in-capital or to undistributed capital gains. These reclassifications have no effect on net assets or NAV per share.
| | Paid-in capital | Distributions in Excess of Net Investment Income | Accumulated Net Realized Gains (Losses) |
Infrastructure Fund
| $690,429 | $(3,936,090) | $ 3,245,661 |
Global Real Estate Fund
| — | 9,598,818 | (9,598,818) |
U.S. Real Estate Fund
| — | 485,161 | (485,161) |
Real Assets Securities Fund
| (85,576) | (26,556) | 112,132 |
9.Indemnification
Under the Funds’ organizational documents, its officers and trustees are indemnified against certain liabilities arising out of the performance of their duties to the Funds. In addition, in the normal course of business, the Trust, on behalf of the Funds, enters into contracts with vendors and others that provide for indemnification. The Funds’ maximum exposure under these arrangements is unknown, since this would involve the resolution of certain claims, as well as future claims that may be made, against the Funds. Thus an estimate of the financial impact, if any, of these arrangements cannot be made at this time. However, based on experience, the Funds expect the risk of loss due to these warranties and indemnities to be unlikely.
10.Subsequent Events
GAAP requires recognition in the financial statements of the effects of all subsequent events that provide additional evidence about conditions that existed at the date of the Statements of Assets and Liabilities. For non-recognized subsequent events that must be disclosed to keep the financial statements from being misleading, the Funds are required to disclose the nature of the event as well as an estimate of their financial effect, or a statement that such an estimate cannot be made.
Management has evaluated subsequent events in the preparation of the Funds' financial statements and has determined that herein, there are no additional events that require recognition or disclosure in the financial statements.
BROOKFIELD INVESTMENT FUNDS
Report of Independent Registered Public Accounting Firm
December 31, 2015
To the Board of Trustees of Brookfield Investment Funds and Shareholders of:
Brookfield Global Listed Infrastructure Fund
Brookfield Global Listed Real Estate Fund
Brookfield U.S. Listed Real Estate Fund
Brookfield Real Assets Securities Fund
We have audited the accompanying statements of assets and liabilities, including the schedules of investments, of Brookfield Global Listed Infrastructure Fund, Brookfield Global Listed Real Estate Fund, Brookfield U.S. Listed Real Estate Fund, and Brookfield Real Assets Securities Fund (collectively, the “Funds”), each a series comprising the Brookfield Investment Funds as of December 31, 2015, and the related statements of operations for the year then ended, the statements of changes in net assets for each of the two years in the period then ended (as to Brookfield Real Assets Securities Fund, for the year then ended, and for the period November 19, 2014 (commencement of operations) through December 31, 2014), and the financial highlights for each of the periods presented. These financial statements and financial highlights are the responsibility of the Funds' management. Our responsibility is to express an opinion on these financial statements and financial highlights based on our audits.
We conducted our audits in accordance with the standards of the Public Company Accounting Oversight Board (United States). Those standards require that we plan and perform the audit to obtain reasonable assurance about whether the financial statements and financial highlights are free of material misstatement. The Funds are not required to have, nor were we engaged to perform, an audit of their internal control over financial reporting. Our audits included consideration of internal control over financial reporting as a basis for designing audit procedures that are appropriate in the circumstances, but not for the purpose of expressing an opinion on the effectiveness of the Funds' internal control over financial reporting. Accordingly, we express no such opinion. An audit also includes examining, on a test basis, evidence supporting the amounts and disclosures in the financial statements, assessing the accounting principles used and significant estimates made by management, as well as evaluating the overall financial statement presentation. Our procedures included confirmation of securities owned as of December 31, 2015, by correspondence with the custodian and brokers; where replies were not received from brokers, we performed other auditing procedures. We believe that our audits provide a reasonable basis for our opinion.
In our opinion, the financial statements and financial highlights referred to above present fairly, in all material respects, the financial position of Brookfield Global Listed Infrastructure Fund, Brookfield Global Listed Real Estate Fund, Brookfield U.S. Listed Real Estate Fund, and Brookfield Real Assets Securities Fund, each a series comprising the Brookfield Investment Funds as of December 31, 2015, and the results of their operations for the period then ended, the changes in their net assets and the financial highlights for each of the periods presented, in conformity with accounting principles generally accepted in the United States of America.
DELOITTE & TOUCHE LLP
Philadelphia, Pennsylvania
February 26, 2016
78Brookfield Investment Management Inc.
BROOKFIELD INVESTMENT FUNDS
Tax Information (Unaudited)
December 31, 2015
QUALIFIED DIVIDEND INCOME/DIVIDENDS RECEIVED DEDUCTION
For the fiscal year ended December 31, 2015, certain dividends paid by the Funds may be subject to a maximum tax rate of 15%, as provided for by the Jobs and Growth Tax Relief Reconciliation Act of 2003. The percentage of dividends declared from ordinary income designated as qualified dividend income was as follows:
Infrastructure Fund
| 100.00% |
Global Real Estate Fund
| 32.40% |
U.S. Real Estate Fund
| 23.27% |
Real Assets Securities Fund
| 48.24% |
For corporate shareholders, the percentage of ordinary distributions qualifying for the corporate dividends received deductions for the year ended December 31, 2015, was as follows:
Infrastructure Fund
| 100.00% |
Global Real Estate Fund
| 7.40% |
U.S. Real Estate Fund
| 15.50% |
Real Assets Securities Fund
| 18.80% |
The percentage of taxable ordinary income distributions that are designated as short-term capital gain distributions under the Internal Revenue Section 871(k)(2)(C) for each Fund was as follows:
Infrastructure Fund
| 0.00% |
Global Real Estate Fund
| 28.41% |
U.S. Real Estate Fund
| 37.44% |
Real Assets Securities Fund
| 0.00% |
BROOKFIELD INVESTMENT FUNDS
Information Concerning Directors and Officers (Unaudited)
The following tables provide information concerning the trustees and officers of the Funds.
Trustees of the Fund
| Name, Address and Age | Position(s) Held with Funds and Term of Office and Length of Time Served | Principal Occupation(s) During Past 5 Years and Other Directorships Held by Trustee | Number of Portfolios in Fund Complex |
| Independent Trustees | | | |
Edward A. Kuczmarski
c/o Brookfield Place,
250 Vesey Street,
New York, New York
10281-1023
Born: 1949 | Director, Chairman of the Board, Member of the Audit Committee, Chairman of the Nominating and Compensation Committee Served Since 2011 | Director/Trustee of several investment companies advised by the Adviser (2011-Present); Certified Public Accountant and Retired Partner of Crowe Horwath LLP (1980-2013); Trustee of the Empire Builder Tax Free Bond Fund (1984-2013); Director of ISI Funds (2007-2015); Trustee of the Daily Income Fund (2006-2015), Director of the California Daily Tax Free Income Fund, Inc. (2006-2015); Trustee of the Stralem Funds (2014-Present). | 9 |
Louis P. Salvatore
c/o Brookfield Place,
250 Vesey Street,
New York, New York
10281-1023
Born: 1946 | Director, Chairman of the Audit Committee, Member of the Nominating and Compensation Committee Served Since 2011 | Director/Trustee of several investment companies advised by the Adviser (2005-Present); Director of SP Fiber Technologies, Inc. (2012-2015); Director of Gramercy Property Trust (2012-Present); Director of Turner Corp. (2003-Present); Director of Jackson Hewitt Tax Services, Inc. (2004-2011); Employee of Arthur Andersen LLP (2002-Present). | 9 |
Stuart A. McFarland
c/o Brookfield Place,
250 Vesey Street,
New York, New York
10281-1023
Born: 1947 | Director, Member of the Audit Committee, Member of the Nominating and Compensation Committee Served Since 2013 | Director/Trustee of several investment companies advised by the Adviser (2006-Present); Director of United Guaranty Corporation (2011-Present); Director of Brandywine Funds (2003-2013); Director of New Castle Investment Corp. (2000-Present); Managing Partner of Federal City Capital Advisors (1997-Present); Director of New America High Income Fund (2013-Present); Director of New Senior Investment Group, Inc. (2014-Present). | 9 |
Heather S. Goldman
c/o Brookfield Place,
250 Vesey Street,
New York, New York
10281-1023
Born: 1967 | Director, Member of the Audit Committee, Member of the Nominating and Compensation Committee Served Since 2013 | Director/Trustee of several investment companies advised by the Adviser (2013-Present); Global Head of Marketing and Business Development of the Adviser (2011-2013); Managing Partner of Brookfield Financial (2009-2011); Director and Board Chair of University Settlement House (2003-2013); Member of the Honorary Board of University Settlement House (2014-Present); Co-Founder & President of Capstak, Inc. (2014-Present). | 9 |
80Brookfield Investment Management Inc.
BROOKFIELD INVESTMENT FUNDS
Information Concerning Directors and Officers (Unaudited) (continued)
Trustees of the Fund (continued)
| Name, Address and Age | Position(s) Held with Funds and Term of Office and Length of Time Served | Principal Occupation(s) During Past 5 Years and Other Directorships Held by Trustee | Number of Portfolios in Fund Complex |
| Interested Trustee | | | |
Jonathan C. Tyras
c/o Brookfield Place,
250 Vesey Street,
New York, New York
10281-1023
Born: 1968 | Director Served Since 2014 | Managing Director and Chief Financial Officer of the Adviser (2010-Present); General Counsel and Secretary of the Adviser (2006-Present); Director/Trustee of several investment companies advised by the Adviser (2012-Present); Secretary of several investment companies advised by the Adviser (2006-2014); Vice President of Brookfield Investment Funds (2011-2014); Chief Financial Officer of Brookfield Investment Management (UK) Limited (2011-Present); Director of Brookfield Investment Management (UK) Limited (2013-Present); Chief Financial Officer of Brookfield Investment Management (Canada) Inc. (2011-Present); Director of Brookfield Investment Management (Canada) Inc. (2015-Present); Chief Executive Officer of Brookfield Investment Management (US) LLC (2011-Present); Managing Director of AMP Capital Brookfield Pty Limited (2011-2012); Chairman of Brookfield Soundvest Capital Management (2015-Present). | 9 |
BROOKFIELD INVESTMENT FUNDS
Information Concerning Directors and Officers (Unaudited) (continued)
Officers of the Fund
| Name, Address and Year of Birth | Position(s) Held with Funds | Term of Office and Length of Time Served | Principal Occupation(s) During Past 5 Years |
Brian F. Hurley*
c/o Brookfield Place,
250 Vesey Street,
New York, New York
10281-1023
Born: 1977 | President | Since 2014 | President of several investment companies advised by the Adviser (2014-Present); Managing Director (2014-Present) and Assistant General Counsel (2010-Present) of the Adviser; Director of the Adviser (2010-2014); Secretary of Brookfield Investment Funds (2011-2014); Director of Brookfield Soundvest Capital Management (2015-Present). |
Angela W. Ghantous*
c/o Brookfield Place,
250 Vesey Street,
New York, New York
10281-1023
Born: 1975 | Treasurer | Since 2012 | Treasurer of several investment companies advised by the Adviser (2012-Present); Director of the Adviser (2012-Present); Vice President of the Adviser (2009-2012). |
Alexis I. Rieger*
c/o Brookfield Place,
250 Vesey Street,
New York, New York
10281-1023
Born: 1980 | Secretary | Since 2014 | Secretary of several investment companies advised by the Adviser (2014-Present); Vice President and Associate General Counsel of the Adviser (2011-Present). |
Seth Gelman*
c/o Brookfield Place,
250 Vesey Street,
New York, New York
10281-1023
Born: 1975 | Chief Compliance Officer (“CCO”) | Since 2011 | CCO of several investment companies advised by the Adviser (2009-Present); CCO of the Adviser (2009-Present). |
* Interested person as defined by the Investment Company Act of 1940, as amended (the “1940 Act”) because of affiliations with Brookfield Investment Management Inc., Adviser of the Fund.
The Fund’s Statement of Additional Information includes additional information about the directors, and is available, without charge, upon request by calling 1-855-777-8001.
82Brookfield Investment Management Inc.
BROOKFIELD INVESTMENT FUNDS
Joint Notice of Privacy Policy (Unaudited)
Brookfield Investment Management Inc. (“BIM”), on its own behalf and on behalf of the funds managed by BIM and its affiliates, recognizes and appreciates the importance of respecting the privacy of our clients and shareholders. Our relationships are based on integrity and trust and we maintain high standards to safeguard your non-public personal information (“Personal Information”) at all times. This privacy policy (“Policy”) describes the types of Personal Information we collect about you, the steps we take to safeguard that information and the circumstances in which it may be disclosed.
If you hold shares of a Fund through a financial intermediary, such as a broker, investment adviser, bank or trust company, the privacy policy of your financial intermediary will also govern how your Personal Information will be shared with other parties.
WHAT INFORMATION DO WE COLLECT?
We collect the following Personal Information about you:
| • | Information we receive from you in applications or other forms, correspondence or conversations, including but not limited to name, address, phone number, social security number, assets, income and date of birth. |
| • | Information about transactions with us, our affiliates, or others, including but not limited to account number, balance and payment history, parties to transactions, cost basis information, and other financial information. |
| • | Information we may receive from our due diligence, such as your creditworthiness and your credit history. |
WHAT IS OUR PRIVACY POLICY?
We may share your Personal Information with our affiliates in order to provide products or services to you or to support our business needs. We will not disclose your Personal Information to nonaffiliated third parties unless 1) we have received proper consent from you; 2) we are legally permitted to do so; or 3) we reasonably believe, in good faith, that we are legally required to do so. For example, we may disclose your Personal Information with the following in order to assist us with various aspects of conducting our business, to comply with laws or industry regulations, and/or to effect any transaction on your behalf;
| • | Unaffiliated service providers (e.g. transfer agents, securities broker-dealers, administrators, investment advisors or other firms that assist us in maintaining and supporting financial products and services provided to you); |
| • | Government agencies, other regulatory bodies and law enforcement officials (e.g. for reporting suspicious transactions); |
| • | Other organizations, with your consent or as directed by you; and |
| • | Other organizations, as permitted or required by law (e.g. for fraud protection) |
When we share your Personal Information, the information is made available for limited purposes and under controlled circumstances designed to protect your privacy. We require third parties to comply with our standards for security and confidentiality.
HOW DO WE PROTECT CLIENT INFORMATION?
We restrict access to your Personal Information to those persons who require such information to assist us with providing products or services to you. It is our practice to maintain and monitor physical, electronic, and procedural safeguards that comply with federal standards to guard client nonpublic personal information. We regularly train our employees on privacy and information security and on their obligations to protect client information.
CONTACT INFORMATION
For questions concerning our Privacy Policy, please contact our client services representative at 1-855-777-8001.
[THIS PAGE IS INTENTIONALLY LEFT BLANK]
[THIS PAGE IS INTENTIONALLY LEFT BLANK]
[THIS PAGE IS INTENTIONALLY LEFT BLANK]
Investment Adviser and Administrator
Brookfield Investment Management Inc.
Brookfield Place
250 Vesey Street, 15th Floor
New York, New York 10281-1023
www.brookfieldim.com
Please direct your inquiries to:
Investor Relations
Phone: 1-855-777-8001
E-mail: funds@brookfield.com
Transfer Agent
Shareholder inquiries relating to distributions, address changes and shareholder account information should be directed to the Funds’ transfer agent:
U.S. Bancorp Fund Services, LLC
615 East Michigan Street
Milwaukee, Wisconsin 53202
1-855-244-4859
Fund Accounting Agent
U.S. Bancorp Fund Services, LLC
615 East Michigan Street
Milwaukee, Wisconsin 53202
Sub-Administrator
U.S. Bancorp Fund Services, LLC
1201 South Alma School Road, Suite 3000
Mesa, Arizona 85210
Independent Registered Public Accounting Firm
Deloitte & Touche LLP
1700 Market Street
Philadelphia, Pennsylvania 19103
Legal Counsel
Paul Hastings LLP
75 East 55th Street
New York, New York 10022
Custodian
U.S. Bank National Association
1555 North River Center Drive, Suite 302
Milwaukee, Wisconsin 53212
Distributor
Quasar Distributors, LLC
615 East Michigan Street
Milwaukee, Wisconsin 53202
The Funds file their complete schedule of portfolio holdings with the SEC for the first and third quarters of each fiscal year on Form N-Q. The Funds' Form N-Q will be available on the SEC's website at www.sec.gov. In addition, the Funds' Form N-Q may be reviewed and copied at the SEC's Public Reference Room in Washington, D.C. Information on the operation of the Public Reference Room may be obtained by calling 1-800-SEC-0330.
You may obtain a description of the Funds' proxy voting policies and procedures, and information regarding how the Funds voted proxies relating to portfolio securities during the most recent 12-month period ended June 30, without charge, upon request by calling 1-855-777-8001, or go to the SEC's website at www.sec.gov.
Brookfield Investment Management Inc.
Brookfield Place
250 Vesey Street, 15th Floor
New York, New York 10281-1023
1-855-777-8001
www.brookfieldim.com
Item 2. Code of Ethics.
As of the end of the period covered by this report, the Registrant had adopted a Code of Ethics for Principal Executive and Principal Financial Officers (the “Code”). There were no amendments to or waivers from the Code during the period covered by this report. A copy of the Registrant’s Code will be provided upon request to any person without charge by contacting Investor Relations at (855) 777-8001 or by writing to Secretary, Brookfield Investment Funds, Brookfield Place, 250 Vesey Street, 15th Floor, New York, NY 10281-1023.
Item 3. Audit Committee Financial Expert.
The Registrant’s Board of Directors has determined that three members serving on the Registrant’s audit committee are audit committee financial experts. Their names are Edward A. Kuczmarski, Stuart A. McFarland and Louis P. Salvatore. Messrs. Kuczmarski, McFarland and Salvatore are each independent.
Item 4. Principal Accountant Fees and Services.
(a) Audit Fees
The aggregate fees billed by the Funds’ independent registered public accounting firm, Deloitte & Touche LLP (“Deloitte”), to the Funds for the Funds’ two most recent fiscal years for professional services rendered for the audit of the Registrant’s annual financial statements and the review of financial statements that are included in the Registrant’s annual and semi-annual reports to shareholders (“Audit Fees”) were $131,250 and $148,000 for the fiscal years ended December 31, 2015 and December 31, 2014, respectively.
(b) Audit-Related Fees
There were no fees billed by Deloitte to the Funds in its two recent fiscal years for services rendered for assurance and related services that are reasonably related to the performance of the audit or review of the Fund’s financial statements, but are not reported as Audit Fees (“Audit-Related Fees”).
For the Funds’ two most recent fiscal years, there were no Audit-Related Fees billed by Deloitte for engagements related directly to the operations and financial reporting of one or more Funds by a Fund Service Provider. A Fund Service Provider is (a) any investment adviser to the Fund (not including any Subadvisor whose role is primarily portfolio management and is subcontracted with or overseen by another investment adviser) or (b) any entity that provides ongoing services to the Fund and is controlling, controlled by or under common control with a Fund investment adviser described in (a).
(c) Tax Fees
For the fiscal years ended December 31, 2015 and December 31, 2014, Deloitte billed the Registrant aggregate fees of $32,400 and $24,000, respectively. Each bill is for professional services rendered for tax compliance, tax advice and tax planning. The nature of the services comprising the Tax Fees was the review of the Registrant’s income tax returns and tax distribution requirements.
For the Funds’ two most recent fiscal years, Tax Fees billed by Deloitte for engagements by Fund Service Providers that related directly to the operations and financial reporting of the Funds were $0 for fiscal 2015 and $0 for fiscal 2014, respectively.
The services for which Tax Fees were charged comprise all services performed by professional staff in Deloitte’s tax division except those services related to the audit. Typically, this category would include fees for tax compliance, tax planning, and tax advice. Tax compliance, tax advice, and tax planning services include preparation of original and amended tax returns, claims for refund and tax payment-planning services, assistance with tax audits and appeals, tax advice related to mergers and acquisitions and requests for rulings or technical advice from taxing authorities.
(d) All Other Fees
There were no other fees billed by Deloitte to the Funds for all other non-audit services (“Other Fees”) for the fiscal years ended December 31, 2015 and December 31, 2014. During the same period, there were no Other Fees billed by Deloitte for engagements by Fund Service Providers that related directly to the operations and financial reporting of the Funds.
(e) (1) According to policies adopted by the Audit Committee, services provided by Deloitte to the Funds must be pre-approved by the Audit Committee. On an annual basis, the Audit Committee reviews and pre-approves various types of services that Deloitte may perform for the Funds without specific approval of each engagement, subject to specified budget limitations. As contemplated by the Sarbanes-Oxley Act of 2002 and related SEC rules, the Audit Committee also pre-approves non-audit services provided by Deloitte to any Fund Service Provider for any engagement that relates directly to the operations and financial reporting of the Funds. Any engagement that is not already pre-approved or that will exceed a pre-approved budget must be submitted to the Audit Committee for pre-approval.
(e) (2) None.
(f) Not applicable.
(g) The aggregate fees billed by Deloitte in 2015 and 2014 for non-audit services rendered to the Funds and Fund Service Providers were $347,400 and $324,000, respectively. For the fiscal year ended December 31, 2015, this amount reflects the amounts disclosed above in Item 4(b),(c),(d), plus $315,000 in fees billed to the Fund Service Providers for non-audit services that did not relate directly to the operations and financial reporting of the Funds. For the fiscal year ended December 31, 2014, this amount reflects the amounts disclosed above in Item 4(b),(c),(d), plus $300,000 in fees billed to the Fund Service Providers for non-audit services that did not relate directly to the operations and financial reporting of the Funds.
(h) The Trust’s Audit Committee has considered whether the provision of non-audit services by registrant’s independent registered public accounting firm to the registrant’s investment advisor, and any entity controlling, controlled, or under common control with the investment advisor that provided ongoing services to the registrant that were not pre-approved by the Committee (because such services did not relate directly to the operations and financial reporting of the registrant) was compatible with maintaining the independence of the independent registered public accounting firm.
Item 5. Audit Committee of Listed Registrants.
Not applicable.
Item 6. Investments.
Schedule of Investments is included as part of the report to shareholders filed under Item 1 of this Form.
Item 7. Disclosure of Proxy Voting Policies and Procedures for Closed-End Management Investment Companies.
Not applicable.
Item 8. Portfolio Managers of Closed-End Management Investment Companies.
Not applicable.
Item 9. Purchases of Equity Securities by Closed-End Management Investment Company and Affiliated Purchasers.
Not applicable.
Item 10. Submission of Matters to a Vote of Security Holders.
The registrant’s nominating committee charter does not contain any procedure by which shareholders may recommend nominees to the registrant’s board of trustees.
Item 11. Controls and Procedures.
(a) The Registrant’s principal executive officer and principal financial officer have concluded that the Registrant’s Disclosure Controls and Procedures are effective, based on their evaluation of such Disclosure Controls and Procedures as of a date within 90 days of the filing of this report on Form N-CSR.
(b) As of the date of filing this Form N-CSR, the Registrant’s principal executive officer and principal financial officer are aware of no changes in the Registrant’s internal control over financial reporting that occurred during the Registrant’s second fiscal quarter of the period covered by this report that has materially affected or is reasonably likely to materially affect the Registrant’s internal control over financial reporting.
Item 12. Exhibits.
(a)(1) None.
(2) A separate certification for each principal executive officer and principal financial officer of the Registrant as required by Rule 30a-2(a) under the Investment Company Act of 1940 is attached as an exhibit to this Form N-CSR.
(3) Not Applicable.
(b) A separate certification for each principal executive officer and principal financial officer of the Registrant as required by Rule 30a-2(b) under the Investment Company Act of 1940 is attached as an exhibit to this Form N-CSR.
SIGNATURES
Pursuant to the requirements of the Securities Exchange Act of 1934 and the Investment Company Act of 1940, the Registrant has duly caused this report to be signed on its behalf by the undersigned, thereunto duly authorized.
BROOKFIELD INVESTMENT FUNDS
| | |
By: | | /s/ Brian F. Hurley |
| | Brian F. Hurley |
| | President and Principal Executive Officer |
|
| Date: February 29, 2016 |
Pursuant to the requirements of the Securities Exchange Act of 1934 and the Investment Company Act of 1940, this report has been signed below by the following persons on behalf of the Registrant and in the capacities and on the dates indicated.
| | |
| By: | | /s/ Brian F. Hurley |
| | Brian F. Hurley |
| | President and Principal Executive Officer |
|
| Date: February 29, 2016 |
| | |
| By: | | /s/ Angela W. Ghantous |
| | Angela W. Ghantous |
| | Treasurer and Principal Financial Officer |
|
| Date: February 29, 2016 |