UNITED STATES
SECURITIES AND EXCHANGE COMMISSION
WASHINGTON, D.C. 20549
FORM N-CSR
CERTIFIED SHAREHOLDER REPORT OF REGISTERED
MANAGEMENT INVESTMENT COMPANIES
Investment Company Act file number 811-22558
BROOKFIELD INVESTMENT FUNDS
(Exact name of registrant as specified in charter)
BROOKFIELD PLACE
250 VESEY STREET
NEW YORK, NEW YORK 10281-1023
(Address of principal executive offices) (Zip code)
KIM G. REDDING, PRESIDENT
BROOKFIELD INVESTMENT FUNDS
BROOKFIELD PLACE
250 VESEY STREET
NEW YORK, NEW YORK 10281-1023
(Name and address of agent for service)
Registrant’s telephone number, including area code: (800) 497-3746
Date of fiscal year end: December 31, 2012
Date of reporting period: December 31, 2012
Item 1. Reports to Shareholders.
IN PROFILE
Brookfield is a global alternative asset manager with approximately $175 billion in assets under management as of December 31, 2012. We have over a 100-year history of owning and operating assets with a focus on property, renewable power, infrastructure and private equity. We offer a range of public and private investment products and services, which leverage our expertise and experience and provide us with a distinct competitive advantage in the markets where we operate. On behalf of our clients, Brookfield is also an active investor in the public securities markets, where our experience extends over 30 years. Over this time, we have successfully developed several investment operations and built expertise in the management of institutional portfolios, retail mutual funds, and structured product investments.
Through our registered investment advisor, Brookfield Investment Management Inc., our public market activities complement our core competencies as a direct investor. These activities encompass global listed real estate and infrastructure equities, corporate high yield investments, opportunistic credit strategies and a dedicated insurance asset management division. Headquartered in New York, NY, Brookfield Investment Management Inc. maintains offices and investment teams in Toronto, Chicago, Boston and London.
This report is for shareholder information. This is not a prospectus intended for the use in the purchase or sale of Fund shares.
| | | | | | |
| NOT FDIC INSURED | | MAY LOSE VALUE | | | NOT BANK GUARANTEED | |
© Copyright 2012. Brookfield Investment Management Inc.
LETTER TO SHAREHOLDERS
Dear Shareholders,
I am pleased to provide the Annual Report for Brookfield Global Listed Real Estate Fund (the “Real Estate Fund”), Brookfield Global Listed Infrastructure Fund (the “Infrastructure Fund”) and Brookfield High Yield Fund (the “High Yield Fund”) (each a “Fund” and, collectively, the “Funds”) for the year ended December 31, 2012.
Despite ongoing macroeconomic volatility and political uncertainty, global capital markets generally experienced positive results during 2012. Investor confidence improved as the year progressed, due in large part to meaningful central bank activity around the world. Further momentum was provided by signs of stabilization within the global economy, as the U.S. housing market continued to heal, sovereign debt concerns in Europe began to subside, and evidence of stability emerged in China. With liquidity continuing to flood the market and interest rates remaining near historic lows, risk tolerance levels began to increase once again.
Within this environment, demand for income-producing asset classes with upside growth potential began to accelerate. In particular, real estate and infrastructure equities produced attractive returns, as investors sought the unique combination of yield, stability and growth offered by these securities. Similarly, high yield corporate bonds provided impressive returns, as strong corporate credit and liquidity as well as attractive spreads led to continued demand for the asset class.
Moving forward, we expect demand for higher-yielding investments to remain strong, particularly as interest rates and inflation remain muted. We maintain our positive outlook for real estate and infrastructure equities, both of which offer bond-like current income, relatively stable cash flows and equity return potential. Additionally, we anticipate demand for Real Assets to accelerate in the near term, as investors recognize the portfolio benefits of increased allocations to the asset class. The public markets offer a highly liquid and transparent means of achieving these allocations, which should directly benefit public real estate and infrastructure securities.
Furthermore, we continue to believe that high yield bonds represent an attractive investment option, as robust corporate cash flows, stable interest rates and solid credit discipline remain supportive of the market. We acknowledge potential challenges to future performance, from uncertain fiscal policy in the U.S. to low nominal yields and above par pricing in the high yield market. However, yield spreads remain attractive and corporate earnings are generally positive, suggesting high yield bonds continue to be a compelling source of stability and yield.
In addition to performance information, this report provides the Funds’ audited financial statements including the schedules of investments as of December 31, 2012.
We welcome your questions and comments, and encourage you to contact our Investor Relations team at (800) 497-3746 or visit us at www.brookfieldim.com for more information. Thank you for your support.
Sincerely,

Kim G. Redding
President
2012 Annual Report
1
LETTER TO SHAREHOLDERS (continued)
The Dow Jones Brookfield Global Infrastructure Composite Index was created on July 1, 2008 and is comprised of infrastructure companies with at least 70% of its annual cash flows derived from owning and operating infrastructure assets. The Index is maintained by Dow Jones Indexes. The Index is unmanaged and, unlike the Fund, is not affected by cash flows or trading and other expenses. It is not possible to invest directly in an index. Index performance is shown for illustrative purposes only and does not predict or depict the performance of the Fund.
The FTSE EPRA/NAREIT Developed Index is calculated by the FTSE Group. Performance is calculated by price, total return and net total return and the Index is calculated daily. Constituents must meet minimum market capitalization, liquidity requirements, and real estate activity requirements in order to be included within the Index. North American and Asian companies must be of a minimum of US$200 million in market capitalization with liquidity of US$100 million. European companies are bound by US$50 million market cap minimum and liquidity of US$25 million. The Index is unmanaged and, unlike the Fund, is not affected by cash flows or trading and other expenses. It is not possible to invest directly in an index. Index performance is shown for illustrative purposes only and does not predict or depict the performance of the Fund.
The BofA Merrill Lynch U.S. High Yield Master II Index is an unmanaged index that tracks the performance of below investment grade U.S. dollar-denominated corporate bonds publicly issued in the U.S. domestic market. The Index is unmanaged and, unlike the Fund, is not affected by cash flows or trading and other expenses. It is not possible to invest directly in an index. Index performance is shown for illustrative purposes only and does not predict or depict the performance of the Fund.
These views represent the opinions of Brookfield Investment Management Inc. and are not intended to predict or depict the performance of any investment. These views are as of the close of business on December 31, 2012 and subject to change based on subsequent developments.
Must be preceded or accompanied by a prospectus.
Mutual fund investing involves risk. Principal loss is possible. Investors should be aware of the risks involved with investing in a fund concentrating in REITs and real estate securities, such as declines in the value of real estate and increased susceptibility to adverse economic or regulatory developments. Investments in infrastructure entities involve greater exposure to the potential adverse economic, regulatory, political and other changes affecting such entities. Investment in lower-rated and non-rated securities presents a greater risk of loss to principal and interest than higher-rated securities. Investments in asset-backed and mortgage-backed securities include additional risks that investors should be aware of, such as credit risk, prepayment risk, possible illiquidity and default, as well as increased susceptibility to adverse economic developments. Investments in debt securities typically decrease in value when interest rates rise. This risk is usually greater for longer-term debt securities. Investments in foreign securities involve greater volatility and political, economic and currency risks and differences in accounting methods.
Quasar Distributors, LLC is the distributor of Brookfield Investment Funds.
Brookfield Investment Management Inc.
2
ABOUT YOUR FUND’S EXPENSES
As a shareholder of a fund, you may incur two types of costs: (1) transaction costs, including sales charges (loads) on purchase payments, reinvested dividends or other distributions, redemption fees and exchange fees; and (2) ongoing costs, including management fees, distribution (12b-1) fees and other fund expenses. This example is intended to help you understand your ongoing costs (in dollars) of investing in the Fund and to compare these costs with the ongoing costs of investing in other mutual funds. The example is based on an investment of $1,000 invested at the beginning of the period and held for the entire period as indicated below.
Actual Fund Return
The table below provides information about actual account values and actual expenses. You may use the information on this line, together with the amount you invested, to estimate the expense that you paid over the period. Simply divide your account value by $1,000 (for example, an $8,600 account value divided by $1,000 = 8.6), then multiply the result by the number in the first line under the heading entitles “Expenses Paid During Period” to estimate the expenses you paid on your account during this period.
Hypothetical Example for Comparison Purposes
The table below also provides information about hypothetical account values and hypothetical expenses, which are based on the Fund’s actual expense ratio and an assumed rate of return of 5% per year before expenses, which is not the Fund’s actual return. The hypothetical account values and expenses may not be used to estimate the actual ending account balance or expenses you paid for the period. You may use this information to compare the ongoing costs of investing in the Fund and the other funds. To do so, compare this 5% hypothetical example with hypothetical examples that appear in shareholders’ reports of other funds.
Please note that the expenses shown in the table are meant to highlight your ongoing costs only and do not reflect any transactional costs, such as sales charges (loads), redemption fees or exchange fees. Therefore, the hypothetical account values and expenses in the table are useful in comparing ongoing costs only, and will not help you determine the relative total costs of owning different funds. In addition, if these transactional costs were included, your costs overall would have been higher.
| | | | | | | | | | | | | | | | |
| | | Annualized
Expense
Ratio | | | Beginning
Account Value
(07/01/12) | | | Ending
Account Value
(12/31/12) | | | Expense
Paid During
Period(1)
(07/01/12-
12/31/12) | |
| | | | |
REAL ESTATE FUND | | | | | | | | | | | | | | | | |
Actual | | | | | | | | | | | | | | | | |
Class A Shares | | | 1.20 | % | | $ | 1,000 | | | $ | 1,150 | | | $ | 6.48 | |
Class C Shares | | | 1.95 | % | | | 1,000 | | | | 1,147 | | | | 10.52 | |
Class Y Shares | | | 0.95 | % | | | 1,000 | | | | 1,151 | | | | 5.14 | |
Class I Shares | | | 0.95 | % | | | 1,000 | | | | 1,151 | | | | 5.14 | |
Hypothetical (assuming a 5% return before expenses) | | | | | | | | | | | | | | | | |
Class A Shares | | | 1.20 | % | | | 1,000 | | | | 1,019 | | | | 6.09 | |
Class C Shares | | | 1.95 | % | | | 1,000 | | | | 1,015 | | | | 9.88 | |
Class Y Shares | | | 0.95 | % | | | 1,000 | | | | 1,020 | | | | 4.82 | |
Class I Shares | | | 0.95 | % | | | 1,000 | | | | 1,020 | | | | 4.82 | |
2012 Annual Report
3
ABOUT YOUR FUND’S EXPENSES (continued)
| | | | | | | | | | | | | | | | |
| | | Annualized
Expense
Ratio | | | Beginning
Account Value
(07/01/12) | | | Ending
Account Value
(12/31/12) | | | Expense
Paid During
Period(1)
(07/01/12-
12/31/12) | |
| | | | |
INFRASTRUCTURE FUND | | | | | | | | | | | | | | | | |
Actual | | | | | | | | | | | | | | | | |
Class A Shares | | | 1.35 | % | | $ | 1,000 | | | $ | 1,097 | | | $ | 7.12 | |
Class C Shares | | | 2.10 | % | | | 1,000 | | | | 1,092 | | | | 11.04 | |
Class Y Shares | | | 1.10 | % | | | 1,000 | | | | 1,098 | | | | 5.80 | |
Class I Shares | | | 1.10 | % | | | 1,000 | | | | 1,098 | | | | 5.80 | |
Hypothetical (assuming a 5% return before expenses) | | | | | | | | | | | | | | | | |
Class A Shares | | | 1.35 | % | | | 1,000 | | | | 1,018 | | | | 6.85 | |
Class C Shares | | | 2.10 | % | | | 1,000 | | | | 1,015 | | | | 10.63 | |
Class Y Shares | | | 1.10 | % | | | 1,000 | | | | 1,020 | | | | 5.58 | |
Class I Shares | | | 1.10 | % | | | 1,000 | | | | 1,020 | | | | 5.58 | |
| | | | |
HIGH YIELD FUND | | | | | | | | | | | | | | | | |
Actual | | | | | | | | | | | | | | | | |
Class A Shares | | | 1.10 | % | | $ | 1,000 | | | $ | 1,057 | | | $ | 5.69 | |
Class C Shares | | | 1.85 | % | | | 1,000 | | | | 1,053 | | | | 9.55 | |
Class Y Shares | | | 0.85 | % | | | 1,000 | | | | 1,058 | | | | 4.40 | |
Class I Shares | | | 0.85 | % | | | 1,000 | | | | 1,058 | | | | 4.40 | |
Hypothetical (assuming a 5% return before expenses) | | | | | | | | | | | | | | | | |
Class A Shares | | | 1.10 | % | | | 1,000 | | | | 1,020 | | | | 5.58 | |
Class C Shares | | | 1.85 | % | | | 1,000 | | | | 1,016 | | | | 9.37 | |
Class Y Shares | | | 0.85 | % | | | 1,000 | | | | 1,021 | | | | 4.32 | |
Class I Shares | | | 0.85 | % | | | 1,000 | | | | 1,021 | | | | 4.32 | |
| (1) | Expenses are equal to the Funds’ annualized expense ratio multiplied by the average account value over the period, multiplied by 184/366 (to reflect a six-month period). |
Brookfield Investment Management Inc.
4
BROOKFIELD GLOBAL LISTED REAL ESTATE FUND
PORTFOLIO STRATEGY
Individual contributors to performance included Lennar Corp., SOHO China Ltd. and Brookdale Senior Living, Inc. The Fund’s non-benchmark exposure to Lennar Corp. was a key positive in 2012. The company benefited from an improving U.S. housing market all year. U.S. homebuilders were up significantly in the year outperforming all other property sectors in which we invest.
The Fund’s overweight in SOHO China Ltd. was another positive driver of performance. A recent bond issuance at good pricing and the overall rebound in China’s economy drove outperformance in the year.
Non-benchmark exposure to Brookdale Senior Living contributed to relative performance of the Fund. Healthcare operators specializing in private pay facilities were strong this year due to (i) the aging population in the U.S., (ii) attractive supply fundamentals and (iii) uncertainty surrounding the U.S. government’s Medicare reimbursements. In addition, Brookdale Senior Living rallied strongly late in the year on rumors that the company may pursue a restructuring into a REIT or Operating Company/Property Company.
Detractors to performance included Sumitomo Realty & Development Co. Ltd., Camden Property Trust and Wharf Holdings. Japanese developers as a whole were strong in 2012 due to expectations for a potential decline in vacancy rates in 2013 as well as the government’s focus on improving the Japanese economy. As a result, the Fund’s zero weight to Sumitomo Realty & Development Co. Ltd. detracted from relative performance. We favor other Japanese developers with strong performance and lower leverage levels on their balance sheets.
An overweight position in Camden Property Trust detracted from Fund performance in 2012. Notwithstanding generally good fundamentals, the U.S. residential sector was weak in the year on fears that apartment occupancy and rent growth may fall as home ownership rises in light of a U.S. housing market that has clearly bottomed.
The Fund’s zero weight in Wharf Holdings detracted from performance as Hong Kong retail fundamentals accelerated quickly in 2012 due to the rebound in China’s economy.
GLOBAL REAL ESTATE MARKET OVERVIEW AND OUTLOOK
Global equity markets ended 2012 with another quarter of positive performance. The MSCI World Index (“Broad Equity Markets”) closed the fourth quarter up 2.6%, finishing the 12 month period up 16.5%. Like recent years preceding 2012, we saw a number of dramatic (albeit less severe) ups and downs in global equity markets caused by shifting investor confidence in the global macroeconomic recovery. We saw the strongest first quarter in over a decade (+11.7%) and wide-reaching investor confidence give way to a strongly negative second quarter (-4.9%) on worsening fears of the European crisis and contagion.
However, some stability emerged in the second half of the year as continued macroeconomic weakness drove corresponding actions by governments and central banks worldwide. In particular, central bank announcements in September created positive momentum in equity markets. Ben Bernanke and the U.S. Federal Reserve announced third round Quantitative Easing (QE3), pledging up to US$40 billion per month to buy mortgage-backed securities until the U.S. labor market improves. Across the pond, the European Central Bank (ECB) pledged a new and potentially unlimited short dated government bond-buying program coined Outright Monetary Transactions or “OMT” to reduce yields on European sovereign debt to strengthen sovereign balance sheets.
As the year came to a close positive drivers of investor sentiment included continual improvement in the U.S. housing market, evidence of economic stability in China, enthusiasm over the outcome of the Japanese election, and a Europe region that appears to be gradually stabilizing. These developments countered the two week selloff following the U.S. presidential election as well as fears of the U.S. fiscal cliff. A deal to address taxes was reached on January 1 as part of the fiscal cliff negotiations, leading markets sharply higher in the New Year.
Property securities closed 2012 ahead of broad equity markets, up 5.8% in the fourth quarter and 28.7% in the year as measured by the FTSE EPRA/NAREIT Developed Index (the “Index”). This represents a 12% one year outperformance over Broad Equity Markets. We believe strength among real estate securities reflects strong
2012 Annual Report
5
BROOKFIELD GLOBAL LISTED REAL ESTATE FUND
underlying property fundamentals as well as investors’ demand for yield in a low rate environment. Furthermore, we believe portfolio allocations will begin to shift from bonds to equities, which should benefit real asset securities such as REITs as they generally exhibit an attractive mix of bond-like yields with equity returns. Also, publicly traded real estate companies generally maintain an advantage in their ability to access inexpensive capital, fueling accretive property acquisitions.
U.S. housing fundamentals improve
Commercial real estate in 2012 was impacted by an improving U.S. housing market. Inventory is at historically low levels with net absorption (or sales net of cancellations) up materially throughout 2012 according to Zelman & Associates. Prices are on the rise as well and are up 7.4% including distressed sales year over year according to the CoreLogic Home Price Index as of November 30, 2012. Along with publicly listed homebuilders, this continued improvement in the housing market benefitted industries like timber that are correlated to U.S. housing. These sectors outperformed in 2012, with timber REITs up 37.0% as measured by the FTSE NAREIT All Equity REITs Index and homebuilders up 97.2% as measured by the International Securities Exchange Homebuilders Index. Conversely, apartments were under pressure this year on fears that apartment occupancy and rent growth may fall as home ownership rises in light of a U.S. housing market that has clearly bottomed. The group was up 6.9% this year as measured by the FTSE NAREIT All Equity REITs Index, making apartments the weakest performing U.S. real estate sector by far. In light of favorable apartment demographics, we view weakness as a buying opportunity.
Ample and cheap capital fuels real estate securities
REITs capitalized on the low interest rate environment to strengthen balance sheets and fund acquisitions and capital expenditures. Across the globe, REITs exhibited their ability to tap public equity and debt markets all year. This included the following key examples:
| – | | Hong Kong property companies issuing debt and accessing the U.S. dollar market. This included Wharf (Holdings) Ltd., which issued US$600 million at a 4.735% yield, upsized from US$500 million due to strong demand and Sun Hung Kai, which priced a US$500 million 10-year bond at Treasuries plus 270 basis points for a 4.50% coupon. |
| – | | General Growth Properties (GGP), a U.S. regional mall REIT, refinanced $3.1 billion of debt with a weighted average term of 9 years (up from a remaining term-to-maturity of 3.9 years) and a weighted average rate of 4.20% (down from a rate of 5.24%). The company was among the hardest hit during the 2008 global financial crisis, illustrating the foothold REITs have in their continued recovery. |
| – | | European real estate companies have continued to issue debt to shore up balance sheets amid ongoing volatility, particularly following the ECB announcement in early September. Unibail-Rodamco SE issued a six year €750 million bond with a fixed coupon of 2.25% in order to address its financing needs, including current and future development projects. The issuance was successful and was four times oversubscribed. Klepierre issued a seven year €500 million bond with a 2.75% coupon. This issuance was almost six times oversubscribed. |
| – | | Simon Property Group (SPG), the largest and generally considered one of the highest quality REITs globally, issued US$500 million of 10 year senior unsecured notes at a 2.75% coupon and US$750 million of five year notes at a 1.50% coupon. According to SPG, there was US$4 billion of demand for the notes and “the coupons…represent the lowest rates ever achieved for 10 year and 5 year bonds issued by a real estate investment trust.” |
We believe ongoing issuance and refinancing are a distinct competitive advantage for listed property companies versus their private market peers. Furthermore, many companies are now seeking to gain access to this capital by seeking IPOs and REIT conversions.
IPOs and REIT conversions abound as companies seek to capitalize on real estate rebound
We saw a flurry of REIT IPOs and REIT conversions late in 2012. Global Logistics Properties Ltd. (GLP) launched a successful approximately US$1 billion JREIT IPO in the fourth quarter. GLP is a unit of the Government of Singapore Investment Corp and is now one of the largest industrial JREITs owning 30 properties valued at over
Brookfield Investment Management Inc.
6
BROOKFIELD GLOBAL LISTED REAL ESTATE FUND
US$2.6 billion. Mexican REITs continued to list IPOs this year including hotel owner Concentradora Fibra Hotelera Mexicana SA and industrial REIT Macquarie Mexico Real Estate Management. We are positive on Mexican real estate for a number of reasons including the country’s strong industrial production, strategic export location bordering the U.S. and two oceans, and a strong and competitive labor market.
2012 also brought the conversion of two U.S. single family homes for rent companies into REITs. The first was American Homes for Rent in November, which is a private REIT and may list in 2013, followed by Silver Bay Realty Trust (SBY) in December. SBY is the first publicly traded single family home REIT and sold 13.25 million shares for $18.50 per share. Both conversions follow Iron Mountain, Inc. (IRM), a document storage company, which filed documentation to convert to a REIT during the third quarter.
Property transactions illustrate stable fundamentals
A number of large scale property transactions occurred among listed real estate companies in 2012. In many cases, we have seen transaction cap rates reaching lows not seen in a number of years. Important transactions in 2012 include:
| – | | Simon Property Group (SPG) announced two substantial deals, increasing its asset base in accretive transactions. First, SPG announced the acquisition of a 28.7% equity stake in French retail REIT Klepierre (LI) from BNP Paribas for approximately US$2 billion. SPG also announced the acquisition of its partner’s interest in 26 retail assets of “The Mills,” a joint venture between SPG and Farallon Capital Management, L.L.C. in a transaction valued at US$1.5 billion. |
| – | | In Australia, Lend Lease Group (LLC:AU) announced that it secured funding of A$2 billion for the first of two commercial office towers at Barangaroo South, near Sydney’s central business district. Canada Pension Plan Investment Board committed A$1 billion, Lend Lease-managed Australian Prime Property Fund Commercial and two of its investors have committed A$500 million, and Lend Lease will invest A$500 million. |
| – | | Health Care REIT (HCN) announced it has entered into a definitive agreement to acquire healthcare owner/operator Sunrise Senior Living, Inc. (SRZ) for approximately US$950 million in cash and will assume SRZ’s existing debt at an average interest rate of approximately 4.9%. The purchase price of US$14.50 per share represents a significant premium to SRZ’s prior close. |
| – | | Equity Residential (EQR) and AvalonBay Communities, Inc. (AVB) agreed to buy Archstone from Lehman Brothers for US$16 billion dollars. EQR and AVB are the two largest apartment REITs in the U.S. and the transaction, which is expected to close in the first quarter of 2013, makes them even larger. Under the terms of the deal, EQR will acquire 60% and AVB will acquire 40% of Archstone’s multifamily assets, which include 45,000 units across high barrier to entry markets in the U.S. |
| – | | Australian Dexus Property Group (DXS) sold most of its U.S. industrial portfolio at an approximately 10% premium to book value. Pricing on the transactions is unsurprising given 2012 was a huge year for industrial companies, which were up 40.6% globally as measured by the Index. |
| – | | ProLogis completed a 50/50 joint venture partnership with Norges Bank Investment Management to invest in a European industrial portfolio. The equity commitment equals €2.4 billion, with €1.2 billion contributions from both parties. |
OUTLOOK
As we look ahead to 2013, we believe hurdles to global macroeconomic stability will persist. While the U.S. Congress tackled one part of the fiscal cliff problem, many investors believe the most difficult negotiations to cut spending and reduce the U.S. deficit are yet to come. In addition, Southern Europe remains challenged. We believe the real estate securities asset class is poised to continue to perform well in this environment. Investor demand for bonds is expected to shift to equities over the medium term. As described above, the real estate securities asset class continues to benefit from favorable access to capital with low cost debt fueling accretive property acquisitions. New supply remains at historical lows providing a strong foundation for real estate fundamentals. Further, we anticipate demand will slowly begin to improve as unemployment falls. However, we are monitoring the possibility of rising long term interest rates, which would likely create short term headwinds for the real estate securities asset class.
2012 Annual Report
7
BROOKFIELD GLOBAL LISTED REAL ESTATE FUND
Macro indicators have improved in the Asia Pacific region. The election of Mr. Shinzo Abe as Japan’s new prime minister and the change in government in China are both believed to be “market friendly” transitions. Mr. Abe is espousing aggressive easing policies and set a 2% inflation target to break Japan’s characteristic low growth, deflationary market environment. This coincides with what we believe is a favorable point in the property market cycle where new supply is low and demand is improving. We acknowledge a number of Japanese office towers are under construction, but it will take several years for this new construction to impact market vacancy numbers due to the earthquake resistant building requirements. The new Chinese leadership generally appears to support reforms leading to more liberalization in the marketplace. And while we believe policies to avoid a housing bubble will remain in place, new tightening policies are now less likely. Indicatively, land sale volumes have increased and prices in the housing market are firming. In Hong Kong, where valuations are richer, we favor office companies. Concerns over significant financial company layoffs and consequent decreasing rental rates and increasing vacancy appear to have been overblown.
London remains a bright spot in Europe. Pricing remains strong and we are seeing buyers from all corners of the globe investing in real estate. In the fourth quarter, sovereign wealth funds from Malaysia and Azerbaijan were the latest groups to make significant investments in the city.
A key portfolio thematic within the portfolio’s U.S. exposure remains housing related sectors (homebuilders, timber). We have modestly trimmed our timber exposure on announcements that mills are increasing output in 2013 and beyond, which led lumber futures to rally strongly and we believe this fervor may cool. We brought portfolio exposure to a slight overweight to the apartment sector relative to the Index. Given significant outperformance among industrial companies globally in 2012, we sold out of the sector to take profits as valuations reached our targets.
Brookfield Investment Management Inc.
8
BROOKFIELD GLOBAL LISTED REAL ESTATE FUND
AVERAGE ANNUAL TOTAL RETURNS
| | | | | | | | |
| As of December 31, 2012 | | 1 Year | | | Since
Inception* | |
Class A Shares (excluding sales charge) | | | N/A | | | | 14.89% | |
Class A Shares (including sales charge) | | | N/A | | | | 9.40% | |
Class C Shares | | | N/A | | | | 14.39% | |
Class Y Shares | | | 32.93% | | | | 30.71% | |
Class I Shares | | | 32.83% | | | | 30.62% | |
FTSE EPRA/NAREIT Developed Index | | | 28.65% | | | | 11.34% | |
| * | Classes A and C were incepted on April 30, 2012 and Classes Y and I were incepted on November 30, 2011. The FTSE/EPRA NAREIT Developed Index references Class A’s inception date. |
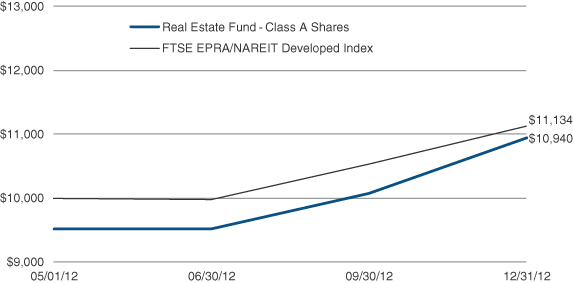
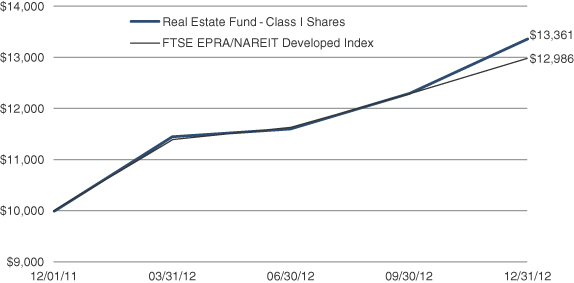
The graphs below illustrate a hypothetical investment of $10,000 in the Real Estate Fund — Class A Shares from the commencement of investment operations on May 1, 2012 to December 31, 2012 compared to the FTSE EPRA/NAREIT Developed Index and Class I Shares from the commencement of investment operations on December 1, 2011 to December 31, 2012 compared to the FTSE EPRA/NAREIT Developed Index.
Class A Shares
2012 Annual Report
9
BROOKFIELD GLOBAL LISTED REAL ESTATE FUND
Class I Shares
Performance data quoted represents past performance; past performance does not guarantee future results. The investment return and principal value of an investment will fluctuate so that an investor’s shares, when redeemed, may be worth more or less than their original cost. Current performance of the Fund may be lower or higher than the performance quoted. Performance data current to the most recent month end may be obtained by calling 855.244.4859. The Fund imposes a 2.00% redemption fee on shares redeemed within 60 days. Performance data does not reflect the imposition of the redemption fee and if it had, performance would have been lower.
Based on Class A Shares, the Fund’s gross expense ratio is 2.54% and the net expense ratio is 1.23%. The Adviser has contractually agreed to waive fees and/or reimburse Fund expenses through May 1, 2013. There is no guarantee that such waiver/reimbursement will be continued after that date.
Disclosure
Performance data quoted represents past performance results and does not guarantee future results. Current performance may be lower or higher than the performance data quoted.
All returns shown in USD.
The Fund’s portfolio holdings are subject to change without notice. The mention of specific securities is not a recommendation or solicitation for any person to buy, sell or hold any particular security. There is no assurance that the Brookfield Global Listed Real Estate Fund currently holds these securities. Please refer to the Schedule of Investments contained in this report for a full listing of Fund holdings.
Mutual fund investing involves risk. Principal loss is possible.
The MSCI World Index is a free float-adjusted market capitalization weighted index that is designed to measure the equity market performance of developed markets. The MSCI World Index consists of the following 24 developed market country indices: Australia, Austria, Belgium, Canada, Denmark, Finland, France, Germany, Greece, Hong Kong, Ireland, Israel, Italy, Japan, Netherlands, New Zealand, Norway, Portugal, Singapore, Spain, Sweden, Switzerland, the United Kingdom, and the United States.
Brookfield Investment Management Inc.
10
BROOKFIELD GLOBAL LISTED REAL ESTATE FUND
The FTSE EPRA/NAREIT Developed Index is calculated by the FTSE Group. Performance is calculated by price, total return and net total return and the Index is calculated daily. Constituents must meet minimum market capitalization, liquidity requirements, and real estate activity requirements in order to be included within the Index. North American and Asian companies must be of a minimum of US$200 million in market capitalization with liquidity of US$100 million. European companies are bound by US$50 million market cap minimum and liquidity of US$25 million. The Index is unmanaged and, unlike the Fund, is not affected by cash flows or trading and other expenses. It is not possible to invest directly in an index. Index performance is shown for illustrative purposes only and does not predict or depict the performance of the Fund.
The FTSE NAREIT All Equity REITs Index contains all tax-qualified REITs with more than 50 percent of total assets in qualifying real estate assets other than mortgages secured by real property that also meet minimum size and liquidity criteria.
The International Securities Exchange Homebuilders Index includes residential construction companies and prefabricated house manufacturers.
Beta is a measure of volatility, or systematic risk, of a security or portfolio in comparison to the market as a whole. Correlation is a statistical measure of how two securities move in relation to each other.
These views represent the opinions of Brookfield Investment Management Inc. and are not intended to predict or depict the performance of any investment. These views are as of the close of business on December 31, 2012 and subject to change based on subsequent developments.
2012 Annual Report
11
BROOKFIELD GLOBAL LISTED REAL ESTATE FUND
Portfolio Characteristics (Unaudited)
December 31, 2012
| | |
| ASSET ALLOCATION BY GEOGRAPHY | | Percent of
Net Assets |
United States | | 47.0% |
Japan | | 10.2% |
Australia | | 8.1% |
Hong Kong | | 7.3% |
United Kingdom | | 5.4% |
China | | 4.1% |
Singapore | | 3.8% |
France | | 2.4% |
Norway | | 2.0% |
Germany | | 1.5% |
Canada | | 1.4% |
Russia | | 1.4% |
Austria | | 1.0% |
Italy | | 1.0% |
Other Assets in Excess of Liabilities | | 3.4% |
Total | | 100.0% |
ASSET ALLOCATION BY SECTOR
| | |
Diversified | | 20.4% |
Office | | 17.0% |
Retail | | 11.0% |
Residential | | 10.3% |
Self Storage | | 8.5% |
Regional Malls | | 7.2% |
Mixed | | 4.0% |
Real Estate Operator / Developer | | 3.6% |
Healthcare | | 3.5% |
Homebuilders | | 2.9% |
Hotel | | 2.9% |
Manufactured Homes | | 1.9% |
Strip Centers | | 1.7% |
Timber | | 1.5% |
Diversified Real Estate / Land | | 0.2% |
Other Assets in Excess of Liabilities | | 3.4% |
Total | | 100.0% |
| | |
| TOP TEN HOLDINGS | | |
Public Storage | | 4.9% |
Simon Property Group, Inc. | | 4.9% |
Westfield Group | | 4.3% |
Hongkong Land Holdings Ltd. | | 3.9% |
Mitsui Fudosan Company Ltd. | | 3.6% |
Mitsubishi Estate Company Ltd. | | 3.6% |
AvalonBay Communities, Inc. | | 2.9% |
SOHO China Ltd. | | 2.6% |
Kilroy Realty Corp. | | 2.5% |
Iron Mountain, Inc. | | 2.4% |
Brookfield Investment Management Inc.
12
BROOKFIELD GLOBAL LISTED REAL ESTATE FUND
Schedule of Investments
December 31, 2012
| | | | | | | | |
| | | Shares | | | Value
(Note 2) | |
COMMON STOCKS – 96.6% | | | | | | | | |
AUSTRALIA – 8.1% | | | | | | | | |
Diversified – 1.9% | | | | | | | | |
Dexus Property Group 1
(Cost $646,121) | | | 677,800 | | | $ | 719,898 | |
| | | | | | | | |
Retail – 6.2% | | | | | | | | |
Westfield Group 1 | | | 146,600 | | | | 1,619,036 | |
Westfield Retail Trust | | | 232,000 | | | | 731,954 | |
| | | | | | | | |
Total Retail
(Cost $2,041,057) | | | | | | | 2,350,990 | |
Total AUSTRALIA
(Cost $2,687,178) | | | | | | | 3,070,888 | |
AUSTRIA – 1.0% | | | | | | | | |
Residential – 1.0% | | | | | | | | |
Conwert Immobilien Invest SE 1
(Cost $347,322) | | | 28,800 | | | | 372,684 | |
Total AUSTRIA
(Cost $347,322) | | | | | | | 372,684 | |
CANADA – 1.4% | | | | | | | | |
Residential – 1.4% | | | | | | | | |
Boardwalk Real Estate Investment Trust 1
(Cost $501,091) | | | 8,300 | | | | 538,453 | |
Total CANADA
(Cost $501,091) | | | | | | | 538,453 | |
CHINA – 4.1% | | | | | | | | |
Diversified – 1.0% | | | | | | | | |
KWG Property Holding Ltd. 1
(Cost $366,909) | | | 510,400 | | | | 391,912 | |
| | | | | | | | |
Homebuilders – 0.5% | | | | | | | | |
Evergrande Real Estate Group Ltd. 1
(Cost $184,359) | | | 348,700 | | | | 196,687 | |
| | | | | | | | |
Real Estate Operator/Developer – 2.6% | | | | | | | | |
SOHO China Ltd. 1
(Cost $797,263) | | | 1,185,396 | | | | 963,894 | |
Total CHINA
(Cost $1,348,531) | | | | | | | 1,552,493 | |
FRANCE – 2.4% | | | | | | | | |
Diversified – 1.4% | | | | | | | | |
Unibail-Rodamco SE 1
(Cost $430,472) | | | 2,200 | | | | 533,510 | |
| | | | | | | | |
Retail – 1.0% | | | | | | | | |
Mercialys SA 1
(Cost $337,372) | | | 16,000 | | | | 363,378 | |
Total FRANCE
(Cost $767,844) | | | | | | | 896,888 | |
See Notes to Financial Statements.
2012 Annual Report
13
BROOKFIELD GLOBAL LISTED REAL ESTATE FUND
Schedule of Investments
December 31, 2012
| | | | | | | | |
| | | Shares | | | Value
(Note 2) | |
COMMON STOCKS (continued) | | | | | | | | |
GERMANY – 1.5% | | | | | | | | |
Office – 1.5% | | | | | | | | |
Alstria Office REIT-AG 1
(Cost $498,489) | | | 44,900 | | | $ | 548,271 | |
Total GERMANY
(Cost $498,489) | | | | | | | 548,271 | |
HONG KONG – 7.3% | | | | | | | | |
Diversified – 2.4% | | | | | | | | |
Sun Hung Kai Properties Ltd. 1
(Cost $780,825) | | | 60,151 | | | | 912,204 | |
| | | | | | | | |
Office – 3.9% | | | | | | | | |
Hongkong Land Holdings Ltd. 1
(Cost $1,284,430) | | | 207,652 | | | | 1,466,618 | |
| | | | | | | | |
Retail – 1.0% | | | | | | | | |
Hang Lung Properties Ltd. 1
(Cost $344,659) | | | 91,701 | | | | 369,043 | |
Total HONG KONG
(Cost $2,409,914) | | | | | | | 2,747,865 | |
ITALY – 1.0% | | | | | | | | |
Office – 1.0% | | | | | | | | |
Beni Stabili SpA 1
(Cost $332,472) | | | 624,000 | | | | 367,694 | |
Total ITALY
(Cost $332,472) | | | | | | | 367,694 | |
JAPAN – 10.2% | | | | | | | | |
Diversified – 4.7% | | | | | | | | |
Hulic Company Ltd. 1 | | | 62,400 | | | | 423,378 | |
Mitsui Fudosan Company Ltd. 1 | | | 54,800 | | | | 1,340,577 | |
| | | | | | | | |
Total Diversified
(Cost $1,473,010) | | | | | | | 1,763,955 | |
| | | | | | | | |
Diversified Real Estate/Land – 0.2% | | | | | | | | |
GLP J-Reit 1,2
(Cost $72,729) | | | 100 | | | | 76,413 | |
| | | | | | | | |
Office – 5.3% | | | | | | | | |
Japan Real Estate Investment Corp. 1 | | | 68 | | | | 669,945 | |
Mitsubishi Estate Company Ltd. 1 | | | 55,955 | | | | 1,339,602 | |
| | | | | | | | |
Total Office
(Cost $1,627,347) | | | | | | | 2,009,547 | |
Total JAPAN
(Cost $3,173,086) | | | | | | | 3,849,915 | |
See Notes to Financial Statements.
Brookfield Investment Management Inc.
14
BROOKFIELD GLOBAL LISTED REAL ESTATE FUND
Schedule of Investments
December 31, 2012
| | | | | | | | |
| | | Shares | | | Value
(Note 2) | |
COMMON STOCKS (continued) | | | | | | | | |
NORWAY – 2.0% | | | | | | | | |
Diversified – 2.0% | | | | | | | | |
Norwegian Property ASA 1
(Cost $715,733) | | | 489,900 | | | $ | 758,457 | |
Total NORWAY
(Cost $715,733) | | | | | | | 758,457 | |
POLAND – 1.4% | | | | | | | | |
Retail – 1.4% | | | | | | | | |
Atrium European Real Estate Ltd. 1
(Cost $474,603) | | | 93,000 | | | | 547,304 | |
Total POLAND
(Cost $474,603) | | | | | | | 547,304 | |
SINGAPORE – 3.8% | | | | | | | | |
Diversified – 2.0% | | | | | | | | |
CapitaLand Ltd. 1
(Cost $612,511) | | | 240,300 | | | | 739,670 | |
| | | | | | | | |
Hotel – 0.9% | | | | | | | | |
Overseas Union Enterprise Ltd. 1
(Cost $296,668) | | | 156,000 | | | | 357,691 | |
| | | | | | | | |
Regional Malls – 0.9% | | | | | | | | |
CapitaMalls Asia Ltd. 1
(Cost $295,842) | | | 219,168 | | | | 352,982 | |
Total SINGAPORE
(Cost $1,205,021) | | | | | | | 1,450,343 | |
UNITED KINGDOM – 5.4% | | | | | | | | |
Diversified – 3.5% | | | | | | | | |
British Land Company PLC 1,2 | | | 79,800 | | | | 737,246 | |
Safestore Holdings PLC 1 | | | 326,700 | | | | 573,167 | |
| | | | | | | | |
Total Diversified
(Cost $1,239,492) | | | | | | | 1,310,413 | |
| | | | | | | | |
Office – 0.5% | | | | | | | | |
Songbird Estates PLC 1,2
(Cost $174,251) | | | 92,700 | | | | 179,199 | |
| | | | | | | | |
Retail – 1.4% | | | | | | | | |
Hammerson PLC 1
(Cost $472,533) | | | 68,900 | | | | 552,493 | |
Total UNITED KINGDOM
(Cost $1,886,276) | | | | | | | 2,042,105 | |
UNITED STATES – 47.0% | | | | | | | | |
Diversified – 1.5% | | | | | | | | |
Vornado Realty Trust
(Cost $561,167) | | | 7,000 | | | | 560,560 | |
| | | | | | | | |
See Notes to Financial Statements.
2012 Annual Report
15
BROOKFIELD GLOBAL LISTED REAL ESTATE FUND
Schedule of Investments
December 31, 2012
| | | | | | | | |
| | | Shares | | | Value
(Note 2) | |
COMMON STOCKS (continued) | | | | | | | | |
Healthcare – 3.5% | | | | | | | | |
Brookdale Senior Living, Inc. 2 | | | 21,900 | | | $ | 554,508 | |
Health Care REIT, Inc. | | | 12,362 | | | | 757,667 | |
| | | | | | | | |
Total Healthcare
(Cost $1,104,252) | | | | | | | 1,312,175 | |
| | | | | | | | |
Homebuilders – 2.4% | | | | | | | | |
Lennar Corp.
(Cost $674,320) | | | 23,300 | | | | 901,011 | |
| | | | | | | | |
Hotel – 2.0% | | | | | | | | |
Hyatt Hotels Corp. 2 | | | 9,600 | | | | 370,272 | |
Pebblebrook Hotel Trust | | | 16,200 | | | | 374,220 | |
| | | | | | | | |
Total Hotel
(Cost $669,787) | | | | | | | 744,492 | |
| | | | | | | | |
Manufactured Homes – 1.9% | | | | | | | | |
Equity Lifestyle Properties, Inc.
(Cost $742,022) | | | 10,900 | | | | 733,461 | |
| | | | | | | | |
Mixed – 4.0% | | | | | | | | |
Kilroy Realty Corp. | | | 19,700 | | | | 933,189 | |
Liberty Property Trust | | | 15,600 | | | | 558,012 | |
| | | | | | | | |
Total Mixed
(Cost $1,450,461) | | | | | | | 1,491,201 | |
| | | | | | | | |
Office – 4.8% | | | | | | | | |
Corporate Office Properties Trust | | | 21,900 | | | | 547,062 | |
Digital Realty Trust, Inc. | | | 5,400 | | | | 366,606 | |
SL Green Realty Corp. | | | 11,900 | | | | 912,135 | |
| | | | | | | | |
Total Office
(Cost $1,772,545) | | | | | | | 1,825,803 | |
| | | | | | | | |
Real Estate Operator/Developer – 1.0% | | | | | | | | |
DuPont Fabros Technology, Inc.
(Cost $368,801) | | | 14,900 | | | | 359,984 | |
| | | | | | | | |
Regional Malls – 6.3% | | | | | | | | |
The Macerich Co. | | | 9,400 | | | | 548,020 | |
Simon Property Group, Inc. | | | 11,600 | | | | 1,833,844 | |
| | | | | | | | |
Total Regional Malls
(Cost $2,249,685) | | | | | | | 2,381,864 | |
| | | | | | | | |
Residential – 7.9% | | | | | | | | |
AvalonBay Communities, Inc. | | | 8,200 | | | | 1,111,838 | |
BRE Properties, Inc. | | | 14,900 | | | | 757,367 | |
Equity Residential | | | 13,000 | | | | 736,710 | |
Essex Property Trust, Inc. | | | 2,600 | | | | 381,290 | |
| | | | | | | | |
Total Residential
(Cost $2,897,247) | | | | | | | 2,987,205 | |
| | | | | | | | |
See Notes to Financial Statements.
Brookfield Investment Management Inc.
16
BROOKFIELD GLOBAL LISTED REAL ESTATE FUND
Schedule of Investments
December 31, 2012
| | | | | | | | |
| | | Shares | | | Value
(Note 2) | |
COMMON STOCKS (continued) | | | | | | | | |
Self Storage – 8.5% | | | | | | | | |
Iron Mountain, Inc. | | | 29,485 | | | $ | 915,509 | |
Public Storage | | | 12,700 | | | | 1,840,992 | |
Sovran Self Storage, Inc. | | | 7,400 | | | | 459,540 | |
| | | | | | | | |
Total Self Storage
(Cost $3,152,531) | | | | | | | 3,216,041 | |
| | | | | | | | |
Strip Centers – 1.7% | | | | | | | | |
DDR Corp.
(Cost $586,471) | | | 41,200 | | | | 645,192 | |
| | | | | | | | |
Timber – 1.5% | | | | | | | | |
Rayonier, Inc.
(Cost $503,403) | | | 10,900 | | | | 564,947 | |
Total UNITED STATES
(Cost $16,732,692) | | | | | | | 17,723,936 | |
Total COMMON STOCKS
(Cost $33,080,252) | | | | | | | 36,467,296 | |
Total Investments – 96.6%
(Cost $33,080,252) | | | | | | | 36,467,296 | |
Other Assets in Excess of Liabilities – 3.4% | | | | | | | 1,266,014 | |
| | |
TOTAL NET ASSETS – 100.0% | | | | | | $ | 37,733,310 | |
| |
The following notes should be read in conjunction with the accompanying Schedule of Investments.
| | | | | | |
1 | | | — | | | Foreign security or a U.S. security of a foreign company. |
2 | | | — | | | Non-income producing security. |
See Notes to Financial Statements.
2012 Annual Report
17
BROOKFIELD GLOBAL LISTED INFRASTRUCTURE FUND
PORTFOLIO STRATEGY
Individual contributors to performance included Ferrovial SA, Consolidated Edison Inc. and SBA Communications Corp. An overweight position in Ferrovial SA was a strong contributor to Fund performance over the period. Ferrovial SA is a Spanish diversified infrastructure company that owns and operates two main assets: the Heathrow Airport in London and Highway 407 outside of Toronto. We believe both are high quality, stable assets which we believe are independent of impacts from Spanish GDP. The company rebounded following its disproportionate selloff in the early part of 2012 on fears surrounding the European sovereign debt crisis.
An underweight position in Consolidated Edison Inc. contributed positively to relative Fund performance as the company was weak in 2012. Consolidated Edison Inc. provides electric service to metropolitan New York. In the wake of “Superstorm Sandy” the company underperformed on investor concerns over potential capital expenditures required to repair the storm’s damage to the New York utility system. Additionally, highly regulated infrastructure companies offering bond-like, defensive risk/return characteristics underperformed higher risk infrastructure peers late in the year.
The Fund’s overweight position in SBA Communications Corp. was a positive contributor to Fund performance. The company benefitted from strong momentum in the communications sector as investors continued to recognize significant growth potential for towers due to the proliferation of mobile devices and the growing need for 4G data. In addition, the company benefitted from strong earnings announcements as well as positive company-specific news flow.
Detractors to performance included Atlantia S.p.A., Spectra Energy Corp. and Tokyo Gas Company Ltd. Atlantia S.p.A. was the weakest individual Fund exposure during the period. The company sold off amid broad market movements on uncertainty regarding the European sovereign debt crisis, in particular Southern Europe. Further, we were overweight the company early in the year as toll roads underperformed and underweight during the sector’s strongest run in the fourth quarter.
An overweight position in the Spectra Energy Corp. detracted from the Fund’s performance. Spectra Energy Corp. underperformed in the period on concerns surrounding weakness in natural gas liquids prices. However, we believe the company is poised to create value in the coming year.
Japanese gas distribution companies, including Tokyo Gas Company Ltd., were weak in the period on concerns that government policy may be moving towards restarting Japan’s idle nuclear power plants. Gas is an important alternative power source for electricity generation, and the idle nuclear plants have previously been a positive for Tokyo Gas Company Ltd. and its peers.
INFRASTRUCTURE MARKET OVERVIEW AND OUTLOOK
Global equity markets ended 2012 with another quarter of positive performance. The MSCI World Index (“Broad Equity Markets”) closed the quarter up 2.6%, finishing the 12 month period up 16.5%. Like recent years preceding 2012, we saw a number of dramatic (albeit less severe) ups and downs in global equity markets caused by shifting investor confidence in the global macroeconomic recovery. We saw the strongest first quarter in over a decade (+11.7%) and wide-reaching investor confidence give way to a strongly negative second quarter (-4.9%) on worsening fears of the European crisis and contagion.
However, some stability emerged in the second half of the year as continued macroeconomic weakness drove corresponding actions by governments and central banks worldwide. In particular, central bank announcements in September created positive momentum in equity markets. Ben Bernanke and the U.S. Federal Reserve announced QE3, pledging up to US$40 billion per month to buy mortgage backed securities until the U.S. labor market improves. Across the pond, the ECB pledged a new and potentially unlimited short dated government bond-buying program coined Outright Monetary Transactions or “OMT” to reduce yields on European sovereign debt to strengthen sovereign balance sheets.
As the year came to a close positive drivers of investor sentiment included continual improvement in the U.S. housing market, evidence of economic stability in China, enthusiasm over the outcome of the Japanese election, and a Europe region that appears to be gradually stabilizing. These developments countered the two week selloff
Brookfield Investment Management Inc.
18
BROOKFIELD GLOBAL LISTED INFRASTRUCTURE FUND
following the U.S. presidential election as well as fears of the U.S. fiscal cliff. A deal to address taxes was reached on January 1 as part of the fiscal cliff negotiations, leading markets sharply higher in the New Year.
Global infrastructure securities were up 1.8% in the fourth quarter, bringing the asset class to a 2012 return of 13.8% as measured by the Dow Jones Brookfield Global Infrastructure Composite Index (the “Benchmark”). Global infrastructure securities underperformed Broad Equity Markets during the strong rally in the first quarter (+4.3%) and outperformed in the second quarter selloff (+0.7%). Conversely, amid downward market movements in the fourth quarter, higher yielding securities within the asset class underperformed. Master Limited Partnerships (“MLPs”) were down 3.4% as measured by the Alerian MLP Index. We believe underperformance of these higher yielding securities indicates investors’ concern, prior to the January 1 tax legislation passage, over the likely tax increases on dividends. Further, many high yielding securities have been very strong for several months and underperformance could be the result of a modest correction.
Importantly, we believe the infrastructure securities asset class is poised to perform well in an environment of the slowly recovering global economy forecasted for 2013. We are excited to pursue these opportunities targeting strong nominal and absolute returns on behalf of our investors in the coming year.
A growing infrastructure securities asset class
We believe one of the distinct attributes about infrastructure securities is the asset class has been growing rapidly while historically it continued to offer stable cash flows. There is simply not enough good infrastructure around the world. This is true in developed markets, where much of the infrastructure is reaching the end of its useful life and needs to be replaced or repaired. In emerging markets, there is a substantial need for new infrastructure as these economies grow.
In addition, governments are cash strapped and privatizing infrastructure assets to raise capital, particularly in the Europe region. These types of asset sales can represent potentially attractive entry points for investors. One of the best examples of this in 2012 was an announcement from the Portuguese government regarding its decision to sell the Portuguese airport concession company ANA-Aeroportos de Portugal SA (“ANA”) as part of the country’s agreed austerity measures precedent to the bailout it received from the EU and IMF last year. ANA holds the concession to operate the country’s 10 airports. Many of the bidders (and the winner) are in the global infrastructure securities investment universe, including Fraport AG (owner of the Frankfurt airport concession), Flughafen Zuerich AG (owner of the Zurich airport concession) and CCR SA (a Brazilian toll road company). The winning bid was Vinci SA’s €3 billion bid. Vinci SA is a French diversified infrastructure company.
The airport infrastructure sector was strong in 2012, up 34.5%. Strength has been driven partly by corporate transaction announcements. Currently 10 companies with a market cap of approximately US$35 billion currently comprise the sector.
A changing North American energy infrastructure landscape
Seventeen MLPs completed successful IPOs valued at approximately US$5.6 billion in total in 2012. This included listings by EQT Midstream Partners (EQM), Summit Midstream Partners (SMLP) and Western Gas Equity Partners L.P. (WGP US), among others. We believe the surge of MLP IPOs reflects companies’ desire to tap investor demand for current income amid the low interest rate environment. We too find MLPs compelling. These companies generally own high quality, pure-play infrastructure assets with stable, predictable and growing cash flows. We believe opportunities in the space will continue to arise, especially following the sector’s underperformance in late 2012.
The MLP IPO rush is indicative of a broader transformation in the North American energy infrastructure market. The continued growth of shale gas exploration and the expansion of the oil sands in Western Canada are impacting North American energy infrastructure companies in ways that would have been unimaginable a decade ago. In December, an important development occurred when the U.S. Department of Energy (DOE) issued a report supportive of natural gas drilling, and therefore positive for the energy infrastructure sector. The study was intended to protect public interest, including agriculture, by examining impacts on domestic natural gas pricing as additional natural gas export facilities become operational. Current laws require natural gas companies to obtain a license when exporting natural gas to non-Free Trade Agreement (“FTA”) countries. The report concluded that
2012 Annual Report
19
BROOKFIELD GLOBAL LISTED INFRASTRUCTURE FUND
additional export facilities in the U.S. would likely have a minimal impact on natural gas pricing and benefits would likely outweigh any costs, therefore paving the way for DOE approval for more terminals.1
Attractive opportunities among Asian natural gas companies
Continued changes in North American energy infrastructure will impact markets worldwide, including China which is likely to become an importer of natural gas. Chinese natural gas distribution companies look particularly attractive given energy has been identified as a top priority for Chinese national security. Furthermore, China has come under pressure for its significant use of coal mining and now aims to reduce its coal use. As such, the Chinese government has issued directives to increase the use of natural gas for power generation, vehicle fuel as well as heating and cooking fuel given the current low consumer market penetration. Indeed, gas demand in 2011 equaled roughly 130 billion cubic meters (bcm), which amounts to 4% of the country’s total energy consumption. By 2015 the government is targeting consumption to rise to 8% of total energy consumption, potentially exceeding 260 bcm.
Increased consumption cannot be supported by domestic natural gas supply, or consequently the existing natural gas infrastructure. Domestic natural gas supply accounted for approximately 80% of 2010 consumption. And we estimate domestic supply will cover just 60% of consumption by 2015. As a result, China will need to import liquefied natural gas (or “LNG”), requiring new Central Asian pipelines with an estimated growth requirement of over 40 bcm by 2015. We believe this will create a significant growth opportunity in Chinese natural gas infrastructure, particularly for city gas distributors, operators of midstream gas distribution pipelines, and LNG focused gas infrastructure.
Increasing demand and transaction activity among tower companies
Communications infrastructure (i.e. cell towers) was the strongest performing infrastructure sector this year, up 35.7%. Growing demand for wireless data service globally is expected to benefit cell tower owners in the global infrastructure securities asset class as wireless providers will require additional tower locations to expand their 4G footprint. Transaction activity among tower owners supported public market valuations of companies in the communications infrastructure sector. In February, SBA Communications Corp. (SBAC), a communications infrastructure company in our universe, announced a US$1.09 billion acquisition of 2,300 tower sites throughout the U.S. and Central America from cell tower firm Mobilitie LLC. SBAC issued $285 million in common equity in March to repay debt associated with the transaction.
OUTLOOK
Throughout 2012, we remained focused on our medium term outlook as we constructed portfolio positions. Key sector exposures include oil and gas pipelines, U.S. communications, and transportation infrastructure. Amid uncertainty and market weakness surrounding the fiscal cliff negotiations in December we began to transition the portfolio to increase exposure to pro-growth stocks and reduce exposure to some of the most defensive securities. As part of this trade we added U.S. railroads and Chinese transportation companies while selling U.S./UK water and U.S. electricity transmission and distribution companies.
As we look ahead to 2013, we believe hurdles to global macroeconomic stability will persist. Macro indicators have improved in the Asia Pacific region. The election of Mr. Shinzo Abe as Japan’s new prime minister and the change in government in China are both believed to be “market friendly” transitions. Mr. Abe is espousing aggressive easing policies and set a 2% inflation target to break Japan’s characteristic low growth, deflationary market environment. The new Chinese leadership generally appears to support reforms leading to more liberalization in the marketplace. On the other hand, while the U.S. Congress tackled one part of the fiscal cliff problem, many investors believe the most difficult negotiations to cut spending and reduce the U.S. deficit are yet to come. In addition, Southern Europe remains challenged.
Against this macro background, we believe infrastructure securities will benefit from a number of key trends in 2013, remaining an important and attractive global asset class. Investor demand for bonds is expected to shift to equities over the medium term, which should benefit real asset securities such as infrastructure securities as they generally exhibit an attractive mix of bond-like yields with equity returns. Infrastructure securities continue to offer stable fundamentals coupled with growth, capital appreciation, diversification, attractive risk adjusted returns, as well as an important hedge against inflation. We believe global investors will continue to recognize this in the New Year.
Brookfield Investment Management Inc.
20
BROOKFIELD GLOBAL LISTED INFRASTRUCTURE FUND
AVERAGE ANNUAL TOTAL RETURNS
| | | | | | | | |
| As of December 31, 2012 | | 1 Year | | | Since
Inception* | |
Class A Shares (excluding sales charge) | | | 16.87% | | | | 17.00% | |
Class A Shares (including sales charge) | | | 11.28% | | | | 11.43% | |
Class C Shares | | | N/A | | | | 7.19% | |
Class Y Shares | | | 17.06% | | | | 17.31% | |
Class I Shares | | | 17.16% | | | | 17.40% | |
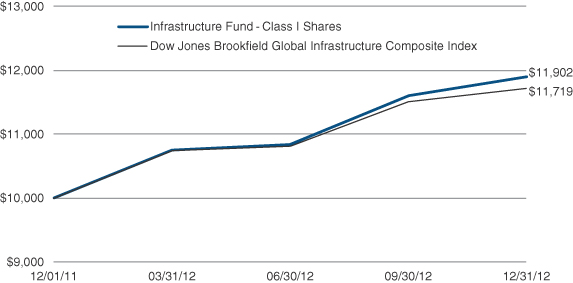
Dow Jones Brookfield Global Infrastructure Composite Index | | | 13.77% | | | | 13.96% | |
| * | Class A was incepted on December 29, 2011, Class C was incepted on April 30, 2012 and Classes Y and I were incepted on November 30, 2011. The Dow Jones Brookfield Global Infrastructure Composite Index references Class A’s inception date. |
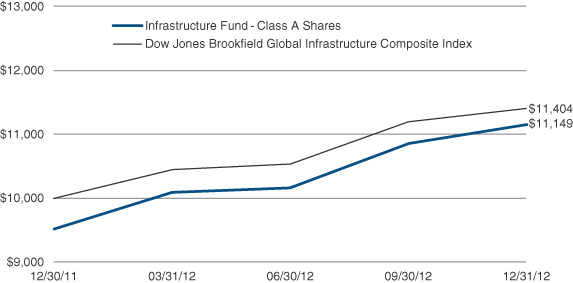
The graphs below illustrate a hypothetical investment of $10,000 in the Infrastructure Fund — Class A Shares from the commencement of investment operations on December 30, 2011 to December 31, 2012 compared to the Dow Jones Brookfield Global Infrastructure Composite Index and Class I Shares from the commencement of investment operations on December 1, 2011 to December 31, 2012 compared to the Dow Jones Brookfield Global Infrastructure Composite Index.
Class A Shares
2012 Annual Report
21
BROOKFIELD GLOBAL LISTED INFRASTRUCTURE FUND
Class I Shares
Performance data quoted represents past performance; past performance does not guarantee future results. The investment return and principal value of an investment will fluctuate so that an investor’s shares, when redeemed, may be worth more or less than their original cost. Current performance of the Fund may be lower or higher than the performance quoted. Performance data current to the most recent month end may be obtained by calling 855.244.4859. The Fund imposes a 2.00% redemption fee on shares redeemed within 60 days. Performance data does not reflect the imposition of the redemption fee and if it had, performance would have been lower.
Based on Class A Shares, the Fund’s gross expense ratio is 2.16% and the net expense ratio is 1.42%. The Adviser has contractually agreed to waive fees and/or reimburse Fund expenses through May 1, 2013. There is no guarantee that such waiver/reimbursement will be continued after that date.
Disclosure
Performance data quoted represents past performance results and does not guarantee future results. Current performance may be lower or higher than the performance data quoted.
All returns shown in USD.
The Fund’s portfolio holdings are subject to change without notice. The mention of specific securities is not a recommendation or solicitation for any person to buy, sell or hold any particular security. There is no assurance that the Brookfield Global Listed Infrastructure Fund currently holds these securities. Please refer to the Schedule of Investments contained in this report for a full listing of Fund holdings.
Mutual fund investing involves risk. Principal loss is possible.
The Dow Jones Brookfield Global Infrastructure Composite Index was created on July 1, 2008 and is comprised of infrastructure companies with at least 70% of its annual cash flows derived from owning and operating infrastructure assets. The Index is maintained by Dow Jones Indexes. The Index is unmanaged and, unlike the Fund, is not affected by cash flows or trading and other expenses. It is not possible to invest directly in an index. Index performance is shown for illustrative purposes only and does not predict or depict the performance of the Fund.
Brookfield Investment Management Inc.
22
BROOKFIELD GLOBAL LISTED INFRASTRUCTURE FUND
MSCI World Index is a free float-adjusted market capitalization weighted index that is designed to measure the equity market performance of developed markets. The MSCI World Index consists of the following 24 developed market country indices: Australia, Austria, Belgium, Canada, Denmark, Finland, France, Germany, Greece, Hong Kong, Ireland, Israel, Italy, Japan, Netherlands, New Zealand, Norway, Portugal, Singapore, Spain, Sweden, Switzerland, the United Kingdom, and the United States.
The Alerian MLP Total Return Index is a composite of the 50 most prominent energy Master Limited Partnerships (MLPs) and is calculated using a float-adjusted, capitalization-weighted methodology.
As measured by the Dow Jones Brookfield Airports Infrastructure Index, a global index of companies that derive at least 70% of cash flows from infrastructure lines of business and at least 50% of cash flows from the development, ownership, lease, concession or management of airports and related facilities.
The Dow Jones Brookfield Communications Infrastructure Index is a global index of companies that derive at least 70% of cash flows from infrastructure lines of business and at least 50% of cash flows from the development, lease, concession, or management of broadcast/mobile towers, satellites and fibre optic/copper (excludes telecom services) cable.
Beta is a measure of volatility, or systematic risk, of a security or portfolio in comparison to the market as a whole. A Basis Point is one hundredth of one percent (0.01%).
Cash flow refers to the amount of cash generated and used by a company over a given period.
These views represent the opinions of Brookfield Investment Management Inc. and are not intended to predict or depict the performance of any investment. These views are as of the close of business on December 31, 2012 and subject to change based on subsequent developments.
| 1 | Federal Register Notice of Availability of the LNG Export Study |
| | www.fossil.energy.gov/programs/gasregulation/LNGStudy.html. |
2012 Annual Report
23
BROOKFIELD GLOBAL LISTED INFRASTRUCTURE FUND
Portfolio Characteristics (Unaudited)
December 31, 2012
| | |
| ASSET ALLOCATION BY GEOGRAPHY | | Percent of
Net Assets |
United States | | 56.9% |
Canada | | 13.5% |
United Kingdom | | 6.9% |
Spain | | 3.5% |
Hong Kong | | 3.4% |
France | | 3.3% |
Japan | | 2.4% |
China | | 2.3% |
Italy | | 1.8% |
Netherlands | | 1.5% |
Switzerland | | 1.5% |
United Arab Emirates | | 1.0% |
Brazil | | 0.8% |
Australia | | 0.5% |
Other Assets in Excess of Liabilities | | 0.7% |
Total | | 100.0% |
ASSET ALLOCATION BY SECTOR
| | |
Oil & Gas Storage & Transportation | | 61.7% |
Infrastructure — Communications | | 12.4% |
Transmission & Distribution | | 10.7% |
Toll Roads | | 4.8% |
Rail | | 2.8% |
Infrastructure — Diversified | | 2.1% |
Water | | 1.9% |
Airports | | 1.5% |
Ports | | 1.4% |
Other Assets in Excess of Liabilities | | 0.7% |
Total | | 100.0% |
| | |
| TOP TEN HOLDINGS | | |
American Tower Corp. | | 5.3% |
Enbridge, Inc. | | 5.3% |
Kinder Morgan, Inc. | | 5.0% |
National Grid PLC | | 5.0% |
TransCanada Corp. | | 4.9% |
Crown Castle International Corp. | | 4.0% |
The Williams Companies, Inc. | | 4.0% |
Spectra Energy Corp. | | 3.5% |
Sempra Energy | | 3.5% |
PG&E Corp. | | 3.0% |
Brookfield Investment Management Inc.
24
BROOKFIELD GLOBAL LISTED INFRASTRUCTURE FUND
Schedule of Investments
December 31, 2012
| | | | | | | | |
| | | Shares | | | Value
(Note 2) | |
COMMON STOCKS – 99.3% | | | | | | | | |
AUSTRALIA – 0.5% | | | | | | | | |
Transmission & Distribution – 0.5% | | | | | | | | |
Spark Infrastructure Group 1
(Cost $525,807) | | | 326,100 | | | $ | 570,115 | |
Total AUSTRALIA
(Cost $525,807) | | | | | | | 570,115 | |
BRAZIL – 0.8% | | | | | | | | |
Transmission & Distribution – 0.8% | | | | | | | | |
Transmissora Alianca de Energia Eletrica SA 1
(Cost $1,079,315) | | | 95,200 | | | | 1,013,607 | |
Total BRAZIL
(Cost $1,079,315) | | | | | | | 1,013,607 | |
CANADA – 13.5% | | | | | | | | |
Oil & Gas Storage & Transportation – 13.5% | | | | | | | | |
Enbridge, Inc. 1 | | | 146,800 | | | | 6,348,985 | |
Keyera Corp. 1 | | | 34,200 | | | | 1,692,637 | |
Pembina Pipeline Corp. 1 | | | 61,600 | | | | 1,762,477 | |
TransCanada Corp. 1 | | | 124,700 | | | | 5,894,636 | |
Veresen, Inc. 1 | | | 51,500 | | | | 612,491 | |
| | | | | | | | |
Total Oil & Gas Storage & Transportation
(Cost $15,254,300) | | | | | | | 16,311,226 | |
Total CANADA
(Cost $15,254,300) | | | | | | | 16,311,226 | |
CHINA – 2.3% | | | | | | | | |
Oil & Gas Storage & Transportation – 1.4% | | | | | | | | |
Beijing Enterprises Holdings Ltd. 1
(Cost $1,578,050) | | | 246,200 | | | | 1,614,895 | |
| | | | | | | | |
Toll Roads – 0.9% | | | | | | | | |
Anhui Expressway Co. 1 | | | 64,500 | | | | 36,788 | |
Jiangsu Expressway Company Ltd. 1 | | | 512,800 | | | | 533,907 | |
Sichuan Expressway Company Ltd. 1 | | | 355,900 | | | | 129,600 | |
Zhejiang Expressway Company Ltd. 1 | | | 508,000 | | | | 401,836 | |
Total Toll Roads
(Cost $1,082,537) | | | | | | | 1,102,131 | |
Total CHINA
(Cost $2,660,587) | | | | | | | 2,717,026 | |
FRANCE – 3.3% | | | | | | | | |
Infrastructure – Communications – 0.8% | | | | | | | | |
Eutelsat Communications SA 1
(Cost $999,393) | | | 29,100 | | | | 967,877 | |
| | | | | | | | |
Toll Roads – 2.5% | | | | | | | | |
Groupe Eurotunnel SA 1
(Cost $2,926,940) | | | 389,503 | | | | 3,026,740 | |
Total FRANCE
(Cost $3,926,333) | | | | | | | 3,994,617 | |
See Notes to Financial Statements.
2012 Annual Report
25
BROOKFIELD GLOBAL LISTED INFRASTRUCTURE FUND
Schedule of Investments
December 31, 2012
| | | | | | | | |
| | | Shares | | | Value
(Note 2) | |
COMMON STOCKS (continued) | | | | | | | | |
HONG KONG – 3.4% | | | | | | | | |
Oil & Gas Storage & Transportation – 2.9% | | | | | | | | |
China Resources Gas Group Ltd. 1 | | | 18,800 | | | $ | 38,981 | |
Hong Kong & China Gas Company Ltd. 1 | | | 1,244,800 | | | | 3,420,100 | |
| | | | | | | | |
Total Oil & Gas Storage & Transportation
(Cost $3,137,813) | | | | | | | 3,459,081 | |
| | | | | | | | |
Ports – 0.4% | | | | | | | | |
Hutchison Port Holdings Trust 1
(Cost $432,569) | | | 547,100 | | | | 437,885 | |
| | | | | | | | |
Rail – 0.1% | | | | | | | | |
Guangshen Railway Company Ltd. 1
(Cost $185,350) | | | 471,600 | | | | 189,299 | |
Total HONG KONG
(Cost $3,755,732) | | | | | | | 4,086,265 | |
ITALY – 1.8% | | | | | | | | |
Oil & Gas Storage & Transportation – 1.8% | | | | | | | | |
Snam SpA 1
(Cost $2,082,296) | | | 471,334 | | | | 2,199,993 | |
Total ITALY
(Cost $2,082,296) | | | | | | | 2,199,993 | |
JAPAN – 2.4% | | | | | | | | |
Oil & Gas Storage & Transportation – 2.4% | | | | | | | | |
Tokyo Gas Company Ltd. 1
(Cost $3,284,414) | | | 640,800 | | | | 2,927,851 | |
Total JAPAN
(Cost $3,284,414) | | | | | | | 2,927,851 | |
NETHERLANDS – 1.5% | | | | | | | | |
Oil & Gas Storage & Transportation – 1.5% | | | | | | | | |
Koninklijke Vopak NV 1
(Cost $1,824,953) | | | 25,000 | | | | 1,767,200 | |
Total NETHERLANDS
(Cost $1,824,953) | | | | | | | 1,767,200 | |
SPAIN – 3.5% | | | | | | | | |
Infrastructure – Diversified – 2.1% | | | | | | | | |
Ferrovial SA 1
(Cost $2,003,767) | | | 175,900 | | | | 2,618,522 | |
| | | | | | | | |
Toll Roads – 1.4% | | | | | | | | |
Abertis Infraestructuras SA 1
(Cost $1,461,615) | | | 100,923 | | | | 1,666,891 | |
Total SPAIN
(Cost $3,465,382) | | | | | | | 4,285,413 | |
See Notes to Financial Statements.
Brookfield Investment Management Inc.
26
BROOKFIELD GLOBAL LISTED INFRASTRUCTURE FUND
Schedule of Investments
December 31, 2012
| | | | | | | | |
| | | Shares | | | Value
(Note 2) | |
COMMON STOCKS (continued) | | | | | | | | |
SWITZERLAND – 1.5% | | | | | | | | |
Airports – 1.5% | | | | | | | | |
Flughafen Zuerich AG 1
(Cost $1,485,639) | | | 3,887 | | | $ | 1,799,824 | |
Total SWITZERLAND
(Cost $1,485,639) | | | | | | | 1,799,824 | |
UNITED ARAB EMIRATES – 1.0% | | | | | | | | |
Ports – 1.0% | | | | | | | | |
DP World Ltd. 1
(Cost $1,134,418) | | | 100,000 | | | | 1,181,793 | |
Total UNITED ARAB EMIRATES
(Cost $1,134,418) | | | | | | | 1,181,793 | |
UNITED KINGDOM – 6.9% | | | | | | | | |
Transmission & Distribution – 5.0% | | | | | | | | |
National Grid PLC 1
(Cost $5,642,730) | | | 525,200 | | | | 6,023,767 | |
| | | | | | | | |
Water – 1.9% | | | | | | | | |
United Utilities Group PLC 1
(Cost $2,166,577) | | | 212,700 | | | | 2,341,563 | |
Total UNITED KINGDOM
(Cost $7,809,307) | | | | | | | 8,365,330 | |
UNITED STATES – 56.9% | | | | | | | | |
Infrastructure – Communications – 11.6% | | | | | | | | |
American Tower Corp. | | | 82,422 | | | | 6,368,748 | |
Crown Castle International Corp. 2 | | | 67,142 | | | | 4,844,967 | |
SBA Communications Corp. 2 | | | 38,900 | | | | 2,762,678 | |
| | | | | | | | |
Total Infrastructure – Communications
(Cost $12,365,796) | | | | | | | 13,976,393 | |
| | | | | | | | |
Oil & Gas Storage & Transportation – 38.2% | | | | | | | | |
Access Midstream Partners L.P. | | | 90,800 | | | | 3,045,432 | |
Enbridge Energy Management LLC 2 | | | 1 | | | | 21 | |
Energy Transfer Equity L.P. | | | 60,000 | | | | 2,728,800 | |
Enterprise Products Partners L.P. | | | 66,100 | | | | 3,310,288 | |
EQT Midstream Partners L.P. | | | 39,300 | | | | 1,224,195 | |
Inergy L.P. | | | 135,800 | | | | 2,470,202 | |
Kinder Morgan, Inc. | | | 171,944 | | | | 6,074,782 | |
MarkWest Energy Partners L.P. | | | 47,200 | | | | 2,407,672 | |
MPLX L.P. 2 | | | 39,100 | | | | 1,219,529 | |
ONEOK, Inc. | | | 81,900 | | | | 3,501,225 | |
Sempra Energy | | | 59,200 | | | | 4,199,648 | |
Southwest Gas Corp. | | | 40,700 | | | | 1,726,087 | |
Spectra Energy Corp. | | | 154,200 | | | | 4,221,996 | |
Sunoco Logistics Partners L.P. | | | 59,000 | | | | 2,934,070 | |
Targa Resources Corp. | | | 23,200 | | | | 1,225,888 | |
The Williams Companies, Inc. | | | 146,100 | | | | 4,783,314 | |
Western Gas Equity Partners L.P. | | | 34,600 | | | | 1,036,270 | |
| | | | | | | | |
Total Oil & Gas Storage & Transportation
(Cost $43,758,626) | | | | | | | 46,109,419 | |
| | | | | | | | |
See Notes to Financial Statements.
2012 Annual Report
27
BROOKFIELD GLOBAL LISTED INFRASTRUCTURE FUND
Schedule of Investments
December 31, 2012
| | | | | | | | |
| | | Shares | | | Value
(Note 2) | |
COMMON STOCKS (continued) | | | | | | | | |
Rail – 2.7% | | | | | | | | |
Norfolk Southern Corp. | | | 28,600 | | | $ | 1,768,624 | |
Union Pacific Corp. | | | 12,100 | | | | 1,521,212 | |
| | | | | | | | |
Total Rail
(Cost $3,227,683) | | | | | | | 3,289,836 | |
| | | | | | | | |
Transmission & Distribution – 4.4% | | | | | | | | |
Northeast Utilities | | | 45,100 | | | | 1,762,508 | |
PG&E Corp. | | | 89,600 | | | | 3,600,128 | |
Total Transmission & Distribution
(Cost $5,495,155) | | | | | | | 5,362,636 | |
Total UNITED STATES
(Cost $64,847,260) | | | | | | | 68,738,284 | |
Total COMMON STOCKS
(Cost $113,135,743) | | | | | | | 119,958,544 | |
Total Investments – 99.3%
(Cost $113,135,743) | | | | | | | 119,958,544 | |
Other Assets in Excess of Liabilities – 0.7% | | | | | | | 805,237 | |
| | |
TOTAL NET ASSETS – 100.0% | | | | | | $ | 120,763,781 | |
| |
The following notes should be read in conjunction with the accompanying Schedule of Investments.
| | | | | | |
1 | | | — | | | Foreign security or a U.S. security of a foreign company. |
2 | | | — | | | Non-income producing security. |
See Notes to Financial Statements.
Brookfield Investment Management Inc.
28
BROOKFIELD HIGH YIELD FUND
PORTFOLIO STRATEGY
The Fund’s top three contributors to performance in 2012 were Realogy Group, HCA, Inc. and Associated Materials. Realogy Group, an operator of real estate brokerage firms, benefited from stronger housing sales and a financial restructuring which provided the company with the flexibility to move forward, culminating in an IPO late in the year. HCA, Inc., an operator of acute-care hospitals, reported strong operating results, benefited from several bond offerings which boosted liquidity and from market enthusiasm over health care reform. Associated Materials is a producer of vinyl windows and siding used in new home construction. It benefited from stronger housing starts during the year which increased investor enthusiasm for housing related bonds even though the company hasn’t yet seen the benefits of the stronger housing market.
The largest detractors from performance were Arch Coal, Casella Waste Systems and Level 3 Communications. Arch Coal, a large producer of thermal and metallurgical coal suffered from lower prices as U.S. utilities shifted production from coal-fired to gas-fired plants, and as coal demand from China declined due to slower economic growth. Casella Waste Systems’ results were lower than anticipated as slower economic growth reduced the volume of high-value waste to their system, lower energy prices reduced the cash flow from their waste-to-energy plant, and higher costs from hurricane Irene reduced profits. Bonds from Level 3 Communications were generally higher during the year; however, the Fund sold its position in a market pullback resulting in a minor loss.
HIGH YIELD MARKET OVERVIEW AND OUTLOOK
Markets entered 2012 on a cautious note following a lackluster equity market in 2011 due to fears of slackening economic growth and yet another round of European currency concerns. Concerns about China’s economic growth possibly impacting the global economy turned into a “wall of worry” that markets climbed in the first quarter of 2012. Weak economic data in the U.S. pushed markets lower in the second quarter of 2012 for the third consecutive year. Fears passed, however, as worldwide central banks continued injecting liquidity into the system, and on the heels of a successful Euro summit in the summer. There were surprises on the upside when U.S. and Chinese GDP results were announced in July. In early September, the European Central Bank announced bond purchases which relieved pressure on the Euro and fueled further optimism. The primary focus for investors toward the end of the period was the U.S. presidential election in November 2012 which had created uncertainty up until Election Day. Additionally, “Superstorm Sandy” threw investors a curveball by bringing widespread destruction to the greater New York area and represented a new risk to economic growth. At the end of the year, all eyes were on Washington as lawmakers attempted to deal with the so-called “fiscal cliff” in which negotiations concluded at the last possible minute.
In this generally positive environment, both equity markets and the high yield bond market produced attractive total returns. The high yield market, as measured by BofA Merrill Lynch U.S. High Yield Master II Index, was up 15.6% compressing the high yield spread, the fundamental measure of value in fixed income markets, by 207 basis points helped by a mild tailwind of slightly lower U.S. Treasury bond yields which fell 12 basis points to 1.76%. Fueling these results on a macro level was continued worldwide central-bank easing which flooded the markets with liquidity at a time of very low yields. Excellent credit fundamentals, low defaults and attractive spreads have attracted a portion of that cash into the high yield market which pushed prices higher.
It is very unusual in the fourth year of the credit cycle to have returns of this magnitude, as typically the high yield market is well into its re-risking phase, cash flows are diminishing, and interest rates are rising. That is not the case in this cycle however; as companies have not yet begun substantial re-risking, interest rates remain stable and cash flows, if not earnings, remain robust and growing. It is interesting to note that despite robust returns, both for the quarter and the year, the relative return of lower quality credit to higher-quality credit is not indicating an overheated market which suggests to Brookfield that investors are not overreaching for yield.
Typically in a bull market, the more volatile rated credits outperform better quality names. We saw that during the period as CCCs outperformed, returning 20.3% in the period, compared to 15.0% for single Bs. The modest outperformance of CCCs in the current market environment suggests to Brookfield that investors are maintaining a fair degree of credit discipline despite their enthusiasm for high yield bonds. One of the key indicators that Brookfield uses to gauge the end of the credit cycle is a loosening of credit standards. We are not yet seeing that in the market and consequently believe the current cycle is not yet entering its final phase.
2012 Annual Report
29
BROOKFIELD HIGH YIELD FUND
Corporate credit has been sound for the past couple of years, and we saw a small decline in the default rate at the end of the calendar year. Note that this year’s default rate of 1.1%1 remains well below the market’s 25-year average default rate of 4.2%.2 No high yield bond issuers defaulted in the months of October or December. The 2012 calendar year represents the third year in which high yield defaults were less than 2%, which is normal for the midpoint of the credit cycle. It is not at all unusual, however, for the default rate to pop up in any individual year for idiosyncratic, as opposed to systemic, reasons.
The year saw stabilization in rating agency activity which began deteriorating in the third quarter of 2011. The trailing 12-month upgrade/downgrade ratio ended the year at 1.2x3. This means that credit is still modestly improving, although the rate of improvement is slowing, at least as measured by the ratings agencies. Brookfield noted that companies reported generally acceptable cash flows through the third quarter but more and more companies are reporting flat earnings and warning of more difficult times ahead.
For the calendar year, the market saw outperformance in housing, financial services, and wireless communications, which were up 22%, 19%, and 19%, respectively. Lagging industries for the year included food and drug retailing, metals and mining, and utilities, which were up 7.1%, 10.7%, and 11.5%, respectively. The outperformers for the year were industries that continue to recover from the 2008 recession. Metals companies underperformed due to weak global demand for their products stemming from slowing growth overseas. Forest products and utilities also lagged due to credit difficulties faced by a few companies in those industries.
Supply and demand was positive for the year. Fund flows were a positive $26 billion which was 2.5 times larger than 2011 inflows. New issue volume was a robust $344 billion, up from $219 billion the prior year.4 Refinancing of debt continued to be the primary use of proceeds for new issuers, representing 55% of all volume, slightly lower from the 59% of refinancing represented in 2011. Refinancing of debt has the effect of reducing overall risk to high yield investors by extending debt maturities and reducing “credit hammers” in high yield companies.
Earlier this year, we tempered our longer term enthusiasm for the high yield market with the recognition that the strong rally, spread compression and above-par market levels limited future price appreciation. The market seemed to agree and sold off in May on European concerns, but rebounded strongly in June and thereafter. While normally we would expect the yield spread to be 100 basis points narrower than current levels, we note the unusually depressed level of the benchmark Treasury yields, which may be artificially depressed from Federal Reserve actions. Somewhat tempering our caution, is a recognition of the distinct seasonality in historic high yield returns whereby November through May typically represent seasonally strong periods, while June through October represents seasonally challenging periods. While, of course, markets will pursue their own path, we consider the market to be benefiting from a seasonally strong tailwind.
We believe the high yield market is trading at a substantial premium to par value which limits further upside appreciation. Investors, therefore, should look at current return as the best indicator of possible future total returns and evaluate the attractiveness of the market on that basis, rather than looking at past total return performance. We note that the absolute level of yield in the high yield market is at or near historic lows, but note that spread to government bond rates remains attractive given the current state of corporate credit, and believe the high yield market continues to represent value at today’s levels.
Brookfield Investment Management Inc.
30
BROOKFIELD HIGH YIELD FUND
AVERAGE ANNUAL TOTAL RETURNS
| | | | | | | | |
| As of December 31, 2012 | | 1 Year | | | Since
Inception* | |
Average Annual Total Returns | | | | | | | | |
Class A Shares (excluding sales charge) | | | N/A | | | | 5.84% | |
Class A Shares (including sales charge) | | | N/A | | | | 0.86% | |
Class C Shares | | | N/A | | | | 5.27% | |
Class Y Shares | | | 10.46% | | | | 10.48% | |
Class I Shares | | | 10.57% | | | | 10.48% | |
BofA Merrill Lynch U.S. High Yield Master II Index | | | 15.58% | | | | 8.81% | |
| * | Classes A and C were incepted on April 30, 2012. Classes Y and I were incepted on November 30, 2011. The BofA Merrill Lynch U.S. High Yield Master II Index references Class A’s inception date. |
The graphs below illustrate a hypothetical investment of $10,000 in the Infrastructure Fund — Class A Shares from the commencement of investment operations on May 1, 2012 to December 31, 2012 compared to the BofA Merrill Lynch U.S. High Yield Master II Index and Class I Shares from the commencement of investment operations on December 1, 2011 to December 31, 2012 compared to the BofA Merrill Lynch U.S. High Yield Master II Index.
Class A Shares
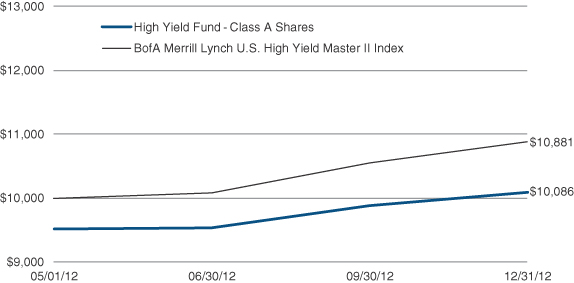
2012 Annual Report
31
BROOKFIELD HIGH YIELD FUND
Class I Shares
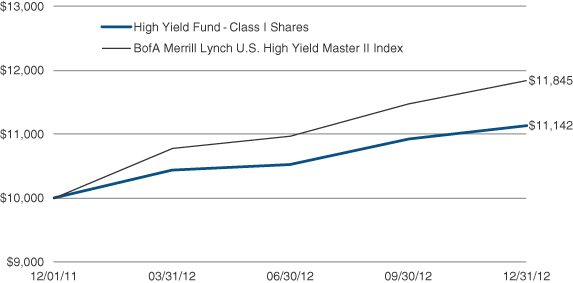
Performance data quoted represents past performance; past performance does not guarantee future results. The investment return and principal value of an investment will fluctuate so that an investor’s shares, when redeemed, may be worth more or less than their original cost. Current performance of the Fund may be lower or higher than the performance quoted. Performance data current to the most recent month end may be obtained by calling 855.244.4859. The Fund imposes a 2.00% redemption fee on shares redeemed within 60 days. Performance data does not reflect the imposition of the redemption fee and if it had, performance would have been lower.
Based on Class A Shares, the Fund’s gross expense ratio is 2.52% and the net expense ratio is 1.16%. The Adviser has contractually agreed to waive fees and/or reimburse Fund expenses through May 1, 2013. There is no guarantee that such waiver/reimbursement will be continued after that date.
Disclosure
Performance data quoted represents past performance results and does not guarantee future results. Current performance may be lower or higher than the performance data quoted.
All returns shown in USD.
The Fund’s portfolio holdings are subject to change without notice. The mention of specific securities is not a recommendation or solicitation for any person to buy, sell or hold any particular security. There is no assurance that the Brookfield High Yield Fund currently holds these securities. Please refer to the Schedule of Investments contained in this report for a full listing of Fund holdings.
Mutual fund investing involves risk. Principal loss is possible.
The BofA Merrill Lynch U.S. High Yield Master II Index is an unmanaged index that tracks the performance of below investment grade U.S. dollar-denominated corporate bonds publicly issued in the U.S. domestic market. The index is unmanaged and, unlike the Fund, is not affected by cash flows or trading and other expenses. It is not possible to invest directly in an index. Index performance is shown for illustrative purposes only and does not predict or depict the performance of the Fund.
Brookfield Investment Management Inc.
32
BROOKFIELD HIGH YIELD FUND
The Russell 2000 Index measures the performance of the small-cap segment of the U.S. equity universe. The Russell 2000 is a subset of the Russell 3000® Index representing approximately 10% of the total market capitalization of that index. It includes approximately 2000 of the smallest securities based on a combination of their market cap and current index membership.
A basis point is one hundredth of one percent (0.01%). Ratings are provided by ratings agencies such as Standard & Poor’s or Moody’s, who assign a rating based on their analysis of the issuer’s credit worthiness. The highest rating given is AAA and the lowest is C.
These views represent the opinions of Brookfield Investment Management Inc. and are not intended to predict or depict the performance of any investment. These views are as of the close of business on December 31, 2012 and subject to change based on subsequent developments.
| 1 | JP Morgan, High Yield Default Monitor, January 2, 2013 p. 1. |
| 2 | JP Morgan, High Yield Default Monitor, January 2, 2013 p. 2. |
| 3 | JP Morgan, High Yield Default Monitor, January 2, 2013 p. 10. |
| 4 | Credit Suisse “Leveraged Finance Strategy Update,” January 2, 2013, p. 2. |
2012 Annual Report
33
BROOKFIELD HIGH YIELD FUND
Portfolio Characteristics (Unaudited)
December 31, 2012
| | |
| CREDIT QUALITY | | Percent of
Net Assets |
BBB | | 3.3% |
BB | | 24.6% |
B | | 46.5% |
CCC | | 6.5% |
Other Assets in Excess of Liabilities | | 19.1% |
Total | | 100.0% |
ASSET ALLOCATION BY SECTOR
| | |
Services | | 13.7% |
Basic Industry | | 13.2% |
Energy | | 11.0% |
Healthcare | | 9.6% |
Capital Goods | | 8.0% |
Automotive | | 6.4% |
Media | | 6.3% |
Telecommunications | | 3.9% |
Consumer Cyclical | | 3.2% |
Consumer Non-Cyclical | | 2.8% |
Utility | | 2.0% |
Technology & Electronics | | 0.8% |
Other Assets in Excess of Liabilities | | 19.1% |
Total | | 100.0% |
| | |
| TOP TEN HOLDINGS | | |
HCA, Inc. | | 1.6% |
Health Management Associates, Inc. | | 1.5% |
Windstream Corp. | | 1.4% |
Ford Motor Co. | | 1.4% |
Mueller Water Products, Inc. | | 1.3% |
Jaguar Land Rover PLC | | 1.3% |
NRG Energy, Inc. | | 1.3% |
AAR Corp. | | 1.2% |
Limited Brands, Inc. | | 1.2% |
American Axle & Manufacturing, Inc. | | 1.2% |
Brookfield Investment Management Inc.
34
BROOKFIELD HIGH YIELD FUND
Schedule of Investments
December 31, 2012
| | | | | | | | | | | | | | | | |
| | | Interest
Rate | | | Maturity | | | Principal
Amount
(000s) | | | Value
(Note 2) | |
CORPORATE BONDS – 80.9% | | | | | | | | | | | | | | | | |
Automotive – 6.4% | | | | | | | | | | | | | | | | |
American Axle & Manufacturing, Inc. . | | | 7.88 | % | | | 03/01/17 | | | | $300 | | | $ | 310,500 | |
Ford Motor Co. | | | 6.50 | | | | 08/01/18 | | | | 300 | | | | 347,250 | |
Jaguar Land Rover PLC 1,2,3 | | | 8.13 | | | | 05/15/21 | | | | 300 | | | | 330,000 | |
Pittsburgh Glass Works LLC 1,3 | | | 8.50 | | | | 04/15/16 | | | | 250 | | | | 230,000 | |
Tenneco, Inc. | | | 6.88 | | | | 12/15/20 | | | | 200 | | | | 217,750 | |
Visteon Corp. | | | 6.75 | | | | 04/15/19 | | | | 180 | | | | 191,700 | |
| | | | | | | | | | | | | | | | |
Total Automotive
(Cost – $1,556,385) | | | | | | | | | | | | | | | 1,627,200 | |
| | | | | | | | | | | | | | | | |
Basic Industry – 13.2% | | | | | | | | | | | | | | | | |
ArcelorMittal 2 | | | 6.13 | | | | 06/01/18 | | | | 150 | | | | 152,025 | |
Alpha Natural Resources, Inc. | | | 6.25 | | | | 06/01/21 | | | | 250 | | | | 228,750 | |
Arch Coal, Inc. | | | 7.25 | | | | 06/15/21 | | | | 275 | | | | 253,687 | |
Associated Materials LLC/AMH New Finance, Inc. . | | | 9.13 | | | | 11/01/17 | | | | 200 | | | | 203,000 | |
Building Materials Corporation of America 1,3 | | | 6.75 | | | | 05/01/21 | | | | 250 | | | | 276,250 | |
Cascades, Inc. 2 | | | 7.88 | | | | 01/15/20 | | | | 200 | | | | 213,000 | |
FMG Resources August 2006 Property Ltd. 1,2,3 | | | 6.88 | | | | 04/01/22 | | | | 200 | | | | 204,500 | |
Hexion US Finance Corp. | | | 6.63 | | | | 04/15/20 | | | | 100 | | | | 101,750 | |
Hexion US Finance Corp./Hexion Nova Scotia Finance ULC | | | 9.00 | | | | 11/15/20 | | | | 50 | | | | 45,625 | |
Huntsman International LLC | | | 8.63 | | | | 03/15/21 | | | | 200 | | | | 228,500 | |
Ineos Group Holdings SA 1,2,3 | | | 8.50 | | | | 02/15/16 | | | | 300 | | | | 298,500 | |
Masonite International Corp. 1,2,3 | | | 8.25 | | | | 04/15/21 | | | | 250 | | | | 267,500 | |
Ply Gem Industries, Inc. | | | 8.25 | | | | 02/15/18 | | | | 250 | | | | 270,000 | |
Steel Dynamics, Inc. | | | 7.63 | | | | 03/15/20 | | | | 125 | | | | 138,125 | |
Tembec Industries, Inc. 2 | | | 11.25 | | | | 12/15/18 | | | | 200 | | | | 212,000 | |
United States Steel Corp. | | | 7.00 | | | | 02/01/18 | | | | 125 | | | | 133,437 | |
Verso Paper Holdings LLC /Verso Paper, Inc. | | | 11.75 | | | | 01/15/19 | | | | 150 | | | | 157,500 | |
| | | | | | | | | | | | | | | | |
Total Basic Industry
(Cost – $3,232,336) | | | | | | | | | | | | | | | 3,384,149 | |
| | | | | | | | | | | | | | | | |
Capital Goods – 8.0% | | | | | | | | | | | | | | | | |
AAR Corp. 1,3 | | | 7.25 | | | | 01/15/22 | | | | 300 | | | | 317,625 | |
Berry Plastics Corp. | | | 9.50 | | | | 05/15/18 | | | | 250 | | | | 275,000 | |
Coleman Cable, Inc. | | | 9.00 | | | | 02/15/18 | | | | 200 | | | | 215,000 | |
Crown Cork & Seal Company, Inc. | | | 7.38 | | | | 12/15/26 | | | | 250 | | | | 277,500 | |
Mueller Water Products, Inc. | | | 7.38 | | | | 06/01/17 | | | | 325 | | | | 335,562 | |
Owens-Illinois, Inc. | | | 7.80 | | | | 05/15/18 | | | | 250 | | | | 288,125 | |
Tekni-Plex, Inc. 1,3 | | | 9.75 | | | | 06/01/19 | | | | 125 | | | | 136,250 | |
Terex Corp. | | | 6.50 | | | | 04/01/20 | | | | 200 | | | | 212,000 | |
| | | | | | | | | | | | | | | | |
Total Capital Goods
(Cost – $1,930,486) | | | | | | | | | | | | | | | 2,057,062 | |
| | | | | | | | | | | | | | | | |
Consumer Cyclical – 3.2% | | | | | | | | | | | | | | | | |
Levi Strauss & Co. | | | 7.63 | | | | 05/15/20 | | | | 200 | | | | 218,000 | |
Limited Brands, Inc. | | | 7.60 | | | | 07/15/37 | | | | 300 | | | | 314,250 | |
Phillips-Van Heusen Corp. | | | 7.38 | | | | 05/15/20 | | | | 250 | | | | 280,312 | |
| | | | | | | | | | | | | | | | |
Total Consumer Cyclical
(Cost – $767,583) | | | | | | | | | | | | | | | 812,562 | |
| | | | | | | | | | | | | | | | |
See Notes to Financial Statements.
2012 Annual Report
35
BROOKFIELD HIGH YIELD FUND
Schedule of Investments
December 31, 2012
| | | | | | | | | | | | | | | | |
| | | Interest
Rate | | | Maturity | | | Principal
Amount
(000s) | | | Value
(Note 2) | |
CORPORATE BONDS (continued) | | | | | | | | | | | | | | | | |
Consumer Non – Cyclical – 2.8% | | | | | | | | | | | | | | | | |
B&G Foods, Inc . | | | 7.63 | % | | | 01/15/18 | | | $ | 184 | | | $ | 197,800 | |
C&S Group Enterprises LLC 1,3 | | | 8.38 | | | | 05/01/17 | | | | 220 | | | | 232,650 | |
Jarden Corp. | | | 6.13 | | | | 11/15/22 | | | | 250 | | | | 270,000 | |
| | | | | | | | | | | | | | | | |
Total Consumer Non-Cyclical
(Cost – $682,005) | | | | | | | | | | | | | | | 700,450 | |
| | | | | | | | | | | | | | | | |
Energy – 11.0% | | | | | | | | | | | | | | | | |
BreitBurn Energy Partners L.P./BreitBurn Finance Corp. | | | 8.63 | | | | 10/15/20 | | | | 250 | | | | 272,500 | |
Calfrac Holdings L.P. 1,3 | | | 7.50 | | | | 12/01/20 | | | | 250 | | | | 247,500 | |
Crosstex Energy L.P./Crosstex Energy Finance Corp. | | | 8.88 | | | | 02/15/18 | | | | 200 | | | | 216,000 | |
EV Energy Partners L.P./EV Energy Finance Corp. | | | 8.00 | | | | 04/15/19 | | | | 225 | | | | 238,781 | |
Frac Tech Services LLC/Frac Tech Finance, Inc. 1,3 | | | 8.13 | | | | 11/15/18 | | | | 181 | | | | 186,882 | |
Hilcorp Energy ILP /Hilcorp Finance Co. 1,3 | | | 8.00 | | | | 02/15/20 | | | | 200 | | | | 219,000 | |
Key Energy Services, Inc. | | | 6.75 | | | | 03/01/21 | | | | 250 | | | | 250,000 | |
Linn Energy LLC/Linn Energy Finance Corp. | | | 8.63 | | | | 04/15/20 | | | | 250 | | | | 272,500 | |
Niska Gas Storage US LLC/Niska Gas Storage Canada ULC | | | 8.88 | | | | 03/15/18 | | | | 200 | | | | 205,500 | |
Precision Drilling Corp. 2 | | | 6.63 | | | | 11/15/20 | | | | 250 | | | | 268,750 | |
SESI LLC | | | 7.13 | | | | 12/15/21 | | | | 200 | | | | 222,500 | |
Trinidad Drilling Ltd. 1,2,3 | | | 7.88 | | | | 01/15/19 | | | | 200 | | | | 212,500 | |
| | | | | | | | | | | | | | | | |
Total Energy
(Cost – $2,744,053) | | | | | | | | | | | | | | | 2,812,413 | |
| | | | | | | | | | | | | | | | |
Healthcare – 9.6% | | | | | | | | | | | | | | | | |
CHS/Community Health Systems, Inc. | | | 7.13 | | | | 07/15/20 | | | | 125 | | | | 133,438 | |
DJO Finance LLC/DJO Finance Corp. 1,3 | | | 9.88 | | | | 04/15/18 | | | | 125 | | | | 129,063 | |
Fresenius Medical Care US Finance II, Inc. 1,3 | | | 5.88 | | | | 01/31/22 | | | | 200 | | | | 217,000 | |
HCA, Inc. | | | 8.00 | | | | 10/01/18 | | | | 350 | | | | 405,125 | |
Health Management Associates, Inc. | | | 7.38 | | | | 01/15/20 | | | | 350 | | | | 378,000 | |
inVentiv Health, Inc. 1,3 | | | 9.00 | | | | 01/15/18 | | | | 100 | | | | 101,000 | |
inVentiv Health, Inc. 1,3 | | | 10.25 | | | | 08/15/18 | | | | 200 | | | | 172,500 | |
Kindred Healthcare, Inc. | | | 8.25 | | | | 06/01/19 | | | | 125 | | | | 121,563 | |
Pharmaceutical Product Development, Inc. 1,3 | | | 9.50 | | | | 12/01/19 | | | | 250 | | | | 283,750 | |
Polymer Group, Inc. | | | 7.75 | | | | 02/01/19 | | | | 200 | | | | 214,500 | |
Service Corporation International | | | 8.00 | | | | 11/15/21 | | | | 250 | | | | 307,500 | |
| | | | | | | | | | | | | | | | |
Total Healthcare
(Cost – $2,353,193) | | | | | | | | | | | | | | | 2,463,439 | |
| | | | | | | | | | | | | | | | |
Media – 6.3% | | | | | | | | | | | | | | | | |
Cablevision Systems Corp. | | | 8.63 | | | | 09/15/17 | | | | 200 | | | | 233,250 | |
CCO Holdings LLC/CCO Holdings Capital Corp. | | | 6.63 | | | | 01/31/22 | | | | 100 | | | | 109,250 | |
CCO Holdings LLC/CCO Holdings Capital Corp. | | | 8.13 | | | | 04/30/20 | | | | 200 | | | | 224,000 | |
Cenveo Corp. | | | 8.88 | | | | 02/01/18 | | | | 100 | | | | 95,000 | |
Clear Channel Worldwide Holdings, Inc. | | | 7.63 | | | | 03/15/20 | | | | 125 | | | | 125,938 | |
Deluxe Corp. | | | 7.00 | | | | 03/15/19 | | | | 200 | | | | 211,500 | |
Lamar Media Corp. | | | 7.88 | | | | 04/15/18 | | | | 200 | | | | 221,000 | |
Mediacom LLC/Mediacom Capital Corp. | | | 9.13 | | | | 08/15/19 | | | | 250 | | | | 276,875 | |
National CineMedia LLC | | | 6.00 | | | | 04/15/22 | | | | 100 | | | | 106,000 | |
| | | | | | | | | | | | | | | | |
Total Media
(Cost – $1,515,944) | | | | | | | | | | | | | | | 1,602,813 | |
| | | | | | | | | | | | | | | | |
See Notes to Financial Statements.
Brookfield Investment Management Inc.
36
BROOKFIELD HIGH YIELD FUND
Schedule of Investments
December 31, 2012
| | | | | | | | | | | | | | | | |
| | | Interest
Rate | | | Maturity | | | Principal
Amount
(000s) | | | Value
(Note 2) | |
CORPORATE BONDS (continued) | | | | | | | | | | | | | | | | |
Services – 13.7% | | | | | | | | | | | | | | | | |
AMC Entertainment, Inc. | | | 8.75 | % | | | 06/01/19 | | | | $250 | | | $ | 276,875 | |
Avis Budget Car Rental LLC/Avis Budget Finance, Inc. | | | 8.25 | | | | 01/15/19 | | | | 200 | | | | 221,000 | |
Avis Budget Car Rental LLC/Avis Budget Finance, Inc. | | | 9.75 | | | | 03/15/20 | | | | 100 | | | | 115,500 | |
Boyd Gaming Corp. 1,3 | | | 9.00 | | | | 07/01/20 | | | | 250 | | | | 246,250 | |
Caesars Entertainment Operating Company, Inc. | | | 11.25 | | | | 06/01/17 | | | | 250 | | | | 267,813 | |
Casella Waste Systems, Inc. 1,3 | | | 7.75 | | | | 02/15/19 | | | | 325 | | | | 308,750 | |
Cedar Fair L.P./Canada’s Wonderland Co./Magnum Management Corp. | | | 9.13 | | | | 08/01/18 | | | | 200 | | | | 225,000 | |
Chester Downs & Marina LLC 1,3 | | | 9.25 | | | | 02/01/20 | | | | 250 | | | | 245,625 | |
CityCenter Holdings LLC/CityCenter Finance Corp. | | | 7.63 | | | | 01/15/16 | | | | 200 | | | | 214,000 | |
Iron Mountain, Inc. | | | 8.38 | | | | 08/15/21 | | | | 250 | | | | 277,500 | |
MGM Resorts International | | | 7.63 | | | | 01/15/17 | | | | 200 | | | | 214,000 | |
MGM Resorts International 1,3 | | | 8.63 | | | | 02/01/19 | | | | 50 | | | | 55,750 | �� |
MTR Gaming Group, Inc. | | | 11.50 | | | | 08/01/19 | | | | 251 | | | | 266,325 | |
Standard Pacific Corp. | | | 8.38 | | | | 05/15/18 | | | | 200 | | | | 232,000 | |
UR Merger Sub Corp. 1,3 | | | 7.63 | | | | 04/15/22 | | | | 100 | | | | 111,750 | |
UR Merger Sub Corp. | | | 8.25 | | | | 02/01/21 | | | | 200 | | | | 225,500 | |
| | | | | | | | | | | | | | | | |
Total Services
(Cost – $3,340,818) | | | | | | | | | | | | | | | 3,503,638 | |
| | | | | | | | | | | | | | | | |
Technology & Electronics – 0.8% | | | | | | | | | | | | | | | | |
First Data Corp. 1,3
(Cost – $194,659) | | | 7.38 | | | | 06/15/19 | | | | 200 | | | | 207,000 | |
| | | | | | | | | | | | | | | | |
Telecommunications – 3.9% | | | | | | | | | | | | | | | | |
CenturyLink, Inc. | | | 7.65 | | | | 03/15/42 | | | | 250 | | | | 261,277 | |
Cincinnati Bell, Inc. | | | 8.38 | | | | 10/15/20 | | | | 81 | | | | 87,683 | |
Cincinnati Bell, Inc. | | | 8.75 | | | | 03/15/18 | | | | 100 | | | | 103,250 | |
Frontier Communications Corp. | | | 7.13 | | | | 03/15/19 | | | | 175 | | | | 190,313 | |
Windstream Corp. | | | 7.00 | | | | 03/15/19 | | | | 350 | | | | 357,875 | |
| | | | | | | | | | | | | | | | |
Total Telecommunications
(Cost – $957,881) | | | | | | | | | | | | | | | 1,000,398 | |
| | | | | | | | | | | | | | | | |
Utility – 2.0% | | | | | | | | | | | | | | | | |
Calpine Corp. 1,3 | | | 7.25 | | | | 10/15/17 | | | | 180 | | | | 191,700 | |
NRG Energy, Inc. | | | 8.50 | | | | 06/15/19 | | | | 300 | | | | 330,000 | |
| | | | | | | | | | | | | | | | |
Total Utility
(Cost – $489,508) | | | | | | | | | | | | | | | 521,700 | |
CORPORATE BONDS
(Cost – $19,764,851) | | | | | | | | | | | | | | | 20,692,824 | |
Total Investments – 80.9%
(Cost – $19,764,851) | | | | | | | | | | | | | | | 20,692,824 | |
Other Assets in Excess of Liabilities – 19.1% | | | | | | | | | | | | | | | 4,898,228 | |
| | | | |
TOTAL NET ASSETS – 100.0% | | | | | | | | | | | | | | $ | 25,591,052 | |
| |
See Notes to Financial Statements.
2012 Annual Report
37
BROOKFIELD HIGH YIELD FUND
Schedule of Investments
December 31, 2012
The following notes should be read in conjunction with the accompanying Schedule of Investments.
| | | | | | |
1 | | | — | | | Security exempt from registration under Rule 144A of the Securities Act of 1933. These securities may only be resold in transactions exempt from registration, normally to qualified institutional buyers. As of December 31, 2012, the total value of all such investments was $5,429,295 or 21.22% of net assets. |
2 | | | — | | | Foreign security or a U.S. security of a foreign company. |
3 | | | — | | | Private Placement. |
See Notes to Financial Statements.
Brookfield Investment Management Inc.
38
BROOKFIELD INVESTMENT FUNDS
Statements of Assets and Liabilities
December 31, 2012
| | | | | | | | | | | | |
| | | Real Estate
Fund | | | Infrastructure
Fund | | | High Yield
Fund | |
Assets: | | | | | | | | | | | | |
Investments in securities, at value (Note 2) | | $ | 36,467,296 | | | $ | 119,958,544 | | | $ | 20,692,824 | |
Cash | | | 1,415,597 | | | | 5,150,314 | | | | 4,513,081 | |
Interest and dividends receivable | | | 103,397 | | | | 347,649 | | | | 409,916 | |
Receivable for investments sold | | | — | | | | 2,270,236 | | | | — | |
Receivable for fund shares sold | | | 106,701 | | | | 191,923 | | | | 19,000 | |
Net receivable from Adviser | | | 25,040 | | | | — | | | | 25,588 | |
Prepaid expenses | | | 19,036 | | | | 36,965 | | | | 19,136 | |
| | | | | | | | | | | | |
Total assets | | | 38,137,067 | | | | 127,955,631 | | | | 25,679,545 | |
| | | | | | | | | | | | |
| | | |
Liabilities: | | | | | | | | | | | | |
Payable for investments purchased | | | 312,291 | | | | 7,010,345 | | | | — | |
Payable for fund shares purchased | | | — | | | | 3,818 | | | | — | |
Distribution fee payable | | | 268 | | | | 8,170 | | | | 56 | |
Dividend payable | | | — | | | | — | | | | 249 | |
Investment advisory fee payable | | | — | | | | 32,266 | | | | — | |
Administration fee payable | | | — | | | | 14,834 | | | | — | |
Trustees’ fee payable | | | 2,917 | | | | 2,917 | | | | 2,917 | |
Accrued expenses | | | 88,281 | | | | 119,500 | | | | 85,271 | |
| | | | | | | | | | | | |
Total liabilities | | | 403,757 | | | | 7,191,850 | | | | 88,493 | |
| | | | | | | | | | | | |
| | | |
Net Assets | | $ | 37,733,310 | | | $ | 120,763,781 | | | $ | 25,591,052 | |
| | | | | | | | | | | | |
| | | |
Composition of Net Assets: | | | | | | | | | | | | |
Paid-in capital (Note 6) | | $ | 34,753,666 | | | $ | 113,590,673 | | | $ | 24,612,074 | |
Undistributed (Distributions in excess of) net investment income | | | (617,362 | ) | | | 4,782 | | | | 101 | |
Accumulated net realized gain on investments, foreign currency and foreign currency translations | | | 210,727 | | | | 339,836 | | | | 50,904 | |
Net unrealized appreciation on investments, foreign currency and foreign currency translations | | | 3,386,279 | | | | 6,828,490 | | | | 927,973 | |
| | | | | | | | | | | | |
Net assets applicable to capital shares outstanding | | $ | 37,733,310 | | | $ | 120,763,781 | | | $ | 25,591,052 | |
| | | | | | | | | | | | |
Total investments at cost | | $ | 33,080,252 | | | $ | 113,135,743 | | | $ | 19,764,851 | |
| | | | | | | | | | | | |
| | | |
Net Assets | | | | | | | | | | | | |
| | | |
Class A Shares — Net Assets | | $ | 639,186 | | | $ | 16,546,762 | | | $ | 10,543 | |
Shares outstanding | | | 53,296 | | | | 1,424,721 | | | | 1,010 | |
Net asset value and redemption price per share | | $ | 11.99 | | | $ | 11.61 | | | $ | 10.44 | |
Offering price per share based on a maximum sales charge of 4.75% | | $ | 12.59 | | | $ | 12.19 | | | $ | 10.96 | |
| | | |
Class C Shares — Net Assets | | $ | 67,207 | | | $ | 829,040 | | | $ | 25,322 | |
Shares outstanding | | | 5,602 | | | | 71,677 | | | | 2,428 | |
Net asset value and redemption price per share | | $ | 12.00 | | | $ | 11.57 | | | $ | 10.43 | |
| | | |
Class Y Shares — Net Assets | | $ | 9,101,008 | | | $ | 20,299,905 | | | $ | 8,325 | |
Shares outstanding | | | 757,895 | | | | 1,746,992 | | | | 798 | |
Net asset value and redemption price per share | | $ | 12.01 | | | $ | 11.62 | | | $ | 10.43 | |
| | | |
Class I Shares — Net Assets | | $ | 27,925,909 | | | $ | 83,088,074 | | | $ | 25,546,862 | |
Shares outstanding | | | 2,326,428 | | | | 7,142,560 | | | | 2,447,175 | |
Net asset value and redemption price per share | | $ | 12.00 | | | $ | 11.63 | | | $ | 10.44 | |
See Notes to Financial Statements.
2012 Annual Report
39
BROOKFIELD INVESTMENT FUNDS
Statements of Operations
For the Year Ended December 31, 2012
| | | | | | | | | | | | |
| | | Real Estate
Fund | | | Infrastructure
Fund | | | High Yield
Fund | |
Investment Income: | | | | | | | | | | | | |
Interest | | $ | — | | | $ | — | | | $ | 1,521,929 | |
Dividends | | | 638,967 | | | | 2,222,613 | | | | — | |
Foreign withholding tax | | | (33,149 | ) | | | (193,135 | ) | | | — | |
| | | | | | | | | | | | |
Total investment income | | | 605,818 | | | | 2,029,478 | | | | 1,521,929 | |
| | | | | | | | | | | | |
| | | |
Expenses: | | | | | | | | | | | | |
Investment advisory fees (Note 4) | | | 157,224 | | | | 524,223 | | | | 155,759 | |
Administration fees (Note 4) | | | 31,445 | | | | 92,510 | | | | 35,945 | |
Distribution fees — Class A | | | 234 | | | | 12,670 | | | | 12 | |
Distribution fees — Class C | | | 52 | | | | 1,291 | | | | 45 | |
Registration fees | | | 73,581 | | | | 84,368 | | | | 74,327 | |
Audit and tax services | | | 72,685 | | | | 72,685 | | | | 77,919 | |
Offering fees | | | 58,482 | | | | 77,693 | | | | 57,918 | |
Transfer agent fees | | | 52,598 | | | | 67,320 | | | | 55,361 | |
Fund accounting fees | | | 39,328 | | | | 43,516 | | | | 46,183 | |
Trustees’ fees | | | 35,000 | | | | 35,000 | | | | 35,000 | |
Custodian fees | | | 17,325 | | | | 42,653 | | | | 3,496 | |
Legal fees | | | 12,326 | | | | 35,302 | | | | 16,442 | |
Insurance | | | 3,180 | | | | 7,522 | | | | 7,517 | |
Miscellaneous | | | 2,509 | | | | 3,623 | | | | 2,979 | |
Reports to shareholders | | | 1,668 | | | | 15,621 | | | | 3,348 | |
| | | | | | | | | | | | |
Total operating expenses | | | 557,637 | | | | 1,115,997 | | | | 572,251 | |
Less expenses waived and reimbursed by the investment advisor (Note 4) | | | (336,765 | ) | | | (380,615 | ) | | | (334,926 | ) |
| | | | | | | | | | | | |
Net expenses | | | 220,872 | | | | 735,382 | | | | 237,325 | |
| | | | | | | | | | | | |
Net investment income | | | 384,946 | | | | 1,294,096 | | | | 1,284,604 | |
| | | | | | | | | | | | |
| | | |
Net Realized and Unrealized Gain (Loss ) on Investments, Foreign Currency and Foreign Currency Translations: | | | | | | | | | | | | |
Net realized gain (loss) on: | | | | | | | | | | | | |
Investments | | | 1,919,054 | | | | 1,846,558 | | | | 279,133 | |
Foreign currency and foreign currency translations | | | (50,815 | ) | | | (183,444 | ) | | | — | |
| | | | | | | | | | | | |
Net realized gain on investments, foreign currency and foreign currency translations | | | 1,868,239 | | | | 1,663,114 | | | | 279,133 | |
| | | | | | | | | | | | |
Net change in unrealized appreciation (depreciation) on: | | | | | | | | | | | | |
Investments | | | 3,372,119 | | | | 6,713,509 | | | | 834,446 | |
Foreign currency and foreign currency translations | | | (859 | ) | | | 12,553 | | | | — | |
| | | | | | | | | | | | |
Net change in unrealized appreciation on investments, foreign currency and foreign currency translations | | | 3,371,260 | | | | 6,726,062 | | | | 834,446 | |
| | | | | | | | | | | | |
Net realized and unrealized gain on investments, foreign currency and foreign currency translations | | | 5,239,499 | | | | 8,389,176 | | | | 1,113,579 | |
| | | | | | | | | | | | |
Net increase in net assets resulting from operations | | $ | 5,624,445 | | | $ | 9,683,272 | | | $ | 2,398,183 | |
| | | | | | | | | | | | |
See Notes to Financial Statements.
Brookfield Investment Management Inc.
40
BROOKFIELD INVESTMENT FUNDS
Statements of Changes in Net Assets
| | | | | | | | | | | | | | | | |
| | | Real Estate Fund | | | Infrastructure Fund | |
| | | For the
Year Ended
December 31, 2012 | | | For the period
December 1, 20111
through
December 31, 2011 | | | For the
Year Ended
December 31, 2012 | | | For the period
December 1, 20111
through
December 31, 2011 | |
Increase (Decrease) in Net Assets Resulting from Operations: | | | | | | | | | | | | | | | | |
Net investment income | | $ | 384,946 | | | $ | 14,211 | | | $ | 1,294,096 | | | $ | 7,332 | |
Net realized gain (loss) on investments, foreign currency and foreign currency translations | | | 1,868,239 | | | | (1,114 | ) | | | 1,663,114 | | | | 4,745 | |
Net unrealized appreciation on investments, foreign currency and foreign currency translations | | | 3,371,260 | | | | 15,019 | | | | 6,726,062 | | | | 102,428 | |
| | | | | | | | | | | | | | | | |
Net increase in net assets resulting from operations | | | 5,624,445 | | | | 28,116 | | | | 9,683,272 | | | | 114,505 | |
| | | | | | | | | | | | | | | | |
| | | | |
Distributions to Shareholders: | | | | | | | | | | | | | | | | |
From net investment income: | | | | | | | | | | | | | | | | |
Class A shares | | | (14,943 | ) | | | — | | | | (147,904 | ) | | | — | |
Class C shares | | | (340 | ) | | | — | | | | (6,648 | ) | | | — | |
Class Y shares | | | (24,642 | ) | | | (48 | ) | | | (200,205 | ) | | | (11 | ) |
Class I shares | | | (1,184,889 | ) | | | (19,420 | ) | | | (805,345 | ) | | | (8,220 | ) |
From net realized gain on investments: | | | | | | | | | | | | | | | | |
Class A shares | | | (17,294 | ) | | | — | | | | (199,187 | ) | | | — | |
Class C shares | | | (364 | ) | | | — | | | | (9,850 | ) | | | — | |
Class Y shares | | | (869 | ) | | | — | | | | (248,338 | ) | | | — | |
Class I shares | | | (1,412,344 | ) | | | — | | | | (998,961 | ) | | | | |
| | | | | | | | | | | | | | | | |
Total distributions paid | | | (2,655,685 | ) | | | (19,468 | ) | | | (2,616,438 | ) | | | (8,231 | ) |
| | | | | | | | | | | | | | | | |
| | | | |
Capital Share Transactions (Note 6): | | | | | | | | | | | | | | | | |
Proceeds from shares sold | | | 30,596,112 | | | | 5,025,000 | | | | 104,603,851 | | | | 12,317,501 | |
Reinvestment of dividends and distributions | | | 2,655,316 | | | | 19,468 | | | | 2,604,430 | | | | 8,230 | |
Cost of shares redeemed | | | (3,539,994 | ) | | | — | | | | (5,945,169 | ) | | | — | |
Redemption fees | | | — | | | | — | | | | 1,830 | | | | — | |
| | | | | | | | | | | | | | | | |
Net increase in capital share transactions | | | 29,711,434 | | | | 5,044,468 | | | | 101,264,942 | | | | 12,325,731 | |
| | | | | | | | | | | | | | | | |
Total increase in net assets | | | 32,680,194 | | | | 5,053,116 | | | | 108,331,776 | | | | 12,432,005 | |
| | | | |
Net Assets: | | | | | | | | | | | | | | | | |
Beginning of period | | | 5,053,116 | | | | — | | | | 12,432,005 | | | | — | |
| | | | | | | | | | | | | | | | |
End of period | | $ | 37,733,310 | | | $ | 5,053,116 | | | $ | 120,763,781 | | | $ | 12,432,005 | |
| | | | | | | | | | | | | | | | |
(including undistributed (distributions in excess of) net investment income) | | $ | (617,362 | ) | | $ | (4,135 | ) | | $ | 4,782 | | | $ | (80 | ) |
| | | | | | | | | | | | | | | | |
| 1 | Commencement of Operations. |
See Notes to Financial Statements.
2012 Annual Report
41
BROOKFIELD INVESTMENT FUNDS
Statements of Changes in Net Assets (continued)
| | | | | | | | |
| | | High Yield Fund | |
| | | For the Year
Ended
December 31, 2012 | | | For the Period
December 1, 20111
through
December 31, 2011 | |
Increase in Net Assets Resulting from Operations: | | | | | | | | |
Net investment income | | $ | 1,284,604 | | | $ | 53,593 | |
Net realized gain on investments, foreign currency and foreign currency translations | | | 279,133 | | | | — | |
Net unrealized appreciation on investments, foreign currency and foreign currency translations | | | 834,446 | | | | 93,527 | |
| | | | | | | | |
Net increase in net assets resulting from operations | | | 2,398,183 | | | | 147,120 | |
| | | | | | | | |
| | |
Distributions to Shareholders: | | | | | | | | |
From net investment income: | | | | | | | | |
Class A shares | | | (269 | ) | | | — | |
Class C shares | | | (277 | ) | | | — | |
Class Y shares | | | (494 | ) | | | (33 | ) |
Class I shares | | | (1,283,463 | ) | | | (53,562 | ) |
From net realized gain on investments: | | | | | | | | |
Class A shares | | | (94 | ) | | | — | |
Class C shares | | | (227 | ) | | | — | |
Class Y shares | | | (74 | ) | | | — | |
Class I shares | | | (227,834 | ) | | | — | |
| | | | | | | | |
Total distributions paid | | | (1,512,732 | ) | | | (53,595 | ) |
| | | | | | | | |
| | |
Capital Share Transactions (Note 6): | | | | | | | | |
Proceeds from shares sold | | | 5,036,416 | | | | 20,025,000 | |
Reinvestment of dividends and distributions | | | 1,059,256 | | | | 37,537 | |
Cost of shares redeemed | | | (1,546,133 | ) | | | — | |
| | | | | | | | |
Net increase in capital share transactions | | | 4,549,539 | | | | 20,062,537 | |
| | | | | | | | |
Total increase in net assets | | | 5,434,990 | | | | 20,156,062 | |
| | | | | | | | |
| | |
Net Assets: | | | | | | | | |
Beginning of period | | | 20,156,062 | | | | — | |
| | | | | | | | |
End of period | | $ | 25,591,052 | | | $ | 20,156,062 | |
| | | | | | | | |
(including undistributed net investment income) | | $ | 101 | | | $ | — | |
| | | | | | | | |
| 1 | Commencement of Operations. |
See Notes to Financial Statements.
Brookfield Investment Management Inc.
42
BROOKFIELD GLOBAL LISTED REAL ESTATE FUND
Financial Highlights
| | | | |
| Class A | | For the period May 1, 20121
through
December 31, 2012 | |
Per Share Operating Performance: | | | | |
Net asset value, beginning of period | | $ | 11.57 | |
| | | | |
Net investment income2 | | | 0.14 | |
Net realized and unrealized gain on investment transactions | | | 1.50 | |
| | | | |
Net increase in net asset value resulting from operations | | | 1.64 | |
| | | | |
Distributions from net investment income | | | (0.55 | ) |
Distributions from net realized capital gain | | | (0.67 | ) |
| | | | |
Total distributions paid | | | (1.22 | ) |
| | | | |
Net asset value, end of period | | $ | 11.99 | |
| | | | |
| |
Total Investment Return† | | | 14.89 | %4 |
| |
Ratios to Average Net Assets/Supplementary Data: | | | | |
Net assets, end of period (000s) | | $ | 639 | |
Gross operating expenses | | | 2.54 | %3 |
Net expenses, including fee waivers and reimbursement | | | 1.23 | %3 |
Net investment income | | | 2.08 | %3 |
Net investment income, excluding the effect of fee waivers and reimbursement | | | 0.77 | %3 |
Portfolio turnover rate | | | 106 | %4 |
| | | | |
| Class C | | For the period
May 1, 20121
through
December 31, 2012 | |
Per Share Operating Performance: | | | | |
Net asset value, beginning of period | | $ | 11.57 | |
| | | | |
Net investment income2 | | | 0.07 | |
Net realized and unrealized gain on investment transactions | | | 1.52 | |
| | | | |
Net increase in net asset value resulting from operations | | | 1.59 | |
| | | | |
Distributions from net investment income | | | (0.49 | ) |
Distributions from net realized capital gain | | | (0.67 | ) |
| | | | |
Total distributions paid | | | (1.16 | ) |
| | | | |
Net asset value, end of period | | $ | 12.00 | |
| | | | |
| |
Total Investment Return† | | | 14.39 | %4 |
| |
Ratios to Average Net Assets/Supplementary Data: | | | | |
Net assets, end of period (000s) | | $ | 67 | |
Gross operating expenses | | | 3.55 | %3 |
Net expenses, including fee waivers and reimbursement | | | 2.04 | %3 |
Net investment income | | | 1.29 | %3 |
Net investment income, excluding the effect of fee waivers and reimbursement | | | (0.22 | )%3 |
Portfolio turnover rate | | | 106 | %4 |
| † | Total investment return is computed based upon the net asset value of the Fund’s shares and excludes the effects of sales charges or contingent deferred sales charges, if applicable. |
| 1 | From the commencement of investment operations on May 1, 2012. |
| 2 | Per share amounts presented are based on average shares outstanding throughout the period indicated. |
See Notes to Financial Statements.
2012 Annual Report
43
BROOKFIELD GLOBAL LISTED REAL ESTATE FUND
Financial Highlights
| | | | | | | | |
| Class Y | | For the Year
Ended
December 31, 2012 | | | For the period
December 1, 20111
through
December 31, 2011 | |
Per Share Operating Performance: | | | | | | | | |
Net asset value, beginning of period | | $ | 10.02 | | | $ | 10.00 | |
| | | | | | | | |
Net investment income2 | | | 0.22 | | | | 0.04 | |
Net realized and unrealized gain on investment transactions | | | 3.00 | | | | 0.02 | |
| | | | | | | | |
Net increase in net asset value resulting from operations | | | 3.22 | | | | 0.06 | |
| | | | | | | | |
Distributions from net investment income | | | (0.56 | ) | | | (0.04 | ) |
Distributions from net realized capital gain | | | (0.67 | ) | | | — | |
| | | | | | | | |
Total distributions paid | | | (1.23 | ) | | | (0.04 | ) |
| | | | | | | | |
Net asset value, end of period | | $ | 12.01 | | | $ | 10.02 | |
| | | | | | | | |
| | |
Total Investment Return† | | | 32.93 | % | | | 0.59 | %4 |
| | |
Ratios to Average Net Assets/Supplementary Data: | | | | | | | | |
Net assets, end of period (000s) | | $ | 9,101 | | | $ | 13 | |
Gross operating expenses | | | 3.24 | % | | | 25.79 | %3 |
Net expenses, including fee waivers and reimbursement | | | 1.11 | % | | | 1.25 | %3 |
Net investment income | | | 3.64 | % | | | 3.35 | %3 |
Net investment income (loss), excluding the effect of fee waivers and reimbursement | | | 1.51 | % | | | (21.19 | )%3 |
Portfolio turnover rate | | | 106 | % | | | 0 | %4 |
| | | | | | | | |
| Class I | | For the Year
Ended
December 31, 2012 | | | For the period
December 1, 20111
through
December 31, 2011 | |
Per Share Operating Performance: | | | | | | | | |
Net asset value, beginning of period | | $ | 10.02 | | | $ | 10.00 | |
| | | | | | | | |
Net investment income2 | | | 0.21 | | | | 0.04 | |
Net realized and unrealized gain on investment transactions | | | 3.00 | | | | 0.02 | |
| | | | | | | | |
Net increase in net asset value resulting from operations | | | 3.21 | | | | 0.06 | |
| | | | | | | | |
Distributions from net investment income | | | (0.56 | ) | | | (0.04 | ) |
Distributions from net realized capital gain | | | (0.67 | ) | | | — | |
| | | | | | | | |
Total distributions paid | | | (1.23 | ) | | | (0.04 | ) |
| | | | | | | | |
Net asset value, end of period | | $ | 12.00 | | | $ | 10.02 | |
| | | | | | | | |
| | |
Total Investment Return† | | | 32.83 | % | | | 0.59 | %4 |
| | |
Ratios to Average Net Assets/Supplementary Data: | | | | | | | | |
Net assets, end of period (000s) | | $ | 27,926 | | | $ | 5,041 | |
Gross operating expenses | | | 2.65 | % | | | 25.79 | %3 |
Net expenses, including fee waivers and reimbursement | | | 1.05 | % | | | 1.25 | %3 |
Net investment income | | | 1.81 | % | | | 3.35 | %3 |
Net investment income (loss), excluding the effect of fee waivers and reimbursement | | | 0.21 | % | | | (21.19 | )%3 |
Portfolio turnover rate | | | 106 | % | | | 0 | %4 |
| † | Total investment return is computed based upon the net asset value of the Fund’s shares and excludes the effects of sales charges or contingent deferred sales charges, if applicable. |
| 1 | From the commencement of investment operations on December 1, 2011. |
| 2 | Per share amounts presented are based on average shares outstanding throughout the period indicated. |
See Notes to Financial Statements.
Brookfield Investment Management Inc.
44
BROOKFIELD GLOBAL LISTED INFRASTRUCTURE FUND
Financial Highlights
| | | | | | | | |
| Class A | | For the Year
Ended
December 31, 2012 | | | For the period
December 30, 20111
through
December 31, 2011 | |
Per Share Operating Performance: | | | | | | | | |
Net asset value, beginning of period | | $ | 10.15 | | | $ | 10.13 | |
| | | | | | | | |
Net investment income3 | | | 0.21 | | | | 0.00 | 6 |
Net realized and unrealized gain on investment transactions | | | 1.50 | | | | 0.02 | |
| | | | | | | | |
Net increase in net asset value resulting from operations | | | 1.71 | | | | 0.02 | |
| | | | | | | | |
Distributions from net investment income | | | (0.11 | ) | | | (0.00 | )6 |
Distributions from net realized capital gain | | | (0.14 | ) | | | — | |
| | | | | | | | |
Total distributions paid | | | (0.25 | ) | | | (0.00 | )6 |
| | | | | | | | |
Redemption fees | | | 0.00 | 6 | | | — | |
| | | | | | | | |
Net asset value, end of period | | $ | 11.61 | | | $ | 10.15 | |
| | | | | | | | |
| | |
Total Investment Return† | | | 16.87 | % | | | 0.20 | %5 |
| | |
Ratios to Average Net Assets/Supplementary Data: | | | | | | | | |
Net assets, end of period (000s) | | $ | 16,547 | | | $ | 2,302 | |
Gross operating expenses | | | 2.16 | % | | | 34.45 | %4 |
Net expenses, including fee waivers and reimbursement | | | 1.42 | % | | | 1.60 | %4 |
Net investment income (loss) | | | 1.85 | % | | | (1.60 | )%4 |
Net investment income (loss), excluding the effect of fee waivers and reimbursement | | | 1.11 | % | | | (34.45 | )%4 |
Portfolio turnover rate | | | 88 | % | | | 1 | %5 |
| | | | |
| Class C | | For the period
May 1, 20122
through
December 31, 2012 | |
Per Share Operating Performance: | | | | |
Net asset value, beginning of period | | $ | 11.02 | |
| | | | |
Net investment income3 | | | 0.10 | |
Net realized and unrealized gain on investment transactions | | | 0.69 | |
| | | | |
Net increase in net asset value resulting from operations | | | 0.79 | |
| | | | |
Distributions from net investment income | | | (0.10 | ) |
Distributions from net realized capital gain | | | (0.14 | ) |
| | | | |
Total distributions paid | | | (0.24 | ) |
| | | | |
Net asset value, end of period | | $ | 11.57 | |
| | | | |
| |
Total Investment Return† | | | 7.19 | %5 |
| |
Ratios to Average Net Assets/Supplementary Data: | | | | |
Net assets, end of period (000s) | | $ | 829 | |
Gross operating expenses | | | 2.63 | %4 |
Net expenses, including fee waivers and reimbursement | | | 2.13 | %4 |
Net investment income | | | 1.67 | %4 |
Net investment income, excluding the effect of fee waivers and reimbursement | | | 1.17 | %4 |
Portfolio turnover rate | | | 88 | %5 |
| † | Total investment return is computed based upon the net asset value of the Fund’s shares and excludes the effects of sales charges or contingent deferred sales charges, if applicable. |
| 1 | From the commencement of investment operations on December 30, 2011. |
| 2 | From the commencement of investment operations on May 1, 2012. |
| 3 | Per share amounts presented are based on average shares outstanding throughout the period indicated. |
| 6 | Rounds to less than $0.005. |
See Notes to Financial Statements.
2012 Annual Report
45
BROOKFIELD GLOBAL LISTED INFRASTRUCTURE FUND
Financial Highlights
| | | | | | | | |
| Class Y | | For the Year
Ended
December 31, 2012 | | | For the period
December 1, 20111
through
December 31, 2011 | |
Per Share Operating Performance: | | | | | | | | |
Net asset value, beginning of period | | $ | 10.15 | | | $ | 10.00 | |
| | | | | | | | |
Net investment income2 | | | 0.24 | | | | 0.03 | |
Net realized and unrealized gain on investment transactions | | | 1.49 | | | | 0.13 | |
| | | | | | | | |
Net increase in net asset value resulting from operations | | | 1.73 | | | | 0.16 | |
| | | | | | | | |
Distributions from net investment income | | | (0.12 | ) | | | (0.01 | ) |
Distributions from net realized capital gain | | | (0.14 | ) | | | — | |
| | | | | | | | |
Total distributions paid | | | (0.26 | ) | | | (0.01 | ) |
| | | | | | | | |
Net asset value, end of period | | $ | 11.62 | | | $ | 10.15 | |
| | | | | | | | |
| | |
Total Investment Return† | | | 17.06 | % | | | 1.58 | %4 |
| | |
Ratios to Average Net Assets/Supplementary Data: | | | | | | | | |
Net assets, end of period (000s) | | $ | 20,300 | | | $ | 13 | |
Gross operating expenses | | | 1.67 | % | | | 18.59 | %3 |
Net expenses, including fee waivers and reimbursement | | | 1.13 | % | | | 1.35 | %3 |
Net investment income | | | 2.86 | % | | | 1.66 | %3 |
Net investment income (loss), excluding the effect of fee waivers and reimbursement | | | 2.32 | % | | | (15.39 | )%3 |
Portfolio turnover rate | | | 88 | % | | | 1 | %4 |
| | | | | | | | |
| Class I | | For the Year
Ended
December 31, 2012 | | | For the period
December 1, 20111
through
December 31, 2011 | |
Per Share Operating Performance: | | | | | | | | |
Net asset value, beginning of period | | $ | 10.15 | | | $ | 10.00 | |
| | | | | | | | |
Net investment income2 | | | 0.24 | | | | 0.02 | |
Net realized and unrealized gain on investment transactions | | | 1.50 | | | | 0.14 | |
| | | | | | | | |
Net increase in net asset value resulting from operations | | | 1.74 | | | | 0.16 | |
| | | | | | | | |
Distributions from net investment income | | | (0.12 | ) | | | (0.01 | ) |
Distributions from net realized capital gain | | | (0.14 | ) | | | — | |
| | | | | | | | |
Total distributions paid | | | (0.26 | ) | | | (0.01 | ) |
| | | | | | | | |
Net asset value, end of period | | $ | 11.63 | | | $ | 10.15 | |
| | | | | | | | |
| | |
Total Investment Return† | | | 17.16 | % | | | 1.58 | %4 |
| | |
Ratios to Average Net Assets/Supplementary Data: | | | | | | | | |
Net assets, end of period (000s) | | $ | 83,088 | | | $ | 10,117 | |
Gross operating expenses | | | 1.78 | % | | | 19.53 | %3 |
Net expenses, including fee waivers and reimbursement | | | 1.17 | % | | | 1.35 | %3 |
Net investment income | | | 2.06 | % | | | 1.66 | %3 |
Net investment income (loss), excluding the effect of fee waivers and reimbursement | | | 1.45 | % | | | (16.34 | )%3 |
Portfolio turnover rate | | | 88 | % | | | 1 | %4 |
| † | Total investment return is computed based upon the net asset value of the Fund’s shares and excludes the effects of sales charges or contingent deferred sales charges, if applicable. |
| 1 | From the commencement of investment operations on December 1, 2011. |
| 2 | Per share amounts presented are based on average shares outstanding throughout the period indicated. |
See Notes to Financial Statements.
Brookfield Investment Management Inc.
46
BROOKFIELD HIGH YIELD FUND
Financial Highlights
| | | | |
| Class A | | For the period
May 1, 20121
through
December 31, 2012 | |
Per Share Operating Performance: | | | | |
Net asset value, beginning of period | | $ | 10.31 | |
| | | | |
Net investment income2 | | | 0.36 | |
Net realized and unrealized gain on investment transactions | | | 0.23 | |
| | | | |
Net increase in net asset value resulting from operations | | | 0.59 | |
| | | | |
Distributions from net investment income | | | (0.37 | ) |
Distributions from net realized capital gain | | | (0.09 | ) |
| | | | |
Total distributions paid | | | (0.46 | ) |
| | | | |
Net asset value, end of period | | $ | 10.44 | |
| | | | |
Total Investment Return† | | | 5.84 | %4 |
| |
Ratios to Average Net Assets/Supplementary Data: | | | | |
Net assets, end of period (000s) | | $ | 11 | |
Gross operating expenses | | | 2.52 | %3 |
Net expenses, including fee waivers and reimbursement | | | 1.16 | %3 |
Net investment income | | | 5.12 | %3 |
Net investment income, excluding the effect of fee waivers and reimbursement | | | 3.76 | %3 |
Portfolio turnover rate | | | 35 | %4 |
| | | | |
| Class C | | For the period
May 1, 20121
through
December 31, 2012 | |
Per Share Operating Performance: | | | | |
Net asset value, beginning of period | | $ | 10.31 | |
| | | | |
Net investment income2 | | | 0.31 | |
Net realized and unrealized gain on investment transactions | | | 0.22 | |
| | | | |
Net increase in net asset value resulting from operations | | | 0.53 | |
| | | | |
Distributions from net investment income | | | (0.32 | ) |
Distributions from net realized capital gain | | | (0.09 | ) |
| | | | |
Total distributions paid | | | (0.41 | ) |
| | | | |
Net asset value, end of period | | $ | 10.43 | |
| | | | |
| |
Total Investment Return† | | | 5.27 | %4 |
| |
Ratios to Average Net Assets/Supplementary Data: | | | | |
Net assets, end of period (000s) | | $ | 25 | |
Gross operating expenses | | | 3.44 | %3 |
Net expenses, including fee waivers and reimbursement | | | 1.93 | %3 |
Net investment income | | | 4.43 | %3 |
Net investment income, excluding the effect of fee waivers and reimbursement | | | 2.92 | %3 |
Portfolio turnover rate | | | 35 | %4 |
| † | Total investment return is computed based upon the net asset value of the Fund’s shares and excludes the effects of sales charges or contingent deferred sales charges, if applicable. |
| 1 | From the commencement of investment operations on May 1, 2012. |
| 2 | Per share amounts presented are based on average shares outstanding throughout the period indicated. |
See Notes to Financial Statements.
2012 Annual Report
47
BROOKFIELD HIGH YIELD FUND
Financial Highlights
| | | | | | | | |
| Class Y | | For the Year
Ended
December 31, 2012 | | | For the period
December 1,
20111 through
December 31, 2011 | |
Per Share Operating Performance: | | | | | | | | |
Net asset value, beginning of period | | $ | 10.05 | | | $ | 10.00 | |
| | | | | | | | |
Net investment income2 | | | 0.55 | | | | 0.03 | |
Net realized and unrealized gain on investment transactions | | | 0.47 | | | | 0.05 | |
| | | | | | | | |
Net increase in net asset value resulting from operations | | | 1.02 | | | | 0.08 | |
| | | | | | | | |
Distributions from net investment income | | | (0.55 | ) | | | (0.03 | ) |
Distributions from net realized capital gain | | | (0.09 | ) | | | — | |
| | | | | | | | |
Total distributions paid | | | (0.64 | ) | | | (0.03 | ) |
| | | | | | | | |
Net asset value, end of period | | $ | 10.43 | | | $ | 10.05 | |
| | | | | | | | |
| | |
Total Investment Return† | | | 10.46 | % | | | 0.77 | %4 |
| | |
Ratios to Average Net Assets/Supplementary Data: | | | | | | | | |
Net assets, end of period (000s) | | $ | 8 | | | $ | 13 | |
Gross operating expenses | | | 2.48 | % | | | 6.53 | %3 |
Net expenses, including fee waivers and reimbursement | | | 1.04 | % | | | 1.15 | %3 |
Net investment income | | | 5.31 | % | | | 3.15 | %3 |
Net investment income (loss), excluding the effect of fee waivers and reimbursement | | | 3.87 | % | | | (2.23 | )%3 |
Portfolio turnover rate | | | 35 | % | | | 0 | %4 |
| | | | | | | | |
| Class I | | For the Year
Ended
December 31, 2012 | | | For the period
December 1,
20111 through
December 31, 2011 | |
Per Share Operating Performance: | | | | | | | | |
Net asset value, beginning of period | | $ | 10.05 | | | $ | 10.00 | |
| | | | | | | | |
Net investment income2 | | | 0.56 | | | | 0.03 | |
Net realized and unrealized gain on investment transactions | | | 0.47 | | | | 0.05 | |
| | | | | | | | |
Net increase in net asset value resulting from operations | | | 1.03 | | | | 0.08 | |
| | | | | | | | |
Distributions from net investment income | | | (0.55 | ) | | | (0.03 | ) |
Distributions from net realized capital gain | | | (0.09 | ) | | | — | |
| | | | | | | | |
Total distributions paid | | | (0.64 | ) | | | (0.03 | ) |
| | | | | | | | |
Net asset value, end of period | | $ | 10.44 | | | $ | 10.05 | |
| | | | | | | | |
| | |
Total Investment Return† | | | 10.57 | % | | | 0.77 | %4 |
| | |
Ratios to Average Net Assets/Supplementary Data: | | | | | | | | |
Net assets, end of period (000s) | | $ | 25,547 | | | $ | 20,143 | |
Gross operating expenses | | | 2.39 | % | | | 6.53 | %3 |
Net expenses, including fee waivers and reimbursement | | | 0.99 | % | | | 1.15 | %3 |
Net investment income | | | 5.36 | % | | | 3.15 | %3 |
Net investment income (loss), excluding the effect of fee waivers and reimbursement | | | 3.96 | % | | | (2.23 | )%3 |
Portfolio turnover rate | | | 35 | % | | | 0 | %4 |
| † | Total investment return is computed based upon the net asset value of the Fund’s shares and excludes the effects of sales charges or contingent deferred sales charges, if applicable. |
| 1 | From the commencement of investment operations on December 1, 2011. |
| 2 | Per share amounts presented are based on average shares outstanding throughout the period indicated. |
See Notes to Financial Statements.
Brookfield Investment Management Inc.
48
BROOKFIELD INVESTMENT FUNDS
Notes to Financial Statements
December 31, 2012
1. Organization
Brookfield Investment Funds (the “Trust”) was organized as a statutory trust under the laws of the State of Delaware on May 12, 2011. The Trust is registered under the Investment Company Act of 1940, as amended (the “1940 Act”), as a diversified, open-end management investment company. The Trust consists of four series of underlying portfolios including the Brookfield Global Listed Real Estate Fund (the “Real Estate Fund”), the Brookfield Global Listed Infrastructure Fund (the “Infrastructure Fund”), the Brookfield Global High Yield Fund (the “Global High Yield Fund”), and the Brookfield High Yield Fund (the “High Yield Fund”) (each, a “Fund,” and collectively, the “Funds”). As of December 31, 2012, the Global High Yield Fund has not yet commenced operations.
The Funds currently have four classes of shares: Class A, Class C, Class Y and Class I shares. Each share represents an interest in the same portfolio of assets and have identical voting, dividend, liquidation and other rights. The assets belonging to a particular Fund belong to that Fund for all purposes, and to no other Fund, subject only to the rights of creditors of that Fund. The assets of all Classes within each Fund, has the same rights and is identical in all material respects except that: (i) Class A shares have a maximum front end sales load of 4.75% and Class C shares have a maximum deferred sales charge of 1.00%; (ii) Class A shares have a 12b-1 fee of 0.25% and Class C shares have a 12b-1 fee of 1.00%; and (iii) each Class has exclusive voting rights with respect to matters relating to its own distribution arrangements.
Brookfield Investment Management Inc. (the “Adviser”), wholly-owned subsidiary of Brookfield Asset Management Inc., is registered as an investment adviser under the Investment Advisers Act of 1940, as amended (the “Advisers Act”), and serves as investment adviser to the Funds. AMP Capital Brookfield (US) LLC (the “Sub-Adviser”), a Delaware limited liability company and a registered investment adviser under the Advisers Act, served as investment sub-adviser to the Real Estate Fund and the Infrastructure Fund until March 31, 2012.
The Real Estate Fund and the Infrastructure Fund each seek total return through growth of capital and current income. The Global High Yield Fund and the High Yield Fund each seek total return, consisting of a high level of current income and capital appreciation. There can be no assurance that each Fund will achieve its investment objective.
2. Significant Accounting Policies
The preparation of financial statements in conformity with accounting principles generally accepted in the United States of America (“GAAP”) requires management to make estimates and assumptions that affect the reported amounts of assets and liabilities and disclosure of contingent assets and liabilities at the date of the financial statements and the reported amounts of revenues and expenses during the reporting period. Actual results could differ from those estimates.
Valuation of Investments: Debt securities, including U.S. government securities, listed corporate bonds, other fixed income and asset-backed securities, and unlisted securities and private placement securities, are generally valued at the bid prices furnished by an independent pricing service or, if not valued by an independent pricing service, using bid prices obtained from at least two active and reliable market makers in any such security. If quotes cannot be obtained from two active and reliable market makers then the securities may be priced using a quote obtained from a single active market maker. Short-term debt securities with remaining maturities of sixty days or less are valued at cost with adjusted by the amortization of discount or premium to the date of maturity, unless such valuation, in the judgment of the Adviser’s Valuation Committee, does not represent market value, in which case these securities will be fair valued as determined by the Adviser’s Valuation Committee.
Investments in equity securities listed or traded on any securities exchange or traded in the over-the-counter market are valued at the trade price as of the close of business on the valuation date. Equity securities for which no sales were reported for that date are valued at “fair value” as determined in good faith by the Adviser’s
2012 Annual Report
49
BROOKFIELD INVESTMENT FUNDS
Notes to Financial Statements
December 31, 2012
Valuation Committee. Investments in open-end registered investment companies, if any, are valued at the net asset value (“NAV”) as reported by those investment companies.
When price quotations for certain securities are not readily available, or if the available quotations are not believed to be reflective of market value by the Adviser, those securities will be valued at “fair value” as determined in good faith by the Adviser’s Valuation Committee using procedures adopted by and under the supervision of the Funds’ Board of Trustees. There can be no assurance that a Fund could purchase or sell a portfolio security at the price used to calculate a Fund’s NAV.
Fair valuation procedures may be used to value a substantial portion of the assets of each Fund. A Fund may use the fair value of a security to calculate its NAV when, for example, (1) a portfolio security is not traded in a public market or the principal market in which the security trades is closed, (2) trading in a portfolio security is suspended and not resumed prior to the normal market close, (3) a portfolio security is not traded in significant volume for a substantial period, or (4) the Adviser determines that the quotation or price for a portfolio security provided by a broker-dealer or an independent pricing service is inaccurate.
The “fair value” of securities may be difficult to determine and thus judgment plays a greater role in the valuation process. The fair valuation methodology may include or consider the following guidelines, as appropriate: (1) evaluation of all relevant factors, including but not limited to, pricing history, current market level, supply and demand of the respective security; (2) comparison to the values and current pricing of securities that have comparable characteristics; (3) knowledge of historical market information with respect to the security; (4) other factors relevant to the security which would include, but not be limited to, duration, yield, fundamental analytical data, the Treasury yield curve, and credit quality.
The values assigned to fair valued investments are based on available information and do not necessarily represent amounts that might ultimately be realized, since such amounts depend on future developments inherent in long-term investments. Changes in the fair valuation of portfolio securities may be less frequent and of greater magnitude than changes in the price of portfolio securities valued at their last sale price, by an independent pricing service, or based on market quotations. Imprecision in estimating fair value can also impact the amount of unrealized appreciation or depreciation recorded for a particular portfolio security and differences in the assumptions used could result in a different determination of fair value, and those differences could be material.
The Board has adopted procedures for the valuation of the Funds’ securities and has delegated the day to day responsibilities for valuation determinations under these procedures to the Adviser. Securities are valued using unadjusted quoted market prices, when available, as supplied primarily by third party pricing services or dealers. If a market value or price cannot be determined for a security or a significant event has occurred that would materially affect the value of the security, the security is fair valued by the Adviser’s Valuation Committee. The Valuation Committee is comprised of senior members of the Adviser’s management team.
The Funds have established methods of fair value measurements in accordance with GAAP. Fair value denotes the price that a Fund would receive upon selling an investment in a timely transaction to an independent buyer in the principal or most advantageous market of the investment. A three-tier hierarchy has been established to maximize the use of observable market data and minimize the use of unobservable inputs and to establish classification of fair value measurements for disclosure purposes. Inputs refer broadly to the assumptions that market participants would use in pricing the asset or liability, including assumptions about risk, for example, the risk inherent in a particular valuation technique used to measure fair value including such a pricing model and/or the risk inherent in the inputs to the valuation technique. Inputs may be observable or unobservable. Observable inputs are inputs that reflect the assumptions market participants would use in pricing the asset or liability developed based on market data obtained from sources independent of the reporting entity. Unobservable inputs are inputs that reflect the reporting entity’s own assumptions about the assumptions market participants would
Brookfield Investment Management Inc.
50
BROOKFIELD INVESTMENT FUNDS
Notes to Financial Statements
December 31, 2012
use in pricing the asset or liability developed based on the best information available in the circumstances. The three-tier hierarchy of inputs is summarized in the three broad levels listed below.
| | | | |
| • | | Level 1 - | | quoted prices in active markets for identical investments |
| • | | Level 2 - | | quoted prices in markets that are not active or other significant observable inputs (including, but not limited to: quoted prices for similar investments, quoted prices based on recently executed transactions, interest rates, credit risk, etc.) |
| • | | Level 3 - | | significant unobservable inputs (including each Fund’s own assumptions in determining the fair value of investments) |
The Adviser’s valuation policy, as previously stated, establishes parameters for the sources and types of valuation analysis, as well as, the methodologies and inputs the Adviser uses in determining fair value, including the use of the Adviser’s Valuation Committee. If the Valuation Committee determines that additional techniques, sources or inputs are appropriate or necessary in a given situation, such additional work will be undertaken.
Significant increases or decreases in any of the unobservable inputs in isolation may result in a lower or higher fair value measurement.
To assess the continuing appropriateness of security valuations, the Adviser (or its third party service provider who is subject to oversight by the Adviser), regularly compares one of its prior day prices, prices on comparable securities and sale prices to the current day prices and challenges those prices that exceed certain tolerance levels with the third party pricing service or broker source. For those securities valued by fair valuations, the Valuation Committee reviews and affirms the reasonableness of the valuations based on such methodologies and fair valuation determinations on a regular basis after considering all relevant information that is reasonably available.
The inputs or methodology used for valuing investments are not necessarily an indication of the risk associated with investing in those securities.
The following table summarizes the Fund’s investments categorized in the disclosure hierarchy as of December 31, 2012:
| | | | | | | | | | | | | | | | |
Real Estate Fund | |
| | | | |
| Valuation Inputs | | Level 1 | | | Level 2 | | | Level 3 | | | Total | |
Common Stocks: | | | | | | | | | | | | | | | | |
Australia | | $ | — | | | $ | 3,070,888 | | | $ | — | | | $ | 3,070,888 | |
Austria | | | — | | | | 372,684 | | | | — | | | | 372,684 | |
Canada | | | 538,453 | | | | — | | | | — | | | | 538,453 | |
China | | | — | | | | 1,552,493 | | | | — | | | | 1,552,493 | |
France | | | — | | | | 896,888 | | | | — | | | | 896,888 | |
Germany | | | 548,271 | | | | — | | | | — | | | | 548,271 | |
Hong Kong | | | — | | | | 2,747,865 | | | | — | | | | 2,747,865 | |
Italy | | | — | | | | 367,694 | | | | — | | | | 367,694 | |
Japan | | | 76,413 | | | | 3,773,502 | | | | — | | | | 3,849,915 | |
Norway | | | — | | | | 758,457 | | | | — | | | | 758,457 | |
Poland | | | — | | | | 547,304 | | | | — | | | | 547,304 | |
Singapore | | | — | | | | 1,450,343 | | | | — | | | | 1,450,343 | |
United Kingdom | | | 752,366 | | | | 1,289,739 | | | | — | | | | 2,042,105 | |
United States | | | 17,723,936 | | | | — | | | | — | | | | 17,723,936 | |
| | | | | | | | | | | | | | | | |
Total | | $ | 19,639,439 | | | $ | 16,827,857 | | | $ | — | | | $ | 36,467,296 | |
| | | | | | | | | | | | | | | | |
2012 Annual Report
51
BROOKFIELD INVESTMENT FUNDS
Notes to Financial Statements
December 31, 2012
For further information regarding security characteristics, see the Schedule of Investments.
During the year ended December 31, 2012, the Real Estate Fund did not invest in any Level 3 securities. There was a transfer from Level 1 to Level 2 of $1,466,618. The transfer was due to the security being fair valued as a result of market movements following the close of local trading. There was a transfer from Level 2 to Level 1 of $548,271. At the beginning of the year, the security was being fair valued as a result of market movements following the close of local trading. The basis for recognizing and valuing transfers is as of the end of the period in which transfers occur.
Infrastructure Fund
The following table summarizes the Fund’s investments categorized in the disclosure hierarchy as of December 31, 2012:
| | | | | | | | | | | | | | | | |
| | | | |
| Valuation Inputs | | Level 1 | | | Level 2 | | | Level 3 | | | Total | |
Common Stocks: | | | | | | | | | | | | | | | | |
Australia | | $ | — | | | $ | 570,115 | | | $ | — | | | $ | 570,115 | |
Brazil | | | 1,013,607 | | | | — | | | | — | | | | 1,013,607 | |
Canada | | | 16,311,226 | | | | — | | | | — | | | | 16,311,226 | |
China | | | — | | | | 2,717,026 | | | | — | | | | 2,717,026 | |
France | | | — | | | | 3,994,617 | | | | — | | | | 3,994,617 | |
Hong Kong | | | — | | | | 4,086,265 | | | | — | | | | 4,086,265 | |
Italy | | | — | | | | 2,199,993 | | | | — | | | | 2,199,993 | |
Japan | | | — | | | | 2,927,851 | | | | — | | | | 2,927,851 | |
Netherlands | | | — | | | | 1,767,200 | | | | — | | | | 1,767,200 | |
Spain | | | — | | | | 4,285,413 | | | | — | | | | 4,285,413 | |
Switzerland | | | — | | | | 1,799,824 | | | | — | | | | 1,799,824 | |
United Arab Emirates | | | 1,181,793 | | | | — | | | | — | | | | 1,181,793 | |
United Kingdom | | | — | | | | 8,365,330 | | | | — | | | | 8,365,330 | |
United States | | | 68,738,284 | | | | — | | | | — | | | | 68,738,284 | |
| | | | | | | | | | | | | | | | |
Total | | $ | 87,244,910 | | | $ | 32,713,634 | | | $ | — | | | $ | 119,958,544 | |
| | | | | | | | | | | | | | | | |
For further information regarding security characteristics, see the Schedule of Investments.
During the year ended December 31, 2012, the Infrastructure Fund did not invest in any Level 3 securities and the Infrastructure Fund did not have any transfers between Level 1 and Level 2. The basis for recognizing and valuing transfers is as of the end of the period in which transfers occur.
High Yield Fund
The following table summarizes the Fund’s investments categorized in the disclosure hierarchy as of December 31, 2012:
| | | | | | | | | | | | | | | | |
| | | | |
| Valuation Inputs | | Level 1 | | | Level 2 | | | Level 3 | | | Total | |
Corporate Bonds: | | $ | — | | | $ | 20,692,824 | | | $ | — | | | $ | 20,692,824 | |
| | | | | | | | | | | | | | | | |
Total | | $ | — | | | $ | 20,692,824 | | | $ | — | | | $ | 20,692,824 | |
| | | | | | | | | | | | | | | | |
Brookfield Investment Management Inc.
52
BROOKFIELD INVESTMENT FUNDS
Notes to Financial Statements
December 31, 2012
The following is a reconciliation of assets in which significant unobservable inputs (Level 3) were used in determining fair value:
| | | | | | | | |
| | |
| Investments in Securities | | Corporate
Bonds | | | Total | |
Balance at December 31, 2011 | | $ | 4,317,750 | | | $ | 4,317,750 | |
Accrued Discounts (Premiums) | | | (615 | ) | | | (615 | ) |
Realized Gain/(Loss) | | | 123,970 | | | | 123,970 | |
Change in Unrealized Appreciation | | | 87,023 | | | | 87,023 | |
Purchases at Cost | | | 3,125,940 | | | | 3,125,940 | |
Sales Proceeds | | | (2,438,979 | ) | | | (2,438,979 | ) |
Transfers out of Level 3 | | | (5,215,089 | ) | | | (5,215,089 | )(a) |
| | | | | | | | |
Balance at December 31, 2012 | | $ | — | | | $ | — | |
| | | | | | | | |
Change in Unrealized gains or losses relating to assets still held at reporting date | | $ | — | | | $ | — | |
| | | | | | | | |
| (a) | Transferred due to an increase of observable market data for these securities, primarily an increase in trade basis information versus dealer quotes. |
For the year ended December 31, 2012, there was no security transfer activity between Level 1 and Level 2 for the High Yield Fund. The basis for recognizing and valuing transfers is as of the end of the period in which transfers occur.
Investment Transactions and Investment Income: Securities transactions are recorded on the trade date. Realized gains and losses from securities transactions are calculated on the identified cost basis. Interest income is recorded on the accrual basis. Discounts and premiums on securities are accreted and amortized, respectively on a daily basis, using the effective yield to maturity method adjusted based on management’s assessment of the collectability of such interest. Dividend income is recorded on the ex-dividend date.
Foreign Currency Transactions: Securities and other assets and liabilities denominated in foreign currencies are translated into U.S. dollar amounts at the date of valuation. Purchases and sales of securities and income and expense items denominated in foreign currencies are translated into U.S. dollar amounts on the respective dates of such transactions. The Fund isolates the portion of realized gains or losses resulting from changes in foreign exchange rates on securities from the fluctuations arising from changes in market prices of securities held. Reported net realized foreign exchange gains or losses arise from sales of securities, currency gains or losses realized between the trade and settlement dates on securities transactions and the difference between the amounts of dividends, interest and foreign withholding taxes recorded on the Fund’s books and the U.S. dollar equivalent of the amounts actually received or paid.
Taxes: Each Fund intends to continue to meet the requirements of the Internal Revenue Code of 1986, as amended, applicable to regulated investment companies and to distribute substantially all of its taxable income to its shareholders. Therefore, no federal income or excise tax provision is required. Each Fund may incur an excise tax to the extent it has not distributed all of its taxable income on a calendar year basis.
GAAP provides guidance for how uncertain tax positions should be recognized, measured, presented and disclosed in the financial statements. An evaluation of tax positions taken in the course of preparing the Funds’ tax returns to determine whether the tax positions are “more-likely-than-not” of being sustained by the taxing authority is required. Tax benefits of positions not deemed to meet the more-likely-than-not threshold would be booked as a tax expense in the current year and recognized as: a liability for unrecognized tax benefits; a reduction of an income tax refund receivable; a reduction of a deferred tax asset; an increase in deferred tax liability; or a combination thereof. As of December 31, 2012, the Funds have determined that there are no uncertain tax positions or tax liabilities required to be accrued.
2012 Annual Report
53
BROOKFIELD INVESTMENT FUNDS
Notes to Financial Statements
December 31, 2012
The Funds have reviewed the taxable years open for examination (i.e. not barred by the applicable statute of limitations) by taxing authorities of all major jurisdictions, including the Internal Revenue Service. As of December 31, 2012, open taxable years consisted of the taxable years ended December 31, 2011 through December 31, 2012. No examination of the Funds’ tax returns is currently in progress.
Expenses: Expenses directly attributable to a Fund are charged directly to that Fund, while expenses which are attributable to more than one Fund are allocated among the respective Funds based upon relative net assets.
Dividends and Distributions: Each Fund declares and pays dividends at least annually from net investment income. To the extent these distributions exceed net investment income, they may be classified as return of capital. Each Fund also pays distributions at least annually from its net realized capital gains, if any. Dividends and distributions are recorded on the ex-dividend date. All common shares have equal dividend and other distribution rights. A notice disclosing the source(s) of a distribution will be provided if payment is made from any source other than net investment income. Any such notice would be provided only for informational purposes in order to comply with the requirements of Section 19(a) of the 1940 Act and not for tax reporting purposes. The tax composition of each Fund’s distributions for each calendar year is reported on IRS Form 1099-DIV.
Dividends from net investment income and distributions from realized gains from investment transactions have been determined in accordance with Federal income tax regulations and may differ from net investment income and realized gains recorded by each Fund for financial reporting purposes. These differences, which could be temporary or permanent in nature, may result in reclassification of distributions; however, net investment income, net realized gains and losses and net assets are not affected.
Covered Calls and Other Option Transactions: A Fund may write call options with the purpose of generating realized gains or reducing the Fund’s ownership of certain securities. The Fund may write call options on equity securities in its portfolio (“covered calls”). At the time the call option is sold, the writer of the call option receives a premium from the buyer. Any premiums received by the Fund from writing options may result in short-term capital gains. Writing a covered call is the selling of an option contract entitling the buyer to purchase an underlying security that the Fund owns. When the Fund sells a call option, it generates short-term gains in the form of the premium paid by the buyer of the call option, but the Fund forgoes the opportunity to participate in any increase in the value of the underlying equity security above the exercise price of the option. The writer of the call option has the obligation, upon exercise of the option, to deliver the underlying security upon payment of the exercise price during the option period. If the Fund has written a call option, it may terminate its obligation by effecting a closing purchase transaction. This is accomplished by purchasing a call option with the same terms as the option previously written. However, once the Fund has been assigned an exercise notice, the Fund will be unable to effect a closing purchase transaction. There can be no assurance that a closing purchase transaction can be effected when the Fund so desires.
The Fund will realize a profit from a closing transaction if the price of the transaction is less than the premium it received from writing the option; the Fund will realize a loss from a closing transaction if the price of the transaction is more than the premium it received from writing the option. Since call option prices generally reflect increases in the price of the underlying security, any loss resulting from the repurchase of a call option may also be wholly or partially offset by unrealized appreciation of the underlying security.
When Issued, Delayed Delivery Securities and Forward Commitments: A Fund may purchase securities on a “when issued” and may purchase or sell securities on a “forward commitment” basis in order to hedge against anticipated changes in interest rates and prices and secure a favorable rate of return. When such transactions are negotiated, the price, which is generally expressed in yield terms, is fixed at the time the commitment is made, but delivery and payment for the securities take place at a later date, which can be a month or more after the date of the transaction. At the time the Fund makes the commitment to purchase securities on a when-issued or forward commitment basis, the Adviser will identify collateral consisting of cash or liquid securities equal to the value of the when-issued or forward commitment securities and will monitor the adequacy of such collateral on a daily basis. When issued securities and forward commitments may be sold prior to the settlement date. If the Funds
Brookfield Investment Management Inc.
54
BROOKFIELD INVESTMENT FUNDS
Notes to Financial Statements
December 31, 2012
dispose of the right to acquire a when-issued security prior to its acquisition or disposes of the right to deliver or receive against a forward commitment, they can incur a gain or loss due to market fluctuation. Securities purchased under a forward commitment are subject to market fluctuation, and no interest (or dividends) accrues to the Fund prior to the settlement date. The Fund will segregate with its custodian cash or liquid securities in an aggregate amount at least equal to the amount of its outstanding forward commitments.
3. Risks of Investing in Below-Investment Grade Securities
The High Yield Fund has investments in below-investment grade debt securities. Below-investment grade securities involve a higher degree of credit risk than investment grade debt securities. In the event of an unanticipated default, the Funds would experience a reduction in their income, a decline in the market value of the securities so affected and a decline in the NAV of their shares. During an economic downturn or period of rising interest rates, highly leveraged and other below-investment grade issuers frequently experience financial stress that could adversely affect their ability to service principal and interest payment obligations, to meet projected business goals and to obtain additional financing. The market prices of below-investment grade debt securities are generally less sensitive to interest rate changes than higher-rated investments but are more sensitive to adverse economic or political changes or individual developments specific to the issuer than higher-rated investments. Periods of economic or political uncertainty and change can be expected to result in significant volatility of prices for these securities. Rating services consider these securities to be speculative in nature.
Below-investment grade securities may be subject to market conditions, events of default or other circumstances which cause them to be considered “distressed securities.” Distressed securities frequently do not produce income while they are outstanding. The Funds may be required to bear certain extraordinary expenses in order to protect and recover their investments in certain distressed securities. Therefore, to the extent the Funds seek capital growth through investment in such securities, the Funds’ ability to achieve current income for their shareholders may be diminished. The Funds are also subject to significant uncertainty as to when and in what manner and for what value the obligations evidenced by distressed securities will eventually be satisfied (e.g., through a liquidation of the obligor’s assets, an exchange offer or plan of reorganization involving the securities or a payment of some amount in satisfaction of the obligation). In addition, even if an exchange offer is made or a plan of reorganization is adopted with respect to distressed securities held by the Funds, there can be no assurance that the securities or other assets received by the Funds in connection with such exchange offer or plan of reorganization will not have a lower value or income potential than may have been anticipated when the investment was made. Moreover, any securities received by the Funds upon completion of an exchange offer or plan of reorganization may be restricted as to resale. As a result of the Funds’ participation in negotiations with respect to any exchange offer or plan of reorganization with respect to an issuer of such securities, the Funds may be restricted from disposing of distressed securities.
4. Investment Advisory Agreements and Affiliated Transactions
The Adviser currently serves as the investment adviser to all the Funds pursuant to separate investment advisory agreements (the “Advisory Agreements”) under which the Adviser is responsible for the management of each Fund’s portfolio and provides the necessary personnel, facilities, equipment and certain other services necessary to the operations of each Fund.
Pursuant to an operating expenses limitation agreement (the “Expense Limitation Agreement”), the Adviser has contractually agreed to waive all or a portion of its investment advisory or administration fees, as presented below, and/or to reimburse certain expenses of each Fund to the extent necessary to maintain each Fund’s total annual operating expenses (excluding any front-end or contingent deferred loads, brokerage commissions and other transactional expenses, acquired fund fees and expenses, interest, taxes, and extraordinary expenses, such as litigation; and other expenses not incurred in the ordinary course of a Fund’s business). The Expense Limitation Agreement will continue until at least May 1, 2013 and may not be terminated by the Funds or the Adviser before such time. Thereafter, the Expense Limitation Agreement may only be terminated or amended to increase the expense cap as of May 1st of each calendar year, provided that in the case of a termination by the
2012 Annual Report
55
BROOKFIELD INVESTMENT FUNDS
Notes to Financial Statements
December 31, 2012
Adviser, the Adviser will provide the Board of Trustees with written notice of its intention to terminate the arrangement prior to the expiration of its then current term. Pursuant to the Expense Limitation Agreements, the Adviser retains its right to receive reimbursement of any payments made by it, or to recoup any fees waived by it during the prior three years, provided that after giving effect to such repayment or recoupment, such adjusted total annual operating expenses (expressed as a percentage of average net assets) for each Fund would not exceed the percentage limitations listed below.
The Advisory Agreements provide that each Fund shall pay the Adviser a monthly fee at the annual rates stated below of each Fund’s average daily net assets:
| | | | | | | | | | | | |
| | | Real Estate Fund | | | Infrastructure Fund | | | High Yield Fund | |
Annual Advisory Fee Rate | | | 0.75 | % | | | 0.85 | % | | | 0.65 | % |
Annual cap on expenses — Class A | | | 1.50 | % | | | 1.60 | % | | | 1.40 | % |
Annual cap on expenses — Class C | | | 2.25 | % | | | 2.35 | % | | | 2.15 | % |
Annual cap on expenses — Class Y | | | 1.25 | % | | | 1.35 | % | | | 1.15 | % |
Annual cap on expenses — Class I | | | 1.25 | % | | | 1.35 | % | | | 1.15 | % |
Effective July 1, 2012, the Adviser agreed to reduce the expense caps as follows:
| | | | | | | | | | | | |
| | | Real Estate Fund | | | Infrastructure Fund | | | High Yield Fund | |
Annual cap on expenses — Class A | | | 1.20 | % | | | 1.35 | % | | | 1.10 | % |
Annual cap on expenses — Class C | | | 1.95 | % | | | 2.10 | % | | | 1.85 | % |
Annual cap on expenses — Class Y | | | 0.95 | % | | | 1.10 | % | | | 0.85 | % |
Annual cap on expenses — Class I | | | 0.95 | % | | | 1.10 | % | | | 0.85 | % |
The amount of investment advisory fees waived and expenses reimbursed available to be recouped are listed in the table below:
| | | | | | | | |
| Fund | | December 31, 2014 | | | December 31, 2015 | |
Real Estate Fund | | $ | 104,122 | | | $ | 336,765 | |
Infrastructure Fund | | | 86,563 | | | | 380,615 | |
High Yield Fund | | | 91,591 | | | | 334,926 | |
During the year ended December 31, 2012, the Adviser earned the following in investment advisory fees under the Advisory Agreements. Further, under the Expense Limitation Agreement, the Adviser was required to waive its investment advisory fees and/or reimburse the following costs to the Funds:
| | | | | | | | |
| Fund | | Investment
Advisory Fees | | | Waiver and/or
Expense
Reimbursement | |
Real Estate Fund | | $ | 157,224 | | | $ | 336,765 | |
Infrastructure Fund | | | 524,223 | | | | 380,615 | |
High Yield Fund | | | 155,759 | | | | 334,926 | |
Each Fund entered into separate Administration Agreements with the Adviser. The Adviser entered into a sub-administration agreement with U.S. Bancorp Fund Services, LLC. The Adviser and the Sub-administrator perform administrative services necessary for the operation of the Fund, including maintaining certain books and records of the Funds and preparing reports and other documents required by federal, state and other applicable laws and regulations, and providing the Funds with administrative office facilities. For its services under the Administration Agreements, the Adviser receives from each Fund, respectively, an annual fee equal to 0.15% of its average daily net assets, payable monthly in arrears.
Brookfield Investment Management Inc.
56
BROOKFIELD INVESTMENT FUNDS
Notes to Financial Statements
December 31, 2012
During the year ended December 31, 2012, the Adviser earned the following in Administration fees:
| | | | |
| Fund | | Administration Fees | |
Real Estate Fund | | $ | 31,445 | |
Infrastructure Fund | | | 92,510 | |
High Yield Fund | | | 35,945 | |
Certain officers and/or Trustees of the Trust are officers and/or directors of the Adviser.
5. Purchases and Sales of Investments
Purchases and sales of investments, excluding U.S. Government securities, for the year ended December 31, 2012 were as follows:
| | | | | | | | |
| Fund | | Purchases | | | Sales | |
Real Estate Fund | | $ | 48,228,452 | | | $ | 21,880,659 | |
Infrastructure Fund | | | 153,151,484 | | | | 52,577,316 | |
High Yield Fund | | | 12,446,967 | | | | 6,945,389 | |
6. Shares of Beneficial Interest
The Trust’s Declaration of Trust authorizes the issuance of an unlimited number of full and fractional shares of beneficial interest. With respect to each series, the Trust may offer more than one class of shares. The Trust reserves the right to create and issue additional series or classes. Each share of a series or class represents an equal proportionate interest in that series or class with each other share of that series or class. Currently, each series offers four classes of shares of beneficial interest — “Class A” Shares, “Class C” Shares, “Class Y” Shares, and “Class I” Shares.
The shares of each series or class participate equally in the earnings, dividends and assets of the particular series or class.
Class A Shares commenced operations on April 30, 2012 for the Real Estate Fund and High Yield Fund and Class C commenced operations on April 30, 2012 for the Real Estate Fund, Infrastructure Fund and High Yield Fund.
For the year ended December 31, 2012 and the period ended December 31, 2011, the capital stock transactions by class for Real Estate Fund, Infrastructure Fund and High Yield Fund were as follows:
| | | | | | | | | | | | | | | | |
| | | Real Estate Fund | |
| | | 2012 | | | 20111 | |
| Class A2 | | Shares | | | Amount | | | Shares | | | Amount | |
Proceeds from shares sold | | | 50,493 | | | $ | 609,156 | | | | — | | | $ | — | |
Reinvestment of dividends | | | 2,811 | | | | 31,868 | | | | — | | | | — | |
Cost of shares redeemed | | | (8 | ) | | | (92 | ) | | | — | | | | — | |
| | | | | | | | | | | | | | | | |
Net Increase — Class A | | | 53,296 | | | $ | 640,932 | | | | — | | | $ | — | |
| | | | | | | | | | | | | | | | |
| | | | |
| Class C2 | | | | | | | | | | | | |
Proceeds from shares sold | | | 5,545 | | | $ | 65,518 | | | | — | | | $ | — | |
Reinvestment of dividends | | | 62 | | | | 704 | | | | — | | | | — | |
Cost of shares redeemed | | | (5 | ) | | | (57 | ) | | | — | | | | — | |
| | | | | | | | | | | | | | | | |
Net Increase — Class C | | | 5,602 | | | $ | 66,165 | | | | — | | | $ | — | |
| | | | | | | | | | | | | | | | |
2012 Annual Report
57
BROOKFIELD INVESTMENT FUNDS
Notes to Financial Statements
December 31, 2012
| | | | | | | | | | | | | | | | |
| | | Real Estate Fund | |
| | | 2012 | | | 20111 | |
| Class Y | | Shares | | | Amount | | | Shares | | | Amount | |
| | | | | | | | | | | | | | | | |
Proceeds from shares sold | | | 761,982 | | | $ | 8,921,437 | | | | 1,250 | | | $ | 12,500 | |
Reinvestment of dividends | | | 2,155 | | | | 25,511 | | | | 5 | | | | 48 | |
Cost of shares redeemed | | | (7,497 | ) | | | (88,583 | ) | | | — | | | | — | |
| | | | | | | | | | | | | | | | |
Net Increase — Class Y | | | 756,640 | | | $ | 8,858,365 | | | | 1,255 | | | $ | 12,548 | |
| | | | | | | | | | | | | | | | |
| | | | |
| Class I | | | | | | | | | | | | |
Proceeds from shares sold | | | 1,885,099 | | | $ | 21,000,001 | | | | 501,250 | | | $ | 5,012,500 | |
Reinvestment of dividends | | | 228,939 | | | | 2,597,233 | | | | 1,938 | | | | 19,420 | |
Cost of shares redeemed | | | (290,798 | ) | | | (3,451,262 | ) | | | — | | | | — | |
| | | | | | | | | | | | | | | | |
Net Increase — Class I | | | 1,823,240 | | | $ | 20,145,972 | | | | 503,188 | | | $ | 5,031,920 | |
| | | | | | | | | | | | | | | | |
| |
| | | Infrastructure Fund | |
| | | 2012 | | | 20111 | |
| Class A3 | | Shares | | | Amount | | | Shares | | | Amount | |
Proceeds from shares sold | | | 1,182,160 | | | $ | 13,556,094 | | | | 226,925 | | | $ | 2,298,751 | |
Reinvestment of dividends | | | 29,709 | | | | 340,164 | | | | — | | | | — | |
Cost of shares redeemed | | | (14,073 | ) | | | (162,004 | ) | | | — | | | | — | |
Redemption fees | | | — | | | | 1,830 | | | | | | | | | |
| | | | | | | | | | | | | | | | |
Net Increase — Class A | | | 1,197,796 | | | $ | 13,736,084 | | | | 226,925 | | | $ | 2,298,751 | |
| | | | | | | | | | | | | | | | |
| | | | |
| Class C2 | | | | | | | | | | | | |
Proceeds from shares sold | | | 70,634 | | | $ | 806,137 | | | | — | | | $ | — | |
Reinvestment of dividends | | | 1,154 | | | | 13,163 | | | | — | | | | — | |
Cost of shares redeemed | | | (111 | ) | | | (1,262 | ) | | | — | | | | — | |
| | | | | | | | | | | | | | | | |
Net Increase — Class C | | | 71,677 | | | $ | 818,038 | | | | — | | | $ | — | |
| | | | | | | | | | | | | | | | |
| | | | |
| Class Y | | | | | | | | | | | | |
Proceeds from shares sold | | | 1,747,882 | | | $ | 20,280,951 | | | | 1,250 | | | $ | 12,500 | |
Reinvestment of dividends | | | 38,987 | | | | 446,797 | | | | 1 | | | | 10 | |
Cost of shares redeemed | | | (41,128 | ) | | | (472,126 | ) | | | — | | | | — | |
| | | | | | | | | | | | | | | | |
Net Increase — Class Y | | | 1,745,741 | | | $ | 20,255,622 | | | | 1,251 | | | $ | 12,510 | |
| | | | | | | | | | | | | | | | |
| | | | |
| Class I | | | | | | | | | | | | |
Proceeds from shares sold | | | 6,459,519 | | | $ | 69,960,669 | | | | 996,790 | | | $ | 10,006,250 | |
Reinvestment of dividends | | | 157,307 | | | | 1,804,306 | | | | 195 | | | | 8,220 | |
Cost of shares redeemed | | | (471,251 | ) | | | (5,309,777 | ) | | | — | | | | — | |
| | | | | | | | | | | | | | | | |
Net Increase — Class I | | | 6,145,575 | | | $ | 66,455,198 | | | | 996,985 | | | $ | 10,014,470 | |
| | | | | | | | | | | | | | | | |
Brookfield Investment Management Inc.
58
BROOKFIELD INVESTMENT FUNDS
Notes to Financial Statements
December 31, 2012
| | | | | | | | | | | | | | | | |
| | | High Yield Fund | |
| | | 2012 | | | 20111 | |
| Class A2 | | Shares | | | Amount | | | Shares | | | Amount | |
Proceeds from shares sold | | | 975 | | | $ | 10,126 | | | | — | | | $ | — | |
Reinvestment of dividends | | | 35 | | | | 363 | | | | — | | | | — | |
Cost of shares redeemed | | | — | | | | — | | | | — | | | | — | |
| | | | | | | | | | | | | | | | |
Net Increase — Class A | | | 1,010 | | | $ | 10,489 | | | | — | | | $ | — | |
| | | | | | | | | | | | | | | | |
| | | | |
| Class C2 | | | | | | | | | | | | |
Proceeds from shares sold | | | 2,407 | | | $ | 25,291 | | | | — | | | $ | — | |
Reinvestment of dividends | | | 25 | | | | 255 | | | | — | | | | — | |
Cost of shares redeemed | | | (4 | ) | | | (41 | ) | | | — | | | | — | |
| | | | | | | | | | | | | | | | |
Net Increase — Class C | | | 2,428 | | | $ | 25,505 | | | | — | | | $ | — | |
| | | | | | | | | | | | | | | | |
| | | | |
| Class Y | | | | | | | | | | | | |
Proceeds from shares sold | | | 96 | | | $ | 1,000 | | | | 1,250 | | | $ | 12,500 | |
Reinvestment of dividends | | | 55 | | | | 568 | | | | 3 | | | | 33 | |
Cost of shares redeemed | | | (606 | ) | | | (6,250 | ) | | | — | | | | — | |
| | | | | | | | | | | | | | | | |
Net Increase (Decrease) — Class Y | | | (455 | ) | | $ | (4,682 | ) | | | 1,253 | | | $ | 12,533 | |
| | | | | | | | | | | | | | | | |
| | | | |
| Class I | | | | | | | | | | | | |
Proceeds from shares sold | | | 488,282 | | | $ | 4,999,999 | | | | 2,001,250 | | | $ | 20,012,500 | |
Reinvestment of dividends | | | 102,163 | | | | 1,058,070 | | | | 3,739 | | | | 37,504 | |
Cost of shares redeemed | | | (148,259 | ) | | | (1,539,842 | ) | | | — | | | | — | |
| | | | | | | | | | | | | | | | |
Net Increase — Class I | | | 442,186 | | | $ | 4,518,227 | | | | 2,004,989 | | | $ | 20,050,004 | |
| | | | | | | | | | | | | | | | |
| 1 | Commencement of Operations was December 1, 2011. |
| 2 | Commencement of Operations for Class A and C shares was May 1, 2012. |
| 3 | Commencement of Operations for Brookfield Global Listed Infrastructure Fund Class A shares was December 30, 2011. |
7. Federal Income Tax Information
Income and capital gain distributions are determined in accordance with federal income tax regulations, which may differ from GAAP.
The tax character of distributions paid for the year ended December 31, 2012 were as follows:
| | | | | | | | | | | | |
| | | Real Estate Fund | | | Infrastructure Fund | | | High Yield Fund | |
Ordinary income (including any short- term capital gains) | | $ | 2,628,187 | | | $ | 2,616,438 | | | $ | 1,512,732 | |
Long- term capital gains | | | 27,498 | | | | — | | | | — | |
| | | | | | | | | | | | |
Total distributions | | $ | 2,655,685 | | | $ | 2,616,438 | | | $ | 1,512,732 | |
| | | | | | | | | | | | |
2012 Annual Report
59
BROOKFIELD INVESTMENT FUNDS
Notes to Financial Statements
December 31, 2012
The tax character of distributions paid for the period December 1, 2011 (commencement of operations) to December 31, 2011 were as follows:
| | | | | | | | | | | | |
| | | Real Estate Fund | | | Infrastructure Fund | | | High Yield Fund | |
Ordinary income | | $ | 17,232 | | | $ | 8,231 | | | $ | 53,593 | |
Return of capital | | | 2,236 | | | | — | | | | 2 | |
| | | | | | | | | | | | |
Total distributions | | $ | 19,468 | | | $ | 8,231 | | | $ | 53,595 | |
| | | | | | | | | | | | |
At December 31, 2012, each Fund’s most recently completed tax year-end, the components of distributable earnings on a tax basis were as follows:
| | | | | | | | | | | | |
| | | Real Estate Fund | | | Infrastructure Fund | | | High Yield Fund | |
Undistributed net investment income | | $ | 68,578 | | | $ | — | | | $ | 101 | |
Accumulated gains | | | 236,483 | | | | 552,846 | | | | 51,821 | |
Book basis unrealized appreciation | | | 3,386,279 | | | | 6,828,490 | | | | 927,973 | |
Plus: Cumulative timing difference | | | (711,696 | ) | | | (208,228 | ) | | | (917 | ) |
| | | | | | | | | | | | |
Tax basis unrealized appreciation on investments | | | 2,674,583 | | | | 6,620,262 | | | | 927,056 | |
| | | | | | | | | | | | |
Total tax basis net accumulated gains | | $ | 2,979,644 | | | $ | 7,173,108 | | | $ | 978,978 | |
| | | | | | | | | | | | |
As of December 31, 2012, the Funds’ had no capital loss carryforwards.
Federal Income Tax Basis: The federal income tax basis of the Funds’ investments, not including foreign currency and foreign currency transactions at December 31, 2012 was as follows:
| | | | | | | | | | | | | | | | |
| Fund | | Cost of
Investments | | | Gross
Unrealized
Appreciation | | | Gross
Unrealized
Depreciation | | | Net Unrealized
Appreciation | |
Real Estate Fund | | $ | 33,791,948 | | | $ | 2,744,416 | | | $ | (69,068 | ) | | $ | 2,675,348 | |
Infrastructure Fund | | | 113,343,971 | | | | 7,728,106 | | | | (1,113,533 | ) | | | 6,614,573 | |
High Yield Fund | | | 19,765,768 | | | | 1,005,997 | | | | (78,941 | ) | | | 927,056 | |
Capital Account Reclassifications: Because federal income tax regulations differ in certain respects from GAAP, income and capital gain distributions, if any, determined in accordance with tax regulations may differ from net investment income and realized gains recognized for financial reporting purposes. These differences are primarily due to differing treatments for wash sales and return of capital. Permanent book and tax differences, if any, relating to stockholder distributions will result in reclassifications to paid-in-capital or to undistributed capital gains. These reclassifications have no effect on net assets or NAV per share.
GAAP requires that certain components of net assets relating to permanent differences be reclassified between financial and tax reporting. These reclassifications have no effect on net assets or net asset value per share. For the year ended December 31, 2012, the following table shows the reclassifications made:
| | | | | | | | |
| | | Undistributed
(Distributions in
Excess of)
Net Investment
Income | | | Accumulated
Net Realized
Gain | |
Real Estate Fund | | $ | 226,641 | | | $ | (226,641 | ) |
Infrastructure Fund | | | (129,132 | ) | | | 129,132 | |
High Yield Fund | | | — | | | | — | |
Brookfield Investment Management Inc.
60
BROOKFIELD INVESTMENT FUNDS
Notes to Financial Statements
December 31, 2012
8. Indemnification
Under the Funds’ organizational documents, its officers and trustees are indemnified against certain liabilities arising out of the performance of their duties to the Fund. In addition, in the normal course of business, the Trust, on behalf of the Funds, enters into contracts with vendors and others that provide for indemnification. The Funds’ maximum exposure under these arrangements is unknown, since this would involve the resolution of certain claims, as well as future claims that may be made, against the Funds. Thus an estimate of the financial impact, if any, of these arrangements cannot be made at this time. However, based on experience, the Funds expect the risk of loss due to these warranties and indemnities to be unlikely.
9. New Accounting Pronouncements
In December 2011, the Financial Accounting Standards Board (“FASB”) issued Accounting Standards Update (“ASU”) No. 2011-11 “Disclosures about Offsetting Assets and Liabilities.” ASU 2011-11 requires disclosures to make financial statements that are prepared under U.S. GAAP more comparable to those prepared under IFRS. The new disclosure requirements mandate that entities disclose both gross and net information about instruments and transactions eligible for offset in the Statements of Assets and Liabilities as well as instruments and transactions subject to an agreement similar to a master netting arrangement. In addition, ASU 2011-11 requires disclosure of collateral received and posted in connection with master netting agreements or similar arrangements. New disclosures are required for annual reporting periods beginning on or after January 1, 2013, and interim periods within those annual periods.
Management is currently evaluating the impact ASU No. 2011-11 will have on the Funds’ financial statements and disclosures.
10. Subsequent Events
GAAP requires recognition in the financial statements of the effects of all subsequent events that provide additional evidence about conditions that existed at the date of the Statement of Assets and Liabilities. For non-recognized subsequent events that must be disclosed to keep the financial statements from being misleading, the Funds’ are required to disclose the nature of the event as well as an estimate of their financial effect, or a statement that such an estimate cannot be made.
Management has evaluated subsequent events in the preparation of the Funds’ financial statements and has determined that there are no significant subsequent events that require recognition or disclosure in the financial statements.
2012 Annual Report
61
Report of Independent Registered Public Accounting Firm
To the Shareholders of Brookfield Global Listed Real Estate Fund,
Brookfield Global Listed Infrastructure Fund and Brookfield High Yield Fund
and Board of Trustees of Brookfield Investment Funds:
We have audited the accompanying statements of assets and liabilities, including the schedules of investments, of Brookfield Global Listed Real Estate Fund, Brookfield Global Listed Infrastructure Fund, and Brookfield High Yield Fund (the “Funds”), three of the four series comprising the Brookfield Investment Funds as of December 31, 2012, and the related statements of operations and cash flows for the year then ended, and the statements of changes in net assets and the financial highlights for the year then ended and for the period December 1, 2011 (commencement of operations) through December 31, 2011. These financial statements and financial highlights are the responsibility of the Funds’ management. Our responsibility is to express an opinion on these financial statements and financial highlights based on our audits.
We conducted our audits in accordance with the standards of the Public Company Accounting Oversight Board (United States). Those standards require that we plan and perform the audit to obtain reasonable assurance about whether the financial statements and financial highlights are free of material misstatement. The Funds are not required to have, nor were we engaged to perform, an audit of their internal control over financial reporting. Our audits included consideration of internal control over financial reporting as a basis for designing audit procedures that are appropriate in the circumstances, but not for the purpose of expressing an opinion on the effectiveness of the Funds’ internal control over financial reporting. Accordingly, we express no such opinion. An audit also includes examining, on a test basis, evidence supporting the amounts and disclosures in the financial statements, assessing the accounting principles used and significant estimates made by management, as well as evaluating the overall financial statement presentation. Our procedures included confirmation of securities owned as of December 31, 2012, by correspondence with the custodian and brokers. We believe that our audits provide a reasonable basis for our opinion.
In our opinion, the financial statements and financial highlights referred to above present fairly, in all material respects, the financial position of Brookfield Global Listed Real Estate Fund, Brookfield Global Listed Infrastructure Fund and Brookfield High Yield Fund of the Brookfield Investment Funds as of December 31, 2012, the results of their operations for the year then ended, and the changes in their net assets and the financial highlights for each of the periods presented, in conformity with accounting principles generally accepted in the United States of America.
DELOITTE & TOUCHE LLP
Philadelphia, Pennsylvania
February 28, 2013
Brookfield Investment Management Inc.
62
BROOKFIELD INVESTMENT FUNDS
Tax Information (Unaudited)
December 31, 2012
For the year ended December 31, 2012, certain dividends paid by the Funds may be subject to a maximum tax rate of 15%, as provided for by the Jobs and Growth Tax Relief Reconciliation Act of 2003. The percentage of dividends declared from ordinary income designated as qualified dividend income was as follows:
| | | | |
Real Estate Fund | | | 36.74 | % |
Infrastructure Fund | | | 80.35 | % |
High Yield Fund | | | 0.00 | % |
For corporate shareholders, the percent of ordinary distributions qualifying for the corporate dividends received deductions for the year ended December 31, 2012, was as follows:
| | | | |
Real Estate Fund | | | 3.20 | % |
Infrastructure Fund | | | 23.40 | % |
High Yield Fund | | | 0.00 | % |
The percentage of taxable ordinary income distributions that are designated as short-term capital gain distributions under the Internal Revenue Section 871 (k)(2)(C) for each Fund was as follows:
| | | | |
Real Estate Fund | | | 53.40 | % |
Infrastructure Fund | | | 55.66 | % |
High Yield Fund | | | 15.09 | % |
2012 Annual Report
63
BROOKFIELD INVESTMENT FUNDS
Information Concerning Trustees and Officers (Unaudited)
The following tables provide information concerning the trustees and officers of the Funds.
Trustees of the Funds
| | | | | | |
| Name, Address and Age | | Position(s) Held with
Funds and Term of Office
and Length of Time Served | | Principal Occupation(s) During Past 5 Years and
Other Directorships Held by Trustee | | Number of Portfolios
in Fund Complex
Overseen by Trustee |
|
Disinterested Trustees |
| | | |
Rodman L. Drake
c/o Brookfield Place, 250 Vesey Street, New York, New York 10281-1023 Age 70 | | Chairman Elected September 2011 Trustee since September 2011, Member of the Audit Committee, Chairman of the Nominating and Compensation Committee | | Chairman (since 2003) and Director/Trustee of several investment companies advised by the Advisor (1989-Present); Director and/or Lead Director of Crystal River Capital, Inc. (2005- 2010); Chairman of Board (2005-2010), Interim President and Chief Executive Officer of Crystal River Capital, Inc. (2009-2010); Director of Celgene Corporation (2006-Present); Director of Student Loan Corporation (2005-2010); Director of Apex Silver Mines Limited (2007-2009); Co-founder, Baringo Capital LLC (2002-2012); Director of Jackson Hewitt Tax Services Inc. (2004-2011); Director of Animal Medical Center (2002-Present); Director and/or Lead Director of Parsons Brinckerhoff, Inc. (1995-2008); Trustee and Chairman of Excelsior Funds (1994-2007); Trustee of Columbia Atlantic Funds (2007-2009); Chairman of Columbia Atlantic Funds (2009-Present). | | 12 |
| | | |
Edward A. Kuczmarski
c/o Brookfield Place, 250 Vesey Street, New York, New York 10281-1023 Age 63 | | Trustee since September 2011 Member of the Audit Committee, Chairman of the Nominating and Compensation Committee | | Certified Public Accountant and Partner of Crowe Horwath LLP (formerly Hays & Company before merger in 2009) (2009-Present); Trustee of the Empire Builder Tax Free Bond Fund (1984-Present); Director of ISI Funds (2007-Present); Trustee of the Daily Income Fund (2006-Present); Director of the California Daily Tax Free Income Fund, Inc. (1984-Present); Director of the New York Tax Free Income Fund, Inc. (1984-Present) | | 5 |
| | | |
Louis P. Salvatore
c/o Brookfield Place, 250 Vesey Street, New York, New York 10281-1023 Age 66 | | Trustee since August 2011 Chairman of the Audit Committee, Member of the Nominating and Compensation Committee | | Director of SP Fiber Technologies, Inc. (September 2012-Present); Director of Chambers Street Properties (July 2012-Present); Director/Trustee of several investment companies advised by the Adviser (2005- Director of Turner Corp. (2003-Present); Director of Crystal River Capital Inc. (2005-2010); Director of Jackson Hewitt Tax Services, Inc. (2004-2011); Employee of Arthur Andersen LLP (2002-Present). | | 12 |
Brookfield Investment Management Inc.
64
BROOKFIELD INVESTMENT FUNDS
Information Concerning Trustees and Officers (Unaudited)
Trustees of the Funds (continued)
| | | | | | |
| Name, Address and Age | | Position(s) Held with
Funds and Term of Office
and Length of Time Served | | Principal Occupation(s) During Past 5 Years and
Other Directorships Held by Trustee | | Number of Portfolios
in Fund Complex
Overseen by Trustee |
| | | |
Interested Trustee | | | | | | |
| | | |
Kim G. Redding*
c/o Brookfield Place, 250 Vesey Street, New York, New York 10281-1023 Age 57 | | Trustee since September 2011 | | President of several investment companies advised by the Advisor (2010-Present); Chief Executive Officer and Chief Investment Officer of the Advisor (2010-Present); Director, Brookfield Investment Management (UK) Limited (March 2011-Present); Director and Chairman of the Board of Directors, Brookfield Investment Management (Canada) Inc. (January 2011-Present); Co-Chief Executive Officer and Chief Investment Officer of the Advisor (2009- 2010); Director, Brookfield Investment Funds (UCITS) plc (2011-Present); Founder and Chief Executive Officer of Brookfield Redding LLC (2001-2009). | | 12 |
2012 Annual Report
65
BROOKFIELD INVESTMENT FUNDS
Information Concerning Trustees and Officers (Unaudited)
Officers of the Funds
| | | | | | |
| Name, Address and Age | | Position(s)
Held with Funds | | Term of Office and
Length of Time Served | | Principal Occupation(s) During Past 5 Years |
| | | |
Kim G. Redding*
c/o Brookfield Place, 250 Vesey Street, New York, New York 10281-1023 Age 57 | | President | | Since 2011 | | President of several investment companies advised by the Advisor (2010-Present); Chief Executive Officer and Chief Investment Officer of the Advisor (2010-Present); Director, Brookfield Investment Management (UK) Limited (March 2011-Present); Director and Chairman of the Board of Directors, Brookfield Investment Management (Canada) Inc. (January 2011-Present); Co-Chief Executive Officer and Chief Investment Officer of the Advisor (2009- 2010); Director, Brookfield Investment Funds (UCITS) plc (2011-Present); Founder and Chief Executive Officer of Brookfield Redding LLC (2001-2009). |
| | | |
Jonathan C. Tyras*
c/o Brookfield Place, 250 Vesey Street, New York, New York 10281-1023 Age 44 | | Vice President | | Since 2011 | | Managing Director and Chief Financial Officer of the Advisor (2010-Present); General Counsel and Secretary of the Advisor (2006-Present); Vice President and General Counsel (2006-2010) and Secretary (2007-2010) of Crystal River Capital, Inc.; Secretary of several investment companies advised by the Advisor (2006-Present); Chief Financial Officer of Brookfield Investment Management (UK) Limited (March 2011-Present); Chief Financial Officer of Brookfield Investment Management (Canada) Inc. (January 2011-Present);Chief Executive Officer, Brookfield Investment Management (US) LLC (2011-Present); Managing Director, AMP Capital Brookfield Pty Limited (2011-2012). |
| | | |
Angela W. Ghantous*
c/o Brookfield Place, 250 Vesey Street, New York, New York 10281-1023 Age 37 | | Treasurer | | Since 2012 | | Treasurer of several investment companies advised by the Adviser (2012-Present); Director of the Adviser (2012-Present); Vice President of the Adviser (2009-Present); Controller of Brookfield Redding LLC (2006-2009). |
| | | |
Brian F. Hurley*
c/o Brookfield Place, 250 Vesey Street, New York, New York 10281-1023 Age 35 | | Secretary | | Since 2011 | | Director and Assistant General Counsel of the Adviser (2010-Present); Attorney at Paul Hastings LLP (2002-2010). |
| | | |
Seth Gelman*
c/o Brookfield Place, 250 Vesey Street, New York, New York 10281-1023 Age 37 | | Chief Compliance Officer (“CCO”) | | Since 2011 | | CCO of several investment companies advised by the Advisor (2009-Present); Director and CCO of the Advisor (2009- Present); Vice President, Oppenheimer Funds, Inc. (2004- 2009). |
| * | Interested person as defined by the Investment Company Act of 1940, as amended (the “1940 Act”) because of affiliations with Brookfield Investment Management Inc., Adviser of the Brookfield Investment Funds and Brookfield Global Listed Infrastructure Income Fund. |
The Funds’ Statement of Additional Information includes additional information about the Trustees and is available, without charge, upon request by calling 1-800-497-3746.
Brookfield Investment Management Inc.
66
JOINT NOTICE OF PRIVACY POLICY (Unaudited)
Brookfield Investment Management Inc. (“BIM”), on its own behalf and on behalf the funds managed by BIM and its affiliates, recognizes and appreciates the importance of respecting the privacy of our clients and shareholders. Our relationships are based on integrity and trust and we maintain high standards to safeguard your non-public personal information (“Personal Information”) at all times. This privacy policy (“Policy”) describes the types of Personal Information we collect about you, the steps we take to safeguard that information and the circumstances in which it may be disclosed.
If you hold shares of a Fund through a financial intermediary, such as a broker, investment adviser, bank or trust company, the privacy policy of your financial intermediary will also govern how your Personal Information will be shared with other parties.
WHAT INFORMATION DO WE COLLECT?
We collect the following Personal Information about you:
| | • | | Information we receive from you in applications or other forms, correspondence or conversations, including but not limited to name, address, phone number, social security number, assets, income and date of birth. |
| | • | | Information about transactions with us, our affiliates, or others, including but not limited to account number, balance and payment history, parties to transactions, cost basis information, and other financial information. |
| | • | | Information we may receive from our due diligence, such as your creditworthiness and your credit history. |
WHAT IS OUR PRIVACY POLICY?
We may share your Personal Information with our affiliates in order to provide products or services to you or to support our business needs. We will not disclose your Personal Information to nonaffiliated third parties unless 1) we have received proper consent from you; 2) we are legally permitted to do so; or 3) we reasonably believe, in good faith ,that we are legally required to do so. For example, we may disclose your Personal Information with the following in order to assist us with various aspects of conducting our business, to comply with laws or industry regulations, and/or to effect any transaction on your behalf:
| | • | | Unaffiliated service providers (e.g. transfer agents, securities broker-dealers, administrators, investment advisors or other firms that assist us in maintaining and supporting financial products and services provided to you); |
| | • | | Government agencies, other regulatory bodies and law enforcement officials (e.g. for reporting suspicious transactions); |
| | • | | Other organizations, with your consent or as directed by you; and |
| | • | | Other organizations, as permitted or required by law (e.g. for fraud protection) |
When we share your Personal Information, the information is made available for limited purposes and under controlled circumstances designed to protect your privacy. We require third parties to comply with our standards for security and confidentiality.
HOW DO WE PROTECT CLIENT INFORMATION?
We restrict access to your Personal Information to those persons who require such information to assist us with providing products or services to you. It is our practice to maintain and monitor physical, electronic, and procedural safeguards that comply with federal standards to guard client nonpublic personal information. We regularly train our employees on privacy and information security and on their obligations to protect client information.
CONTACT INFORMATION
For questions concerning our Privacy Policy, please contact our client services representative at 1-800-497-3746.
2012 Annual Report
67
CORPORATE INFORMATION
Investment Adviser and Administrator
Brookfield Investment Management Inc.
Brookfield Place
250 Vesey Street
New York, New York 10281-1023
www.brookfieldim.com
Please direct your inquiries to:
Investor Relations
Phone: 1-800-497-3746
E-mail: funds@brookfield.com
Transfer Agent
Stockholder inquiries relating to distributions,
address changes and stockholder account
information should be directed to the Fund’s
transfer agent:
U.S. Bancorp Fund Services LLC
615 East Michigan Street
Milwaukee, Wisconsin 53202
1-855-244-4859
Sub-Administrator and Fund Accounting Agent
U.S. Bancorp Fund Services, LLC
615 East Michigan Street
Milwaukee, Wisconsin 53202
Independent Registered Public Accounting Firm
Deloitte & Touche LLP
1700 Market Street
Philadelphia, Pennsylvania 19103
Legal Counsel
Paul Hastings LLP
75 East 55th Street
New York, New York 10022
Custodian
U.S. Bank National Association
1555 North River Center Drive, Suite 302
Milwaukee, Wisconsin 53212
Distributor
Quasar Distributors, LLC
615 East Michigan Street
Milwaukee, Wisconsin 53202
The Funds will file their complete schedules of portfolio holdings with the SEC for the first and third quarters of each fiscal year on Form N-Q. The Funds’ Form N-Q will be available on the SEC’s website at www.sec.gov. In addition, the Funds’ Form N-Q may be reviewed and copied at the SEC’s Public Reference Room in Washington, D.C. Information on the operation of the Public Reference Room may be obtained by calling 1-800-SEC-0330.
You may obtain a description of the Funds’ proxy voting policies and procedures, and information regarding how the Funds voted proxies relating to portfolio securities during the most recent 12-month period ended June 30, without charge, upon request by calling 1-800-497-3746, or go to the SEC’s website at www.sec.gov.

Item 2. Code of Ethics.
As of the end of the period covered by this report, the Registrant had adopted a Code of Ethics for Principal Executive and Principal Financial Officers (the “Code”). There were no amendments to or waivers from the Code during the period covered by this report. A copy of the Registrant’s Code will be provided upon request to any person without charge by contacting Investor Relations at (800) 497-3746 or by writing to Secretary, Brookfield Investment Funds, Brookfield Place, 250 Vesey Street, 15th Floor, New York, NY 10281-1023.
Item 3. Audit Committee Financial Expert.
The Registrant’s Board of Trustees has determined that three members serving on the Registrant’s audit committee are audit committee financial experts and they are Messrs. Rodman L. Drake, Edward A. Kuczmarski and Louis P. Salvatore. Messrs. Rodman L. Drake, Edward A. Kuczmarski and Louis P. Salvatore are each independent.
Item 4. Principal Accountant Fees and Services.
Audit Fees
For each fiscal years ended December 31, 2012 and December 31, 2011, Deloitte & Touche LLP billed the Registrant aggregate fees of $158,000 and $113,000, respectively. Each bill is for professional services rendered for the audit of the Registrant’s annual financial statements and the review of financial statements that are included in the Registrant’s annual and semi-annual reports to shareholders.
Tax Fees
For each fiscal years ended December 31, 2012 and December 31, 2011, Deloitte & Touche LLP billed the Registrant aggregate fees of $6,000 and $6,000, respectively. Each bill is for professional services rendered for tax compliance, tax advice and tax planning. The nature of the services comprising the Tax Fees was the review of the Registrant’s income tax returns and tax distribution requirements.
Audit-Related Fees
For the fiscal years ended December 31, 2012 and December 31, 2011, the Audit-related fees were $4,397 and $5,289, respectively.
All Other Fees
For the fiscal years ended December 31, 2012 and December 31, 2011, there were no Other Fees.
Item 5. Audit Committee of Listed Registrants.
Not applicable.
Item 6. Schedule of Investments.
Please see Item 1.
Item 7. Disclosure of Proxy Voting Policies and Procedures for Closed-End Management Investment Companies.
Not applicable.
Item 8. Portfolio Managers of Closed-End Management Investment Companies.
Not applicable.
Item 9. Purchases of Equity Securities by Closed-End Management Investment Company and Affiliated Purchasers.
Not applicable.
Item 10. Submission of Matters to a Vote of Security Holders.
Not applicable.
Item 11. Controls and Procedures.
(a) The Registrant’s principal executive officer and principal financial officer have concluded that the Registrant’s Disclosure Controls and Procedures are effective, based on their evaluation of such Disclosure Controls and Procedures as of a date within 90 days of the filing of this report on Form N-CSR.
(b) As of the date of filing this Form N-CSR, the Registrant’s principal executive officer and principal financial officer are aware of no changes in the Registrant’s internal control over financial reporting that occurred during the Registrant’s second fiscal quarter of the period covered by this report that has materially affected or is reasonably likely to materially affect the Registrant’s internal control over financial reporting.
Item 12. Exhibits.
| | |
| (a)(1) None. |
|
| (2) A separate certification for each principal executive officer and principal financial officer of the Registrant as required by Rule 30a-2(a) under the Investment Company Act of 1940 is attached as an exhibit to this Form N-CSR. |
|
| (3) None. |
|
(b) A separate certification for each principal executive officer and principal financial officer of the Registrant as required by Rule 30a-2(b) under the Investment Company Act of 1940 is attached as an exhibit to this Form N-CSR. |
SIGNATURES
Pursuant to the requirements of the Securities Exchange Act of 1934 and the Investment Company Act of 1940, the Registrant has duly caused this report to be signed on its behalf by the undersigned, thereunto duly authorized.
BROOKFIELD INVESTMENT FUNDS
| | |
| By: | | /s/ Kim G. Redding |
| | Kim G. Redding |
| | President and Principal Executive Officer |
|
| Date: March 8, 2013 |
Pursuant to the requirements of the Securities Exchange Act of 1934 and the Investment Company Act of 1940, this report has been signed below by the following persons on behalf of the Registrant and in the capacities and on the dates indicated.
| | |
| By: | | /s/ Kim G. Redding |
| | Kim G. Redding |
| | President and Principal Executive Officer |
|
| Date: March 8, 2013 |
| | |
| By: | | /s/ Angela W. Ghantous |
| | Angela W. Ghantous |
| | Treasurer and Principal Financial Officer |
|
| Date: March 8, 2013 |