UNITED STATES
SECURITIES AND EXCHANGE COMMISSION
WASHINGTON, D.C. 20549
FORM N-CSR
CERTIFIED SHAREHOLDER REPORT OF REGISTERED
MANAGEMENT INVESTMENT COMPANIES
Investment Company Act file number 811-22558
BROOKFIELD INVESTMENT FUNDS
(Exact name of registrant as specified in charter)
BROOKFIELD PLACE
250 VESEY STREET, 15th Floor
NEW YORK, NEW YORK 10281-1023
(Address of principal executive offices) (Zip code)
KIM G. REDDING, PRESIDENT
BROOKFIELD INVESTMENT FUNDS
BROOKFIELD PLACE
250 VESEY STREET 15th Floor
NEW YORK, NEW YORK 10281-1023
(Name and address of agent for service)
Registrant’s telephone number, including area code: (855) 777-8001
Date of fiscal year end: December 31, 2013
Date of reporting period: December 31, 2013
Item 1. Reports to Shareholders.
Brookfield Investment Management 2013 ANNUAL REPORT Brookfield Global Listed Infrastructure Fund Brookfield Global Listed Real Estate Fund Brookfield U.S. Listed Real Estate Fund

IN PROFILE Brookfield Asset Management Inc. is a global alternative asset manager with over $187 billion in assets under management as of December 31, 2013. Brookfield has over a 100-year history of owning and operating assets with a focus on property, renewable power, infrastructure and private equity. The company offers a range of public and private investment products and services, which leverage its expertise and experience and provide it with a competitive advantage in the markets where it operates. On behalf of its clients, Brookfield is also an active investor in the public securities markets, where its experience extends over 30 years. Over this time, the company has successfully developed several investment operations and built expertise in the management of institutional portfolios, retail mutual funds, and structured product investments. Brookfield’s public market activities are conducted by Brookfield Investment Management, a registered investment adviser. These activities complement Brookfield’s core competencies and include global listed real estate and infrastructure equities, corporate high yield investments, opportunistic credit strategies and a dedicated insurance asset management division. Headquartered in New York, NY, Brookfield Investment Management maintains offices and investment teams in Toronto, Chicago, Boston and London and has over $10 billion of assets under management as of December 31, 2013.
TABLE OF CONTENTS
This report is for shareholder information. This is not a prospectus intended for the use in the purchase or sale of Fund shares.
| | | | |
| NOT FDIC INSURED | | MAY LOSE VALUE | | NOT BANK GUARANTEED |
© Copyright 2013. Brookfield Investment Management Inc.
[THIS PAGE IS INTENTIONALLY LEFT BLANK]
LETTER TO SHAREHOLDERS
Dear Shareholders,
I am pleased to provide the Annual Report for Brookfield Global Listed Infrastructure Fund (the “Infrastructure Fund”), Brookfield Global Listed Real Estate Fund (the “Global Real Estate Fund”) for the year ended December 31, 2013 and the Brookfield U.S. Listed Real Estate Fund (the “U.S. Real Estate Fund”) (each a “Fund” and, collectively, the “Funds”) for the period from December 11, 2013 (commencement of operations) to December 31, 2013.
Overall capital market performance was mixed during the year, as the positive catalyst of an improving economic environment was offset by concerns over rising interest rates. Accordingly, equity markets generally produced attractive results while fixed income markets were more challenged. The U.S. economy gained further strength over the course of the year, driven largely by an improving labor market, an expansion in household net worth and continued recovery of both the residential and commercial property markets. This positive momentum led the U.S. Federal Reserve to begin tapering its asset purchase program in a move that had been widely discussed and debated in the marketplace for months. Importantly, the Federal Reserve also reiterated its commitment to maintaining a low interest rate environment for the foreseeable future and to providing sufficient support as needed. As a result, market volatility following the announcement was minimal and we believe implementation will serve to reduce uncertainty moving forward. We also note that despite the recent increase in interest rates, yields remain near historic lows and supportive of economic growth.
Within this environment, demand for global real estate and infrastructure securities was shaped by broader capital market volatility, as sentiment turned more cautious following the back-up in interest rates. However, fundamentals of these asset classes generally continued to improve, reflecting the ongoing recovery of many developed market economies. Accordingly, companies operating in higher growth sectors and geographies tended to generate the most attractive performance during the year.
Moving forward, we anticipate a period of normalizing interest rates and economic growth in the medium term. We expect accommodative monetary policy to continue in the U.S. and across many developed markets, providing further support for the global economic recovery. We maintain our positive outlook for real estate and infrastructure equities, as we believe these securities are well-positioned to benefit from an improving economy while providing an opportunity for attractive income. Additionally, we believe recent performance has resulted in compelling valuation levels for select opportunities, which may lead to meaningful return potential. Against this backdrop, we believe our fundamental, bottom-up approach to investing and active management style are well-suited to identify and potentially capitalize on attractive investment opportunities.
In addition to performance information, this report provides the Funds’ audited financial statements as of December 31, 2013.
We welcome your questions and comments, and encourage you to contact our Investor Relations team at (855) 777-8001 or visit us at www.brookfieldim.com for more information. Thank you for your support.
|
| Sincerely, |
|
 |
|
| Kim G. Redding |
| President |
2013 Annual Report 1
LETTER TO SHAREHOLDERS (continued)
These views represent the opinions of Brookfield Investment Management Inc. and are not intended to predict or depict the performance of any investment. These views are as of the close of business on December 31, 2013 and subject to change based on subsequent developments.
Must be preceded or accompanied by a prospectus.
Mutual fund investing involves risk. Principal loss is possible. Investors should be aware of the risks involved with investing in a fund concentrating in REITs and real estate securities, such as declines in the value of real estate and increased susceptibility to adverse economic or regulatory developments. Investments in infrastructure entities involve greater exposure to the potential adverse economic, regulatory, political and other changes affecting such entities. Investment in lower-rated and non-rated securities presents a greater risk of loss to principal and interest than higher-rated securities. Investments in asset-backed and mortgage-backed securities include additional risks that investors should be aware of, such as credit risk, prepayment risk, possible illiquidity and default, as well as increased susceptibility to adverse economic developments. Investments in debt securities typically decrease in value when interest rates rise. This risk is usually greater for longer-term debt securities. Investments in foreign securities involve greater volatility and political, economic and currency risks and differences in accounting methods. Investing is small and mid-cap companies involve additional risks such as limited liquidity and greater volatility. Investments in MLPs could involve certain risks related to investing in the underlying assets of the MLPs and risks associated with pooled investment vehicles. Using derivatives exposes the Funds to additional risks, may increase the volatility of the Fund’s net asset value and may not provide the result intended.
Past performance does not guarantee future results.
Quasar Distributors, LLC is the distributor of Brookfield Investment Funds.
2 Brookfield Investment Management Inc.
ABOUT YOUR FUND’S EXPENSES
As a shareholder of a fund, you may incur two types of costs: (1) transaction costs, including sales charges (loads) on purchase payments, reinvested dividends or other distributions, redemption fees and exchange fees; and (2) ongoing costs, including management fees, distribution (12b-1) fees and other Fund expenses. This example is intended to help you understand your ongoing costs (in dollars) of investing in the Fund and to compare these costs with the ongoing costs of investing in other mutual funds. The example is based on an investment of $1,000 invested at the beginning of the period and held for the entire period as indicated below.
Actual Fund Return
The table below provides information about actual account values and actual expenses. You may use the information on this line, together with the amount you invested, to estimate the expense that you paid over the period. Simply divide your account value by $1,000 (for example, an $8,600 account value divided by $1,000 = 8.6), then multiply the result by the number in the first line under the heading entitled “Expenses Paid During Period” to estimate the expenses you paid on your account during this period.
Hypothetical Example for Comparison Purposes
The table below also provides information about hypothetical account values and hypothetical expenses, which is not the Fund’s actual expense ratio and an assumed rate of return of 5% per year before expenses, which is not the Fund’s actual return. The hypothetical account values and expenses may not be used to estimate the actual ending account balance or expenses you paid for the period. You may use this information to compare the ongoing costs of investing in the Fund and the other funds. To do so, compare this 5% hypothetical example with hypothetical examples that appear in shareholders’ reports of other funds.
Please note that the expenses shown in the table are meant to highlight your ongoing costs only and do not reflect any transactional costs, such as sales charges (loads), redemption fees or exchange fees. Therefore, the hypothetical account values and expenses in the table are useful in comparing ongoing costs only, and will not help you determine the relative total costs of owning different funds. In addition, if these transactional costs were included, your costs overall would have been higher.
| | | | | | | | | | | | | | | | |
| | | Annualized
Expense
Ratio | | | Beginning
Account
Value
(07/01/13) | | | Ending
Account Value
(12/31/13) | | | Expenses
Paid During
Period
(07/01/13–
12/31/13) (1) | |
INFRASTRUCTURE FUND | | | | | | | | | | | | | | | | |
Actual | | | | | | | | | | | | | | | | |
Class A Shares | | | 1.35 | % | | $ | 1,000.00 | | | $ | 1,133.20 | | | $ | 7.26 | |
Class C Shares | | | 2.10 | % | | | 1,000.00 | | | | 1,129.00 | | | | 11.27 | |
Class Y Shares | | | 1.10 | % | | | 1,000.00 | | | | 1,134.50 | | | | 5.92 | |
Class I Shares | | | 1.10 | % | | | 1,000.00 | | | | 1,134.40 | | | | 5.92 | |
Hypothetical (assuming a 5% return before expenses) | | | | | | | | | | | | | | | | |
Class A Shares | | | 1.35 | % | | | 1,000.00 | | | | 1,018.40 | | | | 6.87 | |
Class C Shares | | | 2.10 | % | | | 1,000.00 | | | | 1,014.62 | | | | 10.66 | |
Class Y Shares | | | 1.10 | % | | | 1,000.00 | | | | 1,019.66 | | | | 5.60 | |
Class I Shares | | | 1.10 | % | | | 1,000.00 | | | | 1,019.66 | | | | 5.60 | |
2013 Annual Report 3
ABOUT YOUR FUND’S EXPENSES
| | | | | | | | | | | | | | | | |
| | | Annualized
Expense
Ratio | | | Beginning
Account
Value
(07/01/13) | | | Ending
Account Value
(12/31/13) | | | Expenses
Paid During
Period
(07/01/13–
12/31/13) (1) | |
GLOBAL REAL ESTATE FUND | | | | | | | | | | | | | | | | |
Actual | | | | | | | | | | | | | | | | |
Class A Shares | | | 1.20 | % | | $ | 1,000.00 | | | $ | 1,032.40 | | | $ | 6.15 | |
Class C Shares | | | 1.95 | % | | | 1,000.00 | | | | 1,029.00 | | | | 9.97 | |
Class Y Shares | | | 0.95 | % | | | 1,000.00 | | | | 1,033.50 | | | | 4.87 | |
Class I Shares | | | 0.95 | % | | | 1,000.00 | | | | 1,033.50 | | | | 4.87 | |
Hypothetical (assuming a 5% return before expenses) | | | | | | | | | | | | | | | | |
Class A Shares | | | 1.20 | % | | | 1,000.00 | | | | 1,019.16 | | | | 6.11 | |
Class C Shares | | | 1.95 | % | | | 1,000.00 | | | | 1,015.38 | | | | 9.91 | |
Class Y Shares | | | 0.95 | % | | | 1,000.00 | | | | 1,020.42 | | | | 4.84 | |
Class I Shares | | | 0.95 | % | | | 1,000.00 | | | | 1,020.42 | | | | 4.84 | |
| | | | |
| | | Annualized
Expense
Ratio | | | Beginning
Account
Value
(12/11/13) | | | Ending
Account Value
(12/31/13) | | | Expenses
Paid During
Period
(12/11/13–
12/31/13)(2) | |
U.S. REAL ESTATE FUND | | | | | | | | | | | | | | | | |
Actual | | | | | | | | | | | | | | | | |
Class A Shares | | | 1.20 | % | | $ | 1,000.00 | | | $ | 1,016.20 | | | $ | 0.66 | |
Class C Shares | | | 1.95 | % | | | 1,000.00 | | | | 1,015.80 | | | | 1.08 | |
Class Y Shares | | | 0.95 | % | | | 1,000.00 | | | | 1,016.40 | | | | 0.52 | |
Class I Shares | | | 0.95 | % | | | 1,000.00 | | | | 1,016.40 | | | | 0.52 | |
| | | | |
| | | Annualized
Expense
Ratio | | | Beginning
Account
Value
(07/01/13) | | | Ending
Account Value
(12/31/13) | | | Expenses
Paid During
Period
(07/01/13–
12/31/13)(1) | |
Hypothetical (assuming a 5% return before expenses) | | | | | | | | | | | | | | | | |
Class A Shares | | | 1.20 | % | | | 1,000.00 | | | | 1,019.16 | | | | 6.11 | |
Class C Shares | | | 1.95 | % | | | 1,000.00 | | | | 1,015.38 | | | | 9.91 | |
Class Y Shares | | | 0.95 | % | | | 1,000.00 | | | | 1,020.42 | | | | 4.84 | |
Class I Shares | | | 0.95 | % | | | 1,000.00 | | | | 1,020.42 | | | | 4.84 | |
| (1) | Expenses are equal to the Funds’ annualized expense ratio multiplied by the average account value over the period, multiplied by 184/365 (to reflect a six-month period). |
| (2) | Expenses are equal to the Funds’ annualized expense ratio multiplied by the average account value over the period, multiplied by 20/365 (to reflect a 20 day period). The Fund commenced operations on December 11, 2013. |
4 Brookfield Investment Management Inc.
BROOKFIELD GLOBAL LISTED INFRASTRUCTURE FUND
MANAGEMENT DISCUSSION OF FUND PERFORMANCE
Individual contributors to performance included Access Midstream Partners, LP, EQT Midstream Partners LP and ONEOK, Inc.
The Fund’s overweight to Access Midstream Partners, LP, a Master Limited Partnership (“MLP”) was the strongest performer by security on a relative basis. The company maintains operations in most of the major shale gas basins in the U.S., and its contracts are generally fixed fee and therefore not exposed to commodity price volatility. The company had positive momentum in 2013 after management stated in 2012 that they feel the firm can grow their distributions by more than 15% per year for the foreseeable future. In addition, the MLP sector had a strong year and outperformed the Dow Jones Brookfield Global Infrastructure Composite Index.
Overweight exposure to EQT Midstream Partners LP was a positive contributor to relative Fund returns. We believe the company benefitted from an attractive growth profile and competitive positioning within the Marcellus and Utica shale formations, two of the fastest growing basins.
Overweight exposure to ONEOK, Inc. also drove positive relative performance gains in 2013. The company announced its intention to spin off its utility business in order to become a pure play General Partner, which tend to trade at strong valuations due to cash flows collected from underlying MLPs. The stock price was re-rated according to its new intended structure and gained ground in 2013 as a result.
Detractors to performance included Cheniere Energy, Inc., Cia de Saneamento Basico do Estado de Sao Paulo and Groupe Eurotunnel SA. Zero exposure to midstream pipeline company Cheniere Energy, Inc. was the largest detractor from Fund performance. The company has had a strong year due to investor optimism regarding its potential to receive approval from the Department of Energy for exports of liquefied natural gas to non-FTA countries.
Overweight exposure to Brazilian water and sewage treatment company, Cia de Saneamento Basico do Estado de Sao Paulo (“Sabesp”) detracted from Fund performance. Brazilian stocks and currencies suffered in 2013 as investors moved capital to the U.S. We believe Sabesp, in particular, was weak as fears of inflation sparked public demonstrations, and investors feared that the Brazilian government would not permit increases in rates for water due to turmoil. Subsequently, the Brazilian government has shown openness to discuss pricing with Sabesp, a situation we continue to monitor.
Overweight exposure to Groupe Eurotunnel SA was negative as potential regulatory changes were announced pertaining to the company’s allowable tolls, and we sold the Fund’s position to protect against potential losses. Thereafter, the company rebounded.
INFRASTRUCTURE MARKET OVERVIEW AND OUTLOOK
Infrastructure closes 2013 in positive territory
Market sentiment throughout 2013 was driven by interest rates – first by euphoria over low rates and later by fear over their imminent rise. Governments across the globe helped drive yields on fixed income investments to all-time lows. Not least was the Japanese government’s unprecedented monthly debt purchase announcement equaling 7.5 trillion yen, or approximately US$76 billion. Following several months of yield focused equity investing spurred by all-time low fixed income yields, markets reversed course in May when U.S. Federal Reserve Chairman Ben Bernanke foreshadowed a reduction in government bond purchases. Thereafter, interest rates rose substantially with the yield on the 10-year U.S. Treasury Note increasing 118 basis points, from 1.86% on January 2 to 3.04% on December 31.
Global equity market movements were generally positive, and the MSCI World Index rose 27.4%1 for the 12-month period ended December 31, 2013. U.S. markets outpaced global markets for the year, but ongoing political and monetary policy turmoil drove volatility in U.S. markets. International outliers included Japan, where optimism over the new Abe government’s policies led the market to outperform, and Europe, which rebounded in the year on
2013 Annual Report 5
BROOKFIELD GLOBAL LISTED INFRASTRUCTURE FUND
signs of stabilization. Boosting markets into year-end was the Fed’s tapering announcement on December 18. The Committee’s decision to reduce purchases of agency mortgage-backed securities and longer-term Treasury securities by a total of US$10 billion per month was generally perceived as dovish. The announcement also included a provision that the targeted federal funds rate would remain “exceptionally low” until unemployment in the U.S. falls below 6.5%, further boosting sentiment.
Global infrastructure securities as measured by the Dow Jones Brookfield Global Infrastructure Composite Index2 returned 18.8% for the 12-month period ended December 31, 2013. As was the case more broadly, Europe was a bright spot among infrastructure stocks as the region rebounded off its lows. European infrastructure securities returned a strong 22.5% in 2013, followed by the Americas and Asia Pacific, up 13.6% and 11.3% respectively. Higher growth sectors levered to an economic recovery were also strong, led by airports (+26.6%) and toll roads (+25.0%). Communications (+7.7%) and water (+9.4%) lagged. Water suffered from its low growth profile while communications companies may have been impacted by relatively higher leverage levels3.
We believe underperformance of the infrastructure asset class in 2013 creates investment opportunities for the year ahead. While a steep increase in interest rates would present a downside risk for infrastructure securities, we expect a modest rise in long-term interest rates at a moderate pace. A number of positive trends, particularly investor demand for infrastructure securities as well as rapid growth in the asset class, support our positive outlook for the space in 2014.
Master Limited Partnerships remain strong in 2013
Master Limited Partnerships had a banner year, and the Alerian MLP Total Return Index4 returned 27.6% for the 12-month period ended December 31, 2013. MLPs have been among the highest yielding infrastructure securities and have offered strong earnings growth driven by new pipelines which should become operational in the coming years. Demand for MLPs did not slow in 2013. Indicatively, dedicated MLP funds have been highly successful. Five closed end and six open end funds totaling more than US$4.2 billion (including leverage)5 were raised this year, indicating ongoing retail investor demand for MLPs. We remain constructive on the MLP sector due to expectations that strong earnings growth will offset the impact of rising interest rates.
Infrastructure securities asset class grows
Estimates indicate a $25 trillion gap in government infrastructure spending over the next 25 years, creating a significant opportunity for investment by publicly traded infrastructure companies6. Listed infrastructure companies have taken action in 2013, and we have seen notable expansion of the infrastructure securities investment universe.
Privatizations
Cash strapped governments have increasingly turned to private companies to recapitalize their balance sheets. In 2013, the first ever privatization of a U.S. airport occurred. Rights to operate the San Juan airport in Puerto Rico were sold to Grupo Aeroportuario del Sureste (ASUR), a Mexican airport company that operates the Cancun airport among others, together with partner Highstar Capital. In the first quarter of 2013, the consortium received the final approvals required by the Federal Aviation Administration (FAA) to operate the airport. The transaction may pave the way for others. In fact, under the Airport Privatization Pilot Program, the FAA has already agreed to permit up to 10 public airport sponsors to sell or lease an airport in the U.S.
Emerging markets also offer significant privatization opportunities as many of these governments are capital constrained. We view Brazil especially positively in light of attractive valuations, even though the macro climate is characterized by inflation, low savings rates and low growth forecasts. President Dilma Rousseff’s administration has made significant attempts to stimulate economic growth by promoting private ownership of infrastructure assets. In 2012, President Rousseff unveiled an infrastructure privatization initiative to privatize 7,500 kilometers of toll roads requiring US$20 billion of capital investment and 10,000 kilometers of railroads requiring US$45 billion of investment. During 2013, the success of Brazilian infrastructure privatizations varied, but the two
6 Brookfield Investment Management Inc.
BROOKFIELD GLOBAL LISTED INFRASTRUCTURE FUND
most recent airport auctions were a boon to the Rousseff administration. The most publicized sale was the Galeao Airport in Rio. The winning bid came from a Brazilian private construction group Odebrecht SA together with a unit of Changi Airport Group, which bid 19 billion reais for the asset. This significantly outpaced the required minimum bid of 4.8 billion reais. Odebrecht SA was also awarded another Brazilian auction, BR-163 highway, an 851 kilometer toll road.
IPOs
New investment opportunities also arose through a number of successful IPOs. For instance, Mexican infrastructure company Infraestructura Energetica Nova SAB de CV (IENOVA) completed an IPO in March priced at the top end of the range at 34.00 Mexican pesos per share, or approximately US$2.75. IENOVA is a subsidiary of portfolio holding Sempra Energy (SRE), a U.S. long-haul pipeline company, and owns and operates natural gas pipelines and distribution facilities in Mexico as well as the Costa Azul liquefied natural gas (or LNG) facility near Ensenada, Mexico. Separately, NRGY Yield (NYLD) listed in July and issued 22,511,250 common shares at US$22 per share in a well-received offering. NYLD was spun out of NRG Energy, Inc. and is a diversified infrastructure company with a history of stable cash flows driven by long term contracts.
Exploring new territory
Beyond IPOs and privatizations, growth opportunities for infrastructure securities come in the form of new development and expansions. For instance, new mining operations in Canada’s oil sands continue to be announced, creating opportunities for pipeline companies to meet the growing transportation need. For example, Suncor Energy recently announced that its Fort Hills Project, located in Alberta’s Athabasca region, will be in production as early as late 2017. Enbridge Inc., an oil and gas pipeline company, was selected by Suncor and its partners to develop a new US$1.6 billion pipeline (Wood Buffalo Extension) to transport crude oil from the Fort Hills Project to Hardisty, Alberta, an important hub for oil sands production. Other companies in the infrastructure universe may benefit as additional mining operations are approved.
Separately, new LNG exports are being approved by the U.S. Department of Energy (DOE), providing international growth avenues for listed companies in our investment universe. The DOE has taken a number of steps toward relaxing its policy regarding the export of LNG to international countries without Free Trade Agreements (FTAs) with the U.S. Last December, the DOE issued a report that was supportive of natural gas drilling, and therefore positive for the energy infrastructure sector. The study was intended to protect public interest by examining the impact on domestic natural gas pricing as additional LNG export facilities become operational. Current laws require natural gas companies to obtain a license when exporting natural gas to non-FTA countries. The report concluded that additional LNG export facilities in the U.S. for exports of up to 10 billion cubic feet (“bcf”) per day would likely have a minimal impact on natural gas pricing, and that benefits would likely outweigh any costs.
Subsequent to this decision the DOE has approved five projects. We believe ongoing approvals mark an important shift for the global infrastructure securities asset class. North American energy infrastructure companies may benefit as their pipelines connect to these export facilities and are anticipated to see additional volume as exports grow. Additionally, as the 10 bcf per day amount addressed in the DOE study draws nearer, there will be winners and losers. We believe that reaching 10 bcf per day may trigger an additional study, which would create approval delays and could effectively cap non-FTA exports in the medium term. We are monitoring the situation closely.
OUTLOOK
As we look ahead to the New Year, we do not plan to make dramatic changes to portfolio exposures. We continue to favor high growth sectors in the U.S., including pipelines and rail companies. Crude by rail shipments out of the Bakken shale region in the U.S. have grown dramatically, and we expect growth to continue into 2014. We also anticipate crude by rail growth out of Canada, where rail loading facilities are being constructed. Within Europe, we remain cautious on regulated businesses like UK water companies in light of regulatory uncertainty. We favor transportation infrastructure in Spain and Italy, where signs of improving traffic driven by GDP growth should benefit transportation operators in the region.
2013 Annual Report 7
BROOKFIELD GLOBAL LISTED INFRASTRUCTURE FUND
We also expect continued opportunities to arise within emerging markets. In Brazil, we anticipate short term volatility until the October 2014 elections, but have identified ongoing value opportunities among high quality companies in the country. We continue to favor gas utilities in China, and December’s Third Plenum boosted optimism for economic reform in the region. Finally, energy reform in Mexico may necessitate infrastructure build-out, spurring new opportunities for U.S. energy infrastructure companies.
We aim to capitalize on growth opportunities in the coming year. We believe infrastructure securities are generally well positioned to benefit from an improving macro economy while providing an opportunity for attractive income and capital preservation against ongoing market volatility into 2014.
AVERAGE ANNUAL TOTAL RETURNS
| | | | | | | | |
| As of December 31, 2013 | | 1 Year | | | Since Inception* | |
Class A Shares (excluding sales charge) | | | 22.86 | % | | | 19.89 | % |
Class A Shares (including sales charge) | | | 17.01 | % | | | 16.99 | % |
Class C Shares (excluding sales charge) | | | 21.85 | % | | | 17.33 | % |
Class C Shares (including sales charge) | | | 20.85 | % | | | 17.33 | % |
Class Y Shares | | | 23.11 | % | | | 20.06 | % |
Class I Shares | | | 23.09 | % | | | 20.10 | % |
Dow Jones Brookfield Global Infrastructure Composite Index | | | 18.77 | % | | | 17.19 | % |
| * | Class A was incepted on December 29, 2011, Class C was incepted on May 1, 2012 and Classes Y and I were incepted on December 1, 2011. The Dow Jones Brookfield Global Infrastructure Composite Index references Class I’s inception date. |
Performance data quoted represents past performance; past performance does not guarantee future results. The investment return and principal value of an investment will fluctuate so that an investor’s shares, when redeemed, may be worth more or less than their original cost. Current performance of the Fund may be lower or higher than the performance quoted. Performance data current to the most recent month end may be obtained by calling 855.244.4859. The Fund imposes a 2.00% redemption fee on shares redeemed within 60 days. Performance data does not reflect the imposition of the redemption fee and if it had, performance would have been lower. Performance shown including sales charge reflects the Class A maximum sales charge of 4.75% and the Class C Contingent Deferred Sales Charge (CDSC) of 1.00%. Performance data excluding sales charge does not reflect the deduction of the sales charge or CDSC and if reflected, the sales charge or fee would reduce the performance quoted.
As per the prospectus dated April 30, 2013, the Fund’s gross expense ratio for Class A, Class C, Class Y and Class I is 2.16%, 2.63%, 1.67% and 1.78%, respectively. And the Fund’s net expense ratio for Class A, Class C, Class Y and Class I is 1.35%, 2.10%, 1.10% and 1.10%, respectively for the year ended December 31, 2012.
The Adviser has contractually agreed to reimburse the Fund’s expenses through May 1, 2015. There is no guarantee that such reimbursement will be continued after that date.
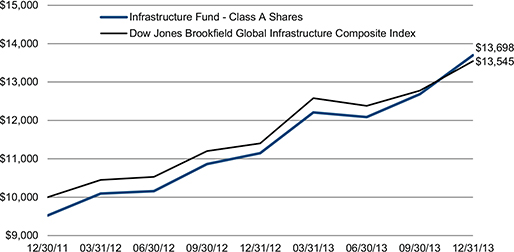
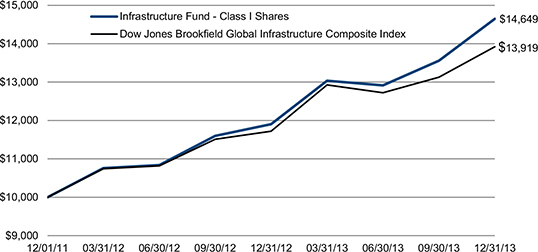
The graphs below illustrate a hypothetical investment of $10,000 in the Infrastructure Fund—Class A Shares from the commencement of investment operations on December 29, 2011 to December 31, 2013 compared to the Dow Jones Brookfield Global Infrastructure Composite Index and Class I Shares from the commencement of investment operations on December 1, 2011 to December 31, 2013 compared to the Dow Jones Brookfield Global Infrastructure Composite Index.
8 Brookfield Investment Management Inc.
BROOKFIELD GLOBAL LISTED INFRASTRUCTURE FUND
Class A Shares
Class I Shares
Disclosure
Performance data quoted represents past performance results and does not guarantee future results. Current performance may be lower or higher than the performance data quoted.
All returns shown in USD.
The Fund’s portfolio holdings are subject to change without notice. The mention of specific securities is not a recommendation or solicitation for any person to buy, sell or hold any particular security. There is no assurance that the Brookfield Global Listed Infrastructure Fund currently holds these securities. Please refer to the Schedule of Investments contained in this report for a full listing of fund holdings.
2013 Annual Report 9
BROOKFIELD GLOBAL LISTED INFRASTRUCTURE FUND
Mutual fund investing involves risk. Principal loss is possible.
A basis point (bps) is a unit that is equal to 1/100th of 1%.
These views represent the opinions of Brookfield Investment Management Inc. and are not intended to predict or depict the performance of any investment. These views are as of the close of business on December 31, 2013 and subject to change based on subsequent developments.
| 1 | The MSCI World Index is a free float-adjusted market capitalization weighted index that is designed to measure the equity market performance of developed markets. You cannot invest directly in an index. |
| 2 | The Dow Jones Brookfield Global Infrastructure Composite Index is calculated and maintained by S&P Dow Jones Indices and comprises infrastructure companies with at least 70% of its annual cash flows derived from owning and operating infrastructure assets, including Master Limited Partnerships. You cannot invest directly in an index. |
| 3 | Sector and regional performance is measured by The Dow Jones Brookfield Infrastructure Indices, which aim to measure the stock performance of companies worldwide that are owners and operators of infrastructure assets. To be included in the indices, a company must have more than 70% of estimated cash flows (based on publicly available information) derived from the following infrastructure sectors: airports, toll roads, ports, communications, electricity transmission & distribution, oil & gas storage & transportation, water or diversified (multiple sectors). |
| 4 | The Alerian MLP Total Return Index is a composite of the 50 most prominent energy Master Limited Partnerships (MLPs) and is calculated using a float-adjusted, capitalization-weighted methodology. You cannot invest directly in an index. |
| 5 | As of December 31, 2013. Source: Morningstar. |
| 6 | Source: Estimates by Brookfield Investment Management, based on Organization of Economic Cooperation and Development data in August 2003 indicated a $25 trillion gap. |
10 Brookfield Investment Management Inc.
BROOKFIELD GLOBAL LISTED INFRASTRUCTURE FUND
Portfolio Characteristics (Unaudited)
December 31, 2013
| | | | |
ASSET ALLOCATION BY GEOGRAPHY | | Percent of Net Assets | |
United States | | | 48.4 | % |
Canada | | | 14.1 | % |
United Kingdom | | | 7.5 | % |
China | | | 6.6 | % |
Italy | | | 5.0 | % |
Spain | | | 4.2 | % |
Brazil | | | 4.0 | % |
France | | | 3.2 | % |
Switzerland | | | 1.9 | % |
Hong Kong | | | 1.7 | % |
Australia | | | 1.0 | % |
Mexico | | | 0.4 | % |
Other Assets in Excess of Liabilities | | | 2.0 | % |
Total | | | 100.0 | % |
| |
ASSET ALLOCATION BY SECTOR | | | | |
Pipelines | | | 34.4 | % |
Communications | | | 13.6 | % |
Midstream | | | 11.2 | % |
Toll Roads | | | 9.6 | % |
Electricity Transmission & Distribution | | | 8.2 | % |
Rail | | | 5.6 | % |
Other | | | 4.7 | % |
Water | | | 3.9 | % |
Gas Utilities | | | 3.4 | % |
Airports | | | 1.9 | % |
Ports | | | 1.1 | % |
Diversified | | | 0.4 | % |
Other Assets in Excess of Liabilities | | | 2.0 | % |
Total | | | 100.0 | % |
| |
TOP TEN HOLDINGS | | | | |
American Tower Corp. | | | 6.0 | % |
Enbridge, Inc. | | | 4.8 | % |
National Grid PLC | | | 4.7 | % |
Spectra Energy Corp. | | | 4.4 | % |
TransCanada Corp. | | | 3.9 | % |
Crown Castle International Corp. | | | 3.7 | % |
Sempra Energy | | | 3.2 | % |
Snam SpA | | | 3.2 | % |
Union Pacific Corp. | | | 3.1 | % |
The Williams Companies, Inc. | | | 3.0 | % |
2013 Annual Report 11
BROOKFIELD GLOBAL LISTED INFRASTRUCTURE FUND
Schedule of Investments
December 31, 2013
| | | | | | | | |
| | | | | | Value | |
| | | Shares | | | (Note 2) | |
| |
COMMON STOCKS – 98.0% | | | | | | | | |
AUSTRALIA – 1.0% | | | | | | | | |
Diversified – 0.4% | | | | | | | | |
DUET Group | | | 851,400 | | | $ | 1,521,117 | |
| | | | | | | | |
Electricity Transmission & Distribution – 0.6% | | | | | | | | |
Spark Infrastructure Group | | | 1,508,800 | | | | 2,192,410 | |
| |
Total AUSTRALIA | | | | | | | 3,713,527 | |
| |
BRAZIL – 4.0% | | | | | | | | |
Toll Roads – 2.9% | | | | | | | | |
CCR SA | | | 1,457,500 | | | | 11,007,736 | |
| | | | | | | | |
Water – 1.1% | | | | | | | | |
Cia de Saneamento Basico do Estado de Sao Paulo | | | 381,400 | | | | 4,325,076 | |
| |
Total BRAZIL | | | | | | | 15,332,812 | |
| |
CANADA – 14.1% | | | | | | | | |
Midstream – 0.9% | | | | | | | | |
Keyera Corp. | | | 59,600 | | | | 3,586,941 | |
| | | | | | | | |
Pipelines – 11.1% | | | | | | | | |
Enbridge, Inc. | | | 415,200 | | | | 18,140,204 | |
Pembina Pipeline Corp. | | | 155,500 | | | | 5,477,816 | |
TransCanada Corp. | | | 325,900 | | | | 14,892,150 | |
Veresen, Inc. | | | 274,100 | | | | 3,682,190 | |
| | | | | | | | |
Total Pipelines | | | | | | | 42,192,360 | |
| | | | | | | | |
Rail – 2.1% | | | | | | | | |
Canadian National Railway Co. | | | 141,200 | | | | 8,049,962 | |
| |
Total CANADA | | | | | | | 53,829,263 | |
| |
CHINA – 6.6% | | | | | | | | |
Gas Utilities – 1.6% | | | | | | | | |
ENN Energy Holdings Ltd. | | | 802,700 | | | | 5,949,116 | |
| | | | | | | | |
Pipelines – 4.3% | | | | | | | | |
Beijing Enterprises Holdings Ltd. | | | 911,100 | | | | 9,050,211 | |
Kunlun Energy Company Ltd. | | | 4,197,000 | | | | 7,418,829 | |
| | | | | | | | |
Total Pipelines | | | | | | | 16,469,040 | |
| | | | | | | | |
Toll Roads – 0.7% | | | | | | | | |
Anhui Expressway Co. | | | 1,235,300 | | | | 685,785 | |
Sichuan Expressway Company Ltd. | | | 2,079,900 | | | | 615,124 | |
Zhejiang Expressway Company Ltd. | | | 1,511,100 | | | | 1,430,659 | |
| | | | | | | | |
Total Toll Roads | | | | | | | 2,731,568 | |
| |
Total CHINA | | | | | | | 25,149,724 | |
| |
FRANCE – 3.2% | | | | | | | | |
Communications – 1.7% | | | | | | | | |
Eutelsat Communications SA | | | 212,500 | | | | 6,630,532 | |
| | | | | | | | |
Toll Roads – 1.5% | | | | | | | | |
Vinci SA | | | 85,600 | | | | 5,626,618 | |
| |
Total FRANCE | | | | | | | 12,257,150 | |
| |
See Notes to Financial Statements.
12 Brookfield Investment Management Inc.
BROOKFIELD GLOBAL LISTED INFRASTRUCTURE FUND
Schedule of Investments (continued)
December 31, 2013
| | | | | | | | |
| | | | | | Value | |
| | | Shares | | | (Note 2) | |
| |
COMMON STOCKS (continued) | | | | | | | | |
HONG KONG – 1.7% | | | | | | | | |
Gas Utilities – 0.2% | | | | | | | | |
Hong Kong & China Gas Company Ltd. | | | 282,730 | | | $ | 649,144 | |
| | | | | | | | |
Ports – 1.1% | | | | | | | | |
COSCO Pacific Ltd. | | | 3,034,800 | | | | 4,177,081 | |
| | | | | | | | |
Rail – 0.4% | | | | | | | | |
Guangshen Railway Company Ltd. | | | 3,327,400 | | | | 1,544,593 | |
| |
Total HONG KONG | | | | | | | 6,370,818 | |
| |
ITALY – 5.0% | | | | | | | | |
Pipelines – 3.2% | | | | | | | | |
Snam SpA | | | 2,165,034 | | | | 12,101,200 | |
| | | | | | | | |
Toll Roads – 1.8% | | | | | | | | |
Atlantia SpA | | | 301,400 | | | | 6,751,341 | |
| |
Total ITALY | | | | | | | 18,852,541 | |
| |
MEXICO – 0.4% | | | | | | | | |
Pipelines – 0.4% | | | | | | | | |
Infraestructura Energetica Nova SAB de CV | | | 360,100 | | | | 1,438,855 | |
| |
Total MEXICO | | | | | | | 1,438,855 | |
| |
SPAIN – 4.2% | | | | | | | | |
Electricity Transmission & Distribution – 1.5% | | | | | | | | |
Red Electrica Corp. SA | | | 87,800 | | | | 5,861,522 | |
| | | | | | | | |
Toll Roads – 2.7% | | | | | | | | |
Ferrovial SA | | | 530,100 | | | | 10,269,037 | |
| |
Total SPAIN | | | | | | | 16,130,559 | |
| |
SWITZERLAND – 1.9% | | | | | | | | |
Airports – 1.9% | | | | | | | | |
Flughafen Zuerich AG | | | 12,187 | | | | 7,126,039 | |
| |
Total SWITZERLAND | | | | | | | 7,126,039 | |
| |
UNITED KINGDOM – 7.5% | | | | | | | | |
Electricity Transmission & Distribution – 4.7% | | | | | | | | |
National Grid PLC | | | 1,361,700 | | | | 17,810,049 | |
| | | | | | | | |
Water – 2.8% | | | | | | | | |
Pennon Group PLC | | | 483,500 | | | | 5,283,231 | |
United Utilities Group PLC | | | 504,300 | | | | 5,614,677 | |
| | | | | | | | |
Total Water | | | | | | | 10,897,908 | |
| |
Total UNITED KINGDOM | | | | | | | 28,707,957 | |
| |
UNITED STATES – 48.4% | | | | | | | | |
Communications – 11.9% | | | | | | | | |
American Tower Corp. | | | 283,922 | | | | 22,662,654 | |
Crown Castle International Corp. 1 | | | 189,642 | | | | 13,925,412 | |
SBA Communications Corp. 1 | | | 98,700 | | | | 8,867,208 | |
| | | | | | | | |
Total Communications | | | | | | | 45,455,274 | |
| | | | | | | | |
See Notes to Financial Statements.
2013 Annual Report 13
BROOKFIELD GLOBAL LISTED INFRASTRUCTURE FUND
Schedule of Investments (continued)
December 31, 2013
| | | | | | | | |
| | | | | | Value | |
| | | Shares | | | (Note 2) | |
| |
COMMON STOCKS (continued) | | | | | | | | |
Electricity Transmission & Distribution – 1.4% | | | | | | | | |
Northeast Utilities | | | 125,300 | | | $ | 5,311,467 | |
| | | | | | | | |
Gas Utilities – 1.6% | | | | | | | | |
NiSource, Inc. | | | 186,800 | | | | 6,141,984 | |
| | | | | | | | |
Midstream – 10.3% | | | | | | | | |
Access Midstream Partners LP | | | 135,900 | | | | 7,689,222 | |
Crestwood Equity Partners LP | | | 327,400 | | | | 4,527,942 | |
EQT Midstream Partners LP | | | 87,400 | | | | 5,138,246 | |
MarkWest Energy Partners LP | | | 92,300 | | | | 6,103,799 | |
Targa Resources Corp. | | | 49,200 | | | | 4,337,964 | |
The Williams Companies, Inc. | | | 299,700 | | | | 11,559,429 | |
| | | | | | | | |
Total Midstream | | | | | | | 39,356,602 | |
| | | | | | | | |
Other – 4.7% | | | | | | | | |
EV Energy Partners LP | | | 108,700 | | | | 3,688,191 | |
Teekay Corp. | | | 144,300 | | | | 6,927,843 | |
Waste Connections, Inc. | | | 164,300 | | | | 7,168,409 | |
| | | | | | | | |
Total Other | | | | | | | 17,784,443 | |
| | | | | | | | |
Pipelines – 15.4% | | | | | | | | |
Enbridge Energy Management LLC 1 | | | 1 | | | | 23 | |
Energy Transfer Equity LP | | | 97,700 | | | | 7,985,998 | |
Enterprise Products Partners LP | | | 155,300 | | | | 10,296,390 | |
MPLX LP | | | 93,600 | | | | 4,168,944 | |
SemGroup Corp. | | | 110,500 | | | | 7,207,915 | |
Sempra Energy | | | 134,900 | | | | 12,108,624 | |
Spectra Energy Corp. | | | 474,000 | | | | 16,883,880 | |
| | | | | | | | |
Total Pipelines | | | | | | | 58,651,774 | |
| | | | | | | | |
Rail – 3.1% | | | | | | | | |
Union Pacific Corp. | | | 70,000 | | | | 11,760,000 | |
| |
Total UNITED STATES | | | | | | | 184,461,544 | |
| |
Total COMMON STOCKS
(Cost $324,984,869) | | | | | | | 373,370,789 | |
| |
Total Investments – 98.0%
(Cost $324,984,869) | | | | | | | 373,370,789 | |
Other Assets in Excess of Liabilities – 2.0% | | | | | | | 7,455,467 | |
| |
TOTAL NET ASSETS – 100.0% | | | | | | $ | 380,826,256 | |
| |
| |
The following notes should be read in conjunction with the accompanying Schedule of Investments.
| 1 | — Non-income producing security. |
See Notes to Financial Statements.
14 Brookfield Investment Management Inc.
BROOKFIELD GLOBAL LISTED REAL ESTATE FUND
MANAGEMENT DISCUSSION OF FUND PERFORMANCE
Individual contributors to performance included Safestore Holdings PLC, Mitsubishi Estate Company Ltd. and AEON Mall Co., Ltd. The Fund’s overweight in Safestore Holdings PLC contributed to relative performance. Weak 2013 same store sales growth was caused by new value added taxes assessed by the government that were not fully passed through to tenants via increased rent. As this phenomenon passed, the stock performed well.
The Fund’s allocation to Mitsubishi Estate Company contributed to performance as Japanese REITs rallied strongly in early 2013. Mitsubishi Estate Company, Ltd. was a beneficiary of the rally, and the Fund’s overweight to the company contributed positively.
The Fund’s overweight position in AEON Mall Co., Ltd. benefitted Fund performance because we initiated a position after its stock price significantly underperformed its peer group following an equity offering. We were able to gain exposure on this weakness. Thereafter, the stock price traded up to its peers.
Detractors to performance included Sumitomo Realty & Development Co., Ltd, Norwegian Property ASA and Evergrande Real Estate Group Ltd. While owning Mitsubishi Estate Company Ltd. benefitted the Fund during the sharp rally in Japanese REITs, zero exposure to Sumitomo Realty & Development Co., Ltd. during the same period detracted from Fund performance.
Norwegian Property ASA screens attractively from a valuation perspective and we are positive on its fundamentals. However, it remained unloved by market participants in 2013 due to its complicated development pipeline. As such, the Fund’s overweight positioning to the company detracted from performance.
Evergrande Real Estate Group Ltd. is a pure-play homebuilder in Hong Kong and China. During the period, the company poorly executed the development and delivery of homes, causing the Fund’s overweight exposure to detract from performance. The macroeconomic environment within tier three Chinese cities where the company develops caused additional challenges for the company.
GLOBAL REAL ESTATE MARKET OVERVIEW AND OUTLOOK
Global real estate securities challenged in 2013 amid rising rates
Market sentiment throughout 2013 was driven by interest rates – first by euphoria over low rates and later by fear over their imminent rise. Governments across the globe helped drive yields on fixed income investments to all-time lows. Not least was the Japanese government’s unprecedented monthly debt purchase announcement equaling 7.5 trillion yen, or approximately US$76 billion. Following several months of yield focused equity investing spurred by all-time low fixed income yields, markets reversed course in May when U.S. Federal Reserve Chairman Ben Bernanke foreshadowed a reduction in government bond purchases. Thereafter, interest rates rose substantially with the yield on the 10-year U.S. Treasury Note increasing 118 basis points, from 1.86% on January 2 to 3.04% on December 31.
Global equity market movements were generally positive, and the MSCI World Index rose 27.4%1 for the 12-month period ended December 31, 2013. U.S. markets outpaced global markets for the year, but ongoing political and monetary policy turmoil drove volatility in U.S. markets. International outliers included Japan, where optimism over the new Abe government’s policies led the market to outperform, and Europe, which rebounded during the year on signs of stabilization. Boosting markets into year-end was the Fed’s tapering announcement on December 18. The Committee’s decision to reduce purchases of agency mortgage-backed securities and longer-term Treasury securities by a total of US$10 billion per month was generally perceived as dovish. The announcement also included a provision that the targeted federal funds rate would remain “exceptionally low” until unemployment in the U.S. falls below 6.5%, further boosting sentiment.
Concern over rising interest rates has undoubtedly weighed on global real estate securities throughout much of 2013. Global real estate securities returned 4.4% for the year ended December 31, 2013 as measured by the FTSE EPRA/NAREIT Developed Index2. Europe was the bright spot in the asset class, returning 16.2% and outperforming Asia Pacific (4.4%) and North America (1.3%) by a wide margin (as measured by the FTSE EPRA/ NAREIT Developed Index in U.S. dollars).
2013 Annual Report 15
BROOKFIELD GLOBAL LISTED REAL ESTATE FUND
While rising rates led real estate securities to underperform in 2013, our forecast for 2014 is brighter. We believe the market has priced in much of the impact of rising rates on Real Estate Investment Trusts (REITs) and, given the spread between short and long term rates is currently wide by historical standards, we believe long term rates will rise only modestly in the medium term from current levels. We see opportunity among attractively priced companies, and believe many of the sectors least vulnerable in a rising rate environment are the most attractively valued – a winning combination for active management. Furthermore, we remain positive on REIT fundamentals. Capital markets and transaction activity throughout the year illustrate positive trends among listed real estate companies.
Transaction activity
Global REIT debt and equity offerings were strong in 2013. The availability and efficiency of capital provided public real estate companies with a distinct advantage over private companies in funding external growth opportunities such as developments and Mergers and Acquisitions (M&A) activities. In some cases we saw long-term financing near record low rates providing support for higher public valuations in the sector. And in the U.S., more unsecured debt was issued than in any other year since markets reopened in 2009 following the global financial crisis, with over US$28 billion raised according to the National Association of Real Estate Investment Trusts3.
The trend was global. Australian REITs like the GPT Group (GPT) tapped U.S. debt markets to access inexpensive long-term financing. GPT raised two tranches of notes, A$150 million of 12-year notes issued at a 3.6% coupon and A$100 million of 15-year notes issued at a 3.8% coupon. Listed real estate companies throughout Europe refinanced existing debt at lower rates, shoring up balance sheets and growing portfolios. Interestingly, GAGFAH S.A. (German residential), which is one of the region’s more highly leveraged REITs, refinanced a €1.06 billion loan with a 3.90% coupon maturing in five years representing a 43 basis point reduction versus its previous loan. Simon Property Group, Inc., the largest U.S. regional mall REIT, announced the sale of €750 million of its 2.375% senior unsecured notes due October 2, 2020. Finally, U.S. REIT, Ventas, Inc., raised US$500 million in 2.7% senior notes due in 2020.
The real estate securities IPO market in 2013 was strong as well. Across the globe, key IPOs included the following:
Prologis, the largest U.S. industrial REIT, capitalized on first quarter demand for Japanese real estate securities through its 100 billion yen (US$1 billion) IPO of its Japanese REIT (J-REIT) Nippon Prologis REIT, Inc. (NPR).
Nomura Real Estate Master Fund Inc., a Japanese real estate company owning industrial and other commercial properties in Japan, raised a sizeable US$1.8 billion IPO.
Deutsche Annington Immobilien AG, Germany’s largest residential landlord, majority owned by Terra Firma Capital Partners Ltd, raised approximately €575 million (US$782 million) in an IPO in July.
Mexican Fibra, Terrafina, completed a successful 8.3 billion Mexican peso (US$665 million) IPO. Terrafina, was sponsored by Prudential Real Estate Investors and owns a large industrial portfolio in Mexico.
The U.S. IPO market was also robust. Early in the year, housing focused Tri Pointe Homes, a California focused homebuilder, and American Residential Properties, completed IPOs. In the fourth quarter, three Blackstone Group LP (Blackstone) companies completed IPOs, including Brixmor Property Group, Inc. (BRX), Extended Stay America, Inc. (STAY) and Hilton Worldwide Inc. (HLT).
16 Brookfield Investment Management Inc.
BROOKFIELD GLOBAL LISTED REAL ESTATE FUND
M&A activity is also on the rise, and we believe the current valuation spread between public and private real estate may drive increased M&A in the space. One of the most notable transactions in the fourth quarter was the ongoing bidding war between Dexus Property Group and GPT Group, two Australian diversified REITs with large office portfolios, for Commonwealth Property Office Fund, the third primary owner of office assets in Australia. According to our estimates, bids have now exceeded net tangible assets (NTA), while many real estate securities in the country are trading below NTA.
In the U.S., direct investors have paid a premium in private markets, with several recent transactions having closed at sub-6% cap rates. However, public market valuations generally imply between a 5.5% and 7.0% cap rate. For example, a UBS AG fund acquired a 50% stake in trophy Chicago, Illinois asset Water Tower Place. The transaction values the building at US$810 million representing a 4.5% cap rate4. 2013 M&A deals include Brookfield Office Properties (BPO) acquisition of MPG Office Trust (MPG). MPG’s portfolio includes seven class A office properties totaling 8.3 million square feet for which BPO has committed a total of US$1.15 billion. In the fourth quarter Tri Pointe Homes, a homebuilder controlled by Starwood Capital, announced it will acquire the homebuilding and real estate subsidiary of Weyerhaeuser Co. for US$2.7 billion. Weyerhaeuser Co.’s core business is timber, and we believe the transaction clarifies its structure.
OUTLOOK
As we look ahead to 2014, we are increasingly constructive on the outlook for global real estate securities. We anticipate the interest rate environment will be less impactful than it was in 2013, supporting property valuations. In addition, we expect economic growth will be strong enough to drive increases in occupancy, rental rates, and cash flow but not strong enough to encourage significant new construction. We maintain most of our existing biases, but are selectively reviewing markets and sectors/sub-sectors that have exhibited weakness in recent months to identify new opportunities. We remain focused on higher growth sectors and maintain an overweight to Europe, underweight positioning in the Asia Pacific, and roughly equal weighting within North America. Within Europe we favor the Continent, where investor interest has been constrained and stocks are trading at attractive valuations, over the UK where investor interest is strong and valuations are higher.
Within the Asia Pacific region, we remain overweight Australian real estate securities, which appear attractively priced, especially given recent underperformance. We believe valuations are poised to increase as international interest in Australian property grows, particularly from neighboring Asian countries. The portfolio is underweight Japan on the basis of valuation as real estate stocks continue to trade at a premium to Net Asset Value (NAV). We believe China and Hong Kong are past the peak in their residential property cycles and that their residential markets are poised to deteriorate. Most companies in our Chinese and Hong Kong investment universe either have exposure to the residential sector or operate in sectors that are highly correlated to the housing market. Furthermore, both markets are vulnerable in a rising rate environment. In the U.S. we have high conviction in companies with pricing power such as the apartment sector, specifically Northern California apartments, as well as West Coast office markets.
2013 Annual Report 17
BROOKFIELD GLOBAL LISTED REAL ESTATE FUND
AVERAGE ANNUAL TOTAL RETURNS
| | | | | | | | |
| As of December 31, 2013 | | 1 Year | | | Since Inception* | |
Class A Shares (excluding sales charge) | | | 4.99 | % | | | 11.87 | % |
Class A Shares (including sales charge) | | | -0.01 | % | | | 8.65 | % |
Class C Shares (excluding sales charge) | | | 4.18 | % | | | 11.06 | % |
Class C Shares (including sales charge) | | | 3.19 | % | | | 11.06 | % |
Class Y Shares | | | 5.20 | % | | | 17.78 | % |
Class I Shares | | | 5.20 | % | | | 17.74 | % |
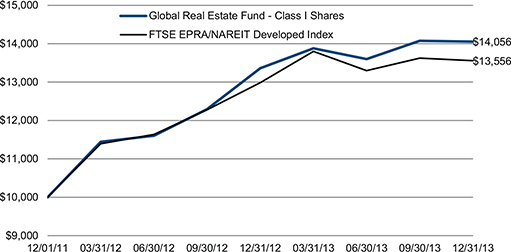
FTSE EPRA/NAREIT Developed Index | | | 4.39 | % | | | 15.71 | % |
| * | Classes A and C were incepted on May 1, 2012 and Classes Y and I were incepted on December 1, 2011. The FTSE/EPRA NAREIT Developed Index references Class I’s inception date. |
Performance data quoted represents past performance; past performance does not guarantee future results. The investment return and principal value of an investment will fluctuate so that an investor’s shares, when redeemed, may be worth more or less than their original cost. Current performance of the Fund may be lower or higher than the performance quoted. Performance data current to the most recent month end may be obtained by calling 855.244.4859. The Fund imposes a 2.00% redemption fee on shares redeemed within 60 days. Performance data does not reflect the imposition of the redemption fee and if it had, performance would have been lower. Performance shown including sales charge reflects the Class A maximum sales charge of 4.75% and the Class C Contingent Deferred Sales Charge (CDSC) of 1.00%. Performance data excluding sales charge does not reflect the deduction of the sales charge or CDSC and if reflected, the sales charge or fee would reduce the performance quoted.
As per the prospectus dated April 30, 2013, the Fund’s gross expense ratio for Class A, Class C, Class Y and Class I is 2.54%, 3.55%, 3.24% and 2.65%, respectively. And the Fund’s net expense ratio for Class A, Class C, Class Y and Class I is 1.20%, 1.95%, 0.95% and 0.95%, respectively for the year ended December 31, 2012.
The Adviser has contractually agreed to reimburse the Fund’s expenses through May 1, 2015. There is no guarantee that such reimbursement will be continued after that date.
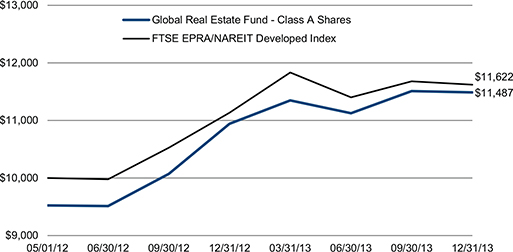
The graphs below illustrate a hypothetical investment of $10,000 in the Global Real Estate Fund—Class A Shares from the commencement of investment operations on May 1, 2012 to December 31, 2013 compared to the FTSE EPRA/NAREIT Developed Index and Class I Shares from the commencement of investment operations on December 1, 2011 to December 31, 2013 compared to the FTSE EPRA/NAREIT Developed Index.
18 Brookfield Investment Management Inc.
BROOKFIELD GLOBAL LISTED REAL ESTATE FUND
Class A Shares
Class I Shares
Disclosure
Performance data quoted represents past performance results and does not guarantee future results. Current performance may be lower or higher than the performance data quoted.
All returns shown in USD.
The Fund’s portfolio holdings are subject to change without notice. The mention of specific securities is not a recommendation or solicitation for any person to buy, sell or hold any particular security. There is no assurance that the Brookfield Global Listed Real Estate Fund currently holds these securities. Please refer to the Schedule of Investments contained in this report for a full listing of fund holdings.
2013 Annual Report 19
BROOKFIELD GLOBAL LISTED REAL ESTATE FUND
Mutual fund investing involves risk. Principal loss is possible.
A basis point (bps) is a unit that is equal to 1/100th of 1%.
A capitalization rate is a rate of return on a real estate investment property which is based on the anticipated income that the property will generate.
These views represent the opinions of Brookfield Investment Management Inc. and are not intended to predict or depict the performance of any investment. These views are as of the close of business on December 31, 2013 and subject to change based on subsequent developments.
| 1 | The MSCI World Index is a free float-adjusted market capitalization weighted index that is designed to measure the equity market performance of developed markets. You cannot invest directly in an index. |
| 2 | The FTSE EPRA/NAREIT Developed Index is a free-float adjusted, liquidity, size and revenue screened index designed to track the performance of listed real estate companies and REITS worldwide. You cannot invest directly in an index. |
| 3 | National Association of Real Estate Investment Trusts® “Historical Offerings of Securities”; reit.com. |
| 4 | Source: Real Capital Analytics. |
20 Brookfield Investment Management Inc.
BROOKFIELD GLOBAL LISTED REAL ESTATE FUND
Portfolio Characteristics (Unaudited)
December 31, 2013
| | | | |
| | | Percent of | |
| ASSET ALLOCATION BY GEOGRAPHY | | Net Assets | |
United States | | | 44.4 | % |
Australia | | | 9.1 | % |
Japan | | | 6.2 | % |
Hong Kong | | | 5.4 | % |
Germany | | | 3.8 | % |
France | | | 3.7 | % |
Netherlands | | | 3.5 | % |
United Kingdom | | | 3.4 | % |
Russia | | | 1.8 | % |
Norway | | | 1.7 | % |
Singapore | | | 1.7 | % |
Austria | | | 1.4 | % |
Italy | | | 0.9 | % |
Brazil | | | 0.7 | % |
Other Assets in Excess of Liabilities | | | 12.3 | % |
Total | | | 100.0 | % |
| |
ASSET ALLOCATION BY SECTOR | | | | |
Office | | | 17.1 | % |
Real Estate - Diversified | | | 14.7 | % |
Residential | | | 14.2 | % |
Retail | | | 10.9 | % |
Regional Malls | | | 7.8 | % |
Healthcare | | | 5.0 | % |
Hotel | | | 3.8 | % |
Mixed | | | 3.2 | % |
Industrial | | | 3.1 | % |
Self Storage | | | 2.5 | % |
Timber | | | 1.9 | % |
Developer - Office | | | 1.7 | % |
Real Estate Operator/Developer | | | 1.0 | % |
Strip Centers | | | 0.8 | % |
Other Assets in Excess of Liabilities | | | 12.3 | % |
Total | | | 100.0 | % |
| |
TOP TEN HOLDINGS | | | | |
Simon Property Group, Inc. | | | 6.2 | % |
Equity Residential | | | 5.0 | % |
Mitsubishi Estate Company Ltd. | | | 4.0 | % |
Ventas, Inc. | | | 3.6 | % |
Sun Hung Kai Properties Ltd. | | | 3.6 | % |
Dexus Property Group | | | 3.0 | % |
Corio NV | | | 2.8 | % |
Unibail-Rodamco SE | | | 2.7 | % |
AvalonBay Communities, Inc. | | | 2.6 | % |
Highwoods Properties, Inc. | | | 2.6 | % |
2013 Annual Report 21
BROOKFIELD GLOBAL LISTED REAL ESTATE FUND
Schedule of Investments
December 31, 2013
| | | | | | | | |
| | | | | | Value | |
| | | Shares | | | (Note 2) | |
COMMON STOCKS – 87.7% | | | | | | | | |
AUSTRALIA – 9.1% | | | | | | | | |
Industrial – 1.8% | | | | | | | | |
Goodman Group | | | 549,400 | | | $ | 2,327,671 | |
| | | | | | | | |
Real Estate – Diversified – 4.7% | | | | | | | | |
Dexus Property Group | | | 4,209,400 | | | | 3,785,852 | |
Mirvac Group | | | 1,476,700 | | | | 2,220,527 | |
| | | | | | | | |
Total Real Estate - Diversified | | | | | | | 6,006,379 | |
| | | | | | | | |
Retail – 2.6% | | | | | | | | |
Westfield Retail Trust | | | 1,218,600 | | | | 3,237,367 | |
| |
Total AUSTRALIA | | | | | | | 11,571,417 | |
| |
AUSTRIA – 1.4% | | | | | | | | |
Residential – 1.4% | | | | | | | | |
Conwert Immobilien Invest SE | | | 139,300 | | | | 1,786,698 | |
| |
Total AUSTRIA | | | | | | | 1,786,698 | |
| |
BRAZIL – 0.7% | | | | | | | | |
Retail – 0.7% | | | | | | | | |
Multiplan Empreendimentos Imobiliarios SA | | | 45,200 | | | | 955,326 | |
| |
Total BRAZIL | | | | | | | 955,326 | |
| |
FRANCE – 3.7% | | | | | | | | |
Hotel – 1.0% | | | | | | | | |
Accor SA | | | 25,800 | | | | 1,218,536 | |
| | | | | | | | |
Real Estate – Diversified – 2.7% | | | | | | | | |
Unibail-Rodamco SE | | | 13,500 | | | | 3,459,514 | |
| |
Total FRANCE. | | | | | | | 4,678,050 | |
| |
GERMANY – 3.8% | | | | | | | | |
Mixed – 1.0% | | | | | | | | |
DIC Asset AG | | | 141,908 | | | | 1,307,972 | |
| | | | | | | | |
Office – 1.8% | | | | | | | | |
Alstria Office REIT – AG | | | 180,900 | | | | 2,277,613 | |
| | | | | | | | |
Real Estate Operator/Developer – 1.0% | | | | | | | | |
LEG Immobilien AG | | | 20,200 | | | | 1,194,763 | |
| |
Total GERMANY | | | | | | | 4,780,348 | |
| |
HONG KONG – 5.4% | | | | | | | | |
Office – 1.8% | | | | | | | | |
Hongkong Land Holdings Ltd. | | | 400,200 | | | | 2,364,621 | |
| | | | | | | | |
Real Estate – Diversified – 3.6% | | | | | | | | |
Sun Hung Kai Properties Ltd. | | | 358,251 | | | | 4,553,142 | |
| |
Total HONG KONG | | | | | | | 6,917,763 | |
| |
ITALY – 0.9% | | | | | | | | |
Office – 0.9% | | | | | | | | |
Beni Stabili SpA | | | 1,701,900 | | | | 1,147,728 | |
| |
Total ITALY | | | | | | | 1,147,728 | |
| |
See Notes to Financial Statements.
22 Brookfield Investment Management Inc.
BROOKFIELD GLOBAL LISTED REAL ESTATE FUND
Schedule of Investments (continued)
December 31, 2013
| | | | | | | | |
| | | | | | Value | |
| | | Shares | | | (Note 2) | |
COMMON STOCKS (continued) | | | | | | | | |
JAPAN – 6.2% | | | | | | | | |
Industrial – 1.3% | | | | | | | | |
Japan Logistics Fund, Inc. | | | 163 | | | $ | 1,727,399 | |
| | | | | | | | |
Office – 4.0% | | | | | | | | |
Mitsubishi Estate Company Ltd. | | | 169,055 | | | | 5,059,147 | |
| | | | | | | | |
Real Estate – Diversified – 0.9% | | | | | | | | |
GLP J-Reit | | | 1,193 | | | | 1,165,239 | |
| |
Total JAPAN | | | | | | | 7,951,785 | |
| |
NETHERLANDS – 3.5% | | | | | | | | |
Retail – 3.5% | | | | | | | | |
Corio NV | | | 80,500 | | | | 3,612,626 | |
Vastned Retail NV | | | 17,300 | | | | 785,129 | |
| | | | | | | | |
Total Retail | | | | | | | 4,397,755 | |
| |
Total NETHERLANDS | | | | | | | 4,397,755 | |
| |
NORWAY – 1.7% | | | | | | | | |
Real Estate – Diversified – 1.7% | | | | | | | | |
Norwegian Property ASA | | | 1,773,236 | | | | 2,125,439 | |
| |
Total NORWAY | | | | | | | 2,125,439 | |
| |
RUSSIA – 1.8% | | | | | | | | |
Retail – 1.8% | | | | | | | | |
Atrium European Real Estate Ltd. | | | 391,400 | | | | 2,259,228 | |
| |
Total RUSSIA | | | | | | | 2,259,228 | |
| |
SINGAPORE – 1.7% | | | | | | | | |
Developer – Office – 1.7% | | | | | | | | |
Keppel Land Ltd. | | | 836,200 | | | | 2,219,614 | |
| |
Total SINGAPORE | | | | | | | 2,219,614 | |
| |
UNITED KINGDOM – 3.4% | | | | | | | | |
Real Estate – Diversified – 1.1% | | | | | | | | |
Safestore Holdings PLC | | | 547,000 | | | | 1,458,353 | |
| | | | | | | | |
Retail – 2.3% | | | | | | | | |
Hammerson PLC | | | 345,300 | | | | 2,874,697 | |
| |
Total UNITED KINGDOM | | | | | | | 4,333,050 | |
| |
UNITED STATES – 44.4% | | | | | | | | |
Healthcare – 5.0% | | | | | | | | |
HCP, Inc. | | | 47,300 | | | | 1,717,936 | |
Ventas, Inc. | | | 81,000 | | | | 4,639,680 | |
| | | | | | | | |
Total Healthcare | | | | | | | 6,357,616 | |
| | | | | | | | |
Hotel – 2.8% | | | | | | | | |
Host Hotels & Resorts, Inc. | | | 122,300 | | | | 2,377,512 | |
Hyatt Hotels Corp. 1 | | | 24,400 | | | | 1,206,824 | |
| | | | | | | | |
Total Hotel | | | | | | | 3,584,336 | |
| | | | | | | | |
Mixed – 2.2% | | | | | | | | |
Liberty Property Trust | | | 83,100 | | | | 2,814,597 | |
| | | | | | | | |
See Notes to Financial Statements.
2013 Annual Report 23
BROOKFIELD GLOBAL LISTED REAL ESTATE FUND
Schedule of Investments (continued)
December 31, 2013
| | | | | | | | |
| | | | | | Value | |
| | | Shares | | | (Note 2) | |
COMMON STOCKS (continued) | | | | | | | | |
Office – 8.6% | | | | | | | | |
Corporate Office Properties Trust | | | 26,700 | | | $ | 632,523 | |
Douglas Emmett, Inc. | | | 92,850 | | | | 2,162,476 | |
DuPont Fabros Technology, Inc. | | | 58,200 | | | | 1,438,122 | |
Highwoods Properties, Inc. | | | 90,400 | | | | 3,269,768 | |
Mack-Cali Realty Corp. | | | 81,800 | | | | 1,757,064 | |
SL Green Realty Corp. | | | 18,600 | | | | 1,718,268 | |
| | | | | | | | |
Total Office | | | | | | | 10,978,221 | |
| | | | | | | | |
Regional Malls – 7.8% | | | | | | | | |
CBL & Associates Properties, Inc. | | | 111,700 | | | | 2,006,132 | |
Simon Property Group, Inc. | | | 51,800 | | | | 7,881,888 | |
| | | | | | | | |
Total Regional Malls | | | | | | | 9,888,020 | |
| | | | | | | | |
Residential – 12.8% | | | | | | | | |
AvalonBay Communities, Inc. | | | 28,300 | | | | 3,345,909 | |
Camden Property Trust | | | 30,000 | | | | 1,706,400 | |
Equity Residential | | | 122,200 | | | | 6,338,514 | |
Essex Property Trust, Inc. | | | 15,800 | | | | 2,267,458 | |
Mid-America Apartment Communities, Inc. | | | 44,300 | | | | 2,690,782 | |
| | | | | | | | |
Total Residential | | | | | | | 16,349,063 | |
| | | | | | | | |
Self Storage – 2.5% | | | | | | | | |
Iron Mountain, Inc. | | | 103,185 | | | | 3,131,665 | |
| | | | | | | | |
Strip Centers – 0.8% | | | | | | | | |
Brixmor Property Group, Inc. | | | 51,800 | | | | 1,053,094 | |
| | | | | | | | |
Timber – 1.9% | | | | | | | | |
Weyerhaeuser Co. | | | 75,500 | | | | 2,383,535 | |
| |
Total UNITED STATES | | | | | | | 56,540,147 | |
| |
Total COMMON STOCKS
(Cost $111,105,427) | | | | | | | 111,664,348 | |
| |
Total Investments – 87.7%
(Cost $111,105,427) | | | | | | | 111,664,348 | |
Other Assets in Excess of Liabilities – 12.3% | | | | | | | 15,651,406 | |
| |
TOTAL NET ASSETS – 100.0% | | | | | | $ | 127,315,754 | |
| |
| |
The following notes should be read in conjunction with the accompanying Schedule of Investments.
1 — Non-income producing security.
See Notes to Financial Statements.
24 Brookfield Investment Management Inc.
BROOKFIELD U.S. LISTED REAL ESTATE FUND
MANAGEMENT DISCUSSION OF FUND PERFORMANCE
Individual contributors to performance included Weyerhaeuser Co., DuPont Fabros Technology, Inc. and Iron Mountain, Inc. Non-benchmark exposure to Weyerhaeuser Co., a timber company, benefitted Fund performance. The position benefitted from the pending acquisition of its homebuilding subsidiary by Tri Pointe Homes, a homebuilder controlled by Starwood Capital, for US$2.7 billion. Market participants appear to have liked the acquisition price.
The Fund’s overweight to DuPont Fabros Technology, Inc. was a strong contributor during the period. The company trades at a higher implied capitalization rate and more attractive valuation than its data center peers and it is developing in the two strongest data center markets in the U.S., Northern Virginia and Chicago.
Non-benchmark holding Iron Mountain, Inc. (IRM) was a large contributor to Fund performance. The company is seeking conversion to REIT status and therefore, its stock price moved throughout 2013 on speculation of the potential conversion. IRM has been strong since inception of the Fund as the U.S. Internal Revenue Service announced it would resume REIT conversion decisions prior to the Fund’s inception.
Detractors to performance included Equity Residential, Essex Property Trust, Inc. and AvalonBay Communities, Inc. Overweight exposure to these three companies detracted from Fund performance driven by weakness in the residential apartment sector. We continue to favor the apartment sector despite recent weakness.
U.S. REAL ESTATE MARKET OVERVIEW AND OUTLOOK
Real estate securities challenged in 2013 amid rising rates
Market sentiment throughout 2013 was driven by interest rates – first by euphoria over low rates and later by fear over their imminent rise. Following several months of yield focused equity investing spurred by all-time low fixed income yields, markets reversed course in May when U.S. Federal Reserve Chairman Ben Bernanke foreshadowed a reduction in government bond purchases. Interest rates rose substantially, and the yield on the 10-year U.S. Treasury Note increased 118 basis points throughout the year from 1.86% on January 2 to 3.04% on December 31.
Overall, U.S. markets outpaced global markets and the S&P 500 Total Return Index1 rose 32.4% for the 12-month period ended December 31, 2013. However, ongoing political and monetary policy turmoil drove volatility in U.S. markets. Boosting markets into year-end was the Fed’s tapering announcement on December 18. The Committee’s decision to reduce purchases of agency mortgage-backed securities and longer-term Treasury securities by a total of US$10 billion per month was generally perceived as dovish. The announcement also included a provision that the targeted federal funds rate would remain “exceptionally low” until unemployment in the U.S. falls below 6.5%, further boosting sentiment.
Concern over rising interest rates undoubtedly weighed on U.S. real estate securities in 2013. U.S. real estate securities returned 2.5% for the 12-month period ended December 31, 2013, as measured by the MSCI U.S. REIT Total Return Index2. While rising rates led real estate securities to underperform in 2013, our forecast for 2014 is brighter. We believe the market has priced in much of the impact of rising rates on REITs and, given the spread between short and long term rates is currently wide by historical standards, we believe long term rates will rise only modestly in the medium term from current levels. We see opportunity among attractively priced companies, and believe many of the sectors least vulnerable in a rising rate environment are the most attractively valued – a potentially winning combination for active management. Furthermore, we remain positive on REIT fundamentals. Capital markets and transaction activity throughout the year illustrate positive trends among listed real estate companies.
Transaction activity
REIT debt and equity offerings were strong in 2013. The availability and efficiency of capital provided public real estate companies with a distinct advantage over private companies in funding external growth opportunities such
2013 Annual Report 25
BROOKFIELD U.S. LISTED REAL ESTATE FUND
as developments and Mergers and Acquisitions (M&A) activities. More unsecured debt was issued than in any other year since markets reopened in 2009 following the global financial crisis, with over US$28 billion raised according to the National Association of Real Estate Investment Trusts3. For example, Ventas, Inc. raised US$500 million in 2.7% senior notes due in 2020.
The real estate securities IPO market in 2013 was strong as well, including the following successful transactions:
American Residential Properties (ARPI), which sold 13.7 million shares raising US$288 million. ARPI is the latest single family housing REIT to list publicly in a REIT sector born in late 2012 with the REIT conversion of American Homes For Rent.
Empire State Realty Trust, which owns the Empire State building in New York City. The company listed 71,500,000 shares of common stock priced at $13.00 per share.
Three Blackstone Group LP (Blackstone) IPOs, including Brixmor Property Group (BRX), Extended Stay America, Inc. (STAY) and Hilton Worldwide Inc. (HLT).
M&A activity is also on the rise, and we believe the current valuation spread between public and private real estate may drive increased M&A in the space. In the U.S., direct investors have paid a premium in private markets, with several recent transactions having closed at sub-6% cap rates. However, public market valuations generally imply between a 5.5% and 7.0% cap rate. For example, a UBS AG fund acquired a 50% stake in trophy Chicago, Illinois asset Water Tower Place. The transaction values the building at US$810 million representing a 4.5% cap rate4. 2013 M&A deals include Brookfield Office Properties (BPO) acquisition of MPG Office Trust (MPG). MPG’s portfolio includes seven class A office properties totaling 8.3 million square feet for which BPO has committed a total of US$1.15 billion. In the fourth quarter Tri Pointe Homes, a homebuilder controlled by Starwood Capital, announced it will acquire the homebuilding and real estate subsidiary of Weyerhaeuser Co. for US$2.7 billion.
As we look ahead to 2014, we are increasingly constructive on the outlook for U.S. real estate securities. We anticipate the interest rate environment will be less impactful than it was in 2013, supporting property valuations. In addition, we expect economic growth will be strong enough to drive increases in occupancy, rental rates, and cash flow but not strong enough to encourage significant new construction. We maintain most of our existing biases, but are selectively reviewing markets and sectors/sub-sectors that have exhibited weakness in recent months to identify new opportunities. We have high conviction in companies with pricing power such as the apartment sector, specifically Northern California apartments, as well as West Coast office markets.
26 Brookfield Investment Management Inc.
BROOKFIELD U.S. LISTED REAL ESTATE FUND
AVERAGE ANNUAL TOTAL RETURNS
| | | | |
| As of December 31, 2013** | | Since Inception* | |
Class A Shares (excluding sales charge) | | | 1.62 | % |
Class A Shares (including sales charge) | | | -3.21 | % |
Class C Shares (excluding sales charge) | | | 1.58 | % |
Class C Shares (including sales charge) | | | 0.58 | % |
Class Y Shares | | | 1.64 | % |
Class I Shares | | | 1.64 | % |
MSCI U.S. REIT Total Return Index | | | -0.71 | % |
| * | Classes A, C , Y and I were incepted on December 11, 2013. |
| ** | Total Returns are not annualized |
Performance data quoted represents past performance; past performance does not guarantee future results. The investment return and principal value of an investment will fluctuate so that an investor’s shares, when redeemed, may be worth more or less than their original cost. Current performance of the Fund may be lower or higher than the performance quoted. Performance data current to the most recent month end may be obtained by calling 855.244.4859. The Fund imposes a 2.00% redemption fee on shares redeemed within 60 days. Performance data does not reflect the imposition of the redemption fee and if it had, performance would have been lower. Performance shown including sales charge reflects the Class A maximum sales charge of 4.75% and the Class C Contingent Deferred Sales Charge (CDSC) of 1.00%. Performance data excluding sales charge does not reflect the deduction of the sales charge or CDSC and if reflected, the sales charge or fee would reduce the performance quoted.
As per the prospectus dated November 13, 2013, the Fund’s gross expense ratio for Class A, Class C, Class Y and Class I is 2.52%, 3.27%, 2.27% and 2.27%, respectively. And the Fund’s net expense ratio for Class A, Class C, Class Y and Class I is 1.20%, 1.95%, 0.95% and 0.95% respectively for the year ended December 31, 2012.
The Adviser has contractually agreed to reimburse the Fund’s expenses through May 1, 2015. There is no guarantee that such reimbursement will be continued after that date.
The graphs below illustrate a hypothetical investment of $10,000 in the U.S Real Estate Fund—Class A Shares from the commencement of investment operations on December 11, 2013 to December 31, 2013 compared to the MSCI U.S. REIT Total Return Index and Class I Shares from the commencement of investment operations on December 11, 2013 to December 31, 2013 compared to the MSCI U.S. REIT Total Return Index.
2013 Annual Report 27
BROOKFIELD U.S. LISTED REAL ESTATE FUND
Class A Shares
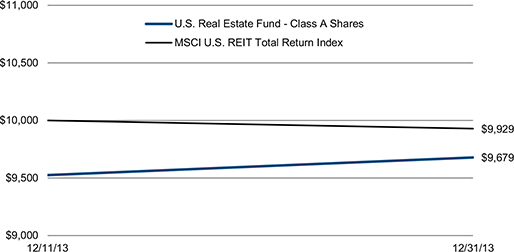
Class I Shares
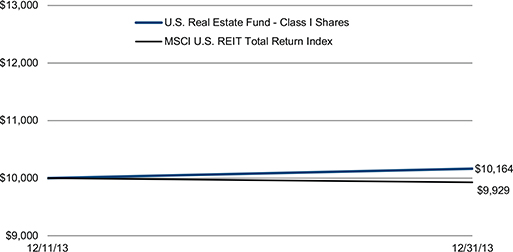
Disclosure
Performance data quoted represents past performance results and does not guarantee future results. Current performance may be lower or higher than the performance data quoted.
All returns shown in USD.
The Fund’s portfolio holdings are subject to change without notice. The mention of specific securities is not a recommendation or solicitation for any person to buy, sell or hold any particular security. There is no assurance that the Brookfield U.S. Listed Real Estate Fund currently holds these securities. Please refer to the Schedule of Investments contained in this report for a full listing of fund holdings.
28 Brookfield Investment Management Inc.
BROOKFIELD U.S. LISTED REAL ESTATE FUND
Mutual fund investing involves risk. Principal loss is possible.
A basis point (bps) is a unit that is equal to 1/100th of 1%.
A capitalization rate is a rate of return on a real estate investment property which is based on the anticipated income that the property will generate.
These views represent the opinions of Brookfield Investment Management Inc. and are not intended to predict or depict the performance of any investment. These views are as of the close of business on December 31, 2013 and subject to change based on subsequent developments.
| 1 | The S&P 500 Total Return Index is a broad based unmanaged index of 500 stocks, which is widely recognized as representative of the U.S. equity market in general. You cannot invest directly in an index |
| 2 | The MSCI U.S. REIT Total Return Index (RMS) is a total return market capitalization-weighted index which prices once per day after market close. It is calculated by MSCI and is composed of equity REITs that are included in the MSCI US Investable Market 2500 Index. You cannot invest directly in an index. |
| 3 | National Association of Real Estate Investment Trusts® “Historical Offerings of Securities”; reit.com. |
| 4 | Source: Real Capital Analytics. |
2013 Annual Report 29
BROOKFIELD U.S. LISTED REAL ESTATE FUND
Portfolio Characteristics (Unaudited)
December 31, 2013
| | | | |
ASSET ALLOCATION BY SECTOR | | | | |
Residential | | | 25.6 | % |
Office | | | 20.4 | % |
Regional Malls | | | 17.8 | % |
Healthcare | | | 11.6 | % |
Self Storage | | | 4.9 | % |
Mixed | | | 4.8 | % |
Hotel | | | 4.7 | % |
Timber | | | 3.7 | % |
Manufactured Homes | | | 3.0 | % |
Strip Centers | | | 2.0 | % |
Other Assets in Excess of Liabilities | | | 1.5 | % |
Total | | | 100.0 | % |
| |
TOP TEN HOLDINGS | | | | |
Simon Property Group, Inc. | | | 13.9 | % |
Equity Residential | | | 8.0 | % |
Ventas, Inc. | | | 7.1 | % |
AvalonBay Communities, Inc. | | | 6.7 | % |
Highwoods Properties, Inc. | | | 6.1 | % |
Iron Mountain, Inc. | | | 4.9 | % |
Liberty Property Trust | | | 4.8 | % |
Douglas Emmett, Inc. | | | 4.5 | % |
HCP, Inc. | | | 4.5 | % |
Essex Property Trust, Inc. | | | 4.0 | % |
30 Brookfield Investment Management Inc.
BROOKFIELD U.S. LISTED REAL ESTATE FUND
Schedule of Investments
December 31, 2013
| | | | | | | | |
| | | | | | Value | |
| | | Shares | | | (Note 2) | |
COMMON STOCKS – 98.5% | | | | | | | | |
Healthcare – 11.6% | | | | | | | | |
HCP, Inc. | | | 31,400 | | | $ | 1,140,448 | |
Ventas, Inc. | | | 31,600 | | | | 1,810,048 | |
| | | | | | | | |
Total Healthcare | | | | | | | 2,950,496 | |
| | | | | | | | |
Hotel – 4.7% | | | | | | | | |
Host Hotels & Resorts, Inc. | | | 34,300 | | | | 666,792 | |
Hyatt Hotels Corp. 1 | | | 10,700 | | | | 529,222 | |
| | | | | | | | |
Total Hotel. | | | | | | | 1,196,014 | |
| | | | | | | | |
Manufactured Homes – 3.0% | | | | | | | | |
Equity Lifestyle Properties, Inc. | | | 20,800 | | | | 753,584 | |
| | | | | | | | |
Mixed – 4.8% | | | | | | | | |
Liberty Property Trust | | | 36,000 | | | | 1,219,320 | |
| | | | | | | | |
Office – 20.4% | | | | | | | | |
Corporate Office Properties Trust | | | 12,200 | | | | 289,018 | |
Douglas Emmett, Inc. | | | 49,500 | | | | 1,152,855 | |
DuPont Fabros Technology, Inc. | | | 32,500 | | | | 803,075 | |
Highwoods Properties, Inc. | | | 42,700 | | | | 1,544,459 | |
Mack-Cali Realty Corp. | | | 29,800 | | | | 640,104 | |
SL Green Realty Corp. | | | 8,300 | | | | 766,754 | |
| | | | | | | | |
Total Office | | | | | | | 5,196,265 | |
| | | | | | | | |
Regional Malls – 17.8% | | | | | | | | |
CBL & Associates Properties, Inc. | | | 55,900 | | | | 1,003,964 | |
Simon Property Group, Inc. | | | 23,200 | | | | 3,530,112 | |
| | | | | | | | |
Total Regional Malls | | | | | | | 4,534,076 | |
| | | | | | | | |
Residential – 25.6% | | | | | | | | |
AvalonBay Communities, Inc. 1 | | | 14,500 | | | | 1,714,335 | |
Camden Property Trust | | | 13,100 | | | | 745,128 | |
Equity Residential | | | 39,300 | | | | 2,038,491 | |
Essex Property Trust, Inc. | | | 7,000 | | | | 1,004,570 | |
Mid-America Apartment Communities, Inc. | | | 16,400 | | | | 996,136 | |
| | | | | | | | |
Total Residential | | | | | | | 6,498,660 | |
| | | | | | | | |
Self Storage – 4.9% | | | | | | | | |
Iron Mountain, Inc. | | | 40,600 | | | | 1,232,210 | |
| | | | | | | | |
Strip Centers – 2.0% | | | | | | | | |
Brixmor Property Group, Inc. | | | 25,000 | | | | 508,250 | |
| | | | | | | | |
Timber – 3.7% | | | | | | | | |
Weyerhaeuser Co. | | | 29,800 | | | | 940,786 | |
| |
Total COMMON STOCKS
(Cost $24,734,242) | | | | | | | 25,029,661 | |
| |
Total Investments – 98.5%
(Cost $24,734,242) | | | | | | | 25,029,661 | |
Other Assets in Excess of Liabilities – 1.5% | | | | | | | 381,832 | |
| |
TOTAL NET ASSETS – 100.0% | | | | | | $ | 25,411,493 | |
| |
See Notes to Financial Statements.
2013 Annual Report 31
BROOKFIELD U.S. LISTED REAL ESTATE FUND
Schedule of Investments (continued)
December 31, 2013
The following notes should be read in conjunction with the accompanying Schedule of Investments.
1 — Non-income producing security.
See Notes to Financial Statements.
32 Brookfield Investment Management Inc.
BROOKFIELD INVESTMENT FUNDS
Statements of Assets and Liabilities
December 31, 2013
| | | | | | | | | | | | |
| | | Infrastructure | | | Global Real | | | U.S. Real | |
| | | Fund | | | Estate Fund | | | Estate Fund | |
Assets: | | | | | | | | | | | | |
Investments in securities, at value (Note 2) | | $ | 373,370,789 | | | $ | 111,664,348 | | | $ | 25,029,661 | |
Cash | | | 9,835,948 | | | | 5,848,368 | | | | 207,075 | |
Dividends receivable | | | 915,055 | | | | 515,553 | | | | 133,172 | |
Receivable for investments sold | | | 665,258 | | | | 104,121 | | | | 73,505 | |
Receivable for fund shares sold | | | 2,091,275 | | | | 11,109,657 | | | | — | |
Net receivable from Adviser | | | — | | | | — | | | | 28,816 | |
Deferred offering costs | | | — | | | | — | | | | 47,260 | |
Prepaid expenses | | | 47,111 | | | | 15,741 | | | | 63,117 | |
| | | | | | | | | | | | |
Total assets | | | 386,925,436 | | | | 129,257,788 | | | | 25,582,606 | |
| | | | | | | | | | | | |
Liabilities: | | | | | | | | | | | | |
Payable for investments purchased | | | 5,051,979 | | | | 916,120 | | | | 84,675 | |
Payable for fund shares purchased | | | 521,757 | | | | 854,274 | | | | — | |
Distribution fee payable | | | 51,799 | | | | 937 | | | | — | |
Investment advisory fee payable | | | 240,930 | | | | 39,800 | | | | — | |
Administration fee payable | | | 46,188 | | | | 13,870 | | | | — | |
Accrued organizational costs | | | — | | | | — | | | | 2,358 | |
Accrued offering costs | | | — | | | | — | | | | 50,000 | |
Trustees’ fee payable | | | 3,679 | | | | 3,750 | | | | — | |
Accrued expenses | | | 182,848 | | | | 113,283 | | | | 34,080 | |
| | | | | | | | | | | | |
Total liabilities | | | 6,099,180 | | | | 1,942,034 | | | | 171,113 | |
| | | | | | | | | | | | |
Net Assets | | $ | 380,826,256 | | | $ | 127,315,754 | | | $ | 25,411,493 | |
| | | | | | | | | | | | |
Composition of Net Assets | | | | | | | | | | | | |
Paid-in capital (Note 6) | | $ | 329,673,526 | | | $ | 128,680,975 | | | $ | 25,118,026 | |
Undistributed (Distributions in excess of) net investment income | | | 4,782 | | | | (773,886 | ) | | | — | |
Accumulated net realized gain (loss) on investment, foreign currency and foreign currency transactions and foreign currency translations | | | 2,755,607 | | | | (1,150,101 | ) | | | (1,952 | ) |
Net unrealized appreciation on investments, foreign currency and foreign currency translation | | | 48,392,341 | | | | 558,766 | | | | 295,419 | |
| | | | | | | | | | | | |
Net assets applicable to capital shares outstanding | | $ | 380,826,256 | | | $ | 127,315,754 | | | $ | 25,411,493 | |
| | | | | | | | | | | | |
Total investments at cost | | $ | 324,984,869 | | | $ | 111,105,427 | | | $ | 24,734,242 | |
| | | | | | | | | | | | |
Net Assets | | | | | | | | | | | | |
Class A Shares — Net Assets | | $ | 104,349,355 | | | $ | 4,942,351 | | | $ | 1,016 | |
Shares outstanding | | | 7,502,504 | | | | 417,140 | | | | 101 | |
Net asset value and redemption price per share | | $ | 13.91 | | | $ | 11.85 | | | $ | 10.11 | * |
Offering price per share based on a maximum sales charge of 4.75% | | $ | 14.60 | | | $ | 12.44 | | | $ | 10.61 | * |
Class C Shares — Net Assets. | | $ | 15,377,912 | | | $ | 833,408 | | | $ | 1,016 | |
Shares outstanding | | | 1,114,683 | | | | 70,478 | | | | 100 | |
Net asset value and redemption price per share | | $ | 13.80 | | | $ | 11.83 | | | $ | 10.11 | * |
Class Y Shares — Net Assets | | $ | 76,013,741 | | | $ | 51,694,451 | | | $ | 1,016 | |
Shares outstanding | | | 5,458,210 | | | | 4,355,302 | | | | 101 | |
Net asset value and redemption price per share | | $ | 13.93 | | | $ | 11.87 | | | $ | 10.11 | * |
Class I Shares — Net Assets | | $ | 185,085,248 | | | $ | 69,845,544 | | | $ | 25,408,445 | |
Shares outstanding | | | 13,276,353 | | | | 5,887,704 | | | | 2,513,571 | |
Net asset value and redemption price per share | | $ | 13.94 | | | $ | 11.86 | | | $ | 10.11 | |
| |
| * | Net asset value does not recalculate due to fractional shares outstanding. |
See Notes to Financial Statements.
2013 Annual Report 33
BROOKFIELD INVESTMENT FUNDS
Statements of Operations
For the Year Ended December 31, 2013
| | | | | | | | | | | | |
| | | Infrastructure | | | Global Real | | | U.S. Real | |
| | | Fund | | | Estate Fund | | | Estate Fund 1 | |
Investment Income: | | | | | | | | | | | | |
Dividends | | $ | 7,541,805 | | | $ | 2,371,088 | | | $ | 113,204 | |
Foreign withholding tax | | | (576,667 | ) | | | (124,199 | ) | | | — | |
Total investment income | | | 6,965,138 | | | | 2,246,889 | | | | 113,204 | |
Expenses: | | | | | | | | | | | | |
Investment advisory fees (Note 3) | | | 2,269,602 | | | | 593,715 | | | | 10,367 | |
Administration fees (Note 3) | | | 400,518 | | | | 118,743 | | | | 2,073 | |
Distribution fees — Class A | | | 168,344 | | | | 6,804 | | | | — | |
Distribution fees — Class C | | | 80,721 | | | | 3,280 | | | | — | |
Fund accounting fees | | | 140,325 | | | | 77,614 | | | | 3,224 | |
Transfer agent fees | | | 131,447 | | | | 64,731 | | | | 3,156 | |
Registration fees | | | 109,562 | | | | 72,233 | | | | 320 | |
Legal fees | | | 80,440 | | | | 22,005 | | | | 438 | |
Custodian fees | | | 75,952 | | | | 53,235 | | | | 487 | |
Audit and tax services | | | 55,385 | | | | 53,401 | | | | 26,000 | |
Trustees’ fees | | | 43,262 | | | | 43,333 | | | | — | |
Reports to shareholders | | | 36,355 | | | | 11,305 | | | | 395 | |
Insurance | | | 23,616 | | | | 6,701 | | | | — | |
Miscellaneous | | | 6,195 | | | | 4,250 | | | | 190 | |
Offering fees | | | — | | | | — | | | | 2,740 | |
Organizational fees | | | — | | | | — | | | | 5,000 | |
| | | | | | | | | | | | |
Total operating expenses | | | 3,621,724 | | | | 1,131,350 | | | | 54,390 | |
Less expenses reimbursed by the investment adviser (Note 3) | | | (435,670 | ) | | | (369,168 | ) | | | (41,257 | ) |
| | | | | | | | | | | | |
Net expenses | | | 3,186,054 | | | | 762,182 | | | | 13,133 | |
| | | | | | | | | | | | |
Net investment income | | | 3,779,084 | | | | 1,484,707 | | | | 100,071 | |
| | | | | | | | | | | | |
Realized and Unrealized Gain (Loss) on Investments, Foreign Currency and Foreign Currency Translations: | | | | | | | | | | | | |
Net realized gain (loss) on: | | | | | | | | | | | | |
Investments | | | 6,864,673 | | | | 3,886,903 | | | | 12,003 | |
Foreign currency and foreign currency transactions | | | (454,996 | ) | | | (264,727 | ) | | | — | |
| | | | | | | | | | | | |
Net realized gain (loss) on investments, foreign currency and foreign currency transactions | | | 6,409,677 | | | | 3,622,176 | | | | 12,003 | |
| | | | | | | | | | | | |
Net change in unrealized appreciation (depreciation) on: | | | | | | | | | | | | |
Investments | | | 41,563,119 | | | | (2,828,123 | ) | | | 295,419 | |
Foreign currency and foreign currency translations | | | 732 | | | | 610 | | | | — | |
| | | | | | | | | | | | |
Net change in unrealized appreciation (depreciation) on investments, foreign currency and foreign currency translations | | | 41,563,851 | | | | (2,827,513 | ) | | | 295,419 | |
| | | | | | | | | | | | |
Net realized and unrealized gain on investments, foreign currency and foreign currency translations | | | 47,973,528 | | | | 794,663 | | | | 307,422 | |
| | | | | | | | | | | | |
Net increase in net assets resulting from operations | | $ | 51,752,612 | | | $ | 2,279,370 | | | $ | 407,493 | |
| | | | | | | | | | | | |
| 1 | For the Period December 11, 2013 (commencement of operations) through December 31, 2013. |
See Notes to Financial Statements.
34 Brookfield Investment Management Inc.
BROOKFIELD INVESTMENT FUNDS
Statements of Changes in Net Assets
| | | | | | | | | | | | | | | | |
| | | Infrastructure Fund | | | Global Real Estate Fund | |
| | | For the Year | | | For the Year | | | For the Year | | | For the Year | |
| | | Ended | | | Ended | | | Ended | | | Ended | |
| | | December 31, 2013 | | | December 31, 2012 | | | December 31, 2013 | | | December 31, 2012 | |
Increase (Decrease) in Net Assets | | | | | | | | | | | | | | | | |
Resulting from Operations: | | | | | | | | | | | | | | | | |
Net investment income | | $ | 3,779,084 | | | $ | 1,294,096 | | | $ | 1,484,707 | | | $ | 384,946 | |
Net realized gain on investments, foreign currency and foreign currency transactions | | | 6,409,677 | | | | 1,663,114 | | | | 3,622,176 | | | | 1,868,239 | |
Net unrealized appreciation (depreciation) on investments, foreign currency and foreign currency translations | | | 41,563,851 | | | | 6,726,062 | | | | (2,827,513 | ) | | | 3,371,260 | |
| | | | | | | | | | | | | | | | |
Net increase in net assets resulting from operations | | | 51,752,612 | | | | 9,683,272 | | | | 2,279,370 | | | | 5,624,445 | |
| | | | | | | | | | | | | | | | |
Distributions to Shareholders: | | | | | | | | | | | | | | | | |
From net investment income: | | | | | | | | | | | | | | | | |
Class A shares | | | (1,182,363 | ) | | | (147,904 | ) | | | (68,747 | ) | | | (14,943 | ) |
Class C shares | | | (104,963 | ) | | | (6,648 | ) | | | (7,457 | ) | | | (340 | ) |
Class Y shares | | | (808,000 | ) | | | (200,205 | ) | | | (535,110 | ) | | | (24,642 | ) |
Class I shares | | | (2,757,379 | ) | | | (805,345 | ) | | | (1,425,136 | ) | | | (1,184,889 | ) |
From net realized gain on investments: | | | | | | | | | | | | | | | | |
Class A shares | | | (799,350 | ) | | | (199,187 | ) | | | (176,957 | ) | | | (17,294 | ) |
Class C shares | | | (118,438 | ) | | | (9,850 | ) | | | (32,633 | ) | | | (364 | ) |
Class Y shares | | | (577,619 | ) | | | (248,338 | ) | | | (1,666,498 | ) | | | (869 | ) |
Class I shares | | | (1,416,412 | ) | | | (998,961 | ) | | | (2,711,697 | ) | | | (1,412,344 | ) |
| | | | | | | | | | | | | | | | |
Total distributions paid | | | (7,764,524 | ) | | | (2,616,438 | ) | | | (6,624,235 | ) | | | (2,655,685 | ) |
| | | | | | | | | | | | | | | | |
Capital Share Transactions (Note 5): | | | | | | | | | | | | | | | | |
Proceeds from shares sold | | | 280,609,570 | | | | 104,603,851 | | | | 120,730,845 | | | | 30,596,112 | |
Reinvestment of dividends and distributions | | | 7,099,249 | | | | 2,604,430 | | | | 6,408,539 | | | | 2,655,316 | |
Cost of shares redeemed | | | (71,662,604 | ) | | | (5,945,169 | ) | | | (33,219,288 | ) | | | (3,539,994 | ) |
Redemption fees | | | 28,172 | | | | 1,830 | | | | 7,213 | | | | — | |
| | | | | | | | | | | | | | | | |
Net increase in capital share transactions | | | 216,074,387 | | | | 101,264,942 | | | | 93,927,309 | | | | 29,711,434 | |
| | | | | | | | | | | | | | | | |
Total increase in net assets | | | 260,062,475 | | | | 108,331,776 | | | | 89,582,444 | | | | 32,680,194 | |
Net Assets: | | | | | | | | | | | | | | | | |
Beginning of year | | | 120,763,781 | | | | 12,432,005 | | | | 37,733,310 | | | | 5,053,116 | |
| | | | | | | | | | | | | | | | |
End of year | | $ | 380,826,256 | | | $ | 120,763,781 | | | $ | 127,315,754 | | | $ | 37,733,310 | |
| | | | | | | | | | | | | | | | |
(including undistributed (distributions in excess of) net investment income) | | $ | 4,782 | | | $ | 4,782 | | | $ | (773,886 | ) | | $ | (617,362 | ) |
| | | | | | | | | | | | | | | | |
See Notes to Financial Statements.
2013 Annual Report 35
BROOKFIELD INVESTMENT FUNDS
Statements of Changes in Net Assets (continued)
| | | | |
| | | U.S. Real Estate | |
| | | Fund | |
| | | For the Period | |
| | | December 11, | |
| | | 20131 | |
| | | through | |
| | | December 31, 2013 | |
Increase in Net Assets Resulting from Operations: | | | | |
Net investment income | | $ | 100,071 | |
Net realized gain on investments | | | 12,003 | |
Net unrealized appreciation on investments | | | 295,419 | |
| | | | |
Net increase in net assets resulting from operations | | | 407,493 | |
| | | | |
Distributions to Shareholders: | | | | |
From net investment income: | | | | |
Class A shares | | | (5 | ) |
Class C shares | | | (5 | ) |
Class Y shares | | | (5 | ) |
Class I shares | | | (136,870 | ) |
| | | | |
Total distributions paid | | | (136,885 | ) |
| | | | |
Capital Share Transactions (Note 5): | | | | |
Proceeds from shares sold | | | 25,004,000 | |
Reinvestment of dividends and distributions | | | 136,885 | |
| | | | |
Net increase in capital share transactions | | | 25,140,885 | |
| | | | |
Total increase in net assets | | | 25,411,493 | |
Net Assets: | | | | |
Beginning of period | | | — | |
| | | | |
End of period | | $ | 25,411,493 | |
| | | | |
(including undistributed net investment income) | | | — | |
| | | | |
| 1 | Commencement of operations. |
See Notes to Financial Statements.
36 Brookfield Investment Management Inc.
BROOKFIELD GLOBAL LISTED INFRASTRUCTURE FUND
Financial Highlights
| | | | | | | | | | | | |
| | | | | | | | | For the Period | |
| | | For the Year | | | For the Year | | | December 29, | |
| | | Ended | | | Ended | | | 20111 through | |
| Class A | | December 31, 2013 | | | December 31, 2012 | | | December 31, 2011 | |
Per Share Operating Performance: | | | | | | | | | | | | |
Net asset value, beginning of period | | $ | 11.61 | | | $ | 10.15 | | | $ | 10.13 | |
| | | | | | | | | | | | |
Net investment income2 | | | 0.17 | | | | 0.21 | | | | 0.00 | 5 |
Net realized and unrealized gain on investment transactions | | | 2.46 | | | | 1.50 | | | | 0.02 | |
| | | | | | | | | | | | |
Net increase in net asset value resulting from operations | | | 2.63 | | | | 1.71 | | | | 0.02 | |
| | | | | | | | | | | | |
Distributions from net investment income | | | (0.22 | ) | | | (0.11 | ) | | | (0.00 | )5 |
Distributions from net realized capital gain | | | (0.11 | ) | | | (0.14 | ) | | | — | |
| | | | | | | | | | | | |
Total distributions paid | | | (0.33 | ) | | | (0.25 | ) | | | (0.00 | )5 |
| | | | | | | | | | | | |
Redemption fees | | | 0.00 | 5 | | | 0.00 | 5 | | | — | |
| | | | | | | | | | | | |
Net asset value, end of period | | $ | 13.91 | | | $ | 11.61 | | | $ | 10.15 | |
| | | | | | | | | | | | |
Total Investment Return† | | | 22.86 | % | | | 16.87 | % | | | 0.20 | %4 |
Ratios to Average Net Assets/Supplementary Data: | | | | | | | | | | | | |
Net assets, end of period (000s) | | $ | 104,349 | | | $ | 16,547 | | | $ | 2,302 | 3 |
Gross operating expenses | | | 1.51 | % | | | 2.16 | % | | | 34.45 | %3 |
Net expenses, including fee waivers and reimbursement | | | 1.35 | % | | | 1.42 | % | | | 1.60 | %3 |
Net investment income (loss) | | | 1.30 | % | | | 1.85 | % | | | (1.60 | )%3 |
Net investment income (loss), excluding the effect of fee waivers and reimbursement | | | 1.14 | % | | | 1.11 | % | | | (34.45 | )%3 |
Portfolio turnover rate | | | 64 | % | | | 88 | % | | | 1 | %4 |
| † | Total investment return is computed based upon the net asset value of the Fund’s shares and excludes the effects of sales charges or contingent deferred sales charges, if applicable. Distributions are assumed to be reinvested at the net asset value of the Class on the ex-date of the distribution. |
| 1 | Commencement of operations. |
| 2 | Per share amounts presented are based on average shares outstanding throughout the period indicated. |
| 5 | Rounds to less than $0.005. |
| | | | | | | | |
| | | | | | For the Period | |
| | | For the Year | | | May 1, 20121 | |
| | | Ended | | | through | |
| Class C | | December 31, 2013 | | | December 31, 2012 | |
Per Share Operating Performance: | | | | | | | | |
Net asset value, beginning of period | | $ | 11.57 | | | $ | 11.02 | |
| | | | | | | | |
Net investment income2 | | | 0.08 | | | | 0.10 | |
Net realized and unrealized gain on investment transactions | | | 2.43 | | | | 0.69 | |
| | | | | | | | |
Net increase in net asset value resulting from operations | | | 2.51 | | | | 0.79 | |
| | | | | | | | |
Distributions from net investment income | | | (0.17 | ) | | | (0.10 | ) |
Distributions from net realized capital gain | | | (0.11 | ) | | | (0.14 | ) |
| | | | | | | | |
Total distributions paid | | | (0.28 | ) | | | (0.24 | ) |
Redemption fees | | | 0.00 | 5 | | | — | |
| | | | | | | | |
Net asset value, end of period | | $ | 13.80 | | | $ | 11.57 | |
| | | | | | | | |
Total Investment Return† | | | 21.85 | % | | | 7.19 | %4 |
Ratios to Average Net Assets/Supplementary Data: | | | | | | | | |
Net assets, end of period (000s) | | $ | 15,378 | | | $ | 829 | |
Gross operating expenses | | | 2.26 | % | | | 2.63 | %3 |
Net expenses, including fee waivers and reimbursement | | | 2.10 | % | | | 2.13 | %3 |
Net investment income | | | 0.58 | % | | | 1.67 | %3 |
Net investment income, excluding the effect of fee waivers and reimbursement | | | 0.42 | % | | | 1.17 | %3 |
Portfolio turnover rate | | | 64 | % | | | 88 | %4 |
| † | Total investment return is computed based upon the net asset value of the Fund’s shares and excludes the effects of sales charges or contingent deferred sales charges, if applicable. Distributions are assumed to be reinvested at the net asset value of the Class on the ex-date of the distribution. |
| 1 | Commencement of operations. |
| 2 | Per share amounts presented are based on average shares outstanding throughout the period indicated. |
| 5 | Rounds to less than $0.005. |
See Notes to Financial Statements.
2013 Annual Report 37
BROOKFIELD GLOBAL LISTED INFRASTRUCTURE FUND
Financial Highlights
| | | | | | | | | | | | |
| | | | | | | | | For the Period | |
| | | For the Year | | | For the Year | | | December 1, 20111 | |
| | | Ended | | | Ended | | | through | |
| Class Y | | December 31, 2013 | | | December 31, 2012 | | | December 31, 2011 | |
Per Share Operating Performance: | | | | | | | | | | | | |
Net asset value, beginning of period | | $ | 11.62 | | | $ | 10.15 | | | $ | 10.00 | |
| | | | | | | | | | | | |
Net investment income2 | | | 0.19 | | | | 0.24 | | | | 0.03 | |
Net realized and unrealized gain on investment transactions | | | 2.47 | | | | 1.49 | | | | 0.13 | |
| | | | | | | | | | | | |
Net increase in net asset value resulting from operations | | | 2.66 | | | | 1.73 | | | | 0.16 | |
| | | | | | | | | | | | |
Distributions from net investment income | | | (0.24 | ) | | | (0.12 | ) | | | (0.01 | ) |
Distributions from net realized capital gain | | | (0.11 | ) | | | (0.14 | ) | | | — | |
Total distributions paid | | | (0.35 | ) | | | (0.26 | ) | | | (0.01 | ) |
| | | | | | | | | | | | |
Redemption fees | | | 0.00 | 5 | | | — | | | | — | |
| | | | | | | | | | | | |
Net asset value, end of period | | $ | 13.93 | | | $ | 11.62 | | | $ | 10.15 | |
| | | | | | | | | | | | |
Total Investment Return† | | | 23.11 | % | | | 17.06 | % | | | 1.58 | %4 |
Ratios to Average Net Assets/Supplementary Data: | | | | | | | | | | | | |
Net assets, end of period (000s) | | $ | 76,014 | | | $ | 20,300 | | | $ | 13 | |
Gross operating expenses | | | 1.26 | % | | | 1.67 | % | | | 18.59 | %3 |
Net expenses, including fee waivers and reimbursement | | | 1.10 | % | | | 1.13 | % | | | 1.35 | %3 |
Net investment income | | | 1.49 | % | | | 2.86 | % | | | 1.66 | %3 |
Net investment income (loss), excluding the effect of fee waivers and reimbursement | | | 1.33 | % | | | 2.32 | % | | | (15.39 | )%3 |
Portfolio turnover rate | | | 64 | % | | | 88 | % | | | 1 | %4 |
| † | Total investment return is computed based upon the net asset value of the Fund’s shares and excludes the effects of sales charges or contingent deferred sales charges, if applicable. Distributions are assumed to be reinvested at the net asset value of the Class on the ex-date of the distribution. |
| 1 | Commencement of operations. |
| 2 | Per share amounts presented are based on average shares outstanding throughout the period indicated. |
| 5 | Rounds to less than $0.005. |
| | | | | | | | | | | | |
| | | | | | | | | For the Period | |
| | | For the Year | | | For the Year | | | December 1, 20111 | |
| | | Ended | | | Ended | | | through | |
| Class I | | December 31, 2013 | | | December 31, 2012 | | | December 31, 2011 | |
Per Share Operating Performance: | | | | | | | | | | | | |
Net asset value, beginning of period | | $ | 11.63 | | | $ | 10.15 | | | $ | 10.00 | |
| | | | | | | | | | | | |
Net investment income2 | | | 0.19 | | | | 0.24 | | | | 0.02 | |
Net realized and unrealized gain on investment transactions | | | 2.47 | | | | 1.50 | | | | 0.14 | |
| | | | | | | | | | | | |
Net increase in net asset value resulting from operations | | | 2.66 | | | | 1.74 | | | | 0.16 | |
| | | | | | | | | | | | |
Distributions from net investment income | | | (0.24 | ) | | | (0.12 | ) | | | (0.01 | ) |
Distributions from net realized capital gain | | | (0.11 | ) | | | (0.14 | ) | | | — | |
| | | | | | | | | | | | |
Total distributions paid | | | (0.35 | ) | | | (0.26 | ) | | | (0.01 | ) |
| | | | | | | | | | | | |
Redemption fees | | | 0.00 | 5 | | | — | | | | — | |
| | | | | | | | | | | | |
Net asset value, end of period | | $ | 13.94 | | | $ | 11.63 | | | $ | 10.15 | |
| | | | | | | | | | | | |
Total Investment Return† | | | 23.09 | % | | | 17.16 | % | | | 1.58 | %4 |
Ratios to Average Net Assets/Supplementary Data: | | | | | | | | | | | | |
Net assets, end of period (000s) | | $ | 185,085 | | | $ | 83,088 | | | $ | 10,117 | |
Gross operating expenses | | | 1.26 | % | | | 1.78 | % | | | 19.53 | %3 |
Net expenses, including fee waivers and reimbursement | | | 1.10 | % | | | 1.17 | % | | | 1.35 | %3 |
Net investment income | | | 1.49 | % | | | 2.06 | % | | | 1.66 | %3 |
Net investment income (loss), excluding the effect of fee waivers and reimbursement | | | 1.33 | % | | | 1.45 | % | | | (16.34 | )%3 |
Portfolio turnover rate | | | 64 | % | | | 88 | % | | | 1 | %4 |
| † | Total investment return is computed based upon the net asset value of the Fund’s shares and excludes the effects of sales charges or contingent deferred sales charges, if applicable. Distributions are assumed to be reinvested at the net asset value of the Class on the ex-date of the distribution. |
| 1 | Commencement of operations. |
| 2 | Per share amounts presented are based on average shares outstanding throughout the period indicated. |
| 5 | Rounds to less than $0.005. |
See Notes to Financial Statements.
38 Brookfield Investment Management Inc.
BROOKFIELD GLOBAL LISTED REAL ESTATE FUND
Financial Highlights
| | | | | | | | |
| | | | | | For the Period | |
| | | For the Year | | | May 1, 20121 | |
| | | Ended | | | through | |
| Class A | | December 31, 2013 | | | December 31, 2012 | |
Per Share Operating Performance: | | | | | | | | |
Net asset value, beginning of period | | $ | 11.99 | | | $ | 11.57 | |
| | | | | | | | |
Net investment income2 | | | 0.21 | | | | 0.14 | |
Net realized and unrealized gain on investment transactions. | | | 0.38 | | | | 1.50 | |
| | | | | | | | |
Net increase in net asset value resulting from operations | | | 0.59 | | | | 1.64 | |
| | | | | | | | |
Distributions from net investment income | | | (0.25 | ) | | | (0.55 | ) |
Distributions from net realized capital gain | | | (0.48 | ) | | | (0.67 | ) |
| | | | | | | | |
Total distributions paid | | | (0.73 | ) | | | (1.22 | ) |
| | | | | | | | |
Redemption fees | | | 0.00 | 5 | | | — | |
Net asset value, end of period | | $ | 11.85 | | | $ | 11.99 | |
| | | | | | | | |
Total Investment Return† | | | 4.99 | % | | | 14.89 | %4 |
Ratios to Average Net Assets/Supplementary Data: | | | | | | | | |
Net assets, end of period (000s) | | $ | 4,942 | | | $ | 639 | |
Gross operating expenses | | | 1.66 | % | | | 2.54 | %3 |
Net expenses, including fee waivers and reimbursement | | | 1.20 | % | | | 1.23 | %3 |
Net investment income | | | 1.69 | % | | | 2.08 | %3 |
Net investment income, excluding the effect of fee waivers and reimbursement | | | 1.23 | % | | | 0.77 | %3 |
Portfolio turnover rate | | | 147 | % | | | 106 | %4 |
| † | Total investment return is computed based upon the net asset value of the Fund’s shares and excludes the effects of sales charges or contingent deferred sales charges, if applicable. Distributions are assumed to be reinvested at the net asset value of the Class on the ex-date of the distribution. |
| 1 | Commencement of operations. |
| 2 | Per share amounts presented are based on average shares outstanding throughout the period indicated. |
| 5 | Rounds to less than $0.005. |
| | | | | | | | |
| | | | | | For the Period | |
| | | For the Year | | | May 1, 20121 | |
| | | Ended | | | through | |
| Class C | | December 31, 2013 | | | December 31, 2012 | |
Per Share Operating Performance: | | | | | | | | |
Net asset value, beginning of period | | $ | 12.00 | | | $ | 11.57 | |
| | | | | | | | |
Net investment income2 | | | 0.11 | | | | 0.07 | |
Net realized and unrealized gain on investment transactions | | | 0.39 | | | | 1.52 | |
| | | | | | | | |
Net increase in net asset value resulting from operations | | | 0.50 | | | | 1.59 | |
| | | | | | | | |
Distributions from net investment income | | | (0.19 | ) | | | (0.49 | ) |
Distributions from net realized capital gain | | | (0.48 | ) | | | (0.67 | ) |
| | | | | | | | |
Total distributions paid | | | (0.67 | ) | | | (1.16 | ) |
| | | | | | | | |
Net asset value, end of period | | $ | 11.83 | | | $ | 12.00 | |
| | | | | | | | |
Total Investment Return† | | | 4.18 | % | | | 14.39 | %4 |
Ratios to Average Net Assets/Supplementary Data: | | | | | | | | |
Net assets, end of period (000s) | | $ | 833 | | | $ | 67 | |
Gross operating expenses | | | 2.41 | % | | | 3.55 | %3 |
Net expenses, including fee waivers and reimbursement | | | 1.95 | % | | | 2.04 | %3 |
Net investment income | | | 0.91 | % | | | 1.29 | %3 |
Net investment income (loss), excluding the effect of fee waivers and reimbursement | | | 0.45 | % | | | (0.22 | )%3 |
Portfolio turnover rate | | | 147 | % | | | 106 | %4 |
| † | Total investment return is computed based upon the net asset value of the Fund’s shares and excludes the effects of sales charges or contingent deferred sales charges, if applicable. Distributions are assumed to be reinvested at the net asset value of the Class on the ex-date of the distribution. |
| 1 | Commencement of operations. |
| 2 | Per share amounts presented are based on average shares outstanding throughout the period indicated. |
See Notes to Financial Statements.
2013 Annual Report 39
BROOKFIELD GLOBAL LISTED REAL ESTATE FUND
Financial Highlights
| | | | | | | | | | | | |
| | | | | | | | | For the Period | |
| | | For the Year | | | For the Year | | | December 1, 20111 | |
| | | Ended | | | Ended | | | through | |
| Class Y | | December 31, 2013 | | | December 31, 2012 | | | December 31, 2011 | |
Per Share Operating Performance: | | | | | | | | | | | | |
Net asset value, beginning of period | | $ | 12.01 | | | $ | 10.02 | | | $ | 10.00 | |
| | | | | | | | | | | | |
Net investment income2 | | | 0.25 | | | | 0.22 | | | | 0.04 | |
Net realized and unrealized gain on investment transactions | | | 0.37 | | | | 3.00 | | | | 0.02 | |
| | | | | | | | | | | | |
Net increase in net asset value resulting from operations | | | 0.62 | | | | 3.22 | | | | 0.06 | |
| | | | | | | | | | | | |
Distributions from net investment income | | | (0.28 | ) | | | (0.56 | ) | | | (0.04 | ) |
Distributions from net realized capital gain | | | (0.48 | ) | | | (0.67 | ) | | | — | |
| | | | | | | | | | | | |
Total distributions paid | | | (0.76 | ) | | | (1.23 | ) | | | (0.04 | ) |
| | | | | | | | | | | | |
Redemption fees | | | 0.00 | 5 | | | — | | | | — | |
| | | | | | | | | | | | |
Net asset value, end of period | | $ | 11.87 | | | $ | 12.01 | | | $ | 10.02 | |
| | | | | | | | | | | | |
Total Investment Return† | | | 5.20 | % | | | 32.93 | % | | | 0.59 | %4 |
Ratios to Average Net Assets/Supplementary Data: | | | | | | | | | | | | |
Net assets, end of period (000s) | | $ | 51,694 | | | $ | 9,101 | | | $ | 13 | |
Gross operating expenses | | | 1.41 | % | | | 3.24 | % | | | 25.79 | %3 |
Net expenses, including fee waivers and reimbursement | | | 0.95 | % | | | 1.11 | % | | | 1.25 | %3 |
Net investment income | | | 1.98 | % | | | 3.64 | % | | | 3.35 | %3 |
Net investment income (loss), excluding the effect of fee waivers and reimbursement | | | 1.52 | % | | | 1.51 | % | | | (21.19 | )%3 |
Portfolio turnover rate | | | 147 | % | | | 106 | % | | | 0 | %4 |
| † | Total investment return is computed based upon the net asset value of the Fund’s shares and excludes the effects of sales charges or contingent deferred sales charges, if applicable. Distributions are assumed to be reinvested at the net asset value of the Class on the ex-date of the distribution. |
| 1 | Commencement of operations. |
| 2 | Per share amounts presented are based on average shares outstanding throughout the period indicated. |
| 5 | Rounds to less than $0.005. |
| | | | | | | | | | | | |
| | | | | | | | | For the Period | |
| | | For the Year | | | For the Year | | | December 1, 20111 | |
| | | Ended | | | Ended | | | through | |
| Class I | | December 31, 2013 | | | December 31, 2012 | | | December 31, 2011 | |
Per Share Operating Performance: | | | | | | | | | | | | |
Net asset value, beginning of period | | $ | 12.00 | | | $ | 10.02 | | | $ | 10.00 | |
| | | | | | | | | | | | |
Net investment income2 | | | 0.23 | | | | 0.21 | | | | 0.04 | |
Net realized and unrealized gain on investment transactions | | | 0.39 | | | | 3.00 | | | | 0.02 | |
| | | | | | | | | | | | |
Net increase in net asset value resulting from operations | | | 0.62 | | | | 3.21 | | | | 0.06 | |
| | | | | | | | | | | | |
Distributions from net investment income | | | (0.28 | ) | | | (0.56 | ) | | | (0.04 | ) |
Distributions from net realized capital gain | | | (0.48 | ) | | | (0.67 | ) | | | — | |
| | | | | | | | | | | | |
Total distributions paid | | | (0.76 | ) | | | (1.23 | ) | | | (0.04 | ) |
| | | | | | | | | | | | |
Redemption fees | | | 0.00 | 5 | | | — | | | | — | |
| | | | | | | | | | | | |
Net asset value, end of period | | $ | 11.86 | | | $ | 12.00 | | | $ | 10.02 | |
| | | | | | | | | | | | |
Total Investment Return† | | | 5.20 | % | | | 32.83 | % | | | 0.59 | %4 |
Ratios to Average Net Assets/Supplementary Data: | | | | | | | | | | | | |
Net assets, end of period (000s) | | $ | 69,846 | | | $ | 27,926 | | | $ | 5,041 | |
Gross operating expenses | | | 1.41 | % | | | 2.65 | % | | | 25.79 | %3 |
Net expenses, including fee waivers and reimbursement | | | 0.95 | % | | | 1.05 | % | | | 1.25 | %3 |
Net investment income | | | 1.86 | % | | | 1.81 | % | | | 3.35 | %3 |
Net investment income (loss), excluding the effect of fee waivers and reimbursement | | | 1.40 | % | | | 0.21 | % | | | (21.19 | )%3 |
Portfolio turnover rate | | | 147 | % | | | 106 | % | | | 0 | %4 |
| † | Total investment return is computed based upon the net asset value of the Fund’s shares and excludes the effects of sales charges or contingent deferred sales charges, if applicable. Distributions are assumed to be reinvested at the net asset value of the Class on the ex-date of the distribution. |
| 1 | Commencement of operations |
| 2 | Per share amounts presented are based on average shares outstanding throughout the period indicated. |
| 5 | Rounds to less than $0.005. |
See Notes to Financial Statements.
40 Brookfield Investment Management Inc.
BROOKFIELD U.S. LISTED REAL ESTATE FUND
Financial Highlights
| | | | |
| | | For the Period | |
| | | December 11, | |
| | | 20131 through | |
| Class A | | December 31, 2013 | |
Per Share Operating Performance: | | | | |
Net asset value, beginning of period | | $ | 10.00 | |
| | | | |
Net investment income2 | | | 0.04 | |
Net realized and unrealized gain on investment transactions | | | 0.12 | |
| | | | |
Net increase in net asset value resulting from operations | | | 0.16 | |
| | | | |
Distributions from net investment income | | | (0.05 | ) |
| | | | |
Net asset value, end of period | | $ | 10.11 | |
| | | | |
Total Investment Return† | | | 1.62 | %4 |
Ratios to Average Net Assets/Supplementary Data: | | | | |
Net assets, end of period (000s) | | $ | 1 | |
Gross operating expenses | | | 3.82 | %3,5 |
Net expenses, including fee waivers and reimbursement | | | 0.80 | %3,5 |
Net investment income | | | 8.17 | %3,5 |
Net investment income, excluding the effect of fee waivers and reimbursement | | | 5.15 | %3,5 |
Portfolio turnover rate | | | 4 | %4 |
| † | Total investment return is computed based upon the net asset value of the Fund’s shares and excludes the effects of sales charges or contingent deferred sales charges, if applicable. Distributions are assumed to be reinvested at the net asset value of the Class on the ex-date of the distribution. |
| 1 | Commencement of operations. |
| 2 | Per share amounts presented are based on average shares outstanding throughout the period indicated. |
| 5 | Organization costs were not annualized in the calculation of the income and expense ratios. If these expenses were annualized, the gross and net expense ratios would have been 4.16% and 1.20%, respectively. |
| | | | |
| | | For the Period | |
| | | December 11, | |
| | | 20131 through | |
| Class C | | December 31, 2013 | |
Per Share Operating Performance: | | | | |
Net asset value, beginning of period | | $ | 10.00 | |
| | | | |
Net investment income2 | | | 0.04 | |
Net realized and unrealized gain on investment transactions | | | 0.12 | |
| | | | |
Net increase in net asset value resulting from operations | | | 0.16 | |
| | | | |
Distributions from net investment income | | | (0.05 | ) |
| | | | |
Net asset value, end of period | | $ | 10.11 | |
| | | | |
Total Investment Return† | | | 1.58 | %4 |
Ratios to Average Net Assets/Supplementary Data: | | | | |
Net assets, end of period (000s) | | $ | 1 | |
Gross operating expenses | | | 4.54 | %3,5 |
Net expenses, including fee waivers and reimbursement | | | 1.52 | %3,5 |
Net investment income | | | 7.45 | %3,5 |
Net investment income, excluding the effect of fee waivers and reimbursement | | | 4.43 | %3,5 |
Portfolio turnover rate | | | 4 | %4 |
| † | Total investment return is computed based upon the net asset value of the Fund’s shares and excludes the effects of sales charges or contingent deferred sales charges, if applicable. Distributions are assumed to be reinvested at the net asset value of the Class on the ex-date of the distribution. |
| 1 | Commencement of operations. |
| 2 | Per share amounts presented are based on average shares outstanding throughout the period indicated. |
| 5 | Organization costs were not annualized in the calculation of the income and expense ratios. If these expenses were annualized, the gross and net expense ratios would have been 4.89% and 1.95%, respectively. |
See Notes to Financial Statements.
2013 Annual Report 41
BROOKFIELD U.S. LISTED REAL ESTATE FUND
Financial Highlights
| | | | |
| | | For the Period | |
| | | December 11, | |
| | | 20131 through | |
| Class Y | | December 31, 2013 | |
Per Share Operating Performance: | | | | |
Net asset value, beginning of period | | $ | 10.00 | |
| | | | |
Net investment income2 | | | 0.04 | |
Net realized and unrealized gain on investment transactions | | | 0.12 | |
| | | | |
Net increase in net asset value resulting from operations | | | 0.16 | |
| | | | |
Distributions from net investment income | | | (0.05 | ) |
| | | | |
Net asset value, end of period | | $ | 10.11 | |
| | | | |
Total Investment Return† | | | 1.64 | %4 |
Ratios to Average Net Assets/Supplementary Data: | | | | |
Net assets, end of period (000s) | | $ | 1 | |
Gross operating expenses | | | 3.46 | %3,5 |
Net expenses, including fee waivers and reimbursement | | | 0.44 | %3,5 |
Net investment income | | | 8.54 | %3,5 |
Net investment income, excluding the effect of fee waivers and reimbursement | | | 5.52 | %3,5 |
Portfolio turnover rate | �� | | 4 | %4 |
| † | Total investment return is computed based upon the net asset value of the Fund’s shares and excludes the effects of sales charges or contingent deferred sales charges, if applicable. Distributions are assumed to be reinvested at the net asset value of the Class on the ex-date of the distribution. |
| 1 | Commencement of operations. |
| 2 | Per share amounts presented are based on average shares outstanding throughout the period indicated. |
| 5 | Organization costs were not annualized in the calculation of the income and expense ratios. If these expenses were annualized, the gross and net expense ratios would have been 3.80% and 0.95%, respectively. |
| | | | |
| | | For the Period | |
| | | December 11, | |
| | | 20131 through | |
| Class I | | December 31, 2013 | |
Per Share Operating Performance: | | | | |
Net asset value, beginning of period | | $ | 10.00 | |
| | | | |
Net investment income2 | | | 0.04 | |
Net realized and unrealized gain on investment transactions | | | 0.12 | |
| | | | |
Net increase in net asset value resulting from operations | | | 0.16 | |
| | | | |
Distributions from net investment income | | | (0.05 | ) |
| | | | |
Net asset value, end of period | | $ | 10.11 | |
| | | | |
Total Investment Return† | | | 1.64 | %4 |
Ratios to Average Net Assets/Supplementary Data: | | | | |
Net assets, end of period (000s) | | $ | 25,408 | |
Gross operating expenses | | | 3.59 | %3,5 |
Net expenses, including fee waivers and reimbursement | | | 0.61 | %3,5 |
Net investment income | | | 7.58 | %3,5 |
Net investment income, excluding the effect of fee waivers and reimbursement | | | 4.60 | %3,5 |
Portfolio turnover rate | | | 4 | %4 |
| † | Total investment return is computed based upon the net asset value of the Fund’s shares and excludes the effects of sales charges or contingent deferred sales charges, if applicable. Distributions are assumed to be reinvested at the net asset value of the Class on the ex-date of the distribution. |
| 1 | Commencement of operations. |
| 2 | Per share amounts presented are based on average shares outstanding throughout the period indicated. |
| 5 | Organization costs were not annualized in the calculation of the income and expense ratios. If these expenses were annualized, the gross and net expense ratios would have been 3.93% and 0.95%, respectively. |
See Notes to Financial Statements.
42 Brookfield Investment Management Inc.
BROOKFIELD INVESTMENT FUNDS
Notes to Financial Statements
December 31, 2013
1. Organization
Brookfield Investment Funds (the “Trust”) was organized as a statutory trust under the laws of the State of Delaware on May 12, 2011. The Trust is registered under the Investment Company Act of 1940, as amended (the “1940 Act”), as an open-end management investment company. The Trust consists of four series of underlying portfolios including the Brookfield Global Listed Infrastructure Fund (the “Infrastructure Fund”), the Brookfield Global Listed Real Estate Fund (the “Global Real Estate Fund”), the Brookfield Global High Yield Fund (the “Global High Yield Fund”), and the Brookfield U.S. Listed Real Estate Fund (the “U.S. Real Estate Fund”) (each, a “Fund,” and collectively, the “Funds”). The Infrastructure Fund, Global Real Estate Fund and Global High Yield Fund are each a diversified open-end management investment company and the U.S. Real Estate Fund is a non-diversified open-end management investment company. The U.S. Real Estate Fund commenced operations on December 11, 2013. As of December 31, 2013, the Global High Yield Fund has not yet commenced operations.
The Funds currently have four classes of shares: Class A, Class C, Class Y and Class I shares. Each share represents an interest in the same portfolio of assets and have identical voting, dividend, liquidation and other rights. The assets of all Classes within each Fund have the same rights and are identical in all material respects except that: (i) Class A shares have a maximum front end sales charge of 4.75% and Class C shares have a maximum deferred sales charge of 1.00%; (ii) Class A shares have a 12b-1 fee of 0.25% and Class C shares have a 12b-1 fee of 1.00%; and (iii) each Class has exclusive voting rights with respect to matters relating to its own distribution arrangements. The assets belonging to a particular Fund belong to that Fund for all purposes, and to no other Fund, subject only to the rights of creditors of that Fund.
Brookfield Investment Management Inc. (the “Adviser”), a wholly-owned subsidiary of Brookfield Asset Management Inc., is registered as an investment adviser under the Investment Advisers Act of 1940, as amended (the “Advisers Act”), and serves as investment adviser to the Funds.
The Infrastructure Fund, the Global Real Estate Fund and the U.S. Listed Real Estate Fund each seek total return through growth of capital and current income.
2. Significant Accounting Policies
The preparation of financial statements in conformity with accounting principles generally accepted in the United States of America (“GAAP”) requires management to make estimates and assumptions that affect the reported amounts of assets and liabilities and disclosure of contingent assets and liabilities at the date of the financial statements and the reported amounts of increases and decreases in net assets from operations during the reporting period. Actual results could differ from those estimates.
Valuation of Investments: Investments in equity securities listed or traded on any securities exchange or traded in the over-the-counter market are valued at the last quoted price as of the close of business on the valuation date. Equity securities for which no sales were reported for that date are valued at “fair value” as determined in good faith by the Adviser’s Valuation Committee. Investments in open-end registered investment companies, if any, are valued at the net asset value (“NAV”) as reported by those investment companies.
When price quotations for certain securities are not readily available, or if the available quotations are not believed to be reflective of market value by the Adviser, those securities will be valued at “fair value” as determined in good faith by the Adviser’s Valuation Committee using procedures adopted by and under the supervision of the Fund’s Board of Trustees (the “Board”). There can be no assurance that the Fund could purchase or sell a portfolio security at the price used to calculate the Fund’s NAV.
Fair valuation procedures may be used to value a portion of the assets of each Fund. A Fund may use the fair value of a security to calculate its NAV when, for example, (1) a portfolio security is not traded in a public market or the principal market in which the security trades is closed, (2) trading in a portfolio security is suspended and not
2013 Annual Report 43
BROOKFIELD INVESTMENT FUNDS
Notes to Financial Statements (continued)
December 31, 2013
resumed prior to the normal market close, (3) a portfolio security is not traded in significant volume for a substantial period, or (4) the Adviser determines that the quotation or price for a portfolio security provided by a broker-dealer or an independent pricing service is inaccurate.
The “fair value” of securities may be difficult to determine and thus judgment plays a greater role in the valuation process. The fair valuation methodology may include or consider the following guidelines, as appropriate: (1) evaluation of all relevant factors, including but not limited to, pricing history, current market level, supply and demand of the respective security; (2) comparison to the values and current pricing of securities that have comparable characteristics; (3) knowledge of historical market information with respect to the security; (4) other factors relevant to the security which would include, but not be limited to, duration, yield, fundamental analytical data, the Treasury yield curve, and credit quality.
The values assigned to fair valued investments are based on available information and do not necessarily represent amounts that might ultimately be realized, since such amounts depend on future developments inherent in long-term investments. Changes in the fair valuation of portfolio securities may be less frequent and of greater magnitude than changes in the price of portfolio securities valued at their last sale price, by an independent pricing service, or based on market quotations. Imprecision in estimating fair value can also impact the amount of unrealized appreciation or depreciation recorded for a particular portfolio security and differences in the assumptions used could result in a different determination of fair value, and those differences could be material.
The Board has adopted procedures for the valuation of the Funds’ securities and has delegated the day to day responsibilities for valuation determinations under these procedures to the Adviser. The Board has reviewed and approved the valuation procedures utilized by the Adviser and regularly reviews the application of the procedures to the securities in the Funds’ portfolios. Securities are valued using unadjusted quoted market prices, when available, as supplied primarily by third party pricing services or dealers. If a market value or price cannot be determined for a security or a significant event has occurred that would materially affect the value of the security, the security is fair valued by the Adviser’s Valuation Committee. The Adviser’s Valuation Committee is comprised of senior members of the Adviser’s management team. As of December 31, 2013, there were no securities that were fair valued by the Adviser’s Valuation Committee.
The Funds have established methods of fair value measurements in accordance with GAAP. Fair value denotes the price that a Fund would receive upon selling an investment in a timely transaction to an independent buyer in the principal or most advantageous market of the investment. A three-tier hierarchy has been established to maximize the use of observable market data and minimize the use of unobservable inputs and to establish classification of fair value measurements for disclosure purposes. Inputs refer broadly to the assumptions that market participants would use in pricing the asset or liability, including assumptions about risk, for example, the risk inherent in a particular valuation technique used to measure fair value including such a pricing model and/or the risk inherent in the inputs to the valuation technique. Inputs may be observable or unobservable. Observable inputs are inputs that reflect the assumptions market participants would use in pricing the asset or liability developed based on market data obtained from sources independent of the reporting entity. Unobservable inputs are inputs that reflect the reporting entity’s own assumptions about the assumptions market participants would use in pricing the asset or liability developed based on the best information available in the circumstances. The three-tier hierarchy of inputs is summarized in the three broad levels listed below.
| | • Level 1 - | quoted prices in active markets for identical assets or liabilities |
| | • Level 2 - | quoted prices in markets that are not active or other significant observable inputs (including, but not limited to: quoted prices for similar assets or liabilities, quoted prices based on recently executed transactions, interest rates, credit risk, etc.) |
| | • Level 3 - | significant unobservable inputs (including each Fund’s own assumptions in determining the fair value of assets or liabilities) |
The Adviser’s valuation policy, as previously stated, establishes parameters for the sources and types of valuation analysis, as well as, the methodologies and inputs the Adviser uses in determining fair value, including the use of the Adviser’s Valuation Committee. If the Adviser’s Valuation Committee determines that additional techniques, sources or inputs are appropriate or necessary in a given situation, such additional work will be undertaken.
44 Brookfield Investment Management Inc.
BROOKFIELD INVESTMENT FUNDS
Notes to Financial Statements (continued)
December 31, 2013
Significant increases or decreases in any of the unobservable inputs in isolation may result in a lower or higher fair value measurement.
To assess the continuing appropriateness of security valuations, the Adviser (or its third party service provider, who is subject to oversight by the Adviser), regularly compares one of its prior day prices, prices on comparable securities and sale prices to the current day prices and challenges those prices that exceed certain tolerance levels with the third party pricing service or broker source. For those securities valued by fair valuations, the Adviser’s Valuation Committee reviews and affirms the reasonableness of the valuations based on such methodologies and fair valuation determinations on a regular basis after considering all relevant information that is reasonably available.
The inputs or methodology used for valuing investments are not necessarily an indication of the risk associated with investing in those securities.
Infrastructure Fund
The following table summarizes the Infrastructure Fund’s investments categorized in the disclosure hierarchy as of December 31, 2013:
| | | | | | | | | | | | | | | | |
| Valuation Inputs | | Level 1 | | | Level 2 | | | Level 3 | | | Total | |
Common Stocks: | | | | | | | | | | | | | | | | |
Australia | | $ | — | | | $ | 3,713,527 | | | $ | — | | | $ | 3,713,527 | |
Brazil | | | 4,325,076 | | | | 11,007,736 | | | | — | | | | 15,332,812 | |
Canada | | | 53,829,263 | | | | — | | | | — | | | | 53,829,263 | |
China | | | — | | | | 25,149,724 | | | | — | | | | 25,149,724 | |
France | | | — | | | | 12,257,150 | | | | — | | | | 12,257,150 | |
Hong Kong | | | — | | | | 6,370,818 | | | | — | | | | 6,370,818 | |
Italy | | | — | | | | 18,852,541 | | | | — | | | | 18,852,541 | |
Mexico | | | 1,438,855 | | | | — | | | | — | | | | 1,438,855 | |
Spain | | | — | | | | 16,130,559 | | | | — | | | | 16,130,559 | |
Switzerland | | | — | | | | 7,126,039 | | | | — | | | | 7,126,039 | |
United Kingdom | | | — | | | | 28,707,957 | | | | — | | | | 28,707,957 | |
United States | | | 184,461,544 | | | | — | | | | — | | | | 184,461,544 | |
| | | | | | | | | | | | | | | | |
Total | | $ | 244,054,738 | | | $ | 129,316,051 | | | $ | — | | | $ | 373,370,789 | |
| | | | | | | | | | | | | | | | |
For further information regarding security characteristics, see the Schedule of Investments.
Level 2 securities are fair valued as a result of foreign market movements following the close of local trading. During the year ended December 31, 2013, there were no transfers between Level 1 and Level 2. The basis for recognizing and valuing transfers is as of the end of the period in which transfers occur.
During the year ended December 31, 2013, the Infrastructure Fund did not invest in any level 3 securities.
2013 Annual Report 45
BROOKFIELD INVESTMENT FUNDS
Notes to Financial Statements (continued)
December 31, 2013
Global Real Estate Fund
The following table summarizes the Global Real Estate Fund’s investments categorized in the disclosure hierarchy as of December 31, 2013:
| | | | | | | | | | | | | | | | |
| Valuation Inputs | | Level 1 | | | Level 2 | | | Level 3 | | | Total | |
Common Stocks: | | | | | | | | | | | | | | | | |
Australia | | $ | — | | | $ | 11,571,417 | | | $ | — | | | $ | 11,571,417 | |
Austria | | | — | | | | 1,786,698 | | | | — | | | | 1,786,698 | |
Brazil | | | — | | | | 955,326 | | | | — | | | | 955,326 | |
France | | | — | | | | 4,678,050 | | | | — | | | | 4,678,050 | |
Germany | | | 2,277,613 | | | | 2,502,735 | | | | — | | | | 4,780,348 | |
Hong Kong | | | — | | | | 6,917,763 | | | | — | | | | 6,917,763 | |
Italy | | | — | | | | 1,147,728 | | | | — | | | | 1,147,728 | |
Japan | | | — | | | | 7,951,785 | | | | — | | | | 7,951,785 | |
Netherlands | | | — | | | | 4,397,755 | | | | — | | | | 4,397,755 | |
Norway | | | 2,125,439 | | | | — | | | | — | | | | 2,125,439 | |
Russia | | | — | | | | 2,259,228 | | | | — | | | | 2,259,228 | |
Singapore | | | — | | | | 2,219,614 | | | | — | | | | 2,219,614 | |
United Kingdom | | | 1,458,353 | | | | 2,874,697 | | | | — | | | | 4,333,050 | |
United States | | | 56,540,147 | | | | — | | | | — | | | | 56,540,147 | |
| | | | | | | | | | | | | | | | |
Total | | $ | 62,401,552 | | | $ | 49,262,796 | | | $ | — | | | $ | 111,664,348 | |
| | | | | | | | | | | | | | | | |
For further information regarding security characteristics, see the Schedule of Investments.
Level 2 securities are fair valued as a result of foreign market movements following the close of local trading. During the year ended December 31, 2013, transfers from Level 1 to Level 2 were $1,165,239 and transfers from Level 2 to Level 1 were $2,125,439 due to these market movements. The basis for recognizing and valuing transfers is as of the end of the period in which transfers occur.
During the year ended December 31, 2013, the Global Real Estate Fund did not invest in any Level 3 securities.
U.S. Real Estate Fund
The following table summarizes the U.S. Real Estate Fund’s investments categorized in the disclosure hierarchy as of December 31, 2013:
| | | | | | | | | | | | | | | | |
| Valuation Inputs | | Level 1 | | | Level 2 | | | Level 3 | | | Total | |
Common Stocks | | $ | 25,029,661 | | | $ | — | | | $ | — | | | $ | 25,029,661 | |
| | | | | | | | | | | | | | | | |
Total | | $ | 25,029,661 | | | $ | — | | | $ | — | | | $ | 25,029,661 | |
| | | | | | | | | | | | | | | | |
For further information regarding security characteristics, see the Schedule of Investments.
During the period ended December 31, 2013, there were no transfers. The basis for recognizing and valuing transfers is as of the end of the period in which transfers occur.
During the period ended December 31, 2013, the U.S. Real Estate Fund did not invest in any Level 3 securities.
Investment Transactions and Investment Income: Securities transactions are recorded on the trade date. Realized gains and losses from securities transactions are calculated on the identified cost basis. Interest income is recorded on the accrual basis. Discounts and premiums on securities are accreted and amortized, respectively, on a daily basis, using the effective yield to maturity method adjusted based on management’s assessment of the collectability of such interest. Dividend income is recorded on the ex-dividend date.
46 Brookfield Investment Management Inc.
BROOKFIELD INVESTMENT FUNDS
Notes to Financial Statements (continued)
December 31, 2013
Foreign Currency Transactions: Securities and other assets and liabilities denominated in foreign currencies are translated into U.S. dollar amounts at the date of valuation. Purchases and sales of securities and income and expense items denominated in foreign currencies are translated into U.S. dollar amounts on the respective dates of such transactions. The Funds do not isolate the portion of realized gains or losses resulting from changes in foreign exchange rates on securities from the fluctuations arising from changes in market prices of securities held. The Funds do not isolate the portion of unrealized gains or losses resulting from changes in foreign exchange rates on securities from the fluctuations arising from changes in market prices of securities held.
Reported net realized foreign exchange gains or losses arise from sales of securities, currency gains or losses realized between the trade and settlement dates on securities transactions and the difference between the amounts of dividends, interest and foreign withholding taxes recorded on a Fund’s books and the U.S. dollar equivalent of the amounts actually received or paid.
Taxes: Each Fund intends to continue to meet the requirements of the Internal Revenue Code of 1986, as amended, applicable to regulated investment companies and to distribute substantially all of its taxable income to its shareholders. Therefore, no federal income or excise tax provision is required. Each Fund may incur an excise tax to the extent it has not distributed all of its taxable income on a calendar year basis.
GAAP provides guidance for how uncertain tax positions should be recognized, measured, presented and disclosed in the financial statements. An evaluation of tax positions taken in the course of preparing the Funds’ tax returns to determine whether the tax positions are “more-likely-than-not” of being sustained by the taxing authority is required. Tax benefits of positions not deemed to meet the more-likely-than-not threshold would be booked as a tax expense in the current year and recognized as: a liability for unrecognized tax benefits; a reduction of an income tax refund receivable; a reduction of a deferred tax asset; an increase in a deferred tax liability; or a combination thereof. As of December 31, 2013, each Fund has determined that there are no uncertain tax positions or tax liabilities required to be accrued.
The Funds have reviewed the taxable years open for examination (i.e. not barred by the applicable statute of limitations) by taxing authorities of all major jurisdictions, including the Internal Revenue Service. As of December 31, 2013, open taxable periods consisted of the taxable years ended December 31, 2011 through December 31, 2013 for the Infrastructure Fund and Global Real Estate Fund and for the period December 11, 2013 (commencement of operations) through December 31, 2013 for the U.S. Real Estate Fund. No examination of the Funds’ tax returns is currently in progress.
Expenses: Expenses directly attributable to a Fund are charged directly to that Fund, while expenses which are attributable to more than one Fund are allocated among the respective Funds based upon relative net assets.
Dividends and Distributions: Each Fund declares and pays dividends quarterly from net investment income. Distributions of realized capital gains in excess of capital loss carryforwards are distributed at least annually. Dividends and distributions are recorded on the ex-dividend date. All common shares have equal dividend and other distribution rights. A notice disclosing the source(s) of a distribution will be provided if payment is made from any source other than net investment income. Any such notice would be provided only for informational purposes in order to comply with the requirements of Section 19(a) of the 1940 Act and not for tax reporting purposes. The tax composition of each Funds’ distributions for each calendar year is reported on IRS Form 1099-DIV.
Dividends from net investment income and distributions from realized gains from investment transactions have been determined in accordance with Federal income tax regulations and may differ from net investment income and realized gains recorded by each Fund for financial reporting purposes. These differences, which could be temporary or permanent in nature, may result in reclassification of distributions; however, net investment income, net realized gains and losses and net assets are not affected.
2013 Annual Report 47
BROOKFIELD INVESTMENT FUNDS
Notes to Financial Statements (continued)
December 31, 2013
3. Investment Advisory Agreements and Related Party Transactions
The Adviser currently serves as the investment adviser to each Fund pursuant to separate investment advisory agreements (the “Advisory Agreements”) under which the Adviser is responsible for the management of each Fund’s portfolio and provides the necessary personnel, facilities, equipment and certain other services necessary to the operations of each Fund.
Pursuant to operating expenses limitation agreements (the “Expense Limitation Agreements”), the Adviser has contractually agreed to waive all or a portion of its investment advisory or administration fees, as presented below, and/or to reimburse certain expenses of each Fund to the extent necessary to maintain each Fund’s total annual operating expenses (excluding any front-end or contingent deferred charges, brokerage commissions and other transactional expenses, acquired fund fees and expenses, interest, taxes, and extraordinary expenses, such as litigation; and other expenses not incurred in the ordinary course of a Fund’s business). The Expense Limitation Agreements will continue until at least May 1, 2015 and may not be terminated by the Funds or the Adviser before such time. Thereafter, the Expense Limitation Agreements may only be terminated or amended to increase the expense cap as of May 1st of each calendar year, provided that in the case of a termination by the Adviser, the Adviser will provide the Board of Trustees with written notice of its intention to terminate the arrangement prior to the expiration of its then current term. Pursuant to the Expense Limitation Agreements, the Adviser retains its right to receive reimbursement of any payments made by it, or to recoup any fees waived by it during the prior three years, provided that after giving effect to such repayment or recoupment, such adjusted total annual operating expenses (expressed as a percentage of average net assets) for each Fund would not exceed the percentage limitations listed below.
The Advisory Agreements provide that each Fund shall pay the Adviser a monthly fee at the annual rates stated below of each Fund’s average daily net assets:
| | | | | | |
| | | Annual Advisory
Fee Rate | | Annual Expense
Cap from July 1,
2012 | | Annual Expense
Cap through
June 30, 2012 |
Infrastructure Fund | | | | | | |
Class A | | 0.85% | | 1.35% | | 1.60% |
Class C | | 0.85% | | 2.10% | | 2.35% |
Class Y | | 0.85% | | 1.10% | | 1.35% |
Class I | | 0.85% | | 1.10% | | 1.35% |
Global Real Estate Fund | | | | | | |
Class A | | 0.75% | | 1.20% | | 1.50% |
Class C | | 0.75% | | 1.95% | | 2.25% |
Class Y | | 0.75% | | 0.95% | | 1.25% |
Class I | | 0.75% | | 0.95% | | 1.25% |
U.S. Real Estate Fund | | | | | | |
Class A | | 0.75% | | 1.20%* | | N/A |
Class C | | 0.75% | | 1.95%* | | N/A |
Class Y | | 0.75% | | 0.95%* | | N/A |
Class I | | 0.75% | | 0.95%* | | N/A |
| * | Annual Expense Cap was effective December 11, 2013 (commencement of operations). |
48 Brookfield Investment Management Inc.
BROOKFIELD INVESTMENT FUNDS
Notes to Financial Statements (continued)
December 31, 2013
The amount of investment advisory fees waived and/or expenses reimbursed available to be recouped are listed in the table below:
| | | | | | | | | | | | |
| Fund | | December 31, 2014 | | | December 31, 2015 | | | December 31, 2016 | |
Infrastructure Fund | | $ | 86,563 | | | $ | 380,615 | | | $ | 435,670 | |
Global Real Estate Fund | | | 104,122 | | | | 336,765 | | | | 369,168 | |
U.S. Real Estate Fund | | | — | | | | — | | | | 41,257 | |
For the year ended December 31, 2013, the Funds did not recoup any expenses.
During the year ended December 31, 2013, the Adviser earned the following in investment advisory fees under the Advisory Agreements. Further, under the Expense Limitation Agreements, the Adviser was required to waive its investment advisory fees and/or reimburse the following costs to the Funds:
| | | | | | | | |
| Fund | | Investment
Advisory Fees | | | Waiver and/or Expense Reimbursement | |
Infrastructure Fund | | $ | 2,269,602 | | | $ | 435,670 | |
Global Real Estate Fund | | | 593,715 | | | | 369,168 | |
U.S. Real Estate Fund* | | | 10,367 | | | | 41,257 | |
| * | From the commencement of operations on December 11, 2013. |
Each Fund has entered into separate Administration Agreements with the Adviser. The Adviser has entered into a sub-administration agreement with U.S. Bancorp Fund Services, LLC. The Adviser and the sub-administrator perform administrative services necessary for the operation of the Funds, including maintaining certain books and records of the Funds and preparing reports and other documents required by federal, state and other applicable laws and regulations, and providing the Funds with administrative office facilities. For its services under the Administration Agreements, the Adviser receives from each Fund, respectively, an annual fee equal to 0.15% of its average daily net assets, payable monthly in arrears.
During the year ended December 31, 2013, the Adviser earned the following in Administration fees:
| | | | |
| Fund | | Administration Fees | |
Infrastructure Fund | | $ | 400,518 | |
Global Real Estate Fund | | | 118,743 | |
U.S. Real Estate Fund* | | | 2,073 | |
| * | From the commencement of operations on December 11, 2013. |
Certain officers and/or Trustees of the Trust are officers and/or directors of the Adviser.
4. Purchases and Sales of Investments
Purchases and sales of investments, excluding U.S. Government securities, for the year ended December 31, 2013 were as follows:
| | | | | | | | |
| Fund | | Purchases | | | Sales | |
Infrastructure Fund | | $ | 372,753,323 | | | $ | 165,898,586 | |
Global Real Estate Fund | | | 185,092,129 | | | | 110,613,635 | |
U.S. Real Estate Fund* | | | 25,866,091 | | | | 1,107,862 | |
| * | From the commencement of operations on December 11, 2013. |
2013 Annual Report 49
BROOKFIELD INVESTMENT FUNDS
Notes to Financial Statements (continued)
December 31, 2013
5. Shares of Beneficial Interest
The Trust’s Declaration of Trust authorizes the issuance of an unlimited number of full and fractional shares of beneficial interest. With respect to each series, the Trust may offer more than one class of shares. The Trust reserves the right to create and issue additional series or classes. Each share of a series or class represents an equal proportionate interest in that series or class with each other share of that series or class. Currently, each series offers four classes of shares of beneficial interest — “Class A” Shares, “Class C” Shares, “Class Y” Shares, and “Class I” Shares.
The shares of each series or class participate equally in the earnings, dividends and assets of the particular series or class.
| | | | | | | | | | | | | | | | |
| | | Infrastructure Fund | |
| | | 2013 | | | 2012 | |
| Class A | | Shares | | | Amount | | | Shares | | | Amount | |
Proceeds from shares sold | | | 6,941,185 | | | $ | 88,870,491 | | | | 1,182,160 | | | $ | 13,556,094 | |
Reinvestment of dividends | | | 122,407 | | | | 1,610,457 | | | | 29,709 | | | | 340,164 | |
Cost of shares redeemed | | | (985,809 | ) | | | (12,871,007 | ) | | | (14,073 | ) | | | (162,004 | ) |
Redemption fees | | | — | | | | 20,738 | | | | — | | | | 1,830 | |
| | | | | | | | | | | | | | | | |
Net Increase — Class A | | | 6,077,783 | | | $ | 77,630,679 | | | | 1,197,796 | | | $ | 13,736,084 | |
| | | | | | | | | | | | | | | | |
| |
| | | Infrastructure Fund | |
| | | 2013 | | | 2012 | |
| Class C1 | | Shares | | | Amount | | | Shares | | | Amount | |
Proceeds from shares sold | | | 1,069,393 | | | $ | 13,615,850 | | | | 70,634 | | | $ | 806,137 | |
Reinvestment of dividends | | | 12,080 | | | | 159,183 | | | | 1,154 | | | | 13,163 | |
Cost of shares redeemed | | | (38,467 | ) | | | (504,709 | ) | | | (111 | ) | | | (1,262 | ) |
Redemption fees | | | — | | | | 596 | | | | — | | | | — | |
| | | | | | | | | | | | | | | | |
Net Increase — Class C | | | 1,043,006 | | | $ | 13,270,920 | | | | 71,677 | | | $ | 818,038 | |
| | | | | | | | | | | | | | | | |
| |
| | | Infrastructure Fund | |
| | | 2013 | | | 2012 | |
| Class Y | | Shares | | | Amount | | | Shares | | | Amount | |
Proceeds from shares sold | | | 4,409,818 | | | $ | 56,807,091 | | | | 1,747,882 | | | $ | 20,280,951 | |
Reinvestment of dividends | | | 87,999 | | | | 1,155,818 | | | | 38,987 | | | | 446,797 | |
Cost of shares redeemed | | | (786,599 | ) | | | (10,386,243 | ) | | | (41,128 | ) | | | (472,126 | ) |
Redemption fees | | | — | | | | 2,639 | | | | — | | | | — | |
| | | | | | | | | | | | | | | | |
Net Increase — Class Y | | | 3,711,218 | | | $ | 47,579,305 | | | | 1,745,741 | | | $ | 20,255,622 | |
| | | | | | | | | | | | | | | | |
50 Brookfield Investment Management Inc.
BROOKFIELD INVESTMENT FUNDS
Notes to Financial Statements (continued)
December 31, 2013
| | | | | | | | | | | | | | | | |
| | | Infrastructure Fund | |
| | | 2013 | | | 2012 | |
| Class I | | Shares | | | Amount | | | Shares | | | Amount | |
Proceeds from shares sold | | | 9,690,755 | | | $ | 121,316,138 | | | | 6,459,519 | | | $ | 69,960,669 | |
Reinvestment of dividends | | | 319,389 | | | | 4,173,791 | | | | 157,307 | | | | 1,804,306 | |
Cost of shares redeemed | | | (3,876,351 | ) | | | (47,900,645 | ) | | | (471,251 | ) | | | (5,309,777 | ) |
Redemption fees | | | — | | | | 4,199 | | | | — | | | | — | |
Net Increase — Class I | | | 6,133,793 | | | $ | 77,593,483 | | | | 6,145,575 | | | $ | 66,455,198 | |
| |
| | | Global Real Estate Fund | |
| | | 2013 | | | 2012 | |
| Class A1 | | Shares | | | Amount | | | Shares | | | Amount | |
Proceeds from shares sold | | | 422,265 | | | $ | 5,238,830 | | | | 50,493 | | | $ | 609,156 | |
Reinvestment of dividends | | | 16,226 | | | | 193,549 | | | | 2,811 | | | | 31,868 | |
Cost of shares redeemed | | | (74,647 | ) | | | (923,703 | ) | | | (8 | ) | | | (92 | ) |
Redemption fees | | | — | | | | 611 | | | | — | | | | — | |
Net Increase — Class A | | | 363,844 | | | $ | 4,509,287 | | | | 53,296 | | | $ | 640,932 | |
| |
| | | Global Real Estate Fund | |
| | | 2013 | | | 2012 | |
| Class C1 | | Shares | | | Amount | | | Shares | | | Amount | |
Proceeds from shares sold | | | 64,192 | | | $ | 801,834 | | | | 5,545 | | | $ | 65,518 | |
Reinvestment of dividends | | | 2,928 | | | | 34,794 | | | | 62 | | | | 704 | |
Cost of shares redeemed | | | (2,244 | ) | | | (29,583 | ) | | | (5 | ) | | | (57 | ) |
Net Increase — Class C | | | 64,876 | | | $ | 807,045 | | | | 5,602 | | | $ | 66,165 | |
| |
| | | Global Real Estate Fund | |
| | | 2013 | | | 2012 | |
| Class Y | | Shares | | | Amount | | | Shares | | | Amount | |
Proceeds from shares sold | | | 3,670,381 | | | $ | 45,001,209 | | | | 761,982 | | | $ | 8,921,437 | |
Reinvestment of dividends | | | 172,456 | | | | 2,057,373 | | | | 2,155 | | | | 25,511 | |
Cost of shares redeemed | | | (245,430 | ) | | | (3,013,058 | ) | | | (7,497 | ) | | | (88,583 | ) |
Redemption fees | | | — | | | | 590 | | | | — | | | | — | |
Net Increase — Class Y | | | 3,597,407 | | | $ | 44,046,114 | | | | 756,640 | | | $ | 8,858,365 | |
| |
| | | Global Real Estate Fund | |
| | | 2013 | | | 2012 | |
| Class I | | Shares | | | Amount | | | Shares | | | Amount | |
Proceeds from shares sold | | | 5,555,495 | | | $ | 69,688,972 | | | | 1,885,099 | | | $ | 21,000,001 | |
Reinvestment of dividends | | | 344,270 | | | | 4,122,823 | | | | 228,939 | | | | 2,597,233 | |
Cost of shares redeemed | | | (2,338,489 | ) | | | (29,252,944 | ) | | | (290,798 | ) | | | (3,451,262 | ) |
Redemption fees | | | — | | | | 6,012 | | | | — | | | | — | |
Net Increase — Class I | | | 3,561,276 | | | $ | 44,564,863 | | | | 1,823,240 | | | $ | 20,145,972 | |
2013 Annual Report 51
BROOKFIELD INVESTMENT FUNDS
Notes to Financial Statements (continued)
December 31, 2013
| | | | | | | | |
| | | U.S. Real Estate Fund | |
| | | 20132 | |
| Class A | | Shares | | | Amount | |
Proceeds from shares sold | | | 100 | | | $ | 1,000 | |
Reinvestment of dividends | | | 1 | | | | 5 | |
Cost of shares redeemed | | | — | | | | — | |
| | | | | | | | |
Net Increase — Class A | | | 101 | | | $ | 1,005 | |
| | | | | | | | |
| |
| | | U.S. Real Estate Fund | |
| | | 20132 | |
| Class C | | Shares | | | Amount | |
Proceeds from shares sold | | | 100 | | | $ | 1,000 | |
Reinvestment of dividends | | | 0 | 3 | | | 5 | |
Cost of shares redeemed | | | — | | | | — | |
| | | | | | | | |
Net Increase — Class C | | | 100 | | | $ | 1,005 | |
| | | | | | | | |
| |
| | | U.S. Real Estate Fund | |
| | | 20132 | |
| Class Y | | Shares | | | Amount | |
Proceeds from shares sold | | | 100 | | | $ | 1,000 | |
Reinvestment of dividends | | | 1 | | | | 5 | |
Cost of shares redeemed | | | — | | | | — | |
| | | | | | | | |
Net Increase — Class Y | | | 101 | | | $ | 1,005 | |
| | | | | | | | |
| |
| | | U.S. Real Estate Fund | |
| | | 20132 | |
| Class I | | Shares | | | Amount | |
Proceeds from shares sold | | | 2,500,100 | | | $ | 25,001,000 | |
Reinvestment of dividends | | | 13,471 | | | | 136,870 | |
Cost of shares redeemed | | | — | | | | — | |
| | | | | | | | |
Net Increase — Class I | | | 2,513,571 | | | $ | 25,137,870 | |
| | | | | | | | |
| 1 | Commencement of operations for these Class A and C shares was May 1, 2012. |
| 2 | Commencement of operations was December 11, 2013. |
| 3 | Rounds to less than 1 share. |
52 Brookfield Investment Management Inc.
BROOKFIELD INVESTMENT FUNDS
Notes to Financial Statements (continued)
December 31, 2013
6. Federal Income Tax Information
Income and capital gain distributions are determined in accordance with Federal income tax regulations, which may differ from GAAP.
The tax character of distributions paid for the year ended December 31, 2013 were as follows:
| | | | | | | | | | | | |
| | | Infrastructure Fund | | | Global Real Estate
Fund | | | U.S. Real Estate
Fund* | |
Ordinary income (including any short-term capital gains) | | $ | 7,453,056 | | | $ | 5,730,008 | | | $ | 136,885 | # |
Long-term capital gains | | | 311,468 | | | | 894,227 | | | | — | |
| | | | | | | | | | | | |
Total distributions | | $ | 7,764,524 | | | $ | 6,624,235 | | | $ | 136,885 | |
| | | | | | | | | | | | |
| * | From the commencement of operations on December 11, 2013. |
| # | A portion of this amount ($22,859) relates to a return of capital. |
The tax character of distributions paid for the year ended December 31, 2012 were as follows:
| | | | | | | | |
| | | Infrastructure Fund | | | Global Real
Estate Fund | |
Ordinary income (including any short-term capital gains) | | $ | 2,616,438 | | | $ | 2,628,187 | |
Long-term capital gains | | | — | | | | 27,498 | |
| | | | | | | | |
Total distributions | | $ | 2,616,438 | | | $ | 2,655,685 | |
| | | | | | | | |
At December 31, 2013, each Fund’s most recently completed tax year-end, the components of net assets (excluding paid-in capital) on a tax basis were as follows:
| | | | | | | | | | | | |
| | | Infrastructure Fund | | | Global Real Estate
Fund | | | U.S. Real Estate
Fund* | |
Post-October Loss | | $ | — | | | $ | (362,883 | ) | | $ | — | |
Undistributed net investment income | | | 1,380,218 | | | | 22,136 | | | | — | |
Undistributed Long-term capital gains | | | 2,264,881 | | | | — | | | | | |
Other accumulated losses | | | — | | | | (32,815 | ) | | | (549 | ) |
Book basis unrealized appreciation (depreciation) | | | 47,501,210 | | | | (991,503 | ) | | | 294,016 | |
Plus: Cumulative timing difference | | | — | | | | — | | | | — | |
| | | | | | | | | | | | |
Tax basis unrealized appreciation (depreciation) on investments | | | 47,501,210 | | | | (991,503 | ) | | | 294,016 | |
Total tax basis net accumulated gains (losses) | | $ | 51,146,309 | | | $ | (1,365,065 | ) | | $ | 293,467 | |
| | | | | | | | | | | | |
| * | From the commencement of operations on December 11, 2013. |
As of December 31, 2013, the Funds had no capital loss carryforwards.
Federal Income Tax Basis: The Federal income tax basis of each Fund’s investments, not including foreign currency translations, at December 31, 2013 was as follows:
| | | | | | | | | | | | | | | | |
| Fund | | Cost of Investments | | | Gross Unrealized
Appreciation | | | Gross Unrealized
Depreciation | | | Net Unrealized
Appreciation
(Depreciation) | |
Infrastructure Fund | | $ | 325,869,579 | | | $ | 50,501,405 | | | $ | (3,000,195 | ) | | $ | 47,501,210 | |
Global Real Estate Fund | | | 112,655,851 | | | | 4,655,380 | | | | (5,646,883 | ) | | | (991,503 | ) |
U.S. Real Estate Fund | | | 24,735,645 | | | | 436,271 | | | | (142,255 | ) | | | 294,016 | |
2013 Annual Report 53
BROOKFIELD INVESTMENT FUNDS
Notes to Financial Statements (concluded)
December 31, 2013
Capital Account Reclassifications: Because Federal income tax regulations differ in certain respects from GAAP, income and capital gain distributions, if any, determined in accordance with tax regulations may differ from net investment income and realized gains recognized for financial reporting purposes. These differences are primarily due to differing treatments for wash sales, partnership income/expense and return of capital. Permanent book and tax differences, if any, relating to shareholder distributions will result in reclassifications to paid-in-capital or to undistributed capital gains. These reclassifications have no effect on net assets or NAV per share.
| | | | | | | | | | | | |
| | | Paid-in capital | | | Undistributed
(Distributions in
Excess of) Net
Investment Income | | | Accumulated Net
Realized Gain
(Loss) | |
Infrastructure Fund | | $ | 8,466 | | | $ | 1,073,621 | | | $ | (1,082,087 | ) |
Global Real Estate Fund | | | — | | | | 395,219 | | | | (395,219 | ) |
U.S. Real Estate Fund | | | (22,859 | ) | | | 36,814 | | | | (13,955 | ) |
7. Indemnification
Under the Funds’ organizational documents, its officers and trustees are indemnified against certain liabilities arising out of the performance of their duties to the Funds. In addition, in the normal course of business, the Trust, on behalf of the Funds, enters into contracts with vendors and others that provide for indemnification. The Funds’ maximum exposure under these arrangements is unknown, since this would involve the resolution of certain claims, as well as future claims that may be made, against the Funds. Thus an estimate of the financial impact, if any, of these arrangements cannot be made at this time. However, based on experience, the Funds expect the risk of loss due to these warranties and indemnities to be unlikely.
8. New Accounting Pronouncements
In June 2013, FASB issued Accounting Standards Update 2013-08 Financial Services – Investment Companies (Topic 946) –Amendments to the Scope, Measurement, and Disclosure Requirements (“ASU 2013-08”) which is effective for interim and annual reporting periods in fiscal years that begin after December 15, 2013. ASU 2013-08 sets forth a methodology for determining whether an entity should be characterized as an investment company and prescribes fair value accounting for an investment company’s non-controlling ownership interest in another investment company. FASB has determined that a fund registered under the Investment Company Act of 1940 automatically meets ASU 2013-08’s criteria for an investment company. Although still evaluating the potential impacts of ASU 2013-08 to the fund, management expects that the impact of the fund’s adoption will be limited to additional financial statement disclosures.
9. Subsequent Events
GAAP requires recognition in the financial statements of the effects of all subsequent events that provide additional evidence about conditions that existed at the date of the Statements of Assets and Liabilities. For non-recognized subsequent events that must be disclosed to keep the financial statements from being misleading, the Funds are required to disclose the nature of the event as well as an estimate of their financial effect, or a statement that such an estimate cannot be made.
Management has evaluated subsequent events in the preparation of the Funds’ financial statements and has determined that herein, there are no events that require recognition or disclosure in the financial statements.
54 Brookfield Investment Management Inc.
BROOKFIELD INVESTMENT FUNDS
Report of Independent Registered Public Accounting Firm
December 31, 2013
To the Shareholders of Brookfield Global Listed Infrastructure Fund,
Brookfield Global Listed Real Estate Fund and Brookfield U.S. Listed Real Estate Fund
and Board of Trustees of Brookfield Investment Funds:
We have audited the accompanying statements of assets and liabilities, including the schedules of investments, of Brookfield Global Listed Infrastructure Fund, Brookfield Global Listed Real Estate Fund and Brookfield U.S. Listed Real Estate Fund (the “Funds”), three of the four series comprising the Brookfield Investment Funds as of December 31, 2013, the related statements of operations for the year then ended (as to Brookfield U.S. Listed Real Estate Fund, for the period December 11, 2013 (commencement of operations) through December 31, 2013), the statements of changes in net assets for each of the two years in the period then ended (as to Brookfield U.S. Listed Real Estate Fund, for the period December 11, 2013 (commencement of operations) through December 31, 2013) and the financial highlights for each of the periods presented. These financial statements and financial highlights are the responsibility of the Funds’ management. Our responsibility is to express an opinion on these financial statements and financial highlights based on our audits.
We conducted our audits in accordance with the standards of the Public Company Accounting Oversight Board (United States). Those standards require that we plan and perform the audit to obtain reasonable assurance about whether the financial statements and financial highlights are free of material misstatement. The Funds are not required to have, nor were we engaged to perform, an audit of their internal control over financial reporting. Our audits included consideration of internal control over financial reporting as a basis for designing audit procedures that are appropriate in the circumstances, but not for the purpose of expressing an opinion on the effectiveness of the Funds’ internal control over financial reporting. Accordingly, we express no such opinion. An audit also includes examining, on a test basis, evidence supporting the amounts and disclosures in the financial statements, assessing the accounting principles used and significant estimates made by management, as well as evaluating the overall financial statement presentation. Our procedures included confirmation of securities owned as of December 31, 2013, by correspondence with the custodian and brokers. We believe that our audits provide a reasonable basis for our opinion.
In our opinion, the financial statements and financial highlights referred to above present fairly, in all material respects, the financial position of Brookfield Global Listed Infrastructure Fund, Brookfield Global Listed Real Estate Fund and Brookfield U.S. Listed Real Estate Fund of the Brookfield Investment Funds as of December 31, 2013, and the results of their operations, the changes in their net assets and the financial highlights for each of the periods presented, in conformity with accounting principles generally accepted in the United States of America.
DELOITTE & TOUCHE LLP
Philadelphia, Pennsylvania
February 27, 2014
2013 Annual Report 55
BROOKFIELD INVESTMENT FUNDS
Tax Information (Unaudited)
December 31, 2013
QUALIFIED DIVIDEND INCOME/DIVIDENDS RECEIVED DEDUCTION
For the year ended December 31, 2013, certain dividends paid by the Funds may be subject to a maximum tax rate of 15%, as provided for by the jobs and Growth Tax Relief Reconciliation Act of 2003. The percentage of dividends declared from ordinary income designated as qualified dividend income was as follows:
| | | | |
Infrastructure Fund | | | 93.65 | % |
Global Real Estate Fund | | | 22.24 | % |
U.S. Real Estate Fund | | | 10.97 | % |
For corporate shareholders, the percentage of ordinary distributions qualifying for the corporate dividends received deductions for the year ended December 31, 2013, was as follows:
| | | | |
Infrastructure Fund | | | 24.50 | % |
Global Real Estate Fund | | | 2.00 | % |
U.S. Real Estate Fund | | | 8.00 | % |
The percentage of taxable ordinary income distributions that are designated as short-term capital gain distributions under the Internal Revenue Section 871(k)(2)(C) for each Fund was as follows:
| | | | |
Infrastructure Fund | | | 34.89 | % |
Global Real Estate Fund | | | 64.46 | % |
U.S. Real Estate Fund | | | — | |
56 Brookfield Investment Management Inc.
BROOKFIELD INVESTMENT FUNDS
Information Concerning Trustees and Officers (Unaudited)
The following tables provide information concerning the trustees and officers of the Funds.
Trustees of the Fund
| | | | | | |
Name, Address and Year
of Birth | | Position(s) Held with Funds
and Term of Office and
Length of Time Served | | Principal Occupation(s) During Past 5 Years and Other Directorships Held by Trustee | | Number of Portfolios
in Fund Complex
Overseen by Trustee |
Independent Trustees | | | | | | |
| | | |
Rodman L. Drake
c/o Brookfield Place, 250 Vesey Street, New York, New York 10281-1023
Born: 1943 | | Trustee and Chairman of the Board, Member of the Audit Committee, Member of the Nominating and Compensation Committee Since 2011 | | Chairman and Director/Trustee of several investment companies advised by the Adviser (1989-Present); Director and/or Lead Director of Crystal River Capital, Inc. (2005-2010); Chairman of the Board (2005-2010); Interim President and Chief Executive Officer of Crystal River Capital, Inc. (2009-2010); Director of Celgene Corporation (2006-Present); Director of Chimerix Corporation (2013-Present); Director of Student Loan Corporation (2005-2010); Director of Apex Silver Mines Limited (2007-2009); Co-founder of Baringo Capital LLC (2002-Present); Director of Jackson Hewitt Tax Services Inc. (2004-2011); Director of Animal Medical Center (2002-Present); Trustee of Columbia Atlantic Funds (2007-2009); Chairman of Columbia Atlantic Funds (2009-Present). | | 12 |
| | | |
Edward A. Kuczmarski c/o Brookfield Place, 250 Vesey Street, New York, New York 10281-1023 Born: 1949 | | Trustee, Member of the Audit Committee, Chairman of the Nominating and Compensation Committee Since 2011 | | Certified Public Accountant and Retired Partner of Crowe Horwath LLP (formerly Hays & Company LLP before merger in 2009) (1980-2013); Director of ISI Funds (2007-Present); Trustee of the Daily Income Fund (2006- Present); Director of the California Daily Tax Free Income Fund, Inc. (2006-Present). | | 11 |
| | | |
Louis P. Salvatore
c/o Brookfield Place, 250 Vesey Street, New York, New York 10281-1023 Born: 1946 | | Trustee, Chairman of the Audit Committee, Member of the Nominating and Compensation Committee Since 2011 | | Director of SP Fiber Technologies, Inc. (2012-Present); Director of Chambers Street Properties (2012-Present); Director/Trustee of several investment companies advised by the Adviser (2005-Present); Director of Crystal River Capital, Inc. (2005-2010); Director of Turner Corp. (2003-Present); Director of Jackson Hewitt Tax Services, Inc. (2004-2011); Employee of Arthur Andersen LLP (2002-Present). | | 12 |
| | | |
Stuart A. McFarland
c/o Brookfield Place,
250 Vesey Street, New York, New York 10281-1023 Born: 1947 | | Trustee, Member of the Audit Committee, Member of the Nominating and Compensation Committee Since 2011 | | Director/Trustee of several investment companies advised by the Adviser (2006-Present); Director of United Guaranty Corporation (2011-Present); Director of Brandywine Funds (2003-2013); Director of New Castle Investment Corp. (2000-Present); Managing Partner of Federal City Capital Advisors (1997-Present). | | 12 |
2013 Annual Report 57
BROOKFIELD INVESTMENT FUNDS
Information Concerning Trustees and Officers (Unaudited) (continued)
Trustees of the Fund (continued)
| | | | | | |
Name, Address and Year
of Birth | | Position(s) Held with Funds
and Term of Office and
Length of Time Served | | Principal Occupation(s) During Past 5 Years and Other Directorships Held by Trustee | | Number of Portfolios
in Fund Complex
Overseen by Trustee |
Interested Trustees | | | | | | |
| | | |
Kim G. Redding
c/o Brookfield Place,
250 Vesey Street, New York, New York
10281-1023 Born: 1955 | | Trustee Since 2011 | | President of several investment companies advised by the Adviser (2010-Present); Chief Investment Strategist of Brookfield Asset Management Inc. (2013-Present); Co-Chief Investment Officer of the Adviser (2010-Present); Director of Brookfield Investment Management (UK) Limited (2011-Present); Director and Chairman of the Board of Directors of Brookfield Investment Management (Canada) Inc. (2011- Present); Chief Executive Officer of the Adviser (2009-2013); Director of Brookfield Investment Funds (UCITS) plc (2011-Present); Director of Brookfield Investment Funds (QIF) PLC (2011-Present); Founder and Chief Executive Officer of Brookfield Redding LLC (2007-2009). | | 11 |
| | | |
Heather Goldman
c/o Brookfield Place,
250 Vesey Street, New York, New York
10281-1023 Born: 1967 | | Trustee Since 2011 | | Director/Trustee of several investment companies advised by the Adviser (2013-Present); Global Head of Marketing and Business Development of the Adviser (2011-2013); Managing Partner of Brookfield Financial (2009-2011); Head of Investor Relations of Starwood Capital Group Global (2007-2009). | | 12 |
58 Brookfield Investment Management Inc.
BROOKFIELD INVESTMENT FUNDS
Information Concerning Trustees and Officers (Unaudited) (continued)
Officers of the Fund
| | | | | | |
Name, Address and Year of Birth | | Position(s) Held
with Funds | | Term of Office and
Length of Time
Served | | Principal Occupation(s) During Past 5 Years |
Kim G. Redding*
c/o Brookfield Place,
250 Vesey Street, New York, New York 10281-1023 Born: 1955 | | President | | Since 2011 | | President of several investment companies advised by the Adviser (2010-Present); Chief Investment Strategist of Brookfield Asset Management Inc. (2013-Present); Co-Chief Investment Officer of the Adviser (2010-Present); Director of Brookfield Investment Management (UK) Limited (2011-Present); Director and Chairman of the Board of Directors of Brookfield Investment Management (Canada) Inc. (2011- Present); Chief Executive Officer of the Adviser (2009-2013); Director of Brookfield Investment Funds (UCITS) plc (2011-Present); Director of Brookfield Investment Funds (QIF) PLC (2011-Present); Founder and Chief Executive Officer of Brookfield Redding LLC (2007-2009). |
| | | |
Jonathan C. Tyras*
c/o Brookfield Place,
250 Vesey Street, New York, New York 10281-1023 Born: 1968 | | Vice President | | Since 2011 | | Managing Director and Chief Financial Officer of the Adviser (2010-Present); General Counsel and Secretary of the Adviser (2006-Present); Vice President and General Counsel (2006-2010) and Secretary (2007-2010) of Crystal River Capital, Inc.; Secretary of several investment companies advised by the Adviser (2006-Present); Chief Financial Officer of Brookfield Investment Management (UK) Limited (2011-Present); Chief Financial Officer of Brookfield Investment Management (Canada) Inc. (2011-Present); Chief Executive Officer of Brookfield Investment Management (US) LLC (2011-Present); Vice President of Brookfield Investment Funds (2011-Present); Managing Director of AMP Capital Brookfield Pty Limited (2011-2012). |
| | | |
Angela W. Ghantous*
c/o Brookfield Place,
250 Vesey Street, New York, New York 10281-1023 Born: 1975 | | Treasurer | | Since 2012 | | Treasurer of several investment companies advised by the Adviser (2012-Present); Director of the Adviser (2012- Present); Vice President of the Adviser (2009-2012); Controller of Brookfield Redding LLC (2007-2009). |
| | | |
Brian F. Hurley*
c/o Brookfield Place,
250 Vesey Street, New York, New York 10281-1023 Born: 1977 | | Secretary | | Since 2011 | | Director and Assistant General Counsel of the Adviser (2010-Present); Attorney at Paul Hastings LLP (2002-2010). |
| | | |
Seth Gelman*
c/o Brookfield Place,
250 Vesey Street, New York, New York 10281-1023 Born: 1975 | | Chief Compliance Officer (“CCO”) | | Since 2011 | | CCO of several investment companies advised by the Adviser (2009-Present); Director and CCO of the Adviser (2009-Present); Vice President, Oppenheimer Funds, Inc. (2004-2009). |
| * | Interested person as defined by the Investment Company Act of 1940, as amended (the “1940 Act”) because of affiliations with Brookfield Investment Management Inc., Adviser of the Fund. |
The Fund’s Statement of Additional Information includes additional information about the directors and is available, without charge, upon request by calling 1-855-777-8001.
2013 Annual Report 59
BROOKFIELD INVESTMENT FUNDS
Board Considerations Relating to the Investment Advisory Agreement (Unaudited)
December 31, 2013
At an in-person meeting held on August 22, 2013, the Board, including a majority of the Trustees who are not considered to be “interested persons” of the Trust (the “Independent Trustees”) under the Investment Company Act of 1940 (the “1940 Act”), initially approved the Trust’s advisory agreement (the “Advisory Agreement”) with Brookfield Investment Management Inc. (the “Adviser”) for the Brookfield U.S. Listed Real Estate Fund, a new series of the Trust (the “Fund”).
In considering the Advisory Agreement, the Board reviewed information provided by the Adviser relating to the Fund and the Adviser, and other information regarding the nature, extent and quality of services to be provided by the Adviser under the Advisory Agreement, as more fully discussed below.
The Independent Trustees were separately advised by independent legal counsel throughout the process. Prior to voting to approve the Advisory Agreement at the meeting held on August 22, 2013, the Independent Trustees also received a memorandum from their independent legal counsel discussing the legal standards for their consideration of the proposed initial approval of the Advisory Agreement. The Board also received information from the Adviser regarding the Fund at a special telephonic meeting held on July 24, 2013, during which representatives of the Adviser responded to questions from the Independent Trustees.
In considering whether to approve the Advisory Agreement, the Board reviewed and analyzed the factors it deemed relevant, including: (1) the nature, extent and quality of the services to be provided to the Fund by the Adviser; (2) the Adviser’s personnel and operations; (3) the level and method of computing the Fund’s proposed advisory fees; (4) any “fall-out” benefits to the Adviser and its affiliates (i.e., ancillary benefits realized by the Adviser or its affiliates from the Adviser’s relationship with the Trust); and (5) the anticipated effect of growth in size on the Fund’s performance and expenses.
Nature, extent and quality of services. In considering the nature, extent and quality of the services to be provided by the Adviser to the Fund, the Board took into account the extensive responsibilities that the Adviser would have as investment adviser to the Fund, including the provision of investment advisory services to the Fund, compliance with the Fund’s policies and objective, review of brokerage matters including with respect to trade allocation and best execution, oversight of general fund compliance with federal and state laws, and the implementation of Board directives as they relate to the Fund. The Board also considered the Adviser’s risk management processes and the Adviser’s role in coordinating the activities of the Fund’s other service providers. The Board considered the Adviser’s current level of staffing and its overall resources. The Board reviewed the Adviser’s history and investment experience, as well as information regarding the Adviser’s investment personnel who would be providing services to the Fund. The Board also evaluated the expertise and performance of the personnel who would be overseeing the compliance with the Fund’s investment restrictions, tax and other requirements. The Board further took into account its knowledge of the Adviser’s management and the quality of services the Adviser provided to other funds of the Trust, through Board meetings, discussions and reports during the preceding year.
The Board also recognized the Adviser’s reputation and experience in serving as an investment adviser to the Trust. The Board considered the Adviser’s investment process and philosophy. The Board took into account that the Adviser’s responsibilities would include the development and maintenance of an investment program for the Fund which would be consistent with the Fund’s investment objective, the selection of investment securities and the placement of orders for the purchase and sale of such securities, as well as the implementation of compliance controls related to performance of these services.
Based on its consideration and review of the foregoing information, the Board concluded that the nature, extent and quality of services to be provided by the Adviser were satisfactory and that there was a reasonable basis on which to conclude that it would provide a high quality of investment services to the Fund.
Performance. While the Fund had not yet commenced operations, the Board did consider the Fund’s investment policies and strategy. In addition, the Board considered the performance of other funds managed by the Fund’s portfolio managers.
60 Brookfield Investment Management Inc.
BROOKFIELD INVESTMENT FUNDS
Board Considerations Relating to the Investment Advisory Agreement (Unaudited) (continued)
December 31, 2013
Fees and expenses. The Board considered the proposed management fee payable under the Advisory Agreement, and took into account that the proposed fee was consistent with the management fee charged by the Adviser to the other comparable series of the Trust and were in line with a relevant peer group. The Board noted that the Fund’s proposed management fee included both advisory and administrative fees.
The Board also considered that the Adviser had agreed to enter into an expense limitation agreement with the Fund, pursuant to which the Adviser would agree to waive a portion of its management fee and/or reimburse certain expenses as a means of limiting the Fund’s total annual operating expenses. The Board concluded that the contract rate advisory fee and total fund expenses for the Fund were reasonable.
Profitability. As the Fund had not commenced operation, the Board did not consider the anticipated profitability of the Adviser with respect to the Fund. However, the Board specifically noted that the Adviser agreed to enter into a contractual expense waiver for the Fund, in order to limit the Fund’s net operating expenses.
Economies of scale. The Board also considered the probable effect of the Fund’s growth in size on its performance and fees. The Board also noted that if the Fund’s assets increase over time, the Fund may realize other economies of scale if assets increase proportionally more than certain other fixed expenses. The Board noted the Fund’s expense limitation agreement with the Adviser served to limit the Fund’s expenses until the Fund had the opportunity to grow its assets. The Board concluded that the proposed advisory fee structure for the Fund was reasonable at this time.
Other factors. As part of its evaluation of the Adviser’s compensation, the Board considered other benefits that may be realized by the Adviser and its affiliates from their relationship with the Trust. Among them, the Board recognized the opportunity to provide advisory services to additional portfolios of the Trust and reputational benefits. The Board concluded that the benefits that may accrue to the Adviser and its affiliates by virtue of the Adviser’s relationship to the Fund were fair and reasonable in light of the anticipated costs of providing investment advisory services to the Fund and the ongoing commitment of the Adviser to the Fund.
Conclusion. In considering the initial approval of the Advisory Agreement, the Board, including the Independent Trustees, did not identify any single factor as controlling, and each Trustee may have attributed different weights to various factors. Based on all of the above-mentioned considerations, and the recommendations of management, the Board, including a majority of the Independent Trustees, determined that approval of the Advisory Agreement was in the best interests of the Fund. After full consideration of these and other factors, the Board, including a majority of the Independent Trustees, with the assistance of independent legal counsel, approved the Advisory Agreement with respect to the Fund.
2013 Annual Report 61
BROOKFIELD INVESTMENT FUNDS
Joint Notice of Privacy Policy (Unaudited)
Brookfield Investment Management Inc. (“BIM”), on its own behalf and on behalf of the funds managed by BIM and its affiliates, recognizes and appreciates the importance of respecting the privacy of our clients and shareholders. Our relationships are based on integrity and trust and we maintain high standards to safeguard your non-public personal information (“Personal Information”) at all times. This privacy policy (“Policy”) describes the types of Personal Information we collect about you, the steps we take to safeguard that information and the circumstances in which it may be disclosed.
If you hold shares of a Fund through a financial intermediary, such as a broker, investment adviser, bank or trust company, the privacy policy of your financial intermediary will also govern how your Personal Information will be shared with other parties.
WHAT INFORMATION DO WE COLLECT?
We collect the following Personal Information about you:
| | • | | Information we receive from you in applications or other forms, correspondence or conversations, including but not limited to name, address, phone number, social security number, assets, income and date of birth. |
| | • | | Information about transactions with us, our affiliates, or others, including but not limited to account number, balance and payment history, parties to transactions, cost basis information, and other financial information. |
| | • | | Information we may receive from our due diligence, such as your creditworthiness and your credit history. |
WHAT IS OUR PRIVACY POLICY?
We may share your Personal Information with our affiliates in order to provide products or services to you or to support our business needs. We will not disclose your Personal Information to nonaffiliated third parties unless 1) we have received proper consent from you; 2) we are legally permitted to do so; or 3) we reasonably believe, in good faith, that we are legally required to do so. For example, we may disclose your Personal Information with the following in order to assist us with various aspects of conducting our business, to comply with laws or industry regulations, and/or to effect any transaction on your behalf;
| | • | | Unaffiliated service providers (e.g. transfer agents, securities broker-dealers, administrators, investment advisors or other firms that assist us in maintaining and supporting financial products and services provided to you); |
| | • | | Government agencies, other regulatory bodies and law enforcement officials (e.g. for reporting suspicious transactions); |
| | • | | Other organizations, with your consent or as directed by you; and |
| | • | | Other organizations, as permitted or required by law (e.g. for fraud protection) |
When we share your Personal Information, the information is made available for limited purposes and under controlled circumstances designed to protect your privacy. We require third parties to comply with our standards for security and confidentiality.
HOW DO WE PROTECT CLIENT INFORMATION?
We restrict access to your Personal Information to those persons who require such information to assist us with providing products or services to you. It is our practice to maintain and monitor physical, electronic, and procedural safeguards that comply with federal standards to guard client nonpublic personal information. We regularly train our employees on privacy and information security and on their obligations to protect client information.
CONTACT INFORMATION
For questions concerning our Privacy Policy, please contact our client services representative at 1-855-777-8001.
62 Brookfield Investment Management Inc.
CORPORATE INFORMATION
| | |
| Investment Adviser and Administrator | | Independent Registered Public Accounting Firm |
| Brookfield Investment Management Inc. | | Deloitte & Touche LLP |
| Brookfield Place | | 1700 Market Street |
| 250 Vesey Street, 15th Floor | | Philadelphia, Pennsylvania 19103 |
New York, New York 10281-1023 www.brookfieldim.com | | Legal Counsel |
| | Paul Hastings LLP |
| Please direct your inquiries to: | | 75 East 55th Street |
| Investor Relations | | New York, New York 10022 |
| Phone: 1-855-777-8001 | | |
| E-mail: funds@brookfield.com | | Custodian |
| | U.S. Bank National Association |
| Transfer Agent | | 1555 North River Center Drive, Suite 302 |
| Shareholder inquiries relating to distributions, address | | Milwaukee, Wisconsin 53212 |
changes and shareholder account information should be directed to the Funds’ transfer agent: | | Distributor |
| | Quasar Distributors, LLC |
| U.S. Bancorp Fund Services, LLC | | 615 East Michigan Street |
| 615 East Michigan Street | | Milwaukee, Wisconsin 53202 |
| Milwaukee, Wisconsin 53202 | | |
| 1-855-244-4859 | | |
| |
| Fund Accounting Agent | | |
| U.S. Bancorp Fund Services, LLC | | |
| 615 East Michigan Street | | |
| Milwaukee, Wisconsin 53202 | | |
| |
| Sub-Administrator | | |
| U.S. Bancorp Fund Services, LLC | | |
| 1201 South Alma School Road, Suite 3000 | | |
| Mesa, Arizona 85210 | | |
The Funds file their complete schedule of portfolio holdings with the SEC for the first and third quarters of each fiscal year on Form N-Q. The Funds’ Form N-Q will be available on the SEC’s website at www.sec.gov. In addition, the Funds’ Form N-Q may be reviewed and copied at the SEC’s Public Reference Room in Washington, D.C. Information on the operation of the Public Reference Room may be obtained by calling 1-800-SEC-0330.
You may obtain a description of the Funds’ proxy voting policies and procedures, and information regarding how the Funds voted proxies relating to portfolio securities during the most recent 12-month period ended June 30, without charge, upon request by calling 1-855-777-8001, or go to the SEC’s website at www.sec.gov.

Item 2. Code of Ethics.
As of the end of the period covered by this report, the Registrant had adopted a Code of Ethics for Principal Executive and Principal Financial Officers (the “Code”). There were no amendments to or waivers from the Code during the period covered by this report. A copy of the Registrant’s Code will be provided upon request to any person without charge by contacting Investor Relations at (855) 777-8001 or by writing to Secretary, Brookfield Investment Funds, Brookfield Place, 250 Vesey Street, 15th Floor, New York, NY 10281-1023.
Item 3. Audit Committee Financial Expert.
The Registrant’s Board of Trustees has determined that three members serving on the Registrant’s audit committee are audit committee financial experts and they are Messrs. Rodman L. Drake, Edward A. Kuczmarski, Stuart A. McFarland and Louis P. Salvatore. Messrs. Rodman L. Drake, Edward A. Kuczmarski, Stuart A. McFarland and Louis P. Salvatore are each independent.
Item 4. Principal Accountant Fees and Services.
Audit Fees
For each fiscal years ended December 31, 2013 and December 31, 2012, Deloitte & Touche LLP billed the Registrant aggregate fees of $107,000 and $158,000, respectively. Each bill is for professional services rendered for the audit of the Registrant’s annual financial statements and the review of financial statements that are included in the Registrant’s annual and semi-annual reports to shareholders.
Tax Fees
For each fiscal years ended December 31, 2013 and December 31, 2012, Deloitte & Touche LLP billed the Registrant aggregate fees of $13,000 and $6,000, respectively. Each bill is for professional services rendered for tax compliance, tax advice and tax planning. The nature of the services comprising the Tax Fees was the review of the Registrant’s income tax returns and tax distribution requirements.
Audit-Related Fees
For the fiscal years ended December 31, 2013 and December 31, 2012, the Audit-related fees were $0 and $4,397, respectively.
All Other Fees
For the fiscal years ended December 31, 2013 and December 31, 2012, there were no Other Fees.
Item 5. Audit Committee of Listed Registrants.
Not applicable.
Item 6. Schedule of Investments.
Please see Item 1.
Item 7. Disclosure of Proxy Voting Policies and Procedures for Closed-End Management Investment Companies.
Not applicable.
Item 8. Portfolio Managers of Closed-End Management Investment Companies.
Not applicable.
Item 9. Purchases of Equity Securities by Closed-End Management Investment Company and Affiliated Purchasers.
Not applicable.
Item 10. Submission of Matters to a Vote of Security Holders.
Not applicable.
Item 11. Controls and Procedures.
(a) The Registrant’s principal executive officer and principal financial officer have concluded that the Registrant’s Disclosure Controls and Procedures are effective, based on their evaluation of such Disclosure Controls and Procedures as of a date within 90 days of the filing of this report on Form N-CSR.
(b) As of the date of filing this Form N-CSR, the Registrant’s principal executive officer and principal financial officer are aware of no changes in the Registrant’s internal control over financial reporting that occurred during the Registrant’s second fiscal quarter of the period covered by this report that has materially affected or is reasonably likely to materially affect the Registrant’s internal control over financial reporting.
Item 12. Exhibits.
(a)(1) None.
(2) A separate certification for each principal executive officer and principal financial officer of the Registrant as required by Rule 30a-2(a) under the Investment Company Act of 1940 is attached as an exhibit to this Form N-CSR.
(3) None.
(b) A separate certification for each principal executive officer and principal financial officer of the Registrant as required by Rule 30a-2(b) under the Investment Company Act of 1940 is attached as an exhibit to this Form N-CSR.
SIGNATURES
Pursuant to the requirements of the Securities Exchange Act of 1934 and the Investment Company Act of 1940, the Registrant has duly caused this report to be signed on its behalf by the undersigned, thereunto duly authorized.
| | |
| BROOKFIELD INVESTMENT FUNDS |
| |
| By: | | /s/ Kim G. Redding |
| | Kim G. Redding President and Principal Executive Officer |
Date: March 7, 2014
Pursuant to the requirements of the Securities Exchange Act of 1934 and the Investment Company Act of 1940, this report has been signed below by the following persons on behalf of the Registrant and in the capacities and on the dates indicated.
| | |
| By: | | /s/ Kim G. Redding |
| | Kim G. Redding President and Principal Executive Officer |
Date: March 7, 2014
| | |
| |
| By: | | /s/ Angela W. Ghantous |
| | Angela W. Ghantous Treasurer and Principal Financial Officer |
Date: March 7, 2014