UNITED STATES
SECURITIES AND EXCHANGE COMMISSION
Washington, D.C. 20549
FORM N-CSR
CERTIFIED SHAREHOLDER REPORT OF REGISTERED
MANAGEMENT INVESTMENT COMPANIES
Investment Company Act file number 811-22564
GMO Series Trust
(Exact name of the registrant as specified in charter)
| | |
| 40 Rowes Wharf, Boston, MA | | 02110 |
| (Address of principal executive offices) | | (Zip Code) |
Sheppard N. Burnett, Chief Executive Officer, 40 Rowes Wharf, Boston, MA 02110
(Name and address of agent for services)
Registrant’s telephone number, including area code: 617-346-7646
Date of fiscal year end: 02/29/16
Date of reporting period: 02/29/16
Item 1. Reports to Stockholders.
The annual reports for each series of the registrant for the period ended February 29, 2016 are filed herewith.
GMO Series Trust
Annual Report
February 29, 2016
Benchmark-Free Allocation Series Fund
Emerging Countries Series Fund
Global Asset Allocation Series Fund
Global Equity Allocation Series Fund
International Developed Equity Allocation Series Fund
International Equity Allocation Series Fund
For a free copy of the Funds’ proxy voting guidelines, shareholders may call 1-617-346-7646 (collect) or visit the Securities and Exchange Commission’s website at www.sec.gov. Information regarding how the Funds voted proxies relating to portfolio securities during the most recent 12-month period ended June 30 is available on GMO’s website www.dc.gmo.com, or on the Securities and Exchange Commission’s website at www.sec.gov.
The Funds file their complete schedule of portfolio holdings with the Securities and Exchange Commission for the first and third quarter of each fiscal year on Form N-Q, which is available on the Commission’s website at www.sec.gov. The Funds’ Form N-Q may be reviewed and copied at the Commission’s Public Reference Room in Washington, D.C. Information on the operation of the Public Reference Room may be obtained by calling 1-800-SEC-0330.
This report is prepared for the general information of shareholders. It is authorized for distribution to prospective investors only when preceded or accompanied by a prospectus for GMO Series Trust, which contains a complete discussion of the risks associated with an investment in these Funds and other important information. The GMO Series Trust prospectus can be obtained at www.dc.gmo.com.
An investment in the Funds is subject to risk, including the possible loss of the principal amount invested. There can be no assurance that the Funds will achieve the stated investment objectives. Please see the Funds’ prospectus regarding specific risks for each Fund. General risks may include: market risk, management and operational risk, non-U.S. investment risk, smaller company risk and derivatives risk.
The Funds are distributed by Funds Distributor LLC. Funds Distributor LLC is not affiliated with GMO.
TABLE OF CONTENTS
GMO Benchmark-Free Allocation Series Fund
(A Series of GMO Series Trust)
Portfolio Management
Day-to-day management of the Fund’s portfolio is the responsibility of the Asset Allocation Team at Grantham, Mayo, Van Otterloo & Co. LLC.
Management Discussion and Analysis of Fund Performance
Although GMO does not manage the Fund to, or control the Fund’s risk relative to, any securities index or securities benchmark, a discussion of the Fund’s performance relative to the Consumer Price Index (“CPI���) is included for comparative purposes only.
Class R6 shares of GMO Benchmark-Free Allocation Series Fund returned -11.48% (net) for the fiscal year ended February 29, 2016, as compared with +1.07% for the CPI.
The Fund’s exposures to emerging market and European value equities, cross-sectional interest rates and FX positions (primarily Euro rate exposures), and select fundamentally researched international developed equity holdings contributed to the negative performance. The Fund’s exposure to U.S. fundamentally researched equities and TIPS positively contributed to performance.
The views expressed herein are exclusively those of Grantham, Mayo, Van Otterloo & Co. LLC as of the date of this report and are subject to change. GMO disclaims any responsibility to update such views. They are not meant as investment advice. References to specific securities are not recommendations of such securities and may not be representative of any GMO portfolio’s current or future investments.
Comparison of Change in Value of a $10,000,000 Investment in
GMO Benchmark-Free Allocation Series Fund Class R6 Shares and the
Consumer Price Index
As of February 29, 2016
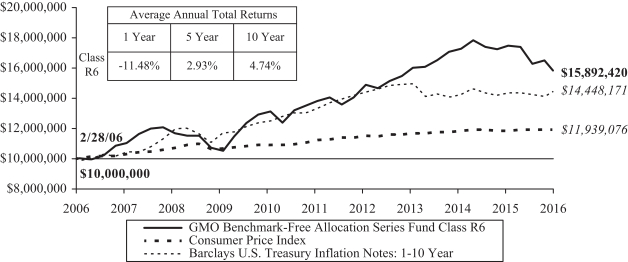
Performance data quoted represents past performance and is not indicative of future results. The investment return and principal value of an investment will fluctuate so that an investor’s shares, when redeemed, may be worth more or less than their original cost. Current performance data may be lower or higher than the performance data provided herein. To obtain performance information up to the most recent month-end, visit www.gmo.com. Performance data shown above for GMO Benchmark-Free Allocation Series Fund (the “Fund”) reflect the performance data of GMO Benchmark-Free Allocation Fund (the “Institutional Fund”) through January 24, 2013 (the commencement date of the Fund), re-stated to reflect the additional fees and expenses of the Fund. Performance data shown above for the Fund is net of all fees after reimbursement from the Manager. Returns would have been lower had certain expenses not been reimbursed during the periods shown and do not include the effect of taxes on distributions and redemptions. All information is unaudited.
| | The Fund invests substantially all of its assets in shares of the Institutional Fund. Prior to January 1, 2012, the Institutional Fund served as a principal component of a broader GMO real return strategy. Beginning on January 1, 2012, the Institutional Fund has been managed as a standalone investment vehicle. |
2
GMO Benchmark-Free Allocation Series Fund
(A Series of GMO Series Trust)
Investment Concentration Summary
February 29, 2016 (Unaudited)
| | | | |
Asset Class Summary* | | % of Total Net Assets | |
Common Stocks | | | 45.2 | % |
Debt Obligations | | | 25.8 | |
Short-Term Investments | | | 23.8 | |
Investment Funds | | | 1.6 | |
Preferred Stocks | | | 1.6 | |
Futures Contracts | | | 1.1 | |
Options Purchased | | | 0.8 | |
Swap Contracts | | | 0.6 | |
Rights/Warrants | | | 0.1 | |
Forward Currency Contracts | | | 0.1 | |
Loan Participations | | | 0.1 | |
Loan Assignments | | | 0.0 | ^ |
Reverse Repurchase Agreements | | | (0.0 | )^ |
Written/Credit Linked Options | | | (0.8 | ) |
Securities Sold Short | | | (1.3 | ) |
Other | | | 1.3 | |
| | | | |
| | | 100.0 | % |
| | | | |
| | | | |
| Country Summary** | | Debt Obligations as a
% of Total Net Assets | |
United States | | | 19.6 | % |
Other Emerging*** | | | 4.0 | |
Mexico | | | 2.2 | |
Sweden | | | 1.1 | |
Australia | | | 1.0 | |
Denmark | | | 1.0 | |
Other Developed**** | | | (0.5 | ) |
Euro Region***** | | | (1.8 | ) |
United Kingdom | | | (3.9 | ) |
| | | | |
| | | 22.7 | % |
| | | | |
| | | | |
| Country Summary** | | Equity Investments as a % of Total Net Assets | |
United States | | | 18.3 | % |
China | | | 4.4 | |
Other Developed**** | | | 3.7 | |
Japan | | | 3.1 | |
United Kingdom | | | 2.6 | |
Korea | | | 2.5 | |
Other Emerging*** | | | 2.5 | |
Taiwan | | | 1.9 | |
France | | | 1.7 | |
Germany | | | 1.4 | |
Russia | | | 1.3 | |
Canada | | | 1.1 | |
Brazil | | | 1.0 | |
| | | | |
| | | 45.5 | % |
| | | | |
| * | The table above incorporates aggregate indirect asset class exposure resulting from investments in shares of a series of GMO Trust (the “Institutional Fund”) and the series of GMO |
| | Trust in which the Institutional Fund invests (collectively referred to as the “Underlying Funds”). Derivative financial instruments, if any, are based on market values or unrealized appreciation/depreciation rather than notional amounts. |
| ** | The table above incorporates aggregate indirect country exposure associated with investments in the Institutional Fund and Underlying Funds, if any. The table excludes short-term investments, if any. The table includes exposure through the use of certain derivative financial instruments and excludes exposure through certain currency linked derivatives such as forward currency contracts and currency options, if any. The table is based on duration adjusted net exposures (both investments and derivatives), taking into account the market value of securities and the notional amounts of swaps and other derivative financial instruments. For example, U.S. asset-backed securities may represent a relatively small percentage due to their short duration, even though they represent a large percentage of market value (direct and indirect). Duration is based on GMO’s models. The greater the duration of a bond, the greater its contribution to the concentration percentage. Credit default swap exposures are factored into the duration adjusted exposure using the reference security and applying the same methodology to that security. The tables are not normalized, thus, due to the exclusions listed above and negative exposures, which may be attributable to derivatives or short sales, if any, the tables may not total to 100%. |
| *** | “Other Emerging” is comprised of emerging countries that each represents less than 1.0% of Investments. |
| **** | “Other Developed” is comprised of developed countries that each represents less than 1.0% of Investments. |
| ***** | “Euro Region” is comprised of derivative financial instruments attributed to the Eurozone and not a particular country. |
3
GMO Benchmark-Free Allocation Series Fund
(A Series of GMO Series Trust)
Schedule of Investments
(showing percentage of total net assets)
February 29, 2016
| | | | | | | | | | | | |
| Shares | | Description | | Value ($) |
| | | | | | | | | | | | |
| | | | | | | MUTUAL FUNDS — 99.5% | | | | | |
| | | |
| | | | | | | Affiliated Issuers — 99.5% | | | | | |
| | | | 11,359,317 | | | GMO Benchmark-Free Allocation Fund, Class III | | | | 266,489,574 | |
| | | | | | | | | | | | |
| | | |
| | | | | | | TOTAL MUTUAL FUNDS (Cost $301,051,765) | | | | 266,489,574 | |
| | | | | | | | | | | | |
| | | |
| | | | | | | TOTAL INVESTMENTS — 99.5%
(Cost $301,051,765) | | | | 266,489,574 | |
| | | | | | | Other Assets and Liabilities (net) — 0.5% | | | | 1,433,359 | |
| | | | | | | | | | | | |
| | | |
| | | | | | | TOTAL NET ASSETS — 100.0% | | | | $267,922,933 | |
| | | | | | | | | | | | |
See accompanying notes to the financial statements.
4
GMO Emerging Countries Series Fund
(A Series of GMO Series Trust)
Portfolio Management
Day-to-day management of the Fund’s portfolio is the responsibility of the Emerging Markets Equity Team at Grantham, Mayo, Van Otterloo & Co. LLC.
Management Discussion and Analysis of Fund Performance
Class R6 shares of GMO Emerging Countries Series Fund returned -22.92% (net) for the fiscal year ended February 29, 2016, as compared with -21.27% for the S&P/IFCI Composite Index.
Country-sector allocation detracted from the Fund’s relative returns for the fiscal year. The Fund’s overweight in Brazil Telecommunications and underweight in China Information Technology detracted from relative performance. The Fund’s overweights in Russia Energy and Taiwan Information Technology added to relative performance.
Stock selection was neutral overall during the fiscal year. The Fund’s stock selections in Greece Financials and Taiwan Information Technology detracted from relative performance, while the stock selections in India Financials and Korea Materials added to relative performance.
The views expressed herein are exclusively those of Grantham, Mayo, Van Otterloo & Co. LLC as of the date of this report and are subject to change. GMO disclaims any responsibility to update such views. They are not meant as investment advice. References to specific securities are not recommendations of such securities and may not be representative of any GMO portfolio’s current or future investments.
Comparison of Change in Value of a $10,000,000 Investment in
GMO Emerging Countries Series Fund Class R6 Shares and the
S&P/IFCI Composite Index
As of February 29, 2016
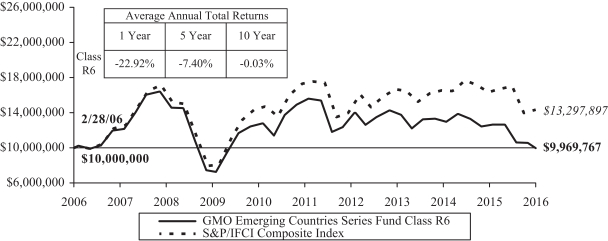
Performance data quoted represents past performance and is not indicative of future results. The investment return and principal value of an investment will fluctuate so that an investor’s shares, when redeemed, may be worth more or less than their original cost. Current performance data may be lower or higher than the performance data provided herein. To obtain performance information up to the most recent month-end, visit www.gmo.com. Performance data shown above for GMO Emerging Countries Series Fund (the “Fund”) reflect the performance data of GMO Emerging Countries Fund (the “Institutional Fund”) through May 2, 2014 (the commencement date of the Fund), re-stated to reflect the additional fees and expenses of the Fund. Performance data shown above for the Fund is net of all fees after reimbursement from the Manager. Returns would have been lower had certain expenses not been reimbursed during the periods shown and do not include the effect of taxes on distributions and redemptions. All information is unaudited.
| | The Fund invests substantially all of its assets in shares of the Institutional Fund. |
| | For S&P disclaimers please visit http://www.gmo.com/America/_Disclaimers/_BenchmarkDisclaimers.htm. |
5
GMO Emerging Countries Series Fund
(A Series of GMO Series Trust)
Investment Concentration Summary
February 29, 2016 (Unaudited)
| | | | |
| Asset Class Summary* | | % of Total Net Assets | |
Common Stocks | | | 82.9 | % |
Preferred Stocks | | | 10.6 | |
Investment Funds | | | 2.6 | |
Short-Term Investments | | | 1.5 | |
Mutual Funds | | | 0.0 | ^ |
Rights/Warrants | | | 0.0 | ^ |
Written Options | | | (0.0 | )^ |
Other | | | 2.4 | |
| | | | |
| | | 100.0 | % |
| | | | |
| | | | |
| Country Summary** | | % of Investments | |
Taiwan | | | 20.5 | % |
South Korea | | | 15.8 | |
Russia | | | 14.9 | |
India | | | 11.4 | |
China | | | 10.5 | |
Brazil | | | 9.3 | |
Turkey | | | 5.1 | |
South Africa | | | 2.4 | |
Thailand | | | 2.4 | |
Poland | | | 1.2 | |
Mexico | | | 1.0 | |
Philippines | | | 0.9 | |
Czech Republic | | | 0.8 | |
United Kingdom*** | | | 0.8 | |
Indonesia | | | 0.7 | |
Greece | | | 0.5 | |
United States*** | | | 0.4 | |
Egypt | | | 0.3 | |
Malaysia | | | 0.3 | |
Belgium*** | | | 0.2 | |
Chile | | | 0.2 | |
Colombia | | | 0.2 | |
Panama | | | 0.1 | |
Qatar | | | 0.1 | |
| | | | |
| | | 100.0 | % |
| | | | |
| * | The table above incorporates aggregate indirect asset class exposure resulting from investments in shares of a series of GMO Trust (the “Institutional Fund”) and the series of GMO Trust in which the Institutional Fund invests (collectively referred to as the “Underlying Funds”), if any. Derivative financial instruments, if any, are based on market values or unrealized appreciation/depreciation rather than notional amounts. |
| ** | The table above incorporates aggregate indirect country exposure associated with investments in the Institutional Fund and Underlying Funds. The table excludes short-term investments, if any. The table excludes exposure through forward currency contracts and includes other derivative financial instruments, if any. The table takes into account the market value of securities and options and the notional amounts of swap contracts and other derivative financial instruments, if any. |
| *** | Includes companies that derive more than 50% of their revenues or profits from emerging markets. |
| | | | |
| Industry Group Summary | | % of Equity Investments**** | |
Banks | | | 20.0 | % |
Technology Hardware & Equipment | | | 17.3 | |
Telecommunication Services | | | 15.6 | |
Automobiles & Components | | | 11.9 | |
Energy | | | 11.3 | |
Utilities | | | 3.9 | |
Materials | | | 3.6 | |
Semiconductors & Semiconductor Equipment | | | 3.5 | |
Diversified Financials | | | 2.0 | |
Capital Goods | | | 1.8 | |
Food, Beverage & Tobacco | | | 1.5 | |
Insurance | | | 1.5 | |
Food & Staples Retailing | | | 0.8 | |
Household & Personal Products | | | 0.8 | |
Transportation | | | 0.8 | |
Health Care Equipment & Services | | | 0.8 | |
Software & Services | | | 0.7 | |
Consumer Durables & Apparel | | | 0.6 | |
Retailing | | | 0.4 | |
Real Estate | | | 0.4 | |
Pharmaceuticals, Biotechnology & Life Sciences | | | 0.3 | |
Consumer Services | | | 0.3 | |
Media | | | 0.2 | |
| | | | |
| | | 100.0 | % |
| | | | |
| **** | Equity investments may consist of common stocks and other stock-related securities, such as preferred stocks, if any. This table excludes exposure to derivative contracts, short-term investments and ETFs, if any. For a summary of derivative contract and ETF exposure, if any, see the Schedule of Investments of the Institutional Fund. |
6
GMO Emerging Countries Series Fund
(A Series of GMO Series Trust)
Schedule of Investments
(showing percentage of total net assets)
February 29, 2016
| | | | | | | | | | | | |
| Shares | | Description | | Value ($) |
| | | | | | | | | | | | |
| | | | | | | MUTUAL FUNDS — 99.0% | | | | | |
| | | |
| | | | | | | Affiliated Issuers — 99.0% | | | | | |
| | | | 1,350,970 | | | GMO Emerging Countries Fund, Class III | | | | 9,078,518 | |
| | | | | | | | | | | | |
| | | |
| | | | | | | TOTAL MUTUAL FUNDS (Cost $12,660,233) | | | | 9,078,518 | |
| | | | | | | | | | | | |
| | | |
| | | | | | | TOTAL INVESTMENTS — 99.0%
(Cost $12,660,233) | | | | 9,078,518 | |
| | | | | | | Other Assets and Liabilities (net) — 1.0% | | | | 95,319 | |
| | | | | | | | | | | | |
| | | |
| | | | | | | TOTAL NET ASSETS — 100.0% | | | | $9,173,837 | |
| | | | | | | | | | | | |
See accompanying notes to the financial statements.
7
GMO Global Asset Allocation Series Fund
(A Series of GMO Series Trust)
Portfolio Management
Day-to-day management of the Fund’s portfolio is the responsibility of the Asset Allocation Team at Grantham, Mayo, Van Otterloo & Co. LLC.
Management Discussion and Analysis of Fund Performance
Class R6 shares of GMO Global Asset Allocation Series Fund returned -10.95% (net) for the fiscal year ended February 29, 2016, as compared with -7.50% for the Fund’s benchmark, the GMO Global Asset Allocation Index (65% MSCI ACWI and 35% Barclays U.S. Aggregate Index).
The Fund’s underweight in equities and allocations to cash and GMO Alpha Only Fund added to relative performance. The Fund’s exposures to European value and emerging market equities, cross-sectional interest rates and FX positions (primarily Euro rate exposures), and select fundamentally researched international developed equity holdings contributed to the negative relative performance. Exposure to U.S. quality stocks contributed positively to relative performance.
The views expressed herein are exclusively those of Grantham, Mayo, Van Otterloo & Co. LLC as of the date of this report and are subject to change. GMO disclaims any responsibility to update such views. They are not meant as investment advice. References to specific securities are not recommendations of such securities and may not be representative of any GMO portfolio’s current or future investments.
Comparison of Change in Value of a $10,000,000 Investment in
GMO Global Asset Allocation Series Fund Class R6 Shares and the
GMO Global Asset Allocation Index
As of February 29, 2016
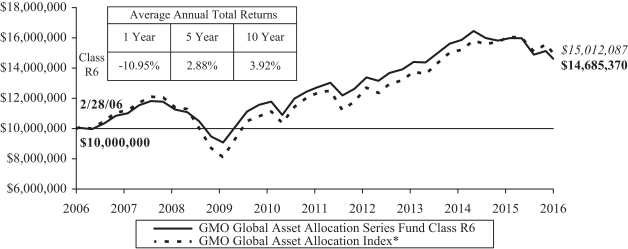
Performance data quoted represents past performance and is not indicative of future results. The investment return and principal value of an investment will fluctuate so that an investor’s shares, when redeemed, may be worth more or less than their original cost. Current performance data may be lower or higher than the performance data provided herein. To obtain performance information up to the most recent month-end, visit www.gmo.com. Performance data shown above for GMO Global Asset Allocation Series Fund (the “Fund”) reflect the performance data of GMO Global Asset Allocation Fund (the “Institutional Fund”) through July 31, 2012 (the commencement date of the Fund), re-stated to reflect the additional fees and expenses of the Fund. Performance data shown above for the Fund is net of all fees after reimbursement from the Manager. Returns would have been lower had certain expenses not been reimbursed during the periods shown and do not include the effect of taxes on distributions and redemptions. All information is unaudited.
| | The Fund invests substantially all of its assets in shares of the Institutional Fund. |
| * | The GMO Global Asset Allocation Index is comprised of 48.75% S&P 500 Index, 16.25% MSCI ACWI ex USA and 35% Barclays U.S. Aggregate Index through 3/31/2007, and 65% MSCI ACWI (All Country World Index) and 35% Barclays U.S. Aggregate Index thereafter. |
| | MSCI data may not be reproduced or used for any other purpose. MSCI provides no warranties, has not prepared or approved this report, and has no liability hereunder. |
| | For S&P disclaimers please visit http://www.gmo.com/America/_Disclaimers/_BenchmarkDisclaimers.htm. |
8
GMO Global Asset Allocation Series Fund
(A Series of GMO Series Trust)
Investment Concentration Summary
February 29, 2016 (Unaudited)
| | | | |
Asset Class Summary* | | % of Total Net Assets | |
Common Stocks | | | 50.7 | % |
Short-Term Investments | | | 25.5 | |
Debt Obligations | | | 20.4 | |
Preferred Stocks | | | 1.3 | |
Options Purchased | | | 1.3 | |
Mutual Funds | | | 1.1 | |
Swap Contracts | | | 0.9 | |
Futures Contracts | | | 0.8 | |
Investment Funds | | | 0.1 | |
Loan Participations | | | 0.1 | |
Forward Currency Contracts | | | 0.1 | |
Rights/Warrants | | | 0.1 | |
Loan Assignments | | | 0.0 | ^ |
Reverse Repurchase Agreements | | | (0.0 | )^ |
Written/Credit Linked Options | | | (1.4 | ) |
Other | | | (1.0 | ) |
| | | | |
| | | 100.0 | % |
| | | | |
| | | | |
| Country Summary** | | Debt Obligations as a % of Investments | |
United States | | | 14.6 | % |
Other Emerging*** | | | 3.9 | |
Mexico | | | 2.1 | |
Australia | | | 1.1 | |
Sweden | | | 1.1 | |
Denmark | | | 1.0 | |
Other Developed**** | | | (0.5 | ) |
Euro Region***** | | | (1.7 | ) |
United Kingdom | | | (3.9 | ) |
| | | | |
| | | 17.7 | % |
| | | | |
| | | | |
| Country Summary** | | Equity Investments as a % of Investments | |
United States | | | 16.5 | % |
Other Developed**** | | | 6.1 | |
Japan | | | 5.8 | |
United Kingdom | | | 4.4 | |
Taiwan | | | 2.8 | |
Germany | | | 2.6 | |
France | | | 2.6 | |
Other Emerging*** | | | 2.5 | |
Korea | | | 2.0 | |
Russia | | | 1.8 | |
India | | | 1.5 | |
Brazil | | | 1.3 | |
China | | | 1.2 | |
Canada | | | 1.1 | |
Switzerland | | | 1.0 | |
| | | | |
| | | 53.2 | % |
| | | | |
| * | The table above incorporates aggregate indirect asset class exposure resulting from investments in shares of a series of GMO Trust (the “Institutional Fund”) and the series of GMO Trust in which the Institutional Fund invests (collectively referred to as the |
| | “Underlying Funds”), if any, except for GMO Alpha Only Fund. Derivative financial instruments, if any, are based on market values or unrealized appreciation/depreciation rather than notional amounts. |
| ** | The table above incorporates aggregate indirect country exposure associated with investments in the Institutional Fund and Underlying Funds, if any. The table excludes short-term investments, if any. The table includes exposure through the use of certain derivative financial instruments and excludes exposure through certain currency linked derivatives such as forward currency contracts and currency options, if any. The table is based on duration adjusted net exposures (both investments and derivatives), taking into account the market value of securities and the notional amounts of swaps and other derivative financial instruments. For example, U.S. asset-backed securities may represent a relatively small percentage due to their short duration, even though they represent a large percentage of market value (direct and indirect). Duration is based on GMO’s models. The greater the duration of a bond, the greater its contribution to the concentration percentage. Credit default swap exposures are factored into the duration adjusted exposure using the reference security and applying the same methodology to that security. The tables are not normalized, thus, due to the exclusions listed above and negative exposures, which may be attributable to derivatives or short sales, if any, the tables may not total to 100%. |
| *** | “Other Emerging” is comprised of emerging countries that each represents less than 1.0% of Investments. |
| **** | “Other Developed” is comprised of developed countries that each represents less than 1.0% of Investments. |
| ***** | “Euro Region” is comprised of derivative financial instruments attributed to the Eurozone and not a particular country. |
9
GMO Global Asset Allocation Series Fund
(A Series of GMO Series Trust)
Schedule of Investments
(showing percentage of total net assets)
February 29, 2016
| | | | | | | | | | | | |
| Shares | | Description | | Value ($) |
| | | | | | | | | | | | |
| | | | | | | MUTUAL FUNDS — 98.8% | | | | | |
| | | |
| | | | | | | Affiliated Issuers — 98.8% | | | | | |
| | | | 31,101,325 | | | GMO Global Asset Allocation Fund, Class III | | | | 286,132,190 | |
| | | | | | | | | | | | |
| | | |
| | | | | | | TOTAL MUTUAL FUNDS (Cost $348,492,744) | | | | 286,132,190 | |
| | | | | | | | | | | | |
| | | |
| | | | | | | TOTAL INVESTMENTS — 98.8%
(Cost $348,492,744) | | | | 286,132,190 | |
| | | | | | | Other Assets and Liabilities (net) — 1.2% | | | | 3,585,340 | |
| | | | | | | | | | | | |
| | | |
| | | | | | | TOTAL NET ASSETS — 100.0% | | | | $289,717,530 | |
| | | | | | | | | | | | |
See accompanying notes to the financial statements.
10
GMO Global Equity Allocation Series Fund
(A Series of GMO Series Trust)
Portfolio Management
Day-to-day management of the Fund’s portfolio is the responsibility of the Asset Allocation Team at Grantham, Mayo, Van Otterloo & Co. LLC.
Management Discussion and Analysis of Fund Performance
Class R6 shares of GMO Global Equity Allocation Series Fund returned -16.02% (net) for the fiscal year ended February 29, 2016, as compared with -12.32% for the MSCI ACWI.
GMO groups companies with common economic characteristics, and group allocation had a negative impact on performance relative to the benchmark. The Fund’s exposure to European value stocks was the largest detractor from relative performance, outweighing the positive impact from owning U.S. quality stocks and other U.S. stocks. The Fund’s emerging markets exposure also had a negative impact.
Among countries, having an underweight in the U.S. and an overweight in emerging markets detracted from relative performance, which outweighed the positive impact from being underweight Australia. Both sector allocation and stock selection had negative impacts. By sector, an overweight position in Energy detracted from relative performance, which outweighed the positive impact from being overweight Telecommunications Services.
Top stock detractors included overweight positions in Canadian health care company Valeant Pharmaceuticals and U.K. energy company Royal Dutch Shell, as well as an underweight position in U.S. social networking company Facebook. Top stock contributors included overweight positions in U.S. internet retail company Amazon, Japanese telecom Nippon Telegraph and Telephone, and Russian energy company Surgutneftegas.
The views expressed herein are exclusively those of Grantham, Mayo, Van Otterloo & Co. LLC as of the date of this report and are subject to change. GMO disclaims any responsibility to update such views. They are not meant as investment advice. References to specific securities are not recommendations of such securities and may not be representative of any GMO portfolio’s current or future investments.
Comparison of Change in Value of a $10,000,000 Investment in
GMO Global Equity Allocation Series Fund Class R6 Shares and the MSCI ACWI +
As of February 29, 2016
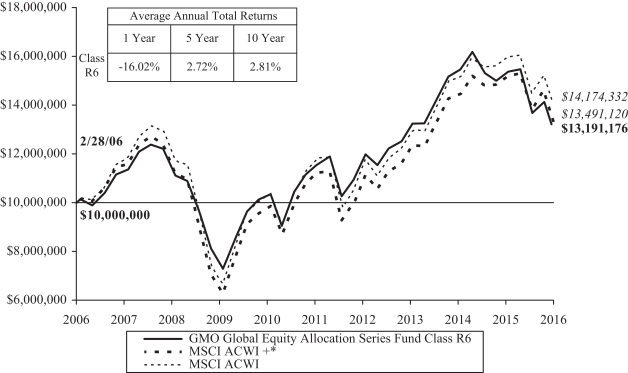
Performance data quoted represents past performance and is not indicative of future results. The investment return and principal value of an investment will fluctuate so that an investor’s shares, when redeemed, may be worth more or less than their original cost. Current performance data may be lower or higher than the performance data provided herein. To obtain performance information up to the most recent month-end, visit www.gmo.com. Performance data shown above for GMO Global Equity Allocation Series Fund (the “Fund”) reflect the performance data of GMO Global Equity Allocation Fund (the “Institutional Fund”) through September 4, 2012 (the commencement date of the Fund), re-stated to reflect the additional fees and expenses of the Fund. Performance data shown above for the Fund is net of all fees after reimbursement from the Manager. Returns would have been lower had certain expenses not been reimbursed during the periods shown and do not include the effect of taxes on distributions and redemptions. All information is unaudited.
| | The Fund invests substantially all of its assets in shares of the Institutional Fund. |
| * | The MSCI ACWI + represents 75% S&P 500 Index and 25% MSCI ACWI ex-USA prior to May 30, 2008 and MSCI ACWI thereafter. |
| | For S&P disclaimers please visit http://www.gmo.com/America/_Disclaimers/_BenchmarkDisclaimers.htm. |
11
GMO Global Equity Allocation Series Fund
(A Series of GMO Series Trust)
Investment Concentration Summary
February 29, 2016 (Unaudited)
| | | | |
| Asset Class Summary* | | % of Total Net Assets | |
Common Stocks | | | 92.9 | % |
Short-Term Investments | | | 3.3 | |
Preferred Stocks | | | 2.2 | |
Investment Funds | | | 0.2 | |
Futures Contracts | | | 0.0 | ^ |
Rights/Warrants | | | 0.0 | ^ |
Swap Contracts | | | (0.0 | )^ |
Written Options | | | (0.0 | )^ |
Other | | | 1.4 | |
| | | | |
| | | 100.0 | % |
| | | | |
| | | | |
| Country/Region Summary** | | % of Investments | |
United States | | | 37.5 | % |
Japan | | | 10.5 | |
United Kingdom | | | 6.9 | |
Germany | | | 4.7 | |
France | | | 4.7 | |
Taiwan | | | 4.7 | |
Other Developed*** | | | 3.9 | |
Korea | | | 3.4 | |
Russia | | | 3.2 | |
Other Emerging**** | | | 2.8 | |
India | | | 2.6 | |
Canada | | | 2.2 | |
Brazil | | | 2.2 | |
China | | | 2.0 | |
Switzerland | | | 1.7 | |
Australia | | | 1.5 | |
Hong Kong | | | 1.2 | |
Netherlands | | | 1.2 | |
Italy | | | 1.1 | |
Turkey | | | 1.0 | |
Spain | | | 1.0 | |
| | | | |
| | | 100.0 | % |
| | | | |
| * | The table above incorporates aggregate indirect asset class exposure resulting from investments in shares of a series of GMO Trust (the “Institutional Fund”) and the series of GMO Trust in which the Institutional Fund invests (collectively referred to as the “Underlying Funds”), if any. Derivative financial instruments, if any, are based on market values or unrealized appreciation/depreciation rather than notional amounts. |
| ** | The table above incorporates aggregate indirect country exposure associated with investments in the Institutional Fund and Underlying Funds, if any. The table excludes short-term investments and includes exposure through the use of derivative financial instruments, if any. The table excludes exposure through forward currency contracts, if any. |
| *** | “Other Developed” is comprised of developed countries that each represents less than 1.0% of Investments. |
| **** | “Other Emerging” is comprised of emerging countries that each represents less than 1.0% of Investments. |
12
GMO Global Equity Allocation Series Fund
(A Series of GMO Series Trust)
Schedule of Investments
(showing percentage of total net assets)
February 29, 2016
| | | | | | | | | | | | |
| | | Shares | | Description | | Value ($) |
| | | | | | | | | | | | |
| | | | | | | MUTUAL FUNDS — 98.9% | | | | | |
| | | |
| | | | | | | Affiliated Issuers — 98.9% | | | | | |
| | | | 1,952,707 | | | GMO Global Equity Allocation Fund, Class III | | | | 12,829,283 | |
| | | | | | | | | | | | |
| | | |
| | | | | | | TOTAL MUTUAL FUNDS (Cost $17,040,230) | | | | 12,829,283 | |
| | | | | | | | | | | | |
| | | |
| | | | | | | TOTAL INVESTMENTS — 98.9%
(Cost $17,040,230) | | | | 12,829,283 | |
| | | | | | | Other Assets and Liabilities (net) — 1.1% | | | | 144,391 | |
| | | | | | | | | | | | |
| | | |
| | | | | | | TOTAL NET ASSETS — 100.0% | | | | $12,973,674 | |
| | | | | | | | | | | | |
See accompanying notes to the financial statements.
13
GMO International Developed Equity Allocation Series Fund
(A Series of GMO Series Trust)
Portfolio Management
Day-to-day management of the Fund’s portfolio is the responsibility of the Asset Allocation Team at Grantham, Mayo, Van Otterloo & Co. LLC.
Management Discussion and Analysis of Fund Performance
Class R6 shares of GMO International Developed Equity Allocation Series Fund returned -19.90% (net) for the fiscal year ended February 29, 2016, as compared with -15.18% for the MSCI EAFE Index.
GMO groups companies with common economic characteristics, and group allocation had a negative impact on performance relative to the benchmark. The Fund’s exposure to European value stocks was the largest detractor from relative performance, outweighing the positive impact from owning Japanese value stocks. The Fund’s emerging markets exposure also had a negative impact.
Among countries, having an overweight in Canada was the largest detractor from relative performance, which outweighed the positive impact from being underweight Australia. The Fund’s emerging markets exposure also detracted. Both sector allocation and stock selection had negative impacts. By sector, an overweight position in Energy and an underweight position in Consumer Staples detracted from relative performance, which outweighed the positive impact from being overweight Telecommunications Services.
Top stock detractors included overweight positions in Canadian health care company Valeant Pharmaceuticals, U.K. energy company Royal Dutch Shell, and German chemical company BASF. Top stock contributors included overweight positions in Japanese telecoms Nippon Telegraph and Telephone and NTT DoCoMo and an underweight position in Swiss pharmaceutical Novartis.
The views expressed herein are exclusively those of Grantham, Mayo, Van Otterloo & Co. LLC as of the date of this report and are subject to change. GMO disclaims any responsibility to update such views. They are not meant as investment advice. References to specific securities are not recommendations of such securities and may not be representative of any GMO portfolio’s current or future investments.
Comparison of Change in Value of a $10,000,000 Investment in
GMO International Developed Equity Allocation Series Fund
Class R6 Shares and the MSCI EAFE Index
As of February 29, 2016
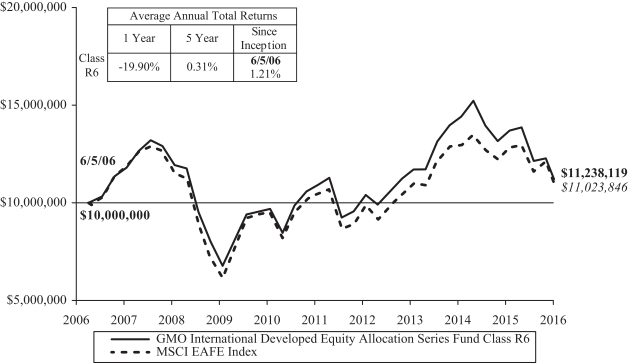
Performance data quoted represents past performance and is not indicative of future results. The investment return and principal value of an investment will fluctuate so that an investor’s shares, when redeemed, may be worth more or less than their original cost. Current performance data may be lower or higher than the performance data provided herein. To obtain performance information up to the most recent month-end, visit www.gmo.com. Performance data shown above for GMO International Developed Equity Allocation Series Fund (the “Fund”) reflect the performance data of GMO International Developed Equity Allocation Fund (the “Institutional Fund”) through January 12, 2015 (the commencement date of the Fund), re-stated to reflect the additional fees and expenses of the Fund. Performance data shown above for the Fund is net of all fees after reimbursement from the Manager. Returns would have been lower had certain expenses not been reimbursed during the periods shown and do not include the effect of taxes on distributions and redemptions. All information is unaudited.
| | The Fund invests substantially all of its assets in shares of the Institutional Fund. |
| | MSCI data may not be reproduced or used for any other purpose. MSCI provides no warranties, has not prepared or approved this report, and has no liability hereunder. |
14
GMO International Developed Equity Allocation Series Fund
(A Series of GMO Series Trust)
Investment Concentration Summary
February 29, 2016 (Unaudited)
| | | | |
| Asset Class Summary* | | % of Total Net Assets | |
Common Stocks | | | 93.0 | % |
Short-Term Investments | | | 3.5 | |
Preferred Stocks | | | 1.5 | |
Investment Funds | | | 0.1 | |
Futures Contracts | | | 0.0 | ^ |
Rights/Warrants | | | 0.0 | ^ |
Swap Contracts | | | 0.0 | ^ |
Written Options | | | (0.0 | )^ |
Other | | | 1.9 | |
| | | | |
| | | 100.0 | % |
| | | | |
| | | | |
| Country/Region Summary** | | % of Investments | |
Japan | | | 23.3 | % |
United Kingdom | | | 15.2 | |
Germany | | | 10.6 | |
France | | | 10.5 | |
Canada | | | 5.0 | |
Other Emerging*** | | | 4.4 | |
Switzerland | | | 3.8 | |
Australia | | | 3.4 | |
Other Developed**** | | | 3.1 | |
Hong Kong | | | 2.8 | |
Netherlands | | | 2.6 | |
Italy | | | 2.6 | |
Spain | | | 2.2 | |
Taiwan | | | 2.1 | |
Norway | | | 1.6 | |
Korea | | | 1.5 | |
Russia | | | 1.4 | |
Sweden | | | 1.4 | |
Belgium | | | 1.3 | |
India | | | 1.2 | |
| | | | |
| | | 100.0 | % |
| | | | |
| * | The table above incorporates aggregate indirect asset class exposure resulting from investments in shares of a series of GMO Trust (the “Institutional Fund”) and the series of GMO Trust in which the Institutional Fund invests (collectively referred to as the “Underlying Funds”), if any. Derivative financial instruments, if any, are based on market values or unrealized appreciation/depreciation rather than notional amounts. |
| ** | The table above incorporates aggregate indirect country exposure associated with investments in the Institutional Fund and Underlying Funds, if any. The table excludes short-term investments and includes exposure through the use of derivative financial instruments, if any. The table excludes exposure through forward currency contracts, if any. |
| *** | “Other Emerging” is comprised of emerging countries that each represents less than 1.0% of Investments. |
| **** | “Other Developed” is comprised of developed countries that each represents less than 1.0% of Investments. |
15
GMO International Developed Equity Allocation Series Fund
(A Series of GMO Series Trust)
Schedule of Investments
(showing percentage of total net assets)
February 29, 2016
| | | | | | | | | | | | |
| Shares | | Description | | Value ($) |
| | | | | | | | | | | | |
| | | | | | | MUTUAL FUNDS — 98.6% | | | | | |
| | | |
| | | | | | | Affiliated Issuers — 98.6% | | | | | |
| | | | 650,688 | | | GMO International Developed Equity Allocation Fund, Class III | | | | 8,491,472 | |
| | | | | | | | | | | | |
| | | |
| | | | | | | TOTAL MUTUAL FUNDS (Cost $9,918,771) | | | | 8,491,472 | |
| | | | | | | | | | | | |
| | | |
| | | | | | | TOTAL INVESTMENTS — 98.6%
(Cost $9,918,771) | | | | 8,491,472 | |
| | | | | | | Other Assets and Liabilities (net) — 1.4% | | | | 124,578 | |
| | | | | | | | | | | | |
| | | |
| | | | | | | TOTAL NET ASSETS — 100.0% | | | | $8,616,050 | |
| | | | | | | | | | | | |
See accompanying notes to the financial statements.
16
GMO International Equity Allocation Series Fund
(A Series of GMO Series Trust)
Portfolio Management
Day-to-day management of the Fund’s portfolio is the responsibility of the Asset Allocation Team at Grantham, Mayo, Van Otterloo & Co. LLC.
Management Discussion and Analysis of Fund Performance
Class R6 shares of GMO International Equity Allocation Series Fund returned -20.53% (net) for the fiscal year ended February 29, 2016, as compared with -17.37% for the MSCI ACWI ex USA.
GMO groups companies with common economic characteristics, and group allocation had a negative impact on performance relative to the benchmark. The Fund’s exposures to European value stocks and emerging markets stocks detracted from relative performance, outweighing the positive impact from owning Japanese value stocks.
Among countries, the positive impact from being underweight Australia and from several other country exposures outweighed the negative impact from an underweight exposure in Switzerland. Both sector allocation and stock selection had negative impacts. By sector, an overweight position in Energy and underweight in Consumer Staples detracted from relative performance, which outweighed the positive impact from being overweight Telecommunications Services.
Top stock detractors included overweight positions in Canadian health care company Valeant Pharmaceuticals, U.K. energy company Royal Dutch Shell, and Brazilian utility Cia Energetica de Minas Gerais Cemig. Top stock contributors included overweight positions in Japanese telecoms Nippon Telegraph and Telephone and NTT DoCoMo and Russian energy company Surgutneftegas.
The views expressed herein are exclusively those of Grantham, Mayo, Van Otterloo & Co. LLC as of the date of this report and are subject to change. GMO disclaims any responsibility to update such views. They are not meant as investment advice. References to specific securities are not recommendations of such securities and may not be representative of any GMO portfolio’s current or future investments.
Comparison of Change in Value of a $10,000,000 Investment in
GMO International Equity Allocation Series Fund Class R6 Shares and the
MSCI ACWI ex USA
As of February 29, 2016
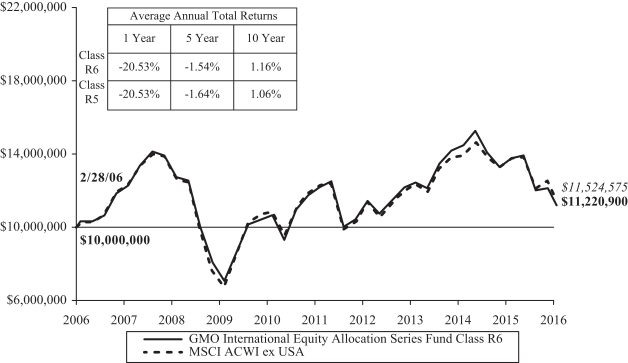
Performance data quoted represents past performance and is not indicative of future results. The investment return and principal value of an investment will fluctuate so that an investor’s shares, when redeemed, may be worth more or less than their original cost. Current performance data may be lower or higher than the performance data provided herein. To obtain performance information up to the most recent month-end, visit www.gmo.com. Performance data shown above for GMO International Equity Allocation Series Fund (the “Fund”) reflect the performance data of GMO International Equity Allocation Fund (the “Institutional Fund”) through March 30, 2012 (the commencement date of the Fund), re-stated to reflect the additional fees and expenses of the Fund. Performance data shown above for the Fund is net of all fees after reimbursement from the Manager. Returns would have been lower had certain expenses not been reimbursed during the periods shown and do not include the effect of taxes on distributions and redemptions. All information is unaudited.
| | The Fund invests substantially all of its assets in shares of the Institutional Fund. |
| | MSCI data may not be reproduced or used for any other purpose. MSCI provides no warranties, has not prepared or approved this report, and has no liability hereunder. |
17
GMO International Equity Allocation Series Fund
(A Series of GMO Series Trust)
Investment Concentration Summary
February 29, 2016 (Unaudited)
| | | | |
| Asset Class Summary* | | % of Total Net Assets | |
Common Stocks | | | 92.0 | % |
Preferred Stocks | | | 3.2 | |
Short-Term Investments | | | 3.1 | |
Investment Funds | | | 0.2 | |
Futures Contracts | | | 0.0 | ^ |
Rights/Warrants | | | 0.0 | ^ |
Swap Contracts | | | 0.0 | ^ |
Written Options | | | (0.0 | )^ |
Other | | | 1.5 | |
| | | | |
| | | 100.0 | % |
| | | | |
| | | | |
| Country/Region Summary** | | % of Investments | |
Japan | | | 17.4 | % |
United Kingdom | | | 11.5 | |
Germany | | | 7.9 | |
France | | | 7.9 | |
Taiwan | | | 6.8 | |
Korea | | | 4.9 | |
Russia | | | 4.6 | |
India | | | 3.8 | |
Other Developed*** | | | 3.8 | |
Canada | | | 3.7 | |
Brazil | | | 3.2 | |
China | | | 2.8 | |
Switzerland | | | 2.8 | |
Other Emerging**** | | | 2.8 | |
Australia | | | 2.6 | |
Hong Kong | | | 2.1 | |
Netherlands | | | 2.0 | |
Italy | | | 1.9 | |
Spain | | | 1.7 | |
Turkey | | | 1.5 | |
Norway | | | 1.2 | |
Thailand | | | 1.1 | |
Belgium | | | 1.0 | |
Sweden | | | 1.0 | |
| | | | |
| | | 100.0 | % |
| | | | |
| * | The table above incorporates aggregate indirect asset class exposure resulting from investments in shares of a series of GMO Trust (the “Institutional Fund”) and the series of GMO Trust in which the Institutional Fund invests (collectively referred to as the “Underlying Funds”), if any. Derivative financial instruments, if any, are based on market values or unrealized appreciation/depreciation rather than notional amounts. |
| ** | The table above incorporates aggregate indirect country exposure associated with investments in the Institutional Fund and Underlying Funds, if any. The table excludes short-term investments and includes exposure through the use of derivative financial instruments, if any. |
| | The table excludes exposure through forward currency contracts, if any. |
| *** | “Other Developed” is comprised of developed countries that each represents less than 1.0% of Investments. |
| **** | “Other Emerging” is comprised of emerging countries that each represents less than 1.0% of Investments. |
18
GMO International Equity Allocation Series Fund
(A Series of GMO Series Trust)
Schedule of Investments
(showing percentage of total net assets)
February 29, 2016
| | | | | | | | | | | | |
| | | Shares | | Description | | Value ($) |
| | | | | | | | | | | | |
| | | | | | | MUTUAL FUNDS — 99.0% | | | | | |
| | | |
| | | | | | | Affiliated Issuers — 99.0% | | | | | |
| | | | 28,808,131 | | | GMO International Equity Allocation Fund, Class III | | | | 224,703,420 | |
| | | | | | | | | | | | |
| | | |
| | | | | | | TOTAL MUTUAL FUNDS (Cost $282,156,253) | | | | 224,703,420 | |
| | | | | | | | | | | | |
| | | |
| | | | | | | TOTAL INVESTMENTS — 99.0%
(Cost $282,156,253) | | | | 224,703,420 | |
| | | | | | | Other Assets and Liabilities (net) — 1.0% | | | | 2,178,062 | |
| | | | | | | | | | | | |
| | | |
| | | | | | | TOTAL NET ASSETS — 100.0% | | | | $226,881,482 | |
| | | | | | | | | | | | |
See accompanying notes to the financial statements.
19
GMO Series Trust
Statements of Assets and Liabilities — February 29, 2016
| | | | | | | | | | | | | | | | | | | | | | | | | | | | | | |
| | | Benchmark-
Free
Allocation
Series Fund | | Emerging
Countries
Series Fund | | Global Asset
Allocation
Series Fund | | Global
Equity
Allocation
Series Fund | | International
Developed
Equity
Allocation
Series Fund | | International
Equity
Allocation
Series Fund |
Assets: | | | | | | | | | | | | | | | | | | | | | | | | | | | | | | |
Investments in affiliated issuers, at value (Notes 2 and 10)(a) | | | $ | 266,489,574 | | | | $ | 9,078,518 | | | | $ | 286,132,190 | | | | $ | 12,829,283 | | | | $ | 8,491,472 | | | | $ | 224,703,420 | |
Cash | | | | 1,381,462 | | | | | 97,971 | | | | | 3,571,141 | | | | | 136,241 | | | | | 96,557 | | | | | 2,236,537 | |
Receivable for Fund shares sold | | | | 483,255 | | | | | — | | | | | 112,780 | | | | | 14,943 | | | | | 29,613 | | | | | 3,518 | |
Receivable for reimbursement by GMO (Note 5) | | | | 2,542 | | | | | 279 | | | | | 2,108 | | | | | 155 | | | | | 248 | | | | | 310 | |
| | | | | | | | | | | | | | | | | | | | | | | | | | | | | | |
Total assets | | | | 268,356,833 | | | | | 9,176,768 | | | | | 289,818,219 | | | | | 12,980,622 | | | | | 8,617,890 | | | | | 226,943,785 | |
| | | | | | | | | | | | | | | | | | | | | | | | | | | | | | |
Liabilities: | | | | | | | | | | | | | | | | | | | | | | | | | | | | | | |
Payable for Fund shares repurchased | | | | 407,912 | | | | | 865 | | | | | 75,103 | | | | | 5,480 | | | | | — | | | | | 48,464 | |
Payable to affiliate for (Note 5): | | | | | | | | | | | | | | | | | | | | | | | | | | | | | | |
Administration fee | | | | 11,277 | | | | | 389 | | | | | 12,113 | | | | | 543 | | | | | 360 | | | | | 9,580 | |
Payable for 12b-1 fee — Class R5 | | | | — | | | | | — | | | | | — | | | | | — | | | | | — | | | | | 2,409 | |
Accrued expenses | | | | 14,711 | | | | | 1,677 | | | | | 13,473 | | | | | 925 | | | | | 1,480 | | | | | 1,850 | |
| | | | | | | | | | | | | | | | | | | | | | | | | | | | | | |
Total liabilities | | | | 433,900 | | | | | 2,931 | | | | | 100,689 | | | | | 6,948 | | | | | 1,840 | | | | | 62,303 | |
| | | | | | | | | | | | | | | | | | | | | | | | | | | | | | |
Net assets | | | $ | 267,922,933 | | | | $ | 9,173,837 | | | | $ | 289,717,530 | | | | $ | 12,973,674 | | | | $ | 8,616,050 | | | | $ | 226,881,482 | |
| | | | | | | | | | | | | | | | | | | | | | | | | | | | | | |
Net assets consist of: | | | | | | | | | | | | | | | | | | | | | | | | | | | | | | |
Paid-in capital | | | $ | 303,531,755 | | | | $ | 13,143,307 | | | | $ | 354,365,978 | | | | $ | 17,513,717 | | | | $ | 10,047,899 | | | | $ | 284,656,657 | |
Accumulated undistributed net investment income | | | | — | | | | | — | | | | | 296,268 | | | | | 3,876 | | | | | 1,988 | | | | | 184,139 | |
Distributions in excess of net investment income (loss) | | | | (21,875 | ) | | | | (762 | ) | | | | — | | | | | — | | | | | — | | | | | — | |
Accumulated net realized loss | | | | (1,024,756 | ) | | | | (386,993 | ) | | | | (2,584,162 | ) | | | | (332,972 | ) | | | | (6,538 | ) | | | | (506,481 | ) |
Net unrealized depreciation | | | | (34,562,191 | ) | | | | (3,581,715 | ) | | | | (62,360,554 | ) | | | | (4,210,947 | ) | | | | (1,427,299 | ) | | | | (57,452,833 | ) |
| | | | | | | | | | | | | | | | | | | | | | | | | | | | | | |
| | | $ | 267,922,933 | | | | $ | 9,173,837 | | | | $ | 289,717,530 | | | | $ | 12,973,674 | | | | $ | 8,616,050 | | | | $ | 226,881,482 | |
| | | | | | | | | | | | | | | | | | | | | | | | | | | | | | |
Net assets attributable to: | | | | | | | | | | | | | | | | | | | | | | | | | | | | | | |
Class R5 shares | | | $ | — | | | | $ | — | | | | $ | — | | | | $ | — | | | | $ | — | | | | $ | 14,554,889 | |
| | | | | | | | | | | | | | | | | | | | | | | | | | | | | | |
Class R6 shares | | | $ | 267,922,933 | | | | $ | 9,173,837 | | | | $ | 289,717,530 | | | | $ | 12,973,674 | | | | $ | 8,616,050 | | | | $ | 212,326,593 | |
| | | | | | | | | | | | | | | | | | | | | | | | | | | | | | |
Shares outstanding: | | | | | | | | | | | | | | | | | | | | | | | | | | | | | | |
Class R5 | | | | — | | | | | — | | | | | — | | | | | — | | | | | — | | | | | 1,896,138 | |
| | | | | | | | | | | | | | | | | | | | | | | | | | | | | | |
Class R6 | | | | 29,520,361 | | | | | 1,286,021 | | | | | 35,656,233 | | | | | 1,547,187 | | | | | 1,016,378 | | | | | 27,647,378 | |
| | | | | | | | | | | | | | | | | | | | | | | | | | | | | | |
Net asset value per share: | | | | | | | | | | | | | | | | | | | | | | | | | | | | | | |
Class R5 | | | $ | — | | | | $ | — | | | | $ | — | | | | $ | — | | | | $ | — | | | | $ | 7.68 | |
| | | | | | | | | | | | | | | | | | | | | | | | | | | | | | |
Class R6 | | | $ | 9.08 | | | | $ | 7.13 | | | | $ | 8.13 | | | | $ | 8.39 | | | | $ | 8.48 | | | | $ | 7.68 | |
| | | | | | | | | | | | | | | | | | | | | | | | | | | | | | |
(a) Cost of investments — affiliated issuers: | | | $ | 301,051,765 | | | | $ | 12,660,233 | | | | $ | 348,492,744 | | | | $ | 17,040,230 | | | | $ | 9,918,771 | | | | $ | 282,156,253 | |
See accompanying notes to the financial statements.
20
GMO Series Trust
Statements of Operations — Year Ended February 29, 2016
| | | | | | | | | | | | | | | |
| | | Benchmark-
Free
Allocation
Series Fund | | Emerging
Countries
Series Fund | | Global Asset
Allocation
Series Fund |
Investment Income: | | | | | | | | | | | | | | | |
Dividends from affiliated issuers (Note 10) | | | $ | 3,738,915 | | | | $ | 279,269 | | | | $ | 11,757,311 | |
Interest | | | | 239 | | | | | — | | | | | 357 | |
| | | | | | | | | | | | | | | |
Total investment income | | | | 3,739,154 | | | | | 279,269 | | | | | 11,757,668 | |
| | | | | | | | | | | | | | | |
Expenses: | | | | | | | | | | | | | | | |
Administration fee — (Note 5) | | | | 143,062 | | | | | 5,834 | | | | | 209,015 | |
Registration fees | | | | 36,992 | | | | | 3,833 | | | | | 24,888 | |
Miscellaneous | | | | — | | | | | 112 | | | | | — | |
| | | | | | | | | | | | | | | |
Total expenses | | | | 180,054 | | | | | 9,779 | | | | | 233,903 | |
| | | | | | | | | | | | | | | |
Fees and expenses reimbursed by GMO (Note 5) | | | | (36,992 | ) | | | | (3,833 | ) | | | | (24,888 | ) |
| | | | | | | | | | | | | | | |
Net expenses | | | | 143,062 | | | | | 5,946 | | | | | 209,015 | |
| | | | | | | | | | | | | | | |
Net investment income (loss) | | | | 3,596,092 | | | | | 273,323 | | | | | 11,548,653 | |
| | | | | | | | | | | | | | | |
Realized and unrealized gain (loss): | | | | | | | | | | | | | | | |
Net realized gain (loss) on: | | | | | | | | | | | | | | | |
Investments in affiliated issuers | | | | 726,067 | | | | | (447,447 | ) | | | | 13,525,776 | |
Realized gain distributions from affiliated issuers (Note 10) | | | | 1,929,086 | | | | | 152,394 | | | | | 17,302,247 | |
| | | | | | | | | | | | | | | |
Net realized gain (loss) | | | | 2,655,153 | | | | | (295,053 | ) | | | | 30,828,023 | |
| | | | | | | | | | | | | | | |
Change in net unrealized appreciation (depreciation) on: | | | | | | | | | | | | | | | |
Investments in affiliated issuers | | | | (40,547,732 | ) | | | | (2,953,407 | ) | | | | (85,504,307 | ) |
| | | | | | | | | | | | | | | |
Net unrealized gain (loss) | | | | (40,547,732 | ) | | | | (2,953,407 | ) | | | | (85,504,307 | ) |
| | | | | | | | | | | | | | | |
Net realized and unrealized gain (loss) | | | | (37,892,579 | ) | | | | (3,248,460 | ) | | | | (54,676,284 | ) |
| | | | | | | | | | | | | | | |
Net increase (decrease) in net assets resulting from operations | | | $ | (34,296,487 | ) | | | $ | (2,975,137 | ) | | | $ | (43,127,631 | ) |
| | | | | | | | | | | | | | | |
See accompanying notes to the financial statements.
21
GMO Series Trust
Statements of Operations — Year Ended February 29, 2016 — (Continued)
| | | | | | | | | | | | | | | |
| | | Global
Equity
Allocation
Series Fund | | International
Developed
Equity
Allocation
Series Fund | | International
Equity
Allocation
Series Fund |
Investment Income: | | | | | | | | | | | | | | | |
Dividends from affiliated issuers (Note 10) | | | $ | 392,082 | | | | $ | 297,767 | | | | $ | 7,755,500 | |
Interest | | | | 140 | | | | | — | | | | | 267 | |
| | | | | | | | | | | | | | | |
Total investment income | | | | 392,222 | | | | | 297,767 | | | | | 7,755,767 | |
| | | | | | | | | | | | | | | |
Expenses: | | | | | | | | | | | | | | | |
Administration fee — (Note 5) | | | | 7,671 | | | | | 4,817 | | | | | 125,698 | |
12b-1 fee — Class R5 (Note 5) | | | | — | | | | | — | | | | | 18,469 | |
Registration fees | | | | 3,077 | | | | | 6,822 | | | | | 6,366 | |
Miscellaneous | | | | — | | | | | 2 | | | | | — | |
| | | | | | | | | | | | | | | |
Total expenses | | | | 10,748 | | | | | 11,641 | | | | | 150,533 | |
| | | | | | | | | | | | | | | |
Fees and expenses reimbursed by GMO (Note 5) | | | | (3,077 | ) | | | | (6,822 | ) | | | | (6,366 | ) |
| | | | | | | | | | | | | | | |
Net expenses | | | | 7,671 | | | | | 4,819 | | | | | 144,167 | |
| | | | | | | | | | | | | | | |
Net investment income (loss) | | | | 384,551 | | | | | 292,948 | | | | | 7,611,600 | |
| | | | | | | | | | | | | | | |
Realized and unrealized gain (loss): | | | | | | | | | | | | | | | |
Net realized gain (loss) on: | | | | | | | | | | | | | | | |
Investments in affiliated issuers | | | | (742,206 | ) | | | | 45,605 | | | | | 52,949 | |
Realized gain distributions from affiliated issuers (Note 10) | | | | 1,325,738 | | | | | — | | | | | 9,844,763 | |
| | | | | | | | | | | | | | | |
Net realized gain (loss) | | | | 583,532 | | | | | 45,605 | | | | | 9,897,712 | |
| | | | | | | | | | | | | | | |
Change in net unrealized appreciation (depreciation) on: | | | | | | | | | | | | | | | |
Investments in affiliated issuers | | | | (3,610,444 | ) | | | | (2,373,979 | ) | | | | (73,508,121 | ) |
| | | | | | | | | | | | | | | |
Net unrealized gain (loss) | | | | (3,610,444 | ) | | | | (2,373,979 | ) | | | | (73,508,121 | ) |
| | | | | | | | | | | | | | | |
Net realized and unrealized gain (loss) | | | | (3,026,912 | ) | | | | (2,328,374 | ) | | | | (63,610,409 | ) |
| | | | | | | | | | | | | | | |
Net increase (decrease) in net assets resulting from operations | | | $ | (2,642,361 | ) | | | $ | (2,035,426 | ) | | | $ | (55,998,809 | ) |
| | | | | | | | | | | | | | | |
See accompanying notes to the financial statements.
22
GMO Series Trust
Statements of Changes in Net Assets
| | | | | | | | | | | | | | | | | | | | |
| | | Benchmark-Free
Allocation Series Fund | | Emerging Countries
Series Fund |
| | | Year Ended
February 29, 2016 | | Period from
May 1, 2014
through
February 28, 2015(a) | | Year Ended
February 29, 2016 | | Period from
May 2, 2014
(commencement
of operations)
through
February 28, 2015 |
Increase (decrease) in net assets: | | | | | | | | | | | | | | | | | | | | |
Operations: | | | | | | | | | | | | | | | | | | | | |
Net investment income (loss) | | | $ | 3,596,092 | | | | $ | 4,561,061 | | | | $ | 273,323 | | | | $ | 530,770 | |
Net realized gain (loss) | | | | 2,655,153 | | | | | 6,839,730 | | | | | (295,053 | ) | | | | (60,367 | ) |
Change in net unrealized appreciation (depreciation) | | | | (40,547,732 | ) | | | | (5,257,955 | ) | | | | (2,953,407 | ) | | | | (628,308 | ) |
| | | | | | | | | | | | | | | | | | | | |
| | | | |
Net increase (decrease) in net assets from operations | | | | (34,296,487 | ) | | | | 6,142,836 | | | | | (2,975,137 | ) | | | | (157,905 | ) |
| | | | | | | | | | | | | | | | | | | | |
Distributions to shareholders from: | | | | | | | | | | | | | | | | | | | | |
Net investment income | | | | | | | | | | | | | | | | | | | | |
Class R6 | | | | (4,023,611 | ) | | | | (7,047,863 | ) | | | | (273,280 | ) | | | | (531,065 | ) |
| | | | | | | | | | | | | | | | | | | | |
Net realized gains | | | | | | | | | | | | | | | | | | | | |
Class R6 | | | | (5,674,620 | ) | | | | (3,257,552 | ) | | | | — | | | | | (32,083 | ) |
| | | | | | | | | | | | | | | | | | | | |
Return of capital | | | | | | | | | | | | | | | | | | | | |
Class R6 | | | | — | | | | | — | | | | | (13,299 | ) | | | | — | |
| | | | | | | | | | | | | | | | | | | | |
Net share transactions (Note 9): | | | | | | | | | | | | | | | | | | | | |
Class R6 | | | | 30,808,107 | | | | | 120,829,659 | | | | | (1,359,313 | ) | | | | 14,515,919 | |
| | | | | | | | | | | | | | | | | | | | |
Increase (decrease) in net assets resulting from net share transactions | | | | 30,808,107 | | | | | 120,829,659 | | | | | (1,359,313 | ) | | | | 14,515,919 | |
| | | | | | | | | | | | | | | | | | | | |
Total increase (decrease) in net assets | | | | (13,186,611 | ) | | | | 116,667,080 | | | | | (4,621,029 | ) | | | | 13,794,866 | |
| | | | |
| Net assets: | | | | | | | | | | | | | | | | | | | | |
Beginning of period | | | | 281,109,544 | | | | | 164,442,464 | | | | | 13,794,866 | | | | | — | |
| | | | | | | | | | | | | | | | | | | | |
End of period | | | $ | 267,922,933 | | | | $ | 281,109,544 | | | | $ | 9,173,837 | | | | $ | 13,794,866 | |
| | | | | | | | | | | | | | | | | | | | |
Accumulated undistributed net investment income | | | $ | — | | | | $ | 98,367 | | | | $ | — | | | | $ | — | |
| | | | | | | | | | | | | | | | | | | | |
Distributions in excess of net investment income | | | $ | (21,875 | ) | | | $ | — | | | | $ | (762 | ) | | | $ | (805 | ) |
| | | | | | | | | | | | | | | | | | | | |
| (a) | On September 18, 2014, the Trustees approved a change in the fiscal year end of the Fund from April 30 to February 28/29 which resulted in a ten month period. |
See accompanying notes to the financial statements.
23
GMO Series Trust
Statements of Changes in Net Assets — (Continued)
| | | | | | | | | | | | | | | | | | | | |
| | | Global Asset
Allocation Series Fund | | Global Equity
Allocation Series Fund |
| | | Year Ended
February 29, 2016 | | Period from
May 1, 2014
through
February 28, 2015(a) | | Year Ended
February 29, 2016 | | Period from
May 1, 2014
through
February 28, 2015(a) |
Increase (decrease) in net assets: | | | | | | | | | | | | | | | | | | | | |
Operations: | | | | | | | | | | | | | | | | | | | | |
Net investment income (loss) | | | $ | 11,548,653 | | | | $ | 29,428,528 | | | | $ | 384,551 | | | | $ | 496,964 | |
Net realized gain (loss) | | | | 30,828,023 | | | | | 45,602,118 | | | | | 583,532 | | | | | 625,026 | |
Change in net unrealized appreciation (depreciation) | | | | (85,504,307 | ) | | | | (56,500,980 | ) | | | | (3,610,444 | ) | | | | (907,828 | ) |
| | | | | | | | | | | | | | | | | | | | |
| | | | |
Net increase (decrease) in net assets from operations | | | | (43,127,631 | ) | | | | 18,529,666 | | | | | (2,642,361 | ) | | | | 214,162 | |
| | | | | | | | | | | | | | | | | | | | |
Distributions to shareholders from: | | | | | | | | | | | | | | | | | | | | |
Net investment income | | | | | | | | | | | | | | | | | | | | |
Class R6 | | | | (11,683,073 | ) | | | | (29,763,737 | ) | | | | (383,520 | ) | | | | (492,710 | ) |
| | | | | | | | | | | | | | | | | | | | |
Net realized gains | | | | | | | | | | | | | | | | | | | | |
Class R6 | | | | (47,114,249 | ) | | | | (31,435,087 | ) | | | | (1,042,868 | ) | | | | (646,156 | ) |
| | | | | | | | | | | | | | | | | | | | |
Net share transactions (Note 9): | | | | | | | | | | | | | | | | | | | | |
Class R6 | | | | (424,331,521 | ) | | | | 55,910,593 | | | | | 250,021 | | | | | 11,381,869 | |
| | | | | | | | | | | | | | | | | | | | |
Increase (decrease) in net assets resulting from net share transactions | | | | (424,331,521 | ) | | | | 55,910,593 | | | | | 250,021 | | | | | 11,381,869 | |
| | | | | | | | | | | | | | | | | | | | |
Total increase (decrease) in net assets | | | | (526,256,474 | ) | | | | 13,241,435 | | | | | (3,818,728 | ) | | | | 10,457,165 | |
| | | | |
| Net assets: | | | | | | | | | | | | | | | | | | | | |
Beginning of period | | | | 815,974,004 | | | | | 802,732,569 | | | | | 16,792,402 | | | | | 6,335,237 | |
| | | | | | | | | | | | | | | | | | | | |
End of period | | | $ | 289,717,530 | | | | $ | 815,974,004 | | | | $ | 12,973,674 | | | | $ | 16,792,402 | |
| | | | | | | | | | | | | | | | | | | | |
Accumulated undistributed net investment income | | | $ | 296,268 | | | | $ | 312,564 | | | | $ | 3,876 | | | | $ | 2,845 | |
| | | | | | | | | | | | | | | | | | | | |
| (a) | On September 18, 2014, the Trustees approved a change in the fiscal year end of the Fund from April 30 to February 28/29 which resulted in a ten month period. |
See accompanying notes to the financial statements.
24
GMO Series Trust
Statements of Changes in Net Assets — (Continued)
| | | | | | | | | | | | | | | | | | | | |
| | | International Developed Equity
Allocation Series Fund | | International Equity
Allocation Series Fund |
| | | Year Ended
February 29, 2016 | | Period from
January 12, 2015
(commencement
of operations)
through
February 28, 2015 | | Year Ended
February 29, 2016 | | Period from
May 1, 2014
through
February 28, 2015(a) |
Increase (decrease) in net assets: | | | | | | | | | | | | | | | | | | | | |
Operations: | | | | | | | | | | | | | | | | | | | | |
Net investment income (loss) | | | $ | 292,948 | | | | $ | (651 | ) | | | $ | 7,611,600 | | | | $ | 12,589,971 | |
Net realized gain (loss) | | | | 45,605 | | | | | 9,027 | | | | | 9,897,712 | | | | | 6,289,441 | |
Change in net unrealized appreciation (depreciation) | | | | (2,373,979 | ) | | | | 946,680 | | | | | (73,508,121 | ) | | | | (35,585,759 | ) |
| | | | | | | | | | | | | | | | | | | | |
| | | | |
Net increase (decrease) in net assets from operations | | | | (2,035,426 | ) | | | | 955,056 | | | | | (55,998,809 | ) | | | | (16,706,347 | ) |
| | | | | | | | | | | | | | | | | | | | |
Distributions to shareholders from: | | | | | | | | | | | | | | | | | | | | |
Net investment income | | | | | | | | | | | | | | | | | | | | |
Class R5 | | | | — | | | | | — | | | | | (507,233 | ) | | | | (835,499 | ) |
Class R6 | | | | (290,923 | ) | | | | — | | | | | (7,076,063 | ) | | | | (11,537,810 | ) |
| | | | | | | | | | | | | | | | | | | | |
Total distributions from net investment income | | | | (290,923 | ) | | | | — | | | | | (7,583,296 | ) | | | | (12,373,309 | ) |
| | | | | | | | | | | | | | | | | | | | |
Net realized gains | | | | | | | | | | | | | | | | | | | | |
Class R5 | | | | — | | | | | — | | | | | (831,911 | ) | | | | (1,175,323 | ) |
Class R6 | | | | (60,556 | ) | | | | — | | | | | (11,037,606 | ) | | | | (15,408,520 | ) |
| | | | | | | | | | | | | | | | | | | | |
Total distributions from net realized gains | | | | (60,556 | ) | | | | — | | | | | (11,869,517 | ) | | | | (16,583,843 | ) |
| | | | | | | | | | | | | | | | | | | | |
Net share transactions (Note 9): | | | | | | | | | | | | | | | | | | | | |
Class R5 | | | | — | | | | | — | | | | | (1,161,713 | ) | | | | 854,473 | |
Class R6 | | | | 392,568 | | | | | 9,655,331 | | | | | 25,420,473 | | | | | (7,936,846 | ) |
| | | | | | | | | | | | | | | | | | | | |
Increase (decrease) in net assets resulting from net share transactions | | | | 392,568 | | | | | 9,655,331 | | | | | 24,258,760 | | | | | (7,082,373 | ) |
| | | | | | | | | | | | | | | | | | | | |
Total increase (decrease) in net assets | | | | (1,994,337 | ) | | | | 10,610,387 | | | | | (51,192,862 | ) | | | | (52,745,872 | ) |
| | | | |
| Net assets: | | | | | | | | | | | | | | | | | | | | |
Beginning of period | | | | 10,610,387 | | | | | — | | | | | 278,074,344 | | | | | 330,820,216 | |
| | | | | | | | | | | | | | | | | | | | |
End of period | | | $ | 8,616,050 | | | | $ | 10,610,387 | | | | $ | 226,881,482 | | | | $ | 278,074,344 | |
| | | | | | | | | | | | | | | | | | | | |
Accumulated undistributed net investment income | | | $ | 1,988 | | | | $ | — | | | | $ | 184,139 | | | | $ | 157,650 | |
| | | | | | | | | | | | | | | | | | | | |
| (a) | On September 18, 2014, the Trustees approved a change in the fiscal year end of the Fund from April 30 to February 28/29 which resulted in a ten month period. |
See accompanying notes to the financial statements.
25
GMO Series Trust
Financial Highlights
(For a share outstanding throughout each period)
BENCHMARK-FREE ALLOCATION SERIES FUND
| | | | | | | | | | | | | | | | | | | | |
| | | Class R6 Shares |
| | | Year Ended
February 29, 2016 | | Period from
May 1, 2014
through
February 28, 2015(a) | | Year Ended
April 30, 2014 | | Period from
January 24, 2013
(commencement
of operations)
through
April 30, 2013 |
Net asset value, beginning of period | | | $ | 10.61 | | | | $ | 10.84 | | | | $ | 10.35 | | | | $ | 10.00 | |
| | | | | | | | | | | | | | | | | | | | |
Income (loss) from investment operations: | | | | | | | | | | | | | | | | | | | | |
Net investment income (loss)(b)† | | | | 0.12 | | | | | 0.23 | | | | | 0.15 | | | | | (0.00 | )(c) |
Net realized and unrealized gain (loss) | | | | (1.31 | ) | | | | 0.03 | | | | | 0.58 | | | | | 0.35 | |
| | | | | | | | | | | | | | | | | | | | |
Total from investment operations | | | | (1.19 | ) | | | | 0.26 | | | | | 0.73 | | | | | 0.35 | |
| | | | | | | | | | | | | | | | | | | | |
Less distributions to shareholders: | | | | | | | | | | | | | | | | | | | | |
From net investment income | | | | (0.14 | ) | | | | (0.32 | ) | | | | (0.23 | ) | | | | — | |
From net realized gains | | | | (0.20 | ) | | | | (0.17 | ) | | | | (0.01 | ) | | | | — | |
| | | | | | | | | | | | | | | | | | | | |
Total distributions | | | | (0.34 | ) | | | | (0.49 | ) | | | | (0.24 | ) | | | | — | |
| | | | | | | | | | | | | | | | | | | | |
Net asset value, end of period | | | $ | 9.08 | | | | $ | 10.61 | | | | $ | 10.84 | | | | $ | 10.35 | |
| | | | | | | | | | | | | | | | | | | | |
Total Return(d) | | | | (11.48 | )% | | | | 2.47 | %** | | | | 7.15 | % | | | | 3.50 | %** |
| Ratios/Supplemental Data: | | | | | | | | | | | | | | | | | | | | |
Net assets, end of period (000’s) | | | $ | 267,923 | | | | $ | 281,110 | | | | $ | 164,442 | | | | $ | 160,138 | |
Net expenses to average daily net assets(e) | | | | 0.05 | % | | | | 0.05 | %* | | | | 0.05 | % | | | | 0.05 | %* |
Net investment income (loss) to average daily net assets(b) | | | | 1.26 | % | | | | 2.53 | %* | | | | 1.41 | % | | | | (0.05 | )%* |
Portfolio turnover rate | | | | 27 | % | | | | 6 | %** | | | | 8 | % | | | | 0 | %** |
Fees and expenses reimbursed and/or waived by GMO to average daily net assets: | | | | 0.01 | % | | | | 0.02 | %* | | | | 0.00 | %(f) | | | | 0.01 | %* |
| (a) | On September 18, 2014, the Trustees approved a change in the fiscal year end of the Fund from April 30 to February 28/29 which resulted in a ten month period. |
| (b) | Net investment income is affected by the timing of the declaration of dividends by the Institutional Fund in which the Fund invests. |
| (c) | Rounds to less than $0.01. |
| (d) | The total returns would have been lower had certain expenses not been reimbursed during the periods shown and assumes the effect of reinvested distributions, if any. |
| (e) | Net expenses exclude expenses incurred indirectly through investment in the Institutional Fund and Underlying Funds, if any (Note 5). |
| (f) | Fees and expenses reimbursed by GMO to average daily net assets were less than 0.01%. |
| † | Calculated using average shares outstanding throughout the period. |
See accompanying notes to the financial statements.
26
GMO Series Trust
Financial Highlights
(For a share outstanding throughout each period)
EMERGING COUNTRIES SERIES FUND
| | | | | | | | | | |
| | | Class R6 Shares |
| | | Year Ended
February 29, 2016 | | Period from
May 2, 2014
(commencement
of operations)
through
February 28, 2015 |
Net asset value, beginning of period | | | $ | 9.51 | | | | $ | 10.00 | |
| | | | | | | | | | |
Income (loss) from investment operations: | | | | | | | | | | |
Net investment income (loss)(a)† | | | | 0.20 | | | | | 0.35 | |
Net realized and unrealized gain (loss) | | | | (2.36 | ) | | | | (0.47 | ) |
| | | | | | | | | | |
Total from investment operations | | | | (2.16 | ) | | | | (0.12 | ) |
| | | | | | | | | | |
Less distributions to shareholders: | | | | | | | | | | |
From net investment income | | | | (0.21 | ) | | | | (0.35 | ) |
From net realized gains | | | | — | | | | | (0.02 | ) |
Return of capital | | | | (0.01 | ) | | | | — | |
| | | | | | | | | | |
Total distributions | | | | (0.22 | ) | | | | (0.37 | ) |
| | | | | | | | | | |
Net asset value, end of period | | | $ | 7.13 | | | | $ | 9.51 | |
| | | | | | | | | | |
Total Return(b) | | | | (22.92 | )% | | | | (1.01 | )%** |
| Ratios/Supplemental Data: | | | | | | | | | | |
Net assets, end of period (000’s) | | | $ | 9,174 | | | | $ | 13,795 | |
Net expenses to average daily net assets(c) | | | | 0.05 | % | | | | 0.05 | %* |
Net investment income (loss) to average daily net assets(a) | | | | 2.36 | % | | | | 4.17 | %* |
Portfolio turnover rate | | | | 9 | % | | | | 17 | %** |
Fees and expenses reimbursed and/or waived by GMO to average daily net assets: | | | | 0.03 | % | | | | 0.01 | %* |
| (a) | Net investment income is affected by the timing of the declaration of dividends by the Institutional Fund in which the Fund invests. |
| (b) | The total returns would have been lower had certain expenses not been reimbursed during the periods shown and assumes the effect of reinvested distributions, if any. |
| (c) | Net expenses exclude expenses incurred indirectly through investment in the Institutional Fund and Underlying Funds, if any (Note 5). |
| † | Calculated using average shares outstanding throughout the period. |
See accompanying notes to the financial statements.
27
GMO Series Trust
Financial Highlights
(For a share outstanding throughout each period)
GLOBAL ASSET ALLOCATION SERIES FUND
| | | | | | | | | | | | | | | | | | | | |
| | | Class R6 Shares |
| | | Year Ended
February 29, 2016 | | Period from
May 1, 2014
through
February 28, 2015(a) | | Year Ended
April 30, 2014 | | Period from
July 31, 2012
(commencement
of operations)
through
April 30, 2013 |
Net asset value, beginning of period | | | $ | 10.90 | | | | $ | 11.52 | | | | $ | 10.84 | | | | $ | 10.00 | |
| | | | | | | | | | | | | | | | | | | | |
Income (loss) from investment operations: | | | | | | | | | | | | | | | | | | | | |
Net investment income (loss)(b)† | | | | 0.28 | | | | | 0.41 | | | | | 0.27 | | | | | 0.32 | |
Net realized and unrealized gain (loss) | | | | (1.40 | ) | | | | (0.17 | ) | | | | 0.69 | | | | | 0.79 | |
| | | | | | | | | | | | | | | | | | | | |
Total from investment operations | | | | (1.12 | ) | | | | 0.24 | | | | | 0.96 | | | | | 1.11 | |
| | | | | | | | | | | | | | | | | | | | |
Less distributions to shareholders: | | | | | | | | | | | | | | | | | | | | |
From net investment income | | | | (0.37 | ) | | | | (0.42 | ) | | | | (0.26 | ) | | | | (0.27 | ) |
From net realized gains | | | | (1.28 | ) | | | | (0.44 | ) | | | | (0.02 | ) | | | | (0.00 | )(c) |
| | | | | | | | | | | | | | | | | | | | |
Total distributions | | | | (1.65 | ) | | | | (0.86 | ) | | | | (0.28 | ) | | | | (0.27 | ) |
| | | | | | | | | | | | | | | | | | | | |
Net asset value, end of period | | | $ | 8.13 | | | | $ | 10.90 | | | | $ | 11.52 | | | | $ | 10.84 | |
| | | | | | | | | | | | | | | | | | | | |
Total Return(d) | | | | (10.95 | )% | | | | 2.31 | %** | | | | 9.02 | % | | | | 11.36 | %** |
| Ratios/Supplemental Data: | | | | | | | | | | | | | | | | | | | | |
Net assets, end of period (000’s) | | | $ | 289,718 | | | | $ | 815,974 | | | | $ | 802,733 | | | | $ | 592,415 | |
Net expenses to average daily net assets(e) | | | | 0.05 | % | | | | 0.05 | %* | | | | 0.05 | % | | | | 0.05 | %* |
Net investment income (loss) to average daily net assets(b) | | | | 2.76 | % | | | | 4.33 | %* | | | | 2.46 | % | | | | 4.07 | %* |
Portfolio turnover rate | | | | 7 | % | | | | 6 | %** | | | | 2 | % | | | | 6 | %** |
Fees and expenses reimbursed and/or waived by GMO to average daily net assets | | | | 0.01 | % | | | | 0.00 | %*(f) | | | | 0.00 | %(f) | | | | 0.00 | %*(f) |
| (a) | On September 18, 2014, the Trustees approved a change in the fiscal year end of the Fund from April 30 to February 28/29 which resulted in a ten month period. |
| (b) | Net investment income is affected by the timing of the declaration of dividends by the Institutional Fund in which the Fund invests. |
| (c) | Rounds to less than $0.01. |
| (d) | The total returns would have been lower had certain expenses not been reimbursed during the periods shown and assumes the effect of reinvested distributions, if any. |
| (e) | Net expenses exclude expenses incurred indirectly through investment in the Institutional Fund and Underlying Funds, if any (Note 5). |
| (f) | Fees and expenses reimbursed by GMO to average daily net assets were less than 0.01%. |
| † | Calculated using average shares outstanding throughout the period. |
See accompanying notes to the financial statements.
28
GMO Series Trust
Financial Highlights
(For a share outstanding throughout each period)
GLOBAL EQUITY ALLOCATION SERIES FUND
| | | | | | | | | | | | | | | | | | | | |
| | | Class R6 Shares |
| | | Year Ended
February 29, 2016 | | Period from
May 1, 2014
through
February 28, 2015(a) | | Year Ended
April 30, 2014 | | Period from
September 4, 2012
(commencement
of operations)
through April 30,
2013 |
Net asset value, beginning of period | | | $ | 11.05 | | | | $ | 12.02 | | | | $ | 11.14 | | | | $ | 10.00 | |
| | | | | | | | | | | | | | | | | | | | |
Income (loss) from investment operations: | | | | | | | | | | | | | | | | | | | | |
Net investment income (loss)(b)† | | | | 0.25 | | | | | 0.53 | | | | | 0.45 | | | | | 0.26 | |
Net realized and unrealized gain (loss) | | | | (1.93 | ) | | | | (0.52 | ) | | | | 1.14 | | | | | 1.23 | |
| | | | | | | | | | | | | | | | | | | | |
Total from investment operations | | | | (1.68 | ) | | | | 0.01 | | | | | 1.59 | | | | | 1.49 | |
| | | | | | | | | | | | | | | | | | | | |
Less distributions to shareholders: | | | | | | | | | | | | | | | | | | | | |
From net investment income | | | | (0.27 | ) | | | | (0.38 | ) | | | | (0.49 | ) | | | | (0.35 | ) |
From net realized gains | | | | (0.71 | ) | | | | (0.60 | ) | | | | (0.22 | ) | | | | — | |
| | | | | | | | | | | | | | | | | | | | |
Total distributions | | | | (0.98 | ) | | | | (0.98 | ) | | | | (0.71 | ) | | | | (0.35 | ) |
| | | | | | | | | | | | | | | | | | | | |
Net asset value, end of period | | | $ | 8.39 | | | | $ | 11.05 | | | | $ | 12.02 | | | | $ | 11.14 | |
| | | | | | | | | | | | | | | | | | | | |
Total Return(c) | | | | (16.02 | )% | | | | 0.28 | %** | | | | 14.70 | % | | | | 15.29 | %** |
| Ratios/Supplemental Data: | | | | | | | | | | | | | | | | | | | | |
Net assets, end of period (000’s) | | | $ | 12,974 | | | | $ | 16,792 | | | | $ | 6,335 | | | | $ | 1,461 | |
Net expenses to average daily net assets(d) | | | | 0.05 | % | | | | 0.05 | %* | | | | 0.05 | % | | | | 0.05 | %* |
Net investment income (loss) to average daily net assets(b) | | | | 2.51 | % | | | | 5.55 | %* | | | | 3.94 | % | | | | 3.76 | %* |
Portfolio turnover rate | | | | 18 | % | | | | 23 | %** | | | | 28 | % | | | | 46 | %** |
Fees and expenses reimbursed and/or waived by GMO to average daily net assets: | | | | 0.02 | % | | | | 0.02 | %* | | | | 0.03 | % | | | | 0.58 | %* |
| (a) | On September 18, 2014, the Trustees approved a change in the fiscal year end of the Fund from April 30 to February 28/29 which resulted in a ten month period. |
| (b) | Net investment income is affected by the timing of the declaration of dividends by the Institutional Fund in which the Fund invests. |
| (c) | The total returns would have been lower had certain expenses not been reimbursed during the periods shown and assumes the effect of reinvested distributions, if any. |
| (d) | Net expenses exclude expenses incurred indirectly through investment in the Institutional Fund and Underlying Funds, if any (Note 5). |
| † | Calculated using average shares outstanding throughout the period. |
See accompanying notes to the financial statements.
29
GMO Series Trust
Financial Highlights
(For a share outstanding throughout each period)
INTERNATIONAL DEVELOPED EQUITY ALLOCATION SERIES FUND
| | | | | | | | | | |
| | | Class R6 Shares |
| | | Year Ended
February 29, 2016 | | Period from
January 12, 2015
(commencement
of operations)
through
February 28, 2015 |
Net asset value, beginning of period | | | $ | 11.00 | | | | $ | 10.00 | |
| | | | | | | | | | |
Income (loss) from investment operations: | | | | | | | | | | |
Net investment income (loss)(a)† | | | | 0.31 | | | | | 0.00 | (b) |
Net realized and unrealized gain (loss) | | | | (2.47 | ) | | | | 1.00 | |
| | | | | | | | | | |
Total from investment operations | | | | (2.16 | ) | | | | 1.00 | |
| | | | | | | | | | |
Less distributions to shareholders: | | | | | | | | | | |
From net investment income | | | | (0.30 | ) | | | | — | |
From net realized gains | | | | (0.06 | ) | | | | — | |
| | | | | | | | | | |
Total distributions | | | | (0.36 | ) | | | | — | |
| | | | | | | | | | |
Net asset value, end of period | | | $ | 8.48 | | | | $ | 11.00 | |
| | | | | | | | | | |
Total Return(c) | | | | (19.90 | )% | | | | 10.00 | %** |
| Ratios/Supplemental Data: | | | | | | | | | | |
Net assets, end of period (000’s) | | | $ | 8,616 | | | | $ | 10,610 | |
Net expenses to average daily net assets(d) | | | | 0.05 | % | | | | 0.05 | %* |
Net investment income (loss) to average daily net assets(a) | | | | 3.04 | % | | | | (0.05 | )%* |
Portfolio turnover rate | | | | 7 | % | | | | 2 | %** |
Fees and expenses reimbursed and/or waived by GMO to average daily net assets: | | | | 0.07 | % | | | | 0.05 | %* |
| (a) | Net investment income is affected by the timing of the declaration of dividends by the Institutional Fund in which the Fund invests. |
| (b) | Rounds to less than $0.01. |
| (c) | The total returns would have been lower had certain expenses not been reimbursed during the periods shown and assumes the effect of reinvested distributions, if any. |
| (d) | Net expenses exclude expenses incurred indirectly through investment in the Institutional Fund and Underlying Funds, if any (Note 5). |
| † | Calculated using average shares outstanding throughout the period. |
See accompanying notes to the financial statements.
30
GMO Series Trust
Financial Highlights
(For a share outstanding throughout each period)
INTERNATIONAL EQUITY ALLOCATION SERIES FUND
| | | | | | | | | | | | | | | | | | | | | | | | | | | | | | | | | | | | | | | | | | | | | |
| | | Class R5 Shares | | Class R6 Shares |
| | | Year Ended
February 29,
2016 | | Period from
May 1, 2014
through
February 28,
2015(a) | | Year
Ended
April 30,
2014 | | Period from
April 5, 2013
(commencement
of operations)
through
April 30,
2013 | | Year Ended
February 29,
2016 | | Period from
May 1, 2014
through
February 28,
2015(a) | | Year Ended
April 30, | | Period from
March 30, 2012
(commencement
of operations)
through
April 30,
2012 |
| | | | | | | | 2014 | | 2013 | |
Net asset value, beginning of period | | | $ | 10.50 | | | | $ | 12.10 | | | | $ | 10.97 | | | | $ | 10.40 | | | | $ | 10.51 | | | | $ | 12.10 | | | | $ | 10.97 | | | | $ | 9.77 | | | | $ | 10.00 | |
| | | | | | | | | | | | | | | | | | | | | | | | | | | | | | | | | | | | | | | | | | | | | |
Income (loss) from investment operations: | | | | | | | | | | | | | | | | | | | | | | | | | | | | | | | | | | | | | | | | | | | | | |
Net investment income (loss)(b)† | | | | 0.26 | | | | | 0.43 | | | | | 0.31 | | | | | (0.00 | )(c) | | | | 0.29 | | | | | 0.45 | | | | | 0.33 | | | | | 0.33 | | | | | (0.00 | )(c) |
Net realized and unrealized gain (loss) | | | | (2.34 | ) | | | | (1.00 | ) | | | | 1.20 | | | | | 0.57 | | | | | (2.37 | ) | | | | (1.00 | ) | | | | 1.19 | | | | | 1.18 | | | | | (0.23 | ) |
| | | | | | | | | | | | | | | | | | | | | | | | | | | | | | | | | | | | | | | | | | | | | |
Total from investment operations | | | | (2.08 | ) | | | | (0.57 | ) | | | | 1.51 | | | | | 0.57 | | | | | (2.08 | ) | | | | (0.55 | ) | | | | 1.52 | | | | | 1.51 | | | | | (0.23 | ) |
| | | | | | | | | | | | | | | | | | | | | | | | | | | | | | | | | | | | | | | | | | | | | |
Less distributions to shareholders: | | | | | | | | | | | | | | | | | | | | | | | | | | | | | | | | | | | | | | | | | | | | | |
From net investment income | | | | (0.28 | ) | | | | (0.43 | ) | | | | (0.33 | ) | | | | — | | | | | (0.29 | ) | | | | (0.44 | ) | | | | (0.34 | ) | | | | (0.31 | ) | | | | — | |
From net realized gains | | | | (0.46 | ) | | | | (0.60 | ) | | | | (0.05 | ) | | | | — | | | | | (0.46 | ) | | | | (0.60 | ) | | | | (0.05 | ) | | | | — | | | | | — | |
| | | | | | | | | | | | | | | | | | | | | | | | | | | | | | | | | | | | | | | | | | | | | |
Total distributions | | | | (0.74 | ) | | | | (1.03 | ) | | | | (0.38 | ) | | | | — | | | | | (0.75 | ) | | | | (1.04 | ) | | | | (0.39 | ) | | | | (0.31 | ) | | | | — | |
| | | | | | | | | | | | | | | | | | | | | | | | | | | | | | | | | | | | | | | | | | | | | |
Net asset value, end of period | | | $ | 7.68 | | | | $ | 10.50 | | | | $ | 12.10 | | | | $ | 10.97 | | | | $ | 7.68 | | | | $ | 10.51 | | | | $ | 12.10 | | | | $ | 10.97 | | | | $ | 9.77 | |
| | | | | | | | | | | | | | | | | | | | | | | | | | | | | | | | | | | | | | | | | | | | | |
Total Return(d) | | | | (20.53 | )% | | | | (4.61 | )%** | | | | 13.96 | % | | | | 5.48 | %** | | | | (20.53 | )% | | | | (4.45 | )%** | | | | 14.04 | % | | | | 15.77 | % | | | | (2.30 | )%** |
| Ratios/Supplemental Data: | | | | | | | | | | | | | | | | | | | | | | | | | | | | | | | | | | | | | | | | | | | | | |
Net assets, end of period (000’s) | | | $ | 14,555 | | | | $ | 21,100 | | | | $ | 23,446 | | | | $ | 23,190 | | | | $ | 212,327 | | | | $ | 256,975 | | | | $ | 307,375 | | | | $ | 280,869 | | | | $ | 183,330 | |
Net expenses to average daily net assets(e) | | | | 0.15 | % | | | | 0.15 | %* | | | | 0.15 | % | | | | 0.15 | %* | | | | 0.05 | % | | | | 0.05 | %* | | | | 0.05 | % | | | | 0.05 | % | | | | 0.05 | %* |
Net investment income (loss) to average daily net assets(b) | | | | 2.76 | % | | | | 4.57 | %* | | | | 2.78 | % | | | | (0.15 | )%* | | | | 3.05 | % | | | | 4.85 | %* | | | | 2.92 | % | | | | 3.26 | % | | | | (0.05 | )%* |
Portfolio turnover rate | | | | 4 | % | | | | 8 | %** | | | | 6 | % | | | | 3 | %** | | | | 4 | % | | | | 8 | %** | | | | 6 | % | | | | 3 | % | | | | 0 | %** |
Fees and expenses reimbursed and/or waived by GMO to average daily net assets:(f) | | | | 0.00 | % | | | | 0.00 | %* | | | | 0.00 | % | | | | 0.00 | %* | | | | 0.00 | % | | | | 0.00 | %* | | | | 0.00 | % | | | | 0.00 | % | | | | 0.00 | %* |
| (a) | On September 18, 2014, the Trustees approved a change in the fiscal year end of the Fund from April 30 to February 28/29 which resulted in a ten month period. |
| (b) | Net investment income is affected by the timing of the declaration of dividends by the Institutional Fund in which the Fund invests. |
| (c) | Rounds to less than $0.01. |
| (d) | The total returns would have been lower had certain expenses not been reimbursed during the periods shown and assumes the effect of reinvested distributions, if any. |
| (e) | Net expenses exclude expenses incurred indirectly through investment in the Institutional Fund and Underlying Funds, if any (Note 5). |
| (f) | Fees and expenses reimbursed by GMO to average daily net assets were less than 0.01%. |
| † | Calculated using average shares outstanding throughout the period. |
31
GMO Series Trust
Notes to Financial Statements
February 29, 2016
Each of Benchmark-Free Allocation Series Fund, Emerging Countries Series Fund, Global Asset Allocation Series Fund, Global Equity Allocation Series Fund, International Developed Equity Allocation Series Fund and International Equity Allocation Series Fund (each a “Fund” and collectively the “Funds”) is a series of GMO Series Trust (the “Trust”). The Trust is registered under the Investment Company Act of 1940, as amended (the “1940 Act”), as an open-end management investment company. The Trust was established as a Massachusetts business trust under the laws of The Commonwealth of Massachusetts on May 27, 2011. The Declaration of Trust of the Trust permits the Trustees of the Trust (“Trustees”) to create an unlimited number of series of shares (“Funds”) and to subdivide Funds into classes. The Funds are diversified as that term is defined in the 1940 Act. The Funds are advised and managed by Grantham, Mayo, Van Otterloo & Co. LLC (“GMO”).
On September 18, 2014, the Trustees approved a change in the fiscal year end of the Funds from April 30 to February 28/29. Accordingly, the Funds’ financial statements and related notes include information for the ten month period ended February 28, 2015 and the one year period ended April 30 of prior years, if applicable.
Each Fund invests substantially all of its assets in shares of another fund that is a series of GMO Trust and is managed by GMO (each an “Institutional Fund”). The performance and operations of each Fund are directly affected by the performance and operations of the relevant Institutional Fund. Each Institutional Fund, except GMO Emerging Countries Fund, is a fund of funds that invests primarily in shares of other GMO Funds (“Underlying Funds”). Information about the Institutional Funds for their fiscal year ended February 29, 2016 is contained in the Institutional Funds’ financial statements of the same date. Additional selected information about the Institutional Funds and Underlying Funds as of the date of this report can be found in Note 11, “Institutional Fund information.” The Funds’ financial statements should be read in conjunction with the financial statements of the Institutional Funds and Underlying Funds, which can be obtained from the Securities and Exchange Commission’s (“SEC”) EDGAR database on its website at www.sec.gov or by calling (617) 346-7646 (collect) or visiting www.gmo.com.
The following table provides information about each Fund’s benchmark (if any), investment objective and the portion of the corresponding Institutional Fund owned by the Fund as of February 29, 2016:
| | | | | | | | |
| | | | |
| Fund Name | | Benchmark | | Investment Objective | | Percent of
Institutional Fund
Owned | |
| Benchmark-Free Allocation Series Fund | | Not Applicable | | Positive total return not “relative” return | | | 1.6% | |
| Emerging Countries Series Fund | | S&P/IFCI Composite Index | | Total return in excess of benchmark | | | 43.6% | |
| Global Asset Allocation Series Fund | | GMO Global Asset Allocation Index (65% MSCI ACWI and 35% Barclays U.S. Aggregate Index) | | Total return greater than benchmark | | | 8.6% | |
| Global Equity Allocation Series Fund | | MSCI ACWI | | Total return greater than benchmark | | | 0.4% | |
International Developed Equity Allocation Series Fund | | MSCI EAFE Index | | Total return greater than benchmark | | | 0.9% | |
International Equity Allocation Series Fund | | MSCI ACWI ex USA | | Total return greater than benchmark | | | 19.8% | |
| 2. | Significant accounting policies |
The following is a summary of significant accounting policies followed by each Fund in the preparation of its financial statements. These policies are in conformity with accounting principles generally accepted in the United States of America (“U.S. GAAP”) and have been consistently followed by the Funds in preparing these financial statements. The preparation of financial statements in accordance with U.S. GAAP requires management to make estimates and assumptions that affect the reported amounts and
32
GMO Series Trust
Notes to Financial Statements — (Continued)
February 29, 2016
disclosures in the financial statements. Actual results could differ from those estimates. The accounting records of the Funds are maintained in U.S. dollars.
Portfolio valuation
Investments in shares of the Institutional Funds are valued at their most recent net asset value. See Note 11 for details on Institutional Fund valuation policies.
U.S. GAAP requires the Funds to disclose the fair value of their investments in a three-level hierarchy (Levels 1, 2 and 3). The valuation hierarchy is based upon the relative observability of inputs to the valuation of the Funds’ investments. The inputs or methodologies used for valuing securities are not necessarily an indication of the risk associated with investing in those securities.
Changes in valuation techniques may result in transfers into or out of an investment’s assigned level within the fair value hierarchy. In addition, in periods of market dislocation, the observability of prices and inputs may be reduced for many instruments. This condition, as well as changes related to the liquidity of investments, could cause a security to be reclassified between levels.
U.S. GAAP requires additional disclosures about fair value measurements for material Level 3 securities and derivatives, if any (determined by each category of asset or liability as compared to a Fund’s total net assets). At February 29, 2016, there were no direct holdings of material Level 3 classes of investments or derivatives with significant unobservable inputs subject to this additional disclosure.
In May 2015, the Financial Accounting Standards Board (“FASB”) issued Disclosures for Investments in Certain Entities That Calculate Net Asset Value per Share (or its Equivalent). This standard eliminates the requirement to include investments whose fair values are measured at net asset value (“NAV”) as a practical expedient within the fair value hierarchy table in an effort to reduce inconsistency in the leveling of certain investments. The new guidance is effective for fiscal years beginning after December 15, 2015. GMO is currently evaluating the impact, if any, of this guidance on the Funds’ financial statements and disclosures.
The three levels are defined as follows:
Level 1 – Valuations based on quoted prices for identical securities in active markets.
Level 2 – Valuations determined using other significant direct or indirect observable inputs.
Level 3 – Valuations based primarily on inputs that are unobservable and significant.
Each Fund classified its investments as Level 1 as of February 29, 2016. For the summary of valuation inputs of the Institutional Funds and the series of GMO Trust in which the Institutional Funds and Underlying Funds invest, if any, please refer to their most recent financial statements and/or for the net aggregate indirect exposure to these valuation methodologies as of the date of this report, see Note 11. The Institutional Funds and Underlying Funds have a February 28/29 fiscal year end.
The Funds had no transfers between levels of the fair value hierarchy during the year ended February 29, 2016.
Cash
Cash, if any, on the Statements of Assets and Liabilities consists of cash balances held with the custodian.
Taxes and distributions
Each Fund has elected or intends to elect to be treated and intends to qualify each tax year as a regulated investment company under Subchapter M of the Internal Revenue Code of 1986, as amended (the “Code”). Each Fund intends to distribute its net investment income, if any, and its net realized short-term and long-term capital gains, if any, after giving effect to any available capital loss carryforwards for U.S. federal income tax purposes. Therefore, each Fund makes no provision for U.S. federal income or excise taxes.
The policy of each Fund is to declare and pay dividends of its net investment income, if any, at least annually, although the Funds are permitted to, and will from time to time declare and pay dividends of net investment income, if any, more frequently. Each Fund also intends to distribute net realized short-term and long-term capital gains, if any, at least annually. In addition, each Fund may, from time to time at their discretion, make unscheduled distributions in advance of large redemptions by shareholders or as otherwise deemed appropriate by a Fund. Typically all distributions are reinvested in additional shares of each Fund, at net asset value, unless GMO or its agents receive and process a shareholder election to receive cash distributions. Distributions to shareholders are recorded by each Fund on the ex-dividend date.
33
GMO Series Trust
Notes to Financial Statements — (Continued)
February 29, 2016
Foreign taxes paid by the Institutional Funds may be treated, to the extent permissible under the Code and if each Fund so elects, as if paid by U.S. shareholders of each Fund.
Income and capital gain distributions for each Fund are determined in accordance with U.S. federal income tax regulations, which may differ from U.S. GAAP. Certain capital accounts in the financial statements are periodically adjusted for permanent differences in order to reflect their tax character. These adjustments have no impact on net assets or net asset value per share. Temporary differences that arise from recognizing certain items of income, expense, gain or loss in different periods for financial statement and tax purposes will likely reverse at some time in the future. Distributions in excess of net investment income or net realized gains are temporary over-distributions for financial statement purposes resulting from differences in the recognition or classification of income or distributions for financial statement and tax purposes.
U.S. GAAP and tax accounting differences for each Fund primarily relate to reasons described in the following table:
| | | | | | | | | | | | | | | | | | | | | | | | |
| | | | | | | |
| Differences related to: | | Benchmark-Free
Allocation
Series Fund | | | Emerging
Countries
Series Fund | | | Global
Asset
Allocation
Series Fund | | | Global
Equity
Allocation
Series Fund | | | International
Developed
Equity
Allocation
Series Fund | | | International
Equity
Allocation
Series Fund | |
| Capital loss carry forwards | | | | | | | X | | | | | | | | | | | | | | | | | |
| Losses on wash sale transactions | | | X | | | | X | | | | X | | | | X | | | | X | | | | X | |
| Mutual fund distributions received | | | X | | | | | | | | | | | | | | | | | | | | | |
| Post-October capital losses | | | | | | | X | | | | X | | | | | | | | | | | | | |
The tax character of distributions declared by each Fund to shareholders is as follows:
| | | | | | | | | | | | | | | | | | | | | | | | | | | | |
| | | |
| | | Tax year ended February 29, 2016 | | | Tax period ended February 28, 2015 | |
| | | | | | | | |
| Fund Name | | Ordinary
Income
(including
any net
short-term
capital gain)
($) | | | Net
Long-Term
Capital
Gain
($) | | | Return of
Capital
($) | | | Total
Distributions
($) | | | Ordinary
Income
(including
any net
short-term
capital gain)
($) | | | Net
Long-Term
Capital
Gain
($) | | | Total
Distributions
($) | |
| Benchmark-Free Allocation Series Fund | | | 3,937,592 | | | | 5,760,639 | | | | — | | | | 9,698,231 | | | | 7,171,605 | | | | 3,133,810 | | | | 10,305,415 | |
| Emerging Countries Series Fund | | | 273,280 | | | | — | | | | 13,299 | | | | 286,579 | | | | 563,148 | | | | — | | | | 563,148 | |
| Global Asset Allocation Series Fund | | | 11,685,616 | | | | 47,111,706 | | | | — | | | | 58,797,322 | | | | 29,763,737 | | | | 31,435,087 | | | | 61,198,824 | |
| Global Equity Allocation Series Fund | | | 383,520 | | | | 1,042,868 | | | | — | | | | 1,426,388 | | | | 507,643 | | | | 631,223 | | | | 1,138,866 | |
| International Developed Equity Allocation Series Fund | | | 351,479 | | | | — | | | | — | | | | 351,479 | | | | — | | | | — | | | | — | |
| International Equity Allocation Series Fund | | | 7,585,111 | | | | 11,867,702 | | | | — | | | | 19,452,813 | | | | 12,373,309 | | | | 16,583,843 | | | | 28,957,152 | |
34
GMO Series Trust
Notes to Financial Statements — (Continued)
February 29, 2016
Distributions in excess of a Fund’s tax basis earnings and profits, if significant, are reported in the Funds’ financial statements as a return of capital.
As of February 29, 2016, the components of distributable earnings on a tax basis and certain tax attributes for the Funds consisted of the following:
| | | | | | | | | | | | | | | | | | | | |
| | | | | | |
| Fund Name | | Undistributed
Ordinary Income
(including any
Net Short-Term
capital gain) ($) | | | Undistributed
Net Long-Term
Capital Gain ($) | | | Late-Year
Ordinary Loss
Deferral ($) | | | Capital Loss
Carryforwards ($) | | | Post-October
Capital Losses
($) | |
| Benchmark-Free Allocation Series Fund | | | — | | | | — | | | | (21,875) | | | | — | | | | (56,936 | ) |
| Emerging Countries Series Fund | | | — | | | | — | | | | (762) | | | | (95,609 | ) | | | (88,714 | ) |
| Global Asset Allocation Series Fund | | | 319,703 | | | | — | | | | (23,435) | | | | — | | | | (1,299,827 | ) |
| Global Equity Allocation Series Fund | | | 5,018 | | | | 131,433 | | | | (1,142) | | | | — | | | | — | |
| International Developed Equity Allocation Series Fund | | | 2,691 | | | | — | | | | (703) | | | | — | | | | — | |
| International Equity Allocation Series Fund | | | 204,974 | | | | — | | | | (20,835) | | | | — | | | | — | |
As of February 29, 2016, certain Funds had capital loss carryforwards available to offset future realized gains, if any, to the extent permitted by the Code. Utilization of the capital loss carryforwards, post-October capital losses, late-year ordinary losses and losses realized subsequent to February 29, 2016, if any, could be subject to further limitations imposed by the Code related to share ownership activity. The Funds’ capital loss carryforwards are as follows:
| | | | | | | | |
| | | |
| Fund Name | | Short-Term ($) | | | Long-Term ($) | |
| | No Expiration
Date | | | No Expiration
Date | |
| Benchmark-Free Allocation Series Fund | | | — | | | | — | |
| Emerging Countries Series Fund | | | (61,260 | ) | | | (34,349 | ) |
| Global Asset Allocation Series Fund | | | — | | | | — | |
| Global Equity Allocation Series Fund | | | — | | | | — | |
| International Developed Equity Allocation Series Fund | | | — | | | | — | |
| International Equity Allocation Series Fund | | | — | | | | — | |
35
GMO Series Trust
Notes to Financial Statements — (Continued)
February 29, 2016
As of February 29, 2016, the approximate cost for U.S. federal income tax purposes and the aggregate investment-level gross and net unrealized appreciation (depreciation) in the value of investments were as follows:
| | | | | | | | | | | | | | | | |
| | | | | |
| Fund Name | | Aggregate
Cost ($) | | | Gross Unrealized
Appreciation ($) | | | Gross Unrealized
(Depreciation) ($) | | | Net Unrealized
Appreciation
(Depreciation) ($) | |
| Benchmark-Free Allocation Series Fund | | | 302,019,585 | | | | — | | | | (35,530,011) | | | | (35,530,011) | |
| Emerging Countries Series Fund | | | 12,862,902 | | | | — | | | | (3,784,384) | | | | (3,784,384) | |
| Global Asset Allocation Series Fund | | | 349,777,079 | | | | — | | | | (63,644,889) | | | | (63,644,889) | |
| Global Equity Allocation Series Fund | | | 17,504,635 | | | | — | | | | (4,675,352) | | | | (4,675,352) | |
| International Developed Equity Allocation Series Fund | | | 9,925,309 | | | | — | | | | (1,433,837) | | | | (1,433,837) | |
| International Equity Allocation Series Fund | | | 282,662,734 | | | | — | | | | (57,959,314) | | | | (57,959,314) | |
The Funds and Institutional Funds are subject to authoritative guidance related to the accounting and disclosure of uncertain tax positions under U.S. GAAP. This guidance sets forth a minimum threshold for the financial statement recognition of tax positions taken based on the technical merits of such positions. United States and non-U.S. tax rules (including the interpretation and application of tax laws) are subject to change. The Funds and Institutional Funds file tax returns and/or adopt certain tax positions in various jurisdictions. Non-U.S. taxes are provided for based on the Funds’ and Institutional Funds’ understanding of the prevailing tax rules of the non-U.S. markets in which they invest. Recently enacted tax rules, including interpretations of tax laws (e.g., guidance pertaining to the U.S. Foreign Account Tax Compliance Act) and proposed legislation currently under consideration in various jurisdictions, including the U.S., might affect the way the Funds, Institutional Funds and their investors are taxed prospectively and/or retroactively. Prior to the expiration of the relevant statutes of limitations, if any, the Funds and Institutional Funds are subject to examination by U.S. federal, state, local and non-U.S. jurisdictions with respect to the tax returns they have filed and the tax positions they have adopted. The Funds’ and Institutional Funds’ U.S. federal income tax returns are generally subject to examination by the Internal Revenue Service for a period of three years after they are filed. State, local and/or non-U.S. tax returns and/or other filings may be subject to examination for different periods, depending upon the tax rules of each applicable jurisdiction.
Security transactions and related investment income
Security transactions are accounted for in the financial statements on trade date. For purposes of daily net asset value calculations, the Funds’ policy is that security transactions are generally accounted for on the following business day. GMO may override that policy and a Fund may account for security transactions on trade date if it experiences significant purchases or redemptions or engages in significant portfolio transactions. Income dividends and capital gain distributions from the Institutional Funds are recorded on the ex-dividend date. Interest income is recorded on the accrual basis and is adjusted for the amortization of premiums and accretion of discounts. Non-cash dividends, if any, are recorded at the fair market value of the asset received. In determining the net gain or loss on securities sold, the Funds use the identified cost basis.
Expenses and class allocations
Most of the expenses of the Trust are directly attributable to an individual Fund. Investment income, common expenses, if any, and realized and unrealized gains and losses are allocated among the classes of shares of the Funds, if applicable, based on the relative net assets of each class. Each Fund incurs fees and expenses indirectly as a shareholder in the Institutional Funds and the Underlying Funds. Because the Underlying Funds owned by the Institutional Funds have different expense and fee levels and the Institutional Funds may own different proportions of the Underlying Funds at different times, the amount of fees and expenses indirectly incurred by a Fund will vary (See Notes 5 and 11).
State Street Bank and Trust Company (“State Street”) serves as the custodian and fund accounting agent for all Funds except Emerging Countries Series Fund. Brown Brothers Harriman & Co. serves as Emerging Countries Series Fund’s custodian and fund accounting agent. State Street serves as the Funds’ transfer agent. Effective January 1, 2014, any cash balances maintained at the transfer agent are held in a Demand Deposit Account and interest income earned, if any, is shown as interest income in the Statements of Operations.
36
GMO Series Trust
Notes to Financial Statements — (Continued)
February 29, 2016
| 3. | Investment and other risks |
The following chart identifies the selected risks associated with each Fund. Risks not marked for a particular Fund may, however, still apply to some extent to that Fund at various times.
| | | | | | | | | | | | | | | | | | | | | | | | | | | | | | |
| | | Multi-Asset Class
Series Funds | | | | | | Equity Series Funds | | | | |
| | | Benchmark-Free Allocation Series Fund | | Global Asset Allocation Series Fund | | Global Equity Allocation Series Fund | | International Equity Allocation Series Fund | | International Developed Equity Allocation Series Fund | | Emerging Countries Series Fund |
| Market Risk — Equities | | ● | | ● | | ● | | ● | | ● | | ● |
| Market Risk — Fixed Income Investments | | ● | | ● | | ● | | ● | | ● | | |
| Market Risk — Asset-Backed Securities | | ● | | ● | | ● | | ● | | ● | | |
| Credit Risk | | ● | | ● | | ● | | ● | | ● | | |
| Illiquidity Risk | | ● | | ● | | ● | | ● | | ● | | ● |
| Smaller Company Risk | | ● | | ● | | ● | | ● | | ● | | ● |
| Derivatives and Short Sales Risk | | ● | | ● | | ● | | ● | | ● | | ● |
| Non-U.S. Investment Risk | | ● | | ● | | ● | | ● | | ● | | ● |
| Currency Risk | | ● | | ● | | ● | | ● | | ● | | ● |
| Focused Investment Risk | | ● | | ● | | ● | | ● | | ● | | ● |
| Leveraging Risk | | ● | | ● | | ● | | ● | | ● | | ● |
| Counterparty Risk | | ● | | ● | | ● | | ● | | ● | | ● |
| Commodities Risk | | ● | | ● | | | | | | | | |
| Merger Arbitrage Risk | | ● | | ● | | | | | | | | |
| Market Disruption and Geopolitical Risk | | ● | | ● | | ● | | ● | | ● | | ● |
| Large Shareholder Risk | | ● | | ● | | ● | | ● | | ● | | ● |
| Management and Operational Risk | | ● | | ● | | ● | | ● | | ● | | ● |
| Fund of Funds Risk | | ● | | ● | | ● | | ● | | ● | | ● |
| Non-Diversified Funds | | ● | | ● | | ● | | ● | | ● | | ● |
Investing in mutual funds involves many risks. The risks of investing in a particular Fund depend on the types of investments in its portfolio and the investment strategies GMO employs on its behalf. This section does not describe every potential risk of investing in the Funds. Funds could be subject to additional risks because of the types of investments they make and market conditions, which may change over time.
37
GMO Series Trust
Notes to Financial Statements — (Continued)
February 29, 2016
Because each Fund invests substantially all of its assets in an Institutional Fund, the most significant risks of investing in a Fund are the risks to which the Fund is exposed through its corresponding Institutional Fund (and, in turn, any Underlying Funds in which the Institutional Fund invests). Those risks include the risks summarized below. Some of the Underlying Funds are non-diversified investment companies under the 1940 Act and therefore a decline in the market price of a particular security held by those Underlying Funds may affect performance of those Underlying Funds more than if they were diversified. In addition to the risks to which each Fund is exposed through investment in its corresponding Institutional Fund, the Fund is subject to the risk that cash flows into or out of the Fund will cause its performance to be worse than the performance of its corresponding Institutional Fund.
References in this section to investments made by a Fund include those made by its corresponding Institutional Fund and any Underlying Funds.
An investment in a Fund is not a bank deposit and, therefore, is not insured or guaranteed by the Federal Deposit Insurance Corporation or any other government agency.
• MARKET RISK. All of the Funds are subject to market risk, which is the risk that the market value of their holdings will decline. Market risks include:
Equities. Funds that invest in equities run the risk that the market prices of equities will decline. That decline may be attributable to factors affecting the issuing company, such as poor performance by the company’s management or reduced demand for its goods or services, or to factors affecting a particular industry, such as a decline in demand, labor or raw material shortages, or increased production costs. A decline also may result from general market conditions not specifically related to a company or industry, such as real or perceived adverse economic conditions, changes in the general outlook for corporate earnings, changes in interest or currency rates, or adverse investor sentiment generally. Equities generally have significant price volatility, and their market price can decline in a rapid or unpredictable manner. If a Fund purchases equities for less than their value as determined by GMO, the Fund runs the risk that the market prices of these equities will not appreciate or will decline for a variety of reasons, one of which may be GMO’s incorrect assessment of their intrinsic value. The market prices of equities trading at high multiples of current earnings often are more sensitive to changes in future earnings expectations than the market prices of equities trading at lower multiples.
Because of GMO Risk Premium Fund’s emphasis on selling put options on stock indices, its net asset value is expected to decline when those indices decline in value. Also, GMO Risk Premium Fund’s investment strategy of writing put options on stock indices can be expected to cause the Fund to underperform the equity markets on which its puts were written when those markets rise sharply because of the Fund’s lack of exposure to the upside of those markets.
Fixed Income Investments. Funds that invest in fixed income securities (including bonds, notes, bills, synthetic debt instruments, and asset-backed securities) are subject to various market risks. The market price of a fixed income investment can decline due to market-related factors, including rising interest rates and widening credit spreads, or decreased liquidity stemming from the market’s uncertainty about the value of a fixed income investment (or class of fixed income investments). In addition, the market price of fixed income investments with complex structures, such as asset-backed securities, and sovereign and quasi-sovereign debt instruments can decline due to market uncertainty about their credit quality and the reliability of their payment streams. Some fixed income securities also are subject to unscheduled prepayment, and a Fund may be unable to invest prepayments at as high a yield as was provided by the fixed income security. When interest rates rise, these securities also may be repaid more slowly than anticipated, and the market price of the Fund’s investment may decrease. During periods of economic uncertainty and change, the market price of a Fund’s investments in below investment grade securities (commonly referred to as “junk bonds”) may be particularly volatile. Often below investment grade securities are subject to greater sensitivity to interest rate and economic changes than higher rated bonds and can be more difficult to value, exposing a Fund to the risk that the price at which it sells them will be less than the price at which they were valued when held by the Fund. See “Credit Risk” and “Illiquidity Risk” below for more information about these risks.
A risk run by each Fund with a significant investment in fixed income securities is that an increase in prevailing interest rates will cause the market price of those securities to decline. The risk associated with increases in interest rates (also called “interest rate risk”) is generally greater for Funds investing in fixed income securities with longer durations. In addition, in managing some Funds, GMO may seek to evaluate potential investments in part by considering the volatility of interest rates. The value of a Fund’s investments may be significantly impaired if GMO’s assessment proves incorrect.
38
GMO Series Trust
Notes to Financial Statements — (Continued)
February 29, 2016
The extent to which a fixed income security’s price changes with changes in interest rates is referred to as interest rate duration, which can be measured mathematically or empirically. A longer-maturity investment generally has longer interest rate duration because the investment’s fixed rate is locked in for a longer period of time. Floating-rate or adjustable-rate securities, however, generally have shorter interest rate durations because their interest rates are not fixed but rather float up and down as interest rates change. Conversely, inverse floating-rate securities have durations that move in the opposite direction from short-term interest rates and thus tend to underperform fixed rate securities when interest rates rise but outperform them when interest rates decline. Fixed income securities paying no interest, such as zero coupon and principal-only securities, are subject to additional interest rate risk.
The market price of inflation-indexed bonds (including Inflation-Protected Securities issued by the U.S. Treasury (“TIPS”)) typically declines during periods of rising real interest rates (i.e., nominal interest rate minus inflation) and increases during periods of declining real interest rates. In some interest rate environments, such as when real interest rates are rising faster than nominal interest rates, the market price of inflation-indexed bonds may decline more than the price of non-inflation-indexed (or nominal) fixed income bonds with similar maturities.
Generally, when interest rates on short term U.S. Treasury obligations equal or approach zero, a Fund that invests a substantial portion of its assets in U.S. Treasury obligations, such as GMO U.S. Treasury Fund, will have a negative return unless GMO waives or reduces its management fees.
Fixed income securities denominated in foreign currencies also are subject to currency risk. See “Currency Risk” below.
In response to government intervention, economic or market developments, or other factors, fixed income markets may experience periods of high volatility, reduced liquidity or both. During those periods, a Fund could have unusually high shareholder redemptions, requiring it to generate cash by selling securities when it would otherwise not do so, including at unfavorable prices. Fixed income investments may be difficult to value during such periods. In recent periods, central banks and governmental financial regulators, including the U.S. Federal Reserve, have maintained historically low interest rates by purchasing bonds. Steps to curtail or “taper” such activities and other actions by central banks or regulators (such as intervention in foreign currency markets or currency controls) could have a material adverse effect on the Funds.
Asset-Backed Securities. Investments in asset-backed securities not only are subject to all of the market risks described above for fixed income securities but to other market risks as well.
A Fund’s investments in asset-backed securities are exposed to greater risk of severe credit downgrades, illiquidity, and defaults than many other types of fixed income investments. These risks are particularly acute during periods of adverse market conditions, such as those that occurred in 2008. Asset-backed securities may be backed by many types of assets, including pools of residential and commercial mortgages, automobile loans, educational loans, home equity loans, and credit-card receivables. They also may be backed by pools of corporate or sovereign bonds, bank loans to corporations, or a combination of bonds and loans (commonly referred to as “collateralized debt obligations” or “collateralized loan obligations”) and by the fees payable to service providers.
As described under “Market Risk — Fixed Income Investments” above, the market price of fixed income investments with complex structures, such as asset-backed securities, can decline due to a variety of factors, including market uncertainty about their credit quality and the reliability of their payment streams. Payment of interest on asset-backed securities and repayment of principal largely depend on the cash flow generated by the assets backing the securities, as well as the deal structure (e.g., the amount of underlying assets or other support available to produce the cash flows necessary to service interest and make principal payments), the quality of the underlying assets, the level of credit support and the credit quality of the credit-support provider, if any, and the reliability of various other service providers with access to the payment stream. A problem in any one of these factors can lead to a reduction in the payment stream GMO expected a Fund to receive at the time the Fund purchased the asset-backed security. Asset-backed securities involve risk of loss of principal if obligors of the underlying obligations default and the value of the defaulted obligations exceeds whatever credit support the securities may have. Asset-backed securities backed by sub-prime mortgage loans, in particular, may expose a Fund to significantly greater declines in value due to defaults because sub-prime mortgage loans are typically made to less creditworthy borrowers and thus have a higher risk of default than conventional mortgage loans. The obligations of issuers (and obligors of asset-backed securities) also are subject to bankruptcy, insolvency and other laws affecting the rights and remedies of creditors. As of the date of this report, many asset-backed securities owned by the Funds that were once rated investment grade are now rated below investment grade. See “Credit Risk” below for more information about credit risk.
39
GMO Series Trust
Notes to Financial Statements — (Continued)
February 29, 2016
With the deterioration of worldwide economic and liquidity conditions that occurred and became acute in 2008, the markets for asset-backed securities became fractured, and uncertainty about the creditworthiness of those securities (and underlying assets) caused credit spreads (the difference between yields on asset-backed securities and U.S. Government securities) to widen dramatically. Concurrently, systemic risks of the type evidenced by the insolvency of Lehman Brothers and subsequent market disruptions reduced the ability of financial institutions to make markets in many fixed income securities. These events reduced liquidity and contributed to substantial declines in the market prices of asset-backed and other fixed income securities. These conditions may occur again. Also, government actions and proposals affecting the terms of underlying home and consumer loans, changes in demand for products (e.g., automobiles) financed by those loans, and the inability of borrowers to refinance existing loans (e.g., sub-prime mortgages) have had, and may continue to have, adverse valuation and liquidity effects on asset-backed securities.
The market price of an asset-backed security may depend on the servicing of its underlying assets and is, therefore, subject to risks associated with the negligence or defalcation of its servicer. In some circumstances, the mishandling of documentation for underlying assets also may affect the rights of holders of those underlying assets. The insolvency of an entity that generated the assets underlying an asset-backed security is likely to result in a decline in the market price of that security, as well as costs and delays. The obligations underlying asset-backed securities, in particular securities backed by pools of residential and commercial mortgages, also are subject to unscheduled prepayment, and a Fund may be unable to invest prepayments at as high a yield as was provided by the asset-backed security. When interest rates rise, these obligations also may be repaid more slowly than anticipated, and the market price of the Fund’s investment may decrease.
In addition, the existence of insurance on an asset-backed security does not guarantee that the principal and/or interest will be paid because the insurer could default on its obligations.
The risk of investing in asset-backed securities has increased since the deterioration in worldwide economic and liquidity conditions referred to above because performance of the various sectors in which the assets underlying asset-backed securities are concentrated (e.g., auto loans, student loans, sub-prime mortgages, and credit card receivables) has become more highly correlated. See “Focused Investment Risk” below for more information about risks of investing in correlated sectors. A single financial institution may serve as trustee for many asset-backed securities. As a result, a disruption in that institution’s business may have a material impact on many investments. The risks associated with asset-backed securities are particularly pronounced for GMO Debt Opportunities Fund, which has invested a substantial portion of its assets in asset-backed securities, and for each Fund that has invested a substantial portion of its assets in GMO Debt Opportunities Fund.
• CREDIT RISK. This is the risk that the issuer or guarantor of a fixed income investment or the obligor of an obligation underlying an asset-backed security will be unable or unwilling to satisfy its obligation to pay principal and interest or otherwise to honor its obligations in a timely manner. The market price of a fixed income investment will normally decline as a result of the issuer’s, guarantor’s, or obligor’s failure to meet its payment obligations or the downgrading of its credit rating. This risk is particularly acute in environments (like those of 2008) in which financial services firms are exposed to systemic risks of the type evidenced by the insolvency of Lehman Brothers and subsequent market disruptions.
All fixed income securities are subject to credit risk. Financial strength and solvency of an issuer are the primary factors influencing credit risk. The risk varies depending upon whether the issuer is a corporation, a government or government entity, whether the particular security has a priority over other obligations of the issuer in payment of principal and interest and whether it has any collateral backing or credit enhancement. Credit risk may change over the term of a fixed income security. U.S. government securities are subject to varying degrees of credit risk depending upon whether the securities are supported by the full faith and credit of the United States, supported by the ability to borrow from the U.S. Treasury, supported only by the credit of the issuing U.S. government agency, instrumentality, or corporation, or otherwise supported by the United States. For example, issuers of many types of U.S. government securities (e.g., the Federal Home Loan Mortgage Corporation (“Freddie Mac”), Federal National Mortgage Association (“Fannie Mae”), and Federal Home Loan Banks), although chartered or sponsored by Congress, are not funded by Congressional appropriations and their fixed income securities, including mortgage-backed and other asset-backed securities, are neither guaranteed nor insured by the U.S. government. These securities are subject to more credit risk than U.S. government securities that are supported by the full faith and credit of the United States (e.g., U.S. Treasury bonds). Investments in sovereign debt involve the risk that the governmental entities responsible for repayment may be unable or unwilling to pay interest and repay principal when due. A governmental entity’s ability and willingness to pay interest and repay principal in a timely manner may be affected by a variety of factors, including its cash flow, the size of its reserves, its access to foreign exchange, the relative size of its debt service burden to its economy as a whole, and political constraints. Investments in quasi-sovereign issuers
40
GMO Series Trust
Notes to Financial Statements — (Continued)
February 29, 2016
are subject to the additional risk that the issuer may default independently of its sovereign. Sovereign debt risk is greater for fixed income securities issued or guaranteed by emerging countries.
In many cases, the credit risk of a fixed income security is reflected in its credit ratings, and a Fund holding a rated security is subject to the risk that the investment’s rating will be downgraded.
Securities issued by the U.S. government historically have presented minimal credit risk. However, recent events have led to a downgrade in the long-term credit rating of U.S. bonds by several major rating agencies and have introduced greater uncertainty about the repayment by the United States of its obligations. A further credit rating downgrade could decrease, and a default in the payment of principal or interest on U.S. government securities would decrease the value of a Fund’s investments, and could increase the volatility of a Fund’s portfolio.
As described under “Market Risk — Asset-Backed Securities” above, asset-backed securities may be backed by many types of assets and their payment of interest and repayment of principal largely depend on the cash flows generated by the assets backing them. The credit risk of a particular asset-backed security depends on many factors, as described under “Market Risk — Asset-Backed Securities” above.
The obligations of issuers also may be subject to bankruptcy, insolvency and other laws affecting the rights and remedies of creditors. A Fund also is exposed to credit risk on a reference security to the extent it writes protection under credit default swaps. See “Derivatives and Short Sales Risk” below for more information regarding risks associated with the use of credit default swaps.
The extent to which the market price of a fixed income security changes in response to a credit event depends on many factors and can be difficult to predict. For example, even though the effective duration of a long-term floating rate security is very short, an adverse credit event or change in the perceived creditworthiness of its issuer could cause its market price to decline much more than its effective duration would suggest.
Credit risk is particularly pronounced for below investment grade securities (commonly referred to as “junk bonds”). The sovereign debt of many non-U.S. governments, including their sub-divisions and instrumentalities, is below investment grade. Many asset-backed securities also are below investment grade. Below investment grade securities have speculative characteristics, often are less liquid than higher quality securities, present a greater risk of default and are more susceptible to real or perceived adverse industry conditions. Investments in distressed or defaulted instruments generally are considered speculative and may involve substantial risks not normally associated with investments in healthier companies, including adverse business, financial or economic conditions that can lead to defaulted payments and insolvency proceedings. In particular, distressed or defaulted obligations might be repaid, if at all, only after lengthy workout or bankruptcy proceedings, during which the issuer might not make any interest or other payments, and a Fund may incur additional expenses to seek recovery. If GMO’s evaluation of the eventual recovery value of a distressed or defaulted instrument should prove incorrect, a Fund may lose a substantial portion or all of its investment or it may be required to accept cash or instruments with a value less than the Fund’s original investment. In the event of default of sovereign debt, the Funds may be unable to pursue legal action against the issuer.
• ILLIQUIDITY RISK. Illiquidity risk is the risk that low trading volume, lack of a market maker, large position size, or legal restrictions (including daily price fluctuation limits or “circuit breakers”) limits or prevents a Fund from selling particular securities or closing derivative positions at desirable prices. In addition to these risks, a Fund is exposed to illiquidity risk when it has an obligation to purchase particular securities (e.g., as a result of entering into reverse repurchase agreements, writing a put, or closing a short position). To the extent a Fund’s investments include asset-backed securities, distressed or defaulted instruments, emerging country debt securities, securities of companies with smaller market capitalizations or smaller total float-adjusted market capitalizations, or emerging market securities, it is subject to increased illiquidity risk. These types of investments can be difficult to value, exposing a Fund to the risk that the price at which it sells them will be less than the value placed on them when they were held by the Fund. Illiquidity risk also may be greater in times of financial stress. For example, TIPS have experienced periods of greatly reduced liquidity during disruptions in fixed income markets, such as the events surrounding the bankruptcy of Lehman Brothers in 2008. Less liquid securities are more susceptible than other securities to price declines when market prices decline generally.
All of the Funds with benchmarks may buy securities that are less liquid than those in their benchmarks.
41
GMO Series Trust
Notes to Financial Statements — (Continued)
February 29, 2016
GMO Risk Premium Fund’s ability to use options as part of its investment program depends on the liquidity of the options market. In addition, that market may not be liquid when GMO Risk Premium Fund seeks to close out an option position. Also, the hours of trading for options on an exchange may not conform to the hours during which the securities held by GMO Risk Premium Fund are traded. To the extent that the options markets close before the markets for the underlying securities, significant price and rate movements can take place in the markets for underlying securities that are not immediately reflected in the options markets. If GMO Risk Premium Fund receives a redemption request and is unable to close out an option it has sold, the Fund may temporarily be leveraged in relation to its assets.
• SMALLER COMPANY RISK. Companies with smaller market capitalizations, including small- and mid-cap companies, may have limited product lines, markets, or financial resources, may lack the competitive strength of larger companies, may have inexperienced managers or may depend on a few key employees. In addition, their securities often are less widely held and trade less frequently and in lesser quantities, and their market prices often fluctuate more, than the securities of companies with larger market capitalizations. Market risk and illiquidity risk are particularly pronounced for securities of these companies.
• DERIVATIVES AND SHORT SALES RISK. All of the Funds may invest in derivatives, which are financial contracts whose value depends on, or is derived from, the value of underlying assets, reference rates, or indices. Derivatives involve the risk that their value may not change as expected relative to changes in the value of the assets, rates, or indices they are designed to track. Derivatives include futures contracts, forward contracts, foreign currency contracts, swap contracts, contracts for differences, options on securities and indices, options on futures contracts, options on swap contracts, interest rate caps, floors and collars, reverse repurchase agreements, and other over-the-counter (“OTC”) contracts. Derivatives may relate to securities, commodities, currencies, currency exchange rates, interest rates, inflation rates, and indices.
The use of derivatives involves risks that are in addition to, and potentially greater than, the risks of investing directly in securities and other more traditional assets. In particular, a Fund’s use of OTC derivatives exposes it to the risk that the counterparties will be unable or unwilling to make timely settlement payments or otherwise honor their obligations. An OTC derivatives contract typically can be closed only with the consent of the other party to the contract. If the counterparty defaults, the Fund will still have contractual remedies but may not be able to enforce them. Because the contract for each OTC derivative is individually negotiated, the counterparty may interpret contractual terms (e.g., the definition of default) differently than the Fund, and if it does, the Fund may decide not to pursue its claims against the counterparty to avoid the cost and unpredictability of legal proceedings. The Fund, therefore, may be unable to obtain payments GMO believes are owed to it under OTC derivatives contracts, or those payments may be delayed or made only after the Fund has incurred the cost of litigation.
A Fund may invest in derivatives that (i) do not require the counterparty to post collateral (e.g., foreign currency forwards), (ii) require collateral but that do not provide for the Fund’s security interest in it to be perfected, (iii) require a significant upfront deposit by the Fund unrelated to the derivative’s intrinsic value, or (iv) do not require that collateral be regularly marked-to-market. When a counterparty’s obligations are not fully secured by collateral, a Fund runs a greater risk of being unable to recover what it is owed if the counterparty defaults. Even when derivatives are required by contract to be collateralized, a Fund typically will not receive the collateral for one or more days after the collateral is required to be posted.
The Funds may invest in derivatives with a limited number of counterparties, and events affecting the creditworthiness of any of those counterparties may have a pronounced effect on the Funds. Derivatives risk is particularly acute in environments (like those of 2008) in which financial services firms are exposed to systemic risks of the type evidenced by the insolvency of Lehman Brothers and subsequent market disruptions. In addition, during those periods, a Fund may have a greater need for cash to provide collateral for large swings in its mark-to-market obligations under the derivatives in which it has invested.
Derivatives also present other risks described in this section, including market risk, illiquidity risk, currency risk, credit risk, and counterparty risk. Many derivatives, in particular OTC derivatives, are complex and their valuation often requires modeling and judgment, which increases the risk of mispricing or improper valuation. The pricing models used may not produce valuations that are consistent with the values a Fund realizes when it closes or sells an OTC derivative. Valuation risk is more pronounced when a Fund enters into OTC derivatives with specialized terms because the value of those derivatives in some cases is determined only by reference to similar derivatives with more standardized terms. As a result, incorrect valuations may result in increased cash payments to counterparties, undercollateralization and/or errors in the calculation of a Fund’s net asset value.
A Fund’s use of derivatives may not be effective or have the desired results. Moreover, suitable derivatives will not be available in all circumstances. For example, the economic costs of taking some derivative positions may be prohibitive, and if a counterparty or
42
GMO Series Trust
Notes to Financial Statements — (Continued)
February 29, 2016
its affiliate is deemed to be an affiliate of a Fund, the Funds will not be permitted to trade with that counterparty. In addition, GMO may decide not to use derivatives to hedge or otherwise reduce a Fund’s risk exposures, potentially resulting in losses for the Fund.
Swap contracts and other OTC derivatives are highly susceptible to illiquidity risk (see “Illiquidity Risk” above) and counterparty risk (see “Counterparty Risk” below). These derivatives are also subject to documentation risk, which is the risk that ambiguities, inconsistencies or errors in the documentation relating to a derivative transaction may lead to a dispute with the counterparty or unintended investment results. In addition, see “Commodities risk” below for a discussion of certain risks specific to commodity-related derivatives. Because many derivatives have a leverage component (i.e., a notional value in excess of the assets needed to establish and/or maintain the derivative position), adverse changes in the value or level of the underlying asset, rate or index may result in a loss substantially greater than the amount invested in the derivative itself. See “Leveraging Risk” below.
A Fund’s use of derivatives may be subject to special tax rules and could generate additional taxable income for shareholders. In addition, the tax treatment of a Fund’s use of derivatives may be unclear because there is little case or other law interpreting the terms of most derivatives or determining their tax treatment.
Derivatives Regulation. The U.S. government has enacted legislation that provides for new regulation of the derivatives market, including clearing, margin, reporting, and registration requirements. The European Union (and some other countries) are implementing similar requirements, which will affect a Fund when it enters into a derivatives transaction with a counterparty organized in that country or otherwise subject to that country’s derivatives regulations. Because these requirements are new and evolving (and some of the rules are not yet final), their ultimate impact remains unclear.
Transactions in some types of swaps (including interest rate swaps and credit default swaps on North American and European indices) are required to be centrally cleared. In a transaction involving those swaps (“cleared derivatives”), a Fund’s counterparty is a clearing house rather than a bank or broker. Since the Funds are not members of clearing houses and only members of a clearing house (“clearing members”) can participate directly in the clearing house, the Funds hold cleared derivatives through accounts at clearing members. In cleared derivatives positions, the Funds make payments (including margin payments) to and receive payments from a clearing house through their accounts at clearing members. Clearing members guarantee performance of their clients’ obligations to the clearing house.
In some ways, cleared derivative arrangements are less favorable to mutual funds than bilateral arrangements, for example, by requiring that funds provide more margin for their cleared derivatives positions. Also, as a general matter, in contrast to a bilateral derivatives position, following a period of notice to a Fund, a clearing member at any time can require termination of an existing cleared derivatives position or an increase in margin requirements above those required at the outset of a transaction. Clearing houses also have broad rights to increase margin requirements for existing positions or to terminate those positions at any time. Any increase in margin requirements or termination of existing cleared derivatives positions by the clearing member or the clearing house could interfere with the ability of a Fund to pursue its investment strategy. Further, any increase in margin requirements by a clearing member could expose a Fund to greater credit risk to its clearing member margin for cleared derivatives positions in excess of a clearing house’s margin requirements typically is held by the clearing member (see “Counterparty Risk” below). Also, a Fund is subject to risk if it enters into a derivatives transaction that is required to be cleared (or that GMO expects to be cleared), and no clearing member is willing or able to clear the transaction on the Fund’s behalf. While the documentation in place between the Funds and their clearing members generally provides that the clearing members will accept for clearing all cleared derivatives transactions that are within credit limits (specified in advance) for each Fund, the Funds are still subject to the risk that no clearing member will be willing or able to clear a transaction. In those cases, the position might have to be terminated, and the Fund could lose some or all of the benefit of the position, including loss of an increase in the value of the position and loss of hedging protection. In addition, the documentation governing the relationship between the Funds and clearing members is drafted by the clearing members and generally is less favorable to the Funds than typical bilateral derivatives documentation. For example, documentation relating to cleared derivatives generally includes a one-way indemnity by the Funds in favor of the clearing member for losses the clearing member incurs as the Funds’ clearing member and typically does not provide the Funds any remedies if the clearing member defaults or becomes insolvent. While futures contracts entail similar risks, the risks likely are more pronounced for cleared derivatives due to their more limited liquidity and market history.
Some types of cleared derivatives are required to be executed on an exchange or on a swap execution facility. A swap execution facility is a trading platform where multiple market participants can execute derivatives by accepting bids and offers made by multiple other participants in the platform. While this execution requirement is designed to increase transparency and liquidity in the cleared derivatives market, trading on a swap execution facility can create additional costs and risks for the Funds. For example,
43
GMO Series Trust
Notes to Financial Statements — (Continued)
February 29, 2016
swap execution facilities typically charge fees, and if a Fund executes derivatives on a swap execution facility through a broker intermediary, the intermediary may impose fees as well. Also, a Fund may indemnify a swap execution facility, or a broker intermediary who executes cleared derivatives on a swap execution facility on the Fund’s behalf, against any losses or costs that may be incurred as a result of the Fund’s transactions on the swap execution facility. If a Fund wishes to execute a package of transactions that include a swap that is required to be executed on a swap execution facility as well as other transactions (for example, a transaction that includes both a security and an interest rate swap that hedges interest rate exposure with respect to such security), the Fund may be unable to execute all components of the package on the swap execution facility. In that case, the Fund would need to trade some components of the package on the swap execution facility and other components in another manner, which could subject the Fund to the risk that some components would be executed successfully and others would not, or that the components would be executed at different times, leaving the Fund with an unhedged position for a period of time.
The U.S. government and the European Union have proposed mandatory minimum margin requirements for uncleared derivatives. Such requirements could increase the amount of margin required to be provided by a Fund in connection with its derivatives transactions and, therefore, make derivatives transactions more expensive.
These and other new rules and regulations could, among other things, further restrict a Fund’s ability to engage in, or increase the cost to the Fund of derivatives transactions, for example, by making some types of derivatives no longer available to the Fund, or otherwise limiting liquidity. The implementation of the clearing requirement has increased the costs of derivatives transactions for the Funds, since the Funds have to pay fees to their clearing members and are typically required to post more margin for cleared derivatives than they have historically posted for bilateral derivatives. The costs of derivatives transactions are expected to increase further as clearing members raise their fees as to cover the costs of additional capital requirements and other regulatory changes applicable to the clearing members, and when rules imposing mandatory minimum margin requirements on bilateral swaps become effective. These rules and regulations are new and evolving, so their potential impact on the Funds and the financial system are not yet known. While the new rules and regulations and central clearing of some derivatives transactions are designed to reduce systemic risk (i.e., the risk that the interdependence of large derivatives dealers could cause them to suffer liquidity, solvency or other challenges simultaneously), there is no assurance that they will achieve that result, and in the meantime, as noted above, central clearing and related requirements expose the Funds to new kinds of costs and risks.
Options. Some GMO Funds, particularly GMO Risk Premium Fund, are permitted to write options. The market price of an option is affected by many factors, including changes in the market prices or dividend rates of underlying securities (or in the case of indices, the securities in such indices); the time remaining before expiration; changes in interest rates or exchange rates; and changes in the actual or perceived volatility of the relevant stock market and underlying securities. The market price of an option also may be adversely affected if the market for the option becomes less liquid. In addition, since an American-style option allows the holder to exercise its rights any time before the option’s expiration, the writer of an American-style option has no control over when it will be required to fulfill its obligations as a writer of the option. (The writer of a European-style option is not subject to this risk because the holder may only exercise the option on its expiration date.) If a GMO Fund writes a call option and does not hold the underlying security or instrument, the Fund’s potential loss is theoretically unlimited.
National securities exchanges generally have established limits on the maximum number of options an investor or group of investors acting in concert may write. GMO Funds and GMO will likely constitute such a group. If applicable, these limits restrict a GMO Fund’s ability to purchase or write options on a particular security.
Unlike exchange-traded options, which are standardized with respect to the underlying instrument, expiration date, contract size, and strike price, the terms of OTC options (i.e., options not traded on exchanges) generally are established through negotiation with the other party to the option contract. While a GMO Fund has greater flexibility to tailor an OTC option, OTC options generally expose a Fund to greater credit risk than exchange-traded options, which are guaranteed by the clearing organization of the exchanges where they are traded. Purchasing and writing put and call options are highly specialized activities and entail greater than ordinary market risks.
Special tax rules apply to a Fund’s transactions in options, which could increase the taxes payable by shareholders. In particular, a Fund’s options transactions potentially could cause a substantial portion of the Fund’s distributions to consist of amounts taxable to shareholders subject to U.S. income tax at ordinary income tax rates.
44
GMO Series Trust
Notes to Financial Statements — (Continued)
February 29, 2016
Short Investment Exposure. Some Funds may sell securities or currencies short as part of their investment programs in an attempt to increase their returns or for hedging purposes. Short sales expose a Fund to the risk that it will be required to acquire, convert, or exchange a security or currency to replace the borrowed security or currency when the security or currency sold short has appreciated in value, thus resulting in a loss to the Fund.
Purchasing a security or currency to close out a short position can itself cause the price of the security or currency to rise further, thereby exacerbating any losses. A Fund that sells short a security or currency it does not own also may have to pay borrowing fees to a broker and may be required to pay the broker any dividends or interest it receives on a borrowed security. A Fund also may create short investment exposure by taking a derivative position in which the value of the derivative moves in the opposite direction from the price of an underlying investment, pool of investments, index or currency. See “Derivatives and Short Sales Risk” above for a discussion of the specific risks of a Fund’s investments in derivatives.
Short sales of securities or currencies a Fund does not own and “short” derivative positions involve forms of investment leverage, and the amount of the Fund’s potential loss is theoretically unlimited. A Fund is subject to increased leveraging risk and other investment risks described in this ���Investment and other risks” section to the extent it sells short securities or currencies it does not own or takes “short” derivative positions.
• NON-U.S. INVESTMENT RISK. Funds that invest in non-U.S. securities are subject to additional and more varied risks than Funds that only invest in U.S. securities. Non-U.S. securities markets often include securities of only a small number of companies in a small number of industries. As a result, the market prices of many of the securities traded on those markets fluctuate more than those of U.S. securities. In addition, issuers of non-U.S. securities often are not subject to as much regulation as U.S. issuers, and the reporting, accounting, custody, and auditing standards to which those issuers are subject differ, in some cases significantly, from U.S. standards. Transactions in non-U.S. securities generally involve higher commission rates, transfer taxes, and custodial costs. In addition, some jurisdictions may limit a Fund’s ability to profit from short-term trading (as defined in the relevant jurisdiction).
A Fund may be subject to non-U.S. taxation, including potentially on a retroactive basis, on (i) capital gains it realizes or dividends, interest, or other amounts it receives or accrues in respect of non-U.S. investments, (ii) transactions in those investments, and (iii) repatriation of proceeds generated from the sale or other disposition of those investments. A Fund may seek a refund of taxes paid, but its efforts may not be successful, in which case the Fund will have incurred additional expenses for no economic benefit. A Fund’s decision to seek a refund is in its sole discretion, and, particularly in light of the cost involved, it may decide not to seek a refund, even if eligible. The outcome of a Fund’s efforts to obtain a refund is not predictable, and some refunds may not be reflected in a Fund’s net asset value.
Also, investing in non-U.S. securities exposes a Fund to the risk of nationalization, expropriation, or confiscatory taxation of assets of their issuers, other government involvement in the economy or in the affairs of specific companies or industries (including in the case of wholly or partially state-owned enterprises), adverse changes in investment regulations, capital requirements or exchange controls (which may include suspension of the ability to transfer currency from a country), and adverse political and diplomatic developments, including the imposition of economic sanctions.
In some non-U.S. securities markets, custody arrangements for securities provide significantly less protection than custody arrangements in U.S. securities markets, and prevailing custody and trade settlement practices (e.g., the requirement to pay for securities prior to receipt) expose a Fund to credit and other risks it does not have in the United States with respect to brokers, custodians, clearing banks or other clearing agents, escrow agents, and issuers. Fluctuations in foreign currency exchange rates also affect the market value of a Fund’s non-U.S. investments (see “Currency Risk” below).
The Funds need a license to invest directly in many non-U.S. securities markets. These licenses are often subject to limitations, including maximum investment amounts. Once a license is obtained, a Fund’s ability to continue to invest directly is subject to the risk that the license will be terminated or suspended. If a license to invest in a particular market is terminated or suspended, to obtain exposure to that market the Fund will be required to purchase American Depositary Receipts, Global Depositary Receipts, shares of other funds that are licensed to invest directly, or derivative instruments. The receipt of a non-U.S. license by one of GMO’s clients may preclude other clients, including a Fund, from obtaining a similar license, and this could limit the Fund’s investment opportunities. In addition, the activities of a GMO client could cause the suspension or revocation of a license and thereby limit the Funds’ investment opportunities.
45
GMO Series Trust
Notes to Financial Statements — (Continued)
February 29, 2016
Funds that invest a significant portion of their assets in securities of issuers tied economically to emerging countries (or investments related to emerging markets) are subject to greater non-U.S. investment risk than Funds investing primarily in more developed non-U.S. countries (or markets). The risks of investing in those securities include: greater fluctuations in currency exchange rates; increased risk of default (by both government and private issuers); greater social, economic, and political uncertainty and instability (including the risk of war or natural disaster); increased risk of nationalization, expropriation, or other confiscation of assets of issuers of securities in a Fund’s portfolio; greater governmental involvement in the economy or in the affairs of specific companies or industries (including in the case of wholly or partially state-owned enterprises); less governmental supervision and regulation of the securities markets and participants in those markets; controls on non-U.S. investment, capital controls and limitations on repatriation of invested capital, dividends, interest and other income and on a Fund’s ability to exchange local currencies for U.S. dollars; inability to purchase and sell investments or otherwise settle security or derivative transactions (i.e., a market freeze); unavailability of currency hedging techniques; differences in, or lack of, auditing and financial reporting standards and resulting unavailability of material information about issuers; slower clearance and settlement; difficulties in obtaining and enforcing legal judgments; and significantly smaller market capitalizations of issuers. In addition, the economies of emerging countries may be predominantly based on only a few industries or dependent on revenues from particular commodities.
• CURRENCY RISK. Currency risk is the risk that fluctuations in exchange rates will adversely affect the market value of a Fund’s investments. Currency risk includes the risk that the foreign currencies in which a Fund’s investments are traded, in which a Fund receives income, or in which a Fund has taken a position, will decline in value relative to the U.S. dollar. Currency risk also includes the risk that the currency to which the Fund has obtained exposure through hedging declines in value relative to the currency being hedged, in which event the Fund may realize a loss on both the hedging instrument and the currency being hedged. Currency exchange rates can fluctuate significantly for many reasons. See “Market Disruption and Geopolitical Risk” below.
Many of the Funds use derivatives to take currency positions that are under- or over-weighted (in some cases significantly) relative to the currency exposure of their portfolios and their benchmarks. If the exchange rates of the currencies involved do not move as expected, a Fund could lose money on both its holdings of a particular currency and the derivative. See also “Non-U.S. Investment Risk” above.
Some currencies are illiquid (e.g., some emerging country currencies), and a Fund may not be able to convert them into U.S. dollars, in which case GMO may decide to purchase U.S. dollars in a parallel market with an unfavorable exchange rate. Exchange rates for many currencies (e.g., some emerging country currencies) are particularly affected by exchange control regulations.
Derivative transactions in foreign currencies (such as futures, forwards, options, and swaps) may involve leveraging risk in addition to currency risk, as described below under “Leveraging Risk.” In addition, the obligations of counterparties in currency derivative transactions are often not secured by collateral, which increases counterparty risk (see “Counterparty Risk” below).
• FOCUSED INVESTMENT RISK. Funds with investments that are focused in particular countries, regions, sectors, industries, or issuers that are subject to the same or similar risk factors and funds with investments whose prices are strongly correlated are subject to greater overall risk than funds with investments that are more diversified. A Fund that invests in the securities of a small number of issuers has greater exposure to adverse developments affecting those issuers and to a decline in the market price of particular securities than Funds investing in the securities of a larger number of issuers.
Securities, sectors, or companies that share common characteristics are often subject to similar business risks and regulatory burdens, and often react similarly to specific economic, market, political or other developments.
Similarly, Funds having a significant portion of their assets in investments tied economically (or related) to a particular geographic region, country or market (e.g., emerging markets) have more exposure to regional and country economic risks than funds making investments throughout the world. The political and economic prospects of one country or group of countries within the same geographic region may affect other countries in that region, and a recession, debt crisis or decline in the value of the currency of one country can spread to other countries. Furthermore, companies in a particular geographic region or country are vulnerable to events affecting other companies in that region or country because they often share common characteristics, are exposed to similar business risks and regulatory burdens, and react similarly to specific economic, market, political or other developments. See also “Non-U.S. Investment Risk” above.
Because GMO Resources Fund concentrates its investments in the natural resources sector, it is particularly exposed to adverse developments, including adverse price movements, affecting issuers in the natural resources sector and is subject to greater risks
46
GMO Series Trust
Notes to Financial Statements — (Continued)
February 29, 2016
than a fund that invests in a wider range of industries. In addition, the market prices of securities of companies in the natural resources sector may be more volatile than those of securities of companies in other industries. Some of the commodities used as raw materials or produced by these companies are subject to broad price fluctuations as a result of industry-wide supply and demand factors. Companies in the natural resources sector often have limited pricing power over the supplies they purchase and the products they sell, which can affect their profitability. Companies in the natural resources sector also may be subject to special risks associated with natural or man-made disasters. In addition, the natural resources sector can be especially affected by political and economic developments, government regulations including changes in tax law or interpretations of law, energy conservation, and the success of exploration projects. Specifically, the natural resource sector can be significantly affected by import controls, worldwide competition, changes in consumer sentiment and spending, and can be subject to liability for, among other things, environmental damage, depletion of resources, and mandated expenditures for safety and pollution control. GMO Resources Fund’s concentration in the securities of natural resource companies exposes it to the price movements of natural resources to a greater extent than if it were more broadly diversified. Because GMO Resources Fund invests primarily in the natural resources sector, it runs the risk of performing poorly during an economic downturn or a decline in demand for natural resources.
Because GMO Risk Premium Fund can have substantial exposure through a limited number of options contracts and because the Fund’s exposures may relate to relatively few stock indices, the Fund is subject to focused investment risk.
• LEVERAGING RISK. The use of reverse repurchase agreements and other derivatives and securities lending creates leverage (i.e., a Fund’s investment exposures exceed its net asset value). Leverage increases a Fund’s losses when the value of its investments (including derivatives) declines. Because many derivatives have a leverage component (i.e., a notional value in excess of the assets needed to establish or maintain the derivative position), adverse changes in the value or level of the underlying asset, rate, or index may result in a loss substantially greater than the amount invested in the derivative itself. In the case of swaps, the risk of loss generally is related to a notional principal amount, even if the parties have not made any initial investment. Some derivatives have the potential for unlimited loss, regardless of the size of the initial investment. A Fund’s portfolio also will be leveraged if it borrows money to meet redemption requests or settle investment transactions or if it exercises its right to delay payment on a redemption.
A Fund may manage some of its derivative positions by offsetting derivative positions against one another or against other assets. To the extent offsetting positions do not behave in relation to one another as expected, a Fund may perform as if it were leveraged.
• COUNTERPARTY RISK. Funds that enter into contracts with counterparties, such as repurchase or reverse repurchase agreements or OTC derivatives contracts, or that lend their securities run the risk that the counterparty will be unable or unwilling to make timely settlement payments or otherwise honor its obligations. If a counterparty fails to meet its contractual obligations, goes bankrupt, or otherwise experiences a business interruption, the Fund could miss investment opportunities or otherwise hold investments it would prefer to sell, resulting in losses for the Fund. In addition, a Fund may suffer losses if a counterparty fails to comply with applicable laws or other requirements. The Funds are not subject to any limits on their exposure to any one counterparty nor to a requirement that counterparties with whom they enter into contracts maintain a specific rating by a nationally recognized rating organization. Counterparty risk is pronounced during unusually adverse market conditions and is particularly acute in environments (like those of 2008) in which financial services firms are exposed to systemic risks of the type evidenced by the insolvency of Lehman Brothers and subsequent market disruptions.
Participants in OTC derivatives markets typically are not subject to the same level of credit evaluation and regulatory oversight as are members of exchange-based markets, and, therefore, OTC derivatives generally expose a Fund to greater counterparty risk than exchange-traded derivatives. A Fund is subject to the risk that a counterparty will not settle a derivative in accordance with its terms because of a dispute over the terms of the contract (whether or not bona fide) or because of a credit or liquidity problem. If a counterparty’s obligation to a Fund is not collateralized, then the Fund is essentially an unsecured creditor of the counterparty. If a counterparty defaults, the Fund will have contractual remedies (whether or not the obligation is collateralized), but the Fund may be unable to enforce them, thus causing the Fund to suffer a loss. Counterparty risk is greater for derivatives with longer maturities because of the longer time during which events may occur that prevent settlement. Counterparty risk also is greater when a Fund has entered into derivatives contracts with a single or small group of counterparties as it sometimes does as a result of its use of swaps and other OTC derivatives. Funds that use swap contracts are subject, in particular, to the creditworthiness of the counterparties because some types of swap contracts have durations longer than six months (and, in some cases, decades). The creditworthiness of a counterparty may be adversely affected by greater than average volatility in the markets, even if the counterparty’s net market exposure is small relative to its capital. Counterparty risk still exists even if a counterparty’s obligations are secured by collateral because the Fund’s interest in the collateral may not be perfected or additional collateral may not be
47
GMO Series Trust
Notes to Financial Statements — (Continued)
February 29, 2016
promptly posted as required. To the extent that GMO’s view with respect to a particular counterparty changes adversely (whether due to external events or otherwise), existing transactions will not necessarily be terminated or modified. Additionally, new transactions may be entered into with a counterparty that is no longer considered a desirable counterparty if the transaction is primarily designed to reduce the overall risk of potential exposure to that counterparty (for example, re-establishing the transaction with a lower notional amount).
The Funds also are subject to counterparty risk because they execute their securities transactions through brokers and dealers. If a broker or dealer fails to meet its contractual obligations, goes bankrupt, or otherwise experiences a business interruption, the Funds could miss investment opportunities or be unable to dispose of investments they would prefer to sell, resulting in losses for the Funds.
Counterparty risk with respect to derivatives has been and will continue to be affected by new rules and regulations relating to the derivatives market. As described under “Derivatives and Short Sales Risk” above, some derivatives transactions are required to be centrally cleared, and a party to a cleared derivatives transaction is subject to the credit risk of the clearing house and the clearing member through which it holds its cleared position. Credit risk of market participants with respect to derivatives that are centrally cleared is concentrated in a few clearing houses, and it is not clear how an insolvency proceeding of a clearing house would be conducted and what impact an insolvency of a clearing house would have on the financial system.
• COMMODITIES RISK. Commodity prices can be extremely volatile and are affected by many factors. Exposure to commodities can cause the net asset value of a Fund’s shares to decline or fluctuate in a rapid and unpredictable manner. The value of commodity-related derivatives or indirect investments in commodities may fluctuate more than the commodity, commodities or commodity index to which they relate. See “Derivatives and Short Sales Risk” above for a discussion of specific risks of a Fund’s derivatives investments, including commodity-related derivatives.
• MERGER ARBITRAGE RISK. Some Funds may engage in transactions in which a Fund purchases securities at prices below the value of the consideration GMO expects to be paid for them upon consummation of a proposed merger, exchange offer, tender offer, or other similar transaction (“merger arbitrage transactions”). The purchase price may substantially exceed the market price of the securities before the announcement of the transaction.
If a Fund engages in a merger arbitrage transaction and that transaction later appears unlikely to be consummated or, in fact, is not consummated or is delayed, the market prices of the securities purchased by the Fund may decline sharply, resulting in losses to the Fund. The risk/reward payout of merger arbitrage strategies typically is asymmetric – the losses in failed transactions often far exceeding the gains in successful transactions. A merger arbitrage transaction can fail for many reasons, including regulatory and antitrust restrictions, political motivations, industry weakness, stock specific events, failed financings, and general market declines.
Merger arbitrage strategies depend for success on the overall volume of merger activity, which has historically been cyclical. When merger activity is low, GMO may be unable to identify enough opportunities to provide sufficient diversification. Merger arbitrage strategies are subject to the risk of overall market movements, and a Fund may experience losses even if a transaction is consummated. A Fund’s investments in derivatives or short sales of securities to hedge or otherwise adjust long or short investment exposure in connection with a merger arbitrage transaction may not perform as expected or may otherwise reduce the Fund’s gains or increase its losses.
Also a Fund may be unable to hedge against market fluctuations or other risks. In addition, a Fund that sells securities short that GMO expects it to receive upon consummation of a transaction but it does not actually receive (and thus has an unintended “naked” short position) may be required to cover its short position at a time when the securities sold short have appreciated in value, thus resulting in a loss.
• MARKET DISRUPTION AND GEOPOLITICAL RISK. The Funds are subject to the risk that geopolitical and other events will disrupt securities markets and adversely affect global economies and markets, thereby decreasing the value of the Funds’ investments. Sudden or significant changes in the supply or prices of commodities or other economic inputs (e.g., the marked decline in oil prices in late 2014) may have material and unexpected effects on both global securities markets and individual countries, regions, sectors, companies, or industries, which could significantly reduce the value of a Fund’s investments. Terrorism in the United States and around the world has increased geopolitical risk. The terrorist attacks on September 11, 2001 resulted in the closure of some U.S. securities markets for four days, and similar attacks are possible in the future. Securities markets may be susceptible to market manipulation (e.g., the manipulation of the London Interbank Offered Rate (LIBOR)) or other fraudulent
48
GMO Series Trust
Notes to Financial Statements — (Continued)
February 29, 2016
trade practices, which could disrupt the orderly functioning of these markets or reduce the value of investments traded in them, including investments of the Funds. While the U.S. government has always honored its credit obligations, a default by the U.S. government (as has been threatened in recent years) would be highly disruptive to the U.S. and global securities markets and could significantly reduce the value of the Funds’ investments. Similarly, political events within the United States at times have resulted, and may in the future result, in a shutdown of government services, which could adversely affect the U.S. economy, decrease the value of many Fund investments, and increase uncertainty in or impair the operation of the U.S. or other securities markets. Uncertainty surrounding the sovereign debt of several European Union countries, as well as the continued existence of the European Union itself, has disrupted and may continue to disrupt markets in the United States and around the world. If one or more country changes its currency or leaves the European Union or if the European Union dissolves, the world’s securities markets likely will be significantly disrupted. Substantial government interventions (e.g., currency controls) also could adversely affect the Funds. War, terrorism, economic uncertainty, and related geopolitical events have led, and in the future may lead, to increased short-term market volatility and may have adverse long-term effects on U.S. and world economies and markets generally. Likewise, natural and environmental disasters, such as the earthquake and tsunami in Japan in early 2011, and systemic market dislocations of the kind surrounding the insolvency of Lehman Brothers in 2008, if repeated, would be highly disruptive to economies and markets, adversely affecting individual companies and industries, securities markets, interest rates, credit ratings, inflation, investor sentiment, and other factors affecting the value of the Funds’ investments. During such market disruptions, the Funds’ exposure to the risks described elsewhere in this “Investment and other risks” section will likely increase. Market disruptions, including sudden government interventions, can also prevent the Funds from implementing their investment programs and achieving their investment objectives. For example, a market disruption may adversely affect the orderly functioning of the securities markets and may cause the Funds’ derivatives counterparties to discontinue offering derivatives on some underlying commodities, securities, reference rates, or indices, or to offer them on a more limited basis. To the extent a Fund has focused its investments in the stock index of a particular region, adverse geopolitical and other events in that region could have a disproportionate impact on the Fund.
• LARGE SHAREHOLDER RISK. To the extent a large number of shares of a Fund is held by a single shareholder (e.g., an institutional investor, financial intermediary, or another GMO Fund) or a group of shareholders with a common investment strategy (e.g., GMO asset allocation accounts), the Fund is subject to the risk that a redemption by those shareholders of all or a large portion of their Fund shares will adversely affect the Fund’s performance by forcing the Fund to sell portfolio securities to raise the cash needed to satisfy the redemption request. In addition, GMO Funds and other accounts over which GMO has investment discretion that invest in the Funds are not limited in how often they may purchase or sell Fund shares. The GMO Asset Allocation Funds and separate accounts managed by GMO for its clients hold substantial percentages of the shares of many Funds, and asset allocation decisions by GMO may result in substantial redemptions from (or investments in) those Funds. These transactions may adversely affect the Fund’s performance to the extent that the Fund is required to sell investments (or invest cash) when it would not otherwise do so. Redemptions of a large number of shares also may increase transaction costs or, by necessitating a sale of portfolio securities, have adverse tax consequences for Fund shareholders. Additionally, redemptions by a large shareholder also potentially limit the use of any capital loss carryforwards and certain other losses to offset future realized capital gains (if any) and may limit or prevent a Fund’s use of tax equalization. In addition, to the extent a Fund invests in other GMO Funds subject to large shareholder risk, the Fund is indirectly subject to this risk.
• MANAGEMENT AND OPERATIONAL RISK. Each Fund is subject to management risk because it relies on GMO’s ability to achieve its investment objective. Each Fund runs the risk that GMO’s investment techniques will fail to produce desired results and cause the Fund to incur significant losses. GMO also may fail to use derivatives effectively, choosing to hedge or not to hedge positions at disadvantageous times.
For some Funds, GMO uses quantitative analyses and models as part of its investment process. GMO’s models support portfolio decisions but are not necessarily predictive of future market events. These analyses and models also make simplifying assumptions that may limit their effectiveness. The data available and utilized for analysis or manipulation by the models is subject to limitations (e.g., inaccuracies, staleness). Any of those assumptions and/or limitations could adversely affect a Fund’s performance. The Funds also run the risk that GMO’s assessment of an investment may be wrong.
There can be no assurance that key GMO personnel will continue to be employed by GMO. The loss of their services could have an adverse impact on GMO’s ability to achieve the Funds’ investment objectives.
The Funds also are subject to the risk of loss as a result of other services provided by GMO and other service providers, including pricing, administrative, accounting, tax, legal, custody, transfer agency, and other services. Operational risk includes the possibility of loss caused by inadequate procedures and controls, human error, and system failures by a service provider. For example, trading
49
GMO Series Trust
Notes to Financial Statements — (Continued)
February 29, 2016
delays or errors could prevent a Fund from benefiting from potential investment gains or avoiding losses. GMO is not contractually liable to the Funds for losses associated with operational risk absent its willful misfeasance, bad faith, gross negligence, or reckless disregard of its contractual obligations to provide services to the Funds. Other Fund service providers also have contractual limitations on their liability to the Funds for losses resulting from their errors.
The Funds and their service providers (including GMO) are susceptible to cyber-attacks and technological malfunctions that may have effects that are similar to those of a cyber-attack. Cyber-attacks include, among others, stealing or corrupting data maintained online or digitally, preventing legitimate users from accessing information or services on a website, releasing confidential information without authorization, and causing operational disruption. Successful cyber-attacks against, or security breakdowns of, a Fund, GMO, a sub-adviser, or a custodian, transfer agent, or other service provider may adversely affect the Fund or its shareholders. For instance, cyber-attacks may interfere with the processing of shareholder transactions, affect a Fund’s ability to calculate its net asset value, cause the release of private shareholder information or confidential Fund information, impede trading, cause reputational damage, and subject the Fund to regulatory fines, penalties or financial losses, reimbursement or other compensation costs, and additional compliance costs. While GMO has established business continuity plans and systems designed to prevent cyber-attacks, such plans and systems are subject to inherent limitations. Similar types of cyber security risks also are present for issuers of securities in which the Funds invest, which could result in material adverse consequences for such issuers, and may cause a Fund’s investment in such securities to lose value.
• FUND OF FUNDS RISK AND RELATED CONSIDERATIONS. Because each Fund invests substantially all of its assets in an Institutional Fund, which may invest in other GMO Funds, closed-end funds, money market funds, ETFs and other investment companies (for purposes of this risk disclosure, “Underlying Funds”), the Funds are exposed to the risk that the Institutional Funds or the Underlying Funds will not perform as expected. The Funds also are indirectly exposed to all of the risks of an investment in the Underlying Funds.
Because a Fund bears the fees and expenses of its corresponding Institutional Fund, and the Institutional Fund bears the fees and expenses of the Underlying Funds in which it invests (absent reimbursement of those fees and expenses), the Fund and its corresponding Institutional Fund will incur additional expenses when investing in Underlying Funds. In addition, total Fund expenses will increase if an Institutional Fund or its successor increases its fees or incurs additional expenses, or when an Institutional Fund makes a new or further investment in Underlying Funds with higher fees or expenses than the average fees and expenses of the Underlying Funds then in the Institutional Fund’s portfolio.
Because some Underlying Funds (e.g., many of the GMO Bond Funds) invest a substantial portion of their assets in other GMO Funds (pursuant to an exemptive order obtained from the SEC), the GMO Asset Allocation Funds have more tiers of investments than funds in many other groups of investment companies and therefore may be subject to greater fund of funds risk. In addition, to the extent a Fund and its corresponding Institutional Fund invest in shares of other GMO Funds, they are indirectly subject to Large Shareholder Risk because those other GMO Funds are more likely to have large shareholders (e.g., other GMO Funds). See “Large Shareholder Risk” above.
Investments in ETFs involve the risk that the ETF’s performance may not track the performance of the index the ETF is designed to track. In addition, ETFs often use derivatives to track the performance of the relevant index, and, therefore, investments in those ETFs are subject to the same derivatives risks discussed above.
• NON-DIVERSIFIED FUNDS. Some of the Funds invest substantially all of their assets in Institutional Funds that are not “diversified” investment companies within the meaning of the 1940 Act. This means the Institutional Funds are allowed to invest in the securities of relatively few issuers. As a result, they may be subject to greater credit, market and other risks, and poor performance by a single issuer may have a greater impact on their performance, than if they were “diversified.”
The following Institutional Funds are not diversified investment companies within the meaning of the 1940 Act:
• GMO Core Plus Bond Fund
• GMO Emerging Countries Fund
• GMO Emerging Country Debt Fund
• GMO Foreign Fund
• GMO Quality Fund
In addition, each GMO Asset Allocation Fund and each GMO Bond Fund (other than GMO U.S. Treasury Fund) invests a portion of its assets in shares of one or more other GMO Funds that are not diversified investment companies under the 1940 Act. Except
50
GMO Series Trust
Notes to Financial Statements — (Continued)
February 29, 2016
as otherwise noted in the Fund summaries of the Institutional Funds’ Prospectus under “Principal investment strategies,” each of the GMO Asset Allocation Funds may invest without limitation in other GMO Funds that are not diversified.
Temporary Defensive Positions
Temporary defensive positions are positions that are inconsistent with a Fund’s principal investment strategies and are taken in response to adverse market, economic, political, or other conditions. The Funds normally do not take temporary defensive positions. To the extent a Fund takes a temporary defensive position, or otherwise holds cash, cash equivalents, or high quality debt investments on a temporary basis, the Fund may not achieve its investment objective.
The following paragraphs provide additional information about whether, and to what extent, the Institutional Funds and certain other GMO Funds take temporary defensive positions.
The GMO Equity Funds (other than GMO Global Focused Equity Fund), GMO Global Asset Allocation Fund, GMO Global Equity Allocation Fund, GMO International Equity Allocation Fund, GMO International Developed Equity Allocation Fund, GMO Alpha Only Fund, GMO Risk Premium Fund, and GMO Taiwan Fund normally do not take temporary defensive positions.
GMO Special Opportunities Fund may, from time to time, take temporary defensive positions. GMO Global Focused Equity Fund may hold up to 20% of its assets in cash or cash equivalents.
GMO Benchmark-Free Allocation Fund, GMO Benchmark-Free Fund, GMO Implementation Fund and the GMO Bond Funds (other than GMO U.S. Treasury Fund) may take temporary defensive positions if deemed prudent by GMO. Many of the GMO Bond Funds have previously taken temporary defensive positions and have exercised the right to honor redemption requests in-kind.
To the extent a Fund takes a temporary defensive position, or otherwise holds cash, cash equivalents or high quality debt instruments on a temporary basis, the Fund may not achieve its investment objective.
| 4. | Derivative financial instruments |
At February 29, 2016, the Funds held no derivative financial instruments directly. For a listing of derivative financial instruments held by the Institutional Funds or Underlying Funds, if any, as well as the uses of derivative financial instruments by the Institutional Funds or Underlying Funds, if any, please refer to the Institutional Funds’ or Underlying Funds’ most recent financial statements.
| 5. | Fees and other transactions with affiliates |
Expenses
Shareholders of the Funds do not pay any transaction-based expenses directly to the Fund, as shares of the Fund are sold without an initial sales charge or a contingent deferred sales charge upon redemption. Certain Institutional Funds and Underlying Funds charge purchase premiums and/or redemption fees. These amounts are retained by the relevant Institutional Fund or Underlying Fund to help offset estimated portfolio transaction costs and other related costs (e.g., bid to ask spreads, stamp duties and transfer fees) incurred by the Institutional Fund or Underlying Fund as a result of the purchase or redemption by allocating estimated transaction costs to the purchasing or redeeming shareholder. An Institutional Fund or Underlying Fund may impose a new purchase premium and/or redemption fee or modify an existing fee at any time. To the extent that a Fund invests in an Institutional Fund that charges purchase premiums and/or redemption fees, the Fund will pay those costs when it buys and sells shares of the Institutional Fund.
The costs of managing, administering, and operating the Fund are spread among each class of shares. These costs cover such things as a Fund’s allocable share of the expenses of its corresponding Institutional Fund and administration and certain other fees and expenses (e.g., state registration fees) of the Fund. See the “Indirect expenses” table in Note 11 for more information.
Management Fees
The Funds do not charge a management fee directly, but each Fund indirectly bears the management fees of its corresponding Institutional Fund and/or Underlying Funds in which the Institutional Fund invests.
51
GMO Series Trust
Notes to Financial Statements — (Continued)
February 29, 2016
Administration Fees
Each Fund pays GMO an administration fee equal to 0.20% of that Fund’s average daily net asset value; provided that if a Fund invests substantially all of its assets in Class III shares of an Institutional Fund, such fee shall be reduced to an annual rate of 0.05%, and provided further that if a Fund invests substantially all of its assets in a class of shares of an Institutional Fund other than Class III shares, such fee rate shall be reduced by the shareholder service fee rate charged by that class of shares of the Institutional Fund. Administrative services provided by GMO may include, without limitation: processing aggregated purchase and redemption orders for shareholders of record; coordinating operation of the National Security Clearing Corporation’s Fund/SERV system with intermediary platforms; providing information about and processing dividend payments; assisting with the production and distribution of shareholder communications to shareholders of record such as proxies, shareholder reports and dividend and tax notices; preparing tax returns and related documentation; assisting with the production of registration statements; paying the Trust’s registration fees pursuant to Section 24(f)(2) of the 1940 Act; providing assistance with respect to the audits of the Funds; establishing and maintaining certain information about the shares on an internet site; maintaining certain of the Trust’s records; preparing and submitting reports to various regulatory agencies; preparing and submitting reports and meeting materials to the Trustees and to existing shareholders; supervising, negotiating, and administering contractual arrangements with (to the extent appropriate) and monitoring the performance of, third party accounting agents, custodians, depositories, transfer agents, pricing agents, independent accountants and auditors, attorneys, printers, insurers, and other persons in any capacity deemed to be necessary or desirable to Trust or Fund operations and paying for the expenses of such service providers (excluding any sub-transfer agent/recordkeeping payments, whether paid pursuant to the Trust’s Rule 12b-1 Plan or otherwise); providing direct client service, maintenance, and reporting to platform sponsors, retirement plans, and other shareholders of record, such services to include, without limitation, professional and informative reporting, recordholder account information, access to analysis and explanation of Fund reports, and assistance in the correction and maintenance of recordholder account information, and otherwise maintaining the relationships with the recordholders; furnishing office space and equipment, providing bookkeeping and clerical services (excluding determination of net asset value, shareholder services, and fund accounting services for the Fund being supplied by other service providers as the Fund may engage from time to time); and providing individuals affiliated with GMO to serve as officers of the Trust and paying all salaries, fees, and expenses of such officers and Trustees who are affiliated with GMO. GMO has retained State Street Bank to assist it in providing administrative support services.
Sub-transfer Agent/Recordkeeping Payments
Sub-transfer agent/recordkeeping payments are made by Class R4 and Class R5 shares of the Funds to unaffiliated third parties (e.g., financial intermediaries) for providing sub-transfer agency, recordkeeping, and other administrative services to retirement plan participants and other investors who hold shares of the Funds through an omnibus account. Class R4 shares pay for sub-transfer agent/recordkeeping services at an annual rate of 0.25% of Class R4’s average daily net assets. Class R4 is offered but has no shareholders as of February 29, 2016. Class R5 shares pay for sub-transfer agent/recordkeeping services at an annual rate of 0.10% of Class R5’s average daily net assets. Class R6 shares do not make payments to third parties for sub-transfer agent/recordkeeping services. Sub-transfer agent/recordkeeping payments by Class R4 and Class R5 shares are made pursuant to a distribution and service plan under Rule 12b-1.
Expense Reimbursement
GMO has contractually agreed to reimburse each Fund for state registration fees to the extent that they are borne by the Fund. The Funds’ contractual expense limitations will continue through at least June 30, 2016, and may not be terminated prior to this date without the action or consent of the Funds’ Board of Trustees.
52
GMO Series Trust
Notes to Financial Statements — (Continued)
February 29, 2016
| 6. | Purchases and sales of securities |
Cost of purchases and proceeds from sales of securities, excluding short-term investments, for the year ended February 29, 2016 are noted in the table below:
| | | | | | | | | | | | | | | | |
| | | | | |
| Fund Name | | Purchases ($)
U.S. Government
Securities | | | Purchases ($)
Investments
(Non-U.S.
Government
Securities) | | | Sales ($)
U.S. Government
Securities | | | Sales ($)
Investments
(Non-U.S.
Government
Securities) | |
| Benchmark-Free Allocation Series Fund | | | — | | | | 106,711,823 | | | | — | | | | 78,373,737 | |
| Emerging Countries Series Fund | | | — | | | | 992,076 | | | | — | | | | 2,170,906 | |
| Global Asset Allocation Series Fund | | | — | | | | 31,302,524 | | | | — | | | | 480,802,343 | |
| Global Equity Allocation Series Fund | | | — | | | | 3,507,000 | | | | — | | | | 2,749,090 | |
| International Developed Equity Allocation Series Fund | | | — | | | | 1,008,279 | | | | — | | | | 638,569 | |
| International Equity Allocation Series Fund | | | — | | | | 33,453,212 | | | | — | | | | 10,846,676 | |
In the normal course of business the Funds enter into contracts with third party service providers that contain a variety of representations and warranties and that provide general indemnifications. The Funds’ maximum exposure under these arrangements is unknown, as it involves possible future claims that may or may not be made against the Funds. Based on experience, GMO is of the view that the risk of loss to the Funds in connection with the Funds’ indemnification obligations is remote; however, there can be no assurance that such obligations will not result in material liabilities that adversely affect the Funds.
| 8. | Principal shareholders and related parties as of February 29, 2016 |
| | | | | | | | |
| | | |
| Fund Name | | Number of
shareholders that
held more than
10% of the
outstanding shares
of the Fund | | | Percentage of
outstanding shares of
the Fund held by
those shareholders
owning greater than
10% of the
outstanding shares of
the Fund | |
| Benchmark-Free Allocation Series Fund | | | 3 | | | | 58.26% | |
| Emerging Countries Series Fund | | | 1 | | | | 100.00% | |
| Global Asset Allocation Series Fund | | | 2 | | | | 96.80% | |
| Global Equity Allocation Series Fund | | | 3 | | | | 100.00% | |
| International Developed Equity Allocation Series Fund | | | 1 | | | | 100.00% | |
| International Equity Allocation Series Fund | | | 3 | | | | 97.39% | |
53
GMO Series Trust
Notes to Financial Statements — (Continued)
February 29, 2016
The Declaration of Trust permits each Fund to issue an unlimited number of shares of beneficial interest (without par value). Transactions in the Funds’ shares were as follows:
| | | | | | | | | | | | | | | | | | | | |
| | | Year Ended
February 29, 2016 | | Period from May 1, 2014
through February 28, 2015(a) |
| | Shares | | Amount | | Shares | | Amount |
Benchmark-Free Allocation Series Fund | | | | | | | | | | | | | | | | | | | | |
Class R6: | | | | | | | | | | | | | | | | | | | | |
Shares sold | | | | 14,386,999 | | | | $ | 144,905,477 | | | | | 13,869,945 | | | | $ | 147,934,426 | |
Shares issued to shareholders in reinvestment of distributions | | | | 980,562 | | | | | 9,698,231 | | | | | 992,891 | | | | | 10,305,414 | |
Shares repurchased | | | | (12,351,878 | ) | | | | (123,795,601 | ) | | | | (3,525,198 | ) | | | | (37,410,181 | ) |
| | | | | | | | | | | | | | | | | | | | | |
Net increase (decrease) | | | | 3,015,683 | | | | $ | 30,808,107 | | | | | 11,337,638 | | | | $ | 120,829,659 | |
| | | | | | | | | | | | | | | | | | | | | |
| | | | | | | | | | | | | | | | | | | | |
| | | Year Ended
February 29, 2016 | | Period from May 2, 2014
(commencement of operations)
through February 28, 2015 |
| | Shares | | Amount | | Shares | | Amount |
Emerging Countries Series Fund | | | | | | | | | | | | | | | | | | | | |
Class R6: | | | | | | | | | | | | | | | | | | | | |
Shares sold | | | | 182,301 | | | | $ | 1,564,385 | | | | | 1,790,713 | | | | $ | 17,898,782 | |
Shares issued to shareholders in reinvestment of distributions | | | | 37,404 | | | | | 286,579 | | | | | 61,364 | | | | | 563,148 | |
Shares repurchased | | | | (383,973 | ) | | | | (3,210,277 | ) | | | | (401,788 | ) | | | | (3,946,011 | ) |
| | | | | | | | | | | | | | | | | | | | | |
Net increase (decrease) | | | | (164,268 | ) | | | $ | (1,359,313 | ) | | | | 1,450,289 | | | | $ | 14,515,919 | |
| | | | | | | | | | | | | | | | | | | | | |
| | | | | | | | | | | | | | | | | | | | |
| | | Year Ended
February 29, 2016 | | Period from May 1, 2014
through February 28, 2015(a) |
| | Shares | | Amount | | Shares | | Amount |
Global Asset Allocation Series Fund | | | | | | | | | | | | | | | | | | | | |
Class R6: | | | | | | | | | | | | | | | | | | | | |
Shares sold | | | | 3,515,547 | | | | $ | 35,128,082 | | | | | 9,624,527 | | | | $ | 108,673,853 | |
Shares issued to shareholders in reinvestment of distributions | | | | 6,576,381 | | | | | 58,797,323 | | | | | 5,790,724 | | | | | 61,198,824 | |
Shares repurchased | | | | (49,306,025 | ) | | | | (518,256,926 | ) | | | | (10,219,666 | ) | | | | (113,962,084 | ) |
| | | | | | | | | | | | | | | | | | | | | |
Net increase (decrease) | | | | (39,214,097 | ) | | | $ | (424,331,521 | ) | | | | 5,195,585 | | | | $ | 55,910,593 | |
| | | | | | | | | | | | | | | | | | | | | |
| | | | | | | | | | | | | | | | | | | | |
| | | Year Ended
February 29, 2016 | | Period from May 1, 2014
through February 28, 2015(a) |
| | Shares | | Amount | | Shares | | Amount |
Global Equity Allocation Series Fund | | | | | | | | | | | | | | | | | | | | |
Class R6: | | | | | | | | | | | | | | | | | | | | |
Shares sold | | | | 366,984 | | | | $ | 3,716,399 | | | | | 1,264,169 | | | | $ | 14,501,102 | |
Shares issued to shareholders in reinvestment of distributions | | | | 152,795 | | | | | 1,426,388 | | | | | 105,785 | | | | | 1,138,866 | |
Shares repurchased | | | | (492,690 | ) | | | | (4,892,766 | ) | | | | (376,696 | ) | | | | (4,258,099 | ) |
| | | | | | | | | | | | | | | | | | | | | |
Net increase (decrease) | | | | 27,089 | | | | $ | 250,021 | | | | | 993,258 | | | | $ | 11,381,869 | |
| | | | | | | | | | | | | | | | | | | | | |
54
GMO Series Trust
Notes to Financial Statements — (Continued)
February 29, 2016
| | | | | | | | | | | | | | | | | | | | |
| | | Year Ended
February 29, 2016 | | Period from January 12, 2015
through February 28, 2015 |
| | Shares | | Amount | | Shares | | Amount |
International Developed Equity Allocation Series Fund | | | | | | | | | | | | | | | | | | | | |
Class R6: | | | | | | | | | | | | | | | | | | | | |
Shares sold | | | | 135,324 | | | | $ | 1,308,938 | | | | | 994,811 | | | | $ | 9,967,753 | |
Shares issued to shareholders in reinvestment of distributions | | | | 37,301 | | | | | 351,479 | | | | | — | | | | | — | |
Shares repurchased | | | | (121,032 | ) | | | | (1,267,849 | ) | | | | (30,026 | ) | | | | (312,422 | ) |
| | | | | | | | | | | | | | | | | | | | | |
Net increase (decrease) | | | | 51,593 | | | | $ | 392,568 | | | | | 964,785 | | | | $ | 9,655,331 | |
| | | | | | | | | | | | | | | | | | | | | |
| | | | | | | | | | | | | | | | | | | | |
| | | Year Ended
February 29, 2016 | | Period from May 1, 2014
through February 28, 2015(a) |
| | Shares | | Amount | | Shares | | Amount |
International Equity Allocation Series Fund | | | | | | | | | | | | | | | | | | | | |
Class R5: | | | | | | | | | | | | | | | | | | | | |
Shares sold | | | | 164,096 | | | | $ | 1,555,173 | | | | | 215,048 | | | | $ | 2,442,550 | |
Shares issued to shareholders in reinvestment of distributions | | | | 155,756 | | | | | 1,339,144 | | | | | 188,065 | | | | | 2,010,822 | |
Shares repurchased | | | | (432,727 | ) | | | | (4,056,030 | ) | | | | (332,006 | ) | | | | (3,598,899 | ) |
| | | | | | | | | | | | | | | | | | | | | |
Net increase (decrease) | | | | (112,875 | ) | | | $ | (1,161,713 | ) | | | | 71,107 | | | | $ | 854,473 | |
| | | | | | | | | | | | | | | | | | | | | |
| | | |
| | | Year Ended
February 29, 2016 | | Period from May 1, 2014
through February 28, 2015(a) |
| | Shares | | Amount | | Shares | | Amount |
Class R6: | | | | | | | | | | | | | | | | | | | | |
Shares sold | | | | 3,051,023 | | | | $ | 26,362,030 | | | | | 1,304,346 | | | | $ | 14,847,322 | |
Shares issued to shareholders in reinvestment of distributions | | | | 2,107,075 | | | | | 18,113,669 | | | | | 2,526,485 | | | | | 26,946,330 | |
Shares repurchased | | | | (1,966,839 | ) | | | | (19,055,226 | ) | | | | (4,771,940 | ) | | | | (49,730,498 | ) |
| | | | | | | | | | | | | | | | | | | | | |
Net increase (decrease) | | | | 3,191,259 | | | | $ | 25,420,473 | | | | | (941,109 | ) | | | $ | (7,936,846 | ) |
| | | | | | | | | | | | | | | | | | | | | |
| | (a) | On September 18, 2014, the Trustees approved a change in the fiscal year end of the Fund from April 30 to February 28/29 which resulted in a ten month period. |
55
GMO Series Trust
Notes to Financial Statements — (Continued)
February 29, 2016
| 10. | Investments in affiliated issuers |
A summary of the Funds’ transactions in the shares of the Institutional Funds during the year ended February 29, 2016 is set forth below:
| | | | | | | | | | | | | | | | | | | | | | | | | | | | | | | | | | | |
| | | | | | | | |
Fund Affiliate | | Value,
beginning of
period | | Purchases | | Sales
Proceeds | | Dividend
Income | | Distributions
of Realized
Gains | | Return of
Capital | | Value, end
of period |
Benchmark-Free Allocation Series Fund | | | | | | | | | | | | | | | | | | | | | | | | | | | | | | | | | | | |
GMO Benchmark-Free Allocation Fund, Class III | | | $ | 277,973,153 | | | | $ | 106,711,823 | | | | $ | 78,373,737 | | | | $ | 3,738,915 | | | | $ | 1,929,086 | | | | $ | — | | | | $ | 266,489,574 | |
| | | | | | | | | | | | | | | | | | | | | | | | | | | | | | | | | | | | |
Emerging Countries Series Fund | | | | | | | | | | | | | | | | | | | | | | | | | | | | | | | | | | | |
GMO Emerging Countries Fund, Class III | | | $ | 13,674,155 | | | | $ | 992,076 | | | | $ | 2,170,906 | | | | $ | 279,269 | | | | $ | 152,394 | | | | $ | 15,953 | | | | $ | 9,078,518 | |
| | | | | | | | | | | | | | | | | | | | | | | | | | | | | | | | | | | | |
Global Asset Allocation Series Fund | | | | | | | | | | | | | | | | | | | | | | | | | | | | | | | | | | | |
GMO Global Asset Allocation Fund, Class III | | | $ | 807,610,539 | | | | $ | 31,302,524 | | | | $ | 480,802,343 | | | | $ | 11,757,311 | | | | $ | 17,302,247 | | | | $ | — | | | | $ | 286,132,190 | |
| | | | | | | | | | | | | | | | | | | | | | | | | | | | | | | | | | | | |
Global Equity Allocation Series Fund | | | | | | | | | | | | | | | | | | | | | | | | | | | | | | | | | | | |
GMO Global Equity Allocation Fund, Class III | | | $ | 16,424,022 | | | | $ | 3,507,000 | | | | $ | 2,749,090 | | | | $ | 392,082 | | | | $ | 1,325,738 | | | | $ | — | | | | $ | 12,829,283 | |
| | | | | | | | | | | | | | | | | | | | | | | | | | | | | | | | | | | | |
International Developed Equity Allocation Series Fund | | | | | | | | | | | | | | | | | | | | | | | | | | | | | | | | | | | |
GMO International Developed Equity Allocation Fund, Class III | | | $ | 10,450,137 | | | | $ | 1,008,279 | | | | $ | 638,569 | | | | $ | 297,767 | | | | $ | — | | | | $ | — | | | | $ | 8,491,472 | |
| | | | | | | | | | | | | | | | | | | | | | | | | | | | | | | | | | | | |
International Equity Allocation Series Fund | | | | | | | | | | | | | | | | | | | | | | | | | | | | | | | | | | | |
GMO International Equity Allocation Fund, Class III | | | $ | 275,552,056 | | | | $ | 33,453,212 | | | | $ | 10,846,676 | | | | $ | 7,755,500 | | | | $ | 9,844,763 | | | | $ | — | | | | $ | 224,703,420 | |
| | | | | | | | | | | | | | | | | | | | | | | | | | | | | | | | | | | | |
| | | | | | | | | | | | | | | | | | | | | | | | | | | | | | | | | | | | |
| 11. | Institutional Fund information |
Valuation
Shares of the Institutional Funds and other open-end registered investment companies are valued at their most recent net asset value. Direct investments held by the Institutional Funds and Underlying Funds are valued as follows: Exchange-traded securities (other than exchange-traded options) for which market quotations are readily available are valued at (i) the last sale price or (ii) official closing price or (iii) most recent quoted price published by the exchange (if no reported last sale or official closing price) or (iv) the quoted price provided by a pricing source (in the event GMO deems the private market to be a more reliable indicator of market value than the exchange). Exchange-traded options are valued at the last sale price, provided that price is between the closing bid and ask prices. If the last sale price is not within this range, then they will be valued at the closing bid price for long positions and the closing ask price for short positions. Cleared derivatives are valued using the price quoted (which may be based on a model) by the relevant clearing house. If an updated quote for a cleared derivative is not available by the time that a Fund calculates its net asset value on any business day, then that derivative will generally be valued using an industry standard model, which may differ from the model used by the relevant clearing house. OTC derivatives are generally valued at the price determined by an industry standard model. Unlisted securities for which market quotations are readily available are generally valued at the most recent quoted price. If quotations are not readily available or circumstances make an existing valuation methodology or procedure unreliable, derivatives and other securities are valued at fair value as determined in good faith by the Trustees of GMO Trust (the “Institutional Trustees”) or persons acting at their direction pursuant to procedures approved by the Institutional Trustees. Because of the uncertainty inherent in pricing, and in particular fair value pricing, the value determined for a particular security may be materially different from the value realized upon its sale. See the table below for information about the Institutional Funds’ and Underlying Funds’ investments in securities and derivatives, if any, that were fair valued using methods determined in good faith by or at the direction of the Institutional Trustees. The Institutional Funds and/or the Underlying Funds classify such securities as Level 3. Levels are defined in Note 2.
56
GMO Series Trust
Notes to Financial Statements — (Continued)
February 29, 2016
The foregoing valuation methodologies are modified for equities that trade in non-U.S. securities markets which close prior to the close of the New York Stock Exchange (“NYSE”) due to time zone differences, including the value of equities that underlie futures, options and other derivatives (to the extent the market for those derivatives closes prior to the close of the NYSE). In those cases, the price will generally be adjusted, to the extent practicable and available, based on inputs from an independent pricing service approved by the Institutional Trustees that are intended to reflect valuation changes through the NYSE close. The table below shows the percentage of net assets of the Institutional Funds’ and Underlying Funds’ investments in securities and derivatives that were valued using fair value inputs obtained from that independent pricing service as of February 29, 2016. These securities listed on foreign exchanges (including the value of equity securities that underlie futures, options and other derivatives (to the extent the market for such instruments closes prior to the close of the NYSE)) are classified as Level 2. Levels are defined in Note 2.
Typically, the Institutional Funds and Underlying Funds value fixed income securities at the price supplied by a specific relevant pricing source determined by GMO. Although GMO normally does not evaluate pricing sources for the Institutional Funds or Underlying Funds on a day-to-day basis, it does evaluate pricing sources on an ongoing basis and may change a pricing source at any time. GMO monitors erratic or unusual movements (including unusual inactivity) in the prices supplied for a security and has discretion to override a price supplied by a source (e.g., by taking a price supplied by another) when it believes that the price supplied is not reliable. Alternative pricing sources are often but not always available for securities held by the Institutional Funds and Underlying Funds, although the prices supplied by those alternative sources do not necessarily align with the prices supplied by primary pricing sources. See the table below for information about securities for which no alternative pricing source was available.
“Quoted price” typically means the bid price for securities held long and the ask price for securities sold short. If a market quotation for a security does not involve a bid or an ask, the “quoted price” may be the price provided by a market participant or other third party pricing source in accordance with the market practice for that security. If an updated quote for a security is not available by the time that an Institutional Fund or Underlying Fund calculates its net asset value on any business day, the Institutional Fund or Underlying Fund will generally use a quoted price from a prior day to value that security.
In the case of derivatives, prices determined by a model may reflect an estimate of the average of bid and ask prices, regardless of whether an Institutional Fund or Underlying Fund has a long position or a short position.
As discussed above, the Institutional Funds and Underlying Funds invest in securities and/or derivatives which may have been fair valued using methods determined in good faith by or at the direction of the Institutional Trustees, fair valued using inputs obtained from an independent pricing service or valued using prices for which no alternative pricing source was available. The table below presents securities and/or derivatives on a net basis, based on market values or unrealized appreciation/(depreciation), which will tend to understate the Institutional Funds’ or Underlying Funds’ exposure. The net aggregate indirect exposure to these valuation methodologies (based on each Fund’s net assets) as of February 29, 2016 is as follows:
Securities and derivatives
| | | | | | | | | | | | | | | | |
| | | | | |
| Fund Name | | Fair valued using methods determined in
good faith by or at the
direction of the
Institutional Trustees | | | Fair valued using inputs obtained
from an
independent
pricing service
(Net) | | | Single source;
No alternative pricing source
was available | | | Level 3 securities
and derivatives | |
| Benchmark-Free Allocation Series Fund | | | < 1% | | | | 23% | | | | < 1% | | | | 1% | |
| Emerging Countries Series Fund | | | < 1% | | | | 85% | | | | — | | | | < 1% | |
| Global Asset Allocation Series Fund | | | < 1% | | | | 33% | | | | < 1% | | | | < 1% | |
| Global Equity Allocation Series Fund | | | < 1% | | | | 56% | | | | — | | | | < 1% | |
| International Developed Equity Allocation Series Fund | | | < 1% | | | | 89% | | | | — | | | | < 1% | |
| International Equity Allocation Series Fund | | | < 1% | | | | 89% | | | | — | | | | < 1% | |
57
GMO Series Trust
Notes to Financial Statements — (Continued)
February 29, 2016
Indirect expenses
The Funds incur fees and expenses indirectly as a shareholder in the Institutional Funds and through their indirect exposure to the Underlying Funds, if any. For the year ended February 29, 2016, these indirect fees and expenses expressed as an annualized percentage of the Fund’s average daily net assets were as follows:
| | | | | | | | | | | | | | | | |
| | | | | |
| Fund Name | | Indirect Net Expenses (excluding shareholder
service fees) | | | Indirect Shareholder Service Fees | | | Indirect Interest
Expense | | | Total Indirect Expenses | |
| Benchmark-Free Allocation Series Fund | | | 0.655% | | | | 0.149% | | | | 0.050% | | | | 0.854% | |
| Emerging Countries Series Fund | | | 1.153% | | | | 0.149% | | | | 0.000% | | | | 1.302% | |
| Global Asset Allocation Series Fund | | | 0.418% | | | | 0.066% | | | | 0.004% | | | | 0.488% | |
| Global Equity Allocation Series Fund | | | 0.508% | | | | 0.069% | | | | 0.000% | | | | 0.577% | |
| International Developed Equity Allocation Series Fund | | | 0.532% | | | | 0.086% | | | | 0.000% | | | | 0.618% | |
| International Equity Allocation Series Fund | | | 0.606% | | | | 0.078% | | | | 0.000% | | | | 0.684% | |
Other information
For the year ended February 29, 2016, the portfolio turnover of the Institutional Funds was as follows:
| | | | |
| | |
| Institutional Fund Name | | Portfolio
Turnover | |
| Benchmark-Free Allocation Fund | | | 53% | |
| Emerging Countries Fund | | | 60% | |
| Global Asset Allocation Fund | | | 20% | |
| Global Equity Allocation Fund | | | 15% | |
| International Developed Equity Allocation Fund | | | 14% | |
| International Equity Allocation Fund | | | 14% | |
As of February 29, 2016, the premium on cash purchases and fee on cash redemptions for the Institutional Funds were as follows:
| | | | | | | | | | | | |
| | | | | | | |
| | | Benchmark-Free
Allocation
Fund | | Emerging
Countries Fund | | Global Asset
Allocation Fund | | Global Equity
Allocation Fund | | International
Developed
Equity
Allocation
Fund | | International
Equity
Allocation
Fund |
| Purchase Premium | | 0.18% | | — | | 0.14% | | 0.19% | | 0.08% | | 0.27% |
| Redemption Fee | | 0.18% | | — | | 0.14% | | 0.19% | | 0.08% | | 0.27% |
58
Report of Independent Registered Public Accounting Firm
To the Trustees of GMO Series Trust and Shareholders of GMO Benchmark-Free Allocation Series Fund, GMO Emerging Countries Series Fund, GMO Global Asset Allocation Series Fund, GMO Global Equity Allocation Series Fund, GMO International Developed Equity Allocation Series Fund, and GMO International Equity Allocation Series Fund:
In our opinion, the accompanying statements of assets and liabilities, including the schedules of investments, and the related statements of operations and of changes in net assets and the financial highlights present fairly, in all material respects, the financial position of the GMO Benchmark-Free Allocation Series Fund, GMO Emerging Countries Series Fund, GMO Global Asset Allocation Series Fund, GMO Global Equity Allocation Series Fund, GMO International Developed Equity Allocation Series Fund, and GMO International Equity Allocation Series Fund (collectively, the “Funds”) at February 29, 2016, the results of their operations, the changes in each of their net assets, and the financial highlights for each of the periods indicated, in conformity with accounting principles generally accepted in the United States of America. These financial statements and financial highlights (hereafter referred to as “financial statements”) are the responsibility of the Funds’ management. Our responsibility is to express an opinion on these financial statements based on our audits. We conducted our audits of these financial statements in accordance with the standards of the Public Company Accounting Oversight Board (United States). Those standards require that we plan and perform the audit to obtain reasonable assurance about whether the financial statements are free of material misstatement. An audit includes examining, on a test basis, evidence supporting the amounts and disclosures in the financial statements, assessing the accounting principles used and significant estimates made by management, and evaluating the overall financial statement presentation. We believe that our audits, which included confirmation of securities at February 29, 2016 by correspondence with the custodian and transfer agent, and the application of alternative auditing procedures where securities purchased had not been received, provide a reasonable basis for our opinion.
PricewaterhouseCoopers LLP
Boston, Massachusetts
April 26, 2016
59
GMO Series Trust
Fund Expenses
February 29, 2016 (Unaudited)
Expense Examples: The following information is in relation to expenses for the six-month period ended February 29, 2016.
As a shareholder of the Funds, you may incur two types of costs: (1) transaction costs; and (2) ongoing costs, including indirect management fees, indirect shareholder service fees, and distribution (12b-1) fees for Funds with Class R5 shares, if applicable, and other Fund expenses. This example is intended to help you understand your ongoing costs (in U.S. dollars) of investing in the Funds and to compare these costs with the ongoing costs of investing in other mutual funds.
These examples are based on an investment of $1,000 invested at the beginning of the period and held for the entire period, September 1, 2015 through February 29, 2016.
Actual Expenses
This section of the table for each class below provides information about actual account values and actual expenses. You may use the information in this section, together with the amount you invested, to estimate the expenses that you paid over the period. Simply divide your account value by $1,000 (for example, a $10,000,000 account value divided by $1,000 = 10,000), then multiply the result by the number in the first section under the heading entitled “Expenses Paid During the Period” to estimate the expenses you paid on your account during this period.
Hypothetical Example for Comparison Purposes
This section of the table for each class below provides information about hypothetical account values and hypothetical expenses based on the Funds’ actual expense ratio and an assumed rate of return of 5% per year before expenses, which is not the Funds’ actual return. The hypothetical account values and expenses may not be used to estimate the actual ending account balance or expenses you paid for the period. You may use this information to compare the ongoing costs of investing in the Fund with other funds. To do so, compare this 5% hypothetical example with the 5% hypothetical examples that appear in the shareholder reports of other funds.
Please note that the expenses shown in the table are meant to highlight your ongoing costs only and do not reflect any transactional costs, such as purchase premium and redemption fees. Therefore, this section of the table is useful in comparing ongoing costs only, and will not help you determine the relative total costs of owning different funds. In addition, if these transactional costs were included, your costs would have been higher.
| | | | | | | | | | | | | | | | | | | | | | | | | | | | |
| | | Actual | | | Hypothetical | | | | |
| | | Beginning
Account Value
September 1, 2015 | | | Ending
Account Value
February 29, 2016 | | | Expenses Paid
During the Period* | | | Beginning
Account Value
September 1, 2015 | | | Ending
Account Value
February 29, 2016 | | | Expenses Paid
During the Period* | | | Annualized
Expense Ratio | |
Benchmark-Free Allocation Series Fund | | | | | | | | | | | | | | | | | |
Class R6 | | | $1,000.00 | | | | $950.30 | | | | $4.36 | | | | $1,000.00 | | | | $1,020.39 | | | | $4.52 | | | | 0.90% | |
Emerging Countries Series Fund | | | | | | | | | | | | | | | | | |
Class R6 | | | $1,000.00 | | | | $933.90 | | | | $6.40 | | | | $1,000.00 | | | | $1,018.25 | | | | $6.67 | | | | 1.33% | |
Global Asset Allocation Series Fund | | | | | | | | | | | | | | | | | |
Class R6 | | | $1,000.00 | | | | $959.80 | | | | $2.63 | | | | $1,000.00 | | | | $1,022.18 | | | | $2.72 | | | | 0.54% | |
Global Equity Allocation Series Fund | | | | | | | | | | | | | | | | | |
Class R6 | | | $1,000.00 | | | | $929.30 | | | | $3.02 | | | | $1,000.00 | | | | $1,021.73 | | | | $3.17 | | | | 0.63% | |
International Developed Equity Allocation Series Fund | | | | | | | | | | | | | | | | | |
Class R6 | | | $1,000.00 | | | | $877.50 | | | | $3.13 | | | | $1,000.00 | | | | $1,021.53 | | | | $3.37 | | | | 0.67% | |
International Equity Allocation Series Fund | | | | | | | | | | | | | | | | | |
Class R5 | | | $1,000.00 | | | | $892.50 | | | | $3.91 | | | | $1,000.00 | | | | $1,020.74 | | | | $4.17 | | | | 0.83% | |
Class R6 | | | $1,000.00 | | | | $892.10 | | | | $3.43 | | | | $1,000.00 | | | | $1,021.23 | | | | $3.67 | | | | 0.73% | |
| | * | Expenses are calculated using each class’s annualized net expense ratio (including indirect expenses incurred) for the six months ended February 29, 2016, multiplied by the average account value over the period, multiplied by 182 days in the period, divided by 366 days in the year. |
60
GMO Series Trust
Tax Information for the Tax Year-Ended February 29, 2016 (Unaudited)
The following information is being provided in order to meet reporting requirements set forth by the Code and/or to meet state specific requirements. Shareholders should consult their tax advisors.
With respect to distributions paid, the applicable Funds designate the following amounts (or, if subsequently determined to be different, the maximum amount allowable) for the fiscal year ended February 29, 2016:
| | | | | | | | | | | | | | | | | | | | | | | | |
| | | | | | | |
| Fund Name | | Dividend
Received
Deduction
(corporate
shareholders)(1) | | | Qualified
Dividend
Income
(non-corporate
shareholders) (1) | | | Short-
Term
Capital
Gain
Dividends(2)
($) | | | Long-Term
Capital Gain
Distributions
($) | | | Foreign
Taxes
Paid(3)
($) | | | Foreign
Source
Income(3)
($) | |
| Benchmark-Free Allocation Series Fund | | | 2.48% | | | | 6.74% | | | | — | | | | 5,760,639 | | | | — | | | | — | |
| Emerging Countries Series Fund | | | — | | | | 100.00% | | | | — | | | | — | | | | 66,389 | | | | 352,968 | |
| Global Asset Allocation Series Fund | | | 10.30% | | | | 42.82% | | | | — | | | | 47,111,706 | | | | 489,669 | | | | 4,169,398 | |
| Global Equity Allocation Series Fund | | | 25.74% | | | | 100.00% | | | | — | | | | 1,042,868 | | | | 39,634 | | | | 335,607 | |
| International Developed Equity Allocation Series Fund | | | — | | | | 95.08% | | | | 60,556 | | | | — | | | | 36,494 | | | | 334,184 | |
| International Equity Allocation Series Fund | | | — | | | | 100.00% | | | | — | | | | 11,869,517 | | | | 1,030,237 | | | | 8,613,533 | |
| | (1) | Presented as a percentage of net investment income and short-term capital gain distributions paid, if any. |
| | (2) | These amounts are generally exempt from U.S. withholding taxes for non-U.S. shareholders, provided certain conditions are satisfied by both the Funds and the Funds’ shareholders. |
| | (3) | The Funds expect to elect to treat foreign taxes attributed to foreign source income from the Institutional Funds, as if incurred directly by the Funds’ shareholders. |
In early 2017, the Funds will notify applicable shareholders of amounts for use in preparing 2016 U.S. federal income tax forms.
61
Trustees and Officers (Unaudited)
The following tables present information regarding each Trustee and officer of the Trust as of February 29, 2016. Each Trustee’s and officer’s year of birth (“YOB”) is set forth after his or her name. Unless otherwise noted, (i) each Trustee and officer has engaged in the principal occupation(s) noted in the table for at least the most recent five years, although not necessarily in the same capacity, and (ii) the address of each Trustee and officer is c/o GMO Series Trust, 40 Rowes Wharf, Boston, MA 02110. Each Trustee serves in office for a term of eight years or, if sooner, until the Trustee dies, resigns or is removed, or until the election and qualification of the Trustee’s successor. Each officer serves in office until his or her successor is elected and determined to be qualified to carry out the duties and responsibilities of the office, or until the officer resigns or is removed from office.
Management of the Series Trust
| | | | | | | | | | | | | |
| Independent Trustees |
| | | | | |
Name and
Year of Birth | | Position(s) Held with the Trust | | Length of Time Served | | Principal
Occupation(s) During Past
5 Years | | Number of
Portfolios in
Fund Complex1
Overseen | | Other Directorships Held in the Past Five Years |
Maria D. Furman YOB: 1954 | | Trustee | | Since August 2011. | | Retired. | | | | 12 | | | Trustee of MassMutual Funds (88 portfolios) and MML Series Investment Fund II. |
| | | | | |
Sandra Whiston YOB: 1947 | | Trustee | | Since November 2011. | | Retired (2008 – present); Head of Institutional Management, Putnam Investments (2005 – 2008). | | | | 12 | | | None. |
| |
| Interested Trustee and Officer | | |
| | | | | |
Name and
Year of Birth | | Position(s) Held with the Trust | | Length of Time Served | | Principal
Occupation(s) During Past
5 Years | | Number of
Portfolios in
Fund Complex1
Overseen | | Other Directorships Held in the Past Five Years |
Joseph B. Kittredge, Jr.2 YOB: 1954 | | Chairman of the Board of Trustees | | Chairman of the Board of Trustees since November 2011; Trustee since May 2011; President and Chief Executive Officer of the Trust, May 2011 – October 2013. | | General Counsel, Grantham, Mayo, Van Otterloo & Co. LLC (2005 – present); Partner, Ropes & Gray, LLP (1988 – 2005). | | | | 50 | | | None. |
| 1 | The Fund Complex includes series of each of GMO Trust and GMO Series Trust. Mr. Kittredge also serves as a Trustee of GMO Trust. |
| 2 | Mr. Kittredge is an “interested person” of the Trust, as such term is used in the 1940 Act (an “Interested Trustee”), by virtue of his position with GMO indicated in the table above and his interest as a member of GMO. |
62
| | | | | | |
| Officers |
| | | |
Name and
Year of Birth | | Position(s) Held
with the Trust | | Length of
Time Served | | Principal Occupation(s)
During Past 5 Years* |
Sheppard N. Burnett YOB: 1968 | | President and Chief Executive Officer | | President since October 2013; Chief Executive Officer since October 2013; Chief Financial Officer, May 2011 – October 2013; Treasurer, May 2011 – October 2013. | | Head of Fund Treasury and Tax, Grantham, Mayo, Van Otterloo & Co. LLC (December 2006 – present). |
| | | |
Carly Cushman YOB: 1984 | | Treasurer, Chief Accounting Officer, and Chief Financial Officer | | Chief Accounting Officer since June 2015; Treasurer and Chief Financial Officer since April 2014; Assistant Treasurer, October 2013 – April 2014. | | Fund Administrator, Grantham, Mayo, Van Otterloo & Co. LLC (December 2009 – present); Senior Accountant, Renaissance HealthCare (February 2009 – December 2009); Auditor/Senior Auditor, Deloitte & Touche (September 2006 – February 2009). |
| | | |
John L. Nasrah YOB: 1977 | | Assistant Treasurer and Chief Tax Officer | | Since November 2011. | | Fund Administrator, Grantham, Mayo, Van Otterloo & Co. LLC (September 2004 –present). |
| | | |
Betty Chang YOB: 1972 | | Assistant Treasurer | | Since October 2013. | | Fund Administrator, Grantham, Mayo, Van Otterloo & Co. LLC (July 2010 – present); Assistant Treasurer (June 2009 – July 2010), Manager, Fund Administration and Regulatory Affairs (2006 – 2009), Hambrecht & Quist Capital Management LLC. |
| | | |
Mahmoodur Rahman YOB: 1967 | | Assistant Treasurer | | Since November 2011. | | Fund Administrator, Grantham, Mayo, Van Otterloo & Co. LLC (April 2007 – present). |
| | | |
Cathy Tao YOB: 1974 | | Assistant Treasurer | | Since April 2015. | | Fund Administrator, Grantham, Mayo, Van Otterloo & Co. LLC (October 2007 – present). |
| | | |
Brian Kadehjian YOB: 1974 | | Assistant Treasurer and Treasury Officer | | Assistant Treasurer since February 2015; Treasury Officer since October 2013. | | Fund Administrator, Grantham, Mayo, Van Otterloo & Co. LLC (April 2002 – present). |
| | | |
Douglas Y. Charton YOB: 1982 | | Chief Legal Officer, Vice President and Clerk | | Since September 2015. | | Legal Counsel, Grantham, Mayo, Van Otterloo & Co. LLC (July 2015 – present); Associate, K&L Gates LLP (September 2007 – July 2015). |
| | | |
Megan Bunting YOB: 1978 | | Vice President and Assistant Clerk | | Since October 2013. | | Legal Counsel, Grantham, Mayo, Van Otterloo & Co. LLC (September 2006 – present). |
| | | |
Meta S. David YOB: 1982 | | Vice President and Assistant Clerk | | Since October 2013. | | Legal Counsel, Grantham, Mayo, Van Otterloo & Co. LLC (August 2012 – present). |
| | | |
Gregory L. Pottle YOB: 1971 | | Chief Compliance Officer, Vice President and Assistant Clerk | | Chief Compliance Officer since May 2015; Vice President and Assistant Clerk since November 2011. | | Chief Compliance Officer, Grantham, Mayo, Van Otterloo & Co. LLC (May 2015 – present); Legal Counsel, Grantham, Mayo, Van Otterloo & Co. LLC (March 2000 – May 2015). |
| | | |
| Claire Wilkinson YOB: 1965 | | Anti-Money Laundering Officer | | Since March 2016. | | Compliance Associate, GMO UK Limited (April 2013 – present); General Counsel, MVision Private Equity Advisers Limited (November 2009 – January 2013). |
| * | Each officer of the Trust may also serve as an officer and/or director of certain pooled investment vehicles of which GMO or an affiliate of GMO serves as the investment adviser. With the exception of Ms. Tao, each officer listed in the table above also serves as an officer of GMO Trust. |
63
Item 2. Code of Ethics.
As of February 29, 2016, the registrant has adopted a Code of Ethics that applies to the Principal Executive Officer and Principal Financial Officer pursuant to the Sarbanes-Oxley Act of 2002 (the “Code of Ethics”). During the period ended February 29, 2016, there were no substantive amendments to a provision of the Code of Ethics nor were there any waivers granted from a provision of the Code of Ethics. A copy of the registrant’s Code of Ethics is filed with this Form N-CSR under item 12 (a).
Item 3. Audit Committee Financial Expert.
The registrant’s Board of Trustees has determined that the registrant does not have an “audit committee financial expert” (as such term has been defined in Form N-CSR) serving on its audit committee. The registrant’s Board believes that, although none of its members individually meets all required elements of the definition of an “audit committee financial expert”, the members of the registrant’s audit committee collectively possess the knowledge and experience necessary to execute all of the audit committee’s functions, duties and powers.
Item 4. Principal Accountant Fees and Services. *
| | (a) | AUDIT FEES: The aggregate fees billed to the registrant for professional services rendered by its independent auditors, PricewaterhouseCoopers LLP for the audit of the registrant’s annual financial statements for 2016 and 2015 were $66,000 and $66,000, respectively. |
| | (b) | AUDIT-RELATED FEES: The aggregate fees billed to the registrant in 2016 and 2015 for engagements for audit-related services rendered by PricewaterhouseCoopers LLP that related directly to the operations and financial reporting of the Funds were $0 and $500, respectively. The aggregate fees billed in 2016 and 2015 to the registrant’s Investment Advisor, and any entity controlling, controlled, or under common control with the Advisor that provides ongoing services to the Funds (each, a “Service Affiliate”) for engagements for audit-related services rendered by PricewaterhouseCoopers LLP that related directly to the operations and financial reporting of the Funds were $504,899 and $519,544, respectively. |
| | (c) | TAX FEES: The aggregate fees billed to the registrant in 2016 and 2015 for professional services rendered by PricewaterhouseCoopers LLP for tax compliance, tax advice, and tax planning, including the preparation of Form 1120 RIC, Form 8613 and review of excise tax distribution calculations, were $51,050 and $15,640, respectively. The aggregate fees billed in 2016 and 2015 to the registrant’s Service Affiliates for engagements for tax services rendered by PricewaterhouseCoopers LLP that related directly to the operations and financial reporting of the Funds were $0 and $0, respectively. |
| | (d) | ALL OTHER FEES: No such fees were billed by PricewaterhouseCoopers LLP to the registrant or to the registrant’s Service Affiliates that related directly to the operations and financial reporting of the Funds in 2016 or 2015. |
| | (e) | (1) The Audit Committee has adopted an Audit and Non-Audit Services Pre-Approval Policy (the “Policy”), which sets forth the procedures and the conditions pursuant to which services to be performed by the independent auditor are to be preapproved. Under the Policy, the Audit Committee pre-approves, on an annual basis, the following services: (1) the engagement, scope and terms of the annual audit; (2) certain audit-related services; (3) certain tax services that the Committee believes would not impair, and are consistent with the SEC’s rules on auditor independence; and (4) certain permissible non-audit services that the Committee believes are routine and recurring services and that would not impair, and are consistent with the SEC’s rules on auditor independence, subject to certain limitations on the projected fees associated with each service. All other types of services not included on the schedule to the policy, or for which the projected fees exceed those provided in the schedule, require the specific pre-approval by the Audit Committee or the Chairperson of the Committee (if timing necessitates that preapproval is required before the Committee’s next regularly scheduled meeting) if they are to be provided by the independent auditor. |
| | (g) | NON-AUDIT FEES: The aggregate fees billed by PricewaterhouseCoopers LLP in 2016 and 2015 for non-audit services rendered to the registrant and the registrant’s Service Affiliates were $590,949 and $570,684, respectively. For the fiscal period ended February 29, 2016, this amount reflects the amounts disclosed above in Item 4(b),(c),(d), plus $35,000 in fees billed to the Funds’ Service Affiliates for non-audit services that did not relate directly to the operations and financial reporting of the Funds. For the fiscal year ended February 28, 2015, this amount reflects the amounts disclosed above in Item 4(b),(c),(d), plus $35,000 in fees billed to the Funds’ Service Affiliates for non-audit services that did not relate directly to the operations and financial reporting of the Funds. |
| | (h) | The registrant’s Audit Committee has considered whether the provision of non-audit services by the registrant’s independent registered public accounting firm to the registrant’s Investment Advisor, and any entity controlling, controlled, or under common control with the Advisor that provided ongoing services to the registrant that were not pre-approved by the Committee (because such services did not relate directly to the operations and financial reporting of the registrant) was compatible with maintaining the independence of the independent registered public accounting firm. |
| * | Includes information regarding all series of GMO Series Trust. |
Item 5. Audit Committee of Listed Registrants.
Not applicable to this registrant.
Item 6. Schedule of Investments.
The complete schedule of investments for each series of the registrant is included as part of the annual reports to shareholders filed under Item 1 of this Form N-CSR.
Item 7. Disclosure of Proxy Voting Policies and Procedures for Closed-End Management Investment Companies.
Not applicable to this registrant.
Item 8. Portfolio Managers of Closed-End Management Investment Companies.
Not applicable to this registrant.
Item 9. Purchases of Equity Securities by Closed-End Management Investment Company and Affiliated Purchasers.
Not applicable to this registrant.
Item 10. Submission of Matters to a Vote of Security Holders.
There were no material changes to the procedures by which shareholders may recommend nominees to the registrant’s Board of Trustees.
Item 11. Controls and Procedures.
| | (a) | The registrant’s Principal Executive Officer and Principal Financial Officer have concluded as of a date within 90 days of the filing of this report, based on their evaluation of the registrant’s disclosure controls and procedures (as defined in Rule 30a-3(c) under the Investment Company Act of 1940) that the design and operation of such procedures are effective to provide reasonable assurance that information required to be disclosed by the registrant on Form N-CSR is recorded, processed, summarized, and reported within the time periods specified in the Commission’s rules and forms. |
| | (b) | There were no changes in the registrant’s internal control over financial reporting (as defined in Rule 30a-3(d) under the Investment Company Act of 1940) that occurred during the second fiscal quarter of the period covered by this report that has materially affected, or is reasonably likely to materially affect, the registrant’s internal control over financial reporting. |
Item 12. Exhibits.
(a)(1) Code of Ethics described in Item 2 is attached hereto as EX-99.CODEETH.
(a)(2) Certifications by the Principal Executive Officer and Principal Financial Officer of the registrant as required by Rule 30a-2(a) under the Investment Company Act of 1940 are attached hereto as EX-99.CERT.
(a)(3) Not applicable to this registrant.
| | (b) | Certifications by the Principal Executive Officer and Principal Financial Officer of the registrant pursuant to Section 906 of the Sarbanes-Oxley Act of 2002 and required by Rule 30a-2(b) under the Investment Company Act of 1940 are attached hereto as EX-99.906CERT. |
SIGNATURES
Pursuant to the requirements of the Securities Exchange Act of 1934 and the Investment Company Act of 1940, the registrant has duly caused this report to be signed on its behalf by the undersigned, thereunto duly authorized.
| | | | |
| (Registrant) | | GMO Series Trust | | |
| | |
| By (Signature and Title): | | /s/ Sheppard N. Burnett | | |
| | Sheppard N. Burnett, Chief Executive Officer | | |
| | |
| | Date: May 3, 2016 | | |
Pursuant to the requirements of the Securities Exchange Act of 1934 and the Investment Company Act of 1940, this report has been signed below by the following persons on behalf of the registrant and in the capacities and on the dates indicated.
| | | | |
| By (Signature and Title): | | /s/ Sheppard N. Burnett | | |
| | Sheppard N. Burnett, Principal Executive Officer | | |
| | |
| | Date: May 3, 2016 | | |
| | |
| By (Signature and Title): | | /s/ Carly Cushman | | |
| | Carly Cushman, Principal Financial Officer | | |
| | |
| | Date: May 3, 2016 | | |