UNITED STATES
SECURITIES AND EXCHANGE COMMISSION
Washington, D.C. 20549
FORM N-CSR
CERTIFIED SHAREHOLDER REPORT OF REGISTERED
MANAGEMENT INVESTMENT COMPANIES
Investment Company Act file number 811-22649
iShares U.S. ETF Trust
(Exact name of Registrant as specified in charter)
c/o: State Street Bank and Trust Company
1 Iron Street, Boston, MA 02210
(Address of principal executive offices) (Zip code)
The Corporation Trust Company
1209 Orange Street, Wilmington, DE 19801
(Name and address of agent for service)
Registrant’s telephone number, including area code: 415-670-2000
Date of fiscal year end: October 31, 2014
Date of reporting period: October 31, 2014
Item 1. Reports to Stockholders.
OCTOBER 31, 2014
| | | | |
2014 ANNUAL REPORT | | | |  |
iShares U.S. ETF Trust
| Ø | | iShares Liquidity Income ETF | ICSH | BATS |
| Ø | | iShares Short Maturity Bond ETF | NEAR | BATS |
Table of Contents
Management’s Discussion of Fund Performance
iSHARES® U.S. ETF TRUST
U.S. BOND MARKET OVERVIEW
Domestic bond markets delivered modestly positive performance for the 12-month period ended October 31, 2014 (the “reporting period”), as uneven global economic conditions and actions by the U.S. Federal Reserve Bank (the “Fed”) largely drove bond market performance.
The reporting period began in an uncertain environment for fixed-income instruments, spurred by concerns of a change in Fed policy. Since the financial crisis of 2008, the Fed’s bond-buying program (known as quantitative easing or “QE”) had created an environment of low yields on longer-term Treasury bonds and other “safe haven” securities and generated gains for fixed-income investors. Generally improving economic data and unclear Fed announcements regarding tapering QE drove up uncertainty about when — and by how much — the Fed would begin to scale back its bond purchases.
In December 2013, the Fed removed these uncertainties. Citing improving jobless data, the Fed announced that it would begin cutting its bond-buying program by $10 billion per month in January 2014. The tapering program continued through October 2014, when the Fed made a final $15 billion bond purchase. The Fed assured markets that its benchmark interest rate would remain near zero for a considerable time after the taper concluded, keeping short-term interest rates low. In October 2014, though, the Fed signaled that the short-term interest rate hike might occur sooner than had been expected should inflation and employment data improve further.
During the reporting period, economic conditions generally improved. The unemployment rate declined steadily, reaching a six-year low of 5.8% by October 2014. Gross domestic product (“GDP”) levels declined in the first quarter of 2014, but grew by 4.6% and 3.5% for the second and third quarters of 2014, respectively. Inflation rates hovered near the Fed’s target 2.0% rate, edging up to 2.1% in May and June 2014 before dipping to 1.7% in August and September 2014.
Because bond markets had priced in the Fed’s tapering of QE before it was announced, the taper’s effect on bond yields was muted. During the course of the reporting period, weak first-quarter 2014 economic data in the U.S., geopolitical concerns in emerging markets, and declining fixed-income yields in the eurozone drove up demand for U.S. bonds, benefiting bond prices. As measured by the 10-year U.S. Treasury bond yield, longer-term yields climbed early in the reporting period, before drifting downward throughout the remainder of the reporting period to finish lower than they began (bond yields and bond prices move in opposite directions).
For the reporting period, bond performance was positive. In general, shorter-term bonds lagged longer-term bonds, as market participants anticipated a rise in short-term rates. Long-term Treasury bonds generated particularly strong results. Late in the reporting period, fears related to potential spread of the Ebola virus, weak economic conditions in Europe, and tension in emerging markets drove up demand for more secure U.S. bonds, particularly Treasury bonds. Treasury inflation-protected securities (TIPS) achieved relatively weak overall returns, as inflation levels remained low.
Investment grade corporate bonds outperformed high yield during the reporting period. Although high-yield bonds performed in line with the broader bond market, high yield began to underperform late in the reporting period as their spreads (the difference in yield compared with Treasury bonds) widened and investors shifted away from riskier investments.
Mortgage-backed securities delivered modestly positive results for the reporting period. Asset-backed bond prices were softened by the Fed’s reduced purchases of Treasury and agency mortgage-backed bonds. However, the rising demand that benefited Treasury bonds near the end of the reporting period also pushed down 30-year mortgage rates to their lowest levels since June 2013, because the rate is tied to the 10-year U.S. Treasury bond.
| | | | |
MANAGEMENT’S DISCUSSIONSOF FUND PERFORMANCE | | | 5 | |
Management’s Discussion of Fund Performance
iSHARES® LIQUIDITY INCOME ETF
Performance as of October 31, 2014
| | | | |
| | | Cumulative Total Returns | |
| | | Since Inception | |
Fund NAV | | | 0.45% | |
Fund Market | | | 0.39% | |
Bank of America Merrill Lynch 6-month US Treasury Bill Index | | | 0.12% | |
GROWTH OF $10,000 INVESTMENT
(SINCE INCEPTION AT NET ASSET VALUE)
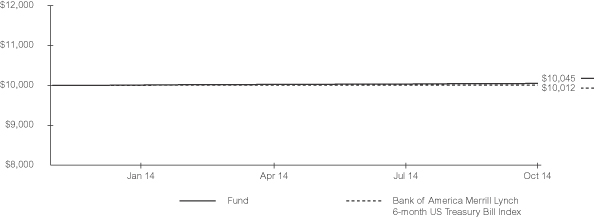
The inception date of the Fund was 12/11/13. The first day of secondary market trading was 12/13/13.
The Bank of America Merrill Lynch 6-month US Treasury Bill Index is an unmanaged index that measures the performance of government securities with less than 6 months remaining to maturity.
Past performance is no guarantee of future results. Performance results do not reflect the deduction of taxes that a shareholder would pay on fund distributions or on the redemption or sale of fund shares. See “About Fund Performance” on page 10 for more information.
| | | | | | | | | | | | | | | | | | | | | | | | | | |
| Shareholder Expenses | |
| Actual | | | Hypothetical 5% Return | | | | |
Beginning
Account Value
(5/1/14) | | | Ending
Account Value
(10/31/14) | | | Expenses Paid
During Period a | | | Beginning
Account Value
(5/1/14) | | | Ending
Account Value
(10/31/14) | | | Expenses Paid
During Period a | | | Annualized
Expense Ratio | |
| $ | 1,000.00 | | | $ | 1,002.10 | | | $ | 0.91 | | | $ | 1,000.00 | | | $ | 1,024.30 | | | $ | 0.92 | | | | 0.18% | |
| a | Expenses are calculated using the Fund’s annualized expense ratio (as disclosed in the table), multiplied by the average account value for the period, multiplied by the number of days in the period (184 days) and divided by the number of days in the year (365 days). See “Shareholder Expenses” on page 10 for more information. | |
| | |
| 6 | | 2014 iSHARES ANNUAL REPORTTO SHAREHOLDERS |
Management’s Discussion of Fund Performance (Continued)
iSHARES® LIQUIDITY INCOME ETF
The iShares Liquidity Income ETF (the “Fund”) seeks to provide current income consistent with preservation of capital by investing, under normal circumstances, at least 80% of its net assets in a portfolio of U.S. dollar-denominated investment-grade fixed- and floating-rate debt securities and maintain a dollar-weighted average maturity that is less than 180 days. The Fund is an actively managed exchange-traded fund that does not seek to replicate the performance of a specified index. For the period from December 11, 2013 (inception date of the Fund) through October 31, 2014 (the “reporting period”), the total return for the Fund was 0.45%, net of fees.
During the reporting period, short-term interest rates remained low as the Fed kept its target lending rate between 0 to 0.25%. Credit conditions continued to improve throughout the reporting period, as the economy created more jobs and the Fed kept an accommodative stance with its bond purchasing program. However, as the reporting period came to a close, the Fed officially ended its bond purchasing program, but declared to maintain its commitment to a near zero interest rate policy “for a considerable time.”
Improvement in credit conditions caused credit spreads to decrease on investment-grade debt, which positively contributed to the Fund’s performance during the reporting period. Investments in debt issued by highly rated issuers detracted from performance as they generated less income than slightly lower rated bonds.
As of October 31, 2014, the Fund held primarily high quality short-term corporate bonds, repurchase agreements, commercial paper and certificates of deposit. The Fund had large exposures to financial and industrial issuers in the corporate bond sector, as well as asset-backed securities backed by auto loans.
PORTFOLIO ALLOCATION
As of 10/31/14
| | |
| Investment Type | | Percentage of
Total Investments 1 |
| | | | |
Corporate Bonds & Notes | | | 60.61 | % |
Repurchase Agreements | | | 17.90 | |
Asset-Backed Securities | | | 10.10 | |
Commercial Paper | | | 5.78 | |
Certificates of Deposit | | | 5.61 | |
| | | | |
TOTAL | | | 100.00 | % |
| | | | |
BOND CREDIT QUALITY
As of 10/31/14
| | |
| Moody’s Credit Rating 2 | | Percentage of
Total Investments 1 |
| | | | |
Aaa | | | 10.10 | % |
Aa | | | 23.82 | |
A | | | 34.48 | |
Baa | | | 7.92 | |
P-2 | | | 10.90 | |
Not Rated | | | 12.78 | |
| | | | |
TOTAL | | | 100.00 | % |
| | | | |
| | 1 | Excludes money market funds. |
| | 2 | Credit quality ratings shown reflect the ratings assigned by Moody’s Investors Service (“Moody’s”), a widely used independent, nationally recognized statistical rating organization. Moody’s credit ratings are opinions of the credit quality of individual obligations or of an issuer’s general creditworthiness. Investment grade ratings are credit ratings of Baa or higher. Below investment grade ratings are credit ratings of Ba or lower. Unrated investments do not necessarily indicate low credit quality. Credit quality ratings are subject to change. |
| | | | |
MANAGEMENT’S DISCUSSIONSOF FUND PERFORMANCE | | | 7 | |
Management’s Discussion of Fund Performance
iSHARES® SHORT MATURITY BOND ETF
Performance as of October 31, 2014
| | | | | | | | | | | | | | | | | | |
| | | Average Annual Total Returns | | | | | Cumulative Total Returns | |
| | | 1 Year | | | Since Inception | | | | | 1 Year | | | Since Inception | |
Fund NAV | | | 0.96% | | | | 1.00% | | | | | | 0.96% | | | | 1.10% | |
Fund Market | | | 1.06% | | | | 1.11% | | | | | | 1.06% | | | | 1.22% | |
Barclays Short-Term
Government/Corporate Index | | | 0.21% | | | | 0.20% | | | | | | 0.21% | | | | 0.22% | |
GROWTH OF $10,000 INVESTMENT
(SINCE INCEPTION NET ASSET VALUE)
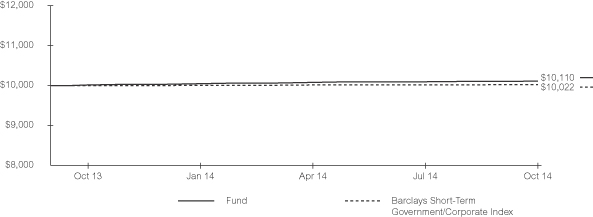
The inception date of the Fund was 9/25/13. The first day of secondary market trading was 9/26/13.
The Barclays Short-Term Government/Corporate Index is an unmanaged index that measures the performance of government and corporate securities with less than 1 year remaining to maturity.
Past performance is no guarantee of future results. Performance results do not reflect the deduction of taxes that a shareholder would pay on fund distributions or on the redemption or sale of fund shares. See “About Fund Performance” on page 10 for more information.
| | | | | | | | | | | | | | | | | | | | | | | | | | |
| Shareholder Expenses | |
| Actual | | | Hypothetical 5% Return | | | | |
Beginning
Account Value
(5/1/14) | | | Ending
Account Value
(10/31/14) | | | Expenses Paid
During Period a | | | Beginning
Account Value
(5/1/14) | | | Ending
Account Value
(10/31/14) | | | Expenses Paid
During Period a | | | Annualized
Expense Ratio | |
| $ | 1,000.00 | | | $ | 1,003.30 | | | $ | 1.26 | | | $ | 1,000.00 | | | $ | 1,023.90 | | | $ | 1.28 | | | | 0.25% | |
| a | Expenses are calculated using the Fund’s annualized expense ratio (as disclosed in the table), multiplied by the average account value for the period, multiplied by the number of days in the period (184 days) and divided by the number of days in the year (365 days). See “Shareholder Expenses” on page 10 for more information. | |
| | |
| 8 | | 2014 iSHARES ANNUAL REPORTTO SHAREHOLDERS |
Management’s Discussion of Fund Performance (Continued)
iSHARES® SHORT MATURITY BOND ETF
The iShares Short Maturity Bond ETF (the “Fund”) seeks to maximize current income by primarily investing, under normal circumstances, at least 80% of its nets assets in a portfolio of U.S. dollar-denominated investment-grade fixed income securities and maintain a weighted average maturity that is less than three years. The Fund is an actively managed exchange-traded fund that does not seek to replicate the performance of a specified index. For the 12-month reporting period ended October 31, 2014, the total return for the Fund was 0.96%, net of fees.
During the reporting period, short-term interest rates remained low as the Fed kept its target lending rate between 0 to 0.25%. Credit conditions continued to improve throughout the reporting period, as the economy created more jobs and the Fed kept an accommodative stance with its bond purchasing program. However, as the reporting period came to a close, the Fed officially ended its bond purchasing program, but declared to maintain its commitment to a near zero interest rate policy “for a considerable time.”
The Fund held primarily investment grade corporate bonds and securitized debt. An improvement in credit conditions caused credit spreads to decrease on investment grade debt, which positively contributed to the Fund’s performance during the reporting period. For securitized credit, a positive macroeconomic backdrop and continued demand for shorter duration securitized debt led to net negative supply and higher bond prices during the period, which also benefited the Fund. On the negative side, the Fund’s small allocation to non-USD securities underperformed compared to other sectors for the reporting period.
As of October 31, 2014, the Fund held positions primarily in short maturity investment-grade corporate bonds and securitized debt, including bonds backed by commercial mortgages, auto loans, credit cards and student loans.
PORTFOLIO ALLOCATION
As of 10/31/14
| | |
| Investment Type | | Percentage of
Total Investments 1 |
| | | | |
Corporate Bonds & Notes | | | 59.02 | % |
Asset-Backed Securities | | | 24.91 | |
Mortgage-Backed Securities | | | 15.71 | |
Municipal Debt Obligations | | | 0.36 | |
| | | | |
TOTAL | | | 100.00 | % |
| | | | |
BOND CREDIT QUALITY
As of 10/31/14
| | |
| Moody’s Credit Rating 2 | | Percentage of
Total Investments 1 |
| | | | |
Aaa | | | 18.55 | % |
Aa | | | 7.28 | |
A | | | 10.48 | |
Baa | | | 45.89 | |
Ba | | | 0.93 | |
Not Rated | | | 16.87 | |
| | | | |
TOTAL | | | 100.00 | % |
| | | | |
| | 1 | Excludes money market funds. |
| | 2 | Credit quality ratings shown reflect the ratings assigned by Moody’s Investors Service (“Moody’s”), a widely used independent, nationally recognized statistical rating organization. Moody’s credit ratings are opinions of the credit quality of individual obligations or of an issuer’s general creditworthiness. Investment grade ratings are credit ratings of Baa or higher. Below investment grade ratings are credit ratings of Ba or lower. Unrated investments do not necessarily indicate low credit quality. Credit quality ratings are subject to change. |
| | | | |
MANAGEMENT’S DISCUSSIONSOF FUND PERFORMANCE | | | 9 | |
About Fund Performance
Past performance is no guarantee of future results. Current performance may be lower or higher than the performance data quoted. Performance data current to the most recent month-end is available at www.iShares.com. Performance results assume reinvestment of all dividends and capital gain distributions and do not reflect the deduction of taxes that a shareholder would pay on fund distributions or on the redemption or sale of fund shares. The investment return and principal value of shares will vary with changes in market conditions. Shares may be worth more or less than their original cost when they are redeemed or sold in the market. Performance for certain funds may reflect a waiver of a portion of investment management fees. Without such waiver, performance would have been lower.
Net asset value or “NAV” is the value of one share of a fund as calculated in accordance with the standard formula for valuing mutual fund shares. The price used to calculate market return (“Market Price”) is determined by using the midpoint between the highest bid and the lowest offer on the primary stock exchange on which shares of a fund are listed for trading, as of the time that such fund’s NAV is calculated. Since shares of a fund may not have traded in the secondary market until after the fund’s inception, for the period from inception to the first day of secondary trading, the NAV of the fund is used as a proxy for the Market Price to calculate market returns. Market and NAV returns assume that dividends and capital gain distributions have been reinvested at Market Price and NAV, respectively.
An index is a statistical composite that tracks a specified financial market or sector. Unlike a fund, an index does not actually hold a portfolio of securities and therefore does not incur the expenses incurred by a fund. These expenses negatively impact fund performance. Also, market returns do not include brokerage commissions that may be payable on secondary market transactions. If brokerage commissions were included, market returns would be lower.
Shareholder Expenses
As a shareholder of a Fund, you incur two types of costs: (1) transaction costs, including brokerage commissions on purchases and sales of fund shares and (2) ongoing costs, including management fees and other fund expenses. The expense example, which is based on an investment of $1,000 invested on May 1, 2014 and held through October 31, 2014, is intended to help you understand your ongoing costs (in dollars and cents) of investing in a Fund and to compare these costs with the ongoing costs of investing in other funds.
Actual Expenses — The table provides information about actual account values and actual expenses. Annualized expense ratios reflect contractual and voluntary fee waivers, if any. To estimate the expenses that you paid on your account over the period, simply divide your account value by $1,000 (for example, an $8,600 account value divided by $1,000 = 8.6), then multiply the result by the number for your Fund under the heading entitled “Expenses Paid During Period.”
Hypothetical Example for Comparison Purposes — The table also provides information about hypothetical account values and hypothetical expenses based on each Fund’s actual expense ratio and an assumed rate of return of 5% per year before expenses. You may use this information to compare the ongoing costs of investing in your Fund and other funds. To do so, compare this 5% hypothetical example with the 5% hypothetical examples that appear in the shareholder reports of the other funds.
Please note that the expenses shown in the table are meant to highlight your ongoing costs only and do not reflect any transactional costs, such as brokerage commissions paid on purchases and sales of fund shares. Therefore, the hypothetical examples are useful in comparing ongoing costs only and will not help you determine the relative total costs of owning different funds. In addition, if these transactional costs were included, your costs would have been higher.
| | |
| 10 | | 2014 iSHARES ANNUAL REPORTTO SHAREHOLDERS |
Schedule of Investments
iSHARES® LIQUIDITY INCOME ETF
October 31, 2014
| | | | | | | | |
| Security | | Principal
(000s) | | | Value | |
| | | | | | | | |
ASSET-BACKED SECURITIES — 9.86% | |
BMW Vehicle Lease Trust
Series 2014-1, Class A2 | | | | | | | | |
0.45%, 03/21/16 (Call 09/20/15) | | $ | 375 | | | $ | 374,970 | |
CarMax Auto Owner Trust
Series 2014-1, Class A2 | | | | | | | | |
0.47%, 02/15/17 | | | 207 | | | | 207,222 | |
Series 2014-2, Class A2 | | | | | | | | |
0.46%, 04/17/17 | | | 200 | | | | 199,903 | |
Honda Auto Receivables Owner Trust
Series 2014-2, Class A2 | | | | | | | | |
0.39%, 09/19/16 (Call 11/18/15) | | | 250 | | | | 249,977 | |
Mercedes-Benz Auto Lease Trust Series 2014-A, Class A2A | | | | | | | | |
0.48%, 06/15/16 | | | 250 | | | | 250,111 | |
Volkswagen Auto Loan
Enhanced Trust
Series 2014-1, Class A2 | | | | | | | | |
0.42%, 03/20/17 | | | 200 | | | | 199,796 | |
| | | | | | | | |
TOTAL ASSET-BACKED SECURITIES
(Cost: $1,482,146) | | | | 1,481,979 | |
| |
CERTIFICATES OF DEPOSIT — 5.48% | | | | | |
Bank of Nova Scotia (The) | | | | | | | | |
0.67%, 09/11/15 | | | 571 | | | | 572,837 | |
Credit Suisse New York | | | | | | | | |
0.56%, 08/24/15 | | | 250 | | | | 249,899 | |
| | | | | | | | |
TOTAL CERTIFICATES OF DEPOSIT
(Cost: $822,090) | | | | 822,736 | |
| |
COMMERCIAL PAPERa —5.65% | | | | | |
Nissan Motor Acceptance Corp. | | | | | | | | |
0.40%, 04/20/15 | | | 350 | | | | 349,349 | |
Vodafone Group PLC | | | | | | | | |
0.44%, 04/10/15 | | | 500 | | | | 499,154 | |
| | | | | | | | |
TOTAL COMMERCIAL PAPER
(Cost: $847,738) | | | | 848,503 | |
|
CORPORATE BONDS & NOTES — 59.17% | |
| | |
AUTO MANUFACTURERS — 3.42% | | | | | | | | |
Daimler Finance North America LLC | | | | | | | | |
2.63%, 09/15/16b | | | 500 | | | | 514,377 | |
| | | | | | | | |
| | | | 514,377 | |
| | | | | | | | |
| Security | | Principal
(000s) | | | Value | |
| | | | | | | | |
BANKS — 35.45% | | | | | | | | |
Bank of America N.A. | | | | | | | | |
0.70%, 11/14/16c | | $ | 275 | | | $ | 275,111 | |
Bank of Montreal | | | | | | | | |
0.70%, 09/11/15c | | | 350 | | | | 351,336 | |
Banque Federative du Credit Mutuel SA | | | | | | | | |
1.08%, 01/20/17b,c | | | 500 | | | | 503,949 | |
BPCE SA | | | | | | | | |
0.73%, 07/15/15c | | | 500 | | | | 500,874 | |
1.08%, 02/10/17c | | | 250 | | | | 252,245 | |
Commonwealth Bank of Australia | | | | | | | | |
0.44%, 12/04/15b,c,d | | | 250 | | | | 250,085 | |
0.73%, 09/20/16b,c | | | 250 | | | | 251,499 | |
Macquarie Bank Ltd. | | | | | | | | |
0.68%, 06/15/16b,c | | | 275 | | | | 274,955 | |
National Australia Bank Ltd. | | | | | | | | |
0.66%, 12/02/16b,c | | | 600 | | | | 602,728 | |
Suncorp-Metway Ltd. | | | | | | | | |
0.70%, 05/23/16b,c | | | 500 | | | | 501,000 | |
Toronto-Dominion Bank (The) | | | | | | | | |
2.38%, 10/19/16 | | | 200 | | | | 206,248 | |
Wells Fargo & Co. | | | | | | | | |
0.43%, 10/28/15c | | | 600 | | | | 600,393 | |
Westpac Banking Corp. | | | | | | | | |
0.99%, 09/25/15c | | | 750 | | | | 754,876 | |
| | | | | | | | |
| | | | 5,325,299 | |
DIVERSIFIED FINANCIAL SERVICES — 5.82% | | | | | |
General Electric Capital Corp. | | | | | | | | |
0.43%, 01/08/16c | | | 200 | | | | 200,208 | |
0.43%, 05/11/16c | | | 150 | | | | 150,007 | |
0.83%, 01/08/16c | | | 350 | | | | 352,017 | |
1.10%, 05/09/16c | | | 170 | | | | 171,715 | |
| | | | | | | | |
| | | | 873,947 | |
MANUFACTURING — 3.33% | | | | | |
Tyco Electronics Group SA | | | | | | | | |
0.43%, 01/29/16c | | | 500 | | | | 499,780 | |
| | | | | | | | |
| | | | 499,780 | |
MEDIA — 3.38% | | | | | |
NBCUniversal Media LLC | | | | | | | | |
3.65%, 04/30/15 | | | 500 | | | | 507,870 | |
| | | | | | | | |
| | | | 507,870 | |
| | | | |
SCHEDULESOF INVESTMENTS | | | 11 | |
Schedule of Investments (Continued)
iSHARES® LIQUIDITY INCOME ETF
October 31, 2014
| | | | | | | | |
| Security | | Principal
(000s) | | | Value | |
| | | | | | | | |
OIL & GAS — 1.67% | | | | | |
Devon Energy Corp. | | | | | | | | |
0.68%, 12/15/15c | | $ | 250 | | | $ | 250,806 | |
| | | | | | | | |
| | | | 250,806 | |
PHARMACEUTICALS — 1.66% | | | | | |
Bayer US Finance LLC | | | | | | | | |
0.48%, 10/07/16b,c | | | 250 | | | | 250,191 | |
| | | | | | | | |
| | | | 250,191 | |
TELECOMMUNICATIONS — 4.44% | | | | | |
America Movil SAB de CV | | | | | | | | |
2.38%, 09/08/16 | | | 250 | | | | 255,948 | |
Verizon Communications Inc. | | | | | | | | |
2.50%, 09/15/16 | | | 400 | | | | 411,819 | |
| | | | | | | | |
| | | | | | | 667,767 | |
| | | | | | | | |
TOTAL CORPORATE BONDS & NOTES
(Cost: $8,872,603) | | | | 8,890,037 | |
| |
REPURCHASE AGREEMENTS —17.47% | | | | | |
Citigroup Global Markets Inc.,
0.39%, 11/03/14c (Purchased on 9/29/14 to be repurchased at $750,024, collateralized by U.S. Treasury obligations, 0.63%, due 11/30/17, par and fair value of $771,700 and $765,035, respectively) | | | 750 | | | | 750,000 | |
Morgan Stanley & Co. LLC,
0.49%, 12/16/14c (Purchased on 9/17/14 to be repurchased at $600,735, collateralized by U.S. government agency obligations, 4.65%, due 7/20/60, par and fair value of $6,038,476 and $618,000, respectively) | | | 600 | | | | 600,000 | |
RBS Securities Inc.,
1.00%, 11/03/14 (Purchased on 9/02/14 to be repurchased at $525,904, collateralized by U.S. government agency obligations, 5.00%, due 6/01/41, par and fair value of $520,000 and $542,341, respectively) | | | 525 | | | | 525,000 | |
| | | | | | | | |
| Security | | Principal
or Shares
(000s) | | | Value | |
| | | | | | | | |
SG Americas Securities LLC,
0.33%, 11/03/14c (Purchased on 1/09/14 to be repurchased at $750,021, collateralized by various corporate debt obligations, 1.75% to 9.70%, due 1/15/15 to 4/01/30, par and fair value of $847,237 and $861,751, respectively) | | $ | 750 | | | $ | 750,000 | |
| | | | | | | | |
TOTAL REPURCHASE AGREEMENTS
(Cost: $2,625,000) | | | | 2,625,000 | |
|
MONEY MARKET FUNDS — 4.03% | |
BlackRock Cash Funds: Institutional, SL Agency Shares | | | | | | | | |
0.13%e,f,g | | | 235 | | | | 234,970 | |
BlackRock Cash Funds: Prime,
SL Agency Shares | | | | | | | | |
0.11%e,f,g | | | 370 | | | | 369,649 | |
| | | | | | | | |
TOTAL MONEY MARKET FUNDS | | | | | |
(Cost: $604,619) | | | | | | | 604,619 | |
| | | | | | | | |
TOTAL INVESTMENTS
IN SECURITIES — 101.66% | | | | | |
(Cost: $15,254,196) | | | | | | | 15,272,874 | |
Other Assets, Less Liabilities — (1.66)% | | | | (248,915 | ) |
| | | | | | | | |
NET ASSETS — 100.00% | | | | | | $ | 15,023,959 | |
| | | | | | | | |
| a | Rates shown are discount rates paid at the time of purchase. |
| b | This security may be resold to qualified institutional buyers under Rule 144A of the Securities Act of 1933. |
| c | Variable rate security. Rate shown is as of report date. |
| d | All or a portion of this security represents a security on loan. See Note 1. |
| e | Affiliated issuer. See Note 2. |
| f | The rate quoted is the annualized seven-day yield of the fund at period end. |
| g | All or a portion of this security represents an investment of securities lending collateral. See Note 1. |
See notes to financial statements.
| | |
| 12 | | 2014 iSHARES ANNUAL REPORTTO SHAREHOLDERS |
Schedule of Investments
iSHARES® SHORT MATURITY BOND ETF
October 31, 2014
| | | | | | | | |
Security | |
Principal
(000s) | | | Value | |
| | | | | | | | |
ASSET-BACKED SECURITIES — 23.50% | | | | | |
ABCLO 2007-1 Ltd.
Series 2007-1A, Class A1B | | | | | | | | |
0.58%, 04/15/21a,b | | $ | 1,500 | | | $ | 1,474,135 | |
ACAS CLO Ltd.
Series 2007-1A, Class A1S | | | | | | | | |
0.44%, 04/20/21a,b | | | 761 | | | | 752,539 | |
American Credit Acceptance Receivables Trust
Series 2014-1, Class A | | | | | | | | |
1.14%, 03/12/18a | | | 459 | | | | 459,506 | |
American Homes 4 Rent
Series 2014-SFR1, Class A | | | | | | | | |
1.25%, 06/17/31a,b | | | 457 | | | | 453,588 | |
AmeriCredit Automobile Receivables Trust | | | | | | | | |
Series 2011-2, Class C | | | | | | | | |
3.19%, 10/12/16 (Call 05/08/15) | | | 158 | | | | 159,256 | |
Series 2012-3, Class D | | | | | | | | |
3.03%, 07/09/18 (Call 07/08/16) | | | 1,700 | | | | 1,742,816 | |
Series 2013-1, Class D | | | | | | | | |
2.09%, 02/08/19 (Call 11/08/16) | | | 2,500 | | | | 2,506,390 | |
ARI Fleet Lease Trust
Series 2014-A, Class A2 | | | | | | | | |
0.81%, 11/15/22a | | | 1,045 | | | | 1,046,311 | |
Avalon IV Capital Ltd.
Series 2012-1AR, Class AR | | | | | | | | |
1.40%, 04/17/23a,b | | | 1,435 | | | | 1,432,994 | |
Cabela’s Credit Card Master
Note Trust
Series 2014-2, Class A | | | | | | | | |
1.00%, 07/15/22b | | | 3,500 | | | | 3,491,778 | |
Chase Issuance Trust
Series 2013-A9, Class A | | | | | | | | |
0.57%, 11/16/20b | | | 2,000 | | | | 2,004,056 | |
Chatham Light CLO II Ltd.
Series 2005-2A, Class B | | | | | | | | |
0.94%, 08/03/19a,b | | | 2,000 | | | | 1,974,200 | |
Chesapeake Funding LLC
Series 2012-1A, Class B | | | | | | | | |
1.75%, 11/07/23a,b | | | 1,635 | | | | 1,650,519 | |
Citibank Credit Card Issuance Trust Series 2013-A4, Class A4 | | | | | | | | |
0.57%, 07/24/20b | | | 2,000 | | | | 2,003,970 | |
| | | | | | | | |
Security | |
Principal
(000s) | | | Value | |
| | | | | | | | |
CNH Wholesale Master Note Trust Series 2013-2A, Class B | | | | | | | | |
1.05%, 08/15/19a,b | | $ | 300 | | | $ | 300,270 | |
COA Caerus CLO Ltd.
Series 2007-6A, Class A1 | | | | | | | | |
0.87%, 12/13/19a,b | | | 2,000 | | | | 1,977,792 | |
Cornerstone CLO Ltd.
Series 2007-1A, Class A1S | | | | | | | | |
0.45%, 07/15/21a,b | | | 421 | | | | 417,977 | |
Credit Acceptance Auto Loan Trust | | | | | | | | |
Series 2012-1A, Class A | | | | | | | | |
2.20%, 09/16/19a | | | 102 | | | | 102,429 | |
Series 2013-2A, Class A | | | | | | | | |
1.50%, 04/15/21a | | | 1,000 | | | | 1,003,154 | |
Dryden XXII Senior Loan Fund
Series 2011-22A, Class A1R | | | | | | | | |
1.40%, 01/15/22a,b | | | 1,420 | | | | 1,418,224 | |
DT Auto Owner Trust
Series 2014-1A, Class B | |
1.43%, 03/15/18a | | | 2,000 | | | | 2,006,468 | |
Eagle Creek CLO Ltd.
Series 2006-1A, Class B | | | | | | | | |
1.14%, 02/28/18a,b | | | 1,330 | | | | 1,321,466 | |
Ford Credit Auto Owner Trust
Series 2012-B, Class D | | | | | | | | |
2.93%, 10/15/18 (Call 05/15/16) | | | 1,790 | | | | 1,842,553 | |
Ford Credit Floorplan Master Owner Trust A | | | | | | | | |
Series 2010-3, Class C | | | | | | | | |
4.99%, 02/15/17a | | | 150 | | | | 152,363 | |
Series 2012-2, Class D | | | | | | | | |
3.50%, 01/15/19 | | | 1,885 | | | | 1,967,987 | |
ING Investment Management Co.Ltd. Series 2012-1RA, Class A1R | | | | | | | | |
1.43%, 03/14/22a,b | | | 1,435 | | | | 1,432,456 | |
Katonah Ltd.
Series 2007-10A, Class A2B | | | | | | | | |
0.48%, 04/17/20a,b | | | 1,386 | | | | 1,370,994 | |
Mayport CLO Ltd.
Series 2006-1A, Class A3L | | | | | | | | |
0.88%, 02/22/20a,b | | | 2,070 | | | | 2,047,185 | |
MBNA Credit Card Master Note Trust
Series 2005-B3, Class B3 | | | | | | | | |
0.38%, 03/19/18c | | | 590 | | | | 735,693 | |
| | | | |
SCHEDULESOF INVESTMENTS | | | 13 | |
Schedule of Investments (Continued)
iSHARES® SHORT MATURITY BOND ETF
October 31, 2014
| | | | | | | | |
Security | |
Principal
(000s) | | | Value | |
| | | | | | | | |
Navient Student Loan Trust
Series 2014-CT, Class A | | | | | | | | |
0.85%, 09/16/24a,b | | $ | 376 | | | $ | 375,630 | |
OHA Intrepid Leveraged Loan
Fund Ltd.
Series 2011-1AR, Class AR | | | | | | | | |
1.15%, 04/20/21a,b | | | 987 | | | | 982,462 | |
OneMain Financial Issuance Trust
Series 2014-2A, Class A | | | | | | | | |
2.47%, 09/18/24a | | | 3,310 | | | | 3,311,036 | |
Palmer Square CLO Ltd.
Series 2014-1A, Class A1 | | | | | | | | |
1.54%, 10/17/22a,b | | | 2,500 | | | | 2,492,935 | |
PFS Financing Corp. | | | | | | | | |
Series 2014-AA, Class A | | | | | | | | |
0.75%, 02/15/19a,b | | | 1,000 | | | | 1,001,996 | |
Series 2014-AA, Class B | | | | | | | | |
1.10%, 02/15/19a,b | | | 1,100 | | | | 1,102,113 | |
Series 2014-BA, Class A | | | | | | | | |
0.83%, 10/15/19a,b | | | 1,915 | | | | 1,914,025 | |
Regatta Funding Ltd.
Series 2007-1A, Class A1L | | | | | | | | |
0.48%, 06/15/20a,b | | | 891 | | | | 880,867 | |
Santander Drive Auto Receivables Trust | | | | | | | | |
Series 2012-2, Class D | | | | | | | | |
3.87%, 02/15/18 (Call 05/15/16) | | | 2,000 | | | | 2,068,482 | |
Series 2012-AA, Class C | | | | | | | | |
1.78%, 11/15/18a | | | 1,545 | | | | 1,558,350 | |
Series 2012-AA, Class D | | | | | | | | |
2.46%, 12/17/18 (Call 10/15/16)a | | | 2,500 | | | | 2,528,880 | |
Series 2013-1, Class C | | | | | | | | |
1.76%, 01/15/19 | | | 2,250 | | | | 2,264,573 | |
Series 2013-2, Class B | | | | | | | | |
1.33%, 03/15/18 | | | 2,400 | | | | 2,409,794 | |
Series 2013-5, Class A2B | | | | | | | | |
0.53%, 04/17/17b | | | 176 | | | | 176,262 | |
Series 2013-5, Class B | | | | | | | | |
1.55%, 10/15/18 | | | 775 | | | | 777,442 | |
Series 2014-1, Class D | | | | | | | | |
2.91%, 04/15/20 (Call 05/15/17) | | | 2,345 | | | | 2,366,668 | |
Series 2014-3, Class B | | | | | | | | |
1.45%, 05/15/19 | | | 785 | | | | 785,523 | |
| | | | | | | | |
Security | |
Principal
(000s) | | | Value | |
| | | | | | | | |
Series 2014-4, Class A3 | | | | | | | | |
1.08%, 09/17/18 (Call 11/15/16) | | $ | 1,375 | | | $ | 1,378,220 | |
Series 2014-S1, Class R | | | | | | | | |
1.42%, 08/16/18a | | | 804 | | | | 804,005 | |
Silver Bay Realty 2014-1 Trust | | | | | | | | |
1.15%, 09/17/31a,b | | | 1,042 | | | | 1,031,891 | |
SLM Private Credit Student
Loan Trust | | | | | | | | |
Series 2004-B, Class A2 | | | | | | | | |
0.43%, 06/15/21b | | | 2,879 | | | | 2,864,524 | |
Series 2005-A, Class A2 | | | | | | | | |
0.37%, 12/15/20b | | | 1,245 | | | | 1,244,647 | |
SLM Private Education Loan Trust | | | | | | | | |
Series 2011-A, Class A1 | | | | | | | | |
1.15%, 10/15/24a,b | | | 1,125 | | | | 1,130,760 | |
Series 2011-C, Class A1 | | | | | | | | |
1.55%, 12/15/23a,b | | | 1,180 | | | | 1,188,427 | |
Series 2012-B, Class A2 | | | | | | | | |
3.48%, 10/15/30a | | | 1,250 | | | | 1,304,316 | |
Series 2013-A, Class A1 | | | | | | | | |
0.75%, 08/15/22a,b | | | 1,616 | | | | 1,617,706 | |
Series 2013-C, Class A2B | | | | | | | | |
1.55%, 10/15/31a,b | | | 1,750 | | | | 1,781,883 | |
Series 2014-A, Class A1 | | | | | | | | |
0.75%, 07/15/22a,b | | | 2,446 | | | | 2,444,393 | |
SLM Student Loan Trust | | | | | | | | |
Series 2004-A, Class A2 | | | | | | | | |
0.43%, 03/16/20b | | | 721 | | | | 719,654 | |
Series 2006-4, Class A5 | | | | | | | | |
0.33%, 10/27/25b | | | 2,652 | | | | 2,646,452 | |
Series 2006-A, Class A4 | | | | | | | | |
0.42%, 12/15/23b | | | 1,125 | | | | 1,113,301 | |
Series 2011-C, Class A2A | | | | | | | | |
3.40%, 10/17/44a,b | | | 2,000 | | | | 2,160,450 | |
Series 2012-A, Class A1 | | | | | | | | |
1.55%, 08/15/25a,b | | | 996 | | | | 1,006,495 | |
Series 2012-C, Class A1 | | | | | | | | |
1.25%, 08/15/23a,b | | | 2,054 | | | | 2,065,420 | |
Series 2012-E, Class A1 | | | | | | | | |
0.90%, 10/16/23a,b | | | 919 | | | | 921,469 | |
Series 2012-E, Class A2B | | | | | | | | |
1.90%, 06/15/45a,b | | | 250 | | | | 257,274 | |
Series 2013-A, Class A2B | | | | | | | | |
1.20%, 05/17/27a,b | | | 265 | | | | 266,632 | |
| | |
| 14 | | 2014 iSHARES ANNUAL REPORTTO SHAREHOLDERS |
Schedule of Investments (Continued)
iSHARES® SHORT MATURITY BOND ETF
October 31, 2014
| | | | | | | | |
Security | |
Principal
(000s) | | | Value | |
| | | | | | | | |
Series 2013-B, Class A1 | | | | | | | | |
0.80%, 07/15/22a,b | | $ | 1,808 | | | $ | 1,808,198 | |
Series 2013-C, Class A1 | | | | | | | | |
1.00%, 02/15/22a,b | | | 1,810 | | | | 1,817,514 | |
Wheels SPV 2 LLC
Series 2014-1A, Class A2 | | | | | | | | |
0.84%, 03/20/23a | | | 580 | | | | 578,837 | |
| | | | | | | | |
TOTAL ASSET-BACKED SECURITIES | | | | | |
(Cost: $98,499,353) | | | | 98,398,575 | |
|
COLLATERALIZED MORTGAGE
OBLIGATIONS — 14.82% | |
| |
MORTGAGE-BACKED SECURITIES — 14.82% | | | | | |
Banc of America Commercial Mortgage Trust
Series 2007-3, Class A1A | | | | | | | | |
5.56%, 06/10/49b | | | 1,071 | | | | 1,158,876 | |
Banc of America Merrill Lynch Commercial Mortgage Inc. | | | | | | | | |
Series 2005-4, Class A5A | | | | | | | | |
4.93%, 07/10/45 | | | 526 | | | | 536,006 | |
Series 2005-4, Class A5B | | | | | | | | |
5.00%, 07/10/45b | | | 2,730 | | | | 2,798,922 | |
Series 2006-2, Class A4 | | | | | | | | |
5.73%, 05/10/45b | | | 1,925 | | | | 2,023,188 | |
Banc of America Merrill Lynch Commercial Mortgage
Securities Trust
Series 2013-DSNY, Class A | | | | | | | | |
1.20%, 09/15/26a,b | | | 525 | | | | 524,346 | |
Bear Stearns Commercial Mortgage Securities Inc. | | | | | | | | |
Series 2005-PWR7, Class A3 | | | | | | | | |
5.12%, 02/11/41b | | | 2,197 | | | | 2,206,669 | |
Series 2005-PWR8, Class A4 | | | | | | | | |
4.67%, 06/11/41 | | | 209 | | | | 211,181 | |
Series 2006-PW12, Class A4 | | | | | | | | |
5.70%, 09/11/38b | | | 1,228 | | | | 1,300,519 | |
Series 2006-PW14, Class A1A | | | | | | | | |
5.19%, 12/11/38 | | | 218 | | | | 233,736 | |
Series 2007-PW15, Class A1A | | | | | | | | |
5.32%, 02/11/44 | | | 259 | | | | 278,760 | |
| | | | | | | | |
Security | |
Principal
(000s) | | | Value | |
| | | | | | | | |
Brunel Residential Mortgage Securitisation PLC
Series 2007-1A, Class A4C | | | | | | | | |
0.43%, 01/13/39 (Call 01/13/15)a,b | | $ | 1,757 | | | $ | 1,741,685 | |
Citigroup Commercial Mortgage Trust | | | | | | | | |
Series 2006-C5, Class A4 | | | | | | | | |
5.43%, 10/15/49 | | | 2,000 | | | | 2,130,460 | |
Series 2014-388G, Class A | | | | | | | | |
0.90%, 06/15/33a,b | | | 2,125 | | | | 2,123,438 | |
COMM Mortgage Trust | | | | | | | | |
Series 2006-C7, Class A4 | | | | | | | | |
5.76%, 06/10/46b | | | 1,866 | | | | 1,972,175 | |
Series 2007-C9, Class A4 | | | | | | | | |
5.80%, 12/10/49b | | | 1,320 | | | | 1,452,614 | |
Series 2014-PAT, Class A | | | | | | | | |
0.95%, 08/13/27a,b | | | 2,200 | | | | 2,192,458 | |
Credit Suisse Commercial
Mortgage Trust | | | | | | | | |
Series 2006-C1, Class AJ | | | | | | | | |
5.46%, 02/15/39b | | | 791 | | | | 825,594 | |
Series 2006-C5, Class A3 | | | | | | | | |
5.31%, 12/15/39 | | | 498 | | | | 529,443 | |
Series 2014-SURF, Class A | | | | | | | | |
1.01%, 02/15/29a,b | | | 2,000 | | | | 2,001,376 | |
DBRR Trust
Series 2013-EZ2, Class A | | | | | | | | |
0.85%, 02/25/45 (Call 12/17/14)a,b | | | 1,097 | | | | 1,096,246 | |
FCT Marsollier Mortgages
Series 2009-1, Class A | | | | | | | | |
0.58%, 09/27/50b,c | | EUR | 480 | | | | 598,470 | |
GMAC Commercial Mortgage Securities Inc.
Series 2006-C1, Class A1A | | | | | | | | |
5.23%, 11/10/45b | | $ | 1,837 | | | | 1,905,758 | |
Granite Master Issuer PLC | | | | | | | | |
Series 2004-1, Class 2A1 | | | | | | | | |
0.55%, 03/20/44b | | | 1,119 | | | | 1,113,173 | |
Series 2005-1, Class A4 | | | | | | | | |
0.36%, 12/20/54b | | | 444 | | | | 442,040 | |
Series 2006-1A, Class A5 | | | | | | | | |
0.30%, 12/20/54a,b | | | 640 | | | | 635,185 | |
| | | | |
SCHEDULESOF INVESTMENTS | | | 15 | |
Schedule of Investments (Continued)
iSHARES® SHORT MATURITY BOND ETF
October 31, 2014
| | | | | | | | |
Security | |
Principal
(000s) | | | Value | |
| | | | | | | | |
Series 2006-3, Class A3 | | | | | | | | |
0.24%, 12/20/54b | | $ | 1,870 | | | $ | 1,854,618 | |
Series 2006-3, Class A4 | | | | | | | | |
0.24%, 12/20/54b | | | 505 | | | | 500,581 | |
Series 2007-1, Class 2A1 | | | | | | | | |
0.30%, 12/20/54b | | | 765 | | | | 759,088 | |
Series 2007-2, Class 2A1 | | | | | | | | |
0.23%, 12/17/54b | | | 605 | | | | 599,817 | |
Series 2007-2, Class 3A1 | | | | | | | | |
0.33%, 12/17/54b | | | 820 | | | | 815,064 | |
Series 2007-2, Class 4A1 | | | | | | | | |
0.24%, 12/17/54b | | | 153 | | | | 151,553 | |
GS Mortgage Securities Trust
Series 2006-GG8, Class AM | | | | | | | | |
5.59%, 11/10/39 (Call 10/06/16) | | | 1,000 | | | | 1,072,347 | |
JPMorgan Chase Commercial Mortgage Securities Corp. | | | | | | | | |
Series 2005-CB13, Class A4 | | | | | | | | |
5.24%, 01/12/43b | | | 801 | | | | 826,441 | |
Series 2006-LDP9, Class A3 | | | | | | | | |
5.34%, 05/15/47 | | | 2,464 | | | | 2,633,064 | |
Series 2007-CB18, Class A1A | | | | | | | | |
5.43%, 06/12/47b | | | 248 | | | | 266,917 | |
Series 2007-CB18, Class A4 | | | | | | | | |
5.44%, 06/12/47 | | | 1,931 | | | | 2,075,711 | |
Series 2007-CB20, Class A4 | | | | | | | | |
5.79%, 02/12/51b | | | 1,895 | | | | 2,071,144 | |
LB-UBS Commercial Mortgage Trust | | | | | | | | |
Series 06–C4, Class AM | | | | | | | | |
5.85%, 06/15/38b | | | 1,250 | | | | 1,337,087 | |
Series 2006-C7, Class A3 | | | | | | | | |
5.35%, 11/15/38 | | | 525 | | | | 564,254 | |
Series 2007-C2, Class A3 | | | | | | | | |
5.43%, 02/15/40 | | | 1,976 | | | | 2,139,137 | |
ML-CFC Commercial Mortgage Trust Series 2007-9, Class A4 | | | | | | | | |
5.70%, 09/12/49 | | | 1,425 | | | | 1,554,856 | |
Morgan Stanley Capital I Inc. | | | | | | | | |
Series 2006-IQ12, Class A1A | | | | | | | | |
5.32%, 12/15/43 | | | 389 | | | | 416,704 | |
Series 2007-IQ15, Class A4 | | | | | | | | |
5.91%, 06/11/49b | | | 1,679 | | | | 1,842,926 | |
Series 2007-T25, Class A3 | | | | | | | | |
5.51%, 11/12/49b | | | 493 | | | | 530,527 | |
| | | | | | | | |
Security | |
Principal
(000s) | | | Value | |
| | | | | | | | |
Morgan Stanley Capital I Trust | | | | | | | | |
Series 2006-HQ9, Class A4FL | | | | | | | | |
0.30%, 07/12/44b | | $ | 3,822 | | | $ | 3,808,298 | |
Series 2007-HQ11, Class A4FL | | | | | | | | |
0.29%, 02/12/44b | | | 1,960 | | | | 1,943,720 | |
Morgan Stanley Re-REMIC Trust Series 2011-IO, Class B | | | | | | | | |
0.00%, 03/23/51a | | | 1,152 | | | | 1,139,156 | |
Puma Finance Ltd.
Series G5, Class A1 | | | | | | | | |
0.37%, 02/21/38a,b | | | 664 | | | | 658,925 | |
Wachovia Bank Commercial Mortgage Trust | | | | | | | | |
Series 2006-C24, Class A3 | | | | | | | | |
5.56%, 03/15/45b | | | 205 | | | | 213,113 | |
Series 2006-C29, Class A1A | | | | | | | | |
5.30%, 11/15/48 | | | 238 | | | | 255,626 | |
| | | | | | | | |
TOTAL COLLATERALIZED MORTGAGE OBLIGATIONS | | | | | |
(Cost: $62,217,252) | | | | 62,062,992 | |
|
CORPORATE BONDS & NOTES — 55.67% | |
| | |
ADVERTISING — 0.18% | | | | | | | | |
Omnicom Group Inc. | | | | | | | | |
5.90%, 04/15/16 | | | 700 | | | | 748,063 | |
| | | | | | | | |
| | | | 748,063 | |
AGRICULTURE — 1.98% | | | | | |
Altria Group Inc. | | | | | | | | |
4.13%, 09/11/15 | | | 200 | | | | 205,923 | |
BAT International Finance PLC | | | | | | | | |
1.40%, 06/05/15a | | | 1,000 | | | | 1,004,070 | |
Bunge Ltd. Finance Corp. | | | | | | | | |
5.10%, 07/15/15 | | | 2,500 | | | | 2,575,470 | |
Lorillard Tobacco Co. | | | | | | | | |
3.50%, 08/04/16 | | | 1,400 | | | | 1,451,776 | |
Reynolds American Inc. | | | | | | | | |
1.05%, 10/30/15 | | | 3,035 | | | | 3,040,791 | |
| | | | | | | | |
| | | | 8,278,030 | |
AIRLINES — 1.07% | | | | | |
Continental Airlines Inc. 2009-1 Pass Through Trust
Series 09-1 | | | | | | | | |
9.00%, 01/08/18 | | | 2,612 | | | | 2,899,610 | |
| | |
| 16 | | 2014 iSHARES ANNUAL REPORTTO SHAREHOLDERS |
Schedule of Investments (Continued)
iSHARES® SHORT MATURITY BOND ETF
October 31, 2014
| | | | | | | | |
Security | |
Principal
(000s) | | | Value | |
| | | | | | | | |
Delta Air Lines 2010-1 Class B Pass Through Trust
Series 101B | | | | | | | | |
6.38%, 07/02/17a | | $ | 1,500 | | | $ | 1,563,750 | |
| | | | | | | | |
| | | | 4,463,360 | |
AUTO MANUFACTURERS — 1.43% | | | | | | | | |
Daimler Finance North America LLC | | | | | | | | |
0.58%, 08/01/17a,b | | | 1,700 | | | | 1,697,693 | |
2.63%, 09/15/16a | | | 1,000 | | | | 1,028,754 | |
3.00%, 03/28/16a | | | 750 | | | | 772,025 | |
Nissan Motor Acceptance Corp. | | | | | | | | |
0.78%, 03/03/17a,b | | | 250 | | | | 250,520 | |
0.94%, 09/26/16a,b | | | 750 | | | | 754,791 | |
1.00%, 03/15/16a | | | 1,500 | | | | 1,501,408 | |
| | | | | | | | |
| | | | 6,005,191 | |
BANKS — 17.80% | | | | | | | | |
Abbey National Treasury
Services PLC/London | | | | | | | | |
4.00%, 04/27/16 | | | 1,750 | | | | 1,829,583 | |
ABN AMRO Bank NV | | | | | | | | |
1.03%, 10/28/16a,b | | | 635 | | | | 639,953 | |
Bank of America Corp. | | | | | | | | |
1.05%, 03/22/16b | | | 2,750 | | | | 2,764,140 | |
1.35%, 11/21/16 | | | 300 | | | | 300,269 | |
3.63%, 03/17/16 | | | 5,250 | | | | 5,435,440 | |
3.70%, 09/01/15 | | | 1,000 | | | | 1,023,500 | |
Series B | | | | | | | | |
5.30%, 09/30/15 | | | 700 | | | | 727,930 | |
Banque Federative du Credit
Mutuel SA | | | | | | | | |
1.08%, 01/20/17a,b,d | | | 1,000 | | | | 1,007,897 | |
Barclays Bank PLC | | | | | | | | |
0.81%, 02/17/17b | | | 3,150 | | | | 3,157,853 | |
BNP Paribas SA | | | | | | | | |
0.82%, 12/12/16b | | | 750 | | | | 752,675 | |
3.60%, 02/23/16 | | | 1,000 | | | | 1,035,274 | |
BPCE SA | | | | | | | | |
0.86%, 06/17/17b | | | 700 | | | | 700,541 | |
1.08%, 02/10/17b | | | 1,900 | | | | 1,917,058 | |
Capital One Financial Corp. | | | | | | | | |
1.00%, 11/06/15 | | | 2,220 | | | | 2,225,639 | |
3.15%, 07/15/16d | | | 1,400 | | | | 1,449,829 | |
5.50%, 06/01/15 | | | 1,250 | | | | 1,284,415 | |
| | | | | | | | |
Security | |
Principal
(000s) | | | Value | |
| | | | | | | | |
Citigroup Inc. | | | | | | | | |
1.19%, 07/25/16b | | $ | 975 | | | $ | 984,406 | |
1.25%, 01/15/16 | | | 1,074 | | | | 1,078,577 | |
4.59%, 12/15/15 | | | 145 | | | | 151,044 | |
Danske Bank A/S | | | | | | | | |
3.75%, 04/01/15a | | | 1,000 | | | | 1,012,642 | |
Deutsche Bank AG/London | | | | | | | | |
3.25%, 01/11/16 | | | 500 | | | | 514,544 | |
Deutsche Bank Financial LLC | | | | | | | | |
5.38%, 03/02/15 | | | 1,100 | | | | 1,115,967 | |
Fifth Third Bancorp | | | | | | | | |
0.65%, 12/20/16b | | | 750 | | | | 746,842 | |
3.63%, 01/25/16 | | | 2,250 | | | | 2,325,589 | |
Goldman Sachs Group Inc. (The) | | | | | | | | |
0.68%, 03/22/16b | | | 4,665 | | | | 4,660,195 | |
1.60%, 11/23/15 | | | 1,700 | | | | 1,713,382 | |
3.63%, 02/07/16 | | | 1,750 | | | | 1,806,040 | |
5.35%, 01/15/16 | | | 2,500 | | | | 2,635,837 | |
Huntington National Bank (The) | | | | | | | | |
0.66%, 04/24/17 (Call 03/25/17)b | | | 1,405 | | | | 1,405,181 | |
ING Bank NV | | | | | | | | |
1.18%, 03/07/16a,b | | | 800 | | | | 806,538 | |
4.00%, 03/15/16a,d | | | 1,250 | | | | 1,300,996 | |
Intesa Sanpaolo SpA | | | | | | | | |
3.13%, 01/15/16 | | | 1,600 | | | | 1,633,610 | |
3.63%, 08/12/15a | | | 200 | | | | 203,575 | |
JPMorgan Chase & Co. | | | | | | | | |
0.85%, 02/26/16b | | | 1,575 | | | | 1,580,180 | |
3.45%, 03/01/16 | | | 3,800 | | | | 3,925,860 | |
5.15%, 10/01/15 | | | 1,700 | | | | 1,765,863 | |
5.25%, 05/01/15 | | | 2,150 | | | | 2,197,549 | |
KeyCorp | | | | | | | | |
3.75%, 08/13/15 | | | 2,250 | | | | 2,303,266 | |
Morgan Stanley | | | | | | | | |
1.48%, 02/25/16b | | | 1,750 | | | | 1,771,670 | |
3.80%, 04/29/16 | | | 500 | | | | 519,693 | |
5.38%, 10/15/15 | | | 1,350 | | | | 1,409,231 | |
6.00%, 04/28/15 | | | 370 | | | | 379,545 | |
MUFG Union Bank N.A. | | | | | | | | |
0.99%, 09/26/16b | | | 1,000 | | | | 1,007,734 | |
Regions Financial Corp. | | | | | | | | |
7.75%, 11/10/14 | | | 750 | | | | 750,762 | |
Royal Bank of Scotland Group PLC | | | | | | | | |
1.17%, 03/31/17b | | | 1,150 | | | | 1,153,811 | |
| | | | |
SCHEDULESOF INVESTMENTS | | | 17 | |
Schedule of Investments (Continued)
iSHARES® SHORT MATURITY BOND ETF
October 31, 2014
| | | | | | | | |
Security | |
Principal
(000s) | | | Value | |
| | | | | | | | |
Royal Bank of Scotland PLC (The) | | | | | | | | |
3.95%, 09/21/15d | | $ | 160 | | | $ | 164,453 | |
Standard Chartered PLC | | | | | | | | |
3.20%, 05/12/16a | | | 730 | | | | 754,435 | |
State Bank of India/London | | | | | | | | |
4.50%, 07/27/15c | | | 750 | | | | 767,714 | |
Sumitomo Mitsui Trust Bank Ltd. | | | | | | | | |
1.01%, 09/16/16a,b | | | 500 | | | | 502,971 | |
Wachovia Corp. | | | | | | | | |
0.60%, 10/15/16b | | | 3,250 | | | | 3,246,682 | |
| | | | | | | | |
| | | | | | | 74,548,380 | |
BEVERAGES — 0.07% | | | | | |
Coca-Cola Enterprises Inc. | | | | | | | | |
2.13%, 09/15/15 | | | 300 | | | | 303,428 | |
| | | | | | | | |
| | | | | | | 303,428 | |
CHEMICALS — 0.52% | | | | | |
Airgas Inc. | | | | | | | | |
3.25%, 10/01/15 (Call 09/01/15) | | | 665 | | | | 680,124 | |
Ecolab Inc. | | | | | | | | |
1.00%, 08/09/15d | | | 1,500 | | | | 1,504,829 | |
| | | | | | | | |
| | | | | | | 2,184,953 | |
COMMERCIAL SERVICES — 0.53% | | | | | |
ERAC USA Finance LLC | | | | | | | | |
1.40%, 04/15/16a | | | 410 | | | | 412,786 | |
5.60%, 05/01/15a | | | 1,359 | | | | 1,390,201 | |
5.90%, 11/15/15a | | | 400 | | | | 420,986 | |
| | | | | | | | |
| | | | | | | 2,223,973 | |
COMPUTERS — 0.73% | | | | | |
Computer Sciences Corp. | | | | | | | | |
2.50%, 09/15/15 | | | 725 | | | | 735,208 | |
Hewlett-Packard Co. | | | | | | | | |
2.13%, 09/13/15 | | | 1,750 | | | | 1,769,794 | |
2.35%, 03/15/15 | | | 550 | | | | 553,304 | |
| | | | | | | | |
| | | | | | | 3,058,306 | |
DIVERSIFIED FINANCIAL SERVICES — 4.58% | | | | | |
Air Lease Corp. | | | | | | | | |
4.50%, 01/15/16 | | | 2,300 | | | | 2,374,750 | |
Bear Stearns Companies Inc. (The) | | | | | | | | |
5.30%, 10/30/15 | | | 700 | | | | 732,119 | |
Caisse Centrale Desjardins | | | | | | | | |
0.58%, 09/12/17a,b | | | 3,800 | | | | 3,799,993 | |
Ford Motor Credit Co. LLC | | | | | | | | |
1.48%, 05/09/16b | | | 1,500 | | | | 1,518,486 | |
| | | | | | | | |
Security | |
Principal
(000s) | | | Value | |
| | | | | | | | |
1.70%, 05/09/16 | | $ | 250 | | | $ | 251,865 | |
2.50%, 01/15/16 | | | 1,000 | | | | 1,016,976 | |
4.21%, 04/15/16 | | | 3,500 | | | | 3,652,544 | |
5.63%, 09/15/15 | | | 260 | | | | 270,591 | |
12.00%, 05/15/15 | | | 1,200 | | | | 1,270,400 | |
Harley-Davidson Financial
Services Inc. | | | | | | | | |
1.15%, 09/15/15a | | | 1,200 | | | | 1,205,294 | |
HSBC Finance Corp. | | | | | | | | |
0.66%, 06/01/16b | | | 2,025 | | | | 2,024,133 | |
5.00%, 06/30/15 | | | 1,025 | | | | 1,052,417 | |
| | | | | | | | |
| | | | | | | 19,169,568 | |
ELECTRIC — 2.65% | | | | | |
Duke Energy Florida Inc. | | | | | | | | |
0.65%, 11/15/15 | | | 370 | | | | 370,624 | |
Jersey Central Power & Light Co. | | | | | | | | |
5.63%, 05/01/16 | | | 1,500 | | | | 1,597,188 | |
LG&E and KU Energy LLC | | | | | | | | |
2.13%, 11/15/15 | | | 1,233 | | | | 1,248,224 | |
Nevada Power Co. Series M | | | | | | | | |
5.95%, 03/15/16 | | | 1,091 | | | | 1,165,073 | |
Oncor Electric Delivery Co. LLC | | | | | | | | |
6.38%, 01/15/15 | | | 2,415 | | | | 2,442,828 | |
Progress Energy Inc. | | | | | | | | |
5.63%, 01/15/16 | | | 2,225 | | | | 2,349,720 | |
Southern Power Co. Series D | | | | | | | | |
4.88%, 07/15/15 | | | 1,871 | | | | 1,923,921 | |
| | | | | | | | |
| | | | | | | 11,097,578 | |
ELECTRONICS — 0.30% | | | | | |
Thermo Fisher Scientific Inc. | | | | | | | | |
3.20%, 05/01/15 | | | 1,000 | | | | 1,011,808 | |
3.20%, 03/01/16 | | | 239 | | | | 246,350 | |
| | | | | | | | |
| | | | | | | 1,258,158 | |
FOOD — 0.25% | | | | | |
Nabisco Inc. | | | | | | | | |
7.55%, 06/15/15 | | | 1,000 | | | | 1,041,654 | |
| | | | | | | | |
| | | | | | | 1,041,654 | |
FOREST PRODUCTS & PAPER — 0.39% | | | | | |
Georgia-Pacific LLC | | | | | | | | |
7.70%, 06/15/15 | | | 1,000 | | | | 1,041,229 | |
International Paper Co. | | | | | | | | |
5.30%, 04/01/15 | | | 594 | | | | 604,984 | |
| | | | | | | | |
| | | | | | | 1,646,213 | |
| | |
| 18 | | 2014 iSHARES ANNUAL REPORTTO SHAREHOLDERS |
Schedule of Investments (Continued)
iSHARES® SHORT MATURITY BOND ETF
October 31, 2014
| | | | | | | | |
Security | |
Principal
(000s) | | | Value | |
| | | | | | | | |
HEALTH CARE — PRODUCTS — 1.27% | | | | | |
Covidien International Finance SA | | | | | | | | |
1.35%, 05/29/15 | | $ | 1,000 | | | $ | 1,004,749 | |
2.80%, 06/15/15d | | | 370 | | | | 375,213 | |
Life Technologies Corp. | | | | | | | | |
3.50%, 01/15/16 | | | 3,810 | | | | 3,922,993 | |
| | | | | | | | |
| | | | | | | 5,302,955 | |
HEALTH CARE — SERVICES — 0.18% | | | | | |
Coventry Health Care Inc. | | | | | | | | |
6.13%, 01/15/15 | | | 750 | | | | 757,964 | |
| | | | | | | | |
| | | | | | | 757,964 | |
INSURANCE — 2.26% | | | | | | | | |
American International Group Inc. | | | | | | | | |
2.38%, 08/24/15 | | | 1,555 | | | | 1,573,414 | |
5.05%, 10/01/15 | | | 1,187 | | | | 1,234,125 | |
Aon Corp. | | | | | | | | |
3.50%, 09/30/15 | | | 1,656 | | | | 1,698,478 | |
Hartford Financial Services
Group Inc. (The) | | | | | | | | |
4.00%, 03/30/15 | | | 2,000 | | | | 2,027,192 | |
Liberty Mutual Group Inc. | | | | | | | | |
6.70%, 08/15/16a | | | 785 | | | | 860,330 | |
Manulife Financial Corp. | | | | | | | | |
3.40%, 09/17/15 | | | 1,448 | | | | 1,483,431 | |
Prudential Financial Inc. Series D | | | | | | | | |
4.75%, 09/17/15 | | | 585 | | | | 605,170 | |
| | | | | | | | |
| | | | | | | 9,482,140 | |
LEISURE TIME — 0.96% | | | | | |
Carnival Corp. | | | | | | | | |
1.20%, 02/05/16 | | | 4,000 | | | | 4,004,676 | |
| | | | | | | | |
| | | | | | | 4,004,676 | |
MANUFACTURING — 0.31% | | | | | |
Pentair Finance SA | | | | | | | | |
1.35%, 12/01/15 | | | 1,300 | | | | 1,304,211 | |
| | | | | | | | |
| | | | | | | 1,304,211 | |
MEDIA — 1.68% | | | | | |
COX Communications Inc. | | | | | | | | |
5.50%, 10/01/15 | | | 1,850 | | | | 1,931,468 | |
DIRECTV Holdings LLC/DIRECTV Financing Co. Inc. | | | | | | | | |
3.13%, 02/15/16 | | | 3,900 | | | | 4,007,180 | |
| | | | | | | | |
Security | |
Principal
(000s) | | | Value | |
| | | | | | | | |
Time Warner Cable Inc. | | | | | | | | |
3.50%, 02/01/15 | | $ | 1,100 | | | $ | 1,107,544 | |
| | | | | | | | |
| | | | | | | 7,046,192 | |
MINING — 0.49% | | | | | |
Freeport-McMoRan Inc. | | | | | | | | |
1.40%, 02/13/15 | | | 2,026 | | | | 2,029,203 | |
| | | | | | | | |
| | | | | | | 2,029,203 | |
OIL & GAS — 1.51% | | | | | |
Anadarko Petroleum Corp. | | | | | | | | |
5.95%, 09/15/16 | | | 1,300 | | | | 1,412,654 | |
Marathon Oil Corp. | | | | | | | | |
0.90%, 11/01/15 | | | 1,200 | | | | 1,201,117 | |
Noble Holding International Ltd. | | | | | | | | |
3.45%, 08/01/15 | | | 1,500 | | | | 1,525,527 | |
Pioneer Natural Resources Co. | | | | | | | | |
5.88%, 07/15/16 | | | 1,300 | | | | 1,397,611 | |
Sunoco Inc. | | | | | | | | |
9.63%, 04/15/15 | | | 752 | | | | 780,453 | |
| | | | | | | | |
| | | | | | | 6,317,362 | |
OIL & GAS SERVICES — 0.70% | | | | | |
Weatherford International
Ltd./Bermuda | | | | | | | | |
5.50%, 02/15/16 | | | 2,781 | | | | 2,936,494 | |
| | | | | | | | |
| | | | | | | 2,936,494 | |
PHARMACEUTICALS — 2.68% | | | | | |
AbbVie Inc. | | | | | | | | |
1.20%, 11/06/15 | | | 1,850 | | | | 1,860,452 | |
Express Scripts Holding Co. | | | | | | | | |
3.13%, 05/15/16 | | | 2,000 | | | | 2,070,614 | |
McKesson Corp. | | | | | | | | |
0.95%, 12/04/15 | | | 587 | | | | 588,290 | |
3.25%, 03/01/16 | | | 2,400 | | | | 2,469,922 | |
Mylan Inc./PA | | | | | | | | |
1.80%, 06/24/16 | | | 500 | | | | 506,267 | |
7.88%, 07/15/20 (Call 07/15/15)a | | | 776 | | | | 835,223 | |
Zoetis Inc. | | | | | | | | |
1.15%, 02/01/16 | | | 2,900 | | | | 2,906,571 | |
| | | | | | | | |
| | | | | | | 11,237,339 | |
REAL ESTATE INVESTMENT TRUSTS — 4.30% | |
American Tower Corp. | | | | | | | | |
4.63%, 04/01/15 | | | 3,300 | | | | 3,352,269 | |
| | | | |
SCHEDULESOF INVESTMENTS | | | 19 | |
Schedule of Investments (Continued)
iSHARES® SHORT MATURITY BOND ETF
October 31, 2014
| | | | | | | | |
Security | |
Principal
(000s) | | | Value | |
| | | | | | | | |
Boston Properties LP | | | | | | | | |
5.00%, 06/01/15 | | $ | 1,175 | | | $ | 1,204,105 | |
5.63%, 04/15/15 | | | 200 | | | | 204,448 | |
ERP Operating LP | | | | | | | | |
5.38%, 08/01/16 | | | 900 | | | | 968,422 | |
6.58%, 04/13/15 | | | 570 | | | | 585,014 | |
HCP Inc. | | | | | | | | |
3.75%, 02/01/16 | | | 1,250 | | | | 1,294,327 | |
6.00%, 03/01/15 | | | 1,150 | | | | 1,170,283 | |
7.07%, 06/08/15 | | | 1,375 | | | | 1,423,969 | |
Health Care REIT Inc. | | | | | | | | |
5.88%, 05/15/15 | | | 2,100 | | | | 2,157,429 | |
Host Hotels & Resorts LP | | | | | | | | |
5.88%, 06/15/19 (Call 06/15/15) | | | 2,420 | | | | 2,549,893 | |
Nationwide Health Properties Inc. | | | | | | | | |
6.00%, 05/20/15 | | | 1,975 | | | | 2,031,317 | |
Ventas Realty LP/Ventas
Capital Corp. | | | | | | | | |
3.13%, 11/30/15 | | | 1,050 | | | | 1,076,336 | |
| | | | | | | | |
| | | | | | | 18,017,812 | |
RETAIL — 0.91% | | | | | |
AutoZone Inc. | | | | | | | | |
5.75%, 01/15/15 | | | 1,500 | | | | 1,514,854 | |
CVS Health Corp. | | | | | | | | |
3.25%, 05/18/15 | | | 193 | | | | 195,831 | |
Macy’s Retail Holdings Inc. | | | | | | | | |
7.88%, 07/15/15 | | | 2,000 | | | | 2,098,972 | |
| | | | | | | | |
| | | | | | | 3,809,657 | |
SAVINGS & LOANS — 0.38% | | | | | |
Amsouth Bank/Birmingham AL
Series AI | | | | | | | | |
5.20%, 04/01/15 | | | 250 | | | | 254,208 | |
Santander Holdings USA Inc./PA | | | | | | | | |
3.00%, 09/24/15 (Call 08/24/15) | | | 1,000 | | | | 1,016,881 | |
4.63%, 04/19/16 | | | 319 | | | | 335,547 | |
| | | | | | | | |
| | | | | | | 1,606,636 | |
SOFTWARE — 0.38% | | | | | |
Fiserv Inc. | | | | | | | | |
3.13%, 10/01/15 | | | 945 | | | | 965,601 | |
3.13%, 06/15/16 | | | 600 | | | | 619,783 | |
| | | | | | | | |
| | | | | | | 1,585,384 | |
TELECOMMUNICATIONS — 1.33% | | | | | |
America Movil SAB de CV | | | | | | | | |
5.75%, 01/15/15 | | | 1,300 | | | | 1,311,648 | |
| | | | | | | | |
Security | |
Principal
(000s) | | | Value | |
| | | | | | | | |
Verizon Communications Inc. | | | | | | | | |
1.76%, 09/15/16b | | $ | 3,250 | | | $ | 3,323,375 | |
4.90%, 09/15/15 | | | 400 | | | | 415,104 | |
Vodafone Group PLC | | | | | | | | |
0.62%, 02/19/16b | | | 500 | | | | 501,008 | |
| | | | | | | | |
| | | | | | | 5,551,135 | |
TRANSPORTATION — 1.86% | | | | | |
Asciano Finance Ltd. | | | | | | | | |
3.13%, 09/23/15a | | | 1,185 | | | | 1,205,215 | |
CSX Corp. | | | | | | | | |
6.25%, 04/01/15 | | | 417 | | | | 426,868 | |
JB Hunt Transport Services Inc. | | | | | | | | |
3.38%, 09/15/15 | | | 857 | | | | 877,548 | |
Kansas City Southern de Mexico SA de CV | | | | | | | | |
0.93%, 10/28/16b | | | 1,000 | | | | 1,000,404 | |
Ryder System Inc. | | | | | | | | |
3.15%, 03/02/15 | | | 1,385 | | | | 1,396,555 | |
7.20%, 09/01/15 | | | 1,000 | | | | 1,053,224 | |
Union Pacific Corp. | | | | | | | | |
7.00%, 02/01/16 | | | 1,700 | | | | 1,822,268 | |
| | | | | | | | |
| | | | | | | 7,782,082 | |
TRUCKING & LEASING — 1.99% | | | | | |
GATX Corp. | | | | | | | | |
4.75%, 05/15/15 | | | 825 | | | | 841,750 | |
GATX Financial Corp. | | | | | | | | |
5.70%, 04/15/15d | | | 1,000 | | | | 1,022,027 | |
Penske Truck Leasing Co. LP/PTL Finance Corp. | | | | | | | | |
2.50%, 03/15/16a | | | 2,453 | | | | 2,500,416 | |
3.13%, 05/11/15a | | | 3,905 | | | | 3,949,974 | |
| | | | | | | | |
| | | | | | | 8,314,167 | |
| | | | | | | | |
TOTAL CORPORATE BONDS & NOTES | | | | | |
(Cost: $233,284,942) | | | | | | | 233,112,264 | |
|
MUNICIPAL DEBT OBLIGATIONS — 0.34% | |
| |
CALIFORNIA — 0.34% | | | | | |
State of California GO | | | | | | | | |
0.85%, 02/01/15 | | | 1,435 | | | | 1,437,253 | |
| | | | | | | | |
| | | | | | | 1,437,253 | |
| | | | | | | | |
TOTAL MUNICIPAL DEBT OBLIGATIONS | | | | | |
(Cost: $1,435,534) | | | | | | | 1,437,253 | |
| | |
| 20 | | 2014 iSHARES ANNUAL REPORTTO SHAREHOLDERS |
Schedule of Investments (Continued)
iSHARES® SHORT MATURITY BOND ETF
October 31, 2014
| | | | | | | | |
Security | | Principal
or Shares
(000s) | | | Value | |
| | | | | | | | |
SHORT-TERM INVESTMENTS — 6.91% | |
|
MONEY MARKET FUNDS — 6.91% | |
BlackRock Cash Funds: Institutional,
SL Agency Shares | |
0.13%e,f,g | | $ | 2,507 | | | $ | 2,506,812 | |
BlackRock Cash Funds: Prime,
SL Agency Shares | |
0.11%e,f,g | | | 240 | | | | 240,368 | |
BlackRock Cash Funds: Treasury,
SL Agency Shares | |
0.00%e,f | | | 26,169 | | | | 26,169,256 | |
| | | | | | | | |
| | | | | | | 28,916,436 | |
| | | | | | | | |
TOTAL SHORT-TERM INVESTMENTS
(Cost: $28,916,436) | | | | 28,916,436 | |
| | | | | | | | |
TOTAL INVESTMENTS
IN SECURITIES — 101.24%
(Cost: $424,353,517) | | | | 423,927,520 | |
Other Assets, Less Liabilities — (1.24)% | | | | (5,195,129 | ) |
| | | | | | | | |
NET ASSETS — 100.00% | | | | | | $ | 418,732,391 | |
| | | | | | | | |
| | |
EUR | | — Euro |
GO | | — General Obligation |
USD | | — United States Dollar |
| a | This security may be resold to qualified institutional buyers under Rule 144A of the Securities Act of 1933. |
| b | Variable rate security. Rate shown is as of report date. |
| c | This security may be resold to qualified foreign investors and foreign institutional buyers under Regulation S of the Securities Act of 1933. |
| d | All or a portion of this security represents a security on loan. See Note 1. |
| e | Affiliated issuer. See Note 2. |
| f | The rate quoted is the annualized seven-day yield of the fund at period end. |
| g | All or a portion of this security represents an investment of securities lending collateral. See Note 1. |
Forward currency contracts as of October 31, 2014 were as follows:
| | | | | | | | | | | | | | | | |
| | | Currency
to be
Delivered | | Currency
to be
Received | | Settlement
Date | | | Counter- party | | | Unrealized
Appreciation
(Depreciation) | |
| | EUR 1,058,626 | | USD 1,350,648 | | | 1/21/15 | | | | JPM | | | $ | 23,603 | |
| | | | | | | | | | | | | | | | |
| | | | | | | | | | | | | | | | | |
Counterparties:
JPM — JPMorgan Chase Bank N.A.
See notes to financial statements.
| | | | |
SCHEDULESOF INVESTMENTS | | | 21 | |
Statements of Assets and Liabilities
iSHARES® U.S. ETF TRUST
October 31, 2014
| | | | | | | | |
| | | iShares
Liquidity
Income
ETF | | | iShares
Short
Maturity Bond
ETF | |
| | |
ASSETS | | | | | | | | |
Investments, at cost: | | | | | | | | |
Unaffiliated | | $ | 12,024,577 | | | $ | 395,437,081 | |
Repurchase agreements — unaffiliated | | | 2,625,000 | | | | — | |
Affiliated (Note 2) | | | 604,619 | | | | 28,916,436 | |
| | | | | | | | |
Total cost of investments | | $ | 15,254,196 | | | $ | 424,353,517 | |
| | | | | | | | |
Investments in securities, at fair value (including securities on loana) (Note 1): | | | | | | | | |
Unaffiliated | | $ | 12,043,255 | | | $ | 395,011,084 | |
Repurchase agreements — unaffiliated | | | 2,625,000 | | | | — | |
Affiliated (Note 2) | | | 604,619 | | | | 28,916,436 | |
| | | | | | | | |
Total fair value of investments | | | 15,272,874 | | | | 423,927,520 | |
Foreign currency, at valueb | | | — | | | | 1,014 | |
Cash | | | 157 | | | | — | |
Receivables: | | | | | | | | |
Investment securities sold | | | — | | | | 1,590,049 | |
Interest | | | 10,947 | | | | 2,202,090 | |
Unrealized appreciation on forward currency contracts (Note 1) | | | — | | | | 23,603 | |
Capital shares sold | | | — | | | | 5,018,135 | |
| | | | | | | | |
Total Assets | | | 15,283,978 | | | | 432,762,411 | |
| | | | | | | | |
| | |
LIABILITIES | | | | | | | | |
Payables: | | | | | | | | |
Investment securities purchased | | | — | | | | 9,608,916 | |
Collateral for securities on loan (Note 1) | | | 257,500 | | | | 2,747,180 | |
Due to custodian | | | — | | | | 1,590,049 | |
Investment advisory fees (Note 2) | | | 2,519 | | | | 83,875 | |
| | | | | | | | |
Total Liabilities | | | 260,019 | | | | 14,030,020 | |
| | | | | | | | |
| | |
NET ASSETS | | $ | 15,023,959 | | | $ | 418,732,391 | |
| | | | | | | | |
| | |
Net assets consist of: | | | | | | | | |
Paid-in capital | | $ | 14,986,905 | | | $ | 418,800,480 | |
Undistributed net investment income | | | 8,549 | | | | 220,189 | |
Undistributed net realized gain | | | 9,827 | | | | 114,140 | |
Net unrealized appreciation (depreciation) | | | 18,678 | | | | (402,418 | ) |
| | | | | | | | |
NET ASSETS | | $ | 15,023,959 | | | $ | 418,732,391 | |
| | | | | | | | |
| | |
Shares outstandingc | | | 300,000 | | | | 8,350,000 | |
| | | | | | | | |
| | |
Net asset value per share | | $ | 50.08 | | | $ | 50.15 | |
| | | | | | | | |
| a | Securities on loan with values of $250,085 and $2,678,292, respectively. See Note 1. |
| b | Cost of foreign currency: $ — and $1,032, respectively. |
| c | No par value, unlimited number of shares authorized. |
See notes to financial statements.
| | |
| 22 | | 2014 iSHARES ANNUAL REPORTTO SHAREHOLDERS |
Statements of Operations
iSHARES® U.S. ETF TRUST
Year ended October 31, 2014
| | | | | | | | |
| | | iShares
Liquidity
Income
ETFa | | | iShares
Short
Maturity Bond
ETF | |
| | |
NET INVESTMENT INCOME | | | | | | | | |
Interest — unaffiliated | | $ | 110,157 | | | $ | 2,886,982 | |
Interest — affiliated (Note 2) | | | 437 | | | | 12,299 | |
Securities lending income — affiliated (Note 2) | | | 447 | | | | 3,561 | |
| | | | | | | | |
Total investment income | | | 111,041 | | | | 2,902,842 | |
| | | | | | | | |
| | |
EXPENSES | | | | | | | | |
Investment advisory fees (Note 2) | | | 37,636 | | | | 646,592 | |
| | | | | | | | |
Total expenses | | | 37,636 | | | | 646,592 | |
| | | | | | | | |
Net investment income | | | 73,405 | | | | 2,256,250 | |
| | | | | | | | |
| | |
NET REALIZED AND UNREALIZED GAIN (LOSS) | | | | | | | | |
Net realized gain (loss) from: | | | | | | | | |
Investments — unaffiliated | | | 9,827 | | | | 30,369 | |
Foreign currency transactions | | | — | | | | 52,068 | |
| | | | | | | | |
Net realized gain | | | 9,827 | | | | 82,437 | |
| | | | | | | | |
Net change in unrealized appreciation/depreciation on: | | | | | | | | |
Investments | | | 18,678 | | | | (444,673 | ) |
Forward currency contracts | | | — | | | | 20,418 | |
Translation of assets and liabilities in foreign currencies | | | — | | | | (18 | ) |
| | | | | | | | |
Net change in unrealized appreciation/depreciation | | | 18,678 | | | | (424,273 | ) |
| | | | | | | | |
Net realized and unrealized gain (loss) | | | 28,505 | | | | (341,836 | ) |
| | | | | | | | |
NET INCREASE IN NET ASSETS RESULTING FROM OPERATIONS | | $ | 101,910 | | | $ | 1,914,414 | |
| | | | | | | | |
| a | For the period from December 11, 2013 (commencement of operations) to October 31, 2014. |
See notes to financial statements.
Statements of Changes in Net Assets
iSHARES® U.S. ETF TRUST
| | | | | | | | | | | | |
| | | iShares
Liquidity
Income
ETF | | | iShares
Short
Maturity Bond
ETF | |
| | | Period from
December 11, 2013a to
October 31, 2014 | | | Year ended October 31, 2014 | | | Period from
September 25, 2013a to October 31, 2013 | |
| | | |
INCREASE (DECREASE) IN NET ASSETS | | | | | | | | | | | | |
| | | |
OPERATIONS: | | | | | | | | | | | | |
Net investment income | | $ | 73,405 | | | $ | 2,256,250 | | | $ | 26,162 | |
Net realized gain (loss) | | | 9,827 | | | | 82,437 | | | | (829 | ) |
Net change in unrealized appreciation/depreciation | | | 18,678 | | | | (424,273 | ) | | | 21,855 | |
| | | | | | | | | | | | |
Net increase in net assets resulting from operations | | | 101,910 | | | | 1,914,414 | | | | 47,188 | |
| | | | | | | | | | | | |
| | | |
DISTRIBUTIONS TO SHAREHOLDERS: | | | | | | | | | | | | |
From net investment income | | | (64,856 | ) | | | (2,029,397 | ) | | | — | |
| | | | | | | | | | | | |
Total distributions to shareholders | | | (64,856 | ) | | | (2,029,397 | ) | | | — | |
| | | | | | | | | | | | |
| | | |
CAPITAL SHARE TRANSACTIONS: | | | | | | | | | | | | |
Proceeds from shares sold | | | 27,504,454 | | | | 358,853,096 | | | | 102,586,403 | |
Cost of shares redeemed | | | (12,517,549 | ) | | | (42,639,313 | ) | | | — | |
| | | | | | | | | | | | |
Net increase in net assets from capital share transactions | | | 14,986,905 | | | | 316,213,783 | | | | 102,586,403 | |
| | | | | | | | | | | | |
INCREASE IN NET ASSETS | | | 15,023,959 | | | | 316,098,800 | | | | 102,633,591 | |
| | | |
NET ASSETS | | | | | | | | | | | | |
Beginning of period | | | — | | | | 102,633,591 | | | | — | |
| | | | | | | | | | | | |
End of period | | $ | 15,023,959 | | | $ | 418,732,391 | | | $ | 102,633,591 | |
| | | | | | | | | | | | |
Undistributed net investment income included in net assets at end of period | | $ | 8,549 | | | $ | 220,189 | | | $ | 25,018 | |
| | | | | | | | | | | | |
| | | |
SHARES ISSUED AND REDEEMED | | | | | | | | | | | | |
Shares sold | | | 550,000 | | | | 7,150,000 | | | | 2,050,000 | |
Shares redeemed | | | (250,000 | ) | | | (850,000 | ) | | | — | |
| | | | | | | | | | | | |
Net increase in shares outstanding | | | 300,000 | | | | 6,300,000 | | | | 2,050,000 | |
| | | | | | | | | | | | |
| a | Commencement of operations. |
See notes to financial statements.
| | |
| 24 | | 2014 iSHARES ANNUAL REPORTTO SHAREHOLDERS |
Financial Highlights
iSHARES® U.S. ETF TRUST
(For a share outstanding throughout the period)
iShares Liquidity Income ETF
| | | | |
| | | Period from
Dec. 11, 2013a to
Oct. 31, 2014 | |
Net asset value, beginning of period | | $ | 49.99 | |
| | | | |
Income from investment operations: | | | | |
Net investment incomeb | | | 0.16 | |
Net realized and unrealized gainc | | | 0.06 | |
| | | | |
Total from investment operations | | | 0.22 | |
| | | | |
Less distributions from: | | | | |
Net investment income | | | (0.13 | ) |
| | | | |
Total distributions | | | (0.13 | ) |
| | | | |
Net asset value, end of period | | $ | 50.08 | |
| | | | |
| |
Total return | | | 0.45 | %d |
| | | | |
| |
Ratios/Supplemental data: | | | | |
Net assets, end of period (000s) | | $ | 15,024 | |
Ratio of expenses to average net assetse | | | 0.18 | % |
Ratio of net investment income to average net assetse | | | 0.35 | % |
Portfolio turnover ratef | | | 71 | % |
| a | Commencement of operations. |
| b | Based on average shares outstanding throughout the period. |
| c | The amount reported for a share outstanding may not accord with the change in aggregate gains and losses in securities for the fiscal period due to the timing of capital share transactions in relation to the fluctuating market values of the Fund’s underlying securities. |
| e | Annualized for periods of less than one year. |
| f | Portfolio turnover rate excludes portfolio securities received or delivered as a result of processing capital share transactions in Creation Units. |
See notes to financial statements.
Financial Highlights (Continued)
iSHARES® U.S. ETF TRUST
(For a share outstanding throughout each period)
iShares Short Maturity Bond ETF
| | | | | | | | |
| | | Year ended
Oct. 31, 2014 | | | Period from
Sep. 25, 2013a to Oct. 31, 2013 | |
Net asset value, beginning of period | | $ | 50.07 | | | $ | 50.00 | |
| | | | | | | | |
Income from investment operations: | | | | | | | | |
Net investment incomeb | | | 0.44 | | | | 0.02 | |
Net realized and unrealized gainc | | | 0.04 | | | | 0.05 | |
| | | | | | | | |
Total from investment operations | | | 0.48 | | | | 0.07 | |
| | | | | | | | |
Less distributions from: | | | | | | | | |
Net investment income | | | (0.40 | ) | | | — | |
| | | | | | | | |
Total distributions | | | (0.40 | ) | | | — | |
| | | | | | | | |
Net asset value, end of period | | $ | 50.15 | | | $ | 50.07 | |
| | | | | | | | |
| | |
Total return | | | 0.96 | % | | | 0.14 | %d |
| | | | | | | | |
| | |
Ratios/Supplemental data: | | | | | | | | |
Net assets, end of period (000s) | | $ | 418,732 | | | $ | 102,634 | |
Ratio of expenses to average net assetse | | | 0.25 | % | | | 0.25 | % |
Ratio of net investment income to average net assetse | | | 0.87 | % | | | 0.42 | % |
Portfolio turnover ratef | | | 35 | % | | | 2 | % |
| a | Commencement of operations. |
| b | Based on average shares outstanding throughout each period. |
| c | The amounts reported for a share outstanding may not accord with the change in aggregate gains and losses in securities for the fiscal period due to the timing of capital share transactions in relation to the fluctuating market values of the Fund’s underlying securities. |
| e | Annualized for periods of less than one year. |
| f | Portfolio turnover rates exclude portfolio securities received or delivered as a result of processing capital share transactions in Creation Units. |
See notes to financial statements.
| | |
| 26 | | 2014 iSHARES ANNUAL REPORTTO SHAREHOLDERS |
Notes to Financial Statements
iSHARES® U.S. ETF TRUST
iShares U.S. ETF Trust (the “Trust”) is registered under the Investment Company Act of 1940, as amended (the “1940 Act”), as an open-end management investment company. The Trust was established as a Delaware statutory trust pursuant to an Agreement and Declaration of Trust dated June 21, 2011.
These financial statements relate only to the following funds (each, a “Fund,” and collectively, the “Funds”):
| | |
| iShares ETF | | Diversification Classification |
Liquidity Incomea | | Diversified |
Short Maturity Bond | | Non-diversified |
| | a | | The Fund commenced operations on December 11, 2013. |
Pursuant to the Trust’s organizational documents, the Funds’ officers and trustees are indemnified against certain liabilities that may arise out of the performance of their duties to the Funds. Additionally, in the normal course of business, the Funds enter into contracts with service providers that contain general indemnification clauses. The Funds’ maximum exposure under these arrangements is unknown as this would involve future claims that may be made against the Funds that have not yet occurred.
| 1. | SIGNIFICANT ACCOUNTING POLICIES |
The following significant accounting policies are consistently followed by the Funds in the preparation of their financial statements in conformity with accounting principles generally accepted in the United States of America (“U.S. GAAP”). The preparation of financial statements in conformity with U.S. GAAP requires management to make certain estimates and assumptions that affect the reported amounts of assets and liabilities and disclosures of contingent assets and liabilities at the date of the financial statements and the reported amounts of revenue and expenses during the reporting period. Actual results could differ from those estimates. Each Fund is considered an investment company under U.S. GAAP and follows the accounting and reporting guidance applicable to investment companies in the Financial Accounting Standards Board Accounting Standards Codification Topic 946 (ASC 946).
SECURITY VALUATION
Each Fund’s investments are valued at fair value each day that the Fund’s listing exchange is open and, for financial reporting purposes, as of the report date should the reporting period end on a day that the Fund’s listing exchange is not open. U.S. GAAP defines fair value as the price a fund would receive to sell an asset or pay to transfer a liability in an orderly transaction between market participants at the measurement date. The BlackRock Global Valuation Methodologies Committee (the “Global Valuation Committee”) provides oversight of the valuation of investments for the Funds. The investments of each Fund are valued pursuant to policies and procedures developed by the Global Valuation Committee and approved by the Board of Trustees of the Trust (the “Board”).
| | • | | Fixed income investments are valued at the last available bid price received from independent pricing services. In determining the value of a fixed income investment, pricing services may use certain information with respect to transactions in such investments, quotations from dealers, pricing matrixes, market transactions in comparable investments, various relationships observed in the market between investments, and calculated yield measures. |
| | • | | Open-end U.S. mutual funds are valued at that day’s published net asset value (NAV). |
| | | | |
NOTESTO FINANCIAL STATEMENTS | | | 27 | |
Notes to Financial Statements (Continued)
iSHARES® U.S. ETF TRUST
| | • | | Forward currency contracts are valued based on that day’s prevailing forward exchange rate for the underlying currencies. |
| | • | | Repurchase agreements are valued at amortized cost, which approximates market value. |
In the event that application of these methods of valuation results in a price for an investment which is deemed not to be representative of the fair value of such investment or if a price is not available, the investment will be valued based upon other available factors deemed relevant by the Global Valuation Committee, in accordance with policies approved by the Board. These factors include but are not limited to (i) attributes specific to the investment; (ii) the principal market for the investment; (iii) the customary participants in the principal market for the investment; (iv) data assumptions by market participants for the investment, if reasonably available; (v) quoted prices for similar investments in active markets; and (vi) other factors, such as future cash flows, interest rates, yield curves, volatilities, prepayment speeds, loss severities, credit risks and/or default rates. Valuations based on such factors are reported to the Board on a quarterly basis.
The Global Valuation Committee employs various methods for calibrating valuation approaches for investments where an active market does not exist, including regular due diligence of the Trust’s pricing vendors, a regular review of key inputs and assumptions, transactional back-testing or disposition analysis to compare unrealized gains and losses to realized gains and losses, reviews of missing or stale prices, reviews of large movements in market values, and reviews of market related activity.
Various inputs are used in determining the fair value of financial instruments. Inputs may be based on independent market data (“observable inputs”) or they may be internally developed (“unobservable inputs”). These inputs are categorized into a disclosure hierarchy consisting of three broad levels for financial reporting purposes. The level of a value determined for a financial instrument within the fair value hierarchy is based on the lowest level of any input that is significant to the fair value measurement in its entirety. The categorization of a value determined for a financial instrument within the hierarchy is based upon the pricing transparency of the instrument and is not necessarily an indication of the risk associated with investing in the instrument. The three levels of the fair value hierarchy are as follows:
| | • | | Level 1 — Unadjusted quoted prices in active markets for identical assets or liabilities; |
| | • | | Level 2 — Inputs other than quoted prices included within Level 1 that are observable for the asset or liability either directly or indirectly, including quoted prices for similar assets or liabilities in active markets, quoted prices for identical or similar assets or liabilities in markets that are not considered to be active, inputs other than quoted prices that are observable for the asset or liability (such as exchange rates, financing terms, interest rates, yield curves, volatilities, prepayment speeds, loss severities, credit risks and default rates) or other market-corroborated inputs; and |
| | • | | Level 3 — Unobservable inputs for the asset or liability, including the Global Valuation Committee’s assumptions used in determining the fair value of investments. |
Changes in valuation techniques may result in transfers in or out of an assigned level within the disclosure hierarchy. In accordance with the Trust’s policy, transfers between different levels of the fair value hierarchy are deemed to have occurred as of the beginning of the reporting period.
| | |
| 28 | | 2014 iSHARES ANNUAL REPORTTO SHAREHOLDERS |
Notes to Financial Statements (Continued)
iSHARES® U.S. ETF TRUST
The following table summarizes the value of each of the Funds’ investments according to the fair value hierarchy as of October 31, 2014. The breakdown of each Fund’s investments into major categories is disclosed in its respective schedule of investments.
| | | | | | | | | | | | | | | | |
iShares ETF and Investment Type | | Investments | |
| | Level 1 | | | Level 2 | | | Level 3 | | | Total | |
Liquidity Income | | | | | | | | | | | | | | | | |
Assets: | | | | |
Asset-Backed Securities | | $ | — | | | $ | 1,481,979 | | | $ | — | | | $ | 1,481,979 | |
Certificates of Deposit | | | — | | | | 822,736 | | | | — | | | | 822,736 | |
Commercial Paper | | | — | | | | 848,503 | | | | — | | | | 848,503 | |
Corporate Bonds & Notes | | | — | | | | 8,389,037 | | | | 501,000 | | | | 8,890,037 | |
Repurchase Agreements | | | — | | | | 2,625,000 | | | | — | | | | 2,625,000 | |
Money Market Funds | | | 604,619 | | | | — | | | | — | | | | 604,619 | |
| | | | | | | | | | | | | | | | |
| | $ | 604,619 | | | $ | 14,167,255 | | | $ | 501,000 | | | $ | 15,272,874 | |
| | | | | | | | | | | | | | | | |
Short Maturity Bond | | | | | | | | | | | | | | | | |
Assets: | | | | |
Asset-Backed Securities | | $ | — | | | $ | 97,594,570 | | | $ | 804,005 | | | $ | 98,398,575 | |
Collateralized Mortgage Obligations | | | — | | | | 59,827,590 | | | | 2,235,402 | | | | 62,062,992 | |
Corporate Bonds & Notes | | | — | | | | 233,112,264 | | | | — | | | | 233,112,264 | |
Municipal Debt Obligations | | | — | | | | 1,437,253 | | | | — | | | | 1,437,253 | |
Money Market Funds | | | 28,916,436 | | | | — | | | | — | | | | 28,916,436 | |
Forward Currency Contractsa | | | — | | | | 23,603 | | | | — | | | | 23,603 | |
| | | | | | | | | | | | | | | | |
| | $ | 28,916,436 | | | $ | 391,995,280 | | | $ | 3,039,407 | | | $ | 423,951,123 | |
| | | | | | | | | | | | | | | | |
| | | | | | | | | | | | | | | | | |
| | a | | Shown at the unrealized appreciation (depreciation) on the contracts. |
The following table includes a rollforward for the year ended October 31, 2014 of investments whose values are classified as Level 3 as of the beginning or end of the year.
| | | | |
| iShares Liquidity Income ETF | | Corporate Bonds & Notes | |
Balance at beginning of period | | $ | — | |
Realized gain (loss) and change in unrealized appreciation/depreciation | | | 1,000 | |
Purchases | | | 500,000 | |
Sales | | | — | |
Transfers ina | | | — | |
Transfers outa | | | — | |
| | | | |
Balance at end of periodb | | $ | 501,000 | |
| | | | |
Net change in unrealized appreciation/depreciation on investments still held at end of period | | $ | 1,000 | |
| | | | |
| | | | | |
| | a | | Represents the value as of the beginning of the reporting period. |
| | b | | The Fund’s investments that are categorized as Level 3 were valued utilizing a single broker quote without adjustment. Such valuations are based on unobservable inputs. A significant change in third party information could result in a significantly lower or higher value in such Level 3 investments. |
| | | | |
NOTESTO FINANCIAL STATEMENTS | | | 29 | |
Notes to Financial Statements (Continued)
iSHARES® U.S. ETF TRUST
SECURITY TRANSACTIONS AND INCOME RECOGNITION
Security transactions are accounted for on trade date. Realized gains and losses on investment transactions are determined using the specific identification method. Interest income, including amortization and accretion of premiums and discounts on debt securities, is recognized daily on the accrual basis.
REPURCHASE AGREEMENTS
The Funds may enter into repurchase agreements. In a repurchase agreement, a Fund purchases a security from a counterparty who agrees to repurchase the same security at a mutually agreed upon date and price. On a daily basis, the counterparty is required to maintain collateral subject to the agreement and in value no less than the agreed repurchase amount. The agreements are conditioned upon the collateral being deposited under the Federal Reserve book entry system or held in a segregated account by the Fund’s custodian or designated sub-custodians under tri-party repurchase agreements. In the event the counterparty defaults and the fair value of the collateral declines, the Fund could experience losses, delays and costs in liquidating the collateral.
Repurchase agreements are entered into by the Funds under Master Repurchase Agreements (each, an “MRA”). The MRA permits the Funds, under certain circumstances including an event of default (such as bankruptcy or insolvency), to offset payables and/or receivables with collateral held by and/or posted to the counterparty. As a result, one single net payment is created. Bankruptcy or insolvency laws of a particular jurisdiction may impose restrictions on or prohibitions against such a right of offset in the event of the MRA counterparty’s bankruptcy or insolvency. Based on the terms of the MRA, the Fund receives securities as collateral with a market value in excess of the repurchase price at maturity. Upon a bankruptcy or insolvency of the MRA counterparty, the Fund would recognize a liability with respect to such excess collateral. The liability reflects the Fund’s obligation under bankruptcy law to return the excess to the counterparty.
The following table summarizes the Funds’ open repurchase agreements as of October 31, 2014 which are subject to offset under an MRA:
| | | | | | | | | | | | |
| iShares ETF | | Market Value of
Repurchase
Agreements | | | Non-cash
Collateral
Received a | | | Net
Amount | |
Liquidity Income | | $ | 2,625,000 | | | $ | 2,625,000 | | | $ | — | |
| | a | | Collateral received in excess of the market value of repurchase agreements is not presented for financial reporting purposes. The total collateral received is disclosed in the Fund’s schedule of investments. |
FOREIGN CURRENCY TRANSLATION
The accounting records of the Funds are maintained in U.S. dollars. Foreign currencies, as well as investment securities and other assets and liabilities denominated in foreign currencies, are translated into U.S. dollars using exchange rates deemed appropriate by the investment adviser. Purchases and sales of securities, income receipts and expense payments are translated into U.S. dollars on the respective dates of such transactions.
Each Fund does not isolate the effect of fluctuations in foreign exchange rates from the effect of fluctuations in the market prices of securities. Such fluctuations are reflected by the Funds as a component of realized and unrealized gains and losses from investments for financial reporting purposes.
| | |
| 30 | | 2014 iSHARES ANNUAL REPORTTO SHAREHOLDERS |
Notes to Financial Statements (Continued)
iSHARES® U.S. ETF TRUST
FOREIGN TAXES
The Funds may be subject to foreign taxes (a portion of which may be reclaimable) on income, stock dividends, capital gains on investments, or certain foreign currency transactions. All foreign taxes are recorded in accordance with the applicable foreign tax regulations and rates that exist in the foreign jurisdictions in which the Funds invest. These foreign taxes, if any, are paid by the Funds and are reflected in their statements of operations as follows: foreign taxes withheld at source are presented as a reduction of income, foreign taxes on securities lending income are presented as a reduction of securities lending income, foreign taxes on stock dividends are presented as “other foreign taxes,” and foreign taxes on capital gains from sales of investments and foreign taxes on foreign currency transactions are included in their respective net realized gain (loss) categories. Foreign taxes payable or deferred as of October 31, 2014, if any, are disclosed in the Funds’ statements of assets and liabilities.
DISTRIBUTIONS TO SHAREHOLDERS
Dividends and distributions paid by each Fund are recorded on the ex-dividend dates. Distributions are determined on a tax basis and may differ from net investment income and net realized capital gains for financial reporting purposes. Dividends and distributions are paid in U.S. dollars and cannot be automatically reinvested in additional shares of the Funds.
LOANS OF PORTFOLIO SECURITIES
Each Fund may lend its investment securities to approved borrowers, such as brokers, dealers and other financial institutions. The borrower pledges and maintains with the Fund collateral consisting of cash, an irrevocable letter of credit issued by a bank, or securities issued or guaranteed by the U.S. government. The initial collateral received by each Fund is required to have a value of at least 102% of the current value of the loaned securities plus the interest accrued on such securities, if any, for securities traded on U.S. exchanges and a value of at least 105% for all other securities. The collateral is maintained thereafter, at a value equal to at least 100% of the current value of the securities on loan plus accrued interest, if any. The market value of the loaned securities is determined at the close of each business day of the Funds and any additional required collateral is delivered to the Funds on the next business day. During the term of the loan, each Fund is entitled to all distributions made on or in respect of the loaned securities. Loans of securities are terminable at any time and the borrower, after notice, is required to return borrowed securities within the standard time period for settlement of securities transactions.
Any cash received as collateral for securities on loan may be reinvested in certain short-term instruments either directly on behalf of a fund or through one or more joint accounts or money market funds, including those managed by BlackRock Fund Advisors (“BFA”), the Funds’ investment adviser, or its affiliates. As of October 31, 2014, any securities on loan were collateralized by cash. The cash collateral received was invested in money market funds managed by BFA and is disclosed in the schedules of investments. The value of any securities on loan as of October 31, 2014 and the value of the related collateral are disclosed in the statements of assets and liabilities. Income earned by the Funds from securities lending is disclosed in the statements of operations.
The risks of securities lending include the risk that the borrower may not provide additional collateral when required or may not return the securities when due. To mitigate these risks, the Funds benefit from a borrower default indemnity provided by BlackRock, Inc. (“BlackRock”). BlackRock’s indemnity allows for full replacement of securities lent. Each Fund could suffer a loss if the value of the investments purchased with cash collateral falls below the value of the cash collateral received.
Securities lending transactions are entered into by the Funds under Master Securities Lending Agreements (“MSLA”) which provide the right, in the event of default (including bankruptcy or insolvency) for the non-defaulting party to liquidate the collateral and calculate a net exposure to the defaulting party or request additional collateral. In the event that a borrower defaults, a Fund, as lender, would offset the market value of the collateral received against the market value of the securities loaned. The value of the collateral is typically greater than that of the market value of the securities loaned, leaving the lender with a net amount
| | | | |
NOTESTO FINANCIAL STATEMENTS | | | 31 | |
Notes to Financial Statements (Continued)
iSHARES® U.S. ETF TRUST
payable to the defaulting party. However, bankruptcy or insolvency laws of a particular jurisdiction may impose restrictions on or prohibitions against such a right of offset in the event of an MSLA counterparty’s bankruptcy or insolvency. Under the MSLA, the borrower can resell or re-pledge the loaned securities, and a Fund can reinvest cash collateral, or, upon an event of default, resell or re-pledge the collateral.
The following table is a summary of each Fund’s securities lending agreements which are subject to offset under an MSLA as of October 31, 2014:
| | | | | | | | | | | | |
| iShares ETF | | Market Value of
Securities on Loan | | | Cash Collateral
Received a | | | Net
Amount | |
Liquidity Income | | $ | 250,085 | | | $ | 250,085 | | | $ | — | |
Short Maturity Bond | | | 2,678,292 | | | | 2,678,292 | | | | — | |
| | a | | Collateral received in excess of the market value of securities on loan is not presented for financial reporting purposes. The total collateral received is disclosed in each Fund’s statement of assets and liabilities. |
RECENT ACCOUNTING STANDARD
In June 2014, the Financial Accounting Standards Board issued guidance to improve the financial reporting of reverse repurchase agreements and other similar transactions. The guidance will require expanded disclosure for entities that enter into reverse repurchase agreements and similar transactions accounted for as secured borrowings, including securities lending. The guidance is effective for financial statements for fiscal years beginning after December 15, 2014, and interim periods within those fiscal years. Management is evaluating the impact, if any, of this guidance on the Funds’ financial statements and disclosures.
| 2. | INVESTMENT ADVISORY AGREEMENT AND OTHER TRANSACTIONS WITH AFFILIATES |
Pursuant to an Investment Advisory Agreement with the Trust, BFA manages the investment of each Fund’s assets. BFA is a California corporation indirectly owned by BlackRock. Under the Investment Advisory Agreement, BFA is responsible for substantially all expenses of the Funds, except interest, taxes, brokerage commissions and other expenses connected with the execution of portfolio transactions, distribution fees, litigation expenses and any extraordinary expenses.
BFA has entered into a sub-advisory agreement with BlackRock Financial Management, Inc. (the “Sub-Adviser”), an affiliate of BFA, under which BFA pays the Sub-Adviser for services it provides to the iShares Short Maturity Bond ETF. The sub-advisory agreement will terminate effective December 4, 2014.
For its investment advisory services to each Fund, BFA is entitled to an annual investment advisory fee based on the average daily net assets of each Fund as follows:
| | | | |
| iShares ETF | | Investment
Advisory Fee | |
Liquidity Income | | | 0.18 | % |
Short Maturity Bond | | | 0.25 | |
The U.S. Securities and Exchange Commission has issued an exemptive order which permits BlackRock Institutional Trust Company, N.A. (“BTC”), an affiliate of BFA, to serve as securities lending agent for the Funds, subject to applicable conditions. As securities lending agent, BTC bears all operational costs directly related to securities lending. Effective January 1, 2014, each Fund is responsible for fees in connection with the investment of cash collateral received for securities on loan in a money market fund managed by BFA, however, BTC has agreed to reduce the amount of securities lending income it receives in order to
| | |
| 32 | | 2014 iSHARES ANNUAL REPORTTO SHAREHOLDERS |
Notes to Financial Statements (Continued)
iSHARES® U.S. ETF TRUST
effectively limit the collateral investment fees each Fund bears to an annual rate of 0.04% (the “collateral investment fees”). Securities lending income is equal to the total of income earned from the reinvestment of cash collateral, net of fees and other payments to and from borrowers of securities, and less the collateral investment fees. The Funds retain a portion of securities lending income and remit a remaining portion to BTC as compensation for its services as securities lending agent.
Pursuant to a securities lending agreement effective January 1, 2014, (i) each Fund retains 75% of securities lending income and (ii) the amount retained can never be less than 70% of the total of securities lending income plus the collateral investment fees.
In addition, commencing the business day following the date that the aggregate securities lending income plus the collateral investment fees generated across all 1940 Act iShares exchange-traded funds (the “iShares ETF Complex”) in a given calendar year exceeds the aggregate securities lending income generated across the iShares ETF Complex in calendar year 2013 and pursuant to a securities lending agreement, (i) each Fund will receive for the remainder of that calendar year 80% of securities lending income and (ii) the amount retained can never be less than 70% of the total of securities lending income plus the collateral investment fees.
For the year ended October 31, 2014, each Fund paid to BTC the following amounts in total for securities lending agent services and collateral investment fees:
| | | | |
| iShares ETF | | Fees Paid to BTC | |
Liquidity Income | | $ | 186 | |
Short Maturity Bond | | | 1,526 | |
Prior to January 1, 2014, each Fund retained 65% of securities lending income and paid no collateral investment fees.
BlackRock Investments, LLC, an affiliate of BFA, is the distributor for each Fund. Pursuant to the distribution agreement, BFA is responsible for any fees or expenses for distribution services provided to the Funds.
Each Fund may invest its positive cash balances in certain money market funds managed by BFA or an affiliate. The income earned on these temporary cash investments is included in “Interest – affiliated” in the statements of operations.
The PNC Financial Services Group, Inc. is the largest stockholder of BlackRock and is considered to be an affiliate of the Funds for 1940 Act purposes.
Certain trustees and officers of the Trust are also officers of BTC and/or BFA.
| 3. | INVESTMENT PORTFOLIO TRANSACTIONS |
Purchases and sales of investments (excluding in-kind transactions and short-term investments) for the year ended October 31, 2014 were as follows:
| | | | | | | | | | | | | | | | |
| | | U.S. Government Obligations | | | Other Securities | |
| iShares ETF | | Purchases | | | Sales | | | Purchases | | | Sales | |
Liquidity Income | | $ | 999,531 | | | $ | 1,001,122 | | | $ | 19,316,310 | | | $ | 8,374,004 | |
Short Maturity Bond | | | — | | | | — | | | | 379,425,371 | | | | 81,362,235 | |
There were no in-kind transactions for the year ended October 31, 2014.
| | | | |
NOTESTO FINANCIAL STATEMENTS | | | 33 | |
Notes to Financial Statements (Continued)
iSHARES® U.S. ETF TRUST
| 4. | CAPITAL SHARE TRANSACTIONS |
Capital shares are issued and redeemed by each Fund only in aggregations of a specified number of shares or multiples thereof (“Creation Units”) at net asset value. Except when aggregated in Creation Units, shares of each Fund are not redeemable. Transactions in capital shares for each Fund are disclosed in detail in the statements of changes in net assets.
The consideration for the purchase of Creation Units of a fund in the Trust generally consists of the in-kind deposit of a designated portfolio of securities and a specified amount of cash. Certain funds in the Trust may be offered in Creation Units solely or partially for cash in U.S. dollars. Investors purchasing and redeeming Creation Units may pay a purchase transaction fee and a redemption transaction fee directly to State Street Bank and Trust Company, the Trust’s administrator, to offset transfer and other transaction costs associated with the issuance and redemption of Creation Units, including Creation Units for cash. Investors transacting in Creation Units for cash may also pay an additional variable charge to compensate the relevant fund for certain transaction costs (i.e., stamp taxes, taxes on currency or other financial transactions, and brokerage costs) and market impact expenses relating to investing in portfolio securities. Such variable charges, if any, are included in “Proceeds from shares sold” in the statements of changes in net assets.
| 5. | FORWARD CURRENCY CONTRACTS |
Each Fund may enter into forward currency contracts for the purpose of hedging against the effects of foreign currencies on the value of such Fund’s assets that are denominated in a non-U.S. currency. A forward currency contract is an obligation to purchase or sell a currency against another currency at a specified future date at an agreed upon price and quantity. Forward currency contracts are traded over-the-counter (“OTC”) and not on an organized exchange. The contract is marked-to-market daily and the change in market value is recorded as unrealized appreciation or depreciation. When the contract is closed, a realized gain or loss equal to the difference between the value at the time it was opened and the value at the time it was closed is recorded. Losses may arise if there are unfavorable movements in the value of a foreign currency relative to the U.S. dollar or if the counterparties do not meet the terms of the agreement. The Fund’s use of forward currency contracts also involves the risks of imperfect correlation between the value of its currency positions and its other investments or the Fund failing to close out its position due to an illiquid market.
The following table shows the value of forward currency contracts held by the iShares Short Maturity Bond ETF as of October 31, 2014 and the related locations in the statement of assets and liabilities, presented by risk exposure category:
| | | | |
| Assets | |
Forward currency contracts: | | | | |
Unrealized appreciation on forward currency contracts/ Net assets consist of — net unrealized appreciation | | $ | 23,603 | |
| | | | |
| | | | | |
| | |
| 34 | | 2014 iSHARES ANNUAL REPORTTO SHAREHOLDERS |
Notes to Financial Statements (Continued)
iSHARES® U.S. ETF TRUST
The following table shows the realized and unrealized gains (losses) on forward currency contracts held by the iShares Short Maturity Bond ETF during the year ended October 31, 2014 and the related locations in the statement of operations, presented by risk exposure category:
| | | | | | | | |
| | | Net Realized
Gain (Loss) | | | Net Change in
Unrealized
Appreciation/Depreciation | |
Forward currency contracts: | | | | | | | | |
Foreign currency transactions/Forward currency contracts | | $ | 52,068 | | | $ | 20,418 | |
| | | | | | | | |
| | | | | | | | | |
For the year ended October 31, 2014, the average quarter-end number of forward currency contracts and average amounts sold in U.S. dollars for the iShares Short Maturity Bond ETF were 2 and $3,607,611, respectively.
The Funds’ risk of loss from counterparty credit risk on OTC derivatives is generally limited to the aggregate unrealized gain netted against any collateral held by the Funds. In order to better define their contractual rights and to secure rights that will help the Funds to mitigate their counterparty risk, the Funds may enter into an International Swaps and Derivatives Association, Inc. master agreement (“ISDA Master Agreement”) or similar agreement with their derivative contract counterparties. An ISDA Master Agreement is a bilateral agreement between the Funds and a counterparty that governs OTC derivatives and foreign exchange contracts and typically contains, among other things, collateral posting terms and netting provisions in the event of a default and/or termination event. The provisions of the ISDA Master Agreement typically permit a single net payment in the event of default including the bankruptcy or insolvency of the counterparty. However, bankruptcy or insolvency laws of a particular jurisdiction may impose restrictions on or prohibitions against the right of offset in bankruptcy or insolvency.
The collateral requirements under an ISDA Master Agreement are typically calculated by netting the mark-to-market amount for each transaction under such agreement, and comparing that amount to the value of any collateral currently pledged by the parties. Forward currency contracts held by the Funds generally do not require collateral. To the extent amounts due to the Funds from the counterparty are not fully collateralized, contractually or otherwise, the Funds bear the risk of loss from counterparty non-performance. The Funds attempt to mitigate counterparty risk by only entering into agreements with counterparties that they believe have the financial resources to honor their obligations and by monitoring the financial stability of those counterparties.
For financial reporting purposes, the Funds do not offset financial assets and financial liabilities that are subject to netting arrangements in the statements of assets and liabilities.
The following table presents the exposure of the open forward currency contracts held by the iShares Short Maturity Bond ETF that are subject to potential offset on the statement of assets and liabilities as of October 31, 2014:
| | | | | | | | | | | | |
| | | Derivative
Assets
Subject to
Offsetting | | | Derivatives
Available
for Offset | | | Net
Amount of
Derivative
Assets | |
Forward currency contracts | | $ | 23,603 | | | $ | — | | | $ | 23,603 | |
| | | | | | | | | | | | |
| | | | | | | | | | | | | |
| | | | |
NOTESTO FINANCIAL STATEMENTS | | | 35 | |
Notes to Financial Statements (Continued)
iSHARES® U.S. ETF TRUST
In the normal course of business, each Fund’s investment activities expose it to various types of risk associated with the financial instruments and markets in which it invests. The significant types of financial risks each Fund is exposed to include market risk and credit risk. Each Fund’s prospectus provides details of these and other types of risk.
MARKET RISK
Market risk arises mainly from uncertainty about future values of financial instruments influenced by price, currency and interest rate movements. It represents the potential loss each Fund may suffer through holding market positions in the face of market movements. Each Fund is exposed to market risk by virtue of its investment in fixed income and financial derivative instruments. The fair value of securities held by the Funds may decline due to general market conditions, economic trends or events that are not specifically related to the issuers of the securities including local, regional or global political, social or economic instability or to factors that affect a particular industry or group of industries. The extent of each Fund’s exposure to market risk is the market value of the investments held as shown in the Fund’s schedule of investments.
A diversified portfolio, where this is appropriate and consistent with a fund’s objectives, minimizes the risk that a price change of a particular investment will have a material impact on the NAV of a fund. The investment concentrations within each Fund’s portfolio are disclosed in its schedule of investments.
Each Fund invests a substantial amount of its assets in securities of non-U.S. issuers that trade in non-U.S. markets. This involves certain considerations and risks not typically associated with securities of U.S. issuers. Such risks include, but are not limited to: generally less liquid and less efficient securities markets; generally greater price volatility; exchange rate fluctuations and exchange controls; imposition of restrictions on the expatriation of funds or other assets of the Fund; less publicly available information about issuers; the imposition of withholding or other taxes; higher transaction and custody costs; settlement delays and risk of loss attendant in settlement procedures; difficulties in enforcing contractual obligations; less regulation of securities markets; different accounting, disclosure and reporting requirements; more substantial governmental involvement in the economy; higher inflation rates; greater social, economic and political uncertainties; the risk of nationalization or expropriation of assets; and the risk of war. These risks are heightened for investments in issuers from countries with less developed markets.
Each Fund invests a substantial amount of its assets in fixed-income securities. Changes in market interest rates or economic conditions, including the decision in December 2013 by the Federal Reserve Bank to taper its quantitative easing policy, may affect the value and/or liquidity of such investments. Interest rate risk is the risk that prices of bonds and other fixed-income securities will decrease as interest rates rise and increase as interest rates fall. Securities with longer durations tend to be more sensitive to interest rate changes, usually making them more volatile than securities with shorter durations. Given the environment of historically low interest rates, each Fund may be subject to a greater risk of price losses if interest rates rise.
CREDIT RISK
Credit risk is the risk that an issuer or guarantor of debt instruments or the counterparty to a financial transaction, including derivatives contracts, repurchase agreements or loans of portfolio securities, is unable or unwilling to make timely interest and/or principal payments or to otherwise honor its obligations. BFA and its affiliates manage counterparty credit risk by entering into transactions only with counterparties that it believes have the financial resources to honor their obligations and by monitoring the financial stability of those counterparties. Financial assets, which potentially expose the Funds to issuer and counterparty credit risks, consist principally of financial instruments and receivables due from counterparties. The extent of each Fund’s exposure to credit and counterparty risks with respect to those financial assets is approximated by their value recorded in its statement of assets and liabilities.
| | |
| 36 | | 2014 iSHARES ANNUAL REPORTTO SHAREHOLDERS |
Notes to Financial Statements (Continued)
iSHARES® U.S. ETF TRUST
Each Fund is treated as an entity separate from the Trust’s other funds for federal income tax purposes. It is the policy of each Fund to qualify as a regulated investment company by complying with the provisions applicable to regulated investment companies, as defined under Subchapter M of the Internal Revenue Code of 1986, as amended, and to annually distribute substantially all of its ordinary income and any net capital gains (taking into account any capital loss carryforwards) sufficient to relieve it from all, or substantially all, federal income and excise taxes. Accordingly, no provision for federal income taxes is required.
U.S. GAAP requires that certain components of net assets be adjusted to reflect permanent differences between financial and tax reporting. These reclassifications have no effect on net assets or net asset values per share. The following permanent differences as of October 31, 2014, attributable to foreign currency transactions, were reclassified to the following accounts:
| | | | | | | | | | | | |
| iShares ETF | | Paid-in
Capital | | | Undistributed
Net Investment
Income/Distributions
in Excess of Net
Investment Income | | | Undistributed
Net Realized
Gain/Accumulated
Net Realized Loss | |
Short Maturity Bond | | $ | 294 | | | $ | (31,682 | ) | | $ | 31,388 | |
The tax character of distributions paid during the year ended October 31, 2014 was as follows:
| | | | |
| iShares ETF | | 2014 | |
Liquidity Income | | | | |
Ordinary income | | $ | 64,856 | |
| | | | |
Short Maturity Bond | | | | |
Ordinary income | | $ | 2,029,397 | |
| | | | |
| | | | | |
As of October 31, 2014, the tax components of accumulated net earnings (losses) were as follows:
| | | | | | | | | | | | |
| iShares ETF | | Undistributed
Ordinary
Income | | | Net
Unrealized
Gains (Losses) a | | | Total | |
Liquidity Income | | $ | 18,376 | | | $ | 18,678 | | | $ | 37,054 | |
Short Maturity Bond | | | 229,156 | | | | (297,245 | ) | | | (68,089 | ) |
| | a | | The difference between book-basis and tax-basis unrealized gains (losses) was attributable primarily to the tax deferral of losses on wash sales and the treatment of straddles. |
| | | | |
NOTESTO FINANCIAL STATEMENTS | | | 37 | |
Notes to Financial Statements (Continued)
iSHARES® U.S. ETF TRUST
As of October 31, 2014, gross unrealized appreciation and gross unrealized depreciation based on cost for federal income tax purposes were as follows:
| | | | | | | | | | | | | | | | |
| iShares ETF | | Tax Cost | | | Gross
Unrealized
Appreciation | | | Gross
Unrealized
Depreciation | | | Net Unrealized
Appreciation
(Depreciation) | |
Liquidity Income | | $ | 15,254,196 | | | $ | 20,254 | | | $ | (1,576 | ) | | $ | 18,678 | |
Short Maturity Bond | | | 424,224,741 | | | | 330,299 | | | | (627,520 | ) | | | (297,221 | ) |
Management has analyzed tax laws and regulations and their application to the Funds as of October 31, 2014, inclusive of the open tax return years, and does not believe there are any uncertain tax positions that require recognition of a tax liability in the Funds’ financial statements.
Management has evaluated the impact of all subsequent events on the Funds through the date the financial statements were available to be issued and has determined that there were no subsequent events requiring adjustment or disclosure in the financial statements.
| | |
| 38 | | 2014 iSHARES ANNUAL REPORTTO SHAREHOLDERS |
Report of Independent Registered Public Accounting Firm
To the Shareholders and Board of Trustees of
iShares U.S. ETF Trust:
In our opinion, the accompanying statements of assets and liabilities, including the schedules of investments, and the related statements of operations and of changes in net assets and the financial highlights present fairly, in all material respects, the financial position of iShares Liquidity Income ETF and iShares Short Maturity Bond ETF (the “Funds”) at October 31, 2014, the results of each of their operations, the changes in each of their net assets and their financial highlights for each of the periods presented, in conformity with accounting principles generally accepted in the United States of America. These financial statements and financial highlights (hereafter referred to as “financial statements”) are the responsibility of the Funds’ management; our responsibility is to express an opinion on these financial statements based on our audits. We conducted our audits of these financial statements in accordance with the standards of the Public Company Accounting Oversight Board (United States). Those standards require that we plan and perform the audit to obtain reasonable assurance about whether the financial statements are free of material misstatement. An audit includes examining, on a test basis, evidence supporting the amounts and disclosures in the financial statements, assessing the accounting principles used and significant estimates made by management, and evaluating the overall financial statement presentation. We believe that our audits, which included confirmation of securities at October 31, 2014 by correspondence with the custodian, transfer agent and brokers, provide a reasonable basis for our opinion.
PricewaterhouseCoopers LLP
San Francisco, California
December 19, 2014
| | | | |
REPORTOF INDEPENDENT REGISTERED PUBLIC ACCOUNTING FIRM | | | 39 | |
Tax Information (Unaudited)
iSHARES® U.S. ETF TRUST
Under Section 871(k)(1)(C) of the Internal Revenue Code, the Funds hereby designate the following maximum amounts allowable as interest-related dividends for the fiscal year ended October 31, 2014:
| | | | |
| iShares ETF | | Interest-
Related
Dividends | |
Liquidity Income | | $ | 41,266 | |
Short Maturity Bond | | | 1,779,383 | |
| | |
| 40 | | 2014 iSHARES ANNUAL REPORTTO SHAREHOLDERS |
Board Review and Approval of Investment Advisory Contract
iSHARES® U.S. ETF TRUST
I. iShares Liquidity Income ETF
Under Section 15(c) of the Investment Company Act of 1940 (the “1940 Act”), the Trust’s Board of Trustees (the “Board”), including a majority of Trustees who are not “interested persons” of the Trust (as that term is defined in the 1940 Act) (the “Independent Trustees”), is required annually to consider and approve the Investment Advisory Contract between the Trust and BFA (the “Advisory Contract”) on behalf of the Fund. The Independent Trustees requested, and BFA provided, such information as the Independent Trustees, with advice from independent counsel, deemed reasonably necessary to evaluate the Advisory Contract. A committee of Independent Trustees (the “15(c) Committee”), with independent counsel, met with management on March 12, 2014, May 6, 2014, and May 12, 2014, to discuss the types of information the Independent Trustees required and the manner in which management would organize and present such information. At a meeting held on May 16, 2014, management presented preliminary information to the Board relating to the continuance of the Advisory Contract, and the Board, including the Independent Trustees, reviewed and discussed such information at length. The Independent Trustees requested from management certain additional information, which management agreed to provide. At a meeting held on June 12-13, 2014, the Board, including the Independent Trustees, reviewed the additional information provided by management in response to these requests. After extensive discussions, the Board, including all of the Independent Trustees, approved the continuance of the Advisory Contract for the Fund, based on a review of qualitative and quantitative information provided by BFA, including the additional information management provided at the request of the Independent Trustees. The Board noted its satisfaction with the extent and quality of information provided and its frequent interactions with management, as well as the detailed responses and other information provided by BFA. The Board also noted that the Board and BFA agreed to discuss potential enhancements and adjustments to the 15(c) process for the coming year. The Independent Trustees were advised by their independent counsel throughout the process, including about the legal standards applicable to their review. In approving the Advisory Contract for the Fund, the Board, including the Independent Trustees, considered the following factors, no one of which was controlling, and reached the following conclusions:
Expenses and Performance of the Fund — The Board reviewed statistical information prepared by Lipper Inc. (“Lipper”), an independent provider of investment company data, regarding the expense ratio components, including actual advisory fees, waivers/reimbursements, and gross and net total expenses of the Fund in comparison with the same information for other exchange traded funds (including funds sponsored by an “at cost” service provider) and, in the limited instances where no comparable ETFs existed and the comparison group would not otherwise be reasonable in Lipper’s judgment, pure index institutional mutual funds, objectively selected by Lipper as comprising the Fund’s applicable peer group pursuant to Lipper’s proprietary ETF methodology (the “Lipper Group”). The Board noted that, prior to 2014, Lipper had used a different methodology to determine the Fund’s Lipper group, which included mutual funds, closed-end funds, exchange traded funds, and/or funds with differing investment objective classifications, investment focuses and other characteristics (e.g. actively managed funds and funds sponsored by “at cost” service providers), as applicable. The Board further noted that, after consideration by the 15(c) Committee, the Board determined to use instead Lipper’s proprietary ETF methodology to determine the Fund’s Lipper Group. This determination was based on, among other considerations, the increased number and types of ETFs available for comparative purposes than was the case in prior years. The Board was provided with a detailed description of Lipper’s proprietary ETF methodology used by Lipper to determine the applicable Lipper Group and to prepare this information. At the Board’s request, Lipper provided, and the Board considered, information on the impact to the iShares funds’ comparative fee rankings that were attributable to the change from a pure index group methodology to Lipper’s proprietary ETF methodology. The Board further noted that due to the limitations in providing comparable funds in the Lipper Group, the statistical information provided in Lipper’s report may or may not provide meaningful direct comparisons to the Fund in all instances.
The Board also noted that the investment advisory fee rate and overall expenses for the Fund were lower than the median of the investment advisory fee rates and overall expenses of the funds in its Lipper Group.
| | | | |
BOARD REVIEWAND APPROVALOF INVESTMENT ADVISORY CONTRACT | | | 41 | |
Board Review and Approval of Investment Advisory Contract (Continued)
iSHARES® U.S. ETF TRUST
In addition, the Board reviewed statistical information prepared by Lipper regarding the performance of the Fund for the one-, three-, five-, ten-year, and since inception periods, as applicable, and the “last quarter” period ended December 31, 2013, and a comparison of the Fund’s performance to its performance benchmark index for the same periods. To the extent that any of the comparison funds included in the Lipper Group track the same index as the Fund, Lipper also provided, and the Board reviewed, a comparison of the Fund’s performance to that of such relevant comparison funds for the same periods. The Board noted that the Fund generally performed in line with its respective performance benchmark index over the relevant periods. In considering this information, the Board noted that the Lipper Group may include funds that are not exchange traded funds or index funds, and that may have different investment objectives and/or benchmarks from the Fund. In addition, the Board noted that the Fund seeks to track its own benchmark index and that, during the prior year, the Board received periodic reports on the Fund’s performance in comparison with its relevant benchmark index. Such periodic comparative performance information, including detailed information on certain specific iShares funds requested by the Boards, was also considered.
Based on this review, the other factors considered at the meeting, and their general knowledge of ETF pricing, the Board concluded that the investment advisory fee rate and expense level and the historical performance of the Fund supported the Board’s approval of the continuance of the Advisory Contract for the coming year.
Nature, Extent and Quality of Services Provided by BFA — Based on management’s representations, including information about recent and proposed enhancements to the iShares business, including with respect to shareholder servicing and support, the Board expected that there would be no diminution in the scope of services required of or provided by BFA under the Advisory Contract for the coming year as compared to the scope of services provided by BFA during prior years. In reviewing the scope of these services, the Board considered BFA’s investment philosophy and experience, noting that BFA and its affiliates have committed significant resources over time, including during the past year, to supporting the Fund and its shareholders. The Board acknowledged that resources to support the iShares funds and their shareholders have been added or enhanced in recent years, including in such areas as investor education, product management, customized portfolio consulting support, capital markets support, and proprietary risk and performance analytics tools. The Board also considered BFA’s compliance program and its compliance record with respect to the Fund. In that regard, the Board noted that BFA reports to the Board about portfolio management and compliance matters on a periodic basis in connection with regularly scheduled meetings of the Board, and on other occasions as necessary and appropriate, and has provided information and made appropriate officers available as needed to provide further assistance with these matters. The Board also reviewed the background and experience of the persons responsible for the day-to-day management of the Fund, as well as the resources available to them in managing the Fund. In addition to the above considerations, the Board reviewed and considered detailed presentations regarding BFA’s investment performance, investment and risk management processes and strategies provided at the June 12-13, 2014 meeting and throughout the previous year, and matters related to BFA’s portfolio compliance policies and procedures. The Board noted that the Fund had met its investment objective consistently since its inception date.
Based on review of this information, and the performance information discussed above, the Board concluded that the nature, extent and quality of services provided by BFA to the Fund under the Advisory Contract supported the Board’s approval of the continuance of the Advisory Contract for the coming year.
Costs of Services Provided to the Fund and Profits Realized by BFA and Affiliates — The Board reviewed information about the profitability to BlackRock of the Fund based on the fees payable to BFA and its affiliates (including fees under the Advisory Contract), and all other sources of revenue and expense to BFA and its affiliates from the Fund’s operations for the last calendar year. The Board reviewed BlackRock’s profitability methodology for the iShares funds, noting that the 15(c) Committee had focused on the methodology and proposed presentation during its meetings. The Board discussed the sources of direct and ancillary revenue with management, including the revenues to BTC from securities lending by the Fund. The Board also discussed BFA’s profit margin as reflected in the Fund’s profitability analysis and reviewed information regarding potential
| | |
| 42 | | 2014 iSHARES ANNUAL REPORTTO SHAREHOLDERS |
Board Review and Approval of Investment Advisory Contract (Continued)
iSHARES® U.S. ETF TRUST
economies of scale (as discussed below). Based on this review, the Board concluded that the profits realized by BFA and its affiliates under the Advisory Contract and from other relationships between the Fund and BFA and/or its affiliates, if any, were within a reasonable range in light of the factors considered.
Economies of Scale — The Board reviewed information regarding potential economies of scale or other efficiencies that may result from increases in the Fund’s assets, noting that the issue of economies of scale had been focused on extensively by the 15(c) Committee during its meetings and addressed by management. The Board and the 15(c) Committee reviewed information provided by BFA regarding scale benefits shared with the iShares funds through relatively low fee rates established at inception, breakpoints, waivers, or other fee reductions, as well as through additional investment in the iShares business and the provision of improved or additional infrastructure and services to the iShares funds and their shareholders. The Board and the 15(c) Committee received information regarding BlackRock’s historical profitability, including BFA’s and its affiliates’ costs in providing services. The cost information distinguished between fixed and variable costs, and explained how the level of fixed and variable costs, as well as the nature of such costs, may impact the existence or size of scale benefits. The Board noted that the Advisory Contract for the Fund did not provide for any breakpoints in the Fund’s investment advisory fee rate as the assets of the Fund increase. However, the Board further noted management’s assertion that future economies of scale for the Fund had been taken into consideration by fixing the investment advisory fee rate at the low end of the market place, effectively giving Fund shareholders, from inception, the benefits of a lower fee. The Board noted that it would continue to monitor the sharing of economies of scale to determine the appropriateness of adding breakpoints in the future. Based on this review, as well as the other factors considered at the meeting, the Board, recognizing its responsibility to consider this issue at least annually, concluded that the investment advisory fee rate incorporates potential economies of scale and supported the Board’s approval of the continuance of the Advisory Contract for the coming year.
Fees and Services Provided for Other Comparable Funds/Accounts Managed by BFA and its Affiliates — The Board received and considered information regarding the investment advisory/management fee rates for other funds/accounts in the U.S. for which BFA (or its affiliates) provides investment advisory/management services, including open-end and closed-end funds registered under the 1940 Act (including sub-advised funds), collective trust funds, separately managed accounts, and institutional separate accounts (together, the “Other Accounts”), and acknowledged BFA’s assertion that the iShares funds are fundamentally different investment vehicles from the Other Accounts. The Board noted that BFA and its affiliates do manage Other Accounts with a substantially similar investment objective and strategy as the Fund. The Board further noted that BFA provided the Board with detailed information regarding how the Other Accounts (particularly institutional clients) generally differ from the Fund, including in terms of the different, generally more extensive services provided to the Fund, as well as other significant differences in the approach of BFA and its affiliates to the Fund, on one hand, and Other Accounts, on the other. In that regard, the Board considered that the pricing of services to institutional clients is typically based on a number of factors beyond the nature and extent of the specific services to be provided and often depends on the overall relationship between the client and its affiliates and the adviser and its affiliates. In addition, the Board considered the relative complexity and inherent risks and challenges of managing and providing other services to the Fund, as a publicly traded exchange traded fund, as compared to the Other Accounts that are institutional clients in light of differing regulatory requirements and client-imposed mandates. The Board also considered the “all-inclusive” nature of the Fund’s advisory fee structure, and the Fund expenses borne by BFA under this arrangement. The Board noted that the investment advisory fee rate under the Advisory Contract for the Fund was generally higher than the investment advisory/management fee rates for the Other Accounts that are institutional clients of BFA (or its affiliates) and concluded that the differences appeared to be consistent with the factors discussed.
Other Benefits to BFA and/or its Affiliates — The Board reviewed the “fallout” benefits or ancillary revenue received by BFA and/or its affiliates in connection with the services provided to the Fund by BFA, such as payment of revenue to BTC, the Fund’s securities lending agent, for loaning portfolio securities (which was included in the profit margins reviewed by the Board pursuant to BFA’s profitability methodology), and payment of advisory fees and/or administration fees to BFA and BTC (or their affiliates) in
| | | | |
BOARD REVIEWAND APPROVALOF INVESTMENT ADVISORY CONTRACT | | | 43 | |
Board Review and Approval of Investment Advisory Contract (Continued)
iSHARES® U.S. ETF TRUST
connection with any investments by the Fund in other funds for which BFA (or its affiliates) provides investment advisory services and/or administration services. The Board noted that BFA generally does not use soft dollars or consider the value of research or other services that may be provided to BFA (including its affiliates) in selecting brokers for portfolio transactions for the Fund. The Board further noted that any portfolio transactions on behalf of the Fund placed through a BFA affiliate or purchased from an underwriting syndicate in which a BFA affiliate participates, are reported to the Board pursuant to Rule 17e-1 or Rule 10f-3, as applicable, under the 1940 Act. The Board concluded that any such ancillary benefits would not be disadvantageous to the Fund’s shareholders and thus would not alter the Board’s conclusion with respect to the appropriateness of approving the continuance of the Advisory Contract for the coming year.
Based on the considerations described above, the Board determined that the Fund’s investment advisory fee rate under the Advisory Contract does not constitute a fee that is so disproportionately large as to bear no reasonable relationship to the services rendered and that could not have been the product of arm’s-length bargaining, and concluded that it is in the best interest of the Fund and its shareholders to approve the continuance of the Advisory Contract for the coming year.
II. iShares Short Maturity Bond ETF
Under Section 15(c) of the Investment Company Act of 1940 (the “1940 Act”), the Trust’s Board of Trustees (the “Board”), including a majority of Trustees who are not “interested persons” of the Trust (as that term is defined in the 1940 Act) (the “Independent Trustees”), is required annually to consider and approve the Investment Advisory Contract between the Trust and BFA (the “Advisory Contract”), and the Sub-Advisory Agreement between BFA and BlackRock Financial Management, Inc. (“BFM”) (the “Sub-Advisory Agreement”), on behalf of the Fund. The Advisory Contract and the Sub-Advisory Agreement are referred to hereafter as the “Advisory Agreements”. The Independent Trustees requested, and BFA provided, such information as the Independent Trustees, with advice from independent counsel, deemed reasonably necessary to evaluate the Advisory Agreements. A committee of Independent Trustees (the “15(c) Committee”), with independent counsel, met with management on March 12, 2014, May 6, 2014, and May 12, 2014, to discuss the types of information the Independent Trustees required and the manner in which management would organize and present such information. At a meeting held on May 16, 2014, management presented preliminary information to the Board relating to the continuance of the Advisory Agreements, and the Board, including the Independent Trustees, reviewed and discussed such information at length. The Independent Trustees requested from management certain additional information, which management agreed to provide. At a meeting held on June 12-13, 2014, the Board, including the Independent Trustees, reviewed the additional information provided by management in response to these requests. After extensive discussions, the Board, including all of the Independent Trustees, approved the continuance of the Advisory Agreements for the Fund, based on a review of qualitative and quantitative information provided by BFA, including the additional information management provided at the request of the Independent Trustees. The Board noted its satisfaction with the extent and quality of information provided and its frequent interactions with management, as well as the detailed responses and other information provided by BFA. The Board also noted that the Board and BFA agreed to discuss potential enhancements and adjustments to the 15(c) process for the coming year. The Independent Trustees were advised by their independent counsel throughout the process, including about the legal standards applicable to their review. In approving the Advisory Agreements for the Fund, the Board, including the Independent Trustees, considered the following factors, no one of which was controlling, and reached the following conclusions:
Expenses and Performance of the Fund — The Board reviewed statistical information prepared by Lipper Inc. (“Lipper”), an independent provider of investment company data, regarding the expense ratio components, including actual advisory fees, waivers/reimbursements, and gross and net total expenses of the Fund in comparison with the same information for other exchange traded funds (including funds sponsored by an “at cost” service provider) and, in the limited instances where no comparable ETFs existed and the comparison group would not otherwise be reasonable in Lipper’s judgment, pure index institutional mutual funds, objectively selected by Lipper as comprising the Fund’s applicable peer group pursuant to Lipper’s
| | |
| 44 | | 2014 iSHARES ANNUAL REPORTTO SHAREHOLDERS |
Board Review and Approval of Investment Advisory Contract (Continued)
iSHARES® U.S. ETF TRUST
proprietary ETF methodology (the “Lipper Group”). The Board noted that, prior to 2014, Lipper had used a different methodology to determine the Fund’s Lipper group, which included mutual funds, closed-end funds, exchange traded funds, and/or funds with differing investment objective classifications, investment focuses and other characteristics (e.g. actively managed funds and funds sponsored by “at cost” service providers), as applicable. The Board further noted that, after consideration by the 15(c) Committee, the Board determined to use instead Lipper’s proprietary ETF methodology to determine the Fund’s Lipper Group. This determination was based on, among other considerations, the increased number and types of ETFs available for comparative purposes than was the case in prior years. The Board was provided with a detailed description of Lipper’s proprietary ETF methodology used by Lipper to determine the applicable Lipper Group and to prepare this information. At the Board’s request, Lipper provided, and the Board considered, information on the impact to the iShares funds’ comparative fee rankings that were attributable to the change from a pure index group methodology to Lipper’s proprietary ETF methodology. The Board further noted that due to the limitations in providing comparable funds in the Lipper Group, the statistical information provided in Lipper’s report may or may not provide meaningful direct comparisons to the Fund in all instances.
The Board also noted that the investment advisory fee rate and overall expenses for the Fund were lower than the median of the investment advisory fee rates and overall expenses of the funds in its Lipper Group. The Board also noted that BFA pays BFM for its sub-advisory services, and that there are no additional fees imposed on the Fund in respect of the services provided under the Sub-Advisory Agreement.
In addition, the Board reviewed statistical information prepared by Lipper regarding the performance of the Fund for the one-, three-, five-, ten-year, and since inception periods, as applicable, and the “last quarter” period ended December 31, 2013, and a comparison of the Fund’s performance to its performance benchmark index for the same periods. To the extent that any of the comparison funds included in the Lipper Group track the same index as the Fund, Lipper also provided, and the Board reviewed, a comparison of the Fund’s performance to that of such relevant comparison funds for the same periods. The Board noted that the Fund generally performed in line with its respective performance benchmark index over the relevant periods. In considering this information, the Board noted that the Lipper Group may include funds that are not exchange traded funds or index funds, and that may have different investment objectives and/or benchmarks from the Fund. In addition, the Board noted that the Fund seeks to track its own benchmark index and that, during the prior year, the Board received periodic reports on the Fund’s performance in comparison with its relevant benchmark index. Such periodic comparative performance information, including detailed information on certain specific iShares funds requested by the Boards, was also considered.
Based on this review, the other factors considered at the meeting, and their general knowledge of ETF pricing, the Board concluded that the investment advisory fee rate and expense level and the historical performance of the Fund supported the Board’s approval of the continuance of the Advisory Agreements for the coming year.
Nature, Extent and Quality of Services Provided by BFA and BFM or their Affiliates — Based on management’s representations, including information about recent and proposed enhancements to the iShares business, including with respect to shareholder servicing and support, the Board expected that there would be no diminution in the scope of services required of or provided by BFA (and any services provided by BFM on BFA’s behalf or at BFA’s direction) under the Advisory Agreements for the coming year as compared to the scope of services provided by BFA and BFM during prior years. In reviewing the scope of these services, the Board considered the investment philosophy and experience of BFA and BFM, noting that BFA and its affiliates have committed significant resources over time, including during the past year, to supporting the Fund and its shareholders. The Board acknowledged that resources to support the iShares funds and their shareholders have been added or enhanced in recent years, including in such areas as investor education, product management, customized portfolio consulting support, capital markets support, and proprietary risk and performance analytics tools. The Board also considered the compliance program of BFA and BFM and their compliance record with respect to the Fund. In that regard, the Board noted that BFA reports to the Board about portfolio management and compliance matters on a periodic basis in connection with regularly scheduled
| | | | |
BOARD REVIEWAND APPROVALOF INVESTMENT ADVISORY CONTRACT | | | 45 | |
Board Review and Approval of Investment Advisory Contract (Continued)
iSHARES® U.S. ETF TRUST
meetings of the Board, and on other occasions as necessary and appropriate, and has provided information and made appropriate officers available as needed to provide further assistance with these matters. The Board also reviewed the background and experience of the persons responsible for the day-to-day management of the Fund, as well as the resources available to them in managing the Fund. In addition to the above considerations, the Board reviewed and considered detailed presentations regarding BFA’s investment performance, investment and risk management processes and strategies provided at the June 12-13, 2014 meeting and throughout the previous year, and matters related to BFA’s and BFM’s portfolio compliance policies and procedures, and BFA’s oversight of the services provided by BFM. The Board noted that the Fund had met its investment objective consistently since its inception date.
Based on review of this information, and the performance information discussed above, the Board concluded that the nature, extent and quality of services provided by BFA and BFM to the Fund under the Advisory Agreements supported the Board’s approval of the continuance of the Advisory Agreements for the coming year.
Costs of Services Provided to the Fund and Profits Realized by BFA and its Affiliates — The Board reviewed information about the profitability to BlackRock of the Fund based on the fees payable to BFA and its affiliates (including fees under the Advisory Contract), and all other sources of revenue and expense to BFA and its affiliates from the Fund’s operations for the last calendar year. The Board reviewed BlackRock’s profitability methodology for the iShares funds, noting that the 15(c) Committee had focused on the methodology and proposed presentation during its meetings. The Board discussed the sources of direct and ancillary revenue with management, including the revenues to BTC from securities lending by the Fund. The Board also discussed BFA’s profit margin as reflected in the Fund’s profitability analysis and reviewed information regarding potential economies of scale (as discussed below). Based on this review, the Board concluded that the profits realized by BFA and its affiliates under the Advisory Agreements and from other relationships between the Fund and BFA and/or its affiliates, if any, were within a reasonable range in light of the factors considered.
Economies of Scale — The Board reviewed information regarding potential economies of scale or other efficiencies that may result from increases in the Fund’s assets, noting that the issue of economies of scale had been focused on extensively by the 15(c) Committee during its meetings and addressed by management. The Board and the 15(c) Committee reviewed information provided by BFA regarding scale benefits shared with the iShares funds through relatively low fee rates established at inception, breakpoints, waivers, or other fee reductions, as well as through additional investment in the iShares business and the provision of improved or additional infrastructure and services to the iShares funds and their shareholders. The Board and the 15(c) Committee received information regarding BlackRock’s historical profitability, including BFA’s and its affiliates’ costs in providing services. The cost information distinguished between fixed and variable costs, and explained how the level of fixed and variable costs, as well as the nature of such costs, may impact the existence or size of scale benefits. The Board noted that the Advisory Contract for the Fund did not provide for any breakpoints in the Fund’s investment advisory fee rate as the assets of the Fund increase. However, the Board noted that should material economies of scale exist in the future, a breakpoint structure for the Fund may be appropriate, and that it would continue to monitor the sharing of economies of scale to determine the appropriateness of adding breakpoints in the future. Based on this review, as well as the other factors considered at the meeting, the Board, recognizing its responsibility to consider this issue at least annually, concluded that the investment advisory fee rate incorporates potential economies of scale and supported the Board’s approval of the continuance of the Advisory Agreements for the coming year.
Fees and Services Provided for Other Comparable Funds/Accounts Managed by BFA and its Affiliates — The Board received and considered information regarding the investment advisory/management fee rates for other funds/accounts in the U.S. for which BFA (or its affiliates) provides investment advisory/management services, including open-end and closed-end funds registered under the 1940 Act (including sub-advised funds), collective trust funds, separately managed accounts, and institutional separate accounts (together, the “Other Accounts”), and acknowledged BFA’s assertion that the iShares funds are
| | |
| 46 | | 2014 iSHARES ANNUAL REPORTTO SHAREHOLDERS |
Board Review and Approval of Investment Advisory Contract (Continued)
iSHARES® U.S. ETF TRUST
fundamentally different investment vehicles from the Other Accounts. The Board noted that BFA and its affiliates do manage Other Accounts with a substantially similar investment objective and strategy as the Fund. The Board further noted that BFA provided the Board with detailed information regarding how the Other Accounts (particularly institutional clients) generally differ from the Fund, including in terms of the different, generally more extensive services provided to the Fund, as well as other significant differences in the approach of BFA and its affiliates to the Fund, on one hand, and Other Accounts, on the other. In that regard, the Board considered that the pricing of services to institutional clients is typically based on a number of factors beyond the nature and extent of the specific services to be provided and often depends on the overall relationship between the client and its affiliates and the adviser and its affiliates. In addition, the Board considered the relative complexity and inherent risks and challenges of managing and providing other services to the Fund, as a publicly traded exchange traded fund, as compared to the Other Accounts that are institutional clients in light of differing regulatory requirements and client-imposed mandates. The Board also considered the “all-inclusive” nature of the Fund’s advisory fee structure, and the Fund expenses borne by BFA under this arrangement. The Board noted that the investment advisory fee rate under the Advisory Contract for the Fund was generally higher than the investment advisory/management fee rates for the Other Accounts that are institutional clients of BFA (or its affiliates) and concluded that the differences appeared to be consistent with the factors discussed.
Other Benefits to BFA and/or its Affiliates — The Board reviewed the “fallout” benefits or ancillary revenue received by BFA and/or its affiliates in connection with the services provided to the Fund by BFA, such as payment of revenue to BTC, the Fund’s securities lending agent, for loaning portfolio securities (which was included in the profit margins reviewed by the Board pursuant to BFA’s profitability methodology), and payment of advisory fees and/or administration fees to BFA and BTC (or their affiliates) in connection with any investments by the Fund in other funds for which BFA (or its affiliates) provides investment advisory services and/or administration services. The Board noted that BFA and BFM generally do not use soft dollars or consider the value of research or other services that may be provided to BFA and BFM (including their affiliates) in selecting brokers for portfolio transactions for the Fund. The Board further noted that any portfolio transactions on behalf of the Fund placed through a BFA affiliate or purchased from an underwriting syndicate in which a BFA affiliate participates, are reported to the Board pursuant to Rule 17e-1 or Rule 10f-3, as applicable, under the 1940 Act. The Board concluded that any such ancillary benefits would not be disadvantageous to the Fund’s shareholders and thus would not alter the Board’s conclusion with respect to the appropriateness of approving the continuance of the Advisory Agreements for the coming year.
Based on the considerations described above, the Board determined that the Fund’s investment advisory fee rate under the Advisory Contract does not constitute a fee that is so disproportionately large as to bear no reasonable relationship to the services rendered and that could not have been the product of arm’s-length bargaining, and concluded that it is in the best interest of the Fund and its shareholders to approve the continuance of the Advisory Agreements for the coming year.
| | | | |
BOARD REVIEWAND APPROVALOF INVESTMENT ADVISORY CONTRACT | | | 47 | |
Supplemental Information (Unaudited)
iSHARES® U.S. ETF TRUST
Section 19(a) Notices
The amounts and sources of distributions reported are only estimates and are not being provided for tax reporting purposes. The actual amounts and sources of the amounts for tax reporting purposes will depend upon each Fund’s investment experience during the year and may be subject to changes based on the tax regulations. Shareholders will receive a Form 1099-DIV each calendar year that will inform them how to report distributions for federal income tax purposes.
| | | | | | | | | | | | | | | | | | | | | | | | | | | | | | | | |
| | | Total Cumulative Distributions
for the Fiscal Year | | | % Breakdown of the Total Cumulative
Distributions for the Fiscal Year | |
| iShares ETF | | Net
Investment
Income | | | Net
Realized
Capital
Gains | | | Return
of
Capital | | | Total Per Share | | | Net
Investment
Income | | | Net
Realized
Capital
Gains | | | Return
of
Capital | | | Total
Per
Share | |
Short Maturity Bond | | $ | 0.400049 | | | $ | — | | | $ | — | | | $ | 0.400049 | | | | 100 | % | | | — | % | | | — | % | | | 100 | % |
Premium/Discount Information
The tables that follow present information about the differences between the daily market price on secondary markets for shares of a Fund and that Fund’s net asset value. Net asset value, or “NAV,” is the price per share at which each Fund issues and redeems shares. It is calculated in accordance with the standard formula for valuing mutual fund shares. The “Market Price” of each Fund generally is determined using the midpoint between the highest bid and the lowest offer on the primary stock exchange on which the shares of such Fund are listed for trading, as of the time that the Fund’s NAV is calculated. Each Fund’s Market Price may be at, above or below its NAV. The NAV of each Fund will fluctuate with changes in the fair value of its portfolio holdings. The Market Price of each Fund will fluctuate in accordance with changes in its NAV, as well as market supply and demand.
Premiums or discounts are the differences (expressed as a percentage) between the NAV and Market Price of a Fund on a given day, generally at the time NAV is calculated. A premium is the amount that a Fund is trading above the reported NAV, expressed as a percentage of the NAV. A discount is the amount that a Fund is trading below the reported NAV, expressed as a percentage of the NAV.
The following information shows the frequency distributions of premiums and discounts for each of the Funds included in this report. The information shown for each Fund is for five calendar years (or for each full calendar quarter completed after the inception date of such Fund if less than five years) through the date of the most recent calendar quarter-end. The specific periods covered for each Fund are disclosed in the table for such Fund.
Each line in the table shows the number of trading days in which the Fund traded within the premium/discount range indicated. The number of trading days in each premium/discount range is also shown as a percentage of the total number of trading days in the period covered by each table. All data presented here represents past performance, which cannot be used to predict future results.
| | |
| 48 | | 2014 iSHARES ANNUAL REPORTTO SHAREHOLDERS |
Supplemental Information (Unaudited) (Continued)
iSHARES® U.S. ETF TRUST
iShares Liquidity Income ETF
Period Covered: January 1, 2014 through September 30, 2014
| | | | | | | | |
Premium/Discount Range | | Number
of Days | | | Percentage of
Total Days | |
Between 0.5% and –0.5% | | | 188 | | | | 100.00 | % |
| | | | | | | | |
iShares Short Maturity Bond ETF
Period Covered: October 1, 2013 through September 30, 2014
| | | | | | | | |
Premium/Discount Range | | Number
of Days | | | Percentage of
Total Days | |
Between 0.5% and –0.5% | | | 252 | | | | 100.00 | % |
| | | | | | | | |
| | | | |
SUPPLEMENTAL INFORMATION | | | 49 | |
Trustee and Officer Information
iSHARES® U.S. ETF TRUST
The Board of Trustees has responsibility for the overall management and operations of the Trust, including general supervision of the duties performed by BFA and other service providers. Each Trustee serves until he or she resigns, is removed, dies, retires or becomes incapacitated. The President, Chief Compliance Officer, Treasurer and Secretary shall each hold office until their successors are chosen and qualify, and all other officers shall hold office until he or she resigns or is removed. Trustees who are not “interested persons” (as defined in the 1940 Act) of the Trust are referred to as independent trustees (“Independent Trustees”).
The registered investment companies advised by BFA or its affiliates are organized into one complex of closed-end funds, two complexes of open-end funds and one complex of exchange-traded funds (“Exchange-Traded Fund Complex”) (each, a “BlackRock Fund Complex”). Each Fund is included in the BlackRock Fund Complex referred to as the Exchange-Traded Fund Complex. Each Trustee also serves as a Director of iShares, Inc., a Director of iShares MSCI Russia Capped ETF, Inc. and a Trustee of iShares Trust and, as a result, oversees a total of 294 funds (as of October 31, 2014) within the Exchange-Traded Fund Complex. With the exception of Robert S. Kapito and Mark Wiedman, the address of each Trustee and officer is c/o BlackRock, Inc., 400 Howard Street, San Francisco, CA 94105. The address of Mr. Kapito and Mr. Wiedman is c/o BlackRock, Inc., Park Avenue Plaza, 55 East 52nd Street, New York, NY 10055. The Board has designated Robert H. Silver as its Independent Chairman. Additional information about the Funds’ Trustees and Officers may be found in the Funds’ combined Statement of Additional Information, which is available without charge, upon request, by calling toll-free 1-800-iShares (1-800-474-2737).
Interested Trustees
| | | | | | |
| | | | |
| Name (Age) | | Position(s) | | Principal Occupation(s)
During the Past 5 Years | | Other Directorships Held by Trustee |
Robert S. Kapitoa (57) | | Trustee
(since 2011). | | President and Director, BlackRock, Inc. (since 2006); Vice Chairman of BlackRock, Inc. and Head of BlackRock, Inc.’s Portfolio Management Group (since its formation in 1998) and BlackRock, Inc.’s predecessor entities (since 1988); Trustee, University of Pennsylvania (since 2009); President of Board of Directors, Hope & Heroes Children’s Cancer Fund (since 2002); President of the Board of Directors, Periwinkle Theatre for Youth (since 1983). | | Trustee of iShares Trust (since 2009); Director of iShares, Inc. (since 2009); Director of iShares MSCI Russia Capped ETF, Inc. (since 2010); Director of BlackRock, Inc. (since 2006). |
| | | |
Mark Wiedmanb (43) | | Trustee
(since 2013) | | Managing Director, BlackRock, Inc. (since 2007); Global Head of iShares (since 2011); Head of Corporate Strategy, BlackRock, Inc. (2009-2011). | | Trustee of iShares Trust (since 2013); Director of iShares, Inc. (since 2013); Director of iShares MSCI Russia Capped ETF, Inc. (since 2013); Director of PennyMac Financial Services, Inc. (since 2008). |
| a | | Robert S. Kapito is deemed to be an “interested person” (as defined in the 1940 Act) of the Trust due to his affiliations with BlackRock, Inc. |
| b | | Mark Wiedman is deemed to be an “interested person” (as defined in the 1940 Act) of the Trust due to his affiliations with BlackRock, Inc. and its affiliates. |
| | |
| 50 | | 2014 iSHARES ANNUAL REPORTTO SHAREHOLDERS |
Trustee and Officer Information (Continued)
iSHARES® U.S. ETF TRUST
Independent Trustees
| | | | | | |
| | | | |
| Name (Age) | | Position(s) | | Principal Occupation(s)
During the Past 5 Years | | Other Directorships Held by Trustee |
Robert H. Silver (59) | | Trustee
(since 2011); Independent Chairman
(since 2012). | | President and Co-Founder of The Bravitas Group, Inc. (since 2006); Director and Vice Chairman of the YMCA of Greater NYC (2001-2011); Broadway Producer (2006-2011); Co-Founder and Vice President of Parentgiving Inc. (since 2008); Director and Member of the Audit and Compensation Committee of EPAM Systems, Inc. (2006-2009); President and Chief Operating Officer of UBS Financial Services Inc. (formerly Paine Webber Inc.) (2003-2005) and various executive positions with UBS and its affiliates (1988-2005); CPA and Audit Manager of KPMG, LLP (formerly Peat Marwick Mitchell) (1977-1983). | | Trustee of iShares Trust (since 2007); Director of iShares, Inc. (since 2007); Director of iShares MSCI Russia Capped ETF, Inc. (since 2010); Independent Chairman of iShares, Inc., iShares MSCI Russia Capped ETF, Inc. and iShares Trust (since 2012). |
| | | |
Cecilia H. Herbert (65) | | Trustee
(since 2011); Nominating and Governance Committee Chair and Equity Plus Committee Chair (since 2012). | | Director (1998-2013) and President (2007-2011) of the Board of Directors, Catholic Charities CYO; Trustee (2002-2011) and Chair of the Finance and Investment Committee (2006-2010) of the Thacher School; Member (since 1992) and Chair (1994-2005) of the Investment Committee, Archdiocese of San Francisco; Trustee and Member of the Investment Committee, WNET, the New York public broadcasting/media company (since 2011). | | Trustee of iShares Trust (since 2005); Director of iShares, Inc. (since 2005); Director of iShares MSCI Russia Capped ETF, Inc. (since 2010); Director of Forward Funds (34 portfolios) (since 2009). |
| | | |
Charles A. Hurty (71) | | Trustee
(since 2011); Audit Committee Chair
(since 2011). | | Retired; Partner, KPMG LLP (1968-2001). | | Trustee of iShares Trust (since 2005); Director of iShares, Inc. (since 2005); Director of iShares MSCI Russia Capped ETF, Inc. (since 2010); Director of GMAM Absolute Return Strategy Fund (1 portfolio) (since 2002); Director of SkyBridge Alternative Investments Multi-Adviser Hedge Fund Portfolios LLC (2 portfolios) (since 2002). |
| | | |
John E. Kerrigan (59) | | Trustee
(since 2011); Fixed Income Plus Committee Chair
(since 2012). | | Chief Investment Officer, Santa Clara University (since 2002). | | Trustee of iShares Trust (since 2005); Director of iShares, Inc. (since 2005); Director of iShares MSCI Russia Capped ETF, Inc. (since 2010). |
| | | | |
TRUSTEEAND OFFICER INFORMATION | | | 51 | |
Trustee and Officer Information (Continued)
iSHARES® U.S. ETF TRUST
Independent Trustees (Continued)
| | | | | | |
| | | | |
| Name (Age) | | Position(s) | | Principal Occupation(s)
During the Past 5 Years | | Other Directorships Held by Trustee |
John E. Martinez (53) | | Trustee
(since 2011); Securities Lending Committee Chair
(since 2012). | | Director of FirstREX Agreement Corp. (formerly EquityRock, Inc.) (since 2005). | | Trustee of iShares Trust (since 2003); Director of iShares, Inc. (since 2003); Director of iShares MSCI Russia Capped ETF, Inc. (since 2010). |
| | | |
George G.C. Parker (75) | | Trustee
(since 2011). | | Dean Witter Distinguished Professor of Finance, Emeritus, Stanford University Graduate School of Business (Professor since 1973; Emeritus since 2006). | | Trustee of iShares Trust (since 2000); Director of iShares, Inc. (since 2002); Director of iShares MSCI Russia Capped ETF, Inc. (since 2010); Director of Tejon Ranch Company (since 1999); Director of Threshold Pharmaceuticals (since 2004); Director of Colony Financial, Inc. (since 2009); Director of First Republic Bank (since 2010). |
| | | |
Madhav V. Rajan (50) | | Trustee
(since 2011); 15(c) Committee Chair
(since 2012). | | Robert K. Jaedicke Professor of Accounting and Senior Associate Dean for Academic Affairs and Head of MBA Program, Stanford University Graduate School of Business (since 2001); Professor of Law (by courtesy), Stanford Law School (since 2005); Visiting Professor, University of Chicago (2007-2008). | | Trustee of iShares Trust (since 2011); Director of iShares, Inc. (since 2011); Director of iShares MSCI Russia Capped ETF, Inc. (since 2011), Director, Cavium, Inc. (since 2013). |
| | |
| 52 | | 2014 iSHARES ANNUAL REPORTTO SHAREHOLDERS |
Trustee and Officer Information (Continued)
iSHARES® U.S. ETF TRUST
Officers
| | | | |
| | | |
| Name (Age) | | Position(s) | | Principal Occupation(s)
During the Past 5 Years |
Manish Mehta (43) | | President
(since 2013). | | Managing Director, BlackRock, Inc. (since 2009); Chief Operating Officer for iShares (since 2009); Head of Strategy and Corporate Development, BGI (2005-2009); Chief of Staff to the CEO, BGI (2005-2009). |
| | |
Jack Gee (55) | | Treasurer and Chief Financial Officer (since 2011). | | Managing Director, BlackRock, Inc. (since 2009); Senior Director of Fund Administration of Intermediary Investor Business, BGI (2009); Director of Fund Administration of Intermediary Investor Business, BGI (2004-2009). |
| | |
Edward B. Baer (46) | | Vice President and Chief Legal Officer (since 2012). | | Managing Director of Legal & Compliance, BlackRock, Inc. (since 2006); Director of Legal & Compliance, BlackRock, Inc. (2004-2006). |
| | |
Eilleen M. Clavere (62) | | Secretary (since 2011). | | Director of Global Fund Administration, BlackRock, Inc. (since 2009); Director of Legal Administration of Intermediary Investor Business, BGI (2006-2009); Legal Counsel and Vice President of Atlas Funds, Atlas Advisers, Inc. and Atlas Securities, Inc. (2005-2006); Counsel at Kirkpatrick & Lockhart LLP (2001-2005). |
| | |
Scott Radell (45) | | Executive Vice President
(since 2012). | | Managing Director, BlackRock, Inc. (since 2009); Head of Portfolio Solutions, BlackRock, Inc. (since 2009); Head of Portfolio Solutions, BGI (2007-2009); Credit Portfolio Manager, BGI (2005-2007); Credit Research Analyst, BGI (2003-2005). |
| | |
Amy Schioldager (52) | | Executive Vice President
(since 2011). | | Senior Managing Director, BlackRock, Inc. (since 2009); Global Head of Index Equity, BGI (2008-2009); Global Head of U.S. Indexing, BGI (2006-2008); Head of Domestic Equity Portfolio Management, BGI (2001-2006). |
| | |
Ira P. Shapiro (51) | | Vice President
(since 2011). | | Managing Director, BlackRock, Inc. (since 2009); Head of Strategic Product Initiatives for iShares (since 2012); Chief Legal Officer, Exchange-Traded Fund Complex (2007-2012); Associate General Counsel, BGI (2004-2009). |
| | | | |
TRUSTEEAND OFFICER INFORMATION | | | 53 | |
Notes:
| | |
| 54 | | 2014 iSHARES ANNUAL REPORTTO SHAREHOLDERS |
For more information visit www.iShares.com or call 1-800-iShares (1-800-474-2737)
This report is intended for the Funds’ shareholders. It may not be distributed to prospective investors unless it is preceded or accompanied by the current prospectus.
Investing involves risk, including possible loss of principal.
The iShares Funds are distributed by BlackRock Investments, LLC (together with its affiliates, “BlackRock”).
A description of the policies that the Funds use to determine how to vote proxies relating to portfolio securities and information about how the Funds voted proxies relating to portfolio securities during the most recent twelve-month period ending June 30 is available without charge, upon request, by calling toll-free 1-800-474-2737; on the Funds’ website at www.iShares.com; and on the U.S. Securities and Exchange Commission (SEC) website at www.sec.gov.
The Funds file their complete schedules of portfolio holdings with the SEC for the first and third quarters of each fiscal year on Form N-Q. The Funds’ Form N-Q is available on the SEC’s website or may be reviewed and copied at the SEC’s Public Reference Room in Washington, D.C. Information on the operation of the Public Reference Room may be obtained by calling 1-800-SEC-0330. The Funds also disclose their complete schedules of portfolio holdings on a daily and monthly basis on the Funds’ website.
©2014 BlackRock, Inc. All rights reserved. iSHARES and BLACKROCK are registered trademarks of BlackRock, Inc. or its subsidiaries. All other marks are the property of their respective owners.
iS-AR-108-1014
OCTOBER 31, 2014
| | | | |
2014 ANNUAL REPORT | | | |  |
iShares U.S. ETF Trust
| Ø | | iShares Interest Rate Hedged High Yield Bond ETF | HYGH | NYSE Arca |
| Ø | | iShares Interest Rate Hedged Corporate Bond ETF | LQDH | NYSE Arca |
Table of Contents
Management’s Discussion of Fund Performance
iSHARES® U.S. ETF TRUST
U.S. CORPORATE BOND MARKET OVERVIEW
The U.S. bond market delivered a modest return with relatively low volatility for the period from May 27, 2014 to October 31, 2014 (the “reporting period”), as the bond market continued to defy many investors’ expectations for higher rates and lower bond prices.
U.S. economic growth increased at a moderate pace during the reporting period, as the total value of goods and services produced in the United States exceeded $17 trillion. At the beginning of the reporting period, the economy bounced back from a sharp contraction related to unusually cold winter weather, logging a relatively rapid 4.6% annualized growth rate during the second calendar quarter of 2014. Economic growth during the entire reporting period averaged approximately 4.0%.
Inflation remained subdued during the reporting period, as the Consumer Price Index increased at a 1.7% annualized pace for the year ending September 2014. The unemployment rate declined steadily, finishing the reporting period at 5.8% in October 2014. Consumer spending also increased, buoyed by the improving job market. Robust corporate profits led to rising business spending, providing additional fuel for the economic recovery.
The U.S. Federal Reserve Bank (the “Fed”) made several influential policy shifts during the reporting period. The Fed continued to trim bond purchases by $10 billion each month, while noting improvement in labor markets and modestly rising inflation. As a result, investors began to speculate about the possibility of future rate hikes by the Fed. At its meeting in October 2014, the Fed officially ended its bond purchasing program, but maintained its commitment to a near zero interest rate policy “for a considerable time.”
In that environment, bond returns varied widely. U.S. Treasuries led the broader bond market, as investors preferred the relative safety of U.S. government debt. Treasuries rallied during the summer of 2014, as low inflation, moderate growth and global uncertainty increased the appeal of U.S. Treasuries. In particular, long-term Treasuries were one of the best performing sectors of the bond market. At the other end of the maturity spectrum, short-term Treasuries delivered muted returns, as the combination of low yield and slightly higher interest rates meant low total returns.
Within corporate bonds, higher-quality bonds generally outperformed riskier high-yield bonds for the reporting period, reflecting investors’ preference for corporations with stronger balance sheets and lower credit risk. High-yield bond issuances, a measure of investor demand, decreased from relatively high levels during the reporting period. Nevertheless, default rates remained at historically low levels, as the vast majority of high-yield issuers remained strong enough to meet their debt obligations. Despite weak returns in the high-yield sector, the broad bond market posted a positive and relatively stable return during the reporting period, as the combination of moderate economic growth, low inflation and accommodative monetary policy proved to be a positive environment for bond performance.
| | | | |
MANAGEMENT’S DISCUSSIONSOF FUND PERFORMANCE | | | 5 | |
Management’s Discussion of Fund Performance
iSHARES® INTEREST RATE HEDGED HIGH YIELD BOND ETF
Performance as of October 31, 2014
| | |
| | | Cumulative Total Returns |
| | | Since Inception |
Fund NAV | | (1.03)% |
Fund Market | | (1.03)% |
Markit iBoxx USD Liquid High Yield Interest Rate Hedged Index | | (0.48)% |
The inception date of the Fund was 5/27/14. The first day of secondary market trading was 5/28/14.
The Markit iBoxx USD Liquid High Yield Interest Rate Hedged Index is an unmanaged index that reflects the duration hedged performance of U.S. dollar-denominated high yield corporate debt.
For the fiscal period ended 10/31/14, the Fund did not have six months of performance and therefore line graphs are not presented.
Past performance is no guarantee of future results. Performance results do not reflect the deduction of taxes that a shareholder would pay on fund distributions or on the redemption or sale of fund shares. See “About Fund Performance” on page 10 for more information.
| | | | | | | | | | | | | | | | | | | | | | | | | | |
| Shareholder Expenses | |
| Actual | | | Hypothetical 5% Return | | | | |
Beginning
Account Value
(5/27/14) a | | | Ending
Account Value
(10/31/14) | | | Expenses Paid
During Period b,c | | | Beginning
Account Value
(5/1/14) | | | Ending
Account Value
(10/31/14) | | | Expenses Paid
During Period b,c | | | Annualized
Expense Ratio b | |
| $ | 1,000.00 | | | $ | 989.70 | | | $ | 0.26 | | | $ | 1,000.00 | | | $ | 1,024.90 | | | $ | 0.31 | | | | 0.06% | |
| a | The beginning of the period (commencement of operations) is May 27, 2014. |
| b | Annualized expenses ratio and expenses paid during the period do not include fees and expenses of the underlying fund in which the Fund invests. |
| c | Expenses are calculated using the Fund’s annualized expense ratio (as disclosed in the table), multiplied by the average account value for the period, multiplied by the number of days in the period (157 days for actual and 184 days for hypothetical expenses) and divided by the number of days in the year (365 days). See “Shareholder Expenses” on page 10 for more information. |
| | |
| 6 | | 2014 iSHARES ANNUAL REPORTTO SHAREHOLDERS |
Management’s Discussion of Fund Performance (Continued)
iSHARES® INTEREST RATE HEDGED HIGH YIELD BOND ETF
The iShares Interest Rate Hedged High Yield Bond ETF (the “Fund”) seeks to mitigate the interest rate risk of a portfolio composed of U.S. dollar-denominated, high yield corporate bonds. The Fund is an actively managed exchange-traded fund that does not seek to replicate the performance of a specified index. For the reporting period from May 27, 2014 (inception date of the Fund) through October 31, 2014, the total return for the Fund was -1.03%, net of fees.
The Fund currently seeks to achieve its investment objective by investing a substantial portion of its assets in one underlying fund, the iShares iBoxx $ High Yield Corporate Bond ETF, which invests in U.S. dollar-denominated high yield corporate bonds. The Fund attempts to mitigate the interest rate risk of the underlying fund by holding short positions in U.S. Treasury futures.
As global economic growth slowed and geopolitical issues escalated, investors sold out of high-yield corporate bonds and sought the relative safety of more secure bonds, particularly U.S. Treasury bonds. As a result, corporate bond prices declined and credit spreads widened, especially in the second half of the reporting period. Credit spreads represent the additional yield an investor would demand on a bond with credit risk compared to a similar duration U.S. Treasury bond. The effect of the widening credit spreads detracted from Fund performance during the reporting period.
The Fund’s short positions in U.S. Treasury futures helped to mitigate interest rate risk during the reporting period, but also detracted from Fund performance as interest rates declined over the period.
PORTFOLIO ALLOCATION1
As of 10/31/14
| | |
| Maturity | | Percentage of
Total Investments2 |
| | | | |
0-1 Year | | | 0.05 | % |
1-5 Years | | | 28.66 | |
5-10 Years | | | 68.50 | |
15-20 Years | | | 1.67 | |
More than 20 Years | | | 1.12 | |
| | | | |
TOTAL | | | 100.00 | % |
| | | | |
BOND CREDIT QUALITY1
As of 10/31/14
| | |
| Moody’s Credit Rating3 | | Percentage of
Total Investments2 |
| | | | |
Baa | | | 0.85 | % |
Ba | | | 44.59 | |
B | | | 42.60 | |
Caa | | | 11.12 | |
Ca | | | 0.11 | |
Not Rated | | | 0.73 | |
| | | | |
TOTAL | | | 100.00 | % |
| | | | |
| 1 | Reflects the portfolio allocation and bond credit quality of the iShares iBoxx $ High Yield Corporate Bond ETF, the underlying fund in which the Fund invests. |
| 2 | Excludes money market funds. |
| 3 | Credit quality ratings shown reflect the ratings assigned by Moody’s Investors Service (“Moody’s”), a widely used independent, nationally recognized statistical rating organization. Moody’s credit ratings are opinions of the credit quality of individual obligations or of an issuer’s general creditworthiness. Investment grade ratings are credit ratings of Baa or higher. Below investment grade ratings are credit ratings of Ba or lower. Unrated investments do not necessarily indicate low credit quality. Credit quality ratings are subject to change. |
| | | | |
MANAGEMENT’S DISCUSSIONSOF FUND PERFORMANCE | | | 7 | |
Management’s Discussion of Fund Performance
iSHARES® INTEREST RATE HEDGED CORPORATE BOND ETF
Performance as of October 31, 2014
| | |
| | | Cumulative Total Returns |
| | | Since Inception |
Fund NAV | | (1.05)% |
Fund Market | | (1.22)% |
Markit iBoxx USD Liquid Investment Grade Interest Rate Hedged Index | | (0.77)% |
The inception date of the Fund was 5/27/14. The first day of secondary market trading was 5/28/14.
The Markit iBoxx USD Liquid Investment Grade Interest Rate Hedged Index is an unmanaged index that is designed to reflect the duration hedged performance of U.S. dollar-denominated investment grade corporate debt.
For the fiscal period ended 10/31/14, the Fund did not have six months of performance and therefore line graphs are not presented.
Past performance is no guarantee of future results. Performance results do not reflect the deduction of taxes that a shareholder would pay on fund distributions or on the redemption or sale of fund shares. See “About Fund Performance” on page 10 for more information.
| | | | | | | | | | | | | | | | | | | | | | | | | | |
| Shareholder Expenses | |
| Actual | | | Hypothetical 5% Return | | | | |
Beginning
Account Value
(5/27/14) a | | | Ending
Account Value
(10/31/14) | | | Expenses Paid
During Period b,c | | | Beginning
Account Value
(5/1/14) | | | Ending
Account Value
(10/31/14) | | | Expenses Paid
During Period b,c | | | Annualized
Expense Ratio b | |
| $ | 1,000.00 | | | $ | 989.50 | | | $ | 0.47 | | | $ | 1,000.00 | | | $ | 1,024.70 | | | $ | 0.56 | | | | 0.11% | |
| a | The beginning of the period (commencement of operations) is May 27, 2014. |
| b | Annualized expenses ratio and expenses paid during the period do not include fees and expenses of the underlying fund in which the Fund invests. |
| c | Expenses are calculated using the Fund’s annualized expense ratio (as disclosed in the table), multiplied by the average account value for the period, multiplied by the number of days in the period (157 days for actual and 184 days for hypothetical expenses) and divided by the number of days in the year (365 days). See “Shareholder Expenses” on page 10 for more information. |
| | |
| 8 | | 2014 iSHARES ANNUAL REPORTTO SHAREHOLDERS |
Management’s Discussion of Fund Performance (Continued)
iSHARES® INTEREST RATE HEDGED CORPORATE BOND ETF
The iShares Interest Rate Hedged Corporate Bond ETF (the “Fund”) seeks to mitigate the interest rate risk of a portfolio composed of U.S. dollar-denominated, investment-grade corporate bonds. The Fund is an actively managed exchange-traded fund that does not seek to replicate the performance of a specified index. For the reporting period from May 27, 2014 (inception date of the Fund) through October 31, 2014, the total return for the Fund was -1.05%, net of fees.
The Fund currently seeks to achieve its investment objective by investing a substantial portion of its assets in one underlying fund, the iShares iBoxx $ Investment Grade Corporate Bond ETF, which invests in U.S. dollar-denominated investment-grade corporate bonds. The Fund attempts to mitigate the interest rate risk of the underlying fund by holding short positions in U.S. Treasury futures.
As global economic growth slowed and geopolitical issues escalated, investors sold out of investment-grade corporate bonds and sought the relative safety of more secure bonds, particularly U.S. Treasury bonds. As a result, corporate bond prices declined and credit spreads widened, especially in the second half of the reporting period. Credit spreads represent the additional yield an investor would demand on a bond with credit risk compared to a similar duration U.S. Treasury bond. The effect of the widening credit spreads detracted from Fund performance during the reporting period.
The Fund’s short positions in U.S. Treasury futures helped to mitigate interest rate risk during the reporting period, but also detracted from Fund performance as interest rates declined over the period.
PORTFOLIO ALLOCATION1
As of 10/31/14
| | |
| Maturity | | Percentage of
Total Investments2 |
| | | | |
1-5 Years | | | 28.29 | % |
5-10 Years | | | 39.03 | |
10-15 Years | | | 1.26 | |
15-20 Years | | | 4.22 | |
More than 20 Years | | | 27.20 | |
| | | | |
TOTAL | | | 100.00 | % |
| | | | |
BOND CREDIT QUALITY1
As of 10/31/14
| | |
| Moody’s Credit Rating3 | | Percentage of
Total Investments2 |
| | | | |
Aaa | | | 0.87 | % |
Aa | | | 13.08 | |
A | | | 41.24 | |
Baa | | | 44.13 | |
Ba | | | 0.26 | |
Not Rated | | | 0.42 | |
| | | | |
TOTAL | | | 100.00 | % |
| | | | |
| 1 | Reflects the portfolio allocation and bond credit quality of the iShares iBoxx $ Investment Grade Corporate Bond ETF, the underlying fund in which the Fund invests. |
| 2 | Excludes money market funds. |
| 3 | Credit quality ratings shown reflect the ratings assigned by Moody’s Investors Service (“Moody’s”), a widely used independent, nationally recognized statistical rating organization. Moody’s credit ratings are opinions of the credit quality of individual obligations or of an issuer’s general creditworthiness. Investment grade ratings are credit ratings of Baa or higher. Below investment grade ratings are credit ratings of Ba or lower. Unrated investments do not necessarily indicate low credit quality. Credit quality ratings are subject to change. |
| | | | |
MANAGEMENT’S DISCUSSIONSOF FUND PERFORMANCE | | | 9 | |
About Fund Performance
Past performance is no guarantee of future results. Current performance may be lower or higher than the performance data quoted. Performance data current to the most recent month-end is available at www.iShares.com. Performance results assume reinvestment of all dividends and capital gain distributions and do not reflect the deduction of taxes that a shareholder would pay on fund distributions or on the redemption or sale of fund shares. The investment return and principal value of shares will vary with changes in market conditions. Shares may be worth more or less than their original cost when they are redeemed or sold in the market. Performance for certain funds may reflect a waiver of a portion of investment management fees. Without such waiver, performance would have been lower.
Net asset value or “NAV” is the value of one share of a fund as calculated in accordance with the standard formula for valuing mutual fund shares. The price used to calculate market return (“Market Price”) is determined by using the midpoint between the highest bid and the lowest offer on the primary stock exchange on which shares of a fund are listed for trading, as of the time that such fund’s NAV is calculated. Since shares of a fund may not have traded in the secondary market until after the fund’s inception, for the period from inception to the first day of secondary trading, the NAV of the fund is used as a proxy for the Market Price to calculate market returns. Market and NAV returns assume that dividends and capital gain distributions have been reinvested at Market Price and NAV, respectively. Also, market returns do not include brokerage commissions that may be payable on secondary market transactions. If brokerage commissions were included, market returns would be lower.
Shareholder Expenses
As a shareholder of a Fund, you incur two types of costs: (1) transaction costs, including brokerage commissions on purchases and sales of fund shares and (2) ongoing costs, including management fees and other fund expenses. The expense example, which is based on an investment of $1,000 invested on May 1, 2014 (or commencement of operations, as applicable) and held through October 31, 2014, is intended to help you understand your ongoing costs (in dollars and cents) of investing in a Fund and to compare these costs with the ongoing costs of investing in other funds.
Actual Expenses — The table provides information about actual account values and actual expenses. Annualized expense ratios reflect contractual and voluntary fee waivers, if any. To estimate the expenses that you paid on your account over the period, simply divide your account value by $1,000 (for example, an $8,600 account value divided by $1,000 = 8.6), then multiply the result by the number for your Fund under the heading entitled “Expenses Paid During Period.”
Hypothetical Example for Comparison Purposes — The table also provides information about hypothetical account values and hypothetical expenses based on each Fund’s actual expense ratio and an assumed rate of return of 5% per year before expenses. You may use this information to compare the ongoing costs of investing in your Fund and other funds. To do so, compare this 5% hypothetical example with the 5% hypothetical examples that appear in the shareholder reports of the other funds.
Please note that the expenses shown in the table are meant to highlight your ongoing costs only and do not reflect any transactional costs, such as brokerage commissions paid on purchases and sales of fund shares. Therefore, the hypothetical examples are useful in comparing ongoing costs only and will not help you determine the relative total costs of owning different funds. In addition, if these transactional costs were included, your costs would have been higher.
| | |
| 10 | | 2014 iSHARES ANNUAL REPORTTO SHAREHOLDERS |
Schedule of Investments
iSHARES® INTEREST RATE HEDGED HIGH YIELD BOND ETF
October 31, 2014
| | | | | | | | |
| Security | | Shares | | | Value | |
| | | | | | | | |
INVESTMENT COMPANIES — 98.11% | |
| |
EXCHANGE-TRADED FUNDS — 98.11% | | | | | |
iShares iBoxx $ High Yield Corporate Bond ETFa | | | 462,500 | | | $ | 42,795,125 | |
| | | | | | | | |
| | | | | | | 42,795,125 | |
| | | | | | | | |
TOTAL INVESTMENT COMPANIES | | | | | |
(Cost: $43,459,980) | | | | 42,795,125 | |
|
SHORT-TERM INVESTMENTS — 1.23% | |
| |
MONEY MARKET FUNDS — 1.23% | | | | | |
BlackRock Cash Funds: Treasury,
SL Agency Shares | | | | | | | | |
0.00%a,b | | | 536,842 | | | | 536,842 | |
| | | | | | | | |
| | | | | | | 536,842 | |
| | | | | | | | |
TOTAL SHORT-TERM INVESTMENTS | | | | | |
(Cost: $536,842) | | | | 536,842 | |
| | | | | | | | |
TOTAL INVESTMENTS
IN SECURITIES — 99.34% | | | | | |
(Cost: $43,996,822) | | | | 43,331,967 | |
Other Assets, Less Liabilities — 0.66% | | | | 286,612 | |
| | | | | | | | |
NET ASSETS — 100.00% | | | $ | 43,618,579 | |
| | | | | | | | |
| a | Affiliated issuer. See Note 2. |
| b | The rate quoted is the annualized seven-day yield of the fund at period end. |
Open futures contracts as of October 31, 2014 were as follows:
| | | | | | | | | | | | | | | | | | | | |
| Issue | | Number of
Contracts
Purchased (Sold) | | | Expiration | | | Exchange | | | Notional
Value | | | Unrealized
Appreciation
(Depreciation) | |
| 2-Year U.S. Treasury Note | | | (68) | | | | Dec. 2014 | | | | Chicago Board of Trade | | | $ | (14,930,250) | | | $ | (51,301) | |
| 5-Year U.S. Treasury Note | | | (130) | | | | Dec. 2014 | | | | Chicago Board of Trade | | | | (15,525,859) | | | | (134,024) | |
| 10-Year U.S. Treasury Note | | | (78) | | | | Dec. 2014 | | | | Chicago Board of Trade | | | | (9,856,031) | | | | (98,793) | |
| Long U.S. Treasury Bond | | | (3) | | | | Dec. 2014 | | | | Chicago Board of Trade | | | | (423,281) | | | | (5,410) | |
| | | | | | | | | | | | | | | | | | | | |
| Net Unrealized Depreciation | | | $ | (289,528) | |
| | | | | | | | | | | | | | | | | | | | |
| | | | | | | | | | | | | | | | | | | | | |
See notes to financial statements.
| | | | |
SCHEDULESOF INVESTMENTS | | | 11 | |
Schedule of Investments
iSHARES® INTEREST RATE HEDGED CORPORATE BOND ETF
October 31, 2014
| | | | | | | | |
| Security | | Shares | | | Value | |
| | | | | | | | |
INVESTMENT COMPANIES — 96.49% | |
| |
EXCHANGE-TRADED FUNDS — 96.49% | | | | | |
iShares iBoxx $ Investment Grade Corporate Bond ETFa | | | 79,200 | | | $ | 9,451,728 | |
| | | | | | | | |
| | | | | | | 9,451,728 | |
| | | | | | | | |
TOTAL INVESTMENT COMPANIES | | | | | |
(Cost: $9,450,830) | | | | 9,451,728 | |
|
SHORT-TERM INVESTMENTS — 2.16% | |
| |
MONEY MARKET FUNDS — 2.16% | | | | | |
BlackRock Cash Funds: Treasury,
SL Agency Shares | | | | | | | | |
0.00%a,b | | | 211,291 | | | | 211,291 | |
| | | | | | | | |
| | | | | | | 211,291 | |
| | | | | | | | |
TOTAL SHORT-TERM INVESTMENTS | | | | | |
(Cost: $211,291) | | | | 211,291 | |
| | | | | | | | |
TOTAL INVESTMENTS
IN SECURITIES — 98.65% | | | | | |
(Cost: $9,662,121) | | | | 9,663,019 | |
Other Assets, Less Liabilities — 1.35% | | | | 131,921 | |
| | | | | | | | |
NET ASSETS — 100.00% | | | $ | 9,794,940 | |
| | | | | | | | |
| a | Affiliated issuer. See Note 2. |
| b | The rate quoted is the annualized seven-day yield of the fund at period end. |
Open futures contracts as of October 31, 2014 were as follows:
| | | | | | | | | | | | | | | | | | | | |
| Issue | | Number of
Contracts
Purchased (Sold) | | | Expiration | | | Exchange | | | Notional
Value | | | Unrealized
Appreciation
(Depreciation) | |
| 2-Year U.S. Treasury Note | | | (4) | | | | Dec. 2014 | | | | Chicago Board of Trade | | | $ | (878,250) | | | $ | (2,756) | |
| 5-Year U.S. Treasury Note | | | (20) | | | | Dec. 2014 | | | | Chicago Board of Trade | | | | (2,388,594) | | | | (18,628) | |
| 10-Year U.S. Treasury Note | | | (23) | | | | Dec. 2014 | | | | Chicago Board of Trade | | | | (2,906,266) | | | | (24,648) | |
| Long U.S. Treasury Bond | | | (13) | | | | Dec. 2014 | | | | Chicago Board of Trade | | | | (1,834,219) | | | | (19,862) | |
| Ultra Long U.S. Bond | | | (9) | | | | Dec. 2014 | | | | Chicago Board of Trade | | | | (1,411,313) | | | | (28,419) | |
| | | | | | | | | | | | | | | | | | | | |
| Net Unrealized Depreciation | | | $ | (94,313) | |
| | | | | | | | | | | | | | | | | | | | |
| | | | | | | | | | | | | | | | | | | | | |
See notes to financial statements.
| | |
| 12 | | 2014 iSHARES ANNUAL REPORTTO SHAREHOLDERS |
Statements of Assets and Liabilities
iSHARES® U.S. ETF TRUST
October 31, 2014
| | | | | | | | |
| | | iShares
Interest Rate
Hedged High Yield
Bond ETF | | | iShares
Interest Rate
Hedged Corporate
Bond ETF | |
| | |
ASSETS | | | | | | | | |
Investments, at cost: | | | | | | | | |
Affiliated (Note 2) | | $ | 43,996,822 | | | $ | 9,662,121 | |
| | | | | | | | |
Total cost of investments | | $ | 43,996,822 | | | $ | 9,662,121 | |
| | | | | | | | |
Investments in securities, at fair value (Note 1): | | | | | | | | |
Affiliated (Note 2) | | $ | 43,331,967 | | | $ | 9,663,019 | |
| | | | | | | | |
Total fair value of investments | | | 43,331,967 | | | | 9,663,019 | |
Cash pledged to broker | | | 241,000 | | | | 112,000 | |
Receivables: | | | | | | | | |
Futures variation margin | | | 47,703 | | | | 20,797 | |
| | | | | | | | |
Total Assets | | | 43,620,670 | | | | 9,795,816 | |
| | | | | | | | |
| | |
LIABILITIES | | | | | | | | |
Payables: | | | | | | | | |
Investment advisory fees (Note 2) | | | 2,091 | | | | 876 | |
| | | | | | | | |
Total Liabilities | | | 2,091 | | | | 876 | |
| | | | | | | | |
| | |
NET ASSETS | | $ | 43,618,579 | | | $ | 9,794,940 | |
| | | | | | | | |
| | |
Net assets consist of: | | | | | | | | |
Paid-in capital | | $ | 44,698,218 | | | $ | 10,031,329 | |
Accumulated net realized loss | | | (125,256 | ) | | | (142,974 | ) |
Net unrealized depreciation | | | (954,383 | ) | | | (93,415 | ) |
| | | | | | | | |
NET ASSETS | | $ | 43,618,579 | | | $ | 9,794,940 | |
| | | | | | | | |
| | |
Shares outstandinga | | | 450,000 | | | | 100,000 | |
| | | | | | | | |
| | |
Net asset value per share | | $ | 96.93 | | | $ | 97.95 | |
| | | | | | | | |
| a | No par value, unlimited number of shares authorized. |
See notes to financial statements.
Statements of Operations
iSHARES® U.S. ETF TRUST
Period ended October 31, 2014
| | | | | | | | |
| | | iShares
Interest Rate
Hedged High Yield
Bond ETFa | | | iShares
Interest Rate
Hedged Corporate
Bond ETFa | |
| | |
NET INVESTMENT INCOME | | | | | | | | |
Dividends — affiliated (Note 2) | | $ | 518,102 | | | $ | 136,766 | |
| | | | | | | | |
Total investment income | | | 518,102 | | | | 136,766 | |
| | | | | | | | |
| | |
EXPENSES | | | | | | | | |
Investment advisory fees (Note 2) | | | 75,460 | | | | 12,818 | |
| | | | | | | | |
Total expenses | | | 75,460 | | | | 12,818 | |
Less investment advisory fees waived (Note 2) | | | (68,782 | ) | | | (8,292 | ) |
| | | | | | | | |
Net expenses | | | 6,678 | | | | 4,526 | |
| | | | | | | | |
Net investment income | | | 511,424 | | | | 132,240 | |
| | | | | | | | |
| | |
NET REALIZED AND UNREALIZED GAIN (LOSS) | | | | | | | | |
Net realized gain (loss) from: | | | | | | | | |
Investments — affiliated (Note 2) | | | (50,325 | ) | | | 6,162 | |
Futures contracts | | | (74,931 | ) | | | (149,136 | ) |
| | | | | | | | |
Net realized loss | | | (125,256 | ) | | | (142,974 | ) |
| | | | | | | | |
Net change in unrealized appreciation/depreciation on: | | | | | | | | |
Investments | | | (664,855 | ) | | | 898 | |
Futures contracts | | | (289,528 | ) | | | (94,313 | ) |
| | | | | | | | |
Net change in unrealized appreciation/depreciation | | | (954,383 | ) | | | (93,415 | ) |
| | | | | | | | |
Net realized and unrealized loss | | | (1,079,639 | ) | | | (236,389 | ) |
| | | | | | | | |
NET DECREASE IN NET ASSETS RESULTING FROM OPERATIONS | | $ | (568,215 | ) | | $ | (104,149 | ) |
| | | | | | | | |
| a | For the period from May 27, 2014 (commencement of operations) to October 31, 2014. |
See notes to financial statements.
| | |
| 14 | | 2014 iSHARES ANNUAL REPORTTO SHAREHOLDERS |
Statements of Changes in Net Assets
iSHARES® U.S. ETF TRUST
| | | | | | | | |
| | | iShares
Interest Rate
Hedged High Yield
Bond ETF | | | iShares
Interest Rate
Hedged Corporate
Bond ETF | |
| | | Period from
May 27, 2014a to
October 31, 2014 | | | Period from
May 27, 2014a to October 31, 2014 | |
| | |
INCREASE (DECREASE) IN NET ASSETS | | | | | | | | |
| | |
OPERATIONS: | | | | | | | | |
Net investment income | | $ | 511,424 | | | $ | 132,240 | |
Net realized loss | | | (125,256 | ) | | | (142,974 | ) |
Net change in unrealized appreciation/depreciation | | | (954,383 | ) | | | (93,415 | ) |
| | | | | | | | |
Net decrease in net assets resulting from operations | | | (568,215 | ) | | | (104,149 | ) |
| | | | | | | | |
| | |
DISTRIBUTIONS TO SHAREHOLDERS: | | | | | | | | |
From net investment income | | | (511,424 | ) | | | (132,240 | ) |
Return of capital | | | (2,091 | ) | | | (884 | ) |
| | | | | | | | |
Total distributions to shareholders | | | (513,515 | ) | | | (133,124 | ) |
| | | | | | | | |
| | |
CAPITAL SHARE TRANSACTIONS: | | | | | | | | |
Proceeds from shares sold | | | 44,700,309 | | | | 10,032,213 | |
| | | | | | | | |
Net increase in net assets from capital share transactions | | | 44,700,309 | | | | 10,032,213 | |
| | | | | | | | |
INCREASE IN NET ASSETS | | | 43,618,579 | | | | 9,794,940 | |
| | |
NET ASSETS | | | | | | | | |
Beginning of period | | | — | | | | — | |
| | | | | | | | |
End of period | | $ | 43,618,579 | | | $ | 9,794,940 | |
| | | | | | | | |
| | |
SHARES ISSUED | | | | | | | | |
Shares sold | | | 450,000 | | | | 100,000 | |
| | | | | | | | |
Net increase in shares outstanding | | | 450,000 | | | | 100,000 | |
| | | | | | | | |
| a | Commencement of operations. |
See notes to financial statements.
Financial Highlights
iSHARES® U.S. ETF TRUST
(For a share outstanding throughout the period)
iShares Interest Rate Hedged High Yield Bond ETF
| | | | |
| | | Period from
May 27, 2014a to
Oct. 31, 2014 | |
Net asset value, beginning of period | | $ | 100.10 | |
| | | | |
Income from investment operations: | | | | |
Net investment incomeb | | | 1.86 | |
Net realized and unrealized lossc | | | (2.87 | ) |
| | | | |
Total from investment operations | | | (1.01 | ) |
| | | | |
Less distributions from: | | | | |
Net investment income | | | (2.15 | ) |
Return of capital | | | (0.01 | ) |
| | | | |
Total distributions | | | (2.16 | ) |
| | | | |
Net asset value, end of period | | $ | 96.93 | |
| | | | |
| |
Total return | | | (1.03 | )%d |
| | | | |
| |
Ratios/Supplemental data: | | | | |
Net assets, end of period (000s) | | $ | 43,619 | |
Ratio of expenses to average net assetse,f | | | 0.06 | % |
Ratio of expenses to average net assets prior to waived feese,f | | | 0.65 | % |
Ratio of net investment income to average net assetse | | | 4.41 | % |
Portfolio turnover rateg,h | | | 3 | % |
| a | Commencement of operations. |
| b | Based on average shares outstanding throughout the period. |
| c | The amount reported for a share outstanding may not accord with the change in aggregate gains and losses in securities for the fiscal period due to the timing of capital share transactions in relation to the fluctuating market values of the Fund’s investments in its underlying fund. |
| e | Annualized for periods of less than one year. |
| f | The Fund indirectly bears its proportionate share of fees and expenses incurred by the underlying fund in which the Fund is invested. This ratio does not include these indirect fees and expenses. |
| g | Portfolio turnover rate excludes portfolio securities received or delivered as a result of processing capital share transactions in Creation Units. |
| h | Portfolio turnover rate excludes the portfolio activity of the underlying fund in which the Fund is invested. |
See notes to financial statements.
| | |
| 16 | | 2014 iSHARES ANNUAL REPORTTO SHAREHOLDERS |
Financial Highlights (Continued)
iSHARES® U.S. ETF TRUST
(For a share outstanding throughout the period)
iShares Interest Rate Hedged Corporate Bond ETF
| | | | |
| | | Period from
May 27, 2014a to
Oct. 31, 2014 | |
Net asset value, beginning of period | | $ | 100.32 | |
| | | | |
Income from investment operations: | | | | |
Net investment incomeb | | | 1.32 | |
Net realized and unrealized lossc | | | (2.36 | ) |
| | | | |
Total from investment operations | | | (1.04 | ) |
| | | | |
Less distributions from: | | | | |
Net investment income | | | (1.32 | ) |
Return of capital | | | (0.01 | ) |
| | | | |
Total distributions | | | (1.33 | ) |
| | | | |
Net asset value, end of period | | $ | 97.95 | |
| | | | |
| |
Total return | | | (1.05 | )%d |
| | | | |
| |
Ratios/Supplemental data: | | | | |
Net assets, end of period (000s) | | $ | 9,795 | |
Ratio of expenses to average net assetse,f | | | 0.11 | % |
Ratio of expenses to average net assets prior to waived feese,f | | | 0.30 | % |
Ratio of net investment income to average net assetse | | | 3.09 | % |
Portfolio turnover rateg,h | | | 4 | % |
| a | Commencement of operations. |
| b | Based on average shares outstanding throughout the period. |
| c | The amount reported for a share outstanding may not accord with the change in aggregate gains and losses in securities for the fiscal period due to the timing of capital share transactions in relation to the fluctuating market values of the Fund’s investments in its underlying fund. |
| e | Annualized for periods of less than one year. |
| f | The Fund indirectly bears its proportionate share of fees and expenses incurred by the underlying fund in which the Fund is invested. This ratio does not include these indirect fees and expenses. |
| g | Portfolio turnover rate excludes portfolio securities received or delivered as a result of processing capital share transactions in Creation Units. |
| h | Portfolio turnover rate excludes the portfolio activity of the underlying fund in which the Fund is invested. |
See notes to financial statements.
Notes to Financial Statements
iSHARES® U.S. ETF TRUST
iShares U.S. ETF Trust (the “Trust”) is registered under the Investment Company Act of 1940, as amended (the “1940 Act”), as an open-end management investment company. The Trust was established as a Delaware statutory trust pursuant to an Agreement and Declaration of Trust dated June 21, 2011.
These financial statements relate only to the following funds (each, a “Fund,” and collectively, the “Funds”):
| | |
| iShares ETF | | Diversification
Classification |
Interest Rate Hedged High Yield Bonda | | Diversified |
Interest Rate Hedged Corporate Bonda | | Diversified |
| | a | | The Fund commenced operations on May 27, 2014. |
Currently each Fund seeks to achieve its investment objective by investing a substantial portion of its assets in an exchange-traded fund of iShares Trust (an “underlying fund”), an affiliate of the Funds. The financial statements and schedules of investments for the underlying funds can be found elsewhere in this report and should be read in conjunction with the Funds’ financial statements.
Pursuant to the Trust’s organizational documents, the Funds’ officers and trustees are indemnified against certain liabilities that may arise out of the performance of their duties to the Funds. Additionally, in the normal course of business, the Funds enter into contracts with service providers that contain general indemnification clauses. The Funds’ maximum exposure under these arrangements is unknown as this would involve future claims that may be made against the Funds that have not yet occurred.
| 1. | SIGNIFICANT ACCOUNTING POLICIES |
The following significant accounting policies are consistently followed by the Funds in the preparation of their financial statements in conformity with accounting principles generally accepted in the United States of America (“U.S. GAAP”). The preparation of financial statements in conformity with U.S. GAAP requires management to make certain estimates and assumptions that affect the reported amounts of assets and liabilities and disclosures of contingent assets and liabilities at the date of the financial statements and the reported amounts of revenue and expenses during the reporting period. Actual results could differ from those estimates. Each Fund is considered an investment company under U.S. GAAP and follows the accounting and reporting guidance applicable to investment companies in the Financial Accounting Standards Board Accounting Standards Codification Topic 946 (ASC 946).
SECURITY VALUATION
Each Fund’s investments are valued at fair value each day that the Fund’s listing exchange is open and, for financial reporting purposes, as of the report date should the reporting period end on a day that the Fund’s listing exchange is not open. U.S. GAAP defines fair value as the price a fund would receive to sell an asset or pay to transfer a liability in an orderly transaction between market participants at the measurement date. The BlackRock Global Valuation Methodologies Committee (the “Global Valuation Committee”) provides oversight of the valuation of investments for the Funds. The investments of each Fund are valued pursuant to policies and procedures developed by the Global Valuation Committee and approved by the Board of Trustees of the Trust (the “Board”).
| | • | | Exchange-traded funds and closed-end funds traded on a recognized securities exchange are valued at that day’s last reported trade price or the official closing price, as applicable, on the exchange where the fund is primarily traded. Funds traded on a recognized exchange for which there were no sales on that day are valued at the last traded price. |
| | |
| 18 | | 2014 iSHARES ANNUAL REPORTTO SHAREHOLDERS |
Notes to Financial Statements (Continued)
iSHARES® U.S. ETF TRUST
| | • | | Open-end U.S. mutual funds are valued at that day’s published net asset value (NAV). |
| | • | | Futures contracts are valued at that day’s last reported settlement price on the exchange where the contract is traded. |
In the event that application of these methods of valuation results in a price for an investment which is deemed not to be representative of the fair value of such investment or if a price is not available, the investment will be valued based upon other available factors deemed relevant by the Global Valuation Committee, in accordance with policies approved by the Board. These factors include but are not limited to (i) attributes specific to the investment; (ii) the principal market for the investment; (iii) the customary participants in the principal market for the investment; (iv) data assumptions by market participants for the investment, if reasonably available; (v) quoted prices for similar investments in active markets; and (vi) other factors, such as future cash flows, interest rates, yield curves, volatilities, prepayment speeds, loss severities, credit risks and/or default rates. Valuations based on such factors are reported to the Board on a quarterly basis.
The Global Valuation Committee employs various methods for calibrating valuation approaches for investments where an active market does not exist, including regular due diligence of the Trust’s pricing vendors, a regular review of key inputs and assumptions, transactional back-testing or disposition analysis to compare unrealized gains and losses to realized gains and losses, reviews of missing or stale prices, reviews of large movements in market values, and reviews of market related activity.
Various inputs are used in determining the fair value of financial instruments. Inputs may be based on independent market data (“observable inputs”) or they may be internally developed (“unobservable inputs”). These inputs are categorized into a disclosure hierarchy consisting of three broad levels for financial reporting purposes. The level of a value determined for a financial instrument within the fair value hierarchy is based on the lowest level of any input that is significant to the fair value measurement in its entirety. The categorization of a value determined for a financial instrument within the hierarchy is based upon the pricing transparency of the instrument and is not necessarily an indication of the risk associated with investing in the instrument. The three levels of the fair value hierarchy are as follows:
| | • | | Level 1 — Unadjusted quoted prices in active markets for identical assets or liabilities; |
| | • | | Level 2 — Inputs other than quoted prices included within Level 1 that are observable for the asset or liability either directly or indirectly, including quoted prices for similar assets or liabilities in active markets, quoted prices for identical or similar assets or liabilities in markets that are not considered to be active, inputs other than quoted prices that are observable for the asset or liability (such as exchange rates, financing terms, interest rates, yield curves, volatilities, prepayment speeds, loss severities, credit risks and default rates) or other market-corroborated inputs; and |
| | • | | Level 3 — Unobservable inputs for the asset or liability, including the Global Valuation Committee’s assumptions used in determining the fair value of investments. |
Changes in valuation techniques may result in transfers in or out of an assigned level within the disclosure hierarchy. In accordance with the Trust’s policy, transfers between different levels of the fair value hierarchy are deemed to have occurred as of the beginning of the reporting period.
As of October 31, 2014, the value of each of the Funds’ investments was classified as Level 1. The breakdown of each Fund’s investments into major categories is disclosed in its respective schedule of investments.
| | | | |
NOTESTO FINANCIAL STATEMENTS | | | 19 | |
Notes to Financial Statements (Continued)
iSHARES® U.S. ETF TRUST
SECURITY TRANSACTIONS AND INCOME RECOGNITION
Security transactions are accounted for on trade date. Dividend income and capital gain distributions from the underlying funds, if any, are recognized on the ex-dividend date. Interest income is accrued daily. Realized gains and losses on investment transactions are determined using the specific identification method.
DISTRIBUTIONS TO SHAREHOLDERS
Dividends and distributions paid by each Fund are recorded on the ex-dividend dates. Distributions are determined on a tax basis and may differ from net investment income and net realized capital gains for financial reporting purposes. Dividends and distributions are paid in U.S. dollars and cannot be automatically reinvested in additional shares of the Funds.
RECENT ACCOUNTING STANDARD
In June 2014, the Financial Accounting Standards Board issued guidance to improve the financial reporting of reverse repurchase agreements and other similar transactions. The guidance will require expanded disclosure for entities that enter into reverse repurchase agreements and similar transactions accounted for as secured borrowings, including securities lending. The guidance is effective for financial statements for fiscal years beginning after December 15, 2014, and interim periods within those fiscal years. Management is evaluating the impact, if any, of this guidance on the Funds’ financial statements and disclosures.
| 2. | INVESTMENT ADVISORY AGREEMENT AND OTHER TRANSACTIONS WITH AFFILIATES |
Pursuant to an Investment Advisory Agreement with the Trust, BlackRock Fund Advisors (“BFA”) manages the investment of each Fund’s assets. BFA is a California corporation indirectly owned by BlackRock, Inc. (“BlackRock”). Under the Investment Advisory Agreement, BFA is responsible for substantially all expenses of the Funds, except interest, taxes, brokerage commissions and other expenses connected with the execution of portfolio transactions, distribution fees, litigation expenses and any extraordinary expenses.
For its investment advisory services to the iShares Interest Rate Hedged High Yield Bond ETF and the iShares Interest Rate Hedged Corporate Bond ETF, BFA is entitled to an annual investment advisory fee of 0.65% and 0.30%, respectively, based on the average daily net assets of each Fund. In addition, each Fund indirectly pays its pro rata share of fees and expenses attributable to its investments in other registered investment companies (“acquired fund fees and expenses”). The total of the investment advisory fee and acquired fund fees and expenses is each Fund’s total annual fund operating expense.
For each Fund, BFA has contractually agreed to waive a portion of the investment advisory fee through February 29, 2016 in an amount equal to the acquired fund fees and expenses.
For the iShares Interest Rate Hedged High Yield Bond ETF, BFA has contractually agreed to reduce its investment advisory fee for the Fund through February 29, 2016 on assets attributable to the Fund’s investments in the iShares iBoxx $ High Yield Corporate Bond ETF (“HYG”) (and those assets used to hedge the securities in HYG) such that the total annual fund operating expenses on such assets are equal to the investment advisory fee of HYG plus 0.15%. BFA has also contractually agreed to waive the Fund’s investment advisory fee through February 29, 2016 by an additional amount such that the Fund’s total annual fund operating expenses do not exceed 0.55% of average daily net assets.
For the iShares Interest Rate Hedged Corporate Bond ETF, BFA has contractually agreed to reduce its investment advisory fee through February 29, 2016 on assets attributable to the Fund’s investments in the iShares iBoxx $ Investment Grade Corporate Bond ETF (“LQD”) (and those assets used to hedge the securities in LQD) such that the total annual fund operating expenses on such assets are equal to the investment advisory fee of LQD plus 0.15%. BFA has also contractually agreed to waive the Fund’s
| | |
| 20 | | 2014 iSHARES ANNUAL REPORTTO SHAREHOLDERS |
Notes to Financial Statements (Continued)
iSHARES® U.S. ETF TRUST
investment advisory fee through February 29, 2016 by an additional amount such that the Fund’s total annual fund operating expenses do not exceed 0.25% of average daily net assets.
BlackRock Investments, LLC, an affiliate of BFA, is the distributor for each Fund. Pursuant to the distribution agreement, BFA is responsible for any fees or expenses for distribution services provided to the Funds.
Each Fund may invest its positive cash balances in certain money market funds managed by BFA or an affiliate. The income earned on these temporary cash investments is included in “Interest—affiliated” in the statements of operations.
The PNC Financial Services Group, Inc. is the largest stockholder of BlackRock and is considered to be an affiliate of the Funds for 1940 Act purposes.
Investments in issuers considered to be affiliates of the Funds (excluding money market funds) during the period ended October 31, 2014, for purposes of Section 2(a)(3) of the 1940 Act, were as follows:
| | | | | | | | | | | | | | | | | | | | | | | | | | | | |
iShares ETF and
Name of Affiliated Issuer | | Shares Held at Beginning
of Period | | | Shares
Purchased | | | Shares
Sold | | | Shares Held
at End
of Period | | | Value at
End
of Period | | | Dividend
Income | | | Net
Realized
Gain (Loss) | |
Interest Rate Hedged High Yield Bond | | | | | | | | | | | | | | | | | | | | | | | | | | | | |
iShares iBoxx $ High Yield Corporate Bond ETF | | | — | | | | 476,575 | | | | (14,075 | ) | | | 462,500 | | | $ | 42,795,125 | | | $ | 518,102 | | | $ | (50,325 | ) |
| | | | | | | | | | | | | | | | | | | | | | | | | | | | |
| | | | | | | |
Interest Rate Hedged Corporate Bond | | | | | | | | | | | | | | | | | | | | | | | | | | | | |
iShares iBoxx $ Investment Grade Corporate Bond ETF | | | — | | | | 86,150 | | | | (6,950 | ) | | | 79,200 | | | $ | 9,451,728 | | | $ | 136,766 | | | $ | 6,162 | |
| | | | | | | | | | | | | | | | | | | | | | | | | | | | |
| | | | | | | | | | | | | | | | | | | | | | | | | | | | | |
Certain trustees and officers of the Trust are also officers of BlackRock Institutional Trust Company, N.A. and/or BFA.
| 3. | INVESTMENT PORTFOLIO TRANSACTIONS |
Purchases and sales of investments (excluding in-kind transactions and short-term investments) for the period ended October 31, 2014 were as follows:
| | | | | | | | |
| iShares ETF | | Purchases | | | Sales | |
Interest Rate Hedged High Yield Bond | | $ | 612,888 | | | $ | 1,284,509 | |
Interest Rate Hedged Corporate Bond | | | 404,099 | | | | 835,644 | |
In-kind transactions (see Note 4) for the period ended October 31, 2014 were as follows:
| | | | | | | | |
| iShares ETF | | In-kind
Purchases | | | In-kind
Sales | |
Interest Rate Hedged High Yield Bond | | $ | 44,181,926 | | | $ | — | |
Interest Rate Hedged Corporate Bond | | | 9,876,213 | | | | — | |
| | | | |
NOTESTO FINANCIAL STATEMENTS | | | 21 | |
Notes to Financial Statements (Continued)
iSHARES® U.S. ETF TRUST
| 4. | CAPITAL SHARE TRANSACTIONS |
Capital shares are issued and redeemed by each Fund only in aggregations of a specified number of shares or multiples thereof (“Creation Units”) at net asset value. Except when aggregated in Creation Units, shares of each Fund are not redeemable. Transactions in capital shares for each Fund are disclosed in detail in the statements of changes in net assets.
The consideration for the purchase of Creation Units of a fund in the Trust generally consists of the in-kind deposit of a designated portfolio of securities and a specified amount of cash. Certain funds in the Trust may be offered in Creation Units solely or partially for cash in U.S. dollars. Investors purchasing and redeeming Creation Units may pay a purchase transaction fee and a redemption transaction fee directly to State Street Bank and Trust Company, the Trust’s administrator, to offset transfer and other transaction costs associated with the issuance and redemption of Creation Units, including Creation Units for cash. Investors transacting in Creation Units for cash may also pay an additional variable charge to compensate the relevant fund for certain transaction costs (i.e., stamp taxes, taxes on currency or other financial transactions, and brokerage costs) and market impact expenses relating to investing in portfolio securities. Such variable charges, if any, are included in “Proceeds from shares sold” in the statements of changes in net assets.
Each Fund may purchase or sell futures contracts as part of its investment strategy. A futures contract is a standardized, exchange-traded agreement to buy and sell a financial instrument at a set price on a future date. Upon entering into a futures contract, the Fund is required to pledge to the executing broker which holds segregated from its own assets, an amount of cash, U.S. government securities or other high-quality debt and equity securities equal to the minimum initial margin requirements of the exchange on which the contract is traded. Pursuant to the contract, the Fund agrees to receive from or pay to the broker an amount of cash equal to the daily fluctuation in value of the contract. Such receipts or payments are known as margin variation and are recorded by the Fund as unrealized appreciation or depreciation. When the contract is closed, the Fund records a realized gain or loss equal to the difference between the value of the contract at the time it was opened and the value at the time it was closed. Losses may arise if the value of a futures contract decreases due to an unfavorable change in the market rates or values of the underlying instrument during the term of the contract or if the counterparty does not perform under the contract. The use of futures contracts also involves the risk of an imperfect correlation in the movements in the price of futures contracts and the assets underlying such contracts.
The following table shows the value of futures contracts held by the Funds as of October 31, 2014 and the related locations in the statements of assets and liabilities, presented by risk exposure category:
| | | | | | | | |
| Liabilities | |
| | | iShares
Interest Rate
Hedged High Yield
Bond ETF | | | iShares
Interest Rate
Hedged Corporate
Bond ETF | |
Interest rate contracts: | | | | | | | | |
Variation margin / Net assets consist of — net unrealized depreciationa | | $ | 289,528 | | | $ | 94,313 | |
| | | | | | | | |
| | | | | | | | | |
| | a | | Represents cumulative depreciation of futures contracts as reported in the schedules of investments. Only current day’s variation margin is reported separately within the statements of assets and liabilities. |
| | |
| 22 | | 2014 iSHARES ANNUAL REPORTTO SHAREHOLDERS |
Notes to Financial Statements (Continued)
iSHARES® U.S. ETF TRUST
The following table shows the realized and unrealized gains (losses) on futures contracts held by the Funds during the period ended October 31, 2014 and the related locations in the statements of operations, presented by risk exposure category:
| | | | | | | | |
| | | Net Realized Gain (Loss) | |
| | | iShares
Interest Rate
Hedged High Yield
Bond ETF | | | iShares
Interest Rate
Hedged Corporate
Bond ETF | |
Interest rate contracts: | | | | | | | | |
Futures contracts | | $ | (74,931 | ) | | $ | (149,136 | ) |
| | | | | | | | |
| | | | | | | | | |
| | | | | | | | |
| | | Net Change in Unrealized
Appreciation/Depreciation | |
| | | iShares
Interest Rate
Hedged High Yield
Bond ETF | | | iShares
Interest Rate
Hedged Corporate
Bond ETF | |
Interest rate contracts: | | | | | | | | |
Futures contracts | | $ | (289,528 | ) | | $ | (94,313 | ) |
| | | | | | | | |
| | | | | | | | | |
The following table shows the average quarter-end balances of open futures contracts for the period ended October 31, 2014:
| | | | | | | | |
| | | iShares
Interest Rate
Hedged High Yield
Bond ETF | | | iShares
Interest Rate
Hedged Corporate
Bond ETF | |
Average number of contracts sold | | | (215 | ) | | | (70 | ) |
Average value of contracts sold | | $ | (31,778,680 | ) | | $ | (9,533,481 | ) |
In the normal course of business, each Fund’s investment activities expose it to various types of risk associated with the financial instruments and markets in which it invests. The significant types of financial risks each Fund is exposed to include market risk and credit risk. Each Fund’s prospectus provides details of these and other types of risk.
MARKET RISK
Market risk arises mainly from uncertainty about future values of financial instruments influenced by price, currency and interest rate movements. It represents the potential loss each Fund may suffer through holding market positions in the face of market movements. Each Fund is exposed to market risk by virtue of its direct or indirect investment in fixed income and financial derivative instruments. The fair value of securities held by the Funds may decline due to general market conditions, economic trends or events that are not specifically related to the issuers of the securities including local, regional or global political, social or economic instability or to factors that affect a particular industry or group of industries. The extent of each Fund’s exposure to market risk is the market value of the investments held as shown in the Fund’s schedule of investments.
| | | | |
NOTESTO FINANCIAL STATEMENTS | | | 23 | |
Notes to Financial Statements (Continued)
iSHARES® U.S. ETF TRUST
A diversified portfolio, where this is appropriate and consistent with a fund’s objectives, minimizes the risk that a price change of a particular investment will have a material impact on the NAV of a fund. The investment concentrations within each Fund’s portfolio are disclosed in its schedule of investments.
Each Fund invests a substantial amount of its assets indirectly in securities of non-U.S. issuers that trade in non-U.S. markets. This involves certain considerations and risks not typically associated with securities of U.S. issuers. Such risks include, but are not limited to: generally less liquid and less efficient securities markets; generally greater price volatility; exchange rate fluctuations and exchange controls; imposition of restrictions on the expatriation of funds or other assets of the Fund; less publicly available information about issuers; the imposition of withholding or other taxes; higher transaction and custody costs; settlement delays and risk of loss attendant in settlement procedures; difficulties in enforcing contractual obligations; less regulation of securities markets; different accounting, disclosure and reporting requirements; more substantial governmental involvement in the economy; higher inflation rates; greater social, economic and political uncertainties; the risk of nationalization or expropriation of assets; and the risk of war. These risks are heightened for investments in issuers from countries with less developed markets.
Each Fund invests a substantial amount of its assets indirectly in fixed-income securities. Changes in market interest rates or economic conditions, including the decision in December 2013 by the Federal Reserve Bank to taper its quantitative easing policy, may affect the value and/or liquidity of such investments. Interest rate risk is the risk that prices of bonds and other fixed-income securities will decrease as interest rates rise and increase as interest rates fall. Securities with longer durations tend to be more sensitive to interest rate changes, usually making them more volatile than securities with shorter durations. Given the environment of historically low interest rates, each Fund may be subject to a greater risk of price losses if interest rates rise.
CREDIT RISK
Credit risk is the risk that an issuer or guarantor of debt instruments or the counterparty to a financial transaction, including derivatives contracts, repurchase agreements or loans of portfolio securities, is unable or unwilling to make timely interest and/or principal payments or to otherwise honor its obligations. BFA and its affiliates manage counterparty credit risk by entering into transactions only with counterparties that it believes have the financial resources to honor their obligations and by monitoring the financial stability of those counterparties. Financial assets, which potentially expose the Funds to issuer and counterparty credit risks, consist principally of financial instruments and receivables due from counterparties. The extent of each Fund’s exposure to credit and counterparty risks with respect to those financial assets is approximated by their value recorded in its statement of assets and liabilities.
The iShares Interest Rate Hedged High Yield Bond ETF invests a substantial portion of its assets indirectly in high yield securities that are rated below investment-grade (including those bonds rated lower than “BBB-“by Standard & Poor’s Ratings Services and Fitch or “Baa3” by Moody’s), or are unrated which may be more volatile than higher-rated securities of similar maturity. High yield securities may also be subject to greater levels of credit or default risk than higher-rated securities and high yield securities may be less liquid and more difficult to sell at an advantageous time or price or to value than higher-rated securities. In particular, high yield securities are often issued by smaller, less creditworthy companies or by highly leveraged (indebted) companies, which are generally less able than more financially stable companies to make scheduled payments of interest and principal.
Each Fund is treated as an entity separate from the Trust’s other funds for federal income tax purposes. It is the policy of each Fund to qualify as a regulated investment company by complying with the provisions applicable to regulated investment companies, as defined under Subchapter M of the Internal Revenue Code of 1986, as amended, and to annually distribute substantially all of its ordinary income and any net capital gains (taking into account any capital loss carryforwards) sufficient to relieve it from all, or substantially all, federal income and excise taxes. Accordingly, no provision for federal income taxes is required.
| | |
| 24 | | 2014 iSHARES ANNUAL REPORTTO SHAREHOLDERS |
Notes to Financial Statements (Continued)
iSHARES® U.S. ETF TRUST
The tax character of distributions paid during the period ended October 31, 2014 was as follows:
| | | | |
| iShares ETF | | 2014 | |
Interest Rate Hedged High Yield Bond | | | | |
Ordinary income | | $ | 511,424 | |
Return of capital | | | 2,091 | |
| | | | |
| | $ | 513,515 | |
| | | | |
Interest Rate Hedged Corporate Bond | | | | |
Ordinary income | | $ | 132,240 | |
Return of capital | | | 884 | |
| | | | |
| | $ | 133,124 | |
| | | | |
| | | | | |
As of October 31, 2014, the tax components of accumulated net earnings (losses) were as follows:
| | | | | | | | | | | | | | | | |
| iShares ETF | | Undistributed
Ordinary
Income | | | Capital
Loss
Carryforwards | | | Net
Unrealized
Gains (Losses) a | | | Total | |
Interest Rate Hedged High Yield Bond | | $ | — | | | $ | (374,689 | ) | | $ | (704,950 | ) | | $ | (1,079,639 | ) |
Interest Rate Hedged Corporate Bond | | | — | | | | (235,938 | ) | | | (451 | ) | | | (236,389 | ) |
| | a | | The difference between book-basis and tax-basis unrealized gains (losses) was attributable primarily to the tax deferral of losses on wash sales and the realization for tax purposes of unrealized gains (losses) on certain futures contracts. |
As of October 31, 2014, the Funds had non-expiring capital loss carryforwards available to offset future realized capital gains as follows:
| | | | |
| iShares ETF | | Non-
Expiring | |
Interest Rate Hedged High Yield Bond | | $ | 374,689 | |
Interest Rate Hedged Corporate Bond | | | 235,938 | |
As of October 31, 2014, gross unrealized appreciation and gross unrealized depreciation based on cost for federal income tax purposes were as follows:
| | | | | | | | | | | | | | | | |
| iShares ETF | | Tax Cost | | | Gross
Unrealized
Appreciation | | | Gross
Unrealized
Depreciation | | | Net Unrealized
Appreciation
(Depreciation) | |
Interest Rate Hedged High Yield Bond | | $ | 44,036,916 | | | $ | — | | | $ | (704,949 | ) | | $ | (704,949 | ) |
Interest Rate Hedged Corporate Bond | | | 9,663,470 | | | | 898 | | | | (1,349 | ) | | | (451 | ) |
Management has analyzed tax laws and regulations and their application to the Funds as of October 31, 2014 and does not believe there are any uncertain tax positions that require recognition of a tax liability in the Funds’ financial statements.
| | | | |
NOTESTO FINANCIAL STATEMENTS | | | 25 | |
Notes to Financial Statements (Continued)
iSHARES® U.S. ETF TRUST
Management has evaluated the impact of all subsequent events on the Funds through the date the financial statements were available to be issued and has determined that there were no subsequent events requiring adjustment or disclosure in the financial statements.
| | |
| 26 | | 2014 iSHARES ANNUAL REPORTTO SHAREHOLDERS |
Report of Independent Registered Public Accounting Firm
To the Shareholders and Board of Trustees of
iShares U.S. ETF Trust:
In our opinion, the accompanying statements of assets and liabilities, including the schedules of investments, and the related statements of operations and of changes in net assets and the financial highlights present fairly, in all material respects, the financial position of iShares Interest Rate Hedged High Yield Bond ETF and iShares Interest Rate Hedged Corporate Bond ETF (the “Funds”) at October 31, 2014, the results of each of their operations, the changes in each of their net assets and their financial highlights for the period May 27, 2014 (commencement of operations) through October 31, 2014, in conformity with accounting principles generally accepted in the United States of America. These financial statements and financial highlights (hereafter referred to as “financial statements”) are the responsibility of the Funds’ management; our responsibility is to express an opinion on these financial statements based on our audits. We conducted our audits of these financial statements in accordance with the standards of the Public Company Accounting Oversight Board (United States). Those standards require that we plan and perform the audit to obtain reasonable assurance about whether the financial statements are free of material misstatement. An audit includes examining, on a test basis, evidence supporting the amounts and disclosures in the financial statements, assessing the accounting principles used and significant estimates made by management, and evaluating the overall financial statement presentation. We believe that our audits, which included confirmation of securities at October 31, 2014 by correspondence with the custodian, transfer agent and brokers, provide a reasonable basis for our opinion.
PricewaterhouseCoopers LLP
San Francisco, California
December 19, 2014
| | | | |
REPORTOF INDEPENDENT REGISTERED PUBLIC ACCOUNTING FIRM | | | 27 | |
Tax Information (Unaudited)
iSHARES® U.S. ETF TRUST
The Funds hereby designate the following amounts of distributions from direct Federal Obligation Interest for the period ended October 31, 2014:
| | | | |
| iShares ETF | | Federal Obligation
Interest a | |
Interest Rate Hedged High Yield Bond | | $ | 2,825 | |
Interest Rate Hedged Corporate Bond | | | 512 | |
| | a | | The law varies in each state as to whether and what percentage of ordinary income dividends attributable to Federal obligations is exempt from state income tax. We recommend that you consult your tax advisor to determine if any portion of the dividends you received is exempt from state income tax. |
| | |
| 28 | | 2014 iSHARES ANNUAL REPORTTO SHAREHOLDERS |
Board Review and Approval of Investment Advisory
Contract
iSHARES® U.S. ETF TRUST
Under Section 15(c) of the Investment Company Act of 1940 (the “1940 Act”), the Trust’s Board of Trustees (the “Board”), including a majority of Trustees who are not “interested persons” of the Trust (as that term is defined in the 1940 Act) (the “Independent Trustees”), is required to consider and approve the proposed Investment Advisory Contract between the Trust and BFA (the “Advisory Contract”) on behalf of the Funds. The Independent Trustees requested, and BFA provided, such information as the Independent Trustees, with advice from independent counsel, deemed reasonably necessary to evaluate the terms of the proposed Advisory Contract.
At a meeting held on December 4-5, 2013, the Board, including all of the Independent Trustees, approved the selection of BFA as investment adviser and approved the proposed Advisory Contract for the Funds, based on its review of qualitative and quantitative information provided by BFA. The Board also considered information previously provided by BFA, BlackRock Institutional Trust Company, N.A. (“BTC”), and BlackRock, Inc. (“BlackRock”), as applicable, at prior Board meetings. The Independent Trustees were advised by their independent counsel throughout the process.
In selecting BFA and approving the Advisory Contract for the Funds, the Board, including the Independent Trustees, considered the following factors, no one of which was controlling, and made the following conclusions:
Expenses of the Funds — The Board reviewed statistical information prepared by Lipper Inc. (“Lipper”), an independent provider of investment company data, regarding the expense ratio components, including any proposed advisory fees, waivers/reimbursements, and gross and net total expenses of the Funds in comparison with the same information for other registered investment companies objectively selected by Lipper as comprising the Funds’ applicable peer group pursuant to Lipper’s proprietary methodology, and any registered funds that would otherwise have been excluded from Lipper’s comparison group because of the size, sponsor, inception date, or other differentiating factors included in Lipper’s proprietary selection methodology, but that were nonetheless included at the request of BFA (the “Lipper Group”). Because there are few, if any, exchange traded funds or other funds that pursue investment strategies similar to those of the Funds, the Lipper Group included, in part, mutual funds, closed-end funds, exchange traded funds, or funds with differing investment objective classifications, investment focuses and other characteristics (e.g., actively managed funds that are not exchange traded funds and funds sponsored by an “at cost” service provider), as applicable. In support of its review of the statistical information, the Board was provided with a general description of the methodology used by Lipper to determine the applicable Lipper Groups and to prepare this information. The Board also received a detailed explanation from BFA regarding its rationale for including funds that had been excluded from Lipper’s consideration due to Lipper’s methodology parameters, as well as information showing the effect of including these additional funds in the analysis. The Board further noted that due to the limitations in identifying comparable funds in the Lipper Group, the statistical information may or may not provide meaningful direct comparisons to the Funds.
The Board also noted that the proposed investment advisory fee rates and overall expenses for the Funds compared favorably to the investment advisory fee rates and overall expenses of the funds in the Lipper Group.
Based on this review, the other factors considered at the meeting, and their general knowledge of fund pricing, the Board concluded that the proposed investment advisory fees and expense levels of the Funds supported the Board’s approval of the Advisory Contract.
Nature, Extent and Quality of Services to be Provided by BFA — The Board reviewed the scope of services to be provided by BFA under the Advisory Contract. In reviewing the scope of these services, the Board considered BFA’s investment philosophy and experience, noting that BFA and its affiliates have committed significant resources over time, including during the past year, to supporting iShares funds and their shareholders. The Board noted that BFA is an indirect wholly-owned subsidiary of BlackRock. The Board acknowledged that additional resources to support iShares funds and their shareholders have been added or enhanced since BlackRock’s acquisition of BFA in December 2009, including in such areas as risk management, investor
| | | | |
BOARD REVIEWAND APPROVALOF INVESTMENT ADVISORY CONTRACT | | | 29 | |
Board Review and Approval of Investment Advisory
Contract (Continued)
iSHARES® U.S. ETF TRUST
education, product management, customized portfolio consulting support, and capital markets support. The Board considered representations by BFA, BTC, and BlackRock that the scope and quality of services to be provided to the Funds would be similar to the scope and quality of services provided to other iShares funds. The Board also considered BFA’s compliance program and its compliance record with respect to other iShares funds. In that regard, the Board noted that BFA reports to the Board about portfolio management and compliance matters on a periodic basis in connection with regularly scheduled meetings of the Board, and on other occasions as necessary and appropriate, and has provided information and made appropriate officers available as needed to provide further assistance with these matters. The Board also reviewed the background and experience of the persons who will be responsible for the day-to-day management of the Funds. In addition to the above considerations, the Board reviewed and considered BFA’s investment and risk management processes and strategies, and matters related to BFA’s portfolio compliance policies and procedures.
Based on review of this information, the Board concluded that the nature, extent and quality of services to be provided by BFA to the Funds under the Advisory Contract supported the Board’s approval of the Advisory Contract.
Costs of Services to be Provided to the Funds and Profits to be Realized by BFA and Affiliates — The Board did not consider the profitability of the Funds to BFA based on the fees payable under the Advisory Contract or revenue to be received by BFA or its affiliates in connection with services to be provided to the Funds since the proposed relationships had not yet commenced. The Board noted that it expects to receive profitability information from BFA on at least an annual basis following each Fund’s launch and will thus be in a position to evaluate whether, following the expiration of the Advisory Contract’s initial two-year term, any adjustments in the Funds’ fees would be appropriate.
Economies of Scale — The Board reviewed information regarding economies of scale or other efficiencies that may result from increases in the Funds’ assets. The Board noted that the Advisory Contract for the Funds did not provide for any breakpoints in the Funds’ investment advisory fee rates as the assets of the Funds increase. However, the Board noted that should material economies of scale exist in the future, a breakpoint structure for the Funds may be appropriate, and that it would continue to monitor the sharing of economies of scale to determine the appropriateness of adding breakpoints in the future. The Board further considered that with respect to each of the Funds, BFA had contractually agreed to waive a portion of its management fees in an amount equal to the aggregate acquired fund fees and expenses, if any, attributable to the Fund’s investments in other registered investment companies advised by BFA or its affiliates.
Based on this review, as well as the other factors considered at the meeting, the Board, recognizing its responsibility to consider this issue at least annually following an initial two-year period, concluded that the investment advisory fee rates incorporate potential economies of scale and supported the Board’s approval of the Advisory Contract.
Fees and Services Provided for Other Comparable Funds/Accounts Managed by BFA and its Affiliates — The Board considered certain information received at previous meetings regarding the investment advisory/management fee rates for other funds/accounts in the U.S. for which BFA (or its affiliates) provides investment advisory/management services, including open-end and closed-end funds registered under the 1940 Act (including sub-advised funds), collective trust funds and institutional separate accounts (together, the “Other Accounts”). The Board noted that BFA and its affiliates do not manage Other Accounts that have substantially the same investment objectives and strategies as the Funds. The Board further noted that BFA previously provided the Board with detailed information regarding how Other Accounts (particularly institutional clients) generally differ from the iShares funds, including in terms of the different, generally more extensive, services provided to the iShares funds, as well as other significant differences in the approach of BFA and its affiliates to the iShares funds, on one hand, and Other Accounts, on the other. In that regard, the Board considered that the pricing of services to institutional clients is typically based on a number of factors beyond the nature and extent of the specific services to be provided and often depends on the overall relationship between the client and its affiliates and the adviser and its affiliates. In addition, the Board considered the relative complexity and
| | |
| 30 | | 2014 iSHARES ANNUAL REPORTTO SHAREHOLDERS |
Board Review and Approval of Investment Advisory
Contract (Continued)
iSHARES® U.S. ETF TRUST
inherent risks of managing and providing other services to the Funds, as publicly traded exchange traded funds, as compared to Other Accounts that are institutional clients in light of differing regulatory requirements and client-imposed mandates. The Board also considered the “all-inclusive” nature of the Funds’ advisory fee structure, and the Funds’ expenses to be borne by BFA under this arrangement. The Board noted that the investment advisory fee rates under the Advisory Contract for investment companies, including the Funds, were generally higher than the investment advisory/management fee rates for the Other Accounts that are institutional clients of BFA (or its affiliates) and concluded that the differences appeared to be consistent with the factors discussed. The Board considered the proposed investment advisory fee rate for iShares Interest Rate Hedged Corporate Bond ETF in relation to that of iShares iBoxx $ Investment Grade Corporate Bond ETF, and the proposed investment advisory fee rate for iShares Interest Rate Hedged High Yield Bond ETF in relation to that of iShares iBoxx $ High Yield Corporate Bond ETF. The Board noted that each Fund’s proposed advisory fee rate is higher than that of the respective other iShares fund, which invests in similar underlying securities, but unlike the Funds, the other iShares funds are index funds that are not interest rate hedged.
Other Benefits to BFA and/or its Affiliates — Except as noted below, the Board did not consider ancillary revenue to be received by BFA and/or its affiliates in connection with the services to be provided to the Funds by BFA since the proposed relationship had not yet commenced. However, the Board noted that BFA generally would not use soft dollars or consider the value of research or other services that may be provided to BFA (including its affiliates) in selecting brokers for portfolio transactions for the Funds. The Board considered the potential payment of advisory fees and/or administration fees to BFA and BTC (or their affiliates) in connection with any investments by the Funds in other funds for which BFA (or its affiliates) provides investment advisory services and/or administration services. The Board also considered the potential for revenue to BTC, the Funds’ securities lending agent, and its affiliates, in the event of any lending of the Funds’ securities. The Board further noted that any portfolio transactions on behalf of the Funds placed through a BFA affiliate or purchased from an underwriting syndicate in which a BFA affiliate participates, will be reported to the Board pursuant to Rule 17e-1 or Rule 10f-3, as applicable, under the 1940 Act. The Board concluded that the existence of any such ancillary benefits would not alter the Board’s conclusion with respect to the appropriateness of approving the Advisory Contract.
Based on the considerations described above, the Board determined that the investment advisory fee rates under the Advisory Contract do not constitute fees that are so disproportionately large as to bear no reasonable relationship to the services to be rendered and that could not have been the product of arm’s-length bargaining and concluded that it is in the best interest of the Funds and their shareholders to approve the Advisory Contract.
| | | | |
BOARD REVIEWAND APPROVALOF INVESTMENT ADVISORY CONTRACT | | | 31 | |
Supplemental Information (Unaudited)
iSHARES® U.S. ETF TRUST
Section 19(a) Notices
The amounts and sources of distributions reported are only estimates and are not being provided for tax reporting purposes. The actual amounts and sources of the amounts for tax reporting purposes will depend upon each Fund’s investment experience during the year and may be subject to changes based on the tax regulations. Shareholders will receive a Form 1099-DIV each calendar year that will inform them how to report distributions for federal income tax purposes.
| | | | | | | | | | | | | | | | | | | | | | | | | | | | | | | | |
| | | Total Cumulative Distributions
for the Fiscal Year | | | % Breakdown of the Total Cumulative
Distributions for the Fiscal Year | |
| iShares ETF | | Net
Investment
Income | | | Net
Realized
Capital
Gains | | | Return
of
Capital | | | Total
Per
Share | | | Net
Investment
Income | | | Net
Realized
Capital
Gains | | | Return
of
Capital | | | Total
Per
Share | |
Interest Rate Hedged Corporate Bond | | $ | 1.324411 | | | $ | — | | | $ | 0.006830 | | | $ | 1.331241 | | | | 99 | % | | | — | % | | | 1 | % | | | 100 | % |
Premium/Discount Information
The tables that follow present information about the differences between the daily market price on secondary markets for shares of a Fund and that Fund’s net asset value. Net asset value, or “NAV,” is the price per share at which each Fund issues and redeems shares. It is calculated in accordance with the standard formula for valuing mutual fund shares. The “Market Price” of each Fund generally is determined using the midpoint between the highest bid and the lowest offer on the primary stock exchange on which the shares of such Fund are listed for trading, as of the time that the Fund’s NAV is calculated. Each Fund’s Market Price may be at, above or below its NAV. The NAV of each Fund will fluctuate with changes in the fair value of its portfolio holdings. The Market Price of each Fund will fluctuate in accordance with changes in its NAV, as well as market supply and demand.
Premiums or discounts are the differences (expressed as a percentage) between the NAV and Market Price of a Fund on a given day, generally at the time NAV is calculated. A premium is the amount that a Fund is trading above the reported NAV, expressed as a percentage of the NAV. A discount is the amount that a Fund is trading below the reported NAV, expressed as a percentage of the NAV.
The following information shows the frequency distributions of premiums and discounts for each of the Funds included in this report. The information shown for each Fund is for five calendar years (or for each full calendar quarter completed after the inception date of such Fund if less than five years) through the date of the most recent calendar quarter-end. The specific periods covered for each Fund are disclosed in the table for such Fund.
| | |
| 32 | | 2014 iSHARES ANNUAL REPORTTO SHAREHOLDERS |
Supplemental Information (Unaudited) (Continued)
iSHARES® U.S. ETF TRUST
Each line in the table shows the number of trading days in which the Fund traded within the premium/discount range indicated. The number of trading days in each premium/discount range is also shown as a percentage of the total number of trading days in the period covered by each table. All data presented here represents past performance, which cannot be used to predict future results.
iShares Interest Rate Hedged High Yield Bond ETF
Period Covered: July 1, 2014 through September 30, 2014
| | | | | | | | |
Premium/Discount Range | | Number
of Days | | | Percentage of
Total Days | |
Greater than 1.0% | | | 1 | | | | 1.56 | % |
Greater than 0.5% and Less than 1.0% | | | 4 | | | | 6.25 | |
Between 0.5% and –0.5% | | | 59 | | | | 92.19 | |
| | | | | | | | |
| | | 64 | | | | 100.00 | % |
| | | | | | | | |
iShares Interest Rate Hedged Corporate Bond ETF
Period Covered: July 1, 2014 through September 30, 2014
| | | | | | | | |
Premium/Discount Range | | Number
of Days | | | Percentage of
Total Days | |
Greater than 0.5% | | | 4 | | | | 6.25 | % |
Between 0.5% and –0.5% | | | 58 | | | | 90.62 | |
Less than –0.5% | | | 2 | | | | 3.13 | |
| | | | | | | | |
| | | 64 | | | | 100.00 | % |
| | | | | | | | |
| | | | |
SUPPLEMENTAL INFORMATION | | | 33 | |
Trustee and Officer Information
iSHARES® U.S. ETF TRUST
The Board of Trustees has responsibility for the overall management and operations of the Trust, including general supervision of the duties performed by BFA and other service providers. Each Trustee serves until he or she resigns, is removed, dies, retires or becomes incapacitated. The President, Chief Compliance Officer, Treasurer and Secretary shall each hold office until their successors are chosen and qualify, and all other officers shall hold office until he or she resigns or is removed. Trustees who are not “interested persons” (as defined in the 1940 Act) of the Trust are referred to as independent trustees (“Independent Trustees”).
The registered investment companies advised by BFA or its affiliates are organized into one complex of closed-end funds, two complexes of open-end funds and one complex of exchange-traded funds (“Exchange-Traded Fund Complex”) (each, a “BlackRock Fund Complex”). Each Fund is included in the BlackRock Fund Complex referred to as the Exchange-Traded Fund Complex. Each Trustee also serves as a Director of iShares, Inc., a Director of iShares MSCI Russia Capped ETF, Inc. and a Trustee of iShares Trust and, as a result, oversees a total of 294 funds (as of October 31, 2014) within the Exchange-Traded Fund Complex. With the exception of Robert S. Kapito and Mark Wiedman, the address of each Trustee and officer is c/o BlackRock, Inc., 400 Howard Street, San Francisco, CA 94105. The address of Mr. Kapito and Mr. Wiedman is c/o BlackRock, Inc., Park Avenue Plaza, 55 East 52nd Street, New York, NY 10055. The Board has designated Robert H. Silver as its Independent Chairman. Additional information about the Funds’ Trustees and Officers may be found in the Funds’ combined Statement of Additional Information, which is available without charge, upon request, by calling toll-free 1-800-iShares (1-800-474-2737).
Interested Trustees
| | | | | | |
| | | | |
| Name (Age) | | Position(s) | | Principal Occupation(s) During the Past 5 Years | | Other Directorships Held by Trustee |
Robert S. Kapitoa (57) | | Trustee
(since 2011). | | President and Director, BlackRock, Inc. (since 2006); Vice Chairman of BlackRock, Inc. and Head of BlackRock, Inc.’s Portfolio Management Group (since its formation in 1998) and BlackRock, Inc.’s predecessor entities (since 1988); Trustee, University of Pennsylvania (since 2009); President of Board of Directors, Hope & Heroes Children’s Cancer Fund (since 2002); President of the Board of Directors, Periwinkle Theatre for Youth (since 1983). | | Trustee of iShares Trust (since 2009); Director of iShares, Inc. (since 2009); Director of iShares MSCI Russia Capped ETF, Inc. (since 2010); Director of BlackRock, Inc. (since 2006). |
| | | |
Mark Wiedmanb (43) | | Trustee
(since 2013) | | Managing Director, BlackRock, Inc. (since 2007); Global Head of iShares (since 2011); Head of Corporate Strategy, BlackRock, Inc. (2009-2011). | | Trustee of iShares Trust (since 2013); Director of iShares, Inc. (since 2013); Director of iShares MSCI Russia Capped ETF, Inc. (since 2013); Director of PennyMac Financial Services, Inc. (since 2008). |
| a | | Robert S. Kapito is deemed to be an “interested person” (as defined in the 1940 Act) of the Trust due to his affiliations with BlackRock, Inc. |
| b | | Mark Wiedman is deemed to be an “interested person” (as defined in the 1940 Act) of the Trust due to his affiliations with BlackRock, Inc. and its affiliates. |
| | |
| 34 | | 2014 iSHARES ANNUAL REPORTTO SHAREHOLDERS |
Trustee and Officer Information (Continued)
iSHARES® U.S. ETF TRUST
Independent Trustees
| | | | | | |
| | | | |
| Name (Age) | | Position(s) | | Principal Occupation(s) During the Past 5 Years | | Other Directorships Held by Trustee |
Robert H. Silver (59) | | Trustee
(since 2011); Independent Chairman
(since 2012). | | President and Co-Founder of The Bravitas Group, Inc. (since 2006); Director and Vice Chairman of the YMCA of Greater NYC (2001-2011); Broadway Producer (2006-2011); Co-Founder and Vice President of Parentgiving Inc. (since 2008); Director and Member of the Audit and Compensation Committee of EPAM Systems, Inc. (2006-2009); President and Chief Operating Officer of UBS Financial Services Inc. (formerly Paine Webber Inc.) (2003-2005) and various executive positions with UBS and its affiliates (1988-2005); CPA and Audit Manager of KPMG, LLP (formerly Peat Marwick Mitchell) (1977-1983). | | Trustee of iShares Trust (since 2007); Director of iShares, Inc. (since 2007); Director of iShares MSCI Russia Capped ETF, Inc. (since 2010); Independent Chairman of iShares, Inc., iShares MSCI Russia Capped ETF, Inc. and iShares Trust
(since 2012). |
Cecilia H. Herbert (65) | | Trustee
(since 2011); Nominating and Governance Committee Chair and Equity Plus Committee
Chair
(since 2012). | | Director (1998-2013) and President (2007-2011) of the Board of Directors, Catholic Charities CYO; Trustee (2002-2011) and Chair of the Finance and Investment Committee (2006-2010) of the Thacher School; Member (since 1992) and Chair (1994-2005) of the Investment Committee, Archdiocese of San Francisco; Trustee and Member of the Investment Committee, WNET, the New York public broadcasting/media company (since 2011). | | Trustee of iShares Trust (since 2005); Director of iShares, Inc. (since 2005); Director of iShares MSCI Russia Capped ETF, Inc. (since 2010); Director of Forward Funds (34 portfolios) (since 2009). |
Charles A. Hurty (71) | | Trustee (since 2011); Audit Committee
Chair
(since 2011). | | Retired; Partner, KPMG LLP (1968-2001). | | Trustee of iShares Trust (since 2005); Director of iShares, Inc. (since 2005); Director of iShares MSCI Russia Capped ETF, Inc. (since 2010); Director of GMAM Absolute Return Strategy Fund (1 portfolio) (since 2002); Director of SkyBridge Alternative Investments Multi-Adviser Hedge Fund Portfolios LLC
(2 portfolios) (since 2002). |
| | | |
John E. Kerrigan (59) | | Trustee
(since 2011); Fixed Income Plus Committee Chair
(since 2012). | | Chief Investment Officer, Santa Clara University (since 2002). | | Trustee of iShares Trust (since 2005); Director of iShares, Inc. (since 2005); Director of iShares MSCI Russia Capped ETF, Inc. (since 2010). |
| | | | |
TRUSTEEAND OFFICER INFORMATION | | | 35 | |
Trustee and Officer Information (Continued)
iSHARES® U.S. ETF TRUST
Independent Trustees (Continued)
| | | | | | |
| | | | |
| Name (Age) | | Position(s) | | Principal Occupation(s) During the Past 5 Years | | Other Directorships Held by Trustee |
John E. Martinez (53) | | Trustee
(since 2011); Securities Lending Committee
Chair
(since 2012). | | Director of FirstREX Agreement Corp. (formerly EquityRock, Inc.) (since 2005). | | Trustee of iShares Trust (since 2003); Director of iShares, Inc. (since 2003); Director of iShares MSCI Russia Capped ETF, Inc. (since 2010). |
George G.C. Parker (75) | | Trustee
(since 2011). | | Dean Witter Distinguished Professor of Finance, Emeritus, Stanford University Graduate School of Business (Professor since 1973; Emeritus since 2006). | | Trustee of iShares Trust (since 2000); Director of iShares, Inc. (since 2002); Director of iShares MSCI Russia Capped ETF, Inc. (since 2010); Director of Tejon Ranch Company (since 1999); Director of Threshold Pharmaceuticals (since 2004); Director of Colony Financial, Inc. (since 2009); Director of First Republic Bank (since 2010). |
| | | |
Madhav V. Rajan (50) | | Trustee
(since 2011); 15(c) Committee Chair
(since 2012). | | Robert K. Jaedicke Professor of Accounting and Senior Associate Dean for Academic Affairs and Head of MBA Program, Stanford University Graduate School of Business (since 2001); Professor of Law (by courtesy), Stanford Law School (since 2005); Visiting Professor, University of Chicago (2007-2008). | | Trustee of iShares Trust (since 2011); Director of iShares, Inc. (since 2011); Director of iShares MSCI Russia Capped ETF, Inc. (since 2011), Director, Cavium, Inc. (since 2013). |
| | |
| 36 | | 2014 iSHARES ANNUAL REPORTTO SHAREHOLDERS |
Trustee and Officer Information (Continued)
iSHARES® U.S. ETF TRUST
Officers
| | | | |
| | | |
| Name (Age) | | Position(s) | | Principal Occupation(s) During the Past 5 Years |
Manish Mehta (43) | | President (since 2013). | | Managing Director, BlackRock, Inc. (since 2009); Chief Operating Officer for iShares (since 2009); Head of Strategy and Corporate Development, BGI (2005-2009); Chief of Staff to the CEO, BGI (2005-2009). |
| | |
Jack Gee (55) | | Treasurer and Chief Financial Officer (since 2011). | | Managing Director, BlackRock, Inc. (since 2009); Senior Director of Fund Administration of Intermediary Investor Business, BGI (2009); Director of Fund Administration of Intermediary Investor Business, BGI (2004-2009). |
| | |
Edward B. Baer (46) | | Vice President and Chief Legal Officer (since 2012). | | Managing Director of Legal & Compliance, BlackRock, Inc. (since 2006); Director of Legal & Compliance, BlackRock, Inc. (2004-2006). |
| | |
Eilleen M. Clavere (62) | | Secretary (since 2011). | | Director of Global Fund Administration, BlackRock, Inc. (since 2009); Director of Legal Administration of Intermediary Investor Business, BGI (2006-2009); Legal Counsel and Vice President of Atlas Funds, Atlas Advisers, Inc. and Atlas Securities, Inc. (2005-2006); Counsel at Kirkpatrick & Lockhart LLP (2001-2005). |
| | |
Scott Radell (45) | | Executive Vice President (since 2012). | | Managing Director, BlackRock, Inc. (since 2009); Head of Portfolio Solutions, BlackRock, Inc. (since 2009); Head of Portfolio Solutions, BGI (2007-2009); Credit Portfolio Manager, BGI (2005-2007); Credit Research Analyst, BGI (2003-2005). |
| | |
Amy Schioldager (52) | | Executive Vice President (since 2011). | | Senior Managing Director, BlackRock, Inc. (since 2009); Global Head of Index Equity, BGI (2008-2009); Global Head of U.S. Indexing, BGI (2006-2008); Head of Domestic Equity Portfolio Management, BGI (2001-2006). |
| | |
Ira P. Shapiro (51) | | Vice President (since 2011). | | Managing Director, BlackRock, Inc. (since 2009); Head of Strategic Product Initiatives for iShares (since 2012); Chief Legal Officer, Exchange-Traded Fund Complex (2007-2012); Associate General Counsel, BGI (2004-2009). |
| | | | |
TRUSTEEAND OFFICER INFORMATION | | | 37 | |
Schedule of Investments (Unaudited)
iSHARES® iBOXX $ HIGH YIELD CORPORATE BOND ETF
October 31, 2014
| | | | | | | | |
| Security | |
Principal
(000s) | | | Value | |
| | | | | | | | |
CORPORATE BONDS & NOTES — 97.61% | |
|
ADVERTISING — 0.45% | |
Affinion Group Inc. | | | | | | | | |
7.88%, 12/15/18 (Call 12/15/14)a | | $ | 7,200 | | | $ | 5,652,000 | |
CBS Outdoor Americas Capital LLC/CBS Outdoor Americas Capital Corp. | | | | | | | | |
5.25%, 02/15/22 (Call 02/15/17)a,b | | | 6,275 | | | | 6,431,875 | |
5.63%, 02/15/24 (Call 02/15/19)b | | | 3,375 | | | | 3,493,125 | |
5.88%, 03/15/25 (Call 09/15/19)a,b | | | 10,100 | | | | 10,554,500 | |
inVentiv Health Inc. | | | | | | | | |
9.00%, 01/15/18 (Call 01/15/16)b | | | 10,500 | | | | 10,867,500 | |
10.00%, 08/15/18 (Call 08/15/15)b,c | | | 1,285 | | | | 1,156,500 | |
11.00%, 08/15/18 (Call 01/20/15)a,b | | | 2,167 | | | | 1,538,570 | |
Lamar Media Corp. | | | | | | | | |
5.00%, 05/01/23 (Call 05/01/18)a | | | 8,909 | | | | 8,909,000 | |
5.38%, 01/15/24 (Call 01/15/19)a | | | 6,425 | | | | 6,633,813 | |
5.88%, 02/01/22 (Call 02/01/17) | | | 8,350 | | | | 8,788,375 | |
| | | | | | | | |
| | | | | | | 64,025,258 | |
AEROSPACE & DEFENSE — 0.69% | |
B/E Aerospace Inc. | | | | | | | | |
5.25%, 04/01/22 (Call 04/01/17) | | | 18,250 | | | | 20,371,563 | |
6.88%, 10/01/20 (Call 10/01/15) | | | 8,950 | | | | 9,688,375 | |
Meccanica Holdings USA Inc. | | | | | | | | |
6.25%, 07/15/19b | | | 8,650 | | | | 9,319,510 | |
TransDigm Inc. | | | | | | | | |
5.50%, 10/15/20 (Call 10/15/15)a | | | 9,650 | | | | 9,650,000 | |
6.00%, 07/15/22 (Call 07/15/17) | | | 19,480 | | | | 19,869,600 | |
| | | | | | | | |
| Security | |
Principal
(000s) | | | Value | |
| | | | | | | | |
6.50%, 07/15/24 (Call 07/15/19) | | $ | 20,320 | | | $ | 20,828,000 | |
7.50%, 07/15/21 (Call 07/15/16) | | | 8,100 | | | | 8,758,125 | |
| | | | | | | | |
| | | | | | | 98,485,173 | |
AIRLINES — 0.31% | |
Air Canada | | | | | | | | |
6.75%, 10/01/19 (Call 10/01/16)a,b | | | 6,075 | | | | 6,393,937 | |
7.75%, 04/15/21a,b | | | 7,980 | | | | 8,309,175 | |
American Airlines Group Inc. | | | | | | | | |
5.50%, 10/01/19b | | | 14,190 | | | | 14,119,050 | |
Continental Airlines Inc. 2012-3 Pass Through Trust | | | | | | | | |
6.13%, 04/29/18 | | | 6,600 | | | | 6,979,500 | |
U.S. Airways Group Inc. | | | | | | | | |
6.13%, 06/01/18 | | | 7,668 | | | | 7,898,521 | |
| | | | | | | | |
| | | | | | | 43,700,183 | |
APPAREL — 0.24% | |
Hanesbrands Inc. | | | | | | | | |
6.38%, 12/15/20 (Call 12/15/15) | | | 16,280 | | | | 17,297,500 | |
Levi Strauss & Co. | | | | | | | | |
6.88%, 05/01/22 (Call 05/01/17)a | | | 8,050 | | | | 8,754,375 | |
7.63%, 05/15/20 (Call 05/15/15) | | | 8,000 | | | | 8,520,000 | |
| | | | | | | | |
| | | | | | | 34,571,875 | |
AUTO MANUFACTURERS — 1.51% | |
Chrysler Group LLC/CG Co-
Issuer Inc. | | | | | | | | |
8.00%, 06/15/19 (Call 06/15/15) | | | 47,000 | | | | 50,290,000 | |
8.25%, 06/15/21 (Call 06/15/16)a | | | 52,635 | | | | 58,753,819 | |
General Motors Co. | | | | | | | | |
3.50%, 10/02/18 | | | 25,050 | | | | 25,897,191 | |
4.88%, 10/02/23a | | | 24,800 | | | | 26,691,000 | |
Jaguar Land Rover Automotive PLC | | | | | | | | |
4.13%, 12/15/18a,b | | | 10,850 | | | | 10,985,625 | |
4.25%, 11/15/19b | | | 4,275 | | | | 4,296,375 | |
| | |
| 38 | | 2014 iSHARES ANNUAL REPORTTO SHAREHOLDERS |
Schedule of Investments (Unaudited) (Continued)
iSHARES® iBOXX $ HIGH YIELD CORPORATE BOND ETF
October 31, 2014
| | | | | | | | |
| Security | |
Principal
(000s) | | | Value | |
| | | | | | | | |
5.63%, 02/01/23 (Call 02/01/18)a,b | | $ | 7,800 | | | $ | 8,221,200 | |
8.13%, 05/15/21 (Call 05/15/16)b | | | 7,375 | | | | 8,112,500 | |
Navistar International Corp. | | | | | | | | |
8.25%, 11/01/21 (Call 11/01/14)a | | | 20,954 | | | | 21,530,235 | |
| | | | | | | | |
| | | | | | | 214,777,945 | |
AUTO PARTS & EQUIPMENT — 0.84% | |
American Axle & Manufacturing Inc. | | | | | | | | |
6.25%, 03/15/21 (Call 03/15/16)a | | | 6,450 | | | | 6,772,500 | |
6.63%, 10/15/22 (Call 10/15/17)a | | | 7,065 | | | | 7,630,200 | |
Dana Holding Corp. | | | | | | | | |
5.38%, 09/15/21 (Call 09/15/16)a | | | 6,750 | | | | 7,015,479 | |
6.50%, 02/15/19 (Call 02/15/15)a | | | 6,300 | | | | 6,538,859 | |
Goodyear Tire & Rubber Co. (The) | | | | | | | | |
6.50%, 03/01/21 (Call 03/01/16)a | | | 15,450 | | | | 16,686,000 | |
7.00%, 05/15/22 (Call 05/15/17)a | | | 12,395 | | | | 13,479,563 | |
8.25%, 08/15/20 (Call 08/15/15)a | | | 14,845 | | | | 15,958,375 | |
Lear Corp. | | | | | | | | |
4.75%, 01/15/23 (Call 01/15/18)a | | | 6,758 | | | | 6,774,895 | |
Schaeffler Finance BV | | | | | | | | |
4.25%, 05/15/21 (Call 05/15/17)a,b | | | 12,900 | | | | 12,609,750 | |
4.75%, 05/15/21 (Call 05/15/16)b | | | 14,150 | | | | 14,114,625 | |
7.75%, 02/15/17a,b | | | 10,170 | | | | 11,441,250 | |
| | | | | | | | |
| | | | | | | 119,021,496 | |
BANKS — 2.90% | | | | | |
BBVA International Preferred SAU | | | | | | | | |
5.92%, 04/29/49 (Call 04/18/17)a,d | | | 8,761 | | | | 8,936,220 | |
| | | | | | | | |
| Security | |
Principal
(000s) | | | Value | |
| | | | | | | | |
BPCE SA | | | | | | | | |
12.50%, 08/29/49 (Call 09/30/19)a,b,d | | $ | 7,400 | | | $ | 10,096,560 | |
CIT Group Inc. | | | | | | | | |
3.88%, 02/19/19 | | | 16,500 | | | | 16,582,500 | |
4.25%, 08/15/17 | | | 30,100 | | | | 30,965,375 | |
5.00%, 05/15/17a | | | 19,846 | | | | 20,788,685 | |
5.00%, 08/15/22 | | | 20,200 | | | | 21,260,500 | |
5.00%, 08/01/23a | | | 12,350 | | | | 12,936,625 | |
5.25%, 03/15/18a | | | 23,726 | | | | 25,030,930 | |
5.38%, 05/15/20a | | | 11,450 | | | | 12,251,500 | |
5.50%, 02/15/19b | | | 32,530 | | | | 34,644,450 | |
6.63%, 04/01/18a,b | | | 3,900 | | | | 4,268,489 | |
Commerzbank AG | | | | | | | | |
8.13%, 09/19/23b | | | 16,350 | | | | 19,088,625 | |
Credit Agricole SA | | | | | | | | |
6.64%, 05/29/49 (Call 05/31/17)a,b,d | | | 16,745 | | | | 17,843,891 | |
8.38%, 10/29/49 (Call 10/13/19)a,b,d | | | 15,600 | | | | 18,018,000 | |
Fifth Third Bancorp | | | | | | | | |
5.10%, 12/29/49 (Call 06/30/23)d | | | 9,800 | | | | 9,261,000 | |
Regions Bank/Birmingham AL | | | | | | | | |
7.50%, 05/15/18 | | | 4,955 | | | | 5,801,123 | |
Royal Bank of Scotland Group PLC | | | | | | | | |
5.13%, 05/28/24a | | | 37,215 | | | | 37,608,095 | |
6.00%, 12/19/23 | | | 32,971 | | | | 35,354,691 | |
6.10%, 06/10/23 | | | 16,350 | | | | 17,692,546 | |
6.13%, 12/15/22a | | | 37,450 | | | | 40,636,946 | |
Royal Bank of Scotland NV | | | | | | | | |
4.65%, 06/04/18 | | | 2,500 | | | | 2,634,375 | |
Societe Generale SA | | | | | | | | |
5.92%, 12/31/49 (Call 04/05/17)b,d | | | 10,715 | | | | 11,250,750 | |
| | | | | | | | |
| | | | | | | 412,951,876 | |
BEVERAGES — 0.44% | |
Constellation Brands Inc. | | | | | | | | |
3.75%, 05/01/21 | | | 7,600 | | | | 7,590,500 | |
3.88%, 11/15/19 | | | 1,425 | | | | 1,446,375 | |
4.25%, 05/01/23 | | | 15,575 | | | | 15,633,406 | |
4.75%, 11/15/24 | | | 1,200 | | | | 1,227,000 | |
| | | | |
SCHEDULESOF INVESTMENTS | | | 39 | |
Schedule of Investments (Unaudited) (Continued)
iSHARES® iBOXX $ HIGH YIELD CORPORATE BOND ETF
October 31, 2014
| | | | | | | | |
| Security | |
Principal
(000s) | | | Value | |
| | | | | | | | |
6.00%, 05/01/22a | | $ | 10,900 | | | $ | 12,180,750 | |
7.25%, 09/01/16a | | | 11,050 | | | | 12,072,125 | |
7.25%, 05/15/17 | | | 11,499 | | | | 12,835,759 | |
| | | | | | | | |
| | | | | | | 62,985,915 | |
BUILDING MATERIALS — 0.80% | |
Building Materials Corp. of America | | | | | | | | |
5.38%, 11/15/24 (Call 11/15/19)b | | | 4,910 | | | | 4,922,275 | |
6.75%, 05/01/21 (Call 05/01/16)a,b | | | 15,800 | | | | 16,866,500 | |
6.88%, 08/15/18 (Call 12/15/14)b | | | 8,270 | | | | 8,559,450 | |
Lafarge SA | | | | | | | | |
6.20%, 07/09/15b | | | 775 | | | | 800,003 | |
6.50%, 07/15/16a | | | 11,600 | | | | 12,419,583 | |
Masco Corp. | | | | | | | | |
4.80%, 06/15/15 | | | 1,000 | | | | 1,015,000 | |
5.95%, 03/15/22 | | | 6,477 | | | | 7,092,315 | |
6.13%, 10/03/16a | | | 12,653 | | | | 13,570,342 | |
7.13%, 03/15/20 | | | 9,845 | | | | 11,297,137 | |
USG Corp. | | | | | | | | |
6.30%, 11/15/16 | | | 8,569 | | | | 9,018,873 | |
9.75%, 01/15/18 | | | 8,225 | | | | 9,499,875 | |
Vulcan Materials Co. | | | | | | | | |
7.00%, 06/15/18 | | | 6,400 | | | | 7,120,000 | |
7.50%, 06/15/21 | | | 10,100 | | | | 11,766,500 | |
| | | | | | | | |
| | | | | | | 113,947,853 | |
CHEMICALS — 1.66% | |
Ashland Inc. | | | | | | | | |
3.00%, 03/15/16 (Call 02/15/16) | | | 8,750 | | | | 8,837,217 | |
3.88%, 04/15/18 (Call 03/15/18) | | | 11,800 | | | | 11,973,965 | |
4.75%, 08/15/22 (Call 05/15/22)a | | | 18,000 | | | | 18,164,342 | |
Axiall Corp. | | | | | | | | |
4.88%, 05/15/23 (Call 05/15/18)a | | | 6,130 | | | | 5,954,965 | |
Celanese U.S. Holdings LLC | | | | | | | | |
4.63%, 11/15/22 | | | 8,100 | | | | 8,201,250 | |
5.88%, 06/15/21 | | | 3,950 | | | | 4,285,750 | |
| | | | | | | | |
| Security | |
Principal
(000s) | | | Value | |
| | | | | | | | |
Eagle Spinco Inc. | | | | | | | | |
4.63%, 02/15/21 (Call 02/15/18) | | $ | 10,775 | | | $ | 10,505,625 | |
Hexion U.S. Finance Corp. | | | | | | | | |
6.63%, 04/15/20 (Call 04/15/15)a | | | 25,300 | | | | 25,393,248 | |
Hexion U.S. Finance Corp./Hexion Nova Scotia Finance ULC | | | | | | | | |
8.88%, 02/01/18 (Call 11/15/15)a | | | 19,400 | | | | 19,212,741 | |
9.00%, 11/15/20 (Call 11/15/15)a | | | 8,650 | | | | 7,871,066 | |
Huntsman International LLC | | | | | | | | |
4.88%, 11/15/20 (Call 08/15/20)a | | | 11,000 | | | | 11,123,750 | |
8.63%, 03/15/21 (Call 09/15/15)a | | | 9,110 | | | | 9,884,350 | |
Ineos Finance PLC | | | | | | | | |
7.50%, 05/01/20 (Call 05/01/15)a,b | | | 17,960 | | | | 19,194,750 | |
8.38%, 02/15/19 (Call 02/15/15)a,b | | | 15,950 | | | | 17,106,375 | |
Ineos Group Holdings SA | | | | | | | | |
5.88%, 02/15/19 (Call 02/15/16)a,b | | | 9,525 | | | | 9,548,812 | |
6.13%, 08/15/18 (Call 05/15/15)a,b | | | 11,325 | | | | 11,424,094 | |
NOVA Chemicals Corp. | | | | | | | | |
5.00%, 05/01/25 (Call 01/31/25)b | | | 3,520 | | | | 3,634,400 | |
Rockwood Specialties Group Inc. | | | | | | | | |
4.63%, 10/15/20 (Call 10/15/15) | | | 19,250 | | | | 20,097,000 | |
WR Grace & Co-Conn | | | | | | | | |
5.13%, 10/01/21b | | | 13,300 | | | | 13,865,250 | |
| | | | | | | | |
| | | | | | | 236,278,950 | |
COAL — 1.15% | |
Alpha Natural Resources Inc. | | | | | | | | |
6.00%, 06/01/19 (Call 01/20/15)a | | | 10,815 | | | | 5,407,500 | |
| | |
| 40 | | 2014 iSHARES ANNUAL REPORTTO SHAREHOLDERS |
Schedule of Investments (Unaudited) (Continued)
iSHARES® iBOXX $ HIGH YIELD CORPORATE BOND ETF
October 31, 2014
| | | | | | | | |
| Security | |
Principal
(000s) | | | Value | |
| | | | | | | | |
6.25%, 06/01/21 (Call 06/01/16)a | | $ | 10,040 | | | $ | 4,769,000 | |
7.50%, 08/01/20 (Call 08/01/16)a,b | | | 11,975 | | | | 9,580,000 | |
9.75%, 04/15/18a | | | 7,171 | | | | 4,661,150 | |
Arch Coal Inc. | | | | | | | | |
7.00%, 06/15/19 (Call 06/15/15)a | | | 13,950 | | | | 5,614,875 | |
7.25%, 10/01/20 (Call 10/01/15)a | | | 7,380 | | | | 3,542,400 | |
7.25%, 06/15/21 (Call 06/15/16)a | | | 15,500 | | | | 5,735,000 | |
CONSOL Energy Inc. | | | | | | | | |
5.88%, 04/15/22 (Call 04/15/17)b | | | 30,350 | | | | 30,805,250 | |
8.25%, 04/01/20 (Call 04/01/15)a | | | 17,210 | | | | 18,109,894 | |
Peabody Energy Corp. | | | | | | | | |
6.00%, 11/15/18 | | | 22,350 | | | | 21,679,500 | |
6.25%, 11/15/21a | | | 21,378 | | | | 20,255,655 | |
6.50%, 09/15/20a | | | 9,845 | | | | 9,377,362 | |
7.38%, 11/01/16 | | | 9,446 | | | | 9,752,995 | |
Walter Energy Inc. | | | | | | | | |
8.50%, 04/15/21 (Call 04/15/17)a | | | 5,850 | | | | 1,564,875 | |
9.50%, 10/15/19 (Call 10/15/16)a,b | | | 11,925 | | | | 10,315,125 | |
9.88%, 12/15/20 (Call 12/15/16)a | | | 7,650 | | | | 2,237,625 | |
| | | | | | | | |
| | | | | | | 163,408,206 | |
COMMERCIAL SERVICES — 3.51% | |
ADT Corp. (The) | | | | | | | | |
2.25%, 07/15/17 | | | 11,073 | | | | 10,868,249 | |
3.50%, 07/15/22a | | | 16,450 | | | | 14,609,398 | |
4.13%, 04/15/19a | | | 8,125 | | | | 8,053,372 | |
4.13%, 06/15/23a | | | 9,650 | | | | 8,844,333 | |
6.25%, 10/15/21a | | | 14,850 | | | | 15,675,647 | |
Altegrity Inc. | | | | | | | | |
9.50%, 07/01/19 (Call 07/01/17)a,b | | | 10,580 | | | | 10,077,450 | |
Anna Merger Sub Inc. | | | | | | | | |
7.75%, 10/01/22 (Call 10/01/17)a,b | | | 12,250 | | | | 12,525,625 | |
| | | | | | | | |
| Security | |
Principal
(000s) | | | Value | |
| | | | | | | | |
APX Group Inc. | | | | | | | | |
6.38%, 12/01/19 (Call 12/01/15)a | | $ | 14,800 | | | $ | 14,541,000 | |
8.75%, 12/01/20 (Call 12/01/15)a | | | 12,771 | | | | 11,110,770 | |
Ashtead Capital Inc. | | | | | | | | |
5.63%, 10/01/24 (Call 10/01/19)b | | | 9,535 | | | | 9,940,237 | |
6.50%, 07/15/22 (Call 07/15/17)b | | | 5,100 | | | | 5,508,000 | |
Avis Budget Car Rental LLC/Avis Budget Finance Inc. | | | | | | | | |
5.13%, 06/01/22 (Call 06/01/17)b | | | 6,550 | | | | 6,468,125 | |
5.50%, 04/01/23 (Call 04/01/18)a | | | 8,050 | | | | 8,090,250 | |
Cenveo Corp. | | | | | | | | |
6.00%, 08/01/19 (Call 02/01/19)a,b | | | 9,175 | | | | 8,806,082 | |
Ceridian HCM Holding Inc. | | | | | | | | |
11.00%, 03/15/21 (Call 03/15/16)b | | | 7,475 | | | | 8,428,063 | |
Ceridian LLC | | | | | | | | |
8.88%, 07/15/19 (Call 07/15/15)a,b | | | 13,600 | | | | 15,062,000 | |
Ceridian LLC/Comdata Inc. | | | | | | | | |
8.13%, 11/15/17 (Call 11/14/14)b | | | 9,750 | | | | 9,762,187 | |
Global A&T Electronics Ltd. | | | | | | | | |
10.00%, 02/01/19 (Call 02/01/16)b | | | 17,900 | | | | 15,796,750 | |
Harland Clarke Holdings Corp. | | | | | | | | |
9.25%, 03/01/21 (Call 03/01/17)b | | | 12,580 | | | | 12,725,169 | |
Hertz Corp. (The) | | | | | | | | |
5.88%, 10/15/20 (Call 10/15/15)a | | | 12,400 | | | | 12,569,741 | |
6.25%, 10/15/22 (Call 10/15/17)a | | | 9,000 | | | | 9,165,872 | |
6.75%, 04/15/19 (Call 04/15/15) | | | 20,375 | | | | 21,205,760 | |
7.38%, 01/15/21 (Call 01/15/16) | | | 8,125 | | | | 8,587,581 | |
| | | | |
SCHEDULESOF INVESTMENTS | | | 41 | |
Schedule of Investments (Unaudited) (Continued)
iSHARES® iBOXX $ HIGH YIELD CORPORATE BOND ETF
October 31, 2014
| | | | | | | | |
| Security | |
Principal
(000s) | | | Value | |
| | | | | | | | |
7.50%, 10/15/18 (Call 01/20/15)a | | $ | 10,200 | | | $ | 10,585,120 | |
Iron Mountain Inc. | | | | | | | | |
5.75%, 08/15/24 (Call 08/15/17) | | | 17,075 | | | | 17,395,156 | |
6.00%, 08/15/23 (Call 08/15/18) | | | 9,350 | | | | 9,875,937 | |
7.75%, 10/01/19 (Call 10/01/15) | | | 5,780 | | | | 6,213,500 | |
8.38%, 08/15/21 (Call 12/29/14) | | | 6,750 | | | | 7,036,875 | |
Jaguar Holding Co II/Jaguar Merger Sub Inc. | | | | | | | | |
9.50%, 12/01/19 (Call 12/01/14)a,b | | | 11,061 | | | | 11,876,749 | |
Laureate Education Inc. | | | | | | | | |
9.75%, 09/01/19 (Call 09/01/15)a,b | | | 23,950 | | | | 24,668,500 | |
R.R. Donnelley & Sons Co. | | | | | | | | |
6.00%, 04/01/24 | | | 5,525 | | | | 5,552,625 | |
7.00%, 02/15/22a | | | 6,850 | | | | 7,329,500 | |
7.63%, 06/15/20a | | | 950 | | | | 1,059,250 | |
7.88%, 03/15/21a | | | 7,325 | | | | 8,222,313 | |
Service Corp. International/U.S. | | | | | | | | |
5.38%, 01/15/22 (Call 07/15/17)a | | | 6,550 | | | | 6,784,490 | |
5.38%, 05/15/24 (Call 05/15/19)a | | | 7,775 | | | | 7,988,813 | |
ServiceMaster Co. (The) | | | | | | | | |
7.00%, 08/15/20 (Call 08/15/15)a | | | 7,556 | | | | 8,047,140 | |
8.00%, 02/15/20 (Call 02/15/15) | | | 419 | | | | 447,283 | |
United Rentals North America Inc. | | | | | | | | |
5.75%, 07/15/18 (Call 07/15/15)a | | | 13,500 | | | | 14,141,250 | |
5.75%, 11/15/24 (Call 05/15/19)a | | | 13,525 | | | | 14,167,437 | |
6.13%, 06/15/23 (Call 12/15/17)a | | | 15,875 | | | | 17,065,625 | |
7.38%, 05/15/20 (Call 05/15/16) | | | 11,950 | | | | 12,995,625 | |
| | | | | | | | |
| Security | |
Principal
(000s) | | | Value | |
| | | | | | | | |
7.63%, 04/15/22 (Call 04/15/17) | | $ | 21,250 | | | $ | 23,640,625 | |
8.25%, 02/01/21 (Call 02/01/16) | | | 10,795 | | | | 11,793,537 | |
8.38%, 09/15/20 (Call 09/15/15)a | | | 13,680 | | | | 14,825,700 | |
| | | | | | | | |
| | | | | | | 500,134,711 | |
COMPUTERS — 0.76% | |
Dell Inc. | | | | | | | | |
3.10%, 04/01/16a | | | 2,150 | | | | 2,160,750 | |
4.63%, 04/01/21a | | | 6,210 | | | | 6,008,175 | |
5.65%, 04/15/18 | | | 8,459 | | | | 8,924,245 | |
5.88%, 06/15/19a | | | 9,850 | | | | 10,453,313 | |
NCR Corp. | | | | | | | | |
4.63%, 02/15/21 (Call 02/15/17) | | | 7,750 | | | | 7,711,250 | |
5.00%, 07/15/22 (Call 07/15/17) | | | 9,800 | | | | 9,751,000 | |
5.88%, 12/15/21 (Call 12/15/17)a | | | 6,375 | | | | 6,566,250 | |
6.38%, 12/15/23 (Call 12/15/18)a | | | 12,750 | | | | 13,515,000 | |
Sungard Availability Services Capital Inc. | | | | | | | | |
8.75%, 04/01/22 (Call 04/01/19)a,b | | | 6,450 | | | | 4,773,000 | |
SunGard Data Systems Inc. | | | | | | | | |
6.63%, 11/01/19 (Call 11/01/15) | | | 15,550 | | | | 16,016,500 | |
7.38%, 11/15/18 (Call 01/20/15)a | | | 8,225 | | | | 8,554,000 | |
7.63%, 11/15/20 (Call 11/15/15)a | | | 13,210 | | | | 14,085,162 | |
| | | | | | | | |
| | | | | | | 108,518,645 | |
COSMETICS & PERSONAL CARE — 0.11% | |
Avon Products Inc. | | | | | | | | |
4.60%, 03/15/20 | | | 7,800 | | | | 7,416,708 | |
5.00%, 03/15/23a | | | 9,168 | | | | 8,572,080 | |
| | | | | | | | |
| | | | | | | 15,988,788 | |
DISTRIBUTION & WHOLESALE — 0.62% | |
HD Supply Inc. | | | | | | | | |
7.50%, 07/15/20 (Call 10/15/16)a | | | 20,740 | | | | 22,243,650 | |
| | |
| 42 | | 2014 iSHARES ANNUAL REPORTTO SHAREHOLDERS |
Schedule of Investments (Unaudited) (Continued)
iSHARES® iBOXX $ HIGH YIELD CORPORATE BOND ETF
October 31, 2014
| | | | | | | | |
| Security | |
Principal
(000s) | | | Value | |
| | | | | | | | |
8.13%, 04/15/19 (Call 04/15/15) | | $ | 19,548 | | | $ | 21,209,580 | |
11.00%, 04/15/20 (Call 04/15/16)a | | | 13,930 | | | | 15,915,025 | |
11.50%, 07/15/20 (Call 10/15/16) | | | 15,450 | | | | 18,018,563 | |
VWR Funding Inc. | | | | | | | | |
7.25%, 09/15/17 (Call 01/20/15)a | | | 10,525 | | | | 11,011,781 | |
| | | | | | | | |
| | | | | | | 88,398,599 | |
DIVERSIFIED FINANCIAL SERVICES — 7.35% | |
AerCap Ireland Capital Ltd./AerCap Global Aviation Trust | | | | | | | | |
2.75%, 05/15/17a,b | | | 6,500 | | | | 6,435,000 | |
3.75%, 05/15/19b | | | 18,950 | | | | 18,831,562 | |
4.50%, 05/15/21b | | | 17,150 | | | | 17,321,500 | |
5.00%, 10/01/21a,b | | | 13,800 | | | | 14,283,000 | |
Aircastle Ltd. | | | | | | | | |
4.63%, 12/15/18a | | | 6,650 | | | | 6,749,750 | |
5.13%, 03/15/21 | | | 8,250 | | | | 8,353,125 | |
6.25%, 12/01/19 | | | 8,350 | | | | 8,934,500 | |
6.75%, 04/15/17 | | | 8,050 | | | | 8,633,625 | |
Ally Financial Inc. | | | | | | | | |
2.75%, 01/30/17a | | | 15,050 | | | | 15,068,812 | |
3.13%, 01/15/16a | | | 5,500 | | | | 5,582,500 | |
3.50%, 07/18/16a | | | 15,500 | | | | 15,713,125 | |
3.50%, 01/27/19 | | | 13,350 | | | | 13,416,750 | |
4.75%, 09/10/18a | | | 12,450 | | | | 13,088,063 | |
5.13%, 09/30/24a | | | 10,800 | | | | 11,259,000 | |
5.50%, 02/15/17a | | | 27,652 | | | | 29,311,120 | |
6.25%, 12/01/17a | | | 19,010 | | | | 20,748,130 | |
7.50%, 09/15/20 | | | 26,500 | | | | 31,542,245 | |
8.00%, 12/31/18a | | | 8,425 | | | | 9,804,594 | |
8.00%, 03/15/20 | | | 27,010 | | | | 32,547,050 | |
Denali Borrower LLC/Denali Finance Corp. | | | | | | | | |
5.63%, 10/15/20 (Call 10/15/16)a,b | | | 25,875 | | | | 27,330,469 | |
E*TRADE Financial Corp. | | | | | | | | |
6.00%, 11/15/17 (Call 11/15/14)a | | | 8,900 | | | | 9,178,125 | |
6.38%, 11/15/19 (Call 11/15/15)a | | | 12,875 | | | | 13,727,969 | |
6.75%, 06/01/16 | | | 7,150 | | | | 7,596,875 | |
| | | | | | | | |
| Security | |
Principal
(000s) | | | Value | |
| | | | | | | | |
General Motors Financial Co. Inc. | | | | | | | | |
2.63%, 07/10/17a | | $ | 4,440 | | | $ | 4,489,950 | |
2.75%, 05/15/16 | | | 11,865 | | | | 12,042,975 | |
3.25%, 05/15/18a | | | 12,520 | | | | 12,817,350 | |
3.50%, 07/10/19a | | | 12,950 | | | | 13,366,861 | |
4.25%, 05/15/23a | | | 12,965 | | | | 13,337,744 | |
4.38%, 09/25/21 | | | 21,050 | | | | 22,049,875 | |
4.75%, 08/15/17 | | | 15,384 | | | | 16,422,420 | |
6.75%, 06/01/18a | | | 8,515 | | | | 9,685,813 | |
Icahn Enterprises LP/Icahn Enterprises Finance Corp. | | | | | | | | |
4.88%, 03/15/19 (Call 07/15/16)a | | | 21,025 | | | | 21,521,190 | |
5.88%, 02/01/22 (Call 08/01/17) | | | 22,845 | | | | 23,558,906 | |
6.00%, 08/01/20 (Call 02/01/17)a | | | 28,675 | | | | 30,208,657 | |
Series WI | | | | | | | | |
3.50%, 03/15/17 (Call 02/15/17)a | | | 19,225 | | | | 19,465,312 | |
ILFC E-Capital Trust II | | | | | | | | |
6.25%, 12/21/65 (Call 12/21/15)a,b,d | | | 6,400 | | | | 6,208,000 | |
International Lease Finance Corp. | | | | | | | | |
3.88%, 04/15/18 | | | 13,350 | | | | 13,383,375 | |
4.63%, 04/15/21a | | | 8,100 | | | | 8,262,000 | |
5.75%, 05/15/16 | | | 16,210 | | | | 16,922,849 | |
5.88%, 04/01/19a | | | 11,800 | | | | 12,714,658 | |
5.88%, 08/15/22a | | | 11,600 | | | | 12,658,500 | |
6.25%, 05/15/19 | | | 19,850 | | | | 21,720,658 | |
8.25%, 12/15/20a | | | 16,680 | | | | 20,153,358 | |
8.63%, 09/15/15a | | | 3,500 | | | | 3,692,980 | |
8.63%, 01/15/22 | | | 11,246 | | | | 13,999,162 | |
8.75%, 03/15/17 | | | 25,500 | | | | 28,678,356 | |
8.88%, 09/01/17a | | | 8,190 | | | | 9,375,199 | |
Jefferies Finance LLC/JFIN Co-
Issuer Corp. | | | | | | | | |
6.88%, 04/15/22 (Call 04/15/17)b | | | 6,750 | | | | 6,514,071 | |
7.38%, 04/01/20 (Call 04/01/16)b | | | 11,200 | | | | 11,088,000 | |
| | | | |
SCHEDULESOF INVESTMENTS | | | 43 | |
Schedule of Investments (Unaudited) (Continued)
iSHARES® iBOXX $ HIGH YIELD CORPORATE BOND ETF
October 31, 2014
| | | | | | | | |
| Security | |
Principal
(000s) | | | Value | |
| | | | | | | | |
7.50%, 04/15/21 (Call 10/15/17)b | | $ | 5,050 | | | $ | 5,024,830 | |
Nationstar Mortgage LLC/Nationstar Capital Corp. | | | | | | | | |
6.50%, 08/01/18 (Call 08/01/15)a | | | 7,850 | | | | 7,653,750 | |
6.50%, 07/01/21 (Call 01/01/17) | | | 9,400 | | | | 8,718,500 | |
7.88%, 10/01/20 (Call 10/01/16) | | | 6,500 | | | | 6,386,250 | |
Navient Corp. | | | | | | | | |
4.63%, 09/25/17 | | | 7,921 | | | | 8,079,420 | |
4.88%, 06/17/19a | | | 14,500 | | | | 14,717,500 | |
5.50%, 01/15/19 | | | 21,350 | | | | 22,097,250 | |
5.50%, 01/25/23a | | | 16,015 | | | | 16,015,000 | |
6.00%, 01/25/17 | | | 18,821 | | | | 19,903,207 | |
6.13%, 03/25/24a | | | 12,300 | | | | 12,730,500 | |
6.25%, 01/25/16a | | | 26,261 | | | | 27,304,247 | |
7.25%, 01/25/22a | | | 12,450 | | | | 13,881,750 | |
8.00%, 03/25/20a | | | 25,450 | | | | 29,140,250 | |
8.45%, 06/15/18 | | | 39,350 | | | | 45,006,562 | |
Nuveen Investments Inc. | | | | | | | | |
9.13%, 10/15/17 (Call 11/07/14)a,b | | | 4,100 | | | | 4,376,750 | |
9.50%, 10/15/20 (Call 10/15/16)b | | | 9,025 | | | | 10,938,300 | |
Springleaf Finance Corp. | | | | | | | | |
6.90%, 12/15/17a | | | 40,530 | | | | 43,975,050 | |
7.75%, 10/01/21 | | | 9,600 | | | | 10,752,000 | |
Series I | | | | | | | | |
5.40%, 12/01/15a | | | 10,100 | | | | 10,403,000 | |
| | | | | | | | |
| | | | | | | 1,046,899,224 | |
ELECTRIC — 3.79% | |
AES Corp./VA | | | | | | | | |
4.88%, 05/15/23 (Call 05/15/18)a | | | 11,005 | | | | 10,948,591 | |
5.50%, 03/15/24 (Call 03/15/19) | | | 13,200 | | | | 13,458,313 | |
7.38%, 07/01/21 (Call 06/01/21)a | | | 15,975 | | | | 18,305,859 | |
8.00%, 10/15/17 | | | 7,921 | | | | 9,021,491 | |
8.00%, 06/01/20 | | | 10,280 | | | | 11,921,021 | |
9.75%, 04/15/16 | | | 608 | | | | 671,840 | |
| | | | | | | | |
| Security | |
Principal
(000s) | | | Value | |
| | | | | | | | |
Calpine Corp. | | | | | | | | |
5.38%, 01/15/23 (Call 10/15/18) | | $ | 20,000 | | | $ | 20,150,000 | |
5.75%, 01/15/25 (Call 10/15/19)a | | | 25,300 | | | | 25,679,500 | |
5.88%, 01/15/24 (Call 11/01/18)a,b | | | 9,200 | | | | 9,890,000 | |
6.00%, 01/15/22 (Call 11/01/16)b | | | 11,550 | | | | 12,430,687 | |
7.88%, 01/15/23 (Call 01/15/17)b | | | 15,684 | | | | 17,330,820 | |
DPL Inc. | | | | | | | | |
6.50%, 10/15/16 (Call 09/15/16)a | | | 1,115 | | | | 1,190,203 | |
7.25%, 10/15/21 (Call 07/15/21) | | | 12,690 | | | | 13,514,298 | |
Dynegy Finance I Inc./Dynegy Finance II Inc. | | | | | | | | |
6.75%, 11/01/19 (Call 05/01/17)b | | | 25,325 | | | | 26,116,406 | |
7.38%, 11/01/22 (Call 11/01/18)b | | | 25,160 | | | | 26,543,800 | |
7.63%, 11/01/24 (Call 11/01/19)b | | | 18,900 | | | | 19,986,750 | |
EDP Finance BV | | | | | | | | |
4.90%, 10/01/19b | | | 15,650 | | | | 16,315,125 | |
5.25%, 01/14/21b | | | 12,448 | | | | 12,992,600 | |
6.00%, 02/02/18b | | | 16,200 | | | | 17,536,500 | |
Enel SpA | | | | | | | | |
8.75%, 09/24/73 (Call 09/24/23)a,b,d | | | 20,457 | | | | 23,883,547 | |
FirstEnergy Corp. | | | | | | | | |
Series A | | | | | | | | |
2.75%, 03/15/18 (Call 02/15/18) | | | 9,400 | | | | 9,488,924 | |
Series B | | | | | | | | |
4.25%, 03/15/23 (Call 12/15/22)a | | | 14,750 | | | | 14,781,499 | |
FirstEnergy Transmission LLC | | | | | | | | |
4.35%, 01/15/25 (Call 10/15/24)b | | | 9,550 | | | | 9,779,891 | |
GenOn Energy Inc. | | | | | | | | |
9.50%, 10/15/18a | | | 11,260 | | | | 11,710,595 | |
| | |
| 44 | | 2014 iSHARES ANNUAL REPORTTO SHAREHOLDERS |
Schedule of Investments (Unaudited) (Continued)
iSHARES® iBOXX $ HIGH YIELD CORPORATE BOND ETF
October 31, 2014
| | | | | | | | |
| Security | |
Principal
(000s) | | | Value | |
| | | | | | | | |
9.88%, 10/15/20 (Call 10/15/15)a | | $ | 9,100 | | | $ | 9,439,979 | |
IPALCO Enterprises Inc. | | | | | | | | |
5.00%, 05/01/18 (Call 04/01/18) | | | 6,250 | | | | 6,624,571 | |
7.25%, 04/01/16a,b | | | 6,645 | | | | 7,085,615 | |
NRG Energy Inc. | | | | | | | | |
6.25%, 07/15/22 (Call 07/15/18) | | | 17,700 | | | | 18,569,357 | |
6.25%, 05/01/24 (Call 05/01/19)b | | | 16,250 | | | | 16,796,600 | |
6.63%, 03/15/23 (Call 09/15/17)a | | | 15,350 | | | | 16,206,934 | |
7.63%, 01/15/18a | | | 19,530 | | | | 21,821,086 | |
7.88%, 05/15/21 (Call 05/15/16)a | | | 18,788 | | | | 20,463,730 | |
8.25%, 09/01/20 (Call 09/01/15) | | | 15,855 | | | | 17,070,950 | |
PPL Capital Funding Inc. Series A | | | | | | | | |
6.70%, 03/30/67 (Call 03/30/17)d | | | 7,150 | | | | 7,257,250 | |
PPL Energy Supply LLC | | | | | | | | |
4.60%, 12/15/21 (Call 09/15/21)a | | | 13,500 | | | | 12,700,732 | |
RJS Power Holdings LLC | | | | | | | | |
5.13%, 07/15/19 (Call 07/15/16)a,b | | | 20,150 | | | | 20,076,332 | |
RRI Energy Inc. | | | | | | | | |
7.88%, 06/15/17a | | | 12,170 | | | | 12,338,799 | |
| | | | | | | | |
| | | | | | | 540,100,195 | |
ELECTRONICS — 0.24% | |
Flextronics International Ltd. | | | | | | | | |
4.63%, 02/15/20a | | | 8,425 | | | | 8,593,500 | |
5.00%, 02/15/23a | | | 7,850 | | | | 8,046,250 | |
Rexel SA | | | | | | | | |
5.25%, 06/15/20 (Call 06/15/16)a,b | | | 8,850 | | | | 8,916,375 | |
6.13%, 12/15/19 (Call 12/15/15)b | | | 7,900 | | | | 8,176,500 | |
| | | | | | | | |
| | | | | | | 33,732,625 | |
| | | | | | | | |
| Security | |
Principal
(000s) | | | Value | |
| | | | | | | | |
ENGINEERING & CONSTRUCTION — 0.23% | |
Abengoa Finance SAU | | | | | | | | |
7.75%, 02/01/20a,b | | $ | 7,650 | | | $ | 7,994,250 | |
8.88%, 11/01/17a,b | | | 12,093 | | | | 13,151,137 | |
AECOM Technology Corp. | | | | | | | | |
5.75%, 10/15/22 (Call 10/15/17)b | | | 3,125 | | | | 3,289,063 | |
5.88%, 10/15/24 (Call 07/15/24)a,b | | | 7,950 | | | | 8,367,375 | |
| | | | | | | | |
| | | | | | | 32,801,825 | |
ENTERTAINMENT — 0.81% | |
AMC Entertainment Inc. | | | | | | | | |
9.75%, 12/01/20 (Call 12/01/15) | | | 1,570 | | | | 1,742,700 | |
Cinemark USA Inc. | | | | | | | | |
4.88%, 06/01/23 (Call 06/01/18) | | | 8,800 | | | | 8,646,000 | |
5.13%, 12/15/22 (Call 12/15/17)a | | | 5,900 | | | | 5,929,500 | |
GLP Capital LP/GLP Financing II Inc. | | | | | | | | |
4.38%, 11/01/18 (Call 08/01/18)a | | | 8,700 | | | | 8,939,250 | |
4.88%, 11/01/20 (Call 08/01/20) | | | 15,825 | | | | 16,458,000 | |
5.38%, 11/01/23 (Call 08/01/23) | | | 8,050 | | | | 8,472,625 | |
Pinnacle Entertainment Inc. | | | | | | | | |
6.38%, 08/01/21 (Call 08/01/16) | | | 14,440 | | | | 15,452,429 | |
7.50%, 04/15/21 (Call 04/15/15) | | | 16,886 | | | | 18,046,912 | |
Regal Entertainment Group | | | | | | | | |
5.75%, 03/15/22 (Call 03/15/17)a | | | 12,850 | | | | 12,689,375 | |
WMG Acquisition Corp. | | | | | | | | |
6.00%, 01/15/21 (Call 01/15/16)b | | | 7,039 | | | | 7,205,549 | |
6.75%, 04/15/22 (Call 04/15/17)b | | | 12,350 | | | | 12,164,750 | |
| | | | | | | | |
| | | | | | | 115,747,090 | |
| | | | |
SCHEDULESOF INVESTMENTS | | | 45 | |
Schedule of Investments (Unaudited) (Continued)
iSHARES® iBOXX $ HIGH YIELD CORPORATE BOND ETF
October 31, 2014
| | | | | | | | |
| Security | |
Principal
(000s) | | | Value | |
| | | | | | | | |
ENVIRONMENTAL CONTROL — 0.37% | |
Clean Harbors Inc. | | | | | | | | |
5.13%, 06/01/21 (Call 12/01/16)a | | $ | 8,975 | | | $ | 9,132,063 | |
5.25%, 08/01/20 (Call 08/01/16) | | | 14,279 | | | | 14,635,975 | |
Covanta Holding Corp. | | | | | | | | |
5.88%, 03/01/24 (Call 03/01/19) | | | 6,400 | | | | 6,592,000 | |
6.38%, 10/01/22 (Call 04/01/17)a | | | 6,375 | | | | 6,789,375 | |
7.25%, 12/01/20 (Call 12/01/15) | | | 5,400 | | | | 5,751,000 | |
Tervita Corp. | | | | | | | | |
8.00%, 11/15/18 (Call 11/15/15)b | | | 10,350 | | | | 9,832,500 | |
| | | | | | | | |
| | | | | | | 52,732,913 | |
FOOD — 1.43% | |
Albertsons Holdings LLC/Saturn Acquisition Merger Sub Inc. | | | | | | | | |
7.75%, 10/15/22 (Call 10/15/17)b | | | 19,650 | | | | 19,257,000 | |
Aramark Services Inc. | | | | | | | | |
5.75%, 03/15/20 (Call 03/15/15)a | | | 15,550 | | | | 16,269,187 | |
Big Heart Pet Brands | | | | | | | | |
7.63%, 02/15/19 (Call 01/20/15)a | | | 1,194 | | | | 1,191,015 | |
H.J. Heinz Co. | | | | | | | | |
4.25%, 10/15/20 (Call 04/15/15)a | | | 50,300 | | | | 50,918,690 | |
Post Holdings Inc. | | | | | | | | |
6.00%, 12/15/22 (Call 06/15/18)a,b | | | 8,700 | | | | 8,373,750 | |
6.75%, 12/01/21 (Call 12/01/17)b | | | 13,175 | | | | 13,158,531 | |
7.38%, 02/15/22 (Call 02/15/17)a | | | 24,700 | | | | 25,349,610 | |
Smithfield Foods Inc. | | | | | | | | |
5.25%, 08/01/18 (Call 08/01/15)a,b | | | 7,725 | | | | 7,956,750 | |
5.88%, 08/01/21 (Call 08/01/16)a,b | | | 7,175 | | | | 7,623,438 | |
| | | | | | | | |
| Security | |
Principal
(000s) | | | Value | |
| | | | | | | | |
6.63%, 08/15/22 (Call 08/15/17) | | $ | 15,455 | | | $ | 16,768,675 | |
7.75%, 07/01/17 | | | 8,329 | | | | 9,266,013 | |
SUPERVALU Inc. | | | | | | | | |
6.75%, 06/01/21 (Call 06/01/17)a | | | 5,650 | | | | 5,565,250 | |
8.00%, 05/01/16 | | | 9,400 | | | | 10,105,000 | |
U.S. Foods Inc. | | | | | | | | |
8.50%, 06/30/19 (Call 01/20/15) | | | 11,350 | | | | 12,073,562 | |
| | | | | | | | |
| | | | | | | 203,876,471 | |
FOREST PRODUCTS & PAPER — 0.05% | |
Verso Paper Holdings LLC/Verso Paper Inc. | | | | | | | | |
11.75%, 01/15/19 (Call 01/15/15)a | | | 6,940 | | | | 7,078,801 | |
| | | | | | | | |
| | | | | | | 7,078,801 | |
GAS — 0.32% | |
NGL Energy Partners LP/NGL Energy Finance Corp. | | | | | | | | |
5.13%, 07/15/19 (Call 06/15/19)b | | | 6,000 | | | | 6,045,000 | |
6.88%, 10/15/21 (Call 10/15/16)b | | | 6,250 | | | | 6,625,000 | |
Sabine Pass LNG LP | | | | | | | | |
6.50%, 11/01/20 (Call 11/01/16)a | | | 6,600 | | | | 6,979,942 | |
7.50%, 11/30/16 | | | 24,600 | | | | 26,393,020 | |
| | | | | | | | |
| | | | | | | 46,042,962 | |
HEALTH CARE — PRODUCTS — 1.33% | |
Alere Inc. | | | | | | | | |
6.50%, 06/15/20 (Call 06/15/16) | | | 6,875 | | | | 7,115,625 | |
7.25%, 07/01/18 (Call 12/15/15) | | | 8,350 | | | | 8,882,396 | |
8.63%, 10/01/18 (Call 01/20/15) | | | 6,415 | | | | 6,695,656 | |
Biomet Inc. | | | | | | | | |
6.50%, 08/01/20 (Call 08/01/15) | | | 25,820 | | | | 27,627,400 | |
6.50%, 10/01/20 (Call 10/01/15) | | | 13,500 | | | | 14,326,875 | |
| | |
| 46 | | 2014 iSHARES ANNUAL REPORTTO SHAREHOLDERS |
Schedule of Investments (Unaudited) (Continued)
iSHARES® iBOXX $ HIGH YIELD CORPORATE BOND ETF
October 31, 2014
| | | | | | | | |
| Security | |
Principal
(000s) | | | Value | |
| | | | | | | | |
ConvaTec Healthcare E SA | | | | | | | | |
10.50%, 12/15/18 (Call 12/15/14)b | | $ | 12,147 | | | $ | 12,875,820 | |
Crimson Merger Sub Inc. | | | | | | | | |
6.63%, 05/15/22 (Call 05/15/17)a,b | | | 22,825 | | | | 21,341,375 | |
DJO Finance LLC/DJO Finance Corp. | | | | | | | | |
9.88%, 04/15/18 (Call 04/15/15) | | | 6,850 | | | | 7,226,750 | |
Hologic Inc. | | | | | | | | |
6.25%, 08/01/20 (Call 08/01/15)a | | | 15,625 | | | | 16,406,250 | |
Kinetic Concepts Inc./KCI USA Inc. | | | | | | | | |
10.50%, 11/01/18 (Call 11/01/15)a | | | 29,490 | | | | 32,512,725 | |
12.50%, 11/01/19 (Call 11/01/15) | | | 9,040 | | | | 10,057,000 | |
Mallinckrodt International Finance SA | | | | | | | | |
4.75%, 04/15/23 | | | 9,300 | | | | 8,951,250 | |
Mallinckrodt International Finance SA/Mallinckrodt CB LLC | | | | | | | | |
5.75%, 08/01/22 (Call 08/01/17)b | | | 14,600 | | | | 15,293,500 | |
| | | | | | | | |
| | | | | | | 189,312,622 | |
HEALTH CARE — SERVICES — 5.85% | |
Amsurg Corp. | | | | | | | | |
5.63%, 07/15/22 (Call 07/15/17)a,b | | | 17,800 | | | | 18,378,500 | |
CHS/Community Health Systems Inc. | | | | | | | | |
5.13%, 08/15/18 (Call 08/15/15)a | | | 25,900 | | | | 26,903,625 | |
5.13%, 08/01/21 (Call 02/01/17) | | | 15,200 | | | | 15,922,000 | |
6.88%, 02/01/22 (Call 02/01/18)a | | | 49,850 | | | | 53,838,000 | |
7.13%, 07/15/20 (Call 07/15/16)a | | | 19,650 | | | | 21,222,000 | |
8.00%, 11/15/19 (Call 11/15/15) | | | 32,718 | | | | 35,335,440 | |
| | | | | | | | |
| Security | |
Principal
(000s) | | | Value | |
| | | | | | | | |
DaVita HealthCare Partners Inc. | | | | | | | | |
5.13%, 07/15/24 (Call 07/15/19)a | | $ | 28,150 | | | $ | 28,713,000 | |
5.75%, 08/15/22 (Call 08/15/17)a | | | 21,000 | | | | 22,338,750 | |
6.63%, 11/01/20 (Call 11/01/14) | | | 12,000 | | | | 12,630,000 | |
Fresenius Medical Care U.S. Finance II Inc. | | | | | | | | |
5.63%, 07/31/19b | | | 14,650 | | | | 15,675,500 | |
5.88%, 01/31/22a,b | | | 12,515 | | | | 13,641,350 | |
Fresenius Medical Care U.S. Finance Inc. | | | | | | | | |
5.75%, 02/15/21b | | | 9,400 | | | | 10,093,250 | |
6.50%, 09/15/18a,b | | | 6,310 | | | | 6,941,000 | |
6.88%, 07/15/17 | | | 7,800 | | | | 8,560,500 | |
HCA Holdings Inc. | | | | | | | | |
6.25%, 02/15/21 | | | 15,700 | | | | 16,956,000 | |
7.75%, 05/15/21 (Call 11/15/15) | | | 24,230 | | | | 26,107,825 | |
HCA Inc. | | | | | | | | |
3.75%, 03/15/19 | | | 24,905 | | | | 24,936,131 | |
4.25%, 10/15/19a | | | 10,100 | | | | 10,264,125 | |
4.75%, 05/01/23a | | | 20,290 | | | | 20,619,713 | |
5.00%, 03/15/24a | | | 33,200 | | | | 34,196,000 | |
5.25%, 04/15/25a | | | 15,950 | | | | 16,548,125 | |
5.88%, 03/15/22a | | | 21,550 | | | | 23,570,312 | |
5.88%, 05/01/23a | | | 21,400 | | | | 22,951,500 | |
6.50%, 02/15/16a | | | 13,950 | | | | 14,717,250 | |
6.50%, 02/15/20a | | | 46,630 | | | | 52,050,737 | |
7.25%, 09/15/20 (Call 03/15/15)a | | | 16,060 | | | | 17,023,600 | |
7.50%, 02/15/22 | | | 30,255 | | | | 35,133,619 | |
8.00%, 10/01/18 | | | 7,750 | | | | 8,902,813 | |
LifePoint Hospitals Inc. | | | | | | | | |
5.50%, 12/01/21 (Call 12/01/16) | | | 16,650 | | | | 17,440,875 | |
6.63%, 10/01/20 (Call 10/01/15) | | | 5,900 | | | | 6,268,750 | |
MPH Acquisition Holdings LLC | | | | | | | | |
6.63%, 04/01/22 (Call 04/01/17)b | | | 15,325 | | | | 16,052,938 | |
| | | | |
SCHEDULESOF INVESTMENTS | | | 47 | |
Schedule of Investments (Unaudited) (Continued)
iSHARES® iBOXX $ HIGH YIELD CORPORATE BOND ETF
October 31, 2014
| | | | | | | | |
| Security | |
Principal
(000s) | | | Value | |
| | | | | | | | |
Tenet Healthcare Corp. | | | | | | | | |
4.38%, 10/01/21a | | $ | 18,600 | | | $ | 18,507,000 | |
4.50%, 04/01/21 | | | 12,625 | | | | 12,688,125 | |
4.75%, 06/01/20a | | | 7,700 | | | | 7,873,250 | |
5.00%, 03/01/19b | | | 17,205 | | | | 17,226,506 | |
5.50%, 03/01/19b | | | 9,000 | | | | 9,202,500 | |
6.00%, 10/01/20a | | | 28,409 | | | | 30,610,697 | |
6.25%, 11/01/18 | | | 16,110 | | | | 17,499,488 | |
8.00%, 08/01/20 (Call 08/01/15)a | | | 12,160 | | | | 13,011,200 | |
8.13%, 04/01/22a | | | 45,600 | | | | 52,326,000 | |
| | | | | | | | |
| | | | | | | 832,877,994 | |
HOLDING COMPANIES — DIVERSIFIED — 0.25% | |
Harbinger Group Inc. | | | | | | | | |
7.75%, 01/15/22 (Call 01/15/17) | | | 9,200 | | | | 9,338,000 | |
7.88%, 07/15/19 (Call 01/15/16) | | | 14,925 | | | | 16,156,313 | |
Nielsen Co. Luxembourg Sarl (The) | | | | | | | | |
5.50%, 10/01/21 (Call 10/01/16)a,b | | | 10,200 | | | | 10,557,000 | |
| | | | | | | | |
| | | | | | | 36,051,313 | |
HOME BUILDERS — 1.13% | |
Brookfield Residential Properties Inc. | | | | | | | | |
6.50%, 12/15/20 (Call 12/15/15)a,b | | | 10,150 | | | | 10,784,375 | |
Brookfield Residential Properties Inc./Brookfield Residential U.S. Corp. | | | | | | | | |
6.13%, 07/01/22 (Call 07/01/17)a,b | | | 8,400 | | | | 8,904,000 | |
Centex Corp. | | | | | | | | |
6.50%, 05/01/16a | | | 7,400 | | | | 7,927,250 | |
DR Horton Inc. | | | | | | | | |
3.63%, 02/15/18 (Call 11/15/17)a | | | 6,700 | | | | 6,800,500 | |
3.75%, 03/01/19 (Call 12/01/18) | | | 8,000 | | | | 8,020,000 | |
5.75%, 08/15/23 (Call 05/15/23)a | | | 6,600 | | | | 7,012,500 | |
| | | | | | | | |
| Security | |
Principal
(000s) | | | Value | |
| | | | | | | | |
K. Hovnanian Enterprises Inc. | | | | | | | | |
7.25%, 10/15/20 (Call 10/15/15)a,b | | $ | 8,600 | | | $ | 9,073,000 | |
KB Home | | | | | | | | |
4.75%, 05/15/19 (Call 02/15/19)a | | | 7,224 | | | | 7,178,850 | |
7.00%, 12/15/21 (Call 09/15/21)a | | | 7,350 | | | | 7,846,125 | |
Lennar Corp. | | | | | | | | |
4.50%, 06/15/19 (Call 04/16/19) | | | 7,750 | | | | 7,905,000 | |
4.75%, 12/15/17 (Call 09/15/17) | | | 1,125 | | | | 1,175,625 | |
4.75%, 11/15/22 (Call 08/15/22) | | | 9,950 | | | | 9,800,750 | |
12.25%, 06/01/17 | | | 7,325 | | | | 8,991,437 | |
Standard Pacific Corp. | | | | | | | | |
8.38%, 05/15/18 | | | 8,875 | | | | 10,250,625 | |
8.38%, 01/15/21a | | | 7,570 | | | | 8,856,900 | |
Taylor Morrison Communities Inc./Monarch Communities Inc. | | | | | | | | |
5.25%, 04/15/21 (Call 04/15/16)a,b | | | 8,000 | | | | 8,020,000 | |
Toll Brothers Finance Corp. | | | | | | | | |
4.38%, 04/15/23 (Call 01/15/23)a | | | 6,250 | | | | 6,125,000 | |
5.88%, 02/15/22 (Call 11/15/21) | | | 6,280 | | | | 6,751,000 | |
8.91%, 10/15/17 | | | 5,300 | | | | 6,187,750 | |
TRI Pointe Holdings Inc. | | | | | | | | |
4.38%, 06/15/19b | | | 6,900 | | | | 6,900,000 | |
5.88%, 06/15/24b | | | 7,000 | | | | 7,140,000 | |
| | | | | | | | |
| | | | | | | 161,650,687 | |
HOUSEHOLD PRODUCTS & WARES — 1.75% | |
Reynolds Group Issuer Inc./Reynolds Group Issuer LLC | | | | | | | | |
5.75%, 10/15/20 (Call 10/15/15)a | | | 57,050 | | | | 59,332,000 | |
6.88%, 02/15/21 (Call 02/15/16) | | | 16,900 | | | | 17,998,500 | |
7.13%, 04/15/19 (Call 01/20/15) | | | 22,815 | | | | 23,699,081 | |
| | |
| 48 | | 2014 iSHARES ANNUAL REPORTTO SHAREHOLDERS |
Schedule of Investments (Unaudited) (Continued)
iSHARES® iBOXX $ HIGH YIELD CORPORATE BOND ETF
October 31, 2014
| | | | | | | | |
| Security | |
Principal
(000s) | | | Value | |
| | | | | | | | |
7.88%, 08/15/19 (Call 08/15/15)a | | $ | 24,360 | | | $ | 26,174,820 | |
8.25%, 02/15/21 (Call 02/15/16)a | | | 16,555 | | | | 17,796,625 | |
8.50%, 05/15/18 (Call 01/20/15) | | | 16,160 | | | | 16,766,000 | |
9.00%, 04/15/19 (Call 01/20/15) | | | 25,575 | | | | 26,725,875 | |
9.88%, 08/15/19 (Call 08/15/15) | | | 38,471 | | | | 42,005,331 | |
Spectrum Brands Inc. | | | | | | | | |
6.38%, 11/15/20 (Call 11/15/16)a | | | 8,760 | | | | 9,285,600 | |
6.63%, 11/15/22 (Call 11/15/17)a | | | 8,730 | | | | 9,384,750 | |
| | | | | | | | |
| | | | | | | 249,168,582 | |
INSURANCE — 0.27% | |
Hartford Financial Services Group Inc. (The) | | | | | | | | |
8.13%, 06/15/68 (Call 06/15/18)d | | | 8,442 | | | | 9,760,640 | |
Hockey Merger Sub 2 Inc. | | | | | | | | |
7.88%, 10/01/21 (Call 10/01/16)a,b | | | 14,450 | | | | 15,064,125 | |
Voya Financial Inc. | | | | | | | | |
5.65%, 05/15/53 (Call 05/15/23)a,d | | | 13,525 | | | | 13,525,000 | |
| | | | | | | | |
| | | | | | | 38,349,765 | |
INTERNET — 0.57% | |
Equinix Inc. | | | | | | | | |
4.88%, 04/01/20 (Call 04/01/17) | | | 7,500 | | | | 7,631,250 | |
5.38%, 04/01/23 (Call 04/01/18)a | | | 16,450 | | | | 16,964,062 | |
7.00%, 07/15/21 (Call 07/15/16) | | | 13,704 | | | | 14,937,360 | |
IAC/InterActiveCorp | | | | | | | | |
4.75%, 12/15/22 (Call 12/15/17) | | | 7,700 | | | | 7,546,000 | |
4.88%, 11/30/18 (Call 11/30/14)a | | | 8,100 | | | | 8,343,000 | |
| | | | | | | | |
| Security | |
Principal
(000s) | | | Value | |
| | | | | | | | |
Ymobile Corp. | | | | | | | | |
8.25%, 04/01/18 (Call 04/01/15)b | | $ | 4,725 | | | $ | 5,014,170 | |
Zayo Group LLC/Zayo Capital Inc. | | | | | | | | |
8.13%, 01/01/20 (Call 07/01/15)a | | | 11,402 | | | | 12,200,140 | |
10.13%, 07/01/20 (Call 07/01/16)a | | | 7,725 | | | | 8,632,688 | |
| | | | | | | | |
| | | | | | | 81,268,670 | |
IRON & STEEL — 1.82% | |
AK Steel Corp. | | | | | | | | |
7.63%, 05/15/20 (Call 05/15/15)a | | | 9,000 | | | | 9,045,000 | |
7.63%, 10/01/21 (Call 10/01/17) | | | 8,550 | | | | 8,592,750 | |
ArcelorMittal | | | | | | | | |
4.25%, 08/05/15a | | | 1,200 | | | | 1,227,000 | |
4.25%, 03/01/16a | | | 8,550 | | | | 8,742,375 | |
5.00%, 02/25/17 | | | 18,901 | | | | 19,751,545 | |
5.75%, 08/05/20a | | | 14,078 | | | | 14,957,875 | |
6.00%, 03/01/21a | | | 25,085 | | | | 26,715,525 | |
6.13%, 06/01/18a | | | 25,900 | | | | 27,842,500 | |
6.75%, 02/25/22a | | | 16,900 | | | | 18,801,250 | |
10.35%, 06/01/19 | | | 26,800 | | | | 33,031,000 | |
Commercial Metals Co. | | | | | | | | |
6.50%, 07/15/17 | | | 6,378 | | | | 6,838,419 | |
7.35%, 08/15/18 | | | 8,100 | | | | 8,985,432 | |
Steel Dynamics Inc. | | | | | | | | |
5.13%, 10/01/21 (Call 10/01/17)a,b | | | 12,955 | | | | 13,408,425 | |
5.25%, 04/15/23 (Call 04/15/18)a | | | 6,950 | | | | 7,271,438 | |
5.50%, 10/01/24 (Call 10/01/19)a,b | | | 8,450 | | | | 8,914,750 | |
6.13%, 08/15/19 (Call 08/15/16) | | | 6,800 | | | | 7,310,000 | |
United States Steel Corp. | | | | | | | | |
6.05%, 06/01/17a | | | 7,384 | | | | 7,911,077 | |
7.00%, 02/01/18 | | | 9,000 | | | | 9,922,500 | |
7.38%, 04/01/20 | | | 10,950 | | | | 12,226,964 | |
7.50%, 03/15/22 (Call 03/15/17) | | | 6,800 | | | | 7,446,000 | |
| | | | | | | | |
| | | | | | | 258,941,825 | |
| | | | |
SCHEDULESOF INVESTMENTS | | | 49 | |
Schedule of Investments (Unaudited) (Continued)
iSHARES® iBOXX $ HIGH YIELD CORPORATE BOND ETF
October 31, 2014
| | | | | | | | |
| Security | |
Principal
(000s) | | | Value | |
| | | | | | | | |
LEISURE TIME — 0.06% | |
Royal Caribbean Cruises Ltd. | | | | | | | | |
5.25%, 11/15/22 | | $ | 8,005 | | | $ | 8,310,865 | |
Sabre GLBL Inc. | | | | | | | | |
8.50%, 05/15/19 (Call 05/15/15)b | | | 142 | | | | 152,650 | |
| | | | | | | | |
| | | | | | | 8,463,515 | |
LODGING — 2.60% | |
Boyd Gaming Corp. | | | | | | | | |
9.13%, 12/01/18 (Call 12/01/14)a | | | 8,150 | | | | 8,553,847 | |
Caesars Entertainment Operating Co. Inc. | | | | | | | | |
8.50%, 02/15/20 (Call 02/15/16)a | | | 16,350 | | | | 12,344,250 | |
9.00%, 02/15/20 (Call 02/15/16)a | | | 21,136 | | | | 15,958,475 | |
9.00%, 02/15/20 (Call 02/15/16) | | | 21,000 | | | | 15,855,789 | |
10.00%, 12/15/18 (Call 01/20/15)a | | | 11,276 | | | | 1,808,816 | |
10.00%, 12/15/18 (Call 01/20/15) | | | 48,605 | | | | 7,560,585 | |
10.75%, 02/01/16 (Call 01/20/15)a | | | 8,250 | | | | 1,632,295 | |
11.25%, 06/01/17 (Call 01/20/15) | | | 34,060 | | | | 25,763,117 | |
12.75%, 04/15/18 (Call 01/20/15) | | | 10,645 | | | | 1,916,100 | |
Caesars Entertainment Resort Properties LLC/Caesars Entertainment Resort Properties Finance Inc. | | | | | | | | |
8.00%, 10/01/20 (Call 10/01/16)b | | | 17,300 | | | | 16,716,125 | |
11.00%, 10/01/21 (Call 10/01/16)a,b | | | 18,950 | | | | 17,718,250 | |
Caesars Growth Properties Holdings LLC/Caesars Growth Properties Finance Inc. | | | | | | | | |
9.38%, 05/01/22 (Call 05/01/17)b | | | 9,625 | | | | 8,941,807 | |
| | | | | | | | |
| Security | |
Principal
(000s) | | | Value | |
| | | | | | | | |
Felcor Lodging LP | | | | | | | | |
5.63%, 03/01/23 (Call 03/01/18) | | $ | 8,350 | | | $ | 8,307,325 | |
6.75%, 06/01/19 (Call 06/01/15) | | | 8,770 | | | | 9,143,300 | |
Hilton Worldwide Finance LLC/Hilton Worldwide Finance Corp. | | | | | | | | |
5.63%, 10/15/21 (Call 10/15/16)b | | | 24,100 | | | | 25,305,000 | |
MGM Resorts International | | | | | | | | |
5.25%, 03/31/20a | | | 9,200 | | | | 9,430,000 | |
6.63%, 12/15/21a | | | 21,000 | | | | 22,995,000 | |
6.75%, 10/01/20a | | | 17,400 | | | | 19,140,000 | |
7.50%, 06/01/16 | | | 9,920 | | | | 10,664,000 | |
7.63%, 01/15/17a | | | 12,100 | | | | 13,204,125 | |
7.75%, 03/15/22 | | | 16,300 | | | | 18,826,500 | |
8.63%, 02/01/19a | | | 15,312 | | | | 17,838,480 | |
10.00%, 11/01/16 | | | 7,850 | | | | 8,890,125 | |
11.38%, 03/01/18 | | | 8,320 | | | | 10,150,400 | |
Studio City Finance Ltd. | | | | | | | | |
8.50%, 12/01/20 (Call 12/01/15)b | | | 12,700 | | | | 13,811,250 | |
Wynn Las Vegas LLC/Wynn Las Vegas Capital Corp. | | | | | | | | |
4.25%, 05/30/23 (Call 02/28/23)a,b | | | 7,900 | | | | 7,900,000 | |
5.38%, 03/15/22 (Call 03/15/17)a | | | 16,200 | | | | 17,010,000 | |
7.75%, 08/15/20 (Call 08/15/15)a | | | 22,160 | | | | 23,766,600 | |
| | | | | | | | |
| | | | | | | 371,151,561 | |
MACHINERY — 0.86% | |
BlueLine Rental Finance Corp. | | | | | | | | |
7.00%, 02/01/19 (Call 02/01/16)b | | | 13,600 | | | | 14,348,000 | |
Case New Holland Industrial Inc. | | | | | | | | |
7.88%, 12/01/17 | | | 24,000 | | | | 27,060,000 | |
CNH Industrial Capital LLC | | | | | | | | |
3.25%, 02/01/17 | | | 8,300 | | | | 8,300,000 | |
3.38%, 07/15/19a,b | | | 8,200 | | | | 7,984,750 | |
3.63%, 04/15/18a | | | 10,250 | | | | 10,301,250 | |
| | |
| 50 | | 2014 iSHARES ANNUAL REPORTTO SHAREHOLDERS |
Schedule of Investments (Unaudited) (Continued)
iSHARES® iBOXX $ HIGH YIELD CORPORATE BOND ETF
October 31, 2014
| | | | | | | | |
| Security | |
Principal
(000s) | | | Value | |
| | | | | | | | |
3.88%, 11/01/15a | | $ | 11,320 | | | $ | 11,475,650 | |
6.25%, 11/01/16 | | | 8,170 | | | | 8,701,050 | |
Manitowoc Co. Inc. (The) | | | | | | | | |
8.50%, 11/01/20 (Call 11/01/15) | | | 625 | | | | 676,563 | |
Terex Corp. | | | | | | | | |
6.00%, 05/15/21 (Call 11/15/16) | | | 14,750 | | | | 15,376,875 | |
Zebra Technologies Corp. | | | | | | | | |
7.25%, 10/15/22 (Call 10/15/17)b | | | 17,095 | | | | 17,949,750 | |
| | | | | | | | |
| | | | | | | 122,173,888 | |
MANUFACTURING — 0.99% | |
Bombardier Inc. | | | | | | | | |
4.25%, 01/15/16a,b | | | 10,925 | | | | 11,184,469 | |
4.75%, 04/15/19a,b | | | 10,600 | | | | 10,947,680 | |
5.75%, 03/15/22a,b | | | 8,300 | | | | 8,466,000 | |
6.00%, 10/15/22 (Call 04/15/17)a,b | | | 20,000 | | | | 20,636,000 | |
6.13%, 01/15/23a,b | | | 20,325 | | | | 20,985,562 | |
7.50%, 03/15/18a,b | | | 11,050 | | | | 12,210,250 | |
7.75%, 03/15/20a,b | | | 15,120 | | | | 16,802,100 | |
Gates Global LLC/Gates Global Co. | | | | | | | | |
6.00%, 07/15/22 (Call 07/15/17)b | | | 16,675 | | | | 16,091,375 | |
Trinseo Materials Operating SCA/Trinseo Materials Finance Inc. | | | | | | | | |
8.75%, 02/01/19 (Call 08/01/15)a | | | 22,545 | | | | 23,897,700 | |
| | | | | | | | |
| | | | | | | 141,221,136 | |
MEDIA — 8.72% | |
AMC Networks Inc. | | | | | | | | |
4.75%, 12/15/22 (Call 12/15/17) | | | 9,375 | | | | 9,328,125 | |
7.75%, 07/15/21 (Call 07/15/16) | | | 12,100 | | | | 13,158,750 | |
Cablevision Systems Corp. | | | | | | | | |
5.88%, 09/15/22a | | | 10,900 | | | | 11,090,750 | |
7.75%, 04/15/18 | | | 12,400 | | | | 13,764,000 | |
8.00%, 04/15/20a | | | 8,550 | | | | 9,811,125 | |
8.63%, 09/15/17a | | | 18,170 | | | | 20,532,100 | |
| | | | | | | | |
| Security | |
Principal
(000s) | | | Value | |
| | | | | | | | |
CCO Holdings LLC/CCO Holdings Capital Corp. | | | | | | | | |
5.13%, 02/15/23 (Call 02/15/18) | | $ | 16,350 | | | $ | 16,288,687 | |
5.25%, 03/15/21 (Call 03/15/16)a | | | 7,900 | | | | 7,998,750 | |
5.25%, 09/30/22 (Call 09/30/17)a | | | 20,150 | | | | 20,351,500 | |
5.75%, 09/01/23 (Call 03/01/18)a | | | 7,550 | | | | 7,738,750 | |
5.75%, 01/15/24 (Call 07/15/18)a | | | 17,042 | | | | 17,468,050 | |
6.50%, 04/30/21 (Call 04/30/15) | | | 25,430 | | | | 26,828,650 | |
6.63%, 01/31/22 (Call 01/31/17) | | | 12,450 | | | | 13,228,125 | |
7.00%, 01/15/19 (Call 01/20/15) | | | 22,025 | | | | 22,961,062 | |
7.25%, 10/30/17 (Call 01/20/15)a | | | 15,080 | | | | 15,702,050 | |
7.38%, 06/01/20 (Call 12/01/15)a | | | 13,020 | | | | 13,947,675 | |
8.13%, 04/30/20 (Call 04/30/15) | | | 11,250 | | | | 11,925,000 | |
CCOH Safari LLC | | | | | | | | |
5.50%, 12/01/22 (Call 12/01/17) | | | 3,740 | | | | 3,777,400 | |
5.75%, 12/01/24 (Call 12/01/19) | | | 6,185 | | | | 6,219,791 | |
Cequel Communications Holdings I LLC/Cequel Capital Corp. | | | | | | | | |
5.13%, 12/15/21 (Call 06/15/16)b | | | 7,550 | | | | 7,399,000 | |
5.13%, 12/15/21 (Call 06/15/16)a,b | | | 13,325 | | | | 13,058,500 | |
6.38%, 09/15/20 (Call 09/15/15)b | | | 25,825 | | | | 26,922,562 | |
Clear Channel Worldwide Holdings Inc. | | | | | | | | |
6.50%, 11/15/22 (Call 11/15/17) | | | 44,635 | | | | 46,452,106 | |
| | | | |
SCHEDULESOF INVESTMENTS | | | 51 | |
Schedule of Investments (Unaudited) (Continued)
iSHARES® iBOXX $ HIGH YIELD CORPORATE BOND ETF
October 31, 2014
| | | | | | | | |
| Security | |
Principal
(000s) | | | Value | |
| | | | | | | | |
Series A | | | | | | | | |
7.63%, 03/15/20 (Call 03/15/15)a | | $ | 500 | | | $ | 527,500 | |
Series B | | | | | | | | |
7.63%, 03/15/20 (Call 03/15/15)a | | | 32,480 | | | | 34,510,000 | |
CSC Holdings LLC | | | | | | | | |
5.25%, 06/01/24b | | | 12,350 | | | | 12,350,000 | |
6.75%, 11/15/21a | | | 15,500 | | | | 17,243,750 | |
8.63%, 02/15/19a | | | 9,014 | | | | 10,580,183 | |
DISH DBS Corp. | | | | | | | | |
4.25%, 04/01/18a | | | 19,750 | | | | 20,260,105 | |
4.63%, 07/15/17a | | | 14,000 | | | | 14,630,000 | |
5.00%, 03/15/23a | | | 25,325 | | | | 25,293,344 | |
5.13%, 05/01/20a | | | 19,150 | | | | 19,903,384 | |
5.88%, 07/15/22a | | | 31,900 | | | | 33,814,000 | |
6.75%, 06/01/21 | | | 33,730 | | | | 37,355,975 | |
7.13%, 02/01/16a | | | 19,784 | | | | 20,980,928 | |
7.88%, 09/01/19 | | | 24,116 | | | | 27,977,485 | |
Gannett Co. Inc. | | | | | | | | |
5.13%, 10/15/19 (Call 10/15/16) | | | 11,335 | | | | 11,703,388 | |
5.13%, 07/15/20 (Call 07/15/16) | | | 9,450 | | | | 9,804,375 | |
6.38%, 10/15/23 (Call 10/15/18) | | | 10,380 | | | | 11,288,250 | |
iHeartCommunications Inc. | | | | | | | | |
9.00%, 12/15/19 (Call 07/15/15)a | | | 25,800 | | | | 26,122,500 | |
9.00%, 03/01/21 (Call 03/01/16)a | | | 26,640 | | | | 26,573,400 | |
9.00%, 09/15/22 (Call 09/15/17)a,b | | | 17,100 | | | | 17,100,000 | |
10.00%, 01/15/18 (Call 07/15/16)a | | | 14,400 | | | | 12,015,000 | |
11.25%, 03/01/21 (Call 03/01/16)a | | | 8,550 | | | | 9,052,313 | |
McClatchy Co. (The) | | | | | | | | |
9.00%, 12/15/22 (Call 12/15/17)a | | | 15,030 | | | | 17,021,475 | |
McGraw-Hill Global Education Holdings LLC/McGraw-Hill Global Education Finance | | | | | | | | |
9.75%, 04/01/21 (Call 04/01/16)a | | | 13,000 | | | | 14,690,000 | |
| | | | | | | | |
| Security | |
Principal
(000s) | | | Value | |
| | | | | | | | |
Nara Cable Funding Ltd. | | | | | | | | |
8.88%, 12/01/18 (Call 12/01/14)b | | $ | 12,350 | | | $ | 12,946,875 | |
Nielsen Finance LLC/Nielsen Finance Co. | | | | | | | | |
4.50%, 10/01/20 (Call 10/01/16)a | | | 12,800 | | | | 12,802,560 | |
5.00%, 04/15/22 (Call 04/15/17)a,b | | | 25,300 | | | | 25,742,750 | |
Numericable Group SA | | | | | | | | |
4.88%, 05/15/19 (Call 05/15/16)a,b | | | 38,000 | | | | 38,095,000 | |
6.00%, 05/15/22 (Call 05/15/17)b | | | 67,700 | | | | 69,561,750 | |
6.25%, 05/15/24 (Call 05/15/19)a,b | | | 25,750 | | | | 26,522,500 | |
Quebecor Media Inc. | | | | | | | | |
5.75%, 01/15/23 | | | 14,100 | | | | 14,523,000 | |
Sinclair Television Group Inc. | | | | | | | | |
5.38%, 04/01/21 (Call 04/01/16) | | | 9,150 | | | | 9,218,625 | |
5.63%, 08/01/24 (Call 08/01/19)a,b | | | 8,800 | | | | 8,690,000 | |
6.13%, 10/01/22 (Call 10/01/17)a | | | 8,275 | | | | 8,564,625 | |
Sirius XM Radio Inc. | | | | | | | | |
4.25%, 05/15/20 (Call 05/15/16)a,b | | | 8,650 | | | | 8,585,125 | |
4.63%, 05/15/23 (Call 05/15/18)b | | | 8,025 | | | | 7,704,000 | |
5.75%, 08/01/21 (Call 08/01/16)a,b | | | 9,225 | | | | 9,547,875 | |
5.88%, 10/01/20 (Call 10/01/16)b | | | 10,650 | | | | 11,209,125 | |
6.00%, 07/15/24 (Call 07/15/19)b | | | 26,400 | | | | 27,588,000 | |
Time Inc. | | | | | | | | |
5.75%, 04/15/22 (Call 04/15/17)a,b | | | 4,525 | | | | 4,423,188 | |
Unitymedia Hessen GmbH & Co. KG/Unitymedia NRW GmbH | | | | | | | | |
5.50%, 01/15/23 (Call 01/15/18)a,b | | | 15,900 | | | | 16,615,500 | |
| | |
| 52 | | 2014 iSHARES ANNUAL REPORTTO SHAREHOLDERS |
Schedule of Investments (Unaudited) (Continued)
iSHARES® iBOXX $ HIGH YIELD CORPORATE BOND ETF
October 31, 2014
| | | | | | | | |
| Security | |
Principal
(000s) | | | Value | |
| | | | | | | | |
7.50%, 03/15/19 (Call 03/15/15)b | | $ | 7,550 | | | $ | 7,946,375 | |
Unitymedia KabelBW GmbH | | | | | | | | |
6.13%, 01/15/25 (Call 01/15/20)b | | | 14,050 | | | | 14,664,687 | |
Univision Communications Inc. | | | | | | | | |
5.13%, 05/15/23 (Call 05/15/18)a,b | | | 10,190 | | | | 10,724,975 | |
6.75%, 09/15/22 (Call 09/15/17)b | | | 18,649 | | | | 20,583,834 | |
6.88%, 05/15/19 (Call 05/15/15)a,b | | | 19,400 | | | | 20,418,500 | |
7.88%, 11/01/20 (Call 11/01/15)b | | | 10,980 | | | | 11,858,400 | |
8.50%, 05/15/21 (Call 11/15/15)a,b | | | 15,300 | | | | 16,562,250 | |
Videotron Ltd. | | | | | | | | |
5.00%, 07/15/22 | | | 12,650 | | | | 13,092,750 | |
5.38%, 06/15/24 (Call 03/15/24)b | | | 10,400 | | | | 10,712,000 | |
9.13%, 04/15/18 (Call 01/19/15) | | | 1,829 | | | | 1,888,443 | |
WideOpenWest Finance LLC/WideOpenWest Capital Corp. | | | | | | | | |
10.25%, 07/15/19 (Call 07/15/15) | | | 13,600 | | | | 14,926,000 | |
| | | | | | | | |
| | | | | | | 1,242,468,575 | |
MINING — 2.05% | |
Alcoa Inc. | | | | | | | | |
5.13%, 10/01/24 (Call 07/01/24) | | | 16,400 | | | | 17,199,500 | |
5.40%, 04/15/21 (Call 01/15/21)a | | | 16,724 | | | | 18,270,970 | |
5.55%, 02/01/17 | | | 2,500 | | | | 2,682,250 | |
5.72%, 02/23/19a | | | 13,290 | | | | 14,826,656 | |
5.87%, 02/23/22a | | | 12,090 | | | | 13,465,238 | |
6.15%, 08/15/20 | | | 16,750 | | | | 18,948,437 | |
6.75%, 07/15/18 | | | 10,665 | | | | 12,118,106 | |
Aleris International Inc. | | | | | | | | |
7.63%, 02/15/18 (Call 01/20/15)a | | | 9,150 | | | | 9,401,625 | |
7.88%, 11/01/20 (Call 11/01/15)a | | | 7,900 | | | | 8,156,750 | |
| | | | | | | | |
| Security | |
Principal
(000s) | | | Value | |
| | | | | | | | |
First Quantum Minerals Ltd. | | | | | | | | |
6.75%, 02/15/20 (Call 02/15/17)b | | $ | 18,223 | | | $ | 17,904,098 | |
7.00%, 02/15/21 (Call 02/15/18)a,b | | | 17,973 | | | | 17,523,675 | |
7.25%, 05/15/22 (Call 05/15/17)b | | | 16,625 | | | | 16,292,500 | |
FMG Resources August 2006 Pty Ltd. | | | | | | | | |
6.00%, 04/01/17 (Call 04/01/15)a,b | | | 17,400 | | | | 17,704,500 | |
6.88%, 02/01/18 (Call 01/19/15)a,b | | | 6,556 | | | | 6,703,056 | |
6.88%, 04/01/22 (Call 04/01/17)a,b | | | 16,900 | | | | 17,491,500 | |
8.25%, 11/01/19 (Call 11/01/15)a,b | | | 25,870 | | | | 26,872,462 | |
Lundin Mining Corp. | | | | | | | | |
7.50%, 11/01/20 (Call 11/01/17)b | | | 5,825 | | | | 6,087,125 | |
7.88%, 11/01/22 (Call 11/01/18)b | | | 5,000 | | | | 5,212,500 | |
Novelis Inc. | | | | | | | | |
8.38%, 12/15/17 (Call 01/20/15)a | | | 18,693 | | | | 19,534,185 | |
8.75%, 12/15/20 (Call 12/15/15)a | | | 23,240 | | | | 25,360,650 | |
| | | | | | | | |
| | | | | | | 291,755,783 | |
OFFICE & BUSINESS EQUIPMENT — 0.22% | |
CDW LLC/CDW Finance Corp. | | | | | | | | |
6.00%, 08/15/22 (Call 08/15/17)a | | | 11,300 | | | | 11,921,500 | |
8.50%, 04/01/19 (Call 04/01/15)a | | | 17,616 | | | | 18,761,040 | |
| | | | | | | | |
| | | | | | | 30,682,540 | |
OIL & GAS — 9.53% | |
American Energy-Permian Basin LLC/AEPB Finance Corp. | | | | | | | | |
7.13%, 11/01/20 (Call 01/31/17)b | | | 11,000 | | | | 9,611,213 | |
7.38%, 11/01/21 (Call 07/31/17)b | | | 9,428 | | | | 8,235,835 | |
| | | | |
SCHEDULESOF INVESTMENTS | | | 53 | |
Schedule of Investments (Unaudited) (Continued)
iSHARES® iBOXX $ HIGH YIELD CORPORATE BOND ETF
October 31, 2014
| | | | | | | | |
| Security | |
Principal
(000s) | | | Value | |
| | | | | | | | |
Antero Resources Corp. | | | | | | | | |
5.13%, 12/01/22 (Call 06/01/17)a,b | | $ | 18,100 | | | $ | 18,018,117 | |
Antero Resources Finance Corp. | | | | | | | | |
5.38%, 11/01/21 (Call 11/01/16) | | | 16,200 | | | | 16,383,627 | |
6.00%, 12/01/20 (Call 12/01/15) | | | 9,450 | | | | 9,828,000 | |
Athlon Holdings LP/Athlon Finance Corp. | | | | | | | | |
6.00%, 05/01/22 (Call 05/01/17)b | | | 11,250 | | | | 12,073,990 | |
7.38%, 04/15/21 (Call 04/15/16) | | | 8,350 | | | | 9,115,748 | |
Berry Petroleum Co. LLC | | | | | | | | |
6.38%, 09/15/22 (Call 03/15/17)a | | | 9,750 | | | | 9,017,905 | |
BreitBurn Energy Partners LP/BreitBurn Finance Corp. | | | | | | | | |
7.88%, 04/15/22 (Call 01/15/17) | | | 13,250 | | | | 12,854,637 | |
California Resources Corp. | | | | | | | | |
5.00%, 01/15/20 (Call 12/15/19)b | | | 9,500 | | | | 9,583,125 | |
5.50%, 09/15/21 (Call 06/15/21)b | | | 5,550 | | | | 5,674,875 | |
6.00%, 11/15/24 (Call 08/15/24)b | | | 13,675 | | | | 13,999,781 | |
Calumet Specialty Products Partners LP/Calumet Finance Corp. | | | | | | | | |
6.50%, 04/15/21 (Call 04/15/17)b | | | 15,175 | | | | 14,643,875 | |
Chaparral Energy Inc. | | | | | | | | |
7.63%, 11/15/22 (Call 05/15/17)a | | | 9,700 | | | | 9,578,750 | |
8.25%, 09/01/21 (Call 09/01/16) | | | 6,870 | | | | 6,973,050 | |
Chesapeake Energy Corp. | | | | | | | | |
3.25%, 03/15/16 (Call 01/20/15)a | | | 8,775 | | | | 8,805,621 | |
4.88%, 04/15/22 (Call 04/15/17)a | | | 21,250 | | | | 21,770,912 | |
| | | | | | | | |
| Security | |
Principal
(000s) | | | Value | |
| | | | | | | | |
5.38%, 06/15/21 (Call 06/15/16)a | | $ | 13,850 | | | $ | 14,410,755 | |
5.75%, 03/15/23a | | | 18,300 | | | | 20,109,495 | |
6.13%, 02/15/21 | | | 17,580 | | | | 19,539,950 | |
6.50%, 08/15/17 | | | 10,540 | | | | 11,458,452 | |
6.63%, 08/15/20a | | | 23,600 | | | | 26,633,114 | |
6.88%, 11/15/20a | | | 7,176 | | | | 8,210,087 | |
7.25%, 12/15/18a | | | 11,245 | | | | 12,858,448 | |
Cimarex Energy Co. | | | | | | | | |
4.38%, 06/01/24 (Call 03/01/24) | | | 11,325 | | | | 11,526,057 | |
Concho Resources Inc. | | | | | | | | |
5.50%, 10/01/22 (Call 10/01/17) | | | 9,700 | | | | 10,252,340 | |
5.50%, 04/01/23 (Call 10/01/17) | | | 24,083 | | | | 25,505,925 | |
6.50%, 01/15/22 (Call 01/15/17)a | | | 9,680 | | | | 10,406,000 | |
7.00%, 01/15/21 (Call 01/15/16) | | | 8,517 | | | | 9,186,239 | |
Denbury Resources Inc. | | | | | | | | |
4.63%, 07/15/23 (Call 01/15/18)a | | | 19,800 | | | | 18,218,946 | |
5.50%, 05/01/22 (Call 05/01/17)a | | | 21,575 | | | | 21,280,467 | |
6.38%, 08/15/21 (Call 08/15/16) | | | 5,480 | | | | 5,705,237 | |
Energy XXI Gulf Coast Inc. | | | | | | | | |
6.88%, 03/15/24 (Call 03/15/19)a,b | | | 9,150 | | | | 7,323,953 | |
7.50%, 12/15/21 (Call 12/15/16)a | | | 8,590 | | | | 7,163,076 | |
9.25%, 12/15/17 (Call 12/15/14)a | | | 12,000 | | | | 11,741,123 | |
EP Energy LLC/Everest Acquisition Finance Inc. | | | | | | | | |
Series WI | | | | | | | | |
6.88%, 05/01/19 (Call 05/01/15)a | | | 12,450 | | | | 13,006,605 | |
9.38%, 05/01/20 (Call 05/01/16)a | | | 32,715 | | | | 35,976,685 | |
EPL Oil & Gas Inc. | | | | | | | | |
8.25%, 02/15/18 (Call 02/15/15)a | | | 9,200 | | | | 8,947,000 | |
| | |
| 54 | | 2014 iSHARES ANNUAL REPORTTO SHAREHOLDERS |
Schedule of Investments (Unaudited) (Continued)
iSHARES® iBOXX $ HIGH YIELD CORPORATE BOND ETF
October 31, 2014
| | | | | | | | |
| Security | |
Principal
(000s) | | | Value | |
| | | | | | | | |
EXCO Resources Inc. | | | | | | | | |
7.50%, 09/15/18 (Call 01/20/15)a | | $ | 13,485 | | | $ | 11,919,633 | |
8.50%, 04/15/22 (Call 04/15/17)a | | | 7,825 | | | | 6,875,130 | |
Halcon Resources Corp. | | | | | | | | |
8.88%, 05/15/21 (Call 11/15/16) | | | 22,300 | | | | 18,445,436 | |
9.25%, 02/15/22 (Call 08/15/17)a | | | 6,400 | | | | 5,307,976 | |
9.75%, 07/15/20 (Call 07/15/16) | | | 17,795 | | | | 15,011,056 | |
Hercules Offshore Inc. | | | | | | | | |
8.75%, 07/15/21 (Call 07/15/17)a,b | | | 6,850 | | | | 4,344,643 | |
Hilcorp Energy I LP/Hilcorp Finance Co. | | | | | | | | |
5.00%, 12/01/24 (Call 06/01/19)b | | | 8,425 | | | | 8,082,418 | |
Jupiter Resources Inc. | | | | | | | | |
8.50%, 10/01/22 (Call 10/01/17)b | | | 17,000 | | | | 14,960,000 | |
Kodiak Oil & Gas Corp. | | | | | | | | |
5.50%, 02/01/22 (Call 08/01/17) | | | 6,600 | | | | 6,700,436 | |
8.13%, 12/01/19 (Call 12/01/15)a | | | 13,259 | | | | 14,273,254 | |
Laredo Petroleum Inc. | | | | | | | | |
5.63%, 01/15/22 (Call 01/15/17) | | | 7,525 | | | | 7,468,562 | |
7.38%, 05/01/22 (Call 05/01/17)a | | | 8,400 | | | | 8,822,662 | |
9.50%, 02/15/19 (Call 02/15/15) | | | 9,025 | | | | 9,584,503 | |
Linn Energy LLC/Linn Energy Finance Corp. | | | | | | | | |
6.25%, 11/01/19 (Call 11/01/15) | | | 29,250 | | | | 27,055,326 | |
6.50%, 05/15/19 (Call 05/15/15)a | | | 21,100 | | | | 19,882,192 | |
6.50%, 09/15/21 (Call 09/15/17) | | | 11,575 | | | | 10,568,238 | |
7.75%, 02/01/21 (Call 09/15/15) | | | 17,260 | | | | 17,039,074 | |
| | | | | | | | |
| Security | |
Principal
(000s) | | | Value | |
| | | | | | | | |
8.63%, 04/15/20 (Call 04/15/15) | | $ | 22,995 | | | $ | 23,163,558 | |
MEG Energy Corp. | | | | | | | | |
6.38%, 01/30/23 (Call 07/30/17)b | | | 13,250 | | | | 13,015,789 | |
6.50%, 03/15/21 (Call 03/15/15)a,b | | | 13,200 | | | | 13,137,564 | |
7.00%, 03/31/24 (Call 09/30/18)a,b | | | 16,325 | | | | 16,434,046 | |
Memorial Production Partners LP/Memorial Production Finance Corp. | | | | | | | | |
6.88%, 08/01/22 (Call 08/01/17)b | | | 10,100 | | | | 9,169,428 | |
7.63%, 05/01/21 (Call 05/01/17) | | | 10,000 | | | | 9,649,895 | |
Midstates Petroleum Co. Inc./Midstates Petroleum Co. LLC | | | | | | | | |
9.25%, 06/01/21 (Call 06/01/16) | | | 11,700 | | | | 10,077,504 | |
10.75%, 10/01/20 (Call 10/01/16)a | | | 9,664 | | | | 8,730,911 | |
Newfield Exploration Co. | | | | | | | | |
5.63%, 07/01/24 | | | 15,300 | | | | 16,561,214 | |
5.75%, 01/30/22a | | | 11,300 | | | | 12,288,569 | |
6.88%, 02/01/20 (Call 02/01/15) | | | 11,085 | | | | 11,526,635 | |
Oasis Petroleum Inc. | | | | | | | | |
6.50%, 11/01/21 (Call 11/01/16) | | | 6,850 | | | | 7,089,750 | |
6.88%, 03/15/22 (Call 09/15/17) | | | 17,675 | | | | 18,602,937 | |
6.88%, 01/15/23 (Call 07/15/17)a | | | 6,000 | | | | 6,270,000 | |
7.25%, 02/01/19 (Call 02/01/15)a | | | 5,965 | | | | 6,143,950 | |
Offshore Group Investments Ltd. | | | | | | | | |
7.13%, 04/01/23 (Call 04/01/18)a | | | 13,325 | | | | 11,024,880 | |
7.50%, 11/01/19 (Call 11/01/15)a | | | 18,800 | | | | 16,079,114 | |
| | | | |
SCHEDULESOF INVESTMENTS | | | 55 | |
Schedule of Investments (Unaudited) (Continued)
iSHARES® iBOXX $ HIGH YIELD CORPORATE BOND ETF
October 31, 2014
| | | | | | | | |
| Security | |
Principal
(000s) | | | Value | |
| | | | | | | | |
Pacific Drilling SA | | | | | | | | |
5.38%, 06/01/20 (Call 06/01/16)a,b | | $ | 11,775 | | | $ | 10,624,968 | |
Pacific Drilling V Ltd. | | | | | | | | |
7.25%, 12/01/17 (Call 12/01/15)b | | | 8,075 | | | | 7,913,500 | |
Paragon Offshore PLC | | | | | | | | |
6.75%, 07/15/22 (Call 07/15/18)a,b | | | 7,925 | | | | 6,300,375 | |
7.25%, 08/15/24 (Call 08/15/19)a,b | | | 9,400 | | | | 7,285,000 | |
Penn Virginia Corp. | | | | | | | | |
8.50%, 05/01/20 (Call 05/01/17)a | | | 13,850 | | | | 13,573,000 | |
Precision Drilling Corp. | | | | | | | | |
5.25%, 11/15/24 (Call 05/15/19)b | | | 4,537 | | | | 4,264,780 | |
6.63%, 11/15/20 (Call 11/15/15) | | | 11,020 | | | | 11,323,193 | |
Puma International Financing SA | | | | | | | | |
6.75%, 02/01/21 (Call 02/01/17)b | | | 14,000 | | | | 14,315,000 | |
QEP Resources Inc. | | | | | | | | |
5.25%, 05/01/23 (Call 02/01/23) | | | 8,750 | | | | 8,528,284 | |
5.38%, 10/01/22 (Call 07/01/22) | | | 7,960 | | | | 7,868,662 | |
6.88%, 03/01/21a | | | 10,600 | | | | 11,440,795 | |
Range Resources Corp. | | | | | | | | |
5.00%, 08/15/22 (Call 02/15/17) | | | 10,300 | | | | 10,840,271 | |
5.00%, 03/15/23 (Call 03/15/18)a | | | 12,250 | | | | 12,909,598 | |
5.75%, 06/01/21 (Call 06/01/16)a | | | 8,500 | | | | 9,010,000 | |
6.75%, 08/01/20 (Call 08/01/15) | | | 8,250 | | | | 8,725,936 | |
Rosetta Resources Inc. | | | | | | | | |
5.63%, 05/01/21 (Call 05/01/17)a | | | 10,390 | | | | 10,157,356 | |
5.88%, 06/01/22 (Call 12/01/17)a | | | 11,160 | | | | 10,852,693 | |
| | | | | | | | |
| Security | |
Principal
(000s) | | | Value | |
| | | | | | | | |
5.88%, 06/01/24 (Call 06/01/19) | | $ | 7,500 | | | $ | 7,177,762 | |
Samson Investment Co. | | | | | | | | |
9.75%, 02/15/20 (Call 02/15/16)a | | | 35,630 | | | | 26,343,931 | |
Sanchez Energy Corp. | | | | | | | | |
6.13%, 01/15/23 (Call 07/15/18)a,b | | | 21,050 | | | | 20,042,174 | |
7.75%, 06/15/21 (Call 06/15/17) | | | 8,250 | | | | 8,620,696 | |
SandRidge Energy Inc. | | | | | | | | |
7.50%, 03/15/21 (Call 03/15/16)a | | | 18,520 | | | | 16,760,507 | |
7.50%, 02/15/23 (Call 08/15/17) | | | 13,381 | | | | 12,109,805 | |
8.13%, 10/15/22 (Call 04/15/17)a | | | 14,000 | | | | 12,765,948 | |
8.75%, 01/15/20 (Call 01/15/15)a | | | 7,475 | | | | 6,982,827 | |
Seventy Seven Energy Inc. | | | | | | | | |
6.50%, 07/15/22 (Call 07/15/17)b | | | 8,365 | | | | 7,904,846 | |
Seventy Seven Operating LLC | | | | | | | | |
6.63%, 11/15/19 (Call 11/15/15)a | | | 11,360 | | | | 11,218,000 | |
SM Energy Co. | | | | | | | | |
5.00%, 01/15/24 (Call 07/15/18) | | | 8,425 | | | | 7,919,500 | |
6.50%, 01/01/23 (Call 07/01/17) | | | 6,327 | | | | 6,535,587 | |
Tesoro Corp. | | | | | | | | |
4.25%, 10/01/17 (Call 09/01/17) | | | 4,200 | | | | 4,316,135 | |
5.38%, 10/01/22 (Call 10/01/17)a | | | 8,175 | | | | 8,410,978 | |
Tullow Oil PLC | | | | | | | | |
6.00%, 11/01/20 (Call 11/01/16)a,b | | | 11,200 | | | | 10,584,000 | |
6.25%, 04/15/22 (Call 04/15/17)a,b | | | 10,350 | | | | 9,467,145 | |
Ultra Petroleum Corp. | | | | | | | | |
5.75%, 12/15/18 (Call 12/15/15)a,b | | | 8,070 | | | | 8,009,475 | |
| | |
| 56 | | 2014 iSHARES ANNUAL REPORTTO SHAREHOLDERS |
Schedule of Investments (Unaudited) (Continued)
iSHARES® iBOXX $ HIGH YIELD CORPORATE BOND ETF
October 31, 2014
| | | | | | | | |
| Security | |
Principal
(000s) | | | Value | |
| | | | | | | | |
6.13%, 10/01/24 (Call 10/01/19)a,b | | $ | 14,650 | | | $ | 13,844,250 | |
Whiting Petroleum Corp. | | | | | | | | |
5.00%, 03/15/19 (Call 12/15/18)a | | | 17,550 | | | | 18,164,250 | |
5.75%, 03/15/21 (Call 12/15/20) | | | 18,983 | | | | 20,121,980 | |
WPX Energy Inc. | | | | | | | | |
5.25%, 01/15/17a | | | 6,530 | | | | 6,816,341 | |
5.25%, 09/15/24 (Call 06/15/24) | | | 8,720 | | | | 8,524,629 | |
6.00%, 01/15/22 (Call 10/15/21)a | | | 17,795 | | | | 18,722,273 | |
| | | | | | | | |
| | | | | | | 1,358,231,748 | |
OIL & GAS SERVICES — 0.28% | |
CGG SA | | | | | | | | |
6.50%, 06/01/21 (Call 06/01/16)a | | | 11,360 | | | | 9,144,800 | |
6.88%, 01/15/22 (Call 07/15/17)a,b | | | 7,925 | | | | 6,379,625 | |
7.75%, 05/15/17 (Call 01/19/15) | | | 1,912 | | | | 1,854,640 | |
SESI LLC | | | | | | | | |
6.38%, 05/01/19 (Call 05/01/15) | | | 7,600 | | | | 7,954,825 | |
7.13%, 12/15/21 (Call 12/15/16) | | | 12,760 | | | | 13,877,357 | |
| | | | | | | | |
| | | | | | | 39,211,247 | |
PACKAGING & CONTAINERS — 1.43% | |
Ardagh Packaging Finance PLC | | | | | | | | |
9.13%, 10/15/20 (Call 10/15/15)a,b | | | 12,796 | | | | 13,819,680 | |
Ardagh Packaging Finance PLC/Ardagh Holdings USA Inc. | | | | | | | | |
6.00%, 06/30/21 (Call 06/30/17)a,b | | | 7,050 | | | | 6,979,500 | |
6.25%, 01/31/19 (Call 01/31/16)a,b | | | 6,525 | | | | 6,557,625 | |
6.75%, 01/31/21 (Call 01/31/17)a,b | | | 6,700 | | | | 6,901,000 | |
| | | | | | | | |
| Security | |
Principal
(000s) | | | Value | |
| | | | | | | | |
Ball Corp. | | | | | | | | |
4.00%, 11/15/23a | | $ | 18,750 | | | $ | 18,000,000 | |
5.00%, 03/15/22a | | | 12,946 | | | | 13,528,570 | |
5.75%, 05/15/21 (Call 11/15/15)a | | | 7,050 | | | | 7,384,875 | |
6.75%, 09/15/20 (Call 03/15/15)a | | | 7,980 | | | | 8,379,000 | |
Berry Plastics Corp. | | | | | | | | |
5.50%, 05/15/22 (Call 05/15/17)a | | | 8,500 | | | | 8,542,500 | |
9.75%, 01/15/21 (Call 01/15/16)a | | | 16,165 | | | | 18,023,975 | |
Beverage Packaging Holdings Luxembourg II SA/Beverage Packaging Holdings II Issuer Inc. | | | | | | | | |
5.63%, 12/15/16 (Call 12/15/15)b | | | 10,500 | | | | 10,526,250 | |
6.00%, 06/15/17 (Call 06/15/16)b | | | 11,350 | | | | 11,378,375 | |
Crown Americas LLC/Crown Americas Capital Corp. III | | | | | | | | |
6.25%, 02/01/21 (Call 02/01/16) | | | 12,265 | | | | 13,000,900 | |
Crown Americas LLC/Crown Americas Capital Corp. IV | | | | | | | | |
4.50%, 01/15/23a | | | 17,100 | | | | 16,800,750 | |
Sealed Air Corp. | | | | | | | | |
5.25%, 04/01/23 (Call 01/01/23)a,b | | | 7,400 | | | | 7,622,000 | |
6.50%, 12/01/20 (Call 09/01/20)a,b | | | 6,500 | | | | 7,198,750 | |
8.13%, 09/15/19 (Call 09/15/15)a,b | | | 12,460 | | | | 13,503,525 | |
8.38%, 09/15/21 (Call 09/15/16)b | | | 13,220 | | | | 14,971,650 | |
| | | | | | | | |
| | | | | | | 203,118,925 | |
PHARMACEUTICALS — 1.51% | |
Endo Finance LLC | | | | | | | | |
5.75%, 01/15/22 (Call 01/15/17)a,b | | | 11,075 | | | | 11,158,062 | |
| | | | |
SCHEDULESOF INVESTMENTS | | | 57 | |
Schedule of Investments (Unaudited) (Continued)
iSHARES® iBOXX $ HIGH YIELD CORPORATE BOND ETF
October 31, 2014
| | | | | | | | |
| Security | |
Principal
(000s) | | | Value | |
| | | | | | | | |
Endo Finance LLC & Endo Finco Inc. | | | | | | | | |
5.38%, 01/15/23 (Call 07/15/17)b | | $ | 10,500 | | | $ | 10,276,875 | |
7.00%, 07/15/19 (Call 07/15/15)a,b | | | 7,475 | | | | 7,867,438 | |
7.00%, 12/15/20 (Call 12/15/15)b | | | 1,370 | | | | 1,445,350 | |
Grifols Worldwide Operations Ltd. | | | | | | | | |
5.25%, 04/01/22 (Call 04/01/17)b | | | 16,175 | | | | 16,579,375 | |
NBTY Inc. | | | | | | | | |
9.00%, 10/01/18 (Call 01/20/15) | | | 12,125 | | | | 12,594,844 | |
Valeant Pharmaceuticals International Inc. | | | | | | | | |
5.63%, 12/01/21 (Call 12/01/16)a,b | | | 14,450 | | | | 14,323,562 | |
6.38%, 10/15/20 (Call 10/15/16)a,b | | | 33,950 | | | | 34,798,750 | |
6.75%, 08/15/18 (Call 08/15/15)a,b | | | 28,988 | | | | 30,835,985 | |
6.75%, 08/15/21 (Call 02/15/16)a,b | | | 10,520 | | | | 10,901,350 | |
6.88%, 12/01/18 (Call 12/01/14)b | | | 15,200 | | | | 15,751,000 | |
7.00%, 10/01/20 (Call 10/01/15)a,b | | | 10,735 | | | | 11,244,912 | |
7.25%, 07/15/22 (Call 07/15/16)b | | | 7,950 | | | | 8,377,313 | |
7.50%, 07/15/21 (Call 07/15/16)b | | | 27,600 | | | | 29,566,500 | |
| | | | | | | | |
| | | | | | | 215,721,316 | |
PIPELINES — 4.24% | |
Access Midstream Partners LP/ACMP Finance Corp. | | | | | | | | |
4.88%, 05/15/23 (Call 12/15/17)a | | | 23,700 | | | | 24,776,885 | |
4.88%, 03/15/24 (Call 03/15/19)a | | | 10,897 | | | | 11,399,996 | |
5.88%, 04/15/21 (Call 04/15/15)a | | | 11,689 | | | | 12,314,851 | |
| | | | | | | | |
| Security | |
Principal
(000s) | | | Value | |
| | | | | | | | |
6.13%, 07/15/22 (Call 01/15/17)a | | $ | 11,770 | | | $ | 12,760,753 | |
Atlas Pipeline Partners LP/Atlas Pipeline Finance Corp. | | | | | | | | |
4.75%, 11/15/21 (Call 05/15/16) | | | 6,900 | | | | 6,905,951 | |
5.88%, 08/01/23 (Call 02/01/18) | | | 10,225 | | | | 10,622,058 | |
6.63%, 10/01/20 (Call 10/01/16) | | | 8,300 | | | | 8,834,885 | |
Crestwood Midstream Partners LP/Crestwood Midstream Finance Corp. | | | | | | | | |
6.00%, 12/15/20 (Call 12/15/16) | | | 7,865 | | | | 7,982,975 | |
6.13%, 03/01/22 (Call 11/01/16) | | | 9,369 | | | | 9,452,009 | |
DCP Midstream LLC | | | | | | | | |
5.85%, 05/21/43 (Call 05/21/23)a,b,d | | | 9,061 | | | | 8,937,229 | |
Energy Transfer Equity LP | | | | | | | | |
5.88%, 01/15/24 | | | 18,725 | | | | 19,661,250 | |
7.50%, 10/15/20a | | | 18,530 | | | | 21,355,825 | |
Kinder Morgan Finance Co. LLC | | | | | | | | |
5.70%, 01/05/16a | | | 11,745 | | | | 12,247,937 | |
6.00%, 01/15/18b | | | 12,740 | | | | 13,918,213 | |
Kinder Morgan Inc./DE | | | | | | | | |
5.00%, 02/15/21 (Call 01/15/21)a,b | | | 14,375 | | | | 15,219,531 | |
5.63%, 11/15/23 (Call 08/15/23)a,b | | | 12,450 | | | | 13,632,750 | |
7.00%, 06/15/17a | | | 11,809 | | | | 13,107,990 | |
7.25%, 06/01/18 | | | 7,300 | | | | 8,298,348 | |
8.25%, 02/15/16a | | | 2,300 | | | | 2,485,688 | |
MarkWest Energy Partners LP/MarkWest Energy Finance Corp. | | | | | | | | |
4.50%, 07/15/23 (Call 04/15/23)a | | | 17,050 | | | | 17,433,814 | |
5.50%, 02/15/23 (Call 08/15/17)a | | | 12,075 | | | | 12,833,917 | |
6.25%, 06/15/22 (Call 12/15/16) | | | 7,591 | | | | 8,213,047 | |
| | |
| 58 | | 2014 iSHARES ANNUAL REPORTTO SHAREHOLDERS |
Schedule of Investments (Unaudited) (Continued)
iSHARES® iBOXX $ HIGH YIELD CORPORATE BOND ETF
October 31, 2014
| | | | | | | | |
| Security | |
Principal
(000s) | | | Value | |
| | | | | | | | |
6.75%, 11/01/20 (Call 11/01/15) | | $ | 7,965 | | | $ | 8,438,941 | |
NGPL PipeCo LLC | | | | | | | | |
7.12%, 12/15/17a,b | | | 19,990 | | | | 20,056,601 | |
9.63%, 06/01/19 (Call 06/01/15)a,b | | | 8,900 | | | | 9,482,291 | |
NuStar Logistics LP | | | | | | | | |
4.80%, 09/01/20 | | | 7,518 | | | | 7,477,469 | |
ONEOK Inc. | | | | | | | | |
4.25%, 02/01/22 (Call 11/02/21)a | | | 10,000 | | | | 9,894,366 | |
Penn Virginia Resource Partners LP/Penn Virginia Resource Finance Corp. | | | | | | | | |
6.50%, 05/15/21 (Call 05/15/16) | | | 3,725 | | | | 3,952,920 | |
8.38%, 06/01/20 (Call 06/01/16) | | | 675 | | | | 745,875 | |
Regency Energy Partners LP/Regency Energy Finance Corp. | | | | | | | | |
4.50%, 11/01/23 (Call 08/01/23) | | | 11,450 | | | | 11,280,334 | |
5.00%, 10/01/22 (Call 07/01/22) | | | 11,125 | | | | 11,291,875 | |
5.50%, 04/15/23 (Call 10/15/17)a | | | 12,529 | | | | 12,967,515 | |
5.75%, 09/01/20 (Call 06/01/20)a | | | 6,650 | | | | 7,075,424 | |
5.88%, 03/01/22 (Call 12/01/21)a | | | 16,035 | | | | 17,157,450 | |
6.50%, 07/15/21 (Call 07/15/16)a | | | 8,000 | | | | 8,489,494 | |
6.88%, 12/01/18 (Call 12/01/14)a | | | 10,319 | | | | 10,705,963 | |
Rockies Express Pipeline LLC | | | | | | | | |
5.63%, 04/15/20b | | | 12,440 | | | | 12,968,700 | |
6.00%, 01/15/19b | | | 9,175 | | | | 9,633,750 | |
6.85%, 07/15/18a,b | | | 9,200 | | | | 9,844,000 | |
Sabine Pass Liquefaction LLC | | | | | | | | |
5.63%, 02/01/21 (Call 11/01/20)a | | | 32,385 | | | | 33,923,288 | |
| | | | | | | | |
| Security | |
Principal
(000s) | | | Value | |
| | | | | | | | |
5.63%, 04/15/23a | | $ | 16,000 | | | $ | 16,602,650 | |
5.63%, 04/15/23 (Call 01/15/23)b | | | 8,100 | | | | 8,405,091 | |
5.75%, 05/15/24b | | | 31,570 | | | | 32,717,383 | |
6.25%, 03/15/22a,b | | | 15,550 | | | | 16,702,768 | |
Targa Resources Partners LP/Targa Resources Partners Finance Corp. | | | | | | | | |
4.25%, 11/15/23 (Call 05/15/18) | | | 10,500 | | | | 10,386,955 | |
5.25%, 05/01/23 (Call 11/01/17)a | | | 8,300 | | | | 8,705,128 | |
6.88%, 02/01/21 (Call 02/01/16) | | | 8,100 | | | | 8,721,142 | |
Tesoro Logistics LP/Tesoro Logistics Finance Corp. | | | | | | | | |
5.50%, 10/15/19 (Call 09/15/19)b | | | 1,675 | | | | 1,721,063 | |
5.88%, 10/01/20 (Call 10/01/16)a | | | 10,550 | | | | 10,792,578 | |
6.13%, 10/15/21 (Call 10/15/16) | | | 7,950 | | | | 8,147,622 | |
6.25%, 10/15/22 (Call 10/15/18)b | | | 3,030 | | | | 3,129,075 | |
| | | | | | | | |
| | | | | | | 603,813,613 | |
REAL ESTATE — 0.27% | |
CBRE Services Inc. | | | | | | | | |
5.00%, 03/15/23 (Call 03/15/18) | | | 12,340 | | | | 12,648,500 | |
Realogy Group LLC | | | | | | | | |
7.63%, 01/15/20 (Call 01/15/16)a,b | | | 9,677 | | | | 10,467,789 | |
7.88%, 02/15/19 (Call 02/15/15)a,b | | | 950 | | | | 998,687 | |
Realogy Group LLC/Realogy Co-
Issuer Corp. | | | | | | | | |
4.50%, 04/15/19a,b | | | 7,300 | | | | 7,309,125 | |
Realogy Group LLC/Sunshine Group Florida Ltd. (The) | | | | | | | | |
3.38%, 05/01/16b | | | 6,750 | | | | 6,817,500 | |
| | | | | | | | |
| | | | | | | 38,241,601 | |
| | | | |
SCHEDULESOF INVESTMENTS | | | 59 | |
Schedule of Investments (Unaudited) (Continued)
iSHARES® iBOXX $ HIGH YIELD CORPORATE BOND ETF
October 31, 2014
| | | | | | | | |
| Security | |
Principal
(000s) | | | Value | |
| | | | | | | | |
REAL ESTATE INVESTMENT TRUSTS — 0.46% | |
Crown Castle International Corp. | | | | | | | | |
4.88%, 04/15/22a | | $ | 14,479 | | | $ | 14,587,593 | |
5.25%, 01/15/23 | | | 28,075 | | | | 28,706,687 | |
iStar Financial Inc. | | | | | | | | |
4.00%, 11/01/17 (Call 08/01/17) | | | 9,400 | | | | 9,329,500 | |
5.00%, 07/01/19 (Call 07/01/16) | | | 12,975 | | | | 12,942,563 | |
MPT Operating Partnership LP / MPT Finance Corp. | | | | | | | | |
6.88%, 05/01/21 (Call 05/01/16) | | | 175 | | | | 188,125 | |
| | | | | | | | |
| | | | | | | 65,754,468 | |
RETAIL — 2.99% | |
1011778 BC ULC/New Red Finance Inc. | | | | | | | | |
6.00%, 04/01/22 (Call 10/01/17)a,b | | | 21,445 | | | | 21,773,108 | |
AmeriGas Finance LLC/AmeriGas Finance Corp. | | | | | | | | |
6.75%, 05/20/20 (Call 05/20/16) | | | 9,150 | | | | 9,789,907 | |
7.00%, 05/20/22 (Call 05/20/17)a | | | 15,410 | | | | 16,580,707 | |
AmeriGas Partners LP/AmeriGas Finance Corp. | | | | | | | | |
6.25%, 08/20/19 (Call 08/20/15)a | | | 7,480 | | | | 7,882,577 | |
Best Buy Co. Inc. | | | | | | | | |
5.00%, 08/01/18a | | | 7,706 | | | | 7,937,180 | |
5.50%, 03/15/21 (Call 12/15/20)a | | | 10,600 | | | | 10,865,000 | |
Burger King Corp. | | | | | | | | |
9.88%, 10/15/18 (Call 12/12/14) | | | 8,960 | | | | 9,441,600 | |
Claire’s Stores Inc. | | | | | | | | |
8.88%, 03/15/19 (Call 03/15/15)a | | | 6,455 | | | | 5,535,163 | |
9.00%, 03/15/19 (Call 03/15/15)b | | | 18,250 | | | | 18,615,000 | |
| | | | | | | | |
| Security | |
Principal
(000s) | | | Value | |
| | | | | | | | |
Ferrellgas LP/Ferrellgas Finance Corp. | | | | | | | | |
6.50%, 05/01/21 (Call 05/01/16) | | $ | 8,200 | | | $ | 8,261,360 | |
6.75%, 01/15/22 (Call 11/15/16) | | | 8,200 | | | | 8,252,587 | |
J.C. Penney Corp. Inc. | | | | | | | | |
5.65%, 06/01/20a | | | 6,150 | | | | 5,104,500 | |
8.13%, 10/01/19a | | | 6,625 | | | | 6,360,000 | |
L Brands Inc. | | | | | | | | |
5.63%, 02/15/22a | | | 17,033 | | | | 18,310,475 | |
5.63%, 10/15/23a | | | 7,500 | | | | 8,062,500 | |
6.63%, 04/01/21a | | | 18,020 | | | | 20,407,650 | |
6.90%, 07/15/17a | | | 10,512 | | | | 11,720,880 | |
7.00%, 05/01/20a | | | 6,110 | | | | 6,934,850 | |
8.50%, 06/15/19a | | | 8,050 | | | | 9,599,625 | |
Michaels Stores Inc. | | | | | | | | |
5.88%, 12/15/20 (Call 12/15/16)a,b | | | 9,275 | | | | 9,344,563 | |
Neiman Marcus Group Ltd. LLC | | | | | | | | |
8.00%, 10/15/21 (Call 10/15/16)a,b | | | 15,550 | | | | 16,521,875 | |
Party City Holdings Inc. Series WI | | | | | | | | |
8.88%, 08/01/20 (Call 08/01/15)a | | | 11,650 | | | | 12,669,375 | |
Petco Animal Supplies Inc. | | | | | | | | |
9.25%, 12/01/18 (Call 01/20/15)a,b | | | 9,250 | | | | 9,654,688 | |
QVC Inc. | | | | | | | | |
3.13%, 04/01/19a | | | 5,730 | | | | 5,757,691 | |
4.38%, 03/15/23a | | | 13,025 | | | | 12,941,645 | |
4.45%, 02/15/25b | | | 10,000 | | | | 9,685,378 | |
4.85%, 04/01/24 | | | 9,275 | | | | 9,378,798 | |
5.13%, 07/02/22a | | | 8,865 | | | | 9,298,982 | |
7.38%, 10/15/20 (Call 04/15/15)b | | | 7,814 | | | | 8,243,770 | |
Rite Aid Corp. | | | | | | | | |
6.75%, 06/15/21 (Call 06/15/16)a | | | 13,816 | | | | 14,783,120 | |
8.00%, 08/15/20 (Call 08/15/15)a | | | 9,950 | | | | 10,733,563 | |
9.25%, 03/15/20 (Call 03/15/16)a | | | 15,950 | | | | 17,620,762 | |
| | |
| 60 | | 2014 iSHARES ANNUAL REPORTTO SHAREHOLDERS |
Schedule of Investments (Unaudited) (Continued)
iSHARES® iBOXX $ HIGH YIELD CORPORATE BOND ETF
October 31, 2014
| | | | | | | | |
| Security | |
Principal
(000s) | | | Value | |
| | | | | | | | |
Sally Holdings LLC/Sally Capital Inc. | | | | | | | | |
5.75%, 06/01/22 (Call 06/01/17)a | | $ | 13,200 | | | $ | 14,058,000 | |
6.88%, 11/15/19 (Call 11/15/15)a | | | 13,900 | | | | 14,873,000 | |
Sears Holdings Corp. | | | | | | | | |
6.63%, 10/15/18a | | | 14,995 | | | | 13,907,862 | |
Suburban Propane Partners LP/Suburban Energy Finance Corp. | | | | | | | | |
5.50%, 06/01/24 (Call 06/01/19)a | | | 8,150 | | | | 8,105,530 | |
Toys R Us Inc. | | | | | | | | |
10.38%, 08/15/17 (Call 02/15/15)a | | | 5,890 | | | | 4,590,519 | |
Toys R Us Property Co. II LLC | | | | | | | | |
8.50%, 12/01/17 (Call 01/20/15)a | | | 12,225 | | | | 12,255,563 | |
| | | | | | | | |
| | | | | | | 425,859,353 | |
SEMICONDUCTORS — 1.20% | |
Advanced Micro Devices Inc. | | | | | | | | |
6.75%, 03/01/19 | | | 11,700 | | | | 11,056,500 | |
7.00%, 07/01/24 (Call 07/01/19)a | | | 8,625 | | | | 7,611,563 | |
7.50%, 08/15/22a | | | 7,750 | | | | 7,168,750 | |
7.75%, 08/01/20 (Call 08/01/15)a | | | 7,950 | | | | 7,612,125 | |
Amkor Technology Inc. | | | | | | | | |
6.38%, 10/01/22 (Call 10/01/16)a | | | 8,575 | | | | 8,575,000 | |
6.63%, 06/01/21 (Call 06/01/15)a | | | 6,125 | | | | 6,201,563 | |
Freescale Semiconductor Inc. | | | | | | | | |
5.00%, 05/15/21 (Call 05/15/16)b | | | 8,000 | | | | 7,900,000 | |
6.00%, 01/15/22 (Call 11/15/16)a,b | | | 15,090 | | | | 15,542,700 | |
8.05%, 02/01/20 (Call 06/01/15)a | | | 1,061 | | | | 1,119,355 | |
10.75%, 08/01/20 (Call 08/01/15)a | | | 8,480 | | | | 9,285,600 | |
| | | | | | | | |
| Security | |
Principal
(000s) | | | Value | |
| | | | | | | | |
Micron Technology Inc. | | | | | | | | |
5.50%, 02/01/25 (Call 08/01/19)b | | $ | 19,735 | | | $ | 19,932,350 | |
5.88%, 02/15/22 (Call 02/15/17)a,b | | | 8,850 | | | | 9,292,500 | |
NXP BV/NXP Funding LLC | | | | | | | | |
3.50%, 09/15/16a,b | | | 7,500 | | | | 7,593,750 | |
3.75%, 06/01/18b | | | 11,775 | | | | 11,833,875 | |
5.75%, 02/15/21 (Call 02/15/17)a,b | | | 10,075 | | | | 10,603,937 | |
5.75%, 03/15/23 (Call 03/15/18)a,b | | | 7,150 | | | | 7,543,250 | |
Sensata Technologies BV | | | | | | | | |
4.88%, 10/15/23b | | | 7,873 | | | | 7,853,317 | |
5.63%, 11/01/24a,b | | | 2,280 | | | | 2,405,400 | |
6.50%, 05/15/19 (Call 05/15/15)a,b | | | 11,450 | | | | 11,979,562 | |
| | | | | | | | |
| | | | | | | 171,111,097 | |
SHIPBUILDING — 0.15% | |
Huntington Ingalls Industries Inc. | | | | | | | | |
6.88%, 03/15/18 (Call 03/15/15) | | | 9,835 | | | | 10,277,575 | |
7.13%, 03/15/21 (Call 03/15/16)a | | | 9,860 | | | | 10,599,500 | |
| | | | | | | | |
| | | | | | | 20,877,075 | |
SOFTWARE — 2.42% | |
Activision Blizzard Inc. | | | | | | | | |
5.63%, 09/15/21 (Call 09/15/16)b | | | 24,100 | | | | 25,606,250 | |
6.13%, 09/15/23 (Call 09/15/18)a,b | | | 12,875 | | | | 13,937,187 | |
Audatex North America Inc. | | | | | | | | |
6.00%, 06/15/21 (Call 06/15/17)b | | | 22,675 | | | | 23,978,812 | |
BMC Software Inc. | | | | | | | | |
8.13%, 07/15/21 (Call 07/15/16)b | | | 27,625 | | | | 26,658,125 | |
First Data Corp. | | | | | | | | |
6.75%, 11/01/20 (Call 11/01/15)a,b | | | 23,602 | | | | 25,372,150 | |
7.38%, 06/15/19 (Call 06/15/15)a,b | | | 26,000 | | | | 27,495,000 | |
| | | | |
SCHEDULESOF INVESTMENTS | | | 61 | |
Schedule of Investments (Unaudited) (Continued)
iSHARES® iBOXX $ HIGH YIELD CORPORATE BOND ETF
October 31, 2014
| | | | | | | | |
| Security | |
Principal
(000s) | | | Value | |
| | | | | | | | |
8.25%, 01/15/21 (Call 01/15/16)b | | $ | 31,952 | | | $ | 34,588,040 | |
8.88%, 08/15/20 (Call 08/15/15)a,b | | | 7,350 | | | | 7,947,188 | |
10.63%, 06/15/21 (Call 04/15/16) | | | 8,946 | | | | 10,287,900 | |
11.25%, 01/15/21 (Call 01/15/16) | | | 8,855 | | | | 10,183,250 | |
11.75%, 08/15/21 (Call 05/15/16)a | | | 26,985 | | | | 31,603,950 | |
12.63%, 01/15/21 (Call 01/15/16)a | | | 50,232 | | | | 60,745,558 | |
IMS Health Inc. | | | | | | | | |
6.00%, 11/01/20 (Call 11/01/15)b | | | 1,050 | | | | 1,089,375 | |
Infor U.S. Inc. | | | | | | | | |
9.38%, 04/01/19 (Call 04/01/15) | | | 17,050 | | | | 18,584,500 | |
11.50%, 07/15/18 (Call 07/15/15) | | | 9,320 | | | | 10,310,250 | |
Nuance Communications Inc. | | | | | | | | |
5.38%, 08/15/20 (Call 08/15/16)b | | | 16,800 | | | | 16,842,000 | |
| | | | | | | | |
| | | | | | | 345,229,535 | |
STORAGE & WAREHOUSING — 0.20% | |
Algeco Scotsman Global Finance PLC | | | | | | | | |
8.50%, 10/15/18 (Call 10/15/15)a,b | | | 15,750 | | | | 16,340,625 | |
10.75%, 10/15/19 (Call 10/15/16)b | | | 12,550 | | | | 12,361,750 | |
| | | | | | | | |
| | | | | | | 28,702,375 | |
TELECOMMUNICATIONS — 13.57% | |
Alcatel-Lucent USA Inc. | | | | | | | | |
4.63%, 07/01/17a,b | | | 10,750 | | | | 10,884,375 | |
6.75%, 11/15/20 (Call 11/15/16)a,b | | | 16,480 | | | | 17,015,600 | |
8.88%, 01/01/20 (Call 07/01/16)b | | | 8,500 | | | | 9,307,500 | |
Altice Financing SA | | | | | | | | |
6.50%, 01/15/22 (Call 12/15/16)a,b | | | 14,500 | | | | 14,935,000 | |
| | | | | | | | |
| Security | |
Principal
(000s) | | | Value | |
| | | | | | | | |
7.88%, 12/15/19 (Call 12/15/15)b | | $ | 7,550 | | | $ | 8,050,188 | |
Altice Finco SA | | | | | | | | |
8.13%, 01/15/24 (Call 12/15/18)a,b | | | 6,800 | | | | 7,123,000 | |
9.88%, 12/15/20 (Call 12/15/16)a,b | | | 7,750 | | | | 8,680,000 | |
Altice SA | | | | | | | | |
7.75%, 05/15/22 (Call 05/15/17)a,b | | | 46,700 | | | | 48,859,875 | |
Avaya Inc. | | | | | | | | |
7.00%, 04/01/19 (Call 04/01/15)a,b | | | 16,540 | | | | 16,250,550 | |
10.50%, 03/01/21 (Call 03/01/17)a,b | | | 22,995 | | | | 20,120,625 | |
CenturyLink Inc. | | | | | | | | |
5.80%, 03/15/22a | | | 21,209 | | | | 22,428,517 | |
6.00%, 04/01/17 | | | 8,600 | | | | 9,266,500 | |
6.45%, 06/15/21 | | | 20,400 | | | | 22,338,000 | |
Series V | | | | | | | | |
5.63%, 04/01/20a | | | 16,755 | | | | 17,718,412 | |
Series W | | | | | | | | |
6.75%, 12/01/23a | | | 12,900 | | | | 14,319,000 | |
Cincinnati Bell Inc. | | | | | | | | |
8.38%, 10/15/20 (Call 10/15/15)a | | | 11,344 | | | | 12,123,900 | |
8.75%, 03/15/18 (Call 01/20/15)a | | | 2,149 | | | | 2,224,215 | |
CommScope Inc. | | | | | | | | |
5.00%, 06/15/21 (Call 06/15/17)b | | | 9,650 | | | | 9,650,000 | |
5.50%, 06/15/24 (Call 06/15/19)a,b | | | 11,205 | | | | 11,289,038 | |
Embarq Corp. | | | | | | | | |
7.08%, 06/01/16 | | | 15,250 | | | | 16,490,438 | |
Frontier Communications Corp. | | | | | | | | |
6.25%, 09/15/21 (Call 06/15/21)a | | | 13,850 | | | | 14,300,125 | |
6.88%, 01/15/25 (Call 10/15/24) | | | 12,175 | | | | 12,372,844 | |
7.13%, 03/15/19a | | | 6,650 | | | | 7,348,250 | |
7.13%, 01/15/23 | | | 15,240 | | | | 16,211,550 | |
7.63%, 04/15/24a | | | 12,600 | | | | 13,497,750 | |
| | |
| 62 | | 2014 iSHARES ANNUAL REPORTTO SHAREHOLDERS |
Schedule of Investments (Unaudited) (Continued)
iSHARES® iBOXX $ HIGH YIELD CORPORATE BOND ETF
October 31, 2014
| | | | | | | | |
| Security | |
Principal
(000s) | | | Value | |
| | | | | | | | |
8.13%, 10/01/18 | | $ | 10,580 | | | $ | 11,981,850 | |
8.25%, 04/15/17a | | | 9,070 | | | | 10,181,075 | |
8.50%, 04/15/20a | | | 18,930 | | | | 21,816,825 | |
8.75%, 04/15/22 | | | 9,110 | | | | 10,522,050 | |
9.25%, 07/01/21 | | | 7,450 | | | | 8,865,500 | |
Hughes Satellite Systems Corp. | | | | | | | | |
6.50%, 06/15/19 | | | 17,820 | | | | 19,379,250 | |
7.63%, 06/15/21 | | | 15,090 | | | | 16,787,625 | |
Inmarsat Finance PLC | | | | | | | | |
4.88%, 05/15/22 (Call 05/15/17)a,b | | | 14,925 | | | | 14,925,000 | |
Intelsat Jackson Holdings SA | | | | | | | | |
5.50%, 08/01/23 (Call 08/01/18)a | | | 32,185 | | | | 32,265,462 | |
6.63%, 12/15/22 (Call 12/15/17)a | | | 20,100 | | | | 21,155,250 | |
7.25%, 04/01/19 (Call 04/01/15)a | | | 26,813 | | | | 28,153,650 | |
7.25%, 10/15/20 (Call 10/15/15) | | | 39,770 | | | | 42,454,475 | |
7.50%, 04/01/21 (Call 04/01/16) | | | 18,265 | | | | 19,726,200 | |
8.50%, 11/01/19 (Call 11/01/14) | | | 2,025 | | | | 2,106,000 | |
Intelsat Luxembourg SA | | | | | | | | |
6.75%, 06/01/18 (Call 06/01/15) | | | 9,800 | | | | 10,143,000 | |
7.75%, 06/01/21 (Call 06/01/17)a | | | 32,925 | | | | 34,324,312 | |
8.13%, 06/01/23 (Call 06/01/18)a | | | 16,650 | | | | 17,773,875 | |
Koninklijke KPN NV | | | | | | | | |
7.00%, 03/28/73 (Call 03/28/23)b,d | | | 10,350 | | | | 10,841,625 | |
Level 3 Communications Inc. | | | | | | | | |
11.88%, 02/01/19 (Call 02/01/15)a | | | 8,550 | | | | 9,223,313 | |
Level 3 Escrow II Inc. | | | | | | | | |
5.38%, 08/15/22 (Call 08/15/17)a,b | | | 15,150 | | | | 15,415,125 | |
Level 3 Financing Inc. | | | | | | | | |
6.13%, 01/15/21 (Call 11/15/16)a,b | | | 10,525 | | | | 11,077,563 | |
| | | | | | | | |
| Security | |
Principal
(000s) | | | Value | |
| | | | | | | | |
7.00%, 06/01/20 (Call 06/01/16) | | $ | 14,000 | | | $ | 15,015,000 | |
8.13%, 07/01/19 (Call 07/01/15) | | | 17,950 | | | | 19,206,500 | |
8.63%, 07/15/20 (Call 01/15/16) | | | 15,795 | | | | 17,374,500 | |
9.38%, 04/01/19 (Call 04/01/15) | | | 7,912 | | | | 8,455,950 | |
Millicom International Cellular SA | | | | | | | | |
4.75%, 05/22/20 (Call 05/22/17)b | | | 8,278 | | | | 8,195,220 | |
6.63%, 10/15/21 (Call 10/15/17)b | | | 16,010 | | | | 17,130,700 | |
Nokia OYJ | | | | | | | | |
5.38%, 05/15/19a | | | 16,650 | | | | 17,929,839 | |
PAETEC Holding Corp. | | | | | | | | |
9.88%, 12/01/18 (Call 12/01/14) | | | 6,135 | | | | 6,480,094 | |
SBA Communications Corp. | | | | | | | | |
4.88%, 07/15/22 (Call 07/15/17)b | | | 12,892 | | | | 12,666,390 | |
5.63%, 10/01/19 (Call 10/01/16) | | | 7,300 | | | | 7,628,500 | |
SBA Telecommunications Inc. | | | | | | | | |
5.75%, 07/15/20 (Call 07/15/16)a | | | 12,157 | | | | 12,704,065 | |
SoftBank Corp. | | | | | | | | |
4.50%, 04/15/20a,b | | | 38,900 | | | | 39,335,680 | |
Sprint Communications Inc. | | | | | | | | |
6.00%, 12/01/16a | | | 32,600 | | | | 34,556,000 | |
6.00%, 11/15/22a | | | 37,600 | | | | 37,553,000 | |
7.00%, 03/01/20a,b | | | 17,450 | | | | 19,413,125 | |
7.00%, 08/15/20 | | | 26,250 | | | | 27,759,375 | |
8.38%, 08/15/17a | | | 22,020 | | | | 24,855,075 | |
9.00%, 11/15/18a,b | | | 50,720 | | | | 59,596,000 | |
9.13%, 03/01/17a | | | 15,250 | | | | 17,232,500 | |
11.50%, 11/15/21 | | | 15,264 | | | | 19,614,240 | |
Sprint Corp. | | | | | | | | |
7.13%, 06/15/24a,b | | | 41,600 | | | | 42,744,000 | |
7.25%, 09/15/21b | | | 37,100 | | | | 39,326,000 | |
7.88%, 09/15/23a,b | | | 68,000 | | | | 73,270,000 | |
| | | | |
SCHEDULESOF INVESTMENTS | | | 63 | |
Schedule of Investments (Unaudited) (Continued)
iSHARES® iBOXX $ HIGH YIELD CORPORATE BOND ETF
October 31, 2014
| | | | | | | | |
| Security | |
Principal
(000s) | | | Value | |
| | | | | | | | |
T-Mobile USA Inc. | | | | | | | | |
5.25%, 09/01/18 (Call 09/01/15)a | | $ | 6,650 | | | $ | 6,916,000 | |
6.00%, 03/01/23 (Call 09/01/18) | | | 4,080 | | | | 4,202,400 | |
6.13%, 01/15/22 (Call 01/15/18) | | | 18,500 | | | | 19,332,500 | |
6.25%, 04/01/21 (Call 04/01/17) | | | 31,600 | | | | 33,101,000 | |
6.38%, 03/01/25 (Call 09/01/19) | | | 26,170 | | | | 26,955,100 | |
6.46%, 04/28/19 (Call 04/28/15)a | | | 20,850 | | | | 21,788,250 | |
6.50%, 01/15/24 (Call 01/15/19)a | | | 17,675 | | | | 18,514,562 | |
6.54%, 04/28/20 (Call 04/28/16)a | | | 23,525 | | | | 24,965,906 | |
6.63%, 11/15/20 (Call 11/15/15) | | | 15,020 | | | | 15,883,650 | |
6.63%, 04/28/21 (Call 04/28/17)a | | | 21,325 | | | | 22,497,875 | |
6.63%, 04/01/23 (Call 04/01/18) | | | 30,483 | | | | 32,311,980 | |
6.73%, 04/28/22 (Call 04/28/17) | | | 26,129 | | | | 27,631,417 | |
6.84%, 04/28/23 (Call 04/28/18)a | | | 9,825 | | | | 10,439,063 | |
Telecom Italia Capital SA | | | | | | | | |
7.00%, 06/04/18a | | | 18,340 | | | | 20,540,800 | |
7.18%, 06/18/19 | | | 16,250 | | | | 18,494,016 | |
Telecom Italia SpA | | | | | | | | |
5.30%, 05/30/24a,b | | | 28,050 | | | | 28,470,750 | |
tw telecom holdings Inc. | | | | | | | | |
5.38%, 10/01/22 (Call 10/01/17) | | | 13,450 | | | | 14,694,125 | |
UPCB Finance III Ltd. | | | | | | | | |
6.63%, 07/01/20 (Call 07/01/15)a,b | | | 15,400 | | | | 16,189,250 | |
UPCB Finance V Ltd. | | | | | | | | |
7.25%, 11/15/21 (Call 11/15/16)b | | | 12,070 | | | | 13,322,262 | |
UPCB Finance VI Ltd. | | | | | | | | |
6.88%, 01/15/22 (Call 01/15/17)b | | | 13,260 | | | | 14,453,400 | |
| | | | | | | | |
| Security | |
Principal
(000s) | | | Value | |
| | | | | | | | |
Virgin Media Finance PLC | | | | | | | | |
6.00%, 10/15/24 (Call 10/15/19)a,b | | $ | 6,250 | | | $ | 6,515,625 | |
6.38%, 04/15/23 (Call 04/15/18)a,b | | | 8,650 | | | | 9,212,250 | |
Virgin Media Secured Finance PLC | | | | | | | | |
5.25%, 01/15/21 | | | 7,800 | | | | 8,073,000 | |
5.38%, 04/15/21 (Call 04/15/17)b | | | 14,250 | | | | 14,748,750 | |
5.50%, 01/15/25 (Call 01/15/19)a,b | | | 7,450 | | | | 7,710,750 | |
West Corp. | | | | | | | | |
5.38%, 07/15/22 (Call 07/15/17)a,b | | | 16,775 | | | | 16,271,750 | |
7.88%, 01/15/19 (Call 11/15/14) | | | 5,677 | | | | 5,907,657 | |
Wind Acquisition Finance SA | | | | | | | | |
4.75%, 07/15/20 (Call 07/15/16)a,b | | | 33,350 | | | | 32,432,875 | |
6.50%, 04/30/20 (Call 04/30/16)b | | | 9,625 | | | | 9,985,938 | |
7.38%, 04/23/21 (Call 04/23/17)a,b | | | 43,300 | | | | 42,001,000 | |
Windstream Corp. | | | | | | | | |
6.38%, 08/01/23 (Call 02/01/18) | | | 11,850 | | | | 11,938,875 | |
7.50%, 06/01/22 (Call 06/01/17)a | | | 7,500 | | | | 7,987,500 | |
7.50%, 04/01/23 (Call 04/01/16)a | | | 9,450 | | | | 9,946,125 | |
7.75%, 10/15/20 (Call 10/15/15) | | | 10,715 | | | | 11,438,262 | |
7.75%, 10/01/21 (Call 10/01/16)a | | | 16,600 | | | | 17,762,000 | |
7.88%, 11/01/17 | | | 18,827 | | | | 20,992,105 | |
| | | | | | | | |
| | | | | | | 1,933,594,798 | |
TRANSPORTATION — 0.31% | |
CHC Helicopter SA | | | | | | | | |
9.25%, 10/15/20 (Call 10/15/15) | | | 15,740 | | | | 16,919,271 | |
| | |
| 64 | | 2014 iSHARES ANNUAL REPORTTO SHAREHOLDERS |
Schedule of Investments (Unaudited) (Continued)
iSHARES® iBOXX $ HIGH YIELD CORPORATE BOND ETF
October 31, 2014
| | | | | | | | |
| Security | | Principal
or Shares
(000s) | | | Value | |
Florida East Coast Holdings Corp. | | | | | | | | |
6.75%, 05/01/19
(Call 05/01/16)a,b | | $ | 15,681 | | | $ | 16,190,633 | |
Navios Maritime Holdings Inc./Navios Maritime Finance II U.S. Inc. | | | | | | | | |
7.38%, 01/15/22
(Call 01/15/17)b | | | 11,100 | | | | 11,155,500 | |
| | | | | | | | |
| | | | | | | 44,265,404 | |
| | | | | | | | |
TOTAL CORPORATE BONDS & NOTES | |
(Cost: $13,919,705,700) | | | | 13,905,478,590 | |
|
SHORT-TERM INVESTMENTS — 16.20% | |
| |
MONEY MARKET FUNDS — 16.20% | | | | | |
BlackRock Cash Funds: Institutional,
SL Agency Shares | | | | | |
0.13%e,f,g | | | 1,920,282 | | | | 1,920,282,045 | |
BlackRock Cash Funds: Prime,
SL Agency Shares | | | | | |
0.11%e,f,g | | | 184,128 | | | | 184,127,788 | |
BlackRock Cash Funds: Treasury,
SL Agency Shares | | | | | |
0.00%e,f | | | 203,468 | | | | 203,468,101 | |
| | | | | | | | |
| | | | 2,307,877,934 | |
| | | | | | | | |
TOTAL SHORT-TERM INVESTMENTS | | | | | |
(Cost: $2,307,877,934) | | | | 2,307,877,934 | |
| | | | | | | | |
TOTAL INVESTMENTS
IN SECURITIES —113.81% | | | | | | | | |
(Cost: $16,227,583,634) | | | | 16,213,356,524 | |
Other Assets, Less Liabilities — (13.81)% | | | | (1,966,932,225 | ) |
| | | | | | | | |
NET ASSETS — 100.00% | | | $ | 14,246,424,299 | |
| | | | | | | | |
| a | All or a portion of this security represents a security on loan. |
| b | This security may be resold to qualified institutional buyers under Rule 144A of the Securities Act of 1933. |
| c | Payment-in-kind (PIK) security. Income may be paid in cash or additional securities at the issuer’s discretion. |
| d | Variable rate security. Rate shown is as of report date. |
| f | The rate quoted is the annualized seven-day yield of the fund at period end. |
| g | All or a portion of this security represents an investment of securities lending collateral. |
See notes to financial statements.
| | | | |
SCHEDULESOF INVESTMENTS | | | 65 | |
Schedule of Investments (Unaudited)
iSHARES® iBOXX $ INVESTMENT GRADE CORPORATE BOND ETF
October 31, 2014
| | | | | | | | |
| Security | |
Principal
(000s) | | | Value | |
| | | | | | | | |
CORPORATE BONDS & NOTES — 98.01% | |
|
ADVERTISING — 0.22% | |
Omnicom Group Inc. | | | | | | | | |
3.63%, 05/01/22 | | $ | 9,069 | | | $ | 9,276,326 | |
3.65%, 11/01/24 (Call 08/01/24) | | | 1,635 | | | | 1,628,020 | |
4.45%, 08/15/20 | | | 14,195 | | | | 15,356,361 | |
WPP Finance 2010 | | | | | | | | |
3.75%, 09/19/24 | | | 4,000 | | | | 3,984,620 | |
4.75%, 11/21/21 | | | 8,875 | | | | 9,702,308 | |
| | | | | | | | |
| | | | | | | 39,947,635 | |
AEROSPACE & DEFENSE — 1.34% | |
Boeing Co. (The) | | | | | | | | |
4.88%, 02/15/20a | | | 4,277 | | | | 4,836,084 | |
General Dynamics Corp. | | | | | | | | |
1.00%, 11/15/17 | | | 1,900 | | | | 1,886,156 | |
2.25%, 11/15/22 (Call 08/15/22) | | | 16,580 | | | | 15,872,115 | |
L-3 Communications Corp. | | | | | | | | |
4.75%, 07/15/20 | | | 8,023 | | | | 8,703,481 | |
5.20%, 10/15/19 | | | 10,215 | | | | 11,300,313 | |
Lockheed Martin Corp. | | | | | | | | |
3.35%, 09/15/21 | | | 18,839 | | | | 19,547,258 | |
4.07%, 12/15/42 | | | 10,000 | | | | 9,799,873 | |
4.25%, 11/15/19 | | | 1,872 | | | | 2,046,670 | |
Northrop Grumman Corp. | | | | | | | | |
1.75%, 06/01/18 | | | 5,097 | | | | 5,057,611 | |
3.25%, 08/01/23 | | | 12,595 | | | | 12,583,598 | |
4.75%, 06/01/43 | | | 7,750 | | | | 8,211,290 | |
Raytheon Co. | | | | | | | | |
2.50%, 12/15/22 (Call 09/15/22) | | | 1,319 | | | | 1,279,503 | |
3.13%, 10/15/20 | | | 21,677 | | | | 22,609,610 | |
United Technologies Corp. | | | | | | | | |
3.10%, 06/01/22a | | | 26,118 | | | | 26,564,043 | |
4.50%, 04/15/20 | | | 6,015 | | | | 6,701,372 | |
4.50%, 06/01/42 | | | 38,589 | | | | 41,478,811 | |
5.38%, 12/15/17 | | | 10,888 | | | | 12,211,151 | |
5.70%, 04/15/40 | | | 5,996 | | | | 7,421,516 | |
6.13%, 02/01/19 | | | 6,888 | | | | 8,065,689 | |
6.13%, 07/15/38 | | | 11,936 | | | | 15,648,768 | |
| | | | | | | | |
| | | | | | | 241,824,912 | |
| | | | | | | | |
| Security | |
Principal
(000s) | | | Value | |
| | | | | | | | |
AGRICULTURE — 1.54% | |
Altria Group Inc. | | | | | | | | |
2.85%, 08/09/22 | | $ | 9,065 | | | $ | 8,799,337 | |
4.00%, 01/31/24a | | | 14,237 | | | | 14,735,194 | |
4.25%, 08/09/42a | | | 12,183 | | | | 11,412,012 | |
4.75%, 05/05/21a | | | 21,353 | | | | 23,518,025 | |
5.38%, 01/31/44a | | | 13,923 | | | | 15,392,520 | |
9.25%, 08/06/19 | | | 8,508 | | | | 11,067,786 | |
9.70%, 11/10/18 | | | 19,589 | | | | 25,249,426 | |
Archer-Daniels-Midland Co. | | | | | | | | |
4.48%, 03/01/21 | | | 8,955 | | | | 9,864,429 | |
Lorillard Tobacco Co. | | | | | | | | |
6.88%, 05/01/20a | | | 10,651 | | | | 12,543,946 | |
8.13%, 06/23/19 | | | 4,224 | | | | 5,172,347 | |
Philip Morris International Inc. | | | | | | | | |
1.88%, 01/15/19 | | | 9,100 | | | | 9,075,748 | |
2.50%, 08/22/22 | | | 12,266 | | | | 11,882,843 | |
2.90%, 11/15/21a | | | 9,671 | | | | 9,753,652 | |
3.88%, 08/21/42a | | | 4,430 | | | | 4,140,810 | |
4.13%, 03/04/43a | | | 8,095 | | | | 7,866,009 | |
4.38%, 11/15/41 | | | 8,934 | | | | 9,022,433 | |
4.50%, 03/26/20a | | | 9,614 | | | | 10,673,926 | |
4.88%, 11/15/43a | | | 6,107 | | | | 6,660,090 | |
5.65%, 05/16/18a | | | 21,096 | | | | 23,845,699 | |
6.38%, 05/16/38 | | | 21,810 | | | | 28,017,824 | |
Reynolds American Inc. | | | | | | | | |
3.25%, 11/01/22a | | | 6,149 | | | | 5,999,828 | |
4.75%, 11/01/42 | | | 14,045 | | | | 13,695,308 | |
| | | | | | | | |
| | | | | | | 278,389,192 | |
AUTO MANUFACTURERS — 0.87% | |
American Honda Finance Corp. | | | | | | | | |
2.13%, 10/10/18 | | | 13,290 | | | | 13,381,635 | |
2.25%, 08/15/19 | | | 5,000 | | | | 5,015,500 | |
Daimler Finance North America LLC | | | | | | | | |
8.50%, 01/18/31 | | | 16,394 | | | | 24,822,490 | |
Ford Motor Co. | | | | | | | | |
4.75%, 01/15/43a | | | 19,748 | | | | 20,207,254 | |
7.45%, 07/16/31a | | | 18,512 | | | | 24,804,308 | |
Toyota Motor Credit Corp. | | | | | | | | |
2.00%, 10/24/18 | | | 18,660 | | | | 18,794,311 | |
2.10%, 01/17/19a | | | 5,250 | | | | 5,279,179 | |
2.13%, 07/18/19 | | | 4,850 | | | | 4,852,919 | |
| | |
| 66 | | 2014 iSHARES ANNUAL REPORTTO SHAREHOLDERS |
Schedule of Investments (Unaudited) (Continued)
iSHARES® iBOXX $ INVESTMENT GRADE CORPORATE BOND ETF
October 31, 2014
| | | | | | | | |
| Security | |
Principal
(000s) | | | Value | |
| | | | | | | | |
3.30%, 01/12/22 | | $ | 14,853 | | | $ | 15,463,983 | |
3.40%, 09/15/21 | | | 14,421 | | | | 15,039,545 | |
4.25%, 01/11/21 | | | 4,000 | | | | 4,378,983 | |
Series B | | | | | | | | |
4.50%, 06/17/20 | | | 5,304 | | | | 5,890,688 | |
| | | | | | | | |
| | | | | | | 157,930,795 | |
AUTO PARTS & EQUIPMENT — 0.01% | |
Delphi Corp. | | | | | | | | |
5.00%, 02/15/23 (Call 02/15/18) | | | 1,000 | | | | 1,070,000 | |
| | | | | | | | |
| | | | | | | 1,070,000 | |
BANKS — 26.55% | |
Abbey National Treasury Services PLC/London | | | | | | | | |
2.35%, 09/10/19 | | | 11,602 | | | | 11,545,302 | |
3.05%, 08/23/18 | | | 8,285 | | | | 8,626,877 | |
4.00%, 03/13/24 | | | 6,590 | | | | 6,805,434 | |
Australia & New Zealand Banking Group Ltd./New York NY | | | | | | | | |
1.88%, 10/06/17a | | | 5,000 | | | | 5,063,697 | |
2.25%, 06/13/19a | | | 15,000 | | | | 15,042,108 | |
Bank of America Corp. | | | | | | | | |
2.00%, 01/11/18a | | | 20,545 | | | | 20,580,498 | |
2.60%, 01/15/19 | | | 31,099 | | | | 31,430,941 | |
2.65%, 04/01/19a | | | 22,182 | | | | 22,405,737 | |
3.30%, 01/11/23 | | | 31,209 | | | | 30,908,735 | |
4.00%, 04/01/24a | | | 25,861 | | | | 26,728,249 | |
4.10%, 07/24/23 | | | 22,687 | | | | 23,752,779 | |
4.13%, 01/22/24a | | | 21,391 | | | | 22,250,270 | |
4.20%, 08/26/24a | | | 17,224 | | | | 17,368,466 | |
4.25%, 10/22/26 | | | 7,000 | | | | 6,946,488 | |
4.88%, 04/01/44 | | | 9,183 | | | | 9,830,657 | |
5.00%, 05/13/21 | | | 9,650 | | | | 10,702,868 | |
5.00%, 01/21/44 | | | 15,460 | | | | 16,902,081 | |
5.63%, 07/01/20 | | | 25,685 | | | | 29,192,834 | |
5.65%, 05/01/18 | | | 33,790 | | | | 37,738,155 | |
5.70%, 01/24/22 | | | 24,569 | | | | 28,285,022 | |
5.75%, 12/01/17 | | | 26,440 | | | | 29,457,444 | |
5.88%, 01/05/21 | | | 14,675 | | | | 16,986,577 | |
5.88%, 02/07/42 | | | 19,138 | | | | 23,175,454 | |
6.11%, 01/29/37 | | | 17,270 | | | | 20,276,436 | |
6.88%, 04/25/18 | | | 46,345 | | | | 53,683,643 | |
| | | | | | | | |
| Security | |
Principal
(000s) | | | Value | |
| | | | | | | | |
6.88%, 11/15/18a | | $ | 1,363 | | | $ | 1,594,250 | |
7.63%, 06/01/19a | | | 20,440 | | | | 24,825,915 | |
7.75%, 05/14/38 | | | 12,168 | | | | 16,949,974 | |
Bank of America N.A. | | | | | | | | |
6.00%, 10/15/36 | | | 6,895 | | | | 8,377,277 | |
Bank of Montreal | | | | | | | | |
1.45%, 04/09/18 (Call 03/09/18)a | | | 12,032 | | | | 11,904,608 | |
2.38%, 01/25/19 (Call 12/25/18)a | | | 9,450 | | | | 9,554,196 | |
2.55%, 11/06/22 (Call 10/06/22) | | | 9,000 | | | | 8,662,380 | |
Bank of New York Mellon Corp. (The) | | | | | | | | |
2.10%, 01/15/19 (Call 12/15/18) | | | 5,668 | | | | 5,678,804 | |
2.20%, 05/15/19 (Call 04/15/19)a | | | 5,941 | | | | 5,963,173 | |
2.30%, 09/11/19 (Call 08/11/19) | | | 12,430 | | | | 12,464,437 | |
3.55%, 09/23/21 (Call 08/23/21) | | | 17,280 | | | | 17,945,715 | |
3.65%, 02/04/24 (Call 01/05/24) | | | 6,000 | | | | 6,189,136 | |
Bank of Nova Scotia (The) | | | | | | | | |
1.38%, 12/18/17 (Call 11/18/17) | | | 3,500 | | | | 3,485,665 | |
1.45%, 04/25/18a | | | 22,053 | | | | 21,823,649 | |
2.05%, 10/30/18 | | | 13,500 | | | | 13,534,000 | |
2.05%, 06/05/19 | | | 20,245 | | | | 20,144,330 | |
2.80%, 07/21/21 | | | 3,000 | | | | 3,002,792 | |
4.38%, 01/13/21 | | | 3,424 | | | | 3,776,643 | |
Barclays Bank PLC | | | | | | | | |
2.50%, 02/20/19a | | | 26,616 | | | | 26,791,953 | |
3.75%, 05/15/24 | | | 20,300 | | | | 20,562,375 | |
5.13%, 01/08/20 | | | 10,705 | | | | 12,020,960 | |
5.14%, 10/14/20a | | | 17,734 | | | | 19,231,055 | |
6.75%, 05/22/19 | | | 19,664 | | | | 23,335,239 | |
Barclays PLC | | | | | | | | |
4.38%, 09/11/24 | | | 8,000 | | | | 7,764,161 | |
BNP Paribas SA | | | | | | | | |
2.40%, 12/12/18 | | | 15,895 | | | | 16,019,196 | |
2.45%, 03/17/19a | | | 8,000 | | | | 8,083,646 | |
| | | | |
SCHEDULESOF INVESTMENTS | | | 67 | |
Schedule of Investments (Unaudited) (Continued)
iSHARES® iBOXX $ INVESTMENT GRADE CORPORATE BOND ETF
October 31, 2014
| | | | | | | | |
| Security | |
Principal
(000s) | | | Value | |
| | | | | | | | |
2.70%, 08/20/18 | | $ | 7,780 | | | $ | 7,955,416 | |
3.25%, 03/03/23a | | | 12,625 | | | | 12,668,643 | |
4.25%, 10/15/24 | | | 10,000 | | | | 10,049,750 | |
5.00%, 01/15/21 | | | 31,740 | | | | 35,557,300 | |
BPCE SA | | | | | | | | |
2.50%, 12/10/18 | | | 24,750 | | | | 24,949,807 | |
2.50%, 07/15/19 | | | 4,250 | | | | 4,260,689 | |
4.00%, 04/15/24a | | | 9,650 | | | | 9,974,046 | |
Branch Banking & Trust Co. | | | | | | | | |
2.30%, 10/15/18 (Call 09/15/18)a | | | 15,500 | | | | 15,750,742 | |
3.80%, 10/30/26 (Call 09/30/26) | | | 7,300 | | | | 7,399,160 | |
Capital One Financial Corp. | | | | | | | | |
2.45%, 04/24/19 (Call 03/24/19) | | | 8,358 | | | | 8,351,361 | |
3.75%, 04/24/24 (Call 03/24/24) | | | 19,360 | | | | 19,626,998 | |
4.75%, 07/15/21 | | | 10,547 | | | | 11,590,864 | |
Capital One N.A./Mclean VA | | | | | | | | |
2.40%, 09/05/19 (Call 08/15/19) | | | 11,525 | | | | 11,514,146 | |
2.95%, 07/23/21 | | | 25,240 | | | | 25,351,818 | |
Citigroup Inc. | | | | | | | | |
1.75%, 05/01/18a | | | 12,659 | | | | 12,561,774 | |
2.50%, 09/26/18a | | | 13,869 | | | | 14,030,302 | |
2.50%, 07/29/19 | | | 11,736 | | | | 11,792,586 | |
2.55%, 04/08/19 | | | 17,860 | | | | 18,025,250 | |
3.38%, 03/01/23a | | | 17,648 | | | | 17,653,993 | |
3.50%, 05/15/23a | | | 22,089 | | | | 21,625,074 | |
3.75%, 06/16/24a | | | 15,706 | | | | 15,940,927 | |
3.88%, 10/25/23 | | | 16,955 | | | | 17,448,752 | |
4.00%, 08/05/24 | | | 7,000 | | | | 6,998,742 | |
4.05%, 07/30/22 | | | 21,225 | | | | 21,826,820 | |
4.50%, 01/14/22 | | | 31,927 | | | | 34,572,104 | |
5.30%, 05/06/44 | | | 5,500 | | | | 5,871,506 | |
5.38%, 08/09/20a | | | 23,266 | | | | 26,446,388 | |
5.50%, 09/13/25 | | | 18,984 | | | | 21,068,815 | |
5.88%, 02/22/33 | | | 5,800 | | | | 6,514,059 | |
5.88%, 01/30/42 | | | 10,168 | | | | 12,464,867 | |
6.13%, 11/21/17a | | | 35,293 | | | | 39,815,565 | |
6.13%, 05/15/18 | | | 26,443 | | | | 30,035,223 | |
6.13%, 08/25/36 | | | 19,020 | | | | 22,331,867 | |
| | | | | | | | |
| Security | |
Principal
(000s) | | | Value | |
| | | | | | | | |
6.63%, 06/15/32 | | $ | 7,250 | | | $ | 8,820,014 | |
6.68%, 09/13/43 | | | 7,500 | | | | 9,562,282 | |
6.88%, 03/05/38a | | | 5,584 | | | | 7,430,238 | |
8.13%, 07/15/39 | | | 31,940 | | | | 48,370,514 | |
8.50%, 05/22/19 | | | 23,159 | | | | 29,051,303 | |
Commonwealth Bank of Australia/New York NY | | | | | | | | |
2.25%, 03/13/19 | | | 15,250 | | | | 15,374,527 | |
2.30%, 09/06/19 | | | 15,000 | | | | 15,023,532 | |
Cooperatieve Centrale Raiffeisen-Boerenleenbank BA/Netherlands | | | | | | | | |
3.88%, 02/08/22 | | | 32,808 | | | | 34,774,046 | |
3.95%, 11/09/22a | | | 16,500 | | | | 16,740,869 | |
4.50%, 01/11/21 | | | 9,843 | | | | 10,841,062 | |
4.63%, 12/01/23a | | | 22,100 | | | | 23,229,562 | |
5.25%, 05/24/41 | | | 14,915 | | | | 17,290,948 | |
5.75%, 12/01/43a | | | 7,620 | | | | 8,873,056 | |
Cooperatieve Centrale Raiffeisen-Boerenleenbank BA/NY | | | | | | | | |
1.70%, 03/19/18 | | | 13,150 | | | | 13,231,218 | |
2.25%, 01/14/19 | | | 20,000 | | | | 20,234,832 | |
Credit Suisse/New York NY | | | | | | | | |
2.30%, 05/28/19a | | | 23,320 | | | | 23,295,770 | |
3.00%, 10/29/21 | | | 9,665 | | | | 9,573,590 | |
3.63%, 09/09/24 | | | 30,000 | | | | 30,159,771 | |
4.38%, 08/05/20 | | | 12,380 | | | | 13,490,279 | |
5.30%, 08/13/19a | | | 13,402 | | | | 15,150,595 | |
5.40%, 01/14/20a | | | 13,297 | | | | 14,910,274 | |
6.00%, 02/15/18 | | | 12,008 | | | | 13,448,960 | |
Deutsche Bank AG/London | | | | | | | | |
2.50%, 02/13/19a | | | 18,778 | | | | 18,974,350 | |
3.70%, 05/30/24a | | | 18,150 | | | | 18,360,830 | |
Discover Bank/Greenwood DE | | | | | | | | |
2.00%, 02/21/18 | | | 17,500 | | | | 17,553,384 | |
3.20%, 08/09/21 (Call 07/09/21) | | | 3,000 | | | | 3,011,831 | |
4.20%, 08/08/23 | | | 12,735 | | | | 13,302,277 | |
Fifth Third Bancorp | | | | | | | | |
4.30%, 01/16/24 (Call 12/16/23)a | | | 520 | | | | 543,022 | |
8.25%, 03/01/38 | | | 14,273 | | | | 21,269,577 | |
| | |
| 68 | | 2014 iSHARES ANNUAL REPORTTO SHAREHOLDERS |
Schedule of Investments (Unaudited) (Continued)
iSHARES® iBOXX $ INVESTMENT GRADE CORPORATE BOND ETF
October 31, 2014
| | | | | | | | |
| Security | |
Principal
(000s) | | | Value | |
| | | | | | | | |
Fifth Third Bank/Cincinnati OH | | | | | | | | |
2.38%, 04/25/19 (Call 03/25/19) | | $ | 10,000 | | | $ | 10,062,945 | |
2.88%, 10/01/21 (Call 09/01/21) | | | 7,000 | | | | 6,952,413 | |
Goldman Sachs Group Inc. (The) | | | | | | | | |
2.38%, 01/22/18 | | | 26,342 | | | | 26,632,031 | |
2.63%, 01/31/19a | | | 11,250 | | | | 11,352,454 | |
2.90%, 07/19/18 | | | 32,759 | | | | 33,606,538 | |
3.63%, 01/22/23a | | | 21,123 | | | | 21,247,621 | |
3.85%, 07/08/24 (Call 04/08/24) | | | 22,000 | | | | 22,251,121 | |
4.00%, 03/03/24 | | | 32,185 | | | | 32,934,782 | |
4.80%, 07/08/44 (Call 01/08/44) | | | 18,644 | | | | 19,329,091 | |
5.25%, 07/27/21 | | | 39,970 | | | | 44,657,082 | |
5.38%, 03/15/20 | | | 14,037 | | | | 15,762,522 | |
5.75%, 01/24/22 | | | 35,263 | | | | 40,589,600 | |
5.95%, 01/18/18 | | | 23,331 | | | | 26,103,878 | |
5.95%, 01/15/27 | | | 5,951 | | | | 6,834,421 | |
6.00%, 06/15/20 | | | 15,695 | | | | 18,115,743 | |
6.13%, 02/15/33a | | | 29,582 | | | | 36,173,219 | |
6.15%, 04/01/18 | | | 33,580 | | | | 37,901,363 | |
6.25%, 02/01/41 | | | 23,637 | | | | 29,377,371 | |
6.45%, 05/01/36 | | | 7,859 | | | | 9,330,738 | |
6.75%, 10/01/37 | | | 50,059 | | | | 61,458,360 | |
7.50%, 02/15/19 | | | 19,575 | | | | 23,432,040 | |
HSBC Bank USA N.A./New York NY | | | | | | | | |
4.88%, 08/24/20 | | | 8,510 | | | | 9,346,465 | |
5.63%, 08/15/35a | | | 1,493 | | | | 1,776,220 | |
5.88%, 11/01/34 | | | 4,000 | | | | 4,904,193 | |
HSBC Holdings PLC | | | | | | | | |
4.00%, 03/30/22 | | | 24,223 | | | | 25,846,106 | |
4.25%, 03/14/24 | | | 11,900 | | | | 12,242,201 | |
4.88%, 01/14/22 | | | 11,245 | | | | 12,545,317 | |
5.10%, 04/05/21a | | | 27,344 | | | | 30,910,680 | |
5.25%, 03/14/44 | | | 19,625 | | | | 21,395,870 | |
6.10%, 01/14/42 | | | 6,637 | | | | 8,581,132 | |
6.50%, 05/02/36a | | | 22,425 | | | | 27,899,373 | |
6.50%, 09/15/37 | | | 27,854 | | | | 34,745,837 | |
6.80%, 06/01/38 | | | 17,690 | | | | 22,808,184 | |
| | | | | | | | |
| Security | |
Principal
(000s) | | | Value | |
| | | | | | | | |
HSBC USA Inc. | | | | | | | | |
1.63%, 01/16/18 | | $ | 16,295 | | | $ | 16,279,393 | |
2.25%, 06/23/19a | | | 19,500 | | | | 19,567,940 | |
2.63%, 09/24/18 | | | 3,413 | | | | 3,504,905 | |
3.50%, 06/23/24 | | | 5,000 | | | | 5,074,751 | |
5.00%, 09/27/20a | | | 3,490 | | | | 3,831,186 | |
Intesa Sanpaolo SpA | | | | | | | | |
3.88%, 01/16/18 | | | 13,890 | | | | 14,514,244 | |
3.88%, 01/15/19 | | | 15,150 | | | | 15,788,644 | |
5.25%, 01/12/24 | | | 7,825 | | | | 8,524,981 | |
JPMorgan Chase & Co. | | | | | | | | |
1.63%, 05/15/18a | | | 22,446 | | | | 22,230,507 | |
1.80%, 01/25/18a | | | 11,555 | | | | 11,548,764 | |
2.20%, 10/22/19 | | | 10,000 | | | | 9,896,573 | |
2.35%, 01/28/19a | | | 9,750 | | | | 9,841,916 | |
3.20%, 01/25/23 | | | 32,158 | | | | 31,929,019 | |
3.25%, 09/23/22a | | | 27,988 | | | | 28,073,271 | |
3.38%, 05/01/23 | | | 21,176 | | | | 20,683,878 | |
3.63%, 05/13/24a | | | 6,635 | | | | 6,713,971 | |
3.88%, 02/01/24a | | | 11,248 | | | | 11,644,909 | |
3.88%, 09/10/24 | | | 12,545 | | | | 12,500,643 | |
4.25%, 10/15/20 | | | 15,975 | | | | 17,182,758 | |
4.35%, 08/15/21 | | | 22,135 | | | | 23,896,286 | |
4.40%, 07/22/20 | | | 18,938 | | | | 20,552,580 | |
4.50%, 01/24/22 | | | 32,580 | | | | 35,538,385 | |
4.63%, 05/10/21 | | | 24,642 | | | | 27,058,621 | |
4.85%, 02/01/44 | | | 20,400 | | | | 22,104,691 | |
4.95%, 03/25/20a | | | 7,675 | | | | 8,535,424 | |
5.40%, 01/06/42 | | | 11,150 | | | | 12,971,036 | |
5.50%, 10/15/40 | | | 10,312 | | | | 12,022,095 | |
5.60%, 07/15/41 | | | 11,440 | | | | 13,611,383 | |
5.63%, 08/16/43 | | | 13,973 | | | | 15,886,302 | |
6.00%, 01/15/18 | | | 35,877 | | | | 40,405,470 | |
6.30%, 04/23/19 | | | 28,601 | | | | 33,304,975 | |
6.40%, 05/15/38a | | | 16,684 | | | | 21,513,451 | |
JPMorgan Chase Bank N.A. | | | | | | | | |
6.00%, 10/01/17 | | | 13,480 | | | | 15,154,549 | |
KeyBank N.A./Cleveland OH | | | | | | | | |
1.65%, 02/01/18 | | | 10,500 | | | | 10,474,969 | |
KeyCorp | | | | | | | | |
2.30%, 12/13/18 (Call 11/13/18) | | | 8,800 | | | | 8,825,395 | |
5.10%, 03/24/21a | | | 9,901 | | | | 11,106,984 | |
| | | | |
SCHEDULESOF INVESTMENTS | | | 69 | |
Schedule of Investments (Unaudited) (Continued)
iSHARES® iBOXX $ INVESTMENT GRADE CORPORATE BOND ETF
October 31, 2014
| | | | | | | | |
| Security | |
Principal
(000s) | | | Value | |
| | | | | | | | |
Lloyds Bank PLC | | | | | | | | |
2.30%, 11/27/18 | | $ | 12,530 | | | $ | 12,606,129 | |
2.35%, 09/05/19 | | | 10,000 | | | | 9,967,896 | |
6.38%, 01/21/21 | | | 7,741 | | | | 9,274,099 | |
Manufacturers & Traders Trust Co. | | | | | | | | |
2.30%, 01/30/19 (Call 12/30/18) | | | 2,600 | | | | 2,631,314 | |
Morgan Stanley | | | | | | | | |
2.13%, 04/25/18 | | | 9,192 | | | | 9,207,978 | |
2.38%, 07/23/19a | | | 26,360 | | | | 26,155,040 | |
2.50%, 01/24/19a | | | 37,705 | | | | 37,971,484 | |
3.70%, 10/23/24 | | | 15,000 | | | | 14,996,277 | |
3.75%, 02/25/23a | | | 33,556 | | | | 34,085,349 | |
4.10%, 05/22/23 | | | 18,029 | | | | 18,192,956 | |
4.35%, 09/08/26 | | | 23,704 | | | | 23,823,738 | |
4.88%, 11/01/22 | | | 11,020 | | | | 11,758,962 | |
5.00%, 11/24/25 | | | 26,962 | | | | 28,641,849 | |
5.50%, 01/26/20 | | | 22,306 | | | | 25,117,430 | |
5.50%, 07/24/20 | | | 14,035 | | | | 15,891,113 | |
5.50%, 07/28/21a | | | 30,599 | | | | 34,868,451 | |
5.63%, 09/23/19 | | | 32,562 | | | | 36,936,402 | |
5.75%, 01/25/21a | | | 33,534 | | | | 38,521,445 | |
5.95%, 12/28/17 | | | 7,085 | | | | 7,971,042 | |
6.38%, 07/24/42 | | | 27,899 | | | | 36,002,078 | |
6.63%, 04/01/18 | | | 35,712 | | | | 40,915,281 | |
7.25%, 04/01/32 | | | 2,362 | | | | 3,203,995 | |
7.30%, 05/13/19a | | | 33,810 | | | | 40,420,714 | |
Series F | | | | | | | | |
3.88%, 04/29/24 | | | 18,612 | | | | 18,915,195 | |
MUFG Union Bank N.A. | | | | | | | | |
2.63%, 09/26/18 (Call 08/26/18) | | | 14,750 | | | | 15,053,363 | |
National Australia Bank Ltd./New York | | | | | | | | |
2.30%, 07/25/18a | | | 7,500 | | | | 7,624,816 | |
3.00%, 01/20/23a | | | 9,759 | | | | 9,650,114 | |
Northern Trust Corp. | | | | | | | | |
3.95%, 10/30/25 | | | 8,500 | | | | 8,803,016 | |
PNC Bank N.A. | | | | | | | | |
2.20%, 01/28/19 (Call 12/29/18)b | | | 14,525 | | | | 14,588,683 | |
2.25%, 07/02/19 (Call 06/02/19)b | | | 5,250 | | | | 5,250,317 | |
| | | | | | | | |
| Security | |
Principal
(000s) | | | Value | |
| | | | | | | | |
2.70%, 11/01/22 (Call 10/01/22)b | | $ | 16,250 | | | $ | 15,697,099 | |
2.95%, 01/30/23 (Call 12/30/22)a,b | | | 5,800 | | | | 5,626,091 | |
3.80%, 07/25/23 (Call 06/25/23)b | | | 12,928 | | | | 13,396,671 | |
PNC Financial Services Group Inc. (The) | | | | | | | | |
3.90%, 04/29/24 (Call 03/29/24)b | | | 9,815 | | | | 9,937,250 | |
PNC Funding Corp. | | | | | | | | |
3.30%, 03/08/22 (Call 02/06/22)b | | | 7,069 | | | | 7,188,685 | |
4.38%, 08/11/20b | | | 3,773 | | | | 4,119,370 | |
5.13%, 02/08/20b | | | 3,965 | | | | 4,473,962 | |
Regions Financial Corp. | | | | | | | | |
2.00%, 05/15/18 (Call 04/15/18) | | | 15,000 | | | | 14,875,125 | |
Royal Bank of Canada | | | | | | | | |
1.50%, 01/16/18a | | | 11,500 | | | | 11,467,484 | |
2.15%, 03/15/19a | | | 6,000 | | | | 6,036,652 | |
2.20%, 07/27/18 | | | 23,871 | | | | 24,231,247 | |
Royal Bank of Scotland Group PLC | | | | | | | | |
6.40%, 10/21/19a | | | 16,912 | | | | 19,746,301 | |
Royal Bank of Scotland PLC (The) | | | | | | | | |
5.63%, 08/24/20a | | | 6,059 | | | | 6,954,424 | |
6.13%, 01/11/21 | | | 14,899 | | | | 17,466,150 | |
Societe Generale SA | | | | | | | | |
2.63%, 10/01/18a | | | 10,500 | | | | 10,683,797 | |
2.75%, 10/12/17a | | | 10,750 | | | | 11,067,773 | |
State Street Corp. | | | | | | | | |
3.10%, 05/15/23a | | | 11,707 | | | | 11,387,089 | |
3.70%, 11/20/23 | | | 8,680 | | | | 8,976,643 | |
4.38%, 03/07/21 | | | 6,815 | | | | 7,503,838 | |
Sumitomo Mitsui Banking Corp. | | | | | | | | |
1.50%, 01/18/18 | | | 6,750 | | | | 6,675,071 | |
2.25%, 07/11/19a | | | 5,000 | | | | 4,974,884 | |
2.45%, 01/10/19 | | | 11,335 | | | | 11,435,424 | |
3.20%, 07/18/22 | | | 6,099 | | | | 6,151,031 | |
SunTrust Banks Inc. | | | | | | | | |
2.35%, 11/01/18 (Call 10/01/18) | | | 3,185 | | | | 3,204,805 | |
| | |
| 70 | | 2014 iSHARES ANNUAL REPORTTO SHAREHOLDERS |
Schedule of Investments (Unaudited) (Continued)
iSHARES® iBOXX $ INVESTMENT GRADE CORPORATE BOND ETF
October 31, 2014
| | | | | | | | |
| Security | |
Principal
(000s) | | | Value | |
| | | | | | | | |
2.50%, 05/01/19 (Call 04/01/19) | | $ | 5,000 | | | $ | 5,025,408 | |
Svenska Handelsbanken AB | | | | | | | | |
1.63%, 03/21/18a | | | 14,050 | �� | | | 14,047,921 | |
2.25%, 06/17/19 | | | 6,250 | | | | 6,288,686 | |
2.50%, 01/25/19 | | | 16,375 | | | | 16,738,733 | |
Toronto-Dominion Bank (The) | | | | | | | | |
1.40%, 04/30/18 | | | 16,565 | | | | 16,371,330 | |
2.13%, 07/02/19a | | | 10,000 | | | | 9,964,739 | |
2.25%, 11/05/19 | | | 7,000 | | | | 6,990,676 | |
2.63%, 09/10/18 | | | 13,081 | | | | 13,406,674 | |
U.S. Bancorp/MN | | | | | | | | |
1.95%, 11/15/18 (Call 10/15/18) | | | 9,455 | | | | 9,467,200 | |
2.20%, 04/25/19 (Call 03/25/19) | | | 16,260 | | | | 16,313,946 | |
2.95%, 07/15/22 (Call 06/15/22) | | | 16,097 | | | | 15,757,592 | |
3.00%, 03/15/22 (Call 02/15/22) | | | 3,087 | | | | 3,102,557 | |
3.60%, 09/11/24 (Call 08/11/24) | | | 10,000 | | | | 10,086,103 | |
3.70%, 01/30/24 (Call 12/29/23) | | | 4,500 | | | | 4,671,225 | |
4.13%, 05/24/21 (Call 04/23/21) | | | 10,649 | | | | 11,550,220 | |
U.S. Bank N.A./Cincinnati | | | | | | | | |
2.13%, 10/28/19 (Call 09/28/19) | | | 18,235 | | | | 18,164,513 | |
UBS AG/Stamford CT | | | | | | | | |
2.38%, 08/14/19 | | | 30,000 | | | | 30,058,692 | |
4.88%, 08/04/20 | | | 20,325 | | | | 22,732,187 | |
5.75%, 04/25/18 | | | 17,586 | | | | 19,825,535 | |
5.88%, 12/20/17 | | | 23,283 | | | | 26,225,615 | |
Wachovia Corp. | | | | | | | | |
5.50%, 08/01/35 | | | 12,398 | | | | 14,092,860 | |
5.75%, 02/01/18 | | | 27,083 | | | | 30,544,159 | |
Wells Fargo & Co. | | | | | | | | |
1.50%, 01/16/18 | | | 25,783 | | | | 25,724,661 | |
2.13%, 04/22/19a | | | 20,025 | | | | 20,012,707 | |
2.15%, 01/15/19 | | | 7,463 | | | | 7,486,270 | |
3.00%, 01/22/21 | | | 17,660 | | | | 17,935,906 | |
3.30%, 09/09/24a | | | 9,806 | | | | 9,757,723 | |
| | | | | | | | |
| Security | |
Principal
(000s) | | | Value | |
| | | | | | | | |
3.50%, 03/08/22 | | $ | 26,300 | | | $ | 27,151,039 | |
4.10%, 06/03/26a | | | 27,065 | | | | 27,436,029 | |
4.13%, 08/15/23a | | | 21,269 | | | | 22,158,199 | |
4.60%, 04/01/21 | | | 18,207 | | | | 20,156,522 | |
4.65%, 11/04/44 | | | 5,495 | | | | 5,513,941 | |
5.38%, 02/07/35 | | | 824 | | | | 960,141 | |
5.38%, 11/02/43a | | | 21,836 | | | | 24,319,142 | |
5.61%, 01/15/44a | | | 18,704 | | | | 21,572,531 | |
5.63%, 12/11/17 | | | 21,359 | | | | 23,959,988 | |
Series M | | | | | | | | |
3.45%, 02/13/23a | | | 29,265 | | | | 29,198,124 | |
Wells Fargo Bank N.A. | | | | | | | | |
5.85%, 02/01/37 | | | 10,000 | | | | 12,453,978 | |
6.00%, 11/15/17 | | | 11,272 | | | | 12,764,724 | |
6.60%, 01/15/38 | | | 18,634 | | | | 25,312,802 | |
Westpac Banking Corp. | | | | | | | | |
1.60%, 01/12/18 | | | 7,000 | | | | 7,010,382 | |
2.25%, 07/30/18 | | | 5,795 | | | | 5,890,193 | |
2.25%, 01/17/19a | | | 16,170 | | | | 16,342,036 | |
4.88%, 11/19/19 | | | 18,140 | | | | 20,361,051 | |
| | | | | | | | |
| | | | | | | 4,805,919,960 | |
BEVERAGES — 2.91% | |
Anheuser-Busch InBev Finance Inc. | | | | | | | | |
1.25%, 01/17/18a | | | 14,395 | | | | 14,209,660 | |
2.15%, 02/01/19a | | | 14,293 | | | | 14,304,675 | |
2.63%, 01/17/23 | | | 11,718 | | | | 11,254,843 | |
3.70%, 02/01/24a | | | 16,161 | | | | 16,652,015 | |
4.00%, 01/17/43a | | | 6,817 | | | | 6,491,486 | |
4.63%, 02/01/44a | | | 11,200 | | | | 11,715,590 | |
Anheuser-Busch InBev Worldwide Inc. | | | | | | | | |
2.50%, 07/15/22 | | | 19,647 | | | | 18,843,418 | |
3.75%, 07/15/42 | | | 12,392 | | | | 11,354,423 | |
5.00%, 04/15/20 | | | 10,712 | | | | 12,005,637 | |
5.38%, 01/15/20 | | | 25,778 | | | | 29,268,547 | |
6.88%, 11/15/19a | | | 9,027 | | | | 10,883,538 | |
7.75%, 01/15/19 | | | 20,753 | | | | 25,152,648 | |
8.20%, 01/15/39 | | | 15,094 | | | | 22,915,596 | |
Bottling Group LLC | | | | | | | | |
5.13%, 01/15/19a | | | 12,932 | | | | 14,518,465 | |
Coca-Cola Co. (The) | | | | | | | | |
1.15%, 04/01/18 | | | 16,790 | | | | 16,620,765 | |
1.65%, 03/14/18a | | | 9,794 | | | | 9,879,284 | |
| | | | |
SCHEDULESOF INVESTMENTS | | | 71 | |
Schedule of Investments (Unaudited) (Continued)
iSHARES® iBOXX $ INVESTMENT GRADE CORPORATE BOND ETF
October 31, 2014
| | | | | | | | |
| Security | |
Principal
(000s) | | | Value | |
| | | | | | | | |
1.65%, 11/01/18 | | $ | 18,860 | | | $ | 18,844,652 | |
2.45%, 11/01/20a | | | 17,048 | | | | 17,286,989 | |
3.15%, 11/15/20 | | | 10,081 | | | | 10,579,030 | |
3.20%, 11/01/23a | | | 25,025 | | | | 25,478,533 | |
3.30%, 09/01/21 | | | 8,603 | | | | 8,997,134 | |
4.88%, 03/15/19 | | | 2,000 | | | | 2,253,036 | |
5.35%, 11/15/17a | | | 3,800 | | | | 4,257,314 | |
Diageo Capital PLC | | | | | | | | |
2.63%, 04/29/23 (Call 01/29/23)a | | | 17,598 | | | | 16,867,642 | |
5.75%, 10/23/17 | | | 8,797 | | | | 9,881,722 | |
Diageo Investment Corp. | | | | | | | | |
2.88%, 05/11/22 | | | 10,404 | | | | 10,349,213 | |
Pepsi Bottling Group Inc. (The) Series B | | | | | | | | |
7.00%, 03/01/29 | | | 8,770 | | | | 11,905,580 | |
PepsiCo Inc. | | | | | | | | |
2.25%, 01/07/19 (Call 12/07/18)a | | | 4,600 | | | | 4,656,515 | |
2.75%, 03/05/22 | | | 13,742 | | | | 13,660,584 | |
2.75%, 03/01/23 | | | 13,592 | | | | 13,266,970 | |
3.00%, 08/25/21a | | | 5,596 | | | | 5,709,694 | |
3.13%, 11/01/20 | | | 10,599 | | | | 10,994,981 | |
3.60%, 03/01/24 (Call 12/01/23)a | | | 13,000 | | | | 13,435,044 | |
4.00%, 03/05/42a | | | 8,748 | | | | 8,410,029 | |
4.50%, 01/15/20 | | | 11,840 | | | | 13,131,196 | |
4.88%, 11/01/40 | | | 12,115 | | | | 13,247,624 | |
5.00%, 06/01/18 | | | 14,719 | | | | 16,438,833 | |
5.50%, 01/15/40 | | | 10,495 | | | | 12,400,337 | |
7.90%, 11/01/18 | | | 15,940 | | | | 19,564,330 | |
| | | | | | | | |
| | | | | | | 527,687,572 | |
BIOTECHNOLOGY — 1.48% | |
Amgen Inc. | | | | | | | | |
2.20%, 05/22/19 (Call 04/22/19) | | | 15,415 | | | | 15,313,898 | |
3.45%, 10/01/20 | | | 7,585 | | | | 7,832,564 | |
3.63%, 05/15/22 (Call 02/15/22) | | | 6,265 | | | | 6,416,797 | |
3.63%, 05/22/24 (Call 02/22/24)a | | | 8,900 | | | | 8,941,077 | |
3.88%, 11/15/21 (Call 08/15/21) | | | 17,223 | | | | 18,066,932 | |
| | | | | | | | |
| Security | |
Principal
(000s) | | | Value | |
| | | | | | | | |
4.10%, 06/15/21 (Call 03/15/21) | | $ | 13,821 | | | $ | 14,751,775 | |
5.15%, 11/15/41 (Call 05/15/41) | | | 22,627 | | | | 24,290,331 | |
5.38%, 05/15/43 (Call 11/15/42) | | | 10,450 | | | | 11,595,397 | |
5.65%, 06/15/42 (Call 12/15/41) | | | 8,507 | | | | 9,760,170 | |
5.70%, 02/01/19 | | | 17,444 | | | | 19,723,252 | |
6.38%, 06/01/37a | | | 9,234 | | | | 11,303,691 | |
6.40%, 02/01/39 | | | 10,922 | | | | 13,592,542 | |
Celgene Corp. | | | | | | | | |
3.25%, 08/15/22a | | | 8,531 | | | | 8,556,668 | |
3.63%, 05/15/24 (Call 02/15/24) | | | 12,000 | | | | 12,115,432 | |
4.63%, 05/15/44 (Call 11/15/43) | | | 10,000 | | | | 10,252,904 | |
Gilead Sciences Inc. | | | | | | | | |
3.70%, 04/01/24 (Call 01/01/24) | | | 30,487 | | | | 31,479,571 | |
4.40%, 12/01/21 (Call 09/01/21) | | | 8,010 | | | | 8,804,956 | |
4.50%, 04/01/21 (Call 01/01/21) | | | 4,434 | | | | 4,895,469 | |
4.80%, 04/01/44 (Call 10/01/43) | | | 14,845 | | | | 16,247,088 | |
5.65%, 12/01/41 (Call 06/01/41) | | | 11,850 | | | | 14,375,733 | |
| | | | | | | | |
| | | | | | | 268,316,247 | |
CHEMICALS — 2.17% | |
CF Industries Inc. | | | | | | | | |
3.45%, 06/01/23a | | | 10,750 | | | | 10,629,973 | |
4.95%, 06/01/43a | | | 10,495 | | | | 10,601,830 | |
5.15%, 03/15/34a | | | 6,255 | | | | 6,643,599 | |
5.38%, 03/15/44 | | | 5,495 | | | | 5,897,314 | |
6.88%, 05/01/18 | | | 11,300 | | | | 13,034,906 | |
7.13%, 05/01/20 | | | 30 | | | | 36,093 | |
Dow Chemical Co. (The) | | | | | | | | |
3.00%, 11/15/22 (Call 08/15/22)a | | | 2,350 | | | | 2,295,106 | |
3.50%, 10/01/24 (Call 07/01/24) | | | 5,000 | | | | 4,928,798 | |
| | |
| 72 | | 2014 iSHARES ANNUAL REPORTTO SHAREHOLDERS |
Schedule of Investments (Unaudited) (Continued)
iSHARES® iBOXX $ INVESTMENT GRADE CORPORATE BOND ETF
October 31, 2014
| | | | | | | | |
| Security | |
Principal
(000s) | | | Value | |
| | | | | | | | |
4.13%, 11/15/21 (Call 08/15/21)a | | $ | 13,408 | | | $ | 14,197,726 | |
4.25%, 11/15/20 (Call 08/15/20) | | | 15,771 | | | | 16,904,935 | |
4.38%, 11/15/42 (Call 05/15/42) | | | 11,250 | | | | 10,664,095 | |
5.25%, 11/15/41 (Call 05/15/41) | | | 9,145 | | | | 9,717,553 | |
7.38%, 11/01/29 | | | 8,397 | | | | 11,249,811 | |
8.55%, 05/15/19 | | | 25,037 | | | | 31,524,049 | |
9.40%, 05/15/39 | | | 8,551 | | | | 13,607,319 | |
E.I. du Pont de Nemours & Co. | | | | | | | | |
2.80%, 02/15/23 | | | 14,492 | | | | 14,217,591 | |
3.63%, 01/15/21a | | | 13,316 | | | | 14,109,831 | |
4.15%, 02/15/43a | | | 6,215 | | | | 5,965,677 | |
4.63%, 01/15/20a | | | 9,423 | | | | 10,460,018 | |
6.00%, 07/15/18 | | | 11,791 | | | | 13,513,684 | |
Eastman Chemical Co. | | | | | | | | |
3.60%, 08/15/22 (Call 05/15/22)a | | | 6,288 | | | | 6,375,646 | |
Ecolab Inc. | | | | | | | | |
4.35%, 12/08/21 | | | 15,053 | | | | 16,389,481 | |
5.50%, 12/08/41a | | | 7,698 | | | | 9,018,349 | |
LYB International Finance BV | | | | | | | | |
4.00%, 07/15/23 | | | 2,390 | | | | 2,475,714 | |
4.88%, 03/15/44 (Call 09/15/43)a | | | 7,350 | | | | 7,586,045 | |
5.25%, 07/15/43 | | | 10,009 | | | | 10,875,784 | |
LyondellBasell Industries NV | | | | | | | | |
5.00%, 04/15/19 (Call 01/15/19) | | | 21,000 | | | | 23,085,544 | |
5.75%, 04/15/24 (Call 01/15/24) | | | 16,620 | | | | 19,339,860 | |
6.00%, 11/15/21 (Call 08/17/21) | | | 12,222 | | | | 14,232,138 | |
Monsanto Co. | | | | | | | | |
3.38%, 07/15/24 (Call 04/15/24)a | | | 5,444 | | | | 5,480,743 | |
4.40%, 07/15/44 (Call 01/15/44) | | | 16,000 | | | | 16,060,930 | |
4.70%, 07/15/64 (Call 01/15/64)a | | | 5,110 | | | | 5,232,478 | |
| | | | | | | | |
| Security | |
Principal
(000s) | | | Value | |
| | | | | | | | |
Mosaic Co. (The) | | | | | | | | |
4.25%, 11/15/23 (Call 08/15/23) | | $ | 10,100 | | | $ | 10,581,624 | |
Potash Corp. of Saskatchewan Inc. | | | | | | | | |
3.63%, 03/15/24 (Call 12/15/23)a | | | 8,753 | | | | 8,983,224 | |
Rohm & Haas Co. | | | | | | | | |
7.85%, 07/15/29 | | | 12,506 | | | | 17,360,311 | |
| | | | | | | | |
| | | | | | | 393,277,779 | |
COMMERCIAL SERVICES — 0.17% | |
Synchrony Financial | | | | | | | | |
3.00%, 08/15/19 (Call 07/15/19)a | | | 10,500 | | | | 10,601,371 | |
3.75%, 08/15/21 (Call 06/15/21) | | | 4,940 | | | | 5,018,618 | |
4.25%, 08/15/24 (Call 05/15/24) | | | 14,895 | | | | 15,119,777 | |
| | | | | | | | |
| | | | | | | 30,739,766 | |
COMPUTERS — 2.70% | |
Apple Inc. | | | | | | | | |
1.00%, 05/03/18 | | | 41,656 | | | | 40,862,836 | |
2.10%, 05/06/19a | | | 22,010 | | | | 22,165,884 | |
2.40%, 05/03/23a | | | 48,000 | | | | 46,336,008 | |
2.85%, 05/06/21a | | | 28,540 | | | | 28,983,178 | |
3.45%, 05/06/24 | | | 20,325 | | | | 20,963,668 | |
3.85%, 05/04/43 | | | 31,032 | | | | 29,714,121 | |
4.45%, 05/06/44a | | | 10,050 | | | | 10,554,626 | |
EMC Corp./MA | | | | | | | | |
1.88%, 06/01/18 | | | 15,759 | | | | 15,636,486 | |
2.65%, 06/01/20 | | | 23,975 | | | | 23,646,991 | |
3.38%, 06/01/23 (Call 03/01/23) | | | 17,395 | | | | 17,033,895 | |
Hewlett-Packard Co. | | | | | | | | |
2.75%, 01/14/19a | | | 16,310 | | | | 16,397,578 | |
3.75%, 12/01/20 | | | 12,840 | | | | 13,146,120 | |
4.30%, 06/01/21a | | | 14,905 | | | | 15,602,475 | |
4.38%, 09/15/21a | | | 14,775 | | | | 15,541,047 | |
4.65%, 12/09/21a | | | 13,807 | | | | 14,752,543 | |
5.50%, 03/01/18 | | | 8,780 | | | | 9,769,867 | |
6.00%, 09/15/41 | | | 11,430 | | | | 12,701,681 | |
| | | | |
SCHEDULESOF INVESTMENTS | | | 73 | |
Schedule of Investments (Unaudited) (Continued)
iSHARES® iBOXX $ INVESTMENT GRADE CORPORATE BOND ETF
October 31, 2014
| | | | | | | | |
| Security | |
Principal
(000s) | | | Value | |
| | | | | | | | |
International Business Machines Corp. | | | | | | | | |
1.25%, 02/08/18 | | $ | 1,970 | | | $ | 1,953,671 | |
1.63%, 05/15/20 | | | 10,655 | | | | 10,263,062 | |
1.88%, 08/01/22 | | | 7,440 | | | | 6,863,986 | |
1.95%, 02/12/19a | | | 6,640 | | | | 6,650,668 | |
3.38%, 08/01/23 | | | 20,725 | | | | 20,946,306 | |
3.63%, 02/12/24a | | | 16,495 | | | | 16,911,556 | |
4.00%, 06/20/42 | | | 15,206 | | | | 14,588,141 | |
7.63%, 10/15/18 | | | 21,548 | | | | 26,147,119 | |
8.38%, 11/01/19 | | | 4,987 | | | | 6,421,318 | |
Seagate HDD Cayman | | | | | | | | |
3.75%, 11/15/18c | | | 7,000 | | | | 7,218,750 | |
4.75%, 06/01/23 | | | 10,750 | | | | 11,126,250 | |
4.75%, 01/01/25a,c | | | 5,000 | | | | 5,062,500 | |
| | | | | | | | |
| | | | | | | 487,962,331 | |
COSMETICS & PERSONAL CARE — 0.30% | |
Procter & Gamble Co. (The) | | | | | | | | |
1.60%, 11/15/18a | | | 5,000 | | | | 4,967,043 | |
2.30%, 02/06/22 | | | 7,115 | | | | 7,011,354 | |
3.10%, 08/15/23 | | | 14,834 | | | | 15,089,164 | |
4.70%, 02/15/19 | | | 6,527 | | | | 7,295,854 | |
5.55%, 03/05/37 | | | 15,255 | | | | 19,211,557 | |
| | | | | | | | |
| | | | | | | 53,574,972 | |
DIVERSIFIED FINANCIAL SERVICES — 5.04% | |
American Express Co. | | | | | | | | |
1.55%, 05/22/18 | | | 3,681 | | | | 3,623,094 | |
2.65%, 12/02/22a | | | 6,500 | | | | 6,327,076 | |
4.05%, 12/03/42 | | | 11,906 | | | | 11,498,462 | |
7.00%, 03/19/18 | | | 15,592 | | | | 18,169,719 | |
American Express Credit Corp. | | | | | | | | |
2.13%, 07/27/18 | | | 12,163 | | | | 12,261,586 | |
2.13%, 03/18/19 | | | 15,645 | | | | 15,647,001 | |
2.25%, 08/15/19 | | | 20,250 | | | | 20,298,740 | |
Ameriprise Financial Inc. | | | | | | | | |
4.00%, 10/15/23 | | | 10,000 | | | | 10,525,512 | |
Associates Corp. of North America | | | | | | | | |
6.95%, 11/01/18 | | | 2,825 | | | | 3,310,119 | |
Bear Stearns Companies Inc. (The) | | | | | | | | |
6.40%, 10/02/17 | | | 24,645 | | | | 27,845,175 | |
7.25%, 02/01/18 | | | 20,442 | | | | 23,762,625 | |
| | | | | | | | |
| Security | |
Principal
(000s) | | | Value | |
| | | | | | | | |
BP Capital Markets PLC | | | | | | | | |
2.52%, 01/15/20 | | $ | 2,775 | | | $ | 2,786,184 | |
Capital One Bank USA N.A. | | | | | | | | |
2.25%, 02/13/19 (Call 01/13/19) | | | 13,970 | | | | 13,911,368 | |
3.38%, 02/15/23 | | | 9,580 | | | | 9,474,947 | |
CME Group Inc./IL | | | | | | | | |
3.00%, 09/15/22 | | | 1,547 | | | | 1,553,700 | |
5.30%, 09/15/43 (Call 03/15/43) | | | 10,518 | | | | 12,333,784 | |
Ford Motor Credit Co. LLC | | | | | | | | |
2.38%, 01/16/18 | | | 20,660 | | | | 20,860,691 | |
2.38%, 03/12/19a | | | 11,500 | | | | 11,480,428 | |
2.88%, 10/01/18a | | | 3,175 | | | | 3,249,224 | |
3.66%, 09/08/24a | | | 8,000 | | | | 7,970,400 | |
4.25%, 09/20/22 | | | 12,995 | | | | 13,662,531 | |
4.38%, 08/06/23a | | | 10,029 | | | | 10,639,766 | |
5.00%, 05/15/18 | | | 16,121 | | | | 17,622,610 | |
5.75%, 02/01/21a | | | 13,670 | | | | 15,645,899 | |
5.88%, 08/02/21 | | | 29,758 | | | | 34,322,464 | |
8.13%, 01/15/20 | | | 12,508 | | | | 15,632,371 | |
General Electric Capital Corp. | | | | | | | | |
1.63%, 04/02/18a | | | 19,190 | | | | 19,266,921 | |
2.30%, 01/14/19a | | | 21,594 | | | | 21,985,067 | |
3.10%, 01/09/23 | | | 28,954 | | | | 29,075,358 | |
3.15%, 09/07/22a | | | 22,877 | | | | 23,149,236 | |
3.45%, 05/15/24 (Call 02/13/24)a | | | 12,443 | | | | 12,687,817 | |
4.38%, 09/16/20 | | | 1,721 | | | | 1,889,691 | |
4.63%, 01/07/21 | | | 28,173 | | | | 31,303,020 | |
4.65%, 10/17/21a | | | 20,452 | | | | 22,833,247 | |
5.30%, 02/11/21 | | | 21,935 | | | | 24,850,598 | |
5.50%, 01/08/20a | | | 16,540 | | | | 19,125,698 | |
5.63%, 05/01/18 | | | 29,503 | | | | 33,367,893 | |
5.88%, 01/14/38 | | | 50,914 | | | | 62,814,384 | |
6.00%, 08/07/19 | | | 17,834 | | | | 20,910,538 | |
6.15%, 08/07/37 | | | 12,346 | | | | 15,549,787 | |
6.88%, 01/10/39 | | | 37,033 | | | | 50,635,221 | |
Series A | | | | | | | | |
5.55%, 05/04/20 | | | 390 | | | | 450,123 | |
6.75%, 03/15/32 | | | 42,157 | | | | 55,976,065 | |
Goldman Sachs Capital I | | | | | | | | |
6.35%, 02/15/34 | | | 13,958 | | | | 16,324,940 | |
| | |
| 74 | | 2014 iSHARES ANNUAL REPORTTO SHAREHOLDERS |
Schedule of Investments (Unaudited) (Continued)
iSHARES® iBOXX $ INVESTMENT GRADE CORPORATE BOND ETF
October 31, 2014
| | | | | | | | |
| Security | |
Principal
(000s) | | | Value | |
| | | | | | | | |
HSBC Finance Corp. | | | | | | | | |
6.68%, 01/15/21 | | $ | 29,691 | | | $ | 34,928,558 | |
Intercontinental Exchange Inc. | | | | | | | | |
4.00%, 10/15/23 | | | 10,000 | | | | 10,546,915 | |
Jefferies Group LLC | | | | | | | | |
5.13%, 04/13/18 | | | 16,279 | | | | 17,637,144 | |
6.88%, 04/15/21 | | | 5,452 | | | | 6,354,996 | |
Nomura Holdings Inc. | | | | | | | | |
2.75%, 03/19/19a | | | 12,500 | | | | 12,620,386 | |
6.70%, 03/04/20 | | | 13,643 | | | | 16,202,659 | |
NYSE Euronext | | | | | | | | |
2.00%, 10/05/17 | | | 6,705 | | | | 6,830,667 | |
| | | | | | | | |
| | | | | | | 911,732,405 | |
ELECTRIC — 1.16% | |
Berkshire Hathaway Energy Co. | | | | | | | | |
5.15%, 11/15/43 (Call 05/15/43) | | | 8,060 | | | | 9,110,310 | |
6.13%, 04/01/36 | | | 14,660 | | | | 18,341,485 | |
6.50%, 09/15/37a | | | 10,600 | | | | 13,884,882 | |
Consolidated Edison Co. of New York Inc. | | | | | | | | |
4.45%, 03/15/44 (Call 09/15/43) | | | 8,000 | | | | 8,379,976 | |
Duke Energy Carolinas LLC | | | | | | | | |
5.30%, 02/15/40 | | | 5,420 | | | | 6,496,943 | |
Duke Energy Florida Inc. | | | | | | | | |
6.40%, 06/15/38a | | | 11,116 | | | | 15,143,488 | |
Exelon Generation Co. LLC | | | | | | | | |
5.60%, 06/15/42 (Call 12/15/41)a | | | 11,280 | | | | 12,198,014 | |
6.25%, 10/01/39 | | | 6,720 | | | | 7,898,037 | |
Georgia Power Co. | | | | | | | | |
4.30%, 03/15/42a | | | 11,795 | | | | 12,021,297 | |
Nisource Finance Corp. | | | | | | | | |
4.80%, 02/15/44 (Call 08/15/43) | | | 5,713 | | | | 6,054,597 | |
6.40%, 03/15/18a | | | 9,398 | | | | 10,801,958 | |
Oncor Electric Delivery Co. LLC | | | | | | | | |
7.00%, 09/01/22 | | | 8,588 | | | | 10,932,431 | |
Pacific Gas & Electric Co. | | | | | | | | |
3.50%, 10/01/20 (Call 07/01/20)a | | | 1,386 | | | | 1,455,910 | |
5.40%, 01/15/40a | | | 9,525 | | | | 11,106,288 | |
| | | | | | | | |
| Security | |
Principal
(000s) | | | Value | |
| | | | | | | | |
5.80%, 03/01/37 | | $ | 7,610 | | | $ | 9,213,565 | |
6.05%, 03/01/34 | | | 34,334 | | | | 42,716,444 | |
8.25%, 10/15/18 | | | 5,383 | | | | 6,571,593 | |
Southern California Edison Co. | | | | | | | | |
4.65%, 10/01/43 (Call 04/01/43) | | | 7,500 | | | | 8,349,734 | |
| | | | | | | | |
| | | | | | | 210,676,952 | |
ELECTRONICS — 0.65% | |
Honeywell International Inc. | | | | | | | | |
4.25%, 03/01/21a | | | 3,626 | | | | 4,020,275 | |
5.00%, 02/15/19 | | | 11,324 | | | | 12,706,078 | |
5.30%, 03/01/18 | | | 7,983 | | | | 8,940,419 | |
Koninklijke Philips NV | | | | | | | | |
3.75%, 03/15/22 | | | 14,343 | | | | 14,887,317 | |
5.75%, 03/11/18 | | | 9,859 | | | | 11,062,633 | |
6.88%, 03/11/38 | | | 5,166 | | | | 6,851,558 | |
Thermo Fisher Scientific Inc. | | | | | | | | |
2.40%, 02/01/19 | | | 14,192 | | | | 14,237,453 | |
3.15%, 01/15/23 (Call 10/15/22) | | | 9,078 | | | | 8,957,455 | |
3.60%, 08/15/21 (Call 05/15/21)a | | | 16,256 | | | | 16,844,990 | |
4.15%, 02/01/24 (Call 11/01/23) | | | 12,975 | | | | 13,640,192 | |
4.50%, 03/01/21a | | | 5,192 | | | | 5,630,857 | |
| | | | | | | | |
| | | | | | | 117,779,227 | |
ENGINEERING & CONSTRUCTION — 0.10% | |
ABB Finance USA Inc. | | | | | | | | |
2.88%, 05/08/22a | | | 15,513 | | | | 15,443,258 | |
4.38%, 05/08/42 | | | 3,075 | | | | 3,217,524 | |
| | | | | | | | |
| | | | | | | 18,660,782 | |
ENVIRONMENTAL CONTROL — 0.09% | |
Republic Services Inc. | | | | | | | | |
3.55%, 06/01/22 (Call 03/01/22)a | | | 6,835 | | | | 7,005,794 | |
5.00%, 03/01/20 | | | 8,007 | | | | 8,911,833 | |
| | | | | | | | |
| | | | | | | 15,917,627 | |
FOOD — 1.83% | |
ConAgra Foods Inc. | | | | | | | | |
1.90%, 01/25/18 | | | 11,645 | | | | 11,591,540 | |
3.20%, 01/25/23 (Call 10/25/22) | | | 9,497 | | | | 9,206,672 | |
| | | | |
SCHEDULESOF INVESTMENTS | | | 75 | |
Schedule of Investments (Unaudited) (Continued)
iSHARES® iBOXX $ INVESTMENT GRADE CORPORATE BOND ETF
October 31, 2014
| | | | | | | | |
| Security | |
Principal
(000s) | | | Value | |
| | | | | | | | |
General Mills Inc. | | | | | | | | |
3.15%, 12/15/21 (Call 09/15/21) | | $ | 16,624 | | | $ | 16,936,584 | |
5.65%, 02/15/19 | | | 8,850 | | | | 10,105,888 | |
Kellogg Co. | | | | | | | | |
4.00%, 12/15/20 | | | 4,515 | | | | 4,853,552 | |
Series B | | | | | | | | |
7.45%, 04/01/31 | | | 15,201 | | | | 20,040,413 | |
Kraft Foods Group Inc. | | | | | | | | |
3.50%, 06/06/22 | | | 21,001 | | | | 21,496,101 | |
5.00%, 06/04/42a | | | 19,528 | | | | 20,859,448 | |
5.38%, 02/10/20 | | | 10,330 | | | | 11,746,495 | |
6.13%, 08/23/18 | | | 750 | | | | 862,851 | |
6.50%, 02/09/40 | | | 8,224 | | | | 10,195,716 | |
6.88%, 01/26/39 | | | 14,522 | | | | 18,773,991 | |
Kroger Co. (The) | | | | | | | | |
6.15%, 01/15/20 | | | 7,627 | | | | 8,878,141 | |
Mondelez International Inc. | | | | | | | | |
2.25%, 02/01/19 (Call 01/01/19) | | | 6,734 | | | | 6,719,097 | |
4.00%, 02/01/24 (Call 11/01/23)a | | | 5,750 | | | | 5,940,512 | |
5.38%, 02/10/20a | | | 15,150 | | | | 17,215,640 | |
6.50%, 02/09/40 | | | 21,751 | | | | 27,598,234 | |
Sysco Corp. | | | | | | | | |
2.35%, 10/02/19 (Call 09/02/19) | | | 8,000 | | | | 8,042,742 | |
3.00%, 10/02/21 (Call 08/02/21) | | | 4,000 | | | | 4,051,222 | |
3.50%, 10/02/24 (Call 07/02/24)a | | | 13,000 | | | | 13,227,980 | |
4.35%, 10/02/34 (Call 04/02/34) | | | 2,225 | | | | 2,294,706 | |
4.50%, 10/02/44 (Call 04/02/44)a | | | 12,000 | | | | 12,329,306 | |
Tyson Foods Inc. | | | | | | | | |
2.65%, 08/15/19 (Call 07/15/19) | | | 13,000 | | | | 13,137,415 | |
3.95%, 08/15/24 (Call 05/15/24) | | | 15,000 | | | | 15,280,083 | |
Unilever Capital Corp. | | | | | | | | |
2.20%, 03/06/19 | | | 11,391 | | | | 11,507,776 | |
4.25%, 02/10/21 | | | 8,763 | | | | 9,688,809 | |
| | | | | | | | |
| Security | |
Principal
(000s) | | | Value | |
| | | | | | | | |
4.80%, 02/15/19 | | $ | 7,064 | | | $ | 7,888,716 | |
5.90%, 11/15/32 | | | 7,625 | | | | 10,103,906 | |
| | | | | | | | |
| | | | | | | 330,573,536 | |
FOREST PRODUCTS & PAPER — 0.35% | |
International Paper Co. | | | | | | | | |
3.65%, 06/15/24 (Call 03/15/24)a | | | 6,000 | | | | 5,940,266 | |
4.75%, 02/15/22 (Call 11/15/21) | | | 7,627 | | | | 8,284,132 | |
4.80%, 06/15/44 (Call 12/15/43)a | | | 6,400 | | | | 6,328,334 | |
7.30%, 11/15/39 | | | 3,050 | | | | 3,962,289 | |
7.50%, 08/15/21 | | | 10,669 | | | | 13,346,708 | |
7.95%, 06/15/18a | | | 21,528 | | | | 25,764,743 | |
| | | | | | | | |
| | | | | | | 63,626,472 | |
GAS — 0.05% | |
Sempra Energy | | | | | | | | |
6.00%, 10/15/39 | | | 6,990 | | | | 8,778,880 | |
| | | | | | | | |
| | | | | | | 8,778,880 | |
HEALTH CARE — PRODUCTS — 0.72% | |
Baxter International Inc. | | | | | | | | |
1.85%, 06/15/18 | | | 4,758 | | | | 4,757,324 | |
3.20%, 06/15/23 (Call 03/15/23)a | | | 16,457 | | | | 16,522,311 | |
Becton, Dickinson and Co. | | | | | | | | |
3.13%, 11/08/21a | | | 12,875 | | | | 12,902,761 | |
Boston Scientific Corp. | | | | | | | | |
6.00%, 01/15/20 | | | 9,053 | | | | 10,388,036 | |
Covidien International Finance SA | | | | | | | | |
6.00%, 10/15/17 | | | 7,250 | | | | 8,198,135 | |
6.55%, 10/15/37 | | | 12,935 | | | | 16,918,811 | |
Medtronic Inc. | | | | | | | | |
1.38%, 04/01/18 | | | 8,204 | | | | 8,120,963 | |
2.75%, 04/01/23 (Call 01/01/23) | | | 8,924 | | | | 8,618,207 | |
3.63%, 03/15/24 (Call 12/15/23)a | | | 13,944 | | | | 14,165,733 | |
4.00%, 04/01/43 (Call 10/01/42) | | | 8,000 | | | | 7,577,860 | |
4.45%, 03/15/20 | | | 13,593 | | | | 14,833,197 | |
| | |
| 76 | | 2014 iSHARES ANNUAL REPORTTO SHAREHOLDERS |
Schedule of Investments (Unaudited) (Continued)
iSHARES® iBOXX $ INVESTMENT GRADE CORPORATE BOND ETF
October 31, 2014
| | | | | | | | |
| Security | |
Principal
(000s) | | | Value | |
| | | | | | | | |
St. Jude Medical Inc. | | | | | | | | |
3.25%, 04/15/23 (Call 01/15/23) | | $ | 7,468 | | | $ | 7,446,621 | |
| | | | | | | | |
| | | | | | | 130,449,959 | |
HEALTH CARE — SERVICES — 1.08% | |
Aetna Inc. | | | | | | | | |
2.75%, 11/15/22 (Call 08/15/22) | | | 12,080 | | | | 11,659,652 | |
3.95%, 09/01/20 | | | 18,315 | | | | 19,613,120 | |
6.63%, 06/15/36 | | | 7,798 | | | | 10,054,228 | |
Cigna Corp. | | | | | | | | |
4.00%, 02/15/22 (Call 11/15/21) | | | 5,005 | | | | 5,271,242 | |
5.38%, 02/15/42 (Call 08/15/41) | | | 9,455 | | | | 10,730,165 | |
Humana Inc. | | | | | | | | |
4.95%, 10/01/44 (Call 04/01/44) | | | 5,000 | | | | 5,190,641 | |
UnitedHealth Group Inc. | | | | | | | | |
2.88%, 03/15/22 (Call 12/15/21)a | | | 12,054 | | | | 12,058,447 | |
2.88%, 03/15/23 | | | 5,500 | | | | 5,408,880 | |
4.25%, 03/15/43 (Call 09/15/42)a | | | 12,080 | | | | 12,003,621 | |
5.80%, 03/15/36 | | | 4,000 | | | | 4,873,302 | |
6.00%, 02/15/18 | | | 10,334 | | | | 11,760,218 | |
6.88%, 02/15/38 | | | 12,310 | | | | 16,904,458 | |
WellPoint Inc. | | | | | | | | |
2.25%, 08/15/19 | | | 10,125 | | | | 10,027,357 | |
3.13%, 05/15/22 | | | 8,808 | | | | 8,734,230 | |
3.30%, 01/15/23 | | | 13,350 | | | | 13,225,683 | |
3.50%, 08/15/24 (Call 05/15/24) | | | 5,000 | | | | 4,975,337 | |
4.63%, 05/15/42 | | | 10,595 | | | | 10,744,679 | |
4.65%, 01/15/43 | | | 9,410 | | | | 9,610,611 | |
4.65%, 08/15/44 (Call 02/15/44) | | | 5,000 | | | | 5,085,729 | |
5.85%, 01/15/36 | | | 2,950 | | | | 3,474,134 | |
6.38%, 06/15/37 | | | 3,470 | | | | 4,297,149 | |
| | | | | | | | |
| | | | | | | 195,702,883 | |
INSURANCE — 2.06% | |
Aflac Inc. | | | | | | | | |
8.50%, 05/15/19a | | | 8,475 | | | | 10,712,029 | |
| | | | | | | | |
| Security | |
Principal
(000s) | | | Value | |
| | | | | | | | |
American International Group Inc. | | | | | | | | |
2.30%, 07/16/19 (Call 06/16/19) | | $ | 10,000 | | | $ | 10,099,298 | |
3.38%, 08/15/20 | | | 11,500 | | | | 11,929,985 | |
4.13%, 02/15/24a | | | 13,045 | | | | 13,752,182 | |
4.50%, 07/16/44 (Call 01/16/44) | | | 18,030 | | | | 18,297,392 | |
4.88%, 06/01/22 | | | 6,394 | | | | 7,116,485 | |
5.85%, 01/16/18a | | | 24,509 | | | | 27,568,902 | |
6.25%, 05/01/36 | | | 9,750 | | | | 12,373,580 | |
6.40%, 12/15/20a | | | 14,357 | | | | 17,204,613 | |
Berkshire Hathaway Finance Corp. | | | | | | | | |
3.00%, 05/15/22a | | | 10,267 | | | | 10,341,145 | |
4.25%, 01/15/21a | | | 6,817 | | | | 7,489,732 | |
5.40%, 05/15/18a | | | 18,171 | | | | 20,521,310 | |
5.75%, 01/15/40 | | | 6,350 | | | | 7,731,093 | |
Berkshire Hathaway Inc. | | | | | | | | |
1.55%, 02/09/18 | | | 7,000 | | | | 7,016,027 | |
2.10%, 08/14/19a | | | 10,000 | | | | 10,067,470 | |
4.50%, 02/11/43a | | | 8,871 | | | | 9,302,379 | |
Chubb Corp. (The) | | | | | | | | |
6.00%, 05/11/37 | | | 4,075 | | | | 5,199,836 | |
MetLife Inc. | | | | | | | | |
3.60%, 04/10/24a | | | 8,525 | | | | 8,712,061 | |
4.13%, 08/13/42 | | | 4,658 | | | | 4,505,111 | |
4.75%, 02/08/21 | | | 8,494 | | | | 9,410,915 | |
4.88%, 11/13/43 | | | 10,110 | | | | 11,038,702 | |
5.70%, 06/15/35 | | | 3,905 | | | | 4,588,091 | |
5.88%, 02/06/41 | | | 12,850 | | | | 15,696,186 | |
6.38%, 06/15/34 | | | 7,875 | | | | 9,997,976 | |
7.72%, 02/15/19 | | | 11,653 | | | | 14,243,004 | |
Series A | | | | | | | | |
6.82%, 08/15/18 | | | 7,624 | | | | 8,961,638 | |
Series D | | | | | | | | |
4.37%, 09/15/23 | | | 11,975 | | | | 12,885,418 | |
Prudential Financial Inc. | | | | | | | | |
4.60%, 05/15/44 | | | 10,000 | | | | 10,127,229 | |
7.38%, 06/15/19a | | | 10,082 | | | | 12,262,303 | |
Series D | | | | | | | | |
6.00%, 12/01/17 | | | 11,184 | | | | 12,619,322 | |
6.63%, 12/01/37 | | | 9,050 | | | | 11,670,955 | |
| | | | |
SCHEDULESOF INVESTMENTS | | | 77 | |
Schedule of Investments (Unaudited) (Continued)
iSHARES® iBOXX $ INVESTMENT GRADE CORPORATE BOND ETF
October 31, 2014
| | | | | | | | |
| Security | |
Principal
(000s) | | | Value | |
| | | | | | | | |
Travelers Companies Inc. (The) | | | | | | | | |
5.35%, 11/01/40 | | $ | 6,950 | | | $ | 8,181,737 | |
6.25%, 06/15/37 | | | 8,585 | | | | 11,085,775 | |
| | | | | | | | |
| | | | | | | 372,709,881 | |
INTERNET — 0.54% | |
Amazon.com Inc. | | | | | | | | |
1.20%, 11/29/17 | | | 2,755 | | | | 2,728,129 | |
2.50%, 11/29/22 (Call 08/29/22) | | | 25,532 | | | | 23,836,073 | |
eBay Inc. | | | | | | | | |
2.20%, 08/01/19 (Call 07/01/19)a | | | 7,500 | | | | 7,427,902 | |
2.60%, 07/15/22 (Call 04/15/22) | | | 14,488 | | | | 13,631,735 | |
2.88%, 08/01/21 (Call 06/01/21) | | | 11,048 | | | | 10,806,329 | |
3.45%, 08/01/24 (Call 05/01/24)a | | | 5,000 | | | | 4,884,973 | |
4.00%, 07/15/42 (Call 01/15/42) | | | 9,470 | | | | 8,138,285 | |
Google Inc. | | | | | | | | |
3.38%, 02/25/24 | | | 17,570 | | | | 18,172,393 | |
3.63%, 05/19/21 | | | 7,161 | | | | 7,658,140 | |
| | | | | | | | |
| | | | | | | 97,283,959 | |
MACHINERY — 0.69% | |
Caterpillar Financial Services Corp. | | | | | | | | |
2.10%, 06/09/19 | | | 3,150 | | | | 3,161,695 | |
5.45%, 04/15/18 | | | 1,846 | | | | 2,073,329 | |
7.15%, 02/15/19 | | | 8,320 | | | | 10,032,793 | |
Caterpillar Inc. | | | | | | | | |
3.40%, 05/15/24 (Call 02/15/24)a | | | 8,715 | | | | 8,941,583 | |
3.80%, 08/15/42 | | | 14,690 | | | | 14,011,572 | |
3.90%, 05/27/21 | | | 16,382 | | | | 17,612,845 | |
5.20%, 05/27/41a | | | 10,860 | | | | 12,556,885 | |
7.90%, 12/15/18 | | | 15,100 | | | | 18,573,542 | |
Deere & Co. | | | | | | | | |
2.60%, 06/08/22 (Call 03/08/22) | | | 11,871 | | | | 11,652,148 | |
3.90%, 06/09/42 (Call 12/09/41)a | | | 12,210 | | | | 11,934,547 | |
4.38%, 10/16/19 | | | 10,425 | | | | 11,487,225 | |
| | | | | | | | |
| Security | |
Principal
(000s) | | | Value | |
| | | | | | | | |
John Deere Capital Corp. | | | | | | | | |
1.95%, 12/13/18 | | $ | 3,259 | | | $ | 3,256,920 | |
| | | | | | | | |
| | | | | | | 125,295,084 | |
MANUFACTURING — 0.77% | |
3M Co. | | | | | | | | |
5.70%, 03/15/37 | | | 3,350 | | | | 4,250,203 | |
Danaher Corp. | | | | | | | | |
5.40%, 03/01/19 | | | 2,919 | | | | 3,332,747 | |
Eaton Corp. | | | | | | | | |
1.50%, 11/02/17 | | | 12,100 | | | | 12,067,969 | |
2.75%, 11/02/22 | | | 13,980 | | | | 13,602,107 | |
4.15%, 11/02/42a | | | 6,490 | | | | 6,393,680 | |
General Electric Co. | | | | | | | | |
2.70%, 10/09/22 | | | 28,185 | | | | 27,875,402 | |
3.38%, 03/11/24a | | | 3,000 | | | | 3,080,519 | |
4.13%, 10/09/42 | | | 11,072 | | | | 11,187,207 | |
4.50%, 03/11/44 | | | 19,592 | | | | 20,921,352 | |
5.25%, 12/06/17 | | | 21,444 | | | | 23,869,630 | |
Illinois Tool Works Inc. | | | | | | | | |
3.90%, 09/01/42 (Call 03/01/42) | | | 12,902 | | | | 12,478,141 | |
| | | | | | | | |
| | | | | | | 139,058,957 | |
MEDIA — 6.18% | |
21st Century Fox America Inc. | | | | | | | | |
3.00%, 09/15/22 | | | 19,685 | | | | 19,417,888 | |
4.50%, 02/15/21 | | | 6,607 | | | | 7,213,466 | |
6.15%, 03/01/37a | | | 8,275 | | | | 10,169,560 | |
6.15%, 02/15/41a | | | 15,112 | | | | 18,620,497 | |
6.20%, 12/15/34 | | | 12,879 | | | | 16,068,527 | |
6.40%, 12/15/35a | | | 7,700 | | | | 9,807,593 | |
6.65%, 11/15/37 | | | 8,827 | | | | 11,402,619 | |
Comcast Cable Communications Holdings Inc. | | | | | | | | |
9.46%, 11/15/22 | | | 2,091 | | | | 3,002,928 | |
Comcast Corp. | | | | | | | | |
2.85%, 01/15/23a | | | 5,885 | | | | 5,812,470 | |
3.13%, 07/15/22 | | | 15,767 | | | | 16,042,554 | |
3.38%, 02/15/25 (Call 11/15/24) | | | 10,000 | | | | 10,046,632 | |
3.60%, 03/01/24a | | | 19,271 | | | | 19,886,099 | |
4.20%, 08/15/34 (Call 02/15/34) | | | 2,000 | | | | 2,018,510 | |
4.25%, 01/15/33 | | | 11,745 | | | | 11,955,879 | |
| | |
| 78 | | 2014 iSHARES ANNUAL REPORTTO SHAREHOLDERS |
Schedule of Investments (Unaudited) (Continued)
iSHARES® iBOXX $ INVESTMENT GRADE CORPORATE BOND ETF
October 31, 2014
| | | | | | | | |
| Security | |
Principal
(000s) | | | Value | |
| | | | | | | | |
4.65%, 07/15/42 | | $ | 13,247 | | | $ | 13,992,389 | |
4.75%, 03/01/44a | | | 13,506 | | | | 14,501,951 | |
5.15%, 03/01/20a | | | 16,368 | | | | 18,598,304 | |
5.65%, 06/15/35 | | | 12,002 | | | | 14,345,238 | |
5.70%, 05/15/18 | | | 9,035 | | | | 10,245,976 | |
5.88%, 02/15/18 | | | 12,685 | | | | 14,391,762 | |
6.30%, 11/15/17 | | | 6,771 | | | | 7,726,586 | |
6.40%, 05/15/38a | | | 1,800 | | | | 2,309,033 | |
6.40%, 03/01/40a | | | 8,229 | | | | 10,714,587 | |
6.45%, 03/15/37a | | | 17,954 | | | | 23,149,500 | |
6.50%, 11/15/35a | | | 2,150 | | | | 2,809,857 | |
6.55%, 07/01/39a | | | 12,853 | | | | 16,938,557 | |
6.95%, 08/15/37 | | | 25,528 | | | | 34,615,562 | |
7.05%, 03/15/33 | | | 2,110 | | | | 2,875,463 | |
DIRECTV Holdings LLC/DIRECTV Financing Co. Inc. | | | | | | | | |
1.75%, 01/15/18 | | | 11,200 | | | | 11,159,999 | |
3.80%, 03/15/22a | | | 11,621 | | | | 11,880,511 | |
4.45%, 04/01/24 (Call 01/01/24) | | | 17,420 | | | | 18,212,283 | |
4.60%, 02/15/21 (Call 11/15/20) | | | 18,045 | | | | 19,501,051 | |
5.00%, 03/01/21 | | | 13,541 | | | | 14,971,812 | |
5.15%, 03/15/42 | | | 11,748 | | | | 12,020,811 | |
5.20%, 03/15/20a | | | 5,905 | | | | 6,610,472 | |
5.88%, 10/01/19a | | | 5,058 | | | | 5,803,470 | |
6.00%, 08/15/40 (Call 05/15/40) | | | 17,125 | | | | 19,263,056 | |
6.38%, 03/01/41a | | | 11,165 | | | | 13,132,273 | |
Discovery Communications LLC | | | | | | | | |
4.88%, 04/01/43 | | | 10,000 | | | | 10,045,004 | |
5.05%, 06/01/20 | | | 13,983 | | | | 15,536,783 | |
6.35%, 06/01/40 | | | 5,100 | | | | 6,115,868 | |
Historic TW Inc. | | | | | | | | |
6.63%, 05/15/29 | | | 11,725 | | | | 14,665,188 | |
NBCUniversal Media LLC | | | | | | | | |
2.88%, 01/15/23 | | | 14,111 | | | | 13,966,915 | |
4.38%, 04/01/21 | | | 25,315 | | | | 27,847,295 | |
4.45%, 01/15/43a | | | 18,407 | | | | 18,803,224 | |
5.15%, 04/30/20 | | | 20,659 | | | | 23,450,064 | |
5.95%, 04/01/41a | | | 17,289 | | | | 21,390,212 | |
6.40%, 04/30/40 | | | 5,925 | | | | 7,649,597 | |
Thomson Reuters Corp. | | | | | | | | |
6.50%, 07/15/18 | | | 6,979 | | | | 8,012,106 | |
| | | | | | | | |
| Security | |
Principal
(000s) | | | Value | |
| | | | | | | | |
Time Warner Cable Inc. | | | | | | | | |
4.00%, 09/01/21 (Call 06/01/21)a | | $ | 6,473 | | | $ | 6,880,464 | |
4.50%, 09/15/42 (Call 03/15/42)a | | | 16,860 | | | | 16,694,961 | |
5.00%, 02/01/20 | | | 17,223 | | | | 19,182,135 | |
5.50%, 09/01/41 (Call 03/01/41) | | | 8,320 | | | | 9,400,911 | |
5.88%, 11/15/40 (Call 05/15/40) | | | 11,725 | | | | 13,821,623 | |
6.55%, 05/01/37 | | | 8,443 | | | | 10,618,803 | |
6.75%, 07/01/18 | | | 26,053 | | | | 30,322,784 | |
6.75%, 06/15/39a | | | 18,619 | | | | 24,105,103 | |
7.30%, 07/01/38 | | | 23,147 | | | | 31,546,961 | |
8.25%, 04/01/19a | | | 24,586 | | | | 30,537,331 | |
8.75%, 02/14/19 | | | 10,354 | | | | 13,009,631 | |
Time Warner Entertainment Co. LP | | | | | | | | |
8.38%, 03/15/23 | | | 13,713 | | | | 18,428,156 | |
Time Warner Inc. | | | | | | | | |
3.55%, 06/01/24 (Call 03/01/24)a | | | 18,000 | | | | 17,977,581 | |
4.70%, 01/15/21 | | | 8,473 | | | | 9,279,419 | |
4.75%, 03/29/21 | | | 7,410 | | | | 8,146,729 | |
4.88%, 03/15/20 | | | 16,546 | | | | 18,225,257 | |
6.10%, 07/15/40 | | | 10,140 | | | | 12,055,861 | |
6.25%, 03/29/41 | | | 14,195 | | | | 17,038,382 | |
6.50%, 11/15/36a | | | 9,850 | | | | 12,118,247 | |
7.63%, 04/15/31 | | | 16,844 | | | | 23,154,633 | |
7.70%, 05/01/32 | | | 18,767 | | | | 26,106,318 | |
Viacom Inc. | | | | | | | | |
4.25%, 09/01/23 (Call 06/01/23) | | | 14,624 | | | | 15,114,875 | |
4.38%, 03/15/43 | | | 17,945 | | | | 16,538,331 | |
5.85%, 09/01/43 (Call 03/01/43) | | | 14,388 | | | | 16,268,022 | |
6.88%, 04/30/36 | | | 5,813 | | | | 7,321,297 | |
Walt Disney Co. (The) | | | | | | | | |
1.10%, 12/01/17 | | | 13,300 | | | | 13,234,001 | |
1.85%, 05/30/19 | | | 8,188 | | | | 8,149,516 | |
2.35%, 12/01/22 | | | 12,899 | | | | 12,488,799 | |
2.75%, 08/16/21a | | | 12,250 | | | | 12,387,439 | |
| | | | | | | | |
| | | | | | | 1,118,871,551 | |
| | | | |
SCHEDULESOF INVESTMENTS | | | 79 | |
Schedule of Investments (Unaudited) (Continued)
iSHARES® iBOXX $ INVESTMENT GRADE CORPORATE BOND ETF
October 31, 2014
| | | | | | | | |
| Security | |
Principal
(000s) | | | Value | |
| | | | | | | | |
METAL FABRICATE & HARDWARE — 0.12% | |
Precision Castparts Corp. | | | | | | | | |
1.25%, 01/15/18 | | $ | 15,849 | | | $ | 15,737,835 | |
2.50%, 01/15/23 (Call 10/15/22) | | | 5,940 | | | | 5,771,940 | |
| | | | | | | | |
| | | | | | | 21,509,775 | |
MINING — 2.61% | |
Barrick Gold Corp. | | | | | | | | |
3.85%, 04/01/22a | | | 14,778 | | | | 14,111,857 | |
4.10%, 05/01/23a | | | 17,360 | | | | 16,650,271 | |
5.25%, 04/01/42 | | | 1,450 | | | | 1,317,202 | |
6.95%, 04/01/19a | | | 3,094 | | | | 3,574,025 | |
Barrick North America Finance LLC | | | | | | | | |
4.40%, 05/30/21 | | | 15,739 | | | | 16,049,863 | |
5.70%, 05/30/41 | | | 17,374 | | | | 16,581,827 | |
5.75%, 05/01/43a | | | 11,784 | | | | 11,365,963 | |
Barrick PD Australia Finance Pty Ltd. | | | | | | | | |
5.95%, 10/15/39 | | | 2,250 | | | | 2,213,131 | |
BHP Billiton Finance USA Ltd. | | | | | | | | |
2.88%, 02/24/22a | | | 8,068 | | | | 8,081,412 | |
3.25%, 11/21/21 | | | 6,569 | | | | 6,764,966 | |
3.85%, 09/30/23 | | | 20,260 | | | | 21,176,121 | |
4.13%, 02/24/42a | | | 17,660 | | | | 17,343,838 | |
5.00%, 09/30/43 | | | 20,499 | | | | 22,888,376 | |
6.50%, 04/01/19a | | | 14,658 | | | | 17,359,239 | |
Freeport-McMoRan Inc. | | | | | | | | |
2.38%, 03/15/18 | | | 15,737 | | | | 15,779,565 | |
3.10%, 03/15/20a | | | 10,530 | | | | 10,486,448 | |
3.55%, 03/01/22 (Call 12/01/21) | | | 23,683 | | | | 23,066,489 | |
3.88%, 03/15/23 (Call 12/15/22)a | | | 22,517 | | | | 22,191,060 | |
5.45%, 03/15/43 (Call 09/15/42)a | | | 15,145 | | | | 15,582,793 | |
Goldcorp Inc. | | | | | | | | |
3.70%, 03/15/23 (Call 12/15/22)a | | | 1,000 | | | | 965,845 | |
Newmont Mining Corp. | | | | | | | | |
3.50%, 03/15/22 (Call 12/15/21)a | | | 14,862 | | | | 13,806,140 | |
| | | | | | | | |
| Security | |
Principal
(000s) | | | Value | |
| | | | | | | | |
4.88%, 03/15/42 (Call 09/15/41)a | | $ | 22,216 | | | $ | 18,828,535 | |
5.13%, 10/01/19a | | | 5,319 | | | | 5,780,264 | |
6.25%, 10/01/39 | | | 4,184 | | | | 4,090,452 | |
Rio Tinto Alcan Inc. | | | | | | | | |
6.13%, 12/15/33a | | | 250 | | | | 302,863 | |
Rio Tinto Finance USA Ltd. | | | | | | | | |
3.50%, 11/02/20a | | | 152 | | | | 157,539 | |
3.75%, 09/20/21 | | | 18,980 | | | | 19,763,762 | |
4.13%, 05/20/21 | | | 7,955 | | | | 8,449,921 | |
5.20%, 11/02/40 | | | 15,470 | | | | 16,848,833 | |
6.50%, 07/15/18 | | | 15,419 | | | | 17,860,619 | |
7.13%, 07/15/28 | | | 3,400 | | | | 4,394,088 | |
9.00%, 05/01/19 | | | 14,239 | | | | 18,405,729 | |
Rio Tinto Finance USA PLC | | | | | | | | |
2.25%, 12/14/18 (Call 11/14/18) | | | 15,714 | | | | 15,799,882 | |
2.88%, 08/21/22 (Call 05/21/22)a | | | 17,056 | | | | 16,590,011 | |
3.50%, 03/22/22 (Call 12/22/21) | | | 12,321 | | | | 12,563,920 | |
4.13%, 08/21/42 (Call 02/21/42)a | | | 15,121 | | | | 14,137,476 | |
Teck Resources Ltd. | | | | | | | | |
3.75%, 02/01/23 (Call 11/01/22)a | | | 9,180 | | | | 8,633,697 | |
6.25%, 07/15/41 (Call 01/15/41) | | | 12,075 | | | | 12,195,257 | |
| | | | | | | | |
| | | | | | | 472,159,279 | |
OFFICE & BUSINESS EQUIPMENT — 0.12% | |
Xerox Corp. | | | | | | | | |
4.50%, 05/15/21a | | | 14,166 | | | | 15,079,288 | |
6.35%, 05/15/18a | | | 6,622 | | | | 7,555,033 | |
| | | | | | | | |
| | | | | | | 22,634,321 | |
OIL & GAS — 8.70% | |
Anadarko Finance Co. | | | | | | | | |
7.50%, 05/01/31 | | | 5,000 | | | | 6,712,333 | |
Anadarko Petroleum Corp. | | | | | | | | |
6.20%, 03/15/40 | | | 10,620 | | | | 12,822,480 | |
6.45%, 09/15/36 | | | 23,542 | | | | 29,124,255 | |
Apache Corp. | | | | | | | | |
3.25%, 04/15/22 (Call 01/15/22)a | | | 7,083 | | | | 7,150,342 | |
| | |
| 80 | | 2014 iSHARES ANNUAL REPORTTO SHAREHOLDERS |
Schedule of Investments (Unaudited) (Continued)
iSHARES® iBOXX $ INVESTMENT GRADE CORPORATE BOND ETF
October 31, 2014
| | | | | | | | |
| Security | |
Principal
(000s) | | | Value | |
| | | | | | | | |
4.25%, 01/15/44 (Call 07/15/43) | | $ | 1,970 | | | $ | 1,835,200 | |
4.75%, 04/15/43 (Call 10/15/42)a | | | 24,510 | | | | 24,425,073 | |
5.10%, 09/01/40 (Call 03/01/40) | | | 10,585 | | | | 10,996,204 | |
6.00%, 01/15/37 | | | 12,085 | | | | 14,105,998 | |
BP Capital Markets PLC | | | | | | | | |
1.38%, 11/06/17a | | | 10,150 | | | | 10,100,340 | |
1.38%, 05/10/18a | | | 10,809 | | | | 10,641,456 | |
2.24%, 09/26/18 | | | 6,201 | | | | 6,252,840 | |
2.24%, 05/10/19a | | | 7,835 | | | | 7,822,979 | |
2.50%, 11/06/22 | | | 5,000 | | | | 4,742,263 | |
2.75%, 05/10/23 | | | 14,985 | | | | 14,360,574 | |
3.25%, 05/06/22a | | | 22,410 | | | | 22,445,952 | |
3.56%, 11/01/21 | | | 14,629 | | | | 15,083,903 | |
3.81%, 02/10/24a | | | 15,759 | | | | 16,118,545 | |
3.99%, 09/26/23a | | | 2,940 | | | | 3,066,831 | |
4.50%, 10/01/20 | | | 16,186 | | | | 17,651,581 | |
4.74%, 03/11/21a | | | 14,545 | | | | 16,044,069 | |
4.75%, 03/10/19a | | | 8,587 | | | | 9,461,643 | |
Canadian Natural Resources Ltd. | | | | | | | | |
6.25%, 03/15/38 | | | 14,779 | | | | 17,764,204 | |
Cenovus Energy Inc. | | | | | | | | |
4.45%, 09/15/42 (Call 03/15/42) | | | 11,907 | | | | 11,477,359 | |
5.70%, 10/15/19 | | | 4,742 | | | | 5,404,523 | |
6.75%, 11/15/39a | | | 13,485 | | | | 17,085,080 | |
Chevron Corp. | | | | | | | | |
1.10%, 12/05/17 (Call 11/05/17) | | | 25,301 | | | | 25,183,808 | |
1.72%, 06/24/18 (Call 05/24/18) | | | 6,484 | | | | 6,525,230 | |
2.36%, 12/05/22 (Call 09/05/22) | | | 24,958 | | | | 24,141,756 | |
2.43%, 06/24/20 (Call 05/24/20) | | | 7,859 | | | | 7,963,525 | |
3.19%, 06/24/23 (Call 03/24/23) | | | 20,485 | | | | 20,965,375 | |
4.95%, 03/03/19 | | | 18,069 | | | | 20,302,612 | |
ConocoPhillips | | | | | | | | |
5.75%, 02/01/19 | | | 18,858 | | | | 21,659,695 | |
| | | | | | | | |
| Security | |
Principal
(000s) | | | Value | |
| | | | | | | | |
6.00%, 01/15/20 | | $ | 10,988 | | | $ | 12,926,839 | |
6.50%, 02/01/39 | | | 37,727 | | | | 50,048,548 | |
ConocoPhillips Co. | | | | | | | | |
1.05%, 12/15/17 (Call 11/15/17) | | | 6,690 | | | | 6,613,888 | |
2.40%, 12/15/22 (Call 09/15/22)a | | | 18,500 | | | | 17,864,488 | |
ConocoPhillips Holding Co. | | | | | | | | |
6.95%, 04/15/29 | | | 5,263 | | | | 7,130,102 | |
Continental Resources Inc./OK | | | | | | | | |
3.80%, 06/01/24 (Call 03/01/24)a | | | 8,350 | | | | 8,258,767 | |
4.50%, 04/15/23 (Call 01/15/23)a | | | 15,000 | | | | 15,687,178 | |
5.00%, 09/15/22 (Call 03/15/17)a | | | 20,339 | | | | 21,566,019 | |
Devon Energy Corp. | | | | | | | | |
2.25%, 12/15/18 (Call 11/15/18) | | | 6,150 | | | | 6,156,255 | |
3.25%, 05/15/22 (Call 02/15/22)a | | | 10,856 | | | | 10,806,503 | |
4.75%, 05/15/42 (Call 11/15/41)a | | | 12,658 | | | | 12,898,189 | |
5.60%, 07/15/41 (Call 01/15/41) | | | 10,323 | | | | 11,715,522 | |
7.95%, 04/15/32 | | | 9,310 | | | | 13,112,151 | |
Devon Financing Corp. LLC | | | | | | | | |
7.88%, 09/30/31a | | | 9,460 | | | | 13,230,794 | |
Encana Corp. | | | | | | | | |
6.50%, 08/15/34 | | | 13,085 | | | | 16,082,729 | |
6.50%, 02/01/38 | | | 4,400 | | | | 5,432,656 | |
Ensco PLC | | | | | | | | |
4.70%, 03/15/21 | | | 13,425 | | | | 14,135,965 | |
EOG Resources Inc. | | | | | | | | |
2.63%, 03/15/23 (Call 12/15/22) | | | 16,325 | | | | 15,743,138 | |
4.10%, 02/01/21 | | | 5,821 | | | | 6,290,556 | |
5.63%, 06/01/19 | | | 6,669 | | | | 7,635,936 | |
Exxon Mobil Corp. | | | | | | | | |
1.82%, 03/15/19 (Call 02/15/19)a | | | 15,395 | | | | 15,448,074 | |
3.18%, 03/15/24 (Call 12/15/23)a | | | 10,000 | | | | 10,320,708 | |
| | | | |
SCHEDULESOF INVESTMENTS | | | 81 | |
Schedule of Investments (Unaudited) (Continued)
iSHARES® iBOXX $ INVESTMENT GRADE CORPORATE BOND ETF
October 31, 2014
| | | | | | | | |
| Security | |
Principal
(000s) | | | Value | |
| | | | | | | | |
Freeport-McMoran Oil & Gas LLC/FCX Oil & Gas Inc. | | | | | | | | |
6.50%, 11/15/20 (Call 11/15/15)a | | $ | 6,029 | | | $ | 6,593,517 | |
6.88%, 02/15/23 (Call 02/15/18) | | | 14,523 | | | | 16,435,361 | |
Hess Corp. | | | | | | | | |
5.60%, 02/15/41a | | | 8,268 | | | | 9,378,400 | |
6.00%, 01/15/40 | | | 8,965 | | | | 10,545,596 | |
7.30%, 08/15/31 | | | 10,318 | | | | 13,584,709 | |
8.13%, 02/15/19 | | | 10,322 | | | | 12,651,770 | |
Husky Energy Inc. | | | | | | | | |
4.00%, 04/15/24 (Call 01/15/24)a | | | 12,000 | | | | 12,312,596 | |
Marathon Oil Corp. | | | | | | | | |
2.80%, 11/01/22 (Call 08/01/22) | | | 4,275 | | | | 4,148,953 | |
5.90%, 03/15/18 | | | 9,530 | | | | 10,760,740 | |
6.60%, 10/01/37 | | | 8,450 | | | | 10,603,339 | |
Marathon Petroleum Corp. | | | | | | | | |
3.63%, 09/15/24 (Call 06/15/24) | | | 7,220 | | | | 7,178,515 | |
4.75%, 09/15/44 (Call 03/15/44) | | | 7,285 | | | | 7,256,459 | |
5.13%, 03/01/21 | | | 13,685 | | | | 15,286,584 | |
6.50%, 03/01/41 (Call 09/01/40) | | | 11,566 | | | | 14,029,005 | |
Nabors Industries Inc. | | | | | | | | |
6.15%, 02/15/18 | | | 12,045 | | | | 13,510,739 | |
Nexen Energy ULC | | | | | | | | |
5.88%, 03/10/35 | | | 4,798 | | | | 5,559,344 | |
6.40%, 05/15/37a | | | 13,638 | | | | 16,953,806 | |
Noble Energy Inc. | | | | | | | | |
4.15%, 12/15/21 (Call 09/15/21)a | | | 9,010 | | | | 9,589,033 | |
5.25%, 11/15/43 (Call 05/15/43) | | | 9,765 | | | | 10,432,795 | |
6.00%, 03/01/41 (Call 09/01/40) | | | 6,965 | | | | 8,101,797 | |
8.25%, 03/01/19 | | | 10,502 | | | | 12,948,957 | |
Occidental Petroleum Corp. | | | | | | | | |
2.70%, 02/15/23 (Call 11/15/22) | | | 9,556 | | | | 9,225,994 | |
| | | | | | | | |
| Security | |
Principal
(000s) | | | Value | |
| | | | | | | | |
3.13%, 02/15/22 (Call 11/15/21) | | $ | 6,096 | | | $ | 6,123,700 | |
Series 1 | | | | | | | | |
4.10%, 02/01/21 (Call 11/01/20) | | | 16,170 | | | | 17,407,626 | |
Petro-Canada | | | | | | | | |
6.80%, 05/15/38 | | | 10,385 | | | | 13,886,866 | |
Phillips 66 | | | | | | | | |
4.30%, 04/01/22a | | | 13,844 | | | | 14,762,095 | |
5.88%, 05/01/42 | | | 17,240 | | | | 20,490,412 | |
Pride International Inc. | | | | | | | | |
6.88%, 08/15/20 | | | 9,430 | | | | 11,014,579 | |
Shell International Finance BV | | | | | | | | |
1.90%, 08/10/18 | | | 18,710 | | | | 18,886,041 | |
2.00%, 11/15/18a | | | 21,150 | | | | 21,398,115 | |
2.25%, 01/06/23a | | | 10,989 | | | | 10,423,370 | |
2.38%, 08/21/22 | | | 5,763 | | | | 5,569,273 | |
3.40%, 08/12/23a | | | 18,708 | | | | 19,172,037 | |
4.30%, 09/22/19 | | | 23,271 | | | | 25,624,801 | |
4.38%, 03/25/20 | | | 5,375 | | | | 5,944,623 | |
4.55%, 08/12/43a | | | 19,201 | | | | 20,673,137 | |
5.50%, 03/25/40 | | | 16,800 | | | | 20,249,809 | |
6.38%, 12/15/38 | | | 13,195 | | | | 17,497,061 | |
Statoil ASA | | | | | | | | |
2.45%, 01/17/23 | | | 15,503 | | | | 14,897,702 | |
2.65%, 01/15/24 | | | 14,504 | | | | 13,936,005 | |
2.90%, 11/08/20a | | | 6,377 | | | | 6,530,711 | |
3.15%, 01/23/22 | | | 5,892 | | | | 6,019,106 | |
3.70%, 03/01/24a | | | 7,600 | | | | 7,865,813 | |
3.95%, 05/15/43 | | | 11,957 | | | | 11,506,476 | |
4.80%, 11/08/43a | | | 6,361 | | | | 7,024,457 | |
5.10%, 08/17/40 | | | 5,755 | | | | 6,522,617 | |
5.25%, 04/15/19 | | | 13,348 | | | | 15,136,038 | |
Series FXD | | | | | | | | |
1.95%, 11/08/18 | | | 11,905 | | | | 11,959,411 | |
Suncor Energy Inc. | | | | | | | | |
6.10%, 06/01/18 | | | 8,125 | | | | 9,306,673 | |
6.50%, 06/15/38a | | | 6,603 | | | | 8,629,038 | |
6.85%, 06/01/39a | | | 14,320 | | | | 19,439,304 | |
Total Capital Canada Ltd. | | | | | | | | |
1.45%, 01/15/18 | | | 2,203 | | | | 2,196,299 | |
2.75%, 07/15/23 | | | 11,487 | | | | 11,133,591 | |
Total Capital International SA | | | | | | | | |
2.13%, 01/10/19a | | | 7,000 | | | | 7,047,188 | |
| | |
| 82 | | 2014 iSHARES ANNUAL REPORTTO SHAREHOLDERS |
Schedule of Investments (Unaudited) (Continued)
iSHARES® iBOXX $ INVESTMENT GRADE CORPORATE BOND ETF
October 31, 2014
| | | | | | | | |
| Security | |
Principal
(000s) | | | Value | |
| | | | | | | | |
2.70%, 01/25/23 | | $ | 13,459 | | | $ | 13,041,670 | |
2.88%, 02/17/22a | | | 15,762 | | | | 15,742,717 | |
3.70%, 01/15/24 | | | 12,250 | | | | 12,622,391 | |
3.75%, 04/10/24a | | | 12,206 | | | | 12,751,021 | |
Total Capital SA | | | | | | | | |
2.13%, 08/10/18 | | | 14,337 | | | | 14,510,419 | |
4.45%, 06/24/20 | | | 16,406 | | | | 18,220,256 | |
Transocean Inc. | | | | | | | | |
2.50%, 10/15/17 | | | 2,861 | | | | 2,818,128 | |
3.80%, 10/15/22 (Call 07/15/22)a | | | 4,650 | | | | 4,194,072 | |
6.00%, 03/15/18a | | | 16,003 | | | | 17,065,625 | |
6.38%, 12/15/21a | | | 7,840 | | | | 8,199,774 | |
6.50%, 11/15/20a | | | 11,882 | | | | 12,229,987 | |
6.80%, 03/15/38a | | | 14,772 | | | | 13,864,952 | |
Valero Energy Corp. | | | | | | | | |
6.13%, 02/01/20a | | | 10,324 | | | | 11,959,815 | |
6.63%, 06/15/37a | | | 15,673 | | | | 19,132,667 | |
7.50%, 04/15/32 | | | 8,281 | | | | 10,770,225 | |
9.38%, 03/15/19a | | | 2,279 | | | | 2,907,720 | |
| | | | | | | | |
| | | | | | | 1,573,936,455 | |
OIL & GAS SERVICES — 0.87% | |
Baker Hughes Inc. | | | | | | | | |
3.20%, 08/15/21 (Call 05/15/21) | | | 1,950 | | | | 2,004,641 | |
5.13%, 09/15/40 | | | 16,432 | | | | 18,349,079 | |
7.50%, 11/15/18 | | | 9,716 | | | | 11,732,619 | |
Halliburton Co. | | | | | | | | |
3.50%, 08/01/23 (Call 05/01/23) | | | 9,550 | | | | 9,806,902 | |
4.75%, 08/01/43 (Call 02/01/43) | | | 6,150 | | | | 6,565,247 | |
6.15%, 09/15/19 | | | 11,036 | | | | 12,938,611 | |
6.70%, 09/15/38 | | | 7,395 | | | | 9,781,380 | |
7.45%, 09/15/39 | | | 10,660 | | | | 15,250,991 | |
National Oilwell Varco Inc. | | | | | | | | |
2.60%, 12/01/22 (Call 09/01/22) | | | 14,103 | | | | 13,501,747 | |
3.95%, 12/01/42 (Call 06/01/42) | | | 11,084 | | | | 10,437,139 | |
Schlumberger Investment SA | | | | | | | | |
3.65%, 12/01/23 (Call 09/01/23)a | | | 14,695 | | | | 15,315,700 | |
| | | | | | | | |
| Security | |
Principal
(000s) | | | Value | |
| | | | | | | | |
Weatherford International Ltd./Bermuda | | | | | | | | |
4.50%, 04/15/22 (Call 01/15/22)a | | $ | 6,895 | | | $ | 7,087,465 | |
5.13%, 09/15/20 | | | 8,670 | | | | 9,481,044 | |
9.63%, 03/01/19 | | | 11,620 | | | | 14,797,812 | |
| | | | | | | | |
| | | | | | | 157,050,377 | |
PHARMACEUTICALS — 4.90% | |
Abbott Laboratories | | | | | | | | |
5.13%, 04/01/19 | | | 10,808 | | | | 12,183,722 | |
AbbVie Inc. | | | | | | | | |
1.75%, 11/06/17a | | | 37,566 | | | | 37,691,666 | |
2.00%, 11/06/18a | | | 13,386 | | | | 13,325,311 | |
2.90%, 11/06/22 | | | 34,164 | | | | 33,366,848 | |
4.40%, 11/06/42 | | | 22,837 | | | | 22,703,337 | |
Actavis Funding SCS | | | | | | | | |
3.85%, 06/15/24 (Call 03/15/24)c | | | 10,000 | | | | 9,758,004 | |
4.85%, 06/15/44 (Call 12/15/43)a,c | | | 15,085 | | | | 14,211,499 | |
Actavis Inc. | | | | | | | | |
3.25%, 10/01/22 (Call 07/01/22)a | | | 24,473 | | | | 23,516,776 | |
4.63%, 10/01/42 (Call 04/01/42) | | | 16,219 | | | | 14,916,193 | |
AstraZeneca PLC | | | | | | | | |
1.95%, 09/18/19 | | | 4,588 | | | | 4,573,854 | |
4.00%, 09/18/42 | | | 9,950 | | | | 9,546,387 | |
6.45%, 09/15/37a | | | 26,691 | | | | 35,049,308 | |
Bristol-Myers Squibb Co. | | | | | | | | |
2.00%, 08/01/22 | | | 8,184 | | | | 7,615,166 | |
Eli Lilly & Co. | | | | | | | | |
5.55%, 03/15/37 | | | 5,239 | | | | 6,298,064 | |
Express Scripts Holding Co. | | | | | | | | |
2.25%, 06/15/19 | | | 10,264 | | | | 10,216,171 | |
3.50%, 06/15/24 (Call 03/15/24) | | | 9,137 | | | | 9,078,516 | |
3.90%, 02/15/22 | | | 11,200 | | | | 11,655,813 | |
4.75%, 11/15/21 | | | 8,435 | | | | 9,252,451 | |
Forest Laboratories Inc. | | | | | | | | |
4.38%, 02/01/19c | | | 3,500 | | | | 3,663,395 | |
4.88%, 02/15/21c | | | 10,250 | | | | 10,865,028 | |
| | | | |
SCHEDULESOF INVESTMENTS | | | 83 | |
Schedule of Investments (Unaudited) (Continued)
iSHARES® iBOXX $ INVESTMENT GRADE CORPORATE BOND ETF
October 31, 2014
| | | | | | | | |
| Security | |
Principal
(000s) | | | Value | |
| | | | | | | | |
GlaxoSmithKline Capital Inc. | | | | | | | | |
2.80%, 03/18/23a | | $ | 14,835 | | | $ | 14,537,828 | |
5.65%, 05/15/18 | | | 27,919 | | | | 31,621,068 | |
6.38%, 05/15/38a | | | 23,131 | | | | 30,331,796 | |
GlaxoSmithKline Capital PLC | | | | | | | | |
2.85%, 05/08/22 | | | 21,119 | | | | 21,019,409 | |
Johnson & Johnson | | | | | | | | |
5.15%, 07/15/18 | | | 12,957 | | | | 14,608,350 | |
5.95%, 08/15/37 | | | 8,430 | | | | 11,181,866 | |
McKesson Corp. | | | | | | | | |
2.28%, 03/15/19 | | | 11,562 | | | | 11,536,476 | |
3.80%, 03/15/24 (Call 12/15/23) | | | 11,981 | | | | 12,242,868 | |
4.88%, 03/15/44 (Call 09/15/43)a | | | 7,604 | | | | 8,140,488 | |
Medco Health Solutions Inc. | | | | | | | | |
7.13%, 03/15/18 | | | 17,907 | | | | 20,872,539 | |
Merck & Co. Inc. | | | | | | | | |
1.10%, 01/31/18a | | | 7,005 | | | | 6,952,725 | |
1.30%, 05/18/18a | | | 13,818 | | | | 13,742,479 | |
2.40%, 09/15/22 (Call 06/15/22) | | | 15,381 | | | | 14,890,015 | |
2.80%, 05/18/23 | | | 4,750 | | | | 4,696,106 | |
3.88%, 01/15/21 (Call 10/15/20) | | | 16,439 | | | | 17,654,636 | |
4.15%, 05/18/43a | | | 7,750 | | | | 8,091,859 | |
6.50%, 12/01/33 | | | 5,672 | | | | 7,795,254 | |
6.55%, 09/15/37 | | | 13,060 | | | | 18,163,100 | |
Merck Sharp & Dohme Corp. | | | | | | | | |
5.00%, 06/30/19 | | | 13,330 | | | | 14,998,816 | |
Novartis Capital Corp. | | | | | | | | |
2.40%, 09/21/22 | | | 20,644 | | | | 20,185,939 | |
3.40%, 05/06/24 | | | 22,275 | | | | 22,907,768 | |
4.40%, 04/24/20 | | | 2,182 | | | | 2,423,691 | |
4.40%, 05/06/44 | | | 20,123 | | | | 21,683,078 | |
Novartis Securities Investment Ltd. | | | | | | | | |
5.13%, 02/10/19 | | | 20,973 | | | | 23,611,005 | |
Pfizer Inc. | | | | | | | | |
1.50%, 06/15/18a | | | 13,895 | | | | 13,859,757 | |
2.10%, 05/15/19 | | | 9,119 | | | | 9,175,201 | |
3.00%, 06/15/23a | | | 18,860 | | | | 18,791,010 | |
3.40%, 05/15/24a | | | 7,500 | | | | 7,612,888 | |
| | | | | | | | |
| Security | |
Principal
(000s) | | | Value | |
| | | | | | | | |
4.30%, 06/15/43 | | $ | 6,891 | | | $ | 7,048,931 | |
4.40%, 05/15/44a | | | 3,460 | | | | 3,553,510 | |
6.20%, 03/15/19 | | | 21,428 | | | | 25,037,699 | |
7.20%, 03/15/39 | | | 23,346 | | | | 33,142,946 | |
Sanofi | | | | | | | | |
1.25%, 04/10/18a | | | 12,190 | | | | 12,055,906 | |
4.00%, 03/29/21 | | | 24,001 | | | | 25,877,074 | |
Wyeth LLC | | | | | | | | |
5.95%, 04/01/37 | | | 18,822 | | | | 23,234,810 | |
6.50%, 02/01/34 | | | 5,319 | | | | 6,976,427 | |
Zoetis Inc. | | | | | | | | |
1.88%, 02/01/18 | | | 3,200 | | | | 3,176,722 | |
3.25%, 02/01/23 (Call 11/01/22) | | | 16,960 | | | | 16,819,293 | |
4.70%, 02/01/43 (Call 08/01/42)a | | | 7,875 | | | | 8,159,978 | |
| | | | | | | | |
| | | | | | | 887,898,820 | |
PIPELINES — 2.22% | |
Energy Transfer Partners LP | | | | | | | | |
3.60%, 02/01/23 (Call 11/01/22) | | | 9,344 | | | | 9,159,760 | |
4.65%, 06/01/21 (Call 03/01/21) | | | 7,763 | | | | 8,277,694 | |
5.20%, 02/01/22 (Call 11/01/21)a | | | 6,550 | | | | 7,177,806 | |
6.50%, 02/01/42 (Call 08/01/41) | | | 9,680 | | | | 11,246,391 | |
Enterprise Products Operating LLC | | | | | | | | |
2.55%, 10/15/19 (Call 09/15/19) | | | 8,000 | | | | 8,020,778 | |
3.35%, 03/15/23 (Call 12/15/22) | | | 11,617 | | | | 11,538,345 | |
3.75%, 02/15/25 (Call 11/15/24) | | | 7,425 | | | | 7,464,235 | |
3.90%, 02/15/24 (Call 11/15/23)a | | | 7,240 | | | | 7,429,608 | |
4.45%, 02/15/43 (Call 08/15/42) | | | 7,405 | | | | 7,165,434 | |
4.85%, 08/15/42 (Call 02/15/42) | | | 6,595 | | | | 6,791,090 | |
4.85%, 03/15/44 (Call 09/15/43) | | | 17,200 | | | | 17,734,905 | |
| | |
| 84 | | 2014 iSHARES ANNUAL REPORTTO SHAREHOLDERS |
Schedule of Investments (Unaudited) (Continued)
iSHARES® iBOXX $ INVESTMENT GRADE CORPORATE BOND ETF
October 31, 2014
| | | | | | | | |
| Security | |
Principal
(000s) | | | Value | |
| | | | | | | | |
5.10%, 02/15/45 (Call 08/15/44) | | $ | 12,820 | | | $ | 13,698,735 | |
5.20%, 09/01/20 | | | 11,308 | | | | 12,707,245 | |
5.95%, 02/01/41 | | | 7,210 | | | | 8,574,844 | |
Kinder Morgan Energy Partners LP | | | | | | | | |
2.65%, 02/01/19a | | | 8,342 | | | | 8,347,175 | |
3.50%, 03/01/21 (Call 01/01/21) | | | 7,451 | | | | 7,440,548 | |
3.95%, 09/01/22 (Call 06/01/22) | | | 11,254 | | | | 11,233,892 | |
5.50%, 03/01/44 (Call 09/01/43) | | | 9,150 | | | | 9,120,798 | |
5.95%, 02/15/18 | | | 10,870 | | | | 12,121,920 | |
6.95%, 01/15/38 | | | 13,269 | | | | 15,446,930 | |
ONEOK Partners LP | | | | | | | | |
3.38%, 10/01/22 (Call 07/01/22) | | | 10,946 | | | | 10,695,749 | |
Plains All American Pipeline LP/PAA Finance Corp. | | | | | | | | |
3.60%, 11/01/24 (Call 08/01/24) | | | 5,000 | | | | 4,969,815 | |
3.65%, 06/01/22 (Call 03/01/22) | | | 7,848 | | | | 8,022,814 | |
Spectra Energy Partners LP | | | | | | | | |
4.75%, 03/15/24 (Call 12/15/23) | | | 10,500 | | | | 11,407,601 | |
TransCanada PipeLines Ltd. | | | | | | | | |
2.50%, 08/01/22 | | | 8,000 | | | | 7,594,272 | |
3.80%, 10/01/20 | | | 9,442 | | | | 9,904,734 | |
4.63%, 03/01/34 (Call 12/01/33) | | | 11,500 | | | | 12,072,738 | |
6.10%, 06/01/40 | | | 8,850 | | | | 10,642,237 | |
6.20%, 10/15/37 | | | 8,375 | | | | 10,125,308 | |
6.50%, 08/15/18 | | | 8,737 | | | | 10,107,065 | |
7.13%, 01/15/19 | | | 8,197 | | | | 9,738,661 | |
7.63%, 01/15/39a | | | 13,010 | | | | 18,132,809 | |
Williams Companies Inc. (The) | | | | | | | | |
3.70%, 01/15/23 (Call 10/15/22) | | | 3,000 | | | | 2,826,305 | |
4.55%, 06/24/24 (Call 03/24/24) | | | 16,520 | | | | 16,230,542 | |
| | | | | | | | |
| Security | |
Principal
(000s) | | | Value | |
| | | | | | | | |
Williams Partners LP | | | | | | | | |
3.35%, 08/15/22 (Call 05/15/22) | | $ | 12,800 | | | $ | 12,558,356 | |
3.90%, 01/15/25 (Call 10/15/24) | | | 5,125 | | | | 5,087,008 | |
4.30%, 03/04/24 (Call 12/04/23) | | | 6,420 | | | | 6,617,500 | |
5.25%, 03/15/20 | | | 16,468 | | | | 18,296,450 | |
6.30%, 04/15/40 | | | 14,708 | | | | 17,059,008 | |
| | | | | | | | |
| | | | | | | 402,787,105 | |
REAL ESTATE INVESTMENT TRUSTS — 1.02% | |
American Tower Corp. | | | | | | | | |
3.40%, 02/15/19a | | | 11,764 | | | | 12,018,040 | |
3.50%, 01/31/23 | | | 7,356 | | | | 7,043,936 | |
4.50%, 01/15/18 | | | 13,376 | | | | 14,276,256 | |
4.70%, 03/15/22 | | | 2,100 | | | | 2,208,802 | |
5.00%, 02/15/24a | | | 7,203 | | | | 7,596,753 | |
Boston Properties LP | | | | | | | | |
3.70%, 11/15/18 (Call 08/15/18) | | | 8,820 | | | | 9,378,855 | |
3.85%, 02/01/23 (Call 11/01/22) | | | 15,583 | | | | 16,060,781 | |
4.13%, 05/15/21 (Call 02/15/21) | | | 4,226 | | | | 4,489,674 | |
ERP Operating LP | | | | | | | | |
4.50%, 07/01/44 (Call 01/01/44) | | | 6,000 | | | | 6,037,652 | |
4.63%, 12/15/21 (Call 09/15/21) | | | 12,685 | | | | 13,995,213 | |
HCP Inc. | | | | | | | | |
2.63%, 02/01/20 (Call 11/01/19) | | | 5,575 | | | | 5,524,686 | |
3.88%, 08/15/24 (Call 05/15/24) | | | 5,000 | | | | 4,994,437 | |
4.25%, 11/15/23 (Call 08/15/23) | | | 8,000 | | | | 8,305,770 | |
5.38%, 02/01/21 (Call 11/03/20) | | | 14,750 | | | | 16,542,447 | |
Simon Property Group LP | | | | | | | | |
3.38%, 10/01/24 | | | 9,725 | | | | 9,788,773 | |
4.38%, 03/01/21 (Call 12/01/20) | | | 10,179 | | | | 11,190,710 | |
| | | | |
SCHEDULESOF INVESTMENTS | | | 85 | |
Schedule of Investments (Unaudited) (Continued)
iSHARES® iBOXX $ INVESTMENT GRADE CORPORATE BOND ETF
October 31, 2014
| | | | | | | | |
| Security | |
Principal
(000s) | | | Value | |
| | | | | | | | |
5.65%, 02/01/20 (Call 11/01/19) | | $ | 15,220 | | | $ | 17,707,383 | |
6.13%, 05/30/18 | | | 7,499 | | | | 8,601,628 | |
Weyerhaeuser Co. | | | | | | | | |
7.38%, 03/15/32 | | | 6,547 | | | | 8,562,802 | |
| | | | | | | | |
| | | | | | | 184,324,598 | |
RETAIL — 4.02% | |
Costco Wholesale Corp. | | | | | | | | |
1.13%, 12/15/17 | | | 9,950 | | | | 9,888,045 | |
1.70%, 12/15/19 | | | 10,038 | | | | 9,826,957 | |
CVS Health Corp. | | | | | | | | |
2.25%, 12/05/18 (Call 11/05/18) | | | 12,600 | | | | 12,706,857 | |
2.25%, 08/12/19 (Call 07/12/19) | | | 5,000 | | | | 4,989,799 | |
4.00%, 12/05/23 (Call 09/05/23) | | | 25,638 | | | | 27,009,446 | |
5.30%, 12/05/43 (Call 06/05/43) | | | 7,000 | | | | 8,029,392 | |
6.13%, 09/15/39a | | | 5,345 | | | | 6,722,160 | |
Home Depot Inc. (The) | | | | | | | | |
2.00%, 06/15/19 (Call 05/15/19) | | | 10,000 | | | | 9,998,160 | |
2.25%, 09/10/18 (Call 08/10/18) | | | 12,301 | | | | 12,528,668 | |
2.70%, 04/01/23 (Call 01/01/23) | | | 7,313 | | | | 7,196,558 | |
3.75%, 02/15/24 (Call 11/15/23)a | | | 12,104 | | | | 12,824,293 | |
4.20%, 04/01/43 (Call 10/01/42) | | | 5,545 | | | | 5,664,313 | |
4.40%, 04/01/21 (Call 01/01/21) | | | 13,522 | | | | 15,042,736 | |
4.40%, 03/15/45 (Call 09/15/44)a | | | 9,765 | | | | 10,265,777 | |
4.88%, 02/15/44 (Call 08/15/43) | | | 7,050 | | | | 7,929,782 | |
5.88%, 12/16/36 | | | 30,722 | | | | 38,601,855 | |
5.95%, 04/01/41 (Call 10/01/40) | | | 15,090 | | | | 19,185,194 | |
Lowe’s Companies Inc. | | | | | | | | |
3.12%, 04/15/22 (Call 01/15/22) | | | 14,555 | | | | 14,933,950 | |
| | | | | | | | |
| Security | |
Principal
(000s) | | | Value | |
| | | | | | | | |
4.65%, 04/15/42 (Call 10/15/41) | | $ | 8,555 | | | $ | 9,222,239 | |
Macy’s Retail Holdings Inc. | | | | | | | | |
2.88%, 02/15/23 (Call 11/15/22) | | | 6,630 | | | | 6,383,131 | |
McDonald’s Corp. | | | | | | | | |
2.63%, 01/15/22 | | | 16,833 | | | | 16,714,646 | |
5.35%, 03/01/18 | | | 4,148 | | | | 4,645,553 | |
6.30%, 10/15/37 | | | 9,701 | | | | 12,554,617 | |
6.30%, 03/01/38 | | | 5,628 | | | | 7,303,253 | |
Target Corp. | | | | | | | | |
2.30%, 06/26/19a | | | 12,509 | | | | 12,597,130 | |
2.90%, 01/15/22 | | | 12,587 | | | | 12,632,250 | |
3.50%, 07/01/24 | | | 6,500 | | | | 6,592,373 | |
3.88%, 07/15/20 | | | 6,671 | | | | 7,186,703 | |
4.00%, 07/01/42a | | | 17,550 | | | | 16,970,885 | |
6.00%, 01/15/18 | | | 10,918 | | | | 12,420,045 | |
6.50%, 10/15/37a | | | 14,364 | | | | 18,846,058 | |
7.00%, 01/15/38 | | | 2,930 | | | | 4,030,113 | |
Wal-Mart Stores Inc. | | | | | | | | |
1.13%, 04/11/18 | | | 16,468 | | | | 16,245,369 | |
1.95%, 12/15/18 | | | 5,217 | | | | 5,250,500 | |
2.55%, 04/11/23 (Call 01/11/23)a | | | 19,875 | | | | 19,348,867 | |
3.25%, 10/25/20 | | | 6,683 | | | | 7,011,556 | |
3.30%, 04/22/24 (Call 01/22/24)a | | | 19,110 | | | | 19,593,812 | |
3.63%, 07/08/20 | | | 22,029 | | | | 23,619,507 | |
4.00%, 04/11/43 (Call 10/11/42) | | | 5,000 | | | | 5,003,417 | |
4.25%, 04/15/21 | | | 19,162 | | | | 21,115,577 | |
4.30%, 04/22/44 (Call 10/22/43)a | | | 16,010 | | | | 16,706,326 | |
4.75%, 10/02/43 (Call 04/02/43)a | | | 13,749 | | | | 15,360,974 | |
4.88%, 07/08/40 | | | 7,434 | | | | 8,306,463 | |
5.00%, 10/25/40 | | | 14,036 | | | | 16,007,359 | |
5.25%, 09/01/35 | | | 22,592 | | | | 26,445,364 | |
5.63%, 04/01/40 | | | 19,669 | | | | 24,224,036 | |
5.63%, 04/15/41a | | | 21,955 | | | | 27,298,957 | |
5.80%, 02/15/18 | | | 4,241 | | | | 4,822,733 | |
5.88%, 04/05/27 | | | 2,329 | | | | 2,954,994 | |
6.20%, 04/15/38 | | | 7,441 | | | | 9,762,895 | |
| | |
| 86 | | 2014 iSHARES ANNUAL REPORTTO SHAREHOLDERS |
Schedule of Investments (Unaudited) (Continued)
iSHARES® iBOXX $ INVESTMENT GRADE CORPORATE BOND ETF
October 31, 2014
| | | | | | | | |
| Security | |
Principal
(000s) | | | Value | |
| | | | | | | | |
6.50%, 08/15/37a | | $ | 33,908 | | | $ | 45,928,111 | |
7.55%, 02/15/30 | | | 5,119 | | | | 7,336,338 | |
Walgreen Co. | | | | | | | | |
3.10%, 09/15/22a | | | 13,684 | | | | 13,423,648 | |
5.25%, 01/15/19 | | | 9,388 | | | | 10,438,515 | |
| | | | | | | | |
| | | | | | | 727,648,256 | |
SEMICONDUCTORS — 0.59% | |
Intel Corp. | | | | | | | | |
1.35%, 12/15/17 | | | 35,530 | | | | 35,435,213 | |
2.70%, 12/15/22 | | | 5,039 | | | | 4,945,978 | |
3.30%, 10/01/21 | | | 19,317 | | | | 20,138,905 | |
4.00%, 12/15/32 | | | 6,304 | | | | 6,322,394 | |
4.25%, 12/15/42 | | | 6,525 | | | | 6,468,286 | |
4.80%, 10/01/41 | | | 26,344 | | | | 28,366,258 | |
Texas Instruments Inc. | | | | | | | | |
1.65%, 08/03/19 | | | 5,167 | | | | 5,051,643 | |
| | | | | | | | |
| | | | | | | 106,728,677 | |
SOFTWARE — 1.96% | |
Microsoft Corp. | | | | | | | | |
1.63%, 12/06/18 | | | 6,950 | | | | 6,931,633 | |
2.13%, 11/15/22 | | | 6,837 | | | | 6,590,445 | |
2.38%, 05/01/23 (Call 02/01/23)a | | | 11,319 | | | | 10,976,311 | |
3.00%, 10/01/20a | | | 7,507 | | | | 7,833,179 | |
3.50%, 11/15/42 | | | 9,634 | | | | 8,806,361 | |
3.63%, 12/15/23 (Call 09/15/23)a | | | 12,900 | | | | 13,692,059 | |
4.20%, 06/01/19 | | | 18,783 | | | | 20,686,321 | |
4.50%, 10/01/40 | | | 9,600 | | | | 10,255,933 | |
5.20%, 06/01/39 | | | 5,069 | | | | 5,925,597 | |
5.30%, 02/08/41 | | | 9,457 | | | | 11,227,238 | |
Oracle Corp. | | | | | | | | |
2.25%, 10/08/19a | | | 22,323 | | | | 22,391,962 | |
2.38%, 01/15/19a | | | 21,798 | | | | 22,137,829 | |
2.50%, 10/15/22 | | | 10,143 | | | | 9,794,255 | |
2.80%, 07/08/21a | | | 14,852 | | | | 14,948,545 | |
3.40%, 07/08/24 (Call 04/08/24)a | | | 22,066 | | | | 22,297,916 | |
3.63%, 07/15/23 | | | 8,175 | | | | 8,473,299 | |
3.88%, 07/15/20a | | | 3,874 | | | | 4,165,700 | |
4.30%, 07/08/34 (Call 01/08/34) | | | 20,260 | | | | 20,901,197 | |
| | | | | | | | |
| Security | |
Principal
(000s) | | | Value | |
| | | | | | | | |
4.50%, 07/08/44 (Call 01/08/44)a | | $ | 13,752 | | | $ | 14,222,803 | |
5.00%, 07/08/19 | | | 21,966 | | | | 24,702,595 | |
5.38%, 07/15/40 | | | 27,060 | | | | 31,236,608 | |
5.75%, 04/15/18 | | | 28,410 | | | | 32,223,491 | |
6.13%, 07/08/39 | | | 15,810 | | | | 19,865,162 | |
6.50%, 04/15/38 | | | 3,289 | | | | 4,303,805 | |
| | | | | | | | |
| | | | | | | 354,590,244 | |
TELECOMMUNICATIONS — 8.46% | |
AT&T Corp. | | | | | | | | |
8.00%, 11/15/31 | | | 9,926 | | | | 14,463,441 | |
AT&T Inc. | | | | | | | | |
1.40%, 12/01/17a | | | 9,885 | | | | 9,840,859 | |
2.30%, 03/11/19a | | | 3,000 | | | | 3,018,827 | |
2.38%, 11/27/18a | | | 18,290 | | | | 18,497,065 | |
2.63%, 12/01/22 (Call 09/01/22)a | | | 19,427 | | | | 18,500,198 | |
3.00%, 02/15/22a | | | 21,990 | | | | 21,738,448 | |
3.88%, 08/15/21 | | | 19,764 | | | | 20,727,876 | |
3.90%, 03/11/24 (Call 12/11/23)a | | | 8,550 | | | | 8,779,641 | |
4.30%, 12/15/42 (Call 06/15/42) | | | 3,000 | | | | 2,809,687 | |
4.35%, 06/15/45 (Call 12/15/44) | | | 27,489 | | | | 25,817,911 | |
4.45%, 05/15/21 | | | 12,350 | | | | 13,433,120 | |
4.80%, 06/15/44 (Call 12/15/43) | | | 23,525 | | | | 23,775,758 | |
5.35%, 09/01/40 | | | 46,990 | | | | 50,413,818 | |
5.50%, 02/01/18 | | | 27,169 | | | | 30,372,934 | |
5.55%, 08/15/41 | | | 27,123 | | | | 29,897,257 | |
5.60%, 05/15/18 | | | 10,356 | | | | 11,672,140 | |
5.80%, 02/15/19 | | | 20,571 | | | | 23,547,371 | |
6.30%, 01/15/38a | | | 18,040 | | | | 21,704,792 | |
6.50%, 09/01/37a | | | 11,420 | | | | 14,108,758 | |
6.55%, 02/15/39a | | | 12,300 | | | | 15,328,184 | |
British Telecommunications PLC | | | | | | | | |
2.35%, 02/14/19 | | | 15,850 | | | | 15,908,507 | |
5.95%, 01/15/18 | | | 13,439 | | | | 15,154,386 | |
9.63%, 12/15/30a | | | 20,923 | | | | 33,097,525 | |
CC Holdings GS V LLC/Crown Castle GS III Corp. | | | | | | | | |
3.85%, 04/15/23 | | | 1,527 | | | | 1,518,938 | |
| | | | |
SCHEDULESOF INVESTMENTS | | | 87 | |
Schedule of Investments (Unaudited) (Continued)
iSHARES® iBOXX $ INVESTMENT GRADE CORPORATE BOND ETF
October 31, 2014
| | | | | | | | |
| Security | |
Principal
(000s) | | | Value | |
| | | | | | | | |
Cisco Systems Inc. | | | | | | | | |
2.13%, 03/01/19 | | $ | 6,285 | | | $ | 6,307,516 | |
3.63%, 03/04/24 | | | 8,500 | | | | 8,804,696 | |
4.45%, 01/15/20a | | | 38,507 | | | | 42,472,632 | |
4.95%, 02/15/19 | | | 17,713 | | | | 19,781,951 | |
5.50%, 01/15/40a | | | 24,483 | | | | 28,844,382 | |
5.90%, 02/15/39 | | | 17,280 | | | | 21,290,812 | |
Deutsche Telekom International Finance BV | | | | | | | | |
6.00%, 07/08/19a | | | 7,461 | | | | 8,692,680 | |
6.75%, 08/20/18 | | | 7,082 | | | | 8,277,971 | |
8.75%, 06/15/30 | | | 36,644 | | | | 53,459,008 | |
GTE Corp. | | | | | | | | |
6.94%, 04/15/28 | | | 200 | | | | 246,801 | |
New Cingular Wireless Services Inc. | | | | | | | | |
8.75%, 03/01/31 | | | 8,268 | | | | 12,689,121 | |
Orange SA | | | | | | | | |
2.75%, 02/06/19 | | | 9,785 | | | | 9,954,482 | |
4.13%, 09/14/21a | | | 11,316 | | | | 12,007,366 | |
5.38%, 07/08/19 | | | 3,370 | | | | 3,806,591 | |
5.38%, 01/13/42a | | | 9,332 | | | | 10,140,476 | |
5.50%, 02/06/44 (Call 08/06/43)a | | | 10,722 | | | | 11,923,085 | |
9.00%, 03/01/31 | | | 28,543 | | | | 42,353,473 | |
Qwest Corp. | | | | | | | | |
6.75%, 12/01/21 | | | 16,852 | | | | 19,397,158 | |
6.88%, 09/15/33 (Call 01/20/15) | | | 6,480 | | | | 6,496,200 | |
Rogers Communications Inc. | | | | | | | | |
4.10%, 10/01/23 (Call 07/01/23)a | | | 10,516 | | | | 11,017,672 | |
5.00%, 03/15/44 (Call 09/15/43)a | | | 7,505 | | | | 7,872,101 | |
6.80%, 08/15/18 | | | 15,260 | | | | 17,792,398 | |
Telefonica Emisiones SAU | | | | | | | | |
3.19%, 04/27/18 | | | 8,272 | | | | 8,573,428 | |
4.57%, 04/27/23a | | | 11,350 | | | | 12,043,092 | |
5.13%, 04/27/20 | | | 11,974 | | | | 13,264,671 | |
5.46%, 02/16/21a | | | 9,841 | | | | 11,034,590 | |
5.88%, 07/15/19a | | | 12,111 | | | | 13,869,053 | |
7.05%, 06/20/36 | | | 23,185 | | | | 29,800,520 | |
| | | | | | | | |
| Security | |
Principal
(000s) | | | Value | |
| | | | | | | | |
Telefonica Europe BV | | | | | | | | |
8.25%, 09/15/30 | | $ | 8,478 | | | $ | 11,542,141 | |
Verizon Communications Inc. | | | | | | | | |
2.45%, 11/01/22 (Call 08/01/22) | | | 17,500 | | | | 16,429,567 | |
3.00%, 11/01/21 (Call 09/01/21) | | | 3,000 | | | | 2,978,286 | |
3.45%, 03/15/21 | | | 8,000 | | | | 8,203,140 | |
3.50%, 11/01/21a | | | 11,612 | | | | 11,859,019 | |
3.65%, 09/14/18 | | | 34,657 | | | | 36,700,664 | |
3.85%, 11/01/42 (Call 05/01/42) | | | 8,454 | | | | 7,448,952 | |
4.15%, 03/15/24 (Call 12/15/23) | | | 6,000 | | | | 6,247,172 | |
4.40%, 11/01/34 (Call 05/01/34) | | | 1,580 | | | | 1,549,579 | |
4.50%, 09/15/20 | | | 20,657 | | | | 22,432,103 | |
4.60%, 04/01/21 | | | 9,312 | | | | 10,121,744 | |
4.75%, 11/01/41a | | | 7,800 | | | | 7,891,489 | |
5.05%, 03/15/34 (Call 12/15/33)a | | | 9,000 | | | | 9,527,138 | |
5.15%, 09/15/23 | | | 79,975 | | | | 89,010,160 | |
5.85%, 09/15/35 | | | 7,940 | | | | 9,251,461 | |
6.00%, 04/01/41 | | | 3,660 | | | | 4,306,467 | |
6.10%, 04/15/18 | | | 10,636 | | | | 12,099,802 | |
6.25%, 04/01/37 | | | 4,932 | | | | 6,026,402 | |
6.35%, 04/01/19 | | | 12,848 | | | | 14,967,410 | |
6.40%, 09/15/33 | | | 39,300 | | | | 48,096,822 | |
6.40%, 02/15/38 | | | 11,264 | | | | 13,812,219 | |
6.55%, 09/15/43 | | | 111,531 | | | | 141,260,480 | |
6.90%, 04/15/38 | | | 10,595 | | | | 13,665,061 | |
7.35%, 04/01/39a | | | 8,515 | | | | 11,498,381 | |
7.75%, 12/01/30 | | | 20,515 | | | | 28,081,156 | |
8.75%, 11/01/18 | | | 3,426 | | | | 4,264,626 | |
Vodafone Group PLC | | | | | | | | |
1.50%, 02/19/18 | | | 11,871 | | | | 11,727,172 | |
2.50%, 09/26/22a | | | 9,750 | | | | 9,105,671 | |
2.95%, 02/19/23 | | | 17,260 | | | | 16,522,435 | |
4.38%, 02/19/43a | | | 26,743 | | | | 25,028,266 | |
5.45%, 06/10/19 | | | 12,650 | | | | 14,281,455 | |
6.15%, 02/27/37a | | | 7,286 | | | | 8,526,502 | |
| | | | | | | | |
| | | | | | | 1,530,804,309 | |
| | |
| 88 | | 2014 iSHARES ANNUAL REPORTTO SHAREHOLDERS |
Schedule of Investments (Unaudited) (Continued)
iSHARES® iBOXX $ INVESTMENT GRADE CORPORATE BOND ETF
October 31, 2014
| | | | | | | | |
| Security | | Principal
or Shares
(000s) | | | Value | |
| | | | | | | | |
TRANSPORTATION — 0.85% | |
Burlington Northern Santa Fe LLC | | | | | | | | |
3.85%, 09/01/23 (Call 06/01/23) | | $ | 5,000 | | | $ | 5,226,460 | |
4.45%, 03/15/43 (Call 09/15/42) | | | 4,981 | | | | 5,010,256 | |
4.55%, 09/01/44 (Call 03/01/44) | | | 8,000 | | | | 8,183,540 | |
4.70%, 10/01/19 | | | 7,268 | | | | 8,117,910 | |
4.90%, 04/01/44 (Call 10/01/43)a | | | 13,395 | | | | 14,472,219 | |
5.75%, 05/01/40 (Call 11/01/39) | | | 8,343 | | | | 9,958,538 | |
CSX Corp. | | | | | | | | |
4.10%, 03/15/44 (Call 09/15/43)a | | | 8,250 | | | | 7,900,195 | |
FedEx Corp. | | | | | | | | |
4.00%, 01/15/24 | | | 9,951 | | | | 10,471,126 | |
5.10%, 01/15/44 | | | 10,000 | | | | 11,008,156 | |
Union Pacific Corp. | | | | | | | | |
4.16%, 07/15/22 (Call 04/15/22) | | | 9,291 | | | | 10,185,352 | |
United Parcel Service Inc. | | | | | | | | |
2.45%, 10/01/22 | | | 13,782 | | | | 13,422,917 | |
3.13%, 01/15/21 | | | 10,914 | | | | 11,329,684 | |
5.13%, 04/01/19a | | | 16,934 | | | | 19,110,231 | |
5.50%, 01/15/18 | | | 1,269 | | | | 1,425,532 | |
6.20%, 01/15/38 | | | 13,757 | | | | 18,129,852 | |
| | | | | | | | |
| | | | | | | 153,951,968 | |
| | | | | | | | |
TOTAL CORPORATE BONDS & NOTES | |
(Cost: $17,223,186,758) | | | | 17,739,783,500 | |
|
SHORT-TERM INVESTMENTS — 8.27% | |
| |
MONEY MARKET FUNDS — 8.27% | | | | | |
BlackRock Cash Funds: Institutional,
SL Agency Shares | | | | | |
0.13%b,d,e | | | 1,149,845 | | | | 1,149,844,556 | |
BlackRock Cash Funds: Prime,
SL Agency Shares | | | | | | | | |
0.11%b,d,e | | | 110,254 | | | | 110,253,771 | |
| | | | | | | | |
| Security | |
Shares
(000s) | | | Value | |
| | | | | | | | |
BlackRock Cash Funds: Treasury,
SL Agency Shares | | | | | |
0.00%b,d | | | 237,083 | | | $ | 237,083,479 | |
| | | | | | | | |
| | | | | | | 1,497,181,806 | |
| | | | | | | | |
TOTAL SHORT-TERM INVESTMENTS | | | | | |
(Cost: $1,497,181,806) | | | | 1,497,181,806 | |
| | | | | | | | |
TOTAL INVESTMENTS
IN SECURITIES — 106.28% | | | | | |
(Cost: $18,720,368,564) | | | | 19,236,965,306 | |
Other Assets, Less Liabilities — (6.28)% | | | | (1,135,879,364 | ) |
| | | | | | | | |
NET ASSETS — 100.00% | | | | | | $ | 18,101,085,942 | |
| | | | | | | | |
| a | All or a portion of this security represents a security on loan. |
| c | This security may be resold to qualified institutional buyers under Rule 144A of the Securities Act of 1933. |
| d | The rate quoted is the annualized seven-day yield of the fund at period end. |
| e | All or a portion of this security represents an investment of securities lending collateral. |
See notes to financial statements.
| | | | |
SCHEDULESOF INVESTMENTS | | | 89 | |
Statements of Assets and Liabilities (Unaudited)
iSHARES® TRUST
October 31, 2014
| | | | | | | | |
| | | iShares iBoxx
$ High Yield
Corporate
Bond ETF | | | iShares iBoxx
$ Investment
Grade Corporate
Bond ETF | |
| | |
ASSETS | | | | | | | | |
Investments, at cost: | | | | | | | | |
Unaffiliated | | $ | 13,919,705,700 | | | $ | 17,142,869,628 | |
Affiliated | | | 2,307,877,934 | | | | 1,577,498,936 | |
| | | | | | | | |
Total cost of investments | | $ | 16,227,583,634 | | | $ | 18,720,368,564 | |
| | | | | | | | |
Investments in securities, at fair value (including securities on loana) | | | | | | | | |
Unaffiliated | | $ | 13,905,478,590 | | | $ | 17,659,505,372 | |
Affiliated | | | 2,307,877,934 | | | | 1,577,459,934 | |
| | | | | | | | |
Total fair value of investments | | | 16,213,356,524 | | | | 19,236,965,306 | |
Cash | | | 516,389 | | | | – | |
Receivables: | | | | | | | | |
Investment securities sold | | | 3,849,374 | | | | 59,339,854 | |
Due from custodian | | | 1,917,591 | | | | 747,010 | |
Interest | | | 228,842,099 | | | | 187,249,413 | |
Capital shares sold | | | 1,166,744 | | | | 14,013,653 | |
| | | | | | | | |
Total Assets | | | 16,449,648,721 | | | | 19,498,315,236 | |
| | | | | | | | |
| | |
LIABILITIES | | | | | | | | |
Payables: | | | | | | | | |
Investment securities purchased | | | 90,688,072 | | | | 133,808,505 | |
Collateral for securities on loan | | | 2,104,409,833 | | | | 1,260,098,327 | |
Capital shares redeemed | | | 757,165 | | | | – | |
Securities related to in-kind transactions | | | 1,627,500 | | | | 1,071,164 | |
Investment advisory fees | | | 5,741,852 | | | | 2,251,298 | |
| | | | | | | | |
Total Liabilities | | | 2,203,224,422 | | | | 1,397,229,294 | |
| | | | | | | | |
| | |
NET ASSETS | | $ | 14,246,424,299 | | | $ | 18,101,085,942 | |
| | | | | | | | |
| | |
Net assets consist of: | | | | | | | | |
Paid-in capital | | $ | 14,065,523,774 | | | $ | 17,393,132,452 | |
Undistributed net investment income | | | 61,042,079 | | | | 50,201,053 | |
Undistributed net realized gain | | | 134,085,556 | | | | 141,155,695 | |
Net unrealized appreciation (depreciation) | | | (14,227,110 | ) | | | 516,596,742 | |
| | | | | | | | |
NET ASSETS | | $ | 14,246,424,299 | | | $ | 18,101,085,942 | |
| | | | | | | | |
| | |
Shares outstandingb | | | 154,000,000 | | | | 152,000,000 | |
| | | | | | | | |
| | |
Net asset value per share | | $ | 92.51 | | | $ | 119.09 | |
| | | | | | | | |
| a | Securities on loan with values of $2,056,735,380 and $1,229,621,712, respectively. |
| b | No par value, unlimited number of shares authorized. |
See notes to financial statements.
| | |
| 90 | | 2014 iSHARES ANNUAL REPORTTO SHAREHOLDERS |
Selected Audited Financial Statements
February 28, 2014
iShares Trust
iShares iBoxx $ High Yield Corporate Bond ETF | HYG | NYSE Arca
iShares iBoxx $ Investment Grade Corporate Bond ETF | LQD | NYSE Arca
Schedule of Investments
iSHARES® iBOXX $ HIGH YIELD CORPORATE BOND ETF
February 28, 2014
| | | | | | | | |
Security | | Principal
(000s) | | | Value | |
| | | | | | | | |
CORPORATE BONDS & NOTES — 97.76% | |
| |
AEROSPACE & DEFENSE — 1.33% | | | | | |
B/E Aerospace Inc. | | | | | | | | |
5.25%, 04/01/22 (Call 04/01/17)a | | $ | 21,550 | | | $ | 22,196,500 | |
6.88%, 10/01/20 (Call 10/01/15)a | | | 11,750 | | | | 12,895,625 | |
Bombardier Inc. | | | | | | | | |
4.25%, 01/15/16a,b | | | 13,425 | | | | 13,962,000 | |
5.75%, 03/15/22b | | | 8,300 | | | | 8,424,500 | |
6.13%, 01/15/23a,b | | | 21,775 | | | | 22,101,625 | |
7.50%, 03/15/18a,b | | | 6,550 | | | | 7,336,000 | |
7.75%, 03/15/20a,b | | | 14,070 | | | | 15,723,225 | |
Huntington Ingalls Industries Inc. | | | | | | | | |
6.88%, 03/15/18 (Call 03/15/15)a | | | 9,835 | | | | 10,625,215 | |
7.13%, 03/15/21 (Call 03/15/16)a | | | 9,960 | | | | 11,046,985 | |
Meccanica Holdings USA Inc. | | | | | | | | |
6.25%, 07/15/19b | | | 7,650 | | | | 8,089,875 | |
TransDigm Inc. | | | | | | | | |
5.50%, 10/15/20 (Call 10/15/15)a | | | 9,250 | | | | 9,365,625 | |
7.50%, 07/15/21 (Call 07/15/16)a | | | 9,350 | | | | 10,308,375 | |
7.75%, 12/15/18 (Call 12/15/14) | | | 26,179 | | | | 28,011,530 | |
| | | | | | | | |
| | | | | | | 180,087,080 | |
AIR FREIGHT & LOGISTICS — 0.10% | | | | | |
CEVA Group PLC | | | | | | | | |
8.38%, 12/01/17 (Call 03/31/14)a,b | | | 13,500 | | | | 14,107,500 | |
| | | | | | | | |
| | | | | | | 14,107,500 | |
AIRLINES — 0.27% | | | | | | | | |
Air Canada | | | | | | | | |
6.75%, 10/01/19 (Call 10/01/16)b | | | 3,375 | | | | 3,609,146 | |
American Airlines Inc. | | | | | | | | |
7.50%, 03/15/16 (Call 03/31/14)b | | | 1,098 | | | | 1,139,724 | |
| | | | | | | | |
Security | | Principal
(000s) | | | Value | |
| | | | | | | | |
Continental Airlines Inc. 2012-3 Pass Through Trust | | | | | | | | |
6.13%, 04/29/18 | | $ | 7,350 | | | $ | 7,791,000 | |
United Airlines Inc. | | | | | | | | |
6.75%, 09/15/15 (Call 03/31/14)b | | | 13,380 | | | | 13,697,775 | |
US Airways Group Inc. | | | | | | | | |
6.13%, 06/01/18a | | | 10,103 | | | | 10,647,274 | |
| | | | | | | | |
| | | | | | | 36,884,919 | |
AUTO COMPONENTS — 1.25% | | | | | |
American Axle & Manufacturing Inc. | | | | | | | | |
6.25%, 03/15/21 (Call 03/15/16) | | | 6,450 | | | | 6,901,500 | |
6.63%, 10/15/22 (Call 10/15/17)a | | | 9,150 | | | | 9,950,625 | |
Dana Holding Corp. | | | | | | | | |
5.38%, 09/15/21 (Call 09/15/16)a | | | 9,500 | | | | 9,773,550 | |
6.50%, 02/15/19 (Call 02/15/15) | | | 6,300 | | | | 6,722,131 | |
Goodyear Tire & Rubber Co. (The) | | | | | | | | |
6.50%, 03/01/21 (Call 03/01/16) | | | 14,900 | | | | 16,315,500 | |
7.00%, 05/15/22 (Call 05/15/17)a | | | 11,670 | | | | 12,982,875 | |
8.25%, 08/15/20 (Call 08/15/15)a | | | 12,495 | | | | 13,963,162 | |
Icahn Enterprises LP/Icahn Enterprises Finance Corp. | | | | | | | | |
3.50%, 03/15/17 (Call 02/15/17)b | | | 11,750 | | | | 11,926,250 | |
4.88%, 03/15/19 (Call 07/15/16)b | | | 11,925 | | | | 12,148,594 | |
5.88%, 02/01/22 (Call 08/01/17)b | | | 11,345 | | | | 11,571,900 | |
6.00%, 08/01/20 (Call 02/01/17)a | | | 9,600 | | | | 10,224,000 | |
6.00%, 08/01/20 (Call 02/01/17)b | | | 13,625 | | | | 14,510,625 | |
Lear Corp. | | | | | | | | |
4.75%, 01/15/23 (Call 01/15/18)a,b | | | 8,658 | | | | 8,398,554 | |
| | |
| 92 | | 2014 iSHARES ANNUAL REPORTTO SHAREHOLDERS |
Schedule of Investments (Continued)
iSHARES® iBOXX $ HIGH YIELD CORPORATE BOND ETF
February 28, 2014
| | | | | | | | |
Security | | Principal
(000s) | | | Value | |
| | | | | | | | |
Schaeffler Finance BV | | | | | | | | |
4.75%, 05/15/21 (Call 05/15/16)a,b | | $ | 14,150 | | | $ | 14,326,875 | |
7.75%, 02/15/17a,b | | | 570 | | | | 646,950 | |
8.50%, 02/15/19 (Call 02/15/15)b | | | 8,915 | | | | 9,962,512 | |
| | | | | | | | |
| | | | | | | 170,325,603 | |
AUTOMOBILES — 1.23% | | | | | | | | |
Chrysler Group LLC/CG Co-Issuer Inc. | | | | | | | | |
8.00%, 06/15/19 (Call 06/15/15)b | | | 6,650 | | | | 7,315,000 | |
8.00%, 06/15/19 (Call 06/15/15)a | | | 26,050 | | | | 28,655,000 | |
8.25%, 06/15/21 (Call 06/15/16)b | | | 22,375 | | | | 25,339,687 | |
8.25%, 06/15/21 (Call 06/15/16)a | | | 28,210 | | | | 31,947,825 | |
General Motors Co. | | | | | | | | |
3.50%, 10/02/18a,b | | | 15,300 | | | | 15,797,250 | |
4.88%, 10/02/23b | | | 25,250 | | | | 26,572,519 | |
Jaguar Land Rover Automotive PLC | | | | | | | | |
4.13%, 12/15/18b | | | 12,650 | | | | 12,903,000 | |
5.63%, 02/01/23 (Call 02/01/18)b | | | 9,800 | | | | 10,232,091 | |
8.13%, 05/15/21 (Call 05/15/16)b | | | 7,375 | | | | 8,385,646 | |
| | | | | | | | |
| | | | | | | 167,148,018 | |
BEVERAGES — 0.45% | | | | | | | | |
Constellation Brands Inc. | | | | | | | | |
3.75%, 05/01/21a | | | 9,250 | | | | 8,995,625 | |
4.25%, 05/01/23a | | | 15,275 | | | | 14,969,500 | |
6.00%, 05/01/22a | | | 8,800 | | | | 9,746,000 | |
7.25%, 09/01/16 | | | 12,050 | | | | 13,646,625 | |
7.25%, 05/15/17 | | | 11,599 | | | | 13,425,843 | |
| | | | | | | | |
| | | | | | | 60,783,593 | |
BUILDING PRODUCTS — 0.80% | | | | | |
Building Materials Corp. of America | | | | | | | | |
6.75%, 05/01/21 (Call 05/01/16)b | | | 16,400 | | | | 17,794,000 | |
6.88%, 08/15/18 (Call 08/15/14)b | | | 6,970 | | | | 7,335,925 | |
| | | | | | | | |
Security | | Principal
(000s) | | | Value | |
| | | | | | | | |
Grifols Inc. | | | | | | | | |
8.25%, 02/01/18 (Call 03/31/14)a | | $ | 21,785 | | | $ | 23,309,950 | |
Masco Corp. | | | | | | | | |
4.80%, 06/15/15 | | | 4,000 | | | | 4,160,000 | |
5.95%, 03/15/22 | | | 7,000 | | | | 7,560,000 | |
6.13%, 10/03/16 | | | 16,803 | | | | 18,525,307 | |
7.13%, 03/15/20a | | | 10,345 | | | | 11,974,338 | |
USG Corp. | | | | | | | | |
6.30%, 11/15/16 | | | 8,229 | | | | 8,907,893 | |
9.75%, 01/15/18a | | | 7,785 | | | | 9,342,000 | |
| | | | | | | | |
| | | | | | | 108,909,413 | |
CAPITAL MARKETS — 0.47% | | | | | | | | |
Affinion Group Inc. | | | | | | | | |
7.88%, 12/15/18 (Call 12/15/14)a | | | 9,250 | | | | 8,220,938 | |
E*TRADE Financial Corp. | | | | | | | | |
6.00%, 11/15/17 (Call 11/15/14)a | | | 9,750 | | | | 10,322,812 | |
6.38%, 11/15/19 (Call 11/15/15)a | | | 13,125 | | | | 14,224,219 | |
6.75%, 06/01/16 | | | 2,550 | | | | 2,760,375 | |
Nuveen Investments Inc. | | | | | | | | |
9.13%, 10/15/17 (Call 10/15/14)a,b | | | 9,600 | | | | 10,056,000 | |
9.50%, 10/15/20 (Call 10/15/16)a,b | | | 10,425 | | | | 11,128,687 | |
Virgin Media Secured Finance PLC | | | | | | | | |
5.25%, 01/15/21 | | | 6,800 | | | | 7,021,000 | |
| | | | | | | | |
| | | | | | | 63,734,031 | |
CHEMICALS — 2.10% | | | | | | | | |
Ashland Inc. | | | | | | | | |
3.00%, 03/15/16 (Call 02/15/16)a | | | 5,000 | | | | 5,104,318 | |
3.88%, 04/15/18 (Call 03/15/18) | | | 12,750 | | | | 13,224,883 | |
4.75%, 08/15/22 (Call 05/15/22) | | | 20,300 | | | | 20,399,115 | |
Axiall Corp. | | | | | | | | |
4.88%, 05/15/23 (Call 05/15/18)a,b | | | 5,330 | | | | 5,277,285 | |
| | | | |
SCHEDULESOF INVESTMENTS | | | 93 | |
Schedule of Investments (Continued)
iSHARES® iBOXX $ HIGH YIELD CORPORATE BOND ETF
February 28, 2014
| | | | | | | | |
Security | | Principal
(000s) | | | Value | |
| | | | | | | | |
Celanese U.S. Holdings LLC | | | | | | | | |
4.63%, 11/15/22 | | $ | 8,700 | | | $ | 8,665,895 | |
5.88%, 06/15/21a | | | 8,400 | | | | 9,030,120 | |
6.63%, 10/15/18 (Call 10/15/14) | | | 10,380 | | | | 10,993,465 | |
Eagle Spinco Inc. | | | | | | | | |
4.63%, 02/15/21 (Call 02/15/18)b | | | 12,275 | | | | 12,203,239 | |
Hexion U.S. Finance Corp. | | | | | | | | |
6.63%, 04/15/20 (Call 04/15/15) | | | 25,400 | | | | 26,289,000 | |
Hexion U.S. Finance Corp./Hexion Nova Scotia Finance ULC | | | | | | | | |
8.88%, 02/01/18 (Call 03/31/14)a | | | 20,250 | | | | 21,133,236 | |
9.00%, 11/15/20 (Call 11/15/15)a | | | 7,950 | | | | 8,148,750 | |
Huntsman International LLC | | | | | | | | |
4.88%, 11/15/20 (Call 08/15/20)a | | | 10,000 | | | | 10,175,000 | |
8.63%, 03/15/21 (Call 09/15/15)a | | | 11,010 | | | | 12,441,300 | |
Ineos Finance PLC | | | | | | | | |
7.50%, 05/01/20 (Call 05/01/15)a,b | | | 14,610 | | | | 15,997,950 | |
8.38%, 02/15/19 (Call 02/15/15)b | | | 15,050 | | | | 16,627,171 | |
Ineos Group Holdings SA | | | | | | | | |
5.88%, 02/15/19 (Call 02/15/16)b | | | 2,725 | | | | 2,799,938 | |
6.13%, 08/15/18 (Call 05/15/15)a,b | | | 12,025 | | | | 12,460,906 | |
Momentive Performance Materials Inc. | | | | | | | | |
8.88%, 10/15/20 (Call 10/15/15)a | | | 19,000 | | | | 20,330,000 | |
9.00%, 01/15/21 (Call 01/15/16)a | | | 11,408 | | | | 9,639,760 | |
Rockwood Specialties Group Inc. | | | | | | | | |
4.63%, 10/15/20 (Call 10/15/15)a | | | 20,600 | | | | 21,346,750 | |
| | | | | | | | |
Security | | Principal
(000s) | | | Value | |
| | | | | | | | |
Trinseo Materials Operating SCA/Trinseo Materials Finance Inc. | | | | | | | | |
8.75%, 02/01/19 (Call 08/01/15)a,b | | $ | 21,475 | | | $ | 22,387,687 | |
| | | | | | | | |
| | | | | | | 284,675,768 | |
COMMERCIAL BANKS — 3.01% | | | | | |
BBVA International Preferred SAU | | | | | | | | |
5.92%, 04/29/49 (Call 04/18/17)a,c | | | 10,561 | | | | 10,376,183 | |
BPCE SA | | | | | | | | |
12.50%, 12/31/49 (Call 09/30/19)b,c | | | 7,400 | | | | 9,398,000 | |
CIT Group Inc. | | | | | | | | |
3.88%, 02/19/19 | | | 12,000 | | | | 12,224,020 | |
4.25%, 08/15/17 | | | 27,650 | | | | 29,198,400 | |
4.75%, 02/15/15b | | | 8,600 | | | | 8,858,000 | |
5.00%, 05/15/17 | | | 27,800 | | | | 29,902,375 | |
5.00%, 08/15/22a | | | 23,750 | | | | 24,996,875 | |
5.00%, 08/01/23a | | | 13,400 | | | | 13,977,875 | |
5.25%, 03/15/18 | | | 32,076 | | | | 34,762,365 | |
5.38%, 05/15/20a | | | 13,750 | | | | 14,850,998 | |
5.50%, 02/15/19b | | | 32,380 | | | | 35,175,896 | |
Commerzbank AG | | | | | | | | |
8.13%, 09/19/23a,b | | | 9,450 | | | | 10,707,795 | |
Credit Agricole SA | | | | | | | | |
6.64%, 12/31/49 (Call 05/31/17)a,b,c | | | 14,345 | | | | 14,703,625 | |
8.38%, 12/31/49 (Call 10/13/19)a,b,c | | | 16,600 | | | | 18,675,000 | |
Fifth Third Bancorp | | | | | | | | |
5.10%, 12/31/49 (Call 06/30/23)c | | | 10,350 | | | | 9,573,750 | |
Regions Bank | | | | | | | | |
7.50%, 05/15/18 | | | 10,200 | | | | 12,131,625 | |
Resona Preferred Global Securities (Cayman) Ltd. | | | | | | | | |
7.19%, 12/31/49 (Call 07/30/15)a,b,c | | | 4,600 | | | | 4,887,500 | |
Royal Bank of Scotland Group PLC | | | | | | | | |
6.00%, 12/19/23a | | | 21,321 | | | | 22,013,933 | |
| | |
| 94 | | 2014 iSHARES ANNUAL REPORTTO SHAREHOLDERS |
Schedule of Investments (Continued)
iSHARES® iBOXX $ HIGH YIELD CORPORATE BOND ETF
February 28, 2014
| | | | | | | | |
Security | | Principal
(000s) | | | Value | |
| | | | | | | | |
6.10%, 06/10/23a | | $ | 19,500 | | | $ | 20,340,280 | |
6.13%, 12/15/22a | | | 37,900 | | | | 39,838,956 | |
Societe Generale SA | | | | | | | | |
5.92%, 12/31/49 (Call 04/05/17)a,b,c | | | 13,415 | | | | 14,354,050 | |
UBS Preferred Funding Trust V Series 1 | | | | | | | | |
6.24%, 05/29/49 (Call 05/15/16)a,c | | | 16,875 | | | | 17,929,688 | |
| | | | | | | | |
| | | | | | | 408,877,189 | |
COMMERCIAL SERVICES & SUPPLIES — 2.36% | |
ADT Corp. (The) | | | | | | | | |
2.25%, 07/15/17 | | | 15,000 | | | | 14,876,880 | |
3.50%, 07/15/22 | | | 11,400 | | | | 10,402,806 | |
4.13%, 06/15/23 | | | 13,950 | | | | 13,041,498 | |
6.25%, 10/15/21a,b | | | 19,500 | | | | 20,589,110 | |
Algeco Scotsman Global Finance PLC | | | | | | | | |
8.50%, 10/15/18 (Call 10/15/15)a,b | | | 17,550 | | | | 19,129,500 | |
10.75%, 10/15/19 (Call 10/15/16)b | | | 13,550 | | | | 14,871,125 | |
APX Group Inc. | | | | | | | | |
6.38%, 12/01/19 (Call 12/01/15) | | | 10,550 | | | | 10,866,500 | |
8.75%, 12/01/20 (Call 12/01/15)a,b | | | 1,990 | | | | 2,069,600 | |
8.75%, 12/01/20 (Call 12/01/15)a | | | 8,181 | | | | 8,528,693 | |
Ceridian Corp. | | | | | | | | |
8.88%, 07/15/19 (Call 07/15/15)b | | | 16,250 | | | | 18,547,066 | |
11.25%, 11/15/15 (Call 03/31/14)a | | | 12,450 | | | | 12,512,250 | |
Ceridian HCM Holding Inc. | | | | | | | | |
11.00%, 03/15/21 (Call 03/15/16)b | | | 3,675 | | | | 4,200,554 | |
Clean Harbors Inc. | | | | | | | | |
5.13%, 06/01/21 (Call 12/01/16)a | | | 10,725 | | | | 10,939,500 | |
5.25%, 08/01/20 (Call 08/01/16)a | | | 12,779 | | | | 13,162,370 | |
| | | | | | | | |
Security | | Principal
(000s) | | | Value | |
| | | | | | | | |
Covanta Holding Corp. | | | | | | | | |
5.88%, 03/01/24 (Call 03/01/19) | | $ | 2,250 | | | $ | 2,294,863 | |
Global A&T Electronics Ltd. | | | | | | | | |
10.00%, 02/01/19 (Call 02/01/16)b | | | 14,700 | | | | 12,127,500 | |
Interactive Data Corp. | | | | | | | | |
10.25%, 08/01/18 (Call 08/01/14)a | | | 9,650 | | | | 10,458,187 | |
Iron Mountain Inc. | | | | | | | | |
5.75%, 08/15/24 (Call 08/15/17)a | | | 16,450 | | | | 16,079,875 | |
6.00%, 08/15/23 (Call 08/15/18)a | | | 11,400 | | | | 12,140,715 | |
7.75%, 10/01/19 (Call 10/01/15) | | | 7,680 | | | | 8,539,151 | |
8.38%, 08/15/21 (Call 08/15/14) | | | 9,050 | | | | 9,671,307 | |
R.R. Donnelley & Sons Co. | | | | | | | | |
7.00%, 02/15/22a | | | 7,100 | | | | 7,881,000 | |
7.63%, 06/15/20 | | | 6,850 | | | | 7,757,625 | |
7.88%, 03/15/21a | | | 8,575 | | | | 9,775,500 | |
8.25%, 03/15/19 | | | 8,350 | | | | 9,769,500 | |
Tervita Corp. | | | | | | | | |
8.00%, 11/15/18 (Call 11/15/15)a,b | | | 9,850 | | | | 10,379,437 | |
TransUnion LLC/TransUnion Financing Corp. | | | | | | | | |
11.38%, 06/15/18 (Call 06/15/14) | | | 11,750 | | | | 12,682,656 | |
West Corp. | | | | | | | | |
7.88%, 01/15/19 (Call 11/15/14)a | | | 13,050 | | | | 14,012,437 | |
8.63%, 10/01/18 (Call 10/01/14) | | | 3,540 | | | | 3,814,350 | |
| | | | | | | | |
| | | | | | | 321,121,555 | |
COMMUNICATIONS EQUIPMENT — 0.72% | |
Alcatel-Lucent USA Inc. | | | | | | | | |
4.63%, 07/01/17a,b | | | 9,450 | | | | 9,709,621 | |
6.75%, 11/15/20 (Call 11/15/16)b | | | 15,880 | | | | 16,872,500 | |
8.88%, 01/01/20 (Call 07/01/16)b | | | 9,050 | | | | 10,266,635 | |
| | | | |
SCHEDULESOF INVESTMENTS | | | 95 | |
Schedule of Investments (Continued)
iSHARES® iBOXX $ HIGH YIELD CORPORATE BOND ETF
February 28, 2014
| | | | | | | | |
Security | | Principal
(000s) | | | Value | |
| | | | | | | | |
Avaya Inc. | | | | | | | | |
7.00%, 04/01/19 (Call 04/01/15)a,b | | $ | 17,040 | | | $ | 16,912,200 | |
10.50%, 03/01/21 (Call 03/01/17)a,b | | | 22,845 | | | | 21,588,525 | |
CommScope Inc. | | | | | | | | |
8.25%, 01/15/19 (Call 01/15/15)a,b | | | 4,951 | | | | 5,390,401 | |
Nokia OYJ | | | | | | | | |
5.38%, 05/15/19 | | | 16,500 | | | | 17,527,214 | |
| | | | | | | | |
| | | | | | | 98,267,096 | |
COMPUTERS & PERIPHERALS — 0.38% | | | | | |
Dell Inc. | | | | | | | | |
3.10%, 04/01/16 | | | 2,150 | | | | 2,181,085 | |
4.63%, 04/01/21a | | | 7,700 | | | | 7,168,857 | |
5.65%, 04/15/18 | | | 8,900 | | | | 9,276,508 | |
5.88%, 06/15/19a | | | 5,600 | | | | 5,836,921 | |
NCR Corp. | | | | | | | | |
4.63%, 02/15/21 (Call 02/15/17)a | | | 9,150 | | | | 9,218,625 | |
5.00%, 07/15/22 (Call 07/15/17) | | | 13,250 | | | | 13,415,625 | |
5.88%, 12/15/21 (Call 12/15/17)b | | | 4,750 | | | | 5,082,500 | |
| | | | | | | | |
| | | | | | | 52,180,121 | |
CONSTRUCTION & ENGINEERING — 0.12% | |
Abengoa Finance SAU | | | | | | | | |
7.75%, 02/01/20a,b | | | 7,650 | | | | 8,264,789 | |
8.88%, 11/01/17b | | | 7,293 | | | | 8,217,701 | |
| | | | | | | | |
| | | | | | | 16,482,490 | |
CONSTRUCTION MATERIALS — 0.32% | | | | | |
Lafarge SA | | | | | | | | |
6.20%, 07/09/15b | | | 3,325 | | | | 3,553,207 | |
6.50%, 07/15/16 | | | 8,000 | | | | 8,817,309 | |
Vulcan Materials Co. | | | | | | | | |
6.50%, 12/01/16a | | | 8,550 | | | | 9,661,500 | |
7.00%, 06/15/18a | | | 7,900 | | | | 9,124,500 | |
7.50%, 06/15/21 | | | 10,250 | | | | 11,966,875 | |
| | | | | | | | |
| | | | | | | 43,123,391 | |
CONSUMER FINANCE — 4.68% | | | | | |
Ally Financial Inc. | | | | | | | | |
2.75%, 01/30/17 | | | 1,700 | | | | 1,724,748 | |
3.13%, 01/15/16a | | | 13,000 | | | | 13,319,892 | |
| | | | | | | | |
Security | | Principal
(000s) | | | Value | |
| | | | | | | | |
3.50%, 07/18/16 | | $ | 20,100 | | | $ | 20,753,250 | |
3.50%, 01/27/19 | | | 15,350 | | | | 15,445,938 | |
4.63%, 06/26/15a | | | 28,290 | | | | 29,409,022 | |
4.75%, 09/10/18a | | | 12,950 | | | | 13,791,750 | |
5.50%, 02/15/17a | | | 26,240 | | | | 28,688,053 | |
6.25%, 12/01/17a | | | 19,110 | | | | 21,462,575 | |
7.50%, 09/15/20a | | | 25,500 | | | | 30,842,398 | |
8.00%, 12/31/18a | | | 9,525 | | | | 11,340,495 | |
8.00%, 03/15/20a | | | 32,510 | | | | 40,393,675 | |
8.30%, 02/12/15 | | | 19,850 | | | | 21,115,174 | |
General Motors Financial Co. Inc. | | | | | | | | |
2.75%, 05/15/16 | | | 11,865 | | | | 12,087,351 | |
3.25%, 05/15/18 | | | 14,570 | | | | 14,911,063 | |
4.25%, 05/15/23a | | | 16,265 | | | | 16,386,988 | |
4.75%, 08/15/17 | | | 24,284 | | | | 26,277,046 | |
6.75%, 06/01/18a | | | 10,315 | | | | 11,965,274 | |
ILFC E-Capital Trust II | | | | | | | | |
6.25%, 12/21/65 (Call 12/21/15)a,b,c | | | 10,400 | | | | 9,880,000 | |
SLM Corp. | | | | | | | | |
4.63%, 09/25/17a | | | 11,086 | | | | 11,584,539 | |
4.88%, 06/17/19a | | | 20,000 | | | | 20,600,000 | |
5.50%, 01/15/19a | | | 18,400 | | | | 19,439,455 | |
5.50%, 01/25/23a | | | 16,565 | | | | 16,370,840 | |
6.00%, 01/25/17 | | | 21,400 | | | | 23,385,852 | |
6.25%, 01/25/16 | | | 38,961 | | | | 42,161,708 | |
7.25%, 01/25/22a | | | 15,600 | | | | 17,183,912 | |
8.00%, 03/25/20a | | | 25,600 | | | | 29,505,382 | |
8.45%, 06/15/18a | | | 43,850 | | | | 51,980,557 | |
Springleaf Finance Corp. | | | | | | | | |
6.90%, 12/15/17 | | | 36,980 | | | | 40,539,325 | |
7.75%, 10/01/21a | | | 7,850 | | | | 8,713,500 | |
Series I | | | | | | | | |
5.40%, 12/01/15a | | | 13,800 | | | | 14,490,000 | |
| | | | | | | | |
| | | | | | | 635,749,762 | |
CONTAINERS & PACKAGING — 1.47% | | | | | |
Ardagh Packaging Finance PLC | | | | | | | | |
7.38%, 10/15/17 (Call 10/15/14)a,b | | | 9,200 | | | | 9,809,500 | |
9.13%, 10/15/20 (Call 10/15/15)a,b | | | 12,676 | | | | 14,038,670 | |
| | |
| 96 | | 2014 iSHARES ANNUAL REPORTTO SHAREHOLDERS |
Schedule of Investments (Continued)
iSHARES® iBOXX $ HIGH YIELD CORPORATE BOND ETF
February 28, 2014
| | | | | | | | |
Security | | Principal
(000s) | | | Value | |
| | | | | | | | |
Ardagh Packaging Finance PLC/
Ardagh Holdings USA Inc. | | | | | | | | |
6.25%, 01/31/19 (Call 01/31/16)a,b | | $ | 5,325 | | | $ | 5,524,688 | |
6.75%, 01/31/21 (Call 01/31/17)b | | | 6,700 | | | | 6,968,000 | |
7.38%, 10/15/17 (Call 10/15/14)a,b | | | 2,150 | | | | 2,289,768 | |
Ball Corp. | | | | | | | | |
4.00%, 11/15/23a | | | 13,750 | | | | 13,173,579 | |
5.00%, 03/15/22a | | | 13,200 | | | | 13,615,986 | |
5.75%, 05/15/21 (Call 11/15/15)a | | | 8,900 | | | | 9,478,500 | |
6.75%, 09/15/20 (Call 03/15/15) | | | 7,780 | | | | 8,441,300 | |
Berry Plastics Corp. | | | | | | | | |
9.50%, 05/15/18 (Call 05/15/14)a | | | 8,350 | | | | 8,862,740 | |
9.75%, 01/15/21 (Call 01/15/16)a | | | 14,450 | | | | 16,778,092 | |
Beverage Packaging Holdings Luxembourg II SA/Beverage Packaging Holdings II | | | | | | | | |
5.63%, 12/15/16 (Call 12/15/15)b | | | 8,950 | | | | 9,218,500 | |
6.00%, 06/15/17 (Call 06/15/16)a,b | | | 9,900 | | | | 10,271,250 | |
Crown Americas LLC/Crown Americas Capital Corp. III | | | | | | | | |
6.25%, 02/01/21 (Call 02/01/16) | | | 11,000 | | | | 11,990,000 | |
Crown Americas LLC/Crown Americas Capital Corp. IV | | | | | | | | |
4.50%, 01/15/23 | | | 16,500 | | | | 16,211,250 | |
Sealed Air Corp. | | | | | | | | |
5.25%, 04/01/23 (Call 01/01/23)a,b | | | 6,850 | | | | 6,969,875 | |
6.50%, 12/01/20 (Call 09/01/20)a,b | | | 7,500 | | | | 8,231,250 | |
8.13%, 09/15/19 (Call 09/15/15)b | | | 12,210 | | | | 13,690,462 | |
8.38%, 09/15/21 (Call 09/15/16)a,b | | | 12,270 | | | | 14,171,850 | |
| | | | | | | | |
| | | | | | | 199,735,260 | |
| | | | | | | | |
Security | | Principal
(000s) | | | Value | |
| | | | | | | | |
DISTRIBUTORS — 0.69% | | | | | | | | |
HD Supply Inc. | | | | | | | | |
7.50%, 07/15/20 (Call 10/15/16)a | | $ | 21,850 | | | $ | 23,925,750 | |
8.13%, 04/15/19 (Call 04/15/15) | | | 19,940 | | | | 22,407,575 | |
11.00%, 04/15/20 (Call 04/15/16)a | | | 11,580 | | | | 14,142,075 | |
11.50%, 07/15/20 (Call 10/15/16)a | | | 16,300 | | | | 19,886,000 | |
VWR Funding Inc. | | | | | | | | |
7.25%, 09/15/17 (Call 09/15/14)a | | | 12,875 | | | | 13,679,688 | |
| | | | | | | | |
| | | | | | | 94,041,088 | |
DIVERSIFIED CONSUMER SERVICES — 0.43% | |
Laureate Education Inc. | | | | | | | | |
9.25%, 09/01/19 (Call 09/01/15)b | | | 24,300 | | | | 26,001,000 | |
Service Corp. International | | | | | | | | |
5.38%, 01/15/22 (Call 07/15/17)b | | | 8,400 | | | | 8,547,000 | |
ServiceMaster Co. | | | | | | | | |
7.00%, 08/15/20 (Call 08/15/15) | | | 11,850 | | | | 12,316,890 | |
8.00%, 02/15/20 (Call 02/15/15) | | | 10,800 | | | | 11,548,387 | |
| | | | | | | | |
| | | | | | | 58,413,277 | |
DIVERSIFIED FINANCIAL SERVICES — 0.55% | |
Denali Borrower LLC/Denali Finance Corp. | | | | | | | | |
5.63%, 10/15/20 (Call 10/15/16)a,b | | | 25,125 | | | | 25,815,937 | |
ING U.S. Inc. | | | | | | | | |
5.65%, 05/15/53 (Call 05/15/23)a,c | | | 12,675 | | | | 12,421,500 | |
Nationstar Mortgage LLC/Nationstar Capital Corp. | | | | | | | | |
6.50%, 08/01/18 (Call 08/01/15)a | | | 6,850 | | | | 6,884,250 | |
6.50%, 07/01/21 (Call 01/01/17)a | | | 10,800 | | | | 10,260,000 | |
7.88%, 10/01/20 (Call 10/01/16) | | | 6,700 | | | | 6,783,750 | |
| | | | |
SCHEDULESOF INVESTMENTS | | | 97 | |
Schedule of Investments (Continued)
iSHARES® iBOXX $ HIGH YIELD CORPORATE BOND ETF
February 28, 2014
| | | | | | | | |
Security | | Principal
(000s) | | | Value | |
| | | | | | | | |
Nielsen Co. Luxembourg Sarl (The) | | | | | | | | |
5.50%, 10/01/21 (Call 10/01/16)b | | $ | 11,450 | | | $ | 12,008,188 | |
| | | | | | | | |
| | | | | | | 74,173,625 | |
DIVERSIFIED TELECOMMUNICATION SERVICES — 8.46% | | | | | |
Altice Financing SA | | | | | | | | |
6.50%, 01/15/22 (Call 12/15/16)b | | | 13,900 | | | | 14,438,625 | |
7.88%, 12/15/19 (Call 12/15/15)b | | | 6,750 | | | | 7,374,375 | |
Altice Finco SA | | | | | | | | |
8.13%, 01/15/24 (Call 12/15/18)b | | | 6,800 | | | | 7,208,000 | |
9.88%, 12/15/20 (Call 12/15/16)b | | | 6,750 | | | | 7,695,000 | |
CCO Holdings LLC/CCO Holdings Capital Corp. | | | | | | | | |
5.13%, 02/15/23 (Call 02/15/18) | | | 18,250 | | | | 17,793,750 | |
5.25%, 03/15/21 (Call 03/15/16)a,b | | | 7,750 | | | | 7,827,500 | |
5.25%, 09/30/22 (Call 09/30/17) | | | 20,250 | | | | 20,224,688 | |
5.75%, 09/01/23 (Call 03/01/18)b | | | 9,700 | | | | 9,736,375 | |
5.75%, 01/15/24 (Call 07/15/18)a | | | 16,650 | | | | 16,712,438 | |
6.50%, 04/30/21 (Call 04/30/15) | | | 25,430 | | | | 27,178,312 | |
6.63%, 01/31/22 (Call 01/31/17)a | | | 14,950 | | | | 16,071,250 | |
7.00%, 01/15/19 (Call 03/31/14)a | | | 22,925 | | | | 24,243,187 | |
7.25%, 10/30/17 (Call 03/31/14)a | | | 14,580 | | | | 15,454,800 | |
7.38%, 06/01/20 (Call 12/01/15)a | | | 13,020 | | | | 14,240,625 | |
8.13%, 04/30/20 (Call 04/30/15)a | | | 15,050 | | | | 16,460,938 | |
CenturyLink Inc. | | | | | | | | |
5.80%, 03/15/22a | | | 21,452 | | | | 21,988,300 | |
6.00%, 04/01/17a | | | 9,900 | | | | 10,939,500 | |
6.45%, 06/15/21 | | | 22,300 | | | | 23,916,750 | |
| | | | | | | | |
Security | | Principal
(000s) | | | Value | |
| | | | | | | | |
Series V | | | | | | | | |
5.63%, 04/01/20a | | $ | 17,760 | | | $ | 18,559,200 | |
Series W | | | | | | | | |
6.75%, 12/01/23 | | | 12,300 | | | | 13,099,500 | |
Cincinnati Bell Inc. | | | | | | | | |
8.38%, 10/15/20 (Call 10/15/15)a | | | 10,244 | | | | 11,140,350 | |
8.75%, 03/15/18 (Call 03/31/14) | | | 12,420 | | | | 12,994,425 | |
Embarq Corp. | | | | | | | | |
7.08%, 06/01/16 | | | 15,250 | | | | 17,119,717 | |
Frontier Communications Corp. | | | | | | | | |
7.13%, 03/15/19 | | | 9,500 | | | | 10,473,750 | |
7.13%, 01/15/23a | | | 14,300 | | | | 14,979,250 | |
7.63%, 04/15/24a | | | 14,450 | | | | 15,280,875 | |
8.13%, 10/01/18a | | | 9,450 | | | | 10,985,625 | |
8.25%, 04/15/17a | | | 8,770 | | | | 10,195,125 | |
8.50%, 04/15/20a | | | 18,165 | | | | 20,980,575 | |
8.75%, 04/15/22 | | | 17,510 | | | | 19,961,400 | |
Hughes Satellite Systems Corp. | | | | | | | | |
6.50%, 06/15/19 | | | 18,320 | | | | 20,083,300 | |
7.63%, 06/15/21 | | | 15,790 | | | | 17,803,225 | |
Intelsat (Luxembourg) SA | | | | | | | | |
6.75%, 06/01/18 (Call 06/01/15)b | | | 9,800 | | | | 10,437,000 | |
7.75%, 06/01/21 (Call 06/01/17)a,b | | | 30,375 | | | | 32,729,062 | |
8.13%, 06/01/23 (Call 06/01/18)b | | | 12,850 | | | | 13,958,313 | |
Intelsat Jackson Holdings SA | | | | | | | | |
5.50%, 08/01/23 (Call 08/01/18)a,b | | | 33,035 | | | | 32,704,650 | |
6.63%, 12/15/22 (Call 12/15/17)b | | | 11,300 | | | | 11,921,500 | |
6.63%, 12/15/22 (Call 12/15/17)a | | | 13,800 | | | | 14,559,000 | |
7.25%, 04/01/19 (Call 04/01/15) | | | 24,213 | | | | 26,089,507 | |
7.25%, 10/15/20 (Call 10/15/15)a | | | 39,370 | | | | 42,814,875 | |
7.50%, 04/01/21 (Call 04/01/16) | | | 19,165 | | | | 21,129,412 | |
8.50%, 11/01/19 (Call 11/01/14) | | | 10,500 | | | | 11,340,000 | |
| | |
| 98 | | 2014 iSHARES ANNUAL REPORTTO SHAREHOLDERS |
Schedule of Investments (Continued)
iSHARES® iBOXX $ HIGH YIELD CORPORATE BOND ETF
February 28, 2014
| | | | | | | | |
Security | | Principal
(000s) | | | Value | |
| | | | | | | | |
Koninklijke KPN NV | | | | | | | | |
7.00%, 03/28/73 (Call 03/28/23)a,b,c | | $ | 11,100 | | | $ | 11,612,820 | |
Level 3 Communications Inc. | | | | | | | | |
11.88%, 02/01/19 (Call 02/01/15) | | | 10,850 | | | | 12,477,500 | |
Level 3 Financing Inc. | | | | | | | | |
6.13%, 01/15/21 (Call 11/15/16)a,b | | | 6,525 | | | | 6,916,500 | |
7.00%, 06/01/20 (Call 06/01/16)a | | | 14,800 | | | | 16,150,500 | |
8.13%, 07/01/19 (Call 07/01/15) | | | 21,950 | | | | 24,118,660 | |
8.63%, 07/15/20 (Call 01/15/16) | | | 17,145 | | | | 19,288,125 | |
9.38%, 04/01/19 (Call 04/01/15)a | | | 9,630 | | | | 10,713,375 | |
PAETEC Holding Corp. | | | | | | | | |
9.88%, 12/01/18 (Call 12/01/14)a | | | 11,700 | | | | 12,914,460 | |
SBA Telecommunications Inc. | | | | | | | | |
5.75%, 07/15/20 (Call 07/15/16) | | | 13,707 | | | | 14,426,618 | |
SoftBank Corp. | | | | | | | | |
4.50%, 04/15/20a,b | | | 22,400 | | | | 22,456,000 | |
Telecom Italia Capital SA | | | | | | | | |
7.00%, 06/04/18 | | | 3,800 | | | | 4,308,250 | |
tw telecom holdings Inc. | | | | | | | | |
5.38%, 10/01/22 (Call 10/01/17)a | | | 15,900 | | | | 16,178,250 | |
UPCB Finance III Ltd. | | | | | | | | |
6.63%, 07/01/20 (Call 07/01/15)b | | | 17,300 | | | | 18,467,750 | |
UPCB Finance V Ltd. | | | | | | | | |
7.25%, 11/15/21 (Call 11/15/16)b | | | 12,070 | | | | 13,337,350 | |
UPCB Finance VI Ltd. | | | | | | | | |
6.88%, 01/15/22 (Call 01/15/17)b | | | 10,950 | | | | 11,908,125 | |
Virgin Media Finance PLC | | | | | | | | |
6.38%, 04/15/23 (Call 04/15/18)a,b | | | 13,350 | | | | 14,017,500 | |
8.38%, 10/15/19 (Call 10/15/14)a | | | 9,450 | | | | 10,198,758 | |
| | | | | | | | |
Security | | Principal
(000s) | | | Value | |
| | | | | | | | |
Virgin Media Secured Finance PLC | | | | | | | | |
5.38%, 04/15/21 (Call 04/15/17)b | | $ | 17,950 | | | $ | 18,443,625 | |
Wind Acquisition Holdings Finance SA | | | | | | | | |
6.50%, 04/30/20 (Call 04/30/16)a,b | | | 11,925 | | | | 13,117,500 | |
7.25%, 02/15/18 (Call 03/31/14)b | | | 30,500 | | | | 32,082,120 | |
11.75%, 07/15/17 (Call��03/31/14)b | | | 34,085 | | | | 36,130,100 | |
12.25%, 07/15/17 (Call 03/31/14)a,b | | | 15,200 | | | | 15,808,000 | |
Windstream Corp. | | | | | | | | |
6.38%, 08/01/23 (Call 02/01/18)a | | | 12,000 | | | | 11,820,000 | |
7.50%, 06/01/22 (Call 06/01/17)a | | | 10,650 | | | | 11,315,625 | |
7.50%, 04/01/23 (Call 04/01/16)a | | | 9,350 | | | | 9,840,875 | |
7.75%, 10/15/20 (Call 10/15/15) | | | 11,715 | | | | 12,637,556 | |
7.75%, 10/01/21 (Call 10/01/16)a | | | 15,150 | | | | 16,362,000 | |
7.88%, 11/01/17a | | | 18,125 | | | | 20,798,437 | |
| | | | | | | | |
| | | | | | | 1,148,690,428 | |
ELECTRIC UTILITIES — 2.03% | | | | | |
DPL Inc. | | | | | | | | |
6.50%, 10/15/16 (Call 09/15/16)a | | | 10,620 | | | | 11,412,527 | |
7.25%, 10/15/21 (Call 07/15/21)a | | | 11,890 | | | | 11,849,475 | |
EDP Finance BV | | | | | | | | |
4.90%, 10/01/19a,b | | | 22,000 | | | | 23,049,400 | |
5.25%, 01/14/21b | | | 12,948 | | | | 13,468,510 | |
6.00%, 02/02/18b | | | 13,000 | | | | 14,158,300 | |
Enel SpA | | | | | | | | |
8.75%, 09/24/73 (Call 09/24/23)b,c | | | 16,000 | | | | 17,819,200 | |
| | | | |
SCHEDULESOF INVESTMENTS | | | 99 | |
Schedule of Investments (Continued)
iSHARES® iBOXX $ HIGH YIELD CORPORATE BOND ETF
February 28, 2014
| | | | | | | | |
Security | | Principal
(000s) | | | Value | |
| | | | | | | | |
Energy Future Intermediate Holding Co. LLC/EFIH Finance Inc. | | | | | | | | |
6.88%, 08/15/17 (Call 02/15/15)a,b | | $ | 3,500 | | | $ | 3,587,272 | |
10.00%, 12/01/20 (Call 12/01/15)a | | | 37,342 | | | | 38,835,680 | |
10.25%, 12/01/20 (Call 12/01/15)b | | | 21,050 | | | | 21,892,000 | |
12.25%, 03/01/22 (Call 03/01/17)a,b | | | 31,020 | | | | 35,983,200 | |
FirstEnergy Corp. | | | | | | | | |
Series A | | | | | | | | |
2.75%, 03/15/18 (Call 02/15/18) | | | 4,200 | | | | 4,222,411 | |
Series B | | | | | | | | |
4.25%, 03/15/23 (Call 12/15/22)a | | | 11,300 | | | | 11,071,842 | |
Ipalco Enterprises Inc. | | | | | | | | |
5.00%, 05/01/18 (Call 04/01/18)a | | | 9,000 | | | | 9,518,041 | |
7.25%, 04/01/16a,b | | | 8,645 | | | | 9,555,341 | |
PPL Capital Funding Inc. | | | | | | | | |
Series A | | | | | | | | |
6.70%, 03/30/67 (Call 03/30/17)c | | | 10,150 | | | | 10,200,750 | |
RRI Energy Inc. | | | | | | | | |
7.88%, 06/15/17a | | | 11,770 | | | | 11,946,626 | |
Texas Competitive Electric Holdings Co. LLC/TCEH Finance Inc. | | | | | | | | |
11.50%, 10/01/20 (Call 04/01/16)a,b | | | 25,300 | | | | 18,595,500 | |
15.00%, 04/01/21 (Call 10/01/15)a | | | 30,400 | | | | 8,360,000 | |
| | | | | | | | |
| | | | | | | 275,526,075 | |
ELECTRICAL EQUIPMENT — 0.18% | | | | | |
Realogy Group LLC | | | | | | | | |
7.63%, 01/15/20 (Call 01/15/16)b | | | 10,120 | | | | 11,294,704 | |
7.88%, 02/15/19 (Call 02/15/15)a,b | | | 12,050 | | | | 13,052,340 | |
| | | | | | | | |
| | | | | | | 24,347,044 | |
| | | | | | | | |
Security | | Principal
(000s) | | | Value | |
| | | | | | | | |
ELECTRONIC EQUIPMENT, INSTRUMENTS & COMPONENTS — 0.25% | |
Flextronics International Ltd. | | | | | | | | |
4.63%, 02/15/20a | | $ | 8,425 | | | $ | 8,511,186 | |
5.00%, 02/15/23 | | | 9,300 | | | | 9,379,970 | |
Rexel SA | | | | | | | | |
5.25%, 06/15/20 (Call 06/15/16)b | | | 8,850 | | | | 8,982,750 | |
6.13%, 12/15/19 (Call 12/15/15)b | | | 6,400 | | | | 6,720,000 | |
| | | | | | | | |
| | | | | | | 33,593,906 | |
ENERGY EQUIPMENT & SERVICES — 0.72% | |
CGG | | | | | | | | |
6.50%, 06/01/21 (Call 06/01/16)a | | | 11,760 | | | | 12,060,907 | |
7.75%, 05/15/17 (Call 03/31/14)a | | | 8,585 | | | | 8,792,246 | |
Hercules Offshore Inc. | | | | | | | | |
8.75%, 07/15/21 (Call 07/15/17)a,b | | | 8,150 | | | | 9,088,521 | |
Hornbeck Offshore Services Inc. | | | | | | | | |
5.00%, 03/01/21 (Call 03/01/16) | | | 8,450 | | | | 8,390,107 | |
Offshore Group Investments Ltd. | | | | | | | | |
7.13%, 04/01/23 (Call 04/01/18)a | | | 11,725 | | | | 11,988,515 | |
7.50%, 11/01/19 (Call 11/01/15) | | | 18,900 | | | | 20,383,845 | |
Oil States International Inc. | | | | | | | | |
5.13%, 01/15/23 (Call 01/15/18) | | | 3,200 | | | | 3,585,759 | |
6.50%, 06/01/19 (Call 06/01/14) | | | 150 | | | | 158,625 | |
Pacific Drilling SA | | | | | | | | |
5.38%, 06/01/20 (Call 06/01/16)a,b | | | 12,825 | | | | 12,869,543 | |
Precision Drilling Corp. | | | | | | | | |
6.63%, 11/15/20 (Call 11/15/15) | | | 10,270 | | | | 10,979,827 | |
| | | | | | | | |
| | | | | | | 98,297,895 | |
| | |
| 100 | | 2014 iSHARES ANNUAL REPORTTO SHAREHOLDERS |
Schedule of Investments (Continued)
iSHARES® iBOXX $ HIGH YIELD CORPORATE BOND ETF
February 28, 2014
| | | | | | | | |
Security | | Principal
(000s) | | | Value | |
| | | | | | | | |
FOOD & STAPLES RETAILING — 0.68% | | | | | |
Rite Aid Corp. | | | | | | | | |
6.75%, 06/15/21 (Call 06/15/16)a | | $ | 13,150 | | | $ | 14,432,125 | |
8.00%, 08/15/20 (Call 08/15/15)a | | | 10,400 | | | | 11,664,012 | |
9.25%, 03/15/20 (Call 03/15/16)a | | | 15,900 | | | | 18,312,008 | |
SUPERVALU Inc. | | | | | | | | |
6.75%, 06/01/21 (Call 06/01/17)a | | | 7,300 | | | | 7,354,750 | |
8.00%, 05/01/16 | | | 12,500 | | | | 13,781,250 | |
US Foods Inc. | | | | | | | | |
8.50%, 06/30/19 (Call 06/30/14)a | | | 24,450 | | | | 26,498,910 | |
| | | | | | | | |
| | | | | | | 92,043,055 | |
FOOD PRODUCTS — 1.22% | | | | | | | | |
ARAMARK Corp. | | | | | | | | |
5.75%, 03/15/20 (Call 03/15/15)b | | | 18,850 | | | | 19,910,312 | |
Big Heart Pet Brands | | | | | | | | |
7.63%, 02/15/19 (Call 03/31/14)a | | | 22,450 | | | | 23,404,125 | |
Hawk Acquisition Sub Inc. | | | | | | | | |
4.25%, 10/15/20 (Call 04/15/15)b | | | 49,950 | | | | 49,700,250 | |
Post Holdings Inc. | | | | | | | | |
6.75%, 12/01/21 (Call 12/01/17)b | | | 3,125 | | | | 3,343,750 | |
7.38%, 02/15/22 (Call 02/15/17)a | | | 22,550 | | | | 24,523,125 | |
Smithfield Foods Inc. | | | | | | | | |
5.25%, 08/01/18 (Call 08/01/15)a,b | | | 8,375 | | | | 8,772,813 | |
5.88%, 08/01/21 (Call 08/01/16)b | | | 7,525 | | | | 7,750,750 | |
6.63%, 08/15/22 (Call 08/15/17)a | | | 17,055 | | | | 18,502,969 | |
7.75%, 07/01/17 | | | 8,129 | | | | 9,419,479 | |
| | | | | | | | |
| | | | | | | 165,327,573 | |
| | | | | | | | |
Security | | Principal
(000s) | | | Value | |
| | | | | | | | |
GAS UTILITIES — 0.76% | | | | | | | | |
AmeriGas Finance LLC/AmeriGas Finance Corp. | | | | | | | | |
6.75%, 05/20/20 (Call 05/20/16)a | | $ | 11,350 | | | $ | 12,365,731 | |
7.00%, 05/20/22 (Call 05/20/17)a | | | 19,060 | | | | 20,828,530 | |
AmeriGas Partners LP/AmeriGas Finance Corp. | | | | | | | | |
6.25%, 08/20/19 (Call 08/20/15)a | | | 8,230 | | | | 8,856,260 | |
Ferrellgas LP/Ferrellgas Finance Corp. | | | | | | | | |
6.50%, 05/01/21 (Call 05/01/16) | | | 4,950 | | | | 5,161,676 | |
Sabine Pass LNG LP | | | | | | | | |
6.50%, 11/01/20 (Call 11/01/16)a | | | 10,700 | | | | 11,229,176 | |
7.50%, 11/30/16 | | | 28,700 | | | | 31,792,330 | |
Suburban Propane Partners LP/Suburban Energy Finance Corp. | | | | | | | | |
7.50%, 10/01/18 (Call 10/01/14) | | | 11,695 | | | | 12,472,786 | |
| | | | | | | | |
| | | | | | | 102,706,489 | |
HEALTH CARE EQUIPMENT & SUPPLIES — 1.15% | |
Alere Inc. | | | | | | | | |
6.50%, 06/15/20 (Call 06/15/16)a | | | 8,375 | | | | 8,825,156 | |
7.25%, 07/01/18 (Call 12/15/15) | | | 7,400 | | | | 8,121,500 | |
8.63%, 10/01/18 (Call 10/01/14) | | | 10,215 | | | | 10,981,125 | |
Biomet Inc. | | | | | | | | |
6.50%, 08/01/20 (Call 08/01/15) | | | 27,550 | | | | 29,754,000 | |
6.50%, 10/01/20 (Call 10/01/15)a | | | 14,000 | | | | 14,927,500 | |
ConvaTec Healthcare E SA | | | | | | | | |
10.50%, 12/15/18 (Call 12/15/14)b | | | 13,147 | | | | 14,658,905 | |
| | | | |
SCHEDULESOF INVESTMENTS | | | 101 | |
Schedule of Investments (Continued)
iSHARES® iBOXX $ HIGH YIELD CORPORATE BOND ETF
February 28, 2014
| | | | | | | | |
Security | | Principal
(000s) | | | Value | |
| | | | | | | | |
DJO Finance LLC/DJO Finance Corp. | | | | | | | | |
9.88%, 04/15/18 (Call 04/15/15)a | | $ | 4,450 | | | $ | 4,872,750 | |
Hologic Inc. | | | | | | | | |
6.25%, 08/01/20 (Call 08/01/15) | | | 15,525 | | | | 16,572,938 | |
Kinetic Concepts Inc./KCI USA Inc. | | | | | | | | |
10.50%, 11/01/18 (Call 11/01/15)a | | | 30,050 | | | | 34,820,437 | |
12.50%, 11/01/19 (Call 11/01/15)a | | | 11,290 | | | | 13,068,175 | |
| | | | | | | | |
| | | | | | | 156,602,486 | |
HEALTH CARE PROVIDERS & SERVICES — 5.43% | |
CHS/Community Health Systems Inc. | | | | | | | | |
5.13%, 08/15/18 (Call 08/15/15) | | | 27,350 | | | | 28,922,625 | |
7.13%, 07/15/20 (Call 07/15/16)a | | | 21,400 | | | | 23,433,000 | |
8.00%, 11/15/19 (Call 11/15/15) | | | 36,000 | | | | 39,960,000 | |
DaVita HealthCare Partners Inc. | | | | | | | | |
5.75%, 08/15/22 (Call 08/15/17)a | | | 18,200 | | | | 19,292,000 | |
6.38%, 11/01/18 (Call 03/31/14)a | | | 14,875 | | | | 15,618,750 | |
6.63%, 11/01/20 (Call 11/01/14) | | | 13,700 | | | | 14,744,625 | |
Fresenius Medical Care US Finance II Inc. | | | | | | | | |
5.63%, 07/31/19b | | | 14,450 | | | | 15,533,750 | |
5.88%, 01/31/22b | | | 11,450 | | | | 12,280,125 | |
Fresenius Medical Care US Finance Inc. | | | | | | | | |
5.75%, 02/15/21a,b | | | 11,000 | | | | 11,783,750 | |
6.50%, 09/15/18b | | | 5,810 | | | | 6,536,250 | |
6.88%, 07/15/17a | | | 9,900 | | | | 11,211,750 | |
FWCT-2 Escrow Corp./Community Health Systems Inc. | | | | | | | | |
5.13%, 08/01/21 (Call 02/01/17)b | | | 10,600 | | | | 10,971,000 | |
| | | | | | | | |
Security | | Principal
(000s) | | | Value | |
| | | | | | | | |
6.88%, 02/01/22 (Call 02/01/18)b | | $ | 18,450 | | | $ | 19,603,125 | |
HCA Holdings Inc. | | | | | | | | |
4.75%, 05/01/23 | | | 22,650 | | | | 22,706,625 | |
5.88%, 03/15/22a | | | 22,250 | | | | 24,308,125 | |
6.25%, 02/15/21a | | | 17,300 | | | | 18,857,000 | |
6.50%, 02/15/16a | | | 21,250 | | | | 23,162,500 | |
6.50%, 02/15/20 | | | 47,980 | | | | 54,097,450 | |
7.25%, 09/15/20 (Call 03/15/15) | | | 26,810 | | | | 29,155,875 | |
7.50%, 02/15/22a | | | 32,755 | | | | 38,077,687 | |
7.75%, 05/15/21 (Call 11/15/15)a | | | 26,130 | | | | 28,938,975 | |
7.88%, 02/15/20 (Call 08/15/14) | | | 22,760 | | | | 24,353,200 | |
8.00%, 10/01/18a | | | 11,850 | | | | 14,131,125 | |
8.50%, 04/15/19 (Call 04/15/14) | | | 26,900 | | | | 28,245,000 | |
HCA Inc. | | | | | | | | |
5.88%, 05/01/23a | | | 23,950 | | | | 25,267,250 | |
LifePoint Hospitals Inc. | | | | | | | | |
5.50%, 12/01/21 (Call 12/01/16)b | | | 4,850 | | | | 5,074,313 | |
6.63%, 10/01/20 (Call 10/01/15) | | | 4,000 | | | | 4,345,000 | |
MultiPlan Inc. | | | | | | | | |
9.88%, 09/01/18 (Call 09/01/14)b | | | 150 | | | | 163,875 | |
Tenet Healthcare Corp. | | | | | | | | |
4.38%, 10/01/21 | | | 21,500 | | | | 21,258,125 | |
4.50%, 04/01/21 | | | 17,325 | | | | 17,281,688 | |
4.75%, 06/01/20a | | | 13,100 | | | | 13,427,500 | |
6.00%, 10/01/20b | | | 29,535 | | | | 31,971,637 | |
6.25%, 11/01/18 | | | 21,560 | | | | 23,877,700 | |
8.00%, 08/01/20 (Call 08/01/15)a | | | 15,560 | | | | 17,116,000 | |
8.13%, 04/01/22 | | | 37,100 | | | | 41,598,375 | |
| | | | | | | | |
| | | | | | | 737,305,775 | |
HEALTH CARE TECHNOLOGY — 0.09% | | | | | |
IMS Health Inc. | | | | | | | | |
6.00%, 11/01/20 (Call 11/01/15)b | | | 10,400 | | | | 11,128,000 | |
12.50%, 03/01/18 (Call 03/01/15)b | | | 1,100 | | | | 1,254,000 | |
| | | | | | | | |
| | | | | | | 12,382,000 | |
| | |
| 102 | | 2014 iSHARES ANNUAL REPORTTO SHAREHOLDERS |
Schedule of Investments (Continued)
iSHARES® iBOXX $ HIGH YIELD CORPORATE BOND ETF
February 28, 2014
| | | | | | | | |
Security | | Principal
(000s) | | | Value | |
| | | | | | | | |
HOTELS, RESTAURANTS & LEISURE — 4.04% | |
Boyd Gaming Corp. | | | | | | | | |
9.13%, 12/01/18 (Call 12/01/14)a | | $ | 8,150 | | | $ | 8,841,800 | |
Burger King Corp. | | | | | | | | |
9.88%, 10/15/18 (Call 10/15/14)a | | | 12,860 | | | | 14,066,268 | |
Caesars Entertainment Operating Co. Inc. | | | | | | | | |
5.63%, 06/01/15a | | | 3,700 | | | | 3,547,375 | |
8.50%, 02/15/20 (Call 02/15/16)a | | | 21,850 | | | | 20,976,000 | |
9.00%, 02/15/20 (Call 02/15/16)a | | | 48,050 | | | | 46,848,750 | |
10.00%, 12/15/18 (Call 03/31/14)a | | | 62,897 | | | | 30,586,036 | |
10.75%, 02/01/16 (Call 03/31/14)a | | | 10,250 | | | | 8,430,625 | |
11.25%, 06/01/17 (Call 03/31/14) | | | 31,960 | | | | 32,679,100 | |
12.75%, 04/15/18 (Call 04/15/14) | | | 15,445 | | | | 8,494,750 | |
Caesars Entertainment Resort Properties LLC/Caesars Entertainment Resort Properties Finance Inc. | | | | | | | | |
8.00%, 10/01/20 (Call 10/01/16)a,b | | | 18,400 | | | | 19,567,808 | |
11.00%, 10/01/21 (Call 10/01/16)a,b | | | 20,850 | | | | 22,006,441 | |
Felcor Lodging LP | | | | | | | | |
5.63%, 03/01/23 (Call 03/01/18) | | | 8,600 | | | | 8,632,250 | |
6.75%, 06/01/19 (Call 06/01/15)a | | | 11,020 | | | | 11,867,559 | |
10.00%, 10/01/14a | | | 1,141 | | | | 1,196,624 | |
GLP Capital LP/GLP Financing II Inc. | | | | | | | | |
4.38%, 11/01/18 (Call 08/01/18)b | | | 7,150 | | | | 7,418,125 | |
4.88%, 11/01/20 (Call 08/01/20)b | | | 10,625 | | | | 10,996,875 | |
5.38%, 11/01/23 (Call 08/01/23)a,b | | | 10,250 | | | | 10,583,125 | |
| | | | | | | | |
Security | | Principal
(000s) | | | Value | |
| | | | | | | | |
Hilton Worldwide Finance LLC/Hilton Worldwide Finance Corp. | | | | | | | | |
5.63%, 10/15/21 (Call 10/15/16)a,b | | $ | 11,250 | | | $ | 11,925,000 | |
MGM Resorts International | | | | | | | | |
5.25%, 03/31/20a | | | 7,550 | | | | 7,760,505 | |
6.63%, 07/15/15 | | | 14,100 | | | | 15,024,118 | |
6.63%, 12/15/21a | | | 21,250 | | | | 23,372,692 | |
6.75%, 10/01/20a | | | 18,100 | | | | 20,037,448 | |
7.50%, 06/01/16 | | | 12,570 | | | | 14,026,883 | |
7.63%, 01/15/17a | | | 13,850 | | | | 15,783,819 | |
7.75%, 03/15/22a | | | 16,100 | | | | 18,450,508 | |
8.63%, 02/01/19a | | | 14,750 | | | | 17,632,778 | |
10.00%, 11/01/16 | | | 9,100 | | | | 10,920,000 | |
11.38%, 03/01/18a | | | 9,420 | | | | 12,186,604 | |
Mohegan Tribal Gaming Authority | | | | | | | | |
9.75%, 09/01/21 (Call 09/01/16)a,b | | | 8,375 | | | | 9,233,065 | |
Pinnacle Entertainment Inc. | | | | | | | | |
7.50%, 04/15/21 (Call 04/15/15)a | | | 15,896 | | | | 17,286,900 | |
PNK Finance Corp. | | | | | | | | |
6.38%, 08/01/21 (Call 08/01/16)a,b | | | 14,940 | | | | 15,616,609 | |
Sabre Holdings Corp. | | | | | | | | |
8.35%, 03/15/16 | | | 8,150 | | | | 9,128,001 | |
Sabre Inc. | | | | | | | | |
8.50%, 05/15/19 (Call 05/15/15)b | | | 13,150 | | | | 14,662,250 | |
Wynn Las Vegas LLC/Wynn Las Vegas Capital Corp. | | | | | | | | |
4.25%, 05/30/23 (Call 02/28/23)a,b | | | 8,650 | | | | 8,408,121 | |
5.38%, 03/15/22 (Call 03/15/17)a | | | 12,300 | | | | 12,961,125 | |
7.75%, 08/15/20 (Call 08/15/15)a | | | 24,220 | | | | 26,997,261 | |
| | | | | | | | |
| | | | | | | 548,153,198 | |
| | | | |
SCHEDULESOF INVESTMENTS | | | 103 | |
Schedule of Investments (Continued)
iSHARES® iBOXX $ HIGH YIELD CORPORATE BOND ETF
February 28, 2014
| | | | | | | | |
Security | | Principal
(000s) | | | Value | |
| | | | | | | | |
HOUSEHOLD DURABLES — 1.21% | | | | | |
Brookfield Residential Properties Inc. | | | | | | | | |
6.13%, 07/01/22 (Call 07/01/17)b | | $ | 9,450 | | | $ | 9,709,875 | |
6.50%, 12/15/20 (Call 12/15/15)a,b | | | 9,150 | | | | 9,721,875 | |
Centex Corp. | | | | | | | | |
6.50%, 05/01/16a | | | 10,100 | | | | 11,172,620 | |
DR Horton Inc. | | | | | | | | |
3.63%, 02/15/18 (Call 11/15/17) | | | 7,900 | | | | 8,106,980 | |
3.75%, 03/01/19 (Call 12/01/18) | | | 3,900 | | | | 3,948,750 | |
5.75%, 08/15/23 (Call 05/15/23)a | | | 7,600 | | | | 7,999,000 | |
Jarden Corp. | | | | | | | | |
7.50%, 05/01/17a | | | 8,330 | | | | 9,558,675 | |
K. Hovnanian Enterprises Inc. | | | | | | | | |
7.25%, 10/15/20 (Call 10/15/15)a,b | | | 9,800 | | | | 10,682,000 | |
KB Home | | | | | | | | |
7.00%, 12/15/21 (Call 09/15/21)a | | | 8,950 | | | | 9,576,500 | |
Lennar Corp. | | | | | | | | |
4.50%, 06/15/19 (Call 04/16/19) | | | 3,750 | | | | 3,843,750 | |
4.75%, 12/15/17 (Call 09/15/17)a | | | 8,025 | | | | 8,506,500 | |
4.75%, 11/15/22 (Call 08/15/22) | | | 4,550 | | | | 4,368,000 | |
12.25%, 06/01/17 | | | 11,275 | | | | 14,544,750 | |
Standard Pacific Corp. | | | | | | | | |
8.38%, 05/15/18 | | | 9,225 | | | | 10,977,750 | |
8.38%, 01/15/21a | | | 8,670 | | | | 10,338,975 | |
Taylor Morrison Communities Inc./Monarch Communities Inc. | | | | | | | | |
5.25%, 04/15/21 (Call 04/15/16)b | | | 10,350 | | | | 10,324,125 | |
Toll Brothers Finance Corp. | | | | | | | | |
4.38%, 04/15/23 (Call 01/15/23)a | | | 10,900 | | | | 10,545,750 | |
| | | | | | | | |
Security | | Principal
(000s) | | | Value | |
| | | | | | | | |
5.88%, 02/15/22 (Call 11/15/21) | | $ | 7,180 | | | $ | 7,718,500 | |
8.91%, 10/15/17a | | | 2,750 | | | | 3,327,500 | |
| | | | | | | | |
| | | | | | | 164,971,875 | |
HOUSEHOLD PRODUCTS — 0.30% | | | | | |
Harbinger Group Inc. | | | | | | | | |
7.88%, 07/15/19 (Call 01/15/16) | | | 18,575 | | | | 20,061,000 | |
Spectrum Brands Inc. | | | | | | | | |
6.38%, 11/15/20 (Call 11/15/16) | | | 8,860 | | | | 9,590,950 | |
6.63%, 11/15/22 (Call 11/15/17)a | | | 9,650 | | | | 10,494,375 | |
| | | | | | | | |
| | | | | | | 40,146,325 | |
INDEPENDENT POWER PRODUCERS & ENERGY TRADERS — 2.27% | |
AES Corp. (The) | | | | | | | | |
4.88%, 05/15/23 (Call 05/15/18)a | | | 12,005 | | | | 11,655,998 | |
7.38%, 07/01/21 (Call 06/01/21) | | | 15,175 | | | | 17,252,371 | |
8.00%, 10/15/17 | | | 20,771 | | | | 24,521,788 | |
8.00%, 06/01/20 | | | 11,580 | | | | 13,553,825 | |
9.75%, 04/15/16a | | | 2,000 | | | | 2,343,342 | |
Calpine Corp. | | | | | | | | |
5.88%, 01/15/24 (Call 11/01/18)a,b | | | 8,200 | | | | 8,374,250 | |
6.00%, 01/15/22 (Call 11/01/16)a,b | | | 14,350 | | | | 15,182,632 | |
7.50%, 02/15/21 (Call 11/01/15)b | | | 27,287 | | | | 30,152,135 | |
7.88%, 07/31/20
(Call 07/31/15)a,b | | | 16,829 | | | | 18,648,297 | |
7.88%, 01/15/23
(Call 01/15/17)a,b | | | 16,934 | | | | 19,039,441 | |
GenOn Energy Inc. | | | | | | | | |
9.50%, 10/15/18a | | | 9,210 | | | | 9,567,354 | |
9.88%, 10/15/20
(Call 10/15/15) | | | 11,650 | | | | 11,937,905 | |
NRG Energy Inc. | | | | | | | | |
6.25%, 07/15/22 (Call 07/15/18)a,b | | | 16,250 | | | | 16,859,585 | |
| | |
| 104 | | 2014 iSHARES ANNUAL REPORTTO SHAREHOLDERS |
Schedule of Investments (Continued)
iSHARES® iBOXX $ HIGH YIELD CORPORATE BOND ETF
February 28, 2014
| | | | | | | | |
Security | | Principal
(000s) | | | Value | |
| | | | | | | | |
6.63%, 03/15/23 (Call 09/15/17)a | | $ | 16,700 | | | $ | 17,616,731 | |
7.63%, 01/15/18 | | | 18,430 | | | | 20,796,467 | |
7.63%, 05/15/19 (Call 05/15/14)a | | | 12,620 | | | | 13,249,443 | |
7.88%, 05/15/21 (Call 05/15/16)a | | | 19,100 | | | | 21,189,498 | |
8.25%, 09/01/20 (Call 09/01/15)a | | | 20,655 | | | | 22,865,112 | |
8.50%, 06/15/19 (Call 06/15/14)a | | | 12,605 | | | | 13,339,269 | |
| | | | | | | | |
| | | | | | | 308,145,443 | |
INSURANCE — 0.08% | | | | | |
Hartford Financial Services Group Inc. | | | | | | | | |
8.13%, 06/15/68 (Call 06/15/18)c | | | 9,042 | | | | 10,579,140 | |
| | | | | | | | |
| | | | | | | 10,579,140 | |
INTERNET & CATALOG RETAIL — 0.33% | | | | | |
QVC Inc. | | | | | | | | |
4.38%, 03/15/23 | | | 11,525 | | | | 11,201,347 | |
5.13%, 07/02/22 | | | 8,350 | | | | 8,526,619 | |
7.38%, 10/15/20 (Call 04/15/15)b | | | 9,814 | | | | 10,672,725 | |
7.50%, 10/01/19 (Call 10/01/14)b | | | 13,000 | | | | 13,910,000 | |
| | | | | | | | |
| | | | | | | 44,310,691 | |
INTERNET SOFTWARE & SERVICES — 0.59% | |
eAccess Ltd. | | | | | | | | |
8.25%, 04/01/18 (Call 04/01/15)b | | | 2,900 | | | | 3,146,500 | |
Equinix Inc. | | | | | | | | |
4.88%, 04/01/20 (Call 04/01/17)a | | | 8,800 | | | | 8,921,000 | |
5.38%, 04/01/23 (Call 04/01/18)a | | | 16,600 | | | | 16,816,042 | |
7.00%, 07/15/21 (Call 07/15/16)a | | | 13,600 | | | | 15,090,427 | |
IAC/InterActiveCorp | | | | | | | | |
4.75%, 12/15/22 (Call 12/15/17) | | | 6,850 | | | | 6,627,375 | |
4.88%, 11/30/18 (Call 11/30/14)b | | | 5,600 | | | | 5,824,000 | |
| | | | | | | | |
Security | | Principal
(000s) | | | Value | |
| | | | | | | | |
Zayo Group LLC/Zayo Capital Inc. | | | | | | | | |
8.13%, 01/01/20 (Call 07/01/15)a | | $ | 13,350 | | | $ | 14,701,688 | |
10.13%, 07/01/20 (Call 07/01/16)a | | | 7,725 | | | | 8,961,000 | |
| | | | | | | | |
| | | | | | | 80,088,032 | |
IT SERVICES — 2.32% | | | | | |
Audatex North America Inc. | | | | | | | | |
6.00%, 06/15/21 (Call 06/15/17)b | | | 22,700 | | | | 24,118,750 | |
First Data Corp. | | | | | | | | |
6.75%, 11/01/20 (Call 11/01/15)a,b | | | 30,288 | | | | 32,699,240 | |
7.38%, 06/15/19 (Call 06/15/15)b | | | 28,200 | | | | 30,561,750 | |
8.25%, 01/15/21 (Call 01/15/16)a,b | | | 34,652 | | | | 37,575,485 | |
8.88%, 08/15/20 (Call 08/15/15)b | | | 10,000 | | | | 11,102,725 | |
10.63%, 06/15/21 (Call 04/15/16)b | | | 11,000 | | | | 12,312,742 | |
11.25%, 01/15/21 (Call 01/15/16)a,b | | | 12,950 | | | | 14,698,250 | |
11.75%, 08/15/21 (Call 05/15/16)a,b | | | 38,525 | | | | 41,173,594 | |
11.75%, 08/15/21 (Call 05/15/16)b | | | 4,000 | | | | 4,275,000 | |
12.63%, 01/15/21 (Call 01/15/16)a | | | 49,582 | | | | 59,293,126 | |
SunGard Data Systems Inc. | | | | | | | | |
6.63%, 11/01/19 (Call 11/01/15) | | | 17,750 | | | | 18,925,937 | |
7.38%, 11/15/18 (Call 03/31/14) | | | 16,125 | | | | 17,132,813 | |
7.63%, 11/15/20 (Call 11/15/15)a | | | 10,510 | | | | 11,561,000 | |
| | | | | | | | |
| | | | | | | 315,430,412 | |
MACHINERY — 0.95% | | | | | | | | |
BlueLine Rental Finance Corp. | | | | | | | | |
7.00%, 02/01/19 (Call 02/01/16)b | | | 7,350 | | | | 7,717,500 | |
| | | | |
SCHEDULESOF INVESTMENTS | | | 105 | |
Schedule of Investments (Continued)
iSHARES® iBOXX $ HIGH YIELD CORPORATE BOND ETF
February 28, 2014
| | | | | | | | |
Security | | Principal
(000s) | | | Value | |
| | | | | | | | |
Case New Holland Inc. | | | | | | | | |
7.88%, 12/01/17 | | $ | 24,700 | | | $ | 28,899,000 | |
CNH Capital LLC | | | | | | | | |
3.25%, 02/01/17a | | | 7,800 | | | | 7,936,500 | |
3.63%, 04/15/18 | | | 9,950 | | | | 10,086,813 | |
3.88%, 11/01/15a | | �� | 10,570 | | | | 10,873,887 | |
6.25%, 11/01/16a | | | 7,670 | | | | 8,417,825 | |
Manitowoc Co. Inc. (The) | | | | | | | | |
8.50%, 11/01/20 (Call 11/01/15)a | | | 9,000 | | | | 10,203,750 | |
Navistar International Corp. | | | | | | | | |
8.25%, 11/01/21 (Call 11/01/14)a | | | 19,850 | | | | 20,743,250 | |
SPX Corp. | | | | | | | | |
6.88%, 09/01/17a | | | 8,300 | | | | 9,441,250 | |
Terex Corp. | | | | | | | | |
6.00%, 05/15/21 (Call 11/15/16)a | | | 13,500 | | | | 14,191,875 | |
| | | | | | | | |
| | | | | | | 128,511,650 | |
MEDIA — 7.18% | | | | | | | | |
AMC Entertainment Inc. | | | | | | | | |
9.75%, 12/01/20 (Call 12/01/15)a | | | 11,120 | | | | 12,786,454 | |
AMC Networks Inc. | | | | | | | | |
4.75%, 12/15/22 (Call 12/15/17) | | | 10,725 | | | | 10,741,675 | |
7.75%, 07/15/21 (Call 07/15/16) | | | 10,900 | | | | 12,371,919 | |
Cablevision Systems Corp. | | | | | | | | |
5.88%, 09/15/22a | | | 12,400 | | | | 12,896,000 | |
7.75%, 04/15/18a | | | 14,000 | | | | 16,135,000 | |
8.00%, 04/15/20a | | | 9,700 | | | | 11,397,500 | |
8.63%, 09/15/17a | | | 12,800 | | | | 15,264,000 | |
Cequel Communications Holdings I LLC/Cequel Capital Corp. | | | | | | | | |
5.13%, 12/15/21 (Call 06/15/16)b | | | 12,375 | | | | 12,328,594 | |
6.38%, 09/15/20 (Call 09/15/15)a,b | | | 24,775 | | | | 26,137,625 | |
Cinemark USA Inc. | | | | | | | | |
4.88%, 06/01/23 (Call 06/01/18) | | | 9,000 | | | | 8,707,500 | |
| | | | | | | | |
Security | | Principal
(000s) | | | Value | |
| | | | | | | | |
5.13%, 12/15/22 (Call 12/15/17)a | | $ | 6,700 | | | $ | 6,672,076 | |
Clear Channel Communications Inc. | | | | | | | | |
9.00%, 12/15/19 (Call 07/15/15)a | | | 23,100 | | | | 24,283,875 | |
9.00%, 03/01/21 (Call 03/01/16)a | | | 32,590 | | | | 34,138,025 | |
11.25%, 03/01/21 (Call 03/01/16)a | | | 7,700 | | | | 8,562,525 | |
14.00%, 02/01/21 (Call 08/01/15)a,d | | | 2,401 | | | | 2,382,764 | |
Clear Channel Worldwide Holdings Inc. | | | | | | | | |
6.50%, 11/15/22 (Call 11/15/17)a | | | 10,375 | | | | 10,971,563 | |
6.50%, 11/15/22 (Call 11/15/17) | | | 34,225 | | | | 36,449,625 | |
Series A | | | | | | | | |
7.63%, 03/15/20 (Call 03/15/15) | | | 1,000 | | | | 1,075,000 | |
Series B | | | | | | | | |
7.63%, 03/15/20 (Call 03/15/15)a | | | 31,280 | | | | 33,782,400 | |
CSC Holdings LLC | | | | | | | | |
6.75%, 11/15/21a | | | 16,500 | | | | 18,645,000 | |
8.63%, 02/15/19a | | | 9,270 | | | | 11,147,175 | |
DISH DBS Corp. | | | | | | | | |
4.25%, 04/01/18 | | | 21,900 | | | | 22,745,248 | |
4.63%, 07/15/17a | | | 15,550 | | | | 16,474,336 | |
5.00%, 03/15/23 | | | 26,025 | | | | 25,927,406 | |
5.13%, 05/01/20 | | | 18,450 | | | | 19,107,141 | |
5.88%, 07/15/22 | | | 32,800 | | | | 34,631,808 | |
6.75%, 06/01/21a | | | 32,530 | | | | 36,514,925 | |
7.13%, 02/01/16 | | | 26,184 | | | | 28,751,037 | |
7.75%, 05/31/15 | | | 13,800 | | | | 14,865,194 | |
7.88%, 09/01/19a | | | 23,880 | | | | 28,050,785 | |
Gannett Co. Inc. | | | | | | | | |
5.13%, 10/15/19 (Call 10/15/16)b | | | 8,575 | | | | 8,978,460 | |
5.13%, 07/15/20 (Call 07/15/16)b | | | 13,750 | | | | 14,091,399 | |
6.38%, 10/15/23 (Call 10/15/18)a,b | | | 9,750 | | | | 10,210,715 | |
| | |
| 106 | | 2014 iSHARES ANNUAL REPORTTO SHAREHOLDERS |
Schedule of Investments (Continued)
iSHARES® iBOXX $ HIGH YIELD CORPORATE BOND ETF
February 28, 2014
| | | | | | | | |
Security | | Principal
(000s) | | | Value | |
| | | | | | | | |
inVentiv Health Inc. | | | | | | | | |
9.00%, 01/15/18 (Call 01/15/16)a,b | | $ | 13,000 | | | $ | 13,747,500 | |
11.00%, 08/15/18 (Call 08/15/14)a,b | | | 4,927 | | | | 4,532,840 | |
Lamar Media Corp. | | | | | | | | |
5.00%, 05/01/23 (Call 05/01/18)a | | | 8,600 | | | | 8,562,328 | |
5.38%, 01/15/24 (Call 01/15/19)b | | | 2,425 | | | | 2,498,808 | |
5.88%, 02/01/22 (Call 02/01/17)a | | | 7,350 | | | | 7,772,394 | |
7.88%, 04/15/18 (Call 04/15/14)a | | | 10,310 | | | | 10,786,658 | |
McClatchy Co. (The) | | | | | | | | |
9.00%, 12/15/22 (Call 12/15/17) | | | 15,000 | | | | 17,145,000 | |
Nara Cable Funding Ltd. | | | | | | | | |
8.88%, 12/01/18 (Call 03/31/14)b | | | 19,450 | | | | 21,103,250 | |
Nielsen Finance LLC/Nielsen Finance Co. | | | | | | | | |
4.50%, 10/01/20 (Call 10/01/16)a | | | 13,000 | | | | 13,066,797 | |
7.75%, 10/15/18 (Call 10/15/14)a | | | 18,840 | | | | 20,182,350 | |
Quebecor Media Inc. | | | | | | | | |
5.75%, 01/15/23a | | | 14,700 | | | | 14,883,750 | |
Regal Cinemas Corp. | | | | | | | | |
8.63%, 07/15/19 (Call 07/15/14)a | | | 1,000 | | | | 1,071,339 | |
Regal Entertainment Group | | | | | | | | |
5.75%, 03/15/22 (Call 03/15/17) | | | 6,350 | | | | 6,492,875 | |
Sinclair Television Group Inc. | | | | | | | | |
5.38%, 04/01/21 (Call 04/01/16)a | | | 10,600 | | | | 10,619,419 | |
6.13%, 10/01/22 (Call 10/01/17) | | | 9,150 | | | | 9,463,975 | |
Sirius XM Holdings Inc. | | | | | | | | |
4.25%, 05/15/20 (Call 05/15/16)a,b | | | 10,150 | | | | 9,896,250 | |
4.63%, 05/15/23 (Call 05/15/18)a,b | | | 8,825 | | | | 8,339,625 | |
| | | | | | | | |
Security | | Principal
(000s) | | | Value | |
| | | | | | | | |
5.25%, 08/15/22 (Call 08/15/17)a,b | | $ | 6,625 | | | $ | 6,856,875 | |
5.75%, 08/01/21 (Call 08/01/16)a,b | | | 11,075 | | | | 11,504,156 | |
5.88%, 10/01/20 (Call 10/01/16)b | | | 8,350 | | | | 8,777,986 | |
Unitymedia Hessen GmbH & Co. KG | | | | | | | | |
5.50%, 01/15/23 (Call 01/15/18)b | | | 19,200 | | | | 19,883,856 | |
7.50%, 03/15/19 (Call 03/15/15)b | | | 12,500 | | | | 13,580,395 | |
Univision Communications Inc. | | | | | | | | |
5.13%, 05/15/23 (Call 05/15/18)a,b | | | 11,025 | | | | 11,277,945 | |
6.75%, 09/15/22 (Call 09/15/17)b | | | 19,650 | | | | 21,762,375 | |
6.88%, 05/15/19 (Call 05/15/15)b | | | 20,300 | | | | 21,822,500 | |
7.88%, 11/01/20 (Call 11/01/15)b | | | 12,830 | | | | 14,215,528 | |
8.50%, 05/15/21 (Call 11/15/15)a,b | | | 15,400 | | | | 17,074,750 | |
Videotron Ltee | | | | | | | | |
5.00%, 07/15/22 | | | 12,150 | | | | 12,241,125 | |
9.13%, 04/15/18 (Call 03/31/14)a | | | 11,174 | | | | 11,620,960 | |
WideOpenWest Finance LLC/WideOpenWest Capital Corp. | | | | | | | | |
10.25%, 07/15/19 (Call 07/15/15) | | | 13,250 | | | | 15,105,000 | |
WMG Acquisition Corp. | | | | | | | | |
6.00%, 01/15/21 (Call 01/15/16)a,b | | | 7,739 | | | | 8,125,950 | |
11.50%, 10/01/18 (Call 10/01/14) | | | 12,690 | | | | 14,413,944 | |
| | | | | | | | |
| | | | | | | 975,653,252 | |
METALS & MINING — 3.73% | | | | | |
AK Steel Corp. | | | | | | | | |
7.63%, 05/15/20 (Call 05/15/15)a | | | 10,250 | | | | 10,173,126 | |
Aleris International Inc. | | | | | | | | |
7.63%, 02/15/18 (Call 03/31/14)a | | | 9,600 | | | | 10,150,956 | |
| | | | |
SCHEDULESOF INVESTMENTS | | | 107 | |
Schedule of Investments (Continued)
iSHARES® iBOXX $ HIGH YIELD CORPORATE BOND ETF
February 28, 2014
| | | | | | | | |
Security | | Principal
(000s) | | | Value | |
| | | | | | | | |
7.88%, 11/01/20 (Call 11/01/15)a | | $ | 9,050 | | | $ | 9,581,688 | |
ArcelorMittal SA | | | | | | | | |
4.25%, 02/25/15a | | | 3,650 | | | | 3,739,985 | |
4.25%, 08/05/15a | | | 21,100 | | | | 21,721,804 | |
4.25%, 03/01/16a | | | 8,550 | | | | 8,877,064 | |
5.00%, 02/25/17 | | | 24,376 | | | | 26,081,101 | |
5.75%, 08/05/20a | | | 12,700 | | | | 13,626,475 | |
6.00%, 03/01/21a | | | 25,785 | | | | 27,859,501 | |
6.13%, 06/01/18 | | | 26,400 | | | | 29,079,956 | |
6.75%, 02/25/22a | | | 18,900 | | | | 21,015,836 | |
9.50%, 02/15/15 | | | 8,543 | | | | 9,158,569 | |
10.35%, 06/01/19 | | | 25,700 | | | | 32,799,625 | |
Commercial Metals Co. | | | | | | | | |
6.50%, 07/15/17a | | | 6,786 | | | | 7,612,212 | |
7.35%, 08/15/18a | | | 9,250 | | | | 10,579,697 | |
First Quantum Minerals Ltd. | | | | | | | | |
6.75%, 02/15/20 (Call 02/15/17)a,b | | | 20,474 | | | | 21,087,962 | |
7.00%, 02/15/21 (Call 02/15/18)a,b | | | 20,474 | | | | 21,087,962 | |
FMG Resources (August 2006) Pty Ltd. | | | | | | | | |
6.00%, 04/01/17 (Call 04/01/15)a,b | | | 19,150 | | | | 20,227,188 | |
6.38%, 02/01/16 (Call 03/14/14)a,b | | | 12,900 | | | | 13,332,150 | |
6.88%, 02/01/18 (Call 03/31/14)a,b | | | 15,950 | | | | 16,787,375 | |
6.88%, 04/01/22 (Call 04/01/17)a,b | | | 17,300 | | | | 18,770,500 | |
7.00%, 11/01/15 (Call 03/14/14)a,b | | | 9,882 | | | | 10,232,811 | |
8.25%, 11/01/19 (Call 11/01/15)a,b | | | 22,920 | | | | 25,326,600 | |
Novelis Inc. | | | | | | | | |
8.38%, 12/15/17 (Call 03/31/14)a | | | 17,600 | | | | 18,771,942 | |
8.75%, 12/15/20 (Call 12/15/15)a | | | 23,290 | | | | 26,150,117 | |
Steel Dynamics Inc. | | | | | | | | |
5.25%, 04/15/23 (Call 04/15/18) | | | 6,450 | | | | 6,625,234 | |
| | | | | | | | |
Security | | Principal
(000s) | | | Value | |
| | | | | | | | |
6.13%, 08/15/19 (Call 08/15/16)a | | $ | 7,750 | | | $ | 8,497,512 | |
United States Steel Corp. | | | | | | | | |
6.05%, 06/01/17a | | | 8,500 | | | | 9,210,274 | |
7.00%, 02/01/18a | | | 8,290 | | | | 9,160,450 | |
7.38%, 04/01/20a | | | 9,650 | | | | 10,512,304 | |
7.50%, 03/15/22 (Call 03/15/17)a | | | 7,800 | | | | 8,326,500 | |
Walter Energy Inc. | | | | | | | | |
8.50%, 04/15/21 (Call 04/15/17)a | | | 7,900 | | | | 5,776,875 | |
9.50%, 10/15/19 (Call 10/15/16)a,b | | | 8,525 | | | | 8,610,250 | |
9.88%, 12/15/20 (Call 12/15/16)a | | | 8,650 | | | | 6,692,938 | |
| | | | | | | | |
| | | | | | | 507,244,539 | |
MULTI-UTILITIES — 0.16% | | | | | | | | |
Puget Energy Inc. | | | | | | | | |
5.63%, 07/15/22 (Call 04/15/22)a | | | 6,427 | | | | 7,282,526 | |
6.00%, 09/01/21 | | | 7,575 | | | | 8,749,081 | |
6.50%, 12/15/20 | | | 4,560 | | | | 5,394,390 | |
| | | | | | | | |
| | | | | | | 21,425,997 | |
MULTILINE RETAIL — 0.31% | | | | | | | | |
JC Penney Corp. Inc. | | | | | | | | |
5.65%, 06/01/20 | | | 8,200 | | | | 6,560,000 | |
Neiman Marcus Group Inc. (The) | | | | | | | | |
8.00%, 10/15/21 (Call 10/15/16)a,b | | | 14,800 | | | | 15,836,000 | |
Sears Holdings Corp. | | | | | | | | |
6.63%, 10/15/18a | | | 21,045 | | | | 19,887,525 | |
| | | | | | | | |
| | | | | | | 42,283,525 | |
OFFICE ELECTRONICS — 0.18% | | | | | |
CDW LLC/CDW Finance Corp. | | | | | | | | |
8.50%, 04/01/19 (Call 04/01/15) | | | 21,260 | | | | 23,386,000 | |
12.54%, 10/12/17 (Call 03/31/14)a | | | 902 | | | | 947,100 | |
| | | | | | | | |
| | | | | | | 24,333,100 | |
OIL, GAS & CONSUMABLE FUELS — 12.79% | |
Access Midstream Partners LP/ACMP Finance Corp. | | | | | | | | |
4.88%, 05/15/23 (Call 12/15/17)a | | | 24,100 | | | | 24,644,450 | |
| | |
| 108 | | 2014 iSHARES ANNUAL REPORTTO SHAREHOLDERS |
Schedule of Investments (Continued)
iSHARES® iBOXX $ HIGH YIELD CORPORATE BOND ETF
February 28, 2014
| | | | | | | | |
Security | | Principal
(000s) | | | Value | |
| | | | | | | | |
5.88%, 04/15/21 (Call 04/15/15) | | $ | 12,900 | | | $ | 13,730,646 | |
6.13%, 07/15/22 (Call 01/15/17)a | | | 13,380 | | | | 14,467,492 | |
Alpha Natural Resources Inc. | | | | | | | | |
6.00%, 06/01/19 (Call 06/01/14)a | | | 13,115 | | | | 11,206,162 | |
6.25%, 06/01/21 (Call 06/01/16)a | | | 11,940 | | | | 10,035,451 | |
9.75%, 04/15/18a | | | 8,900 | | | | 9,211,500 | |
Antero Resources Finance Corp. | | | | | | | | |
5.38%, 11/01/21 (Call 11/01/16)b | | | 11,300 | | | | 11,506,533 | |
6.00%, 12/01/20 (Call 12/01/15)a | | | 12,700 | | | | 13,493,750 | |
7.25%, 08/01/19 (Call 08/01/14) | | | 1,090 | | | | 1,171,750 | |
Arch Coal Inc. | | | | | | | | |
7.00%, 06/15/19 (Call 06/15/15)a | | | 16,450 | | | | 13,670,600 | |
7.25%, 10/01/20 (Call 10/01/15)a | | | 8,130 | | | | 6,650,033 | |
7.25%, 06/15/21 (Call 06/15/16)a | | | 17,500 | | | | 14,175,000 | |
Atlas Pipeline Partners LP/Atlas Pipeline Finance Corp. | | | | | | | | |
4.75%, 11/15/21 (Call 05/15/16) | | | 8,350 | | | | 7,951,697 | |
5.88%, 08/01/23 (Call 02/01/18) | | | 13,675 | | | | 13,435,757 | |
6.63%, 10/01/20 (Call 10/01/16)a | | | 1,800 | | | | 1,928,189 | |
Berry Petroleum Co. LLC | | | | | | | | |
6.38%, 09/15/22 (Call 03/15/17) | | | 10,500 | | | | 10,956,163 | |
BreitBurn Energy Partners LP/BreitBurn Finance Corp. | | | | | | | | |
7.88%, 04/15/22 (Call 01/15/17)a | | | 12,900 | | | | 14,072,035 | |
Chaparral Energy Inc. | | | | | | | | |
7.63%, 11/15/22 (Call 05/15/17)a | | | 10,300 | | | | 11,163,246 | |
| | | | | | | | |
Security | | Principal
(000s) | | | Value | |
| | | | | | | | |
8.25%, 09/01/21 (Call 09/01/16) | | $ | 7,970 | | | $ | 8,710,932 | |
Chesapeake Energy Corp. | | | | | | | | |
3.25%, 03/15/16 (Call 03/31/14)a | | | 9,925 | | | | 10,013,031 | |
5.38%, 06/15/21 (Call 06/15/16) | | | 14,050 | | | | 15,056,833 | |
5.75%, 03/15/23a | | | 20,250 | | | | 21,698,649 | |
6.13%, 02/15/21a | | | 19,580 | | | | 21,727,115 | |
6.50%, 08/15/17a | | | 11,250 | | | | 12,731,746 | |
6.63%, 08/15/20a | | | 25,500 | | | | 29,085,606 | |
7.25%, 12/15/18 | | | 14,345 | | | | 16,811,334 | |
9.50%, 02/15/15 | | | 11,656 | | | | 12,547,926 | |
Chesapeake Oilfield Operating LLC/Chesapeake Oilfield Finance Inc. | | | | | | | | |
6.63%, 11/15/19 (Call 11/15/15) | | | 11,660 | | | | 12,300,214 | |
Concho Resources Inc. | | | | | | | | |
5.50%, 10/01/22 (Call 10/01/17) | | | 11,450 | | | | 12,033,321 | |
5.50%, 04/01/23 (Call 10/01/17) | | | 23,700 | | | | 24,660,002 | |
6.50%, 01/15/22 (Call 01/15/17) | | | 10,030 | | | | 10,909,518 | |
7.00%, 01/15/21 (Call 01/15/16)a | | | 11,960 | | | | 13,225,795 | |
CONSOL Energy Inc. | | | | | | | | |
8.00%, 04/01/17 (Call 04/01/14) | | | 24,850 | | | | 25,925,093 | |
8.25%, 04/01/20 (Call 04/01/15) | | | 20,710 | | | | 22,473,885 | |
Continental Resources Inc. | | | | | | | | |
5.00%, 09/15/22 (Call 03/15/17) | | | 1,496 | | | | 1,567,060 | |
Crestwood Midstream Partners LP/Crestwood Midstream Finance Corp. | | | | | | | | |
6.00%, 12/15/20 (Call 12/15/16) | | | 3,615 | | | | 3,773,844 | |
6.13%, 03/01/22 (Call 11/01/16)b | | | 7,600 | | | | 7,928,722 | |
| | | | |
SCHEDULESOF INVESTMENTS | | | 109 | |
Schedule of Investments (Continued)
iSHARES® iBOXX $ HIGH YIELD CORPORATE BOND ETF
February 28, 2014
| | | | | | | | |
Security | | Principal
(000s) | | | Value | |
| | | | | | | | |
DCP Midstream LLC | | | | | | | | |
5.85%, 05/21/43 (Call 05/21/23)b,c | | $ | 10,705 | | | $ | 10,062,700 | |
Denbury Resources Inc. | | | | | | | | |
4.63%, 07/15/23 (Call 01/15/18) | | | 20,550 | | | | 19,357,023 | |
6.38%, 08/15/21 (Call 08/15/16) | | | 7,280 | | | | 7,812,820 | |
8.25%, 02/15/20 (Call 02/15/15) | | | 16,590 | | | | 18,097,903 | |
El Paso LLC | | | | | | | | |
7.00%, 06/15/17 | | | 17,015 | | | | 19,232,177 | |
7.25%, 06/01/18 | | | 9,650 | | | | 11,051,368 | |
8.25%, 02/15/16 | | | 3,800 | | | | 4,124,714 | |
Energy Transfer Equity LP | | | | | | | | |
5.88%, 01/15/24a | | | 8,725 | | | | 8,855,875 | |
7.50%, 10/15/20 | | | 19,180 | | | | 21,865,200 | |
Energy XXI Gulf Coast Inc. | | | | | | | | |
7.50%, 12/15/21 (Call 12/15/16)b | | | 9,890 | | | | 10,320,514 | |
9.25%, 12/15/17 (Call 12/15/14) | | | 12,600 | | | | 13,752,527 | |
EP Energy LLC/EP Energy Finance Inc. | | | | | | | | |
Series WI 9.38%, 05/01/20 (Call 05/01/16) | | | 32,615 | | | | 37,833,400 | |
EP Energy LLC/Everest Acquisition Finance Inc. Series WI | | | | | | | | |
6.88%, 05/01/19 (Call 05/01/15) | | | 13,500 | | | | 14,536,286 | |
Halcon Resources Corp. | | | | | | | | |
8.88%, 05/15/21 (Call 11/15/16)a | | | 23,850 | | | | 23,875,229 | |
9.25%, 02/15/22 (Call 08/15/17)a,b | | | 4,250 | | | | 4,337,014 | |
9.75%, 07/15/20 (Call 07/15/16)a | | | 14,695 | | | | 15,413,386 | |
9.75%, 07/15/20 (Call 07/15/16)a,b | | | 4,100 | | | | 4,300,434 | |
Kinder Morgan Finance Co. LLC | | | | | | | | |
6.00%, 01/15/18a,b | | | 12,990 | | | | 14,305,035 | |
| | | | | | | | |
Security | | Principal
(000s) | | | Value | |
| | | | | | | | |
Kinder Morgan Finance Co. ULC | | | | | | | | |
5.70%, 01/05/16a | | $ | 11,745 | | | $ | 12,551,636 | |
Kinder Morgan Inc. | | | | | | | | |
5.00%, 02/15/21 (Call 01/15/21)b | | | 9,250 | | | | 9,319,375 | |
5.63%, 11/15/23 (Call 08/15/23)a,b | | | 10,700 | | | | 10,766,875 | |
Kodiak Oil & Gas Corp. | | | | | | | | |
5.50%, 02/01/22 (Call 08/01/17)a | | | 7,850 | | | | 8,040,711 | |
8.13%, 12/01/19 (Call 12/01/15) | | | 7,750 | | | | 8,605,947 | |
Laredo Petroleum Inc. | | | | | | | | |
5.63%, 01/15/22 (Call 01/15/17)b | | | 3,825 | | | | 3,901,500 | |
7.38%, 05/01/22 (Call 05/01/17)a | | | 10,200 | | | | 11,298,654 | |
9.50%, 02/15/19 (Call 02/15/15) | | | 11,500 | | | | 12,767,123 | |
Linn Energy LLC/Linn Energy Finance Corp. | | | | | | | | |
6.50%, 05/15/19 (Call 05/15/15)a | | | 12,750 | | | | 13,349,436 | |
7.00%, 11/01/19 (Call 11/01/15)a,b | | | 30,600 | | | | 31,770,970 | |
7.75%, 02/01/21 (Call 09/15/15) | | | 16,060 | | | | 17,404,741 | |
8.63%, 04/15/20 (Call 04/15/15) | | | 16,845 | | | | 18,327,045 | |
MarkWest Energy Partners LP/MarkWest Energy Finance Corp. | | | | | | | | |
4.50%, 07/15/23 (Call 04/15/23)a | | | 14,200 | | | | 13,747,071 | |
5.50%, 02/15/23 (Call 08/15/17) | | | 12,475 | | | | 12,879,648 | |
6.25%, 06/15/22 (Call 12/15/16) | | | 7,591 | | | | 8,195,498 | |
6.75%, 11/01/20 (Call 11/01/15)a | | | 9,765 | | | | 10,638,974 | |
MEG Energy Corp. | | | | | | | | |
6.38%, 01/30/23 (Call 07/30/17)b | | | 8,750 | | | | 8,992,453 | |
| | |
| 110 | | 2014 iSHARES ANNUAL REPORTTO SHAREHOLDERS |
Schedule of Investments (Continued)
iSHARES® iBOXX $ HIGH YIELD CORPORATE BOND ETF
February 28, 2014
| | | | | | | | |
Security | | Principal
(000s) | | | Value | |
| | | | | | | | |
6.50%, 03/15/21 (Call 03/15/15)b | | $ | 15,650 | | | $ | 16,476,680 | |
7.00%, 03/31/24 (Call 09/30/18)a,b | | | 15,025 | | | | 15,755,322 | |
Midstates Petroleum Co. Inc./Midstates Petroleum Co. LLC | | | | | | | | |
9.25%, 06/01/21 (Call 06/01/16) | | | 8,650 | | | | 9,086,489 | |
10.75%, 10/01/20 (Call 10/01/16)a | | | 10,764 | | | | 11,812,583 | |
Newfield Exploration Co. | | | | | | | | |
5.63%, 07/01/24 | | | 16,150 | | | | 16,889,615 | |
5.75%, 01/30/22a | | | 14,000 | | | | 15,008,595 | |
6.88%, 02/01/20 (Call 02/01/15)a | | | 13,885 | | | | 14,872,210 | |
7.13%, 05/15/18 (Call 03/31/14) | | | 3,706 | | | | 3,839,581 | |
NGPL PipeCo LLC | | | | | | | | |
7.12%, 12/15/17a,b | | | 22,040 | | | | 21,591,239 | |
9.63%, 06/01/19 (Call 06/01/15)a,b | | | 10,350 | | | | 10,999,952 | |
Oasis Petroleum Inc. | | | | | | | | |
6.50%, 11/01/21 (Call 11/01/16) | | | 7,050 | | | | 7,614,000 | |
6.88%, 03/15/22 (Call 09/15/17)a,b | | | 14,975 | | | | 16,322,750 | |
6.88%, 01/15/23 (Call 07/15/17) | | | 7,950 | | | | 8,625,750 | |
7.25%, 02/01/19 (Call 02/01/15)a | | | 7,015 | | | | 7,523,588 | |
Peabody Energy Corp. | | | | | | | | |
6.00%, 11/15/18 | | | 24,650 | | | | 26,595,467 | |
6.25%, 11/15/21a | | | 22,078 | | | | 22,925,521 | |
6.50%, 09/15/20a | | | 10,570 | | | | 11,217,420 | |
7.38%, 11/01/16 | | | 11,996 | | | | 13,530,402 | |
Penn Virginia Corp. | | | | | | | | |
8.50%, 05/01/20 (Call 05/01/17)a | | | 11,350 | | | | 12,555,938 | |
Penn Virginia Resource Partners LP/Penn Virginia Resource Finance Corp. II | | | | | | | | |
6.50%, 05/15/21 (Call 05/15/16) | | | 7,500 | | | | 7,877,037 | |
| | | | | | | | |
Security | | Principal
(000s) | | | Value | |
| | | | | | | | |
8.38%, 06/01/20 (Call 06/01/16)a | | $ | 10,534 | | | $ | 11,758,578 | |
QEP Resources Inc. | | | | | | | | |
5.25%, 05/01/23 (Call 02/01/23)a | | | 11,450 | | | | 11,337,102 | |
5.38%, 10/01/22 (Call 07/01/22)a | | | 5,960 | | | | 5,975,416 | |
6.88%, 03/01/21 | | | 11,450 | | | | 12,516,166 | |
Range Resources Corp. | | | | | | | | |
5.00%, 08/15/22 (Call 02/15/17) | | | 11,000 | | | | 11,292,657 | |
5.00%, 03/15/23 (Call 03/15/18) | | | 12,250 | | | | 12,422,882 | |
5.75%, 06/01/21 (Call 06/01/16) | | | 8,500 | | | | 9,130,081 | |
6.75%, 08/01/20 (Call 08/01/15) | | | 9,750 | | | | 10,579,220 | |
Regency Energy Partners LP/Regency Energy Finance Corp. | | | | | | | | |
4.50%, 11/01/23 (Call 08/01/23)a | | | 12,000 | | | | 11,188,075 | |
5.50%, 04/15/23 (Call 10/15/17)a | | | 10,850 | | | | 10,931,375 | |
5.75%, 09/01/20 (Call 06/01/20) | | | 6,650 | | | | 6,943,875 | |
5.88%, 03/01/22 (Call 01/01/22) | | | 4,000 | | | | 4,179,200 | |
6.50%, 07/15/21 (Call 07/15/16)a | | | 10,000 | | | | 10,825,000 | |
6.88%, 12/01/18 (Call 12/01/14) | | | 12,480 | | | | 13,322,400 | |
Rockies Express Pipeline LLC | | | | | | | | |
3.90%, 04/15/15b | | | 8,700 | | | | 8,749,663 | |
5.63%, 04/15/20a,b | | | 14,840 | | | | 14,250,975 | |
6.00%, 01/15/19b | | | 8,975 | | | | 8,888,229 | |
6.85%, 07/15/18a,b | | | 8,650 | | | | 8,853,784 | |
Rosetta Resources Inc. | | | | | | | | |
5.63%, 05/01/21 (Call 05/01/17)a | | | 4,600 | | | | 4,721,542 | |
5.88%, 06/01/22 (Call 12/01/17) | | | 11,810 | | | | 12,125,981 | |
| | | | |
SCHEDULESOF INVESTMENTS | | | 111 | |
Schedule of Investments (Continued)
iSHARES® iBOXX $ HIGH YIELD CORPORATE BOND ETF
February 28, 2014
| | | | | | | | |
Security | | Principal
(000s) | | | Value | |
| | | | | | | | |
Sabine Pass Liquefaction LLC | | | | | | | | |
5.63%, 04/15/23a,b | | $ | 14,350 | | | $ | 14,053,430 | |
5.88%, 02/01/21a,b | | | 33,650 | | | | 34,407,125 | |
6.25%, 03/15/22b | | | 9,600 | | | | 9,859,115 | |
Samson Investment Co. | | | | | | | | |
10.75%, 02/15/20 (Call 02/15/16)a,b | | | 33,730 | | | | 37,364,414 | |
SandRidge Energy Inc. | | | | | | | | |
7.50%, 03/15/21 (Call 03/15/16)a | | | 19,370 | | | | 20,355,209 | |
7.50%, 02/15/23 (Call 08/15/17)a | | | 13,650 | | | | 14,366,625 | |
8.13%, 10/15/22 (Call 04/15/17)a | | | 12,550 | | | | 13,484,755 | |
8.75%, 01/15/20 (Call 01/15/15)a | | | 8,875 | | | | 9,584,685 | |
SESI LLC | | | | | | | | |
6.38%, 05/01/19 (Call 05/01/15) | | | 7,750 | | | | 8,258,171 | |
7.13%, 12/15/21 (Call 12/15/16) | | | 12,910 | | | | 14,346,959 | |
SM Energy Co. | | | | | | | | |
5.00%, 01/15/24 (Call 07/15/18)a,b | | | 8,825 | | | | 8,584,806 | |
6.50%, 01/01/23 (Call 07/01/17) | | | 7,777 | | | | 8,316,373 | |
Targa Resources Partners LP/Targa Resources Partners Finance Corp. | | | | | | | | |
4.25%, 11/15/23 (Call 05/15/18)a,b | | | 11,050 | | | | 10,351,802 | |
5.25%, 05/01/23 (Call 11/01/17) | | | 12,750 | | | | 12,790,648 | |
6.88%, 02/01/21 (Call 02/01/16) | | | 9,900 | | | | 10,687,209 | |
Tesoro Corp. | | | | | | | | |
4.25%, 10/01/17 (Call 09/01/17)a | | | 1,700 | | | | 1,784,881 | |
5.38%, 10/01/22 (Call 10/01/17)a | | | 10,675 | | | | 10,987,084 | |
Tesoro Logistics LP/Tesoro Logistics Finance Corp. | | | | | | | | |
6.13%, 10/15/21 (Call 10/15/16)a | | | 4,400 | | | | 4,602,926 | |
| | | | | | | | |
Security | | Principal
(000s) | | | Value | |
| | | | | | | | |
Ultra Petroleum Corp. | | | | | | | | |
5.75%, 12/15/18 (Call 12/15/15)a,b | | $ | 2,700 | | | $ | 2,855,250 | |
Whiting Petroleum Corp. | | | | | | | | |
5.00%, 03/15/19 (Call 12/15/18) | | | 20,250 | | | | 21,414,375 | |
5.75%, 03/15/21 (Call 12/15/20) | | | 14,675 | | | | 15,849,000 | |
WPX Energy Inc. | | | | | | | | |
5.25%, 01/15/17a | | | 2,800 | | | | 3,006,251 | |
6.00%, 01/15/22 (Call 10/15/21)a | | | 20,045 | | | | 20,355,758 | |
| | | | | | | | |
| | | | | | | 1,737,121,533 | |
PAPER & FOREST PRODUCTS — 0.07% | | | | | |
Verso Paper Holdings LLC/Verso Paper Inc. | | | | | | | | |
11.75%, 01/15/19 (Call 01/15/15)a | | | 8,900 | | | | 9,556,375 | |
| | | | | | | | |
| | | | | | | 9,556,375 | |
PHARMACEUTICALS — 1.92% | | | | | |
Endo Finance Co. | | | | | | | | |
5.75%, 01/15/22 (Call 01/15/17)a,b | | | 12,075 | | | | 12,497,625 | |
Endo Health Solutions Inc. | | | | | | | | |
7.00%, 07/15/19 (Call 07/15/15) | | | 9,700 | | | | 10,524,500 | |
7.00%, 12/15/20 (Call 12/15/15)a | | | 9,120 | | | | 9,895,200 | |
7.25%, 01/15/22 (Call 07/15/16)a | | | 7,900 | | | | 8,690,000 | |
Forest Laboratories Inc. | | | | | | | | |
4.38%, 02/01/19b | | | 7,025 | | | | 7,499,188 | |
4.88%, 02/15/21b | | | 12,000 | | | | 12,825,000 | |
5.00%, 12/15/21b | | | 16,850 | | | | 18,029,500 | |
NBTY Inc. | | | | | | | | |
9.00%, 10/01/18 (Call 10/01/14) | | | 9,125 | | | | 9,877,812 | |
Valeant Pharmaceuticals International Inc. | | | | | | | | |
5.63%, 12/01/21 (Call 12/01/16)b | | | 4,850 | | | | 5,141,000 | |
6.38%, 10/15/20 (Call 10/15/16)a,b | | | 36,850 | | | | 40,258,625 | |
| | |
| 112 | | 2014 iSHARES ANNUAL REPORTTO SHAREHOLDERS |
Schedule of Investments (Continued)
iSHARES® iBOXX $ HIGH YIELD CORPORATE BOND ETF
February 28, 2014
| | | | | | | | |
Security | | Principal
(000s) | | | Value | |
| | | | | | | | |
6.75%, 10/01/17 (Call 10/01/14)b | | $ | 8,900 | | | $ | 9,434,000 | |
6.75%, 08/15/21 (Call 02/15/16)a,b | | | 13,020 | | | | 14,175,525 | |
6.88%, 12/01/18 (Call 12/01/14)b | | | 18,250 | | | | 19,436,250 | |
7.00%, 10/01/20 (Call 10/01/15)b | | | 14,085 | | | | 15,370,256 | |
7.25%, 07/15/22 (Call 07/15/16)a,b | | | 11,150 | | | | 12,404,375 | |
VPII Escrow Corp./Valeant Pharmaceuticals International Inc. | | | | | | | | |
6.75%, 08/15/18 (Call 08/15/15)b | | | 22,300 | | | | 24,530,000 | |
7.50%, 07/15/21 (Call 07/15/16)b | | | 26,150 | | | | 29,745,625 | |
| | | | | | | | |
| | | | | | | 260,334,481 | |
PROFESSIONAL SERVICES — 0.09% | | | | | |
Jaguar Holding Co. | | | | | | | | |
9.50%, 12/01/19 (Call 12/01/14)a,b | | | 11,461 | | | | 12,821,994 | |
| | | | | | | | |
| | | | | | | 12,821,994 | |
REAL ESTATE MANAGEMENT & DEVELOPMENT — 0.15% | | | | | |
CBRE Services Inc. | | | | | | | | |
5.00%, 03/15/23 (Call 03/15/18) | | | 12,875 | | | | 12,939,375 | |
Realogy Group LLC/Sunshine Group Florida Ltd. (The) | | | | | | | | |
3.38%, 05/01/16a,b | | | 6,750 | | | | 6,783,751 | |
| | | | | | | | |
| | | | | | | 19,723,126 | |
ROAD & RAIL — 0.80% | | | | | |
Aviation Capital Group Corp. | | | | | | | | |
3.88%, 09/27/16b | | | 8,100 | | | | 8,383,500 | |
6.75%, 04/06/21b | | | 13,690 | | | | 14,990,550 | |
7.13%, 10/15/20b | | | 5,215 | | | | 5,853,837 | |
Avis Budget Car Rental LLC/Avis Budget Finance Inc. | | | | | | | | |
5.50%, 04/01/23 (Call 04/01/18) | | | 4,350 | | | | 4,388,063 | |
8.25%, 01/15/19 (Call 10/15/14) | | | 12,500 | | | | 13,466,344 | |
| | | | | | | | |
Security | | Principal
(000s) | | | Value | |
| | | | | | | | |
Hertz Corp. (The) | | | | | | | | |
5.88%, 10/15/20 (Call 10/15/15)a | | $ | 12,650 | | | $ | 13,472,247 | |
6.25%, 10/15/22 (Call 10/15/17)a | | | 1,550 | | | | 1,641,067 | |
6.75%, 04/15/19 (Call 04/15/15)a | | | 20,600 | | | | 22,089,924 | |
7.38%, 01/15/21 (Call 01/15/16) | | | 9,725 | | | | 10,703,705 | |
7.50%, 10/15/18 (Call 10/15/14)a | | | 13,200 | | | | 14,113,963 | |
| | | | | | | | |
| | | | | | | 109,103,200 | |
SEMICONDUCTORS & SEMICONDUCTOR EQUIPMENT — 1.18% | |
Advanced Micro Devices Inc. | | | | | | | | |
6.75%, 03/01/19b | | | 8,450 | | | | 8,488,053 | |
7.50%, 08/15/22a | | | 9,150 | | | | 9,084,679 | |
7.75%, 08/01/20 (Call 08/01/15)a | | | 8,800 | | | | 9,053,000 | |
8.13%, 12/15/17 (Call 03/31/14)a | | | 10,970 | | | | 11,465,968 | |
Amkor Technology Inc. | | | | | | | | |
6.38%, 10/01/22 (Call 10/01/16)a | | | 6,575 | | | | 6,788,687 | |
6.63%, 06/01/21 (Call 06/01/15)a | | | 7,925 | | | | 8,355,559 | |
Freescale Semiconductor Inc. | | | | | | | | |
5.00%, 05/15/21 (Call 05/15/16)a,b | | | 8,350 | | | | 8,502,661 | |
6.00%, 01/15/22 (Call 11/15/16)a,b | | | 13,740 | | | | 14,556,277 | |
8.05%, 02/01/20 (Call 06/01/15)a | | | 13,300 | | | | 14,609,832 | |
10.13%, 12/15/16 (Call 03/20/14)a | | | 1,278 | | | | 1,305,158 | |
10.75%, 08/01/20 (Call 08/01/15)a | | | 10,980 | | | | 12,741,669 | |
Micron Technology Inc. | | | | | | | | |
5.88%, 02/15/22 (Call 02/15/17)b | | | 3,650 | | | | 3,805,125 | |
NXP BV/NXP Funding LLC | | | | | | | | |
3.50%, 09/15/16a,b | | | 10,500 | | | | 10,762,500 | |
3.75%, 06/01/18b | | | 9,525 | | | | 9,620,250 | |
| | | | |
SCHEDULESOF INVESTMENTS | | | 113 | |
Schedule of Investments (Continued)
iSHARES® iBOXX $ HIGH YIELD CORPORATE BOND ETF
February 28, 2014
| | | | | | | | |
Security | | Principal
(000s) | | | Value | |
| | | | | | | | |
5.75%, 02/15/21 (Call 02/15/17)a,b | | $ | 10,075 | | | $ | 10,679,500 | |
5.75%, 03/15/23 (Call 03/15/18)b | | | 950 | | | | 997,500 | |
Sensata Technologies BV | | | | | | | | |
4.88%, 10/15/23b | | | 9,473 | | | | 9,283,540 | |
6.50%, 05/15/19 (Call 05/15/15)b | | | 9,550 | | | | 10,242,375 | |
| | | | | | | | |
| | | | | | | 160,342,333 | |
SOFTWARE — 0.93% | | | | | |
Activision Blizzard Inc. | | | | | | | | |
5.63%, 09/15/21 (Call 09/15/16)a,b | | | 26,800 | | | | 28,739,106 | |
6.13%, 09/15/23 (Call 09/15/18)a,b | | | 12,575 | | | | 13,616,312 | |
BMC Software Inc. | | | | | | | | |
8.13%, 07/15/21 (Call 07/15/16)b | | | 24,675 | | | | 25,939,594 | |
Infor US Inc. | | | | | | | | |
9.38%, 04/01/19 (Call 04/01/15)a | | | 16,900 | | | | 19,097,000 | |
11.50%, 07/15/18 (Call 07/15/15) | | | 11,770 | | | | 13,667,912 | |
Nuance Communications Inc. | | | | | | | | |
5.38%, 08/15/20 (Call 08/15/16)a,b | | | 18,150 | | | | 18,150,000 | |
NuStar Logistics LP | | | | | | | | |
4.80%, 09/01/20 | | | 7,918 | | | | 7,713,914 | |
| | | | | | | | |
| | | | | | | 126,923,838 | |
SPECIALTY RETAIL — 1.60% | | | | | |
Best Buy Co. Inc. | | | | | | | | |
5.00%, 08/01/18 | | | 8,700 | | | | 8,993,625 | |
5.50%, 03/15/21 (Call 12/15/20)a | | | 10,850 | | | | 10,809,313 | |
Claire’s Stores Inc. | | | | | | | | |
8.88%, 03/15/19 (Call 03/15/15)a | | | 8,005 | | | | 7,764,850 | |
9.00%, 03/15/19 (Call 03/15/15)a,b | | | 19,500 | | | | 20,475,000 | |
L Brands Inc. | | | | | | | | |
5.63%, 02/15/22 | | | 18,800 | | | | 19,740,000 | |
5.63%, 10/15/23a | | | 5,000 | | | | 5,225,000 | |
6.63%, 04/01/21a | | | 16,040 | | | | 18,004,900 | |
| | | | | | | | |
Security | | Principal
(000s) | | | Value | |
| | | | | | | | |
6.90%, 07/15/17 | | $ | 13,162 | | | $ | 15,070,490 | |
7.00%, 05/01/20a | | | 8,460 | | | | 9,665,550 | |
8.50%, 06/15/19a | | | 8,950 | | | | 10,851,875 | |
Michaels Stores Inc. | | | | | | | | |
7.75%, 11/01/18 (Call 11/01/14) | | | 16,655 | | | | 17,862,487 | |
Party City Holdings Inc. Series WI | | | | | | | | |
8.88%, 08/01/20 (Call 08/01/15)a | | | 13,200 | | | | 14,652,000 | |
Petco Animal Supplies Inc. | | | | | | | | |
9.25%, 12/01/18 (Call 03/31/14)a,b | | | 10,050 | | | | 10,803,750 | |
Sally Holdings LLC/Sally Capital Inc. | | | | | | | | |
5.75%, 06/01/22 (Call 06/01/17)a | | | 14,450 | | | | 15,317,000 | |
6.88%, 11/15/19 (Call 11/15/15)a | | | 12,250 | | | | 13,444,375 | |
Toys R Us Inc. | | | | | | | | |
10.38%, 08/15/17 (Call 02/15/15)a | | | 8,450 | | | | 7,309,250 | |
Toys R Us Property Co. II LLC | | | | | | | | |
8.50%, 12/01/17 (Call 03/31/14)a | | | 10,975 | | | | 11,276,812 | |
| | | | | | | | |
| | | | | | | 217,266,277 | |
TEXTILES, APPAREL & LUXURY GOODS — 0.40% | |
Hanesbrands Inc. | | | | | | | | |
6.38%, 12/15/20 (Call 12/15/15)a | | | 17,080 | | | | 18,766,650 | |
Levi Strauss & Co. | | | | | | | | |
6.88%, 05/01/22 (Call 05/01/17) | | | 12,000 | | | | 13,170,000 | |
7.63%, 05/15/20 (Call 05/15/15)a | | | 4,800 | | | | 5,232,000 | |
PVH Corp. | | | | | | | | |
4.50%, 12/15/22 (Call 12/15/17)a | | | 11,425 | | | | 11,310,750 | |
7.38%, 05/15/20 (Call 05/15/15) | | | 5,351 | | | | 5,926,233 | |
| | | | | | | | |
| | | | | | | 54,405,633 | |
| | |
| 114 | | 2014 iSHARES ANNUAL REPORTTO SHAREHOLDERS |
Schedule of Investments (Continued)
iSHARES® iBOXX $ HIGH YIELD CORPORATE BOND ETF
February 28, 2014
| | | | | | | | |
Security | | Principal
(000s) | | | Value | |
| | | | | | | | |
TOBACCO — 1.65% | | | | | |
Reynolds Group Issuer Inc./Reynolds Group Issuer LLC | | | | | | | | |
5.75%, 10/15/20 (Call 10/15/15) | | $ | 52,600 | | | $ | 54,967,000 | |
6.88%, 02/15/21 (Call 02/15/16)a | | | 16,700 | | | | 18,140,375 | |
7.13%, 04/15/19 (Call 10/15/14) | | | 21,215 | | | | 22,514,419 | |
7.88%, 08/15/19 (Call 08/15/15)a | | | 24,510 | | | | 27,052,912 | |
8.25%, 02/15/21 (Call 02/15/16)a | | | 16,405 | | | | 17,922,463 | |
8.50%, 05/15/18 (Call 05/15/14)a | | | 14,860 | | | | 15,640,150 | |
9.00%, 04/15/19 (Call 10/15/14)a | | | 25,425 | | | | 27,331,875 | |
9.88%, 08/15/19 (Call 08/15/15) | | | 36,021 | | | | 40,523,625 | |
| | | | | | | | |
| | | | | | | 224,092,819 | |
TRADING COMPANIES & DISTRIBUTORS — 2.75% | |
Aircastle Ltd. | | | | | | | | |
4.63%, 12/15/18a | | | 7,300 | | | | 7,556,274 | |
6.25%, 12/01/19a | | | 5,950 | | | | 6,440,875 | |
6.75%, 04/15/17a | | | 9,000 | | | | 10,056,281 | |
9.75%, 08/01/18 (Call 08/01/14)a | | | 6,375 | | | | 6,885,000 | |
International Lease Finance Corp. | | | | | | | | |
3.88%, 04/15/18 | | | 12,500 | | | | 12,812,500 | |
4.63%, 04/15/21 | | | 11,100 | | | | 11,211,000 | |
4.88%, 04/01/15 | | | 13,550 | | | | 14,057,439 | |
5.75%, 05/15/16a | | | 19,010 | | | | 20,515,324 | |
5.88%, 04/01/19a | | | 12,300 | | | | 13,525,791 | |
5.88%, 08/15/22a | | | 13,700 | | | | 14,659,000 | |
6.25%, 05/15/19a | | | 19,850 | | | | 22,249,903 | |
6.75%, 09/01/16b | | | 17,600 | | | | 19,782,205 | |
7.13%, 09/01/18b | | | 22,400 | | | | 26,162,320 | |
8.25%, 12/15/20 | | | 16,880 | | | | 20,672,568 | |
8.63%, 09/15/15 | | | 20,050 | | | | 22,176,838 | |
8.63%, 01/15/22 | | | 11,300 | | | | 14,092,999 | |
8.75%, 03/15/17 | | | 25,150 | | | | 29,640,834 | |
8.88%, 09/01/17a | | | 6,000 | | | | 7,204,394 | |
| | | | | | | | |
Security | | Principal
(000s) | | | Value | |
| | | | | | | | |
United Rentals (North America) Inc. | | | | | | | | |
5.75%, 07/15/18 (Call 07/15/15) | | $ | 13,600 | | | $ | 14,576,386 | |
6.13%, 06/15/23 (Call 12/15/17)a | | | 7,500 | | | | 7,931,250 | |
7.38%, 05/15/20 (Call 05/15/16) | | | 11,100 | | | | 12,382,565 | |
7.63%, 04/15/22 (Call 04/15/17) | | | 20,950 | | | | 23,727,813 | |
8.25%, 02/01/21 (Call 02/01/16) | | | 12,295 | | | | 13,831,875 | |
8.38%, 09/15/20 (Call 09/15/15)a | | | 14,610 | | | | 16,316,565 | |
9.25%, 12/15/19 (Call 12/15/14) | | | 4,460 | | | | 4,899,283 | |
| | | | | | | | |
| | | | | | | 373,367,282 | |
TRANSPORTATION INFRASTRUCTURE — 0.16% | |
CHC Helicopter SA | | | | | | | | |
9.25%, 10/15/20 (Call 10/15/15)a | | | 20,003 | | | | 21,750,488 | |
| | | | | | | | |
| | | | | | | 21,750,488 | |
WIRELESS TELECOMMUNICATION SERVICES — 5.92% | |
Cricket Communications Inc. | | | | | | | | |
7.75%, 10/15/20 (Call 10/15/15) | | | 26,800 | | | | 30,384,500 | |
Crown Castle International Corp. | | | | | | | | |
5.25%, 01/15/23a | | | 27,075 | | | | 27,718,031 | |
7.13%, 11/01/19 (Call 11/01/14)a | | | 10,750 | | | | 11,475,625 | |
MetroPCS Wireless Inc. | | | | | | | | |
6.63%, 11/15/20 (Call 11/15/15) | | | 20,420 | | | | 21,874,925 | |
7.88%, 09/01/18 (Call 09/01/14)a | | | 18,965 | | | | 20,197,725 | |
Millicom International Cellular SA | | | | | | | | |
4.75%, 05/22/20 (Call 05/22/17)b | | | 7,978 | | | | 7,758,605 | |
6.63%, 10/15/21 (Call 10/15/17)b | | | 6,410 | | | | 6,698,450 | |
| | | | |
SCHEDULESOF INVESTMENTS | | | 115 | |
Schedule of Investments (Continued)
iSHARES® iBOXX $ HIGH YIELD CORPORATE BOND ETF
February 28, 2014
| | | | | | | | |
Security | | Principal
(000s) | | | Value | |
| | | | | | | | |
NII Capital Corp. | | | | | | | | |
7.63%, 04/01/21 (Call 04/01/16)a | | $ | 20,550 | | | $ | 7,552,125 | |
8.88%, 12/15/19 (Call 12/15/14)a | | | 10,760 | | | | 4,734,400 | |
10.00%, 08/15/16 (Call 03/31/14)a | | | 11,260 | | | | 5,151,450 | |
NII International Telecom SCA | | | | | | | | |
7.88%, 08/15/19 (Call 02/15/17)a,b | | | 12,200 | | | | 8,479,000 | |
11.38%, 08/15/19 (Call 02/15/17)a,b | | | 15,850 | | | | 11,689,375 | |
SBA Communications Corp. | | | | | | | | |
5.63%, 10/01/19 (Call 10/01/16)a | | | 8,600 | | | | 8,997,750 | |
Sprint Communications Inc. | | | | | | | | |
6.00%, 12/01/16a | | | 37,950 | | | | 41,507,812 | |
6.00%, 11/15/22a | | | 40,550 | | | | 41,665,125 | |
7.00%, 03/01/20a,b | | | 20,550 | | | | 23,683,875 | |
7.00%, 08/15/20a | | | 25,700 | | | | 28,045,125 | |
8.38%, 08/15/17a | | | 22,320 | | | | 26,170,200 | |
9.00%, 11/15/18b | | | 50,470 | | | | 61,636,487 | |
9.13%, 03/01/17a | | | 20,950 | | | | 24,799,563 | |
11.50%, 11/15/21a | | | 13,620 | | | | 18,250,800 | |
Sprint Corp. | | | | | | | | |
7.13%, 06/15/24a,b | | | 39,300 | | | | 41,363,250 | |
7.25%, 09/15/21b | | | 37,600 | | | | 41,172,000 | |
7.88%, 09/15/23b | | | 68,850 | | | | 76,251,375 | |
T-Mobile USA Inc. | | | | | | | | |
5.25%, 09/01/18 (Call 09/01/15) | | | 12,950 | | | | 13,662,250 | |
6.13%, 01/15/22 (Call 01/15/18)a | | | 11,700 | | | | 12,358,125 | |
6.25%, 04/01/21 (Call 04/01/17)a | | | 34,950 | | | | 37,396,500 | |
6.46%, 04/28/19 (Call 04/28/15)a | | | 13,700 | | | | 14,641,875 | |
6.50%, 01/15/24 (Call 01/15/19)a | | | 14,925 | | | | 15,820,500 | |
6.54%, 04/28/20 (Call 04/28/16) | | | 19,175 | | | | 20,804,875 | |
6.63%, 04/28/21 (Call 04/28/17)a | | | 26,525 | | | | 28,746,469 | |
| | | | | | | | |
Security | | Principal
or Shares
(000s) | | | Value | |
| | | | | | | | |
6.63%, 04/01/23 (Call 04/01/18)a | | $ | 30,475 | | | $ | 32,760,625 | |
6.73%, 04/28/22 (Call 04/28/17) | | | 25,450 | | | | 27,486,000 | |
6.84%, 04/28/23 (Call 04/28/18)a | | | 2,325 | | | | 2,522,625 | |
| | | | | | | | |
| | | | | | | 803,457,417 | |
| | | | | | | | |
TOTAL CORPORATE BONDS & NOTES | | | | | |
(Cost: $12,871,048,021) | | | | | | | 13,277,187,480 | |
|
SHORT-TERM INVESTMENTS — 18.72% | |
| |
MONEY MARKET FUNDS — 18.72% | | | | | |
BlackRock Cash Funds: Institutional,
SL Agency Shares | | | | | |
0.13%e,f,g | | | 2,272,835 | | | | 2,272,835,305 | |
BlackRock Cash Funds: Prime,
SL Agency Shares | | | | | |
0.11%e,f,g | | | 191,149 | | | | 191,149,347 | |
BlackRock Cash Funds: Treasury,
SL Agency Shares | | | | | |
0.00%e,f | | | 78,243 | | | | 78,242,595 | |
| | | | | | | | |
| | | | | | | 2,542,227,247 | |
| | | | | | | | |
TOTAL SHORT-TERM INVESTMENTS | | | | | |
(Cost: $2,542,227,247) | | | | 2,542,227,247 | |
| | | | | | | | |
TOTAL INVESTMENTS
IN SECURITIES — 116.48% | | | | | |
(Cost: $15,413,275,268) | | | | | | | 15,819,414,727 | |
Other Assets, Less Liabilities — (16.48)% | | | | (2,238,555,474 | ) |
| | | | | | | | |
NET ASSETS — 100.00% | | | | | | $ | 13,580,859,253 | |
| | | | | | | | |
| a | All or a portion of this security represents a security on loan. See Note 1. |
| b | This security may be resold to qualified institutional buyers under Rule 144A of the Securities Act of 1933. |
| c | Variable rate security. Rate shown is as of report date. |
| d | Payment-in-kind (PIK) security. Income may be paid in cash or additional securities at the issuer’s discretion. |
| e | Affiliated issuer. See Note 2. |
| f | The rate quoted is the annualized seven-day yield of the fund at period end. |
| g | All or a portion of this security represents an investment of securities lending collateral. See Note 1. |
See notes to financial statements.
| | |
| 116 | | 2014 iSHARES ANNUAL REPORTTO SHAREHOLDERS |
Schedule of Investments
iSHARES® iBOXX $ INVESTMENT GRADE CORPORATE BOND ETF
February 28, 2014
| | | | | | | | |
| Security | |
Principal
(000s) | | | Value | |
CORPORATE BONDS & NOTES — 96.94% | |
| |
AEROSPACE & DEFENSE — 1.82% | | | | | |
Boeing Co. (The) | | | | | | | | |
4.88%, 02/15/20a | | $ | 4,277 | | | $ | 4,841,847 | |
General Dynamics Corp. | | | | | | | | |
1.00%, 11/15/17 | | | 1,900 | | | | 1,873,895 | |
2.25%, 11/15/22 (Call 08/15/22) | | | 15,685 | | | | 14,530,109 | |
Honeywell International Inc. | | | | | | | | |
4.25%, 03/01/21 | | | 3,126 | | | | 3,428,595 | |
5.00%, 02/15/19 | | | 11,037 | | | | 12,566,954 | |
5.30%, 03/01/18 | | | 7,983 | | | | 9,142,247 | |
L-3 Communications Corp. | | | | | | | | |
4.75%, 07/15/20 | | | 8,023 | | | | 8,543,402 | |
5.20%, 10/15/19a | | | 9,715 | | | | 10,716,130 | |
Lockheed Martin Corp. | | | | | | | | |
3.35%, 09/15/21a | | | 22,179 | | | | 22,631,330 | |
4.07%, 12/15/42 | | | 8,000 | | | | 7,438,770 | |
4.25%, 11/15/19 | | | 1,872 | | | | 2,039,861 | |
Northrop Grumman Corp. | | | | | | | | |
1.75%, 06/01/18 | | | 4,086 | | | | 4,055,605 | |
3.25%, 08/01/23 | | | 17,235 | | | | 16,521,173 | |
4.75%, 06/01/43a | | | 7,750 | | | | 7,723,331 | |
Precision Castparts Corp. | | | | | | | | |
1.25%, 01/15/18 | | | 18,254 | | | | 18,025,073 | |
2.50%, 01/15/23 (Call 10/15/22) | | | 4,125 | | | | 3,863,107 | |
Raytheon Co. | | | | | | | | |
2.50%, 12/15/22 (Call 09/15/22) | | | 1,500 | | | | 1,406,045 | |
3.13%, 10/15/20 | | | 19,845 | | | | 20,337,525 | |
United Technologies Corp. | | | | | | | | |
1.80%, 06/01/17 | | | 14,922 | | | | 15,251,754 | |
3.10%, 06/01/22 | | | 25,087 | | | | 25,161,523 | |
4.50%, 04/15/20 | | | 16,415 | | | | 18,216,440 | |
4.50%, 06/01/42 | | | 39,164 | | | | 39,771,590 | |
5.38%, 12/15/17 | | | 9,888 | | | | 11,335,105 | |
5.70%, 04/15/40 | | | 5,355 | | | | 6,385,420 | |
6.13%, 02/01/19 | | | 5,638 | | | | 6,715,097 | |
6.13%, 07/15/38a | | | 12,041 | | | | 15,083,009 | |
| | | | | | | | |
| | | | 307,604,937 | |
| | | | | | | | |
| Security | |
Principal
(000s) | | | Value | |
AIR FREIGHT & LOGISTICS — 0.49% | | | | | |
FedEx Corp. | | | | | | | | |
4.00%, 01/15/24 | | $ | 12,651 | | | $ | 12,853,626 | |
5.10%, 01/15/44 | | | 10,000 | | | | 10,315,474 | |
United Parcel Service Inc. | | | | | | | | |
2.45%, 10/01/22a | | | 15,650 | | | | 14,854,434 | |
3.13%, 01/15/21a | | | 7,536 | | | | 7,747,367 | |
5.13%, 04/01/19 | | | 18,874 | | | | 21,644,222 | |
5.50%, 01/15/18 | | | 1,269 | | | | 1,456,594 | |
6.20%, 01/15/38 | | | 10,910 | | | | 13,785,616 | |
| | | | | | | | |
| | | | | | | 82,657,333 | |
AUTOMOBILES — 0.22% | | | | | |
Ford Motor Co. | | | | | | | | |
4.75%, 01/15/43a | | | 19,388 | | | | 18,641,448 | |
7.45%, 07/16/31 | | | 14,475 | | | | 18,587,906 | |
| | | | | | | | |
| | | | | | | 37,229,354 | |
BEVERAGES — 3.15% | | | | | |
Anheuser-Busch InBev Finance Inc. | | | | | | | | |
1.25%, 01/17/18 | | | 13,500 | | | | 13,357,825 | |
2.15%, 02/01/19 | | | 13,000 | | | | 13,104,334 | |
2.63%, 01/17/23 | | | 6,500 | | | | 6,170,127 | |
3.70%, 02/01/24 | | | 20,750 | | | | 21,092,732 | |
4.00%, 01/17/43 | | | 12,380 | | | | 11,430,487 | |
4.63%, 02/01/44 | | | 9,000 | | | | 9,178,946 | |
Anheuser-Busch InBev Worldwide Inc. | | | | | | | | |
1.38%, 07/15/17 | | | 14,950 | | | | 15,027,339 | |
2.50%, 07/15/22 | | | 9,917 | | | | 9,413,982 | |
3.75%, 07/15/42 | | | 11,281 | | | | 9,995,055 | |
5.00%, 04/15/20 | | | 16,352 | | | | 18,550,217 | |
5.38%, 01/15/20 | | | 30,988 | | | | 35,789,448 | |
6.88%, 11/15/19 | | | 9,027 | | | | 11,128,176 | |
7.75%, 01/15/19 | | | 19,728 | | | | 24,691,800 | |
8.20%, 01/15/39 | | | 9,980 | | | | 15,135,266 | |
Bottling Group LLC | | | | | | | | |
5.13%, 01/15/19 | | | 12,037 | | | | 13,715,008 | |
Coca-Cola Co. (The) | | | | | | | | |
1.15%, 04/01/18 | | | 17,000 | | | | 16,776,919 | |
1.65%, 03/14/18 | | | 6,478 | | | | 6,516,703 | |
1.65%, 11/01/18 | | | 17,500 | | | | 17,469,305 | |
2.45%, 11/01/20 | | | 15,645 | | | | 15,583,506 | |
3.15%, 11/15/20 | | | 9,597 | | | | 9,947,730 | |
| | | | |
SCHEDULESOF INVESTMENTS | | | 117 | |
Schedule of Investments (Continued)
iSHARES® iBOXX $ INVESTMENT GRADE CORPORATE BOND ETF
February 28, 2014
| | | | | | | | |
| Security | |
Principal
(000s) | | | Value | |
3.20%, 11/01/23 | | $ | 20,500 | | | $ | 20,193,279 | |
3.30%, 09/01/21 | | | 23,003 | | | | 23,738,270 | |
5.35%, 11/15/17 | | | 3,800 | | | | 4,348,417 | |
Diageo Capital PLC | | | | | | | | |
1.50%, 05/11/17 | | | 7,525 | | | | 7,590,547 | |
2.63%, 04/29/23 (Call 01/29/23) | | | 10,636 | | | | 9,946,813 | |
5.75%, 10/23/17 | | | 9,797 | | | | 11,246,203 | |
Diageo Investment Corp. | | | | | | | | |
2.88%, 05/11/22 | | | 10,204 | | | | 9,927,962 | |
Pepsi Bottling Group Inc. (The) Series B | | | | | | | | |
7.00%, 03/01/29 | | | 8,285 | | | | 10,918,026 | |
PepsiCo Inc. | | | | | | | | |
1.25%, 08/13/17 | | | 9,564 | | | | 9,561,554 | |
2.25%, 01/07/19 (Call 12/07/18) | | | 4,600 | | | | 4,652,093 | |
2.75%, 03/05/22 | | | 11,929 | | | | 11,583,878 | |
2.75%, 03/01/23 | | | 21,225 | | | | 20,137,308 | |
3.00%, 08/25/21 | | | 5,496 | | | | 5,531,344 | |
3.13%, 11/01/20 | | | 11,581 | | | | 11,879,066 | |
3.60%, 03/01/24 (Call 12/01/23) | | | 12,000 | | | | 12,030,035 | |
4.00%, 03/05/42 | | | 8,700 | | | | 7,993,830 | |
4.50%, 01/15/20 | | | 11,534 | | | | 12,801,311 | |
4.88%, 11/01/40 | | | 5,885 | | | | 6,171,885 | |
5.00%, 06/01/18 | | | 6,635 | | | | 7,501,943 | |
5.50%, 01/15/40 | | | 9,785 | | | | 11,060,030 | |
7.90%, 11/01/18 | | | 14,804 | | | | 18,663,498 | |
| | | | | | | | |
| | | | | | | 531,552,197 | |
BIOTECHNOLOGY — 1.21% | | | | | |
Amgen Inc. | | | | | | | | |
2.13%, 05/15/17 | | | 13,191 | | | | 13,537,095 | |
3.45%, 10/01/20 | | | 14,500 | | | | 15,097,356 | |
3.63%, 05/15/22 (Call 02/15/22)a | | | 5,650 | | | | 5,774,513 | |
3.88%, 11/15/21 (Call 08/15/21) | | | 13,275 | | | | 13,959,114 | |
4.10%, 06/15/21 (Call 03/15/21)a | | | 15,445 | | | | 16,512,432 | |
5.15%, 11/15/41 (Call 05/15/41)a | | | 26,632 | | | | 27,825,747 | |
| | | | | | | | |
| Security | |
Principal
(000s) | | | Value | |
5.38%, 05/15/43 (Call 11/15/42)a | | $ | 10,450 | | | $ | 11,351,458 | |
5.65%, 06/15/42 (Call 12/15/41)a | | | 7,500 | | | | 8,366,042 | |
5.70%, 02/01/19 | | | 9,983 | | | | 11,640,997 | |
5.85%, 06/01/17 | | | 3,380 | | | | 3,855,314 | |
6.38%, 06/01/37a | | | 11,339 | | | | 13,661,326 | |
6.40%, 02/01/39 | | | 12,173 | | | | 14,730,153 | |
Celgene Corp. | | | | | | | | |
3.25%, 08/15/22 | | | 13,650 | | | | 13,368,029 | |
Gilead Sciences Inc. | | | | | | | | |
4.40%, 12/01/21 (Call 09/01/21) | | | 15,810 | | | | 17,176,982 | |
4.50%, 04/01/21 (Call 01/01/21) | | | 2,184 | | | | 2,393,195 | |
5.65%, 12/01/41 (Call 06/01/41) | | | 13,255 | | | | 15,353,374 | |
| | | | | | | | |
| | | | | | | 204,603,127 | |
CAPITAL MARKETS — 6.75% | | | | | |
Ameriprise Financial Inc. | | | | | | | | |
4.00%, 10/15/23 | | | 5,110 | | | | 5,208,100 | |
5.30%, 03/15/20 | | | 6,000 | | | | 6,880,610 | |
Bank of New York Mellon Corp. (The) | | | | | | | | |
2.10%, 01/15/19 (Call 12/15/18) | | | 5,668 | | | | 5,682,235 | |
3.55%, 09/23/21 (Call 08/23/21) | | | 16,920 | | | | 17,583,555 | |
3.65%, 02/04/24 (Call 01/05/24) | | | 6,000 | | | | 6,090,366 | |
Bear Stearns Companies Inc. (The)/J.P. Morgan Chase & Co. | | | | | | | | |
6.40%, 10/02/17a | | | 24,855 | | | | 28,894,628 | |
7.25%, 02/01/18 | | | 20,617 | | | | 24,729,628 | |
Deutsche Bank AG London | | | | | | | | |
2.50%, 02/13/19 | | | 8,000 | | | | 8,076,173 | |
6.00%, 09/01/17 | | | 33,799 | | | | 38,735,117 | |
Goldman Sachs Group Inc. (The) | | | | | | | | |
2.38%, 01/22/18 | | | 25,517 | | | | 25,900,740 | |
2.90%, 07/19/18 | | | 35,589 | | | | 36,560,448 | |
3.63%, 01/22/23a | | | 31,845 | | | | 31,448,542 | |
| | |
| 118 | | 2014 iSHARES ANNUAL REPORTTO SHAREHOLDERS |
Schedule of Investments (Continued)
iSHARES® iBOXX $ INVESTMENT GRADE CORPORATE BOND ETF
February 28, 2014
| | | | | | | | |
| Security | |
Principal
(000s) | | | Value | |
4.00%, 03/03/24 | | $ | 3,425 | | | $ | 3,441,934 | |
5.25%, 07/27/21 | | | 39,396 | | | | 43,901,027 | |
5.38%, 03/15/20 | | | 12,632 | | | | 14,258,066 | |
5.75%, 01/24/22 | | | 43,418 | | | | 49,602,946 | |
5.95%, 01/18/18 | | | 23,527 | | | | 26,884,122 | |
5.95%, 01/15/27 | | | 5,175 | | | | 5,657,549 | |
6.00%, 06/15/20 | | | 15,625 | | | | 18,110,742 | |
6.13%, 02/15/33a | | | 14,080 | | | | 16,425,097 | |
6.15%, 04/01/18 | | | 39,980 | | | | 46,071,049 | |
6.25%, 09/01/17 | | | 30,670 | | | | 35,251,981 | |
6.25%, 02/01/41 | | | 26,832 | | | | 32,096,245 | |
6.45%, 05/01/36 | | | 5,729 | | | | 6,376,201 | |
6.75%, 10/01/37 | | | 49,514 | | | | 57,060,869 | |
7.50%, 02/15/19 | | | 19,250 | | | | 23,566,189 | |
Jefferies Group LLC | | | | | | | | |
5.13%, 04/13/18 | | | 16,419 | | | | 18,025,985 | |
6.88%, 04/15/21 | | | 432 | | | | 504,109 | |
Merrill Lynch & Co. Inc. | | | | | | | | |
5.70%, 05/02/17 | | | 5,000 | | | | 5,578,898 | |
Morgan Stanley | | | | | | | | |
2.13%, 04/25/18 | | | 1,750 | | | | 1,760,570 | |
2.50%, 01/24/19a | | | 36,350 | | | | 36,558,853 | |
3.75%, 02/25/23a | | | 39,820 | | | | 39,796,096 | |
4.10%, 05/22/23 | | | 35,490 | | | | 35,314,019 | |
4.75%, 03/22/17 | | | 24,425 | | | | 26,792,413 | |
4.88%, 11/01/22 | | | 8,130 | | | | 8,596,894 | |
5.00%, 11/24/25 | | | 23,595 | | | | 24,536,589 | |
5.50%, 01/26/20a | | | 21,133 | | | | 24,062,347 | |
5.50%, 07/24/20a | | | 10,575 | | | | 12,039,335 | |
5.50%, 07/28/21a | | | 23,536 | | | | 26,793,319 | |
5.63%, 09/23/19 | | | 30,562 | | | | 35,135,356 | |
5.75%, 01/25/21 | | | 28,534 | | | | 32,801,340 | |
5.95%, 12/28/17 | | | 11,285 | | | | 12,929,755 | |
6.25%, 08/28/17 | | | 10,736 | | | | 12,374,036 | |
6.38%, 07/24/42a | | | 16,037 | | | | 19,763,452 | |
6.63%, 04/01/18 | | | 34,980 | | | | 41,136,050 | |
7.25%, 04/01/32a | | | 2,362 | | | | 3,059,215 | |
7.30%, 05/13/19 | | | 35,755 | | | | 43,796,907 | |
Series F | | | | | | | | |
5.55%, 04/27/17a | | | 15,730 | | | | 17,626,984 | |
Nomura Holdings Inc. | | | | | | | | |
6.70%, 03/04/20 | | | 13,748 | | | | 16,089,731 | |
Northern Trust Corp. | | | | | | | | |
3.95%, 10/30/25 | | | 6,500 | | | | 6,594,778 | |
| | | | | | | | |
| Security | |
Principal
(000s) | | | Value | |
State Street Corp. | | | | | | | | |
3.10%, 05/15/23 | | $ | 8,000 | | | $ | 7,619,249 | |
3.70%, 11/20/23 | | | 6,680 | | | | 6,799,818 | |
4.38%, 03/07/21 | | | 8,915 | | | | 9,825,232 | |
| | | | | | | | |
| | | | | | | 1,140,405,489 | |
CHEMICALS — 1.92% | | | | | | | | |
CF Industries Inc. | | | | | | | | |
3.45%, 06/01/23 | | | 14,000 | | | | 13,307,624 | |
4.95%, 06/01/43a | | | 10,495 | | | | 10,025,275 | |
6.88%, 05/01/18 | | | 100 | | | | 116,520 | |
Dow Chemical Co. (The) | | | | | | | | |
3.00%, 11/15/22 (Call 08/15/22) | | | 1,350 | | | | 1,287,742 | |
4.13%, 11/15/21 (Call 08/15/21)a | | | 18,066 | | | | 18,954,303 | |
4.25%, 11/15/20 (Call 08/15/20) | | | 15,408 | | | | 16,461,907 | |
4.38%, 11/15/42 (Call 05/15/42) | | | 10,250 | | | | 9,392,529 | |
5.25%, 11/15/41 (Call 05/15/41) | | | 8,645 | | | | 8,954,594 | |
7.38%, 11/01/29 | | | 8,235 | | | | 10,628,775 | |
8.55%, 05/15/19 | | | 21,700 | | | | 28,074,486 | |
9.40%, 05/15/39 | | | 8,509 | | | | 13,212,721 | |
E.I. du Pont de Nemours and Co. | | | | | | | | |
2.80%, 02/15/23 | | | 13,597 | | | | 12,882,805 | |
3.63%, 01/15/21 | | | 8,500 | | | | 8,863,698 | |
4.15%, 02/15/43 | | | 6,175 | | | | 5,837,288 | |
4.63%, 01/15/20 | | | 11,823 | | | | 13,158,317 | |
6.00%, 07/15/18 | | | 14,631 | | | | 17,109,720 | |
Eastman Chemical Co. | | | | | | | | |
2.40%, 06/01/17 | | | 18,350 | | | | 18,859,235 | |
3.60%, 08/15/22 (Call 05/15/22) | | | 5,838 | | | | 5,806,212 | |
Ecolab Inc. | | | | | | | | |
4.35%, 12/08/21 | | | 9,488 | | | | 10,206,040 | |
5.50%, 12/08/41 | | | 7,598 | | | | 8,506,871 | |
LYB International Finance BV | | | | | | | | |
4.00%, 07/15/23 | | | 11,190 | | | | 11,386,944 | |
5.25%, 07/15/43a | | | 9,750 | | | | 10,266,750 | |
LyondellBasell Industries NV | | | | | | | | |
5.00%, 04/15/19 (Call 01/15/19) | | | 21,000 | | | | 23,422,342 | |
| | | | |
SCHEDULESOF INVESTMENTS | | | 119 | |
Schedule of Investments (Continued)
iSHARES® iBOXX $ INVESTMENT GRADE CORPORATE BOND ETF
February 28, 2014
| | | | | | | | |
| Security | |
Principal
(000s) | | | Value | |
5.75%, 04/15/24 (Call 01/15/24)a | | $ | 10,900 | | | $ | 12,504,874 | |
6.00%, 11/15/21 (Call 08/17/21) | | | 8,472 | | | | 9,971,314 | |
Mosaic Co. (The) | | | | | | | | |
4.25%, 11/15/23 (Call 08/15/23)a | | | 11,000 | | | | 11,160,757 | |
Rohm and Haas Co. | | | | | | | | |
6.00%, 09/15/17 | | | 1,167 | | | | 1,339,632 | |
7.85%, 07/15/29a | | | 10,075 | | | | 13,469,917 | |
| | | | | | | | |
| | | | 325,169,192 | |
COMMERCIAL BANKS — 10.62% | | | | | |
Abbey National Treasury Services PLC | | | | | | | | |
3.05%, 08/23/18 | | | 3,827 | | | | 3,977,830 | |
Australia and New Zealand Banking Group Ltd. | | | | | | | | |
1.88%, 10/06/17a | | | 12,000 | | | | 12,137,063 | |
Bank of America N.A. | | | | | | | | |
5.30%, 03/15/17 | | | 20,500 | | | | 22,784,301 | |
6.00%, 10/15/36 | | | 6,895 | | | | 8,171,355 | |
Bank of Montreal | | | | | | | | |
1.40%, 09/11/17a | | | 9,700 | | | | 9,690,300 | |
1.45%, 04/09/18 (Call 03/09/18) | | | 11,600 | | | | 11,455,609 | |
2.38%, 01/25/19 (Call 12/25/18) | | | 8,950 | | | | 9,100,309 | |
2.55%, 11/06/22 (Call 10/06/22) | | | 13,200 | | | | 12,444,111 | |
Bank of Nova Scotia | | | | | | | | |
1.38%, 12/18/17 (Call 11/18/17) | | | 3,500 | | | | 3,478,469 | |
1.45%, 04/25/18a | | | 18,000 | | | | 17,758,800 | |
2.05%, 10/30/18 | | | 10,000 | | | | 10,026,623 | |
2.55%, 01/12/17 | | | 13,246 | | | | 13,794,741 | |
4.38%, 01/13/21 | | | 3,424 | | | | 3,766,401 | |
Barclays Bank PLC | | | | | | | | |
2.50%, 02/20/19a | | | 15,600 | | | | 15,755,367 | |
5.13%, 01/08/20a | | | 9,205 | | | | 10,414,728 | |
5.14%, 10/14/20a | | | 17,434 | | | | 18,889,519 | |
6.75%, 05/22/19 | | | 19,664 | | | | 23,774,887 | |
BB&T Corp. | | | | | | | | |
1.60%, 08/15/17 (Call 07/14/17) | | | 6,448 | | | | 6,491,290 | |
| | | | | | | | |
| Security | |
Principal
(000s) | | | Value | |
2.15%, 03/22/17 (Call 02/22/17) | | $ | 2,835 | | | $ | 2,915,447 | |
BNP Paribas SA | | | | | | | | |
2.38%, 09/14/17a | | | 24,664 | | | | 25,367,476 | |
2.40%, 12/12/18a | | | 15,000 | | | | 15,121,017 | |
2.70%, 08/20/18 | | | 7,780 | | | | 7,974,511 | |
3.25%, 03/03/23a | | | 5,625 | | | | 5,449,940 | |
5.00%, 01/15/21a | | | 33,620 | | | | 37,537,144 | |
BPCE SA | | | | | | | | |
2.50%, 12/10/18 | | | 20,500 | | | | 20,544,198 | |
Branch Banking & Trust Co. | | | | | | | | |
2.30%, 10/15/18 (Call 09/15/18)a | | | 15,500 | | | | 15,739,844 | |
Commonwealth Bank of Australia | | | | | | | | |
1.90%, 09/18/17a | | | 9,675 | | | | 9,800,199 | |
Credit Suisse New York | | | | | | | | |
4.38%, 08/05/20a | | | 12,380 | | | | 13,511,427 | |
5.30%, 08/13/19a | | | 18,652 | | | | 21,394,452 | |
5.40%, 01/14/20a | | | 12,352 | | | | 13,963,984 | |
6.00%, 02/15/18a | | | 12,008 | | | | 13,893,256 | |
Discover Bank | | | | | | | | |
2.00%, 02/21/18 | | | 8,250 | | | | 8,236,819 | |
4.20%, 08/08/23 | | | 8,000 | | | | 8,210,468 | |
Fifth Third Bancorp | | | | | | | | |
4.30%, 01/16/24 (Call 12/16/23) | | | 520 | | | | 525,574 | |
8.25%, 03/01/38 | | | 14,413 | | | | 20,262,141 | |
HSBC Bank (USA) N.A. | | | | | | | | |
4.88%, 08/24/20 | | | 5,510 | | | | 6,032,219 | |
5.63%, 08/15/35a | | | 1,493 | | | | 1,637,654 | |
5.88%, 11/01/34 | | | 4,000 | | | | 4,506,218 | |
HSBC Holdings PLC | | | | | | | | |
4.00%, 03/30/22 | | | 19,563 | | | | 20,253,556 | |
4.88%, 01/14/22 | | | 14,000 | | | | 15,351,606 | |
5.10%, 04/05/21a | | | 27,155 | | | | 30,431,829 | |
6.10%, 01/14/42 | | | 9,525 | | | | 11,678,226 | |
6.50%, 05/02/36 | | | 22,425 | | | | 26,750,345 | |
6.50%, 09/15/37 | | | 29,204 | | | | 34,996,964 | |
6.80%, 06/01/38 | | | 17,690 | | | | 21,866,535 | |
HSBC USA Inc. | | | | | | | | |
1.63%, 01/16/18 | | | 16,295 | | | | 16,236,115 | |
2.63%, 09/24/18 | | | 2,000 | | | | 2,053,440 | |
5.00%, 09/27/20a | | | 3,000 | | | | 3,276,654 | |
| | |
| 120 | | 2014 iSHARES ANNUAL REPORTTO SHAREHOLDERS |
Schedule of Investments (Continued)
iSHARES® iBOXX $ INVESTMENT GRADE CORPORATE BOND ETF
February 28, 2014
| | | | | | | | |
| Security | |
Principal
(000s) | | | Value | |
Intesa Sanpaolo SpA | | | | | | | | |
3.88%, 01/16/18 | | $ | 13,390 | | | $ | 13,852,580 | |
3.88%, 01/15/19a | | | 12,000 | | | | 12,252,618 | |
5.25%, 01/12/24 | | | 19,675 | | | | 20,338,069 | |
J.P. Morgan Chase Bank N.A. | | | | | | | | |
6.00%, 10/01/17 | | | 30,230 | | | | 34,724,902 | |
KeyBank N.A. | | | | | | | | |
1.65%, 02/01/18 | | | 9,000 | | | | 8,960,582 | |
KeyCorp | | | | | | | | |
2.30%, 12/13/18 (Call 11/13/18) | | | 10,000 | | | | 10,042,190 | |
5.10%, 03/24/21a | | | 10,201 | | | | 11,422,149 | |
Lloyds Bank PLC | | | | | | | | |
2.30%, 11/27/18 | | | 11,830 | | | | 11,909,625 | |
6.38%, 01/21/21 | | | 7,133 | | | | 8,591,807 | |
Murray Street Investment Trust I | | | | | | | | |
4.65%, 03/09/17b | | | 16,150 | | | | 17,540,240 | |
National Australia Bank Ltd. | | | | | | | | |
2.30%, 07/25/18a | | | 7,000 | | | | 7,098,155 | |
2.75%, 03/09/17 | | | 11,500 | | | | 12,013,378 | |
3.00%, 01/20/23a | | | 9,134 | | | | 8,708,888 | |
Perrigo Co. PLC | | | | | | | | |
4.00%, 11/15/23 (Call 08/15/23)c | | | 7,500 | | | | 7,557,573 | |
PNC Bank N.A. | | | | | | | | |
2.20%, 01/28/19 (Call 12/29/18)d | | | 3,525 | | | | 3,552,652 | |
2.70%, 11/01/22 (Call 10/01/22)d | | | 15,250 | | | | 14,329,353 | |
2.95%, 01/30/23 (Call 12/30/22)d | | | 5,000 | | | | 4,766,868 | |
3.80%, 07/25/23 (Call 06/25/23)a,d | | | 17,100 | | | | 17,242,566 | |
PNC Funding Corp. | | | | | | | | |
3.30%, 03/08/22 (Call 02/06/22)d | | | 7,069 | | | | 7,088,097 | |
4.38%, 08/11/20d | | | 3,523 | | | | 3,872,955 | |
5.13%, 02/08/20d | | | 3,769 | | | | 4,294,313 | |
Rabobank Nederland | | | | | | | | |
1.70%, 03/19/18a | | | 18,400 | | | | 18,366,762 | |
2.25%, 01/14/19 | | | 20,000 | | | | 20,093,198 | |
3.88%, 02/08/22 | | | 28,435 | | | | 29,338,229 | |
3.95%, 11/09/22a | | | 15,500 | | | | 15,303,207 | |
4.50%, 01/11/21a | | | 16,043 | | | | 17,397,955 | |
| | | | | | | | |
| Security | |
Principal
(000s) | | | Value | |
4.63%, 12/01/23 | | $ | 19,250 | | | $ | 19,774,349 | |
5.25%, 05/24/41a | | | 20,455 | | | | 22,080,354 | |
5.75%, 12/01/43a | | | 6,000 | | | | 6,499,573 | |
Royal Bank of Canada | | | | | | | | |
1.50%, 01/16/18a | | | 11,500 | | | | 11,456,240 | |
2.20%, 07/27/18 | | | 24,046 | | | | 24,395,852 | |
Royal Bank of Scotland Group PLC | | | | | | | | |
5.63%, 08/24/20a | | | 5,931 | | | | 6,739,761 | |
6.13%, 01/11/21a | | | 11,077 | | | | 12,959,993 | |
6.40%, 10/21/19 | | | 16,412 | | | | 19,029,085 | |
Societe Generale SA | | | | | | | | |
2.63%, 10/01/18 | | | 10,500 | | | | 10,672,592 | |
2.75%, 10/12/17a | | | 10,750 | | | | 11,125,847 | |
Sumitomo Mitsui Banking Corp. | | | | | | | | |
1.50%, 01/18/18a | | | 6,750 | | | | 6,680,538 | |
1.80%, 07/18/17 | | | 14,000 | | | | 14,146,894 | |
2.45%, 01/10/19 | | | 11,000 | | | | 11,149,844 | |
3.20%, 07/18/22 | | | 6,099 | | | | 6,023,374 | |
SunTrust Banks Inc. | | | | | | | | |
2.35%, 11/01/18 (Call 10/01/18) | | | 13,385 | | | | 13,504,183 | |
Svenska Handelsbanken AB | | | | | | | | |
1.63%, 03/21/18 | | | 14,050 | | | | 13,918,187 | |
2.50%, 01/25/19a | | | 6,750 | | | | 6,847,097 | |
2.88%, 04/04/17 | | | 11,186 | | | | 11,716,626 | |
Toronto-Dominion Bank (The) | | | | | | | | |
1.40%, 04/30/18 | | | 15,720 | | | | 15,512,994 | |
2.63%, 09/10/18 | | | 12,875 | | | | 13,308,651 | |
U.S. Bancorp | | | | | | | | |
1.65%, 05/15/17 (Call 04/15/17) | | | 15,200 | | | | 15,505,447 | |
1.95%, 11/15/18 (Call 10/15/18) | | | 7,455 | | | | 7,509,304 | |
2.95%, 07/15/22 (Call 06/15/22) | | | 22,087 | | | | 21,211,708 | |
3.00%, 03/15/22 (Call 02/15/22) | | | 3,087 | | | | 3,067,660 | |
3.70%, 01/30/24 (Call 12/29/23) | | | 3,000 | | | | 3,063,243 | |
4.13%, 05/24/21 (Call 04/23/21) | | | 10,649 | | | | 11,491,427 | |
UBS AG Stamford | | | | | | | | |
4.88%, 08/04/20 | | | 18,325 | | | | 20,491,360 | |
| | | | |
SCHEDULESOF INVESTMENTS | | | 121 | |
Schedule of Investments (Continued)
iSHARES® iBOXX $ INVESTMENT GRADE CORPORATE BOND ETF
February 28, 2014
| | | | | | | | |
| Security | |
Principal
(000s) | | | Value | |
5.75%, 04/25/18 | | $ | 18,286 | | | $ | 21,059,070 | |
5.88%, 12/20/17 | | | 23,283 | | | | 26,816,929 | |
Wachovia Bank N.A./Wells Fargo & Co. | | | | | | | | |
5.85%, 02/01/37 | | | 9,500 | | | | 11,377,071 | |
6.00%, 11/15/17 | | | 11,272 | | | | 13,017,626 | |
6.60%, 01/15/38 | | | 20,604 | | | | 26,933,868 | |
Wachovia Corp./Wells Fargo & Co. | | | | | | | | |
5.50%, 08/01/35 | | | 11,903 | | | | 12,952,736 | |
5.75%, 06/15/17 | | | 20,395 | | | | 23,303,203 | |
5.75%, 02/01/18 | | | 27,293 | | | | 31,533,702 | |
Wells Fargo & Co. | | | | | | | | |
1.50%, 01/16/18 | | | 34,833 | | | | 34,778,427 | |
2.10%, 05/08/17 | | | 12,850 | | | | 13,238,682 | |
2.15%, 01/15/19a | | | 5,000 | | | | 5,035,593 | |
3.00%, 01/22/21 | | | 15,000 | | | | 15,144,968 | |
3.50%, 03/08/22 | | | 19,123 | | | | 19,547,141 | |
4.13%, 08/15/23 | | | 19,500 | | | | 19,916,602 | |
4.60%, 04/01/21 | | | 16,831 | | | | 18,705,112 | |
5.38%, 02/07/35 | | | 550 | | | | 617,032 | |
5.38%, 11/02/43 | | | 27,250 | | | | 29,061,645 | |
5.61%, 01/15/44 | | | 14,144 | | | | 15,599,058 | |
5.63%, 12/11/17 | | | 23,934 | | | | 27,495,970 | |
Series M | | | | | | | | |
3.45%, 02/13/23 | | | 32,425 | | | | 31,727,435 | |
Wells Fargo Bank N.A. | | | | | | | | |
5.95%, 08/26/36 | | | 200 | | | | 241,167 | |
Westpac Banking Corp. | | | | | | | | |
1.60%, 01/12/18a | | | 7,000 | | | | 6,985,579 | |
2.00%, 08/14/17 | | | 11,500 | | | | 11,717,603 | |
2.25%, 07/30/18 | | | 5,795 | | | | 5,869,235 | |
2.25%, 01/17/19 | | | 22,000 | | | | 22,058,373 | |
4.88%, 11/19/19 | | | 18,280 | | | | 20,502,078 | |
| | | | | | | | |
| | | | 1,795,207,960 | |
COMMERCIAL SERVICES & SUPPLIES — 0.38% | |
Republic Services Inc. | | | | | | | | |
3.55%, 06/01/22 (Call 03/01/22) | | | 5,300 | | | | 5,292,507 | |
5.00%, 03/01/20a | | | 14,107 | | | | 15,756,522 | |
Unilever Capital Corp. | | | | | | | | |
2.20%, 03/06/19 | | | 12,000 | | | | 12,097,488 | |
4.25%, 02/10/21 | | | 19,513 | | | | 21,312,953 | |
| | | | | | | | |
| Security | |
Principal
(000s) | | | Value | |
4.80%, 02/15/19 | | $ | 6,814 | | | $ | 7,704,959 | |
5.90%, 11/15/32 | | | 2,020 | | | | 2,565,814 | |
| | | | | | | | |
| | | | 64,730,243 | |
COMMUNICATIONS EQUIPMENT — 0.77% | |
CC Holdings GS V LLC/Crown Castle GS III Corp. | | | | | | | | |
3.85%, 04/15/23 | | | 1,000 | | | | 980,848 | |
Cisco Systems Inc. | | | | | | | | |
2.13%, 03/01/19 | | | 5,000 | | | | 5,034,323 | |
2.90%, 03/04/21 | | | 1,100 | | | | 1,110,299 | |
3.15%, 03/14/17a | | | 11,299 | | | | 12,023,502 | |
3.63%, 03/04/24 | | | 7,000 | | | | 7,055,805 | |
4.45%, 01/15/20 | | | 33,678 | | | | 37,417,056 | |
4.95%, 02/15/19 | | | 17,853 | | | | 20,290,140 | |
5.50%, 01/15/40 | | | 23,963 | | | | 27,073,412 | |
5.90%, 02/15/39 | | | 16,525 | | | | 19,485,383 | |
| | | | | | | | |
| | | | 130,470,768 | |
COMPUTERS & PERIPHERALS — 1.71% | | | | | |
Apple Inc. | | | | | | | | |
1.00%, 05/03/18 | | | 33,000 | | | | 32,247,214 | |
2.40%, 05/03/23a | | | 62,250 | | | | 57,542,176 | |
3.85%, 05/04/43 | | | 27,177 | | | | 23,744,972 | |
EMC Corp. | | | | | | | | |
1.88%, 06/01/18 | | | 9,508 | | | | 9,530,440 | |
2.65%, 06/01/20 | | | 25,750 | | | | 25,834,465 | |
3.38%, 06/01/23 (Call 03/01/23) | | | 17,755 | | | | 17,579,460 | |
Hewlett-Packard Co. | | | | | | | | |
2.60%, 09/15/17 | | | 16,600 | | | | 17,165,499 | |
2.75%, 01/14/19 | | | 19,400 | | | | 19,706,830 | |
3.75%, 12/01/20 | | | 6,490 | | | | 6,660,218 | |
4.30%, 06/01/21a | | | 11,510 | | | | 12,020,975 | |
4.38%, 09/15/21 | | | 5,823 | | | | 6,090,373 | |
4.65%, 12/09/21a | | | 22,147 | | | | 23,565,517 | |
5.50%, 03/01/18a | | | 8,780 | | | | 9,949,984 | |
6.00%, 09/15/41 | | | 9,680 | | | | 10,333,378 | |
Seagate HDD Cayman | | | | | | | | |
3.75%, 11/15/18c | | | 7,000 | | | | 7,218,750 | |
4.75%, 06/01/23c | | | 10,750 | | | | 10,481,250 | |
| | | | | | | | |
| | | | 289,671,501 | |
CONSUMER FINANCE — 2.69% | |
American Express Bank FSB | | | | | | | | |
6.00%, 09/13/17 | | | 11,737 | | | | 13,540,421 | |
| | |
| 122 | | 2014 iSHARES ANNUAL REPORTTO SHAREHOLDERS |
Schedule of Investments (Continued)
iSHARES® iBOXX $ INVESTMENT GRADE CORPORATE BOND ETF
February 28, 2014
| | | | | | | | |
| Security | |
Principal
(000s) | | | Value | |
American Express Co. | |
1.55%, 05/22/18 | | $ | 2,887 | | | $ | 2,857,805 | |
2.65%, 12/02/22a | | | 19,900 | | | | 18,889,205 | |
4.05%, 12/03/42 | | | 11,046 | | | | 10,137,986 | |
6.15%, 08/28/17 | | | 18,565 | | | | 21,551,834 | |
7.00%, 03/19/18 | | | 18,882 | | | | 22,739,457 | |
American Express Credit Corp. | | | | | | | | |
2.13%, 07/27/18 | | | 8,362 | | | | 8,463,088 | |
2.38%, 03/24/17 | | | 9,250 | | | | 9,570,794 | |
American Honda Finance Corp. | | | | | | | | |
2.13%, 10/10/18 | | | 8,500 | | | | 8,617,928 | |
Capital One Bank (USA) N.A. | | | | | | | | |
2.25%, 02/13/19 | | | 5,000 | | | | 5,012,387 | |
3.38%, 02/15/23 | | | 8,790 | | | | 8,552,439 | |
8.80%, 07/15/19 | | | 7,340 | | | | 9,462,671 | |
Capital One Financial Corp. | | | | | | | | |
4.75%, 07/15/21 | | | 14,750 | | | | 16,123,313 | |
6.75%, 09/15/17a | | | 4,967 | | | | 5,829,231 | |
Caterpillar Financial Services Corp. | | | | | | | | |
5.45%, 04/15/18 | | | 1,427 | | | | 1,631,922 | |
7.15%, 02/15/19 | | | 7,714 | | | | 9,510,081 | |
Ford Motor Credit Co. LLC | | | | | | | | |
2.38%, 01/16/18 | | | 21,500 | | | | 21,794,606 | |
2.88%, 10/01/18a | | | 3,175 | | | | 3,255,010 | |
3.00%, 06/12/17a | | | 6,404 | | | | 6,683,663 | |
4.25%, 02/03/17 | | | 3,908 | | | | 4,209,892 | |
4.25%, 09/20/22a | | | 12,495 | | | | 12,942,923 | |
4.38%, 08/06/23a | | | 9,180 | | | | 9,488,448 | |
5.00%, 05/15/18 | | | 13,121 | | | | 14,582,043 | |
5.75%, 02/01/21 | | | 10,505 | | | | 12,028,194 | |
5.88%, 08/02/21 | | | 26,858 | | | | 30,992,405 | |
6.63%, 08/15/17 | | | 9,008 | | | | 10,437,777 | |
8.13%, 01/15/20 | | | 23,108 | | | | 29,280,630 | |
HSBC Finance Corp. | | | | | | | | |
6.68%, 01/15/21 | | | 34,857 | | | | 40,839,514 | |
John Deere Capital Corp. | | | | | | | | |
1.95%, 12/13/18 | | | 3,259 | | | | 3,275,821 | |
Toyota Motor Credit Corp. | | | | | | | | |
1.25%, 10/05/17 | | | 9,900 | | | | 9,861,093 | |
1.75%, 05/22/17 | | | 2,100 | | | | 2,140,950 | |
2.00%, 10/24/18 | | | 27,400 | | | | 27,612,128 | |
2.10%, 01/17/19 | | | 5,250 | | | | 5,290,950 | |
3.30%, 01/12/22 | | | 16,714 | | | | 17,052,380 | |
| | | | | | | | |
| Security | |
Principal
(000s) | | | Value | |
3.40%, 09/15/21 | | $ | 9,889 | | | $ | 10,207,030 | |
4.25%, 01/11/21 | | | 5,000 | | | | 5,475,825 | |
Series B | | | | | | | | |
4.50%, 06/17/20 | | | 4,304 | | | | 4,810,280 | |
| | | | | | | | |
| | | | 454,752,124 | |
DIVERSIFIED FINANCIAL SERVICES — 12.01% | |
Associates Corp. of North America | | | | | | | | |
6.95%, 11/01/18 | | | 442 | | | | 529,571 | |
Bank of America Corp. | | | | | | | | |
2.00%, 01/11/18 | | | 18,255 | | | | 18,342,732 | |
2.60%, 01/15/19 | | | 16,206 | | | | 16,409,051 | |
3.30%, 01/11/23a | | | 27,074 | | | | 26,389,125 | |
3.88%, 03/22/17 | | | 7,264 | | | | 7,792,350 | |
4.10%, 07/24/23 | | | 20,600 | | | | 21,177,097 | |
4.13%, 01/22/24 | | | 7,441 | | | | 7,605,011 | |
5.00%, 05/13/21 | | | 19,950 | | | | 22,164,683 | |
5.00%, 01/21/44a | | | 12,500 | | | | 13,073,088 | |
5.42%, 03/15/17 | | | 780 | | | | 862,961 | |
5.63%, 07/01/20 | | | 24,045 | | | | 27,694,394 | |
5.65%, 05/01/18 | | | 34,070 | | | | 38,902,836 | |
5.70%, 01/24/22a | | | 20,979 | | | | 24,234,230 | |
5.75%, 12/01/17 | | | 37,450 | | | | 42,655,921 | |
5.88%, 01/05/21a | | | 14,390 | | | | 16,834,674 | |
5.88%, 02/07/42a | | | 16,681 | | | | 19,469,031 | |
6.00%, 09/01/17a | | | 17,315 | | | | 19,790,905 | |
6.11%, 01/29/37 | | | 16,940 | | | | 19,058,444 | |
6.40%, 08/28/17 | | | 13,780 | | | | 15,921,310 | |
6.88%, 04/25/18 | | | 58,015 | | | | 69,072,003 | |
6.88%, 11/15/18 | | | 1,213 | | | | 1,462,218 | |
7.63%, 06/01/19 | | | 16,215 | | | | 20,187,573 | |
7.75%, 05/14/38 | | | 10,048 | | | | 13,476,727 | |
BP Capital Markets PLC | | | | | | | | |
1.38%, 11/06/17a | | | 10,150 | | | | 10,122,203 | |
1.38%, 05/10/18 | | | 11,900 | | | | 11,709,482 | |
1.85%, 05/05/17 | | | 10,585 | | | | 10,794,486 | |
2.24%, 09/26/18 | | | 4,500 | | | | 4,566,256 | |
2.24%, 05/10/19 | | | 13,350 | | | | 13,417,396 | |
2.50%, 11/06/22 | | | 3,000 | | | | 2,794,256 | |
2.75%, 05/10/23a | | | 14,590 | | | | 13,631,399 | |
3.25%, 05/06/22 | | | 25,453 | | | | 25,302,501 | |
3.56%, 11/01/21 | | | 15,000 | | | | 15,468,776 | |
3.81%, 02/10/24 | | | 15,000 | | | | 15,143,546 | |
| | | | |
SCHEDULESOF INVESTMENTS | | | 123 | |
Schedule of Investments (Continued)
iSHARES® iBOXX $ INVESTMENT GRADE CORPORATE BOND ETF
February 28, 2014
| | | | | | | | |
| Security | |
Principal
(000s) | | | Value | |
3.99%, 09/26/23 | | $ | 2,000 | | | $ | 2,055,520 | |
4.50%, 10/01/20 | | | 15,457 | | | | 17,004,111 | |
4.74%, 03/11/21a | | | 14,317 | | | | 15,924,344 | |
4.75%, 03/10/19 | | | 8,587 | | | | 9,660,857 | |
Citigroup Inc. | | | | | | | | |
1.75%, 05/01/18 | | | 9,400 | | | | 9,289,409 | |
2.50%, 09/26/18a | | | 10,246 | | | | 10,368,003 | |
3.38%, 03/01/23a | | | 17,500 | | | | 17,009,319 | |
3.50%, 05/15/23a | | | 15,750 | | | | 14,984,659 | |
3.88%, 10/25/23a | | | 13,215 | | | | 13,248,525 | |
4.05%, 07/30/22 | | | 15,800 | | | | 16,056,611 | |
4.50%, 01/14/22 | | | 28,683 | | | | 30,607,701 | |
5.38%, 08/09/20 | | | 29,312 | | | | 33,282,583 | |
5.50%, 02/15/17 | | | 5,595 | | | | 6,205,356 | |
5.50%, 09/13/25 | | | 14,950 | | | | 16,133,103 | |
5.88%, 02/22/33 | | | 5,550 | | | | 5,934,070 | |
5.88%, 01/30/42 | | | 21,683 | | | | 25,177,111 | |
6.00%, 08/15/17 | | | 17,321 | | | | 19,803,664 | |
6.13%, 11/21/17 | | | 34,984 | | | | 40,438,376 | |
6.13%, 05/15/18a | | | 24,550 | | | | 28,454,970 | |
6.13%, 08/25/36 | | | 16,410 | | | | 18,142,016 | |
6.63%, 06/15/32 | | | 7,250 | | | | 8,363,670 | |
6.68%, 09/13/43 | | | 7,000 | | | | 8,277,641 | |
6.88%, 03/05/38 | | | 10,384 | | | | 13,344,053 | |
8.13%, 07/15/39 | | | 25,605 | | | | 37,255,482 | |
8.50%, 05/22/19a | | | 36,634 | | | | 47,163,883 | |
CME Group Inc. | | | | | | | | |
5.30%, 09/15/43 (Call 03/15/43) | | | 10,518 | | | | 11,611,913 | |
Daimler Finance North America LLC | | | | | | | | |
8.50%, 01/18/31 | | | 15,540 | | | | 23,116,525 | |
Deutsche Telekom International Finance BV | | | | | | | | |
6.00%, 07/08/19 | | | 9,061 | | | | 10,655,465 | |
6.75%, 08/20/18 | | | 7,082 | | | | 8,451,692 | |
8.75%, 06/15/30 | | | 35,200 | | | | 50,615,618 | |
General Electric Capital Corp. | | | | | | | | |
1.63%, 04/02/18a | | | 15,000 | | | | 15,005,903 | |
2.30%, 04/27/17 | | | 16,388 | | | | 16,956,005 | |
2.30%, 01/14/19a | | | 7,631 | | | | 7,763,076 | |
3.10%, 01/09/23a | | | 20,917 | | | | 20,478,084 | |
3.15%, 09/07/22 | | | 23,700 | | | | 23,298,524 | |
4.38%, 09/16/20 | | | 1,621 | | | | 1,778,597 | |
| | | | | | | | |
| Security | |
Principal
(000s) | | | Value | |
4.63%, 01/07/21 | | $ | 24,880 | | | $ | 27,522,853 | |
4.65%, 10/17/21 | | | 21,045 | | | | 23,233,335 | |
5.30%, 02/11/21 | | | 24,230 | | | | 27,362,348 | |
5.40%, 02/15/17a | | | 2,000 | | | | 2,248,862 | |
5.50%, 01/08/20 | | | 20,660 | | | | 23,941,723 | |
5.63%, 09/15/17 | | | 11,430 | | | | 13,093,409 | |
5.63%, 05/01/18a | | | 28,990 | | | | 33,466,702 | |
5.88%, 01/14/38 | | | 45,172 | | | | 53,594,215 | |
6.00%, 08/07/19 | | | 12,974 | | | | 15,386,725 | |
6.15%, 08/07/37 | | | 9,350 | | | | 11,343,787 | |
6.88%, 01/10/39 | | | 32,638 | | | | 43,057,316 | |
Series A | | | | | | | | |
5.55%, 05/04/20 | | | 390 | | | | 454,676 | |
6.75%, 03/15/32 | | | 46,222 | | | | 59,063,280 | |
Goldman Sachs Capital I | | | | | | | | |
6.35%, 02/15/34a | | | 23,875 | | | | 24,934,453 | |
IntercontinentalExchange Group Inc. | | | | | | | | |
4.00%, 10/15/23 | | | 8,000 | | | | 8,297,610 | |
J.P. Morgan Chase & Co. | | | | | | | | |
1.63%, 05/15/18a | | | 8,200 | | | | 8,112,196 | |
1.80%, 01/25/18a | | | 9,555 | | | | 9,574,071 | |
2.00%, 08/15/17 | | | 24,462 | | | | 24,822,800 | |
3.20%, 01/25/23 | | | 36,638 | | | | 35,573,087 | |
3.25%, 09/23/22 | | | 21,178 | | | | 20,855,180 | |
3.38%, 05/01/23a | | | 19,405 | | | | 18,432,196 | |
3.88%, 02/01/24a | | | 5,250 | | | | 5,307,325 | |
4.25%, 10/15/20 | | | 36,790 | | | | 39,591,106 | |
4.35%, 08/15/21 | | | 20,870 | | | | 22,414,405 | |
4.40%, 07/22/20 | | | 16,025 | | | | 17,446,852 | |
4.50%, 01/24/22 | | | 31,663 | | | | 34,285,067 | |
4.63%, 05/10/21 | | | 23,833 | | | | 26,099,506 | |
4.85%, 02/01/44 | | | 9,000 | | | | 9,249,326 | |
4.95%, 03/25/20 | | | 1,817 | | | | 2,038,328 | |
5.40%, 01/06/42 | | | 12,450 | | | | 13,791,866 | |
5.50%, 10/15/40 | | | 8,486 | | | | 9,472,354 | |
5.60%, 07/15/41 | | | 13,940 | | | | 15,811,851 | |
5.63%, 08/16/43a | | | 7,500 | | | | 8,187,185 | |
6.00%, 01/15/18 | | | 35,842 | | | | 41,378,779 | |
6.13%, 06/27/17 | | | 5,827 | | | | 6,678,135 | |
6.30%, 04/23/19 | | | 19,785 | | | | 23,481,305 | |
6.40%, 05/15/38 | | | 19,520 | | | | 24,229,670 | |
NYSE Euronext | | | | | | | | |
2.00%, 10/05/17 | | | 5,000 | | | | 5,105,037 | |
| | | | | | | | |
| | | | 2,028,911,596 | |
| | |
| 124 | | 2014 iSHARES ANNUAL REPORTTO SHAREHOLDERS |
Schedule of Investments (Continued)
iSHARES® iBOXX $ INVESTMENT GRADE CORPORATE BOND ETF
February 28, 2014
| | | | | | | | |
| Security | |
Principal
(000s) | | | Value | |
DIVERSIFIED TELECOMMUNICATION SERVICES — 6.65% | | | | | |
AT&T Corp. | | | | | | | | |
8.00%, 11/15/31 | | $ | 9,253 | | | $ | 12,682,302 | |
AT&T Inc. | | | | | | | | |
1.40%, 12/01/17 | | | 9,885 | | | | 9,807,554 | |
1.70%, 06/01/17 | | | 6,694 | | | | 6,759,071 | |
2.38%, 11/27/18 | | | 31,000 | | | | 31,376,976 | |
2.63%, 12/01/22 (Call 09/01/22)a | | | 16,367 | | | | 15,142,689 | |
3.00%, 02/15/22 | | | 21,641 | | | | 20,862,407 | |
3.88%, 08/15/21 | | | 18,002 | | | | 18,650,412 | |
4.35%, 06/15/45 (Call 12/15/44) | | | 12,164 | | | | 10,737,119 | |
4.45%, 05/15/21 | | | 22,490 | | | | 24,271,757 | |
5.35%, 09/01/40 | | | 43,520 | | | | 44,670,020 | |
5.50%, 02/01/18 | | | 26,527 | | | | 30,235,374 | |
5.55%, 08/15/41 | | | 26,133 | | | | 27,462,558 | |
5.60%, 05/15/18 | | | 10,356 | | | | 11,897,152 | |
5.80%, 02/15/19 | | | 20,012 | | | | 23,368,034 | |
6.30%, 01/15/38 | | | 24,700 | | | | 28,157,852 | |
6.50%, 09/01/37 | | | 19,625 | | | | 22,806,937 | |
6.55%, 02/15/39 | | | 11,865 | | | | 13,911,971 | |
British Telecommunications PLC | | | | | | | | |
2.35%, 02/14/19 | | | 14,150 | | | | 14,183,561 | |
5.95%, 01/15/18a | | | 25,464 | | | | 29,292,731 | |
9.63%, 12/15/30 | | | 13,250 | | | | 20,356,321 | |
Orange | | | | | | | | |
2.75%, 02/06/19 | | | 8,000 | | | | 8,095,918 | |
4.13%, 09/14/21a | | | 16,116 | | | | 16,689,644 | |
5.38%, 07/08/19 | | | 3,370 | | | | 3,804,446 | |
5.38%, 01/13/42a | | | 9,332 | | | | 9,457,277 | |
5.50%, 02/06/44 (Call 08/06/43) | | | 6,000 | | | | 6,180,038 | |
8.75%, 03/01/31 | | | 27,370 | | | | 39,093,575 | |
Qwest Corp. | | | | | | | | |
6.75%, 12/01/21 | | | 15,094 | | | | 17,056,220 | |
6.88%, 09/15/33 (Call 03/31/14) | | | 5,400 | | | | 5,346,000 | |
Telefonica Emisiones SAU | | | | | | | | |
3.19%, 04/27/18a | | | 6,372 | | | | 6,594,192 | |
4.57%, 04/27/23a | | | 8,850 | | | | 9,039,390 | |
5.13%, 04/27/20a | | | 10,974 | | | | 11,946,406 | |
5.46%, 02/16/21a | | | 19,741 | | | | 21,589,547 | |
| | | | | | | | |
| Security | |
Principal
(000s) | | | Value | |
5.88%, 07/15/19 | | $ | 15,951 | | | $ | 18,091,624 | |
7.05%, 06/20/36a | | | 23,395 | | | | 27,680,028 | |
Telefonica Europe BV | | | | | | | | |
8.25%, 09/15/30 | | | 8,478 | | | | 10,813,466 | |
Verizon Communications Inc. | | | | | | | | |
2.45%, 11/01/22 (Call 08/01/22) | | | 20,700 | | | | 18,830,448 | |
3.50%, 11/01/21 | | | 10,608 | | | | 10,706,748 | |
3.65%, 09/14/18 | | | 36,160 | | | | 38,530,020 | |
3.85%, 11/01/42 (Call 05/01/42) | | | 12,010 | | | | 10,184,823 | |
4.50%, 09/15/20 | | | 17,332 | | | | 18,788,867 | |
4.60%, 04/01/21 | | | 13,552 | | | | 14,662,714 | |
4.75%, 11/01/41 | | | 7,800 | | | | 7,509,873 | |
5.15%, 09/15/23 | | | 53,297 | | | | 58,417,397 | |
5.50%, 04/01/17 | | | 2,000 | | | | 2,246,824 | |
5.50%, 02/15/18 | | | 7,225 | | | | 8,196,531 | |
5.85%, 09/15/35 | | | 17,990 | | | | 20,174,769 | |
6.00%, 04/01/41 | | | 3,000 | | | | 3,402,293 | |
6.10%, 04/15/18 | | | 18,636 | | | | 21,577,812 | |
6.25%, 04/01/37 | | | 3,993 | | | | 4,606,764 | |
6.35%, 04/01/19 | | | 12,314 | | | | 14,569,106 | |
6.40%, 09/15/33 | | | 33,400 | | | | 39,687,881 | |
6.40%, 02/15/38 | | | 5,645 | | | | 6,611,825 | |
6.55%, 09/15/43 | | | 96,540 | | | | 118,147,670 | |
6.90%, 04/15/38a | | | 15,950 | | | | 19,667,431 | |
7.35%, 04/01/39 | | | 8,061 | | | | 10,436,512 | |
7.75%, 12/01/30 | | | 23,990 | | | | 31,586,945 | |
8.75%, 11/01/18a | | | 13,426 | | | | 17,241,335 | |
| | | | | | | | |
| | | | 1,123,895,157 | |
ELECTRIC UTILITIES — 1.01% | |
Duke Energy Carolinas LLC | | | | | | | | |
5.30%, 02/15/40a | | | 5,420 | | | | 6,184,703 | |
Duke Energy Florida Inc. | | | | | | | | |
6.40%, 06/15/38 | | | 11,013 | | | | 14,369,648 | |
Georgia Power Co. | | | | | | | | |
4.30%, 03/15/42 | | | 11,685 | | | | 11,165,433 | |
MidAmerican Energy Holdings Co. | | | | | | | | |
5.15%, 11/15/43 (Call 05/15/43)c | | | 5,500 | | | | 5,812,402 | |
6.13%, 04/01/36 | | | 19,300 | | | | 23,020,642 | |
6.50%, 09/15/37a | | | 11,050 | | | | 13,706,122 | |
| | | | |
SCHEDULESOF INVESTMENTS | | | 125 | |
Schedule of Investments (Continued)
iSHARES® iBOXX $ INVESTMENT GRADE CORPORATE BOND ETF
February 28, 2014
| | | | | | | | |
| Security | |
Principal
(000s) | | | Value | |
Nisource Finance Corp. | | | | | | | | |
4.80%, 02/15/44 (Call 08/15/43) | | $ | 5,000 | | | $ | 4,774,188 | |
6.40%, 03/15/18a | | | 7,638 | | | | 8,919,809 | |
Oncor Electric Delivery Co. LLC | | | | | | | | |
7.00%, 09/01/22 | | | 7,618 | | | | 9,450,306 | |
Pacific Gas & Electric Co. | | | | | | | | |
3.50%, 10/01/20 (Call 07/01/20)a | | | 389 | | | | 404,249 | |
5.40%, 01/15/40 | | | 9,525 | | | | 10,506,905 | |
5.80%, 03/01/37 | | | 5,100 | | | | 5,881,266 | |
6.05%, 03/01/34a | | | 35,550 | | | | 42,044,477 | |
8.25%, 10/15/18 | | | 5,383 | | | | 6,778,511 | |
Southern California Edison Co. | | | | | | | | |
4.65%, 10/01/43 (Call 04/01/43) | | | 8,000 | | | | 8,334,131 | |
| | | | | | | | |
| | | | | | | 171,352,792 | |
ELECTRICAL EQUIPMENT — 0.32% | |
ABB Finance (USA) Inc. | | | | | | | | |
2.88%, 05/08/22 | | | 13,029 | | | | 12,707,549 | |
4.38%, 05/08/42 | | | 5,175 | | | | 5,071,602 | |
Eaton Corp. PLC | | | | | | | | |
1.50%, 11/02/17 | | | 12,100 | | | | 12,085,087 | |
2.75%, 11/02/22 | | | 22,880 | | | | 21,680,104 | |
4.15%, 11/02/42 | | | 2,965 | | | | 2,739,423 | |
| | | | | | | | |
| | | | | | | 54,283,765 | |
ENERGY EQUIPMENT & SERVICES — 1.44% | |
Baker Hughes Inc. | | | | | | | | |
3.20%, 08/15/21 (Call 05/15/21) | | | 950 | | | | 967,738 | |
5.13%, 09/15/40 | | | 15,700 | | | | 17,330,800 | |
7.50%, 11/15/18 | | | 9,716 | | | | 12,063,147 | |
Ensco PLC | | | | | | | | |
4.70%, 03/15/21 | | | 11,030 | | | | 11,844,622 | |
Halliburton Co. | | | | | | | | |
3.50%, 08/01/23 (Call 05/01/23)a | | | 9,550 | | | | 9,598,885 | |
4.75%, 08/01/43 | | | 6,150 | | | | 6,383,362 | |
6.15%, 09/15/19 | | | 10,036 | | | | 12,020,951 | |
6.70%, 09/15/38 | | | 7,500 | | | | 9,688,954 | |
7.45%, 09/15/39 | | | 12,945 | | | | 18,128,353 | |
Nabors Industries Inc. | | | | | | | | |
6.15%, 02/15/18 | | | 12,750 | | | | 14,418,350 | |
| | | | | | | | |
| Security | |
Principal
(000s) | | | Value | |
National Oilwell Varco Inc. | | | | | | | | |
2.60%, 12/01/22 (Call 09/01/22) | | $ | 17,208 | | | $ | 16,300,161 | |
3.95%, 12/01/42 (Call 06/01/42) | | | 10,685 | | | | 9,842,319 | |
Pride International Inc. | | | | | | | | |
6.88%, 08/15/20 | | | 9,130 | | | | 11,055,246 | |
Transocean Inc. | | | | | | | | |
2.50%, 10/15/17 | | | 2,861 | | | | 2,897,700 | |
3.80%, 10/15/22 (Call 07/15/22) | | | 17,950 | | | | 17,036,912 | |
6.00%, 03/15/18 | | | 17,043 | | | | 19,210,495 | |
6.38%, 12/15/21 | | | 7,307 | | | | 8,170,193 | |
6.50%, 11/15/20 | | | 6,782 | | | | 7,687,476 | |
6.80%, 03/15/38a | | | 8,274 | | | | 9,123,791 | |
Weatherford International Ltd. | | | | | | | | |
4.50%, 04/15/22 (Call 01/15/22)a | | | 5,895 | | | | 6,138,013 | |
5.13%, 09/15/20 | | | 7,170 | | | | 7,840,810 | |
9.63%, 03/01/19 | | | 11,725 | | | | 15,269,191 | |
| | | | | | | | |
| | | | 243,017,469 | |
FOOD & STAPLES RETAILING — 2.80% | |
Costco Wholesale Corp. | | | | | | | | |
1.13%, 12/15/17 | | | 19,950 | | | | 19,795,785 | |
1.70%, 12/15/19 | | | 15,823 | | | | 15,493,461 | |
CVS Caremark Corp. | | | | | | | | |
2.25%, 12/05/18 (Call 11/05/18) | | | 20,500 | | | | 20,693,452 | |
4.00%, 12/05/23 (Call 09/05/23) | | | 23,481 | | | | 24,078,429 | |
5.75%, 06/01/17 | | | 15,100 | | | | 17,152,046 | |
5.75%, 05/15/41 (Call 11/15/40) | | | 11,335 | | | | 13,046,237 | |
6.13%, 09/15/39 | | | 23,845 | | | | 28,546,886 | |
6.25%, 06/01/27 | | | 1,710 | | | | 2,081,939 | |
Kroger Co. (The) | | | | | | | | |
6.15%, 01/15/20 | | | 10,997 | | | | 13,002,696 | |
Wal-Mart Stores Inc. | | | | | | | | |
1.13%, 04/11/18 | | | 14,614 | | | | 14,430,783 | |
1.95%, 12/15/18 | | | 5,217 | | | | 5,269,569 | |
2.55%, 04/11/23 (Call 01/11/23) | | | 16,620 | | | | 15,653,274 | |
3.25%, 10/25/20 | | | 4,421 | | | | 4,597,317 | |
| | |
| 126 | | 2014 iSHARES ANNUAL REPORTTO SHAREHOLDERS |
Schedule of Investments (Continued)
iSHARES® iBOXX $ INVESTMENT GRADE CORPORATE BOND ETF
February 28, 2014
| | | | | | | | |
| Security | |
Principal
(000s) | | | Value | |
3.63%, 07/08/20 | | $ | 20,478 | | | $ | 21,852,596 | |
4.00%, 04/11/43 (Call 10/11/42) | | | 5,000 | | | | 4,662,118 | |
4.25%, 04/15/21 | | | 17,939 | | | | 19,642,243 | |
4.75%, 10/02/43 (Call 04/02/43) | | | 13,580 | | | | 14,351,476 | |
4.88%, 07/08/40a | | | 14,670 | | | | 15,680,531 | |
5.00%, 10/25/40 | | | 19,005 | | | | 20,764,551 | |
5.25%, 09/01/35 | | | 17,730 | | | | 19,949,269 | |
5.38%, 04/05/17 | | | 13,659 | | | | 15,507,165 | |
5.63%, 04/01/40 | | | 16,040 | | | | 18,929,688 | |
5.63%, 04/15/41 | | | 27,785 | | | | 32,860,297 | |
5.80%, 02/15/18 | | | 4,241 | | | | 4,935,837 | |
5.88%, 04/05/27 | | | 830 | | | | 1,020,238 | |
6.20%, 04/15/38 | | | 6,441 | | | | 8,056,613 | |
6.50%, 08/15/37 | | | 36,073 | | | | 46,760,727 | |
7.55%, 02/15/30 | | | 4,568 | | | | 6,359,632 | |
Walgreen Co. | | | | | | | | |
1.80%, 09/15/17 | | | 10,000 | | | | 10,116,889 | |
3.10%, 09/15/22a | | | 7,800 | | | | 7,532,353 | |
5.25%, 01/15/19a | | | 9,388 | | | | 10,647,114 | |
| | | | | | | | |
| | | | | | | 473,471,211 | |
FOOD PRODUCTS — 1.55% | |
Archer-Daniels-Midland Co. | | | | | | | | |
4.48%, 03/01/21 | | | 9,405 | | | | 10,199,218 | |
ConAgra Foods Inc. | | | | | | | | |
1.90%, 01/25/18 | | | 10,755 | | | | 10,751,796 | |
3.20%, 01/25/23 (Call 10/25/22) | | | 9,050 | | | | 8,621,829 | |
4.65%, 01/25/43 (Call 07/25/42)a | | | 12,000 | | | | 11,430,412 | |
General Mills Inc. | | | | | | | | |
3.15%, 12/15/21 (Call 09/15/21) | | | 12,704 | | | | 12,775,084 | |
5.65%, 02/15/19a | | | 1,350 | | | | 1,566,239 | |
5.70%, 02/15/17 | | | 2,455 | | | | 2,771,397 | |
Kellogg Co. | | | | | | | | |
4.00%, 12/15/20 | | | 3,362 | | | | 3,576,410 | |
Series B | | | | | | | | |
7.45%, 04/01/31 | | | 15,260 | | | | 20,031,439 | |
Kraft Foods Group Inc. | | | | | | | | |
2.25%, 06/05/17 | | | 17,644 | | | | 18,176,473 | |
3.50%, 06/06/22 | | | 25,412 | | | | 25,575,656 | |
5.00%, 06/04/42 | | | 25,068 | | | | 25,939,138 | |
| | | | | | | | |
| Security | |
Principal
(000s) | | | Value | |
5.38%, 02/10/20 | | $ | 10,330 | | | $ | 11,824,491 | |
6.50%, 02/09/40 | | | 5,325 | | | | 6,573,321 | |
6.88%, 01/26/39 | | | 5,975 | | | | 7,651,138 | |
Mondelez International Inc. | | | | | | | | |
5.38%, 02/10/20 | | | 25,490 | | | | 29,155,131 | |
6.13%, 08/23/18a | | | 8,518 | | | | 9,920,408 | |
6.50%, 08/11/17 | | | 17,728 | | | | 20,629,643 | |
6.50%, 02/09/40a | | | 20,289 | | | | 25,346,005 | |
| | | | | | | | |
| | | | | | | 262,515,228 | |
HEALTH CARE EQUIPMENT & SUPPLIES — 0.77% | |
Abbott Laboratories | | | | | | | | |
5.13%, 04/01/19a | | | 8,808 | | | | 10,108,706 | |
Baxter International Inc. | | | | | | | | |
1.85%, 06/15/18a | | | 3,635 | | | | 3,636,125 | |
3.20%, 06/15/23 (Call 03/15/23)a | | | 15,992 | | | | 15,702,828 | |
Becton, Dickinson and Co. | | | | | | | | |
3.13%, 11/08/21 | | | 9,948 | | | | 10,059,569 | |
Boston Scientific Corp. | | | | | | | | |
6.00%, 01/15/20a | | | 9,053 | | | | 10,568,646 | |
Covidien International Finance SA | | | | | | | | |
6.00%, 10/15/17 | | | 7,250 | | | | 8,343,325 | |
6.55%, 10/15/37 | | | 12,950 | | | | 16,623,367 | |
Medtronic Inc. | | | | | | | | |
1.38%, 04/01/18 | | | 10,450 | | | | 10,356,425 | |
2.75%, 04/01/23 (Call 01/01/23) | | | 6,514 | | | | 6,198,591 | |
3.63%, 03/15/24 (Call 12/15/23) | | | 10,000 | | | | 10,129,018 | |
4.00%, 04/01/43 (Call 10/01/42)a | | | 8,000 | | | | 7,439,647 | |
4.45%, 03/15/20 | | | 13,366 | | | | 14,858,579 | |
St. Jude Medical Inc. | | | | | | | | |
3.25%, 04/15/23 (Call 01/15/23) | | | 6,868 | | | | 6,654,517 | |
| | | | | | | | |
| | | | | | | 130,679,343 | |
HEALTH CARE PROVIDERS & SERVICES — 1.16% | |
Aetna Inc. | | | | | | | | |
2.75%, 11/15/22 (Call 08/15/22) | | | 13,065 | | | | 12,337,571 | |
3.95%, 09/01/20 | | | 5,483 | | | | 5,821,182 | |
6.63%, 06/15/36 | | | 7,398 | | | | 9,230,394 | |
| | | | |
SCHEDULESOF INVESTMENTS | | | 127 | |
Schedule of Investments (Continued)
iSHARES® iBOXX $ INVESTMENT GRADE CORPORATE BOND ETF
February 28, 2014
| | | | | | | | |
| Security | |
Principal
(000s) | | | Value | |
Cigna Corp. | | | | | | | | |
4.00%, 02/15/22 (Call 11/15/21)a | | $ | 4,301 | | | $ | 4,474,629 | |
5.38%, 02/15/42 (Call 08/15/41) | | | 11,255 | | | | 12,326,482 | |
Express Scripts Holding Co. | | | | | | | | |
2.65%, 02/15/17 | | | 8,000 | | | | 8,320,596 | |
3.90%, 02/15/22a | | | 11,000 | | | | 11,316,298 | |
4.75%, 11/15/21a | | | 2,375 | | | | 2,583,168 | |
Medco Health Solutions Inc. | | | | | | | | |
7.13%, 03/15/18 | | | 16,312 | | | | 19,478,699 | |
UnitedHealth Group Inc. | | | | | | | | |
2.88%, 03/15/22 (Call 12/15/21)a | | | 14,254 | | | | 13,864,941 | |
2.88%, 03/15/23 | | | 5,000 | | | | 4,774,814 | |
4.25%, 03/15/43 (Call 09/15/42) | | | 11,500 | | | | 10,887,476 | |
5.80%, 03/15/36 | | | 4,000 | | | | 4,650,070 | |
6.00%, 02/15/18 | | | 10,334 | | | | 12,025,506 | |
6.88%, 02/15/38 | | | 12,323 | | | | 16,187,129 | |
WellPoint Inc. | | | | | | | | |
3.13%, 05/15/22 | | | 7,623 | | | | 7,347,172 | |
3.30%, 01/15/23a | | | 14,550 | | | | 14,033,994 | |
4.63%, 05/15/42 | | | 10,280 | | | | 9,950,351 | |
4.65%, 01/15/43 | | | 9,410 | | | | 9,130,149 | |
5.85%, 01/15/36 | | | 2,950 | | | | 3,312,332 | |
6.38%, 06/15/37 | | | 3,470 | | | | 4,161,215 | |
| | | | | | | | |
| | | | | | | 196,214,168 | |
HOTELS, RESTAURANTS & LEISURE — 0.21% | |
McDonald’s Corp. | | | | | | | | |
2.63%, 01/15/22 | | | 11,276 | | | | 11,011,816 | |
5.35%, 03/01/18 | | | 4,148 | | | | 4,742,587 | |
6.30%, 10/15/37 | | | 9,701 | | | | 12,304,355 | |
6.30%, 03/01/38 | | | 5,308 | | | | 6,747,518 | |
| | | | | | | | |
| | | | | | | 34,806,276 | |
HOUSEHOLD PRODUCTS — 0.38% | |
Kimberly-Clark Corp. | | | | | | | | |
6.13%, 08/01/17 | | | 665 | | | | 771,053 | |
Procter & Gamble Co. (The) | | | | | | | | |
1.60%, 11/15/18 | | | 5,000 | | | | 4,991,206 | |
2.30%, 02/06/22 | | | 22,915 | | | | 21,982,866 | |
3.10%, 08/15/23a | | | 14,000 | | | | 13,900,922 | |
4.70%, 02/15/19a | | | 4,122 | | | | 4,683,332 | |
| | | | | | | | |
| Security | |
Principal
(000s) | | | Value | |
5.55%, 03/05/37 | | $ | 15,145 | | | $ | 17,918,380 | |
| | | | | | | | |
| | | | | | | 64,247,759 | |
INDEPENDENT POWER PRODUCERS & ENERGY TRADERS — 0.10% | |
Exelon Generation Co. LLC | | | | | | | | |
5.60%, 06/15/42 (Call 12/15/41) | | | 9,280 | | | | 9,410,209 | |
6.25%, 10/01/39a | | | 6,720 | | | | 7,270,627 | |
| | | | | | | | |
| | | | | | | 16,680,836 | |
INDUSTRIAL CONGLOMERATES — 0.68% | |
3M Co. | | | | | | | | |
5.70%, 03/15/37 | | | 3,350 | | | | 4,007,852 | |
Danaher Corp. | | | | | | | | |
5.40%, 03/01/19 | | | 2,087 | | | | 2,412,582 | |
General Electric Co. | | | | | | | | |
2.70%, 10/09/22a | | | 31,275 | | | | 30,194,355 | |
4.13%, 10/09/42 | | | 21,397 | | | | 20,728,669 | |
5.25%, 12/06/17 | | | 23,319 | | | | 26,577,933 | |
Koninklijke Philips NV | | | | | | | | |
3.75%, 03/15/22 | | | 12,004 | | | | 12,375,831 | |
5.75%, 03/11/18 | | | 9,507 | | | | 10,955,366 | |
6.88%, 03/11/38 | | | 6,432 | | | | 8,280,173 | |
| | | | | | | | |
| | | | | | | 115,532,761 | |
INSURANCE — 2.39% | |
Aflac Inc. | | | | | | | | |
8.50%, 05/15/19 | | | 2,500 | | | | 3,238,602 | |
American International Group Inc. | | | | | | | | |
3.38%, 08/15/20a | | | 10,000 | | | | 10,252,829 | |
3.80%, 03/22/17 | | | 17,692 | | | | 18,974,781 | |
4.13%, 02/15/24 | | | 10,650 | | | | 10,936,721 | |
4.88%, 06/01/22 | | | 22,994 | | | | 25,228,906 | |
5.45%, 05/18/17 | | | 6,173 | | | | 6,934,491 | |
5.85%, 01/16/18 | | | 26,119 | | | | 30,030,080 | |
6.25%, 05/01/36 | | | 9,750 | | | | 11,982,694 | |
6.40%, 12/15/20 | | | 14,896 | | | | 17,839,341 | |
8.25%, 08/15/18 | | | 23,875 | | | | 29,923,731 | |
Berkshire Hathaway Finance Corp. | | | | | | | | |
1.60%, 05/15/17a | | | 19,887 | | | | 20,255,900 | |
3.00%, 05/15/22 | | | 17,867 | | | | 17,743,505 | |
4.25%, 01/15/21a | | | 6,517 | | | | 7,126,645 | |
5.40%, 05/15/18a | | | 10,771 | | | | 12,424,905 | |
5.75%, 01/15/40 | | | 5,850 | | | | 6,769,732 | |
| | |
| 128 | | 2014 iSHARES ANNUAL REPORTTO SHAREHOLDERS |
Schedule of Investments (Continued)
iSHARES® iBOXX $ INVESTMENT GRADE CORPORATE BOND ETF
February 28, 2014
| | | | | | | | |
| Security | |
Principal
(000s) | | | Value | |
Berkshire Hathaway Inc. | | | | | | | | |
1.55%, 02/09/18 | | $ | 7,000 | | | $ | 7,003,753 | |
4.50%, 02/11/43a | | | 8,871 | | | | 8,708,520 | |
Chubb Corp. (The) | | | | | | | | |
6.00%, 05/11/37 | | | 4,075 | | | | 4,967,252 | |
MetLife Inc. | | | | | | | | |
4.13%, 08/13/42a | | | 4,000 | | | | 3,686,383 | |
4.75%, 02/08/21 | | | 5,094 | | | | 5,661,524 | |
4.88%, 11/13/43 | | | 10,000 | | | | 10,380,691 | |
5.70%, 06/15/35 | | | 3,820 | | | | 4,398,372 | |
5.88%, 02/06/41 | | | 16,550 | | | | 19,381,409 | |
6.38%, 06/15/34 | | | 7,875 | | | | 9,694,146 | |
7.72%, 02/15/19a | | | 17,053 | | | | 21,385,968 | |
Series A | | | | | | | | |
6.82%, 08/15/18 | | | 13,229 | | | | 15,935,848 | |
Series D | | | | | | | | |
4.37%, 09/15/23a | | | 8,500 | | | | 8,999,979 | |
Prudential Financial Inc. | | | | | | | | |
7.38%, 06/15/19 | | | 9,082 | | | | 11,316,370 | |
Series D | | | | | | | | |
6.00%, 12/01/17 | | | 11,184 | | | | 12,941,387 | |
6.63%, 12/01/37 | | | 9,525 | | | | 11,931,460 | |
Travelers Companies Inc. (The) | | | | | | | | |
5.35%, 11/01/40a | | | 6,950 | | | | 7,878,299 | |
6.25%, 06/15/37 | | | 8,515 | | | | 10,652,578 | |
| | | | | | | | |
| | | | | | | 404,586,802 | |
INTERNET & CATALOG RETAIL — 0.12% | |
Amazon.com Inc. | | | | | | | | |
1.20%, 11/29/17 | | | 5,155 | | | | 5,108,133 | |
2.50%, 11/29/22 (Call 08/29/22)a | | | 16,094 | | | | 14,997,041 | |
| | | | | | | | |
| | | | | | | 20,105,174 | |
INTERNET SOFTWARE & SERVICES — 0.26% | |
eBay Inc. | | | | | | | | |
1.35%, 07/15/17 | | | 5,196 | | | | 5,211,645 | |
2.60%, 07/15/22 (Call 04/15/22)a | | | 12,088 | | | | 11,448,897 | |
4.00%, 07/15/42 (Call 01/15/42) | | | 12,082 | | | | 10,578,638 | |
Google Inc. | | | | | | | | |
3.38%, 02/25/24 | | | 10,820 | | | | 10,886,015 | |
3.63%, 05/19/21 | | | 5,361 | | | | 5,715,701 | |
| | | | | | | | |
| | | | 43,840,896 | |
| | | | | | | | |
| Security | |
Principal
(000s) | | | Value | |
IT SERVICES — 0.86% | |
Fidelity National Information Services Inc. | | | | | | | | |
3.50%, 04/15/23 (Call 01/15/23)a | | $ | 400 | | | $ | 376,636 | |
International Business Machines Corp. | | | | | | | | |
1.25%, 02/06/17a | | | 13,777 | | | | 13,908,308 | |
1.25%, 02/08/18 | | | 1,970 | | | | 1,951,698 | |
1.63%, 05/15/20a | | | 1,250 | | | | 1,197,127 | |
1.88%, 08/01/22 | | | 4,440 | | | | 3,999,723 | |
1.95%, 02/12/19 | | | 5,000 | | | | 5,021,992 | |
3.38%, 08/01/23 | | | 22,410 | | | | 22,307,571 | |
3.63%, 02/12/24a | | | 14,460 | | | | 14,579,972 | |
4.00%, 06/20/42 | | | 13,250 | | | | 12,271,864 | |
5.70%, 09/14/17 | | | 33,805 | | | | 38,901,989 | |
7.63%, 10/15/18 | | | 11,548 | | | | 14,458,006 | |
8.38%, 11/01/19 | | | 12,737 | | | | 16,819,500 | |
| | | | | | | | |
| | | | 145,794,386 | |
LIFE SCIENCES TOOLS & SERVICES — 0.33% | |
Thermo Fisher Scientific Inc. | | | | | | | | |
2.40%, 02/01/19 | | | 16,482 | | | | 16,542,479 | |
3.15%, 01/15/23 (Call 10/15/22) | | | 8,575 | | | | 8,248,024 | |
3.60%, 08/15/21 (Call 05/15/21) | | | 16,396 | | | | 16,801,837 | |
4.15%, 02/01/24 (Call 11/01/23)a | | | 8,100 | | | | 8,328,064 | |
4.50%, 03/01/21 | | | 5,192 | | | | 5,606,570 | |
| | | | | | | | |
| | | | 55,526,974 | |
MACHINERY — 0.61% | |
Caterpillar Inc. | | | | | | | | |
3.80%, 08/15/42 | | | 14,795 | | | | 13,135,468 | |
3.90%, 05/27/21 | | | 11,487 | | | | 12,206,531 | |
5.20%, 05/27/41 | | | 10,860 | | | | 11,925,140 | |
7.90%, 12/15/18 | | | 13,993 | | | | 17,722,365 | |
Deere & Co. | | | | | | | | |
2.60%, 06/08/22 (Call 03/08/22) | | | 13,910 | | | | 13,392,242 | |
3.90%, 06/09/42 (Call 12/09/41)a | | | 10,710 | | | | 9,907,651 | |
4.38%, 10/16/19 | | | 11,683 | | | | 12,982,540 | |
| | | | |
SCHEDULESOF INVESTMENTS | | | 129 | |
Schedule of Investments (Continued)
iSHARES® iBOXX $ INVESTMENT GRADE CORPORATE BOND ETF
February 28, 2014
| | | | | | | | |
| Security | |
Principal
(000s) | | | Value | |
Illinois Tool Works Inc. | | | | | | | | |
3.90%, 09/01/42 (Call 03/01/42) | | $ | 12,550 | | | $ | 11,376,254 | |
| | | | | | | | |
| | | | | | | 102,648,191 | |
MEDIA — 6.35% | | | | | |
21st Century Fox America Inc. | | | | | | | | |
3.00%, 09/15/22a | | | 18,750 | | | | 18,047,378 | |
4.50%, 02/15/21 | | | 4,524 | | | | 4,929,785 | |
6.15%, 03/01/37 | | | 5,100 | | | | 5,859,319 | |
6.15%, 02/15/41a | | | 15,630 | | | | 17,966,122 | |
6.20%, 12/15/34 | | | 12,947 | | | | 14,943,930 | |
6.40%, 12/15/35a | | | 11,400 | | | | 13,497,730 | |
6.65%, 11/15/37a | | | 8,827 | | | | 10,648,830 | |
CBS Corp. | | | | | | | | |
7.88%, 07/30/30 | | | 11,130 | | | | 14,455,759 | |
Comcast Cable Communications Holdings Inc. | | | | | | | | |
9.46%, 11/15/22 | | | 2,091 | | | | 2,976,140 | |
Comcast Corp. | | | | | | | | |
2.85%, 01/15/23a | | | 5,885 | | | | 5,681,271 | |
3.13%, 07/15/22a | | | 13,122 | | | | 13,024,619 | |
3.60%, 03/01/24 | | | 10,000 | | | | 10,076,494 | |
4.25%, 01/15/33a | | | 26,650 | | | | 26,189,576 | |
4.65%, 07/15/42 | | | 11,830 | | | | 11,834,820 | |
4.75%, 03/01/44 | | | 5,000 | | | | 5,091,882 | |
5.15%, 03/01/20 | | | 16,208 | | | | 18,528,493 | |
5.65%, 06/15/35 | | | 6,000 | | | | 6,777,407 | |
5.70%, 05/15/18 | | | 9,035 | | | | 10,446,828 | |
5.88%, 02/15/18a | | | 11,790 | | | | 13,653,230 | |
6.30%, 11/15/17 | | | 14,053 | | | | 16,424,499 | |
6.40%, 05/15/38 | | | 800 | | | | 983,534 | |
6.40%, 03/01/40 | | | 6,800 | | | | 8,383,088 | |
6.45%, 03/15/37 | | | 16,530 | | | | 20,365,327 | |
6.50%, 11/15/35 | | | 2,150 | | | | 2,661,905 | |
6.55%, 07/01/39a | | | 13,775 | | | | 17,237,160 | |
6.95%, 08/15/37 | | | 27,313 | | | | 35,486,322 | |
7.05%, 03/15/33 | | | 300 | | | | 388,983 | |
DIRECTV Holdings LLC/DIRECTV Financing Co. Inc. | | | | | | | | |
1.75%, 01/15/18a | | | 11,200 | | | | 11,116,181 | |
2.40%, 03/15/17 | | | 18,588 | | | | 19,114,477 | |
3.80%, 03/15/22a | | | 11,113 | | | | 10,966,186 | |
| | | | | | | | |
| Security | |
Principal
(000s) | | | Value | |
4.60%, 02/15/21 (Call 11/15/20) | | $ | 16,685 | | | $ | 17,613,625 | |
5.00%, 03/01/21a | | | 13,211 | | | | 14,265,486 | |
5.15%, 03/15/42 | | | 11,429 | | | | 10,744,605 | |
5.20%, 03/15/20 | | | 5,100 | | | | 5,627,331 | |
5.88%, 10/01/19 | | | 4,562 | | | | 5,246,470 | |
6.00%, 08/15/40 (Call 05/15/40) | | | 12,325 | | | | 12,757,871 | |
6.38%, 03/01/41 | | | 13,235 | | | | 14,325,446 | |
Discovery Communications LLC | | | | | | | | |
4.88%, 04/01/43 | | | 10,000 | | | | 9,693,845 | |
5.05%, 06/01/20a | | | 17,823 | | | | 19,838,847 | |
6.35%, 06/01/40 | | | 4,350 | | | | 5,027,987 | |
Historic TW Inc. | | | | | | | | |
6.63%, 05/15/29 | | | 11,830 | | | | 14,240,081 | |
NBCUniversal Media LLC | | | | | | | | |
2.88%, 01/15/23a | | | 13,425 | | | | 12,942,021 | |
4.38%, 04/01/21 | | | 25,925 | | | | 28,154,682 | |
4.45%, 01/15/43 | | | 23,925 | | | | 23,069,504 | |
5.15%, 04/30/20 | | | 14,949 | | | | 17,081,290 | |
5.95%, 04/01/41 | | | 17,450 | | | | 20,479,430 | |
6.40%, 04/30/40 | | | 3,425 | | | | 4,190,881 | |
Omnicom Group Inc. | | | | | | | | |
3.63%, 05/01/22 | | | 5,158 | | | | 5,143,257 | |
4.45%, 08/15/20 | | | 19,200 | | | | 20,748,741 | |
Thomson Reuters Corp. | | | | | | | | |
6.50%, 07/15/18 | | | 6,979 | | | | 8,155,984 | |
Time Warner Cable Inc. | | | | | | | | |
4.00%, 09/01/21 (Call 06/01/21) | | | 16,365 | | | | 16,996,496 | |
4.50%, 09/15/42 (Call 03/15/42)a | | | 14,750 | | | | 13,460,635 | |
5.00%, 02/01/20 | | | 20,463 | | | | 22,572,273 | |
5.50%, 09/01/41 (Call 03/01/41) | | | 7,320 | | | | 7,627,269 | |
5.85%, 05/01/17 | | | 2,373 | | | | 2,685,571 | |
5.88%, 11/15/40 (Call 05/15/40) | | | 12,650 | | | | 13,752,928 | |
6.55%, 05/01/37 | | | 8,443 | | | | 9,787,527 | |
6.75%, 07/01/18 | | | 33,813 | | | | 39,971,622 | |
6.75%, 06/15/39 | | | 19,659 | | | | 23,284,338 | |
7.30%, 07/01/38 | | | 18,750 | | | | 23,560,674 | |
8.25%, 04/01/19 | | | 22,389 | | | | 28,210,559 | |
8.75%, 02/14/19 | | | 9,604 | | | | 12,253,068 | |
| | |
| 130 | | 2014 iSHARES ANNUAL REPORTTO SHAREHOLDERS |
Schedule of Investments (Continued)
iSHARES® iBOXX $ INVESTMENT GRADE CORPORATE BOND ETF
February 28, 2014
| | | | | | | | |
| Security | |
Principal
(000s) | | | Value | |
Time Warner Entertainment Co. LP | | | | | | | | |
8.38%, 03/15/23a | | $ | 13,853 | | | $ | 18,231,407 | |
Time Warner Inc. | | | | | | | | |
4.70%, 01/15/21 | | | 16,073 | | | | 17,602,296 | |
4.75%, 03/29/21 | | | 6,160 | | | | 6,770,598 | |
4.88%, 03/15/20 | | | 19,680 | | | | 21,847,628 | |
6.10%, 07/15/40 | | | 15,340 | | | | 17,451,413 | |
6.25%, 03/29/41 | | | 7,095 | | | | 8,245,451 | |
6.50%, 11/15/36 | | | 9,850 | | | | 11,580,627 | |
7.63%, 04/15/31 | | | 17,019 | | | | 22,467,747 | |
7.70%, 05/01/32 | | | 17,963 | | | | 23,833,264 | |
Viacom Inc. | | | | | | | | |
4.25%, 09/01/23 (Call 06/01/23) | | | 15,392 | | | | 15,854,425 | |
4.38%, 03/15/43a | | | 16,050 | | | | 14,168,313 | |
5.85%, 09/01/43 (Call 03/01/43) | | | 10,000 | | | | 10,982,075 | |
6.88%, 04/30/36 | | | 5,813 | | | | 7,066,691 | |
Walt Disney Co. (The) | | | | | | | | |
1.10%, 12/01/17 | | | 12,300 | | | | 12,220,228 | |
2.35%, 12/01/22a | | | 2,500 | | | | 2,341,686 | |
2.75%, 08/16/21 | | | 11,250 | | | | 11,262,413 | |
| | | | | | | | |
| | | | | | | 1,073,193,881 | |
METALS & MINING — 3.17% | | | | | |
Alcoa Inc. | | | | | | | | |
5.40%, 04/15/21 (Call 01/15/21)a | | | 12,893 | | | | 13,574,958 | |
5.72%, 02/23/19 | | | 5,046 | | | | 5,543,397 | |
6.15%, 08/15/20a | | | 8,299 | | | | 9,177,565 | |
6.75%, 07/15/18a | | | 11,774 | | | | 13,458,180 | |
Barrick Gold Corp. | | | | | | | | |
3.85%, 04/01/22a | | | 12,375 | | | | 11,844,632 | |
4.10%, 05/01/23a | | | 15,000 | | | | 14,345,673 | |
5.25%, 04/01/42 | | | 1,250 | | | | 1,130,158 | |
6.95%, 04/01/19a | | | 12,344 | | | | 14,604,604 | |
Barrick North America Finance LLC | | | | | | | | |
4.40%, 05/30/21 | | | 7,981 | | | | 8,078,427 | |
5.70%, 05/30/41 | | | 17,620 | | | | 16,873,326 | |
5.75%, 05/01/43 | | | 10,000 | | | | 9,754,460 | |
| | | | | | | | |
| Security | |
Principal
(000s) | | | Value | |
Barrick PD Australia Finance Pty Ltd. | | | | | | | | |
5.95%, 10/15/39 | | $ | 2,250 | | | $ | 2,208,593 | |
BHP Billiton Finance (USA) Ltd. | | | | | | | | |
2.05%, 09/30/18 | | | 3,345 | | | | 3,386,017 | |
2.88%, 02/24/22 | | | 8,068 | | | | 7,937,072 | |
3.25%, 11/21/21 | | | 18,899 | | | | 19,233,401 | |
3.85%, 09/30/23 | | | 17,000 | | | | 17,419,647 | |
4.13%, 02/24/42a | | | 17,900 | | | | 16,836,284 | |
5.00%, 09/30/43a | | | 17,150 | | | | 18,063,960 | |
5.40%, 03/29/17 | | | 5,000 | | | | 5,637,062 | |
6.50%, 04/01/19a | | | 14,356 | | | | 17,345,156 | |
Cliffs Natural Resources Inc. | | | | | | | | |
6.25%, 10/01/40a | | | 8,608 | | | | 7,377,780 | |
Freeport-McMoRan Copper & Gold Inc. | | | | | | | | |
2.38%, 03/15/18a | | | 18,211 | | | | 18,356,500 | |
3.10%, 03/15/20 | | | 13,530 | | | | 13,431,270 | |
3.55%, 03/01/22 (Call 12/01/21) | | | 27,849 | | | | 26,909,784 | |
3.88%, 03/15/23 (Call 12/15/22)a | | | 21,185 | | | | 20,544,099 | |
5.45%, 03/15/43 (Call 09/15/42)a | | | 15,250 | | | | 15,022,487 | |
Newmont Mining Corp. | | | | | | | | |
3.50%, 03/15/22 (Call 12/15/21)a | | | 17,425 | | | | 15,883,234 | |
4.88%, 03/15/42 (Call 09/15/41) | | | 18,048 | | | | 14,681,541 | |
5.13%, 10/01/19a | | | 3,319 | | | | 3,549,288 | |
6.25%, 10/01/39 | | | 4,650 | | | | 4,501,163 | |
Rio Tinto Alcan Inc. | | | | | | | | |
6.13%, 12/15/33 | | | 250 | | | | 288,463 | |
Rio Tinto Finance (USA) Ltd. | | | | | | | | |
3.50%, 11/02/20 | | | 152 | | | | 157,063 | |
3.75%, 09/20/21 | | | 15,518 | | | | 15,993,375 | |
4.13%, 05/20/21 | | | 6,940 | | | | 7,336,713 | |
5.20%, 11/02/40 | | | 14,402 | | | | 15,234,349 | |
6.50%, 07/15/18 | | | 21,799 | | | | 25,889,624 | |
7.13%, 07/15/28 | | | 3,400 | | | | 4,307,698 | |
9.00%, 05/01/19 | | | 23,479 | | | | 30,703,674 | |
Rio Tinto Finance (USA) PLC | | | | | | | | |
1.63%, 08/21/17 (Call 07/21/17) | | | 3,004 | | | | 3,024,091 | |
| | | | |
SCHEDULESOF INVESTMENTS | | | 131 | |
Schedule of Investments (Continued)
iSHARES® iBOXX $ INVESTMENT GRADE CORPORATE BOND ETF
February 28, 2014
| | | | | | | | |
| Security | |
Principal
(000s) | | | Value | |
2.25%, 12/14/18 (Call 11/14/18)a | | $ | 11,880 | | | $ | 12,003,515 | |
2.88%, 08/21/22 (Call 05/21/22)a | | | 10,056 | | | | 9,593,331 | |
3.50%, 03/22/22 (Call 12/22/21) | | | 14,221 | | | | 14,232,341 | |
4.13%, 08/21/42 (Call 02/21/42) | | | 12,920 | | | | 11,620,099 | |
Teck Resources Ltd. | | | | | | | | |
3.75%, 02/01/23 (Call 11/01/22)a | | | 11,780 | | | | 11,235,307 | |
6.25%, 07/15/41 (Call 01/15/41) | | | 6,825 | | | | 7,147,249 | |
| | | | | | | | |
| | | | | | | 535,476,610 | |
MULTI-UTILITIES — 0.05% | | | | | |
Sempra Energy | | | | | | | | |
6.00%, 10/15/39 | | | 6,740 | | | | 7,959,193 | |
| | | | | | | | |
| | | | | | | 7,959,193 | |
MULTILINE RETAIL — 0.59% | | | | | |
Macy’s Retail Holdings Inc. | | | | | | | | |
2.88%, 02/15/23 (Call 11/15/22) | | | 3,630 | | | | 3,378,794 | |
Target Corp. | | | | | | | | |
2.90%, 01/15/22 | | | 10,263 | | | | 10,066,094 | |
3.88%, 07/15/20 | | | 6,671 | | | | 7,159,659 | |
4.00%, 07/01/42a | | | 20,165 | | | | 18,356,185 | |
5.38%, 05/01/17 | | | 12,888 | | | | 14,549,783 | |
6.00%, 01/15/18 | | | 15,718 | | | | 18,253,628 | |
6.50%, 10/15/37 | | | 17,060 | | | | 21,256,136 | |
7.00%, 01/15/38 | | | 4,930 | | | | 6,502,045 | |
| | | | | | | | |
| | | | | | | 99,522,324 | |
OFFICE ELECTRONICS — 0.12% | | | | | |
Xerox Corp. | | | | | | | | |
4.50%, 05/15/21 | | | 14,121 | | | | 14,895,640 | |
6.35%, 05/15/18 | | | 4,785 | | | | 5,582,786 | |
| | | | | | | | |
| | | | | | | 20,478,426 | |
OIL, GAS & CONSUMABLE FUELS — 9.11% | |
Anadarko Petroleum Corp. | | | | | | | | |
6.20%, 03/15/40 | | | 11,750 | | | | 13,684,925 | |
6.38%, 09/15/17 | | | 16,785 | | | | 19,403,183 | |
6.45%, 09/15/36 | | | 18,817 | | | | 22,338,884 | |
| | | | | | | | |
| Security | |
Principal
(000s) | | | Value | |
Apache Corp. | | | | | | | | |
2.63%, 01/15/23 (Call 10/15/22)a | | $ | 5,000 | | | $ | 4,749,667 | |
3.25%, 04/15/22 (Call 01/15/22) | | | 11,883 | | | | 12,024,461 | |
4.75%, 04/15/43 (Call 10/15/42) | | | 24,975 | | | | 25,098,486 | |
5.10%, 09/01/40 (Call 03/01/40) | | | 9,850 | | | | 10,381,053 | |
6.00%, 01/15/37 | | | 11,790 | | | | 13,836,320 | |
Canadian Natural Resources Ltd. | | | | | | | | |
5.70%, 05/15/17 | | | 6,273 | | | | 7,107,485 | |
6.25%, 03/15/38a | | | 13,371 | | | | 15,774,036 | |
Cenovus Energy Inc. | | | | | | | | |
4.45%, 09/15/42 (Call 03/15/42)a | | | 10,602 | | | | 9,932,434 | |
5.70%, 10/15/19 | | | 742 | | | | 857,525 | |
6.75%, 11/15/39 | | | 16,575 | | | | 20,611,099 | |
Chevron Corp. | | | | | | | | |
1.10%, 12/05/17 (Call 11/05/17) | | | 25,476 | | | | 25,291,467 | |
1.72%, 06/24/18 (Call 05/24/18)a | | | 5,918 | | | | 5,947,628 | |
2.36%, 12/05/22 (Call 09/05/22) | | | 21,902 | | | | 20,497,254 | |
2.43%, 06/24/20 (Call 05/24/20)a | | | 6,109 | | | | 6,127,464 | |
3.19%, 06/24/23 (Call 03/24/23) | | | 25,450 | | | | 25,238,017 | |
4.95%, 03/03/19 | | | 17,209 | | | | 19,687,519 | |
ConocoPhillips | | | | | | | | |
5.75%, 02/01/19 | | | 15,696 | | | | 18,443,323 | |
6.00%, 01/15/20 | | | 10,938 | �� | | | 13,088,834 | |
6.50%, 02/01/39 | | | 31,642 | | | | 41,350,677 | |
6.95%, 04/15/29 | | | 4,470 | | | | 5,951,202 | |
ConocoPhillips Co. | | | | | | | | |
1.05%, 12/15/17 (Call 11/15/17) | | | 14,590 | | | | 14,470,328 | |
2.40%, 12/15/22 (Call 09/15/22) | | | 15,750 | | | | 14,882,835 | |
Continental Resources Inc. | | | | | | | | |
4.50%, 04/15/23 (Call 01/15/23)a | | | 10,000 | | | | 10,356,407 | |
| | |
| 132 | | 2014 iSHARES ANNUAL REPORTTO SHAREHOLDERS |
Schedule of Investments (Continued)
iSHARES® iBOXX $ INVESTMENT GRADE CORPORATE BOND ETF
February 28, 2014
| | | | | | | | |
| Security | |
Principal
(000s) | | | Value | |
5.00%, 09/15/22 (Call 03/15/17)a | | $ | 20,500 | | | $ | 21,407,574 | |
Devon Energy Corp. | | | | | | | | |
1.88%, 05/15/17 (Call 04/15/17) | | | 6,005 | | | | 6,082,765 | |
2.25%, 12/15/18 (Call 11/15/18) | | | 15,000 | | | | 15,034,991 | |
3.25%, 05/15/22 (Call 02/15/22)a | | | 4,679 | | | | 4,607,447 | |
4.75%, 05/15/42 (Call 11/15/41)a | | | 9,175 | | | | 9,031,692 | |
5.60%, 07/15/41 (Call 01/15/41) | | | 7,850 | | | | 8,598,990 | |
7.95%, 04/15/32 | | | 13,510 | | | | 18,532,521 | |
Devon Financing Corp. ULC | | | | | | | | |
7.88%, 09/30/31 | | | 9,460 | | | | 12,902,124 | |
Encana Corp. | | | | | | | | |
6.50%, 08/15/34 | | | 12,190 | | | | 13,945,601 | |
6.50%, 02/01/38 | | | 4,400 | | | | 5,114,169 | |
Energy Transfer Partners LP | | | | | | | | |
3.60%, 02/01/23 (Call 11/01/22)a | | | 8,514 | | | | 8,109,220 | |
4.65%, 06/01/21 (Call 03/01/21) | | | 13,263 | | | | 13,902,527 | |
5.20%, 02/01/22 (Call 11/01/21) | | | 3,984 | | | | 4,282,411 | |
6.50%, 02/01/42 (Call 08/01/41)a | | | 13,480 | | | | 14,933,229 | |
Enterprise Products Operating LLC | | | | | | | | |
3.35%, 03/15/23 (Call 12/15/22) | | | 8,256 | | | | 8,074,992 | |
3.90%, 02/15/24 (Call 11/15/23) | | | 8,400 | | | | 8,451,266 | |
4.45%, 02/15/43 (Call 08/15/42) | | | 7,205 | | | | 6,670,728 | |
4.85%, 08/15/42 (Call 02/15/42)a | | | 5,650 | | | | 5,567,213 | |
4.85%, 03/15/44 (Call 09/15/43)a | | | 13,850 | | | | 13,723,101 | |
5.10%, 02/15/45 (Call 08/15/44) | | | 10,425 | | | | 10,659,835 | |
5.20%, 09/01/20 | | | 11,308 | | | | 12,783,248 | |
5.95%, 02/01/41 | | | 9,910 | | | | 11,233,881 | |
| | | | | | | | |
| Security | |
Principal
(000s) | | | Value | |
Series L | | | | | | | | |
6.30%, 09/15/17 | | $ | 5,757 | | | $ | 6,683,620 | |
EOG Resources Inc. | | | | | | | | |
2.63%, 03/15/23 (Call 12/15/22) | | | 14,575 | | | | 13,739,546 | |
4.10%, 02/01/21 | | | 5,821 | | | | 6,239,029 | |
5.63%, 06/01/19 | | | 3,669 | | | | 4,258,777 | |
Hess Corp. | | | | | | | | |
5.60%, 02/15/41a | | | 7,268 | | | | 7,927,261 | |
6.00%, 01/15/40 | | | 8,300 | | | | 9,412,555 | |
7.30%, 08/15/31 | | | 9,668 | | | | 12,173,702 | |
8.13%, 02/15/19 | | | 12,162 | | | | 15,321,927 | |
Kinder Morgan Energy Partners LP | | | | | | | | |
2.65%, 02/01/19a | | | 9,442 | | | | 9,469,332 | |
3.50%, 03/01/21 (Call 01/01/21) | | | 5,000 | | | | 5,017,285 | |
3.95%, 09/01/22 (Call 06/01/22) | | | 11,500 | | | | 11,476,433 | |
5.50%, 03/01/44 (Call 09/01/43) | | | 9,000 | | | | 9,091,762 | |
5.95%, 02/15/18 | | | 10,870 | | | | 12,429,297 | |
6.95%, 01/15/38a | | | 7,375 | | | | 8,677,505 | |
Marathon Oil Corp. | | | | | | | | |
2.80%, 11/01/22 (Call 08/01/22)a | | | 11,175 | | | | 10,536,836 | |
5.90%, 03/15/18 | | | 9,093 | | | | 10,453,135 | |
6.60%, 10/01/37 | | | 8,450 | | | | 10,530,367 | |
Marathon Petroleum Corp. | | | | | | | | |
5.13%, 03/01/21 | | | 10,435 | | | | 11,654,756 | |
6.50%, 03/01/41 (Call 09/01/40) | | | 10,726 | | | | 12,870,549 | |
Noble Energy Inc. | | | | | | | | |
4.15%, 12/15/21 (Call 09/15/21)a | | | 8,702 | | | | 9,180,060 | |
5.25%, 11/15/43 (Call 05/15/43)a | | | 8,000 | | | | 8,365,054 | |
6.00%, 03/01/41 (Call 09/01/40) | | | 11,115 | | | | 12,739,305 | |
8.25%, 03/01/19a | | | 9,742 | | | | 12,275,386 | |
Occidental Petroleum Corp. | | | | | | | | |
2.70%, 02/15/23 (Call 11/15/22)a | | | 7,550 | | | | 7,139,137 | |
| | | | |
SCHEDULESOF INVESTMENTS | | | 133 | |
Schedule of Investments (Continued)
iSHARES® iBOXX $ INVESTMENT GRADE CORPORATE BOND ETF
February 28, 2014
| | | | | | | | |
| Security | |
Principal
(000s) | | | Value | |
3.13%, 02/15/22 (Call 11/15/21) | | $ | 19,046 | | | $ | 18,939,401 | |
Series 1 | | | | | | | | |
4.10%, 02/01/21 (Call 11/01/20) | | | 13,310 | | | | 14,392,086 | |
ONEOK Partners LP | | | | | | | | |
3.38%, 10/01/22 (Call 07/01/22) | | | 9,390 | | | | 9,041,359 | |
Petro-Canada | | | | | | | | |
6.80%, 05/15/38 | | | 9,915 | | | | 12,516,124 | |
Petrohawk Energy Corp. | | | | | | | | |
7.25%, 08/15/18 (Call 08/15/14) | | | 16,100 | | | | 17,106,250 | |
Phillips 66 | | | | | | | | |
2.95%, 05/01/17 | | | 14,175 | | | | 14,875,245 | |
4.30%, 04/01/22 | | | 13,409 | | | | 14,104,222 | |
5.88%, 05/01/42a | | | 16,480 | | | | 18,757,869 | |
Plains All American Pipeline LP/PAA Finance Corp. | | | | | | | | |
3.65%, 06/01/22 (Call 03/01/22)a | | | 6,160 | | | | 6,185,363 | |
Plains Exploration & Production Co. | | | | | | | | |
6.13%, 06/15/19 (Call 06/15/16) | | | 5,700 | | | | 6,276,912 | |
6.50%, 11/15/20 (Call 11/15/15)a | | | 9,275 | | | | 10,235,981 | |
6.75%, 02/01/22 (Call 02/01/17) | | | 5,775 | | | | 6,380,829 | |
6.88%, 02/15/23 (Call 02/15/18)a | | | 15,000 | | | | 16,720,717 | |
Schlumberger Investment SA | | | | | | | | |
3.65%, 12/01/23 (Call 09/01/23) | | | 13,000 | | | | 13,256,417 | |
Shell International Finance BV | | | | | | | | |
1.13%, 08/21/17 | | | 3,445 | | | | 3,441,058 | |
1.90%, 08/10/18 | | | 18,850 | | | | 19,015,265 | |
2.00%, 11/15/18 | | | 18,550 | | | | 18,723,302 | |
2.25%, 01/06/23a | | | 13,850 | | | | 12,772,163 | |
2.38%, 08/21/22 | | | 10,119 | | | | 9,497,360 | |
3.40%, 08/12/23a | | | 13,202 | | | | 13,218,860 | |
4.30%, 09/22/19 | | | 22,751 | | | | 25,252,147 | |
4.38%, 03/25/20 | | | 5,375 | | | | 5,976,512 | |
| | | | | | | | |
| Security | |
Principal
(000s) | | | Value | |
4.55%, 08/12/43 | | $ | 19,950 | | | $ | 20,298,832 | |
5.20%, 03/22/17 | | | 4,882 | | | | 5,483,267 | |
5.50%, 03/25/40 | | | 16,940 | | | | 19,611,352 | |
6.38%, 12/15/38 | | | 12,619 | | | | 16,092,319 | |
Suncor Energy Inc. | | | | | | | | |
6.10%, 06/01/18a | | | 15,525 | | | | 18,146,384 | |
6.50%, 06/15/38 | | | 6,145 | | | | 7,509,991 | |
6.85%, 06/01/39a | | | 10,925 | | | | 13,889,344 | |
Total Capital Canada Ltd. | | | | | | | | |
1.45%, 01/15/18 | | | 2,000 | | | | 1,998,847 | |
2.75%, 07/15/23 | | | 13,664 | | | | 12,916,033 | |
Total Capital International SA | | | | | | | | |
1.50%, 02/17/17 | | | 1,416 | | | | 1,436,437 | |
1.55%, 06/28/17 | | | 7,708 | | | | 7,795,924 | |
2.13%, 01/10/19 | | | 7,000 | | | | 7,086,849 | |
2.70%, 01/25/23 | | | 11,280 | | | | 10,693,448 | |
2.88%, 02/17/22a | | | 15,255 | | | | 15,025,412 | |
3.70%, 01/15/24 | | | 7,250 | | | | 7,360,826 | |
3.75%, 04/10/24 | | | 3,000 | | | | 3,063,456 | |
Total Capital SA | | | | | | | | |
2.13%, 08/10/18 | | | 16,248 | | | | 16,495,928 | |
4.45%, 06/24/20 | | | 16,546 | | | | 18,367,741 | |
TransCanada PipeLines Ltd. | | | | | | | | |
2.50%, 08/01/22 | | | 8,000 | | | | 7,508,226 | |
3.80%, 10/01/20 | | | 12,476 | | | | 13,195,352 | |
4.63%, 03/01/34 (Call 12/01/33) | | | 10,000 | | | | 10,140,398 | |
6.10%, 06/01/40 | | | 8,850 | | | | 10,517,202 | |
6.20%, 10/15/37 | | | 8,300 | | | | 9,978,337 | |
6.50%, 08/15/18 | | | 8,737 | | | | 10,407,999 | |
7.13%, 01/15/19 | | | 5,966 | | | | 7,294,092 | |
7.63%, 01/15/39 | | | 12,900 | | | | 17,889,657 | |
Valero Energy Corp. | | | | | | | | |
6.13%, 06/15/17 | | | 11,015 | | | | 12,595,525 | |
6.13%, 02/01/20a | | | 10,324 | | | | 12,112,097 | |
6.63%, 06/15/37 | | | 14,693 | | | | 17,577,468 | |
7.50%, 04/15/32 | | | 8,181 | | | | 10,300,367 | |
9.38%, 03/15/19 | | | 1,499 | | | | 1,966,576 | |
Williams Partners LP | | | | | | | | |
3.35%, 08/15/22 (Call 05/15/22) | | | 12,600 | | | | 12,081,757 | |
5.25%, 03/15/20 | | | 9,468 | | | | 10,502,920 | |
6.30%, 04/15/40a | | | 14,848 | | | | 16,579,057 | |
| | | | | | | | |
| | | | 1,539,049,516 | |
| | |
| 134 | | 2014 iSHARES ANNUAL REPORTTO SHAREHOLDERS |
Schedule of Investments (Continued)
iSHARES® iBOXX $ INVESTMENT GRADE CORPORATE BOND ETF
February 28, 2014
| | | | | | | | |
| Security | |
Principal
(000s) | | | Value | |
PAPER & FOREST PRODUCTS — 0.38% | | | | | |
International Paper Co. | | | | | | | | |
4.75%, 02/15/22 (Call 11/15/21)a | | $ | 6,627 | | | $ | 7,200,994 | |
7.30%, 11/15/39 | | | 6,050 | | | | 7,934,035 | |
7.50%, 08/15/21a | | | 11,074 | | | | 13,986,730 | |
7.95%, 06/15/18 | | | 27,624 | | | | 34,070,419 | |
9.38%, 05/15/19 | | | 1,309 | | | | 1,731,832 | |
| | | | | | | | |
| | | | 64,924,010 | |
PHARMACEUTICALS — 4.91% | | | | | |
AbbVie Inc. | | | | | | | | |
1.75%, 11/06/17 | | | 37,416 | | | | 37,761,945 | |
2.00%, 11/06/18a | | | 20,525 | | | | 20,539,117 | |
2.90%, 11/06/22a | | | 34,829 | | | | 33,651,801 | |
4.40%, 11/06/42 | | | 21,255 | | | | 20,905,438 | |
Actavis Inc. | | | | | | | | |
1.88%, 10/01/17a | | | 13,100 | | | | 13,113,426 | |
3.25%, 10/01/22 (Call 07/01/22)a | | | 19,845 | | | | 19,100,056 | |
4.63%, 10/01/42 (Call 04/01/42) | | | 5,650 | | | | 5,372,242 | |
AstraZeneca PLC | | | | | | | | |
1.95%, 09/18/19 | | | 14,038 | | | | 13,867,732 | |
4.00%, 09/18/42 | | | 9,950 | | | | 9,224,247 | |
5.90%, 09/15/17 | | | 15,154 | | | | 17,514,573 | |
6.45%, 09/15/37a | | | 27,652 | | | | 34,722,650 | |
Bristol-Myers Squibb Co. | | | | | | | | |
0.88%, 08/01/17 | | | 1,162 | | | | 1,148,694 | |
2.00%, 08/01/22 | | | 14,104 | | | | 12,863,564 | |
Eli Lilly and Co. | | | | | | | | |
5.20%, 03/15/17 | | | 5,324 | | | | 5,965,257 | |
5.55%, 03/15/37 | | | 4,650 | | | | 5,320,454 | |
GlaxoSmithKline Capital Inc. | | | | | | | | |
2.80%, 03/18/23a | | | 20,440 | | | | 19,623,794 | |
5.65%, 05/15/18 | | | 24,529 | | | | 28,421,399 | |
6.38%, 05/15/38 | | | 23,341 | | | | 29,899,599 | |
GlaxoSmithKline Capital PLC | | | | | | | | |
1.50%, 05/08/17 | | | 16,554 | | | | 16,744,568 | |
2.85%, 05/08/22a | | | 24,886 | | | | 24,466,524 | |
Johnson & Johnson | | | | | | | | |
5.15%, 07/15/18a | | | 13,062 | | | | 15,066,839 | |
5.55%, 08/15/17 | | | 8,910 | | | | 10,265,438 | |
5.95%, 08/15/37 | | | 7,430 | | | | 9,288,546 | |
| | | | | | | | |
| Security | |
Principal
(000s) | | | Value | |
Merck & Co. Inc. | | | | | | | | |
1.10%, 01/31/18a | | $ | 7,005 | | | $ | 6,908,304 | |
1.30%, 05/18/18 | | | 13,340 | | | | 13,153,151 | |
2.40%, 09/15/22 (Call 06/15/22) | | | 17,250 | | | | 16,276,814 | |
2.80%, 05/18/23 | | | 2,000 | | | | 1,912,359 | |
3.88%, 01/15/21 (Call 10/15/20) | | | 15,079 | | | | 16,187,225 | |
4.15%, 05/18/43a | | | 4,000 | | | | 3,841,906 | |
5.00%, 06/30/19 | | | 16,659 | | | | 19,103,767 | |
5.85%, 06/30/39a | | | 4,440 | | | | 5,329,125 | |
6.00%, 09/15/17 | | | 8,967 | | | | 10,398,994 | |
6.55%, 09/15/37 | | | 13,200 | | | | 17,052,366 | |
Novartis Capital Corp. | | | | | | | | |
2.40%, 09/21/22 | | | 22,412 | | | | 21,208,736 | |
3.40%, 05/06/24 | | | 20,250 | | | | 20,321,837 | |
4.40%, 04/24/20a | | | 2,182 | | | | 2,411,369 | |
4.40%, 05/06/44a | | | 11,900 | | | | 12,000,912 | |
Novartis Securities Investment Ltd. | | | | | | | | |
5.13%, 02/10/19 | | | 31,248 | | | | 35,777,088 | |
Pfizer Inc. | | | | | | | | |
1.50%, 06/15/18 | | | 10,000 | | | | 9,917,127 | |
3.00%, 06/15/23a | | | 17,500 | | | | 16,959,366 | |
4.30%, 06/15/43 | | | 5,056 | | | | 4,964,097 | |
6.20%, 03/15/19 | | | 29,303 | | | | 35,071,105 | |
7.20%, 03/15/39 | | | 23,121 | | | | 32,089,118 | |
Sanofi | | | | | | | | |
1.25%, 04/10/18 | | | 11,860 | | | | 11,674,074 | |
4.00%, 03/29/21 | | | 21,996 | | | | 23,575,104 | |
Schering-Plough Corp./Merck & Co. Inc. | | | | | | | | |
6.50%, 12/01/33 | | | 18,862 | | | | 24,398,272 | |
Wyeth LLC | | | | | | | | |
5.95%, 04/01/37 | | | 22,918 | | | | 27,644,668 | |
6.50%, 02/01/34 | | | 4,794 | | | | 6,123,873 | |
Zoetis Inc. | | | | | | | | |
1.88%, 02/01/18 | | | 3,200 | | | | 3,207,590 | |
3.25%, 02/01/23 (Call 11/01/22)a | | | 17,025 | | | | 16,410,820 | |
4.70%, 02/01/43 (Call 08/01/42) | | | 10,275 | | | | 10,153,683 | |
| | | | | | | | |
| | | | | | | 828,920,753 | |
| | | | |
SCHEDULESOF INVESTMENTS | | | 135 | |
Schedule of Investments (Continued)
iSHARES® iBOXX $ INVESTMENT GRADE CORPORATE BOND ETF
February 28, 2014
| | | | | | | | |
| Security | |
Principal
(000s) | | | Value | |
REAL ESTATE INVESTMENT TRUSTS (REITS) — 0.84% | |
American Tower Corp. | | | | | | | | |
3.40%, 02/15/19 | | $ | 6,316 | | | $ | 6,547,063 | |
3.50%, 01/31/23 | | | 7,256 | | | | 6,852,296 | |
4.50%, 01/15/18 | | | 11,376 | | | | 12,403,848 | |
4.70%, 03/15/22 | | | 6,000 | | | | 6,252,806 | |
5.00%, 02/15/24 | | | 6,978 | | | | 7,298,347 | |
Boston Properties LP | | | | | | | | |
3.70%, 11/15/18 (Call 08/15/18) | | | 7,820 | | | | 8,378,062 | |
3.85%, 02/01/23 (Call 11/01/22)a | | | 16,500 | | | | 16,668,830 | |
4.13%, 05/15/21 | | | 3,601 | | | | 3,791,947 | |
ERP Operating LP | | | | | | | | |
4.63%, 12/15/21 (Call 09/15/21) | | | 9,826 | | | | 10,670,629 | |
HCP Inc. | | | | | | | | |
2.63%, 02/01/20 (Call 11/01/19) | | | 5,575 | | | | 5,463,112 | |
4.25%, 11/15/23 (Call 08/15/23) | | | 6,000 | | | | 6,141,413 | |
5.38%, 02/01/21 (Call 11/03/20) | | | 12,712 | | | | 14,238,290 | |
Simon Property Group LP | | | | | | | | |
4.38%, 03/01/21 (Call 12/01/20)a | | | 9,679 | | | | 10,545,656 | |
5.65%, 02/01/20 (Call 11/01/19) | | | 11,743 | | | | 13,757,916 | |
6.13%, 05/30/18 | | | 10,735 | | | | 12,587,079 | |
| | | | | | | | |
| | | | | | | 141,597,294 | |
ROAD & RAIL — 0.28% | | | | | |
Burlington Northern Santa Fe Corp. | | | | | | | | |
3.85%, 09/01/23 (Call 06/01/23) | | | 5,000 | | | | 5,090,202 | |
4.45%, 03/15/43 (Call 09/15/42) | | | 4,881 | | | | 4,661,848 | |
4.70%, 10/01/19 | | | 7,268 | | | | 8,107,392 | |
5.75%, 05/01/40 (Call 11/01/39) | | | 10,993 | | | | 12,653,632 | |
CSX Corp. | | | | | | | | |
4.10%, 03/15/44 (Call 09/15/43)a | | | 8,250 | | | | 7,439,579 | |
| | | | | | | | |
| Security | |
Principal
(000s) | | | Value | |
Union Pacific Corp. | | | | | | | | |
4.16%, 07/15/22 (Call 04/15/22) | | $ | 7,941 | | | $ | 8,421,932 | |
| | | | | | | | |
| | | | | | | 46,374,585 | |
SEMICONDUCTORS & SEMICONDUCTOR EQUIPMENT — 0.68% | | | | | |
Intel Corp. | | | | | | | | |
1.35%, 12/15/17 | | | 35,775 | | | | 35,782,756 | |
2.70%, 12/15/22 | | | 4,550 | | | | 4,320,828 | |
3.30%, 10/01/21 | | | 26,257 | | | | 26,828,833 | |
4.00%, 12/15/32 | | | 5,000 | | | | 4,850,316 | |
4.25%, 12/15/42a | | | 15,725 | | | | 14,833,787 | |
4.80%, 10/01/41 | | | 16,796 | | | | 17,164,692 | |
Texas Instruments Inc. | | | | | | | | |
1.65%, 08/03/19 | | | 10,867 | | | | 10,578,442 | |
| | | | | | | | |
| | | | | | | 114,359,654 | |
SOFTWARE — 1.80% | | | | | |
Microsoft Corp. | | | | | | | | |
1.63%, 12/06/18 | | | 5,750 | | | | 5,744,106 | |
2.13%, 11/15/22a | | | 6,837 | | | | 6,341,045 | |
2.38%, 05/01/23 (Call 02/01/23)a | | | 10,000 | | | | 9,364,573 | |
3.00%, 10/01/20a | | | 7,369 | | | | 7,623,970 | |
3.50%, 11/15/42a | | | 8,927 | | | | 7,713,896 | |
3.63%, 12/15/23 (Call 09/15/23)a | | | 28,950 | | | | 29,766,280 | |
4.20%, 06/01/19 | | | 20,823 | | | | 23,217,233 | |
4.50%, 10/01/40 | | | 9,600 | | | | 9,718,748 | |
5.20%, 06/01/39a | | | 4,500 | | | | 4,971,290 | |
5.30%, 02/08/41 | | | 6,638 | | | | 7,457,380 | |
Oracle Corp. | | | | | | | | |
1.20%, 10/15/17 | | | 16,737 | | | | 16,663,894 | |
2.38%, 01/15/19 | | | 19,573 | | | | 19,974,624 | |
2.50%, 10/15/22 | | | 28,743 | | | | 27,020,716 | |
3.63%, 07/15/23a | | | 8,175 | | | | 8,287,782 | |
3.88%, 07/15/20 | | | 3,874 | | | | 4,167,335 | |
5.00%, 07/08/19 | | | 22,141 | | | | 25,285,622 | |
5.38%, 07/15/40 | | | 30,305 | | | | 34,094,080 | |
5.75%, 04/15/18 | | | 27,760 | | | | 32,220,849 | |
6.13%, 07/08/39 | | | 15,950 | | | | 19,437,517 | |
6.50%, 04/15/38a | | | 3,289 | | | | 4,165,752 | |
| | | | | | | | |
| | | | 303,236,692 | |
| | |
| 136 | | 2014 iSHARES ANNUAL REPORTTO SHAREHOLDERS |
Schedule of Investments (Continued)
iSHARES® iBOXX $ INVESTMENT GRADE CORPORATE BOND ETF
February 28, 2014
| | | | | | | | |
| Security | |
Principal
(000s) | | | Value | |
SPECIALTY RETAIL — 0.73% | | | | | |
Home Depot Inc. (The) | | | | | | | | |
2.25%, 09/10/18 (Call 08/10/18) | | $ | 16,301 | | | $ | 16,646,642 | |
2.70%, 04/01/23 (Call 01/01/23) | | | 5,500 | | | | 5,247,164 | |
3.75%, 02/15/24 (Call 11/15/23) | | | 9,837 | | | | 10,133,587 | |
4.20%, 04/01/43 (Call 10/01/42) | | | 5,345 | | | | 5,199,349 | |
4.40%, 04/01/21 (Call 01/01/21) | | | 9,822 | | | | 10,868,149 | |
4.88%, 02/15/44 (Call 08/15/43) | | | 7,050 | | | | 7,588,138 | |
5.88%, 12/16/36 | | | 31,802 | | | | 38,294,210 | |
5.95%, 04/01/41 (Call 10/01/40) | | | 13,195 | | | | 16,126,571 | |
Lowe’s Companies Inc. | | | | | | | | |
3.12%, 04/15/22 (Call 01/15/22)a | | | 1,466 | | | | 1,467,161 | |
4.65%, 04/15/42 (Call 10/15/41) | | | 12,255 | | | | 12,259,868 | |
| | | | | | | | |
| | | | 123,830,839 | |
TOBACCO — 1.49% | | | | | |
Altria Group Inc. | | | | | | | | |
2.85%, 08/09/22a | | | 3,565 | | | | 3,339,488 | |
4.00%, 01/31/24 | | | 14,000 | | | | 13,955,197 | |
4.25%, 08/09/42 | | | 18,239 | | | | 16,057,889 | |
4.75%, 05/05/21 | | | 21,234 | | | | 23,147,115 | |
5.38%, 01/31/44a | | | 12,028 | | | | 12,503,300 | |
9.25%, 08/06/19 | | | 4,508 | | | | 6,013,590 | |
9.70%, 11/10/18 | | | 19,804 | | | | 26,334,270 | |
9.95%, 11/10/38 | | | 3,193 | | | | 5,064,523 | |
Lorillard Tobacco Co. | | | | | | | | |
6.88%, 05/01/20a | | | 10,598 | | | | 12,462,716 | |
8.13%, 06/23/19a | | | 953 | | | | 1,192,123 | |
Philip Morris International Inc. | | | | | | | | |
1.13%, 08/21/17 | | | 3,350 | | | | 3,335,383 | |
1.88%, 01/15/19 | | | 8,500 | | | | 8,475,577 | |
2.50%, 08/22/22 | | | 10,350 | | | | 9,704,384 | |
2.90%, 11/15/21a | | | 9,695 | | | | 9,557,854 | |
3.88%, 08/21/42 | | | 3,625 | | | | 3,179,967 | |
4.13%, 03/04/43 | | | 16,198 | | | | 14,748,606 | |
| | | | | | | | |
| Security | |
Principal
(000s) | | | Value | |
4.38%, 11/15/41 | | $ | 7,449 | | | $ | 7,071,321 | |
4.50%, 03/26/20 | | | 9,364 | | | | 10,359,107 | |
4.88%, 11/15/43 | | | 4,150 | | | | 4,232,377 | |
5.65%, 05/16/18 | | | 21,198 | | | | 24,528,621 | |
6.38%, 05/16/38a | | | 16,734 | | | | 20,406,820 | |
Reynolds American Inc. | | | | | | | | |
3.25%, 11/01/22a | | | 3,365 | | | | 3,211,290 | |
4.75%, 11/01/42 | | | 14,105 | | | | 13,338,766 | |
| | | | | | | | |
| | | | 252,220,284 | |
WIRELESS TELECOMMUNICATION SERVICES — 1.06% | |
Cellco Partnership/Verizon Wireless Capital LLC | | | | | | | | |
8.50%, 11/15/18 | | | 21,127 | | | | 26,928,204 | |
New Cingular Wireless Services Inc. | | | | | | | | |
8.75%, 03/01/31 | | | 6,550 | | | | 9,622,902 | |
Rogers Communications Inc. | | | | | | | | |
4.10%, 10/01/23 (Call 07/01/23) | | | 8,000 | | | | 8,167,150 | |
6.80%, 08/15/18 | | | 15,400 | | | | 18,437,263 | |
Vodafone Group PLC | | | | | | | | |
1.25%, 09/26/17 | | | 14,500 | | | | 14,379,456 | |
1.50%, 02/19/18 | | | 27,421 | | | | 27,222,628 | |
1.63%, 03/20/17 | | | 7,350 | | | | 7,436,094 | |
2.50%, 09/26/22 | | | 2,750 | | | | 2,530,335 | |
2.95%, 02/19/23a | | | 28,500 | | | | 26,846,900 | |
4.38%, 02/19/43 | | | 25,300 | | | | 22,789,645 | |
5.45%, 06/10/19 | | | 5,650 | | | | 6,513,853 | |
6.15%, 02/27/37 | | | 6,525 | | | | 7,413,064 | |
| | | | | | | | |
| | | | 178,287,494 | |
| | | | | | | | |
TOTAL CORPORATE BONDS & NOTES | | | | | |
(Cost: $15,984,857,056) | | | | 16,381,596,564 | |
|
FOREIGN AGENCY OBLIGATIONS — 0.78% | |
|
NORWAY — 0.64% | |
Statoil ASA | | | | | | | | |
2.45%, 01/17/23a | | | 7,130 | | | | 6,694,454 | |
2.65%, 01/15/24 | | | 12,322 | | | | 11,478,219 | |
2.90%, 11/08/20 | | | 5,000 | | | | 5,062,815 | |
3.13%, 08/17/17 | | | 16,566 | | | | 17,603,257 | |
3.15%, 01/23/22a | | | 5,892 | | | | 5,918,207 | |
3.70%, 03/01/24 | | | 17,000 | | | | 17,312,185 | |
3.95%, 05/15/43 | | | 10,000 | | | | 9,196,057 | |
| | | | |
SCHEDULESOF INVESTMENTS | | | 137 | |
Schedule of Investments (Continued)
iSHARES® iBOXX $ INVESTMENT GRADE CORPORATE BOND ETF
February 28, 2014
| | | | | | | | |
| Security | | Principal
or Shares
(000s) | | | Value | |
4.80%, 11/08/43 | | $ | 6,000 | | | $ | 6,352,462 | |
5.10%, 08/17/40 | | | 5,275 | | | | 5,781,819 | |
5.25%, 04/15/19a | | | 12,573 | | | | 14,473,840 | |
Series FXD | | | | | | | | |
1.95%, 11/08/18 | | | 7,905 | | | | 7,947,095 | |
| | | | | | | | |
| | | | 107,820,410 | |
CANADA — 0.14% | | | | | |
Nexen Energy ULC | | | | | | | | |
5.88%, 03/10/35 | | | 10,298 | | | | 11,249,971 | |
6.40%, 05/15/37 | | | 11,454 | | | | 13,326,463 | |
| | | | | | | | |
| | | | 24,576,434 | |
| | | | | | | | |
TOTAL FOREIGN AGENCY OBLIGATIONS | | | | | |
(Cost: $131,271,245) | | | | 132,396,844 | |
| |
U.S. GOVERNMENT OBLIGATIONS — 0.24% | | | | | |
U.S. Treasury Notes | | | | | | | | |
1.50%, 12/31/18a | | | 40,000 | | | | 40,066,001 | |
| | | | | | | | |
| | | | 40,066,001 | |
| | | | | | | | |
TOTAL U.S. GOVERNMENT OBLIGATIONS | |
(Cost: $39,571,584) | | | | 40,066,001 | |
|
SHORT-TERM INVESTMENTS — 8.66% | |
|
MONEY MARKET FUNDS — 8.66% | |
BlackRock Cash Funds: Institutional,
SL Agency Shares | | | | | |
0.13%d,e,f | | | 1,093,276 | | | | 1,093,275,531 | |
BlackRock Cash Funds: Prime,
SL Agency Shares | | | | | |
0.11%d,e,f | | | 91,946 | | | | 91,946,347 | |
BlackRock Cash Funds: Treasury,
SL Agency Shares | | | | | |
0.00%d,e | | | 278,078 | | | | 278,077,577 | |
| | | | | | | | |
| | | | | | | 1,463,299,455 | |
| | | | | | | | |
TOTAL SHORT-TERM INVESTMENTS | | | | | |
(Cost: $1,463,299,455) | | | | 1,463,299,455 | |
| | | | | | | | |
| | | | | | |
| | | | |
Value | |
TOTAL INVESTMENTS
IN SECURITIES — 106.62% | | | | |
(Cost: $17,618,999,340) | | | | $ | 18,017,358,864 | |
Other Assets, Less Liabilities — (6.62)% | | | (1,119,058,141 | ) |
| | | | | | |
NET ASSETS — 100.00% | | | | $ | 16,898,300,723 | |
| | | | | | |
| a | All or a portion of this security represents a security on loan. See Note 1. |
| b | Step coupon security. Coupon rate will either increase (step-up bond) or decrease (step-down bond) at regular intervals until maturity. Interest rate shown reflects the rate currently in effect. |
| c | This security may be resold to qualified institutional buyers under Rule 144A of the Securities Act of 1933. |
| d | Affiliated issuer. See Note 2. |
| e | The rate quoted is the annualized seven-day yield of the fund at period end. |
| f | All or a portion of this security represents an investment of securities lending collateral. See Note 1. |
See notes to financial statements.
| | |
| 138 | | 2014 iSHARES ANNUAL REPORTTO SHAREHOLDERS |
Statements of Assets and Liabilities
iSHARES® TRUST
February 28, 2014
| | | | | | | | |
| | | iShares iBoxx
$ High Yield
Corporate
Bond ETF | | | iShares iBoxx
$ Investment
Grade Corporate
Bond ETF | |
| | |
ASSETS | | | | | | | | |
Investments, at cost: | | | | | | | | |
Unaffiliated | | $ | 12,871,048,021 | | | $ | 16,099,715,065 | |
Affiliated (Note 2) | | | 2,542,227,247 | | | | 1,519,284,275 | |
| | | | | | | | |
Total cost of investments | | $ | 15,413,275,268 | | | $ | 17,618,999,340 | |
| | | | | | | | |
Investments in securities, at fair value (including securities on loana) (Note 1): | | | | | | | | |
Unaffiliated | | $ | 13,277,187,480 | | | $ | 16,498,912,605 | |
Affiliated (Note 2) | | | 2,542,227,247 | | | | 1,518,446,259 | |
| | | | | | | | |
Total fair value of investments | | | 15,819,414,727 | | | | 18,017,358,864 | |
Cash | | | 62,400 | | | | — | |
Receivables: | | | | | | | | |
Investment securities sold | | | 13,575,519 | | | | 3,009,630 | |
Interest | | | 231,962,809 | | | | 183,289,808 | |
Capital shares sold | | | 19,739,289 | | | | 58,974,434 | |
| | | | | | | | |
Total Assets | | | 16,084,754,744 | | | | 18,262,632,736 | |
| | | | | | | | |
| | |
LIABILITIES | | | | | | | | |
Payables: | | | | | | | | |
Investment securities purchased | | | 33,999,940 | | | | 175,974,987 | |
Collateral for securities on loan (Note 1) | | | 2,463,984,652 | | | | 1,185,221,878 | |
Capital shares redeemed | | | 215,585 | | | | 1,251,703 | |
Securities related to in-kind transactions (Note 4) | | | 532,014 | | | | — | |
Investment advisory fees (Note 2) | | | 5,163,300 | | | | 1,883,445 | |
| | | | | | | | |
Total Liabilities | | | 2,503,895,491 | | | | 1,364,332,013 | |
| | | | | | | | |
| | |
NET ASSETS | | $ | 13,580,859,253 | | | $ | 16,898,300,723 | |
| | | | | | | | |
| | |
Net assets consist of: | | | | | | | | |
Paid-in capital | | $ | 13,119,247,426 | | | $ | 16,482,162,358 | |
Undistributed net investment income | | | 66,938,963 | | | | 48,522,914 | |
Accumulated net realized loss | | | (11,466,595 | ) | | | (30,744,073 | ) |
Net unrealized appreciation | | | 406,139,459 | | | | 398,359,524 | |
| | | | | | | | |
NET ASSETS | | $ | 13,580,859,253 | | | $ | 16,898,300,723 | |
| | | | | | | | |
| | |
Shares outstandingb | | | 143,500,000 | | | | 144,400,000 | |
| | | | | | | | |
| | |
Net asset value per share | | $ | 94.64 | | | $ | 117.02 | |
| | | | | | | | |
| a | Securities on loan with values of $2,363,302,047 and $1,145,919,971, respectively. See Note 1. |
| b | No par value, unlimited number of shares authorized. |
See notes to financial statements.
Statements of Operations
iSHARES® TRUST
Year ended February 28, 2014
| | | | | | | | |
| | | iShares iBoxx
$ High Yield
Corporate
Bond ETF | | | iShares iBoxx
$ Investment
Grade Corporate
Bond ETF | |
| | |
NET INVESTMENT INCOME | | | | | | | | |
Interest — unaffiliated | | $ | 970,731,755 | | | $ | 719,289,480 | |
Interest — affiliated (Note 2) | | | 20,801 | | | | 2,102,109 | |
Securities lending income — affiliated (Note 2) | | | 9,655,953 | | | | 1,793,359 | |
| | | | | | | | |
Total investment income | | | 980,408,509 | | | | 723,184,948 | |
| | | | | | | | |
| | |
EXPENSES | | | | | | | | |
Investment advisory fees (Note 2) | | | 75,192,652 | | | | 28,440,517 | |
| | | | | | | | |
Total expenses | | | 75,192,652 | | | | 28,440,517 | |
| | | | | | | | |
Net investment income | | | 905,215,857 | | | | 694,744,431 | |
| | | | | | | | |
| | |
NET REALIZED AND UNREALIZED GAIN (LOSS) | | | | | | | | |
Net realized gain (loss) from: | | | | | | | | |
Investments — unaffiliated | | | 1,517,649 | | | | (23,384,235 | ) |
Investments — affiliated (Note 2) | | | — | | | | (586,173 | ) |
In-kind redemptions — unaffiliated | | | 380,213,213 | | | | 788,204,765 | |
In-kind redemptions — affiliated (Note 2) | | | — | | | | 988,364 | |
| | | | | | | | |
Net realized gain | | | 381,730,862 | | | | 765,222,721 | |
| | | | | | | | |
Net change in unrealized appreciation/depreciation | | | (243,049,932 | ) | | | (1,495,959,269 | ) |
| | | | | | | | |
Net realized and unrealized gain (loss) | | | 138,680,930 | | | | (730,736,548 | ) |
| | | | | | | | |
NET INCREASE (DECREASE) IN NET ASSETS RESULTING FROM OPERATIONS | | $ | 1,043,896,787 | | | $ | (35,992,117 | ) |
| | | | | | | | |
See notes to financial statements.
| | |
| 140 | | 2014 iSHARES ANNUAL REPORTTO SHAREHOLDERS |
Statements of Changes in Net Assets
iSHARES® TRUST
| | | | | | | | | | | | | | | | |
| | | iShares iBoxx
$ High Yield
Corporate
Bond ETF | | | iShares iBoxx
$ Investment
Grade Corporate
Bond ETF | |
| | | Year ended
February 28, 2014 | | | Year ended February 28, 2013 | | | Year ended February 28, 2014 | | | Year ended February 28, 2013 | |
| | | |
INCREASE (DECREASE) IN NET ASSETS | | | | | | | | | | | | | |
| | | | |
OPERATIONS: | | | | | | | | | | | | | | | | |
Net investment income | | $ | 905,215,857 | | | $ | 1,046,911,356 | | | $ | 694,744,431 | | | $ | 896,297,381 | |
Net realized gain | | | 381,730,862 | | | | 321,382,310 | | | | 765,222,721 | | | | 460,397,233 | |
Net change in unrealized appreciation/depreciation | | | (243,049,932 | ) | | | 63,903,250 | | | | (1,495,959,269 | ) | | | 166,872,420 | |
| | | | | | | | | | | | | | | | |
Net increase (decrease) in net assets resulting from operations | | | 1,043,896,787 | | | | 1,432,196,916 | | | | (35,992,117 | ) | | | 1,523,567,034 | |
| | | | | | | | | | | | | | | | |
| | | | |
DISTRIBUTIONS TO SHAREHOLDERS: | | | | | | | | | | | | | | | | |
From net investment income | | | (920,212,310 | ) | | | (1,045,834,956 | ) | | | (719,984,353 | ) | | | (889,474,785 | ) |
From net realized gain | | | — | | | | — | | | | — | | | | (1,970,502 | ) |
| | | | | | | | | | | | | | | | |
Total distributions to shareholders | | | (920,212,310 | ) | | | (1,045,834,956 | ) | | | (719,984,353 | ) | | | (891,445,287 | ) |
| | | | | | | | | | | | | | | | |
| | | | |
CAPITAL SHARE TRANSACTIONS: | | | | | | | | | | | | | | | | |
Proceeds from shares sold | | | 6,299,437,487 | | | | 5,201,572,482 | | | | 5,974,503,669 | | | | 8,500,579,576 | |
Cost of shares redeemed | | | (7,919,752,649 | ) | | | (4,769,162,667 | ) | | | (12,357,229,328 | ) | | | (4,658,787,969 | ) |
| | | | | | | | | | | | | | | | |
Net increase (decrease) in net assets from capital share transactions | | | (1,620,315,162 | ) | | | 432,409,815 | | | | (6,382,725,659 | ) | | | 3,841,791,607 | |
| | | | | | | | | | | | | | | | |
INCREASE (DECREASE) IN NET ASSETS | | | (1,496,630,685 | ) | | | 818,771,775 | | | | (7,138,702,129 | ) | | | 4,473,913,354 | |
| | | | |
NET ASSETS | | | | | | | | | | | | | | | | |
Beginning of year | | | 15,077,489,938 | | | | 14,258,718,163 | | | | 24,037,002,852 | | | | 19,563,089,498 | |
| | | | | | | | | | | | | | | | |
End of year | | $ | 13,580,859,253 | | | $ | 15,077,489,938 | | | $ | 16,898,300,723 | | | $ | 24,037,002,852 | |
| | | | | | | | | | | | | | | | |
Undistributed net investment income included in net assets at end of year | | $ | 66,938,963 | | | $ | 81,935,416 | | | $ | 48,522,914 | | | $ | 73,762,836 | |
| | | | | | | | | | | | | | | | |
| | | | |
SHARES ISSUED AND REDEEMED | | | | | | | | | | | | | | | | |
Shares sold | | | 68,000,000 | | | | 57,100,000 | | | | 51,200,000 | | | | 71,800,000 | |
Shares redeemed | | | (85,400,000 | ) | | | (52,200,000 | ) | | | (107,000,000 | ) | | | (39,000,000 | ) |
| | | | | | | | | | | | | | | | |
Net increase (decrease) in shares outstanding | | | (17,400,000 | ) | | | 4,900,000 | | | | (55,800,000 | ) | | | 32,800,000 | |
| | | | | | | | | | | | | | | | |
See notes to financial statements.
Financial Highlights
iSHARES® TRUST
(For a share outstanding throughout each period)
| | | | | | | | | | | | | | | | | | | | |
| | | iShares iBoxx $ High Yield Corporate Bond ETF | |
| | | Year ended
Feb. 28, 2014 | | | Year ended Feb. 28, 2013 | | | Year ended Feb. 29, 2012 | | | Year ended
Feb. 28, 2011 | | | Year ended Feb. 28, 2010 | |
Net asset value, beginning of year | | $ | 93.71 | | | $ | 91.40 | | | $ | 91.75 | | | $ | 86.03 | | | $ | 68.49 | |
| | | | | | | | | | | | | | | | | | | | |
Income from investment operations: | | | | | | | | | | | | | | | | | | | | |
Net investment incomea | | | 5.58 | | | | 6.15 | | | | 6.74 | | | | 7.45 | | | | 8.31 | |
Net realized and unrealized gain (loss)b | | | 0.98 | | | | 2.31 | | | | (0.45 | ) | | | 5.65 | | | | 17.47 | |
| | | | | | | | | | | | | | | | | | | | |
Total from investment operations | | | 6.56 | | | | 8.46 | | | | 6.29 | | | | 13.10 | | | | 25.78 | |
| | | | | | | | | | | | | | | | | | | | |
Less distributions from: | | | | | | | | | | | | | | | | | | | | |
Net investment income | | | (5.63 | ) | | | (6.15 | ) | | | (6.64 | ) | | | (7.38 | ) | | | (8.24 | ) |
| | | | | | | | | | | | | | | | | | | | |
Total distributions | | | (5.63 | ) | | | (6.15 | ) | | | (6.64 | ) | | | (7.38 | ) | | | (8.24 | ) |
| | | | | | | | | | | | | | | | | | | | |
Net asset value, end of year | | $ | 94.64 | | | $ | 93.71 | | | $ | 91.40 | | | $ | 91.75 | | | $ | 86.03 | |
| | | | | | | | | | | | | | | | | | | | |
| | | | | |
Total return | | | 7.31 | % | | | 9.68 | % | | | 7.35 | % | | | 16.11 | % | | | 39.50 | % |
| | | | | | | | | | | | | | | | | | | | |
| | | | | |
Ratios/Supplemental data: | | | | | | | | | | | | | | | | | | | | |
Net assets, end of year (000s) | | $ | 13,580,859 | | | $ | 15,077,490 | | | $ | 14,258,718 | | | $ | 8,257,928 | | | $ | 4,611,414 | |
Ratio of expenses to average net assets | | | 0.50 | % | | | 0.50 | % | | | 0.50 | % | | | 0.50 | % | | | 0.50 | % |
Ratio of net investment income to average
net assets | | | 6.01 | % | | | 6.73 | % | | | 7.60 | % | | | 8.44 | % | | | 10.30 | % |
Portfolio turnover ratec | | | 11 | % | | | 19 | % | | | 13 | % | | | 16 | % | | | 67 | % |
| a | Based on average shares outstanding throughout each period. |
| b | The amounts reported for a share outstanding may not accord with the change in aggregate gains and losses in securities for the fiscal period due to the timing of capital share transactions in relation to the fluctuating market values of the Fund’s underlying securities. |
| c | Portfolio turnover rates exclude portfolio securities received or delivered as a result of processing capital share transactions in Creation Units. |
See notes to financial statements.
| | |
| 142 | | 2014 iSHARES ANNUAL REPORTTO SHAREHOLDERS |
Financial Highlights (Continued)
iSHARES® TRUST
(For a share outstanding throughout each period)
| | | | | | | | | | | | | | | | | | | | |
| | | iShares iBoxx $ Investment Grade Corporate Bond ETF | |
| | | Year ended
Feb. 28, 2014 | | | Year ended Feb. 28, 2013 | | | Year ended Feb. 29, 2012 | | | Year ended
Feb. 28, 2011 | | | Year ended Feb. 28, 2010 | |
Net asset value, beginning of year | | $ | 120.06 | | | $ | 116.86 | | | $ | 108.74 | | | $ | 105.18 | | | $ | 93.78 | |
| | | | | | | | | | | | | | | | | | | | |
Income from investment operations: | | | | | | | | | | | | | | | | | | | | |
Net investment incomea | | | 4.25 | | | | 4.60 | | | | 5.00 | | | | 5.24 | | | | 5.76 | |
Net realized and unrealized gain (loss)b | | | (2.94 | ) | | | 3.22 | | | | 8.08 | | | | 3.58 | | | | 11.33 | |
| | | | | | | | | | | | | | | | | | | | |
Total from investment operations | | | 1.31 | | | | 7.82 | | | | 13.08 | | | | 8.82 | | | | 17.09 | |
| | | | | | | | | | | | | | | | | | | | |
Less distributions from: | | | | | | | | | | | | | | | | | | | | |
Net investment income | | | (4.35 | ) | | | (4.61 | ) | | | (4.96 | ) | | | (5.26 | ) | | | (5.69 | ) |
Net realized gain | | | — | | | | (0.01 | ) | | | — | | | | — | | | | — | |
| | | | | | | | | | | | | | | | | | | | |
Total distributions | | | (4.35 | ) | | | (4.62 | ) | | | (4.96 | ) | | | (5.26 | ) | | | (5.69 | ) |
| | | | | | | | | | | | | | | | | | | | |
Net asset value, end of year | | $ | 117.02 | | | $ | 120.06 | | | $ | 116.86 | | | $ | 108.74 | | | $ | 105.18 | |
| | | | | | | | | | | | | | | | | | | | |
| | | | | |
Total return | | | 1.19 | % | | | 6.81 | % | | | 12.37 | % | | | 8.59 | % | | | 18.70 | % |
| | | | | | | | | | | | | | | | | | | | |
| | | | | |
Ratios/Supplemental data: | | | | | | | | | | | | | | | | | | | | |
Net assets, end of year (000s) | | $ | 16,898,301 | | | $ | 24,037,003 | | | $ | 19,563,089 | | | $ | 12,940,161 | | | $ | 12,190,805 | |
Ratio of expenses to average net assets | | | 0.15 | % | | | 0.15 | % | | | 0.15 | % | | | 0.15 | % | | | 0.15 | % |
Ratio of net investment income to average
net assets | | | 3.66 | % | | | 3.87 | % | | | 4.48 | % | | | 4.83 | % | | | 5.71 | % |
Portfolio turnover ratec | | | 6 | % | | | 5 | % | | | 4 | % | | | 7 | % | | | 79 | % |
| a | Based on average shares outstanding throughout each period. |
| b | The amounts reported for a share outstanding may not accord with the change in aggregate gains and losses in securities for the fiscal period due to the timing of capital share transactions in relation to the fluctuating market values of the Fund’s underlying securities. |
| c | Portfolio turnover rates exclude portfolio securities received or delivered as a result of processing capital share transactions in Creation Units. |
See notes to financial statements.
Notes to Financial Statements
iSHARES® TRUST
iShares Trust (the “Trust”) is registered under the Investment Company Act of 1940, as amended (the “1940 Act”), as an open-end management investment company. The Trust was established as a Delaware statutory trust pursuant to an Agreement and Declaration of Trust dated December 16, 1999.
These financial statements relate only to the following funds (each, a “Fund,” and collectively, the “Funds”):
| | | | |
| iShares Bond ETF | | Former Namea | | Diversification
Classification |
iBoxx $ High Yield Corporate | | iShares iBoxx $ High Yield Corporate Bond Fund | | Diversified |
iBoxx $ Investment Grade Corporate | | iShares iBoxx $ Investment Grade Corporate Bond Fund | | Diversified |
| | a | | The Funds changed their names effective July 1, 2013. |
The investment objective of each Fund is to seek investment results that correspond generally to the price and yield performance, before fees and expenses, of its underlying index. The investment adviser uses a “passive” or index approach to try to achieve each Fund’s investment objective.
Non-diversified funds generally hold securities of fewer issuers than diversified funds and may be more susceptible to the risks associated with these particular issuers, or to a single economic, political or regulatory occurrence affecting these issuers.
Each Fund may invest in securities of non-U.S. issuers that trade in non-U.S. markets. This involves certain considerations and risks not typically associated with securities of U.S. issuers. Such risks include, but are not limited to: generally less liquid and less efficient securities markets; generally greater price volatility; exchange rate fluctuations and exchange controls; imposition of restrictions on the expatriation of funds or other assets of the Funds; less publicly available information about issuers; the imposition of withholding or other taxes; higher transaction and custody costs; settlement delays and risk of loss attendant in settlement procedures; difficulties in enforcing contractual obligations; less regulation of securities markets; different accounting, disclosure and reporting requirements; more substantial governmental involvement in the economy; higher inflation rates; greater social, economic and political uncertainties; the risk of nationalization or expropriation of assets; and the risk of war.
The Funds invest a significant portion of their assets in fixed-income securities. Changes in market interest rates or economic conditions, including the Federal Reserve Bank’s decision in December 2013 to taper its quantitative easing policy, may affect the value and/or liquidity of such investments. Interest rate risk is the risk that prices of bonds and other fixed-income securities will increase as interest rates fall and decrease as interest rates rise. The Funds may be subject to a greater risk of rising interest rates due to the current period of historically low rates.
Pursuant to the Trust’s organizational documents, the Funds’ officers and trustees are indemnified against certain liabilities that may arise out of the performance of their duties to the Funds. Additionally, in the normal course of business, the Funds enter into contracts with service providers that contain general indemnification clauses. The Funds’ maximum exposure under these arrangements is unknown as this would involve future claims that may be made against the Funds that have not yet occurred.
| 1. | SIGNIFICANT ACCOUNTING POLICIES |
The following significant accounting policies are consistently followed by the Funds in the preparation of their financial statements in conformity with accounting principles generally accepted in the United States of America (“U.S. GAAP”). The preparation of financial statements in conformity with U.S. GAAP requires management to make certain estimates and assumptions that affect the reported amounts of assets and liabilities and disclosures of contingent assets and liabilities at the date of the financial statements and the reported amounts of revenue and expenses during the reporting period. Actual results could differ from those estimates.
| | |
| 144 | | 2014 iSHARES ANNUAL REPORTTO SHAREHOLDERS |
Notes to Financial Statements (Continued)
iSHARES® TRUST
SECURITY VALUATION
Each Fund’s investments are valued at fair value each day that the Fund’s listing exchange is open and, for financial reporting purposes, as of the report date should the reporting period end on a day that the Fund’s listing exchange is not open. U.S. GAAP defines fair value as the price a fund would receive to sell an asset or pay to transfer a liability in an orderly transaction between market participants at the measurement date. The BlackRock Global Valuation Methodologies Committee (the “Global Valuation Committee”) provides oversight of the valuation of investments for the Funds. The investments of each Fund are valued pursuant to policies and procedures developed by the Global Valuation Committee and approved by the Board of Trustees of the Trust (the “Board”).
| | • | | Fixed income investments are valued at the last available bid price received from independent pricing services. In determining the value of a fixed income investment, pricing services may use certain information with respect to transactions in such investments, quotations from dealers, pricing matrixes, market transactions in comparable investments, various relationships observed in the market between investments, and calculated yield measures. |
| | • | | Open-end U.S. mutual funds are valued at that day’s published net asset value (NAV). |
In the event that application of these methods of valuation results in a price for an investment which is deemed not to be representative of the fair value of such investment or if a price is not available, the investment will be valued based upon other available factors deemed relevant by the Global Valuation Committee, in accordance with policies approved by the Board. These factors include but are not limited to (i) attributes specific to the investment; (ii) the principal market for the investment; (iii) the customary participants in the principal market for the investment; (iv) data assumptions by market participants for the investment, if reasonably available; (v) quoted prices for similar investments in active markets; and (vi) other factors, such as future cash flows, interest rates, yield curves, volatilities, prepayment speeds, loss severities, credit risks and/or default rates. Valuations based on such factors are reported to the Board on a quarterly basis.
The Global Valuation Committee employs various methods for calibrating valuation approaches for investments where an active market does not exist, including regular due diligence of the Trust’s pricing vendors, a regular review of key inputs and assumptions, transactional back-testing or disposition analysis to compare unrealized gains and losses to realized gains and losses, reviews of missing or stale prices, reviews of large movements in market values, and reviews of market related activity.
Fair value pricing could result in a difference between the prices used to calculate a Fund’s net asset value and the prices used by the Fund’s underlying index, which in turn could result in a difference between the Fund’s performance and the performance of the Fund’s underlying index.
Various inputs are used in determining the fair value of financial instruments. Inputs may be based on independent market data (“observable inputs”) or they may be internally developed (“unobservable inputs”). These inputs are categorized into a disclosure hierarchy consisting of three broad levels for financial reporting purposes. The level of a value determined for a financial instrument within the fair value hierarchy is based on the lowest level of any input that is significant to the fair value measurement in its entirety. The categorization of a value determined for a financial instrument within the hierarchy is based upon the pricing transparency of the instrument and is not necessarily an indication of the risk associated with investing in the instrument. The three levels of the fair value hierarchy are as follows:
| | • | | Level 1 — Unadjusted quoted prices in active markets for identical assets or liabilities; |
| | • | | Level 2 — Inputs other than quoted prices included within Level 1 that are observable for the asset or liability either directly or indirectly, including quoted prices for similar assets or liabilities in active markets, quoted prices for identical or similar assets or liabilities in markets that are not considered to be active, inputs other than quoted prices that are observable for |
| | | | |
NOTESTO FINANCIAL STATEMENTS | | | 145 | |
Notes to Financial Statements (Continued)
iSHARES® TRUST
| | the asset or liability (such as exchange rates, financing terms, interest rates, yield curves, volatilities, prepayment speeds, loss severities, credit risks and default rates) or other market-corroborated inputs; and |
| | • | | Level 3 — Unobservable inputs for the asset or liability, including the Global Valuation Committee’s assumptions used in determining the fair value of investments. |
Changes in valuation techniques may result in transfers in or out of an assigned level within the disclosure hierarchy. In accordance with the Trust’s policy, transfers between different levels of the fair value hierarchy are deemed to have occurred as of the beginning of the reporting period.
The following table summarizes the value of each of the Funds’ investments according to the fair value hierarchy as of February 28, 2014. The breakdown of each Fund’s investments into major categories is disclosed in its respective schedule of investments.
| | | | | | | | | | | | | | | | |
iShares Bond ETF and
Investment Type | | Investments | |
| | Level 1 | | | Level 2 | | | Level 3 | | | Total | |
iBoxx $ High Yield Corporate | | | | | | | | | | | | | | | | |
Assets: | | | | | | | | | | | | | | | | |
Corporate Bonds & Notes | | $ | — | | | $ | 13,277,187,480 | | | $ | — | | | $ | 13,277,187,480 | |
Money Market Funds | | | 2,542,227,247 | | | | — | | | | — | | | | 2,542,227,247 | |
| | | | | | | | | | | | | | | | |
| | $ | 2,542,227,247 | | | $ | 13,277,187,480 | | | $ | — | | | $ | 15,819,414,727 | |
| | | | | | | | | | | | | | | | |
| | | | |
iBoxx $ Investment Grade Corporate | | | | | | | | | | | | | | | | |
Assets: | | | | | | | | | | | | | | | | |
Corporate Bonds & Notes | | $ | — | | | $ | 16,381,596,564 | | | $ | — | | | $ | 16,381,596,564 | |
Foreign Agency Obligations | | | — | | | | 132,396,844 | | | | — | | | | 132,396,844 | |
U.S. Government Obligations | | | — | | | | 40,066,001 | | | | — | | | | 40,066,001 | |
Money Market Funds | | | 1,463,299,455 | | | | — | | | | — | | | | 1,463,299,455 | |
| | | | | | | | | | | | | | | | |
| | $ | 1,463,299,455 | | | $ | 16,554,059,409 | | | $ | — | | | $ | 18,017,358,864 | |
| | | | | | | | | | | | | | | | |
| | | | | | | | | | | | | | | | | |
SECURITY TRANSACTIONS AND INCOME RECOGNITION
Security transactions are accounted for on trade date. Realized gains and losses on investment transactions are determined using the specific identification method. Interest income, including amortization and accretion of premiums and discounts on debt securities, is recognized daily on the accrual basis.
DISTRIBUTIONS TO SHAREHOLDERS
Dividends and distributions paid by each Fund are recorded on the ex-dividend dates. Distributions are determined on a tax basis and may differ from net investment income and net realized capital gains for financial reporting purposes. Dividends and distributions are paid in U.S. dollars and cannot be automatically reinvested in additional shares of the Funds.
FEDERAL INCOME TAXES
Each Fund is treated as an entity separate from the Trust’s other funds for federal income tax purposes. It is the policy of each Fund to qualify as a regulated investment company by complying with the provisions applicable to regulated investment
| | |
| 146 | | 2014 iSHARES ANNUAL REPORTTO SHAREHOLDERS |
Notes to Financial Statements (Continued)
iSHARES® TRUST
companies, as defined under Subchapter M of the Internal Revenue Code of 1986, as amended, and to annually distribute substantially all of its ordinary income and any net capital gains (taking into account any capital loss carryforwards) sufficient to relieve it from all, or substantially all, federal income and excise taxes. Accordingly, no provision for federal income taxes is required.
LOANS OF PORTFOLIO SECURITIES
Each Fund may lend its investment securities to approved borrowers, such as brokers, dealers and other financial institutions. The borrower pledges and maintains with the Fund collateral consisting of cash, an irrevocable letter of credit issued by a bank, or securities issued or guaranteed by the U.S. government. The initial collateral received by each Fund is required to have a value of at least 102% of the current value of the loaned securities plus the interest accrued on such securities, if any, for securities traded on U.S. exchanges and a value of at least 105% for all other securities. The collateral is maintained thereafter, at a value equal to at least 100% of the current value of the securities on loan plus accrued interest, if any. The market value of the loaned securities is determined at the close of each business day of the Funds and any additional required collateral is delivered to the Funds on the next business day. Any securities lending cash collateral may be reinvested in certain short-term instruments either directly on behalf of a fund or through one or more joint accounts or money market funds, including those managed by BlackRock Fund Advisors (“BFA”), the Funds’ investment adviser, or its affiliates.
As of February 28, 2014, any securities on loan were collateralized by cash. The cash collateral received was invested in money market funds managed by BFA. The value of any securities on loan as of February 28, 2014 and the value of the related collateral are disclosed in the statements of assets and liabilities. Income earned by the Funds from securities lending is disclosed in the statements of operations.
The risks of securities lending include the risk that the borrower may not provide additional collateral when required or may not return the securities when due. To mitigate these risks, the Funds benefit from a borrower default indemnity provided by BlackRock, Inc. (“BlackRock”). BlackRock’s indemnity allows for full replacement of securities lent. Each Fund could suffer a loss if the value of the investments purchased with cash collateral falls below the value of the cash collateral received.
Securities lending transactions are entered into by the Funds under Master Securities Lending Agreements (“MSLA”) which provide the right, in the event of default (including bankruptcy or insolvency) for the non-defaulting party to liquidate the collateral and calculate a net exposure to the defaulting party. In the event that a borrower defaults, a Fund, as lender, would offset the market value of the collateral received against the market value of the securities loaned. The value of the collateral is typically greater than that of the market value of the securities loaned, leaving the lender with a net amount payable to the defaulting party. However, bankruptcy or insolvency laws of a particular jurisdiction may impose restrictions on or prohibitions against such a right of offset in the event of an MSLA counterparty’s bankruptcy or insolvency. Under the MSLA, the borrower can resell or re-pledge the loaned securities, and a Fund can reinvest cash collateral, or, upon an event of default, resell or repledge the collateral.
As of February 28, 2014, the following Funds had securities on loan with a market value as disclosed in the Funds’ statements of assets and liabilities:
| | | | |
| iShares Bond ETF | | Market Value of
Securities on Loan | |
iBoxx $ High Yield Corporate | | $ | 2,363,302,047 | |
iBoxx $ Investment Grade Corporate | | | 1,145,919,971 | |
As of February 28, 2014, the value of the related collateral, as disclosed in the Funds’ schedules of investments, exceeded the market value of the securities on loan.
| | | | |
NOTESTO FINANCIAL STATEMENTS | | | 147 | |
Notes to Financial Statements (Continued)
iSHARES® TRUST
| 2. | INVESTMENT ADVISORY AGREEMENT AND OTHER TRANSACTIONS WITH AFFILIATES |
Pursuant to an Investment Advisory Agreement with the Trust, BFA manages the investment of each Fund’s assets. BFA is a California corporation indirectly owned by BlackRock. Under the Investment Advisory Agreement, BFA is responsible for substantially all expenses of the Funds, except interest, taxes, brokerage commissions and other expenses connected with the execution of portfolio transactions, distribution fees, litigation expenses and any extraordinary expenses.
For its investment advisory services to the iShares iBoxx $ High Yield Corporate Bond ETF, BFA is entitled to an annual investment advisory fee based on the Fund’s allocable portion of the aggregate of the average daily net assets of the Fund and certain other iShares funds, as follows:
| | | | | |
| Investment Advisory Fee | | Aggregate Average Daily Net Assets |
| | | 0.5000% | | | First $19 billion |
| | | 0.4750a | | | Over $19 billion, up to and including $33 billion |
| | | 0.4513a | | | Over $33 billion, up to and including $58 billionb |
| | | 0.4287a | | | Over $58 billionb |
| | a | | Investment advisory fee level reflects a 5% reduction (rounded to the fourth decimal place) from the investment advisory fee at the prior aggregate average daily net asset level. |
| | b | | Breakpoint level was added effective July 1, 2013. |
Effective July 1, 2013, for its investment advisory services to the iShares iBoxx $ Investment Grade Corporate Bond ETF, BFA is entitled to an annual investment advisory fee based on the Fund’s allocable portion of the aggregate of the average daily net assets of the Fund and certain other iShares funds, as follows:
| | | | | |
| Investment Advisory Fee | | Aggregate Average Daily Net Assets |
| | | 0.1500% | | | First $121 billion |
| | | 0.1425a | | | Over $121 billion, up to and including $211 billion |
| | | 0.1354a | | | Over $211 billion |
| | a | | Investment advisory fee level reflects a 5% reduction (rounded to the fourth decimal place) from the investment advisory fee at the prior aggregate average daily net asset level. |
Prior to July 1, 2013, for its investment advisory services to the iShares iBoxx $ Investment Grade Corporate Bond ETF, BFA was entitled to an annual investment advisory fee of 0.15% based on the Fund’s average daily net assets.
The U.S. Securities and Exchange Commission has issued an exemptive order which permits BlackRock Institutional Trust Company, N.A. (“BTC”), an affiliate of BFA, to serve as securities lending agent for the Funds, subject to applicable conditions. As securities lending agent, BTC bears all operational costs directly related to securities lending. Effective January 1, 2014 each Fund is responsible for fees in connection with the investment of cash collateral received for securities on loan in a money market fund managed by BFA, however, BTC has agreed to reduce the amount of securities lending income it receives in order to effectively limit the collateral investment fees each Fund bears to an annual rate of 0.04% until December 31, 2014 and 0.05% thereafter (the “collateral investment fees”). Securities lending income is equal to the total of income earned from the reinvestment of cash collateral, net of fees and other payments to and from borrowers of securities, and less the collateral investment fees. The Funds retain a portion of securities lending income and remit a remaining portion to BTC as compensation for its services as securities lending agent.
Pursuant to a securities lending agreement effective January 1, 2014, (i) each Fund retains 75% of securities lending income and (ii) the amount retained can never be less than 70% of the total of securities lending income plus the collateral investment fees. Prior to January 1, 2014, each Fund retained 65% of securities lending income and paid no collateral investment fees.
| | |
| 148 | | 2014 iSHARES ANNUAL REPORTTO SHAREHOLDERS |
Notes to Financial Statements (Continued)
iSHARES® TRUST
For the year ended February 28, 2014, each Fund paid to BTC the following amounts in total for securities lending agent services and collateral investment fees:
| | | | |
| iShares Bond ETF | | Fees Paid
to BTC | |
iBoxx $ High Yield Corporate | | $ | 5,034,950 | |
iBoxx $ Investment Grade Corporate | | | 930,532 | |
In addition, commencing the business day following the date that the aggregate securities lending income generated across all 1940 Act iShares exchange-traded funds (the “iShares ETF Complex”) in a given calendar year exceeds the aggregate securities lending income generated across the iShares ETF Complex in calendar year 2013 (or lesser amount as may be agreed to by the Funds and BTC) and pursuant to a securities lending agreement, (i) each Fund will receive for the remainder of that calendar year 80% of securities lending income and (ii) the amount retained can never be less than 70% of the total of securities lending income plus the collateral investment fees.
BlackRock Investments, LLC, an affiliate of BFA, is the distributor for each Fund. Pursuant to the distribution agreement, BFA is responsible for any fees or expenses for distribution services provided to the Funds.
Each Fund may invest its positive cash balances in certain money market funds managed by BFA or an affiliate. The income earned on these temporary cash investments is included in “Interest – affiliated” in the statements of operations.
The PNC Financial Services Group, Inc. is the largest stockholder of BlackRock and is considered to be an affiliate of the Funds for 1940 Act purposes.
Investments in issuers considered to be affiliates of the Funds (excluding money market funds) during the year ended February 28, 2014, for purposes of Section 2(a)(3) of the 1940 Act, were as follows:
| | | | | | | | | | | | | | | | | | | | | | | | | | | | |
iShares Bond ETF and Name of Affiliated Issuer | | Principal
Held at Beginning
of Year (000s) | | | Principal
Purchased
(000s) | | | Principal Sold (000s) | | | Principal Held at End of Year (000s) | | | Value at End of Year | | | Interest
Income | | | Net Realized
Gain (Loss) | |
iBoxx $ Investment Grade Corporate | | | | | | | | | | | | | | | | | | | | | | | | | | | | |
PNC Bank N.A. | | | | | | | | | | | | | | | | | | | | | | | | | | | | |
2.20%, 01/28/19 | | $ | — | | | $ | 3,525 | | | $ | — | | | $ | 3,525 | | | $ | 3,552,652 | | | $ | 5,404 | | | $ | — | |
2.70%, 11/01/22 | | | 14,250 | | | | 1,000 | | | | — | | | | 15,250 | | | | 14,329,353 | | | | 390,417 | | | | — | |
2.95%, 01/30/23 | | | 5,000 | | | | — | | | | — | | | | 5,000 | | | | 4,766,868 | | | | 146,904 | | | | — | |
3.80%, 07/23/25 | | | — | | | | 17,100 | | | | — | | | | 17,100 | | | | 17,242,566 | | | | 260,043 | | | | — | |
| | | | | | | | | | | | | | | | | | | | | | | | | | | | |
| | | | | | | | | | | | | | | | | | $ | 39,891,439 | | | $ | 802,768 | | | $ | — | |
| | | | | | | | | | | | | | | | | | | | | | | | | | | | |
PNC Funding Corp. | | | | | | | | | | | | | | | | | | | | | | | | | | | | |
2.70%, 09/19/16 | | $ | 13,654 | | | $ | 1,000 | | | $ | (14,654 | ) | | $ | — | | | $ | — | | | $ | 84,933 | | | $ | (171,477 | ) |
3.30%, 03/08/22 | | | 19,738 | | | | 10,781 | | | | (23,450 | ) | | | 7,069 | | | | 7,088,097 | | | | 598,910 | | | | (1,033,375 | ) |
4.38%, 08/11/20 | | | 10,208 | | | | 915 | | | | (7,600 | ) | | | 3,523 | | | | 3,872,955 | | | | 267,939 | | | | 514,296 | |
5.13%, 02/08/20 | | | 18,839 | | | | 930 | | | | (16,000 | ) | | | 3,769 | | | | 4,294,313 | | | | 323,101 | | | | 1,092,747 | |
| | | | | | | | | | | | | | | | | | | | | | | | | | | | |
| | | | | | | | | | | | | | | | | | $ | 15,255,365 | | | $ | 1,274,883 | | | $ | 402,191 | |
| | | | | | | | | | | | | | | | | | | | | | | | | | | | |
| | | | | | | | | | | | | | | | | | | | | | | | | | | | | |
| | | | |
NOTESTO FINANCIAL STATEMENTS | | | 149 | |
Notes to Financial Statements (Continued)
iSHARES® TRUST
Certain trustees and officers of the Trust are also officers of BTC and/or BFA.
| 3. | INVESTMENT PORTFOLIO TRANSACTIONS |
Purchases and sales of investments (excluding in-kind transactions and short-term investments) for the year ended February 28, 2014 were as follows:
| | | | | | | | |
| iShares Bond ETF | | Purchases | | | Sales | |
iBoxx $ High Yield Corporate | | $ | 3,148,077,841 | | | $ | 1,666,532,702 | |
iBoxx $ Investment Grade Corporate | | | 3,837,511,274 | | | | 1,117,143,464 | |
In-kind transactions (see Note 4) for the year ended February 28, 2014 were as follows:
| | | | | | | | |
| iShares Bond ETF | | In-kind
Purchases | | | In-kind
Sales | |
iBoxx $ High Yield Corporate | | $ | 4,679,649,597 | | | $ | 7,725,157,809 | |
iBoxx $ Investment Grade Corporate | | | 3,006,465,321 | | | | 12,102,870,152 | |
| 4. | CAPITAL SHARE TRANSACTIONS |
Capital shares are issued and redeemed by each Fund only in aggregations of a specified number of shares or multiples thereof (“Creation Units”) at net asset value. Except when aggregated in Creation Units, shares of each Fund are not redeemable. Transactions in capital shares for each Fund are disclosed in detail in the statements of changes in net assets.
The consideration for the purchase of Creation Units of a fund in the Trust generally consists of the in-kind deposit of a designated portfolio of securities and a specified amount of cash. Certain funds in the Trust may be offered in Creation Units solely or partially for cash in U.S. dollars. Investors purchasing and redeeming Creation Units may pay a purchase transaction fee and a redemption transaction fee directly to State Street Bank and Trust Company, the Trust’s administrator, to offset transfer and other transaction costs associated with the issuance and redemption of Creation Units, including Creation Units for cash. Investors transacting in Creation Units for cash may also pay an additional variable charge to compensate the relevant fund for certain transaction costs (i.e., stamp taxes, taxes on currency or other financial transactions, and brokerage costs) and market impact expenses relating to investing in portfolio securities.
From time to time, settlement of securities related to in-kind contributions or in-kind redemptions may be delayed. In such cases, securities related to in-kind contributions are reflected as “Due from custodian” and securities related to in-kind redemptions are reflected as “Securities related to in-kind transactions” in the statements of assets and liabilities.
| | |
| 150 | | 2014 iSHARES ANNUAL REPORTTO SHAREHOLDERS |
Notes to Financial Statements (Continued)
iSHARES® TRUST
U.S. GAAP requires that certain components of net assets be adjusted to reflect permanent differences between financial and tax reporting. These reclassifications have no effect on net assets or net asset values per share. The following permanent differences as of February 28, 2014, attributable to realized gains (losses) from in-kind redemptions, were reclassified to the following accounts:
| | | | | | | | | | | | |
| iShares Bond ETF | | Paid-in
Capital | | | Undistributed Net Investment Income/Distributions
in Excess of Net
Investment Income | | | Undistributed Net Realized Gain/Accumulated Net Realized Loss | |
iBoxx $ High Yield Corporate | | $ | 380,100,467 | | | $ | — | | | $ | (380,100,467 | ) |
iBoxx $ Investment Grade Corporate | | | 786,864,602 | | | | — | | | | (786,864,602 | ) |
The tax character of distributions paid during the years ended February 28, 2014 and February 28, 2013 was as follows:
| | | | | | | | |
| iShares Bond ETF | | 2014 | | | 2013 | |
iBoxx $ High Yield Corporate | | | | | | | | |
Ordinary income | | $ | 920,212,310 | | | $ | 1,045,834,956 | |
| | | | | | | | |
| | |
iBoxx $ Investment Grade Corporate | | | | | | | | |
Ordinary income | | $ | 719,984,353 | | | $ | 889,474,785 | |
Long-term capital gain | | | — | | | | 1,970,502 | |
| | | | | | | | |
| | $ | 719,984,353 | | | $ | 891,445,287 | |
| | | | | | | | |
| | | | | | | | | |
As of February 28, 2014, the tax components of accumulated net earnings (losses) were as follows:
| | | | | | | | | | | | | | | | |
| iShares Bond ETF | | Undistributed
Ordinary
Income | | | Capital
Loss Carryforwards | | | Net Unrealized Gains (Losses) a | | | Total | |
iBoxx $ High Yield Corporate | | $ | 66,938,963 | | | $ | (11,239,329 | ) | | $ | 405,912,193 | | | $ | 461,611,827 | |
iBoxx $ Investment Grade Corporate | | | 48,522,914 | | | | (28,579,925 | ) | | | 396,195,376 | | | | 416,138,365 | |
| | a | | The difference between book-basis and tax-basis unrealized gains (losses) was attributable primarily to the tax deferral of losses on wash sales. |
As of February 28, 2014, the Funds had capital loss carryforwards available to offset future realized capital gains through the indicated expiration dates as follows:
| | | | | | | | | | | | | | | | |
| iShares Bond ETF | | Non- Expiring a | | | Expiring
2017 | | | Expiring
2018 | | | Total | |
iBoxx $ High Yield Corporate | | $ | 4,564,787 | | | $ | 6,496,723 | | | $ | 177,819 | | | $ | 11,239,329 | |
iBoxx $ Investment Grade Corporate | | | 28,579,925 | | | | — | | | | — | | | | 28,579,925 | |
| | a | | Must be utilized prior to losses subject to expiration. |
| | | | |
NOTESTO FINANCIAL STATEMENTS | | | 151 | |
Notes to Financial Statements (Continued)
iSHARES® TRUST
For the year ended February 28, 2014, the iBoxx $ High Yield Corporate Bond ETF utilized $1,636,983 of its capital loss carryforwards.
As of February 28, 2014, gross unrealized appreciation and gross unrealized depreciation based on cost for federal income tax purposes were as follows:
| | | | | | | | | | | | | | | | |
| iShares Bond ETF | | Tax Cost | | | Gross Unrealized Appreciation | | | Gross Unrealized Depreciation | | | Net Unrealized Appreciation (Depreciation) | |
iBoxx $ High Yield Corporate | | $ | 15,413,502,534 | | | $ | 532,887,293 | | | $ | (126,975,100 | ) | | $ | 405,912,193 | |
iBoxx $ Investment Grade Corporate | | | 17,621,163,488 | | | | 580,542,279 | | | | (184,346,903 | ) | | | 396,195,376 | |
Management has analyzed tax laws and regulations and their application to the Funds as of February 28, 2014, inclusive of the open tax return years, and does not believe there are any uncertain tax positions that require recognition of a tax liability in the Funds’ financial statements.
Management has evaluated the impact of all subsequent events on the Funds through the date the financial statements were available to be issued and has determined that there were no subsequent events requiring adjustment or disclosure in the financial statements.
| | |
| 152 | | 2014 iSHARES ANNUAL REPORTTO SHAREHOLDERS |
Report of Independent Registered Public Accounting Firm
To the Shareholders and Board of Trustees of
iShares Trust:
In our opinion, the accompanying statements of assets and liabilities, including the schedules of investments, and the related statements of operations and of changes in net assets and the financial highlights present fairly, in all material respects, the financial position of iShares iBoxx $ High Yield Corporate Bond ETF and iShares iBoxx $ Investment Grade Corporate Bond ETF (the “Funds”) at February 28, 2014, the results of each of their operations, the changes in each of their net assets and their financial highlights for each of the periods presented, in conformity with accounting principles generally accepted in the United States of America. These financial statements and financial highlights (hereafter referred to as “financial statements”) are the responsibility of the Funds’ management; our responsibility is to express an opinion on these financial statements based on our audits. We conducted our audits of these financial statements in accordance with the standards of the Public Company Accounting Oversight Board (United States). Those standards require that we plan and perform the audit to obtain reasonable assurance about whether the financial statements are free of material misstatement. An audit includes examining, on a test basis, evidence supporting the amounts and disclosures in the financial statements, assessing the accounting principles used and significant estimates made by management, and evaluating the overall financial statement presentation. We believe that our audits, which included confirmation of securities at February 28, 2014 by correspondence with the custodian, transfer agent and brokers, provide a reasonable basis for our opinion.
PricewaterhouseCoopers LLP
San Francisco, California
April 21, 2014
| | | | |
REPORTOF INDEPENDENT REGISTERED PUBLIC ACCOUNTING FIRM | | | 153 | |
Notes:
| | |
| 154 | | 2014 iSHARES ANNUAL REPORTTO SHAREHOLDERS |
For more information visit www.iShares.com or call 1-800-iShares (1-800-474-2737)
This report is intended for the Funds’ shareholders. It may not be distributed to prospective investors unless it is preceded or accompanied by the current prospectus.
Investing involves risk, including possible loss of principal.
The iShares Funds are distributed by BlackRock Investments, LLC (together with its affiliates, “BlackRock”).
A description of the policies that the Funds use to determine how to vote proxies relating to portfolio securities and information about how the Funds voted proxies relating to portfolio securities during the most recent twelve-month period ending June 30 is available without charge, upon request, by calling toll-free 1-800-474-2737; on the Funds’ website at www.iShares.com; and on the U.S. Securities and Exchange Commission (SEC) website at www.sec.gov.
The Funds file their complete schedules of portfolio holdings with the SEC for the first and third quarters of each fiscal year on Form N-Q. The Funds’ Form N-Q is available on the SEC’s website or may be reviewed and copied at the SEC’s Public Reference Room in Washington, D.C. Information on the operation of the Public Reference Room may be obtained by calling 1-800-SEC-0330. The Funds also disclose their complete schedules of portfolio holdings on a daily and monthly basis on the Funds’ website.
©2014 BlackRock, Inc. All rights reserved. iSHARES and BLACKROCK are registered trademarks of BlackRock, Inc. or its subsidiaries. All other marks are the property of their respective owners.
iS-AR-1010-1014
OCTOBER 31, 2014
| | | | |
2014 ANNUAL REPORT | | | |  |
iShares U.S. ETF Trust
| Ø | | iShares Commodities Select Strategy ETF | COMT | NASDAQ |
Table of Contents
Management’s Discussion of Fund Performance
iSHARES® COMMODITIES SELECT STRATEGY ETF
Performance as of October 31, 2014
| | | | |
| | | Cumulative Total Returns | |
| | | Since Inception | |
Fund NAV | | | 1.28% | |
Fund Market | | | 1.46% | |
S&P GSCI Commodity Total Return Index | | | 1.13% | |
The inception date of the Fund was 10/15/14. The first day of secondary market trading was 10/16/14.
The S&P GSCITM Commodity Total Return Index is an unmanaged index that measures the performance of general commodity price movements and inflation in the world economy.
For the fiscal period ended 10/31/14, the Fund did not have six months of performance and therefore line graphs are not presented.
Past performance is no guarantee of future results. Performance results do not reflect the deduction of taxes that a shareholder would pay on fund distributions or on the redemption or sale of fund shares. See “About Fund Performance” on page 7 for more information.
| | | | | | | | | | | | | | | | | | | | | | | | | | |
| Shareholder Expenses | |
| Actual | | | Hypothetical 5% Return | | | | |
Beginning
Account Value
(10/15/14) a | | | Ending
Account Value
(10/31/14) | | | Expenses Paid
During Period b | | | Beginning
Account Value
(5/1/14) | | | Ending
Account Value
(10/31/14) | | | Expenses Paid
During Period b | | | Annualized
Expense Ratio | |
| $ | 1,000.00 | | | $ | 1,012.80 | | | $ | 0.21 | | | $ | 1,000.00 | | | $ | 1,022.80 | | | $ | 2.45 | | | | 0.48% | |
| a | The beginning of the period (commencement of operations) is October 15, 2014. | |
| b | Expenses are calculated using the Fund’s annualized expense ratio (as disclosed in the table), multiplied by the average account value for the period, multiplied by the number of days in the period (16 days for actual and 184 days for hypothetical expenses) and divided by the number of days in the year (365 days). See “Shareholder Expenses” on page 7 for more information. | |
| | | | |
MANAGEMENT’S DISCUSSIONOF FUND PERFORMANCE | | | 5 | |
Management’s Discussion of Fund Performance (Continued)
iSHARES® COMMODITIES SELECT STRATEGY ETF
The iShares Commodities Select Strategy ETF (the “Fund”) seeks total return by providing investors with broad commodity exposure. The Fund is an actively managed exchange-traded fund that does not seek to replicate the performance of a specified index. For the period from October 15, 2014 (inception date of the Fund) through October 31, 2014 (the “reporting period”), the total return for the Fund was 1.28%, net of fees.
The Fund seeks to achieve its investment objective through investments in commodity-linked futures contracts and commodity producer stocks, thereby obtaining exposure to the commodities markets.
As of October 31, 2014, energy (including energy futures and stocks) comprised approximately two-thirds of the Fund’s portfolio. The price of oil ended the reporting period at its lowest level in more than two years, reflecting increased production in the U.S., declining demand in Europe and Asia, and a stronger U.S. dollar (oil is traded primarily in U.S. dollars). Natural gas prices have been buffeted by increased shale gas production in the U.S. and volatility in demand resulting from unusual weather patterns.
Agriculture futures and stocks comprised approximately 16% of the portfolio at the end of the reporting period. A record-breaking growing season in 2014, including an all-time high in global wheat production, and weaker global economic growth led to a general decline in the prices of agricultural products.
Metals futures and stocks comprised approximately 12% of the portfolio as of October 31, 2014. Metals prices have been mixed but generally weaker as slowing economic growth in many regions of the globe led to reduced demand for metals.
PORTFOLIO ALLOCATION
As of 10/31/14
| | | | |
| Sector/Investment Type | | % of
Net Assets | |
Energy Equities | | | 15.18 | % |
Agriculture Equities | | | 8.56 | |
Base Metals Equities | | | 4.72 | |
Precious Metals Equities | | | 3.86 | |
Timber Equities | | | 3.06 | |
Short-Term Investments | | | 49.67 | |
Cash | | | 15.12 | |
Other Assets (Liabilities) | | | (0.17 | ) |
| | | | |
TOTAL | | | 100.00 | % |
| | | | |
COMMODITY-LINKED FUTURES
As of 10/31/14
| | | | |
| Sector Exposure1 | | % of
Net Assets | |
Energy Futures | | | 53.54 | % |
Agriculture Futures | | | 7.55 | |
Base Metals Futures | | | 1.91 | |
Precious Metals Futures | | | 0.54 | |
Livestock Futures | | | 1.44 | |
| | | | |
TOTAL | | | 64.98 | % |
| | | | |
| | 1 | Exposures are calculated as the notional value of the futures contracts adjusted for net unrealized appreciation (depreciation) as a percentage of net assets. |
| | |
| 6 | | 2014 iSHARES ANNUAL REPORTTO SHAREHOLDERS |
About Fund Performance
Past performance is no guarantee of future results. Current performance may be lower or higher than the performance data quoted. Performance data current to the most recent month-end is available at www.iShares.com. Performance results assume reinvestment of all dividends and capital gain distributions and do not reflect the deduction of taxes that a shareholder would pay on fund distributions or on the redemption or sale of fund shares. The investment return and principal value of shares will vary with changes in market conditions. Shares may be worth more or less than their original cost when they are redeemed or sold in the market. Performance for certain funds may reflect a waiver of a portion of investment management fees. Without such waiver, performance would have been lower.
Net asset value or “NAV” is the value of one share of a fund as calculated in accordance with the standard formula for valuing mutual fund shares. The price used to calculate market return (“Market Price”) is determined by using the midpoint between the highest bid and the lowest offer on the primary stock exchange on which shares of a fund are listed for trading, as of the time that such fund’s NAV is calculated. Since shares of a fund may not have traded in the secondary market until after the fund’s inception, for the period from inception to the first day of secondary trading, the NAV of the fund is used as a proxy for the Market Price to calculate market returns. Market and NAV returns assume that dividends and capital gain distributions have been reinvested at Market Price and NAV, respectively. Also, market returns do not include brokerage commissions that may be payable on secondary market transactions. If brokerage commissions were included, market returns would be lower.
Shareholder Expenses
As a shareholder of the Fund, you incur two types of costs: (1) transaction costs, including brokerage commissions on purchases and sales of fund shares and (2) ongoing costs, including management fees and other fund expenses. The expense example, which is based on an investment of $1,000 invested on May 1, 2014 (or commencement of operations, as applicable) and held through October 31, 2014, is intended to help you understand your ongoing costs (in dollars and cents) of investing in the Fund and to compare these costs with the ongoing costs of investing in other funds.
Actual Expenses — The table provides information about actual account values and actual expenses. Annualized expense ratios reflect contractual and voluntary fee waivers, if any. To estimate the expenses that you paid on your account over the period, simply divide your account value by $1,000 (for example, an $8,600 account value divided by $1,000 = 8.6), then multiply the result by the number for your Fund under the heading entitled “Expenses Paid During Period.”
Hypothetical Example for Comparison Purposes — The table also provides information about hypothetical account values and hypothetical expenses based on the Fund’s actual expense ratio and an assumed rate of return of 5% per year before expenses. You may use this information to compare the ongoing costs of investing in your Fund and other funds. To do so, compare this 5% hypothetical example with the 5% hypothetical examples that appear in the shareholder reports of the other funds.
Please note that the expenses shown in the table are meant to highlight your ongoing costs only and do not reflect any transactional costs, such as brokerage commissions paid on purchases and sales of fund shares. Therefore, the hypothetical examples are useful in comparing ongoing costs only and will not help you determine the relative total costs of owning different funds. In addition, if these transactional costs were included, your costs would have been higher.
| | | | |
ABOUT FUND PERFORMANCE / SHAREHOLDER EXPENSES | | | 7 | |
Consolidated Schedule of Investments
iSHARES® COMMODITIES SELECT STRATEGY ETF
October 31, 2014
| | | | | | | | |
| Security | | Shares | | | Value | |
| | | | | | | | |
COMMON STOCKS — 35.38% | |
| |
AGRICULTURAL PRODUCTS — 1.42% | | | | | |
Archer-Daniels-Midland Co. | | | 4,180 | | | $ | 196,460 | |
Bunge Ltd. | | | 944 | | | | 83,686 | |
Fresh Del Monte Produce Inc. | | | 228 | | | | 7,321 | |
| | | | | | | | |
| | | | | | | 287,467 | |
ALUMINUM — 0.34% | | | | | |
Alcoa Inc. | | | 3,476 | | | | 58,258 | |
Aluminum Corp. of China Ltd.
Class H SP ADRa | | | 468 | | | | 5,204 | |
Constellium NV Class Aa | | | 260 | | | | 5,265 | |
| | | | | | | | |
| | | | | | | 68,727 | |
COAL & CONSUMABLE FUELS — 0.10% | | | | | |
Cameco Corp. | | | 392 | | | | 6,813 | |
CONSOL Energy Inc. | | | 228 | | | | 8,390 | |
Denison Mines Corp.a | | | 444 | | | | 413 | |
Peabody Energy Corp. | | | 268 | | | | 2,795 | |
Yanzhou Coal Mining Co. Ltd. Class H SP ADR | | | 192 | | | | 1,615 | |
| | | | | | | | |
| | | | | | | 20,026 | |
CONSTRUCTION & FARM MACHINERY & HEAVY TRUCKS — 1.63% | |
AGCO Corp. | | | 672 | | | | 29,776 | |
CNH Industrial NV | | | 7,348 | | | | 59,886 | |
Deere & Co. | | | 2,820 | | | | 241,223 | |
| | | | | | | | |
| | | | | | | 330,885 | |
DIVERSIFIED METALS & MINING — 4.38% | | | | | |
BHP Billiton Ltd. SP ADR | | | 5,536 | | | | 329,060 | |
BHP Billiton PLC SP ADR | | | 3,644 | | | | 189,634 | |
Freeport-McMoRan Inc. | | | 3,584 | | | | 102,144 | |
HudBay Minerals Inc. | | | 800 | | | | 6,136 | |
Nevsun Resources Ltd. | | | 688 | | | | 2,332 | |
Rio Tinto PLC SP ADR | | | 4,280 | | | | 205,312 | |
Sesa Sterlite Ltd. SP ADR | | | 1,024 | | | | 17,244 | |
Teck Resources Ltd. Class B | | | 1,612 | | | | 25,437 | |
Turquoise Hill Resources Ltd.a | | | 3,404 | | | | 11,403 | |
| | | | | | | | |
| | | | | | | 888,702 | |
FERTILIZERS & AGRICULTURAL CHEMICALS — 5.52% | |
Agrium Inc. | | | 996 | | | | 97,429 | |
CF Industries Holdings Inc. | | | 344 | | | | 89,440 | |
Monsanto Co. | | | 3,636 | | | | 418,285 | |
Mosaic Co. (The) | | | 2,208 | | | | 97,837 | |
Potash Corp. of Saskatchewan Inc. | | | 5,752 | | | | 196,546 | |
| | | | | | | | |
| Security | | Shares | | | Value | |
| | | | | | | | |
Sociedad Quimica y Minera de Chile SA Series B SP ADR | | | 644 | | | $ | 15,282 | |
Syngenta AG SP ADR | | | 3,280 | | | | 203,360 | |
| | | | | | | | |
| | | | | | | 1,118,179 | |
FOREST PRODUCTS — 0.03% | | | | | |
Deltic Timber Corp. | | | 88 | | | | 5,728 | |
| | | | | | | | |
| | | | | | | 5,728 | |
GOLD — 3.31% | | | | | |
Agnico-Eagle Mines Ltd. | | | 1,708 | | | | 40,138 | |
Alamos Gold Inc.a | | | 1,036 | | | | 7,739 | |
AngloGold Ashanti Ltd. SP ADRa | | | 3,276 | | | | 27,092 | |
AuRico Gold Inc. | | | 2,024 | | | | 6,497 | |
B2Gold Corp.a | | | 5,600 | | | | 9,352 | |
Barrick Gold Corp. | | | 9,484 | | | | 112,575 | |
Compania de Minas Buenaventura SA SP ADR | | | 1,504 | | | | 13,837 | |
Eldorado Gold Corp. | | | 5,832 | | | | 31,959 | |
Franco-Nevada Corp. | | | 1,268 | | | | 59,279 | |
Gold Fields Ltd. SP ADR | | | 5,772 | | | | 18,413 | |
Goldcorp Inc. | | | 6,624 | | | | 124,399 | |
Harmony Gold Mining Co. Ltd. SP ADRa | | | 2,984 | | | | 4,834 | |
IAMGOLD Corp.a | | | 3,072 | | | | 5,806 | |
Kinross Gold Corp.a | | | 9,320 | | | | 20,038 | |
New Gold Inc.a | | | 4,104 | | | | 14,774 | |
Newmont Mining Corp. | | | 4,060 | | | | 76,166 | |
NovaGold Resources Inc.a | | | 1,912 | | | | 4,723 | |
Pretium Resources Inc.a | | | 780 | | | | 3,557 | |
Primero Mining Corp.a | | | 548 | | | | 1,874 | |
Randgold Resources Ltd. | | | 748 | | | | 43,541 | |
Rubicon Minerals Corp.a | | | 3,016 | | | | 2,570 | |
Sandstorm Gold Ltd.a | | | 956 | | | | 2,763 | |
Sibanye Gold Ltd. SP ADR | | | 1,464 | | | | 10,760 | |
Yamana Gold Inc. | | | 7,172 | | | | 28,544 | |
| | | | | | | | |
| | | | | | | 671,230 | |
INTEGRATED OIL & GAS — 8.40% | | | | | |
BP PLC SP ADR | | | 3,508 | | | | 152,458 | |
Cenovus Energy Inc. | | | 852 | | | | 21,096 | |
Chevron Corp. | | | 2,136 | | | | 256,213 | |
China Petroleum & Chemical Corp. Class H SP ADR | | | 288 | | | | 25,050 | |
Ecopetrol SA SP ADR | | | 276 | | | | 7,397 | |
Eni SpA SP ADR | | | 1,512 | | | | 64,260 | |
Exxon Mobil Corp. | | | 4,796 | | | | 463,821 | |
Hess Corp. | | | 296 | | | | 25,104 | |
Imperial Oil Ltd. | | | 288 | | | | 13,789 | |
| | |
| 8 | | 2014 iSHARES ANNUAL REPORTTO SHAREHOLDERS |
Consolidated Schedule of Investments (Continued)
iSHARES® COMMODITIES SELECT STRATEGY ETF
October 31, 2014
| | | | | | | | |
| Security | | Shares | | | Value | |
| | | | | | | | |
InterOil Corp.a | | | 44 | | | $ | 2,492 | |
Occidental Petroleum Corp. | | | 876 | | | | 77,903 | |
Petrobras Argentina SA Class B SP ADR | | | 76 | | | | 513 | |
PetroChina Co. Ltd. Class H SP ADR | | | 236 | | | | 29,618 | |
Petroleo Brasileiro SA SP ADR | | | 1,676 | | | | 19,609 | |
Royal Dutch Shell PLC Class A SP ADR | | | 2,212 | | | | 158,799 | |
Royal Dutch Shell PLC Class B SP ADR | | | 1,380 | | | | 103,045 | |
Sasol Ltd. SP ADR | | | 564 | | | | 28,307 | |
Statoil ASA SP ADR | | | 1,184 | | | | 27,173 | |
Suncor Energy Inc. | | | 1,648 | | | | 58,570 | |
Total SA SP ADR | | | 2,660 | | | | 159,307 | |
YPF SA SP ADR | | | 216 | | | | 7,597 | |
| | | | | | | | |
| | | | | | | 1,702,121 | |
OIL & GAS DRILLING — 0.36% | | | | | |
Diamond Offshore Drilling Inc. | | | 84 | | | | 3,168 | |
Ensco PLC Class A | | | 296 | | | | 12,015 | |
Helmerich & Payne Inc. | | | 136 | | | | 11,808 | |
Nabors Industries Ltd. | | | 364 | | | | 6,497 | |
Nobel Corp. PLC | | | 320 | | | | 6,694 | |
North Atlantic Drilling Ltd. | | | 92 | | | | 569 | |
Ocean Rig UDW Inc. | | | 64 | | | | 880 | |
Pacific Drilling SAa | | | 84 | | | | 612 | |
Precision Drilling Corp. | | | 368 | | | | 3,062 | |
Rowan Companies PLC Class A | | | 156 | | | | 3,786 | |
Seadrill Ltd. | | | 468 | | | | 10,764 | |
Transocean Ltd. | | | 428 | | | | 12,767 | |
Vantage Drilling Co.a | | | 232 | | | | 224 | |
| | | | | | | | |
| | | | | | | 72,846 | |
OIL & GAS EQUIPMENT & SERVICES — 1.53% | |
Baker Hughes Inc. | | | 456 | | | | 24,150 | |
Cameron International Corp.a | | | 212 | | | | 12,625 | |
CGG SP ADRa | | | 184 | | | | 1,078 | |
CHC Group Ltd.a | | | 36 | | | | 242 | |
Core Laboratories NV | | | 44 | | | | 6,139 | |
FMC Technologies Inc.a | | | 244 | | | | 13,674 | |
Frank’s International NV | | | 36 | | | | 620 | |
Halliburton Co. | | | 888 | | | | 48,964 | |
McDermott International Inc.a | | | 248 | | | | 952 | |
National Oilwell Varco Inc. | | | 448 | | | | 32,543 | |
Oceaneering International Inc. | | | 112 | | | | 7,870 | |
Schlumberger Ltd. | | | 1,356 | | | | 133,783 | |
Superior Energy Services Inc. | | | 160 | | | | 4,024 | |
Tenaris SA SP ADR | | | 248 | | | | 9,831 | |
Tesco Corp. | | | 40 | | | | 762 | |
| | | | | | | | |
| Security | | Shares | | | Value | |
| | | | | | | | |
Weatherford International Ltd.a | | | 808 | | | $ | 13,267 | |
| | | | | | | | |
| | | | | | | 310,524 | |
OIL & GAS EXPLORATION & PRODUCTION — 3.06% | |
Advantage Oil & Gas Ltd.a | | | 192 | | | | 820 | |
Anadarko Petroleum Corp. | | | 568 | | | | 52,131 | |
Apache Corp. | | | 432 | | | | 33,350 | |
Baytex Energy Corp. | | | 188 | | | | 5,743 | |
Bellatrix Exploration Ltd.a | | | 216 | | | | 1,004 | |
Cabot Oil & Gas Corp. | | | 468 | | | | 14,555 | |
Canadian Natural Resources Ltd. | | | 1,228 | | | | 42,833 | |
Chesapeake Energy Corp. | | | 584 | | | | 12,953 | |
Cimarex Energy Co. | | | 96 | | | | 10,912 | |
CNOOC Ltd. SP ADR | | | 180 | | | | 28,147 | |
Cobalt International Energy Inc.a | | | 332 | | | | 3,888 | |
Concho Resources Inc.a | | | 128 | | | | 13,956 | |
ConocoPhillips | | | 1,384 | | | | 99,856 | |
Continental Resources Inc.a | | | 96 | | | | 5,411 | |
Crescent Point Energy Corp. | | | 444 | | | | 14,665 | |
Denbury Resources Inc. | | | 396 | | | | 4,910 | |
Devon Energy Corp. | | | 432 | | | | 25,920 | |
Encana Corp. | | | 832 | | | | 15,500 | |
Energen Corp. | | | 84 | | | | 5,687 | |
Energy XXI (Bermuda) Ltd. | | | 104 | | | | 800 | |
Enerplus Corp. | | | 232 | | | | 3,318 | |
EOG Resources Inc. | | | 616 | | | | 58,551 | |
EQT Corp. | | | 172 | | | | 16,175 | |
Geopark Ltd.a | | | 28 | | | | 241 | |
Kodiak Oil & Gas Corp.a | | | 300 | | | | 3,237 | |
Kosmos Energy Ltd.a | | | 124 | | | | 1,157 | |
Marathon Oil Corp. | | | 760 | | | | 26,904 | |
Murphy Oil Corp. | | | 188 | | | | 10,037 | |
Noble Energy Inc. | | | 404 | | | | 23,282 | |
Pengrowth Energy Corp. | | | 596 | | | | 2,402 | |
Penn West Petroleum Ltd. | | | 556 | | | | 2,513 | |
Pioneer Natural Resources Co. | | | 160 | | | | 30,250 | |
QEP Resources Inc. | | | 188 | | | | 4,713 | |
Range Resources Corp. | | | 188 | | | | 12,859 | |
Southwestern Energy Co.a | | | 396 | | | | 12,874 | |
Talisman Energy Inc. | | | 1,072 | | | | 6,839 | |
Ultra Petroleum Corp.a | | | 172 | | | | 3,922 | |
Whiting Petroleum Corp.a | | | 132 | | | | 8,084 | |
| | | | | | | | |
| | | | | | | 620,399 | |
OIL & GAS REFINING & MARKETING — 0.53% | | | | | |
Cosan Ltd. Class A | | | 156 | | | | 1,652 | |
HollyFrontier Corp. | | | 184 | | | | 8,350 | |
| | | | |
CONSOLIDATED SCHEDULEOF INVESTMENTS | | | 9 | |
Consolidated Schedule of Investments (Continued)
iSHARES® COMMODITIES SELECT STRATEGY ETF
October 31, 2014
| | | | | | | | |
| Security | | Shares | | | Value | |
| | | | | | | | |
Marathon Petroleum Corp. | | | 260 | | | $ | 23,634 | |
Phillips 66 | | | 516 | | | | 40,506 | |
Tesoro Corp. | | | 120 | | | | 8,569 | |
Valero Energy Corp. | | | 488 | | | | 24,444 | |
| | | | | | | | |
| | | | | | | 107,155 | |
OIL & GAS STORAGE & TRANSPORTATION — 1.20% | |
Cheniere Energy Inc.a | | | 224 | | | | 16,800 | |
Dorian LPG Ltd.a | | | 24 | | | | 344 | |
Enbridge Inc. | | | 864 | | | | 40,919 | |
GasLog Ltd. | | | 36 | | | | 750 | |
Golar LNG Ltd. | | | 84 | | | | 4,713 | |
Kinder Morgan Inc. | | | 672 | | | | 26,006 | |
Kinder Morgan Management LLCa | | | 122 | | | | 11,589 | |
Navigator Holdings Ltd.a | | | 20 | | | | 485 | |
Nordic American Tankers Ltd. | | | 92 | | | | 777 | |
ONEOK Inc. | | | 212 | | | | 12,495 | |
Pembina Pipeline Corp.a | | | 332 | | | | 13,758 | |
Scorpio Tankers Inc. | | | 164 | | | | 1,432 | |
Ship Finance International Ltd. | | | 60 | | | | 1,031 | |
Spectra Energy Corp. | | | 684 | | | | 26,765 | |
Teekay Corp. | | | 48 | | | | 2,806 | |
TransCanada Corp. | | | 720 | | | | 35,489 | |
Tsakos Energy Navigation Ltd. | | | 68 | | | | 460 | |
Ultrapar Participacoes SA SP ADR | | | 444 | | | | 9,635 | |
Williams Companies Inc. (The) | | | 684 | | | | 37,969 | |
| | | | | | | | |
| | | | | | | 244,223 | |
PAPER PACKAGING — 0.72% | | | | | |
MeadWestvaco Corp. | | | 1,316 | | | | 58,128 | |
Packaging Corp. of America | | | 768 | | | | 55,357 | |
Sonoco Products Co. | | | 796 | | | | 32,533 | |
| | | | | | | | |
| | | | | | | 146,018 | |
PAPER PRODUCTS — 1.11% | | | | | |
Fibria Celulose SA SP ADRa | | | 1,732 | | | | 21,182 | |
International Paper Co. | | | 3,340 | | | | 169,071 | |
KapStone Paper and Packaging Corp.a | | | 660 | | | | 20,302 | |
Resolute Forest Products Inc.a | | | 740 | | | | 13,734 | |
| | | | | | | | |
| | | | | | | 224,289 | |
PRECIOUS METALS & MINERALS — 0.07% | | | | | |
Dominion Diamond Corp.a | | | 1,044 | | | | 14,626 | |
| | | | | | | | |
| | | | | | | 14,626 | |
SILVER — 0.47% | | | | | | | | |
First Majestic Silver Corp.a | | | 984 | | | | 5,048 | |
Fortuna Silver Mines Inc.a | | | 1,056 | | | | 3,685 | |
MAG Silver Corp.a | | | 488 | | | | 2,948 | |
| | | | | | | | |
| Security | | Shares | | | Value | |
| | | | | | | | |
Pan American Silver Corp. | | | 1,268 | | | $ | 11,704 | |
Silver Standard Resources Inc.a | | | 676 | | | | 2,954 | |
Silver Wheaton Corp. | | | 2,996 | | | | 52,040 | |
Tahoe Resources Inc.a | | | 1,032 | | | | 17,916 | |
| | | | | | | | |
| | | | | | | 96,295 | |
SPECIALIZED REITS — 1.20% | | | | | |
Plum Creek Timber Co. Inc. | | | 1,384 | | | | 56,758 | |
Potlatch Corp. | | | 316 | | | | 13,901 | |
Rayonier Inc. | | | 988 | | | | 33,068 | |
Weyerhaeuser Co. | | | 4,132 | | | | 139,910 | |
| | | | | | | | |
| | | | | | | 243,637 | |
| | | | | | | | |
TOTAL COMMON STOCKS | | | | | |
(Cost: $7,016,294) | | | | 7,173,077 | |
|
SHORT-TERM INVESTMENTS — 49.67% | |
| |
MONEY MARKET FUNDS — 49.67% | | | | | |
BlackRock Cash Funds: Treasury, SL Agency Shares | | | | | | | | |
0.00%b,c | | | 10,069,712 | | | | 10,069,712 | |
| | | | | | | | |
| | | | | | | 10,069,712 | |
| | | | | | | | |
TOTAL SHORT-TERM INVESTMENTS | | | | | |
(Cost: $10,069,712) | | | | 10,069,712 | |
| | | | | | | | |
TOTAL INVESTMENTS
IN SECURITIES — 85.05% | | | | | |
(Cost: $17,086,006) | | | | | | | 17,242,789 | |
Other Assets, Less Liabilities — 14.95% | | | | 3,030,299 | |
| | | | | | | | |
NET ASSETS — 100.00% | | | $ | 20,273,088 | |
| | | | | | | | |
SP ADR — Sponsored American Depositary Receipts
| a | Non-income earning security. |
| b | Affiliated issuer. See Note 2. |
| c | The rate quoted is the annualized seven-day yield of the fund at period end. |
| | |
| 10 | | 2014 iSHARES ANNUAL REPORTTO SHAREHOLDERS |
Consolidated Schedule of Investments (Continued)
iSHARES® COMMODITIES SELECT STRATEGY ETF
October 31, 2014
Open futures contracts as of October 31, 2014 were as followsd:
| | | | | | | | | | | | | | | | | | |
| Issue | | Number of
Contracts
Purchased (Sold) | | | Expiration | | Exchange | | | Notional
Value | | | Unrealized
Appreciation
(Depreciation) | |
| Aluminum | | | 2 | | | Jun. 2015 | | | London Metal Exchange | | | $ | 102,350 | | | $ | 5,368 | |
| Brent Crude Oil | | | 48 | | | Jun. 2015 | | | New York Mercantile Exchange | | | | 4,254,720 | | | | 81,568 | |
| KC Red Wheat | | | 3 | | | Mar. 2015 | | | Chicago Board of Trade | | | | 89,850 | | | | 865 | |
| Cocoa | | | 1 | | | May 2015 | | | ICE Futures U.S. | | | | 28,870 | | | | (2,064 | ) |
| Coffee | | | 1 | | | May 2015 | | | ICE Futures U.S. | | | | 73,050 | | | | (10,147 | ) |
| Copper | | | 1 | | | Dec. 2014 | | | London Metal Exchange | | | | 168,250 | | | | 1,909 | |
| Corn | | | 20 | | | May 2015 | | | Chicago Board of Trade | | | | 398,000 | | | | 28,318 | |
| Cotton | | | 4 | | | Mar 2015 | | | ICE Futures U.S. | | | | 125,840 | | | | 2,291 | |
| Gold | | | 1 | | | Apr. 2015 | | | COMEX | | | | 117,290 | | | | (7,313 | ) |
| Lead | | | 1 | | | Jun. 2015 | | | London Metal Exchange | | | | 50,569 | | | | 15 | |
| Lean Hogs | | | 3 | | | Dec. 2014 | | | Chicago Mercantile Exchange | | | | 105,630 | | | | (4,691 | ) |
| Live Cattle | | | 3 | | | Jun. 2015 | | | Chicago Mercantile Exchange | | | | 186,840 | | | | 4,429 | |
| Natural Gas | | | 49 | | | Apr. 2015 | | | New York Mercantile Exchange | | | | 1,797,320 | | | | (7,161 | ) |
| Soybean | | | 5 | | | May 2015 | | | Chicago Board of Trade | | | | 264,500 | | | | 19,770 | |
| Sugar | | | 9 | | | Jul. 2015 | | | ICE Futures U.S. | | | | 167,530 | | | | (4,870 | ) |
| Wheat | | | 12 | | | May 2015 | | | Chicago Board of Trade | | | | 331,950 | | | | 16,884 | |
| WTI Crude Oil | | | 59 | | | Dec. 2014 | | | ICE Futures Europe | | | | 4,751,860 | | | | (23,737 | ) |
| Zinc | | | 1 | | | May 2015 | | | London Metal Exchange | | | | 57,913 | | | | 684 | |
| | | | | | | | | | | | | | | | | | |
| Net Unrealized Appreciation | | | $ | 102,118 | |
| | | | | | | | | | | | | | | | | | |
| | | | | | | | | | | | | | | | | | | |
| d | Represents positions held in the Subsidiary. |
See notes to consolidated financial statements.
| | | | |
CONSOLIDATED SCHEDULEOF INVESTMENTS | | | 11 | |
Consolidated Statement of Assets and Liabilities
iSHARES® COMMODITIES SELECT STRATEGY ETF
October 31, 2014
| | | | |
| | |
ASSETS | | | | |
Investments, at cost: | | | | |
Unaffiliated | | $ | 7,016,294 | |
Affiliated (Note 2) | | | 10,069,712 | |
| | | | |
Total cost of investments | | $ | 17,086,006 | |
| | | | |
Investments in securities, at fair value (Note 1): | | | | |
Unaffiliated | | $ | 7,173,077 | |
Affiliated (Note 2) | | | 10,069,712 | |
| | | | |
Total fair value of investments | | | 17,242,789 | |
Casha | | | 2,540,021 | |
Cash pledged to brokera | | | 524,000 | |
Receivables: | | | | |
Dividends and interest | | | 2,243 | |
Futures variation margin | | | 7,975 | |
| | | | |
Total Assets | | | 20,317,028 | |
| | | | |
| |
LIABILITIES | | | | |
Payables: | | | | |
Futures variation margin | | | 39,590 | |
Foreign taxes (Note 1) | | | 90 | |
Investment advisory fees (Note 2) | | | 4,260 | |
| | | | |
Total Liabilities | | | 43,940 | |
| | | | |
| |
NET ASSETS | | $ | 20,273,088 | |
| | | | |
| |
Net assets consist of: | | | | |
Paid-in capital | | $ | 20,016,294 | |
Accumulated net investment loss | | | (2,015 | ) |
Net unrealized appreciation | | | 258,809 | |
| | | | |
NET ASSETS | | $ | 20,273,088 | |
| | | | |
| |
Shares outstandingb | | | 400,000 | |
| | | | |
| |
Net asset value per share | | $ | 50.68 | |
| | | | |
| a | Represents assets held in the Subsidiary. |
| b | No par value, unlimited number of shares authorized. |
See notes to consolidated financial statements.
| | |
| 12 | | 2014 iSHARES ANNUAL REPORTTO SHAREHOLDERS |
Consolidated Statement of Operations
iSHARES® COMMODITIES SELECT STRATEGY ETF
Period from October 15, 2014 (commencement of operations) to October 31, 2014
| | | | |
| | |
NET INVESTMENT INCOME | | | | |
Dividends — unaffiliateda | | $ | 2,241 | |
Interest — affiliated (Note 2) | | | 4 | |
| | | | |
Total investment income | | | 2,245 | |
| | | | |
| |
EXPENSES | | | | |
Investment advisory fees (Note 2) | | | 4,260 | |
| | | | |
Total expenses | | | 4,260 | |
| | | | |
Net investment loss | | | (2,015 | ) |
| | | | |
| |
NET REALIZED AND UNREALIZED GAIN (LOSS) | | | | |
Net change in unrealized appreciation/depreciation on: | | | | |
Investments | | | 156,693 | |
Futures contracts | | | 102,118 | |
Translation of assets and liabilities in foreign currencies | | | (2 | ) |
| | | | |
Net change in unrealized appreciation/depreciation | | | 258,809 | |
| | | | |
Net realized and unrealized gain | | | 258,809 | |
| | | | |
NET INCREASE IN NET ASSETS RESULTING FROM OPERATIONS | | $ | 256,794 | |
| | | | |
| a | Net of foreign withholding tax of $32. |
See notes to consolidated financial statements.
| | | | |
CONSOLIDATED FINANCIAL STATEMENTS | | | 13 | |
Consolidated Statement of Changes in Net Assets
iSHARES® COMMODITIES SELECT STRATEGY ETF
| | | | |
| | | Period from
October 15, 2014a to October 31, 2014 | |
| |
INCREASE (DECREASE) IN NET ASSETS | | | | |
| |
OPERATIONS: | | | | |
Net investment loss | | $ | (2,015 | ) |
Net change in unrealized appreciation/depreciation | | | 258,809 | |
| | | | |
Net increase in net assets resulting from operations | | | 256,794 | |
| | | | |
| |
CAPITAL SHARE TRANSACTIONS: | | | | |
Proceeds from shares sold | | | 20,016,294 | |
| | | | |
Net increase in net assets from capital share transactions | | | 20,016,294 | |
| | | | |
INCREASE IN NET ASSETS | | | 20,273,088 | |
| |
NET ASSETS | | | | |
Beginning of period | | | — | |
| | | | |
End of period | | $ | 20,273,088 | |
| | | | |
Accumulated net investment loss included in net assets at end of period | | $ | (2,015 | ) |
| | | | |
| |
SHARES ISSUED | | | | |
Shares sold | | | 400,000 | |
| | | | |
Net increase in shares outstanding | | | 400,000 | |
| | | | |
| a | Commencement of operations. |
See notes to consolidated financial statements.
| | |
| 14 | | 2014 iSHARES ANNUAL REPORTTO SHAREHOLDERS |
Consolidated Financial Highlights
iSHARES® COMMODITIES SELECT STRATEGY ETF
(For a share outstanding throughout the period)
| | | | |
| | | Period from
Oct. 15, 2014a to
Oct. 31, 2014 | |
Net asset value, beginning of period | | $ | 50.04 | |
| | | | |
Income from investment operations: | | | | |
Net investment income (loss)b | | | (0.01 | ) |
Net realized and unrealized gainc | | | 0.65 | |
| | | | |
Total from investment operations | | | 0.64 | |
| | | | |
Net asset value, end of period | | $ | 50.68 | |
| | | | |
| |
Total return | | | 1.28 | %d |
| | | | |
| |
Ratios/Supplemental data: | | | | |
Net assets, end of period (000s) | | $ | 20,273 | |
Ratio of expenses to average net assetse | | | 0.48 | % |
Ratio of net investment income (loss) to average net assetse | | | (0.23 | )% |
Portfolio turnover ratef | | | 0 | % |
| a | Commencement of operations. |
| b | Based on average shares outstanding throughout the period. |
| c | The amount reported for a share outstanding may not accord with the change in aggregate gains and losses in securities for the fiscal period due to the timing of capital share transactions in relation to the fluctuating market values of the Fund’s underlying securities. |
| e | Annualized for periods of less than one year. |
| f | Portfolio turnover rate excludes portfolio securities received or delivered as a result of processing capital share transactions in Creation Units. |
See notes to consolidated financial statements.
| | | | |
CONSOLIDATED FINANCIAL HIGHLIGHTS | | | 15 | |
Notes to Consolidated Financial Statements
iSHARES® COMMODITIES SELECT STRATEGY ETF
iShares U.S. ETF Trust (the “Trust”) is registered under the Investment Company Act of 1940, as amended (the “1940 Act”), as an open-end management investment company. The Trust was established as a Delaware statutory trust pursuant to an Agreement and Declaration of Trust dated June 21, 2011.
These consolidated financial statements relate only to the following fund (the “Fund”):
| | |
| iShares ETF | | Diversification Classification |
Commodities Select Strategya | | Non-diversified |
| | a | | The Fund commenced operations on October 15, 2014. |
The Fund carries out its investment strategies associated with investment in commodity-linked futures contracts and other derivatives (“commodity-linked investments”) by investing up to 25% of its total assets in iShares Commodities Strategy Cayman Ltd., a wholly-owned subsidiary of the Fund organized in the Cayman Islands (the “Subsidiary”). The investment adviser of the Fund also serves as the investment adviser to the Subsidiary. Investments in the Subsidiary enable the Fund to hold the commodity-linked investments and satisfy regulated investment company tax requirements. As of October 31, 2014, the net assets of the Subsidiary were $3,032,406 which represented 14.96% of the Fund’s consolidated net assets. For the period from October 15, 2014 (commencement of operations) to October 31, 2014 the Subsidiary had no net investment income, no realized gains or losses and $102,118 of net unrealized appreciation. The accompanying consolidated schedule of investments and consolidated financial statements for the Fund include the positions and accounts, respectively, of its Subsidiary. Intercompany accounts and transactions, if any, have been eliminated.
Pursuant to the Trust’s organizational documents, the Fund’s officers and trustees are indemnified against certain liabilities that may arise out of the performance of their duties to the Fund. Additionally, in the normal course of business, the Fund enters into contracts with service providers that contain general indemnification clauses. The Fund’s maximum exposure under these arrangements is unknown as this would involve future claims that may be made against the Fund that have not yet occurred.
| 1. | SIGNIFICANT ACCOUNTING POLICIES |
The following significant accounting policies are consistently followed by the Fund in the preparation of its financial statements in conformity with accounting principles generally accepted in the United States of America (“U.S. GAAP”). The preparation of financial statements in conformity with U.S. GAAP requires management to make certain estimates and assumptions that affect the reported amounts of assets and liabilities and disclosures of contingent assets and liabilities at the date of the financial statements and the reported amounts of revenue and expenses during the reporting period. Actual results could differ from those estimates. The Fund is considered an investment company under U.S. GAAP and follows the accounting and reporting guidance applicable to investment companies in the Financial Accounting Standards Board Accounting Standards Codification Topic 946 (ASC 946).
SECURITY VALUATION
The Fund’s investments are valued at fair value each day that the Fund’s listing exchange is open and, for financial reporting purposes, as of the report date should the reporting period end on a day that the Fund’s listing exchange is not open. U.S. GAAP defines fair value as the price a fund would receive to sell an asset or pay to transfer a liability in an orderly transaction between market participants at the measurement date. The BlackRock Global Valuation Methodologies Committee (the “Global Valuation Committee”) provides oversight of the valuation of investments for the Fund. The investments of the Fund are valued pursuant to
| | |
| 16 | | 2014 iSHARES ANNUAL REPORTTO SHAREHOLDERS |
Notes to Consolidated Financial Statements (Continued)
iSHARES® COMMODITIES SELECT STRATEGY ETF
policies and procedures developed by the Global Valuation Committee and approved by the Board of Trustees of the Trust (the “Board”).
| | • | | Equity investments traded on a recognized securities exchange are valued at that day’s last reported trade price or the official closing price, as applicable, on the exchange where the stock is primarily traded. Equity investments traded on a recognized exchange for which there were no sales on that day are valued at the last traded price. |
| | • | | Open-end U.S. mutual funds are valued at that day’s published net asset value (NAV). |
| | • | | Futures contracts are valued at that day’s last reported settlement price on the exchange where the contract is traded. |
In the event that application of these methods of valuation results in a price for an investment which is deemed not to be representative of the fair value of such investment or if a price is not available, the investment will be valued based upon other available factors deemed relevant by the Global Valuation Committee, in accordance with policies approved by the Board. These factors include but are not limited to (i) attributes specific to the investment; (ii) the principal market for the investment; (iii) the customary participants in the principal market for the investment; (iv) data assumptions by market participants for the investment, if reasonably available; (v) quoted prices for similar investments in active markets; and (vi) other factors, such as future cash flows, interest rates, yield curves, volatilities, prepayment speeds, loss severities, credit risks and/or default rates. Valuations based on such factors are reported to the Board on a quarterly basis.
The Global Valuation Committee employs various methods for calibrating valuation approaches for investments where an active market does not exist, including regular due diligence of the Trust’s pricing vendors, a regular review of key inputs and assumptions, transactional back-testing or disposition analysis to compare unrealized gains and losses to realized gains and losses, reviews of missing or stale prices, reviews of large movements in market values, and reviews of market related activity.
Various inputs are used in determining the fair value of financial instruments. Inputs may be based on independent market data (“observable inputs”) or they may be internally developed (“unobservable inputs”). These inputs are categorized into a disclosure hierarchy consisting of three broad levels for financial reporting purposes. The level of a value determined for a financial instrument within the fair value hierarchy is based on the lowest level of any input that is significant to the fair value measurement in its entirety. The categorization of a value determined for a financial instrument within the hierarchy is based upon the pricing transparency of the instrument and is not necessarily an indication of the risk associated with investing in the instrument. The three levels of the fair value hierarchy are as follows:
| | • | | Level 1 — Unadjusted quoted prices in active markets for identical assets or liabilities; |
| | • | | Level 2 — Inputs other than quoted prices included within Level 1 that are observable for the asset or liability either directly or indirectly, including quoted prices for similar assets or liabilities in active markets, quoted prices for identical or similar assets or liabilities in markets that are not considered to be active, inputs other than quoted prices that are observable for the asset or liability (such as exchange rates, financing terms, interest rates, yield curves, volatilities, prepayment speeds, loss severities, credit risks and default rates) or other market-corroborated inputs; and |
| | • | | Level 3 — Unobservable inputs for the asset or liability, including the Global Valuation Committee’s assumptions used in determining the fair value of investments. |
Changes in valuation techniques may result in transfers in or out of an assigned level within the disclosure hierarchy. In accordance with the Trust’s policy, transfers between different levels of the fair value hierarchy are deemed to have occurred as of the beginning of the reporting period.
| | | | |
NOTESTO CONSOLIDATED FINANCIAL STATEMENTS | | | 17 | |
Notes to Consolidated Financial Statements (Continued)
iSHARES® COMMODITIES SELECT STRATEGY ETF
As of October 31, 2014, the value of each of the Fund’s investments was classified as Level 1. The breakdown of the Fund’s investments into major categories is disclosed in its consolidated schedule of investments.
SECURITY TRANSACTIONS AND INCOME RECOGNITION
Security transactions are accounted for on trade date. Dividend income and capital gain distributions, if any, are recognized on the ex-dividend date, net of any foreign taxes withheld at source. Any taxes withheld that are reclaimable from foreign tax authorities as of October 31, 2014 are reflected in dividends receivable. Non-cash dividends received in the form of stock in an elective dividend, if any, are recorded as dividend income at fair value. Distributions received by the Fund may include a return of capital that is estimated by management. Such amounts are recorded as a reduction of the cost of investments or reclassified to capital gains. Interest income is accrued daily. Realized gains and losses on investment transactions are determined using the specific identification method.
FOREIGN CURRENCY TRANSLATION
The accounting records of the Fund are maintained in U.S. dollars. Foreign currencies, as well as investment securities and other assets and liabilities denominated in foreign currencies, are translated into U.S. dollars using exchange rates deemed appropriate by the investment adviser. Purchases and sales of securities, income receipts and expense payments are translated into U.S. dollars on the respective dates of such transactions.
The Fund does not isolate the effect of fluctuations in foreign exchange rates from the effect of fluctuations in the market prices of securities. Such fluctuations are reflected by the Fund as a component of realized and unrealized gains and losses from investments for financial reporting purposes.
FOREIGN TAXES
The Fund may be subject to foreign taxes (a portion of which may be reclaimable) on income, stock dividends, capital gains on investments, or certain foreign currency transactions. All foreign taxes are recorded in accordance with the applicable foreign tax regulations and rates that exist in the foreign jurisdictions in which the Fund invests. These foreign taxes, if any, are paid by the Fund and are reflected in its consolidated statement of operations as follows: foreign taxes withheld at source are presented as a reduction of income, foreign taxes on securities lending income are presented as a reduction of securities lending income, foreign taxes on stock dividends are presented as “other foreign taxes,” and foreign taxes on capital gains from sales of investments and foreign taxes on foreign currency transactions are included in their respective net realized gain (loss) categories. Foreign taxes payable or deferred as of October 31, 2014, if any, are disclosed in the Fund’s consolidated statement of assets and liabilities.
DISTRIBUTIONS TO SHAREHOLDERS
Dividends and distributions paid by the Fund are recorded on the ex-dividend dates. Distributions are determined on a tax basis and may differ from net investment income and net realized capital gains for financial reporting purposes. Dividends and distributions are paid in U.S. dollars and cannot be automatically reinvested in additional shares of the Fund.
RECENT ACCOUNTING STANDARD
In June 2014, the Financial Accounting Standards Board issued guidance to improve the financial reporting of reverse repurchase agreements and other similar transactions. The guidance will require expanded disclosure for entities that enter into reverse repurchase agreements and similar transactions accounted for as secured borrowings, including securities lending. The guidance
| | |
| 18 | | 2014 iSHARES ANNUAL REPORTTO SHAREHOLDERS |
Notes to Consolidated Financial Statements (Continued)
iSHARES® COMMODITIES SELECT STRATEGY ETF
is effective for financial statements for fiscal years beginning after December 15, 2014, and interim periods within those fiscal years. Management is evaluating the impact, if any, of this guidance on the Fund’s financial statements and disclosures.
| 2. | INVESTMENT ADVISORY AGREEMENT AND OTHER TRANSACTIONS WITH AFFILIATES |
Pursuant to an Investment Advisory Agreement with the Trust, BlackRock Fund Advisors (“BFA”) manages the investment of the Fund’s assets. BFA is a California corporation indirectly owned by BlackRock, Inc. (“BlackRock”). Under the Investment Advisory Agreement, BFA is responsible for substantially all expenses of the Fund, except interest, taxes, brokerage commissions and other expenses connected with the execution of portfolio transactions, distribution fees, litigation expenses and any extraordinary expenses.
The Subsidiary has entered into a separate contract with BFA under which BFA provides investment advisory services to the Subsidiary but does not receive separate compensation from the Subsidiary for providing it with such services. The Subsidiary has also entered into separate arrangements that provide for the provision of other services to the Subsidiary (including administrative, custody, transfer agency and other services), and BFA pays the costs and expenses related to the provision of those services.
BFA has entered into a sub-advisory agreement with BlackRock International Limited (the “Sub-Adviser”), an affiliate of BFA, under which BFA pays the Sub-Adviser for services it provides to the Fund and the Subsidiary.
For its investment advisory services to the Fund, BFA is entitled to an annual investment advisory fee of 0.48% based on the average daily net assets of the Fund.
BlackRock Investments, LLC, an affiliate of BFA, is the distributor for the Fund. Pursuant to the distribution agreement, BFA is responsible for any fees or expenses for distribution services provided to the Fund.
The Fund may invest its positive cash balances in certain money market funds managed by BFA or an affiliate. The income earned on these temporary cash investments is included in “Interest – affiliated” in the consolidated statement of operations.
The PNC Financial Services Group, Inc. is the largest stockholder of BlackRock and is considered to be an affiliate of the Fund for 1940 Act purposes.
Certain trustees and officers of the Trust are also officers of BlackRock Institutional Trust Company, N.A. and/or BFA.
| 3. | INVESTMENT PORTFOLIO TRANSACTIONS |
Purchases and sales of investments (excluding in-kind transactions and short-term investments) for the period ended October 31, 2014, were $ — and $ —, respectively. In-kind purchases and sales (see Note 4) for the period ended October 31, 2014, were $7,016,294 and $ —, respectively.
| 4. | CAPITAL SHARE TRANSACTIONS |
Capital shares are issued and redeemed by the Fund only in aggregations of a specified number of shares or multiples thereof (“Creation Units”) at net asset value. Except when aggregated in Creation Units, shares of the Fund are not redeemable. Transactions in capital shares for the Fund are disclosed in detail in the consolidated statements of changes in net assets.
The consideration for the purchase of Creation Units of a fund in the Trust generally consists of the in-kind deposit of a designated portfolio of securities and a specified amount of cash. Certain funds in the Trust may be offered in Creation Units solely or partially for cash in U.S. dollars. Investors purchasing and redeeming Creation Units may pay a purchase transaction fee
| | | | |
NOTESTO CONSOLIDATED FINANCIAL STATEMENTS | | | 19 | |
Notes to Consolidated Financial Statements (Continued)
iSHARES® COMMODITIES SELECT STRATEGY ETF
and a redemption transaction fee directly to State Street Bank and Trust Company, the Trust’s administrator, to offset transfer and other transaction costs associated with the issuance and redemption of Creation Units, including Creation Units for cash. Investors transacting in Creation Units for cash may also pay an additional variable charge to compensate the relevant fund for certain transaction costs (i.e., stamp taxes, taxes on currency or other financial transactions, and brokerage costs) and market impact expenses relating to investing in portfolio securities. Such variable charges, if any, are included in “Proceeds from shares sold” in the consolidated statement of changes in net assets.
The Fund may purchase or sell futures contracts as part of its investment strategy. A futures contract is a standardized, exchange-traded agreement to buy and sell a financial instrument at a set price on a future date. Upon entering into a futures contract, the Fund is required to pledge to the executing broker which holds segregated from its own assets, an amount of cash, U.S. government securities or other high-quality debt and equity securities equal to the minimum initial margin requirements of the exchange on which the contract is traded. Pursuant to the contract, the Fund agrees to receive from or pay to the broker an amount of cash equal to the daily fluctuation in value of the contract. Such receipts or payments are known as margin variation and are recorded by the Fund as unrealized appreciation or depreciation. When the contract is closed, the Fund records a realized gain or loss equal to the difference between the value of the contract at the time it was opened and the value at the time it was closed. Losses may arise if the value of a futures contract decreases due to an unfavorable change in the market rates or values of the underlying instrument during the term of the contract or if the counterparty does not perform under the contract. The use of futures contracts also involves the risk of an imperfect correlation in the movements in the price of futures contracts and the assets underlying such contracts.
The following table shows the value of futures contracts held by the Fund as of October 31, 2014 and the related locations in the consolidated statement of assets and liabilities, presented by risk exposure category:
| | | | |
| Assets | | | |
Commodity contracts: | | | | |
Variation margin / Net assets consist of — net unrealized appreciationa | | $ | 162,101 | |
| | | | |
| | | | | |
| | a | | Represents cumulative appreciation of futures contracts as reported in the consolidated schedule of investments. Only current day’s variation margin is reported separately within the consolidated statement of assets and liabilities. |
| | | | |
| Liabilities | | | |
Commodity contracts: | | | | |
Variation margin / Net assets consist of — net unrealized depreciationb | | $ | 59,983 | |
| | | | |
| | | | | |
| | b | | Represents cumulative depreciation of futures contracts as reported in the consolidated schedule of investments. Only current day’s variation margin is reported separately within the consolidated statement of assets and liabilities. |
The following table shows the realized and unrealized gains (losses) on futures contracts held by the Fund during the period ended October 31, 2014 and the related locations in the consolidated statement of operations, presented by risk exposure category:
| | | | | | | | |
| | | Net Realized Gain (Loss) | | | Net Change in Unrealized Appreciation/Depreciation | |
Commodity contracts: | | | | | | | | |
Futures contracts | | $ | — | | | $ | 102,118 | |
| | | | | | | | |
| | | | | | | | | |
| | |
| 20 | | 2014 iSHARES ANNUAL REPORTTO SHAREHOLDERS |
Notes to Consolidated Financial Statements (Continued)
iSHARES® COMMODITIES SELECT STRATEGY ETF
The following table shows the average quarter-end balances of open futures contracts for the period ended October 31, 2014:
| | | | |
Average number of contracts purchased | | | 223 | |
Average value of contracts purchased | | $ | 13,072,331 | |
In the normal course of business, the Fund’s investment activities expose it to various types of risk associated with the financial instruments and markets in which it invests. The significant types of financial risks the Fund is exposed to include market risk and credit risk. The Fund’s prospectus provides details of these and other types of risk.
MARKET RISK
Market risk arises mainly from uncertainty about future values of financial instruments influenced by price, currency and interest rate movements. It represents the potential loss the Fund may suffer through holding market positions in the face of market movements. The Fund is exposed to market risk by virtue of its investment in equity and financial derivative instruments. The fair value of securities held by the Fund may decline due to general market conditions, economic trends or events that are not specifically related to the issuers of the securities including local, regional or global political, social or economic instability or to factors that affect a particular industry or group of industries. The extent of the Fund’s exposure to market risk is the market value of the investments held as shown in the Fund’s consolidated schedule of investments.
The Fund invests all or substantially all of its assets in securities and derivatives linked to commodities or commodities markets. Commodity prices may be influenced or characterized by unpredictable factors, including, where applicable, high volatility, changes in supply and demand relationships, weather, agriculture, trade, pestilence, political instability, changes in interest rates and monetary and other governmental policies. Securities of companies held by the Fund that are dependent on a single commodity, or are concentrated in a single commodity sector, may typically exhibit volatility attributable to commodity prices.
A diversified portfolio, where this is appropriate and consistent with a fund’s objectives, minimizes the risk that a price change of a particular investment will have a material impact on the NAV of a fund. The investment concentrations within the Fund’s portfolio are disclosed in its consolidated schedule of investments.
The Fund invests a substantial amount of its assets in securities of non-U.S. issuers that trade in non-U.S. markets. This involves certain considerations and risks not typically associated with securities of U.S. issuers. Such risks include, but are not limited to: generally less liquid and less efficient securities markets; generally greater price volatility; exchange rate fluctuations and exchange controls; imposition of restrictions on the expatriation of funds or other assets of the Fund; less publicly available information about issuers; the imposition of withholding or other taxes; higher transaction and custody costs; settlement delays and risk of loss attendant in settlement procedures; difficulties in enforcing contractual obligations; less regulation of securities markets; different accounting, disclosure and reporting requirements; more substantial governmental involvement in the economy; higher inflation rates; greater social, economic and political uncertainties; the risk of nationalization or expropriation of assets; and the risk of war. These risks are heightened for investments in issuers from countries with less developed markets.
CREDIT RISK
Credit risk is the risk that an issuer or guarantor of debt instruments or the counterparty to a financial transaction, including derivatives contracts, repurchase agreements or loans of portfolio securities, is unable or unwilling to make timely interest and/or principal payments or to otherwise honor its obligations. BFA and its affiliates manage counterparty credit risk by entering into transactions only with counterparties that it believes have the financial resources to honor their obligations and by monitoring the
| | | | |
NOTESTO CONSOLIDATED FINANCIAL STATEMENTS | | | 21 | |
Notes to Consolidated Financial Statements (Continued)
iSHARES® COMMODITIES SELECT STRATEGY ETF
financial stability of those counterparties. Financial assets, which potentially expose the Fund to issuer and counterparty credit risks, consist principally of financial instruments and receivables due from counterparties. The extent of the Fund’s exposure to credit and counterparty risks with respect to those financial assets is approximated by their value recorded in its consolidated statement of assets and liabilities.
The Fund is treated as an entity separate from the Trust’s other funds for federal income tax purposes. It is the policy of the Fund to qualify as a regulated investment company by complying with the provisions applicable to regulated investment companies, as defined under Subchapter M of the Internal Revenue Code of 1986, as amended, and to annually distribute substantially all of its ordinary income and any net capital gains (taking into account any capital loss carryforwards) sufficient to relieve it from all, or substantially all, federal income and excise taxes. Accordingly, no provision for federal income taxes is required.
Net income and realized gains from investments held by the Subsidiary are treated as ordinary income for tax purposes and any net income or net gains will pass through to the Fund as such. Accordingly, the net investment income (loss) and realized gains (losses) reported in the Fund’s financial statements for such investments held by the Subsidiary may differ significantly from distributions. In addition, if a net loss is realized by the Subsidiary in any taxable year, the loss will not be available to offset the Fund’s ordinary income and/or capital gains for that year.
As of October 31, 2014, the tax components of accumulated net earnings (losses) were as follows:
| | | | | | | | | | | | |
| iShares ETF | | Undistributed
Ordinary
Income | | | Net Unrealized
Gains (Losses) a | | | Total | |
Commodities Select Strategy | | | 92,128 | | | | 164,666 | | | | 256,794 | |
| a | The difference between book-basis and tax-basis unrealized gains (losses) was attributable primarily to the realization for tax purposes of unrealized gains (losses) on certain futures contracts. |
The Fund may own shares in certain foreign investment entities, referred to, under U.S. tax law, as “passive foreign investment companies.” The Fund may elect to mark-to-market annually the shares of each passive foreign investment company and would be required to distribute to shareholders any such marked-to-market gains.
As of October 31, 2014, the cost of investments for federal income tax purposes was $17,180,149. Net unrealized appreciation was $62,640, of which $277,217 represented gross unrealized appreciation on securities and $214,577 represented gross unrealized depreciation on securities.
Management has analyzed tax laws and regulations and their application to the Fund as of October 31, 2014, and does not believe there are any uncertain tax positions that require recognition of a tax liability in the Fund’s consolidated financial statements.
Management has evaluated the impact of all subsequent events on the Fund through the date the consolidated financial statements were available to be issued and has determined that there were no subsequent events requiring adjustment or disclosure in the consolidated financial statements.
| | |
| 22 | | 2014 iSHARES ANNUAL REPORTTO SHAREHOLDERS |
Report of Independent Registered Public Accounting Firm
To the Shareholders and Board of Trustees of
iShares U.S. ETF Trust:
In our opinion, the accompanying statement of assets and liabilities, including the schedule of investments, and the related statement of operations and of changes in net assets and the financial highlights present fairly, in all material respects, the financial position of iShares Commodities Select Strategy ETF (the “Fund”) at October 31, 2014, the results of its operations, the changes in its net assets and its financial highlights for the period October 15, 2014 (commencement of operations) through October 31, 2014, in conformity with accounting principles generally accepted in the United States of America. These financial statements and financial highlights (hereafter referred to as “financial statements”) are the responsibility of the Fund’s management; our responsibility is to express an opinion on these financial statements based on our audit. We conducted our audit of these financial statements in accordance with the standards of the Public Company Accounting Oversight Board (United States). Those standards require that we plan and perform the audit to obtain reasonable assurance about whether the financial statements are free of material misstatement. An audit includes examining, on a test basis, evidence supporting the amounts and disclosures in the financial statements, assessing the accounting principles used and significant estimates made by management, and evaluating the overall financial statement presentation. We believe that our audit, which included confirmation of securities at October 31, 2014 by correspondence with the custodian, transfer agent and brokers, provides a reasonable basis for our opinion.
PricewaterhouseCoopers LLP
San Francisco, California
December 19, 2014
| | | | |
REPORTOF INDEPENDENT REGISTERED PUBLIC ACCOUNTING FIRM | | | 23 | |
Board Review and Approval of Investment Advisory
Contract
iSHARES® COMMODITIES SELECT STRATEGY ETF
Under Section 15(c) of the Investment Company Act of 1940 (the “1940 Act”), the Trust’s Board of Trustees (the “Board”), including a majority of Trustees who are not “interested persons” of the Trust (as that term is defined in the 1940 Act) (the “Independent Trustees”), is required to consider and approve the proposed Investment Advisory Contract between the Trust and BFA (the “Advisory Contract”) on behalf of the Fund. The Independent Trustees requested, and BFA provided, such information as the Independent Trustees, with advice from independent counsel, deemed reasonably necessary to evaluate the terms of the proposed Advisory Contract.
At a meeting held on May 15-16, 2014, the Board, including a majority of the Independent Trustees, approved the selection of BFA as investment adviser and approved the proposed Advisory Contract for the Fund, based on its review of qualitative and quantitative information provided by BFA. The Board also considered information previously provided by BFA, BlackRock Institutional Trust Company, N.A. (“BTC”), and BlackRock, Inc. (“BlackRock”), as applicable, at prior Board meetings. The Independent Trustees were advised by their independent counsel throughout the process.
In selecting BFA and approving the Advisory Contract for the Fund, the Board, including the Independent Trustees, considered the following factors, no one of which was controlling, and made the following conclusions:
Expenses of the Fund — The Board reviewed statistical information prepared by Lipper Inc. (“Lipper”), an independent provider of investment company data, regarding the expense ratio components, including actual advisory fees, waivers/reimbursements, and gross and net total expenses of the Fund in comparison with the same information for other exchange traded funds (including a fund sponsored by an “at cost” service provider) (the “Lipper Group”). The Board was provided with a detailed description of Lipper’s proprietary ETF methodology used by Lipper to determine the applicable Lipper Group and to prepare this information. The Board further noted that due to the limitations in providing comparable funds in the Lipper Group, the statistical information provided in Lipper’s report may or may not provide meaningful direct comparisons to the Fund in all instances.
The Board also noted that the proposed investment advisory fee rate and overall expenses for the Fund were lower than the median of the investment advisory fee rates and overall expenses of the funds in the Lipper Group.
Based on this review, the other factors considered at the meeting, and their general knowledge of fund pricing, the Board concluded that the proposed investment advisory fee and expense levels of the Fund supported the Board’s approval of the Advisory Contract.
Nature, Extent and Quality of Services to be Provided by BFA — The Board reviewed the scope of services to be provided by BFA under the Advisory Contract. In reviewing the scope of these services, the Board considered BFA’s investment philosophy and experience, noting that BFA and its affiliates have committed significant resources over time, including during the past year, to supporting iShares funds and their shareholders. The Board acknowledged that resources to support the iShares funds and their shareholders have been added or enhanced in recent years, including in such areas as investor education, product management, customized portfolio consulting support, capital markets support, and proprietary risk and performance analytics tools. The Board considered representations by BFA, BTC, and BlackRock that the scope and quality of services to be provided to the Fund would be similar to the scope and quality of services provided to other iShares funds. The Board also considered BFA’s compliance program and its compliance record with respect to other iShares funds. In that regard, the Board noted that BFA reports to the Board about portfolio management and compliance matters on a periodic basis in connection with regularly scheduled meetings of the Board, and on other occasions as necessary and appropriate, and has provided information and made appropriate officers available as needed to provide further assistance with these matters. The Board also reviewed the background and experience of the persons who will be responsible for the day-to-day management of the Fund, as well as the resources that will be available to them in managing the Fund. In addition to the above considerations, the Board reviewed and considered detailed presentations regarding BFA’s investment performance, investment and risk management processes and
| | |
| 24 | | 2014 iSHARES ANNUAL REPORTTO SHAREHOLDERS |
Board Review and Approval of Investment Advisory
Contract (Continued)
iSHARES® COMMODITIES SELECT STRATEGY ETF
strategies provided at the June 12-13, 2014 meeting and throughout the previous year, and matters related to BFA’s portfolio compliance policies and procedures.
Based on review of this information, the Board concluded that the nature, extent and quality of services to be provided by BFA to the Fund under the Advisory Contract supported the Board’s approval of the Advisory Contract.
Costs of Services to be Provided to the Fund and Profits to be Realized by BFA and Affiliates — The Board did not consider the profitability of the Fund to BFA based on the fees payable under the Advisory Contract or revenue to be received by BFA or its affiliates in connection with services to be provided to the Fund since the proposed relationship had not yet commenced. The Board noted that it expects to receive profitability information from BFA on at least an annual basis following the Fund’s launch and will thus be in a position to evaluate whether, following the expiration of the Advisory Contract’s initial two-year term, any adjustments in the Fund’s fees would be appropriate.
Economies of Scale — The Board reviewed information regarding economies of scale or other efficiencies that may result from increases in the Fund’s assets. The Board noted that the Advisory Contract for the Fund did not provide for any breakpoints in the Fund’s investment advisory fee rate as the assets of the Fund increase. However, the Board noted that should material economies of scale exist in the future, a breakpoint structure for the Fund may be appropriate, and that it would continue to monitor the sharing of economies of scale to determine the appropriateness of adding breakpoints in the future.
Based on this review, as well as the other factors considered at the meeting, the Board, recognizing its responsibility to consider this issue at least annually following an initial two-year period, concluded that the investment advisory fee rate incorporates potential economies of scale and supported the Board’s approval of the Advisory Contract.
Fees and Services Provided for Other Comparable Funds/Accounts Managed by BFA and its Affiliates — The Board received and considered information regarding the investment advisory/management fee rates for other funds/accounts in the U.S. for which BFA (or its affiliates) provides investment advisory/management services, including open-end and closed-end funds registered under the 1940 Act (including sub-advised funds), collective trust funds, separately managed accounts, and institutional separate accounts (together, the “Other Accounts”), and acknowledged BFA’s assertion that the iShares funds are fundamentally different investment vehicles from the Other Accounts. The Board noted that BFA and its affiliates do not manage Other Accounts with a substantially similar investment objective and strategy as the Fund. The Board further noted that BFA provided the Board with detailed information regarding how the Other Accounts (particularly institutional clients) generally differ from the Fund, including in terms of the different, generally more extensive services to be provided to the Fund, as well as other significant differences in the approach of BFA and its affiliates to the Fund, on one hand, and Other Accounts, on the other. In that regard, the Board considered that the pricing of services to institutional clients is typically based on a number of factors beyond the nature and extent of the specific services to be provided and often depends on the overall relationship between the client and its affiliates and the adviser and its affiliates. In addition, the Board considered the relative complexity and inherent risks and challenges of managing and providing other services to the Fund, as a publicly traded exchange traded fund, as compared to the Other Accounts that are institutional clients in light of differing regulatory requirements and client-imposed mandates. The Board also considered the “all-inclusive” nature of the Fund’s advisory fee structure, and the Fund expenses to be borne by BFA under this arrangement. The Board noted that the investment advisory fee rate under the Advisory Contract for the Fund was generally higher than the investment advisory/management fee rates for the Other Accounts that are institutional clients of BFA (or its affiliates) and concluded that the differences appeared to be consistent with the factors discussed.
Other Benefits to BFA and/or its Affiliates — Except as noted below, the Board did not consider the “fallout” benefits or ancillary revenue to be received by BFA and/or its affiliates in connection with the services to be provided to the Fund by BFA since the proposed relationship had not yet commenced. However, the Board noted that BFA generally does not use soft dollars
| | | | |
BOARD REVIEWAND APPROVALOF INVESTMENT ADVISORY CONTRACT | | | 25 | |
Board Review and Approval of Investment Advisory
Contract (Continued)
iSHARES® COMMODITIES SELECT STRATEGY ETF
or consider the value of research or other services that may be provided to BFA (including its affiliates) in selecting brokers for portfolio transactions for the Fund. The Board considered the potential payment of advisory fees and/or administration fees to BFA and BTC (or their affiliates) in connection with any investments by the Fund in other funds for which BFA (or its affiliates) provides investment advisory services and/or administration services. The Board also considered the potential for revenue to BTC, the Fund’s securities lending agent, and its affiliates in the event of any loaning of portfolio securities of the Fund. The Board further noted that any portfolio transactions on behalf of the Fund placed through a BFA affiliate or purchased from an underwriting syndicate in which a BFA affiliate participates, will be reported to the Board pursuant to Rule 17e-1 or Rule 10f-3, as applicable, under the 1940 Act. The Board concluded that the existence of any such ancillary benefits would not alter the Board’s conclusion with respect to the appropriateness of approving the Advisory Contract.
Based on the considerations described above, the Board determined that the investment advisory fee rate under the Advisory Contract does not constitute a fee that is so disproportionately large as to bear no reasonable relationship to the services to be rendered and that could not have been the product of arm’s-length bargaining and concluded that it is in the best interest of the Fund and its shareholders to approve the Advisory Contract.
| | |
| 26 | | 2014 iSHARES ANNUAL REPORTTO SHAREHOLDERS |
Trustee and Officer Information
iSHARES® U.S. ETF TRUST
The Board of Trustees has responsibility for the overall management and operations of the Trust, including general supervision of the duties performed by BFA and other service providers. Each Trustee serves until he or she resigns, is removed, dies, retires or becomes incapacitated. The President, Chief Compliance Officer, Treasurer and Secretary shall each hold office until their successors are chosen and qualify, and all other officers shall hold office until he or she resigns or is removed. Trustees who are not “interested persons” (as defined in the 1940 Act) of the Trust are referred to as independent trustees (“Independent Trustees”).
The registered investment companies advised by BFA or its affiliates are organized into one complex of closed-end funds, two complexes of open-end funds and one complex of exchange-traded funds (“Exchange-Traded Fund Complex”) (each, a “BlackRock Fund Complex”). Each Fund is included in the BlackRock Fund Complex referred to as the Exchange-Traded Fund Complex. Each Trustee also serves as a Director of iShares, Inc., a Director of iShares MSCI Russia Capped ETF, Inc. and a Trustee of iShares Trust and, as a result, oversees a total of 294 funds (as of October 31, 2014) within the Exchange-Traded Fund Complex. With the exception of Robert S. Kapito and Mark Wiedman, the address of each Trustee and Officer is c/o BlackRock, Inc., 400 Howard Street, San Francisco, CA 94105. The address of Mr. Kapito and Mr. Wiedman is c/o BlackRock, Inc., Park Avenue Plaza, 55 East 52nd Street, New York, NY 10055. The Board has designated Robert H. Silver as its Independent Chairman. Additional information about the Funds’ Trustees and officers may be found in the Funds’ combined Statement of Additional Information, which is available without charge, upon request, by calling toll-free 1-800-iShares (1-800-474-2737).
Interested Trustees
| | | | | | |
| | | | |
| Name (Age) | | Position(s) | | Principal Occupation(s) During the Past 5 Years | | Other Directorships Held by Trustee |
Robert S. Kapitoa (57) | | Trustee
(since 2011). | | President and Director, BlackRock, Inc. (since 2006); Vice Chairman of BlackRock, Inc. and Head of BlackRock, Inc.’s Portfolio Management Group (since its formation in 1998) and BlackRock, Inc.’s predecessor entities (since 1988); Trustee, University of Pennsylvania (since 2009); President of Board of Directors, Hope & Heroes Children’s Cancer Fund (since 2002); President of the Board of Directors, Periwinkle Theatre for Youth (since 1983). | | Trustee of iShares Trust (since 2009); Director of iShares, Inc. (since 2009); Director of iShares MSCI Russia Capped ETF, Inc. (since 2010); Director of BlackRock, Inc. (since 2006). |
| | | |
Mark Wiedmanb (43) | | Trustee
(since 2013) | | Managing Director, BlackRock, Inc. (since 2007); Global Head of iShares (since 2011); Head of Corporate Strategy, BlackRock, Inc. (2009-2011). | | Trustee of iShares Trust (since 2013); Director of iShares, Inc. (since 2013); Director of iShares MSCI Russia Capped ETF, Inc. (since 2013); Director of PennyMac Financial Services, Inc. (since 2008). |
| a | | Robert S. Kapito is deemed to be an “interested person” (as defined in the 1940 Act) of the Trust due to his affiliations with BlackRock, Inc. |
| b | | Mark Wiedman is deemed to be an “interested person” (as defined in the 1940 Act) of the Trust due to his affiliations with BlackRock, Inc. and its affiliates. |
| | |
| 27 | | 2014 iSHARES ANNUAL REPORTTO SHAREHOLDERS |
Trustee and Officer Information (Continued)
iSHARES® U.S. ETF TRUST
Independent Trustees
| | | | | | |
| | | | |
| Name (Age) | | Position(s) | | Principal Occupation(s) During the Past 5 Years | | Other Directorships Held by Trustee |
Robert H. Silver (59) | | Trustee
(since 2011); Independent Chairman
(since 2012). | | President and Co-Founder of The Bravitas Group, Inc. (since 2006); Director and Vice Chairman of the YMCA of Greater NYC (2001-2011); Broadway Producer (2006-2011); Co-Founder and Vice President of Parentgiving Inc. (since 2008); Director and Member of the Audit and Compensation Committee of EPAM Systems, Inc. (2006-2009); President and Chief Operating Officer of UBS Financial Services Inc. (formerly Paine Webber Inc.) (2003-2005) and various executive positions with UBS and its affiliates (1988-2005); CPA and Audit Manager of KPMG, LLP (formerly Peat Marwick Mitchell) (1977-1983).
| | Trustee of iShares Trust (since 2007); Director of iShares, Inc. (since 2007); Director of iShares MSCI Russia Capped ETF, Inc. (since 2010); Independent Chairman of iShares, Inc., iShares MSCI Russia Capped ETF, Inc. and iShares Trust
(since 2012). |
Cecilia H. Herbert (65) | | Trustee
(since 2011); Nominating and Governance Committee Chair and Equity Plus Committee
Chair
(since 2012). | | Director (1998-2013) and President (2007-2011) of the Board of Directors, Catholic Charities CYO; Trustee (2002-2011) and Chair of the Finance and Investment Committee (2006-2010) of the Thacher School; Member (since 1992) and Chair (1994-2005) of the Investment Committee, Archdiocese of San Francisco; Trustee and Member of the Investment Committee, WNET, the New York public broadcasting/media company (since 2011).
| | Trustee of iShares Trust (since 2005); Director of iShares, Inc. (since 2005); Director of iShares MSCI Russia Capped ETF, Inc. (since 2010); Director of Forward Funds (34 portfolios) (since 2009). |
Charles A. Hurty (71) | | Trustee (since 2011); Audit Committee
Chair
(since 2011). | | Retired; Partner, KPMG LLP (1968-2001). | | Trustee of iShares Trust (since 2005); Director of iShares, Inc. (since 2005); Director of iShares MSCI Russia Capped ETF, Inc. (since 2010); Director of GMAM Absolute Return Strategy Fund (1 portfolio) (since 2002); Director of SkyBridge Alternative Investments Multi-Adviser Hedge Fund Portfolios LLC
(2 portfolios) (since 2002). |
| | | |
John E. Kerrigan (59) | | Trustee
(since 2011); Fixed Income Plus Committee Chair
(since 2012). | | Chief Investment Officer, Santa Clara University (since 2002). | | Trustee of iShares Trust (since 2005); Director of iShares, Inc. (since 2005); Director of iShares MSCI Russia Capped ETF, Inc. (since 2010). |
| | | | |
TRUSTEEAND OFFICER INFORMATION | | | 28 | |
Trustee and Officer Information (Continued)
iSHARES® U.S. ETF TRUST
Independent Trustees (Continued)
| | | | | | |
| | | | |
| Name (Age) | | Position(s) | | Principal Occupation(s) During the Past 5 Years | | Other Directorships Held by Trustee |
John E. Martinez (53) | | Trustee
(since 2011); Securities Lending Committee
Chair
(since 2012).
| | Director of FirstREX Agreement Corp. (formerly EquityRock, Inc.) (since 2005). | | Trustee of iShares Trust (since 2003); Director of iShares, Inc. (since 2003); Director of iShares MSCI Russia Capped ETF, Inc. (since 2010). |
George G.C. Parker (75) | | Trustee
(since 2011). | | Dean Witter Distinguished Professor of Finance, Emeritus, Stanford University Graduate School of Business (Professor since 1973; Emeritus since 2006). | | Trustee of iShares Trust (since 2000); Director of iShares, Inc. (since 2002); Director of iShares MSCI Russia Capped ETF, Inc. (since 2010); Director of Tejon Ranch Company (since 1999); Director of Threshold Pharmaceuticals (since 2004); Director of Colony Financial, Inc. (since 2009); Director of First Republic Bank (since 2010). |
| | | |
Madhav V. Rajan (50) | | Trustee
(since 2011); 15(c) Committee Chair
(since 2012). | | Robert K. Jaedicke Professor of Accounting and Senior Associate Dean for Academic Affairs and Head of MBA Program, Stanford University Graduate School of Business (since 2001); Professor of Law (by courtesy), Stanford Law School (since 2005); Visiting Professor, University of Chicago (2007-2008). | | Trustee of iShares Trust (since 2011); Director of iShares, Inc. (since 2011); Director of iShares MSCI Russia Capped ETF, Inc. (since 2011), Director, Cavium, Inc. (since 2013). |
| | |
| 29 | | 2014 iSHARES ANNUAL REPORTTO SHAREHOLDERS |
Trustee and Officer Information (Continued)
iSHARES® U.S. ETF TRUST
Officers
| | | | |
| | | |
| Name (Age) | | Position(s) | | Principal Occupation(s) During the Past 5 Years |
Manish Mehta (43) | | President (since 2013). | | Managing Director, BlackRock, Inc. (since 2009); Chief Operating Officer for iShares (since 2009); Head of Strategy and Corporate Development, BGI (2005-2009); Chief of Staff to the CEO, BGI (2005-2009). |
| | |
Jack Gee (55) | | Treasurer and Chief Financial Officer (since 2011). | | Managing Director, BlackRock, Inc. (since 2009); Senior Director of Fund Administration of Intermediary Investor Business, BGI (2009); Director of Fund Administration of Intermediary Investor Business, BGI (2004-2009). |
| | |
Edward B. Baer (46) | | Vice President and Chief Legal Officer (since 2012). | | Managing Director of Legal & Compliance, BlackRock, Inc. (since 2006); Director of Legal & Compliance, BlackRock, Inc. (2004-2006). |
| | |
Eilleen M. Clavere (62) | | Secretary (since 2011). | | Director of Global Fund Administration, BlackRock, Inc. (since 2009); Director of Legal Administration of Intermediary Investor Business, BGI (2006-2009); Legal Counsel and Vice President of Atlas Funds, Atlas Advisers, Inc. and Atlas Securities, Inc. (2005-2006); Counsel at Kirkpatrick & Lockhart LLP (2001-2005). |
| | |
Scott Radell (45) | | Executive Vice President (since 2012). | | Managing Director, BlackRock, Inc. (since 2009); Head of Portfolio Solutions, BlackRock, Inc. (since 2009); Head of Portfolio Solutions, BGI (2007-2009); Credit Portfolio Manager, BGI (2005-2007); Credit Research Analyst, BGI (2003-2005). |
| | |
Amy Schioldager (52) | | Executive Vice President (since 2011). | | Senior Managing Director, BlackRock, Inc. (since 2009); Global Head of Index Equity, BGI (2008-2009); Global Head of U.S. Indexing, BGI (2006-2008); Head of Domestic Equity Portfolio Management, BGI (2001-2006). |
| | |
Ira P. Shapiro (51) | | Vice President (since 2011). | | Managing Director, BlackRock, Inc. (since 2009); Head of Strategic Product Initiatives for iShares (since 2012); Chief Legal Officer, Exchange-Traded Fund Complex (2007-2012); Associate General Counsel, BGI (2004-2009). |
| | | | |
TRUSTEEAND OFFICER INFORMATION | | | 30 | |
For more information visit www.iShares.com or call 1-800-iShares (1-800-474-2737)
This report is intended for the Fund’s shareholders. It may not be distributed to prospective investors unless it is preceded or accompanied by the current prospectus.
Investing involves risk, including possible loss of principal.
The iShares Funds are distributed by BlackRock Investments, LLC (together with its affiliates, “BlackRock”).
A description of the policies that the Fund uses to determine how to vote proxies relating to portfolio securities and information about how the Fund voted proxies relating to portfolio securities during the most recent twelve-month period ending June 30 is available without charge, upon request, by calling toll-free 1-800-474-2737; on the Fund’s website at www.iShares.com; and on the U.S. Securities and Exchange Commission (SEC) website at www.sec.gov.
The Fund files its complete schedule of portfolio holdings with the SEC for the first and third quarters of each fiscal year on Form N-Q. The Fund’s Form N-Q is available on the SEC’s website or may be reviewed and copied at the SEC’s Public Reference Room in Washington, D.C. Information on the operation of the Public Reference Room may be obtained by calling 1-800-SEC-0330. The Fund also discloses its complete schedule of portfolio holdings on a daily and monthly basis on the Fund’s website.
©2014 BlackRock, Inc. All rights reserved. iSHARES and BLACKROCK are registered trademarks of BlackRock, Inc. or its subsidiaries. All other marks are the property of their respective owners.
iS-AR-1011-1014
Item 2. Code of Ethics.
iShares U.S. ETF Trust (the “Registrant”) adopted a new code of ethics on July 1, 2011 that applies to persons appointed by the Registrant’s Board of Trustees as the President and/or Chief Financial Officer, and any persons performing similar functions. For the fiscal year ended October 31, 2014, there were no amendments to any provision of the former and new codes of ethics, nor were there any waivers granted from any provision of the former and new codes of ethics. A copy of the new code of ethics is filed with this Form N-CSR under Item 12(a)(1).
Item 3. Audit Committee Financial Expert.
The Registrant’s Board of Trustees has determined that the Registrant has more than one audit committee financial expert, as that term is defined under Item 3(b) and 3(c), serving on its audit committee. The audit committee financial experts serving on the Registrant’s audit committee are Charles A. Hurty, John E. Kerrigan, Robert H. Silver and Madhav V. Rajan, all of whom are independent, as that term is defined under Item 3(a)(2).
Item 4. Principal Accountant Fees and Services.
The principal accountant fees disclosed in items 4(a), 4(b), 4(c), 4(d) and 4(g) are for the five series of the Registrant for which the fiscal year-end is October 31, 2014 (the “Funds”), and whose annual financial statements are reported in Item 1.
| | (a) | Audit Fees – The aggregate fees billed for each of the last two fiscal years for professional services rendered by the principal accountant for the audit of the Funds’ annual financial statements or services that are normally provided by the accountant in connection with statutory and regulatory filings or engagements for those fiscal years, were $11,700 for the fiscal year ended October 31, 2013 and $60,490 for the fiscal year ended October 31, 2014. |
| | (b) | Audit-Related Fees – There were no fees billed for the fiscal years ended October 31, 2013 and October 31, 2014 for assurance and related services by the principal accountant that were reasonably related to the performance of the audit of the Fund’s financial statements and are not reported under (a) of this Item. |
| | (c) | Tax Fees – The aggregate fees billed in each of the last two fiscal years for professional services rendered by the principal accountant for the review of the Funds’ tax returns and excise tax calculations, were $3,870 for the fiscal year ended October 31, 2013 and $18,385 for the fiscal year ended October 31, 2014. |
| | (d) | All Other Fees – There were no other fees billed for the fiscal years ended October 31, 2013 and October 31, 2014 for products and services provided by the principal accountant, other than the services reported in (a) through (c) of this Item. |
| | (e) | (1) The Registrant’s audit committee charter, as amended, provides that the audit committee is responsible for the approval, prior to appointment, of the engagement of the principal accountant to annually audit and provide their opinion on the Registrant’s financial statements. The audit committee must also approve, prior to appointment, the engagement of the principal accountant to provide non-audit services to the Registrant or to any entity controlling, controlled by or under common control with the Registrant’s investment adviser (“Adviser Affiliate”) that provides ongoing services to the Registrant, if the engagement relates directly to the operations and financial reporting of the Registrant. |
(2) There were no services described in (b) through (d) above (including services required by the audit committee pursuant to paragraph (c)(7)(ii) of Rule 2-01 of Regulation S-X) that were approved by the audit committee pursuant to paragraph (c)(7)(i)(C) of Rule 2-01 of Regulation S-X.
| | (f) | None of the hours expended on the principal accountant’s engagement to audit the Funds’ financial statements for the fiscal year ended October 31, 2014 were attributable to work performed by persons other than the principal accountant’s full-time, permanent employees. |
| | (g) | The aggregate non-audit fees billed by the Registrant’s principal accountant for services rendered to the Funds, and rendered to the Registrant’s investment adviser, and any Adviser Affiliate that provides ongoing services to the Registrant for the last two fiscal years were, $4,486,112 for the fiscal year ended October 31, 2013 and $3,359,197 for the fiscal year ended October 31, 2014. |
| | (h) | The Registrant’s audit committee has considered whether the provision of non-audit services rendered to the Registrant’s investment adviser and any Adviser Affiliate that were not pre-approved pursuant to paragraph (c)(7)(ii) of Rule 2-01 of Regulation S-X, if any, are compatible with maintaining the principal accountant’s independence, and has determined that the provision of these services do not compromise the principal accountant’s independence. |
Item 5. Audit Committee of Listed Registrants.
The Registrant is a listed issuer as defined in Rule 10A-3 under the Exchange Act and has a separately-designated standing audit committee established in accordance with Section 3(a)(58)(A) of the Exchange Act. The Registrant’s audit committee members are Cecilia H. Herbert, Charles A. Hurty, John E. Kerrigan, Robert H. Silver, John E. Martinez and Madhav V. Rajan.
Item 6. Investments.
(a) Schedules of investments are included as part of the reports to shareholders filed under Item 1 of this Form.
(b) Not applicable.
Item 7. Disclosure of Proxy Voting Policies and Procedures for Closed-End Management Investment Companies.
Not applicable to the Registrant.
Item 8. Portfolio Managers of Closed-End Management Investment Companies.
Not applicable to the Registrant.
Item 9. Purchases of Equity Securities by Closed-End Management Investment Company and Affiliated Purchasers.
Not applicable to the Registrant.
Item 10. Submission of Matters to a Vote of Security Holders.
There were no material changes to the procedures by which shareholders may recommend nominees to the Registrant’s Board of Trustees.
Item 11. Controls and Procedures.
| | (a) | The President (the Registrant’s Principal Executive Officer) and Chief Financial Officer (the Registrant’s Principal Financial Officer) have concluded that, based on their evaluation as of a date within 90 days of the filing date of this report, the disclosure controls and procedures of the Registrant (as defined in Rule 30a-3(c) under the Investment Company Act of 1940) are reasonably designed to achieve the purposes described in Section 4(a) of the attached certification. |
| | (b) | There were no changes in the Registrant’s internal control over financial reporting (as defined in Rule 30a-3(d) under the Investment Company Act of 1940) that occurred during the second fiscal quarter of the period covered by this report that have materially affected, or are reasonably likely to materially affect, the Registrant’s internal control over financial reporting. |
Item 12. Exhibits.
(a) (1) Code of Ethics for Senior Officers that is the subject of Item 2 is attached.
(a) (2) Section 302 Certifications are attached.
(a) (3) Not applicable to the Registrant.
(b) Section 906 Certifications are attached.
SIGNATURES
Pursuant to the requirements of the Securities Exchange Act of 1934 and the Investment Company Act of 1940, the Registrant has duly caused this report to be signed on its behalf by the undersigned, thereunto duly authorized.
iShares U.S. ETF Trust
| | |
| By: | | /s/ Manish Mehta |
| | Manish Mehta, President (Principal Executive Officer) |
| Date: | | December 23, 2014 |
Pursuant to the requirements of the Securities Exchange Act of 1934 and the Investment Company Act of 1940, this report has been signed below by the following persons on behalf of the Registrant and in the capacities and on the dates indicated.
| | |
| By: | | /s/ Manish Mehta |
| | Manish Mehta, President (Principal Executive Officer) |
| Date: | | December 23, 2014 |
| |
| By: | | /s/ Jack Gee |
| | Jack Gee, Treasurer and Chief Financial Officer (Principal Financial Officer) |
| Date: | | December 23, 2014 |