UNITED STATES
SECURITIES AND EXCHANGE COMMISSION
Washington, D.C. 20549
FORM N-CSR
CERTIFIED SHAREHOLDER REPORT OF REGISTERED
MANAGEMENT INVESTMENT COMPANIES
Investment Company Act file number 811-22649
iShares U.S. ETF Trust
(Exact name of Registrant as specified in charter)
c/o: State Street Bank and Trust Company
1 Iron Street, Boston, MA 02210
(Address of principal executive offices) (Zip code)
The Corporation Trust Company
1209 Orange Street, Wilmington, DE 19801
(Name and address of agent for service)
Registrant’s telephone number, including area code: (415) 670-2000
Date of fiscal year end: July 31, 2016
Date of reporting period: July 31, 2016
| Item 1. | Reports to Stockholders. |
Copies of the annual reports transmitted to shareholders pursuant to Rule 30e-1 under the Investment Company Act of 1940 are attached.
JULY 31, 2016
| | | | |
2016 ANNUAL REPORT | | | |  |
iShares U.S. ETF Trust
| Ø | | iShares Enhanced International Large-Cap ETF | IEIL | NYSE Arca |
| Ø | | iShares Enhanced International Small-Cap ETF | IEIS | NYSE Arca |
| Ø | | iShares Enhanced U.S. Large-Cap ETF | IELG | NYSE Arca |
| Ø | | iShares Enhanced U.S. Small-Cap ETF | IESM | NYSE Arca |
Table of Contents
Management’s Discussion of Fund Performance
iSHARES® U.S. ETF TRUST
GLOBAL EQUITY MARKET OVERVIEW
Global equity markets declined modestly for the 12 months ended July 31, 2016 (the “reporting period”). The MSCI ACWI, a broad global equity index that includes both developed and emerging markets, returned -0.44% for the reporting period.
The modest overall decline in global stock markets masked significant volatility during the reporting period. Stocks fell during the first half of the reporting period amid lower energy prices and weaker global economic growth, including slowdowns in stronger developed economies such as the U.S. and U.K. In response, many of the world’s central banks took more aggressive actions to stimulate economic activity, including expanded quantitative easing measures and negative interest rates.
In the U.S., the Federal Reserve Bank (the “Fed”) postponed plans to raise its short-term interest rate target until December 2015, when it ended a seven-year period of near-zero interest rates by increasing the federal funds target rate from a range of 0%-0.25% to a range of 0.25%-0.50%. It was the Fed’s first interest rate hike since June 2006.
Central bank stimulus activity and a recovery in energy prices helped global equity markets reverse course after bottoming in mid-February 2016. The global equity market rally in the latter half of the reporting period was also driven by signs of stabilization in China, which had experienced a marked economic slowdown that put downward pressure on its currency. Late in the reporting period, market volatility increased following the “Brexit” referendum in the U.K., where an affirmative vote to leave the European Union led to a sharp decline in the British pound (which fell by 18% against the U.S. dollar for the reporting period) and increased expectations of an interest rate cut from the Bank of England.
Among developed markets, the U.S. was one of the few markets to advance, returning approximately 4% for the reporting period. Although employment growth remained robust, other segments of the U.S. economy struggled, leading to three consecutive quarters of growth below a 1.5% annual rate. As a result, the Fed — which was expected to raise short-term interest rates further in 2016 — held rates steady through the first seven months of the year. Stable Fed monetary policy provided a favorable backdrop for U.S. equity market performance.
Equity markets in the Asia/Pacific region were mixed. Australia and New Zealand posted positive returns for the reporting period, benefiting from improving economic growth. However, other markets in the region, including Japan and Singapore, fell during the reporting period. In particular, the Japanese equity market declined by nearly 20%, but a strong rally in the Japanese yen (which appreciated by 17% against the U.S. dollar) helped offset the overall market decline.
European stock markets declined by approximately 10% for the reporting period. Markets in Italy and Spain, which were adversely affected by political instability and struggling banking sectors, declined the most, while Belgium and Denmark performed best. In the U.K., the equity market advanced by about 4%, but the sharp decline in the British pound led to negative returns in U.S. dollar terms.
Emerging markets stocks declined by approximately 1% for the reporting period in U.S. dollar terms. Latin American equity markets generated the best returns, led by rebounding markets in Peru and Brazil. Stock markets in Eastern Europe fell the most, primarily because of sharp declines in Greece, Poland, and the Czech Republic.
| | | | |
MANAGEMENT’S DISCUSSIONSOF FUND PERFORMANCE | | | 5 | |
Management’s Discussion of Fund Performance
iSHARES® ENHANCED INTERNATIONAL LARGE-CAP ETF
Performance as of July 31, 2016
| | | | | | | | | | | | | | | | | | | | |
| | | Average Annual Total Returns | | | | | | Cumulative Total Returns | |
| | | 1 Year | | | Since Inception | | | | | | 1 Year | | | Since Inception | |
Fund NAV | | | (6.35)% | | | | (1.81)% | | | | | | | | (6.35)% | | | | (4.34)% | |
Fund Market | | | (6.82)% | | | | (2.00)% | | | | | | | | (6.82)% | | | | (4.79)% | |
MSCI World ex USA Index | | | (6.88)% | | | | (2.80)% | | | | | | | | (6.88)% | | | | (6.68)% | |
GROWTH OF $10,000 INVESTMENT
(SINCE INCEPTION AT NET ASSET VALUE)
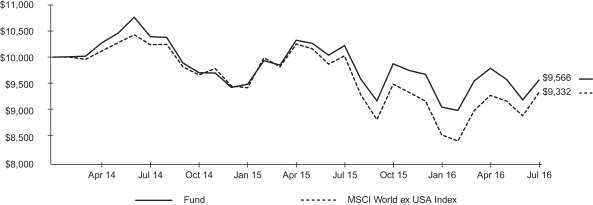
The inception date of the Fund was 2/25/14. The first day of secondary market trading was 2/27/14.
The MSCI World ex USA Index is an unmanaged broad-based index that measures the performance of the large- and mid-capitalization sectors of developed equity markets, excluding the United States.
Past performance is no guarantee of future results. Performance results do not reflect the deduction of taxes that a shareholder would pay on fund distributions or on the redemption or sale of fund shares. See “About Fund Performance” on page 14 for more information.
| | | | | | | | | | | | | | | | | | | | | | | | | | |
| Shareholder Expenses | |
| Actual | | | Hypothetical 5% Return | | | | |
Beginning
Account Value
(2/1/16) | | | Ending
Account Value
(7/31/16) | | | Expenses Paid
During Period a | | | Beginning
Account Value
(2/1/16) | | | Ending
Account Value
(7/31/16) | | | Expenses Paid
During Period a | | | Annualized
Expense Ratio | |
| $ | 1,000.00 | | | $ | 1,056.50 | | | $ | 1.79 | | | $ | 1,000.00 | | | $ | 1,023.10 | | | $ | 1.76 | | | | 0.35% | |
| a | Expenses are calculated using the Fund’s annualized expense ratio (as disclosed in the table), multiplied by the average account value for the period, multiplied by the number of days in the period (182 days) and divided by the number of days in the year (366 days). See “Shareholder Expenses” on page 14 for more information. | |
| | |
| 6 | | 2016 iSHARES ANNUAL REPORTTO SHAREHOLDERS |
Management’s Discussion of Fund Performance (Continued)
iSHARES® ENHANCED INTERNATIONAL LARGE-CAP ETF
The iShares Enhanced International Large-Cap ETF (the “Fund”) seeks long-term capital appreciation by investing, under normal circumstances, at least 80% of its net assets in equity securities of international large-capitalization issuers. The Fund is an actively managed exchange-traded fund that does not seek to replicate the performance of a specified index. For the 12-month reporting period ended July 31, 2016, the total return for the Fund was -6.35%, net of fees.
The Fund declined for the reporting period and performed in line with the -6.88% return of the MSCI World ex USA Index. The Fund combines the investment characteristics, or factors, of quality, value, and size exposures based on BlackRock insights. Quality is defined as a company that exhibits positive fundamentals, including high cash earnings, low earnings variability, and low debt-to-equity ratio, while value refers to companies with lower relative valuations based on measures such as price-to-earnings and price-to-book ratios. Size refers to relative market capitalization, and the Fund attempts to invest in stocks with lower relative market capitalizations.
The Fund was positioned to have less volatility than the broader market, and this positioning added value during the reporting period as the broad international equity markets experienced periods of significant volatility, particularly over the latter half of the reporting period. For example, international equity markets declined significantly in early 2016 amid lower energy prices and slowing global growth. International stocks subsequently rebounded somewhat before falling substantially again in late June following the U.K.’s referendum to leave the European Union.
The Fund’s exposure to stocks with smaller relative market capitalizations also added value, while exposure to value-oriented stocks detracted from performance.
As of the end of the reporting period, the Fund’s largest sector overweights relative to the MSCI World ex USA Index were telecommunication services and financials, while the largest underweights were consumer discretionary and healthcare.
Special Note: On June 23, 2016, the Board unanimously voted to close and liquidate the Fund. After the close of business on August 23, 2016, subject to applicable law, the Fund no longer accepted creation orders. Trading in the Fund was halted prior to market open on August 24, 2016. Proceeds of the liquidation were sent to shareholders on August 30, 2016.
ALLOCATION BY SECTOR
As of 7/31/16
| | |
| Sector | | Percentage of
Total Investments* |
| | | | |
Financials | | | 28.92 | % |
Industrials | | | 16.73 | |
Telecommunication Services | | | 10.42 | |
Consumer Staples | | | 10.18 | |
Health Care | | | 7.29 | |
Materials | | | 6.75 | |
Energy | | | 5.89 | |
Utilities | | | 5.07 | |
Consumer Discretionary | | | 4.88 | |
Information Technology | | | 3.87 | |
| | | | |
TOTAL | | | 100.00 | % |
| | | | |
TEN LARGEST COUNTRIES
As of 7/31/16
| | |
| Country | | Percentage of
Total Investments* |
| | | | |
Japan | | | 26.15 | % |
Switzerland | | | 13.14 | |
United Kingdom | | | 12.21 | |
Canada | | | 9.29 | |
Denmark | | | 5.90 | |
Netherlands | | | 5.53 | |
Belgium | | | 5.30 | |
France | | | 4.29 | |
Australia | | | 4.02 | |
Germany | | | 3.30 | |
| | | | |
TOTAL | | | 89.13 | % |
| | | | |
| | * | Excludes money market funds. |
| | | | |
MANAGEMENT’S DISCUSSIONSOF FUND PERFORMANCE | | | 7 | |
Management’s Discussion of Fund Performance
iSHARES® ENHANCED INTERNATIONAL SMALL-CAP ETF
Performance as of July 31, 2016
| | | | | | | | | | | | | | | | | | | | |
| | | Average Annual Total Returns | | | | | | Cumulative Total Returns | |
| | | 1 Year | | | Since Inception | | | | | | 1 Year | | | Since Inception | |
Fund NAV | | | 6.62% | | | | 1.55% | | | | | | | | 6.62% | | | | 3.80% | |
Fund Market | | | 5.99% | | | | 1.40% | | | | | | | | 5.99% | | | | 3.43% | |
MSCI World ex USA Small Cap Index | | | 2.55% | | | | 0.69% | | | | | | | | 2.55% | | | | 1.68% | |
GROWTH OF $10,000 INVESTMENT
(SINCE INCEPTION AT NET ASSET VALUE)
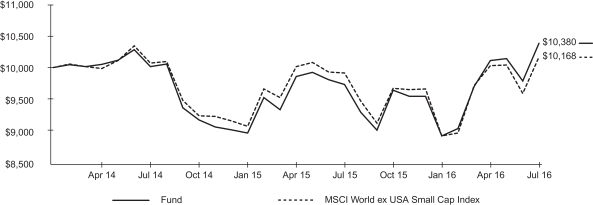
The inception date of the Fund was 2/25/14. The first day of secondary market trading was 2/27/14.
The MSCI World ex USA Small Cap Index is an unmanaged broad-based index that measures the performance of the small-capitalization sector of developed equity markets, excluding the United States.
Past performance is no guarantee of future results. Performance results do not reflect the deduction of taxes that a shareholder would pay on fund distributions or on the redemption or sale of fund shares. See “About Fund Performance” on page 14 for more information.
| | | | | | | | | | | | | | | | | | | | | | | | | | |
| Shareholder Expenses | |
| Actual | | | Hypothetical 5% Return | | | | |
Beginning
Account Value
(2/1/16) | | | Ending
Account Value
(7/31/16) | | | Expenses Paid
During Period a | | | Beginning
Account Value
(2/1/16) | | | Ending
Account Value
(7/31/16) | | | Expenses Paid
During Period a | | | Annualized
Expense Ratio | |
| $ | 1,000.00 | | | $ | 1,162.40 | | | $ | 2.63 | | | $ | 1,000.00 | | | $ | 1,022.40 | | | $ | 2.46 | | | | 0.49% | |
| a | Expenses are calculated using the Fund’s annualized expense ratio (as disclosed in the table), multiplied by the average account value for the period, multiplied by the number of days in the period (182 days) and divided by the number of days in the year (366 days). See “Shareholder Expenses” on page 14 for more information. | |
| | |
| 8 | | 2016 iSHARES ANNUAL REPORTTO SHAREHOLDERS |
Management’s Discussion of Fund Performance (Continued)
iSHARES® ENHANCED INTERNATIONAL SMALL-CAP ETF
The iShares Enhanced International Small-Cap ETF (the “Fund”) seeks long-term capital appreciation by investing, under normal circumstances, at least 80% of its net assets in equity securities of international small-capitalization issuers. The Fund is an actively managed exchange-traded fund that does not seek to replicate the performance of a specified index. For the 12-month reporting period ended July 31, 2016, the total return for the Fund was 6.62%, net of fees.
The Fund posted a positive return for the reporting period and outperformed the 2.55% return of the MSCI World ex USA Small Cap Index. The Fund combines the investment characteristics, or factors, of quality, value, and size exposures based on BlackRock insights. Quality is defined as a company that exhibits positive fundamentals, including high cash earnings, low earnings variability, and low debt-to-equity ratio, while value refers to companies with lower relative valuations based on measures such as price-to-earnings and price-to-book ratios. Size refers to relative market capitalization, and the Fund attempts to invest in stocks with lower relative market capitalizations.
The Fund was positioned to have less volatility than the broader market, and this positioning added value during the reporting period as the broad international equity markets experienced periods of significant volatility, particularly over the latter half of the reporting period. For example, international equity markets declined significantly in early 2016 amid lower energy prices and slowing global growth. International stocks subsequently rebounded somewhat before falling substantially again in late June following the U.K.’s referendum to leave the European Union.
The Fund’s exposure to value detracted from performance during the reporting period as value-oriented international stocks underperformed. The Fund’s exposure to stocks with smaller relative market capitalizations had little impact on overall performance.
As of the end of the reporting period, the Fund’s largest sector overweights relative to the MSCI World ex USA Small Cap Index were consumer discretionary and information technology, while the largest underweights were financials and industrials.
Special Note: On June 23, 2016, the Board unanimously voted to close and liquidate the Fund. After the close of business on August 23, 2016, subject to applicable law, the Fund no longer accepted creation orders. Trading in the Fund was halted prior to market open on August 24, 2016. Proceeds of the liquidation were sent to shareholders on August 30, 2016.
ALLOCATION BY SECTOR
As of 7/31/16
| | |
| Sector | | Percentage of
Total Investments* |
| | | | |
Consumer Discretionary | | | 18.80 | % |
Industrials | | | 16.65 | |
Financials | | | 16.49 | |
Information Technology | | | 12.82 | |
Materials | | | 11.78 | |
Consumer Staples | | | 7.83 | |
Energy | | | 6.42 | |
Health Care | | | 5.77 | |
Telecommunication Services | | | 2.40 | |
Utilities | | | 1.04 | |
| | | | |
TOTAL | | | 100.00 | % |
| | | | |
TEN LARGEST COUNTRIES As of 7/31/16
| | |
| Country | | Percentage of
Total Investments* |
| | | | |
Japan | | | 33.65 | % |
United Kingdom | | | 10.71 | |
Australia | | | 7.82 | |
Canada | | | 6.52 | |
Denmark | | | 6.18 | |
Finland | | | 4.60 | |
Germany | | | 4.11 | |
Belgium | | | 3.99 | |
New Zealand | | | 3.90 | |
France | | | 3.23 | |
| | | | |
TOTAL | | | 84.71 | % |
| | | | |
| | * | Excludes money market funds. |
| | | | |
MANAGEMENT’S DISCUSSIONSOF FUND PERFORMANCE | | | 9 | |
Management’s Discussion of Fund Performance
iSHARES® ENHANCED U.S. LARGE-CAP ETF
Performance as of July 31, 2016
| | | | | | | | | | | | | | | | | | | | |
| | | Average Annual Total Returns | | | | | | Cumulative Total Returns | |
| | | 1 Year | | | Since Inception | | | | | | 1 Year | | | Since Inception | |
Fund NAV | | | 5.57% | | | | 12.26% | | | | | | | | 5.57% | | | | 46.36% | |
Fund Market | | | 5.57% | | | | 12.28% | | | | | | | | 5.57% | | | | 46.44% | |
Russell 1000 Index | | | 4.84% | | | | 12.50% | | | | | | | | 4.84% | | | | 47.33% | |
GROWTH OF $10,000 INVESTMENT
(SINCE INCEPTION AT NET ASSET VALUE)
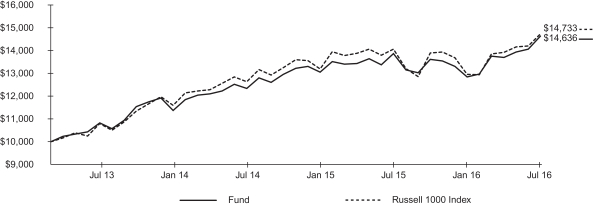
The inception date of the Fund was 4/16/13. The first day of secondary market trading was 4/18/13.
The Russell 1000® Index is an unmanaged broad-based index that measures the performance of the large- and mid-capitalization sectors of the U.S. equity market.
Past performance is no guarantee of future results. Performance results do not reflect the deduction of taxes that a shareholder would pay on fund distributions or on the redemption or sale of fund shares. See “About Fund Performance” on page 14 for more information.
| | | | | | | | | | | | | | | | | | | | | | | | | | |
| Shareholder Expenses | |
| Actual | | | Hypothetical 5% Return | | | | |
Beginning
Account Value
(2/1/16) | | | Ending
Account Value
(7/31/16) | | | Expenses Paid
During Period a | | | Beginning
Account Value
(2/1/16) | | | Ending
Account Value
(7/31/16) | | | Expenses Paid
During Period a | | | Annualized
Expense Ratio | |
| $ | 1,000.00 | | | $ | 1,139.80 | | | $ | 0.96 | | | $ | 1,000.00 | | | $ | 1,024.00 | | | $ | 0.91 | | | | 0.18% | |
| a | Expenses are calculated using the Fund’s annualized expense ratio (as disclosed in the table), multiplied by the average account value for the period, multiplied by the number of days in the period (182 days) and divided by the number of days in the year (366 days). See “Shareholder Expenses” on page 14 for more information. | |
| | |
| 10 | | 2016 iSHARES ANNUAL REPORTTO SHAREHOLDERS |
Management’s Discussion of Fund Performance (Continued)
iSHARES® ENHANCED U.S. LARGE-CAP ETF
The iShares Enhanced U.S. Large-Cap ETF (the “Fund”) seeks long-term capital appreciation by investing, under normal circumstances, at least 80% of its net assets in equity securities of U.S. large-capitalization issuers. The Fund is an actively managed exchange-traded fund that does not seek to replicate the performance of a specified index. For the 12-month reporting period ended July 31, 2016, the total return for the Fund was 5.57%, net of fees.
The Fund posted a positive return for the reporting period and outperformed the 4.84% return of the Russell 1000® Index. The Fund combines the investment characteristics, or factors, of quality, value, and size exposures based on BlackRock insights. Quality is defined as a company that exhibits positive fundamentals, including high cash earnings, low earnings variability, and low debt-to-equity ratio, while value refers to companies with lower relative valuations based on measures such as price-to-earnings and price-to-book ratios. Size refers to relative market capitalization, and the Fund attempts to invest in stocks with lower relative market capitalizations.
The Fund was positioned to have less volatility than the broader market, and this positioning added value during the reporting period as the broad U.S. equity market experienced periods of significant volatility, particularly over the latter half of the reporting period. For example, the domestic equity market declined significantly in early 2016 amid lower energy prices and slowing global growth. Stocks subsequently rebounded until late June, when concerns over the U.K.’s referendum to leave the European Union contributed to another sharp decline.
The Fund’s exposure to stocks with smaller relative market capitalizations also added value, while exposure to value-oriented stocks detracted from performance.
As of the end of the reporting period, the Fund’s largest sector overweights relative to the Russell 1000® Index were information technology and utilities, while the largest underweights were consumer staples and materials.
Special Note: On June 23, 2016, the Board unanimously voted to close and liquidate the Fund. After the close of business on August 23, 2016, subject to applicable law, the Fund no longer accepted creation orders. Trading in the Fund was halted prior to market open on August 24, 2016. Proceeds of the liquidation were sent to shareholders on August 30, 2016.
ALLOCATION BY SECTOR
As of 7/31/16
| | |
| Sector | | Percentage of
Total Investments* |
| | | | |
Information Technology | | | 31.21 | % |
Financials | | | 18.54 | |
Consumer Discretionary | | | 13.30 | |
Health Care | | | 12.65 | |
Utilities | | | 7.13 | |
Consumer Staples | | | 5.60 | |
Industrials | | | 5.09 | |
Energy | | | 4.32 | |
Telecommunication Services | | | 2.16 | |
| | | | |
TOTAL | | | 100.00 | % |
| | | | |
TEN LARGEST FUND HOLDINGS
As of 7/31/16
| | |
| Security | | Percentage of
Total Investments* |
| | | | |
VMware Inc. Class A | | | 2.46 | % |
Johnson & Johnson | | | 2.43 | |
CR Bard Inc. | | | 2.26 | |
Amazon.com Inc. | | | 2.16 | |
AT&T Inc. | | | 2.15 | |
Reinsurance Group of America Inc. | | | 2.15 | |
Intuit Inc. | | | 2.15 | |
Aflac Inc. | | | 2.12 | |
TJX Companies Inc. (The) | | | 2.12 | |
Intel Corp. | | | 2.10 | |
| | | | |
TOTAL | | | 22.10 | % |
| | | | |
| | * | Excludes money market funds. |
| | | | |
MANAGEMENT’S DISCUSSIONSOF FUND PERFORMANCE | | | 11 | |
Management’s Discussion of Fund Performance
iSHARES® ENHANCED U.S. SMALL-CAP ETF
Performance as of July 31, 2016
| | | | | | | | | | | | | | | | | | | | |
| | | Average Annual Total Returns | | | | | | Cumulative Total Returns | |
| | | 1 Year | | | Since Inception | | | | | | 1 Year | | | Since Inception | |
Fund NAV | | | 4.77% | | | | 10.78% | | | | | | | | 4.77% | | | | 40.11% | |
Fund Market | | | 4.71% | | | | 10.76% | | | | | | | | 4.71% | | | | 40.03% | |
Russell 2000 Index | | | 0.00% | | | | 10.34% | | | | | | | | 0.00% | | | | 38.21% | |
GROWTH OF $10,000 INVESTMENT
(SINCE INCEPTION AT NET ASSET VALUE)
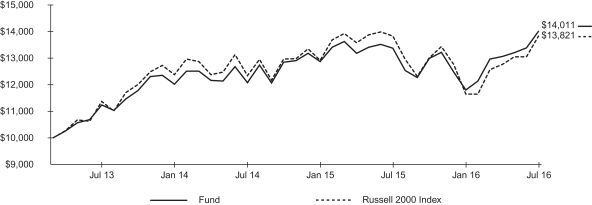
The inception date of the Fund was 4/16/13. The first day of secondary market trading was 4/18/13.
The Russell 2000® Index is an unmanaged broad-based index that measures the performance of the small-capitalization sector of the U.S. equity market.
Past performance is no guarantee of future results. Performance results do not reflect the deduction of taxes that a shareholder would pay on fund distributions or on the redemption or sale of fund shares. See “About Fund Performance” on page 14 for more information.
| | | | | | | | | | | | | | | | | | | | | | | | | | |
| Shareholder Expenses | |
| Actual | | | Hypothetical 5% Return | | | | |
Beginning
Account Value
(2/1/16) | | | Ending
Account Value
(7/31/16) | | | Expenses Paid
During Period a | | | Beginning
Account Value
(2/1/16) | | | Ending
Account Value
(7/31/16) | | | Expenses Paid
During Period a | | | Annualized
Expense Ratio | |
| $ | 1,000.00 | | | $ | 1,187.80 | | | $ | 1.90 | | | $ | 1,000.00 | | | $ | 1,023.10 | | | $ | 1.76 | | | | 0.35% | |
| a | Expenses are calculated using the Fund’s annualized expense ratio (as disclosed in the table), multiplied by the average account value for the period, multiplied by the number of days in the period (182 days) and divided by the number of days in the year (366 days). See “Shareholder Expenses” on page 14 for more information. | |
| | |
| 12 | | 2016 iSHARES ANNUAL REPORTTO SHAREHOLDERS |
Management’s Discussion of Fund Performance (Continued)
iSHARES® ENHANCED U.S. SMALL-CAP ETF
The iShares Enhanced U.S. Small-Cap ETF (the “Fund”) seeks long-term capital appreciation by investing, under normal circumstances, at least 80% of its net assets in equity securities of U.S. small-capitalization issuers. The Fund is an actively managed exchange-traded fund that does not seek to replicate the performance of a specified index. For the 12-month reporting period ended July 31, 2016, the total return for the Fund was 4.77%, net of fees.
The Fund posted a positive return for the reporting period and outperformed the 0.00% return of the Russell 2000® Index. The Fund combines the investment characteristics, or factors, of quality, value, and size exposures based on BlackRock insights. Quality is defined as a company that exhibits positive fundamentals, including high cash earnings, low earnings variability, and low debt-to-equity ratio, while value refers to companies with lower relative valuations based on measures such as price-to-earnings and price-to-book ratios. Size refers to relative market capitalization, and the Fund attempts to invest in stocks with lower relative market capitalizations.
The Fund was positioned to have less volatility than the broader market, and this positioning added value during the reporting period as the broad U.S. equity market experienced periods of significant volatility, particularly over the latter half of the reporting period. For example, the domestic equity market declined significantly in early 2016 amid lower energy prices and slowing global growth. Stocks subsequently rebounded until late June, when concerns over the U.K.’s referendum to leave the European Union contributed to another sharp decline.
The Fund’s exposure to stocks with smaller relative market capitalizations detracted from performance, as did exposure to value-oriented stocks.
As of the end of the reporting period, the Fund’s largest sector overweights relative to the Russell 2000® Index were information technology and consumer staples, while the largest underweights were healthcare and materials.
Special Note: On June 23, 2016, the Board unanimously voted to close and liquidate the Fund. After the close of business on August 23, 2016, subject to applicable law, the Fund no longer accepted creation orders. Trading in the Fund was halted prior to market open on August 24, 2016. Proceeds of the liquidation were sent to shareholders on August 30, 2016.
ALLOCATION BY SECTOR
As of 7/31/16
| | |
| Sector | | Percentage of
Total Investments* |
| | | | |
Information Technology | | | 26.80 | % |
Financials | | | 22.75 | |
Consumer Discretionary | | | 14.88 | |
Industrials | | | 9.20 | |
Health Care | | | 7.58 | |
Utilities | | | 6.30 | |
Energy | | | 4.29 | |
Consumer Staples | | | 4.11 | |
Materials | | | 3.63 | |
Telecommunication Services | | | 0.46 | |
| | | | |
TOTAL | | | 100.00 | % |
| | | | |
TEN LARGEST FUND HOLDINGS
As of 7/31/16
| | |
| Security | | Percentage of
Total Investments* |
| | | | |
Cirrus Logic Inc. | | | 2.61 | % |
Advanced Energy Industries Inc. | | | 2.60 | |
ManTech International Corp./VA Class A | | | 2.49 | |
LogMeIn Inc. | | | 2.32 | |
Children’s Place Inc. (The) | | | 2.19 | |
Cash America International Inc. | | | 2.13 | |
Hyatt Hotels Corp. Class A | | | 2.00 | |
American National Insurance Co. | | | 2.00 | |
Select Income REIT | | | 1.98 | |
MFA Financial Inc. | | | 1.84 | |
| | | | |
TOTAL | | | 22.16 | % |
| | | | |
| | * | Excludes money market funds. |
| | | | |
MANAGEMENT’S DISCUSSIONSOF FUND PERFORMANCE | | | 13 | |
About Fund Performance
Past performance is no guarantee of future results. Current performance may be lower or higher than the performance data quoted. Performance data current to the most recent month-end is available at www.ishares.com. Performance results assume reinvestment of all dividends and capital gain distributions and do not reflect the deduction of taxes that a shareholder would pay on fund distributions or on the redemption or sale of fund shares. The investment return and principal value of shares will vary with changes in market conditions. Shares may be worth more or less than their original cost when they are redeemed or sold in the market. Performance for certain funds may reflect a waiver of a portion of investment advisory fees. Without such a waiver, performance would have been lower.
Net asset value or “NAV” is the value of one share of a fund as calculated in accordance with the standard formula for valuing mutual fund shares. The price used to calculate market return (“Market Price”) is determined by using the midpoint between the highest bid and the lowest offer on the primary stock exchange on which shares of a fund are listed for trading, as of the time that such fund’s NAV is calculated. Certain funds may have a NAV which is determined prior to the opening of regular trading on its listed exchange and their market returns are calculated using the midpoint of the bid/ask spread as of the opening of regular trading on the exchange. Market and NAV returns assume that dividends and capital gain distributions have been reinvested at Market Price and NAV, respectively.
An index is a statistical composite that tracks a specified financial market or sector. Unlike a fund, an index does not actually hold a portfolio of securities and therefore does not incur the expenses incurred by a fund. These expenses negatively impact fund performance. Also, market returns do not include brokerage commissions that may be payable on secondary market transactions. If brokerage commissions were included, market returns would be lower.
Shareholder Expenses
As a shareholder of a Fund, you incur two types of costs: (1) transaction costs, including brokerage commissions on purchases and sales of fund shares and (2) ongoing costs, including management fees and other fund expenses. The expense example, which is based on an investment of $1,000 invested on February 1, 2016 and held through July 31, 2016, is intended to help you understand your ongoing costs (in dollars and cents) of investing in a Fund and to compare these costs with the ongoing costs of investing in other funds.
Actual Expenses — The table provides information about actual account values and actual expenses. Annualized expense ratios reflect contractual and voluntary fee waivers, if any. To estimate the expenses that you paid on your account over the period, simply divide your account value by $1,000 (for example, an $8,600 account value divided by $1,000 = 8.6), then multiply the result by the number corresponding to your Fund under the heading entitled “Expenses Paid During Period.”
Hypothetical Example for Comparison Purposes — The table also provides information about hypothetical account values and hypothetical expenses based on each Fund’s actual expense ratio and an assumed rate of return of 5% per year before expenses. You may use this information to compare the ongoing costs of investing in your Fund and other funds. To do so, compare this 5% hypothetical example with the 5% hypothetical examples that appear in the shareholder reports of the other funds.
Please note that the expenses shown in the table are meant to highlight your ongoing costs only and do not reflect any transactional costs, such as brokerage commissions paid on purchases and sales of fund shares. Therefore, the hypothetical examples are useful in comparing ongoing costs only and will not help you determine the relative total costs of owning different funds. In addition, if these transactional costs were included, your costs would have been higher.
| | |
| 14 | | 2016 iSHARES ANNUAL REPORTTO SHAREHOLDERS |
Schedule of Investments
iSHARES® ENHANCED INTERNATIONAL LARGE-CAP ETF
July 31, 2016
| | | | | | | | |
| Security | | Shares | | | Value | |
COMMON STOCKS — 97.96% | |
| | |
AUSTRALIA — 3.94% | | | | | | | | |
Aristocrat Leisure Ltd. | | | 8,085 | | | $ | 97,952 | |
ASX Ltd. | | | 20,429 | | | | 771,694 | |
Brambles Ltd. | | | 7,425 | | | | 75,903 | |
Caltex Australia Ltd. | | | 2,850 | | | | 71,829 | |
CIMIC Group Ltd. | | | 1,290 | | | | 28,669 | |
Dexus Property Group | | | 11,597 | | | | 86,116 | |
GPT Group (The) | | | 5,805 | | | | 24,752 | |
Qantas Airways Ltd. | | | 65,774 | | | | 157,973 | |
| | | | | | | | |
| | | | | | | 1,314,888 | |
AUSTRIA — 0.58% | | | | | | | | |
OMV AG | | | 7,260 | | | | 192,936 | |
| | | | | | | | |
| | | | | | | 192,936 | |
BELGIUM — 5.19% | | | | | | | | |
Ageas | | | 2,970 | | | | 99,951 | |
bpost SA | | | 5,460 | | | | 143,025 | |
Colruyt SA | | | 1,125 | | | | 62,763 | |
Proximus SADP | | | 10,793 | | | | 336,914 | |
Solvay SA | | | 6,850 | | | | 710,926 | |
Telenet Group Holding NVa | | | 2,565 | | | | 121,688 | |
UCB SA | | | 270 | | | | 21,126 | |
Umicore SA | | | 4,095 | | | | 236,930 | |
| | | | | | | | |
| | | | | | | 1,733,323 | |
CANADA — 9.11% | | | | | | | | |
Agnico Eagle Mines Ltd. | | | 2,235 | | | | 130,221 | |
Alimentation Couche-Tard Inc. Class B | | | 1,050 | | | | 47,530 | |
Bank of Montreal | | | 5,739 | | | | 368,356 | |
Bank of Nova Scotia (The) | | | 1,860 | | | | 94,580 | |
BCE Inc. | | | 495 | | | | 23,736 | |
Canadian Imperial Bank of Commerce/Canada | | | 8,084 | | | | 614,894 | |
Constellation Software Inc./Canada | | | 1,827 | | | | 744,656 | |
Empire Co. Ltd. Class A | | | 5,175 | | | | 82,543 | |
Franco-Nevada Corp. | | | 615 | | | | 47,477 | |
George Weston Ltd. | | | 150 | | | | 13,338 | |
Husky Energy Inc. | | | 4,254 | | | | 50,106 | |
Intact Financial Corp. | | | 165 | | | | 11,842 | |
National Bank of Canada | | | 11,203 | | | | 384,100 | |
Open Text Corp. | | | 615 | | | | 37,521 | |
Rogers Communications Inc. Class B | | | 2,025 | | | | 89,553 | |
SNC-Lavalin Group Inc. | | | 4,691 | | | | 202,346 | |
Thomson Reuters Corp. | | | 2,310 | | | | 97,445 | |
| | | | | | | | |
| | | | | | | 3,040,244 | |
| | | | | | | | |
| Security | | Shares | | | Value | |
DENMARK — 5.79% | | | | | | | | |
AP Moeller – Maersk A/S Class A | | | 305 | | | $ | 398,706 | |
AP Moeller – Maersk A/S Class B | | | 548 | | | | 743,964 | |
Coloplast A/S Class B | | | 5,480 | | | | 430,066 | |
Danske Bank A/S | | | 2,450 | | | | 66,596 | |
Jyske Bank A/S Registered | | | 1,225 | | | | 50,960 | |
TDC A/S | | | 38,394 | | | | 202,145 | |
Vestas Wind Systems A/S | | | 548 | | | | 38,261 | |
| | | | | | | | |
| | | | | | | 1,930,698 | |
FINLAND — 2.35% | | | | | | | | |
Neste OYJ | | | 1,440 | | | | 54,540 | |
Nokian Renkaat OYJ | | | 2,355 | | | | 87,510 | |
Stora Enso OYJ Class R | | | 33,779 | | | | 306,720 | |
UPM-Kymmene OYJ | | | 16,289 | | | | 335,706 | |
| | | | | | | | |
| | | | | | | 784,476 | |
FRANCE — 4.21% | | | | | | | | |
Electricite de France SA | | | 1,470 | | | | 19,241 | |
Eutelsat Communications SA | | | 915 | | | | 18,193 | |
Lagardere SCA | | | 2,025 | | | | 51,732 | |
Peugeot SAa | | | 34,510 | | | | 521,362 | |
SCOR SE | | | 1,110 | | | | 32,440 | |
SES SA | | | 7,080 | | | | 155,138 | |
SFR Group SA | | | 390 | | | | 9,215 | |
Total SA | | | 12,209 | | | | 583,790 | |
Veolia Environnement SA | | | 630 | | | | 13,991 | |
| | | | | | | | |
| | | | | | | 1,405,102 | |
GERMANY — 3.12% | | | | | | | | |
CTS Eventim AG & Co. KGaA | | | 555 | | | | 19,320 | |
Deutsche Lufthansa AG Registered | | | 39,694 | | | | 471,843 | |
MAN SE | | | 345 | | | | 36,180 | |
Muenchener Rueckversicherungs-Gesellschaft AG in Muenchen Registered | | | 1,221 | | | | 203,715 | |
RWE AGa | | | 2,490 | | | | 44,287 | |
Telefonica Deutschland Holding AG | | | 60,195 | | | | 245,693 | |
United Internet AG Registeredb | | | 420 | | | | 18,570 | |
| | | | | | | | |
| | | | | | | 1,039,608 | |
HONG KONG — 0.43% | | | | | | | | |
CK Hutchison Holdings Ltd. | | | 7,500 | | | | 87,758 | |
PCCW Ltd. | | | 33,000 | | | | 24,027 | |
Yue Yuen Industrial Holdings Ltd. | | | 7,500 | | | | 30,445 | |
| | | | | | | | |
| | | | | | | 142,230 | |
ISRAEL — 2.16% | | | | | | | | |
Bank Hapoalim BM | | | 36,976 | | | | 188,984 | |
| | | | |
SCHEDULESOF INVESTMENTS | | | 15 | |
Schedule of Investments (Continued)
iSHARES® ENHANCED INTERNATIONAL LARGE-CAP ETF
July 31, 2016
| | | | | | | | |
| Security | | Shares | | | Value | |
Bank Leumi le-Israel BMa | | | 29,806 | | | $ | 107,528 | |
Bezeq The Israeli Telecommunication Corp. Ltd. | | | 198,657 | | | | 396,282 | |
Teva Pharmaceutical Industries Ltd. | | | 495 | | | | 26,663 | |
| | | | | | | | |
| | | | | | | 719,457 | |
ITALY — 0.28% | | | | | | | | |
EXOR SpA | | | 1,455 | | | | 56,670 | |
Mediaset SpA | | | 11,790 | | | | 35,703 | |
| | | | | | | | |
| | | | | | | 92,373 | |
JAPAN — 25.65% | | | | | | | | |
Aisin Seiki Co. Ltd. | | | 1,500 | | | | 69,449 | |
Aozora Bank Ltd. | | | 60,000 | | | | 221,886 | |
Canon Inc. | | | 4,500 | | | | 128,873 | |
Chubu Electric Power Co. Inc. | | | 3,000 | | | | 44,187 | |
Daiichi Sankyo Co. Ltd. | | | 10,500 | | | | 252,139 | |
Eisai Co. Ltd. | | | 6,000 | | | | 353,847 | |
ITOCHU Corp. | | | 6,000 | | | | 68,644 | |
Japan Airlines Co. Ltd. | | | 19,500 | | | | 608,109 | |
Japan Exchange Group Inc. | | | 1,500 | | | | 21,515 | |
JX Holdings Inc. | | | 147,000 | | | | 556,387 | |
Kansai Electric Power Co. Inc. (The)a | | | 7,500 | | | | 69,991 | |
Kawasaki Heavy Industries Ltd. | | | 138,000 | | | | 413,387 | |
KDDI Corp. | | | 12,000 | | | | 368,249 | |
Kuraray Co. Ltd. | | | 1,500 | | | | 19,144 | |
Lawson Inc. | | | 1,500 | | | | 115,773 | |
Marubeni Corp. | | | 45,000 | | | | 211,289 | |
Mitsubishi UFJ Financial Group Inc. | | | 40,500 | | | | 206,284 | |
Mitsui & Co. Ltd. | | | 21,000 | | | | 247,631 | |
Mizuho Financial Group Inc. | | | 436,500 | | | | 711,706 | |
Nexon Co. Ltd. | | | 3,000 | | | | 45,080 | |
Nippon Telegraph & Telephone Corp. | | | 15,000 | | | | 714,397 | |
Nippon Yusen KK | | | 48,000 | | | | 86,179 | |
Oracle Corp. Japan | | | 3,000 | | | | 183,246 | |
Park24 Co. Ltd. | | | 1,500 | | | | 51,081 | |
Resona Holdings Inc. | | | 121,500 | | | | 491,999 | |
Shinsei Bank Ltd. | | | 48,000 | | | | 73,064 | |
Sompo Japan Nipponkoa Holdings Inc. | | | 1,500 | | | | 49,237 | |
Sumitomo Chemical Co. Ltd. | | | 18,000 | | | | 80,792 | |
Sumitomo Corp. | | | 6,000 | | | | 63,463 | |
Sumitomo Mitsui Financial Group Inc. | | | 16,500 | | | | 532,585 | |
Sumitomo Rubber Industries Ltd. | | | 4,500 | | | | 64,283 | |
Suntory Beverage & Food Ltd. | | | 3,000 | | | | 130,995 | |
Takeda Pharmaceutical Co. Ltd. | | | 1,500 | | | | 67,151 | |
Tohoku Electric Power Co. Inc. | | | 6,000 | | | | 77,397 | |
| | | | | | | | |
| Security | | Shares | | | Value | |
Tokyo Electric Power Co. Holdings Inc.a | | | 133,500 | | | $ | 526,262 | |
Tokyo Gas Co. Ltd. | | | 60,000 | | | | 257,013 | |
West Japan Railway Co. | | | 6,000 | | | | 374,982 | |
| | | | | | | | |
| | | | | | | 8,557,696 | |
NETHERLANDS — 5.43% | | | | | | | | |
Aegon NV | | | 46,395 | | | | 189,159 | |
AerCap Holdings NVa | | | 1,305 | | | | 47,646 | |
Altice NV Class Aa | | | 540 | | | | 8,016 | |
Altice NV Class Ba | | | 435 | | | | 6,433 | |
Boskalis Westminster | | | 4,635 | | | | 170,317 | |
Koninklijke Ahold Delhaize NV | | | 46,621 | | | | 1,113,581 | |
NN Group NV | | | 10,224 | | | | 275,821 | |
| | | | | | | | |
| | | | | | | 1,810,973 | |
NORWAY — 0.10% | | | | | | | | |
Orkla ASA | | | 3,541 | | | | 32,917 | |
| | | | | | | | |
| | | | | | | 32,917 | |
SINGAPORE — 1.71% | | | | | | | | |
ComfortDelGro Corp. Ltd. | | | 19,500 | | | | 40,943 | |
Singapore Airlines Ltd. | | | 27,000 | | | | 220,728 | |
Singapore Exchange Ltd. | | | 11,500 | | | | 64,474 | |
StarHub Ltd. | | | 84,000 | | | | 245,164 | |
| | | | | | | | |
| | | | | | | 571,309 | |
SPAIN — 0.17% | | | | | | | | |
Endesa SA | | | 525 | | | | 11,034 | |
Mediaset Espana Comunicacion SA | | | 4,110 | | | | 47,247 | |
| | | | | | | | |
| | | | | | | 58,281 | |
SWEDEN — 2.88% | | | | | | | | |
Boliden AB | | | 15,436 | | | | 340,434 | |
ICA Gruppen AB | | | 13,944 | | | | 467,828 | |
Nordea Bank AB | | | 16,151 | | | | 144,317 | |
Skandinaviska Enskilda Banken AB Class A | | | 1,035 | | | | 9,103 | |
| | | | | | | | |
| | | | | | | 961,682 | |
SWITZERLAND — 12.89% | | | | | | | | |
Aryzta AG | | | 6,220 | | | | 234,589 | |
Baloise Holding AG Registered | | | 2,542 | | | | 287,223 | |
Banque Cantonale Vaudoise Registered | | | 90 | | | | 61,089 | |
Barry Callebaut AG Registered | | | 198 | | | | 259,780 | |
Credit Suisse Group AG Registered | | | 33,145 | | | | 382,396 | |
Helvetia Holding AG Registered | | | 150 | | | | 75,586 | |
Lonza Group AG Registered | | | 1 | | | | 189 | |
Novartis AG Registered | | | 4,110 | | | | 341,490 | |
| | |
| 16 | | 2016 iSHARES ANNUAL REPORTTO SHAREHOLDERS |
Schedule of Investments (Continued)
iSHARES® ENHANCED INTERNATIONAL LARGE-CAP ETF
July 31, 2016
| | | | | | | | |
| Security | | Shares | | | Value | |
PSP Swiss Property AG Registered | | | 315 | | | $ | 31,860 | |
Swiss Life Holding AG Registered | | | 2,588 | | | | 593,142 | |
Swiss Prime Site AG Registered | | | 416 | | | | 38,331 | |
Swiss Re AG | | | 7,459 | | | | 627,854 | |
Swisscom AG Registered | | | 1,340 | | | | 661,508 | |
Zurich Insurance Group AG | | | 2,923 | | | | 704,399 | |
| | | | | | | | |
| | | | | | | 4,299,436 | |
UNITED KINGDOM — 11.97% | | | | | | | | |
3i Group PLC | | | 35,868 | | | | 293,828 | |
Ashtead Group PLC | | | 4,365 | | | | 69,313 | |
AstraZeneca PLC | | | 10,912 | | | | 731,348 | |
BP PLC | | | 49,905 | | | | 282,826 | |
BT Group PLC | | | 16,995 | | | | 93,269 | |
Centrica PLC | | | 186,098 | | | | 595,716 | |
GlaxoSmithKline PLC | | | 7,260 | | | | 162,708 | |
Imperial Brands PLC | | | 4,995 | | | | 264,180 | |
Investec PLC | | | 3,525 | | | | 21,037 | |
J Sainsbury PLC | | | 169,186 | | | | 503,841 | |
Just Eat PLCa | | | 4,065 | | | | 28,983 | |
Marks & Spencer Group PLC | | | 12,765 | | | | 54,115 | |
Micro Focus International PLC | | | 1,410 | | | | 36,243 | |
Old Mutual PLC | | | 21,510 | | | | 60,145 | |
Rentokil Initial PLC | | | 124,691 | | | | 355,937 | |
Rightmove PLC | | | 825 | | | | 44,373 | |
Royal Dutch Shell PLC Class A | | | 5,265 | | | | 135,892 | |
Royal Mail PLC | | | 8,640 | | | | 58,447 | |
RSA Insurance Group PLC | | | 19,665 | | | | 129,946 | |
Sky PLC | | | 5,835 | | | | 71,312 | |
| | | | | | | | |
| | | | | | | 3,993,459 | |
| | | | | | | | |
TOTAL COMMON STOCKS
(Cost: $37,921,225) | | | | | | | 32,681,088 | |
| | | | | | | | |
| Security | | Shares | | | Value | |
PREFERRED STOCKS — 0.12% | |
| | |
GERMANY — 0.12% | | | | | | | | |
Bayerische Motoren Werke AG | | | 540 | | | $ | 39,130 | |
| | | | | | | | |
| | | | | | | 39,130 | |
| | | | | | | | |
TOTAL PREFERRED STOCKS
(Cost: $51,508) | | | | | | | 39,130 | |
|
SHORT-TERM INVESTMENTS — 0.04% | |
| | |
MONEY MARKET FUNDS — 0.04% | | | | | | | | |
BlackRock Cash Funds: Treasury,
SL Agency Shares | | | | | | | | |
0.28%c,d | | | 14,393 | | | | 14,393 | |
| | | | | | | | |
| | | | | | | 14,393 | |
| | | | | | | | |
TOTAL SHORT-TERM INVESTMENTS
(Cost: $14,393) | | | | 14,393 | |
| | | | | | | | |
TOTAL INVESTMENTS
IN SECURITIES — 98.12%
(Cost: $37,987,126)e | | | | 32,734,611 | |
Other Assets, Less Liabilities — 1.88% | | | | 627,047 | |
| | | | | | | | |
NET ASSETS — 100.00% | | | $ | 33,361,658 | |
| | | | | | | | |
| a | Non-income earning security. |
| b | This security may be resold to qualified foreign investors and foreign institutional buyers under Regulation S of the Securities Act of 1933. |
| c | Affiliated money market fund. |
| d | The rate quoted is the annualized seven-day yield of the fund at period end. |
| e | The cost of investments for federal income tax purposes was $38,129,377. Net unrealized depreciation was $5,394,766, of which $1,498,475 represented gross unrealized appreciation on securities and $6,893,241 represented gross unrealized depreciation on securities. |
Schedule 1 — Fair Value Measurements
Various inputs are used in determining the fair value of financial instruments. For description of the input levels and information about the Fund’s policy regarding valuation of financial instruments, see Note 1.
The following table summarizes the value of the Fund’s investments according to the fair value hierarchy as of July 31, 2016. The breakdown of the Fund’s investments into major categories is disclosed in the schedule of investments above.
| | | | | | | | | | | | | | | | |
| | | Level 1 | | | Level 2 | | | Level 3 | | | Total | |
Investments: | | | | | | | | | | | | | | | | |
Assets: | | | | | | | | | | | | | | | | |
Common stocks | | $ | 32,681,088 | | | $ | — | | | $ | — | | | $ | 32,681,088 | |
Preferred stocks | | | 39,130 | | | | — | | | | — | | | | 39,130 | |
Money market funds | | | 14,393 | | | | — | | | | — | | | | 14,393 | |
| | | | | | | | | | | | | | | | |
Total | | $ | 32,734,611 | | | $ | — | | | $ | — | | | $ | 32,734,611 | |
| | | | | | | | | | | | | | | | |
| | | | | | | | | | | | | | | | | |
See notes to financial statements.
| | | | |
SCHEDULESOF INVESTMENTS | | | 17 | |
Schedule of Investments
iSHARES® ENHANCED INTERNATIONAL SMALL-CAP ETF
July 31, 2016
| | | | | | | | |
| Security | | Shares | | | Value | |
COMMON STOCKS — 98.05% | | | | | | | | |
| | |
AUSTRALIA — 7.76% | | | | | | | | |
Cabcharge Australia Ltd. | | | 9,504 | | | $ | 28,605 | |
Downer EDI Ltd. | | | 8,288 | | | | 26,268 | |
Estia Health Ltd. | | | 29,114 | | | | 113,517 | |
Evolution Mining Ltd. | | | 245,784 | | | | 526,799 | |
FlexiGroup Ltd./Australia | | | 40,352 | | | | 61,339 | |
Independence Group NL | | | 9,192 | | | | 28,085 | |
McMillan Shakespeare Ltd. | | | 9,460 | | | | 101,380 | |
Metals X Ltd. | | | 10,192 | | | | 12,665 | |
Mineral Resources Ltd. | | | 1,866 | | | | 13,927 | |
MYOB Group Ltd. | | | 3,848 | | | | 11,026 | |
Northern Star Resources Ltd. | | | 122,624 | | | | 491,166 | |
OZ Minerals Ltd. | | | 3,720 | | | | 18,067 | |
Pact Group Holdings Ltd. | | | 2,792 | | | | 12,075 | |
Sandfire Resources NL | | | 14,145 | | | | 61,603 | |
St. Barbara Ltd.a | | | 4,240 | | | | 9,700 | |
| | | | | | | | |
| | | | | | | 1,516,222 | |
AUSTRIA — 0.38% | | | | | | | | |
Austria Technologie & Systemtechnik AG | | | 2,312 | | | | 27,418 | |
EVN AG | | | 2,160 | | | | 25,241 | |
S IMMO AG | | | 1,257 | | | | 12,159 | |
UNIQA Insurance Group AG | | | 1,544 | | | | 9,565 | |
| | | | | | | | |
| | | | | | | 74,383 | |
BELGIUM — 3.96% | | | | | | | | |
AGFA-Gevaert NVa | | | 40,750 | | | | 147,278 | |
Cie. d’Entreprises CFE | | | 840 | | | | 77,401 | |
Euronav NV | | | 3,072 | | | | 26,452 | |
Gimv NV | | | 384 | | | | 20,861 | |
Intervest Offices & Warehouses NV | | | 416 | | | | 11,837 | |
Nyrstar NVa | | | 8,523 | | | | 77,714 | |
Orange Belgium SAa | | | 17,012 | | | | 412,433 | |
| | | | | | | | |
| | | | | | | 773,976 | |
CANADA — 6.47% | | | | | | | | |
Amaya Inc.a | | | 8,470 | | | | 131,267 | |
Artis REIT | | | 1,648 | | | | 17,250 | |
Cogeco Communications Inc. | | | 2,866 | | | | 141,229 | |
Dominion Diamond Corp. | | | 8,728 | | | | 80,249 | |
Granite REIT | | | 354 | | | | 11,032 | |
Intertain Group Ltd. (The)a | | | 1,472 | | | | 11,683 | |
Laurentian Bank of Canada | | | 5,506 | | | | 204,398 | |
Mainstreet Equity Corp.a | | | 872 | | | | 22,903 | |
Milestone Apartments REIT | | | 4,880 | | | | 78,324 | |
| | | | | | | | |
| Security | | Shares | | | Value | |
Morguard REIT | | | 1,498 | | | $ | 18,035 | |
NorthWest Healthcare Properties REIT | | | 2,144 | | | | 16,786 | |
Spin Master Corp.a,b | | | 576 | | | | 11,838 | |
TMX Group Ltd. | | | 9,429 | | | | 421,180 | |
Transcontinental Inc. Class A | | | 1,712 | | | | 24,694 | |
Valener Inc. | | | 1,056 | | | | 18,269 | |
Wajax Corp. | | | 1,249 | | | | 13,514 | |
Yellow Pages Ltd./Canadaa | | | 2,832 | | | | 40,980 | |
| | | | | | | | |
| | | | | | | 1,263,631 | |
DENMARK — 6.13% | | | | | | | | |
Bavarian Nordic A/Sa | | | 2,524 | | | | 96,195 | |
Dfds A/S | | | 10,202 | | | | 466,429 | |
IC Group A/S | | | 328 | | | | 8,260 | |
NKT Holding A/S | | | 248 | | | | 12,800 | |
Per Aarsleff Holding A/S | | | 512 | | | | 12,008 | |
Rockwool International A/S Class B | | | 2,560 | | | | 484,947 | |
Schouw & Co. | | | 1,669 | | | | 96,856 | |
TORM PLCa | | | 2,068 | | | | 19,898 | |
| | | | | | | | |
| | | | | | | 1,197,393 | |
FINLAND — 4.57% | | | | | | | | |
Atria OYJ | | | 1,096 | | | | 10,969 | |
Cramo OYJ | | | 4,344 | | | | 102,546 | |
HKScan OYJ Class A | | | 5,851 | | | | 20,741 | |
PKC Group OYJ | | | 824 | | | | 15,250 | |
Ramirent OYJ | | | 6,201 | | | | 52,562 | |
Sanoma OYJ | | | 34,042 | | | | 273,134 | |
Sponda OYJ | | | 55,082 | | | | 252,541 | |
Tieto OYJ | | | 4,210 | | | | 121,180 | |
YIT OYJ | | | 6,424 | | | | 43,640 | |
| | | | | | | | |
| | | | | | | 892,563 | |
FRANCE — 3.21% | | | | | | | | |
Adociaa | | | 96 | | | | 5,579 | |
Assystem | | | 640 | | | | 17,599 | |
Cegedim SAa | | | 464 | | | | 13,563 | |
Cegid Group SA | | | 784 | | | | 53,698 | |
Cellectis SAa | | | 1,656 | | | | 43,333 | |
Cie. des Alpes | | | 1,257 | | | | 24,950 | |
Ubisoft Entertainment SAa | | | 11,386 | | | | 467,598 | |
| | | | | | | | |
| | | | | | | 626,320 | |
GERMANY — 4.08% | | | | | | | | |
ADLER Real Estate AGa | | | 952 | | | | 14,287 | |
Bauer AG | | | 1,072 | | | | 14,805 | |
Borussia Dortmund GmbH & Co. KGaA | | | 17,450 | | | | 77,020 | |
CENTROTEC Sustainable AG | | | 1,640 | | | | 25,858 | |
| | |
| 18 | | 2016 iSHARES ANNUAL REPORTTO SHAREHOLDERS |
Schedule of Investments (Continued)
iSHARES® ENHANCED INTERNATIONAL SMALL-CAP ETF
July 31, 2016
| | | | | | | | |
| Security | | Shares | | | Value | |
CTS Eventim AG & Co. KGaA | | | 1,552 | | | $ | 54,027 | |
Deutsche Beteiligungs AG | | | 1,136 | | | | 35,976 | |
DIC Asset AG | | | 1,065 | | | | 10,378 | |
Draegerwerk AG & Co. KGaA | | | 184 | | | | 10,498 | |
MLP AG | | | 8,320 | | | | 32,191 | |
PATRIZIA Immobilien AGa | | | 6,615 | | | | 167,029 | |
RHOEN-KLINIKUM AG | | | 11,792 | | | | 347,462 | |
Sixt Leasing AG | | | 336 | | | | 7,176 | |
| | | | | | | | |
| | | | | | | 796,707 | |
HONG KONG — 0.18% | | | | | | | | |
SmarTone Telecommunications Holdings Ltd. | | | 20,162 | | | | 35,907 | |
| | | | | | | | |
| | | | | | | 35,907 | |
ISRAEL — 3.18% | |
Delek Automotive Systems Ltd. | | | 10,484 | | | | 92,973 | |
Harel Insurance Investments & Financial Services Ltd. | | | 2,408 | | | | 8,864 | |
Ituran Location and Control Ltd. | | | 648 | | | | 15,526 | |
Migdal Insurance & Financial Holding Ltd.a | | | 21,464 | | | | 13,150 | |
Oil Refineries Ltd.a | | | 497,008 | | | | 178,649 | |
Tower Semiconductor Ltd.a | | | 23,058 | | | | 311,501 | |
| | | | | | | | |
| | | | | | | 620,663 | |
ITALY — 0.08% | | | | | | | | |
Juventus Football Club SpAa | | | 46,808 | | | | 15,258 | |
| | | | | | | | |
| | | | | | | 15,258 | |
JAPAN — 33.39% | | | | | | | | |
Achilles Corp. | | | 8,000 | | | | 11,007 | |
Aderans Co. Ltd. | | | 2,400 | | | | 10,983 | |
Aichi Corp. | | | 5,600 | | | | 44,971 | |
Arcland Sakamoto Co. Ltd. | | | 3,200 | | | | 35,814 | |
Asahi Diamond Industrial Co. Ltd. | | | 1,600 | | | | 12,443 | |
Asahi Holdings Inc. | | | 3,200 | | | | 54,861 | |
Ashikaga Holdings Co. Ltd. | | | 4,800 | | | | 16,158 | |
Avex Group Holdings Inc. | | | 1,600 | | | | 18,937 | |
Cawachi Ltd. | | | 2,400 | | | | 56,203 | |
CKD Corp. | | | 2,400 | | | | 22,645 | |
Comforia Residential REIT Inc. | | | 56 | | | | 133,436 | |
Cosmo Energy Holdings Co. Ltd. | | | 9,600 | | | | 106,786 | |
Create Restaurants Holdings Inc. | | | 2,400 | | | | 24,847 | |
DCM Holdings Co. Ltd. | | | 1,600 | | | | 13,739 | |
Dip Corp. | | | 8,000 | | | | 242,767 | |
Doshisha Co. Ltd. | | | 800 | | | | 16,838 | |
Dydo Drinco Inc. | | | 1,600 | | | | 83,368 | |
Enplas Corp. | | | 1,600 | | | | 45,244 | |
| | | | | | | | |
| Security | | Shares | | | Value | |
Foster Electric Co. Ltd. | | | 6,400 | | | $ | 125,146 | |
France Bed Holdings Co. Ltd. | | | 3,200 | | | | 28,789 | |
Fuji Soft Inc. | | | 1,600 | | | | 40,061 | |
Fujibo Holdings Inc. | | | 16,000 | | | | 47,617 | |
G-Tekt Corp. | | | 4,400 | | | | 67,834 | |
Geo Holdings Corp. | | | 24,000 | | | | 348,929 | |
Godo Steel Ltd. | | | 8,000 | | | | 13,504 | |
Heiwa Corp. | | | 1,600 | | | | 33,004 | |
Heiwado Co. Ltd. | | | 1,600 | | | | 31,130 | |
Hitachi Maxell Ltd. | | | 12,400 | | | | 209,318 | |
Hokkaido Electric Power Co. Inc. | | | 2,400 | | | | 19,109 | |
Hokuetsu Bank Ltd. (The) | | | 8,000 | | | | 16,783 | |
Hokuetsu Kishu Paper Co. Ltd. | | | 8,000 | | | | 56,828 | |
Hokuto Corp. | | | 1,600 | | | | 29,803 | |
Idemitsu Kosan Co. Ltd. | | | 22,581 | | | | 441,991 | |
IwaiCosmo Holdings Inc. | | | 3,200 | | | | 28,352 | |
J-Oil Mills Inc. | | | 16,000 | | | | 54,174 | |
Japan Petroleum Exploration Co. Ltd. | | | 1,600 | | | | 33,472 | |
Japan Rental Housing Investments Inc. | | | 16 | | | | 13,692 | |
Juki Corp. | | | 1,600 | | | | 13,942 | |
Kamei Corp. | | | 4,800 | | | | 39,389 | |
Kanamoto Co. Ltd. | | | 2,400 | | | | 50,372 | |
Kanematsu Corp. | | | 16,000 | | | | 26,384 | |
Kasai Kogyo Co. Ltd. | | | 800 | | | | 8,048 | |
Kenedix Residential Investment Corp. | | | 25 | | | | 67,986 | |
Kenedix Retail REIT Corp. | | | 16 | | | | 43,729 | |
KEY Coffee Inc. | | | 800 | | | | 15,378 | |
Kinugawa Rubber Industrial Co. Ltd. | | | 16,000 | | | | 121,462 | |
Kohnan Shoji Co. Ltd. | | | 20,800 | | | | 428,847 | |
Kura Corp. | | | 800 | | | | 42,387 | |
Life Corp. | | | 800 | | | | 23,613 | |
Maruha Nichiro Corp. | | | 17,800 | | | | 452,620 | |
MCUBS MidCity Investment Corp. | | | 8 | | | | 29,117 | |
Megachips Corp. | | | 6,400 | | | | 78,248 | |
Mimasu Semiconductor Industry Co. Ltd. | | | 1,600 | | | | 16,564 | |
Ministop Co. Ltd. | | | 1,600 | | | | 26,868 | |
Mitsubishi Steel Manufacturing Co. Ltd. | | | 16,000 | | | | 26,853 | |
Mixi Inc. | | | 10,484 | | | | 377,479 | |
Morinaga Milk Industry Co. Ltd. | | | 16,000 | | | | 118,964 | |
Murata Manufacturing Co. Ltd. | | | 302 | | | | 37,792 | |
Musashi Seimitsu Industry Co. Ltd. | | | 1,600 | | | | 33,160 | |
NEC Capital Solutions Ltd. | | | 800 | | | | 11,920 | |
Nichiha Corp. | | | 1,600 | | | | 31,271 | |
Nikkon Holdings Co. Ltd. | | | 1,600 | | | | 32,255 | |
| | | | |
SCHEDULESOF INVESTMENTS | | | 19 | |
Schedule of Investments (Continued)
iSHARES® ENHANCED INTERNATIONAL SMALL-CAP ETF
July 31, 2016
| | | | | | | | |
| Security | | Shares | | | Value | |
Nippon Coke & Engineering Co. Ltd. | | | 32,000 | | | $ | 20,920 | |
Nippon Koei Co. Ltd. | | | 8,000 | | | | 25,604 | |
Nippon Signal Co. Ltd. | | | 1,600 | | | | 15,394 | |
Nishimatsuya Chain Co. Ltd. | | | 6,400 | | | | 91,612 | |
Nissha Printing Co. Ltd. | | | 1,600 | | | | 31,911 | |
Nisshin OilliO Group Ltd. (The) | | | 16,000 | | | | 75,718 | |
Nisshin Steel Co. Ltd. | | | 1,600 | | | | 20,015 | |
Okinawa Electric Power Co. Inc. (The) | | | 3,600 | | | | 72,502 | |
Pacific Industrial Co. Ltd. | | | 4,800 | | | | 54,611 | |
Park24 Co. Ltd. | | | 806 | | | | 27,447 | |
Pioneer Corp.a | | | 4,000 | | | | 7,377 | |
Press Kogyo Co. Ltd. | | | 16,800 | | | | 62,620 | |
Prima Meat Packers Ltd. | | | 16,000 | | | | 51,051 | |
Riso Kagaku Corp. | | | 1,600 | | | | 23,262 | |
Round One Corp. | | | 2,400 | | | | 16,299 | |
Saizeriya Co. Ltd. | | | 2,400 | | | | 53,510 | |
Sanyo Shokai Ltd. | | | 16,000 | | | | 29,819 | |
Senshu Ikeda Holdings Inc. | | | 18,400 | | | | 80,613 | |
Shinko Electric Industries Co. Ltd. | | | 16,800 | | | | 93,438 | |
Showa Corp. | | | 1,600 | | | | 9,367 | |
Tachi-S Co. Ltd. | | | 1,600 | | | | 27,789 | |
Taiho Kogyo Co. Ltd. | | | 2,400 | | | | 25,924 | |
Taikisha Ltd. | | | 1,600 | | | | 43,495 | |
Takata Corp.a | | | 5,600 | | | | 22,840 | |
Tamron Co. Ltd. | | | 1,600 | | | | 23,402 | |
Tatsuta Electric Wire and Cable Co. Ltd. | | | 3,200 | | | | 10,460 | |
TOKAI Holdings Corp. | | | 6,400 | | | | 41,903 | |
Tokyo Seimitsu Co. Ltd. | | | 800 | | | | 19,055 | |
Tokyo TY Financial Group Inc. | | | 1,800 | | | | 47,632 | |
Topy Industries Ltd. | | | 16,000 | | | | 35,908 | |
Toridoll.corp. | | | 1,600 | | | | 46,914 | |
Towa Bank Ltd. (The) | | | 80,000 | | | | 71,035 | |
TPR Co. Ltd. | | | 1,600 | | | | 34,440 | |
Tsukuba Bank Ltd. | | | 5,600 | | | | 17,540 | |
UKC Holdings Corp. | | | 4,800 | | | | 76,343 | |
Unipres Corp. | | | 7,600 | | | | 125,400 | |
United Super Markets Holdings Inc. | | | 3,200 | | | | 30,943 | |
Warabeya Nichiyo Co. Ltd. | | | 2,400 | | | | 50,630 | |
Yahagi Construction Co. Ltd. | | | 1,600 | | | | 14,550 | |
Yellow Hat Ltd. | | | 1,600 | | | | 36,844 | |
Yorozu Corp. | | | 7,200 | | | | 113,320 | |
| | | | | | | | |
| | | | | | | 6,524,688 | |
NETHERLANDS — 1.02% | |
COSMO Pharmaceuticals NVa | | | 742 | | | | 119,847 | |
| | | | | | | | |
| Security | | Shares | | | Value | |
Delta Lloyd NV | | | 22,448 | | | $ | 80,203 | |
| | | | | | | | |
| | | | | | | 200,050 | |
NEW ZEALAND — 3.87% | | | | | | | | |
Air New Zealand Ltd. | | | 21,376 | | | | 34,070 | |
Fletcher Building Ltd. | | | 71,550 | | | | 500,022 | |
Ryman Healthcare Ltd. | | | 32,323 | | | | 222,157 | |
| | | | | | | | |
| | | | | | | 756,249 | |
NORWAY — 2.18% | | | | | | | | |
BW LPG Ltd.b | | | 1,272 | | | | 4,532 | |
REC Silicon ASAa | | | 267,856 | | | | 50,691 | |
TGS Nopec Geophysical Co. ASA | | | 22,335 | | | | 371,503 | |
| | | | | | | | |
| | | | | | | 426,726 | |
SINGAPORE — 1.75% | | | | | | | | |
AIMS AMP Capital Industrial REIT | | | 39,200 | | | | 42,904 | |
Cambridge Industrial Trust | | | 116,800 | | | | 47,830 | |
Chip Eng Seng Corp. Ltd. | | | 32,000 | | | | 15,010 | |
Ezion Holdings Ltd.a | | | 20,000 | | | | 4,467 | |
Far East Hospitality Trust | | | 40,000 | | | | 19,060 | |
First REIT | | | 24,000 | | | | 23,230 | |
k1 Ventures Ltd. | | | 14,640 | | | | 9,592 | |
Noble Group Ltd.a | | | 821,796 | | | | 99,122 | |
Perennial Real Estate Holdings Ltd. | | | 18,400 | | | | 11,919 | |
Yangzijiang Shipbuilding Holdings Ltd. | | | 7,200 | | | | 4,664 | |
Yanlord Land Group Ltd. | | | 72,000 | | | | 63,256 | |
| | | | | | | | |
| | | | | | | 341,054 | |
SPAIN — 0.14% | | | | | | | | |
Abengoa SA Class Ba | | | 43,864 | | | | 10,889 | |
Tubacex SA | | | 6,608 | | | | 17,402 | |
| | | | | | | | |
| | | | | | | 28,291 | |
SWEDEN — 1.97% | | | | | | | | |
Bure Equity AB | | | 4,114 | | | | 42,305 | |
Haldex AB | | | 1,936 | | | | 23,878 | |
Hemfosa Fastigheter AB | | | 1,694 | | | | 18,214 | |
Industrial & Financial Systems Class B | | | 742 | | | | 31,607 | |
Industrivarden AB Class C | | | 2,887 | | | | 48,718 | |
Modern Times Group MTG AB Class B | | | 1,282 | | | | 33,517 | |
NetEnt AB | | | 1,104 | | | | 9,373 | |
Nolato AB Class B | | | 2,819 | | | | 76,145 | |
Peab AB | | | 3,870 | | | | 31,202 | |
Sweco AB Class B | | | 1,815 | | | | 33,393 | |
Tethys Oil AB | | | 5,638 | | | | 37,164 | |
| | | | | | | | |
| | | | | | | 385,516 | |
SWITZERLAND — 3.10% | | | | | | | | |
Autoneum Holding AG | | | 734 | | | | 207,338 | |
| | |
| 20 | | 2016 iSHARES ANNUAL REPORTTO SHAREHOLDERS |
Schedule of Investments (Continued)
iSHARES® ENHANCED INTERNATIONAL SMALL-CAP ETF
July 31, 2016
| | | | | | | | |
| Security | | Shares | | | Value | |
BKW AG | | | 1,432 | | | $ | 65,936 | |
Emmi AG | | | 136 | | | | 87,951 | |
Intershop Holdings AG | | | 112 | | | | 55,047 | |
Mobilezone Holding AG | | | 5,050 | | | | 65,055 | |
St Galler Kantonalbank AG Registered | | | 128 | | | | 52,745 | |
Swissquote Group Holding SA Registered | | | 480 | | | | 11,920 | |
Vetropack Holding AG Bearer | | | 16 | | | | 25,247 | |
Zehnder Group AGa | | | 864 | | | | 33,525 | |
| | | | | | | | |
| | | | | | | 604,764 | |
UNITED KINGDOM — 10.63% | | | | | | | | |
Beazley PLC | | | 18,064 | | | | 95,047 | |
Berendsen PLC | | | 6,936 | | | | 117,598 | |
BGEO Group PLC | | | 560 | | | | 20,305 | |
Big Yellow Group PLC | | | 2,192 | | | | 20,663 | |
Cape PLC | | | 7,224 | | | | 17,840 | |
Carillion PLC | | | 3,280 | | | | 11,614 | |
Centamin PLC | | | 92,384 | | | | 203,490 | |
Chesnara PLC | | | 3,424 | | | | 14,218 | |
Dairy Crest Group PLC | | | 9,440 | | | | 75,577 | |
Dart Group PLC | | | 22,724 | | | | 146,328 | |
Debenhams PLC | | | 240,616 | | | | 179,061 | |
Devro PLC | | | 3,896 | | | | 14,665 | |
Entertainment One Ltd. | | | 19,644 | | | | 51,458 | |
Fenner PLC | | | 4,584 | | | | 9,799 | |
FirstGroup PLCa | | | 23,232 | | | | 30,938 | |
Go-Ahead Group PLC | | | 5,606 | | | | 136,060 | |
Greencore Group PLC | | | 4,872 | | | | 21,191 | |
Greggs PLC | | | 5,688 | | | | 78,087 | |
GVC Holdings PLC | | | 1,827 | | | | 15,306 | |
Halfords Group PLC | | | 2,656 | | | | 12,430 | |
Intermediate Capital Group PLC | | | 2,548 | | | | 19,384 | |
Kcom Group PLC | | | 12,088 | | | | 17,654 | |
Laird PLC | | | 3,696 | | | | 14,393 | |
Lancashire Holdings Ltd. | | | 24,856 | | | | 198,833 | |
LondonMetric Property PLC | | | 12,568 | | | | 26,999 | |
Mitie Group PLC | | | 27,560 | | | | 91,003 | |
Moneysupermarket.com Group PLC | | | 6,776 | | | | 26,855 | |
Morgan Advanced Materials PLC | | | 3,616 | | | | 13,155 | |
Northgate PLC | | | 41,243 | | | | 209,177 | |
Paragon Group of Companies PLC (The) | | | 5,624 | | | | 20,362 | |
Paysafe Group PLCa | | | 10,352 | | | | 53,053 | |
QinetiQ Group PLC | | | 8,176 | | | | 24,392 | |
Restaurant Group PLC (The) | | | 1,888 | | | | 8,879 | |
| | | | | | | | |
| Security | | Shares | | | Value | |
Savills PLC | | | 1,000 | | | $ | 9,281 | |
Shanks Group PLC | | | 15,064 | | | | 21,101 | |
Speedy Hire PLC | | | 19,048 | | | | 8,725 | |
Trinity Mirror PLC | | | 12,200 | | | | 12,148 | |
TT electronics PLC | | | 9,400 | | | | 16,817 | |
Vesuvius PLC | | | 2,768 | | | | 13,524 | |
| | | | | | | | |
| | | | | | | 2,077,410 | |
| | | | | | | | |
TOTAL COMMON STOCKS
(Cost: $17,176,899) | | | | | | | 19,157,771 | |
|
PREFERRED STOCKS — 1.19% | |
| | |
ITALY — 1.19% | | | | | | | | |
Intesa Sanpaolo SpA | | | 111,592 | | | | 232,605 | |
| | | | | | | | |
| | | | | | | 232,605 | |
| | | | | | | | |
TOTAL PREFERRED STOCKS
(Cost: $350,024) | | | | | | | 232,605 | |
|
SHORT-TERM INVESTMENTS — 0.11% | |
| | |
MONEY MARKET FUNDS — 0.11% | | | | | | | | |
BlackRock Cash Funds: Treasury,
SL Agency Shares | | | | | | | | |
0.28%c,d | | | 21,793 | | | | 21,793 | |
| | | | | | | | |
| | | | | | | 21,793 | |
| | | | | | | | |
TOTAL SHORT-TERM INVESTMENTS
(Cost: $21,793) | | | | 21,793 | |
| | | | | | | | |
TOTAL INVESTMENTS
IN SECURITIES — 99.35%
(Cost: $17,548,716)e | | | | 19,412,169 | |
Other Assets, Less Liabilities — 0.65% | | | | 126,164 | |
| | | | | | | | |
NET ASSETS — 100.00% | | | | | | $ | 19,538,333 | |
| | | | | | | | |
| a | Non-income earning security. |
| b | This security may be resold to qualified institutional buyers under Rule 144A of the Securities Act of 1933. |
| c | Affiliated money market fund. |
| d | The rate quoted is the annualized seven-day yield of the fund at period end. |
| e | The cost of investments for federal income tax purposes was $17,722,610. Net unrealized appreciation was $1,689,559, of which $3,449,467 represented gross unrealized appreciation on securities and $1,759,908 represented gross unrealized depreciation on securities. |
| | | | |
SCHEDULESOF INVESTMENTS | | | 21 | |
Schedule of Investments (Continued)
iSHARES® ENHANCED INTERNATIONAL SMALL-CAP ETF
July 31, 2016
Schedule 1 — Fair Value Measurements
Various inputs are used in determining the fair value of financial instruments. For description of the input levels and information about the Fund’s policy regarding valuation of financial instruments, see Note 1.
The following table summarizes the value of the Fund’s investments according to the fair value hierarchy as of July 31, 2016. The breakdown of the Fund’s investments into major categories is disclosed in the schedule of investments above.
| | | | | | | | | | | | | | | | |
| | | Level 1 | | | Level 2 | | | Level 3 | | | Total | |
Investments: | | | | | | | | | | | | | | | | |
Assets: | | | | | | | | | | | | | | | | |
Common stocks | | $ | 19,157,771 | | | $ | — | | | $ | — | | | $ | 19,157,771 | |
Preferred stocks | | | 232,605 | | | | — | | | | — | | | | 232,605 | |
Money market funds | | | 21,793 | | | | — | | | | — | | | | 21,793 | |
| | | | | | | | | | | | | | | | |
Total | | $ | 19,412,169 | | | $ | — | | | $ | — | | | $ | 19,412,169 | |
| | | | | | | | | | | | | | | | |
| | | | | | | | | | | | | | | | | |
See notes to financial statements.
| | |
| 22 | | 2016 iSHARES ANNUAL REPORTTO SHAREHOLDERS |
Schedule of Investments
iSHARES® ENHANCED U.S. LARGE-CAP ETF
July 31, 2016
| | | | | | | | |
| Security | | Shares | | | Value | |
COMMON STOCKS — 97.83% | |
| | |
AEROSPACE & DEFENSE — 2.01% | | | | | | | | |
General Dynamics Corp. | | | 6,133 | | | $ | 900,876 | |
L-3 Communications Holdings Inc. | | | 2,932 | | | | 444,579 | |
| | | | | | | | |
| | | | | | | 1,345,455 | |
AIR FREIGHT & LOGISTICS — 1.50% | | | | | | | | |
FedEx Corp. | | | 6,210 | | | | 1,005,399 | |
| | | | | | | | |
| | | | | | | 1,005,399 | |
AIRLINES — 0.34% | | | | | | | | |
Allegiant Travel Co. | | | 1,724 | | | | 223,723 | |
| | | | | | | | |
| | | | | | | 223,723 | |
BANKS — 1.81% | | | | | | | | |
Commerce Bancshares Inc./MO | | | 7,268 | | | | 343,704 | |
JPMorgan Chase & Co. | | | 13,510 | | | | 864,234 | |
| | | | | | | | |
| | | | | | | 1,207,938 | |
BEVERAGES — 0.20% | | | | | | | | |
Molson Coors Brewing Co. | | | 588 | | | | 60,070 | |
PepsiCo Inc. | | | 669 | | | | 72,868 | |
| | | | | | | | |
| | | | | | | 132,938 | |
COMMUNICATIONS EQUIPMENT — 2.84% | | | | | |
Cisco Systems Inc. | | | 43,548 | | | | 1,329,521 | |
F5 Networks Inc.a | | | 4,622 | | | | 570,447 | |
| | | | | | | | |
| | | | | | | 1,899,968 | |
CONSTRUCTION & ENGINEERING — 0.79% | |
Jacobs Engineering Group Inc.a | | | 1,560 | | | | 83,491 | |
Quanta Services Inc.a | | | 17,492 | | | | 447,795 | |
| | | | | | | | |
| | | | | | | 531,286 | |
DIVERSIFIED FINANCIAL SERVICES — 2.31% | |
Berkshire Hathaway Inc. Class Ba | | | 767 | �� | | | 110,655 | |
CBOE Holdings Inc. | | | 14,371 | | | | 988,725 | |
CME Group Inc. | | | 2,245 | | | | 229,529 | |
FactSet Research Systems Inc. | | | 265 | | | | 45,569 | |
Nasdaq Inc. | | | 2,405 | | | | 170,178 | |
| | | | | | | | |
| | | | | | | 1,544,656 | |
DIVERSIFIED TELECOMMUNICATION SERVICES — 2.11% | |
AT&T Inc. | | | 32,559 | | | | 1,409,479 | |
| | | | | | | | |
| | | | | | | 1,409,479 | |
ELECTRIC UTILITIES — 2.00% | |
Alliant Energy Corp. | | | 6,162 | | | | 248,020 | |
Great Plains Energy Inc. | | | 2,847 | | | | 84,784 | |
PG&E Corp. | | | 13,763 | | | | 880,006 | |
Xcel Energy Inc. | | | 2,816 | | | | 123,848 | |
| | | | | | | | |
| | | | | | | 1,336,658 | |
| | | | | | | | |
| Security | | Shares | | | Value | |
ELECTRICAL EQUIPMENT — 0.06% | | | | | | | | |
Regal Beloit Corp. | | | 650 | | | $ | 39,656 | |
| | | | | | | | |
| | | | | | | 39,656 | |
ELECTRONIC EQUIPMENT, INSTRUMENTS & COMPONENTS — 4.46% | |
Arrow Electronics Inc.a | | | 1,051 | | | | 69,881 | |
Avnet Inc. | | | 1,879 | | | | 77,227 | |
Corning Inc. | | | 60,589 | | | | 1,346,288 | |
Ingram Micro Inc. Class A | | | 37,544 | | | | 1,285,506 | |
Jabil Circuit Inc. | | | 10,082 | | | | 205,169 | |
| | | | | | | | |
| | | | | | | 2,984,071 | |
ENERGY EQUIPMENT & SERVICES — 3.61% | |
Helmerich & Payne Inc. | | | 6,377 | | | | 395,182 | |
National Oilwell Varco Inc. | | | 22,434 | | | | 725,740 | |
Schlumberger Ltd. | | | 16,088 | | | | 1,295,406 | |
| | | | | | | | |
| | | | | | | 2,416,328 | |
FOOD & STAPLES RETAILING — 2.21% | |
CVS Health Corp. | | | 1,521 | | | | 141,027 | |
Wal-Mart Stores Inc. | | | 18,358 | | | | 1,339,583 | |
| | | | | | | | |
| | | | | | | 1,480,610 | |
FOOD PRODUCTS — 2.22% | | | | | | | | |
Archer-Daniels-Midland Co. | | | 24,762 | | | | 1,116,271 | |
Hormel Foods Corp. | | | 3,454 | | | | 129,007 | |
JM Smucker Co. (The) | | | 713 | | | | 109,916 | |
Tyson Foods Inc. Class A | | | 1,751 | | | | 128,874 | |
| | | | | | | | |
| | | | | | | 1,484,068 | |
GAS UTILITIES — 0.58% | | | | | | | | |
Atmos Energy Corp. | | | 4,527 | | | | 361,210 | |
Piedmont Natural Gas Co. Inc. | | | 494 | | | | 29,541 | |
| | | | | | | | |
| | | | | | | 390,751 | |
HEALTH CARE EQUIPMENT & SUPPLIES — 3.39% | |
Abbott Laboratories | | | 3,823 | | | | 171,079 | |
Becton Dickinson and Co. | | | 1,411 | | | | 248,336 | |
CR Bard Inc. | | | 6,595 | | | | 1,475,500 | |
Medtronic PLC | | | 4,219 | | | | 369,711 | |
| | | | | | | | |
| | | | | | | 2,264,626 | |
HEALTH CARE PROVIDERS & SERVICES — 3.98% | |
Aetna Inc. | | | 1,048 | | | | 120,740 | |
AmerisourceBergen Corp. | | | 10,931 | | | | 931,212 | |
Anthem Inc. | | | 9,418 | | | | 1,236,960 | |
Cardinal Health Inc. | | | 977 | | | | 81,677 | |
Cigna Corp. | | | 269 | | | | 34,691 | |
UnitedHealth Group Inc. | | | 1,781 | | | | 255,039 | |
| | | | | | | | |
| | | | | | | 2,660,319 | |
| | | | |
SCHEDULESOF INVESTMENTS | | | 23 | |
Schedule of Investments (Continued)
iSHARES® ENHANCED U.S. LARGE-CAP ETF
July 31, 2016
| | | | | | | | |
| Security | | Shares | | | Value | |
HOTELS, RESTAURANTS & LEISURE — 1.62% | |
Carnival Corp. | | | 19,433 | | | $ | 907,910 | |
Panera Bread Co. Class Aa | | | 807 | | | | 176,991 | |
| | | | | | | | |
| | | | | | | 1,084,901 | |
HOUSEHOLD PRODUCTS — 0.85% | |
Procter & Gamble Co. (The) | | | 6,645 | | | | 568,746 | |
| | | | | | | | |
| | | | | | | 568,746 | |
INSURANCE — 14.02% | | | | | | | | |
Aflac Inc. | | | 19,188 | | | | 1,386,909 | |
Allied World Assurance Co. Holdings AG | | | 20,292 | | | | 831,769 | |
American Financial Group Inc./OH | | | 3,058 | | | | 223,540 | |
Axis Capital Holdings Ltd. | | | 16,712 | | | | 928,853 | |
Chubb Ltd. | | | 10,183 | | | | 1,275,522 | |
Lincoln National Corp. | | | 4,690 | | | | 204,812 | |
Loews Corp. | | | 31,064 | | | | 1,283,875 | |
MetLife Inc. | | | 7,547 | | | | 322,559 | |
Principal Financial Group Inc. | | | 4,644 | | | | 216,550 | |
Prudential Financial Inc. | | | 6,774 | | | | 510,014 | |
Reinsurance Group of America Inc. | | | 14,191 | | | | 1,408,457 | |
Torchmark Corp. | | | 6,061 | | | | 374,994 | |
Travelers Companies Inc. (The) | | | 2,550 | | | | 296,361 | |
Validus Holdings Ltd. | | | 2,218 | | | | 109,636 | |
| | | | | | | | |
| | | | | | | 9,373,851 | |
INTERNET & CATALOG RETAIL — 2.12% | |
Amazon.com Inc.a | | | 1,866 | | | | 1,415,939 | |
| | | | | | | | |
| | | | | | | 1,415,939 | |
INTERNET SOFTWARE & SERVICES — 3.33% | |
Akamai Technologies Inc.a | | | 1,326 | | | | 67,003 | |
Alphabet Inc. Class Aa | | | 955 | | | | 755,730 | |
Alphabet Inc. Class Ca | | | 995 | | | | 764,946 | |
eBay Inc.a | | | 20,589 | | | | 641,553 | |
| | | | | | | | |
| | | | | | | 2,229,232 | |
IT SERVICES — 5.54% | | | | | | | | |
Amdocs Ltd. | | | 13,319 | | | | 777,297 | |
Automatic Data Processing Inc. | | | 1,774 | | | | 157,797 | |
Jack Henry & Associates Inc. | | | 315 | | | | 28,114 | |
PayPal Holdings Inc.a | | | 19,198 | | | | 714,933 | |
Teradata Corp.a | | | 47,131 | | | | 1,337,578 | |
Total System Services Inc. | | | 11,115 | | | | 565,976 | |
Xerox Corp. | | | 12,224 | | | | 125,907 | |
| | | | | | | | |
| | | | | | | 3,707,602 | |
MACHINERY — 0.28% | | | | | | | | |
AGCO Corp. | | | 3,881 | | | | 186,909 | |
| | | | | | | | |
| | | | | | | 186,909 | |
| | | | | | | | |
| Security | | Shares | | | Value | |
MULTI-UTILITIES — 4.39% | | | | | | | | |
Consolidated Edison Inc. | | | 14,669 | | | $ | 1,174,693 | |
DTE Energy Co. | | | 13,221 | | | | 1,289,312 | |
Public Service Enterprise Group Inc. | | | 10,266 | | | | 472,339 | |
| | | | | | | | |
| | | | | | | 2,936,344 | |
MULTILINE RETAIL — 2.32% | | | | | | | | |
Nordstrom Inc. | | | 23,724 | | | | 1,049,312 | |
Target Corp. | | | 6,699 | | | | 504,636 | |
| | | | | | | | |
| | | | | | | 1,553,948 | |
OIL, GAS & CONSUMABLE FUELS — 0.62% | |
California Resources Corp. | | | 17 | | | | 175 | |
Chevron Corp. | | | 3,655 | | | | 374,564 | |
Occidental Petroleum Corp. | | | 504 | | | | 37,664 | |
| | | | | | | | |
| | | | | | | 412,403 | |
PHARMACEUTICALS — 5.02% | | | | | | | | |
Eli Lilly & Co. | | | 2,760 | | | | 228,776 | |
Johnson & Johnson | | | 12,720 | | | | 1,592,926 | |
Merck & Co. Inc. | | | 9,665 | | | | 566,949 | |
Pfizer Inc. | | | 26,155 | | | | 964,858 | |
| | | | | | | | |
| | | | | | | 3,353,509 | |
SEMICONDUCTORS & SEMICONDUCTOR EQUIPMENT — 2.14% | |
Intel Corp. | | | 39,358 | | | | 1,372,020 | |
Maxim Integrated Products Inc. | | | 1,482 | | | | 60,436 | |
| | | | | | | | |
| | | | | | | 1,432,456 | |
SOFTWARE — 7.26% | | | | | | | | |
Citrix Systems Inc.a | | | 5,227 | | | | 465,883 | |
Intuit Inc. | | | 12,656 | | | | 1,404,689 | |
Microsoft Corp. | | | 23,152 | | | | 1,312,255 | |
Red Hat Inc.a | | | 800 | | | | 60,232 | |
VMware Inc. Class Aa | | | 22,059 | | | | 1,609,866 | |
| | | | | | | | |
| | | | | | | 4,852,925 | |
SPECIALTY RETAIL — 5.58% | | | | | | | | |
Bed Bath & Beyond Inc. | | | 5,809 | | | | 261,115 | |
GameStop Corp. Class A | | | 15,736 | | | | 487,029 | |
O’Reilly Automotive Inc.a | | | 4,527 | | | | 1,315,682 | |
Ross Stores Inc. | | | 4,544 | | | | 280,956 | |
TJX Companies Inc. (The) | | | 16,938 | | | | 1,384,173 | |
| | | | | | | | |
| | | | | | | 3,728,955 | |
TECHNOLOGY HARDWARE, STORAGE & PERIPHERALS — 4.95% | |
Apple Inc. | | | 12,197 | | | | 1,271,049 | |
EMC Corp. | | | 47,417 | | | | 1,340,953 | |
| | |
| 24 | | 2016 iSHARES ANNUAL REPORTTO SHAREHOLDERS |
Schedule of Investments (Continued)
iSHARES® ENHANCED U.S. LARGE-CAP ETF
July 31, 2016
| | | | | | | | |
| Security | | Shares | | | Value | |
Western Digital Corp. | | | 14,727 | | | $ | 699,680 | |
| | | | | | | | |
| | | | | | | 3,311,682 | |
TEXTILES, APPAREL & LUXURY GOODS — 1.37% | |
Coach Inc. | | | 6,371 | | | | 274,654 | |
NIKE Inc. Class B | | | 11,525 | | | | 639,637 | |
| | | | | | | | |
| | | | | | | 914,291 | |
| | | | | | | | |
TOTAL COMMON STOCKS
(Cost: $58,057,383) | | | | | | | 65,421,622 | |
|
SHORT-TERM INVESTMENTS — 0.06% | |
| | |
MONEY MARKET FUNDS — 0.06% | | | | | | | | |
BlackRock Cash Funds: Treasury,
SL Agency Shares | | | | | | | | |
0.28%b,c | | | 40,468 | | | | 40,468 | |
| | | | | | | | |
| | | | | | | 40,468 | |
| | | | | | | | |
TOTAL SHORT-TERM INVESTMENTS
(Cost: $40,468) | | | | | | | 40,468 | |
| | | | | | | | |
| | | | | | | | |
| | | | | | Value | |
TOTAL INVESTMENTS
IN SECURITIES — 97.89%
(Cost: $58,097,851)d | | | $ | 65,462,090 | |
Other Assets, Less Liabilities — 2.11% | | | | 1,410,681 | |
| | | | | | | | |
NET ASSETS — 100.00% | | | | | | $ | 66,872,771 | |
| | | | | | | | |
| a | Non-income earning security. |
| b | Affiliated money market fund. |
| c | The rate quoted is the annualized seven-day yield of the fund at period end. |
| d | The cost of investments for federal income tax purposes was $58,167,422. Net unrealized appreciation was $7,294,668, of which $9,564,217 represented gross unrealized appreciation on securities and $2,269,549 represented gross unrealized depreciation on securities. |
Schedule 1 — Fair Value Measurements
Various inputs are used in determining the fair value of financial instruments. For description of the input levels and information about the Fund’s policy regarding valuation of financial instruments, see Note 1.
The following table summarizes the value of the Fund’s investments according to the fair value hierarchy as of July 31, 2016. The breakdown of the Fund’s investments into major categories is disclosed in the schedule of investments above.
| | | | | | | | | | | | | | | | |
| | | Level 1 | | | Level 2 | | | Level 3 | | | Total | |
Investments: | | | | | | | | | | | | | | | | |
Assets: | | | | | | | | | | | | | | | | |
Common stocks | | $ | 65,421,622 | | | $ | — | | | $ | — | | | $ | 65,421,622 | |
Money market funds | | | 40,468 | | | | — | | | | — | | | | 40,468 | |
| | | | | | | | | | | | | | | | |
Total | | $ | 65,462,090 | | | $ | — | | | $ | — | | | $ | 65,462,090 | |
| | | | | | | | | | | | | | | | |
| | | | | | | | | | | | | | | | | |
See notes to financial statements.
| | | | |
SCHEDULESOF INVESTMENTS | | | 25 | |
Schedule of Investments
iSHARES® ENHANCED U.S. SMALL-CAP ETF
July 31, 2016
| | | | | | | | |
| Security | | Shares | | | Value | |
COMMON STOCKS — 99.47% | | | | | | | | |
| | |
AEROSPACE & DEFENSE — 1.81% | | | | | | | | |
BWX Technologies Inc. | | | 7,434 | | | $ | 273,645 | |
KLX Inc.a | | | 2,587 | | | | 83,560 | |
National Presto Industries Inc. | | | 1,003 | | | | 89,809 | |
| | | | | | | | |
| | | | | | | 447,014 | |
BANKS — 4.36% | | | | | | | | |
1st Source Corp. | | | 624 | | | | 20,973 | |
American National Bankshares Inc. | | | 899 | | | | 23,608 | |
Arrow Financial Corp. | | | 1,163 | | | | 36,739 | |
BancFirst Corp. | | | 247 | | | | 16,196 | |
Bank of Marin Bancorp. | | | 457 | | | | 22,658 | |
Camden National Corp. | | | 350 | | | | 15,218 | |
City Holding Co. | | | 437 | | | | 20,408 | |
CNB Financial Corp./PA | | | 899 | | | | 16,586 | |
Community Trust Bancorp. Inc. | | | 1,356 | | | | 47,162 | |
First Financial Corp./IN | | | 1,098 | | | | 42,053 | |
First Interstate BancSystem Inc. | | | 14,372 | | | | 417,363 | |
First of Long Island Corp. (The) | | | 640 | | | | 19,424 | |
Great Southern Bancorp. Inc. | | | 503 | | | | 19,718 | |
Great Western Bancorp. Inc. | | | 1,103 | | | | 36,586 | |
Heritage Financial Corp./WA | | | 2,486 | | | | 43,405 | |
Horizon Bancorp./IN | | | 767 | | | | 21,108 | |
Lakeland Financial Corp. | | | 636 | | | | 32,659 | |
Merchants Bancshares Inc./VT | | | 503 | | | | 15,985 | |
S&T Bancorp. Inc. | | | 548 | | | | 13,968 | |
State Bank Financial Corp. | | | 986 | | | | 21,574 | |
Stock Yards Bancorp. Inc. | | | 1,255 | | | | 37,073 | |
Tompkins Financial Corp. | | | 254 | | | | 18,476 | |
Triumph Bancorp. Inc.a | | | 1,479 | | | | 25,838 | |
Trustmark Corp. | | | 2,118 | | | | 55,280 | |
Univest Corp. of Pennsylvania | | | 747 | | | | 15,754 | |
WesBanco Inc. | | | 690 | | | | 21,335 | |
| | | | | | | | |
| | | | | | | 1,077,147 | |
BIOTECHNOLOGY — 0.06% | | | | | | | | |
Kite Pharma Inc.a | | | 256 | | | | 14,497 | |
| | | | | | | | |
| | | | | | | 14,497 | |
BUILDING PRODUCTS — 0.06% | | | | | | | | |
AAON Inc. | | | 574 | | | | 15,200 | |
| | | | | | | | |
| | | | | | | 15,200 | |
CAPITAL MARKETS — 2.32% | | | | | | | | |
Artisan Partners Asset Management Inc. | | | 1,159 | | | | 32,406 | |
Diamond Hill Investment Group Inc. | | | 826 | | | | 157,758 | |
| | | | | | | | |
| Security | | Shares | | | Value | |
GAMCO Investors Inc. Class A | | | 421 | | | $ | 14,373 | |
Greenhill & Co. Inc. | | | 617 | | | | 12,235 | |
Houlihan Lokey Inc. | | | 1,507 | | | | 34,555 | |
Moelis & Co. Class A | | | 3,920 | | | | 97,569 | |
WisdomTree Investments Inc. | | | 22,442 | | | | 223,073 | |
| | | | | | | | |
| | | | | | | 571,969 | |
CHEMICALS — 1.74% | | | | | | | | |
Axiall Corp. | | | 3,432 | | | | 112,055 | |
Cabot Corp. | | | 5,719 | | | | 278,458 | |
Hawkins Inc. | | | 886 | | | | 37,868 | |
| | | | | | | | |
| | | | | | | 428,381 | |
COMMERCIAL SERVICES & SUPPLIES — 2.07% | |
Ennis Inc. | | | 19,406 | | | | 336,112 | |
Kimball International Inc. Class B | | | 4,513 | | | | 51,403 | |
McGrath RentCorp | | | 671 | | | | 21,385 | |
Quad/Graphics Inc. | | | 1,656 | | | | 41,996 | |
UniFirst Corp./MA | | | 208 | | | | 24,311 | |
VSE Corp. | | | 564 | | | | 35,848 | |
| | | | | | | | |
| | | | | | | 511,055 | |
COMMUNICATIONS EQUIPMENT — 1.51% | |
Black Box Corp. | | | 1,660 | | | | 22,659 | |
EchoStar Corp. Class Aa | | | 8,282 | | | | 322,584 | |
NETGEAR Inc.a | | | 535 | | | | 27,515 | |
| | | | | | | | |
| | | | | | | 372,758 | |
CONSTRUCTION & ENGINEERING — 0.20% | |
MasTec Inc.a | | | 2,021 | | | | 49,413 | |
| | | | | | | | |
| | | | | | | 49,413 | |
CONSUMER FINANCE — 2.41% | | | | | | | | |
Cash America International Inc. | | | 12,184 | | | | 522,084 | |
Ezcorp Inc. Class Aa | | | 7,968 | | | | 72,190 | |
| | | | | | | | |
| | | | | | | 594,274 | |
DISTRIBUTORS — 0.19% | | | | | | | | |
Core-Mark Holding Co. Inc. | | | 958 | | | | 46,904 | |
| | | | | | | | |
| | | | | | | 46,904 | |
DIVERSIFIED CONSUMER SERVICES — 0.80% | |
Apollo Education Group Inc.a | | | 5,926 | | | | 53,275 | |
Capella Education Co. | | | 2,076 | | | | 124,290 | |
Strayer Education Inc.a | | | 447 | | | | 20,437 | |
| | | | | | | | |
| | | | | | | 198,002 | |
DIVERSIFIED TELECOMMUNICATION SERVICES — 0.15% | |
Inteliquent Inc. | | | 1,803 | | | | 37,052 | |
| | | | | | | | |
| | | | | | | 37,052 | |
| | |
| 26 | | 2016 iSHARES ANNUAL REPORTTO SHAREHOLDERS |
Schedule of Investments (Continued)
iSHARES® ENHANCED U.S. SMALL-CAP ETF
July 31, 2016
| | | | | | | | |
| Security | | Shares | | | Value | |
ELECTRIC UTILITIES — 2.79% | | | | | | | | |
ALLETE Inc. | | | 311 | | | $ | 19,858 | |
El Paso Electric Co. | | | 6,524 | | | | 311,064 | |
Empire District Electric Co. (The) | | | 5,607 | | | | 189,124 | |
MGE Energy Inc. | | | 2,981 | | | | 167,383 | |
| | | | | | | | |
| | | | | | | 687,429 | |
ELECTRONIC EQUIPMENT, INSTRUMENTS & COMPONENTS — 2.60% | |
AVX Corp. | | | 1,679 | | | | 22,935 | |
Benchmark Electronics Inc.a | | | 4,537 | | | | 106,347 | |
Dolby Laboratories Inc. Class A | | | 5,002 | | | | 251,651 | |
Mesa Laboratories Inc. | | | 148 | | | | 17,113 | |
Methode Electronics Inc. | | | 1,046 | | | | 36,642 | |
PC Connection Inc. | | | 834 | | | | 21,526 | |
ScanSource Inc.a | | | 623 | | | | 25,562 | |
Tech Data Corp.a | | | 1,709 | | | | 133,182 | |
TTM Technologies Inc.a | | | 2,575 | | | | 25,621 | |
| | | | | | | | |
| | | | | | | 640,579 | |
ENERGY EQUIPMENT & SERVICES — 3.90% | |
C&J Energy Services Ltd.a | | | 19,392 | | | | 7,175 | |
Diamond Offshore Drilling Inc. | | | 3,292 | | | | 74,794 | |
Key Energy Services Inc.a | | | 27,140 | | | | 1,927 | |
Matrix Service Co.a | | | 4,650 | | | | 77,051 | |
Natural Gas Services Group Inc.a | | | 1,006 | | | | 25,261 | |
Oil States International Inc.a | | | 7,501 | | | | 231,931 | |
Patterson-UTI Energy Inc. | | | 1,024 | | | | 19,855 | |
Rowan Companies PLC Class A | | | 1,767 | | | | 26,929 | |
RPC Inc.a | | | 10,682 | | | | 154,782 | |
Superior Energy Services Inc. | | | 15,792 | | | | 252,198 | |
Unit Corp.a | | | 7,324 | | | | 91,550 | |
| | | | | | | | |
| | | | | | | 963,453 | |
FOOD & STAPLES RETAILING — 0.47% | |
SpartanNash Co. | | | 2,592 | | | | 81,648 | |
Weis Markets Inc. | | | 672 | | | | 34,722 | |
| | | | | | | | |
| | | | | | | 116,370 | |
FOOD PRODUCTS — 1.04% | | | | | | | | |
Fresh Del Monte Produce Inc. | | | 3,418 | | | | 194,313 | |
Omega Protein Corp.a | | | 2,730 | | | | 61,480 | |
| | | | | | | | |
| | | | | | | 255,793 | |
GAS UTILITIES — 2.05% | | | | | | | | |
Chesapeake Utilities Corp. | | | 2,865 | | | | 183,560 | |
New Jersey Resources Corp. | | | 1,537 | | | | 57,238 | |
Northwest Natural Gas Co. | | | 2,613 | | | | 169,688 | |
ONE Gas Inc. | | | 1,481 | | | | 96,206 | |
| | | | | | | | |
| | | | | | | 506,692 | |
| | | | | | | | |
| Security | | Shares | | | Value | |
HEALTH CARE EQUIPMENT & SUPPLIES — 3.14% | |
CryoLife Inc. | | | 1,478 | | | $ | 21,534 | |
Exactech Inc.a | | | 743 | | | | 20,083 | |
Halyard Health Inc.a | | | 3,239 | | | | 112,037 | |
Hill-Rom Holdings Inc. | | | 6,643 | | | | 354,936 | |
ICU Medical Inc.a | | | 1,247 | | | | 145,600 | |
Vascular Solutions Inc.a | | | 2,659 | | | | 121,968 | |
| | | | | | | | |
| | | | | | | 776,158 | |
HEALTH CARE PROVIDERS & SERVICES — 3.18% | |
Addus HomeCare Corp.a | | | 1,327 | | | | 25,027 | |
Almost Family Inc.a | | | 1,010 | | | | 40,188 | |
BioTelemetry Inc.a | | | 2,152 | | | | 40,931 | |
LHC Group Inc.a | | | 1,799 | | | | 81,423 | |
Magellan Health Inc.a | | | 1,964 | | | | 134,475 | |
Triple-S Management Corp. Class Ba | | | 17,363 | | | | 431,471 | |
U.S. Physical Therapy Inc. | | | 518 | | | | 30,883 | |
| | | | | | | | |
| | | | | | | 784,398 | |
HEALTH CARE TECHNOLOGY — 0.06% | |
Quality Systems Inc. | | | 1,175 | | | | 14,429 | |
| | | | | | | | |
| | | | | | | 14,429 | |
HOTELS, RESTAURANTS & LEISURE — 3.81% | |
Bob Evans Farms Inc./DE | | | 1,355 | | | | 49,837 | |
Cheesecake Factory Inc. (The) | | | 2,793 | | | | 144,482 | |
Hyatt Hotels Corp. Class Aa | | | 9,729 | | | | 490,731 | |
Red Robin Gourmet Burgers Inc.a | | | 273 | | | | 13,202 | |
Texas Roadhouse Inc. | | | 5,136 | | | | 242,522 | |
| | | | | | | | |
| | | | | | | 940,774 | |
HOUSEHOLD DURABLES — 0.24% | | | | | | | | |
CSS Industries Inc. | | | 2,241 | | | | 58,961 | |
| | | | | | | | |
| | | | | | | 58,961 | |
INSURANCE — 8.11% | | | | | | | | |
American National Insurance Co. | | | 4,287 | | | | 490,218 | |
Aspen Insurance Holdings Ltd. | | | 5,121 | | | | 235,361 | |
EMC Insurance Group Inc. | | | 1,846 | | | | 51,190 | |
FBL Financial Group Inc. Class A | | | 1,099 | | | | 68,545 | |
Fidelity & Guaranty Life | | | 776 | | | | 16,963 | |
HCI Group Inc. | | | 502 | | | | 15,140 | |
Heritage Insurance Holdings Inc. | | | 20,340 | | | | 252,013 | |
Horace Mann Educators Corp. | | | 7,582 | | | | 259,153 | |
Kansas City Life Insurance Co. | | | 1,894 | | | | 73,771 | |
Maiden Holdings Ltd. | | | 11,239 | | | | 157,009 | |
National Western Life Group Inc. | | | 478 | | | | 90,409 | |
Navigators Group Inc. (The) | | | 823 | | | | 77,090 | |
| | | | |
SCHEDULESOF INVESTMENTS | | | 27 | |
Schedule of Investments (Continued)
iSHARES® ENHANCED U.S. SMALL-CAP ETF
July 31, 2016
| | | | | | | | |
| Security | | Shares | | | Value | |
OneBeacon Insurance Group Ltd. Class A | | | 1,377 | | | $ | 19,292 | |
United Fire Group Inc. | | | 1,660 | | | | 69,720 | |
Universal Insurance Holdings Inc. | | | 5,712 | | | | 124,179 | |
| | | | | | | | |
| | | | | | | 2,000,053 | |
INTERNET & CATALOG RETAIL — 3.74% | |
1-800-Flowers.com Inc. Class Aa | | | 49,107 | | | | 448,347 | |
NutriSystem Inc. | | | 8,204 | | | | 242,674 | |
PetMed Express Inc. | | | 3,352 | | | | 69,487 | |
Wayfair Inc. Class Aa | | | 3,710 | | | | 161,385 | |
| | | | | | | | |
| | | | | | | 921,893 | |
INTERNET SOFTWARE & SERVICES — 3.20% | |
Carbonite Inc.a | | | 2,136 | | | | 23,517 | |
comScore Inc.a | | | 883 | | | | 22,914 | |
LogMeIn Inc.a | | | 6,626 | | | | 569,240 | |
Marketo Inc.a | | | 894 | | | | 31,451 | |
Shutterstock Inc.a | | | 1,814 | | | | 99,933 | |
Stamps.com Inc.a | | | 274 | | | | 20,770 | |
Wix.com Ltd.a | | | 621 | | | | 22,108 | |
| | | | | | | | |
| | | | | | | 789,933 | |
IT SERVICES — 2.92% | | | | | | | | |
CACI International Inc. Class Aa | | | 280 | | | | 26,692 | |
CSG Systems International Inc. | | | 1,631 | | | | 65,664 | |
ManTech International Corp./VA Class A | | | 15,457 | | | | 610,706 | |
Sykes Enterprises Inc.a | | | 563 | | | | 17,279 | |
| | | | | | | | |
| | | | | | | 720,341 | |
LEISURE PRODUCTS — 1.89% | | | | | | | | |
Johnson Outdoors Inc. Class A | | | 811 | | | | 24,695 | |
Sturm Ruger & Co. Inc. | | | 6,125 | | | | 416,500 | |
Vista Outdoor Inc.a | | | 484 | | | | 24,224 | |
| | | | | | | | |
| | | | | | | 465,419 | |
MACHINERY — 1.74% | | | | | | | | |
Briggs & Stratton Corp. | | | 903 | | | | 20,525 | |
Chart Industries Inc.a | | | 1,471 | | | | 44,160 | |
Kennametal Inc. | | | 14,627 | | | | 363,627 | |
| | | | | | | | |
| | | | | | | 428,312 | |
MARINE — 0.06% | | | | | | | | |
Scorpio Bulkers Inc.a | | | 4,167 | | | | 13,709 | |
| | | | | | | | |
| | | | | | | 13,709 | |
MEDIA — 0.24% | | | | | | | | |
Harte-Hanks Inc. | | | 6,542 | | | | 10,860 | |
Time Inc. | | | 2,955 | | | | 48,255 | |
| | | | | | | | |
| | | | | | | 59,115 | |
| | | | | | | | |
| Security | | Shares | | | Value | |
METALS & MINING — 1.87% | | | | | | | | |
Kaiser Aluminum Corp. | | | 5,213 | | | $ | 431,897 | |
Schnitzer Steel Industries Inc. Class A | | | 1,513 | | | | 29,488 | |
| | | | | | | | |
| | | | | | | 461,385 | |
MULTI-UTILITIES — 0.32% | | | | | | | | |
Unitil Corp. | | | 1,823 | | | | 79,738 | |
| | | | | | | | |
| | | | | | | 79,738 | |
MULTILINE RETAIL — 0.24% | | | | | | | | |
Big Lots Inc. | | | 469 | | | | 24,942 | |
Fred’s Inc. Class A | | | 2,135 | | | | 33,925 | |
| | | | | | | | |
| | | | | | | 58,867 | |
OIL, GAS & CONSUMABLE FUELS — 0.36% | |
Bonanza Creek Energy Inc.a | | | 20,422 | | | | 16,401 | |
Denbury Resources Inc. | | | 7,668 | | | | 22,237 | |
Matador Resources Co.a | | | 829 | | | | 17,483 | |
Stone Energy Corp.a,b | | | 1,182 | | | | 14,515 | |
Triangle Petroleum Corp.a | | | 12,917 | | | | 2,771 | |
W&T Offshore Inc.a | | | 8,431 | | | | 16,778 | |
| | | | | | | | |
| | | | | | | 90,185 | |
PERSONAL PRODUCTS — 2.29% | | | | | | | | |
Medifast Inc. | | | 5,006 | | | | 176,311 | |
Nutraceutical International Corp.a | | | 808 | | | | 20,717 | |
USANA Health Sciences Inc.a | | | 2,681 | | | | 368,155 | |
| | | | | | | | |
| | | | | | | 565,183 | |
PHARMACEUTICALS — 1.10% | | | | | | | | |
SciClone Pharmaceuticals Inc.a | | | 25,700 | | | | 271,392 | |
| | | | | | | | |
| | | | | | | 271,392 | |
PROFESSIONAL SERVICES — 1.79% | | | | | | | | |
ICF International Inc.a | | | 1,312 | | | | 54,290 | |
Navigant Consulting Inc.a | | | 2,349 | | | | 46,299 | |
RPX Corp.a | | | 33,826 | | | | 340,628 | |
| | | | | | | | |
| | | | | | | 441,217 | |
REAL ESTATE INVESTMENT TRUSTS (REITS) — 4.73% | |
Agree Realty Corp. | | | 781 | | | | 39,612 | |
Care Capital Properties Inc. | | | 4,820 | | | | 142,576 | |
Dynex Capital Inc. | | | 6,417 | | | | 45,047 | |
Gyrodyne LLC | | | 86 | | | | 1,746 | |
MFA Financial Inc. | | | 60,103 | | | | 451,975 | |
Select Income REIT | | | 17,544 | | | | 487,021 | |
| | | | | | | | |
| | | | | | | 1,167,977 | |
ROAD & RAIL — 1.36% | | | | | | | | |
Knight Transportation Inc. | | | 718 | | | | 21,418 | |
Marten Transport Ltd. | | | 6,204 | | | | 134,317 | |
| | |
| 28 | | 2016 iSHARES ANNUAL REPORTTO SHAREHOLDERS |
Schedule of Investments (Continued)
iSHARES® ENHANCED U.S. SMALL-CAP ETF
July 31, 2016
| | | | | | | | |
| Security | | Shares | | | Value | |
Werner Enterprises Inc. | | | 7,137 | | | $ | 179,281 | |
| | | | | | | | |
| | | | | | | 335,016 | |
SEMICONDUCTORS & SEMICONDUCTOR EQUIPMENT — 6.98% | |
Advanced Energy Industries Inc.a | | | 15,671 | | | | 638,123 | |
Alpha & Omega Semiconductor Ltd.a | | | 3,748 | | | | 53,559 | |
Cirrus Logic Inc.a | | | 13,194 | | | | 641,096 | |
Integrated Device Technology Inc.a | | | 6,440 | | | | 141,616 | |
MaxLinear Inc. Class Aa | | | 3,112 | | | | 67,873 | |
Synaptics Inc.a | | | 3,465 | | | | 180,007 | |
| | | | | | | | |
| | | | | | | 1,722,274 | |
SOFTWARE — 7.08% | | | | | | | | |
AVG Technologies NVa | | | 10,551 | | | | 260,926 | |
Ellie Mae Inc.a | | | 409 | | | | 37,673 | |
Gigamon Inc.a | | | 4,203 | | | | 196,364 | |
HubSpot Inc.a | | | 1,381 | | | | 75,389 | |
Imperva Inc.a | | | 4,162 | | | | 196,114 | |
Infoblox Inc.a | | | 742 | | | | 13,890 | |
Pegasystems Inc. | | | 14,013 | | | | 390,963 | |
Proofpoint Inc.a | | | 1,069 | | | | 81,105 | |
Take-Two Interactive Software Inc.a | | | 712 | | | | 28,608 | |
VirnetX Holding Corp.a,b | | | 6,813 | | | | 22,755 | |
Zendesk Inc.a | | | 14,693 | | | | 444,316 | |
| | | | | | | | |
| | | | | | | 1,748,103 | |
SPECIALTY RETAIL — 3.58% | | | | | | | | |
Ascena Retail Group Inc.a | | | 15,451 | | | | 125,616 | |
Children’s Place Inc. (The) | | | 6,427 | | | | 537,169 | |
Kirkland’s Inc.a | | | 1,616 | | | | 24,628 | |
Select Comfort Corp.a | | | 6,006 | | | | 143,303 | |
Stage Stores Inc. | | | 2,258 | | | | 13,390 | |
Tilly’s Inc. Class Aa | | | 6,781 | | | | 38,584 | |
| | | | | | | | |
| | | | | | | 882,690 | |
TECHNOLOGY HARDWARE, STORAGE &
PERIPHERALS — 2.37% | |
Lexmark International Inc. Class A | | | 5,677 | | | | 208,176 | |
Nimble Storage Inc.a | | | 14,954 | | | | 111,258 | |
Stratasys Ltd.a | | | 12,659 | | | | 265,079 | |
| | | | | | | | |
| | | | | | | 584,513 | |
TEXTILES, APPAREL & LUXURY GOODS — 0.08% | |
Culp Inc. | | | 728 | | | | 20,770 | |
| | | | | | | | |
| | | | | | | 20,770 | |
THRIFTS & MORTGAGE FINANCE — 0.69% | |
First Defiance Financial Corp. | | | 1,345 | | | | 56,073 | |
Meta Financial Group Inc. | | | 558 | | | | 30,517 | |
| | | | | | | | |
| Security | | Shares | | | Value | |
Territorial Bancorp. Inc. | | | 2,412 | | | $ | 64,883 | |
United Financial Bancorp. Inc. | | | 1,519 | | | | 19,975 | |
| | | | | | | | |
| | | | | | | 171,448 | |
TOBACCO — 0.29% | | | | | | | | |
Universal Corp./VA | | | 1,192 | | | | 70,698 | |
| | | | | | | | |
| | | | | | | 70,698 | |
TRADING COMPANIES & DISTRIBUTORS — 0.07% | |
NOW Inc.a | | | 943 | | | | 17,266 | |
| | | | | | | | |
| | | | | | | 17,266 | |
WATER UTILITIES — 1.11% | | | | | | | | |
American States Water Co. | | | 2,670 | | | | 115,344 | |
Artesian Resources Corp. Class A | | | 901 | | | | 30,715 | |
California Water Service Group | | | 1,847 | | | | 62,299 | |
Middlesex Water Co. | | | 692 | | | | 28,587 | |
York Water Co. (The) | | | 1,143 | | | | 35,936 | |
| | | | | | | | |
| | | | | | | 272,881 | |
WIRELESS TELECOMMUNICATION SERVICES — 0.30% | |
U.S. Cellular Corp.a | | | 1,847 | | | | 74,711 | |
| | | | | | | | |
| | | | | | | 74,711 | |
| | | | | | | | |
TOTAL COMMON STOCKS
(Cost: $22,352,300) | | | | | | | 24,543,791 | |
|
SHORT-TERM INVESTMENTS — 0.35% | |
| | |
MONEY MARKET FUNDS — 0.35% | | | | | | | | |
BlackRock Cash Funds: Institutional,
SL Agency Shares | | | | | | | | |
0.57%c,d,e | | | 6,169 | | | | 6,169 | |
BlackRock Cash Funds: Prime,
SL Agency Shares | | | | | | | | |
0.47%c,d,e | | | 341 | | | | 341 | |
BlackRock Cash Funds: Treasury,
SL Agency Shares | | | | | | | | |
0.28%c,d | | | 80,564 | | | | 80,564 | |
| | | | | | | | |
| | | | | | | 87,074 | |
| | | | | | | | |
TOTAL SHORT-TERM INVESTMENTS
(Cost: $87,074) | | | | 87,074 | |
| | | | | | | | |
| | | | |
SCHEDULESOF INVESTMENTS | | | 29 | |
Schedule of Investments (Continued)
iSHARES® ENHANCED U.S. SMALL-CAP ETF
July 31, 2016
| | | | | | | | |
| | | | | | Value | |
TOTAL INVESTMENTS
IN SECURITIES — 99.82%
(Cost: $22,439,374)f | | | $ | 24,630,865 | |
Other Assets, Less Liabilities — 0.18% | | | | 43,623 | |
| | | | | | | | |
NET ASSETS — 100.00% | | | | | | $ | 24,674,488 | |
| | | | | | | | |
| a | Non-income earning security. |
| b | All or a portion of this security represents a security on loan. See Note 1. |
| c | Affiliated money market fund. |
| d | The rate quoted is the annualized seven-day yield of the fund at period end. |
| e | All or a portion of this security represents an investment of securities lending collateral. See Note 1. |
| f | The cost of investments for federal income tax purposes was $22,457,077. Net unrealized appreciation was $2,173,788, of which $4,274,145 represented gross unrealized appreciation on securities and $2,100,357 represented gross unrealized depreciation on securities. |
Schedule 1 — Fair Value Measurements
Various inputs are used in determining the fair value of financial instruments. For description of the input levels and information about the Fund’s policy regarding valuation of financial instruments, see Note 1.
The following table summarizes the value of the Fund’s investments according to the fair value hierarchy as of July 31, 2016. The breakdown of the Fund’s investments into major categories is disclosed in the schedule of investments above.
| | | | | | | | | | | | | | | | |
| | | Level 1 | | | Level 2 | | | Level 3 | | | Total | |
Investments: | | | | | | | | | | | | | | | | |
Assets: | | | | | | | | | | | | | | | | |
Common stocks | | $ | 24,521,036 | | | $ | 22,755 | | | $ | — | | | $ | 24,543,791 | |
Money market funds | | | 87,074 | | | | — | | | | — | | | | 87,074 | |
| | | | | | | | | | | | | | | | |
Total | | $ | 24,608,110 | | | $ | 22,755 | | | $ | — | | | $ | 24,630,865 | |
| | | | | | | | | | | | | | | | |
| | | | | | | | | | | | | | | | | |
See notes to financial statements.
| | |
| 30 | | 2016 iSHARES ANNUAL REPORTTO SHAREHOLDERS |
Statements of Assets and Liabilities
iSHARES® U.S. ETF TRUST
July 31, 2016
| | | | | | | | | | | | |
| | | iShares
Enhanced
International
Large-Cap ETF | | | iShares
Enhanced
International
Small-Cap ETF | | | iShares
Enhanced U.S.
Large-Cap ETF | |
| | | |
ASSETS | | | | | | | | | | | | |
Investments, at cost: | | | | | | | | | | | | |
Unaffiliated | | $ | 37,972,733 | | | $ | 17,526,923 | | | $ | 58,057,383 | |
Affiliated (Note 2) | | | 14,393 | | | | 21,793 | | | | 40,468 | |
| | | | | | | | | | | | |
Total cost of investments | | $ | 37,987,126 | | | $ | 17,548,716 | | | $ | 58,097,851 | |
| | | | | | | | | | | | |
Investments in securities, at fair value (Note 1): | | | | | | | | | | | | |
Unaffiliated | | $ | 32,720,218 | | | $ | 19,390,376 | | | $ | 65,421,622 | |
Affiliated (Note 2) | | | 14,393 | | | | 21,793 | | | | 40,468 | |
| | | | | | | | | | | | |
Total fair value of investments | | | 32,734,611 | | | | 19,412,169 | | | | 65,462,090 | |
Foreign currency, at valuea | | | 448,832 | | | | 77,878 | | | | — | |
Cash | | | — | | | | — | | | | 2,367 | |
Receivables: | | | | | | | | | | | | |
Investment securities sold | | | — | | | | 25,095 | | | | 1,378,309 | |
Dividends and interest | | | 57,168 | | | | 18,443 | | | | 40,495 | |
Tax reclaims | | | 138,665 | | | | 12,554 | | | | — | |
| | | | | | | | | | | | |
Total Assets | | | 33,379,276 | | | | 19,546,139 | | | | 66,883,261 | |
| | | | | | | | | | | | |
| | | |
LIABILITIES | | | | | | | | | | | | |
Payables: | | | | | | | | | | | | |
Investment advisory fees (Note 2) | | | 17,618 | | | | 7,806 | | | | 10,490 | |
| | | | | | | | | | | | |
Total Liabilities | | | 17,618 | | | | 7,806 | | | | 10,490 | |
| | | | | | | | | | | | |
| | | |
NET ASSETS | | $ | 33,361,658 | | | $ | 19,538,333 | | | $ | 66,872,771 | |
| | | | | | | | | | | | |
| | | |
Net assets consist of: | | | | | | | | | | | | |
Paid-in capital | | $ | 42,771,968 | | | $ | 19,176,710 | | | $ | 59,843,587 | |
Undistributed (distributions in excess of) net investment income | | | 11,767 | | | | (7,630 | ) | | | 79,634 | |
Accumulated net realized loss | | | (4,170,954 | ) | | | (1,494,259 | ) | | | (414,689 | ) |
Net unrealized appreciation (depreciation) | | | (5,251,123 | ) | | | 1,863,512 | | | | 7,364,239 | |
| | | | | | | | | | | | |
NET ASSETS | | $ | 33,361,658 | | | $ | 19,538,333 | | | $ | 66,872,771 | |
| | | | | | | | | | | | |
| | | |
Shares outstandingb | | | 1,500,000 | | | | 800,000 | | | | 1,950,000 | |
| | | | | | | | | | | | |
| | | |
Net asset value per share | | $ | 22.24 | | | $ | 24.42 | | | $ | 34.29 | |
| | | | | | | | | | | | |
| a | Cost of foreign currency: $448,015, $77,736 and $ —, respectively. |
| b | No par value, unlimited number of shares authorized. |
See notes to financial statements.
Statements of Assets and Liabilities (Continued)
iSHARES® U.S. ETF TRUST
July 31, 2016
| | | | |
| | | iShares
Enhanced U.S.
Small-Cap ETF | |
| |
ASSETS | | | | |
Investments, at cost: | | | | |
Unaffiliated | | $ | 22,352,300 | |
Affiliated (Note 2) | | | 87,074 | |
| | | | |
Total cost of investments | | $ | 22,439,374 | |
| | | | |
Investments in securities, at fair value (including securities on loana) (Note 1): | | | | |
Unaffiliated | | $ | 24,543,791 | |
Affiliated (Note 2) | | | 87,074 | |
| | | | |
Total fair value of investments | | | 24,630,865 | |
Receivables: | | | | |
Dividends and interest | | | 57,703 | |
| | | | |
Total Assets | | | 24,688,568 | |
| | | | |
| |
LIABILITIES | �� | | | |
Payables: | | | | |
Collateral for securities on loan (Note 1) | | | 6,510 | |
Investment advisory fees (Note 2) | | | 7,570 | |
| | | | |
Total Liabilities | | | 14,080 | |
| | | | |
| |
NET ASSETS | | $ | 24,674,488 | |
| | | | |
| |
Net assets consist of: | | | | |
Paid-in capital | | $ | 22,897,643 | |
Undistributed net investment income | | | 55,737 | |
Accumulated net realized loss | | | (470,383 | ) |
Net unrealized appreciation | | | 2,191,491 | |
| | | | |
NET ASSETS | | $ | 24,674,488 | |
| | | | |
| |
Shares outstandingb | | | 750,000 | |
| | | | |
| |
Net asset value per share | | $ | 32.90 | |
| | | | |
| a | Securities on loan with a value of $6,370. See Note 1. |
| b | No par value, unlimited number of shares authorized. |
See notes to financial statements.
| | |
| 32 | | 2016 iSHARES ANNUAL REPORTTO SHAREHOLDERS |
Statements of Operations
iSHARES® U.S. ETF TRUST
Year ended July 31, 2016
| | | | | | | | | | | | |
| | | iShares
Enhanced
International
Large-Cap ETF | | | iShares
Enhanced
International
Small-Cap ETF | | | iShares
Enhanced U.S.
Large-Cap ETF | |
| | | |
NET INVESTMENT INCOME | | | | | | | | | | | | |
Dividends — unaffiliateda | | $ | 2,069,137 | | | $ | 368,961 | | | $ | 1,584,205 | |
Dividends — affiliated (Note 2) | | | 165 | | | | 43 | | | | 309 | |
Securities lending income — affiliated — net (Note 2) | | | 879 | | | | 23,157 | | | | 17,980 | |
| | | | | | | | | | | | |
Total investment income | | | 2,070,181 | | | | 392,161 | | | | 1,602,494 | |
| | | | | | | | | | | | |
| | | |
EXPENSES | | | | | | | | | | | | |
Investment advisory fees (Note 2) | | | 224,537 | | | | 76,924 | | | | 136,355 | |
| | | | | | | | | | | | |
Total expenses | | | 224,537 | | | | 76,924 | | | | 136,355 | |
| | | | | | | | | | | | |
Net investment income | | | 1,845,644 | | | | 315,237 | | | | 1,466,139 | |
| | | | | | | | | | | | |
| | | |
NET REALIZED AND UNREALIZED GAIN (LOSS) | | | | | | | | | | | | |
Net realized gain (loss) from: | | | | | | | | | | | | |
Investments — unaffiliated | | | (1,980,290 | ) | | | (801,997 | ) | | | 95,659 | |
In-kind redemptions — unaffiliated | | | (526,441 | ) | | | — | | | | 4,047,712 | |
Foreign currency transactions | | | 4,765 | | | | 3,077 | | | | — | |
| | | | | | | | | | | | |
Net realized gain (loss) | | | (2,501,966 | ) | | | (798,920 | ) | | | 4,143,371 | |
| | | | | | | | | | | | |
Net change in unrealized appreciation/depreciation on: | | | | | | | | | | | | |
Investments | | | (5,872,569 | ) | | | 1,682,840 | | | | (1,992,822 | ) |
Translation of assets and liabilities in foreign currencies | | | 3,546 | | | | 560 | | | | — | |
| | | | | | | | | | | | |
Net change in unrealized appreciation/depreciation | | | (5,869,023 | ) | | | 1,683,400 | | | | (1,992,822 | ) |
| | | | | | | | | | | | |
Net realized and unrealized gain (loss) | | | (8,370,989 | ) | | | 884,480 | | | | 2,150,549 | |
| | | | | | | | | | | | |
NET INCREASE (DECREASE) IN NET ASSETS RESULTING
FROM OPERATIONS | | $ | (6,525,345 | ) | | $ | 1,199,717 | | | $ | 3,616,688 | |
| | | | | | | | | | | | |
| a | Net of foreign withholding tax of $213,122, $43,242 and $ —, respectively. |
See notes to financial statements.
Statements of Operations (Continued)
iSHARES® U.S. ETF TRUST
Year ended July 31, 2016
| | | | |
| | | iShares
Enhanced U.S.
Small-Cap ETF | |
| |
NET INVESTMENT INCOME | | | | |
Dividends — unaffiliated | | $ | 463,431 | |
Dividends — affiliated (Note 2) | | | 135 | |
Securities lending income — affiliated — net (Note 2) | | | 28,015 | |
| | | | |
Total investment income | | | 491,581 | |
| | | | |
| |
EXPENSES | | | | |
Investment advisory fees (Note 2) | | | 82,409 | |
| | | | |
Total expenses | | | 82,409 | |
| | | | |
Net investment income | | | 409,172 | |
| | | | |
| |
NET REALIZED AND UNREALIZED GAIN (LOSS) | | | | |
Net realized gain (loss) from: | |
Investments — unaffiliated | | | 126,572 | |
In-kind redemptions — unaffiliated | | | 642,556 | |
| | | | |
Net realized gain | | | 769,128 | |
| | | | |
Net change in unrealized appreciation/depreciation | | | 19,148 | |
| | | | |
Net realized and unrealized gain | | | 788,276 | |
| | | | |
NET INCREASE IN NET ASSETS RESULTING FROM OPERATIONS | | $ | 1,197,448 | |
| | | | |
See notes to financial statements.
| | |
| 34 | | 2016 iSHARES ANNUAL REPORTTO SHAREHOLDERS |
Statements of Changes in Net Assets
iSHARES® U.S. ETF TRUST
| | | | | | | | | | | | | | | | |
| | | iShares
Enhanced
International
Large-Cap ETF | | | iShares
Enhanced
International
Small-Cap ETF | |
| | | Year ended
July 31, 2016 | | | Year ended July 31, 2015 | | | Year ended July 31, 2016 | | | Year ended July 31, 2015 | |
| | | | |
INCREASE (DECREASE) IN NET ASSETS | | | | | | | | | | | | | | | | |
| | | | |
OPERATIONS: | | | | | | | | | | | | | | | | |
Net investment income | | $ | 1,845,644 | | | $ | 1,970,264 | | | $ | 315,237 | | | $ | 261,166 | |
Net realized loss | | | (2,501,966 | ) | | | (2,309,239 | ) | | | (798,920 | ) | | | (629,519 | ) |
Net change in unrealized appreciation/depreciation | | | (5,869,023 | ) | | | 11,017 | | | | 1,683,400 | | | | 216,875 | |
| | | | | | | | | | | | | | | | |
Net increase (decrease) in net assets resulting from operations | | | (6,525,345 | ) | | | (327,958 | ) | | | 1,199,717 | | | | (151,478 | ) |
| | | | | | | | | | | | | | | | |
| | | | |
DISTRIBUTIONS TO SHAREHOLDERS: | | | | | | | | | | | | | | | | |
From net investment income | | | (1,912,879 | ) | | | (1,946,711 | ) | | | (326,068 | ) | | | (287,196 | ) |
| | | | | | | | | | | | | | | | |
Total distributions to shareholders | | | (1,912,879 | ) | | | (1,946,711 | ) | | | (326,068 | ) | | | (287,196 | ) |
| | | | | | | | | | | | | | | | |
| | | | |
CAPITAL SHARE TRANSACTIONS: | | | | | | | | | | | | | | | | |
Proceeds from shares sold | | | 11,344,979 | | | | 54,822,179 | | | | 4,658,618 | | | | 4,567,025 | |
Cost of shares redeemed | | | (52,668,102 | ) | | | — | | | | — | | | | — | |
| | | | | | | | | | | | | | | | |
Net increase (decrease) in net assets from capital
share transactions | | | (41,323,123 | ) | | | 54,822,179 | | | | 4,658,618 | | | | 4,567,025 | |
| | | | | | | | | | | | | | | | |
INCREASE (DECREASE) IN NET ASSETS | | | (49,761,347 | ) | | | 52,547,510 | | | | 5,532,267 | | | | 4,128,351 | |
| | | | |
NET ASSETS | | | | | | | | | | | | | | | | |
Beginning of year | | | 83,123,005 | | | | 30,575,495 | | | | 14,006,066 | | | | 9,877,715 | |
| | | | | | | | | | | | | | | | |
End of year | | $ | 33,361,658 | | | $ | 83,123,005 | | | $ | 19,538,333 | | | $ | 14,006,066 | |
| | | | | | | | | | | | | | | | |
Undistributed (distributions in excess of) net investment income included in net assets at end of year | | $ | 11,767 | | | $ | 46,307 | | | $ | (7,630 | ) | | $ | (6,885 | ) |
| | | | | | | | | | | | | | | | |
| | | | |
SHARES ISSUED AND REDEEMED | | | | | | | | | | | | | | | | |
Shares sold | | | 500,000 | | | | 2,200,000 | | | | 200,000 | | | | 200,000 | |
Shares redeemed | | | (2,400,000 | ) | | | — | | | | — | | | | — | |
| | | | | | | | | | | | | | | | |
Net increase (decrease) in shares outstanding | | | (1,900,000 | ) | | | 2,200,000 | | | | 200,000 | | | | 200,000 | |
| | | | | | | | | | | | | | | | |
See notes to financial statements.
Statements of Changes in Net Assets (Continued)
iSHARES® U.S. ETF TRUST
| | | | | | | | | | | | | | | | |
| | | iShares
Enhanced
U.S.
Large-Cap ETF | | | iShares
Enhanced
U.S.
Small-Cap ETF | |
| | | Year ended
July 31, 2016 | | | Year ended July 31, 2015 | | | Year ended July 31, 2016 | | | Year ended July 31, 2015 | |
| | | | |
INCREASE (DECREASE) IN NET ASSETS | | | | | | | | | | | | | | | | |
| | | | |
OPERATIONS: | | | | | | | | | | | | | | | | |
Net investment income | | $ | 1,466,139 | | | $ | 1,384,522 | | | $ | 409,172 | | | $ | 361,722 | |
Net realized gain (loss) | | | 4,143,371 | | | | 1,387,233 | | | | 769,128 | | | | (563,172 | ) |
Net change in unrealized appreciation/depreciation | | | (1,992,822 | ) | | | 5,474,233 | | | | 19,148 | | | | 2,127,663 | |
| | | | | | | | | | | | | | | | |
Net increase in net assets resulting from operations | | | 3,616,688 | | | | 8,245,988 | | | | 1,197,448 | | | | 1,926,213 | |
| | | | | | | | | | | | | | | | |
| | | | |
DISTRIBUTIONS TO SHAREHOLDERS: | | | | | | | | | | | | | | | | |
From net investment income | | | (1,504,471 | ) | | | (1,346,033 | ) | | | (380,435 | ) | | | (344,193 | ) |
| | | | | | | | | | | | | | | | |
Total distributions to shareholders | | | (1,504,471 | ) | | | (1,346,033 | ) | | | (380,435 | ) | | | (344,193 | ) |
| | | | | | | | | | | | | | | | |
| | | | |
CAPITAL SHARE TRANSACTIONS: | | | | | | | | | | | | | | | | |
Proceeds from shares sold | | | 9,690,504 | | | | 21,862,919 | | | | 1,462,916 | | | | 10,767,793 | |
Cost of shares redeemed | | | (22,736,734 | ) | | | (7,983,323 | ) | | | (3,142,565 | ) | | | — | |
| | | | | | | | | | | | | | | | |
Net increase (decrease) in net assets from capital
share transactions | | | (13,046,230 | ) | | | 13,879,596 | | | | (1,679,649 | ) | | | 10,767,793 | |
| | | | | | | | | | | | | | | | |
INCREASE (DECREASE) IN NET ASSETS | | | (10,934,013 | ) | | | 20,779,551 | | | | (862,636 | ) | | | 12,349,813 | |
| | | | |
NET ASSETS | | | | | | | | | | | | | | | | |
Beginning of year | | | 77,806,784 | | | | 57,027,233 | | | | 25,537,124 | | | | 13,187,311 | |
| | | | | | | | | | | | | | | | |
End of year | | $ | 66,872,771 | | | $ | 77,806,784 | | | $ | 24,674,488 | | | $ | 25,537,124 | |
| | | | | | | | | | | | | | | | |
Undistributed net investment income included in net assets at end of year | | $ | 79,634 | | | $ | 117,966 | | | $ | 55,737 | | | $ | 27,000 | |
| | | | | | | | | | | | | | | | |
| | | | |
SHARES ISSUED AND REDEEMED | | | | | | | | | | | | | | | | |
Shares sold | | | 300,000 | | | | 700,000 | | | | 50,000 | | | | 350,000 | |
Shares redeemed | | | (700,000 | ) | | | (250,000 | ) | | | (100,000 | ) | | | — | |
| | | | | | | | | | | | | | | | |
Net increase (decrease) in shares outstanding | | | (400,000 | ) | | | 450,000 | | | | (50,000 | ) | | | 350,000 | |
| | | | | | | | | | | | | | | | |
See notes to financial statements.
| | |
| 36 | | 2016 iSHARES ANNUAL REPORTTO SHAREHOLDERS |
Financial Highlights
iSHARES® U.S. ETF TRUST
(For a share outstanding throughout each period)
| | | | | | | | |
| | iShares Enhanced International Large-Cap ETF |
| | | | | | | | | | | | |
| | | Year ended
Jul. 31, 2016 | | | Year ended
Jul. 31, 2015 | | | Period from
Feb. 25, 2014a to
Jul. 31, 2014 | |
Net asset value, beginning of period | | $ | 24.45 | | | $ | 25.48 | | | $ | 24.90 | |
| | | | | | | | | | | | |
Income from investment operations: | | | | | | | | | | | | |
Net investment incomeb | | | 0.65 | | | | 0.75 | | | | 0.56 | |
Net realized and unrealized gain (loss)c | | | (2.21 | ) | | | (1.17 | ) | | | 0.40 | |
| | | | | | | | | | | | |
Total from investment operations | | | (1.56 | ) | | | (0.42 | ) | | | 0.96 | |
| | | | | | | | | | | | |
Less distributions from: | | | | | | | | | | | | |
Net investment income | | | (0.65 | ) | | | (0.61 | ) | | | (0.38 | ) |
| | | | | | | | | | | | |
Total distributions | | | (0.65 | ) | | | (0.61 | ) | | | (0.38 | ) |
| | | | | | | | | | | | |
Net asset value, end of period | | $ | 22.24 | | | $ | 24.45 | | | $ | 25.48 | |
| | | | | | | | | | | | |
| | | |
Total return | | | (6.35 | )% | | | (1.59 | )% | | | 3.80 | %d |
| | | | | | | | | | | | |
| | | |
Ratios/Supplemental data: | | | | | | | | | | | | |
Net assets, end of period (000s) | | $ | 33,362 | | | $ | 83,123 | | | $ | 30,575 | |
Ratio of expenses to average net assetse | | | 0.35 | % | | | 0.35 | % | | | 0.35 | % |
Ratio of net investment income to average net assetse | | | 2.88 | % | | | 3.11 | % | | | 5.04 | % |
Portfolio turnover ratef | | | 32 | % | | | 41 | % | | | 20 | % |
| a | Commencement of operations. |
| b | Based on average shares outstanding throughout each period. |
| c | The amounts reported for a share outstanding may not accord with the change in aggregate gains and losses in securities for the fiscal period due to the timing of capital share transactions in relation to the fluctuating market values of the Fund’s underlying securities. |
| e | Annualized for periods of less than one year. |
| f | Portfolio turnover rates exclude portfolio securities received or delivered as a result of processing capital share transactions in Creation Units. |
See notes to financial statements.
Financial Highlights (Continued)
iSHARES® U.S. ETF TRUST
(For a share outstanding throughout each period)
| | | | | | | | |
| | | | | | iShares Enhanced International Small-Cap ETF | | |
| | | | | | | | | | | | |
| | | Year ended
Jul. 31, 2016 | | | Year ended
Jul. 31, 2015 | | | Period from
Feb. 25, 2014a to
Jul. 31, 2014 | |
Net asset value, beginning of period | | $ | 23.34 | | | $ | 24.69 | | | $ | 24.87 | |
| | | | | | | | | | | | |
Income from investment operations: | | | | | | | | | | | | |
Net investment incomeb | | | 0.46 | | | | 0.60 | | | | 0.34 | |
Net realized and unrealized gain (loss)c | | | 1.05 | | | | (1.32 | ) | | | (0.29 | ) |
| | | | | | | | | | | | |
Total from investment operations | | | 1.51 | | | | (0.72 | ) | | | 0.05 | |
| | | | | | | | | | | | |
Less distributions from: | | | | | | | | | | | | |
Net investment income | | | (0.43 | ) | | | (0.63 | ) | | | (0.23 | ) |
| | | | | | | | | | | | |
Total distributions | | | (0.43 | ) | | | (0.63 | ) | | | (0.23 | ) |
| | | | | | | | | | | | |
Net asset value, end of period | | $ | 24.42 | | | $ | 23.34 | | | $ | 24.69 | |
| | | | | | | | | | | | |
| | | |
Total return | | | 6.62 | % | | | (2.82 | )% | | | 0.18 | %d |
| | | | | | | | | | | | |
| | | |
Ratios/Supplemental data: | | | | | | | | | | | | |
Net assets, end of period (000s) | | $ | 19,538 | | | $ | 14,006 | | | $ | 9,878 | |
Ratio of expenses to average net assetse | | | 0.49 | % | | | 0.49 | % | | | 0.49 | % |
Ratio of net investment income to average net assetse | | | 2.01 | % | | | 2.57 | % | | | 3.20 | % |
Portfolio turnover ratef | | | 30 | % | | | 61 | % | | | 17 | % |
| a | Commencement of operations. |
| b | Based on average shares outstanding throughout each period. |
| c | The amounts reported for a share outstanding may not accord with the change in aggregate gains and losses in securities for the fiscal period due to the timing of capital share transactions in relation to the fluctuating market values of the Fund’s underlying securities. |
| e | Annualized for periods of less than one year. |
| f | Portfolio turnover rates exclude portfolio securities received or delivered as a result of processing capital share transactions in Creation Units. |
See notes to financial statements.
| | |
| 38 | | 2016 iSHARES ANNUAL REPORTTO SHAREHOLDERS |
Financial Highlights (Continued)
iSHARES® U.S. ETF TRUST
(For a share outstanding throughout each period)
| | | | | | | | | | | | | | | | |
| | | iShares Enhanced U.S. Large-Cap ETF | |
| | | Year ended
Jul. 31, 2016 | | | Year ended
Jul. 31, 2015 | | | Year ended
Jul. 31, 2014 | | | Period from
Apr. 16, 2013a to Jul. 31, 2013 | |
Net asset value, beginning of period | | $ | 33.11 | | | $ | 30.01 | | | $ | 26.76 | | | $ | 24.79 | |
| | | | | | | | | | | | | | | | |
Income from investment operations: | | | | | | | | | | | | | | | | |
Net investment incomeb | | | 0.62 | | | | 0.62 | | | | 0.54 | | | | 0.14 | |
Net realized and unrealized gainc | | | 1.17 | | | | 3.08 | | | | 3.19 | | | | 1.89 | |
| | | | | | | | | | | | | | | | |
Total from investment operations | | | 1.79 | | | | 3.70 | | | | 3.73 | | | | 2.03 | |
| | | | | | | | | | | | | | | | |
Less distributions from: | | | | | | | | | | | | | | | | |
Net investment income | | | (0.61 | ) | | | (0.60 | ) | | | (0.48 | ) | | | (0.06 | ) |
| | | | | | | | | | | | | | | | |
Total distributions | | | (0.61 | ) | | | (0.60 | ) | | | (0.48 | ) | | | (0.06 | ) |
| | | | | | | | | | | | | | | | |
Net asset value, end of period | | $ | 34.29 | | | $ | 33.11 | | | $ | 30.01 | | | $ | 26.76 | |
| | | | | | | | | | | | | | | | |
| | | | |
Total return | | | 5.57 | % | | | 12.40 | % | | | 14.00 | % | | | 8.19 | %d |
| | | | | | | | | | | | | | | | |
| | | | |
Ratios/Supplemental data: | | | | | | | | | | | | | | | | |
Net assets, end of period (000s) | | $ | 66,873 | | | $ | 77,807 | | | $ | 57,027 | | | $ | 12,043 | |
Ratio of expenses to average net assetse | | | 0.18 | % | | | 0.18 | % | | | 0.18 | % | | | 0.18 | % |
Ratio of net investment income to average net assetse | | | 1.94 | % | | | 1.94 | % | | | 1.87 | % | | | 1.90 | % |
Portfolio turnover ratef | | | 19 | % | | | 44 | % | | | 20 | % | | | 5 | % |
| a | Commencement of operations. |
| b | Based on average shares outstanding throughout each period. |
| c | The amounts reported for a share outstanding may not accord with the change in aggregate gains and losses in securities for the fiscal period due to the timing of capital share transactions in relation to the fluctuating market values of the Fund’s underlying securities. |
| e | Annualized for periods of less than one year. |
| f | Portfolio turnover rates exclude portfolio securities received or delivered as a result of processing capital share transactions in Creation Units. |
See notes to financial statements.
Financial Highlights (Continued)
iSHARES® U.S. ETF TRUST
(For a share outstanding throughout each period)
| | | | | | | | | | | | | | | | |
| | | iShares Enhanced U.S. Small-Cap ETF | |
| | | Year ended
Jul. 31, 2016 | | | Year ended
Jul. 31, 2015 | | | Year ended
Jul. 31, 2014 | | | Period from
Apr. 16, 2013a to Jul. 31, 2013 | |
Net asset value, beginning of period | | $ | 31.92 | | | $ | 29.31 | | | $ | 27.58 | | | $ | 24.67 | |
| | | | | | | | | | | | | | | | |
Income from investment operations: | | | | | | | | | | | | | | | | |
Net investment incomeb | | | 0.52 | | | | 0.57 | c | | | 0.33 | | | | 0.16 | |
Net realized and unrealized gaind | | | 0.95 | | | | 2.58 | | | | 1.73 | | | | 2.88 | |
| | | | | | | | | | | | | | | | |
Total from investment operations | | | 1.47 | | | | 3.15 | | | | 2.06 | | | | 3.04 | |
| | | | | | | | | | | | | | | | |
Less distributions from: | | | | | | | | | | | | | | | | |
Net investment income | | | (0.49 | ) | | | (0.54 | ) | | | (0.33 | ) | | | (0.13 | ) |
| | | | | | | | | | | | | | | | |
Total distributions | | | (0.49 | ) | | | (0.54 | ) | | | (0.33 | ) | | | (0.13 | ) |
| | | | | | | | | | | | | | | | |
Net asset value, end of period | | $ | 32.90 | | | $ | 31.92 | | | $ | 29.31 | | | $ | 27.58 | |
| | | | | | | | | | | | | | | | |
| | | | |
Total return | | | 4.77 | % | | | 10.78 | % | | | 7.43 | % | | | 12.37 | %e |
| | | | | | | | | | | | | | | | |
| | | | |
Ratios/Supplemental data: | | | | | | | | | | | | | | | | |
Net assets, end of period (000s) | | $ | 24,674 | | | $ | 25,537 | | | $ | 13,187 | | | $ | 2,758 | |
Ratio of expenses to average net assetsf | | | 0.35 | % | | | 0.35 | % | | | 0.35 | % | | | 0.35 | % |
Ratio of net investment income to average net assetsf | | | 1.74 | % | | | 1.82 | %c | | | 1.13 | % | | | 2.09 | % |
Portfolio turnover rateg | | | 26 | % | | | 53 | % | | | 39 | % | | | 9 | % |
| a | Commencement of operations. |
| b | Based on average shares outstanding throughout each period. |
| c | Includes a special distribution from Engility Holdings Inc. Excluding such special distribution, the net investment income would have been $0.41 per share and 1.30% of average net assets. |
| d | The amounts reported for a share outstanding may not accord with the change in aggregate gains and losses in securities for the fiscal period due to the timing of capital share transactions in relation to the fluctuating market values of the Fund’s underlying securities. |
| f | Annualized for periods of less than one year. |
| g | Portfolio turnover rates exclude portfolio securities received or delivered as a result of processing capital share transactions in Creation Units. |
See notes to financial statements.
| | |
| 40 | | 2016 iSHARES ANNUAL REPORTTO SHAREHOLDERS |
Notes to Financial Statements
iSHARES® U.S. ETF TRUST
iShares U.S. ETF Trust (the “Trust”) is registered under the Investment Company Act of 1940, as amended (the “1940 Act”), as an open-end management investment company. The Trust was established as a Delaware statutory trust pursuant to an Agreement and Declaration of Trust dated June 21, 2011.
These financial statements relate only to the following funds (each, a “Fund,” and collectively, the “Funds”):
| | |
| iShares ETF | | Diversification Classification |
Enhanced International Large-Cap | | Non-diversified |
Enhanced International Small-Cap | | Non-diversified |
Enhanced U.S. Large-Cap | | Diversified |
Enhanced U.S. Small-Cap | | Diversified |
Pursuant to the Trust’s organizational documents, the Funds’ officers and trustees are indemnified against certain liabilities that may arise out of the performance of their duties to the Funds. Additionally, in the normal course of business, the Funds enter into contracts with service providers that contain general indemnification clauses. The Funds’ maximum exposure under these arrangements is unknown as this would involve future claims that may be made against the Funds that have not yet occurred.
| 1. | SIGNIFICANT ACCOUNTING POLICIES |
The following significant accounting policies are consistently followed by each Fund in the preparation of its financial statements in conformity with accounting principles generally accepted in the United States of America (“U.S. GAAP”). The preparation of financial statements in conformity with U.S. GAAP requires management to make certain estimates and assumptions that affect the reported amounts of assets and liabilities and disclosures of contingent assets and liabilities at the date of the financial statements and the reported amounts of revenue and expenses during the reporting period. Actual results could differ from those estimates. Each Fund is considered an investment company under U.S. GAAP and follows the accounting and reporting guidance applicable to investment companies.
SECURITY VALUATION
Each Fund’s investments are valued at fair value each day that the Fund’s listing exchange is open and, for financial reporting purposes, as of the report date should the reporting period end on a day that the Fund’s listing exchange is not open. U.S. GAAP defines fair value as the price a fund would receive to sell an asset or pay to transfer a liability in an orderly transaction between market participants at the measurement date. The BlackRock Global Valuation Methodologies Committee (the “Global Valuation Committee”) provides oversight of the valuation of investments for the Funds. The investments of each Fund are valued pursuant to policies and procedures developed by the Global Valuation Committee and approved by the Board of Trustees of the Trust (the “Board”).
| | • | | Equity investments traded on a recognized securities exchange are valued at that day’s last reported trade price or the official closing price, as applicable, on the exchange where the stock is primarily traded. Equity investments traded on a recognized exchange for which there were no sales on that day are valued at the last traded price. |
| | • | | Open-end U.S. mutual funds (including money market funds) are valued at that day’s published net asset value (“NAV”). |
In the event that application of these methods of valuation results in a price for an investment which is deemed not to be representative of the fair value of such investment or if a price is not available, the investment will be valued based upon other available factors deemed relevant by the Global Valuation Committee, in accordance with policies approved by the Board. These
| | | | |
NOTESTO FINANCIAL STATEMENTS | | | 41 | |
Notes to Financial Statements (Continued)
iSHARES® U.S. ETF TRUST
factors include but are not limited to (i) attributes specific to the investment; (ii) the principal market for the investment; (iii) the customary participants in the principal market for the investment; (iv) data assumptions by market participants for the investment, if reasonably available; (v) quoted prices for similar investments in active markets; and (vi) other factors, such as future cash flows, interest rates, yield curves, volatilities, prepayment speeds, loss severities, credit risks and/or default rates. Valuations based on such factors are reported to the Board on a quarterly basis.
The Global Valuation Committee employs various methods for calibrating valuation approaches for investments where an active market does not exist, including regular due diligence of the Trust’s pricing vendors, a regular review of key inputs and assumptions, transactional back-testing or disposition analysis to compare unrealized gains and losses to realized gains and losses, reviews of missing or stale prices, reviews of large movements in market values, and reviews of market related activity.
Various inputs are used in determining the fair value of financial instruments. Inputs may be based on independent market data (“observable inputs”) or they may be internally developed (“unobservable inputs”). These inputs are categorized into a disclosure hierarchy consisting of three broad levels for financial reporting purposes. The level of a value determined for a financial instrument within the fair value hierarchy is based on the lowest level of any input that is significant to the fair value measurement in its entirety. The categorization of a value determined for a financial instrument within the hierarchy is based upon the pricing transparency of the instrument and is not necessarily an indication of the risk associated with investing in the instrument. The three levels of the fair value hierarchy are as follows:
| | • | | Level 1 — Unadjusted quoted prices in active markets for identical assets or liabilities; |
| | • | | Level 2 — Inputs other than quoted prices included within Level 1 that are observable for the asset or liability either directly or indirectly, including quoted prices for similar assets or liabilities in active markets, quoted prices for identical or similar assets or liabilities in markets that are not considered to be active, inputs other than quoted prices that are observable for the asset or liability (such as exchange rates, financing terms, interest rates, yield curves, volatilities, prepayment speeds, loss severities, credit risks and default rates) or other market-corroborated inputs; and |
| | • | | Level 3 — Unobservable inputs for the asset or liability, including the Global Valuation Committee’s assumptions used in determining the fair value of investments. |
Changes in valuation techniques may result in transfers in or out of an assigned level within the disclosure hierarchy. In accordance with the Trust’s policy, transfers between different levels of the fair value hierarchy are deemed to have occurred as of the beginning of the reporting period.
SECURITY TRANSACTIONS AND INCOME RECOGNITION
Security transactions are accounted for on trade date. Dividend income and capital gain distributions, if any, are recognized on the ex-dividend date, net of any foreign taxes withheld at source. Any taxes withheld that are reclaimable from foreign tax authorities as of July 31, 2016 are reflected in tax reclaims receivable. Non-cash dividends received in the form of stock in an elective dividend, if any, are recorded as dividend income at fair value. Distributions received by the Funds may include a return of capital that is estimated by management. Such amounts are recorded as a reduction of the cost of investments or reclassified to capital gains. Interest income is accrued daily. Realized gains and losses on investment transactions are determined using the specific identification method.
FOREIGN CURRENCY TRANSLATION
The accounting records of the Funds are maintained in U.S. dollars. Foreign currencies, as well as investment securities and other assets and liabilities denominated in foreign currencies, are translated into U.S. dollars using exchange rates deemed
| | |
| 42 | | 2016 iSHARES ANNUAL REPORTTO SHAREHOLDERS |
Notes to Financial Statements (Continued)
iSHARES® U.S. ETF TRUST
appropriate by the investment adviser. Purchases and sales of securities, income receipts and expense payments are translated into U.S. dollars on the respective dates of such transactions.
Each Fund does not isolate the effect of fluctuations in foreign exchange rates from the effect of fluctuations in the market prices of securities. Such fluctuations are reflected by the Funds as a component of realized and unrealized gains and losses from investments for financial reporting purposes.
FOREIGN TAXES
Certain Funds may be subject to foreign taxes (a portion of which may be reclaimable) on income, stock dividends, capital gains on investments, or certain foreign currency transactions. All foreign taxes are recorded in accordance with the applicable foreign tax regulations and rates that exist in the foreign jurisdictions in which the Funds invest. These foreign taxes, if any, are paid by the Funds and are reflected in their statements of operations as follows: foreign taxes withheld at source are presented as a reduction of income, foreign taxes on securities lending income are presented as a reduction of securities lending income, foreign taxes on stock dividends are presented as “other foreign taxes”, and foreign taxes on capital gains from sales of investments and foreign taxes on foreign currency transactions are included in their respective net realized gain (loss) categories. Foreign taxes payable or deferred as of July 31, 2016, if any, are disclosed in the Funds’ statements of assets and liabilities.
DISTRIBUTIONS TO SHAREHOLDERS
Dividends and distributions paid by each Fund are recorded on the ex-dividend dates. Distributions are determined on a tax basis and may differ from net investment income and net realized capital gains for financial reporting purposes. Dividends and distributions are paid in U.S. dollars and cannot be automatically reinvested in additional shares of the Funds.
LOANS OF PORTFOLIO SECURITIES
Each Fund may lend its investment securities to approved borrowers, such as brokers, dealers and other financial institutions. The borrower pledges and maintains with the Fund collateral consisting of cash, an irrevocable letter of credit issued by a bank, or securities issued or guaranteed by the U.S. government. The initial collateral received by each Fund is required to have a value of at least 102% of the current value of the loaned securities for securities traded on U.S. exchanges and a value of at least 105% for all other securities. The collateral is maintained thereafter at a value equal to at least 100% of the current value of the securities on loan. The market value of the loaned securities is determined at the close of each business day of the Funds. Any additional required collateral is delivered to the Funds and any excess collateral is returned by the Funds on the next business day. During the term of the loan, each Fund is entitled to all distributions made on or in respect of the loaned securities. Loans of securities are terminable at any time and the borrower, after notice, is required to return borrowed securities within the standard time period for settlement of securities transactions.
Any cash received as collateral for securities on loan may be reinvested in certain short-term instruments either directly on behalf of a fund or through one or more joint accounts or money market funds, including those managed by BlackRock Fund Advisors (“BFA”), the Funds’ investment adviser, or its affiliates. As of July 31, 2016, any securities on loan were collateralized by cash. The cash collateral received was invested in money market funds managed by BFA and is disclosed in the schedules of investments. The securities on loan for each Fund are also disclosed in its schedule of investments. The total value of any securities on loan as of July 31, 2016 and the total value of the related collateral are disclosed in the statements of assets and liabilities. Income earned by the Funds from securities lending is disclosed in the statements of operations.
The risks of securities lending include the risk that the borrower may not provide additional collateral when required or may not return the securities when due. To mitigate these risks, the Funds benefit from a borrower default indemnity provided by
| | | | |
NOTESTO FINANCIAL STATEMENTS | | | 43 | |
Notes to Financial Statements (Continued)
iSHARES® U.S. ETF TRUST
BlackRock, Inc. (“BlackRock”). BlackRock’s indemnity allows for full replacement of securities lent. Each Fund could suffer a loss if the value of the investments purchased with cash collateral falls below the value of the cash collateral received.
Securities lending transactions are entered into by the Funds under Master Securities Lending Agreements (“MSLA”) which provide the right, in the event of default (including bankruptcy or insolvency) for the non-defaulting party to liquidate the collateral and calculate a net exposure to the defaulting party or request additional collateral. In the event that a borrower defaults, a Fund, as lender, would offset the market value of the collateral received against the market value of the securities loaned. The value of the collateral is typically greater than that of the market value of the securities loaned, leaving the lender with a net amount payable to the defaulting party. However, bankruptcy or insolvency laws of a particular jurisdiction may impose restrictions on or prohibitions against such a right of offset in the event of an MSLA counterparty’s bankruptcy or insolvency. Under the MSLA, the borrower can resell or re-pledge the loaned securities, and a Fund can reinvest cash collateral, or, upon an event of default, resell or re-pledge the collateral.
The following table is a summary of securities lending agreements which are subject to offset under an MSLA as of July 31, 2016:
| | | | | | | | | | | | |
iShares ETF and
Counterparty | | Market Value of
Securities on Loan | | | Cash Collateral
Received a | | | Net Amount | |
Enhanced U.S. Small-Cap | | | | | | | | | | | | |
Citigroup Global Markets Inc. | | $ | 6,361 | | | $ | 6,361 | | | $ | — | |
JPMorgan Clearing Corp. | | | 9 | | | | 9 | | | | — | |
| | | | | | | | | | | | |
| | $ | 6,370 | | | $ | 6,370 | | | $ | — | |
| | | | | | | | | | | | |
| | | | | | | | | | | | | |
| | a | | Collateral received in excess of the market value of securities on loan is not presented in this table. The total cash collateral received by the Fund is disclosed in the Fund’s statement of assets and liabilities. |
| 2. | INVESTMENT ADVISORY AGREEMENT AND OTHER TRANSACTIONS WITH AFFILIATES |
Pursuant to an Investment Advisory Agreement with the Trust, BFA manages the investment of each Fund’s assets. BFA is a California corporation indirectly owned by BlackRock. Under the Investment Advisory Agreement, BFA is responsible for substantially all expenses of the Funds, except interest, taxes, brokerage commissions and other expenses connected with the execution of portfolio transactions, distribution fees, litigation expenses and any extraordinary expenses.
For its investment advisory services to each Fund, BFA is entitled to an annual investment advisory fee based on the average daily net assets of each Fund as follows:
| | | | |
| iShares ETF | | Investment
Advisory Fee | |
Enhanced International Large-Cap | | | 0.35 | % |
Enhanced International Small-Cap | | | 0.49 | |
Enhanced U.S. Large-Cap | | | 0.18 | |
Enhanced U.S. Small-Cap | | | 0.35 | |
The SEC has issued an exemptive order which permits BlackRock Institutional Trust Company, N.A. (“BTC”), an affiliate of BFA, to serve as securities lending agent for the Funds, subject to applicable conditions. As securities lending agent, BTC bears all operational costs directly related to securities lending. Each Fund is responsible for fees in connection with the investment of cash collateral received for securities on loan in a money market fund managed by BFA, however, BTC has agreed to reduce the amount of securities lending income it receives in order to effectively limit the collateral investment fees each Fund bears to an
| | |
| 44 | | 2016 iSHARES ANNUAL REPORTTO SHAREHOLDERS |
Notes to Financial Statements (Continued)
iSHARES® U.S. ETF TRUST
annual rate of 0.04% (the “collateral investment fees”). Securities lending income is equal to the total of income earned from the reinvestment of cash collateral, net of fees and other payments to and from borrowers of securities, and less the collateral investment fees. The Funds retain a portion of securities lending income and remit the remaining portion to BTC as compensation for its services as securities lending agent.
Pursuant to a securities lending agreement, the iShares Enhanced U.S. Large-Cap ETF and iShares Enhanced U.S. Small-Cap ETF (the “Group 1 Funds”), retain 71.5% of securities lending income and the amount retained can never be less than 65% of the total of securities lending income plus the collateral investment fees.
Pursuant to a securities lending agreement, the iShares Enhanced International Large-Cap ETF and iShares Enhanced International Small-Cap ETF (the “Group 2 Funds”), retain 80% of securities lending income and the amount retained can never be less than 70% of the total of securities lending income plus the collateral investment fees.
In addition, commencing the business day following the date that the aggregate securities lending income plus the collateral investment fees generated across all 1940 Act iShares exchange-traded funds (the “iShares ETF Complex”) in a given calendar year exceeds the aggregate securities lending income generated across the iShares ETF Complex in the calendar year 2013, each Group 1 Fund, pursuant to a securities lending agreement, will retain for the remainder of that calendar year 75% of securities lending income and the amount retained can never be less than 65% of the total of securities lending income plus the collateral investment fees. Each Group 2 Fund will receive for the remainder of that calendar year 85% of securities lending income and the amount retained can never be less than 70% of the total of securities lending income plus the collateral investment fees.
For the year ended July 31, 2016, the total of securities lending agent services and collateral investment fees paid were as follows:
| | | | |
| iShares ETF | | Fees Paid to BTC | |
Enhanced International Large-Cap | | $ | 213 | |
Enhanced International Small-Cap | | | 5,755 | |
Enhanced U.S. Large-Cap | | | 7,373 | |
Enhanced U.S. Small-Cap | | | 11,832 | |
BlackRock Investments, LLC, an affiliate of BFA, is the distributor for each Fund. Pursuant to the distribution agreement, BFA is responsible for any fees or expenses for distribution services provided to the Funds.
Each Fund may invest its positive cash balances in certain money market funds managed by BFA or an affiliate. The income earned on these temporary cash investments is included in “Dividends – affiliated” in the statements of operations.
The PNC Financial Services Group, Inc. is the largest stockholder of BlackRock and is considered to be an affiliate of the Funds for 1940 Act purposes.
Certain trustees and officers of the Trust are also officers of BTC and/or BFA.
| | | | |
NOTESTO FINANCIAL STATEMENTS | | | 45 | |
Notes to Financial Statements (Continued)
iSHARES® U.S. ETF TRUST
| 3. | INVESTMENT PORTFOLIO TRANSACTIONS |
Purchases and sales of investments (excluding in-kind transactions and short-term investments) for the year ended July 31, 2016 were as follows:
| | | | | | | | |
| iShares ETF | | Purchases | | | Sales | |
Enhanced International Large-Cap | | $ | 19,836,550 | | | $ | 22,101,528 | |
Enhanced International Small-Cap | | | 4,787,762 | | | | 4,680,496 | |
Enhanced U.S. Large-Cap | | | 14,002,658 | | | | 14,789,135 | |
Enhanced U.S. Small-Cap | | | 6,511,310 | | | | 6,221,511 | |
In-kind transactions (see Note 4) for the year ended July 31, 2016 were as follows:
| | | | | | | | |
| iShares ETF | | In-kind
Purchases | | | In-kind
Sales | |
Enhanced International Large-Cap | | $ | 11,102,379 | | | $ | 50,490,547 | |
Enhanced International Small-Cap | | | 4,548,551 | | | | — | |
Enhanced U.S. Large-Cap | | | 9,619,108 | | | | 22,380,501 | |
Enhanced U.S. Small-Cap | | | 1,421,349 | | | | 3,072,624 | |
| 4. | CAPITAL SHARE TRANSACTIONS |
Capital shares are issued and redeemed by each Fund only in aggregations of a specified number of shares or multiples thereof (“Creation Units”) at NAV. Except when aggregated in Creation Units, shares of each Fund are not redeemable. Transactions in capital shares for each Fund are disclosed in detail in the statements of changes in net assets.
The consideration for the purchase of Creation Units of a fund in the Trust generally consists of the in-kind deposit of a designated portfolio of securities and a specified amount of cash. Certain funds in the Trust may be offered in Creation Units solely or partially for cash in U.S. dollars. Investors purchasing and redeeming Creation Units may pay a purchase transaction fee and a redemption transaction fee directly to State Street Bank and Trust Company, the Trust’s administrator, to offset transfer and other transaction costs associated with the issuance and redemption of Creation Units, including Creation Units for cash. Investors transacting in Creation Units for cash may also pay an additional variable charge to compensate the relevant fund for certain transaction costs (i.e., stamp taxes, taxes on currency or other financial transactions, and brokerage costs) and market impact expenses relating to investing in portfolio securities. Such variable charges, if any, are included in “Proceeds from shares sold” in the statements of changes in net assets.
In the normal course of business, each Fund’s investment activities expose it to various types of risk associated with the financial instruments and markets in which it invests. The significant types of financial risks each Fund is exposed to include market risk and credit risk. Each Fund’s prospectus provides details of these and other types of risk.
MARKET RISK
Market risk arises mainly from uncertainty about future values of financial instruments influenced by price, currency and interest rate movements. It represents the potential loss each Fund may suffer through holding market positions in the face of market movements. Each Fund is exposed to market risk by virtue of its direct and/or indirect investment in equity instruments. The fair
| | |
| 46 | | 2016 iSHARES ANNUAL REPORTTO SHAREHOLDERS |
Notes to Financial Statements (Continued)
iSHARES® U.S. ETF TRUST
value of securities held by the Funds may decline due to general market conditions, economic trends or events that are not specifically related to the issuers of the securities including local, regional or global political, social or economic instability or to factors that affect a particular industry or group of industries. The extent of each Fund’s exposure to market risk is the market value of the investments held as shown in the Fund’s schedule of investments.
A diversified portfolio, where this is appropriate and consistent with a fund’s objectives, minimizes the risk that a price change of a particular investment will have a material impact on the NAV of a fund. The investment concentrations within each Fund’s portfolio are disclosed in its schedule of investments.
Investing in the securities of non-U.S. issuers, whether directly or indirectly, involves certain considerations and risks not typically associated with securities of U.S. issuers. Such risks include, but are not limited to: generally less liquid and less efficient securities markets; generally greater price volatility; exchange rate fluctuations and exchange controls; imposition of restrictions on the expatriation of funds or other assets of the Fund; less publicly available information about issuers; the imposition of withholding or other taxes; higher transaction and custody costs; settlement delays and risk of loss attendant in settlement procedures; difficulties in enforcing contractual obligations; less regulation of securities markets; different accounting, disclosure and reporting requirements; more substantial governmental involvement in the economy; higher inflation rates; greater social, economic and political uncertainties; the risk of nationalization or expropriation of assets; and the risk of war. These risks are heightened for investments in issuers from countries with less developed markets.
The economies and markets of European countries are often closely connected and interdependent, and events in one European country can have an adverse impact on other European countries. The European financial markets have experienced volatility and adverse trends due to concerns about economic downturns in, or rising government debt levels of several European countries. Responses to the financial problems by European governments, central banks and others, including austerity measures and reforms, may not work, may result in social unrest and may limit future growth and economic recovery or have other unintended consequences. Further defaults or restructurings by governments and others of their debt could have additional adverse effects on economies, financial markets and asset valuations around the world. In addition, the United Kingdom has voted to withdraw from the European Union. The referendum may introduce significant new uncertainties and instability in the financial markets as the United Kingdom negotiates its exit from the European Union.
CREDIT RISK
Credit risk is the risk that an issuer or guarantor of debt instruments or the counterparty to a financial transaction, including derivatives contracts, repurchase agreements or loans of portfolio securities, is unable or unwilling to make timely interest and/or principal payments or to otherwise honor its obligations. BFA and its affiliates manage counterparty credit risk by entering into transactions only with counterparties that they believe have the financial resources to honor their obligations and by monitoring the financial stability of those counterparties. Financial assets, which potentially expose the Funds to issuer and counterparty credit risks, consist principally of financial instruments and receivables due from counterparties. The extent of each Fund’s exposure to credit and counterparty risks with respect to those financial assets is approximated by their value recorded in its statement of assets and liabilities.
Each Fund is treated as an entity separate from the Trust’s other funds for federal income tax purposes. It is the policy of each Fund to qualify as a regulated investment company by complying with the provisions applicable to regulated investment companies, as defined under Subchapter M of the Internal Revenue Code of 1986, as amended, and to annually distribute substantially all of its ordinary income and any net capital gains (taking into account any capital loss carryforwards) sufficient to relieve it from all, or substantially all, federal income and excise taxes. Accordingly, no provision for federal income taxes is required.
| | | | |
NOTESTO FINANCIAL STATEMENTS | | | 47 | |
Notes to Financial Statements (Continued)
iSHARES® U.S. ETF TRUST
U.S. GAAP requires that certain components of net assets be adjusted to reflect permanent differences between financial and tax reporting. These reclassifications have no effect on net assets or NAV per share. The following permanent differences as of July 31, 2016, attributable to passive foreign investment companies, foreign currency transactions and realized gains (losses) from in-kind redemptions, were reclassified to the following accounts:
| | | | | | | | | | | | |
| iShares ETF | | Paid-in
Capital | | | Undistributed
Net Investment
Income/Distributions
in Excess of Net
Investment Income | | | Undistributed
Net Realized
Gain/Accumulated
Net Realized Loss | |
Enhanced International Large-Cap | | $ | (731,270 | ) | | $ | 32,695 | | | $ | 698,575 | |
Enhanced International Small-Cap | | | — | | | | 10,086 | | | | (10,086 | ) |
Enhanced U.S. Large-Cap | | | 3,977,841 | | | | — | | | | (3,977,841 | ) |
Enhanced U.S. Small-Cap | | | 626,251 | | | | — | | | | (626,251 | ) |
The tax character of distributions paid during the years ended July 31, 2016 and July 31, 2015 was as follows:
| | | | | | | | |
| iShares ETF | | 2016 | | | 2015 | |
Enhanced International Large-Cap | | | | | | | | |
Ordinary income | | $ | 1,912,879 | | | $ | 1,946,711 | |
| | | | | | | | |
| | |
Enhanced International Small-Cap | | | | | | | | |
Ordinary income | | $ | 326,068 | | | $ | 287,196 | |
| | | | | | | | |
| | |
Enhanced U.S. Large-Cap | | | | | | | | |
Ordinary income | | $ | 1,504,471 | | | $ | 1,346,033 | |
| | | | | | | | |
| | |
Enhanced U.S. Small-Cap | | | | | | | | |
Ordinary income | | $ | 380,435 | | | $ | 344,193 | |
| | | | | | | | |
| | | | | | | | | |
As of July 31, 2016, the tax components of accumulated net earnings (losses) were as follows:
| | | | | | | | | | | | | | | | | | | | |
| iShares ETF | | Undistributed
Ordinary
Income | | | Capital
Loss
Carryforwards | | | Net
Unrealized
Gains (Losses) a | | | Qualified
Late-Year
Losses b | | | Total | |
Enhanced International Large-Cap | | $ | 77,453 | | | $ | (2,520,004 | ) | | $ | (5,393,374 | ) | | $ | (1,574,385 | ) | | $ | (9,410,310 | ) |
Enhanced International Small-Cap | | | 121,260 | | | | (866,160 | ) | | | 1,689,618 | | | | (583,095 | ) | | | 361,623 | |
Enhanced U.S. Large-Cap | | | 79,634 | | | | — | | | | 7,294,668 | | | | (345,118 | ) | | | 7,029,184 | |
Enhanced U.S. Small-Cap | | | 55,737 | | | | (333,291 | ) | | | 2,173,788 | | | | (119,389 | ) | | | 1,776,845 | |
| | a | | The difference between book-basis and tax-basis unrealized gains (losses) was attributable primarily to the tax deferral of losses on wash sales and the realization for tax purposes of unrealized gains on investments in passive foreign investment companies. |
| | b | | The Funds have elected to defer certain qualified late-year losses and recognize such losses in the next taxable year. |
| | |
| 48 | | 2016 iSHARES ANNUAL REPORTTO SHAREHOLDERS |
Notes to Financial Statements (Continued)
iSHARES® U.S. ETF TRUST
As of July 31, 2016, the following Funds had non-expiring capital loss carryforwards available to offset future realized capital gains as follows:
| | | | |
| iShares ETF | | Non-
Expiring | |
Enhanced International Large-Cap | | $ | 2,520,004 | |
Enhanced International Small-Cap | | | 866,160 | |
Enhanced U.S. Small-Cap | | | 333,291 | |
For the year ended July 31, 2016 the iShares Enhanced U.S. Large Cap ETF utilized $237,466 of its capital loss carryforwards.
The Funds may own shares in certain foreign investment entities, referred to, under U.S. tax law, as “passive foreign investment companies.” The Funds may elect to mark-to-market annually the shares of each passive foreign investment company and would be required to distribute to shareholders any such marked-to-market gains.
Management has analyzed tax laws and regulations and their application to the Funds as of July 31, 2016, inclusive of the open tax return years, and does not believe there are any uncertain tax positions that require recognition of a tax liability in the Funds’ financial statements.
Management has evaluated the impact of all subsequent events on the Funds through the date the financial statements were available to be issued and has determined that there were no subsequent events requiring adjustment or disclosure in the financial statements, except as noted below.
On June 23, 2016, the Board unanimously voted to close and liquidate the Funds. After the close of business on August 23, 2016, subject to applicable law, the Funds no longer accepted creation orders. Trading in the Funds was halted prior to market open on August 24, 2016. Proceeds of the liquidation were sent to shareholders on August 30, 2016.
| | | | |
NOTESTO FINANCIAL STATEMENTS | | | 49 | |
Report of Independent Registered Public Accounting Firm
To the Shareholders and Board of Trustees of
iShares U.S. ETF Trust:
In our opinion, the accompanying statements of assets and liabilities, including the schedules of investments, and the related statements of operations and of changes in net assets and the financial highlights present fairly, in all material respects, the financial position of iShares Enhanced International Large-Cap ETF, iShares Enhanced International Small-Cap ETF, iShares Enhanced U.S. Large-Cap ETF and iShares Enhanced U.S. Small-Cap ETF (the “Funds”) at July 31, 2016, the results of each of their operations, the changes in each of their net assets and their financial highlights for each of the periods presented, in conformity with accounting principles generally accepted in the United States of America. These financial statements and financial highlights (hereafter referred to as “financial statements”) are the responsibility of the Funds’ management. Our responsibility is to express an opinion on these financial statements based on our audits. We conducted our audits of these financial statements in accordance with the standards of the Public Company Accounting Oversight Board (United States). Those standards require that we plan and perform the audit to obtain reasonable assurance about whether the financial statements are free of material misstatement. An audit includes examining, on a test basis, evidence supporting the amounts and disclosures in the financial statements, assessing the accounting principles used and significant estimates made by management, and evaluating the overall financial statement presentation. We believe that our audits, which included confirmation of securities at July 31, 2016 by correspondence with the custodian, transfer agent and brokers, provide a reasonable basis for our opinion.
As discussed in Note 7, the Board of Trustees approved the liquidation of the Funds, which occurred on August 30, 2016.
PricewaterhouseCoopers LLP
San Francisco, California
September 26, 2016
| | |
| 50 | | 2016 iSHARES ANNUAL REPORTTO SHAREHOLDERS |
Tax Information (Unaudited)
iSHARES® U.S. ETF TRUST
The following maximum amounts are hereby designated as qualified dividend income for individuals for the fiscal year ended July 31, 2016:
| | | | |
| iShares ETF | | Qualified
Dividend
Income | |
Enhanced International Large-Cap | | $ | 2,215,889 | |
Enhanced International Small-Cap | | | 329,018 | |
Enhanced U.S. Large-Cap | | | 1,592,299 | |
Enhanced U.S. Small-Cap | | | 370,661 | |
For corporate shareholders, the percentage of income dividends paid during the fiscal year ended July 31, 2016 that qualified for the dividends-received deduction were as follows:
| | | | |
| iShares ETF | | Dividends-
Received
Deduction | |
Enhanced U.S. Large-Cap | | | 96.03 | % |
Enhanced U.S. Small-Cap | | | 86.86 | % |
For the fiscal year ended July 31, 2016, the following Funds earned foreign source income and paid foreign taxes which they intend to pass through to their shareholders:
| | | | | | | | |
| iShares ETF | | Foreign Source
Income Earned | | | Foreign
Taxes Paid | |
Enhanced International Large-Cap | | $ | 2,282,259 | | | $ | 213,122 | |
Enhanced International Small-Cap | | | 412,203 | | | | 43,069 | |
Board Review and Approval on Investment Advisory
Contract
iSHARES® U.S. ETF TRUST
I. iShares Enhanced International Large-Cap ETF, iShares Enhanced U.S. Large-Cap ETF and iShares Enhanced U.S. Small-Cap ETF
Under Section 15(c) of the Investment Company Act of 1940 (the “1940 Act”), the Trust’s Board of Trustees (the “Board”), including a majority of Trustees who are not “interested persons” of the Trust (as that term is defined in the 1940 Act) (the “Independent Trustees”), is required annually to consider and approve the Investment Advisory Contract between the Trust and BFA (the “Advisory Contract”) on behalf of the Funds. The Independent Trustees requested, and BFA provided, such information as the Independent Trustees, with advice from independent counsel, deemed reasonably necessary to evaluate the Advisory Contract. A committee of all of the Independent Trustees (the “15(c) Committee”), with independent counsel, met with management on April 28, 2016 and May 9, 2016. At these meetings, the 15(c) Committee reviewed and discussed information provided in response to the 15(c) Committee’s initial requests, and requested certain additional information, which management agreed to provide. At a meeting held on May 17, 2016, management presented information to the Board relating to the continuance of the Advisory Contract, including information requested by the 15(c) Committee during its meetings. The Board, including the Independent Trustees, reviewed and discussed such information at length. The Independent Trustees requested from management certain additional information, which management agreed to provide. At a meeting held on June 21-23, 2016, the Board, including the Independent Trustees, reviewed the additional information provided by management in response to these requests. After extensive discussions, the Board, including all of the Independent Trustees, approved the continuance of the Advisory Contract for the Funds, based on a review of qualitative and quantitative information provided by BFA, including the additional information management provided at the request of the Independent Trustees. The Board noted its satisfaction with the extent and quality of information provided and its frequent interactions with management, as well as the detailed responses and other information provided by BFA. The Board also noted that the Board and BFA agreed to discuss potential enhancements and adjustments to the 15(c) process for the coming year. The Independent Trustees were advised by their independent counsel throughout the process, including about the legal standards applicable to their review. In approving the Advisory Contract for the Funds, the Board, including the Independent Trustees, considered the following factors, no one of which was controlling, and reached the following conclusions:
Expenses and Performance of the Funds — The Board reviewed statistical information prepared by Broadridge Financial Solutions Inc. (“Broadridge”), an independent provider of investment company data, regarding the expense ratio components, including gross and net total expenses, waivers/reimbursements (if any), and underlying fund fees and expenses (if any) of each Fund in comparison with the same information for other exchange traded funds (including, where applicable, funds sponsored by an “at cost” service provider) and, in the limited instances where no comparable ETFs existed and the comparison group would not otherwise be reasonable in Broadridge’s judgment, pure index institutional mutual funds, objectively selected by Broadridge as comprising such Fund’s applicable peer group pursuant to Broadridge’s proprietary ETF methodology (the “Peer Group”). The Board was provided with a detailed description of Broadridge’s proprietary ETF methodology used by Broadridge to determine the applicable Peer Groups. The Board further noted that due to the limitations in providing comparable funds in the various Peer Groups, the statistical information provided in Broadridge’s report may or may not provide meaningful direct comparisons to the Funds in all instances.
The Board also noted that the investment advisory fee rates and overall expenses (net of waivers and reimbursements) for the Funds were lower than the median of the investment advisory fee rates and overall expenses (net of waivers and reimbursements) of the funds in their respective Peer Group, excluding iShares funds.
In addition, to the extent that any of the comparison funds included in the Peer Group, excluding iShares funds, track the same index as any particular Fund, Broadridge also provided, and the Board reviewed, a comparison of such Fund’s performance for the one-, three-, five-, ten-year, and since inception periods, as applicable, and for the “last quarter” period ended December 31, 2015, to that of such relevant comparison funds for the same periods.
| | |
| 52 | | 2016 iSHARES ANNUAL REPORTTO SHAREHOLDERS |
Board Review and Approval on Investment Advisory
Contract (Continued)
iSHARES® U.S. ETF TRUST
The Board noted that each Fund is an actively managed ETF that does not seek to track the performance of a specified index and that the management team for each Fund manages the Fund’s portfolio in accordance with its investment objective. The Board further noted that during the prior year, the Board received periodic reports on each Fund’s short- and longer-term performance in comparison with its peer group and benchmark index. Such periodic comparative performance information, including additional detailed information on certain specific iShares funds requested by the Board, was also considered. The Board noted that each Fund generally performed in line with expectations relative to each Fund’s peer group and benchmark index.
Based on this review, the other factors considered at the meeting, and their general knowledge of ETF pricing, the Board concluded that the investment advisory fee rate and expense level and the historical performance of each Fund supported the Board’s approval of the continuance of the Advisory Contract for the coming year.
Nature, Extent and Quality of Services Provided by BFA — Based on management’s representations, including information about recent and proposed enhancements to the iShares business, including with respect to capital markets support and analysis, product design and other services, the Board expected that there would be no diminution in the scope of services required of or provided by BFA under the Advisory Contract for the coming year as compared to the scope of services provided by BFA during prior years. In reviewing the scope of these services, the Board considered BFA’s investment philosophy and experience, noting that BFA and its affiliates have committed significant resources over time, including during the past year, to supporting the iShares funds and their shareholders. The Board also considered BFA’s compliance program and its compliance record with respect to the Funds. In that regard, the Board noted that BFA reports to the Board about portfolio management and compliance matters on a periodic basis in connection with regularly scheduled meetings of the Board, and on other occasions as necessary and appropriate, and has provided information and made appropriate officers available as needed to provide further assistance with these matters. The Board also reviewed the background and experience of the persons responsible for the day-to-day management of the Funds, as well as the resources available to them in managing the Funds. In addition to the above considerations, the Board reviewed and considered detailed presentations regarding BFA’s investment performance, investment and risk management processes and strategies provided at the June 21-23, 2016 meeting and throughout the previous year, and matters related to BFA’s portfolio compliance policies and procedures. The Board noted that each Fund had met its investment objective consistently since its respective inception date.
Based on review of this information, and the performance information discussed above, the Board concluded that the nature, extent and quality of services provided by BFA to the Funds under the Advisory Contract supported the Board’s approval of the continuance of the Advisory Contract for the coming year.
Costs of Services Provided to the Funds and Profits Realized by BFA and its Affiliates — The Board reviewed information about the profitability to BlackRock of the Funds, on a Fund-by-Fund basis and in the aggregate, based on the fees payable to BFA and its affiliates (including fees under the Advisory Contract), and all other sources of revenue and expense to BFA and its affiliates from the Funds’ operations for the last calendar year. The Board reviewed BlackRock’s profitability methodology for the iShares funds, noting that the 15(c) Committee had focused on the methodology and profitability presentation during its meetings. The Board discussed the sources of direct and ancillary revenue with management, including the revenues to BTC from securities lending by the Funds. The Board also discussed BFA’s profit margin as reflected in the Funds’ profitability analyses and reviewed information regarding potential economies of scale (as discussed below). Based on this review, the Board concluded that the profits realized by BFA and its affiliates under the Advisory Contract and from other relationships between the Funds and BFA and/or its affiliates, if any, were within a reasonable range in light of the factors considered.
Economies of Scale — The Board reviewed information regarding potential economies of scale or other efficiencies that may result from increases in the Funds’ assets, noting that the issue of economies of scale had been focused on extensively by the 15(c) Committee during its meetings and addressed by management. The Board and the 15(c) Committee reviewed information
| | | | |
BOARD REVIEWAND APPROVALON INVESTMENT ADVISORY CONTRACT | | | 53 | |
Board Review and Approval on Investment Advisory
Contract (Continued)
iSHARES® U.S. ETF TRUST
provided by BFA regarding scale benefits shared with the iShares funds through relatively low fee rates established at inception, breakpoints, waivers, or other fee reductions, as well as through additional investment in the iShares business and the provision of improved or additional infrastructure and services to the iShares funds and their shareholders. The Board and the 15(c) Committee received information regarding BlackRock’s historical profitability, including BFA’s and its affiliates’ costs in providing services. The cost information distinguished, among other things, between fixed and variable costs, and explained how the level of fixed and variable costs, as well as the nature of such costs, may impact the existence or size of scale benefits. The Board noted that the Advisory Contract for the Funds did not provide for any breakpoints in the Funds’ investment advisory fee rates as the assets of the Funds increase. However, the Board noted that should material economies of scale exist in the future that are not otherwise shared, a breakpoint structure for the Funds may be appropriate, and that it would continue to monitor the sharing of economies of scale to determine the appropriateness of adding breakpoints in the future.
Based on this review, as well as the other factors considered at the meeting, the Board, recognizing its responsibility to consider this issue periodically, determined to approve the continuance of the Advisory Contract for the coming year.
Fees and Services Provided for Other Comparable Funds/Accounts Managed by BFA and its Affiliates — The Board received and considered information regarding the investment advisory/management fee rates for other funds/accounts in the U.S. for which BFA (or its affiliates) provides investment advisory/management services, including open-end funds registered under the 1940 Act (including sub-advised funds), collective trust funds, and institutional separate accounts (together, the “Other Accounts”), and acknowledged BFA’s assertion that the iShares funds are fundamentally different investment vehicles from the Other Accounts. The Board noted that BFA and its affiliates do manage Other Accounts with similar investment strategies or investment mandates as the Funds. The Board further noted that BFA provided the Board with detailed information regarding how the Other Accounts (particularly institutional clients) generally differ from the Funds, including in terms of the different and generally more extensive services provided to the Funds, as well as other significant differences. In that regard, the Board considered that the pricing of services to institutional clients is typically based on a number of factors beyond the nature and extent of the specific services to be provided and often depends on the overall relationship between the client and its affiliates and the adviser and its affiliates. In addition, the Board considered the relative complexity and inherent risks and challenges of managing and providing other services to the Funds, as publicly traded exchange traded funds, as compared to the Other Accounts that are institutional clients in light of differing regulatory requirements and client-imposed mandates. The Board also considered the “all-inclusive” nature of the Funds’ advisory fee structure, and the Fund expenses borne by BFA under this arrangement. The Board noted that the investment advisory fee rates under the Advisory Contract for the Funds were generally higher than the investment advisory/management fee rates for certain of the Other Accounts (particularly institutional clients) and concluded that the differences appeared to be consistent with the factors discussed.
Other Benefits to BFA and/or its Affiliates — The Board reviewed the “fallout” benefits or ancillary revenue received by BFA and/or its affiliates in connection with the services provided to the Funds by BFA, such as payment of revenue to BTC, the Funds’ securities lending agent, for loaning portfolio securities (which was included in the profit margins reviewed by the Board pursuant to BFA’s profitability methodology), and payment of advisory fees and/or administration fees to BFA and BTC (or their affiliates) in connection with any investments by the Funds in other funds for which BFA (or its affiliates) provides investment advisory services and/or administration services. The Board noted that BFA generally does not use soft dollars or consider the value of research or other services that may be provided to BFA (including its affiliates) in selecting brokers for portfolio transactions for the Funds. The Board further noted that any portfolio transactions on behalf of the Funds placed through a BFA affiliate or purchased from an underwriting syndicate in which a BFA affiliate participates, are reported to the Board pursuant to Rule 17e-1 or Rule 10f-3, as applicable, under the 1940 Act. The Board concluded that any such ancillary benefits would not be disadvantageous to the Funds’ shareholders and thus would not alter the Board’s conclusion with respect to the appropriateness of approving the continuance of the Advisory Contract for the coming year.
| | |
| 54 | | 2016 iSHARES ANNUAL REPORTTO SHAREHOLDERS |
Board Review and Approval on Investment Advisory
Contract (Continued)
iSHARES® U.S. ETF TRUST
Based on the considerations described above, the Board determined that each Fund’s investment advisory fee rate under the Advisory Contract does not constitute a fee that is so disproportionately large as to bear no reasonable relationship to the services rendered and that could not have been the product of arm’s-length bargaining, and concluded that it is in the best interest of each Fund and its shareholders to approve the continuance of the Advisory Contract for the coming year.
At the June 21-23, 2016 meeting, BFA sought approval from the Board to close and liquidate the Funds in the third quarter of 2016. BFA noted to the Board, among other things, that the Funds had generated limited interest since their launch and did not have favorable prospects to achieve scale, and the Board unanimously voted to close and liquidate the Funds.
II. iShares Enhanced International Small-Cap ETF
Under Section 15(c) of the Investment Company Act of 1940 (the “1940 Act”), the Trust’s Board of Trustees (the “Board”), including a majority of Trustees who are not “interested persons” of the Trust (as that term is defined in the 1940 Act) (the “Independent Trustees”), is required annually to consider and approve the Investment Advisory Contract between the Trust and BFA (the “Advisory Contract”) on behalf of the Fund. The Independent Trustees requested, and BFA provided, such information as the Independent Trustees, with advice from independent counsel, deemed reasonably necessary to evaluate the Advisory Contract. A committee of all of the Independent Trustees (the “15(c) Committee”), with independent counsel, met with management on April 28, 2016 and May 9, 2016. At these meetings, the 15(c) Committee reviewed and discussed information provided in response to the 15(c) Committee’s initial requests, and requested certain additional information, which management agreed to provide. At a meeting held on May 17, 2016, management presented information to the Board relating to the continuance of the Advisory Contract, including information requested by the 15(c) Committee during its meetings. The Board, including the Independent Trustees, reviewed and discussed such information at length. The Independent Trustees requested from management certain additional information, which management agreed to provide. At a meeting held on June 21-23, 2016, the Board, including the Independent Trustees, reviewed the additional information provided by management in response to these requests. After extensive discussions, the Board, including all of the Independent Trustees, approved the continuance of the Advisory Contract for the Fund, based on a review of qualitative and quantitative information provided by BFA, including the additional information management provided at the request of the Independent Trustees. The Board noted its satisfaction with the extent and quality of information provided and its frequent interactions with management, as well as the detailed responses and other information provided by BFA. The Board also noted that the Board and BFA agreed to discuss potential enhancements and adjustments to the 15(c) process for the coming year. The Independent Trustees were advised by their independent counsel throughout the process, including about the legal standards applicable to their review. In approving the Advisory Contract for the Fund, the Board, including the Independent Trustees, considered the following factors, no one of which was controlling, and reached the following conclusions:
Expenses and Performance of the Fund — The Board reviewed statistical information prepared by Broadridge Financial Solutions Inc. (“Broadridge”), an independent provider of investment company data, regarding the expense ratio components, including gross and net total expenses, waivers/reimbursements (if any), and underlying fund fees and expenses (if any) of the Fund in comparison with the same information for other exchange traded funds (including, where applicable, funds sponsored by an “at cost” service provider) and, in the limited instances where no comparable ETFs existed and the comparison group would not otherwise be reasonable in Broadridge’s judgment, pure index institutional mutual funds, objectively selected by Broadridge as comprising the Fund’s applicable peer group pursuant to Broadridge’s proprietary ETF methodology (the “Peer Group”). The Board was provided with a detailed description of Broadridge’s proprietary ETF methodology used by Broadridge to determine the Fund’s Peer Group. The Board further noted that due to the limitations in providing comparable funds in the Peer Group, the statistical information provided in Broadridge’s report may or may not provide meaningful direct comparisons to the Fund in all instances.
| | | | |
BOARD REVIEWAND APPROVALON INVESTMENT ADVISORY CONTRACT | | | 55 | |
Board Review and Approval on Investment Advisory
Contract (Continued)
iSHARES® U.S. ETF TRUST
The Board also noted that the investment advisory fee rate and overall expenses (net of waivers and reimbursements) for the Fund were lower than the median of the investment advisory fee rates and overall expenses (net of waivers and reimbursements) of the funds in its Peer Group, excluding iShares funds.
In addition, to the extent that any of the comparison funds included in the Peer Group, excluding iShares funds, track the same index as the Fund, Broadridge also provided, and the Board reviewed, a comparison of the Fund’s performance for the one-, three-, five-, ten-year, and since inception periods, as applicable, and for the “last quarter” period ended December 31, 2015, to that of such relevant comparison funds for the same periods.
The Board noted that the Fund is an actively managed ETF that does not seek to track the performance of a specified index and that the management team for the Fund manages the Fund’s portfolio in accordance with its investment objective. The Board further noted that during the prior year, the Board received periodic reports on the Fund’s short- and longer-term performance in comparison with its peer group and benchmark index. Such periodic comparative performance information, including additional detailed information on certain specific iShares funds requested by the Board, was also considered. The Board noted that the Fund generally performed in line with expectations relative to the Fund’s peer group and benchmark index over the relevant periods.
Based on this review, the other factors considered at the meeting, and their general knowledge of ETF pricing, the Board concluded that the investment advisory fee rate and expense level and the historical performance of the Fund supported the Board’s approval of the continuance of the Advisory Contract for the coming year.
Nature, Extent and Quality of Services Provided by BFA — Based on management’s representations, including information about recent and proposed enhancements to the iShares business, including with respect to capital markets support and analysis, product design and other services, the Board expected that there would be no diminution in the scope of services required of or provided by BFA under the Advisory Contract for the coming year as compared to the scope of services provided by BFA during prior years. In reviewing the scope of these services, the Board considered BFA’s investment philosophy and experience, noting that BFA and its affiliates have committed significant resources over time, including during the past year, to supporting the iShares funds and their shareholders. The Board also considered BFA’s compliance program and its compliance record with respect to the Fund. In that regard, the Board noted that BFA reports to the Board about portfolio management and compliance matters on a periodic basis in connection with regularly scheduled meetings of the Board, and on other occasions as necessary and appropriate, and has provided information and made appropriate officers available as needed to provide further assistance with these matters. The Board also reviewed the background and experience of the persons responsible for the day-to-day management of the Fund, as well as the resources available to them in managing the Fund. In addition to the above considerations, the Board reviewed and considered detailed presentations regarding BFA’s investment performance, investment and risk management processes and strategies provided at the June 21-23, 2016 meeting and throughout the previous year, and matters related to BFA’s portfolio compliance policies and procedures. The Board noted that the Fund had met its investment objective consistently since its inception date.
Based on review of this information, and the performance information discussed above, the Board concluded that the nature, extent and quality of services provided by BFA to the Fund under the Advisory Contract supported the Board’s approval of the continuance of the Advisory Contract for the coming year.
Costs of Services Provided to the Fund and Profits Realized by BFA and its Affiliates — The Board reviewed information about the profitability to BlackRock of the Fund, based on the fees payable to BFA and its affiliates (including fees under the Advisory Contract), and all other sources of revenue and expense to BFA and its affiliates from the Funds’ operations for the last calendar year. The Board reviewed BlackRock’s profitability methodology for the iShares funds, noting that the 15(c) Committee
| | |
| 56 | | 2016 iSHARES ANNUAL REPORTTO SHAREHOLDERS |
Board Review and Approval on Investment Advisory
Contract (Continued)
iSHARES® U.S. ETF TRUST
had focused on the methodology and profitability presentation during its meetings. The Board discussed the sources of direct and ancillary revenue with management, including the revenues to BTC from securities lending by the Fund. The Board also discussed BFA’s profit margin as reflected in the Fund’s profitability analysis and reviewed information regarding potential economies of scale (as discussed below). Based on this review, the Board concluded that the profits realized by BFA and its affiliates under the Advisory Contract and from other relationships between the Fund and BFA and/or its affiliates, if any, were within a reasonable range in light of the factors considered.
Economies of Scale — The Board reviewed information regarding potential economies of scale or other efficiencies that may result from increases in the Fund’s assets, noting that the issue of economies of scale had been focused on extensively by the 15(c) Committee during its meetings and addressed by management. The Board and the 15(c) Committee reviewed information provided by BFA regarding scale benefits shared with the iShares funds through relatively low fee rates established at inception, breakpoints, waivers, or other fee reductions, as well as through additional investment in the iShares business and the provision of improved or additional infrastructure and services to the iShares funds and their shareholders. The Board and the 15(c) Committee received information regarding BlackRock’s historical profitability, including BFA’s and its affiliates’ costs in providing services. The cost information distinguished, among other things, between fixed and variable costs, and explained how the level of fixed and variable costs, as well as the nature of such costs, may impact the existence or size of scale benefits. The Board noted that the Advisory Contract for the Fund did not provide for any breakpoints in the Fund’s investment advisory fee rate as the assets of the Fund increase. However, the Board noted that should material economies of scale exist in the future that are not otherwise shared, a breakpoint structure for the Fund may be appropriate, and that it would continue to monitor the sharing of economies of scale to determine the appropriateness of adding breakpoints in the future.
Based on this review, as well as the other factors considered at the meeting, the Board, recognizing its responsibility to consider this issue periodically, determined to approve the continuance of the Advisory Contract for the coming year.
Fees and Services Provided for Other Comparable Funds/Accounts Managed by BFA and its Affiliates — The Board received and considered information regarding the investment advisory/management fee rates for other funds/accounts in the U.S. for which BFA (or its affiliates) provides investment advisory/management services, including open-end funds registered under the 1940 Act (including sub-advised funds), collective trust funds, and institutional separate accounts (together, the “Other Accounts”), and acknowledged BFA’s assertion that the iShares funds are fundamentally different investment vehicles from the Other Accounts. The Board noted that BFA and its affiliates do not manage Other Accounts with a similar investment strategy or investment mandate as the Fund. The Board further noted that BFA provided the Board with detailed information regarding how the Other Accounts (particularly institutional clients) generally differ from the Fund, including in terms of the different and generally more extensive services provided to the Fund, as well as other significant differences. In that regard, the Board considered that the pricing of services to institutional clients is typically based on a number of factors beyond the nature and extent of the specific services to be provided and often depends on the overall relationship between the client and its affiliates and the adviser and its affiliates. In addition, the Board considered the relative complexity and inherent risks and challenges of managing and providing other services to the Fund, as a publicly traded exchange traded fund, as compared to the Other Accounts that are institutional clients in light of differing regulatory requirements and client-imposed mandates. The Board also considered the “all-inclusive” nature of the Fund’s advisory fee structure, and the Fund expenses borne by BFA under this arrangement. The Board noted that the investment advisory fee rate under the Advisory Contract for the Fund was generally higher than the investment advisory/management fee rates for certain of the Other Accounts (particularly institutional clients) and concluded that the differences appeared to be consistent with the factors discussed.
Other Benefits to BFA and/or its Affiliates — The Board reviewed the “fallout” benefits or ancillary revenue received by BFA and/or its affiliates in connection with the services provided to the Fund by BFA, such as payment of revenue to BTC, the Fund’s securities lending agent, for loaning portfolio securities (which was included in the profit margins reviewed by the Board pursuant
| | | | |
BOARD REVIEWAND APPROVALON INVESTMENT ADVISORY CONTRACT | | | 57 | |
Board Review and Approval on Investment Advisory
Contract (Continued)
iSHARES® U.S. ETF TRUST
to BFA’s profitability methodology), and payment of advisory fees and/or administration fees to BFA and BTC (or their affiliates) in connection with any investments by the Fund in other funds for which BFA (or its affiliates) provides investment advisory services and/or administration services. The Board noted that BFA generally does not use soft dollars or consider the value of research or other services that may be provided to BFA (including its affiliates) in selecting brokers for portfolio transactions for the Fund. The Board further noted that any portfolio transactions on behalf of the Fund placed through a BFA affiliate or purchased from an underwriting syndicate in which a BFA affiliate participates, are reported to the Board pursuant to Rule 17e-1 or Rule 10f-3, as applicable, under the 1940 Act. The Board concluded that any such ancillary benefits would not be disadvantageous to the Fund’s shareholders and thus would not alter the Board’s conclusion with respect to the appropriateness of approving the continuance of the Advisory Contract for the coming year.
Based on the considerations described above, the Board determined that the Fund’s investment advisory fee rate under the Advisory Contract does not constitute a fee that is so disproportionately large as to bear no reasonable relationship to the services rendered and that could not have been the product of arm’s-length bargaining, and concluded that it is in the best interest of the Fund and its shareholders to approve the continuance of the Advisory Contract for the coming year.
At the June 21-23, 2016 meeting, BFA sought approval from the Board to close and liquidate the Fund in the third quarter of 2016. BFA noted to the Board, among other things, that the Fund had generated limited interest since its launch and did not have favorable prospects to achieve scale, and the Board unanimously voted to close and liquidate the Fund.
| | |
| 58 | | 2016 iSHARES ANNUAL REPORTTO SHAREHOLDERS |
Supplemental Information (Unaudited)
iSHARES® U.S. ETF TRUST
Section 19(a) Notices
The amounts and sources of distributions reported are estimates and are provided pursuant to regulatory requirements and are not being provided for tax reporting purposes. The actual amounts and sources for tax reporting purposes will depend upon each Fund’s investment experience during the year and may be subject to changes based on the tax regulations. Shareholders will receive a Form 1099-DIV each calendar year that will inform them how to report these distributions for federal income tax purposes.
| | | | | | | | | | | | | | | | | | | | | | | | | | | | | | | | |
| | | Total Cumulative Distributions
for the Fiscal Year | | | % Breakdown of the Total Cumulative
Distributions for the Fiscal Year | |
| iShares ETF | | Net
Investment
Income | | | Net
Realized
Capital
Gains | | | Return
of
Capital | | | Total
Per
Share | | | Net
Investment
Income | | | Net
Realized
Capital
Gains | | | Return
of
Capital | | | Total
Per
Share | |
Enhanced International Large-Cap | | $ | 0.649687 | | | $ | — | | | $ | — | | | $ | 0.649687 | | | | 100 | % | | | — | % | | | — | % | | | 100 | % |
Enhanced International Small-Cap | | | 0.429902 | | | | — | | | | — | | | | 0.429902 | | | | 100 | | | | — | | | | — | | | | 100 | |
Enhanced U.S. Large-Cap | | | 0.613487 | | | | — | | | | — | | | | 0.613487 | | | | 100 | | | | — | | | | — | | | | 100 | |
Enhanced U.S. Small-Cap | | | 0.476040 | | | | — | | | | 0.009458 | | | | 0.485498 | | | | 98 | | | | — | | | | 2 | | | | 100 | |
Premium/Discount Information
The Premium/Discount Information section is intended to present information about the differences between the daily market price on secondary markets for shares of a fund and that fund’s NAV. NAV is the price at which a fund issues and redeems shares. It is calculated in accordance with the standard formula for valuing mutual fund shares. The “Market Price” of a fund generally is determined using the midpoint between the highest bid and the lowest offer on the primary stock exchange on which the shares of such fund are listed for trading, as of the time that the fund’s NAV is calculated. A fund’s Market Price may be at, above or below its NAV. The NAV of a fund will fluctuate with changes in the fair value of its portfolio holdings. The Market Price of a fund will fluctuate in accordance with changes in its NAV, as well as market supply and demand.
Premiums or discounts are the differences (expressed as a percentage) between the NAV and Market Price of a fund on a given day, generally at the time the NAV is calculated. A premium is the amount that a fund is trading above the reported NAV, expressed as a percentage of the NAV. A discount is the amount that a fund is trading below the reported NAV, expressed as a percentage of the NAV.
The following information shows the frequency of distributions of premiums and discounts for each of the Funds. The information shown for each Fund is for five calendar years (or from the inception date of such Fund if less than five years) through the date of the most recent calendar quarter-end. The specific periods covered for each Fund are disclosed in the table for such Fund.
| | | | |
SUPPLEMENTAL INFORMATION | | | 59 | |
Supplemental Information (Unaudited) (Continued)
iSHARES® U.S. ETF TRUST
Each line in the table shows the number of trading days in which the Fund traded within the premium/discount range indicated. The number of trading days in each premium/discount range is also shown as a percentage of the total number of trading days in the period covered by each table. All data presented here represents past performance, which cannot be used to predict future results.
iShares Enhanced International Large-Cap ETF
Period Covered: February 25, 2014 through June 30, 2016
| | | | | | | | |
Premium/Discount Range | | Number
of Days | | | Percentage of
Total Days | |
Greater than 1.5% and Less than 2.0% | | | 10 | | | | 1.69 | % |
Greater than 1.0% and Less than 1.5% | | | 24 | | | | 4.05 | |
Greater than 0.5% and Less than 1.0% | | | 153 | | | | 25.80 | |
Between 0.5% and –0.5% | | | 373 | | | | 62.90 | |
Less than –0.5% and Greater than –1.0% | | | 26 | | | | 4.38 | |
Less than –1.0% and Greater than –1.5% | | | 7 | | | | 1.18 | |
| | | | | | | | |
| | | 593 | | | | 100.00 | % |
| | | | | | | | |
iShares Enhanced International Small-Cap ETF
Period Covered: February 25, 2014 through June 30, 2016
| | | | | | | | |
Premium/Discount Range | | Number
of Days | | | Percentage of
Total Days | |
Greater than 2.5% and Less than 3.0% | | | 1 | | | | 0.17 | % |
Greater than 2.0% and Less than 2.5% | | | 2 | | | | 0.34 | |
Greater than 1.5% and Less than 2.0% | | | 19 | | | | 3.20 | |
Greater than 1.0% and Less than 1.5% | | | 77 | | | | 12.98 | |
Greater than 0.5% and Less than 1.0% | | | 246 | | | | 41.49 | |
Between 0.5% and –0.5% | | | 231 | | | | 38.95 | |
Less than –0.5% and Greater than –1.0% | | | 16 | | | | 2.70 | |
Less than –1.0% and Greater than –1.5% | | | 1 | | | | 0.17 | |
| | | | | | | | |
| | | 593 | | | | 100.00 | % |
| | | | | | | | |
iShares Enhanced U.S. Large-Cap ETF
Period Covered: April 16, 2013 through June 30, 2016
| | | | | | | | |
Premium/Discount Range | | Number
of Days | | | Percentage of
Total Days | |
Between 0.5% and –0.5% | | | 810 | | | | 100.00 | % |
| | | | | | | | |
| | |
| 60 | | 2016 iSHARES ANNUAL REPORTTO SHAREHOLDERS |
Supplemental Information (Unaudited) (Continued)
iSHARES® U.S. ETF TRUST
iShares Enhanced U.S. Small-Cap ETF
Period Covered: April 16, 2013 through June 30, 2016
| | | | | | | | |
Premium/Discount Range | | Number
of Days | | | Percentage of
Total Days | |
Between 0.5% and –0.5% | | | 810 | | | | 100.00 | % |
| | | | | | | | |
| | | | |
SUPPLEMENTAL INFORMATION | | | 61 | |
Trustee and Officer Information
iSHARES® U.S. ETF TRUST
The Board of Trustees has responsibility for the overall management and operations of the Funds, including general supervision of the duties performed by BFA and other service providers. Each Trustee serves until he or she resigns, is removed, dies, retires or becomes incapacitated. The President, Chief Compliance Officer, Treasurer and Secretary shall each hold office until their successors are chosen and qualify, and all other officers shall hold office until he or she resigns or is removed. Trustees who are not “interested persons” (as defined in the 1940 Act) of the Trust are referred to as independent trustees (“Independent Trustees”).
The registered investment companies advised by BFA or its affiliates (the “BlackRock-advised Funds”) are organized into one complex of closed-end funds, two complexes of open-end funds and one complex of exchange-traded funds (“Exchange-Traded Fund Complex”) (each, a “BlackRock Fund Complex”). Each Fund is included in the BlackRock Fund Complex referred to as the Exchange-Traded Fund Complex. Each Trustee also serves as a Director of iShares, Inc. and a Trustee of iShares Trust and, as a result, oversees a total of 342 funds (as of July 31, 2016) within the Exchange-Traded Fund Complex. With the exception of Robert S. Kapito, Mark Wiedman, and Benjamin Archibald the address of each Trustee and Officer is c/o BlackRock, Inc., 400 Howard Street, San Francisco, CA 94105. The address of Mr. Kapito, Mr. Wiedman, and Mr. Archibald is c/o BlackRock, Inc., Park Avenue Plaza, 55 East 52nd Street, New York, NY 10055. The Board has designated Cecilia H. Herbert as its Independent Board Chair. Additional information about the Funds’ Trustees and officers may be found in the Funds’ combined Statement of Additional Information, which is available without charge, upon request, by calling toll-free 1-800-iShares (1-800-474-2737).
Interested Trustees
| | | | | | |
| | | | |
| Name (Age) | | Position(s) | | Principal Occupation(s) During the Past 5 Years | | Other Directorships Held by Trustee
During the Past 5 Years |
Robert S. Kapitoa (59) | | Trustee
(since 2011). | | President and Director, BlackRock, Inc. (since 2006); Vice Chairman of BlackRock, Inc. and Head of BlackRock, Inc.’s Portfolio Management Group (since its formation in 1998) and BlackRock, Inc.’s predecessor entities (since 1988); Trustee, University of Pennsylvania (since 2009); President of Board of Directors, Hope & Heroes Children’s Cancer Fund (since 2002); President of the Board of Directors, Periwinkle Theatre for Youth (since 1983). | | Director of iShares, Inc. (since 2009); Trustee of iShares Trust (since 2009). |
| | | |
Mark Wiedmanb (45) | | Trustee
(since 2013) | | Managing Director, BlackRock, Inc. (since 2007); Global Head of iShares (since 2011); Head of Corporate Strategy, BlackRock, Inc. (2009-2011). | | Director of iShares, Inc. (since 2013); Trustee of iShares Trust (since 2013); Director of PennyMac Financial Services, Inc. (since 2008). |
| a | Robert S. Kapito is deemed to be an “interested person” (as defined in the 1940 Act) of the Trust due to his affiliations with BlackRock, Inc. |
| b | Mark Wiedman is deemed to be an “interested person” (as defined in the 1940 Act) of the Trust due to his affiliations with BlackRock, Inc. and its affiliates. |
| | |
| 62 | | 2016 iSHARES ANNUAL REPORTTO SHAREHOLDERS |
Trustee and Officer Information (Continued)
iSHARES® U.S. ETF TRUST
Independent Trusteesc
| | | | | | |
| | | | |
| Name (Age) | | Position(s) | | Principal Occupation(s) During the Past 5 Years | | Other Directorships Held by Trustee
During the Past 5 Years |
Cecilia H. Herbert (67) | | Trustee
(since 2011); Independent Board Chair (since 2016); Nominating and Governance Committee Chair (since 2016). | | Director (1998-2013) and President (2007-2011) of the Board of Directors, Catholic Charities CYO; Trustee (2002-2011) and Chair of the Finance and Investment Committee (2006-2010) of the Thacher School; Member (since 1992) and Chair (1994-2005) of the Investment Committee, Archdiocese of San Francisco; Trustee and Member of the Investment Committee, WNET, the New York public media company (since 2011). | | Director of iShares, Inc. (since 2005); Trustee of iShares Trust (since 2005); Independent Board Chair of iShares Inc. and iShares Trust (Since 2016); Director of Forward Funds (23 portfolios) (since 2009); Director of Salient MF Trust (4 Portfolios) (since 2015). |
Jane D. Carlin (60) | | Trustee
(since 2015); Risk Committee Chair
(since 2016). | | Managing Director and Global Head of Financial Holding Company Governance & Assurance and the Global Head of Operational Risk Management of Morgan Stanley (2006-2012). | | Director of iShares, Inc. (since 2015); Trustee of iShares Trust (since 2015); Director of PHH Corporation (mortgage solutions) (since 2012). |
Charles A. Hurty (72) | | Trustee
(since 2011); Audit Committee Chair
(since 2011). | | Retired; Partner, KPMG LLP (1968-2001). | | Trustee of iShares Trust (since 2005); Director of iShares, Inc. (since 2005); Director of GMAM Absolute Return Strategy Fund (1 portfolio) (since 2002); Director of SkyBridge Alternative Investments Multi-Adviser Hedge Fund Portfolios LLC (2 Portfolios) (since 2002). |
John E. Kerrigan (61) | | Trustee
(since 2011); Securities Lending Committee Chair (since 2016). | | Chief Investment Officer, Santa Clara University (since 2002). | | Director of iShares, Inc. (since 2005); Trustee of iShares Trust (since 2005). |
| | | |
John E. Martinez (55) | | Trustee
(since 2011); Fixed Income Plus Committee Chair
(since 2016). | | Director of FirstREX Agreement Corp. (formerly EquityRock, Inc.) (since 2005). | | Director of iShares, Inc. (since 2003); Trustee of iShares Trust (since 2003); |
| | | | |
TRUSTEEAND OFFICER INFORMATION | | | 63 | |
Trustee and Officer Information (Continued)
iSHARES® U.S. ETF TRUST
Independent Trusteesc (Continued)
| | | | | | |
| | | | |
| Name (Age) | | Position(s) | | Principal Occupation(s) During the Past 5 Years | | Other Directorships Held by Trustee
During the Past 5 Years |
Madhav V. Rajan (51) | | Trustee
(since 2011); Equity Plus Committee Chair and 15(c) Committee Chair (since 2016). | | Robert K. Jaedicke Professor of Accounting and Senior Associate Dean for Academic Affairs and Head of MBA Program, Stanford University Graduate School of Business (since 2001); Professor of Law (by courtesy), Stanford Law School (since 2005); Visiting Professor, University of Chicago (2007-2008). | | Director of iShares, Inc. (since 2011); Trustee of iShares Trust (since 2011); Director, Cavium, Inc. (since 2013). |
| c | Robert H. Silver served as an Independent Trustee until March 31, 2016. |
| | |
| 64 | | 2016 iSHARES ANNUAL REPORTTO SHAREHOLDERS |
Trustee and Officer Information (Continued)
iSHARES® U.S. ETF TRUST
Officers
| | | | |
| | | |
| Name (Age) | | Position(s) | | Principal Occupation(s) During the Past 5 Years |
Manish Mehta (45) | | President
(since 2013). | | Managing Director, BlackRock, Inc. (since 2009); Chief Operating Officer for iShares (since 2009); Head of Strategy and Corporate Development, BGI (2005-2009); Chief of Staff to the CEO, BGI (2005-2009). |
| | |
Jack Gee (56) | | Treasurer and Chief Financial Officer (since 2011). | | Managing Director, BlackRock, Inc. (since 2009); Senior Director of Fund Administration of Intermediary Investor Business, BGI (2009); Director of Fund Administration of Intermediary Investor Business, BGI (2004-2009). |
| | |
Benjamin Archibald (41) | | Secretary
(since 2015). | | Managing Director, BlackRock, Inc. (since 2014); Director, BlackRock, Inc. (2010-2013); Secretary of the BlackRock-advised Mutual Funds (since 2012). |
| | |
Charles Park (48) | | Chief Compliance Officer
(since 2011). | | Chief Compliance Officer of BlackRock Advisors, LLC and the BlackRock-advised Funds in the Equity-Bond Complex, the Equity-Liquidity Complex and the Closed-End Complex (since 2014); Chief Compliance Officer, BFA (since 2006). |
| | |
Scott Radell (47) | | Executive Vice President (since 2012). | | Managing Director, BlackRock, Inc. (since 2009); Head of Portfolio Solutions, BlackRock, Inc. (since 2009); Head of Portfolio Solutions, BGI (2007-2009); Credit Portfolio Manager, BGI (2005-2007); Credit Research Analyst, BGI (2003-2005). |
| | |
Amy Schioldager (53) | | Executive Vice President (since 2011). | | Senior Managing Director, BlackRock, Inc. (since 2009); Global Head of Index Equity, BGI (2008-2009); Global Head of U.S. Indexing, BGI (2006-2008); Head of Domestic Equity Portfolio Management, BGI (2001-2006). |
| | | | |
TRUSTEEAND OFFICER INFORMATION | | | 65 | |
Notes:
| | |
| 66 | | 2016 iSHARES ANNUAL REPORTTO SHAREHOLDERS |
For more information visit www.iShares.com or call 1-800-iShares (1-800-474-2737)
This report is intended for the Funds’ shareholders. It may not be distributed to prospective investors unless it is preceded or accompanied by the current prospectus.
Investing involves risk, including possible loss of principal.
The iShares Funds are distributed by BlackRock Investments, LLC (together with its affiliates, “BlackRock”).
A description of the policies that the Funds use to determine how to vote proxies relating to portfolio securities and information about how the Funds voted proxies relating to portfolio securities during the most recent twelve-month period ending June 30 is available without charge, upon request, by calling toll-free 1-800-474-2737; on the Funds’ website at www.iShares.com; and on the U.S. Securities and Exchange Commission (SEC) website at www.sec.gov.
The Funds file their complete schedules of portfolio holdings with the SEC for the first and third quarters of each fiscal year on Form N-Q. The Funds’ Forms N-Q are available on the SEC’s website or may be reviewed and copied at the SEC’s Public Reference Room in Washington, D.C. Information on the operation of the Public Reference Room may be obtained by calling 1-800-SEC-0330. The Funds also disclose their complete schedules of portfolio holdings on a daily basis on the Funds’ website.
©2016 BlackRock, Inc. All rights reserved. iSHARES and BLACKROCK are registered trademarks of BlackRock, Inc. or its subsidiaries. All other marks are the property of their respective owners.
iS-AR-712-0716
iShares U.S. ETF Trust (the “Registrant”) adopted a new code of ethics on July 1, 2016 that applies to persons appointed by the Registrant’s Board of Trustees as the President and/or Chief Financial Officer, and any persons performing similar functions. For the fiscal year ended July 31, 2016, there were no amendments to any provision of the former and new codes of ethics, nor were there any waivers granted from any provision of the former and new codes of ethics. A copy of the new code of ethics is filed with this Form N-CSR under Item 12(a)(1).
| Item 3. | Audit Committee Financial Expert. |
The Registrant’s Board of Trustees has determined that the Registrant has more than one audit committee financial expert, as that term is defined under Item 3(b) and 3(c), serving on its audit committee. The audit committee financial experts serving on the Registrant’s audit committee are Charles A. Hurty, John E. Kerrigan and Madhav V. Rajan, all of whom are independent, as that term is defined under Item 3(a)(2). Robert H. Silver resigned from the Board of Trustees effective March 31, 2016.
| Item 4. | Principal Accountant Fees and Services. |
The principal accountant fees disclosed in items 4(a), 4(b), 4(c), 4(d) and 4(g) are for the four series of the Registrant for which the fiscal year-end is July 31, 2016 (the “Funds”), and whose annual financial statements are reported in Item 1.
| | (a) | Audit Fees – The aggregate fees billed for each of the last two fiscal years for professional services rendered by the principal accountant for the audit of the Funds’ annual financial statements or services that are normally provided by the accountant in connection with statutory and regulatory filings or engagements for those fiscal years were $56,200 for the fiscal year ended July 31, 2015 and $57,000 for the fiscal year ended July 31, 2016. |
| | (b) | Audit-Related Fees – There were no fees billed for the fiscal years ended July 31, 2015 and July 31, 2016 for assurance and related services by the principal accountant that were reasonably related to the performance of the audit of the Fund’s financial statements and are not reported under (a) of this Item. |
| | (c) | Tax Fees – The aggregate fees billed in each of the last two fiscal years for professional services rendered by the principal accountant for the review of the Funds’ tax returns and excise tax calculations, were $14,928 for the fiscal year ended July 31, 2015 and $15,124 for the fiscal year ended July 31, 2016. |
| | (d) | All Other Fees – There were no other fees billed for the fiscal years ended July 31, 2015 and July 31, 2016 for products and services provided by the principal accountant, other than the services reported in (a) through (c) of this Item. |
| | (e) | (1) The Registrant’s audit committee charter, as amended, provides that the audit committee is responsible for the approval, prior to appointment, of the engagement of the principal accountant to annually audit and provide their opinion on the Registrant’s financial statements. The audit committee must also approve, prior to appointment, the engagement of the principal accountant to provide non-audit services to the Registrant or to any entity controlling, controlled by or under common control with the Registrant’s investment adviser (“Adviser Affiliate”) that provides ongoing services to the Registrant, if the engagement relates directly to the operations and financial reporting of the Registrant. |
(2) There were no services described in (b) through (d) above (including services required by the audit committee pursuant to paragraph (c)(7)(ii) of Rule 2-01 of Regulation S-X) that were approved by the audit committee pursuant to paragraph (c)(7)(i)(C) of Rule 2-01 of Regulation S-X.
| | (f) | None of the hours expended on the principal accountant’s engagement to audit the Funds’ financial statements for the fiscal year ended July 31, 2016 were attributable to work performed by persons other than the principal accountant’s full-time, permanent employees. |
| | (g) | The aggregate non-audit fees billed by the Registrant’s principal accountant for services rendered to the Funds, and rendered to the Registrant’s investment adviser, and any Adviser Affiliate that provides ongoing services to the Registrant for the last two fiscal years were $3,956,652 for the fiscal year ended July 31, 2015 and $4,572,444 for the fiscal year ended July 31, 2016. |
| | (h) | The Registrant’s audit committee has considered whether the provision of non-audit services rendered to the Registrant’s investment adviser and any Adviser Affiliate that were not pre-approved pursuant to paragraph (c)(7)(ii) of Rule 2-01 of Regulation S-X, if any, are compatible with maintaining the principal accountant’s independence, and has determined that the provision of these services do not compromise the principal accountant’s independence. |
| Item 5. | Audit Committee of Listed Registrants. |
The Registrant is a listed issuer as defined in Rule 10A-3 under the Exchange Act and has a separately-designated standing audit committee established in accordance with Section 3(a)(58)(A) of the Exchange Act. The Registrant’s audit committee members are Charles A. Hurty, John E. Kerrigan and Madhav V. Rajan. Robert H. Silver resigned from the Board of Trustees effective March 31, 2016.
| | (a) | Schedules of investments are included as part of the reports to shareholders filed under Item 1 of this Form. |
| Item 7. | Disclosure of Proxy Voting Policies and Procedures for Closed-End Management Investment Companies. |
Not applicable to the Registrant.
| Item 8. | Portfolio Managers of Closed-End Management Investment Companies. |
Not applicable to the Registrant.
| Item 9. | Purchases of Equity Securities by Closed-End Management Investment Company and Affiliated Purchasers. |
Not applicable to the Registrant.
| Item 10. | Submission of Matters to a Vote of Security Holders. |
There were no material changes to the procedures by which shareholders may recommend nominees to the Registrant’s Board of Trustees.
| Item 11. | Controls and Procedures. |
(a) The President (the Registrant’s Principal Executive Officer) and Chief Financial Officer (the Registrant’s Principal Financial Officer) have concluded that, based on their evaluation as of a date within 90 days of the filing date of this report, the disclosure controls and procedures of the Registrant (as defined in Rule 30a-3(c) under the Investment Company Act of 1940) are reasonably designed to achieve the purposes described in Section 4(a) of the attached certification.
(b) There were no changes in the Registrant’s internal control over financial reporting (as defined in Rule 30a-3(d) under the Investment Company Act of 1940) that occurred during the second fiscal quarter of the period covered by this report that have materially affected, or are reasonably likely to materially affect, the Registrant’s internal control over financial reporting.
(a) (1) Code of Ethics for Senior Officers that is the subject of Item 2 is attached.
(a) (2) Section 302 Certifications are attached.
(a) (3) Not applicable to the Registrant.
(b) Section 906 Certifications are attached.
SIGNATURES
Pursuant to the requirements of the Securities Exchange Act of 1934 and the Investment Company Act of 1940, the Registrant has duly caused this report to be signed on its behalf by the undersigned, thereunto duly authorized.
iShares U.S. ETF Trust
By: /s/ Manish Mehta
Manish Mehta, President (Principal Executive Officer)
Date: September 29, 2016
Pursuant to the requirements of the Securities Exchange Act of 1934 and the Investment Company Act of 1940, this report has been signed below by the following persons on behalf of the Registrant and in the capacities and on the dates indicated.
By: /s/ Manish Mehta
Manish Mehta, President (Principal Executive Officer)
Date: September 29, 2016
By: /s/ Jack Gee
Jack Gee, Treasurer and Chief Financial Officer (Principal Financial Officer)
Date: September 29, 2016