UNITED STATES
SECURITIES AND EXCHANGE COMMISSION
Washington, D.C. 20549
FORM N-CSR
CERTIFIED SHAREHOLDER REPORT OF REGISTERED
MANAGEMENT INVESTMENT COMPANIES
Investment Company Act file number 811-22649
iShares U.S. ETF Trust
(Exact name of Registrant as specified in charter)
c/o: State Street Bank and Trust Company
1 Iron Street, Boston, MA 02210
(Address of principal executive offices) (Zip code)
The Corporation Trust Company
1209 Orange Street, Wilmington, DE 19801
(Name and address of agent for service)
Registrant’s telephone number, including area code: (415) 670-2000
Date of fiscal year end: October 31, 2016
Date of reporting period: October 31, 2016
Item 1. Reports to Stockholders.
OCTOBER 31, 2016
| | | | |
2016 ANNUAL REPORT | | | |  |
iShares U.S. ETF Trust
| Ø | | iShares Short Maturity Bond ETF | NEAR | BATS |
| Ø | | iShares Short Maturity Municipal Bond ETF | MEAR | BATS |
| Ø | | iShares Ultra Short-Term Bond ETF | ICSH | BATS |
Table of Contents
Management’s Discussion of Fund Performance
iSHARES® U.S. ETF TRUST
U.S. BOND MARKET OVERVIEW
The U.S. bond market posted positive returns for the 12-month period ended October 31, 2016 (the “reporting period”). The Bloomberg Barclays U.S. Aggregate Bond Index, a broad measure of U.S. bond performance, returned 4.37% for the reporting period.
The bond market’s advance reflected continued uncertainty regarding the economic environment. Overall, the U.S. economy grew by 1.5% for the 12 months ended September 30, 2016 (the most recent data available), decelerating from 2.2% for the 12 months ended September 30, 2015. Although employment growth remained robust, other segments of the economy struggled. For example, industrial production contracted during the reporting period, while consumer spending increased by just 2.2%. As a result, the economy generated three consecutive quarters of anemic growth before rebounding in the final quarter of the reporting period.
Inflation generally remained muted as the consumer price index (“CPI”) rose by 1.6% for the reporting period. Although low by historical standards, the increase in the CPI was notably higher than the 0.2% increase for the 12 months ended October 31, 2015, reflecting a recovery in energy prices after they bottomed in February 2016.
In this environment, the U.S. Federal Reserve Bank (the “Fed”) ended a seven-year period of near-zero interest rates by raising its short-term interest rate target in December 2015. The Fed’s first interest rate hike since June 2006 increased the federal funds target rate from a range of 0%-0.25% to a range of 0.25%-0.50%. Despite expectations of more Fed rate increases in 2016, the slowing economic environment and lack of inflationary pressure led the Fed to hold rates steady for the remainder of the reporting period.
The combination of decelerating economic growth and low inflation pushed most U.S. bond yields lower and bond prices higher for the reporting period. Longer-term bonds fared best as long-term yields declined the most, while short-term bond yields rose slightly, reflecting the Fed rate hike in late 2015.
Sector performance was driven by strong investor demand for yield in a low interest rate environment. Consequently, corporate bonds — which offer the highest yields in the U.S. bond market — delivered the best returns for the reporting period. Lower-quality corporate bonds outperformed as the search for yield led investors to seek out riskier segments of the corporate bond market. In particular, high-yield corporate bonds (those with credit ratings below investment grade) returned more than 10% for the reporting period. Within the corporate sector, bonds issued by utility companies produced the highest returns. Industrial bonds also fared well, led by the strong performance of energy and commodity-related securities, while financial bonds lagged.
U.S. Treasury inflation-protected securities (“TIPS”) were also among the leading performers for the reporting period. The rebound in energy prices led to increased investor demand for inflation protection, which aided performance in the TIPS market.
Mortgage-backed securities posted positive returns for the reporting period but trailed the performance of the overall U.S. bond market. Mortgage-backed securities were held in check by prepayment fears as declining interest rates led to concerns about a renewed wave of mortgage refinancing.
U.S. Treasury and government agency bonds posted the lowest returns among U.S. bonds for the reporting period. Limited demand for the relatively low yields of Treasury and agency bonds weighed on their performance, as did the general underperformance of higher-quality securities.
| | | | |
MANAGEMENT’S DISCUSSIONSOF FUND PERFORMANCE | | | 5 | |
Management’s Discussion of Fund Performance
iSHARES® SHORT MATURITY BOND ETF
Performance as of October 31, 2016
| | | | | | | | | | | | | | | | | | | | |
| | | Average Annual Total Returns | | | | | | Cumulative Total Returns | |
| | | 1 Year | | | Since Inception | | | | | | 1 Year | | | Since Inception | |
Fund NAV | | | 1.28% | | | | 0.97% | | | | | | | | 1.28% | | | | 3.03% | |
Fund Market | | | 1.28% | | | | 0.97% | | | | | | | | 1.28% | | | | 3.03% | |
Bloomberg Barclays Short-Term Government/Corporate Index | | | 0.71% | | | | 0.39% | | | | | | | | 0.71% | | | | 1.21% | |
GROWTH OF $10,000 INVESTMENT
(SINCE INCEPTION AT NET ASSET VALUE)
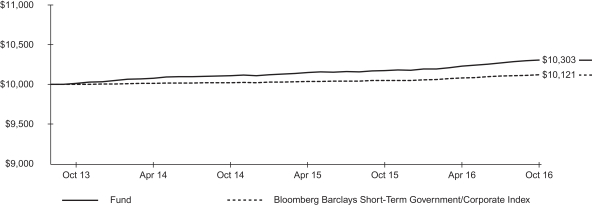
The inception date of the Fund was 9/25/13. The first day of secondary market trading was 9/26/13.
The Bloomberg Barclays Short-Term Government/Corporate Index (formerly the Barclays Short-Term Government/Corporate Index) is an unmanaged index that measures the performance of government and corporate securities with less than 1 year remaining to maturity.
Past performance is no guarantee of future results. Performance results do not reflect the deduction of taxes that a shareholder would pay on fund distributions or on the redemption or sale of fund shares. See “About Fund Performance” on page 12 for more information.
| | | | | | | | | | | | | | | | | | | | | | | | | | |
| Shareholder Expenses | |
| Actual | | | Hypothetical 5% Return | | | | |
Beginning
Account Value
(5/1/16) | | | Ending
Account Value
(10/31/16) | | | Expenses Paid
During Period a | | | Beginning
Account Value
(5/1/16) | | | Ending
Account Value
(10/31/16) | | | Expenses Paid
During Period a | | | Annualized
Expense Ratio | |
| $ | 1,000.00 | | | $ | 1,007.30 | | | $ | 1.26 | | | $ | 1,000.00 | | | $ | 1,023.90 | | | $ | 1.27 | | | | 0.25% | |
| a | Expenses are calculated using the Fund’s annualized expense ratio (as disclosed in the table), multiplied by the average account value for the period, multiplied by the number of days in the period (184 days) and divided by the number of days in the year (366 days). See “Shareholder Expenses” on page 12 for more information. | |
| | |
| 6 | | 2016 iSHARES ANNUAL REPORTTO SHAREHOLDERS |
Management’s Discussion of Fund Performance (Continued)
iSHARES® SHORT MATURITY BOND ETF
The iShares Short Maturity Bond ETF (the “Fund”) seeks to maximize current income by investing, under normal circumstances, at least 80% of its net assets in a portfolio of U.S. dollar-denominated investment-grade fixed income securities and maintain a weighted average maturity that is less than three years. The Fund is an actively managed exchange-traded fund that does not seek to replicate the performance of a specified index. For the 12-month reporting period ended October 31, 2016, the total return for the Fund was 1.28%, net of fees.
Short-term investment-grade bonds produced modestly positive returns for the reporting period. Short-term bond yields faced conflicting influences during the reporting period that contributed some volatility. The Fed’s decision to raise short-term interest rates in December 2015, for the first time in almost seven years, and investor expectations for more rate hikes in 2016 led to higher short-term bond yields early in the reporting period. However, growing demand for short-term bonds from investors seeking stability, particularly in response to the surprise vote by the United Kingdom to exit the European Union, pushed short-term yields lower. Near the end of the reporting period, yields on short-term bonds rose ahead of regulatory changes relating to money market funds.
In that environment, the Fund performed well on both an absolute basis and relative to the Bloomberg Barclays Short-Term Government/Corporate Index during the reporting period. The decision to underweight U.S. Treasury securities in favor of higher-yielding, non-Treasury sectors was a key contributor to relative performance. For example, the Fund’s stake in securitized bonds contributed meaningfully to performance, led by asset-backed securities (“ABS”) and commercial mortgage-backed securities (“CMBS”). ABS and CMBS were in demand for their combination of comparatively attractive yields and high credit quality. Short-term corporate securities were also a source of strength.
The Fund reduced exposure to European banks and sovereign debt ahead of the Brexit vote in June, shifting those assets into ABS. The Fund also took advantage of short-term imbalances in the market to increase its allocation to cash-equivalent securities — such as certificates of deposit, commercial paper, and repurchase agreements — while maintaining a sizable position in short-term floating-rate bonds.
The Fund’s shorter overall duration (price sensitivity to interest rate changes) and yield curve positioning reduced return contributed by falling interest rates, while also reducing volatility for the reporting period.
ALLOCATION BY INVESTMENT TYPE
As of 10/31/16
| | |
| Investment Type | | Percentage of
Total Investments1 |
| | | | |
Corporate Bonds & Notes | | | 44.27 | % |
Asset-backed Securities | | | 35.25 | |
Mortgage-Backed Securities | | | 7.01 | |
Foreign Government Obligations | | | 5.94 | |
Commercial Paper | | | 2.46 | |
Certificates Of Deposit | | | 1.93 | |
U.S. Government Agency Obligations | | | 1.62 | |
Repurchase Agreements | | | 1.52 | |
| | | | |
TOTAL | | | 100.00 | % |
| | | | |
ALLOCATION BY CREDIT QUALITY
As of 10/31/16
| | |
| Moody’s Credit Rating2 | | Percentage of
Total Investments1 |
| | | | |
Aaa | | | 31.01 | % |
Aa | | | 3.27 | |
A | | | 18.56 | |
Baa | | | 20.09 | |
Ba | | | 1.13 | |
P-1 | | | 5.90 | |
Not Rated | | | 20.04 | |
| | | | |
TOTAL | | | 100.00 | % |
| | | | |
| | 1 | Excludes money market funds. |
| | 2 | Credit quality ratings shown reflect the ratings assigned by Moody’s Investors Service (“Moody’s”), a widely used independent, nationally recognized statistical rating organization. Moody’s credit ratings are opinions of the credit quality of individual obligations or of an issuer’s general creditworthiness. Investment grade ratings are credit ratings of Baa or higher. Below investment grade ratings are credit ratings of Ba or lower. Unrated investments do not necessarily indicate low credit quality. Credit quality ratings are subject to change. |
| | | | |
MANAGEMENT’S DISCUSSIONSOF FUND PERFORMANCE | | | 7 | |
Management’s Discussion of Fund Performance
iSHARES® SHORT MATURITY MUNICIPAL BOND ETF
Performance as of October 31, 2016
| | | | | | | | | | | | | | | | | | | | |
| | | Average Annual Total Returns | | | | | | Cumulative Total Returns | |
| | | 1 Year | | | Since Inception | | | | | | 1 Year | | | Since Inception | |
Fund NAV | | | 0.69% | | | | 0.71% | | | | | | | | 0.69% | | | | 1.18% | |
Fund Market | | | 0.49% | | | | 0.62% | | | | | | | | 0.49% | | | | 1.04% | |
Bloomberg Barclays Municipal Bond: 1 Year (1-2) Index | | | 0.40% | | | | 0.56% | | | | | | | | 0.40% | | | | 0.92% | |
GROWTH OF $10,000 INVESTMENT
(SINCE INCEPTION AT NET ASSET VALUE)
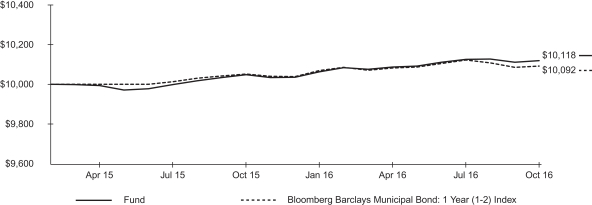
The inception date of the Fund was 3/3/15. The first day of secondary market trading was 3/5/15.
The Bloomberg Barclays Municipal Bond: 1 Year (1-2) Index (formerly the Barclays Municipal Bond: 1 Year (1-2) Index) is an unmanaged index comprised of national municipal bond issues having a maturity of at least one year and less than two years.
Past performance is no guarantee of future results. Performance results do not reflect the deduction of taxes that a shareholder would pay on fund distributions or on the redemption or sale of fund shares. See “About Fund Performance” on page 12 for more information.
| | | | | | | | | | | | | | | | | | | | | | | | | | |
| Shareholder Expenses | |
| Actual | | | Hypothetical 5% Return | | | | |
Beginning
Account Value
(5/1/16) | | | Ending
Account Value
(10/31/16) | | | Expenses Paid
During Period a | | | Beginning
Account Value
(5/1/16) | | | Ending
Account Value
(10/31/16) | | | Expenses Paid
During Period a | | | Annualized
Expense Ratio | |
| $ | 1,000.00 | | | $ | 1,003.10 | | | $ | 1.26 | | | $ | 1,000.00 | | | $ | 1,023.90 | | | $ | 1.27 | | | | 0.25% | |
| a | Expenses are calculated using the Fund’s annualized expense ratio (as disclosed in the table), multiplied by the average account value for the period, multiplied by the number of days in the period (184 days) and divided by the number of days in the year (366 days). See “Shareholder Expenses” on page 12 for more information. | |
| | |
| 8 | | 2016 iSHARES ANNUAL REPORTTO SHAREHOLDERS |
Management’s Discussion of Fund Performance (Continued)
iSHARES® SHORT MATURITY MUNICIPAL BOND ETF
The iShares Short Maturity Municipal Bond ETF (the “Fund”) seeks to maximize tax-free current income by investing, under normal circumstances, at least 80% of its net assets in municipal securities such that the interest on each bond is exempt from U.S. federal income taxes and the federal alternative minimum tax. The Fund will also seek to maintain a weighted average maturity that is less than three years. The Fund is an actively managed exchange-traded fund that does not seek to replicate the performance of a specified index. For the 12-month reporting period ended October 31, 2016, the total return for the Fund was 0.69%, net of fees.
Short-term municipal bonds produced modestly positive returns for the reporting period. Looking at the broader U.S. bond market, longer-term bond yields fell to record lows amid modest economic growth, low inflation, and demand from investors seeking stability and yield in the wake of the surprise vote by the United Kingdom to exit the European Union. Nevertheless, yields on the shortest-term bills and notes rose following the Fed’s decision to raise interest rates in December 2015 for the first time in almost seven years.
It was a similar story in the municipal bond market, where demand for municipal bonds reached a record high at a time when supply was down year over year through June 2016. As a result, the yield on the broad-based Bloomberg Barclays Municipal Bond Index reached a record low in May 2016. However, municipal bond yields rose over the remainder of the reporting period as municipalities moved aggressively to lock in low borrowing costs. Short-term municipal bond yields rose further ahead of regulatory changes relating to money market funds.
The Fund performed well during the reporting period on both an absolute basis and relative to the Bloomberg Barclays Municipal Bond: 1 Year (1-2) Index. Outperformance was derived mainly from sector allocation decisions among health care, education, and tax-backed local and state general obligation bonds. The Fund increased its exposure to bonds maturing in two to three years, which carried attractive valuations as a result of forthcoming money market reforms.
ALLOCATION BY CREDIT QUALITY
As of 10/31/16
| | |
| S&P Credit Rating1 | | Percentage of
Total Investments2 |
| | | | |
AA | | | 18.62 | % |
A | | | 38.39 | |
BBB | | | 5.13 | |
Not Rated | | | 37.86 | |
| | | | |
TOTAL | | | 100.00 | % |
| | | | |
TEN LARGEST STATES
As of 10/31/16
| | |
| State | | Percentage of
Total Investments2 |
| | | | |
New Jersey | | | 27.78 | % |
New York | | | 9.84 | |
Michigan | | | 7.52 | |
Illinois | | | 6.50 | |
Pennsylvania | | | 4.98 | |
Rhode Island | | | 4.84 | |
Georgia | | | 4.74 | |
Ohio | | | 4.70 | |
Maryland | | | 4.51 | |
Oklahoma | | | 4.41 | |
| | | | |
TOTAL | | | 79.82 | % |
| | | | |
| | 1 | Credit quality ratings shown reflect the ratings assigned by Standard & Poor’s Ratings Service (“S&P”), a widely used independent, nationally recognized statistical rating organization. S&P credit ratings are opinions of the credit quality of individual obligations or of an issuer’s general creditworthiness. Investment grade ratings are credit ratings of BBB or higher. Below investment grade ratings are credit ratings of BB or lower. Unrated investments do not necessarily indicate low credit quality. Credit quality ratings are subject to change. |
| | 2 | Excludes money market funds. |
| | | | |
MANAGEMENT’S DISCUSSIONSOF FUND PERFORMANCE | | | 9 | |
Management’s Discussion of Fund Performance
iSHARES® ULTRA SHORT-TERM BOND ETF
Performance as of October 31, 2016
| | | | | | | | | | | | | | | | | | | | |
| | | Average Annual Total Returns | | | | | | Cumulative Total Returns | |
| | | 1 Year | | | Since Inception | | | | | | 1 Year | | | Since Inception | |
Fund NAV | | | 0.90% | | | | 0.58% | | | | | | | | 0.90% | | | | 1.69% | |
Fund Market | | | 0.92% | | | | 0.59% | | | | | | | | 0.92% | | | | 1.70% | |
Bank of America Merrill Lynch 6-Month US Treasury Bill Index | | | 0.64% | | | | 0.33% | | | | | | | | 0.64% | | | | 0.96% | |
GROWTH OF $10,000 INVESTMENT
(SINCE INCEPTION AT NET ASSET VALUE)
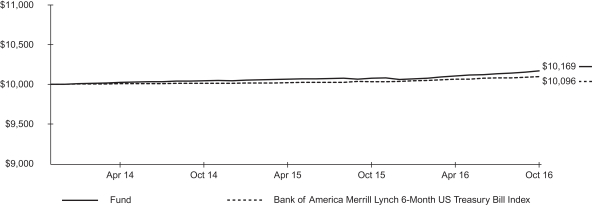
The inception date of the Fund was 12/11/13. The first day of secondary market trading was 12/13/13.
The Bank of America Merrill Lynch 6-Month US Treasury Bill Index is an unmanaged index that measures the performance of government securities with less than 6 months remaining to maturity.
Past performance is no guarantee of future results. Performance results do not reflect the deduction of taxes that a shareholder would pay on fund distributions or on the redemption or sale of fund shares. See “About Fund Performance” on page 12 for more information.
| | | | | | | | | | | | | | | | | | | | | | | | | | |
| Shareholder Expenses | |
| Actual | | | Hypothetical 5% Return | | | | |
Beginning
Account Value
(5/1/16) | | | Ending
Account Value
(10/31/16) | | | Expenses Paid
During Period a | | | Beginning
Account Value
(5/1/16) | | | Ending
Account Value
(10/31/16) | | | Expenses Paid
During Period a | | | Annualized
Expense Ratio | |
| $ | 1,000.00 | | | $ | 1,006.30 | | | $ | 0.91 | | | $ | 1,000.00 | | | $ | 1,024.20 | | | $ | 0.92 | | | | 0.18% | |
| a | Expenses are calculated using the Fund’s annualized expense ratio (as disclosed in the table), multiplied by the average account value for the period, multiplied by the number of days in the period (184 days) and divided by the number of days in the year (366 days). See “Shareholder Expenses” on page 12 for more information. | |
| | |
| 10 | | 2016 iSHARES ANNUAL REPORTTO SHAREHOLDERS |
Management’s Discussion of Fund Performance (Continued)
iSHARES® ULTRA SHORT-TERM BOND ETF
The iShares Ultra Short-Term Bond ETF (the “Fund”) seeks to provide current income consistent with preservation of capital by investing, under normal circumstances, at least 80% of its net assets in a portfolio of U.S. dollar-denominated investment-grade fixed- and floating-rate debt securities and maintain a dollar-weighted average maturity that is less than 180 days. The Fund is an actively managed exchange-traded fund that does not seek to replicate the performance of a specified index. For the 12-month reporting period ended October 31, 2016, the total return for the Fund was 0.90%, net of fees.
Short-term investment-grade bonds produced modestly positive returns for the reporting period. Short-term bond yields faced conflicting influences during the reporting period that contributed to a measure of volatility. The Fed’s decision to raise short-term interest rates in December 2015, for the first time in almost seven years, and investor expectations for more rate hikes in 2016 led to higher short-term bond yields early in the reporting period. However, growing demand for short-term bonds from investors seeking stability, particularly in response to the surprise vote by the United Kingdom to exit the European Union, pushed short-term yields lower. Near the end of the reporting period, yields on short-term bonds rose ahead of regulatory changes relating to money market funds.
In that environment, the Fund performed well on both an absolute basis and relative to the Bank of America Merrill Lynch 6-Month US Treasury Bill Index during the reporting period. The decision to underweight U.S. Treasury securities in favor of higher-yielding, non-Treasury sectors was a key contributor to relative performance. For example, corporate securities generally benefited performance as a result of investor demand for their attractive yields. In particular, the Fund’s high-quality corporate securities, which accounted for nearly 60% of the Fund’s assets on average during the reporting period, were leading sources of strength. The Fund also took advantage of the volatility and short-term imbalances in the market to increase exposure to attractively valued, high-quality securities across multiple sectors.
ALLOCATION BY INVESTMENT TYPE
As of 10/31/16
| | |
| Investment Type | | Percentage of
Total Investments1 |
| | | | |
Corporate Bonds & Notes | | | 38.31 | % |
Commercial Paper | | | 37.04 | |
Certificates Of Deposit | | | 19.23 | |
U.S. Government & Agency Obligations | | | 4.94 | |
Asset-backed Securities | | | 0.48 | |
| | | | |
TOTAL | | | 100.00 | % |
| | | | |
ALLOCATION BY CREDIT QUALITY
As of 10/31/16
| | |
| Moody’s Credit Rating2 | | Percentage of
Total Investments1 |
| | | | |
Aaa | | | 6.83 | % |
Aa | | | 9.89 | |
A | | | 24.20 | |
Baa | | | 1.61 | |
P-1 | | | 56.27 | |
Not Rated | | | 1.20 | |
| | | | |
TOTAL | | | 100.00 | % |
| | | | |
| | 1 | Excludes money market funds. |
| | 2 | Credit quality ratings shown reflect the ratings assigned by Moody’s Investors Service (“Moody’s”), a widely used independent, nationally recognized statistical rating organization. Moody’s credit ratings are opinions of the credit quality of individual obligations or of an issuer’s general creditworthiness. Investment grade ratings are credit ratings of Baa or higher. Below investment grade ratings are credit ratings of Ba or lower. Unrated investments do not necessarily indicate low credit quality. Credit quality ratings are subject to change. |
| | | | |
MANAGEMENT’S DISCUSSIONSOF FUND PERFORMANCE | | | 11 | |
About Fund Performance
Past performance is no guarantee of future results. Current performance may be lower or higher than the performance data quoted. Performance data current to the most recent month-end is available at www.ishares.com. Performance results assume reinvestment of all dividends and capital gain distributions and do not reflect the deduction of taxes that a shareholder would pay on fund distributions or on the redemption or sale of fund shares. The investment return and principal value of shares will vary with changes in market conditions. Shares may be worth more or less than their original cost when they are redeemed or sold in the market. Performance for certain funds may reflect a waiver of a portion of investment advisory fees. Without such a waiver, performance would have been lower.
Net asset value or “NAV” is the value of one share of a fund as calculated in accordance with the standard formula for valuing mutual fund shares. The price used to calculate market return (“Market Price”) is determined by using the midpoint between the highest bid and the lowest offer on the primary stock exchange on which shares of a fund are listed for trading, as of the time that such fund’s NAV is calculated. Certain funds may have a NAV which is determined prior to the opening of regular trading on its listed exchange and their market returns are calculated using the midpoint of the bid/ask spread as of the opening of regular trading on the exchange. Market and NAV returns assume that dividends and capital gain distributions have been reinvested at Market Price and NAV, respectively.
An index is a statistical composite that tracks a specified financial market or sector. Unlike a fund, an index does not actually hold a portfolio of securities and therefore does not incur the expenses incurred by a fund. These expenses negatively impact fund performance. Also, market returns do not include brokerage commissions that may be payable on secondary market transactions. If brokerage commissions were included, market returns would be lower.
Shareholder Expenses
As a shareholder of a Fund, you incur two types of costs: (1) transaction costs, including brokerage commissions on purchases and sales of fund shares and (2) ongoing costs, including management fees and other fund expenses. The expense example, which is based on an investment of $1,000 invested on May 1, 2016 and held through October 31, 2016, is intended to help you understand your ongoing costs (in dollars and cents) of investing in a Fund and to compare these costs with the ongoing costs of investing in other funds.
Actual Expenses — The table provides information about actual account values and actual expenses. Annualized expense ratios reflect contractual and voluntary fee waivers, if any. To estimate the expenses that you paid on your account over the period, simply divide your account value by $1,000 (for example, an $8,600 account value divided by $1,000 = 8.6), then multiply the result by the number corresponding to your Fund under the heading entitled “Expenses Paid During Period.”
Hypothetical Example for Comparison Purposes — The table also provides information about hypothetical account values and hypothetical expenses based on each Fund’s actual expense ratio and an assumed rate of return of 5% per year before expenses. You may use this information to compare the ongoing costs of investing in your Fund and other funds. To do so, compare this 5% hypothetical example with the 5% hypothetical examples that appear in the shareholder reports of the other funds.
Please note that the expenses shown in the table are meant to highlight your ongoing costs only and do not reflect any transactional costs, such as brokerage commissions paid on purchases and sales of fund shares. Therefore, the hypothetical examples are useful in comparing ongoing costs only and will not help you determine the relative total costs of owning different funds. In addition, if these transactional costs were included, your costs would have been higher.
| | |
| 12 | | 2016 iSHARES ANNUAL REPORTTO SHAREHOLDERS |
Schedule of Investments
iSHARES® SHORT MATURITY BOND ETF
October 31, 2016
| | | | | | | | |
Security | | Principal
(000s) | | | Value | |
ASSET-BACKED SECURITIES — 34.41% | |
ACAS CLO Ltd. | | | | | | | | |
Series 2012-1AR, Class A1R | | | | | | | | |
FRN, (3 mo. LIBOR US + 1.250%) | | | | | |
2.11%, 09/20/23 (Call 12/20/16)a | | $ | 4,518 | | | $ | 4,517,322 | |
American Express Credit Account Master Trust | | | | | | | | |
Series 2014-1, Class A | | | | | | | | |
FRN, (1 mo. LIBOR + 0.370%) | | | | | | | | |
0.89%, 12/15/21 | | | 5,000 | | | | 5,016,498 | |
Series 2014-3, Class A | | | | | | | | |
1.49%, 04/15/20 | | | 2,412 | | | | 2,421,093 | |
AmeriCredit Automobile Receivables Trust | | | | | | | | |
Series 2012-3, Class D | | | | | | | | |
3.03%, 07/09/18 (Call 12/08/16) | | | 1,508 | | | | 1,508,867 | |
Series 2013-1, Class D | | | | | | | | |
2.09%, 02/08/19 (Call 07/08/17) | | | 2,500 | | | | 2,508,733 | |
AMMC CLO 15 Ltd. | | | | | | | | |
Series 2014-15A, Class AX | | | | | | | | |
FRN, (3 mo. LIBOR US + 1.300%) | | | | | |
2.13%, 12/09/26 (Call 12/09/16)a | | | 2,250 | | | | 2,244,884 | |
Apidos CLO XII | | | | | | | | |
Series 2013-12A, Class A | | | | | | | | |
FRN, (3 mo. LIBOR US + 1.100%) | | | | | |
1.98%, 04/15/25a | | | 8,000 | | | | 7,966,400 | |
Arbor Realty Collateralized Loan Obligation Ltd. | | | | | | | | |
Series 2014-FL2A, Class A | | | | | | | | |
FRN, (1 mo. LIBOR US + 1.750%) | | | | | |
2.29%, 09/15/25 (Call 03/15/18)a | | | 3,850 | | | | 3,816,120 | |
ARES CLO Ltd. | | | | | | | | |
Series 2012-2A, Class AR | | | | | | | | |
FRN, (3 mo. LIBOR US + 1.290%) | | | | | |
2.16%, 10/12/23 (Call 01/12/17)a | | | 2,000 | | | | 1,999,984 | |
| | | | | | | | |
Security | | Principal
(000s) | | | Value | |
ARI Fleet Lease Trust | | | | | | | | |
Series 2014-A, Class A2 | | | | | | | | |
0.81%, 11/15/22 (Call 06/15/17)a | | $ | 130 | | | $ | 129,929 | |
BA Credit Card Trust | | | | | | | | |
Series 2016-A1, Class A | | | | | | | | |
FRN, (1 mo. LIBOR + 0.390%) | | | | | | | | |
0.91%, 10/15/21 | | | 8,250 | | | | 8,274,690 | |
BlueMountain CLO Ltd. | | | | | | | | |
Series 2012-1A, Class A | | | | | | | | |
FRN, (3 mo. LIBOR US + 1.320%) | | | | | |
2.02%, 07/20/23 (Call 01/20/17)a | | | 12,815 | | | | 12,827,091 | |
Series 2013-4A, Class A | | | | | | | | |
FRN, (3 mo. LIBOR US + 1.500%) | | | | | |
2.38%, 04/15/25 (Call 01/15/17)a | | | 6,100 | | | | 6,100,610 | |
Cabela’s Credit Card Master Note Trust | | | | | | | | |
Series 2012-1A, Class A1 | | | | | | | | |
1.63%, 02/18/20a | | | 10,000 | | | | 10,014,591 | |
Series 2014-2, Class A | | | | | | | | |
FRN, (1 mo. LIBOR + 0.450%) | | | | | | | | |
0.98%, 07/15/22 | | | 3,500 | | | | 3,481,803 | |
Capital One Multi-Asset Execution Trust | | | | | | | | |
Series 2016-A1, Class A1 | | | | | | | | |
FRN, (1 mo. LIBOR + 0.450%) | | | | | | | | |
0.98%, 02/15/22 | | | 28,000 | | | | 28,118,376 | |
Chase Issuance Trust | | | | | | | | |
Series 2013-A9, Class A | | | | | | | | |
FRN, (1 mo. LIBOR + 0.420%) | | | | | | | | |
0.95%, 11/16/20 | | | 11,815 | | | | 11,846,504 | |
Series 2014-A5, Class A5 | | | | | | | | |
FRN, (1 mo. LIBOR + 0.370%) | | | | | | | | |
0.90%, 04/15/21 | | | 2,000 | | | | 2,005,800 | |
Series 2016-A1, Class A | | | | | | | | |
FRN, (1 mo. LIBOR + 0.410%) | | | | | | | | |
0.93%, 05/17/21 | | | 28,750 | | | | 28,867,904 | |
Chesapeake Funding II LLC | | | | | | | | |
Series 2016-1A, Class A2 | | | | | | | | |
FRN, (1 mo. LIBOR US + 1.150%) | | | | | |
1.67%, 03/15/28a | | | 20,000 | | | | 20,160,830 | |
| | | | |
SCHEDULESOF INVESTMENTS | | | 13 | |
Schedule of Investments (Continued)
iSHARES® SHORT MATURITY BOND ETF
October 31, 2016
| | | | | | | | |
Security | | Principal
(000s) | | | Value | |
Series 2016-2A, Class A2 | | | | | | | | |
FRN, (1 mo. LIBOR US + 1.000%) | | | | | |
1.45%, 06/15/28a | | $ | 13,960 | | | $ | 14,037,331 | |
Chesapeake Funding LLC | | | | | | | | |
Series 2014-1A, Class A | | | | | | | | |
FRN, (1 mo. LIBOR US + 0.420%) | | | | | |
0.95%, 03/07/26a | | | 7,278 | | | | 7,276,555 | |
Chrysler Capital Auto Receivables Trust | | | | | | | | |
Series 2013-BA, Class A4 | | | | | | | | |
1.27%, 03/15/19 (Call 12/15/17)a | | | 844 | | | | 844,904 | |
Series 2014-BA, Class A3 | | | | | | | | |
1.27%, 05/15/19 (Call 08/15/18)a | | | 4,001 | | | | 4,002,941 | |
CIFC Funding Ltd. | | | | | | | | |
Series 2012-2A, Class A1R | | | | | | | | |
FRN, (3 mo. LIBOR US + 1.350%) | |
2.19%, 12/05/24 (Call 12/05/16)a | | | 1,500 | | | | 1,499,923 | |
CNH Equipment Trust | | | | | | | | |
Series 2016-A, Class A2B | | | | | | | | |
FRN, (1 mo. LIBOR US + 0.520%) | | | | | |
1.05%, 07/15/19 (Call 01/15/20) | | | 11,839 | | | | 11,863,274 | |
Credit Acceptance Auto Loan Trust | | | | | | | | |
Series 2015-1A, Class A | | | | | | | | |
2.00%, 07/15/22 (Call 05/15/18)a | | | 2,315 | | | | 2,322,816 | |
Discover Card Execution Note Trust | | | | | | | | |
Series 2013-A6, Class A6 | | | | | | | | |
FRN, (1 mo. LIBOR + 0.450%) | | | | | | | | |
0.97%, 04/15/21 | | | 5,420 | | | | 5,441,326 | |
Series 2014-A1, Class A1 | | | | | | | | |
FRN, (1 mo. LIBOR + 0.430%) | | | | | | | | |
0.95%, 07/15/21 | | | 1,090 | | | | 1,094,108 | |
Series 2014-A5, Class A | | | | | | | | |
1.39%, 04/15/20 | | | 11,470 | | | | 11,497,600 | |
Series 2016-A2, Class A2 | | | | | | | | |
FRN, (1 mo. LIBOR + 0.540%) | | | | | | | | |
1.07%, 09/15/21 | | | 19,695 | | | | 19,835,845 | |
| | | | | | | | |
Security | | Principal
(000s) | | | Value | |
Drive Auto Receivables Trust | | | | | | | | |
Series 2016-BA, Class A3 | | | | | | | | |
1.67%, 07/15/19 (Call 01/15/20)a | | $ | 6,740 | | | $ | 6,731,241 | |
Dryden XXII Senior Loan Fund | | | | | | | | |
Series 2011-22A, Class A1R | | | | | | | | |
FRN, (3 mo. LIBOR US + 1.170%) | | | | | |
2.05%, 01/15/22 (Call 01/15/17)a | | | 955 | | | | 953,917 | |
Eastland CLO Ltd. | | | | | | | | |
Series 2007-1A, Class A2A | | | | | | | | |
FRN, (3 mo. LIBOR US + 0.230%) | |
0.99%, 05/01/22 (Call 11/01/16)a | | | 10,587 | | | | 10,544,553 | |
Flatiron CLO Ltd. | | | | | | | | |
Series 2011-1A, Class A | | | | | | | | |
FRN, (3 mo. LIBOR US + 1.550%) | | | | | |
2.43%, 01/15/23a | | | 4,211 | | | | 4,213,845 | |
Ford Credit Floorplan Master Owner Trust | | | | | | | | |
Series 2012-2, Class A | | | | | | | | |
1.92%, 01/15/19 | | | 7,200 | | | | 7,211,799 | |
Series 2012-2, Class D | | | | | | | | |
3.50%, 01/15/19 | | | 1,885 | | | | 1,892,714 | |
Series 2014-1, Class A1 | | | | | | | | |
1.20%, 02/15/19 | | | 17,375 | | | | 17,383,347 | |
Series 2014-1, Class A2 | | | | | | | | |
FRN, (1 mo. LIBOR + 0.400%) | | | | | | | | |
0.92%, 02/15/19 | | | 6,110 | | | | 6,112,911 | |
Series 2014-2, Class A | | | | | | | | |
FRN, (1 mo. LIBOR + 0.500%) | | | | | | | | |
1.02%, 02/15/21 | | | 11,000 | | | | 11,025,389 | |
Series 2014-4, Class A2 | | | | | | | | |
FRN, (1 mo. LIBOR + 0.350%) | | | | | | | | |
0.88%, 08/15/19 | | | 3,000 | | | | 3,002,071 | |
Series 2015-1, Class A2 | | | | | | | | |
FRN, (1 mo. LIBOR + 0.400%) | | | | | | | | |
0.93%, 01/15/20 | | | 18,340 | | | | 18,365,731 | |
Series 2015-4, Class A2 | | | | | | | | |
FRN, (1 mo. LIBOR + 0.600%) | | | | | | | | |
1.13%, 08/15/20 | | | 5,485 | | | | 5,514,473 | |
Series 2016-1, Class A2 | | | | | | | | |
FRN, (1 mo. LIBOR + 0.900%) | | | | | | | | |
1.43%, 02/15/21 | | | 10,000 | | | | 10,108,685 | |
| | |
| 14 | | 2016 iSHARES ANNUAL REPORTTO SHAREHOLDERS |
Schedule of Investments (Continued)
iSHARES® SHORT MATURITY BOND ETF
October 31, 2016
| | | | | | | | |
Security | | Principal
(000s) | | | Value | |
Series 2016-3, Class A2 | | | | | | | | |
FRN, (1 mo. LIBOR + 0.620%) | | | | | | | | |
1.15%, 07/15/21 | | $ | 10,000 | | | $ | 10,005,610 | |
Fraser Sullivan CLO VII Ltd. | | | | | | | | |
Series 2012-7A, Class A1R | | | | | | | | |
FRN, (3 mo. LIBOR US + 1.075%) | | | | | |
1.77%, 04/20/23 (Call 01/20/17)a | | | 2,195 | | | | 2,193,877 | |
Galaxy XV CLO Ltd.
Series 2013-15A, Class A | | | | | | | | |
FRN, (3 mo. LIBOR US + 1.250%) | | | | | |
2.13%, 04/15/25 (Call 01/15/17)a | | | 3,000 | | | | 2,989,500 | |
Golden Credit Card Trust
Series 2015-1A, Class A
FRN, (1 mo. LIBOR + 0.440%) | | | | | | | | |
0.97%, 02/15/20a | | | 3,700 | | | | 3,705,699 | |
GoldenTree Loan Opportunities VII Ltd.
Series 2013-7A, Class A | | | | | | | | |
FRN, (3 mo. LIBOR US + 1.150%) | | | | | |
1.86%, 04/25/25a | | | 22,535 | | | | 22,462,451 | |
Highbridge Loan Management Ltd.
Series 2012-1AR, Class A1R | | | | | | | | |
FRN, (3 mo. LIBOR US + 1.250%) | | | | | |
2.11%, 09/20/22a | | | 1,353 | | | | 1,353,721 | |
Honda Auto Receivables Owner Trust | | | | | | | | |
Series 2016-1, Class A3 | | | | | | | | |
1.22%, 12/18/19 (Call 04/18/19) | | | 8,500 | | | | 8,503,771 | |
Series 2016-2, Class A3 | | | | | | | | |
1.39%, 04/15/20 (Call 06/15/19) | | | 11,570 | | | | 11,600,318 | |
ING IM CLO Ltd.
Series 2012-1RA, Class A1R
FRN, (3 mo. LIBOR + 1.200%) | | | | | | | | |
1.86%, 03/14/22a | | | 2,356 | | | | 2,356,148 | |
Invitation Homes Trust
Series 2013-SFR1, Class A
FRN, (1 mo. LIBOR + 1.150%) | | | | | | | | |
1.68%, 12/17/30a | | | 1,916 | | | | 1,916,491 | |
| | | | | | | | |
Security | | Principal
(000s) | | | Value | |
John Deere Owner Trust
Series 2015-B, Class A2 | | | | | | | | |
0.98%, 06/15/18 (Call 01/15/19) | | $ | 8,803 | | | $ | 8,803,453 | |
LCM X LP
Series 10AR, Class AR | | | | | | | | |
FRN, (3 mo. LIBOR US + 1.260%) | | | | | |
1.94%, 04/15/22a | | | 766 | | | | 765,683 | |
LCM XII LP
Series 12A, Class AR | | | | | | | | |
FRN, (3 mo. LIBOR US + 1.260%) | | | | | |
1.89%, 10/19/22a | | | 5,000 | | | | 4,992,202 | |
Mercedes Benz Auto Receivables Trust
Series 2015-1, Class A2A | | | | | | | | |
0.82%, 06/15/18 (Call 06/15/19) | | | 795 | | | | 794,901 | |
Mercedes-Benz Master Owner Trust
Series 2016-BA, Class A
FRN, (1 mo. LIBOR + 0.700%) | | | | | | | | |
1.22%, 05/17/21a | | | 11,375 | | | | 11,460,013 | |
Navient Private Education Loan Trust | | | | | | | | |
Series 2014-AA, Class A1 | | | | | | | | |
FRN, (1 mo. LIBOR US + 0.480%) | | | | | |
1.01%, 05/16/22a | | | 3 | | | | 2,782 | |
Series 2014-CT, Class A | | | | | | | | |
FRN, (1 mo. LIBOR US + 0.700%) | | | | | |
1.22%, 09/16/24a | | | 2,627 | | | | 2,626,396 | |
Series 2016-AA, Class A1 | | | | | | | | |
FRN, (1 mo. LIBOR US + 1.100%) | | | | | |
1.63%, 12/15/25a | | | 6,822 | | | | 6,850,603 | |
Navient Student Loan Trust
Series 2015-2, Class A2 | | | | | | | | |
FRN, (1 mo. LIBOR US + 0.420%) | | | | | |
0.95%, 08/27/29 (Call 12/25/24) | | | 4,465 | | | | 4,447,841 | |
Nissan Auto Receivables Owner Trust
Series 2016-A, Class A2B | | | | | | | | |
FRN, (1 mo. LIBOR US + 0.350%) | | | | | |
0.88%, 02/15/19 (Call 03/15/20) | | | 1,876 | | | | 1,877,801 | |
| | | | |
SCHEDULESOF INVESTMENTS | | | 15 | |
Schedule of Investments (Continued)
iSHARES® SHORT MATURITY BOND ETF
October 31, 2016
| | | | | | | | |
Security | | Principal
(000s) | | | Value | |
Nissan Master Owner Trust Receivables
Series 2016-A, Class A1
FRN, (1 mo. LIBOR + 0.640%) | | | | | | | | |
1.16%, 06/15/21 | | $ | 18,500 | | | $ | 18,578,101 | |
OneMain Financial Issuance Trust
Series 2014-2A, Class A | | | | | | | | |
2.47%, 09/18/24 (Call 11/18/16)a | | | 2,652 | | | | 2,657,484 | |
Palmer Square CLO Ltd.
Series 2014-1A, Class A1 | | | | | | | | |
FRN, (3 mo. LIBOR US + 1.270%) | | | | | |
2.15%, 10/17/22 (Call 01/17/17)a | | | 1,909 | | | | 1,909,241 | |
PFS Financing Corp. | | | | | | | | |
Series 2014-AA, Class A | | | | | | | | |
FRN, (1 mo. LIBOR + 0.600%) | | | | | | | | |
1.13%, 02/15/19a | | | 1,000 | | | | 999,961 | |
Series 2014-AA, Class B | | | | | | | | |
FRN, (1 mo. LIBOR + 0.950%) | | | | | | | | |
1.48%, 02/15/19a | | | 1,100 | | | | 1,099,188 | |
Series 2014-BA, Class A | | | | | | | | |
FRN, (1 mo. LIBOR + 0.600%) | | | | | | | | |
1.13%, 10/15/19a | | | 1,915 | | | | 1,913,838 | |
Series 2016-A, Class A | | | | | | | | |
FRN, (1 mo. LIBOR + 1.200%) | | | | | | | | |
1.72%, 02/18/20a | | | 12,000 | | | | 12,083,539 | |
Prestige Auto Receivables Trust
Series 2016-2A, Class A2 | | | | | | | | |
1.46%, 07/15/20 (Call 11/15/20)a | | | 15,000 | | | | 14,998,950 | |
Santander Drive Auto Receivables Trust | | | | | | | | |
Series 2012-AA, Class C | | | | | | | | |
1.78%, 11/15/18 (Call 06/15/17)a | | | 336 | | | | 336,670 | |
Series 2012-AA, Class D | | | | | | | | |
2.46%, 12/17/18 (Call 06/15/17)a | | | 2,500 | | | | 2,517,762 | |
Series 2013-1, Class C | | | | | | | | |
1.76%, 01/15/19 (Call 09/15/17) | | | 847 | | | | 848,029 | |
| | | | | | | | |
Security | | Principal
(000s) | | | Value | |
Series 2014-3, Class B | | | | | | | | |
1.45%, 05/15/19 (Call 07/15/18) | | $ | 269 | | | $ | 269,412 | |
Series 2016-1, Class A2B | | | | | | | | |
FRN, (1 mo. LIBOR US + 0.780%) | | | | | |
1.31%, 07/15/19 (Call 09/15/19) | | | 8,021 | | | | 8,039,421 | |
Series 2016-2, Class A2B | | | | | | | | |
FRN, (1 mo. LIBOR US + 0.650%) | | | | | |
1.18%, 07/15/19 (Call 06/15/20) | | | 10,010 | | | | 10,026,184 | |
Silver Bay Realty Trust
Series 2014-1, Class A
FRN, (1 mo. LIBOR + 1.000%) | | | | | | | | |
1.53%, 09/17/31a | | | 985 | | | | 978,920 | |
SLM Private Credit Student Loan Trust | | | | | | | | |
Series 2004-B, Class A2 | | | | | | | | |
FRN, (3 mo. LIBOR US + 0.200%) | | | | | |
1.05%, 06/15/21 | | | 506 | | | | 504,732 | |
Series 2005-A, Class A3 | | | | | | | | |
FRN, (3 mo. LIBOR US + 0.200%) | | | | | |
1.05%, 06/15/23 | | | 1,956 | | | | 1,894,902 | |
Series 2006-A, Class A4 | | | | | | | | |
FRN, (3 mo. LIBOR US + 0.190%) | | | | | |
1.04%, 12/15/23 | | | 472 | | | | 468,105 | |
SLM Private Education Loan Trust | | | | | | | | |
Series 2011-C, Class A2A | | | | | | | | |
FRN, (1 mo. LIBOR US + 3.250%) | | | | | |
3.78%, 10/17/44a | | | 1,623 | | | | 1,687,990 | |
Series 2012-A, Class A1 | | | | | | | | |
FRN, (1 mo. LIBOR US + 1.400%) | | | | | |
1.93%, 08/15/25a | | | 157 | | | | 156,942 | |
Series 2012-B, Class A2 | | | | | | | | |
3.48%, 10/15/30a | | | 799 | | | | 812,192 | |
Series 2012-E, Class A1 | | | | | | | | |
FRN, (1 mo. LIBOR US + 0.750%) | | | | | |
1.28%, 10/16/23a | | | 143 | | | | 142,977 | |
Series 2012-E, Class A2B | | | | | | | | |
FRN, (1 mo. LIBOR US + 1.750%) | | | | | |
2.28%, 06/15/45a | | | 5,250 | | | | 5,331,902 | |
| | |
| 16 | | 2016 iSHARES ANNUAL REPORTTO SHAREHOLDERS |
Schedule of Investments (Continued)
iSHARES® SHORT MATURITY BOND ETF
October 31, 2016
| | | | | | | | |
Security | | Principal
(000s) | | | Value | |
Series 2013-A, Class A1 | | | | | | | | |
FRN, (1 mo. LIBOR US + 0.600%) | | | | | |
1.13%, 08/15/22a | | $ | 883 | | | $ | 883,603 | |
Series 2013-A, Class A2B | | | | | | | | |
FRN, (1 mo. LIBOR US + 1.050%) | | | | | |
1.58%, 05/17/27a | | | 265 | | | | 267,114 | |
Series 2013-B, Class A1 | | | | | | | | |
FRN, (1 mo. LIBOR US + 0.650%) | | | | | |
1.18%, 07/15/22a | | | 592 | | | | 592,164 | |
Series 2013-C, Class A1 | | | | | | | | |
FRN, (1 mo. LIBOR US + 0.850%) | | | | | |
1.38%, 02/15/22a | | | 266 | | | | 266,085 | |
Series 2013-C, Class A2B | | | | | | | | |
FRN, (1 mo. LIBOR US + 1.400%) | | | | | |
1.93%, 10/15/31a | | | 4,550 | | | | 4,606,669 | |
Series 2014-A, Class A1 | | | | | | | | |
FRN, (1 mo. LIBOR US + 0.600%) | | | | | |
1.13%, 07/15/22a | | | 3,384 | | | | 3,387,649 | |
Series 2015-B, Class A1 | | | | | | | | |
FRN, (1 mo. LIBOR US + 0.700%) | | | | | |
1.23%, 02/15/23a | | | 2,027 | | | | 2,030,278 | |
SLM Student Loan Trust | | | | | | | | |
Series 2006-4, Class A5 | | | | | | | | |
FRN, (3 mo. LIBOR US + 0.100%) | | | | | |
0.81%, 10/27/25 (Call 04/25/31) | | | 557 | | | | 555,529 | |
Series 2011-2, Class A1 | | | | | | | | |
FRN, (1 mo. LIBOR US + 0.600%) | | | | | |
1.13%, 11/25/27 (Call 02/25/31) | | | 815 | | | | 814,346 | |
SMB Private Education Loan Trust | | | | | | | | |
Series 2014-A, Class A1 | | | | | | | | |
FRN, (1 mo. LIBOR US + 0.500%) | | | | | |
1.03%, 09/15/21a | | | 702 | | | | 702,558 | |
Series 2015-A, Class A1 | | | | | | | | |
FRN, (1 mo. LIBOR US + 0.600%) | | | | | |
1.13%, 07/17/23a | | | 5,089 | | | | 5,095,911 | |
Series 2015-C, Class A1 | | | | | | | | |
FRN, (1 mo. LIBOR US + 0.900%) | | | | | |
1.43%, 07/15/22a | | | 3,944 | | | | 3,952,515 | |
Series 2016-A, Class A1 | | | | | | | | |
FRN, (1 mo. LIBOR US + 0.700%) | | | | | |
1.23%, 05/15/23a | | | 7,155 | | | | 7,130,475 | |
| | | | | | | | |
Security | | Principal
(000s) | | | Value | |
Series 2016-B, Class A1 | | | | | | | | |
FRN, (1 mo. LIBOR US + 0.650%) | | | | | |
1.18%, 11/15/23a | | $ | 15,708 | | | $ | 15,728,707 | |
Series 2016-C, Class A1 | | | | | | | | |
FRN, (1 mo. LIBOR US + 0.550%) | | | | | |
1.07%, 11/15/23a | | | 10,920 | | | | 10,920,000 | |
SoFi Professional Loan Program LLC | | | | | | | | |
Series 16-C, Class A1 | | | | | | | | |
FRN, (1 mo. LIBOR US + 1.100%) | | | | | |
1.63%, 10/27/36 (Call 01/25/25)a | | | 8,419 | | | | 8,484,315 | |
Series 16-C, Class A2A | | | | | | | | |
1.48%, 05/26/31 (Call 01/25/25)a | | | 6,510 | | | | 6,510,009 | |
Series 2014-A, Class A1 | | | | | | | | |
FRN, (1 mo. LIBOR US + 1.600%) | | | | | |
2.13%, 06/25/25a | | | 811 | | | | 825,111 | |
Series 2014-B, Class A1 | | | | | | | | |
FRN, (1 mo. LIBOR US + 1.250%) | | | | | |
1.78%, 08/25/32a | | | 556 | | | | 561,190 | |
Series 2014-B, Class A2 | | | | | | | | |
2.55%, 08/27/29a | | | 3,208 | | | | 3,245,726 | |
Series 2015-A, Class A1 | | | | | | | | |
FRN, (1 mo. LIBOR US + 1.200%) | | | | | |
1.73%, 03/25/33a | | | 1,638 | | | | 1,646,513 | |
SWAY Residential Trust
Series 2014-1, Class A
FRN, (1 mo. LIBOR + 1.300%) | | | | | | | | |
1.83%, 01/17/32a | | | 6,470 | | | | 6,475,809 | |
Synchrony Credit Card Master Note Trust | | | | | | | | |
Series 2012-3, Class A | | | | | | | | |
FRN, (1 mo. LIBOR + 0.450%) | | | | | | | | |
0.98%, 03/15/20 | | | 9,295 | | | | 9,305,245 | |
Series 2012-6, Class A | | | | | | | | |
1.36%, 08/17/20 | | | 23,119 | | | | 23,154,659 | |
Voya CLO Ltd.
Series 2013-1A, Class A1 | | | | | | | | |
FRN, (3 mo. LIBOR US + 1.140%) | |
1.82%, 04/15/24 (Call 01/15/17)a | | | 1,900 | | | | 1,890,732 | |
| | | | |
SCHEDULESOF INVESTMENTS | | | 17 | |
Schedule of Investments (Continued)
iSHARES® SHORT MATURITY BOND ETF
October 31, 2016
| | | | | | | | |
Security | | Principal
(000s) | | | Value | |
Wheels SPV 2 LLC | | | | | | | | |
Series 2014-1A, Class A2 | | | | | | | | |
0.84%, 03/20/23 (Call 06/20/17)a | | $ | 92 | | | $ | 92,277 | |
Series 2016-1A, Class A2 | | | | | | | | |
1.59%, 05/20/25 (Call 11/20/19)a | | | 1,510 | | | | 1,512,870 | |
World Financial Network Credit Card Master Trust | | | | | | | | |
Series 2014-C, Class A | | | | | | | | |
1.54%, 08/16/21 | | | 15,000 | | | | 15,040,265 | |
Series 2015-A, Class A | | | | | | | | |
FRN, (1 mo. LIBOR + 0.480%) | | | | | | | | |
1.01%, 02/15/22 | | | 15,405 | | | | 15,437,444 | |
| | | | | | | | |
TOTAL ASSET-BACKED SECURITIES | |
(Cost: $693,958,926) | | | | | | | 695,686,799 | |
|
CERTIFICATES OF DEPOSIT — 1.88% | |
Bank of America N.A. | | | | | | | | |
1.23%, 04/03/17 | | | 5,000 | | | | 5,001,735 | |
Bank of Tokyo-Mitsubishi UFJ Ltd./New York NY | | | | | | | | |
1.55%, 10/13/17 | | | 5,000 | | | | 5,002,478 | |
Credit Agricole Corporate and Investment Bank | | | | | | | | |
1.25%, 07/12/17 | | | 5,000 | | | | 4,998,850 | |
Credit Suisse AG/New York NY | | | | | | | | |
1.61%, 08/24/17 | | | 5,000 | | | | 5,006,410 | |
Mizuho Bank Ltd./NY | | | | | | | | |
1.53%, 08/25/17 | | | 5,000 | | | | 5,011,250 | |
Svenska Handelsbanken AB | | | | | | | | |
1.20%, 02/27/17 | | | 3,000 | | | | 3,002,322 | |
UBS AG/Stamford CT | | | | | | | | |
1.53%, 09/01/17 | | | 5,000 | | | | 5,002,566 | |
1.57%, 09/08/17 | | | 5,000 | | | | 5,003,887 | |
| | | | | | | | |
TOTAL CERTIFICATES OF DEPOSIT | |
(Cost: $38,000,000) | | | | | | | 38,029,498 | |
| | | | | | | | |
Security | | Principal
(000s) | | | Value | |
COLLATERALIZED MORTGAGE
OBLIGATIONS — 6.84% | |
|
MORTGAGE-BACKED SECURITIES — 6.84% | |
BAMLL Commercial Mortgage Securities Trust | | | | | | | | |
Series 2013-DSNY, Class A | | | | | | | | |
FRN, (1 mo. LIBOR + 1.050%) | | | | | | | | |
1.57%, 09/15/26a | | $ | 525 | | | $ | 524,511 | |
Series 2014-FL1, Class A | | | | | | | | |
FRN, (1 mo. LIBOR + 1.400%) | | | | | | | | |
1.93%, 12/15/31a | | | 2,670 | | | | 2,674,220 | |
Banc of America Commercial Mortgage Trust | | | | | | | | |
Series 2007-4, Class A1A | | | | | | | | |
5.77%, 02/10/51b | | | 1,533 | | | | 1,561,663 | |
Series 2007-5, Class A4 | | | | | | | | |
5.49%, 02/10/51 | | | 2,895 | | | | 2,960,623 | |
Banc of America Merrill Lynch Commercial Mortgage Inc.
Series 2007-1, Class A4 | | | | | | | | |
5.45%, 01/15/49 | | | 3,883 | | | | 3,887,988 | |
Bear Stearns Commercial Mortgage Securities Trust | | | | | | | | |
Series 2005-PW10, Class AJ | | | | | | | | |
1.00%, 12/11/40b | | | 6,265 | | | | 6,242,851 | |
Series 2006-PW14, Class A1A | | | | | | | | |
5.19%, 12/11/38 | | | 67 | | | | 66,553 | |
Series 2007-PW15, Class A1A | | | | | | | | |
5.32%, 02/11/44 | | | 192 | | | | 192,900 | |
Series 2007-PW15, Class A4 | | | | | | | | |
5.33%, 02/11/44 | | | 526 | | | | 528,600 | |
Series 2007-PW16, Class A4 | | | | | | | | |
5.72%, 06/11/40b | | | 4,285 | | | | 4,341,328 | |
Series 2007-PW17, Class A4 | | | | | | | | |
5.69%, 06/11/50b | | | 6,962 | | | | 7,118,449 | |
Series 2007-PW18, Class A1A | | | | | | | | |
5.60%, 06/11/50 | | | 2,428 | | | | 2,509,763 | |
Series 2007-PW18, Class A4 | | | | | | | | |
5.70%, 06/11/50 | | | 1,126 | | | | 1,157,302 | |
| | |
| 18 | | 2016 iSHARES ANNUAL REPORTTO SHAREHOLDERS |
Schedule of Investments (Continued)
iSHARES® SHORT MATURITY BOND ETF
October 31, 2016
| | | | | | | | |
Security | | Principal
(000s) | | | Value | |
Brunel Residential Mortgage Securitisation PLC
Series 2007-1A, Class A4C | | | | | | | | |
FRN, (3 mo. LIBOR US + 0.200%) | | | | | |
1.08%, 01/13/39 (Call 01/13/17)a | | $ | 640 | | | $ | 637,792 | |
CD Commercial Mortgage Trust
Series 2007-CD4, Class A4 | | | | | | | | |
5.32%, 12/11/49 | | | 6,085 | | | | 6,105,777 | |
CD Mortgage Trust
Series 2007-CD5, Class A4 | | | | | | | | |
5.89%, 11/15/44b | | | 4,156 | | | | 4,247,920 | |
CDGJ Commercial Mortgage Trust
Series 2014-BXCH, Class A
FRN, (1 mo. LIBOR + 1.400%) | | | | | | | | |
1.93%, 12/15/27a | | | 6,374 | | | | 6,383,741 | |
COMM Mortgage Trust | | | | | | | | |
Series 2006-C8, Class AM | | | | | | | | |
5.35%, 12/10/46 | | | 2,966 | | | | 2,963,640 | |
Series 2007-C9, Class A4 | | | | | | | | |
5.81%, 12/10/49b | | | 797 | | | | 810,920 | |
Series 2014-FL5, Class A | | | | | | | | |
FRN, (1 mo. LIBOR + 1.370%) | | | | | | | | |
1.90%, 10/15/31a | | | 1,375 | | | | 1,348,542 | |
Series 2014-PAT, Class A | | | | | | | | |
FRN, (1 mo. LIBOR + 0.800%) | | | | | | | | |
1.33%, 08/13/27a | | | 3,570 | | | | 3,553,214 | |
Commercial Mortgage Trust
Series 2007-GG11, Class A4 | | | | | | | | |
5.74%, 12/10/49 | | | 1,480 | | | | 1,513,269 | |
Credit Suisse Commercial Mortgage Trust
Series 2008-C1, Class A3 | | | | | | | | |
6.06%, 02/15/41b | | | 4,942 | | | | 5,074,897 | |
DBRR Trust
Series 2013-EZ3, Class A | | | | | | | | |
1.64%, 12/18/49a,b | | | 100 | | | | 99,688 | |
GS Mortgage Securities Trust
Series 2006-GG8, Class AM | | | | | | | | |
5.59%, 11/10/39 | | | 273 | | | | 272,564 | |
Hilton USA Trust
Series 2013-HLT, Class EFX | | | | | | | | |
2.66%, 11/05/30a | | | 14,363 | | | | 14,368,716 | |
| | | | | | | | |
Security | | Principal
(000s) | | | Value | |
JPMorgan Chase Commercial Mortgage Securities Trust | | | | | | | | |
Series 2006-LDP9, Class A3 | | | | | | | | |
5.34%, 05/15/47 | | $ | 479 | | | $ | 478,325 | |
Series 2007-CB18, Class A1A | | | | | | | | |
5.43%, 06/12/47b | | | 127 | | | | 127,680 | |
Series 2007-CB18, Class A4 | | | | | | | | |
5.44%, 06/12/47 | | | 1,862 | | | | 1,866,784 | |
Series 2007-CB20, Class A4 | | | | | | | | |
5.79%, 02/12/51b | | | 1,213 | | | | 1,238,231 | |
Series 2007-LDPX, Class A3 | | | | | | | | |
5.42%, 01/15/49 | | | 8,138 | | | | 8,180,437 | |
Series 2013-WT, Class A | | | | | | | | |
2.80%, 02/16/25a | | | 3,889 | | | | 3,897,677 | |
Series 2015-CSMO, Class A | | | | | | | | |
FRN, (1 mo. LIBOR + 1.250%) | | | | | | | | |
1.78%, 01/15/32a | | | 6,930 | | | | 6,930,087 | |
LB Commercial Mortgage Trust
Series 2007-C3, Class A1A | | | | | | | | |
5.87%, 07/15/44b | | | 3,547 | | | | 3,609,214 | |
LB-UBS Commercial Mortgage Trust | | | | | | | | |
Series 2007-C2, Class A1A | | | | | | | | |
5.39%, 02/15/40 | | | 2,086 | | | | 2,103,136 | |
Series 2007-C2, Class A3 | | | | | | | | |
5.43%, 02/15/40 | | | 1,004 | | | | 1,010,111 | |
LMREC Inc.
Series 2016-CRE2, Class A
FRN, (1 mo. LIBOR + 1.700%) | | | | | | | | |
1.00%, 11/24/31a | | | 3,410 | | | | 3,410,000 | |
ML-CFC Commercial Mortgage Trust | | | | | | | | |
Series 2006-4, Class AM | | | | | | | | |
5.20%, 12/12/49 | | | 55 | | | | 55,007 | |
Series 2007-9, Class A4 | | | | | | | | |
5.70%, 09/12/49 | | | 3,423 | | | | 3,514,486 | |
Morgan Stanley Capital I Trust | | | | | | | | |
Series 2006-IQ12, Class A1A | | | | | | | | |
5.32%, 12/15/43 | | | 18 | | | | 18,469 | |
Series 2007-HQ11, Class A4FL | | | | | | | | |
FRN, (1 mo. LIBOR + 0.135%) | | | | | | | | |
0.67%, 02/12/44 | | | 752 | | | | 750,885 | |
Series 2007-IQ13, Class A1A | | | | | | | | |
5.31%, 03/15/44 | | | 3,263 | | | | 3,279,934 | |
| | | | |
SCHEDULESOF INVESTMENTS | | | 19 | |
Schedule of Investments (Continued)
iSHARES® SHORT MATURITY BOND ETF
October 31, 2016
| | | | | | | | |
Security | | Principal
(000s) | | | Value | |
Series 2007-IQ15, Class A4 | | | | | | | | |
5.91%, 06/11/49b | | $ | 2,853 | | | $ | 2,919,196 | |
Series 2007-IQ16 Class A4 | | | | | | | | |
5.81%, 12/12/49 | | | 5,278 | | | | 5,404,334 | |
Series 2007-T25, Class A3 | | | | | | | | |
5.51%, 11/12/49b | | | 28 | | | | 28,018 | |
Series 2007-T27, Class A4 | | | | | | | | |
5.64%, 06/11/42b | | | 8,234 | | | | 8,379,436 | |
| | | | | | | | |
TOTAL COLLATERALIZED MORTGAGE OBLIGATIONS | |
(Cost: $139,392,448) | | | | | | | 138,348,878 | |
|
COMMERCIAL PAPERc — 2.40% | |
AXA Financial Inc. | | | | | | | | |
0.00%, 08/21/17 | | | 5,400 | | | | 5,336,320 | |
Bank of Nova Scotia (The) | | | | | | | | |
0.00%, 08/28/17 | | | 5,000 | | | | 4,944,148 | |
Coca-Cola Co. (The) | | | | | | | | |
0.00%, 07/12/17 | | | 10,000 | | | | 9,927,398 | |
0.00%, 09/13/17 | | | 2,000 | | | | 1,980,962 | |
Lloyds Bank PLC | | | | | | | | |
0.00%, 02/01/17 | | | 4,000 | | | | 3,992,322 | |
Sumitomo Mitsui Financial Group Inc. | | | | | | | | |
0.00%, 07/21/17 | | | 10,000 | | | | 9,915,840 | |
Svenska Handelsbanken AB | | | | | | | | |
0.00%, 05/26/17 | | | 3,500 | | | | 3,475,951 | |
Toronto-Dominion Bank (The) | | | | | | | | |
0.00%, 10/05/17 | | | 9,000 | | | | 8,890,249 | |
| | | | | | | | |
TOTAL COMMERCIAL PAPER | |
(Cost: $48,402,943) | | | | | | | 48,463,190 | |
|
CORPORATE BONDS & NOTES — 43.22% | |
|
AEROSPACE & DEFENSE — 0.01% | |
L-3 Communications Corp. | | | | | | | | |
3.95%, 11/15/16 | | | 161 | | | | 161,142 | |
| | | | | | | | |
| | | | | | | 161,142 | |
AGRICULTURE — 0.88% | | | | | | | | |
BAT International Finance PLC | | | | | | | | |
FRN, (3 mo. LIBOR US + 0.510%) | | | | | |
1.36%, 06/15/18a | | | 2,000 | | | | 2,002,580 | |
Reynolds American Inc. | | | | | | | | |
2.30%, 08/21/17 | | | 15,574 | | | | 15,698,623 | |
| | | | | | | | |
| | | | | | | 17,701,203 | |
| | | | | | | | |
Security | | Principal
(000s) | | | Value | |
AIRLINES — 0.05% | | | | | | | | |
UAL 2009-1 Pass Through Trust | | | | | | | | |
10.40%, 05/01/18 | | $ | 84 | | | $ | 84,335 | |
UAL 2009-2A Pass Through Trust Class A | | | | | | | | |
9.75%, 07/15/18 | | | 900 | | | | 915,489 | |
| | | | | | | | |
| | | | | | | 999,824 | |
AUTO MANUFACTURERS — 1.64% | | | | | |
Daimler Finance North America LLC | | | | | | | | |
FRN, (3 mo. LIBOR US + 0.340%) | | | | | |
1.10%, 08/01/17a | | | 1,700 | | | | 1,701,144 | |
FRN, (3 mo. LIBOR US + 0.710%) | | | | | |
1.47%, 08/03/17a | | | 6,450 | | | | 6,471,762 | |
FRN, (3 mo. LIBOR US + 0.740%) | | | | | |
1.60%, 07/05/19a | | | 3,500 | | | | 3,518,655 | |
General Motors Financial Co. Inc. | | | | | | | | |
2.63%, 07/10/17d | | | 12,965 | | | | 13,069,109 | |
FRN, (3 mo. LIBOR US + 1.450%) | | | | | |
2.24%, 05/09/19 | | | 8,000 | | | | 8,049,632 | |
Nissan Motor Acceptance Corp. | | | | | | | | |
FRN, (3 mo. LIBOR US + 0.550%) | | | | | |
1.39%, 03/03/17a | | | 250 | | | | 250,428 | |
| | | | | | | | |
| | | | | | | 33,060,730 | |
BANKS — 18.58% | | | | | | | | |
American Express Centurion Bank | | | | | | | | |
6.00%, 09/13/17 | | | 7,900 | | | | 8,215,518 | |
Bank of America Corp. | | | | | | | | |
1.35%, 11/21/16 | | | 1,300 | | | | 1,300,313 | |
1.70%, 08/25/17 | | | 5,200 | | | | 5,211,929 | |
FRN, (3 mo. LIBOR US + 0.610%) | | | | | |
1.44%, 08/25/17 | | | 1,250 | | | | 1,251,541 | |
FRN, (3 mo. LIBOR US + 0.870%) | | | | | |
1.72%, 04/01/19d | | | 4,000 | | | | 4,012,456 | |
FRN, (3 mo. LIBOR US + 1.070%) | | | | | |
1.94%, 03/22/18d | | | 6,750 | | | | 6,807,118 | |
Bank of America N.A. | | | | | | | | |
1.25%, 02/14/17 | | | 4,800 | | | | 4,802,621 | |
Bank of Montreal | | | | | | | | |
FRN, (3 mo. LIBOR US + 0.610%) | | | | | |
1.36%, 07/31/18 | | | 3,350 | | | | 3,359,534 | |
| | |
| 20 | | 2016 iSHARES ANNUAL REPORTTO SHAREHOLDERS |
Schedule of Investments (Continued)
iSHARES® SHORT MATURITY BOND ETF
October 31, 2016
| | | | | | | | |
Security | | Principal
(000s) | | | Value | |
FRN, (3 mo. LIBOR US + 0.650%) | | | | | |
1.53%, 07/18/19 | | $ | 3,500 | | | $ | 3,506,734 | |
Bank of New York Mellon Corp. (The) | | | | | | | | |
FRN, (3 mo. LIBOR US + 0.560%) | | | | | |
1.32%, 08/01/18d | | | 10,000 | | | | 10,034,610 | |
Bank of Nova Scotia (The) | | | | | | | | |
1.75%, 03/22/17a | | | 7,407 | | | | 7,428,310 | |
1.95%, 01/30/17a | | | 20,000 | | | | 20,039,840 | |
Banque Federative du Credit Mutuel SA | | | | | | | | |
FRN, (3 mo. LIBOR US + 0.850%) | | | | | |
1.73%, 01/20/17a | | | 1,000 | | | | 1,001,381 | |
Barclays Bank PLC
FRN, (3 mo. LIBOR US + 0.580%) | | | | | |
1.38%, 02/17/17 | | | 7,150 | | | | 7,157,808 | |
BB&T Corp.
FRN, (3 mo. LIBOR US + 0.860%) | | | | | |
1.71%, 06/15/18 (Call 05/15/18) | | | 23,775 | | | | 23,938,620 | |
BNP Paribas SA
FRN, (3 mo. LIBOR US + 0.590%) | | | | | |
1.44%, 12/12/16d | | | 750 | | | | 750,600 | |
BPCE SA | | | | | | | | |
FRN, (3 mo. LIBOR US + 0.630%) | | | | | |
1.49%, 06/17/17 | | | 700 | | | | 701,116 | |
FRN, (3 mo. LIBOR US + 0.850%) | | | | | |
1.66%, 02/10/17 | | | 1,900 | | | | 1,903,257 | |
Branch Banking & Trust Co.
FRN, (3 mo. LIBOR US + 0.300%) | | | | | |
1.12%, 05/23/17 | | | 2,000 | | | | 1,999,456 | |
Capital One N.A./Mclean VA
FRN, (3 mo. LIBOR US + 0.680%) | | | | | |
1.46%, 02/05/18 (Call 01/05/18)d | | | 500 | | | | 500,481 | |
Capital One N.A./Mclean VA | | | | | | | | |
1.50%, 09/05/17 (Call 08/05/17) | | | 6,000 | | | | 6,003,318 | |
FRN, (3 mo. LIBOR US + 1.150%) | | | | | |
1.95%, 08/17/18 (Call 07/18/18) | | | 6,250 | | | | 6,308,619 | |
Citigroup Inc. | | | | | | | | |
1.55%, 08/14/17 | | | 1,750 | | | | 1,753,269 | |
1.85%, 11/24/17d | | | 15,000 | | | | 15,051,030 | |
| | | | | | | | |
Security | | Principal
(000s) | | | Value | |
Credit Suisse AG/New York NY | | | | | | | | |
FRN, (3 mo. LIBOR US + 0.680%) | | | | | |
1.41%, 04/27/18d | | $ | 10,035 | | | $ | 10,037,378 | |
FRN, (3 mo. LIBOR US + 0.690%) | | | | | |
1.44%, 01/29/18d | | | 1,250 | | | | 1,252,111 | |
Deutsche Bank AG/London | | | | | | | | |
FRN, (3 mo. LIBOR US + 0.470%) | | | | | |
1.30%, 05/30/17 | | | 1,000 | | | | 993,140 | |
FRN, (3 mo. LIBOR US + 0.680%) | | | | | |
1.50%, 02/13/18 | | | 3,000 | | | | 2,945,163 | |
Fifth Third Bank/Cincinnati OH | | | | | | | | |
1.35%, 06/01/17 (Call 05/01/17) | | | 20,000 | | | | 20,018,700 | |
Goldman Sachs Group Inc. (The) | | | | | | | | |
5.95%, 01/18/18c | | | 5,000 | | | | 5,260,680 | |
FRN, (3 mo. LIBOR US + 1.040%) | | | | | |
1.92%, 04/25/19 | | | 14,000 | | | | 14,092,610 | |
FRN, (3 mo. LIBOR US + 1.200%) | | | | | |
1.95%, 04/30/18 | | | 7,000 | | | | 7,064,785 | |
HSBC Bank PLC
FRN, (3 mo. LIBOR US + 0.640%) | | | | | |
1.46%, 05/15/18a | | | 5,000 | | | | 5,001,235 | |
HSBC USA Inc. | | | | | | | | |
1.30%, 06/23/17 | | | 4,000 | | | | 3,999,400 | |
FRN, (3 mo. LIBOR US + 0.450%) | | | | | |
1.29%, 03/03/17 | | | 3,000 | | | | 3,000,936 | |
FRN, (3 mo. LIBOR US + 0.770%) | | | | | |
1.56%, 08/07/18 | | | 3,250 | | | | 3,254,725 | |
Huntington National Bank (The) | | | | | | | | |
1.38%, 04/24/17 (Call 03/24/17)d | | | 4,575 | | | | 4,580,444 | |
FRN, (3 mo. LIBOR US + 0.425%) | | | | | |
1.31%, 04/24/17 (Call 03/25/17) | | | 1,405 | | | | 1,404,268 | |
ING Bank NV | | | | | | | | |
FRN, (3 mo. LIBOR US + 0.550%) | | | | | |
1.40%, 03/16/18a | | | 4,250 | | | | 4,253,702 | |
FRN, (3 mo. LIBOR US + 0.610%) | | | | | |
1.43%, 08/15/19a | | | 3,000 | | | | 2,997,294 | |
JPMorgan Chase & Co. | | | | | | | | |
2.00%, 08/15/17 | | | 10,000 | | | | 10,061,980 | |
FRN, (3 mo. LIBOR US + 0.550%) | | | | | |
1.43%, 04/25/18 | | | 3,000 | | | | 2,999,706 | |
| | | | |
SCHEDULESOF INVESTMENTS | | | 21 | |
Schedule of Investments (Continued)
iSHARES® SHORT MATURITY BOND ETF
October 31, 2016
| | | | | | | | |
Security | | Principal
(000s) | | | Value | |
JPMorgan Chase Bank N.A.
FRN, (3 mo. LIBOR US + 0.590%) | | | | | |
1.45%, 09/23/19 (Call 08/23/19) | | $ | 11,500 | | | $ | 11,515,973 | |
Lloyds Bank PLC | | | | | | | | |
4.20%, 03/28/17 | | | 1,100 | | | | 1,113,376 | |
Morgan Stanley | | | | | | | | |
5.45%, 01/09/17 | | | 5,000 | | | | 5,040,780 | |
FRN, (3 mo. LIBOR US + 0.740%) | | | | | |
1.60%, 01/05/18 | | | 1,600 | | | | 1,602,382 | |
FRN, (3 mo. LIBOR US + 1.280%) | | | | | |
2.16%, 04/25/18 | | | 6,282 | | | | 6,348,696 | |
FRN, (3 mo. LIBOR US + 1.375%) | | | | | |
2.13%, 02/01/19 | | | 15,000 | | | | 15,225,810 | |
MUFG Union Bank N.A. | | | | | | | | |
2.13%, 06/16/17 | | | 4,000 | | | | 4,022,304 | |
Nordea Bank AB
FRN, (3 mo. LIBOR US + 0.840%) | | | | | |
1.70%, 09/17/18a | | | 10,000 | | | | 10,067,920 | |
Royal Bank of Canada | | | | | | | | |
FRN, (3 mo. LIBOR US + 0.480%) | | | | | |
1.23%, 07/29/19 | | | 5,000 | | | | 5,013,460 | |
FRN, (3 mo. LIBOR US + 0.540%) | | | | | |
1.29%, 07/30/18 | | | 3,400 | | | | 3,406,120 | |
FRN, (3 mo. LIBOR US + 0.700%) | | | | | |
1.55%, 12/10/18 | | | 2,300 | | | | 2,312,823 | |
Royal Bank of Scotland
Group PLC
FRN, (3 mo. LIBOR US + 0.940%) | | | | | |
1.78%, 03/31/17 | | | 1,150 | | | | 1,149,284 | |
Santander UK PLC | | | | | | | | |
1.38%, 03/13/17 | | | 4,000 | | | | 3,998,200 | |
State Street Corp. | | | | | | | | |
5.38%, 04/30/17 | | | 4,000 | | | | 4,084,676 | |
Sumitomo Mitsui Banking Corp.
FRN, (3 mo. LIBOR US + 0.940%) | | | | | |
1.82%, 01/18/19 | | | 5,500 | | | | 5,531,273 | |
Toronto-Dominion Bank (The)
FRN, (3 mo. LIBOR US + 0.540%) | | | | | |
1.42%, 07/23/18d | | | 5,700 | | | | 5,714,746 | |
U.S. Bancorp. | | | | | | | | |
1.65%, 05/15/17 (Call 04/15/17) | | | 11,000 | | | | 11,024,145 | |
| | | | | | | | |
Security | | Principal
(000s) | | | Value | |
UBS AG/Stamford CT
FRN, (3 mo. LIBOR US + 0.700%) | | | | | |
1.56%, 03/26/18 | | $ | 6,950 | | | $ | 6,977,341 | |
Wells Fargo & Co. | | | | | | | | |
1.40%, 09/08/17d | | | 17,000 | | | | 17,001,819 | |
FRN, (3 mo. LIBOR US + 0.400%) | | | | | |
1.26%, 09/14/18 | | | 4,325 | | | | 4,315,334 | |
FRN, (3 mo. LIBOR US + 0.630%) | | | | | |
1.51%, 04/23/18c | | | 4,000 | | | | 4,012,920 | |
| | | | | | | | |
| | | | | | | 375,737,118 | |
BEVERAGES — 0.57% | |
Anheuser-Busch InBev Worldwide Inc. | | | | | | | | |
1.38%, 07/15/17 | | | 9,700 | | | | 9,728,528 | |
Heineken NV | | | | | | | | |
1.40%, 10/01/17a | | | 1,775 | | | | 1,777,302 | |
| | | | | | | | |
| | | | | | | 11,505,830 | |
BIOTECHNOLOGY — 1.23% | |
Amgen Inc. | | | | | | | | |
1.25%, 05/22/17 | | | 7,250 | | | | 7,257,540 | |
2.13%, 05/15/17 | | | 4,090 | | | | 4,113,104 | |
2.50%, 11/15/16 | | | 10,000 | | | | 10,005,470 | |
5.85%, 06/01/17 | | | 3,500 | | | | 3,595,092 | |
| | | | | | | | |
| | | | | | | 24,971,206 | |
COMMERCIAL SERVICES — 0.14% | |
Synchrony Financial | | | | | | | | |
1.88%, 08/15/17 (Call 07/15/17) | | | 2,728 | | | | 2,734,648 | |
| | | | | | | | |
| | | | | | | 2,734,648 | |
COMPUTERS — 0.83% | |
Hewlett Packard Enterprise Co.
FRN, (3 mo. LIBOR US + 2.180%) | | | | | |
3.04%, 10/05/18a | | | 16,340 | | | | 16,725,624 | |
| | | | | | | | |
| | | | | | | 16,725,624 | |
DIVERSIFIED FINANCIAL SERVICES — 2.43% | |
American Express Credit Corp. | | | | | | | | |
1.13%, 06/05/17d | | | 17,100 | | | | 17,109,610 | |
Ford Motor Credit Co. LLC | | | | | | | | |
1.68%, 09/08/17d | | | 7,000 | | | | 7,005,670 | |
1.72%, 12/06/17 | | | 15,000 | | | | 15,002,130 | |
3.00%, 06/12/17 | | | 2,000 | | | | 2,019,352 | |
8.00%, 12/15/16 | | | 2,000 | | | | 2,015,500 | |
| | |
| 22 | | 2016 iSHARES ANNUAL REPORTTO SHAREHOLDERS |
Schedule of Investments (Continued)
iSHARES® SHORT MATURITY BOND ETF
October 31, 2016
| | | | | | | | |
Security | | Principal
(000s) | | | Value | |
FRN, (3 mo. LIBOR US + 0.570%) | | | | | |
1.41%, 12/06/17 | | $ | 1,000 | | | $ | 999,368 | |
Synchrony Financial
FRN, (3 mo. LIBOR US + 1.400%) | | | | | |
2.19%, 11/09/17d | | | 5,000 | | | | 5,035,295 | |
| | | | | | | | |
| | | | | | | 49,186,925 | |
ELECTRIC — 0.19% | |
Dominion Resources Inc./VA | | | | | | | | |
1.25%, 03/15/17 | | | 1,265 | | | | 1,265,659 | |
Duke Energy Corp. | | | | | | | | |
1.63%, 08/15/17d | | | 1,892 | | | | 1,897,224 | |
2.15%, 11/15/16 | | | 715 | | | | 715,211 | |
| | | | | | | | |
| | | | | | | 3,878,094 | |
FOOD — 1.12% | |
Kraft Heinz Foods Co. | | | | | | | | |
2.25%, 06/05/17 | | | 2,500 | | | | 2,513,195 | |
Wm Wrigley Jr Co. | | | | | | | | |
2.00%, 10/20/17a | | | 20,000 | | | | 20,137,600 | |
| | | | | | | | |
| | | | | | | 22,650,795 | |
HEALTH CARE – PRODUCTS — 0.11% | |
Zimmer Biomet Holdings Inc. | | | | | | | | |
1.45%, 04/01/17 | | | 2,250 | | | | 2,251,098 | |
| | | | | | | | |
| | | | | | | 2,251,098 | |
HEALTH CARE – SERVICES — 1.69% | |
Aetna Inc. | | | | | | | | |
1.75%, 05/15/17 (Call 04/15/17) | | | 5,066 | | | | 5,080,509 | |
Coventry Health Care Inc. | | | | | | | | |
5.95%, 03/15/17 | | | 11,271 | | | | 11,465,661 | |
UnitedHealth Group Inc. | | | | | | | | |
1.45%, 07/17/17 | | | 14,450 | | | | 14,507,439 | |
6.00%, 06/15/17 | | | 3,018 | | | | 3,110,484 | |
| | | | | | | | |
| | | | | | | 34,164,093 | |
HOLDING COMPANIES – DIVERSIFIED — 0.10% | |
MUFG Americas Holdings Corp.
FRN, (3 mo. LIBOR US + 0.570%) | | | | | |
1.36%, 02/09/18 (Call 01/09/18) | | | 2,000 | | | | 1,993,552 | |
| | | | | | | | |
| | | | | | | 1,993,552 | |
HOME FURNISHINGS — 0.50% | |
Whirlpool Corp. | | | | | | | | |
1.35%, 03/01/17 | | | 10,150 | | | | 10,159,257 | |
| | | | | | | | |
| | | | | | | 10,159,257 | |
| | | | | | | | |
Security | | Principal
(000s) | | | Value | |
INSURANCE — 1.82% | |
American International Group Inc. | | | | | | | | |
5.85%, 01/16/18 | | $ | 8,813 | | | $ | 9,264,931 | |
Berkshire Hathaway Finance Corp.
FRN, (3 mo. LIBOR US + 0.690%) | | | | | |
1.54%, 03/15/19 | | | 10,000 | | | | 10,127,120 | |
Hartford Financial Services Group Inc. (The) | | | | | | | | |
5.38%, 03/15/17 | | | 12,177 | | | | 12,348,050 | |
Voya Financial Inc. | | | | | | | | |
2.90%, 02/15/18 | | | 5,000 | | | | 5,082,375 | |
| | | | | | | | |
| | | | | | | 36,822,476 | |
LEISURE TIME — 0.77% | |
Carnival Corp. | | | | | | | | |
1.88%, 12/15/17d | | | 15,400 | | | | 15,498,699 | |
| | | | | | | | |
| | | | | | | 15,498,699 | |
MEDIA — 1.51% | |
Comcast Corp. | | | | | | | | |
6.30%, 11/15/17d | | | 7,500 | | | | 7,890,457 | |
6.50%, 01/15/17d | | | 16,000 | | | | 16,180,720 | |
Cox Communications Inc. | | | | | | | | |
5.88%, 12/01/16a | | | 6,350 | | | | 6,373,419 | |
| | | | | | | | |
| | | | | | | 30,444,596 | |
PHARMACEUTICALS — 2.43% | |
AbbVie Inc. | | | | | | | | |
1.75%, 11/06/17 | | | 25,992 | | | | 26,084,791 | |
Actavis Funding SCS | | | | | | | | |
1.85%, 03/01/17 | | | 12,000 | | | | 12,028,044 | |
FRN, (3 mo. LIBOR US + 1.080%) | | | | | |
1.93%, 03/12/18d | | | 2,000 | | | | 2,018,052 | |
Actavis Inc. | | | | | | | | |
1.88%, 10/01/17d | | | 9,000 | | | | 9,035,451 | |
| | | | | | | | |
| | | | | | | 49,166,338 | |
PIPELINES — 0.15% | |
Southern Natural Gas Co. LLC | | | | | | | | |
5.90%, 04/01/17a | | | 3,000 | | | | 3,050,337 | |
| | | | | | | | |
| | | | | | | 3,050,337 | |
REAL ESTATE INVESTMENT TRUSTS — 1.94% | |
ERP Operating LP | | | | | | | | |
5.75%, 06/15/17 | | | 17,174 | | | | 17,648,981 | |
| | | | |
SCHEDULESOF INVESTMENTS | | | 23 | |
Schedule of Investments (Continued)
iSHARES® SHORT MATURITY BOND ETF
October 31, 2016
| | | | | | | | | | | | |
Security | | | | | Principal
(000s) | | | Value | |
Simon Property Group LP | | | | | | | | | | | | |
2.80%, 01/30/17 (Call 11/01/16)d | | | | | | $ | 13,686 | | | $ | 13,686,000 | |
Ventas Realty LP | | | | | | | | | | | | |
1.25%, 04/17/17 | | | | | | | 7,920 | | | | 7,921,362 | |
| | | | | | | | | | | | |
| | | | | | | | | | | 39,256,343 | |
RETAIL — 0.56% | |
Macy’s Retail Holdings Inc. | | | | | | | | | | | | |
5.90%, 12/01/16 | | | | | | | 5,230 | | | | 5,250,141 | |
Walgreens Boots Alliance Inc. | | | | | | | | | | | | |
1.75%, 11/17/17 | | | | | | | 6,000 | | | | 6,026,316 | |
| | | | | | | | | | | | |
| | | | | | | | | | | 11,276,457 | |
TELECOMMUNICATIONS — 2.16% | |
AT&T Inc. | | | | | | | | | | | | |
1.40%, 12/01/17 | | | | | | | 7,000 | | | | 7,001,687 | |
2.40%, 03/15/17 | | | | | | | 13,500 | | | | 13,568,715 | |
Verizon Communications Inc. | | | | | | | | | | | | |
1.35%, 06/09/17 | | | | | | | 15,000 | | | | 15,014,970 | |
FRN, (3 mo. LIBOR US + 0.400%) | | | | | |
1.23%, 06/09/17 | | | | | | | 3,500 | | | | 3,506,027 | |
FRN, (3 mo. LIBOR US + 1.750%) | | | | | |
2.61%, 09/14/18 | | | | | | | 4,500 | | | | 4,620,600 | |
| | | | | | | | | | | | |
| | | | | | | | | | | 43,711,999 | |
TRANSPORTATION — 0.62% | |
Ryder System Inc. | | | | | | | | | | | | |
2.50%, 03/01/17 (Call 02/01/17) | | | | | | | 10,920 | | | | 10,955,687 | |
5.85%, 11/01/16 | | | | | | | 1,600 | | | | 1,600,000 | |
| | | | | | | | | | | | |
| | | | | | | | | | | 12,555,687 | |
TRUCKING & LEASING — 1.19% | |
GATX Corp. | | | | | | | | | | | | |
1.25%, 03/04/17 | | | | | | | 5,350 | | | | 5,351,477 | |
Penske Truck Leasing Co. LP/PTL Finance Corp. | | | | | | | | | | | | |
3.75%, 05/11/17a | | | | | | | 18,520 | | | | 18,744,888 | |
| | | | | | | | | | | | |
| | | | | | | | | | | 24,096,365 | |
| | | | | | | | | | | | |
TOTAL CORPORATE BONDS & NOTES
(Cost: $872,312,142) | | | | 873,760,436 | |
| | | | | | | | | | | | |
Security | | | | | Principal
(000s) | | | Value | |
|
FOREIGN GOVERNMENT OBLIGATIONS — 5.80% | |
| | | |
JAPAN — 3.79% | | | | | | | | | | | | |
Japan Treasury Discount Bill | | | | | | | | | | | | |
0.00%, 11/14/16c | | | JPY | | | | 4,000,000 | | | $ | 38,064,157 | |
0.00%, 11/21/16c | | | JPY | | | | 1,960,000 | | | | 18,652,165 | |
0.00%, 01/10/17c | | | JPY | | | | 2,080,000 | | | | 19,802,150 | |
| | | | | | | | | | | | |
| | | | | | | | | | | 76,518,472 | |
MEXICO — 2.01% | | | | | | | | | | | | |
Mexico Cetes | | | | | | | | | | | | |
0.00%, 02/16/17 | | | MXN | | | | 776,000 | | | | 40,674,242 | |
| | | | | | | | | | | | |
| | | | | | | | | | | 40,674,242 | |
TOTAL FOREIGN GOVERNMENT OBLIGATIONS | |
(Cost: $120,566,608) | | | | | | | | | | | 117,192,714 | |
|
REPURCHASE AGREEMENTS — 1.48% | |
Mizuho Securities USA Inc., 1.99%, 11/01/16b (Purchased on 10/31/16 to be repurchased at $30,001,656, collateralized by non-agency asset-backed security, 0.00%, due 09/01/21, par and fair value of $120,373,052 and $34,500,000, respectively)e | | | | | | | 30,000 | | | | 30,000,000 | |
| | | | | | | | | | | | |
TOTAL REPURCHASE AGREEMENTS
(Cost: $30,000,000) | | | | 30,000,000 | |
|
U.S. GOVERNMENT AGENCY OBLIGATIONS — 1.58% | |
Federal Home Loan Mortgage Corp. | | | | | | | | | | | | |
1.00%, 04/27/18 (Call 04/27/17) | | | | | | | 23,630 | | | | 23,620,879 | |
Federal National Mortgage Association | | | | | | | | | | | | |
5.00%, 01/01/20 | | | | | | | 8,205 | | | | 8,421,993 | |
| | | | | | | | | | | | |
TOTAL U.S. GOVERNMENT AGENCY OBLIGATIONS | |
(Cost: $32,102,915) | | | | | | | | | | | 32,042,872 | |
| | |
| 24 | | 2016 iSHARES ANNUAL REPORTTO SHAREHOLDERS |
Schedule of Investments (Continued)
iSHARES® SHORT MATURITY BOND ETF
October 31, 2016
| | | | | | | | | | | | |
Security | | | | | Principal
(000s) | | | Value | |
MONEY MARKET FUNDS — 3.08% | |
BlackRock Cash Funds: Institutional,
SL Agency Shares | | | | | |
0.72%f,g,h | | | | | | $ | 35,208 | | | $ | 35,211,258 | |
BlackRock Cash Funds: Treasury,
SL Agency Shares | | | | | |
0.29%f,g | | | | | | | 27,110 | | | | 27,109,677 | |
| | | | | | | | | | | | |
TOTAL MONEY MARKET FUNDS | | | | | |
(Cost: $62,317,548) | | | | | | | | | | | 62,320,935 | |
| | | | | | | | | | | | |
TOTAL INVESTMENTS
IN SECURITIES — 100.69% | | | | | | | | | | | | |
(Cost: $2,037,053,530)i | | | | | | | | | | $ | 2,035,845,322 | |
Other Assets, Less Liabilities — (0.69)% | | | | (13,952,616 | ) |
| | | | | | | | | | | | |
NET ASSETS —100.00% | | | | | | | | | | $ | 2,021,892,706 | |
| | | | | | | | | | | | |
FRN — Floating Rate Note
Currency abbreviations:
JPY — Japanese Yen
MXN — Mexican Peso
��
| a | This security may be resold to qualified institutional buyers under Rule 144A of the Securities Act of 1933. |
| b | Variable rate security. Rate shown is as of report date. |
| c | Rates shown are discount rates paid at the time of purchase. |
| d | All or a portion of this security represents a security on loan. See Note 1. |
| e | Maturity date represents next reset date. |
| f | Affiliated money market fund. |
| g | The rate quoted is the annualized seven-day yield of the fund at period end. |
| h | All or a portion of this security represents an investment of securities lending collateral. See Note 1. |
| i | The cost of investments for federal income tax purposes was $2,033,679,635. Net unrealized appreciation was $2,165,687, of which $7,330,879 represented gross unrealized appreciation on securities and $5,165,192 represented gross unrealized depreciation on securities. |
Schedule 1 — Forward Currency Contracts (Note 5)
Forward currency contracts outstanding as of October 31, 2016 were as follows:
| | | | | | | | | | | | | | | | | | | | | | | | |
Currency purchased | | | Currency sold | | | Counterparty | | Settlement date | | | Unrealized
appreciation
(depreciation) | |
| | USD | | | | 39,687,083 | | | | JPY | | | | 4,000,000,000 | | | MS | | | 11/14/2016 | | | $ | 1,607,692 | |
| | USD | | | | 19,638,216 | | | | JPY | | | | 1,960,000,000 | | | CSI | | | 11/21/2016 | | | | 975,072 | |
| | USD | | | | 20,578,210 | | | | JPY | | | | 2,080,000,000 | | | DB | | | 01/10/2017 | | | | 725,527 | |
| | USD | | | | 41,046,365 | | | | MXN | | | | 776,000,000 | | | GS | | | 02/16/2017 | | | | 261,342 | |
| | | | | | | | | | | | | | | | | | | | | | | | |
| | | | | | | | | | | | | | | | | | | | | | | 3,569,633 | |
| | | | | | | | | | | | | | | | | | | | | | | | |
| | | | | | | | | | | | | Net unrealized appreciation | | | $ | 3,569,633 | |
| | | | | | | | | | | | | | | | | | | | | | | | |
| | | | | | | | | | | | | | | | | | | | | | | | | |
Counterparties:
CSI — Credit Suisse International
DB — Deutsche Bank AG London
GS — Goldman Sachs International
MS — Morgan Stanley and Co. International PLC
Currency abbreviations:
JPY — Japanese Yen
MXN — Mexican Peso
USD — United States Dollar
| | | | |
SCHEDULESOF INVESTMENTS | | | 25 | |
Schedule of Investments (Continued)
iSHARES® SHORT MATURITY BOND ETF
October 31, 2016
Schedule 2 — Fair Value Measurements
Various inputs are used in determining the fair value of financial instruments. For description of the input levels and information about the Fund’s policy regarding valuation of financial instruments, see Note 1.
The following table summarizes the value of the Fund’s investments according to the fair value hierarchy as of October 31, 2016. The breakdown of the Fund’s investments into major categories is disclosed in the schedule of investments above.
| | | | | | | | | | | | | | | | |
| | | Level 1 | | | Level 2 | | | Level 3 | | | Total | |
Investments: | | | | | | | | | | | | | | | | |
Assets: | | | | | | | | | | | | | | | | |
Asset-backed securities | | $ | — | | | $ | 659,815,219 | | | $ | 35,871,580 | | | $ | 695,686,799 | |
Certificates of deposit | | | — | | | | 38,029,498 | | | | — | | | | 38,029,498 | |
Collateralized mortgage obligations | | | — | | | | 134,938,878 | | | | 3,410,000 | | | | 138,348,878 | |
Commercial paper | | | — | | | | 48,463,190 | | | | — | | | | 48,463,190 | |
Corporate bonds & notes | | | — | | | | 873,760,436 | | | | — | | | | 873,760,436 | |
Foreign government obligations | | | — | | | | 117,192,714 | | | | — | | | | 117,192,714 | |
Repurchase agreements | | | — | | | | 30,000,000 | | | | — | | | | 30,000,000 | |
U.S. government agency obligations | | | — | | | | 32,042,872 | | | | — | | | | 32,042,872 | |
Money market funds | | | 62,320,935 | | | | — | | | | — | | | | 62,320,935 | |
| | | | | | | | | | | | | | | | |
Total | | $ | 62,320,935 | | | $ | 1,934,242,807 | | | $ | 39,281,580 | | | $ | 2,035,845,322 | |
| | | | | | | | | | | | | | | | |
Derivative financial instrumentsa: | | | | | | | | | | | | | | | | |
Assets: | | | | | | | | | | | | | | | | |
Forward currency contracts | | $ | — | | | $ | 3,569,633 | | | $ | — | | | $ | 3,569,633 | |
| | | | | | | | | | | | | | | | |
Total | | $ | — | | | $ | 3,569,633 | | | $ | — | | | $ | 3,569,633 | |
| | | | | | | | | | | | | | | | |
| | | | | | | | | | | | | | | | | |
| | a | | Shown at the unrealized appreciation (depreciation) on the contracts. |
The following table includes a rollforward for the year ended October 31, 2016 of investments whose values are classified as Level 3 as of the beginning or end of the year.
| | | | | | | | |
| iShares Short Maturity Bond ETF | | Asset-Backed
Securities | | | Collateralized
Mortgage Obligations | |
Balance at beginning of period | | $ | 102,441 | | | $ | 3,771 | |
Realized gain (loss) and change in unrealized appreciation/depreciation | | | 165,545 | | | | — | |
Purchases | | | 35,705,970 | | | | 3,410,000 | |
Sales | | | (102,376 | ) | | | (3,771 | ) |
Transfers ina | | | — | | | | — | |
Transfers outa | | | — | | | | — | |
| | | | | | | | |
Balance at end of period | | $ | 35,871,580 | | | $ | 3,410,000 | |
| | | | | | | | |
Net change in unrealized appreciation/depreciation on investments still held at end of period | | $ | 119,810 | | | $ | — | |
| | | | | | | | |
| | | | | | | | | |
| | a | | Represents the value as of the beginning of the reporting period. |
The Fund’s investments that are categorized as Level 3 were valued utilizing a single broker quote without adjustment. Such valuations are based on unobservable inputs. A significant change in third party information could result in a significantly lower or higher value in such Level 3 investments.
See notes to financial statements.
| | |
| 26 | | 2016 iSHARES ANNUAL REPORTTO SHAREHOLDERS |
Schedule of Investments
iSHARES® SHORT MATURITY MUNICIPAL BOND ETF
October 31, 2016
| | | | | | | | |
Security | | Principal
(000s) | | | Value | |
MUNICIPAL DEBT OBLIGATIONS — 104.41% | |
| |
ARIZONA — 1.32% | | | | | |
Maricopa County Unified School District No. 60 Higley GOL | | | | | | | | |
3.00%, 07/01/17 (AGM) | | $ | 455 | | | $ | 461,488 | |
| | | | | | | | |
| | | | | | | 461,488 | |
ARKANSAS — 0.41% | |
City of Little Rock AR Sewer Revenue RB | | | | | | | | |
1.15%, 12/01/18 | | | 145 | | | | 145,113 | |
| | | | | | | | |
| | | | | | | 145,113 | |
COLORADO — 0.29% | |
City & County of Denver CO COP | | | | | | | | |
3.00%, 12/01/16 | | | 100 | | | | 100,187 | |
| | | | | | | | |
| | | | | | | 100,187 | |
FLORIDA — 3.47% | |
Village Community Development District No. 7 RB | | | | | | | | |
3.00%, 05/01/17 | | | 585 | | | | 590,183 | |
Volusia County Educational Facility Authority RB | | | | | | | | |
3.00%, 10/15/17 | | | 110 | | | | 112,129 | |
5.00%, 06/01/17 | | | 500 | | | | 511,985 | |
| | | | | | | | |
| | | | | | | 1,214,297 | |
GEORGIA — 4.95% | |
Burke County Development Authority RB | | | | | | | | |
2.20%, 10/01/32 | | | 1,700 | | | | 1,732,640 | |
| | | | | | | | |
| | | | | | | 1,732,640 | |
ILLINOIS — 6.78% | |
Illinois Finance Authority RB | | | | | | | | |
3.00%, 11/15/17 | | | 150 | | | | 153,137 | |
4.00%, 09/01/17 | | | 100 | | | | 102,204 | |
4.00%, 09/01/18 | | | 150 | | | | 156,595 | |
4.00%, 11/15/18 | | | 100 | | | | 105,675 | |
4.00%, 09/01/19 | | | 145 | | | | 154,128 | |
5.00%, 08/15/17 | | | 375 | | | | 385,826 | |
Series A | | | | | | | | |
5.00%, 10/01/20 | | | 100 | | | | 113,713 | |
Illinois State University RB | | | | | | | | |
2.00%, 04/01/17 (AGM) | | | 1,200 | | | | 1,204,296 | |
| | | | | | | | |
| | | | | | | 2,375,574 | |
| | | | | | | | |
Security | | Principal
(000s) | | | Value | |
INDIANA — 0.30% | |
City of Indianapolis Department of Public Utilities Water System Revenue RB
Series B | | | | | | | | |
4.00%, 10/01/18 | | $ | 100 | | | $ | 105,454 | |
| | | | | | | | |
| | | | | | | 105,454 | |
KENTUCKY — 1.18% | |
Hardin County School District Finance Corp. RB | | | | | | | | |
4.00%, 02/01/18 | | | 400 | | | | 414,304 | |
| | | | | | | | |
| | | | | | | 414,304 | |
LOUISIANA — 0.82% | |
City of Ruston LA RB | | | | | | | | |
2.00%, 06/01/18 (AGM) | | | 185 | | | | 187,488 | |
Louisiana Public Facilities Authority RB | | | | | | | | |
0.50%, 12/01/43 (Call 10/31/16) | | | 100 | | | | 100,000 | |
| | | | | | | | |
| | | | | | | 287,488 | |
MARYLAND — 4.71% | |
Maryland Community Development Administration RB | | | | | | | | |
0.63%, 11/01/38 (Call 11/01/16) | | | 1,650 | | | | 1,650,000 | |
| | | | | | | | |
| | | | | | | 1,650,000 | |
MICHIGAN — 7.85% | |
County of Genesee MI GOL
Series B | | | | | | | | |
5.00%, 02/01/19 (BAM) | | | 100 | | | | 107,852 | |
Lawton Community Schools GO | | | | | | | | |
2.00%, 05/01/17 | | | 605 | | | | 608,618 | |
Macomb Township Building Authority RB | | | | | | | | |
3.00%, 04/01/17 | | | 500 | | | | 504,500 | |
3.00%, 04/01/18 | | | 500 | | | | 514,100 | |
Michigan Strategic Fund RB | | | | | | | | |
5.00%, 03/01/17 | | | 1,000 | | | | 1,013,640 | |
| | | | | | | | |
| | | | | | | 2,748,710 | |
NEW HAMPSHIRE — 3.15% | |
County of Cheshire NH GO | | | | | | | | |
2.00%, 12/29/16 | | | 1,100 | | | | 1,102,134 | |
| | | | | | | | |
| | | | | | | 1,102,134 | |
NEW JERSEY — 29.00% | |
City of Cape May NJ GO | | | | | | | | |
2.00%, 07/14/17 | | | 1,100 | | | | 1,107,524 | |
| | | | |
SCHEDULESOF INVESTMENTS | | | 27 | |
Schedule of Investments (Continued)
iSHARES® SHORT MATURITY MUNICIPAL BOND ETF
October 31, 2016
| | | | | | | | |
Security | | Principal
(000s) | | | Value | |
City of Newark NJ RB | | | | | | | | |
5.00%, 09/01/17 | | $ | 2,000 | | | $ | 2,054,840 | |
Hudson County Improvement Authority RB
Series B-1 | | | | | | | | |
2.00%, 06/27/17 (GTD) | | | 500 | | | | 503,500 | |
New Jersey Economic Development Authority RB | | | | | | | | |
Series A | | | | | | | | |
3.00%, 07/15/17 | | | 150 | | | | 151,682 | |
5.00%, 05/01/17 | | | 1,240 | | | | 1,262,729 | |
Series EE | | | | | | | | |
5.00%, 09/01/17 (ETM) | | | 610 | | | | 631,435 | |
New Jersey Educational Facilities Authority RB
Series F | | | | | | | | |
4.00%, 07/01/20 | | | 255 | | | | 279,666 | |
New Jersey Health Care Facilities Financing Authority RB | | | | | | | | |
5.00%, 07/01/19 | | | 160 | | | | 176,130 | |
New Jersey Transportation Trust Fund Authority RB | | | | | | | | |
5.00%, 12/15/17 | | | 2,350 | | | | 2,446,256 | |
Series A | | | | | | | | |
5.00%, 06/15/19 | | | 495 | | | | 532,966 | |
Township of Wayne NJ GO | | | | | | | | |
2.00%, 07/14/17 | | | 1,000 | | | | 1,007,760 | |
| | | | | | | | |
| | | | | | | 10,154,488 | |
NEW YORK — 10.28% | |
Corning City School District | | | | | | | | |
2.00%, 06/22/17 (SAW) | | | 1,000 | | | | 1,005,620 | |
County of Broome NY GOL | | | | | | | | |
2.00%, 05/05/17 | | | 1,000 | | | | 1,005,510 | |
Elmira City School District GO | | | | | | | | |
5.00%, 06/15/17 | | | 300 | | | | 307,941 | |
New York State Dormitory Authority RB Series K | | | | | | | | |
4.00%, 10/01/18 | | | 225 | | | | 236,909 | |
Troy Capital Resource Corp. RB | | | | | | | | |
5.00%, 09/01/18 | | | 975 | | | | 1,042,090 | |
| | | | | | | | |
| | | | | | | 3,598,070 | |
NORTH CAROLINA — 0.70% | |
Charlotte-Mecklenburg Hospital Authority (The) RB | | | | | | | | |
5.00%, 01/15/19 | | | 225 | | | | 243,749 | |
| | | | | | | | |
| | | | | | | 243,749 | |
| | | | | | | | |
Security | | Principal
(000s) | | | Value | |
OHIO — 4.91% | |
City of Avon OH Water System Revenue RB
Series 2 | | | | | | | | |
0.85%, 02/02/17 | | $ | 1,000 | | | $ | 999,980 | |
Urbana City School District GO | | | | | | | | |
5.00%, 12/01/17 | | | 690 | | | | 719,580 | |
| | | | | | | | |
| | | | | | | 1,719,560 | |
OKLAHOMA — 4.60% | |
Cleveland County Justice Authority RB | | | | | | | | |
3.00%, 03/01/17 | | | 1,205 | | | | 1,213,110 | |
Norman Regional Hospital Authority RB | | | | | | | | |
4.00%, 09/01/18 | | | 380 | | | | 397,434 | |
| | | | | | | | |
| | | | | | | 1,610,544 | |
PENNSYLVANIA — 5.20% | |
Pennsylvania Economic Development Financing Authority RB | | | | | | | | |
4.00%, 03/15/19 | | | 1,000 | | | | 1,067,220 | |
Pottsgrove School District GOL | | | | | | | | |
3.00%, 08/15/17 | | | 740 | | | | 752,906 | |
| | | | | | | | |
| | | | | | | 1,820,126 | |
RHODE ISLAND — 5.06% | |
Providence Redevelopment Agency RB Series A | | | | | | | | |
3.00%, 04/01/17 | | | 1,210 | | | | 1,218,942 | |
Town of Coventry RI GO | | | | | | | | |
4.00%, 03/15/17 | | | 545 | | | | 551,393 | |
| | | | | | | | |
| | | | | | | 1,770,335 | |
TENNESSEE — 0.75% | |
Knox County Health Educational & Housing Facility Board RB | | | | | | | | |
4.00%, 09/01/18 | | | 250 | | | | 261,938 | |
| | | | | | | | |
| | | | | | | 261,938 | |
TEXAS — 4.05% | |
Harris County Hospital District RB | | | | | | | | |
5.00%, 02/15/20 | | | 300 | | | | 334,617 | |
Texas Public Finance Authority RB | | | | | | | | |
4.00%, 12/01/19 | | | 1,000 | | | | 1,082,810 | |
| | | | | | | | |
| | | | | | | 1,417,427 | |
UTAH — 0.74% | |
West Valley City Municipal Building Authority RB | | | | | | | | |
2.00%, 02/01/17 (AGM) | | | 260 | | | | 260,645 | |
| | | | | | | | |
| | | | | | | 260,645 | |
| | |
| 28 | | 2016 iSHARES ANNUAL REPORTTO SHAREHOLDERS |
Schedule of Investments (Continued)
iSHARES® SHORT MATURITY MUNICIPAL BOND ETF
October 31, 2016
| | | | | | | | |
Security | | Principal or Shares
(000s) | | | Value | |
WASHINGTON — 2.92% | |
Tobacco Settlement Authority RB | | | | | | | | |
5.00%, 06/01/17 | | $ | 1,000 | | | $ | 1,023,670 | |
| | | | | | | | |
| | | | | | | 1,023,670 | |
WEST VIRGINIA — 0.97% | |
Berkeley County Public Service District RB | | | | | | | | |
2.00%, 12/01/17 | | | 335 | | | | 338,484 | |
| | | | | | | | |
| | | | | | | 338,484 | |
| | | | | | | | |
TOTAL MUNICIPAL DEBT OBLIGATIONS | | | | | |
(Cost: $36,576,728) | | | | | | | 36,556,425 | |
|
MONEY MARKET FUNDS — 0.28% | |
BlackRock Liquidity Funds: MuniCash | | | | | |
0.46%a,b | | | 97,740 | | | | 97,750 | |
| | | | | | | | |
TOTAL MONEY MARKET FUNDS | |
(Cost: $97,747) | | | | | | | 97,750 | |
| | | | | | | | |
| | | | | | |
| | | | Value | |
TOTAL INVESTMENTS
IN SECURITIES — 104.69% | |
(Cost: $36,674,475)c | | | | $ | 36,654,175 | |
Other Assets, Less Liabilities — (4.69)% | | | (1,641,847 | ) |
| | | | | | |
NET ASSETS — 100.00% | | | | $ | 35,012,328 | |
| | | | | | |
COP — Certificates of Participation
ETM — Escrowed to Maturity
GTD — Guaranteed by the Commonwealth, County or State
GO — General Obligation
GOL — General Obligation Limited
RB — Revenue Bond
SAW — State Aid Withholding
Insured by:
AGM — Assured Guaranty Municipal Corp.
BAM — Build America Mutual Assurance Co.
| a | Affiliated money market fund. |
| b | The rate quoted is the annualized seven-day yield of the fund at period end. |
| c | The cost of investments for federal income tax purposes was $36,674,475. Net unrealized depreciation was $20,300, of which $18,165 represented gross unrealized appreciation on securities and $38,465 represented gross unrealized depreciation on securities. |
Schedule 1 — Fair Value Measurements
Various inputs are used in determining the fair value of financial instruments. For description of the input levels and information about the Fund’s policy regarding valuation of financial instruments, see Note 1.
The following table summarizes the value of the Fund’s investments according to the fair value hierarchy as of October 31, 2016. The breakdown of the Fund’s investments into major categories is disclosed in the schedule of investments above.
| | | | | | | | | | | | | | | | |
| | | Level 1 | | | Level 2 | | | Level 3 | | | Total | |
Investments: | | | | | | | | | | | | | | | | |
Assets: | | | | | | | | | | | | | | | | |
Municipal debt obligations | | $ | — | | | $ | 36,556,425 | | | $ | — | | | $ | 36,556,425 | |
Money market funds | | | 97,750 | | | | — | | | | — | | | | 97,750 | |
| | | | | | | | | | | | | | | | |
Total | | $ | 97,750 | | | $ | 36,556,425 | | | $ | — | | | $ | 36,654,175 | |
| | | | | | | | | | | | | | | | |
| | | | | | | | | | | | | | | | | |
See notes to financial statements.
| | | | |
SCHEDULESOF INVESTMENTS | | | 29 | |
Schedule of Investments
iSHARES® ULTRA SHORT-TERM BOND ETF
October 31, 2016
| | | | | | | | |
Security | | Principal
(000s) | | | Value | |
ASSET-BACKED SECURITIES — 0.48% | |
Honda Auto Receivables Owner Trust
Series 2016-2, Class A2 | | | | | | | | |
1.13%, 09/17/18 (Call 06/15/19) | | $ | 120 | | | $ | 120,070 | |
| | | | | | | | |
TOTAL ASSET-BACKED SECURITIES | | | | | |
(Cost: $119,997) | | | | 120,070 | |
|
CERTIFICATES OF DEPOSIT — 19.20% | |
Cooperatieve Rabobank UA/NV | | | | | | | | |
1.31%, 09/08/17 | | | 500 | | | | 500,882 | |
Credit Suisse AG/New York NY | | | | | | | | |
1.22%, 04/24/17 | | | 500 | | | | 500,467 | |
Dexia Credit Local SA/New York NY | | | | | | | | |
1.07%, 05/24/17 | | | 350 | | | | 349,980 | |
Mizuho Bank Ltd./NY | | | | | | | | |
0.52%, 04/24/17 | | | 600 | | | | 600,147 | |
Natixis SA | | | | | | | | |
1.56%, 09/18/17 | | | 250 | | | | 250,507 | |
Norinchukin Bank (The) | | | | | | | | |
1.55%, 09/22/17 | | | 250 | | | | 250,131 | |
Royal Bank of Canada | | | | | | | | |
1.21%, 03/10/17 | | | 350 | | | | 350,478 | |
Svenska Handelsbanken AB | | | | | | | | |
1.28%, 04/21/17 | | | 250 | | | | 250,413 | |
UBS AG/Stamford CT | | | | | | | | |
0.83%, 05/25/17 | | | 250 | | | | 250,378 | |
1.53%, 09/01/17 | | | 250 | | | | 250,128 | |
1.57%, 09/08/17 | | | 250 | | | | 250,194 | |
Wells Fargo Bank N.A. | | | | | | | | |
1.12%, 02/15/17 | | | 500 | | | | 500,263 | |
1.28%, 04/13/17 | | | 250 | | | | 250,287 | |
1.34%, 09/22/17 | | | 250 | | | | 250,388 | |
| | | | | | | | |
TOTAL CERTIFICATES OF DEPOSIT | | | | | |
(Cost: $4,799,897) | | | | 4,804,643 | |
|
COMMERCIAL PAPERa — 36.98% | |
Atlantic Asset Securitization LLC | | | | | | | | |
1.25%, 03/01/17 | | | 350 | | | | 348,761 | |
1.26%, 03/06/17 | | | 250 | | | | 249,067 | |
AXA Financial Inc. | | | | | | | | |
1.71%, 10/10/17 | | | 250 | | | | 246,493 | |
Bank of Nova Scotia (The) | | | | | | | | |
1.26%, 02/21/17 | | | 575 | | | | 573,296 | |
| | | | | | | | |
Security | | Principal
(000s) | | | Value | |
Barton Capital SA | | | | | | | | |
1.00%, 12/13/16 | | $ | 750 | | | $ | 749,438 | |
CAFCO LLC | | | | | | | | |
1.27%, 03/02/17 | | | 500 | | | | 498,212 | |
CHEVRON Corp. | | | | | | | | |
1.06%, 04/03/17 | | | 250 | | | | 249,327 | |
Ciesco LLC | | | | | | | | |
0.90%, 12/13/16 | | | 350 | | | | 349,720 | |
Coca-Cola Co. (The) | | | | | | | | |
0.98%, 03/01/17 | | | 250 | | | | 249,426 | |
0.98%, 06/27/17 | | | 400 | | | | 397,321 | |
Commonwealth Bank of Australia | | | | | | | | |
1.29%, 09/01/17 | | | 500 | | | | 500,578 | |
ING U.S. Funding LLC | | | | | | | | |
1.08%, 02/06/17 | | | 500 | | | | 498,934 | |
1.16%, 02/22/17 | | | 500 | | | | 498,626 | |
1.25%, 06/23/17 | | | 250 | | | | 250,222 | |
Manhattan Asset Funding Co., LLC | | | | | | | | |
0.90%, 11/29/16 | | | 500 | | | | 499,760 | |
Matchpoint Finance PLC | | | | | | | | |
1.33%, 03/06/17 | | | 250 | | | | 249,075 | |
Mitsubishi UFJ Financial Group Inc. | | | | | | | | |
1.44%, 06/06/17 | | | 500 | | | | 496,346 | |
Natixis SA | | | | | | | | |
1.23%, 03/01/17 | | | 350 | | | | 348,913 | |
Suncorp Group Ltd. | | | | | | | | |
1.26%, 02/16/17 | | | 500 | | | | 498,530 | |
Svenska Handelsbanken AB | | | | | | | | |
0.95%, 01/06/17 | | | 500 | | | | 499,378 | |
Victory Receivables Corp. | | | | | | | | |
0.98%, 12/08/16 | | | 500 | | | | 499,661 | |
1.00%, 12/22/16 | | | 500 | | | | 499,485 | |
| | | | | | | | |
TOTAL COMMERCIAL PAPER | | | | | |
(Cost: $9,243,982) | | | | 9,250,569 | |
|
CORPORATE BONDS & NOTES — 38.25% | |
| | |
AEROSPACE & DEFENSE — 2.00% | | | | | | | | |
United Technologies Corp. | | | | | | | | |
FRN, (3 mo. LIBOR US + 0.350%) | | | | | | | | |
1.00%, 11/01/19 | | | 500 | | | | 500,303 | |
| | | | | | | | |
| | | | | | | 500,303 | |
| | |
| 30 | | 2016 iSHARES ANNUAL REPORTTO SHAREHOLDERS |
Schedule of Investments (Continued)
iSHARES® ULTRA SHORT-TERM BOND ETF
October 31, 2016
| | | | | | | | |
Security | | Principal
(000s) | | | Value | |
AUTO MANUFACTURERS — 4.22% | | | | | | | | |
Daimler Finance North America LLC
FRN, (3 mo. LIBOR US + 0.620%) | | | | | | | | |
1.00%, 10/30/19b | | $ | 250 | | | $ | 250,313 | |
Nissan Motor Acceptance Corp. | | | | | | | | |
FRN, (3 mo. LIBOR US + 0.800%) | | | | | | | | |
1.66%, 04/06/18b | | | 300 | | | | 301,366 | |
FRN, (3 mo. LIBOR US + 1.010%) | | | | | | | | |
1.85%, 03/08/19b | | | 250 | | | | 252,622 | |
Toyota Motor Credit Corp.
FRN, (3 mo. LIBOR US + 0.380%) | | | | | | | | |
1.24%, 04/06/18 | | | 250 | | | | 250,431 | |
| | | | | | | | |
| | | | | | | 1,054,732 | |
BANKS — 22.55% | | | | | | | | |
Australia & New Zealand Banking Group Ltd.
FRN, (3 mo. LIBOR US + 0.440%) | | | | | | | | |
1.32%, 01/16/18b | | | 400 | | | | 400,238 | |
Bank of America N.A.
FRN, (3 mo. LIBOR US + 0.470%) | | | | | | | | |
1.29%, 11/14/16 | | | 500 | | | | 499,971 | |
BNP Paribas SA | | | | | | | | |
1.25%, 12/12/16 | | | 250 | | | | 250,157 | |
2.38%, 09/14/17 | | | 250 | | | | 252,197 | |
BPCE SA
FRN, (3 mo. LIBOR US + 0.850%) | | | | | | | | |
1.66%, 02/10/17 | | | 400 | | | | 400,686 | |
Citigroup Inc.
FRN, (3 mo. LIBOR US + 0.860%) | | | | | | | | |
1.69%, 12/07/18 | | | 400 | | | | 401,598 | |
Commonwealth Bank of Australia
FRN, (3 mo. LIBOR US + 0.400%) | | | | | | | | |
1.25%, 03/12/18b | | | 300 | | | | 299,756 | |
Cooperatieve Rabobank UA | | | | | | | | |
3.38%, 01/19/17 | | | 350 | | | | 351,785 | |
JPMorgan Chase & Co. | | | | | | | | |
1.35%, 02/15/17 | | | 300 | | | | 300,228 | |
FRN, (3 mo. LIBOR US + 0.550%) | | | | | | | | |
1.43%, 04/25/18 | | | 400 | | | | 399,961 | |
JPMorgan Chase Bank N.A.
FRN, (3 mo. LIBOR US + 0.450%) | | | | | | | | |
1.31%, 09/21/18 (Call 08/21/18) | | | 250 | | | | 250,162 | |
| | | | | | | | |
Security | | Principal
(000s) | | | Value | |
Lloyds Bank PLC | | | | | | | | |
4.20%, 03/28/17 | | $ | 150 | | | $ | 151,824 | |
Macquarie Bank Ltd. | | | | | | | | |
5.00%, 02/22/17b | | | 325 | | | | 328,586 | |
Mizuho Bank Ltd. | | | | | | | | |
1.50%, 05/17/17 | | | 600 | | | | 601,278 | |
Nordea Bank AB | | | | | | | | |
1.25%, 04/04/17b | | | 250 | | | | 250,271 | |
Sumitomo Mitsui Banking Corp. | | | | | | | | |
1.30%, 01/10/17 | | | 250 | | | | 250,143 | |
Westpac Banking Corp.
FRN, (3 mo. LIBOR US + 0.710%) | | | | | | | | |
1.53%, 05/13/19 | | | 250 | | | | 251,145 | |
| | | | | | | | |
| | | | | | | 5,639,986 | |
COMPUTERS — 2.00% | | | | | |
Apple Inc.
FRN, (3 mo. LIBOR US + 0.250%) | | | | | | | | |
1.01%, 05/03/18 | | | 500 | | | | 501,142 | |
| | | | | | | | |
| | | | | | | 501,142 | |
INSURANCE — 0.86% | | | | | |
Berkshire Hathaway Finance Corp. | | | | | | | | |
FRN, (3 mo. LIBOR US + 0.550%) | | | | | | | | |
1.38%, 03/07/18 | | | 100 | | | | 100,394 | |
1.45%, 03/07/18 | | | 115 | | | | 115,572 | |
| | | | | | | | |
| | | | | | | 215,966 | |
MACHINERY — 2.81% | | | | | |
Caterpillar Financial Services Corp.
FRN, (3 mo. LIBOR US + 0.700%) | | | | | | | | |
1.52%, 02/23/18 | | | 300 | | | | 302,110 | |
John Deere Capital Corp.
FRN, (3 mo. LIBOR US + 0.450%) | | | | | | | | |
1.33%, 07/11/17 | | | 400 | | | | 400,978 | |
| | | | | | | | |
| | | | | | | 703,088 | |
OIL & GAS — 1.81% | | | | | |
BP Capital Markets PLC
FRN, (3 mo. LIBOR US + 0.350%) | | | | | | | | |
1.16%, 02/10/17 | | | 100 | | | | 100,006 | |
Exxon Mobil Corp.
FRN, (3 mo. LIBOR US + 0.600%) | | | | | | | | |
1.43%, 02/28/18 | | | 350 | | | | 352,429 | |
| | | | | | | | |
| | | | | | | 452,435 | |
| | | | |
SCHEDULESOF INVESTMENTS | | | 31 | |
Schedule of Investments (Continued)
iSHARES® ULTRA SHORT-TERM BOND ETF
October 31, 2016
| | | | | | | | |
Security | | Principal
(000s) | | | Value | |
PHARMACEUTICALS — 1.60% | | | | | |
Bayer U.S. Finance LLC
FRN, (3 mo. LIBOR US + 0.280%) | | | | | | | | |
1.14%, 10/06/17b | | $ | 400 | | | $ | 399,867 | |
| | | | | | | | |
| | | | | | | 399,867 | |
RETAIL — 0.40% | | | | | |
Lowe’s Companies Inc.
FRN, (3 mo. LIBOR US + 0.600%) | | | | | | | | |
1.46%, 09/14/18 | | | 100 | | | | 100,875 | |
| | | | | | | | |
| | | | | | | 100,875 | |
| | | | | | | | |
TOTAL CORPORATE BONDS & NOTES | | | | | |
(Cost: $9,541,910) | | | | 9,568,394 | |
|
U.S. GOVERNMENT & AGENCY OBLIGATIONS — 4.93% | |
|
U.S. GOVERNMENT AGENCY OBLIGATIONS — 1.00% | |
Federal Home Loan Mortgage Corp. | | | | | | | | |
1.05%, 07/27/18 (Call 01/27/17) | | | 250 | | | | 250,045 | |
| | | | | | | | |
| | | | | | | 250,045 | |
U.S. GOVERNMENT OBLIGATIONS — 3.93% | | | | | |
U.S. Treasury Note/Bond | | | | | | | | |
0.63%, 06/30/17 | | | 135 | | | | 135,016 | |
0.88%, 06/15/19 | | | 850 | | | | 848,074 | |
| | | | | | | | |
| | | | | | | 983,090 | |
| | | | | | | | |
TOTAL U.S. GOVERNMENT & AGENCY OBLIGATIONS | |
(Cost: $1,233,958) | | | | 1,233,135 | |
| | | | | | | | |
| | | | | | | | |
| | | | | | Value | |
TOTAL INVESTMENTS
IN SECURITIES — 99.84% | | | | | |
(Cost: $24,939,744)c | | | $ | 24,976,811 | |
Other Assets, Less Liabilities — 0.16% | | | | 41,232 | |
| | | | | | | | |
NET ASSETS — 100.00% | | | | | | $ | 25,018,043 | |
| | | | | | | | |
FRN — Floating Rate Note
| a | Rates shown are discount rates paid at the time of purchase. |
| b | This security may be resold to qualified institutional buyers under Rule 144A of the Securities Act of 1933. |
| c | The cost of investments for federal income tax purposes was $24,939,744. Net unrealized appreciation was $37,067, of which $38,595 represented gross unrealized appreciation on securities and $1,528 represented gross unrealized depreciation on securities. |
Schedule 1 — Fair Value Measurements
Various inputs are used in determining the fair value of financial instruments. For description of the input levels and information about the Fund’s policy regarding valuation of financial instruments, see Note 1.
The following table summarizes the value of the Fund’s investments according to the fair value hierarchy as of October 31, 2016. The breakdown of the Fund’s investments into major categories is disclosed in the schedule of investments above.
| | | | | | | | | | | | | | | | |
| | | Level 1 | | | Level 2 | | | Level 3 | | | Total | |
Investments: | | | | | | | | | | | | | | | | |
Assets: | | | | | | | | | | | | | | | | |
Asset-backed securities | | $ | — | | | $ | 120,070 | | | $ | — | | | $ | 120,070 | |
Certificates of deposit | | | — | | | | 4,804,643 | | | | — | | | | 4,804,643 | |
Commercial paper | | | — | | | | 9,250,569 | | | | — | | | | 9,250,569 | |
Corporate bonds & notes | | | — | | | | 9,568,394 | | | | — | | | | 9,568,394 | |
U.S. government & agency obligations | | | — | | | | 1,233,135 | | | | — | | | | 1,233,135 | |
| | | | | | | | | | | | | | | | |
Total | | $ | — | | | $ | 24,976,811 | | | $ | — | | | $ | 24,976,811 | |
| | | | | | | | | | | | | | | | |
| | | | | | | | | | | | | | | | | |
| | |
| 32 | | 2016 iSHARES ANNUAL REPORTTO SHAREHOLDERS |
Schedule of Investments (Continued)
iSHARES® ULTRA SHORT-TERM BOND ETF
October 31, 2016
The following table includes a rollforward for the year ended October 31, 2016 of investments whose values are classified as Level 3 as of the beginning or end of the year.
| | | | |
| iShares Ultra Short-Term Bond ETF | | Corporate Bonds
& Notes | |
Balance at beginning of period | | $ | 250,000 | |
Realized gain (loss) and change in unrealized appreciation/depreciation | | | — | |
Purchases | | | — | |
Sales | | | (250,000 | ) |
Transfers ina | | | — | |
Transfers outa | | | — | |
| | | | |
Balance at end of period | | $ | — | |
| | | | |
Net change in unrealized appreciation/depreciation on investments still held at end of period | | $ | — | |
| | | | |
| | | | | |
| | a | | Represents the value as of the beginning of the reporting period. |
See notes to financial statements.
| | | | |
SCHEDULESOF INVESTMENTS | | | 33 | |
Statements of Assets and Liabilities
iSHARES® U.S. ETF TRUST
October 31, 2016
| | | | | | | | | | | | |
| | | iShares
Short Maturity
Bond ETF | | | iShares
Short Maturity
Municipal
Bond ETF | | | iShares
Ultra
Short-Term
Bond ETF | |
| | | |
ASSETS | | | | | | | | | | | | |
Investments, at cost: | | | | | | | | | | | | |
Unaffiliated | | $ | 1,944,735,982 | | | $ | 36,576,728 | | | $ | 24,939,744 | |
Repurchase agreements — unaffiliated | | | 30,000,000 | | | | — | | | | — | |
Affiliated (Note 2) | | | 62,317,548 | | | | 97,747 | | | | — | |
| | | | | | | | | | | | |
Total cost of investments | | $ | 2,037,053,530 | | | $ | 36,674,475 | | | $ | 24,939,744 | |
| | | | | | | | | | | | |
Investments in securities, at fair value (including securities on loana) (Note 1): | | | | | | | | | |
Unaffiliated | | $ | 1,943,524,387 | | | $ | 36,556,425 | | | $ | 24,976,811 | |
Repurchase agreements — unaffiliated | | | 30,000,000 | | | | — | | | | — | |
Affiliated (Note 2) | | | 62,320,935 | | | | 97,750 | | | | — | |
| | | | | | | | | | | | |
Total fair value of investments | | | 2,035,845,322 | | | | 36,654,175 | | | | 24,976,811 | |
Foreign currency, at valueb | | | 25,142 | | | | — | | | | — | |
Cash | | | 8,536,578 | | | | — | | | | 505,578 | |
Receivables: | | | | | | | | | | | | |
Investment securities sold | | | 13,854,188 | | | | — | | | | — | |
Interest | | | 6,167,883 | | | | 286,029 | | | | 39,465 | |
Unrealized appreciation on forward currency contracts (Note 6) | | | 3,569,633 | | | | — | | | | — | |
| | | | | | | | | | | | |
Total Assets | | | 2,067,998,746 | | | | 36,940,204 | | | | 25,521,854 | |
| | | | | | | | | | | | |
| | | |
LIABILITIES | | | | | | | | | | | | |
Payables: | | | | | | | | | | | | |
Investment securities purchased | | | 10,465,073 | | | | 1,920,688 | | | | 500,000 | |
Collateral for securities on loan (Note 1) | | | 35,207,545 | | | | — | | | | — | |
Investment advisory fees (Note 2) | | | 433,422 | | | | 7,188 | | | | 3,811 | |
| | | | | | | | | | | | |
Total Liabilities | | | 46,106,040 | | | | 1,927,876 | | | | 503,811 | |
| | | | | | | | | | | | |
| | | |
NET ASSETS | | $ | 2,021,892,706 | | | $ | 35,012,328 | | | $ | 25,018,043 | |
| | | | | | | | | | | | |
| | | |
Net assets consist of: | | | | | | | | | | | | |
Paid-in capital | | $ | 2,019,137,213 | | | $ | 35,018,885 | | | $ | 24,964,099 | |
Undistributed net investment income | | | 1,190,183 | | | | 23,331 | | | | 30,202 | |
Accumulated net realized loss | | | (796,079 | ) | | | (9,588 | ) | | | (13,325 | ) |
Net unrealized appreciation (depreciation) | | | 2,361,389 | | | | (20,300 | ) | | | 37,067 | |
| | | | | | | | | | | | |
NET ASSETS | | $ | 2,021,892,706 | | | $ | 35,012,328 | | | $ | 25,018,043 | |
| | | | | | | | | | | | |
| | | |
Shares outstandingc | | | 40,300,000 | | | | 700,000 | | | | 500,000 | |
| | | | | | | | | | | | |
| | | |
Net asset value per share | | $ | 50.17 | | | $ | 50.02 | | | $ | 50.04 | |
| | | | | | | | | | | | |
| a | Securities on loan with values of $34,356,427, $ — and $ —, respectively. See Note 1. |
| b | Cost of foreign currency: $25,178, $ — and $ —, respectively. |
| c | No par value, unlimited number of shares authorized. |
See notes to financial statements.
| | |
| 34 | | 2016 iSHARES ANNUAL REPORTTO SHAREHOLDERS |
Statements of Operations
iSHARES® U.S. ETF TRUST
Year ended October 31, 2016
| | | | | | | | | | | | |
| | | iShares
Short Maturity
Bond ETF | | | iShares
Short Maturity
Municipal
Bond ETF | | | iShares
Ultra
Short-Term
Bond ETF | |
| | | |
NET INVESTMENT INCOME | | | | | | | | | | | | |
Dividends — affiliated (Note 2) | | $ | 425,841 | | | $ | 116 | | | $ | 1,057 | |
Interest — unaffiliated | | | 26,183,837 | | | | 322,748 | | | | 150,761 | |
Securities lending income — affiliated — net (Note 2) | | | 96,621 | | | | — | | | | — | |
| | | | | | | | | | | | |
Total investment income | | | 26,706,299 | | | | 322,864 | | | | 151,818 | |
| | | | | | | | | | | | |
| | | |
EXPENSES | | | | | | | | | | | | |
Investment advisory fees (Note 2) | | | 5,319,552 | | | | 77,985 | | | | 24,539 | |
| | | | | | | | | | | | |
Total expenses | | | 5,319,552 | | | | 77,985 | | | | 24,539 | |
Less investment advisory fees waived (Note 2) | | | — | | | | (80 | ) | | | — | |
| | | | | | | | | | | | |
Net expenses | | | 5,319,552 | | | | 77,905 | | | | 24,539 | |
| | | | | | | | | | | | |
Net investment income | | | 21,386,747 | | | | 244,959 | | | | 127,279 | |
| | | | | | | | | | | | |
| | | |
NET REALIZED AND UNREALIZED GAIN (LOSS) | | | | | | | | | | | | |
Net realized gain (loss) from: | | | | | | | | | | | | |
Investments — unaffiliated | | | 9,921,339 | | | | (486 | ) | | | (13,325 | ) |
Investments — affiliated (Note 2) | | | 326 | | | | — | | | | — | |
Foreign currency transactions | | | (10,358,567 | ) | | | — | | | | — | |
| | | | | | | | | | | | |
Net realized loss | | | (436,902 | ) | | | (486 | ) | | | (13,325 | ) |
| | | | | | | | | | | | |
Net change in unrealized appreciation/depreciation on: | | | | | | | | | | | | |
Investments | | | 2,466,412 | | | | (49,031 | ) | | | 43,430 | |
Forward currency contracts | | | 3,515,316 | | | | — | | | | — | |
Translation of assets and liabilities in foreign currencies | | | (146 | ) | | | — | | | | — | |
| | | | | | | | | | | | |
Net change in unrealized appreciation/depreciation | | | 5,981,582 | | | | (49,031 | ) | | | 43,430 | |
| | | | | | | | | | | | |
Net realized and unrealized gain (loss) | | | 5,544,680 | | | | (49,517 | ) | | | 30,105 | |
| | | | | | | | | | | | |
NET INCREASE IN NET ASSETS RESULTING FROM OPERATIONS | | $ | 26,931,427 | | | $ | 195,442 | | | $ | 157,384 | |
| | | | | | | | | | | | |
See notes to financial statements.
Statements of Changes in Net Assets
iSHARES® U.S. ETF TRUST
| | | | | | | | | | | | | | | | |
| | | iShares
Short Maturity
Bond ETF | | | iShares
Short Maturity
Municipal
Bond ETF | |
| | | Year ended
October 31, 2016 | | | Year ended October 31, 2015 | | | Year ended October 31, 2016 | | | Period from
March 3, 2015a to October 31, 2015 | |
| | | | |
INCREASE (DECREASE) IN NET ASSETS | | | | | | | | | | | | | | | | |
| | | | |
OPERATIONS: | | | | | | | | | | | | | | | | |
Net investment income | | $ | 21,386,747 | | | $ | 7,948,845 | | | $ | 244,959 | | | $ | 150,269 | |
Net realized loss | | | (436,902 | ) | | | (182,842 | ) | | | (486 | ) | | | (9,083 | ) |
Net change in unrealized appreciation/depreciation | | | 5,981,582 | | | | (3,217,775 | ) | | | (49,031 | ) | | | 28,731 | |
| | | | | | | | | | | | | | | | |
Net increase in net assets resulting from operations | | | 26,931,427 | | | | 4,548,228 | | | | 195,442 | | | | 169,917 | |
| | | | | | | | | | | | | | | | |
| | | | |
DISTRIBUTIONS TO SHAREHOLDERS: | | | | | | | | | | | | | | | | |
From net investment income | | | (21,492,109 | ) | | | (7,132,332 | ) | | | (245,082 | ) | | | (126,834 | ) |
| | | | | | | | | | | | | | | | |
Total distributions to shareholders | | | (21,492,109 | ) | | | (7,132,332 | ) | | | (245,082 | ) | | | (126,834 | ) |
| | | | | | | | | | | | | | | | |
| | | | |
CAPITAL SHARE TRANSACTIONS: | | | | | | | | | | | | | | | | |
Proceeds from shares sold | | | 1,159,167,574 | | | | 1,445,296,850 | | | | 5,007,945 | | | | 45,000,000 | |
Cost of shares redeemed | | | (924,020,501 | ) | | | (80,138,822 | ) | | | (4,994,826 | ) | | | (9,994,234 | ) |
| | | | | | | | | | | | | | | | |
Net increase in net assets from capital share transactions | | | 235,147,073 | | | | 1,365,158,028 | | | | 13,119 | | | | 35,005,766 | |
| | | | | | | | | | | | | | | | |
INCREASE (DECREASE) IN NET ASSETS | | | 240,586,391 | | | | 1,362,573,924 | | | | (36,521 | ) | | | 35,048,849 | |
| | | | |
NET ASSETS | | | | | | | | | | | | | | | | |
Beginning of year | | | 1,781,306,315 | | | | 418,732,391 | | | | 35,048,849 | | | | — | |
| | | | | | | | | | | | | | | | |
End of year | | $ | 2,021,892,706 | | | $ | 1,781,306,315 | | | $ | 35,012,328 | | | $ | 35,048,849 | |
| | | | | | | | | | | | | | | | |
Undistributed net investment income included in net assets at end of year | | $ | 1,190,183 | | | $ | 1,113,916 | | | $ | 23,331 | | | $ | 23,435 | |
| | | | | | | | | | | | | | | | |
| | | | |
SHARES ISSUED AND REDEEMED | | | | | | | | | | | | | | | | |
Shares sold | | | 23,150,000 | | | | 28,850,000 | | | | 100,000 | | | | 900,000 | |
Shares redeemed | | | (18,450,000 | ) | | | (1,600,000 | ) | | | (100,000 | ) | | | (200,000 | ) |
| | | | | | | | | | | | | | | | |
Net increase in shares outstanding | | | 4,700,000 | | | | 27,250,000 | | | | — | | | | 700,000 | |
| | | | | | | | | | | | | | | | |
| a | Commencement of operations. |
See notes to financial statements.
| | |
| 36 | | 2016 iSHARES ANNUAL REPORTTO SHAREHOLDERS |
Statements of Changes in Net Assets (Continued)
iSHARES® U.S. ETF TRUST
| | | | | | | | |
| | | iShares
Ultra
Short-Term
Bond ETF | |
| | | Year ended
October 31, 2016 | | | Year ended October 31, 2015 | |
| | |
INCREASE (DECREASE) IN NET ASSETS | | | | | | | | |
| | |
OPERATIONS: | | | | | | | | |
Net investment income | | $ | 127,279 | | | $ | 60,917 | |
Net realized gain (loss) | | | (13,325 | ) | | | 5,153 | |
Net change in unrealized appreciation/depreciation | | | 43,430 | | | | (25,041 | ) |
| | | | | | | | |
Net increase in net assets resulting from operations | | | 157,384 | | | | 41,029 | |
| | | | | | | | |
| | |
DISTRIBUTIONS TO SHAREHOLDERS: | | | | | | | | |
From net investment income | | | (103,710 | ) | | | (62,833 | ) |
From net realized gain | | | — | | | | (9,825 | ) |
| | | | | | | | |
Total distributions to shareholders | | | (103,710 | ) | | | (72,658 | ) |
| | | | | | | | |
| | |
CAPITAL SHARE TRANSACTIONS: | | | | | | | | |
Proceeds from shares sold | | | 22,457,685 | | | | — | |
Cost of shares redeemed | | | (9,986,485 | ) | | | (2,499,161 | ) |
| | | | | | | | |
Net increase (decrease) in net assets from capital share transactions | | | 12,471,200 | | | | (2,499,161 | ) |
| | | | | | | | |
INCREASE (DECREASE) IN NET ASSETS | | | 12,524,874 | | | | (2,530,790 | ) |
| | |
NET ASSETS | | | | | | | | |
Beginning of year | | | 12,493,169 | | | | 15,023,959 | |
| | | | | | | | |
End of year | | $ | 25,018,043 | | | $ | 12,493,169 | |
| | | | | | | | |
Undistributed net investment income included in net assets at end of year | | $ | 30,202 | | | $ | 6,633 | |
| | | | | | | | |
| | |
SHARES ISSUED AND REDEEMED | | | | | | | | |
Shares sold | | | 450,000 | | | | — | |
Shares redeemed | | | (200,000 | ) | | | (50,000 | ) |
| | | | | | | | |
Net increase (decrease) in shares outstanding | | | 250,000 | | | | (50,000 | ) |
| | | | | | | | |
See notes to financial statements.
Financial Highlights
iSHARES® U.S. ETF TRUST
(For a share outstanding throughout each period)
| | | | | | | | | | | | | | | | |
| | | iShares Short Maturity Bond ETF | |
| | | Year ended
Oct. 31, 2016 | | | Year ended
Oct. 31, 2015 | | | Year ended
Oct. 31, 2014 | | | Period from
Sep. 25, 2013a to
Oct. 31, 2013 | |
Net asset value, beginning of period | | $ | 50.04 | | | $ | 50.15 | | | $ | 50.07 | | | $ | 50.00 | |
| | | | | | | | | | | | | | | | |
Income from investment operations: | | | | | | | | | | | | | | | | |
Net investment incomeb | | | 0.50 | | | | 0.44 | | | | 0.44 | | | | 0.02 | |
Net realized and unrealized gain (loss)c | | | 0.14 | | | | (0.13 | ) | | | 0.04 | | | | 0.05 | |
| | | | | | | | | | | | | | | | |
Total from investment operations | | | 0.64 | | | | 0.31 | | | | 0.48 | | | | 0.07 | |
| | | | | | | | | | | | | | | | |
Less distributions from: | | | | | | | | | | | | | | | | |
Net investment income | | | (0.51 | ) | | | (0.42 | ) | | | (0.40 | ) | | | — | |
| | | | | | | | | | | | | | | | |
Total distributions | | | (0.51 | ) | | | (0.42 | ) | | | (0.40 | ) | | | — | |
| | | | | | | | | | | | | | | | |
Net asset value, end of period | | $ | 50.17 | | | $ | 50.04 | | | $ | 50.15 | | | $ | 50.07 | |
| | | | | | | | | | | | | | | | |
| | | | |
Total return | | | 1.28 | % | | | 0.62 | % | | | 0.96 | % | | | 0.14 | %d |
| | | | | | | | | | | | | | | | |
| | | | |
Ratios/Supplemental data: | | | | | | | | | | | | | | | | |
Net assets, end of period (000s) | | $ | 2,021,893 | | | $ | 1,781,306 | | | $ | 418,732 | | | $ | 102,634 | |
Ratio of expenses to average net assetse | | | 0.25 | % | | | 0.25 | % | | | 0.25 | % | | | 0.25 | % |
Ratio of net investment income to average net assetse | | | 1.01 | % | | | 0.87 | % | | | 0.87 | % | | | 0.42 | % |
Portfolio turnover ratef | | | 79 | % | | | 23 | % | | | 35 | % | | | 2 | % |
| a | Commencement of operations. |
| b | Based on average shares outstanding throughout each period. |
| c | The amounts reported for a share outstanding may not accord with the change in aggregate gains and losses in securities for the fiscal period due to the timing of capital share transactions in relation to the fluctuating market values of the Fund’s underlying securities. |
| e | Annualized for periods of less than one year. |
| f | Portfolio turnover rates exclude portfolio securities received or delivered as a result of processing capital share transactions in Creation Units. |
See notes to financial statements.
| | |
| 38 | | 2016 iSHARES ANNUAL REPORTTO SHAREHOLDERS |
Financial Highlights (Continued)
iSHARES® U.S. ETF TRUST
(For a share outstanding throughout each period)
| | |
| | iShares Short Maturity Municipal Bond ETF |
| | | | | | | | |
| | | Year ended
Oct. 31, 2016 | | | Period from
Mar. 3, 2015a to
Oct. 31, 2015 | |
Net asset value, beginning of period | | $ | 50.07 | | | $ | 50.00 | |
| | | | | | | | |
Income from investment operations: | | | | | | | | |
Net investment incomeb | | | 0.39 | | | | 0.20 | |
Net realized and unrealized gain (loss)c | | | (0.04 | ) | | | 0.04 | |
| | | | | | | | |
Total from investment operations | | | 0.35 | | | | 0.24 | |
| | | | | | | | |
Less distributions from: | | | | | | | | |
Net investment income | | | (0.40 | ) | | | (0.17 | ) |
| | | | | | | | |
Total distributions | | | (0.40 | ) | | | (0.17 | ) |
| | | | | | | | |
Net asset value, end of period | | $ | 50.02 | | | $ | 50.07 | |
| | | | | | | | |
| | |
Total return | | | 0.69 | % | | | 0.48 | %d |
| | | | | | | | |
| | |
Ratios/Supplemental data: | | | | | | | | |
Net assets, end of period (000s) | | $ | 35,012 | | | $ | 35,049 | |
Ratio of expenses to average net assetse | | | 0.25 | % | | | 0.25 | % |
Ratio of expenses to average net assets prior to waived feese | | | 0.25 | % | | | 0.25 | % |
Ratio of net investment income to average net assetse | | | 0.79 | % | | | 0.59 | % |
Portfolio turnover ratef | | | 100 | % | | | 184 | % |
| a | Commencement of operations. |
| b | Based on average shares outstanding throughout each period. |
| c | The amounts reported for a share outstanding may not accord with the change in aggregate gains and losses in securities for the fiscal period due to the timing of capital share transactions in relation to the fluctuating market values of the Fund’s underlying securities. |
| e | Annualized for periods of less than one year. |
| f | Portfolio turnover rates exclude portfolio securities received or delivered as a result of processing capital share transactions in Creation Units. |
See notes to financial statements.
Financial Highlights (Continued)
iSHARES® U.S. ETF TRUST
(For a share outstanding throughout each period)
| | |
| | iShares Ultra Short-Term Bond ETF |
| | | | | | | | | | | | |
| | | Year ended
Oct. 31, 2016 | | | Year ended
Oct. 31, 2015 | | | Period from
Dec. 11, 2013a to
Oct. 31, 2014 | |
Net asset value, beginning of period | | $ | 49.97 | | | $ | 50.08 | | | $ | 49.99 | |
| | | | | | | | | | | | |
Income from investment operations: | | | | | | | | | | | | |
Net investment incomeb | | | 0.47 | | | | 0.24 | | | | 0.16 | |
Net realized and unrealized gain (loss)c | | | (0.02 | ) | | | (0.07 | ) | | | 0.06 | |
| | | | | | | | | | | | |
Total from investment operations | | | 0.45 | | | | 0.17 | | | | 0.22 | |
| | | | | | | | | | | | |
Less distributions from: | | | | | | | | | | | | |
Net investment income | | | (0.38 | ) | | | (0.24 | ) | | | (0.13 | ) |
Net realized gain | | | — | | | | (0.04 | ) | | | — | |
| | | | | | | | | | | | |
Total distributions | | | (0.38 | ) | | | (0.28 | ) | | | (0.13 | ) |
| | | | | | | | | | | | |
Net asset value, end of period | | $ | 50.04 | | | $ | 49.97 | | | $ | 50.08 | |
| | | | | | | | | | | | |
| | | |
Total return | | | 0.90 | % | | | 0.32 | % | | | 0.45 | %d |
| | | | | | | | | | | | |
| | | |
Ratios/Supplemental data: | | | | | | | | | | | | |
Net assets, end of period (000s) | | $ | 25,018 | | | $ | 12,493 | | | $ | 15,024 | |
Ratio of expenses to average net assetse | | | 0.18 | % | | | 0.18 | % | | | 0.18 | % |
Ratio of net investment income to average net assetse | | | 0.93 | % | | | 0.47 | % | | | 0.35 | % |
Portfolio turnover ratef | | | 139 | % | | | 41 | % | | | 71 | % |
| a | Commencement of operations. |
| b | Based on average shares outstanding throughout each period. |
| c | The amounts reported for a share outstanding may not accord with the change in aggregate gains and losses in securities for the fiscal period due to the timing of capital share transactions in relation to the fluctuating market values of the Fund’s underlying securities. |
| e | Annualized for periods of less than one year. |
| f | Portfolio turnover rates exclude portfolio securities received or delivered as a result of processing capital share transactions in Creation Units. |
See notes to financial statements.
| | |
| 40 | | 2016 iSHARES ANNUAL REPORTTO SHAREHOLDERS |
Notes to Financial Statements
iSHARES® U.S. ETF TRUST
iShares U.S. ETF Trust (the “Trust”) is registered under the Investment Company Act of 1940, as amended (the “1940 Act”), as an open-end management investment company. The Trust was established as a Delaware statutory trust pursuant to an Agreement and Declaration of Trust dated June 21, 2011.
These financial statements relate only to the following funds (each, a “Fund,” and collectively, the “Funds”):
| | |
| iShares ETF | | Diversification
Classification |
Short Maturity Bond | | Non-diversified |
Short Maturity Municipal Bond | | Diversified |
Ultra Short-Term Bond | | Diversified |
Pursuant to the Trust’s organizational documents, the Funds’ officers and trustees are indemnified against certain liabilities that may arise out of the performance of their duties to the Funds. Additionally, in the normal course of business, the Funds enter into contracts with service providers that contain general indemnification clauses. The Funds’ maximum exposure under these arrangements is unknown as this would involve future claims that may be made against the Funds that have not yet occurred.
| 1. | SIGNIFICANT ACCOUNTING POLICIES |
The following significant accounting policies are consistently followed by each Fund in the preparation of its financial statements in conformity with accounting principles generally accepted in the United States of America (“U.S. GAAP”). The preparation of financial statements in conformity with U.S. GAAP requires management to make certain estimates and assumptions that affect the reported amounts of assets and liabilities and disclosures of contingent assets and liabilities at the date of the financial statements and the reported amounts of revenue and expenses during the reporting period. Actual results could differ from those estimates. Each Fund is considered an investment company under U.S. GAAP and follows the accounting and reporting guidance applicable to investment companies.
SECURITY VALUATION
Each Fund’s investments are valued at fair value each day that the Fund’s listing exchange is open and, for financial reporting purposes, as of the report date should the reporting period end on a day that the Fund’s listing exchange is not open. U.S. GAAP defines fair value as the price a fund would receive to sell an asset or pay to transfer a liability in an orderly transaction between market participants at the measurement date. The BlackRock Global Valuation Methodologies Committee (the “Global Valuation Committee”) provides oversight of the valuation of investments for the Funds. The investments of each Fund are valued pursuant to policies and procedures developed by the Global Valuation Committee and approved by the Board of Trustees of the Trust (the “Board”).
| | • | | Fixed income investments are valued using the last available bid price or current market quotations provided by dealers or prices (including evaluated prices) supplied by approved independent third-party pricing services. The pricing services may use matrix pricing or valuation models that utilize certain inputs and assumptions to derive values, including transaction data, credit quality information, perceived market movements, news, and other relevant information and by other methods, which may include consideration of: yields or prices of securities of comparable quality, coupon, maturity and type; indications as to values from dealers; general market conditions; and/or other factors and assumptions. Pricing services generally value fixed income securities assuming orderly transactions of an institutional round lot size, but a fund may hold or transact in such securities in smaller odd lot sizes. |
| | • | | Open-end U.S. mutual funds (including money market funds) are valued at that day’s published net asset value (“NAV”). |
| | | | |
NOTESTO FINANCIAL STATEMENTS | | | 41 | |
Notes to Financial Statements (Continued)
iSHARES® U.S. ETF TRUST
| | • | | Forward currency contracts are valued based on that day’s prevailing forward exchange rate for the underlying currencies. Interpolated forward exchange rates are used for contracts with interim settlement dates for which quotations are not available. |
| | • | | Repurchase agreements are valued at amortized cost, which approximates market value. |
In the event that application of these methods of valuation results in a price for an investment which is deemed not to be representative of the fair value of such investment or if a price is not available, the investment will be valued based upon other available factors deemed relevant by the Global Valuation Committee, in accordance with policies approved by the Board. These factors include but are not limited to (i) attributes specific to the investment; (ii) the principal market for the investment; (iii) the customary participants in the principal market for the investment; (iv) data assumptions by market participants for the investment, if reasonably available; (v) quoted prices for similar investments in active markets; and (vi) other factors, such as future cash flows, interest rates, yield curves, volatilities, prepayment speeds, loss severities, credit risks and/or default rates. Valuations based on such factors are reported to the Board on a quarterly basis.
The Global Valuation Committee employs various methods for calibrating valuation approaches for investments where an active market does not exist, including regular due diligence of the Trust’s pricing vendors, a regular review of key inputs and assumptions, transactional back-testing or disposition analysis to compare unrealized gains and losses to realized gains and losses, reviews of missing or stale prices, reviews of large movements in market values, and reviews of market related activity.
Various inputs are used in determining the fair value of financial instruments. Inputs may be based on independent market data (“observable inputs”) or they may be internally developed (“unobservable inputs”). These inputs are categorized into a disclosure hierarchy consisting of three broad levels for financial reporting purposes as follows:
| | • | | Level 1 — Unadjusted quoted prices in active markets for identical assets or liabilities; |
| | • | | Level 2 — Inputs other than quoted prices included within Level 1 that are observable for the asset or liability either directly or indirectly, including quoted prices for similar assets or liabilities in active markets, quoted prices for identical or similar assets or liabilities in markets that are not considered to be active, inputs other than quoted prices that are observable for the asset or liability (such as exchange rates, financing terms, interest rates, yield curves, volatilities, prepayment speeds, loss severities, credit risks and default rates) or other market-corroborated inputs; and |
| | • | | Level 3 — Unobservable inputs for the asset or liability based on the best information available in the circumstances, to the extent observable inputs are not available, including the Global Valuation Committee’s assumptions used in determining the fair value of investments. |
The hierarchy gives the highest priority to unadjusted quoted prices in active markets for identical assets or liabilities (Level 1 measurements) and the lowest priority to unobservable inputs (Level 3 measurements). Accordingly, the degree of judgement exercised in determining fair value is greatest for instruments categorized in Level 3. The inputs used to measure fair value may fall into different levels of the fair value hierarchy. In such cases, for disclosure purposes, the fair value hierarchy classification is determined based on the lowest level input that is significant to the fair value measurement in its entirety. The fair value hierarchy for each Fund’s investments is included in its schedule of investments.
Changes in valuation techniques may result in transfers in or out of an assigned level within the fair value hierarchy. In accordance with the Trust’s policy, transfers between different levels of the fair value hierarchy are deemed to have occurred as of the beginning of the reporting period. The categorization of values determined for financial instruments are based on the pricing transparency of the financial instruments and are not necessarily an indication of the risks associated with investing in those securities.
| | |
| 42 | | 2016 iSHARES ANNUAL REPORTTO SHAREHOLDERS |
Notes to Financial Statements (Continued)
iSHARES® U.S. ETF TRUST
SECURITY TRANSACTIONS AND INCOME RECOGNITION
Security transactions are accounted for on trade date. Realized gains and losses on investment transactions are determined using the specific identification method. Interest income, including amortization and accretion of premiums and discounts on debt securities, is recognized daily on the accrual basis. Dividend income and capital gain distributions, if any, are recognized on the ex-dividend date, net of any foreign taxes withheld at source.
REPURCHASE AGREEMENTS
The Funds may enter into repurchase agreements. In a repurchase agreement, a Fund purchases a security from a counterparty who agrees to repurchase the same security at a mutually agreed upon date and price. On a daily basis, the counterparty is required to maintain collateral subject to the agreement and in value no less than the agreed repurchase amount. The agreements are conditioned upon the collateral being deposited under the Federal Reserve book entry system or held in a segregated account by the Fund’s custodian or designated sub-custodians under tri-party repurchase agreements. In the event the counterparty defaults and the fair value of the collateral declines, the Fund could experience losses, delays and costs in liquidating the collateral.
Repurchase agreements are entered into by the Funds under Master Repurchase Agreements (each, an “MRA”). The MRA permits the Funds, under certain circumstances including an event of default (such as bankruptcy or insolvency), to offset payables and/or receivables with collateral held by and/or posted to the counterparty. As a result, one single net payment is created. Bankruptcy or insolvency laws of a particular jurisdiction may impose restrictions on or prohibitions against such a right of offset in the event of the MRA counterparty’s bankruptcy or insolvency. Based on the terms of the MRA, the Fund receives securities as collateral with a market value in excess of the repurchase price at maturity. Upon a bankruptcy or insolvency of the MRA counterparty, the Fund would recognize a liability with respect to such excess collateral. The liability reflects the Fund’s obligation under bankruptcy law to return the excess to the counterparty.
The following table summarizes the Fund’s open repurchase agreements as of October 31, 2016 which are subject to offset under an MRA:
| | | | | | | | | | | | |
| iShares ETF | | Market Value of
Repurchase
Agreements | | | Non-cash
Collateral
Received a | | | Net
Amount | |
Short Maturity Bond | | $ | 30,000,000 | | | $ | 30,000,000 | | | $ | — | |
| | | | | | | | | | | | |
| | | | | | | | | | | | | |
| | a | | Collateral received in excess of the market value of repurchase agreements is not presented in this table. The total collateral received by the Fund is disclosed in the Fund’s schedule of investments. |
FOREIGN CURRENCY TRANSLATION
The accounting records of the Funds are maintained in U.S. dollars. Foreign currencies, as well as investment securities and other assets and liabilities denominated in foreign currencies, are translated into U.S. dollars using exchange rates deemed appropriate by the investment adviser. Purchases and sales of securities, income receipts and expense payments are translated into U.S. dollars on the respective dates of such transactions.
Each Fund does not isolate the effect of fluctuations in foreign exchange rates from the effect of fluctuations in the market prices of securities. Such fluctuations are reflected by the Funds as a component of realized and unrealized gains and losses from investments for financial reporting purposes.
| | | | |
NOTESTO FINANCIAL STATEMENTS | | | 43 | |
Notes to Financial Statements (Continued)
iSHARES® U.S. ETF TRUST
FOREIGN TAXES
The Funds may be subject to foreign taxes (a portion of which may be reclaimable) on income, stock dividends, capital gains on investments, or certain foreign currency transactions. All foreign taxes are recorded in accordance with the applicable foreign tax regulations and rates that exist in the foreign jurisdictions in which the Funds invest. These foreign taxes, if any, are paid by the Funds and are reflected in their statements of operations as follows: foreign taxes withheld at source are presented as a reduction of income, foreign taxes on securities lending income are presented as a reduction of securities lending income, foreign taxes on stock dividends are presented as “other foreign taxes”, and foreign taxes on capital gains from sales of investments and foreign taxes on foreign currency transactions are included in their respective net realized gain (loss) categories. Foreign taxes payable or deferred as of October 31, 2016, if any, are disclosed in the Funds’ statements of assets and liabilities.
DISTRIBUTIONS TO SHAREHOLDERS
Dividends and distributions paid by each Fund are recorded on the ex-dividend dates. Distributions are determined on a tax basis and may differ from net investment income and net realized capital gains for financial reporting purposes. Dividends and distributions are paid in U.S. dollars and cannot be automatically reinvested in additional shares of the Funds.
LOANS OF PORTFOLIO SECURITIES
Each Fund may lend its investment securities to approved borrowers, such as brokers, dealers and other financial institutions. The borrower pledges and maintains with the Fund collateral consisting of cash, an irrevocable letter of credit issued by a bank, or securities issued or guaranteed by the U.S. government. The initial collateral received by each Fund is required to have a value of at least 102% of the current value of the loaned securities plus the interest accrued on such securities, if any, for securities traded on U.S. exchanges and a value of at least 105% for all other securities. The collateral is maintained thereafter at a value equal to at least 100% of the current value of the securities on loan plus accrued interest, if any. The market value of the loaned securities is determined at the close of each business day of the Funds. Any additional required collateral is delivered to the Funds and any excess collateral is returned by the Funds on the next business day. During the term of the loan, each Fund is entitled to all distributions made on or in respect of the loaned securities but does not receive interest income on securities received as collateral. Loans of securities are terminable at any time and the borrower, after notice, is required to return borrowed securities within the standard time period for settlement of securities transactions.
On October 11, 2016, BlackRock, Inc. (“BlackRock”) implemented changes required by amendments to Rule 2a-7 under the 1940 Act, which governs the operations of U.S. money market funds. The Funds may be exposed to additional risks when reinvesting the cash collateral in money market funds that do not seek to maintain a stable NAV per share of $1.00 and which may be subject to redemption gates or liquidity fees under certain circumstances.
Cash received as collateral for securities on loan may be reinvested in certain short-term instruments either directly on behalf of a fund or through one or more joint accounts or money market funds, including those managed by BlackRock Fund Advisors (“BFA”), the Funds’ investment adviser, or its affiliates. As of October 31, 2016, any securities on loan were collateralized by cash and/or U.S. government obligations. Cash collateral received was invested in money market funds managed by BFA and is disclosed in the schedules of investments. The securities on loan for each Fund are also disclosed in its schedule of investments. The total value of any securities on loan as of October 31, 2016 and the total value of the related cash collateral are disclosed in the statements of assets and liabilities. Income earned by the Funds from securities lending is disclosed in the statements of operations.
The risks of securities lending include the risk that the borrower may not provide additional collateral when required or may not return the securities when due. To mitigate these risks, the Funds benefit from a borrower default indemnity provided by
| | |
| 44 | | 2016 iSHARES ANNUAL REPORTTO SHAREHOLDERS |
Notes to Financial Statements (Continued)
iSHARES® U.S. ETF TRUST
BlackRock. BlackRock’s indemnity allows for full replacement of securities lent. Each Fund could suffer a loss if the value of the investments purchased with cash collateral falls below the value of the cash collateral received.
Securities lending transactions are entered into by the Funds under Master Securities Lending Agreements (“MSLA”) which provide the right, in the event of default (including bankruptcy or insolvency) for the non-defaulting party to liquidate the collateral and calculate a net exposure to the defaulting party or request additional collateral. In the event that a borrower defaults, a Fund, as lender, would offset the market value of the collateral received against the market value of the securities loaned. The value of the collateral is typically greater than that of the market value of the securities loaned, leaving the lender with a net amount payable to the defaulting party. However, bankruptcy or insolvency laws of a particular jurisdiction may impose restrictions on or prohibitions against such a right of offset in the event of an MSLA counterparty’s bankruptcy or insolvency. Under the MSLA, the borrower can resell or re-pledge the loaned securities, and a Fund can reinvest cash collateral, or, upon an event of default, resell or re-pledge the collateral.
The following table is a summary of securities lending agreements which are subject to offset under an MSLA as of October 31, 2016:
| | | | | | | | | | | | |
iShares ETF and Counterparty | | Market Value of
Securities on Loan | | | Cash Collateral
Received a | | | Net
Amount | |
Short Maturity Bond | | | | | | | | | | | | |
BNP Paribas Prime Brokerage International Ltd. | | $ | 317,803 | | | $ | 317,803 | | | $ | — | |
Deutsche Bank Securities Inc. | | | 6,896,198 | | | | 6,896,198 | | | | — | |
Goldman Sachs & Co. | | | 2,463,385 | | | | 2,463,385 | | | | — | |
JPMorgan Securities LLC | | | 4,172,834 | | | | 4,172,834 | | | | — | |
Merrill Lynch, Pierce, Fenner & Smith | | | 2,007 | | | | 2,007 | | | | — | |
Morgan Stanley & Co. LLC | | | 1,887,409 | | | | 1,887,409 | | | | — | |
Wells Fargo Securities LLC | | | 15,614,361 | | | | 15,614,361 | | | | — | |
HSBC Securities (USA) Inc. | | | 3,002,430 | | | | 3,002,430 | | | | — | |
| | | | | | | | | | | | |
| | $ | 34,356,427 | | | $ | 34,356,427 | | | $ | — | |
| | | | | | | | | | | | |
| | | | | | | | | | | | | |
| | a | | Collateral received in excess of the market value of securities on loan is not presented in this table. The total cash collateral received by the Fund is disclosed in the Fund’s statement of assets and liabilities. |
| 2. | INVESTMENT ADVISORY AGREEMENT AND OTHER TRANSACTIONS WITH AFFILIATES |
Pursuant to an Investment Advisory Agreement with the Trust, BFA manages the investment of each Fund’s assets. BFA is a California corporation indirectly owned by BlackRock. Under the Investment Advisory Agreement, BFA is responsible for substantially all expenses of the Funds, except interest, taxes, brokerage commissions and other expenses connected with the execution of portfolio transactions, distribution fees, litigation expenses and any extraordinary expenses.
For its investment advisory services to each of the following Funds, BFA is entitled to an annual investment advisory fee based on the average daily net assets of each Fund as follows:
| | | | |
| iShares ETF | | Investment
Advisory Fee | |
Ultra Short-Term Bond | | | 0.18 | % |
Short Maturity Bond | | | 0.25 | |
| | | | |
NOTESTO FINANCIAL STATEMENTS | | | 45 | |
Notes to Financial Statements (Continued)
iSHARES® U.S. ETF TRUST
Effective December 16, 2016, for its investment advisory services to the iShares Ultra Short-Term Bond ETF, BFA will be entitled to an annual investment advisory fee of 0.08% based on the average daily net assets of the Fund.
For its investment advisory services to the iShares Short Maturity Municipal Bond ETF, BFA is entitled to an annual investment advisory fee of 0.25% based on the average daily net assets of the Fund. In addition, the Fund indirectly pays its pro rata share of fees and expenses attributable to its investments in other investment companies (“acquired fund fees and expenses”). BFA’s contractual agreement to waive a portion of its investment advisory fees in an amount equal to the acquired fund fees and expenses attributable to the Fund’s investments in other registered investment companies advised by BFA or its affiliates, if any, expired on February 29, 2016.
The U.S. Securities and Exchange Commission (the “SEC”) has issued an exemptive order which permits BlackRock Institutional Trust Company, N.A. (“BTC”), an affiliate of BFA, to serve as securities lending agent for the Funds, subject to applicable conditions. As securities lending agent, BTC bears all operational costs directly related to securities lending. Each Fund is responsible for fees in connection with the investment of cash collateral received for securities on loan in a money market fund managed by BFA, however, BTC has agreed to reduce the amount of securities lending income it receives in order to effectively limit the collateral investment fees each Fund bears to an annual rate of 0.04% (the “collateral investment fees”). Securities lending income is equal to the total of income earned from the reinvestment of cash collateral, net of fees and other payments to and from borrowers of securities, and less the collateral investment fees. The Funds retain a portion of securities lending income and remit the remaining portion to BTC as compensation for its services as securities lending agent.
Pursuant to a securities lending agreement, each Fund retains 80% of securities lending income and the amount retained can never be less than 70% of the total of securities lending income plus the collateral investment fees. In addition, commencing the business day following the date that the aggregate securities lending income plus the collateral investment fees generated across all 1940 Act iShares exchange-traded funds (the “iShares ETF Complex”) in a given calendar year exceeds the aggregate securities lending income generated across the iShares ETF Complex in the calendar year 2013, each Fund, pursuant to a securities lending agreement, will retain for the remainder of that calendar year 85% of securities lending income and the amount retained can never be less than 70% of the total of securities lending income plus the collateral investment fees.
For the year ended October 31, 2016, the total of securities lending agent services and collateral investment fees paid were as follows:
| | | | |
| iShares ETF | | Fees Paid
to BTC | |
Short Maturity Bond | | $ | 37,169 | |
BlackRock Investments, LLC, an affiliate of BFA, is the distributor for each Fund. Pursuant to the distribution agreement, BFA is responsible for any fees or expenses for distribution services provided to the Funds.
Each Fund may invest its positive cash balances in certain money market funds managed by BFA or an affiliate. The income earned on these temporary cash investments is included in “Dividends – affiliated” in the statements of operations.
The PNC Financial Services Group, Inc. is the largest stockholder of BlackRock and is considered to be an affiliate of the Funds for 1940 Act purposes.
Certain trustees and officers of the Trust are also officers of BTC and/or BFA.
| | |
| 46 | | 2016 iSHARES ANNUAL REPORTTO SHAREHOLDERS |
Notes to Financial Statements (Continued)
iSHARES® U.S. ETF TRUST
| 3. | INVESTMENT PORTFOLIO TRANSACTIONS |
Purchases and sales of investments (excluding in-kind transactions and short-term investments) for the year ended October 31, 2016 were as follows:
| | | | | | | | | | | | | | | | |
| | | U.S. Government Obligations | | | Other Securities | |
| iShares ETF | | Purchases | | | Sales | | | Purchases | | | Sales | |
Short Maturity Bond | | $ | 164,225,709 | | | $ | 131,944,527 | | | $ | 1,301,471,108 | | | $ | 1,065,891,393 | |
Short Maturity Municipal Bond | | | — | | | | — | | | | 27,673,720 | | | | 29,455,850 | |
Ultra Short-Term Bond | | | 1,398,355 | | | | 165,052 | | | | 6,481,165 | | | | 7,205,027 | |
There were no in-kind transactions (see Note 4) for the year ended October 31, 2016.
| 4. | CAPITAL SHARE TRANSACTIONS |
Capital shares are issued and redeemed by each Fund only in aggregations of a specified number of shares or multiples thereof (“Creation Units”) at NAV. Except when aggregated in Creation Units, shares of each Fund are not redeemable. Transactions in capital shares for each Fund are disclosed in detail in the statements of changes in net assets.
The consideration for the purchase of Creation Units of a fund in the Trust generally consists of the in-kind deposit of a designated portfolio of securities and a specified amount of cash. Certain funds in the Trust may be offered in Creation Units solely or partially for cash in U.S. dollars. Investors purchasing and redeeming Creation Units may pay a purchase transaction fee and a redemption transaction fee directly to State Street Bank and Trust Company, the Trust’s administrator, to offset transfer and other transaction costs associated with the issuance and redemption of Creation Units, including Creation Units for cash. Investors transacting in Creation Units for cash may also pay an additional variable charge to compensate the relevant fund for certain transaction costs (i.e., stamp taxes, taxes on currency or other financial transactions, and brokerage costs) and market impact expenses relating to investing in portfolio securities. Such variable charges, if any, are included in “Proceeds from shares sold” in the statements of changes in net assets.
| 5. | FORWARD CURRENCY CONTRACTS |
Each Fund may enter into forward currency contracts for the purpose of hedging against the effects of foreign currencies on the value of such Fund’s assets that are denominated in a non-U.S. currency. A forward currency contract is an obligation to purchase or sell a currency against another currency at a specified future date at an agreed upon price and quantity. Forward currency contracts are traded over-the-counter (“OTC”) and not on an organized exchange. The contract is marked-to-market daily and the change in market value is recorded as unrealized appreciation or depreciation. When the contract is closed, a realized gain or loss equal to the difference between the value at the time it was opened and the value at the time it was closed is recorded. Losses may arise if there are unfavorable movements in the value of a foreign currency relative to the U.S. dollar or if the counterparties do not meet the terms of the agreement. The Fund’s use of forward currency contracts also involves the risks of imperfect correlation between the value of its currency positions and its other investments or the Fund failing to close out its position due to an illiquid market.
| | | | |
NOTESTO FINANCIAL STATEMENTS | | | 47 | |
Notes to Financial Statements (Continued)
iSHARES® U.S. ETF TRUST
The following table shows the value of forward currency contracts held by the iShares Short Maturity Bond ETF as of October 31, 2016 and the related locations in the statement of assets and liabilities, presented by risk exposure category:
| | | | |
| Assets | |
Forward currency contracts: | | | | |
Unrealized appreciation on forward currency contracts/ Net assets consist of – net unrealized appreciation (depreciation) | | $ | 3,569,633 | |
| | | | |
| | | | | |
The following table shows the realized and unrealized gains (losses) on forward currency contracts held by the iShares Short Maturity Bond ETF during the year ended October 31, 2016 and the related locations in the statement of operations, presented by risk exposure category:
| | | | | | | | |
| | | Net Realized
Gain (Loss) | | | Net Change in
Unrealized
Appreciation/Depreciation | |
Forward currency contracts: | | | | | | | | |
Foreign currency transactions/Forward currency contracts | | $ | (11,227,772 | ) | | $ | 3,515,316 | |
| | | | | | | | |
| | | | | | | | | |
For the year ended October 31, 2016, the average quarter-end amounts purchased and sold in U.S. dollars for the iShares Short Maturity Bond ETF were $113,816 and $80,483,377, respectively.
The Funds’ risk of loss from counterparty credit risk on OTC derivatives is generally limited to the aggregate unrealized gain netted against any collateral held by the Funds. In order to better define their contractual rights and to secure rights that will help the Funds to mitigate their counterparty risk, the Funds may enter into an International Swaps and Derivatives Association, Inc. master agreement (“ISDA Master Agreement”) or similar agreement with their derivative contract counterparties. An ISDA Master Agreement is a bilateral agreement between the Funds and a counterparty that governs OTC derivatives and foreign exchange contracts and typically contains, among other things, collateral posting terms and netting provisions in the event of a default and/or termination event. The provisions of the ISDA Master Agreement typically permit a single net payment in the event of default including the bankruptcy or insolvency of the counterparty. However, bankruptcy or insolvency laws of a particular jurisdiction may impose restrictions on or prohibitions against the right of offset in bankruptcy or insolvency.
The collateral requirements under an ISDA Master Agreement are typically calculated by netting the mark-to-market amount for each transaction under such agreement, and comparing that amount to the value of any collateral currently pledged by the parties. Forward currency contracts held by the Funds generally do not require collateral. To the extent amounts due to the Funds from the counterparty are not fully collateralized, contractually or otherwise, the Funds bear the risk of loss from counterparty non-performance. The Funds attempt to mitigate counterparty risk by only entering into agreements with counterparties that they believe have the financial resources to honor their obligations and by monitoring the financial stability of those counterparties.
For financial reporting purposes, the Funds do not offset financial assets and financial liabilities that are subject to netting arrangements in the statements of assets and liabilities.
| | |
| 48 | | 2016 iSHARES ANNUAL REPORTTO SHAREHOLDERS |
Notes to Financial Statements (Continued)
iSHARES® U.S. ETF TRUST
The following table presents the exposure of the open forward currency contracts held by the iShares Short Maturity Bond ETF that are subject to potential offset in the statement of assets and liabilities as of October 31, 2016:
| | | | | | | | | | | | |
| | | Derivative
Assets
Subject to
Offsetting | | | Derivatives
Available
for Offset | | | Net
Amount of Derivative
Assets | |
Forward currency contracts | | $ | 3,569,633 | | | $ | — | | | $ | 3,569,633 | |
| | | | | | | | | | | | |
| | | | | | | | | | | | | |
In the normal course of business, each Fund’s investment activities expose it to various types of risk associated with the financial instruments and markets in which it invests. The significant types of financial risks each Fund is exposed to include market risk and credit risk. Each Fund’s prospectus provides details of these and other types of risk.
MARKET RISK
Market risk arises mainly from uncertainty about future values of financial instruments influenced by price, currency and interest rate movements. It represents the potential loss a fund may suffer through holding market positions in the face of market movements. A fund is exposed to market risk by virtue of its investment in equity, fixed income and/or financial derivative instruments or indirectly by virtue of its investment in underlying funds. The fair value of securities held by a fund may decline due to general market conditions, economic trends or events that are not specifically related to the issuers of the securities including local, regional or global political, social or economic instability or to factors that affect a particular industry or group of industries. The extent of a fund’s exposure to market risk is the market value of the investments held as shown in the fund’s schedule of investments.
A diversified portfolio, where this is appropriate and consistent with a fund’s objectives, minimizes the risk that a price change of a particular investment will have a material impact on the NAV of a fund. The investment concentrations within each Fund’s portfolio are disclosed in its schedule of investments.
Changes in market interest rates or economic conditions may affect the value and/or liquidity of fixed income investments. Interest rate risk is the risk that prices of bonds and other fixed-income securities will decrease as interest rates rise and increase as interest rates fall. Mortgage-backed securities and securities with longer durations tend to be more sensitive to interest rate changes, usually making them more volatile than other types of bonds or securities with shorter durations. Given the environment of historically low interest rates, a fund may be subject to a greater risk of price losses if interest rates rise.
CREDIT RISK
Credit risk is the risk that an issuer or guarantor of debt instruments or the counterparty to a financial transaction, including derivatives contracts, repurchase agreements or loans of portfolio securities, is unable or unwilling to make timely interest and/or principal payments or to otherwise honor its obligations. BFA and its affiliates manage counterparty credit risk by entering into transactions only with counterparties that they believe have the financial resources to honor their obligations and by monitoring the financial stability of those counterparties. Financial assets, which potentially expose a fund to issuer and counterparty credit risks, consist principally of financial instruments and receivables due from counterparties. The extent of a fund’s exposure to credit and counterparty risks with respect to those financial assets is approximated by their value recorded in its statement of assets and liabilities.
| | | | |
NOTESTO FINANCIAL STATEMENTS | | | 49 | |
Notes to Financial Statements (Continued)
iSHARES® U.S. ETF TRUST
High yield securities that are rated below investment-grade (including those bonds rated lower than “BBB-” by Standard & Poor’s Ratings Services and Fitch or “Baa3” by Moody’s) or are unrated, may be more volatile than higher-rated securities of similar maturity. High yield securities may also be subject to greater levels of credit or default risk than higher-rated securities and high yield securities may be less liquid and more difficult to sell at an advantageous time or price or to value than higher-rated securities. In particular, high yield securities are often issued by smaller, less creditworthy companies or by highly leveraged (indebted) companies, which are generally less able than more financially stable companies to make scheduled payments of interest and principal.
Municipal securities are subject to the risk that litigation, legislation or other political events, local business or economic conditions, credit rating downgrades, or the bankruptcy of the issuer could have a significant effect on an issuer’s ability to make payments of principal and/or interest or otherwise affect the value of such securities. Municipal securities can be significantly affected by political changes as well as uncertainties in the municipal market related to government regulation, taxation, legislative changes or the rights of municipal security holders. Because many municipal securities are issued to finance similar projects, such as those related to education, health care, housing, transportation, utilities, and water and sewer, conditions in these sectors can affect the overall municipal market. In addition, changes in the financial condition of an individual municipal insurer can affect the overall municipal market. Municipal securities backed by current or anticipated revenues from a specific project or specific assets can be negatively affected by the discontinuance of the taxation supporting the project or assets or the inability to collect revenues for the project or from the assets.
Each Fund is treated as an entity separate from the Trust’s other funds for federal income tax purposes. It is the policy of each Fund to qualify as a regulated investment company by complying with the provisions applicable to regulated investment companies, as defined under Subchapter M of the Internal Revenue Code of 1986, as amended, and to annually distribute substantially all of its ordinary income and any net capital gains (taking into account any capital loss carryforwards) sufficient to relieve it from all, or substantially all, federal income and excise taxes. Accordingly, no provision for federal income taxes is required.
U.S. GAAP requires that certain components of net assets be adjusted to reflect permanent differences between financial and tax reporting. These reclassifications have no effect on net assets or NAV per share. The following permanent differences as of October 31, 2016, attributable to the use of amortization methods on fixed income securities, foreign currency transactions and undistributed gains, were reclassified to the following accounts:
| | | | | | | | | | | | |
| iShares ETF | | Paid-in
Capital | | | Undistributed
Net Investment
Income/Distributions
in Excess of Net
Investment Income | | | Undistributed
Net Realized
Gain/Accumulated
Net Realized Loss | |
Short Maturity Bond | | $ | — | | | $ | 181,629 | | | $ | (181,629 | ) |
Short Maturity Municipal Bond | | | — | | | | 19 | | | | (19 | ) |
Ultra Short-Term Bond | | | 5,155 | | | | — | | | | (5,155 | ) |
| | |
| 50 | | 2016 iSHARES ANNUAL REPORTTO SHAREHOLDERS |
Notes to Financial Statements (Continued)
iSHARES®U.S. ETF TRUST
The tax character of distributions paid during the years ended October 31, 2016 and October 31, 2015 was as follows:
| | | | | | | | |
| iShares ETF | | 2016 | | | 2015 | |
Short Maturity Bond | | | | | | | | |
Ordinary income | | $ | 21,492,109 | | | $ | 7,132,332 | |
| | | | | | | | |
| | |
Short Maturity Municipal Bond | | | | | | | | |
Tax-exempt income | | $ | 245,046 | | | $ | 126,822 | |
Ordinary income | | | 36 | | | | 12 | |
| | | | | | | | |
| | $ | 245,082 | | | $ | 126,834 | |
| | | | | | | | |
| | |
Ultra Short-Term Bond | | | | | | | | |
Ordinary income | | $ | $103,710 | | | $ | 72,658 | |
| | | | | | | | |
| | | | | | | | | |
As of October 31, 2016, the tax components of accumulated net earnings (losses) were as follows:
| | | | | | | | | | | | | | | | | | | | |
| iShares ETF | | Undistributed
Ordinary
Income | | | Undistributed
Tax-Exempt
Income | | | Capital Loss
Carryforwards | | | Net Unrealized
Gains (Losses) a | | | Total | |
Short Maturity Bond | | $ | 1,408,174 | | | $ | – | | | $ | (818,332 | ) | | $ | 2,165,651 | | | $ | 2,755,493 | |
Short Maturity Municipal Bond | | | – | | | | 23,331 | | | | (9,588 | ) | | | (20,300 | ) | | | (6,557 | ) |
Ultra Short-Term Bond | | | 30,202 | | | | – | | | | (13,325 | ) | | | 37,067 | | | | 53,944 | |
| | a | | The difference between book-basis and tax-basis unrealized gains (losses) was attributable primarily to the treatment of straddles. |
As of October 31, 2016, the following Funds had non-expiring capital loss carryforwards available to offset future realized capital gains as follows:
| | | | |
| iShares ETF | | Non- Expiring | |
Short Maturity Bond | | $ | 818,332 | |
Short Maturity Municipal Bond | | | 9,588 | |
Ultra Short-Term Bond | | | 13,325 | |
Management has analyzed tax laws and regulations and their application to the Funds as of October 31, 2016, inclusive of the open tax return years, and does not believe there are any uncertain tax positions that require recognition of a tax liability in the Funds’ financial statements.
Management has evaluated the impact of all subsequent events on the Funds through the date the financial statements were available to be issued and has determined that there were no subsequent events requiring adjustment or disclosure in the financial statements.
| | | | |
NOTESTO FINANCIAL STATEMENTS | | | 51 | |
Report of Independent Registered Public Accounting Firm
To the Shareholders and Board of Trustees of
iShares U.S. ETF Trust:
In our opinion, the accompanying statements of assets and liabilities, including the schedules of investments, and the related statements of operations and of changes in net assets and the financial highlights present fairly, in all material respects, the financial position of iShares Short Maturity Bond ETF, iShares Short Maturity Municipal Bond ETF and iShares Ultra Short-Term Bond ETF (the “Funds”) at October 31, 2016, the results of each of their operations, the changes in each of their net assets and their financial highlights for each of the periods presented, in conformity with accounting principles generally accepted in the United States of America. These financial statements and financial highlights (hereafter referred to as “financial statements”) are the responsibility of the Funds’ management. Our responsibility is to express an opinion on these financial statements based on our audits. We conducted our audits of these financial statements in accordance with the standards of the Public Company Accounting Oversight Board (United States). Those standards require that we plan and perform the audit to obtain reasonable assurance about whether the financial statements are free of material misstatement. An audit includes examining, on a test basis, evidence supporting the amounts and disclosures in the financial statements, assessing the accounting principles used and significant estimates made by management, and evaluating the overall financial statement presentation. We believe that our audits, which included confirmation of securities at October 31, 2016 by correspondence with the custodian, transfer agent and brokers, provide a reasonable basis for our opinion.
PricewaterhouseCoopers LLP
San Francisco, California
December 21, 2016
| | |
| 52 | | 2016 iSHARES ANNUAL REPORTTO SHAREHOLDERS |
Tax Information (Unaudited)
iSHARES® U.S. ETF TRUST
For the fiscal year ended October 31, 2016, the following Funds hereby designate the following maximum amounts allowable as interest-related dividends eligible for exemption from U.S. withholding tax for nonresident aliens and foreign corporations:
| | | | |
| iShares ETF | | Interest-
Related
Dividends | |
Short Maturity Bond | | $ | 18,299,705 | |
Short Maturity Municipal Bond | | | 244,959 | |
Ultra Short-Term Bond | | | 93,178 | |
The following Funds hereby designate the following amounts of distributions from direct federal obligation interest for the fiscal year ended October 31, 2016:
| | | | |
| iShares ETF | | Federal
Obligation
Interest | |
Short Maturity Bond | | $ | 298,373 | |
Ultra Short-Term Bond | | | 6,830 | |
The law varies in each state as to whether and what percentage of ordinary income dividends attributable to federal obligations is exempt from state income tax. Shareholders are advised to check with their tax advisers to determine if any portion of the dividends received is exempt from state income tax.
Board Review and Approval of Investment Advisory
Contract
iSHARES® U.S. ETF TRUST
I. iShares Short Maturity Bond ETF and iShares Short Maturity Municipal Bond ETF
Under Section 15(c) of the Investment Company Act of 1940 (the “1940 Act”), the Trust’s Board of Trustees (the “Board”), including a majority of Trustees who are not “interested persons” of the Trust (as that term is defined in the 1940 Act) (the “Independent Trustees”), is required annually to consider and approve the Investment Advisory Contract between the Trust and BFA (the “Advisory Contract”) on behalf of the Funds. The Independent Trustees requested, and BFA provided, such information as the Independent Trustees, with advice from independent counsel, deemed reasonably necessary to evaluate the Advisory Contract. A committee of all of the Independent Trustees (the “15(c) Committee”), with independent counsel, met with management on April 28, 2016 and May 9, 2016. At these meetings, the 15(c) Committee reviewed and discussed information provided in response to the 15(c) Committee’s initial requests, and requested certain additional information, which management agreed to provide. At a meeting held on May 17, 2016, management presented information to the Board relating to the continuance of the Advisory Contract, including information requested by the 15(c) Committee during its meetings. The Board, including the Independent Trustees, reviewed and discussed such information at length. The Independent Trustees requested from management certain additional information, which management agreed to provide. At a meeting held on June 21-23, 2016, the Board, including the Independent Trustees, reviewed the additional information provided by management in response to these requests. After extensive discussions, the Board, including all of the Independent Trustees, approved the continuance of the Advisory Contract for the Funds, based on a review of qualitative and quantitative information provided by BFA, including the additional information management provided at the request of the Independent Trustees. The Board noted its satisfaction with the extent and quality of information provided and its frequent interactions with management, as well as the detailed responses and other information provided by BFA. The Board also noted that the Board and BFA agreed to discuss potential enhancements and adjustments to the 15(c) process for the coming year. The Independent Trustees were advised by their independent counsel throughout the process, including about the legal standards applicable to their review. In approving the Advisory Contract for the Funds, the Board, including the Independent Trustees, considered the following factors, no one of which was controlling, and reached the following conclusions:
Expenses and Performance of the Funds — The Board reviewed statistical information prepared by Broadridge Financial Solutions Inc. (“Broadridge”), an independent provider of investment company data, regarding the expense ratio components, including gross and net total expenses, waivers/reimbursements (if any), and underlying fund fees and expenses (if any) of each Fund in comparison with the same information for other exchange traded funds (including, where applicable, funds sponsored by an “at cost” service provider) and, in the limited instances where no comparable ETFs existed and the comparison group would not otherwise be reasonable in Broadridge’s judgment, pure index institutional mutual funds, objectively selected by Broadridge as comprising such Fund’s applicable peer group pursuant to Broadridge’s proprietary ETF methodology (the “Peer Group”). The Board was provided with a detailed description of Broadridge’s proprietary ETF methodology used by Broadridge to determine the applicable Peer Groups. The Board further noted that due to the limitations in providing comparable funds in the various Peer Groups, the statistical information provided in Broadridge’s report may or may not provide meaningful direct comparisons to the Funds in all instances.
The Board also noted that the investment advisory fee rates and overall expenses (net of waivers and reimbursements) for the Funds were lower than the median of the investment advisory fee rates and overall expenses (net of waivers and reimbursements) of the funds in their respective Peer Group, excluding iShares funds.
In addition, to the extent that any of the comparison funds included in the Peer Group, excluding iShares funds, track the same index as any particular Fund, Broadridge also provided, and the Board reviewed, a comparison of such Fund’s performance for the one-, three-, five-, ten-year, and since inception periods, as applicable, and for the “last quarter” period ended December 31, 2015, to that of such relevant comparison funds for the same periods.
| | |
| 54 | | 2016 iSHARES ANNUAL REPORTTO SHAREHOLDERS |
Board Review and Approval of Investment Advisory
Contract (Continued)
iSHARES® U.S. ETF TRUST
The Board noted that each Fund is an actively managed ETF that does not seek to track the performance of a specified index and that the management team for each Fund manages the Fund’s portfolio in accordance with its investment objective. The Board further noted that during the prior year, the Board received periodic reports on each Fund’s short- and longer-term performance in comparison with its peer group and benchmark index. Such periodic comparative performance information, including additional detailed information on certain specific iShares funds requested by the Board, was also considered. The Board noted that each Fund generally performed in line with expectations relative to each Fund’s peer group and benchmark index.
Based on this review, the other factors considered at the meeting, and their general knowledge of ETF pricing, the Board concluded that the investment advisory fee rate and expense level and the historical performance of each Fund supported the Board’s approval of the continuance of the Advisory Contract for the coming year.
Nature, Extent and Quality of Services Provided by BFA — Based on management’s representations, including information about recent and proposed enhancements to the iShares business, including with respect to capital markets support and analysis, product design and other services, the Board expected that there would be no diminution in the scope of services required of or provided by BFA under the Advisory Contract for the coming year as compared to the scope of services provided by BFA during prior years. In reviewing the scope of these services, the Board considered BFA’s investment philosophy and experience, noting that BFA and its affiliates have committed significant resources over time, including during the past year, to supporting the iShares funds and their shareholders. The Board also considered BFA’s compliance program and its compliance record with respect to the Funds. In that regard, the Board noted that BFA reports to the Board about portfolio management and compliance matters on a periodic basis in connection with regularly scheduled meetings of the Board, and on other occasions as necessary and appropriate, and has provided information and made appropriate officers available as needed to provide further assistance with these matters. The Board also reviewed the background and experience of the persons responsible for the day-to-day management of the Funds, as well as the resources available to them in managing the Funds. In addition to the above considerations, the Board reviewed and considered detailed presentations regarding BFA’s investment performance, investment and risk management processes and strategies provided at the June 21-23, 2016 meeting and throughout the previous year, and matters related to BFA’s portfolio compliance policies and procedures. The Board noted that each Fund had met its investment objective consistently since its respective inception date.
Based on review of this information, and the performance information discussed above, the Board concluded that the nature, extent and quality of services provided by BFA to the Funds under the Advisory Contract supported the Board’s approval of the continuance of the Advisory Contract for the coming year.
Costs of Services Provided to the Funds and Profits Realized by BFA and its Affiliates — The Board reviewed information about the profitability to BlackRock of the Funds, on a Fund-by-Fund basis and in the aggregate, based on the fees payable to BFA and its affiliates (including fees under the Advisory Contract), and all other sources of revenue and expense to BFA and its affiliates from the Funds’ operations for the last calendar year. The Board reviewed BlackRock’s profitability methodology for the iShares funds, noting that the 15(c) Committee had focused on the methodology and profitability presentation during its meetings. The Board discussed the sources of direct and ancillary revenue with management, including the revenues to BTC from securities lending by the Funds. The Board also discussed BFA’s profit margin as reflected in the Funds’ profitability analyses and reviewed information regarding potential economies of scale (as discussed below). Based on this review, the Board concluded that the profits realized by BFA and its affiliates under the Advisory Contract and from other relationships between the Funds and BFA and/or its affiliates, if any, were within a reasonable range in light of the factors considered.
Economies of Scale — The Board reviewed information regarding potential economies of scale or other efficiencies that may result from increases in the Funds’ assets, noting that the issue of economies of scale had been focused on extensively by the 15(c) Committee during its meetings and addressed by management. The Board and the 15(c) Committee reviewed information
| | | | |
BOARD REVIEWAND APPROVALOF INVESTMENT ADVISORY CONTRACT | | | 55 | |
Board Review and Approval of Investment Advisory
Contract (Continued)
iSHARES® U.S. ETF TRUST
provided by BFA regarding scale benefits shared with the iShares funds through relatively low fee rates established at inception, breakpoints, waivers, or other fee reductions, as well as through additional investment in the iShares business and the provision of improved or additional infrastructure and services to the iShares funds and their shareholders. The Board and the 15(c) Committee received information regarding BlackRock’s historical profitability, including BFA’s and its affiliates’ costs in providing services. The cost information distinguished, among other things, between fixed and variable costs, and explained how the level of fixed and variable costs, as well as the nature of such costs, may impact the existence or size of scale benefits. The Board noted that the Advisory Contract for the Funds did not provide for any breakpoints in the Funds’ investment advisory fee rates as the assets of the Funds increase. However, the Board noted that should material economies of scale exist in the future that are not otherwise shared, a breakpoint structure for the Funds may be appropriate, and that it would continue to monitor the sharing of economies of scale to determine the appropriateness of adding breakpoints in the future.
Based on this review, as well as the other factors considered at the meeting, the Board, recognizing its responsibility to consider this issue periodically, determined to approve the continuance of the Advisory Contract for the coming year.
Fees and Services Provided for Other Comparable Funds/Accounts Managed by BFA and its Affiliates — The Board received and considered information regarding the investment advisory/management fee rates for other funds/accounts in the U.S. for which BFA (or its affiliates) provides investment advisory/management services, including open-end funds registered under the 1940 Act (including sub-advised funds), collective trust funds, and institutional separate accounts (together, the “Other Accounts”), and acknowledged BFA’s assertion that the iShares funds are fundamentally different investment vehicles from the Other Accounts. The Board noted that BFA and its affiliates do manage Other Accounts with similar investment strategies or investment mandates as the Funds. The Board further noted that BFA provided the Board with detailed information regarding how the Other Accounts (particularly institutional clients) generally differ from the Funds, including in terms of the different and generally more extensive services provided to the Funds, as well as other significant differences. In that regard, the Board considered that the pricing of services to institutional clients is typically based on a number of factors beyond the nature and extent of the specific services to be provided and often depends on the overall relationship between the client and its affiliates and the adviser and its affiliates. In addition, the Board considered the relative complexity and inherent risks and challenges of managing and providing other services to the Funds, as publicly traded exchange traded funds, as compared to the Other Accounts that are institutional clients in light of differing regulatory requirements and client-imposed mandates. The Board also considered the “all-inclusive” nature of the Funds’ advisory fee structure, and the Fund expenses borne by BFA under this arrangement. The Board noted that the investment advisory fee rates under the Advisory Contract for the Funds were generally higher than the investment advisory/management fee rates for certain of the Other Accounts (particularly institutional clients) and concluded that the differences appeared to be consistent with the factors discussed.
Other Benefits to BFA and/or its Affiliates — The Board reviewed the “fallout” benefits or ancillary revenue received by BFA and/or its affiliates in connection with the services provided to the Funds by BFA, such as payment of revenue to BTC, the Funds’ securities lending agent, for loaning portfolio securities (which was included in the profit margins reviewed by the Board pursuant to BFA’s profitability methodology), and payment of advisory fees and/or administration fees to BFA and BTC (or their affiliates) in connection with any investments by the Funds in other funds for which BFA (or its affiliates) provides investment advisory services and/or administration services. The Board noted that BFA generally does not use soft dollars or consider the value of research or other services that may be provided to BFA (including its affiliates) in selecting brokers for portfolio transactions for the Funds. The Board further noted that any portfolio transactions on behalf of the Funds placed through a BFA affiliate or purchased from an underwriting syndicate in which a BFA affiliate participates, are reported to the Board pursuant to Rule 17e-1 or Rule 10f-3, as applicable, under the 1940 Act. The Board concluded that any such ancillary benefits would not be disadvantageous to the Funds’ shareholders and thus would not alter the Board’s conclusion with respect to the appropriateness of approving the continuance of the Advisory Contract for the coming year.
| | |
| 56 | | 2016 iSHARES ANNUAL REPORTTO SHAREHOLDERS |
Board Review and Approval of Investment Advisory
Contract (Continued)
iSHARES® U.S. ETF TRUST
Based on the considerations described above, the Board determined that each Fund’s investment advisory fee rate under the Advisory Contract does not constitute a fee that is so disproportionately large as to bear no reasonable relationship to the services rendered and that could not have been the product of arm’s-length bargaining, and concluded that it is in the best interest of each Fund and its shareholders to approve the continuance of the Advisory Contract for the coming year.
II. iShares Ultra Short-Term Bond ETF
Under Section 15(c) of the Investment Company Act of 1940 (the “1940 Act”), the Trust’s Board of Trustees (the “Board”), including a majority of Trustees who are not “interested persons” of the Trust (as that term is defined in the 1940 Act) (the “Independent Trustees”), is required annually to consider and approve the Investment Advisory Contract between the Trust and BFA (the “Advisory Contract”) on behalf of the Fund. The Independent Trustees requested, and BFA provided, such information as the Independent Trustees, with advice from independent counsel, deemed reasonably necessary to evaluate the Advisory Contract. A committee of all of the Independent Trustees (the “15(c) Committee”), with independent counsel, met with management on April 28, 2016 and May 9, 2016. At these meetings, the 15(c) Committee reviewed and discussed information provided in response to the 15(c) Committee’s initial requests, and requested certain additional information, which management agreed to provide. At a meeting held on May 17, 2016, management presented information to the Board relating to the continuance of the Advisory Contract, including information requested by the 15(c) Committee during its meetings. The Board, including the Independent Trustees, reviewed and discussed such information at length. The Independent Trustees requested from management certain additional information, which management agreed to provide. At a meeting held on June 21-23, 2016, the Board, including the Independent Trustees, reviewed the additional information provided by management in response to these requests. After extensive discussions, the Board, including all of the Independent Trustees, approved the continuance of the Advisory Contract for the Fund, based on a review of qualitative and quantitative information provided by BFA, including the additional information management provided at the request of the Independent Trustees. The Board noted its satisfaction with the extent and quality of information provided and its frequent interactions with management, as well as the detailed responses and other information provided by BFA. The Board also noted that the Board and BFA agreed to discuss potential enhancements and adjustments to the 15(c) process for the coming year. The Independent Trustees were advised by their independent counsel throughout the process, including about the legal standards applicable to their review. In approving the Advisory Contract for the Fund, the Board, including the Independent Trustees, considered the following factors, no one of which was controlling, and reached the following conclusions:
Expenses and Performance of the Fund — The Board reviewed statistical information prepared by Broadridge Financial Solutions Inc. (“Broadridge”), an independent provider of investment company data, regarding the expense ratio components, including gross and net total expenses, waivers/reimbursements (if any), and underlying fund fees and expenses (if any) of the Fund in comparison with the same information for other exchange traded funds (including, where applicable, funds sponsored by an “at cost” service provider) and, in the limited instances where no comparable ETFs existed and the comparison group would not otherwise be reasonable in Broadridge’s judgment, pure index institutional mutual funds, objectively selected by Broadridge as comprising the Fund’s applicable peer group pursuant to Broadridge’s proprietary ETF methodology (the “Peer Group”). The Board was provided with a detailed description of Broadridge’s proprietary ETF methodology used by Broadridge to determine the Fund’s Peer Group. The Board further noted that due to the limitations in providing comparable funds in the Peer Group, the statistical information provided in Broadridge’s report may or may not provide meaningful direct comparisons to the Fund in all instances.
The Board also noted that the investment advisory fee rate and overall expenses (net of waivers and reimbursements) for the Fund were lower than the median of the investment advisory fee rates and overall expenses (net of waivers and reimbursements) of the funds in its Peer Group, excluding iShares funds.
| | | | |
BOARD REVIEWAND APPROVALOF INVESTMENT ADVISORY CONTRACT | | | 57 | |
Board Review and Approval of Investment Advisory
Contract (Continued)
iSHARES® U.S. ETF TRUST
In addition, to the extent that any of the comparison funds included in the Peer Group, excluding iShares funds, track the same index as the Fund, Broadridge also provided, and the Board reviewed, a comparison of the Fund’s performance for the one-, three-, five-, ten-year, and since inception periods, as applicable, and for the “last quarter” period ended December 31, 2015, to that of such relevant comparison funds for the same periods.
The Board noted that the Fund is an actively managed ETF that does not seek to track the performance of a specified index and that the management team for the Fund manages the Fund’s portfolio in accordance with its investment objective. The Board further noted that during the prior year, the Board received periodic reports on the Fund’s short- and longer-term performance in comparison with its peer group and benchmark index. Such periodic comparative performance information, including additional detailed information on certain specific iShares funds requested by the Board, was also considered. The Board noted that the Fund generally performed in line with expectations relative to the Fund’s peer group and benchmark index over the relevant periods over the relevant periods.
Based on this review, the other factors considered at the meeting, and their general knowledge of ETF pricing, the Board concluded that the investment advisory fee rate and expense level and the historical performance of the Fund supported the Board’s approval of the continuance of the Advisory Contract for the coming year.
Nature, Extent and Quality of Services Provided by BFA — Based on management’s representations, including information about recent and proposed enhancements to the iShares business, including with respect to capital markets support and analysis, product design and other services, the Board expected that there would be no diminution in the scope of services required of or provided by BFA under the Advisory Contract for the coming year as compared to the scope of services provided by BFA during prior years. In reviewing the scope of these services, the Board considered BFA’s investment philosophy and experience, noting that BFA and its affiliates have committed significant resources over time, including during the past year, to supporting the iShares funds and their shareholders. The Board also considered BFA’s compliance program and its compliance record with respect to the Fund. In that regard, the Board noted that BFA reports to the Board about portfolio management and compliance matters on a periodic basis in connection with regularly scheduled meetings of the Board, and on other occasions as necessary and appropriate, and has provided information and made appropriate officers available as needed to provide further assistance with these matters. The Board also reviewed the background and experience of the persons responsible for the day-to-day management of the Fund, as well as the resources available to them in managing the Fund. In addition to the above considerations, the Board reviewed and considered detailed presentations regarding BFA’s investment performance, investment and risk management processes and strategies provided at the June 21-23, 2016 meeting and throughout the previous year, and matters related to BFA’s portfolio compliance policies and procedures. The Board noted that the Fund had met its investment objective consistently since its inception date.
Based on review of this information, and the performance information discussed above, the Board concluded that the nature, extent and quality of services provided by BFA to the Fund under the Advisory Contract supported the Board’s approval of the continuance of the Advisory Contract for the coming year.
Costs of Services Provided to the Fund and Profits Realized by BFA and its Affiliates — The Board reviewed information about the profitability to BlackRock of the Fund, based on the fees payable to BFA and its affiliates (including fees under the Advisory Contract), and all other sources of revenue and expense to BFA and its affiliates from the Funds’ operations for the last calendar year. The Board reviewed BlackRock’s profitability methodology for the iShares funds, noting that the 15(c) Committee had focused on the methodology and profitability presentation during its meetings. The Board discussed the sources of direct and ancillary revenue with management, including the revenues to BTC from securities lending by the Fund. The Board also discussed BFA’s profit margin as reflected in the Fund’s profitability analysis and reviewed information regarding potential economies of scale (as discussed below). Based on this review, the Board concluded that the profits realized by BFA and its
| | |
| 58 | | 2016 iSHARES ANNUAL REPORTTO SHAREHOLDERS |
Board Review and Approval of Investment Advisory
Contract (Continued)
iSHARES® U.S. ETF TRUST
affiliates under the Advisory Contract and from other relationships between the Fund and BFA and/or its affiliates, if any, were within a reasonable range in light of the factors considered.
Economies of Scale — The Board reviewed information regarding potential economies of scale or other efficiencies that may result from increases in the Fund’s assets, noting that the issue of economies of scale had been focused on extensively by the 15(c) Committee during its meetings and addressed by management. The Board and the 15(c) Committee reviewed information provided by BFA regarding scale benefits shared with the iShares funds through relatively low fee rates established at inception, breakpoints, waivers, or other fee reductions, as well as through additional investment in the iShares business and the provision of improved or additional infrastructure and services to the iShares funds and their shareholders. The Board and the 15(c) Committee received information regarding BlackRock’s historical profitability, including BFA’s and its affiliates’ costs in providing services. The cost information distinguished, among other things, between fixed and variable costs, and explained how the level of fixed and variable costs, as well as the nature of such costs, may impact the existence or size of scale benefits. The Board noted that the Advisory Contract for the Fund did not provide for any breakpoints in the Fund’s investment advisory fee rate as the assets of the Fund increase. However, the Board noted that should material economies of scale exist in the future that are not otherwise shared, a breakpoint structure for the Fund may be appropriate, and that it would continue to monitor the sharing of economies of scale to determine the appropriateness of adding breakpoints in the future.
Based on this review, as well as the other factors considered at the meeting, the Board, recognizing its responsibility to consider this issue periodically, determined to approve the continuance of the Advisory Contract for the coming year.
Fees and Services Provided for Other Comparable Funds/Accounts Managed by BFA and its Affiliates — The Board received and considered information regarding the investment advisory/management fee rates for other funds/accounts in the U.S. for which BFA (or its affiliates) provides investment advisory/management services, including open-end funds registered under the 1940 Act (including sub-advised funds), collective trust funds, and institutional separate accounts (together, the “Other Accounts”), and acknowledged BFA’s assertion that the iShares funds are fundamentally different investment vehicles from the Other Accounts. The Board noted that BFA and its affiliates do manage Other Accounts with a similar investment strategy or investment mandate as the Fund. The Board further noted that BFA provided the Board with detailed information regarding how the Other Accounts (particularly institutional clients) generally differ from the Fund, including in terms of the different and generally more extensive services provided to the Fund, as well as other significant differences. In that regard, the Board considered that the pricing of services to institutional clients is typically based on a number of factors beyond the nature and extent of the specific services to be provided and often depends on the overall relationship between the client and its affiliates and the adviser and its affiliates. In addition, the Board considered the relative complexity and inherent risks and challenges of managing and providing other services to the Fund, as a publicly traded exchange traded fund, as compared to the Other Accounts that are institutional clients in light of differing regulatory requirements and client-imposed mandates. Further, with respect to comparisons with one or more open-end index mutual funds registered under the 1940 Act managed by BFA (or an affiliate) that track the same index as the Fund and have investment advisory fee rates and overall expenses (net of waivers and reimbursements) that are lower than the investment advisory fee rate and overall expenses (net of waivers and reimbursements) of the Fund, the Board gave weight to management’s explanations of the relevant circumstances applicable to such mutual funds. The Board also considered the “all-inclusive” nature of the Fund’s advisory fee structure, and the Fund expenses borne by BFA under this arrangement. The Board noted that the investment advisory fee rate under the Advisory Contract for the Fund was generally higher than the investment advisory/management fee rates for certain of the Other Accounts (particularly institutional clients) and concluded that the differences appeared to be consistent with the factors discussed.
Other Benefits to BFA and/or its Affiliates — The Board reviewed the “fallout” benefits or ancillary revenue received by BFA and/or its affiliates in connection with the services provided to the Fund by BFA, such as payment of revenue to BTC, the Fund’s securities lending agent, for loaning portfolio securities (which was included in the profit margins reviewed by the Board pursuant
| | | | |
BOARD REVIEWAND APPROVALOF INVESTMENT ADVISORY CONTRACT | | | 59 | |
Board Review and Approval of Investment Advisory
Contract (Continued)
iSHARES® U.S. ETF TRUST
to BFA’s profitability methodology), and payment of advisory fees and/or administration fees to BFA and BTC (or their affiliates) in connection with any investments by the Fund in other funds for which BFA (or its affiliates) provides investment advisory services and/or administration services. The Board noted that BFA generally does not use soft dollars or consider the value of research or other services that may be provided to BFA (including its affiliates) in selecting brokers for portfolio transactions for the Fund. The Board further noted that any portfolio transactions on behalf of the Fund placed through a BFA affiliate or purchased from an underwriting syndicate in which a BFA affiliate participates, are reported to the Board pursuant to Rule 17e-1 or Rule 10f-3, as applicable, under the 1940 Act. The Board concluded that any such ancillary benefits would not be disadvantageous to the Fund’s shareholders and thus would not alter the Board’s conclusion with respect to the appropriateness of approving the continuance of the Advisory Contract for the coming year.
Based on the considerations described above, the Board determined that the Fund’s investment advisory fee rate under the Advisory Contract does not constitute a fee that is so disproportionately large as to bear no reasonable relationship to the services rendered and that could not have been the product of arm’s-length bargaining, and concluded that it is in the best interest of the Fund and its shareholders to approve the continuance of the Advisory Contract for the coming year.
| | |
| 60 | | 2016 iSHARES ANNUAL REPORTTO SHAREHOLDERS |
Supplemental Information (Unaudited)
iSHARES® U.S. ETF TRUST
Section 19(a) Notices
The amounts and sources of distributions reported are estimates and are provided pursuant to regulatory requirements and are not being provided for tax reporting purposes. The actual amounts and sources for tax reporting purposes will depend upon each Fund’s investment experience during the year and may be subject to changes based on the tax regulations. Shareholders will receive a Form 1099-DIV each calendar year that will inform them how to report these distributions for federal income tax purposes.
| | | | | | | | | | | | | | | | | | | | | | | | | | | | | | | | |
| | | Total Cumulative Distributions
for the Fiscal Year | | | % Breakdown of the Total Cumulative
Distributions for the Fiscal Year | |
| iShares ETF | | Net
Investment
Income | | | Net
Realized
Capital
Gains | | | Return
of
Capital | | | Total
Per
Share | | | Net
Investment
Income | | | Net
Realized
Capital
Gains | | | Return
of
Capital | | | Total
Per
Share | |
Short Maturity Bond | | $ | 0.506033 | | | $ | — | | | $ | — | | | $ | 0.506033 | | | | 100 | % | | | — | % | | | — | % | | | 100 | % |
Short Maturity Municipal Bond | | | 0.395864 | | | | — | | | | — | | | | 0.395864 | | | | 100 | | | | — | | | | — | | | | 100 | |
Ultra Short-Term Bond | | | 0.379578 | | | | — | | | | — | | | | 0.379578 | | | | 100 | | | | — | | | | — | | | | 100 | |
Premium/Discount Information
The Premium/Discount Information section is intended to present information about the differences between the daily market price on secondary markets for shares of a fund and that fund’s NAV. NAV is the price at which a fund issues and redeems shares. It is calculated in accordance with the standard formula for valuing mutual fund shares. The “Market Price” of a fund generally is determined using the midpoint between the highest bid and the lowest offer on the primary stock exchange on which the shares of such fund are listed for trading, as of the time that the fund’s NAV is calculated. A fund’s Market Price may be at, above or below its NAV. The NAV of a fund will fluctuate with changes in the fair value of its portfolio holdings. The Market Price of a fund will fluctuate in accordance with changes in its NAV, as well as market supply and demand.
Premiums or discounts are the differences (expressed as a percentage) between the NAV and Market Price of a fund on a given day, generally at the time the NAV is calculated. A premium is the amount that a fund is trading above the reported NAV, expressed as a percentage of the NAV. A discount is the amount that a fund is trading below the reported NAV, expressed as a percentage of the NAV.
The following information shows the frequency of distributions of premiums and discounts for each of the Funds. The information shown for each Fund is for five calendar years (or from the inception date of such Fund if less than five years) through the date of the most recent calendar quarter-end. The specific periods covered for each Fund are disclosed in the table for such Fund.
| | | | |
SUPPLEMENTAL INFORMATION | | | 61 | |
Supplemental Information (Unaudited) (Continued)
iSHARES® U.S. ETF TRUST
Each line in the table shows the number of trading days in which the Fund traded within the premium/discount range indicated. The number of trading days in each premium/discount range is also shown as a percentage of the total number of trading days in the period covered by each table. All data presented here represents past performance, which cannot be used to predict future results.
iShares Short Maturity Bond ETF
Period Covered: September 25, 2013 through September 30, 2016
| | | | | | | | |
Premium/Discount Range | | Number
of Days | | | Percentage of
Total Days | |
Between 0.5% and –0.5% | | | 761 | | | | 100.00 | % |
| | | | | | | | |
iShares Short Maturity Municipal Bond ETF
Period Covered: March 3, 2015 through September 30, 2016
| | | | | | | | |
Premium/Discount Range | | Number
of Days | | | Percentage of
Total Days | |
Between 0.5% and –0.5% | | | 397 | | | | 99.00 | % |
Less than –0.5% and Greater than –1.0% | | | 1 | | | | 0.25 | |
Less than –1.0% | | | 3 | | | | 0.75 | |
| | | | | | | | |
| | | 401 | | | | 100.00 | % |
| | | | | | | | |
iShares Ultra Short-Term Bond ETF
Period Covered: December 11, 2013 through September 30, 2016
| | | | | | | | |
Premium/Discount Range | | Number
of Days | | | Percentage of
Total Days | |
Greater than 0.5% | | | 1 | | | | 0.14 | % |
Between 0.5% and –0.5% | | | 701 | | | | 99.58 | |
Less than –0.5% and Greater than –1.0% | | | 1 | | | | 0.14 | |
Less than –1.0% | | | 1 | | | | 0.14 | |
| | | | | | | | |
| | | 704 | | | | 100.00 | % |
| | | | | | | | |
| | |
| 62 | | 2016 iSHARES ANNUAL REPORTTO SHAREHOLDERS |
Trustee and Officer Information
iSHARES® U.S. ETF TRUST
The Board of Trustees has responsibility for the overall management and operations of the Funds, including general supervision of the duties performed by BFA and other service providers. Each Trustee serves until he or she resigns, is removed, dies, retires or becomes incapacitated. The President, Chief Compliance Officer, Treasurer and Secretary shall each hold office until their successors are chosen and qualify, and all other officers shall hold office until he or she resigns or is removed. Trustees who are not “interested persons” (as defined in the 1940 Act) of the Trust are referred to as independent trustees (“Independent Trustees”).
The registered investment companies advised by BFA or its affiliates (the “BlackRock-advised Funds”) are organized into one complex of closed-end funds, two complexes of open-end funds and one complex of exchange-traded funds (“Exchange-Traded Fund Complex”) (each, a “BlackRock Fund Complex”). Each Fund is included in the BlackRock Fund Complex referred to as the Exchange-Traded Fund Complex. Each Trustee also serves as a Director of iShares, Inc. and a Trustee of iShares Trust, and, as a result, oversees a total of 333 funds (as of October 31, 2016) within the Exchange-Traded Fund Complex. Mr. Lawton also serves as an Advisory Board Member for iShares, Inc. and iShares Trust with respect to 333 funds (as of October 31, 2016) within the Exchange-Traded Fund Complex. With the exception of Robert S. Kapito, Mark Wiedman and Benjamin Archibald, the address of each Trustee, Advisory Board Member and officer is c/o BlackRock, Inc., 400 Howard Street, San Francisco, CA 94105. The address of Mr. Kapito, Mr. Wiedman, and Mr. Archibald is c/o BlackRock, Inc., Park Avenue Plaza, 55 East 52nd Street, New York, NY 10055. The Board has designated Cecilia H. Herbert as its Independent Board Chair. Additional information about the Funds’ Trustees and officers may be found in the Funds’ combined Statement of Additional Information, which is available without charge, upon request, by calling toll-free 1-800-iShares (1-800-474-2737).
Interested Trustees
| | | | | | |
| | | | |
| Name (Age) | | Position(s) | | Principal Occupation(s) During the Past 5 Years | | Other Directorships Held by Trustee
During the Past 5 Years |
Robert S. Kapitoa (59) | | Trustee (since 2011). | | President and Director, BlackRock, Inc. (since 2006); Vice Chairman of BlackRock, Inc. and Head of BlackRock, Inc.’s Portfolio Management Group (since its formation in 1998) and BlackRock, Inc.’s predecessor entities (since 1988); Trustee, University of Pennsylvania (since 2009); President of Board of Directors, Hope & Heroes Children’s Cancer Fund (since 2002); President of the Board of Directors, Periwinkle Theatre for Youth (since 1983). | | Director of iShares, Inc. (since 2009); Trustee of iShares Trust (since 2009). |
| | | |
Mark Wiedmanb (45) | | Trustee (since 2013) | | Managing Director, BlackRock, Inc. (since 2007); Global Head of iShares (since 2011); Head of Corporate Strategy, BlackRock, Inc. (2009-2011). | | Director of iShares, Inc. (since 2013); Trustee of iShares Trust (since 2013); Director of PennyMac Financial Services, Inc. (since 2008). |
| a | | Robert S. Kapito is deemed to be an “interested person” (as defined in the 1940 Act) of the Trust due to his affiliations with BlackRock, Inc. |
| b | | Mark Wiedman is deemed to be an “interested person” (as defined in the 1940 Act) of the Trust due to his affiliations with BlackRock, Inc. and its affiliates. |
| | | | |
TRUSTEEAND OFFICER INFORMATION | | | 63 | |
Trustee and Officer Information (Continued)
iSHARES® U.S. ETF TRUST
Independent Trusteesc
| | | | | | |
| | | | |
| Name (Age) | | Position(s) | | Principal Occupation(s) During the Past 5 Years | | Other Directorships Held by Trustee
During the Past 5 Years |
Cecilia H. Herbert (67) | | Trustee (since 2011); Independent Board Chair (since 2016); Nominating and Governance Committee Chair (since 2016). | | Director (1998-2013) and President (2007-2011) of the Board of Directors, Catholic Charities CYO; Trustee (2002-2011) and Chair of the Finance and Investment Committee (2006-2010) of the Thacher School; Member (since 1992) and Chair (1994-2005) of the Investment Committee, Archdiocese of San Francisco; Trustee and Member of the Investment Committee, WNET, the New York public media company (since 2011). | | Director of iShares, Inc. (since 2005); Trustee of iShares Trust (since 2005); Independent Board Chair of iShares Inc. and iShares Trust (since 2016); Director of Forward Funds (23 portfolios) (since 2009); Trustee of Salient MF Trust (4 portfolios) (since 2015). |
| | | |
Jane D. Carlin (60) | | Trustee (since 2015); Risk Committee Chair (since 2016). | | Managing Director and Global Head of Financial Holding Company Governance & Assurance and the Global Head of Operational Risk Management of Morgan Stanley (2006-2012). | | Director of iShares, Inc. (since 2015); Trustee of iShares Trust (since 2015); Director of PHH Corporation (mortgage solutions) (since 2012). |
| | | |
Charles A. Hurty (73) | | Trustee (since 2011); Audit Committee Chair (since 2011). | | Retired; Partner, KPMG LLP (1968-2001). | | Director of iShares, Inc. (since 2005); Trustee of iShares Trust (since 2005); Director of GMAM Absolute Return Strategy Fund (1 portfolio) (since 2002); Director of SkyBridge Alternative Investments Multi-Adviser Hedge Fund Portfolios LLC (2 portfolios) (since 2002). |
| | | |
John E. Kerrigan (61) | | Trustee (since 2011); Securities Lending Committee Chair (since 2016). | | Chief Investment Officer, Santa Clara University (since 2002). | | Director of iShares, Inc. (since 2005); Trustee of iShares Trust (since 2005). |
| | | |
John E. Martinez (55) | | Trustee (since 2011); Fixed Income Plus Committee Chair (since 2016). | | Director of FirstREX Agreement Corp. (formerly EquityRock, Inc.) (since 2005). | | Director of iShares, Inc. (since 2003); Trustee of iShares Trust (since 2003). |
| | |
| 64 | | 2016 iSHARES ANNUAL REPORTTO SHAREHOLDERS |
Trustee and Officer Information (Continued)
iSHARES® U.S. ETF TRUST
Independent Trusteesc (Continued)
| | | | | | |
| | | | |
| Name (Age) | | Position(s) | | Principal Occupation(s) During the Past 5 Years | | Other Directorships Held by Trustee
During the Past 5 Years |
Madhav V. Rajan (52) | | Trustee (since 2011); Equity Plus Committee Chair and 15(c) Committee Chair (since 2016). | | Robert K. Jaedicke Professor of Accounting and Senior Associate Dean for Academic Affairs and Head of MBA Program, Stanford University Graduate School of Business (since 2001); Professor of Law (by courtesy), Stanford Law School (since 2005); Visiting Professor, University of Chicago (2007-2008). | | Director of iShares, Inc. (since 2011); Trustee of iShares Trust (since 2011); Director, Cavium, Inc. (since 2013). |
| c | | Robert H. Silver served as an Independent Trustee until March 31, 2016. |
| | | | |
TRUSTEEAND OFFICER INFORMATION | | | 65 | |
Trustee and Officer Information (Continued)
iSHARES® U.S. ETF TRUST
Officersd
| | | | |
| | | |
| Name (Age) | | Position(s) | | Principal Occupation(s) During the Past 5 Years |
Martin Small (41) | | President (since 2016). | | Managing Director, BlackRock, Inc. (since 2010); Head of U.S. iShares (since 2015); Co-Head of the U.S. Financial Markets Advisory Group, BlackRock, Inc. (2008-2014). |
| | |
Jack Gee (57) | | Treasurer and Chief Financial Officer (since 2011). | | Managing Director, BlackRock, Inc. (since 2009); Senior Director of Fund Administration of Intermediary Investor Business, BGI (2009). |
| | |
Benjamin Archibald (41) | | Secretary (since 2015). | | Managing Director, BlackRock, Inc. (since 2014); Director, BlackRock, Inc. (2010-2013); Secretary of the BlackRock-advised Mutual Funds (since 2012). |
| | |
Steve Messinger (54) | | Executive Vice President (since 2016). | | Managing Director, BlackRock, Inc. (2007-2014 and since 2016); Managing Director, Beacon Consulting Group (2014-2016). |
| | |
Charles Park (49) | | Chief Compliance Officer (since 2011). | | Chief Compliance Officer of BlackRock Advisors, LLC and the BlackRock-advised Funds in the Equity-Bond Complex, the Equity-Liquidity Complex and the Closed-End Complex (since 2014); Chief Compliance Officer, BFA (since 2006). |
| | |
Scott Radell (47) | | Executive Vice President (since 2012). | | Managing Director, BlackRock, Inc. (since 2009); Head of Portfolio Solutions, BlackRock, Inc. (since 2009); Head of Portfolio Solutions, BGI (2007-2009); Credit Portfolio Manager, BGI (2005-2007); Credit Research Analyst, BGI (2003-2005). |
| | |
Amy Schioldager (54) | | Executive Vice President (since 2011). | | Senior Managing Director, BlackRock, Inc. (since 2009); Global Head of Index Equity, BGI (2008-2009); Global Head of U.S. Indexing, BGI (2006-2008); Head of Domestic Equity Portfolio Management, BGI (2001-2006). |
| d | | Manish Mehta served as President until October 15, 2016. |
| | |
| 66 | | 2016 iSHARES ANNUAL REPORTTO SHAREHOLDERS |
Trustee and Officer Information (Continued)
iSHARES® U.S. ETF TRUST
Advisory Board Member
| | | | | | |
| | | | |
| Name (Age) | | Position(s) | | Principal Occupation(s)
During the Past 5 Years | | Other Directorships
Held by Advisory Board Member
During the Past 5 Years |
Drew E. Lawton (57) | | Advisory Board Member (since 2016). | | Senior Managing Director of New York Life Insurance Company (2010-2015). | | Advisory Board Member of iShares, Inc. (since 2016); Advisory Board Member of iShares Trust (since 2016); Director of Principal Funds, Inc., Principal Variable Contracts Funds, Inc. and Principal Exchange-Traded Funds (124 portfolios) (March 2016-October 2016). |
| | | | |
TRUSTEEAND OFFICER INFORMATION | | | 67 | |
Notes:
| | |
| 68 | | 2016 iSHARES ANNUAL REPORTTO SHAREHOLDERS |
Notes:
Notes:
| | |
| 70 | | 2016 iSHARES ANNUAL REPORTTO SHAREHOLDERS |
For more information visit www.iShares.com or call 1-800-iShares (1-800-474-2737)
This report is intended for the Funds’ shareholders. It may not be distributed to prospective investors unless it is preceded or accompanied by the current prospectus.
Investing involves risk, including possible loss of principal.
The iShares Funds are distributed by BlackRock Investments, LLC (together with its affiliates, “BlackRock”).
A description of the policies that the Funds use to determine how to vote proxies relating to portfolio securities and information about how the Funds voted proxies relating to portfolio securities during the most recent twelve-month period ending June 30 is available without charge, upon request, by calling toll-free 1-800-474-2737; on the Funds’ website at www.iShares.com; and on the U.S. Securities and Exchange Commission (SEC) website at www.sec.gov.
The Funds file their complete schedules of portfolio holdings with the SEC for the first and third quarters of each fiscal year on Form N-Q. The Funds’ Forms N-Q are available on the SEC’s website or may be reviewed and copied at the SEC’s Public Reference Room in Washington, D.C. Information on the operation of the Public Reference Room may be obtained by calling 1-800-SEC-0330. The Funds also disclose their complete schedules of portfolio holdings on a daily basis on the Funds’ website.
©2016 BlackRock, Inc. All rights reserved. iSHARES and BLACKROCK are registered trademarks of BlackRock, Inc. or its subsidiaries. All other marks are the property of their respective owners.
iS-AR-1008-1016
OCTOBER 31, 2016
| | | | |
2016 ANNUAL REPORT | | | |  |
iShares U.S. ETF Trust
| Ø | | iShares Interest Rate Hedged High Yield Bond ETF | HYGH | NYSE Arca |
| Ø | | iShares Interest Rate Hedged Corporate Bond ETF | LQDH | NYSE Arca |
Table of Contents
Management’s Discussion of Fund Performance
iSHARES® U.S. ETF TRUST
U.S. BOND MARKET OVERVIEW
The U.S. bond market posted positive returns for the 12-month period ended October 31, 2016 (the “reporting period”). The Bloomberg Barclays U.S. Aggregate Bond Index, a broad measure of U.S. bond performance, returned 4.37% for the reporting period.
The bond market’s advance reflected continued uncertainty regarding the economic environment. Overall, the U.S. economy grew by 1.5% for the 12 months ended September 30, 2016 (the most recent data available), decelerating from 2.2% for the 12 months ended September 30, 2015. Although employment growth remained robust, other segments of the economy struggled. For example, industrial production contracted during the reporting period, while consumer spending increased by just 2.2%. As a result, the economy generated three consecutive quarters of anemic growth before rebounding in the final quarter of the reporting period.
Inflation generally remained muted as the consumer price index (“CPI”) rose by 1.6% for the reporting period. Although low by historical standards, the increase in the CPI was notably higher than the 0.2% increase for the 12 months ended October 31, 2015, reflecting a recovery in energy prices after they bottomed in February 2016.
In this environment, the U.S. Federal Reserve Bank (the “Fed”) ended a seven-year period of near-zero interest rates by raising its short-term interest rate target in December 2015. The Fed’s first interest rate hike since June 2006 increased the federal funds target rate from a range of 0%-0.25% to a range of 0.25%-0.50%. Despite expectations of more Fed rate increases in 2016, the slowing economic environment and lack of inflationary pressure led the Fed to hold rates steady for the remainder of the reporting period.
The combination of decelerating economic growth and low inflation pushed most U.S. bond yields lower and bond prices higher for the reporting period. Longer-term bonds fared best as long-term yields declined the most, while short-term bond yields rose slightly, reflecting the Fed rate hike in late 2015.
Sector performance was driven by strong investor demand for yield in a low interest rate environment. Consequently, corporate bonds — which offer the highest yields in the U.S. bond market — delivered the best returns for the reporting period. Lower-quality corporate bonds outperformed as the search for yield led investors to seek out riskier segments of the corporate bond market. In particular, high-yield corporate bonds (those with credit ratings below investment grade) returned more than 10% for the reporting period. Within the corporate sector, bonds issued by utility companies produced the highest returns. Industrial bonds also fared well, led by the strong performance of energy and commodity-related securities, while financial bonds lagged.
U.S. Treasury inflation-protected securities (“TIPS”) were also among the leading performers for the reporting period. The rebound in energy prices led to increased investor demand for inflation protection, which aided performance in the TIPS market.
Mortgage-backed securities posted positive returns for the reporting period but trailed the performance of the overall U.S. bond market. Mortgage-backed securities were held in check by prepayment fears as declining interest rates led to concerns about a renewed wave of mortgage refinancing.
U.S. Treasury and government agency bonds posted the lowest returns among U.S. bonds for the reporting period. Limited demand for the relatively low yields of Treasury and agency bonds weighed on their performance, as did the general underperformance of higher-quality securities.
| | | | |
MANAGEMENT’S DISCUSSIONSOF FUND PERFORMANCE | | | 5 | |
Management’s Discussion of Fund Performance
iSHARES® INTEREST RATE HEDGED HIGH YIELD BOND ETF
Performance as of October 31, 2016
| | | | | | | | | | | | | | | | | | | | |
| | | Average Annual Total Returns | | | | | | Cumulative Total Returns | |
| | | 1 Year | | | Since Inception | | | | | | 1 Year | | | Since Inception | |
Fund NAV | | | 4.73% | | | | (0.54)% | | | | | | | | 4.73% | | | | (1.30)% | |
Fund Market | | | 4.81% | | | | (0.52)% | | | | | | | | 4.81% | | | | (1.27)% | |
Markit iBoxx USD Liquid High Yield Interest Rate Hedged Index | | | 6.65% | | | | 0.63% | | | | | | | | 6.65% | | | | 1.53% | |
GROWTH OF $10,000 INVESTMENT
(SINCE INCEPTION AT NET ASSET VALUE)
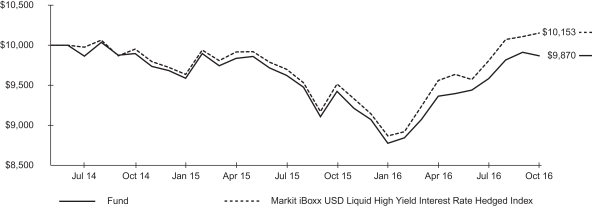
The inception date of the Fund was 5/27/14. The first day of secondary market trading was 5/28/14.
The Markit iBoxx USD Liquid High Yield Interest Rate Hedged Index is an unmanaged index that reflects the duration hedged performance of U.S. dollar-denominated high yield corporate debt.
Past performance is no guarantee of future results. Performance results do not reflect the deduction of taxes that a shareholder would pay on fund distributions or on the redemption or sale of fund shares. See “About Fund Performance” on page 10 for more information.
| | | | | | | | | | | | | | | | | | | | | | | | | | |
| Shareholder Expenses | |
| Actual | | | Hypothetical 5% Return | | | | |
Beginning
Account Value
(5/1/16) | | | Ending
Account Value
(10/31/16) | | | Expenses Paid
During Period a,b | | | Beginning
Account Value
(5/1/16) | | | Ending
Account Value
(10/31/16) | | | Expenses Paid
During Period a,b | | | Annualized
Expense Ratio a | |
| $ | 1,000.00 | | | $ | 1,054.00 | | | $ | 0.15 | | | $ | 1,000.00 | | | $ | 1,025.00 | | | $ | 0.15 | | | | 0.03% | |
| a | Annualized expense ratio and expenses paid during the period do not include fees and expenses of the underlying fund in which the Fund invests. | |
| b | Expenses are calculated using the Fund’s annualized expense ratio (as disclosed in the table), multiplied by the average account value for the period, multiplied by the number of days in the period (184 days) and divided by the number of days in the year (366 days). See “Shareholder Expenses” on page 10 for more information. | |
| | |
| 6 | | 2016 iSHARES ANNUAL REPORTTO SHAREHOLDERS |
Management’s Discussion of Fund Performance (Continued)
iSHARES® INTEREST RATE HEDGED HIGH YIELD BOND ETF
The iShares Interest Rate Hedged High Yield Bond ETF (the “Fund”) seeks to mitigate the interest rate risk of a portfolio composed of U.S. dollar-denominated, high yield corporate bonds. The Fund is an actively managed exchange-traded fund that does not seek to replicate the performance of a specified index.
The Fund currently seeks to achieve its investment objective by investing a substantial portion of its assets in one underlying fund, the iShares iBoxx $ High Yield Corporate Bond ETF. The Fund attempts to mitigate the interest rate risk of the underlying fund by holding short positions in U.S. Treasury futures or interest rate swaps. For the 12-month reporting period ended October 31, 2016, the total return for the Fund was 4.73%, net of fees.
The Fund advanced for the reporting period, reflecting the strong performance of high-yield corporate bonds across all sectors. The most important contributing factor to Fund performance was strong investor demand for yield. With U.S. Treasury bond yields near historically low levels, investors shifted into higher-yielding segments of the bond market, and corporate bonds typically offer some of the highest yields. In addition, lower-quality corporate bonds attracted greater demand because of their yield advantage over higher-rated corporate securities.
Every sector of the Index contributed to performance for the reporting period. Industrial bonds, which represented approximately 85% of the Fund on average during the reporting period, contributed the most to Fund performance, led by the communications industry. Energy and basic materials bonds also contributed to performance, benefiting from rising commodities prices in the second half of the reporting period. Outside of the industrial sector, bonds issued by finance and electric utilities companies contributed to the Fund’s performance for the reporting period.
From a credit perspective, the Fund’s higher-risk, lower credit-quality bonds (Caa-rated) delivered a relatively large contribution to the Fund’s return despite being only 13% of the Fund on average for the reporting period.
The Fund’s interest rate hedging activity detracted from Fund performance for the reporting period. Hedging against interest rate risk can improve returns when bond yields rise, but it can be a drag on performance when bond yields decline, as was the case during the reporting period.
ALLOCATION BY CREDIT QUALITY 1
As of 10/31/16
| | |
| Moody’s Credit Rating 2 | | Percentage of
Total Investments 3 |
| | | | |
Baa | | | 0.61 | % |
Ba | | | 45.59 | |
B | | | 39.52 | |
Caa | | | 12.83 | |
Ca | | | 0.35 | |
C | | | 0.09 | |
Not Rated | | | 1.01 | |
| | | | |
TOTAL | | | 100.00 | % |
| | | | |
ALLOCATION BY MATURITY 1
As of 10/31/16
| | |
| Maturity | | Percentage of Total Investments 3 |
| | | | |
0-1 Year | | | 0.08 | % |
1-5 Years | | | 35.08 | |
5-10 Years | | | 62.83 | |
10-15 Years | | | 1.36 | |
More than 20 Years | | | 0.65 | |
| | | | |
TOTAL | | | 100.00 | % |
| | | | |
| | 1 | Table shown is for the iShares iBoxx $ High Yield Corporate Bond ETF, the underlying fund in which the Fund invests. |
| | 2 | Credit quality ratings shown reflect the ratings assigned by Moody’s Investors Service (“Moody’s”), a widely used independent, nationally recognized statistical rating organization. Moody’s credit ratings are opinions of the credit quality of individual obligations or of an issuer’s general creditworthiness. Investment grade ratings are credit ratings of Baa or higher. Below investment grade ratings are credit ratings of Ba or lower. Unrated investments do not necessarily indicate low credit quality. Credit quality ratings are subject to change. |
| | 3 | Excludes money market funds. |
| | | | |
MANAGEMENT’S DISCUSSIONSOF FUND PERFORMANCE | | | 7 | |
Management’s Discussion of Fund Performance
iSHARES® INTEREST RATE HEDGED CORPORATE BOND ETF
Performance as of October 31, 2016
| | | | | | | | | | | | | | | | | | | | |
| | | Average Annual Total Returns | | | | | | Cumulative Total Returns | |
| | | 1 Year | | | Since Inception | | | | | | 1 Year | | | Since Inception | |
Fund NAV | | | 2.70% | | | | (0.58)% | | | | | | | | 2.70% | | | | (1.40)% | |
Fund Market | | | 2.83% | | | | (0.52)% | | | | | | | | 2.83% | | | | (1.27)% | |
Markit iBoxx USD Liquid Investment Grade Interest Rate Hedged Index | | | 3.91% | | | | 0.42% | | | | | | | | 3.91% | | | | 1.03% | |
GROWTH OF $10,000 INVESTMENT
(SINCE INCEPTION AT NET ASSET VALUE)
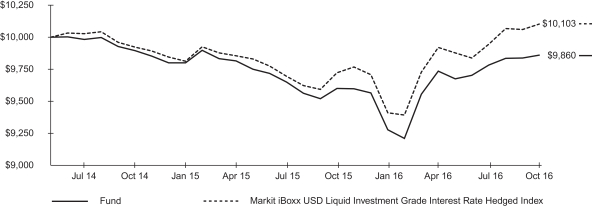
The inception date of the Fund was 5/27/14. The first day of secondary market trading was 5/28/14.
The Markit iBoxx USD Liquid Investment Grade Interest Rate Hedged Index is an unmanaged index that is designed to reflect the duration hedged performance of U.S. dollar-denominated investment-grade corporate debt.
Past performance is no guarantee of future results. Performance results do not reflect the deduction of taxes that a shareholder would pay on fund distributions or on the redemption or sale of fund shares. See “About Fund Performance” on page 10 for more information.
| | | | | | | | | | | | | | | | | | | | | | | | | | |
| Shareholder Expenses | |
| Actual | | | Hypothetical 5% Return | | | | |
Beginning
Account Value
(5/1/16) | | | Ending
Account Value
(10/31/16) | | | Expenses Paid
During Period a,b | | | Beginning
Account Value
(5/1/16) | | | Ending
Account Value
(10/31/16) | | | Expenses Paid
During Period a,b | | | Annualized
Expense Ratio a | |
| $ | 1,000.00 | | | $ | 1,012.70 | | | $ | 0.46 | | | $ | 1,000.00 | | | $ | 1,024.70 | | | $ | 0.46 | | | | 0.09% | |
| a | Annualized expense ratio and expenses paid during the period do not include fees and expenses of the underlying fund in which the Fund invests. | |
| b | Expenses are calculated using the Fund’s annualized expense ratio (as disclosed in the table), multiplied by the average account value for the period, multiplied by the number of days in the period (184 days) and divided by the number of days in the year (366 days). See “Shareholder Expenses” on page 10 for more information. | |
| | |
| 8 | | 2016 iSHARES ANNUAL REPORTTO SHAREHOLDERS |
Management’s Discussion of Fund Performance (Continued)
iSHARES® INTEREST RATE HEDGED CORPORATE BOND ETF
The iShares Interest Rate Hedged Corporate Bond ETF (the “Fund”) seeks to mitigate the interest rate risk of a portfolio composed of U.S. dollar-denominated, investment-grade corporate bonds. The Fund is an actively managed exchange-traded fund that does not seek to replicate the performance of a specified index.
The Fund currently seeks to achieve its investment objective by investing a substantial portion of its assets in one underlying fund, the iShares iBoxx $ Investment Grade Corporate Bond ETF. The Fund attempts to mitigate the interest rate risk of the underlying fund by holding short positions in U.S. Treasury futures or interest rate swaps. For the 12-month reporting period ended October 31, 2016, the total return for the Fund was 2.70%, net of fees.
The Fund’s performance was largely driven by strong investor demand for yield in a low interest rate environment. Corporate bonds — which offer the highest yields in the U.S. bond market — outperformed all other sectors of the bond market. Higher-quality corporate bonds trailed high-yield corporate bonds, as the search for yield led investors to seek out riskier segments of the corporate bond market.
Every sector of the Fund contributed positively to performance for the reporting period. Industrial bonds, which represented approximately 65% of the Fund on average during the reporting period, contributed the most to Fund performance, led by the consumer-oriented and communications industries. Financial bonds, which represented approximately 33% of the Fund on average, also helped performance for the reporting period, with the banking and insurance industries contributing the most to performance. The utilities sector was a modest contributor due to its relatively small weighting in the Fund.
From a credit perspective, the Fund’s position in medium-quality bonds — those rated A and Baa, which represented approximately 84% of the Fund on average for the reporting period — delivered the largest contribution to the Fund’s return.
The Fund’s interest rate hedging activity detracted from Fund performance for the reporting period. Hedging against interest rate risk can improve returns when bond yields rise, but it can be a drag on performance when bond yields decline, as was the case during the reporting period.
ALLOCATION BY CREDIT QUALITY 1
As of 10/31/16
| | |
| Moody’s Credit Rating 2 | | Percentage of
Total Investments 3 |
| | | | |
Aaa | | | 2.95 | % |
Aa | | | 10.40 | |
A | | | 40.68 | |
Baa | | | 42.02 | |
Ba | | | 3.51 | |
Not Rated | | | 0.44 | |
| | | | |
TOTAL | | | 100.00 | % |
| | | | |
ALLOCATION BY MATURITY 1
As of 10/31/16
| | |
| Maturity | | Percentage of
Total Investments 3 |
| | | | |
1-5 Years | | | 23.96 | % |
5-10 Years | | | 40.93 | |
10-15 Years | | | 2.63 | |
15-20 Years | | | 5.83 | |
More than 20 Years | | | 26.65 | |
| | | | |
TOTAL | | | 100.00 | % |
| | | | |
| | 1 | Table shown is for the iShares iBoxx $ Investment Grade Corporate Bond ETF, the underlying fund in which the Fund invests. |
| | 2 | Credit quality ratings shown reflect the ratings assigned by Moody’s Investors Service (“Moody’s”), a widely used independent, nationally recognized statisticalrating organization. Moody’s credit ratings are opinions of the credit quality of individual obligations or of an issuer’s general creditworthiness. Investment grade ratings are credit ratings of Baa or higher. Below investment grade ratings are credit ratings of Ba or lower. Unrated investments do not necessarily indicate low credit quality. Credit quality ratings are subject to change. |
| | 3 | Excludes money market funds. |
| | | | |
MANAGEMENT’S DISCUSSIONSOF FUND PERFORMANCE | | | 9 | |
About Fund Performance
Past performance is no guarantee of future results. Current performance may be lower or higher than the performance data quoted. Performance data current to the most recent month-end is available at www.ishares.com. Performance results assume reinvestment of all dividends and capital gain distributions and do not reflect the deduction of taxes that a shareholder would pay on fund distributions or on the redemption or sale of fund shares. The investment return and principal value of shares will vary with changes in market conditions. Shares may be worth more or less than their original cost when they are redeemed or sold in the market. Performance for certain funds may reflect a waiver of a portion of investment advisory fees. Without such a waiver, performance would have been lower.
Net asset value or “NAV” is the value of one share of a fund as calculated in accordance with the standard formula for valuing mutual fund shares. The price used to calculate market return (“Market Price”) is determined by using the midpoint between the highest bid and the lowest offer on the primary stock exchange on which shares of a fund are listed for trading, as of the time that such fund’s NAV is calculated. Certain funds may have a NAV which is determined prior to the opening of regular trading on its listed exchange and their market returns are calculated using the midpoint of the bid/ask spread as of the opening of regular trading on the exchange. Market and NAV returns assume that dividends and capital gain distributions have been reinvested at Market Price and NAV, respectively.
An index is a statistical composite that tracks a specified financial market or sector. Unlike a fund, an index does not actually hold a portfolio of securities and therefore does not incur the expenses incurred by a fund. These expenses negatively impact fund performance. Also, market returns do not include brokerage commissions that may be payable on secondary market transactions. If brokerage commissions were included, market returns would be lower.
Shareholder Expenses
As a shareholder of a Fund, you incur two types of costs: (1) transaction costs, including brokerage commissions on purchases and sales of fund shares and (2) ongoing costs, including management fees and other fund expenses. The expense example, which is based on an investment of $1,000 invested on May 1, 2016 and held through October 31, 2016, is intended to help you understand your ongoing costs (in dollars and cents) of investing in a Fund and to compare these costs with the ongoing costs of investing in other funds.
Actual Expenses — The table provides information about actual account values and actual expenses. Annualized expense ratios reflect contractual and voluntary fee waivers, if any. To estimate the expenses that you paid on your account over the period, simply divide your account value by $1,000 (for example, an $8,600 account value divided by $1,000 = 8.6), then multiply the result by the number corresponding to your Fund under the heading entitled “Expenses Paid During Period.”
Hypothetical Example for Comparison Purposes — The table also provides information about hypothetical account values and hypothetical expenses based on each Fund’s actual expense ratio and an assumed rate of return of 5% per year before expenses. You may use this information to compare the ongoing costs of investing in your Fund and other funds. To do so, compare this 5% hypothetical example with the 5% hypothetical examples that appear in the shareholder reports of the other funds.
Please note that the expenses shown in the table are meant to highlight your ongoing costs only and do not reflect any transactional costs, such as brokerage commissions paid on purchases and sales of fund shares. Therefore, the hypothetical examples are useful in comparing ongoing costs only and will not help you determine the relative total costs of owning different funds. In addition, if these transactional costs were included, your costs would have been higher.
| | |
| 10 | | 2016 iSHARES ANNUAL REPORTTO SHAREHOLDERS |
Schedule of Investments
iSHARES® INTEREST RATE HEDGED HIGH YIELD BOND ETF
October 31, 2016
| | | | | | | | |
| Security | | Shares | | | Value | |
INVESTMENT COMPANIES — 96.79% | |
|
EXCHANGE-TRADED FUNDS — 96.79% | |
iShares iBoxx $ High Yield Corporate Bond ETFa,b | | | 344,246 | | | $ | 29,612,040 | |
| | | | | | | | |
| | | | | | | 29,612,040 | |
| | | | | | | | |
TOTAL INVESTMENT COMPANIES | | | | | |
(Cost: $32,365,717) | | | | | | | 29,612,040 | |
|
SHORT-TERM INVESTMENTS — 48.25% | |
MONEY MARKET FUNDS — 48.25% | |
BlackRock Cash Funds: Institutional,
SL Agency Shares | | | | | |
0.72%c,d,e | | | 14,096,906 | | | | 14,098,316 | |
BlackRock Cash Funds: Treasury,
SL Agency Shares | | | | | |
0.29%c,d | | | 664,261 | | | | 664,261 | |
| | | | | | | | |
| | | | | | | 14,762,577 | |
| | | | | | | | |
TOTAL SHORT-TERM INVESTMENTS | | | | | |
(Cost: $14,762,577) | | | | | | | 14,762,577 | |
| | | | | | | | |
| |
TOTAL INVESTMENTS IN SECURITIES — 145.04% | | | | | |
(Cost: $47,128,294)f | | | | | | | 44,374,617 | |
Other Assets, Less Liabilities — (45.04)% | | | | (13,778,916 | ) |
| | | | | | | | |
| |
NET ASSETS — 100.00% | | | $ | 30,595,701 | |
| | | | | | | | |
| a | All or a portion of this security represents a security on loan. See Note 1. |
| b | Affiliated issuer. See Schedule 1. |
| c | Affiliated money market fund. |
| d | The rate quoted is the annualized seven-day yield of the fund at period end. |
| e | All or a portion of this security represents an investment of securities lending collateral. See Note 1. |
| f | The cost of investments for federal income tax purposes was $47,148,286. Net unrealized depreciation was $2,773,669, of which $ — represented gross unrealized appreciation on securities and $2,773,669 represented gross unrealized depreciation on securities. |
| | | | |
SCHEDULESOF INVESTMENTS | | | 11 | |
Schedule of Investments (Continued)
iSHARES® INTEREST RATE HEDGED HIGH YIELD BOND ETF
October 31, 2016
Schedule 1 — Affiliates (Note 2)
Investments in issuers considered to be affiliates of the Fund (excluding affiliated money market funds) during the year ended October 31, 2016, for purposes of Section 2(a)(3) of the 1940 Act, were as follows:
| | | | | | | | | | | | | | | | | | | | | | | | | | | | |
| Affiliated issuer | | Shares
held at
beginning
of year | | | Shares
purchased | | | Shares sold | | | Shares
held at end
of year | | | Value at end
of year | | | Dividend
income | | | Net realized
gain (loss) | |
iShares iBoxx $ High Yield Corporate Bond ETF | | | 551,870 | | | | 51,670 | | | | (259,294 | ) | | | 344,246 | | | $ | 29,612,040 | | | $ | 1,975,757 | | | $ | (2,404,768 | ) |
| | | | | | | | | | | | | | | | | | | | | | | | | | | | |
| | | | | | | | | | | | | | | | | | | | | | | | | | | | | |
Schedule 2 — Swaps Contracts (Note 5)
Centrally cleared short interest rate swaps outstanding as of October 31, 2016 were as follows:
| | | | | | | | | | | | | | | | | | | | | | | | | | | | |
| Fixed ratea | | Floating ratea | | | Clearinghouse | | | Expiration
date | | | Notional
amount | | | Value | | | Premiums
paid
(received) | | | Unrealized
appreciation
(depreciation) | |
1.01% | | | 3-month LIBOR | | | | Chicago Mercantile | | | | 12/08/2018 | | | $ | (14,500,000 | ) | | $ | 29,124 | | | $ | 3,504 | | | $ | 25,620 | |
1.17% | | | 3-month LIBOR | | | | Chicago Mercantile | | | | 12/08/2021 | | | | (11,000,000 | ) | | | 109,393 | | | | 5,479 | | | | 103,914 | |
1.44% | | | 3-month LIBOR | | | | Chicago Mercantile | | | | 12/08/2026 | | | | (2,750,000 | ) | | | 76,409 | | | | (2,193 | ) | | | 78,602 | |
| | | | | | | | | | | | | | | | | | | | | | | | | | | | |
| | | | Net unrealized appreciation | | | $ | 208,136 | |
| | | | | | | | | | | | | | | | | | | | | | | | | | | | |
| | | | | | | | | | | | | | | | | | | | | | | | | | | | | |
| | a | | The Fund pays the fixed rate and receives the floating rate. |
Schedule 3 — Fair Value Measurements
Various inputs are used in determining the fair value of financial instruments. For description of the input levels and information about the Fund’s policy regarding valuation of financial instruments, see Note 1.
The following table summarizes the value of the Fund’s investments according to the fair value hierarchy as of October 31, 2016. The breakdown of the Fund’s investments into major categories is disclosed in the schedule of investments above.
| | | | | | | | | | | | | | | | |
| | | Level 1 | | | Level 2 | | | Level 3 | | | Total | |
Investments: | | | | | | | | | | | | | | | | |
Assets: | | | | | | | | | | | | | | | | |
Investment companies | | $ | 29,612,040 | | | $ | — | | | $ | — | | | $ | 29,612,040 | |
Money market funds | | | 14,762,577 | | | | — | | | | — | | | | 14,762,577 | |
| | | | | | | | | | | | | | | | |
Total | | $ | 44,374,617 | | | $ | — | | | $ | — | | | $ | 44,374,617 | |
| | | | | | | | | | | | | | | | |
Derivative financial instrumentsa: | | | | | | | | | | | | | | | | |
Assets: | | | | | | | | | | | | | | | | |
Centrally cleared interest rate swaps | | $ | — | | | $ | 208,136 | | | $ | — | | | $ | 208,136 | |
| | | | | | | | | | | | | | | | |
Total | | $ | — | | | $ | 208,136 | | | $ | — | | | $ | 208,136 | |
| | | | | | | | | | | | | | | | |
| | | | | | | | | | | | | | | | | |
| | a | | Shown at the unrealized appreciation (depreciation) on the contracts. |
See notes to financial statements.
| | |
| 12 | | 2016 iSHARES ANNUAL REPORTTO SHAREHOLDERS |
Schedule of Investments
iSHARES® INTEREST RATE HEDGED CORPORATE BOND ETF
October 31, 2016
| | | | | | | | |
| Security | | Shares | | | Value | |
INVESTMENT COMPANIES — 93.84% | |
|
EXCHANGE-TRADED FUNDS — 93.84% | |
iShares iBoxx $ Investment Grade Corporate Bond ETFa | | | 251,108 | | | $ | 30,379,046 | |
| | | | | | | | |
| | | | | | | 30,379,046 | |
| | | | | | | | |
TOTAL INVESTMENT COMPANIES | | | | | |
(Cost: $29,750,331) | | | | | | | 30,379,046 | |
|
SHORT-TERM INVESTMENTS — 3.53% | |
MONEY MARKET FUNDS — 3.53% | |
BlackRock Cash Funds: Treasury,
SL Agency Shares | | | | | |
0.29%b,c | | | 1,142,609 | | | | 1,142,609 | |
| | | | | | | | |
| | | | | | | 1,142,609 | |
| | | | | | | | |
TOTAL SHORT-TERM INVESTMENTS | | | | | |
(Cost: $1,142,609) | | | | | | | 1,142,609 | |
| | | | | | | | |
| |
TOTAL INVESTMENTS
IN SECURITIES — 97.37% | | | | | |
(Cost: $30,892,940)d | | | | | | | 31,521,655 | |
Other Assets, Less Liabilities — 2.63% | | | | 850,017 | |
| | | | | | | | |
| |
NET ASSETS — 100.00% | | | $ | 32,371,672 | |
| | | | | | | | |
| a | Affiliated issuer. See Schedule 1. |
| b | Affiliated money market fund. |
| c | The rate quoted is the annualized seven-day yield of the fund at period end. |
| d | The cost of investments for federal income tax purposes was $30,892,940. Net unrealized appreciation was $628,715, of which $628,715 represented gross unrealized appreciation on securities and $ — represented gross unrealized depreciation on securities. |
| | | | |
SCHEDULESOF INVESTMENTS | | | 13 | |
Schedule of Investments (Continued)
iSHARES® INTEREST RATE HEDGED CORPORATE BOND ETF
October 31, 2016
Schedule 1 — Affiliates (Note 2)
Investments in issuers considered to be affiliates of the Fund (excluding affiliated money market funds) during the year ended October 31, 2016, for purposes of Section 2(a)(3) of the 1940 Act, were as follows:
| | | | | | | | | | | | | | | | | | | | | | | | | | | | |
| Affiliated issuer | | Shares
held at
beginning
of year | | | Shares
purchased | | | Shares sold | | | Shares
held at end
of year | | | Value at end
of year | | | Dividend
income | | | Net realized
gain (loss) | |
iShares iBoxx $ Investment Grade Corporate Bond ETF | | | 151,666 | | | | 377,044 | | | | (277,602 | ) | | | 251,108 | | | $ | 30,379,046 | | | $ | 1,012,567 | | | $ | 965,745 | |
| | | | | | | | | | | | | | | | | | | | | | | | | | | | |
| | | | | | | | | | | | | | | | | | | | | | | | | | | | | |
Schedule 2 — Swaps Contracts (Note 5)
Centrally cleared short interest rate swaps outstanding as of October 31, 2016 were as follows:
| | | | | | | | | | | | | | | | | | | | | | | | | | | | |
| Fixed ratea | | Floating ratea | | | Clearinghouse | | | Expiration
date | | | Notional
amount | | | Value | | | Premiums
paid
(received) | | | Unrealized
appreciation
(depreciation) | |
1.01% | | | 3-month LIBOR | | | | Chicago Mercantile | | | | 12/08/2018 | | | $ | (5,000,000 | ) | | $ | 10,043 | | | $ | 1,030 | | | $ | 9,013 | |
1.17% | | | 3-month LIBOR | | | | Chicago Mercantile | | | | 12/08/2021 | | | | (10,000,000 | ) | | | 99,449 | | | | 2,969 | | | | 96,480 | |
1.44% | | | 3-month LIBOR | | | | Chicago Mercantile | | | | 12/08/2026 | | | | (9,500,000 | ) | | | 263,957 | | | | 4,037 | | | | 259,920 | |
1.70% | | | 3-month LIBOR | | | | Chicago Mercantile | | | | 12/08/2036 | | | | (4,500,000 | ) | | | 252,005 | | | | (13,203 | ) | | | 265,208 | |
1.77% | | | 3-month LIBOR | | | | Chicago Mercantile | | | | 12/08/2046 | | | | (1,300,000 | ) | | | 98,971 | | | | (9,213 | ) | | | 108,184 | |
| | | | | | | | | | | | | | | | | | | | | | | | | | | | |
| | | | Net unrealized appreciation | | | $ | 738,805 | |
| | | | | | | | | | | | | | | | | | | | | | | | | | | | |
| | | | | | | | | | | | | | | | | | | | | | | | | | | | | |
| | a | | The Fund pays the fixed rate and receives the floating rate. |
Schedule 3 — Fair Value Measurements
Various inputs are used in determining the fair value of financial instruments. For description of the input levels and information about the Fund’s policy regarding valuation of financial instruments, see Note 1.
The following table summarizes the value of the Fund’s investments according to the fair value hierarchy as of October 31, 2016. The breakdown of the Fund’s investments into major categories is disclosed in the schedule of investments above.
| | | | | | | | | | | | | | | | |
| | | Level 1 | | | Level 2 | | | Level 3 | | | Total | |
Investments: | | | | | | | | | | | | | | | | |
Assets: | | | | | | | | | | | | | | | | |
Investment companies | | $ | 30,379,046 | | | $ | — | | | $ | — | | | $ | 30,379,046 | |
Money market funds | | | 1,142,609 | | | | — | | | | — | | | | 1,142,609 | |
| | | | | | | | | | | | | | | | |
Total | | $ | 31,521,655 | | | $ | — | | | $ | — | | | $ | 31,521,655 | |
| | | | | | | | | | | | | | | | |
Derivative financial instrumentsa: | | | | | | | | | | | | | | | | |
Assets: | | | | | | | | | | | | | | | | |
Centrally cleared interest rate swaps | | $ | — | | | $ | 738,805 | | | $ | — | | | $ | 738,805 | |
| | | | | | | | | | | | | | | | |
Total | | $ | — | | | $ | 738,805 | | | $ | — | | | $ | 738,805 | |
| | | | | | | | | | | | | | | | |
| | | | | | | | | | | | | | | | | |
| | a | | Shown at the unrealized appreciation (depreciation) on the contracts. |
See notes to financial statements.
| | |
| 14 | | 2016 iSHARES ANNUAL REPORTTO SHAREHOLDERS |
Statements of Assets and Liabilities
iSHARES® U.S. ETF TRUST
October 31, 2016
| | | | | | | | |
| | | iShares
Interest Rate
Hedged High Yield
Bond ETF | | | iShares
Interest Rate
Hedged Corporate
Bond ETF | |
| | |
ASSETS | | | | | | | | |
Investments, at cost: | | | | | | | | |
Affiliated (Note 2) | | $ | 47,128,294 | | | $ | 30,892,940 | |
| | | | | | | | |
Total cost of investments | | $ | 47,128,294 | | | $ | 30,892,940 | |
| | | | | | | | |
Investments in securities, at fair value (including securities on loana) (Note 1): | | | | | | | | |
Affiliated (Note 2) | | $ | 44,374,617 | | | $ | 31,521,655 | |
| | | | | | | | |
Total fair value of investments | | | 44,374,617 | | | | 31,521,655 | |
Cash | | | 1,000 | | | | 9,000 | |
Cash pledged for centrally cleared swaps | | | 321,000 | | | | 887,000 | |
Receivables: | | | | | | | | |
Investment securities sold | | | 688 | | | | — | |
Dividends | | | 9,791 | | | | 238 | |
| | | | | | | | |
Total Assets | | | 44,707,096 | | | | 32,417,893 | |
| | | | | | | | |
| | |
LIABILITIES | | | | | | | | |
Payables: | | | | | | | | |
Collateral for securities on loan (Note 1) | | | 14,098,316 | | | | — | |
Investment advisory fees (Note 2) | | | 1,307 | | | | 2,745 | |
Variation margin on centrally cleared swaps | | | 11,772 | | | | 43,476 | |
| | | | | | | | |
Total Liabilities | | | 14,111,395 | | | | 46,221 | |
| | | | | | | | |
| | |
NET ASSETS | | $ | 30,595,701 | | | $ | 32,371,672 | |
| | | | | | | | |
| | |
Net assets consist of: | | | | | | | | |
Paid-in capital | | $ | 35,747,898 | | | $ | 33,642,660 | |
Undistributed net investment income | | | 5,770 | | | | — | |
Accumulated net realized loss | | | (2,612,426 | ) | | | (2,638,508 | ) |
Net unrealized appreciation (depreciation) | | | (2,545,541 | ) | | | 1,367,520 | |
| | | | | | | | |
NET ASSETS | | $ | 30,595,701 | | | $ | 32,371,672 | |
| | | | | | | | |
| | |
Shares outstandingb | | | 350,000 | | | | 350,000 | |
| | | | | | | | |
| | |
Net asset value per share | | $ | 87.42 | | | $ | 92.49 | |
| | | | | | | | |
| a | Securities on loan with values of $13,703,244 and $ —, respectively. See Note 1. |
| b | No par value, unlimited number of shares authorized. |
See notes to financial statements.
Statements of Operations
iSHARES® U.S. ETF TRUST
Year ended October 31, 2016
| | | | | | | | |
| | | iShares Interest
Rate Hedged
High Yield
Bond ETF | | | iShares Interest
Rate Hedged
Corporate
Bond ETF | |
| | |
NET INVESTMENT INCOME | | | | | | | | |
Dividends — affiliated (Note 2) | | $ | 1,977,100 | | | $ | 1,014,009 | |
Securities lending income — affiliated — net (Note 2) | | | 73,162 | | | | 2,730 | |
| | | | | | | | |
Total investment income | | | 2,050,262 | | | | 1,016,739 | |
| | | | | | | | |
| | |
EXPENSES | | | | | | | | |
Investment advisory fees (Note 2) | | | 228,766 | | | | 98,162 | |
| | | | | | | | |
Total expenses | | | 228,766 | | | | 98,162 | |
Less investment advisory fees waived (Note 2) | | | (211,056 | ) | | | (65,374 | ) |
| | | | | | | | |
Net expenses | | | 17,710 | | | | 32,788 | |
| | | | | | | | |
Net investment income | | | 2,032,552 | | | | 983,951 | |
| | | | | | | | |
| | |
NET REALIZED AND UNREALIZED GAIN (LOSS) | | | | | | | | |
Net realized gain (loss) from: | | | | | | | | |
Investments — affiliated (Note 2) | | | (155,844 | ) | | | (76,905 | ) |
In-kind redemptions — affiliated (Note 2) | | | (2,248,235 | ) | | | 1,042,650 | |
Swap agreements | | | (1,004,320 | ) | | | (2,409,631 | ) |
Realized gain distributions from affiliated funds | | | 1 | | | | 1 | |
| | | | | | | | |
Net realized loss | | | (3,408,398 | ) | | | (1,443,885 | ) |
| | | | | | | | |
Net change in unrealized appreciation/depreciation on: | | | | | | | | |
Investments | | | 1,480,239 | | | | 1,009,563 | |
Swap agreements | | | 514,327 | | | | 987,742 | |
| | | | | | | | |
Net change in unrealized appreciation/depreciation | | | 1,994,566 | | | | 1,997,305 | |
| | | | | | | | |
Net realized and unrealized gain (loss) | | | (1,413,832 | ) | | | 553,420 | |
| | | | | | | | |
NET INCREASE IN NET ASSETS RESULTING FROM OPERATIONS | | $ | 618,720 | | | $ | 1,537,371 | |
| | | | | | | | |
See notes to financial statements.
| | |
| 16 | | 2016 iSHARES ANNUAL REPORTTO SHAREHOLDERS |
Statements of Changes in Net Assets
iSHARES® U.S. ETF TRUST
| | | | | | | | | | | | | | | | |
| | | iShares
Interest Rate
Hedged High
Yield Bond ETF | | | iShares
Interest Rate
Hedged Corporate
Bond ETF | |
| | | Year ended
October 31, 2016 | | | Year ended October 31, 2015 | | | Year ended October 31, 2016 | | | Year ended October 31, 2015 | |
| | | | |
INCREASE (DECREASE) IN NET ASSETS | | | | | | | | | | | | | | | | |
| | | | |
OPERATIONS: | | | | | | | | | | | | | | | | |
Net investment income | | $ | 2,032,552 | | | $ | 4,163,846 | | | $ | 983,951 | | | $ | 534,132 | |
Net realized loss | | | (3,408,398 | ) | | | (4,670,072 | ) | | | (1,443,885 | ) | | | (625,149 | ) |
Net change in unrealized appreciation/depreciation | | | 1,994,566 | | | | (3,585,724 | ) | | | 1,997,305 | | | | (536,370 | ) |
| | | | | | | | | | | | | | | | |
Net increase (decrease) in net assets resulting from operations | | | 618,720 | | | | (4,091,950 | ) | | | 1,537,371 | | | | (627,387 | ) |
| | | | | | | | | | | | | | | | |
| | | | |
DISTRIBUTIONS TO SHAREHOLDERS: | | | | | | | | | | | | | | | | |
From net investment income | | | (1,756,097 | ) | | | (4,084,037 | ) | | | (731,888 | ) | | | (502,154 | ) |
Return of capital | | | — | | | | (30,974 | ) | | | — | | | | (24,646 | ) |
| | | | | | | | | | | | | | | | |
Total distributions to shareholders | | | (1,756,097 | ) | | | (4,115,011 | ) | | | (731,888 | ) | | | (526,800 | ) |
| | | | | | | | | | | | | | | | |
| | | | |
CAPITAL SHARE TRANSACTIONS: | | | | | | | | | | | | | | | | |
Proceeds from shares sold | | | 4,362,805 | | | | 79,304,038 | | | | 45,014,948 | | | | 19,042,441 | |
Cost of shares redeemed | | | (20,844,250 | ) | | | (66,501,133 | ) | | | (31,875,441 | ) | | | (9,256,512 | ) |
| | | | | | | | | | | | | | | | |
Net increase (decrease) in net assets from capital share transactions | | | (16,481,445 | ) | | | 12,802,905 | | | | 13,139,507 | | | | 9,785,929 | |
| | | | | | | | | | | | | | | | |
INCREASE (DECREASE) IN NET ASSETS | | | (17,618,822 | ) | | | 4,595,944 | | | | 13,944,990 | | | | 8,631,742 | |
| | | | |
NET ASSETS | | | | | | | | | | | | | | | | |
Beginning of year | | | 48,214,523 | | | | 43,618,579 | | | | 18,426,682 | | | | 9,794,940 | |
| | | | | | | | | | | | | | | | |
End of year | | $ | 30,595,701 | | | $ | 48,214,523 | | | $ | 32,371,672 | | | $ | 18,426,682 | |
| | | | | | | | | | | | | | | | |
Undistributed net investment income included in net assets at end of year | | $ | 5,770 | | | $ | — | | | $ | — | | | $ | — | |
| | | | | | | | | | | | | | | | |
| | | | |
SHARES ISSUED AND REDEEMED | | | | | | | | | | | | | | | | |
Shares sold | | | 50,000 | | | | 850,000 | | | | 500,000 | | | | 200,000 | |
Shares redeemed | | | (250,000 | ) | | | (750,000 | ) | | | (350,000 | ) | | | (100,000 | ) |
| | | | | | | | | | | | | | | | |
Net increase (decrease) in shares outstanding | | | (200,000 | ) | | | 100,000 | | | | 150,000 | | | | 100,000 | |
| | | | | | | | | | | | | | | | |
See notes to financial statements.
Financial Highlights
iSHARES® U.S. ETF TRUST
(For a share outstanding throughout each period)
| | | | | | | | |
| | iShares Interest Rate Hedged High Yield Bond ETF | | |
| | | | | | | | | | | | |
| | | Year ended
Oct. 31, 2016 | | | Year ended
Oct. 31, 2015 | | | Period from
May 27, 2014a to
Oct. 31, 2014 | |
Net asset value, beginning of period | | $ | 87.66 | | | $ | 96.93 | | | $ | 100.10 | |
| | | | | | | | | | | | |
Income from investment operations: | | | | | | | | | | | | |
Net investment incomeb | | | 4.86 | | | | 4.80 | | | | 1.86 | |
Net realized and unrealized lossc | | | (0.94 | ) | | | (9.29 | ) | | | (2.87 | ) |
| | | | | | | | | | | | |
Total from investment operations | | | 3.92 | | | | (4.49 | ) | | | (1.01 | ) |
| | | | | | | | | | | | |
Less distributions from: | | | | | | | | | | | | |
Net investment income | | | (4.16 | ) | | | (4.74 | ) | | | (2.15 | ) |
Return of capital | | | — | | | | (0.04 | ) | | | (0.01 | ) |
| | | | | | | | | | | | |
Total distributions | | | (4.16 | ) | | | (4.78 | ) | | | (2.16 | ) |
| | | | | | | | | | | | |
Net asset value, end of period | | $ | 87.42 | | | $ | 87.66 | | | $ | 96.93 | |
| | | | | | | | | | | | |
| | | |
Total return | | | 4.73 | % | | | (4.77 | )% | | | (1.03 | )%d |
| | | | | | | | | | | | |
| | | |
Ratios/Supplemental data: | | | | | | | | | | | | |
Net assets, end of period (000s) | | $ | 30,596 | | | $ | 48,215 | | | $ | 43,619 | |
Ratio of expenses to average net assetse,f | | | 0.05 | % | | | 0.06 | % | | | 0.06 | % |
Ratio of expenses to average net assets prior to waived feese,f | | | 0.65 | % | | | 0.65 | % | | | 0.65 | % |
Ratio of net investment income to average net assetse | | | 5.78 | % | | | 5.21 | % | | | 4.41 | % |
Portfolio turnover rateg,h | | | 0 | %i | | | 3 | % | | | 3 | % |
| a | Commencement of operations. |
| b | Based on average shares outstanding throughout each period. |
| c | The amounts reported for a share outstanding may not accord with the change in aggregate gains and losses in securities for the fiscal period due to the timing of capital share transactions in relation to the fluctuating market values of the Fund’s underlying securities. |
| e | Annualized for periods of less than one year. |
| f | The Fund indirectly bears its proportionate share of fees and expenses incurred by the underlying fund in which the Fund is invested. These ratios do not include these indirect fees and expenses. |
| g | Portfolio turnover rates exclude portfolio securities received or delivered as a result of processing capital share transactions in Creation Units. |
| h | Portfolio turnover rates exclude the portfolio activity of the underlying fund in which the Fund is invested. See page 171 for the portfolio turnover rates of the underlying fund. |
| i | Rounds to less than 1%. |
See notes to financial statements.
| | |
| 18 | | 2016 iSHARES ANNUAL REPORTTO SHAREHOLDERS |
Financial Highlights (Continued)
iSHARES® U.S. ETF TRUST
(For a share outstanding throughout each period)
| | | | | | |
| | iShares Interest Rate Hedged Corporate Bond ETF |
| | | | | | | | | | | | |
| | | Year ended
Oct. 31, 2016 | | | Year ended
Oct. 31, 2015 | | | Period from
May 27, 2014a to
Oct. 31, 2014 | |
Net asset value, beginning of period | | $ | 92.13 | | | $ | 97.95 | | | $ | 100.32 | |
| | | | | | | | | | | | |
Income from investment operations: | | | | | | | | | | | | |
Net investment incomeb | | | 2.74 | | | | 2.95 | | | | 1.32 | |
Net realized and unrealized lossc | | | (0.29 | ) | | | (5.82 | ) | | | (2.36 | ) |
| | | | | | | | | | | | |
Total from investment operations | | | 2.45 | | | | (2.87 | ) | | | (1.04 | ) |
| | | | | | | | | | | | |
Less distributions from: | | | | | | | | | | | | |
Net investment income | | | (2.09 | ) | | | (2.81 | ) | | | (1.32 | ) |
Return of capital | | | — | | | | (0.14 | ) | | | (0.01 | ) |
| | | | | | | | | | | | |
Total distributions | | | (2.09 | ) | | | (2.95 | ) | | | (1.33 | ) |
| | �� | | | | | | | | | | |
Net asset value, end of period | | $ | 92.49 | | | $ | 92.13 | | | $ | 97.95 | |
| | | | | | | | | | | | |
| | | |
Total return | | | 2.70 | % | | | (2.97 | )% | | | (1.05 | )%d |
| | | | | | | | | | | | |
| | | |
Ratios/Supplemental data: | | | | | | | | | | | | |
Net assets, end of period (000s) | | $ | 32,372 | | | $ | 18,427 | | | $ | 9,795 | |
Ratio of expenses to average net assetse,f | | | 0.10 | % | | | 0.11 | % | | | 0.11 | % |
Ratio of expenses to average net assets prior to waived feese,f | | | 0.30 | % | | | 0.30 | % | | | 0.30 | % |
Ratio of net investment income to average net assetse | | | 3.01 | % | | | 3.12 | % | | | 3.09 | % |
Portfolio turnover rateg,h | | | 2 | % | | | 8 | % | | | 4 | % |
| a | Commencement of operations. |
| b | Based on average shares outstanding throughout each period. |
| c | The amounts reported for a share outstanding may not accord with the change in aggregate gains and losses in securities for the fiscal period due to the timing of capital share transactions in relation to the fluctuating market values of the Fund’s underlying securities. |
| e | Annualized for periods of less than one year. |
| f | The Fund indirectly bears its proportionate share of fees and expenses incurred by the underlying fund in which the Fund is invested. These ratios do not include these indirect fees and expenses. |
| g | Portfolio turnover rates exclude portfolio securities received or delivered as a result of processing capital share transactions in Creation Units. |
| h | Portfolio turnover rates exclude the portfolio activity of the underlying fund in which the Fund is invested. See page 172 for the portfolio turnover rates of the underlying fund. |
See notes to financial statements.
Notes to Financial Statements
iSHARES® U.S. ETF TRUST
iShares U.S. ETF Trust (the “Trust”) is registered under the Investment Company Act of 1940, as amended (the “1940 Act”), as an open-end management investment company. The Trust was established as a Delaware statutory trust pursuant to an Agreement and Declaration of Trust dated June 21, 2011.
These financial statements relate only to the following funds (each, a “Fund,” and collectively, the “Funds”):
| | |
| iShares ETF | | Diversification Classification |
Interest Rate Hedged High Yield Bond | | Diversified |
Interest Rate Hedged Corporate Bond | | Diversified |
Currently each Fund seeks to achieve its investment objective by investing a substantial portion of its assets in an exchange-traded fund of iShares Trust (an “underlying fund”), an affiliate of the Funds. The financial statements and schedules of investments for the underlying funds can be found elsewhere in this report and should be read in conjunction with the Funds’ financial statements.
Pursuant to the Trust’s organizational documents, the Funds’ officers and trustees are indemnified against certain liabilities that may arise out of the performance of their duties to the Funds. Additionally, in the normal course of business, the Funds enter into contracts with service providers that contain general indemnification clauses. The Funds’ maximum exposure under these arrangements is unknown as this would involve future claims that may be made against the Funds that have not yet occurred.
| 1. | SIGNIFICANT ACCOUNTING POLICIES |
The following significant accounting policies are consistently followed by each Fund in the preparation of its financial statements in conformity with accounting principles generally accepted in the United States of America (“U.S. GAAP”). The preparation of financial statements in conformity with U.S. GAAP requires management to make certain estimates and assumptions that affect the reported amounts of assets and liabilities and disclosures of contingent assets and liabilities at the date of the financial statements and the reported amounts of revenue and expenses during the reporting period. Actual results could differ from those estimates. Each Fund is considered an investment company under U.S. GAAP and follows the accounting and reporting guidance applicable to investment companies.
SECURITY VALUATION
Each Fund’s investments are valued at fair value each day that the Fund’s listing exchange is open and, for financial reporting purposes, as of the report date should the reporting period end on a day that the Fund’s listing exchange is not open. U.S. GAAP defines fair value as the price a fund would receive to sell an asset or pay to transfer a liability in an orderly transaction between market participants at the measurement date. The BlackRock Global Valuation Methodologies Committee (the “Global Valuation Committee”) provides oversight of the valuation of investments for the Funds. The investments of each Fund are valued pursuant to policies and procedures developed by the Global Valuation Committee and approved by the Board of Trustees of the Trust (the “Board”).
| | • | | Exchange-traded funds and closed-end funds traded on a recognized securities exchange are valued at that day’s last reported trade price or the official closing price, as applicable, on the exchange where the fund is primarily traded. Funds traded on a recognized exchange for which there were no sales on that day are valued at the last traded price. |
| | |
| 20 | | 2016 iSHARES ANNUAL REPORTTO SHAREHOLDERS |
Notes to Financial Statements (Continued)
iSHARES® U.S. ETF TRUST
| | • | | Open-end U.S. mutual funds (including money market funds) are valued at that day’s published net asset value (“NAV”). |
| | • | | Swap agreements are valued utilizing quotes received daily by independent pricing services or through brokers, which are derived using daily swap curves and models that incorporate a number of market data factors, such as discounted cash flows, trades and values of the underlying reference instruments. |
In the event that application of these methods of valuation results in a price for an investment which is deemed not to be representative of the fair value of such investment or if a price is not available, the investment will be valued based upon other available factors deemed relevant by the Global Valuation Committee, in accordance with policies approved by the Board. These factors include but are not limited to (i) attributes specific to the investment; (ii) the principal market for the investment; (iii) the customary participants in the principal market for the investment; (iv) data assumptions by market participants for the investment, if reasonably available; (v) quoted prices for similar investments in active markets; and (vi) other factors, such as future cash flows, interest rates, yield curves, volatilities, prepayment speeds, loss severities, credit risks and/or default rates. Valuations based on such factors are reported to the Board on a quarterly basis.
The Global Valuation Committee employs various methods for calibrating valuation approaches for investments where an active market does not exist, including regular due diligence of the Trust’s pricing vendors, a regular review of key inputs and assumptions, transactional back-testing or disposition analysis to compare unrealized gains and losses to realized gains and losses, reviews of missing or stale prices, reviews of large movements in market values, and reviews of market related activity.
Various inputs are used in determining the fair value of financial instruments. Inputs may be based on independent market data (“observable inputs”) or they may be internally developed (“unobservable inputs”). These inputs are categorized into a disclosure hierarchy consisting of three broad levels for financial reporting purposes as follows:
| | • | | Level 1 — Unadjusted quoted prices in active markets for identical assets or liabilities; |
| | • | | Level 2 — Inputs other than quoted prices included within Level 1 that are observable for the asset or liability either directly or indirectly, including quoted prices for similar assets or liabilities in active markets, quoted prices for identical or similar assets or liabilities in markets that are not considered to be active, inputs other than quoted prices that are observable for the asset or liability (such as exchange rates, financing terms, interest rates, yield curves, volatilities, prepayment speeds, loss severities, credit risks and default rates) or other market-corroborated inputs; and |
| | • | | Level 3 — Unobservable inputs for the asset or liability based on the best information available in the circumstances, to the extent observable inputs are not available, including the Global Valuation Committee’s assumptions used in determining the fair value of investments. |
The hierarchy gives the highest priority to unadjusted quoted prices in active markets for identical assets or liabilities (Level 1 measurements) and the lowest priority to unobservable inputs (Level 3 measurements). Accordingly, the degree of judgement exercised in determining fair value is greatest for instruments categorized in Level 3. The inputs used to measure fair value may fall into different levels of the fair value hierarchy. In such cases, for disclosure purposes, the fair value hierarchy classification is determined based on the lowest level input that is significant to the fair value measurement in its entirety. The fair value hierarchy for each Fund’s investments is included in its schedule of investments.
Changes in valuation techniques may result in transfers in or out of an assigned level within the fair value hierarchy. In accordance with the Trust’s policy, transfers between different levels of the fair value hierarchy are deemed to have occurred as of the beginning of the reporting period. The categorization of values determined for financial instruments are based on the pricing transparency of the financial instruments and are not necessarily an indication of the risks associated with investing in those securities.
| | | | |
NOTESTO FINANCIAL STATEMENTS | | | 21 | |
Notes to Financial Statements (Continued)
iSHARES® U.S. ETF TRUST
SECURITY TRANSACTIONS AND INCOME RECOGNITION
Security transactions are accounted for on trade date. Dividend income and capital gain distributions from underlying funds, if any, are recognized on the ex-dividend date. Interest income is accrued daily. Realized gains and losses on investment transactions are determined using the specific identification method.
DISTRIBUTIONS TO SHAREHOLDERS
Dividends and distributions paid by each Fund are recorded on the ex-dividend dates. Distributions are determined on a tax basis and may differ from net investment income and net realized capital gains for financial reporting purposes. Dividends and distributions are paid in U.S. dollars and cannot be automatically reinvested in additional shares of the Funds.
LOANS OF PORTFOLIO SECURITIES
Each Fund may lend its investment securities to approved borrowers, such as brokers, dealers and other financial institutions. The borrower pledges and maintains with the Fund collateral consisting of cash, an irrevocable letter of credit issued by a bank, or securities issued or guaranteed by the U.S. government. The initial collateral received by each Fund is required to have a value of at least 102% of the current value of the loaned securities for securities traded on U.S. exchanges and a value of at least 105% for all other securities. The collateral is maintained thereafter at a value equal to at least 100% of the current value of the securities on loan. The market value of the loaned securities is determined at the close of each business day of the Funds. Any additional required collateral is delivered to the Funds and any excess collateral is returned by the Funds on the next business day. During the term of the loan, each Fund is entitled to all distributions made on or in respect of the loaned securities but does not receive interest income on securities received as collateral. Loans of securities are terminable at any time and the borrower, after notice, is required to return borrowed securities within the standard time period for settlement of securities transactions.
On October 11, 2016, BlackRock, Inc. (“BlackRock”) implemented changes required by amendments to Rule 2a-7 under the 1940 Act, which governs the operations of U.S. money market funds. The Funds may be exposed to additional risks when reinvesting the cash collateral in money market funds that do not seek to maintain a stable NAV per share of $1.00 and which may be subject to redemption gates or liquidity fees under certain circumstances.
Cash received as collateral for securities on loan may be reinvested in certain short-term instruments either directly on behalf of a fund or through one or more joint accounts or money market funds, including those managed by BlackRock Fund Advisors (“BFA”), the Funds’ investment adviser, or its affiliates. As of October 31, 2016, any securities on loan were collateralized by cash and/or U.S. government obligations. Cash collateral received was invested in money market funds managed by BFA and is disclosed in the schedules of investments. The securities on loan for each Fund are also disclosed in its schedule of investments. The total value of any securities on loan as of October 31, 2016 and the total value of the related cash collateral are disclosed in the statements of assets and liabilities. Income earned by the Funds from securities lending is disclosed in the statements of operations.
The risks of securities lending include the risk that the borrower may not provide additional collateral when required or may not return the securities when due. To mitigate these risks, the Funds benefit from a borrower default indemnity provided by BlackRock. BlackRock’s indemnity allows for full replacement of securities lent. Each Fund could suffer a loss if the value of the investments purchased with cash collateral falls below the value of the cash collateral received.
Securities lending transactions are entered into by the Funds under Master Securities Lending Agreements (“MSLA”) which provide the right, in the event of default (including bankruptcy or insolvency) for the non-defaulting party to liquidate the collateral and calculate a net exposure to the defaulting party or request additional collateral. In the event that a borrower defaults, a Fund,
| | |
| 22 | | 2016 iSHARES ANNUAL REPORTTO SHAREHOLDERS |
Notes to Financial Statements (Continued)
iSHARES® U.S. ETF TRUST
as lender, would offset the market value of the collateral received against the market value of the securities loaned. The value of the collateral is typically greater than that of the market value of the securities loaned, leaving the lender with a net amount payable to the defaulting party. However, bankruptcy or insolvency laws of a particular jurisdiction may impose restrictions on or prohibitions against such a right of offset in the event of an MSLA counterparty’s bankruptcy or insolvency. Under the MSLA, the borrower can resell or re-pledge the loaned securities, and a Fund can reinvest cash collateral, or, upon an event of default, resell or re-pledge the collateral.
The following table is a summary of securities lending agreements which are subject to offset under an MSLA as of October 31, 2016:
| | | | | | | | | | | | |
iShares ETF
and Counterparty | | Market Value of
Securities on Loan | | | Cash Collateral
Received a | | | Net
Amount | |
Interest Rate Hedged High Yield Bond | | | | | | | | | | | | |
JPMorgan Securities LLC | | $ | 13,703,244 | | | $ | 13,703,244 | | | $ | — | |
| | | | | | | | | | | | |
| | | | | | | | | | | | | |
| | a | | Collateral received in excess of the market value of securities on loan is not presented in this table. The total cash collateral received by the Fund is disclosed in the Fund’s statement of assets and liabilities. |
| 2. | INVESTMENT ADVISORY AGREEMENT AND OTHER TRANSACTIONS WITH AFFILIATES |
Pursuant to an Investment Advisory Agreement with the Trust, BFA manages the investment of each Fund’s assets. BFA is a California corporation indirectly owned by BlackRock. Under the Investment Advisory Agreement, BFA is responsible for substantially all expenses of the Funds, except interest, taxes, brokerage commissions and other expenses connected with the execution of portfolio transactions, distribution fees, litigation expenses and any extraordinary expenses.
For its investment advisory services to the iShares Interest Rate Hedged High Yield Bond ETF, BFA is entitled to an annual investment advisory fee of 0.65% based on the average daily net assets of the Fund. In addition, the Fund indirectly pays its pro rata share of fees and expenses attributable to its investments in other investment companies (“acquired fund fees and expenses”). BFA has contractually agreed to reduce its investment advisory fee for the Fund through February 28, 2022 so that the investment management fee is equal to the acquired fund fees and expenses that would have been experienced by the Fund related to its investments in the iShares iBoxx $ High Yield Corporate Bond ETF (“HYG”), after taking into account any fee waivers by HYG, plus 0.05%.
For its investment advisory services to the iShares Interest Rate Hedged Corporate Bond ETF, BFA is entitled to an annual investment advisory fee of 0.30% based on the average daily net assets of the Fund. In addition, the Fund indirectly pays acquired fund fees and expenses. BFA has contractually agreed to reduce its investment advisory fee for the Fund through February 28, 2022 so that the investment advisory fee is equal to the acquired fund fees and expenses that would have been experienced by the Fund related to its investments in the iShares iBoxx $ Investment Grade Corporate Bond ETF (“LQD”), after taking into account any fee waivers by LQD, plus 0.10%.
The U.S. Securities and Exchange Commission (the “SEC”) has issued an exemptive order which permits BlackRock Institutional Trust Company, N.A. (“BTC”), an affiliate of BFA, to serve as securities lending agent for the Funds, subject to applicable conditions. As securities lending agent, BTC bears all operational costs directly related to securities lending. Each Fund is responsible for fees in connection with the investment of cash collateral received for securities on loan in a money market fund managed by BFA, however, BTC has agreed to reduce the amount of securities lending income it receives in order to effectively limit the collateral investment fees each Fund bears to an annual rate of 0.04% (the “collateral investment fees”). Securities lending income is equal to the total of income earned from the reinvestment of cash collateral, net of fees and other payments to
| | | | |
NOTESTO FINANCIAL STATEMENTS | | | 23 | |
Notes to Financial Statements (Continued)
iSHARES® U.S. ETF TRUST
and from borrowers of securities, and less the collateral investment fees. The Funds retain a portion of securities lending income and remit the remaining portion to BTC as compensation for its services as securities lending agent.
Pursuant to a securities lending agreement, each Fund retains 80% of securities lending income and the amount retained can never be less than 70% of the total of securities lending income plus the collateral investment fees. In addition, commencing the business day following the date that the aggregate securities lending income plus the collateral investment fees generated across all 1940 Act iShares exchange-traded funds (the “iShares ETF Complex”) in a given calendar year exceeds the aggregate securities lending income generated across the iShares ETF Complex in the calendar year 2013, each Fund, pursuant to a securities lending agreement, will retain for the remainder of that calendar year 85% of securities lending income and the amount retained can never be less than 70% of the total of securities lending income plus the collateral investment fees.
For the year ended October 31, 2016, the total of securities lending agent services and collateral investment fees paid were as follows:
| | | | |
| iShares ETF | | Fees Paid to BTC | |
Interest Rate Hedged High Yield Bond | | $ | 19,011 | |
Interest Rate Hedged Corporate Bond | | | 1,153 | |
BlackRock Investments, LLC, an affiliate of BFA, is the distributor for each Fund. Pursuant to the distribution agreement, BFA is responsible for any fees or expenses for distribution services provided to the Funds.
Each Fund may invest its positive cash balances in certain money market funds managed by BFA or an affiliate. The income earned on these temporary cash investments is included in “Dividends — affiliated” in the statements of operations.
The PNC Financial Services Group, Inc. is the largest stockholder of BlackRock and is considered to be an affiliate of the Funds for 1940 Act purposes.
Certain trustees and officers of the Trust are also officers of BTC and/or BFA.
| 3. | INVESTMENT PORTFOLIO TRANSACTIONS |
Purchases and sales of investments (excluding in-kind transactions and short-term investments) for the year ended October 31, 2016 were as follows:
| | | | | | | | |
| iShares ETF | | Purchases | | | Sales | |
Interest Rate Hedged High Yield Bond | | $ | 132,354 | | | $ | 793,767 | |
Interest Rate Hedged Corporate Bond | | | 648,809 | | | | 2,235,585 | |
In-kind transactions (see Note 4) for the year ended October 31, 2016 were as follows:
| | | | | | | | |
| iShares ETF | | In-kind
Purchases | | | In-kind
Sales | |
Interest Rate Hedged High Yield Bond | | $ | 4,241,372 | | | $ | 20,266,905 | |
Interest Rate Hedged Corporate Bond | | | 43,066,190 | | | | 30,732,632 | |
| | |
| 24 | | 2016 iSHARES ANNUAL REPORTTO SHAREHOLDERS |
Notes to Financial Statements (Continued)
iSHARES® U.S. ETF TRUST
| 4. | CAPITAL SHARE TRANSACTIONS |
Capital shares are issued and redeemed by each Fund only in aggregations of a specified number of shares or multiples thereof (“Creation Units”) at NAV. Except when aggregated in Creation Units, shares of each Fund are not redeemable. Transactions in capital shares for each Fund are disclosed in detail in the statements of changes in net assets.
The consideration for the purchase of Creation Units of a fund in the Trust generally consists of the in-kind deposit of a designated portfolio of securities and a specified amount of cash. Certain funds in the Trust may be offered in Creation Units solely or partially for cash in U.S. dollars. Investors purchasing and redeeming Creation Units may pay a purchase transaction fee and a redemption transaction fee directly to State Street Bank and Trust Company, the Trust’s administrator, to offset transfer and other transaction costs associated with the issuance and redemption of Creation Units, including Creation Units for cash. Investors transacting in Creation Units for cash may also pay an additional variable charge to compensate the relevant fund for certain transaction costs (i.e., stamp taxes, taxes on currency or other financial transactions, and brokerage costs) and market impact expenses relating to investing in portfolio securities. Such variable charges, if any, are included in “Proceeds from shares sold” in the statements of changes in net assets.
Each Fund may enter into short positions in interest rate swaps in an attempt to mitigate interest rate risk by economically hedging the value of fixed rate bonds, which may decrease when interest rates rise (interest rate risk). Interest rate swaps are agreements in which one party pays a stream of interest payments, either fixed or floating, for another party’s stream of interest payments, either fixed or floating, on the same notional amount for a specified period of time. Interest rate swaps are marked-to-market daily and changes in value are recorded as unrealized appreciation (depreciation). Swap agreements are privately negotiated in the over-the-counter market. Each Fund enters into centrally cleared interest rate swaps.
In a centrally cleared swap, immediately following execution of the swap agreement, the swap agreement is novated to a central counterparty (“CCP”) and the CCP becomes the Funds’ counterparty on the swap. Each Fund is required to interface with the CCP through a broker. Upon entering into a centrally cleared swap, each Fund is required to deposit initial margin with the broker in the form of cash or securities in an amount that varies depending on the size and risk profile of the particular swap. Securities deposited as initial margin are designated on the schedules of investments and cash deposited is recorded on the statements of assets and liabilities as cash pledged for centrally cleared swaps. The daily change in valuation of centrally cleared swaps is recorded as a receivable or payable for variation margin in the statements of assets and liabilities. Payments received from (paid to) the CCP, including at termination, are recorded as realized gain (loss) in the statements of operations.
Swap transactions involve, to varying degrees, elements of interest rate, credit and market risks in excess of the amounts recognized in the statements of assets and liabilities. Such risks involve the possibility that there will be no liquid market for these agreements, that the counterparty to the agreements may default on its obligation to perform or disagree as to the meaning of the contractual terms in the agreements, and that there may be unfavorable changes in interest rates and/or market values associated with these transactions.
| | | | |
NOTESTO FINANCIAL STATEMENTS | | | 25 | |
Notes to Financial Statements (Continued)
iSHARES® U.S. ETF TRUST
The following table shows the value of interest rate swaps held as of October 31, 2016 and the related locations in the statements of assets and liabilities, presented by risk exposure category:
| | | | | | | | |
| Assets | |
| | | iShares
Interest Rate
Hedged High Yield
Bond ETF | | | iShares
Interest Rate
Hedged Corporate
Bond ETF | |
Centrally cleared interest rate swaps: | | | | | | | | |
Variation margin / Net assets consist of – net unrealized appreciation (depreciation)a | | $ | 208,136 | | | $ | 738,805 | |
| | | | | | | | |
| | | | | | | | | |
| | a | | Represents cumulative appreciation of centrally cleared interest rate swaps as reported in the schedules of investments. Only current day’s variation margin is reported separately within the statements of assets and liabilities. |
The following table shows the realized and unrealized gains (losses) on interest rate swaps held during the year ended October 31, 2016 and the related locations in the statements of operations, presented by risk exposure category:
| | | | | | | | |
| | | Net Realized Gain (Loss) | |
| | | iShares
Interest Rate
Hedged High Yield
Bond ETF | | | iShares
Interest Rate
Hedged Corporate
Bond ETF | |
Centrally cleared interest rate swaps: | | | | | | | | |
Swap agreements | | $ | (1,004,320 | ) | | $ | (2,409,631 | ) |
| | | | | | | | |
| | | | | | | | |
| | | Net Change in Unrealized
Appreciation/Depreciation | |
| | | iShares
Interest Rate
Hedged High Yield
Bond ETF | | | iShares
Interest Rate
Hedged Corporate
Bond ETF | |
Centrally cleared interest rate swaps: | | | | | | | | |
Swap agreements | | $ | 514,327 | | | $ | 987,742 | |
| | | | | | | | |
| | | | | | | | | |
The following table shows the average quarter-end balances of open interest rate swaps for the year ended October 31, 2016:
| | | | | | | | |
| | | iShares
Interest Rate
Hedged High Yield
Bond ETF | | | iShares
Interest Rate
Hedged Corporate
Bond ETF | |
Average notional value – pays fixed rate | | $ | 34,929,000 | | | $ | 27,329,000 | |
| | | | | | | | | |
| | |
| 26 | | 2016 iSHARES ANNUAL REPORTTO SHAREHOLDERS |
Notes to Financial Statements (Continued)
iSHARES® U.S. ETF TRUST
In the normal course of business, each Fund’s investment activities expose it to various types of risk associated with the financial instruments and markets in which it invests. The significant types of financial risks each Fund is exposed to include market risk and credit risk. Each Fund’s prospectus provides details of these and other types of risk.
MARKET RISK
Market risk arises mainly from uncertainty about future values of financial instruments influenced by price, currency and interest rate movements. It represents the potential loss a fund may suffer through holding market positions in the face of market movements. A fund is exposed to market risk by virtue of its investment in equity, fixed income and/or financial derivative instruments or indirectly by virtue of its investment in underlying funds. The fair value of securities held by a fund may decline due to general market conditions, economic trends or events that are not specifically related to the issuers of the securities including local, regional or global political, social or economic instability or to factors that affect a particular industry or group of industries. The extent of a fund’s exposure to market risk is the market value of the investments held as shown in the fund’s schedule of investments.
A diversified portfolio, where this is appropriate and consistent with a fund’s objectives, minimizes the risk that a price change of a particular investment will have a material impact on the NAV of a fund. The investment concentrations within each Fund’s portfolio are disclosed in its schedule of investments.
CREDIT RISK
Credit risk is the risk that an issuer or guarantor of debt instruments or the counterparty to a financial transaction, including derivatives contracts, repurchase agreements or loans of portfolio securities, is unable or unwilling to make timely interest and/or principal payments or to otherwise honor its obligations. BFA and its affiliates manage counterparty credit risk by entering into transactions only with counterparties that they believe have the financial resources to honor their obligations and by monitoring the financial stability of those counterparties. Financial assets, which potentially expose a fund to issuer and counterparty credit risks, consist principally of financial instruments and receivables due from counterparties. The extent of a fund’s exposure to credit and counterparty risks with respect to those financial assets is approximated by their value recorded in its statement of assets and liabilities.
Each Fund is treated as an entity separate from the Trust’s other funds for federal income tax purposes. It is the policy of each Fund to qualify as a regulated investment company by complying with the provisions applicable to regulated investment companies, as defined under Subchapter M of the Internal Revenue Code of 1986, as amended, and to annually distribute substantially all of its ordinary income and any net capital gains (taking into account any capital loss carryforwards) sufficient to relieve it from all, or substantially all, federal income and excise taxes. Accordingly, no provision for federal income taxes is required.
U.S. GAAP requires that certain components of net assets be adjusted to reflect permanent differences between financial and tax reporting. These reclassifications have no effect on net assets or NAV per share. The following permanent differences as of
| | | | |
NOTESTO FINANCIAL STATEMENTS | | | 27 | |
Notes to Financial Statements (Continued)
iSHARES® U.S. ETF TRUST
October 31, 2016, attributable to distributions paid in excess of taxable income, the accounting for swap agreements and realized gains (losses) from in-kind redemptions, were reclassified to the following accounts:
| | | | | | | | | | | | | | |
| iShares ETF | | Paid-in Capital | | | Undistributed
Net Investment
Income/Distributions in Excess of Net Investment Income | | | Undistributed
Net Realized
Gain/Accumulated
Net Realized Loss | |
Interest Rate Hedged High Yield Bond | | $ | (2,299,919 | ) | | $ | (270,685 | ) | | $ | 2,570,604 | |
Interest Rate Hedged Corporate Bond | | | 898,761 | | | | (252,063 | ) | | | (646,698 | ) |
The tax character of distributions paid during the years ended October 31, 2016 and October 31, 2015 was as follows:
| | | | | | | | |
| iShares ETF | | 2016 | | | 2015 | |
Interest Rate Hedged High Yield Bond | | | | | | | | |
Ordinary income | | $ | 1,756,097 | | | $ | 4,084,037 | |
Return of capital | | | — | | | | 30,974 | |
| | | | | | | | |
| | $ | 1,756,097 | | | $ | 4,115,011 | |
| | | | | | | | |
Interest Rate Hedged Corporate Bond | | | | | | | | |
Ordinary income | | $ | 731,888 | | | $ | 502,154 | |
Return of capital | | | — | | | | 24,646 | |
| | | | | | | | |
| | $ | 731,888 | | | $ | 526,800 | |
| | | | | | | | |
| | | | | | | | | |
As of October 31, 2016, the tax components of accumulated net earnings (losses) were as follows:
| | | | | | | | | | | | | | | | |
| iShares ETF | | Undistributed
Ordinary
Income | | | Capital Loss
Carryforwards | | | Net Unrealized
Gains (Losses) a | | | Total | |
Interest Rate Hedged High Yield Bond | | $ | 5,770 | | | $ | (2,592,434 | ) | | $ | (2,565,533 | ) | | $ | (5,152,197 | ) |
Interest Rate Hedged Corporate Bond | | | — | | | | (2,638,508 | ) | | | 1,367,520 | | | | (1,270,988 | ) |
| | a | | The difference between book-basis and tax-basis unrealized gains (losses) was attributable primarily to the tax deferral of losses on wash sales. |
As of October 31, 2016, the following Funds had non-expiring capital loss carryforwards available to offset future realized capital gains as follows:
| | | | |
| iShares ETF | | Non-
Expiring | |
Interest Rate Hedged High Yield Bond | | $ | 2,592,434 | |
Interest Rate Hedged Corporate Bond | | | 2,638,508 | |
Management has analyzed tax laws and regulations and their application to the Funds as of October 31, 2016, inclusive of the open tax return years, and does not believe there are any uncertain tax positions that require recognition of a tax liability in the Funds’ financial statements.
| | |
| 28 | | 2016 iSHARES ANNUAL REPORTTO SHAREHOLDERS |
Notes to Financial Statements (Continued)
iSHARES® U.S. ETF TRUST
Management has evaluated the impact of all subsequent events on the Funds through the date the financial statements were available to be issued and has determined that there were no subsequent events requiring adjustment or disclosure in the financial statements.
| | | | |
NOTESTO FINANCIAL STATEMENTS | | | 29 | |
Report of Independent Registered Public Accounting Firm
To the Shareholders and Board of Trustees of
iShares U.S. ETF Trust:
In our opinion, the accompanying statements of assets and liabilities, including the schedules of investments, and the related statements of operations and of changes in net assets and the financial highlights present fairly, in all material respects, the financial position of iShares Interest Rate Hedged High Yield Bond ETF and iShares Interest Rate Hedged Corporate Bond ETF (the “Funds”) at October 31, 2016, the results of each of their operations, the changes in each of their net assets and their financial highlights for each of the periods presented, in conformity with accounting principles generally accepted in the United States of America. These financial statements and financial highlights (hereafter referred to as “financial statements”) are the responsibility of the Funds’ management. Our responsibility is to express an opinion on these financial statements based on our audits. We conducted our audits of these financial statements in accordance with the standards of the Public Company Accounting Oversight Board (United States). Those standards require that we plan and perform the audit to obtain reasonable assurance about whether the financial statements are free of material misstatement. An audit includes examining, on a test basis, evidence supporting the amounts and disclosures in the financial statements, assessing the accounting principles used and significant estimates made by management, and evaluating the overall financial statement presentation. We believe that our audits, which included confirmation of securities at October 31, 2016 by correspondence with the custodian, transfer agent and brokers, provide a reasonable basis for our opinion.
PricewaterhouseCoopers LLP
San Francisco, California
December 21, 2016
| | |
| 30 | | 2016 iSHARES ANNUAL REPORTTO SHAREHOLDERS |
Tax Information (Unaudited)
iSHARES® U.S. ETF TRUST
For the fiscal year ended October 31, 2016, the Funds hereby designate the following maximum amounts allowable as interest-related dividends eligible for exemption from U.S. withholding tax for nonresident aliens and foreign corporations:
| | | | |
| iShares ETF | | Interest-
Related
Dividends | |
Interest Rate Hedged High Yield Bond | | $ | 1,140,319 | |
Interest Rate Hedged Corporate Bond | | | 677,227 | |
Board Review and Approval of Investment Advisory Contract
iSHARES® U.S. ETF TRUST
I. iShares Interest Rate Hedged High Yield Bond ETF
Under Section 15(c) of the Investment Company Act of 1940 (the “1940 Act”), the Trust’s Board of Trustees (the “Board”), including a majority of Trustees who are not “interested persons” of the Trust (as that term is defined in the 1940 Act) (the “Independent Trustees”), is required annually to consider and approve the Investment Advisory Contract between the Trust and BFA (the “Advisory Contract”) on behalf of the Fund. The Independent Trustees requested, and BFA provided, such information as the Independent Trustees, with advice from independent counsel, deemed reasonably necessary to evaluate the Advisory Contract. A committee of all of the Independent Trustees (the “15(c) Committee”), with independent counsel, met with management on April 28, 2016 and May 9, 2016. At these meetings, the 15(c) Committee reviewed and discussed information provided in response to the 15(c) Committee’s initial requests, and requested certain additional information, which management agreed to provide. At a meeting held on May 17, 2016, management presented information to the Board relating to the continuance of the Advisory Contract, including information requested by the 15(c) Committee during its meetings. The Board, including the Independent Trustees, reviewed and discussed such information at length. The Independent Trustees requested from management certain additional information, which management agreed to provide. At a meeting held on June 21-23, 2016, the Board, including the Independent Trustees, reviewed the additional information provided by management in response to these requests. After extensive discussions, the Board, including all of the Independent Trustees, approved the continuance of the Advisory Contract for the Fund, based on a review of qualitative and quantitative information provided by BFA, including the additional information management provided at the request of the Independent Trustees. The Board noted its satisfaction with the extent and quality of information provided and its frequent interactions with management, as well as the detailed responses and other information provided by BFA. The Board also noted that the Board and BFA agreed to discuss potential enhancements and adjustments to the 15(c) process for the coming year. The Independent Trustees were advised by their independent counsel throughout the process, including about the legal standards applicable to their review. In approving the Advisory Contract for the Fund, the Board, including the Independent Trustees, considered the following factors, no one of which was controlling, and reached the following conclusions:
Expenses and Performance of the Fund — The Board reviewed statistical information prepared by Broadridge Financial Solutions Inc. (“Broadridge”), an independent provider of investment company data, regarding the expense ratio components, including gross and net total expenses, waivers/reimbursements (if any), and underlying fund fees and expenses (if any) of the Fund in comparison with the same information for other exchange traded funds (including, where applicable, funds sponsored by an “at cost” service provider) and, in the limited instances where no comparable ETFs existed and the comparison group would
| | | | |
BOARD REVIEWAND APPROVALOF INVESTMENT ADVISORY CONTRACT | | | 31 | |
Board Review and Approval of Investment Advisory Contract (Continued)
iSHARES® U.S. ETF TRUST
not otherwise be reasonable in Broadridge’s judgment, pure index institutional mutual funds, objectively selected by Broadridge as comprising the Fund’s applicable peer group pursuant to Broadridge’s proprietary ETF methodology (the “Peer Group”). The Board was provided with a detailed description of Broadridge’s proprietary ETF methodology used by Broadridge to determine the Fund’s Peer Group. The Board further noted that due to the limitations in providing comparable funds in the Peer Group, the statistical information provided in Broadridge’s report may or may not provide meaningful direct comparisons to the Fund in all instances.
The Board also noted that the investment advisory fee rate and overall expenses (net of waivers and reimbursements) for the Fund were higher than the median of the investment advisory fee rates and overall expenses (net of waivers and reimbursements) of the funds in its Peer Group, excluding iShares funds. The Board further noted that the Fund’s pricing reflects its interest rate hedging strategy, as compared to the competitor funds as determined by Broadridge, which are not interest rate hedged.
In addition, to the extent that any of the comparison funds included in the Peer Group, excluding iShares funds, track the same index as the Fund, Broadridge also provided, and the Board reviewed, a comparison of the Fund’s performance for the one-, three-, five-, ten-year, and since inception periods, as applicable, and for the “last quarter” period ended December 31, 2015, to that of such relevant comparison funds for the same periods.
The Board noted that the Fund is an actively managed ETF that does not seek to track the performance of a specified index and that the management team for the Fund manages the Fund’s portfolio in accordance with its investment objective. The Board further noted that during the prior year, the Board received periodic reports on the Fund’s short- and longer-term performance in comparison with its peer group and benchmark index. Such periodic comparative performance information, including additional detailed information on certain specific iShares funds requested by the Board, was also considered. The Board noted that the Fund generally performed in line with expectations relative to the Fund’s peer group and benchmark index over the relevant periods.
Based on this review, the other factors considered at the meeting, and their general knowledge of ETF pricing, the Board concluded that the investment advisory fee rate and expense level and the historical performance of the Fund supported the Board’s approval of the continuance of the Advisory Contract for the coming year.
Nature, Extent and Quality of Services Provided by BFA — Based on management’s representations, including information about recent and proposed enhancements to the iShares business, including with respect to capital markets support and analysis, product design and other services, the Board expected that there would be no diminution in the scope of services required of or provided by BFA under the Advisory Contract for the coming year as compared to the scope of services provided by BFA during prior years. In reviewing the scope of these services, the Board considered BFA’s investment philosophy and experience, noting that BFA and its affiliates have committed significant resources over time, including during the past year, to supporting the iShares funds and their shareholders. The Board also considered BFA’s compliance program and its compliance record with respect to the Fund. In that regard, the Board noted that BFA reports to the Board about portfolio management and compliance matters on a periodic basis in connection with regularly scheduled meetings of the Board, and on other occasions as necessary and appropriate, and has provided information and made appropriate officers available as needed to provide further assistance with these matters. The Board also reviewed the background and experience of the persons responsible for the day-to-day management of the Fund, as well as the resources available to them in managing the Fund. In addition to the above considerations, the Board reviewed and considered detailed presentations regarding BFA’s investment performance, investment and risk management processes and strategies provided at the June 21-23, 2016 meeting and throughout the previous year, and matters related to BFA’s portfolio compliance policies and procedures. The Board noted that the Fund had met its investment objective consistently since its inception date.
| | |
| 32 | | 2016 iSHARES ANNUAL REPORTTO SHAREHOLDERS |
Board Review and Approval of Investment Advisory Contract (Continued)
iSHARES® U.S. ETF TRUST
Based on review of this information, and the performance information discussed above, the Board concluded that the nature, extent and quality of services provided by BFA to the Fund under the Advisory Contract supported the Board’s approval of the continuance of the Advisory Contract for the coming year.
Costs of Services Provided to the Fund and Profits Realized by BFA and its Affiliates — The Board reviewed information about the profitability to BlackRock of the Fund, based on the fees payable to BFA and its affiliates (including fees under the Advisory Contract), and all other sources of revenue and expense to BFA and its affiliates from the Funds’ operations for the last calendar year. The Board reviewed BlackRock’s profitability methodology for the iShares funds, noting that the 15(c) Committee had focused on the methodology and profitability presentation during its meetings. The Board discussed the sources of direct and ancillary revenue with management, including the revenues to BTC from securities lending by the Fund. The Board also discussed BFA’s profit margin as reflected in the Fund’s profitability analysis and reviewed information regarding potential economies of scale (as discussed below). Based on this review, the Board concluded that the profits realized by BFA and its affiliates under the Advisory Contract and from other relationships between the Fund and BFA and/or its affiliates, if any, were within a reasonable range in light of the factors considered.
Economies of Scale — The Board reviewed information regarding potential economies of scale or other efficiencies that may result from increases in the Fund’s assets, noting that the issue of economies of scale had been focused on extensively by the 15(c) Committee during its meetings and addressed by management. The Board and the 15(c) Committee reviewed information provided by BFA regarding scale benefits shared with the iShares funds through relatively low fee rates established at inception, breakpoints, waivers, or other fee reductions, as well as through additional investment in the iShares business and the provision of improved or additional infrastructure and services to the iShares funds and their shareholders. The Board and the 15(c) Committee received information regarding BlackRock’s historical profitability, including BFA’s and its affiliates’ costs in providing services. The cost information distinguished, among other things, between fixed and variable costs, and explained how the level of fixed and variable costs, as well as the nature of such costs, may impact the existence or size of scale benefits. The Board noted that the Advisory Contract for the Fund did not provide for any breakpoints in the Fund’s investment advisory fee rate as the assets of the Fund increase. However, the Board noted that should material economies of scale exist in the future that are not otherwise shared, a breakpoint structure for the Fund may be appropriate, and that it would continue to monitor the sharing of economies of scale to determine the appropriateness of adding breakpoints in the future.
Based on this review, as well as the other factors considered at the meeting, the Board, recognizing its responsibility to consider this issue periodically, determined to approve the continuance of the Advisory Contract for the coming year.
Fees and Services Provided for Other Comparable Funds/Accounts Managed by BFA and its Affiliates — The Board received and considered information regarding the investment advisory/management fee rates for other funds/accounts in the U.S. for which BFA (or its affiliates) provides investment advisory/management services, including open-end funds registered under the 1940 Act (including sub-advised funds), collective trust funds, and institutional separate accounts (together, the “Other Accounts”), and acknowledged BFA’s assertion that the iShares funds are fundamentally different investment vehicles from the Other Accounts. The Board noted that BFA and its affiliates do not manage Other Accounts with a similar investment strategy or investment mandate as the Fund. The Board further noted that BFA provided the Board with detailed information regarding how the Other Accounts (particularly institutional clients) generally differ from the Fund, including in terms of the different and generally more extensive services provided to the Fund, as well as other significant differences. In that regard, the Board considered that the pricing of services to institutional clients is typically based on a number of factors beyond the nature and extent of the specific services to be provided and often depends on the overall relationship between the client and its affiliates and the adviser and its affiliates. In addition, the Board considered the relative complexity and inherent risks and challenges of managing and providing other services to the Fund, as a publicly traded exchange traded fund, as compared to the Other Accounts that are institutional clients in light of differing regulatory requirements and client-imposed mandates. The Board also considered the “all-inclusive”
| | | | |
BOARD REVIEWAND APPROVALOF INVESTMENT ADVISORY CONTRACT | | | 33 | |
Board Review and Approval of Investment Advisory Contract (Continued)
iSHARES® U.S. ETF TRUST
nature of the Fund’s advisory fee structure, and the Fund expenses borne by BFA under this arrangement. The Board noted that the investment advisory fee rate under the Advisory Contract for the Fund was generally higher than the investment advisory/management fee rates for certain of the Other Accounts (particularly institutional clients) and concluded that the differences appeared to be consistent with the factors discussed.
Other Benefits to BFA and/or its Affiliates — The Board reviewed the “fallout” benefits or ancillary revenue received by BFA and/or its affiliates in connection with the services provided to the Fund by BFA, such as payment of revenue to BTC, the Fund’s securities lending agent, for loaning portfolio securities (which was included in the profit margins reviewed by the Board pursuant to BFA’s profitability methodology), and payment of advisory fees and/or administration fees to BFA and BTC (or their affiliates) in connection with any investments by the Fund in other funds for which BFA (or its affiliates) provides investment advisory services and/or administration services. The Board noted that BFA generally does not use soft dollars or consider the value of research or other services that may be provided to BFA (including its affiliates) in selecting brokers for portfolio transactions for the Fund. The Board further noted that any portfolio transactions on behalf of the Fund placed through a BFA affiliate or purchased from an underwriting syndicate in which a BFA affiliate participates, are reported to the Board pursuant to Rule 17e-1 or Rule 10f-3, as applicable, under the 1940 Act. The Board concluded that any such ancillary benefits would not be disadvantageous to the Fund’s shareholders and thus would not alter the Board’s conclusion with respect to the appropriateness of approving the continuance of the Advisory Contract for the coming year.
Based on the considerations described above, the Board determined that the Fund’s investment advisory fee rate under the Advisory Contract does not constitute a fee that is so disproportionately large as to bear no reasonable relationship to the services rendered and that could not have been the product of arm’s-length bargaining, and concluded that it is in the best interest of the Fund and its shareholders to approve the continuance of the Advisory Contract for the coming year.
II. iShares Interest Rate Hedged Corporate Bond ETF
Under Section 15(c) of the Investment Company Act of 1940 (the “1940 Act”), the Trust’s Board of Trustees (the “Board”), including a majority of Trustees who are not “interested persons” of the Trust (as that term is defined in the 1940 Act) (the “Independent Trustees”), is required annually to consider and approve the Investment Advisory Contract between the Trust and BFA (the “Advisory Contract”) on behalf of the Fund. The Independent Trustees requested, and BFA provided, such information as the Independent Trustees, with advice from independent counsel, deemed reasonably necessary to evaluate the Advisory Contract. A committee of all of the Independent Trustees (the “15(c) Committee”), with independent counsel, met with management on April 28, 2016 and May 9, 2016. At these meetings, the 15(c) Committee reviewed and discussed information provided in response to the 15(c) Committee’s initial requests, and requested certain additional information, which management agreed to provide. At a meeting held on May 17, 2016, management presented information to the Board relating to the continuance of the Advisory Contract, including information requested by the 15(c) Committee during its meetings. The Board, including the Independent Trustees, reviewed and discussed such information at length. The Independent Trustees requested from management certain additional information, which management agreed to provide. At a meeting held on June 21-23, 2016, the Board, including the Independent Trustees, reviewed the additional information provided by management in response to these requests. After extensive discussions, the Board, including all of the Independent Trustees, approved the continuance of the Advisory Contract for the Fund, based on a review of qualitative and quantitative information provided by BFA, including the additional information management provided at the request of the Independent Trustees. The Board noted its satisfaction with the extent and quality of information provided and its frequent interactions with management, as well as the detailed responses and other information provided by BFA. The Board also noted that the Board and BFA agreed to discuss potential enhancements and adjustments to the 15(c) process for the coming year. The Independent Trustees were advised by their independent counsel throughout the process, including about the legal standards applicable to their review. In approving the Advisory Contract for the Fund, the Board, including the Independent Trustees, considered the following factors, no one of which was controlling, and reached the following conclusions:
| | |
| 34 | | 2016 iSHARES ANNUAL REPORTTO SHAREHOLDERS |
Board Review and Approval of Investment Advisory Contract (Continued)
iSHARES® U.S. ETF TRUST
Expenses and Performance of the Fund — The Board reviewed statistical information prepared by Broadridge Financial Solutions Inc. (“Broadridge”), an independent provider of investment company data, regarding the expense ratio components, including gross and net total expenses, waivers/reimbursements (if any), and underlying fund fees and expenses (if any) of the Fund in comparison with the same information for other exchange traded funds (including, where applicable, funds sponsored by an “at cost” service provider) and, in the limited instances where no comparable ETFs existed and the comparison group would not otherwise be reasonable in Broadridge’s judgment, pure index institutional mutual funds, objectively selected by Broadridge as comprising the Fund’s applicable peer group pursuant to Broadridge’s proprietary ETF methodology (the “Peer Group”). The Board was provided with a detailed description of Broadridge’s proprietary ETF methodology used by Broadridge to determine the Fund’s Peer Group. The Board further noted that due to the limitations in providing comparable funds in the Peer Group, the statistical information provided in Broadridge’s report may or may not provide meaningful direct comparisons to the Fund in all instances.
The Board also noted that the investment advisory fee rate and overall expenses (net of waivers and reimbursements) for the Fund were higher than the median of the investment advisory fee rates and overall expenses (net of waivers and reimbursements) of the funds in its Peer Group, excluding iShares funds. The Board further noted that the Fund’s Peer Group contained only four comparison funds identified by Broadridge, excluding iShares funds.
In addition, to the extent that any of the comparison funds included in the Peer Group, excluding iShares funds, track the same index as the Fund, Broadridge also provided, and the Board reviewed, a comparison of the Fund’s performance for the one-, three-, five-, ten-year, and since inception periods, as applicable, and for the “last quarter” period ended December 31, 2015, to that of such relevant comparison funds for the same periods.
The Board noted that the Fund is an actively managed ETF that does not seek to track the performance of a specified index and that the management team for the Fund manages the Fund’s portfolio in accordance with its investment objective. The Board further noted that during the prior year, the Board received periodic reports on the Fund’s short- and longer-term performance in comparison with its peer group and benchmark index. Such periodic comparative performance information, including additional detailed information on certain specific iShares funds requested by the Board, was also considered. The Board noted that the Fund generally performed in line with expectations relative to the Fund’s peer group and benchmark index over the relevant periods.
Based on this review, the other factors considered at the meeting, and their general knowledge of ETF pricing, the Board concluded that the investment advisory fee rate and expense level and the historical performance of the Fund supported the Board’s approval of the continuance of the Advisory Contract for the coming year.
Nature, Extent and Quality of Services Provided by BFA — Based on management’s representations, including information about recent and proposed enhancements to the iShares business, including with respect to capital markets support and analysis, product design and other services, the Board expected that there would be no diminution in the scope of services required of or provided by BFA under the Advisory Contract for the coming year as compared to the scope of services provided by BFA during prior years. In reviewing the scope of these services, the Board considered BFA’s investment philosophy and experience, noting that BFA and its affiliates have committed significant resources over time, including during the past year, to supporting the iShares funds and their shareholders. The Board also considered BFA’s compliance program and its compliance record with respect to the Fund. In that regard, the Board noted that BFA reports to the Board about portfolio management and compliance matters on a periodic basis in connection with regularly scheduled meetings of the Board, and on other occasions as necessary and appropriate, and has provided information and made appropriate officers available as needed to provide further assistance with these matters. The Board also reviewed the background and experience of the persons responsible for the day-to-day management of the Fund, as well as the resources available to them in managing the Fund. In addition to the above
| | | | |
BOARD REVIEWAND APPROVALOF INVESTMENT ADVISORY CONTRACT | | | 35 | |
Board Review and Approval of Investment Advisory Contract (Continued)
iSHARES® U.S. ETF TRUST
considerations, the Board reviewed and considered detailed presentations regarding BFA’s investment performance, investment and risk management processes and strategies provided at the June 21-23, 2016 meeting and throughout the previous year, and matters related to BFA’s portfolio compliance policies and procedures. The Board noted that the Fund had met its investment objective consistently since its inception date.
Based on review of this information, and the performance information discussed above, the Board concluded that the nature, extent and quality of services provided by BFA to the Fund under the Advisory Contract supported the Board’s approval of the continuance of the Advisory Contract for the coming year.
Costs of Services Provided to the Fund and Profits Realized by BFA and its Affiliates — The Board reviewed information about the profitability to BlackRock of the Fund, based on the fees payable to BFA and its affiliates (including fees under the Advisory Contract), and all other sources of revenue and expense to BFA and its affiliates from the Funds’ operations for the last calendar year. The Board reviewed BlackRock’s profitability methodology for the iShares funds, noting that the 15(c) Committee had focused on the methodology and profitability presentation during its meetings. The Board discussed the sources of direct and ancillary revenue with management, including the revenues to BTC from securities lending by the Fund. The Board also discussed BFA’s profit margin as reflected in the Fund’s profitability analysis and reviewed information regarding potential economies of scale (as discussed below). Based on this review, the Board concluded that the profits realized by BFA and its affiliates under the Advisory Contract and from other relationships between the Fund and BFA and/or its affiliates, if any, were within a reasonable range in light of the factors considered.
Economies of Scale — The Board reviewed information regarding potential economies of scale or other efficiencies that may result from increases in the Fund’s assets, noting that the issue of economies of scale had been focused on extensively by the 15(c) Committee during its meetings and addressed by management. The Board and the 15(c) Committee reviewed information provided by BFA regarding scale benefits shared with the iShares funds through relatively low fee rates established at inception, breakpoints, waivers, or other fee reductions, as well as through additional investment in the iShares business and the provision of improved or additional infrastructure and services to the iShares funds and their shareholders. The Board and the 15(c) Committee received information regarding BlackRock’s historical profitability, including BFA’s and its affiliates’ costs in providing services. The cost information distinguished, among other things, between fixed and variable costs, and explained how the level of fixed and variable costs, as well as the nature of such costs, may impact the existence or size of scale benefits. The Board noted that the Advisory Contract for the Fund did not provide for any breakpoints in the Fund’s investment advisory fee rate as the assets of the Fund increase. However, the Board noted that should material economies of scale exist in the future that are not otherwise shared, a breakpoint structure for the Fund may be appropriate, and that it would continue to monitor the sharing of economies of scale to determine the appropriateness of adding breakpoints in the future.
Based on this review, as well as the other factors considered at the meeting, the Board, recognizing its responsibility to consider this issue periodically, determined to approve the continuance of the Advisory Contract for the coming year.
Fees and Services Provided for Other Comparable Funds/Accounts Managed by BFA and its Affiliates — The Board received and considered information regarding the investment advisory/management fee rates for other funds/accounts in the U.S. for which BFA (or its affiliates) provides investment advisory/management services, including open-end funds registered under the 1940 Act (including sub-advised funds), collective trust funds, and institutional separate accounts (together, the “Other Accounts”), and acknowledged BFA’s assertion that the iShares funds are fundamentally different investment vehicles from the Other Accounts. The Board noted that BFA and its affiliates do not manage Other Accounts with a similar investment strategy or investment mandate as the Fund. The Board further noted that BFA provided the Board with detailed information regarding how the Other Accounts (particularly institutional clients) generally differ from the Fund, including in terms of the different and generally more extensive services provided to the Fund, as well as other significant differences. In that regard, the Board considered that
| | |
| 36 | | 2016 iSHARES ANNUAL REPORTTO SHAREHOLDERS |
Board Review and Approval of Investment Advisory Contract (Continued)
iSHARES® U.S. ETF TRUST
the pricing of services to institutional clients is typically based on a number of factors beyond the nature and extent of the specific services to be provided and often depends on the overall relationship between the client and its affiliates and the adviser and its affiliates. In addition, the Board considered the relative complexity and inherent risks and challenges of managing and providing other services to the Fund, as a publicly traded exchange traded fund, as compared to the Other Accounts that are institutional clients in light of differing regulatory requirements and client-imposed mandates. The Board also considered the “all-inclusive” nature of the Fund’s advisory fee structure, and the Fund expenses borne by BFA under this arrangement. The Board noted that the investment advisory fee rate under the Advisory Contract for the Fund was generally higher than the investment advisory/management fee rates for certain of the Other Accounts (particularly institutional clients) and concluded that the differences appeared to be consistent with the factors discussed.
Other Benefits to BFA and/or its Affiliates — The Board reviewed the “fallout” benefits or ancillary revenue received by BFA and/or its affiliates in connection with the services provided to the Fund by BFA, such as payment of revenue to BTC, the Fund’s securities lending agent, for loaning portfolio securities (which was included in the profit margins reviewed by the Board pursuant to BFA’s profitability methodology), and payment of advisory fees and/or administration fees to BFA and BTC (or their affiliates) in connection with any investments by the Fund in other funds for which BFA (or its affiliates) provides investment advisory services and/or administration services. The Board noted that BFA generally does not use soft dollars or consider the value of research or other services that may be provided to BFA (including its affiliates) in selecting brokers for portfolio transactions for the Fund. The Board further noted that any portfolio transactions on behalf of the Fund placed through a BFA affiliate or purchased from an underwriting syndicate in which a BFA affiliate participates, are reported to the Board pursuant to Rule 17e-1 or Rule 10f-3, as applicable, under the 1940 Act. The Board concluded that any such ancillary benefits would not be disadvantageous to the Fund’s shareholders and thus would not alter the Board’s conclusion with respect to the appropriateness of approving the continuance of the Advisory Contract for the coming year.
Based on the considerations described above, the Board determined that the Fund’s investment advisory fee rate under the Advisory Contract does not constitute a fee that is so disproportionately large as to bear no reasonable relationship to the services rendered and that could not have been the product of arm’s-length bargaining, and concluded that it is in the best interest of the Fund and its shareholders to approve the continuance of the Advisory Contract for the coming year.
| | | | |
BOARD REVIEWAND APPROVALOF INVESTMENT ADVISORY CONTRACT | | | 37 | |
Supplemental Information (Unaudited)
iSHARES® U.S. ETF TRUST
Section 19(a) Notices
The amounts and sources of distributions reported are estimates and are provided pursuant to regulatory requirements and are not being provided for tax reporting purposes. The actual amounts and sources for tax reporting purposes will depend upon each Fund’s investment experience during the year and may be subject to changes based on the tax regulations. Shareholders will receive a Form 1099-DIV each calendar year that will inform them how to report these distributions for federal income tax purposes.
| | | | | | | | | | | | | | | | | | | | | | | | | | | | | | | | |
| | | Total Cumulative Distributions
for the Fiscal Year | | | % Breakdown of the Total Cumulative
Distributions for the Fiscal Year | |
| iShares ETF | | Net Investment Income | | | Net Realized Capital Gains | | | Return of Capital | | | Total Per Share | | | Net Investment Income | | | Net Realized Capital Gains | | | Return of Capital | | | Total Per Share | |
Interest Rate Hedged High Yield Bond | | $ | 3.952917 | | | $ | — | | | $ | 0.203537 | | | $ | 4.156454 | | | | 95 | % | | | — | % | | | 5 | % | | | 100 | % |
Interest Rate Hedged Corporate Bond | | | 2.038168 | | | | — | | | | 0.049303 | | | | 2.087471 | | | | 98 | | | | — | | | | 2 | | | | 100 | |
Premium/Discount Information
The Premium/Discount Information section is intended to present information about the differences between the daily market price on secondary markets for shares of a fund and that fund’s NAV. NAV is the price at which a fund issues and redeems shares. It is calculated in accordance with the standard formula for valuing mutual fund shares. The “Market Price” of a fund generally is determined using the midpoint between the highest bid and the lowest offer on the primary stock exchange on which the shares of such fund are listed for trading, as of the time that the fund’s NAV is calculated. A fund’s Market Price may be at, above or below its NAV. The NAV of a fund will fluctuate with changes in the fair value of its portfolio holdings. The Market Price of a fund will fluctuate in accordance with changes in its NAV, as well as market supply and demand.
Premiums or discounts are the differences (expressed as a percentage) between the NAV and Market Price of a fund on a given day, generally at the time the NAV is calculated. A premium is the amount that a fund is trading above the reported NAV, expressed as a percentage of the NAV. A discount is the amount that a fund is trading below the reported NAV, expressed as a percentage of the NAV.
The following information shows the frequency of distributions of premiums and discounts for each of the Funds. The information shown for each Fund is for five calendar years (or from the inception date of such Fund if less than five years) through the date of the most recent calendar quarter-end. The specific periods covered for each Fund are disclosed in the table for such Fund.
| | |
| 38 | | 2016 iSHARES ANNUAL REPORTTO SHAREHOLDERS |
Supplemental Information (Unaudited) (Continued)
iSHARES® U.S. ETF TRUST
Each line in the table shows the number of trading days in which the Fund traded within the premium/discount range indicated. The number of trading days in each premium/discount range is also shown as a percentage of the total number of trading days in the period covered by each table. All data presented here represents past performance, which cannot be used to predict future results.
iShares Interest Rate Hedged High Yield Bond ETF
Period Covered: May 27, 2014 through September 30, 2016
| | | | | | | | |
Premium/Discount Range | | Number
of Days | | | Percentage of
Total Days | |
Greater than 1.5% | | | 4 | | | | 0.67 | % |
Greater than 1.0% and Less than 1.5% | | | 5 | | | | 0.84 | |
Greater than 0.5% and Less than 1.0% | | | 15 | | | | 2.53 | |
Between 0.5% and –0.5% | | | 567 | | | | 95.45 | |
Less than –0.5% and Greater than –1.0% | | | 1 | | | | 0.17 | |
Less than –1.0% and Greater than –1.5% | | | 2 | | | | 0.34 | |
| | | | | | | | |
| | | 594 | | | | 100.00 | % |
| | | | | | | | |
iShares Interest Rate Hedged Corporate Bond ETF
Period Covered: May 27, 2014 through September 30, 2016
| | | | | | | | |
Premium/Discount Range | | Number
of Days | | | Percentage of
Total Days | |
Greater than 2.0% | | | 16 | | | | 2.69 | % |
Greater than –1.5% and Less than –2.0% | | | 1 | | | | 0.17 | |
Greater than –1.0% and Less than –1.5% | | | 8 | | | | 1.35 | |
Greater than –0.5% and Less than –1.0% | | | 9 | | | | 1.52 | |
Between 0.5% and –0.5% | | | 556 | | | | 93.59 | |
Less than –0.5% and Greater than –1.0% | | | 2 | | | | 0.34 | |
Less than –1.0% | | | 2 | | | | 0.34 | |
| | | | | | | | |
| | | 594 | | | | 100.00 | % |
| | | | | | | | |
| | | | |
SUPPLEMENTAL INFORMATION | | | 39 | |
Trustee and Officer Information
iSHARES® U.S. ETF TRUST
The Board of Trustees has responsibility for the overall management and operations of the Funds, including general supervision of the duties performed by BFA and other service providers. Each Trustee serves until he or she resigns, is removed, dies, retires or becomes incapacitated. The President, Chief Compliance Officer, Treasurer and Secretary shall each hold office until their successors are chosen and qualify, and all other officers shall hold office until he or she resigns or is removed. Trustees who are not “interested persons” (as defined in the 1940 Act) of the Trust are referred to as independent trustees (“Independent Trustees”).
The registered investment companies advised by BFA or its affiliates (the “BlackRock-advised Funds”) are organized into one complex of closed-end funds, two complexes of open-end funds and one complex of exchange-traded funds (“Exchange-Traded Fund Complex”) (each, a “BlackRock Fund Complex”). Each Fund is included in the BlackRock Fund Complex referred to as the Exchange-Traded Fund Complex. Each Trustee also serves as a Director of iShares, Inc. and a Trustee of iShares Trust, and, as a result, oversees a total of 333 funds (as of October 31, 2016) within the Exchange-Traded Fund Complex. Mr. Lawton also serves as an Advisory Board Member for iShares, Inc. and iShares Trust with respect to 333 funds (as of October 31, 2016) within the Exchange-Traded Fund Complex. With the exception of Robert S. Kapito, Mark Wiedman and Benjamin Archibald, the address of each Trustee, Advisory Board Member and officer is c/o BlackRock, Inc., 400 Howard Street, San Francisco, CA 94105. The address of Mr. Kapito, Mr. Wiedman, and Mr. Archibald is c/o BlackRock, Inc., Park Avenue Plaza, 55 East 52nd Street, New York, NY 10055. The Board has designated Cecilia H. Herbert as its Independent Board Chair. Additional information about the Funds’ Trustees and officers may be found in the Funds’ combined Statement of Additional Information, which is available without charge, upon request, by calling toll-free 1-800-iShares (1-800-474-2737).
Interested Trustees
| | | | | | |
| | | | |
| Name (Age) | | Position(s) | | Principal Occupation(s) During the Past 5 Years | | Other Directorships Held by Trustee
During the Past 5 Years |
Robert S. Kapitoa (59) | | Trustee (since 2011). | | President and Director, BlackRock, Inc. (since 2006); Vice Chairman of BlackRock, Inc. and Head of BlackRock, Inc.’s Portfolio Management Group (since its formation in 1998) and BlackRock, Inc.’s predecessor entities (since 1988); Trustee, University of Pennsylvania (since 2009); President of Board of Directors, Hope & Heroes Children’s Cancer Fund (since 2002); President of the Board of Directors, Periwinkle Theatre for Youth (since 1983). | | Director of iShares, Inc. (since 2009); Trustee of iShares Trust (since 2009). |
| | | |
Mark Wiedmanb (45) | | Trustee (since 2013) | | Managing Director, BlackRock, Inc. (since 2007); Global Head of iShares (since 2011); Head of Corporate Strategy, BlackRock, Inc. (2009-2011). | | Director of iShares, Inc. (since 2013); Trustee of iShares Trust (since 2013); Director of PennyMac Financial Services, Inc. (since 2008). |
| a | | Robert S. Kapito is deemed to be an “interested person” (as defined in the 1940 Act) of the Trust due to his affiliations with BlackRock, Inc. |
| b | | Mark Wiedman is deemed to be an “interested person” (as defined in the 1940 Act) of the Trust due to his affiliations with BlackRock, Inc. and its affiliates. |
| | |
| 40 | | 2016 iSHARES ANNUAL REPORTTO SHAREHOLDERS |
Trustee and Officer Information (Continued)
iSHARES® U.S. ETF TRUST
Independent Trusteesc
| | | | | | |
| | | | |
| Name (Age) | | Position(s) | | Principal Occupation(s) During the Past 5 Years | | Other Directorships Held by Trustee
During the Past 5 Years |
Cecilia H. Herbert (67) | | Trustee (since 2011); Independent Board Chair (since 2016); Nominating and Governance Committee Chair (since 2016). | | Director (1998-2013) and President (2007-2011) of the Board of Directors, Catholic Charities CYO; Trustee (2002-2011) and Chair of the Finance and Investment Committee (2006-2010) of the Thacher School; Member (since 1992) and Chair (1994-2005) of the Investment Committee, Archdiocese of San Francisco; Trustee and Member of the Investment Committee, WNET, the New York public media company (since 2011). | | Director of iShares, Inc. (since 2005); Trustee of iShares Trust (since 2005); Independent Board Chair of iShares Inc. and iShares Trust (since 2016); Director of Forward Funds (23 portfolios) (since 2009); Trustee of Salient MF Trust (4 portfolios) (since 2015). |
| | | |
Jane D. Carlin (60) | | Trustee (since 2015); Risk Committee Chair (since 2016). | | Managing Director and Global Head of Financial Holding Company Governance & Assurance and the Global Head of Operational Risk Management of Morgan Stanley (2006-2012). | | Director of iShares, Inc. (since 2015); Trustee of iShares Trust (since 2015); Director of PHH Corporation (mortgage solutions) (since 2012). |
| | | |
Charles A. Hurty (73) | | Trustee (since 2011); Audit Committee Chair (since 2011). | | Retired; Partner, KPMG LLP (1968-2001). | | Director of iShares, Inc. (since 2005); Trustee of iShares Trust (since 2005); Director of GMAM Absolute Return Strategy Fund (1 portfolio) (since 2002); Director of SkyBridge Alternative Investments Multi-Adviser Hedge Fund Portfolios LLC (2 portfolios) (since 2002). |
| | | |
John E. Kerrigan (61) | | Trustee (since 2011); Securities Lending Committee Chair (since 2016). | | Chief Investment Officer, Santa Clara University (since 2002). | | Director of iShares, Inc. (since 2005); Trustee of iShares Trust (since 2005). |
| | | |
John E. Martinez (55) | | Trustee (since 2011); Fixed Income Plus Committee Chair (since 2016). | | Director of FirstREX Agreement Corp. (formerly EquityRock, Inc.) (since 2005). | | Director of iShares, Inc. (since 2003); Trustee of iShares Trust (since 2003). |
| | | | |
TRUSTEEAND OFFICER INFORMATION | | | 41 | |
Trustee and Officer Information (Continued)
iSHARES® U.S. ETF TRUST
Independent Trusteesc (Continued)
| | | | | | |
| | | | |
| Name (Age) | | Position(s) | | Principal Occupation(s) During the Past 5 Years | | Other Directorships Held by Trustee
During the Past 5 Years |
| | | |
Madhav V. Rajan (52) | | Trustee (since 2011); Equity Plus Committee Chair and 15(c) Committee Chair (since 2016). | | Robert K. Jaedicke Professor of Accounting and Senior Associate Dean for Academic Affairs and Head of MBA Program, Stanford University Graduate School of Business (since 2001); Professor of Law (by courtesy), Stanford Law School (since 2005); Visiting Professor, University of Chicago (2007-2008). | | Director of iShares, Inc. (since 2011); Trustee of iShares Trust (since 2011); Director, Cavium, Inc. (since 2013). |
| c | | Robert H. Silver served as an Independent Trustee until March 31, 2016. |
| | |
| 42 | | 2016 iSHARES ANNUAL REPORTTO SHAREHOLDERS |
Trustee and Officer Information (Continued)
iSHARES® U.S. ETF TRUST
Officersd
| | | | |
| | | |
| Name (Age) | | Position(s) | | Principal Occupation(s) During the Past 5 Years |
Martin Small (41) | | President (since 2016). | | Managing Director, BlackRock, Inc. (since 2010); Head of U.S. iShares (since 2015); Co-Head of the U.S. Financial Markets Advisory Group, BlackRock, Inc. (2008-2014). |
| | |
Jack Gee (57) | | Treasurer and Chief Financial Officer (since 2011). | | Managing Director, BlackRock, Inc. (since 2009); Senior Director of Fund Administration of Intermediary Investor Business, BGI (2009). |
| | |
Benjamin Archibald (41) | | Secretary (since 2015). | | Managing Director, BlackRock, Inc. (since 2014); Director, BlackRock, Inc. (2010-2013); Secretary of the BlackRock-advised Mutual Funds (since 2012). |
| | |
Steve Messinger (54) | | Executive Vice President (since 2016). | | Managing Director, BlackRock, Inc. (2007-2014 and since 2016); Managing Director, Beacon Consulting Group (2014-2016). |
| | |
Charles Park (49) | | Chief Compliance Officer (since 2011). | | Chief Compliance Officer of BlackRock Advisors, LLC and the BlackRock-advised Funds in the Equity-Bond Complex, the Equity-Liquidity Complex and the Closed-End Complex (since 2014); Chief Compliance Officer, BFA (since 2006). |
| | |
Scott Radell (47) | | Executive Vice President (since 2012). | | Managing Director, BlackRock, Inc. (since 2009); Head of Portfolio Solutions, BlackRock, Inc. (since 2009); Head of Portfolio Solutions, BGI (2007-2009); Credit Portfolio Manager, BGI (2005-2007); Credit Research Analyst, BGI (2003-2005). |
| | |
Amy Schioldager (54) | | Executive Vice President (since 2011). | | Senior Managing Director, BlackRock, Inc. (since 2009); Global Head of Index Equity, BGI (2008-2009); Global Head of U.S. Indexing, BGI (2006-2008); Head of Domestic Equity Portfolio Management, BGI (2001-2006). |
| d | | Manish Mehta served as President until October 15, 2016. |
Advisory Board Member
| | | | | | |
| | | | |
| Name (Age) | | Position(s) | | Principal Occupation(s) During the Past 5 Years | | Other Directorships Held by Advisory Board Member During the Past 5 Years |
Drew E. Lawton (57) | | Advisory Board Member (since 2016). | | Senior Managing Director of New York Life Insurance Company (2010-2015). | | Advisory Board Member of iShares, Inc. (since 2016); Advisory Board Member of iShares Trust (since 2016); Director of Principal Funds, Inc., Principal Variable Contracts Funds, Inc. and Principal Exchange-Traded Funds (124 portfolios) (March 2016-October 2016). |
| | | | |
TRUSTEEAND OFFICER INFORMATION | | | 43 | |
Additional Financial Information
Schedules of Investments (Unaudited)
October 31, 2016
Statements of Assets and Liabilities (Unaudited)
October 31, 2016
Audited Financial Statements
February 29, 2016
iShares Trust
iShares iBoxx $ High Yield Corporate Bond ETF | HYG | NYSE Arca
iShares iBoxx $ Investment Grade Corporate Bond ETF | LQD | NYSE Arca
Schedule of Investments (Unaudited)
iSHARES® iBOXX $ HIGH YIELD CORPORATE BOND ETF
October 31, 2016
| | | | | | | | |
| Security | | Principal
(000s) | | | Value | |
CORPORATE BONDS & NOTES — 97.40% | |
| |
ADVERTISING — 0.43% | | | | | |
inVentiv Health Inc. | | | | | | | | |
9.00%, 01/15/18 (Call 12/01/16)a | | $ | 8,225 | | | $ | 8,327,813 | |
Lamar Media Corp. | | | | | | | | |
5.00%, 05/01/23 (Call 05/01/18)b | | | 8,737 | | | | 9,150,151 | |
5.38%, 01/15/24 (Call 01/15/19)b | | | 8,923 | | | | 9,346,842 | |
5.88%, 02/01/22 (Call 02/01/17)b | | | 7,996 | | | | 8,275,860 | |
Series WI | | | | | | | | |
5.75%, 02/01/26 (Call 02/01/21)b | | | 6,513 | | | | 6,956,861 | |
Outfront Media Capital LLC/Outfront Media Capital Corp. | | | | | | | | |
5.25%, 02/15/22 (Call 02/15/17)b | | | 9,315 | | | | 9,687,600 | |
5.63%, 02/15/24 (Call 02/15/19) | | | 8,342 | | | | 8,633,970 | |
5.88%, 03/15/25 (Call 09/15/19)b | | | 7,530 | | | | 7,852,117 | |
| | | | | | | | |
| | | | 68,231,214 | |
AEROSPACE & DEFENSE — 0.72% | | | | | |
KLX Inc. | | | | | | | | |
5.88%, 12/01/22 (Call 12/01/17)a,b | | | 21,119 | | | | 21,552,499 | |
Meccanica Holdings USA Inc. | | | | | | | | |
6.25%, 07/15/19a,b | | | 7,160 | | | | 7,840,200 | |
TransDigm Inc. | | | | | | | | |
5.50%, 10/15/20 (Call 12/01/16)b | | | 9,200 | | | | 9,467,056 | |
6.00%, 07/15/22 (Call 07/15/17)b | | | 19,476 | | | | 20,297,887 | |
6.38%, 06/15/26 (Call 06/15/21)a,b | | | 17,057 | | | | 17,471,485 | |
6.50%, 07/15/24 (Call 07/15/19)b | | | 20,302 | | | | 21,255,896 | |
6.50%, 05/15/25 (Call 05/15/20)b | | | 8,120 | | | | 8,465,100 | |
| | | | | | | | |
| Security | | Principal
(000s) | | | Value | |
7.50%, 07/15/21 (Call 12/01/16)b | | $ | 8,068 | | | $ | 8,539,086 | |
| | | | | | | | |
| | | | 114,889,209 | |
AIRLINES — 0.28% | | | | | |
Air Canada | | | | | | | | |
7.75%, 04/15/21a,b | | | 6,527 | | | | 7,181,060 | |
American Airlines Group Inc. | | | | | | | | |
4.63%, 03/01/20a,b | | | 8,303 | | | | 8,352,299 | |
5.50%, 10/01/19a,b | | | 12,669 | | | | 13,080,742 | |
6.13%, 06/01/18b | | | 7,763 | | | | 8,075,137 | |
Continental Airlines Inc. 2012-3 Pass Through Trust Class C | | | | | | | | |
6.13%, 04/29/18 | | | 7,023 | | | | 7,367,127 | |
| | | | | | | | |
| | | | 44,056,365 | |
APPAREL — 0.31% | | | | | |
Hanesbrands Inc. | | | | | | | | |
4.63%, 05/15/24 (Call 02/15/24)a,b | | | 15,188 | | | | 15,479,792 | |
4.88%, 05/15/26 (Call 02/15/26)a,b | | | 15,301 | | | | 15,543,903 | |
Levi Strauss & Co. | | | | | | | | |
5.00%, 05/01/25 (Call 05/01/20) | | | 8,736 | | | | 9,026,869 | |
6.88%, 05/01/22 (Call 05/01/17)b | | | 8,821 | | | | 9,278,984 | |
| | | | | | | | |
| | | | 49,329,548 | |
AUTO MANUFACTURERS — 0.69% | | | | | |
Fiat Chrysler Automobile NV | | | | | | | | |
4.50%, 04/15/20b | | | 25,543 | | | | 26,152,104 | |
Fiat Chrysler Automobiles NV | | | | | | | | |
5.25%, 04/15/23b | | | 24,990 | | | | 25,489,800 | |
Jaguar Land Rover Automotive PLC | | | | | | | | |
3.50%, 03/15/20 (Call 12/15/19)a,b | | | 9,200 | | | | 9,352,611 | |
4.13%, 12/15/18a,b | | | 12,222 | | | | 12,516,765 | |
4.25%, 11/15/19a,b | | | 8,640 | | | | 8,965,080 | |
5.63%, 02/01/23 (Call 02/01/18)a,b | | | 7,950 | | | | 8,208,375 | |
Navistar International Corp. | | | | | | | | |
8.25%, 11/01/21 (Call 12/01/16)b | | | 19,907 | | | | 19,556,553 | |
| | | | | | | | |
| | | | 110,241,288 | |
| | | | |
SCHEDULESOF INVESTMENTS | | | 45 | |
Schedule of Investments (Unaudited) (Continued)
iSHARES® iBOXX $ HIGH YIELD CORPORATE BOND ETF
October 31, 2016
| | | | | | | | |
| Security | | Principal
(000s) | | | Value | |
AUTO PARTS & EQUIPMENT — 1.17% | | | | | |
Allison Transmission Inc. | | | | | | | | |
5.00%, 10/01/24 (Call 10/01/19)a | | $ | 17,160 | | | $ | 17,503,200 | |
American Axle & Manufacturing Inc. | | | | | | | | |
6.25%, 03/15/21 (Call 12/01/16)b | | | 6,239 | | | | 6,498,587 | |
6.63%, 10/15/22 (Call 10/15/17)b | | | 9,025 | | | | 9,510,094 | |
Dana Inc. | | | | | | | | |
5.38%, 09/15/21 (Call 12/01/16)b | | | 7,202 | | | | 7,490,080 | |
5.50%, 12/15/24 (Call 12/15/19)b | | | 9,550 | | | | 9,863,139 | |
Goodyear Tire & Rubber Co. (The) | | | | | | | | |
5.00%, 05/31/26 (Call 05/31/21)b | | | 15,045 | | | | 15,124,123 | |
5.13%, 11/15/23 (Call 11/15/18)b | | | 17,575 | | | | 18,090,505 | |
7.00%, 05/15/22 (Call 05/15/17) | | | 10,196 | | | | 10,753,301 | |
Lear Corp. | | | | | | | | |
4.75%, 01/15/23 (Call 01/15/18)b | | | 1,567 | | | | 1,625,762 | |
5.25%, 01/15/25 (Call 01/15/20) | | | 1,827 | | | | 1,959,457 | |
Schaeffler Finance BV | | | | | | | | |
4.25%, 05/15/21 (Call 05/15/17)a | | | 12,850 | | | | 13,219,437 | |
4.75%, 05/15/23 (Call 05/15/18)a,b | | | 9,100 | | | | 9,361,625 | |
ZF North America Capital Inc. | | | | | | | | |
4.00%, 04/29/20a,b | | | 18,049 | | | | 19,019,134 | |
4.50%, 04/29/22a,b | | | 18,394 | | | | 19,459,741 | |
4.75%, 04/29/25a | | | 25,176 | | | | 26,560,680 | |
| | | | | | | | |
| | | | 186,038,865 | |
BANKS — 2.07% | | | | | |
BPCE SA
| | | | | | | | |
VRN, (3 mo. LIBOR US + 12.980%) | | | | | |
12.50%, 08/29/49 (Call 09/30/19)a,b,c | | | 7,610 | | | | 9,624,824 | |
| | | | | | | | |
| Security | | Principal
(000s) | | | Value | |
CIT Group Inc. | | | | | | | | |
3.88%, 02/19/19b | | $ | 18,158 | | | $ | 18,428,607 | |
4.25%, 08/15/17b | | | 1,694 | | | | 1,716,662 | |
5.00%, 08/15/22b | | | 21,634 | | | | 23,013,167 | |
5.00%, 08/01/23b | | | 15,455 | | | | 16,461,121 | |
5.25%, 03/15/18b | | | 24,294 | | | | 25,053,187 | |
5.38%, 05/15/20b | | | 12,687 | | | | 13,576,345 | |
5.50%, 02/15/19a | | | 31,276 | | | | 32,882,948 | |
6.63%, 04/01/18a | | | 12,401 | | | | 13,087,420 | |
Credit Agricole SA | | | | | | | | |
VRN, (3 mo. LIBOR US + 6.982%) | | | | | |
8.38%, 10/29/49 (Call 10/13/19)a,b,c | | | 18,488 | | | | 20,805,317 | |
Fifth Third Bancorp. | | | | | | | | |
VRN, (3 mo. LIBOR US + 3.033%) | | | | | |
5.10%, 12/29/49 (Call 06/30/23)b,c | | | 10,141 | | | | 9,783,479 | |
Royal Bank of Scotland Group PLC | |
5.13%, 05/28/24b | | | 40,110 | | | | 39,591,093 | |
6.00%, 12/19/23b | | | 35,652 | | | | 36,735,585 | |
6.10%, 06/10/23 | | | 16,987 | | | | 17,586,283 | |
6.13%, 12/15/22 | | | 39,652 | | | | 41,835,525 | |
Royal Bank of Scotland NV (The) | | | | | | | | |
4.65%, 06/04/18b | | | 9,150 | | | | 9,381,888 | |
| | | | | | | | |
| | | | 329,563,451 | |
BEVERAGES — 0.52% | | | | | |
Constellation Brands Inc. | | | | | | | | |
3.75%, 05/01/21b | | | 8,420 | | | | 8,902,466 | |
3.88%, 11/15/19b | | | 5,186 | | | | 5,445,300 | |
4.25%, 05/01/23 | | | 18,335 | | | | 19,343,425 | |
4.75%, 11/15/24b | | | 8,231 | | | | 9,040,872 | |
4.75%, 12/01/25b | | | 6,309 | | | | 6,933,053 | |
6.00%, 05/01/22 | | | 11,180 | | | | 12,946,839 | |
Cott Beverages Inc. | | | | | | | | |
5.38%, 07/01/22 (Call 07/01/17)b | | | 9,028 | | | | 9,215,143 | |
6.75%, 01/01/20 (Call 01/01/17)b | | | 10,030 | | | | 10,418,663 | |
| | | | | | | | |
| | | | 82,245,761 | |
BIOTECHNOLOGY — 0.10% | | | | | |
Concordia International Corp. | | | | | | | | |
7.00%, 04/15/23 (Call 04/15/18)a,b | | | 13,401 | | | | 8,048,976 | |
| | |
| 46 | | 2016 iSHARES ANNUAL REPORTTO SHAREHOLDERS |
Schedule of Investments (Unaudited) (Continued)
iSHARES® iBOXX $ HIGH YIELD CORPORATE BOND ETF
October 31, 2016
| | | | | | | | |
| Security | | Principal
(000s) | | | Value | |
9.50%, 10/21/22 (Call 12/15/18)a,b | | $ | 13,570 | | | $ | 8,321,520 | |
| | | | | | | | |
| | | | 16,370,496 | |
BUILDING MATERIALS — 0.84% | | | | | |
Builders FirstSource Inc. | | | | | | | | |
5.63%, 09/01/24 (Call 09/01/19)a,b | | | 13,040 | | | | 13,182,865 | |
Masco Corp. | | | | | | | | |
3.50%, 04/01/21 (Call 03/01/21)b | | | 7,115 | | | | 7,285,760 | |
4.38%, 04/01/26 (Call 01/01/26)b | | | 8,100 | | | | 8,455,333 | |
4.45%, 04/01/25 (Call 01/01/25)b | | | 9,150 | | | | 9,573,188 | |
5.95%, 03/15/22b | | | 6,677 | | | | 7,579,730 | |
7.13%, 03/15/20b | | | 8,615 | | | | 9,874,944 | |
Standard Industries Inc./NJ | | | | | | | | |
5.13%, 02/15/21 (Call 02/15/18)a,b | | | 8,473 | | | | 8,891,354 | |
5.38%, 11/15/24 (Call 11/15/19)a,b | | | 19,446 | | | | 20,156,994 | |
5.50%, 02/15/23 (Call 02/15/19)a,b | | | 7,935 | | | | 8,252,400 | |
6.00%, 10/15/25 (Call 10/15/20)a,b | | | 20,117 | | | | 21,534,243 | |
Summit Materials LLC/Summit Materials Finance Corp. | | | | | | | | |
6.13%, 07/15/23 (Call 07/15/18)b | | | 10,507 | | | | 10,795,943 | |
USG Corp. | | | | | | | | |
9.50%, 01/15/18 | | | 8,314 | | | | 9,015,494 | |
| | | | | | | | |
| | | | 134,598,248 | |
CHEMICALS — 1.62% | | | | | |
Ashland LLC | | | | | | | | |
3.88%, 04/15/18 (Call 03/15/18)b | | | 10,400 | | | | 10,660,000 | |
4.75%, 08/15/22 (Call 05/15/22)b | | | 23,123 | | | | 23,917,969 | |
Blue Cube Spinco Inc. | | | | | | | | |
9.75%, 10/15/23 (Call 10/15/20) | | | 12,222 | | | | 14,277,740 | |
10.00%, 10/15/25 (Call 10/15/20)b | | | 8,729 | | | | 10,428,536 | |
| | | | | | | | |
| Security | | Principal
(000s) | | | Value | |
Chemours Co. (The) | | | | | | | | |
6.63%, 05/15/23 (Call 05/15/18)b | | $ | 22,135 | | | $ | 21,477,460 | |
7.00%, 05/15/25 (Call 05/15/20) | | | 13,020 | | | | 12,581,592 | |
Hexion Inc. | |
6.63%, 04/15/20 (Call 12/01/16)b | | | 26,051 | | | | 22,665,412 | |
8.88%, 02/01/18 (Call 12/01/16) | | | 15,352 | | | | 14,630,324 | |
Hexion Inc./Hexion Nova Scotia Finance ULC | | | | | | | | |
9.00%, 11/15/20 (Call 12/01/16) | | | 10,627 | | | | 7,690,184 | |
Huntsman International LLC | | | | | | | | |
4.88%, 11/15/20 (Call 08/15/20)b | | | 11,095 | | | | 11,544,347 | |
5.13%, 11/15/22 (Call 08/15/22)b | | | 7,260 | | | | 7,494,130 | |
INEOS Group Holdings SA | | | | | | | | |
5.63%, 08/01/24 (Call 08/01/19)a,b | | | 10,000 | | | | 9,897,500 | |
5.88%, 02/15/19 (Call 12/01/16)a,b | | | 10,425 | | | | 10,620,469 | |
NOVA Chemicals Corp. | | | | | | | | |
5.00%, 05/01/25 (Call 01/31/25)a,b | | | 8,555 | | | | 8,651,244 | |
5.25%, 08/01/23 (Call 08/01/18)a,b | | | 8,159 | | | | 8,281,385 | |
Platform Specialty Products Corp. | | | | | | | | |
6.50%, 02/01/22 (Call 02/01/18)a,b | | | 19,752 | | | | 19,159,440 | |
10.38%, 05/01/21 (Call 05/01/18)a | | | 7,929 | | | | 8,581,491 | |
Tronox Finance LLC | | | | | | | | |
6.38%, 08/15/20 (Call 12/01/16)b | | | 15,500 | | | | 13,911,250 | |
7.50%, 03/15/22 (Call 03/15/18)a | | | 9,935 | | | | 8,939,070 | |
WR Grace & Co.-Conn | | | | | | | | |
5.13%, 10/01/21a,b | | | 12,382 | | | | 13,195,674 | |
| | | | | | | | |
| | | | 258,605,217 | |
| | | | |
SCHEDULESOF INVESTMENTS | | | 47 | |
Schedule of Investments (Unaudited) (Continued)
iSHARES® iBOXX $ HIGH YIELD CORPORATE BOND ETF
October 31, 2016
| | | | | | | | |
| Security | | Principal
(000s) | | | Value | |
COAL — 0.33% | | | | | |
CONSOL Energy Inc. | | | | | | | | |
5.88%, 04/15/22 (Call 04/15/17) | | $ | 31,976 | | | $ | 29,596,186 | |
8.00%, 04/01/23 (Call 04/01/18) | | | 8,670 | | | | 8,615,451 | |
Murray Energy Corp. | | | | | | | | |
11.25%, 04/15/21 (Call 04/15/18)a | | | 19,000 | | | | 14,582,500 | |
| | | | | | | | |
| | | | 52,794,137 | |
COMMERCIAL SERVICES — 3.25% | | | | | |
ADT Corp. (The) | | | | | | | | |
3.50%, 07/15/22b | | | 17,492 | | | | 16,591,162 | |
4.13%, 06/15/23b | | | 11,356 | | | | 11,104,010 | |
6.25%, 10/15/21b | | | 17,316 | | | | 18,955,825 | |
APX Group Inc. | | | | | | | | |
6.38%, 12/01/19 (Call 12/01/16)b | | | 16,379 | | | | 16,890,844 | |
7.88%, 12/01/22 (Call 12/01/18)b | | | 9,220 | | | | 9,698,938 | |
8.75%, 12/01/20 (Call 12/01/16)b | | | 15,674 | | | | 15,212,686 | |
Ashtead Capital Inc. | | | | | | | | |
5.63%, 10/01/24 (Call 10/01/19)a,b | | | 9,135 | | | | 9,614,588 | |
6.50%, 07/15/22 (Call 07/15/17)a,b | | | 17,011 | | | | 17,882,814 | |
Avis Budget Car Rental LLC/Avis Budget Finance Inc. | | | | | | | | |
5.13%, 06/01/22 (Call 06/01/17)a,b | | | 6,577 | | | | 6,461,903 | |
5.50%, 04/01/23 (Call 04/01/18)b | | | 11,341 | | | | 11,246,492 | |
Global A&T Electronics Ltd. | | | | | | | | |
10.00%, 02/01/19 (Call 12/01/16)a | | | 20,980 | | | | 16,784,000 | |
Harland Clarke Holdings Corp. | | | | | | | | |
9.25%, 03/01/21 (Call 03/01/17)a | | | 12,447 | | | | 10,642,185 | |
Herc Rentals Inc. | | | | | | | | |
7.50%, 06/01/22 (Call 06/01/19)a,b | | | 10,596 | | | | 10,648,980 | |
7.75%, 06/01/24 (Call 06/01/19)a,b | | | 10,737 | | | | 10,898,055 | |
| | | | | | | | |
| Security | | Principal
(000s) | | | Value | |
Hertz Corp. (The) | | | | | | | | |
5.50%, 10/15/24 (Call 10/15/19)a,b | | $ | 16,360 | | | $ | 15,910,100 | |
5.88%, 10/15/20 (Call 12/01/16)b | | | 11,417 | | | | 11,730,968 | |
6.25%, 10/15/22 (Call 10/15/17)b | | | 8,265 | | | | 8,445,551 | |
6.75%, 04/15/19 (Call 12/01/16)b | | | 8,546 | | | | 8,704,725 | |
7.38%, 01/15/21 (Call 12/01/16) | | | 8,350 | | | | 8,599,240 | |
Iron Mountain Inc. | |
5.75%, 08/15/24 (Call 08/15/17)b | | | 16,773 | | | | 17,156,682 | |
6.00%, 08/15/23 (Call 08/15/18)b | | | 9,811 | | | | 10,445,211 | |
Jaguar Holding Co. II/Pharmaceutical Product Development LLC | | | | | | | | |
6.38%, 08/01/23 (Call 08/01/18)a | | | 18,628 | | | | 18,737,439 | |
Laureate Education Inc. | | | | | | | | |
10.00%, 09/01/19 (Call 12/01/16)a,b | | | 24,682 | | | | 23,127,508 | |
Leidos Holdings Inc. | | | | | | | | |
4.45%, 12/01/20 (Call 09/01/20)b | | | 7,280 | | | | 7,425,600 | |
Prime Security Services Borrower LLC/Prime Finance Inc. | | | | | | | | |
9.25%, 05/15/23 (Call 05/15/19)a,b | | | 55,896 | | | | 59,362,603 | |
RR Donnelley & Sons Co. | | | | | | | | |
6.00%, 04/01/24 | | | 6,820 | | | | 6,479,000 | |
7.00%, 02/15/22 | | | 1,360 | | | | 1,371,560 | |
7.88%, 03/15/21b | | | 7,395 | | | | 7,949,625 | |
Service Corp. International/U.S. | | | | | | | | |
5.38%, 01/15/22 (Call 07/15/17)b | | | 7,310 | | | | 7,608,491 | |
5.38%, 05/15/24 (Call 05/15/19)b | | | 15,675 | | | | 16,548,322 | |
United Rentals North America Inc. | | | | | | | | |
4.63%, 07/15/23 (Call 07/15/18)b | | | 18,470 | | | | 19,063,349 | |
| | |
| 48 | | 2016 iSHARES ANNUAL REPORTTO SHAREHOLDERS |
Schedule of Investments (Unaudited) (Continued)
iSHARES® iBOXX $ HIGH YIELD CORPORATE BOND ETF
October 31, 2016
| | | | | | | | |
| Security | | Principal
(000s) | | | Value | |
5.50%, 07/15/25 (Call 07/15/20)b | | $ | 13,714 | | | $ | 13,885,425 | |
5.50%, 05/15/27 (Call 05/15/22) | | | 3,210 | | | | 3,193,950 | |
5.75%, 11/15/24 (Call 05/15/19)b | | | 14,503 | | | | 15,046,862 | |
5.88%, 09/15/26 (Call 09/15/21)b | | | 12,572 | | | | 12,778,181 | |
6.13%, 06/15/23 (Call 12/15/17)b | | | 15,988 | | | | 16,722,270 | |
7.63%, 04/15/22 (Call 04/15/17)b | | | 23,480 | | | | 24,968,162 | |
| | | | | | | | |
| | | | 517,893,306 | |
COMPUTERS — 1.25% | | | | | |
Dell Inc. | | | | | | | | |
4.63%, 04/01/21b | | | 8,162 | | | | 8,410,686 | |
5.65%, 04/15/18 | | | 8,444 | | | | 8,781,841 | |
5.88%, 06/15/19b | | | 10,248 | | | | 10,936,081 | |
Diamond 1 Finance Corp./Diamond 2 Finance Corp. | | | | | | | | |
5.88%, 06/15/21 (Call 06/15/18)a,b | | | 28,931 | | | | 30,400,695 | |
7.13%, 06/15/24 (Call 06/15/19)a,b | | | 28,642 | | | | 31,265,060 | |
NCR Corp. | | | | | | | | |
4.63%, 02/15/21 (Call 02/15/17)b | | | 8,163 | | | | 8,285,288 | |
5.00%, 07/15/22 (Call 07/15/17) | | | 10,139 | | | | 10,227,716 | |
5.88%, 12/15/21 (Call 12/15/17)b | | | 6,835 | | | | 7,185,294 | |
6.38%, 12/15/23 (Call 12/15/18)b | | | 12,702 | | | | 13,454,964 | |
Western Digital Corp. | | | | | | | | |
10.50%, 04/01/24 (Call 04/01/19)a,b | | | 60,737 | | | | 70,378,999 | |
| | | | | | | | |
| | | | 199,326,624 | |
COSMETICS & PERSONAL CARE — 0.16% | |
Avon International Operations Inc. | | | | | | | | |
7.88%, 08/15/22 (Call 08/15/19)a | | | 8,263 | | | | 8,882,725 | |
| | | | | | | | |
| Security | | Principal
(000s) | | | Value | |
Avon Products Inc. | | | | | | | | |
6.60%, 03/15/20b | | $ | 7,803 | | | $ | 8,015,144 | |
7.00%, 03/15/23b | | | 8,833 | | | | 8,383,748 | |
| | | | | | | | |
| | | | 25,281,617 | |
DISTRIBUTION & WHOLESALE — 0.25% | | | | | |
HD Supply Inc. | | | | | | | | |
5.25%, 12/15/21 (Call 12/15/17)a | | | 21,602 | | | | 22,918,890 | |
5.75%, 04/15/24 (Call 04/15/19)a,b | | | 16,832 | | | | 17,673,600 | |
| | | | | | | | |
| | | | 40,592,490 | |
DIVERSIFIED FINANCIAL SERVICES — 4.44% | |
Aircastle Ltd. | | | | | | | | |
4.63%, 12/15/18b | | | 7,119 | | | | 7,412,616 | |
5.00%, 04/01/23b | | | 8,685 | | | | 8,961,791 | |
5.13%, 03/15/21b | | | 9,655 | | | | 10,284,299 | |
5.50%, 02/15/22 | | | 8,201 | | | | 8,800,232 | |
6.25%, 12/01/19b | | | 8,200 | | | | 8,917,500 | |
Ally Financial Inc. | | | | | | | | |
3.25%, 02/13/18 | | | 10,132 | | | | 10,175,930 | |
3.25%, 11/05/18 | | | 12,766 | | | | 12,718,127 | |
3.50%, 01/27/19b | | | 12,659 | | | | 12,674,824 | |
3.60%, 05/21/18b | | | 16,755 | | | | 16,879,573 | |
3.75%, 11/18/19b | | | 13,561 | | | | 13,594,902 | |
4.13%, 03/30/20b | | | 12,740 | | | | 12,947,025 | |
4.13%, 02/13/22b | | | 11,281 | | | | 11,307,830 | |
4.25%, 04/15/21b | | | 10,382 | | | | 10,472,843 | |
4.63%, 05/19/22b | | | 8,183 | | | | 8,382,854 | |
4.63%, 03/30/25b | | | 8,602 | | | | 8,730,489 | |
4.75%, 09/10/18b | | | 12,275 | | | | 12,618,782 | |
5.13%, 09/30/24b | | | 13,193 | | | | 13,901,258 | |
5.75%, 11/20/25 (Call 10/20/25)b | | | 17,758 | | | | 18,187,680 | |
6.25%, 12/01/17 | | | 14,530 | | | | 15,088,551 | |
7.50%, 09/15/20 | | | 9,425 | | | | 10,646,625 | |
8.00%, 12/31/18b | | | 8,725 | | | | 9,537,516 | |
8.00%, 03/15/20b | | | 17,625 | | | | 19,985,492 | |
Icahn Enterprises LP/Icahn Enterprises Finance Corp. | | | | | | | | |
4.88%, 03/15/19 (Call 12/01/16) | | | 22,818 | | | | 22,766,504 | |
5.88%, 02/01/22 (Call 08/01/17)b | | | 23,446 | | | | 22,369,460 | |
| | | | |
SCHEDULESOF INVESTMENTS | | | 49 | |
Schedule of Investments (Unaudited) (Continued)
iSHARES® iBOXX $ HIGH YIELD CORPORATE BOND ETF
October 31, 2016
| | | | | | | | |
| Security | | Principal
(000s) | | | Value | |
6.00%, 08/01/20 (Call 02/01/17)b | | $ | 29,587 | | | $ | 29,383,619 | |
Jefferies Finance LLC/JFIN Co-Issuer Corp. | | | | | | | | |
6.88%, 04/15/22 (Call 04/15/17)a | | | 7,130 | | | | 6,746,763 | |
7.38%, 04/01/20 (Call 12/01/16)a,b | | | 11,321 | | | | 11,236,093 | |
7.50%, 04/15/21 (Call 10/15/17)a,b | | | 7,550 | | | | 7,390,911 | |
Lincoln Finance Ltd. | | | | | | | | |
7.38%, 04/15/21 (Call 04/15/18)a,b | | | 8,350 | | | | 8,984,531 | |
Nationstar Mortgage LLC/Nationstar Capital Corp. | | | | | | | | |
6.50%, 08/01/18 (Call 12/01/16)b | | | 7,808 | | | | 7,915,360 | |
6.50%, 07/01/21 (Call 01/01/17)b | | | 10,190 | | | | 10,069,891 | |
7.88%, 10/01/20 (Call 12/01/16)b | | | 6,350 | | | | 6,482,103 | |
Navient Corp. | | | | | | | | |
4.63%, 09/25/17 | | | 682 | | | | 692,230 | |
4.88%, 06/17/19b | | | 16,790 | | | | 16,978,887 | |
5.00%, 10/26/20b | | | 8,262 | | | | 8,169,053 | |
5.50%, 01/15/19 | | | 21,455 | | | | 21,937,737 | |
5.50%, 01/25/23b | | | 15,691 | | | | 14,200,355 | |
5.88%, 03/25/21b | | | 8,764 | | | | 8,742,090 | |
5.88%, 10/25/24 | | | 8,683 | | | | 7,749,578 | |
6.13%, 03/25/24b | | | 14,905 | | | | 13,638,075 | |
6.63%, 07/26/21b | | | 12,395 | | | | 12,472,469 | |
7.25%, 01/25/22b | | | 14,743 | | | | 14,908,859 | |
7.25%, 09/25/23 | | | 9,755 | | | | 9,584,288 | |
8.00%, 03/25/20 | | | 26,054 | | | | 28,268,590 | |
8.45%, 06/15/18b | | | 40,817 | | | | 44,133,381 | |
OneMain Financial Holdings LLC | | | | | | | | |
6.75%, 12/15/19 (Call 12/15/16)a | | | 11,856 | | | | 12,270,960 | |
7.25%, 12/15/21 (Call 12/15/17)a,b | | | 13,330 | | | | 13,796,550 | |
Quicken Loans Inc. | | | | | | | | |
5.75%, 05/01/25 (Call 05/01/20)a,b | | | 21,529 | | | | 21,201,873 | |
| | | | | | | | |
| Security | | Principal
(000s) | | | Value | |
Springleaf Finance Corp. | | | | | | | | |
5.25%, 12/15/19b | | $ | 13,343 | | | $ | 13,387,476 | |
6.90%, 12/15/17 | | | 17,622 | | | | 18,443,901 | |
7.75%, 10/01/21b | | | 11,250 | | | | 11,700,000 | |
8.25%, 12/15/20b | | | 17,035 | | | | 18,473,251 | |
| | | | | | | | |
| | | | 706,321,577 | |
ELECTRIC — 3.31% | | | | | |
AES Corp./VA | | | | | | | | |
4.88%, 05/15/23 (Call 05/15/18)b | | | 12,038 | | | | 11,974,078 | |
5.50%, 03/15/24 (Call 03/15/19)b | | | 12,549 | | | | 12,657,549 | |
5.50%, 04/15/25 (Call 04/15/20)b | | | 11,309 | | | | 11,366,427 | |
6.00%, 05/15/26 (Call 05/15/21)b | | | 8,515 | | | | 8,790,770 | |
7.38%, 07/01/21 (Call 06/01/21) | | | 16,933 | | | | 19,091,958 | |
8.00%, 06/01/20b | | | 9,025 | | | | 10,469,000 | |
Calpine Corp. | | | | | | | | |
5.25%, 06/01/26 (Call 06/01/21)a,b | | | 11,053 | | | | 11,218,795 | |
5.38%, 01/15/23 (Call 10/15/18)b | | | 21,272 | | | | 21,059,280 | |
5.50%, 02/01/24 (Call 02/01/19)b | | | 11,450 | | | | 11,188,752 | |
5.75%, 01/15/25 (Call 10/15/19)b | | | 27,307 | | | | 26,590,191 | |
5.88%, 01/15/24 (Call 11/01/18)a,b | | | 8,351 | | | | 8,804,340 | |
6.00%, 01/15/22 (Call 12/01/16)a,b | | | 13,030 | | | | 13,620,389 | |
7.88%, 01/15/23 (Call 01/15/17)a,b | | | 8,283 | | | | 8,666,886 | |
DPL Inc. | | | | | | | | |
7.25%, 10/15/21 (Call 07/15/21)b | | | 13,707 | | | | 14,306,681 | |
Dynegy Inc. | | | | | | | | |
5.88%, 06/01/23 (Call 06/01/18) | | | 8,681 | | | | 7,655,557 | |
6.75%, 11/01/19 (Call 05/01/17)b | | | 37,573 | | | | 37,991,837 | |
7.38%, 11/01/22 (Call 11/01/18)b | | | 31,269 | | | | 30,252,757 | |
| | |
| 50 | | 2016 iSHARES ANNUAL REPORTTO SHAREHOLDERS |
Schedule of Investments (Unaudited) (Continued)
iSHARES® iBOXX $ HIGH YIELD CORPORATE BOND ETF
October 31, 2016
| | | | | | | | |
| Security | | Principal
(000s) | | | Value | |
7.63%, 11/01/24 (Call 11/01/19)b | | $ | 23,473 | | | $ | 22,534,080 | |
8.00%, 01/15/25 (Call 01/15/20)a,b | | | 15,100 | | | | 14,571,500 | |
Enel SpA | | | | | | | | |
VRN, (5 year USD Swap + 5.880%) | | | | | |
8.75%, 09/24/73 (Call 09/24/23)a,b,c | | | 22,857 | | | | 26,685,548 | |
FirstEnergy Corp. | | | | | | | | |
Series A | | | | | | | | |
2.75%, 03/15/18 (Call 02/15/18) | | | 9,400 | | | | 9,496,879 | |
Series B | | | | | | | | |
4.25%, 03/15/23 (Call 12/15/22)b | | | 12,675 | | | | 13,434,684 | |
FirstEnergy Transmission LLC | | | | | | | | |
4.35%, 01/15/25 (Call 10/15/24)a,b | | | 10,350 | | | | 10,939,972 | |
GenOn Energy Inc. | | | | | | | | |
9.50%, 10/15/18 | | | 10,730 | | | | 8,516,938 | |
9.88%, 10/15/20 (Call 12/01/16)b | | | 8,850 | | | | 6,609,844 | |
IPALCO Enterprises Inc. | | | | | | | | |
3.45%, 07/15/20 (Call 06/15/20)b | | | 5,186 | | | | 5,302,166 | |
5.00%, 05/01/18 (Call 04/01/18)b | | | 6,250 | | | | 6,515,625 | |
NRG Energy Inc. | | | | | | | | |
6.25%, 07/15/22 (Call 07/15/18)b | | | 16,984 | | | | 16,933,580 | |
6.25%, 05/01/24 (Call 05/01/19)b | | | 13,118 | | | | 12,757,255 | |
6.63%, 03/15/23 (Call 09/15/17)b | | | 16,486 | | | | 16,444,785 | |
6.63%, 01/15/27 (Call 07/15/21)a,b | | | 22,365 | | | | 20,918,208 | |
7.25%, 05/15/26 (Call 05/15/21)a,b | | | 18,212 | | | | 17,896,204 | |
7.88%, 05/15/21 (Call 12/01/16)b | | | 4,787 | | | | 5,002,415 | |
Talen Energy Supply LLC | | | | | | | | |
4.60%, 12/15/21 (Call 09/15/21)b | | | 12,327 | | | | 10,100,470 | |
| | | | | | | | |
| Security | | Principal
(000s) | | | Value | |
4.63%, 07/15/19 (Call 12/01/16)a,b | | $ | 20,941 | | | $ | 19,893,202 | |
6.50%, 05/01/18 | | | 7,075 | | | | 7,330,639 | |
6.50%, 06/01/25 (Call 06/01/20)b | | | 10,895 | | | | 9,009,375 | |
| | | | | | | | |
| | | | 526,598,616 | |
ELECTRICAL COMPONENTS & EQUIPMENT — 0.18% | |
Anixter Inc. | | | | | | | | |
5.13%, 10/01/21b | | | 6,514 | | | | 6,803,995 | |
Edgewell Personal Care Co. | | | | | | | | |
4.70%, 05/19/21b | | | 11,424 | | | | 12,022,915 | |
4.70%, 05/24/22 | | | 9,140 | | | | 9,514,486 | |
| | | | | | | | |
| | | | 28,341,396 | |
ENERGY – ALTERNATE SOURCES — 0.10% | |
TerraForm Power Operating LLC | | | | | | | | |
6.38%, 02/01/23 (Call 02/01/18)a,b,d | | | 15,659 | | | | 15,698,148 | |
| | | | | | | | |
| | | | 15,698,148 | |
ENGINEERING & CONSTRUCTION — 0.38% | |
AECOM | | | | | | | | |
5.75%, 10/15/22 (Call 10/15/17)b | | | 13,580 | | | | 14,190,602 | |
5.88%, 10/15/24 (Call 07/15/24)b | | | 13,525 | | | | 14,180,962 | |
SBA Communications Corp. | | | | | | | | |
4.88%, 07/15/22 (Call 07/15/17)b | | | 13,057 | | | | 13,318,140 | |
4.88%, 09/01/24 (Call 09/01/19)a | | | 18,270 | | | | 18,270,000 | |
| | | | | | | | |
| | | | 59,959,704 | |
ENTERTAINMENT — 1.52% | | | | | |
AMC Entertainment Holdings Inc. | | | | | | | | |
5.88%, 11/15/26 | | | 6,390 | | | | 6,413,963 | |
Cinemark USA Inc. | | | | | | | | |
4.88%, 06/01/23 (Call 06/01/18) | | | 13,134 | | | | 13,068,330 | |
5.13%, 12/15/22 (Call 12/15/17)b | | | 7,110 | | | | 7,305,525 | |
GLP Capital LP/GLP Financing II Inc. | | | | | | | | |
4.38%, 11/01/18 (Call 08/01/18)b | | | 9,191 | | | | 9,533,508 | |
| | | | |
SCHEDULESOF INVESTMENTS | | | 51 | |
Schedule of Investments (Unaudited) (Continued)
iSHARES® iBOXX $ HIGH YIELD CORPORATE BOND ETF
October 31, 2016
| | | | | | | | |
| Security | | Principal
(000s) | | | Value | |
4.38%, 04/15/21b | | $ | 7,661 | | | $ | 8,071,170 | |
4.88%, 11/01/20 (Call 08/01/20)b | | | 17,509 | | | | 18,690,858 | |
5.38%, 11/01/23 (Call 08/01/23) | | | 9,214 | | | | 9,858,980 | |
5.38%, 04/15/26 | | | 17,830 | | | | 19,024,528 | |
International Game Technology | | | | | | | | |
7.50%, 06/15/19b | | | 9,233 | | | | 10,227,584 | |
International Game Technology PLC | | | | | | | | |
5.63%, 02/15/20 (Call 11/15/19)a,b | | | 11,102 | | | | 11,749,042 | |
6.25%, 02/15/22 (Call 08/15/21)a,b | | | 25,191 | | | | 26,756,293 | |
6.50%, 02/15/25 (Call 08/15/24)a,b | | | 21,878 | | | | 23,737,630 | |
Regal Entertainment Group | | | | | | | | |
5.75%, 03/15/22 (Call 03/15/17)b | | | 13,232 | | | | 13,696,671 | |
Scientific Games International Inc. | | | | | | | | |
7.00%, 01/01/22 (Call 01/01/18)a,b | | | 17,216 | | | | 18,256,707 | |
10.00%, 12/01/22 (Call 12/01/18)b | | | 38,115 | | | | 35,351,662 | |
WMG Acquisition Corp. | | | | | | | | |
6.75%, 04/15/22 (Call 04/15/17)a,b | | | 9,916 | | | | 10,463,859 | |
| | | | | | | | |
| | | | 242,206,310 | |
ENVIRONMENTAL CONTROL — 0.30% | | | | | |
Clean Harbors Inc. | | | | | | | | |
5.13%, 06/01/21 (Call 12/01/16)b | | | 13,908 | | | | 14,220,930 | |
5.25%, 08/01/20 (Call 12/01/16)b | | | 12,983 | | | | 13,298,627 | |
Covanta Holding Corp. | | | | | | | | |
5.88%, 03/01/24 (Call 03/01/19)b | | | 6,997 | | | | 6,848,755 | |
6.38%, 10/01/22 (Call 04/01/17)b | | | 7,237 | | | | 7,363,647 | |
7.25%, 12/01/20 (Call 12/01/16)b | | | 6,104 | | | | 6,271,860 | |
| | | | | | | | |
| | | | 48,003,819 | |
| | | | | | | | |
| Security | | Principal
(000s) | | | Value | |
FOOD — 1.06% | | | | | |
Albertsons Companies LLC/Safeway Inc./New Albertson’s Inc./Albertson’s LLC | | | | | | | | |
5.75%, 03/15/25 (Call 09/15/19)a | | $ | 21,430 | | | $ | 21,128,694 | |
6.63%, 06/15/24 (Call 06/15/19)a | | | 24,216 | | | | 25,124,100 | |
Aramark Services Inc. | | | | | | | | |
5.75%, 03/15/20 (Call 12/01/16)b | | | 891 | | | | 916,616 | |
Post Holdings Inc. | | | | | | | | |
5.00%, 08/15/26 (Call 08/15/21)a,b | | | 30,610 | | | | 29,500,388 | |
6.00%, 12/15/22 (Call 06/15/18)a | | | 11,170 | | | | 11,761,662 | |
6.75%, 12/01/21 (Call 12/01/17)a | | | 16,230 | | | | 17,317,642 | |
7.75%, 03/15/24 (Call 09/15/18)a,b | | | 14,156 | | | | 15,642,380 | |
8.00%, 07/15/25 (Call 07/15/20)a | | | 7,930 | | | | 9,013,294 | |
Smithfield Foods Inc. | | | | | | | | |
5.25%, 08/01/18 (Call 12/01/16)a,b | | | 1,506 | | | | 1,520,369 | |
6.63%, 08/15/22 (Call 08/15/17) | | | 15,287 | | | | 16,119,099 | |
TreeHouse Foods Inc. | | | | | | | | |
4.88%, 03/15/22 (Call 03/15/17) | | | 7,054 | | | | 7,316,762 | |
6.00%, 02/15/24 (Call 02/15/19)a | | | 13,038 | | | | 13,787,685 | |
| | | | | | | | |
| | | | 169,148,691 | |
FOOD SERVICE — 0.11% | | | | | |
Aramark Services Inc. | | | | | | | | |
4.75%, 06/01/26 (Call 06/01/21)a,b | | | 9,478 | | | | 9,409,758 | |
5.13%, 01/15/24 (Call 01/15/19) | | | 6,866 | | | | 7,192,135 | |
5.13%, 01/15/24 (Call 01/15/19)a | | | 570 | | | | 597,075 | |
| | | | | | | | |
| | | | 17,198,968 | |
| | |
| 52 | | 2016 iSHARES ANNUAL REPORTTO SHAREHOLDERS |
Schedule of Investments (Unaudited) (Continued)
iSHARES® iBOXX $ HIGH YIELD CORPORATE BOND ETF
October 31, 2016
| | | | | | | | |
| Security | | Principal
(000s) | | | Value | |
GAS — 0.22% | | | | | |
AmeriGas Partners LP/AmeriGas Finance Corp. | | | | | | | | |
5.63%, 05/20/24 (Call 03/20/24)b | | $ | 11,709 | | | $ | 12,298,953 | |
5.88%, 08/20/26 (Call 05/20/26)b | | | 13,116 | | | | 13,777,006 | |
NGL Energy Partners LP/NGL Energy Finance Corp. | | | | | | | | |
7.50%, 11/01/23 (Call 11/01/19)a | | | 923 | | | | 925,308 | |
Sabine Pass LNG LP | | | | | | | | |
6.50%, 11/01/20 (Call 11/30/16)b | | | 7,055 | | | | 7,308,133 | |
| | | | | | | | |
| | | | 34,309,400 | |
HEALTH CARE – PRODUCTS — 1.26% | | | | | |
Alere Inc. | | | | | | | | |
6.38%, 07/01/23 (Call 07/01/18)a,b | | | 7,430 | | | | 7,706,936 | |
6.50%, 06/15/20 (Call 12/01/16) | | | 7,333 | | | | 7,457,161 | |
7.25%, 07/01/18 (Call 12/01/16)b | | | 7,350 | | | | 7,497,000 | |
ConvaTec Healthcare E SA | | | | | | | | |
10.50%, 12/15/18 (Call 12/01/16)a | | | 13,057 | | | | 13,163,322 | |
DJO Finco Inc./DJO Finance LLC/DJO Finance Corp. | | | | | | | | |
8.13%, 06/15/21 (Call 06/15/18)a,b | | | 16,985 | | | | 15,579,877 | |
Hologic Inc. | | | | | | | | |
5.25%, 07/15/22 (Call 07/15/18)a,b | | | 17,348 | | | | 18,303,875 | |
Kinetic Concepts Inc./KCI USA Inc. | | | | | | | | |
7.88%, 02/15/21 (Call 02/15/18)a,b | | | 9,526 | | | | 10,315,070 | |
9.63%, 10/01/21 (Call 10/01/18)a | | | 33,850 | | | | 32,707,562 | |
12.50%, 11/01/21 (Call 05/01/19)a | | | 8,680 | | | | 8,376,200 | |
Mallinckrodt International Finance SA | | | | | | | | |
4.75%, 04/15/23b | | | 10,897 | | | | 9,507,632 | |
| | | | | | | | |
| Security | | Principal
(000s) | | | Value | |
Mallinckrodt International Finance SA/Mallinckrodt CB LLC | | | | | | | | |
4.88%, 04/15/20 (Call 04/15/17)a,b | | $ | 12,295 | | | $ | 12,355,451 | |
5.50%, 04/15/25 (Call 04/15/20)a,b | | | 12,741 | | | | 11,725,702 | |
5.63%, 10/15/23 (Call 10/15/18)a,b | | | 13,084 | | | | 12,285,876 | |
5.75%, 08/01/22 (Call 08/01/17)a,b | | | 15,260 | | | | 14,458,850 | |
Ortho-Clinical Diagnostics Inc./Ortho-Clinical Diagnostics SA | | | | | | | | |
6.63%, 05/15/22 (Call 05/15/17)a | | | 22,587 | | | | 19,368,352 | |
| | | | | | | | |
| | | | 200,808,866 | |
HEALTH CARE – SERVICES — 6.91% | | | | | |
Acadia Healthcare Co. Inc. | | | | | | | | |
5.63%, 02/15/23 (Call 02/15/18)b | | | 10,766 | | | | 10,779,458 | |
Amsurg Corp. | | | | | | | | |
5.63%, 07/15/22 (Call 07/15/17)b | | | 18,222 | | | | 18,586,440 | |
Centene Corp. | | | | | | | | |
4.75%, 05/15/22 (Call 05/15/19) | | | 17,563 | | | | 17,870,353 | |
4.75%, 01/15/25 (Call 01/15/20) | | | 8,005 | | | | 7,969,978 | |
5.63%, 02/15/21 (Call 02/15/18) | | | 24,122 | | | | 25,418,558 | |
6.13%, 02/15/24 (Call 02/15/19)b | | | 17,352 | | | | 18,479,880 | |
CHS/Community Health Systems Inc. | | | | | | | | |
5.13%, 08/15/18 (Call 12/01/16)b | | | 12,215 | | | | 12,071,856 | |
5.13%, 08/01/21 (Call 02/01/17)b | | | 17,669 | | | | 16,476,343 | |
6.88%, 02/01/22 (Call 02/01/18)b | | | 53,478 | | | | 39,907,957 | |
7.13%, 07/15/20 (Call 07/15/17)b | | | 21,614 | | | | 17,507,340 | |
| | | | |
SCHEDULESOF INVESTMENTS | | | 53 | |
Schedule of Investments (Unaudited) (Continued)
iSHARES® iBOXX $ HIGH YIELD CORPORATE BOND ETF
October 31, 2016
| | | | | | | | |
| Security | | Principal
(000s) | | | Value | |
8.00%, 11/15/19 (Call 12/01/16)b | | $ | 33,004 | | | $ | 28,936,257 | |
DaVita Inc. | | | | | | | | |
5.00%, 05/01/25 (Call 05/01/20)b | | | 27,780 | | | | 26,668,800 | |
5.13%, 07/15/24 (Call 07/15/19) | | | 30,652 | | | | 29,924,015 | |
5.75%, 08/15/22 (Call 08/15/17)b | | | 21,048 | | | | 21,626,820 | |
Fresenius Medical Care U.S. Finance II Inc. | | | | | | | | |
4.13%, 10/15/20 (Call 07/17/20)a | | | 8,650 | | | | 9,014,201 | |
4.75%, 10/15/24 (Call 07/17/24)a,b | | | 6,995 | | | | 7,274,800 | |
5.63%, 07/31/19a,b | | | 13,233 | | | | 14,346,778 | |
5.88%, 01/31/22a,b | | | 12,149 | | | | 13,746,755 | |
6.50%, 09/15/18a,b | | | 6,450 | | | | 6,971,321 | |
Fresenius Medical Care U.S. Finance Inc. | | | | | | | | |
5.75%, 02/15/21a,b | | | 11,222 | | | | 12,524,220 | |
HCA Holdings Inc. | | | | | | | | |
6.25%, 02/15/21b | | | 17,024 | | | | 18,296,071 | |
HCA Inc. | | | | | | | | |
3.75%, 03/15/19b | | | 20,476 | | | | 20,967,791 | |
4.25%, 10/15/19b | | | 10,972 | | | | 11,396,308 | |
4.50%, 02/15/27 (Call 08/15/26) | | | 20,340 | | | | 20,143,253 | |
4.75%, 05/01/23b | | | 22,316 | | | | 23,208,640 | |
5.00%, 03/15/24b | | | 35,299 | | | | 36,877,864 | |
5.25%, 04/15/25b | | | 25,055 | | | | 26,370,388 | |
5.25%, 06/15/26 (Call 12/15/25) | | | 26,399 | | | | 27,652,952 | |
5.38%, 02/01/25b | | | 47,014 | | | | 48,030,678 | |
5.88%, 03/15/22b | | | 25,659 | | | | 28,224,900 | |
5.88%, 05/01/23b | | | 22,533 | | | | 23,892,078 | |
5.88%, 02/15/26 (Call 08/15/25)b | | | 26,604 | | | | 27,971,613 | |
6.50%, 02/15/20b | | | 53,602 | | | | 59,431,217 | |
7.50%, 02/15/22 | | | 34,730 | | | | 39,479,327 | |
8.00%, 10/01/18b | | | 8,250 | | | | 9,135,289 | |
HealthSouth Corp. | | | | | | | | |
5.75%, 11/01/24 (Call 11/01/17)b | | | 20,807 | | | | 21,440,964 | |
| | | | | | | | |
| Security | | Principal
(000s) | | | Value | |
Kindred Healthcare Inc. | | | | | | | | |
6.38%, 04/15/22 (Call 04/15/17)b | | $ | 8,321 | | | $ | 7,712,527 | |
8.00%, 01/15/20b | | | 12,871 | | | | 12,960,726 | |
8.75%, 01/15/23 (Call 01/15/18)b | | | 10,584 | | | | 10,319,400 | |
LifePoint Health Inc. | | | | | | | | |
5.38%, 05/01/24 (Call 05/01/19)a,b | | | 8,905 | | | | 8,860,475 | |
5.50%, 12/01/21 (Call 12/01/16)b | | | 18,782 | | | | 19,423,597 | |
5.88%, 12/01/23 (Call 12/01/18)b | | | 8,195 | | | | 8,356,179 | |
MPH Acquisition Holdings LLC | | | | | | | | |
7.13%, 06/01/24 (Call 06/01/19)a | | | 18,949 | | | | 20,242,743 | |
Tenet Healthcare Corp. | | | | | | | | |
4.38%, 10/01/21b | | | 19,370 | | | | 19,273,150 | |
4.50%, 04/01/21b | | | 15,353 | | | | 15,353,000 | |
4.75%, 06/01/20b | | | 9,021 | | | | 9,223,973 | |
5.00%, 03/01/19b | | | 18,672 | | | | 18,152,732 | |
5.50%, 03/01/19b | | | 7,669 | | | | 7,506,490 | |
6.00%, 10/01/20b | | | 31,238 | | | | 32,905,484 | |
6.25%, 11/01/18b | | | 17,820 | | | | 18,808,055 | |
6.75%, 06/15/23b | | | 33,071 | | | | 30,425,320 | |
8.00%, 08/01/20 (Call 12/01/16)b | | | 13,551 | | | | 13,463,765 | |
8.13%, 04/01/22b | | | 48,944 | | | | 47,750,990 | |
| | | | | | | | |
| | | | 1,099,360,069 | |
HOLDING COMPANIES – DIVERSIFIED — 0.68% | |
HRG Group Inc. | | | | | | | | |
7.75%, 01/15/22 (Call 01/15/17) | | | 15,198 | | | | 15,843,915 | |
7.88%, 07/15/19 (Call 12/01/16) | | | 14,721 | | | | 15,433,497 | |
Leucadia National Corp. | | | | | | | | |
5.50%, 10/18/23 (Call 01/18/23)b | | | 12,580 | | | | 13,175,639 | |
Nielsen Co. Luxembourg Sarl (The) | | | | | | | | |
5.50%, 10/01/21 (Call 12/01/16)a,b | | | 10,506 | | | | 10,933,535 | |
Noble Group Ltd. | | | | | | | | |
6.75%, 01/29/20a,b | | | 21,467 | | | | 17,817,610 | |
| | |
| 54 | | 2016 iSHARES ANNUAL REPORTTO SHAREHOLDERS |
Schedule of Investments (Unaudited) (Continued)
iSHARES® iBOXX $ HIGH YIELD CORPORATE BOND ETF
October 31, 2016
| | | | | | | | |
| Security | | Principal
(000s) | | | Value | |
PetSmart Inc. | | | | | | | | |
7.13%, 03/15/23 (Call 03/15/18)a,b | | $ | 33,852 | | | $ | 35,417,655 | |
| | | | | | | | |
| | | | 108,621,851 | |
HOME BUILDERS — 1.32% | | | | | |
Beazer Homes USA Inc. | | | | | | | | |
8.75%, 03/15/22 (Call 03/15/19)a,b | | | 8,240 | | | | 8,730,966 | |
Brookfield Residential Properties Inc. | | | | | | | | |
6.50%, 12/15/20 (Call 12/01/16)a,b | | | 9,645 | | | | 9,933,489 | |
Brookfield Residential Properties Inc./Brookfield Residential U.S. Corp. | | | | | | | | |
6.13%, 07/01/22 (Call 07/01/17)a,b | | | 9,709 | | | | 9,854,635 | |
CalAtlantic Group Inc. | | | | | | | | |
8.38%, 05/15/18b | | | 9,002 | | | | 9,813,430 | |
8.38%, 01/15/21b | | | 6,988 | | | | 8,280,780 | |
DR Horton Inc. | | | | | | | | |
3.63%, 02/15/18 (Call 11/15/17)b | | | 1,410 | | | | 1,431,150 | |
3.75%, 03/01/19 (Call 12/01/18) | | | 3,773 | | | | 3,886,190 | |
4.00%, 02/15/20b | | | 1,401 | | | | 1,461,495 | |
5.75%, 08/15/23 (Call 05/15/23) | | | 1,572 | | | | 1,747,891 | |
K. Hovnanian Enterprises Inc. | | | | | | | | |
7.25%, 10/15/20 (Call 12/01/16)a,b | | | 9,838 | | | | 8,854,639 | |
KB Home | | | | | | | | |
4.75%, 05/15/19 (Call 02/15/19)b | | | 6,952 | | | | 7,120,369 | |
7.00%, 12/15/21 (Call 09/15/21)b | | | 6,993 | | | | 7,507,860 | |
Lennar Corp. | | | | | | | | |
4.50%, 06/15/19 (Call 04/16/19)b | | | 8,375 | | | | 8,732,682 | |
4.50%, 11/15/19 (Call 08/15/19)b | | | 10,686 | | | | 11,126,798 | |
4.75%, 04/01/21 (Call 02/01/21)b | | | 9,292 | | | | 9,843,759 | |
4.75%, 11/15/22 (Call 08/15/22)b | | | 10,468 | | | | 10,882,358 | |
| | | | | | | | |
| Security | | Principal
(000s) | | | Value | |
4.75%, 05/30/25 (Call 02/28/25) | | $ | 8,460 | | | $ | 8,588,411 | |
4.88%, 12/15/23 (Call 09/15/23)b | | | 6,783 | | | | 6,939,662 | |
PulteGroup Inc. | | | | | | | | |
4.25%, 03/01/21 (Call 02/01/21)b | | | 12,470 | | | | 13,031,150 | |
5.00%, 01/15/27 (Call 10/15/26) | | | 10,015 | | | | 9,964,925 | |
5.50%, 03/01/26 (Call 12/01/25)b | | | 11,868 | | | | 12,342,720 | |
Taylor Morrison Communities Inc./Monarch Communities Inc. | | | | | | | | |
5.25%, 04/15/21 (Call 12/01/16)a,b | | | 8,921 | | | | 9,171,903 | |
Toll Brothers Finance Corp. | | | | | | | | |
4.38%, 04/15/23 (Call 01/15/23)b | | | 6,430 | | | | 6,530,437 | |
5.88%, 02/15/22 (Call 11/15/21)b | | | 7,151 | | | | 7,875,000 | |
8.91%, 10/15/17b | | | 1,611 | | | | 1,707,660 | |
TRI Pointe Group Inc./TRI Pointe Homes Inc. | | | | | | | | |
4.38%, 06/15/19 | | | 7,439 | | | | 7,632,207 | |
5.88%, 06/15/24b | | | 7,600 | | | | 7,875,500 | |
| | | | | | | | |
| | | | 210,868,066 | |
HOME FURNISHINGS — 0.12% | | | | | |
Tempur Sealy International Inc. | | | | | | | | |
5.50%, 06/15/26 (Call 06/15/21)b | | | 10,241 | | | | 10,548,230 | |
5.63%, 10/15/23 (Call 10/15/18) | | | 7,894 | | | | 8,177,339 | |
| | | | | | | | |
| | | | 18,725,569 | |
HOUSEHOLD PRODUCTS & WARES — 0.90% | |
Kronos Acquisition Holdings Inc. | | | | | | | | |
9.00%, 08/15/23 (Call 08/15/18)a | | | 10,150 | | | | 10,429,125 | |
Reynolds Group Issuer Inc./Reynolds Group Issuer LLC | | | | | | | | |
5.75%, 10/15/20 (Call 12/01/16)b | | | 57,206 | | | | 58,841,279 | |
| | | | |
SCHEDULESOF INVESTMENTS | | | 55 | |
Schedule of Investments (Unaudited) (Continued)
iSHARES® iBOXX $ HIGH YIELD CORPORATE BOND ETF
October 31, 2016
| | | | | | | | |
| Security | | Principal
(000s) | | | Value | |
6.88%, 02/15/21 (Call 12/01/16) | | $ | 16,432 | | | $ | 16,997,391 | |
8.25%, 02/15/21 (Call 12/01/16) | | | 16,727 | | | | 17,422,743 | |
9.88%, 08/15/19 (Call 11/06/16) | | | 9,672 | | | | 9,914,411 | |
Spectrum Brands Inc. | | | | | | | | |
5.75%, 07/15/25 (Call 07/15/20)b | | | 18,658 | | | | 20,197,285 | |
6.63%, 11/15/22 (Call 11/15/17) | | | 9,544 | | | | 10,209,373 | |
| | | | | | | | |
| | | | 144,011,607 | |
INSURANCE — 0.50% | | | | | |
Genworth Holdings Inc. | | | | | | | | |
4.80%, 02/15/24 | | | 8,431 | | | | 6,871,265 | |
4.90%, 08/15/23 | | | 6,771 | | | | 5,542,966 | |
6.52%, 05/22/18b | | | 10,185 | | | | 10,282,678 | |
7.20%, 02/15/21 | | | 6,129 | | | | 5,665,494 | |
7.63%, 09/24/21 | | | 12,585 | | | | 11,814,310 | |
7.70%, 06/15/20 | | | 6,650 | | | | 6,465,565 | |
HUB International Ltd. | | | | | | | | |
7.88%, 10/01/21 (Call 12/01/16)a,b | | | 20,478 | | | | 20,938,755 | |
Voya Financial Inc. | | | | | | | | |
VRN, (3 mo. LIBOR US + 3.580%) | | | | | |
5.65%, 05/15/53 (Call 05/15/23)b,c | | | 12,214 | | | | 12,147,760 | |
| | | | | | | | |
| | | | 79,728,793 | |
INTERNET — 1.07% | | | | | |
Equinix Inc. | | | | | | | | |
4.88%, 04/01/20 (Call 04/01/17)b | | | 8,366 | | | | 8,644,866 | |
5.38%, 01/01/22 (Call 01/01/18)b | | | 12,300 | | | | 13,056,450 | |
5.38%, 04/01/23 (Call 04/01/18)b | | | 18,164 | | | | 18,958,675 | |
5.75%, 01/01/25 (Call 01/01/20)b | | | 7,830 | | | | 8,301,758 | |
Netflix Inc. | | | | | | | | |
4.38%, 11/15/26a | | | 10,865 | | | | 10,688,444 | |
5.38%, 02/01/21b | | | 8,025 | | | | 8,671,299 | |
5.50%, 02/15/22 | | | 11,825 | | | | 12,784,438 | |
5.75%, 03/01/24b | | | 7,460 | | | | 8,064,382 | |
5.88%, 02/15/25b | | | 13,751 | | | | 15,221,026 | |
| | | | | | | | |
| Security | | Principal
(000s) | | | Value | |
VeriSign Inc. | | | | | | | | |
4.63%, 05/01/23 (Call 05/01/18)b | | $ | 12,255 | | | $ | 12,632,454 | |
5.25%, 04/01/25 (Call 01/01/25)b | | | 8,748 | | | | 9,294,750 | |
Zayo Group LLC/Zayo Capital Inc. | | | | | | | | |
6.00%, 04/01/23 (Call 04/01/18)b | | | 26,243 | | | | 27,555,150 | |
6.38%, 05/15/25 (Call 05/15/20)b | | | 15,344 | | | | 16,133,251 | |
| | | | | | | | |
| | | | 170,006,943 | |
IRON & STEEL — 1.27% | | | | | |
AK Steel Corp. | | | | | | | | |
7.63%, 05/15/20 (Call 12/01/16)b | | | 9,005 | | | | 9,060,531 | |
7.63%, 10/01/21 (Call 10/01/17)b | | | 6,517 | | | | 6,502,948 | |
Allegheny Technologies Inc. | | | | | | | | |
5.95%, 01/15/21 (Call 10/15/20)b | | | 8,585 | | | | 7,926,816 | |
7.88%, 08/15/23 (Call 05/15/23) | | | 8,808 | | | | 8,400,630 | |
ArcelorMittal | | | | | | | | |
6.13%, 06/01/25b | | | 9,189 | | | | 10,075,690 | |
6.25%, 08/05/20 | | | 7,050 | | | | 7,650,425 | |
6.50%, 03/01/21 | | | 17,700 | | | | 19,474,860 | |
7.25%, 02/25/22b | | | 20,097 | | | | 22,776,149 | |
10.85%, 06/01/19 | | | 18,068 | | | | 21,662,490 | |
Cliffs Natural Resources Inc. | | | | | | | | |
7.75%, 03/31/20 (Call 03/31/17)a,b | | | 7,091 | | | | 6,756,147 | |
8.25%, 03/31/20 (Call 03/31/18)a | | | 8,783 | | | | 9,540,534 | |
Commercial Metals Co. | | | | | | | | |
7.35%, 08/15/18b | | | 5,570 | | | | 5,987,750 | |
Steel Dynamics Inc. | | | | | | | | |
5.13%, 10/01/21 (Call 10/01/17)b | | | 11,934 | | | | 12,411,360 | |
5.25%, 04/15/23 (Call 04/15/18) | | | 6,695 | | | | 6,944,389 | |
5.50%, 10/01/24 (Call 10/01/19)b | | | 8,650 | | | | 9,104,125 | |
| | |
| 56 | | 2016 iSHARES ANNUAL REPORTTO SHAREHOLDERS |
Schedule of Investments (Unaudited) (Continued)
iSHARES® iBOXX $ HIGH YIELD CORPORATE BOND ETF
October 31, 2016
| | | | | | | | |
| Security | | Principal
(000s) | | | Value | |
6.13%, 08/15/19 (Call 12/01/16) | | $ | 5,572 | | | $ | 5,745,603 | |
U.S. Steel Corp. | | | | | | | | |
7.38%, 04/01/20b | | | 6,727 | | | | 6,702,708 | |
7.50%, 03/15/22 (Call 03/15/17)b | | | 6,245 | | | | 5,998,670 | |
8.38%, 07/01/21 (Call 07/01/18)a | | | 18,772 | | | | 19,912,009 | |
| | | | | | | | |
| | | | 202,633,834 | |
LEISURE TIME — 0.26% | | | | | |
NCL Corp. Ltd. | | | | | | | | |
4.63%, 11/15/20 (Call 11/15/17)a,b | | | 10,283 | | | | 10,381,702 | |
5.25%, 11/15/19 (Call 12/01/16)a,b | | | 10,800 | | | | 11,019,506 | |
Royal Caribbean Cruises Ltd. | | | | | | | | |
5.25%, 11/15/22b | | | 11,037 | | | | 12,057,923 | |
Sabre GLBL Inc. | | | | | | | | |
5.25%, 11/15/23 (Call 11/15/18)a,b | | | 8,161 | | | | 8,375,226 | |
| | | | | | | | |
| | | | 41,834,357 | |
LODGING — 2.23% | | | | | |
Boyd Gaming Corp. | | | | | | | | |
6.38%, 04/01/26 (Call 04/01/21)a,b | | | 13,424 | | | | 14,355,626 | |
6.88%, 05/15/23 (Call 05/15/18) | | | 12,579 | | | | 13,474,625 | |
Caesars Entertainment Resort Properties LLC/Caesars Entertainment Resort Properties | | | | | | | | |
8.00%, 10/01/20 (Call 12/01/16)b | | | 17,271 | | | | 17,918,662 | |
11.00%, 10/01/21 (Call 12/01/16)b | | | 19,718 | | | | 21,320,087 | |
Diamond Resorts International Inc. | | | | | | | | |
7.75%, 09/01/23 (Call��09/01/19)a,b | | | 7,985 | | | | 7,843,044 | |
10.75%, 09/01/24 (Call 09/01/19)a,b | | | 10,900 | | | | 10,211,938 | |
Felcor Lodging LP | | | | | | | | |
5.63%, 03/01/23 (Call 03/01/18) | | | 9,545 | | | | 9,820,503 | |
| | | | | | | | |
| Security | | Principal
(000s) | | | Value | |
6.00%, 06/01/25 (Call 06/01/20)b | | $ | 8,165 | | | $ | 8,501,806 | |
Hilton Domestic Operating Co. Inc. | | | | | | | | |
4.25%, 09/01/24 (Call 09/01/19)a,b | | | 17,076 | | | | 17,159,855 | |
Hilton Worldwide Finance LLC/Hilton Worldwide Finance Corp. | | | | | | | | |
5.63%, 10/15/21 (Call 11/16/16)b | | | 25,246 | | | | 25,935,294 | |
MGM Growth Properties Operating Partnership LP/MGP Finance Co-Issuer Inc. | | | | | | | | |
5.63%, 05/01/24 (Call 02/01/24)a,b | | | 17,814 | | | | 19,038,712 | |
MGM Resorts International | | | | | | | | |
4.63%, 09/01/26 (Call 06/01/26) | | | 8,795 | | | | 8,478,773 | |
5.25%, 03/31/20b | | | 9,225 | | | | 9,791,803 | |
6.00%, 03/15/23b | | | 22,256 | | | | 24,052,716 | |
6.63%, 12/15/21 | | | 23,883 | | | | 26,704,299 | |
6.75%, 10/01/20b | | | 17,319 | | | | 19,224,090 | |
7.75%, 03/15/22 | | | 17,060 | | | | 19,746,950 | |
8.63%, 02/01/19b | | | 14,516 | | | | 16,266,993 | |
11.38%, 03/01/18 | | | 7,220 | | | | 8,085,799 | |
Wynn Las Vegas LLC/Wynn Las Vegas Capital Corp. | | | | | | | | |
4.25%, 05/30/23 (Call 02/28/23)a,b | | | 8,350 | | | | 8,025,742 | |
5.38%, 03/15/22 (Call 03/15/17)b | | | 15,706 | | | | 16,196,813 | |
5.50%, 03/01/25 (Call 12/01/24)a,b | | | 32,118 | | | | 32,178,221 | |
| | | | | | | | |
| | | | 354,332,351 | |
MACHINERY — 0.84% | | | | | |
BlueLine Rental Finance Corp. | | | | | | | | |
7.00%, 02/01/19 (Call 12/01/16)a,b | | | 12,660 | | | | 11,081,119 | |
Case New Holland Industrial Inc. | | | | | | | | |
7.88%, 12/01/17b | | | 18,425 | | | | 19,530,500 | |
| | | | |
SCHEDULESOF INVESTMENTS | | | 57 | |
Schedule of Investments (Unaudited) (Continued)
iSHARES® iBOXX $ HIGH YIELD CORPORATE BOND ETF
October 31, 2016
| | | | | | | | |
| Security | | Principal
(000s) | | | Value | |
CNH Industrial Capital LLC | | | | | | | | |
3.38%, 07/15/19b | | $ | 8,166 | | | $ | 8,175,064 | |
3.63%, 04/15/18b | | | 10,470 | | | | 10,561,613 | |
3.88%, 07/16/18 | | | 9,275 | | | | 9,379,344 | |
3.88%, 10/15/21 | | | 10,100 | | | | 10,024,250 | |
4.38%, 11/06/20b | | | 10,148 | | | | 10,350,960 | |
4.88%, 04/01/21b | | | 8,594 | | | | 8,945,817 | |
CNH Industrial NV | | | | | | | | |
4.50%, 08/15/23 | | | 9,550 | | | | 9,563,179 | |
Terex Corp. | | | | | | | | |
6.00%, 05/15/21 (Call 12/01/16)b | | | 15,785 | | | | 16,103,519 | |
Zebra Technologies Corp. | | | | | | | | |
7.25%, 10/15/22 (Call 10/15/17)b | | | 17,931 | | | | 19,365,480 | |
| | | | | | | | |
| | | | 133,080,845 | |
MANUFACTURING — 0.86% | | | | | |
Bombardier Inc. | | | | | | | | |
4.75%, 04/15/19a,b | | | 10,437 | | | | 10,397,576 | |
5.50%, 09/15/18a | | | 13,309 | | | | 13,722,134 | |
5.75%, 03/15/22a | | | 8,350 | | | | 7,389,750 | |
6.00%, 10/15/22 (Call 04/15/17)a | | | 20,685 | | | | 18,377,669 | |
6.13%, 01/15/23a | | | 23,341 | | | | 20,306,670 | |
7.50%, 03/15/18a,b | | | 11,075 | | | | 11,724,756 | |
7.50%, 03/15/25 (Call 03/15/20)a | | | 26,326 | | | | 23,475,170 | |
7.75%, 03/15/20 a,b | | | 14,955 | | | | 15,180,260 | |
Gates Global LLC/Gates Global Co. | | | | | | | | |
6.00%, 07/15/22 (Call 07/15/17)a,b | | | 18,208 | | | | 17,206,560 | |
| | | | | | | | |
| | | | 137,780,545 | |
MEDIA — 10.61% | | | | | |
Altice U.S. Finance I Corp. | | | | | | | | |
5.38%, 07/15/23 (Call 07/15/18)a | | | 17,181 | | | | 17,610,525 | |
5.50%, 05/15/26 (Call 05/15/21)a | | | 27,211 | | | | 27,790,594 | |
AMC Networks Inc. | | | | | | | | |
4.75%, 12/15/22 (Call 12/15/17) | | | 9,890 | | | | 10,083,935 | |
5.00%, 04/01/24 (Call 04/01/20)b | | | 16,575 | | | | 16,790,475 | |
| | | | | | | | |
| Security | | Principal
(000s) | | | Value | |
Cablevision Systems Corp. | | | | | | | | |
5.88%, 09/15/22b | | $ | 10,663 | | | $ | 9,809,960 | |
7.75%, 04/15/18 | | | 12,513 | | | | 13,180,574 | |
8.00%, 04/15/20b | | | 9,000 | | | | 9,562,500 | |
8.63%, 09/15/17 | | | 3,967 | | | | 4,145,515 | |
CCO Holdings LLC/CCO Holdings Capital Corp. | | | | | | | | |
5.13%, 02/15/23 (Call 02/15/18)b | | | 16,953 | | | | 17,540,394 | |
5.13%, 05/01/23 (Call 05/01/18)a,b | | | 20,038 | | | | 20,689,235 | |
5.25%, 03/15/21 (Call 12/01/16)b | | | 8,625 | | | | 8,950,398 | |
5.25%, 09/30/22 (Call 09/30/17) | | | 21,394 | | | | 22,303,245 | |
5.38%, 05/01/25 (Call 05/01/20)a,b | | | 13,147 | | | | 13,545,792 | |
5.50%, 05/01/26 (Call 05/01/21)a | | | 27,028 | | | | 27,771,270 | |
5.75%, 09/01/23 (Call 03/01/18) | | | 9,075 | | | | 9,562,781 | |
5.75%, 01/15/24 (Call 07/15/18)b | | | 17,275 | | | | 18,268,313 | |
5.75%, 02/15/26 (Call 02/15/21)a,b | | | 45,107 | | | | 47,024,047 | |
5.88%, 04/01/24 (Call 04/01/19)a,b | | | 30,543 | | | | 32,278,233 | |
5.88%, 05/01/27 (Call 05/01/21)a,b | | | 13,726 | | | | 14,349,807 | |
6.63%, 01/31/22 (Call 01/31/17) | | | 8,820 | | | | 9,200,025 | |
Cequel Communications Holdings I LLC/Cequel Capital Corp. | | | | | | | | |
5.13%, 12/15/21 (Call 12/01/16)a,b | | | 21,276 | | | | 20,882,030 | |
6.38%, 09/15/20 (Call 12/01/16)a,b | | | 25,879 | | | | 26,655,370 | |
7.75%, 07/15/25 (Call 07/15/20)a | | | 9,261 | | | | 9,927,607 | |
Clear Channel Worldwide Holdings Inc. | | | | | | | | |
6.50%, 11/15/22 (Call 11/15/17)b | | | 47,927 | | | | 48,577,867 | |
| | |
| 58 | | 2016 iSHARES ANNUAL REPORTTO SHAREHOLDERS |
Schedule of Investments (Unaudited) (Continued)
iSHARES® iBOXX $ HIGH YIELD CORPORATE BOND ETF
October 31, 2016
| | | | | | | | |
| Security | | Principal
(000s) | | | Value | |
Series B | | | | | | | | |
7.63%, 03/15/20 (Call 12/01/16)b | | $ | 34,491 | | | $ | 33,456,270 | |
CSC Holdings LLC | | | | | | | | |
5.25%, 06/01/24b | | | 12,845 | | | | 12,010,075 | |
5.50%, 04/15/27 (Call 04/15/22)a,b | | | 22,525 | | | | 22,907,925 | |
6.63%, 10/15/25 (Call 10/15/20)a | | | 17,355 | | | | 18,830,175 | |
6.75%, 11/15/21 | | | 18,427 | | | | 19,389,092 | |
8.63%, 02/15/19b | | | 8,901 | | | | 9,905,623 | |
10.13%, 01/15/23 (Call 01/15/19)a,b | | | 30,776 | | | | 34,699,940 | |
10.88%, 10/15/25 (Call 10/15/20)a,b | | | 35,157 | | | | 40,442,268 | |
DISH DBS Corp. | | | | | | | | |
4.25%, 04/01/18b | | | 20,489 | | | | 20,990,638 | |
5.00%, 03/15/23b | | | 27,110 | | | | 26,668,107 | |
5.13%, 05/01/20b | | | 19,171 | | | | 19,841,985 | |
5.88%, 07/15/22b | | | 35,307 | | | | 36,366,210 | |
5.88%, 11/15/24b | | | 34,674 | | | | 34,825,699 | |
6.75%, 06/01/21 | | | 35,944 | | | | 38,783,576 | |
7.75%, 07/01/26b | | | 35,531 | | | | 39,017,657 | |
7.88%, 09/01/19 | | | 24,368 | | | | 27,137,911 | |
Gray Television Inc. | | | | | | | | |
5.13%, 10/15/24 (Call 10/15/19)a | | | 9,540 | | | | 9,280,402 | |
5.88%, 07/15/26 (Call 07/15/21)a,b | | | 12,222 | | | | 12,189,890 | |
iHeartCommunications Inc. | | | | | | | | |
9.00%, 12/15/19 (Call 12/01/16)b | | | 27,938 | | | | 21,197,958 | |
9.00%, 03/01/21 (Call 12/01/16)b | | | 30,860 | | | | 22,064,900 | |
9.00%, 09/15/22 (Call 09/15/17)b | | | 18,005 | | | | 12,854,531 | |
10.00%, 01/15/18 (Call 12/01/16)b | | | 14,277 | | | | 10,136,670 | |
10.63%, 03/15/23 (Call 03/15/18)b | | | 17,453 | | | | 12,566,160 | |
11.25%, 03/01/21 (Call 12/01/16)b | | | 9,026 | | | | 6,842,836 | |
| | | | | | | | |
| Security | | Principal
(000s) | | | Value | |
Nexstar Broadcasting Inc. | | | | | | | | |
6.88%, 11/15/20 (Call 12/01/16) | | $ | 3,162 | | | $ | 3,273,461 | |
Nexstar Escrow Corp. | |
5.63%, 08/01/24 (Call 08/01/19)a,b | | | 16,360 | | | | 16,237,300 | |
Nielsen Finance LLC/Nielsen Finance Co. | | | | | | | | |
4.50%, 10/01/20 (Call 12/01/16)b | | | 14,050 | | | | 14,313,438 | |
5.00%, 04/15/22 (Call 04/15/17)a,b | | | 42,770 | | | | 43,625,400 | |
Quebecor Media Inc. | | | | | | | | |
5.75%, 01/15/23b | | | 14,806 | | | | 15,472,270 | |
SFR Group SA | | | | | | | | |
6.00%, 05/15/22 (Call 05/15/17)a,b | | | 75,459 | | | | 77,156,827 | |
6.25%, 05/15/24 (Call 05/15/19)a,b | | | 25,466 | | | | 25,481,789 | |
7.38%, 05/01/26 (Call 05/01/21)a,b | | | 96,404 | | | | 97,368,040 | |
Sinclair Television Group Inc. | | | | | | | | |
5.13%, 02/15/27 (Call 08/15/21)a,b | | | 7,650 | | | | 7,332,525 | |
5.38%, 04/01/21 (Call 12/01/16)b | | | 9,500 | | | | 9,844,375 | |
5.63%, 08/01/24 (Call 08/01/19)a,b | | | 9,269 | | | | 9,405,928 | |
6.13%, 10/01/22 (Call 10/01/17)b | | | 8,388 | | | | 8,807,400 | |
Sirius XM Radio Inc. | | | | | | | | |
4.25%, 05/15/20 (Call 12/01/16)a,b | | | 8,556 | | | | 8,744,232 | |
4.63%, 05/15/23 (Call 05/15/18)a,b | | | 10,286 | | | | 10,376,003 | |
5.38%, 04/15/25 (Call 04/15/20)a | | | 17,290 | | | | 17,592,575 | |
5.38%, 07/15/26 (Call 07/15/21)a,b | | | 17,658 | | | | 18,034,115 | |
5.75%, 08/01/21 (Call 12/01/16)a,b | | | 10,425 | | | | 10,894,125 | |
6.00%, 07/15/24 (Call 07/15/19)a,b | | | 25,774 | | | | 27,417,092 | |
| | | | |
SCHEDULESOF INVESTMENTS | | | 59 | |
Schedule of Investments (Unaudited) (Continued)
iSHARES® iBOXX $ HIGH YIELD CORPORATE BOND ETF
October 31, 2016
| | | | | | | | |
| Security | | Principal
(000s) | | | Value | |
TEGNA Inc. | | | | | | | | |
5.13%, 10/15/19 (Call 12/01/16)b | | $ | 9,798 | | | $ | 10,079,693 | |
5.13%, 07/15/20 (Call 12/01/16)b | | | 10,227 | | | | 10,587,786 | |
6.38%, 10/15/23 (Call 10/15/18)b | | | 11,057 | | | | 11,738,388 | |
Tribune Media Co. | | | | | | | | |
5.88%, 07/15/22 (Call 07/15/18)b | | | 18,465 | | | | 18,426,532 | |
Unitymedia GmbH | | | | | | | | |
6.13%, 01/15/25 (Call 01/15/20)a,b | | | 18,628 | | | | 19,311,027 | |
Unitymedia Hessen GmbH & Co. KG/Unitymedia NRW GmbH | | | | | | | | |
5.00%, 01/15/25 (Call 01/15/20)a,b | | | 9,460 | | | | 9,554,600 | |
5.50%, 01/15/23 (Call 01/15/18)a,b | | | 16,161 | | | | 16,496,341 | |
Univision Communications Inc. | | | | | | | | |
5.13%, 05/15/23 (Call 05/15/18)a,b | | | 20,640 | | | | 20,962,500 | |
5.13%, 02/15/25 (Call 02/15/20)a | | | 28,126 | | | | 28,196,315 | |
6.75%, 09/15/22 (Call 09/15/17)a,b | | | 20,760 | | | | 21,981,898 | |
8.50%, 05/15/21 (Call 11/15/16)a | | | 2,449 | | | | 2,515,001 | |
Videotron Ltd. | | | | | | | | |
5.00%, 07/15/22b | | | 16,250 | | | | 17,013,170 | |
5.38%, 06/15/24 (Call 03/15/24)a,b | | | 10,384 | | | | 10,866,137 | |
Virgin Media Secured Finance PLC | | | | | | | | |
5.50%, 08/15/26 (Call 08/15/21)a,b | | | 12,819 | | | | 12,867,071 | |
WideOpenWest Finance LLC/WideOpenWest Capital Corp. | | | | | | | | |
10.25%, 07/15/19 (Call 12/01/16)b | | | 6,002 | | | | 6,302,186 | |
Ziggo Bond Finance BV | | | | | | | | |
5.88%, 01/15/25 (Call 01/15/20)a | | | 6,800 | | | | 6,716,583 | |
| | | | | | | | |
| Security | | Principal
(000s) | | | Value | |
6.00%, 01/15/27 (Call 01/15/22)a,b | | $ | 9,725 | | | $ | 9,534,861 | |
Ziggo Secured Finance BV | | | | | | | | |
5.50%, 01/15/27 (Call 01/15/22)a,b | | | 36,400 | | | | 35,877,889 | |
| | | | | | | | |
| | | | 1,689,311,863 | |
METAL FABRICATE & HARDWARE — 0.31% | |
Novelis Corp. | | | | | | | | |
5.88%, 09/30/26 (Call 09/30/21)a,b | | | 28,270 | | | | 28,439,620 | |
6.25%, 08/15/24 (Call 08/15/19)a | | | 20,051 | | | | 20,781,705 | |
| | | | | | | | |
| | | | 49,221,325 | |
MINING — 3.20% | |
Alcoa Nederland Holding BV | | | | | | | | |
6.75%, 09/30/24 (Call 09/30/19)a,b | | | 13,900 | | | | 14,317,000 | |
7.00%, 09/30/26 (Call 09/30/21)a,b | | | 11,225 | | | | 11,559,505 | |
Aleris International Inc. | | | | | | | | |
9.50%, 04/01/21 (Call 04/01/18)a,b | | | 8,698 | | | | 9,324,528 | |
Anglo American Capital PLC | | | | | | | | |
3.63%, 05/14/20a,b | | | 13,892 | | | | 13,920,430 | |
4.13%, 04/15/21a | | | 7,850 | | | | 7,896,119 | |
4.13%, 09/27/22a | | | 10,936 | | | | 10,825,729 | |
4.45%, 09/27/20a | | | 9,000 | | | | 9,189,855 | |
4.88%, 05/14/25a | | | 11,997 | | | | 12,204,948 | |
9.38%, 04/08/19a,b | | | 13,259 | | | | 15,161,667 | |
Arconic Inc. | | | | | | | | |
5.13%, 10/01/24 (Call 07/01/24)b | | | 21,559 | | | | 22,385,065 | |
5.40%, 04/15/21 (Call 01/15/21)b | | | 21,423 | | | | 22,759,504 | |
5.72%, 02/23/19 | | | 12,440 | | | | 13,260,263 | |
5.87%, 02/23/22b | | | 10,505 | | | | 11,249,441 | |
6.15%, 08/15/20b | | | 16,664 | | | | 18,142,097 | |
6.75%, 07/15/18 | | | 12,582 | | | | 13,450,158 | |
Constellium NV | | | | | | | | |
5.75%, 05/15/24 (Call 05/15/19)a,b | | | 8,536 | | | | 7,624,946 | |
7.88%, 04/01/21 (Call 04/01/18)a,b | | | 8,040 | | | | 8,572,221 | |
| | |
| 60 | | 2016 iSHARES ANNUAL REPORTTO SHAREHOLDERS |
Schedule of Investments (Unaudited) (Continued)
iSHARES® iBOXX $ HIGH YIELD CORPORATE BOND ETF
October 31, 2016
| | | | | | | | |
| Security | | Principal
(000s) | | | Value | |
8.00%, 01/15/23 (Call 01/15/18)a | | $ | 7,490 | | | $ | 7,354,604 | |
FMG Resources August 2006 Pty Ltd. | | | | | | | | |
6.88%, 04/01/22 (Call 04/01/17)a,b | | | 8,545 | | | | 8,815,947 | |
9.75%, 03/01/22 (Call 03/01/18)a,b | | | 38,932 | | | | 45,161,120 | |
Freeport-McMoRan Inc. | | | | | | | | |
2.38%, 03/15/18b | | | 26,284 | | | | 26,034,302 | |
3.10%, 03/15/20b | | | 19,391 | | | | 18,575,959 | |
3.55%, 03/01/22 (Call 12/01/21)b | | | 34,303 | | | | 31,473,003 | |
3.88%, 03/15/23 (Call 12/15/22)b | | | 33,978 | | | | 30,750,090 | |
4.00%, 11/14/21b | | | 12,464 | | | | 11,757,706 | |
4.55%, 11/14/24 (Call 08/14/24)b | | | 15,101 | | | | 13,872,591 | |
Kinross Gold Corp. | | | | | | | | |
5.13%, 09/01/21 (Call 06/01/21) | | | 8,864 | | | | 9,192,706 | |
5.95%, 03/15/24 (Call 12/15/23)b | | | 8,627 | | | | 9,015,215 | |
Lundin Mining Corp. | | | | | | | | |
7.50%, 11/01/20 (Call 11/01/17)a,b | | | 9,554 | | | | 10,121,932 | |
7.88%, 11/01/22 (Call 11/01/18)a | | | 7,845 | | | | 8,433,375 | |
Teck Resources Ltd. | | | | | | | | |
3.00%, 03/01/19b | | | 1,800 | | | | 1,773,000 | |
3.75%, 02/01/23 (Call 11/01/22)b | | | 12,455 | | | | 11,754,406 | |
4.50%, 01/15/21 (Call 10/15/20) | | | 8,972 | | | | 9,016,860 | |
4.75%, 01/15/22 (Call 10/15/21) | | | 11,430 | | | | 11,337,188 | |
8.00%, 06/01/21 (Call 06/01/18)a | | | 10,201 | | | | 11,153,306 | |
8.50%, 06/01/24 (Call 06/01/19)a,b | | | 10,314 | | | | 11,951,348 | |
| | | | | | | | |
| | | | 509,388,134 | |
| | | | | | | | |
| Security | | Principal
(000s) | | | Value | |
OFFICE & BUSINESS EQUIPMENT — 0.19% | |
CDW LLC/CDW Finance Corp. | | | | | | | | |
5.00%, 09/01/23 (Call 03/01/18)b | | $ | 8,539 | | | $ | 8,766,060 | |
5.50%, 12/01/24 (Call 06/01/24)b | | | 8,787 | | | | 9,229,074 | |
6.00%, 08/15/22 (Call 08/15/17)b | | | 10,990 | | | | 11,714,195 | |
| | | | | | | | |
| | | | 29,709,329 | |
OIL & GAS — 8.48% | | | | | |
Antero Resources Corp. | | | | | | | | |
5.13%, 12/01/22 (Call 06/01/17)b | | | 18,829 | | | | 19,017,290 | |
5.38%, 11/01/21 (Call 12/01/16)b | | | 18,465 | | | | 18,741,975 | |
5.63%, 06/01/23 (Call 06/01/18)b | | | 13,991 | | | | 14,308,712 | |
6.00%, 12/01/20 (Call 12/01/16)b | | | 8,294 | | | | 8,501,350 | |
California Resources Corp. | | | | | | | | |
8.00%, 12/15/22 (Call 12/15/18)a | | | 40,046 | | | | 27,131,165 | |
Calumet Specialty Products Partners LP/Calumet Finance Corp. | | | | | | | | |
6.50%, 04/15/21 (Call 04/15/17)b | | | 15,668 | | | | 12,358,135 | |
11.50%, 01/15/21 (Call 04/15/18)a | | | 7,093 | | | | 8,002,424 | |
Carrizo Oil & Gas Inc. | | | | | | | | |
6.25%, 04/15/23 (Call 04/15/18)b | | | 10,920 | | | | 11,302,200 | |
7.50%, 09/15/20 (Call 12/01/16)b | | | 9,591 | | | | 9,962,651 | |
Cenovus Energy Inc. | | | | | | | | |
3.00%, 08/15/22 (Call 05/15/22) | | | 8,511 | | | | 8,270,826 | |
3.80%, 09/15/23 (Call 06/15/23) | | | 7,900 | | | | 7,786,079 | |
5.70%, 10/15/19 | | | 23,595 | | | | 25,428,138 | |
Cheniere Corpus Christi Holdings LLC | | | | | | | | |
7.00%, 06/30/24a,b | | | 23,864 | | | | 25,467,374 | |
| | | | |
SCHEDULESOF INVESTMENTS | | | 61 | |
Schedule of Investments (Unaudited) (Continued)
iSHARES® iBOXX $ HIGH YIELD CORPORATE BOND ETF
October 31, 2016
| | | | | | | | |
| Security | | Principal
(000s) | | | Value | |
Chesapeake Energy Corp. | | | | | | | | |
6.63%, 08/15/20 | | $ | 3,611 | | | $ | 3,412,395 | |
8.00%, 12/15/22 (Call 12/15/18)a,b | | | 41,296 | | | | 42,031,482 | |
Citgo Holding Inc. | | | | | | | | |
10.75%, 02/15/20a | | | 26,934 | | | | 27,437,889 | |
Concho Resources Inc. | | | | | | | | |
5.50%, 10/01/22 (Call 10/01/17)b | | | 12,400 | | | | 12,768,166 | |
5.50%, 04/01/23 (Call 10/01/17)b | | | 26,562 | | | | 27,206,128 | |
6.50%, 01/15/22 (Call 01/15/17)b | | | 9,725 | | | | 10,054,483 | |
Continental Resources Inc./OK | | | | | | | | |
3.80%, 06/01/24 (Call 03/01/24)b | | | 17,642 | | | | 16,017,858 | |
4.50%, 04/15/23 (Call 01/15/23) | | | 26,926 | | | | 25,986,495 | |
5.00%, 09/15/22 (Call 03/15/17)b | | | 35,346 | | | | 34,701,087 | |
7.13%, 04/01/21 (Call 11/10/16) | | | 6,350 | | | | 6,581,775 | |
Denbury Resources Inc. | | | | | | | | |
4.63%, 07/15/23 (Call 01/15/18) | | | 10,964 | | | | 7,976,310 | |
5.50%, 05/01/22 (Call 05/01/17) | | | 14,405 | | | | 11,379,950 | |
9.00%, 05/15/21 (Call 12/15/18)a,b | | | 11,058 | | | | 11,527,965 | |
Diamond Offshore Drilling Inc. | | | | | | | | |
5.88%, 05/01/19 | | | 1,650 | | | | 1,721,521 | |
Ensco PLC | | | | | | | | |
4.50%, 10/01/24 (Call 07/01/24) | | | 12,495 | | | | 10,042,856 | |
4.70%, 03/15/21b | | | 13,613 | | | | 12,516,481 | |
5.20%, 03/15/25 (Call 12/15/24)b | | | 10,800 | | | | 8,791,848 | |
EP Energy LLC/Everest Acquisition Finance Inc. | | | | | | | | |
6.38%, 06/15/23 (Call 06/15/18)b | | | 10,736 | | | | 7,300,480 | |
9.38%, 05/01/20 (Call 12/01/16)b | | | 28,158 | | | | 22,104,030 | |
| | | | | | | | |
| Security | | Principal
(000s) | | | Value | |
Freeport-McMoran Oil & Gas LLC/FCX Oil & Gas Inc. | | | | | | | | |
6.50%, 11/15/20 (Call 11/15/17)b | | $ | 11,178 | | | $ | 11,426,177 | |
6.75%, 02/01/22 (Call 02/01/17) | | | 8,260 | | | | 8,464,244 | |
6.88%, 02/15/23 (Call 02/15/18)b | | | 13,350 | | | | 13,793,554 | |
Gulfport Energy Corp. | | | | | | | | |
6.00%, 10/15/24 (Call 10/15/19)a,b | | | 5,860 | | | | 5,969,875 | |
Halcon Resources Corp. | | | | | | | | |
8.63%, 02/01/20 (Call 02/01/17)a,b | | | 7,294 | | | | 7,385,175 | |
Hilcorp Energy I LP/Hilcorp Finance Co. | | | | | | | | |
5.00%, 12/01/24 (Call 06/01/19)a,b | | | 8,423 | | | | 8,211,264 | |
5.75%, 10/01/25 (Call 04/01/20)a,b | | | 8,405 | | | | 8,466,062 | |
Jupiter Resources Inc. | | | | | | | | |
8.50%, 10/01/22 (Call 10/01/17)a,b | | | 19,720 | | | | 16,556,583 | |
Laredo Petroleum Inc. | | | | | | | | |
5.63%, 01/15/22 (Call 01/15/17)b | | | 7,520 | | | | 7,364,019 | |
7.38%, 05/01/22 (Call 05/01/17)b | | | 9,126 | | | | 9,391,202 | |
MEG Energy Corp. | | | | | | | | |
6.38%, 01/30/23 (Call 07/30/17)a | | | 14,422 | | | | 11,862,095 | |
6.50%, 03/15/21 (Call 12/01/16)a | | | 13,391 | | | | 11,466,044 | |
7.00%, 03/31/24 (Call 09/30/18)a,b | | | 17,551 | | | | 14,391,820 | |
Memorial Production Partners LP/Memorial Production Finance Corp. | | | | | | | | |
6.88%, 08/01/22 (Call 08/01/17) | | | 7,650 | | | | 3,060,000 | |
7.63%, 05/01/21 (Call 05/01/17) | | | 11,501 | | | | 4,801,668 | |
Murphy Oil Corp. | | | | | | | | |
4.00%, 06/01/22 (Call 03/01/22)b | | | 9,384 | | | | 8,860,225 | |
| | |
| 62 | | 2016 iSHARES ANNUAL REPORTTO SHAREHOLDERS |
Schedule of Investments (Unaudited) (Continued)
iSHARES® iBOXX $ HIGH YIELD CORPORATE BOND ETF
October 31, 2016
| | | | | | | | |
| Security | | Principal
(000s) | | | Value | |
4.70%, 12/01/22 (Call 09/01/22)b | | $ | 10,971 | | | $ | 10,527,998 | |
6.88%, 08/15/24 (Call 08/15/19)b | | | 9,415 | | | | 9,854,132 | |
Nabors Industries Inc. | | | | | | | | |
4.63%, 09/15/21 | | | 13,500 | | | | 13,312,033 | |
5.00%, 09/15/20 | | | 11,809 | | | | 11,850,428 | |
6.15%, 02/15/18 | | | 14,367 | | | | 14,916,025 | |
Newfield Exploration Co. | | | | | | | | |
5.38%, 01/01/26 (Call 10/01/25)b | | | 12,520 | | | | 12,864,300 | |
5.63%, 07/01/24b | | | 17,670 | | | | 18,402,156 | |
5.75%, 01/30/22b | | | 13,549 | | | | 14,133,301 | |
Noble Holding International Ltd. | | | | | | | | |
3.95%, 03/15/22 | | | 7,850 | | | | 6,044,500 | |
4.90%, 08/01/20b | | | 7,740 | | | | 6,860,256 | |
7.20%, 04/01/25 (Call 01/01/25)b | | | 8,326 | | | | 6,785,690 | |
Oasis Petroleum Inc. | | | | | | | | |
6.88%, 03/15/22 (Call 09/15/17)b | | | 16,211 | | | | 16,048,890 | |
Pacific Drilling SA | | | | | | | | |
5.38%, 06/01/20 (Call 12/01/16)a,b | | | 9,797 | | | | 2,682,871 | |
Pacific Drilling V Ltd. | | | | | | | | |
7.25%, 12/01/17 (Call 12/01/16)a | | | 9,075 | | | | 3,576,306 | |
PBF Holding Co. LLC/PBF Finance Corp. | | | | | | | | |
7.00%, 11/15/23 (Call 11/15/18)a,b | | | 8,585 | | | | 7,984,314 | |
8.25%, 02/15/20 (Call 12/01/16)b | | | 11,732 | | | | 11,995,970 | |
Permian Resources LLC | | | | | | | | |
13.00%, 11/30/20 (Call 11/30/18)a | | | 9,287 | | | | 10,882,256 | |
Permian Resources LLC/AEPB Finance Corp. | | | | | | | | |
7.13%, 11/01/20 (Call 01/31/17)a | | | 11,647 | | | | 8,640,618 | |
7.38%, 11/01/21 (Call 07/31/17)a | | | 11,205 | | | | 8,323,214 | |
Precision Drilling Corp. | | | | | | | | |
5.25%, 11/15/24 (Call 05/15/19)b | | | 6,975 | | | | 6,138,000 | |
| | | | | | | | |
| Security | | Principal
(000s) | | | Value | |
6.63%, 11/15/20 (Call 12/01/16) | | $ | 10,766 | | | $ | 10,506,943 | |
Pride International Inc. | | | | | | | | |
6.88%, 08/15/20b | | | 14,550 | | | | 14,707,450 | |
8.50%, 06/15/19b | | | 5,754 | | | | 6,232,669 | |
Puma International Financing SA | | | | | | | | |
6.75%, 02/01/21 (Call 02/01/17)a | | | 19,600 | | | | 20,188,280 | |
QEP Resources Inc. | | | | | | | | |
5.25%, 05/01/23 (Call 02/01/23) | | | 10,622 | | | | 10,451,435 | |
5.38%, 10/01/22 (Call 07/01/22)b | | | 9,039 | | | | 8,956,142 | |
6.88%, 03/01/21b | | | 11,037 | | | | 11,596,279 | |
Range Resources Corp. | | | | | | | | |
4.88%, 05/15/25 (Call 02/15/25)b | | | 12,941 | | | | 12,426,173 | |
5.00%, 08/15/22 (Call 05/15/22)a,b | | | 10,867 | | | | 10,595,325 | |
5.00%, 03/15/23 (Call 12/15/22)a,b | | | 12,774 | | | | 12,410,937 | |
5.75%, 06/01/21 (Call 03/01/21)a | | | 8,830 | | | | 8,959,993 | |
Rowan Companies Inc. | | | | | | | | |
4.75%, 01/15/24 (Call 10/15/23) | | | 8,278 | | | | 6,956,279 | |
4.88%, 06/01/22 (Call 03/01/22) | | | 11,737 | | | | 10,152,505 | |
7.88%, 08/01/19b | | | 6,419 | | | | 6,911,166 | |
Sanchez Energy Corp. | | | | | | | | |
6.13%, 01/15/23 (Call 07/15/18)b | | | 20,270 | | | | 17,330,850 | |
7.75%, 06/15/21 (Call 06/15/17)b | | | 11,111 | | | | 10,341,563 | |
Seven Generations Energy Ltd. | | | | | | | | |
6.75%, 05/01/23 (Call 05/01/18)a,b | | | 7,335 | | | | 7,749,428 | |
6.88%, 06/30/23 (Call 06/30/18)a,b | | | 8,075 | | | | 8,589,781 | |
SM Energy Co. | | | | | | | | |
5.00%, 01/15/24 (Call 07/15/18)b | | | 8,728 | | | | 8,173,928 | |
| | | | |
SCHEDULESOF INVESTMENTS | | | 63 | |
Schedule of Investments (Unaudited) (Continued)
iSHARES® iBOXX $ HIGH YIELD CORPORATE BOND ETF
October 31, 2016
| | | | | | | | |
| Security | | Principal
(000s) | | | Value | |
5.63%, 06/01/25 (Call 06/01/20)b | | $ | 9,124 | | | $ | 8,772,959 | |
6.13%, 11/15/22 (Call 11/15/18)b | | | 10,035 | | | | 10,003,641 | |
6.75%, 09/15/26 (Call 09/15/21)b | | | 8,135 | | | | 8,348,544 | |
Southwestern Energy Co. | | | | | | | | |
4.10%, 03/15/22 (Call 12/15/21)b | | | 19,202 | | | | 17,377,810 | |
5.80%, 01/23/20 (Call 12/23/19)b | | | 15,223 | | | | 15,308,629 | |
6.70%, 01/23/25 (Call 10/23/24)b | | | 17,138 | | | | 16,366,790 | |
7.50%, 02/01/18 | | | 2,205 | | | | 2,309,738 | |
Sunoco LP/Sunoco Finance Corp. | | | | | | | | |
5.50%, 08/01/20 (Call 08/01/17)b | | | 9,571 | | | | 9,738,493 | |
6.25%, 04/15/21 (Call 04/15/18)b | | | 13,846 | | | | 14,192,150 | |
6.38%, 04/01/23 (Call 04/01/18) | | | 14,282 | | | | 14,639,050 | |
Tesoro Corp. | | | | | | | | |
4.25%, 10/01/17 (Call 09/01/17)b | | | 1,559 | | | | 1,586,370 | |
5.38%, 10/01/22 (Call 10/01/17)b | | | 7,447 | | | | 7,670,410 | |
Transocean Inc. | | | | | | | | |
3.75%, 10/15/17 | | | 2,225 | | | | 2,219,438 | |
5.05%, 10/15/22 (Call 07/15/22)b | | | 10,062 | | | | 8,603,010 | |
6.00%, 03/15/18b | | | 12,551 | | | | 12,561,032 | |
6.50%, 11/15/20b | | | 9,350 | | | | 9,040,281 | |
7.13%, 12/15/21b | | | 11,060 | | | | 10,661,287 | |
9.00%, 07/15/23 (Call 07/15/20)a,b | | | 22,317 | | | | 21,819,331 | |
Tullow Oil PLC | | | | | | | | |
6.00%, 11/01/20 (Call 12/01/16)a,b | | | 12,920 | | | | 11,991,164 | |
6.25%, 04/15/22 (Call 04/15/17)a | | | 11,285 | | | | 10,280,715 | |
Whiting Petroleum Corp. | | | | | | | | |
5.00%, 03/15/19 (Call 12/15/18) | | | 16,225 | | | | 15,387,232 | |
| | | | | | | | |
| Security | | Principal
(000s) | | | Value | |
5.75%, 03/15/21 (Call 12/15/20)b | | $ | 15,715 | | | $ | 14,619,341 | |
6.25%, 04/01/23 (Call 01/01/23)b | | | 6,964 | | | | 6,419,067 | |
WPX Energy Inc. | | | | | | | | |
5.25%, 09/15/24 (Call 06/15/24)b | | | 9,030 | | | | 8,548,400 | |
6.00%, 01/15/22 (Call 10/15/21)b | | | 18,875 | | | | 18,827,813 | |
7.50%, 08/01/20 (Call 07/01/20) | | | 9,014 | | | | 9,473,919 | |
8.25%, 08/01/23 (Call 06/01/23)b | | | 9,607 | | | | 10,351,543 | |
| | | | | | | | |
| | | | | | | 1,349,486,066 | |
OIL & GAS SERVICES — 0.38% | | | | | |
CGG SA | | | | | | | | |
6.50%, 06/01/21 (Call 12/01/16)b | | | 10,382 | | | | 5,195,326 | |
6.88%, 01/15/22 (Call 07/15/17)b | | | 7,998 | | | | 3,993,002 | |
Transocean Phoenix 2 Ltd. | | | | | | | | |
7.75%, 10/15/24 (Call 10/15/20)a | | | 3,725 | | | | 3,887,969 | |
Weatherford International Ltd. | | | | | | | | |
4.50%, 04/15/22 (Call 01/15/22)b | | | 12,368 | | | | 11,038,440 | |
7.75%, 06/15/21 (Call 05/15/21)b | | | 12,979 | | | | 13,206,132 | |
8.25%, 06/15/23 (Call 03/15/23)b | | | 12,593 | | | | 13,010,143 | |
9.63%, 03/01/19 | | | 8,994 | | | | 9,578,610 | |
| | | | | | | | |
| | | | | | | 59,909,622 | |
PACKAGING & CONTAINERS — 1.86% | | | | | |
Ardagh Packaging Finance PLC/Ardagh Holdings USA Inc. | | | | | | | | |
4.63%, 05/15/23 (Call 05/15/19)a,b | | | 17,515 | | | | 17,733,937 | |
6.00%, 06/30/21 (Call 06/30/17)a,b | | | 8,972 | | | | 9,196,300 | |
6.25%, 01/31/19 (Call 12/01/16)a | | | 6,775 | | | | 6,885,094 | |
6.75%, 01/31/21 (Call 01/31/17)a | | | 7,710 | | | | 7,960,575 | |
| | |
| 64 | | 2016 iSHARES ANNUAL REPORTTO SHAREHOLDERS |
Schedule of Investments (Unaudited) (Continued)
iSHARES® iBOXX $ HIGH YIELD CORPORATE BOND ETF
October 31, 2016
| | | | | | | | |
| Security | | Principal
(000s) | | | Value | |
7.25%, 05/15/24 (Call 05/15/19)a,b | | $ | 29,068 | | | $ | 30,666,740 | |
Ball Corp. | | | | | | | | |
4.00%, 11/15/23b | | | 18,175 | | | | 18,344,327 | |
4.38%, 12/15/20b | | | 16,905 | | | | 18,003,423 | |
5.00%, 03/15/22b | | | 14,793 | | | | 15,913,218 | |
5.25%, 07/01/25 | | | 16,877 | | | | 17,974,005 | |
Berry Plastics Corp. | | | | | | | | |
5.13%, 07/15/23 (Call 07/15/18)b | | | 11,975 | | | | 12,184,562 | |
5.50%, 05/15/22 (Call 05/15/17)b | | | 8,068 | | | | 8,386,136 | |
6.00%, 10/15/22 (Call 10/15/18) | | | 7,520 | | | | 7,955,534 | |
Crown Americas LLC/Crown Americas Capital Corp. | | | | | | | | |
4.25%, 09/30/26 (Call 03/31/26)a,b | | | 7,950 | | | | 7,805,029 | |
Crown Americas LLC/Crown Americas Capital Corp. IV | | | | | | | | |
4.50%, 01/15/23b | | | 16,658 | | | | 17,157,740 | |
Owens-Brockway Glass Container Inc. | | | | | | | | |
5.00%, 01/15/22a,b | | | 8,765 | | | | 9,129,927 | |
5.88%, 08/15/23a,b | | | 11,670 | | | | 12,428,550 | |
Reynolds Group Issuer Inc./Reynolds Group Issuer LLC | | | | | | | | |
5.13%, 07/15/23 (Call 07/15/19)a,b | | | 27,077 | | | | 27,855,464 | |
7.00%, 07/15/24 (Call 07/15/19)a,b | | | 13,053 | | | | 13,999,342 | |
Sealed Air Corp. | | | | | | | | |
4.88%, 12/01/22 (Call 09/01/22)a,b | | | 8,083 | | | | 8,525,358 | |
5.13%, 12/01/24 (Call 09/01/24)a,b | | | 7,185 | | | | 7,610,289 | |
5.25%, 04/01/23 (Call 01/01/23)a,b | | | 7,665 | | | | 8,105,738 | |
5.50%, 09/15/25 (Call 06/15/25)a,b | | | 7,220 | | | | 7,742,535 | |
6.50%, 12/01/20 (Call 09/01/20)a,b | | | 4,200 | | | | 4,809,000 | |
| | | | | | | | |
| | | | | | | 296,372,823 | |
| | | | | | | | |
| Security | | Principal
(000s) | | | Value | |
PHARMACEUTICALS — 2.35% | | | | | |
DPx Holdings BV | | | | | | | | |
7.50%, 02/01/22 (Call 02/01/17)a | | $ | 1,130 | | | $ | 1,189,325 | |
Endo Finance LLC | | | | | | | | |
5.75%, 01/15/22 (Call 01/15/17)a,b | | | 11,711 | | | | 10,539,900 | |
Endo Finance LLC/Endo Finco Inc. | | | | | | | | |
5.38%, 01/15/23 (Call 07/15/17)a,b | | | 13,340 | | | | 11,439,050 | |
Endo Ltd./Endo Finance LLC/Endo Finco Inc. | | | | | | | | |
6.00%, 07/15/23 (Call 07/15/18)a | | | 29,689 | | | | 25,903,652 | |
6.50%, 02/01/25 (Call 02/01/20)a,b | | | 21,640 | | | | 18,123,500 | |
Grifols Worldwide Operations Ltd. | | | | | | | | |
5.25%, 04/01/22 (Call 04/01/17)b | | | 19,033 | | | | 19,830,801 | |
NBTY Inc. | | | | | | | | |
7.63%, 05/15/21 (Call 05/15/18)a,b | | | 18,097 | | | | 17,724,415 | |
Quintiles IMS Inc. | | | | | | | | |
4.88%, 05/15/23 (Call 05/15/18)a | | | 4,600 | | | | 4,743,750 | |
Valeant Pharmaceuticals International Inc. | | | | | | | | |
5.38%, 03/15/20 (Call 03/15/17)a | | | 35,713 | | | | 30,891,745 | |
5.50%, 03/01/23 (Call 03/01/18)a | | | 17,314 | | | | 13,631,889 | |
5.63%, 12/01/21 (Call 12/01/16)a | | | 15,328 | | | | 12,547,062 | |
5.88%, 05/15/23 (Call 05/15/18)a | | | 58,273 | | | | 45,926,117 | |
6.13%, 04/15/25 (Call 04/15/20)a | | | 58,868 | | | | 46,536,143 | |
6.38%, 10/15/20 (Call 12/01/16)a | | | 39,417 | | | | 34,365,522 | |
6.75%, 08/15/18 (Call 12/01/16)a,b | | | 27,183 | | | | 26,639,340 | |
| | | | |
SCHEDULESOF INVESTMENTS | | | 65 | |
Schedule of Investments (Unaudited) (Continued)
iSHARES® iBOXX $ HIGH YIELD CORPORATE BOND ETF
October 31, 2016
| | | | | | | | |
| Security | | Principal
(000s) | | | Value | |
6.75%, 08/15/21 (Call 12/01/16)a | | $ | 11,195 | | | $ | 9,684,412 | |
7.00%, 10/01/20 (Call 12/01/16)a | | | 11,740 | | | | 10,573,827 | |
7.25%, 07/15/22 (Call 12/01/16)a | | | 10,044 | | | | 8,738,280 | |
7.50%, 07/15/21 (Call 12/01/16)a | | | 27,815 | | | | 24,477,200 | |
| | | | | | | | |
| | | | | | | 373,505,930 | |
PIPELINES — 4.01% | | | | | | | | |
Crestwood Midstream Partners LP/Crestwood Midstream Finance Corp. | | | | | | | | |
6.13%, 03/01/22 (Call 11/16/16) | | | 7,794 | | | | 7,988,850 | |
6.25%, 04/01/23 (Call 04/01/18) | | | 12,173 | | | | 12,315,019 | |
DCP Midstream LLC | | | | | | | | |
4.75%, 09/30/21a,b | | | 8,086 | | | | 8,262,373 | |
5.35%, 03/15/20a | | | 5,250 | | | | 5,416,250 | |
VRN, (3 mo. LIBOR US + 3.850%) | | | | | |
5.85%, 05/21/43 (Call 05/21/23)a,b,c | | | 11,613 | | | | 9,783,953 | |
DCP Midstream Operating LP | | | | | | | | |
2.50%, 12/01/17 (Call 11/01/17) | | | 8,208 | | | | 8,175,257 | |
3.88%, 03/15/23 (Call 12/15/22) | | | 9,462 | | | | 9,213,192 | |
Energy Transfer Equity LP | | | | | | | | |
5.50%, 06/01/27 (Call 03/01/27)b | | | 16,845 | | | | 16,255,425 | |
5.88%, 01/15/24 (Call 10/15/23) | | | 20,065 | | | | 20,393,564 | |
7.50%, 10/15/20 | | | 21,794 | | | | 23,918,915 | |
EnLink Midstream Partners LP | | | | | | | | |
2.70%, 04/01/19 (Call 03/01/19) | | | 6,910 | | | | 6,909,582 | |
4.15%, 06/01/25 (Call 03/01/25) | | | 13,112 | | | | 12,774,099 | |
4.40%, 04/01/24 (Call 01/01/24) | | | 10,107 | | | | 10,035,876 | |
4.85%, 07/15/26 (Call 04/15/26)b | | | 8,950 | | | | 9,105,142 | |
| | | | | | | | |
| Security | | Principal
(000s) | | | Value | |
Genesis Energy LP/Genesis Energy Finance Corp. | | | | | | | | |
6.00%, 05/15/23 (Call 05/15/18) | | $ | 6,990 | | | $ | 7,038,348 | |
6.75%, 08/01/22 (Call 08/01/18) | | | 13,082 | | | | 13,523,525 | |
NGPL PipeCo LLC | | | | | | | | |
7.12%, 12/15/17a | | | 22,003 | | | | 22,993,135 | |
9.63%, 06/01/19 (Call 12/01/16)a,b | | | 8,775 | | | | 9,187,425 | |
NuStar Logistics LP | | | | | | | | |
4.80%, 09/01/20 | | | 7,555 | | | | 7,630,634 | |
ONEOK Inc. | | | | | | | | |
4.25%, 02/01/22 (Call 11/02/21)b | | | 9,511 | | | | 9,390,131 | |
7.50%, 09/01/23 (Call 06/01/23) | | | 9,908 | | | | 11,289,225 | |
Rockies Express Pipeline LLC | | | | | | | | |
5.63%, 04/15/20a,b | | | 13,602 | | | | 14,307,876 | |
6.00%, 01/15/19a,b | | | 8,280 | | | | 8,569,800 | |
6.85%, 07/15/18a,b | | | 9,220 | | | | 9,727,100 | |
Sabine Pass Liquefaction LLC | | | | | | | | |
5.00%, 03/15/27 (Call 09/15/26)a,b | | | 25,300 | | | | 25,789,256 | |
5.63%, 02/01/21 (Call 11/01/20)b | | | 34,986 | | | | 36,735,300 | |
5.63%, 04/15/23 (Call 01/15/23)b | | | 25,514 | | | | 27,041,942 | |
5.63%, 03/01/25 (Call 12/01/24) | | | 35,138 | | | | 37,246,280 | |
5.75%, 05/15/24 (Call 02/15/24)b | | | 36,536 | | | | 38,535,663 | |
5.88%, 06/30/26a,b | | | 25,641 | | | | 27,545,513 | |
6.25%, 03/15/22 (Call 12/15/21)b | | | 17,548 | | | | 19,151,996 | |
Targa Resources Partners LP/Targa Resources Partners Finance Corp. | | | | | | | | |
5.38%, 02/01/27 (Call 02/01/22)a,b | | | 7,570 | | | | 7,570,000 | |
Targa Resources Partners LP/Targa Resources Partners Finance Corp. | | | | | | | | |
4.13%, 11/15/19 (Call 12/01/16) | | | 12,199 | | | | 12,305,741 | |
| | |
| 66 | | 2016 iSHARES ANNUAL REPORTTO SHAREHOLDERS |
Schedule of Investments (Unaudited) (Continued)
iSHARES® iBOXX $ HIGH YIELD CORPORATE BOND ETF
October 31, 2016
| | | | | | | | |
| Security | | Principal
(000s) | | | Value | |
4.25%, 11/15/23 (Call 05/15/18) | | $ | 9,574 | | | $ | 9,073,235 | |
5.13%, 02/01/25 (Call 02/01/20)a,b | | | 9,360 | | | | 9,336,600 | |
5.25%, 05/01/23 (Call 11/01/17) | | | 11,730 | | | | 11,769,100 | |
6.75%, 03/15/24 (Call 09/15/19)b | | | 9,583 | | | | 10,178,515 | |
Tesoro Logistics LP/Tesoro Logistics Finance Corp. | | | | | | | | |
5.50%, 10/15/19 (Call 09/15/19) | | | 7,997 | | | | 8,527,515 | |
5.88%, 10/01/20 (Call 12/01/16)b | | | 7,930 | | | | 8,151,888 | |
6.13%, 10/15/21 (Call 11/16/16)b | | | 13,713 | | | | 14,264,157 | |
6.25%, 10/15/22 (Call 10/15/18)b | | | 13,554 | | | | 14,411,595 | |
6.38%, 05/01/24 (Call 05/01/19)b | | | 8,109 | | | | 8,705,138 | |
Williams Companies Inc. (The) | | | | | | | | |
3.70%, 01/15/23 (Call 10/15/22)b | | | 16,321 | | | | 15,790,567 | |
4.55%, 06/24/24 (Call 03/24/24)b | | | 21,066 | | | | 21,434,655 | |
| | | | | | | | |
| | | | | | | 637,769,352 | |
REAL ESTATE — 0.17% | | | | | | | | |
Realogy Group LLC/Realogy Co-Issuer Corp. | | | | | | | | |
4.50%, 04/15/19a,b | | | 7,380 | | | | 7,655,432 | |
4.88%, 06/01/23 (Call 03/01/23)a,b | | | 8,566 | | | | 8,583,845 | |
5.25%, 12/01/21 (Call 12/01/17)a,b | | | 9,849 | | | | 10,299,592 | |
| | | | | | | | |
| | | | | | | 26,538,869 | |
REAL ESTATE INVESTMENT TRUSTS — 1.17% | |
Communications Sales & Leasing Inc./CSL Capital LLC | | | | | | | | |
6.00%, 04/15/23 (Call 04/15/18)a,b | | | 9,656 | | | | 10,044,654 | |
8.25%, 10/15/23 (Call 04/15/19)b | | | 18,865 | | | | 19,902,575 | |
| | | | | | | | |
| Security | | Principal
(000s) | | | Value | |
Equinix Inc. | | | | | | | | |
5.88%, 01/15/26 (Call 01/15/21)b | | $ | 18,873 | | | $ | 20,104,463 | |
ESH Hospitality Inc. | | | | | | | | |
5.25%, 05/01/25 (Call 05/01/20)a,b | | | 21,971 | | | | 21,758,156 | |
Iron Mountain Inc. | | | | | | | | |
4.38%, 06/01/21 (Call 06/01/18)a | | | 7,869 | | | | 8,124,743 | |
6.00%, 10/01/20 (Call 10/01/17)a,b | | | 16,970 | | | | 17,928,097 | |
iStar Inc. | | | | | | | | |
4.00%, 11/01/17 (Call 08/01/17)b | | | 9,545 | | | | 9,549,338 | |
5.00%, 07/01/19 (Call 12/01/16)b | | | 12,789 | | | | 12,677,096 | |
MGM Growth Properties Operating Partnership LP/MGP Finance Co-Issuer Inc. | | | | | | | | |
4.50%, 09/01/26 (Call 06/01/26)a | | | 8,633 | | | | 8,497,339 | |
MPT Operating Partnership LP/MPT Finance Corp. | | | | | | | | |
5.25%, 08/01/26 (Call 08/01/21)b | | | 7,868 | | | | 8,025,360 | |
6.38%, 03/01/24 (Call 03/01/19)b | | | 9,705 | | | | 10,510,212 | |
Vereit Operating Partnership LP | | | | | | | | |
3.00%, 02/06/19 (Call 01/06/19)b | | | 12,957 | | | | 13,073,798 | |
4.13%, 06/01/21 (Call 05/01/21)b | | | 6,377 | | | | 6,630,941 | |
4.60%, 02/06/24 (Call 11/06/23) | | | 8,650 | | | | 8,952,750 | |
4.88%, 06/01/26 (Call 03/01/26)b | | | 10,202 | | | | 10,714,637 | |
| | | | | | | | |
| | | | | | | 186,494,159 | |
RETAIL — 3.30% | | | | | | | | |
1011778 BC ULC/New Red Finance Inc. | | | | | | | | |
4.63%, 01/15/22 (Call 10/01/17)a | | | 20,819 | | | | 21,473,812 | |
| | | | |
SCHEDULESOF INVESTMENTS | | | 67 | |
Schedule of Investments (Unaudited) (Continued)
iSHARES® iBOXX $ HIGH YIELD CORPORATE BOND ETF
October 31, 2016
| | | | | | | | |
| Security | | Principal
(000s) | | | Value | |
6.00%, 04/01/22 (Call 10/01/17)a,b | | $ | 42,524 | | | $ | 44,474,525 | |
AmeriGas Finance LLC/AmeriGas Finance Corp. | | | | | | | | |
7.00%, 05/20/22 (Call 05/20/17)b | | | 15,942 | | | | 16,789,317 | |
Claire’s Stores Inc. | | | | | | | | |
9.00%, 03/15/19 (Call 12/01/16)a | | | 19,446 | | | | 9,880,999 | |
Dollar Tree Inc. | | | | | | | | |
5.25%, 03/01/20 (Call 03/01/17) | | | 12,422 | | | | 12,853,369 | |
5.75%, 03/01/23 (Call 03/01/18)b | | | 46,376 | | | | 49,390,440 | |
Ferrellgas LP/Ferrellgas Finance Corp. | | | | | | | | |
6.50%, 05/01/21 (Call 12/01/16)b | | | 9,015 | | | | 8,383,950 | |
6.75%, 01/15/22 (Call 12/01/16)b | | | 8,484 | | | | 7,953,750 | |
6.75%, 06/15/23 (Call 06/15/19) | | | 8,218 | | | | 7,555,424 | |
JC Penney Corp. Inc. | | | | | | | | |
5.65%, 06/01/20b | | | 6,797 | | | | 6,726,481 | |
5.88%, 07/01/23 (Call 07/01/19)a,b | | | 7,820 | | | | 8,062,746 | |
8.13%, 10/01/19b | | | 6,315 | | | | 6,874,328 | |
KFC Holding Co/Pizza Hut Holdings LLC/Taco Bell of America LLC | | | | | | | | |
5.00%, 06/01/24 (Call 06/01/19)a,b | | | 18,109 | | | | 18,776,014 | |
5.25%, 06/01/26 (Call 06/01/21)a | | | 18,992 | | | | 19,739,810 | |
L Brands Inc. | | | | | | | | |
5.63%, 02/15/22b | | | 17,050 | | | | 18,673,160 | |
5.63%, 10/15/23b | | | 9,875 | | | | 10,874,844 | |
6.63%, 04/01/21b | | | 17,579 | | | | 20,172,681 | |
7.00%, 05/01/20 | | | 6,833 | | | | 7,808,838 | |
8.50%, 06/15/19b | | | 8,650 | | | | 10,060,080 | |
Michaels Stores Inc. | | | | | | | | |
5.88%, 12/15/20 (Call 12/15/16)a | | | 7,655 | | | | 7,865,513 | |
| | | | | | | | |
| Security | | Principal
(000s) | | | Value | |
Neiman Marcus Group Ltd. LLC | | | | | | | | |
8.00%, 10/15/21 (Call 12/01/16)a,b | | $ | 16,764 | | | $ | 13,830,300 | |
Penske Automotive Group Inc. | | | | | | | | |
5.50%, 05/15/26 (Call 05/15/21)b | | | 8,807 | | | | 8,713,849 | |
5.75%, 10/01/22 (Call 10/01/17) | | | 9,194 | | | | 9,525,193 | |
QVC Inc. | | | | | | | | |
3.13%, 04/01/19b | | | 6,840 | | | | 7,000,051 | |
4.38%, 03/15/23b | | | 13,166 | | | | 13,194,869 | |
4.45%, 02/15/25 (Call 11/15/24)b | | | 10,322 | | | | 10,156,818 | |
4.85%, 04/01/24 | | | 10,040 | | | | 10,166,296 | |
5.13%, 07/02/22b | | | 9,441 | | | | 9,872,569 | |
Rite Aid Corp. | | | | | | | | |
6.13%, 04/01/23 (Call 04/01/18)a,b | | | 35,690 | | | | 37,724,330 | |
6.75%, 06/15/21 (Call 12/01/16) | | | 12,900 | | | | 13,512,750 | |
9.25%, 03/15/20 (Call 12/01/16)b | | | 12,979 | | | | 13,660,397 | |
Sally Holdings LLC/Sally Capital Inc. | | | | | | | | |
5.63%, 12/01/25 (Call 12/01/20)b | | | 12,859 | | | | 13,775,590 | |
5.75%, 06/01/22 (Call 06/01/17)b | | | 14,828 | | | | 15,445,215 | |
Suburban Propane Partners LP/Suburban Energy Finance Corp. | | | | | | | | |
5.50%, 06/01/24 (Call 06/01/19)b | | | 9,572 | | | | 9,779,712 | |
Toys R Us Property Co. II LLC | | | | | | | | |
8.50%, 12/01/17 (Call 11/03/16) | | | 13,316 | | | | 13,316,000 | |
TRU Taj LLC/TRU Taj Finance Inc. | | | | | | | | |
12.00%, 08/15/21 (Call 02/15/18)a | | | 11,656 | | | | 11,961,970 | |
| | | | | | | | |
| | | | | | | 526,025,990 | |
SEMICONDUCTORS — 1.56% | | | | | | | | |
Advanced Micro Devices Inc. | | | | | | | | |
7.00%, 07/01/24 (Call 07/01/19) | | | 8,812 | | | | 8,712,865 | |
| | |
| 68 | | 2016 iSHARES ANNUAL REPORTTO SHAREHOLDERS |
Schedule of Investments (Unaudited) (Continued)
iSHARES® iBOXX $ HIGH YIELD CORPORATE BOND ETF
October 31, 2016
| | | | | | | | |
| Security | | Principal
(000s) | | | Value | |
7.50%, 08/15/22 | | $ | 3,705 | | | $ | 3,918,037 | |
Micron Technology Inc. | | | | | | | | |
5.25%, 08/01/23 (Call 02/01/18)a | | | 17,727 | | | | 17,348,085 | |
5.25%, 01/15/24 (Call 05/01/18)a,b | | | 9,696 | | | | 9,495,010 | |
5.50%, 02/01/25 (Call 08/01/19)b | | | 19,772 | | | | 19,450,705 | |
5.63%, 01/15/26 (Call 05/01/20)a,b | | | 8,200 | | | | 7,986,800 | |
5.88%, 02/15/22 (Call 02/15/17)b | | | 10,649 | | | | 10,999,352 | |
NXP BV/NXP Funding LLC | | | | | | | | |
3.75%, 06/01/18a | | | 13,037 | | | | 13,384,110 | |
3.88%, 09/01/22a | | | 18,207 | | | | 19,226,259 | |
4.13%, 06/15/20a,b | | | 8,320 | | | | 8,799,232 | |
4.13%, 06/01/21a | | | 23,593 | | | | 25,088,367 | |
4.63%, 06/15/22a | | | 8,022 | | | | 8,743,980 | |
4.63%, 06/01/23a | | | 15,219 | | | | 16,654,286 | |
5.75%, 02/15/21 (Call 02/15/17)a,b | | | 8,097 | | | | 8,410,759 | |
5.75%, 03/15/23 (Call 03/15/18)a,b | | | 9,872 | | | | 10,513,680 | |
Qorvo Inc. | | | | | | | | |
6.75%, 12/01/23 (Call 12/01/18)b | | | 7,926 | | | | 8,619,525 | |
7.00%, 12/01/25 (Call 12/01/20)b | | | 8,598 | | | | 9,371,820 | |
Sensata Technologies BV | | | | | | | | |
4.88%, 10/15/23a,b | | | 8,800 | | | | 9,132,200 | |
5.00%, 10/01/25a,b | | | 12,771 | | | | 13,122,202 | |
5.63%, 11/01/24a,b | | | 7,940 | | | | 8,422,355 | |
Sensata Technologies UK Financing Co. PLC | | | | | | | | |
6.25%, 02/15/26 (Call 02/15/21)a,b | | | 10,284 | | | | 11,132,430 | |
| | | | | | | | |
| | | | | | | 248,532,059 | |
SHIPBUILDING — 0.14% | | | | | | | | |
Huntington Ingalls Industries Inc. | | | | | | | | |
5.00%, 12/15/21 (Call 12/15/17)a,b | | | 10,325 | | | | 10,841,043 | |
5.00%, 11/15/25 (Call 11/15/20)a,b | | | 10,254 | | | | 10,785,978 | |
| | | | | | | | |
| | | | | | | 21,627,021 | |
| | | | | | | | |
| Security | | Principal
(000s) | | | Value | |
SOFTWARE — 2.60% | | | | | | | | |
BMC Software Finance Inc. | | | | | | | | |
8.13%, 07/15/21 (Call 12/01/16)a | | $ | 28,952 | | | $ | 26,491,080 | |
First Data Corp. | | | | | | | | |
5.00%, 01/15/24 (Call 01/15/19)a,b | | | 34,244 | | | | 34,757,660 | |
5.38%, 08/15/23 (Call 08/15/18)a,b | | | 22,367 | | | | 23,062,981 | |
5.75%, 01/15/24 (Call 01/15/19)a,b | | | 39,587 | | | | 40,296,399 | |
6.75%, 11/01/20 (Call 12/01/16)a,b | | | 18,852 | | | | 19,532,557 | |
7.00%, 12/01/23 (Call 12/01/18)a,b | | | 59,855 | | | | 62,922,569 | |
Inception Merger Sub Inc./Rackspace Hosting Inc. | | | | | | | | |
8.63%, 11/15/24 (Call 11/15/19)a | | | 9,995 | | | | 9,995,000 | |
Infor U.S. Inc. | | | | | | | | |
5.75%, 08/15/20 (Call 08/15/17)a,b | | | 8,640 | | | | 9,059,236 | |
6.50%, 05/15/22 (Call 05/15/18)b | | | 28,778 | | | | 29,821,202 | |
MSCI Inc. | | | | | | | | |
4.75%, 08/01/26 (Call 08/01/21)a,b | | | 8,419 | | | | 8,467,267 | |
5.25%, 11/15/24 (Call 11/15/19)a | | | 14,570 | | | | 15,298,500 | |
5.75%, 08/15/25 (Call 08/15/20)a,b | | | 13,777 | | | | 14,681,460 | |
Nuance Communications Inc. | | | | | | | | |
5.38%, 08/15/20 (Call 12/01/16)a,b | | | 17,393 | | | | 17,838,783 | |
Open Text Corp. | | | | | | | | |
5.63%, 01/15/23 (Call 01/15/18)a | | | 13,250 | | | | 13,755,090 | |
5.88%, 06/01/26 (Call 06/01/21)a,b | | | 10,411 | | | | 11,078,605 | |
Quintiles IMS Inc. | | | | | | | | |
5.00%, 10/15/26 (Call 10/15/21)a | | | 19,700 | | | | 20,364,875 | |
| | | | |
SCHEDULESOF INVESTMENTS | | | 69 | |
Schedule of Investments (Unaudited) (Continued)
iSHARES® iBOXX $ HIGH YIELD CORPORATE BOND ETF
October 31, 2016
| | | | | | | | |
| Security | | Principal
(000s) | | | Value | |
Solera LLC/Solera Finance Inc. | | | | | | | | |
10.50%, 03/01/24 (Call 03/01/19)a | | $ | 31,714 | | | $ | 35,519,680 | |
Veritas U.S. Inc./Veritas Bermuda Ltd. | | | | | | | | |
7.50%, 02/01/23 (Call 02/01/19)a | | | 7,700 | | | | 7,366,334 | |
10.50%, 02/01/24 (Call 02/01/19)a | | | 15,121 | | | | 14,112,933 | |
| | | | | | | | |
| | | | | | | 414,422,211 | |
STORAGE & WAREHOUSING — 0.16% | | | | | |
Algeco Scotsman Global Finance PLC | | | | | | | | |
8.50%, 10/15/18 (Call 12/01/16)a | | | 18,575 | | | | 16,903,250 | |
10.75%, 10/15/19 (Call 12/01/16)a | | | 12,550 | | | | 8,026,394 | |
| | | | | | | | |
| | | | | | | 24,929,644 | |
TELECOMMUNICATIONS — 12.72% | | | | | |
Altice Financing SA | | | | | | | | |
6.50%, 01/15/22 (Call 12/15/16)a | | | 14,780 | | | | 15,448,795 | |
6.63%, 02/15/23 (Call 02/15/18)a | | | 34,724 | | | | 35,787,596 | |
7.50%, 05/15/26 (Call 05/15/21)a,b | | | 49,081 | | | | 50,489,625 | |
Altice Finco SA | | | | | | | | |
8.13%, 01/15/24 (Call 12/15/18)a,b | | | 6,672 | | | | 6,838,800 | |
9.88%, 12/15/20 (Call 12/15/16)a | | | 7,550 | | | | 7,929,286 | |
Altice Luxembourg SA | | | | | | | | |
7.63%, 02/15/25 (Call 02/15/20)a,b | | | 25,989 | | | | 26,884,833 | |
7.75%, 05/15/22 (Call 05/15/17)a,b | | | 48,625 | | | | 50,721,953 | |
Avaya Inc. | | | | | | | | |
7.00%, 04/01/19 (Call 12/01/16)a,b | | | 18,393 | | | | 14,873,332 | |
10.50%, 03/01/21 (Call 03/01/17)a,b | | | 23,336 | | | | 7,700,880 | |
CenturyLink Inc. | | | | | | | | |
5.63%, 04/01/25 (Call 01/01/25)b | | | 9,650 | | | | 9,095,125 | |
| | | | | | | | |
| Security | | Principal
(000s) | | | Value | |
5.80%, 03/15/22b | | $ | 24,404 | | | $ | 24,953,090 | |
6.45%, 06/15/21b | | | 21,297 | | | | 22,734,547 | |
Series V | | | | | | | | |
5.63%, 04/01/20b | | | 18,212 | | | | 19,441,310 | |
Series W | | | | | | | | |
6.75%, 12/01/23b | | | 12,750 | | | | 13,291,875 | |
Series Y | | | | | | | | |
7.50%, 04/01/24 (Call 01/01/24)b | | | 17,769 | | | | 18,546,394 | |
CommScope Inc. | | | | | | | | |
4.38%, 06/15/20 (Call 06/15/17)a,b | | | 8,134 | | | | 8,354,635 | |
5.00%, 06/15/21 (Call 06/15/17)a,b | | | 12,375 | | | | 12,724,594 | |
5.50%, 06/15/24 (Call 06/15/19)a | | | 12,077 | | | | 12,627,953 | |
CommScope Technologies Finance LLC | | | | | | | | |
6.00%, 06/15/25 (Call 06/15/20)a,b | | | 26,278 | | | | 27,559,052 | |
Frontier Communications Corp. | | | | | | | | |
6.25%, 09/15/21 (Call 06/15/21)b | | | 13,090 | | | | 12,520,719 | |
6.88%, 01/15/25 (Call 10/15/24) | | | 12,620 | | | | 10,569,250 | |
7.13%, 03/15/19b | | | 6,875 | | | | 7,356,250 | |
7.13%, 01/15/23 | | | 14,534 | | | | 13,066,650 | |
7.63%, 04/15/24b | | | 12,375 | | | | 11,112,750 | |
8.13%, 10/01/18b | | | 9,600 | | | | 10,457,184 | |
8.50%, 04/15/20b | | | 16,961 | | | | 18,105,867 | |
8.75%, 04/15/22b | | | 8,545 | | | | 8,458,525 | |
8.88%, 09/15/20 (Call 06/15/20)b | | | 16,890 | | | | 17,956,181 | |
9.25%, 07/01/21b | | | 8,350 | | | | 8,818,321 | |
10.50%, 09/15/22 (Call 06/15/22)b | | | 35,369 | | | | 36,999,681 | |
11.00%, 09/15/25 (Call 06/15/25)b | | | 67,809 | | | | 69,080,419 | |
Hughes Satellite Systems Corp. | | | | | | | | |
5.25%, 08/01/26a | | | 13,266 | | | | 13,037,432 | |
6.50%, 06/15/19 | | | 17,112 | | | | 18,694,860 | |
6.63%, 08/01/26a,b | | | 13,970 | | | | 13,797,348 | |
7.63%, 06/15/21 | | | 15,605 | | | | 17,069,049 | |
| | |
| 70 | | 2016 iSHARES ANNUAL REPORTTO SHAREHOLDERS |
Schedule of Investments (Unaudited) (Continued)
iSHARES® iBOXX $ HIGH YIELD CORPORATE BOND ETF
October 31, 2016
| | | | | | | | |
| Security | | Principal
(000s) | | | Value | |
Inmarsat Finance PLC | | | | | | | | |
4.88%, 05/15/22 (Call 05/15/17)a | | $ | 17,654 | | | $ | 16,859,570 | |
6.50%, 10/01/24 (Call 10/01/19)a,b | | | 7,100 | | | | 7,187,641 | |
Intelsat Jackson Holdings SA | | | | | | | | |
5.50%, 08/01/23 (Call 08/01/18) | | | 34,016 | | | | 22,535,600 | |
7.25%, 04/01/19 (Call 12/01/16)b | | | 25,303 | | | | 20,400,544 | |
7.25%, 10/15/20 (Call 12/01/16)b | | | 38,020 | | | | 28,728,862 | |
7.50%, 04/01/21 (Call 12/01/16)b | | | 20,720 | | | | 15,229,200 | |
8.00%, 02/15/24 (Call 02/15/19)a,b | | | 24,138 | | | | 24,363,232 | |
9.50%, 09/30/22a | | | 8,000 | | | | 8,863,008 | |
Intelsat Luxembourg SA | | | | | | | | |
6.75%, 06/01/18 (Call 06/01/17)b | | | 8,483 | | | | 5,853,270 | |
7.75%, 06/01/21 (Call 06/01/17)b | | | 38,501 | | | | 12,512,825 | |
8.13%, 06/01/23 (Call 06/01/18) | | | 17,932 | | | | 5,872,730 | |
Koninklijke KPN NV
| | | | | | | | |
VRN, (10 year USD Swap + 5.330%) | | | | | |
7.00%, 03/28/73 (Call 03/28/23)a,b,c | | | 10,210 | | | | 11,179,950 | |
Level 3 Communications Inc. | | | | | | | | |
5.75%, 12/01/22 (Call 12/01/17)b | | | 10,035 | | | | 10,375,047 | |
Level 3 Financing Inc. | | | | | | | | |
5.13%, 05/01/23 (Call 05/01/18) | | | 11,690 | | | | 11,847,545 | |
5.25%, 03/15/26 (Call 03/15/21)a | | | 13,483 | | | | 13,702,099 | |
5.38%, 08/15/22 (Call 08/15/17)b | | | 16,555 | | | | 17,051,650 | |
5.38%, 01/15/24 (Call 01/15/19) | | | 15,487 | | | | 15,796,037 | |
5.38%, 05/01/25 (Call 05/01/20)b | | | 14,115 | | | | 14,397,300 | |
5.63%, 02/01/23 (Call 02/01/18)b | | | 8,445 | | | | 8,719,463 | |
| | | | | | | | |
| Security | | Principal
(000s) | | | Value | |
6.13%, 01/15/21 (Call 12/01/16) | | $ | 8,290 | | | $ | 8,571,860 | |
Nokia OYJ | | | | | | | | |
5.38%, 05/15/19 | | | 17,200 | | | | 18,382,978 | |
SoftBank Group Corp. | | | | | | | | |
4.50%, 04/15/20a,b | | | 47,124 | | | | 48,576,833 | |
Sprint Communications Inc. | | | | | | | | |
6.00%, 11/15/22 | | | 39,667 | | | | 36,915,300 | |
7.00%, 03/01/20a | | | 17,167 | | | | 18,669,112 | |
7.00%, 08/15/20 | | | 26,554 | | | | 27,612,272 | |
8.38%, 08/15/17 | | | 753 | | | | 784,061 | |
9.00%, 11/15/18a | | | 53,849 | | | | 59,166,589 | |
11.50%, 11/15/21 | | | 16,651 | | | | 19,522,715 | |
Sprint Corp. | | | | | | | | |
7.13%, 06/15/24b | | | 44,906 | | | | 42,211,640 | |
7.25%, 09/15/21 | | | 40,510 | | | | 41,460,284 | |
7.63%, 02/15/25 (Call 11/15/24)b | | | 26,132 | | | | 25,201,047 | |
7.88%, 09/15/23 | | | 76,507 | | | | 75,741,930 | |
T-Mobile USA Inc. | | | | | | | | |
5.25%, 09/01/18 (Call 11/14/16)b | | | 8,450 | | | | 8,566,452 | |
6.00%, 03/01/23 (Call 09/01/18) | | | 22,465 | | | | 23,644,412 | |
6.00%, 04/15/24 (Call 04/15/19) | | | 18,316 | | | | 19,463,087 | |
6.13%, 01/15/22 (Call 01/15/18)b | | | 16,803 | | | | 17,760,319 | |
6.25%, 04/01/21 (Call 04/01/17)b | | | 30,622 | | | | 31,961,712 | |
6.38%, 03/01/25 (Call 09/01/19)b | | | 31,283 | | | | 33,625,055 | |
6.46%, 04/28/19 (Call 11/14/16) | | | 15,857 | | | | 16,094,855 | |
6.50%, 01/15/24 (Call 01/15/19)b | | | 17,100 | | | | 18,318,375 | |
6.50%, 01/15/26 (Call 01/15/21)b | | | 35,171 | | | | 38,616,443 | |
6.54%, 04/28/20 (Call 11/14/16) | | | 23,827 | | | | 24,571,594 | |
6.63%, 11/15/20 (Call 11/14/16) | | | 16,999 | | | | 17,477,799 | |
6.63%, 04/28/21 (Call 04/28/17)b | | | 21,067 | | | | 22,054,511 | |
| | | | |
SCHEDULESOF INVESTMENTS | | | 71 | |
Schedule of Investments (Unaudited) (Continued)
iSHARES® iBOXX $ HIGH YIELD CORPORATE BOND ETF
October 31, 2016
| | | | | | | | |
| Security | | Principal
(000s) | | | Value | |
6.63%, 04/01/23 (Call 04/01/18) | | $ | 30,494 | | | $ | 32,399,875 | |
6.73%, 04/28/22 (Call 04/28/17) | | | 21,291 | | | | 22,302,322 | |
6.84%, 04/28/23 (Call 04/28/18) | | | 10,208 | | | | 10,902,144 | |
Telecom Italia Capital SA | | | | | | | | |
7.00%, 06/04/18b | | | 11,787 | | | | 12,685,759 | |
7.18%, 06/18/19b | | | 11,653 | | | | 13,104,611 | |
Telecom Italia SpA/Milano | | | | | | | | |
5.30%, 05/30/24a,b | | | 28,370 | | | | 28,791,314 | |
UPCB Finance IV Ltd. | | | | | | | | |
5.38%, 01/15/25 (Call 01/15/20)a | | | 20,545 | | | | 20,750,450 | |
UPCB Finance VI Ltd. | | | | | | | | |
6.88%, 01/15/22 (Call 01/15/17)a,b | | | 7,438 | | | | 7,735,390 | |
Virgin Media Finance PLC | | | | | | | | |
5.75%, 01/15/25 (Call 01/15/20)a | | | 7,005 | | | | 6,960,545 | |
6.00%, 10/15/24 (Call 10/15/19)a | | | 9,100 | | | | 9,270,625 | |
6.38%, 04/15/23 (Call 04/15/18)a,b | | | 8,677 | | | | 8,872,233 | |
Virgin Media Secured Finance PLC | | | | | | | | |
5.25%, 01/15/21b | | | 8,122 | | | | 8,661,255 | |
5.25%, 01/15/26 (Call 01/15/20)a,b | | | 15,995 | | | | 15,875,038 | |
5.38%, 04/15/21 (Call 04/15/17)a,b | | | 13,921 | | | | 14,443,245 | |
5.50%, 01/15/25 (Call 01/15/19)a,b | | | 7,872 | | | | 8,042,232 | |
West Corp. | | | | | | | | |
4.75%, 07/15/21 (Call 07/15/18)a,b | | | 6,600 | | | | 6,757,842 | |
5.38%, 07/15/22 (Call 07/15/17)a,b | | | 16,977 | | | | 16,340,362 | |
Wind Acquisition Finance SA | | | | | | | | |
4.75%, 07/15/20 (Call 12/01/16)a,b | | | 34,409 | | | | 34,495,022 | |
6.50%, 04/30/20 (Call 12/01/16)a,b | | | 11,264 | | | | 11,728,640 | |
| | | | | | | | |
| Security | | Principal
or Shares (000s) | | | Value | |
7.38%, 04/23/21 (Call 04/23/17)a,b | | $ | 50,347 | | | $ | 51,495,415 | �� |
Windstream Services LLC | | | | | | | | |
6.38%, 08/01/23 (Call 02/01/18) | | | 9,803 | | | | 8,700,163 | |
7.50%, 06/01/22 (Call 06/01/17)b | | | 7,819 | | | | 7,439,792 | |
7.50%, 04/01/23 (Call 12/01/16)b | | | 1,223 | | | | 1,146,563 | |
7.75%, 10/15/20 (Call 12/01/16)b | | | 11,851 | | | | 12,047,915 | |
7.75%, 10/01/21 (Call 12/01/16)b | | | 14,034 | | | | 13,882,184 | |
| | | | | | | | |
| | | | | | | 2,024,381,905 | |
TRANSPORTATION — 0.36% | | | | | | | | |
Florida East Coast Holdings Corp. | | | | | | | | |
6.75%, 05/01/19 (Call 12/01/16)a,b | | | 14,385 | | | | 14,530,289 | |
Navios Maritime Holdings Inc./Navios Maritime Finance II U.S. Inc. | | | | | | | | |
7.38%, 01/15/22 (Call 01/15/17)a | | | 10,242 | | | | 5,351,445 | |
XPO Logistics Inc. | | | | | | | | |
6.13%, 09/01/23 (Call 09/01/19)a | | | 8,380 | | | | 8,592,293 | |
6.50%, 06/15/22 (Call 06/15/18)a,b | | | 28,349 | | | | 29,376,651 | |
| | | | | | | | |
| | | | | | | 57,850,678 | |
| | | | | | | | |
| |
TOTAL CORPORATE BONDS & NOTES | | | | | |
(Cost: $15,910,125,171) | | | | 15,505,115,141 | |
|
SHORT-TERM INVESTMENTS — 29.84% | |
| |
MONEY MARKET FUNDS — 29.84% | | | | | |
BlackRock Cash Funds: Institutional, | | | | | |
SL Agency Shares | | | | | | | | |
0.72%e,f,g | | | 4,518,260 | | | | 4,518,712,300 | |
| | |
| 72 | | 2016 iSHARES ANNUAL REPORTTO SHAREHOLDERS |
Schedule of Investments (Unaudited) (Continued)
iSHARES® iBOXX $ HIGH YIELD CORPORATE BOND ETF
October 31, 2016
| | | | | | | | |
| Security | |
Shares (000s) | | | Value | |
BlackRock Cash Funds: Treasury, | | | | | |
SL Agency Shares | | | | | | | | |
0.29%e,f | | $ | 231,365 | | | $ | 231,364,816 | |
| | | | | | | | |
| | | | | | | 4,750,077,116 | |
| | | | | | | | |
TOTAL SHORT-TERM INVESTMENTS | | | | | |
(Cost: $4,749,625,290) | | | | | | | 4,750,077,116 | |
| | | | | | | | |
TOTAL INVESTMENTS IN SECURITIES — 127.24% | | | | | | | | |
(Cost: $20,659,750,461)h | | | | | | | 20,255,192,257 | |
Other Assets, Less Liabilities — (27.24)% | | | | (4,336,375,138 | ) |
| | | | | | | | |
NET ASSETS — 100.00% | | | | | | $ | 15,918,817,119 | |
| | | | | | | | |
VRN — Variable Rate Note
| a | This security may be resold to qualified institutional buyers under Rule 144A of the Securities Act of 1933. |
| b | All or a portion of this security represents a security on loan. |
| c | Variable rate security. Rate shown is as of report date. |
| d | Step coupon security. Coupon rate will either increase (step-up bond) or decrease (step-down bond) at regular intervals until maturity. Interest rate shown reflects the rate currently in effect. |
| e | Affiliated money market fund. |
| f | The rate quoted is the annualized seven-day yield of the fund at period end. |
| g | All or a portion of this security represents an investment of securities lending collateral. |
| h | The cost of investments for federal income tax purposes was $20,661,349,133. Net unrealized depreciation was $406,156,876, of which $122,673,684 represented gross unrealized appreciation on securities and $528,830,560 represented gross unrealized depreciation on securities. |
Schedule 1 — Fair Value Measurements
Various inputs are used in determining the fair value of financial instruments. For description of the input levels and information about the Fund’s policy regarding valuation of financial instruments, refer to a recently published shareholder report. Shareholder reports are available on the Fund’s website at www.iShares.com and on the U.S. Securities and Exchange Commission website at www.sec.gov.
The following table summarizes the value of the Fund’s investments according to the fair value hierarchy as of October 31, 2016. The breakdown of the Fund’s investments into major categories is disclosed in the schedule of investments above.
| | | | | | | | | | | | | | | | |
| | | Level 1 | | | Level 2 | | | Level 3 | | | Total | |
Investments: | | | | | | | | | | | | | | | | |
Assets: | | | | | | | | | | | | | | | | |
Corporate bonds & notes | | $ | — | | | $ | 15,505,115,141 | | | $ | — | | | $ | 15,505,115,141 | |
Money market funds | | | 4,750,077,116 | | | | — | | | | — | | | | 4,750,077,116 | |
| | | | | | | | | | | | | | | | |
Total | | $ | 4,750,077,116 | | | $ | 15,505,115,141 | | | $ | — | | | $ | 20,255,192,257 | |
| | | | | | | | | | | | | | | | |
| | | | | | | | | | | | | | | | | |
| | | | |
SCHEDULESOF INVESTMENTS | | | 73 | |
Schedule of Investments (Unaudited)
iSHARES® iBOXX $ INVESTMENT GRADE CORPORATE BOND ETF
October 31, 2016
| | | | | | | | |
| Security | |
Principal
(000s) | | | Value | |
CORPORATE BONDS & NOTES — 98.80% | |
| |
ADVERTISING — 0.25% | | | | | |
Omnicom Group Inc. | | | | | | | | |
3.60%, 04/15/26 (Call 01/15/26) | | $ | 15,100 | | | $ | 15,682,848 | |
3.63%, 05/01/22 | | | 16,694 | | | | 17,753,274 | |
3.65%, 11/01/24 (Call 08/01/24) | | | 11,508 | | | | 12,060,347 | |
4.45%, 08/15/20 | | | 9,690 | | | | 10,514,740 | |
WPP Finance 2010 | | | | | | | | |
3.75%, 09/19/24a | | | 7,675 | | | | 8,029,664 | |
4.75%, 11/21/21a | | | 11,560 | | | | 12,883,832 | |
| | | | | | | | |
| | | | 76,924,705 | |
AEROSPACE & DEFENSE — 1.15% | | | | | |
Boeing Co. (The) | | | | | | | | |
4.88%, 02/15/20a | | | 9,049 | | | | 10,009,202 | |
General Dynamics Corp. | | | | | | | | |
2.25%, 11/15/22 (Call 08/15/22) | | | 11,755 | | | | 11,903,511 | |
L-3 Communications Corp. | | | | | | | | |
4.75%, 07/15/20 | | | 9,868 | | | | 10,708,744 | |
Lockheed Martin Corp. | | | | | | | | |
2.50%, 11/23/20 (Call 10/23/20)a | | | 15,935 | | | | 16,325,544 | |
2.90%, 03/01/25 (Call 12/01/24)a | | | 10,190 | | | | 10,333,585 | |
3.35%, 09/15/21 | | | 12,669 | | | | 13,450,898 | |
3.55%, 01/15/26 (Call 10/15/25) | | | 22,550 | | | | 23,918,974 | |
3.80%, 03/01/45 (Call 09/01/44) | | | 9,830 | | | | 9,730,652 | |
4.07%, 12/15/42 | | | 16,044 | | | | 16,459,867 | |
4.25%, 11/15/19 | | | 8,143 | | | | 8,789,825 | |
4.70%, 05/15/46 (Call 11/15/45)a | | | 24,030 | | | | 27,267,305 | |
Northrop Grumman Corp. | | | | | | | | |
3.25%, 08/01/23a | | | 12,883 | | | | 13,579,191 | |
4.75%, 06/01/43a | | | 13,408 | | | | 15,253,983 | |
Raytheon Co. | | | | | | | | |
2.50%, 12/15/22 (Call 09/15/22) | | | 12,549 | | | | 12,866,856 | |
3.13%, 10/15/20a | | | 12,342 | | | | 12,982,339 | |
| | | | | | | | |
| Security | |
Principal
(000s) | | | Value | |
United Technologies Corp. | | | | | | | | |
2.65%, 11/01/26 (Call 08/01/26) | | $ | 4,160 | | | $ | 4,161,705 | |
3.10%, 06/01/22 | | | 23,156 | | | | 24,365,716 | |
3.75%, 11/01/46 (Call 05/01/46) | | | 5,000 | | | | 4,973,350 | |
4.15%, 05/15/45 (Call 11/16/44)a | | | 8,150 | | | | 8,570,520 | |
4.50%, 04/15/20 | | | 16,074 | | | | 17,603,801 | |
4.50%, 06/01/42 | | | 39,969 | | | | 43,667,032 | |
5.70%, 04/15/40a | | | 13,169 | | | | 16,710,496 | |
6.13%, 07/15/38a | | | 13,191 | | | | 17,344,174 | |
| | | | | | | | |
| | | | 350,977,270 | |
AGRICULTURE — 1.28% | | | | | |
Altria Group Inc. | | | | | | | | |
2.63%, 01/14/20 (Call 12/14/19) | | | 10,390 | | | | 10,672,665 | |
2.63%, 09/16/26 (Call 03/16/26)a | | | 1,365 | | | | 1,353,220 | |
2.85%, 08/09/22 | | | 22,220 | | | | 22,890,520 | |
3.88%, 09/16/46 (Call 03/16/46) | | | 3,000 | | | | 2,952,471 | |
4.00%, 01/31/24 | | | 18,832 | | | | 20,638,742 | |
4.25%, 08/09/42 | | | 17,077 | | | | 17,760,712 | |
4.75%, 05/05/21 | | | 23,146 | | | | 25,822,534 | |
5.38%, 01/31/44 | | | 24,052 | | | | 29,238,831 | |
Philip Morris International Inc. | | | | | | | | |
1.88%, 02/25/21 (Call 01/25/21)a | | | 8,115 | | | | 8,106,511 | |
2.50%, 08/22/22a | | | 9,370 | | | | 9,525,193 | |
2.75%, 02/25/26 (Call 11/25/25) | | | 11,700 | | | | 11,794,724 | |
2.90%, 11/15/21a | | | 14,866 | | | | 15,472,878 | |
3.25%, 11/10/24 | | | 14,409 | | | | 15,134,276 | |
3.38%, 08/11/25 (Call 05/11/25)a | | | 3,450 | | | | 3,656,681 | |
3.88%, 08/21/42a | | | 7,286 | | | | 7,208,449 | |
4.13%, 03/04/43 | | | 8,339 | | | | 8,543,326 | |
4.25%, 11/10/44a | | | 15,206 | | | | 15,933,999 | |
4.38%, 11/15/41a | | | 12,686 | | | | 13,454,183 | |
4.50%, 03/26/20a | | | 13,864 | | | | 15,128,290 | |
4.88%, 11/15/43 | | | 6,961 | | | | 7,932,115 | |
6.38%, 05/16/38a | | | 18,146 | | | | 24,434,095 | |
| | |
| 74 | | 2016 iSHARES ANNUAL REPORTTO SHAREHOLDERS |
Schedule of Investments (Unaudited) (Continued)
iSHARES® iBOXX $ INVESTMENT GRADE CORPORATE BOND ETF
October 31, 2016
| | | | | | | | |
| Security | |
Principal
(000s) | | | Value | |
Reynolds American Inc. | | | | | | | | |
3.25%, 06/12/20 | | $ | 7,971 | | | $ | 8,294,241 | |
4.00%, 06/12/22 | | | 8,999 | | | | 9,685,249 | |
4.45%, 06/12/25 (Call 03/12/25) | | | 33,049 | | | | 36,276,565 | |
5.70%, 08/15/35 (Call 02/15/35)a | | | 9,900 | | | | 11,908,472 | |
5.85%, 08/15/45 (Call 02/15/45) | | | 28,518 | | | | 35,638,525 | |
| | | | | | | | |
| | | | 389,457,467 | |
APPAREL — 0.08% | | | | | |
NIKE Inc. | | | | | | | | |
2.38%, 11/01/26 (Call 08/01/26) | | | 13,500 | | | | 13,359,195 | |
3.88%, 11/01/45 (Call 05/01/45) | | | 10,800 | | | | 11,365,232 | |
| | | | | | | | |
| | | | 24,724,427 | |
AUTO MANUFACTURERS — 2.18% | | | | | |
American Honda Finance Corp. | | | | | | | | |
1.70%, 09/09/21 | | | 11,685 | | | | 11,539,302 | |
2.45%, 09/24/20a | | | 9,600 | | | | 9,819,680 | |
Daimler Finance North America LLC | | | | | | | | |
8.50%, 01/18/31a | | | 17,116 | | | | 27,396,681 | |
Ford Motor Co. | | | | | | | | |
4.75%, 01/15/43a | | | 20,148 | | | | 20,126,865 | |
7.45%, 07/16/31a | | | 21,619 | | | | 28,244,545 | |
Ford Motor Credit Co. LLC | | | | | | | | |
2.60%, 11/04/19a | | | 15,591 | | | | 15,750,201 | |
3.10%, 05/04/23a | | | 10,500 | | | | 10,480,495 | |
3.16%, 08/04/20a | | | 19,700 | | | | 20,165,377 | |
3.20%, 01/15/21a | | | 13,255 | | | | 13,493,579 | |
3.22%, 01/09/22 | | | 12,900 | | | | 13,108,762 | |
3.34%, 03/18/21a | | | 21,648 | | | | 22,235,358 | |
3.66%, 09/08/24 | | | 9,425 | | | | 9,541,648 | |
4.13%, 08/04/25a | | | 17,750 | | | | 18,390,842 | |
4.25%, 09/20/22 | | | 15,945 | | | | 16,965,242 | |
4.38%, 08/06/23a | | | 14,696 | | | | 15,628,833 | |
4.39%, 01/08/26a | | | 12,800 | | | | 13,486,323 | |
5.75%, 02/01/21 | | | 13,920 | | | | 15,576,718 | |
5.88%, 08/02/21 | | | 18,964 | | | | 21,452,407 | |
8.13%, 01/15/20 | | | 18,071 | | | | 21,187,395 | |
General Motors Co. | | | | | | | | |
4.88%, 10/02/23a | | | 13,285 | | | | 14,271,033 | |
| | | | | | | | |
| Security | |
Principal
(000s) | | | Value | |
5.00%, 04/01/35 | | $ | 10,935 | | | $ | 11,105,447 | |
5.20%, 04/01/45 | | | 14,919 | | | | 15,122,143 | |
6.25%, 10/02/43 | | | 25,715 | | | | 29,448,679 | |
6.60%, 04/01/36 (Call 10/01/35) | | | 15,450 | | | | 18,183,959 | |
6.75%, 04/01/46 (Call 10/01/45) | | | 8,455 | | | | 10,315,945 | |
General Motors Financial Co. Inc. | |
3.15%, 01/15/20 (Call 12/15/19) | | | 19,640 | | | | 20,040,077 | |
3.20%, 07/13/20 (Call 06/13/20)a | | | 19,753 | | | | 20,045,897 | |
3.20%, 07/06/21 (Call 06/06/21)a | | | 4,700 | | | | 4,754,490 | |
3.45%, 04/10/22 (Call 02/10/22) | | | 19,831 | | | | 20,006,479 | |
3.70%, 11/24/20 (Call 10/24/20) | | | 19,760 | | | | 20,413,463 | |
3.70%, 05/09/23 (Call 03/09/23)a | | | 12,675 | | | | 12,793,448 | |
4.00%, 01/15/25 (Call 10/15/24)a | | | 14,570 | | | | 14,609,147 | |
4.00%, 10/06/26 (Call 07/06/26) | | | 3,000 | | | | 2,996,250 | |
4.20%, 03/01/21 (Call 02/01/21)a | | | 21,790 | | | | 22,896,034 | |
4.30%, 07/13/25 (Call 04/13/25)a | | | 9,410 | | | | 9,625,066 | |
4.38%, 09/25/21a | | | 11,750 | | | | 12,466,368 | |
5.25%, 03/01/26 (Call 12/01/25)a | | | 12,880 | | | | 14,012,119 | |
Toyota Motor Credit Corp. | | | | | | | | |
1.90%, 04/08/21 | | | 18,836 | | | | 18,883,964 | |
2.15%, 03/12/20a | | | 14,966 | | | | 15,354,411 | |
3.30%, 01/12/22a | | | 10,900 | | | | 11,595,223 | |
3.40%, 09/15/21 | | | 14,002 | | | | 14,965,100 | |
Series B | | | | | | | | |
4.50%, 06/17/20 | | | 6,104 | | | | 6,687,458 | |
| | | | | | | | |
| | | | 665,182,453 | |
BANKS — 26.66% | | | | | |
Australia & New Zealand Banking Group Ltd./New York NY | | | | | | | | |
2.30%, 06/01/21 | | | 15,750 | | | | 15,892,397 | |
| | | | |
SCHEDULESOF INVESTMENTS | | | 75 | |
Schedule of Investments (Unaudited) (Continued)
iSHARES® iBOXX $ INVESTMENT GRADE CORPORATE BOND ETF
October 31, 2016
| | | | | | | | |
| Security | |
Principal
(000s) | | | Value | |
2.70%, 11/16/20a | | $ | 13,100 | | | $ | 13,446,964 | |
3.70%, 11/16/25a | | | 11,500 | | | | 12,397,989 | |
Banco Bilbao Vizcaya Argentaria SA | | | | | | | | |
3.00%, 10/20/20a | | | 13,300 | | | | 13,666,166 | |
Bank of America Corp. | | | | | | | | |
2.50%, 10/21/22 (Call 10/21/21) | | | 15,440 | | | | 15,426,413 | |
2.63%, 10/19/20 | | | 31,900 | | | | 32,413,392 | |
2.63%, 04/19/21a | | | 25,150 | | | | 25,484,797 | |
3.25%, 10/21/27 (Call 10/21/26) | | | 12,935 | | | | 12,953,887 | |
3.30%, 01/11/23a | | | 53,511 | | | | 54,994,004 | |
3.50%, 04/19/26a | | | 33,175 | | | | 34,056,841 | |
3.88%, 08/01/25a | | | 44,629 | | | | 47,029,563 | |
4.00%, 04/01/24a | | | 24,544 | | | | 26,226,189 | |
4.00%, 01/22/25a | | | 33,150 | | | | 34,075,044 | |
4.10%, 07/24/23 | | | 28,576 | | | | 30,680,397 | |
4.13%, 01/22/24 | | | 31,863 | | | | 34,194,416 | |
4.20%, 08/26/24 | | | 42,027 | | | | 43,975,960 | |
4.25%, 10/22/26a | | | 31,818 | | | | 33,381,082 | |
4.45%, 03/03/26a | | | 22,220 | | | | 23,666,842 | |
4.88%, 04/01/44a | | | 15,582 | | | | 17,605,274 | |
5.00%, 05/13/21 | | | 26,520 | | | | 29,412,091 | |
5.00%, 01/21/44 | | | 24,870 | | | | 28,173,365 | |
5.63%, 07/01/20 | | | 38,695 | | | | 43,242,313 | |
5.70%, 01/24/22 | | | 19,973 | | | | 23,037,779 | |
5.88%, 01/05/21a | | | 18,570 | | | | 21,141,991 | |
5.88%, 02/07/42a | | | 20,365 | | | | 25,807,172 | |
6.11%, 01/29/37 | | | 30,334 | | | | 36,738,882 | |
7.75%, 05/14/38 | | | 24,777 | | | | 35,003,427 | |
Series L | | | | | | | | |
2.25%, 04/21/20a | | | 21,035 | | | | 21,121,776 | |
3.95%, 04/21/25a | | | 35,144 | | | | 36,024,396 | |
Bank of America N.A. | | | | | | | | |
6.00%, 10/15/36 | | | 12,865 | | | | 16,191,167 | |
Bank of Montreal | | | | | | | | |
1.90%, 08/27/21 | | | 27,836 | | | | 27,588,705 | |
2.55%, 11/06/22 (Call 10/06/22) | | | 11,243 | | | | 11,387,419 | |
Bank of New York Mellon Corp. (The) | | | | | | | | |
2.05%, 05/03/21 (Call 04/03/21) | | | 150 | | | | 150,316 | |
| | | | | | | | |
| Security | |
Principal
(000s) | | | Value | |
2.20%, 08/16/23 (Call 06/16/23) | | $ | 13,850 | | | $ | 13,621,145 | |
2.45%, 11/27/20 (Call 10/27/20) | | | 15,705 | | | | 15,994,093 | |
2.45%, 08/17/26 (Call 05/17/26)a | | | 10,500 | | | | 10,272,029 | |
2.50%, 04/15/21 (Call 03/15/21) | | | 15,800 | | | | 16,109,366 | |
2.60%, 08/17/20 (Call 07/17/20) | | | 12,816 | | | | 13,141,051 | |
2.80%, 05/04/26 (Call 02/04/26) | | | 9,525 | | | | 9,607,247 | |
3.00%, 02/24/25 (Call 01/24/25)a | | | 7,410 | | | | 7,622,588 | |
3.55%, 09/23/21 (Call 08/23/21) | | | 17,942 | | | | 19,134,519 | |
3.65%, 02/04/24 (Call 01/05/24) | | | 12,076 | | | | 12,949,761 | |
Series G | | | | | | | | |
2.15%, 02/24/20 (Call 01/24/20)a | | | 16,781 | | | | 16,989,564 | |
Bank of Nova Scotia (The) | | | | | | | | |
2.35%, 10/21/20 | | | 12,000 | | | | 12,185,917 | |
2.45%, 03/22/21 | | | 17,125 | | | | 17,402,048 | |
2.80%, 07/21/21a | | | 19,151 | | | | 19,748,496 | |
4.38%, 01/13/21a | | | 4,074 | | | | 4,451,511 | |
4.50%, 12/16/25a | | | 8,600 | | | | 9,040,010 | |
Barclays Bank PLC | | | | | | | | |
5.14%, 10/14/20 | | | 10,484 | | | | 11,303,241 | |
Barclays PLC | | | | | | | | |
2.75%, 11/08/19a | | | 16,850 | | | | 16,992,881 | |
2.88%, 06/08/20a | | | 17,050 | | | | 17,173,009 | |
3.20%, 08/10/21 | | | 7,450 | | | | 7,496,066 | |
3.25%, 01/12/21 | | | 20,700 | | | | 20,959,816 | |
3.65%, 03/16/25a | | | 37,915 | | | | 37,195,620 | |
4.38%, 09/11/24a | | | 22,335 | | | | 22,420,224 | |
4.38%, 01/12/26a | | | 34,976 | | | | 36,010,160 | |
5.20%, 05/12/26a | | | 12,300 | | | | 12,647,352 | |
5.25%, 08/17/45a | | | 20,184 | | | | 21,982,867 | |
BB&T Corp. | | | | | | | | |
2.05%, 05/10/21 (Call 04/09/21)a | | | 11,450 | | | | 11,478,466 | |
2.45%, 01/15/20 (Call 12/15/19) | | | 10,100 | | | | 10,311,598 | |
| | |
| 76 | | 2016 iSHARES ANNUAL REPORTTO SHAREHOLDERS |
Schedule of Investments (Unaudited) (Continued)
iSHARES® iBOXX $ INVESTMENT GRADE CORPORATE BOND ETF
October 31, 2016
| | | | | | | | |
| Security | |
Principal
(000s) | | | Value | |
2.63%, 06/29/20 (Call 05/29/20) | | $ | 16,226 | | | $ | 16,646,422 | |
BNP Paribas SA | | | | | | | | |
2.38%, 05/21/20 | | | 21,895 | | | | 22,151,817 | |
4.25%, 10/15/24a | | | 14,230 | | | | 14,653,029 | |
5.00%, 01/15/21 | | | 32,158 | | | | 35,710,514 | |
BNP Paribas/BNP Paribas U.S. Medium-Term Note Program LLC | | | | | | | | |
3.25%, 03/03/23a | | | 8,774 | | | | 9,134,875 | |
BPCE SA | | | | | | | | |
2.25%, 01/27/20a | | | 15,750 | | | | 15,909,995 | |
2.65%, 02/03/21a | | | 3,250 | | | | 3,330,906 | |
4.00%, 04/15/24a | | | 20,300 | | | | 21,985,933 | |
Branch Banking & Trust Co. | | | | | | | | |
3.63%, 09/16/25 (Call 08/16/25) | | | 12,270 | | | | 12,936,025 | |
3.80%, 10/30/26 (Call 09/30/26) | | | 14,425 | | | | 15,421,899 | |
Capital One Financial Corp. | | | | | | | | |
3.20%, 02/05/25 (Call 01/05/25)a | | | 18,250 | | | | 18,381,597 | |
3.50%, 06/15/23a | | | 12,512 | | | | 12,942,953 | |
3.75%, 04/24/24 (Call 03/24/24)a | | | 16,750 | | | | 17,512,127 | |
3.75%, 07/28/26 (Call 06/28/26)a | | | 9,700 | | | | 9,644,575 | |
4.20%, 10/29/25 (Call 09/29/25)a | | | 15,407 | | | | 15,996,800 | |
4.75%, 07/15/21 | | | 11,039 | | | | 12,150,276 | |
Capital One N.A./Mclean VA | | | | | | | | |
2.95%, 07/23/21 (Call 06/23/21) | | | 16,740 | | | | 17,166,415 | |
Capital One NA/Mclean VA | | | | | | | | |
2.25%, 09/13/21 (Call 08/13/21) | | | 9,350 | | | | 9,305,501 | |
Citigroup Inc. | | | | | | | | |
2.35%, 08/02/21a | | | 14,500 | | | | 14,500,203 | |
2.40%, 02/18/20a | | | 21,072 | | | | 21,283,913 | |
2.65%, 10/26/20a | | | 33,600 | | | | 34,095,886 | |
2.70%, 03/30/21 | | | 28,040 | | | | 28,467,487 | |
3.20%, 10/21/26 (Call 07/21/26) | | | 10,000 | | | | 9,987,800 | |
3.30%, 04/27/25 | | | 17,959 | | | | 18,235,709 | |
| | | | | | | | |
| Security | |
Principal
(000s) | | | Value | |
3.40%, 05/01/26a | | $ | 27,758 | | | $ | 28,199,932 | |
3.50%, 05/15/23a | | | 19,669 | | | | 20,160,798 | |
3.70%, 01/12/26a | | | 29,025 | | | | 30,181,614 | |
3.75%, 06/16/24 | | | 1,681 | | | | 1,770,309 | |
3.88%, 10/25/23 | | | 16,611 | | | | 17,643,585 | |
3.88%, 03/26/25a | | | 15,119 | | | | 15,457,874 | |
4.00%, 08/05/24a | | | 15,488 | | | | 15,998,114 | |
4.05%, 07/30/22 | | | 11,256 | | | | 11,881,366 | |
4.13%, 07/25/28a | | | 15,300 | | | | 15,659,201 | |
4.30%, 11/20/26a | | | 15,245 | | | | 15,905,634 | |
4.40%, 06/10/25 | | | 32,269 | | | | 34,056,006 | |
4.45%, 09/29/27a | | | 44,245 | | | | 46,501,384 | |
4.50%, 01/14/22 | | | 36,279 | | | | 39,806,335 | |
4.60%, 03/09/26 | | | 19,715 | | | | 21,051,338 | |
4.65%, 07/30/45 | | | 11,594 | | | | 12,685,215 | |
4.75%, 05/18/46 | | | 11,750 | | | | 12,097,310 | |
5.30%, 05/06/44 | | | 13,200 | | | | 14,561,270 | |
5.38%, 08/09/20a | | | 17,850 | | | | 19,884,054 | |
5.50%, 09/13/25 | | | 13,964 | | | | 15,652,788 | |
5.88%, 01/30/42 | | | 14,910 | | | | 18,783,889 | |
6.63%, 06/15/32 | | | 13,750 | | | | 16,779,856 | |
6.68%, 09/13/43a | | | 13,303 | | | | 17,063,153 | |
8.13%, 07/15/39 | | | 18,533 | | | | 28,216,828 | |
Citizens Bank N.A./Providence RI | | | | | | | | |
2.45%, 12/04/19 (Call 11/04/19) | | | 1,500 | | | | 1,520,664 | |
2.55%, 05/13/21 (Call 04/13/21)a | | | 7,550 | | | | 7,645,353 | |
Citizens Financial Group Inc. | | | | | | | | |
4.30%, 12/03/25 (Call 11/03/25)a | | | 10,253 | | | | 10,652,980 | |
Commonwealth Bank of Australia/New York NY | | | | | | | | |
2.30%, 03/12/20a | | | 16,109 | | | | 16,306,047 | |
2.40%, 11/02/20a | | | 8,580 | | | | 8,707,943 | |
2.55%, 03/15/21a | | | 12,835 | | | | 13,076,023 | |
Cooperatieve Rabobank UA | | | | | | | | |
3.75%, 07/21/26a | | | 3,800 | | | | 3,806,086 | |
3.88%, 02/08/22a | | | 35,300 | | | | 38,133,439 | |
3.95%, 11/09/22 | | | 27,040 | | | | 28,242,912 | |
4.38%, 08/04/25a | | | 22,734 | | | | 23,884,495 | |
4.50%, 01/11/21a | | | 12,335 | | | | 13,537,407 | |
4.63%, 12/01/23a | | | 19,804 | | | | 21,283,010 | |
| | | | |
SCHEDULESOF INVESTMENTS | | | 77 | |
Schedule of Investments (Unaudited) (Continued)
iSHARES® iBOXX $ INVESTMENT GRADE CORPORATE BOND ETF
October 31, 2016
| | | | | | | | |
| Security | |
Principal
(000s) | | | Value | |
5.25%, 05/24/41 | | $ | 11,708 | | | $ | 14,317,334 | |
5.25%, 08/04/45a | | | 20,375 | | | | 22,922,696 | |
5.75%, 12/01/43a | | | 14,978 | | | | 18,032,125 | |
Cooperatieve Rabobank UA/NY | | | | | | | | |
2.25%, 01/14/20 | | | 14,250 | | | | 14,463,619 | |
2.50%, 01/19/21 | | | 38,300 | | | | 39,035,237 | |
3.38%, 05/21/25a | | | 15,952 | | | | 16,811,658 | |
Credit Suisse AG/New York NY | | | | | | | | |
3.00%, 10/29/21a | | | 20,795 | | | | 21,291,408 | |
3.63%, 09/09/24a | | | 32,625 | | | | 33,805,108 | |
4.38%, 08/05/20a | | | 16,155 | | | | 17,405,754 | |
5.40%, 01/14/20 | | | 11,511 | | | | 12,493,645 | |
Credit Suisse Group Funding Guernsey Ltd. | | | | | | | | |
2.75%, 03/26/20a | | | 24,400 | | | | 24,427,069 | |
3.13%, 12/10/20b | | | 1,000 | | | | 1,010,017 | |
3.13%, 12/10/20 | | | 28,450 | | | | 28,628,120 | |
3.45%, 04/16/21a,b | | | 20,850 | | | | 21,211,862 | |
3.75%, 03/26/25a | | | 32,800 | | | | 32,475,211 | |
3.80%, 09/15/22a | | | 23,303 | | | | 23,686,943 | |
3.80%, 06/09/23a,b | | | 1,250 | | | | 1,260,930 | |
4.55%, 04/17/26a,b | | | 36,500 | | | | 38,229,458 | |
4.88%, 05/15/45a | | | 29,900 | | | | 31,385,285 | |
Deutsche Bank AG | | | | | | | | |
2.95%, 08/20/20 | | | 12,650 | | | | 12,363,027 | |
3.13%, 01/13/21 | | | 5,480 | | | | 5,335,703 | |
3.38%, 05/12/21a | | | 21,200 | | | | 20,859,009 | |
4.10%, 01/13/26 | | | 1,480 | | | | 1,444,444 | |
4.50%, 04/01/25a | | | 18,530 | | | | 17,256,744 | |
Deutsche Bank AG/London | | | | | | | | |
3.70%, 05/30/24a | | | 14,304 | | | | 13,675,368 | |
Discover Bank/Greenwood DE | | | | | | | | |
3.10%, 06/04/20 (Call 05/04/20) | | | 16,630 | | | | 17,071,656 | |
3.20%, 08/09/21 (Call 07/09/21)a | | | 12,494 | | | | 12,829,755 | |
3.45%, 07/27/26 (Call 04/27/26) | | | 6,150 | | | | 6,151,228 | |
4.20%, 08/08/23a | | | 17,295 | | | | 18,562,839 | |
Fifth Third Bancorp. | | | | | | | | |
2.88%, 07/27/20 (Call 06/27/20)a | | | 11,823 | | | | 12,201,607 | |
4.30%, 01/16/24 (Call 12/16/23) | | | 9,205 | | | | 9,814,278 | |
| | | | | | | | |
| Security | |
Principal
(000s) | | | Value | |
8.25%, 03/01/38 | | $ | 11,898 | | | $ | 17,193,023 | |
Fifth Third Bank/Cincinnati OH | | | | | | | | |
2.25%, 06/14/21 (Call 05/14/21)a | | | 1,100 | | | | 1,110,891 | |
2.88%, 10/01/21 (Call 09/01/21)a | | | 17,200 | | | | 17,824,167 | |
3.85%, 03/15/26 (Call 02/15/26) | | | 14,950 | | | | 15,677,234 | |
Goldman Sachs Group Inc. (The) | | | | | | | | |
2.35%, 11/15/21 (Call 11/15/20)a | | | 14,490 | | | | 14,404,266 | |
2.55%, 10/23/19 | | | 7,294 | | | | 7,436,916 | |
2.60%, 04/23/20 (Call 03/23/20) | | | 25,602 | | | | 26,041,663 | |
2.63%, 04/25/21 (Call 03/25/21)a | | | 14,740 | | | | 14,888,360 | |
2.75%, 09/15/20 (Call 08/15/20)a | | | 27,825 | | | | 28,408,972 | |
2.88%, 02/25/21 (Call 01/25/21)a | | | 13,930 | | | | 14,245,350 | |
3.50%, 01/23/25 (Call 10/23/24)a | | | 31,116 | | | | 31,850,045 | |
3.63%, 01/22/23a | | | 27,887 | | | | 29,241,084 | |
3.75%, 05/22/25 (Call 02/22/25)a | | | 30,373 | | | | 31,582,571 | |
3.75%, 02/25/26 (Call 11/25/25)a | | | 23,175 | | | | 24,220,656 | |
3.85%, 07/08/24 (Call 04/08/24)a | | | 23,028 | | | | 24,262,492 | |
4.00%, 03/03/24a | | | 39,319 | | | | 41,903,371 | |
4.25%, 10/21/25a | | | 25,995 | | | | 27,176,753 | |
4.75%, 10/21/45 (Call 04/21/45) | | | 19,630 | | | | 21,506,432 | |
4.80%, 07/08/44 (Call 01/08/44) | | | 18,481 | | | | 20,215,582 | |
5.15%, 05/22/45a | | | 23,075 | | | | 24,896,637 | |
5.25%, 07/27/21 | | | 48,515 | | | | 54,469,120 | |
5.38%, 03/15/20a | | | 35,348 | | | | 39,093,750 | |
5.75%, 01/24/22a | | | 49,387 | | | | 57,048,356 | |
5.95%, 01/15/27 | | | 12,616 | | | | 14,785,627 | |
6.00%, 06/15/20a | | | 22,921 | | | | 25,924,096 | |
6.13%, 02/15/33a | | | 31,496 | | | | 38,984,448 | |
6.25%, 02/01/41 | | | 32,660 | | | | 41,812,325 | |
| | |
| 78 | | 2016 iSHARES ANNUAL REPORTTO SHAREHOLDERS |
Schedule of Investments (Unaudited) (Continued)
iSHARES® iBOXX $ INVESTMENT GRADE CORPORATE BOND ETF
October 31, 2016
| | | | | | | | |
| Security | |
Principal
(000s) | | | Value | |
6.45%, 05/01/36 | | $ | 22,511 | | | $ | 27,365,153 | |
6.75%, 10/01/37 | | | 66,435 | | | | 83,745,808 | |
HSBC Bank USA N.A./New York NY | | | | | | | | |
4.88%, 08/24/20a | | | 20,935 | | | | 22,579,886 | |
5.63%, 08/15/35 | | | 9,763 | | | | 11,365,396 | |
5.88%, 11/01/34a | | | 8,250 | | | | 9,850,423 | |
HSBC Holdings PLC | | | | | | | | |
2.65%, 01/05/22a | | | 6,135 | | | | 6,097,209 | |
2.95%, 05/25/21a | | | 37,575 | | | | 38,114,630 | |
3.40%, 03/08/21a | | | 34,455 | | | | 35,561,922 | |
3.60%, 05/25/23a | | | 29,275 | | | | 30,210,380 | |
3.90%, 05/25/26 | | | 35,450 | | | | 36,627,075 | |
4.00%, 03/30/22a | | | 33,625 | | | | 35,613,431 | |
4.25%, 03/14/24a | | | 15,914 | | | | 16,302,349 | |
4.25%, 08/18/25a | | | 18,350 | | | | 18,809,130 | |
4.30%, 03/08/26 | | | 36,020 | | | | 38,247,920 | |
4.88%, 01/14/22 | | | 5,702 | | | | 6,256,600 | |
5.10%, 04/05/21 | | | 29,664 | | | | 32,625,787 | |
5.25%, 03/14/44a | | | 33,159 | | | | 36,349,214 | |
6.10%, 01/14/42a | | | 8,918 | | | | 11,540,107 | |
6.50%, 05/02/36a | | | 27,758 | | | | 34,658,395 | |
6.50%, 09/15/37 | | | 29,989 | | | | 37,533,426 | |
6.80%, 06/01/38a | | | 12,310 | | | | 15,889,653 | |
HSBC USA Inc. | | | | | | | | |
2.35%, 03/05/20 | | | 19,418 | | | | 19,489,460 | |
2.38%, 11/13/19 | | | 13,150 | | | | 13,258,027 | |
2.75%, 08/07/20a | | | 20,570 | | | | 20,911,143 | |
3.50%, 06/23/24a | | | 11,300 | | | | 11,646,301 | |
5.00%, 09/27/20a | | | 13,390 | | | | 14,415,059 | |
Huntington Bancshares Inc./OH | | | | | | | | |
2.30%, 01/14/22 (Call 12/14/21) | | | 17,500 | | | | 17,336,599 | |
3.15%, 03/14/21 (Call 02/14/21)a | | | 6,075 | | | | 6,268,661 | |
Intesa Sanpaolo SpA | | | | | | | | |
5.25%, 01/12/24a | | | 15,962 | | | | 17,224,768 | |
JPMorgan Chase & Co. | | | | | | | | |
2.20%, 10/22/19a | | | 25,206 | | | | 25,560,006 | |
2.25%, 01/23/20 (Call 12/23/19) | | | 41,458 | | | | 41,820,347 | |
2.30%, 08/15/21 (Call 08/15/20)a | | | 3,800 | | | | 3,799,311 | |
2.40%, 06/07/21 (Call 05/07/21)a | | | 6,050 | | | | 6,093,680 | |
| | | | | | | | |
| Security | |
Principal
(000s) | | | Value | |
2.55%, 10/29/20 (Call 09/29/20) | | $ | 27,865 | | | $ | 28,269,073 | |
2.55%, 03/01/21 (Call 02/01/21)a | | | 31,250 | | | | 31,707,122 | |
2.70%, 05/18/23 (Call 03/18/23) | | | 29,925 | | | | 29,964,713 | |
2.75%, 06/23/20 (Call 05/23/20) | | | 25,674 | | | | 26,269,953 | |
2.95%, 10/01/26 (Call 07/01/26)a | | | 19,390 | | | | 19,196,212 | |
3.13%, 01/23/25 (Call 10/23/24)a | | | 35,979 | | | | 36,175,460 | |
3.20%, 01/25/23a | | | 17,343 | | | | 17,898,266 | |
3.20%, 06/15/26 (Call 03/15/26)a | | | 10,400 | | | | 10,500,977 | |
3.25%, 09/23/22a | | | 40,419 | | | | 41,885,232 | |
3.30%, 04/01/26 (Call 01/01/26) | | | 40,605 | | | | 41,351,896 | |
3.38%, 05/01/23a | | | 26,368 | | | | 26,957,549 | |
3.63%, 05/13/24a | | | 29,309 | | | | 30,806,590 | |
3.88%, 02/01/24a | | | 27,373 | | | | 29,262,952 | |
3.88%, 09/10/24 | | | 38,080 | | | | 39,674,524 | |
3.90%, 07/15/25 (Call 04/15/25) | | | 37,059 | | | | 39,440,845 | |
4.13%, 12/15/26a | | | 11,750 | | | | 12,396,117 | |
4.25%, 10/15/20a | | | 35,475 | | | | 38,239,758 | |
4.25%, 10/01/27a | | | 17,600 | | | | 18,745,718 | |
4.35%, 08/15/21 | | | 35,815 | | | | 39,043,626 | |
4.40%, 07/22/20a | | | 28,868 | | | | 31,195,283 | |
4.50%, 01/24/22 | | | 45,229 | | | | 49,837,772 | |
4.63%, 05/10/21 | | | 26,637 | | | | 29,239,547 | |
4.85%, 02/01/44a | | | 13,664 | | | | 15,867,759 | |
4.95%, 03/25/20 | | | 23,173 | | | | 25,347,744 | |
4.95%, 06/01/45a | | | 13,228 | | | | 14,527,101 | |
5.40%, 01/06/42a | | | 17,641 | | | | 21,363,099 | |
5.50%, 10/15/40 | | | 20,261 | | | | 24,710,303 | |
5.60%, 07/15/41 | | | 18,071 | | | | 22,371,103 | |
5.63%, 08/16/43 | | | 19,662 | | | | 23,119,050 | |
6.40%, 05/15/38 | | | 21,878 | | | | 29,484,228 | |
KeyBank N.A./Cleveland OH | | | | | | | | |
2.25%, 03/16/20a | | | 20,050 | | | | 20,299,406 | |
2.50%, 12/15/19 | | | 8,500 | | | | 8,684,487 | |
3.30%, 06/01/25 | | | 2,550 | | | | 2,644,144 | |
| | | | |
SCHEDULESOF INVESTMENTS | | | 79 | |
Schedule of Investments (Unaudited) (Continued)
iSHARES® iBOXX $ INVESTMENT GRADE CORPORATE BOND ETF
October 31, 2016
| | | | | | | | |
| Security | |
Principal
(000s) | | | Value | |
KeyCorp | | | | | | | | |
2.90%, 09/15/20a | | $ | 11,100 | | | $ | 11,458,235 | |
5.10%, 03/24/21a | | | 20,400 | | | | 22,853,182 | |
Lloyds Bank PLC | |
2.40%, 03/17/20 | | | 17,400 | | | | 17,658,569 | |
2.70%, 08/17/20a | | | 7,350 | | | | 7,557,793 | |
3.50%, 05/14/25a | | | 21,900 | | | | 23,216,847 | |
6.38%, 01/21/21a | | | 7,486 | | | | 8,743,143 | |
Lloyds Banking Group PLC | | | | | | | | |
3.10%, 07/06/21a | | | 6,500 | | | | 6,685,693 | |
4.50%, 11/04/24 | | | 14,850 | | | | 15,336,952 | |
4.58%, 12/10/25a,b | | | 15,626 | | | | 15,891,642 | |
4.65%, 03/24/26a | | | 21,753 | | | | 22,385,314 | |
5.30%, 12/01/45a,b | | | 10,400 | | | | 10,920,084 | |
Manufacturers & Traders Trust Co. | | | | | | | | |
2.10%, 02/06/20 (Call 01/06/20) | | | 8,650 | | | | 8,708,594 | |
2.90%, 02/06/25 (Call 01/06/25) | | | 13,600 | | | | 13,685,957 | |
Mitsubishi UFJ Financial Group Inc. | | | | | | | | |
2.19%, 09/13/21 | | | 19,250 | | | | 19,089,409 | |
2.76%, 09/13/26 | | | 10,000 | | | | 9,818,061 | |
2.95%, 03/01/21 | | | 36,050 | | | | 36,964,387 | |
3.85%, 03/01/26 | | | 39,700 | | | | 42,559,583 | |
Mizuho Financial Group Inc. | | | | | | | | |
2.27%, 09/13/21 | | | 12,350 | | | | 12,277,071 | |
2.84%, 09/13/26a | | | 12,000 | | | | 11,876,286 | |
Morgan Stanley | | | | | | | | |
2.50%, 04/21/21a | | | 27,685 | | | | 27,897,349 | |
2.65%, 01/27/20 | | | 27,252 | | | | 27,716,298 | |
2.80%, 06/16/20a | | | 29,045 | | | | 29,700,845 | |
3.13%, 07/27/26a | | | 26,050 | | | | 26,013,678 | |
3.70%, 10/23/24 | | | 38,360 | | | | 40,169,161 | |
3.75%, 02/25/23a | | | 28,308 | | | | 29,841,071 | |
3.88%, 01/27/26a | | | 42,796 | | | | 45,027,726 | |
3.95%, 04/23/27a | | | 25,915 | | | | 26,655,907 | |
4.00%, 07/23/25a | | | 38,650 | | | | 41,175,944 | |
4.10%, 05/22/23a | | | 26,399 | | | | 27,795,856 | |
4.30%, 01/27/45a | | | 27,724 | | | | 29,071,924 | |
4.35%, 09/08/26 | | | 37,129 | | | | 39,333,085 | |
4.88%, 11/01/22 | | | 26,893 | | | | 29,535,783 | |
| | | | | | | | |
| Security | |
Principal
(000s) | | | Value | |
5.00%, 11/24/25a | | $ | 26,149 | | | $ | 28,895,152 | |
5.50%, 01/26/20a | | | 25,627 | | | | 28,250,275 | |
5.50%, 07/24/20 | | | 7,141 | | | | 7,946,775 | |
5.50%, 07/28/21 | | | 30,005 | | | | 34,091,897 | |
5.75%, 01/25/21 | | | 35,018 | | | | 39,691,614 | |
6.38%, 07/24/42a | | | 26,409 | | | | 35,270,236 | |
7.25%, 04/01/32 | | | 13,848 | | | | 18,914,112 | |
Series F | | | | | | | | |
3.88%, 04/29/24 | | | 36,159 | | | | 38,207,624 | |
National Australia Bank Ltd./New York | | | | | | | | |
1.88%, 07/12/21 | | | 8,000 | | | | 7,917,835 | |
2.50%, 07/12/26a | | | 2,700 | | | | 2,623,171 | |
2.63%, 07/23/20a | | | 18,550 | | | | 18,981,926 | |
2.63%, 01/14/21 | | | 19,800 | | | | 20,233,628 | |
3.00%, 01/20/23a | | | 14,039 | | | | 14,409,593 | |
3.38%, 01/14/26 | | | 5,775 | | | | 6,015,076 | |
Northern Trust Corp. | | | | | | | | |
3.95%, 10/30/25 | | | 6,400 | | | | 6,950,782 | |
PNC Bank N.A. | | | | | | | | |
2.15%, 04/29/21 (Call 03/30/21)a,c | | | 15,750 | | | | 15,889,389 | |
2.30%, 06/01/20 (Call 05/02/20)a,c | | | 3,850 | | | | 3,913,832 | |
2.40%, 10/18/19 (Call 09/18/19)c | | | 5,750 | | | | 5,874,190 | |
2.45%, 11/05/20 (Call 10/06/20)c | | | 11,100 | | | | 11,320,272 | |
2.60%, 07/21/20 (Call 06/21/20)c | | | 12,330 | | | | 12,645,585 | |
2.70%, 11/01/22 (Call 10/01/22)a,c | | | 13,487 | | | | 13,594,588 | |
2.95%, 01/30/23 (Call 12/30/22)c | | | 8,300 | | | | 8,427,370 | |
2.95%, 02/23/25 (Call 01/24/25)c | | | 17,500 | | | | 17,810,438 | |
3.25%, 06/01/25 (Call 05/02/25)c | | | 6,750 | | | | 7,021,352 | |
3.80%, 07/25/23 (Call 06/25/23)c | | | 10,153 | | | | 10,858,716 | |
PNC Financial Services Group Inc. (The) | | | | | | | | |
3.30%, 03/08/22 (Call 02/06/22)c | | | 12,319 | | | | 13,024,985 | |
| | |
| 80 | | 2016 iSHARES ANNUAL REPORTTO SHAREHOLDERS |
Schedule of Investments (Unaudited) (Continued)
iSHARES® iBOXX $ INVESTMENT GRADE CORPORATE BOND ETF
October 31, 2016
| | | | | | | | |
| Security | |
Principal
(000s) | | | Value | |
3.90%, 04/29/24 (Call 03/29/24)c | | $ | 9,990 | | | $ | 10,594,822 | |
4.38%, 08/11/20c | | | 10,774 | | | | 11,723,417 | |
5.13%, 02/08/20a,c | | | 4,565 | | | | 5,029,522 | |
Royal Bank of Canada | | | | | | | | |
2.15%, 03/06/20 | | | 12,000 | | | | 12,140,162 | |
2.35%, 10/30/20a | | | 21,265 | | | | 21,596,317 | |
2.50%, 01/19/21a | | | 17,760 | | | | 18,214,223 | |
4.65%, 01/27/26a | | | 14,000 | | | | 15,166,767 | |
Royal Bank of Scotland Group PLC | | | | | | | | |
3.88%, 09/12/23a | | | 30,855 | | | | 30,220,171 | |
4.80%, 04/05/26a | | | 24,375 | | | | 24,888,472 | |
Santander Holdings USA Inc. | | | | | | | | |
2.65%, 04/17/20 (Call 03/17/20) | | | 10,220 | | | | 10,217,929 | |
4.50%, 07/17/25 (Call 04/17/25)a | | | 16,795 | | | | 17,019,823 | |
Santander UK Group Holdings PLC | | | | | | | | |
2.88%, 10/16/20a | | | 13,127 | | | | 13,179,579 | |
2.88%, 08/05/21 | | | 11,200 | | | | 11,150,472 | |
3.13%, 01/08/21 | | | 18,640 | | | | 18,885,470 | |
Santander UK PLC | | | | | | | | |
2.38%, 03/16/20a | | | 10,317 | | | | 10,371,770 | |
4.00%, 03/13/24 | | | 13,448 | | | | 14,464,626 | |
Skandinaviska Enskilda Banken AB | | | | | | | | |
1.88%, 09/13/21a | | | 1,250 | | | | 1,235,222 | |
2.63%, 03/15/21 | | | 13,600 | | | | 13,906,500 | |
State Street Corp. | | | | | | | | |
1.95%, 05/19/21 | | | 6,600 | | | | 6,606,618 | |
2.55%, 08/18/20 | | | 10,974 | | | | 11,292,182 | |
2.65%, 05/19/26 | | | 9,090 | | | | 9,070,208 | |
3.10%, 05/15/23a | | | 12,313 | | | | 12,638,846 | |
3.30%, 12/16/24a | | | 14,040 | | | | 14,788,842 | |
3.55%, 08/18/25a | | | 16,361 | | | | 17,576,985 | |
3.70%, 11/20/23 | | | 9,520 | | | | 10,312,141 | |
4.38%, 03/07/21 | | | 8,590 | | | | 9,431,505 | |
Sumitomo Mitsui Banking Corp. | | | | | | | | |
2.45%, 01/16/20a | | | 30,450 | | | | 30,791,040 | |
2.65%, 07/23/20a | | | 11,000 | | | | 11,195,169 | |
3.20%, 07/18/22 | | | 10,474 | | | | 10,870,885 | |
| | | | | | | | |
| Security | |
Principal
(000s) | | | Value | |
Sumitomo Mitsui Financial Group Inc. | | | | | | | | |
2.06%, 07/14/21a | | $ | 15,450 | | | $ | 15,214,942 | |
2.44%, 10/19/21 | | | 14,500 | | | | 14,556,840 | |
2.63%, 07/14/26a | | | 22,700 | | | | 21,985,790 | |
2.93%, 03/09/21 | | | 27,100 | | | | 27,722,105 | |
3.01%, 10/19/26 | | | 15,000 | | | | 14,990,250 | |
3.78%, 03/09/26a | | | 19,655 | | | | 20,887,642 | |
SunTrust Bank/Atlanta GA | | | | | | | | |
3.30%, 05/15/26 (Call 04/15/26)a | | | 9,350 | | | | 9,412,522 | |
SunTrust Banks Inc. | | | | | | | | |
2.90%, 03/03/21 (Call 02/03/21)a | | | 10,545 | | | | 10,894,121 | |
Svenska Handelsbanken AB | | | | | | | | |
1.88%, 09/07/21a | | | 1,250 | | | | 1,238,067 | |
2.40%, 10/01/20 | | | 26,350 | | | | 26,823,257 | |
2.45%, 03/30/21 | | | 16,860 | | | | 17,121,278 | |
Toronto-Dominion Bank (The) | | | | | | | | |
1.80%, 07/13/21a | | | 14,550 | | | | 14,450,284 | |
2.13%, 04/07/21 | | | 24,175 | | | | 24,324,750 | |
2.25%, 11/05/19a | | | 12,380 | | | | 12,610,649 | |
2.50%, 12/14/20 | | | 18,350 | | | | 18,766,044 | |
U.S. Bancorp. | |
2.35%, 01/29/21 (Call 12/29/20) | | | 3,900 | | | | 3,980,062 | |
2.95%, 07/15/22 (Call 06/15/22) | | | 17,312 | | | | 17,970,602 | |
3.00%, 03/15/22 (Call 02/15/22) | | | 16,764 | | | | 17,573,493 | |
3.10%, 04/27/26 (Call 03/27/26)a | | | 5,950 | | | | 6,060,639 | |
3.70%, 01/30/24 (Call 12/29/23) | | | 13,340 | | | | 14,390,087 | |
4.13%, 05/24/21 (Call 04/23/21) | | | 10,294 | | | | 11,297,172 | |
Series F | | | | | | | | |
3.60%, 09/11/24 (Call 08/11/24) | | | 16,810 | | | | 17,826,154 | |
Series V | | | | | | | | |
2.38%, 07/22/26 (Call 06/22/26)a | | | 8,800 | | | | 8,557,424 | |
U.S. Bank N.A./Cincinnati OH | | | | | | | | |
2.13%, 10/28/19 (Call 09/28/19) | | | 2,735 | | | | 2,779,588 | |
| | | | |
SCHEDULESOF INVESTMENTS | | | 81 | |
Schedule of Investments (Unaudited) (Continued)
iSHARES® iBOXX $ INVESTMENT GRADE CORPORATE BOND ETF
October 31, 2016
| | | | | | | | |
| Security | |
Principal
(000s) | | | Value | |
2.80%, 01/27/25 (Call 12/27/24) | | $ | 20,217 | | | $ | 20,586,229 | |
UBS AG/Stamford CT | | | | | | | | |
2.35%, 03/26/20a | | | 24,330 | | | | 24,720,409 | |
4.88%, 08/04/20a | | | 9,475 | | | | 10,457,496 | |
Wachovia Corp. | | | | | | | | |
5.50%, 08/01/35 | | | 9,017 | | | | 10,282,989 | |
Wells Fargo & Co. | | | | | | | | |
2.10%, 07/26/21a | | | 25,050 | | | | 24,899,237 | |
2.50%, 03/04/21a | | | 28,375 | | | | 28,681,121 | |
2.55%, 12/07/20a | | | 21,075 | | | | 21,441,140 | |
2.60%, 07/22/20a | | | 28,230 | | | | 28,785,366 | |
3.00%, 01/22/21 | | | 16,779 | | | | 17,297,164 | |
3.00%, 02/19/25a | | | 42,060 | | | | 42,078,363 | |
3.00%, 04/22/26a | | | 51,600 | | | | 51,322,717 | |
3.00%, 10/23/26 | | | 22,795 | | | | 22,689,460 | |
3.30%, 09/09/24 | | | 30,011 | | | | 30,842,266 | |
3.50%, 03/08/22a | | | 35,198 | | | | 37,066,486 | |
3.55%, 09/29/25 | | | 41,103 | | | | 42,546,792 | |
3.90%, 05/01/45 | | | 23,695 | | | | 23,733,168 | |
4.10%, 06/03/26a | | | 31,520 | | | | 33,097,762 | |
4.13%, 08/15/23a | | | 20,814 | | | | 22,136,728 | |
4.30%, 07/22/27a | | | 33,365 | | | | 35,388,007 | |
4.40%, 06/14/46a | | | 19,200 | | | | 19,302,563 | |
4.60%, 04/01/21 | | | 31,190 | | | | 34,200,646 | |
4.65%, 11/04/44 | | | 24,350 | | | | 25,128,735 | |
4.90%, 11/17/45 | | | 27,970 | | | | 30,082,294 | |
5.38%, 02/07/35 | | | 7,866 | | | | 9,312,192 | |
5.38%, 11/02/43 | | | 22,590 | | | | 25,668,436 | |
5.61%, 01/15/44 | | | 30,615 | | | | 35,991,977 | |
Series M | | | | | | | | |
3.45%, 02/13/23a | | | 23,157 | | | | 23,741,705 | |
Series N | | | | | | | | |
2.15%, 01/30/20a | | | 26,579 | | | | 26,696,224 | |
Wells Fargo Bank N.A. | | | | | | | | |
5.85%, 02/01/37 | | | 11,100 | | | | 13,555,846 | |
6.60%, 01/15/38 | | | 21,134 | | | | 28,060,736 | |
Westpac Banking Corp. | | | | | | | | |
2.00%, 08/19/21 | | | 28,450 | | | | 28,249,348 | |
2.10%, 05/13/21 | | | 11,645 | | | | 11,614,923 | |
2.30%, 05/26/20a | | | 11,325 | | | | 11,455,085 | |
2.60%, 11/23/20 | | | 21,150 | | | | 21,606,859 | |
2.70%, 08/19/26 | | | 18,600 | | | | 18,287,715 | |
2.85%, 05/13/26a | | | 20,150 | | | | 20,077,621 | |
| | | | | | | | |
| Security | |
Principal
(000s) | | | Value | |
4.88%, 11/19/19 | | $ | 12,457 | | | $ | 13,553,581 | |
| | | | | | | | |
| | | | 8,138,538,794 | |
BEVERAGES — 4.06% | | | | | |
Anheuser-Busch InBev Finance Inc. | | | | | | | | |
2.63%, 01/17/23a | | | 13,523 | | | | 13,625,105 | |
2.65%, 02/01/21 (Call 01/01/21) | | | 86,875 | | | | 88,827,976 | |
3.30%, 02/01/23 (Call 12/01/22)a | | | 73,200 | | | | 76,442,218 | |
3.65%, 02/01/26 (Call 11/01/25)a | | | 141,340 | | | | 148,487,564 | |
3.70%, 02/01/24a | | | 21,276 | | | | 22,730,112 | |
4.00%, 01/17/43 | | | 6,428 | | | | 6,440,238 | |
4.63%, 02/01/44 | | | 10,075 | | | | 11,125,595 | |
4.70%, 02/01/36 (Call 08/01/35) | | | 72,103 | | | | 80,038,022 | |
4.90%, 02/01/46 (Call 08/01/45)a | | | 134,657 | | | | 153,791,814 | |
Anheuser-Busch InBev Worldwide Inc. | | | | | | | | |
2.50%, 07/15/22a | | | 36,923 | | | | 37,284,314 | |
3.75%, 07/15/42 | | | 11,191 | | | | 10,862,720 | |
5.00%, 04/15/20a | | | 14,912 | | | | 16,561,600 | |
5.38%, 01/15/20 | | | 26,147 | | | | 29,040,566 | |
6.88%, 11/15/19 | | | 7,677 | | | | 8,832,137 | |
8.20%, 01/15/39 | | | 15,762 | | | | 24,911,439 | |
Coca-Cola Co. (The) | | | | | | | | |
1.55%, 09/01/21 | | | 10,850 | | | | 10,765,129 | |
1.88%, 10/27/20a | | | 16,795 | | | | 16,969,275 | |
2.25%, 09/01/26a | | | 7,890 | | | | 7,712,518 | |
2.45%, 11/01/20a | | | 14,384 | | | | 14,851,540 | |
2.50%, 04/01/23 | | | 9,596 | | | | 9,761,342 | |
2.88%, 10/27/25a | | | 26,500 | | | | 27,373,649 | |
3.15%, 11/15/20 | | | 12,197 | | | | 12,925,616 | |
3.20%, 11/01/23a | | | 17,025 | | | | 18,039,779 | |
3.30%, 09/01/21a | | | 17,133 | | | | 18,325,025 | |
Diageo Capital PLC | | | | | | | | |
2.63%, 04/29/23 (Call 01/29/23) | | | 16,665 | | | | 17,104,823 | |
Diageo Investment Corp. | | | | | | | | |
2.88%, 05/11/22 | | | 15,484 | | | | 16,159,921 | |
Molson Coors Brewing Co. | | | | | | | | |
2.10%, 07/15/21 (Call 06/15/21) | | | 14,100 | | | | 14,061,695 | |
| | |
| 82 | | 2016 iSHARES ANNUAL REPORTTO SHAREHOLDERS |
Schedule of Investments (Unaudited) (Continued)
iSHARES® iBOXX $ INVESTMENT GRADE CORPORATE BOND ETF
October 31, 2016
| | | | | | | | |
| Security | |
Principal
(000s) | | | Value | |
3.00%, 07/15/26 (Call 04/15/26) | | $ | 25,350 | | | $ | 25,109,327 | |
4.20%, 07/15/46 (Call 01/15/46) | | | 23,750 | | | | 23,707,172 | |
5.00%, 05/01/42 | | | 9,250 | | | | 10,316,104 | |
Pepsi Bottling Group Inc. (The) Series B | | | | | | | | |
7.00%, 03/01/29 | | | 16,315 | | | | 23,204,896 | |
PepsiCo Inc. | | | | | | | | |
1.70%, 10/06/21 (Call 09/06/21) | | | 3,315 | | | | 3,299,652 | |
1.85%, 04/30/20 (Call 03/30/20) | | | 10,000 | | | | 10,080,223 | |
2.15%, 10/14/20 (Call 09/14/20) | | | 11,360 | | | | 11,551,297 | |
2.38%, 10/06/26 (Call 07/06/26) | | | 7,550 | | | | 7,426,482 | |
2.75%, 03/05/22 | | | 18,143 | | | | 18,900,989 | |
2.75%, 03/01/23 | | | 21,313 | | | | 22,021,470 | |
2.75%, 04/30/25 (Call 01/30/25)a | | | 15,009 | | | | 15,397,020 | |
2.85%, 02/24/26 (Call 11/24/25)a | | | 12,285 | | | | 12,640,310 | |
3.00%, 08/25/21 | | | 9,196 | | | | 9,664,901 | |
3.10%, 07/17/22 (Call 05/17/22) | | | 15,865 | | | | 16,739,390 | |
3.13%, 11/01/20 | | | 11,199 | | | | 11,814,690 | |
3.45%, 10/06/46 (Call 04/06/46) | | | 13,300 | | | | 12,703,894 | |
3.60%, 03/01/24 (Call 12/01/23) | | | 20,505 | | | | 22,177,978 | |
4.00%, 03/05/42 | | | 6,239 | | | | 6,514,007 | |
4.45%, 04/14/46 (Call 10/14/45) | | | 18,470 | | | | 20,591,401 | |
4.50%, 01/15/20a | | | 12,980 | | | | 14,155,339 | |
4.88%, 11/01/40a | | | 10,436 | | | | 12,172,884 | |
5.50%, 01/15/40 | | | 11,774 | | | | 14,799,781 | |
| | | | | | | | |
| | | | 1,238,040,939 | |
BIOTECHNOLOGY — 2.46% | | | | | |
Amgen Inc. | | | | | | | | |
1.85%, 08/19/21 (Call 07/19/21)a | | | 13,340 | | | | 13,143,078 | |
2.13%, 05/01/20 (Call 04/01/20)a | | | 10,378 | | | | 10,485,260 | |
| | | | | | | | |
| Security | |
Principal
(000s) | | | Value | |
2.25%, 08/19/23 (Call 06/19/23)a | | $ | 10,600 | | | $ | 10,372,765 | |
2.60%, 08/19/26 (Call 05/19/26) | | | 11,450 | | | | 11,004,998 | |
3.13%, 05/01/25 (Call 02/01/25) | | | 15,000 | | | | 15,181,659 | |
3.45%, 10/01/20a | | | 8,670 | | | | 9,130,038 | |
3.63%, 05/15/22 (Call 02/15/22) | | | 4,236 | | | | 4,497,312 | |
3.63%, 05/22/24 (Call 02/22/24) | | | 19,165 | | | | 20,097,594 | |
3.88%, 11/15/21 (Call 08/15/21) | | | 24,313 | | | | 26,105,580 | |
4.10%, 06/15/21 (Call 03/15/21) | | | 12,831 | | | | 13,830,740 | |
4.40%, 05/01/45 (Call 11/01/44) | | | 28,089 | | | | 28,560,670 | |
4.56%, 06/15/48 (Call 12/15/47)b | | | 18,817 | | | | 19,216,534 | |
4.66%, 06/15/51 (Call 12/15/50)b | | | 45,568 | | | | 46,596,538 | |
5.15%, 11/15/41 (Call 05/15/41) | | | 4,300 | | | | 4,748,577 | |
Biogen Inc. | | | | | | | | |
2.90%, 09/15/20a | | | 14,915 | | | | 15,354,942 | |
3.63%, 09/15/22 | | | 18,900 | | | | 20,089,311 | |
4.05%, 09/15/25 (Call 06/15/25)a | | | 19,641 | | | | 20,927,108 | |
5.20%, 09/15/45 (Call 03/15/45) | | | 20,640 | | | | 23,138,633 | |
Celgene Corp. | | | | | | | | |
2.88%, 08/15/20 | | | 9,057 | | | | 9,341,528 | |
3.25%, 08/15/22 | | | 8,276 | | | | 8,565,350 | |
3.55%, 08/15/22a | | | 13,261 | | | | 13,960,534 | |
3.63%, 05/15/24 (Call 02/15/24)a | | | 15,166 | | | | 15,651,411 | |
3.88%, 08/15/25 (Call 05/15/25)a | | | 35,125 | | | | 36,876,276 | |
4.63%, 05/15/44 (Call 11/15/43) | | | 8,890 | | | | 9,011,620 | |
5.00%, 08/15/45 (Call 02/15/45)a | | | 32,150 | | | | 34,447,024 | |
Gilead Sciences Inc. | | | | | | | | |
2.50%, 09/01/23 (Call 07/01/23) | | | 6,000 | | | | 5,971,081 | |
| | | | |
SCHEDULESOF INVESTMENTS | | | 83 | |
Schedule of Investments (Unaudited) (Continued)
iSHARES® iBOXX $ INVESTMENT GRADE CORPORATE BOND ETF
October 31, 2016
| | | | | | | | |
| Security | |
Principal
(000s) | | | Value | |
2.55%, 09/01/20 | | $ | 22,609 | | | $ | 23,120,088 | |
2.95%, 03/01/27 (Call 12/01/26)a | | | 18,800 | | | | 18,592,029 | |
3.25%, 09/01/22 (Call 07/01/22) | | | 14,950 | | | | 15,658,322 | |
3.50%, 02/01/25 (Call 11/01/24) | | | 28,697 | | | | 29,846,917 | |
3.65%, 03/01/26 (Call 12/01/25) | | | 31,162 | | | | 32,674,095 | |
3.70%, 04/01/24 (Call 01/01/24) | | | 17,690 | | | | 18,693,034 | |
4.00%, 09/01/36 (Call 03/01/36)a | | | 5,250 | | | | 5,222,717 | |
4.15%, 03/01/47 (Call 09/01/46) | | | 25,985 | | | | 25,687,903 | |
4.40%, 12/01/21 (Call 09/01/21)a | | | 19,264 | | | | 21,310,538 | |
4.50%, 04/01/21 (Call 01/01/21) | | | 9,254 | | | | 10,160,957 | |
4.50%, 02/01/45 (Call 08/01/44)a | | | 18,893 | | | | 19,692,180 | |
4.60%, 09/01/35 (Call 03/01/35)a | | | 17,878 | | | | 19,149,905 | |
4.75%, 03/01/46 (Call 09/01/45)a | | | 30,209 | | | | 32,656,938 | |
4.80%, 04/01/44 (Call 10/01/43)a | | | 20,745 | | | | 22,531,962 | |
5.65%, 12/01/41 (Call 06/01/41) | | | 7,920 | | | | 9,583,750 | |
| | | | | | | | |
| | | | 750,887,496 | |
CHEMICALS — 1.29% | | | | | |
CF Industries Inc. | | | | | | | | |
3.45%, 06/01/23a | | | 100 | | | | 93,500 | |
4.95%, 06/01/43a | | | 100 | | | | 83,852 | |
5.15%, 03/15/34a | | | — | | | | — | |
5.38%, 03/15/44a | | | — | | | | — | |
7.13%, 05/01/20 | | | 2,235 | | | | 2,471,038 | |
Dow Chemical Co. (The) | | | | | | | | |
3.00%, 11/15/22 (Call 08/15/22)a | | | 11,622 | | | | 11,931,571 | |
3.50%, 10/01/24 (Call 07/01/24)a | | | 13,264 | | | | 13,876,728 | |
4.13%, 11/15/21 (Call 08/15/21) | | | 17,523 | | | | 19,016,429 | |
| | | | | | | | |
| Security | |
Principal
(000s) | | | Value | |
4.25%, 11/15/20 (Call 08/15/20) | | $ | 16,329 | | | $ | 17,587,737 | |
4.38%, 11/15/42 (Call 05/15/42) | | | 17,340 | | | | 17,429,478 | |
5.25%, 11/15/41 (Call 05/15/41)a | | | 8,688 | | | | 9,512,609 | |
7.38%, 11/01/29a | | | 6,242 | | | | 8,387,585 | |
9.40%, 05/15/39 | | | 9,976 | | | | 15,955,239 | |
Eastman Chemical Co. | | | | | | | | |
2.70%, 01/15/20 (Call 12/15/19) | | | 12,583 | | | | 12,812,786 | |
3.60%, 08/15/22 (Call 05/15/22) | | | 8,326 | | | | 8,735,648 | |
3.80%, 03/15/25 (Call 12/15/24)a | | | 10,070 | | | | 10,471,033 | |
4.65%, 10/15/44 (Call 04/15/44)a | | | 9,285 | | | | 9,277,572 | |
Ecolab Inc. | | | | | | | | |
2.70%, 11/01/26 (Call 08/01/26) | | | 6,000 | | | | 5,971,560 | |
4.35%, 12/08/21a | | | 19,750 | | | | 21,974,680 | |
5.50%, 12/08/41 | | | 5,408 | | | | 6,651,325 | |
EI du Pont de Nemours & Co. | | | | | | | | |
2.80%, 02/15/23 | | | 19,774 | | | | 19,976,246 | |
3.63%, 01/15/21a | | | 10,403 | | | | 11,080,334 | |
4.15%, 02/15/43a | | | 7,774 | | | | 7,658,247 | |
4.63%, 01/15/20a | | | 12,298 | | | | 13,510,342 | |
LYB International Finance BV | | | | | | | | |
4.00%, 07/15/23a | | | 12,156 | | | | 13,051,400 | |
4.88%, 03/15/44 (Call 09/15/43)a | | | 14,291 | | | | 15,086,221 | |
5.25%, 07/15/43a | | | 7,753 | | | | 8,530,534 | |
LyondellBasell Industries NV | | | | | | | | |
4.63%, 02/26/55 (Call 08/26/54) | | | 17,846 | | | | 16,882,732 | |
5.75%, 04/15/24 (Call 01/15/24)a | | | 9,720 | | | | 11,353,932 | |
6.00%, 11/15/21 (Call 08/17/21) | | | 8,653 | | | | 10,058,807 | |
Monsanto Co. | | | | | | | | |
3.38%, 07/15/24 (Call 04/15/24)a | | | 10,359 | | | | 10,603,942 | |
4.40%, 07/15/44 (Call 01/15/44)a | | | 11,100 | | | | 11,020,729 | |
| | |
| 84 | | 2016 iSHARES ANNUAL REPORTTO SHAREHOLDERS |
Schedule of Investments (Unaudited) (Continued)
iSHARES® iBOXX $ INVESTMENT GRADE CORPORATE BOND ETF
October 31, 2016
| | | | | | | | |
| Security | |
Principal
(000s) | | | Value | |
4.70%, 07/15/64 (Call 01/15/64) | | $ | 10,735 | | | $ | 9,980,652 | |
Mosaic Co. (The) | | | | | | | | |
4.25%, 11/15/23 (Call 08/15/23)a | | | 15,215 | | | | 15,502,372 | |
Potash Corp. of Saskatchewan Inc. | | | | | | | | |
3.63%, 03/15/24 (Call 12/15/23) | | | 10,217 | | | | 10,520,133 | |
Rohm & Haas Co. | | | | | | | | |
7.85%, 07/15/29 | | | 9,631 | | | | 13,458,821 | |
Westlake Chemical Corp. | | | | | | | | |
3.60%, 08/15/26 (Call 05/15/26)b | | | 3,500 | | | | 3,498,085 | |
| | | | | | | | |
| | | | 394,013,899 | |
COMMERCIAL SERVICES — 0.14% | | | | | |
Automatic Data Processing Inc. | | | | | | | | |
2.25%, 09/15/20 (Call 08/15/20)a | | | 11,432 | | | | 11,693,457 | |
3.38%, 09/15/25 (Call 06/15/25)a | | | 9,633 | | | | 10,290,945 | |
S&P Global Inc. | | | | | | | | |
4.40%, 02/15/26 (Call 11/15/25) | | | 9,550 | | | | 10,557,703 | |
Total System Services Inc. | | | | | | | | |
3.80%, 04/01/21 (Call 03/01/21)a | | | 5,150 | | | | 5,429,305 | |
4.80%, 04/01/26 (Call 01/01/26)a | | | 3,550 | | | | 3,889,961 | |
| | | | | | | | |
| | | | 41,861,371 | |
COMPUTERS — 3.69% | | | | | |
Apple Inc. | | | | | | | | |
1.55%, 02/07/20a | | | 13,928 | | | | 13,937,836 | |
1.55%, 08/04/21 (Call 07/04/21) | | | 5,700 | | | | 5,629,902 | |
2.00%, 05/06/20a | | | 9,529 | | | | 9,662,735 | |
2.15%, 02/09/22a | | | 20,220 | | | | 20,335,119 | |
2.25%, 02/23/21 (Call 01/23/21)a | | | 35,610 | | | | 36,206,079 | |
2.40%, 05/03/23 | | | 67,690 | | | | 67,919,198 | |
2.45%, 08/04/26 (Call 05/04/26)a | | | 23,318 | | | | 22,850,122 | |
2.50%, 02/09/25 | | | 19,653 | | | | 19,523,461 | |
| | | | | | | | |
| Security | |
Principal
(000s) | | | Value | |
2.70%, 05/13/22 | | $ | 15,319 | | | $ | 15,806,985 | |
2.85%, 05/06/21a | | | 38,661 | | | | 40,394,049 | |
2.85%, 02/23/23 (Call 12/23/22)a | | | 19,295 | | | | 20,002,364 | |
3.20%, 05/13/25a | | | 26,007 | | | | 27,222,864 | |
3.25%, 02/23/26 (Call 11/23/25) | | | 47,280 | | | | 49,434,691 | |
3.45%, 05/06/24a | | | 28,379 | | | | 30,251,058 | |
3.45%, 02/09/45a | | | 28,881 | | | | 26,679,664 | |
3.85%, 05/04/43a | | | 40,400 | | | | 39,778,652 | |
3.85%, 08/04/46 (Call 02/04/46) | | | 24,705 | | | | 23,987,023 | |
4.38%, 05/13/45 | | | 19,010 | | | | 19,921,588 | |
4.45%, 05/06/44a | | | 17,512 | | | | 18,782,634 | |
4.50%, 02/23/36 (Call 08/23/35)a | | | 7,855 | | | | 8,757,930 | |
4.65%, 02/23/46 (Call 08/23/45) | | | 47,195 | | | | 52,195,320 | |
Diamond 1 Finance Corp./Diamond 2 Finance Corp. | | | | | | | | |
4.42%, 06/15/21 (Call 05/15/21)b | | | 49,264 | | | | 51,547,175 | |
5.45%, 06/15/23 (Call 04/15/23)b | | | 48,151 | | | | 51,562,985 | |
6.02%, 06/15/26 (Call 03/15/26)a,b | | | 58,240 | | | | 63,148,409 | |
8.10%, 07/15/36 (Call 01/15/36)b | | | 19,175 | | | | 22,884,099 | |
8.35%, 07/15/46 (Call 01/15/46)b | | | 23,695 | | | | 28,705,943 | |
Hewlett Packard Enterprise Co. | | | | | | | | |
3.60%, 10/15/20 (Call 09/15/20)a,b | | | 39,155 | | | | 40,644,801 | |
4.40%, 10/15/22 (Call 08/15/22)a,b | | | 18,750 | | | | 20,194,382 | |
4.90%, 10/15/25 (Call 07/15/25)a,b | | | 28,940 | | | | 30,747,176 | |
6.20%, 10/15/35 (Call 04/15/35)b | | | 7,410 | | | | 7,681,673 | |
6.35%, 10/15/45 (Call 04/15/45)a,b | | | 18,525 | | | | 19,213,120 | |
HP Inc. | | | | | | | | |
4.30%, 06/01/21 | | | 17,222 | | | | 18,501,994 | |
4.38%, 09/15/21a | | | 8,280 | | | | 8,899,487 | |
| | | | |
SCHEDULESOF INVESTMENTS | | | 85 | |
Schedule of Investments (Unaudited) (Continued)
iSHARES® iBOXX $ INVESTMENT GRADE CORPORATE BOND ETF
October 31, 2016
| | | | | | | | |
| Security | |
Principal
(000s) | | | Value | |
4.65%, 12/09/21 | | $ | 17,749 | | | $ | 19,348,937 | |
6.00%, 09/15/41a | | | 15,202 | | | | 15,386,081 | |
International Business Machines Corp. | | | | | | | | |
1.63%, 05/15/20a | | | 6,827 | | | | 6,834,071 | |
1.88%, 08/01/22a | | | 8,451 | | | | 8,329,538 | |
2.25%, 02/19/21a | | | 12,550 | | | | 12,803,529 | |
2.88%, 11/09/22 | | | 13,675 | | | | 14,214,662 | |
3.38%, 08/01/23a | | | 15,375 | | | | 16,314,348 | |
3.45%, 02/19/26a | | | 23,900 | | | | 25,355,027 | |
3.63%, 02/12/24a | | | 36,295 | | | | 38,961,619 | |
4.00%, 06/20/42a | | | 5,644 | | | | 5,739,779 | |
4.70%, 02/19/46a | | | 1,000 | | | | 1,115,930 | |
8.38%, 11/01/19a | | | 5,457 | | | | 6,553,980 | |
Seagate HDD Cayman | | | | | | | | |
4.75%, 06/01/23a | | | 14,473 | | | | 14,400,635 | |
4.75%, 01/01/25 | | | 8,686 | | | | 8,305,988 | |
| | | | | | | | |
| | | | 1,126,674,642 | |
COSMETICS & PERSONAL CARE — 0.18% | |
Procter & Gamble Co. (The) | | | | | | | | |
1.70%, 11/03/21 | | | 2,805 | | | | 2,799,250 | |
2.30%, 02/06/22 | | | 10,624 | | | | 10,838,504 | |
2.45%, 11/03/26 | | | 5,000 | | | | 4,992,950 | |
3.10%, 08/15/23a | | | 11,869 | | | | 12,591,277 | |
5.55%, 03/05/37a | | | 16,273 | | | | 22,274,661 | |
| | | | | | | | |
| | | | 53,496,642 | |
DIVERSIFIED FINANCIAL SERVICES — 2.79% | |
AerCap Ireland Capital Ltd./AerCap Global Aviation Trust | | | | | | | | |
3.95%, 02/01/22 (Call 01/01/22)a | | | 12,900 | | | | 13,147,938 | |
4.50%, 05/15/21a | | | 15,900 | | | | 16,555,875 | |
5.00%, 10/01/21a | | | 17,400 | | | | 18,487,500 | |
Air Lease Corp. | | | | | | | | |
3.00%, 09/15/23 (Call 07/15/23) | | | 12,500 | | | | 12,388,250 | |
American Express Co. | |
2.65%, 12/02/22 | | | 22,253 | | | | 22,621,910 | |
4.05%, 12/03/42 | | | 10,384 | | | | 10,508,728 | |
American Express Credit Corp. | | | | | | | | |
2.25%, 05/05/21 (Call 04/04/21)a | | | 26,700 | | | | 26,916,016 | |
2.38%, 05/26/20 (Call 04/25/20) | | | 17,450 | | | | 17,749,082 | |
| | | | | | | | |
| Security | |
Principal
(000s) | | | Value | |
Series F | | | | | | | | |
2.60%, 09/14/20 (Call 08/14/20) | | $ | 14,769 | | | $ | 15,111,409 | |
Ameriprise Financial Inc. | | | | | | | | |
4.00%, 10/15/23 | | | 12,373 | | | | 13,356,755 | |
5.30%, 03/15/20 | | | 3,520 | | | | 3,890,764 | |
Capital One Bank USA N.A. | | | | | | | | |
3.38%, 02/15/23 | | | 15,290 | | | | 15,595,886 | |
CME Group Inc. | | | | | | | | |
3.00%, 09/15/22 | | | 10,848 | | | | 11,444,560 | |
3.00%, 03/15/25 (Call 12/15/24)a | | | 9,669 | | | | 10,012,965 | |
5.30%, 09/15/43 (Call 03/15/43) | | | 7,331 | | | | 9,085,533 | |
GE Capital International Funding Co. Unlimited Co. | | | | | | | | |
2.34%, 11/15/20b | | | 200 | | | | 203,991 | |
2.34%, 11/15/20a | | | 74,514 | | | | 75,982,365 | |
3.37%, 11/15/25a | | | 35,791 | | | | 38,112,819 | |
4.42%, 11/15/35a | | | 141,047 | | | | 153,837,960 | |
HSBC Finance Corp. | | | | | | | | |
6.68%, 01/15/21 | | | 30,746 | | | | 35,094,121 | |
Intercontinental Exchange Inc. | | | | | | | | |
2.75%, 12/01/20 (Call 11/01/20) | | | 16,705 | | | | 17,246,633 | |
3.75%, 12/01/25 (Call 09/01/25)a | | | 18,179 | | | | 19,398,275 | |
4.00%, 10/15/23a | | | 4,975 | | | | 5,390,895 | |
International Lease Finance Corp. | | | | | | | | |
5.88%, 08/15/22a | | | 9,450 | | | | 10,407,096 | |
8.25%, 12/15/20a | | | 11,000 | | | | 13,057,180 | |
Jefferies Group LLC | | | | | | | | |
6.88%, 04/15/21a | | | 11,752 | | | | 13,631,875 | |
Nomura Holdings Inc. | | | | | | | | |
6.70%, 03/04/20a | | | 14,233 | | | | 16,246,621 | |
Synchrony Financial | | | | | | | | |
2.70%, 02/03/20 (Call 01/03/20)a | | | 9,235 | | | | 9,354,017 | |
3.70%, 08/04/26 (Call 05/04/26)a | | | 880 | | | | 869,414 | |
3.75%, 08/15/21 (Call 06/15/21)a | | | 8,990 | | | | 9,430,412 | |
4.25%, 08/15/24 (Call 05/15/24) | | | 12,295 | | | | 12,791,567 | |
| | |
| 86 | | 2016 iSHARES ANNUAL REPORTTO SHAREHOLDERS |
Schedule of Investments (Unaudited) (Continued)
iSHARES® iBOXX $ INVESTMENT GRADE CORPORATE BOND ETF
October 31, 2016
| | | | | | | | |
| Security | |
Principal
(000s) | | | Value | |
4.50%, 07/23/25 (Call 04/24/25) | | $ | 14,950 | | | $ | 15,679,772 | |
Visa Inc. | | | | | | | | |
2.20%, 12/14/20 (Call 11/14/20) | | | 33,340 | | | | 33,925,977 | |
2.80%, 12/14/22 (Call 10/14/22) | | | 31,695 | | | | 32,906,579 | |
3.15%, 12/14/25 (Call 09/14/25)a | | | 49,050 | | | | 51,156,555 | |
4.15%, 12/14/35 (Call 06/14/35)a | | | 24,169 | | | | 26,729,222 | |
4.30%, 12/14/45 (Call 06/14/45) | | | 38,830 | | | | 43,300,009 | |
| | | | | | | | |
| | | | 851,626,526 | |
ELECTRIC — 1.72% | | | | | |
Berkshire Hathaway Energy Co. | | | | | | | | |
4.50%, 02/01/45 (Call 08/01/44)a | | | 11,421 | | | | 12,547,402 | |
5.15%, 11/15/43 (Call 05/15/43) | | | 11,719 | | | | 13,990,870 | |
6.13%, 04/01/36a | | | 22,605 | | | | 29,549,572 | |
6.50%, 09/15/37a | | | 8,226 | | | | 11,176,087 | |
Consolidated Edison Co. of New York Inc. | | | | | | | | |
4.45%, 03/15/44 (Call 09/15/43) | | | 10,436 | | | | 11,532,872 | |
4.63%, 12/01/54 (Call 06/01/54)a | | | 9,890 | | | | 11,021,840 | |
Duke Energy Carolinas LLC | | | | | | | | |
3.88%, 03/15/46 (Call 09/15/45) | | | 600 | | | | 612,516 | |
5.30%, 02/15/40a | | | 8,867 | | | | 10,882,121 | |
Duke Energy Corp. | |
1.80%, 09/01/21 (Call 08/01/21) | | | 12,815 | | | | 12,656,340 | |
2.65%, 09/01/26 (Call 06/01/26)a | | | 15,095 | | | | 14,694,353 | |
3.75%, 04/15/24 (Call 01/15/24) | | | 15,626 | | | | 16,557,135 | |
3.75%, 09/01/46 (Call 03/01/46)a | | | 14,385 | | | | 13,717,460 | |
Duke Energy Florida LLC | | | | | | | | |
6.40%, 06/15/38a | | | 11,036 | | | | 15,152,297 | |
| | | | | | | | |
| Security | |
Principal
(000s) | | | Value | |
Emera U.S. Finance LP | | | | | | | | |
2.70%, 06/15/21 (Call 05/15/21)a,b | | $ | 11,575 | | | $ | 11,783,279 | |
3.55%, 06/15/26 (Call 03/15/26)a,b | | | 12,153 | | | | 12,427,379 | |
4.75%, 06/15/46 (Call 12/15/45)a,b | | | 11,600 | | | | 12,329,385 | |
Exelon Corp. | | | | | | | | |
2.85%, 06/15/20 (Call 05/15/20) | | | 13,401 | | | | 13,795,324 | |
3.40%, 04/15/26 (Call 01/15/26)a | | | 9,675 | | | | 9,990,632 | |
3.95%, 06/15/25 (Call 03/15/25)a | | | 8,575 | | | | 9,144,854 | |
4.45%, 04/15/46 (Call 10/15/45) | | | 7,150 | | | | 7,434,188 | |
5.10%, 06/15/45 (Call 12/15/44)a | | | 1,799 | | | | 2,029,650 | |
Exelon Generation Co. LLC | | | | | | | | |
2.95%, 01/15/20 (Call 12/15/19) | | | 9,325 | | | | 9,637,071 | |
5.60%, 06/15/42 (Call 12/15/41)a | | | 7,708 | | | | 7,863,541 | |
6.25%, 10/01/39 | | | 11,891 | | | | 12,945,785 | |
Fortis Inc. | | | | | | | | |
3.06%, 10/04/26 (Call 07/04/26)b | | | 5,000 | | | | 4,915,000 | |
Georgia Power Co. | | | | | | | | |
4.30%, 03/15/42 | | | 17,602 | | | | 18,652,998 | |
NiSource Finance Corp. | | | | | | | | |
4.80%, 02/15/44 (Call 08/15/43) | | | 7,341 | | | | 8,051,702 | |
Oncor Electric Delivery Co. LLC | | | | | | | | |
7.00%, 09/01/22 | | | 9,223 | | | | 11,580,085 | |
Pacific Gas & Electric Co. | | | | | | | | |
3.50%, 10/01/20 (Call 07/01/20) | | | 10,722 | | | | 11,364,042 | |
5.40%, 01/15/40 | | | 12,281 | | | | 15,182,383 | |
5.80%, 03/01/37 | | | 11,486 | | | | 14,684,627 | |
6.05%, 03/01/34a | | | 35,026 | | | | 45,895,622 | |
Southern California Edison Co. | | | | | | | | |
4.65%, 10/01/43 (Call 04/01/43)a | | | 10,506 | | | | 12,236,753 | |
| | | | |
SCHEDULESOF INVESTMENTS | | | 87 | |
Schedule of Investments (Unaudited) (Continued)
iSHARES® iBOXX $ INVESTMENT GRADE CORPORATE BOND ETF
October 31, 2016
| | | | | | | | |
| Security | |
Principal
(000s) | | | Value | |
Southern Co. (The) | | | | | | | | |
2.35%, 07/01/21 (Call 06/01/21) | | $ | 19,150 | | | $ | 19,324,757 | |
2.95%, 07/01/23 (Call 05/01/23)a | | | 16,650 | | | | 17,064,180 | |
3.25%, 07/01/26 (Call 04/01/26)a | | | 19,035 | | | | 19,552,897 | |
4.40%, 07/01/46 (Call 01/01/46) | | | 23,375 | | | | 24,637,019 | |
Virginia Electric & Power Co. Series A | | | | | | | | |
3.15%, 01/15/26 (Call 10/15/25) | | | 17,251 | | | | 17,842,687 | |
| | | | | | | | |
| | | | 524,456,705 | |
ELECTRONICS — 0.25% | | | | | |
Fortive Corp. | | | | | | | | |
2.35%, 06/15/21 (Call 05/15/21)a,b | | | 1,975 | | | | 1,981,880 | |
3.15%, 06/15/26 (Call 03/15/26)b | | | 16,240 | | | | 16,354,211 | |
Honeywell International Inc. | | | | | | | | |
1.85%, 11/01/21 (Call 10/01/21) | | | 18,000 | | | | 17,956,800 | |
2.50%, 11/01/26 (Call 08/01/26) | | | 18,000 | | | | 17,783,100 | |
4.25%, 03/01/21a | | | 7,899 | | | | 8,698,018 | |
Koninklijke Philips NV | | | | | | | | |
3.75%, 03/15/22 | | | 12,131 | | | | 13,052,590 | |
| | | | | | | | |
| | | | 75,826,599 | |
ENGINEERING & CONSTRUCTION — 0.07% | |
ABB Finance USA Inc. | | | | | | | | |
2.88%, 05/08/22 | | | 14,963 | | | | 15,493,925 | |
4.38%, 05/08/42a | | | 4,367 | | | | 4,890,576 | |
| | | | | | | | |
| | | | 20,384,501 | |
ENVIRONMENTAL CONTROL — 0.09% | |
Republic Services Inc. | | | | | | | | |
3.55%, 06/01/22 (Call 03/01/22) | | | 8,895 | | | | 9,491,050 | |
5.00%, 03/01/20a | | | 9,132 | | | | 10,048,932 | |
Waste Management Inc. | | | | | | | | |
4.10%, 03/01/45 (Call 09/01/44) | | | 9,024 | | | | 9,518,892 | |
| | | | | | | | |
| | | | 29,058,874 | |
| | | | | | | | |
| Security | |
Principal
(000s) | | | Value | |
FOOD — 1.42% | | | | | |
General Mills Inc. | | | | | | | | |
3.15%, 12/15/21 (Call 09/15/21) | | $ | 12,224 | | | $ | 12,849,051 | |
JM Smucker Co. (The) | | | | | | | | |
3.50%, 10/15/21 | | | 25 | | | | 26,570 | |
3.50%, 03/15/25a | | | 21,535 | | | | 22,648,713 | |
Kellogg Co. | | | | | | | | |
3.25%, 04/01/26a | | | 6,450 | | | | 6,582,355 | |
4.00%, 12/15/20 | | | 7,827 | | | | 8,439,514 | |
Series B | | | | | | | | |
7.45%, 04/01/31 | | | 1,456 | | | | 1,995,393 | |
Kraft Heinz Foods Co. | | | | | | | | |
2.80%, 07/02/20 (Call 06/02/20)a | | | 21,350 | | | | 21,957,565 | |
3.00%, 06/01/26 (Call 03/01/26)a | | | 25,080 | | | | 24,815,539 | |
3.50%, 06/06/22a | | | 24,081 | | | | 25,423,533 | |
3.50%, 07/15/22 (Call 05/15/22) | | | 15,645 | | | | 16,501,586 | |
3.95%, 07/15/25 (Call 04/15/25)a | | | 18,465 | | | | 19,729,825 | |
4.38%, 06/01/46 (Call 12/01/45) | | | 42,100 | | | | 42,746,757 | |
5.00%, 07/15/35 (Call 01/15/35) | | | 12,957 | | | | 14,409,719 | |
5.00%, 06/04/42a | | | 21,903 | | | | 24,195,721 | |
5.20%, 07/15/45 (Call 01/15/45) | | | 22,420 | | | | 25,242,678 | |
5.38%, 02/10/20 | | | 9,830 | | | | 10,856,499 | |
6.50%, 02/09/40 | | | 13,519 | | | | 17,578,712 | |
6.88%, 01/26/39 | | | 9,540 | | | | 12,750,085 | |
Kroger Co. (The) | | | | | | | | |
2.65%, 10/15/26 (Call 07/15/26) | | | 1,000 | | | | 971,890 | |
6.15%, 01/15/20 | | | 6,827 | | | | 7,701,651 | |
Mondelez International Inc. | | | | | | | | |
4.00%, 02/01/24 (Call 11/01/23)a | | | 18,924 | | | | 21,022,959 | |
6.50%, 02/09/40a | | | 1,961 | | | | 2,594,168 | |
Sysco Corp. | | | | | | | | |
2.60%, 10/01/20 (Call 09/01/20) | | | 9,320 | | | | 9,533,381 | |
3.30%, 07/15/26 (Call 04/15/26)a | | | 12,685 | | | | 12,928,358 | |
| | |
| 88 | | 2016 iSHARES ANNUAL REPORTTO SHAREHOLDERS |
Schedule of Investments (Unaudited) (Continued)
iSHARES® iBOXX $ INVESTMENT GRADE CORPORATE BOND ETF
October 31, 2016
| | | | | | | | |
| Security | |
Principal
(000s) | | | Value | |
3.75%, 10/01/25 (Call 07/01/25) | | $ | 9,418 | | | $ | 9,913,583 | |
Tyson Foods Inc. | | | | | | | | |
3.95%, 08/15/24 (Call 05/15/24)a | | | 9,600 | | | | 10,157,843 | |
4.50%, 06/15/22 (Call 03/15/22) | | | 17,245 | | | | 18,925,413 | |
Unilever Capital Corp. | | | | | | | | |
4.25%, 02/10/21 | | | 14,063 | | | | 15,502,070 | |
5.90%, 11/15/32 | | | 11,159 | | | | 15,154,580 | |
| | | | | | | | |
| | | | 433,155,711 | |
FOREST PRODUCTS & PAPER — 0.15% | |
International Paper Co. | | | | | | | | |
3.00%, 02/15/27 (Call 11/15/26)a | | | 13,900 | | | | 13,694,174 | |
3.65%, 06/15/24 (Call 03/15/24) | | | 5,965 | | | | 6,180,002 | |
4.40%, 08/15/47 (Call 02/15/47)a | | | 14,935 | | | | 14,521,017 | |
4.80%, 06/15/44 (Call 12/15/43) | | | 9,500 | | | | 9,670,318 | |
7.30%, 11/15/39a | | | 1,050 | | | | 1,371,310 | |
| | | | | | | | |
| | | | 45,436,821 | |
GAS — 0.04% | | | | | |
Sempra Energy | | | | | | | | |
6.00%, 10/15/39a | | | 10,195 | | | | 12,713,387 | |
| | | | | | | | |
| | | | 12,713,387 | |
HEALTH CARE – PRODUCTS — 1.75% | |
Abbott Laboratories | | | | | | | | |
2.00%, 03/15/20a | | | 11,229 | | | | 11,301,314 | |
2.55%, 03/15/22a | | | 8,408 | | | | 8,555,116 | |
2.95%, 03/15/25 (Call 12/15/24)a | | | 10,270 | | | | 10,323,988 | |
Becton Dickinson and Co. | | | | | | | | |
2.68%, 12/15/19 | | | 6,441 | | | | 6,635,966 | |
3.13%, 11/08/21 | | | 10,316 | | | | 10,785,287 | |
3.73%, 12/15/24 (Call 09/15/24) | | | 27,790 | | | | 29,565,792 | |
4.69%, 12/15/44 (Call 06/15/44) | | | 16,775 | | | | 18,298,163 | |
Boston Scientific Corp. | | | | | | | | |
3.85%, 05/15/25a | | | 7,405 | | | | 7,751,508 | |
6.00%, 01/15/20 | | | 6,931 | | | | 7,758,409 | |
| | | | | | | | |
| Security | |
Principal
(000s) | | | Value | |
Medtronic Inc. | | | | | | | | |
2.50%, 03/15/20a | | $ | 30,843 | | | $ | 31,584,237 | |
3.15%, 03/15/22a | | | 34,655 | | | | 36,434,926 | |
3.50%, 03/15/25 | | | 47,719 | | | | 50,617,137 | |
3.63%, 03/15/24 (Call 12/15/23) | | | 5,744 | | | | 6,132,008 | |
4.38%, 03/15/35 | | | 28,734 | | | | 31,541,841 | |
4.45%, 03/15/20a | | | 12,143 | | | | 13,185,511 | |
4.63%, 03/15/45 | | | 49,628 | | | | 56,147,144 | |
St. Jude Medical Inc. | | | | | | | | |
3.25%, 04/15/23 (Call 01/15/23)a | | | 6,142 | | | | 6,266,112 | |
Stryker Corp. | | | | | | | | |
2.63%, 03/15/21 (Call 02/15/21) | | | 10,960 | | | | 11,158,183 | |
3.38%, 11/01/25 (Call 08/01/25) | | | 7,328 | | | | 7,607,937 | |
3.50%, 03/15/26 (Call 12/15/25)a | | | 17,265 | | | | 17,988,757 | |
4.63%, 03/15/46 (Call 09/15/45)a | | | 9,940 | | | | 10,643,253 | |
Thermo Fisher Scientific Inc. | | | | | | | | |
2.95%, 09/19/26 (Call 06/19/26)a | | | 9,120 | | | | 8,974,984 | |
3.00%, 04/15/23 (Call 02/15/23)a | | | 15,015 | | | | 15,233,371 | |
3.15%, 01/15/23 (Call 10/15/22) | | | 7,998 | | | | 8,153,771 | |
3.30%, 02/15/22a | | | 11,042 | | | | 11,541,505 | |
3.60%, 08/15/21 (Call 05/15/21)a | | | 9,856 | | | | 10,421,578 | |
4.15%, 02/01/24 (Call 11/01/23)a | | | 12,866 | | | | 13,876,026 | |
4.50%, 03/01/21 | | | 11,056 | | | | 12,099,959 | |
Zimmer Biomet Holdings Inc. | | | | | | | | |
2.70%, 04/01/20 (Call 03/01/20) | | | 9,870 | | | | 10,017,858 | |
3.15%, 04/01/22 (Call 02/01/22)a | | | 12,350 | | | | 12,655,879 | |
3.55%, 04/01/25 (Call 01/01/25)a | | | 25,003 | | | | 25,475,217 | |
4.45%, 08/15/45 (Call 02/15/45) | | | 17,190 | | | | 16,940,822 | |
| | | | | | | | |
| | | | 535,673,559 | |
| | | | |
SCHEDULESOF INVESTMENTS | | | 89 | |
Schedule of Investments (Unaudited) (Continued)
iSHARES® iBOXX $ INVESTMENT GRADE CORPORATE BOND ETF
October 31, 2016
| | | | | | | | |
| Security | |
Principal
(000s) | | | Value | |
HEALTH CARE – SERVICES — 1.64% | |
Aetna Inc. | | | | | | | | |
2.40%, 06/15/21 (Call 05/15/21)a | | $ | 22,675 | | | $ | 22,877,615 | |
2.75%, 11/15/22 (Call 08/15/22)a | | | 13,797 | | | | 14,022,087 | |
2.80%, 06/15/23 (Call 04/15/23) | | | 18,025 | | | | 18,285,440 | |
3.20%, 06/15/26 (Call 03/15/26) | | | 35,915 | | | | 36,124,539 | |
3.50%, 11/15/24 (Call 08/15/24)a | | | 11,000 | | | | 11,458,265 | |
3.95%, 09/01/20a | | | 1,755 | | | | 1,874,786 | |
4.25%, 06/15/36 (Call 12/15/35) | | | 20,422 | | | | 20,798,069 | |
4.38%, 06/15/46 (Call 12/15/45) | | | 28,350 | | | | 28,592,302 | |
6.63%, 06/15/36 | | | 6,873 | | | | 8,984,398 | |
Anthem Inc. | | | | | | | | |
3.13%, 05/15/22a | | | 11,635 | | | | 11,993,564 | |
3.30%, 01/15/23 | | | 11,290 | | | | 11,641,286 | |
3.50%, 08/15/24 (Call 05/15/24) | | | 8,225 | | | | 8,508,711 | |
4.63%, 05/15/42 | | | 8,814 | | | | 9,170,038 | |
4.65%, 01/15/43 | | | 11,675 | | | | 12,373,944 | |
4.65%, 08/15/44 (Call 02/15/44)a | | | 12,214 | | | | 13,003,260 | |
5.85%, 01/15/36a | | | 9,657 | | | | 11,479,645 | |
6.38%, 06/15/37 | | | 890 | | | | 1,132,271 | |
Cigna Corp. | | | | | | | | |
3.25%, 04/15/25 (Call 01/15/25)a | | | 11,590 | | | | 11,711,746 | |
4.00%, 02/15/22 (Call 11/15/21) | | | 6,314 | | | | 6,766,721 | |
5.38%, 02/15/42 (Call 08/15/41) | | | 10,385 | | | | 12,124,568 | |
Humana Inc. | | | | | | | | |
4.95%, 10/01/44 (Call 04/01/44)a | | | 7,985 | | | | 8,603,701 | |
Laboratory Corp. of America Holdings | | | | | | | | |
3.60%, 02/01/25 (Call 11/01/24) | | | 10,071 | | | | 10,433,641 | |
| | | | | | | | |
| Security | |
Principal
(000s) | | | Value | |
4.70%, 02/01/45 (Call 08/01/44) | | $ | 12,605 | | | $ | 13,439,096 | |
UnitedHealth Group Inc. | | | | | | | | |
2.13%, 03/15/21 | | | 8,246 | | | | 8,315,476 | |
2.70%, 07/15/20 | | | 15,415 | | | | 15,883,431 | |
2.88%, 12/15/21 | | | 8,750 | | | | 9,106,089 | |
2.88%, 03/15/22 (Call 12/15/21)a | | | 13,562 | | | | 14,079,278 | |
2.88%, 03/15/23a | | | 6,777 | | | | 6,968,101 | |
3.10%, 03/15/26a | | | 14,650 | | | | 15,022,825 | |
3.35%, 07/15/22a | | | 18,392 | | | | 19,536,847 | |
3.75%, 07/15/25 | | | 26,487 | | | | 28,653,157 | |
4.25%, 03/15/43 (Call 09/15/42) | | | 5,679 | | | | 6,031,662 | |
4.63%, 07/15/35a | | | 12,810 | | | | 14,488,663 | |
4.75%, 07/15/45a | | | 29,446 | | | | 33,908,930 | |
5.80%, 03/15/36a | | | 4,150 | | | | 5,275,659 | |
6.88%, 02/15/38 | | | 12,520 | | | | 17,423,136 | |
| | | | | | | | |
| | | | 500,092,947 | |
HOLDING COMPANIES – DIVERSIFIED — 0.03% | |
MUFG Americas Holdings Corp. | | | | | | | | |
2.25%, 02/10/20 (Call 01/10/20) | | | 9,071 | | | | 9,130,840 | |
| | | | | | | | |
| | | | 9,130,840 | |
HOUSEWARES — 0.28% | | | | | | | | |
Newell Brands Inc. | | | | | | | | |
3.15%, 04/01/21 (Call 03/01/21)a | | | 12,600 | | | | 13,094,651 | |
3.85%, 04/01/23 (Call 02/01/23)a | | | 19,050 | | | | 20,216,100 | |
4.20%, 04/01/26 (Call 01/01/26)a | | | 26,275 | | | | 28,333,612 | |
5.50%, 04/01/46 (Call 10/01/45)a | | | 20,520 | | | | 24,293,068 | |
| | | | | | | | |
| | | | 85,937,431 | |
INSURANCE — 1.90% | | | | | |
Aflac Inc. | | | | | | | | |
3.63%, 11/15/24a | | | 9,618 | | | | 10,272,477 | |
American International Group Inc. | | | | | | | | |
3.30%, 03/01/21 (Call 02/01/21)a | | | 17,101 | | | | 17,865,175 | |
3.75%, 07/10/25 (Call 04/10/25)a | | | 5,425 | | | | 5,664,106 | |
| | |
| 90 | | 2016 iSHARES ANNUAL REPORTTO SHAREHOLDERS |
Schedule of Investments (Unaudited) (Continued)
iSHARES® iBOXX $ INVESTMENT GRADE CORPORATE BOND ETF
October 31, 2016
| | | | | | | | |
| Security | |
Principal
(000s) | | | Value | |
3.88%, 01/15/35 (Call 07/15/34)a | | $ | 17,173 | | | $ | 16,682,163 | |
3.90%, 04/01/26 (Call 01/01/26)a | | | 18,615 | | | | 19,553,421 | |
4.13%, 02/15/24 | | | 16,495 | | | | 17,726,983 | |
4.38%, 01/15/55 (Call 07/15/54) | | | 7,926 | | | | 7,428,286 | |
4.50%, 07/16/44 (Call 01/16/44) | | | 31,443 | | | | 31,936,262 | |
4.80%, 07/10/45 (Call 01/10/45)a | | | 6,895 | | | | 7,306,343 | |
4.88%, 06/01/22 | | | 17,864 | | | | 19,944,465 | |
6.25%, 05/01/36 | | | 13,057 | | | | 16,001,924 | |
Aon PLC | | | | | | | | |
3.88%, 12/15/25 (Call 09/15/25) | | | 7,000 | | | | 7,406,808 | |
Berkshire Hathaway Finance Corp. | | | | | | | | |
3.00%, 05/15/22 | | | 5,660 | | | | 5,947,165 | |
4.25%, 01/15/21a | | | 4,921 | | | | 5,408,112 | |
5.75%, 01/15/40a | | | 9,588 | | | | 12,495,206 | |
Berkshire Hathaway Inc. | | | | | | | | |
2.20%, 03/15/21 (Call 02/15/21)a | | | 10,300 | | | | 10,512,839 | |
2.75%, 03/15/23 (Call 01/15/23)a | | | 32,397 | | | | 33,360,678 | |
3.13%, 03/15/26 (Call 12/15/25)a | | | 33,380 | | | | 34,638,399 | |
4.50%, 02/11/43a | | | 11,443 | | | | 12,886,156 | |
Chubb Corp. (The) | | | | | | | | |
6.00%, 05/11/37 | | | 8,601 | | | | 11,353,311 | |
Chubb INA Holdings Inc. | | | | | | | | |
2.30%, 11/03/20 (Call 10/03/20) | | | 17,720 | | | | 18,078,821 | |
2.88%, 11/03/22 (Call 09/03/22) | | | 10,124 | | | | 10,528,925 | |
3.15%, 03/15/25a | | | 11,350 | | | | 11,747,990 | |
3.35%, 05/03/26 (Call 02/03/26)a | | | 10,285 | | | | 10,808,727 | |
4.35%, 11/03/45 (Call 05/03/45)a | | | 22,435 | | | | 24,966,756 | |
Manulife Financial Corp. | | | | | | | | |
4.15%, 03/04/26 | | | 15,925 | | | | 17,363,585 | |
5.38%, 03/04/46 | | | 9,300 | | | | 11,058,617 | |
| | | | | | | | |
| Security | |
Principal
(000s) | | | Value | |
MetLife Inc. | | | | | | | | |
3.60%, 04/10/24a | | $ | 9,762 | | | $ | 10,339,526 | |
4.05%, 03/01/45a | | | 9,795 | | | | 9,664,258 | |
4.13%, 08/13/42a | | | 8,328 | | | | 8,372,140 | |
4.60%, 05/13/46 (Call 11/13/45)a | | | 8,150 | | | | 8,839,223 | |
4.75%, 02/08/21a | | | 15,061 | | | | 16,741,383 | |
4.88%, 11/13/43a | | | 13,215 | | | | 14,652,828 | |
5.70%, 06/15/35 | | | 7,175 | | | | 8,692,810 | |
5.88%, 02/06/41 | | | 11,295 | | | | 13,842,444 | |
6.38%, 06/15/34 | | | 8,149 | | | | 10,412,542 | |
Series D | | | | | | | | |
4.37%, 09/15/23a | | | 13,810 | | | | 15,273,019 | |
Prudential Financial Inc. | | | | | | | | |
4.60%, 05/15/44a | | | 12,620 | | | | 13,377,903 | |
5.70%, 12/14/36 | | | 3,970 | | | | 4,725,080 | |
Series D | | | | | | | | |
6.63%, 12/01/37 | | | 9,350 | | | | 12,278,914 | |
Travelers Companies Inc. (The) | | | | | | | | |
5.35%, 11/01/40 | | | 7,925 | | | | 9,862,023 | |
6.25%, 06/15/37 | | | 9,255 | | | | 12,542,193 | |
| | | | | | | | |
| | | | 578,559,986 | |
INTERNET — 0.58% | | | | | |
Alphabet Inc. | | | | | | | | |
2.00%, 08/15/26 (Call 05/15/26)a | | | 20,889 | | | | 20,153,640 | |
3.38%, 02/25/24a | | | 1,000 | | | | 1,080,731 | |
3.63%, 05/19/21a | | | 3,200 | | | | 3,484,484 | |
Amazon.com Inc. | | | | | | | | |
2.50%, 11/29/22 (Call 08/29/22)a | | | 15,622 | | | | 15,981,703 | |
2.60%, 12/05/19 (Call 11/05/19) | | | 14,629 | | | | 15,103,901 | |
3.30%, 12/05/21 (Call 10/05/21)a | | | 13,989 | | | | 14,833,526 | |
3.80%, 12/05/24 (Call 09/05/24) | | | 18,082 | | | | 19,811,189 | |
4.80%, 12/05/34 (Call 06/05/34)a | | | 16,915 | | | | 19,311,615 | |
4.95%, 12/05/44 (Call 06/05/44)a | | | 9,552 | | | | 11,211,194 | |
eBay Inc. | | | | | | | | |
2.60%, 07/15/22 (Call 04/15/22) | | | 12,175 | | | | 12,162,193 | |
| | | | |
SCHEDULESOF INVESTMENTS | | | 91 | |
Schedule of Investments (Unaudited) (Continued)
iSHARES® iBOXX $ INVESTMENT GRADE CORPORATE BOND ETF
October 31, 2016
| | | | | | | | |
| Security | |
Principal
(000s) | | | Value | |
2.88%, 08/01/21 (Call 06/01/21)a | | $ | 5,643 | | | $ | 5,773,445 | |
3.45%, 08/01/24 (Call 05/01/24)a | | | 9,955 | | | | 10,175,008 | |
3.80%, 03/09/22 (Call 02/09/22)a | | | 5,500 | | | | 5,832,965 | |
4.00%, 07/15/42 (Call 01/15/42) | | | 10,297 | | | | 9,087,337 | |
Expedia Inc. | | | | | | | | |
5.00%, 02/15/26 (Call 11/15/25)b | | | 12,100 | | | | 12,568,808 | |
| | | | | | | | |
| | | | 176,571,739 | |
LODGING — 0.04% | | | | | |
Marriott International Inc./MD | | | | | | | | |
2.30%, 01/15/22 (Call 12/15/21)a | | | 7,650 | | | | 7,651,290 | |
Series R | | | | | | | | |
3.13%, 06/15/26 (Call 03/15/26) | | | 4,700 | | | | 4,680,240 | |
| | | | | | | | |
| | | | 12,331,530 | |
MACHINERY — 0.37% | | | | | |
Caterpillar Financial Services Corp. | | | | | | | | |
1.70%, 08/09/21 | | | 15,400 | | | | 15,104,320 | |
Caterpillar Inc. | | | | | | | | |
3.40%, 05/15/24 (Call 02/15/24)a | | | 9,745 | | | | 10,357,390 | |
3.80%, 08/15/42a | | | 20,092 | | | | 20,204,172 | |
3.90%, 05/27/21a | | | 13,022 | | | | 14,078,165 | |
5.20%, 05/27/41a | | | 9,498 | | | | 11,325,481 | |
Deere & Co. | | | | | | | | |
2.60%, 06/08/22 (Call 03/08/22) | | | 15,559 | | | | 15,976,633 | |
3.90%, 06/09/42 (Call 12/09/41) | | | 9,671 | | | | 10,073,760 | |
4.38%, 10/16/19 | | | 3,171 | | | | 3,429,959 | |
John Deere Capital Corp. | | | | | | | | |
2.80%, 03/06/23 | | | 12,900 | | | | 13,293,939 | |
| | | | | | | | |
| | | | 113,843,819 | |
MANUFACTURING — 1.39% | | | | | |
3M Co. | | | | | | | | |
5.70%, 03/15/37 | | | 8,151 | | | | 10,760,279 | |
| | | | | | | | |
| Security | |
Principal
(000s) | | | Value | |
Eaton Corp. | | | | | | | | |
2.75%, 11/02/22 | | $ | 20,055 | | | $ | 20,436,873 | |
4.15%, 11/02/42a | | | 9,440 | | | | 9,704,445 | |
General Electric Co. | | | | | | | | |
2.20%, 01/09/20 (Call 12/09/19) | | | 4,989 | | | | 5,056,825 | |
2.70%, 10/09/22 | | | 31,192 | | | | 32,190,568 | |
3.10%, 01/09/23 | | | 18,967 | | | | 20,031,181 | |
3.15%, 09/07/22a | | | 11,685 | | | | 12,252,865 | |
3.38%, 03/11/24a | | | 10,843 | | | | 11,573,515 | |
3.45%, 05/15/24 (Call 02/13/24) | | | 1,140 | | | | 1,218,774 | |
4.13%, 10/09/42a | | | 27,934 | | | | 29,628,110 | |
4.38%, 09/16/20 | | | 17,386 | | | | 19,119,958 | |
4.50%, 03/11/44a | | | 25,970 | | | | 29,136,346 | |
4.63%, 01/07/21a | | | 16,838 | | | | 18,746,518 | |
4.65%, 10/17/21 | | | 8,485 | | | | 9,580,267 | |
5.30%, 02/11/21 | | | 18,853 | | | | 21,431,072 | |
5.50%, 01/08/20 | | | 10,163 | | | | 11,344,809 | |
5.88%, 01/14/38 | | | 27,309 | | | | 35,490,708 | |
6.15%, 08/07/37 | | | 14,197 | | | | 19,048,471 | |
6.88%, 01/10/39 | | | 26,481 | | | | 38,737,696 | |
Series A | | | | | | | | |
6.75%, 03/15/32a | | | 35,061 | | | | 48,229,621 | |
Illinois Tool Works Inc. | | | | | | | | |
2.65%, 11/15/26 | | | 10,000 | | | | 9,968,500 | |
3.90%, 09/01/42 (Call 03/01/42) | | | 11,480 | | | | 12,132,139 | |
| | | | | | | | |
| | | | 425,819,540 | |
MEDIA — 4.89% | | | | | |
21st Century Fox America Inc. | | | | | | | | |
3.00%, 09/15/22a | | | 14,752 | | | | 15,183,387 | |
4.50%, 02/15/21a | | | 9,338 | | | | 10,260,845 | |
6.15%, 03/01/37a | | | 7,729 | | | | 9,415,518 | |
6.15%, 02/15/41a | | | 22,186 | | | | 27,338,827 | |
6.20%, 12/15/34a | | | 11,364 | | | | 14,123,218 | |
6.40%, 12/15/35a | | | 12,155 | | | | 15,237,075 | |
6.65%, 11/15/37 | | | 15,746 | | | | 20,278,281 | |
CBS Corp. | | | | | | | | |
3.50%, 01/15/25 (Call 10/15/24) | | | 2,565 | | | | 2,637,025 | |
4.00%, 01/15/26 (Call 10/15/25)a | | | 7,970 | | | | 8,471,115 | |
| | |
| 92 | | 2016 iSHARES ANNUAL REPORTTO SHAREHOLDERS |
Schedule of Investments (Unaudited) (Continued)
iSHARES® iBOXX $ INVESTMENT GRADE CORPORATE BOND ETF
October 31, 2016
| | | | | | | | |
| Security | |
Principal
(000s) | | | Value | |
7.88%, 07/30/30 | | $ | 9,645 | | | $ | 13,508,290 | |
Charter Communications Operating LLC/Charter Communications Operating Capital | | | | | | | | |
3.58%, 07/23/20 (Call 06/23/20)a,b | | | 31,413 | | | | 32,528,161 | |
4.46%, 07/23/22 (Call 05/23/22)b | | | 34,451 | | | | 36,778,833 | |
4.91%, 07/23/25 (Call 04/23/25)b | | | 55,595 | | | | 60,056,382 | |
6.38%, 10/23/35 (Call 04/23/35)a,b | | | 28,630 | | | | 33,050,873 | |
6.48%, 10/23/45 (Call 04/23/45)b | | | 37,800 | | | | 44,389,345 | |
Comcast Cable Communications Holdings Inc. | | | | | | | | |
9.46%, 11/15/22 | | | 17,093 | | | | 23,847,485 | |
Comcast Corp. | | | | | | | | |
2.35%, 01/15/27 (Call 10/15/26) | | | 14,470 | | | | 13,997,855 | |
2.75%, 03/01/23 (Call 02/01/23)a | | | 8,175 | | | | 8,390,135 | |
2.85%, 01/15/23 | | | 13,570 | | | | 13,993,023 | |
3.13%, 07/15/22a | | | 11,895 | | | | 12,458,781 | |
3.15%, 03/01/26 (Call 12/01/25)a | | | 26,220 | | | | 27,125,662 | |
3.20%, 07/15/36 (Call 01/15/36)a | | | 13,710 | | | | 13,027,386 | |
3.38%, 02/15/25 (Call 11/15/24) | | | 9,408 | | | | 9,899,350 | |
3.38%, 08/15/25 (Call 05/15/25)a | | | 17,310 | | | | 18,134,794 | |
3.40%, 07/15/46 (Call 01/15/46)a | | | 19,580 | | | | 18,059,852 | |
3.60%, 03/01/24a | | | 19,171 | | | | 20,527,227 | |
4.20%, 08/15/34 (Call 02/15/34) | | | 21,131 | | | | 22,626,468 | |
4.25%, 01/15/33a | | | 19,726 | | | | 21,210,847 | |
4.40%, 08/15/35 (Call 02/15/35) | | | 13,505 | | | | 14,828,242 | |
4.60%, 08/15/45 (Call 02/15/45)a | | | 20,665 | | | | 22,778,534 | |
| | | | | | | | |
| Security | |
Principal
(000s) | | | Value | |
4.65%, 07/15/42 | | $ | 15,551 | | | $ | 17,248,647 | |
4.75%, 03/01/44 | | | 6,568 | | | | 7,315,800 | |
5.15%, 03/01/20a | | | 16,843 | | | | 18,715,974 | |
5.65%, 06/15/35 | | | 12,102 | | | | 15,073,025 | |
6.40%, 05/15/38 | | | 7,825 | | | | 10,520,992 | |
6.40%, 03/01/40a | | | 7,181 | | | | 9,756,318 | |
6.45%, 03/15/37 | | | 16,601 | | | | 22,198,862 | |
6.50%, 11/15/35 | | | 11,527 | | | | 15,457,048 | |
6.55%, 07/01/39 | | | 12,203 | | | | 16,632,854 | |
6.95%, 08/15/37 | | | 22,321 | | | | 31,600,581 | |
7.05%, 03/15/33 | | | 12,060 | | | | 16,722,921 | |
Discovery Communications LLC | | | | | | | | |
4.88%, 04/01/43 | | | 10,279 | | | | 9,758,980 | |
5.05%, 06/01/20 | | | 16,515 | | | | 17,990,757 | |
6.35%, 06/01/40a | | | 7,575 | | | | 8,268,116 | |
Historic TW Inc. | | | | | | | | |
6.63%, 05/15/29 | | | 15,471 | | | | 19,676,067 | |
NBCUniversal Media LLC | | | | | | | | |
2.88%, 01/15/23a | | | 13,180 | | | | 13,579,732 | |
4.38%, 04/01/21a | | | 22,752 | | | | 25,027,696 | |
4.45%, 01/15/43a | | | 15,093 | | | | 16,385,026 | |
5.15%, 04/30/20a | | | 23,787 | | | | 26,467,055 | |
5.95%, 04/01/41 | | | 17,124 | | | | 22,162,908 | |
6.40%, 04/30/40 | | | 10,693 | | | | 14,512,409 | |
Time Warner Cable LLC | | | | | | | | |
4.00%, 09/01/21 (Call 06/01/21) | | | 12,968 | | | | 13,640,227 | |
4.50%, 09/15/42 (Call 03/15/42) | | | 12,630 | | | | 11,728,658 | |
5.00%, 02/01/20 | | | 19,401 | | | | 20,836,230 | |
5.50%, 09/01/41 (Call 03/01/41)a | | | 18,083 | | | | 18,958,291 | |
5.88%, 11/15/40 (Call 05/15/40) | | | 15,296 | | | | 16,598,487 | |
6.55%, 05/01/37 | | | 20,741 | | | | 24,060,178 | |
6.75%, 06/15/39 | | | 14,272 | | | | 17,113,555 | |
7.30%, 07/01/38 | | | 16,635 | | | | 20,913,213 | |
Time Warner Entertainment Co. LP | | | | | | | | |
8.38%, 03/15/23 | | | 11,020 | | | | 14,203,959 | |
8.38%, 07/15/33 | | | 9,555 | | | | 12,826,339 | |
Time Warner Inc. | | | | | | | | |
2.95%, 07/15/26 (Call 04/15/26) | | | 13,505 | | | | 13,300,503 | |
| | | | |
SCHEDULESOF INVESTMENTS | | | 93 | |
Schedule of Investments (Unaudited) (Continued)
iSHARES® iBOXX $ INVESTMENT GRADE CORPORATE BOND ETF
October 31, 2016
| | | | | | | | |
| Security | |
Principal
(000s) | | | Value | |
3.55%, 06/01/24 (Call 03/01/24) | | $ | 9,925 | | | $ | 10,266,255 | |
3.60%, 07/15/25 (Call 04/15/25) | | | 24,200 | | | | 24,994,133 | |
4.70%, 01/15/21 | | | 11,303 | | | | 12,385,659 | |
4.75%, 03/29/21a | | | 12,285 | | | | 13,483,646 | |
4.85%, 07/15/45 (Call 01/15/45) | | | 4,050 | | | | 4,302,163 | |
4.88%, 03/15/20 | | | 13,684 | | | | 14,936,725 | |
6.10%, 07/15/40 | | | 11,120 | | | | 13,368,669 | |
6.25%, 03/29/41 | | | 17,770 | | | | 21,659,387 | |
6.50%, 11/15/36a | | | 11,588 | | | | 14,395,595 | |
7.63%, 04/15/31 | | | 14,204 | | | | 19,584,191 | |
7.70%, 05/01/32a | | | 28,400 | | | | 38,931,348 | |
Viacom Inc. | | | | | | | | |
4.25%, 09/01/23 (Call 06/01/23)a | | | 22,729 | | | | 24,079,921 | |
4.38%, 03/15/43 | | | 24,710 | | | | 22,714,860 | |
5.85%, 09/01/43 (Call 03/01/43)a | | | 12,892 | | | | 14,398,430 | |
6.88%, 04/30/36 | | | 9,944 | | | | 11,713,578 | |
Walt Disney Co. (The) | | | | | | | | |
1.85%, 07/30/26a | | | 18,530 | | | | 17,351,952 | |
2.15%, 09/17/20a | | | 9,025 | | | | 9,205,005 | |
2.30%, 02/12/21a | | | 8,905 | | | | 9,113,461 | |
2.35%, 12/01/22a | | | 11,527 | | | | 11,777,084 | |
2.75%, 08/16/21 | | | 5,423 | | | | 5,664,136 | |
3.00%, 02/13/26a | | | 14,225 | | | | 14,706,363 | |
3.15%, 09/17/25a | | | 9,050 | | | | 9,522,529 | |
4.13%, 06/01/44a | | | 10,737 | | | | 11,533,354 | |
| | | | | | | | |
| | | | 1,493,502,668 | |
METAL FABRICATE & HARDWARE — 0.07% | |
Precision Castparts Corp. | | | | | | | | |
2.50%, 01/15/23 (Call 10/15/22) | | | 7,887 | | | | 7,996,770 | |
3.25%, 06/15/25 (Call 03/15/25) | | | 13,497 | | | | 14,232,683 | |
| | | | | | | | |
| | | | 22,229,453 | |
MINING — 0.87% | | | | | |
Barrick Gold Corp. | | | | | | | | |
5.25%, 04/01/42 | | | 11,800 | | | | 12,926,539 | |
Barrick North America Finance LLC | | | | | | | | |
4.40%, 05/30/21 | | | 8,902 | | | | 9,724,059 | |
| | | | | | | | |
| Security | |
Principal
(000s) | | | Value | |
5.70%, 05/30/41 | | $ | 14,845 | | | $ | 16,948,973 | |
5.75%, 05/01/43a | | | 6,111 | | | | 7,098,541 | |
Barrick PD Australia Finance Pty Ltd. | | | | | | | | |
5.95%, 10/15/39 | | | 7,580 | | | | 8,569,229 | |
BHP Billiton Finance USA Ltd. | | | | | | | | |
2.88%, 02/24/22a | | | 11,743 | | | | 12,211,387 | |
3.25%, 11/21/21 | | | 16,496 | | | | 17,423,413 | |
3.85%, 09/30/23a | | | 17,127 | | | | 18,533,652 | |
4.13%, 02/24/42 | | | 11,615 | | | | 11,723,592 | |
5.00%, 09/30/43a | | | 30,765 | | | | 35,058,862 | |
Goldcorp Inc. | | | | | | | | |
3.70%, 03/15/23 (Call 12/15/22)a | | | 13,095 | | | | 13,476,172 | |
Newmont Mining Corp. | | | | | | | | |
3.50%, 03/15/22 (Call 12/15/21)a | | | 13,457 | | | | 14,190,407 | |
4.88%, 03/15/42 (Call 09/15/41)a | | | 13,996 | | | | 14,519,152 | |
6.25%, 10/01/39 | | | 9,099 | | | | 10,717,114 | |
Rio Tinto Alcan Inc. | | | | | | | | |
6.13%, 12/15/33 | | | 4,400 | | | | 5,052,404 | |
Rio Tinto Finance USA Ltd. | | | | | | | | |
3.75%, 06/15/25 (Call 03/15/25)a | | | 9,691 | | | | 10,272,413 | |
4.13%, 05/20/21 | | | 2,058 | | | | 2,239,497 | |
5.20%, 11/02/40a | | | 14,705 | | | | 16,712,880 | |
7.13%, 07/15/28 | | | 9,348 | | | | 12,379,554 | |
Rio Tinto Finance USA PLC | | | | | | | | |
2.88%, 08/21/22 (Call 05/21/22) | | | 1,730 | | | | 1,784,574 | |
3.50%, 03/22/22 (Call 12/22/21) | | | 2,457 | | | | 2,610,936 | |
4.13%, 08/21/42 (Call 02/21/42)a | | | 11,894 | | | | 11,973,785 | |
| | | | | | | | |
| | | | 266,147,135 | |
OFFICE & BUSINESS EQUIPMENT — 0.04% | |
Xerox Corp. | | | | | | | | |
4.50%, 05/15/21a | | | 12,102 | | | | 12,932,385 | |
| | | | | | | | |
| | | | 12,932,385 | |
OIL & GAS — 6.81% | | | | | |
Anadarko Finance Co. | | | | | | | | |
7.50%, 05/01/31 | | | 10,335 | | | | 13,244,924 | |
| | |
| 94 | | 2016 iSHARES ANNUAL REPORTTO SHAREHOLDERS |
Schedule of Investments (Unaudited) (Continued)
iSHARES® iBOXX $ INVESTMENT GRADE CORPORATE BOND ETF
October 31, 2016
| | | | | | | | |
| Security | |
Principal
(000s) | | | Value | |
Anadarko Petroleum Corp. | | | | | | | | |
4.85%, 03/15/21 (Call 02/15/21)a | | $ | 6,310 | | | $ | 6,848,117 | |
5.55%, 03/15/26 (Call 12/15/25)a | | | 13,500 | | | | 15,297,575 | |
6.20%, 03/15/40 | | | 8,271 | | | | 9,476,970 | |
6.45%, 09/15/36 | | | 25,439 | | | | 30,006,651 | |
6.60%, 03/15/46 (Call 09/15/45)a | | | 13,315 | | | | 16,352,948 | |
Apache Corp. | | | | | | | | |
3.25%, 04/15/22 (Call 01/15/22) | | | 10,017 | | | | 10,271,273 | |
4.25%, 01/15/44 (Call 07/15/43) | | | 6,074 | | | | 5,962,142 | |
4.75%, 04/15/43 (Call 10/15/42) | | | 19,226 | | | | 20,216,660 | |
5.10%, 09/01/40 (Call 03/01/40) | | | 17,015 | | | | 18,103,574 | |
6.00%, 01/15/37 | | | 15,059 | | | | 17,618,092 | |
BP Capital Markets PLC | | | | | | | | |
2.11%, 09/16/21 (Call 08/16/21)a | | | 10,335 | | | | 10,345,386 | |
2.32%, 02/13/20a | | | 9,266 | | | | 9,393,281 | |
2.50%, 11/06/22 | | | 15,763 | | | | 15,805,521 | |
2.52%, 01/15/20a | | | 20,205 | | | | 20,583,559 | |
2.75%, 05/10/23a | | | 13,616 | | | | 13,735,478 | |
3.02%, 01/16/27 (Call 10/16/26)a | | | 12,250 | | | | 12,278,197 | |
3.06%, 03/17/22a | | | 18,530 | | | | 19,238,810 | |
3.12%, 05/04/26 (Call 02/04/26)a | | | 15,950 | | | | 16,111,964 | |
3.25%, 05/06/22 | | | 26,353 | | | | 27,517,347 | |
3.51%, 03/17/25a | | | 8,983 | | | | 9,398,919 | |
3.54%, 11/04/24a | | | 10,263 | | | | 10,740,250 | |
3.56%, 11/01/21a | | | 16,379 | | | | 17,446,434 | |
3.81%, 02/10/24a | | | 6,117 | | | | 6,525,014 | |
3.99%, 09/26/23a | | | 7,126 | | | | 7,715,317 | |
4.50%, 10/01/20 | | | 20,987 | | | | 22,940,797 | |
4.74%, 03/11/21a | | | 15,673 | | | | 17,423,665 | |
Canadian Natural Resources Ltd. | | | | | | | | |
6.25%, 03/15/38 | | | 10,848 | | | | 12,315,881 | |
Chevron Corp. | | | | | | | | |
1.96%, 03/03/20 (Call 02/03/20) | | | 24,016 | | | | 24,193,529 | |
| | | | | | | | |
| Security | |
Principal
(000s) | | | Value | |
2.10%, 05/16/21 (Call 04/15/21) | | $ | 20,950 | | | $ | 21,082,546 | |
2.19%, 11/15/19 (Call 10/15/19) | | | 4,663 | | | | 4,746,370 | |
2.36%, 12/05/22 (Call 09/05/22) | | | 22,223 | | | | 22,359,265 | |
2.42%, 11/17/20 (Call 10/17/20) | | | 15,865 | | | | 16,185,146 | |
2.43%, 06/24/20 (Call 05/24/20)a | | | 8,839 | | | | 9,037,449 | |
2.57%, 05/16/23 (Call 03/16/23) | | | 5,500 | | | | 5,579,922 | |
2.95%, 05/16/26 (Call 02/16/26)a | | | 30,265 | | | | 30,727,955 | |
3.19%, 06/24/23 (Call 03/24/23)a | | | 30,030 | | | | 31,556,218 | |
3.33%, 11/17/25 (Call 08/17/25)a | | | 9,590 | | | | 10,080,656 | |
ConocoPhillips | | | | | | | | |
6.00%, 01/15/20 | | | 14,978 | | | | 16,741,625 | |
6.50%, 02/01/39 | | | 31,849 | | | | 40,384,570 | |
ConocoPhillips Co. | | | | | | | | |
2.40%, 12/15/22 (Call 09/15/22) | | | 8,475 | | | | 8,402,864 | |
2.88%, 11/15/21 (Call 09/15/21) | | | 9,700 | | | | 9,953,481 | |
3.35%, 11/15/24 (Call 08/15/24)a | | | 13,611 | | | | 13,811,019 | |
4.20%, 03/15/21 (Call 02/15/21)a | | | 12,475 | | | | 13,494,362 | |
4.30%, 11/15/44 (Call 05/15/44)a | | | 13,565 | | | | 13,549,294 | |
4.95%, 03/15/26 (Call 12/15/25)a | | | 18,050 | | | | 20,198,937 | |
ConocoPhillips Holding Co. | | | | | | | | |
6.95%, 04/15/29 | | | 17,106 | | | | 21,507,728 | |
Devon Energy Corp. | | | | | | | | |
3.25%, 05/15/22 (Call 02/15/22)a | | | 13,402 | | | | 13,446,609 | |
4.75%, 05/15/42 (Call 11/15/41) | | | 6,361 | | | | 5,991,903 | |
5.00%, 06/15/45 (Call 12/15/44) | | | 11,705 | | | | 11,373,940 | |
| | | | |
SCHEDULESOF INVESTMENTS | | | 95 | |
Schedule of Investments (Unaudited) (Continued)
iSHARES® iBOXX $ INVESTMENT GRADE CORPORATE BOND ETF
October 31, 2016
| | | | | | | | |
| Security | |
Principal
(000s) | | | Value | |
5.60%, 07/15/41 (Call 01/15/41) | | $ | 16,818 | | | $ | 17,343,310 | |
5.85%, 12/15/25 (Call 09/15/25)a | | | 6,125 | | | | 7,020,635 | |
7.95%, 04/15/32 | | | 13,019 | | | | 16,302,107 | |
Devon Financing Co. LLC | | | | | | | | |
7.88%, 09/30/31 | | | 15,473 | | | | 19,570,824 | |
Encana Corp. | | | | | | | | |
6.50%, 08/15/34 | | | 3,450 | | | | 3,723,342 | |
EOG Resources Inc. | | | | | | | | |
2.63%, 03/15/23 (Call 12/15/22)a | | | 17,215 | | | | 17,158,595 | |
4.10%, 02/01/21a | | | 5,036 | | | | 5,395,785 | |
4.15%, 01/15/26 (Call 10/15/25)a | | | 8,750 | | | | 9,478,382 | |
Exxon Mobil Corp. | | | | | | | | |
1.91%, 03/06/20 (Call 02/06/20) | | | 8,425 | | | | 8,502,029 | |
2.22%, 03/01/21 (Call 02/01/21) | | | 37,233 | | | | 37,749,693 | |
2.40%, 03/06/22 (Call 01/06/22) | | | 10,700 | | | | 10,889,904 | |
2.71%, 03/06/25 (Call 12/06/24) | | | 25,952 | | | | 26,292,238 | |
2.73%, 03/01/23 (Call 01/01/23)a | | | 18,150 | | | | 18,518,302 | |
3.04%, 03/01/26 (Call 12/01/25)a | | | 31,621 | | | | 32,690,969 | |
3.18%, 03/15/24 (Call 12/15/23)a | | | 11,935 | | | | 12,459,888 | |
3.57%, 03/06/45 (Call 09/06/44)a | | | 12,780 | | | | 12,752,087 | |
4.11%, 03/01/46 (Call 09/01/45)a | | | 29,585 | | | | 31,906,088 | |
Hess Corp. | | | | | | | | |
4.30%, 04/01/27 (Call 01/01/27) | | | 13,450 | | | | 13,389,206 | |
5.60%, 02/15/41 | | | 13,724 | | | | 13,569,273 | |
6.00%, 01/15/40 | | | 12,733 | | | | 13,088,760 | |
Husky Energy Inc. | | | | | | | | |
4.00%, 04/15/24 (Call 01/15/24)a | | | 16,963 | | | | 17,853,435 | |
Marathon Oil Corp. | | | | | | | | |
2.80%, 11/01/22 (Call 08/01/22)a | | | 10,040 | | | | 9,526,814 | |
| | | | | | | | |
| Security | |
Principal
(000s) | | | Value | |
3.85%, 06/01/25 (Call 03/01/25)a | | $ | 6,284 | | | $ | 6,034,788 | |
6.60%, 10/01/37 | | | 10,206 | | | | 10,804,911 | |
Marathon Petroleum Corp. | | | | | | | | |
3.63%, 09/15/24 (Call 06/15/24) | | | 11,900 | | | | 11,795,461 | |
4.75%, 09/15/44 (Call 03/15/44) | | | 9,392 | | | | 8,314,873 | |
5.13%, 03/01/21a | | | 12,730 | | | | 14,052,504 | |
6.50%, 03/01/41 (Call 09/01/40)a | | | 12,285 | | | | 13,248,822 | |
Nexen Energy ULC | | | | | | | | |
5.88%, 03/10/35 | | | 0 | | | | 0 | |
Noble Energy Inc. | | | | | | | | |
4.15%, 12/15/21 (Call 09/15/21) | | | 11,835 | | | | 12,549,790 | |
5.05%, 11/15/44 (Call 05/15/44) | | | 9,254 | | | | 9,349,689 | |
5.25%, 11/15/43 (Call 05/15/43) | | | 13,095 | | | | 13,576,290 | |
6.00%, 03/01/41 (Call 09/01/40) | | | 11,991 | | | | 13,247,843 | |
Occidental Petroleum Corp. | | | | | | | | |
2.70%, 02/15/23 (Call 11/15/22) | | | 15,856 | | | | 16,053,832 | |
3.13%, 02/15/22 (Call 11/15/21) | | | 9,588 | | | | 10,010,232 | |
3.40%, 04/15/26 (Call 01/15/26)a | | | 13,990 | | | | 14,558,376 | |
3.50%, 06/15/25 (Call 03/15/25)a | | | 10,350 | | | | 10,903,876 | |
4.40%, 04/15/46 (Call 10/15/45)a | | | 14,580 | | | | 15,564,396 | |
4.63%, 06/15/45 (Call 12/15/44) | | | 8,155 | | | | 8,872,647 | |
Series 1 | | | | | | | | |
4.10%, 02/01/21 (Call 11/01/20)a | | | 14,720 | | | | 15,893,598 | |
Petro-Canada | | | | | | | | |
6.80%, 05/15/38a | | | 7,972 | | | | 10,394,236 | |
Phillips 66 | | | | | | | | |
4.30%, 04/01/22a | | | 17,044 | | | | 18,715,929 | |
4.65%, 11/15/34 (Call 05/15/34) | | | 8,650 | | | | 9,114,933 | |
| | |
| 96 | | 2016 iSHARES ANNUAL REPORTTO SHAREHOLDERS |
Schedule of Investments (Unaudited) (Continued)
iSHARES® iBOXX $ INVESTMENT GRADE CORPORATE BOND ETF
October 31, 2016
| | | | | | | | |
| Security | |
Principal
(000s) | | | Value | |
4.88%, 11/15/44 (Call 05/15/44)a | | $ | 17,565 | | | $ | 18,740,445 | |
5.88%, 05/01/42a | | | 22,600 | | | | 27,462,456 | |
Shell International Finance BV | | | | | | | | |
1.75%, 09/12/21a | | | 5,250 | | | | 5,188,548 | |
1.88%, 05/10/21a | | | 20,079 | | | | 19,937,638 | |
2.13%, 05/11/20a | | | 16,472 | | | | 16,614,639 | |
2.25%, 11/10/20a | | | 13,685 | | | | 13,837,471 | |
2.25%, 01/06/23 | | | 16,542 | | | | 16,348,067 | |
2.38%, 08/21/22 | | | 17,901 | | | | 17,919,755 | |
2.50%, 09/12/26a | | | 10,019 | | | | 9,703,660 | |
2.88%, 05/10/26a | | | 24,550 | | | | 24,589,638 | |
3.25%, 05/11/25a | | | 33,259 | | | | 34,496,298 | |
3.40%, 08/12/23a | | | 17,858 | | | | 18,747,127 | |
3.75%, 09/12/46a | | | 7,800 | | | | 7,420,562 | |
4.00%, 05/10/46a | | | 30,275 | | | | 29,870,590 | |
4.13%, 05/11/35a | | | 20,038 | | | | 20,723,227 | |
4.38%, 03/25/20 | | | 17,255 | | | | 18,666,335 | |
4.38%, 05/11/45a | | | 36,068 | | | | 37,496,985 | |
4.55%, 08/12/43 | | | 12,995 | | | | 13,872,355 | |
5.50%, 03/25/40a | | | 14,666 | | | | 17,519,254 | |
6.38%, 12/15/38a | | | 32,302 | | | | 42,422,607 | |
Statoil ASA | | | | | | | | |
2.25%, 11/08/19 | | | 8,470 | | | | 8,605,218 | |
2.45%, 01/17/23a | | | 8,905 | | | | 8,956,778 | |
2.65%, 01/15/24 | | | 13,516 | | | | 13,605,206 | |
2.75%, 11/10/21 | | | 1,730 | | | | 1,789,789 | |
2.90%, 11/08/20 | | | 9,527 | | | | 9,888,617 | |
3.15%, 01/23/22 | | | 13,264 | | | | 13,926,077 | |
3.70%, 03/01/24 | | | 9,920 | | | | 10,697,947 | |
3.95%, 05/15/43 | | | 4,442 | | | | 4,451,011 | |
4.80%, 11/08/43a | | | 11,031 | | | | 12,444,158 | |
5.10%, 08/17/40 | | | 8,502 | | | | 9,871,475 | |
Suncor Energy Inc. | | | | | | | | |
3.60%, 12/01/24 (Call 09/01/24) | | | 7,049 | | | | 7,321,261 | |
6.50%, 06/15/38a | | | 16,910 | | | | 21,679,261 | |
6.85%, 06/01/39 | | | 7,920 | | | | 10,591,816 | |
Total Capital Canada Ltd. | | | | | | | | |
2.75%, 07/15/23a | | | 14,542 | | | | 14,837,107 | |
Total Capital International SA | | | | | | | | |
2.70%, 01/25/23a | | | 12,441 | | | | 12,689,182 | |
2.75%, 06/19/21a | | | 10,850 | | | | 11,240,373 | |
2.88%, 02/17/22a | | | 12,716 | | | | 13,170,720 | |
| | | | | | | | |
| Security | |
Principal
(000s) | | | Value | |
3.70%, 01/15/24a | | $ | 10,050 | | | $ | 10,855,583 | |
3.75%, 04/10/24a | | | 15,197 | | | | 16,443,779 | |
Total Capital SA | | | | | | | | |
4.45%, 06/24/20a | | | 18,331 | | | | 19,967,548 | |
Valero Energy Corp. | | | | | | | | |
3.40%, 09/15/26 (Call 06/15/26) | | | 12,110 | | | | 11,831,721 | |
6.13%, 02/01/20a | | | 8,579 | | | | 9,620,044 | |
6.63%, 06/15/37a | | | 21,143 | | | | 24,759,413 | |
7.50%, 04/15/32a | | | 8,826 | | | | 11,015,458 | |
| | | | | | | | |
| | | | 2,077,396,025 | |
OIL & GAS SERVICES — 0.59% | |
Baker Hughes Inc. | | | | | | | | |
3.20%, 08/15/21 (Call 05/15/21)a | | | 1,554 | | | | 1,623,183 | |
5.13%, 09/15/40 | | | 14,122 | | | | 16,182,863 | |
Halliburton Co. | | | | | | | | |
3.50%, 08/01/23 (Call 05/01/23) | | | 11,996 | | | | 12,383,402 | |
3.80%, 11/15/25 (Call 08/15/25)a | | | 20,895 | | | | 21,631,405 | |
4.75%, 08/01/43 (Call 02/01/43)a | | | 13,941 | | | | 14,586,431 | |
4.85%, 11/15/35 (Call 05/15/35)a | | | 9,825 | | | | 10,538,129 | |
5.00%, 11/15/45 (Call 05/15/45)a | | | 21,115 | | | | 22,989,427 | |
6.70%, 09/15/38a | | | 9,417 | | | | 11,997,782 | |
7.45%, 09/15/39 | | | 14,616 | | | | 20,095,324 | |
National Oilwell Varco Inc. | | | | | | | | |
2.60%, 12/01/22 (Call 09/01/22)a | | | 19,021 | | | | 17,931,412 | |
3.95%, 12/01/42 (Call 06/01/42)a | | | 8,714 | | | | 6,641,367 | |
Schlumberger Investment SA | | | | | | | | |
3.65%, 12/01/23 (Call 09/01/23) | | | 22,202 | | | | 23,735,197 | |
| | | | | | | | |
| | | | 180,335,922 | |
PHARMACEUTICALS — 6.07% | |
AbbVie Inc. | | | | | | | | |
2.30%, 05/14/21 (Call 04/14/21) | | | 18,035 | | | | 18,012,611 | |
2.50%, 05/14/20 (Call 04/14/20) | | | 38,602 | | | | 39,046,985 | |
| | | | |
SCHEDULESOF INVESTMENTS | | | 97 | |
Schedule of Investments (Unaudited) (Continued)
iSHARES® iBOXX $ INVESTMENT GRADE CORPORATE BOND ETF
October 31, 2016
| | | | | | | | |
| Security | |
Principal
(000s) | | | Value | |
2.85%, 05/14/23 (Call 03/14/23) | | $ | 16,800 | | | $ | 16,817,395 | |
2.90%, 11/06/22a | | | 38,114 | | | | 38,572,816 | |
3.20%, 11/06/22 (Call 09/06/22)a | | | 14,043 | | | | 14,445,346 | |
3.20%, 05/14/26 (Call 02/14/26)a | | | 26,240 | | | | 25,869,213 | |
3.60%, 05/14/25 (Call 02/14/25) | | | 49,995 | | | | 50,986,316 | |
4.30%, 05/14/36 (Call 11/14/35) | | | 10,550 | | | | 10,512,869 | |
4.40%, 11/06/42a | | | 28,502 | | | | 27,982,238 | |
4.45%, 05/14/46 (Call 11/14/45) | | | 23,835 | | | | 23,585,178 | |
4.50%, 05/14/35 (Call 11/14/34)a | | | 32,415 | | | | 33,071,193 | |
4.70%, 05/14/45 (Call 11/14/44) | | | 32,435 | | | | 33,272,686 | |
Actavis Funding SCS | | | | | | | | |
3.00%, 03/12/20 (Call 02/12/20)a | | | 45,903 | | | | 47,281,582 | |
3.45%, 03/15/22 (Call 01/15/22) | | | 34,280 | | | | 35,582,613 | |
3.80%, 03/15/25 (Call 12/15/24)a | | | 53,032 | | | | 54,938,156 | |
3.85%, 06/15/24 (Call 03/15/24) | | | 18,400 | | | | 19,174,055 | |
4.55%, 03/15/35 (Call 09/15/34)a | | | 28,605 | | | | 29,531,556 | |
4.75%, 03/15/45 (Call 09/15/44)a | | | 30,690 | | | | 32,069,141 | |
4.85%, 06/15/44 (Call 12/15/43) | | | 22,184 | | | | 23,281,755 | |
Actavis Inc. | | | | | | | | |
3.25%, 10/01/22 (Call 07/01/22)a | | | 15,908 | | | | 16,311,904 | |
4.63%, 10/01/42 (Call 04/01/42) | | | 7,644 | | | | 7,789,231 | |
AstraZeneca PLC | | | | | | | | |
2.38%, 11/16/20 | | | 19,842 | | | | 20,182,409 | |
3.38%, 11/16/25a | | | 22,860 | | | | 23,799,041 | |
4.00%, 09/18/42a | | | 5,017 | | | | 5,052,486 | |
4.38%, 11/16/45a | | | 18,685 | | | | 19,773,958 | |
6.45%, 09/15/37 | | | 33,865 | | | | 45,627,544 | |
| | | | | | | | |
| Security | |
Principal
(000s) | | | Value | |
Baxalta Inc. | | | | | | | | |
2.88%, 06/23/20 (Call 05/23/20)a | | $ | 14,130 | | | $ | 14,430,619 | |
4.00%, 06/23/25 (Call 03/23/25) | | | 18,825 | | | | 19,698,241 | |
5.25%, 06/23/45 (Call 12/23/44) | | | 17,204 | | | | 19,532,804 | |
Bristol-Myers Squibb Co. | | | | | | | | |
2.00%, 08/01/22 | | | 11,188 | | | | 11,172,153 | |
Eli Lilly & Co. | | | | | | | | |
2.75%, 06/01/25 (Call 03/01/25) | | | 11,868 | | | | 12,294,975 | |
3.70%, 03/01/45 (Call 09/01/44) | | | 10,463 | | | | 10,702,135 | |
Express Scripts Holding Co. | | | | | | | | |
3.00%, 07/15/23 (Call 05/15/23)a | | | 14,220 | | | | 14,166,664 | |
3.40%, 03/01/27 (Call 12/01/26)a | | | 18,650 | | | | 18,385,013 | |
3.50%, 06/15/24 (Call 03/15/24) | | | 15,812 | | | | 16,237,030 | |
3.90%, 02/15/22a | | | 8,442 | | | | 9,024,747 | |
4.50%, 02/25/26 (Call 11/27/25)a | | | 14,740 | | | | 15,794,281 | |
4.75%, 11/15/21 | | | 15,786 | | | | 17,474,832 | |
4.80%, 07/15/46 (Call 01/15/46)a | | | 18,150 | | | | 18,176,189 | |
GlaxoSmithKline Capital Inc. | | | | | | | | |
2.80%, 03/18/23 | | | 18,724 | | | | 19,276,596 | |
6.38%, 05/15/38 | | | 33,534 | | | | 46,718,331 | |
GlaxoSmithKline Capital PLC | | | | | | | | |
2.85%, 05/08/22 | | | 22,570 | | | | 23,449,185 | |
Johnson & Johnson | | | | | | | | |
1.65%, 03/01/21 (Call 02/01/21) | | | 11,010 | | | | 11,039,410 | |
2.45%, 03/01/26 (Call 12/01/25) | | | 28,352 | | | | 28,603,686 | |
3.38%, 12/05/23a | | | 8,401 | | | | 9,131,601 | |
3.55%, 03/01/36 (Call 09/01/35)a | | | 13,592 | | | | 14,433,280 | |
3.70%, 03/01/46 (Call 09/01/45) | | | 21,752 | | | | 23,215,955 | |
4.38%, 12/05/33 (Call 06/05/33) | | | 8,670 | | | | 10,029,237 | |
| | |
| 98 | | 2016 iSHARES ANNUAL REPORTTO SHAREHOLDERS |
Schedule of Investments (Unaudited) (Continued)
iSHARES® iBOXX $ INVESTMENT GRADE CORPORATE BOND ETF
October 31, 2016
| | | | | | | | |
| Security | |
Principal
(000s) | | | Value | |
5.95%, 08/15/37a | | $ | 11,974 | | | $ | 16,799,757 | |
McKesson Corp. | | | | | | | | |
3.80%, 03/15/24 (Call 12/15/23)a | | | 12,316 | | | | 13,035,145 | |
4.88%, 03/15/44 (Call 09/15/43) | | | 7,104 | | | | 7,676,680 | |
Mead Johnson Nutrition Co. | | | | | | | | |
3.00%, 11/15/20 | | | 4,010 | | | | 4,139,357 | |
4.13%, 11/15/25 (Call 08/15/25) | | | 9,070 | | | | 9,683,485 | |
Merck & Co. Inc. | | | | | | | | |
1.85%, 02/10/20a | | | 9,624 | | | | 9,730,855 | |
2.35%, 02/10/22 | | | 12,545 | | | | 12,761,109 | |
2.40%, 09/15/22 (Call 06/15/22) | | | 19,496 | | | | 19,815,438 | |
2.75%, 02/10/25 (Call 11/10/24) | | | 33,956 | | | | 34,607,772 | |
2.80%, 05/18/23 | | | 21,487 | | | | 22,130,110 | |
3.70%, 02/10/45 (Call 08/10/44)a | | | 21,078 | | | | 21,460,216 | |
3.88%, 01/15/21 (Call 10/15/20)a | | | 10,129 | | | | 10,941,953 | |
4.15%, 05/18/43 | | | 17,421 | | | | 19,117,340 | |
Mylan NV | | | | | | | | |
3.15%, 06/15/21 (Call 05/15/21)a,b | | | 21,750 | | | | 22,114,506 | |
3.95%, 06/15/26 (Call 03/15/26)a,b | | | 35,530 | | | | 35,425,791 | |
5.25%, 06/15/46 (Call 12/15/45)a,b | | | 12,340 | | | | 12,493,238 | |
Novartis Capital Corp. | | | | | | | | |
2.40%, 09/21/22a | | | 22,395 | | | | 22,876,441 | |
3.00%, 11/20/25 (Call 08/20/25)a | | | 17,215 | | | | 17,958,803 | |
3.40%, 05/06/24 | | | 26,475 | | | | 28,536,370 | |
4.00%, 11/20/45 (Call 05/20/45)a | | | 18,095 | | | | 19,411,386 | |
4.40%, 04/24/20 | | | 8,577 | | | | 9,363,648 | |
4.40%, 05/06/44 | | | 21,830 | | | | 24,652,787 | |
Perrigo Co. PLC | | | | | | | | |
4.00%, 11/15/23 (Call 08/15/23)a | | | 10,590 | | | | 10,905,354 | |
Perrigo Finance Unlimited Co. | | | | | | | | |
3.90%, 12/15/24 (Call 09/15/24) | | | 2,721 | | | | 2,754,359 | |
| | | | | | | | |
| Security | |
Principal
(000s) | | | Value | |
Pfizer Inc. | | | | | | | | |
1.95%, 06/03/21a | | $ | 13,877 | | | $ | 13,933,121 | |
2.75%, 06/03/26a | | | 24,750 | | | | 25,208,672 | |
3.00%, 06/15/23 | | | 11,323 | | | | 11,890,283 | |
3.40%, 05/15/24a | | | 11,040 | | | | 11,867,725 | |
4.30%, 06/15/43a | | | 11,525 | | | | 12,714,132 | |
4.40%, 05/15/44 | | | 6,550 | | | | 7,353,538 | |
7.20%, 03/15/39a | | | 31,034 | | | | 46,020,191 | |
Sanofi | | | | | | | | |
4.00%, 03/29/21 | | | 28,226 | | | | 30,802,100 | |
Shire Acquisitions Investments Ireland DAC | | | | | | | | |
2.40%, 09/23/21 (Call 08/23/21)a | | | 38,250 | | | | 37,893,380 | |
2.88%, 09/23/23 (Call 07/23/23)a | | | 31,700 | | | | 31,215,513 | |
3.20%, 09/23/26 (Call 06/23/26) | | | 36,250 | | | | 35,515,724 | |
Teva Pharmaceutical Finance Netherlands III BV | | | | | | | | |
2.20%, 07/21/21 | | | — | | | | — | |
2.80%, 07/21/23 | | | — | | | | — | |
3.15%, 10/01/26 | | | 330 | | | | 320,842 | |
4.10%, 10/01/46 | | | — | | | | — | |
Wyeth LLC | | | | | | | | |
5.95%, 04/01/37 | | | 20,710 | | | | 26,920,059 | |
6.50%, 02/01/34a | | | 10,170 | | | | 13,613,626 | |
Zoetis Inc. | | | | | | | | |
3.25%, 02/01/23 (Call 11/01/22)a | | | 21,255 | | | | 21,644,647 | |
4.50%, 11/13/25 (Call 08/13/25)a | | | 6,800 | | | | 7,518,189 | |
4.70%, 02/01/43 (Call 08/01/42) | | | 13,305 | | | | 13,620,918 | |
| | | | | | | | |
| | | | 1,852,001,801 | |
PIPELINES — 2.60% | | | | | | | | |
Columbia Pipeline Group Inc. | | | | | | | | |
3.30%, 06/01/20 (Call 05/01/20)a | | | 8,880 | | | | 9,160,509 | |
4.50%, 06/01/25 (Call 03/01/25) | | | 11,611 | | | | 12,516,837 | |
Energy Transfer Partners LP | | | | | | | | |
3.60%, 02/01/23 (Call 11/01/22) | | | 9,744 | | | | 9,617,897 | |
| | | | |
SCHEDULESOF INVESTMENTS | | | 99 | |
Schedule of Investments (Unaudited) (Continued)
iSHARES® iBOXX $ INVESTMENT GRADE CORPORATE BOND ETF
October 31, 2016
| | | | | | | | |
| Security | |
Principal
(000s) | | | Value | |
4.05%, 03/15/25 (Call 12/15/24) | | $ | 11,055 | | | $ | 10,918,816 | |
4.15%, 10/01/20 (Call 08/01/20) | | | 6,310 | | | | 6,611,146 | |
4.65%, 06/01/21 (Call 03/01/21) | | | 8,933 | | | | 9,565,088 | |
4.75%, 01/15/26 (Call 10/15/25) | | | 13,935 | | | | 14,350,653 | |
5.15%, 03/15/45 (Call 09/15/44) | | | 15,944 | | | | 14,709,072 | |
5.20%, 02/01/22 (Call 11/01/21) | | | 13,655 | | | | 14,899,787 | |
6.13%, 12/15/45 (Call 06/15/45) | | | 10,510 | | | | 10,924,131 | |
6.50%, 02/01/42 (Call 08/01/41)a | | | 12,956 | | | | 13,714,045 | |
Enterprise Products Operating LLC | | | | | | | | |
3.35%, 03/15/23 (Call 12/15/22) | | | 14,367 | | | | 14,654,284 | |
3.70%, 02/15/26 (Call 11/15/25)a | | | 12,620 | | | | 12,845,555 | |
3.75%, 02/15/25 (Call 11/15/24)a | | | 13,452 | | | | 13,897,459 | |
3.90%, 02/15/24 (Call 11/15/23) | | | 11,640 | | | | 12,155,027 | |
3.95%, 02/15/27 (Call 11/15/26)a | | | 2,170 | | | | 2,257,777 | |
4.45%, 02/15/43 (Call 08/15/42) | | | 11,988 | | | | 11,551,277 | |
4.85%, 08/15/42 (Call 02/15/42) | | | 11,947 | | | | 12,137,280 | |
4.85%, 03/15/44 (Call 09/15/43) | | | 18,135 | | | | 18,308,173 | |
4.90%, 05/15/46 (Call 11/15/45) | | | 7,810 | | | | 8,038,515 | |
5.10%, 02/15/45 (Call 08/15/44) | | | 13,644 | | | | 14,410,569 | |
5.20%, 09/01/20 | | | 13,343 | | | | 14,862,047 | |
5.95%, 02/01/41 | | | 9,835 | | | | 11,252,968 | |
Kinder Morgan Energy Partners LP | | | | | | | | |
3.50%, 03/01/21 (Call 01/01/21) | | | 11,062 | | | | 11,351,903 | |
| | | | | | | | |
| Security | |
Principal
(000s) | | | Value | |
3.95%, 09/01/22 (Call 06/01/22)a | | $ | 14,169 | | | $ | 14,822,054 | |
5.50%, 03/01/44 (Call 09/01/43) | | | 14,886 | | | | 15,051,190 | |
6.95%, 01/15/38 | | | 10,469 | | | | 11,955,423 | |
Kinder Morgan Inc./DE | | | | | | | | |
3.05%, 12/01/19 (Call 11/01/19) | | | 14,840 | | | | 15,202,878 | |
4.30%, 06/01/25 (Call 03/01/25)a | | | 21,231 | | | | 22,029,126 | |
5.05%, 02/15/46 (Call 08/15/45) | | | 15,625 | | | | 15,121,931 | |
5.30%, 12/01/34 (Call 06/01/34) | | | 7,504 | | | | 7,545,995 | |
5.55%, 06/01/45 (Call 12/01/44)a | | | 18,225 | | | | 18,915,946 | |
7.75%, 01/15/32 | | | 10,269 | | | | 12,520,600 | |
MPLX LP | | | | | | | | |
4.50%, 07/15/23 (Call 04/15/23) | | | 11,650 | | | | 11,990,996 | |
4.88%, 12/01/24 (Call 09/01/24)a | | | 11,540 | | | | 12,060,583 | |
4.88%, 06/01/25 (Call 03/01/25) | | | 15,235 | | | | 15,911,434 | |
ONEOK Partners LP | | | | | | | | |
3.38%, 10/01/22 (Call 07/01/22) | | | 11,801 | | | | 12,022,508 | |
Plains All American Pipeline LP/PAA Finance Corp. | | | | | | | | |
3.60%, 11/01/24 (Call 08/01/24) | | | 13,684 | | | | 13,482,361 | |
3.65%, 06/01/22 (Call 03/01/22) | | | 6,701 | | | | 6,900,205 | |
4.65%, 10/15/25 (Call 07/15/25)a | | | 11,570 | | | | 12,260,525 | |
Regency Energy Partners LP/Regency Energy Finance Corp. | | | | | | | | |
5.88%, 03/01/22 (Call 12/01/21)a | | | 13,141 | | | | 14,686,112 | |
Spectra Energy Partners LP | | | | | | | | |
4.75%, 03/15/24 (Call 12/15/23) | | | 9,345 | | | | 10,210,728 | |
| | |
| 100 | | 2016 iSHARES ANNUAL REPORTTO SHAREHOLDERS |
Schedule of Investments (Unaudited) (Continued)
iSHARES® iBOXX $ INVESTMENT GRADE CORPORATE BOND ETF
October 31, 2016
| | | | | | | | |
| Security | |
Principal
(000s) | | | Value | |
Sunoco Logistics Partners Operations LP | | | | | | | | |
5.35%, 05/15/45 (Call 11/15/44) | | $ | 12,760 | | | $ | 12,870,110 | |
TransCanada PipeLines Ltd. | | | | | | | | |
2.50%, 08/01/22a | | | 7,609 | | | | 7,592,558 | |
3.80%, 10/01/20a | | | 13,288 | | | | 14,121,017 | |
4.63%, 03/01/34 (Call 12/01/33)a | | | 14,914 | | | | 16,329,052 | |
4.88%, 01/15/26 (Call 10/15/25)a | | | 12,705 | | | | 14,557,422 | |
6.10%, 06/01/40 | | | 8,567 | | | | 10,897,879 | |
6.20%, 10/15/37a | | | 10,910 | | | | 13,850,163 | |
7.63%, 01/15/39 | | | 17,446 | | | | 25,803,412 | |
Transcontinental Gas Pipe Line Co. LLC | | | | | | | | |
7.85%, 02/01/26 (Call 11/01/25)b | | | 5,400 | | | | 6,881,272 | |
Williams Partners LP | | | | | | | | |
3.35%, 08/15/22 (Call 05/15/22) | | | 8,831 | | | | 8,797,379 | |
3.60%, 03/15/22 (Call 01/15/22) | | | 10,615 | | | | 10,802,959 | |
3.90%, 01/15/25 (Call 10/15/24) | | | 9,636 | | | | 9,565,831 | |
4.00%, 09/15/25 (Call 06/15/25) | | | 8,665 | | | | 8,645,543 | |
4.30%, 03/04/24 (Call 12/04/23) | | | 14,030 | | | | 14,329,931 | |
5.10%, 09/15/45 (Call 03/15/45) | | | 10,195 | | | | 9,760,168 | |
5.25%, 03/15/20 | | | 18,218 | | | | 19,686,886 | |
6.30%, 04/15/40 | | | 16,828 | | | | 17,807,756 | |
Williams Partners LP/ACMP Finance Corp. | | | | | | | | |
4.88%, 05/15/23 (Call 12/15/17) | | | 18,750 | | | | 18,984,375 | |
4.88%, 03/15/24 (Call 03/15/19) | | | 15,850 | | | | 16,167,000 | |
6.13%, 07/15/22 (Call 01/15/17) | | | 8,570 | | | | 8,867,522 | |
| | | | | | | | |
| | | | 793,719,645 | |
| | | | | | | | |
| Security | |
Principal
(000s) | | | Value | |
REAL ESTATE — 0.07% | | | | | | | | |
Prologis LP | | | | | | | | |
3.75%, 11/01/25 (Call 08/01/25)a | | $ | 8,950 | | | $ | 9,558,278 | |
4.25%, 08/15/23 (Call 05/15/23)a | | | 9,900 | | | | 10,742,441 | |
| | | | | | | | |
| | | | 20,300,719 | |
REAL ESTATE INVESTMENT TRUSTS — 1.05% | |
American Tower Corp. | | | | | | | | |
2.80%, 06/01/20 (Call 05/01/20) | | | 8,860 | | | | 9,030,155 | |
3.30%, 02/15/21 (Call 01/15/21)a | | | 8,429 | | | | 8,748,975 | |
3.38%, 10/15/26 (Call 07/15/26) | | | 3,550 | | | | 3,532,032 | |
3.50%, 01/31/23a | | | 14,346 | | | | 14,779,080 | |
4.00%, 06/01/25 (Call 03/01/25)a | | | 13,577 | | | | 14,277,944 | |
4.70%, 03/15/22a | | | 2,100 | | | | 2,313,591 | |
5.00%, 02/15/24 | | | 12,371 | | | | 13,777,048 | |
Boston Properties LP | | | | | | | | |
2.75%, 10/01/26 (Call 07/01/26) | | | 5,000 | | | | 4,820,033 | |
3.65%, 02/01/26 (Call 11/03/25) | | | 12,350 | | | | 12,827,717 | |
3.85%, 02/01/23 (Call 11/01/22)a | | | 13,758 | | | | 14,525,950 | |
4.13%, 05/15/21 (Call 02/15/21) | | | 11,621 | | | | 12,537,802 | |
Crown Castle International Corp. | | | | | | | | |
2.25%, 09/01/21 (Call 08/01/21)a | | | 2,480 | | | | 2,458,620 | |
3.40%, 02/15/21 (Call 01/15/21) | | | 605 | | | | 628,737 | |
3.70%, 06/15/26 (Call 03/15/26)a | | | 2,450 | | | | 2,511,141 | |
4.45%, 02/15/26 (Call 11/15/25) | | | 3,765 | | | | 4,066,117 | |
4.88%, 04/15/22a | | | 7,575 | | | | 8,351,884 | |
5.25%, 01/15/23 | | | 34,265 | | | | 38,323,141 | |
ERP Operating LP | | | | | | | | |
4.50%, 07/01/44 (Call 01/01/44) | | | 6,423 | | | | 6,894,117 | |
| | | | |
SCHEDULESOF INVESTMENTS | | | 101 | |
Schedule of Investments (Unaudited) (Continued)
iSHARES® iBOXX $ INVESTMENT GRADE CORPORATE BOND ETF
October 31, 2016
| | | | | | | | |
| Security | |
Principal
(000s) | | | Value | |
4.63%, 12/15/21 (Call 09/15/21) | | $ | 13,711 | | | $ | 15,288,492 | |
HCP Inc. | | | | | | | | |
2.63%, 02/01/20 (Call 11/01/19)a | | | 6,637 | | | | 6,714,914 | |
3.88%, 08/15/24 (Call 05/17/24) | | | 9,015 | | | | 9,252,032 | |
4.00%, 06/01/25 (Call 03/01/25) | | | 11,275 | | | | 11,501,598 | |
4.25%, 11/15/23 (Call 08/15/23) | | | 10,628 | | | | 11,115,264 | |
5.38%, 02/01/21 (Call 11/03/20) | | | 9,970 | | | | 11,080,314 | |
Simon Property Group LP | | | | | | | | |
3.30%, 01/15/26 (Call 10/15/25)a | | | 9,800 | | | | 10,217,022 | |
3.38%, 10/01/24 (Call 07/01/24)a | | | 7,899 | | | | 8,266,479 | |
4.38%, 03/01/21 (Call 12/01/20) | | | 10,149 | | | | 11,111,495 | |
5.65%, 02/01/20 (Call 11/01/19) | | | 17,271 | | | | 19,211,082 | |
Welltower Inc. | | | | | | | | |
4.00%, 06/01/25 (Call 03/01/25)a | | | 13,975 | | | | 14,571,678 | |
Weyerhaeuser Co. | | | | | | | | |
7.38%, 03/15/32a | | | 14,489 | | | | 19,031,984 | |
| | | | | | | | |
| | | | 321,766,438 | |
RETAIL — 4.26% | | | | | | | | |
Costco Wholesale Corp. | | | | | | | | |
1.70%, 12/15/19 | | | 9,887 | | | | 9,952,590 | |
CVS Health Corp. | | | | | | | | |
2.13%, 06/01/21 (Call 05/01/21)a | | | 22,325 | | | | 22,340,866 | |
2.75%, 12/01/22 (Call 09/01/22) | | | 16,655 | | | | 16,944,705 | |
2.80%, 07/20/20 (Call 06/20/20)a | | | 32,095 | | | | 33,063,932 | |
2.88%, 06/01/26 (Call 03/01/26) | | | 18,700 | | | | 18,558,602 | |
3.50%, 07/20/22 (Call 05/20/22)a | | | 18,477 | | | | 19,490,207 | |
3.88%, 07/20/25 (Call 04/20/25) | | | 37,838 | | | | 40,368,034 | |
| | | | | | | | |
| Security | |
Principal
(000s) | | | Value | |
4.00%, 12/05/23 (Call 09/05/23)a | | $ | 18,952 | | | $ | 20,525,814 | |
4.88%, 07/20/35 (Call 01/20/35)a | | | 1,763 | | | | 1,979,686 | |
5.13%, 07/20/45 (Call 01/20/45)a | | | 42,160 | | | | 48,951,002 | |
5.30%, 12/05/43 (Call 06/05/43) | | | 7,340 | | | | 8,652,996 | |
Home Depot Inc. (The) | | | | | | | | |
2.00%, 04/01/21 (Call 03/01/21)a | | | 13,140 | | | | 13,297,154 | |
2.13%, 09/15/26 (Call 06/15/26)a | | | 6,505 | | | | 6,267,688 | |
2.63%, 06/01/22 (Call 05/01/22) | | | 16,479 | | | | 16,983,498 | |
2.70%, 04/01/23 (Call 01/01/23)a | | | 10,243 | | | | 10,515,545 | |
3.00%, 04/01/26 (Call 01/01/26)a | | | 15,975 | | | | 16,570,182 | |
3.35%, 09/15/25 (Call 06/15/25) | | | 12,400 | | | | 13,227,396 | |
3.50%, 09/15/56 (Call 03/15/56) | | | 8,980 | | | | 8,324,986 | |
3.75%, 02/15/24 (Call 11/15/23) | | | 20,041 | | | | 21,835,415 | |
4.20%, 04/01/43 (Call 10/01/42) | | | 13,753 | | | | 14,879,202 | |
4.25%, 04/01/46 (Call 10/01/45)a | | | 20,584 | | | | 22,473,119 | |
4.40%, 04/01/21 (Call 01/01/21) | | | 15,518 | | | | 17,131,866 | |
4.40%, 03/15/45 (Call 09/15/44) | | | 13,765 | | | | 15,383,149 | |
4.88%, 02/15/44 (Call 08/15/43) | | | 8,665 | | | | 10,252,204 | |
5.88%, 12/16/36 | | | 38,257 | | | | 50,505,594 | |
5.95%, 04/01/41 (Call 10/01/40)a | | | 14,252 | | | | 19,000,840 | |
Lowe’s Companies Inc. | | | | | | | | |
2.50%, 04/15/26 (Call 01/15/26) | | | 16,036 | | | | 15,845,832 | |
3.12%, 04/15/22 (Call 01/15/22)a | | | 6,544 | | | | 6,873,049 | |
| | |
| 102 | | 2016 iSHARES ANNUAL REPORTTO SHAREHOLDERS |
Schedule of Investments (Unaudited) (Continued)
iSHARES® iBOXX $ INVESTMENT GRADE CORPORATE BOND ETF
October 31, 2016
| | | | | | | | |
| Security | |
Principal
(000s) | | | Value | |
3.38%, 09/15/25 (Call 06/15/25) | | $ | 16,635 | | | $ | 17,668,564 | |
3.70%, 04/15/46 (Call 10/15/45)a | | | 13,735 | | | | 13,541,199 | |
4.38%, 09/15/45 (Call 03/15/45) | | | 8,825 | | | | 9,619,994 | |
4.65%, 04/15/42 (Call 10/15/41)a | | | 6,056 | | | | 6,799,301 | |
Macy’s Retail Holdings Inc. | | | | | | | | |
2.88%, 02/15/23 (Call 11/15/22)a | | | 10,990 | | | | 10,596,337 | |
McDonald’s Corp. | | | | | | | | |
2.63%, 01/15/22 | | | 11,473 | | | | 11,744,688 | |
2.75%, 12/09/20 (Call 11/09/20) | | | 15,550 | | | | 16,029,326 | |
3.70%, 01/30/26 (Call 10/30/25)a | | | 15,830 | | | | 16,713,923 | |
4.70%, 12/09/35 (Call 06/09/35)a | | | 11,177 | | | | 12,263,504 | |
4.88%, 12/09/45 (Call 06/09/45)a | | | 19,834 | | | | 22,197,404 | |
6.30%, 10/15/37 | | | 8,626 | | | | 11,076,282 | |
6.30%, 03/01/38a | | | 10,000 | | | | 12,853,640 | |
Starbucks Corp. | | | | | | | | |
2.10%, 02/04/21 (Call 01/04/21) | | | 15,265 | | | | 15,467,721 | |
3.85%, 10/01/23 (Call 07/01/23) | | | 450 | | | | 496,043 | |
Target Corp. | | | | | | | | |
2.50%, 04/15/26a | | | 17,013 | | | | 16,944,691 | |
2.90%, 01/15/22a | | | 9,579 | | | | 9,994,875 | |
3.50%, 07/01/24 | | | 15,750 | | | | 16,961,893 | |
3.63%, 04/15/46a | | | 10,390 | | | | 10,247,325 | |
3.88%, 07/15/20 | | | 6,956 | | | | 7,514,680 | |
4.00%, 07/01/42a | | | 16,894 | | | | 17,631,663 | |
6.50%, 10/15/37 | | | 1,000 | | | | 1,394,749 | |
TJX Companies Inc. (The) | | | | | | | | |
2.25%, 09/15/26 (Call 06/15/26) | | | 10,000 | | | | 9,617,300 | |
Wal-Mart Stores Inc. | | | | | | | | |
2.55%, 04/11/23 (Call 01/11/23) | | | 23,124 | | | | 23,678,590 | |
3.25%, 10/25/20a | | | 18,968 | | | | 20,201,603 | |
| | | | | | | | |
| Security | |
Principal
(000s) | | | Value | |
3.30%, 04/22/24 (Call 01/22/24)a | | $ | 19,684 | | | $ | 21,057,071 | |
3.63%, 07/08/20a | | | 22,591 | | | | 24,272,143 | |
4.00%, 04/11/43 (Call 10/11/42)a | | | 13,515 | | | | 14,445,258 | |
4.25%, 04/15/21a | | | 15,019 | | | | 16,648,694 | |
4.30%, 04/22/44 (Call 10/22/43)a | | | 5,943 | | | | 6,664,324 | |
4.75%, 10/02/43 (Call 04/02/43)a | | | 9,512 | | | | 11,301,219 | |
4.88%, 07/08/40 | | | 10,744 | | | | 12,802,069 | |
5.00%, 10/25/40 | | | 17,538 | | | | 21,186,390 | |
5.25%, 09/01/35 | | | 33,639 | | | | 42,940,315 | |
5.63%, 04/01/40 | | | 18,675 | | | | 24,258,261 | |
5.63%, 04/15/41 | | | 20,223 | | | | 26,438,353 | |
5.88%, 04/05/27a | | | 5,979 | | | | 7,682,727 | |
6.20%, 04/15/38 | | | 26,411 | | | | 36,692,440 | |
6.50%, 08/15/37a | | | 32,635 | | | | 46,703,958 | |
7.55%, 02/15/30 | | | 9,952 | | | | 14,814,734 | |
Walgreen Co. | | | | | | | | |
3.10%, 09/15/22 | | | 13,109 | | | | 13,527,560 | |
Walgreens Boots Alliance Inc. | | | | | | | | |
2.60%, 06/01/21 (Call 05/01/21)a | | | 10,225 | | | | 10,339,542 | |
2.70%, 11/18/19 (Call 10/18/19)a | | | 16,125 | | | | 16,537,213 | |
3.10%, 06/01/23 (Call 04/01/23)a | | | 9,750 | | | | 9,895,566 | |
3.30%, 11/18/21 (Call 09/18/21) | | | 19,000 | | | | 19,857,924 | |
3.45%, 06/01/26 (Call 03/01/26)a | | | 24,350 | | | | 24,854,783 | |
3.80%, 11/18/24 (Call 08/18/24)a | | | 23,625 | | | | 24,838,267 | |
4.80%, 11/18/44 (Call 05/18/44)a | | | 20,945 | | | | 22,351,928 | |
| | | | | | | | |
| | | | 1,301,561,187 | |
SEMICONDUCTORS — 1.11% | | | | | | | | |
Applied Materials Inc. | | | | | | | | |
4.30%, 06/15/21 | | | 11,249 | | | | 12,425,571 | |
Intel Corp. | | | | | | | | |
2.45%, 07/29/20a | | | 23,410 | | | | 24,080,736 | |
2.60%, 05/19/26 (Call 02/19/26)a | | | 12,100 | | | | 12,149,331 | |
| | | | |
SCHEDULESOF INVESTMENTS | | | 103 | |
Schedule of Investments (Unaudited) (Continued)
iSHARES® iBOXX $ INVESTMENT GRADE CORPORATE BOND ETF
October 31, 2016
| | | | | | | | |
| Security | |
Principal
(000s) | | | Value | |
2.70%, 12/15/22a | | $ | 21,347 | | | $ | 22,062,052 | |
3.10%, 07/29/22 | | | 7,615 | | | | 8,039,278 | |
3.30%, 10/01/21 | | | 23,915 | | | | 25,437,929 | |
3.70%, 07/29/25 (Call 04/29/25)a | | | 28,420 | | | | 31,039,895 | |
4.00%, 12/15/32a | | | 4,589 | | | | 4,910,632 | |
4.10%, 05/19/46 (Call 11/19/45)a | | | 13,510 | | | | 13,945,807 | |
4.25%, 12/15/42 | | | 15,433 | | | | 16,287,994 | |
4.80%, 10/01/41a | | | 17,434 | | | | 19,831,911 | |
4.90%, 07/29/45 (Call 01/29/45)a | | | 23,509 | | | | 26,858,844 | |
Lam Research Corp. | | | | | | | | |
2.80%, 06/15/21 (Call 05/15/21) | | | 7,975 | | | | 8,120,631 | |
NVIDIA Corp. | | | | | | | | |
2.20%, 09/16/21 (Call 08/16/21)a | | | 6,000 | | | | 5,990,013 | |
3.20%, 09/16/26 (Call 06/16/26) | | | 6,750 | | | | 6,741,675 | |
QUALCOMM Inc. | | | | | | | | |
2.25%, 05/20/20 | | | 24,444 | | | | 24,801,068 | |
3.00%, 05/20/22a | | | 27,559 | | | | 28,738,341 | |
3.45%, 05/20/25 (Call 02/20/25)a | | | 13,333 | | | | 13,985,680 | |
4.65%, 05/20/35 (Call 11/20/34) | | | 15,945 | | | | 17,242,945 | |
4.80%, 05/20/45 (Call 11/20/44) | | | 14,240 | | | | 15,643,845 | |
| | | | | | | | |
| | | | 338,334,178 | |
SOFTWARE — 3.91% | | | | | | | | |
Activision Blizzard Inc. | | | | | | | | |
3.40%, 09/15/26 (Call 06/15/26)b | | | 10,500 | | | | 10,447,500 | |
Fidelity National Information Services Inc. | | | | | | | | |
2.25%, 08/15/21 (Call 07/15/21) | | | 1,900 | | | | 1,897,743 | |
3.00%, 08/15/26 (Call 05/15/26) | | | 14,015 | | | | 13,694,076 | |
3.50%, 04/15/23 (Call 01/15/23)a | | | 10,630 | | | | 11,062,032 | |
3.63%, 10/15/20 (Call 09/15/20) | | | 25,225 | | | | 26,596,783 | |
| | | | | | | | |
| Security | |
Principal
(000s) | | | Value | |
5.00%, 10/15/25 (Call 07/15/25)a | | $ | 23,250 | | | $ | 26,118,025 | |
Fiserv Inc. | | | | | | | | |
2.70%, 06/01/20 (Call 05/01/20) | | | 7,700 | | | | 7,875,065 | |
3.85%, 06/01/25 (Call 03/01/25)a | | | 12,850 | | | | 13,653,191 | |
Microsoft Corp. | | | | | | | | |
1.55%, 08/08/21 (Call 07/08/21) | | | 39,925 | | | | 39,463,611 | |
1.85%, 02/12/20 (Call 01/12/20) | | | 14,878 | | | | 15,034,639 | |
2.00%, 11/03/20 (Call 10/03/20)a | | | 23,700 | | | | 24,049,288 | |
2.00%, 08/08/23 (Call 06/08/23) | | | 9,100 | | | | 8,958,033 | |
2.13%, 11/15/22a | | | 6,842 | | | | 6,854,266 | |
2.38%, 02/12/22 (Call 01/12/22) | | | 18,720 | | | | 19,081,232 | |
2.38%, 05/01/23 (Call 02/01/23)a | | | 13,740 | | | | 13,876,648 | |
2.40%, 08/08/26 (Call 05/08/26) | | | 46,590 | | | | 45,736,206 | |
2.65%, 11/03/22 (Call 09/03/22) | | | 11,500 | | | | 11,876,790 | |
2.70%, 02/12/25 (Call 11/12/24)a | | | 26,482 | | | | 26,977,931 | |
3.00%, 10/01/20 | | | 8,563 | | | | 9,000,275 | |
3.13%, 11/03/25 (Call 08/03/25) | | | 33,972 | | | | 35,593,823 | |
3.45%, 08/08/36 (Call 02/08/36)a | | | 25,560 | | | | 25,246,849 | |
3.50%, 02/12/35 (Call 08/12/34) | | | 24,182 | | | | 24,262,354 | |
3.50%, 11/15/42a | | | 9,882 | | | | 9,375,004 | |
3.63%, 12/15/23 (Call 09/15/23)a | | | 25,097 | | | | 27,250,674 | |
3.70%, 08/08/46 (Call 02/08/46) | | | 57,125 | | | | 55,890,095 | |
3.75%, 02/12/45 (Call 08/12/44)a | | | 28,735 | | | | 28,341,339 | |
3.95%, 08/08/56 (Call 02/08/56)a | | | 30,450 | | | | 29,739,787 | |
4.00%, 02/12/55 (Call 08/12/54)a | | | 19,795 | | | | 19,484,610 | |
| | |
| 104 | | 2016 iSHARES ANNUAL REPORTTO SHAREHOLDERS |
Schedule of Investments (Unaudited) (Continued)
iSHARES® iBOXX $ INVESTMENT GRADE CORPORATE BOND ETF
October 31, 2016
| | | | | | | | |
| Security | |
Principal
(000s) | | | Value | |
4.20%, 11/03/35 (Call 05/03/35)a | | $ | 13,875 | | | $ | 15,238,388 | |
4.45%, 11/03/45 (Call 05/03/45)a | | | 39,629 | | | | 43,574,380 | |
4.50%, 10/01/40a | | | 9,400 | | | | 10,356,119 | |
4.75%, 11/03/55 (Call 05/03/55) | | | 7,770 | | | | 8,720,262 | |
5.20%, 06/01/39a | | | 12,719 | | | | 15,361,367 | |
5.30%, 02/08/41a | | | 11,208 | | | | 13,794,695 | |
Oracle Corp. | | | | | | | | |
1.90%, 09/15/21 (Call 08/15/21)a | | | 53,390 | | | | 53,202,452 | |
2.40%, 09/15/23 (Call 07/15/23)a | | | 17,600 | | | | 17,532,583 | |
2.50%, 05/15/22 (Call 03/15/22)a | | | 27,038 | | | | 27,465,173 | |
2.50%, 10/15/22a | | | 37,745 | | | | 38,324,956 | |
2.65%, 07/15/26 (Call 04/15/26)a | | | 38,950 | | | | 38,516,132 | |
2.80%, 07/08/21 | | | 14,772 | | | | 15,316,599 | |
2.95%, 05/15/25 (Call 02/15/25) | | | 37,340 | | | | 38,070,113 | |
3.40%, 07/08/24 (Call 04/08/24)a | | | 29,358 | | | | 30,989,568 | |
3.63%, 07/15/23a | | | 15,163 | | | | 16,228,848 | |
3.85%, 07/15/36 (Call 01/15/36)a | | | 6,425 | | | | 6,456,949 | |
3.88%, 07/15/20 | | | 13,981 | | | | 15,068,809 | |
3.90%, 05/15/35 (Call 11/15/34) | | | 12,985 | | | | 13,196,769 | |
4.00%, 07/15/46 (Call 01/15/46) | | | 36,950 | | | | 36,473,404 | |
4.13%, 05/15/45 (Call 11/15/44) | | | 26,706 | | | | 26,918,337 | |
4.30%, 07/08/34 (Call 01/08/34) | | | 21,941 | | | | 23,392,375 | |
4.38%, 05/15/55 (Call 11/15/54) | | | 23,829 | | | | 24,585,199 | |
4.50%, 07/08/44 (Call 01/08/44)a | | | 10,437 | | | | 11,065,291 | |
5.38%, 07/15/40 | | | 20,285 | | | | 24,196,068 | |
6.13%, 07/08/39 | | | 17,662 | | | | 22,916,816 | |
6.50%, 04/15/38a | | | 13,489 | | | | 18,109,117 | |
| | | | | | | | |
| | | | 1,192,508,638 | |
| | | | | | | | |
| Security | |
Principal
(000s) | | | Value | |
TELECOMMUNICATIONS — 7.73% | |
AT&T Corp. | | | | | | | | |
8.25%, 11/15/31a | | $ | 1,396 | | | $ | 1,995,183 | |
AT&T Inc. | | | | | | | | |
2.45%, 06/30/20 (Call 05/30/20)a | | | 33,910 | | | | 34,099,255 | |
2.63%, 12/01/22 (Call 09/01/22) | | | 14,387 | | | | 14,176,117 | |
2.80%, 02/17/21 (Call 01/17/21)a | | | 29,125 | | | | 29,489,779 | |
3.00%, 02/15/22a | | | 22,083 | | | | 22,328,620 | |
3.00%, 06/30/22 (Call 04/30/22) | | | 35,140 | | | | 35,603,395 | |
3.40%, 05/15/25 (Call 02/15/25)a | | | 65,368 | | | | 65,178,649 | |
3.60%, 02/17/23 (Call 12/17/22)a | | | 29,205 | | | | 29,986,184 | |
3.80%, 03/15/22a | | | 19,122 | | | | 20,107,181 | |
3.88%, 08/15/21a | | | 19,303 | | | | 20,411,606 | |
3.90%, 03/11/24 (Call 12/11/23) | | | 16,267 | | | | 16,930,889 | |
3.95%, 01/15/25 (Call 10/15/24)a | | | 16,910 | | | | 17,551,007 | |
4.13%, 02/17/26 (Call 11/17/25)a | | | 35,623 | | | | 37,251,566 | |
4.30%, 12/15/42 (Call 06/15/42) | | | 21,670 | | | | 19,952,986 | |
4.35%, 06/15/45 (Call 12/15/44) | | | 37,225 | | | | 34,027,372 | |
4.45%, 05/15/21a | | | 14,125 | | | | 15,267,961 | |
4.45%, 04/01/24 (Call 01/01/24)a | | | 16,046 | | | | 17,223,998 | |
4.50%, 05/15/35 (Call 11/15/34) | | | 25,544 | | | | 25,342,555 | |
4.50%, 03/09/48 (Call 09/09/47)b | | | 20,206 | | | | 18,920,378 | |
4.55%, 03/09/49 (Call 09/09/48)b | | | 20,300 | | | | 19,139,246 | |
4.60%, 02/15/21 (Call 11/15/20) | | | 11,955 | | | | 12,898,907 | |
4.75%, 05/15/46 (Call 11/15/45)a | | | 33,869 | | | | 33,143,706 | |
4.80%, 06/15/44 (Call 12/15/43) | | | 35,465 | | | | 34,913,363 | |
| | | | |
SCHEDULESOF INVESTMENTS | | | 105 | |
Schedule of Investments (Unaudited) (Continued)
iSHARES® iBOXX $ INVESTMENT GRADE CORPORATE BOND ETF
October 31, 2016
| | | | | | | | |
| Security | |
Principal
(000s) | | | Value | |
5.00%, 03/01/21a | | $ | 15,754 | | | $ | 17,299,671 | |
5.15%, 03/15/42a | | | 18,913 | | | | 19,424,054 | |
5.20%, 03/15/20a | | | 16,705 | | | | 18,297,732 | |
5.35%, 09/01/40 | | | 26,208 | | | | 27,685,604 | |
5.55%, 08/15/41a | | | 17,323 | | | | 18,737,007 | |
5.65%, 02/15/47 (Call 08/15/46)a | | | 17,350 | | | | 19,124,908 | |
6.00%, 08/15/40 (Call 05/15/40) | | | 16,395 | | | | 18,596,350 | |
6.30%, 01/15/38 | | | 21,113 | | | | 24,308,216 | |
6.38%, 03/01/41 | | | 19,477 | | | | 22,964,818 | |
6.50%, 09/01/37 | | | 2,650 | | | | 3,158,251 | |
6.55%, 02/15/39a | | | 15,050 | | | | 17,843,280 | |
British Telecommunications PLC | | | | | | | | |
9.38%, 12/15/30a | | | 30,556 | | | | 48,663,296 | |
CC Holdings GS V LLC/Crown Castle GS III Corp. | | | | | | | | |
3.85%, 04/15/23a | | | 18,519 | | | | 19,429,305 | |
Cisco Systems Inc. | | | | | | | | |
1.85%, 09/20/21 (Call 08/20/21) | | | 19,400 | | | | 19,332,692 | |
2.20%, 02/28/21 | | | 26,353 | | | | 26,805,481 | |
2.20%, 09/20/23 (Call 07/20/23) | | | 21,750 | | | | 21,647,686 | |
2.45%, 06/15/20a | | | 22,060 | | | | 22,628,506 | |
2.50%, 09/20/26 (Call 06/20/26) | | | 13,917 | | | | 13,805,706 | |
2.95%, 02/28/26a | | | 7,060 | | | | 7,302,279 | |
3.63%, 03/04/24a | | | 14,646 | | | | 15,870,316 | |
4.45%, 01/15/20 | | | 30,110 | | | | 32,718,619 | |
5.50%, 01/15/40a | | | 30,883 | | | | 38,827,130 | |
5.90%, 02/15/39a | | | 20,568 | | | | 26,945,719 | |
Deutsche Telekom International Finance BV | | | | | | | | |
8.75%, 06/15/30 | | | 40,446 | | | | 61,479,190 | |
New Cingular Wireless Services Inc. | | | | | | | | |
8.75%, 03/01/31a | | | 10,368 | | | | 15,815,629 | |
Orange SA | | | | | | | | |
4.13%, 09/14/21 | | | 14,224 | | | | 15,539,030 | |
5.38%, 01/13/42 | | | 10,717 | | | | 12,662,586 | |
5.50%, 02/06/44 (Call 08/06/43)a | | | 10,744 | | | | 13,073,299 | |
9.00%, 03/01/31 | | | 28,843 | | | | 44,813,929 | |
| | | | | | | | |
| Security | |
Principal
(000s) | | | Value | |
Rogers Communications Inc. | | | | | | | | |
4.10%, 10/01/23 (Call 07/01/23)a | | $ | 12,064 | | | $ | 13,178,103 | |
5.00%, 03/15/44 (Call 09/15/43)a | | | 11,725 | | | | 13,208,667 | |
Telefonica Emisiones SAU | | | | | | | | |
4.57%, 04/27/23 | | | 15,725 | | | | 17,212,585 | |
5.13%, 04/27/20 | | | 15,514 | | | | 17,008,456 | |
5.46%, 02/16/21 | | | 21,138 | | | | 23,805,326 | |
7.05%, 06/20/36 | | | 23,325 | | | | 29,687,150 | |
Telefonica Europe BV | | | | | | | | |
8.25%, 09/15/30 | | | 10,293 | | | | 14,618,941 | |
Verizon Communications Inc. | | | | | | | | |
1.75%, 08/15/21 (Call 07/15/21)a | | | 13,200 | | | | 12,920,373 | |
2.45%, 11/01/22 (Call 08/01/22)a | | | 25,556 | | | | 25,536,209 | |
2.63%, 02/21/20a | | | 42,078 | | | | 42,806,307 | |
2.63%, 08/15/26 (Call 05/15/26)a | | | 13,950 | | | | 13,326,289 | |
3.00%, 11/01/21 (Call 09/01/21) | | | 17,009 | | | | 17,478,438 | |
3.45%, 03/15/21a | | | 10,825 | | | | 11,322,495 | |
3.50%, 11/01/21 | | | 28,846 | | | | 30,448,404 | |
3.50%, 11/01/24 (Call 08/01/24)a | | | 37,425 | | | | 38,950,136 | |
3.85%, 11/01/42 (Call 05/01/42) | | | 7,969 | | | | 7,305,476 | |
4.13%, 08/15/46 (Call 02/15/46)a | | | 4,635 | | | | 4,417,231 | |
4.15%, 03/15/24 (Call 12/15/23)a | | | 14,709 | | | | 15,940,841 | |
4.27%, 01/15/36a | | | 34,343 | | | | 34,305,188 | |
4.40%, 11/01/34 (Call 05/01/34)a | | | 27,909 | | | | 28,210,292 | |
4.50%, 09/15/20 | | | 50,096 | | | | 54,501,357 | |
4.52%, 09/15/48 | | | 68,300 | | | | 68,334,935 | |
4.60%, 04/01/21a | | | 17,499 | | | | 19,230,195 | |
4.67%, 03/15/55 | | | 70,700 | | | | 69,170,335 | |
4.75%, 11/01/41 | | | 9,448 | | | | 9,781,852 | |
4.86%, 08/21/46a | | | 60,522 | | | | 63,715,419 | |
5.01%, 08/21/54a | | | 65,990 | | | | 68,193,175 | |
5.05%, 03/15/34 (Call 12/15/33)a | | | 14,237 | | | | 15,449,300 | |
| | |
| 106 | | 2016 iSHARES ANNUAL REPORTTO SHAREHOLDERS |
Schedule of Investments (Unaudited) (Continued)
iSHARES® iBOXX $ INVESTMENT GRADE CORPORATE BOND ETF
October 31, 2016
| | | | | | | | |
| Security | |
Principal
(000s) | | | Value | |
5.15%, 09/15/23 | | $ | 106,142 | | | $ | 121,408,404 | |
5.85%, 09/15/35 | | | 17,581 | | | | 20,781,683 | |
6.00%, 04/01/41 | | | 9,543 | | | | 11,426,269 | |
6.40%, 09/15/33 | | | 16,426 | | | | 20,625,414 | |
6.40%, 02/15/38a | | | 8,662 | | | | 10,782,928 | |
6.55%, 09/15/43 | | | 52,918 | | | | 69,355,717 | |
6.90%, 04/15/38 | | | 1,895 | | | | 2,465,717 | |
7.75%, 12/01/30 | | | 5,872 | | | | 8,271,987 | |
Vodafone Group PLC | | | | | | | | |
2.50%, 09/26/22 | | | 11,548 | | | | 11,497,750 | |
2.95%, 02/19/23a | | | 19,152 | | | | 19,341,557 | |
4.38%, 02/19/43a | | | 23,582 | | | | 22,731,060 | |
6.15%, 02/27/37 | | | 16,988 | | | | 20,039,189 | |
| | | | | | | | |
| | | | 2,359,531,342 | |
TRANSPORTATION — 0.79% | | | | | | | | |
Burlington Northern Santa Fe LLC | | | | | | | | |
3.00%, 04/01/25 (Call 01/01/25) | | | 950 | | | | 980,932 | |
3.85%, 09/01/23 (Call 06/01/23) | | | 6,514 | | | | 7,097,170 | |
3.90%, 08/01/46 (Call 02/01/46)a | | | 10,040 | | | | 10,234,576 | |
4.15%, 04/01/45 (Call 10/01/44) | | | 10,006 | | | | 10,538,259 | |
4.45%, 03/15/43 (Call 09/15/42) | | | 11,262 | | | | 12,284,552 | |
4.55%, 09/01/44 (Call 03/01/44) | | | 7,670 | | | | 8,482,761 | |
4.90%, 04/01/44 (Call 10/01/43) | | | 12,890 | | | | 14,966,885 | |
5.75%, 05/01/40 (Call 11/01/39) | | | 12,302 | | | | 15,638,856 | |
Canadian Pacific Railway Co. | | | | | | | | |
6.13%, 09/15/15 (Call 03/15/15)a | | | 11,688 | | | | 14,047,694 | |
CSX Corp. | | | | | | | | |
2.60%, 11/01/26 (Call 08/01/26) | | | 8,300 | | | | 8,132,664 | |
4.10%, 03/15/44 (Call 09/15/43)a | | | 10,450 | | | | 10,616,061 | |
FedEx Corp. | | | | | | | | |
3.25%, 04/01/26 (Call 01/01/26)a | | | 5,200 | | | | 5,384,257 | |
| | | | | | | | |
| Security | | Principal or Shares (000s) | | | Value | |
4.00%, 01/15/24 | | $ | 8,039 | | | $ | 8,799,772 | |
4.55%, 04/01/46 (Call 10/01/45)a | | | 14,280 | | | | 15,156,349 | |
4.75%, 11/15/45 (Call 05/15/45) | | | 16,830 | | | | 18,272,124 | |
5.10%, 01/15/44a | | | 13,380 | | | | 15,268,897 | |
Union Pacific Corp. | | | | | | | | |
4.16%, 07/15/22 (Call 04/15/22) | | | 8,618 | | | | 9,556,691 | |
United Parcel Service Inc. | | | | | | | | |
2.45%, 10/01/22a | | | 12,471 | | | | 12,779,928 | |
3.13%, 01/15/21 | | | 19,586 | | | | 20,815,752 | |
6.20%, 01/15/38 | | | 16,855 | | | | 23,347,586 | |
| | | | | | | | |
| | | | 242,401,766 | |
WATER — 0.01% | | | | | | | | |
American Water Capital Corp. | | | | | | | | |
6.59%, 10/15/37 | | | 2,585 | | | | 3,621,216 | |
| | | | | | | | |
| | | | 3,621,216 | |
| | | | | | | | |
TOTAL CORPORATE BONDS & NOTES | | | | | |
(Cost: $29,881,212,597) | | | | 30,159,691,138 | |
|
SHORT-TERM INVESTMENTS — 10.75% | |
| |
MONEY MARKET FUNDS — 10.75% | | | | | |
BlackRock Cash Funds: Institutional, | | | | | |
SL Agency Shares | | | | | | | | |
0.72%d,e,f | | | 3,086,600 | | | | 3,086,908,217 | |
BlackRock Cash Funds: Treasury, | | | | | |
SL Agency Shares | | | | | | | | |
0.29%d,e | | | 193,002 | | | | 193,001,855 | |
| | | | | | | | |
| | | | | | | 3,279,910,072 | |
| | | | | | | | |
TOTAL SHORT-TERM INVESTMENTS | | | | | |
(Cost: $3,279,603,689) | | | | | | | 3,279,910,072 | |
| | | | | | | | |
TOTAL INVESTMENTS IN SECURITIES — 109.55% | | | | | |
(Cost: $33,160,816,286)g | | | | | | | 33,439,601,210 | |
Other Assets, Less Liabilities — (9.55)% | | | | (2,913,850,650 | ) |
| | | | | | | | |
NET ASSETS — 100.00% | | | | | | $ | 30,525,750,560 | |
| | | | | | | | |
| a | All or a portion of this security represents a security on loan. |
| b | This security may be resold to qualified institutional buyers under Rule 144A of the Securities Act of 1933. |
| c | Affiliated issuer. See Schedule 1. |
| d | Affiliated money market fund. |
| | | | |
SCHEDULESOF INVESTMENTS | | | 107 | |
Schedule of Investments (Unaudited) (Continued)
iSHARES® iBOXX $ INVESTMENT GRADE CORPORATE BOND ETF
October 31, 2016
| e | The rate quoted is the annualized seven-day yield of the fund at period end. |
| f | All or a portion of this security represents an investment of securities lending collateral. |
| g | The cost of investments for federal income tax purposes was $33,168,717,160. Net unrealized appreciation/depreciation was $270,884,050 of which $442,846,661 represented gross unrealized appreciation on securities and $171,962,611 represented gross unrealized depreciation on securities. |
Schedule 1 — Affiliates
Investments in issuers considered to be affiliates of the Fund (excluding affiliated money market funds) during the period ended October 31, 2016, for purposes of Section 2(a)(3) of the 1940 Act, were as follows:
| | | | | | | | | | | | | | | | | | | | | | | | | | | | |
| Affiliated issuer | | Principal
held at
beginning
of period
(000s) | | | Principal
purchased
(000s) | | | Principal sold
(000s) | | | Principal
held at end
of period
(000s) | | | Value at end
of period | | | Interest
income | | | Net realized
gain (loss) | |
PNC Bank N.A. | | | | | | | | | | | | | | | | | | | | | | | | | | | | |
2.15%, 04/29/21 | | $ | — | | | $ | 15,750 | | | $ | — | | | $ | 15,750 | | | $ | 15,889,389 | | | $ | 86,206 | | | $ | — | |
2.20%, 01/28/19 | | | 6,275 | | | | | | | | (6,275 | ) | | | — | | | | — | | | | 2,602 | | | | (53,213 | ) |
2.25%, 07/02/19 | | | 7,750 | | | | 1,400 | | | | (9,150 | ) | | | — | | | | — | | | | 78,263 | | | | 157,912 | |
2.30%, 06/01/20 | | | — | | | | 3,850 | | | | — | | | | 3,850 | | | | 3,913,832 | | | | 9,136 | | | | — | |
2.40%, 10/18/19 | | | 12,750 | | | | 3,000 | | | | (10,000 | ) | | | 5,750 | | | | 5,874,190 | | | | 218,569 | | | | 120,941 | |
2.45%, 11/05/20 | | | 2,400 | | | | 8,700 | | | | — | | | | 11,100 | | | | 11,320,272 | | | | 120,222 | | | | — | |
2.60%, 07/21/20 | | | 11,000 | | | | 1,330 | | | | — | | | | 12,330 | | | | 12,645,585 | | | | 192,392 | | | | — | |
2.70%, 11/01/22 | | | 9,587 | | | | 7,775 | | | | (3,875 | ) | | | 13,487 | | | | 13,594,588 | | | | 260,067 | | | | 92,946 | |
2.95%, 01/30/23 | | | 7,300 | | | | 1,000 | | | | — | | | | 8,300 | | | | 8,427,370 | | | | 149,416 | | | | — | |
2.95%, 02/23/25 | | | 17,300 | | | | 4,850 | | | | (4,650 | ) | | | 17,500 | | | | 17,810,438 | | | | 377,688 | | | | 247,878 | |
3.25%, 06/01/25 | | | — | | | | 6,750 | | | | — | | | | 6,750 | | | | 7,021,352 | | | | 12,864 | | | | — | |
3.80%, 07/25/23 | | | 15,653 | | | | 6,000 | | | | (11,500 | ) | | | 10,153 | | | | 10,858,716 | | | | 249,607 | | | | 622,894 | |
PNC Financial Services Group Inc. (The) | | | | | | | | | | | | | | | | | | | | | | | | | | | | |
3.30%, 03/08/22 | | | 9,569 | | | | 2,750 | | | | — | | | | 12,319 | | | | 13,024,985 | | | | 197,442 | | | | — | |
3.90%, 04/29/24 | | | 12,540 | | | | 2,750 | | | | (5,300 | ) | | | 9,990 | | | | 10,594,822 | | | | 359,382 | | | | 320,396 | |
4.38%, 08/11/20 | | | 10,724 | | | | 50 | | | | — | | | | 10,774 | | | | 11,723,417 | | | | 196,330 | | | | — | |
5.13%, 02/08/20 | | | 3,965 | | | | 600 | | | | — | | | | 4,565 | | | | 5,029,522 | | | | 85,142 | | | | — | |
| | | | | | | | | | | | | | | | | | | | | | | | | | | | |
| | | $ | 147,728,478 | | | $ | 2,595,328 | | | $ | 1,509,754 | |
| | | | | | | | | | | | | |
| | | | | | | | | | | | | | |
Schedule 2 — Fair Value Measurements
Various inputs are used in determining the fair value of financial instruments. For description of the input levels and information about the Fund’s policy regarding valuation of financial instruments, refer to a recently published shareholder report. Shareholder reports are available on the Fund’s website at www.iShares.com and on the U.S. Securities and Exchange Commission website at www.sec.gov.
The following table summarizes the value of the Fund’s investments according to the fair value hierarchy as of October 31, 2016. The breakdown of the Fund’s investments into major categories is disclosed in the schedule of investments above.
| | | | | | | | | | | | | | | | |
| | | Level 1 | | | Level 2 | | | Level 3 | | | Total | |
Investments: | | | | | | | | | | | | | | | | |
Assets: | | | | | | | | | | | | | | | | |
Corporate bonds & notes | | $ | — | | | $ | 30,159,691,138 | | | $ | — | | | $ | 30,159,691,138 | |
Money market funds | | | 3,279,910,072 | | | | — | | | | — | | | | 3,279,910,072 | |
| | | | | | | | | | | | | | | | |
Total | | $ | 3,279,910,072 | | | $ | 30,159,691,138 | | | $ | — | | | $ | 33,439,601,210 | |
| | | | | | | | | | | | | | | | |
| | | | | | | | | | | | | | | | | |
| | |
| 108 | | 2016 iSHARES ANNUAL REPORTTO SHAREHOLDERS |
Statements of Assets and Liabilities (Unaudited)
iSHARES® TRUST
October 31, 2016
| | | | | | | | |
| | | iShares iBoxx
$ High Yield
Corporate
Bond ETF | | | iShares iBoxx
$ Investment
Grade Corporate
Bond ETF | |
| | |
ASSETS | | | | | | | | |
Investments, at cost: | | | | | | | | |
Unaffiliated | | $ | 15,910,125,171 | | | $ | 29,735,533,957 | |
Affiliated | | | 4,749,625,290 | | | | 3,425,282,329 | |
| | | | | | | | |
Total cost of investments | | $ | 20,659,750,461 | | | $ | 33,160,816,286 | |
| | | | | | | | |
Investments in securities, at fair value (including securities on loana) | | | | | | | | |
Unaffiliated | | $ | 15,505,115,141 | | | $ | 30,011,962,660 | |
Affiliated | | | 4,750,077,116 | | | | 3,427,638,550 | |
| | | | | | | | |
Total fair value of investments | | | 20,255,192,257 | | | | 33,439,601,210 | |
Cash | | | 221,719 | | | | — | |
Receivables: | | | | | | | | |
Investment securities sold | | | 4,217,122 | | | | 28,070,146 | |
Due from custodian | | | 10,738,536 | | | | 206,412 | |
Interest | | | 253,904,838 | | | | 296,601,644 | |
Capital shares sold | | | 161 | | | | 4,094,267 | |
| | | | | | | | |
Total Assets | | | 20,524,274,633 | | | | 33,768,573,679 | |
| | | | | | | | |
| | |
LIABILITIES | | | | | | | | |
Payables: | | | | | | | | |
Investment securities purchased | | | 62,807,475 | | | | 136,764,988 | |
Collateral for securities on loan | | | 4,518,235,642 | | | | 3,086,569,901 | |
Capital shares redeemed | | | 15,654,477 | | | | 15,406,036 | |
Securities related to in-kind transactions | | | 1,287,853 | | | | — | |
Investment advisory fees | | | 7,472,067 | | | | 4,082,194 | |
| | | | | | | | |
Total Liabilities | | | 4,605,457,514 | | | | 3,242,823,119 | |
| | | | | | | | |
| | |
NET ASSETS | | $ | 15,918,817,119 | | | $ | 30,525,750,560 | |
| | | | | | | | |
| | |
Net assets consist of: | | | | | | | | |
Paid-in capital | | $ | 16,622,678,989 | | | $ | 29,694,706,575 | |
Undistributed net investment income | | | 59,212,355 | | | | 75,616,442 | |
Undistributed net realized gain (accumulated net realized loss) | | | (358,516,021 | ) | | | 476,642,619 | |
Net unrealized appreciation (depreciation) | | | (404,558,204 | ) | | | 278,784,924 | |
| | | | | | | | |
NET ASSETS | | $ | 15,918,817,119 | | | $ | 30,525,750,560 | |
| | | | | | | | |
| | |
Shares outstandingb | | | 184,800,000 | | | | 252,600,000 | |
| | | | | | | | |
| | |
Net asset value per share | | $ | 86.14 | | | $ | 120.85 | |
| | | | | | | | |
| a | Securities on loan with values of $ 4,420,047,554 and $ 3,016,790,100 respectively. |
| b | No par value, unlimited number of shares authorized. |
Schedule of Investments
iSHARES® iBOXX $ HIGH YIELD CORPORATE BOND ETF
February 29, 2016
| | | | | | | | |
| Security | |
Principal
(000s) | | | Value | |
CORPORATE BONDS & NOTES — 97.16% | |
| |
ADVERTISING — 0.51% | | | | | |
inVentiv Health Inc. | | | | | | | | |
9.00%, 01/15/18 (Call 03/31/16)a | | $ | 10,800 | | | $ | 11,016,000 | |
Lamar Media Corp. | | | | | | | | |
5.00%, 05/01/23 (Call 05/01/18)b | | | 11,347 | | | | 11,421,465 | |
5.38%, 01/15/24 (Call 01/15/19)b | | | 10,275 | | | | 10,493,087 | |
5.75%, 02/01/26 (Call 02/01/21)a,b | | | 7,655 | | | | 7,908,534 | |
5.88%, 02/01/22 (Call 02/01/17)b | | | 8,200 | | | | 8,528,929 | |
Outfront Media Capital LLC/Outfront Media Capital Corp. | | | | | | | | |
5.25%, 02/15/22 (Call 02/15/17)b | | | 9,975 | | | | 10,226,569 | |
5.63%, 02/15/24 (Call 02/15/19) | | | 11,200 | | | | 11,620,000 | |
5.88%, 03/15/25 (Call 09/15/19)b | | | 7,900 | | | | 8,137,000 | |
| | | | | | | | |
| | | | | | | 79,351,584 | |
AEROSPACE & DEFENSE — 0.73% | | | | | |
KLX Inc. | | | | | | | | |
5.88%, 12/01/22 (Call 12/01/17)a,b | | | 26,840 | | | | 25,766,623 | |
Meccanica Holdings USA Inc. | | | | | | | | |
6.25%, 07/15/19a,b | | | 9,750 | | | | 10,188,750 | |
TransDigm Inc. | | | | | | | | |
5.50%, 10/15/20 (Call 03/31/16)b | | | 10,100 | | | | 9,948,500 | |
6.00%, 07/15/22 (Call 07/15/17)b | | | 24,410 | | | | 23,891,287 | |
6.50%, 07/15/24 (Call 07/15/19)b | | | 23,510 | | | | 22,901,679 | |
6.50%, 05/15/25 (Call 05/15/20)a | | | 9,300 | | | | 8,986,125 | |
7.50%, 07/15/21 (Call 07/15/16)b | | | 10,654 | | | | 10,946,985 | |
| | | | | | | | |
| | | | | | | 112,629,949 | |
| | | | | | | | |
| Security | |
Principal
(000s) | | | Value | |
AIRLINES — 0.37% | | | | | | | | |
Air Canada | | | | | | | | |
6.75%, 10/01/19 (Call 10/01/16)a,b | | $ | 9,225 | | | $ | 9,465,583 | |
7.75%, 04/15/21a | | | 7,180 | | | | 6,947,527 | |
American Airlines Group Inc. | | | | | | | | |
4.63%, 03/01/20a | | | 9,015 | | | | 8,699,475 | |
5.50%, 10/01/19a | | | 15,090 | | | | 15,174,806 | |
6.13%, 06/01/18b | | | 10,110 | | | | 10,539,675 | |
Continental Airlines Inc. 2012-3 Pass Through Trust Class C | | | | | | | | |
6.13%, 04/29/18 | | | 6,750 | | | | 6,975,501 | |
| | | | | | | | |
| | | | | | | 57,802,567 | |
APPAREL — 0.22% | | | | | |
Hanesbrands Inc. | | | | | | | | |
6.38%, 12/15/20 (Call 03/31/16)b | | | 13,030 | | | | 13,481,962 | |
Levi Strauss & Co. | | | | | | | | |
5.00%, 05/01/25 (Call 05/01/20)b | | | 11,115 | | | | 11,116,112 | |
6.88%, 05/01/22 (Call 05/01/17)b | | | 9,246 | | | | 9,916,335 | |
| | | | | | | | |
| | | | | | | 34,514,409 | |
AUTO MANUFACTURERS — 0.72% | | | | | |
Fiat Chrysler Automobile NV | | | | | | | | |
4.50%, 04/15/20b | | | 27,675 | | | | 27,591,975 | |
5.25%, 04/15/23b | | | 28,140 | | | | 26,592,300 | |
Jaguar Land Rover Automotive PLC | | | | | | | | |
3.50%, 03/15/20 (Call 12/15/19)a,b | | | 10,600 | | | | 10,374,750 | |
4.13%, 12/15/18 a,b | | | 12,400 | | | | 12,756,500 | |
4.25%, 11/15/19 a,b | | | 10,240 | | | | 10,214,400 | |
5.63%, 02/01/23 (Call 02/01/18)a,b | | | 9,200 | | | | 9,223,000 | |
Navistar International Corp. | | | | | | | | |
8.25%, 11/01/21 (Call 03/31/16)b | | | 25,531 | | | | 14,999,462 | |
| | | | | | | | |
| | | | | | | 111,752,387 | |
AUTO PARTS & EQUIPMENT — 1.45% | | | | | |
American Axle & Manufacturing Inc. | | | | | |
6.25%, 03/15/21 (Call 03/31/16)b | | | 6,806 | | | | 6,882,908 | |
| | |
| 110 | | 2016 iSHARES ANNUAL REPORTTO SHAREHOLDERS |
Schedule of Investments (Continued)
iSHARES® iBOXX $ HIGH YIELD CORPORATE BOND ETF
February 29, 2016
| | | | | | | | |
| Security | |
Principal
(000s) | | | Value | |
6.63%, 10/15/22 (Call 10/15/17)b | | $ | 12,875 | | | $ | 13,093,875 | |
Dana Holding Corp. | | | | | | | | |
5.38%, 09/15/21 (Call 09/15/16)b | | | 8,150 | | | | 7,890,178 | |
5.50%, 12/15/24 (Call 12/15/19)b | | | 8,800 | | | | 8,151,000 | |
Goodyear Tire & Rubber Co. (The) | | | | | | | | |
5.13%, 11/15/23 (Call 11/15/18)b | | | 19,120 | | | | 19,669,700 | |
6.50%, 03/01/21 (Call 03/31/16)b | | | 16,943 | | | | 17,843,181 | |
7.00%, 05/15/22 (Call 05/15/17)b | | | 13,245 | | | | 14,155,655 | |
Lear Corp. | | | | | | | | |
4.75%, 01/15/23 (Call 01/15/18)b | | | 9,908 | | | | 10,094,457 | |
5.25%, 01/15/25 (Call 01/15/20)b | | | 15,255 | | | | 16,082,584 | |
Schaeffler Finance BV | | | | | | | | |
4.25%, 05/15/21 (Call 05/15/17)a,b | | | 12,900 | | | | 13,145,100 | |
4.75%, 05/15/21 (Call 05/15/16)a,b | | | 17,550 | | | | 17,695,840 | |
4.75%, 05/15/23 (Call 05/15/18)a,b | | | 11,600 | | | | 11,320,476 | |
ZF North America Capital Inc. | | | | | | | | |
4.00%, 04/29/20a,b | | | 19,100 | | | | 19,153,719 | |
4.50%, 04/29/22a,b | | | 19,450 | | | | 19,450,000 | |
4.75%, 04/29/25a | | | 31,455 | | | | 30,000,206 | |
| | | | | | | | |
| | | | | | | 224,628,879 | |
BANKS — 3.09% | | | | | |
BBVA International Preferred SAU | | | | | | | | |
5.92%, 04/29/49 (Call 04/18/17)b,c | | | 9,641 | | | | 9,368,033 | |
BPCE SA | | | | | | | | |
12.50%, 08/29/49 (Call 09/30/19)a,b,c | | | 7,400 | | | | 9,029,480 | |
CIT Group Inc. | | | | | | | | |
3.88%, 02/19/19b | | | 20,900 | | | | 20,795,500 | |
4.25%, 08/15/17 | | | 35,855 | | | | 36,464,535 | |
5.00%, 05/15/17b | | | 19,067 | | | | 19,519,841 | |
| | | | | | | | |
| Security | |
Principal
(000s) | | | Value | |
5.00%, 08/15/22b | | $ | 25,850 | | | $ | 26,011,563 | |
5.00%, 08/01/23b | | | 14,880 | | | | 14,871,398 | |
5.25%, 03/15/18 | | | 32,980 | | | | 33,886,950 | |
5.38%, 05/15/20b | | | 15,010 | | | | 15,486,739 | |
5.50%, 02/15/19a,b | | | 36,324 | | | | 37,595,340 | |
6.63%, 04/01/18a,b | | | 14,101 | | | | 14,815,382 | |
Commerzbank AG | | | | | | | | |
8.13%, 09/19/23a,b | | | 19,850 | | | | 21,735,750 | |
Credit Agricole SA | | | | | | | | |
6.64%, 05/29/49 (Call 05/31/17)a,b,c | | | 12,051 | | | | 11,629,215 | |
8.38%, 10/29/49 (Call 10/13/19)a,c | | | 20,929 | | | | 22,603,320 | |
Fifth Third Bancorp. | | | | | | | | |
5.10%, 12/29/49 (Call 06/30/23)b,c | | | 13,275 | | | | 11,930,906 | |
Royal Bank of Scotland Group PLC | | | | | | | | |
5.13%, 05/28/24b | | | 44,238 | | | | 42,269,086 | |
6.00%, 12/19/23 | | | 39,732 | | | | 40,127,147 | |
6.10%, 06/10/23b | | | 20,262 | | | | 20,570,337 | |
6.13%, 12/15/22 | | | 46,433 | | | | 48,277,676 | |
Royal Bank of Scotland NV | | | | | | | | |
4.65%, 06/04/18 | | | 8,350 | | | | 8,417,635 | |
Societe Generale SA | | | | | | | | |
5.92%, 12/31/49 (Call 04/05/17)a,b,c | | | 14,723 | | | | 14,502,155 | |
| | | | | | | | |
| | | | | | | 479,907,988 | |
BEVERAGES — 0.69% | | | | | |
Constellation Brands Inc. | | | | | | | | |
3.75%, 05/01/21b | | | 8,170 | | | | 8,310,424 | |
3.88%, 11/15/19b | | | 7,625 | | | | 7,894,981 | |
4.25%, 05/01/23b | | | 20,495 | | | | 21,227,354 | |
4.75%, 11/15/24 | | | 9,631 | | | | 10,027,833 | |
4.75%, 12/01/25b | | | 7,125 | | | | 7,427,813 | |
6.00%, 05/01/22b | | | 14,250 | | | | 16,104,077 | |
7.25%, 09/01/16 | | | 775 | | | | 797,010 | |
7.25%, 05/15/17b | | | 10,674 | | | | 11,290,532 | |
Cott Beverages Inc. | | | | | | | | |
5.38%, 07/01/22 (Call 07/01/17)b | | | 11,025 | | | | 10,914,750 | |
6.75%, 01/01/20 (Call 01/01/17)b | | | 12,455 | | | | 12,841,624 | |
| | | | | | | | |
| | | | | | | 106,836,398 | |
| | | | |
SCHEDULESOF INVESTMENTS | | | 111 | |
Schedule of Investments (Continued)
iSHARES® iBOXX $ HIGH YIELD CORPORATE BOND ETF
February 29, 2016
| | | | | | | | |
| Security | |
Principal
(000s) | | | Value | |
BIOTECHNOLOGY — 0.19% | | | | | |
Concordia Healthcare Corp. | | | | | | | | |
7.00%, 04/15/23 (Call 04/15/18)a | | $ | 14,700 | | | $ | 12,642,000 | |
9.50%, 10/21/22 (Call 12/15/18)a,b | | | 17,400 | | | | 16,704,000 | |
| | | | | | | | |
| | | | | | | 29,346,000 | |
BUILDING MATERIALS — 0.88% | | | | | |
Builders FirstSource Inc. | | | | | | | | |
7.63%, 06/01/21 (Call 06/01/16)a | | | 11,267 | | | | 11,456,460 | |
10.75%, 08/15/23 (Call 08/15/18)a | | | 10,250 | | | | 9,553,000 | |
Lafarge SA | | | | | | | | |
6.50%, 07/15/16 | | | 1,100 | | | | 1,119,211 | |
Masco Corp. | | | | | | | | |
4.45%, 04/01/25 (Call 01/01/25)b | | | 9,500 | | | | 9,428,750 | |
5.95%, 03/15/22b | | | 8,777 | | | | 9,592,795 | |
6.13%, 10/03/16 | | | 1,353 | | | | 1,384,146 | |
7.13%, 03/15/20b | | | 8,645 | | | | 9,949,213 | |
Standard Industries Inc./NJ | | | | | | | | |
5.13%, 02/15/21 (Call 02/15/18)a | | | 2,475 | | | | 2,521,406 | |
5.38%, 11/15/24 (Call 11/15/19)a,b | | | 25,610 | | | | 26,074,053 | |
5.50%, 02/15/23 (Call 02/15/19)a | | | 2,185 | | | | 2,216,713 | |
6.00%, 10/15/25 (Call 10/15/20)a,b | | | 22,475 | | | | 22,881,957 | |
USG Corp. | | | | | | | | |
6.30%, 11/15/16b | | | 169 | | | | 174,281 | |
9.75%, 01/15/18b | | | 8,148 | | | | 9,080,596 | |
Vulcan Materials Co. | | | | | | | | |
4.50%, 04/01/25 (Call 01/01/25)b | | | 6,875 | | | | 6,884,114 | |
7.50%, 06/15/21b | | | 12,700 | | | | 14,827,250 | |
| | | | | | | | |
| | | | | | | 137,143,945 | |
CHEMICALS — 1.85% | | | | | |
Ashland Inc. | | | | | | | | |
3.88%, 04/15/18 (Call 03/15/18)b | | | 10,700 | | | | 11,048,820 | |
| | | | | | | | |
| Security | |
Principal
(000s) | | | Value | |
4.75%, 08/15/22 (Call 05/15/22)b | | $ | 22,300 | | | $ | 22,132,750 | |
Axiall Corp. | | | | | | | | |
4.88%, 05/15/23 (Call 05/15/18)b | | | 8,830 | | | | 8,525,365 | |
Blue Cube Spinco Inc. | | | | | | | | |
9.75%, 10/15/23 (Call 10/15/20)a | | | 14,950 | | | | 16,669,250 | |
10.00%, 10/15/25 (Call 10/15/20)a,b | | | 9,100 | | | | 10,078,250 | |
Chemours Co. (The) | | | | | | | | |
6.63%, 05/15/23 (Call 05/15/18)a,b | | | 28,390 | | | | 20,772,296 | |
7.00%, 05/15/25 (Call 05/15/20)a | | | 13,870 | | | | 10,055,750 | |
Eagle Spinco Inc. | | | | | | | | |
4.63%, 02/15/21 (Call 02/15/18)b | | | 14,975 | | | | 14,813,270 | |
Hexion Inc. | | | | | | | | |
6.63%, 04/15/20 (Call 03/31/16)b | | | 33,898 | | | | 26,779,420 | |
8.88%, 02/01/18 (Call 03/31/16) | | | 23,970 | | | | 15,820,200 | |
Hexion Inc./Hexion Nova Scotia Finance ULC | | | | | | | | |
9.00%, 11/15/20 (Call 03/31/16) | | | 9,400 | | | | 3,717,272 | |
Huntsman International LLC | | | | | | | | |
4.88%, 11/15/20 (Call 08/15/20)b | | | 15,315 | | | | 14,509,431 | |
5.13%, 11/15/22 (Call 08/15/22)a,b | | | 7,350 | | | | 6,706,875 | |
INEOS Group Holdings SA | | | | | | | | |
5.88%, 02/15/19 (Call 03/31/16)a,b | | | 12,475 | | | | 12,368,963 | |
6.13%, 08/15/18 (Call 03/31/16)a,b | | | 12,825 | | | | 12,825,000 | |
NOVA Chemicals Corp. | | | | | | | | |
5.00%, 05/01/25 (Call 01/31/25)a,b | | | 9,605 | | | | 9,315,992 | |
5.25%, 08/01/23 (Call 08/01/18)a,b | | | 10,850 | | | | 10,670,576 | |
| | |
| 112 | | 2016 iSHARES ANNUAL REPORTTO SHAREHOLDERS |
Schedule of Investments (Continued)
iSHARES® iBOXX $ HIGH YIELD CORPORATE BOND ETF
February 29, 2016
| | | | | | | | |
| Security | |
Principal
(000s) | | | Value | |
Platform Specialty Products Corp. | | | | | | | | |
6.50%, 02/01/22 (Call 02/01/18)a,b | | $ | 21,925 | | | $ | 17,814,062 | |
10.38%, 05/01/21 (Call 05/01/18)a,b | | | 9,765 | | | | 8,910,563 | |
Tronox Finance LLC | | | | | | | | |
6.38%, 08/15/20 (Call 03/31/16)b | | | 16,300 | | | | 10,309,812 | |
7.50%, 03/15/22 (Call 03/15/18)a | | | 13,253 | | | | 8,274,842 | |
WR Grace & Co.-Conn | | | | | | | | |
5.13%, 10/01/21a,b | | | 15,175 | | | | 15,774,412 | |
| | | | | | | | |
| | | | | | | 287,893,171 | |
COAL — 0.19% | | | | | |
CONSOL Energy Inc. | | | | | | | | |
5.88%, 04/15/22 (Call 04/15/17)b | | | 31,410 | | | | 20,495,025 | |
8.00%, 04/01/23 (Call 04/01/18) | | | 8,500 | | | | 5,657,812 | |
Murray Energy Corp. | | | | | | | | |
11.25%, 04/15/21 (Call 04/15/18)a,b | | | 20,000 | | | | 2,300,000 | |
Peabody Energy Corp. | | | | | | | | |
6.00%, 11/15/18 | | | 21,240 | | | | 557,550 | |
6.25%, 11/15/21 | | | 21,528 | | | | 565,110 | |
6.50%, 09/15/20 | | | 9,145 | | | | 148,606 | |
10.00%, 03/15/22 (Call 03/15/18)a,b | | | 14,055 | | | | 456,788 | |
| | | | | | | | |
| | | | | | | 30,180,891 | |
COMMERCIAL SERVICES — 3.14% | | | | | |
ADT Corp. (The) | | | | | | | | |
2.25%, 07/15/17b | | | 8,573 | | | | 8,603,364 | |
3.50%, 07/15/22b | | | 22,306 | | | | 18,858,902 | |
4.13%, 04/15/19b | | | 10,325 | | | | 10,905,781 | |
4.13%, 06/15/23b | | | 12,825 | | | | 10,822,989 | |
6.25%, 10/15/21b | | | 18,260 | | | | 17,820,664 | |
APX Group Inc. | | | | | | | | |
6.38%, 12/01/19 (Call 03/31/16)b | | | 21,150 | | | | 20,304,000 | |
8.75%, 12/01/20 (Call 03/31/16)b | | | 17,291 | | | | 14,003,981 | |
| | | | | | | | |
| Security | |
Principal
(000s) | | | Value | |
Ashtead Capital Inc. | | | | | | | | |
5.63%, 10/01/24 (Call 10/01/19)a,b | | $ | 10,535 | | | $ | 10,366,733 | |
6.50%, 07/15/22 (Call 07/15/17)a,b | | | 16,430 | | | | 16,881,825 | |
Avis Budget Car Rental LLC/Avis Budget Finance Inc. | | | | | | | | |
5.13%, 06/01/22 (Call 06/01/17)a,b | | | 9,089 | | | | 8,498,215 | |
5.50%, 04/01/23 (Call 04/01/18)b | | | 14,500 | | | | 13,703,675 | |
Global A&T Electronics Ltd. | | | | | | | | |
10.00%, 02/01/19 (Call 03/31/16)a | | | 19,950 | | | | 14,064,750 | |
Harland Clarke Holdings Corp. | | | | | | | | |
9.25%, 03/01/21 (Call 03/01/17)a | | | 13,956 | | | | 9,131,211 | |
Hertz Corp. (The) | | | | | | | | |
5.88%, 10/15/20 (Call 03/31/16)b | | | 14,479 | | | | 14,136,954 | |
6.25%, 10/15/22 (Call 10/15/17)b | | | 9,400 | | | | 8,941,750 | |
6.75%, 04/15/19 (Call 03/31/16)b | | | 24,690 | | | | 24,655,604 | |
7.38%, 01/15/21 (Call 03/31/16)b | | | 9,898 | | | | 9,850,198 | |
7.50%, 10/15/18 (Call 03/31/16)b | | | 14,500 | | | | 14,610,265 | |
Iron Mountain Inc. | | | | | | | | |
5.75%, 08/15/24 (Call 08/15/17)b | | | 20,159 | | | | 20,335,391 | |
6.00%, 08/15/23 (Call 08/15/18)b | | | 11,215 | | | | 11,915,938 | |
Jaguar Holding Co. II/Pharmaceutical Product Development LLC | | | | | | | | |
6.38%, 08/01/23 (Call 08/01/18)a,b | | | 22,669 | | | | 22,954,543 | |
Laureate Education Inc. | | | | | | | | |
9.25%, 09/01/19 (Call 03/31/16)a,b | | | 21,800 | | | | 10,682,000 | |
Leidos Holdings Inc. | | | | | | | | |
4.45%, 12/01/20 (Call 09/01/20)b | | | 7,200 | | | | 6,988,143 | |
| | | | |
SCHEDULESOF INVESTMENTS | | | 113 | |
Schedule of Investments (Continued)
iSHARES® iBOXX $ HIGH YIELD CORPORATE BOND ETF
February 29, 2016
| | | | | | | | |
| Security | |
Principal
(000s) | | | Value | |
RR Donnelley & Sons Co. | | | | | | | | |
6.00%, 04/01/24 | | $ | 8,450 | | | $ | 6,253,000 | |
7.00%, 02/15/22 | | | 7,350 | | | | 6,192,375 | |
7.88%, 03/15/21b | | | 8,025 | | | | 7,483,313 | |
Service Corp. International/U.S. | | | | | | | | |
5.38%, 01/15/22 (Call 07/15/17) | | | 7,750 | | | | 8,098,750 | |
5.38%, 05/15/24 (Call 05/15/19)b | | | 16,620 | | | | 17,679,525 | |
United Rentals North America Inc. | | | | | | | | |
4.63%, 07/15/23 (Call 07/15/18)b | | | 20,945 | | | | 20,945,000 | |
5.50%, 07/15/25 (Call 07/15/20)b | | | 17,920 | | | | 17,059,840 | |
5.75%, 11/15/24 (Call 05/15/19)b | | | 17,677 | | | | 17,235,075 | |
6.13%, 06/15/23 (Call 12/15/17)b | | | 20,014 | | | | 20,524,557 | |
7.38%, 05/15/20 (Call 05/15/16)b | | | 14,454 | | | | 15,158,633 | |
7.63%, 04/15/22 (Call 04/15/17)b | | | 26,295 | | | | 27,954,740 | |
8.25%, 02/01/21 (Call 03/31/16)b | | | 4,156 | | | | 4,363,800 | |
| | | | | | | | |
| | | | | | | 487,985,484 | |
COMPUTERS — 0.46% | | | | | |
Dell Inc. | | | | | | | | |
4.63%, 04/01/21b | | | 7,660 | | | | 7,066,350 | |
5.65%, 04/15/18 | | | 7,209 | | | | 7,461,315 | |
5.88%, 06/15/19b | | | 14,850 | | | | 15,295,500 | |
NCR Corp. | | | | | | | | |
4.63%, 02/15/21 (Call 02/15/17)b | | | 9,979 | | | | 9,504,997 | |
5.00%, 07/15/22 (Call 07/15/17)b | | | 10,914 | | | | 10,341,015 | |
5.88%, 12/15/21 (Call 12/15/17)b | | | 7,475 | | | | 7,344,188 | |
6.38%, 12/15/23 (Call 12/15/18)b | | | 15,295 | | | | 14,989,100 | |
| | | | | | | | |
| | | | | | | 72,002,465 | |
| | | | | | | | |
| Security | |
Principal
(000s) | | | Value | |
COSMETICS & PERSONAL CARE — 0.07% | |
Avon Products Inc. | | | | | | | | |
6.35%, 03/15/20b | | $ | 8,850 | | | $ | 6,383,062 | |
6.75%, 03/15/23 | | | 7,168 | | | | 4,296,432 | |
| | | | | | | | |
| | | | | | | 10,679,494 | |
DISTRIBUTION & WHOLESALE — 0.48% | | | | | |
HD Supply Inc. | | | | | | | | |
5.25%, 12/15/21 (Call 12/15/17)a,b | | | 23,515 | | | | 24,631,963 | |
7.50%, 07/15/20 (Call 10/15/16)b | | | 26,982 | | | | 28,380,250 | |
11.50%, 07/15/20 (Call 10/15/16) | | | 19,895 | | | | 21,983,975 | |
| | | | | | | | |
| | | | | | | 74,996,188 | |
DIVERSIFIED FINANCIAL SERVICES — 6.68% | |
AerCap Ireland Capital Ltd./AerCap Global Aviation Trust | | | | | | | | |
2.75%, 05/15/17b | | | 9,000 | | | | 8,935,785 | |
3.75%, 05/15/19b | | | 24,800 | | | | 24,800,000 | |
4.25%, 07/01/20b | | | 9,600 | | | | 9,624,000 | |
4.50%, 05/15/21b | | | 20,820 | | | | 20,976,150 | |
4.63%, 10/30/20b | | | 20,640 | | | | 20,975,400 | |
4.63%, 07/01/22b | | | 10,455 | | | | 10,481,138 | |
5.00%, 10/01/21b | | | 16,660 | | | | 17,097,325 | |
Aircastle Ltd. | | | | | | | | |
4.63%, 12/15/18b | | | 8,200 | | | | 8,284,608 | |
5.13%, 03/15/21b | | | 11,300 | | | | 11,328,250 | |
5.50%, 02/15/22b | | | 11,262 | | | | 11,219,768 | |
6.25%, 12/01/19b | | | 10,000 | | | | 10,565,333 | |
6.75%, 04/15/17b | | | 7,900 | | | | 8,207,536 | |
Ally Financial Inc. | | | | | | | | |
3.25%, 02/13/18b | | | 12,360 | | | | 12,242,580 | |
3.25%, 11/05/18 | | | 17,150 | | | | 16,849,875 | |
3.50%, 01/27/19b | | | 14,800 | | | | 14,590,333 | |
3.60%, 05/21/18b | | | 21,100 | | | | 20,994,500 | |
3.75%, 11/18/19b | | | 15,750 | | | | 15,572,812 | |
4.13%, 03/30/20b | | | 13,490 | | | | 13,464,774 | |
4.13%, 02/13/22b | | | 12,495 | | | | 12,474,290 | |
4.63%, 05/19/22b | | | 8,000 | | | | 7,980,000 | |
4.63%, 03/30/25b | | | 9,100 | | | | 8,825,895 | |
4.75%, 09/10/18 | | | 17,375 | | | | 17,700,781 | |
5.13%, 09/30/24b | | | 15,425 | | | | 15,502,125 | |
5.50%, 02/15/17b | | | 11,017 | | | | 11,223,569 | |
| | |
| 114 | | 2016 iSHARES ANNUAL REPORTTO SHAREHOLDERS |
Schedule of Investments (Continued)
iSHARES® iBOXX $ HIGH YIELD CORPORATE BOND ETF
February 29, 2016
| | | | | | | | |
| Security | |
Principal
(000s) | | | Value | |
5.75%, 11/20/25 (Call 10/20/25)b | | $ | 15,575 | | | $ | 15,110,687 | |
6.25%, 12/01/17 | | | 18,060 | | | | 18,827,550 | |
7.50%, 09/15/20 | | | 10,100 | | | | 11,185,750 | |
8.00%, 12/31/18 | | | 8,975 | | | | 9,749,094 | |
8.00%, 03/15/20b | | | 19,110 | | | | 21,289,585 | |
E*TRADE Financial Corp. | | | | | | | | |
5.38%, 11/15/22 (Call 11/15/17) | | | 1,380 | | | | 1,434,358 | |
Icahn Enterprises LP/Icahn Enterprises Finance Corp. | | | | | | | | |
3.50%, 03/15/17 (Call 02/15/17)b | | | 25,405 | | | | 25,341,487 | |
4.88%, 03/15/19 (Call 07/15/16) | | | 25,775 | | | | 23,938,531 | |
5.88%, 02/01/22 (Call 08/01/17)b | | | 28,490 | | | | 24,857,525 | |
6.00%, 08/01/20 (Call 02/01/17)b | | | 33,875 | | | | 32,094,865 | |
International Lease Finance Corp. | | | | | | | | |
3.88%, 04/15/18b | | | 14,465 | | | | 14,463,112 | |
4.63%, 04/15/21 | | | 8,800 | | | | 8,864,849 | |
5.88%, 04/01/19b | | | 15,350 | | | | 16,229,678 | |
5.88%, 08/15/22b | | | 14,825 | | | | 15,583,797 | |
6.25%, 05/15/19 | | | 26,158 | | | | 28,054,455 | |
8.25%, 12/15/20b | | | 20,517 | | | | 23,732,055 | |
8.63%, 01/15/22b | | | 13,321 | | | | 15,647,728 | |
8.75%, 03/15/17 | | | 20,899 | | | | 22,056,387 | |
8.88%, 09/01/17b | | | 9,390 | | | | 10,114,485 | |
Jefferies Finance LLC/JFIN Co-Issuer Corp. | | | | | | | | |
6.88%, 04/15/22 (Call 04/15/17)a | | | 7,520 | | | | 5,282,800 | |
7.38%, 04/01/20 (Call 04/01/16)a,b | | | 11,500 | | | | 8,826,250 | |
7.50%, 04/15/21 (Call 10/15/17)a,b | | | 8,550 | | | | 6,398,222 | |
Nationstar Mortgage LLC/Nationstar Capital Corp. | | | | | | | | |
6.50%, 08/01/18 (Call 03/31/16)b | | | 8,800 | | | | 8,536,000 | |
6.50%, 07/01/21 (Call 01/01/17)b | | | 12,950 | | | | 11,428,375 | |
| | | | | | | | |
| Security | |
Principal
(000s) | | | Value | |
7.88%, 10/01/20 (Call 10/01/16)b | | $ | 7,200 | | | $ | 6,786,000 | |
Navient Corp. | | | | | | | | |
4.63%, 09/25/17b | | | 7,921 | | | | 7,936,842 | |
4.88%, 06/17/19b | | | 20,010 | | | | 19,169,580 | |
5.00%, 10/26/20b | | | 8,862 | | | | 7,754,250 | |
5.50%, 01/15/19b | | | 28,200 | | | | 27,918,000 | |
5.50%, 01/25/23b | | | 19,915 | | | | 16,230,725 | |
5.88%, 03/25/21b | | | 12,725 | | | | 11,166,188 | |
5.88%, 10/25/24b | | | 10,800 | | | | 8,748,000 | |
6.00%, 01/25/17 | | | 1,146 | | | | 1,160,325 | |
6.13%, 03/25/24b | | | 19,291 | | | | 16,011,530 | |
7.25%, 01/25/22 | | | 13,279 | | | | 11,917,903 | |
8.00%, 03/25/20b | | | 30,810 | | | | 30,347,850 | |
8.45%, 06/15/18b | | | 51,588 | | | | 54,941,220 | |
OneMain Financial Holdings Inc. | | | | | | | | |
6.75%, 12/15/19 (Call 12/15/16)a | | | 12,674 | | | | 11,976,930 | |
7.25%, 12/15/21 (Call 12/15/17)a,b | | | 16,602 | | | | 15,529,788 | |
Quicken Loans Inc. | | | | | | | | |
5.75%, 05/01/25 (Call 05/01/20)a,b | | | 27,110 | | | | 25,899,538 | |
Springleaf Finance Corp. | | | | | | | | |
5.25%, 12/15/19b | | | 14,650 | | | | 12,875,885 | |
6.90%, 12/15/17 | | | 32,351 | | | | 31,779,704 | |
7.75%, 10/01/21b | | | 13,100 | | | | 11,429,750 | |
| | | | | | | | |
| | | | | | | 1,038,544,460 | |
ELECTRIC — 3.52% | | | | | |
AES Corp./VA | | | | | | | | |
4.88%, 05/15/23 (Call 05/15/18)b | | | 13,780 | | | | 12,358,938 | |
5.50%, 03/15/24 (Call 03/15/19)b | | | 13,950 | | | | 12,721,521 | |
5.50%, 04/15/25 (Call 04/15/20)b | | | 11,809 | | | | 10,657,623 | |
7.38%, 07/01/21 (Call 06/01/21)b | | | 19,500 | | | | 20,377,500 | |
8.00%, 06/01/20b | | | 9,065 | | | | 9,949,109 | |
Calpine Corp. | | | | | | | | |
5.38%, 01/15/23 (Call 10/15/18)b | | | 26,739 | | | | 24,820,161 | |
| | | | |
SCHEDULESOF INVESTMENTS | | | 115 | |
Schedule of Investments (Continued)
iSHARES® iBOXX $ HIGH YIELD CORPORATE BOND ETF
February 29, 2016
| | | | | | | | |
| Security | |
Principal
(000s) | | | Value | |
5.50%, 02/01/24 (Call 02/01/19) | | $ | 11,247 | | | $ | 10,055,443 | |
5.75%, 01/15/25 (Call 10/15/19)b | | | 32,910 | | | | 29,701,275 | |
5.88%, 01/15/24 (Call 11/01/18)a | | | 11,450 | | | | 11,631,769 | |
6.00%, 01/15/22 (Call 11/01/16)a | | | 13,516 | | | | 13,804,750 | |
7.88%, 01/15/23 (Call 01/15/17)a,b | | | 10,833 | | | | 11,449,648 | |
DPL Inc. | | | | | | | | |
6.50%, 10/15/16 (Call 09/15/16)b | | | 589 | | | | 596,363 | |
7.25%, 10/15/21 (Call 07/15/21) | | | 15,437 | | | | 15,111,721 | |
Dynegy Inc. | | | | | | | | |
5.88%, 06/01/23 (Call 06/01/18) | | | 9,300 | | | | 7,137,750 | |
6.75%, 11/01/19 (Call 05/01/17)b | | | 44,865 | | | | 41,948,775 | |
7.38%, 11/01/22 (Call 11/01/18)b | | | 35,735 | | | | 29,711,276 | |
7.63%, 11/01/24 (Call 11/01/19)b | | | 24,770 | | | | 20,497,175 | |
Enel SpA | | | | | | | | |
8.75%, 09/24/73 (Call 09/24/23)a,c | | | 23,507 | | | | 25,510,384 | |
FirstEnergy Corp. | | | | | | | | |
Series A | | | | | | | | |
2.75%, 03/15/18 (Call 02/15/18)b | | | 9,400 | | | | 9,430,906 | |
Series B | | | | | | | | |
4.25%, 03/15/23 (Call 12/15/22)b | | | 15,350 | | | | 15,657,207 | |
FirstEnergy Transmission LLC | | | | | | | | |
4.35%, 01/15/25 (Call 10/15/24)a | | | 9,100 | | | | 9,494,042 | |
GenOn Energy Inc. | | | | | | | | |
7.88%, 06/15/17b | | | 14,923 | | | | 12,432,724 | |
9.50%, 10/15/18 | | | 14,280 | | | | 9,246,300 | |
9.88%, 10/15/20 (Call 03/31/16) | | | 9,450 | | | | 5,481,000 | |
| | | | | | | | |
| Security | |
Principal
(000s) | | | Value | |
IPALCO Enterprises Inc. | | | | | | | | |
3.45%, 07/15/20 (Call 06/15/20)b | | $ | 3,525 | | | $ | 3,508,431 | |
5.00%, 05/01/18 (Call 04/01/18)b | | | 6,250 | | | | 6,511,993 | |
NRG Energy Inc. | | | | | | | | |
6.25%, 07/15/22 (Call 07/15/18) | | | 21,604 | | | | 18,255,380 | |
6.25%, 05/01/24 (Call 05/01/19)b | | | 19,750 | | | | 16,441,875 | |
6.63%, 03/15/23 (Call 09/15/17)b | | | 20,065 | | | | 17,005,088 | |
7.63%, 01/15/18b | | | 21,480 | | | | 22,258,650 | |
7.88%, 05/15/21 (Call 05/15/16)b | | | 25,468 | | | | 23,712,745 | |
8.25%, 09/01/20 (Call 03/31/16)b | | | 23,650 | | | | 22,851,812 | |
Talen Energy Supply LLC | | | | | | | | |
4.60%, 12/15/21 (Call 09/15/21)b | | | 15,445 | | | | 10,155,088 | |
4.63%, 07/15/19 (Call 07/15/16)a | | | 26,375 | | | | 21,231,875 | |
6.50%, 05/01/18b | | | 9,350 | | | | 8,745,641 | |
6.50%, 06/01/25 (Call 06/01/20)b | | | 10,285 | | | | 7,096,650 | |
| | | | | | | | |
| | | | | | | 547,558,588 | |
ELECTRICAL COMPONENTS & EQUIPMENT — 0.20% | |
Anixter Inc. | | | | | | | | |
5.13%, 10/01/21b | | | 7,645 | | | | 7,506,778 | |
Edgewell Personal Care Co. | | | | | | | | |
4.70%, 05/19/21b | | | 11,650 | | | | 12,086,875 | |
4.70%, 05/24/22 | | | 11,825 | | | | 11,943,250 | |
| | | | | | | | |
| | | | | | | 31,536,903 | |
ENERGY – ALTERNATE SOURCES — 0.09% | |
TerraForm Power Operating LLC | | | | | | | | |
5.88%, 02/01/23 (Call 02/01/18)a,b | | | 18,660 | | | | 13,995,000 | |
| | | | | | | | |
| | | | | | | 13,995,000 | |
ENGINEERING & CONSTRUCTION — 0.31% | |
AECOM | | | | | | | | |
5.75%, 10/15/22 (Call 10/15/17)b | | | 17,840 | | | | 17,947,040 | |
| | |
| 116 | | 2016 iSHARES ANNUAL REPORTTO SHAREHOLDERS |
Schedule of Investments (Continued)
iSHARES® iBOXX $ HIGH YIELD CORPORATE BOND ETF
February 29, 2016
| | | | | | | | |
| Security | |
Principal
(000s) | | | Value | |
5.88%, 10/15/24 (Call 07/15/24)b | | $ | 14,824 | | | $ | 14,712,820 | |
SBA Communications Corp. | | | | | | | | |
4.88%, 07/15/22 (Call 07/15/17)b | | | 14,692 | | | | 14,949,110 | |
| | | | | | | | |
| | | | | | | 47,608,970 | |
ENTERTAINMENT — 1.59% | | | | | |
Cinemark USA Inc. | | | | | | | | |
4.88%, 06/01/23 (Call 06/01/18)b | | | 10,250 | | | | 10,250,000 | |
5.13%, 12/15/22 (Call 12/15/17)b | | | 7,700 | | | | 7,826,729 | |
GLP Capital LP/GLP Financing II Inc. | | | | | | | | |
4.38%, 11/01/18 (Call 08/01/18)b | | | 10,500 | | | | 10,578,750 | |
4.88%, 11/01/20 (Call 08/01/20)b | | | 20,780 | | | | 21,052,634 | |
5.38%, 11/01/23 (Call 08/01/23) | | | 9,200 | | | | 9,062,000 | |
International Game Technology | | | | | | | | |
7.50%, 06/15/19b | | | 9,300 | | | | 9,834,750 | |
International Game Technology PLC | | | | | | | | |
5.63%, 02/15/20 (Call 11/15/19)a,b | | | 12,380 | | | | 12,287,150 | |
6.25%, 02/15/22 (Call 08/15/21)a,b | | | 30,225 | | | | 28,562,625 | |
6.50%, 02/15/25 (Call 08/15/24)a | | | 22,840 | | | | 20,327,600 | |
Pinnacle Entertainment Inc. | | | | | | | | |
6.38%, 08/01/21 (Call 08/01/16)b | | | 12,940 | | | | 13,732,575 | |
7.50%, 04/15/21 (Call 03/31/16) | | | 15,805 | | | | 16,476,712 | |
Regal Entertainment Group | | | | | | | | |
5.75%, 03/15/22 (Call 03/15/17)b | | | 16,950 | | | | 17,214,844 | |
Scientific Games International Inc. | | | | | | | | |
7.00%, 01/01/22 (Call 01/01/18)a,b | | | 19,160 | | | | 18,647,104 | |
10.00%, 12/01/22 (Call 12/01/18)b | | | 44,325 | | | | 34,628,906 | |
| | | | | | | | |
| Security | |
Principal
(000s) | | | Value | |
WMG Acquisition Corp. | | | | | | | | |
6.00%, 01/15/21 (Call 03/31/16)a,b | | $ | 6,889 | | | $ | 6,963,631 | |
6.75%, 04/15/22 (Call 04/15/17)a,b | | | 10,100 | | | | 9,430,875 | |
| | | | | | | | |
| | | | | | | 246,876,885 | |
ENVIRONMENTAL CONTROL — 0.36% | | | | | |
Clean Harbors Inc. | | | | | | | | |
5.13%, 06/01/21 (Call 12/01/16) | | | 10,175 | | | | 10,111,406 | |
5.25%, 08/01/20 (Call 08/01/16)b | | | 17,229 | | | | 17,530,163 | |
Covanta Holding Corp. | | | | | | | | |
5.88%, 03/01/24 (Call 03/01/19)b | | | 8,550 | | | | 7,353,000 | |
6.38%, 10/01/22 (Call 04/01/17)b | | | 7,225 | | | | 6,692,326 | |
7.25%, 12/01/20 (Call 03/31/16) | | | 8,168 | | | | 8,082,917 | |
Tervita Corp. | | | | | | | | |
8.00%, 11/15/18 (Call 03/31/16)a | | | 9,350 | | | | 5,834,400 | |
| | | | | | | | |
| | | | | | | 55,604,212 | |
FOOD — 1.16% | | | | | |
Albertson’s Holdings LLC/Safeway Inc. | | | | | | | | |
7.75%, 10/15/22 (Call 10/15/17)a | | | 14,025 | | | | 14,621,063 | |
Aramark Services Inc. | | | | | | | | |
5.75%, 03/15/20 (Call 03/31/16)b | | | 15,200 | | | | 15,690,200 | |
Post Holdings Inc. | | | | | | | | |
6.00%, 12/15/22 (Call 06/15/18)a | | | 12,700 | | | | 13,160,375 | |
6.75%, 12/01/21 (Call 12/01/17)a | | | 17,025 | | | | 18,072,037 | |
7.38%, 02/15/22 (Call 02/15/17)b | | | 28,360 | | | | 29,986,162 | |
7.75%, 03/15/24 (Call 09/15/18)a,b | | | 18,350 | | | | 19,955,625 | |
8.00%, 07/15/25 (Call 07/15/20)a,b | | | 7,620 | | | | 8,388,325 | |
| | | | |
SCHEDULESOF INVESTMENTS | | | 117 | |
Schedule of Investments (Continued)
iSHARES® iBOXX $ HIGH YIELD CORPORATE BOND ETF
February 29, 2016
| | | | | | | | |
| Security | |
Principal
(000s) | | | Value | |
Smithfield Foods Inc. | | | | | | | | |
5.25%, 08/01/18 (Call 03/31/16)a,b | | $ | 7,425 | | | $ | 7,548,750 | |
6.63%, 08/15/22 (Call 08/15/17) | | | 18,119 | | | | 19,206,140 | |
7.75%, 07/01/17b | | | 7,329 | | | | 7,738,966 | |
TreeHouse Foods Inc. | | | | | | | | |
4.88%, 03/15/22 (Call 03/15/17) | | | 4,580 | | | | 4,724,165 | |
6.00%, 02/15/24 (Call 02/15/19)a | | | 16,805 | | | | 17,687,263 | |
U.S. Foods Inc. | | | | | | | | |
8.50%, 06/30/19 (Call 03/31/16) | | | 2,700 | | | | 2,755,620 | |
| | | | | | | | |
| | | | | | | 179,534,691 | |
FOOD SERVICE — 0.05% | | | | | |
Aramark Services Inc. | | | | | | | | |
5.13%, 01/15/24 (Call 01/15/19)a,b | | | 7,845 | | | | 8,207,831 | |
| | | | | | | | |
| | | | | | | 8,207,831 | |
GAS — 0.12% | | | | | |
NGL Energy Partners LP/NGL Energy Finance Corp. | | | | | | | | |
5.13%, 07/15/19 (Call 06/15/19)b | | | 10,750 | | | | 6,315,625 | |
6.88%, 10/15/21 (Call 10/15/16) | | | 8,450 | | | | 4,918,604 | |
Sabine Pass LNG LP | | | | | | | | |
6.50%, 11/01/20 (Call 11/01/16)b | | | 6,550 | | | | 6,908,285 | |
7.50%, 11/30/16b | | | 100 | | | | 104,125 | |
| | | | | | | | |
| | | | | | | 18,246,639 | |
HEALTH CARE – PRODUCTS — 1.42% | | | | | |
Alere Inc. | | | | | | | | |
6.38%, 07/01/23 (Call 07/01/18)a,b | | | 7,645 | | | | 8,390,387 | |
6.50%, 06/15/20 (Call 06/15/16) | | | 8,275 | | | | 8,582,209 | |
7.25%, 07/01/18 (Call 03/31/16)b | | | 8,100 | | | | 8,488,125 | |
ConvaTec Healthcare E SA | | | | | | | | |
10.50%, 12/15/18 (Call 03/31/16)a,b | | | 13,647 | | | | 13,902,681 | |
| | | | | | | | |
| Security | |
Principal
(000s) | | | Value | |
Crimson Merger Sub Inc. | | | | | | | | |
6.63%, 05/15/22 (Call 05/15/17)a | | $ | 26,040 | | | $ | 18,748,800 | |
DJO Finco Inc./DJO Finance LLC/DJO Finance Corp. | | | | | | | | |
8.13%, 06/15/21 (Call 06/15/18)a,b | | | 21,365 | | | | 17,839,775 | |
Hologic Inc. | | | | | | | | |
5.25%, 07/15/22 (Call 07/15/18)a,b | | | 21,518 | | | | 22,561,623 | |
Kinetic Concepts Inc./KCI USA Inc. | | | | | | | | |
7.88%, 02/15/21 (Call 02/15/18)a | | | 8,350 | | | | 8,600,500 | |
10.50%, 11/01/18 (Call 03/31/16)b | | | 36,020 | | | | 33,273,475 | |
12.50%, 11/01/19 (Call 03/31/16) | | | 12,090 | | | | 9,339,525 | |
Mallinckrodt International Finance SA | | | | | | | | |
4.75%, 04/15/23b | | | 11,850 | | | | 10,457,625 | |
Mallinckrodt International Finance SA/Mallinckrodt CB LLC | | | | | | | | |
4.88%, 04/15/20 (Call 04/15/17)a,b | | | 14,595 | | | | 14,382,157 | |
5.50%, 04/15/25 (Call 04/15/20)a,b | | | 12,730 | | | | 11,998,025 | |
5.63%, 10/15/23 (Call 10/15/18)a,b | | | 16,440 | | | | 16,111,200 | |
5.75%, 08/01/22 (Call 08/01/17)a,b | | | 18,700 | | | | 18,513,000 | |
| | | | | | | | |
| | | | | | | 221,189,107 | |
HEALTH CARE – SERVICES — 7.64% | | | | | |
Acadia Healthcare Co. Inc. | | | | | | | | |
5.63%, 02/15/23 (Call 02/15/18)b | | | 12,674 | | | | 12,856,189 | |
Amsurg Corp. | | | | | | | | |
5.63%, 07/15/22 (Call 07/15/17)b | | | 22,398 | | | | 23,235,237 | |
Centene Corp. | | | | | | | | |
4.75%, 05/15/22 (Call 05/15/19) | | | 300 | | | | 303,189 | |
| | |
| 118 | | 2016 iSHARES ANNUAL REPORTTO SHAREHOLDERS |
Schedule of Investments (Continued)
iSHARES® iBOXX $ HIGH YIELD CORPORATE BOND ETF
February 29, 2016
| | | | | | | | |
| Security | |
Principal
(000s) | | | Value | |
Centene Escrow Corp. | | | | | | | | |
5.63%, 02/15/21 (Call 02/15/18)a | | $ | 12,902 | | | $ | 13,523,231 | |
6.13%, 02/15/24 (Call 02/15/19)a | | | 17,900 | | | | 18,951,625 | |
CHS/Community Health Systems Inc. | | | | | | | | |
5.13%, 08/15/18 (Call 03/31/16)b | | | 32,960 | | | | 33,124,800 | |
5.13%, 08/01/21 (Call 02/01/17) | | | 22,779 | | | | 22,864,421 | |
6.88%, 02/01/22 (Call 02/01/18)b | | | 58,950 | | | | 50,896,251 | |
7.13%, 07/15/20 (Call 07/15/16)b | | | 23,940 | | | | 21,725,550 | |
8.00%, 11/15/19 (Call 03/31/16)b | | | 42,061 | | | | 39,852,798 | |
DaVita HealthCare Partners Inc. | | | | | | | | |
5.00%, 05/01/25 (Call 05/01/20)b | | | 31,797 | | | | 31,826,412 | |
5.13%, 07/15/24 (Call 07/15/19)b | | | 34,420 | | | | 34,934,262 | |
5.75%, 08/15/22 (Call 08/15/17)b | | | 24,750 | | | | 26,026,011 | |
Fresenius Medical Care U.S. Finance II Inc. | | | | | | | | |
4.13%, 10/15/20 (Call 07/17/20)a | | | 12,050 | | | | 12,291,000 | |
4.75%, 10/15/24 (Call 07/17/24)a,b | | | 11,790 | | | | 11,960,955 | |
5.63%, 07/31/19a,b | | | 13,825 | | | | 15,034,688 | |
5.88%, 01/31/22a,b | | | 12,424 | | | | 13,571,853 | |
6.50%, 09/15/18a,b | | | 6,241 | | | | 6,864,448 | |
Fresenius Medical Care U.S. Finance Inc. | | | | | | | | |
5.75%, 02/15/21a,b | | | 11,000 | | | | 11,903,038 | |
6.88%, 07/15/17b | | | 6,750 | | | | 7,170,669 | |
HCA Holdings Inc. | | | | | | | | |
6.25%, 02/15/21b | | | 20,185 | | | | 21,438,022 | |
HCA Inc. | | | | | | | | |
3.75%, 03/15/19 | | | 32,495 | | | | 33,101,032 | |
4.25%, 10/15/19b | | | 10,700 | | | | 10,980,064 | |
4.75%, 05/01/23 | | | 24,365 | | | | 24,701,237 | |
| | | | | | | | |
| Security | |
Principal
(000s) | | | Value | |
5.00%, 03/15/24b | | $ | 41,718 | | | $ | 42,708,803 | |
5.25%, 04/15/25b | | | 28,005 | | | | 28,740,131 | |
5.38%, 02/01/25b | | | 53,680 | | | | 54,351,000 | |
5.88%, 03/15/22b | | | 26,825 | | | | 28,870,406 | |
5.88%, 05/01/23b | | | 25,650 | | | | 26,941,408 | |
5.88%, 02/15/26 (Call 08/15/25)b | | | 29,449 | | | | 30,247,033 | |
6.50%, 02/15/20b | | | 59,257 | | | | 65,638,979 | |
7.50%, 02/15/22b | | | 39,116 | | | | 44,201,080 | |
8.00%, 10/01/18b | | | 8,600 | | | | 9,669,668 | |
HealthSouth Corp. | | | | | | | | |
5.75%, 11/01/24 (Call 11/01/17)b | | | 16,965 | | | | 17,134,650 | |
Kindred Healthcare Inc. | | | | | | | | |
6.38%, 04/15/22 (Call 04/15/17)b | | | 11,675 | | | | 9,412,969 | |
8.00%, 01/15/20b | | | 16,300 | | | | 15,077,500 | |
8.75%, 01/15/23 (Call 01/15/18)b | | | 11,540 | | | | 10,357,150 | |
LifePoint Health Inc. | | | | | | | | |
5.50%, 12/01/21 (Call 12/01/16)b | | | 22,500 | | | | 23,283,254 | |
5.88%, 12/01/23 (Call 12/01/18)b | | | 9,195 | | | | 9,588,666 | |
6.63%, 10/01/20 (Call 03/31/16)b | | | 6,100 | | | | 6,317,455 | |
MPH Acquisition Holdings LLC | | | | | | | | |
6.63%, 04/01/22 (Call 04/01/17)a,b | | | 23,631 | | | | 23,808,233 | |
Tenet Healthcare Corp. | | | | | | | | |
4.38%, 10/01/21b | | | 21,270 | | | | 20,977,538 | |
4.50%, 04/01/21b | | | 18,130 | | | | 18,021,220 | |
4.75%, 06/01/20 | | | 9,249 | | | | 9,399,296 | |
5.00%, 03/01/19b | | | 23,739 | | | | 22,670,745 | |
5.50%, 03/01/19b | | | 8,900 | | | | 8,588,500 | |
6.00%, 10/01/20 | | | 34,594 | | | | 36,669,640 | |
6.25%, 11/01/18 | | | 19,310 | | | | 20,351,286 | |
6.75%, 06/15/23b | | | 38,020 | | | | 34,455,625 | |
8.00%, 08/01/20 (Call 03/31/16)b | | | 17,010 | | | | 17,193,443 | |
8.13%, 04/01/22b | | | 55,069 | | | | 54,070,599 | |
| | | | | | | | |
| | | | | | | 1,187,883,259 | |
| | | | |
SCHEDULESOF INVESTMENTS | | | 119 | |
Schedule of Investments (Continued)
iSHARES® iBOXX $ HIGH YIELD CORPORATE BOND ETF
February 29, 2016
| | | | | | | | |
| Security | |
Principal
(000s) | | | Value | |
HOLDING COMPANIES – DIVERSIFIED — 0.59% | |
Argos Merger Sub Inc. | | | | | | | | |
7.13%, 03/15/23 (Call 03/15/18)a,b | | $ | 38,515 | | | $ | 39,477,875 | |
HRG Group Inc. | | | | | | | | |
7.75%, 01/15/22 (Call 01/15/17) | | | 14,074 | | | | 13,194,375 | |
7.88%, 07/15/19 (Call 03/31/16) | | | 11,480 | | | | 11,967,900 | |
Leucadia National Corp. | | | | | | | | |
5.50%, 10/18/23 (Call 01/18/23) | | | 14,200 | | | | 12,699,211 | |
Nielsen Co. Luxembourg Sarl (The) | | | | | | | | |
5.50%, 10/01/21 (Call 10/01/16)a,b | | | 13,715 | | | | 14,180,738 | |
| | | | | | | | |
| | | | | | | 91,520,099 | |
HOME BUILDERS — 1.31% | | | | | |
Brookfield Residential Properties Inc. | | | | | | | | |
6.50%, 12/15/20 (Call 03/31/16)a,b | | | 13,225 | | | | 12,034,750 | |
Brookfield Residential Properties Inc./Brookfield Residential U.S. Corp. | | | | | | | | |
6.13%, 07/01/22 (Call 07/01/17)a | | | 7,900 | | | | 6,550,120 | |
CalAtlantic Group Inc. | | | | | | | | |
8.38%, 05/15/18 | | | 10,577 | | | | 11,634,700 | |
8.38%, 01/15/21b | | | 9,230 | | | | 10,522,200 | |
DR Horton Inc. | | | | | | | | |
3.63%, 02/15/18 (Call 11/15/17)b | | | 6,700 | | | | 6,841,035 | |
3.75%, 03/01/19 (Call 12/01/18)b | | | 8,750 | | | | 8,912,500 | |
4.00%, 02/15/20b | | | 9,408 | | | | 9,572,640 | |
5.75%, 08/15/23 (Call 05/15/23)b | | | 7,700 | | | | 8,108,100 | |
K. Hovnanian Enterprises Inc. | | | | | | | | |
7.25%, 10/15/20 (Call 03/31/16)a,b | | | 12,350 | | | | 9,694,750 | |
| | | | | | | | |
| Security | |
Principal
(000s) | | | Value | |
KB Home | | | | | | | | |
4.75%, 05/15/19 (Call 02/15/19)b | | $ | 7,374 | | | $ | 7,072,571 | |
7.00%, 12/15/21 (Call 09/15/21)b | | | 9,463 | | | | 9,020,388 | |
Lennar Corp. | | | | | | | | |
4.50%, 06/15/19 (Call 04/16/19)b | | | 9,550 | | | | 9,828,860 | |
4.50%, 11/15/19 (Call 08/15/19)b | | | 12,265 | | | | 12,571,625 | |
4.75%, 04/01/21 | | | 9,050 | | | | 9,095,250 | |
4.75%, 11/15/22 (Call 08/15/22)b | | | 13,920 | | | | 13,920,000 | |
4.75%, 05/30/25 (Call 02/28/25)b | | | 9,175 | | | | 8,899,750 | |
4.88%, 12/15/23 (Call 09/15/23)b | | | 6,880 | | | | 6,708,000 | |
12.25%, 06/01/17 | | | 5,325 | | | | 5,899,784 | |
PulteGroup Inc. | | | | | | | | |
5.50%, 03/01/26 (Call 12/01/25) | | | 3,475 | | | | 3,514,094 | |
Taylor Morrison Communities Inc./Monarch Communities Inc. | | | | | | | | |
5.25%, 04/15/21 (Call 04/15/16)a,b | | | 10,150 | | | | 9,477,562 | |
Toll Brothers Finance Corp. | | | | | | | | |
4.38%, 04/15/23 (Call 01/15/23)b | | | 9,850 | | | | 9,449,035 | |
5.88%, 02/15/22 (Call 11/15/21) | | | 7,391 | | | | 7,713,287 | |
8.91%, 10/15/17b | | | 5,800 | | | | 6,366,145 | |
| | | | | | | | |
| | | | | | | 203,407,146 | |
HOUSEHOLD PRODUCTS & WARES — 1.43% | |
Reynolds Group Issuer Inc./Reynolds Group Issuer LLC | | | | | | | | |
5.75%, 10/15/20 (Call 03/31/16)b | | | 67,145 | | | | 68,991,487 | |
6.88%, 02/15/21 (Call 03/31/16)b | | | 21,700 | | | | 22,486,625 | |
7.88%, 08/15/19 (Call 03/31/16) | | | 12,770 | | | | 13,312,725 | |
| | |
| 120 | | 2016 iSHARES ANNUAL REPORTTO SHAREHOLDERS |
Schedule of Investments (Continued)
iSHARES® iBOXX $ HIGH YIELD CORPORATE BOND ETF
February 29, 2016
| | | | | | | | |
| Security | |
Principal
(000s) | | | Value | |
8.25%, 02/15/21 (Call 03/31/16) | | $ | 20,755 | | | $ | 20,443,675 | |
8.50%, 05/15/18 (Call 03/31/16)b | | | 13,460 | | | | 13,406,665 | |
9.00%, 04/15/19 (Call 03/31/16)b | | | 13,000 | | | | 13,070,417 | |
9.88%, 08/15/19 (Call 03/31/16)b | | | 25,161 | | | | 25,915,830 | |
Spectrum Brands Inc. | | | | | | | | |
5.75%, 07/15/25 (Call 07/15/20)b | | | 20,413 | | | | 21,510,199 | |
6.38%, 11/15/20 (Call 11/15/16)b | | | 9,660 | | | | 10,205,404 | |
6.63%, 11/15/22 (Call 11/15/17)b | | | 11,560 | | | | 12,441,450 | |
| | | | | | | | |
| | | | | | | 221,784,477 | |
INSURANCE — 0.50% | | | | | |
Genworth Holdings Inc. | | | | | | | | |
4.80%, 02/15/24 | | | 5,500 | | | | 3,114,375 | |
4.90%, 08/15/23 | | | 6,275 | | | | 3,603,643 | |
6.15%, 11/15/66 (Call 11/15/16)c | | | 2,559 | | | | 537,390 | |
6.52%, 05/22/18 | | | 10,252 | | | | 9,149,910 | |
7.20%, 02/15/21 | | | 6,950 | | | | 4,608,684 | |
7.63%, 09/24/21 | | | 16,075 | | | | 10,609,500 | |
7.70%, 06/15/20b | | | 8,600 | | | | 6,073,750 | |
HUB International Ltd. | | | | | | | | |
7.88%, 10/01/21 (Call 10/01/16)a,b | | | 25,705 | | | | 23,134,500 | |
Voya Financial Inc. | | | | | | | | |
5.65%, 05/15/53 (Call 05/15/23)b,c | | | 17,925 | | | | 16,646,947 | |
| | | | | | | | |
| | | | | | | 77,478,699 | |
INTERNET — 1.10% | | | | | |
Equinix Inc. | | | | | | | | |
4.88%, 04/01/20 (Call 04/01/17) | | | 7,500 | | | | 7,781,250 | |
5.38%, 01/01/22 (Call 01/01/18)b | | | 15,300 | | | | 16,026,750 | |
5.38%, 04/01/23 (Call 04/01/18)b | | | 19,735 | | | | 21,116,450 | |
5.75%, 01/01/25 (Call 01/01/20)b | | | 9,330 | | | | 9,656,550 | |
| | | | | | | | |
| Security | |
Principal
(000s) | | | Value | |
IAC/InterActiveCorp | | | | | | | | |
4.75%, 12/15/22 (Call 12/15/17) | | $ | 9,950 | | | $ | 8,656,500 | |
Netflix Inc. | | | | | | | | |
5.38%, 02/01/21b | | | 13,500 | | | | 14,478,750 | |
5.50%, 02/15/22b | | | 14,200 | | | | 14,927,750 | |
5.75%, 03/01/24b | | | 8,475 | | | | 8,888,156 | |
5.88%, 02/15/25b | | | 15,295 | | | | 16,040,631 | |
VeriSign Inc. | | | | | | | | |
4.63%, 05/01/23 (Call 05/01/18)b | | | 13,184 | | | | 13,085,120 | |
5.25%, 04/01/25 (Call 01/01/25) | | | 10,949 | | | | 10,784,765 | |
Zayo Group LLC/Zayo Capital Inc. | | | | | | | | |
6.00%, 04/01/23 (Call 04/01/18)b | | | 28,200 | | | | 28,115,400 | |
10.13%, 07/01/20 (Call 07/01/16) | | | 1,702 | | | | 1,825,395 | |
| | | | | | | | |
| | | | | | | 171,383,467 | |
IRON & STEEL — 1.63% | | | | | |
AK Steel Corp. | | | | | | | | |
7.63%, 05/15/20 (Call 03/31/16)b | | | 10,875 | | | | 6,579,375 | |
7.63%, 10/01/21 (Call 10/01/17)b | | | 7,400 | | | | 3,845,632 | |
Allegheny Technologies Inc. | | | | | | | | |
5.95%, 01/15/21 (Call 10/15/20)b | | | 7,655 | | | | 5,588,915 | |
7.63%, 08/15/23 (Call 05/15/23)b | | | 9,050 | | | | 6,448,125 | |
ArcelorMittal | | | | | | | | |
5.13%, 06/01/20b | | | 10,190 | | | | 9,094,575 | |
5.50%, 02/25/17 | | | 2,001 | | | | 2,016,007 | |
6.13%, 06/01/18b | | | 28,326 | | | | 28,001,951 | |
6.13%, 06/01/25b | | | 9,045 | | | | 7,326,450 | |
6.25%, 08/05/20b | | | 19,728 | | | | 17,779,860 | |
6.50%, 03/01/21b | | | 29,535 | | | | 26,581,500 | |
7.25%, 02/25/22b | | | 24,925 | | | | 22,370,187 | |
10.85%, 06/01/19 | | | 31,396 | | | | 33,282,900 | |
Cliffs Natural Resources Inc. | | | | | | | | |
4.88%, 04/01/21 (Call 01/01/21)b | | | 2,425 | | | | 279,384 | |
| | | | |
SCHEDULESOF INVESTMENTS | | | 121 | |
Schedule of Investments (Continued)
iSHARES® iBOXX $ HIGH YIELD CORPORATE BOND ETF
February 29, 2016
| | | | | | | | |
| Security | |
Principal
(000s) | | | Value | |
7.75%, 03/31/20 (Call 03/31/17)a,b | | $ | 8,897 | | | $ | 1,334,481 | |
8.25%, 03/31/20 (Call 03/31/18)a,b | | | 9,955 | | | | 7,441,362 | |
Commercial Metals Co. | | | | | | | | |
6.50%, 07/15/17 | | | 6,928 | | | | 7,202,955 | |
7.35%, 08/15/18 | | | 7,250 | | | | 7,504,710 | |
Steel Dynamics Inc. | | | | | | | | |
5.13%, 10/01/21 (Call 10/01/17)b | | | 13,636 | | | | 13,269,977 | |
5.25%, 04/15/23 (Call 04/15/18) | | | 6,875 | | | | 6,505,469 | |
5.50%, 10/01/24 (Call 10/01/19)b | | | 9,300 | | | | 8,841,231 | |
6.13%, 08/15/19 (Call 08/15/16) | | | 7,400 | | | | 7,533,200 | |
U.S. Steel Corp. | | | | | | | | |
6.05%, 06/01/17 | | | 7,184 | | | | 6,462,369 | |
7.00%, 02/01/18b | | | 9,250 | | | | 7,307,500 | |
7.38%, 04/01/20b | | | 10,900 | | | | 6,867,000 | |
7.50%, 03/15/22 (Call 03/15/17)b | | | 7,175 | | | | 3,960,600 | |
| | | | | | | | |
| | | | | | | 253,425,715 | |
LEISURE TIME — 0.33% | | | | | |
NCL Corp. Ltd. | | | | | | | | |
4.63%, 11/15/20 (Call 11/15/17)a,b | | | 11,150 | | | | 10,871,250 | |
5.25%, 11/15/19 (Call 11/15/16)a | | | 15,800 | | | | 15,928,375 | |
Royal Caribbean Cruises Ltd. | | | | | | | | |
5.25%, 11/15/22b | | | 14,819 | | | | 15,096,856 | |
Sabre GLBL Inc. | | | | | | | | |
5.25%, 11/15/23 (Call 11/15/18)a,b | | | 9,335 | | | | 9,475,025 | |
| | | | | | | | |
| | | | | | | 51,371,506 | |
LODGING — 1.99% | | | | | |
Boyd Gaming Corp. | | | | | | | | |
6.88%, 05/15/23 (Call 05/15/18)b | | | 15,735 | | | | 16,177,547 | |
| | | | | | | | |
| Security | |
Principal
(000s) | | | Value | |
Caesars Entertainment Resort
Properties LLC/Caesars Entertainment Resort Properties | | | | | |
8.00%, 10/01/20 (Call 10/01/16)b | | $ | 19,550 | | | $ | 19,061,250 | |
11.00%, 10/01/21 (Call 10/01/16)b | | | 23,685 | | | | 20,724,375 | |
Felcor Lodging LP | | | | | | | | |
5.63%, 03/01/23 (Call 03/01/18) | | | 9,800 | | | | 9,975,199 | |
6.00%, 06/01/25 (Call 06/01/20)b | | | 8,990 | | | | 9,227,111 | |
Hilton Worldwide Finance LLC/Hilton Worldwide Finance Corp. | | | | | | | | |
5.63%, 10/15/21 (Call 10/15/16)b | | | 30,354 | | | | 31,492,275 | |
MGM Resorts International | | | | | | | | |
5.25%, 03/31/20b | | | 10,700 | | | | 10,914,000 | |
6.00%, 03/15/23b | | | 25,685 | | | | 26,327,125 | |
6.63%, 12/15/21b | | | 25,400 | | | | 26,975,488 | |
6.75%, 10/01/20b | | | 22,160 | | | | 23,678,463 | |
7.63%, 01/15/17b | | | 950 | | | | 989,188 | |
7.75%, 03/15/22b | | | 21,150 | | | | 23,060,056 | |
8.63%, 02/01/19b | | | 17,312 | | | | 19,624,018 | |
11.38%, 03/01/18b | | | 7,570 | | | | 8,729,573 | |
Wynn Las Vegas LLC/Wynn Las Vegas Capital Corp. | | | | | | | | |
4.25%, 05/30/23 (Call 02/28/23)a,b | | | 10,700 | | | | 9,890,866 | |
5.38%, 03/15/22 (Call 03/15/17)b | | | 18,650 | | | | 18,650,000 | |
5.50%, 03/01/25 (Call 12/01/24)a,b | | | 35,562 | | | | 33,961,710 | |
| | | | | | | | |
| | | | | | | 309,458,244 | |
MACHINERY — 0.84% | | | | | |
BlueLine Rental Finance Corp. | | | | | | | | |
7.00%, 02/01/19 (Call 03/31/16)a,b | | | 16,975 | | | | 12,434,188 | |
Case New Holland Industrial Inc. | | | | | | | | |
7.88%, 12/01/17b | | | 29,075 | | | | 31,146,594 | |
| | |
| 122 | | 2016 iSHARES ANNUAL REPORTTO SHAREHOLDERS |
Schedule of Investments (Continued)
iSHARES® iBOXX $ HIGH YIELD CORPORATE BOND ETF
February 29, 2016
| | | | | | | | |
| Security | |
Principal
(000s) | | | Value | |
CNH Industrial Capital LLC | | | | | | | | |
3.25%, 02/01/17b | | $ | 3,650 | | | $ | 3,665,987 | |
3.38%, 07/15/19b | | | 9,000 | | | | 8,466,300 | |
3.63%, 04/15/18b | | | 11,400 | | | | 11,296,260 | |
3.88%, 07/16/18b | | | 12,775 | | | | 12,533,233 | |
4.38%, 11/06/20b | | | 12,115 | | | | 11,537,341 | |
6.25%, 11/01/16 | | | 845 | | | | 863,484 | |
Terex Corp. | | | | | | | | |
6.00%, 05/15/21 (Call 11/15/16)b | | | 17,500 | | | | 16,493,750 | |
Zebra Technologies Corp. | | | | | | | | |
7.25%, 10/15/22 (Call 10/15/17)b | | | 21,320 | | | | 22,332,700 | |
| | | | | | | | |
| | | | | | | 130,769,837 | |
MANUFACTURING — 0.84% | | | | | |
Bombardier Inc. | | | | | | | | |
4.75%, 04/15/19a | | | 11,380 | | | | 9,037,617 | |
5.50%, 09/15/18a | | | 15,800 | | | | 14,417,500 | |
5.75%, 03/15/22a,b | | | 8,700 | | | | 6,052,714 | |
6.00%, 10/15/22 (Call 04/15/17)a,b | | | 25,103 | | | | 17,752,842 | |
6.13%, 01/15/23a | | | 26,076 | | | | 18,253,200 | |
7.50%, 03/15/18a | | | 13,200 | | | | 12,606,000 | |
7.50%, 03/15/25 (Call 03/15/20)a,b | | | 31,930 | | | | 22,322,416 | |
7.75%, 03/15/20a | | | 16,620 | | | | 13,296,000 | |
Gates Global LLC/Gates Global Co. | | | | | | | | |
6.00%, 07/15/22 (Call 07/15/17)a,b | | | 23,760 | | | | 17,463,600 | |
| | | | | | | | |
| | | | | | | 131,201,889 | |
MEDIA — 10.52% | | | | | |
Altice U.S. Finance I Corp. | | | | | | | | |
5.38%, 07/15/23 (Call 07/15/18)a | | | 22,650 | | | | 22,933,125 | |
AMC Networks Inc. | | | | | | | | |
4.75%, 12/15/22 (Call 12/15/17)b | | | 10,375 | | | | 10,530,625 | |
7.75%, 07/15/21 (Call 07/15/16) | | | 11,724 | | | | 12,406,923 | |
Cablevision Systems Corp. | | | | | | | | |
5.88%, 09/15/22 | | | 15,150 | | | | 12,006,375 | |
7.75%, 04/15/18b | | | 15,570 | | | | 15,959,250 | |
| | | | | | | | |
| Security | |
Principal
(000s) | | | Value | |
8.00%, 04/15/20b | | $ | 9,400 | | | $ | 8,883,000 | |
8.63%, 09/15/17b | | | 18,220 | | | | 19,381,525 | |
CCO Holdings LLC/CCO Holdings Capital Corp. | | | | | | | | |
5.13%, 02/15/23 (Call 02/15/18)b | | | 20,145 | | | | 20,094,638 | |
5.13%, 05/01/23 (Call 05/01/18)a | | | 24,125 | | | | 23,748,047 | |
5.25%, 03/15/21 (Call 03/31/16)b | | | 10,650 | | | | 11,036,063 | |
5.25%, 09/30/22 (Call 09/30/17)b | | | 25,476 | | | | 25,762,605 | |
5.38%, 05/01/25 (Call 05/01/20)a,b | | | 16,515 | | | | 16,515,000 | |
5.75%, 09/01/23 (Call 03/01/18)b | | | 9,050 | | | | 9,215,163 | |
5.75%, 01/15/24 (Call 07/15/18)b | | | 18,792 | | | | 19,130,444 | |
5.88%, 04/01/24 (Call 04/01/19)a,b | | | 23,075 | | | | 23,594,187 | |
5.88%, 05/01/27 (Call 05/01/21)a,b | | | 18,100 | | | | 18,100,000 | |
6.50%, 04/30/21 (Call 03/31/16) | | | 34,186 | | | | 35,553,440 | |
6.63%, 01/31/22 (Call 01/31/17) | | | 15,889 | | | | 16,691,553 | |
7.00%, 01/15/19 (Call 03/31/16) | | | 7,511 | | | | 7,673,989 | |
7.38%, 06/01/20 (Call 03/31/16)b | | | 12,020 | | | | 12,500,800 | |
CCOH Safari LLC | | | | | | | | |
5.75%, 02/15/26 (Call 02/15/21)a,b | | | 52,410 | | | | 52,547,838 | |
Cequel Communications Holdings I LLC/Cequel Capital Corp. | | | | | | | | |
5.13%, 12/15/21 (Call 06/15/16)a,b | | | 24,700 | | | | 22,415,760 | |
6.38%, 09/15/20 (Call 03/31/16)a,b | | | 31,057 | | | | 30,435,860 | |
Clear Channel Worldwide Holdings Inc. | | | | | | | | |
6.50%, 11/15/22 (Call 11/15/17) | | | 12,870 | | | | 11,711,700 | |
| | | | |
SCHEDULESOF INVESTMENTS | | | 123 | |
Schedule of Investments (Continued)
iSHARES® iBOXX $ HIGH YIELD CORPORATE BOND ETF
February 29, 2016
| | | | | | | | |
| Security | |
Principal
(000s) | | | Value | |
6.50%, 11/15/22 (Call 11/15/17)b | | $ | 40,231 | | | $ | 39,024,070 | |
Series A | | | | | | | | |
7.63%, 03/15/20 (Call 03/31/16)b | | | 500 | | | | 406,875 | |
Series B | | | | | | | | |
7.63%, 03/15/20 (Call 03/31/16)b | | | 37,180 | | | | 32,439,550 | |
CSC Holdings LLC | | | | | | | | |
5.25%, 06/01/24b | | | 15,700 | | | | 13,462,750 | |
6.75%, 11/15/21b | | | 20,445 | | | | 20,659,673 | |
8.63%, 02/15/19 | | | 10,314 | | | | 11,087,550 | |
DISH DBS Corp. | | | | | | | | |
4.25%, 04/01/18 | | | 24,346 | | | | 24,568,522 | |
4.63%, 07/15/17b | | | 15,550 | | | | 15,899,875 | |
5.00%, 03/15/23b | | | 30,325 | | | | 26,790,266 | |
5.13%, 05/01/20b | | | 22,462 | | | | 22,181,225 | |
5.88%, 07/15/22 | | | 42,295 | | | | 40,656,069 | |
5.88%, 11/15/24b | | | 39,054 | | | | 35,154,380 | |
6.75%, 06/01/21b | | | 41,885 | | | | 42,566,993 | |
7.88%, 09/01/19b | | | 29,206 | | | | 31,637,107 | |
iHeartCommunications Inc. | | | | | | | | |
9.00%, 12/15/19 (Call 03/31/16)b | | | 31,850 | | | | 22,613,500 | |
9.00%, 03/01/21 (Call 03/31/16)b | | | 34,350 | | | | 23,400,937 | |
9.00%, 09/15/22 (Call 09/15/17)b | | | 18,700 | | | | 12,549,035 | |
10.00%, 01/15/18 (Call 07/15/16)b | | | 12,200 | | | | 3,886,171 | |
10.63%, 03/15/23 (Call 03/15/18)b | | | 19,070 | | | | 12,745,116 | |
11.25%, 03/01/21 (Call 03/31/16) | | | 11,425 | | | | 7,740,438 | |
McGraw-Hill Global Education Holdings LLC/McGraw-Hill Global Education Finance | | | | | | | | |
9.75%, 04/01/21 (Call 04/01/16)b | | | 14,609 | | | | 15,887,288 | |
Neptune Finco Corp. | | | | | | | | |
6.63%, 10/15/25 (Call 10/15/20)a,b | | | 22,825 | | | | 24,080,375 | |
10.13%, 01/15/23 (Call 01/15/19)a | | | 35,080 | | | | 37,754,850 | |
| | | | | | | | |
| Security | |
Principal
(000s) | | | Value | |
10.88%, 10/15/25 (Call 10/15/20)a,b | | $ | 39,250 | | | $ | 42,390,000 | |
Nielsen Finance LLC/Nielsen Finance Co. | | | | | | | | |
4.50%, 10/01/20 (Call 10/01/16)b | | | 15,350 | | | | 15,707,288 | |
5.00%, 04/15/22 (Call 04/15/17)a,b | | | 44,238 | | | | 45,025,879 | |
Numericable-SFR SA | | | | | | | | |
4.88%, 05/15/19 (Call 05/15/16)a,b | | | 48,460 | | | | 48,429,955 | |
6.00%, 05/15/22 (Call 05/15/17)a,b | | | 84,642 | | | | 83,795,580 | |
6.25%, 05/15/24 (Call 05/15/19)a,b | | | 29,300 | | | | 28,494,250 | |
Quebecor Media Inc. | | | | | | | | |
5.75%, 01/15/23b | | | 17,142 | | | | 17,699,115 | |
Sinclair Television Group Inc. | | | | | | | | |
5.38%, 04/01/21 (Call 04/01/16)b | | | 10,950 | | | | 11,020,025 | |
5.63%, 08/01/24 (Call 08/01/19)a,b | | | 10,925 | | | | 10,878,911 | |
6.13%, 10/01/22 (Call 10/01/17)b | | | 9,955 | | | | 10,218,005 | |
Sirius XM Radio Inc. | | | | | | | | |
4.25%, 05/15/20 (Call 05/15/16)a,b | | | 7,400 | | | | 7,526,654 | |
4.63%, 05/15/23 (Call 05/15/18)a,b | | | 10,932 | | | | 10,651,868 | |
5.38%, 04/15/25 (Call 04/15/20)a | | | 20,850 | | | | 20,876,062 | |
5.75%, 08/01/21 (Call 08/01/16)a,b | | | 13,125 | | | | 13,626,063 | |
5.88%, 10/01/20 (Call 10/01/16)a,b | | | 11,800 | | | | 12,323,194 | |
6.00%, 07/15/24 (Call 07/15/19)a,b | | | 29,250 | | | | 30,895,312 | |
TEGNA Inc. | | | | | | | | |
5.13%, 10/15/19 (Call 10/15/16)b | | | 9,479 | | | | 10,033,522 | |
5.13%, 07/15/20 (Call 07/15/16)b | | | 9,300 | | | | 9,708,053 | |
6.38%, 10/15/23 (Call 10/15/18)b | | | 13,696 | | | | 14,688,960 | |
| | |
| 124 | | 2016 iSHARES ANNUAL REPORTTO SHAREHOLDERS |
Schedule of Investments (Continued)
iSHARES® iBOXX $ HIGH YIELD CORPORATE BOND ETF
February 29, 2016
| | | | | | | | |
| Security | |
Principal
(000s) | | | Value | |
Tribune Media Co. | | | | | | | | |
5.88%, 07/15/22 (Call 07/15/18)a,b | | $ | 24,430 | | | $ | 24,552,150 | |
Unitymedia GmbH | | | | | | | | |
6.13%, 01/15/25 (Call 01/15/20)a,b | | | 19,100 | | | | 19,673,000 | |
Unitymedia Hessen GmbH & Co. KG/Unitymedia NRW GmbH | | | | | | | | |
5.00%, 01/15/25 (Call 01/15/20)a,b | | | 13,460 | | | | 13,401,045 | |
5.50%, 01/15/23 (Call 01/15/18)a,b | | | 20,695 | | | | 21,620,731 | |
Univision Communications Inc. | | | | | | | | |
5.13%, 05/15/23 (Call 05/15/18)a,b | | | 23,230 | | | | 23,055,775 | |
5.13%, 02/15/25 (Call 02/15/20)a,b | | | 30,960 | | | | 30,340,800 | |
6.75%, 09/15/22 (Call 09/15/17)a | | | 24,103 | | | | 25,564,244 | |
8.50%, 05/15/21 (Call 03/31/16)a,b | | | 17,873 | | | | 17,962,365 | |
Videotron Ltd. | | | | | | | | |
5.00%, 07/15/22 | | | 12,350 | | | | 12,627,875 | |
5.38%, 06/15/24 (Call 03/15/24)a,b | | | 10,100 | | | | 10,258,298 | |
WideOpenWest Finance LLC/WideOpenWest Capital Corp. | | | | | | | | |
10.25%, 07/15/19 (Call 03/31/16)b | | | 17,375 | | | | 15,876,406 | |
| | | | | | | | |
| | | | | | | 1,634,941,910 | |
MINING — 1.76% | | | | | |
Alcoa Inc. | | | | | | | | |
5.13%, 10/01/24 (Call 07/01/24)b | | | 24,440 | | | | 22,087,650 | |
5.40%, 04/15/21 (Call 01/15/21)b | | | 26,129 | | | | 25,865,097 | |
5.55%, 02/01/17b | | | 3,050 | | | | 3,116,336 | |
5.72%, 02/23/19b | | | 16,290 | | | | 16,493,625 | |
5.87%, 02/23/22b | | | 11,655 | | | | 11,242,857 | |
6.15%, 08/15/20b | | | 19,713 | | | | 19,910,130 | |
6.75%, 07/15/18b | | | 14,735 | | | | 15,348,838 | |
Aleris International Inc. | | | | | | | | |
7.88%, 11/01/20 (Call 03/31/16)b | | | 1,010 | | | | 780,162 | |
| | | | | | | | |
| Security | |
Principal
(000s) | | | Value | |
FMG Resources August 2006 Pty Ltd. | | | | | | | | |
6.88%, 04/01/22 (Call 04/01/17)a,b | | $ | 8,545 | | | $ | 5,981,500 | |
8.25%, 11/01/19 (Call 03/31/16)a,b | | | 13,293 | | | | 11,830,770 | |
9.75%, 03/01/22 (Call 03/01/18)a,b | | | 42,910 | | | | 39,922,808 | |
Lundin Mining Corp. | | | | | | | | |
7.50%, 11/01/20 (Call 11/01/17)a,b | | | 12,210 | | | | 10,866,900 | |
7.88%, 11/01/22 (Call 11/01/18)a | | | 8,200 | | | | 6,888,000 | |
Novelis Inc. | | | | | | | | |
8.38%, 12/15/17 (Call 03/31/16)b | | | 19,793 | | | | 19,694,035 | |
8.75%, 12/15/20 (Call 03/31/16)b | | | 28,398 | | | | 26,361,083 | |
Teck Resources Ltd. | | | | | | | | |
2.50%, 02/01/18b | | | 9,200 | | | | 7,876,810 | |
3.00%, 03/01/19b | | | 9,250 | | | | 7,053,125 | |
3.75%, 02/01/23 (Call 11/01/22) | | | 13,265 | | | | 8,091,650 | |
4.50%, 01/15/21 (Call 10/15/20) | | | 7,875 | | | | 4,925,813 | |
4.75%, 01/15/22 (Call 10/15/21) | | | 15,500 | | | | 9,413,134 | |
| | | | | | | | |
| | | | | | | 273,750,323 | |
OFFICE & BUSINESS EQUIPMENT — 0.24% | |
CDW LLC/CDW Finance Corp. | | | | | | | | |
5.00%, 09/01/23 (Call 03/01/18)b | | | 10,535 | | | | 10,785,207 | |
5.50%, 12/01/24 (Call 06/01/24)b | | | 11,870 | | | | 12,082,671 | |
6.00%, 08/15/22 (Call 08/15/17)b | | | 13,070 | | | | 13,800,933 | |
| | | | | | | | |
| | | | | | | 36,668,811 | |
OIL & GAS — 4.96% | | | | | |
American Energy-Permian Basin LLC | | | | | | | | |
13.00%, 11/30/20 (Call 11/30/18)a,b | | | 7,675 | | | | 8,135,500 | �� |
| | | | |
SCHEDULESOF INVESTMENTS | | | 125 | |
Schedule of Investments (Continued)
iSHARES® iBOXX $ HIGH YIELD CORPORATE BOND ETF
February 29, 2016
| | | | | | | | |
| Security | |
Principal
(000s) | | | Value | |
American Energy-Permian Basin LLC/AEPB Finance Corp. | | | | | | | | |
7.13%, 11/01/20 (Call 01/31/17)a,b | | $ | 10,600 | | | $ | 2,544,000 | |
7.38%, 11/01/21 (Call 07/31/17)a,b | | | 9,155 | | | | 2,197,200 | |
Antero Resources Corp. | | | | | | | | |
5.13%, 12/01/22 (Call 06/01/17)b | | | 24,232 | | | | 20,657,780 | |
5.38%, 11/01/21 (Call 11/01/16)b | | | 20,150 | | | | 17,505,312 | |
5.63%, 06/01/23 (Call 06/01/18)a,b | | | 14,850 | | | | 12,625,915 | |
6.00%, 12/01/20 (Call 03/31/16)b | | | 10,800 | | | | 9,635,414 | |
Berry Petroleum Co. LLC | | | | | | | | |
6.38%, 09/15/22 (Call 03/15/17) | | | 9,600 | | | | 960,000 | |
BreitBurn Energy Partners LP/BreitBurn Finance Corp. | | | | | | | | |
7.88%, 04/15/22 (Call 01/15/17) | | | 13,100 | | | | 1,441,000 | |
California Resources Corp. | | | | | | | | |
5.00%, 01/15/20 (Call 12/15/19) | | | 4,671 | | | | 607,230 | |
5.50%, 09/15/21 (Call 06/15/21) | | | 11,052 | | | | 1,436,760 | |
6.00%, 11/15/24 (Call 08/15/24) | | | 12,556 | | | | 1,632,280 | |
8.00%, 12/15/22 (Call 12/15/18)a,b | | | 40,028 | | | | 10,007,000 | |
Calumet Specialty Products Partners LP/Calumet Finance Corp. | | | | | | | | |
6.50%, 04/15/21 (Call 04/15/17)b | | | 19,287 | | | | 11,620,417 | |
Carrizo Oil & Gas Inc. | | | | | | | | |
6.25%, 04/15/23 (Call 04/15/18)b | | | 11,085 | | | | 7,981,200 | |
7.50%, 09/15/20 (Call 09/15/16)b | | | 13,650 | | | | 10,783,500 | |
| | | | | | | | |
| Security | |
Principal
(000s) | | | Value | |
Chaparral Energy Inc. | | | | | | | | |
7.63%, 11/15/22 (Call 05/15/17)d | | $ | 9,200 | | | $ | 920,000 | |
8.25%, 09/01/21 (Call 09/01/16)d | | | 6,520 | | | | 652,000 | |
Chesapeake Energy Corp. | | | | | | | | |
7.25%, 12/15/18 | | | 1,500 | | | | 540,000 | |
8.00%, 12/15/22 (Call 12/15/18)a,b | | | 70,406 | | | | 27,810,370 | |
Citgo Holding Inc. | | | | | | | | |
10.75%, 02/15/20a | | | 30,052 | | | | 27,347,320 | |
Comstock Resources Inc. | | | | | | | | |
10.00%, 03/15/20 (Call 03/31/16)a,b | | | 12,325 | | | | 4,529,438 | |
Concho Resources Inc. | | | | | | | | |
5.50%, 10/01/22 (Call 10/01/17)b | | | 12,850 | | | | 12,095,062 | |
5.50%, 04/01/23 (Call 10/01/17)b | | | 31,041 | | | | 28,787,756 | |
6.50%, 01/15/22 (Call 01/15/17)b | | | 12,425 | | | | 11,945,648 | |
7.00%, 01/15/21 (Call 03/31/16) | | | 14,317 | | | | 14,442,274 | |
Denbury Resources Inc. | | | | | | | | |
4.63%, 07/15/23 (Call 01/15/18) | | | 22,039 | | | | 6,415,553 | |
5.50%, 05/01/22 (Call 05/01/17) | | | 19,725 | | | | 6,213,375 | |
6.38%, 08/15/21 (Call 08/15/16)b | | | 6,055 | | | | 1,913,380 | |
Energy XXI Gulf Coast Inc. | | | | | | | | |
6.88%, 03/15/24 (Call 03/15/19)b,d | | | 6,325 | | | | 158,125 | |
9.25%, 12/15/17 (Call 03/31/16)d | | | 9,075 | | | | 272,250 | |
11.00%, 03/15/20 (Call 09/15/17)a,d | | | 19,750 | | | | 2,172,500 | |
EP Energy LLC/Everest Acquisition Finance Inc. | | | | | | | | |
6.38%, 06/15/23 (Call 06/15/18) | | | 13,395 | | | | 3,595,218 | |
9.38%, 05/01/20 (Call 05/01/16) | | | 33,196 | | | | 9,917,305 | |
| | |
| 126 | | 2016 iSHARES ANNUAL REPORTTO SHAREHOLDERS |
Schedule of Investments (Continued)
iSHARES® iBOXX $ HIGH YIELD CORPORATE BOND ETF
February 29, 2016
| | | | | | | | |
| Security | |
Principal
(000s) | | | Value | |
Halcon Resources Corp. | | | | | | | | |
8.63%, 02/01/20 (Call 02/01/17)a,b | | $ | 13,990 | | | $ | 7,729,475 | |
13.00%, 02/15/22 (Call 08/15/18)a,b | | | 15,150 | | | | 2,121,000 | |
Harvest Operations Corp. | | | | | | | | |
6.88%, 10/01/17 | | | 9,294 | | | | 5,901,690 | |
Hilcorp Energy I LP/Hilcorp Finance Co. | | | | | | | | |
5.00%, 12/01/24 (Call 06/01/19)a,b | | | 9,245 | | | | 6,301,947 | |
5.75%, 10/01/25 (Call 04/01/20)a,b | | | 9,925 | | | | 6,773,813 | |
Jupiter Resources Inc. | | | | | | | | |
8.50%, 10/01/22 (Call 10/01/17)a,b | | | 17,400 | | | | 5,655,000 | |
Laredo Petroleum Inc. | | | | | | | | |
5.63%, 01/15/22 (Call 01/15/17)b | | | 7,925 | | | | 5,072,000 | |
7.38%, 05/01/22 (Call 05/01/17)b | | | 12,150 | | | | 7,715,250 | |
Linn Energy LLC/Linn Energy Finance Corp. | | | | | | | | |
6.50%, 09/15/21 (Call 09/15/17) | | | 9,875 | | | | 419,688 | |
7.75%, 02/01/21 (Call 03/31/16) | | | 14,053 | | | | 597,253 | |
8.63%, 04/15/20 (Call 03/31/16) | | | 18,245 | | | | 775,413 | |
12.00%, 12/15/20 (Call 12/15/18)a | | | 19,595 | | | | 1,959,500 | |
MEG Energy Corp. | | | | | | | | |
6.38%, 01/30/23 (Call 07/30/17)a,b | | | 14,972 | | | | 7,074,270 | |
6.50%, 03/15/21 (Call 03/31/16)a,b | | | 13,475 | | | | 6,501,688 | |
7.00%, 03/31/24 (Call 09/30/18)a,b | | | 21,675 | | | | 10,241,438 | |
Memorial Production Partners LP/Memorial Production Finance Corp. | | | | | | | | |
6.88%, 08/01/22 (Call 08/01/17) | | | 9,450 | | | | 2,055,375 | |
| | | | | | | | |
| Security | |
Principal
(000s) | | | Value | |
7.63%, 05/01/21 (Call 05/01/17) | | $ | 12,850 | | | $ | 2,984,695 | |
Midstates Petroleum Co. Inc./Midstates Petroleum Co. LLC | | | | | | | | |
10.00%, 06/01/20 (Call 06/01/17)b | | | 11,550 | | | | 3,060,750 | |
Newfield Exploration Co. | | | | | | | | |
5.38%, 01/01/26 (Call 10/01/25)b | | | 15,125 | | | | 13,017,812 | |
5.63%, 07/01/24b | | | 19,030 | | | | 17,269,725 | |
5.75%, 01/30/22b | | | 16,570 | | | | 15,286,032 | |
Oasis Petroleum Inc. | | | | | | | | |
6.50%, 11/01/21 (Call 11/01/16) | | | 8,350 | | | | 4,993,300 | |
6.88%, 03/15/22 (Call 09/15/17)b | | | 19,075 | | | | 11,142,980 | |
6.88%, 01/15/23 (Call 07/15/17) | | | 7,967 | | | | 4,627,499 | |
7.25%, 02/01/19 (Call 03/31/16)b | | | 8,465 | | | | 5,277,928 | |
Pacific Drilling SA | | | | | | | | |
5.38%, 06/01/20 (Call 06/01/16)a,b | | | 9,775 | | | | 1,857,861 | |
Pacific Drilling V Ltd. | | | | | | | | |
7.25%, 12/01/17 (Call 03/31/16)a | | | 9,075 | | | | 2,484,281 | |
PBF Holding Co. LLC/PBF Finance Corp. | | | | | | | | |
7.00%, 11/15/23 (Call 11/15/18)a,b | | | 8,335 | | | | 7,126,425 | |
8.25%, 02/15/20 (Call 03/31/16)b | | | 14,800 | | | | 14,940,600 | |
Penn Virginia Corp. | | | | | | | | |
8.50%, 05/01/20 (Call 05/01/17) | | | 11,500 | | | | 977,500 | |
Precision Drilling Corp. | | | | | | | | |
5.25%, 11/15/24 (Call 05/15/19)b | | | 6,895 | | | | 4,010,950 | |
6.63%, 11/15/20 (Call 03/31/16) | | | 11,420 | | | | 7,622,850 | |
Puma International Financing SA | | | | | | | | |
6.75%, 02/01/21 (Call 02/01/17)a | | | 19,300 | | | | 17,780,125 | |
| | | | |
SCHEDULESOF INVESTMENTS | | | 127 | |
Schedule of Investments (Continued)
iSHARES® iBOXX $ HIGH YIELD CORPORATE BOND ETF
February 29, 2016
| | | | | | | | |
| Security | |
Principal
(000s) | | | Value | |
QEP Resources Inc. | | | | | | | | |
5.25%, 05/01/23 (Call 02/01/23) | | $ | 13,452 | | | $ | 9,416,400 | |
5.38%, 10/01/22 (Call 07/01/22)b | | | 8,160 | | | | 5,574,259 | |
6.88%, 03/01/21b | | | 12,821 | | | | 9,263,173 | |
Range Resources Corp. | | | | | | | | |
4.88%, 05/15/25 (Call 02/15/25)a,b | | | 13,100 | | | | 11,331,500 | |
5.00%, 08/15/22 (Call 02/15/17)b | | | 13,342 | | | | 11,307,345 | |
5.00%, 03/15/23 (Call 03/15/18)b | | | 16,900 | | | | 13,995,312 | |
5.75%, 06/01/21 (Call 06/01/16) | | | 8,622 | | | | 7,149,075 | |
Sanchez Energy Corp. | | | | | | | | |
6.13%, 01/15/23 (Call 07/15/18)b | | | 20,635 | | | | 7,523,438 | |
7.75%, 06/15/21 (Call 06/15/17) | | | 10,020 | | | | 4,058,100 | |
Seven Generations Energy Ltd. | | | | | | | | |
6.75%, 05/01/23 (Call 05/01/18)a,b | | | 7,915 | | | | 6,812,554 | |
Seventy Seven Energy Inc. | | | | | | | | |
6.50%, 07/15/22 (Call 07/15/17) | | | 8,365 | | | | 125,475 | |
Seventy Seven Operating LLC | | | | | | | | |
6.63%, 11/15/19 (Call 03/31/16) | | | 8,260 | | | | 1,404,200 | |
SM Energy Co. | | | | | | | | |
5.00%, 01/15/24 (Call 07/15/18) | | | 8,105 | | | | 3,221,738 | |
5.63%, 06/01/25 (Call 06/01/20)b | | | 8,824 | | | | 3,551,660 | |
6.13%, 11/15/22 (Call 11/15/18) | | | 14,025 | | | | 6,271,840 | |
6.50%, 01/01/23 (Call 07/01/17) | | | 9,052 | | | | 3,598,170 | |
Sunoco LP/Sunoco Finance Corp. | | | | | | | | |
5.50%, 08/01/20 (Call 08/01/17)a,b | | | 10,650 | | | | 10,224,000 | |
6.38%, 04/01/23 (Call 04/01/18)a,b | | | 15,400 | | | | 14,691,600 | |
| | | | | | | | |
| Security | |
Principal
(000s) | | | Value | |
Tesoro Corp. | | | | | | | | |
4.25%, 10/01/17 (Call 09/01/17)b | | $ | 8,198 | | | $ | 8,319,945 | |
5.38%, 10/01/22 (Call 10/01/17)b | | | 11,325 | | | | 10,733,134 | |
Transocean Inc. | | | | | | | | |
3.00%, 10/15/17b | | | 11,550 | | | | 10,260,827 | |
4.30%, 10/15/22 (Call 07/15/22)b | | | 13,815 | | | | 6,769,350 | |
6.00%, 03/15/18b | | | 19,358 | | | | 15,631,585 | |
6.50%, 11/15/20b | | | 18,250 | | | | 10,585,000 | |
7.13%, 12/15/21b | | | 22,600 | | | | 12,537,124 | |
Tullow Oil PLC | | | | | | | | |
6.00%, 11/01/20 (Call 11/01/16)a | | | 14,420 | | | | 9,409,050 | |
6.25%, 04/15/22 (Call 04/15/17)a | | | 11,700 | | | | 7,160,400 | |
Ultra Petroleum Corp. | | | | | | | | |
5.75%, 12/15/18 (Call 03/31/16)a | | | 10,320 | | | | 567,600 | |
6.13%, 10/01/24 (Call 10/01/19)a | | | 13,795 | | | | 758,725 | |
Whiting Petroleum Corp. | | | | | | | | |
5.00%, 03/15/19 (Call 12/15/18)b | | | 21,950 | | | | 10,920,125 | |
5.75%, 03/15/21 (Call 12/15/20)b | | | 24,378 | | | | 11,396,715 | |
6.25%, 04/01/23 (Call 01/01/23)b | | | 14,070 | | | | 6,437,025 | |
WPX Energy Inc. | | | | | | | | |
5.25%, 09/15/24 (Call 06/15/24)b | | | 9,620 | | | | 5,050,500 | |
6.00%, 01/15/22 (Call 10/15/21)b | | | 20,317 | | | | 11,631,482 | |
7.50%, 08/01/20 (Call 07/01/20) | | | 9,150 | | | | 5,741,625 | |
8.25%, 08/01/23 (Call 06/01/23)b | | | 12,200 | | | | 7,259,000 | |
| | | | | | | | |
| | | | | | | 771,543,246 | |
OIL & GAS SERVICES — 0.12% | | | | | |
CGG SA | | | | | | | | |
6.50%, 06/01/21 (Call 06/01/16)b | | | 11,360 | | | | 3,890,800 | |
| | |
| 128 | | 2016 iSHARES ANNUAL REPORTTO SHAREHOLDERS |
Schedule of Investments (Continued)
iSHARES® iBOXX $ HIGH YIELD CORPORATE BOND ETF
February 29, 2016
| | | | | | | | |
| Security | |
Principal
(000s) | | | Value | |
6.88%, 01/15/22 (Call 07/15/17) | | $ | 9,975 | | | $ | 3,370,054 | |
Weatherford International Ltd./Bermuda | | | | | | | | |
4.50%, 04/15/22 (Call 01/15/22) | | | 2,220 | | | | 1,454,100 | |
5.13%, 09/15/20 | | | 6,600 | | | | 4,607,592 | |
6.00%, 03/15/18 | | | 5,750 | | | | 4,884,873 | |
9.63%, 03/01/19 | | | 600 | | | | 512,625 | |
| | | | | | | | |
| | | | | | | 18,720,044 | |
PACKAGING & CONTAINERS — 1.55% | | | | | |
Ardagh Packaging Finance PLC | | | | | | | | |
9.13%, 10/15/20 (Call 03/31/16)a,b | | | 11,296 | | | | 11,631,350 | |
Ardagh Packaging Finance PLC/Ardagh Holdings USA Inc. | | | | | | | | |
6.00%, 06/30/21 (Call 06/30/17)a,b | | | 9,550 | | | | 8,717,028 | |
6.25%, 01/31/19 (Call 03/31/16)a,b | | | 8,075 | | | | 7,893,313 | |
6.75%, 01/31/21 (Call 01/31/17)a,b | | | 9,700 | | | | 9,133,856 | |
Ball Corp. | | | | | | | | |
4.00%, 11/15/23b | | | 20,096 | | | | 19,568,480 | |
4.38%, 12/15/20b | | | 16,386 | | | | 17,123,370 | |
5.00%, 03/15/22b | | | 18,046 | | | | 18,734,087 | |
5.25%, 07/01/25 | | | 20,000 | | | | 20,850,000 | |
Berry Plastics Corp. | | | | | | | | |
5.13%, 07/15/23 (Call 07/15/18)b | | | 13,625 | | | | 13,676,094 | |
5.50%, 05/15/22 (Call 05/15/17)b | | | 11,180 | | | | 11,627,200 | |
6.00%, 10/15/22 (Call 10/15/18)a,b | | | 7,185 | | | | 7,454,438 | |
Beverage Packaging Holdings Luxembourg II SA/Beverage Packaging Holdings II Issuer Inc. | | | | | | | | |
6.00%, 06/15/17 (Call 06/15/16)a,b | | | 8,650 | | | | 8,574,312 | |
Crown Americas LLC/Crown Americas Capital Corp. IV | | | | | | | | |
4.50%, 01/15/23b | | | 19,912 | | | | 20,310,240 | |
| | | | | | | | |
| Security | |
Principal
(000s) | | | Value | |
Owens-Brockway Glass Container Inc. | | | | | | | | |
5.00%, 01/15/22a,b | | $ | 8,800 | | | $ | 8,712,000 | |
5.88%, 08/15/23a,b | | | 16,200 | | | | 16,686,000 | |
Sealed Air Corp. | | | | | | | | |
4.88%, 12/01/22 (Call 09/01/22)a,b | | | 8,125 | | | | 8,321,553 | |
5.13%, 12/01/24 (Call 09/01/24)a,b | | | 9,175 | | | | 9,496,125 | |
5.25%, 04/01/23 (Call 01/01/23)a,b | | | 7,850 | | | | 8,105,880 | |
5.50%, 09/15/25 (Call 06/15/25)a,b | | | 7,785 | | | | 8,160,407 | |
6.50%, 12/01/20 (Call 09/01/20)a,b | | | 6,150 | | | | 6,852,974 | |
| | | | | | | | |
| | | | | | | 241,628,707 | |
PHARMACEUTICALS — 2.87% | | | | | |
DPx Holdings BV | | | | | | | | |
7.50%, 02/01/22 (Call 02/01/17)a | | | 8,000 | | | | 7,520,000 | |
Endo Finance LLC | | | | | | | | |
5.75%, 01/15/22 (Call 01/15/17)a,b | | | 15,975 | | | | 16,051,301 | |
Endo Finance LLC/Endo Finco Inc. | | | | | | | | |
5.88%, 01/15/23 (Call 07/15/17)a,b | | | 16,135 | | | | 16,034,156 | |
Endo Ltd./Endo Finance LLC/Endo Finco Inc. | | | | | | | | |
6.00%, 07/15/23 (Call 07/15/18)a,b | | | 31,845 | | | | 32,123,644 | |
6.00%, 02/01/25 (Call 02/01/20)a,b | | | 23,510 | | | | 23,392,450 | |
Grifols Worldwide Operations Ltd. | | | | | | | | |
5.25%, 04/01/22 (Call 04/01/17) | | | 20,485 | | | | 21,176,369 | |
NBTY Inc. | | | | | | | | |
9.00%, 10/01/18 (Call 03/31/16)b | | | 11,875 | | | | 12,171,875 | |
Valeant Pharmaceuticals International Inc. | | | | | | | | |
5.38%, 03/15/20 (Call 03/15/17)a | | | 40,760 | | | | 37,091,600 | |
| | | | |
SCHEDULESOF INVESTMENTS | | | 129 | |
Schedule of Investments (Continued)
iSHARES® iBOXX $ HIGH YIELD CORPORATE BOND ETF
February 29, 2016
| | | | | | | | |
| Security | |
Principal
(000s) | | | Value | |
5.50%, 03/01/23 (Call 03/01/18)a | | $ | 19,310 | | | $ | 16,196,263 | |
5.63%, 12/01/21 (Call 12/01/16)a,b | | | 18,995 | | | | 16,299,989 | |
5.88%, 05/15/23 (Call 05/15/18)a,b | | | 66,367 | | | | 56,121,594 | |
6.13%, 04/15/25 (Call 04/15/20)a | | | 66,255 | | | | 55,819,837 | |
6.38%, 10/15/20 (Call 10/15/16)a | | | 45,975 | | | | 42,297,000 | |
6.75%, 08/15/18 (Call 03/31/16)a,b | | | 28,908 | | | | 27,942,210 | |
6.75%, 08/15/21 (Call 03/31/16)a,b | | | 12,070 | | | | 11,044,050 | |
7.00%, 10/01/20 (Call 03/31/16)a,b | | | 13,038 | | | | 12,415,436 | |
7.25%, 07/15/22 (Call 07/15/16)a | | | 9,950 | | | | 9,138,744 | |
7.50%, 07/15/21 (Call 07/15/16)a | | | 34,907 | | | | 33,096,199 | |
| | | | | | | | |
| | | | | | | 445,932,717 | |
PIPELINES — 3.16% | | | | | |
Crestwood Midstream Partners LP/Crestwood Midstream Finance Corp. | | | | | | | | |
6.00%, 12/15/20 (Call 12/15/16)b | | | 9,865 | | | | 7,176,788 | |
6.13%, 03/01/22 (Call 11/01/16)b | | | 13,119 | | | | 9,314,490 | |
6.25%, 04/01/23 (Call 04/01/18)a,b | | | 13,300 | | | | 9,609,250 | |
DCP Midstream LLC | | | | | | | | |
5.85%, 05/21/43 (Call 05/21/23)a,c | | | 10,011 | | | | 5,280,803 | |
DCP Midstream Operating LP | | | | | | | | |
2.50%, 12/01/17 (Call 11/01/17)b | | | 8,100 | | | | 7,397,036 | |
3.88%, 03/15/23 (Call 12/15/22) | | | 10,225 | | | | 7,528,156 | |
Energy Transfer Equity LP | | | | | | | | |
5.50%, 06/01/27 (Call 03/01/27)b | | | 20,790 | | | | 15,696,450 | |
| | | | | | | | |
| Security | |
Principal
(000s) | | | Value | |
5.88%, 01/15/24 (Call 10/15/23)b | | $ | 22,775 | | | $ | 18,860,433 | |
7.50%, 10/15/20 | | | 23,680 | | | | 21,667,200 | |
Genesis Energy LP/Genesis Energy Finance Corp. | | | | | | | | |
6.00%, 05/15/23 (Call 05/15/18)b | | | 7,385 | | | | 5,683,373 | |
6.75%, 08/01/22 (Call 08/01/18) | | | 16,820 | | | | 13,960,600 | |
MPLX LP | | | | | | | | |
4.88%, 12/01/24 (Call 09/01/24)a | | | 489 | | | | 399,496 | |
NGPL PipeCo LLC | | | | | | | | |
7.12%, 12/15/17a | | | 24,940 | | | | 23,230,064 | |
9.63%, 06/01/19 (Call 03/31/16)a,b | | | 12,175 | | | | 11,444,500 | |
NuStar Logistics LP | | | | | | | | |
4.80%, 09/01/20 | | | 7,518 | | | | 6,136,568 | |
ONEOK Inc. | | | | | | | | |
4.25%, 02/01/22 (Call 11/02/21) | | | 9,388 | | | | 7,111,410 | |
7.50%, 09/01/23 (Call 06/01/23) | | | 11,075 | | | | 9,607,562 | |
Rockies Express Pipeline LLC | | | | | | | | |
5.63%, 04/15/20a,b | | | 16,346 | | | | 14,570,416 | |
6.00%, 01/15/19a,b | | | 8,575 | | | | 7,974,750 | |
6.85%, 07/15/18a,b | | | 13,295 | | | | 12,845,606 | |
Sabine Pass Liquefaction LLC | | | | | | | | |
5.63%, 02/01/21 (Call 11/01/20)b | | | 39,115 | | | | 37,067,216 | |
5.63%, 04/15/23 (Call 01/15/23)b | | | 31,391 | | | | 29,036,675 | |
5.63%, 03/01/25 (Call 12/01/24)b | | | 41,070 | | | | 37,271,025 | |
5.75%, 05/15/24 (Call 02/15/24)b | | | 41,902 | | | | 39,204,349 | |
6.25%, 03/15/22 (Call 12/15/21)b | | | 20,250 | | | | 19,338,750 | |
Targa Resources Partners LP/Targa Resources Partners Finance Corp. | | | | | | | | |
4.13%, 11/15/19 (Call 11/15/16) | | | 18,100 | | | | 15,973,250 | |
| | |
| 130 | | 2016 iSHARES ANNUAL REPORTTO SHAREHOLDERS |
Schedule of Investments (Continued)
iSHARES® iBOXX $ HIGH YIELD CORPORATE BOND ETF
February 29, 2016
| | | | | | | | |
| Security | |
Principal
(000s) | | | Value | |
4.25%, 11/15/23 (Call 05/15/18) | | $ | 11,200 | | | $ | 8,293,600 | |
5.00%, 01/15/18 (Call 10/15/17)b | | | 22,291 | | | | 21,357,453 | |
5.25%, 05/01/23 (Call 11/01/17)b | | | 10,975 | | | | 8,661,105 | |
6.75%, 03/15/24 (Call 09/15/19)a,b | | | 12,550 | | | | 10,345,843 | |
6.88%, 02/01/21 (Call 03/31/16) | | | 9,261 | | | | 8,068,646 | |
Tesoro Logistics LP/Tesoro Logistics Finance Corp. | | | | | | | | |
5.50%, 10/15/19 (Call 09/15/19)a,b | | | 8,197 | | | | 7,807,642 | |
5.88%, 10/01/20 (Call 10/01/16) | | | 9,015 | | | | 8,474,100 | |
6.13%, 10/15/21 (Call 10/15/16)b | | | 9,600 | | | | 8,928,000 | |
6.25%, 10/15/22 (Call 10/15/18)a,b | | | 16,580 | | | | 15,253,600 | |
| | | | | | | | |
| | | | | | | 490,576,205 | |
REAL ESTATE — 0.07% | | | | | |
Realogy Group LLC/Realogy
Co-Issuer Corp. | | | | | | | | |
4.50%, 04/15/19a,b | | | 8,450 | | | | 8,650,687 | |
5.25%, 12/01/21 (Call 12/01/17)a | | | 2,355 | | | | 2,393,269 | |
| | | | | | | | |
| | | | | | | 11,043,956 | |
REAL ESTATE INVESTMENT TRUSTS — 0.90% | |
Communications Sales & Leasing Inc./CSL Capital LLC | | | | | | | | |
6.00%, 04/15/23 (Call 04/15/18)a,b | | | 7,011 | | | | 6,695,505 | |
8.25%, 10/15/23 (Call 04/15/19)b | | | 22,800 | | | | 20,292,000 | |
Crown Castle International Corp. | | | | | | | | |
5.25%, 01/15/23 | | | 969 | | | | 1,025,929 | |
Equinix Inc. | | | | | | | | |
5.88%, 01/15/26 (Call 01/15/21)b | | | 23,175 | | | | 24,217,875 | |
| | | | | | | | |
| Security | |
Principal
(000s) | | | Value | |
Iron Mountain Inc. | | | | | | | | |
6.00%, 10/01/20 (Call 10/01/17)a | | $ | 18,975 | | | $ | 20,113,500 | |
iStar Inc. | | | | | | | | |
4.00%, 11/01/17 (Call 08/01/17)b | | | 12,600 | | | | 11,907,000 | |
5.00%, 07/01/19 (Call 07/01/16)b | | | 15,025 | | | | 14,010,812 | |
MPT Operating Partnership LP/MPT Finance Corp. | | | | | | | | |
6.38%, 03/01/24 (Call 03/01/19) | | | 2,235 | | | | 2,280,560 | |
6.88%, 05/01/21 (Call 05/01/16) | | | 7,925 | | | | 8,243,981 | |
Vereit Operating Partnership LP | | | | | | | | |
2.00%, 02/06/17 | | | 9,400 | | | | 9,226,100 | |
3.00%, 02/06/19 (Call 01/06/19)b | | | 12,750 | | | | 12,112,500 | |
4.60%, 02/06/24 (Call 11/06/23) | | | 10,300 | | | | 9,862,250 | |
| | | | | | | | |
| | | | | | | 139,988,012 | |
RETAIL — 3.38% | | | | | |
1011778 BC ULC/New Red Finance Inc. | | | | | | | | |
4.63%, 01/15/22 (Call 10/01/17)a | | | 26,644 | | | | 27,076,965 | |
6.00%, 04/01/22 (Call 10/01/17)a,b | | | 44,852 | | | | 46,758,210 | |
AmeriGas Finance LLC/AmeriGas Finance Corp. | | | | | | | | |
6.75%, 05/20/20 (Call 05/20/16)b | | | 12,775 | | | | 12,966,625 | |
7.00%, 05/20/22 (Call 05/20/17)b | | | 19,317 | | | | 19,824,071 | |
AmeriGas Partners LP/AmeriGas Finance Corp. | | | | | | | | |
6.25%, 08/20/19 (Call 03/31/16)b | | | 7,480 | | | | 7,454,624 | |
Claire’s Stores Inc. | | | | | | | | |
8.88%, 03/15/19 (Call 03/31/16)b | | | 6,930 | | | | 1,022,175 | |
9.00%, 03/15/19 (Call 03/31/16)a | | | 16,125 | | | | 9,288,000 | |
| | | | |
SCHEDULESOF INVESTMENTS | | | 131 | |
Schedule of Investments (Continued)
iSHARES® iBOXX $ HIGH YIELD CORPORATE BOND ETF
February 29, 2016
| | | | | | | | |
| Security | |
Principal
(000s) | | | Value | |
Dollar Tree Inc. | | | | | | | | |
5.25%, 03/01/20 (Call 03/01/17)a | | $ | 13,357 | | | $ | 14,024,850 | |
5.75%, 03/01/23 (Call 03/01/18)a,b | | | 50,830 | | | | 53,997,726 | |
Ferrellgas LP/Ferrellgas Finance Corp. | | | | | | | | |
6.50%, 05/01/21 (Call 05/01/16)b | | | 8,325 | | | | 6,327,000 | |
6.75%, 01/15/22 (Call 11/15/16)b | | | 8,050 | | | | 5,826,188 | |
6.75%, 06/15/23 (Call 06/15/19)a | | | 12,595 | | | | 9,320,300 | |
JC Penney Corp. Inc. | | | | | | | | |
5.65%, 06/01/20b | | | 8,077 | | | | 7,471,225 | |
8.13%, 10/01/19b | | | 9,615 | | | | 9,735,187 | |
L Brands Inc. | | | | | | | | |
5.63%, 02/15/22b | | | 19,847 | | | | 21,295,831 | |
5.63%, 10/15/23 | | | 10,400 | | | | 11,060,041 | |
6.63%, 04/01/21 | | | 23,702 | | | | 26,398,102 | |
6.90%, 07/15/17 | | | 10,262 | | | | 10,981,366 | |
7.00%, 05/01/20 | | | 8,360 | | | | 9,535,347 | |
8.50%, 06/15/19b | | | 10,150 | | | | 11,856,534 | |
Michaels Stores Inc. | | | | | | | | |
5.88%, 12/15/20 (Call 12/15/16)a,b | | | 8,575 | | | | 8,838,846 | |
Neiman Marcus Group Ltd. LLC | | | | | | | | |
8.00%, 10/15/21 (Call 10/15/16)a,b | | | 18,500 | | | | 12,903,750 | |
QVC Inc. | | | | | | | | |
3.13%, 04/01/19 | | | 7,080 | | | | 7,041,077 | |
4.38%, 03/15/23 | | | 15,651 | | | | 15,034,718 | |
4.45%, 02/15/25 (Call 11/15/24)b | | | 12,086 | | | | 11,284,695 | |
4.85%, 04/01/24 | | | 11,340 | | | | 10,939,527 | |
5.13%, 07/02/22 | | | 9,015 | | | | 9,159,632 | |
Rite Aid Corp. | | | | | | | | |
6.13%, 04/01/23 (Call 04/01/18)a,b | | | 35,570 | | | | 38,052,786 | |
6.75%, 06/15/21 (Call 06/15/16)b | | | 14,366 | | | | 15,197,737 | |
9.25%, 03/15/20 (Call 03/31/16)b | | | 12,958 | | | | 13,657,306 | |
| | | | | | | | |
| Security | |
Principal
(000s) | | | Value | |
Sally Holdings LLC/Sally Capital Inc. | | | | | | | | |
5.63%, 12/01/25 (Call 12/01/20)b | | $ | 14,545 | | | $ | 15,163,162 | |
5.75%, 06/01/22 (Call 06/01/17)b | | | 16,218 | | | | 17,045,595 | |
Suburban Propane Partners LP/Suburban Energy Finance Corp. | | | | | | | | |
5.50%, 06/01/24 (Call 06/01/19)b | | | 10,550 | | | | 9,030,800 | |
Toys R Us Inc. | | | | | | | | |
10.38%, 08/15/17 (Call 03/31/16)b | | | 7,740 | | | | 6,493,783 | |
Toys R Us Property Co. II LLC | | | | | | | | |
8.50%, 12/01/17 (Call 03/31/16) | | | 14,375 | | | | 13,422,656 | |
| | | | | | | | |
| | | | | | | 525,486,437 | |
SEMICONDUCTORS — 1.44% | | | | | |
Advanced Micro Devices Inc. | | | | | | | | |
6.75%, 03/01/19 | | | 13,850 | | | | 10,145,125 | |
7.00%, 07/01/24 (Call 07/01/19) | | | 9,831 | | | | 6,193,530 | |
7.50%, 08/15/22 | | | 8,100 | | | | 5,265,000 | |
7.75%, 08/01/20 (Call 03/31/16)b | | | 10,935 | | | | 7,435,800 | |
Micron Technology Inc. | | | | | | | | |
5.25%, 08/01/23 (Call 02/01/18)a,b | | | 21,320 | | | | 18,228,600 | |
5.25%, 01/15/24 (Call 05/01/18)a,b | | | 10,700 | | | | 9,041,500 | |
5.50%, 02/01/25 (Call 08/01/19)b | | | 22,720 | | | | 19,084,800 | |
5.63%, 01/15/26 (Call 05/01/20)a | | | 8,550 | | | | 6,925,500 | |
5.88%, 02/15/22 (Call 02/15/17)b | | | 13,965 | | | | 12,760,519 | |
NXP BV/NXP Funding LLC | | | | | | | | |
3.50%, 09/15/16a,b | | | 2,750 | | | | 2,760,313 | |
3.75%, 06/01/18a | | | 13,716 | | | | 13,853,160 | |
4.13%, 06/15/20a,b | | | 13,270 | | | | 13,386,112 | |
4.63%, 06/15/22a,b | | | 7,800 | | | | 7,741,500 | |
5.75%, 02/15/21 (Call 02/15/17)a,b | | | 10,075 | | | | 10,478,000 | |
| | |
| 132 | | 2016 iSHARES ANNUAL REPORTTO SHAREHOLDERS |
Schedule of Investments (Continued)
iSHARES® iBOXX $ HIGH YIELD CORPORATE BOND ETF
February 29, 2016
| | | | | | | | |
| Security | |
Principal
(000s) | | | Value | |
5.75%, 03/15/23 (Call 03/15/18)a,b | | $ | 9,750 | | | $ | 10,091,250 | |
Qorvo Inc. | | | | | | | | |
6.75%, 12/01/23 (Call 12/01/18)a,b | | | 9,650 | | | | 9,794,750 | |
7.00%, 12/01/25 (Call 12/01/20)a,b | | | 11,200 | | | | 11,396,000 | |
Sensata Technologies BV | | | | | | | | |
4.88%, 10/15/23a,b | | | 9,808 | | | | 9,685,400 | |
5.00%, 10/01/25a,b | | | 13,500 | | | | 13,263,750 | |
5.63%, 11/01/24a,b | | | 7,930 | | | | 8,167,900 | |
Sensata Technologies UK Financing Co. PLC | | | | | | | | |
6.25%, 02/15/26 (Call 02/15/21)a,b | | | 17,350 | | | | 18,347,625 | |
| | | | | | | | |
| | | | | | | 224,046,134 | |
SHIPBUILDING — 0.14% | | | | | |
Huntington Ingalls Industries Inc. | | | | | | | | |
5.00%, 12/15/21 (Call 12/15/17)a,b | | | 9,966 | | | | 10,489,215 | |
5.00%, 11/15/25 (Call 11/15/20)a,b | | | 11,380 | | | | 11,941,831 | |
| | | | | | | | |
| | | | | | | 22,431,046 | |
SOFTWARE — 2.70% | | | | | |
Activision Blizzard Inc. | | | | | | | | |
5.63%, 09/15/21 (Call 09/15/16)a,b | | | 26,750 | | | | 28,120,938 | |
6.13%, 09/15/23 (Call 09/15/18)a,b | | | 17,075 | | | | 18,248,906 | |
Audatex North America Inc. | | | | | | | | |
6.00%, 06/15/21 (Call 06/15/17)a | | | 32,661 | | | | 32,865,131 | |
6.13%, 11/01/23 (Call 11/01/18)a | | | 27,583 | | | | 27,760,320 | |
BMC Software Finance Inc. | | | | | | | | |
8.13%, 07/15/21 (Call 07/15/16)a | | | 31,945 | | | | 20,285,075 | |
First Data Corp. | | | | | | | | |
5.00%, 01/15/24 (Call 01/15/19)a,b | | | 19,430 | | | | 19,733,691 | |
5.38%, 08/15/23 (Call 08/15/18)a,b | | | 25,890 | | | | 26,847,930 | |
| | | | | | | | |
| Security | |
Principal
(000s) | | | Value | |
5.75%, 01/15/24 (Call 01/15/19)a,b | | $ | 46,590 | | | $ | 46,881,188 | |
6.75%, 11/01/20 (Call 03/31/16)a,b | | | 23,152 | | | | 24,436,936 | |
7.00%, 12/01/23 (Call 12/01/18)a,b | | | 67,900 | | | | 67,900,000 | |
Infor U.S. Inc. | | | | | | | | |
5.75%, 08/15/20 (Call 08/15/17)a,b | | | 12,240 | | | | 12,331,800 | |
6.50%, 05/15/22 (Call 05/15/18)a,b | | | 33,160 | | | | 28,766,300 | |
MSCI Inc. | | | | | | | | |
5.25%, 11/15/24 (Call 11/15/19)a,b | | | 17,525 | | | | 18,598,406 | |
5.75%, 08/15/25 (Call 08/15/20)a | | | 15,435 | | | | 16,592,625 | |
Nuance Communications Inc. | | | | | | | | |
5.38%, 08/15/20 (Call 08/15/16)a,b | | | 21,315 | | | | 21,741,300 | |
Solera LLC/Solera Finance Inc. | | | | | | | | |
10.50%, 03/01/24 | | | 9,180 | | | | 8,721,000 | |
| | | | | | | | |
| | | | | | | 419,831,546 | |
STORAGE & WAREHOUSING — 0.12% | | | | | |
Algeco Scotsman Global Finance PLC | | | | | | | | |
8.50%, 10/15/18 (Call 03/31/16)a,b | | | 19,150 | | | | 14,735,818 | |
10.75%, 10/15/19 (Call 10/15/16)a | | | 12,550 | | | | 3,364,968 | |
| | | | | | | | |
| | | | | | | 18,100,786 | |
TELECOMMUNICATIONS — 13.99% | | | | | |
Altice Financing SA | | | | | | | | |
6.50%, 01/15/22 (Call 12/15/16)a | | | 16,649 | | | | 16,773,868 | |
6.63%, 02/15/23 (Call 02/15/18)a | | | 42,386 | | | | 41,856,175 | |
7.88%, 12/15/19 (Call 03/31/16)a,b | | | 10,000 | | | | 10,410,426 | |
Altice Finco SA | | | | | | | | |
8.13%, 01/15/24 (Call 12/15/18)a,b | | | 9,550 | | | | 9,237,238 | |
9.88%, 12/15/20 (Call 12/15/16)a | | | 8,950 | | | | 9,531,750 | |
| | | | |
SCHEDULESOF INVESTMENTS | | | 133 | |
Schedule of Investments (Continued)
iSHARES® iBOXX $ HIGH YIELD CORPORATE BOND ETF
February 29, 2016
| | | | | | | | |
| Security | |
Principal
(000s) | | | Value | |
Altice Luxembourg SA | | | | | | | | |
7.63%, 02/15/25 (Call 02/15/20)a,b | | $ | 28,860 | | | $ | 26,406,900 | |
7.75%, 05/15/22 (Call 05/15/17)a,b | | | 56,925 | | | | 54,790,312 | |
Avaya Inc. | | | | | | | | |
7.00%, 04/01/19 (Call 03/31/16)a,b | | | 20,516 | | | | 12,610,929 | |
10.50%, 03/01/21 (Call 03/01/17)a,b | | | 21,695 | | | | 5,694,938 | |
CenturyLink Inc. | | | | | | | | |
5.63%, 04/01/25 (Call 01/01/25) | | | 9,500 | | | | 8,326,750 | |
5.80%, 03/15/22b | | | 28,539 | | | | 27,718,504 | |
6.00%, 04/01/17b | | | 7,100 | | | | 7,418,790 | |
6.45%, 06/15/21b | | | 24,725 | | | | 25,111,204 | |
Series V | | | | | | | | |
5.63%, 04/01/20b | | | 22,305 | | | | 22,519,574 | |
Series W | | | | | | | | |
6.75%, 12/01/23b | | | 15,350 | | | | 15,004,625 | |
CommScope Inc. | | | | | | | | |
4.38%, 06/15/20 (Call 06/15/17)a,b | | | 9,786 | | | | 10,030,650 | |
5.00%, 06/15/21 (Call 06/15/17)a,b | | | 12,825 | | | | 12,632,625 | |
5.50%, 06/15/24 (Call 06/15/19)a | | | 12,460 | | | | 12,086,200 | |
CommScope Technologies Finance LLC | | | | | | | | |
6.00%, 06/15/25 (Call 06/15/20)a,b | | | 28,540 | | | | 28,254,600 | |
Frontier Communications Corp. | | | | | | | | |
6.25%, 09/15/21 (Call 06/15/21)b | | | 18,022 | | | | 15,971,998 | |
6.88%, 01/15/25 (Call 10/15/24) | | | 16,345 | | | | 13,688,938 | |
7.13%, 03/15/19b | | | 8,200 | | | | 8,251,988 | |
7.13%, 01/15/23 | | | 15,890 | | | | 13,819,374 | |
7.63%, 04/15/24 | | | 14,650 | | | | 12,818,750 | |
8.13%, 10/01/18b | | | 14,825 | | | | 15,453,580 | |
8.25%, 04/15/17b | | | 9,570 | | | | 10,072,425 | |
8.50%, 04/15/20 | | | 20,162 | | | | 20,580,361 | |
8.75%, 04/15/22 | | | 9,520 | | | | 8,883,350 | |
| | | | | | | | |
| Security | |
Principal
(000s) | | | Value | |
8.88%, 09/15/20 (Call 06/15/20)a,b | | $ | 25,154 | | | $ | 25,826,419 | |
9.25%, 07/01/21b | | | 10,200 | | | | 10,200,000 | |
10.50%, 09/15/22 (Call 06/15/22)a,b | | | 42,645 | | | | 42,956,637 | |
11.00%, 09/15/25 (Call 06/15/25)a,b | | | 70,915 | | | | 70,745,513 | |
Hughes Satellite Systems Corp. | | | | | | | | |
6.50%, 06/15/19 | | | 19,912 | | | | 22,052,540 | |
7.63%, 06/15/21 | | | 17,865 | | | | 19,372,359 | |
Inmarsat Finance PLC | | | | | | | | |
4.88%, 05/15/22 (Call 05/15/17)a,b | | | 20,425 | | | | 20,016,500 | |
Intelsat Jackson Holdings SA | | | | | | | | |
5.50%, 08/01/23 (Call 08/01/18)b | | | 40,816 | | | | 26,110,093 | |
6.63%, 12/15/22 (Call 12/15/17)b | | | 23,856 | | | | 11,848,481 | |
7.25%, 04/01/19 (Call 03/31/16)b | | | 30,068 | | | | 22,840,519 | |
7.25%, 10/15/20 (Call 03/31/16)b | | | 44,799 | | | | 30,351,322 | |
7.50%, 04/01/21 (Call 04/01/16)b | | | 26,295 | | | | 18,159,090 | |
Intelsat Luxembourg SA | | | | | | | | |
6.75%, 06/01/18 (Call 06/01/16)b | | | 9,350 | | | | 5,633,375 | |
7.75%, 06/01/21 (Call 06/01/17) | | | 36,975 | | | | 11,277,375 | |
8.13%, 06/01/23 (Call 06/01/18) | | | 16,655 | | | | 5,079,775 | |
Koninklijke KPN NV | | | | | | | | |
7.00%, 03/28/73 (Call 03/28/23)a,c | | | 11,410 | | | | 11,422,551 | |
Level 3 Communications Inc. | | | | | | | | |
5.75%, 12/01/22 (Call 12/01/17)b | | | 12,050 | | | | 12,475,486 | |
Level 3 Financing Inc. | | | | | | | | |
5.13%, 05/01/23 (Call 05/01/18)b | | | 12,590 | | | | 12,841,800 | |
5.38%, 08/15/22 (Call 08/15/17)b | | | 21,109 | | | | 21,689,497 | |
5.38%, 01/15/24 (Call 01/15/19)a,b | | | 21,200 | | | | 21,677,000 | |
| | |
| 134 | | 2016 iSHARES ANNUAL REPORTTO SHAREHOLDERS |
Schedule of Investments (Continued)
iSHARES® iBOXX $ HIGH YIELD CORPORATE BOND ETF
February 29, 2016
| | | | | | | | |
| Security | |
Principal
(000s) | | | Value | |
5.38%, 05/01/25 (Call 05/01/20)b | | $ | 14,625 | | | $ | 14,844,375 | |
5.63%, 02/01/23 (Call 02/01/18)b | | | 11,980 | | | | 12,354,375 | |
6.13%, 01/15/21 (Call 11/15/16) | | | 13,640 | | | | 14,270,850 | |
7.00%, 06/01/20 (Call 06/01/16) | | | 11,950 | | | | 12,502,688 | |
Millicom International Cellular SA | | | | | | | | |
6.63%, 10/15/21 (Call 10/15/17)a | | | 4,460 | | | | 4,192,400 | |
Nokia OYJ | | | | | | | | |
5.38%, 05/15/19b | | | 18,800 | | | | 19,939,265 | |
Sable International Finance Ltd. | | | | | | | | |
6.88%, 08/01/22 (Call 08/01/18)a | | | 14,830 | | | | 14,088,500 | |
SBA Communications Corp. | | | | | | | | |
5.63%, 10/01/19 (Call 10/01/16)b | | | 8,150 | | | | 8,496,375 | |
SBA Telecommunications Inc. | | | | | | | | |
5.75%, 07/15/20 (Call 07/15/16)b | | | 16,307 | | | | 16,907,290 | |
SoftBank Group Corp. | | | | | | | | |
4.50%, 04/15/20a,b | | | 48,945 | | | | 48,406,605 | |
Sprint Communications Inc. | | | | | | | | |
6.00%, 12/01/16 | | | 850 | | | | 846,813 | |
6.00%, 11/15/22 | | | 44,460 | | | | 31,733,325 | |
7.00%, 03/01/20a,b | | | 22,518 | | | | 22,179,406 | |
7.00%, 08/15/20b | | | 32,298 | | | | 24,542,562 | |
8.38%, 08/15/17 | | | 26,478 | | | | 25,749,855 | |
9.00%, 11/15/18a | | | 61,947 | | | | 64,307,181 | |
9.13%, 03/01/17b | | | 14,973 | | | | 15,202,237 | |
11.50%, 11/15/21 | | | 22,339 | | | | 18,960,226 | |
Sprint Corp. | | | | | | | | |
7.13%, 06/15/24 | | | 50,425 | | | | 35,864,781 | |
7.25%, 09/15/21 | | | 43,607 | | | | 32,923,285 | |
7.63%, 02/15/25 (Call 11/15/24) | | | 32,345 | | | | 23,026,405 | |
7.88%, 09/15/23 | | | 86,055 | | | | 63,895,837 | |
T-Mobile USA Inc. | | | | | | | | |
5.25%, 09/01/18 (Call 03/11/16)b | | | 9,150 | | | | 9,365,025 | |
| | | | | | | | |
| Security | |
Principal
(000s) | | | Value | |
6.00%, 03/01/23 (Call 09/01/18)b | | $ | 27,097 | | | $ | 28,020,685 | |
6.13%, 01/15/22 (Call 01/15/18) | | | 20,000 | | | | 20,558,126 | |
6.25%, 04/01/21 (Call 04/01/17)b | | | 34,668 | | | | 36,314,730 | |
6.38%, 03/01/25 (Call 09/01/19)b | | | 34,242 | | | | 34,969,642 | |
6.46%, 04/28/19 (Call 03/11/16)b | | | 20,737 | | | | 21,307,267 | |
6.50%, 01/15/24 (Call 01/15/19)b | | | 21,375 | | | | 22,016,250 | |
6.50%, 01/15/26 (Call 01/15/21) | | | 39,695 | | | | 40,290,425 | |
6.54%, 04/28/20 (Call 04/28/16)b | | | 25,484 | | | | 26,439,650 | |
6.63%, 11/15/20 (Call 03/11/16)b | | | 22,020 | | | | 22,900,800 | |
6.63%, 04/28/21 (Call 04/28/17)b | | | 25,174 | | | | 26,569,989 | |
6.63%, 04/01/23 (Call 04/01/18)b | | | 36,328 | | | | 38,012,809 | |
6.73%, 04/28/22 (Call 04/28/17)b | | | 24,929 | | | | 26,140,549 | |
6.84%, 04/28/23 (Call 04/28/18) | | | 11,355 | | | | 11,844,528 | |
Telecom Italia Capital SA | | | | | | | | |
7.00%, 06/04/18 | | | 11,540 | | | | 12,402,957 | |
7.18%, 06/18/19b | | | 14,785 | | | | 16,448,313 | |
Telecom Italia SpA | | | | | | | | |
5.30%, 05/30/24a,b | | | 32,950 | | | | 31,920,312 | |
UPCB Finance IV Ltd. | | | | | | | | |
5.38%, 01/15/25 (Call 01/15/20)a,b | | | 24,532 | | | | 24,286,680 | |
UPCB Finance V Ltd. | | | | | | | | |
7.25%, 11/15/21 (Call 11/15/16)a | | | 12,029 | | | | 12,711,940 | |
UPCB Finance VI Ltd. | | | | | | | | |
6.88%, 01/15/22 (Call 01/15/17)a,b | | | 11,048 | | | | 11,648,010 | |
Virgin Media Finance PLC | | | | | | | | |
5.75%, 01/15/25 (Call 01/15/20)a,b | | | 7,605 | | | | 7,509,938 | |
| | | | |
SCHEDULESOF INVESTMENTS | | | 135 | |
Schedule of Investments (Continued)
iSHARES® iBOXX $ HIGH YIELD CORPORATE BOND ETF
February 29, 2016
| | | | | | | | |
| Security | |
Principal
(000s) | | | Value | |
6.00%, 10/15/24 (Call 10/15/19)a | | $ | 9,400 | | | $ | 9,461,100 | |
6.38%, 04/15/23 (Call 04/15/18)a,b | | | 10,250 | | | | 10,685,625 | |
Virgin Media Secured Finance PLC | | | | | | | | |
5.25%, 01/15/21 | | | 8,000 | | | | 8,420,000 | |
5.25%, 01/15/26 (Call 01/15/20)a,b | | | 19,507 | | | | 19,551,866 | |
5.38%, 04/15/21 (Call 04/15/17)a,b | | | 12,822 | | | | 13,303,136 | |
5.50%, 01/15/25 (Call 01/15/19)a,b | | | 9,850 | | | | 9,925,268 | |
West Corp. | | | | | | | | |
5.38%, 07/15/22 (Call 07/15/17)a,b | | | 21,522 | | | | 19,208,385 | |
Wind Acquisition Finance SA | | | | | | | | |
4.75%, 07/15/20 (Call 07/15/16)a,b | | | 39,825 | | | | 38,331,562 | |
6.50%, 04/30/20 (Call 04/30/16)a,b | | | 12,242 | | | | 12,401,316 | |
7.38%, 04/23/21 (Call 04/23/17)a,b | | | 55,025 | | | | 50,347,875 | |
Windstream Services LLC | | | | | | | | |
6.38%, 08/01/23 (Call 02/01/18)b | | | 14,300 | | | | 10,467,457 | |
7.50%, 06/01/22 (Call 06/01/17)b | | | 9,100 | | | | 7,052,500 | |
7.50%, 04/01/23 (Call 04/01/16)b | | | 12,900 | | | | 9,746,079 | |
7.75%, 10/15/20 (Call 03/31/16)b | | | 13,480 | | | | 11,133,806 | |
7.75%, 10/01/21 (Call 10/01/16)b | | | 19,550 | | | | 15,818,795 | |
7.88%, 11/01/17b | | | 21,647 | | | | 22,621,115 | |
| | | | | | | | |
| | | | | | | 2,173,922,300 | |
TRANSPORTATION — 0.50% | | | | | |
CHC Helicopter SA | | | | | | | | |
9.25%, 10/15/20 (Call 03/31/16)b | | | 14,210 | | | | 5,044,586 | |
Florida East Coast Holdings Corp. | | | | | | | | |
6.75%, 05/01/19 (Call 05/01/16)a,b | | | 17,931 | | | | 18,110,310 | |
| | | | | | | | |
| Security | | Principal or Shares (000s) | | | Value | |
Navios Maritime Holdings Inc./Navios Maritime Finance II U.S. Inc. | | | | | | | | |
7.38%, 01/15/22 (Call 01/15/17)a | | $ | 11,850 | | | $ | 3,799,406 | |
XPO Logistics Inc. | | | | | | | | |
6.50%, 06/15/22
(Call 06/15/18)a,b | | | 32,218 | | | | 30,365,465 | |
7.88%, 09/01/19
(Call 09/01/16)a,b | | | 19,700 | | | | 20,340,250 | |
| | | | | | | | |
| | | | 77,660,017 | |
| | | | | | | | |
TOTAL CORPORATE BONDS & NOTES | | | | | |
(Cost: $16,754,317,237) | | | | 15,102,511,620 | |
|
SHORT-TERM INVESTMENTS — 27.41% | |
| |
MONEY MARKET FUNDS — 27.41% | | | | | |
BlackRock Cash Funds: Institutional,
SL Agency Shares | | | | | |
0.50%e,f,g | | | 3,799,592 | | | | 3,799,592,031 | |
BlackRock Cash Funds: Prime,
SL Agency Shares | | | | | |
0.49%e,f,g | | | 336,520 | | | | 336,519,974 | |
BlackRock Cash Funds: Treasury,
SL Agency Shares | | | | | |
0.27%e,f | | | 124,421 | | | | 124,421,145 | |
| | | | | | | | |
| | | | | | | 4,260,533,150 | |
| | | | | | | | |
TOTAL SHORT-TERM INVESTMENTS | | | | | |
(Cost: $4,260,533,150) | | | | 4,260,533,150 | |
| | | | | | | | |
TOTAL INVESTMENTS
IN SECURITIES — 124.57% | | | | | |
(Cost: $21,014,850,387) | | | | 19,363,044,770 | |
Other Assets, Less Liabilities — (24.57)% | | | | (3,819,122,373 | ) |
| | | | | | | | |
NET ASSETS — 100.00% | | | $ | 15,543,922,397 | |
| | | | | | | | |
| a | This security may be resold to qualified institutional buyers under Rule 144A of the Securities Act of 1933. |
| b | All or a portion of this security represents a security on loan. See Note 1. |
| c | Variable rate security. Rate shown is as of report date. |
| d | Issuer is in default of interest payments. |
| e | Affiliated issuer. See Note 2. |
| f | The rate quoted is the annualized seven-day yield of the fund at period end. |
| g | All or a portion of this security represents an investment of securities lending collateral. See Note 1. |
See notes to financial statements.
| | |
| 136 | | 2016 iSHARES ANNUAL REPORTTO SHAREHOLDERS |
Schedule of Investments
iSHARES® iBOXX $ INVESTMENT GRADE CORPORATE BOND ETF
February 29, 2016
| | | | | | | | |
| Security | |
Principal
(000s) | | | Value | |
CORPORATE BONDS & NOTES — 98.42% | |
|
ADVERTISING — 0.24% | |
Omnicom Group Inc. | | | | | | | | |
3.63%, 05/01/22a | | $ | 13,819 | | | $ | 13,959,824 | |
3.65%, 11/01/24 (Call 08/01/24) | | | 11,133 | | | | 11,187,418 | |
4.45%, 08/15/20 | | | 9,490 | | | | 10,175,301 | |
WPP Finance 2010 | | | | | | | | |
3.75%, 09/19/24a | | | 12,325 | | | | 12,244,967 | |
4.75%, 11/21/21 | | | 10,660 | | | | 11,580,542 | |
| | | | | | | | |
| | | | 59,148,052 | |
AEROSPACE & DEFENSE — 1.43% | |
Boeing Co. (The) | | | | | | | | |
4.88%, 02/15/20 | | | 7,824 | | | | 8,687,791 | |
General Dynamics Corp. | | | | | | | | |
2.25%, 11/15/22 (Call 08/15/22) | | | 4,480 | | | | 4,423,616 | |
L-3 Communications Corp. | | | | | | | | |
4.75%, 07/15/20 | | | 16,718 | | | | 17,238,012 | |
5.20%, 10/15/19 | | | 7,915 | | | | 8,417,900 | |
Lockheed Martin Corp. | | | | | | | | |
2.50%, 11/23/20 (Call 10/23/20)a | | | 18,130 | | | | 18,458,305 | |
2.90%, 03/01/25 (Call 12/01/24)a | | | 4,190 | | | | 4,165,064 | |
3.35%, 09/15/21 | | | 16,444 | | | | 17,246,421 | |
3.55%, 01/15/26
(Call 10/15/25)a | | | 20,460 | | | | 21,493,662 | |
3.80%, 03/01/45
(Call 09/01/44)a | | | 7,673 | | | | 7,186,424 | |
4.07%, 12/15/42 | | | 16,044 | | | | 15,561,684 | |
4.25%, 11/15/19 | | | 6,443 | | | | 6,952,908 | |
4.70%, 05/15/46
(Call 11/15/45) | | | 31,330 | | | | 33,821,769 | |
Northrop Grumman Corp. | | | | | | | | |
3.25%, 08/01/23 | | | 9,583 | | | | 9,855,196 | |
4.75%, 06/01/43 | | | 14,498 | | | | 15,572,038 | |
Raytheon Co. | | | | | | | | |
2.50%, 12/15/22 (Call 09/15/22) | | | 7,924 | | | | 8,016,338 | |
3.13%, 10/15/20 | | | 16,042 | | | | 16,867,046 | |
| | | | | | | | |
| Security | |
Principal
(000s) | | | Value | |
United Technologies Corp. | | | | | | | | |
3.10%, 06/01/22 | | $ | 32,502 | | | $ | 33,880,657 | |
4.15%, 05/15/45 (Call 11/16/44) | | | 7,150 | | | | 6,971,449 | |
4.50%, 04/15/20a | | | 17,800 | | | | 19,497,036 | |
4.50%, 06/01/42 | | | 43,887 | | | | 45,057,905 | |
5.70%, 04/15/40 | | | 6,869 | | | | 8,189,450 | |
6.13%, 02/01/19 | | | 16,038 | | | | 17,970,154 | |
6.13%, 07/15/38 | | | 9,991 | | | | 12,343,881 | |
| | | | | | | | |
| | | | 357,874,706 | |
AGRICULTURE — 1.42% | | | | | |
Altria Group Inc. | | | | | | | | |
2.63%, 01/14/20 (Call 12/14/19)a | | | 7,575 | | | | 7,708,452 | |
2.85%, 08/09/22a | | | 26,259 | | | | 26,401,424 | |
4.00%, 01/31/24a | | | 13,257 | | | | 14,243,160 | |
4.25%, 08/09/42 | | | 15,977 | | | | 15,238,043 | |
4.75%, 05/05/21 | | | 20,319 | | | | 22,480,328 | |
5.38%, 01/31/44 | | | 19,677 | | | | 22,143,390 | |
9.25%, 08/06/19 | | | 13,828 | | | | 16,934,415 | |
Philip Morris International Inc. | | | | | | | | |
1.88%, 01/15/19a | | | 5,133 | | | | 5,185,091 | |
1.88%, 02/25/21 (Call 01/25/21) | | | 5,000 | | | | 4,973,541 | |
2.50%, 08/22/22 | | | 9,020 | | | | 9,091,321 | |
2.75%, 02/25/26 (Call 11/25/25) | | | 8,000 | | | | 8,074,354 | |
2.90%, 11/15/21a | | | 17,716 | | | | 18,378,368 | |
3.25%, 11/10/24 | | | 12,300 | | | | 12,864,500 | |
3.88%, 08/21/42 | | | 10,586 | | | | 10,136,052 | |
4.13%, 03/04/43 | | | 7,649 | | | | 7,546,659 | |
4.25%, 11/10/44a | | | 4,801 | | | | 4,906,061 | |
4.38%, 11/15/41 | | | 13,736 | | | | 14,141,771 | |
4.50%, 03/26/20a | | | 9,614 | | | | 10,602,973 | |
4.88%, 11/15/43a | | | 9,450 | | | | 10,453,197 | |
6.38%, 05/16/38 | | | 16,296 | | | | 20,858,249 | |
Reynolds American Inc. | | | | | | | | |
3.25%, 06/12/20 | | | 4,446 | | | | 4,613,130 | |
4.00%, 06/12/22a | | | 17,085 | | | | 18,433,087 | |
4.45%, 06/12/25 (Call 03/12/25) | | | 22,540 | | | | 24,501,870 | |
5.70%, 08/15/35 (Call 02/15/35) | | | 9,600 | | | | 10,845,718 | |
| | | | |
SCHEDULESOF INVESTMENTS | | | 137 | |
Schedule of Investments (Continued)
iSHARES® iBOXX $ INVESTMENT GRADE CORPORATE BOND ETF
February 29, 2016
| | | | | | | | |
| Security | |
Principal
(000s) | | | Value | |
5.85%, 08/15/45 (Call 02/15/45)a | | $ | 29,100 | | | $ | 34,153,820 | |
6.88%, 05/01/20 | | | 1,226 | | | | 1,424,430 | |
8.13%, 06/23/19 a | | | 369 | | | | 434,385 | |
| | | | | | | | |
| | | | 356,767,789 | |
APPAREL — 0.04% | | | | | |
NIKE Inc. | | | | | | | | |
3.88%, 11/01/45 (Call 05/01/45) | | | 8,700 | | | | 8,858,727 | |
| | | | | | | | |
| | | | 8,858,727 | |
AUTO MANUFACTURERS — 1.60% | | | | | |
American Honda Finance Corp. | | | | | | | | |
2.25%, 08/15/19a | | | 14,128 | | | | 14,310,767 | |
2.45%, 09/24/20 | | | 5,900 | | | | 5,977,504 | |
Daimler Finance North America LLC | | | | | | | | |
8.50%, 01/18/31 | | | 18,401 | | | | 27,512,435 | |
Ford Motor Co. | | | | | | | | |
4.75%, 01/15/43a | | | 25,743 | | | | 23,780,212 | |
7.45%, 07/16/31 | | | 20,844 | | | | 25,532,187 | |
Ford Motor Credit Co. LLC | | | | | | | | |
3.16%, 08/04/20 | | | 8,350 | | | | 8,315,871 | |
3.20%, 01/15/21 | | | 4,700 | | | | 4,667,594 | |
3.22%, 01/09/22 | | | 9,100 | | | | 8,852,004 | |
4.13%, 08/04/25 | | | 25,500 | | | | 25,383,136 | |
4.39%, 01/08/26 | | | 7,700 | | | | 7,807,515 | |
General Motors Co. | | | | | | | | |
4.88%, 10/02/23 | | | 21,250 | | | | 21,497,562 | |
5.00%, 04/01/35 | | | 5,535 | | | | 4,833,937 | |
5.20%, 04/01/45a | | | 19,869 | | | | 17,144,364 | |
6.25%, 10/02/43 | | | 19,210 | | | | 18,766,249 | |
6.60%, 04/01/36 (Call 10/01/35)a | | | 2,525 | | | | 2,609,260 | |
6.75%, 04/01/46 (Call 10/01/45) | | | 9,805 | | | | 10,310,806 | |
General Motors Financial Co. Inc. | | | | | | | | |
3.15%, 01/15/20 (Call 12/15/19)a | | | 21,573 | | | | 21,046,187 | |
3.20%, 07/13/20 (Call 06/13/20) | | | 16,378 | | | | 15,875,195 | |
3.45%, 04/10/22 (Call 02/10/22) | | | 19,850 | | | | 18,707,633 | |
3.50%, 07/10/19 | | | 3,250 | | | | 3,240,120 | |
| | | | | | | | |
| Security | |
Principal
(000s) | | | Value | |
3.70%, 11/24/20 (Call 10/24/20) | | $ | 4,535 | | | $ | 4,450,150 | |
4.00%, 01/15/25 (Call 10/15/24) | | | 16,400 | | | | 15,165,421 | |
4.20%, 03/01/21 (Call 12/01/20) | | | 8,000 | | | | 8,027,298 | |
4.30%, 07/13/25 (Call 04/13/25)a | | | 2,100 | | | | 1,987,587 | |
4.38%, 09/25/21 | | | 15,500 | | | | 15,494,420 | |
5.25%, 03/01/26 (Call 12/01/25) | | | 4,830 | | | | 4,870,128 | |
Toyota Motor Credit Corp. | | | | | | | | |
2.10%, 01/17/19a | | | 347 | | | | 351,737 | |
2.13%, 07/18/19a | | | 14,850 | | | | 15,011,045 | |
2.15%, 03/12/20a | | | 16,016 | | | | 16,210,553 | |
3.30%, 01/12/22 | | | 11,532 | | | | 12,088,887 | |
3.40%, 09/15/21 | | | 12,652 | | | | 13,357,320 | |
4.25%, 01/11/21 | | | 975 | | | | 1,068,005 | |
Series B | | | | | | | | |
4.50%, 06/17/20 | | | 5,604 | | | | 6,161,093 | |
| | | | | | | | |
| | | | 400,414,182 | |
BANKS — 25.65% | |
Abbey National Treasury Services PLC/United Kingdom | | | | | | | | |
2.35%, 09/10/19 | | | 11,758 | | | | 11,701,579 | |
2.38%, 03/16/20a | | | 18,767 | | | | 18,566,505 | |
4.00%, 03/13/24a | | | 12,166 | | | | 12,966,890 | |
Australia & New Zealand Banking Group Ltd./New York NY | | | | | | | | |
2.25%, 06/13/19 | | | 19,070 | | | | 19,199,039 | |
2.70%, 11/16/20a | | | 9,000 | | | | 9,134,361 | |
3.70%, 11/16/25a | | | 9,000 | | | | 9,526,244 | |
Banco Bilbao Vizcaya Argentaria SA | | | | | | | | |
3.00%, 10/20/20a | | | 19,500 | | | | 19,170,645 | |
Bank of America Corp. | | | | | | | | |
2.63%, 10/19/20a | | | 23,280 | | | | 23,134,027 | |
2.65%, 04/01/19 | | | 29,409 | | | | 29,659,335 | |
3.30%, 01/11/23 | | | 28,011 | | | | 27,934,208 | |
3.88%, 08/01/25a | | | 47,589 | | | | 48,948,004 | |
4.00%, 04/01/24a | | | 41,622 | | | | 42,957,034 | |
| | |
| 138 | | 2016 iSHARES ANNUAL REPORTTO SHAREHOLDERS |
Schedule of Investments (Continued)
iSHARES® iBOXX $ INVESTMENT GRADE CORPORATE BOND ETF
February 29, 2016
| | | | | | | | |
| Security | |
Principal
(000s) | | | Value | |
4.00%, 01/22/25 | | $ | 39,950 | | | $ | 38,845,586 | |
4.10%, 07/24/23 | | | 28,476 | | | | 29,741,528 | |
4.13%, 01/22/24 | | | 35,341 | | | | 36,851,382 | |
4.20%, 08/26/24 | | | 39,352 | | | | 39,438,079 | |
4.25%, 10/22/26 | | | 35,643 | | | | 35,320,762 | |
4.45%, 03/03/26 | | | 3,525 | | | | 3,525,000 | |
4.88%, 04/01/44a | | | 14,167 | | | | 14,743,498 | |
5.00%, 05/13/21a | | | 26,330 | | | | 28,766,576 | |
5.00%, 01/21/44 | | | 16,795 | | | | 17,838,720 | |
5.63%, 07/01/20 | | | 14,385 | | | | 15,918,465 | |
5.70%, 01/24/22 | | | 27,223 | | | | 30,705,783 | |
5.88%, 01/05/21a | | | 16,670 | | | | 18,810,011 | |
5.88%, 02/07/42 | | | 19,115 | | | | 21,934,222 | |
6.11%, 01/29/37 | | | 25,602 | | | | 27,833,368 | |
7.63%, 06/01/19 | | | 34,640 | | | | 40,005,875 | |
7.75%, 05/14/38a | | | 19,277 | | | | 24,636,237 | |
Series L | | | | | | | | |
2.25%, 04/21/20a | | | 31,495 | | | | 30,954,927 | |
3.95%, 04/21/25 | | | 23,894 | | | | 23,115,271 | |
Bank of America N.A. | | | | | | | | |
6.00%, 10/15/36 | | | 9,815 | | | | 11,636,028 | |
Bank of Montreal | | | | | | | | |
2.55%, 11/06/22 (Call 10/06/22) | | | 16,293 | | | | 16,194,771 | |
Bank of New York Mellon Corp. (The) | | | | | | | | |
2.20%, 05/15/19 (Call 04/15/19) | | | 11,941 | | | | 12,020,694 | |
2.30%, 09/11/19 (Call 08/11/19) | | | 5,618 | | | | 5,682,735 | |
2.45%, 11/27/20 (Call 10/27/20) | | | 5,030 | | | | 5,070,091 | |
2.50%, 04/15/21 (Call 03/15/21)a | | | 5,000 | | | | 5,021,374 | |
2.60%, 08/17/20 (Call 07/17/20) | | | 21,421 | | | | 21,775,149 | |
3.00%, 02/24/25 (Call 01/24/25)a | | | 9,710 | | | | 9,739,069 | |
3.55%, 09/23/21 (Call 08/23/21) | | | 20,452 | | | | 21,504,943 | |
3.65%, 02/04/24 (Call 01/05/24) | | | 7,826 | | | | 8,215,204 | |
| | | | | | | | |
| Security | |
Principal
(000s) | | | Value | |
Series G | | | | | | | | |
2.15%, 02/24/20 (Call 01/24/20)a | | $ | 16,317 | | | $ | 16,349,867 | |
Bank of Nova Scotia (The) | | | | | | | | |
2.05%, 06/05/19 | | | 11,003 | | | | 11,002,799 | |
2.35%, 10/21/20a | | | 16,750 | | | | 16,760,420 | |
2.80%, 07/21/21 | | | 18,301 | | | | 18,672,241 | |
4.38%, 01/13/21a | | | 3,674 | | | | 3,991,780 | |
4.50%, 12/16/25 | | | 14,150 | | | | 13,851,567 | |
Barclays Bank PLC | | | | | | | | |
2.50%, 02/20/19 | | | 366 | | | | 366,912 | |
5.14%, 10/14/20a | | | 10,234 | | | | 10,977,488 | |
6.75%, 05/22/19 | | | 17,214 | | | | 19,507,497 | |
Barclays PLC | | | | | | | | |
2.75%, 11/08/19 | | | 30,900 | | | | 29,999,370 | |
2.88%, 06/08/20 | | | 41,700 | | | | 40,056,682 | |
3.25%, 01/12/21 | | | 11,500 | | | | 11,141,465 | |
3.65%, 03/16/25 | | | 19,640 | | | | 18,014,497 | |
4.38%, 09/11/24a | | | 21,335 | | | | 19,529,263 | |
4.38%, 01/12/26 | | | 5,720 | | | | 5,502,042 | |
5.25%, 08/17/45a | | | 26,219 | | | | 25,145,896 | |
BB&T Corp. | | | | | | | | |
2.45%, 01/15/20 (Call 12/15/19) | | | 17,825 | | | | 17,982,275 | |
2.63%, 06/29/20 (Call 05/29/20)a | | | 10,131 | | | | 10,254,112 | |
BNP Paribas SA | | | | | | | | |
2.38%, 05/21/20 | | | 18,870 | | | | 18,623,184 | |
2.45%, 03/17/19 | | | 6,865 | | | | 6,876,282 | |
3.25%, 03/03/23a | | | 16,334 | | | | 16,723,982 | |
4.25%, 10/15/24 | | | 18,305 | | | | 17,805,264 | |
5.00%, 01/15/21 | | | 24,143 | | | | 26,880,420 | |
BPCE SA | | | | | | | | |
2.25%, 01/27/20a | | | 15,500 | | | | 15,380,118 | |
2.50%, 07/15/19 | | | 7,750 | | | | 7,801,534 | |
4.00%, 04/15/24a | | | 23,700 | | | | 25,002,355 | |
Branch Banking & Trust Co. | | | | | | | | |
3.63%, 09/16/25 (Call 08/16/25) | | | 8,670 | | | | 8,949,066 | |
3.80%, 10/30/26 (Call 09/30/26) | | | 13,800 | | | | 14,529,618 | |
Capital One Financial Corp. | | | | | | | | |
2.45%, 04/24/19 (Call 03/24/19)a | | | 7,217 | | | | 7,225,678 | |
| | | | |
SCHEDULESOF INVESTMENTS | | | 139 | |
Schedule of Investments (Continued)
iSHARES® iBOXX $ INVESTMENT GRADE CORPORATE BOND ETF
February 29, 2016
| | | | | | | | |
| Security | |
Principal
(000s) | | | Value | |
3.20%, 02/05/25 (Call 01/05/25)a | | $ | 13,200 | | | $ | 12,647,938 | |
3.50%, 06/15/23 | | | 5,000 | | | | 4,964,588 | |
3.75%, 04/24/24 (Call 03/24/24) | | | 12,725 | | | | 12,730,289 | |
4.20%, 10/29/25 (Call 09/29/25) | | | 6,882 | | | | 6,757,384 | |
4.75%, 07/15/21 | | | 16,667 | | | | 17,982,718 | |
Capital One N.A./Mclean VA | | | | | | | | |
2.40%, 09/05/19 (Call 08/05/19) | | | 18,375 | | | | 18,152,859 | |
2.95%, 07/23/21 (Call 06/23/21) | | | 13,140 | | | | 13,019,810 | |
Citigroup Inc. | | | | | | | | |
2.40%, 02/18/20 | | | 32,712 | | | | 32,377,160 | |
2.50%, 07/29/19 | | | 26,324 | | | | 26,325,622 | |
2.55%, 04/08/19 | | | 21,660 | | | | 21,755,538 | |
2.65%, 10/26/20a | | | 39,825 | | | | 39,679,272 | |
3.30%, 04/27/25 | | | 4,234 | | | | 4,209,389 | |
3.38%, 03/01/23 | | | 2,708 | | | | 2,725,450 | |
3.50%, 05/15/23a | | | 17,775 | | | | 17,459,689 | |
3.70%, 01/12/26a | | | 5,900 | | | | 6,027,318 | |
3.75%, 06/16/24a | | | 16,956 | | | | 17,375,425 | |
3.88%, 10/25/23 | | | 30,286 | | | | 31,543,656 | |
3.88%, 03/26/25 | | | 13,444 | | | | 12,879,083 | |
4.00%, 08/05/24 | | | 17,388 | | | | 17,555,339 | |
4.05%, 07/30/22a | | | 20,096 | | | | 20,423,141 | |
4.30%, 11/20/26 | | | 12,645 | | | | 12,516,505 | |
4.40%, 06/10/25a | | | 35,694 | | | | 35,596,505 | |
4.45%, 09/29/27 | | | 44,870 | | | | 44,145,726 | |
4.50%, 01/14/22 | | | 18,829 | | | | 20,246,859 | |
4.65%, 07/30/45a | | | 15,944 | | | | 15,995,403 | |
5.30%, 05/06/44 | | | 7,850 | | | | 7,805,941 | |
5.38%, 08/09/20a | | | 7,250 | | | | 8,047,204 | |
5.50%, 09/13/25 | | | 21,439 | | | | 22,974,086 | |
5.88%, 01/30/42a | | | 8,910 | | | | 10,158,347 | |
6.13%, 08/25/36 | | | 1,620 | | | | 1,773,005 | |
6.63%, 06/15/32 | | | 13,000 | | | | 14,879,094 | |
6.68%, 09/13/43a | | | 10,803 | | | | 12,573,303 | |
8.13%, 07/15/39 | | | 21,858 | | | | 31,289,749 | |
Citizens Financial Group Inc. | | | | | | | | |
4.30%, 12/03/25 (Call 11/03/25) | | | 4,335 | | | | 4,448,752 | |
| | | | | | | | |
| Security | |
Principal
(000s) | | | Value | |
Commonwealth Bank of Australia/New York NY | | | | | | | | |
2.25%, 03/13/19 | | $ | 14,750 | | | $ | 14,834,354 | |
2.30%, 09/06/19a | | | 16,070 | | | | 16,127,773 | |
2.30%, 03/12/20a | | | 14,609 | | | | 14,589,228 | |
2.40%, 11/02/20a | | | 7,580 | | | | 7,590,335 | |
Cooperatieve Rabobank UA/NY | | | | | | | | |
2.25%, 01/14/20 | | | 6,750 | | | | 6,750,416 | |
2.50%, 01/19/21a | | | 9,900 | | | | 9,933,429 | |
3.38%, 05/21/25a | | | 10,200 | | | | 10,240,915 | |
3.88%, 02/08/22 | | | 25,710 | | | | 27,118,656 | |
3.95%, 11/09/22 | | | 21,990 | | | | 21,961,727 | |
4.38%, 08/04/25a | | | 14,250 | | | | 14,297,655 | |
4.50%, 01/11/21a | | | 21,185 | | | | 23,143,865 | |
4.63%, 12/01/23 | | | 19,750 | | | | 20,149,647 | |
5.25%, 05/24/41a | | | 17,958 | | | | 20,698,132 | |
5.25%, 08/04/45a | | | 21,950 | | | | 22,178,686 | |
5.75%, 12/01/43 | | | 15,628 | | | | 17,240,275 | |
Credit Suisse AG/New York NY | | | | | | | | |
2.30%, 05/28/19 | | | 25,990 | | | | 25,794,249 | |
3.00%, 10/29/21a | | | 15,295 | | | | 15,314,334 | |
3.63%, 09/09/24 | | | 45,950 | | | | 46,129,223 | |
4.38%, 08/05/20a | | | 20,930 | | | | 22,205,439 | |
5.30%, 08/13/19 | | | 6,552 | | | | 7,126,293 | |
5.40%, 01/14/20a | | | 25,351 | | | | 26,746,131 | |
Deutsche Bank AG | | | | | | | | |
2.95%, 08/20/20a | | | 12,900 | | | | 12,491,964 | |
3.13%, 01/13/21 | | | 17,855 | | | | 17,436,132 | |
4.50%, 04/01/25a | | | 4,930 | | | | 4,222,121 | |
Series 1254 | | | | | | | | |
4.10%, 01/13/26a | | | 11,880 | | | | 11,568,656 | |
Deutsche Bank AG/London | | | | | | | | |
2.50%, 02/13/19a | | | 2,413 | | | | 2,355,661 | |
3.70%, 05/30/24a | | | 22,740 | | | | 21,826,134 | |
Discover Bank/Greenwood DE | | | | | | | | |
3.10%, 06/04/20 (Call 05/04/20) | | | 18,180 | | | | 18,134,570 | |
3.20%, 08/09/21 (Call 07/09/21) | | | 12,494 | | | | 12,292,604 | |
4.20%, 08/08/23 | | | 9,045 | | | | 9,192,977 | |
Fifth Third Bancorp. | | | | | | | | |
2.88%, 07/27/20 (Call 06/27/20) | | | 11,698 | | | | 11,784,943 | |
| | |
| 140 | | 2016 iSHARES ANNUAL REPORTTO SHAREHOLDERS |
Schedule of Investments (Continued)
iSHARES® iBOXX $ INVESTMENT GRADE CORPORATE BOND ETF
February 29, 2016
| | | | | | | | |
| Security | |
Principal
(000s) | | | Value | |
4.30%, 01/16/24 (Call 12/16/23) | | $ | 11,235 | | | $ | 11,579,993 | |
8.25%, 03/01/38 | | | 9,348 | | | | 13,314,666 | |
Fifth Third Bank/Cincinnati OH | | | | | | | | |
2.38%, 04/25/19 (Call 03/25/19) | | | 13,850 | | | | 13,907,446 | |
2.88%, 10/01/21 (Call 09/01/21) | | | 12,250 | | | | 12,357,560 | |
Goldman Sachs Group Inc. (The) | | | | | | | | |
2.55%, 10/23/19 | | | 36,669 | | | | 36,750,666 | |
2.60%, 04/23/20 (Call 03/23/20) | | | 4,877 | | | | 4,862,947 | |
2.63%, 01/31/19 | | | 721 | | | | 726,547 | |
2.75%, 09/15/20 (Call 08/15/20)a | | | 32,600 | | | | 32,591,997 | |
2.88%, 02/25/21 (Call 01/25/21) | | | 4,380 | | | | 4,392,748 | |
3.50%, 01/23/25 (Call 10/23/24) | | | 31,551 | �� | | | 31,246,381 | |
3.63%, 01/22/23 | | | 11,782 | | | | 12,001,875 | |
3.75%, 05/22/25 (Call 02/22/25)a | | | 22,573 | | | | 22,914,426 | |
3.75%, 02/25/26 (Call 11/25/25) | | | 12,915 | | | | 13,061,270 | |
3.85%, 07/08/24 (Call 04/08/24) | | | 38,673 | | | | 39,547,880 | |
4.00%, 03/03/24 | | | 33,044 | | | | 34,230,815 | |
4.25%, 10/21/25 | | | 28,210 | | | | 28,072,809 | |
4.75%, 10/21/45 (Call 04/21/45)a | | | 18,430 | | | | 18,737,025 | |
4.80%, 07/08/44 (Call 01/08/44)a | | | 12,481 | | | | 12,560,349 | |
5.15%, 05/22/45a | | | 27,875 | | | | 26,663,703 | |
5.25%, 07/27/21 | | | 38,705 | | | | 42,980,625 | |
5.38%, 03/15/20 | | | 28,748 | | | | 31,545,692 | |
5.75%, 01/24/22 | | | 59,425 | | | | 67,451,119 | |
5.95%, 01/15/27 | | | 15,626 | | | | 17,353,570 | |
6.00%, 06/15/20a | | | 28,446 | | | | 32,003,736 | |
6.13%, 02/15/33 | | | 28,671 | | | | 33,545,939 | |
6.25%, 02/01/41 | | | 37,216 | | | | 44,615,471 | |
6.45%, 05/01/36 | | | 19,156 | | | | 20,891,518 | |
6.75%, 10/01/37 | | | 60,715 | | | | 69,428,434 | |
7.50%, 02/15/19 | | | 15,179 | | | | 17,313,120 | |
| | | | | | | | |
| Security | |
Principal
(000s) | | | Value | |
HSBC Bank USA N.A./New York NY | | | | | | | | |
4.88%, 08/24/20 | | $ | 21,260 | | | $ | 22,593,678 | |
5.63%, 08/15/35 | | | 8,493 | | | | 9,096,771 | |
5.88%, 11/01/34a | | | 7,000 | | | | 7,719,865 | |
HSBC Holdings PLC | | | | | | | | |
4.00%, 03/30/22 | | | 15,773 | | | | 16,456,372 | |
4.25%, 03/14/24a | | | 5,100 | | | | 5,005,143 | |
4.25%, 08/18/25a | | | 26,800 | | | | 25,932,361 | |
4.88%, 01/14/22 | | | 18,502 | | | | 20,097,168 | |
5.10%, 04/05/21 | | | 25,885 | | | | 28,522,311 | |
5.25%, 03/14/44a | | | 21,359 | | | | 20,325,113 | |
6.10%, 01/14/42 | | | 6,668 | | | | 8,237,313 | |
6.50%, 05/02/36a | | | 19,327 | | | | 21,372,604 | |
6.50%, 09/15/37 | | | 31,784 | | | | 35,371,180 | |
6.80%, 06/01/38 | | | 22,310 | | | | 25,264,138 | |
HSBC USA Inc. | | | | | | | | |
2.25%, 06/23/19a | | | 10,000 | | | | 9,863,187 | |
2.35%, 03/05/20 | | | 30,857 | | | | 30,201,116 | |
2.38%, 11/13/19 | | | 11,400 | | | | 11,281,826 | |
2.75%, 08/07/20a | | | 7,900 | | | | 7,830,373 | |
3.50%, 06/23/24 | | | 11,300 | | | | 11,347,104 | |
5.00%, 09/27/20 | | | 9,090 | | | | 9,772,849 | |
Intesa Sanpaolo SpA | | | | | | | | |
3.88%, 01/15/19a | | | 400 | | | | 406,106 | |
5.25%, 01/12/24a | | | 10,610 | | | | 11,036,432 | |
JPMorgan Chase & Co. | | | | | | | | |
2.20%, 10/22/19 | | | 15,006 | | | | 14,964,998 | |
2.25%, 01/23/20 (Call 12/23/19) | | | 42,358 | | | | 42,227,720 | |
2.35%, 01/28/19a | | | 860 | | | | 867,669 | |
2.55%, 10/29/20 (Call 09/29/20)a | | | 12,800 | | | | 12,820,568 | |
2.55%, 03/01/21 (Call 02/01/21) | | | 7,000 | | | | 6,996,343 | |
2.75%, 06/23/20 (Call 05/23/20)a | | | 21,359 | | | | 21,632,015 | |
3.13%, 01/23/25 (Call 10/23/24)a | | | 31,672 | | | | 31,600,624 | |
3.20%, 01/25/23 | | | 29,493 | | | | 29,746,534 | |
3.25%, 09/23/22a | | | 38,369 | | | | 38,898,715 | |
3.38%, 05/01/23a | | | 26,718 | | | | 26,249,585 | |
3.63%, 05/13/24 | | | 19,509 | | | | 20,058,467 | |
3.88%, 02/01/24a | | | 25,323 | | | | 26,583,176 | |
| | | | |
SCHEDULESOF INVESTMENTS | | | 141 | |
Schedule of Investments (Continued)
iSHARES® iBOXX $ INVESTMENT GRADE CORPORATE BOND ETF
February 29, 2016
| | | | | | | | |
| Security | |
Principal
(000s) | | | Value | |
3.88%, 09/10/24 | | $ | 22,555 | | | $ | 22,648,502 | |
3.90%, 07/15/25 (Call 04/15/25)a | | | 27,909 | | | | 29,403,346 | |
4.13%, 12/15/26 | | | 23,200 | | | | 23,527,292 | |
4.25%, 10/15/20 | | | 38,675 | | | | 41,307,232 | |
4.25%, 10/01/27 | | | 27,432 | | | | 27,788,322 | |
4.35%, 08/15/21a | | | 37,737 | | | | 40,648,172 | |
4.40%, 07/22/20a | | | 27,368 | | | | 29,404,831 | |
4.50%, 01/24/22 | | | 33,979 | | | | 36,785,944 | |
4.63%, 05/10/21a | | | 29,887 | | | | 32,565,739 | |
4.85%, 02/01/44a | | | 12,014 | | | | 13,282,170 | |
4.95%, 03/25/20a | | | 24,888 | | | | 27,121,905 | |
4.95%, 06/01/45a | | | 14,065 | | | | 14,145,102 | |
5.40%, 01/06/42a | | | 22,600 | | | | 25,801,656 | |
5.50%, 10/15/40 | | | 12,561 | | | | 14,493,654 | |
5.60%, 07/15/41 | | | 21,081 | | | | 24,719,237 | |
5.63%, 08/16/43 | | | 7,168 | | | | 7,819,905 | |
6.30%, 04/23/19 | | | 29,942 | | | | 33,591,008 | |
6.40%, 05/15/38 | | | 17,578 | | | | 22,188,068 | |
KeyBank N.A./Cleveland OH | | | | | | | | |
2.25%, 03/16/20 | | | 14,250 | | | | 14,176,541 | |
2.50%, 12/15/19 | | | 8,500 | | | | 8,470,643 | |
KeyCorp | | | | | | | | |
2.90%, 09/15/20 | | | 7,000 | | | | 7,009,421 | |
5.10%, 03/24/21a | | | 15,950 | | | | 17,500,094 | |
Lloyds Bank PLC | | | | | | | | |
2.35%, 09/05/19a | | | 6,576 | | | | 6,579,642 | |
2.40%, 03/17/20 | | | 23,300 | | | | 23,221,654 | |
2.70%, 08/17/20 | | | 6,250 | | | | 6,275,931 | |
3.50%, 05/14/25a | | | 21,700 | | | | 22,038,817 | |
6.38%, 01/21/21 | | | 6,486 | | | | 7,597,706 | |
Lloyds Banking Group PLC | | | | | | | | |
4.50%, 11/04/24a | | | 28,200 | | | | 27,887,482 | |
4.58%, 12/10/25b | | | 14,826 | | | | 14,714,805 | |
5.30%, 12/01/45b | | | 3,000 | | | | 2,907,439 | |
Manufacturers & Traders Trust Co. | | | | | | | | |
2.10%, 02/06/20 (Call 01/06/20) | | | 12,900 | | | | 12,715,536 | |
2.30%, 01/30/19 (Call 12/30/18) | | | 5,630 | | | | 5,642,767 | |
2.90%, 02/06/25 (Call 01/06/25) | | | 13,600 | | | | 13,287,317 | |
| | | | | | | | |
| Security | |
Principal
(000s) | | | Value | |
Morgan Stanley | | | | | | | | |
2.38%, 07/23/19a | | $ | 28,260 | | | $ | 28,150,306 | |
2.65%, 01/27/20a | | | 32,087 | | | | 32,075,648 | |
2.80%, 06/16/20a | | | 29,645 | | | | 29,789,765 | |
3.70%, 10/23/24 | | | 37,550 | | | | 38,054,492 | |
3.75%, 02/25/23a | | | 31,743 | | | | 32,549,964 | |
3.88%, 01/27/26 | | | 4,281 | | | | 4,384,116 | |
3.95%, 04/23/27a | | | 25,290 | | | | 24,432,123 | |
4.00%, 07/23/25 | | | 35,150 | | | | 36,286,456 | |
4.10%, 05/22/23 | | | 29,749 | | | | 30,343,977 | |
4.30%, 01/27/45a | | | 29,839 | | | | 28,632,621 | |
4.35%, 09/08/26 | | | 35,779 | | | | 35,829,287 | |
4.88%, 11/01/22 | | | 22,843 | | | | 24,111,705 | |
5.00%, 11/24/25 | | | 26,924 | | | | 28,382,344 | |
5.50%, 01/26/20 | | | 21,477 | | | | 23,609,383 | |
5.50%, 07/24/20 | | | 30,541 | | | | 33,791,793 | |
5.50%, 07/28/21 | | | 32,430 | | | | 36,395,634 | |
5.63%, 09/23/19 | | | 34,277 | | | | 37,487,031 | |
5.75%, 01/25/21 | | | 18,518 | | | | 20,845,757 | |
6.38%, 07/24/42 | | | 26,263 | | | | 32,738,258 | |
7.25%, 04/01/32 | | | 6,732 | | | | 8,913,645 | |
7.30%, 05/13/19 | | | 33,130 | | | | 37,857,038 | |
Series F | | | | | | | | |
3.88%, 04/29/24a | | | 38,282 | | | | 39,516,625 | |
National Australia Bank Ltd./New York | | | | | | | | |
2.63%, 07/23/20a | | | 14,600 | | | | 14,791,549 | |
2.63%, 01/14/21 | | | 6,750 | | | | 6,822,665 | |
3.00%, 01/20/23a | | | 13,539 | | | | 13,719,478 | |
3.38%, 01/14/26a | | | 500 | | | | 515,386 | |
Northern Trust Corp. | | | | | | | | |
3.95%, 10/30/25a | | | 11,650 | | | | 12,462,876 | |
PNC Bank N.A. | | | | | | | | |
2.20%, 01/28/19 (Call 12/29/18)a,c | | | 6,275 | | | | 6,315,815 | |
2.25%, 07/02/19 (Call 06/02/19)a,c | | | 7,750 | | | | 7,808,335 | |
2.40%, 10/18/19 (Call 09/18/19)c | | | 12,750 | | | | 12,900,191 | |
2.45%, 11/05/20
(Call 10/06/20)a,c | | | 2,400 | | | | 2,424,218 | |
2.60%, 07/21/20
(Call 06/21/20)a,c | | | 11,000 | | | | 11,174,466 | |
| | |
| 142 | | 2016 iSHARES ANNUAL REPORTTO SHAREHOLDERS |
Schedule of Investments (Continued)
iSHARES® iBOXX $ INVESTMENT GRADE CORPORATE BOND ETF
February 29, 2016
| | | | | | | | |
| Security | |
Principal
(000s) | | | Value | |
2.70%, 11/01/22 (Call 10/01/22)c | | $ | 9,587 | | | $ | 9,419,403 | |
2.95%, 01/30/23 (Call 12/30/22)c | | | 7,300 | | | | 7,301,418 | |
2.95%, 02/23/25
(Call 01/24/25)a,c | | | 17,300 | | | | 17,177,729 | |
3.80%, 07/25/23 (Call 06/25/23)c | | | 15,653 | | | | 16,476,149 | |
PNC Financial Services Group Inc. (The) | | | | | | | | |
3.90%, 04/29/24 (Call 03/29/24)c | | | 12,540 | | | | 12,946,641 | |
PNC Funding Corp. | | | | | | | | |
3.30%, 03/08/22
(Call 02/06/22)a,c | | | 9,569 | | | | 9,922,566 | |
4.38%, 08/11/20c | | | 10,724 | | | | 11,629,478 | |
5.13%, 02/08/20c | | | 3,965 | | | | 4,366,776 | |
Royal Bank of Canada | | | | | | | | |
2.15%, 03/15/19a | | | 13,114 | | | | 13,192,079 | |
2.15%, 03/06/20 | | | 11,000 | | | | 11,028,447 | |
2.35%, 10/30/20a | | | 30,250 | | | | 30,468,472 | |
2.50%, 01/19/21 | | | 12,260 | | | | 12,389,486 | |
4.65%, 01/27/26 | | | 6,000 | | | | 6,001,462 | |
Royal Bank of Scotland Group PLC | | | | | | | | |
6.40%, 10/21/19 | | | 22,812 | | | | 24,581,461 | |
Santander Holdings USA Inc. | | | | | | | | |
2.65%, 04/17/20 (Call 03/17/20)a | | | 16,275 | | | | 15,735,817 | |
4.50%, 07/17/25 (Call 04/17/25) | | | 16,195 | | | | 15,881,573 | |
Santander UK Group Holdings PLC | | | | | | | | |
2.88%, 10/16/20 | | | 12,225 | | | | 12,034,568 | |
3.13%, 01/08/21 | | | 8,990 | | | | 8,929,025 | |
State Street Corp. | | | | | | | | |
2.55%, 08/18/20a | | | 6,430 | | | | 6,514,069 | |
3.10%, 05/15/23a | | | 22,013 | | | | 22,105,835 | |
3.30%, 12/16/24 | | | 11,615 | | | | 11,973,467 | |
3.55%, 08/18/25 | | | 8,461 | | | | 8,993,642 | |
3.70%, 11/20/23 | | | 9,565 | | | | 10,126,256 | |
4.38%, 03/07/21 | | | 12,465 | | | | 13,622,228 | |
Sumitomo Mitsui Banking Corp. | | | | | | | | |
2.25%, 07/11/19 | | | 11,000 | | | | 11,005,567 | |
| | | | | | | | |
| Security | |
Principal
(000s) | | | Value | |
2.45%, 01/10/19a | | $ | 8,085 | | | $ | 8,160,225 | |
2.45%, 01/16/20a | | | 24,900 | | | | 24,944,150 | |
2.65%, 07/23/20 | | | 10,500 | | | | 10,588,172 | |
3.20%, 07/18/22 | | | 7,449 | | | | 7,589,551 | |
Svenska Handelsbanken AB | | | | | | | | |
2.25%, 06/17/19a | | | 10,102 | | | | 10,159,993 | |
2.40%, 10/01/20a | | | 21,750 | | | | 21,833,479 | |
2.50%, 01/25/19a | | | 2,875 | | | | 2,918,338 | |
Toronto-Dominion Bank (The) | | | | | | | | |
2.13%, 07/02/19a | | | 10,955 | | | | 11,059,794 | |
2.25%, 11/05/19 | | | 25,530 | | | | 25,754,084 | |
2.50%, 12/14/20a | | | 20,525 | | | | 20,735,589 | |
U.S. Bancorp. | | | | | | | | |
2.20%, 04/25/19 (Call 03/25/19) | | | 16,654 | | | | 16,873,357 | |
2.95%, 07/15/22 (Call 06/15/22) | | | 17,547 | | | | 17,742,972 | |
3.00%, 03/15/22 (Call 02/15/22) | | | 11,114 | | | | 11,513,207 | |
3.70%, 01/30/24 (Call 12/29/23) | | | 16,950 | | | | 18,236,274 | |
4.13%, 05/24/21 (Call 04/23/21) | | | 12,719 | | | | 13,901,223 | |
Series F | | | | | | | | |
3.60%, 09/11/24 (Call 08/11/24)a | | | 15,010 | | | | 15,542,962 | |
U.S. Bank N.A./Cincinnati OH | | | | | | | | |
2.13%, 10/28/19 (Call 09/28/19) | | | 19,085 | | | | 19,232,869 | |
2.80%, 01/27/25 (Call 12/27/24) | | | 6,950 | | | | 6,983,184 | |
UBS AG/Stamford CT | | | | | | | | |
2.35%, 03/26/20a | | | 19,930 | | | | 19,917,516 | |
2.38%, 08/14/19a | | | 32,706 | | | | 32,754,631 | |
4.88%, 08/04/20a | | | 9,225 | | | | 10,177,891 | |
Wachovia Corp. | | | | | | | | |
5.50%, 08/01/35 | | | 9,017 | | | | 9,931,804 | |
Wells Fargo & Co. | | | | | | | | |
2.13%, 04/22/19 | | | 21,925 | | | | 22,089,716 | |
2.55%, 12/07/20a | | | 22,250 | | | | 22,418,206 | |
2.60%, 07/22/20a | | | 37,860 | | | | 38,338,486 | |
3.00%, 01/22/21 | | | 13,339 | | | | 13,716,128 | |
3.00%, 02/19/25a | | | 25,135 | | | | 25,112,042 | |
3.30%, 09/09/24a | | | 27,761 | | | | 28,313,921 | |
| | | | |
SCHEDULESOF INVESTMENTS | | | 143 | |
Schedule of Investments (Continued)
iSHARES® iBOXX $ INVESTMENT GRADE CORPORATE BOND ETF
February 29, 2016
| | | | | | | | |
| Security | |
Principal
(000s) | | | Value | |
3.50%, 03/08/22a | | $ | 32,677 | | | $ | 34,222,312 | |
3.55%, 09/29/25a | | | 31,250 | | | | 32,492,241 | |
3.90%, 05/01/45a | | | 31,955 | | | | 30,865,124 | |
4.10%, 06/03/26a | | | 30,674 | | | | 31,492,527 | |
4.13%, 08/15/23 | | | 23,044 | | | | 24,389,502 | |
4.30%, 07/22/27 | | | 32,540 | | | | 33,744,214 | |
4.60%, 04/01/21a | | | 28,240 | | | | 31,075,474 | |
4.65%, 11/04/44 | | | 15,210 | | | | 14,907,797 | |
4.90%, 11/17/45a | | | 17,815 | | | | 18,050,812 | |
5.38%, 02/07/35 | | | 4,074 | | | | 4,708,363 | |
5.38%, 11/02/43 | | | 26,200 | | | | 27,995,939 | |
5.61%, 01/15/44 | | | 29,835 | | | | 32,934,257 | |
Series M | | | | | | | | |
3.45%, 02/13/23 | | | 24,666 | | | | 25,018,117 | |
Series N | | | | | | | | |
2.15%, 01/30/20 | | | 19,679 | | | | 19,601,410 | |
Wells Fargo Bank N.A. | | | | | | | | |
5.85%, 02/01/37 | | | 10,850 | | | | 13,067,012 | |
6.60%, 01/15/38 | | | 18,684 | | | | 24,417,998 | |
Westpac Banking Corp. | | | | | | | | |
2.25%, 01/17/19a | | | 2,243 | | | | 2,260,943 | |
2.30%, 05/26/20a | | | 12,325 | | | | 12,386,626 | |
2.60%, 11/23/20a | | | 21,500 | | | | 21,741,525 | |
4.88%, 11/19/19a | | | 20,507 | | | | 22,375,951 | |
| | | | | | | | |
| | | | 6,429,687,664 | |
BEVERAGES — 4.14% | | | | | | | | |
Anheuser-Busch InBev Finance Inc. | | | | | | | | |
2.15%, 02/01/19a | | | 13,121 | | | | 13,303,440 | |
2.63%, 01/17/23a | | | 13,248 | | | | 13,101,347 | |
2.65%, 02/01/21 (Call 01/01/21) | | | 65,825 | | | | 66,941,642 | |
3.30%, 02/01/23 (Call 12/01/22) | | | 59,350 | | | | 60,999,633 | |
3.65%, 02/01/26 (Call 11/01/25) | | | 121,500 | | | | 125,318,696 | |
3.70%, 02/01/24a | | | 26,146 | | | | 27,664,212 | |
4.00%, 01/17/43a | | | 10,767 | | | | 10,102,690 | |
4.63%, 02/01/44a | | | 12,725 | | | | 13,150,177 | |
4.70%, 02/01/36 (Call 08/01/35) | | | 70,848 | | | | 74,313,714 | |
4.90%, 02/01/46 (Call 08/01/45)a | | | 111,365 | | | | 119,405,553 | |
| | | | | | | | |
| Security | |
Principal
(000s) | | | Value | |
Anheuser-Busch InBev Worldwide Inc. | | | | | | | | |
2.50%, 07/15/22a | | $ | 51,268 | | | $ | 50,748,137 | |
3.75%, 07/15/42 | | | 7,141 | | | | 6,459,931 | |
5.00%, 04/15/20 | | | 12,712 | | | | 13,992,664 | |
5.38%, 01/15/20a | | | 23,947 | | | | 26,682,813 | |
6.88%, 11/15/19 | | | 20,277 | | | | 23,703,835 | |
7.75%, 01/15/19a | | | 11,803 | | | | 13,683,347 | |
8.20%, 01/15/39 | | | 15,162 | | | | 22,231,552 | |
Bottling Group LLC | | | | | | | | |
5.13%, 01/15/19 | | | 1,332 | | | | 1,463,965 | |
Coca-Cola Co. (The) | | | | | | | | |
1.88%, 10/27/20 | | | 20,670 | | | | 20,872,275 | |
2.45%, 11/01/20a | | | 17,009 | | | | 17,554,395 | |
2.50%, 04/01/23a | | | 5,971 | | | | 6,067,822 | |
2.88%, 10/27/25a | | | 19,560 | | | | 19,999,292 | |
3.15%, 11/15/20a | | | 15,006 | | | | 15,952,775 | |
3.20%, 11/01/23a | | | 21,075 | | | | 22,438,529 | |
3.30%, 09/01/21a | | | 13,238 | | | | 14,139,649 | |
Diageo Capital PLC | | | | | | | | |
2.63%, 04/29/23 (Call 01/29/23) | | | 15,314 | | | | 15,372,221 | |
Diageo Investment Corp. | | | | | | | | |
2.88%, 05/11/22 | | | 14,584 | | | | 14,838,656 | |
Pepsi Bottling Group Inc. (The) Series B | | | | | | | | |
7.00%, 03/01/29 | | | 11,865 | | | | 16,272,424 | |
PepsiCo Inc. | | | | | | | | |
1.85%, 04/30/20 (Call 03/30/20)a | | | 16,350 | | | | 16,426,876 | |
2.15%, 10/14/20 (Call 09/14/20) | | | 12,285 | | | | 12,468,726 | |
2.75%, 03/05/22 | | | 15,188 | | | | 15,687,517 | |
2.75%, 03/01/23 | | | 13,713 | | | | 14,044,966 | |
2.75%, 04/30/25 (Call 01/30/25) | | | 11,909 | | | | 12,076,789 | |
2.85%, 02/24/26 (Call 11/24/25) | | | 8,735 | | | | 8,868,139 | |
3.00%, 08/25/21 | | | 8,446 | | | | 8,847,306 | |
3.10%, 07/17/22 (Call 05/17/22) | | | 13,000 | | | | 13,639,723 | |
3.13%, 11/01/20 | | | 16,579 | | | | 17,449,834 | |
3.50%, 07/17/25 (Call 04/17/25)a | | | 550 | | | | 587,626 | |
| | |
| 144 | | 2016 iSHARES ANNUAL REPORTTO SHAREHOLDERS |
Schedule of Investments (Continued)
iSHARES® iBOXX $ INVESTMENT GRADE CORPORATE BOND ETF
February 29, 2016
| | | | | | | | |
| Security | |
Principal
(000s) | | | Value | |
3.60%, 03/01/24 (Call 12/01/23)a | | $ | 10,380 | | | $ | 11,216,160 | |
4.00%, 03/05/42 | | | 5,814 | | | | 5,728,631 | |
4.45%, 04/14/46 (Call 10/14/45) | | | 17,320 | | | | 18,632,574 | |
4.50%, 01/15/20 | | | 13,950 | | | | 15,375,460 | |
4.88%, 11/01/40 | | | 7,786 | | | | 8,671,845 | |
5.50%, 01/15/40 | | | 9,496 | | | | 11,267,261 | |
| | | | | | | | |
| | | | 1,037,764,819 | |
BIOTECHNOLOGY — 2.56% | | | | | | | | |
Amgen Inc. | | | | | | | | |
2.13%, 05/01/20 (Call 04/01/20)a | | | 10,678 | | | | 10,626,931 | |
2.20%, 05/22/19 (Call 04/22/19) | | | 14,815 | | | | 15,003,971 | |
3.13%, 05/01/25 (Call 02/01/25)a | | | 16,050 | | | | 15,906,032 | |
3.45%, 10/01/20a | | | 10,810 | | | | 11,262,326 | |
3.63%, 05/15/22 (Call 02/15/22) | | | 2,486 | | | | 2,571,490 | |
3.63%, 05/22/24 (Call 02/22/24) | | | 16,950 | | | | 17,482,983 | |
3.88%, 11/15/21 (Call 08/15/21)a | | | 31,023 | | | | 33,009,620 | |
4.10%, 06/15/21 (Call 03/15/21) | | | 12,491 | | | | 13,375,929 | |
4.40%, 05/01/45 (Call 11/01/44)a | | | 17,324 | | �� | | 16,560,190 | |
5.15%, 11/15/41 (Call 05/15/41) | | | 26,932 | | | | 27,683,430 | |
5.38%, 05/15/43 (Call 11/15/42)a | | | 14,507 | | | | 15,495,640 | |
5.65%, 06/15/42 (Call 12/15/41) | | | 11,708 | | | | 12,903,768 | |
5.70%, 02/01/19 | | | 3,374 | | | | 3,738,495 | |
6.38%, 06/01/37a | | | 3,834 | | | | 4,489,044 | |
6.40%, 02/01/39a | | | 12,062 | | | | 14,254,439 | |
Biogen Inc. | | | | | | | | |
2.90%, 09/15/20 | | | 7,525 | | | | 7,607,810 | |
3.63%, 09/15/22a | | | 20,500 | | | | 21,160,836 | |
4.05%, 09/15/25 (Call 06/15/25)a | | | 22,200 | | | | 22,905,474 | |
5.20%, 09/15/45 (Call 03/15/45) | | | 22,340 | | | | 22,834,677 | |
| | | | | | | | |
| Security | |
Principal
(000s) | | | Value | |
Celgene Corp. | | | | | | | | |
2.88%, 08/15/20 | | $ | 22,400 | | | $ | 22,733,708 | |
3.25%, 08/15/22 | | | 4,976 | | | | 4,995,135 | |
3.55%, 08/15/22 | | | 13,650 | | | | 14,051,419 | |
3.63%, 05/15/24 (Call 02/15/24) | | | 14,376 | | | | 14,557,071 | |
3.88%, 08/15/25 (Call 05/15/25)a | | | 24,450 | | | | 25,228,828 | |
4.63%, 05/15/44 (Call 11/15/43) | | | 15,020 | | | | 14,416,103 | |
5.00%, 08/15/45 (Call 02/15/45)a | | | 23,450 | | | | 24,010,931 | |
Gilead Sciences Inc. | | | | | | | | |
2.55%, 09/01/20 | | | 21,359 | | | | 21,709,089 | |
3.25%, 09/01/22 (Call 07/01/22) | | | 11,700 | | | | 12,141,075 | |
3.50%, 02/01/25 (Call 11/01/24) | | | 25,772 | | | | 26,843,814 | |
3.65%, 03/01/26 (Call 12/01/25)a | | | 32,262 | | | | 33,677,695 | |
3.70%, 04/01/24 (Call 01/01/24) | | | 18,550 | | | | 19,535,591 | |
4.40%, 12/01/21 (Call 09/01/21) | | | 13,014 | | | | 14,323,543 | |
4.50%, 04/01/21 (Call 01/01/21)a | | | 11,054 | | | | 12,228,127 | |
4.50%, 02/01/45 (Call 08/01/44) | | | 18,343 | | | | 18,564,380 | |
4.60%, 09/01/35 (Call 03/01/35) | | | 13,528 | | | | 14,014,487 | |
4.75%, 03/01/46 (Call 09/01/45)a | | | 25,100 | | | | 26,466,695 | |
4.80%, 04/01/44 (Call 10/01/43) | | | 17,345 | | | | 18,051,852 | |
5.65%, 12/01/41 (Call 06/01/41) | | | 13,145 | | | | 15,277,302 | |
| | | | | | | | |
| | | | 641,699,930 | |
CHEMICALS — 1.72% | | | | | | | | |
CF Industries Inc. | | | | | | | | |
3.45%, 06/01/23a | | | 7,819 | | | | 7,161,271 | |
4.95%, 06/01/43 | | | 4,996 | | | | 3,954,340 | |
5.15%, 03/15/34 | | | 20,455 | | | | 17,464,479 | |
5.38%, 03/15/44a | | | 9,913 | | | | 8,417,426 | |
7.13%, 05/01/20 | | | 4,810 | | | | 5,419,191 | |
| | | | |
SCHEDULESOF INVESTMENTS | | | 145 | |
Schedule of Investments (Continued)
iSHARES® iBOXX $ INVESTMENT GRADE CORPORATE BOND ETF
February 29, 2016
| | | | | | | | |
| Security | |
Principal
(000s) | | | Value | |
Dow Chemical Co. (The) | | | | | | | | |
3.00%, 11/15/22 (Call 08/15/22) | | $ | 20,922 | | | $ | 20,926,235 | |
3.50%, 10/01/24 (Call 07/01/24)a | | | 11,114 | | | | 11,122,315 | |
4.13%, 11/15/21 (Call 08/15/21) | | | 15,548 | | | | 16,427,163 | |
4.25%, 11/15/20 (Call 08/15/20) | | | 16,470 | | | | 17,440,291 | |
4.38%, 11/15/42 (Call 05/15/42) | | | 11,965 | | | | 10,642,401 | |
5.25%, 11/15/41 (Call 05/15/41) | | | 8,015 | | | | 7,914,951 | |
7.38%, 11/01/29 | | | 10,977 | | | | 13,842,573 | |
8.55%, 05/15/19a | | | 17,112 | | | | 20,110,440 | |
9.40%, 05/15/39 | | | 11,976 | | | | 16,990,178 | |
Eastman Chemical Co. | | | | | | | | |
2.70%, 01/15/20 (Call 12/15/19) | | | 8,203 | | | | 8,134,115 | |
3.60%, 08/15/22 (Call 05/15/22) | | | 14,376 | | | | 14,330,179 | |
3.80%, 03/15/25 (Call 12/15/24)a | | | 10,520 | | | | 10,222,311 | |
4.65%, 10/15/44 (Call 04/15/44)a | | | 7,245 | | | | 6,211,182 | |
Ecolab Inc. | | | | | | | | |
4.35%, 12/08/21 | | | 10,800 | | | | 11,731,999 | |
5.50%, 12/08/41a | | | 10,708 | | | | 11,958,181 | |
EI du Pont de Nemours & Co. | | | | | | | | |
2.80%, 02/15/23a | | | 9,029 | | | | 8,916,443 | |
3.63%, 01/15/21a | | | 15,313 | | | | 16,077,845 | |
4.15%, 02/15/43a | | | 7,774 | | | | 6,804,322 | |
4.63%, 01/15/20a | | | 13,623 | | | | 14,799,921 | |
LYB International Finance BV | | | | | | | | |
4.00%, 07/15/23a | | | 8,411 | | | | 8,465,918 | |
4.88%, 03/15/44 (Call 09/15/43)a | | | 13,210 | | | | 11,890,929 | |
5.25%, 07/15/43 | | | 10,128 | | | | 9,501,026 | |
LyondellBasell Industries NV | | | | | | | | |
4.63%, 02/26/55 (Call 08/26/54)a | | | 11,985 | | | | 9,843,772 | |
5.00%, 04/15/19 (Call 01/15/19) | | | 18,350 | | | | 19,357,973 | |
| | | | | | | | |
| Security | |
Principal
(000s) | | | Value | |
5.75%, 04/15/24 (Call 01/15/24) | | $ | 12,870 | | | $ | 14,406,763 | |
6.00%, 11/15/21 (Call 08/17/21) | | | 12,653 | | | | 14,078,243 | |
Monsanto Co. | | | | | | | | |
3.38%, 07/15/24 (Call 04/15/24)a | | | 12,309 | | | | 12,158,068 | |
4.40%, 07/15/44 (Call 01/15/44)a | | | 11,000 | | | | 9,536,730 | |
4.70%, 07/15/64 (Call 01/15/64) | | | 4,235 | | | | 3,382,833 | |
Mosaic Co. (The) | | | | | | | | |
4.25%, 11/15/23 (Call 08/15/23)a | | | 9,990 | | | | 9,795,608 | |
Potash Corp. of
Saskatchewan Inc. | | | | | | | | |
3.63%, 03/15/24 (Call 12/15/23) | | | 12,792 | | | | 12,566,481 | |
Rohm & Haas Co. | | | | | | | | |
7.85%, 07/15/29 | | | 7,306 | | | | 9,439,032 | |
| | | | | | | | |
| | | | 431,443,128 | |
COMMERCIAL SERVICES — 0.32% | |
Automatic Data Processing Inc. | | | | | | | | |
2.25%, 09/15/20 (Call 08/15/20)a | | | 9,557 | | | | 9,764,149 | |
3.38%, 09/15/25 (Call 06/15/25) | | | 15,368 | | | | 16,310,716 | |
McGraw Hill Financial Inc. | | | | | | | | |
4.40%, 02/15/26 (Call 11/15/25) | | | 7,250 | | | | 7,615,849 | |
Synchrony Financial | | | | | | | | |
3.00%, 08/15/19 (Call 07/15/19) | | | 17,346 | | | | 17,314,845 | |
3.75%, 08/15/21 (Call 06/15/21) | | | 8,990 | | | | 9,032,028 | |
4.25%, 08/15/24 (Call 05/15/24)a | | | 20,845 | | | | 20,840,752 | |
| | | | | | | | |
| | | | 80,878,339 | |
COMPUTERS — 3.24% | | | | | | | | |
Apple Inc. | | | | | | | | |
1.55%, 02/07/20a | | | 18,038 | | | | 17,931,709 | |
2.00%, 05/06/20a | | | 11,824 | | | | 11,966,819 | |
2.10%, 05/06/19 | | | 20,995 | | | | 21,412,754 | |
| | |
| 146 | | 2016 iSHARES ANNUAL REPORTTO SHAREHOLDERS |
Schedule of Investments (Continued)
iSHARES® iBOXX $ INVESTMENT GRADE CORPORATE BOND ETF
February 29, 2016
| | | | | | | | |
| Security | |
Principal
(000s) | | | Value | |
2.15%, 02/09/22 | | $ | 16,641 | | | $ | 16,571,719 | |
2.25%, 02/23/21 (Call 01/23/21) | | | 19,710 | | | | 20,048,787 | |
2.40%, 05/03/23a | | | 67,620 | | | | 66,957,892 | |
2.50%, 02/09/25 | | | 32,013 | | | | 31,378,112 | |
2.70%, 05/13/22a | | | 15,044 | | | | 15,375,656 | |
2.85%, 05/06/21a | | | 42,121 | | | | 43,886,219 | |
2.85%, 02/23/23 (Call 12/23/22) | | | 19,095 | | | | 19,509,379 | |
3.20%, 05/13/25a | | | 29,807 | | | | 30,760,368 | |
3.25%, 02/23/26 (Call 11/23/25) | | | 18,755 | | | | 19,373,669 | |
3.45%, 05/06/24 | | | 28,364 | | | | 29,901,031 | |
3.45%, 02/09/45 | | | 26,372 | | | | 22,764,002 | |
3.85%, 05/04/43 | | | 29,500 | | | | 27,484,787 | |
4.38%, 05/13/45a | | | 16,615 | | | | 16,767,929 | |
4.45%, 05/06/44 | | | 12,412 | | | | 12,656,516 | |
4.50%, 02/23/36 (Call 08/23/35) | | | 18,300 | | | | 19,085,361 | |
4.65%, 02/23/46 (Call 08/23/45) | | | 30,225 | | | | 31,638,732 | |
EMC Corp./MA | | | | | | | | |
2.65%, 06/01/20a | | | 23,235 | | | | 21,073,058 | |
3.38%, 06/01/23 (Call 03/01/23)a | | | 8,264 | | | | 6,775,552 | |
Hewlett Packard Enterprise Co. | | | | | | | | |
3.60%, 10/15/20 (Call 09/15/20)a,b | | | 31,855 | | | | 31,692,600 | |
4.40%, 10/15/22 (Call 08/15/22)a,b | | | 8,900 | | | | 8,689,654 | |
4.90%, 10/15/25 (Call 07/15/25)b | | | 29,200 | | | | 27,720,083 | |
6.20%, 10/15/35 (Call 04/15/35)b | | | 12,200 | | | | 10,528,036 | |
6.35%, 10/15/45 (Call 04/15/45)b | | | 23,400 | | | | 19,901,546 | |
HP Inc. | | | | | | | | |
3.75%, 12/01/20a | | | 2,297 | | | | 2,338,262 | |
4.30%, 06/01/21 | | | 14,447 | | | | 14,599,566 | |
4.38%, 09/15/21a | | | 15,055 | | | | 15,202,673 | |
4.65%, 12/09/21a | | | 18,068 | | | | 18,414,302 | |
6.00%, 09/15/41a | | | 7,027 | | | | 5,808,277 | |
International Business Machines Corp. | | | | | | | | |
1.63%, 05/15/20a | | | 13,005 | | | | 12,933,774 | |
| | | | | | | | |
| Security | |
Principal
(000s) | | | Value | |
1.88%, 08/01/22a | | $ | 16,651 | | | $ | 16,006,380 | |
1.95%, 02/12/19a | | | 856 | | | | 863,935 | |
2.25%, 02/19/21 | | | 10,000 | | | | 10,083,941 | |
2.88%, 11/09/22 | | | 15,675 | | | | 16,029,735 | |
3.38%, 08/01/23 | | | 21,075 | | | | 21,870,958 | |
3.45%, 02/19/26 | | | 10,550 | | | | 10,754,249 | |
3.63%, 02/12/24a | | | 15,795 | | | | 16,593,602 | |
4.00%, 06/20/42a | | | 13,679 | | | | 13,090,081 | |
4.70%, 02/19/46 | | | 5,000 | | | | 5,231,454 | |
8.38%, 11/01/19a | | | 6,537 | | | | 8,052,065 | |
Seagate HDD Cayman | | | | | | | | |
4.75%, 06/01/23a | | | 11,310 | | | | 9,132,825 | |
4.75%, 01/01/25 | | | 16,325 | | | | 12,447,812 | |
| | | | | | | | |
| | | | 811,305,861 | |
COSMETICS & PERSONAL CARE — 0.24% | |
Procter & Gamble Co. (The) | | | | | | | | |
2.30%, 02/06/22 | | | 19,463 | | | | 19,765,973 | |
3.10%, 08/15/23a | | | 5,004 | | | | 5,289,644 | |
4.70%, 02/15/19 | | | 16,216 | | | | 17,699,782 | |
5.55%, 03/05/37 | | | 13,348 | | | | 16,732,346 | |
| | | | | | | | |
| | | | 59,487,745 | |
DIVERSIFIED FINANCIAL SERVICES — 4.51% | |
American Express Co. | | | | | | | | |
2.65%, 12/02/22 | | | 21,978 | | | | 21,343,831 | |
4.05%, 12/03/42a | | | 15,894 | | | | 15,167,806 | |
American Express Credit Corp. | | | | | | | | |
2.13%, 03/18/19 | | | 14,491 | | | | 14,489,180 | |
2.25%, 08/15/19a | | | 13,115 | | | | 13,118,577 | |
2.38%, 05/26/20 (Call 04/25/20) | | | 21,245 | | | | 21,190,490 | |
Series F | | | | | | | | |
2.60%, 09/14/20 (Call 08/14/20) | | | 10,529 | | | | 10,573,715 | |
Ameriprise Financial Inc. | | | | | | | | |
4.00%, 10/15/23 | | | 17,473 | | | | 18,562,726 | |
5.30%, 03/15/20 | | | 3,270 | | | | 3,641,575 | |
BP Capital Markets PLC | | | | | | | | |
2.52%, 01/15/20 | | | 11,380 | | | | 11,197,238 | |
Capital One Bank USA N.A. | | | | | | | | |
2.25%, 02/13/19 (Call 01/13/19) | | | 520 | | | | 515,209 | |
3.38%, 02/15/23a | | | 30,240 | | | | 29,574,599 | |
| | | | |
SCHEDULESOF INVESTMENTS | | | 147 | |
Schedule of Investments (Continued)
iSHARES® iBOXX $ INVESTMENT GRADE CORPORATE BOND ETF
February 29, 2016
| | | | | | | | |
| Security | |
Principal
(000s) | | | Value | |
CME Group Inc./IL | | | | | | | | |
3.00%, 09/15/22 | | $ | 5,098 | | | $ | 5,277,888 | |
3.00%, 03/15/25 (Call 12/15/24) | | | 14,769 | | | | 14,798,067 | |
5.30%, 09/15/43 (Call 03/15/43) | | | 9,081 | | | | 10,515,914 | |
Ford Motor Credit Co. LLC | | | | | | | | |
2.38%, 03/12/19a | | | 19,400 | | | | 19,082,038 | |
2.60%, 11/04/19a | | | 9,541 | | | | 9,375,769 | |
3.66%, 09/08/24a | | | 16,300 | | | | 15,826,086 | |
4.25%, 09/20/22 | | | 16,695 | | | | 17,070,796 | |
4.38%, 08/06/23 | | | 13,287 | | | | 13,601,959 | |
5.75%, 02/01/21 | | | 12,070 | | | | 13,197,561 | |
5.88%, 08/02/21a | | | 30,129 | | | | 33,239,762 | |
8.13%, 01/15/20 | | | 9,121 | | | | 10,604,615 | |
GE Capital International Funding Co. | | | | | | | | |
2.34%, 11/15/20a,b | | | 42,414 | | | | 42,856,849 | |
3.37%, 11/15/25b | | | 25,481 | | | | 26,636,419 | |
4.42%, 11/15/35b | | | 68,347 | | | | 71,161,222 | |
General Electric Co. | | | | | | | | |
2.20%, 01/09/20 (Call 12/09/19) | | | 10,089 | | | | 10,277,248 | |
2.30%, 01/14/19 | | | 550 | | | | 565,244 | |
3.10%, 01/09/23a | | | 14,660 | | | | 15,360,276 | |
3.15%, 09/07/22a | | | 11,735 | | | | 12,305,693 | |
3.45%, 05/15/24 (Call 02/13/24)a | | | 1,140 | | | | 1,214,144 | |
4.38%, 09/16/20 | | | 10,736 | | | | 11,865,835 | |
4.63%, 01/07/21 | | | 16,486 | | | | 18,344,948 | |
4.65%, 10/17/21 | | | 31,035 | | | | 35,160,582 | |
5.30%, 02/11/21 | | | 23,553 | | | | 26,955,224 | |
5.50%, 01/08/20a | | | 10,848 | | | | 12,346,051 | |
5.88%, 01/14/38 | | | 52,359 | | | | 65,868,957 | |
6.00%, 08/07/19 | | | 5,966 | | | | 6,834,032 | |
6.15%, 08/07/37 | | | 16,797 | | | | 21,678,171 | |
6.88%, 01/10/39 | | | 37,981 | | | | 52,856,779 | |
Series A | | | | | | | | |
5.55%, 05/04/20a | | | 938 | | | | 1,073,905 | |
6.75%, 03/15/32 | | | 46,346 | | | | 61,396,020 | |
HSBC Finance Corp. | | | | | | | | |
6.68%, 01/15/21 | | | 42,418 | | | | 47,196,426 | |
| | | | | | | | |
| Security | |
Principal
(000s) | | | Value | |
Intercontinental Exchange Inc. | | | | | | | | |
2.75%, 12/01/20 (Call 11/01/20)a | | $ | 8,730 | | | $ | 8,866,492 | |
3.75%, 12/01/25 (Call 09/01/25) | | | 19,075 | | | | 19,734,240 | |
4.00%, 10/15/23 | | | 6,725 | | | | 7,062,703 | |
Jefferies Group LLC | | | | | | | | |
6.88%, 04/15/21 | | | 7,752 | | | | 8,658,215 | |
8.50%, 07/15/19a | | | 8,391 | | | | 9,483,836 | |
Nomura Holdings Inc. | | | | | | | | |
2.75%, 03/19/19a | | | 8,930 | | | | 8,983,428 | |
6.70%, 03/04/20 | | | 17,383 | | | | 19,940,264 | |
Synchrony Financial | | | | | | | | |
2.70%, 02/03/20 (Call 01/03/20) | | | 4,985 | | | | 4,887,539 | |
4.50%, 07/23/25 (Call 04/24/25) | | | 7,550 | | | | 7,641,721 | |
Visa Inc. | | | | | | | | |
2.20%, 12/14/20 (Call 11/14/20) | | | 36,515 | | | | 37,220,945 | |
2.80%, 12/14/22 (Call 10/14/22) | | | 23,320 | | | | 24,016,475 | |
3.15%, 12/14/25 (Call 09/14/25)a | | | 46,600 | | | | 48,445,602 | |
4.15%, 12/14/35 (Call 06/14/35)a | | | 13,450 | | | | 14,282,790 | |
4.30%, 12/14/45 (Call 06/14/45) | | | 44,040 | | | | 47,283,665 | |
| | | | | | | | |
| | | | 1,130,427,341 | |
ELECTRIC — 1.08% | | | | | | | | |
Berkshire Hathaway Energy Co. | | | | | | | | |
4.50%, 02/01/45 (Call 08/01/44) | | | 12,796 | | | | 12,796,981 | |
5.15%, 11/15/43 (Call 05/15/43)a | | | 8,819 | | | | 9,704,641 | |
6.13%, 04/01/36 | | | 18,280 | | | | 21,774,436 | |
6.50%, 09/15/37 | | | 11,286 | | | | 14,037,290 | |
Consolidated Edison Co. of New York Inc. | | | | | | | | |
4.45%, 03/15/44 (Call 09/15/43) | | | 9,379 | | | | 9,853,922 | |
4.63%, 12/01/54 (Call 06/01/54) | | | 8,165 | | | | 8,374,129 | |
| | |
| 148 | | 2016 iSHARES ANNUAL REPORTTO SHAREHOLDERS |
Schedule of Investments (Continued)
iSHARES® iBOXX $ INVESTMENT GRADE CORPORATE BOND ETF
February 29, 2016
| | | | | | | | |
| Security | |
Principal
(000s) | | | Value | |
Duke Energy Carolinas LLC | | | | | | | | |
5.30%, 02/15/40 | | $ | 7,767 | | | $ | 9,168,942 | |
Duke Energy Corp. | | | | | | | | |
3.75%, 04/15/24 (Call 01/15/24)a | | | 6,426 | | | | 6,614,394 | |
Duke Energy Florida LLC | | | | | | | | |
6.40%, 06/15/38 | | | 14,536 | | | | 19,094,430 | |
Exelon Corp. | | | | | | | | |
2.85%, 06/15/20 (Call 05/15/20) | | | 7,932 | | | | 7,984,904 | |
3.95%, 06/15/25 (Call 03/15/25)a,b | | | 15,700 | | | | 15,892,776 | |
5.10%, 06/15/45 (Call 12/15/44)b | | | 1,724 | | | | 1,760,733 | |
Exelon Generation Co. LLC | | | | | | | | |
2.95%, 01/15/20 (Call 12/15/19)a | | | 3,550 | | | | 3,553,733 | |
5.60%, 06/15/42 (Call 12/15/41)a | | | 4,608 | | | | 4,166,759 | |
6.25%, 10/01/39a | | | 11,895 | | | | 11,820,436 | |
Georgia Power Co. | | | | | | | | |
4.30%, 03/15/42 | | | 10,277 | | | | 10,083,509 | |
NiSource Finance Corp. | | | | | | | | |
4.80%, 02/15/44 (Call 08/15/43) | | | 6,791 | | | | 6,998,635 | |
Oncor Electric Delivery Co. LLC | | | | | | | | |
7.00%, 09/01/22 | | | 10,623 | | | | 12,934,542 | |
Pacific Gas & Electric Co. | | | | | | | | |
3.50%, 10/01/20 (Call 07/01/20) | | | 3,087 | | | | 3,258,813 | |
5.40%, 01/15/40 | | | 10,531 | | | | 12,286,388 | |
5.80%, 03/01/37 | | | 10,093 | | | | 12,125,764 | |
6.05%, 03/01/34 | | | 34,965 | | | | 42,912,142 | |
Southern California Edison Co. | | | | | | | | |
4.65%, 10/01/43 (Call 04/01/43) | | | 9,396 | | | | 10,382,292 | |
Virginia Electric & Power Co. Series A | | | | | | | | |
3.15%, 01/15/26 (Call 10/15/25) | | | 2,000 | | | | 2,049,535 | |
| | | | | | | | |
| | | | 269,630,126 | |
| | | | | | | | |
| Security | |
Principal
(000s) | | | Value | |
ELECTRONICS — 0.46% | | | | | | | | |
Honeywell International Inc. | | | | | | | | |
4.25%, 03/01/21 | | $ | 5,849 | | | $ | 6,480,548 | |
5.00%, 02/15/19 | | | 11,524 | | | | 12,698,411 | |
Koninklijke Philips NV | | | | | | | | |
3.75%, 03/15/22 | | | 9,781 | | | | 10,115,953 | |
6.88%, 03/11/38 | | | 13,444 | | | | 15,715,729 | |
Thermo Fisher Scientific Inc. | | | | | | | | |
2.40%, 02/01/19a | | | 3,397 | | | | 3,408,998 | |
3.15%, 01/15/23 (Call 10/15/22) | | | 6,398 | | | | 6,268,631 | |
3.30%, 02/15/22 | | | 9,592 | | | | 9,587,498 | |
3.60%, 08/15/21 (Call 05/15/21) | | | 18,306 | | | | 18,728,684 | |
4.15%, 02/01/24 (Call 11/01/23) | | | 21,901 | | | | 22,829,173 | |
4.50%, 03/01/21 | | | 8,706 | | | | 9,357,524 | |
| | | | | | | | |
| | | | 115,191,149 | |
ENGINEERING & CONSTRUCTION — 0.09% | |
ABB Finance USA Inc. | | | | | | | | |
2.88%, 05/08/22 | | | 18,088 | | | | 18,357,336 | |
4.38%, 05/08/42a | | | 4,367 | | | | 4,561,459 | |
| | | | | | | | |
| | | | 22,918,795 | |
ENVIRONMENTAL CONTROL — 0.14% | |
Republic Services Inc. | | | | | | | | |
3.55%, 06/01/22 (Call 03/01/22) | | | 12,795 | | | | 13,403,969 | |
5.00%, 03/01/20a | | | 9,032 | | | | 9,864,505 | |
Waste Management Inc. | | | | | | | | |
4.10%, 03/01/45 (Call 09/01/44) | | | 11,874 | | | | 11,539,713 | |
| | | | | | | | |
| | | | 34,808,187 | |
FOOD — 1.64% | | | | | | | | |
ConAgra Foods Inc. | | | | | | | | |
3.20%, 01/25/23 (Call 10/25/22) | | | 821 | | | | 814,841 | |
General Mills Inc. | |
3.15%, 12/15/21 (Call 09/15/21) | | | 17,474 | | | | 18,201,416 | |
5.65%, 02/15/19 | | | 8,850 | | | | 9,781,973 | |
JM Smucker Co. (The) | | | | | | | | |
3.50%, 10/15/21 | | | 25 | | | | 26,112 | |
3.50%, 03/15/25a | | | 21,365 | | | | 22,025,836 | |
| | | | |
SCHEDULESOF INVESTMENTS | | | 149 | |
Schedule of Investments (Continued)
iSHARES® iBOXX $ INVESTMENT GRADE CORPORATE BOND ETF
February 29, 2016
| | | | | | | | |
| Security | |
Principal
(000s) | | | Value | |
Kellogg Co. | | | | | | | | |
4.00%, 12/15/20a | | $ | 8,252 | | | $ | 8,801,282 | |
Series B | | | | | | | | |
7.45%, 04/01/31 | | | 10,256 | | | | 13,152,369 | |
Kraft Foods Group Inc. | | | | | | | | |
3.50%, 06/06/22 | | | 19,031 | | | | 19,606,170 | |
5.00%, 06/04/42 | | | 26,003 | | | | 26,912,822 | |
5.38%, 02/10/20 | | | 22,280 | | | | 24,667,661 | |
6.50%, 02/09/40 | | | 13,169 | | | | 15,681,096 | |
6.88%, 01/26/39 | | | 13,990 | | | | 17,172,490 | |
Kraft Heinz Foods Co. | | | | | | | | |
2.80%, 07/02/20 (Call 06/02/20)a,b | | | 20,900 | | | | 21,146,217 | |
3.50%, 07/15/22 (Call 05/15/22)b | | | 17,245 | | | | 17,775,879 | |
3.95%, 07/15/25 (Call 04/15/25)a,b | | | 10,515 | | | | 11,018,861 | |
5.00%, 07/15/35 (Call 01/15/35)b | | | 9,095 | | | | 9,496,379 | |
5.20%, 07/15/45 (Call 01/15/45)b | | | 17,550 | | | | 18,893,191 | |
Kroger Co. (The) | | | | | | | | |
6.15%, 01/15/20 | | | 7,777 | | | | 8,921,219 | |
Mondelez International Inc. | | | | | | | | |
2.25%, 02/01/19 (Call 01/01/19) | | | 9,384 | | | | 9,445,015 | |
4.00%, 02/01/24 (Call 11/01/23) | | | 20,874 | | | | 21,749,547 | |
6.50%, 02/09/40a | | | 1,961 | | | | 2,451,922 | |
Sysco Corp. | | | | | | | | |
2.60%, 10/01/20 (Call 09/01/20) | | | 8,845 | | | | 8,853,590 | |
3.75%, 10/01/25 (Call 07/01/25)a | | | 13,520 | | | | 13,995,853 | |
Tyson Foods Inc. | | | | | | | | |
2.65%, 08/15/19 (Call 07/15/19) | | | 13,270 | | | | 13,448,962 | |
3.95%, 08/15/24 (Call 05/15/24) | | | 15,500 | | | | 16,352,257 | |
4.50%, 06/15/22 (Call 03/15/22) | | | 10,520 | | | | 11,339,829 | |
Unilever Capital Corp. | | | | | | | | |
2.20%, 03/06/19 | | | 14,061 | | | | 14,412,071 | |
| | | | | | | | |
| Security | |
Principal
(000s) | | | Value | |
4.25%, 02/10/21 | | $ | 11,963 | | | $ | 13,287,257 | |
4.80%, 02/15/19 | | | 7,814 | | | | 8,564,076 | |
5.90%, 11/15/32 | | | 9,709 | | | | 12,653,150 | |
| | | | | | | | |
| | | | 410,649,343 | |
FOREST PRODUCTS & PAPER — 0.07% | |
International Paper Co. | | | | | | | | |
3.65%, 06/15/24 (Call 03/15/24)a | | | 10,325 | | | | 10,067,559 | |
4.80%, 06/15/44 (Call 12/15/43) | | | 8,600 | | | | 7,229,791 | |
7.30%, 11/15/39 | | | 1,050 | | | | 1,136,034 | |
| | | | | | | | |
| | | | 18,433,384 | |
GAS — 0.04% | | | | | | | | |
Sempra Energy | | | | | | | | |
6.00%, 10/15/39 | | | 10,045 | | | | 11,071,396 | |
| | | | | | | | |
| | | | 11,071,396 | |
HEALTH CARE – PRODUCTS — 1.62% | |
Becton Dickinson and Co. | | | | | | | | |
2.68%, 12/15/19a | | | 19,641 | | | | 20,051,359 | |
3.13%, 11/08/21 | | | 11,291 | | | | 11,572,136 | |
3.73%, 12/15/24 (Call 09/15/24) | | | 12,770 | | | | 13,161,383 | |
4.69%, 12/15/44 (Call 06/15/44) | | | 13,625 | | | | 14,046,771 | |
Boston Scientific Corp. | | | | | | | | |
3.85%, 05/15/25 | | | 11,305 | | | | 11,331,017 | |
6.00%, 01/15/20a | | | 8,806 | | | | 9,852,002 | |
Covidien International Finance SA | | | | | | | | |
2.95%, 06/15/23 (Call 03/15/23) | | | 6,069 | | | | 6,123,575 | |
6.55%, 10/15/37 | | | 12,486 | | | | 16,077,602 | |
Medtronic Inc. | | | | | | | | |
2.50%, 03/15/20a | | | 21,518 | | | | 21,994,421 | |
2.75%, 04/01/23 (Call 01/01/23) | | | 22,564 | | | | 22,631,507 | |
3.15%, 03/15/22 | | | 24,330 | | | | 25,375,241 | |
3.50%, 03/15/25a | | | 45,894 | | | | 48,182,348 | |
3.63%, 03/15/24 (Call 12/15/23) | | | 10,994 | | | | 11,650,569 | |
4.00%, 04/01/43 (Call 10/01/42) | | | 8,486 | | | | 8,168,474 | |
4.38%, 03/15/35 | | | 28,388 | | | | 29,362,994 | |
| | |
| 150 | | 2016 iSHARES ANNUAL REPORTTO SHAREHOLDERS |
Schedule of Investments (Continued)
iSHARES® iBOXX $ INVESTMENT GRADE CORPORATE BOND ETF
February 29, 2016
| | | | | | | | |
| Security | |
Principal
(000s) | | | Value | |
4.45%, 03/15/20 | | $ | 17,143 | | | $ | 18,738,605 | |
4.63%, 03/15/45 | | | 43,123 | | | | 45,843,712 | |
St. Jude Medical Inc. | | | | | | | | |
3.25%, 04/15/23 (Call 01/15/23) | | | 4,542 | | | | 4,561,392 | |
Stryker Corp. | | | | | | | | |
3.38%, 11/01/25 (Call 08/01/25) | | | 6,535 | | | | 6,482,261 | |
Zimmer Biomet Holdings Inc. | | | | | | | | |
2.70%, 04/01/20 (Call 03/01/20) | | | 20,695 | | | | 20,718,061 | |
3.15%, 04/01/22 (Call 02/01/22)a | | | 8,300 | | | | 8,262,793 | |
3.55%, 04/01/25 (Call 01/01/25)a | | | 24,520 | | | | 24,240,568 | |
4.45%, 08/15/45 (Call 02/15/45) | | | 9,340 | | | | 8,597,546 | |
| | | | | | | | |
| | | | 407,026,337 | |
HEALTH CARE – SERVICES — 1.53% | |
Aetna Inc. | | | | | | | | |
2.75%, 11/15/22 (Call 08/15/22) | | | 15,510 | | | | 15,162,492 | |
3.50%, 11/15/24 (Call 08/15/24) | | | 5,400 | | | | 5,429,096 | |
3.95%, 09/01/20 | | | 11,115 | | | | 11,789,937 | |
6.63%, 06/15/36 | | | 11,323 | | | | 13,688,556 | |
Anthem Inc. | | | | | | | | |
2.25%, 08/15/19 | | | 10,295 | | | | 10,177,796 | |
3.13%, 05/15/22 | | | 15,185 | | | | 14,919,053 | |
3.30%, 01/15/23 | | | 8,275 | | | | 8,171,867 | |
3.50%, 08/15/24 (Call 05/15/24)a | | | 9,375 | | | | 9,325,811 | |
4.63%, 05/15/42 | | | 12,134 | | | | 11,377,971 | |
4.65%, 01/15/43 | | | 12,975 | | | | 12,174,427 | |
4.65%, 08/15/44 (Call 02/15/44) | | | 12,394 | | | | 11,682,547 | |
5.85%, 01/15/36a | | | 9,582 | | | | 10,323,643 | |
6.38%, 06/15/37 | | | 5,790 | | | | 6,719,855 | |
Cigna Corp. | | | | | | | | |
3.25%, 04/15/25 (Call 01/15/25)a | | | 13,690 | | | | 13,458,892 | |
4.00%, 02/15/22 (Call 11/15/21) | | | 8,289 | | | | 8,749,044 | |
| | | | | | | | |
| Security | |
Principal
(000s) | | | Value | |
5.38%, 02/15/42 (Call 08/15/41) | | $ | 10,385 | | | $ | 11,474,402 | |
Humana Inc. | | | | | | | | |
4.95%, 10/01/44 (Call 04/01/44)a | | | 8,785 | | | | 8,656,280 | |
Laboratory Corp. of America Holdings | | | | | | | | |
3.60%, 02/01/25 (Call 11/01/24)a | | | 8,821 | | | | 8,730,697 | |
4.70%, 02/01/45 (Call 08/01/44)a | | | 14,155 | | | | 13,341,894 | |
UnitedHealth Group Inc. | | | | | | | | |
2.13%, 03/15/21 | | | 3,850 | | | | 3,845,936 | |
2.70%, 07/15/20 | | | 24,579 | | | | 25,196,764 | |
2.88%, 12/15/21a | | | 5,150 | | | | 5,318,966 | |
2.88%, 03/15/22 (Call 12/15/21) | | | 10,180 | | | | 10,384,277 | |
2.88%, 03/15/23a | | | 13,227 | | | | 13,401,456 | |
3.10%, 03/15/26 | | | 7,500 | | | | 7,557,160 | |
3.35%, 07/15/22 | | | 5,700 | | | | 5,959,364 | |
3.75%, 07/15/25 | | | 27,623 | | | | 29,398,217 | |
4.25%, 03/15/43 (Call 09/15/42)a | | | 8,139 | | | | 8,164,179 | |
4.63%, 07/15/35 | | | 14,660 | | | | 15,762,910 | |
4.75%, 07/15/45 | | | 28,116 | | | | 30,624,493 | |
5.80%, 03/15/36a | | | 4,000 | | | | 4,780,593 | |
6.88%, 02/15/38 | | | 14,009 | | | | 18,801,875 | |
| | | | | | | | |
| | | | 384,550,450 | |
HOLDING COMPANIES – DIVERSIFIED — 0.05% | |
MUFG Americas Holdings Corp. | | | | | | | | |
2.25%, 02/10/20 (Call 01/10/20) | | | 12,771 | | | | 12,604,844 | |
| | | | | | | | |
| | | | 12,604,844 | |
INSURANCE — 1.79% | | | | | | | | |
ACE INA Holdings Inc. | | | | | | | | |
2.30%, 11/03/20 (Call 10/03/20)a | | | 10,720 | | | | 10,836,935 | |
2.88%, 11/03/22 (Call 09/03/22) | | | 14,000 | | | | 14,250,496 | |
3.15%, 03/15/25 | | | 12,425 | | | | 12,516,708 | |
3.35%, 05/03/26 (Call 02/03/26) | | | 18,875 | | | | 19,339,676 | |
4.35%, 11/03/45 (Call 05/03/45)a | | | 18,085 | | | | 18,841,803 | |
| | | | |
SCHEDULESOF INVESTMENTS | | | 151 | |
Schedule of Investments (Continued)
iSHARES® iBOXX $ INVESTMENT GRADE CORPORATE BOND ETF
February 29, 2016
| | | | | | | | |
| Security | |
Principal
(000s) | | | Value | |
Aflac Inc. | | | | | | | | |
3.63%, 11/15/24 | | $ | 13,043 | | | $ | 13,520,130 | |
American International Group Inc. | | | | | | | | |
2.30%, 07/16/19 (Call 06/16/19) | | | 9,381 | | | | 9,297,745 | |
3.30%, 03/01/21 (Call 02/01/21) | | | 2,655 | | | | 2,683,022 | |
3.38%, 08/15/20 | | | 455 | | | | 460,332 | |
3.75%, 07/10/25 (Call 04/10/25) | | | 3,457 | | | | 3,376,673 | |
3.88%, 01/15/35 (Call 07/15/34)a | | | 13,023 | | | | 10,880,989 | |
4.13%, 02/15/24 | | | 17,895 | | | | 18,121,966 | |
4.38%, 01/15/55 (Call 07/15/54) | | | 9,889 | | | | 7,942,530 | |
4.50%, 07/16/44 (Call 01/16/44) | | | 31,634 | | | | 27,465,838 | |
4.80%, 07/10/45 (Call 01/10/45) | | | 8,500 | | | | 7,824,604 | |
4.88%, 06/01/22 | | | 19,914 | | | | 21,646,064 | |
6.25%, 05/01/36 | | | 12,807 | | | | 14,000,117 | |
6.40%, 12/15/20 | | | 1,357 | | | | 1,550,170 | |
Berkshire Hathaway Finance Corp. | | | | | | | | |
3.00%, 05/15/22 | | | 14,795 | | | | 15,268,544 | |
4.25%, 01/15/21a | | | 9,871 | | | | 10,812,755 | |
5.75%, 01/15/40a | | | 8,388 | | | | 9,951,443 | |
Berkshire Hathaway Inc. | | | | | | | | |
2.10%, 08/14/19a | | | 10,680 | | | | 10,895,156 | |
4.50%, 02/11/43a | | | 6,943 | | | | 6,986,771 | |
Chubb Corp. (The) | | | | | | | | |
6.00%, 05/11/37 | | | 4,851 | | | | 6,040,056 | |
MetLife Inc. | | | | | | | | |
3.60%, 04/10/24 | | | 8,175 | | | | 8,210,690 | |
4.05%, 03/01/45a | | | 13,685 | | | | 12,148,032 | |
4.13%, 08/13/42 | | | 7,128 | | | | 6,450,817 | |
4.60%, 05/13/46 (Call 12/13/45)a | | | 8,100 | | | | 7,897,912 | |
4.75%, 02/08/21 | | | 16,361 | | | | 17,923,829 | |
4.88%, 11/13/43 | | | 17,765 | | | | 18,190,303 | |
5.70%, 06/15/35a | | | 4,725 | | | | 5,301,653 | |
5.88%, 02/06/41a | | | 8,300 | | | | 9,475,081 | |
| | | | | | | | |
| Security | |
Principal
(000s) | | | Value | |
6.38%, 06/15/34 | | $ | 8,149 | | | $ | 9,711,093 | |
7.72%, 02/15/19 | | | 1,805 | | | | 2,088,297 | |
Series D | | | | | | | | |
4.37%, 09/15/23 | | | 14,360 | | | | 15,400,452 | |
Prudential Financial Inc. | | | | | | | | |
4.60%, 05/15/44a | | | 15,320 | | | | 14,744,334 | |
5.70%, 12/14/36 | | | 170 | | | | 183,466 | |
7.38%, 06/15/19 | | | 9,607 | | | | 11,069,543 | |
Series D | | | | | | | | |
6.63%, 12/01/37 | | | 11,845 | | | | 14,018,555 | |
Travelers Companies Inc. (The) | | | | | | | | |
5.35%, 11/01/40 | | | 7,925 | | | | 9,396,428 | |
6.25%, 06/15/37 | | | 9,055 | | | | 11,651,744 | |
| | | | | | | | |
| | | | 448,372,752 | |
INTERNET — 0.67% | | | | | | | | |
Amazon.com Inc. | | | | | | | | |
2.50%, 11/29/22 (Call 08/29/22)a | | | 19,569 | | | | 19,451,195 | |
2.60%, 12/05/19 (Call 11/05/19) | | | 13,170 | | | | 13,497,110 | |
3.30%, 12/05/21 (Call 10/05/21) | | | 5,348 | | | | 5,640,551 | |
3.80%, 12/05/24 (Call 09/05/24)a | | | 16,582 | | | | 17,771,589 | |
4.80%, 12/05/34 (Call 06/05/34) | | | 11,370 | | | | 12,281,935 | |
4.95%, 12/05/44 (Call 06/05/44)a | | | 19,828 | | | | 21,915,153 | |
eBay Inc. | | | | | | | | |
2.20%, 08/01/19 (Call 07/01/19)a | | | 18,400 | | | | 18,265,976 | |
2.60%, 07/15/22 (Call 04/15/22)a | | | 7,234 | | | | 6,766,388 | |
2.88%, 08/01/21 (Call 06/01/21)a | | | 5,418 | | | | 5,354,855 | |
3.45%, 08/01/24 (Call 05/01/24)a | | | 15,030 | | | | 14,256,788 | |
4.00%, 07/15/42 (Call 01/15/42)a | | | 6,647 | | | | 5,069,156 | |
Expedia Inc. | | | | | | | | |
5.00%, 02/15/26 (Call 11/15/25)a,b | | | 4,000 | | | | 3,812,765 | |
| | |
| 152 | | 2016 iSHARES ANNUAL REPORTTO SHAREHOLDERS |
Schedule of Investments (Continued)
iSHARES® iBOXX $ INVESTMENT GRADE CORPORATE BOND ETF
February 29, 2016
| | | | | | | | |
| Security | |
Principal
(000s) | | | Value | |
Google Inc. | | | | | | | | |
3.38%, 02/25/24a | | $ | 10,865 | | | $ | 11,733,192 | |
3.63%, 05/19/21a | | | 12,310 | | | | 13,372,304 | |
| | | | | | | | |
| | | | 169,188,957 | |
MACHINERY — 0.46% | |
Caterpillar Financial Services Corp. | | | | | | | | |
2.10%, 06/09/19 | | | 12,478 | | | | 12,584,762 | |
7.15%, 02/15/19 | | | 11,015 | | | | 12,653,952 | |
Caterpillar Inc. | | | | | | | | |
3.40%, 05/15/24 (Call 02/15/24)a | | | 12,620 | | | | 12,875,635 | |
3.80%, 08/15/42a | | | 20,048 | | | | 18,313,804 | |
3.90%, 05/27/21a | | | 11,872 | | | | 12,681,791 | |
5.20%, 05/27/41 | | | 8,798 | | | | 9,535,654 | |
7.90%, 12/15/18 | | | 892 | | | | 1,036,363 | |
Deere & Co. | | | | | | | | |
2.60%, 06/08/22 (Call 03/08/22) | | | 11,809 | | | | 11,837,477 | |
3.90%, 06/09/42 (Call 12/09/41)a | | | 15,296 | | | | 14,485,736 | |
4.38%, 10/16/19 | | | 8,171 | | | | 8,859,285 | |
John Deere Capital Corp. | | | | | | | | |
1.95%, 12/13/18 | | | 259 | | | | 260,670 | |
| | | | | | | | |
| | | | 115,125,129 | |
MANUFACTURING — 0.64% | | | | | | | | |
3M Co. | | | | | | | | |
5.70%, 03/15/37 | | | 5,651 | | | | 7,191,077 | |
Eaton Corp. | | | | | | | | |
2.75%, 11/02/22 | | | 19,448 | | | | 19,048,939 | |
4.15%, 11/02/42a | | | 12,640 | | | | 12,008,191 | |
General Electric Co. | | | | | | | | |
2.70%, 10/09/22a | | | 48,952 | | | | 50,363,908 | |
3.38%, 03/11/24a | | | 8,293 | | | | 8,838,092 | |
4.13%, 10/09/42 | | | 22,758 | | | | 22,838,939 | |
4.50%, 03/11/44 | | | 28,250 | | | | 30,043,479 | |
Illinois Tool Works Inc. | | | | | | | | |
3.90%, 09/01/42 (Call 03/01/42)a | | | 9,680 | | | | 9,507,450 | |
| | | | | | | | |
| | | | 159,840,075 | |
MEDIA — 6.12% | | | | | | | | |
21st Century Fox America Inc. | | | | | | | | |
3.00%, 09/15/22 | | | 15,152 | | | | 15,176,943 | |
| | | | | | | | |
| Security | |
Principal
(000s) | | | Value | |
4.50%, 02/15/21 | | $ | 9,121 | | | $ | 9,934,716 | |
6.15%, 03/01/37 | | | 5,690 | | | | 6,152,552 | |
6.15%, 02/15/41 | | | 20,231 | | | | 21,823,766 | |
6.20%, 12/15/34 | | | 12,114 | | | | 13,494,933 | |
6.40%, 12/15/35 | | | 14,805 | | | | 16,677,738 | |
6.65%, 11/15/37 | | | 13,696 | | | | 15,536,527 | |
CBS Corp. | | | | | | | | |
3.50%, 01/15/25 (Call 10/15/24)a | | | 2,065 | | | | 2,006,316 | |
4.00%, 01/15/26 (Call 10/15/25)a | | | 12,270 | | | | 12,302,884 | |
7.88%, 07/30/30 | | | 7,295 | | | | 9,411,989 | |
CCO Safari II LLC | | | | | | | | |
3.58%, 07/23/20 (Call 06/23/20)b | | | 22,160 | | | | 22,196,801 | |
4.46%, 07/23/22 (Call 05/23/22)b | | | 39,050 | | | | 39,635,145 | |
4.91%, 07/23/25 (Call 04/23/25)b | | | 53,470 | | | | 54,684,138 | |
6.38%, 10/23/35 (Call 04/23/35)a,b | | | 19,400 | | | | 20,157,892 | |
6.48%, 10/23/45 (Call 04/23/45)a,b | | | 35,210 | | | | 37,096,615 | |
Comcast Cable Communications Holdings Inc. | | | | | | | | |
9.46%, 11/15/22 | | | 13,268 | | | | 18,544,613 | |
Comcast Corp. | | | | | | | | |
2.75%, 03/01/23 (Call 02/01/23) | | | 6,000 | | | | 6,113,286 | |
2.85%, 01/15/23 | | | 9,820 | | | | 10,092,474 | |
3.13%, 07/15/22a | | | 15,205 | | | | 15,914,563 | |
3.15%, 03/01/26 (Call 12/01/25) | | | 10,620 | | | | 10,890,232 | |
3.38%, 02/15/25 (Call 11/15/24) | | | 8,048 | | | | 8,425,532 | |
3.38%, 08/15/25 (Call 05/15/25)a | | | 15,760 | | | | 16,553,347 | |
3.60%, 03/01/24 | | | 14,671 | | | | 15,623,422 | |
4.20%, 08/15/34 (Call 02/15/34) | | | 14,640 | | | | 14,780,405 | |
4.25%, 01/15/33 | | | 22,926 | | | | 23,478,583 | |
4.40%, 08/15/35 (Call 02/15/35)a | | | 11,690 | | | | 12,147,160 | |
| | | | |
SCHEDULESOF INVESTMENTS | | | 153 | |
Schedule of Investments (Continued)
iSHARES® iBOXX $ INVESTMENT GRADE CORPORATE BOND ETF
February 29, 2016
| | | | | | | | |
| Security | |
Principal
(000s) | | | Value | |
4.60%, 08/15/45 (Call 02/15/45)a | | $ | 15,709 | | | $ | 16,535,364 | |
4.65%, 07/15/42 | | | 5,811 | | | | 6,162,972 | |
4.75%, 03/01/44 | | | 12,148 | | | | 12,929,423 | |
5.15%, 03/01/20a | | | 20,368 | | | | 22,842,956 | |
5.65%, 06/15/35a | | | 12,002 | | | | 14,081,583 | |
6.40%, 05/15/38 | | | 4,200 | | | | 5,313,617 | |
6.40%, 03/01/40a | | | 11,979 | | | | 15,053,901 | |
6.45%, 03/15/37 | | | 23,361 | | | | 29,513,734 | |
6.50%, 11/15/35 | | | 12,069 | | | | 15,324,411 | |
6.55%, 07/01/39 | | | 16,503 | | | | 21,311,519 | |
6.95%, 08/15/37 | | | 16,321 | | | | 21,695,099 | |
7.05%, 03/15/33 | | | 8,910 | | | | 11,667,407 | |
DIRECTV Holdings LLC/DIRECTV Financing Co. Inc. | | | | | | | | |
3.80%, 03/15/22 | | | 15,522 | | | | 15,938,831 | |
3.95%, 01/15/25 (Call 10/15/24)a | | | 8,135 | | | | 8,257,481 | |
4.45%, 04/01/24 (Call 01/01/24) | | | 22,571 | | | | 23,888,016 | |
4.60%, 02/15/21 (Call 11/15/20) | | | 9,130 | | | | 9,789,414 | |
5.00%, 03/01/21 | | | 26,079 | | | | 28,446,736 | |
5.15%, 03/15/42 | | | 16,388 | | | | 15,423,737 | |
5.20%, 03/15/20 | | | 16,405 | | | | 17,982,131 | |
5.88%, 10/01/19 | | | 4,574 | | | | 5,110,858 | |
6.00%, 08/15/40 (Call 05/15/40) | | | 13,495 | | | | 13,980,001 | |
6.38%, 03/01/41 | | | 10,827 | | | | 11,619,759 | |
Discovery Communications LLC | | | | | | | | |
4.88%, 04/01/43a | | | 9,384 | | | | 7,532,573 | |
5.05%, 06/01/20 | | | 14,315 | | | | 15,083,180 | |
6.35%, 06/01/40a | | | 10,810 | | | | 10,406,366 | |
Historic TW Inc. | | | | | | | | |
6.63%, 05/15/29 | | | 12,271 | | | | 14,164,644 | |
NBCUniversal Media LLC | | | | | | | | |
2.88%, 01/15/23 | | | 16,030 | | | | 16,400,323 | |
4.38%, 04/01/21 | | | 27,652 | | | | 30,553,519 | |
4.45%, 01/15/43 | | | 19,213 | | | | 19,369,803 | |
5.15%, 04/30/20 | | | 10,537 | | | | 11,847,160 | |
5.95%, 04/01/41 | | | 18,024 | | | | 21,730,511 | |
6.40%, 04/30/40 | | | 7,743 | | | | 9,818,166 | |
| | | | | | | | |
| Security | |
Principal
(000s) | | | Value | |
Time Warner Cable Inc. | | | | | | | | |
4.00%, 09/01/21 (Call 06/01/21) | | $ | 19,118 | | | $ | 19,490,893 | |
4.50%, 09/15/42 (Call 03/15/42)a | | | 15,880 | | | | 12,986,905 | |
5.00%, 02/01/20 | | | 18,186 | | | | 19,532,093 | |
5.50%, 09/01/41 (Call 03/01/41) | | | 16,373 | | | | 14,566,718 | |
5.88%, 11/15/40 (Call 05/15/40) | | | 16,391 | | | | 15,260,827 | |
6.55%, 05/01/37a | | | 25,897 | | | | 26,106,714 | |
6.75%, 06/15/39a | | | 14,453 | | | | 14,698,766 | |
7.30%, 07/01/38a | | | 16,270 | | | | 17,392,207 | |
8.25%, 04/01/19 | | | 8,564 | | | | 9,811,196 | |
8.75%, 02/14/19a | | | 15,724 | | | | 18,029,583 | |
Time Warner Entertainment Co. LP | | | | | | | | |
8.38%, 03/15/23 | | | 12,104 | | | | 14,755,024 | |
8.38%, 07/15/33 | | | 6,340 | | | | 7,506,918 | |
Time Warner Inc. | | | | | | | | |
3.55%, 06/01/24 (Call 03/01/24) | | | 12,575 | | | | 12,439,035 | |
3.60%, 07/15/25 (Call 04/15/25)a | | | 27,550 | | | | 26,966,403 | |
4.70%, 01/15/21a | | | 11,103 | | | | 11,953,339 | |
4.75%, 03/29/21 | | | 13,510 | | | | 14,585,722 | |
4.85%, 07/15/45 (Call 01/15/45) | | | 13,500 | | | | 12,577,176 | |
4.88%, 03/15/20 | | | 8,301 | | | | 8,962,231 | |
6.10%, 07/15/40a | | | 7,870 | | | | 8,290,626 | |
6.25%, 03/29/41a | | | 15,870 | | | | 17,052,620 | |
6.50%, 11/15/36 | | | 13,748 | | | | 14,806,647 | |
7.63%, 04/15/31 | | | 8,804 | | | | 10,690,867 | |
7.70%, 05/01/32 | | | 23,691 | | | | 28,601,540 | |
Verizon Communications Inc. | | | | | | | | |
4.52%, 09/15/48a | | | 48,750 | | | | 44,320,156 | |
4.67%, 03/15/55 | | | 53,675 | | | | 46,998,490 | |
Viacom Inc. | | | | | | | | |
4.25%, 09/01/23 (Call 06/01/23)a | | | 19,275 | | | | 18,933,929 | |
4.38%, 03/15/43 | | | 16,920 | | | | 11,483,020 | |
5.85%, 09/01/43 (Call 03/01/43) | | | 20,517 | | | | 17,387,926 | |
6.88%, 04/30/36a | | | 7,644 | | | | 7,192,694 | |
| | |
| 154 | | 2016 iSHARES ANNUAL REPORTTO SHAREHOLDERS |
Schedule of Investments (Continued)
iSHARES® iBOXX $ INVESTMENT GRADE CORPORATE BOND ETF
February 29, 2016
| | | | | | | | |
| Security | |
Principal
(000s) | | | Value | |
Walt Disney Co. (The) | | | | | | | | |
1.85%, 05/30/19a | | $ | 13,113 | | | $ | 13,380,723 | |
2.15%, 09/17/20 | | | 4,400 | | | | 4,484,706 | |
2.30%, 02/12/21 | | | 10,605 | | | | 10,838,560 | |
2.35%, 12/01/22a | | | 20,627 | | | | 20,764,359 | |
2.75%, 08/16/21 | | | 7,358 | | | | 7,642,607 | |
3.00%, 02/13/26a | | | 8,500 | | | | 8,899,807 | |
3.15%, 09/17/25 | | | 6,350 | | | | 6,720,119 | |
4.13%, 06/01/44 | | | 9,500 | | | | 9,834,677 | |
| | | | | | | | |
| | | | 1,534,573,590 | |
METAL FABRICATE & HARDWARE — 0.11% | |
Precision Castparts Corp. | | | | | | | | |
2.50%, 01/15/23 (Call 10/15/22) | | | 16,437 | | | | 16,268,818 | |
3.25%, 06/15/25 (Call 03/15/25) | | | 10,669 | | | | 10,921,386 | |
| | | | | | | | |
| | | | 27,190,204 | |
MINING — 1.36% | | | | | | | | |
Barrick Gold Corp. | | | | | | | | |
5.25%, 04/01/42a | | | 6,150 | | | | 4,755,957 | |
Barrick North America Finance LLC | | | | | | | | |
4.40%, 05/30/21 | | | 15,477 | | | | 15,169,947 | |
5.70%, 05/30/41 | | | 12,345 | | | | 9,727,464 | |
5.75%, 05/01/43a | | | 10,161 | | | | 8,445,691 | |
Barrick PD Australia Finance Pty Ltd. | | | | | | | | |
5.95%, 10/15/39 | | | 11,480 | | | | 9,217,795 | |
BHP Billiton Finance USA Ltd. | | | | | | | | |
2.88%, 02/24/22a | | | 7,918 | | | | 7,639,861 | |
3.25%, 11/21/21a | | | 13,586 | | | | 13,574,747 | |
3.85%, 09/30/23a | | | 21,817 | | | | 21,767,619 | |
4.13%, 02/24/42a | | | 7,465 | | | | 6,571,497 | |
5.00%, 09/30/43 | | | 34,465 | | | | 33,558,226 | |
6.50%, 04/01/19a | | | 21,397 | | | | 23,490,127 | |
Goldcorp Inc. | | | | | | | | |
3.70%, 03/15/23 (Call 12/15/22)a | | | 11,545 | | | | 11,099,304 | |
Newmont Mining Corp. | | | | | | | | |
3.50%, 03/15/22 (Call 12/15/21)a | | | 14,694 | | | | 13,999,585 | |
4.88%, 03/15/42 (Call 09/15/41) | | | 18,946 | | | | 14,567,619 | |
| | | | | | | | |
| Security | |
Principal
(000s) | | | Value | |
5.13%, 10/01/19a | | $ | 10,079 | | | $ | 10,567,037 | |
6.25%, 10/01/39 | | | 5,749 | | | | 5,106,676 | |
Rio Tinto Alcan Inc. | | | | | | | | |
6.13%, 12/15/33 | | | 3,100 | | | | 3,157,358 | |
Rio Tinto Finance USA Ltd. | | | | | | | | |
3.50%, 11/02/20a | | | 5,902 | | | | 5,883,807 | |
3.75%, 09/20/21a | | | 15,480 | | | | 15,310,141 | |
3.75%, 06/15/25 (Call 03/15/25)a | | | 6,616 | | | | 6,320,685 | |
4.13%, 05/20/21a | | | 9,438 | | | | 9,557,335 | |
5.20%, 11/02/40a | | | 13,755 | | | | 12,988,976 | |
7.13%, 07/15/28 | | | 8,298 | | | | 9,440,519 | |
9.00%, 05/01/19 | | | 19,707 | | | | 22,776,324 | |
Rio Tinto Finance USA PLC | | | | | | | | |
2.25%, 12/14/18 (Call 11/14/18)a | | | 114 | | | | 110,713 | |
2.88%, 08/21/22 (Call 05/21/22)a | | | 14,797 | | | | 13,788,910 | |
3.50%, 03/22/22 (Call 12/22/21)a | | | 21,030 | | | | 20,464,880 | |
4.13%, 08/21/42 (Call 02/21/42)a | | | 14,994 | | | | 12,616,626 | |
| | | | | | | | |
| | | | 341,675,426 | |
OFFICE & BUSINESS EQUIPMENT — 0.05% | |
Xerox Corp. | | | | | | | | |
4.50%, 05/15/21a | | | 12,662 | | | | 12,137,131 | |
| | | | | | | | |
| | | | 12,137,131 | |
OIL & GAS — 6.23% | | | | | | | | |
Anadarko Finance Co. | | | | | | | | |
7.50%, 05/01/31 | | | 6,685 | | | | 6,083,350 | |
Anadarko Petroleum Corp. | | | | | | | | |
6.20%, 03/15/40 | | | 6,121 | | | | 4,802,771 | |
6.45%, 09/15/36 | | | 25,689 | | | | 21,493,904 | |
Apache Corp. | | | | | | | | |
3.25%, 04/15/22 (Call 01/15/22) | | | 13,017 | | | | 11,328,767 | |
4.25%, 01/15/44 (Call 07/15/43) | | | 11,224 | | | | 8,022,146 | |
4.75%, 04/15/43 (Call 10/15/42) | | | 8,219 | | | | 6,238,632 | |
5.10%, 09/01/40 (Call 03/01/40) | | | 15,015 | | | | 11,008,081 | |
6.00%, 01/15/37 | | | 11,884 | | | | 9,846,134 | |
| | | | |
SCHEDULESOF INVESTMENTS | | | 155 | |
Schedule of Investments (Continued)
iSHARES® iBOXX $ INVESTMENT GRADE CORPORATE BOND ETF
February 29, 2016
| | | | | | | | |
| Security | |
Principal
(000s) | | | Value | |
BP Capital Markets PLC | | | | | | | | |
2.24%, 05/10/19 | | $ | 2,871 | | | $ | 2,835,020 | |
2.32%, 02/13/20a | | | 21,012 | | | | 20,434,430 | |
2.50%, 11/06/22 | | | 15,163 | | | | 14,143,070 | |
2.75%, 05/10/23a | | | 13,626 | | | | 12,884,386 | |
3.06%, 03/17/22a | | | 10,230 | | | | 9,962,649 | |
3.25%, 05/06/22 | | | 17,103 | | | | 16,846,534 | |
3.51%, 03/17/25a | | | 12,995 | | | | 12,657,368 | |
3.54%, 11/04/24 | | | 11,338 | | | | 10,971,588 | |
3.56%, 11/01/21a | | | 15,629 | | | | 15,797,054 | |
3.81%, 02/10/24a | | | 18,828 | | | | 18,792,381 | |
3.99%, 09/26/23a | | | 3,440 | | | | 3,486,535 | |
4.50%, 10/01/20a | | | 17,587 | | | | 18,539,950 | |
4.74%, 03/11/21 | | | 18,583 | | | | 19,817,123 | |
4.75%, 03/10/19 | | | 10,957 | | | | 11,535,234 | |
Canadian Natural Resources Ltd. | | | | | | | | |
6.25%, 03/15/38 | | | 14,048 | | | | 10,321,347 | |
Cenovus Energy Inc. | | | | | | | | |
4.45%, 09/15/42 (Call 03/15/42) | | | 1,353 | | | | 791,505 | |
Chevron Corp. | | | | | | | | |
1.96%, 03/03/20 (Call 02/03/20)a | | | 19,009 | | | | 18,678,631 | |
2.19%, 11/15/19 (Call 10/15/19) | | | 6,000 | | | | 5,986,268 | |
2.36%, 12/05/22 (Call 09/05/22) | | | 15,208 | | | | 14,723,243 | |
2.42%, 11/17/20 (Call 10/17/20)a | | | 12,270 | | | | 12,304,585 | |
2.43%, 06/24/20 (Call 05/24/20)a | | | 12,739 | | | | 12,738,097 | |
3.19%, 06/24/23 (Call 03/24/23)a | | | 23,255 | | | | 23,392,549 | |
3.33%, 11/17/25 (Call 08/17/25)a | | | 15,790 | | | | 15,839,870 | |
4.95%, 03/03/19 | | | 23,109 | | | | 25,064,021 | |
ConocoPhillips | | | | | | | | |
5.75%, 02/01/19a | | | 17,343 | | | | 18,046,132 | |
6.00%, 01/15/20a | | | 11,428 | | | | 11,981,245 | |
6.50%, 02/01/39a | | | 33,959 | | | | 33,568,244 | |
ConocoPhillips Co. | | | | | | | | |
2.20%, 05/15/20 (Call 04/15/20)a | | | 1,740 | | | | 1,602,555 | |
| | | | | | | | |
| Security | |
Principal
(000s) | | | Value | |
2.40%, 12/15/22 (Call 09/15/22) | | $ | 9,125 | | | $ | 7,934,644 | |
2.88%, 11/15/21 (Call 09/15/21) | | | 8,900 | | | | 8,084,174 | |
3.35%, 11/15/24 (Call 08/15/24)a | | | 15,861 | | | | 13,977,643 | |
4.30%, 11/15/44 (Call 05/15/44)a | | | 9,555 | | | | 7,618,877 | |
ConocoPhillips Holding Co. | | | | | | | | |
6.95%, 04/15/29 | | | 12,856 | | | | 13,755,920 | |
Devon Energy Corp. | | | | | | | | |
3.25%, 05/15/22 (Call 02/15/22)a | | | 12,702 | | | | 9,781,225 | |
4.75%, 05/15/42 (Call 11/15/41) | | | 6,383 | | | | 4,093,826 | |
5.00%, 06/15/45 (Call 12/15/44)a | | | 14,200 | | | | 9,339,696 | |
5.60%, 07/15/41 (Call 01/15/41) | | | 18,418 | | | | 12,561,584 | |
5.85%, 12/15/25 (Call 09/15/25)a | | | 5,000 | | | | 4,347,250 | |
7.95%, 04/15/32 | | | 10,414 | | | | 8,314,121 | |
Devon Financing Co. LLC | | | | | | | | |
7.88%, 09/30/31 | | | 12,813 | | | | 10,266,416 | |
Ensco PLC | | | | | | | | |
4.70%, 03/15/21a | | | 24,110 | | | | 12,922,237 | |
5.75%, 10/01/44 (Call 04/01/44) | | | 4,121 | | | | 1,955,002 | |
EOG Resources Inc. | | | | | | | | |
2.63%, 03/15/23 (Call 12/15/22)a | | | 15,222 | | | | 13,738,164 | |
4.10%, 02/01/21 | | | 9,146 | | | | 9,315,397 | |
4.15%, 01/15/26 (Call 10/15/25) | | | 2,300 | | | | 2,269,274 | |
5.63%, 06/01/19 | | | 11,769 | | | | 12,411,091 | |
Exxon Mobil Corp. | | | | | | | | |
1.82%, 03/15/19 (Call 02/15/19)a | | | 18,420 | | | | 18,566,058 | |
1.91%, 03/06/20 (Call 02/06/20) | | | 16,275 | | | | 16,244,790 | |
2.22%, 03/01/21 | | | 3,190 | | | | 3,190,000 | |
2.40%, 03/06/22 (Call 01/06/22) | | | 15,650 | | | | 15,582,705 | |
| | |
| 156 | | 2016 iSHARES ANNUAL REPORTTO SHAREHOLDERS |
Schedule of Investments (Continued)
iSHARES® iBOXX $ INVESTMENT GRADE CORPORATE BOND ETF
February 29, 2016
| | | | | | | | |
| Security | |
Principal
(000s) | | | Value | |
2.71%, 03/06/25 (Call 12/06/24)a | | $ | 19,200 | | | $ | 18,876,900 | |
3.04%, 03/01/26 | | | 2,335 | | | | 2,335,000 | |
3.18%, 03/15/24 (Call 12/15/23) | | | 11,535 | | | | 11,861,843 | |
3.57%, 03/06/45 (Call 09/06/44)a | | | 14,380 | | | | 13,119,635 | |
4.11%, 03/01/46 | | | 1,440 | | | | 1,440,000 | |
Hess Corp. | | | | | | | | |
5.60%, 02/15/41 | | | 14,948 | | | | 10,777,215 | |
6.00%, 01/15/40 | | | 7,733 | | | | 5,789,306 | |
7.30%, 08/15/31 | | | 11,263 | | | | 9,786,602 | |
8.13%, 02/15/19 | | | 4,573 | | | | 4,816,895 | |
Husky Energy Inc. | | | | | | | | |
4.00%, 04/15/24 (Call 01/15/24)a | | | 17,413 | | | | 14,221,197 | |
Marathon Oil Corp. | | | | | | | | |
2.80%, 11/01/22 (Call 08/01/22)a | | | 9,240 | | | | 6,052,200 | |
3.85%, 06/01/25 (Call 03/01/25)a | | | 11,834 | | | | 8,138,242 | |
6.60%, 10/01/37 | | | 9,256 | | | | 6,254,221 | |
Marathon Petroleum Corp. | | | | | | | | |
3.63%, 09/15/24 (Call 06/15/24) | | | 11,400 | | | | 9,291,000 | |
4.75%, 09/15/44 (Call 03/15/44) | | | 6,892 | | | | 4,455,885 | |
5.13%, 03/01/21 | | | 15,330 | | | | 15,320,198 | |
6.50%, 03/01/41 (Call 09/01/40) | | | 6,075 | | | | 4,733,640 | |
Nexen Energy ULC | | | | | | | | |
5.88%, 03/10/35 | | | 9,023 | | | | 9,677,326 | |
6.40%, 05/15/37 | | | 16,830 | | | | 19,029,604 | |
Noble Energy Inc. | | | | | | | | |
4.15%, 12/15/21 (Call 09/15/21) | | | 11,810 | | | | 10,300,546 | |
5.05%, 11/15/44 (Call 05/15/44) | | | 10,560 | | | | 7,806,586 | |
5.25%, 11/15/43 (Call 05/15/43) | | | 14,295 | | | | 10,565,625 | |
6.00%, 03/01/41 (Call 09/01/40) | | | 9,075 | | | | 6,824,218 | |
8.25%, 03/01/19 | | | 5,502 | | | | 5,612,040 | |
| | | | | | | | |
| Security | |
Principal
(000s) | | | Value | |
Occidental Petroleum Corp. | | | | | | | | |
2.70%, 02/15/23 (Call 11/15/22) | | $ | 11,256 | | | $ | 10,658,973 | |
3.13%, 02/15/22 (Call 11/15/21) | | | 10,238 | | | | 10,134,335 | |
3.50%, 06/15/25 (Call 03/15/25)a | | | 13,900 | | | | 13,483,623 | |
4.63%, 06/15/45 (Call 12/15/44)a | | | 11,155 | | | | 10,670,128 | |
Series 1 | | | | | | | | |
4.10%, 02/01/21 (Call 11/01/20) | | | 10,370 | | | | 10,932,528 | |
Petro-Canada | | | | | | | | |
6.80%, 05/15/38 | | | 11,872 | | | | 10,962,737 | |
Phillips 66 | | | | | | | | |
4.30%, 04/01/22a | | | 15,094 | | | | 15,448,256 | |
4.65%, 11/15/34 (Call 05/15/34) | | | 15,300 | | | | 13,728,919 | |
4.88%, 11/15/44 (Call 05/15/44)a | | | 20,445 | | | | 18,755,630 | |
5.88%, 05/01/42 | | | 17,650 | | | | 16,967,651 | |
Pride International Inc. | | | | | | | | |
6.88%, 08/15/20a | | | 5,300 | | | | 3,107,125 | |
Shell International Finance BV | | | | | | | | |
2.13%, 05/11/20 | | | 20,842 | | | | 20,348,707 | |
2.25%, 11/10/20a | | | 8,410 | | | | 8,244,057 | |
2.25%, 01/06/23 | | | 21,592 | | | | 20,181,364 | |
2.38%, 08/21/22a | | | 13,651 | | | | 13,191,169 | |
3.25%, 05/11/25a | | | 38,859 | | | | 37,858,913 | |
3.40%, 08/12/23a | | | 8,958 | | | | 8,922,483 | |
4.13%, 05/11/35a | | | 22,778 | | | | 21,162,425 | |
4.30%, 09/22/19 | | | 19,646 | | | | 20,710,039 | |
4.38%, 03/25/20 | | | 11,474 | | | | 12,165,104 | |
4.38%, 05/11/45 | | | 31,555 | | | | 29,160,427 | |
4.55%, 08/12/43a | | | 15,852 | | | | 15,014,081 | |
5.50%, 03/25/40a | | | 11,416 | | | | 12,062,545 | |
6.38%, 12/15/38 | | | 25,327 | | | | 29,020,720 | |
Southwestern Energy Co. | | | | | | | | |
4.05%, 01/23/20 (Call 12/23/19) | | | 7,413 | | | | 4,818,450 | |
Statoil ASA | | | | | | | | |
2.25%, 11/08/19 | | | 8,470 | | | | 8,373,743 | |
2.45%, 01/17/23a | | | 15,303 | | | | 14,396,825 | |
2.65%, 01/15/24 | | | 9,849 | | | | 9,172,418 | |
| | | | |
SCHEDULESOF INVESTMENTS | | | 157 | |
Schedule of Investments (Continued)
iSHARES® iBOXX $ INVESTMENT GRADE CORPORATE BOND ETF
February 29, 2016
| | | | | | | | |
| Security | |
Principal
(000s) | | | Value | |
2.75%, 11/10/21 | | $ | 1,880 | | | $ | 1,818,423 | |
2.90%, 11/08/20 | | | 9,377 | | | | 9,305,303 | |
3.15%, 01/23/22 | | | 9,792 | | | | 9,717,575 | |
3.70%, 03/01/24a | | | 9,170 | | | | 9,230,602 | |
3.95%, 05/15/43 | | | 9,867 | | | | 8,582,696 | |
4.80%, 11/08/43a | | | 9,331 | | | | 9,217,019 | |
5.10%, 08/17/40 | | | 7,752 | | | | 7,891,146 | |
5.25%, 04/15/19 | | | 14,518 | | | | 15,679,228 | |
Suncor Energy Inc. | | | | | | | | |
3.60%, 12/01/24 (Call 09/01/24)a | | | 9,109 | | | | 8,330,706 | |
6.50%, 06/15/38a | | | 11,135 | | | | 10,157,792 | |
6.85%, 06/01/39 | | | 6,470 | | | | 5,998,633 | |
Total Capital Canada Ltd. | | | | | | | | |
2.75%, 07/15/23a | | | 9,962 | | | | 9,531,149 | |
Total Capital International SA | | | | | | | | |
2.10%, 06/19/19a | | | 16,250 | | | | 16,038,292 | |
2.13%, 01/10/19a | | | 2,150 | | | | 2,133,006 | |
2.70%, 01/25/23a | | | 7,891 | | | | 7,555,909 | |
2.75%, 06/19/21a | | | 14,300 | | | | 14,280,406 | |
2.88%, 02/17/22a | | | 15,812 | | | | 15,640,527 | |
3.70%, 01/15/24a | | | 16,300 | | | | 16,587,027 | |
3.75%, 04/10/24a | | | 10,406 | | | | 10,577,617 | |
Total Capital SA | | | | | | | | |
4.45%, 06/24/20 | | | 3,356 | | | | 3,590,305 | |
Valero Energy Corp. | | | | | | | | |
6.13%, 02/01/20a | | | 12,629 | | | | 13,508,736 | |
6.63%, 06/15/37 | | | 18,893 | | | | 18,769,062 | |
7.50%, 04/15/32 | | | 8,826 | | | | 9,368,299 | |
9.38%, 03/15/19a | | | 2,604 | | | | 3,023,969 | |
| | | | | | | | |
| | | | 1,562,108,219 | |
OIL & GAS SERVICES — 0.80% | | | | | |
Baker Hughes Inc. | | | | | | | | |
3.20%, 08/15/21 (Call 05/15/21) | | | 8,663 | | | | 8,644,675 | |
5.13%, 09/15/40a | | | 19,997 | | | | 17,973,366 | |
Halliburton Co. | | | | | | | | |
2.70%, 11/15/20 (Call 10/15/20)a | | | 8,805 | | | | 8,643,634 | |
3.38%, 11/15/22 (Call 09/15/22) | | | 16,405 | | | | 16,168,230 | |
3.50%, 08/01/23 (Call 05/01/23) | | | 13,851 | | | | 13,159,474 | |
| | | | | | | | |
| Security | |
Principal
(000s) | | | Value | |
3.80%, 11/15/25 (Call 08/15/25)a | | $ | 25,765 | | | $ | 24,398,705 | |
4.75%, 08/01/43 (Call 02/01/43) | | | 3,274 | | | | 2,712,308 | |
4.85%, 11/15/35 (Call 05/15/35)a | | | 14,900 | | | | 13,317,332 | |
5.00%, 11/15/45 (Call 05/15/45)a | | | 20,100 | | | | 17,878,673 | |
6.15%, 09/15/19 | | | 13,716 | | | | 14,927,308 | |
6.70%, 09/15/38a | | | 9,165 | | | | 9,562,587 | |
7.45%, 09/15/39 | | | 11,616 | | | | 13,389,532 | |
National Oilwell Varco Inc. | | | | | | | | |
2.60%, 12/01/22 (Call 09/01/22)a | | | 18,651 | | | | 15,196,122 | |
3.95%, 12/01/42 (Call 06/01/42)a | | | 10,574 | | | | 7,031,710 | |
Schlumberger Investment SA | | | | | | | | |
3.65%, 12/01/23 (Call 09/01/23) | | | 17,802 | | | | 18,282,981 | |
| | | | | | | | |
| | | | 201,286,637 | |
PHARMACEUTICALS — 6.12% | | | | | |
Abbott Laboratories | | | | | | | | |
2.00%, 03/15/20a | | | 14,639 | | | | 14,548,306 | |
2.55%, 03/15/22 | | | 4,883 | | | | 4,857,162 | |
2.95%, 03/15/25 (Call 12/15/24)a | | | 17,870 | | | | 17,679,225 | |
5.13%, 04/01/19 | | | 6,835 | | | | 7,506,686 | |
AbbVie Inc. | | | | | | | | |
2.50%, 05/14/20 (Call 04/14/20) | | | 47,147 | | | | 47,281,190 | |
2.90%, 11/06/22 | | | 41,439 | | | | 41,133,495 | |
3.20%, 11/06/22 (Call 09/06/22)a | | | 9,915 | | | | 10,056,457 | |
3.60%, 05/14/25 (Call 02/14/25)a | | | 41,945 | | | | 42,805,590 | |
4.40%, 11/06/42 | | | 27,347 | | | | 26,188,685 | |
4.50%, 05/14/35 (Call 11/14/34) | | | 33,240 | | | | 32,965,800 | |
4.70%, 05/14/45 (Call 11/14/44) | | | 31,620 | | | | 31,735,739 | |
Actavis Funding SCS | | | | | | | | |
3.00%, 03/12/20 (Call 02/12/20) | | | 35,145 | | | | 35,729,862 | |
| | |
| 158 | | 2016 iSHARES ANNUAL REPORTTO SHAREHOLDERS |
Schedule of Investments (Continued)
iSHARES® iBOXX $ INVESTMENT GRADE CORPORATE BOND ETF
February 29, 2016
| | | | | | | | |
| Security | |
Principal
(000s) | | | Value | |
3.45%, 03/15/22 (Call 01/15/22) | | $ | 45,264 | | | $ | 46,188,264 | |
3.80%, 03/15/25 (Call 12/15/24) | | | 57,584 | | | | 59,303,239 | |
3.85%, 06/15/24 (Call 03/15/24) | | | 14,700 | | | | 15,180,887 | |
4.55%, 03/15/35 (Call 09/15/34) | | | 16,160 | | | | 16,311,431 | |
4.75%, 03/15/45 (Call 09/15/44)a | | | 34,065 | | | | 34,895,730 | |
4.85%, 06/15/44 (Call 12/15/43) | | | 19,815 | | | | 20,219,161 | |
Actavis Inc. | | | | | | | | |
3.25%, 10/01/22 (Call 07/01/22) | | | 25,608 | | | | 25,686,086 | |
4.63%, 10/01/42 (Call 04/01/42) | | | 5,464 | | | | 5,410,119 | |
AstraZeneca PLC | | | | | | | | |
1.95%, 09/18/19a | | | 12,427 | | | | 12,364,650 | |
2.38%, 11/16/20 | | | 21,240 | | | | 21,360,497 | |
3.38%, 11/16/25a | | | 25,100 | | | | 25,535,658 | |
4.00%, 09/18/42a | | | 12,712 | | | | 12,189,094 | |
4.38%, 11/16/45 | | | 11,510 | | | | 11,646,644 | |
6.45%, 09/15/37a | | | 31,550 | | | | 40,130,966 | |
Baxalta Inc. | | | | | | | | |
2.88%, 06/23/20 (Call 05/23/20)b | | | 14,130 | | | | 13,839,986 | |
3.60%, 06/23/22 (Call 04/23/22)a,b | | | 815 | | | | 811,726 | |
4.00%, 06/23/25 (Call 03/23/25)b | | | 22,225 | | | | 21,966,561 | |
5.25%, 06/23/45 (Call 12/23/44)b | | | 9,040 | | | | 8,649,401 | |
Bristol-Myers Squibb Co. | | | | | | | | |
2.00%, 08/01/22a | | | 12,238 | | | | 12,108,184 | |
Eli Lilly & Co. | | | | | | | | |
2.75%, 06/01/25 (Call 03/01/25) | | | 12,300 | | | | 12,557,028 | |
3.70%, 03/01/45 (Call 09/01/44)a | | | 10,813 | | | | 10,732,277 | |
Express Scripts Holding Co. | | | | | | | | |
2.25%, 06/15/19 | | | 13,131 | | | | 13,060,255 | |
3.50%, 06/15/24 (Call 03/15/24) | | | 13,162 | | | | 12,606,157 | |
| | | | | | | | |
| Security | |
Principal
(000s) | | | Value | |
3.90%, 02/15/22 | | $ | 13,302 | | | $ | 13,606,430 | |
4.50%, 02/25/26 (Call 11/25/25) | | | 9,000 | | | | 9,077,133 | |
4.75%, 11/15/21 | | | 18,036 | | | | 19,300,015 | |
GlaxoSmithKline Capital Inc. | | | | | | | | |
2.80%, 03/18/23a | | | 15,224 | | | | 15,617,973 | |
6.38%, 05/15/38 | | | 30,434 | | | | 39,217,493 | |
GlaxoSmithKline Capital PLC | | | | | | | | |
2.85%, 05/08/22 | | | 31,120 | | | | 32,015,011 | |
Johnson & Johnson | | | | | | | | |
1.65%, 03/01/21 (Call 02/01/21) | | | 4,585 | | | | 4,587,844 | |
2.45%, 03/01/26 (Call 12/01/25) | | | 1,465 | | | | 1,469,927 | |
3.38%, 12/05/23a | | | 4,161 | | | | 4,568,651 | |
4.38%, 12/05/33 (Call 06/05/33) | | | 11,400 | | | | 12,751,397 | |
5.95%, 08/15/37a | | | 9,474 | | | | 12,629,009 | |
McKesson Corp. | | | | | | | | |
2.28%, 03/15/19 | | | 16,782 | | | | 16,836,798 | |
3.80%, 03/15/24 (Call 12/15/23) | | | 4,116 | | | | 4,198,113 | |
4.88%, 03/15/44 (Call 09/15/43)a | | | 14,654 | | | | 14,599,997 | |
Mead Johnson Nutrition Co. | | | | | | | | |
3.00%, 11/15/20 | | | 14,720 | | | | 14,938,710 | |
4.13%, 11/15/25 (Call 08/15/25)a | | | 8,620 | | | | 8,924,210 | |
Merck & Co. Inc. | | | | | | | | |
1.85%, 02/10/20a | | | 20,885 | | | | 21,116,038 | |
2.35%, 02/10/22 | | | 12,045 | | | | 12,165,516 | |
2.40%, 09/15/22 (Call 06/15/22) | | | 11,146 | | | | 11,204,866 | |
2.75%, 02/10/25 (Call 11/10/24)a | | | 32,818 | | | | 33,044,513 | |
2.80%, 05/18/23 | | | 26,487 | | | | 27,034,950 | |
3.70%, 02/10/45 (Call 08/10/44) | | | 18,862 | | | | 17,999,458 | |
3.88%, 01/15/21 (Call 10/15/20)a | | | 10,379 | | | | 11,212,414 | |
4.15%, 05/18/43 | | | 18,721 | | | | 19,254,148 | |
Merck Sharp & Dohme Corp. | | | | | | | | |
5.00%, 06/30/19 | | | 11,607 | | | | 12,912,951 | |
| | | | |
SCHEDULESOF INVESTMENTS | | | 159 | |
Schedule of Investments (Continued)
iSHARES® iBOXX $ INVESTMENT GRADE CORPORATE BOND ETF
February 29, 2016
| | | | | | | | |
| Security | |
Principal
(000s) | | | Value | |
Novartis Capital Corp. | | | | | | | | |
2.40%, 09/21/22 | | $ | 5,045 | | | $ | 5,110,814 | |
3.00%, 11/20/25 (Call 08/20/25)a | | | 26,650 | | | | 27,449,439 | |
3.40%, 05/06/24 | | | 26,325 | | | | 28,064,151 | |
4.00%, 11/20/45 (Call 05/20/45)a | | | 19,120 | | | | 19,491,142 | |
4.40%, 04/24/20 | | | 8,387 | | | | 9,272,151 | |
4.40%, 05/06/44 | | | 20,883 | | | | 22,532,318 | |
Novartis Securities Investment Ltd. | | | | | | | | |
5.13%, 02/10/19 | | | 24,036 | | | | 26,517,104 | |
Perrigo Co. PLC | | | | | | | | |
4.00%, 11/15/23 (Call 08/15/23) | | | 6,290 | | | | 6,228,703 | |
Perrigo Finance Unlimited Co. | | | | | | | | |
3.90%, 12/15/24 (Call 09/15/24)a | | | 3,721 | | | | 3,615,149 | |
Pfizer Inc. | | | | | | | | |
2.10%, 05/15/19a | | | 19,470 | | | | 19,859,729 | |
3.00%, 06/15/23a | | | 11,233 | | | | 11,594,671 | |
3.40%, 05/15/24a | | | 14,525 | | | | 15,267,386 | |
4.30%, 06/15/43a | | | 12,075 | | | | 12,438,878 | |
6.20%, 03/15/19 | | | 33,823 | | | | 38,127,531 | |
7.20%, 03/15/39 | | | 27,103 | | | | 37,638,646 | |
Sanofi | | | | | | | | |
4.00%, 03/29/21a | | | 21,651 | | | | 23,496,639 | |
Wyeth LLC | | | | | | | | |
5.95%, 04/01/37 | | | 20,120 | | | | 24,643,676 | |
6.50%, 02/01/34 | | | 8,495 | | | | 10,874,450 | |
Zoetis Inc. | | | | | | | | |
3.25%, 02/01/23 (Call 11/01/22) | | | 21,105 | | | | 20,377,635 | |
4.50%, 11/13/25 (Call 08/13/25) | | | 5,600 | | | | 5,773,518 | |
4.70%, 02/01/43 (Call 08/01/42) | | | 13,080 | | | | 11,425,145 | |
| | | | | | | | |
| | | | 1,535,324,638 | |
PIPELINES — 2.35% | | | | | | | | |
Columbia Pipeline Group Inc. | | | | | | | | |
3.30%, 06/01/20 (Call 05/01/20)b | | | 11,850 | | | | 11,055,316 | |
4.50%, 06/01/25 (Call 03/01/25)b | | | 10,111 | | | | 9,171,258 | |
| | | | | | | | |
| Security | |
Principal
(000s) | | | Value | |
Energy Transfer Partners LP | | | | | | | | |
3.60%, 02/01/23 (Call 11/01/22) | | $ | 3,844 | | | $ | 3,139,933 | |
4.05%, 03/15/25 (Call 12/15/24)a | | | 13,505 | | | | 11,185,921 | |
4.15%, 10/01/20 (Call 08/01/20)a | | | 7,820 | | | | 7,097,432 | |
4.65%, 06/01/21 (Call 03/01/21) | | | 10,483 | | | | 8,989,173 | |
4.75%, 01/15/26 (Call 10/15/25) | | | 15,545 | | | | 13,329,837 | |
5.15%, 03/15/45 (Call 09/15/44)a | | | 11,145 | | | | 8,050,535 | |
5.20%, 02/01/22 (Call 11/01/21) | | | 8,505 | | | | 7,271,775 | |
6.13%, 12/15/45 (Call 06/15/45)a | | | 17,300 | | | | 14,186,519 | |
6.50%, 02/01/42 (Call 08/01/41) | | | 5,610 | | | | 4,542,417 | |
Enterprise Products Operating LLC | | | | | | | | |
2.55%, 10/15/19 (Call 09/15/19)a | | | 12,800 | | | | 12,426,671 | |
3.35%, 03/15/23 (Call 12/15/22) | | | 17,077 | | | | 15,970,547 | |
3.70%, 02/15/26 (Call 11/15/25)a | | | 10,570 | | | | 9,865,827 | |
3.75%, 02/15/25 (Call 11/15/24)a | | | 3,852 | | | | 3,630,763 | |
3.90%, 02/15/24 (Call 11/15/23) | | | 6,495 | | | | 6,177,721 | |
4.45%, 02/15/43 (Call 08/15/42) | | | 8,488 | | | | 6,827,550 | |
4.85%, 08/15/42 (Call 02/15/42) | | | 9,497 | | | | 8,085,817 | |
4.85%, 03/15/44 (Call 09/15/43) | | | 17,860 | | | | 15,178,948 | |
4.90%, 05/15/46 (Call 11/15/45) | | | 11,720 | | | | 10,317,468 | |
5.10%, 02/15/45 (Call 08/15/44)a | | | 15,891 | | | | 13,987,648 | |
5.20%, 09/01/20 | | | 9,643 | | | | 10,153,974 | |
5.95%, 02/01/41a | | | 10,985 | | | | 10,333,431 | |
| | |
| 160 | | 2016 iSHARES ANNUAL REPORTTO SHAREHOLDERS |
Schedule of Investments (Continued)
iSHARES® iBOXX $ INVESTMENT GRADE CORPORATE BOND ETF
February 29, 2016
| | | | | | | | |
| Security | |
Principal
(000s) | | | Value | |
Kinder Morgan Energy Partners LP | | | | | | | | |
2.65%, 02/01/19 | | $ | 10,792 | | | $ | 10,090,520 | |
3.50%, 03/01/21 (Call 01/01/21) | | | 12,361 | | | | 11,155,802 | |
3.95%, 09/01/22 (Call 06/01/22)a | | | 15,351 | | | | 13,870,243 | |
5.50%, 03/01/44 (Call 09/01/43) | | | 11,160 | | | | 9,082,120 | |
6.95%, 01/15/38 | | | 14,269 | | | | 12,873,349 | |
Kinder Morgan Inc./DE | | | | | | | | |
3.05%, 12/01/19 (Call 11/01/19)a | | | 10,290 | | | | 9,497,717 | |
4.30%, 06/01/25 (Call 03/01/25)a | | | 12,200 | | | | 11,156,900 | |
5.05%, 02/15/46 (Call 08/15/45)a | | | 9,050 | | | | 6,980,537 | |
5.30%, 12/01/34 (Call 06/01/34) | | | 11,754 | | | | 9,266,736 | |
5.55%, 06/01/45 (Call 12/01/44)a | | | 20,425 | | | | 16,945,193 | |
7.75%, 01/15/32 | | | 9,569 | | | | 9,092,688 | |
ONEOK Partners LP | | | | | | | | |
3.38%, 10/01/22 (Call 07/01/22) | | | 13,601 | | | | 10,744,532 | |
Plains All American Pipeline LP/PAA Finance Corp. | | | | | | | | |
3.60%, 11/01/24 (Call 08/01/24) | | | 11,230 | | | | 8,749,242 | |
3.65%, 06/01/22 (Call 03/01/22)a | | | 13,811 | | | | 11,359,547 | |
4.65%, 10/15/25 (Call 07/15/25)a | | | 5,190 | | | | 4,364,933 | |
Regency Energy Partners LP/Regency Energy Finance Corp. | | | | | | | | |
5.88%, 03/01/22 (Call 12/01/21) | | | 13,800 | | | | 12,119,160 | |
Spectra Energy Partners LP | | | | | | | | |
4.75%, 03/15/24 (Call 12/15/23) | | | 14,645 | | | | 14,626,351 | |
Sunoco Logistics Partners Operations LP | | | | | | | | |
5.35%, 05/15/45 (Call 11/15/44)a | | | 13,060 | | | | 9,670,669 | |
| | | | | | | | |
| Security | |
Principal
(000s) | | | Value | |
TransCanada PipeLines Ltd. | | | | | | | | |
2.50%, 08/01/22a | | $ | 15,719 | | | $ | 14,538,773 | |
3.80%, 10/01/20a | | | 7,538 | | | | 7,615,231 | |
4.63%, 03/01/34 (Call 12/01/33) | | | 14,214 | | | | 12,952,458 | |
4.88%, 01/15/26 (Call 10/15/25) | | | 9,305 | | | | 9,605,337 | |
6.10%, 06/01/40 | | | 7,217 | | | | 7,327,103 | |
6.20%, 10/15/37 | | | 12,810 | | | | 12,938,195 | |
7.13%, 01/15/19 | | | 197 | | | | 216,272 | |
7.63%, 01/15/39 | | | 10,271 | | | | 11,811,650 | |
Transcontinental Gas Pipe Line Co. LLC | | | | | | | | |
7.85%, 02/01/26 (Call 11/01/25)b | | | 2,000 | | | | 2,104,107 | |
Williams Partners LP | | | | | | | | |
3.35%, 08/15/22 (Call 05/15/22)a | | | 11,806 | | | | 8,972,560 | |
3.60%, 03/15/22 (Call 01/15/22) | | | 20,300 | | | | 15,935,500 | |
3.90%, 01/15/25 (Call 10/15/24) | | | 9,950 | | | | 7,460,486 | |
4.00%, 09/15/25 (Call 06/15/25)a | | | 2,615 | | | | 1,989,780 | |
4.30%, 03/04/24 (Call 12/04/23) | | | 10,620 | | | | 8,294,857 | |
5.10%, 09/15/45 (Call 03/15/45) | | | 5,845 | | | | 3,977,464 | |
5.25%, 03/15/20 | | | 22,868 | | | | 20,391,167 | |
6.30%, 04/15/40 | | | 13,428 | | | | 10,154,925 | |
Williams Partners LP/ACMP Finance Corp. | | | | | | | | |
4.88%, 05/15/23 (Call 12/15/17) | | | 11,500 | | | | 9,372,500 | |
4.88%, 03/15/24 (Call 03/15/19) | | | 11,975 | | | | 9,588,981 | |
6.13%, 07/15/22 (Call 01/15/17)a | | | 2,300 | | | | 2,024,000 | |
| | | | | | | | |
| | | | 589,894,066 | |
REAL ESTATE — 0.03% | | | | | | | | |
Prologis LP | | | | | | | | |
3.75%, 11/01/25 (Call 08/01/25)a | | | 8,100 | | | | 8,243,202 | |
| | | | | | | | |
| | | | 8,243,202 | |
| | | | |
SCHEDULESOF INVESTMENTS | | | 161 | |
Schedule of Investments (Continued)
iSHARES® iBOXX $ INVESTMENT GRADE CORPORATE BOND ETF
February 29, 2016
| | | | | | | | |
| Security | |
Principal
(000s) | | | Value | |
REAL ESTATE INVESTMENT TRUSTS — 1.04% | |
American Tower Corp. | | | | | | | | |
2.80%, 06/01/20 (Call 05/01/20)a | | $ | 5,925 | | | $ | 5,882,536 | |
3.30%, 02/15/21 (Call 01/15/21) | | | 4,700 | | | | 4,704,585 | |
3.40%, 02/15/19 | | | 5,909 | | | | 6,003,899 | |
3.50%, 01/31/23 | | | 11,246 | | | | 11,032,543 | |
4.00%, 06/01/25 (Call 03/01/25) | | | 15,551 | | | | 15,489,566 | |
4.70%, 03/15/22 | | | 2,100 | | | | 2,221,868 | |
5.00%, 02/15/24 | | | 14,210 | | | | 15,174,008 | |
Boston Properties LP | | | | | | | | |
3.65%, 02/01/26 (Call 11/01/25) | | | 3,000 | | | | 3,031,953 | |
3.85%, 02/01/23 (Call 11/01/22)a | | | 11,183 | | | | 11,565,266 | |
4.13%, 05/15/21 (Call 02/15/21) | | | 7,021 | | | | 7,445,172 | |
Crown Castle International Corp. | | | | | | | | |
5.25%, 01/15/23a | | | 19,950 | | | | 21,143,409 | |
ERP Operating LP | | | | | | | | |
4.50%, 07/01/44 (Call 01/01/44) | | | 11,775 | | | | 12,164,136 | |
4.63%, 12/15/21 (Call 09/15/21) | | | 10,487 | | | | 11,727,408 | |
HCP Inc. | | | | | | | | |
2.63%, 02/01/20 (Call 11/01/19) | | | 15,326 | | | | 15,020,617 | |
3.88%, 08/15/24 (Call 05/17/24) | | | 11,070 | | | | 10,397,382 | |
4.00%, 06/01/25 (Call 03/01/25)a | | | 1,000 | | | | 946,752 | |
4.25%, 11/15/23 (Call 08/15/23) | | | 5,975 | | | | 5,827,284 | |
5.38%, 02/01/21 (Call 11/03/20)a | | | 25,420 | | | | 27,270,190 | |
Prologis LP | | | | | | | | |
4.25%, 08/15/23 (Call 05/15/23) | | | 3,600 | | | | 3,828,590 | |
Simon Property Group LP | | | | | | | | |
3.30%, 01/15/26 (Call 10/15/25)a | | | 2,800 | | | | 2,822,145 | |
| | | | | | | | |
| Security | |
Principal
(000s) | | | Value | |
3.38%, 10/01/24 (Call 07/01/24)a | | $ | 15,184 | | | $ | 15,449,334 | |
4.38%, 03/01/21 (Call 12/01/20) | | | 10,759 | | | | 11,725,544 | |
5.65%, 02/01/20 (Call 11/01/19) | | | 12,171 | | | | 13,637,746 | |
Welltower Inc. | | | | | | | | |
4.00%, 06/01/25 (Call 03/01/25) | | | 8,000 | | | | 7,855,170 | |
Weyerhaeuser Co. | | | | | | | | |
7.38%, 03/15/32a | | | 16,014 | | | | 18,784,838 | |
| | | | | | | | |
| | | | 261,151,941 | |
RETAIL — 4.35% | | | | | | | | |
Costco Wholesale Corp. | | | | | | | | |
1.70%, 12/15/19a | | | 12,883 | | | | 12,968,007 | |
CVS Health Corp. | | | | | | | | |
2.25%, 08/12/19 (Call 07/12/19)a | | | 12,014 | | | | 12,122,649 | |
2.75%, 12/01/22 (Call 09/01/22) | | | 18,358 | | | | 18,291,287 | |
2.80%, 07/20/20 (Call 06/20/20) | | | 32,865 | | | | 33,654,769 | |
3.50%, 07/20/22 (Call 05/20/22) | | | 13,045 | | | | 13,655,573 | |
3.88%, 07/20/25 (Call 04/20/25)a | | | 27,021 | | | | 28,797,977 | |
4.00%, 12/05/23 (Call 09/05/23)a | | | 9,793 | | | | 10,581,564 | |
4.88%, 07/20/35 (Call 01/20/35) | | | 26,975 | | | | 28,846,342 | |
5.13%, 07/20/45 (Call 01/20/45) | | | 42,810 | | | | 48,030,311 | |
5.30%, 12/05/43 (Call 06/05/43) | | | 11,500 | | | | 12,956,759 | |
Home Depot Inc. (The) | | | | | | | | |
2.00%, 06/15/19 (Call 05/15/19) | | | 9,548 | | | | 9,734,982 | |
2.00%, 04/01/21 (Call 03/01/21) | | | 8,000 | | | | 8,048,849 | |
2.63%, 06/01/22 (Call 05/01/22)a | | | 21,354 | | | | 21,735,972 | |
2.70%, 04/01/23 (Call 01/01/23)a | | | 12,843 | | | | 13,171,457 | |
| | |
| 162 | | 2016 iSHARES ANNUAL REPORTTO SHAREHOLDERS |
Schedule of Investments (Continued)
iSHARES® iBOXX $ INVESTMENT GRADE CORPORATE BOND ETF
February 29, 2016
| | | | | | | | |
| Security | |
Principal
(000s) | | | Value | |
3.00%, 04/01/26 (Call 01/01/26) | | $ | 10,000 | | | $ | 10,326,196 | |
3.35%, 09/15/25 (Call 06/15/25) | | | 5,050 | | | | 5,353,483 | |
3.75%, 02/15/24 (Call 11/15/23)a | | | 17,791 | | | | 19,457,141 | |
4.20%, 04/01/43 (Call 10/01/42)a | | | 15,728 | | | | 16,292,546 | |
4.25%, 04/01/46 (Call 10/01/45) | | | 23,330 | | | | 24,377,844 | |
4.40%, 04/01/21 (Call 01/01/21) | | | 10,618 | | | | 11,841,348 | |
4.40%, 03/15/45 (Call 09/15/44) | | | 12,415 | | | | 13,168,977 | |
4.88%, 02/15/44 (Call 08/15/43) | | | 12,820 | | | | 14,588,801 | |
5.88%, 12/16/36 | | | 38,602 | | | | 48,214,438 | |
5.95%, 04/01/41 (Call 10/01/40) | | | 2,552 | | | | 3,228,693 | |
Lowe’s Companies Inc. | | | | | | | | |
3.12%, 04/15/22 (Call 01/15/22) | | | 6,844 | | | | 7,132,064 | |
3.38%, 09/15/25 (Call 06/15/25)a | | | 7,985 | | | | 8,384,628 | |
4.38%, 09/15/45 (Call 03/15/45) | | | 14,750 | | | | 15,460,158 | |
4.65%, 04/15/42 (Call 10/15/41) | | | 5,106 | | | | 5,481,533 | |
Macy’s Retail Holdings Inc. | | | | | | | | |
2.88%, 02/15/23 (Call 11/15/22) | | | 8,790 | | | | 7,925,012 | |
McDonald’s Corp. | | | | | | | | |
2.63%, 01/15/22 | | | 10,123 | | | | 10,248,600 | |
2.75%, 12/09/20 (Call 11/09/20)a | | | 6,225 | | | | 6,405,696 | |
3.70%, 01/30/26 (Call 10/30/25)a | | | 12,930 | | | | 13,460,868 | |
4.70%, 12/09/35 (Call 06/09/35) | | | 8,777 | | | | 9,072,151 | |
4.88%, 12/09/45 (Call 06/09/45)a | | | 10,680 | | | | 11,189,400 | |
6.30%, 10/15/37 | | | 11,276 | | | | 13,438,968 | |
6.30%, 03/01/38 | | | 22,400 | | | | 26,728,726 | |
| | | | | | | | |
| Security | |
Principal
(000s) | | | Value | |
Target Corp. | | | | | | | | |
2.30%, 06/26/19a | | $ | 10,264 | | | $ | 10,538,860 | |
2.90%, 01/15/22 | | | 12,014 | | | | 12,462,742 | |
3.50%, 07/01/24a | | | 11,500 | | | | 12,341,525 | |
3.88%, 07/15/20 | | | 16,231 | | | | 17,731,366 | |
4.00%, 07/01/42a | | | 17,993 | | | | 18,322,841 | |
6.50%, 10/15/37 | | | 15,714 | | | | 20,816,347 | |
7.00%, 01/15/38 | | | 4,393 | | | | 6,127,426 | |
Wal-Mart Stores Inc. | | | | | | | | |
1.95%, 12/15/18 | | | 217 | | | | 220,781 | |
2.55%, 04/11/23 (Call 01/11/23)a | | | 21,302 | | | | 21,821,811 | |
3.25%, 10/25/20 | | | 14,638 | | | | 15,610,260 | |
3.30%, 04/22/24 (Call 01/22/24)a | | | 20,461 | | | | 21,731,200 | |
3.63%, 07/08/20a | | | 14,679 | | | | 15,807,686 | |
4.00%, 04/11/43 (Call 10/11/42) | | | 16,465 | | | | 16,464,705 | |
4.25%, 04/15/21 | | | 19,069 | | | | 21,298,650 | |
4.30%, 04/22/44 (Call 10/22/43)a | | | 5,943 | | | | 6,245,459 | |
4.75%, 10/02/43 (Call 04/02/43) | | | 8,112 | | | | 8,993,736 | |
4.88%, 07/08/40 | | | 8,244 | | | | 9,136,852 | |
5.00%, 10/25/40 | | | 12,188 | | | | 13,730,907 | |
5.25%, 09/01/35a | | | 31,086 | | | | 36,856,805 | |
5.63%, 04/01/40 | | | 21,075 | | | | 25,489,808 | |
5.63%, 04/15/41 | | | 19,533 | | | | 23,963,168 | |
5.88%, 04/05/27a | | | 5,929 | | | | 7,487,218 | |
6.20%, 04/15/38 | | | 20,287 | | | | 25,956,298 | |
6.50%, 08/15/37 | | | 32,583 | | | | 42,784,770 | |
7.55%, 02/15/30 | | | 14,752 | | | | 21,165,385 | |
Walgreen Co. | | | | | | | | |
3.10%, 09/15/22a | | | 18,159 | | | | 17,885,903 | |
5.25%, 01/15/19a | | | 1,748 | | | | 1,885,806 | |
Walgreens Boots Alliance Inc. | | | | | | | | |
2.70%, 11/18/19 (Call 10/18/19)a | | | 10,325 | | | | 10,412,187 | |
3.30%, 11/18/21 (Call 09/18/21) | | | 15,550 | | | | 15,657,370 | |
3.80%, 11/18/24 (Call 08/18/24) | | | 23,025 | | | | 23,085,480 | |
4.80%, 11/18/44 (Call 05/18/44) | | | 16,315 | | | | 14,843,137 | |
| | | | | | | | |
| | | | 1,091,250,258 | |
| | | | |
SCHEDULESOF INVESTMENTS | | | 163 | |
Schedule of Investments (Continued)
iSHARES® iBOXX $ INVESTMENT GRADE CORPORATE BOND ETF
February 29, 2016
| | | | | | | | |
| Security | |
Principal
(000s) | | | Value | |
SEMICONDUCTORS — 1.09% | | | | | | | | |
Applied Materials Inc. | | | | | | | | |
4.30%, 06/15/21 | | $ | 2,089 | | | $ | 2,275,844 | |
Intel Corp. | | | | | | | | |
2.45%, 07/29/20a | | | 26,135 | | | | 26,690,902 | |
2.70%, 12/15/22a | | | 15,947 | | | | 16,191,823 | |
3.10%, 07/29/22 | | | 5,715 | | | | 5,986,212 | |
3.30%, 10/01/21a | | | 25,728 | | | | 27,268,384 | |
3.70%, 07/29/25 (Call 04/29/25)a | | | 21,020 | | | | 22,699,710 | |
4.00%, 12/15/32a | | | 14,754 | | | | 14,894,828 | |
4.25%, 12/15/42a | | | 10,033 | | | | 9,942,636 | |
4.80%, 10/01/41 | | | 14,209 | | | | 15,122,438 | |
4.90%, 07/29/45 (Call 01/29/45) | | | 24,784 | | | | 26,855,469 | |
QUALCOMM Inc. | | | | | | | | |
2.25%, 05/20/20a | | | 19,989 | | | | 20,180,659 | |
3.00%, 05/20/22 | | | 16,159 | | | | 16,379,407 | |
3.45%, 05/20/25 (Call 02/20/25)a | | | 24,783 | | | | 24,971,517 | |
4.65%, 05/20/35 (Call 11/20/34) | | | 13,670 | | | | 13,136,766 | |
4.80%, 05/20/45 (Call 11/20/44) | | | 23,435 | | | | 21,673,253 | |
Texas Instruments Inc. | | | | | | | | |
1.65%, 08/03/19 | | | 7,770 | | | | 7,783,148 | |
| | | | | | | | |
| | | | 272,052,996 | |
SOFTWARE — 3.20% | | | | | | | | |
Fidelity National Information Services Inc. | | | | | | | | |
3.50%, 04/15/23 (Call 01/15/23) | | | 10,080 | | | | 9,729,371 | |
3.63%, 10/15/20 (Call 09/15/20) | | | 27,750 | | | | 28,333,868 | |
5.00%, 10/15/25 (Call 07/15/25) | | | 12,600 | | | | 13,079,125 | |
Fiserv Inc. | | | | | | | | |
2.70%, 06/01/20 (Call 05/01/20) | | | 5,100 | | | | 5,138,603 | |
3.85%, 06/01/25 (Call 03/01/25) | | | 13,500 | | | | 13,926,655 | |
Microsoft Corp. | | | | | | | | |
1.63%, 12/06/18a | | | 241 | | | | 244,160 | |
| | | | | | | | |
| Security | |
Principal
(000s) | | | Value | |
1.85%, 02/12/20 (Call 01/12/20)a | | $ | 21,128 | | | $ | 21,442,249 | |
2.00%, 11/03/20 (Call 10/03/20) | | | 20,540 | | | | 20,875,574 | |
2.13%, 11/15/22a | | | 11,777 | | | | 11,717,461 | |
2.38%, 02/12/22 (Call 01/12/22) | | | 16,570 | | | | 16,926,583 | |
2.38%, 05/01/23 (Call 02/01/23) | | | 13,390 | | | | 13,494,786 | |
2.65%, 11/03/22 (Call 09/03/22) | | | 17,050 | | | | 17,573,911 | |
2.70%, 02/12/25 (Call 11/12/24)a | | | 33,430 | | | | 34,066,029 | |
3.00%, 10/01/20a | | | 14,063 | | | | 14,885,265 | |
3.13%, 11/03/25 (Call 08/03/25)a | | | 21,170 | | | | 22,196,853 | |
3.50%, 02/12/35 (Call 08/12/34)a | | | 25,132 | | | | 24,243,596 | |
3.50%, 11/15/42 | | | 7,882 | | | | 7,227,825 | |
3.63%, 12/15/23 (Call 09/15/23)a | | | 16,622 | | | | 18,126,318 | |
3.75%, 02/12/45 (Call 08/12/44) | | | 24,635 | | | | 23,805,298 | |
4.00%, 02/12/55 (Call 08/12/54) | | | 15,825 | | | | 14,614,759 | |
4.20%, 06/01/19 | | | 7,933 | | | | 8,650,131 | |
4.20%, 11/03/35 (Call 05/03/35) | | | 14,575 | | | | 15,267,343 | |
4.45%, 11/03/45 (Call 05/03/45) | | | 40,380 | | | | 43,495,503 | |
4.50%, 10/01/40 | | | 11,450 | | | | 12,205,086 | |
4.75%, 11/03/55 (Call 05/03/55)a | | | 5,930 | | | | 6,257,756 | |
5.20%, 06/01/39 | | | 11,719 | | | | 13,609,001 | |
5.30%, 02/08/41a | | | 14,044 | | | | 16,732,039 | |
Oracle Corp. | | | | | | | | |
2.25%, 10/08/19a | | | 18,561 | | | | 19,027,828 | |
2.50%, 05/15/22 (Call 03/15/22) | | | 30,738 | | | | 30,980,744 | |
2.50%, 10/15/22 | | | 25,195 | | | | 25,263,037 | |
2.80%, 07/08/21a | | | 27,927 | | | | 28,974,486 | |
2.95%, 05/15/25 (Call 02/15/25) | | | 33,390 | | | | 33,694,126 | |
| | |
| 164 | | 2016 iSHARES ANNUAL REPORTTO SHAREHOLDERS |
Schedule of Investments (Continued)
iSHARES® iBOXX $ INVESTMENT GRADE CORPORATE BOND ETF
February 29, 2016
| | | | | | | | |
| Security | |
Principal
(000s) | | | Value | |
3.40%, 07/08/24 (Call 04/08/24)a | | $ | 18,258 | | | $ | 19,138,436 | |
3.63%, 07/15/23 | | | 13,243 | | | | 14,146,784 | |
3.88%, 07/15/20 | | | 5,974 | | | | 6,470,675 | |
3.90%, 05/15/35 (Call 11/15/34)a | | | 13,230 | | | | 12,793,673 | |
4.13%, 05/15/45 (Call 11/15/44) | | | 15,831 | | | | 15,591,127 | |
4.30%, 07/08/34 (Call 01/08/34) | | | 26,041 | | | | 26,633,842 | |
4.38%, 05/15/55 (Call 11/15/54) | | | 19,639 | | | | 18,803,936 | |
4.50%, 07/08/44 (Call 01/08/44)a | | | 8,887 | | | | 9,140,334 | |
5.00%, 07/08/19 | | | 23,804 | | | | 26,425,575 | |
5.38%, 07/15/40a | | | 31,610 | | | | 35,931,722 | |
6.13%, 07/08/39 | | | 16,860 | | | | 20,959,614 | |
6.50%, 04/15/38 | | | 7,764 | | | | 9,970,780 | |
| | | | | | | | |
| | | | 801,811,867 | |
TELECOMMUNICATIONS — 7.38% | |
AT&T Corp. | | | | | | | | |
8.25%, 11/15/31 | | | 17,919 | | | | 24,150,065 | |
AT&T Inc. | | | | | | | | |
2.30%, 03/11/19 | | | 11,865 | | | | 11,970,421 | |
2.45%, 06/30/20 (Call 05/30/20) | | | 18,910 | | | | 18,821,808 | |
2.63%, 12/01/22 (Call 09/01/22) | | | 21,087 | | | | 20,549,661 | |
2.80%, 02/17/21 (Call 01/17/21) | | | 15,000 | | | | 15,120,923 | |
3.00%, 02/15/22 | | | 27,983 | | | | 27,859,648 | |
3.00%, 06/30/22 (Call 04/30/22) | | | 26,106 | | | | 25,885,057 | |
3.40%, 05/15/25 (Call 02/15/25) | | | 60,488 | | | | 59,432,001 | |
3.88%, 08/15/21 | | | 20,453 | | | | 21,489,268 | |
3.90%, 03/11/24 (Call 12/11/23)a | | | 20,045 | | | | 20,713,591 | |
4.13%, 02/17/26 (Call 11/17/25) | | | 15,500 | | | | 15,992,495 | |
4.30%, 12/15/42 (Call 06/15/42) | | | 23,705 | | | | 20,135,705 | |
4.35%, 06/15/45 (Call 12/15/44) | | | 42,519 | | | | 36,217,348 | |
| | | | | | | | |
| Security | |
Principal
(000s) | | | Value | |
4.45%, 05/15/21 | | $ | 17,635 | | | $ | 18,870,684 | |
4.50%, 05/15/35 (Call 11/15/34) | | | 37,494 | | | | 34,530,287 | |
4.75%, 05/15/46 (Call 11/15/45)a | | | 44,244 | | | | 40,399,657 | |
4.80%, 06/15/44 (Call 12/15/43)a | | | 18,230 | | | | 16,601,658 | |
5.35%, 09/01/40 | | | 48,808 | | | | 47,378,716 | |
5.55%, 08/15/41a | | | 13,217 | | | | 13,192,497 | |
5.65%, 02/15/47 (Call 08/15/46) | | | 8,000 | | | | 8,278,324 | |
5.80%, 02/15/19 | | | 3,775 | | | | 4,155,584 | |
6.30%, 01/15/38 | | | 19,390 | | | | 20,842,623 | |
6.50%, 09/01/37 | | | 8,750 | | | | 9,679,643 | |
6.55%, 02/15/39a | | | 19,925 | | | | 21,753,372 | |
British Telecommunications PLC | | | | | | | | |
2.35%, 02/14/19 | | | 1,370 | | | | 1,382,489 | |
9.63%, 12/15/30 | | | 31,156 | | | | 44,776,515 | |
CC Holdings GS V LLC/Crown Castle GS III Corp. | | | | | | | | |
3.85%, 04/15/23 | | | 20,119 | | | | 20,294,564 | |
Cisco Systems Inc. | | | | | | | | |
2.13%, 03/01/19a | | | 6,065 | | | | 6,186,019 | |
2.20%, 02/28/21 | | | 16,210 | | | | 16,363,366 | |
2.45%, 06/15/20a | | | 13,810 | | | | 14,142,577 | |
2.95%, 02/28/26 | | | 6,385 | | | | 6,478,957 | |
3.50%, 06/15/25a | | | 940 | | | | 998,905 | |
3.63%, 03/04/24a | | | 13,131 | | | | 14,124,740 | |
4.45%, 01/15/20 | | | 30,510 | | | | 33,501,924 | |
4.95%, 02/15/19 | | | 141 | | | | 154,859 | |
5.50%, 01/15/40 | | | 22,083 | | | | 26,222,935 | |
5.90%, 02/15/39a | | | 28,295 | | | | 34,966,531 | |
Deutsche Telekom International Finance BV | | | | | | | | |
6.00%, 07/08/19 | | | 4,761 | | | | 5,352,139 | |
8.75%, 06/15/30 | | | 43,296 | | | | 60,520,682 | |
GTE Corp. | | | | | | | | |
6.94%, 04/15/28 | | | 2,424 | | | | 2,904,589 | |
New Cingular Wireless Services Inc. | | | | | | | | |
8.75%, 03/01/31a | | | 14,643 | | | | 20,380,578 | |
Orange SA | | | | | | | | |
2.75%, 02/06/19 | | | 3,319 | | | | 3,390,282 | |
4.13%, 09/14/21a | | | 14,724 | | | | 15,773,497 | |
| | | | |
SCHEDULESOF INVESTMENTS | | | 165 | |
Schedule of Investments (Continued)
iSHARES® iBOXX $ INVESTMENT GRADE CORPORATE BOND ETF
February 29, 2016
| | | | | | | | |
| Security | |
Principal
(000s) | | | Value | |
5.38%, 07/08/19 | | $ | 7,051 | | | $ | 7,775,797 | |
5.38%, 01/13/42a | | | 14,527 | | | | 15,411,731 | |
5.50%, 02/06/44 (Call 08/06/43)a | | | 8,044 | | | | 8,859,506 | |
9.00%, 03/01/31a | | | 33,093 | | | | 46,085,054 | |
Qwest Corp. | | | | | | | | |
6.75%, 12/01/21a | | | 8,271 | | | | 8,808,615 | |
6.88%, 09/15/33 (Call 03/31/16) | | | 16,409 | | | | 15,200,272 | |
Rogers Communications Inc. | | | | | | | | |
4.10%, 10/01/23 (Call 07/01/23)a | | | 15,039 | | | | 16,078,772 | |
5.00%, 03/15/44 (Call 09/15/43)a | | | 10,925 | | | | 11,192,065 | |
Telefonica Emisiones SAU | | | | | | | | |
4.57%, 04/27/23a | | | 15,500 | | | | 16,393,398 | |
5.13%, 04/27/20 | | | 13,064 | | | | 14,018,815 | |
5.46%, 02/16/21 | | | 14,138 | | | | 15,490,216 | |
5.88%, 07/15/19a | | | 12,061 | | | | 13,211,268 | |
7.05%, 06/20/36a | | | 24,025 | | | | 28,541,820 | |
Telefonica Europe BV | |
8.25%, 09/15/30 | | | 14,628 | | | | 19,171,862 | |
Verizon Communications Inc. | | | | | | | | |
2.45%, 11/01/22 (Call 08/01/22)a | | | 19,056 | | | | 18,442,174 | |
2.63%, 02/21/20 | | | 37,328 | | | | 37,873,765 | |
3.00%, 11/01/21 (Call 09/01/21) | | | 14,719 | | | | 14,981,160 | |
3.45%, 03/15/21a | | | 12,550 | | | | 13,060,569 | |
3.50%, 11/01/21a | | | 18,952 | | | | 19,919,200 | |
3.50%, 11/01/24 (Call 08/01/24)a | | | 23,400 | | | | 23,912,338 | |
3.85%, 11/01/42 (Call 05/01/42) | | | 11,600 | | | | 9,682,434 | |
4.15%, 03/15/24 (Call 12/15/23)a | | | 18,134 | | | | 19,312,015 | |
4.27%, 01/15/36a | | | 31,950 | | | | 28,684,272 | |
4.40%, 11/01/34 (Call 05/01/34) | | | 22,044 | | | | 20,576,970 | |
4.50%, 09/15/20 | | | 39,146 | | | | 42,645,512 | |
4.60%, 04/01/21a | | | 9,349 | | | | 10,220,498 | |
4.75%, 11/01/41 | | | 7,450 | | | | 7,115,646 | |
4.86%, 08/21/46 | | | 44,222 | | | | 43,175,800 | |
5.01%, 08/21/54 | | | 54,690 | | | | 50,598,176 | |
| | | | | | | | |
| Security | |
Principal
(000s) | | | Value | |
5.05%, 03/15/34 (Call 12/15/33) | | $ | 7,852 | | | $ | 7,860,180 | |
5.15%, 09/15/23 | | | 87,020 | | | | 98,471,197 | |
5.85%, 09/15/35 | | | 17,675 | | | | 19,148,704 | |
6.00%, 04/01/41 | | | 6,743 | | | | 7,400,824 | |
6.25%, 04/01/37 | | | 9,082 | | | | 10,190,960 | |
6.35%, 04/01/19 | | | 12,385 | | | | 13,981,460 | |
6.40%, 09/15/33 | | | 23,351 | | | | 27,068,762 | |
6.40%, 02/15/38 | | | 6,262 | | | | 7,007,585 | |
6.55%, 09/15/43 | | | 65,193 | | | | 79,469,387 | |
6.90%, 04/15/38 | | | 2,045 | | | | 2,483,400 | |
7.75%, 12/01/30a | | | 12,872 | | | | 17,145,565 | |
Vodafone Group PLC | | | | | | | | |
2.50%, 09/26/22 | | | 15,448 | | | | 14,718,076 | |
2.95%, 02/19/23a | | | 18,610 | | | | 17,901,212 | |
4.38%, 02/19/43a | | | 14,313 | | | | 11,925,456 | |
5.45%, 06/10/19 | | | 16,400 | | | | 17,985,304 | |
6.15%, 02/27/37a | | | 18,388 | | | | 18,949,378 | |
| | | | | | | | |
| | | | 1,850,084,354 | |
TRANSPORTATION — 0.78% | | | | | | | | |
Burlington Northern Santa Fe LLC | | | | | | | | |
3.00%, 04/01/25 (Call 01/01/25)a | | | 2,400 | | | | 2,394,045 | |
3.85%, 09/01/23 (Call 06/01/23)a | | | 6,824 | | | | 7,316,661 | |
4.15%, 04/01/45 (Call 10/01/44) | | | 15,616 | | | | 15,085,960 | |
4.45%, 03/15/43 (Call 09/15/42) | | | 6,746 | | | | 6,796,706 | |
4.55%, 09/01/44 (Call 03/01/44)a | | | 9,679 | | | | 9,979,338 | |
4.70%, 10/01/19 | | | 6,497 | | | | 7,096,240 | |
4.90%, 04/01/44 (Call 10/01/43) | | | 12,340 | | | | 13,281,675 | |
5.75%, 05/01/40 (Call 11/01/39) | | | 10,117 | | | | 11,890,047 | |
Canadian Pacific Railway Co. | | | | | | | | |
6.13%, 09/15/15 (Call 03/15/15) | | | 6,988 | | | | 7,227,904 | |
CSX Corp. | | | | | | | | |
4.10%, 03/15/44 (Call 09/15/43)a | | | 7,450 | | | | 6,868,795 | |
| | |
| 166 | | 2016 iSHARES ANNUAL REPORTTO SHAREHOLDERS |
Schedule of Investments (Continued)
iSHARES® iBOXX $ INVESTMENT GRADE CORPORATE BOND ETF
February 29, 2016
| | | | | | | | |
| Security | | Principal
or Shares
(000s) | | | Value | |
FedEx Corp. | | | | | | | | |
4.00%, 01/15/24a | | $ | 12,589 | | | $ | 13,311,551 | |
4.75%, 11/15/45 (Call 05/15/45)a | | | 17,130 | | | | 17,081,296 | |
5.10%, 01/15/44 | | | 4,780 | | | | 4,920,395 | |
8.00%, 01/15/19 | | | 1,835 | | | | 2,121,676 | |
Union Pacific Corp. | | | | | | | | |
4.16%, 07/15/22 (Call 04/15/22) | | | 7,218 | | | | 7,938,570 | |
United Parcel Service Inc. | | | | | | | | |
2.45%, 10/01/22a | | | 5,296 | | | | 5,388,342 | |
3.13%, 01/15/21 | | | 22,211 | | | | 23,527,271 | |
5.13%, 04/01/19 | | | 11,821 | | | | 13,106,269 | |
6.20%, 01/15/38 | | | 15,950 | | | | 21,188,548 | |
| | | | | | | | |
| | | | 196,521,289 | |
WATER — 0.02% | | | | | | | | |
American Water Capital Corp. | | | | | | | | |
6.59%, 10/15/37 | | | 3,085 | | | | 4,115,793 | |
| | | | | | | | |
| | | | 4,115,793 | |
| | | | | | | | |
TOTAL CORPORATE BONDS & NOTES | | | | | |
(Cost: $25,097,060,245) | | | | 24,674,590,818 | |
|
U.S. GOVERNMENT OBLIGATIONS — 0.15% | |
U.S. Treasury Note/Bond | | | | | | | | |
2.50%, 02/15/46 | | | 40,000 | | | | 39,040,799 | |
| | | | | | | | |
| | | | 39,040,799 | |
| | | | | | | | |
TOTAL U.S. GOVERNMENT OBLIGATIONS | |
(Cost: $39,050,080) | | | | | | | 39,040,799 | |
|
SHORT-TERM INVESTMENTS — 10.30% | |
|
MONEY MARKET FUNDS — 10.30% | |
BlackRock Cash Funds: Institutional,
SL Agency Shares | | | | | |
0.50%c,d,e | | | 2,156,532 | | | | 2,156,531,783 | |
BlackRock Cash Funds: Prime,
SL Agency Shares | | | | | | | | |
0.49%c,d,e | | | 190,998 | | | | 190,998,405 | |
BlackRock Cash Funds: Treasury,
SL Agency Shares | | | | | |
0.27%c,d | | | 234,943 | | | | 234,942,632 | |
| | | | | | | | |
| | | | | | | 2,582,472,820 | |
| | | | | | | | |
TOTAL SHORT-TERM INVESTMENTS | | | | | |
(Cost: $2,582,472,820) | | | | 2,582,472,820 | |
| | | | | | | | |
| | | | | | |
| | | | |
Value | |
TOTAL INVESTMENTS
IN SECURITIES — 108.87% | | | | |
(Cost: $27,718,583,145) | | $ | 27,296,104,437 | |
Other Assets, Less Liabilities — (8.87)% | | | (2,224,806,584 | ) |
| | | | | | |
NET ASSETS — 100.00% | | $ | 25,071,297,853 | |
| | | | | | |
| a | All or a portion of this security represents a security on loan. See Note 1. |
| b | This security may be resold to qualified institutional buyers under Rule 144A of the Securities Act of 1933. |
| c | Affiliated issuer. See Note 2. |
| d | The rate quoted is the annualized seven-day yield of the fund at period end. |
| e | All or a portion of this security represents an investment of securities lending collateral. See Note 1. |
See notes to financial statements.
| | | | |
SCHEDULESOF INVESTMENTS | | | 167 | |
Statements of Assets and Liabilities
iSHARES® TRUST
February 29, 2016
| | | | | | | | |
| | | iShares iBoxx
$ High Yield
Corporate
Bond ETF | | | iShares iBoxx
$ Investment Grade
Corporate
Bond ETF | |
| | |
ASSETS | | | | | | | | |
Investments, at cost: | | | | | | | | |
Unaffiliated | | $ | 16,754,317,237 | | | $ | 25,007,557,416 | |
Affiliated (Note 2) | | | 4,260,533,150 | | | | 2,711,025,729 | |
| | | | | | | | |
Total cost of investments | | $ | 21,014,850,387 | | | $ | 27,718,583,145 | |
| | | | | | | | |
Investments in securities, at fair value (including securities on loana) (Note 1): | | | | | | | | |
Unaffiliated | | $ | 15,102,511,620 | | | $ | 24,583,768,432 | |
Affiliated (Note 2) | | | 4,260,533,150 | | | | 2,712,336,005 | |
| | | | | | | | |
Total fair value of investments | | | 19,363,044,770 | | | | 27,296,104,437 | |
Cash | | | 11,160,154 | | | | — | |
Receivables: | | | | | | | | |
Investment securities sold | | | 5,560,527 | | | | 132,061,922 | |
Due from custodian (Note 4) | | | 25,001,157 | | | | 8,815,583 | |
Interest | | | 300,763,992 | | | | 263,685,439 | |
Capital shares sold | | | 59,465,163 | | | | 80,374,217 | |
| | | | | | | | |
Total Assets | | | 19,764,995,763 | | | | 27,781,041,598 | |
| | | | | | | | |
| | |
LIABILITIES | | | | | | | | |
Payables: | | | | | | | | |
Investment securities purchased | | | 79,578,674 | | | | 359,082,803 | |
Collateral for securities on loan (Note 1) | | | 4,136,112,005 | | | | 2,347,530,188 | |
Due to custodian | | | — | | | | 320,943 | |
Investment advisory fees (Note 2) | | | 5,382,687 | | | | 2,809,811 | |
| | | | | | | | |
Total Liabilities | | | 4,221,073,366 | | | | 2,709,743,745 | |
| | | | | | | | |
| | |
NET ASSETS | | $ | 15,543,922,397 | | | $ | 25,071,297,853 | |
| | | | | | | | |
| | |
Net assets consist of: | | | | | | | | |
Paid-in capital | | $ | 17,600,331,698 | | | $ | 25,565,142,074 | |
Undistributed net investment income | | | 62,175,544 | | | | 67,846,436 | |
Accumulated net realized loss | | | (466,779,228 | ) | | | (139,211,949 | ) |
Net unrealized depreciation | | | (1,651,805,617 | ) | | | (422,478,708 | ) |
| | | | | | | | |
NET ASSETS | | $ | 15,543,922,397 | | | $ | 25,071,297,853 | |
| | | | | | | | |
| | |
Shares outstandingb | | | 196,500,000 | | | | 218,400,000 | |
| | | | | | | | |
| | |
Net asset value per share | | $ | 79.10 | | | $ | 114.80 | |
| | | | | | | | |
| a | Securities on loan with values of $3,993,687,354 and $2,278,227,168, respectively. See Note 1. |
| b | No par value, unlimited number of shares authorized. |
See notes to financial statements.
| | |
| 168 | | 2016 iSHARES ANNUAL REPORTTO SHAREHOLDERS |
Statements of Operations
iSHARES® TRUST
Year ended February 29, 2016
| | | | | | | | |
| | | iShares iBoxx
$ High Yield
Corporate
Bond ETF | | | iShares iBoxx
$ Investment Grade
Corporate
Bond ETF | |
| | |
NET INVESTMENT INCOME | | | | | | | | |
Interest — unaffiliated | | $ | 875,263,829 | | | $ | 802,130,623 | |
Interest — affiliated (Note 2) | | | 86,964 | | | | 3,599,626 | |
Securities lending income — affiliated — net (Note 2) | | | 14,457,750 | | | | 4,013,102 | |
Other income | | | 79,572 | | | | — | |
| | | | | | | | |
Total investment income | | | 889,888,115 | | | | 809,743,351 | |
| | | | | | | | |
| | |
EXPENSES | | | | | | | | |
Investment advisory fees (Note 2) | | | 72,764,253 | | | | 33,482,363 | |
| | | | | | | | |
Total expenses | | | 72,764,253 | | | | 33,482,363 | |
| | | | | | | | |
Net investment income | | | 817,123,862 | | | | 776,260,988 | |
| | | | | | | | |
| | |
NET REALIZED AND UNREALIZED GAIN (LOSS) | | | | | | | | |
Net realized gain (loss) from: | | | | | | | | |
Investments — unaffiliated | | | (338,936,075 | ) | | | (121,676,354 | ) |
Investments — affiliated (Note 2) | | | — | | | | (121,254 | ) |
In-kind redemptions — unaffiliated | | | (211,608,352 | ) | | | 97,565,737 | |
In-kind redemptions — affiliated (Note 2) | | | — | | | | 298,212 | |
| | | | | | | | |
Net realized loss | | | (550,544,427 | ) | | | (23,933,659 | ) |
| | | | | | | | |
Net change in unrealized appreciation/depreciation | | | (1,614,136,767 | ) | | | (1,243,443,520 | ) |
| | | | | | | | |
Net realized and unrealized loss | | | (2,164,681,194 | ) | | | (1,267,377,179 | ) |
| | | | | | | | |
NET DECREASE IN NET ASSETS RESULTING FROM OPERATIONS | | $ | (1,347,557,332 | ) | | $ | (491,116,191 | ) |
| | | | | | | | |
See notes to financial statements.
Statements of Changes in Net Assets
iSHARES® TRUST
| | | | | | | | | | | | | | | | |
| | | iShares iBoxx
$ High Yield
Corporate
Bond ETF | | | iShares iBoxx
$ Investment Grade
Corporate
Bond ETF | |
| | | Year ended
February 29, 2016 | | | Year ended
February 28, 2015 | | | Year ended
February 29, 2016 | | | Year ended
February 28, 2015 | |
| | | | |
INCREASE (DECREASE) IN NET ASSETS | | | | | | | | | | | | | | | | |
| | | | |
OPERATIONS: | | | | | | | | | | | | | | | | |
Net investment income | | $ | 817,123,862 | | | $ | 732,892,833 | | | $ | 776,260,988 | | | $ | 618,202,082 | |
Net realized gain (loss) | | | (550,544,427 | ) | | | 89,571,496 | | | | (23,933,659 | ) | | | 243,946,253 | |
Net change in unrealized appreciation/depreciation | | | (1,614,136,767 | ) | | | (443,808,309 | ) | | | (1,243,443,520 | ) | | | 422,605,288 | |
| | | | | | | | | | | | | | | | |
Net increase (decrease) in net assets resulting from operations | | | (1,347,557,332 | ) | | | 378,656,020 | | | | (491,116,191 | ) | | | 1,284,753,623 | |
| | | | | | | | | | | | | | | | |
| | | | |
DISTRIBUTIONS TO SHAREHOLDERS: | | | | | | | | | | | | | | | | |
From net investment income | | | (826,678,362 | ) | | | (728,101,752 | ) | | | (766,535,606 | ) | | | (608,603,942 | ) |
| | | | | | | | | | | | | | | | |
Total distributions to shareholders | | | (826,678,362 | ) | | | (728,101,752 | ) | | | (766,535,606 | ) | | | (608,603,942 | ) |
| | | | | | | | | | | | | | | | |
| | | | |
CAPITAL SHARE TRANSACTIONS: | | | | | | | | | | | | | | | | |
Proceeds from shares sold | | | 15,759,326,271 | | | | 10,814,656,864 | | | | 21,273,520,436 | | | | 9,047,865,314 | |
Cost of shares redeemed | | | (16,062,347,566 | ) | | | (6,024,890,999 | ) | | | (16,988,727,472 | ) | | | (4,578,159,032 | ) |
| | | | | | | | | | | | | | | | |
Net increase (decrease) in net assets from capital share transactions | | | (303,021,295 | ) | | | 4,789,765,865 | | | | 4,284,792,964 | | | | 4,469,706,282 | |
| | | | | | | | | | | | | | | | |
INCREASE (DECREASE) IN NET ASSETS | | | (2,477,256,989 | ) | | | 4,440,320,133 | | | | 3,027,141,167 | | | | 5,145,855,963 | |
| | | | |
NET ASSETS | | | | | | | | | | | | | | | | |
Beginning of year | | | 18,021,179,386 | | | | 13,580,859,253 | | | | 22,044,156,686 | | | | 16,898,300,723 | |
| | | | | | | | | | | | | | | | |
End of year | | $ | 15,543,922,397 | | | $ | 18,021,179,386 | | | $ | 25,071,297,853 | | | $ | 22,044,156,686 | |
| | | | | | | | | | | | | | | | |
Undistributed net investment income included in net assets at end of year | | $ | 62,175,544 | | | $ | 71,730,044 | | | $ | 67,846,436 | | | $ | 58,121,054 | |
| | | | | | | | | | | | | | | | |
| | | | |
SHARES ISSUED AND REDEEMED | | | | | | | | | | | | | | | | |
Shares sold | | | 188,200,000 | | | | 117,800,000 | | | | 183,000,000 | | | | 75,600,000 | |
Shares redeemed | | | (188,200,000 | ) | | | (64,800,000 | ) | | | (146,100,000 | ) | | | (38,500,000 | ) |
| | | | | | | | | | | | | | | | |
Net increase in shares outstanding | | | — | | | | 53,000,000 | | | | 36,900,000 | | | | 37,100,000 | |
| | | | | | | | | | | | | | | | |
See notes to financial statements.
| | |
| 170 | | 2016 iSHARES ANNUAL REPORTTO SHAREHOLDERS |
Financial Highlights
iSHARES® TRUST
(For a share outstanding throughout each period)
| | | | | | | | | | | | | | | | | | | | |
| | | iShares iBoxx $ High Yield Corporate Bond ETF | |
| | | Year ended
Feb. 29, 2016 | | | Year ended
Feb. 28, 2015 | | | Year ended
Feb. 28, 2014 | | | Year ended
Feb. 28, 2013 | | | Year ended
Feb. 29, 2012 | |
Net asset value, beginning of year | | $ | 91.71 | | | $ | 94.64 | | | $ | 93.71 | | | $ | 91.40 | | | $ | 91.75 | |
| | | | | | | | | | | | | | | | | | | | |
Income from investment operations: | | | | | | | | | | | | | | | | | | | | |
Net investment incomea | | | 4.79 | | | | 4.96 | | | | 5.58 | | | | 6.15 | | | | 6.74 | |
Net realized and unrealized gain (loss)b | | | (12.62 | ) | | | (2.89 | ) | | | 0.98 | | | | 2.31 | | | | (0.45 | ) |
| | | | | | | | | | | | | | | | | | | | |
Total from investment operations | | | (7.83 | ) | | | 2.07 | | | | 6.56 | | | | 8.46 | | | | 6.29 | |
| | | | | | | | | | | | | | | | | | | | |
Less distributions from: | | | | | | | | | | | | | | | | | | | | |
Net investment income | | | (4.78 | ) | | | (5.00 | ) | | | (5.63 | ) | | | (6.15 | ) | | | (6.64 | ) |
| | | | | | | | | | | | | | | | | | | | |
Total distributions | | | (4.78 | ) | | | (5.00 | ) | | | (5.63 | ) | | | (6.15 | ) | | | (6.64 | ) |
| | | | | | | | | | | | | | | | | | | | |
Net asset value, end of year | | $ | 79.10 | | | $ | 91.71 | | | $ | 94.64 | | | $ | 93.71 | | | $ | 91.40 | |
| | | | | | | | | | | | | | | | | | | | |
| | | | | |
Total return | | | (8.76 | )% | | | 2.22 | % | | | 7.31 | % | | | 9.68 | % | | | 7.35 | % |
| | | | | | | | | | | | | | | | | | | | |
| | | | | |
Ratios/Supplemental data: | | | | | | | | | | | | | | | | | | | | |
Net assets, end of year (000s) | | $ | 15,543,922 | | | $ | 18,021,179 | | | $ | 13,580,859 | | | $ | 15,077,490 | | | $ | 14,258,718 | |
Ratio of expenses to average net assets | | | 0.50 | % | | | 0.50 | % | | | 0.50 | % | | | 0.50 | % | | | 0.50 | % |
Ratio of net investment income to average net assets | | | 5.60 | % | | | 5.37 | % | | | 6.01 | % | | | 6.73 | % | | | 7.60 | % |
Portfolio turnover ratec | | | 11 | % | | | 11 | % | | | 11 | % | | | 19 | % | | | 13 | % |
| a | Based on average shares outstanding throughout each period. |
| b | The amounts reported for a share outstanding may not accord with the change in aggregate gains and losses in securities for the fiscal period due to the timing of capital share transactions in relation to the fluctuating market values of the Fund’s underlying securities. |
| c | Portfolio turnover rates exclude portfolio securities received or delivered as a result of processing capital share transactions in Creation Units. |
See notes to financial statements.
Financial Highlights (Continued)
iSHARES® TRUST
(For a share outstanding throughout each period)
| | | | | | | | | | | | | | | | | | | | |
| | | iShares iBoxx $ Investment Grade Corporate Bond ETF | |
| | | Year ended
Feb. 29, 2016 | | | Year ended
Feb. 28, 2015 | | | Year ended
Feb. 28, 2014 | | | Year ended
Feb. 28, 2013 | | | Year ended
Feb. 29, 2012 | |
Net asset value, beginning of year | | $ | 121.46 | | | $ | 117.02 | | | $ | 120.06 | | | $ | 116.86 | | | $ | 108.74 | |
| | | | | | | | | | | | | | | | | | | | |
Income from investment operations: | | | | | | | | | | | | | | | | | | | | |
Net investment incomea | | | 4.00 | | | | 4.06 | | | | 4.25 | | | | 4.60 | | | | 5.00 | |
Net realized and unrealized gain (loss)b | | | (6.70 | ) | | | 4.42 | | | | (2.94 | ) | | | 3.22 | | | | 8.08 | |
| | | | | | | | | | | | | | | | | | | | |
Total from investment operations | | | (2.70 | ) | | | 8.48 | | | | 1.31 | | | | 7.82 | | | | 13.08 | |
| | | | | | | | | | | | | | | | | | | | |
Less distributions from: | | | | | | | | | | | | | | | | | | | | |
Net investment income | | | (3.96 | ) | | | (4.04 | ) | | | (4.35 | ) | | | (4.61 | ) | | | (4.96 | ) |
Net realized gain | | | — | | | | — | | | | — | | | | (0.01 | ) | | | — | |
| | | | | | | | | | | | | | | | | | | | |
Total distributions | | | (3.96 | ) | | | (4.04 | ) | | | (4.35 | ) | | | (4.62 | ) | | | (4.96 | ) |
| | | | | | | | | | | | | | | | | | | | |
Net asset value, end of year | | $ | 114.80 | | | $ | 121.46 | | | $ | 117.02 | | | $ | 120.06 | | | $ | 116.86 | |
| | | | | | | | | | | | | | | | | | | | |
| | | | | |
Total return | | | (2.19 | )% | | | 7.35 | % | | | 1.19 | % | | | 6.81 | % | | | 12.37 | % |
| | | | | | | | | | | | | | | | | | | | |
| | | | | |
Ratios/Supplemental data: | | | | | | | | | | | | | | | | | | | | |
Net assets, end of year (000s) | | $ | 25,071,298 | | | $ | 22,044,157 | | | $ | 16,898,301 | | | $ | 24,037,003 | | | $ | 19,563,089 | |
Ratio of expenses to average net assets | | | 0.15 | % | | | 0.15 | % | | | 0.15 | % | | | 0.15 | % | | | 0.15 | % |
Ratio of net investment income to average net assets | | | 3.44 | % | | | 3.42 | % | | | 3.66 | % | | | 3.87 | % | | | 4.48 | % |
Portfolio turnover ratec | | | 13 | % | | | 9 | % | | | 6 | % | | | 5 | % | | | 4 | % |
| a | Based on average shares outstanding throughout each period. |
| b | The amounts reported for a share outstanding may not accord with the change in aggregate gains and losses in securities for the fiscal period due to the timing of capital share transactions in relation to the fluctuating market values of the Fund’s underlying securities. |
| c | Portfolio turnover rates exclude portfolio securities received or delivered as a result of processing capital share transactions in Creation Units. |
See notes to financial statements.
| | |
| 172 | | 2016 iSHARES ANNUAL REPORTTO SHAREHOLDERS |
Notes to Financial Statements
iSHARES® TRUST
iShares Trust (the “Trust”) is registered under the Investment Company Act of 1940, as amended (the “1940 Act”), as an open-end management investment company. The Trust was established as a Delaware statutory trust pursuant to an Agreement and Declaration of Trust dated December 16, 1999.
These financial statements relate only to the following funds (each, a “Fund,” and collectively, the “Funds”):
| | |
| iShares ETF | | Diversification Classification |
iBoxx $ High Yield Corporate Bond | | Diversified |
iBoxx $ Investment Grade Corporate Bond | | Diversified |
The investment objective of each Fund is to seek investment results that correspond generally to the price and yield performance, before fees and expenses, of its underlying index. The investment adviser uses a “passive” or index approach to try to achieve each Fund’s investment objective.
Pursuant to the Trust’s organizational documents, the Funds’ officers and trustees are indemnified against certain liabilities that may arise out of the performance of their duties to the Funds. Additionally, in the normal course of business, the Funds enter into contracts with service providers that contain general indemnification clauses. The Funds’ maximum exposure under these arrangements is unknown as this would involve future claims that may be made against the Funds that have not yet occurred.
| 1. | SIGNIFICANT ACCOUNTING POLICIES |
The following significant accounting policies are consistently followed by the Funds in the preparation of their financial statements in conformity with accounting principles generally accepted in the United States of America (“U.S. GAAP”). The preparation of financial statements in conformity with U.S. GAAP requires management to make certain estimates and assumptions that affect the reported amounts of assets and liabilities and disclosures of contingent assets and liabilities at the date of the financial statements and the reported amounts of revenue and expenses during the reporting period. Actual results could differ from those estimates. Each Fund is considered an investment company under U.S. GAAP and follows the accounting and reporting guidance applicable to investment companies.
SECURITY VALUATION
Each Fund’s investments are valued at fair value each day that the Fund’s listing exchange is open and, for financial reporting purposes, as of the report date should the reporting period end on a day that the Fund’s listing exchange is not open. U.S. GAAP defines fair value as the price a fund would receive to sell an asset or pay to transfer a liability in an orderly transaction between market participants at the measurement date. The BlackRock Global Valuation Methodologies Committee (the “Global Valuation Committee”) provides oversight of the valuation of investments for the Funds. The investments of each Fund are valued pursuant to policies and procedures developed by the Global Valuation Committee and approved by the Board of Trustees of the Trust (the “Board”).
| | • | | Fixed income investments are valued using the last available bid price or current market quotations provided by dealers or prices (including evaluated prices) supplied by approved independent third-party pricing services. The pricing services may use matrix pricing or valuation models that utilize certain inputs and assumptions to derive values, including transaction data, credit quality information, perceived market movements, news, and other relevant information and by other methods, which may include consideration of: yields or prices of securities of comparable quality, coupon, maturity and type; indications as to values from dealers; general market conditions; and/or other factors and assumptions. Pricing services |
| | | | |
NOTESTO FINANCIAL STATEMENTS | | | 173 | |
Notes to Financial Statements (Continued)
iSHARES® TRUST
| | generally value fixed income securities assuming orderly transactions of an institutional round lot size, but a fund may hold or transact in such securities in smaller odd lot sizes. |
| | • | | Open-end U.S. mutual funds are valued at that day’s published net asset value (“NAV”). |
In the event that application of these methods of valuation results in a price for an investment which is deemed not to be representative of the fair value of such investment or if a price is not available, the investment will be valued based upon other available factors deemed relevant by the Global Valuation Committee, in accordance with policies approved by the Board. These factors include but are not limited to (i) attributes specific to the investment; (ii) the principal market for the investment; (iii) the customary participants in the principal market for the investment; (iv) data assumptions by market participants for the investment, if reasonably available; (v) quoted prices for similar investments in active markets; and (vi) other factors, such as future cash flows, interest rates, yield curves, volatilities, prepayment speeds, loss severities, credit risks and/or default rates. Valuations based on such factors are reported to the Board on a quarterly basis.
The Global Valuation Committee employs various methods for calibrating valuation approaches for investments where an active market does not exist, including regular due diligence of the Trust’s pricing vendors, a regular review of key inputs and assumptions, transactional back-testing or disposition analysis to compare unrealized gains and losses to realized gains and losses, reviews of missing or stale prices, reviews of large movements in market values, and reviews of market related activity.
Fair value pricing could result in a difference between the prices used to calculate a Fund’s NAV and the prices used by the Fund’s underlying index, which in turn could result in a difference between the Fund’s performance and the performance of the Fund’s underlying index.
Various inputs are used in determining the fair value of financial instruments. Inputs may be based on independent market data (“observable inputs”) or they may be internally developed (“unobservable inputs”). These inputs are categorized into a disclosure hierarchy consisting of three broad levels for financial reporting purposes. The level of a value determined for a financial instrument within the fair value hierarchy is based on the lowest level of any input that is significant to the fair value measurement in its entirety. The categorization of a value determined for a financial instrument within the hierarchy is based upon the pricing transparency of the instrument and is not necessarily an indication of the risk associated with investing in the instrument. The three levels of the fair value hierarchy are as follows:
| | • | | Level 1 — Unadjusted quoted prices in active markets for identical assets or liabilities; |
| | • | | Level 2 — Inputs other than quoted prices included within Level 1 that are observable for the asset or liability either directly or indirectly, including quoted prices for similar assets or liabilities in active markets, quoted prices for identical or similar assets or liabilities in markets that are not considered to be active, inputs other than quoted prices that are observable for the asset or liability (such as exchange rates, financing terms, interest rates, yield curves, volatilities, prepayment speeds, loss severities, credit risks and default rates) or other market-corroborated inputs; and |
| | • | | Level 3 — Unobservable inputs for the asset or liability, including the Global Valuation Committee’s assumptions used in determining the fair value of investments. |
Changes in valuation techniques may result in transfers in or out of an assigned level within the disclosure hierarchy. In accordance with the Trust’s policy, transfers between different levels of the fair value hierarchy are deemed to have occurred as of the beginning of the reporting period.
| | | | |
NOTESTO FINANCIAL STATEMENTS | | | 174 | |
Notes to Financial Statements (Continued)
iSHARES® TRUST
The following table summarizes the value of each of the Funds’ investments according to the fair value hierarchy as of February 29, 2016. The breakdown of each Fund’s investments into major categories is disclosed in its respective schedule of investments.
| | | | | | | | | | | | | | | | |
| iShares ETF | | Level 1 | | | Level 2 | | | Level 3 | | | Total | |
iBoxx $ High Yield Corporate Bond | | | | | | | | | | | | | | | | |
Investments: | | | | | | | | | | | | | | | | |
Assets: | | | | | | | | | | | | | | | | |
Corporate Bonds & Notes | | $ | — | | | $ | 15,102,511,620 | | | $ | — | | | $ | 15,102,511,620 | |
Money Market Funds | | | 4,260,533,150 | | | | — | | | | — | | | | 4,260,533,150 | |
| | | | | | | | �� | | | | | | | | |
Total | | $ | 4,260,533,150 | | | $ | 15,102,511,620 | | | $ | — | | | $ | 19,363,044,770 | |
| | | | | | | | | | | | | | | | |
| | | | |
iBoxx $ Investment Grade Corporate Bond | | | | | | | | | | | | | | | | |
Investments: | | | | | | | | | | | | | | | | |
Assets: | | | | | | | | | | | | | | | | |
Corporate Bonds & Notes | | $ | — | | | $ | 24,674,590,818 | | | $ | — | | | $ | 24,674,590,818 | |
U.S. Government Obligations | | | — | | | | 39,040,799 | | | | — | | | | 39,040,799 | |
Money Market Funds | | | 2,582,472,820 | | | | — | | | | — | | | | 2,582,472,820 | |
| | | | | | | | | | | | | | | | |
Total | | $ | 2,582,472,820 | | | $ | 24,713,631,617 | | | $ | — | | | $ | 27,296,104,437 | |
| | | | | | | | | | | | | | | | |
| | | | | | | | | | | | | | | | | |
SECURITY TRANSACTIONS AND INCOME RECOGNITION
Security transactions are accounted for on trade date. Realized gains and losses on investment transactions are determined using the specific identification method. Interest income, including amortization and accretion of premiums and discounts on debt securities, is recognized daily on the accrual basis
DISTRIBUTIONS TO SHAREHOLDERS
Dividends and distributions paid by each Fund are recorded on the ex-dividend dates. Distributions are determined on a tax basis and may differ from net investment income and net realized capital gains for financial reporting purposes. Dividends and distributions are paid in U.S. dollars and cannot be automatically reinvested in additional shares of the Funds.
LOANS OF PORTFOLIO SECURITIES
Each Fund may lend its investment securities to approved borrowers, such as brokers, dealers and other financial institutions. The borrower pledges and maintains with the Fund collateral consisting of cash, an irrevocable letter of credit issued by a bank, or securities issued or guaranteed by the U.S. government. The initial collateral received by each Fund is required to have a value of at least 102% of the current value of the loaned securities plus the interest accrued on such securities, if any, for securities traded on U.S. exchanges and a value of at least 105% for all other securities. The collateral is maintained thereafter at a value equal to at least 100% of the current value of the securities on loan plus accrued interest, if any. The market value of the loaned securities is determined at the close of each business day of the Funds. Any additional required collateral is delivered to the Funds and any excess collateral is returned by the Funds on the next business day. During the term of the loan, each Fund is entitled to all distributions made on or in respect of the loaned securities. Loans of securities are terminable at any time and the borrower, after notice, is required to return borrowed securities within the standard time period for settlement of securities transactions.
| | | | |
NOTESTO FINANCIAL STATEMENTS | | | 175 | |
Notes to Financial Statements (Continued)
iSHARES® TRUST
Any cash received as collateral for securities on loan may be reinvested in certain short-term instruments either directly on behalf of a fund or through one or more joint accounts or money market funds, including those managed by BlackRock Fund Advisors (“BFA”), the Funds’ investment adviser, or its affiliates. As of February 29, 2016, any securities on loan were collateralized by cash. The cash collateral received was invested in money market funds managed by BFA and is disclosed in the schedules of investments. The securities on loan for each Fund are also disclosed in its schedule of investments. The total value of any securities on loan as of February 29, 2016 and the total value of the related collateral are disclosed in the statements of assets and liabilities. Income earned by the Funds from securities lending is disclosed in the statements of operations.
The risks of securities lending include the risk that the borrower may not provide additional collateral when required or may not return the securities when due. To mitigate these risks, the Funds benefit from a borrower default indemnity provided by BlackRock, Inc. (“BlackRock”). BlackRock’s indemnity allows for full replacement of securities lent. Each Fund could suffer a loss if the value of the investments purchased with cash collateral falls below the value of the cash collateral received.
Securities lending transactions are entered into by the Funds under Master Securities Lending Agreements (“MSLA”) which provide the right, in the event of default (including bankruptcy or insolvency) for the non-defaulting party to liquidate the collateral and calculate a net exposure to the defaulting party or request additional collateral. In the event that a borrower defaults, a Fund, as lender, would offset the market value of the collateral received against the market value of the securities loaned. The value of the collateral is typically greater than that of the market value of the securities loaned, leaving the lender with a net amount payable to the defaulting party. However, bankruptcy or insolvency laws of a particular jurisdiction may impose restrictions on or prohibitions against such a right of offset in the event of an MSLA counterparty’s bankruptcy or insolvency. Under the MSLA, the borrower can resell or re-pledge the loaned securities, and a Fund can reinvest cash collateral, or, upon an event of default, resell or re-pledge the collateral.
The following table is a summary of securities lending agreements which are subject to offset under an MSLA as of February 29, 2016:
| | | | | | | | | | | | |
iShares ETF
and Counterparty | | Market Value of
Securities on Loan | | | Cash Collateral
Received a | | | Net
Amount | |
iBoxx $ High Yield Corporate Bond | | | | | | | | | | | | |
Barclays Capital Inc. | | $ | 296,417,330 | | | $ | 296,417,330 | | | $ | — | |
BNP Paribas Prime Brokerage Inc. | | | 72,772,181 | | | | 72,772,181 | | | | — | |
Citigroup Global Markets Inc. | | | 485,805,448 | | | | 485,805,448 | | | | — | |
Credit Suisse Securities (USA) LLC | | | 271,989,843 | | | | 271,989,843 | | | | — | |
Deutsche Bank Securities Inc. | | | 294,828,347 | | | | 294,828,347 | | | | — | |
Goldman Sachs & Co. | | | 286,014,330 | | | | 286,014,330 | | | | — | |
HSBC Securities (USA) Inc. | | | 8,316,690 | | | | 8,316,690 | | | | — | |
Jefferies LLC | | | 76,387,638 | | | | 76,387,638 | | | | — | |
JPMorgan Clearing Corp. | | | 971,899,231 | | | | 971,899,231 | | | | — | |
JPMorgan Securities LLC | | | 357,497,235 | | | | 357,497,235 | | | | — | |
Merrill Lynch, Pierce, Fenner & Smith | | | 190,153,020 | | | | 190,153,020 | | | | — | |
Morgan Stanley & Co. LLC | | | 228,861,166 | | | | 228,861,166 | | | | — | |
National Financial Services LLC | | | 92,061 | | | | 92,061 | | | | — | |
RBC Capital Markets LLC | | | 300,277,712 | | | | 300,277,712 | | | | — | |
SG Americas Securities LLC | | | 95,580,875 | | | | 95,580,875 | | | | — | |
UBS Securities LLC | | | 22,143,887 | | | | 22,143,887 | | | | — | |
Wells Fargo Securities LLC | | | 34,650,360 | | | | 34,650,360 | | | | — | |
| | | | | | | | | | | | |
| | $ | 3,993,687,354 | | | $ | 3,993,687,354 | | | $ | — | |
| | | | | | | | | | | | |
| | | | | | | | | | | | | |
| | |
| 176 | | 2016 iSHARES ANNUAL REPORTTO SHAREHOLDERS |
Notes to Financial Statements (Continued)
iSHARES® TRUST
| | | | | | | | | | | | |
iShares ETF and Counterparty | | Market Value of
Securities on Loan | | | Cash Collateral
Received a | | | Net
Amount | |
iBoxx $ Investment Grade Corporate Bond | | | | | | | | | | | | |
Barclays Capital Inc. | | $ | 207,388,148 | | | $ | 207,388,148 | | | $ | — | |
BNP Paribas Prime Brokerage Inc. | | | 26,281,887 | | | | 26,281,887 | | | | — | |
Citigroup Global Markets Inc. | | | 151,176,634 | | | | 151,176,634 | | | | — | |
Credit Suisse Securities (USA) LLC | | | 47,598,754 | | | | 47,598,754 | | | | — | |
Deutsche Bank Securities Inc. | | | 88,999,057 | | | | 88,999,057 | | | | — | |
Goldman Sachs & Co. | | | 492,213,605 | | | | 492,213,605 | | | | — | |
HSBC Securities (USA) Inc. | | | 129,228,878 | | | | 129,228,878 | | | | — | |
Jefferies LLC | | | 51,276,550 | | | | 51,276,550 | | | | — | |
JPMorgan Clearing Corp. | | | 141,557,798 | | | | 141,557,798 | | | | — | |
JPMorgan Securities LLC | | | 260,366,516 | | | | 260,366,516 | | | | — | |
Merrill Lynch, Pierce, Fenner & Smith | | | 79,318,064 | | | | 79,318,064 | | | | — | |
Morgan Stanley & Co. LLC | | | 67,036,945 | | | | 67,036,945 | | | | — | |
RBC Capital Markets LLC | | | 356,760,596 | | | | 356,760,596 | | | | — | |
Scotia Capital (USA) Inc. | | | 6,992,109 | | | | 6,992,109 | | | | — | |
SG Americas Securities LLC | | | 77,475,092 | | | | 77,475,092 | | | | — | |
UBS Securities LLC | | | 2,580,055 | | | | 2,580,055 | | | | — | |
Wells Fargo Securities LLC | | | 91,976,480 | | | | 91,976,480 | | | | — | |
| | | | | | | | | | | | |
| | $ | 2,278,227,168 | | | $ | 2,278,227,168 | | | $ | — | |
| | | | | | | | | | | | |
| | | | | | | | | | | | | |
| | a | | Collateral received in excess of the market value of securities on loan is not presented in this table. The total cash collateral received was in excess of the market value of securities loaned at year end and is disclosed in each Fund’s statement of assets and liabilities. |
��
| 2. | INVESTMENT ADVISORY AGREEMENT AND OTHER TRANSACTIONS WITH AFFILIATES |
Pursuant to an Investment Advisory Agreement with the Trust, BFA manages the investment of each Fund’s assets. BFA is a California corporation indirectly owned by BlackRock. Under the Investment Advisory Agreement, BFA is responsible for substantially all expenses of the Funds, except interest, taxes, brokerage commissions and other expenses connected with the execution of portfolio transactions, distribution fees, litigation expenses and any extraordinary expenses.
For its investment advisory services to the iShares iBoxx $ High Yield Corporate Bond ETF, BFA is entitled to an annual investment advisory fee based on the Fund’s allocable portion of the aggregate of the average daily net assets of the Fund and certain other iShares funds, as follows:
| | | | | |
| Investment Advisory Fee | | Aggregate Average Daily Net Assets |
| | | 0.5000 | % | | First $19 billion |
| | | 0.4750 | a | | Over $19 billion, up to and including $33 billion |
| | | 0.4513 | a | | Over $33 billion, up to and including $58 billion |
| | | 0.4287 | a | | Over $58 billion |
| | a | | Investment advisory fee level reflects a 5% reduction (rounded to the fourth decimal place) from the investment advisory fee at the prior aggregate average daily net asset level. |
| | | | |
NOTESTO FINANCIAL STATEMENTS | | | 177 | |
Notes to Financial Statements (Continued)
iSHARES® TRUST
For its investment advisory services to the iShares iBoxx $ Investment Grade Corporate Bond ETF, BFA is entitled to an annual investment advisory fee based on the Fund’s allocable portion of the aggregate of the average daily net assets of the Fund and certain other iShares funds, as follows:
| | | | | |
| Investment Advisory Fee | | Aggregate Average Daily Net Assets |
| | | 0.1500 | % | | First $121 billion |
| | | 0.1425 | a | | Over $121 billion, up to and including $181 billion |
| | | 0.1354 | a | | Over $181 billion, up to and including $231 billion |
| | | 0.1287 | a | | Over $231 billion, up to and including $281 billion |
| | | 0.1222 | a | | Over $281 billion |
| | a | | Investment advisory fee level reflects a 5% reduction (rounded to the fourth decimal place) from the investment advisory fee at the prior aggregate average daily net asset level. |
Prior to July 1, 2015, for its investment advisory services to the iShares iBoxx $ Investment Grade Corporate Bond ETF, BFA was entitled to an annual investment advisory fee based on the Fund’s allocable portion of the aggregate of the average daily net assets of the Fund and certain other iShares funds, as follows:
| | | | | |
| Investment Advisory Fee | | Aggregate Average Daily Net Assets |
| | | 0.1500 | % | | First $121 billion |
| | | 0.1425 | a | | Over $121 billion, up to and including $211 billion |
| | | 0.1354 | a | | Over $211 billion |
| | a | | Investment advisory fee level reflects a 5% reduction (rounded to the fourth decimal place) from the investment advisory fee at the prior aggregate average daily net asset level. |
The U.S. Securities and Exchange Commission has issued an exemptive order which permits BlackRock Institutional Trust Company, N.A. (“BTC”), an affiliate of BFA, to serve as securities lending agent for the Funds, subject to applicable conditions. As securities lending agent, BTC bears all operational costs directly related to securities lending. Each Fund is responsible for fees in connection with the investment of cash collateral received for securities on loan in a money market fund managed by BFA, however, BTC has agreed to reduce the amount of securities lending income it receives in order to effectively limit the collateral investment fees each Fund bears to an annual rate of 0.04% (the “collateral investment fees”). Securities lending income is equal to the total of income earned from the reinvestment of cash collateral, net of fees and other payments to and from borrowers of securities, and less the collateral investment fees. The Funds retain a portion of securities lending income and remit the remaining portion to BTC as compensation for its services as securities lending agent.
Pursuant to a securities lending agreement, each Fund retains 80% of securities lending income and the amount retained can never be less than 70% of the total of securities lending income plus the collateral investment fees. In addition, commencing the business day following the date that the aggregate securities lending income plus the collateral investment fees generated across all 1940 Act iShares exchange-traded funds (the “iShares ETF Complex”) in a given calendar year exceeds the aggregate securities lending income generated across the iShares ETF Complex in the calendar year 2013, each Fund, pursuant to a securities lending agreement, will retain for the remainder of that calendar year 85% of securities lending income and the amount retained can never be less than 70% of the total of securities lending income plus the collateral investment fees.
| | |
| 178 | | 2016 iSHARES ANNUAL REPORTTO SHAREHOLDERS |
Notes to Financial Statements (Continued)
iSHARES® TRUST
For the year ended February 29, 2016, the total of securities lending agent services and collateral investment fees paid were as follows:
| | | | |
| iShares ETF | | Fees Paid to BTC | |
iBoxx $ High Yield Corporate Bond | | $ | 4,577,634 | |
iBoxx $ Investment Grade Corporate Bond | | | 1,631,385 | |
BlackRock Investments, LLC, an affiliate of BFA, is the distributor for each Fund. Pursuant to the distribution agreement, BFA is responsible for any fees or expenses for distribution services provided to the Funds.
Cross trading is the buying or selling of portfolio securities between funds to which BFA (or an affiliate) serves as investment adviser. At its regularly scheduled quarterly meetings, the Board reviews such transactions as of the most recent calendar quarter for compliance with the requirements and restrictions set forth by Rule 17a-7.
For the year ended February 29, 2016, transactions executed by the Funds pursuant to Rule 17a-7 under the 1940 Act were as follows:
| | | | | | | | |
| iShares ETF | | Purchases | | | Sales | |
iBoxx $ High Yield Corporate Bond | | $ | — | | | $ | 25,783,754 | |
iBoxx $ Investment Grade Corporate Bond | | | 60,471,393 | | | | 1,047,265,433 | |
Each Fund may invest its positive cash balances in certain money market funds managed by BFA or an affiliate. The income earned on these temporary cash investments is included in “Interest – affiliated” in the statements of operations.
The PNC Financial Services Group, Inc. is the largest stockholder of BlackRock and is considered to be an affiliate of the Funds for 1940 Act purposes.
| | | | |
NOTESTO FINANCIAL STATEMENTS | | | 179 | |
Notes to Financial Statements (Continued)
iSHARES® TRUST
Investments in issuers considered to be affiliates of the Funds (excluding money market funds) during the year ended February 29, 2016, for purposes of Section 2(a)(3) of the 1940 Act, were as follows:
| | | | | | | | | | | | | | | | | | | | | | | | | | | | |
iShares ETF and
Name of Affiliated
Issuer | | Principal Held
at Beginning
of Year
(000s) | | | Principal
Purchased
(000s) | | | Principal
Sold
(000s) | | | Principal Held
at End of
Year (000s) | | | Value at
End
of Year | | | Interest
Income | | | Net
Realized
Gain (Loss) | |
iBoxx $ Investment Grade Corporate Bond | | | | | | | | | | | | | | | | | | | | | | | | | | | | |
PNC Bank N.A. | | | | | | | | | | | | | | | | | | | | | | | | | | | | |
2.20%, 01/28/19 | | $ | 17,525 | | | $ | — | | | $ | (11,250 | ) | | $ | 6,275 | | | $ | 6,315,815 | | | $ | 327,445 | | | $ | 50,451 | |
2.25%, 07/02/19 | | | 5,250 | | | | 2,500 | | | | — | | | | 7,750 | | | | 7,808,335 | | | | 131,849 | | | | — | |
2.40%, 10/18/19 | | | 2,250 | | | | 10,500 | | | | — | | | | 12,750 | | | | 12,900,191 | | | | 150,093 | | | | — | |
2.45%, 11/05/20 | | | — | | | | 2,400 | | | | — | | | | 2,400 | | | | 2,424,218 | | | | — | | | | — | |
2.60%, 07/21/20 | | | — | | | | 11,000 | | | | — | | | | 11,000 | | | | 11,174,466 | | | | 153,135 | | | | — | |
2.70%, 11/01/22 | | | 25,550 | | | | 19,287 | | | | (35,250 | ) | | | 9,587 | | | | 9,419,403 | | | | 619,444 | | | | (40,252 | ) |
2.95%, 01/30/23 | | | 5,800 | | | | 1,500 | | | | — | | | | 7,300 | | | | 7,301,418 | | | | 177,735 | | | | — | |
2.95%, 02/23/25 | | | — | | | | 17,300 | | | | — | | | | 17,300 | | | | 17,177,729 | | | | 286,878 | | | | — | |
3.80%, 07/25/23 | | | 19,928 | | | | 1,225 | | | | (5,500 | ) | | | 15,653 | | | | 16,476,149 | | | | 630,157 | | | | 166,759 | |
PNC Financial Services Group Inc. (The) | | | | | | | | | | | | | | | | | | | | | | | | | | | | |
3.90%, 04/29/24 | | | 10,470 | | | | 2,070 | | | | — | | | | 12,540 | | | | 12,946,641 | | | | 431,415 | | | | — | |
PNC Funding Corp. | | | | | | | | | | | | | | | | | | | | | | | | | | | | |
3.30%, 03/08/22 | | | 8,069 | | | | 1,500 | | | | — | | | | 9,569 | | | | 9,922,566 | | | | 238,355 | | | | — | |
4.38%, 08/11/20 | | | 3,773 | | | | 6,951 | | | | — | | | | 10,724 | | | | 11,629,478 | | | | 241,583 | | | | — | |
5.13%, 02/08/20 | | | 3,965 | | | | — | | | | — | | | | 3,965 | | | | 4,366,776 | | | | 122,210 | | | | — | |
| | | | | | | | | | | | | | | | | | | | | | | | | | | | |
| | | | | | | | | | | | | | | | | | $ | 129,863,185 | | �� | $ | 3,510,299 | | | $ | 176,958 | |
| | | | | | | | | | | | | | | | | | | | | | | | | | | | |
| | | | | | | | | | | | | | | | | | | | | | | | | | | | | |
Certain trustees and officers of the Trust are also officers of BTC and/or BFA.
| 3. | INVESTMENT PORTFOLIO TRANSACTIONS |
Purchases and sales of investments (excluding in-kind transactions and short-term investments) for the year ended February 29, 2016 were as follows:
| | | | | | | | | | | | | | | | |
| | | U.S. Government Obligations | | | Other Securities | |
| iShares ETF | | Purchases | | | Sales | | | Purchases | | | Sales | |
iBoxx $ High Yield Corporate Bond | | $ | — | | | $ | — | | | $ | 2,190,025,940 | | | $ | 1,565,472,187 | |
iBoxx $ Investment Grade Corporate Bond | | | 103,148,598 | | | | 84,873,565 | | | | 4,556,107,390 | | | | 2,758,811,257 | |
| | |
| 180 | | 2016 iSHARES ANNUAL REPORTTO SHAREHOLDERS |
Notes to Financial Statements (Continued)
iSHARES® TRUST
In-kind transactions (see Note 4) for the year ended February 29, 2016 were as follows:
| | | | | | | | |
| iShares ETF | | In-kind
Purchases | | | In-kind
Sales | |
iBoxx $ High Yield Corporate Bond | | $ | 14,673,838,874 | | | $ | 15,561,804,233 | |
iBoxx $ Investment Grade Corporate Bond | | | 19,211,417,256 | | | | 16,674,166,978 | |
| 4. | CAPITAL SHARE TRANSACTIONS |
Capital shares are issued and redeemed by each Fund only in aggregations of a specified number of shares or multiples thereof (“Creation Units”) at NAV. Except when aggregated in Creation Units, shares of each Fund are not redeemable. Transactions in capital shares for each Fund are disclosed in detail in the statements of changes in net assets.
The consideration for the purchase of Creation Units of a fund in the Trust generally consists of the in-kind deposit of a designated portfolio of securities and a specified amount of cash. Certain funds in the Trust may be offered in Creation Units solely or partially for cash in U.S. dollars. Investors purchasing and redeeming Creation Units may pay a purchase transaction fee and a redemption transaction fee directly to State Street Bank and Trust Company, the Trust’s administrator, to offset transfer and other transaction costs associated with the issuance and redemption of Creation Units, including Creation Units for cash. Investors transacting in Creation Units for cash may also pay an additional variable charge to compensate the relevant fund for certain transaction costs (i.e., stamp taxes, taxes on currency or other financial transactions, and brokerage costs) and market impact expenses relating to investing in portfolio securities. Such variable charges, if any, are included in “Proceeds from shares sold” in the statements of changes in net assets.
From time to time, settlement of securities related to in-kind contributions or in-kind redemptions may be delayed. In such cases, securities related to in-kind contributions are reflected as “Due from custodian” and securities related to in-kind redemptions are reflected as “Securities related to in-kind transactions” in the statements of assets and liabilities.
In the normal course of business, each Fund’s investment activities expose it to various types of risk associated with the financial instruments and markets in which it invests. The significant types of financial risks each Fund is exposed to include market risk and credit risk. Each Fund’s prospectus provides details of these and other types of risk.
BFA uses a “passive” or index approach to try to achieve each Fund’s investment objective following the securities included in its underlying index during upturns as well as downturns. BFA does not take steps to reduce market exposure or to lessen the effects of a declining market. Divergence from the underlying index and the composition of the portfolio is monitored by BFA.
MARKET RISK
Market risk arises mainly from uncertainty about future values of financial instruments influenced by price, currency and interest rate movements. It represents the potential loss each Fund may suffer through holding market positions in the face of market movements. Each Fund is exposed to market risk by virtue of its investment in fixed income instruments. The fair value of securities held by the Funds may decline due to general market conditions, economic trends or events that are not specifically related to the issuers of the securities including local, regional or global political, social or economic instability or to factors that affect a particular industry or group of industries. The extent of each Fund’s exposure to market risk is the market value of the investments held as shown in the Fund’s schedule of investments.
| | | | |
NOTESTO FINANCIAL STATEMENTS | | | 181 | |
Notes to Financial Statements (Continued)
iSHARES® TRUST
A diversified portfolio, where this is appropriate and consistent with a fund’s objectives, minimizes the risk that a price change of a particular investment will have a material impact on the NAV of a fund. The investment concentrations within each Fund’s portfolio are disclosed in its schedule of investments.
Each Fund invests a substantial amount of its assets in fixed-income securities. Changes in market interest rates or economic conditions, may affect the value and/or liquidity of such investments. Interest rate risk is the risk that prices of bonds and other fixed-income securities will decrease as interest rates rise and increase as interest rates fall. Securities with longer durations tend to be more sensitive to interest rate changes, usually making them more volatile than securities with shorter durations. Given the environment of historically low interest rates, each Fund may be subject to a greater risk of price losses if interest rates rise.
CREDIT RISK
Credit risk is the risk that an issuer or guarantor of debt instruments or the counterparty to a financial transaction, including derivatives contracts, repurchase agreements or loans of portfolio securities, is unable or unwilling to make timely interest and/or principal payments or to otherwise honor its obligations. BFA and its affiliates manage counterparty credit risk by entering into transactions only with counterparties that they believe have the financial resources to honor their obligations and by monitoring the financial stability of those counterparties. Financial assets, which potentially expose the Funds to issuer and counterparty credit risks, consist principally of financial instruments and receivables due from counterparties. The extent of each Fund’s exposure to credit and counterparty risks with respect to those financial assets is approximated by their value recorded in its statement of assets and liabilities.
The iShares $ iBoxx High Yield Corporate Bond ETF invests a substantial portion of its assets in high yield securities that are rated below investment-grade (including those bonds rated lower than “BBB- “ by Standard & Poor’s Ratings Services and Fitch or “Baa3” by Moody’s), or are unrated which may be more volatile than higher-rated securities of similar maturity. High yield securities may also be subject to greater levels of credit or default risk than higher-rated securities and high yield securities may be less liquid and more difficult to sell at an advantageous time or price or to value than higher-rated securities. In particular, high yield securities are often issued by smaller, less creditworthy companies or by highly leveraged (indebted) companies, which are generally less able than more financially stable companies to make scheduled payments of interest and principal.
Each Fund is treated as an entity separate from the Trust’s other funds for federal income tax purposes. It is the policy of each Fund to qualify as a regulated investment company by complying with the provisions applicable to regulated investment companies, as defined under Subchapter M of the Internal Revenue Code of 1986, as amended, and to annually distribute substantially all of its ordinary income and any net capital gains (taking into account any capital loss carryforwards) sufficient to relieve it from all, or substantially all, federal income and excise taxes. Accordingly, no provision for federal income taxes is required.
U.S. GAAP requires that certain components of net assets be adjusted to reflect permanent differences between financial and tax reporting. These reclassifications have no effect on net assets or NAV per share. The following permanent differences as of
| | |
| 182 | | 2016 iSHARES ANNUAL REPORTTO SHAREHOLDERS |
Notes to Financial Statements (Continued)
iSHARES® TRUST
February 29, 2016, attributable to realized gains (losses) from in-kind redemptions, were reclassified to the following accounts:
| | | | | | | | | | | | |
| iShares ETF | | Paid-in
Capital | | | Undistributed
Net Investment
Income/Distributions
in Excess of Net
Investment Income | | | Undistributed Net Realized Gain/Accumulated Net Realized Loss | |
iBoxx $ High Yield Corporate Bond | | $ | (211,898,459 | ) | | $ | — | | | $ | 211,898,459 | |
iBoxx $ Investment Grade Corporate Bond | | | 88,030,167 | | | | — | | | | (88,030,167 | ) |
The tax character of distributions paid during the years ended February 29, 2016 and February 28, 2015 was as follows:
| | | | | | | | |
| iShares ETF | | 2016 | | | 2015 | |
iBoxx $ High Yield Corporate Bond | | | | | | | | |
Ordinary income | | $ | 826,678,362 | | | $ | 728,101,752 | |
| | | | | | | | |
| | |
iBoxx $ Investment Grade Corporate Bond | | | | | | | | |
Ordinary income | | $ | 766,535,606 | | | $ | 608,603,942 | |
| | | | | | | | |
| | | | | | | | | |
As of February 29, 2016, the tax components of accumulated net earnings (losses) were as follows:
| | | | | | | | | | | | | | | | | | | | |
| iShares ETF | | Undistributed
Ordinary
Income | | | Capital
Loss
Carryforwards | | | Net Unrealized
Gains (Losses) a | | | Qualified
Late-Year
Losses b | | | Total | |
iBoxx $ High Yield Corporate Bond | | $ | 62,175,544 | | | $ | (280,131,210 | ) | | $ | (1,653,404,289 | ) | | $ | (185,049,346 | ) | | $ | (2,056,409,301 | ) |
iBoxx $ Investment Grade Corporate Bond | | | 67,846,436 | | | | (29,965,426 | ) | | | (430,379,582 | ) | | | (101,345,649 | ) | | | (493,844,221 | ) |
| | a | | The difference between book-basis and tax-basis unrealized gains (losses) was attributable primarily to the tax deferral of losses on wash sales. |
| | b | | The Funds have elected to defer certain qualified late-year losses and recognize such losses in the next taxable year. |
As of February 29, 2016, the following Funds had capital loss carryforwards available to offset future realized capital gains through the indicated expiration dates as follows:
| | | | | | | | | | | | | | | | |
| iShares ETF | | Non-
Expiring a | | | Expiring
2017 | | | Expiring
2018 | | | Total | |
iBoxx $ High Yield Corporate Bond | | $ | 273,456,668 | | | $ | 6,496,723 | | | $ | 177,819 | | | $ | 280,131,210 | |
iBoxx $ Investment Grade Corporate Bond | | | 29,965,426 | | | | — | | | | — | | | | 29,965,426 | |
| | a | | Must be utilized prior to losses subject to expiration. |
| | | | |
NOTESTO FINANCIAL STATEMENTS | | | 183 | |
Notes to Financial Statements (Continued)
iSHARES® TRUST
As of February 29, 2016, gross unrealized appreciation and gross unrealized depreciation based on cost for federal income tax purposes were as follows:
| | | | | | | | | | | | | | | | |
| iShares ETF | | Tax Cost | | | Gross
Unrealized
Appreciation | | | Gross
Unrealized
Depreciation | | | Net Unrealized
Appreciation
(Depreciation) | |
iBoxx $ High Yield Corporate Bond | | $ | 21,016,449,059 | | | $ | 56,792,719 | | | $ | (1,710,197,008 | ) | | $ | (1,653,404,289 | ) |
iBoxx $ Investment Grade Corporate Bond | | | 27,726,484,019 | | | | 233,621,968 | | | | (664,001,550 | ) | | | (430,379,582 | ) |
Management has analyzed tax laws and regulations and their application to the Funds as of February 29, 2016, inclusive of the open tax return years, and does not believe there are any uncertain tax positions that require recognition of a tax liability in the Funds’ financial statements.
Management has evaluated the impact of all subsequent events on the Funds through the date the financial statements were available to be issued and has determined that there were no subsequent events requiring adjustment or disclosure in the financial statements.
| | |
| 184 | | 2016 iSHARES ANNUAL REPORTTO SHAREHOLDERS |
Report of Independent Registered Public Accounting Firm
To the Shareholders and Board of Trustees of
iShares Trust:
In our opinion, the accompanying statements of assets and liabilities, including the schedules of investments, and the related statements of operations and of changes in net assets and the financial highlights present fairly, in all material respects, the financial position of iShares iBoxx $ High Yield Corporate Bond ETF and iShares iBoxx $ Investment Grade Corporate Bond ETF (the “Funds”) at February 29, 2016, the results of each of their operations, the changes in each of their net assets and their financial highlights for each of the periods presented, in conformity with accounting principles generally accepted in the United States of America. These financial statements and financial highlights (hereafter referred to as “financial statements”) are the responsibility of the Funds’ management. Our responsibility is to express an opinion on these financial statements based on our audits. We conducted our audits of these financial statements in accordance with the standards of the Public Company Accounting Oversight Board (United States). Those standards require that we plan and perform the audit to obtain reasonable assurance about whether the financial statements are free of material misstatement. An audit includes examining, on a test basis, evidence supporting the amounts and disclosures in the financial statements, assessing the accounting principles used and significant estimates made by management, and evaluating the overall financial statement presentation. We believe that our audits, which included confirmation of securities at February 29, 2016 by correspondence with the custodian, transfer agent and brokers, provide a reasonable basis for our opinion.
PricewaterhouseCoopers LLP
San Francisco, California
April 20, 2016
| | | | |
REPORTOF INDEPENDENT REGISTERED PUBLIC ACCOUNTING FIRM | | | 185 | |
Notes:
| | |
| 186 | | 2016 iSHARES ANNUAL REPORTTO SHAREHOLDERS |
For more information visit www.iShares.com or call 1-800-iShares (1-800-474-2737)
This report is intended for the Funds’ shareholders. It may not be distributed to prospective investors unless it is preceded or accompanied by the current prospectus.
Investing involves risk, including possible loss of principal.
The iShares Funds are distributed by BlackRock Investments, LLC (together with its affiliates, “BlackRock”).
A description of the policies that the Funds use to determine how to vote proxies relating to portfolio securities and information about how the Funds voted proxies relating to portfolio securities during the most recent twelve-month period ending June 30 is available without charge, upon request, by calling toll-free 1-800-474-2737; on the Funds’ website at www.iShares.com; and on the U.S. Securities and Exchange Commission (SEC) website at www.sec.gov.
The Funds file their complete schedules of portfolio holdings with the SEC for the first and third quarters of each fiscal year on Form N-Q. The Funds’ Forms N-Q are available on the SEC’s website or may be reviewed and copied at the SEC’s Public Reference Room in Washington, D.C. Information on the operation of the Public Reference Room may be obtained by calling 1-800-SEC-0330. The Funds also disclose their complete schedules of portfolio holdings on a daily basis on the Funds’ website.
©2016 BlackRock, Inc. All rights reserved. iSHARES and BLACKROCK are registered trademarks of BlackRock, Inc. or its subsidiaries. All other marks are the property of their respective owners.
iS-AR-1010-1016
OCTOBER 31, 2016
| | | | |
2016 ANNUAL REPORT | | | |  |
iShares U.S. ETF Trust
| Ø | | iShares Interest Rate Hedged 10+ Year Credit Bond ETF | CLYH | NYSE Arca |
Table of Contents
Management’s Discussion of Fund Performance
iSHARES® INTEREST RATE HEDGED 10+ YEAR CREDIT BOND ETF
U.S. BOND MARKET OVERVIEW
The U.S. bond market posted positive returns for the 12-month period ended October 31, 2016 (the “reporting period”). The Bloomberg Barclays U.S. Aggregate Bond Index, a broad measure of U.S. bond performance, returned 4.37% for the reporting period.
The bond market’s advance reflected continued uncertainty regarding the economic environment. Overall, the U.S. economy grew by 1.5% for the 12 months ended September 30, 2016 (the most recent data available), decelerating from 2.2% for the 12 months ended September 30, 2015. Although employment growth remained robust, other segments of the economy struggled. For example, industrial production contracted during the reporting period, while consumer spending increased by just 2.2%. As a result, the economy generated three consecutive quarters of anemic growth before rebounding in the final quarter of the reporting period.
Inflation generally remained muted as the consumer price index (“CPI”) rose by 1.6% for the reporting period. Although low by historical standards, the increase in the CPI was notably higher than the 0.2% increase for the 12 months ended October 31, 2015, reflecting a recovery in energy prices after they bottomed in February 2016.
In this environment, the U.S. Federal Reserve Bank (the “Fed”) ended a seven-year period of near-zero interest rates by raising its short-term interest rate target in December 2015. The Fed’s first interest rate hike since June 2006 increased the federal funds target rate from a range of 0%-0.25% to a range of 0.25%-0.50%. Despite expectations of more Fed rate increases in 2016, the slowing economic environment and lack of inflationary pressure led the Fed to hold rates steady for the remainder of the reporting period.
The combination of decelerating economic growth and low inflation pushed most U.S. bond yields lower and bond prices higher for the reporting period. Longer-term bonds fared best as long-term yields declined the most, while short-term bond yields rose slightly, reflecting the Fed rate hike in late 2015.
Sector performance was driven by strong investor demand for yield in a low interest rate environment. Consequently, corporate bonds — which offer the highest yields in the U.S. bond market — delivered the best returns for the reporting period. Lower-quality corporate bonds outperformed as the search for yield led investors to seek out riskier segments of the corporate bond market. In particular, high-yield corporate bonds (those with credit ratings below investment grade) returned more than 10% for the reporting period. Within the corporate sector, bonds issued by utility companies produced the highest returns. Industrial bonds also fared well, led by the strong performance of energy and commodity-related securities, while financial bonds lagged.
U.S. Treasury inflation-protected securities (“TIPS”) were also among the leading performers for the reporting period. The rebound in energy prices led to increased investor demand for inflation protection, which aided performance in the TIPS market.
Mortgage-backed securities posted positive returns for the reporting period but trailed the performance of the overall U.S. bond market. Mortgage-backed securities were held in check by prepayment fears as declining interest rates led to concerns about a renewed wave of mortgage refinancing.
U.S. Treasury and government agency bonds posted the lowest returns among U.S. bonds for the reporting period. Limited demand for the relatively low yields of Treasury and agency bonds weighed on their performance, as did the general underperformance of higher-quality securities.
| | | | |
MANAGEMENT’S DISCUSSIONOF FUND PERFORMANCE | | | 5 | |
Management’s Discussion of Fund Performance
iSHARES® INTEREST RATE HEDGED 10+ YEAR CREDIT BOND ETF
Performance as of October 31, 2016
| | | | | | | | | | | | | | | | | | | | |
| | | Average Annual Total Returns | | | | | | Cumulative Total Returns | |
| | | 1 Year | | | Since Inception | | | | | | 1 Year | | | Since Inception | |
Fund NAV | | | 2.49% | | | | (0.61)% | | | | | | | | 2.49% | | | | (0.77)% | |
Fund Market | | | 2.71% | | | | (0.54)% | | | | | | | | 2.71% | | | | (0.69)% | |
Bloomberg Barclays U.S. Long Credit Interest Rate Swaps Hedged Index | | | 3.89% | | | | (0.07)% | | | | | | | | 3.89% | | | | (0.08)% | |
GROWTH OF $10,000 INVESTMENT
(SINCE INCEPTION AT NET ASSET VALUE)
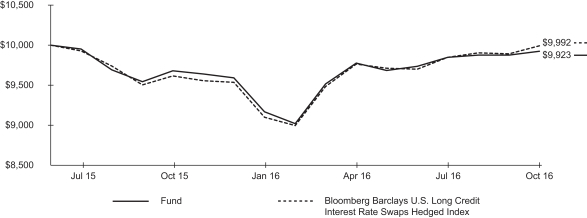
The inception date of the Fund was 7/22/15. The first day of secondary market trading was 7/23/15.
The Bloomberg Barclays U.S. Long Credit Interest Rate Swaps Hedged Index (formerly the Barclays U.S. Long Credit Interest Rate Swaps Hedged Index) is an unmanaged index that consists of the Bloomberg Barclays U.S. Long Credit Index plus interest rate swaps that intend to hedge the interest rate exposure of the existing Bloomberg Barclays U.S. Long Credit Index.
Past performance is no guarantee of future results. Performance results do not reflect the deduction of taxes that a shareholder would pay on fund distributions or on the redemption or sale of fund shares. See “About Fund Performance” on page 8 for more information.
| | | | | | | | | | | | | | | | | | | | | | | | | | |
| Shareholder Expenses | |
| Actual | | | Hypothetical 5% Return | | | | |
Beginning
Account Value
(5/1/16) | | | Ending Account Value (10/31/16) | | | Expenses Paid
During Period a,b | | | Beginning
Account Value (5/1/16) | | | Ending
Account Value (10/31/16) | | | Expenses Paid
During Period a,b | | | Annualized
Expense Ratio a | |
| $ | 1,000.00 | | | $ | 1,014.90 | | | $ | 0.46 | | | $ | 1,000.00 | | | $ | 1,024.70 | | | $ | 0.46 | | | | 0.09% | |
| a | Annualized expense ratio and expenses paid during the period do not include fees and expenses of the underlying fund in which the Fund invests. | |
| b | Expenses are calculated using the Fund’s annualized expense ratio (as disclosed in the table), multiplied by the average account value for the period, multiplied by the number of days in the period (184 days) and divided by the number of days in the year (366 days). See “Shareholder Expenses” on page 8 for more information. | |
| | |
| 6 | | 2016 iSHARES ANNUAL REPORTTO SHAREHOLDERS |
Management’s Discussion of Fund Performance (Continued)
iSHARES® INTEREST RATE HEDGED 10+ YEAR CREDIT BOND ETF
The iShares Interest Rate Hedged 10+ Year Credit Bond ETF (the “Fund”) seeks to mitigate the interest rate risk of a portfolio composed of investment-grade U.S. corporate bonds and U.S. dollar-denominated bonds, including those of non-U.S. corporations and governments, with remaining maturities greater than ten years. The Fund is an actively managed exchange-traded fund that does not seek to replicate the performance of a specified index.
The Fund currently seeks to achieve its investment objective by investing a substantial portion of its assets in one underlying fund, the iShares 10+ Year Credit Bond ETF. The Fund attempts to mitigate the interest rate risk of the underlying fund by holding short positions in U.S. Treasury futures or interest rate swaps. For the 12-month reporting period ended October 31, 2016, the total return for the Fund was 2.49%, net of fees.
The Fund’s performance was largely driven by strong investor demand for yield in a low interest rate environment, which narrowed the difference in yield between U.S. Treasuries and corporate bonds. Corporate bonds — which typically offer higher yields than U.S. Treasuries — outperformed all other sectors of the bond market. Higher-quality corporate bonds trailed high-yield bonds, as the search for yield led investors to seek out riskier segments of the corporate bond market.
Every sector of the Fund contributed positively to performance for the reporting period. Corporate bonds, which represented approximately 82% of the Fund on average during the reporting period, contributed the majority of the Fund’s return. Within the corporate sector, industrial bonds contributed the most to Fund performance, led by the consumer-oriented and communications industries. The Fund’s energy bonds also performed well as oil and gas prices rebounded in the second half of the reporting period. Financial bonds also helped Fund performance for the reporting period, with the banking and insurance industries contributing the most to performance.
Non-corporate credit securities also contributed to the Fund’s return for the reporting period. These securities tend to be higher quality than corporate bonds, and consequently offer lower yields.
From a credit quality perspective, the Fund’s position in medium-quality bonds — those rated A and Baa, which represented approximately 80% of the Fund on average for the reporting period — delivered the largest contribution to the Fund’s return.
The Fund’s interest rate hedging activity detracted from Fund performance for the reporting period. Hedging against interest rate risk can improve returns when bond yields rise, but it can be a drag on performance when bond yields decline, as was the case during the reporting period.
ALLOCATION BY INVESTMENT TYPE 1
As of 10/31/16
| | |
| Investment Type | | Percentage of
Total Investments 2 |
| | | | |
Corporate Bonds & Notes | | | 86.46 | % |
Municipal Debt Obligations | | | 7.97 | |
Foreign Government Obligations | | | 5.57 | |
| | | | |
TOTAL | | | 100.00 | % |
| | | | |
ALLOCATION BY CREDIT QUALITY 1
As of 10/31/16
| | |
| Moody’s Credit Rating 3 | | Percentage of
Total Investments 2 |
| | | | |
Aaa | | | 3.69 | % |
Aa | | | 12.78 | |
A | | | 36.40 | |
Baa | | | 42.61 | |
Ba | | | 3.44 | |
B | | | 0.01 | |
Not Rated | | | 1.07 | |
| | | | |
TOTAL | | | 100.00 | % |
| | | | |
| | 1 | Table shown is for the iShares 10+ Year Credit Bond ETF, the underlying fund in which the Fund invests. |
| | 2 | Excludes money market funds. |
| | 3 | Credit quality ratings shown reflect the ratings assigned by Moody’s Investors Service (“Moody’s”), a widely used independent, nationally recognized statistical rating organization. Moody’s credit ratings are opinions of the credit quality of individual obligations or of an issuer’s general creditworthiness. Investment grade ratings are credit ratings of Baa or higher. Below investment grade ratings are credit ratings of Ba or lower. Unrated investments do not necessarily indicate low credit quality. Credit quality ratings are subject to change. |
| | | | |
MANAGEMENT’S DISCUSSIONOF FUND PERFORMANCE | | | 7 | |
About Fund Performance
Past performance is no guarantee of future results. Current performance may be lower or higher than the performance data quoted. Performance data current to the most recent month-end is available at www.ishares.com. Performance results assume reinvestment of all dividends and capital gain distributions and do not reflect the deduction of taxes that a shareholder would pay on fund distributions or on the redemption or sale of fund shares. The investment return and principal value of shares will vary with changes in market conditions. Shares may be worth more or less than their original cost when they are redeemed or sold in the market. Performance for certain funds may reflect a waiver of a portion of investment advisory fees. Without such a waiver, performance would have been lower.
Net asset value or “NAV” is the value of one share of a fund as calculated in accordance with the standard formula for valuing mutual fund shares. The price used to calculate market return (“Market Price”) is determined by using the midpoint between the highest bid and the lowest offer on the primary stock exchange on which shares of a fund are listed for trading, as of the time that such fund’s NAV is calculated. Certain funds may have a NAV which is determined prior to the opening of regular trading on its listed exchange and their market returns are calculated using the midpoint of the bid/ask spread as of the opening of regular trading on the exchange. Market and NAV returns assume that dividends and capital gain distributions have been reinvested at Market Price and NAV, respectively.
An index is a statistical composite that tracks a specified financial market or sector. Unlike a fund, an index does not actually hold a portfolio of securities and therefore does not incur the expenses incurred by a fund. These expenses negatively impact fund performance. Also, market returns do not include brokerage commissions that may be payable on secondary market transactions. If brokerage commissions were included, market returns would be lower.
Shareholder Expenses
As a shareholder of a Fund, you incur two types of costs: (1) transaction costs, including brokerage commissions on purchases and sales of fund shares and (2) ongoing costs, including management fees and other fund expenses. The expense example, which is based on an investment of $1,000 invested on May 1, 2016 and held through October 31, 2016, is intended to help you understand your ongoing costs (in dollars and cents) of investing in a Fund and to compare these costs with the ongoing costs of investing in other funds.
Actual Expenses — The table provides information about actual account values and actual expenses. Annualized expense ratios reflect contractual and voluntary fee waivers, if any. To estimate the expenses that you paid on your account over the period, simply divide your account value by $1,000 (for example, an $8,600 account value divided by $1,000 = 8.6), then multiply the result by the number under the heading entitled “Expenses Paid During Period.”
Hypothetical Example for Comparison Purposes — The table also provides information about hypothetical account values and hypothetical expenses based on the Fund’s actual expense ratio and an assumed rate of return of 5% per year before expenses. You may use this information to compare the ongoing costs of investing in your Fund and other funds. To do so, compare this 5% hypothetical example with the 5% hypothetical examples that appear in the shareholder reports of the other funds.
Please note that the expenses shown in the table are meant to highlight your ongoing costs only and do not reflect any transactional costs, such as brokerage commissions paid on purchases and sales of fund shares. Therefore, the hypothetical examples are useful in comparing ongoing costs only and will not help you determine the relative total costs of owning different funds. In addition, if these transactional costs were included, your costs would have been higher.
| | |
| 8 | | 2016 iSHARES ANNUAL REPORTTO SHAREHOLDERS |
Schedule of Investments
iSHARES® INTEREST RATE HEDGED 10+ YEAR CREDIT BOND ETF
October 31, 2016
| | | | | | | | |
| Security | | Shares | | | Value | |
INVESTMENT COMPANIES — 91.01% | |
| |
EXCHANGE-TRADED FUNDS — 91.01% | | | | | |
iShares 10+ Year Credit Bond ETFa | | | 124,896 | | | $ | 7,666,116 | |
| | | | | | | | |
| | | | | | | 7,666,116 | |
| | | | | | | | |
TOTAL INVESTMENT COMPANIES | | | | | |
(Cost: $7,252,392) | | | | 7,666,116 | |
|
SHORT-TERM INVESTMENTS — 4.49% | |
| |
MONEY MARKET FUNDS — 4.49% | | | | | |
BlackRock Cash Funds: Treasury,
SL Agency Shares | | | | | |
0.29%b,c | | | 377,931 | | | | 377,931 | |
| | | | | | | | |
| | | | | | | 377,931 | |
| | | | | | | | |
TOTAL SHORT-TERM INVESTMENTS | | | | | |
(Cost: $377,931) | | | | 377,931 | |
| | | | | | | | |
| | | | | | | | |
| | | | | | Value | |
TOTAL INVESTMENTS
IN SECURITIES — 95.50% | | | | | |
(Cost: $7,630,323)d | | | | | | $ | 8,044,047 | |
Other Assets, Less Liabilities — 4.50% | | | | 379,159 | |
| | | | | | | | |
NET ASSETS — 100.00% | | | $ | 8,423,206 | |
| | | | | | | | |
| a | Affiliated issuer. See Schedule 1. |
| b | Affiliated money market fund. |
| c | The rate quoted is the annualized seven-day yield of the fund at period end. |
| d | The cost of investments for federal income tax purposes was $7,630,882. Net unrealized appreciation was $413,165, of which $413,165 represented gross unrealized appreciation on securities and $ — represented gross unrealized depreciation on securities. |
Schedule 1 — Affiliates (Note 2)
Investments in issuers considered to be affiliates of the Fund (excluding affiliated money market funds) during the year ended October 31, 2016, for purposes of Section 2(a)(3) of the 1940 Act, were as follows:
| | | | | | | | | | | | | | | | | | | | | | | | | | | | |
| Affiliated issuer | | Shares
held at
beginning
of year | | | Shares
purchased | | | Shares sold | | | Shares
held at end
of year | | | Value at end
of year | | | Dividend
income | | | Net realized
gain (loss) | |
iShares 10+ Year Credit Bond ETF | | | 134,996 | | | | 27,692 | | | | (37,792 | ) | | | 124,896 | | | $ | 7,666,116 | | | $ | 300,645 | | | $ | (22,436 | ) |
| | | | | | | | | | | | | | | | | | | | | | | | | | | | |
| | | | | | | | | | | | | | | | | | | | | | | | | | | | | |
Schedule 2 — Swaps Contracts (Note 5)
Centrally cleared short interest rate swaps outstanding as of October 31, 2016 were as follows:
| | | | | | | | | | | | | | | | | | | | | | | | | | | | |
| Fixed rate a | | Floating rate a | | | Clearinghouse | | | Expiration
date | | | Notional
amount | | | Value | | | Premiums
paid
(received) | | | Unrealized
appreciation
(depreciation) | |
1.01% | | | 3-month LIBOR | | | | Chicago Mercantile | | | | 12/08/2018 | | | $ | (500,000 | ) | | $ | 1,004 | | | $ | 60 | | | $ | 944 | |
1.17% | | | 3-month LIBOR | | | | Chicago Mercantile | | | | 12/08/2021 | | | | (1,000,000 | ) | | | 9,945 | | | | 86 | | | | 9,859 | |
1.44% | | | 3-month LIBOR | | | | Chicago Mercantile | | | | 12/08/2026 | | | | (2,150,000 | ) | | | 59,738 | | | | (2,042 | ) | | | 61,780 | |
1.70% | | | 3-month LIBOR | | | | Chicago Mercantile | | | | 12/08/2036 | | | | (2,500,000 | ) | | | 140,002 | | | | (10,052 | ) | | | 150,054 | |
1.77% | | | 3-month LIBOR | | | | Chicago Mercantile | | | | 12/08/2046 | | | | (1,500,000 | ) | | | 114,197 | | | | (12,718 | ) | | | 126,915 | |
| | | | | | | | | | | | | | | | | | | | | | | | | | | | |
| | | | | | | | | | | | | | | Net unrealized appreciation | | | $ | 349,552 | |
| | | | | | | | | | | | | | | | | | | | | | | | | | | | |
| | | | | | | | | | | | | | | | | | | | | | | | | | | | | |
| | a | | The Fund pays the fixed rate and receives the floating rate. |
Schedule of Investments (Continued)
iSHARES® INTEREST RATE HEDGED 10+ YEAR CREDIT BOND ETF
October 31, 2016
Schedule 3 — Fair Value Measurements
Various inputs are used in determining the fair value of financial instruments. For description of the input levels and information about the Fund’s policy regarding valuation of financial instruments, see Note 1.
The following table summarizes the value of the Fund’s investments according to the fair value hierarchy as of October 31, 2016. The breakdown of the Fund’s investments into major categories is disclosed in the schedule of investments above.
| | | | | | | | | | | | | | | | |
| | | Level 1 | | | Level 2 | | | Level 3 | | | Total | |
Investments: | | | | | | | | | | | | | | | | |
Assets: | | | | | | | | | | | | | | | | |
Investment companies | | $ | 7,666,116 | | | $ | — | | | $ | — | | | $ | 7,666,116 | |
Money market funds | | | 377,931 | | | | — | | | | — | | | | 377,931 | |
| | | | | | | | | | | | | | | | |
Total | | $ | 8,044,047 | | | $ | — | | | $ | — | | | $ | 8,044,047 | |
| | | | | | | | | | | | | | | | |
Derivative financial instrumentsa: | | | | | | | | | | | | | | | | |
Assets: | | | | | | | | | | | | | | | | |
Centrally cleared interest rate swaps | | $ | — | | | $ | 349,552 | | | $ | — | | | $ | 349,552 | |
| | | | | | | | | | | | | | | | |
Total | | $ | — | | | $ | 349,552 | | | $ | — | | | $ | 349,552 | |
| | | | | | | | | | | | | | | | |
| | | | | | | | | | | | | | | | | |
| | a | | Shown at the unrealized appreciation (depreciation) on the contracts. |
See notes to financial statements.
| | |
| 10 | | 2016 iSHARES ANNUAL REPORTTO SHAREHOLDERS |
Statement of Assets and Liabilities
iSHARES® INTEREST RATE HEDGED 10+ YEAR CREDIT BOND ETF
October 31, 2016
| | | | |
| | |
ASSETS | | | | |
Investments, at cost: | | | | |
Affiliated (Note 2) | | $ | 7,630,323 | |
| | | | |
Total cost of investments | | $ | 7,630,323 | |
| | | | |
Investments in securities, at fair value (Note 1): | | | | |
Affiliated (Note 2) | | $ | 8,044,047 | |
| | | | |
Total fair value of investments | | | 8,044,047 | |
Cash | | | 6,000 | |
Cash pledged for centrally cleared swaps | | | 395,000 | |
Receivables: | | | | |
Dividends | | | 61 | |
| | | | |
Total Assets | | | 8,445,108 | |
| | | | |
| |
LIABILITIES | | | | |
Payables: | | | | |
Investment advisory fees (Note 2) | | | 714 | |
Variation margin on centrally cleared swaps | | | 21,188 | |
| | | | |
Total Liabilities | | | 21,902 | |
| | | | |
| |
NET ASSETS | | $ | 8,423,206 | |
| | | | |
| |
Net assets consist of: | | | | |
Paid-in capital | | $ | 8,497,973 | |
Accumulated net realized loss | | | (838,043 | ) |
Net unrealized appreciation | | | 763,276 | |
| | | | |
NET ASSETS | | $ | 8,423,206 | |
| | | | |
| |
Shares outstandinga | | | 350,000 | |
| | | | |
| |
Net asset value per share | | $ | 24.07 | |
| | | | |
| a | No par value, unlimited number of shares authorized. |
See notes to financial statements.
Statement of Operations
iSHARES® INTEREST RATE HEDGED 10+ YEAR CREDIT BOND ETF
Year ended October 31, 2016
| | | | |
| | |
NET INVESTMENT INCOME | | | | |
Dividends — affiliated (Note 2) | | $ | 301,142 | |
| | | | |
Total investment income | | | 301,142 | |
| | | | |
| |
EXPENSES | | | | |
Investment advisory fees (Note 2) | | | 27,175 | |
| | | | |
Total expenses | | | 27,175 | |
Less investment advisory fees waived (Note 2) | | | (19,375 | ) |
| | | | |
Net expenses | | | 7,800 | |
| | | | |
Net investment income | | | 293,342 | |
| | | | |
| |
NET REALIZED AND UNREALIZED GAIN (LOSS) | | | | |
Net realized gain (loss) from: | | | | |
Investments — affiliated (Note 2) | | | (317 | ) |
In-kind redemptions — affiliated (Note 2) | | | (22,122 | ) |
Swap agreements | | | (914,198 | ) |
Realized gain distributions from affiliated funds | | | 1 | |
| | | | |
Net realized loss | | | (936,636 | ) |
| | | | |
Net change in unrealized appreciation/depreciation on: | | | | |
Investments | | | 381,314 | |
Swap agreements | | | 407,714 | |
| | | | |
Net change in unrealized appreciation/depreciation | | | 789,028 | |
| | | | |
Net realized and unrealized loss | | | (147,608 | ) |
| | | | |
NET INCREASE IN NET ASSETS RESULTING FROM OPERATIONS | | $ | 145,734 | |
| | | | |
See notes to financial statements.
| | |
| 12 | | 2016 iSHARES ANNUAL REPORTTO SHAREHOLDERS |
Statements of Changes in Net Assets
iSHARES® INTEREST RATE HEDGED 10+ YEAR CREDIT BOND ETF
| | | | | | | | |
| | | Year ended October 31, 2016 | | | Period from
July 22, 2015a to
October 31, 2015 | |
| | |
INCREASE (DECREASE) IN NET ASSETS | | | | | | | | |
| | |
OPERATIONS: | | | | | | | | |
Net investment income | | $ | 293,342 | | | $ | 40,904 | |
Net realized loss | | | (936,636 | ) | | | (35,744 | ) |
Net change in unrealized appreciation/depreciation | | | 789,028 | | | | (25,752 | ) |
| | | | | | | | |
Net increase (decrease) in net assets resulting from operations | | | 145,734 | | | | (20,592 | ) |
| | | | | | | | |
| | |
DISTRIBUTIONS TO SHAREHOLDERS: | | | | | | | | |
From net investment income | | | (200,730 | ) | | | (22,101 | ) |
Return of capital | | | (6,500 | ) | | | (11,253 | ) |
| | | | | | | | |
Total distributions to shareholders | | | (207,230 | ) | | | (33,354 | ) |
| | | | | | | | |
| | |
CAPITAL SHARE TRANSACTIONS: | | | | | | | | |
Proceeds from shares sold | | | 1,201,441 | | | | 8,483,227 | |
Cost of shares redeemed | | | (1,146,020 | ) | | | — | |
| | | | | | | | |
Net increase in net assets from capital share transactions | | | 55,421 | | | | 8,483,227 | |
| | | | | | | | |
INCREASE (DECREASE) IN NET ASSETS | | | (6,075 | ) | | | 8,429,281 | |
| | |
NET ASSETS | | | | | | | | |
Beginning of period | | | 8,429,281 | | | | — | |
| | | | | | | | |
End of period | | $ | 8,423,206 | | | $ | 8,429,281 | |
| | | | | | | | |
| | |
SHARES ISSUED AND REDEEMED | | | | | | | | |
Shares sold | | | 50,000 | | | | 350,000 | |
Shares redeemed | | | (50,000 | ) | | | — | |
| | | | | | | | |
Net increase in shares outstanding | | | — | | | | 350,000 | |
| | | | | | | | |
| a | Commencement of operations. |
See notes to financial statements.
Financial Highlights
iSHARES® INTEREST RATE HEDGED 10+ YEAR CREDIT BOND ETF
(For a share outstanding throughout each period)
| | | | | | | | |
| | | Year ended
Oct. 31, 2016 | | | Period from
Jul. 22, 2015a to
Oct. 31, 2015 | |
Net asset value, beginning of period | | $ | 24.08 | | | $ | 25.10 | |
| | | | | | | | |
Income from investment operations: | | | | | | | | |
Net investment incomeb | | | 0.89 | | | | 0.26 | |
Net realized and unrealized lossc | | | (0.28 | ) | | | (1.09 | ) |
| | | | | | | | |
Total from investment operations | | | 0.61 | | | | (0.83 | ) |
| | | | | | | | |
Less distributions from: | | | | | | | | |
Net investment income | | | (0.60 | ) | | | (0.13 | ) |
Return of capital | | | (0.02 | ) | | | (0.06 | ) |
| | | | | | | | |
Total distributions | | | (0.62 | ) | | | (0.19 | ) |
| | | | | | | | |
Net asset value, end of period | | $ | 24.07 | | | $ | 24.08 | |
| | | | | | | | |
| | |
Total return | | | 2.49 | %d | | | (3.19 | )%d,e |
| | | | | | | | |
| | |
Ratios/Supplemental data: | | | | | | | | |
Net assets, end of period (000s) | | $ | 8,423 | | | $ | 8,429 | |
Ratio of expenses to average net assetsf,g | | | 0.10 | % | | | 0.12 | % |
Ratio of expenses to average net assets prior to waived feesf,g | | | 0.35 | % | | | 0.35 | % |
Ratio of net investment income to average net assetsf | | | 3.78 | % | | | 3.80 | % |
Portfolio turnover rateh,i | | | 9 | % | | | 4 | % |
| a | Commencement of operations. |
| b | Based on average shares outstanding throughout each period. |
| c | The amounts reported for a share outstanding may not accord with the change in aggregate gains and losses in securities for the fiscal period due to the timing of capital share transactions in relation to the fluctuating market values of the Fund’s underlying securities. |
| d | The total return disclosed is based on the net asset value (“NAV”) calculated daily for the creation and redemption of shares in the Fund, which may differ from the NAV calculated for financial reporting purposes. Based on the NAV calculated for financial reporting purposes, the total returns for the year ended October 31, 2016 and the period ended October 31, 2015 were 2.62% and -3.31%, respectively. |
| f | Annualized for periods of less than one year. |
| g | The Fund indirectly bears its proportionate share of fees and expenses incurred by the underlying fund in which the Fund is invested. These ratios do not include these indirect fees and expenses. |
| h | Portfolio turnover rates exclude portfolio securities received or delivered as a result of processing capital share transactions in Creation Units. |
| i | Portfolio turnover rates exclude the portfolio activity of the underlying fund in which the Fund is invested. |
See notes to financial statements.
| | |
| 14 | | 2016 iSHARES ANNUAL REPORTTO SHAREHOLDERS |
Notes to Financial Statements
iSHARES® INTEREST RATE HEDGED 10+ YEAR CREDIT BOND ETF
iShares U.S. ETF Trust (the “Trust”) is registered under the Investment Company Act of 1940, as amended (the “1940 Act”), as an open-end management investment company. The Trust was established as a Delaware statutory trust pursuant to an Agreement and Declaration of Trust dated June 21, 2011.
These financial statements relate only to the following fund (the “Fund”):
| | |
| iShares ETF | | Diversification Classification |
Interest Rate Hedged 10+ Year Credit Bond | | Diversified |
Currently the Fund seeks to achieve its investment objective by investing a substantial portion of its assets in an exchange-traded fund of iShares Trust (an “underlying fund”), an affiliate of the Fund. The financial statements and schedules of investments for the underlying fund can be found elsewhere in this report and should be read in conjunction with the Fund’s financial statements.
Pursuant to the Trust’s organizational documents, the Fund’s officers and trustees are indemnified against certain liabilities that may arise out of the performance of their duties to the Fund. Additionally, in the normal course of business, the Fund enters into contracts with service providers that contain general indemnification clauses. The Fund’s maximum exposure under these arrangements is unknown as this would involve future claims that may be made against the Fund that have not yet occurred.
| 1. | SIGNIFICANT ACCOUNTING POLICIES |
The following significant accounting policies are consistently followed by the Fund in the preparation of its financial statements in conformity with accounting principles generally accepted in the United States of America (“U.S. GAAP”). The preparation of financial statements in conformity with U.S. GAAP requires management to make certain estimates and assumptions that affect the reported amounts of assets and liabilities and disclosures of contingent assets and liabilities at the date of the financial statements and the reported amounts of revenue and expenses during the reporting period. Actual results could differ from those estimates. The Fund is considered an investment company under U.S. GAAP and follows the accounting and reporting guidance applicable to investment companies.
SECURITY VALUATION
The Fund’s investments are valued at fair value each day that the Fund’s listing exchange is open and, for financial reporting purposes, as of the report date should the reporting period end on a day that the Fund’s listing exchange is not open. U.S. GAAP defines fair value as the price a fund would receive to sell an asset or pay to transfer a liability in an orderly transaction between market participants at the measurement date. The BlackRock Global Valuation Methodologies Committee (the “Global Valuation Committee”) provides oversight of the valuation of investments for the Fund. The investments of the Fund are valued pursuant to policies and procedures developed by the Global Valuation Committee and approved by the Board of Trustees of the Trust (the “Board”).
| | • | | Exchange-traded funds and closed-end funds traded on a recognized securities exchange are valued at that day’s last reported trade price or the official closing price, as applicable, on the exchange where the fund is primarily traded. Funds traded on a recognized exchange for which there were no sales on that day are valued at the last traded price. |
| | • | | Open-end U.S. mutual funds (including money market funds) are valued at that day’s published net asset value (“NAV”). |
| | • | | Swap agreements are valued utilizing quotes received daily by independent pricing services or through brokers, which are derived using daily swap curves and models that incorporate a number of market data factors, such as discounted cash flows, trades and values of the underlying reference instruments. |
| | | | |
NOTESTO FINANCIAL STATEMENTS | | | 15 | |
Notes to Financial Statements (Continued)
iSHARES® INTEREST RATE HEDGED 10+ YEAR CREDIT BOND ETF
In the event that application of these methods of valuation results in a price for an investment which is deemed not to be representative of the fair value of such investment or if a price is not available, the investment will be valued based upon other available factors deemed relevant by the Global Valuation Committee, in accordance with policies approved by the Board. These factors include but are not limited to (i) attributes specific to the investment; (ii) the principal market for the investment; (iii) the customary participants in the principal market for the investment; (iv) data assumptions by market participants for the investment, if reasonably available; (v) quoted prices for similar investments in active markets; and (vi) other factors, such as future cash flows, interest rates, yield curves, volatilities, prepayment speeds, loss severities, credit risks and/or default rates. Valuations based on such factors are reported to the Board on a quarterly basis.
The Global Valuation Committee employs various methods for calibrating valuation approaches for investments where an active market does not exist, including regular due diligence of the Trust’s pricing vendors, a regular review of key inputs and assumptions, transactional back-testing or disposition analysis to compare unrealized gains and losses to realized gains and losses, reviews of missing or stale prices, reviews of large movements in market values, and reviews of market related activity.
Various inputs are used in determining the fair value of financial instruments. Inputs may be based on independent market data (“observable inputs”) or they may be internally developed (“unobservable inputs”). These inputs are categorized into a disclosure hierarchy consisting of three broad levels for financial reporting purposes as follows:
| | • | | Level 1 — Unadjusted quoted prices in active markets for identical assets or liabilities; |
| | • | | Level 2 — Inputs other than quoted prices included within Level 1 that are observable for the asset or liability either directly or indirectly, including quoted prices for similar assets or liabilities in active markets, quoted prices for identical or similar assets or liabilities in markets that are not considered to be active, inputs other than quoted prices that are observable for the asset or liability (such as exchange rates, financing terms, interest rates, yield curves, volatilities, prepayment speeds, loss severities, credit risks and default rates) or other market-corroborated inputs; and |
| | • | | Level 3 — Unobservable inputs for the asset or liability based on the best information available in the circumstances, to the extent observable inputs are not available, including the Global Valuation Committee’s assumptions used in determining the fair value of investments. |
The hierarchy gives the highest priority to unadjusted quoted prices in active markets for identical assets or liabilities (Level 1 measurements) and the lowest priority to unobservable inputs (Level 3 measurements). Accordingly, the degree of judgement exercised in determining fair value is greatest for instruments categorized in Level 3. The inputs used to measure fair value may fall into different levels of the fair value hierarchy. In such cases, for disclosure purposes, the fair value hierarchy classification is determined based on the lowest level input that is significant to the fair value measurement in its entirety. The fair value hierarchy for the Fund’s investments is included in its schedule of investments.
Changes in valuation techniques may result in transfers in or out of an assigned level within the fair value hierarchy. In accordance with the Trust’s policy, transfers between different levels of the fair value hierarchy are deemed to have occurred as of the beginning of the reporting period. The categorization of values determined for financial instruments are based on the pricing transparency of the financial instruments and are not necessarily an indication of the risks associated with investing in those securities.
SECURITY TRANSACTIONS AND INCOME RECOGNITION
Security transactions are accounted for on trade date. Dividend income and capital gain distributions from the Underlying Funds, if any, are recognized on the ex-dividend date. Interest income is accrued daily. Realized gains and losses on investment transactions are determined using the specific identification method.
| | |
| 16 | | 2016 iSHARES ANNUAL REPORTTO SHAREHOLDERS |
Notes to Financial Statements (Continued)
iSHARES® INTEREST RATE HEDGED 10+ YEAR CREDIT BOND ETF
DISTRIBUTIONS TO SHAREHOLDERS
Dividends and distributions paid by the Fund are recorded on the ex-dividend dates. Distributions are determined on a tax basis and may differ from net investment income and net realized capital gains for financial reporting purposes. Dividends and distributions are paid in U.S. dollars and cannot be automatically reinvested in additional shares of the Fund.
| 2. | INVESTMENT ADVISORY AGREEMENT AND OTHER TRANSACTIONS WITH AFFILIATES |
Pursuant to an Investment Advisory Agreement with the Trust, BlackRock Fund Advisors (“BFA”) manages the investment of the Fund’s assets. BFA is a California corporation indirectly owned by BlackRock, Inc. (“BlackRock”). Under the Investment Advisory Agreement, BFA is responsible for substantially all expenses of the Fund, except interest, taxes, brokerage commissions and other expenses connected with the execution of portfolio transactions, distribution fees, litigation expenses and any extraordinary expenses.
For its investment advisory services to the Fund, BFA is entitled to an annual investment advisory fee of 0.35% based on the average daily net assets of the Fund. In addition, the Fund indirectly pays its pro rata share of fees and expenses attributable to its investments in other investment companies (“acquired fund fees and expenses”). BFA has contractually agreed to reduce its investment advisory fee for the Fund through February 28, 2022 so that the investment advisory fee is equal to the acquired fund fees and expenses that would be been experienced by the Fund related to its investments in the iShares 10+ Year Credit Bond ETF (“CLY”), after taking into account any fee waivers by CLY, plus 0.10%.
BlackRock Investments, LLC, an affiliate of BFA, is the distributor for the Fund. Pursuant to the distribution agreement, BFA is responsible for any fees or expenses for distribution services provided to the Fund.
The Fund may invest its positive cash balances in certain money market funds managed by BFA or an affiliate. The income earned on these temporary cash investments is included in “Dividends – affiliated” in the statement of operations.
The PNC Financial Services Group, Inc. is the largest stockholder of BlackRock and is considered to be an affiliate of the Fund for 1940 Act purposes.
Certain trustees and officers of the Trust are also officers of BlackRock Institutional Trust Company, N.A. and/or BFA.
| 3. | INVESTMENT PORTFOLIO TRANSACTIONS |
Purchases and sales of investments (excluding in-kind transactions and short-term investments) for the year ended October 31, 2016, were $611,569 and $1,120,948, respectively.
In-kind purchases and sales (see Note 4) for the year ended October 31, 2016, were $1,129,399 and $1,075,051, respectively.
| 4. | CAPITAL SHARE TRANSACTIONS |
Capital shares are issued and redeemed by the Fund only in aggregations of a specified number of shares or multiples thereof (“Creation Units”) at NAV. Except when aggregated in Creation Units, shares of the Fund are not redeemable. Transactions in capital shares for the Fund are disclosed in detail in the statements of changes in net assets.
The consideration for the purchase of Creation Units of a fund in the Trust generally consists of the in-kind deposit of a designated portfolio of securities and a specified amount of cash. Certain funds in the Trust may be offered in Creation Units solely or partially for cash in U.S. dollars. Investors purchasing and redeeming Creation Units may pay a purchase transaction fee
| | | | |
NOTESTO FINANCIAL STATEMENTS | | | 17 | |
Notes to Financial Statements (Continued)
iSHARES® INTEREST RATE HEDGED 10+ YEAR CREDIT BOND ETF
and a redemption transaction fee directly to State Street Bank and Trust Company, the Trust’s administrator, to offset transfer and other transaction costs associated with the issuance and redemption of Creation Units, including Creation Units for cash. Investors transacting in Creation Units for cash may also pay an additional variable charge to compensate the relevant fund for certain transaction costs (i.e., stamp taxes, taxes on currency or other financial transactions, and brokerage costs) and market impact expenses relating to investing in portfolio securities. Such variable charges, if any, are included in “Proceeds from shares sold” in the statement of changes in net assets.
The Fund may enter into short positions in interest rate swaps in an attempt to mitigate interest rate risk by economically hedging the value of fixed rate bonds, which may decrease when interest rates rise (interest rate risk). Interest rate swaps are agreements in which one party pays a stream of interest payments, either fixed or floating, for another party’s stream of interest payments, either fixed or floating, on the same notional amount for a specified period of time. Interest rate swaps are marked-to-market daily and changes in value are recorded as unrealized appreciation (depreciation). Swap agreements are privately negotiated in the over-the-counter market. The Fund enters into centrally cleared interest rate swaps.
In a centrally cleared swap, immediately following execution of the swap agreement, the swap agreement is novated to a central counterparty (“CCP”) and the CCP becomes the Fund’s counterparty on the swap. The Fund is required to interface with the CCP through a broker. Upon entering into a centrally cleared swap, the Fund is required to deposit initial margin with the broker in the form of cash or securities in an amount that varies depending on the size and risk profile of the particular swap. Securities deposited as initial margin are designated on the schedule of investments and cash deposited is recorded on the statement of assets and liabilities as cash pledged for centrally cleared swaps. The daily change in valuation of centrally cleared swaps is recorded as a receivable or payable for variation margin in the statement of assets and liabilities. Payments received from (paid to) the CCP, including at termination, are recorded as realized gain (loss) in the statement of operations.
Swap transactions involve, to varying degrees, elements of interest rate, credit and market risks in excess of the amounts recognized in the statement of assets and liabilities. Such risks involve the possibility that there will be no liquid market for these agreements, that the counterparty to the agreements may default on its obligation to perform or disagree as to the meaning of the contractual terms in the agreements, and that there may be unfavorable changes in interest rates and/or market values associated with these transactions.
The following table shows the value of interest rate swaps held by the Fund as of October 31, 2016 and the related locations in the statement of assets and liabilities, presented by risk exposure category:
| | | | |
| Assets | |
Centrally cleared interest rate swaps: | | | | |
Variation margin / Net assets consist of – net unrealized appreciationa | | $ | 349,552 | |
| | | | |
| | | | | |
| | a | | Represents cumulative appreciation of centrally cleared interest rate swaps as reported in the schedule of investments. Only current day’s variation margin is reported separately within the statement of assets and liabilities. |
| | |
| 18 | | 2016 iSHARES ANNUAL REPORTTO SHAREHOLDERS |
Notes to Financial Statements (Continued)
iSHARES® INTEREST RATE HEDGED 10+ YEAR CREDIT BOND ETF
The following table shows the realized and unrealized gains (losses) on interest rate swaps held by the Fund during the year ended October 31, 2016 and the related locations in the statement of operations, presented by risk exposure category:
| | | | | | | | |
| | | Net Realized
Gain (Loss) | | | Net Change in
Unrealized
Appreciation/Depreciation | |
Centrally cleared interest rate swaps: | | | | | | | | |
Swap agreements | | $ | (914,198 | ) | | $ | 407,714 | |
| | | | | | | | |
| | | | | | | | | |
For the year ended October 31, 2016, the average quarter-end notional amount of open interest rate swaps for the Fund (where the Fund pays the fixed rate), was $6,386,000.
In the normal course of business, the Fund’s investment activities expose it to various types of risk associated with the financial instruments and markets in which it invests. The significant types of financial risks the Fund is exposed to include market risk and credit risk. The Fund’s prospectus provides details of these and other types of risk.
MARKET RISK
Market risk arises mainly from uncertainty about future values of financial instruments influenced by price, currency and interest rate movements. It represents the potential loss a fund may suffer through holding market positions in the face of market movements. A fund is exposed to market risk by virtue of its investment in equity, fixed income and/or financial derivative instruments or indirectly by virtue of its investment in underlying funds. The fair value of securities held by a fund may decline due to general market conditions, economic trends or events that are not specifically related to the issuers of the securities including local, regional or global political, social or economic instability or to factors that affect a particular industry or group of industries. The extent of a fund’s exposure to market risk is the market value of the investments held as shown in the fund’s schedule of investments.
A diversified portfolio, where this is appropriate and consistent with a fund’s objectives, minimizes the risk that a price change of a particular investment will have a material impact on the NAV of a fund. The investment concentrations within the Fund’s portfolio are disclosed in its schedule of investments.
CREDIT RISK
Credit risk is the risk that an issuer or guarantor of debt instruments or the counterparty to a financial transaction, including derivatives contracts, repurchase agreements or loans of portfolio securities, is unable or unwilling to make timely interest and/or principal payments or to otherwise honor its obligations. BFA and its affiliates manage counterparty credit risk by entering into transactions only with counterparties that they believe have the financial resources to honor their obligations and by monitoring the financial stability of those counterparties. Financial assets, which potentially expose a fund to issuer and counterparty credit risks, consist principally of financial instruments and receivables due from counterparties. The extent of a fund’s exposure to credit and counterparty risks with respect to those financial assets is approximated by their value recorded in its statement of assets and liabilities.
| | | | |
NOTESTO FINANCIAL STATEMENTS | | | 19 | |
Notes to Financial Statements (Continued)
iSHARES® INTEREST RATE HEDGED 10+ YEAR CREDIT BOND ETF
The Fund is treated as an entity separate from the Trust’s other funds for federal income tax purposes. It is the policy of the Fund to qualify as a regulated investment company by complying with the provisions applicable to regulated investment companies, as defined under Subchapter M of the Internal Revenue Code of 1986, as amended, and to annually distribute substantially all of its ordinary income and any net capital gains (taking into account any capital loss carryforwards) sufficient to relieve it from all, or substantially all, federal income and excise taxes. Accordingly, no provision for federal income taxes is required.
U.S. GAAP requires that certain components of net assets be adjusted to reflect permanent differences between financial and tax reporting. These reclassifications have no effect on net assets or NAV per share. The following permanent differences as of October 31, 2016, attributable to the accounting for swap agreements and realized gains (losses) from in-kind redemptions, were reclassified to the following accounts:
| | | | | | | | |
Paid-in
Capital | | Undistributed Net Investment Income/Distributions
in Excess of Net
Investment Income | | | Undistributed Net Realized Gain/Accumulated Net Realized Loss | |
| $(22,922) | | $ | (92,612) | | | $ | 115,534 | |
The tax character of distributions paid during the years ended October 31, 2016 and October 31, 2015 was as follows:
| | | | | | | | |
| | | 2016 | | | 2015 | |
Ordinary income | | $ | 200,730 | | | $ | 22,101 | |
Return of capital | | | 6,500 | | | | 11,253 | |
| | | | | | | | |
| | $ | 207,230 | | | $ | 33,354 | |
| | | | | | | | |
| | | | | | | | | |
As of October 31, 2016, the tax components of accumulated net earnings (losses) were as follows:
| | | | | | | | |
Capital
Loss
Carryforwards | | Net
Unrealized
Gains (Losses) a | | | Total | |
| $(837,484) | | $ | 762,717 | | | $ | (74,767) | |
| | a | | The difference between book-basis and tax-basis unrealized gains (losses) was attributable primarily to the tax deferral of losses on wash sales. |
As of October 31, 2016, the Fund had non-expiring capital loss carryforwards in amount of $837,484 available to offset future realized capital gains.
Management has analyzed tax laws and regulations and their application to the Fund as of October 31, 2016, inclusive of the open tax return years, and does not believe there are any uncertain tax positions that require recognition of a tax liability in the Fund’s financial statements.
| | |
| 20 | | 2016 iSHARES ANNUAL REPORTTO SHAREHOLDERS |
Notes to Financial Statements (Continued)
iSHARES® INTEREST RATE HEDGED 10+ YEAR CREDIT BOND ETF
Management has evaluated the impact of all subsequent events on the Fund through the date the financial statements were available to be issued and has determined that there were no subsequent events requiring adjustment or disclosure in the financial statements.
| | | | |
NOTESTO FINANCIAL STATEMENTS | | | 21 | |
Report of Independent Registered Public Accounting Firm
To the Shareholders and Board of Trustees of
iShares U.S. ETF Trust:
In our opinion, the accompanying statement of assets and liabilities, including the schedule of investments, and the related statements of operations and of changes in net assets and the financial highlights present fairly, in all material respects, the financial position of iShares Interest Rate Hedged 10+ Year Credit Bond ETF (the “Fund”) at October 31, 2016, the results of its operations, the changes in its net assets and its financial highlights for each of the periods presented, in conformity with accounting principles generally accepted in the United States of America. These financial statements and financial highlights (hereafter referred to as “financial statements”) are the responsibility of the Fund’s management. Our responsibility is to express an opinion on these financial statements based on our audits. We conducted our audits of these financial statements in accordance with the standards of the Public Company Accounting Oversight Board (United States). Those standards require that we plan and perform the audit to obtain reasonable assurance about whether the financial statements are free of material misstatement. An audit includes examining, on a test basis, evidence supporting the amounts and disclosures in the financial statements, assessing the accounting principles used and significant estimates made by management, and evaluating the overall financial statement presentation. We believe that our audits, which included confirmation of securities at October 31, 2016 by correspondence with the custodian, transfer agent and brokers, provide a reasonable basis for our opinion.
PricewaterhouseCoopers LLP
San Francisco, California
December 21, 2016
| | |
| 22 | | 2016 iSHARES ANNUAL REPORTTO SHAREHOLDERS |
Tax Information (Unaudited)
iSHARES® INTEREST RATE HEDGED 10+ YEAR CREDIT BOND ETF
For the fiscal year ended October 31, 2016, the Fund hereby designates $194,233 as the maximum amount allowable as interest-related dividends eligible for exemption from U.S. withholding tax for nonresident aliens and foreign corporations.
Board Review and Approval of Investment Advisory
Contract
iSHARES® INTEREST RATE HEDGED 10+ YEAR CREDIT BOND ETF
Under Section 15(c) of the Investment Company Act of 1940 (the “1940 Act”), the Trust’s Board of Trustees (the “Board”), including a majority of Trustees who are not “interested persons” of the Trust (as that term is defined in the 1940 Act) (the “Independent Trustees”), is required annually to consider and approve the Investment Advisory Contract between the Trust and BFA (the “Advisory Contract”) on behalf of the Fund. The Independent Trustees requested, and BFA provided, such information as the Independent Trustees, with advice from independent counsel, deemed reasonably necessary to evaluate the Advisory Contract. A committee of all of the Independent Trustees (the “15(c) Committee”), with independent counsel, met with management on April 28, 2016 and May 9, 2016. At these meetings, the 15(c) Committee reviewed and discussed information provided in response to the 15(c) Committee’s initial requests, and requested certain additional information, which management agreed to provide. At a meeting held on May 17, 2016, management presented information to the Board relating to the continuance of the Advisory Contract, including information requested by the 15(c) Committee during its meetings. The Board, including the Independent Trustees, reviewed and discussed such information at length. The Independent Trustees requested from management certain additional information, which management agreed to provide. At a meeting held on June 21-23, 2016, the Board, including the Independent Trustees, reviewed the additional information provided by management in response to these requests. After extensive discussions, the Board, including all of the Independent Trustees, approved the continuance of the Advisory Contract for the Fund, based on a review of qualitative and quantitative information provided by BFA, including the additional information management provided at the request of the Independent Trustees. The Board noted its satisfaction with the extent and quality of information provided and its frequent interactions with management, as well as the detailed responses and other information provided by BFA. The Board also noted that the Board and BFA agreed to discuss potential enhancements and adjustments to the 15(c) process for the coming year. The Independent Trustees were advised by their independent counsel throughout the process, including about the legal standards applicable to their review. In approving the Advisory Contract for the Fund, the Board, including the Independent Trustees, considered the following factors, no one of which was controlling, and reached the following conclusions:
Expenses and Performance of the Fund — The Board reviewed statistical information prepared by Broadridge Financial Solutions Inc. (“Broadridge”), an independent provider of investment company data, regarding the expense ratio components, including gross and net total expenses, waivers/reimbursements (if any), and underlying fund fees and expenses (if any) of the Fund in comparison with the same information for other exchange traded funds (including, where applicable, funds sponsored by an “at cost” service provider) and, in the limited instances where no comparable ETFs existed and the comparison group would not otherwise be reasonable in Broadridge’s judgment, pure index institutional mutual funds, objectively selected by Broadridge as comprising the Fund’s applicable peer group pursuant to Broadridge’s proprietary ETF methodology (the “Peer Group”). The Board was provided with a detailed description of Broadridge’s proprietary ETF methodology used by Broadridge to determine the Fund’s Peer Group. The Board further noted that due to the limitations in providing comparable funds in the Peer Group, the statistical information provided in Broadridge’s report may or may not provide meaningful direct comparisons to the Fund in all instances.
The Board also noted that the investment advisory fee rate and overall expenses (net of waivers and reimbursements) for the Fund were higher than the median of the investment advisory fee rates and overall expenses (net of waivers and
| | | | |
BOARD REVIEWAND APPROVALOF INVESTMENT ADVISORY CONTRACT | | | 23 | |
Board Review and Approval of Investment Advisory
Contract (Continued)
iSHARES® INTEREST RATE HEDGED 10+ YEAR CREDIT BOND ETF
reimbursements) of the funds in its Peer Group, excluding iShares funds. The Board further noted that the Fund’s Peer Group contained only four comparison funds identified by Broadridge, excluding iShares funds.
In addition, to the extent that any of the comparison funds included in the Peer Group, excluding iShares funds, track the same index as the Fund, Broadridge also provided, and the Board reviewed, a comparison of the Fund’s performance for the one-, three-, five-, ten-year, and since inception periods, as applicable, and for the “last quarter” period ended December 31, 2015, to that of such relevant comparison funds for the same periods.
The Board noted that the Fund is an actively managed ETF that does not seek to track the performance of a specified index and that the management team for the Fund manages the Fund’s portfolio in accordance with its investment objective. The Board further noted that during the prior year, the Board received periodic reports on the Fund’s short- and longer-term performance in comparison with its peer group and benchmark index. Such periodic comparative performance information, including additional detailed information on certain specific iShares funds requested by the Board, was also considered. The Board noted that the Fund generally performed in line with expectations relative to the Fund’s peer group and benchmark index over the relevant periods.
Based on this review, the other factors considered at the meeting, and their general knowledge of ETF pricing, the Board concluded that the investment advisory fee rate and expense level and the historical performance of the Fund supported the Board’s approval of the continuance of the Advisory Contract for the coming year.
Nature, Extent and Quality of Services Provided by BFA — Based on management’s representations, including information about recent and proposed enhancements to the iShares business, including with respect to capital markets support and analysis, product design and other services, the Board expected that there would be no diminution in the scope of services required of or provided by BFA under the Advisory Contract for the coming year as compared to the scope of services provided by BFA during prior years. In reviewing the scope of these services, the Board considered BFA’s investment philosophy and experience, noting that BFA and its affiliates have committed significant resources over time, including during the past year, to supporting the iShares funds and their shareholders. The Board also considered BFA’s compliance program and its compliance record with respect to the Fund. In that regard, the Board noted that BFA reports to the Board about portfolio management and compliance matters on a periodic basis in connection with regularly scheduled meetings of the Board, and on other occasions as necessary and appropriate, and has provided information and made appropriate officers available as needed to provide further assistance with these matters. The Board also reviewed the background and experience of the persons responsible for the day-to-day management of the Fund, as well as the resources available to them in managing the Fund. In addition to the above considerations, the Board reviewed and considered detailed presentations regarding BFA’s investment performance, investment and risk management processes and strategies provided at the June 21-23, 2016 meeting and throughout the previous year, and matters related to BFA’s portfolio compliance policies and procedures. The Board noted that the Fund had met its investment objective consistently since its inception date.
Based on review of this information, and the performance information discussed above, the Board concluded that the nature, extent and quality of services provided by BFA to the Fund under the Advisory Contract supported the Board’s approval of the continuance of the Advisory Contract for the coming year.
Costs of Services Provided to the Fund and Profits Realized by BFA and its Affiliates — The Board reviewed information about the profitability to BlackRock of the Fund, based on the fees payable to BFA and its affiliates (including fees under the Advisory Contract), and all other sources of revenue and expense to BFA and its affiliates from the Fund’s operations for the last calendar year. The Board reviewed BlackRock’s profitability methodology for the iShares funds, noting that the 15(c) Committee had focused on the methodology and profitability presentation during its meetings. The Board discussed the sources of direct and
| | |
| 24 | | 2016 iSHARES ANNUAL REPORTTO SHAREHOLDERS |
Board Review and Approval of Investment Advisory
Contract (Continued)
iSHARES® INTEREST RATE HEDGED 10+ YEAR CREDIT BOND ETF
ancillary revenue with management, including the revenues to BTC from securities lending by the Fund. The Board also discussed BFA’s profit margin as reflected in the Fund’s profitability analysis and reviewed information regarding potential economies of scale (as discussed below). Based on this review, the Board concluded that the profits realized by BFA and its affiliates under the Advisory Contract and from other relationships between the Fund and BFA and/or its affiliates, if any, were within a reasonable range in light of the factors considered.
Economies of Scale — The Board reviewed information regarding potential economies of scale or other efficiencies that may result from increases in the Fund’s assets, noting that the issue of economies of scale had been focused on extensively by the 15(c) Committee during its meetings and addressed by management. The Board and the 15(c) Committee reviewed information provided by BFA regarding scale benefits shared with the iShares funds through relatively low fee rates established at inception, breakpoints, waivers, or other fee reductions, as well as through additional investment in the iShares business and the provision of improved or additional infrastructure and services to the iShares funds and their shareholders. The Board and the 15(c) Committee received information regarding BlackRock’s historical profitability, including BFA’s and its affiliates’ costs in providing services. The cost information distinguished, among other things, between fixed and variable costs, and explained how the level of fixed and variable costs, as well as the nature of such costs, may impact the existence or size of scale benefits. The Board noted that the Advisory Contract for the Fund did not provide for any breakpoints in the Fund’s investment advisory fee rate as the assets of the Fund increase. However, the Board noted that should material economies of scale exist in the future that are not otherwise shared, a breakpoint structure for the Fund may be appropriate, and that it would continue to monitor the sharing of economies of scale to determine the appropriateness of adding breakpoints in the future.
Based on this review, as well as the other factors considered at the meeting, the Board, recognizing its responsibility to consider this issue periodically, determined to approve the continuance of the Advisory Contract for the coming year.
Fees and Services Provided for Other Comparable Funds/Accounts Managed by BFA and its Affiliates — The Board received and considered information regarding the investment advisory/management fee rates for other funds/accounts in the U.S. for which BFA (or its affiliates) provides investment advisory/management services, including open-end funds registered under the 1940 Act (including sub-advised funds), collective trust funds, and institutional separate accounts (together, the “Other Accounts”), and acknowledged BFA’s assertion that the iShares funds are fundamentally different investment vehicles from the Other Accounts. The Board noted that BFA and its affiliates do not manage Other Accounts with a similar investment strategy or investment mandate as the Fund. The Board further noted that BFA provided the Board with detailed information regarding how the Other Accounts (particularly institutional clients) generally differ from the Fund, including in terms of the different and generally more extensive services provided to the Fund, as well as other significant differences. In that regard, the Board considered that the pricing of services to institutional clients is typically based on a number of factors beyond the nature and extent of the specific services to be provided and often depends on the overall relationship between the client and its affiliates and the adviser and its affiliates. In addition, the Board considered the relative complexity and inherent risks and challenges of managing and providing other services to the Fund, as a publicly traded exchange traded fund, as compared to the Other Accounts that are institutional clients in light of differing regulatory requirements and client-imposed mandates. The Board also considered the “all-inclusive” nature of the Fund’s advisory fee structure, and the Fund expenses borne by BFA under this arrangement. The Board noted that the investment advisory fee rate under the Advisory Contract for the Fund was generally higher than the investment advisory/management fee rates for certain of the Other Accounts (particularly institutional clients) and concluded that the differences appeared to be consistent with the factors discussed.
Other Benefits to BFA and/or its Affiliates — The Board reviewed the “fallout” benefits or ancillary revenue received by BFA and/or its affiliates in connection with the services provided to the Fund by BFA, such as payment of revenue to BTC, the Fund’s securities lending agent, for loaning portfolio securities (which was included in the profit margins reviewed by the Board pursuant to BFA’s profitability methodology), and payment of advisory fees and/or administration fees to BFA and BTC (or their affiliates) in
| | | | |
BOARD REVIEWAND APPROVALOF INVESTMENT ADVISORY CONTRACT | | | 25 | |
Board Review and Approval of Investment Advisory
Contract (Continued)
iSHARES® INTEREST RATE HEDGED 10+ YEAR CREDIT BOND ETF
connection with any investments by the Fund in other funds for which BFA (or its affiliates) provides investment advisory services and/or administration services. The Board noted that BFA generally does not use soft dollars or consider the value of research or other services that may be provided to BFA (including its affiliates) in selecting brokers for portfolio transactions for the Fund. The Board further noted that any portfolio transactions on behalf of the Fund placed through a BFA affiliate or purchased from an underwriting syndicate in which a BFA affiliate participates, are reported to the Board pursuant to Rule 17e-1 or Rule 10f-3, as applicable, under the 1940 Act. The Board concluded that any such ancillary benefits would not be disadvantageous to the Fund’s shareholders and thus would not alter the Board’s conclusion with respect to the appropriateness of approving the continuance of the Advisory Contract for the coming year.
Based on the considerations described above, the Board determined that the Fund’s investment advisory fee rate under the Advisory Contract does not constitute a fee that is so disproportionately large as to bear no reasonable relationship to the services rendered and that could not have been the product of arm’s-length bargaining, and concluded that it is in the best interest of the Fund and its shareholders to approve the continuance of the Advisory Contract for the coming year.
| | |
| 26 | | 2016 iSHARES ANNUAL REPORTTO SHAREHOLDERS |
Supplemental Information (Unaudited)
iSHARES® INTEREST RATE HEDGED 10+ YEAR CREDIT BOND ETF
Section 19(a) Notices
The amounts and sources of distributions reported are estimates and are provided pursuant to regulatory requirements and are not being provided for tax reporting purposes. The actual amounts and sources for tax reporting purposes will depend upon the Fund’s investment experience during the year and may be subject to changes based on the tax regulations. Shareholders will receive a Form 1099-DIV each calendar year that will inform them how to report these distributions for federal income tax purposes.
| | | | | | | | | | | | | | | | | | | | | | | | | | | | | | |
Total Cumulative Distributions
for the Fiscal Year | | | % Breakdown of the Total Cumulative
Distributions for the Fiscal Year | |
Net Investment Income | | | Net
Realized
Capital
Gains | | | Return
of
Capital | | | Total Per Share | | | Net
Investment
Income | | | Net
Realized
Capital
Gains | | | Return
of
Capital | | | Total
Per
Share | |
| $ | 0.603924 | | | $ | — | | | $ | 0.019899 | | | $ | 0.623823 | | | | 97 | % | | | — | % | | | 3 | % | | | 100 | % |
Premium/Discount Information
The Premium/Discount Information section is intended to present information about the differences between the daily market price on secondary markets for shares of a fund and that fund’s NAV. NAV is the price at which a fund issues and redeems shares. It is calculated in accordance with the standard formula for valuing mutual fund shares. The “Market Price” of a fund generally is determined using the midpoint between the highest bid and the lowest offer on the primary stock exchange on which the shares of such fund are listed for trading, as of the time that the fund’s NAV is calculated. A fund’s Market Price may be at, above or below its NAV. The NAV of a fund will fluctuate with changes in the fair value of its portfolio holdings. The Market Price of a fund will fluctuate in accordance with changes in its NAV, as well as market supply and demand.
Premiums or discounts are the differences (expressed as a percentage) between the NAV and Market Price of a fund on a given day, generally at the time the NAV is calculated. A premium is the amount that a fund is trading above the reported NAV, expressed as a percentage of the NAV. A discount is the amount that a fund is trading below the reported NAV, expressed as a percentage of the NAV.
The following information shows the frequency of distributions of premiums and discounts for the Fund. The information shown for the Fund is for five calendar years (or from the inception date of the Fund if less than five years) through the date of the most recent calendar quarter-end. The specific periods covered for the Fund are disclosed in the table for the Fund.
| | | | |
SUPPLEMENTAL INFORMATION | | | 27 | |
Supplemental Information (Unaudited) (Continued)
iSHARES® INTEREST RATE HEDGED 10+ YEAR CREDIT BOND ETF
Each line in the table shows the number of trading days in which the Fund traded within the premium/discount range indicated. The number of trading days in each premium/discount range is also shown as a percentage of the total number of trading days in the period covered by each table. All data presented here represents past performance, which cannot be used to predict future results.
Period Covered: July 22, 2015 through September 30, 2016
| | | | | | | | |
Premium/Discount Range | | Number
of Days | | | Percentage of
Total Days | |
Greater than 1.5% and Less than 2.0% | | | 1 | | | | 0.33 | % |
Greater than 1.0% and Less than 1.5% | | | 5 | | | | 1.65 | |
Greater than 0.5% and Less than 1.0% | | | 11 | | | | 3.63 | |
Between 0.5% and –0.5% | | | 274 | | | | 90.43 | |
Less than –0.5% and Greater than –1.0% | | | 12 | | | | 3.96 | |
| | | | | | | | |
| | | 303 | | | | 100 | % |
| | | | | | | | |
| | |
| 28 | | 2016 iSHARES ANNUAL REPORTTO SHAREHOLDERS |
Trustee and Officer Information
iSHARES® U.S. ETF TRUST
The Board of Trustees has responsibility for the overall management and operations of the Funds, including general supervision of the duties performed by BFA and other service providers. Each Trustee serves until he or she resigns, is removed, dies, retires or becomes incapacitated. The President, Chief Compliance Officer, Treasurer and Secretary shall each hold office until their successors are chosen and qualify, and all other officers shall hold office until he or she resigns or is removed. Trustees who are not “interested persons” (as defined in the 1940 Act) of the Trust are referred to as independent trustees (“Independent Trustees”).
The registered investment companies advised by BFA or its affiliates (the “BlackRock-advised Funds”) are organized into one complex of closed-end funds, two complexes of open-end funds and one complex of exchange-traded funds (“Exchange-Traded Fund Complex”) (each, a “BlackRock Fund Complex”). The Fund is included in the BlackRock Fund Complex referred to as the Exchange-Traded Fund Complex. Each Trustee also serves as a Director of iShares, Inc. and a Trustee of iShares Trust, and, as a result, oversees a total of 333 funds (as of October 31, 2016) within the Exchange-Traded Fund Complex. Mr. Lawton also serves as an Advisory Board Member for iShares, Inc. and iShares Trust with respect to 333 funds (as of October 31, 2016) within the Exchange-Traded Fund Complex. With the exception of Robert S. Kapito, Mark Wiedman and Benjamin Archibald, the address of each Trustee, Advisory Board Member and officer is c/o BlackRock, Inc., 400 Howard Street, San Francisco, CA 94105. The address of Mr. Kapito, Mr. Wiedman, and Mr. Archibald is c/o BlackRock, Inc., Park Avenue Plaza, 55 East 52nd Street, New York, NY 10055. The Board has designated Cecilia H. Herbert as its Independent Board Chair. Additional information about the Fund’s Trustees and officers may be found in the Fund’s combined Statement of Additional Information, which is available without charge, upon request, by calling toll-free 1-800-iShares (1-800-474-2737).
Interested Trustees
| | | | | | |
| | | | |
| Name (Age) | | Position(s) | | Principal Occupation(s) During the Past 5 Years | | Other Directorships Held by Trustee
During the Past 5 Years |
Robert S. Kapitoa (59) | | Trustee (since 2011). | | President and Director, BlackRock, Inc. (since 2006); Vice Chairman of BlackRock, Inc. and Head of BlackRock, Inc.’s Portfolio Management Group (since its formation in 1998) and BlackRock, Inc.’s predecessor entities (since 1988); Trustee, University of Pennsylvania (since 2009); President of Board of Directors, Hope & Heroes Children’s Cancer Fund (since 2002); President of the Board of Directors, Periwinkle Theatre for Youth (since 1983). | | Director of iShares, Inc. (since 2009); Trustee of iShares Trust (since 2009). |
| | | |
Mark Wiedmanb (45) | | Trustee (since 2013) | | Managing Director, BlackRock, Inc. (since 2007); Global Head of iShares (since 2011); Head of Corporate Strategy, BlackRock, Inc. (2009-2011). | | Director of iShares, Inc. (since 2013); Trustee of iShares Trust (since 2013); Director of PennyMac Financial Services, Inc. (since 2008). |
| a | Robert S. Kapito is deemed to be an “interested person” (as defined in the 1940 Act) of the Trust due to his affiliations with BlackRock, Inc. |
| b | Mark Wiedman is deemed to be an “interested person” (as defined in the 1940 Act) of the Trust due to his affiliations with BlackRock, Inc. and its affiliates. |
| | | | |
2016 iSHARES ANNUAL REPORTTO SHAREHOLDERS | | | 29 | |
Trustee and Officer Information (Continued)
iSHARES® U.S. ETF TRUST
Independent Trusteesc
| | | | | | |
| | | | |
| Name (Age) | | Position(s) | | Principal Occupation(s) During the Past 5 Years | | Other Directorships Held by Trustee
During the Past 5 Years |
Cecilia H. Herbert (67) | | Trustee (since 2011); Independent Board Chair (since 2016); Nominating and Governance Committee Chair (since 2016). | | Director (1998-2013) and President (2007-2011) of the Board of Directors, Catholic Charities CYO; Trustee (2002-2011) and Chair of the Finance and Investment Committee (2006-2010) of the Thacher School; Member (since 1992) and Chair (1994-2005) of the Investment Committee, Archdiocese of San Francisco; Trustee and Member of the Investment Committee, WNET, the New York public media company (since 2011). | | Director of iShares, Inc. (since 2005); Trustee of iShares Trust (since 2005); Independent Board Chair of iShares Inc. and iShares Trust (since 2016); Director of Forward Funds (23 portfolios) (since 2009); Trustee of Salient MF Trust (4 portfolios) (since 2015). |
| | | |
Jane D. Carlin (60) | | Trustee (since 2015); Risk Committee Chair (since 2016). | | Managing Director and Global Head of Financial Holding Company Governance & Assurance and the Global Head of Operational Risk Management of Morgan Stanley (2006-2012). | | Director of iShares, Inc. (since 2015); Trustee of iShares Trust (since 2015); Director of PHH Corporation (mortgage solutions) (since 2012). |
| | | |
Charles A. Hurty (73) | | Trustee (since 2011); Audit Committee Chair (since 2011). | | Retired; Partner, KPMG LLP (1968-2001). | | Director of iShares, Inc. (since 2005); Trustee of iShares Trust (since 2005); Director of GMAM Absolute Return Strategy Fund (1 portfolio) (since 2002); Director of SkyBridge Alternative Investments Multi-Adviser Hedge Fund Portfolios LLC (2 portfolios) (since 2002). |
| | | |
John E. Kerrigan (61) | | Trustee (since 2011); Securities Lending Committee Chair (since 2016). | | Chief Investment Officer, Santa Clara University (since 2002). | | Director of iShares, Inc. (since 2005); Trustee of iShares Trust (since 2005). |
| | | |
John E. Martinez (55) | | Trustee (since 2011); Fixed Income Plus Committee Chair (since 2016). | | Director of FirstREX Agreement Corp. (formerly EquityRock, Inc.) (since 2005). | | Director of iShares, Inc. (since 2003); Trustee of iShares Trust (since 2003). |
| | |
| 30 | | 2016 iSHARES ANNUAL REPORTTO SHAREHOLDERS |
Trustee and Officer Information (Continued)
iSHARES® U.S. ETF TRUST
Independent Directorsc (Continued)
| | | | | | |
| | | | |
| Name (Age) | | Position(s) | | Principal Occupation(s) During the Past 5 Years | | Other Directorships Held by Trustee
During the Past 5 Years |
Madhav V. Rajan (52) | | Trustee (since 2011); Equity Plus Committee Chair and 15(c) Committee Chair (since 2016). | | Robert K. Jaedicke Professor of Accounting and Senior Associate Dean for Academic Affairs and Head of MBA Program, Stanford University Graduate School of Business (since 2001); Professor of Law (by courtesy), Stanford Law School (since 2005); Visiting Professor, University of Chicago (2007-2008). | | Director of iShares, Inc. (since 2011); Trustee of iShares Trust (since 2011); Director, Cavium, Inc. (since 2013). |
| c | Robert H. Silver served as an Independent Trustee until March 31, 2016. |
| | | | |
TRUSTEEAND OFFICER INFORMATION | | | 31 | |
Trustee and Officer Information (Continued)
iSHARES® U.S. ETF TRUST
Officersd
| | | | |
| | | |
| Name (Age) | | Position(s) | | Principal Occupation(s) During the Past 5 Years |
Martin Small (41) | | President
(since 2016). | | Managing Director, BlackRock, Inc. (since 2010); Head of U.S. iShares (since 2015); Co-Head of the U.S. Financial Markets Advisory Group, BlackRock, Inc. (2008-2014). |
| | |
Jack Gee (57) | | Treasurer and Chief Financial Officer (since 2011). | | Managing Director, BlackRock, Inc. (since 2009); Senior Director of Fund Administration of Intermediary Investor Business, BGI (2009). |
| | |
Benjamin Archibald (41) | | Secretary
(since 2015). | | Managing Director, BlackRock, Inc. (since 2014); Director, BlackRock, Inc. (2010-2013); Secretary of the BlackRock-advised Mutual Funds (since 2012). |
| | |
Steve Messinger (54) | | Executive Vice President
(since 2016). | | Managing Director, BlackRock, Inc. (2007-2014 and since 2016); Managing Director, Beacon Consulting Group (2014-2016). |
| | |
Charles Park (49) | | Chief Compliance Officer
(since 2011). | | Chief Compliance Officer of BlackRock Advisors, LLC and the BlackRock-advised Funds in the Equity-Bond Complex, the Equity-Liquidity Complex and the Closed-End Complex (since 2014); Chief Compliance Officer, BFA (since 2006). |
| | |
Scott Radell (47) | | Executive Vice President (since 2012). | | Managing Director, BlackRock, Inc. (since 2009); Head of Portfolio Solutions, BlackRock, Inc. (since 2009); Head of Portfolio Solutions, BGI (2007-2009); Credit Portfolio Manager, BGI (2005-2007); Credit Research Analyst, BGI (2003-2005). |
| | |
Amy Schioldager (54) | | Executive Vice President (since 2011). | | Senior Managing Director, BlackRock, Inc. (since 2009); Global Head of Index Equity, BGI (2008-2009); Global Head of U.S. Indexing, BGI (2006-2008); Head of Domestic Equity Portfolio Management, BGI (2001-2006). |
| d | Manish Mehta served as President until October 15, 2016. |
| | |
| 32 | | 2016 iSHARES ANNUAL REPORTTO SHAREHOLDERS |
Trustee and Officer Information (Continued)
iSHARES® U.S. ETF TRUST
Advisory Board Member
| | | | | | |
| | | | |
| Name (Age) | | Position(s) | | Principal Occupation(s)
During the Past 5 Years | | Other Directorships
Held by Advisory Board Member
During the Past 5 Years |
Drew E. Lawton (57) | | Advisory Board Member
(since 2016). | | Senior Managing Director of New York Life Insurance Company (2010-2015). | | Advisory Board Member of iShares, Inc. (since 2016); Advisory Board Member of iShares Trust (since 2016); Director of Principal Funds, Inc., Principal Variable Contracts Funds, Inc. and Principal Exchange-Traded Funds (124 portfolios) (March 2016-October 2016). |
| | | | |
TRUSTEEAND OFFICER INFORMATION | | | 33 | |
Additional Financial Information
Schedule of Investments (Unaudited)
October 31, 2016
Statement of Assets and Liabilities (Unaudited)
October 31, 2016
Audited Financial Statements
February 29, 2016
iShares Trust
iShares 10+ Year Credit Bond ETF | CLY | NYSE Arca
Schedule of Investments (Unaudited)
iSHARES® 10+ YEAR CREDIT BOND ETF
October 31, 2016
| | | | | | | | | | |
| Security | | | |
Principal
(000s) | | | Value | |
CORPORATE BONDS & NOTES — 84.55% | |
|
ADVERTISING — 0.03% | |
WPP Finance 2010 | |
5.13%, 09/07/42 | | | | $ | 55 | | | $ | 58,149 | |
5.63%, 11/15/43 | | | | | 229 | | | | 264,179 | |
| | | | | | | | | | |
| | | | | | | | | 322,328 | |
AEROSPACE & DEFENSE — 1.59% | |
Boeing Co. (The) | |
3.30%, 03/01/35 | | (Call 09/01/34) | | | 275 | | | | 272,377 | |
3.38%, 06/15/46 | | (Call 12/15/45) | | | 600 | | | | 579,636 | |
3.50%, 03/01/45 | | (Call 09/01/44) | | | 403 | | | | 398,531 | |
6.63%, 02/15/38 | | | | | 16 | | | | 22,603 | |
6.88%, 03/15/39a | | | | | 282 | | | | 413,181 | |
General Dynamics Corp. | |
3.60%, 11/15/42 | | (Call 05/15/42) | | | 406 | | | | 406,755 | |
Lockheed Martin Corp. | |
3.60%, 03/01/35 | | (Call 09/01/34) | | | 419 | | | | 415,849 | |
3.80%, 03/01/45 | | (Call 09/01/44) | | | 624 | | | | 620,081 | |
4.07%, 12/15/42 | | | | | 1,450 | | | | 1,501,171 | |
4.50%, 05/15/36 | | (Call 11/15/35)a | | | 775 | | | | 864,520 | |
4.70%, 05/15/46 | | (Call 11/15/45) | | | 1,009 | | | | 1,145,558 | |
4.85%, 09/15/41 | | | | | 400 | | | | 453,940 | |
Series B | | | | | | | | | | |
6.15%, 09/01/36 | | | | | 189 | | | | 245,980 | |
Northrop Grumman Corp. | |
3.85%, 04/15/45 | | (Call 10/15/44) | | | 100 | | | | 100,783 | |
4.75%, 06/01/43 | | | | | 451 | | | | 512,512 | |
5.05%, 11/15/40 | | | | | 311 | | | | 358,633 | |
Northrop Grumman Systems Corp. | |
7.75%, 02/15/31 | | | | | 555 | | | | 806,498 | |
Raytheon Co. | |
4.20%, 12/15/44 | | (Call 06/15/44) | | | 218 | | | | 240,441 | |
4.70%, 12/15/41 | | | | | 378 | | | | 438,703 | |
4.88%, 10/15/40 | | | | | 112 | | | | 131,772 | |
7.20%, 08/15/27 | | | | | 155 | | | | 213,551 | |
Rockwell Collins Inc. | |
4.80%, 12/15/43 | | (Call 06/15/43) | | | 261 | | | | 291,172 | |
United Technologies Corp. | |
3.75%, 11/01/46 | | (Call 05/01/46) | | | 500 | | | | 497,335 | |
4.15%, 05/15/45 | | (Call 11/16/44) | | | 625 | | | | 659,719 | |
4.50%, 06/01/42 | | | | | 2,700 | | | | 2,952,801 | |
5.40%, 05/01/35 | | | | | 11 | | | | 13,262 | |
5.70%, 04/15/40 | | | | | 572 | | | | 727,887 | |
| | | | | | | | | | |
| Security | | | |
Principal
(000s) | | | Value | |
6.05%, 06/01/36 | | | | $ | 196 | | | $ | 253,054 | |
6.13%, 07/15/38 | | | | | 18 | | | | 23,892 | |
6.70%, 08/01/28 | | | | | 775 | | | | 1,056,496 | |
7.50%, 09/15/29 | | | | | 114 | | | | 167,396 | |
| | | | | | | | | | |
| | | | | | | | | 16,786,089 | |
AGRICULTURE — 1.14% | |
Altria Group Inc. | |
3.88%, 09/16/46 | | (Call 03/16/46) | | | 350 | | | | 345,450 | |
4.25%, 08/09/42 | | | | | 400 | | | | 415,244 | |
4.50%, 05/02/43 | | | | | 411 | | | | 444,196 | |
5.38%, 01/31/44 | | | | | 1,702 | | | | 2,076,338 | |
Archer-Daniels-Midland Co. | |
4.02%, 04/16/43 | | | | | 799 | | | | 836,633 | |
4.54%, 03/26/42 | | | | | 378 | | | | 423,874 | |
Lowe’s Companies Inc. | |
4.25%, 09/15/44 | | (Call 03/15/44) | | | 407 | | | | 436,064 | |
Philip Morris International Inc. | |
3.88%, 08/21/42 | | | | | 26 | | | | 25,727 | |
4.13%, 03/04/43 | | | | | 217 | | | | 222,069 | |
4.25%, 11/10/44a | | | | | 1,850 | | | | 1,946,903 | |
4.38%, 11/15/41 | | | | | 86 | | | | 91,242 | |
4.50%, 03/20/42 | | | | | 171 | | | | 184,907 | |
4.88%, 11/15/43 | | | | | 430 | | | | 489,056 | |
6.38%, 05/16/38 | | | | | 929 | | | | 1,249,951 | |
Reynolds American Inc. | |
5.70%, 08/15/35 | | (Call 02/15/35) | | | 136 | | | | 164,065 | |
5.85%, 08/15/45 | | (Call 02/15/45) | | | 1,300 | | | | 1,621,243 | |
6.15%, 09/15/43 | | | | | 381 | | | | 488,202 | |
7.25%, 06/15/37a | | | | | 403 | | | | 553,549 | |
| | | | | | | | | | |
| | | | | | | | | 12,014,713 | |
AIRLINES — 0.40% | |
American Airlines 2014-1 Pass Through Trust Class A | | | | | | | | |
3.70%, 04/01/28a | | | | | 0 | | | | 0 | |
American Airlines 2015-1 Pass Through Trust Class A | | | | | | | | |
3.38%, 11/01/28 | | | | | 1,207 | | | | 1,230,937 | |
American Airlines 2016-1 Pass Through Trust Class AA | | | | | | | | |
3.58%, 07/15/29 | | | | | 18 | | | | 18,876 | |
American Airlines 2016-2 Pass Through Trust Class AA | | | | | | | | |
3.20%, 12/15/29 | | | | | 84 | | | | 85,380 | |
| | | | |
SCHEDULEOF INVESTMENTS | | | 35 | |
Schedule of Investments (Unaudited) (Continued)
iSHARES® 10+ YEAR CREDIT BOND ETF
October 31, 2016
| | | | | | | | | | |
| Security | | | |
Principal
(000s) | | | Value | |
American Airlines Pass Through Trust
Series 2016-3, Class AA | | | | | | | | |
3.00%, 04/15/30 | | | | $ | 1,000 | | | $ | 1,006,180 | |
Latam Airlines 2015-1 Pass Through Trust A | | | | | | | | |
4.20%, 08/15/29 | | | | | 484 | | | | 475,263 | |
United Airlines 2014-2 Pass Through Trust Class A | | | | | | | | |
3.75%, 03/03/28a | | | | | 565 | | | | 593,075 | |
United Airlines 2015-1 Pass Through Trust Class AA | | | | | | | | |
3.45%, 06/01/29 | | | | | 79 | | | | 82,944 | |
United Airlines 2016-2 Class AA Pass Through Trust
Series AA | | | | | | | | |
2.88%, 04/07/30 | | | | | 750 | | | | 751,320 | |
| | | | | | | | | | |
| | | | | | | | | 4,243,975 | |
APPAREL — 0.15% | |
NIKE Inc. | |
3.38%, 11/01/46 | | (Call 05/01/46) | | | 250 | | | | 242,602 | |
3.63%, 05/01/43 | | (Call 11/01/42) | | | 300 | | | | 303,261 | |
3.88%, 11/01/45 | | (Call 05/01/45) | | | 600 | | | | 626,964 | |
VF Corp. | |
6.00%, 10/15/33 | | | | | 150 | | | | 186,642 | |
6.45%, 11/01/37 | | | | | 201 | | | | 268,444 | |
| | | | | | | | | | |
| | | | | | | | | 1,627,913 | |
AUTO MANUFACTURERS — 0.86% | |
Daimler Finance North America LLC | |
8.50%, 01/18/31 | | | | | 950 | | | | 1,521,378 | |
Ford Holdings LLC | |
9.30%, 03/01/30 | | | | | 300 | | | | 425,067 | |
Ford Motor Co. | |
4.75%, 01/15/43a | | | | | 1,186 | | | | 1,185,087 | |
6.38%, 02/01/29 | | | | | 350 | | | | 421,438 | |
6.63%, 10/01/28a | | | | | 16 | | | | 19,863 | |
7.40%, 11/01/46 | | | | | 114 | | | | 159,963 | |
7.45%, 07/16/31 | | | | | 1,300 | | | | 1,703,910 | |
General Motors Co. | |
5.00%, 04/01/35a | | | | | 102 | | | | 103,657 | |
5.20%, 04/01/45 | | | | | 800 | | | | 813,000 | |
6.25%, 10/02/43 | | | | | 700 | | | | 801,500 | |
| | | | | | | | | | |
| Security | | | |
Principal
(000s) | | | Value | |
6.60%, 04/01/36 | | (Call 10/01/35) | | $ | 1,400 | | | $ | 1,646,750 | |
6.75%, 04/01/46 | | (Call 10/01/45) | | | 190 | | | | 232,750 | |
| | | | | | | | | | |
| | | | | | | | | 9,034,363 | |
AUTO PARTS & EQUIPMENT — 0.22% | |
BorgWarner Inc. | |
4.38%, 03/15/45 | | (Call 09/15/44) | | | 185 | | | | 186,597 | |
Delphi Automotive PLC | |
4.40%, 10/01/46 | | (Call 04/01/46) | | | 700 | | | | 689,640 | |
Johnson Controls Inc. | |
4.63%, 07/02/44 | | (Call 01/02/44) | | | 300 | | | | 317,046 | |
4.95%, 07/02/64 | | (Call 01/02/64) | | | 107 | | | | 107,471 | |
5.25%, 12/01/41 | | (Call 06/01/41) | | | 5 | | | | 5,692 | |
5.70%, 03/01/41 | | | | | 5 | | | | 5,939 | |
6.00%, 01/15/36 | | | | | 791 | | | | 960,701 | |
| | | | | | | | | | |
| | | | | | | | | 2,273,086 | |
BANKS — 7.86% | |
Bank of America Corp. | |
3.25%, 10/21/27 | | (Call 10/21/26) | | | 2,000 | | | | 2,002,920 | |
4.25%, 10/22/26 | | | | | — | | | | — | |
4.88%, 04/01/44 | | | | | 1,360 | | | | 1,545,314 | |
5.00%, 01/21/44 | | | | | 1,603 | | | | 1,828,751 | |
5.88%, 02/07/42 | | | | | 570 | | | | 719,123 | |
6.11%, 01/29/37 | | | | | 1,400 | | | | 1,694,476 | |
6.75%, 06/01/28 | | | | | 14 | | | | 17,148 | |
7.75%, 05/14/38 | | | | | 800 | | | | 1,131,896 | |
Series L | | | | | | | | | | |
4.75%, 04/21/45a | | | | | 8 | | | | 8,328 | |
Bank of America N.A. | |
6.00%, 10/15/36 | | | | | 250 | | | | 313,933 | |
Bank of New York Mellon Corp. (The) | |
3.00%, 10/30/28 | | (Call 07/30/28) | | | 85 | | | | 84,926 | |
Bank One Corp. | |
7.63%, 10/15/26 | | | | | 481 | | | | 633,818 | |
8.00%, 04/29/27 | | | | | 229 | | | | 308,032 | |
Barclays PLC | |
5.25%, 08/17/45 | | | | | 810 | | | | 882,835 | |
Branch Banking & Trust Co. | |
3.80%, 10/30/26 | | (Call 09/30/26) | | | 528 | | | | 565,947 | |
Citigroup Inc. | |
4.13%, 07/25/28a | | | | | 350 | | | | 358,284 | |
4.30%, 11/20/26 | | | | | 1,250 | | | | 1,303,425 | |
4.45%, 09/29/27a | | | | | 2,425 | | | | 2,552,846 | |
| | |
| 36 | | 2016 iSHARES ANNUAL REPORTTO SHAREHOLDERS |
Schedule of Investments (Unaudited) (Continued)
iSHARES® 10+ YEAR CREDIT BOND ETF
October 31, 2016
| | | | | | | | | | |
| Security | | | |
Principal
(000s) | | | Value | |
4.65%, 07/30/45 | | | | $ | 750 | | | $ | 823,245 | |
4.75%, 05/18/46 | | | | | 250 | | | | 256,432 | |
5.30%, 05/06/44 | | | | | 515 | | | | 564,950 | |
5.88%, 02/22/33 | | | | | 266 | | | | 304,514 | |
5.88%, 01/30/42 | | | | | 900 | | | | 1,143,837 | |
6.00%, 10/31/33 | | | | | 266 | | | | 311,643 | |
6.13%, 08/25/36 | | | | | 500 | | | | 592,855 | |
6.63%, 01/15/28 | | | | | 11 | | | | 13,678 | |
6.63%, 06/15/32 | | | | | 575 | | | | 715,260 | |
6.68%, 09/13/43 | | | | | 296 | | | | 378,871 | |
6.88%, 02/15/98 | | | | | 100 | | | | 137,055 | |
8.13%, 07/15/39 | | | | | 1,510 | | | | 2,307,824 | |
Cooperatieve Rabobank UA | |
5.25%, 05/24/41 | | | | | 1,050 | | | | 1,281,871 | |
5.25%, 08/04/45 | | | | | 291 | | | | 326,528 | |
5.75%, 12/01/43 | | | | | 850 | | | | 1,019,592 | |
Credit Suisse Group Funding Guernsey Ltd. | | | | | | | | |
4.88%, 05/15/45a | | | | | 1,036 | | | | 1,085,148 | |
Fifth Third Bancorp. | |
8.25%, 03/01/38 | | | | | 544 | | | | 784,747 | |
First Republic Bank/CA | |
4.38%, 08/01/46 | | (Call 02/01/46) | | | 250 | | | | 237,752 | |
Goldman Sachs Group Inc. (The) | | | | | | | | |
4.75%, 10/21/45 | | (Call 04/21/45) | | | 1,200 | | | | 1,314,204 | |
4.80%, 07/08/44 | | (Call 01/08/44) | | | 1,100 | | | | 1,195,964 | |
5.15%, 05/22/45a | | | | | 1,000 | | | | 1,078,420 | |
5.95%, 01/15/27 | | | | | 850 | | | | 992,367 | |
6.13%, 02/15/33 | | | | | 1,700 | | | | 2,102,390 | |
6.25%, 02/01/41 | | | | | 1,500 | | | | 1,926,990 | |
6.45%, 05/01/36 | | | | | 650 | | | | 789,445 | |
6.75%, 10/01/37 | | | | | 2,965 | | | | 3,732,401 | |
HSBC Bank PLC | |
7.65%, 05/01/25 | | | | | 100 | | | | 123,984 | |
HSBC Bank USA N.A./New York NY | | | | | | | | |
5.63%, 08/15/35 | | | | | 1,750 | | | | 2,044,998 | |
HSBC Holdings PLC | |
5.25%, 03/14/44 | | | | | 1,400 | | | | 1,535,758 | |
6.10%, 01/14/42 | | | | | 416 | | | | 538,346 | |
6.50%, 05/02/36 | | | | | 1,056 | | | | 1,314,467 | |
6.50%, 09/15/37 | | | | | 1,007 | | | | 1,260,532 | |
6.80%, 06/01/38 | | | | | 600 | | | | 777,276 | |
7.63%, 05/17/32 | | | | | 371 | | | | 491,957 | |
| | | | | | | | | | |
| Security | | | |
Principal
(000s) | | | Value | |
JPMorgan Chase & Co. | |
2.95%, 10/01/26 | | (Call 07/01/26) | | $ | — | | | $ | — | |
4.13%, 12/15/26 | | | | | 1,321 | | | | 1,395,663 | |
4.25%, 10/01/27a | | | | | 1,718 | | | | 1,830,254 | |
4.85%, 02/01/44a | | | | | 1,543 | | | | 1,793,799 | |
4.95%, 06/01/45a | | | | | 718 | | | | 787,129 | |
5.40%, 01/06/42 | | | | | 1,862 | | | | 2,254,938 | |
5.50%, 10/15/40 | | | | | 517 | | | | 631,598 | |
5.60%, 07/15/41 | | | | | 746 | | | | 925,525 | |
5.63%, 08/16/43 | | | | | 419 | | | | 491,428 | |
6.40%, 05/15/38 | | | | | 945 | | | | 1,270,165 | |
KfW | |
0.01%, 04/18/36 | | | | | 1,500 | | | | 871,050 | |
0.01%, 06/29/37a | | | | | 1,200 | | | | 676,884 | |
Lloyds Banking Group PLC | |
5.30%, 12/01/45b | | | | | 500 | | | | 523,565 | |
Morgan Stanley | |
3.95%, 04/23/27 | | | | | 1,350 | | | | 1,387,368 | |
4.30%, 01/27/45 | | | | | 1,200 | | | | 1,257,696 | |
4.35%, 09/08/26 | | | | | 400 | | | | 423,628 | |
6.38%, 07/24/42 | | | | | 1,155 | | | | 1,544,224 | |
7.25%, 04/01/32 | | | | | 1,000 | | | | 1,366,970 | |
Regions Financial Corp. | |
7.38%, 12/10/37 | | | | | 475 | | | | 591,071 | |
Travelers Companies Inc. (The) | |
4.30%, 08/25/45 | | (Call 02/25/45) | | | 175 | | | | 194,050 | |
Wachovia Corp. | |
5.50%, 08/01/35 | | | | | 481 | | | | 547,787 | |
6.55%, 10/15/35 | | | | | 150 | | | | 187,790 | |
7.50%, 04/15/35 | | | | | 57 | | | | 75,853 | |
Wells Fargo & Co. | |
3.90%, 05/01/45 | | | | | 2,463 | | | | 2,467,729 | |
4.30%, 07/22/27a | | | | | 2,385 | | | | 2,535,732 | |
4.40%, 06/14/46 | | | | | 500 | | | | 502,335 | |
4.65%, 11/04/44 | | | | | 2,430 | | | | 2,510,773 | |
4.90%, 11/17/45 | | | | | 940 | | | | 1,010,303 | |
5.38%, 02/07/35 | | | | | 341 | | | | 402,390 | |
5.38%, 11/02/43 | | | | | 400 | | | | 456,352 | |
5.61%, 01/15/44 | | | | | 1,956 | | | | 2,298,124 | |
Wells Fargo Capital X | |
5.95%, 12/01/86 | | | | | 311 | | | | 336,965 | |
| | | | | | | | | | |
| | | | | | | | | 83,006,441 | |
| | | | |
SCHEDULEOF INVESTMENTS | | | 37 | |
Schedule of Investments (Unaudited) (Continued)
iSHARES® 10+ YEAR CREDIT BOND ETF
October 31, 2016
| | | | | | | | | | |
| Security | | | |
Principal
(000s) | | | Value | |
BEVERAGES — 2.50% | |
Anheuser-Busch Companies LLC | |
5.95%, 01/15/33 | | | | $ | 21 | | | $ | 25,542 | |
6.45%, 09/01/37 | | | | | 200 | | | | 263,558 | |
Anheuser-Busch InBev Finance Inc. | |
4.00%, 01/17/43 | | | | | 200 | | | | 200,532 | |
4.63%, 02/01/44 | | | | | 245 | | | | 269,936 | |
4.70%, 02/01/36 | | (Call 08/01/35) | | | 4,200 | | | | 4,673,844 | |
4.90%, 02/01/46 | | (Call 08/01/45) | | | 6,550 | | | | 7,479,314 | |
Anheuser-Busch InBev Worldwide Inc. | |
3.75%, 07/15/42 | | | | | 1,200 | | | | 1,172,808 | |
6.38%, 01/15/40 | | | | | 300 | | | | 398,994 | |
8.00%, 11/15/39 | | | | | 136 | | | | 211,525 | |
8.20%, 01/15/39 | | | | | 935 | | | | 1,473,448 | |
Brown-Forman Corp. | |
3.75%, 01/15/43 | | (Call 07/15/42) | | | 309 | | | | 300,577 | |
4.50%, 07/15/45 | | (Call 01/15/45)a | | | 118 | | | | 130,286 | |
Coca-Cola FEMSA SAB de CV | |
5.25%, 11/26/43 | | | | | 271 | | | | 317,422 | |
Diageo Capital PLC | |
3.88%, 04/29/43 | | (Call 10/29/42) | | | 136 | | | | 138,229 | |
5.88%, 09/30/36 | | | | | 650 | | | | 839,397 | |
Diageo Investment Corp. | |
4.25%, 05/11/42 | | | | | 507 | | | | 546,064 | |
7.45%, 04/15/35 | | | | | 11 | | | | 16,121 | |
Dr Pepper Snapple Group Inc. | |
4.50%, 11/15/45 | | (Call 05/15/45) | | | 300 | | | | 325,635 | |
7.45%, 05/01/38 | | | | | 90 | | | | 129,131 | |
Fomento Economico Mexicano SAB de CV | |
4.38%, 05/10/43 | | | | | 364 | | | | 371,033 | |
Molson Coors Brewing Co. | |
4.20%, 07/15/46 | | (Call 01/15/46) | | | 915 | | | | 919,227 | |
5.00%, 05/01/42 | | | | | 906 | | | | 1,013,678 | |
Pepsi Bottling Group Inc. (The)
Series B | |
7.00%, 03/01/29 | | | | | 950 | | | | 1,356,933 | |
PepsiAmericas Inc. | |
5.50%, 05/15/35 | | | | | 11 | | | | 13,514 | |
PepsiCo Inc. | |
3.45%, 10/06/46 | | (Call 04/06/46) | | | 500 | | | | 477,590 | |
3.60%, 08/13/42 | | | | | 532 | | | | 526,717 | |
4.00%, 03/05/42 | | | | | 207 | | | | 216,537 | |
4.25%, 10/22/44 | | (Call 04/22/44) | | | 509 | | | | 551,883 | |
4.45%, 04/14/46 | | (Call 10/14/45) | | | 1,075 | | | | 1,203,785 | |
| | | | | | | | | | |
| Security | | | |
Principal
(000s) | | | Value | |
4.60%, 07/17/45 | | (Call 01/17/45) | | $ | 280 | | | $ | 319,724 | |
4.88%, 11/01/40 | | | | | 196 | | | | 228,193 | |
5.50%, 01/15/40 | | | | | 246 | | | | 310,191 | |
| | | | | | | | | | |
| | | | | | | | | 26,421,368 | |
BIOTECHNOLOGY — 1.66% | |
Amgen Inc. | |
4.40%, 05/01/45 | | (Call 11/01/44) | | | 1,094 | | | | 1,114,337 | |
4.56%, 06/15/48 | | (Call 12/15/47)b | | | 1,250 | | | | 1,279,888 | |
4.66%, 06/15/51 | | (Call 12/15/50)b | | | 3,800 | | | | 3,921,752 | |
4.95%, 10/01/41 | | | | | 205 | | | | 221,289 | |
5.15%, 11/15/41 | | (Call 05/15/41) | | | 125 | | | | 138,353 | |
Biogen Inc. | |
5.20%, 09/15/45 | | (Call 03/15/45) | | | 1,050 | | | | 1,184,368 | |
Celgene Corp. | |
4.63%, 05/15/44 | | (Call 11/15/43) | | | 525 | | | | 530,308 | |
5.00%, 08/15/45 | | (Call 02/15/45) | | | 1,100 | | | | 1,184,370 | |
5.25%, 08/15/43 | | | | | 500 | | | | 549,140 | |
Gilead Sciences Inc. | |
2.95%, 03/01/27 | | (Call 12/01/26) | | | 1,250 | | | | 1,236,350 | |
4.15%, 03/01/47 | | (Call 09/01/46) | | | 950 | | | | 939,151 | |
4.50%, 02/01/45 | | (Call 08/01/44) | | | 1,426 | | | | 1,486,776 | |
4.60%, 09/01/35 | | (Call 03/01/35) | | | 764 | | | | 822,828 | |
4.75%, 03/01/46 | | (Call 09/01/45) | | | 1,469 | | | | 1,592,940 | |
4.80%, 04/01/44 | | (Call 10/01/43) | | | 593 | | | | 644,425 | |
5.65%, 12/01/41 | | (Call 06/01/41) | | | 536 | | | | 648,758 | |
| | | | | | | | | | |
| | | | | | | | | 17,495,033 | |
BUILDING MATERIALS — 0.04% | |
Owens Corning | |
7.00%, 12/01/36 | | | | | 299 | | | | 373,954 | |
Vulcan Materials Co. | |
7.15%, 11/30/37 | | | | | 7 | | | | 8,558 | |
| | | | | | | | | | |
| | | | | | | | | 382,512 | |
CHEMICALS — 1.44% | |
Agrium Inc. | |
4.13%, 03/15/35 | | (Call 09/15/34) | | | 87 | | | | 84,464 | |
4.90%, 06/01/43 | | (Call 12/01/42) | | | 436 | | | | 453,266 | |
5.25%, 01/15/45 | | (Call 07/15/44) | | | 254 | | | | 280,408 | |
6.13%, 01/15/41 | | (Call 07/15/40)a | | | 268 | | | | 318,770 | |
7.13%, 05/23/36a | | | | | 100 | | | | 127,871 | |
Albemarle Corp. | |
5.45%, 12/01/44 | | (Call 06/01/44) | | | 261 | | | | 291,764 | |
Dow Chemical Co. (The) | |
4.25%, 10/01/34 | | (Call 04/01/34)a | | | 900 | | | | 912,879 | |
| | |
| 38 | | 2016 iSHARES ANNUAL REPORTTO SHAREHOLDERS |
Schedule of Investments (Unaudited) (Continued)
iSHARES® 10+ YEAR CREDIT BOND ETF
October 31, 2016
| | | | | | | | | | |
| Security | | | |
Principal
(000s) | | | Value | |
4.38%, 11/15/42 | | (Call 05/15/42) | | $ | 86 | | | $ | 86,310 | |
4.63%, 10/01/44 | | (Call 04/01/44)a | | | 1,000 | | | | 1,043,500 | |
5.25%, 11/15/41 | | (Call 05/15/41) | | | 535 | | | | 587,912 | |
7.38%, 11/01/29 | | | | | 250 | | | | 337,240 | |
9.40%, 05/15/39 | | | | | 400 | | | | 639,312 | |
Eastman Chemical Co. | |
4.65%, 10/15/44 | | (Call 04/15/44)a | | | 700 | | | | 704,900 | |
4.80%, 09/01/42 | | (Call 03/01/42) | | | 280 | | | | 282,114 | |
Ecolab Inc. | |
5.50%, 12/08/41 | | | | | 538 | | | | 666,399 | |
EI du Pont de Nemours & Co. | |
4.15%, 02/15/43 | | | | | 423 | | | | 417,552 | |
4.90%, 01/15/41 | | | | | 496 | | | | 538,309 | |
5.60%, 12/15/36a | | | | | 11 | | | | 12,969 | |
Lubrizol Corp. | |
6.50%, 10/01/34 | | | | | 120 | | | | 157,896 | |
LYB International Finance BV | |
4.88%, 03/15/44 | | (Call 09/15/43) | | | 710 | | | | 751,464 | |
5.25%, 07/15/43 | | | | | 200 | | | | 220,428 | |
LyondellBasell Industries NV | |
4.63%, 02/26/55 | | (Call 08/26/54) | | | 700 | | | | 667,464 | |
Methanex Corp. | |
5.65%, 12/01/44 | | (Call 06/01/44)a | | | 200 | | | | 171,750 | |
Monsanto Co. | |
3.60%, 07/15/42 | | (Call 01/15/42) | | | 240 | | | | 209,995 | |
3.95%, 04/15/45 | | (Call 10/15/44) | | | 215 | | | | 202,992 | |
4.20%, 07/15/34 | | (Call 01/15/34) | | | 573 | | | | 567,196 | |
4.40%, 07/15/44 | | (Call 01/15/44) | | | 800 | | | | 798,896 | |
4.65%, 11/15/43 | | (Call 05/15/43) | | | 24 | | | | 24,076 | |
4.70%, 07/15/64 | | (Call 01/15/64) | | | 275 | | | | 256,806 | |
5.88%, 04/15/38 | | | | | 11 | | | | 12,680 | |
Series 1 | | | | | | | | | | |
5.50%, 07/30/35a | | | | | 100 | | | | 112,140 | |
Mosaic Co. (The) | |
5.45%, 11/15/33 | | (Call 05/15/33)a | | | 208 | | | | 210,246 | |
5.63%, 11/15/43 | | (Call 05/15/43)a | | | 486 | | | | 492,308 | |
Potash Corp. of Saskatchewan Inc. | |
5.63%, 12/01/40a | | | | | 569 | | | | 649,781 | |
5.88%, 12/01/36 | | | | | 101 | | | | 118,161 | |
PPG Industries Inc. | |
5.50%, 11/15/40a | | | | | 14 | | | | 16,487 | |
Praxair Inc. | |
3.55%, 11/07/42 | | (Call 05/07/42) | | | 400 | | | | 397,656 | |
| | | | | | | | | | |
| Security | | | |
Principal
(000s) | | | Value | |
Rohm & Haas Co. | |
7.85%, 07/15/29 | | | | $ | 221 | | | $ | 309,716 | |
RPM International Inc. | |
5.25%, 06/01/45 | | (Call 12/01/44) | | | 11 | | | | 11,143 | |
Sherwin-Williams Co. (The) | |
4.00%, 12/15/42 | | (Call 06/15/42) | | | 350 | | | | 328,178 | |
Valspar Corp. (The) | |
4.40%, 02/01/45 | | (Call 08/01/44) | | | 211 | | | | 203,674 | |
Westlake Chemical Corp. | |
5.00%, 08/15/46 | | (Call 02/15/46)b | | | 500 | | | | 495,450 | |
| | | | | | | | | | |
| | | | | | | | | 15,172,522 | |
COMMERCIAL SERVICES — 0.69% | |
Board of Trustees of The Leland Stanford Junior University (The) | |
3.46%, 05/01/47 | | | | | 16 | | | | 16,570 | |
California Institute of Technology | |
4.32%, 08/01/45 | | | | | 12 | | | | 13,373 | |
4.70%, 11/01/11 | | | | | 100 | | | | 102,893 | |
Catholic Health Initiatives | |
4.35%, 11/01/42 | | | | | 500 | | | | 483,215 | |
Cleveland Clinic Foundation (The) | |
4.86%, 01/01/14 | | | | | 247 | | | | 262,302 | |
Equifax Inc. | |
7.00%, 07/01/37 | | | | | 11 | | | | 13,896 | |
George Washington University (The) | |
4.87%, 09/15/45 | | | | | 16 | | | | 18,203 | |
Series 2016 | | | | | | | | | | |
3.55%, 09/15/46 | | | | | 450 | | | | 414,679 | |
Johns Hopkins University
Series 2013 | |
4.08%, 07/01/53 | | | | | 11 | | | | 11,583 | |
Massachusetts Institute of Technology | | | | | | | | |
3.96%, 07/01/38 | | | | | 9 | | | | 9,979 | |
4.68%, 07/01/14 | | | | | 511 | | | | 564,026 | |
5.60%, 07/01/11 | | | | | 550 | | | | 719,994 | |
Metropolitan Museum of Art (The)
Series 2015 | | | | | | | | |
3.40%, 07/01/45 | | | | | 113 | | | | 111,748 | |
Moody’s Corp. | |
5.25%, 07/15/44 | | | | | 250 | | | | 293,283 | |
| | | | |
SCHEDULEOF INVESTMENTS | | | 39 | |
Schedule of Investments (Unaudited) (Continued)
iSHARES® 10+ YEAR CREDIT BOND ETF
October 31, 2016
| | | | | | | | | | |
| Security | | | |
Principal
(000s) | | | Value | |
Northwestern University | |
3.69%, 12/01/38 | | | | $ | 586 | | | $ | 626,827 | |
3.87%, 12/01/48 | | | | | 11 | | | | 12,064 | |
President and Fellows of Harvard College | |
3.15%, 07/15/46 | | (Call 01/15/46) | | | 250 | | | | 245,697 | |
3.30%, 07/15/56 | | (Call 01/15/56) | | | 250 | | | | 245,010 | |
3.62%, 10/01/37 | | | | | 200 | | | | 211,096 | |
Princeton University | |
5.70%, 03/01/39 | | | | | 350 | | | | 488,887 | |
S&P Global Inc. | |
2.95%, 01/22/27 | | (Call 10/22/26)a,b | | | 560 | | | | 552,608 | |
6.55%, 11/15/37 | | | | | 61 | | | | 74,815 | |
Tufts University
Series 2012 | |
5.02%, 04/15/12 | | | | | 200 | | | | 223,360 | |
University of Notre Dame du Lac
Series 2015 | |
3.44%, 02/15/45 | | | | | 9 | | | | 9,247 | |
University of Southern California | |
3.03%, 10/01/39 | | | | | 250 | | | | 237,368 | |
5.25%, 10/01/11 | | | | | 250 | | | | 313,073 | |
Verisk Analytics Inc. | |
5.50%, 06/15/45 | | (Call 12/15/44) | | | 111 | | | | 115,451 | |
Western Union Co. (The) | |
6.20%, 11/17/36 | | | | | 150 | | | | 156,609 | |
6.20%, 06/21/40a | | | | | 300 | | | | 309,066 | |
William Marsh Rice University | |
3.57%, 05/15/45 | | | | | 421 | | | | 438,253 | |
| | | | | | | | | | |
| | | | | | | | | 7,295,175 | |
COMPUTERS — 1.79% | |
Apple Inc. | |
3.45%, 02/09/45 | | | | | 1,870 | | | | 1,728,198 | |
3.85%, 05/04/43 | | | | | 975 | | | | 958,912 | |
3.85%, 08/04/46 | | (Call 02/04/46) | | | 745 | | | | 730,301 | |
4.38%, 05/13/45 | | | | | 1,300 | | | | 1,377,909 | |
4.45%, 05/06/44 | | | | | 673 | | | | 723,226 | |
4.50%, 02/23/36 | | (Call 08/23/35) | | | 1,750 | | | | 1,943,340 | |
4.65%, 02/23/46 | | (Call 08/23/45) | | | 2,150 | | | | 2,373,493 | |
Diamond 1 Finance Corp./Diamond 2 Finance Corp. | | | | | | | | |
8.10%, 07/15/36 | | (Call 01/15/36)b | | | 800 | | | | 955,096 | |
8.35%, 07/15/46 | | (Call 01/15/46)b | | | 1,200 | | | | 1,455,984 | |
| | | | | | | | | | |
| Security | | | |
Principal
(000s) | | | Value | |
Hewlett Packard Enterprise Co. | |
6.20%, 10/15/35 | | (Call 04/15/35)b | | $ | 287 | | | $ | 297,260 | |
6.60%, 10/15/45 | | (Call 04/15/45)b | | | 900 | | | | 924,579 | |
HP Enterprise Services LLC | |
7.45%, 10/15/29 | | | | | 410 | | | | 495,641 | |
HP Inc. | |
6.00%, 09/15/41a | | | | | 653 | | | | 662,939 | |
International Business Machines Corp. | | | | | | | | |
4.00%, 06/20/42 | | | | | 600 | | | | 610,182 | |
4.70%, 02/19/46a | | | | | 900 | | | | 1,004,337 | |
5.60%, 11/30/39a | | | | | 374 | | | | 463,139 | |
5.88%, 11/29/32 | | | | | 261 | | | | 335,985 | |
6.22%, 08/01/27 | | | | | 400 | | | | 516,232 | |
6.50%, 01/15/28 | | | | | 505 | | | | 670,322 | |
Seagate HDD Cayman | |
4.88%, 06/01/27 | | (Call 03/01/27) | | | 300 | | | | 271,107 | |
5.75%, 12/01/34 | | (Call 06/01/34) | | | 425 | | | | 366,503 | |
| | | | | | | | | | |
| | | | | | | | | 18,864,685 | |
COSMETICS & PERSONAL CARE — 0.29% | |
Colgate-Palmolive Co. | | | | | | | | |
4.00%, 08/15/45 | | | | | 367 | | | | 403,124 | |
Estee Lauder Companies Inc. (The) | | | | | | | | |
3.70%, 08/15/42 | | | | | 200 | | | | 197,748 | |
4.38%, 06/15/45 | | (Call 12/15/44) | | | 300 | | | | 329,688 | |
6.00%, 05/15/37 | | | | | 200 | | | | 254,112 | |
Procter & Gamble Co. (The) | |
5.50%, 02/01/34a | | | | | 117 | | | | 154,880 | |
5.55%, 03/05/37 | | | | | 1,128 | | | | 1,540,182 | |
5.80%, 08/15/34 | | | | | 131 | | | | 180,598 | |
| | | | | | | | | | |
| | | | | | | | | 3,060,332 | |
DISTRIBUTION & WHOLESALE — 0.09% | |
WW Grainger Inc. | |
3.75%, 05/15/46 | | (Call 11/15/45) | | | 303 | | | | 304,954 | |
4.60%, 06/15/45 | | (Call 12/15/44) | | | 600 | | | | 680,868 | |
| | | | | | | | | | |
| | | | | | | | | 985,822 | |
DIVERSIFIED FINANCIAL SERVICES — 1.35% | |
American Express Co. | |
4.05%, 12/03/42 | | | | | 675 | | | | 682,216 | |
AXA Financial Inc. | |
7.00%, 04/01/28 | | | | | 14 | | | | 17,796 | |
CME Group Inc. | |
5.30%, 09/15/43 | | (Call 03/15/43) | | | 400 | | | | 494,936 | |
| | |
| 40 | | 2016 iSHARES ANNUAL REPORTTO SHAREHOLDERS |
Schedule of Investments (Unaudited) (Continued)
iSHARES® 10+ YEAR CREDIT BOND ETF
October 31, 2016
| | | | | | | | | | |
| Security | | | |
Principal
(000s) | | | Value | |
Credit Suisse USA Inc. | |
7.13%, 07/15/32 | | | | $ | 468 | | | $ | 631,491 | |
GE Capital International Funding Co. Unlimited Co. | | | | | | | | |
4.42%, 11/15/35 | | | | | 6,150 | | | | 6,710,265 | |
Goldman Sachs Capital I | |
6.35%, 02/15/34 | | | | | 526 | | | | 634,114 | |
Invesco Finance PLC | |
5.38%, 11/30/43 | | | | | 16 | | | | 18,390 | |
Jefferies Group LLC | |
6.25%, 01/15/36 | | | | | 300 | | | | 305,307 | |
6.45%, 06/08/27 | | | | | 500 | | | | 558,450 | |
6.50%, 01/20/43 | | | | | 150 | | | | 155,107 | |
Legg Mason Inc. | |
5.63%, 01/15/44 | | | | | 300 | | | | 303,291 | |
National Rural Utilities Cooperative Finance Corp. | | | | | | | | |
4.02%, 11/01/32 | | (Call 05/01/32) | | | 100 | | | | 105,442 | |
Series C | | | | | | | | | | |
8.00%, 03/01/32 | | | | | 271 | | | | 396,313 | |
Visa Inc. | |
4.15%, 12/14/35 | | (Call 06/14/35) | | | 900 | | | | 993,564 | |
4.30%, 12/14/45 | | (Call 06/14/45) | | | 2,000 | | | | 2,230,160 | |
| | | | | | | | | | |
| | | | | | | | | 14,236,842 | |
ELECTRIC — 9.95% | |
AEP Texas Central Co.
Series E | |
6.65%, 02/15/33 | | | | | 250 | | | | 314,710 | |
Alabama Power Co. | |
3.75%, 03/01/45 | | (Call 09/01/44) | | | 634 | | | | 642,591 | |
3.85%, 12/01/42 | | | | | 50 | | | | 50,787 | |
4.10%, 01/15/42 | | | | | 11 | | | | 11,508 | |
4.15%, 08/15/44 | | (Call 02/15/44) | | | 462 | | | | 493,518 | |
4.30%, 01/02/46 | | (Call 07/02/45) | | | 600 | | | | 654,780 | |
6.00%, 03/01/39 | | | | | 126 | | | | 161,986 | |
6.13%, 05/15/38 | | | | | 273 | | | | 352,992 | |
Series 11-C | | | | | | | | | | |
5.20%, 06/01/41 | | | | | 911 | | | | 1,085,766 | |
Ameren Illinois Co. | |
4.15%, 03/15/46 | | (Call 09/15/45)a | | | 257 | | | | 280,706 | |
4.80%, 12/15/43 | | (Call 06/15/43) | | | 11 | | | | 12,833 | |
Appalachian Power Co. | |
4.40%, 05/15/44 | | (Call 11/15/43) | | | 11 | | | | 11,562 | |
4.45%, 06/01/45 | | (Call 12/01/44) | | | 200 | | | | 214,558 | |
| | | | | | | | | | |
| Security | | | |
Principal
(000s) | | | Value | |
6.38%, 04/01/36 | | | | $ | 761 | | | $ | 956,782 | |
7.00%, 04/01/38 | | | | | 231 | | | | 314,627 | |
Series L | | | | | | | | | | |
5.80%, 10/01/35 | | | | | 5 | | | | 5,930 | |
Series P | | | | | | | | | | |
6.70%, 08/15/37 | | | | | 11 | | | | 14,553 | |
Arizona Public Service Co. | |
3.75%, 05/15/46 | | (Call 11/15/45) | | | 425 | | | | 428,204 | |
4.50%, 04/01/42 | | (Call 10/01/41) | | | 201 | | | | 223,405 | |
4.70%, 01/15/44 | | (Call 07/15/43) | | | 150 | | | | 171,555 | |
5.05%, 09/01/41 | | (Call 03/01/41) | | | 100 | | | | 118,968 | |
5.50%, 09/01/35 | | | | | 250 | | | | 305,500 | |
Berkshire Hathaway Energy Co. | |
4.50%, 02/01/45 | | (Call 08/01/44) | | | 1,250 | | | | 1,369,975 | |
5.15%, 11/15/43 | | (Call 05/15/43) | | | 790 | | | | 939,041 | |
5.95%, 05/15/37 | | | | | 350 | | | | 444,206 | |
6.13%, 04/01/36a | | | | | 1,750 | | | | 2,283,330 | |
6.50%, 09/15/37 | | | | | 200 | | | | 272,850 | |
8.48%, 09/15/28 | | | | | 374 | | | | 566,322 | |
Black Hills Corp. | |
3.15%, 01/15/27 | | (Call 07/15/26) | | | 280 | | | | 279,796 | |
4.20%, 09/15/46 | | (Call 03/15/46) | | | 250 | | | | 249,000 | |
CenterPoint Energy Houston Electric LLC | | | | | | | | |
3.55%, 08/01/42 | | (Call 02/01/42) | | | 1,025 | | | | 1,012,997 | |
4.50%, 04/01/44 | | (Call 10/01/43)a | | | 300 | | | | 344,208 | |
Cleco Power LLC | |
6.00%, 12/01/40 | | | | | 441 | | | | 569,715 | |
CMS Energy Corp. | |
2.95%, 02/15/27 | | | | | 55 | | | | 54,808 | |
4.70%, 03/31/43 | | (Call 09/30/42) | | | 3 | | | | 3,310 | |
4.88%, 03/01/44 | | (Call 09/01/43) | | | 200 | | | | 229,008 | |
Commonwealth Edison Co. | |
3.70%, 03/01/45 | | (Call 09/01/44) | | | 1,225 | | | | 1,227,487 | |
3.80%, 10/01/42 | | (Call 04/01/42) | | | 311 | | | | 314,660 | |
4.35%, 11/15/45 | | (Call 05/15/45) | | | 100 | | | | 109,775 | |
4.60%, 08/15/43 | | (Call 02/15/43) | | | 233 | | | | 264,257 | |
4.70%, 01/15/44 | | (Call 07/15/43) | | | 461 | | | | 533,022 | |
5.88%, 02/01/33 | | | | | 100 | | | | 125,509 | |
5.90%, 03/15/36 | | | | | 514 | | | | 658,542 | |
Connecticut Light & Power Co. (The) | | | | | | | | |
4.30%, 04/15/44 | | (Call 10/15/43) | | | 361 | | | | 394,541 | |
6.35%, 06/01/36 | | | | | 155 | | | | 206,152 | |
| | | | |
SCHEDULEOF INVESTMENTS | | | 41 | |
Schedule of Investments (Unaudited) (Continued)
iSHARES® 10+ YEAR CREDIT BOND ETF
October 31, 2016
| | | | | | | | | | |
| Security | | | |
Principal
(000s) | | | Value | |
Consolidated Edison Co. of New York Inc. | | | | | | | | |
3.85%, 06/15/46 | | (Call 12/15/45) | | $ | 925 | | | $ | 940,605 | |
3.95%, 03/01/43 | | (Call 09/01/42) | | | 727 | | | | 749,820 | |
4.45%, 03/15/44 | | (Call 09/15/43) | | | 600 | | | | 663,984 | |
4.50%, 12/01/45 | | (Call 06/01/45) | | | 207 | | | | 231,014 | |
5.50%, 12/01/39 | | | | | 200 | | | | 246,474 | |
5.70%, 06/15/40 | | | | | 295 | | | | 375,951 | |
6.30%, 08/15/37 | | | | | 8 | | | | 10,569 | |
Series 05-A | | | | | | | | | | |
5.30%, 03/01/35 | | | | | 100 | | | | 119,246 | |
Series 06-A | | | | | | | | | | |
5.85%, 03/15/36 | | | | | 325 | | | | 412,981 | |
Series 06-B | | | | | | | | | | |
6.20%, 06/15/36 | | | | | 461 | | | | 597,862 | |
Series 06-E | | | | | | | | | | |
5.70%, 12/01/36 | | | | | 544 | | | | 673,015 | |
Series 08-B | | | | | | | | | | |
6.75%, 04/01/38 | | | | | 200 | | | | 279,862 | |
Series 12-A | | | | | | | | | | |
4.20%, 03/15/42 | | | | | 8 | | | | 8,455 | |
Consumers Energy Co. | |
3.25%, 08/15/46 | | (Call 02/15/46) | | | 500 | | | | 477,535 | |
3.95%, 05/15/43 | | (Call 11/15/42)a | | | 75 | | | | 79,500 | |
4.10%, 11/15/45 | | (Call 05/15/45)a | | | 255 | | | | 278,516 | |
4.35%, 08/31/64 | | (Call 02/28/64) | | | 11 | | | | 11,878 | |
Delmarva Power & Light Co. | |
4.00%, 06/01/42 | | (Call 12/01/41) | | | 755 | | | | 775,929 | |
Dominion Gas Holdings LLC | |
4.80%, 11/01/43 | | (Call 05/01/43) | | | 165 | | | | 176,291 | |
Dominion Resources Inc./VA | |
4.70%, 12/01/44 | | (Call 06/01/44) | | | 625 | | | | 684,919 | |
6.30%, 03/15/33 | | | | | 275 | | | | 332,340 | |
7.00%, 06/15/38 | | | | | 380 | | | | 504,587 | |
Series B | | | | | | | | | | |
5.95%, 06/15/35 | | | | | 290 | | | | 349,053 | |
Series C | | | | | | | | | | |
4.05%, 09/15/42 | | (Call 03/15/42)a | | | 155 | | | | 153,326 | |
4.90%, 08/01/41 | | (Call 02/01/41) | | | 7 | | | | 7,696 | |
Series F | | | | | | | | | | |
5.25%, 08/01/33 | | | | | 819 | | | | 908,304 | |
DTE Electric Co. | |
3.70%, 03/15/45 | | (Call 09/15/44) | | | 216 | | | | 220,903 | |
3.70%, 06/01/46 | | (Call 12/01/45) | | | 135 | | | | 137,611 | |
| | | | | | | | | | |
| Security | | | |
Principal
(000s) | | | Value | |
3.95%, 06/15/42 | | (Call 12/15/41) | | $ | 164 | | | $ | 173,481 | |
4.30%, 07/01/44 | | (Call 01/01/44) | | | 103 | | | | 114,778 | |
5.70%, 10/01/37 | | | | | 231 | | | | 294,396 | |
Series A | | | | | | | | | | |
4.00%, 04/01/43 | | (Call 10/01/42) | | | 208 | | | | 222,352 | |
6.63%, 06/01/36 | | | | | 206 | | | | 285,256 | |
DTE Energy Co. | |
6.38%, 04/15/33 | | | | | 135 | | | | 171,739 | |
Duke Energy Carolinas LLC | |
3.75%, 06/01/45 | | (Call 12/01/44) | | | 540 | | | | 542,851 | |
3.88%, 03/15/46 | | (Call 09/15/45) | | | 1,000 | | | | 1,020,860 | |
4.00%, 09/30/42 | | (Call 03/30/42) | | | 718 | | | | 746,483 | |
4.25%, 12/15/41 | | (Call 06/15/41) | | | 344 | | | | 370,378 | |
5.30%, 02/15/40a | | | | | 500 | | | | 611,880 | |
6.00%, 01/15/38 | | | | | 57 | | | | 74,488 | |
6.05%, 04/15/38 | | | | | 900 | | | | 1,187,010 | |
6.10%, 06/01/37 | | | | | 500 | | | | 638,260 | |
6.45%, 10/15/32 | | | | | 86 | | | | 113,056 | |
Series A | | | | | | | | | | |
6.00%, 12/01/28 | | | | | 16 | | | | 20,249 | |
Duke Energy Corp. | |
3.75%, 09/01/46 | | (Call 03/01/46) | | | 80 | | | | 76,074 | |
4.80%, 12/15/45 | | (Call 06/15/45) | | | 100 | | | | 111,301 | |
Duke Energy Florida LLC | |
3.40%, 10/01/46 | | (Call 04/01/46)a | | | 750 | | | | 716,467 | |
3.85%, 11/15/42 | | (Call 05/15/42) | | | 280 | | | | 284,519 | |
5.65%, 04/01/40 | | | | | 100 | | | | 127,062 | |
6.35%, 09/15/37 | | | | | 100 | | | | 135,918 | |
6.40%, 06/15/38 | | | | | 200 | | | | 274,782 | |
Duke Energy Florida Project Finance LLC | | | | | | | | |
Series 2026 | | | | | | | | | | |
2.54%, 09/01/31 | | | | | 750 | | | | 748,725 | |
Duke Energy Indiana LLC | |
3.75%, 05/15/46 | | (Call 11/15/45) | | | 1,000 | | | | 1,002,030 | |
6.12%, 10/15/35 | | | | | 76 | | | | 96,769 | |
6.35%, 08/15/38 | | | | | 21 | | | | 28,481 | |
6.45%, 04/01/39 | | | | | 418 | | | | 570,424 | |
Duke Energy Progress LLC | |
3.70%, 10/15/46 | | (Call 04/15/46) | | | 500 | | | | 496,920 | |
4.10%, 05/15/42 | | (Call 11/15/41) | | | 396 | | | | 417,812 | |
4.10%, 03/15/43 | | (Call 09/15/42) | | | 186 | | | | 194,253 | |
4.15%, 12/01/44 | | (Call 06/01/44) | | | 800 | | | | 844,296 | |
| | |
| 42 | | 2016 iSHARES ANNUAL REPORTTO SHAREHOLDERS |
Schedule of Investments (Unaudited) (Continued)
iSHARES® 10+ YEAR CREDIT BOND ETF
October 31, 2016
| | | | | | | | | | |
| Security | | | |
Principal
(000s) | | | Value | |
4.20%, 08/15/45 | | (Call 02/15/45) | | $ | 475 | | | $ | 507,951 | |
4.38%, 03/30/44 | | (Call 09/30/43) | | | 359 | | | | 392,825 | |
6.30%, 04/01/38 | | | | | 250 | | | | 336,927 | |
El Paso Electric Co. | |
5.00%, 12/01/44 | | (Call 06/01/44) | | | 250 | | | | 279,717 | |
6.00%, 05/15/35 | | | | | 154 | | | | 184,694 | |
Emera U.S. Finance LP | |
4.75%, 06/15/46 | | (Call 12/15/45)b | | | 700 | | | | 741,419 | |
Entergy Louisiana LLC | |
3.05%, 06/01/31 | | (Call 03/01/31) | | | 450 | | | | 452,155 | |
3.25%, 04/01/28 | | (Call 01/01/28) | | | 475 | | | | 490,851 | |
4.95%, 01/15/45 | | (Call 01/15/25) | | | 100 | | | | 104,907 | |
Entergy Mississippi Inc. | |
2.85%, 06/01/28 | | (Call 03/01/28) | | | 300 | | | | 299,940 | |
Entergy Texas Inc. | |
5.15%, 06/01/45 | | (Call 06/01/25) | | | 11 | | | | 11,828 | |
Exelon Corp. | |
4.45%, 04/15/46 | | (Call 10/15/45)a | | | 555 | | | | 579,931 | |
4.95%, 06/15/35 | | (Call 12/15/34) | | | 350 | | | | 383,512 | |
5.10%, 06/15/45 | | (Call 12/15/44) | | | 15 | | | | 16,923 | |
5.63%, 06/15/35 | | | | | 371 | | | | 430,657 | |
Exelon Generation Co. LLC | |
5.60%, 06/15/42 | | (Call 12/15/41)a | | | 671 | | | | 685,896 | |
6.25%, 10/01/39 | | | | | 655 | | | | 715,542 | |
Florida Power & Light Co. | |
3.80%, 12/15/42 | | (Call 06/15/42) | | | 200 | | | | 206,958 | |
4.05%, 06/01/42 | | (Call 12/01/41) | | | 930 | | | | 1,003,516 | |
4.05%, 10/01/44 | | (Call 04/01/44) | | | 750 | | | | 809,467 | |
4.13%, 02/01/42 | | (Call 08/01/41) | | | 456 | | | | 494,669 | |
4.95%, 06/01/35 | | | | | 200 | | | | 234,926 | |
5.25%, 02/01/41 | | (Call 08/01/40) | | | 421 | | | | 523,484 | |
5.65%, 02/01/37 | | | | | 96 | | | | 122,442 | |
5.69%, 03/01/40 | | | | | 99 | | | | 129,441 | |
5.95%, 02/01/38 | | | | | 213 | | | | 283,117 | |
Georgia Power Co. | |
4.30%, 03/15/42 | | | | | 439 | | | | 465,371 | |
4.30%, 03/15/43 | | | | | 21 | | | | 22,086 | |
5.40%, 06/01/40 | | | | | 200 | | | | 238,734 | |
5.95%, 02/01/39 | | | | | 114 | | | | 143,931 | |
Series 07-A | | | | | | | | | | |
5.65%, 03/01/37 | | | | | 100 | | | | 121,401 | |
Series 10-C | | | | | | | | | | |
4.75%, 09/01/40 | | | | | 200 | | | | 222,056 | |
| | | | | | | | | | |
| Security | | | |
Principal
(000s) | | | Value | |
Hydro-Quebec | |
9.50%, 11/15/30a | | | | $ | 200 | | | $ | 335,948 | |
Iberdrola International BV | |
6.75%, 07/15/36a | | | | | 300 | | | | 388,227 | |
Idaho Power Co. | |
3.65%, 03/01/45 | | (Call 09/01/44) | | | 11 | | | | 11,077 | |
Indiana Michigan Power Co. | |
6.05%, 03/15/37 | | | | | 5 | | | | 6,169 | |
Series K | | | | | | | | | | |
4.55%, 03/15/46 | | (Call 09/15/45) | | | 500 | | | | 543,430 | |
Interstate Power & Light Co. | |
3.70%, 09/15/46 | | (Call 03/15/46) | | | 500 | | | | 488,465 | |
6.25%, 07/15/39 | | | | | 5 | | | | 6,619 | |
Jersey Central Power & Light Co. | |
6.15%, 06/01/37 | | | | | 100 | | | | 114,805 | |
John Sevier Combined Cycle Generation LLC | | | | | | | | |
4.63%, 01/15/42 | | | | | 234 | | | | 265,742 | |
Kansas City Power & Light Co. | |
5.30%, 10/01/41 | | (Call 04/01/41) | | | 307 | | | | 343,441 | |
Series B | | | | | | | | | | |
6.05%, 11/15/35 | | | | | 5 | | | | 6,151 | |
Kentucky Utilities Co. | |
4.38%, 10/01/45 | | (Call 04/01/45) | | | 100 | | | | 110,276 | |
5.13%, 11/01/40 | | (Call 05/01/40) | | | 284 | | | | 341,027 | |
Louisville Gas & Electric Co. | |
4.38%, 10/01/45 | | (Call 04/01/45) | | | 209 | | | | 230,096 | |
4.65%, 11/15/43 | | (Call 05/15/43) | | | 151 | | | | 172,755 | |
5.13%, 11/15/40 | | (Call 05/15/40) | | | 150 | | | | 179,143 | |
MidAmerican Energy Co. | |
4.25%, 05/01/46 | | (Call 11/01/45)a | | | 111 | | | | 121,632 | |
4.40%, 10/15/44 | | (Call 04/15/44) | | | 225 | | | | 252,412 | |
4.80%, 09/15/43 | | (Call 03/15/43) | | | 378 | | | | 443,836 | |
5.75%, 11/01/35 | | | | | 11 | | | | 13,833 | |
6.75%, 12/30/31 | | | | | 11 | | | | 15,404 | |
Mississippi Power Co.
Series 12-A | |
4.25%, 03/15/42 | | | | | 356 | | | | 323,942 | |
Nevada Power Co. | |
5.38%, 09/15/40 | | (Call 03/15/40) | | | 8 | | | | 9,674 | |
5.45%, 05/15/41 | | (Call 11/15/40) | | | 606 | | | | 749,792 | |
6.65%, 04/01/36 | | | | | 100 | | | | 136,427 | |
| | | | |
SCHEDULEOF INVESTMENTS | | | 43 | |
Schedule of Investments (Unaudited) (Continued)
iSHARES® 10+ YEAR CREDIT BOND ETF
October 31, 2016
| | | | | | | | | | |
| Security | | | |
Principal
(000s) | | | Value | |
NiSource Finance Corp. | | | | | | | | |
4.80%, 02/15/44 | | (Call 08/15/43) | | $ | 615 | | | $ | 673,880 | |
5.25%, 02/15/43 | | (Call 08/15/42) | | | 325 | | | | 376,100 | |
5.65%, 02/01/45 | | (Call 08/01/44) | | | 6 | | | | 7,468 | |
5.80%, 02/01/42 | | (Call 08/01/41)a | | | 250 | | | | 302,385 | |
5.95%, 06/15/41 | | (Call 12/15/40) | | | 256 | | | | 311,890 | |
Northern States Power Co./MN | | | | | | | | |
3.40%, 08/15/42 | | (Call 02/15/42) | | | 700 | | | | 680,225 | |
3.60%, 05/15/46 | | (Call 11/15/45) | | | 50 | | | | 50,243 | |
4.00%, 08/15/45 | | (Call 02/15/45) | | | 90 | | | | 96,284 | |
4.13%, 05/15/44 | | (Call 11/15/43) | | | 7 | | | | 7,597 | |
4.85%, 08/15/40 | | (Call 02/15/40) | | | 300 | | | | 355,080 | |
5.25%, 07/15/35 | | | | | 50 | | | | 61,022 | |
5.35%, 11/01/39 | | | | | 5 | | | | 6,252 | |
6.25%, 06/01/36 | | | | | 106 | | | | 143,932 | |
NSTAR Electric Co. | |
4.40%, 03/01/44 | | (Call 09/01/43) | | | 100 | | | | 110,705 | |
5.50%, 03/15/40 | | | | | 211 | | | | 264,204 | |
Oglethorpe Power Corp. | |
4.25%, 04/01/46 | | (Call 10/01/45) | | | 500 | | | | 514,455 | |
4.55%, 06/01/44a | | | | | 550 | | | | 575,900 | |
5.25%, 09/01/50 | | | | | 25 | | | | 28,114 | |
5.38%, 11/01/40 | | | | | 150 | | | | 176,995 | |
5.95%, 11/01/39 | | | | | 5 | | | | 6,249 | |
Ohio Edison Co. | |
6.88%, 07/15/36 | | | | | 200 | | | | 253,340 | |
8.25%, 10/15/38a | | | | | 11 | | | | 15,987 | |
Ohio Power Co.
Series G | | | | | | | | |
6.60%, 02/15/33 | | | | | 10 | | | | 12,654 | |
Oklahoma Gas & Electric Co. | | | | | | | | |
4.00%, 12/15/44 | | (Call 06/15/44) | | | 335 | | | | 348,092 | |
4.55%, 03/15/44 | | (Call 09/15/43) | | | 186 | | | | 210,492 | |
5.25%, 05/15/41 | | (Call 11/15/40) | | | 200 | | | | 244,540 | |
Oncor Electric Delivery Co. LLC | |
4.55%, 12/01/41 | | (Call 06/01/41) | | | 250 | | | | 280,002 | |
5.25%, 09/30/40 | | | | | 305 | | | | 372,570 | |
5.30%, 06/01/42 | | (Call 12/01/41) | | | 473 | | | | 587,669 | |
7.25%, 01/15/33 | | | | | 411 | | | | 576,958 | |
7.50%, 09/01/38 | | | | | 148 | | | | 217,070 | |
Pacific Gas & Electric Co. | |
4.25%, 03/15/46 | | (Call 09/15/45)a | | | 11 | | | | 11,928 | |
4.30%, 03/15/45 | | (Call 09/15/44)a | | | 107 | | | | 116,664 | |
| | | | | | | | | | |
| Security | | | |
Principal
(000s) | | | Value | |
4.45%, 04/15/42 | | (Call 10/15/41) | | $ | 800 | | | $ | 877,232 | |
4.50%, 12/15/41 | | (Call 06/15/41)a | | | 270 | | | | 297,216 | |
4.60%, 06/15/43 | | (Call 12/15/42) | | | 13 | | | | 14,505 | |
4.75%, 02/15/44 | | (Call 08/15/43) | | | 382 | | | | 436,710 | |
5.13%, 11/15/43 | | (Call 05/15/43) | | | 396 | | | | 475,398 | |
5.40%, 01/15/40 | | | | | 421 | | | | 520,739 | |
5.80%, 03/01/37 | | | | | 16 | | | | 20,410 | |
6.05%, 03/01/34 | | | | | 2,750 | | | | 3,603,737 | |
6.25%, 03/01/39 | | | | | 261 | | | | 345,752 | |
6.35%, 02/15/38 | | | | | 21 | | | | 28,207 | |
PacifiCorp | |
4.10%, 02/01/42 | | (Call 08/01/41) | | | 245 | | | | 261,655 | |
6.00%, 01/15/39 | | | | | 425 | | | | 558,688 | |
6.10%, 08/01/36 | | | | | 105 | | | | 137,495 | |
6.25%, 10/15/37a | | | | | 121 | | | | 161,839 | |
PECO Energy Co. | | | | | | | | |
4.15%, 10/01/44 | | (Call 04/01/44) | | | 255 | | | | 272,845 | |
5.95%, 10/01/36 | | | | | 111 | | | | 143,298 | |
Pennsylvania Electric Co. | |
6.15%, 10/01/38 | | | | | 100 | | | | 114,374 | |
Potomac Electric Power Co. | |
4.15%, 03/15/43 | | (Call 09/15/42) | | | 66 | | | | 69,682 | |
6.50%, 11/15/37 | | | | | 175 | | | | 239,540 | |
7.90%, 12/15/38 | | | | | 11 | | | | 16,779 | |
PPL Capital Funding Inc. | |
4.70%, 06/01/43 | | (Call 12/01/42) | | | 676 | | | | 707,887 | |
5.00%, 03/15/44 | | (Call 09/15/43) | | | 365 | | | | 404,190 | |
PPL Electric Utilities Corp. | |
5.20%, 07/15/41 | | (Call 01/15/41) | | | 350 | | | | 424,725 | |
6.25%, 05/15/39 | | | | | 61 | | | | 82,418 | |
Progress Energy Inc. | |
7.75%, 03/01/31 | | | | | 9 | | | | 12,377 | |
PSEG Power LLC | |
8.63%, 04/15/31 | | | | | 720 | | | | 935,273 | |
Public Service Co. of Colorado | |
3.55%, 06/15/46 | | (Call 12/15/45) | | | 950 | | | | 939,626 | |
3.60%, 09/15/42 | | (Call 03/15/42) | | | 246 | | | | 245,038 | |
4.30%, 03/15/44 | | (Call 09/15/43) | | | 411 | | | | 455,035 | |
6.25%, 09/01/37 | | | | | 60 | | | | 81,509 | |
6.50%, 08/01/38 | | | | | 100 | | | | 139,887 | |
Public Service Electric & Gas Co. | |
3.65%, 09/01/42 | | (Call 03/01/42) | | | 25 | | | | 25,173 | |
3.80%, 03/01/46 | | (Call 09/01/45) | | | 450 | | | | 469,516 | |
| | |
| 44 | | 2016 iSHARES ANNUAL REPORTTO SHAREHOLDERS |
Schedule of Investments (Unaudited) (Continued)
iSHARES® 10+ YEAR CREDIT BOND ETF
October 31, 2016
| | | | | | | | | | |
| Security | | | |
Principal
(000s) | | | Value | |
3.95%, 05/01/42 | | (Call 11/01/41) | | $ | 270 | | | $ | 284,364 | |
4.05%, 05/01/45 | | (Call 11/01/44) | | | 125 | | | | 134,849 | |
4.15%, 11/01/45 | | (Call 05/01/45) | | | 16 | | | | 17,495 | |
5.38%, 11/01/39 | | | | | 100 | | | | 124,091 | |
5.50%, 03/01/40 | | | | | 107 | | | | 135,547 | |
5.80%, 05/01/37 | | | | | 216 | | | | 281,109 | |
Series I | | | | | | | | | | |
4.00%, 06/01/44 | | (Call 12/01/43)a | | | 220 | | | | 233,977 | |
Puget Sound Energy Inc. | |
4.30%, 05/20/45 | | (Call 11/20/44) | | | 111 | | | | 121,932 | |
4.43%, 11/15/41 | | (Call 05/15/41) | | | 125 | | | | 138,497 | |
5.48%, 06/01/35 | | | | | 308 | | | | 371,411 | |
5.64%, 04/15/41 | | (Call 10/15/40) | | | 360 | | | | 461,012 | |
5.76%, 10/01/39 | | | | | 281 | | | | 362,147 | |
5.76%, 07/15/40 | | | | | 150 | | | | 192,219 | |
5.80%, 03/15/40 | | | | | 56 | | | | 71,887 | |
6.27%, 03/15/37 | | | | | 5 | | | | 6,584 | |
6.72%, 06/15/36 | | | | | 150 | | | | 206,760 | |
7.02%, 12/01/27 | | | | | 300 | | | | 402,315 | |
San Diego Gas & Electric Co. | | | | | | | | |
3.95%, 11/15/41 | | | | | 261 | | | | 273,776 | |
4.30%, 04/01/42 | | (Call 10/01/41)a | | | 158 | | | | 174,587 | |
4.50%, 08/15/40 | | | | | 191 | | | | 216,947 | |
5.35%, 05/15/35 | | | | | 125 | | | | 153,424 | |
5.35%, 05/15/40 | | | | | 75 | | | | 93,336 | |
6.00%, 06/01/39 | | | | | 150 | | | | 200,466 | |
6.13%, 09/15/37 | | | | | 100 | | | | 133,702 | |
South Carolina Electric & Gas Co. | | | | | | | | |
4.10%, 06/15/46 | | (Call 12/15/45) | | | 500 | | | | 518,490 | |
4.35%, 02/01/42 | | (Call 08/01/41)a | | | 244 | | | | 257,086 | |
4.50%, 06/01/64 | | (Call 12/01/63) | | | 261 | | | | 264,717 | |
4.60%, 06/15/43 | | (Call 12/15/42) | | | 116 | | | | 126,587 | |
5.10%, 06/01/65 | | (Call 12/01/64) | | | 150 | | | | 168,882 | |
5.30%, 05/15/33 | | | | | 5 | | | | 5,810 | |
5.45%, 02/01/41 | | (Call 08/01/40)a | | | 420 | | | | 505,096 | |
6.05%, 01/15/38 | | | | | 248 | | | | 315,446 | |
Southaven Combined Cycle Generation LLC | | | | | | | | |
3.85%, 08/15/33 | | | | | 2 | | | | 1,832 | |
Southern California Edison Co. | | | | | | | | |
3.90%, 12/01/41 | | (Call 06/01/41) | | | 106 | | | | 111,504 | |
4.05%, 03/15/42 | | (Call 09/15/41) | | | 50 | | | | 53,642 | |
4.50%, 09/01/40 | | (Call 03/01/40) | | | 23 | | | | 25,957 | |
| | | | | | | | | | |
| Security | | | |
Principal
(000s) | | | Value | |
4.65%, 10/01/43 | | (Call 04/01/43) | | $ | 391 | | | $ | 457,650 | |
5.50%, 03/15/40 | | | | | 217 | | | | 274,978 | |
5.63%, 02/01/36 | | | | | 75 | | | | 94,080 | |
5.75%, 04/01/35 | | | | | 105 | | | | 132,231 | |
6.00%, 01/15/34a | | | | | 266 | | | | 344,209 | |
6.05%, 03/15/39 | | | | | 150 | | | | 201,246 | |
6.65%, 04/01/29 | | | | | 321 | | | | 417,265 | |
Series 05-B | | | | | | | | | | |
5.55%, 01/15/36 | | | | | 55 | | | | 68,449 | |
Series 05-E | | | | | | | | | | |
5.35%, 07/15/35 | | | | | 639 | | | | 780,130 | |
Series 06-E | | | | | | | | | | |
5.55%, 01/15/37 | | | | | 180 | | | | 224,645 | |
Series 08-A | | | | | | | | | | |
5.95%, 02/01/38 | | | | | 632 | | | | 835,043 | |
Series 13-A | | | | | | | | | | |
3.90%, 03/15/43 | | (Call 09/15/42) | | | 205 | | | | 216,095 | |
Series C | | | | | | | | | | |
3.60%, 02/01/45 | | (Call 08/01/44) | | | 600 | | | | 605,550 | |
Southern Co. (The) | |
4.25%, 07/01/36 | | (Call 01/01/36)a | | | 750 | | | | 779,565 | |
4.40%, 07/01/46 | | (Call 01/01/46) | | | 775 | | | | 816,571 | |
Southern Power Co. | |
5.15%, 09/15/41 | | | | | 200 | | | | 212,428 | |
Southwestern Electric Power Co. | | | | | | | | |
3.90%, 04/01/45 | | (Call 10/01/44) | | | 611 | | | | 593,477 | |
6.20%, 03/15/40 | | | | | 140 | | | | 174,703 | |
Southwestern Public Service Co. | |
3.40%, 08/15/46 | | (Call 02/15/46) | | | 500 | | | | 479,645 | |
4.50%, 08/15/41 | | (Call 02/15/41) | | | 100 | | | | 112,096 | |
6.00%, 10/01/36 | | | | | 561 | | | | 696,386 | |
Tampa Electric Co. | |
4.10%, 06/15/42 | | (Call 12/15/41) | | | 300 | | | | 307,989 | |
4.20%, 05/15/45 | | (Call 11/15/44)a | | | 11 | | | | 11,477 | |
4.35%, 05/15/44 | | (Call 11/15/43) | | | 560 | | | | 596,574 | |
6.55%, 05/15/36 | | | | | 5 | | | | 6,637 | |
Toledo Edison Co. (The) | | | | | | | | |
6.15%, 05/15/37 | | | | | 200 | | | | 242,210 | |
TransAlta Corp. | |
6.50%, 03/15/40a | | | | | 211 | | | | 197,285 | |
Tri-State Generation & Transmission Association Inc. | | | | | | | | |
4.25%, 06/01/46 | | (Call 12/01/45) | | | 350 | | | | 357,080 | |
| | | | |
SCHEDULEOF INVESTMENTS | | | 45 | |
Schedule of Investments (Unaudited) (Continued)
iSHARES® 10+ YEAR CREDIT BOND ETF
October 31, 2016
| | | | | | | | | | |
| Security | | | |
Principal
(000s) | | | Value | |
Union Electric Co. | |
3.90%, 09/15/42 | | (Call 03/15/42) | | $ | 920 | | | $ | 963,111 | |
8.45%, 03/15/39 | | | | | 111 | | | | 182,000 | |
Virginia Electric & Power Co. | |
4.00%, 01/15/43 | | (Call 07/15/42)a | | | 266 | | | | 275,488 | |
4.20%, 05/15/45 | | (Call 11/15/44)a | | | 7 | | | | 7,508 | |
4.45%, 02/15/44 | | (Call 08/15/43) | | | 170 | | | | 189,587 | |
8.88%, 11/15/38 | | | | | 700 | | | | 1,160,488 | |
Series A | | | | | | | | | | |
6.00%, 05/15/37 | | | | | 284 | | | | 372,071 | |
Series B | | | | | | | | | | |
6.00%, 01/15/36 | | | | | 250 | | | | 320,465 | |
Series D | | | | | | | | | | |
4.65%, 08/15/43 | | (Call 02/15/43) | | | 21 | | | | 24,087 | |
Westar Energy Inc. | |
4.10%, 04/01/43 | | (Call 10/01/42) | | | 105 | | | | 109,428 | |
4.13%, 03/01/42 | | (Call 09/01/41) | | | 347 | | | | 363,607 | |
4.25%, 12/01/45 | | (Call 06/01/45) | | | 400 | | | | 427,560 | |
Wisconsin Electric Power Co. | |
3.65%, 12/15/42 | | (Call 06/15/42) | | | 100 | | | | 99,361 | |
4.25%, 06/01/44 | | (Call 12/01/43) | | | 100 | | | | 108,905 | |
4.30%, 12/15/45 | | (Call 06/15/45) | | | 600 | | | | 657,216 | |
Wisconsin Power & Light Co. | |
4.10%, 10/15/44 | | (Call 04/15/44) | | | 600 | | | | 629,190 | |
6.38%, 08/15/37 | | | | | 140 | | | | 190,557 | |
Wisconsin Public Service Corp. | |
4.75%, 11/01/44 | | (Call 05/01/44) | | | 305 | | | | 356,209 | |
Xcel Energy Inc. | |
4.80%, 09/15/41 | | (Call 03/15/41) | | | 5 | | | | 5,620 | |
6.50%, 07/01/36 | | | | | 50 | | | | 66,100 | |
| | | | | | | | | | |
| | | | | | | | | 105,056,941 | |
ELECTRICAL COMPONENTS & EQUIPMENT — 0.02% | |
Emerson Electric Co. | |
6.00%, 08/15/32 | | | | | 135 | | | | 170,162 | |
6.13%, 04/15/39 | | | | | 12 | | | | 15,801 | |
| | | | | | | | | | |
| | | | | | | | | 185,963 | |
ELECTRONICS — 0.23% | |
Fortive Corp. | |
4.30%, 06/15/46 | | (Call 12/15/45)b | | | 225 | | | | 231,937 | |
Honeywell International Inc. | |
5.38%, 03/01/41 | | | | | 500 | | | | 640,355 | |
5.70%, 03/15/36 | | | | | 11 | | | | 14,044 | |
5.70%, 03/15/37 | | | | | 600 | | | | 770,082 | |
| | | | | | | | | | |
| Security | | | |
Principal
(000s) | | | Value | |
Koninklijke Philips NV | |
5.00%, 03/15/42 | | | | $ | 519 | | | $ | 559,539 | |
Thermo Fisher Scientific Inc. | |
5.30%, 02/01/44 | | (Call 08/01/43)a | | | 208 | | | | 245,332 | |
| | | | | | | | | | |
| | | | | | | | | 2,461,289 | |
ENGINEERING & CONSTRUCTION — 0.03% | |
ABB Finance USA Inc. | |
4.38%, 05/08/42 | | | | | 257 | | | | 284,612 | |
| | | | | | | | | | |
| | | | | | | | | 284,612 | |
ENVIRONMENTAL CONTROL — 0.12% | |
Waste Management Inc. | | | | | | | | |
3.90%, 03/01/35 | | (Call 09/01/34) | | | 763 | | | | 794,390 | |
4.10%, 03/01/45 | | (Call 09/01/44) | | | 183 | | | | 193,738 | |
6.13%, 11/30/39 | | | | | 207 | | | | 273,530 | |
7.00%, 07/15/28 | | | | | 18 | | | | 23,939 | |
| | | | | | | | | | |
| | | | | | | | | 1,285,597 | |
FOOD — 1.56% | |
Ahold Finance USA LLC | | | | | | | | |
6.88%, 05/01/29 | | | | | 11 | | | | 14,135 | |
Campbell Soup Co. | |
3.80%, 08/02/42 | | | | | 6 | | | | 5,813 | |
ConAgra Foods Inc. | |
7.00%, 10/01/28 | | | | | 230 | | | | 295,447 | |
7.13%, 10/01/26 | | | | | — | | | | — | |
8.25%, 09/15/30 | | | | | 200 | | | | 275,630 | |
Delhaize America LLC | |
9.00%, 04/15/31 | | | | | 5 | | | | 6,784 | |
General Mills Inc. | |
4.15%, 02/15/43 | | (Call 08/15/42) | | | 5 | | | | 5,171 | |
5.40%, 06/15/40 | | | | | 656 | | | | 787,843 | |
Hershey Co. (The) | |
3.38%, 08/15/46 | | (Call 02/15/46) | | | 250 | | | | 235,847 | |
JM Smucker Co. (The) | |
4.25%, 03/15/35 | | | | | 600 | | | | 636,456 | |
4.38%, 03/15/45 | | | | | 124 | | | | 131,811 | |
Kellogg Co. | |
4.50%, 04/01/46 | | | | | 335 | | | | 348,809 | |
Series B | | | | | | | | | | |
7.45%, 04/01/31 | | | | | 500 | | | | 678,920 | |
Koninklijke Ahold Delhaize NV | | | | | | | | |
5.70%, 10/01/40 | | | | | 500 | | | | 586,320 | |
Kraft Heinz Foods Co. | |
4.38%, 06/01/46 | | (Call 12/01/45) | | | 1,700 | | | | 1,716,847 | |
| | |
| 46 | | 2016 iSHARES ANNUAL REPORTTO SHAREHOLDERS |
Schedule of Investments (Unaudited) (Continued)
iSHARES® 10+ YEAR CREDIT BOND ETF
October 31, 2016
| | | | | | | | | | |
| Security | | | |
Principal
(000s) | | | Value | |
5.00%, 07/15/35 | | (Call 01/15/35) | | $ | 400 | | | $ | 445,988 | |
5.00%, 06/04/42 | | | | | 1,750 | | | | 1,929,410 | |
5.20%, 07/15/45 | | (Call 01/15/45) | | | 850 | | | | 952,918 | |
6.50%, 02/09/40 | | | | | 456 | | | | 591,551 | |
6.88%, 01/26/39 | | | | | 571 | | | | 770,747 | |
Kroger Co. (The) | |
3.88%, 10/15/46 | | (Call 04/15/46)a | | | 300 | | | | 286,599 | |
5.00%, 04/15/42 | | (Call 10/15/41) | | | 100 | | | | 111,405 | |
5.15%, 08/01/43 | | (Call 02/01/43) | | | 500 | | | | 568,215 | |
5.40%, 07/15/40 | | (Call 01/15/40) | | | 300 | | | | 348,999 | |
6.90%, 04/15/38 | | | | | 253 | | | | 339,493 | |
7.50%, 04/01/31 | | | | | 322 | | | | 447,989 | |
Mondelez International Inc. | |
6.50%, 02/09/40a | | | | | 222 | | | | 293,679 | |
6.88%, 01/26/39 | | | | | 400 | | | | 540,105 | |
Sysco Corp. | |
4.50%, 04/01/46 | | (Call 10/01/45) | | | 500 | | | | 527,130 | |
4.85%, 10/01/45 | | (Call 04/01/45) | | | 100 | | | | 109,935 | |
5.38%, 09/21/35 | | | | | 500 | | | | 581,400 | |
6.63%, 03/17/39 | | | | | 11 | | | | 14,380 | |
Tyson Foods Inc. | |
4.88%, 08/15/34 | | (Call 02/15/34) | | | 425 | | | | 457,938 | |
5.15%, 08/15/44 | | (Call 02/15/44) | | | 305 | | | | 344,650 | |
Unilever Capital Corp. | |
5.90%, 11/15/32 | | | | | 778 | | | | 1,058,391 | |
| | | | | | | | | | |
| | | | | | | | | 16,446,755 | |
FOREST PRODUCTS & PAPER — 0.51% | |
Domtar Corp. | |
6.75%, 02/15/44 | | (Call 08/15/43) | | | 205 | | | | 226,459 | |
Georgia-Pacific LLC | |
7.75%, 11/15/29 | | | | | 803 | | | | 1,130,785 | |
8.88%, 05/15/31 | | | | | 14 | | | | 21,922 | |
International Paper Co. | |
3.00%, 02/15/27 | | (Call 11/15/26) | | | 500 | | | | 492,985 | |
4.40%, 08/15/47 | | (Call 02/15/47) | | | 500 | | | | 489,580 | |
4.80%, 06/15/44 | | (Call 12/15/43) | | | 525 | | | | 536,424 | |
5.00%, 09/15/35 | | (Call 03/15/35)a | | | 50 | | | | 53,907 | |
5.15%, 05/15/46 | | (Call 11/15/45) | | | 190 | | | | 205,073 | |
6.00%, 11/15/41 | | (Call 05/15/41) | | | 786 | | | | 912,735 | |
7.30%, 11/15/39 | | | | | 240 | | | | 313,442 | |
8.70%, 06/15/38 | | | | | 246 | | | | 360,402 | |
WestRock MWV LLC | |
7.95%, 02/15/31 | | | | | 11 | | | | 14,645 | |
| | | | | | | | | | |
| Security | | | |
Principal
(000s) | | | Value | |
8.20%, 01/15/30 | | | | $ | 430 | | | $ | 580,315 | |
| | | | | | | | | | |
| | | | | | | | | 5,338,674 | |
GAS — 0.57% | |
Atmos Energy Corp. | | | | | | | | |
4.13%, 10/15/44 | | (Call 04/15/44) | | | 713 | | | | 737,834 | |
4.15%, 01/15/43 | | (Call 07/15/42) | | | 100 | | | | 104,100 | |
5.50%, 06/15/41 | | (Call 12/15/40) | | | 5 | | | | 6,121 | |
Dominion Gas Holdings LLC | | | | | | | | |
4.60%, 12/15/44 | | (Call 06/15/44)a | | | 350 | | | | 367,150 | |
KeySpan Corp. | |
5.80%, 04/01/35 | | | | | 208 | | | | 244,069 | |
8.00%, 11/15/30 | | | | | 130 | | | | 179,962 | |
ONE Gas Inc. | |
4.66%, 02/01/44 | | (Call 08/01/43)a | | | 354 | | | | 392,558 | |
Piedmont Natural Gas Co. Inc. | |
4.10%, 09/18/34 | | (Call 03/18/34) | | | 207 | | | | 213,181 | |
4.65%, 08/01/43 | | (Call 02/01/43) | | | 153 | | | | 167,198 | |
Sempra Energy | |
6.00%, 10/15/39 | | | | | 875 | | | | 1,089,882 | |
Southern California Gas Co. | |
3.75%, 09/15/42 | | (Call 03/15/42) | | | 5 | | | | 5,096 | |
Series KK | | | | | | | | | | |
5.75%, 11/15/35 | | | | | 225 | | | | 284,177 | |
Southern Co. Gas Capital Corp. | | | | | | | | |
3.95%, 10/01/46 | | (Call 04/01/46) | | | 600 | | | | 591,480 | |
4.40%, 06/01/43 | | (Call 12/01/42) | | | 6 | | | | 6,213 | |
5.88%, 03/15/41 | | (Call 09/15/40) | | | 643 | | | | 780,538 | |
6.00%, 10/01/34 | | | | | 95 | | | | 115,830 | |
Southwest Gas Corp. | |
3.80%, 09/29/46 | | (Call 03/29/46) | | | 365 | | | | 355,590 | |
Washington Gas Light Co.
Series K | | | | | | | | |
3.80%, 09/15/46 | | (Call 03/15/46)a | | | 400 | | | | 398,300 | |
| | | | | | | | | | |
| | | | | | | | | 6,039,279 | |
HAND & MACHINE TOOLS — 0.03% | |
Stanley Black & Decker Inc. | |
5.20%, 09/01/40 | | | | | 255 | | | | 292,503 | |
| | | | | | | | | | |
| | | | | | | | | 292,503 | |
HEALTH CARE – PRODUCTS — 1.20% | |
Baxter International Inc. | |
3.50%, 08/15/46 | | (Call 02/15/46) | | | 685 | | | | 615,699 | |
Becton Dickinson and Co. | | | | | | | | |
4.69%, 12/15/44 | | (Call 06/15/44) | | | 450 | | | | 493,713 | |
| | | | |
SCHEDULEOF INVESTMENTS | | | 47 | |
Schedule of Investments (Unaudited) (Continued)
iSHARES® 10+ YEAR CREDIT BOND ETF
October 31, 2016
| | | | | | | | | | |
| Security | | | |
Principal
(000s) | | | Value | |
4.88%, 05/15/44 | | (Call 11/15/43) | | $ | 490 | | | $ | 542,156 | |
5.00%, 11/12/40 | | | | | 200 | | | | 220,580 | |
6.00%, 05/15/39 | | | | | 100 | | | | 122,824 | |
Boston Scientific Corp. | | | | | | | | |
7.00%, 11/15/35 | | | | | 250 | | | | 316,562 | |
7.38%, 01/15/40 | | | | | 200 | | | | 261,618 | |
Danaher Corp. | |
4.38%, 09/15/45 | | (Call 03/15/45) | | | 400 | | | | 447,868 | |
Medtronic Inc. | |
4.38%, 03/15/35 | | | | | 1,711 | | | | 1,883,332 | |
4.50%, 03/15/42 | | (Call 09/15/41) | | | 86 | | | | 94,347 | |
4.63%, 03/15/44 | | (Call 09/15/43) | | | 650 | | | | 731,692 | |
4.63%, 03/15/45 | | | | | 2,500 | | | | 2,821,150 | |
5.55%, 03/15/40 | | | | | 291 | | | | 354,260 | |
6.50%, 03/15/39 | | | | | 100 | | | | 136,660 | |
St. Jude Medical Inc. | |
4.75%, 04/15/43 | | (Call 10/15/42) | | | 420 | | | | 439,530 | |
Stryker Corp. | |
4.10%, 04/01/43 | | (Call 10/01/42) | | | 350 | | | | 347,193 | |
4.38%, 05/15/44 | | (Call 11/15/43) | | | 135 | | | | 139,452 | |
4.63%, 03/15/46 | | (Call 09/15/45)a | | | 725 | | | | 778,404 | |
Zimmer Biomet Holdings Inc. | |
4.25%, 08/15/35 | | (Call 02/15/35) | | | 437 | | | | 428,942 | |
4.45%, 08/15/45 | | (Call 02/15/45) | | | 504 | | | | 498,607 | |
5.75%, 11/30/39 | | | | | 900 | | | | 1,038,339 | |
| | | | | | | | | | |
| | | | | | | | | 12,712,928 | |
HEALTH CARE – SERVICES — 1.92% | |
Aetna Inc. | |
4.13%, 11/15/42 | | (Call 05/15/42) | | | 200 | | | | 198,592 | |
4.25%, 06/15/36 | | (Call 12/15/35) | | | 1,300 | | | | 1,323,985 | |
4.38%, 06/15/46 | | (Call 12/15/45) | | | 1,500 | | | | 1,526,430 | |
4.50%, 05/15/42 | | (Call 11/15/41) | | | 250 | | | | 261,508 | |
4.75%, 03/15/44 | | (Call 09/15/43) | | | 225 | | | | 243,848 | |
6.63%, 06/15/36 | | | | | 200 | | | | 261,176 | |
6.75%, 12/15/37a | | | | | 185 | | | | 247,941 | |
Anthem Inc. | |
4.63%, 05/15/42 | | | | | 600 | | | | 626,388 | |
4.65%, 01/15/43 | | | | | 871 | | | | 923,940 | |
4.65%, 08/15/44 | | (Call 02/15/44) | | | 200 | | | | 213,578 | |
4.85%, 08/15/54 | | (Call 02/15/54) | | | 475 | | | | 514,629 | |
5.10%, 01/15/44 | | | | | 225 | | | | 253,944 | |
5.85%, 01/15/36 | | | | | 21 | | | | 24,903 | |
5.95%, 12/15/34 | | | | | 382 | | | | 452,372 | |
6.38%, 06/15/37 | | | | | 300 | | | | 380,925 | |
| | | | | | | | | | |
| Security | | | |
Principal
(000s) | | | Value | |
Ascension Health | |
3.95%, 11/15/46 | | | | $ | 508 | | | $ | 529,433 | |
4.85%, 11/15/53 | | | | | 11 | | | | 12,834 | |
Baylor Scott & White Holdings | | | | | | | | |
3.97%, 11/15/46 | | (Call 05/15/46) | | | 250 | | | | 252,895 | |
4.19%, 11/15/45 | | (Call 05/15/45) | | | 16 | | | | 16,834 | |
Cigna Corp. | |
5.38%, 02/15/42 | | (Call 08/15/41) | | | 247 | | | | 288,056 | |
5.88%, 03/15/41 | | (Call 09/15/40) | | | 403 | | | | 490,898 | |
6.15%, 11/15/36 | | | | | 100 | | | | 122,309 | |
7.88%, 05/15/27 | | | | | 11 | | | | 15,101 | |
Dignity Health | |
4.50%, 11/01/42 | | | | | 100 | | | | 100,543 | |
5.27%, 11/01/64 | | | | | 196 | | | | 213,085 | |
Humana Inc. | |
4.63%, 12/01/42 | | (Call 06/01/42) | | | 350 | | | | 357,315 | |
4.95%, 10/01/44 | | (Call 04/01/44) | | | 200 | | | | 215,042 | |
8.15%, 06/15/38 | | | | | 240 | | | | 343,808 | |
Kaiser Foundation Hospitals | |
4.88%, 04/01/42 | | | | | 334 | | | | 390,232 | |
Laboratory Corp. of America Holdings | | | | | | | | |
4.70%, 02/01/45 | | (Call 08/01/44)a | | | 398 | | | | 423,787 | |
Mayo Clinic
Series 2013 | |
4.00%, 11/15/47 | | | | | 11 | | | | 11,356 | |
Memorial Sloan-Kettering Cancer Center | | | | | | | | |
Series 2015 | | | | | | | | | | |
4.20%, 07/01/55 | | | | | 522 | | | | 553,957 | |
New York and Presbyterian Hospital (The) | | | | | | | | |
4.02%, 08/01/45 | | | | | 21 | | | | 21,901 | |
4.06%, 08/01/56 | | | | | 750 | | | | 767,805 | |
4.76%, 08/01/16 | | | | | 500 | | | | 511,915 | |
Northwell Healthcare Inc. | |
3.98%, 11/01/46 | | (Call 11/01/45) | | | 500 | | | | 488,020 | |
Ochsner Clinic Foundation | |
5.90%, 05/15/45 | | (Call 11/15/44) | | | 11 | | | | 13,770 | |
Premier Health Partners
Series G | |
2.91%, 11/15/26 | | (Call 05/15/26) | | | 250 | | | | 245,085 | |
| | |
| 48 | | 2016 iSHARES ANNUAL REPORTTO SHAREHOLDERS |
Schedule of Investments (Unaudited) (Continued)
iSHARES® 10+ YEAR CREDIT BOND ETF
October 31, 2016
| | | | | | | | | | |
| Security | | | |
Principal
(000s) | | | Value | |
Providence St Joseph Health Obligated Group | | | | | | | | |
Series I | | | | | | | | | | |
3.74%, 10/01/47 | | | | $ | 250 | | | $ | 244,720 | |
Quest Diagnostics Inc. | |
4.70%, 03/30/45 | | (Call 09/30/44) | | | 22 | | | | 22,858 | |
Texas Health Resources | |
4.33%, 11/15/55 | | | | | 9 | | | | 9,758 | |
UnitedHealth Group Inc. | |
3.95%, 10/15/42 | | (Call 04/15/42)a | | | 7 | | | | 7,132 | |
4.25%, 03/15/43 | | (Call 09/15/42) | | | 500 | | | | 532,890 | |
4.38%, 03/15/42 | | (Call 09/15/41) | | | 500 | | | | 540,510 | |
4.63%, 07/15/35 | | | | | 255 | | | | 289,264 | |
4.63%, 11/15/41 | | (Call 05/15/41) | | | 180 | | | | 199,386 | |
4.75%, 07/15/45 | | | | | 1,300 | | | | 1,503,281 | |
5.70%, 10/15/40 | | (Call 04/15/40)a | | | 461 | | | | 576,743 | |
5.80%, 03/15/36 | | | | | 695 | | | | 887,557 | |
5.95%, 02/15/41 | | (Call 08/15/40)a | | | 536 | | | | 694,951 | |
6.50%, 06/15/37 | | | | | 146 | | | | 197,783 | |
6.63%, 11/15/37a | | | | | 111 | | | | 153,685 | |
6.88%, 02/15/38 | | | | | 400 | | | | 559,112 | |
| | | | | | | | | | |
| | | | | | | | | 20,259,770 | |
HOLDING COMPANIES – DIVERSIFIED — 0.02% | |
Hutchison Whampoa International Ltd. | | | | | | | | |
7.45%, 11/24/33b | | | | | 50 | | | | 71,823 | |
Leucadia National Corp. | |
6.63%, 10/23/43 | | (Call 07/23/43) | | | 175 | | | | 174,344 | |
| | | | | | | | | | |
| | | | | | | | | 246,167 | |
HOME FURNISHINGS — 0.05% | |
Whirlpool Corp. | |
4.50%, 06/01/46 | | (Call 12/01/45) | | | 300 | | | | 311,055 | |
5.15%, 03/01/43 | | | | | 155 | | | | 174,504 | |
| | | | | | | | | | |
| | | | | | | | | 485,559 | |
HOUSEHOLD PRODUCTS & WARES — 0.13% | |
Kimberly-Clark Corp. | |
3.20%, 07/30/46 | | (Call 01/30/46) | | | 800 | | | | 748,608 | |
3.70%, 06/01/43 | | | | | 18 | | | | 18,444 | |
5.30%, 03/01/41 | | | | | 6 | | | | 7,580 | |
6.63%, 08/01/37 | | | | | 400 | | | | 573,388 | |
| | | | | | | | | | |
| | | | | | | | | 1,348,020 | |
| | | | | | | | | | |
| Security | | | |
Principal
(000s) | | | Value | |
HOUSEWARES — 0.15% | |
Newell Brands Inc. | |
5.38%, 04/01/36 | | (Call 10/01/35) | | $ | 590 | | | $ | 683,019 | |
5.50%, 04/01/46 | | (Call 10/01/45) | | | 800 | | | | 943,480 | |
| | | | | | | | | | |
| | | | | | | | | 1,626,499 | |
INSURANCE — 3.49% | |
ACE Capital Trust II | |
9.70%, 04/01/30 | | | | | 100 | | | | 150,464 | |
Aflac Inc. | |
4.00%, 10/15/46 | | (Call 04/15/46) | | | 500 | | | | 496,290 | |
6.45%, 08/15/40 | | | | | 400 | | | | 526,968 | |
Alleghany Corp. | |
4.90%, 09/15/44 | | (Call 03/15/44) | | | 200 | | | | 201,412 | |
Allstate Corp. (The) | |
4.50%, 06/15/43 | | | | | 1,000 | | | | 1,132,000 | |
5.35%, 06/01/33 | | | | | 68 | | | | 81,529 | |
5.55%, 05/09/35 | | | | | 326 | | | | 402,463 | |
5.95%, 04/01/36 | | | | | 50 | | | | 64,574 | |
American International Group Inc. | |
3.88%, 01/15/35 | | (Call 07/15/34) | | | 1,515 | | | | 1,473,640 | |
4.38%, 01/15/55 | | (Call 07/15/54) | | | 250 | | | | 234,907 | |
4.50%, 07/16/44 | | (Call 01/16/44) | | | 1,011 | | | | 1,029,784 | |
4.70%, 07/10/35 | | (Call 01/10/35) | | | 700 | | | | 748,797 | |
4.80%, 07/10/45 | | (Call 01/10/45) | | | 286 | | | | 304,556 | |
6.25%, 05/01/36 | | | | | 532 | | | | 653,099 | |
Aon Corp. | |
8.21%, 01/01/27 | | | | | 314 | | | | 414,172 | |
Aon PLC | |
4.45%, 05/24/43 | | (Call 02/24/43) | | | 600 | | | | 602,790 | |
4.60%, 06/14/44 | | (Call 03/14/44) | | | 300 | | | | 315,081 | |
4.75%, 05/15/45 | | (Call 11/15/44)a | | | 246 | | | | 258,871 | |
Arch Capital Group U.S. Inc. | |
5.14%, 11/01/43 | | | | | 475 | | | | 505,609 | |
Assurant Inc. | |
6.75%, 02/15/34 | | | | | 235 | | | | 285,894 | |
AXA SA | |
8.60%, 12/15/30 | | | | | 767 | | | | 1,076,860 | |
AXIS Specialty Finance PLC | |
5.15%, 04/01/45 | | | | | 5 | | | | 5,200 | |
Berkshire Hathaway Finance Corp. | | | | | | | | |
4.30%, 05/15/43a | | | | | 118 | | | | 129,362 | |
4.40%, 05/15/42a | | | | | 504 | | | | 557,202 | |
5.75%, 01/15/40 | | | | | 430 | | | | 560,587 | |
| | | | |
SCHEDULEOF INVESTMENTS | | | 49 | |
Schedule of Investments (Unaudited) (Continued)
iSHARES® 10+ YEAR CREDIT BOND ETF
October 31, 2016
| | | | | | | | | | |
| Security | | | |
Principal
(000s) | | | Value | |
Berkshire Hathaway Inc. | |
4.50%, 02/11/43a | | | | $ | 700 | | | $ | 789,971 | |
Chubb Corp. (The) | |
6.00%, 05/11/37 | | | | | 485 | | | | 638,221 | |
Chubb INA Holdings Inc. | |
4.15%, 03/13/43 | | | | | 485 | | | | 520,260 | |
4.35%, 11/03/45 | | (Call 05/03/45) | | | 1,250 | | | | 1,395,488 | |
Cincinnati Financial Corp. | | | | | | | | |
6.92%, 05/15/28 | | | | | 11 | | | | 14,224 | |
Endurance Specialty Holdings Ltd. | | | | | | | | |
7.00%, 07/15/34 | | | | | 230 | | | | 276,702 | |
Everest Reinsurance Holdings Inc. | | | | | | | | |
4.87%, 06/01/44 | | | | | 261 | | | | 262,723 | |
Hartford Financial Services Group Inc. (The) | | | | | | | | |
4.30%, 04/15/43 | | | | | 14 | | | | 13,429 | |
5.95%, 10/15/36 | | | | | 281 | | | | 323,819 | |
6.10%, 10/01/41 | | | | | 490 | | | | 587,539 | |
6.63%, 03/30/40 | | | | | 100 | | | | 125,954 | |
Lincoln National Corp. | |
6.15%, 04/07/36 | | | | | 225 | | | | 258,842 | |
6.30%, 10/09/37 | | | | | 16 | | | | 18,881 | |
7.00%, 06/15/40 | | | | | 481 | | | | 613,179 | |
Loews Corp. | | | | | | | | |
4.13%, 05/15/43 | | (Call 11/15/42) | | | 308 | | | | 306,207 | |
6.00%, 02/01/35 | | | | | 150 | | | | 184,478 | |
Manulife Financial Corp. | |
5.38%, 03/04/46 | | | | | 431 | | | | 512,006 | |
Markel Corp. | |
5.00%, 03/30/43 | | | | | 3 | | | | 3,124 | |
5.00%, 04/05/46 | | | | | 475 | | | | 497,714 | |
Marsh & McLennan Companies Inc. | | | | | | | | |
5.88%, 08/01/33 | | | | | 205 | | | | 252,619 | |
MetLife Inc. | |
4.05%, 03/01/45a | | | | | 1,155 | | | | 1,141,925 | |
4.13%, 08/13/42 | | | | | 348 | | | | 346,232 | |
4.60%, 05/13/46 | | (Call 11/13/45)a | | | 850 | | | | 918,349 | |
4.72%, 12/15/44 | | | | | 618 | | | | 676,710 | |
4.88%, 11/13/43 | | | | | 489 | | | | 542,907 | |
5.70%, 06/15/35a | | | | | 431 | | | | 525,277 | |
6.40%, 12/15/66 | | (Call 12/15/31) | | | 820 | | | | 918,695 | |
6.50%, 12/15/32 | | | | | 458 | | | | 588,901 | |
10.75%, 08/01/69 | | (Call 08/01/34) | | | 16 | | | | 26,140 | |
| | | | | | | | | | |
| Security | | | |
Principal
(000s) | | | Value | |
Principal Financial Group Inc. | |
4.35%, 05/15/43a | | | | $ | 600 | | | $ | 598,062 | |
4.63%, 09/15/42 | | | | | 5 | | | | 5,155 | |
6.05%, 10/15/36 | | | | | 166 | | | | 202,900 | |
Progressive Corp. (The) | |
2.45%, 01/15/27 | | | | | 900 | | | | 878,148 | |
3.70%, 01/26/45a | | | | | 200 | | | | 200,122 | |
4.35%, 04/25/44 | | | | | 236 | | | | 259,860 | |
6.25%, 12/01/32 | | | | | 173 | | | | 222,736 | |
Protective Life Corp. | |
8.45%, 10/15/39a | | | | | 200 | | | | 277,128 | |
Prudential Financial Inc. | |
4.60%, 05/15/44a | | | | | 700 | | | | 740,908 | |
5.10%, 08/15/43 | | | | | 11 | | | | 12,288 | |
5.40%, 06/13/35 | | | | | 445 | | | | 511,750 | |
5.63%, 05/12/41 | | | | | 13 | | | | 15,378 | |
5.70%, 12/14/36 | | | | | 300 | | | | 355,743 | |
5.80%, 11/16/41 | | | | | 150 | | | | 181,158 | |
5.90%, 03/17/36 | | | | | 210 | | | | 251,880 | |
6.20%, 11/15/40 | | | | | 200 | | | | 251,472 | |
6.63%, 06/21/40 | | | | | 5 | | | | 6,537 | |
Series B | | | | | | | | | | |
5.75%, 07/15/33 | | | | | 8 | | | | 9,387 | |
Series D | | | | | | | | | | |
6.63%, 12/01/37 | | | | | 1,006 | | | | 1,320,194 | |
Transatlantic Holdings Inc. | |
8.00%, 11/30/39 | | | | | 200 | | | | 267,486 | |
Travelers Companies Inc. (The) | |
3.75%, 05/15/46 | | (Call 11/15/45) | | | 600 | | | | 611,418 | |
4.60%, 08/01/43 | | | | | 66 | | | | 75,961 | |
5.35%, 11/01/40 | | | | | 300 | | | | 374,406 | |
6.25%, 06/15/37 | | | | | 1,000 | | | | 1,351,890 | |
6.75%, 06/20/36 | | | | | 50 | | | | 70,278 | |
Travelers Property Casualty Corp. | |
6.38%, 03/15/33 | | | | | 110 | | | | 146,016 | |
Trinity Acquisition PLC | |
6.13%, 08/15/43 | | | | | 100 | | | | 111,400 | |
Unum Group | |
5.75%, 08/15/42 | | | | | 305 | | | | 338,239 | |
Validus Holdings Ltd. | |
8.88%, 01/26/40 | | | | | 134 | | | | 182,562 | |
Voya Financial Inc. | |
4.80%, 06/15/46 | | | | | 100 | | | | 98,260 | |
5.70%, 07/15/43 | | | | | 290 | | | | 315,210 | |
| | |
| 50 | | 2016 iSHARES ANNUAL REPORTTO SHAREHOLDERS |
Schedule of Investments (Unaudited) (Continued)
iSHARES® 10+ YEAR CREDIT BOND ETF
October 31, 2016
| | | | | | | | | | |
| Security | | | |
Principal
(000s) | | | Value | |
WR Berkley Corp. | |
4.75%, 08/01/44a | | | | $ | 50 | | | $ | 50,118 | |
6.25%, 02/15/37 | | | | | 400 | | | | 477,944 | |
XLIT Ltd. | |
5.50%, 03/31/45 | | | | | 500 | | | | 482,305 | |
6.25%, 05/15/27 | | | | | 86 | | | | 101,870 | |
| | | | | | | | | | |
| | | | | | | | | 36,848,796 | |
INTERNET — 0.23% | |
Alibaba Group Holding Ltd. | |
4.50%, 11/28/34 | | (Call 05/28/34)a | | | 400 | | | | 422,103 | |
Amazon.com Inc. | |
4.80%, 12/05/34 | | (Call 06/05/34) | | | 800 | | | | 913,176 | |
4.95%, 12/05/44 | | (Call 06/05/44) | | | 750 | | | | 882,405 | |
eBay Inc. | |
4.00%, 07/15/42 | | (Call 01/15/42) | | | 300 | | | | 264,165 | |
| | | | | | | | | | |
| | | | | | | | | 2,481,849 | |
IRON & STEEL — 0.44% | |
Nucor Corp. | |
5.20%, 08/01/43 | | (Call 02/01/43) | | | 314 | | | | 353,828 | |
6.40%, 12/01/37 | | | | | 286 | | | | 353,181 | |
Reliance Steel & Aluminum Co. | |
6.85%, 11/15/36 | | | | | 100 | | | | 108,949 | |
Vale Overseas Ltd. | |
6.88%, 11/21/36 | | | | | 1,700 | | | | 1,710,625 | |
6.88%, 11/10/39 | | | | | 1,400 | | | | 1,380,750 | |
8.25%, 01/17/34a | | | | | 255 | | | | 287,194 | |
Vale SA | |
5.63%, 09/11/42a | | | | | 535 | | | | 464,112 | |
| | | | | | | | | | |
| | | | | | | | | 4,658,639 | |
LEISURE TIME — 0.02% | |
Harley-Davidson Inc. | |
4.63%, 07/28/45 | | (Call 01/28/45) | | | 216 | | | | 227,204 | |
| | | | | | | | | | |
| | | | | | | | | 227,204 | |
LODGING — 0.02% | |
Starwood Hotels & Resorts Worldwide LLC | | | | | | | | |
4.50%, 10/01/34 | | (Call 04/01/34) | | | 186 | | | | 188,001 | |
| | | | | | | | | | |
| | | | | | | | | 188,001 | |
MACHINERY — 0.48% | |
Caterpillar Inc. | |
3.80%, 08/15/42a | | | | | 1,277 | | | | 1,288,825 | |
4.30%, 05/15/44 | | (Call 11/15/43)a | | | 386 | | | | 418,768 | |
4.75%, 05/15/64 | | (Call 11/15/63) | | | 203 | | | | 224,412 | |
| | | | | | | | | | |
| Security | | | |
Principal
(000s) | | | Value | |
5.20%, 05/27/41 | | | | $ | 500 | | | $ | 599,275 | |
5.30%, 09/15/35 | | | | | 11 | | | | 12,999 | |
6.05%, 08/15/36 | | | | | 111 | | | | 142,953 | |
Cummins Inc. | |
4.88%, 10/01/43 | | (Call 04/01/43) | | | 200 | | | | 230,416 | |
Deere & Co. | |
3.90%, 06/09/42 | | (Call 12/09/41) | | | 900 | | | | 938,736 | |
5.38%, 10/16/29 | | | | | 405 | | | | 510,656 | |
7.13%, 03/03/31 | | | | | 111 | | | | 153,249 | |
8.10%, 05/15/30 | | | | | 50 | | | | 73,921 | |
Rockwell Automation Inc. | |
6.70%, 01/15/28 | | | | | 200 | | | | 265,100 | |
XYLEM Inc. | |
4.38%, 11/01/46 | | (Call 05/01/46) | | | 250 | | | | 251,080 | |
| | | | | | | | | | |
| | | | | | | | | 5,110,390 | |
MANUFACTURING — 1.57% | |
3M Co. | |
3.13%, 09/19/46 | | (Call 03/19/46) | | | 515 | | | | 482,581 | |
3.88%, 06/15/44 | | | | | 200 | | | | 213,042 | |
5.70%, 03/15/37 | | | | | 292 | | | | 387,767 | |
6.38%, 02/15/28 | | | | | 140 | | | | 187,645 | |
Dover Corp. | |
5.38%, 03/01/41 | | (Call 12/01/40) | | | 365 | | | | 450,425 | |
Eaton Corp. | |
4.00%, 11/02/32 | | | | | 1,073 | | | | 1,106,778 | |
4.15%, 11/02/42 | | | | | 166 | | | | 171,616 | |
General Electric Co. | |
4.13%, 10/09/42a | | | | | 577 | | | | 612,451 | |
4.50%, 03/11/44 | | | | | 1,050 | | | | 1,182,143 | |
5.88%, 01/14/38 | | | | | 1,300 | | | | 1,698,970 | |
6.15%, 08/07/37 | | | | | 997 | | | | 1,336,947 | |
6.88%, 01/10/39 | | | | | 1,246 | | | | 1,822,636 | |
Series A | | | | | | | | | | |
6.75%, 03/15/32 | | | | | 2,600 | | | | 3,573,492 | |
Illinois Tool Works Inc. | |
3.90%, 09/01/42 | | (Call 03/01/42) | | | 850 | | | | 899,334 | |
4.88%, 09/15/41 | | (Call 03/15/41) | | | 313 | | | | 369,587 | |
Ingersoll-Rand Global Holding Co. Ltd. | | | | | | | | |
5.75%, 06/15/43 | | | | | 236 | | | | 288,099 | |
Ingersoll-Rand Luxembourg Finance SA | | | | | | | | |
4.65%, 11/01/44 | | (Call 05/01/44) | | | 200 | | | | 215,476 | |
| | | | |
SCHEDULEOF INVESTMENTS | | | 51 | |
Schedule of Investments (Unaudited) (Continued)
iSHARES® 10+ YEAR CREDIT BOND ETF
October 31, 2016
| | | | | | | | | | |
| Security | | | |
Principal
(000s) | | | Value | |
Parker-Hannifin Corp. | |
4.20%, 11/21/34 | | (Call 05/21/34) | | $ | 336 | | | $ | 363,928 | |
4.45%, 11/21/44 | | (Call 05/21/44) | | | 428 | | | | 486,829 | |
Series A | | | | | | | | | | |
6.25%, 05/15/38 | | | | | 100 | | | | 135,142 | |
Tyco Electronics Group SA | | | | | | | | |
7.13%, 10/01/37 | | | | | 236 | | | | 324,358 | |
Tyco International Finance SA | | | | | | | | |
5.13%, 09/14/45 | | (Call 03/14/45) | | | 271 | | | | 310,656 | |
| | | | | | | | | | |
| | | | | | | | | 16,619,902 | |
MEDIA — 5.13% | |
21st Century Fox America Inc. | |
4.75%, 09/15/44 | | (Call 03/15/44) | | | 600 | | | | 636,084 | |
4.95%, 10/15/45 | | (Call 04/15/45) | | | 456 | | | | 500,569 | |
5.40%, 10/01/43 | | | | | 456 | | | | 522,904 | |
6.15%, 03/01/37 | | | | | 400 | | | | 489,820 | |
6.15%, 02/15/41 | | | | | 426 | | | | 529,723 | |
6.20%, 12/15/34a | | | | | 740 | | | | 917,038 | |
6.40%, 12/15/35 | | | | | 202 | | | | 253,759 | |
6.55%, 03/15/33 | | | | | 640 | | | | 804,691 | |
6.65%, 11/15/37 | | | | | 780 | | | | 1,006,099 | |
6.90%, 08/15/39 | | | | | 11 | | | | 14,442 | |
7.75%, 12/01/45 | | | | | 533 | | | | 762,142 | |
7.85%, 03/01/39 | | | | | 350 | | | | 489,325 | |
8.15%, 10/17/36 | | | | | 100 | | | | 142,751 | |
CBS Corp. | |
2.90%, 01/15/27 | | (Call 10/15/26) | | | 445 | | | | 433,808 | |
4.60%, 01/15/45 | | (Call 07/15/44) | | | 200 | | | | 202,568 | |
4.85%, 07/01/42 | | (Call 01/01/42) | | | 342 | | | | 355,246 | |
4.90%, 08/15/44 | | (Call 02/15/44) | | | 100 | | | | 104,474 | |
5.50%, 05/15/33 | | | | | 604 | | | | 662,781 | |
5.90%, 10/15/40 | | (Call 04/15/40) | | | 211 | | | | 247,834 | |
7.88%, 07/30/30 | | | | | 438 | | | | 613,896 | |
Charter Communications Operating LLC/Charter Communications Operating Capital | | | | | | | | |
6.38%, 10/23/35 | | (Call 04/23/35)b | | | 975 | | | | 1,126,856 | |
6.48%, 10/23/45 | | (Call 04/23/45)b | | | 2,090 | | | | 2,449,605 | |
6.83%, 10/23/55 | | (Call 04/23/55)b | | | 321 | | | | 378,902 | |
Comcast Corp. | | | | | | | | |
2.35%, 01/15/27 | | (Call 10/15/26) | | | 1,000 | | | | 968,130 | |
3.20%, 07/15/36 | | (Call 01/15/36)a | | | 535 | | | | 507,881 | |
3.40%, 07/15/46 | | (Call 01/15/46) | | | 365 | | | | 336,567 | |
| | | | | | | | | | |
| Security | | | |
Principal
(000s) | | | Value | |
4.20%, 08/15/34 | | (Call 02/15/34) | | $ | 1,510 | | | $ | 1,617,467 | |
4.25%, 01/15/33 | | | | | 942 | | | | 1,012,499 | |
4.40%, 08/15/35 | | (Call 02/15/35) | | | 100 | | | | 109,959 | |
4.50%, 01/15/43 | | | | | 711 | | | | 770,880 | |
4.60%, 08/15/45 | | (Call 02/15/45) | | | 1,825 | | | | 2,019,417 | |
4.65%, 07/15/42 | | | | | 870 | | | | 963,838 | |
4.75%, 03/01/44 | | | | | 1,316 | | | | 1,474,091 | |
5.65%, 06/15/35 | | | | | 11 | | | | 13,730 | |
6.40%, 05/15/38 | | | | | 206 | | | | 277,161 | |
6.40%, 03/01/40 | | | | | 216 | | | | 295,056 | |
6.45%, 03/15/37 | | | | | 278 | | | | 373,123 | |
6.50%, 11/15/35 | | | | | 511 | | | | 690,744 | |
6.55%, 07/01/39 | | | | | 264 | | | | 362,773 | |
6.95%, 08/15/37 | | | | | 633 | | | | 899,531 | |
7.05%, 03/15/33 | | | | | 161 | | | | 222,705 | |
Discovery Communications LLC | | | | | | | | |
4.88%, 04/01/43 | | | | | 250 | | | | 238,280 | |
4.95%, 05/15/42 | | | | | 175 | | | | 168,436 | |
6.35%, 06/01/40 | | | | | 840 | | | | 907,435 | |
Grupo Televisa SAB | |
5.00%, 05/13/45 | | (Call 11/13/44)a | | | 800 | | | | 758,728 | |
6.13%, 01/31/46 | | (Call 07/31/45) | | | 400 | | | | 439,520 | |
6.63%, 01/15/40 | | | | | 400 | | | | 457,236 | |
Historic TW Inc. | |
6.63%, 05/15/29 | | | | | 1,280 | | | | 1,628,787 | |
NBCUniversal Media LLC | |
4.45%, 01/15/43 | | | | | 816 | | | | 878,661 | |
5.95%, 04/01/41 | | | | | 675 | | | | 874,247 | |
6.40%, 04/30/40 | | | | | 832 | | | | 1,130,646 | |
TCI Communications Inc. | |
7.13%, 02/15/28 | | | | | 400 | | | | 551,844 | |
Thomson Reuters Corp. | |
5.50%, 08/15/35 | | | | | 150 | | | | 168,048 | |
5.65%, 11/23/43 | | (Call 05/23/43) | | | 186 | | | | 212,520 | |
5.85%, 04/15/40 | | | | | 600 | | | | 687,126 | |
Time Warner Cable LLC | |
4.50%, 09/15/42 | | (Call 03/15/42) | | | 525 | | | | 491,731 | |
5.50%, 09/01/41 | | (Call 03/01/41) | | | 650 | | | | 691,840 | |
5.88%, 11/15/40 | | (Call 05/15/40) | | | 821 | | | | 897,435 | |
6.55%, 05/01/37 | | | | | 300 | | | | 351,291 | |
6.75%, 06/15/39 | | | | | 811 | | | | 965,788 | |
7.30%, 07/01/38 | | | | | 1,050 | | | | 1,318,527 | |
Time Warner Companies Inc. | | | | | | | | |
6.95%, 01/15/28 | | | | | 21 | | | | 27,194 | |
| | |
| 52 | | 2016 iSHARES ANNUAL REPORTTO SHAREHOLDERS |
Schedule of Investments (Unaudited) (Continued)
iSHARES® 10+ YEAR CREDIT BOND ETF
October 31, 2016
| | | | | | | | | | |
| Security | | | |
Principal
(000s) | | | Value | |
Time Warner Entertainment Co. LP | | | | | | | | |
8.38%, 07/15/33 | | | | $ | 1,000 | | | $ | 1,347,670 | |
Time Warner Inc. | |
4.65%, 06/01/44 | | (Call 12/01/43) | | | 1,400 | | | | 1,451,534 | |
4.85%, 07/15/45 | | (Call 01/15/45) | | | 1,232 | | | | 1,319,226 | |
4.90%, 06/15/42 | | | | | 243 | | | | 259,638 | |
5.35%, 12/15/43 | | | | | 400 | | | | 453,428 | |
5.38%, 10/15/41a | | | | | 250 | | | | 279,900 | |
6.10%, 07/15/40 | | | | | 175 | | | | 210,530 | |
6.20%, 03/15/40 | | | | | 164 | | | | 199,608 | |
6.25%, 03/29/41 | | | | | 200 | | | | 245,398 | |
6.50%, 11/15/36 | | | | | 300 | | | | 370,971 | |
7.63%, 04/15/31 | | | | | 500 | | | | 697,205 | |
7.70%, 05/01/32 | | | | | 800 | | | | 1,102,344 | |
Viacom Inc. | |
4.38%, 03/15/43 | | | | | 1,025 | | | | 941,381 | |
4.50%, 02/27/42 | | | | | 125 | | | | 116,745 | |
4.85%, 12/15/34 | | (Call 06/15/34) | | | 290 | | | | 292,230 | |
4.88%, 06/15/43 | | (Call 12/15/42) | | | 100 | | | | 98,203 | |
5.25%, 04/01/44 | | (Call 10/01/43) | | | 375 | | | | 394,136 | |
5.85%, 09/01/43 | | (Call 03/01/43) | | | 650 | | | | 723,983 | |
6.88%, 04/30/36 | | | | | 850 | | | | 1,009,851 | |
Walt Disney Co. (The) | |
3.00%, 07/30/46 | | | | | 125 | | | | 111,356 | |
3.70%, 12/01/42 | | | | | 275 | | | | 276,936 | |
4.13%, 06/01/44 | | | | | 350 | | | | 377,080 | |
4.38%, 08/16/41 | | | | | 500 | | | | 549,640 | |
7.00%, 03/01/32 | | | | | 391 | | | | 547,771 | |
Series E | | | | | | | | | | |
4.13%, 12/01/41 | | | | | 387 | | | | 412,171 | |
| | | | | | | | | | |
| | | | | | | | | 54,195,124 | |
METAL FABRICATE & HARDWARE — 0.10% | |
Precision Castparts Corp. | |
3.90%, 01/15/43 | | (Call 07/15/42) | | | 166 | | | | 173,689 | |
4.20%, 06/15/35 | | (Call 12/15/34) | | | 500 | | | | 543,460 | |
4.38%, 06/15/45 | | (Call 12/15/44) | | | 11 | | | | 12,395 | |
Valmont Industries Inc. | |
5.00%, 10/01/44 | | (Call 04/01/44) | | | 205 | | | | 193,092 | |
5.25%, 10/01/54 | | (Call 04/01/54) | | | 130 | | | | 119,642 | |
| | | | | | | | | | |
| | | | | | | | | 1,042,278 | |
MINING — 1.22% | |
Barrick Gold Corp. | |
5.25%, 04/01/42 | | | | | 740 | | | | 810,204 | |
| | | | | | | | | | |
| Security | | | |
Principal
(000s) | | | Value | |
Barrick North America Finance LLC | | | | | | | | |
5.70%, 05/30/41 | | | | $ | 555 | | | $ | 631,962 | |
5.75%, 05/01/43 | | | | | 500 | | | | 583,580 | |
7.50%, 09/15/38 | | | | | 200 | | | | 243,108 | |
Barrick PD Australia Finance Pty Ltd. | | | | | | | | |
5.95%, 10/15/39 | | | | | 700 | | | | 802,515 | |
BHP Billiton Finance USA Ltd. | |
4.13%, 02/24/42 | | | | | 880 | | | | 889,346 | |
5.00%, 09/30/43 | | | | | 1,173 | | | | 1,335,707 | |
Goldcorp Inc. | |
5.45%, 06/09/44 | | (Call 12/09/43) | | | 161 | | | | 171,148 | |
Newmont Mining Corp. | |
4.88%, 03/15/42 | | (Call 09/15/41) | | | 315 | | | | 327,408 | |
5.88%, 04/01/35a | | | | | 351 | | | | 398,009 | |
6.25%, 10/01/39 | | | | | 960 | | | | 1,129,824 | |
Rio Tinto Alcan Inc. | |
5.75%, 06/01/35 | | | | | 11 | | | | 11,864 | |
6.13%, 12/15/33 | | | | | 11 | | | | 12,457 | |
7.25%, 03/15/31 | | | | | 225 | | | | 274,921 | |
Rio Tinto Finance USA Ltd. | |
5.20%, 11/02/40 | | | | | 980 | | | | 1,119,532 | |
7.13%, 07/15/28 | | | | | 292 | | | | 386,450 | |
Rio Tinto Finance USA PLC | |
4.13%, 08/21/42 | | (Call 02/21/42) | | | 731 | | | | 740,379 | |
4.75%, 03/22/42 | | (Call 09/22/41)a | | | 155 | | | | 168,820 | |
Southern Copper Corp. | |
5.25%, 11/08/42 | | | | | 740 | | | | 699,981 | |
5.88%, 04/23/45 | | | | | 800 | | | | 799,216 | |
6.75%, 04/16/40 | | | | | 800 | | | | 869,720 | |
7.50%, 07/27/35 | | | | | 400 | | | | 473,400 | |
Vale Canada Ltd. | |
7.20%, 09/15/32 | | | | | 50 | | | | 50,937 | |
| | | | | | | | | | |
| | | | | | | | | 12,930,488 | |
OFFICE & BUSINESS EQUIPMENT — 0.04% | |
Xerox Corp. | |
4.80%, 03/01/35a | | | | | 161 | | | | 150,851 | |
6.75%, 12/15/39a | | | | | 250 | | | | 256,995 | |
| | | | | | | | | | |
| | | | | | | | | 407,846 | |
OIL & GAS — 6.41% | |
Anadarko Finance Co. | |
7.50%, 05/01/31 | | | | | 475 | | | | 603,160 | |
| | | | |
SCHEDULEOF INVESTMENTS | | | 53 | |
Schedule of Investments (Unaudited) (Continued)
iSHARES® 10+ YEAR CREDIT BOND ETF
October 31, 2016
| | | | | | | | | | |
| Security | | | |
Principal
(000s) | | | Value | |
Anadarko Petroleum Corp. | |
4.50%, 07/15/44 | | (Call 01/15/44) | | $ | 325 | | | $ | 305,471 | |
6.20%, 03/15/40 | | | | | 750 | | | | 863,062 | |
6.45%, 09/15/36 | | | | | 900 | | | | 1,061,928 | |
6.60%, 03/15/46 | | (Call 09/15/45)a | | | 1,000 | | | | 1,230,580 | |
Apache Corp. | |
4.25%, 01/15/44 | | (Call 07/15/43) | | | 225 | | | | 221,607 | |
4.75%, 04/15/43 | | (Call 10/15/42) | | | 1,300 | | | | 1,366,521 | |
5.10%, 09/01/40 | | (Call 03/01/40) | | | 1,000 | | | | 1,058,700 | |
6.00%, 01/15/37 | | | | | 750 | | | | 875,730 | |
BP Capital Markets PLC | |
3.02%, 01/16/27 | | (Call 10/16/26)a | | | 400 | | | | 401,224 | |
Burlington Resources Finance Co. | |
7.20%, 08/15/31 | | | | | 614 | | | | 798,912 | |
7.40%, 12/01/31 | | | | | 500 | | | | 662,530 | |
Canadian Natural Resources Ltd. | |
5.85%, 02/01/35 | | | | | 225 | | | | 239,488 | |
6.25%, 03/15/38 | | | | | 1,130 | | | | 1,287,115 | |
6.45%, 06/30/33 | | | | | 200 | | | | 221,864 | |
7.20%, 01/15/32 | | | | | 450 | | | | 526,513 | |
CNOOC Nexen Finance 2014 ULC | | | | | | | | |
4.88%, 04/30/44a | | | | | 1,000 | | | | 1,103,033 | |
Conoco Funding Co. | |
7.25%, 10/15/31 | | | | | 400 | | | | 520,616 | |
ConocoPhillips | |
5.90%, 10/15/32 | | | | | 13 | | | | 15,282 | |
6.50%, 02/01/39 | | | | | 1,081 | | | | 1,378,902 | |
ConocoPhillips Canada Funding Co. I | | | | | | | | |
5.95%, 10/15/36 | | | | | 350 | | | | 409,223 | |
ConocoPhillips Co. | |
4.15%, 11/15/34 | | (Call 05/15/34) | | | 415 | | | | 409,759 | |
4.30%, 11/15/44 | | (Call 05/15/44) | | | 725 | | | | 726,784 | |
5.95%, 03/15/46 | | (Call 09/15/45)a | | | 250 | | | | 311,410 | |
ConocoPhillips Holding Co. | | | | | | | | |
6.95%, 04/15/29 | | | | | 1,300 | | | | 1,644,448 | |
Devon Energy Corp. | |
4.75%, 05/15/42 | | (Call 11/15/41) | | | 1,625 | | | | 1,531,562 | |
5.00%, 06/15/45 | | (Call 12/15/44) | | | 500 | | | | 484,375 | |
5.60%, 07/15/41 | | (Call 01/15/41) | | | 375 | | | | 388,125 | |
7.95%, 04/15/32 | | | | | 80 | | | | 100,300 | |
Devon Financing Co. LLC | | | | | | | | |
7.88%, 09/30/31 | | | | | 550 | | | | 695,750 | |
| | | | | | | | | | |
| Security | | | |
Principal
(000s) | | | Value | |
Ecopetrol SA | |
5.88%, 05/28/45 | | | | $ | 900 | | | $ | 795,051 | |
7.38%, 09/18/43 | | | | | 750 | | | | 772,215 | |
Encana Corp. | |
6.50%, 08/15/34 | | | | | 1,050 | | | | 1,131,375 | |
6.50%, 02/01/38 | | | | | 500 | | | | 538,125 | |
Eni USA Inc. | |
7.30%, 11/15/27 | | | | | 205 | | | | 246,748 | |
EOG Resources Inc. | |
3.90%, 04/01/35 | | (Call 10/01/34) | | | 300 | | | | 295,842 | |
5.10%, 01/15/36 | | (Call 07/15/35) | | | 250 | | | | 281,413 | |
Exxon Mobil Corp. | |
3.57%, 03/06/45 | | (Call 09/06/44) | | | 334 | | | | 333,115 | |
4.11%, 03/01/46 | | (Call 09/01/45)a | | | 1,450 | | | | 1,564,463 | |
Hess Corp. | |
4.30%, 04/01/27 | | (Call 01/01/27) | | | 500 | | | | 497,500 | |
5.60%, 02/15/41 | | | | | 500 | | | | 495,625 | |
5.80%, 04/01/47 | | (Call 10/01/46)a | | | 1,050 | | | | 1,076,250 | |
6.00%, 01/15/40 | | | | | 200 | | | | 206,000 | |
7.13%, 03/15/33 | | | | | 225 | | | | 258,469 | |
7.30%, 08/15/31 | | | | | 621 | | | | 728,122 | |
Kerr-McGee Corp. | |
7.88%, 09/15/31 | | | | | 14 | | | | 17,718 | |
Marathon Oil Corp. | |
5.20%, 06/01/45 | | (Call 12/01/44) | | | 300 | | | | 280,125 | |
6.60%, 10/01/37 | | | | | 630 | | | | 673,312 | |
6.80%, 03/15/32 | | | | | 26 | | | | 28,177 | |
Marathon Petroleum Corp. | |
4.75%, 09/15/44 | | (Call 03/15/44) | | | 650 | | | | 578,032 | |
5.00%, 09/15/54 | | (Call 03/15/54) | | | 200 | | | | 169,496 | |
5.85%, 12/15/45 | | (Call 06/15/45) | | | 125 | | | | 125,304 | |
6.50%, 03/01/41 | | (Call 09/01/40) | | | 615 | | | | 662,503 | |
Nexen Energy ULC | |
6.40%, 05/15/37 | | | | | 904 | | | | 1,148,523 | |
7.50%, 07/30/39 | | | | | 375 | | | | 534,248 | |
7.88%, 03/15/32 | | | | | 160 | | | | 224,325 | |
Noble Energy Inc. | |
5.25%, 11/15/43 | | (Call 05/15/43) | | | 820 | | | | 857,671 | |
6.00%, 03/01/41 | | (Call 09/01/40) | | | 735 | | | | 809,580 | |
Occidental Petroleum Corp. | |
4.40%, 04/15/46 | | (Call 10/15/45) | | | 950 | | | | 1,018,542 | |
4.63%, 06/15/45 | | (Call 12/15/44) | | | 200 | | | | 219,194 | |
Petro-Canada | |
5.35%, 07/15/33 | | | | | 125 | | | | 139,689 | |
| | |
| 54 | | 2016 iSHARES ANNUAL REPORTTO SHAREHOLDERS |
Schedule of Investments (Unaudited) (Continued)
iSHARES® 10+ YEAR CREDIT BOND ETF
October 31, 2016
| | | | | | | | | | |
| Security | | | |
Principal
(000s) | | | Value | |
5.95%, 05/15/35 | | | | $ | 11 | | | $ | 13,085 | |
6.80%, 05/15/38 | | | | | 1,250 | | | | 1,644,888 | |
Petroleos Mexicanos | |
5.50%, 06/27/44 | | | | | 1,323 | | | | 1,139,937 | |
5.63%, 01/23/46 | | | | | 1,550 | | | | 1,339,076 | |
6.38%, 01/23/45a | | | | | 1,400 | | | | 1,335,278 | |
6.50%, 06/02/41 | | | | | 1,850 | | | | 1,798,515 | |
6.63%, 06/15/35 | | | | | 1,755 | | | | 1,771,058 | |
6.63%, 06/15/38 | | | | | 300 | | | | 299,901 | |
6.75%, 09/21/47a,b | | | | | 1,892 | | | | 1,879,570 | |
Phillips 66 | |
4.65%, 11/15/34 | | (Call 05/15/34) | | | 629 | | | | 664,891 | |
4.88%, 11/15/44 | | (Call 05/15/44) | | | 1,350 | | | | 1,453,815 | |
5.88%, 05/01/42 | | | | | 365 | | | | 446,490 | |
Shell International Finance BV | |
3.75%, 09/12/46a | | | | | 500 | | | | 478,295 | |
4.00%, 05/10/46 | | | | | 1,300 | | | | 1,285,648 | |
4.13%, 05/11/35 | | | | | 565 | | | | 585,058 | |
4.38%, 05/11/45a | | | | | 2,000 | | | | 2,100,760 | |
4.55%, 08/12/43 | | | | | 1,881 | | | | 2,004,412 | |
5.50%, 03/25/40 | | | | | 346 | | | | 410,937 | |
6.38%, 12/15/38 | | | | | 931 | | | | 1,224,777 | |
Statoil ASA | |
3.95%, 05/15/43 | | | | | 800 | | | | 802,392 | |
4.25%, 11/23/41 | | | | | 250 | | | | 260,172 | |
4.80%, 11/08/43 | | | | | 450 | | | | 509,341 | |
5.10%, 08/17/40 | | | | | 380 | | | | 443,870 | |
6.50%, 12/01/28b | | | | | 100 | | | | 130,095 | |
6.80%, 01/15/28 | | | | | 75 | | | | 100,062 | |
7.15%, 01/15/29 | | | | | 350 | | | | 488,568 | |
Suncor Energy Inc. | |
5.95%, 12/01/34 | | | | | 150 | | | | 177,407 | |
6.50%, 06/15/38 | | | | | 600 | | | | 771,798 | |
6.85%, 06/01/39 | | | | | 600 | | | | 805,680 | |
Tosco Corp. | |
7.80%, 01/01/27 | | | | | 364 | | | | 467,751 | |
8.13%, 02/15/30 | | | | | 61 | | | | 83,397 | |
Valero Energy Corp. | |
4.90%, 03/15/45a | | | | | 545 | | | | 534,100 | |
6.63%, 06/15/37a | | | | | 1,100 | | | | 1,289,134 | |
7.50%, 04/15/32 | | | | | 258 | | | | 322,768 | |
10.50%, 03/15/39 | | | | | 11 | | | | 17,066 | |
| | | | | | | | | | |
| Security | | | |
Principal
(000s) | | | Value | |
XTO Energy Inc. | |
6.75%, 08/01/37 | | | | $ | 350 | | | $ | 492,761 | |
| | | | | | | | | | |
| | | | | | | | | 67,723,479 | |
OIL & GAS SERVICES — 0.49% | |
Baker Hughes Inc. | |
5.13%, 09/15/40 | | | | | 490 | | | | 563,358 | |
Halliburton Co. | |
4.50%, 11/15/41 | | (Call 05/15/41) | | | 672 | | | | 676,254 | |
4.75%, 08/01/43 | | (Call 02/01/43) | | | 825 | | | | 865,021 | |
4.85%, 11/15/35 | | (Call 05/15/35)a | | | 1,033 | | | | 1,107,397 | |
5.00%, 11/15/45 | | (Call 05/15/45) | | | 265 | | | | 290,983 | |
6.70%, 09/15/38 | | | | | 21 | | | | 26,841 | |
7.45%, 09/15/39 | | | | | 825 | | | | 1,131,941 | |
National Oilwell Varco Inc. | | | | | | | | |
3.95%, 12/01/42 | | (Call 06/01/42) | | | 705 | | | | 539,790 | |
| | | | | | | | | | |
| | | | | | | | | 5,201,585 | |
PACKAGING & CONTAINERS — 0.03% | |
Sonoco Products Co. | |
5.75%, 11/01/40 | | (Call 05/01/40) | | | 253 | | | | 286,525 | |
| | | | | | | | | | |
| | | | | | | | | 286,525 | |
PHARMACEUTICALS — 4.93% | |
Abbott Laboratories | |
5.30%, 05/27/40 | | | | | 603 | | | | 701,982 | |
6.00%, 04/01/39 | | | | | 450 | | | | 563,386 | |
AbbVie Inc. | |
4.30%, 05/14/36 | | (Call 11/14/35) | | | 750 | | | | 750,960 | |
4.40%, 11/06/42 | | | | | 1,500 | | | | 1,478,145 | |
4.45%, 05/14/46 | | (Call 11/14/45) | | | 800 | | | | 795,024 | |
4.50%, 05/14/35 | | (Call 11/14/34)a | | | 1,850 | | | | 1,898,988 | |
4.70%, 05/14/45 | | (Call 11/14/44)a | | | 1,675 | | | | 1,723,089 | |
Actavis Funding SCS | |
4.55%, 03/15/35 | | (Call 09/15/34)a | | | 1,850 | | | | 1,908,164 | |
4.75%, 03/15/45 | | (Call 09/15/44)a | | | 2,200 | | | | 2,305,798 | |
4.85%, 06/15/44 | | (Call 12/15/43) | | | 450 | | | | 473,036 | |
Actavis Inc. | |
4.63%, 10/01/42 | | (Call 04/01/42) | | | 300 | | | | 307,896 | |
AmerisourceBergen Corp. | |
4.25%, 03/01/45 | | (Call 09/01/44) | | | 336 | | | | 346,977 | |
AstraZeneca PLC | |
4.00%, 09/18/42 | | | | | 650 | | | | 659,406 | |
4.38%, 11/16/45 | | | | | 800 | | | | 852,912 | |
6.45%, 09/15/37 | | | | | 1,200 | | | | 1,630,464 | |
| | | | |
SCHEDULEOF INVESTMENTS | | | 55 | |
Schedule of Investments (Unaudited) (Continued)
iSHARES® 10+ YEAR CREDIT BOND ETF
October 31, 2016
| | | | | | | | | | |
| Security | | | |
Principal
(000s) | | | Value | |
Baxalta Inc. | |
5.25%, 06/23/45 | | (Call 12/23/44) | | $ | 600 | | | $ | 679,488 | |
Bristol-Myers Squibb Co. | |
3.25%, 08/01/42 | | | | | 19 | | | | 18,461 | |
4.50%, 03/01/44 | | (Call 09/01/43) | | | 518 | | | | 602,009 | |
5.88%, 11/15/36 | | | | | 820 | | | | 1,064,868 | |
Cardinal Health Inc. | |
4.50%, 11/15/44 | | (Call 05/15/44) | | | 200 | | | | 208,252 | |
4.60%, 03/15/43 | | | | | 650 | | | | 687,362 | |
Eli Lilly & Co. | |
3.70%, 03/01/45 | | (Call 09/01/44) | | | 732 | | | | 752,335 | |
5.50%, 03/15/27 | | | | | 459 | | | | 572,130 | |
5.55%, 03/15/37 | | | | | 166 | | | | 207,820 | |
Express Scripts Holding Co. | |
3.40%, 03/01/27 | | (Call 12/01/26) | | | 1,175 | | | | 1,156,835 | |
4.80%, 07/15/46 | | (Call 01/15/46)a | | | 500 | | | | 500,010 | |
6.13%, 11/15/41 | | | | | 400 | | | | 475,172 | |
GlaxoSmithKline Capital Inc. | |
4.20%, 03/18/43a | | | | | 5 | | | | 5,501 | |
5.38%, 04/15/34 | | | | | 200 | | | | 241,070 | |
6.38%, 05/15/38 | | | | | 2,326 | | | | 3,242,770 | |
Johnson & Johnson | |
3.55%, 03/01/36 | | (Call 09/01/35) | | | 1,270 | | | | 1,346,098 | |
3.70%, 03/01/46 | | (Call 09/01/45) | | | 725 | | | | 779,049 | |
4.38%, 12/05/33 | | (Call 06/05/33) | | | 1,250 | | | | 1,452,313 | |
4.50%, 09/01/40 | | | | | 508 | | | | 608,589 | |
4.50%, 12/05/43 | | (Call 06/05/43) | | | 379 | | | | 455,334 | |
4.85%, 05/15/41 | | | | | 11 | | | | 13,775 | |
4.95%, 05/15/33 | | | | | 261 | | | | 320,210 | |
5.85%, 07/15/38 | | | | | 213 | | | | 296,302 | |
5.95%, 08/15/37 | | | | | 200 | | | | 280,632 | |
6.95%, 09/01/29 | | | | | 14 | | | | 20,264 | |
McKesson Corp. | |
4.88%, 03/15/44 | | (Call 09/15/43) | | | 634 | | | | 690,527 | |
6.00%, 03/01/41 | | (Call 09/01/40) | | | 80 | | | | 98,795 | |
Mead Johnson Nutrition Co. | |
4.60%, 06/01/44 | | (Call 12/01/43) | | | 203 | | | | 208,061 | |
5.90%, 11/01/39 | | | | | 340 | | | | 404,314 | |
Merck & Co. Inc. | |
3.60%, 09/15/42 | | (Call 03/15/42) | | | 11 | | | | 11,079 | |
3.70%, 02/10/45 | | (Call 08/10/44) | | | 1,600 | | | | 1,640,544 | |
4.15%, 05/18/43 | | | | | 700 | | | | 768,551 | |
6.50%, 12/01/33 | | | | | 344 | | | | 468,958 | |
6.55%, 09/15/37 | | | | | 207 | | | | 288,252 | |
| | | | | | | | | | |
| Security | | | |
Principal
(000s) | | | Value | |
Merck Sharp & Dohme Corp. | |
5.75%, 11/15/36 | | | | $ | 500 | | | $ | 628,755 | |
5.85%, 06/30/39 | | | | | 11 | | | | 14,280 | |
5.95%, 12/01/28 | | | | | 400 | | | | 510,532 | |
Mylan Inc. | |
5.40%, 11/29/43 | | (Call 05/29/43) | | | 200 | | | | 211,394 | |
Mylan NV | |
5.25%, 06/15/46 | | (Call 12/15/45)b | | | 950 | | | | 962,008 | |
Novartis Capital Corp. | |
3.70%, 09/21/42 | | | | | 200 | | | | 202,888 | |
4.00%, 11/20/45 | | (Call 05/20/45)a | | | 600 | | | | 649,050 | |
4.40%, 05/06/44 | | | | | 1,300 | | | | 1,479,530 | |
Perrigo Co. PLC | |
5.30%, 11/15/43 | | (Call 05/15/43) | | | 250 | | | | 255,940 | |
Perrigo Finance Unlimited Co. | |
4.90%, 12/15/44 | | (Call 06/15/44) | | | 221 | | | | 215,871 | |
Pfizer Inc. | |
4.30%, 06/15/43 | | | | | 371 | | | | 411,131 | |
4.40%, 05/15/44 | | | | | 806 | | | | 906,428 | |
5.60%, 09/15/40 | | | | | 100 | | | | 126,032 | |
7.20%, 03/15/39 | | | | | 1,500 | | | | 2,233,620 | |
Pharmacia LLC | |
6.60%, 12/01/28 | | | | | 900 | | | | 1,215,000 | |
Teva Pharmaceutical Finance Co. LLC | | | | | | | | |
6.15%, 02/01/36a | | | | | 600 | | | | 736,404 | |
Teva Pharmaceutical Finance Netherlands III BV | | | | | | | | |
3.15%, 10/01/26 | | | | | 1,000 | | | | 972,250 | |
4.10%, 10/01/46a | | | | | 1,240 | | | | 1,150,261 | |
Wyeth LLC | |
5.95%, 04/01/37 | | | | | 1,225 | | | | 1,596,763 | |
6.00%, 02/15/36 | | | | | 21 | | | | 27,008 | |
6.50%, 02/01/34 | | | | | 18 | | | | 24,057 | |
Zoetis Inc. | |
4.70%, 02/01/43 | | (Call 08/01/42) | | | 590 | | | | 604,756 | |
| | | | | | | | | | |
| | | | | | | | | 52,095,915 | |
PIPELINES — 3.47% | |
Buckeye Partners LP | |
5.60%, 10/15/44 | | (Call 04/15/44) | | | 100 | | | | 103,574 | |
5.85%, 11/15/43 | | (Call 05/15/43) | | | 350 | | | | 371,161 | |
CenterPoint Energy Resources Corp. | |
5.85%, 01/15/41 | | (Call 07/15/40) | | | 100 | | | | 119,159 | |
6.63%, 11/01/37 | | | | | 11 | | | | 13,514 | |
| | |
| 56 | | 2016 iSHARES ANNUAL REPORTTO SHAREHOLDERS |
Schedule of Investments (Unaudited) (Continued)
iSHARES® 10+ YEAR CREDIT BOND ETF
October 31, 2016
| | | | | | | | | | |
| Security | | | |
Principal
(000s) | | | Value | |
Columbia Pipeline Group Inc. | |
5.80%, 06/01/45 | | (Call 12/01/44) | | $ | 175 | | | $ | 207,400 | |
El Paso Natural Gas Co. LLC | |
8.38%, 06/15/32 | | | | | 11 | | | | 13,773 | |
Enable Midstream Partners LP | | | | | | | | |
5.00%, 05/15/44 | | (Call 11/15/43) | | | 125 | | | | 105,938 | |
Enbridge Energy Partners LP | | | | | | | | |
5.50%, 09/15/40 | | (Call 03/15/40) | | | 200 | | | | 206,650 | |
Series B | | | | | | | | | | |
7.50%, 04/15/38 | | | | | 461 | | | | 566,352 | |
Enbridge Inc. | |
4.50%, 06/10/44 | | (Call 12/10/43) | | | 200 | | | | 182,982 | |
Energy Transfer Partners LP | |
4.90%, 03/15/35 | | (Call 09/15/34) | | | 220 | | | | 205,414 | |
5.15%, 02/01/43 | | (Call 08/01/42) | | | 355 | | | | 329,064 | |
5.15%, 03/15/45 | | (Call 09/15/44) | | | 550 | | | | 512,682 | |
6.05%, 06/01/41 | | (Call 12/01/40) | | | 50 | | | | 50,658 | |
6.13%, 12/15/45 | | (Call 06/15/45) | | | 625 | | | | 653,500 | |
6.50%, 02/01/42 | | (Call 08/01/41) | | | 1,080 | | | | 1,150,351 | |
6.63%, 10/15/36 | | | | | 135 | | | | 146,788 | |
7.50%, 07/01/38 | | | | | 511 | | | | 585,688 | |
8.25%, 11/15/29 | | (Call 08/15/29) | | | 100 | | | | 124,487 | |
EnLink Midstream Partners LP | |
5.05%, 04/01/45 | | (Call 10/01/44) | | | 250 | | | | 221,250 | |
5.60%, 04/01/44 | | (Call 10/01/43) | | | 180 | | | | 171,450 | |
Enterprise Products Operating LLC | |
3.95%, 02/15/27 | | (Call 11/15/26) | | | 220 | | | | 228,899 | |
4.45%, 02/15/43 | | (Call 08/15/42) | | | 875 | | | | 843,124 | |
4.85%, 08/15/42 | | (Call 02/15/42) | | | 225 | | | | 228,942 | |
4.85%, 03/15/44 | | (Call 09/15/43) | | | 700 | | | | 705,754 | |
4.90%, 05/15/46 | | (Call 11/15/45) | | | 1,045 | | | | 1,081,084 | |
4.95%, 10/15/54 | | (Call 04/15/54) | | | 950 | | | | 931,808 | |
5.10%, 02/15/45 | | (Call 08/15/44) | | | 750 | | | | 792,345 | |
5.70%, 02/15/42 | | | | | 470 | | | | 528,477 | |
5.95%, 02/01/41 | | | | | 298 | | | | 339,994 | |
6.13%, 10/15/39 | | | | | 145 | | | | 166,406 | |
7.55%, 04/15/38 | | | | | 212 | | | | 275,519 | |
Series D | | | | | | | | | | |
6.88%, 03/01/33 | | | | | 264 | | | | 324,208 | |
Series H | | | | | | | | | | |
6.65%, 10/15/34 | | | | | 111 | | | | 132,295 | |
Kinder Morgan Energy Partners LP | |
4.70%, 11/01/42 | | (Call 05/01/42) | | | 215 | | | | 197,288 | |
5.00%, 08/15/42 | | (Call 02/15/42) | | | 250 | | | | 239,020 | |
| | | | | | | | | | |
| Security | | | |
Principal
(000s) | | | Value | |
5.00%, 03/01/43 | | (Call 09/01/42) | | $ | 100 | | | $ | 95,724 | |
5.40%, 09/01/44 | | (Call 03/01/44) | | | 360 | | | | 358,438 | |
5.50%, 03/01/44 | | (Call 09/01/43) | | | 250 | | | | 253,050 | |
5.80%, 03/15/35 | | | | | 775 | | | | 811,805 | |
6.38%, 03/01/41 | | | | | 230 | | | | 247,411 | |
6.55%, 09/15/40 | | | | | 100 | | | | 108,753 | |
6.95%, 01/15/38 | | | | | 900 | | | | 1,026,729 | |
7.30%, 08/15/33 | | | | | 11 | | | | 12,968 | |
7.40%, 03/15/31 | | | | | 118 | | | | 138,151 | |
7.50%, 11/15/40 | | | | | 416 | | | | 495,236 | |
7.75%, 03/15/32 | | | | | 100 | | | | 119,743 | |
Kinder Morgan Inc./DE | | | | | | | | |
5.05%, 02/15/46 | | (Call 08/15/45) | | | 425 | | | | 412,628 | |
5.30%, 12/01/34 | | (Call 06/01/34) | | | 1,950 | | | | 1,974,433 | |
5.55%, 06/01/45 | | (Call 12/01/44) | | | 2,100 | | | | 2,173,941 | |
7.75%, 01/15/32 | | | | | 25 | | | | 30,516 | |
Magellan Midstream Partners LP | | | | | | | | |
4.20%, 12/01/42 | | (Call 06/01/42) | | | 200 | | | | 190,798 | |
4.20%, 03/15/45 | | (Call 09/15/44) | | | 350 | | | | 334,632 | |
4.25%, 09/15/46 | | (Call 03/15/46) | | | 320 | | | | 311,427 | |
5.15%, 10/15/43 | | (Call 04/15/43) | | | 250 | | | | 269,965 | |
ONEOK Partners LP | | | | | | | | |
6.13%, 02/01/41 | | (Call 08/01/40) | | | 545 | | | | 602,100 | |
6.20%, 09/15/43 | | (Call 03/15/43) | | | 25 | | | | 28,054 | |
6.65%, 10/01/36 | | | | | 450 | | | | 512,244 | |
6.85%, 10/15/37 | | | | | 400 | | | | 463,864 | |
Phillips 66 Partners LP | | | | | | | | |
4.90%, 10/01/46 | | (Call 04/01/46) | | | 500 | | | | 501,515 | |
Plains All American Pipeline LP/PAA Finance Corp. | | | | | | | | |
4.70%, 06/15/44 | | (Call 12/15/43) | | | 250 | | | | 228,528 | |
4.90%, 02/15/45 | | (Call 08/15/44) | | | 725 | | | | 687,771 | |
5.15%, 06/01/42 | | (Call 12/01/41) | | | 430 | | | | 412,804 | |
6.65%, 01/15/37 | | | | | 350 | | | | 385,549 | |
Southern Natural Gas Co. LLC | |
8.00%, 03/01/32 | | | | | 12 | | | | 15,025 | |
Spectra Energy Capital LLC | |
7.50%, 09/15/38 | | | | | 226 | | | | 279,006 | |
Spectra Energy Partners LP | | | | | | | | |
4.50%, 03/15/45 | | (Call 09/15/44)a | | | 285 | | | | 283,937 | |
5.95%, 09/25/43 | | (Call 03/25/43) | | | 241 | | | | 283,751 | |
Sunoco Logistics Partners Operations LP | | | | | | | | |
4.95%, 01/15/43 | | (Call 07/15/42) | | | 750 | | | | 712,613 | |
| | | | |
SCHEDULEOF INVESTMENTS | | | 57 | |
Schedule of Investments (Unaudited) (Continued)
iSHARES® 10+ YEAR CREDIT BOND ETF
October 31, 2016
| | | | | | | | | | |
| Security | | | |
Principal
(000s) | | | Value | |
5.30%, 04/01/44 | | (Call 10/01/43) | | $ | 303 | | | $ | 302,276 | |
6.10%, 02/15/42 | | | | | 175 | | | | 188,631 | |
6.85%, 02/15/40 | | | | | 16 | | | | 18,300 | |
Tennessee Gas Pipeline Co. LLC | | | | | | | | |
7.00%, 10/15/28 | | | | | 375 | | | | 445,177 | |
Texas Eastern Transmission LP | | | | | | | | |
7.00%, 07/15/32 | | | | | 276 | | | | 342,530 | |
TransCanada PipeLines Ltd. | |
4.63%, 03/01/34 | | (Call 12/01/33) | | | 655 | | | | 721,528 | |
5.00%, 10/16/43 | | (Call 04/16/43) | | | 410 | | | | 465,653 | |
5.60%, 03/31/34 | | | | | 300 | | | | 357,345 | |
5.85%, 03/15/36 | | | | | 100 | | | | 121,873 | |
6.10%, 06/01/40 | | | | | 324 | | | | 413,213 | |
6.20%, 10/15/37 | | | | | 550 | | | | 696,547 | |
7.25%, 08/15/38 | | | | | 400 | | | | 563,640 | |
7.63%, 01/15/39 | | | | | 925 | | | | 1,359,611 | |
Transcontinental Gas Pipe Line Co. LLC | | | | | | | | |
4.45%, 08/01/42 | | (Call 02/01/42) | | | 635 | | | | 584,759 | |
5.40%, 08/15/41 | | (Call 02/15/41) | | | 26 | | | | 27,111 | |
Western Gas Partners LP | | | | | | | | |
5.45%, 04/01/44 | | (Call 10/01/43) | | | 380 | | | | 388,075 | |
Williams Partners LP | | | | | | | | |
4.90%, 01/15/45 | | (Call 07/15/44) | | | 825 | | | | 769,412 | |
5.10%, 09/15/45 | | (Call 03/15/45) | | | 200 | | | | 191,392 | |
5.40%, 03/04/44 | | (Call 09/04/43) | | | 600 | | | | 585,258 | |
5.80%, 11/15/43 | | (Call 05/15/43) | | | 50 | | | | 50,784 | |
6.30%, 04/15/40 | | | | | 250 | | | | 267,780 | |
| | | | | | | | | | |
| | | | | | | | | 36,681,002 | |
REAL ESTATE INVESTMENT TRUSTS — 0.69% | |
American Tower Corp. | | | | | | | | |
3.13%, 01/15/27 | | (Call 10/15/26) | | | 500 | | | | 487,475 | |
3.38%, 10/15/26 | | (Call 07/15/26) | | | 410 | | | | 407,966 | |
AvalonBay Communities Inc. | | | | | | | | |
3.90%, 10/15/46 | | (Call 04/15/46)a | | | 350 | | | | 341,299 | |
Boston Properties LP | | | | | | | | |
2.75%, 10/01/26 | | (Call 07/01/26) | | | 500 | | | | 483,565 | |
Brandywine Operating Partnership LP | | | | | | | | |
4.55%, 10/01/29 | | (Call 07/01/29) | | | 5 | | | | 5,138 | |
ERP Operating LP | | | | | | | | |
4.50%, 07/01/44 | | (Call 01/01/44) | | | 640 | | | | 683,328 | |
| | | | | | | | | | |
| Security | | | |
Principal
(000s) | | | Value | |
Federal Realty Investment Trust | | | | | | | | |
4.50%, 12/01/44 | | (Call 06/01/44) | | $ | 267 | | | $ | 290,280 | |
HCP Inc. | | | | | | | | | | |
6.75%, 02/01/41 | | (Call 08/01/40) | | | 230 | | | | 279,080 | |
Kilroy Realty LP | | | | | | | | | | |
4.25%, 08/15/29 | | (Call 05/15/29) | | | 14 | | | | 14,494 | |
Kimco Realty Corp. | | | | | | | | |
4.25%, 04/01/45 | | (Call 10/01/44) | | | 200 | | | | 199,412 | |
Omega Healthcare Investors Inc. | | | | | | | | |
4.50%, 04/01/27 | | (Call 01/01/27) | | | 302 | | | | 300,345 | |
Realty Income Corp. | | | | | | | | |
5.88%, 03/15/35 | | | | | 250 | | | | 298,857 | |
Simon Property Group LP | | | | | | | | |
4.25%, 10/01/44 | | (Call 04/01/44) | | | 14 | | | | 14,954 | |
4.75%, 03/15/42 | | (Call 09/15/41) | | | 280 | | | | 319,556 | |
6.75%, 02/01/40 | | (Call 11/01/39) | | | 550 | | | | 776,495 | |
Ventas Realty LP | | | | | | | | |
4.38%, 02/01/45 | | (Call 08/01/44) | | | 447 | | | | 439,562 | |
5.70%, 09/30/43 | | (Call 03/30/43) | | | 11 | | | | 12,918 | |
Welltower Inc. | | | | | | | | | | |
5.13%, 03/15/43 | | (Call 09/15/42)a | | | 205 | | | | 219,692 | |
6.50%, 03/15/41 | | (Call 09/15/40) | | | 200 | | | | 250,774 | |
Weyerhaeuser Co. | |
6.88%, 12/15/33 | | | | | 325 | | | | 411,973 | |
6.95%, 10/01/27a | | | | | 278 | | | | 345,148 | |
7.38%, 03/15/32 | | | | | 516 | | | | 683,623 | |
| | | | | | | | | | |
| | | | | | | | | 7,265,934 | |
RETAIL — 3.93% | |
Bed Bath & Beyond Inc. | |
4.92%, 08/01/34 | | (Call 02/01/34)a | | | 350 | | | | 350,416 | |
5.17%, 08/01/44 | | (Call 02/01/44) | | | 425 | | | | 405,450 | |
CVS Health Corp. | |
4.88%, 07/20/35 | | (Call 01/20/35) | | | 1,100 | | | | 1,240,525 | |
5.13%, 07/20/45 | | (Call 01/20/45) | | | 2,325 | | | | 2,705,277 | |
5.30%, 12/05/43 | | (Call 06/05/43) | | | 18 | | | | 21,161 | |
Darden Restaurants Inc. | |
6.80%, 10/15/37 | | | | | 210 | | | | 243,600 | |
Home Depot Inc. (The) | |
3.50%, 09/15/56 | | (Call 03/15/56) | | | 640 | | | | 595,821 | |
4.20%, 04/01/43 | | (Call 10/01/42) | | | 121 | | | | 131,450 | |
4.25%, 04/01/46 | | (Call 10/01/45) | | | 1,150 | | | | 1,267,369 | |
4.40%, 03/15/45 | | (Call 09/15/44) | | | 700 | | | | 781,634 | |
4.88%, 02/15/44 | | (Call 08/15/43) | | | 711 | | | | 840,857 | |
| | |
| 58 | | 2016 iSHARES ANNUAL REPORTTO SHAREHOLDERS |
Schedule of Investments (Unaudited) (Continued)
iSHARES® 10+ YEAR CREDIT BOND ETF
October 31, 2016
| | | | | | | | | | |
| Security | | | |
Principal
(000s) | | | Value | |
5.40%, 09/15/40 | | (Call 03/15/40) | | $ | 21 | | | $ | 26,108 | |
5.88%, 12/16/36 | | | | | 1,525 | | | | 2,017,987 | |
5.95%, 04/01/41 | | (Call 10/01/40) | | | 963 | | | | 1,286,655 | |
Kohl’s Corp. | |
5.55%, 07/17/45 | | (Call 01/17/45) | | | 300 | | | | 291,222 | |
Lowe’s Companies Inc. | |
3.70%, 04/15/46 | | (Call 10/15/45) | | | 800 | | | | 790,144 | |
4.38%, 09/15/45 | | (Call 03/15/45) | | | 750 | | | | 817,350 | |
4.65%, 04/15/42 | | (Call 10/15/41) | | | 400 | | | | 452,396 | |
5.00%, 09/15/43 | | (Call 03/15/43) | | | 600 | | | | 705,396 | |
5.50%, 10/15/35 | | | | | 11 | | | | 13,510 | |
5.80%, 10/15/36 | | | | | 16 | | | | 20,239 | |
5.80%, 04/15/40 | | (Call 10/15/39)a | | | 300 | | | | 386,676 | |
6.65%, 09/15/37 | | | | | 100 | | | | 139,665 | |
6.88%, 02/15/28 | | | | | 600 | | | | 803,034 | |
Macy’s Retail Holdings Inc. | |
4.30%, 02/15/43 | | (Call 08/15/42) | | | 76 | | | | 63,195 | |
4.50%, 12/15/34 | | (Call 06/15/34)a | | | 107 | | | | 97,492 | |
5.13%, 01/15/42 | | (Call 07/15/41)a | | | 200 | | | | 186,366 | |
6.38%, 03/15/37a | | | | | 213 | | | | 224,116 | |
6.70%, 07/15/34 | | | | | 200 | | | | 214,484 | |
6.90%, 04/01/29a | | | | | 850 | | | | 958,936 | |
6.90%, 01/15/32 | | | | | 50 | | | | 55,342 | |
McDonald’s Corp. | |
3.63%, 05/01/43 | | | | | 11 | | | | 10,239 | |
3.70%, 02/15/42 | | | | | 518 | | | | 491,266 | |
4.60%, 05/26/45 | | (Call 11/26/44)a | | | 300 | | | | 321,507 | |
4.70%, 12/09/35 | | (Call 06/09/35) | | | 675 | | | | 742,000 | |
4.88%, 07/15/40 | | | | | 6 | | | | 6,566 | |
4.88%, 12/09/45 | | (Call 06/09/45) | | | 1,450 | | | | 1,623,608 | |
5.70%, 02/01/39 | | | | | 275 | | | | 330,660 | |
6.30%, 10/15/37 | | | | | 360 | | | | 461,779 | |
6.30%, 03/01/38 | | | | | 200 | | | | 257,116 | |
Nordstrom Inc. | |
5.00%, 01/15/44 | | (Call 07/15/43) | | | 257 | | | | 261,734 | |
6.95%, 03/15/28 | | | | | 450 | | | | 561,105 | |
QVC Inc. | |
5.45%, 08/15/34 | | (Call 02/15/34)a | | | 350 | | | | 323,312 | |
5.95%, 03/15/43 | | | | | 100 | | | | 93,875 | |
Starbucks Corp. | |
4.30%, 06/15/45 | | (Call 12/15/44) | | | 197 | | | | 222,159 | |
Target Corp. | |
3.63%, 04/15/46a | | | | | 1,505 | | | | 1,482,786 | |
| | | | | | | | | | |
| Security | | | |
Principal
(000s) | | | Value | |
4.00%, 07/01/42a | | | | $ | 1,100 | | | $ | 1,154,197 | |
6.35%, 11/01/32 | | | | | 282 | | | | 374,832 | |
Tiffany & Co. | |
4.90%, 10/01/44 | | (Call 04/01/44) | | | 83 | | | | 80,810 | |
Wal-Mart Stores Inc. | |
4.00%, 04/11/43 | | (Call 10/11/42) | | | 1,475 | | | | 1,576,790 | |
4.30%, 04/22/44 | | (Call 10/22/43)a | | | 900 | | | | 1,012,500 | |
4.75%, 10/02/43 | | (Call 04/02/43) | | | 566 | | | | 670,557 | |
4.88%, 07/08/40 | | | | | 168 | | | | 199,685 | |
5.00%, 10/25/40 | | | | | 348 | | | | 421,289 | |
5.25%, 09/01/35 | | | | | 1,200 | | | | 1,533,072 | |
5.63%, 04/01/40 | | | | | 116 | | | | 151,039 | |
5.63%, 04/15/41 | | | | | 314 | | | | 411,949 | |
5.88%, 04/05/27 | | | | | 21 | | | | 26,959 | |
6.20%, 04/15/38 | | | | | 2,250 | | | | 3,119,985 | |
6.50%, 08/15/37 | | | | | 1,700 | | | | 2,433,329 | |
7.55%, 02/15/30 | | | | | 683 | | | | 1,021,440 | |
Walgreen Co. | |
4.40%, 09/15/42 | | | | | 125 | | | | 126,634 | |
Walgreens Boots Alliance Inc. | |
4.50%, 11/18/34 | | (Call 05/18/34) | | | 150 | | | | 155,883 | |
4.65%, 06/01/46 | | (Call 12/01/45) | | | 750 | | | | 787,125 | |
4.80%, 11/18/44 | | (Call 05/18/44) | | | 900 | | | | 966,267 | |
| | | | | | | | | | |
| | | | | | | | | 41,547,927 | |
SEMICONDUCTORS — 0.72% | |
Analog Devices Inc. | |
5.30%, 12/15/45 | | (Call 06/15/45) | | | 300 | | | | 323,496 | |
Applied Materials Inc. | |
5.10%, 10/01/35 | | (Call 04/01/35) | | | 400 | | | | 462,944 | |
5.85%, 06/15/41 | | | | | 311 | | | | 383,342 | |
Intel Corp. | |
4.00%, 12/15/32 | | | | | 386 | | | | 412,391 | |
4.10%, 05/19/46 | | (Call 11/19/45)a | | | 450 | | | | 464,976 | |
4.25%, 12/15/42 | | | | | 371 | | | | 391,527 | |
4.80%, 10/01/41 | | | | | 1,080 | | | | 1,226,869 | |
4.90%, 07/29/45 | | (Call 01/29/45) | | | 1,400 | | | | 1,608,614 | |
KLA-Tencor Corp. | |
5.65%, 11/01/34 | | (Call 07/01/34)a | | | 200 | | | | 217,996 | |
QUALCOMM Inc. | |
4.65%, 05/20/35 | | (Call 11/20/34) | | | 850 | | | | 923,823 | |
4.80%, 05/20/45 | | (Call 11/20/44) | | | 1,060 | | | | 1,166,890 | |
| | | | | | | | | | |
| | | | | | | | | 7,582,868 | |
| | | | |
SCHEDULEOF INVESTMENTS | | | 59 | |
Schedule of Investments (Unaudited) (Continued)
iSHARES® 10+ YEAR CREDIT BOND ETF
October 31, 2016
| | | | | | | | | | |
| Security | | | |
Principal
(000s) | | | Value | |
SOFTWARE — 2.37% | |
Fidelity National Information Services Inc. | | | | | | | | |
4.50%, 08/15/46 | | (Call 02/15/46) | | $ | 250 | | | $ | 245,645 | |
Microsoft Corp. | |
3.45%, 08/08/36 | | (Call 02/08/36) | | | 1,000 | | | | 989,460 | |
3.50%, 02/12/35 | | (Call 08/12/34)a | | | 1,300 | | | | 1,302,652 | |
3.50%, 11/15/42 | | | | | 350 | | | | 333,102 | |
3.70%, 08/08/46 | | (Call 02/08/46) | | | 3,250 | | | | 3,180,937 | |
3.75%, 05/01/43 | | (Call 11/01/42) | | | 623 | | | | 614,502 | |
3.75%, 02/12/45 | | (Call 08/12/44) | | | 428 | | | | 421,516 | |
3.95%, 08/08/56 | | (Call 02/08/56) | | | 500 | | | | 489,135 | |
4.00%, 02/12/55 | | (Call 08/12/54) | | | 1,500 | | | | 1,483,215 | |
4.20%, 11/03/35 | | (Call 05/03/35) | | | 521 | | | | 570,391 | |
4.45%, 11/03/45 | | (Call 05/03/45) | | | 1,900 | | | | 2,091,444 | |
4.50%, 10/01/40 | | | | | 404 | | | | 446,994 | |
4.75%, 11/03/55 | | (Call 05/03/55) | | | 500 | | | | 563,795 | |
4.88%, 12/15/43 | | (Call 06/15/43)a | | | 504 | | | | 581,853 | |
5.20%, 06/01/39 | | | | | 322 | | | | 389,733 | |
5.30%, 02/08/41 | | | | | 623 | | | | 766,115 | |
Oracle Corp. | |
3.25%, 05/15/30 | | (Call 02/15/30)a | | | 836 | | | | 854,141 | |
3.85%, 07/15/36 | | (Call 01/15/36) | | | 1,000 | | | | 1,009,020 | |
3.90%, 05/15/35 | | (Call 11/15/34) | | | 1,007 | | | | 1,020,816 | |
4.00%, 07/15/46 | | (Call 01/15/46) | | | 1,595 | | | | 1,574,201 | |
4.13%, 05/15/45 | | (Call 11/15/44) | | | 1,400 | | | | 1,404,438 | |
4.30%, 07/08/34 | | (Call 01/08/34)a | | | 982 | | | | 1,047,824 | |
4.38%, 05/15/55 | | (Call 11/15/54)a | | | 354 | | | | 365,112 | |
4.50%, 07/08/44 | | (Call 01/08/44) | | | 717 | | | | 764,200 | |
5.38%, 07/15/40 | | | | | 1,069 | | | | 1,273,724 | |
6.13%, 07/08/39 | | | | | 946 | | | | 1,227,662 | |
6.50%, 04/15/38a | | | | | 40 | | | | 54,005 | |
| | | | | | | | | | |
| | | | | | | | | 25,065,632 | |
TELECOMMUNICATIONS — 7.08% | |
America Movil SAB de CV | |
4.38%, 07/16/42a | | | | | 643 | | | | 632,841 | |
6.13%, 11/15/37 | | | | | 125 | | | | 147,684 | |
6.13%, 03/30/40 | | | | | 1,721 | | | | 2,062,171 | |
6.38%, 03/01/35 | | | | | 145 | | | | 177,173 | |
AT&T Corp. | |
8.25%, 11/15/31 | | | | | 501 | | | | 723,945 | |
AT&T Inc. | |
4.30%, 12/15/42 | | (Call 06/15/42) | | | 851 | | | | 789,677 | |
| | | | | | | | | | |
| Security | | | |
Principal
(000s) | | | Value | |
4.35%, 06/15/45 | | (Call 12/15/44) | | $ | 829 | | | $ | 764,628 | |
4.50%, 05/15/35 | | (Call 11/15/34) | | | 1,208 | | | | 1,193,842 | |
4.50%, 03/09/48 | | (Call 09/09/47)b | | | 5,048 | | | | 4,764,908 | |
4.55%, 03/09/49 | | (Call 09/09/48)b | | | 1,281 | | | | 1,204,691 | |
4.75%, 05/15/46 | | (Call 11/15/45) | | | 2,000 | | | | 1,954,700 | |
4.80%, 06/15/44 | | (Call 12/15/43) | | | 1,820 | | | | 1,803,256 | |
5.15%, 03/15/42 | | | | | 1,016 | | | | 1,039,541 | |
5.35%, 09/01/40 | | | | | 657 | | | | 693,188 | |
5.65%, 02/15/47 | | (Call 08/15/46)a | | | 1,250 | | | | 1,386,025 | |
6.00%, 08/15/40 | | (Call 05/15/40) | | | 259 | | | | 291,362 | |
6.30%, 01/15/38 | | | | | 858 | | | | 1,000,334 | |
6.35%, 03/15/40 | | | | | 325 | | | | 378,202 | |
6.38%, 03/01/41 | | | | | 633 | | | | 745,104 | |
6.50%, 09/01/37 | | | | | 376 | | | | 454,456 | |
AT&T Mobility LLC | |
7.13%, 12/15/31a | | | | | 650 | | | | 863,844 | |
BellSouth Telecommunications LLC | | | | | | | | |
6.38%, 06/01/28a | | | | | 200 | | | | 240,012 | |
British Telecommunications PLC | |
9.38%, 12/15/30 | | | | | 1,391 | | | | 2,220,384 | |
Cisco Systems Inc. | |
5.50%, 01/15/40a | | | | | 1,750 | | | | 2,209,340 | |
5.90%, 02/15/39 | | | | | 767 | | | | 1,009,257 | |
Corning Inc. | |
4.70%, 03/15/37a | | | | | 75 | | | | 77,599 | |
4.75%, 03/15/42 | | | | | 347 | | | | 354,207 | |
5.75%, 08/15/40 | | | | | 248 | | | | 288,042 | |
7.25%, 08/15/36 | | (Call 08/15/26) | | | 205 | | | | 248,210 | |
Deutsche Telekom International Finance BV | | | | | | | | |
8.75%, 06/15/30 | | | | | 1,954 | | | | 2,979,850 | |
9.25%, 06/01/32 | | | | | 219 | | | | 353,043 | |
Harris Corp. | |
4.85%, 04/27/35 | | (Call 10/27/34) | | | 442 | | | | 477,334 | |
5.05%, 04/27/45 | | (Call 10/27/44) | | | 475 | | | | 519,816 | |
6.15%, 12/15/40 | | | | | 105 | | | | 128,249 | |
Juniper Networks Inc. | |
5.95%, 03/15/41a | | | | | 250 | | | | 258,318 | |
Koninklijke KPN NV | |
8.38%, 10/01/30 | | | | | 501 | | | | 684,927 | |
Motorola Solutions Inc. | |
5.50%, 09/01/44 | | | | | 246 | | | | 236,197 | |
New Cingular Wireless Services Inc. | | | | | | | | |
8.75%, 03/01/31 | | | | | 556 | | | | 836,569 | |
| | |
| 60 | | 2016 iSHARES ANNUAL REPORTTO SHAREHOLDERS |
Schedule of Investments (Unaudited) (Continued)
iSHARES® 10+ YEAR CREDIT BOND ETF
October 31, 2016
| | | | | | | | | | |
| Security | | | |
Principal
(000s) | | | Value | |
Orange SA | |
5.38%, 01/13/42 | | | | $ | 350 | | | $ | 413,983 | |
5.50%, 02/06/44 | | (Call 08/06/43)a | | | 670 | | | | 818,003 | |
9.00%, 03/01/31 | | | | | 1,605 | | | | 2,519,850 | |
Qwest Corp. | |
6.88%, 09/15/33 | | (Call 12/01/16) | | | 710 | | | | 702,900 | |
7.13%, 11/15/43 | | (Call 12/01/16)a | | | 323 | | | | 323,000 | |
7.25%, 10/15/35 | | (Call 12/01/16) | | | 11 | | | | 11,000 | |
Rogers Communications Inc. | |
4.50%, 03/15/43 | | (Call 09/15/42) | | | 150 | | | | 155,805 | |
5.00%, 03/15/44 | | (Call 09/15/43) | | | 620 | | | | 698,628 | |
5.45%, 10/01/43 | | (Call 04/01/43) | | | 21 | | | | 24,483 | |
7.50%, 08/15/38 | | | | | 595 | | | | 827,264 | |
Telefonica Emisiones SAU | |
7.05%, 06/20/36 | | | | | 1,275 | | | | 1,620,092 | |
Telefonica Europe BV | |
8.25%, 09/15/30 | | | | | 593 | | | | 845,244 | |
TELUS Corp. | |
2.80%, 02/16/27 | | (Call 11/16/26) | | | 250 | | | | 245,133 | |
Verizon Communications Inc. | |
3.85%, 11/01/42 | | (Call 05/01/42) | | | 1,176 | | | | 1,079,568 | |
4.13%, 08/15/46 | | (Call 02/15/46)a | | | 120 | | | | 114,685 | |
4.27%, 01/15/36 | | | | | 1,700 | | | | 1,698,980 | |
4.40%, 11/01/34 | | (Call 05/01/34) | | | 2,500 | | | | 2,534,475 | |
4.52%, 09/15/48 | | | | | 2,550 | | | | 2,551,887 | |
4.67%, 03/15/55 | | | | | 3,000 | | | | 2,945,610 | |
4.75%, 11/01/41 | | | | | 515 | | | | 536,403 | |
4.86%, 08/21/46 | | | | | 2,900 | | | | 3,075,247 | |
5.01%, 08/21/54 | | | | | 2,677 | | | | 2,764,832 | |
5.05%, 03/15/34 | | (Call 12/15/33) | | | 851 | | | | 925,028 | |
5.85%, 09/15/35 | | | | | 730 | | | | 871,394 | |
6.00%, 04/01/41 | | | | | 948 | | | | 1,143,629 | |
6.25%, 04/01/37 | | | | | 16 | | | | 19,806 | |
6.40%, 09/15/33 | | | | | 800 | | | | 999,576 | |
6.40%, 02/15/38 | | | | | 401 | | | | 499,626 | |
6.55%, 09/15/43 | | | | | 2,400 | | | | 3,161,664 | |
6.90%, 04/15/38 | | | | | 1,000 | | | | 1,301,170 | |
Vodafone Group PLC | |
4.38%, 02/19/43 | | | | | 1,145 | | | | 1,103,379 | |
6.15%, 02/27/37 | | | | | 1,035 | | | | 1,220,213 | |
6.25%, 11/30/32 | | | | | 400 | | | | 479,692 | |
7.88%, 02/15/30 | | | | | 302 | | | | 411,146 | |
| | | | | | | | | | |
| | | | | | | | | 74,836,321 | |
| | | | | | | | | | |
| Security | | | |
Principal
(000s) | | | Value | |
TEXTILES — 0.03% | |
Cintas Corp. No. 2 | |
6.15%, 08/15/36 | | | | $ | 249 | | | $ | 308,817 | |
| | | | | | | | | | |
| | | | | | | | | 308,817 | |
TOYS, GAMES & HOBBIES — 0.09% | |
Hasbro Inc. | |
5.10%, 05/15/44 | | (Call 11/15/43) | | | 151 | | | | 155,557 | |
6.35%, 03/15/40 | | | | | 295 | | | | 352,708 | |
Mattel Inc. | |
5.45%, 11/01/41 | | (Call 05/01/41) | | | 350 | | | | 363,839 | |
6.20%, 10/01/40a | | | | | 61 | | | | 69,240 | |
| | | | | | | | | | |
| | | | | | | | | 941,344 | |
TRANSPORTATION — 2.80% | |
Burlington Northern Santa Fe LLC | |
3.90%, 08/01/46 | | (Call 02/01/46) | | | 415 | | | | 422,752 | |
4.15%, 04/01/45 | | (Call 10/01/44) | | | 700 | | | | 738,241 | |
4.38%, 09/01/42 | | (Call 03/01/42) | | | 437 | | | | 472,012 | |
4.40%, 03/15/42 | | (Call 09/15/41) | | | 463 | | | | 502,239 | |
4.45%, 03/15/43 | | (Call 09/15/42) | | | 11 | | | | 12,038 | |
4.55%, 09/01/44 | | (Call 03/01/44) | | | 457 | | | | 506,091 | |
4.70%, 09/01/45 | | (Call 03/01/45) | | | 600 | | | | 685,116 | |
4.90%, 04/01/44 | | (Call 10/01/43) | | | 1,100 | | | | 1,277,089 | |
4.95%, 09/15/41 | | (Call 03/15/41)a | | | 114 | | | | 133,045 | |
5.05%, 03/01/41 | | (Call 09/01/40) | | | 26 | | | | 30,654 | |
5.15%, 09/01/43 | | (Call 03/01/43) | | | 173 | | | | 208,005 | |
5.40%, 06/01/41 | | (Call 12/01/40) | | | 420 | | | | 512,198 | |
5.75%, 05/01/40 | | (Call 11/01/39) | | | 466 | | | | 592,873 | |
6.15%, 05/01/37 | | | | | 161 | | | | 213,452 | |
6.20%, 08/15/36 | | | | | 350 | | | | 465,822 | |
Canadian National Railway Co. | | | | | | | | |
3.20%, 08/02/46 | | (Call 02/02/46) | | | 450 | | | | 425,884 | |
3.50%, 11/15/42 | | (Call 05/15/42) | | | 170 | | | | 166,252 | |
4.50%, 11/07/43 | | (Call 05/07/43) | | | 205 | | | | 232,505 | |
6.20%, 06/01/36 | | | | | 250 | | | | 341,410 | |
6.25%, 08/01/34 | | | | | 111 | | | | 149,323 | |
6.38%, 11/15/37 | | | | | 200 | | | | 276,350 | |
6.90%, 07/15/28 | | | | | 700 | | | | 979,251 | |
Canadian Pacific Railway Co. | | | | | | | | |
4.80%, 09/15/35 | | (Call 03/15/35) | | | 122 | | | | 137,027 | |
4.80%, 08/01/45 | | (Call 02/01/45) | | | 100 | | | | 113,823 | |
5.75%, 03/15/33 | | | | | 107 | | | | 124,041 | |
5.75%, 01/15/42 | | | | | 261 | | | | 326,963 | |
5.95%, 05/15/37 | | | | | 16 | | | | 19,783 | |
| | | | |
SCHEDULEOF INVESTMENTS | | | 61 | |
Schedule of Investments (Unaudited) (Continued)
iSHARES® 10+ YEAR CREDIT BOND ETF
October 31, 2016
| | | | | | | | | | |
| Security | | | |
Principal
(000s) | | | Value | |
6.13%, 09/15/15 | | (Call 03/15/15) | | $ | 256 | | | $ | 307,794 | |
7.13%, 10/15/31 | | | | | 790 | | | | 1,070,300 | |
CSX Corp. | |
3.95%, 05/01/50 | | (Call 11/01/49) | | | 300 | | | | 291,096 | |
4.10%, 03/15/44 | | (Call 09/15/43) | | | 900 | | | | 915,606 | |
4.25%, 11/01/66 | | (Call 05/01/66) | | | 500 | | | | 486,505 | |
4.40%, 03/01/43 | | (Call 09/01/42) | | | 200 | | | | 210,524 | |
4.50%, 08/01/54 | | (Call 02/01/54) | | | 500 | | | | 522,525 | |
4.75%, 05/30/42 | | (Call 11/30/41) | | | 500 | | | | 550,495 | |
5.50%, 04/15/41 | | (Call 10/15/40) | | | 70 | | | | 83,399 | |
6.00%, 10/01/36 | | | | | 450 | | | | 563,972 | |
6.15%, 05/01/37 | | | | | 75 | | | | 94,850 | |
6.22%, 04/30/40 | | | | | 105 | | | | 135,356 | |
FedEx Corp. | |
3.88%, 08/01/42 | | | | | 309 | | | | 297,091 | |
3.90%, 02/01/35a | | | | | 1,000 | | | | 993,440 | |
4.10%, 04/15/43 | | | | | 52 | | | | 51,599 | |
4.10%, 02/01/45 | | | | | 200 | | | | 199,040 | |
4.50%, 02/01/65 | | | | | 86 | | | | 84,514 | |
4.55%, 04/01/46 | | (Call 10/01/45) | | | 775 | | | | 826,863 | |
4.75%, 11/15/45 | | (Call 05/15/45) | | | 600 | | | | 652,032 | |
4.90%, 01/15/34 | | | | | 338 | | | | 376,762 | |
5.10%, 01/15/44 | | | | | 416 | | | | 475,355 | |
Kansas City Southern | |
4.30%, 05/15/43 | | (Call 11/15/42) | | | 100 | | | | 99,967 | |
4.95%, 08/15/45 | | (Call 02/15/45) | | | 450 | | | | 494,109 | |
Norfolk Southern Corp. | |
4.45%, 06/15/45 | | (Call 12/15/44)a | | | 441 | | | | 479,640 | |
4.65%, 01/15/46 | | (Call 07/15/45)a | | | 585 | | | | 653,556 | |
4.80%, 08/15/43 | | (Call 02/15/43) | | | 1,024 | | | | 1,158,062 | |
4.84%, 10/01/41 | | | | | 479 | | | | 542,439 | |
6.00%, 03/15/05 | | | | | 11 | | | | 12,812 | |
6.00%, 05/23/11 | | | | | 436 | | | | 504,932 | |
NorthWestern Corp. | | | | | | | | |
4.18%, 11/15/44 | | (Call 05/15/44) | | | 161 | | | | 169,409 | |
Union Pacific Corp. | |
3.35%, 08/15/46 | | (Call 02/15/46) | | | 250 | | | | 236,667 | |
3.38%, 02/01/35 | | (Call 08/01/34) | | | 516 | | | | 513,853 | |
3.88%, 02/01/55 | | (Call 08/01/54) | | | 675 | | | | 663,781 | |
4.05%, 11/15/45 | | (Call 05/15/45) | | | 300 | | | | 315,573 | |
4.05%, 03/01/46 | | (Call 09/01/45) | | | 420 | | | | 442,827 | |
4.15%, 01/15/45 | | (Call 07/15/44)a | | | 75 | | | | 80,019 | |
4.30%, 06/15/42 | | (Call 12/15/41) | | | 550 | | | | 591,893 | |
| | | | | | | | | | |
| Security | | | |
Principal
(000s) | | | Value | |
4.38%, 11/15/65 | | (Call 05/15/65) | | $ | 6 | | | $ | 6,397 | |
4.75%, 09/15/41 | | (Call 03/15/41) | | | 8 | | | | 9,075 | |
4.75%, 12/15/43 | | (Call 06/15/43) | | | 100 | | | | 114,147 | |
4.82%, 02/01/44 | | (Call 08/01/43) | | | 570 | | | | 658,909 | |
4.85%, 06/15/44 | | (Call 12/15/43) | | | 14 | | | | 16,218 | |
6.63%, 02/01/29 | | | | | 307 | | | | 411,825 | |
United Parcel Service Inc. | |
3.40%, 11/15/46 | | (Call 05/15/46) | | | 110 | | | | 107,306 | |
3.63%, 10/01/42 | | | | | 105 | | | | 106,636 | |
4.88%, 11/15/40 | | (Call 05/15/40) | | | 530 | | | | 633,191 | |
6.20%, 01/15/38 | | | | | 700 | | | | 967,603 | |
United Parcel Service of America Inc. | | | | | | | | |
8.38%, 04/01/30c | | | | | 214 | | | | 310,567 | |
| | | | | | | | | | |
| | | | | | | | | 29,554,770 | |
TRUCKING & LEASING — 0.04% | |
GATX Corp. | |
4.50%, 03/30/45 | | (Call 09/30/44) | | | 200 | | | | 184,084 | |
5.20%, 03/15/44 | | (Call 09/15/43) | | | 250 | | | | 258,285 | |
| | | | | | | | | | |
| | | | | | | | | 442,369 | |
WATER — 0.14% | |
American Water Capital Corp. | | | | | | | | |
4.30%, 12/01/42 | | (Call 06/01/42)a | | | 16 | | | | 17,603 | |
4.30%, 09/01/45 | | (Call 03/01/45) | | | 500 | | | | 552,740 | |
6.59%, 10/15/37 | | | | | 239 | | | | 335,295 | |
United Utilities PLC | |
6.88%, 08/15/28 | | | | | 275 | | | | 316,583 | |
Veolia Environnement SA | |
6.75%, 06/01/38 | | | | | 225 | | | | 290,765 | |
| | | | | | | | | | |
| | | | | | | | | 1,512,986 | |
| | | | | | | | | | |
TOTAL CORPORATE BONDS & NOTES
| | | | | |
(Cost: $876,303,523) | | | | | | | 893,051,746 | |
|
FOREIGN GOVERNMENT OBLIGATIONSd — 5.44% | |
| | |
CANADA — 0.14% | | | | | | | | |
Province of Quebec Canada | |
7.50%, 09/15/29 | | | | | 1,000 | | | | 1,481,410 | |
| | | | | | | | | | |
| | | | | | | | | 1,481,410 | |
CHILE — 0.04% | |
Chile Government International Bond | | | | | | | | |
3.63%, 10/30/42a | | | | | 450 | | | | 458,649 | |
| | | | | | | | | | |
| | | | | | | | | 458,649 | |
| | |
| 62 | | 2016 iSHARES ANNUAL REPORTTO SHAREHOLDERS |
Schedule of Investments (Unaudited) (Continued)
iSHARES® 10+ YEAR CREDIT BOND ETF
October 31, 2016
| | | | | | | | | | |
| Security | | | |
Principal
(000s) | | | Value | |
COLOMBIA — 0.60% | |
Colombia Government International Bond | | | | | | | | |
5.00%, 06/15/45 | | (Call 12/15/44) | | $ | 650 | | | $ | 663,000 | |
5.63%, 02/26/44 | | (Call 08/26/43) | | | 2,200 | | | | 2,413,642 | |
6.13%, 01/18/41a | | | | | 1,500 | | | | 1,721,970 | |
7.38%, 09/18/37a | | | | | 800 | | | | 1,029,504 | |
10.38%, 01/28/33 | | | | | 300 | | | | 457,854 | |
| | | | | | | | | | |
| | | | | | | | | 6,285,970 | |
HUNGARY — 0.07% | |
Hungary Government International Bond | | | | | | | | |
7.63%, 03/29/41 | | | | | 500 | | | | 758,125 | |
| | | | | | | | | | |
| | | | | | | | | 758,125 | |
ISRAEL — 0.08% | |
Israel Government International Bond | | | | | | | | |
4.50%, 01/30/43 | | | | | 800 | | | | 881,480 | |
| | | | | | | | | | |
| | | | | | | | | 881,480 | |
ITALY — 0.12% | |
Republic of Italy Government International Bond | | | | | | | | |
5.38%, 06/15/33 | | | | | 1,092 | | | | 1,287,140 | |
| | | | | | | | | | |
| | | | | | | | | 1,287,140 | |
MEXICO — 1.33% | |
Mexico Government International Bond | | | | | | | | |
4.35%, 01/15/47 | | | | | 700 | | | | 664,496 | |
4.60%, 01/23/46 | | | | | 2,600 | | | | 2,549,326 | |
4.75%, 03/08/44 | | | | | 3,140 | | | | 3,131,365 | |
5.55%, 01/21/45 | | | | | 1,300 | | | | 1,457,989 | |
5.75%, 10/12/49 | | | | | 2,130 | | | | 2,179,587 | |
6.05%, 01/11/40 | | | | | 700 | | | | 832,314 | |
6.75%, 09/27/34a | | | | | 1,025 | | | | 1,329,712 | |
7.50%, 04/08/33 | | | | | 477 | | | | 663,068 | |
8.30%, 08/15/31 | | | | | 800 | | | | 1,278,832 | |
| | | | | | | | | | |
| | | | | | | | | 14,086,689 | |
PANAMA — 0.41% | |
Panama Government International Bond | | | | | | | | |
6.70%, 01/26/36 | | | | | 1,480 | | | | 1,969,037 | |
8.88%, 09/30/27 | | | | | 500 | | | | 736,835 | |
| | | | | | | | | | |
| Security | | | |
Principal
(000s) | | | Value | |
9.38%, 04/01/29a | | | | $ | 1,030 | | | $ | 1,565,950 | |
| | | | | | | | | | |
| | | | | | | | | 4,271,822 | |
PERU — 0.60% | |
Peruvian Government International Bond | | | | | | | | |
4.13%, 08/25/27a | | | | | 1,100 | | | | 1,227,875 | |
5.63%, 11/18/50a | | | | | 1,475 | | | | 1,869,857 | |
6.55%, 03/14/37a | | | | | 495 | | | | 678,893 | |
8.75%, 11/21/33a | | | | | 1,650 | | | | 2,598,667 | |
| | | | | | | | | | |
| | | | | | | | | 6,375,292 | |
PHILIPPINES — 0.97% | |
Philippine Government International Bond | | | | | | | | |
3.95%, 01/20/40 | | | | | 1,400 | | | | 1,501,500 | |
5.00%, 01/13/37 | | | | | 1,400 | | | | 1,711,500 | |
6.38%, 01/15/32 | | | | | 1,400 | | | | 1,909,250 | |
6.38%, 10/23/34 | | | | | 1,600 | | | | 2,224,000 | |
7.75%, 01/14/31 | | | | | 1,400 | | | | 2,108,750 | |
9.50%, 02/02/30 | | | | | 450 | | | | 750,938 | |
| | | | | | | | | | |
| | | | | | | | | 10,205,938 | |
SOUTH AFRICA — 0.19% | |
Republic of South Africa Government International Bond | | | | | | | | |
5.00%, 10/12/46 | | | | | 1,000 | | | | 968,750 | |
5.38%, 07/24/44a | | | | | 800 | | | | 832,000 | |
6.25%, 03/08/41 | | | | | 200 | | | | 233,000 | |
| | | | | | | | | | |
| | | | | | | | | 2,033,750 | |
SOUTH KOREA — 0.10% | |
Export-Import Bank of Korea | |
2.38%, 04/21/27 | | | | | 200 | | | | 196,736 | |
Korea International Bond | |
4.13%, 06/10/44a | | | | | 700 | | | | 887,370 | |
| | | | | | | | | | |
| | | | | | | | | 1,084,106 | |
SUPRANATIONAL — 0.33% | |
Asian Development Bank | |
5.82%, 06/16/28 | | | | | 310 | | | | 408,571 | |
European Investment Bank | |
4.88%, 02/15/36 | | | | | 845 | | | | 1,125,202 | |
Inter-American Development Bank | |
3.20%, 08/07/42 | | | | | 300 | | | | 313,374 | |
3.88%, 10/28/41 | | | | | 500 | | | | 586,030 | |
4.38%, 01/24/44 | | | | | 400 | | | | 503,900 | |
| | | | |
SCHEDULEOF INVESTMENTS | | | 63 | |
Schedule of Investments (Unaudited) (Continued)
iSHARES® 10+ YEAR CREDIT BOND ETF
October 31, 2016
| | | | | | | | | | |
| Security | | | |
Principal
(000s) | | | Value | |
International Bank for Reconstruction & Development | | | | | | | | |
4.75%, 02/15/35 | | | | $ | 440 | | | $ | 571,705 | |
| | | | | | | | | | |
| | | | | | | | | 3,508,782 | |
URUGUAY — 0.46% | |
Uruguay Government International Bond | | | | | | | | |
4.13%, 11/20/45 | | | 300 | | | | 273,594 | |
4.38%, 10/27/27 | | | 1,500 | | | | 1,590,825 | |
5.10%, 06/18/50a | | | 1,750 | | | | 1,746,780 | |
7.63%, 03/21/36a | | | 865 | | | | 1,191,572 | |
| | | | | | | | | | |
| | | | | | | | | 4,802,771 | |
| | | | | | | | | | |
TOTAL FOREIGN GOVERNMENT OBLIGATIONS | |
(Cost: $56,893,050) | | | | | | | 57,521,924 | |
|
MUNICIPAL DEBT OBLIGATIONS — 7.80% | |
|
CALIFORNIA — 2.50% | |
Alameda County Joint Powers Authority RB BAB | | | | | | | | |
7.05%, 12/01/44 | | | | | 135 | | | | 193,585 | |
Bay Area Toll Authority RB BAB | |
6.26%, 04/01/49 | | | | | 700 | | | | 1,015,301 | |
Series S-1 | | | | | | | | |
6.79%, 04/01/30 | | | | | 250 | | | | 319,625 | |
7.04%, 04/01/50 | | | | | 850 | | | | 1,303,084 | |
Series S-3 | | | | | | | | |
6.91%, 10/01/50 | | | | | 100 | | | | 152,750 | |
California State Public Works Board RB BAB
Series G-2 | | | | | | | | |
8.36%, 10/01/34 | | | | | 360 | | | | 539,258 | |
City of Los Angeles Department of Airports RB BAB | | | | | | | | |
6.58%, 05/15/39 | | | | | 530 | | | | 707,916 | |
City of San Francisco CA Public Utilities Commission Water Revenue RB BAB | | | | | | | | |
6.95%, 11/01/50 | | | | | 320 | | | | 473,872 | |
County of Sonoma CA RB
Series A | | | | | | | | |
6.00%, 12/01/29 | | (GTD) | | | 550 | | | | 665,021 | |
| | | | | | | | | | |
| Security | | | |
Principal
(000s) | | | Value | |
East Bay Municipal Utility District Water System Revenue RB BAB
Series B | | | | | | | | |
5.87%, 06/01/40 | | | | $ | 340 | | | $ | 455,478 | |
Los Angeles Community College District/CA GO BAB | | | | | | | | |
6.60%, 08/01/42 | | | | | 350 | | | | 520,719 | |
6.75%, 08/01/49 | | | | | 300 | | | | 457,986 | |
Los Angeles County Metropolitan Transportation Authority RB BAB
Series A | | | | | | | | |
5.74%, 06/01/39 | | | | | 400 | | | | 511,084 | |
Los Angeles County Public Works Financing Authority RB BAB | | | | | | | | |
7.62%, 08/01/40 | | | | | 350 | | | | 520,251 | |
Los Angeles Department of Water & Power RB BAB | | | | | | | | |
Series A | | | | | | | | |
6.60%, 07/01/50 | | | | | 550 | | | | 824,532 | |
Series D | | | | | | | | |
6.57%, 07/01/45 | | | | | 400 | | | | 587,308 | |
Los Angeles Unified School District/CA GO BAB | | | | | | | | |
5.75%, 07/01/34 | | | | | 800 | | | | 1,032,648 | |
6.76%, 07/01/34 | | | | | 550 | | | | 775,538 | |
Regents of the University of California Medical Center Pooled Revenue RB BAB | | | | | | | | |
6.55%, 05/15/48 | | | | | 550 | | | | 763,873 | |
Sacramento Municipal Utility District RB BAB | | | | | | | | |
6.16%, 05/15/36 | | | | | 100 | | | | 129,346 | |
San Diego County Regional Transportation Commission RB BAB | | | | | | | | |
5.91%, 04/01/48 | | | | | 300 | | | | 408,417 | |
San Diego County Water Authority Financing Corp. RB BAB | | | | | | | | |
6.14%, 05/01/49 | | | | | 400 | | | | 551,476 | |
State of California GO BAB | |
7.30%, 10/01/39 | | | | | 845 | | | | 1,244,474 | |
7.35%, 11/01/39 | | | | | 700 | | | | 1,032,479 | |
7.50%, 04/01/34 | | | | | 2,475 | | | | 3,639,413 | |
| | |
| 64 | | 2016 iSHARES ANNUAL REPORTTO SHAREHOLDERS |
Schedule of Investments (Unaudited) (Continued)
iSHARES® 10+ YEAR CREDIT BOND ETF
October 31, 2016
| | | | | | | | | | |
| Security | | | |
Principal
(000s) | | | Value | |
7.55%, 04/01/39 | | | | $ | 1,550 | | | $ | 2,387,465 | |
7.60%, 11/01/40 | | | | | 800 | | | | 1,251,616 | |
7.63%, 03/01/40 | | | | | 300 | | | | 459,417 | |
7.95%, 03/01/36 | | (Call 03/01/20) | | | 750 | | | | 893,775 | |
University of California RB | | | | | | | | |
Series AD | | | | | | | | | | |
4.86%, 05/15/12 | | | | | 780 | | | | 815,311 | |
Series AN | | | | | | | | | | |
4.77%, 05/15/44 | | (Call 05/15/24) | | | 650 | | | | 704,561 | |
University of California RB BAB | |
5.77%, 05/15/43 | | | | | 200 | | | | 256,516 | |
5.95%, 05/15/45 | | | | | 650 | | | | 844,883 | |
| | | | | | | | | | |
| | | | | | | | | 26,438,978 | |
COLORADO — 0.10% | |
Colorado Bridge Enterprise RB BAB
Series A | | | | | | | | |
6.08%, 12/01/40 | | | | | 300 | | | | 395,928 | |
Denver City & County School District No. 1 COP
Series B | | | | | | | | |
7.02%, 12/15/37 | | | | | 435 | | | | 604,211 | |
| | | | | | | | | | |
| | | | | | | | | 1,000,139 | |
CONNECTICUT — 0.13% | |
State of Connecticut GO
Series A | | | | | | | | |
5.85%, 03/15/32 | | | | | 200 | | | | 252,252 | |
State of Connecticut GO BAB | |
5.09%, 10/01/30 | | | | | 200 | | | | 237,900 | |
5.63%, 12/01/29 | | | | | 720 | | | | 878,141 | |
| | | | | | | | | | |
| | | | | | | | | 1,368,293 | |
DISTRICT OF COLUMBIA — 0.02% | |
District of Columbia Water & Sewer Authority RB | | | | | | | | |
4.81%, 10/01/14 | | | | | 200 | | | | 222,240 | |
| | | | | | | | | | |
| | | | | | | | | 222,240 | |
GEORGIA — 0.17% | |
Municipal Electric Authority of Georgia RB BAB | | | | | | | | |
Project J, Series 2010-A | | | | | | | | |
6.64%, 04/01/57 | | | | | 350 | | | | 455,917 | |
Project P, Series 2010A | | | | | | | | |
7.06%, 04/01/57 | | | | | 1,150 | | | | 1,360,588 | |
| | | | | | | | | | |
| | | | | | | | | 1,816,505 | |
| | | | | | | | | | |
| Security | | | |
Principal
(000s) | | | Value | |
ILLINOIS — 0.86% | |
Chicago Transit Authority RB | | | | | | | | |
Series A | | | | | | | | | | |
6.90%, 12/01/40 | | | | $ | 600 | | | $ | 773,634 | |
Series B | | | | | | | | | | |
6.90%, 12/01/40 | | | | | 225 | | | | 288,684 | |
Chicago Transit Authority RB BAB
Series B | | | | | | | | |
6.20%, 12/01/40 | | | | | 120 | | | | 146,497 | |
City of Chicago IL GO
Series C | | | | | | | | |
7.78%, 01/01/35 | | | | | 1,000 | | | | 1,105,320 | |
County of Cook IL GO BAB | | | | | | | | |
6.23%, 11/15/34 | | | | | 200 | | | | 244,996 | |
Illinois State Toll Highway Authority RB BAB | | | | | | | | |
6.18%, 01/01/34 | | | | | 580 | | | | 754,232 | |
Metropolitan Water Reclamation District of Greater Chicago GOL BAB | | | | | | | | |
5.72%, 12/01/38 | | | | | 500 | | | | 635,385 | |
State of Illinois GO | |
5.10%, 06/01/33 | | | | | 4,370 | | | | 4,143,328 | |
5.65%, 12/01/38 | | | | | 725 | | | | 712,668 | |
State of Illinois GO BAB
Series 3 | | | | | | | | |
6.73%, 04/01/35 | | | | | 300 | | | | 316,536 | |
| | | | | | | | | | |
| | | | | | | | | 9,121,280 | |
KANSAS — 0.04% | |
Kansas Development Finance Authority RB
Series H | |
4.73%, 04/15/37 | | | | | 100 | | | | 107,983 | |
State of Kansas Department of Transportation RB BAB | | | | | | | | |
4.60%, 09/01/35 | | | | | 300 | | | | 352,656 | |
| | | | | | | | | | |
| | | | | | | | | 460,639 | |
KENTUCKY — 0.02% | |
Louisville & Jefferson County Metropolitan Sewer District RB BAB | | | | | | | | |
6.25%, 05/15/43 | | | | | 145 | | | | 199,339 | |
| | | | | | | | | | |
| | | | | | | | | 199,339 | |
| | | | |
SCHEDULEOF INVESTMENTS | | | 65 | |
Schedule of Investments (Unaudited) (Continued)
iSHARES® 10+ YEAR CREDIT BOND ETF
October 31, 2016
| | | | | | | | | | |
| Security | | | |
Principal
(000s) | | | Value | |
MARYLAND — 0.03% | | | | | |
Maryland State Transportation Authority RB BAB | | | | | | | | |
5.89%, 07/01/43 | | | | $ | 200 | | | $ | 263,882 | |
| | | | | | | | | | |
| | | | | | | | | 263,882 | |
MASSACHUSETTS — 0.34% | | | | | |
Commonwealth of Massachusetts GOL BAB | | | | | | | | |
4.91%, 05/01/29 | | | | | 240 | | | | 293,496 | |
Series E | | | | | | | | | | |
5.46%, 12/01/39 | | | | | 695 | | | | 911,847 | |
Commonwealth of Massachusetts Transportation Fund Revenue RB BAB
Series A | | | | | | | | |
5.73%, 06/01/40 | | | | | 350 | | | | 469,353 | |
Massachusetts Clean Water Trust (The) RB BAB
Series B | | | | | | | | |
5.19%, 08/01/40 | | | | | 550 | | | | 659,197 | |
Massachusetts School Building Authority RB BAB | | | | | | | | |
5.72%, 08/15/39 | | | | | 450 | | | | 597,861 | |
University of Massachusetts Building Authority RB BAB | | | | | | | | |
5.45%, 11/01/40 | | | | | 550 | | | | 694,034 | |
| | | | | | | | | | |
| | | | | | | | | 3,625,788 | |
MISSOURI — 0.14% | | | | | |
Health & Educational Facilities Authority of the State of Missouri RB | | | | | | | | |
3.09%, 09/15/51 | | | | | 100 | | | | 92,448 | |
Series A | | | | | | | | | | |
3.65%, 01/15/46 | | | | | 250 | | | | 258,460 | |
Missouri Highway & Transportation Commission RB BAB | | | | | | | | |
5.45%, 05/01/33 | | | | | 500 | | | | 614,140 | |
University of Missouri RB BAB | | | | | | | | |
5.79%, 11/01/41 | | | | | 400 | | | | 541,508 | |
| | | | | | | | | | |
| | | | | | | | | 1,506,556 | |
| | | | | | | | | | |
| Security | | | |
Principal
(000s) | | | Value | |
NEVADA — 0.02% | |
County of Clark Department of Aviation RB BAB
Series C | | | | | | | | |
6.82%, 07/01/45 | | | | $ | 120 | | | $ | 180,130 | |
| | | | | | | | | | |
| | | | | | | | | 180,130 | |
NEW JERSEY — 0.51% | |
New Jersey Economic Development Authority RB
Series A | | | | | | | | |
7.43%, 02/15/29 | | (NPFGC) | | | 675 | | | | 840,895 | |
New Jersey State Turnpike Authority RB BAB | | | | | | | | |
7.10%, 01/01/41 | | | | | 1,225 | | | | 1,800,284 | |
Series F | | | | | | | | |
7.41%, 01/01/40 | | | | | 750 | | | | 1,138,425 | |
New Jersey Transportation Trust Fund Authority RB BAB
Series C | | | | | | | | |
5.75%, 12/15/28 | | | | | 1,020 | | | | 1,129,099 | |
Rutgers The State University of New Jersey RB BAB | | | | | | | | |
5.67%, 05/01/40 | | | | | 350 | | | | 434,774 | |
| | | | | | | | | | |
| | | | | | | | | 5,343,477 | |
NEW YORK — 1.32% | |
City of New York NY GO BAB | |
5.85%, 06/01/40 | | | | | 290 | | | | 392,820 | |
5.99%, 12/01/36 | | | | | 145 | | | | 189,316 | |
6.27%, 12/01/37 | | | | | 625 | | | | 858,025 | |
Series C-1 | | | | | | | | |
5.52%, 10/01/37 | | | | | 185 | | | | 237,076 | |
Housing Development Corp./NY RB | | | | | | | | |
3.71%, 02/15/48 | | | | | 500 | | | | 512,435 | |
Metropolitan Transportation Authority RB BAB | | | | | | | | |
6.09%, 11/15/40 | | | | | 250 | | | | 333,895 | |
Series 2010-A | | | | | | | | |
6.67%, 11/15/39 | | | | | 225 | | | | 313,432 | |
Series A | | | | | | | | |
5.87%, 11/15/39 | | | | | 350 | | | | 443,055 | |
Series B | | | | | | | | |
6.65%, 11/15/39 | | | | | 350 | | | | 481,999 | |
| | |
| 66 | | 2016 iSHARES ANNUAL REPORTTO SHAREHOLDERS |
Schedule of Investments (Unaudited) (Continued)
iSHARES® 10+ YEAR CREDIT BOND ETF
October 31, 2016
| | | | | | | | | | |
| Security | | | |
Principal
(000s) | | | Value | |
Series C-1 | | | | | | | | |
6.69%, 11/15/40 | | | | $ | 475 | | | $ | 659,908 | |
Series E | | | | | | | | |
6.81%, 11/15/40 | | | | | 300 | | | | 418,968 | |
New York City Transitional Finance Authority Future Tax Secured Revenue RB
Series G-3 | | | | | | | | |
5.27%, 05/01/27 | | | | | 450 | | | | 545,535 | |
New York City Transitional Finance Authority Future Tax Secured Revenue RB BAB | | | | | | | | |
5.51%, 08/01/37 | | | | | 200 | | | | 254,252 | |
5.57%, 11/01/38 | | | | | 250 | | | | 319,263 | |
New York City Water & Sewer System RB BAB | | | | | | | | |
5.44%, 06/15/43 | | | | | 350 | | | | 460,691 | |
5.75%, 06/15/41 | | | | | 275 | | | | 370,722 | |
5.88%, 06/15/44 | | | | | 550 | | | | 765,572 | |
6.01%, 06/15/42 | | | | | 350 | | | | 488,467 | |
New York State Dormitory Authority RB BAB | | | | | | | | |
5.39%, 03/15/40 | | | | | 625 | | | | 806,837 | |
5.50%, 03/15/30 | | | | | 200 | | | | 248,218 | |
5.63%, 03/15/39 | | | | | 350 | | | | 445,924 | |
New York State Urban Development Corp. RB BAB | | | | | | | | |
5.84%, 03/15/40 | | | | | 350 | | | | 450,943 | |
Port Authority of New York & New Jersey RB | | | | | | | | |
4.46%, 10/01/62 | | | 835 | | | | 912,146 | |
4.82%, 06/01/45 | | (Call 06/01/25) | | | 100 | | | | 108,098 | |
4.93%, 10/01/51 | | | | | 1,000 | | | | 1,198,340 | |
Series 182 | | | | | | | | |
5.31%, 08/01/46 | | (Call 08/01/24) | | | 1,250 | | | | 1,389,012 | |
Series 192 | | | | | | | | |
4.81%, 10/15/65 | | | | | 300 | | | | 346,299 | |
| | | | | | | | | | |
| | | | | | | | | 13,951,248 | |
OHIO — 0.35% | |
American Municipal Power Inc. RB BAB | | | | | | | | |
7.50%, 02/15/50 | | | 620 | | | | 893,029 | |
8.08%, 02/15/50 | | | | | 500 | | | | 801,750 | |
| | | | | | | | | | |
| Security | | | |
Principal
(000s) | | | Value | |
Ohio State University (The) RB | | | | | | | | |
Series A | | | | | | | | |
3.80%, 12/01/46 | | | | $ | 500 | | | $ | 520,030 | |
4.80%, 06/01/11 | | | | | 200 | | | | 212,056 | |
Ohio State University (The) RB BAB | | | | | | | | |
4.91%, 06/01/40 | | | 550 | | | | 671,847 | |
Ohio University RB | | | | | | | | |
5.59%, 12/01/14 | | | 150 | | | | 170,193 | |
Ohio Water Development Authority Water Pollution Control Loan Fund RB BAB | | | | | | | | |
4.88%, 12/01/34 | | | 400 | | | | 466,124 | |
| | | | | | | | | | |
| | | | | | | | | 3,735,029 | |
OREGON — 0.11% | |
Oregon School Boards Association GOL | | | | | | | | |
Series B | | | | | | | | |
5.55%, 06/30/28 | | (NPFGC) | | | 250 | | | | 302,215 | |
5.68%, 06/30/28 | | (NPFGC) | | | 500 | | | | 613,760 | |
State of Oregon Department of Transportation RB BAB
Series 2010-A | | | | | | | | |
5.83%, 11/15/34 | | | 175 | | | | 232,213 | |
| | | | | | | | | | |
| | | | | | | | | 1,148,188 | |
PENNSYLVANIA — 0.10% | |
Commonwealth of Pennsylvania GO BAB | | | | | | | | |
5.45%, 02/15/30 | | | 300 | | | | 368,799 | |
Pennsylvania Turnpike Commission RB BAB
Series B | | | | | | | | |
5.56%, 12/01/49 | | | 480 | | | | 620,482 | |
| | | | | | | | | | |
| | | | | | | | | 989,281 | |
SOUTH CAROLINA — 0.05% | |
South Carolina Public Service Authority RB
Series C | | | | | | | | |
5.78%, 12/01/41 | | | 400 | | | | 500,516 | |
| | | | | | | | | | |
| | | | | | | | | 500,516 | |
TEXAS — 0.81% | |
City of Houston TX Combined Utility System Revenue RB
Series B | | | | | | | | |
3.83%, 05/15/28 | | | 300 | | | | 329,637 | |
| | | | |
SCHEDULEOF INVESTMENTS | | | 67 | |
Schedule of Investments (Unaudited) (Continued)
iSHARES® 10+ YEAR CREDIT BOND ETF
October 31, 2016
| | | | | | | | | | |
| Security | | | |
Principal
(000s) | | | Value | |
City of Houston TX GOL
Series A | | | | | | | | |
6.29%, 03/01/32 | | $ | 495 | | | $ | 611,647 | |
City of San Antonio TX Electric & Gas Systems Revenue RB | | | | | | | | |
4.43%, 02/01/42 | | | 250 | | | | 285,318 | |
5.81%, 02/01/41 | | | | | 550 | | | | 729,740 | |
Dallas Area Rapid Transit RB BAB | | | | | | | | |
6.00%, 12/01/44 | | | 425 | | | | 593,326 | |
Dallas Convention Center Hotel Development Corp. RB BAB | | | | | | | | |
7.09%, 01/01/42 | | | 340 | | | | 471,767 | |
Dallas County Hospital District GOL BAB
Series C | | | | | | | | |
5.62%, 08/15/44 | | | 250 | | | | 322,565 | |
Dallas Independent School District GO BAB | | | | | | | | |
6.45%, 02/15/35 | | (Call 02/15/21)
(PSF) | | | 550 | | | | 649,033 | |
North Texas Tollway Authority RB BAB | | | | | | | | |
6.72%, 01/01/49 | | | 200 | | | | 299,084 | |
8.91%, 02/01/30 | | (Call 02/01/20) | | | 550 | | | | 657,189 | |
State of Texas GO BAB | | | | | | | | |
5.52%, 04/01/39 | | | 675 | | | | 904,851 | |
Series A | | | | | | | | |
4.63%, 04/01/33 | | | | | 500 | | | | 594,005 | |
4.68%, 04/01/40 | | | | | 300 | | | | 362,670 | |
Texas Transportation Commission State Highway Fund RB BAB
Series B | | | | | | | | |
5.18%, 04/01/30 | | | 825 | | | | 1,030,276 | |
University of Texas System (The) RB BAB | | | | | | | | |
Series B | | | | | | | | |
6.28%, 08/15/41 | | (Call 08/15/19) | | | 370 | | | | 414,914 | |
Series D | | | | | | | | |
5.13%, 08/15/42 | | | | | 250 | | | | 316,335 | |
| | | | | | | | | | |
| | | | | | | | | 8,572,357 | |
| | | | | | | | | | |
| Security | | | | Principal
or Shares
(000s) | | | Value | |
UTAH — 0.03% | |
Utah Transit Authority RB BAB
Series B | | | | | | | | |
5.94%, 06/15/39 | | $ | 250 | | | $ | 339,875 | |
| | | | | | | | | | |
| | | | | | | | | 339,875 | |
VIRGINIA — 0.04% | |
University of Virginia RB BAB | | | | | | | | |
6.20%, 09/01/39 | | | 300 | | | | 432,753 | |
| | | | | | | | | | |
| | | | | | | | | 432,753 | |
WASHINGTON — 0.11% | |
Central Puget Sound Regional Transit Authority RB BAB | | | | | | | | |
5.49%, 11/01/39 | | | 150 | | | | 198,152 | |
State of Washington GO BAB | | | | | | | | |
5.14%, 08/01/40 | | | 750 | | | | 958,836 | |
| | | | | | | | | | |
| | | | | | | | | 1,156,988 | |
| | | | | | | | | | |
TOTAL MUNICIPAL DEBT OBLIGATIONS
| | | | | |
(Cost: $80,225,090) | | | | | | | 82,373,481 | |
|
SHORT-TERM INVESTMENTS — 10.13% | |
|
MONEY MARKET FUNDS — 10.13% | |
BlackRock Cash Funds: Institutional,
SL Agency Shares | | | | | |
0.72%e,f,g | | | 93,013 | | | | 93,022,294 | |
BlackRock Cash Funds: Treasury,
SL Agency Shares | | | | | |
0.29%e,f | | | | | 13,981 | | | | 13,980,754 | |
| | | | | | | | | | |
| | | | | | | | | 107,003,048 | |
| | | | | | | | | | |
TOTAL SHORT-TERM INVESTMENTS
| | | | | |
(Cost: $106,994,043) | | | | | | | 107,003,048 | |
| | | | | | | | | | |
| | |
| 68 | | 2016 iSHARES ANNUAL REPORTTO SHAREHOLDERS |
Schedule of Investments (Unaudited) (Continued)
iSHARES® 10+ YEAR CREDIT BOND ETF
October 31, 2016
| | | | | | | | | | |
| | | | | | | | Value | |
TOTAL INVESTMENTS
IN SECURITIES —107.92% | | | | | | | | |
(Cost: $1,120,415,706)h | | | | | | $ | 1,139,950,199 | |
Other Assets, Less Liabilities — (7.92)% | | | | (83,684,494 | ) |
| | | | | | | | | | |
NET ASSETS — 100.00% | | | $ | 1,056,265,705 | |
| | | | | | | | | | |
BAB — Build America Bond
COP — Certificates of Participation
GO — General Obligation
GOL — General Obligation Limited
GTD — Guaranteed by the Commonwealth, County or State
PSF — Permanent School Fund
RB — Revenue Bond
Insured by:
NPFGC — National Public Finance Guarantee Corp.
| a | All or a portion of this security represents a security on loan. See Note 1. |
| b | This security may be resold to qualified institutional buyers under Rule 144A of the Securities Act of 1933. |
| c | Step coupon security. Coupon rate will either increase (step-up bond) or decrease (step-down bond) at regular intervals until maturity. Interest rate shown reflects the rate currently in effect. |
| d | Investments are denominated in U.S. dollars. |
| e | Affiliated money market fund. |
| f | The rate quoted is the annualized seven-day yield of the fund at period end. |
| g | All or a portion of this security represents an investment of securities lending collateral. See Note 1. |
| h | The cost of investments for federal income tax purposes was $1,120,655,741. Net unrealized appreciation was $19,294,458, of which $ 29,714,842 represented gross unrealized appreciation on securities and $ 10,420,384 represented gross unrealized depreciation on securities. |
Schedule 1 — Fair Value Measurements
Various inputs are used in determining the fair value of financial instruments. For description of the input levels and information about the Fund’s policy regarding valuation of financial instruments, refer to a recently published shareholder report. Shareholder reports are available on the Fund’s website at www.iShares.com and on the U.S. Securities and Exchange Commission website at www.sec.gov.
The following table summarizes the value of the Fund’s investments according to the fair value hierarchy as of October 31, 2016. The breakdown of the Fund’s investments into major categories is disclosed in the schedule of investments above.
| | | | | | | | | | | | | | | | |
| | | Level 1 | | | Level 2 | | | Level 3 | | | Total | |
Investments: | | | | | | | | | | | | | | | | |
Assets: | | | | | | | | | | | | | | | | |
Corporate bonds & notes | | $ | — | | | $ | 893,051,746 | | | $ | — | | | $ | 893,051,746 | |
Foreign government obligations | | | — | | | | 57,521,924 | | | | — | | | | 57,521,924 | |
Municipal debt obligations | | | — | | | | 82,373,481 | | | | — | | | | 82,373,481 | |
Money market funds | | | 107,003,048 | | | | — | | | | — | | | | 107,003,048 | |
| | | | | | | | | | | | | | | | |
Total | | $ | 107,003,048 | | | $ | 1,032,947,151 | | | $ | — | | | $ | 1,139,950,199 | |
| | | | | | | | | | | | | | | | |
| | | | | | | | | | | | | | | | | |
| | | | |
SCHEDULEOF INVESTMENTS | | | 69 | |
Statement of Assets and Liabilities (Unaudited)
iSHARES® 10+ YEAR CREDIT BOND ETF
October 31, 2016
| | | | |
| | |
ASSETS | | | | |
Investments, at cost: | | | | |
Unaffiliated | | $ | 1,013,421,663 | |
Affiliated | | | 106,994,043 | |
| | | | |
Total cost of investments | | $ | 1,120,415,706 | |
| | | | |
Investments in securities, at fair value (including securities on loana) | | | | |
Unaffiliated | | $ | 1,032,947,151 | |
Affiliated | | | 107,003,048 | |
| | | | |
Total fair value of investments | | | 1,139,950,199 | |
Receivables: | | | | |
Investment securities sold | | | 7,170,592 | |
Interest | | | 12,651,262 | |
| | | | |
Total Assets | | | 1,159,772,053 | |
| | | | |
| |
LIABILITIES | | | | |
Payables: | | | | |
Investment securities purchased | | | 10,312,288 | |
Collateral for securities on loan | | | 93,013,285 | |
Investment advisory fees | | | 180,775 | |
| | | | |
Total Liabilities | | | 103,506,348 | |
| | | | |
| |
NET ASSETS | | $ | 1,056,265,705 | |
| | | | |
| |
Net assets consist of: | | | | |
Paid-in capital | | $ | 1,039,179,948 | |
Undistributed net investment income | | | 3,115,443 | |
Accumulated net realized loss | | | (5,564,179 | ) |
Net unrealized appreciation | | | 19,534,493 | |
| | | | |
NET ASSETS | | $ | 1,056,265,705 | |
| | | | |
| |
Shares outstandingb | | | 17,200,000 | |
| | | | |
| |
Net asset value per share | | $ | 61.41 | |
| | | | |
| a | Securities on loan with a value of $90,823,398. |
| b | No par value, unlimited number of shares authorized. |
| | |
| 70 | | STATEMENTOF ASSETSAND LIABILITIES |
Schedule of Investments
iSHARES® 10+ YEAR CREDIT BOND ETF
February 29, 2016
| | | | | | | | |
Security | | Principal
(000s) | | | Value | |
CORPORATE BONDS & NOTES — 82.24% | |
| |
ADVERTISING — 0.04% | | | | | |
WPP Finance 2010 | | | | | | | | |
5.13%, 09/07/42 | | $ | 55 | | | $ | 51,703 | |
5.63%, 11/15/43 | | | 229 | | | | 232,708 | |
| | | | | | | | |
| | | | | | | 284,411 | |
AEROSPACE & DEFENSE — 1.66% | | | | | |
Boeing Co. (The) | | | | | | | | |
3.30%, 03/01/35 (Call 09/01/34) | | | 295 | | | | 278,624 | |
3.50%, 03/01/45 (Call 09/01/44) | | | 403 | | | | 378,506 | |
6.63%, 02/15/38 | | | 16 | | | | 21,898 | |
6.88%, 03/15/39 | | | 282 | | | | 399,545 | |
General Dynamics Corp. | | | | | | | | |
3.60%, 11/15/42 (Call 05/15/42)a | | | 406 | | | | 398,476 | |
Lockheed Martin Corp. | | | | | | | | |
3.60%, 03/01/35 (Call 09/01/34) | | | 411 | | | | 383,558 | |
3.80%, 03/01/45 (Call 09/01/44) | | | 374 | | | | 349,069 | |
4.07%, 12/15/42 | | | 1,006 | | | | 980,340 | |
4.50%, 05/15/36 (Call 11/15/35) | | | 941 | | | | 988,927 | |
4.70%, 05/15/46 (Call 11/15/45) | | | 509 | | | | 546,543 | |
4.85%, 09/15/41 | | | 529 | | | | 569,560 | |
Series B | | | | | | | | |
6.15%, 09/01/36 | | | 189 | | | | 233,086 | |
Northrop Grumman Corp. | | | | | | | | |
3.85%, 04/15/45 (Call 10/15/44)a | | | 100 | | | | 95,610 | |
4.75%, 06/01/43 | | | 451 | | | | 489,485 | |
5.05%, 11/15/40 | | | 311 | | | | 346,784 | |
Northrop Grumman Systems Corp. | | | | | | | | |
7.75%, 02/15/31 | | | 505 | | | | 708,055 | |
Raytheon Co. | | | | | | | | |
4.20%, 12/15/44 (Call 06/15/44)a | | | 218 | | | | 233,037 | |
4.70%, 12/15/41 | | | 398 | | | | 452,297 | |
4.88%, 10/15/40 | | | 100 | | | | 115,864 | |
7.20%, 08/15/27 | | | 155 | | | | 212,429 | |
Rockwell Collins Inc. | | | | | | | | |
4.80%, 12/15/43 (Call 06/15/43) | | | 261 | | | | 287,643 | |
United Technologies Corp. | | | | | | | | |
4.15%, 05/15/45 (Call 11/16/44) | | | 75 | | | | 72,774 | |
4.50%, 06/01/42 | | | 2,884 | | | | 2,951,269 | |
5.40%, 05/01/35 | | | 11 | | | | 12,678 | |
5.70%, 04/15/40 | | | 222 | | | | 262,422 | |
6.05%, 06/01/36 | | | 196 | | | | 237,265 | |
6.13%, 07/15/38 | | | 18 | | | | 22,185 | |
| | | | | | | | |
Security | | Principal
(000s) | | | Value | |
6.70%, 08/01/28 | | $ | 775 | | | $ | 1,005,547 | |
7.50%, 09/15/29 | | | 14 | | | | 19,368 | |
| | | | | | | | |
| | | | | | | 13,052,844 | |
AGRICULTURE — 1.30% | | | | | |
Altria Group Inc. | | | | | | | | |
4.25%, 08/09/42 | | | 476 | | | | 453,473 | |
4.50%, 05/02/43 | | | 11 | | | | 10,881 | |
5.38%, 01/31/44 | | | 1,902 | | | | 2,145,608 | |
9.95%, 11/10/38 | | | 121 | | | | 197,961 | |
10.20%, 02/06/39 | | | 138 | | | | 230,878 | |
Archer-Daniels-Midland Co. | | | | | | | | |
4.02%, 04/16/43a | | | 649 | | | | 626,719 | |
4.54%, 03/26/42 | | | 378 | | | | 393,668 | |
Lowe’s Companies Inc. | | | | | | | | |
4.25%, 09/15/44 (Call 03/15/44) | | | 307 | | | | 313,610 | |
Philip Morris International Inc. | | | | | | | | |
3.88%, 08/21/42 | | | 26 | | | | 24,899 | |
4.13%, 03/04/43 | | | 217 | | | | 217,185 | |
4.25%, 11/10/44a | | | 1,800 | | | | 1,842,229 | |
4.38%, 11/15/41 | | | 86 | | | | 88,352 | |
4.50%, 03/20/42 | | | 21 | | | | 21,993 | |
4.88%, 11/15/43 | | | 230 | | | | 255,276 | |
6.38%, 05/16/38 | | | 657 | | | | 844,106 | |
Reynolds American Inc. | | | | | | | | |
5.70%, 08/15/35 (Call 02/15/35) | | | 311 | | | | 350,584 | |
5.85%, 08/15/45 (Call 02/15/45) | | | 1,060 | | | | 1,244,318 | |
6.15%, 09/15/43 | | | 381 | | | | 451,928 | |
7.25%, 06/15/37 | | | 403 | | | | 507,976 | |
| | | | | | | | |
| | | | | | | 10,221,644 | |
AIRLINES — 0.37% | | | | | |
American Airlines 2014-1 Pass Through Trust Class A | | | | | | | | |
3.70%, 04/01/28 | | | 215 | | | | 213,931 | |
American Airlines 2015-1 Pass Through Trust Class A | | | | | | | | |
3.38%, 11/01/28 | | | 1,337 | | | | 1,290,592 | |
American Airlines 2016-1 Pass Through Trust Class AA | | | | | | | | |
3.58%, 07/15/29 | | | 18 | | | | 18,135 | |
United Airlines 2014-1 Pass Through Trust Class A | | | | | | | | |
4.00%, 10/11/27a | | | 353 | | | | 361,128 | |
| | | | |
SCHEDULEOF INVESTMENTS | | | 71 | |
Schedule of Investments (Continued)
iSHARES® 10+ YEAR CREDIT BOND ETF
February 29, 2016
| | | | | | | | |
Security | | Principal
(000s) | | | Value | |
United Airlines 2014-2 Pass Through Trust Class A | | | | | | | | |
3.75%, 03/03/28 | | $ | 1,026 | | | $ | 1,028,565 | |
United Airlines 2015-1 Pass Through Trust Class AA | | | | | | | | |
3.45%, 06/01/29 | | | 4 | | | | 4,010 | |
| | | | | | | | |
| | | | | | | 2,916,361 | |
APPAREL — 0.16% | | | | | |
NIKE Inc. | | | | | | | | |
3.63%, 05/01/43 (Call 11/01/42) | | | 255 | | | | 248,327 | |
3.88%, 11/01/45 (Call 05/01/45) | | | 525 | | | | 532,841 | |
VF Corp. | | | | | | | | |
6.00%, 10/15/33 | | | 150 | | | | 184,869 | |
6.45%, 11/01/37 | | | 221 | | | | 290,150 | |
| | | | | | | | |
| | | | | | | 1,256,187 | |
AUTO MANUFACTURERS — 0.77% | | | | | |
Daimler Finance North America LLC | | | | | | | | |
8.50%, 01/18/31 | | | 560 | | | | 837,149 | |
Ford Holdings LLC | | | | | | | | |
9.30%, 03/01/30a | | | 100 | | | | 133,343 | |
Ford Motor Co. | | | | | | | | |
4.75%, 01/15/43a | | | 900 | | | | 816,341 | |
6.38%, 02/01/29 | | | 350 | | | | 390,372 | |
6.63%, 10/01/28 | | | 16 | | | | 18,179 | |
7.40%, 11/01/46 | | | 114 | | | | 137,916 | |
7.45%, 07/16/31 | | | 1,231 | | | | 1,486,260 | |
General Motors Co. | | | | | | | | |
5.00%, 04/01/35 | | | 102 | | | | 88,310 | |
5.20%, 04/01/45 | | | 710 | | | | 605,593 | |
6.25%, 10/02/43 | | | 831 | | | | 798,318 | |
6.60%, 04/01/36 (Call 10/01/35) | | | 710 | | | | 733,693 | |
| | | | | | | | |
| | | | | | | 6,045,474 | |
AUTO PARTS & EQUIPMENT — 0.17% | | | | | |
BorgWarner Inc. | | | | | | | | |
4.38%, 03/15/45 (Call 09/15/44)a | | | 185 | | | | 164,542 | |
Johnson Controls Inc. | | | | | | | | |
4.63%, 07/02/44 (Call 01/02/44) | | | 375 | | | | 340,115 | |
4.95%, 07/02/64 (Call 01/02/64) | | | 100 | | | | 86,838 | |
5.25%, 12/01/41 (Call 06/01/41) | | | 5 | | | | 4,958 | |
5.70%, 03/01/41 | | | 5 | | | | 5,268 | |
6.00%, 01/15/36 | | | 641 | | | | 699,018 | |
| | | | | | | | |
| | | | | | | 1,300,739 | |
| | | | | | | | |
Security | | Principal
(000s) | | | Value | |
BANKS — 8.11% | | | | | |
Bank of America Corp. | | | | | | | | |
4.25%, 10/22/26 | | $ | 1,953 | | | $ | 1,937,849 | |
4.88%, 04/01/44 | | | 1,314 | | | | 1,368,542 | |
5.00%, 01/21/44 | | | 1,153 | | | | 1,217,563 | |
5.88%, 02/07/42 | | | 570 | | | | 659,418 | |
6.11%, 01/29/37 | | | 600 | | | | 648,259 | |
6.75%, 06/01/28 | | | 14 | | | | 16,235 | |
7.75%, 05/14/38 | | | 931 | | | | 1,189,108 | |
Series L | | | | | | | | |
4.75%, 04/21/45 | | | 8 | | | | 7,339 | |
Bank One Corp. | | | | | | | | |
7.63%, 10/15/26 | | | 231 | | | | 291,604 | |
8.00%, 04/29/27 | | | 229 | | | | 296,557 | |
Barclays PLC | | | | | | | | |
5.25%, 08/17/45a | | | 810 | | | | 773,826 | |
Branch Banking & Trust Co. | | | | | | | | |
3.80%, 10/30/26 (Call 09/30/26) | | | 528 | | | | 551,827 | |
Citigroup Inc. | | | | | | | | |
4.30%, 11/20/26 | | | 1,000 | | | | 975,499 | |
4.45%, 09/29/27 | | | 1,750 | | | | 1,712,554 | |
4.65%, 07/30/45 | | | 1,050 | | | | 1,056,736 | |
4.95%, 11/07/43 | | | 421 | | | | 438,531 | |
5.30%, 05/06/44 | | | 565 | | | | 564,157 | |
5.88%, 02/22/33 | | | 16 | | | | 16,911 | |
5.88%, 01/30/42 | | | 626 | | | | 709,036 | |
6.00%, 10/31/33 | | | 16 | | | | 17,159 | |
6.13%, 08/25/36 | | | 422 | | | | 461,857 | |
6.63%, 01/15/28 | | | 11 | | | | 13,718 | |
6.63%, 06/15/32 | | | 625 | | | | 710,140 | |
6.68%, 09/13/43 | | | 296 | | | | 344,577 | |
6.88%, 02/15/98 | | | 100 | | | | 129,074 | |
8.13%, 07/15/39 | | | 510 | | | | 727,322 | |
Comerica Inc. | | | | | | | | |
3.80%, 07/22/26 | | | 125 | | | | 120,399 | |
Cooperatieve Rabobank UA/NY | | | | | | | | |
5.25%, 05/24/41 | | | 350 | | | | 403,251 | |
5.25%, 08/04/45a | | | 541 | | | | 548,329 | |
5.75%, 12/01/43 | | | 850 | | | | 943,710 | |
Credit Suisse Group Funding Guernsey Ltd. | | | | | | | | |
4.88%, 05/15/45a | | | 786 | | | | 716,022 | |
Discover Bank/Greenwood DE | | | | | | | | |
4.25%, 03/13/26 | | | 500 | | | | 492,318 | |
| | |
| 72 | | 2016 iSHARES ANNUAL REPORTTO SHAREHOLDERS |
Schedule of Investments (Continued)
iSHARES® 10+ YEAR CREDIT BOND ETF
February 29, 2016
| | | | | | | | |
Security | | Principal
(000s) | | | Value | |
Fifth Third Bancorp. | | | | | | | | |
8.25%, 03/01/38 | | $ | 464 | | | $ | 655,186 | |
Goldman Sachs Group Inc. (The) | | | | | | | | |
4.75%, 10/21/45 (Call 04/21/45) | | | 986 | | | | 1,000,059 | |
4.80%, 07/08/44 (Call 01/08/44) | | | 1,861 | | | | 1,886,813 | |
5.15%, 05/22/45 | | | 550 | | | | 525,217 | |
5.95%, 01/15/27 | | | 800 | | | | 884,947 | |
6.13%, 02/15/33a | | | 951 | | | | 1,110,625 | |
6.25%, 02/01/41 | | | 1,220 | | | | 1,463,457 | |
6.45%, 05/01/36 | | | 450 | | | | 495,274 | |
6.75%, 10/01/37 | | | 2,465 | | | | 2,797,327 | |
HSBC Bank PLC | | | | | | | | |
7.65%, 05/01/25 | | | 100 | | | | 125,225 | |
HSBC Bank USA N.A./New York NY | | | | | | | | |
5.63%, 08/15/35 | | | 1,750 | | | | 1,849,187 | |
HSBC Holdings PLC | | | | | | | | |
5.25%, 03/14/44 | | | 612 | | | | 581,062 | |
6.10%, 01/14/42 | | | 416 | | | | 516,391 | |
6.50%, 05/02/36 | | | 1,056 | | | | 1,155,097 | |
6.50%, 09/15/37 | | | 1,007 | | | | 1,104,891 | |
6.80%, 06/01/38 | | | 600 | | | | 681,761 | |
7.63%, 05/17/32 | | | 421 | | | | 502,979 | |
JPMorgan Chase & Co. | | | | | | | | |
4.13%, 12/15/26 | | | 1,821 | | | | 1,842,091 | |
4.25%, 10/01/27 | | | 968 | | | | 980,247 | |
4.85%, 02/01/44a | | | 1,543 | | | | 1,704,284 | |
4.95%, 06/01/45a | | | 718 | | | | 724,644 | |
5.40%, 01/06/42 | | | 362 | | | | 413,893 | |
5.50%, 10/15/40 | | | 517 | | | | 596,860 | |
5.60%, 07/15/41 | | | 666 | | | | 780,637 | |
5.63%, 08/16/43 | | | 319 | | | | 348,101 | |
6.40%, 05/15/38 | | | 945 | | | | 1,201,666 | |
KfW | | | | | | | | |
0.00%, 04/18/36 | | | 1,200 | | | | 669,865 | |
0.00%, 06/29/37 | | | 800 | | | | 426,846 | |
Morgan Stanley | | | | | | | | |
3.95%, 04/23/27 | | | 800 | | | | 770,484 | |
4.30%, 01/27/45 | | | 1,300 | | | | 1,242,001 | |
4.35%, 09/08/26 | | | 331 | | | | 329,856 | |
6.38%, 07/24/42 | | | 1,055 | | | | 1,309,536 | |
7.25%, 04/01/32 | | | 941 | | | | 1,233,653 | |
Regions Bank/Birmingham AL | | | | | | | | |
6.45%, 06/26/37 | | | 271 | | | | 317,814 | |
| | | | | | | | |
Security | | Principal
(000s) | | | Value | |
Regions Financial Corp. | | | | | | | | |
7.38%, 12/10/37 | | $ | 200 | | | $ | 246,952 | |
Travelers Companies Inc. (The) | | | | | | | | |
4.30%, 08/25/45 (Call 02/25/45) | | | 200 | | | | 207,448 | |
Wachovia Corp. | | | | | | | | |
5.50%, 08/01/35 | | | 376 | | | | 408,502 | |
6.55%, 10/15/35 | | | 150 | | | | 178,641 | |
7.50%, 04/15/35 | | | 57 | | | | 74,329 | |
Wells Fargo & Co. | | | | | | | | |
3.90%, 05/01/45 | | | 1,513 | | | | 1,451,840 | |
4.10%, 06/03/26 | | | 1,008 | | | | 1,034,192 | |
4.30%, 07/22/27 | | | 1,185 | | | | 1,229,188 | |
4.65%, 11/04/44a | | | 2,180 | | | | 2,126,000 | |
4.90%, 11/17/45 | | | 590 | | | | 600,215 | |
5.38%, 02/07/35 | | | 341 | | | | 392,489 | |
5.38%, 11/02/43 | | | 350 | | | | 371,725 | |
5.61%, 01/15/44 | | | 2,006 | | | | 2,200,545 | |
Wells Fargo Bank N.A. | | | | | | | | |
5.95%, 08/26/36 | | | 476 | | | | 574,226 | |
Wells Fargo Capital X | | | | | | | | |
5.95%, 12/01/86 | | | 311 | | | | 308,779 | |
| | | | | | | | |
| | | | | | | 63,692,474 | |
BEVERAGES — 2.46% | | | | | |
Anheuser-Busch Companies LLC | | | | | | | | |
5.95%, 01/15/33 | | | 21 | | | | 24,140 | |
6.45%, 09/01/37 | | | 200 | | | | 246,738 | |
Anheuser-Busch InBev Finance Inc. | | | | | | | | |
4.00%, 01/17/43 | | | 50 | | | | 46,866 | |
4.63%, 02/01/44 | | | 245 | | | | 253,413 | |
4.70%, 02/01/36 (Call 08/01/35) | | | 2,814 | | | | 2,942,206 | |
4.90%, 02/01/46 (Call 08/01/45) | | | 4,820 | | | | 5,165,593 | |
Anheuser-Busch InBev
Worldwide Inc. | | | | | | | | |
3.75%, 07/15/42 | | | 1,400 | | | | 1,264,899 | |
6.38%, 01/15/40 | | | 300 | | | | 371,141 | |
8.00%, 11/15/39 | | | 136 | | | | 195,710 | |
8.20%, 01/15/39 | | | 935 | | | | 1,363,276 | |
Brown-Forman Corp. | | | | | | | | |
3.75%, 01/15/43 (Call 07/15/42) | | | 309 | | | | 292,936 | |
4.50%, 07/15/45 (Call 01/15/45)a | | | 118 | | | | 125,118 | |
Coca-Cola FEMSA SAB de CV | | | | | | | | |
5.25%, 11/26/43 | | | 271 | | | | 290,450 | |
| | | | |
SCHEDULEOF INVESTMENTS | | | 73 | |
Schedule of Investments (Continued)
iSHARES® 10+ YEAR CREDIT BOND ETF
February 29, 2016
| | | | | | | | |
Security | | Principal
(000s) | | | Value | |
Diageo Capital PLC | | | | | | | | |
3.88%, 04/29/43 (Call 10/29/42)a | | $ | 136 | | | $ | 131,883 | |
5.88%, 09/30/36 | | | 773 | | | | 942,975 | |
Diageo Investment Corp. | | | | | | | | |
4.25%, 05/11/42 | | | 202 | | | | 207,165 | |
7.45%, 04/15/35 | | | 11 | | | | 15,202 | |
Dr Pepper Snapple Group Inc. | | | | | | | | |
4.50%, 11/15/45 (Call 05/15/45) | | | 363 | | | | 370,737 | |
7.45%, 05/01/38 | | | 100 | | | | 140,045 | |
Fomento Economico Mexicano SAB de CV | | | | | | | | |
4.38%, 05/10/43 | | | 514 | | | | 471,516 | |
Molson Coors Brewing Co. | | | | | | | | |
5.00%, 05/01/42 | | | 456 | | | | 450,738 | |
Pepsi Bottling Group Inc. (The)
Series B | | | | | | | | |
7.00%, 03/01/29 | | | 1,428 | | | | 1,957,048 | |
PepsiAmericas Inc. | | | | | | | | |
5.50%, 05/15/35 | | | 11 | | | | 12,856 | |
PepsiCo Inc. | | | | | | | | |
3.60%, 08/13/42 | | | 502 | | | | 468,646 | |
4.00%, 03/05/42 | | | 207 | | | | 205,025 | |
4.25%, 10/22/44 (Call 04/22/44)a | | | 509 | | | | 518,258 | |
4.60%, 07/17/45 (Call 01/17/45) | | | 300 | | | | 327,945 | |
4.88%, 11/01/40 | | | 216 | | | | 236,156 | |
5.50%, 01/15/40 | | | 246 | | | | 290,195 | |
| | | | | | | | |
| | | | | | | 19,328,876 | |
BIOTECHNOLOGY — 1.56% | | | | | |
Amgen Inc. | | | | | | | | |
4.40%, 05/01/45 (Call 11/01/44) | | | 546 | | | | 521,801 | |
4.95%, 10/01/41 | | | 225 | | | | 223,065 | |
5.15%, 11/15/41 (Call 05/15/41) | | | 1,100 | | | | 1,121,869 | |
5.38%, 05/15/43 (Call 11/15/42) | | | 1,598 | | | | 1,695,515 | |
5.65%, 06/15/42 (Call 12/15/41) | | | 21 | | | | 23,095 | |
5.75%, 03/15/40 | | | 300 | | | | 328,608 | |
6.38%, 06/01/37 | | | 618 | | | | 723,032 | |
6.40%, 02/01/39 | | | 291 | | | | 343,540 | |
6.90%, 06/01/38 | | | 41 | | | | 51,002 | |
Biogen Inc. | | | | | | | | |
5.20%, 09/15/45 (Call 03/15/45) | | | 863 | | | | 881,301 | |
Celgene Corp. | | | | | | | | |
4.63%, 05/15/44 (Call 11/15/43) | | | 275 | | | | 259,093 | |
5.00%, 08/15/45 (Call 02/15/45) | | | 1,050 | | | | 1,072,738 | |
5.25%, 08/15/43 | | | 405 | | | | 413,326 | |
| | | | | | | | |
Security | | Principal
(000s) | | | Value | |
Gilead Sciences Inc. | | | | | | | | |
4.50%, 02/01/45 (Call 08/01/44) | | $ | 1,376 | | | $ | 1,395,970 | |
4.60%, 09/01/35 (Call 03/01/35) | | | 514 | | | | 533,222 | |
4.75%, 03/01/46 (Call 09/01/45) | | | 1,594 | | | | 1,674,902 | |
4.80%, 04/01/44 (Call 10/01/43) | | | 613 | | | | 642,894 | |
5.65%, 12/01/41 (Call 06/01/41) | | | 286 | | | | 331,039 | |
| | | | | | | | |
| | | | | | | 12,236,012 | |
BUILDING MATERIALS — 0.04% | | | | | |
Owens Corning | | | | | | | | |
7.00%, 12/01/36 | | | 319 | | | | 345,793 | |
| | | | | | | | |
| | | | | | | 345,793 | |
CHEMICALS — 1.63% | | | | | |
Agrium Inc. | | | | | | | | |
4.13%, 03/15/35 (Call 09/15/34) | | | 87 | | | | 70,682 | |
4.90%, 06/01/43 (Call 12/01/42) | | | 286 | | | | 247,104 | |
5.25%, 01/15/45 (Call 07/15/44) | | | 254 | | | | 229,284 | |
6.13%, 01/15/41 (Call 07/15/40) | | | 268 | | | | 265,119 | |
7.13%, 05/23/36 | | | 100 | | | | 109,836 | |
Albemarle Corp. | | | | | | | | |
5.45%, 12/01/44 (Call 06/01/44) | | | 261 | | | | 251,456 | |
CF Industries Inc. | | | | | | | | |
4.95%, 06/01/43 | | | 300 | | | | 239,032 | |
5.15%, 03/15/34 | | | 510 | | | | 437,001 | |
5.38%, 03/15/44a | | | 200 | | | | 169,786 | |
Dow Chemical Co. (The) | | | | | | | | |
4.25%, 10/01/34 (Call 04/01/34) | | | 950 | | | | 865,488 | |
4.38%, 11/15/42 (Call 05/15/42) | | | 16 | | | | 14,361 | |
4.63%, 10/01/44 (Call 04/01/44)a | | | 416 | | | | 385,850 | |
5.25%, 11/15/41 (Call 05/15/41) | | | 385 | | | | 382,853 | |
7.38%, 11/01/29 | | | 336 | | | | 426,193 | |
9.40%, 05/15/39 | | | 469 | | | | 666,540 | |
Eastman Chemical Co. | | | | | | | | |
4.65%, 10/15/44 (Call 04/15/44) | | | 475 | | | | 407,981 | |
4.80%, 09/01/42 (Call 03/01/42) | | | 275 | | | | 239,354 | |
Ecolab Inc. | | | | | | | | |
5.50%, 12/08/41 | | | 338 | | | | 379,233 | |
EI du Pont de Nemours & Co. | | | | | | | | |
4.15%, 02/15/43a | | | 443 | | | | 389,976 | |
4.90%, 01/15/41 | | | 496 | | | | 484,833 | |
5.60%, 12/15/36 | | | 11 | | | | 11,398 | |
Lubrizol Corp. | | | | | | | | |
6.50%, 10/01/34 | | | 120 | | | | 156,094 | |
| | |
| 74 | | 2016 iSHARES ANNUAL REPORTTO SHAREHOLDERS |
Schedule of Investments (Continued)
iSHARES® 10+ YEAR CREDIT BOND ETF
February 29, 2016
| | | | | | | | |
Security | | Principal
(000s) | | | Value | |
LYB International Finance BV | | | | | | | | |
4.88%, 03/15/44 (Call 09/15/43) | | $ | 345 | | | $ | 311,634 | |
5.25%, 07/15/43 | | | 237 | | | | 221,988 | |
LyondellBasell Industries NV | | | | | | | | |
4.63%, 02/26/55 (Call 08/26/54) | | | 763 | | | | 626,086 | |
Methanex Corp. | | | | | | | | |
5.65%, 12/01/44 (Call 06/01/44) | | | 200 | | | | 154,485 | |
Monsanto Co. | | | | | | | | |
3.60%, 07/15/42 (Call 01/15/42)a | | | 260 | | | | 195,783 | |
3.95%, 04/15/45 (Call 10/15/44) | | | 235 | | | | 187,891 | |
4.20%, 07/15/34 (Call 01/15/34) | | | 573 | | | | 511,329 | |
4.40%, 07/15/44 (Call 01/15/44) | | | 800 | | | | 693,881 | |
4.65%, 11/15/43 (Call 05/15/43) | | | 16 | | | | 14,056 | |
4.70%, 07/15/64 (Call 01/15/64) | | | 25 | | | | 19,544 | |
5.88%, 04/15/38 | | | 11 | | | | 11,366 | |
Series 1 | | | | | | | | |
5.50%, 07/30/35 | | | 100 | | | | 100,473 | |
Mosaic Co. (The) | | | | | | | | |
5.45%, 11/15/33 (Call 05/15/33) | | | 208 | | | | 197,569 | |
5.63%, 11/15/43 (Call 05/15/43) | | | 486 | | | | 451,618 | |
Potash Corp. of Saskatchewan Inc. | | | | | | | | |
5.63%, 12/01/40a | | | 614 | | | | 649,184 | |
5.88%, 12/01/36 | | | 101 | | | | 109,452 | |
PPG Industries Inc. | | | | | | | | |
5.50%, 11/15/40 | | | 14 | | | | 15,715 | |
Praxair Inc. | | | | | | | | |
3.20%, 01/30/26 (Call 10/30/25)a | | | 250 | | | | 261,195 | |
3.55%, 11/07/42 (Call 05/07/42) | | | 400 | | | | 370,023 | |
Rohm & Haas Co. | | | | | | | | |
7.85%, 07/15/29 | | | 221 | | | | 288,449 | |
RPM International Inc. | | | | | | | | |
5.25%, 06/01/45 (Call 12/01/44) | | | 11 | | | | 10,822 | |
Sherwin-Williams Co. (The) | | | | | | | | |
4.00%, 12/15/42 (Call 06/15/42) | | | 350 | | | | 349,434 | |
Valspar Corp. (The) | | | | | | | | |
4.40%, 02/01/45 (Call 08/01/44) | | | 211 | | | | 197,566 | |
| | | | | | | | |
| | | | | | | 12,778,997 | |
COMMERCIAL SERVICES — 0.62% | | | | | |
Board of Trustees of The Leland Stanford Junior University (The) | | | | | | | | |
3.46%, 05/01/47 | | | 16 | | | | 15,849 | |
California Institute of Technology | | | | | | | | |
4.32%, 08/01/45 | | | 12 | | | | 13,192 | |
| | | | | | | | |
Security | | Principal
(000s) | | | Value | |
Catholic Health Initiatives | | | | | | | | |
4.35%, 11/01/42 | | $ | 546 | | | $ | 536,872 | |
Cleveland Clinic Foundation (The) | | | | | | | | |
4.86%, 01/01/14 | | | 267 | | | | 278,220 | |
Equifax Inc. | | | | | | | | |
7.00%, 07/01/37 | | | 11 | | | | 12,737 | |
George Washington University (The) | | | | | | | | |
4.87%, 09/15/45 | | | 16 | | | | 18,213 | |
Johns Hopkins University
Series 2013 | | | | | | | | |
4.08%, 07/01/53 | | | 11 | | | | 11,580 | |
Massachusetts Institute of Technology | | | | | | | | |
3.96%, 07/01/38 | | | 9 | | | | 9,745 | |
4.68%, 07/01/14 | | | 511 | | | | 559,069 | |
5.60%, 07/01/11 | | | 428 | | | | 558,945 | |
McGraw Hill Financial Inc. | | | | | | | | |
4.40%, 02/15/26 (Call 11/15/25) | | | 500 | | | | 524,533 | |
6.55%, 11/15/37 | | | 11 | | | | 12,667 | |
Metropolitan Museum of Art (The)
Series 2015 | | | | | | | | |
3.40%, 07/01/45 | | | 13 | | | | 12,509 | |
Northwestern University | | | | | | | | |
3.69%, 12/01/38 | | | 286 | | | | 293,472 | |
3.87%, 12/01/48 | | | 11 | | | | 11,531 | |
President and Fellows of Harvard College | | | | | | | | |
3.62%, 10/01/37 | | | 5 | | | | 5,120 | |
6.30%, 10/01/37 (Call 04/01/16) | | | 291 | | | | 292,746 | |
Princeton University | | | | | | | | |
5.70%, 03/01/39 | | | 380 | | | | 510,614 | |
Tufts University
Series 2012 | | | | | | | | |
5.02%, 04/15/12 | | | 250 | | | | 274,730 | |
University of Notre Dame du Lac
Series 2015 | | | | | | | | |
3.44%, 02/15/45 | | | 9 | | | | 8,805 | |
University of Southern California | | | | | | | | |
5.25%, 10/01/11 | | | 250 | | | | 300,215 | |
Verisk Analytics Inc. | | | | | | | | |
5.50%, 06/15/45 (Call 12/15/44)a | | | 111 | | | | 102,521 | |
Western Union Co. (The) | | | | | | | | |
6.20%, 11/17/36a | | | 116 | | | | 112,572 | |
6.20%, 06/21/40a | | | 350 | | | | 334,764 | |
| | | | |
SCHEDULEOF INVESTMENTS | | | 75 | |
Schedule of Investments (Continued)
iSHARES® 10+ YEAR CREDIT BOND ETF
February 29, 2016
| | | | | | | | |
Security | | Principal
(000s) | | | Value | |
William Marsh Rice University | | | | | | | | |
3.57%, 05/15/45 | | $ | 21 | | | $ | 20,870 | |
| | | | | | | | |
| | | | | | | 4,832,091 | |
COMPUTERS — 1.30% | | | | | |
Apple Inc. | | | | | | | | |
3.45%, 02/09/45 | | | 1,920 | | | | 1,662,771 | |
3.85%, 05/04/43 | | | 425 | | | | 395,163 | |
4.38%, 05/13/45 | | | 933 | | | | 941,461 | |
4.45%, 05/06/44 | | | 573 | | | | 583,188 | |
4.50%, 02/23/36 (Call 08/23/35) | | | 1,250 | | | | 1,306,385 | |
4.65%, 02/23/46 (Call 08/23/45) | | | 205 | | | | 215,170 | |
Hewlett Packard Enterprise Co. | | | | | | | | |
6.20%, 10/15/35 (Call 04/15/35)b | | | 287 | | | | 250,550 | |
6.35%, 10/15/45 (Call 04/15/45)b | | | 778 | | | | 664,013 | |
HP Enterprise Services LLC | | | | | | | | |
7.45%, 10/15/29 | | | 430 | | | | 489,967 | |
HP Inc. | | | | | | | | |
6.00%, 09/15/41 | | | 553 | | | | 450,726 | |
International Business Machines Corp. | | | | | | | | |
4.00%, 06/20/42a | | | 406 | | | | 386,923 | |
4.70%, 02/19/46 | | | 500 | | | | 523,145 | |
5.60%, 11/30/39a | | | 324 | | | | 376,183 | |
5.88%, 11/29/32 | | | 311 | | | | 376,966 | |
6.22%, 08/01/27 | | | 555 | | | | 702,573 | |
6.50%, 01/15/28 | | | 355 | | | | 452,098 | |
Seagate HDD Cayman | | | | | | | | |
4.88%, 06/01/27 (Call 03/01/27)b | | | 410 | | | | 287,000 | |
5.75%, 12/01/34 (Call 06/01/34) | | | 250 | | | | 149,375 | |
| | | | | | | | |
| | | | | | | 10,213,657 | |
COSMETICS & PERSONAL CARE — 0.29% | | | | | |
Colgate-Palmolive Co. | | | | | | | | |
4.00%, 08/15/45 | | | 261 | | | | 277,414 | |
Estee Lauder Companies Inc. (The) | | | | | | | | |
3.70%, 08/15/42 | | | 200 | | | | 190,896 | |
4.38%, 06/15/45 (Call 12/15/44) | | | 11 | | | | 11,527 | |
6.00%, 05/15/37 | | | 280 | | | | 348,928 | |
Procter & Gamble Co. (The) | | | | | | | | |
5.50%, 02/01/34 | | | 61 | | | | 74,747 | |
5.55%, 03/05/37 | | | 960 | | | | 1,208,123 | |
5.80%, 08/15/34a | | | 131 | | | | 165,330 | |
| | | | | | | | |
| | | | | | | 2,276,965 | |
| | | | | | | | |
Security | | Principal
(000s) | | | Value | |
DISTRIBUTION & WHOLESALE — 0.09% | | | | | |
WW Grainger Inc. | | | | | | | | |
4.60%, 06/15/45 (Call 12/15/44) | | $ | 635 | | | $ | 688,363 | |
| | | | | | | | |
| | | | | | | 688,363 | |
DIVERSIFIED FINANCIAL SERVICES — 2.30% | |
American Express Co. | | | | | | | | |
4.05%, 12/03/42 | | | 687 | | | | 658,792 | |
AXA Financial Inc. | | | | | | | | |
7.00%, 04/01/28 | | | 14 | | | | 17,622 | |
Charles Schwab Corp. (The) | | | | | | | | |
3.45%, 02/13/26 (Call 11/13/25) | | | 90 | | | | 93,455 | |
CME Group Inc./IL | | | | | | | | |
5.30%, 09/15/43 (Call 03/15/43) | | | 341 | | | | 391,625 | |
Credit Suisse USA Inc. | | | | | | | | |
7.13%, 07/15/32a | | | 468 | | | | 583,684 | |
GE Capital International Funding Co. | | | | | | | | |
4.42%, 11/15/35b | | | 5,500 | | | | 5,719,523 | |
General Electric Co. | | | | | | | | |
5.88%, 01/14/38 | | | 808 | | | | 1,012,448 | |
6.15%, 08/07/37 | | | 222 | | | | 287,996 | |
6.88%, 01/10/39 | | | 1,271 | | | | 1,765,111 | |
Series A | | | | | | | | |
6.75%, 03/15/32 | | | 2,469 | | | | 3,281,122 | |
Goldman Sachs Capital I | | | | | | | | |
6.35%, 02/15/34 | | | 326 | | | | 366,774 | |
Invesco Finance PLC | | | | | | | | |
5.38%, 11/30/43 | | | 16 | | | | 17,638 | |
Jefferies Group LLC | | | | | | | | |
6.25%, 01/15/36 | | | 411 | | | | 354,164 | |
6.45%, 06/08/27 | | | 271 | | | | 264,802 | |
Legg Mason Inc. | | | | | | | | |
5.63%, 01/15/44 | | | 218 | | | | 209,552 | |
National Rural Utilities Cooperative Finance Corp.
Series C | | | | | | | | |
8.00%, 03/01/32 | | | 271 | | | | 385,751 | |
Visa Inc. | | | | | | | | |
4.15%, 12/14/35 (Call 06/14/35) | | | 878 | | | | 929,630 | |
4.30%, 12/14/45 (Call 06/14/45) | | | 1,640 | | | | 1,753,936 | |
| | | | | | | | |
| | | | | | | 18,093,625 | |
ELECTRIC — 9.73% | | | | | |
Alabama Power Co. | | | | | | | | |
3.75%, 03/01/45 (Call 09/01/44) | | | 471 | | | | 450,920 | |
| | |
| 76 | | 2016 iSHARES ANNUAL REPORTTO SHAREHOLDERS |
Schedule of Investments (Continued)
iSHARES® 10+ YEAR CREDIT BOND ETF
February 29, 2016
| | | | | | | | |
Security | | Principal
(000s) | | | Value | |
3.85%, 12/01/42 | | $ | 50 | | | $ | 49,098 | |
4.10%, 01/15/42 | | | 11 | | | | 11,070 | |
4.15%, 08/15/44 (Call 02/15/44) | | | 412 | | | | 423,060 | |
4.30%, 01/02/46 (Call 07/02/45) | | | 257 | | | | 270,249 | |
6.00%, 03/01/39 | | | 126 | | | | 157,952 | |
6.13%, 05/15/38 | | | 273 | | | | 345,637 | |
Series 11-C | | | | | | | | |
5.20%, 06/01/41 | | | 911 | | | | 1,058,205 | |
Ameren Corp. | | | | | | | | |
3.65%, 02/15/26 (Call 11/15/25) | | | 210 | | | | 215,340 | |
Ameren Illinois Co. | | | | | | | | |
4.15%, 03/15/46 (Call 09/15/45)a | | | 257 | | | | 270,081 | |
4.80%, 12/15/43 (Call 06/15/43) | | | 11 | | | | 12,533 | |
Appalachian Power Co. | | | | | | | | |
4.40%, 05/15/44 (Call 11/15/43) | | | 11 | | | | 10,756 | |
4.45%, 06/01/45 (Call 12/01/44) | | | 200 | | | | 199,997 | |
6.38%, 04/01/36 | | | 761 | | | | 886,262 | |
7.00%, 04/01/38 | | | 231 | | | | 293,804 | |
Series L | | | | | | | | |
5.80%, 10/01/35 | | | 5 | | | | 5,727 | |
Series P | | | | | | | | |
6.70%, 08/15/37 | | | 11 | | | | 12,789 | |
Arizona Public Service Co. | | | | | | | | |
4.50%, 04/01/42 (Call 10/01/41) | | | 151 | | | | 162,772 | |
4.70%, 01/15/44 (Call 07/15/43) | | | 250 | | | | 280,748 | |
5.50%, 09/01/35 | | | 150 | | | | 177,789 | |
Berkshire Hathaway Energy Co. | | | | | | | | |
4.50%, 02/01/45 (Call 08/01/44) | | | 1,250 | | | | 1,248,006 | |
5.15%, 11/15/43 (Call 05/15/43) | | | 810 | | | | 877,403 | |
5.95%, 05/15/37 | | | 450 | | | | 531,025 | |
6.13%, 04/01/36 | | | 1,040 | | | | 1,237,318 | |
6.50%, 09/15/37 | | | 194 | | | | 242,204 | |
8.48%, 09/15/28 | | | 224 | | | | 321,049 | |
CenterPoint Energy Houston
Electric LLC | | | | | | | | |
3.55%, 08/01/42 (Call 02/01/42) | | | 450 | | | | 423,474 | |
4.50%, 04/01/44 (Call 10/01/43) | | | 335 | | | | 365,201 | |
Cleco Power LLC | | | | | | | | |
6.00%, 12/01/40 | | | 361 | | | | 417,000 | |
CMS Energy Corp. | | | | | | | | |
4.70%, 03/31/43 (Call 09/30/42) | | | 3 | | | | 3,064 | |
4.88%, 03/01/44 (Call 09/01/43) | | | 336 | | | | 349,815 | |
Commonwealth Edison Co. | | | | | | | | |
3.70%, 03/01/45 (Call 09/01/44) | | | 1,355 | | | | 1,283,435 | |
| | | | | | | | |
Security | | Principal
(000s) | | | Value | |
3.80%, 10/01/42 (Call 04/01/42) | | $ | 111 | | | $ | 107,212 | |
4.60%, 08/15/43 (Call 02/15/43) | | | 8 | | | | 8,663 | |
4.70%, 01/15/44 (Call 07/15/43) | | | 461 | | | | 505,449 | |
5.88%, 02/01/33 | | | 100 | | | | 121,366 | |
5.90%, 03/15/36 | | | 514 | | | | 634,792 | |
Connecticut Light & Power Co. (The) | | | | | | | | |
4.30%, 04/15/44 (Call 10/15/43) | | | 311 | | | | 328,666 | |
6.35%, 06/01/36 | | | 155 | | | | 203,681 | |
Consolidated Edison Co. of
New York Inc. | | | | | | | | |
3.95%, 03/01/43 (Call 09/01/42) | | | 327 | | | | 320,097 | |
4.45%, 03/15/44 (Call 09/15/43) | | | 500 | | | | 527,888 | |
4.50%, 12/01/45 (Call 06/01/45) | | | 257 | | | | 275,332 | |
5.50%, 12/01/39 | | | 208 | | | | 246,292 | |
5.70%, 06/15/40 | | | 315 | | | | 391,491 | |
Series 05-A | | | | | | | | |
5.30%, 03/01/35 | | | 50 | | | | 57,796 | |
Series 06-A | | | | | | | | |
5.85%, 03/15/36 | | | 325 | | | | 399,182 | |
Series 06-B | | | | | | | | |
6.20%, 06/15/36 | | | 461 | | | | 574,440 | |
Series 06-E | | | | | | | | |
5.70%, 12/01/36 | | | 544 | | | | 647,005 | |
Series 08-B | | | | | | | | |
6.75%, 04/01/38 | | | 340 | | | | 457,420 | |
Series 12-A | | | | | | | | |
4.20%, 03/15/42 | | | 8 | | | | 8,076 | |
Consumers Energy Co. | | | | | | | | |
3.95%, 05/15/43 (Call 11/15/42)a | | | 75 | | | | 76,750 | |
4.10%, 11/15/45 (Call 05/15/45)a | | | 255 | | | | 267,501 | |
4.35%, 08/31/64 (Call 02/28/64) | | | 11 | | | | 11,090 | |
Delmarva Power & Light Co. | | | | | | | | |
4.00%, 06/01/42 (Call 12/01/41) | | | 605 | | | | 604,032 | |
Dominion Gas Holdings LLC | | | | | | | | |
4.80%, 11/01/43 (Call 05/01/43) | | | 15 | | | | 14,864 | |
Dominion Resources Inc./VA | | | | | | | | |
4.70%, 12/01/44 (Call 06/01/44)a | | | 325 | | | | 314,537 | |
6.30%, 03/15/33 | | | 275 | | | | 322,289 | |
7.00%, 06/15/38 | | | 350 | | | | 432,013 | |
Series B | | | | | | | | |
5.95%, 06/15/35 | | | 310 | | | | 349,885 | |
Series C | | | | | | | | |
4.05%, 09/15/42 (Call 03/15/42)a | | | 5 | | | | 4,400 | |
4.90%, 08/01/41 (Call 02/01/41) | | | 7 | | | | 6,841 | |
| | | | |
SCHEDULEOF INVESTMENTS | | | 77 | |
Schedule of Investments (Continued)
iSHARES® 10+ YEAR CREDIT BOND ETF
February 29, 2016
| | | | | | | | |
Security | | Principal
(000s) | | | Value | |
Series F | | | | | | | | |
5.25%, 08/01/33 | | $ | 319 | | | $ | 339,314 | |
DTE Electric Co. | | | | | | | | |
3.70%, 03/15/45 (Call 09/15/44) | | | 216 | | | | 210,005 | |
3.95%, 06/15/42 (Call 12/15/41) | | | 158 | | | | 157,743 | |
4.30%, 07/01/44 (Call 01/01/44) | | | 53 | | | | 56,957 | |
5.70%, 10/01/37 | | | 231 | | | | 283,984 | |
Series A | | | | | | | | |
4.00%, 04/01/43 (Call 10/01/42) | | | 200 | | | | 205,306 | |
6.63%, 06/01/36 | | | 200 | | | | 268,682 | |
DTE Energy Co. | | | | | | | | |
6.38%, 04/15/33 | | | 135 | | | | 165,725 | |
Duke Energy Carolinas LLC | | | | | | | | |
3.75%, 06/01/45 (Call 12/01/44)a | | | 590 | | | | 550,235 | |
4.00%, 09/30/42 (Call 03/30/42) | | | 718 | | | | 724,997 | |
4.25%, 12/15/41 (Call 06/15/41) | | | 344 | | | | 359,283 | |
5.30%, 02/15/40 | | | 545 | | | | 645,122 | |
6.00%, 01/15/38 | | | 7 | | | | 8,956 | |
6.05%, 04/15/38 | | | 646 | | | | 826,948 | |
6.10%, 06/01/37 | | | 400 | | | | 495,782 | |
6.45%, 10/15/32 | | | 86 | | | | 111,280 | |
Series A | | | | | | | | |
6.00%, 12/01/28 | | | 16 | | | | 19,989 | |
Duke Energy Florida LLC | | | | | | | | |
3.85%, 11/15/42 (Call 05/15/42) | | | 280 | | | | 274,952 | |
6.35%, 09/15/37 | | | 211 | | | | 277,043 | |
6.40%, 06/15/38 | | | 251 | | | | 334,370 | |
Duke Energy Indiana LLC | | | | | | | | |
6.12%, 10/15/35 | | | 76 | | | | 91,265 | |
6.35%, 08/15/38 | | | 21 | | | | 27,855 | |
6.45%, 04/01/39 | | | 418 | | | | 559,151 | |
Duke Energy Progress LLC | | | | | | | | |
4.10%, 05/15/42 (Call 11/15/41) | | | 396 | | | | 399,776 | |
4.10%, 03/15/43 (Call 09/15/42) | | | 136 | | | | 137,547 | |
4.15%, 12/01/44 (Call 06/01/44) | | | 972 | | | | 978,458 | |
4.20%, 08/15/45 (Call 02/15/45) | | | 405 | | | | 419,539 | |
4.38%, 03/30/44 (Call 09/30/43) | | | 359 | | | | 377,668 | |
6.30%, 04/01/38 | | | 250 | | | | 328,968 | |
El Paso Electric Co. | | | | | | | | |
6.00%, 05/15/35 | | | 154 | | | | 179,995 | |
Entergy Arkansas Inc. | | | | | | | | |
3.50%, 04/01/26 (Call 01/01/26) | | | 500 | | | | 525,904 | |
Entergy Louisiana LLC | | | | | | | | |
4.95%, 01/15/45 (Call 01/15/25) | | | 205 | | | | 211,052 | |
| | | | | | | | |
Security | | Principal
(000s) | | | Value | |
Entergy Texas Inc. | | | | | | | | |
5.15%, 06/01/45 (Call 06/01/25) | | $ | 11 | | | $ | 11,317 | |
Exelon Corp. | | | | | | | | |
4.95%, 06/15/35 (Call 12/15/34)b | | | 350 | | | | 353,839 | |
5.10%, 06/15/45 (Call 12/15/44)b | | | 15 | | | | 15,320 | |
5.63%, 06/15/35 | | | 21 | | | | 22,995 | |
Exelon Generation Co. LLC | | | | | | | | |
5.60%, 06/15/42 (Call 12/15/41) | | | 721 | | | | 651,404 | |
6.25%, 10/01/39a | | | 355 | | | | 348,128 | |
FirstEnergy Solutions Corp. | | | | | | | | |
6.80%, 08/15/39 | | | 281 | | | | 259,142 | |
Florida Power & Light Co. | | | | | | | | |
3.80%, 12/15/42 (Call 06/15/42) | | | 100 | | | | 101,504 | |
4.05%, 06/01/42 (Call 12/01/41) | | | 930 | | | | 974,244 | |
4.05%, 10/01/44 (Call 04/01/44) | | | 808 | | | | 844,138 | |
4.13%, 02/01/42 (Call 08/01/41) | | | 306 | | | | 320,080 | |
4.95%, 06/01/35 | | | 200 | | | | 231,795 | |
5.25%, 02/01/41 (Call 08/01/40) | | | 171 | | | | 206,839 | |
5.65%, 02/01/37 | | | 96 | | | | 120,989 | |
5.69%, 03/01/40 | | | 99 | | | | 125,559 | |
5.95%, 02/01/38 | | | 113 | | | | 146,923 | |
Georgia Power Co. | | | | | | | | |
4.30%, 03/15/42 | | | 439 | | | | 431,578 | |
4.30%, 03/15/43 | | | 21 | | | | 20,605 | |
5.40%, 06/01/40 | | | 315 | | | | 355,071 | |
5.95%, 02/01/39 | | | 14 | | | | 16,862 | |
Series 07-A | | | | | | | | |
5.65%, 03/01/37 | | | 100 | | | | 113,174 | |
Series 10-C | | | | | | | | |
4.75%, 09/01/40 | | | 169 | | | | 178,345 | |
Hydro-Quebec | | | | | | | | |
9.50%, 11/15/30 | | | 200 | | | | 340,533 | |
Iberdrola International BV | | | | | | | | |
6.75%, 07/15/36 | | | 346 | | | | 417,306 | |
Idaho Power Co. | | | | | | | | |
3.65%, 03/01/45 (Call 09/01/44) | | | 11 | | | | 10,379 | |
Indiana Michigan Power Co. | | | | | | | | |
6.05%, 03/15/37 | | | 5 | | | | 5,963 | |
Series K | | | | | | | | |
4.55%, 03/15/46 | | | 250 | | | | 249,143 | |
Interstate Power & Light Co. | | | | | | | | |
6.25%, 07/15/39 | | | 5 | | | | 6,588 | |
Jersey Central Power & Light Co. | | | | | | | | |
6.15%, 06/01/37 | | | 186 | | | | 208,298 | |
| | |
| 78 | | 2016 iSHARES ANNUAL REPORTTO SHAREHOLDERS |
Schedule of Investments (Continued)
iSHARES® 10+ YEAR CREDIT BOND ETF
February 29, 2016
| | | | | | | | |
Security | | Principal
(000s) | | | Value | |
John Sevier Combined Cycle Generation LLC | | | | | | | | |
4.63%, 01/15/42 | | $ | 236 | | | $ | 259,765 | |
Kansas City Power & Light Co. | | | | | | | | |
5.30%, 10/01/41 (Call 04/01/41) | | | 262 | | | | 295,883 | |
Series B | | | | | | | | |
6.05%, 11/15/35 | | | 5 | | | | 6,132 | |
Kentucky Utilities Co. | | | | | | | | |
4.38%, 10/01/45 (Call 04/01/45) | | | 100 | | | | 108,404 | |
5.13%, 11/01/40 (Call 05/01/40) | | | 184 | | | | 215,877 | |
Louisville Gas & Electric Co. | | | | | | | | |
4.38%, 10/01/45 (Call 04/01/45)a | | | 109 | | | | 117,762 | |
4.65%, 11/15/43 (Call 05/15/43) | | | 11 | | | | 12,316 | |
5.13%, 11/15/40 (Call 05/15/40) | | | 100 | | | | 117,341 | |
MidAmerican Energy Co. | | | | | | | | |
4.25%, 05/01/46 (Call 11/01/45) | | | 111 | | | | 115,992 | |
4.40%, 10/15/44 (Call 04/15/44) | | | 225 | | | | 241,704 | |
4.80%, 09/15/43 (Call 03/15/43) | | | 28 | | | | 31,482 | |
5.75%, 11/01/35 | | | 11 | | | | 13,485 | |
6.75%, 12/30/31 | | | 11 | | | | 14,768 | |
Mississippi Power Co.
Series 12-A | | | | | | | | |
4.25%, 03/15/42 | | | 350 | | | | 265,686 | |
Nevada Power Co. | | | | | | | | |
5.38%, 09/15/40 (Call 03/15/40) | | | 8 | | | | 9,307 | |
5.45%, 05/15/41 (Call 11/15/40) | | | 606 | | | | 713,458 | |
NiSource Finance Corp. | | | | | | | | |
4.80%, 02/15/44 (Call 08/15/43) | | | 455 | | | | 479,366 | |
5.25%, 02/15/43 (Call 08/15/42) | | | 325 | | | | 359,267 | |
5.65%, 02/01/45 (Call 08/01/44) | | | 6 | | | | 6,910 | |
5.80%, 02/01/42 (Call 08/01/41) | | | 250 | | | | 296,371 | |
5.95%, 06/15/41 (Call 12/15/40) | | | 276 | | | | 316,883 | |
Northern States Power Co./MN | | | | | | | | |
3.40%, 08/15/42 (Call 02/15/42) | | | 724 | | | | 678,267 | |
4.00%, 08/15/45 (Call 02/15/45) | | | 90 | | | | 92,987 | |
4.13%, 05/15/44 (Call 11/15/43) | | | 7 | | | | 7,400 | |
4.85%, 08/15/40 (Call 02/15/40) | | | 390 | | | | 452,019 | |
5.25%, 07/15/35 | | | 50 | | | | 59,801 | |
5.35%, 11/01/39 | | | 5 | | | | 6,070 | |
6.25%, 06/01/36 | | | 106 | | | | 139,236 | |
NSTAR Electric Co. | | | | | | | | |
4.40%, 03/01/44 (Call 09/01/43) | | | 100 | | | | 106,814 | |
5.50%, 03/15/40 | | | 211 | | | | 257,366 | |
| | | | | | | | |
Security | | Principal
(000s) | | | Value | |
Oglethorpe Power Corp. | | | | | | | | |
4.55%, 06/01/44a | | $ | 668 | | | $ | 661,692 | |
5.25%, 09/01/50 | | | 25 | | | | 26,844 | |
5.38%, 11/01/40 | | | 150 | | | | 169,191 | |
5.95%, 11/01/39 | | | 5 | | | | 5,879 | |
Ohio Edison Co. | | | | | | | | |
6.88%, 07/15/36 | | | 355 | | | | 444,173 | |
8.25%, 10/15/38 | | | 11 | | | | 16,383 | |
Ohio Power Co. Series G | | | | | | | | |
6.60%, 02/15/33 | | | 10 | | | | 12,059 | |
Oklahoma Gas & Electric Co. | | | | | | | | |
4.00%, 12/15/44 (Call 06/15/44) | | | 366 | | | | 356,225 | |
4.55%, 03/15/44 (Call 09/15/43) | | | 186 | | | | 201,033 | |
5.25%, 05/15/41 (Call 11/15/40) | | | 100 | | | | 116,726 | |
Oncor Electric Delivery Co. LLC | | | | | | | | |
4.55%, 12/01/41 (Call 06/01/41) | | | 250 | | | | 255,294 | |
5.25%, 09/30/40 | | | 305 | | | | 335,917 | |
5.30%, 06/01/42 (Call 12/01/41) | | | 406 | | | | 460,600 | |
7.25%, 01/15/33 | | | 411 | | | | 537,262 | |
7.50%, 09/01/38 | | | 168 | | | | 229,431 | |
Pacific Gas & Electric Co. | | | | | | | | |
4.25%, 03/15/46 (Call 09/15/45) | | | 11 | | | | 11,206 | |
4.30%, 03/15/45 (Call 09/15/44) | | | 107 | | | | 110,767 | |
4.45%, 04/15/42 (Call 10/15/41) | | | 466 | | | | 490,959 | |
4.50%, 12/15/41 (Call 06/15/41) | | | 290 | | | | 305,332 | |
4.60%, 06/15/43 (Call 12/15/42) | | | 13 | | | | 13,919 | |
4.75%, 02/15/44 (Call 08/15/43) | | | 382 | | | | 417,373 | |
5.13%, 11/15/43 (Call 05/15/43) | | | 346 | | | | 392,117 | |
5.40%, 01/15/40 | | | 421 | | | | 492,473 | |
5.80%, 03/01/37 | | | 16 | | | | 19,273 | |
6.05%, 03/01/34 | | | 2,075 | | | | 2,523,972 | |
6.25%, 03/01/39 | | | 261 | | | | 331,753 | |
6.35%, 02/15/38 | | | 21 | | | | 26,763 | |
PacifiCorp | | | | | | | | |
4.10%, 02/01/42 (Call 08/01/41) | | | 290 | | | | 294,141 | |
6.00%, 01/15/39 | | | 400 | | | | 506,547 | |
6.10%, 08/01/36 | | | 105 | | | | 134,366 | |
6.25%, 10/15/37 | | | 121 | | | | 156,832 | |
PECO Energy Co. | | | | | | | | |
4.15%, 10/01/44 (Call 04/01/44) | | | 255 | | | | 263,173 | |
5.95%, 10/01/36 | | | 111 | | | | 138,297 | |
Pennsylvania Electric Co. | | | | | | | | |
6.15%, 10/01/38 | | | 225 | | | | 251,281 | |
| | | | |
SCHEDULEOF INVESTMENTS | | | 79 | |
Schedule of Investments (Continued)
iSHARES® 10+ YEAR CREDIT BOND ETF
February 29, 2016
| | | | | | | | |
Security | | Principal
(000s) | | | Value | |
Potomac Electric Power Co. | | | | | | | | |
4.15%, 03/15/43 (Call 09/15/42) | | $ | 66 | | | $ | 67,940 | |
6.50%, 11/15/37 | | | 175 | | | | 233,764 | |
7.90%, 12/15/38 | | | 11 | | | | 16,673 | |
PPL Capital Funding Inc. | | | | | | | | |
4.70%, 06/01/43 (Call 12/01/42) | | | 676 | | | | 688,423 | |
5.00%, 03/15/44 (Call 09/15/43) | | | 385 | | | | 405,200 | |
PPL Electric Utilities Corp. | | | | | | | | |
5.20%, 07/15/41 (Call 01/15/41) | | | 391 | | | | 460,388 | |
6.25%, 05/15/39 | | | 5 | | | | 6,618 | |
Progress Energy Inc. | | | | | | | | |
7.75%, 03/01/31 | | | 9 | | | | 12,117 | |
PSEG Power LLC | | | | | | | | |
8.63%, 04/15/31 | | | 720 | | | | 866,505 | |
Public Service Co. of Colorado | | | | | | | | |
3.60%, 09/15/42 (Call 03/15/42) | | | 246 | | | | 237,430 | |
4.30%, 03/15/44 (Call 09/15/43) | | | 411 | | | | 436,460 | |
6.25%, 09/01/37 | | | 60 | | | | 80,082 | |
6.50%, 08/01/38 | | | 100 | | | | 138,065 | |
Public Service Electric & Gas Co. | | | | | | | | |
3.80%, 03/01/46 | | | 250 | | | | 248,890 | |
3.95%, 05/01/42 (Call 11/01/41) | | | 220 | | | | 226,845 | |
4.05%, 05/01/45 (Call 11/01/44)a | | | 125 | | | | 130,654 | |
4.15%, 11/01/45 (Call 05/01/45) | | | 16 | | | | 16,895 | |
5.38%, 11/01/39 | | | 100 | | | | 122,306 | |
5.50%, 03/01/40 | | | 7 | | | | 8,723 | |
5.80%, 05/01/37 | | | 216 | | | | 274,767 | |
Series I | | | | | | | | |
4.00%, 06/01/44 (Call 12/01/43) | | | 240 | | | | 247,352 | |
Puget Sound Energy Inc. | | | | | | | | |
4.30%, 05/20/45 (Call 11/20/44) | | | 111 | | | | 117,440 | |
4.43%, 11/15/41 (Call 05/15/41) | | | 125 | | | | 133,770 | |
5.48%, 06/01/35 | | | 308 | | | | 362,506 | |
5.64%, 04/15/41 (Call 10/15/40) | | | 360 | | | | 453,139 | |
5.76%, 10/01/39 | | | 131 | | | | 163,615 | |
5.80%, 03/15/40 | | | 56 | | | | 71,129 | |
6.27%, 03/15/37 | | | 5 | | | | 6,472 | |
6.72%, 06/15/36 | | | 150 | | | | 203,606 | |
7.02%, 12/01/27 | | | 271 | | | | 368,184 | |
San Diego Gas & Electric Co. | | | | | | | | |
3.95%, 11/15/41 | | | 11 | | | | 11,161 | |
4.30%, 04/01/42 (Call 10/01/41) | | | 158 | | | | 168,441 | |
4.50%, 08/15/40 | | | 211 | | | | 230,495 | |
| | | | | | | | |
Security | | Principal
(000s) | | | Value | |
5.35%, 05/15/35 | | $ | 125 | | | $ | 150,095 | |
5.35%, 05/15/40 | | | 75 | | | | 91,135 | |
6.13%, 09/15/37 | | | 100 | | | | 132,050 | |
South Carolina Electric & Gas Co. | | | | | | | | |
4.35%, 02/01/42 (Call 08/01/41) | | | 244 | | | | 243,630 | |
4.50%, 06/01/64 (Call 12/01/63) | | | 261 | | | | 260,488 | |
4.60%, 06/15/43 (Call 12/15/42) | | | 116 | | | | 121,313 | |
5.10%, 06/01/65 (Call 12/01/64) | | | 150 | | | | 164,213 | |
5.30%, 05/15/33 | | | 5 | | | | 5,629 | |
5.45%, 02/01/41 (Call 08/01/40) | | | 420 | | | | 484,908 | |
6.05%, 01/15/38 | | | 248 | | | | 302,717 | |
Southaven Combined Cycle Generation LLC | | | | | | | | |
3.85%, 08/15/33 | | | 2 | | | | 1,923 | |
Southern California Edison Co. | | | | | | | | |
3.90%, 12/01/41 (Call 06/01/41) | | | 106 | | | | 106,169 | |
4.05%, 03/15/42 (Call 09/15/41) | | | 50 | | | | 50,963 | |
4.50%, 09/01/40 (Call 03/01/40) | | | 23 | | | | 24,839 | |
4.65%, 10/01/43 (Call 04/01/43) | | | 341 | | | | 376,861 | |
5.50%, 03/15/40 | | | 242 | | | | 297,733 | |
5.63%, 02/01/36 | | | 75 | | | | 91,859 | |
5.75%, 04/01/35 | | | 5 | | | | 6,229 | |
6.00%, 01/15/34a | | | 266 | | | | 337,012 | |
6.05%, 03/15/39 | | | 150 | | | | 193,075 | |
6.65%, 04/01/29 | | | 121 | | | | 156,415 | |
Series 05-B | | | | | | | | |
5.55%, 01/15/36 | | | 55 | | | | 65,768 | |
Series 05-E | | | | | | | | |
5.35%, 07/15/35 | | | 289 | | | | 345,164 | |
Series 06-E | | | | | | | | |
5.55%, 01/15/37 | | | 180 | | | | 216,086 | |
Series 08-A | | | | | | | | |
5.95%, 02/01/38 | | | 664 | | | | 845,014 | |
Series 13-A | | | | | | | | |
3.90%, 03/15/43 (Call 09/15/42) | | | 155 | | | | 155,772 | |
Series C | | | | | | | | |
3.60%, 02/01/45 (Call 08/01/44) | | | 661 | | | | 632,343 | |
Southern Power Co. | | | | | | | | |
5.15%, 09/15/41 | | | 200 | | | | 183,788 | |
Southwestern Electric Power Co. | | | | | | | | |
3.90%, 04/01/45 (Call 10/01/44) | | | 661 | | | | 599,024 | |
6.20%, 03/15/40 | | | 140 | | | | 167,555 | |
| | |
| 80 | | 2016 iSHARES ANNUAL REPORTTO SHAREHOLDERS |
Schedule of Investments (Continued)
iSHARES® 10+ YEAR CREDIT BOND ETF
February 29, 2016
| | | | | | | | |
Security | | Principal
(000s) | | | Value | |
Southwestern Public Service Co. | | | | | | | | |
4.50%, 08/15/41 (Call 02/15/41) | | $ | 50 | | | $ | 54,091 | |
6.00%, 10/01/36 | | | 561 | | | | 685,171 | |
Tampa Electric Co. | | | | | | | | |
4.10%, 06/15/42 (Call 12/15/41) | | | 315 | | | | 314,500 | |
4.20%, 05/15/45 (Call 11/15/44) | | | 11 | | | | 11,260 | |
4.35%, 05/15/44 (Call 11/15/43) | | | 385 | | | | 401,501 | |
6.55%, 05/15/36 | | | 5 | | | | 6,581 | |
Toledo Edison Co. (The) | | | | | | | | |
6.15%, 05/15/37 | | | 1 | | | | 1,170 | |
TransAlta Corp. | | | | | | | | |
6.50%, 03/15/40 | | | 136 | | | | 70,720 | |
Union Electric Co. | | | | | | | | |
3.90%, 09/15/42 (Call 03/15/42) | | | 940 | | | | 953,927 | |
8.45%, 03/15/39 | | | 11 | | | | 17,723 | |
Virginia Electric & Power Co. | | | | | | | | |
4.00%, 01/15/43 (Call 07/15/42) | | | 266 | | | | 263,406 | |
4.20%, 05/15/45 (Call 11/15/44) | | | 7 | | | | 7,201 | |
4.45%, 02/15/44 (Call 08/15/43) | | | 120 | | | | 128,744 | |
8.88%, 11/15/38 | | | 774 | | | | 1,240,187 | |
Series A | | | | | | | | |
6.00%, 05/15/37 | | | 284 | | | | 354,832 | |
Series B | | | | | | | | |
6.00%, 01/15/36 | | | 250 | | | | 311,784 | |
Series D | | | | | | | | |
4.65%, 08/15/43 (Call 02/15/43) | | | 21 | | | | 22,659 | |
Westar Energy Inc. | | | | | | | | |
4.10%, 04/01/43 (Call 10/01/42) | | | 5 | | | | 5,140 | |
4.13%, 03/01/42 (Call 09/01/41) | | | 335 | | | | 348,784 | |
4.25%, 12/01/45 (Call 06/01/45) | | | 350 | | | | 375,722 | |
Wisconsin Electric Power Co. | | | | | | | | |
3.65%, 12/15/42 (Call 06/15/42) | | | 265 | | | | 253,624 | |
4.25%, 06/01/44 (Call 12/01/43)a | | | 247 | | | | 263,318 | |
4.30%, 12/15/45 (Call 06/15/45) | | | 195 | | | | 211,770 | |
Wisconsin Power & Light Co. | | | | | | | | |
4.10%, 10/15/44 (Call 04/15/44) | | | 663 | | | | 684,383 | |
6.38%, 08/15/37 | | | 140 | | | | 187,346 | |
Wisconsin Public Service Corp. | | | | | | | | |
4.75%, 11/01/44 (Call 05/01/44) | | | 155 | | | | 180,087 | |
Xcel Energy Inc. | | | | | | | | |
4.80%, 09/15/41 (Call 03/15/41) | | | 5 | | | | 5,216 | |
6.50%, 07/01/36 | | | 50 | | | | 62,003 | |
| | | | | | | | |
| | | | | | | 76,410,792 | |
| | | | | | | | |
Security | | Principal
(000s) | | | Value | |
ELECTRICAL COMPONENTS & EQUIPMENT — 0.02% | |
Emerson Electric Co. | | | | | | | | |
6.00%, 08/15/32 | | $ | 135 | | | $ | 164,933 | |
6.13%, 04/15/39 | | | 12 | | | | 15,334 | |
| | | | | | | | |
| | | | | | | 180,267 | |
ELECTRONICS — 0.27% | | | | | |
Honeywell International Inc. | | | | | | | | |
5.38%, 03/01/41 | | | 611 | | | | 728,933 | |
5.70%, 03/15/36 | | | 11 | | | | 13,339 | |
5.70%, 03/15/37 | | | 191 | | | | 232,889 | |
Koninklijke Philips NV | | | | | | | | |
5.00%, 03/15/42 | | | 533 | | | | 517,155 | |
6.88%, 03/11/38 | | | 354 | | | | 414,214 | |
Thermo Fisher Scientific Inc. | | | | | | | | |
5.30%, 02/01/44 (Call 08/01/43) | | | 208 | | | | 220,152 | |
| | | | | | | | |
| | | | | | | 2,126,682 | |
ENGINEERING & CONSTRUCTION — 0.03% | | | | | |
ABB Finance USA Inc. | | | | | | | | |
4.38%, 05/08/42 | | | 257 | | | | 269,979 | |
| | | | | | | | |
| | | | | | | 269,979 | |
ENVIRONMENTAL CONTROL — 0.25% | | | | | |
Republic Services Inc. | | | | | | | | |
5.70%, 05/15/41 (Call 11/15/40) | | | 691 | | | | 779,318 | |
6.09%, 03/15/35 | | | 50 | | | | 58,241 | |
6.20%, 03/01/40 | | | 41 | | | | 49,064 | |
Waste Management Inc. | |
3.90%, 03/01/35 (Call 09/01/34) | | | 613 | | | | 595,372 | |
4.10%, 03/01/45 (Call 09/01/44) | | | 203 | | | | 198,957 | |
6.13%, 11/30/39 | | | 207 | | | | 259,632 | |
| | | | | | | | |
| | | | 1,940,584 | |
FOOD — 1.56% | | | | | |
Ahold Finance USA LLC | | | | | | | | |
6.88%, 05/01/29 | | | 11 | | | | 13,646 | |
Campbell Soup Co. | | | | | | | | |
3.80%, 08/02/42 | | | 6 | | | | 5,450 | |
ConAgra Foods Inc. | | | | | | | | |
7.00%, 10/01/28 | | | 230 | | | | 278,799 | |
7.13%, 10/01/26 | | | 57 | | | | 68,730 | |
8.25%, 09/15/30 | | | 284 | | | | 393,332 | |
Delhaize America LLC | | | | | | | | |
9.00%, 04/15/31 | | | 5 | | | | 6,662 | |
Delhaize Group | | | | | | | | |
5.70%, 10/01/40 | | | 627 | | | | 662,125 | |
| | | | |
SCHEDULEOF INVESTMENTS | | | 81 | |
Schedule of Investments (Continued)
iSHARES® 10+ YEAR CREDIT BOND ETF
February 29, 2016
| | | | | | | | |
Security | | Principal
(000s) | | | Value | |
General Mills Inc. | | | | | | | | |
4.15%, 02/15/43 (Call 08/15/42) | | $ | 5 | | | $ | 5,000 | |
5.40%, 06/15/40 | | | 476 | | | | 552,060 | |
Hershey Co. (The) | | | | | | | | |
7.20%, 08/15/27 | | | 11 | | | | 15,061 | |
JM Smucker Co. (The) | | | | | | | | |
4.25%, 03/15/35 | | | 650 | | | | 653,396 | |
4.38%, 03/15/45 | | | 118 | | | | 118,294 | |
Kellogg Co. | | | | | | | | |
4.50%, 04/01/46 | | | 85 | | | | 85,561 | |
Series B | | | | | | | | |
7.45%, 04/01/31 | | | 726 | | | | 915,350 | |
Kraft Foods Group Inc. | | | | | | | | |
5.00%, 06/04/42 | | | 1,375 | | | | 1,434,688 | |
6.50%, 02/09/40 | | | 306 | | | | 363,889 | |
6.88%, 01/26/39 | | | 571 | | | | 696,403 | |
Kraft Heinz Foods Co. | | | | | | | | |
5.00%, 07/15/35 (Call 01/15/35)b | | | 623 | | | | 652,591 | |
5.20%, 07/15/45 (Call 01/15/45)b | | | 650 | | | | 697,833 | |
Kroger Co. (The) | | | | | | | | |
5.00%, 04/15/42 (Call 10/15/41) | | | 100 | | | | 107,399 | |
5.15%, 08/01/43 (Call 02/01/43) | | | 250 | | | | 274,384 | |
5.40%, 07/15/40 (Call 01/15/40) | | | 366 | | | | 407,586 | |
6.90%, 04/15/38 | | | 253 | | | | 326,561 | |
7.50%, 04/01/31 | | | 397 | | | | 526,832 | |
Mondelez International Inc. | | | | | | | | |
6.50%, 02/09/40 | | | 72 | | | | 90,025 | |
6.88%, 01/26/39 | | | 450 | | | | 567,440 | |
Sysco Corp. | | | | | | | | |
4.85%, 10/01/45 (Call 04/01/45) | | | 269 | | | | 274,932 | |
5.38%, 09/21/35 | | | 400 | | | | 445,205 | |
6.63%, 03/17/39 | | | 11 | | | | 13,763 | |
Tyson Foods Inc. | | | | | | | | |
4.88%, 08/15/34 (Call 02/15/34) | | | 549 | | | | 565,965 | |
5.15%, 08/15/44 (Call 02/15/44) | | | 255 | | | | 272,345 | |
Unilever Capital Corp. | | | | | | | | |
5.90%, 11/15/32 | | | 610 | | | | 797,634 | |
| | | | | | | | |
| | | | 12,288,941 | |
FOREST PRODUCTS & PAPER — 0.45% | | | | | |
Domtar Corp. | | | | | | | | |
6.75%, 02/15/44 (Call 08/15/43) | | | 205 | | | | 202,209 | |
Georgia-Pacific LLC | | | | | | | | |
7.75%, 11/15/29 | | | 791 | | | | 1,033,492 | |
8.88%, 05/15/31 | | | 14 | | | | 20,027 | |
| | | | | | | | |
Security | | Principal
(000s) | | | Value | |
International Paper Co. | | | | | | | | |
4.80%, 06/15/44 (Call 12/15/43) | | $ | 125 | | | $ | 106,036 | |
5.00%, 09/15/35 (Call 03/15/35) | | | 50 | | | | 48,425 | |
5.15%, 05/15/46 (Call 11/15/45) | | | 210 | | | | 187,633 | |
6.00%, 11/15/41 (Call 05/15/41) | | | 786 | | | | 769,818 | |
7.30%, 11/15/39 | | | 260 | | | | 281,304 | |
8.70%, 06/15/38 | | | 246 | | | | 314,059 | |
WestRock MWV LLC | | | | | | | | |
7.95%, 02/15/31 | | | 11 | | | | 13,606 | |
8.20%, 01/15/30 | | | 450 | | | | 572,314 | |
| | | | | | | | |
| | | | 3,548,923 | |
GAS — 0.55% | | | | | |
AGL Capital Corp. | | | | | | | | |
4.40%, 06/01/43 (Call 12/01/42) | | | 6 | | | | 5,805 | |
5.88%, 03/15/41 (Call 09/15/40) | | | 643 | | | | 735,969 | |
6.00%, 10/01/34 | | | 95 | | | | 110,711 | |
Atmos Energy Corp. | | | | | | | | |
4.13%, 10/15/44 (Call 04/15/44)a | | | 713 | | | | 714,780 | |
5.50%, 06/15/41 (Call 12/15/40) | | | 5 | | | | 5,943 | |
Dominion Gas Holdings LLC | | | | | | | | |
4.60%, 12/15/44 (Call 06/15/44)a | | | 417 | | | | 394,108 | |
KeySpan Corp. | | | | | | | | |
5.80%, 04/01/35 | | | 228 | | | | 257,599 | |
8.00%, 11/15/30 | | | 130 | | | | 177,841 | |
ONE Gas Inc. | | | | | | | | |
4.66%, 02/01/44 (Call 08/01/43) | | | 374 | | | | 410,793 | |
Piedmont Natural Gas Co. Inc. | | | | | | | | |
4.10%, 09/18/34 (Call 03/18/34) | | | 207 | | | | 209,386 | |
4.65%, 08/01/43 (Call 02/01/43) | | | 3 | | | | 3,237 | |
Sempra Energy | | | | | | | | |
6.00%, 10/15/39 | | | 901 | | | | 991,845 | |
Southern California Gas Co. | | | | | | | | |
3.75%, 09/15/42 (Call 03/15/42) | | | 5 | | | | 4,942 | |
Series KK | | | | | | | | |
5.75%, 11/15/35 | | | 225 | | | | 281,511 | |
| | | | | | | | |
| | | | 4,304,470 | |
HAND & MACHINE TOOLS — 0.00% | | | | | |
Stanley Black & Decker Inc. | | | | | | | | |
5.20%, 09/01/40 | | | 5 | | | | 5,653 | |
| | | | | | | | |
| | | | 5,653 | |
HEALTH CARE – PRODUCTS — 1.18% | | | | | |
Becton Dickinson and Co. | | | | | | | | |
4.69%, 12/15/44 (Call 06/15/44) | | | 496 | | | | 509,788 | |
| | |
| 82 | | 2016 iSHARES ANNUAL REPORTTO SHAREHOLDERS |
Schedule of Investments (Continued)
iSHARES® 10+ YEAR CREDIT BOND ETF
February 29, 2016
| | | | | | | | |
Security | | Principal
(000s) | | | Value | |
4.88%, 05/15/44 (Call 11/15/43) | | $ | 360 | | | $ | 371,966 | |
5.00%, 11/12/40 | | | 150 | | | | 156,981 | |
6.00%, 05/15/39 | | | 186 | | | | 217,602 | |
Boston Scientific Corp. | | | | | | | | |
7.00%, 11/15/35 | | | 100 | | | | 121,181 | |
7.38%, 01/15/40 | | | 211 | | | | 267,873 | |
Covidien International Finance SA | | | | | | | | |
6.55%, 10/15/37 | | | 396 | | | | 510,063 | |
Danaher Corp. | | | | | | | | |
4.38%, 09/15/45 (Call 03/15/45) | | | 9 | | | | 9,641 | |
Medtronic Inc. | | | | | | | | |
4.00%, 04/01/43 (Call 10/01/42) | | | 291 | | | | 278,915 | |
4.38%, 03/15/35 | | | 1,565 | | | | 1,615,244 | |
4.50%, 03/15/42 (Call 09/15/41) | | | 11 | | | | 11,322 | |
4.63%, 03/15/44 (Call 09/15/43) | | | 420 | | | | 441,223 | |
4.63%, 03/15/45 | | | 2,098 | | | | 2,232,238 | |
5.55%, 03/15/40 | | | 291 | | | | 342,270 | |
St. Jude Medical Inc. | | | | | | | | |
4.75%, 04/15/43 (Call 10/15/42) | | | 440 | | | | 438,020 | |
Stryker Corp. | | | | | | | | |
4.10%, 04/01/43 (Call 10/01/42) | | | 374 | | | | 347,402 | |
4.38%, 05/15/44 (Call 11/15/43) | | | 135 | | | | 131,056 | |
Zimmer Biomet Holdings Inc. | | | | | | | | |
4.25%, 08/15/35 (Call 02/15/35) | | | 407 | | | | 375,992 | |
4.45%, 08/15/45 (Call 02/15/45) | | | 524 | | | | 479,075 | |
5.75%, 11/30/39 | | | 381 | | | | 419,880 | |
| | | | | | | | |
| | | | 9,277,732 | |
HEALTH CARE – SERVICES — 1.64% | | | | | |
Aetna Inc. | | | | | | | | |
4.13%, 11/15/42 (Call 05/15/42) | | | 261 | | | | 239,788 | |
4.50%, 05/15/42 (Call 11/15/41) | | | 359 | | | | 347,712 | |
4.75%, 03/15/44 (Call 09/15/43) | | | 225 | | | | 228,129 | |
6.63%, 06/15/36 | | | 311 | | | | 376,745 | |
6.75%, 12/15/37 | | | 285 | | | | 348,129 | |
Anthem Inc. | | | | | | | | |
4.63%, 05/15/42 | | | 776 | | | | 727,274 | |
4.65%, 01/15/43 | | | 771 | | | | 724,828 | |
4.65%, 08/15/44 (Call 02/15/44) | | | 241 | | | | 226,188 | |
4.85%, 08/15/54 (Call 02/15/54) | | | 175 | | | | 163,215 | |
5.10%, 01/15/44 | | | 175 | | | | 174,738 | |
5.85%, 01/15/36 | | | 21 | | | | 23,063 | |
5.95%, 12/15/34 | | | 2 | | | | 2,227 | |
6.38%, 06/15/37 | | | 458 | | | | 529,361 | |
| | | | | | | | |
Security | | Principal
(000s) | | | Value | |
Ascension Health | | | | | | | | |
4.85%, 11/15/53 | | $ | 11 | | | $ | 12,395 | |
Baylor Scott & White Holdings | | | | | | | | |
4.19%, 11/15/45 (Call 05/15/45) | | | 16 | | | | 16,067 | |
Cigna Corp. | | | | | | | | |
5.38%, 02/15/42 (Call 08/15/41) | | | 241 | | | | 262,740 | |
5.88%, 03/15/41 (Call 09/15/40) | | | 403 | | | | 455,010 | |
6.15%, 11/15/36 | | | 100 | | | | 115,288 | |
7.88%, 05/15/27 | | | 11 | | | | 14,593 | |
Dignity Health | | | | | | | | |
4.50%, 11/01/42 | | | 100 | | | | 100,619 | |
5.27%, 11/01/64 | | | 216 | | | | 232,338 | |
Humana Inc. | | | | | | | | |
4.63%, 12/01/42 (Call 06/01/42) | | | 306 | | | | 284,478 | |
4.95%, 10/01/44 (Call 04/01/44) | | | 141 | | | | 137,629 | |
8.15%, 06/15/38 | | | 360 | | | | 501,561 | |
Kaiser Foundation Hospitals | | | | | | | | |
4.88%, 04/01/42 | | | 354 | | | | 391,060 | |
Laboratory Corp. of America Holdings | | | | | | | | |
4.70%, 02/01/45 (Call 08/01/44)a | | | 398 | | | | 376,360 | |
Mayo Clinic
Series 2013 | | | | | | | | |
4.00%, 11/15/47 | | | 11 | | | | 10,981 | |
Memorial Sloan-Kettering Cancer Center
Series 2015 | | | | | | | | |
4.20%, 07/01/55 | | | 272 | | | | 271,481 | |
New York and Presbyterian Hospital (The) | | | | | | | | |
4.02%, 08/01/45 | | | 21 | | | | 20,800 | |
Ochsner Clinic Foundation | | | | | | | | |
5.90%, 05/15/45 (Call 11/15/44) | | | 11 | | | | 12,477 | |
Quest Diagnostics Inc. | | | | | | | | |
4.70%, 03/30/45 (Call 09/30/44) | | | 16 | | | | 15,012 | |
5.75%, 01/30/40 | | | 250 | | | | 266,557 | |
Texas Health Resources | | | | | | | | |
4.33%, 11/15/55 | | | 9 | | | | 9,205 | |
UnitedHealth Group Inc. | | | | | | | | |
3.95%, 10/15/42 (Call 04/15/42) | | | 7 | | | | 6,657 | |
4.25%, 03/15/43 (Call 09/15/42) | | | 291 | | | | 290,544 | |
4.38%, 03/15/42 (Call 09/15/41) | | | 571 | | | | 581,178 | |
4.63%, 07/15/35 | | | 255 | | | | 273,130 | |
4.63%, 11/15/41 (Call 05/15/41) | | | 180 | | | | 190,090 | |
| | | | |
SCHEDULEOF INVESTMENTS | | | 83 | |
Schedule of Investments (Continued)
iSHARES® 10+ YEAR CREDIT BOND ETF
February 29, 2016
| | | | | | | | |
Security | | Principal
(000s) | | | Value | |
4.75%, 07/15/45 | | $ | 891 | | | $ | 971,675 | |
5.70%, 10/15/40 (Call 04/15/40) | | | 561 | | | | 677,241 | |
5.80%, 03/15/36 | | | 695 | | | | 833,049 | |
5.95%, 02/15/41 (Call 08/15/40) | | | 536 | | | | 668,083 | |
6.50%, 06/15/37 | | | 21 | | | | 27,020 | |
6.63%, 11/15/37 | | | 11 | | | | 14,381 | |
6.88%, 02/15/38 | | | 535 | | | | 719,290 | |
| | | | | | | | |
| | | | 12,870,386 | |
HOLDING COMPANIES – DIVERSIFIED — 0.02% | |
Hutchison Whampoa International Ltd. | | | | | | | | |
7.45%, 11/24/33b | | | 50 | | | | 69,781 | |
Leucadia National Corp. | | | | | | | | |
6.63%, 10/23/43 (Call 07/23/43) | | | 100 | | | | 75,994 | |
| | | | | | | | |
| | | | 145,775 | |
HOME FURNISHINGS — 0.02% | | | | | |
Whirlpool Corp. | | | | | | | | |
5.15%, 03/01/43 | | | 155 | | | | 158,199 | |
| | | | | | | | |
| | | | 158,199 | |
HOUSEHOLD PRODUCTS & WARES — 0.09% | |
Kimberly-Clark Corp. | | | | | | | | |
3.70%, 06/01/43 | | | 18 | | | | 17,370 | |
6.63%, 08/01/37 | | | 518 | | | | 698,752 | |
| | | | | | | | |
| | | | 716,122 | |
INSURANCE — 3.54% | | | | | |
ACE INA Holdings Inc. | | | | | | | | |
4.15%, 03/13/43 | | | 485 | | | | 478,801 | |
4.35%, 11/03/45 (Call 05/03/45) | | | 835 | | | | 868,879 | |
Aflac Inc. | | | | | | | | |
6.45%, 08/15/40 | | | 431 | | | | 528,439 | |
Alleghany Corp. | | | | | | | | |
4.90%, 09/15/44 (Call 03/15/44) | | | 263 | | | | 249,095 | |
Allstate Corp. (The) | | | | | | | | |
4.50%, 06/15/43 | | | 875 | | | | 915,930 | |
5.35%, 06/01/33 | | | 5 | | | | 5,727 | |
5.55%, 05/09/35 | | | 201 | | | | 236,209 | |
American International Group Inc. | | | | | | | | |
3.88%, 01/15/35 (Call 07/15/34) | | | 1,465 | | | | 1,236,492 | |
4.38%, 01/15/55 (Call 07/15/54) | | | 250 | | | | 201,366 | |
4.50%, 07/16/44 (Call 01/16/44) | | | 911 | | | | 797,402 | |
4.70%, 07/10/35 (Call 01/10/35) | | | 514 | | | | 482,261 | |
4.80%, 07/10/45 (Call 01/10/45) | | | 11 | | | | 10,094 | |
6.25%, 05/01/36 | | | 532 | | | | 576,144 | |
| | | | | | | | |
Security | | Principal
(000s) | | | Value | |
6.25%, 03/15/87 | | $ | 300 | | | $ | 309,000 | |
8.18%, 05/15/68 (Call 05/15/38)a,c | | | 21 | | | | 26,197 | |
Aon Corp. | | | | | | | | |
8.21%, 01/01/27 | | | 314 | | | | 383,080 | |
Aon PLC | | | | | | | | |
4.45%, 05/24/43 (Call 02/24/43) | | | 361 | | | | 332,636 | |
4.60%, 06/14/44 (Call 03/14/44)a | | | 300 | | | | 284,975 | |
4.75%, 05/15/45 (Call 11/15/44) | | | 246 | | | | 239,921 | |
Arch Capital Group U.S. Inc. | | | | | | | | |
5.14%, 11/01/43 | | | 495 | | | | 504,859 | |
Assurant Inc. | | | | | | | | |
6.75%, 02/15/34 | | | 235 | | | | 272,367 | |
AXA SA | | | | | | | | |
8.60%, 12/15/30 | | | 767 | | | | 997,100 | |
AXIS Specialty Finance PLC | | | | | | | | |
5.15%, 04/01/45 | | | 5 | | | | 4,955 | |
Berkshire Hathaway Finance Corp. | | | | | | | | |
4.30%, 05/15/43a | | | 68 | | | | 66,294 | |
4.40%, 05/15/42a | | | 324 | | | | 320,021 | |
5.75%, 01/15/40 | | | 400 | | | | 472,048 | |
Berkshire Hathaway Inc. | | | | | | | | |
4.50%, 02/11/43a | | | 853 | | | | 858,337 | |
Chubb Corp. (The) | | | | | | | | |
6.00%, 05/11/37 | | | 460 | | | | 567,300 | |
Cincinnati Financial Corp. | | | | | | | | |
6.92%, 05/15/28 | | | 11 | | | | 14,088 | |
Endurance Specialty Holdings Ltd. | | | | | | | | |
7.00%, 07/15/34 | | | 230 | | | | 267,807 | |
Everest Reinsurance Holdings Inc. | | | | | | | | |
4.87%, 06/01/44 | | | 261 | | | | 251,602 | |
Hartford Financial Services Group Inc. (The) | | | | | | | | |
4.30%, 04/15/43 | | | 14 | | | | 12,924 | |
5.95%, 10/15/36 | | | 306 | | | | 353,497 | |
6.10%, 10/01/41 | | | 365 | | | | 436,911 | |
6.63%, 03/30/40 | | | 105 | | | | 129,414 | |
Lincoln National Corp. | | | | | | | | |
6.15%, 04/07/36 | | | 225 | | | | 244,664 | |
6.30%, 10/09/37 | | | 16 | | | | 17,692 | |
7.00%, 06/15/40 | | | 481 | | | | 565,485 | |
Loews Corp. | | | | | | | | |
4.13%, 05/15/43 (Call 11/15/42) | | | 308 | | | | 280,521 | |
6.00%, 02/01/35a | | | 150 | | | | 170,997 | |
| | |
| 84 | | 2016 iSHARES ANNUAL REPORTTO SHAREHOLDERS |
Schedule of Investments (Continued)
iSHARES® 10+ YEAR CREDIT BOND ETF
February 29, 2016
| | | | | | | | |
Security | | Principal
(000s) | | | Value | |
Markel Corp. | | | | | | | | |
5.00%, 03/30/43 | | $ | 3 | | | $ | 3,018 | |
Marsh & McLennan Companies Inc. | | | | | | | | |
3.75%, 03/14/26 (Call 12/14/25)a | | | 80 | | | | 81,042 | |
5.88%, 08/01/33 | | | 205 | | | | 235,818 | |
MetLife Inc. | | | | | | | | |
4.05%, 03/01/45 | | | 1,155 | | | | 1,035,156 | |
4.13%, 08/13/42 | | | 368 | | | | 333,060 | |
4.60%, 05/13/46 (Call 12/13/45)a | | | 274 | | | | 268,299 | |
4.72%, 12/15/44 | | | 518 | | | | 513,138 | |
4.88%, 11/13/43 | | | 489 | | | | 497,592 | |
5.70%, 06/15/35 | | | 451 | | | | 507,158 | |
6.40%, 12/15/66 (Call 12/15/31) | | | 740 | | | | 725,200 | |
6.50%, 12/15/32 | | | 458 | | | | 552,371 | |
10.75%, 08/01/69 (Call 08/01/34) | | | 16 | | | | 23,360 | |
Principal Financial Group Inc. | | | | | | | | |
4.35%, 05/15/43a | | | 500 | | | | 454,711 | |
4.63%, 09/15/42 | | | 5 | | | | 4,754 | |
6.05%, 10/15/36 | | | 166 | | | | 184,613 | |
Progressive Corp. (The) | | | | | | | | |
3.70%, 01/26/45 | | | 250 | | | | 231,961 | |
4.35%, 04/25/44 | | | 261 | | | | 269,181 | |
6.25%, 12/01/32 | | | 173 | | | | 216,299 | |
Protective Life Corp. | | | | | | | | |
8.45%, 10/15/39 | | | 249 | | | | 328,963 | |
Prudential Financial Inc. | | | | | | | | |
4.60%, 05/15/44a | | | 346 | | | | 331,235 | |
5.10%, 08/15/43 | | | 11 | | | | 10,793 | |
5.40%, 06/13/35 | | | 470 | | | | 495,464 | |
5.63%, 05/12/41 | | | 13 | | | | 13,714 | |
5.70%, 12/14/36 | | | 289 | | | | 314,559 | |
5.80%, 11/16/41 | | | 100 | | | | 108,004 | |
5.90%, 03/17/36 | | | 210 | | | | 230,660 | |
6.20%, 11/15/40 | | | 100 | | | | 112,163 | |
6.63%, 06/21/40 | | | 5 | | | | 5,892 | |
Series B | | | | | | | | |
5.75%, 07/15/33 | | | 8 | | | | 8,730 | |
Series D | | | | | | | | |
6.63%, 12/01/37 | | | 906 | | | | 1,065,048 | |
Transatlantic Holdings Inc. | | | | | | | | |
8.00%, 11/30/39 | | | 200 | | | | 265,503 | |
Travelers Companies Inc. (The) | | | | | | | | |
4.60%, 08/01/43 | | | 66 | | | | 71,291 | |
| | | | | | | | |
Security | | Principal
(000s) | | | Value | |
5.35%, 11/01/40 | | $ | 310 | | | $ | 366,557 | |
6.25%, 06/15/37 | | | 772 | | | | 991,970 | |
6.75%, 06/20/36 | | | 50 | | | | 67,467 | |
Travelers Property Casualty Corp. | | | | | | | | |
6.38%, 03/15/33 | | | 110 | | | | 140,786 | |
Trinity Acquisition PLC | | | | | | | | |
6.13%, 08/15/43 | | | 100 | | | | 108,653 | |
Unum Group | | | | | | | | |
5.75%, 08/15/42 | | | 255 | | | | 263,473 | |
Validus Holdings Ltd. | | | | | | | | |
8.88%, 01/26/40 | | | 134 | | | | 172,144 | |
Voya Financial Inc. | | | | | | | | |
5.70%, 07/15/43 | | | 290 | | | | 315,063 | |
WR Berkley Corp. | | | | | | | | |
4.75%, 08/01/44 | | | 16 | | | | 15,491 | |
6.25%, 02/15/37 | | | 300 | | | | 345,797 | |
XLIT Ltd. | | | | | | | | |
5.50%, 03/31/45 | | | 449 | | | | 423,570 | |
6.25%, 05/15/27 | | | 86 | | | | 101,697 | |
| | | | | | | | |
| | | | 27,782,949 | |
INTERNET — 0.30% | | | | | |
Alibaba Group Holding Ltd. | | | | | | | | |
4.50%, 11/28/34 (Call 05/28/34)a | | | 414 | | | | 408,411 | |
Amazon.com Inc. | | | | | | | | |
4.80%, 12/05/34 (Call 06/05/34) | | | 608 | | | | 659,050 | |
4.95%, 12/05/44 (Call 06/05/44) | | | 900 | | | | 993,582 | |
eBay Inc. | | | | | | | | |
4.00%, 07/15/42 (Call 01/15/42) | | | 400 | | | | 305,107 | |
| | | | | | | | |
| | | | 2,366,150 | |
IRON & STEEL — 0.36% | | | | | |
Nucor Corp. | | | | | | | | |
5.20%, 08/01/43 (Call 02/01/43) | | | 214 | | | | 200,370 | |
6.40%, 12/01/37 | | | 286 | | | | 304,829 | |
Reliance Steel & Aluminum Co. | | | | | | | | |
6.85%, 11/15/36 | | | 100 | | | | 99,333 | |
Vale Overseas Ltd. | | | | | | | | |
6.88%, 11/21/36a | | | 1,830 | | | | 1,264,988 | |
6.88%, 11/10/39 | | | 875 | | | | 596,094 | |
8.25%, 01/17/34a | | | 250 | | | | 193,750 | |
Vale SA | | | | | | | | |
5.63%, 09/11/42a | | | 285 | | | | 177,056 | |
| | | | | | | | |
| | | | 2,836,420 | |
| | | | |
SCHEDULEOF INVESTMENTS | | | 85 | |
Schedule of Investments (Continued)
iSHARES® 10+ YEAR CREDIT BOND ETF
February 29, 2016
| | | | | | | | |
Security | | Principal
(000s) | | | Value | |
LEISURE TIME — 0.03% | | | | | |
Harley-Davidson Inc. | | | | | | | | |
4.63%, 07/28/45 (Call 01/28/45) | | $ | 211 | | | $ | 208,162 | |
| | | | | | | | |
| | | | 208,162 | |
LODGING — 0.02% | | | | | |
Starwood Hotels & Resorts Worldwide Inc. | | | | | | | | |
4.50%, 10/01/34 (Call 04/01/34) | | | 206 | | | | 188,720 | |
| | | | | | | | |
| | | | 188,720 | |
MACHINERY — 0.44% | | | | | |
Caterpillar Inc. | | | | | | | | |
3.80%, 08/15/42 | | | 809 | | | | 725,787 | |
4.30%, 05/15/44 (Call 11/15/43)a | | | 286 | | | | 276,908 | |
4.75%, 05/15/64 (Call 11/15/63)a | | | 203 | | | | 193,431 | |
5.20%, 05/27/41 | | | 614 | | | | 664,802 | |
5.30%, 09/15/35 | | | 11 | | | | 12,045 | |
6.05%, 08/15/36 | | | 111 | | | | 131,044 | |
Cummins Inc. | | | | | | | | |
4.88%, 10/01/43 (Call 04/01/43)a | | | 230 | | | | 243,054 | |
Deere & Co. | | | | | | | | |
3.90%, 06/09/42 (Call 12/09/41) | | | 746 | | | | 709,448 | |
5.38%, 10/16/29 | | | 255 | | | | 301,843 | |
7.13%, 03/03/31 | | | 11 | | | | 14,984 | |
8.10%, 05/15/30 | | | 50 | | | | 72,864 | |
Rockwell Automation Inc. | | | | | | | | |
6.70%, 01/15/28a | | | 100 | | | | 131,996 | |
| | | | | | | | |
| | | | 3,478,206 | |
MANUFACTURING — 0.89% | | | | | |
3M Co. | | | | | | | | |
3.88%, 06/15/44 | | | 291 | | | | 296,800 | |
5.70%, 03/15/37 | | | 286 | | | | 361,828 | |
6.38%, 02/15/28 | | | 40 | | | | 53,568 | |
Dover Corp. | | | | | | | | |
5.38%, 03/01/41 (Call 12/01/40) | | | 365 | | | | 428,766 | |
Eaton Corp. | | | | | | | | |
4.00%, 11/02/32 | | | 723 | | | | 710,891 | |
4.15%, 11/02/42a | | | 116 | | | | 110,597 | |
General Electric Co. | | | | | | | | |
4.13%, 10/09/42 | | | 571 | | | | 574,229 | |
4.50%, 03/11/44 | | | 1,359 | | | | 1,439,751 | |
Illinois Tool Works Inc. | | | | | | | | |
3.90%, 09/01/42 (Call 03/01/42)a | | | 714 | | | | 697,863 | |
4.88%, 09/15/41 (Call 03/15/41) | | | 163 | | | | 182,116 | |
| | | | | | | | |
Security | | Principal
(000s) | | | Value | |
Ingersoll-Rand Global Holding Co. Ltd. | | | | | | | | |
5.75%, 06/15/43 | | $ | 236 | | | $ | 267,553 | |
Ingersoll-Rand Luxembourg Finance SA | | | | | | | | |
4.65%, 11/01/44 (Call 05/01/44) | | | 200 | | | | 196,575 | |
Parker-Hannifin Corp. | | | | | | | | |
4.20%, 11/21/34 (Call 05/21/34) | | | 336 | | | | 346,835 | |
4.45%, 11/21/44 (Call 05/21/44)a | | | 278 | | | | 293,221 | |
Series A | | | | | | | | |
6.25%, 05/15/38 | | | 100 | | | | 129,756 | |
Tyco Electronics Group SA | | | | | | | | |
7.13%, 10/01/37 | | | 236 | | | | 306,969 | |
Tyco International Finance SA | | | | | | | | |
3.90%, 02/14/26 (Call 11/14/25) | | | 305 | | | | 308,914 | |
5.13%, 09/14/45 (Call 03/14/45) | | | 264 | | | | 270,671 | |
| | | | | | | | |
| | | | 6,976,903 | |
MEDIA — 5.54% | |
21st Century Fox America Inc. | | | | | | | | |
4.75%, 09/15/44 (Call 03/15/44) | | | 859 | | | | 803,066 | |
4.95%, 10/15/45 (Call 04/15/45) | | | 476 | | | | 463,018 | |
5.40%, 10/01/43 | | | 426 | | | | 422,374 | |
6.15%, 02/15/41 | | | 446 | | | | 487,671 | |
6.20%, 12/15/34 | | | 690 | | | | 771,188 | |
6.40%, 12/15/35 | | | 202 | | | | 230,097 | |
6.55%, 03/15/33 | | | 656 | | | | 758,539 | |
6.65%, 11/15/37 | | | 475 | | | | 556,407 | |
6.90%, 08/15/39 | | | 11 | | | | 12,525 | |
7.75%, 12/01/45 | | | 308 | | | | 400,091 | |
7.85%, 03/01/39 | | | 225 | | | | 294,969 | |
8.15%, 10/17/36 | | | 100 | | | | 133,801 | |
CBS Corp. | | | | | | | | |
4.60%, 01/15/45 (Call 07/15/44) | | | 200 | | | | 172,040 | |
4.85%, 07/01/42 (Call 01/01/42) | | | 130 | | | | 114,861 | |
4.90%, 08/15/44 (Call 02/15/44) | | | 100 | | | | 88,930 | |
5.50%, 05/15/33 | | | 624 | | | | 623,275 | |
5.90%, 10/15/40 (Call 04/15/40) | | | 211 | | | | 212,074 | |
7.88%, 07/30/30a | | | 438 | | | | 561,427 | |
CCO Safari II LLC | | | | | | | | |
6.38%, 10/23/35 (Call 04/23/35)b | | | 801 | | | | 837,549 | |
6.48%, 10/23/45 (Call 04/23/45)b | | | 1,790 | | | | 1,880,498 | |
6.83%, 10/23/55 (Call 04/23/55)b | | | 321 | | | | 329,628 | |
| | |
| 86 | | 2016 iSHARES ANNUAL REPORTTO SHAREHOLDERS |
Schedule of Investments (Continued)
iSHARES® 10+ YEAR CREDIT BOND ETF
February 29, 2016
| | | | | | | | |
Security | | Principal
(000s) | | | Value | |
Comcast Corp. | | | | | | | | |
4.20%, 08/15/34 (Call 02/15/34) | | $ | 1,060 | | | $ | 1,074,749 | |
4.25%, 01/15/33 | | | 992 | | | | 1,009,988 | |
4.50%, 01/15/43 | | | 711 | | | | 732,379 | |
4.60%, 08/15/45 (Call 02/15/45) | | | 1,150 | | | | 1,214,736 | |
4.65%, 07/15/42 | | | 877 | | | | 923,713 | |
4.75%, 03/01/44 | | | 1,316 | | | | 1,414,181 | |
5.65%, 06/15/35 | | | 11 | | | | 12,965 | |
6.40%, 05/15/38 | | | 136 | | | | 172,041 | |
6.40%, 03/01/40 | | | 16 | | | | 20,407 | |
6.45%, 03/15/37 | | | 298 | | | | 376,035 | |
6.50%, 11/15/35 | | | 511 | | | | 650,631 | |
6.55%, 07/01/39 | | | 14 | | | | 18,289 | |
6.95%, 08/15/37 | | | 633 | | | | 842,886 | |
7.05%, 03/15/33 | | | 161 | | | | 213,164 | |
DIRECTV Holdings LLC/DIRECTV Financing Co. Inc. | | | | | | | | |
5.15%, 03/15/42 | | | 1,066 | | | | 999,300 | |
6.00%, 08/15/40 (Call 05/15/40) | | | 226 | | | | 233,042 | |
6.35%, 03/15/40 | | | 325 | | | | 356,535 | |
6.38%, 03/01/41 | | | 536 | | | | 586,957 | |
Discovery Communications LLC | | | | | | | | |
4.88%, 04/01/43 | | | 181 | | | | 144,718 | |
6.35%, 06/01/40a | | | 750 | | | | 717,808 | |
Grupo Televisa SAB | | | | | | | | |
5.00%, 05/13/45 (Call 11/13/44) | | | 586 | | | | 499,984 | |
6.63%, 01/15/40 | | | 271 | | | | 280,760 | |
Historic TW Inc. | | | | | | | | |
6.63%, 05/15/29 | | | 1,280 | | | | 1,473,630 | |
NBCUniversal Media LLC | | | | | | | | |
4.45%, 01/15/43 | | | 816 | | | | 827,653 | |
5.95%, 04/01/41 | | | 549 | | | | 673,656 | |
6.40%, 04/30/40 | | | 832 | | | | 1,057,635 | |
TCI Communications Inc. | | | | | | | | |
7.13%, 02/15/28 | | | 200 | | | | 263,613 | |
7.88%, 02/15/26 | | | 370 | | | | 507,284 | |
Thomson Reuters Corp. | | | | | | | | |
5.50%, 08/15/35 | | | 150 | | | | 152,519 | |
5.65%, 11/23/43 (Call 05/23/43) | | | 186 | | | | 188,324 | |
5.85%, 04/15/40 | | | 616 | | | | 643,746 | |
Time Warner Cable Inc. | | | | | | | | |
4.50%, 09/15/42 (Call 03/15/42) | | | 300 | | | | 243,000 | |
5.50%, 09/01/41 (Call 03/01/41) | | | 492 | | | | 430,586 | |
| | | | | | | | |
Security | | Principal
(000s) | | | Value | |
5.88%, 11/15/40 (Call 05/15/40) | | $ | 720 | | | $ | 651,893 | |
6.55%, 05/01/37 | | | 317 | | | | 314,822 | |
6.75%, 06/15/39 | | | 811 | | | | 805,272 | |
7.30%, 07/01/38 | | | 850 | | | | 892,344 | |
Time Warner Companies Inc. | | | | | | | | |
6.95%, 01/15/28 | | | 21 | | | | 25,279 | |
Time Warner Entertainment Co. LP | | | | | | | | |
8.38%, 07/15/33 | | | 973 | | | | 1,148,767 | |
Time Warner Inc. | | | | | | | | |
4.65%, 06/01/44 (Call 12/01/43) | | | 1,366 | | | | 1,207,540 | |
4.85%, 07/15/45 (Call 01/15/45) | | | 357 | | | | 332,701 | |
4.90%, 06/15/42 | | | 243 | | | | 219,416 | |
5.35%, 12/15/43 | | | 466 | | | | 452,210 | |
5.38%, 10/15/41 | | | 200 | | | | 193,646 | |
6.10%, 07/15/40 | | | 175 | | | | 180,405 | |
6.20%, 03/15/40 | | | 14 | | | | 14,518 | |
6.25%, 03/29/41a | | | 286 | | | | 302,503 | |
6.50%, 11/15/36 | | | 413 | | | | 441,853 | |
7.63%, 04/15/31 | | | 508 | | | | 615,395 | |
7.70%, 05/01/32 | | | 764 | | | | 918,505 | |
Verizon Communications Inc. | | | | | | | | |
4.52%, 09/15/48 | | | 1,100 | | | | 1,001,192 | |
4.67%, 03/15/55 | | | 1,174 | | | | 1,028,672 | |
Viacom Inc. | | | | | | | | |
4.38%, 03/15/43 | | | 900 | | | | 602,176 | |
4.50%, 02/27/42 | | | 125 | | | | 86,583 | |
4.85%, 12/15/34 (Call 06/15/34) | | | 310 | | | | 241,171 | |
4.88%, 06/15/43 (Call 12/15/42) | | | 100 | | | | 72,759 | |
5.25%, 04/01/44 (Call 10/01/43) | | | 325 | | | | 253,214 | |
5.85%, 09/01/43 (Call 03/01/43) | | | 625 | | | | 521,999 | |
6.88%, 04/30/36 | | | 290 | | | | 276,769 | |
Walt Disney Co. (The) | | | | | | | | |
4.13%, 06/01/44 | | | 250 | | | | 259,580 | |
4.38%, 08/16/41 | | | 505 | | | | 542,664 | |
7.00%, 03/01/32 | | | 266 | | | | 378,925 | |
Series E | | | | | | | | |
4.13%, 12/01/41 | | | 412 | | | | 427,659 | |
| | | | | | | | |
| | | | 43,521,374 | |
METAL FABRICATE & HARDWARE — 0.12% | | | | | |
Precision Castparts Corp. | | | | | | | | |
3.90%, 01/15/43 (Call 07/15/42) | | | 166 | | | | 165,189 | |
4.20%, 06/15/35 (Call 12/15/34) | | | 500 | | | | 523,931 | |
4.38%, 06/15/45 (Call 12/15/44) | | | 11 | | | | 11,780 | |
| | | | |
SCHEDULEOF INVESTMENTS | | | 87 | |
Schedule of Investments (Continued)
iSHARES® 10+ YEAR CREDIT BOND ETF
February 29, 2016
| | | | | | | | |
Security | | Principal
(000s) | | | Value | |
Valmont Industries Inc. | | | | | | | | |
5.00%, 10/01/44 (Call 04/01/44) | | $ | 80 | | | $ | 71,526 | |
5.25%, 10/01/54 (Call 04/01/54) | | | 230 | | | | 197,799 | |
| | | | | | | | |
| | | | 970,225 | |
MINING — 1.07% | | | | | |
Barrick Gold Corp. | | | | | | | | |
5.25%, 04/01/42 | | | 360 | | | | 276,516 | |
Barrick North America Finance LLC | | | | | | | | |
5.70%, 05/30/41 | | | 575 | | | | 452,519 | |
5.75%, 05/01/43 | | | 200 | | | | 164,379 | |
7.50%, 09/15/38 | | | 27 | | | | 23,678 | |
Barrick PD Australia Finance Pty Ltd. | | | | | | | | |
5.95%, 10/15/39 | | | 605 | | | | 487,201 | |
BHP Billiton Finance USA Ltd. | | | | | | | | |
4.13%, 02/24/42 | | | 930 | | | | 793,137 | |
5.00%, 09/30/43 | | | 1,023 | | | | 991,745 | |
Goldcorp Inc. | | | | | | | | |
5.45%, 06/09/44 (Call 12/09/43) | | | 161 | | | | 138,138 | |
Newmont Mining Corp. | | | | | | | | |
4.88%, 03/15/42 (Call 09/15/41) | | | 235 | | | | 183,454 | |
5.88%, 04/01/35 | | | 176 | | | | 149,421 | |
6.25%, 10/01/39 | | | 904 | | | | 801,590 | |
Rio Tinto Alcan Inc. | | | | | | | | |
5.75%, 06/01/35 | | | 11 | | | | 10,798 | |
6.13%, 12/15/33 | | | 11 | | | | 11,257 | |
7.25%, 03/15/31 | | | 225 | | | | 242,353 | |
Rio Tinto Finance USA Ltd. | | | | | | | | |
5.20%, 11/02/40a | | | 900 | | | | 850,985 | |
7.13%, 07/15/28 | | | 292 | | | | 330,186 | |
Rio Tinto Finance USA PLC | | | | | | | | |
4.13%, 08/21/42 (Call 02/21/42) | | | 731 | | | | 613,185 | |
4.75%, 03/22/42 (Call 09/22/41) | | | 55 | | | | 49,605 | |
Southern Copper Corp. | | | | | | | | |
5.25%, 11/08/42 | | | 610 | | | | 458,263 | |
5.88%, 04/23/45 | | | 375 | | | | 298,125 | |
6.75%, 04/16/40 | | | 800 | | | | 707,000 | |
7.50%, 07/27/35a | | | 388 | | | | 368,115 | |
Vale Canada Ltd. | | | | | | | | |
7.20%, 09/15/32 | | | 50 | | | | 27,000 | |
| | | | | | | | |
| | | | 8,428,650 | |
OFFICE & BUSINESS EQUIPMENT — 0.04% | | | | | |
Xerox Corp. | | | | | | | | |
4.80%, 03/01/35a | | | 161 | | | | 151,255 | |
| | | | | | | | |
Security | | Principal
(000s) | | | Value | |
6.75%, 12/15/39 | | $ | 175 | | | $ | 146,859 | |
| | | | | | | | |
| | | | 298,114 | |
OIL & GAS — 5.12% | | | | | |
Anadarko Finance Co. | | | | | | | | |
7.50%, 05/01/31 | | | 400 | | | | 358,646 | |
Anadarko Petroleum Corp. | | | | | | | | |
4.50%, 07/15/44 (Call 01/15/44) | | | 325 | | | | 222,116 | |
6.20%, 03/15/40 | | | 805 | | | | 636,389 | |
6.45%, 09/15/36 | | | 730 | | | | 609,758 | |
Apache Corp. | | | | | | | | |
4.25%, 01/15/44 (Call 07/15/43) | | | 225 | | | | 159,980 | |
4.75%, 04/15/43 (Call 10/15/42) | | | 1,025 | | | | 775,538 | |
5.10%, 09/01/40 (Call 03/01/40) | | | 280 | | | | 204,914 | |
6.00%, 01/15/37 | | | 911 | | | | 750,534 | |
Burlington Resources Finance Co. | | | | | | | | |
7.20%, 08/15/31 | | | 284 | | | | 299,176 | |
7.40%, 12/01/31 | | | 591 | | | | 640,346 | |
Canadian Natural Resources Ltd. | | | | | | | | |
5.85%, 02/01/35 | | | 225 | | | | 162,000 | |
6.25%, 03/15/38 | | | 900 | | | | 666,000 | |
6.45%, 06/30/33 | | | 200 | | | | 151,000 | |
Cenovus Energy Inc. | | | | | | | | |
4.45%, 09/15/42 (Call 03/15/42) | | | 65 | | | | 36,887 | |
CNOOC Nexen Finance 2014 ULC | | | | | | | | |
4.88%, 04/30/44 | | | 1,200 | | | | 1,240,218 | |
Conoco Funding Co. | | | | | | | | |
7.25%, 10/15/31 | | | 297 | | | | 314,381 | |
ConocoPhillips | | | | | | | | |
5.90%, 10/15/32 | | | 13 | | | | 12,201 | |
6.50%, 02/01/39 | | | 656 | | | | 649,808 | |
ConocoPhillips Canada Funding Co. I | | | | | | | | |
5.95%, 10/15/36 | | | 200 | | | | 187,375 | |
ConocoPhillips Co. | | | | | | | | |
4.15%, 11/15/34 (Call 05/15/34) | | | 415 | | | | 339,083 | |
4.30%, 11/15/44 (Call 05/15/44)a | | | 725 | | | | 581,511 | |
ConocoPhillips Holding Co. | | | | | | | | |
6.95%, 04/15/29 | | | 1,491 | | | | 1,570,892 | |
Devon Energy Corp. | | | | | | | | |
4.75%, 05/15/42 (Call 11/15/41) | | | 1,575 | | | | 1,028,053 | |
5.00%, 06/15/45 (Call 12/15/44) | | | 350 | | | | 228,828 | |
5.60%, 07/15/41 (Call 01/15/41) | | | 125 | | | | 84,554 | |
7.95%, 04/15/32 | | | 80 | | | | 63,204 | |
Devon Financing Co. LLC | | | | | | | | |
7.88%, 09/30/31 | | | 200 | | | | 157,686 | |
| | |
| 88 | | 2016 iSHARES ANNUAL REPORTTO SHAREHOLDERS |
Schedule of Investments (Continued)
iSHARES® 10+ YEAR CREDIT BOND ETF
February 29, 2016
| | | | | | | | |
Security | | Principal
(000s) | | | Value | |
Diamond Offshore Drilling Inc. | | | | | | | | |
4.88%, 11/01/43 (Call 05/01/43)a | | $ | 260 | | | $ | 150,800 | |
5.70%, 10/15/39a | | | 150 | | | | 94,500 | |
Ecopetrol SA | | | | | | | | |
5.38%, 06/26/26 (Call 03/26/26) | | | 300 | | | | 243,750 | |
5.88%, 05/28/45 | | | 300 | | | | 211,125 | |
7.38%, 09/18/43 | | | 1,100 | | | | 874,500 | |
Eni USA Inc. | | | | | | | | |
7.30%, 11/15/27 | | | 205 | | | | 235,726 | |
Ensco PLC | | | | | | | | |
5.75%, 10/01/44 (Call 04/01/44) | | | 625 | | | | 293,750 | |
EOG Resources Inc. | | | | | | | | |
3.90%, 04/01/35 (Call 10/01/34) | | | 396 | | | | 323,329 | |
5.10%, 01/15/36 (Call 07/15/35) | | | 275 | | | | 259,889 | |
Exxon Mobil Corp. | | | | | | | | |
3.57%, 03/06/45 (Call 09/06/44) | | | 34 | | | | 31,432 | |
4.11%, 03/01/46 | | | 145 | | | | 145,000 | |
Hess Corp. | | | | | | | | |
5.60%, 02/15/41 | | | 301 | | | | 215,701 | |
6.00%, 01/15/40 | | | 200 | | | | 149,059 | |
7.13%, 03/15/33 | | | 225 | | | | 186,711 | |
7.30%, 08/15/31 | | | 1,012 | | | | 865,938 | |
7.88%, 10/01/29 | | | 174 | | | | 155,794 | |
Kerr-McGee Corp. | | | | | | | | |
7.88%, 09/15/31 | | | 14 | | | | 12,758 | |
Marathon Oil Corp. | | | | | | | | |
5.20%, 06/01/45 (Call 12/01/44) | | | 250 | | | | 148,750 | |
6.60%, 10/01/37 | | | 630 | | | | 415,800 | |
6.80%, 03/15/32 | | | 26 | | | | 17,940 | |
Marathon Petroleum Corp. | | | | | | | | |
4.75%, 09/15/44 (Call 03/15/44) | | | 650 | | | | 416,122 | |
5.00%, 09/15/54 (Call 03/15/54) | | | 200 | | | | 122,293 | |
5.85%, 12/15/45 (Call 06/15/45) | | | 125 | | | | 90,726 | |
6.50%, 03/01/41 (Call 09/01/40) | | | 365 | | | | 284,903 | |
Murphy Oil Corp. | | | | | | | | |
7.05%, 05/01/29 | | | 200 | | | | 110,000 | |
Nexen Energy ULC | | | | | | | | |
6.40%, 05/15/37 | | | 324 | | | | 372,811 | |
7.50%, 07/30/39 | | | 375 | | | | 472,095 | |
7.88%, 03/15/32 | | | 160 | | | | 206,443 | |
Noble Energy Inc. | | | | | | | | |
5.25%, 11/15/43 (Call 05/15/43) | | | 570 | | | | 423,283 | |
6.00%, 03/01/41 (Call 09/01/40) | | | 785 | | | | 612,215 | |
| | | | | | | | |
Security | | Principal
(000s) | | | Value | |
Noble Holding International Ltd. | | | | | | | | |
5.25%, 03/15/42 | | $ | 460 | | | $ | 179,400 | |
6.05%, 03/01/41 | | | 125 | | | | 52,500 | |
6.20%, 08/01/40 | | | 30 | | | | 12,600 | |
6.95%, 04/01/45 (Call 10/01/44) | | | 200 | | | | 90,000 | |
Occidental Petroleum Corp. | | | | | | | | |
4.63%, 06/15/45 (Call 12/15/44) | | | 214 | | | | 204,573 | |
Petro-Canada | | | | | | | | |
5.35%, 07/15/33 | | | 125 | | | | 101,105 | |
5.95%, 05/15/35 | | | 11 | | | | 9,367 | |
6.80%, 05/15/38 | | | 812 | | | | 750,068 | |
Petroleos Mexicanos | | | | | | | | |
5.50%, 06/27/44 | | | 825 | | | | 636,192 | |
5.50%, 06/27/44b | | | 1,750 | | | | 1,346,157 | |
5.63%, 01/23/46b | | | 1,100 | | | | 859,657 | |
6.38%, 01/23/45 | | | 1,050 | | | | 911,194 | |
6.50%, 06/02/41 | | | 750 | | | | 657,859 | |
6.63%, 06/15/35 | | | 1,755 | | | | 1,591,250 | |
6.63%, 06/15/38 | | | 300 | | | | 257,193 | |
Phillips 66 | | | | | | | | |
4.65%, 11/15/34 (Call 05/15/34) | | | 379 | | | | 347,446 | |
4.88%, 11/15/44 (Call 05/15/44) | | | 1,168 | | | | 1,061,623 | |
5.88%, 05/01/42 | | | 365 | | | | 351,542 | |
Rowan Companies Inc. | | | | | | | | |
5.40%, 12/01/42 (Call 06/01/42) | | | 25 | | | | 12,375 | |
5.85%, 01/15/44 (Call 07/15/43) | | | 350 | | | | 178,500 | |
Shell International Finance BV | | | | | | | | |
4.13%, 05/11/35 | | | 585 | | | | 545,566 | |
4.38%, 05/11/45 | | | 1,225 | | | | 1,132,817 | |
4.55%, 08/12/43 | | | 1,731 | | | | 1,637,631 | |
5.50%, 03/25/40 | | | 346 | | | | 367,049 | |
6.38%, 12/15/38 | | | 913 | | | | 1,053,872 | |
Statoil ASA | | | | | | | | |
3.95%, 05/15/43 | | | 850 | | | | 728,203 | |
4.25%, 11/23/41 | | | 250 | | | | 226,036 | |
4.80%, 11/08/43 | | | 150 | | | | 147,513 | |
5.10%, 08/17/40 | | | 380 | | | | 387,497 | |
6.50%, 12/01/28b | | | 100 | | | | 125,463 | |
6.80%, 01/15/28 | | | 75 | | | | 90,794 | |
7.15%, 01/15/29 | | | 100 | | | | 124,654 | |
Suncor Energy Inc. | | | | | | | | |
5.95%, 12/01/34 | | | 150 | | | | 127,982 | |
6.50%, 06/15/38a | | | 456 | | | | 413,305 | |
6.85%, 06/01/39 | | | 670 | | | | 621,639 | |
| | | | |
SCHEDULEOF INVESTMENTS | | | 89 | |
Schedule of Investments (Continued)
iSHARES® 10+ YEAR CREDIT BOND ETF
February 29, 2016
| | | | | | | | |
Security | | Principal
(000s) | | | Value | |
Tosco Corp. | | | | | | | | |
7.80%, 01/01/27 | | $ | 364 | | | $ | 399,117 | |
8.13%, 02/15/30 | | | 61 | | | | 68,613 | |
Valero Energy Corp. | | | | | | | | |
4.90%, 03/15/45a | | | 340 | | | | 272,728 | |
6.63%, 06/15/37 | | | 1,002 | | | | 986,747 | |
7.50%, 04/15/32 | | | 278 | | | | 295,169 | |
10.50%, 03/15/39 | | | 11 | | | | 13,859 | |
XTO Energy Inc. | | | | | | | | |
6.75%, 08/01/37 | | | 411 | | | | 563,098 | |
| | | | | | | | |
| | | | 40,214,174 | |
OIL & GAS SERVICES — 0.59% | | | | | |
Baker Hughes Inc. | | | | | | | | |
5.13%, 09/15/40 | | | 390 | | | | 343,734 | |
6.88%, 01/15/29 | | | 664 | | | | 734,981 | |
Cameron International Corp. | | | | | | | | |
5.13%, 12/15/43 (Call 06/15/43) | | | 350 | | | | 326,228 | |
5.95%, 06/01/41 (Call 12/01/40) | | | 16 | | | | 16,186 | |
Halliburton Co. | | | | | | | | |
4.50%, 11/15/41 (Call 05/15/41) | | | 422 | | | | 339,092 | |
4.75%, 08/01/43 (Call 02/01/43) | | | 725 | | | | 602,968 | |
4.85%, 11/15/35 (Call 05/15/35) | | | 1,025 | | | | 915,897 | |
5.00%, 11/15/45 (Call 05/15/45) | | | 15 | | | | 13,194 | |
6.70%, 09/15/38 | | | 21 | | | | 22,108 | |
7.45%, 09/15/39 | | | 851 | | | | 969,122 | |
National Oilwell Varco Inc. | | | | | | | | |
3.95%, 12/01/42 (Call 06/01/42)a | | | 530 | | | | 361,637 | |
| | | | | | | | |
| | | | 4,645,147 | |
PACKAGING & CONTAINERS — 0.04% | | | | | |
Sonoco Products Co. | | | | | | | | |
5.75%, 11/01/40 (Call 05/01/40) | | | 253 | | | | 279,058 | |
| | | | | | | | |
| | | | 279,058 | |
PHARMACEUTICALS — 4.49% | | | | | |
Abbott Laboratories | | | | | | | | |
5.30%, 05/27/40 | | | 523 | | | | 596,107 | |
6.00%, 04/01/39 | | | 433 | | | | 543,020 | |
AbbVie Inc. | | | | | | | | |
4.40%, 11/06/42 | | | 1,540 | | | | 1,472,393 | |
4.50%, 05/14/35 (Call 11/14/34) | | | 1,370 | | | | 1,362,993 | |
4.70%, 05/14/45 (Call 11/14/44) | | | 866 | | | | 867,341 | |
Actavis Funding SCS | | | | | | | | |
4.55%, 03/15/35 (Call 09/15/34) | | | 1,258 | | | | 1,264,299 | |
4.75%, 03/15/45 (Call 09/15/44)a | | | 1,803 | | | | 1,834,248 | |
| | | | | | | | |
Security | | Principal
(000s) | | | Value | |
4.85%, 06/15/44 (Call 12/15/43) | | $ | 399 | | | $ | 408,849 | |
Actavis Inc. | | | | | | | | |
4.63%, 10/01/42 (Call 04/01/42) | | | 281 | | | | 278,243 | |
AmerisourceBergen Corp. | | | | | | | | |
4.25%, 03/01/45 (Call 09/01/44) | | | 336 | | | | 314,225 | |
AstraZeneca PLC | | | | | | | | |
4.00%, 09/18/42 | | | 455 | | | | 436,312 | |
4.38%, 11/16/45 | | | 460 | | | | 462,670 | |
6.45%, 09/15/37a | | | 1,230 | | | | 1,566,607 | |
Baxalta Inc. | | | | | | | | |
5.25%, 06/23/45 (Call 12/23/44)b | | | 655 | | | | 616,763 | |
Bristol-Myers Squibb Co. | | | | | | | | |
3.25%, 08/01/42 | | | 7 | | | | 6,351 | |
4.50%, 03/01/44 (Call 09/01/43)a | | | 368 | | | | 409,047 | |
5.88%, 11/15/36 | | | 820 | | | | 1,020,457 | |
Cardinal Health Inc. | | | | | | | | |
4.50%, 11/15/44 (Call 05/15/44) | | | 136 | | | | 130,494 | |
4.60%, 03/15/43 | | | 600 | | | | 589,981 | |
Eli Lilly & Co. | | | | | | | | |
3.70%, 03/01/45 (Call 09/01/44)a | | | 482 | | | | 475,267 | |
5.50%, 03/15/27 | | | 459 | | | | 566,575 | |
5.55%, 03/15/37 | | | 166 | | | | 200,773 | |
Express Scripts Holding Co. | | | | | | | | |
6.13%, 11/15/41a | | | 208 | | | | 216,676 | |
GlaxoSmithKline Capital Inc. | | | | | | | | |
4.20%, 03/18/43 | | | 5 | | | | 5,073 | |
5.38%, 04/15/34 | | | 200 | | | | 232,946 | |
6.38%, 05/15/38 | | | 1,708 | | | | 2,194,384 | |
Johnson & Johnson | | | | | | | | |
3.55%, 03/01/36 (Call 09/01/35) | | | 170 | | | | 170,961 | |
3.70%, 03/01/46 (Call 09/01/45) | | | 75 | | | | 75,407 | |
4.38%, 12/05/33 (Call 06/05/33) | | | 1,704 | | | | 1,893,596 | |
4.50%, 09/01/40a | | | 208 | | | | 232,512 | |
4.50%, 12/05/43 (Call 06/05/43)a | | | 179 | | | | 203,124 | |
4.85%, 05/15/41 | | | 11 | | | | 12,942 | |
4.95%, 05/15/33 | | | 261 | | | | 309,231 | |
5.85%, 07/15/38 | | | 63 | | | | 82,800 | |
5.95%, 08/15/37 | | | 218 | | | | 287,883 | |
6.95%, 09/01/29 | | | 14 | | | | 20,119 | |
McKesson Corp. | | | | | | | | |
4.88%, 03/15/44 (Call 09/15/43) | | | 684 | | | | 681,243 | |
6.00%, 03/01/41 (Call 09/01/40) | | | 80 | | | | 90,496 | |
Mead Johnson Nutrition Co. | | | | | | | | |
4.60%, 06/01/44 (Call 12/01/43) | | | 203 | | | | 193,732 | |
| | |
| 90 | | 2016 iSHARES ANNUAL REPORTTO SHAREHOLDERS |
Schedule of Investments (Continued)
iSHARES® 10+ YEAR CREDIT BOND ETF
February 29, 2016
| | | | | | | | |
Security | | Principal
(000s) | | | Value | |
5.90%, 11/01/39 | | $ | 360 | | | $ | 395,107 | |
Merck & Co. Inc. | | | | | | | | |
3.60%, 09/15/42 (Call 03/15/42) | | | 11 | | | | 10,319 | |
3.70%, 02/10/45 (Call 08/10/44) | | | 1,424 | | | | 1,353,531 | |
4.15%, 05/18/43 | | | 240 | | | | 245,534 | |
6.50%, 12/01/33 | | | 364 | | | | 478,301 | |
6.55%, 09/15/37 | | | 107 | | | | 143,152 | |
Merck Sharp & Dohme Corp. | | | | | | | | |
5.75%, 11/15/36 | | | 700 | | | | 859,002 | |
5.85%, 06/30/39 | | | 11 | | | | 13,758 | |
5.95%, 12/01/28 | | | 506 | | | | 645,137 | |
Mylan Inc. | | | | | | | | |
5.40%, 11/29/43 (Call 05/29/43) | | | 247 | | | | 219,186 | |
Novartis Capital Corp. | | | | | | | | |
3.70%, 09/21/42 | | | 363 | | | | 353,415 | |
4.00%, 11/20/45 (Call 05/20/45)a | | | 21 | | | | 21,401 | |
4.40%, 05/06/44 | | | 1,350 | | | | 1,457,537 | |
Perrigo Co. PLC | | | | | | | | |
5.30%, 11/15/43 (Call 05/15/43) | | | 250 | | | | 239,156 | |
Perrigo Finance Unlimited Co. | | | | | | | | |
4.90%, 12/15/44 (Call 06/15/44) | | | 221 | | | | 198,708 | |
Pfizer Inc. | | | | | | | | |
4.30%, 06/15/43 | | | 196 | | | | 202,074 | |
4.40%, 05/15/44a | | | 281 | | | | 294,532 | |
5.60%, 09/15/40 | | | 100 | | | | 119,422 | |
7.20%, 03/15/39 | | | 1,802 | | | | 2,508,400 | |
Pharmacia Corp. | | | | | | | | |
6.60%, 12/01/28 | | | 650 | | | | 860,420 | |
Teva Pharmaceutical Finance Co. LLC | | | | | | | | |
6.15%, 02/01/36a | | | 426 | | | | 464,138 | |
Wyeth LLC | | | | | | | | |
5.95%, 04/01/37 | | | 1,030 | | | | 1,262,429 | |
6.00%, 02/15/36 | | | 21 | | | | 25,879 | |
6.50%, 02/01/34 | | | 18 | | | | 23,283 | |
Zoetis Inc. | | | | | | | | |
4.70%, 02/01/43 (Call 08/01/42) | | | 590 | | | | 515,876 | |
| | | | | | | | |
| | | | 35,235,837 | |
PIPELINES — 2.97% | | | | | |
Buckeye Partners LP | | | | | | | | |
5.60%, 10/15/44 (Call 04/15/44) | | | 100 | | | | 75,035 | |
5.85%, 11/15/43 (Call 05/15/43) | | | 445 | | | | 330,796 | |
CenterPoint Energy Resources Corp. | | | | | | | | |
5.85%, 01/15/41 (Call 07/15/40) | | | 269 | | | | 292,602 | |
| | | | | | | | |
Security | | Principal
(000s) | | | Value | |
6.63%, 11/01/37 | | $ | 11 | | | $ | 12,770 | |
Colonial Pipeline Co. | | | | | | | | |
4.20%, 04/15/43 (Call 10/15/42)b | | | 25 | | | | 21,968 | |
Columbia Pipeline Group Inc. | | | | | | | | |
5.80%, 06/01/45 (Call 12/01/44)b | | | 25 | | | | 21,122 | |
El Paso Natural Gas Co. LLC | | | | | | | | |
8.38%, 06/15/32 | | | 11 | | | | 10,680 | |
Enable Midstream Partners LP | | | | | | | | |
5.00%, 05/15/44 (Call 11/15/43) | | | 125 | | | | 71,250 | |
Enbridge Energy Partners LP Series B | | | | | | | | |
7.50%, 04/15/38 | | | 481 | | | | 411,255 | |
Enbridge Inc. | | | | | | | | |
4.50%, 06/10/44 (Call 12/10/43) | | | 200 | | | | 143,328 | |
Energy Transfer Partners LP | | | | | | | | |
4.90%, 03/15/35 (Call 09/15/34) | | | 230 | | | | 166,935 | |
5.15%, 02/01/43 (Call 08/01/42)a | | | 355 | | | | 257,174 | |
5.15%, 03/15/45 (Call 09/15/44)a | | | 500 | | | | 363,627 | |
6.05%, 06/01/41 (Call 12/01/40) | | | 136 | | | | 105,484 | |
6.13%, 12/15/45 (Call 06/15/45) | | | 450 | | | | 369,381 | |
6.50%, 02/01/42 (Call 08/01/41) | | | 1,130 | | | | 923,818 | |
6.63%, 10/15/36 | | | 145 | | | | 121,692 | |
7.50%, 07/01/38 | | | 11 | | | | 9,997 | |
8.25%, 11/15/29 (Call 08/15/29) | | | 50 | | | | 50,025 | |
EnLink Midstream Partners LP | | | | | | | | |
5.60%, 04/01/44 (Call 10/01/43) | | | 200 | | | | 122,000 | |
Enterprise Products Operating LLC | | | | | | | | |
3.70%, 02/15/26 (Call 11/15/25)a | | | 600 | | | | 562,214 | |
4.45%, 02/15/43 (Call 08/15/42) | | | 725 | | | | 587,331 | |
4.85%, 08/15/42 (Call 02/15/42) | | | 125 | | | | 106,643 | |
4.85%, 03/15/44 (Call 09/15/43) | | | 750 | | | | 637,240 | |
4.90%, 05/15/46 (Call 11/15/45) | | | 495 | | | | 434,368 | |
4.95%, 10/15/54 (Call 04/15/54) | | | 950 | | | | 741,486 | |
5.10%, 02/15/45 (Call 08/15/44) | | | 200 | | | | 176,411 | |
5.70%, 02/15/42 | | | 470 | | | | 436,445 | |
5.95%, 02/01/41 | | | 198 | | | | 187,912 | |
6.13%, 10/15/39 | | | 145 | | | | 139,147 | |
7.55%, 04/15/38 | | | 212 | | | | 233,664 | |
Series D | | | | | | | | |
6.88%, 03/01/33 | | | 264 | | | | 276,608 | |
Series H | | | | | | | | |
6.65%, 10/15/34 | | | 111 | | | | 113,865 | |
Kinder Morgan Energy Partners LP | | | | | | | | |
4.70%, 11/01/42 (Call 05/01/42) | | | 115 | | | | 84,223 | |
| | | | |
SCHEDULEOF INVESTMENTS | | | 91 | |
Schedule of Investments (Continued)
iSHARES® 10+ YEAR CREDIT BOND ETF
February 29, 2016
| | | | | | | | |
Security | | Principal
(000s) | | | Value | |
5.00%, 08/15/42 (Call 02/15/42) | | $ | 250 | | | $ | 192,350 | |
5.40%, 09/01/44 (Call 03/01/44) | | | 360 | | | | 288,933 | |
5.50%, 03/01/44 (Call 09/01/43) | | | 250 | | | | 203,979 | |
5.80%, 03/15/35 | | | 825 | | | | 669,018 | |
6.38%, 03/01/41 | | | 230 | | | | 192,876 | |
6.55%, 09/15/40 | | | 100 | | | | 83,958 | |
6.95%, 01/15/38 | | | 522 | | | | 465,265 | |
7.30%, 08/15/33 | | | 11 | | | | 9,986 | |
7.40%, 03/15/31 | | | 118 | | | | 110,971 | |
7.50%, 11/15/40 | | | 416 | | | | 372,859 | |
7.75%, 03/15/32 | | | 100 | | | | 93,826 | |
Kinder Morgan Inc./DE | | | | | | | | |
5.05%, 02/15/46 (Call 08/15/45) | | | 325 | | | | 252,304 | |
5.30%, 12/01/34 (Call 06/01/34) | | | 1,950 | | | | 1,544,781 | |
5.55%, 06/01/45 (Call 12/01/44) | | | 1,450 | | | | 1,195,831 | |
7.75%, 01/15/32 | | | 25 | | | | 23,987 | |
Magellan Midstream Partners LP | | | | | | | | |
4.20%, 12/01/42 (Call 06/01/42) | | | 200 | | | | 153,205 | |
4.20%, 03/15/45 (Call 09/15/44) | | | 200 | | | | 153,935 | |
5.15%, 10/15/43 (Call 04/15/43) | | | 250 | | | | 213,158 | |
ONEOK Partners LP | | | | | | | | |
6.13%, 02/01/41 (Call 08/01/40) | | | 565 | | | | 415,081 | |
6.20%, 09/15/43 (Call 03/15/43) | | | 25 | | | | 18,383 | |
6.65%, 10/01/36 | | | 50 | | | | 38,843 | |
6.85%, 10/15/37 | | | 400 | | | | 315,178 | |
Plains All American Pipeline LP/PAA Finance Corp. | | | | | | | | |
4.70%, 06/15/44 (Call 12/15/43) | | | 250 | | | | 164,894 | |
4.90%, 02/15/45 (Call 08/15/44) | | | 325 | | | | 221,177 | |
5.15%, 06/01/42 (Call 12/01/41) | | | 470 | | | | 323,491 | |
6.65%, 01/15/37 | | | 350 | | | | 284,002 | |
Southern Natural Gas Co. LLC | | | | | | | | |
8.00%, 03/01/32 | | | 12 | | | | 11,272 | |
Spectra Energy Capital LLC | | | | | | | | |
7.50%, 09/15/38 | | | 251 | | | | 248,041 | |
Spectra Energy Partners LP | | | | | | | | |
4.50%, 03/15/45 (Call 09/15/44) | | | 250 | | | | 201,349 | |
5.95%, 09/25/43 (Call 03/25/43) | | | 241 | | | | 226,738 | |
Sunoco Logistics Partners Operations LP | | | | | | | | |
4.95%, 01/15/43 (Call 07/15/42) | | | 750 | | | | 523,028 | |
5.30%, 04/01/44 (Call 10/01/43) | | | 303 | | | | 222,303 | |
6.10%, 02/15/42 | | | 175 | | | | 134,832 | |
6.85%, 02/15/40 | | | 16 | | | | 13,444 | |
| | | | | | | | |
Security | | Principal
(000s) | | | Value | |
Texas Eastern Transmission LP | | | | | | | | |
7.00%, 07/15/32 | | $ | 296 | | | $ | 326,246 | |
TransCanada PipeLines Ltd. | | | | | | | | |
4.63%, 03/01/34 (Call 12/01/33) | | | 655 | | | | 596,338 | |
5.00%, 10/16/43 (Call 04/16/43)a | | | 330 | | | | 306,252 | |
5.60%, 03/31/34 | | | 100 | | | | 99,324 | |
5.85%, 03/15/36 | | | 100 | | | | 95,905 | |
6.10%, 06/01/40 | | | 74 | | | | 73,901 | |
6.20%, 10/15/37 | | | 384 | | | | 384,434 | |
7.25%, 08/15/38 | | | 536 | | | | 600,922 | |
7.63%, 01/15/39 | | | 1,025 | | | | 1,186,950 | |
Transcontinental Gas Pipe Line Co. LLC | | | | | | | | |
4.45%, 08/01/42 (Call 02/01/42) | | | 635 | | | | 463,550 | |
5.40%, 08/15/41 (Call 02/15/41) | | | 26 | | | | 20,930 | |
Western Gas Partners LP | | | | | | | | |
5.45%, 04/01/44 (Call 10/01/43) | | | 150 | | | | 99,000 | |
Williams Partners LP | | | | | | | | |
4.90%, 01/15/45 (Call 07/15/44) | | | 495 | | | | 329,175 | |
5.40%, 03/04/44 (Call 09/04/43) | | | 600 | | | | 414,000 | |
5.80%, 11/15/43 (Call 05/15/43) | | | 50 | | | | 35,500 | |
6.30%, 04/15/40 | | | 200 | | | | 150,000 | |
| | | | | | | | |
| | | | 23,364,201 | |
REAL ESTATE INVESTMENT TRUSTS — 0.61% | |
Brandywine Operating Partnership LP | | | | | | | | |
4.55%, 10/01/29 (Call 07/01/29) | | | 5 | | | | 4,954 | |
ERP Operating LP | | | | | | | | |
4.50%, 07/01/44 (Call 01/01/44) | | | 660 | | | | 678,043 | |
Federal Realty Investment Trust | | | | | | | | |
4.50%, 12/01/44 (Call 06/01/44) | | | 111 | | | | 113,509 | |
HCP Inc. | | | | | | | | |
6.75%, 02/01/41 (Call 08/01/40) | | | 230 | | | | 250,085 | |
Kilroy Realty LP | | | | | | | | |
4.25%, 08/15/29 (Call 05/15/29) | | | 14 | | | | 14,225 | |
Kimco Realty Corp. | | | | | | | | |
4.25%, 04/01/45 (Call 10/01/44) | | | 316 | | | | 297,882 | |
Omega Healthcare Investors Inc. | | | | | | | | |
4.50%, 04/01/27 (Call 01/01/27) | | | 302 | | | | 288,237 | |
Realty Income Corp. | | | | | | | | |
4.13%, 10/15/26 (Call 07/15/26) | | | 5 | | | | 5,120 | |
5.88%, 03/15/35 | | | 250 | | | | 282,963 | |
Simon Property Group LP | | | | | | | | |
4.25%, 10/01/44 (Call 04/01/44)a | | | 14 | | | | 13,863 | |
| | |
| 92 | | 2016 iSHARES ANNUAL REPORTTO SHAREHOLDERS |
Schedule of Investments (Continued)
iSHARES® 10+ YEAR CREDIT BOND ETF
February 29, 2016
| | | | | | | | |
Security | | Principal
(000s) | | | Value | |
4.75%, 03/15/42 (Call 09/15/41) | | $ | 300 | | | $ | 316,970 | |
6.75%, 02/01/40 (Call 11/01/39) | | | 550 | | | | 726,184 | |
Ventas Realty LP | | | | | | | | |
4.38%, 02/01/45 (Call 08/01/44) | | | 467 | | | | 421,963 | |
5.70%, 09/30/43 (Call 03/30/43) | | | 11 | | | | 12,206 | |
Welltower Inc. | | | | | | | | |
5.13%, 03/15/43 (Call 09/15/42) | | | 225 | | | | 222,247 | |
6.50%, 03/15/41 (Call 09/15/40) | | | 187 | | | | 217,328 | |
Weyerhaeuser Co. | | | | | | | | |
6.95%, 10/01/27 | | | 278 | | | | 321,463 | |
7.38%, 03/15/32 | | | 541 | | | | 631,675 | |
| | | | | | | | |
| | | | 4,818,917 | |
RETAIL — 4.14% | | | | | |
Bed Bath & Beyond Inc. | | | | | | | | |
4.92%, 08/01/34 (Call 02/01/34) | | | 342 | | | | 288,817 | |
5.17%, 08/01/44 (Call 02/01/44) | | | 175 | | | | 139,026 | |
CVS Health Corp. | | | | | | | | |
4.88%, 07/20/35 (Call 01/20/35) | | | 679 | | | | 730,051 | |
5.13%, 07/20/45 (Call 01/20/45) | | | 1,981 | | | | 2,204,135 | |
5.30%, 12/05/43 (Call 06/05/43) | | | 18 | | | | 20,218 | |
5.75%, 05/15/41 (Call 11/15/40) | | | 11 | | | | 12,660 | |
6.13%, 09/15/39 | | | 746 | | | | 907,322 | |
6.25%, 06/01/27 | | | 471 | | | | 564,264 | |
Darden Restaurants Inc. | | | | | | | | |
7.05%, 10/15/37 | | | 205 | | | | 225,326 | |
Home Depot Inc. (The) | | | | | | | | |
4.20%, 04/01/43 (Call 10/01/42) | | | 21 | | | | 21,649 | |
4.25%, 04/01/46 (Call 10/01/45) | | | 1,050 | | | | 1,093,450 | |
4.40%, 03/15/45 (Call 09/15/44) | | | 776 | | | | 827,194 | |
4.88%, 02/15/44 (Call 08/15/43) | | | 411 | | | | 463,209 | |
5.40%, 09/15/40 (Call 03/15/40) | | | 21 | | | | 25,077 | |
5.88%, 12/16/36 | | | 1,075 | | | | 1,333,311 | |
5.95%, 04/01/41 (Call 10/01/40) | | | 1,013 | | | | 1,290,481 | |
Kohl’s Corp. | | | | | | | | |
5.55%, 07/17/45 (Call 01/17/45) | | | 105 | | | | 90,649 | |
Lowe���s Companies Inc. | | | | | | | | |
4.38%, 09/15/45 (Call 03/15/45) | | | 250 | | | | 261,182 | |
4.65%, 04/15/42 (Call 10/15/41) | | | 439 | | | | 472,705 | |
5.00%, 09/15/43 (Call 03/15/43) | | | 440 | | | | 493,518 | |
5.50%, 10/15/35 | | | 11 | | | | 12,786 | |
5.80%, 10/15/36 | | | 16 | | | | 19,235 | |
5.80%, 04/15/40 (Call 10/15/39) | | | 411 | | | | 498,424 | |
6.65%, 09/15/37 | | | 161 | | | | 211,898 | |
6.88%, 02/15/28 | | | 650 | | | | 857,466 | |
| | | | | | | | |
Security | | Principal
(000s) | | | Value | |
Macy’s Retail Holdings Inc. | | | | | | | | |
4.30%, 02/15/43 (Call 08/15/42) | | $ | 76 | | | $ | 54,042 | |
4.50%, 12/15/34 (Call 06/15/34) | | | 107 | | | | 83,871 | |
5.13%, 01/15/42 (Call 07/15/41) | | | 236 | | | | 187,920 | |
6.38%, 03/15/37a | | | 213 | | | | 200,456 | |
6.70%, 07/15/34a | | | 255 | | | | 249,455 | |
6.90%, 04/01/29 | | | 600 | | | | 657,508 | |
6.90%, 01/15/32 | | | 12 | | | | 13,147 | |
McDonald’s Corp. | | | | | | | | |
3.63%, 05/01/43 | | | 11 | | | | 9,438 | |
3.70%, 02/15/42 | | | 518 | | | | 452,060 | |
4.60%, 05/26/45 (Call 11/26/44) | | | 311 | | | | 311,488 | |
4.70%, 12/09/35 (Call 06/09/35) | | | 100 | | | | 103,473 | |
4.88%, 12/09/45 (Call 06/09/45)a | | | 1,521 | | | | 1,592,911 | |
5.70%, 02/01/39 | | | 50 | | | | 56,138 | |
6.30%, 10/15/37 | | | 360 | | | | 428,890 | |
6.30%, 03/01/38 | | | 365 | | | | 435,561 | |
Nordstrom Inc. | | | | | | | | |
5.00%, 01/15/44 (Call 07/15/43) | | | 277 | | | | 260,742 | |
6.95%, 03/15/28 | | | 180 | | | | 216,148 | |
QVC Inc. | | | | | | | | |
5.45%, 08/15/34 (Call 02/15/34) | | | 418 | | | | 344,305 | |
Starbucks Corp. | | | | | | | | |
4.30%, 06/15/45 (Call 12/15/44) | | | 217 | | | | 233,508 | |
Target Corp. | | | | | | | | |
4.00%, 07/01/42 | | | 1,071 | | | | 1,081,477 | |
6.35%, 11/01/32 | | | 9 | | | | 11,555 | |
6.50%, 10/15/37 | | | 911 | | | | 1,206,781 | |
Tiffany & Co. | | | | | | | | |
4.90%, 10/01/44 (Call 04/01/44) | | | 83 | | | | 76,876 | |
Wal-Mart Stores Inc. | | | | | | | | |
4.00%, 04/11/43 (Call 10/11/42)a | | | 1,061 | | | | 1,064,477 | |
4.30%, 04/22/44 (Call 10/22/43)a | | | 942 | | | | 992,264 | |
4.75%, 10/02/43 (Call 04/02/43) | | | 16 | | | | 17,748 | |
4.88%, 07/08/40 | | | 168 | | | | 187,106 | |
5.00%, 10/25/40 | | | 348 | | | | 393,961 | |
5.25%, 09/01/35 | | | 1,265 | | | | 1,487,214 | |
5.63%, 04/01/40 | | | 16 | | | | 19,379 | |
5.63%, 04/15/41 | | | 289 | | | | 354,082 | |
5.88%, 04/05/27 | | | 21 | | | | 26,454 | |
6.20%, 04/15/38 | | | 1,914 | | | | 2,449,025 | |
6.50%, 08/15/37 | | | 1,764 | | | | 2,322,087 | |
7.55%, 02/15/30 | | | 533 | | | | 765,197 | |
| | | | |
SCHEDULEOF INVESTMENTS | | | 93 | |
Schedule of Investments (Continued)
iSHARES® 10+ YEAR CREDIT BOND ETF
February 29, 2016
| | | | | | | | |
Security | | Principal
(000s) | | | Value | |
Walgreen Co. | | | | | | | | |
4.40%, 09/15/42 | | $ | 125 | | | $ | 107,325 | |
Walgreens Boots Alliance Inc. | | | | | | | | |
4.50%, 11/18/34 (Call 05/18/34) | | | 226 | | | | 204,445 | |
4.80%, 11/18/44 (Call 05/18/44) | | | 919 | | | | 831,530 | |
| | | | | | | | |
| | | | 32,554,097 | |
SEMICONDUCTORS — 0.65% | | | | | |
Analog Devices Inc. | | | | | | | | |
5.30%, 12/15/45 (Call 06/15/45) | | | 87 | | | | 92,098 | |
Applied Materials Inc. | | | | | | | | |
5.10%, 10/01/35 (Call 04/01/35) | | | 420 | | | | 436,698 | |
5.85%, 06/15/41 | | | 311 | | | | 349,175 | |
Intel Corp. | | | | | | | | |
4.00%, 12/15/32 | | | 386 | | | | 393,587 | |
4.25%, 12/15/42 | | | 21 | | | | 20,834 | |
4.80%, 10/01/41 | | | 1,030 | | | | 1,097,824 | |
4.90%, 07/29/45 (Call 01/29/45) | | | 1,201 | | | | 1,300,781 | |
KLA-Tencor Corp. | | | | | | | | |
5.65%, 11/01/34 (Call 07/01/34) | | | 215 | | | | 206,372 | |
QUALCOMM Inc. | | | | | | | | |
4.65%, 05/20/35 (Call 11/20/34) | | | 526 | | | | 493,519 | |
4.80%, 05/20/45 (Call 11/20/44) | | | 760 | | | | 687,138 | |
| | | | | | | | |
| | | | 5,078,026 | |
SOFTWARE — 1.81% | | | | | |
Microsoft Corp. | | | | | | | | |
3.50%, 02/12/35 (Call 08/12/34) | | | 758 | | | | 729,487 | |
3.50%, 11/15/42 | | | 350 | | | | 320,905 | |
3.75%, 05/01/43 (Call 11/01/42) | | | 373 | | | | 357,042 | |
3.75%, 02/12/45 (Call 08/12/44) | | | 178 | | | | 171,006 | |
4.00%, 02/12/55 (Call 08/12/54) | | | 1,523 | | | | 1,420,735 | |
4.20%, 11/03/35 (Call 05/03/35) | | | 521 | | | | 541,963 | |
4.45%, 11/03/45 (Call 05/03/45) | | | 1,201 | | | | 1,278,518 | |
4.50%, 10/01/40 | | | 404 | | | | 432,143 | |
4.75%, 11/03/55 (Call 05/03/55) | | | 371 | | | | 392,265 | |
4.88%, 12/15/43 (Call 06/15/43)a | | | 504 | | | | 566,896 | |
5.20%, 06/01/39 | | | 322 | | | | 375,292 | |
5.30%, 02/08/41 | | | 623 | | | | 735,822 | |
Oracle Corp. | | | | | | | | |
3.25%, 05/15/30 (Call 02/15/30)a | | | 1,336 | | | | 1,303,026 | |
3.90%, 05/15/35 (Call 11/15/34) | | | 750 | | | | 726,305 | |
4.13%, 05/15/45 (Call 11/15/44) | | | 350 | | | | 341,573 | |
4.30%, 07/08/34 (Call 01/08/34) | | | 1,382 | | | | 1,407,946 | |
4.38%, 05/15/55 (Call 11/15/54) | | | 264 | | | | 252,794 | |
| | | | | | | | |
Security | | Principal
(000s) | | | Value | |
4.50%, 07/08/44 (Call 01/08/44) | | $ | 717 | | | $ | 736,611 | |
5.38%, 07/15/40 | | | 819 | | | | 929,673 | |
6.13%, 07/08/39 | | | 996 | | | | 1,226,765 | |
| | | | | | | | |
| | | | 14,246,767 | |
TELECOMMUNICATIONS — 7.58% | | | | | |
Alltel Corp. | | | | | | | | |
7.88%, 07/01/32a | | | 190 | | | | 235,621 | |
America Movil SAB de CV | | | | | | | | |
4.38%, 07/16/42a | | | 643 | | | | 595,110 | |
6.13%, 11/15/37 | | | 125 | | | | 137,913 | |
6.13%, 03/30/40 | | | 1,321 | | | | 1,472,124 | |
6.38%, 03/01/35 | | | 145 | | | | 164,281 | |
AT&T Corp. | | | | | | | | |
8.25%, 11/15/31 | | | 945 | | | | 1,322,228 | |
AT&T Inc. | | | | | | | | |
4.30%, 12/15/42 (Call 06/15/42) | | | 501 | | | | 427,191 | |
4.35%, 06/15/45 (Call 12/15/44) | | | 729 | | | | 622,698 | |
4.50%, 05/15/35 (Call 11/15/34) | | | 1,185 | | | | 1,091,720 | |
4.75%, 05/15/46 (Call 11/15/45) | | | 1,195 | | | | 1,084,824 | |
4.80%, 06/15/44 (Call 12/15/43) | | | 2,070 | | | | 1,882,511 | |
5.35%, 09/01/40 | | | 1,025 | | | | 1,000,442 | |
5.55%, 08/15/41 | | | 307 | | | | 306,587 | |
5.65%, 02/15/47 (Call 08/15/46) | | | 250 | | | | 258,145 | |
6.15%, 09/15/34 | | | 667 | | | | 740,969 | |
6.30%, 01/15/38 | | | 2,328 | | | | 2,513,476 | |
6.40%, 05/15/38 | | | 350 | | | | 380,154 | |
6.45%, 06/15/34 | | | 560 | | | | 620,142 | |
6.50%, 09/01/37a | | | 376 | | | | 417,008 | |
6.55%, 02/15/39 | | | 606 | | | | 673,995 | |
AT&T Mobility LLC | | | | | | | | |
7.13%, 12/15/31 | | | 400 | | | | 494,941 | |
BellSouth Capital Funding Corp. | | | | | | | | |
7.88%, 02/15/30 | | | 36 | | | | 42,729 | |
BellSouth LLC | | | | | | | | |
6.55%, 06/15/34 | | | 261 | | | | 284,105 | |
6.88%, 10/15/31 | | | 311 | | | | 366,550 | |
BellSouth Telecommunications LLC | | | | | | | | |
6.38%, 06/01/28a | | | 200 | | | | 218,393 | |
British Telecommunications PLC | | | | | | | | |
9.63%, 12/15/30 | | | 1,441 | | | | 2,075,830 | |
Cisco Systems Inc. | | | | | | | | |
5.50%, 01/15/40 | | | 1,591 | | | | 1,895,492 | |
5.90%, 02/15/39 | | | 549 | | | | 679,130 | |
| | |
| 94 | | 2016 iSHARES ANNUAL REPORTTO SHAREHOLDERS |
Schedule of Investments (Continued)
iSHARES® 10+ YEAR CREDIT BOND ETF
February 29, 2016
| | | | | | | | |
Security | | Principal
(000s) | | | Value | |
Corning Inc. | | | | | | | | |
4.70%, 03/15/37a | | $ | 75 | | | $ | 72,472 | |
4.75%, 03/15/42 | | | 341 | | | | 325,802 | |
5.75%, 08/15/40 | | | 148 | | | | 157,916 | |
7.25%, 08/15/36 (Call 08/15/26) | | | 205 | | | | 238,717 | |
Deutsche Telekom International Finance BV | | | | | | | | |
8.75%, 06/15/30 | | | 1,580 | | | | 2,211,461 | |
9.25%, 06/01/32 | | | 219 | | | | 324,546 | |
Embarq Corp. | | | | | | | | |
8.00%, 06/01/36 | | | 556 | | | | 533,760 | |
GTE Corp. | | | | | | | | |
6.94%, 04/15/28 | | | 214 | | | | 256,992 | |
Harris Corp. | | | | | | | | |
4.85%, 04/27/35 (Call 10/27/34) | | | 242 | | | | 245,385 | |
5.05%, 04/27/45 (Call 10/27/44) | | | 150 | | | | 153,768 | |
6.15%, 12/15/40 | | | 105 | | | | 119,924 | |
Juniper Networks Inc. | | | | | | | | |
5.95%, 03/15/41 | | | 275 | | | | 243,766 | |
Koninklijke KPN NV | | | | | | | | |
8.38%, 10/01/30 | | | 426 | | | | 555,753 | |
Motorola Solutions Inc. | | | | | | | | |
5.50%, 09/01/44 | | | 266 | | | | 196,194 | |
New Cingular Wireless Services Inc. | | | | | | | | |
8.75%, 03/01/31 | | | 576 | | | | 814,129 | |
Orange SA | | | | | | | | |
5.38%, 01/13/42 | | | 271 | | | | 289,341 | |
5.50%, 02/06/44 (Call 08/06/43)a | | | 716 | | | | 782,733 | |
9.00%, 03/01/31 | | | 1,155 | | | | 1,609,557 | |
Pacific Bell Telephone Co. | | | | | | | | |
7.13%, 03/15/26 | | | 675 | | | | 835,903 | |
Qwest Corp. | | | | | | | | |
6.88%, 09/15/33 (Call 03/31/16) | | | 680 | | | | 625,600 | |
7.13%, 11/15/43 (Call 03/31/16)a | | | 343 | | | | 325,850 | |
7.25%, 10/15/35 (Call 03/31/16) | | | 11 | | | | 10,684 | |
Rogers Communications Inc. | | | | | | | | |
4.50%, 03/15/43 (Call 09/15/42) | | | 150 | | | | 141,925 | |
5.00%, 03/15/44 (Call 09/15/43) | | | 620 | | | | 631,219 | |
5.45%, 10/01/43 (Call 04/01/43) | | | 21 | | | | 22,855 | |
7.50%, 08/15/38 | | | 455 | | | | 591,982 | |
Telefonica Emisiones SAU | | | | | | | | |
7.05%, 06/20/36 | | | 1,075 | | | | 1,276,536 | |
Telefonica Europe BV | | | | | | | | |
8.25%, 09/15/30 | | | 587 | | | | 761,599 | |
| | | | | | | | |
Security | | Principal
(000s) | | | Value | |
Verizon Communications Inc. | | | | | | | | |
3.85%, 11/01/42 (Call 05/01/42) | | $ | 476 | | | $ | 398,930 | |
4.27%, 01/15/36a | | | 500 | | | | 458,018 | |
4.40%, 11/01/34 (Call 05/01/34) | | | 2,089 | | | | 1,957,272 | |
4.75%, 11/01/41 | | | 265 | | | | 251,437 | |
4.86%, 08/21/46 | | | 2,512 | | | | 2,435,214 | |
5.01%, 08/21/54 | | | 3,277 | | | | 3,027,279 | |
5.05%, 03/15/34 (Call 12/15/33) | | | 1,101 | | | | 1,107,485 | |
5.85%, 09/15/35 | | | 580 | | | | 628,901 | |
6.00%, 04/01/41 | | | 373 | | | | 415,109 | |
6.25%, 04/01/37 | | | 16 | | | | 18,315 | |
6.40%, 09/15/33 | | | 800 | | | | 928,776 | |
6.40%, 02/15/38 | | | 401 | | | | 461,834 | |
6.55%, 09/15/43 | | | 3,996 | | | | 4,841,551 | |
6.90%, 04/15/38 | | | 800 | | | | 971,501 | |
7.35%, 04/01/39 | | | 211 | | | | 265,244 | |
7.75%, 12/01/30 | | | 990 | | | | 1,319,772 | |
7.75%, 06/15/32 | | | 461 | | | | 568,216 | |
Verizon Florida LLC
Series E | | | | | | | | |
6.86%, 02/01/28a | | | 550 | | | | 514,691 | |
Verizon Maryland LLC
Series B | | | | | | | | |
5.13%, 06/15/33a | | | 426 | | | | 434,078 | |
Verizon New York Inc.
Series B | | | | | | | | |
7.38%, 04/01/32 | | | 11 | | | | 12,534 | |
Vodafone Group PLC | | | | | | | | |
4.38%, 02/19/43 | | | 320 | | | | 265,404 | |
6.15%, 02/27/37 | | | 1,041 | | | | 1,070,851 | |
6.25%, 11/30/32 | | | 461 | | | | 465,256 | |
7.88%, 02/15/30 | | | 302 | | | | 356,861 | |
| | | | | | | | |
| | | | 59,535,207 | |
TEXTILES — 0.05% | | | | | |
Cintas Corp. No. 2 | | | | | | | | |
6.15%, 08/15/36 | | | 332 | | | | 401,740 | |
| | | | | | | | |
| | | | 401,740 | |
TOYS, GAMES & HOBBIES — 0.09% | | | | | |
Hasbro Inc. | | | | | | | | |
5.10%, 05/15/44 (Call 11/15/43) | | | 151 | | | | 144,261 | |
6.35%, 03/15/40 | | | 315 | | | | 350,024 | |
Mattel Inc. | | | | | | | | |
5.45%, 11/01/41 (Call 05/01/41) | | | 175 | | | | 172,377 | |
6.20%, 10/01/40 | | | 11 | | | | 11,783 | |
| | | | | | | | |
| | | | 678,445 | |
| | | | |
SCHEDULEOF INVESTMENTS | | | 95 | |
Schedule of Investments (Continued)
iSHARES® 10+ YEAR CREDIT BOND ETF
February 29, 2016
| | | | | | | | |
Security | | Principal
(000s) | | | Value | |
TRANSPORTATION — 2.83% | | | | | |
Burlington Northern Santa Fe LLC | | | | | | | | |
4.15%, 04/01/45 (Call 10/01/44) | | $ | 523 | | | $ | 508,365 | |
4.38%, 09/01/42 (Call 03/01/42) | | | 357 | | | | 357,844 | |
4.40%, 03/15/42 (Call 09/15/41) | | | 313 | | | | 314,926 | |
4.45%, 03/15/43 (Call 09/15/42) | | | 11 | | | | 11,155 | |
4.55%, 09/01/44 (Call 03/01/44) | | | 357 | | | | 367,339 | |
4.70%, 09/01/45 (Call 03/01/45) | | | 461 | | | | 486,681 | |
4.90%, 04/01/44 (Call 10/01/43) | | | 1,281 | | | | 1,380,615 | |
4.95%, 09/15/41 (Call 03/15/41) | | | 14 | | | | 15,029 | |
5.05%, 03/01/41 (Call 09/01/40) | | | 26 | | | | 28,273 | |
5.15%, 09/01/43 (Call 03/01/43) | | | 173 | | | | 191,929 | |
5.40%, 06/01/41 (Call 12/01/40) | | | 270 | | | | 306,480 | |
5.75%, 05/01/40 (Call 11/01/39) | | | 466 | | | | 549,524 | |
6.15%, 05/01/37 | | | 161 | | | | 196,263 | |
6.20%, 08/15/36 | | | 350 | | | | 427,423 | |
Canadian National Railway Co. | | | | | | | | |
3.50%, 11/15/42 (Call 05/15/42) | | | 170 | | | | 159,049 | |
4.50%, 11/07/43 (Call 05/07/43) | | | 255 | | | | 278,694 | |
6.20%, 06/01/36 | | | 170 | | | | 221,287 | |
6.25%, 08/01/34 | | | 111 | | | | 142,991 | |
6.38%, 11/15/37 | | | 181 | | | | 240,752 | |
6.90%, 07/15/28 | | | 490 | | | | 673,930 | |
Canadian Pacific Railway Co. | | | | | | | | |
3.70%, 02/01/26 (Call 11/01/25) | | | 575 | | | | 579,604 | |
4.80%, 09/15/35 (Call 03/15/35) | | | 114 | | | | 114,853 | |
4.80%, 08/01/45 (Call 02/01/45)a | | | 100 | | | | 99,845 | |
5.75%, 03/15/33 | | | 7 | | | | 7,751 | |
5.75%, 01/15/42 | | | 261 | | | | 290,863 | |
5.95%, 05/15/37 | | | 16 | | | | 18,063 | |
6.13%, 09/15/15 (Call 03/15/15) | | | 6 | | | | 6,218 | |
7.13%, 10/15/31 | | | 440 | | | | 558,744 | |
CSX Corp. | | | | | | | | |
3.95%, 05/01/50 (Call 11/01/49) | | | 300 | | | | 255,597 | |
4.10%, 03/15/44 (Call 09/15/43) | | | 922 | | | | 848,443 | |
4.40%, 03/01/43 (Call 09/01/42) | | | 137 | | | | 131,160 | |
4.50%, 08/01/54 (Call 02/01/54) | | | 389 | | | | 355,937 | |
4.75%, 05/30/42 (Call 11/30/41) | | | 352 | | | | 353,555 | |
5.50%, 04/15/41 (Call 10/15/40) | | | 70 | | | | 76,925 | |
6.00%, 10/01/36 | | | 246 | | | | 283,276 | |
6.15%, 05/01/37 | | | 25 | | | | 29,343 | |
6.22%, 04/30/40 | | | 105 | | | | 124,334 | |
FedEx Corp. | | | | | | | | |
3.88%, 08/01/42 | | | 209 | | | | 182,496 | |
| | | | | | | | |
Security | | Principal
(000s) | | | Value | |
3.90%, 02/01/35 | | $ | 936 | | | $ | 851,613 | |
4.10%, 04/15/43 | | | 2 | | | | 1,811 | |
4.10%, 02/01/45 | | | 261 | | | | 235,615 | |
4.50%, 02/01/65 | | | 86 | | | | 76,326 | |
4.75%, 11/15/45 (Call 05/15/45) | | | 645 | | | | 644,968 | |
4.90%, 01/15/34 | | | 338 | | | | 347,760 | |
5.10%, 01/15/44 | | | 166 | | | | 171,787 | |
Kansas City Southern | | | | | | | | |
4.30%, 05/15/43 (Call 11/15/42)b | | | 100 | | | | 91,598 | |
4.95%, 08/15/45 (Call 02/15/45)b | | | 496 | | | | 499,059 | |
Norfolk Southern Corp. | | | | | | | | |
4.45%, 06/15/45 (Call 12/15/44) | | | 441 | | | | 424,230 | |
4.65%, 01/15/46 (Call 07/15/45) | | | 605 | | | | 599,111 | |
4.80%, 08/15/43 (Call 02/15/43) | | | 899 | | | | 908,550 | |
4.84%, 10/01/41 | | | 479 | | | | 486,561 | |
6.00%, 03/15/05 | | | 11 | | | | 11,801 | |
6.00%, 05/23/11 | | | 436 | | | | 467,790 | |
NorthWestern Corp. | | | | | | | | |
4.18%, 11/15/44 (Call 05/15/44) | | | 161 | | | | 169,697 | |
Union Pacific Corp. | | | | | | | | |
3.38%, 02/01/35 (Call 08/01/34) | | | 516 | | | | 477,384 | |
3.88%, 02/01/55 (Call 08/01/54) | | | 725 | | | | 650,692 | |
4.05%, 11/15/45 (Call 05/15/45)a | | | 381 | | | | 377,093 | |
4.05%, 03/01/46 (Call 09/01/45) | | | 170 | | | | 169,422 | |
4.15%, 01/15/45 (Call 07/15/44) | | | 75 | | | | 75,375 | |
4.30%, 06/15/42 (Call 12/15/41) | | | 259 | | | | 263,875 | |
4.38%, 11/15/65 (Call 05/15/65) | | | 6 | | | | 5,670 | |
4.75%, 09/15/41 (Call 03/15/41) | | | 8 | | | | 8,665 | |
4.75%, 12/15/43 (Call 06/15/43) | | | 100 | | | | 108,711 | |
4.82%, 02/01/44 (Call 08/01/43) | | | 570 | | | | 626,336 | |
4.85%, 06/15/44 (Call 12/15/43) | | | 14 | | | | 15,459 | |
6.63%, 02/01/29 | | | 307 | | | | 411,277 | |
United Parcel Service Inc. | | | | | | | | |
3.63%, 10/01/42 | | | 5 | | | | 4,904 | |
4.88%, 11/15/40 (Call 05/15/40) | | | 530 | | | | 610,475 | |
6.20%, 01/15/38 | | | 838 | | | | 1,103,609 | |
United Parcel Service of America Inc. | | | | | | | | |
8.38%, 04/01/30d | | | 114 | | | | 166,546 | |
| | | | | | | | |
| | | | 22,239,326 | |
TRUCKING & LEASING — 0.04% | | | | | |
GATX Corp. | | | | | | | | |
5.20%, 03/15/44 (Call 09/15/43) | | | 300 | | | | 293,082 | |
| | | | | | | | |
| | | | 293,082 | |
| | |
| 96 | | 2016 iSHARES ANNUAL REPORTTO SHAREHOLDERS |
Schedule of Investments (Continued)
iSHARES® 10+ YEAR CREDIT BOND ETF
February 29, 2016
| | | | | | | | |
Security | | Principal
(000s) | | | Value | |
WATER — 0.20% | | | | | |
American Water Capital Corp. | | | | | | | | |
4.30%, 12/01/42 (Call 06/01/42) | | $ | 16 | | | $ | 16,964 | |
4.30%, 09/01/45 (Call 03/01/45)a | | | 500 | | | | 531,873 | |
6.59%, 10/15/37 | | | 239 | | | | 326,851 | |
United Utilities PLC | | | | | | | | |
6.88%, 08/15/28 | | | 300 | | | | 341,456 | |
Veolia Environnement SA | | | | | | | | |
6.75%, 06/01/38 | | | 250 | | | | 321,880 | |
| | | | | | | | |
| | | | | | | 1,539,024 | |
| | | | | | | | |
TOTAL CORPORATE BONDS & NOTES
(Cost: $689,319,216) | | | | 645,987,939 | |
|
FOREIGN GOVERNMENT OBLIGATIONSe — 6.65% | |
| | |
CANADA — 0.15% | | | | | | | | |
Province of Quebec Canada | | | | | | | | |
7.50%, 09/15/29 | | | 800 | | | | 1,206,260 | |
| | | | | | | | |
| | | | 1,206,260 | |
CHILE — 0.05% | | | | | |
Chile Government International Bond | | | | | | | | |
3.63%, 10/30/42a | | | 450 | | | | 411,434 | |
| | | | | | | | |
| | | | 411,434 | |
COLOMBIA — 0.56% | | | | | |
Colombia Government International Bond | | | | | | | | |
5.00%, 06/15/45 (Call 12/15/44) | | | 400 | | | | 337,393 | |
5.63%, 02/26/44 (Call 08/26/43) | | | 2,400 | | | | 2,179,483 | |
6.13%, 01/18/41 | | | 950 | | | | 911,946 | |
7.38%, 09/18/37a | | | 900 | | | | 979,585 | |
| | | | | | | | |
| | | | 4,408,407 | |
ISRAEL — 0.06% | | | | | |
Israel Government International Bond | | | | | | | | |
4.50%, 01/30/43 | | | 400 | | | | 430,520 | |
| | | | | | | | |
| | | | 430,520 | |
ITALY — 0.15% | | | | | |
Italy Government International Bond | | | | | | | | |
5.38%, 06/15/33a | | | 967 | | | | 1,142,942 | |
| | | | | | | | |
| | | | 1,142,942 | |
MEXICO — 1.32% | | | | | |
Mexico Government International Bond | | | | | | | | |
4.60%, 01/23/46 | | | 1,350 | | | | 1,247,008 | |
| | | | | | | | |
Security | | Principal
(000s) | | | Value | |
4.75%, 03/08/44 | | $ | 1,890 | | | $ | 1,781,245 | |
5.55%, 01/21/45 | | | 550 | | | | 576,914 | |
5.75%, 10/12/49 | | | 2,030 | | | | 1,958,693 | |
6.05%, 01/11/40 | | | 1,570 | | | | 1,753,493 | |
6.75%, 09/27/34 | | | 1,075 | | | | 1,330,736 | |
7.50%, 04/08/33 | | | 477 | | | | 634,794 | |
8.30%, 08/15/31 | | | 755 | | | | 1,113,160 | |
| | | | | | | | |
| | | | 10,396,043 | |
PANAMA — 0.41% | | | | | |
Panama Government International Bond | | | | | | | | |
6.70%, 01/26/36 | | | 1,230 | | | | 1,526,148 | |
7.13%, 01/29/26a | | | 500 | | | | 638,056 | |
9.38%, 04/01/29 | | | 730 | | | | 1,080,716 | |
| | | | | | | | |
| | | | 3,244,920 | |
PERU — 0.51% | | | | | |
Peruvian Government International Bond | | | | | | | | |
4.13%, 08/25/27a | | | 700 | | | | 716,337 | |
5.63%, 11/18/50 | | | 1,275 | | | | 1,370,249 | |
6.55%, 03/14/37a | | | 495 | | | | 592,065 | |
8.75%, 11/21/33a | | | 900 | | | | 1,296,304 | |
| | | | | | | | |
| | | | 3,974,955 | |
PHILIPPINES — 1.11% | | | | | |
Philippine Government International Bond | | | | | | | | |
3.95%, 01/20/40 | | | 1,000 | | | | 1,070,000 | |
5.00%, 01/13/37a | | | 1,600 | | | | 1,950,000 | |
5.50%, 03/30/26 | | | 1,400 | | | | 1,704,500 | |
6.38%, 01/15/32 | | | 1,400 | | | | 1,870,750 | |
6.38%, 10/23/34 | | | 800 | | | | 1,102,000 | |
7.75%, 01/14/31 | | | 200 | | | | 296,250 | |
9.50%, 02/02/30 | | | 450 | | | | 741,938 | |
| | | | | | | | |
| | | | 8,735,438 | |
SOUTH AFRICA — 0.12% | | | | | |
South Africa Government International Bond | | | | | | | | |
5.38%, 07/24/44a | | | 800 | | | | 740,000 | |
6.25%, 03/08/41 | | | 200 | | | | 205,676 | |
| | | | | | | | |
| | | | 945,676 | |
SOUTH KOREA — 0.17% | | | | | |
Export-Import Bank of Korea | | | | | | | | |
3.25%, 08/12/26 | | | 450 | | | | 468,591 | |
| | | | |
SCHEDULEOF INVESTMENTS | | | 97 | |
Schedule of Investments (Continued)
iSHARES® 10+ YEAR CREDIT BOND ETF
February 29, 2016
| | | | | | | | |
Security | | Principal
(000s) | | | Value | |
Korea International Bond | | | | | | | | |
4.13%, 06/10/44a | | $ | 700 | | | $ | 853,963 | |
| | | | | | | | |
| | | | 1,322,554 | |
SUPRANATIONAL — 0.38% | | | | | |
Asian Development Bank | | | | | | | | |
5.82%, 06/16/28 | | | 310 | | | | 411,796 | |
European Investment Bank | | | | | | | | |
4.88%, 02/15/36 | | | 715 | | | | 939,199 | |
Inter-American Development Bank | | | | | | | | |
3.20%, 08/07/42 | | | 335 | | | | 348,049 | |
3.88%, 10/28/41 | | | 395 | | | | 460,742 | |
4.38%, 01/24/44 | | | 200 | | | | 252,778 | |
International Bank for Reconstruction & Development | | | | | | | | |
4.75%, 02/15/35 | | | 460 | | | | 593,119 | |
| | | | | | | | |
| | | | 3,005,683 | |
TURKEY — 1.20% | | | | | |
Turkey Government International Bond | | | | | | | | |
4.88%, 04/16/43 | | | 500 | | | | 439,735 | |
6.63%, 02/17/45 | | | 2,600 | | | | 2,924,792 | |
6.75%, 05/30/40 | | | 600 | | | | 669,186 | |
6.88%, 03/17/36 | | | 1,150 | | | | 1,292,646 | |
7.25%, 03/05/38 | | | 800 | | | | 939,544 | |
8.00%, 02/14/34a | | | 1,500 | | | | 1,881,540 | |
11.88%, 01/15/30 | | | 780 | | | | 1,289,699 | |
| | | | | | | | |
| | | | 9,437,142 | |
URUGUAY — 0.46% | | | | | |
Uruguay Government International Bond | | | | | | | | |
4.13%, 11/20/45 | | | 300 | | | | 245,550 | |
4.38%, 10/27/27 | | | 900 | | | | 902,250 | |
5.10%, 06/18/50a | | | 1,500 | | | | 1,350,000 | |
7.63%, 03/21/36a | | | 865 | | | | 1,078,223 | |
| | | | | | | | |
| | | | 3,576,023 | |
| | | | | | | | |
TOTAL FOREIGN GOVERNMENT OBLIGATIONS
| |
(Cost: $54,642,503) | | | | | | | 52,237,997 | |
|
MUNICIPAL DEBT OBLIGATIONS — 8.58% | |
| | |
CALIFORNIA — 2.76% | | | | | | | | |
Alameda County Joint Powers Authority RB BAB | | | | | | | | |
7.05%, 12/01/44 | | | 135 | | | | 189,529 | |
| | | | | | | | |
Security | | Principal
(000s) | | | Value | |
Bay Area Toll Authority RB BAB | | | | | | | | |
6.26%, 04/01/49 | | $ | 550 | | | $ | 768,377 | |
Series S1 | | | | | | | | |
6.79%, 04/01/30 | | | 250 | | | | 321,648 | |
7.04%, 04/01/50 | | | 750 | | | | 1,089,435 | |
California State Public Works Board RB BAB
Series G-2 | | | | | | | | |
8.36%, 10/01/34 | | | 360 | | | | 538,726 | |
City of Los Angeles Department of Airports RB BAB | | | | | | | | |
6.58%, 05/15/39 | | | 280 | | | | 373,727 | |
City of San Francisco CA Public Utilities Commission Water Revenue RB BAB | | | | | | | | |
6.95%, 11/01/50 | | | 360 | | | | 514,847 | |
County of Sonoma CA RB
Series A | | | | | | | | |
6.00%, 12/01/29 (GTD) | | | 300 | | | | 368,973 | |
East Bay Municipal Utility District Water System Revenue RB BAB
Series B | | | | | | | | |
5.87%, 06/01/40 | | | 330 | | | | 432,175 | |
Los Angeles Community College District/CA GO BAB | | | | | | | | |
6.75%, 08/01/49 | | | 500 | | | | 727,855 | |
Los Angeles County Metropolitan Transportation Authority RB BAB
Series A | | | | | | | | |
5.74%, 06/01/39 | | | 400 | | | | 511,768 | |
Los Angeles County Public Works Financing Authority RB BAB | | | | | | | | |
7.62%, 08/01/40 | | | 350 | | | | 514,419 | |
Los Angeles Department of Water & Power RB BAB | | | | | | | | |
6.57%, 07/01/45 | | | 500 | | | | 704,330 | |
6.60%, 07/01/50 | | | 300 | | | | 428,631 | |
Los Angeles Unified School District/CA GO BAB | | | | | | | | |
5.75%, 07/01/34 | | | 800 | | | | 997,872 | |
6.76%, 07/01/34 | | | 550 | | | | 754,688 | |
| | |
| 98 | | 2016 iSHARES ANNUAL REPORTTO SHAREHOLDERS |
Schedule of Investments (Continued)
iSHARES® 10+ YEAR CREDIT BOND ETF
February 29, 2016
| | | | | | | | |
Security | | Principal
(000s) | | | Value | |
Regents of the University of California Medical Center Pooled Revenue RB BAB | | | | | | | | |
6.55%, 05/15/48 | | $ | 450 | | | $ | 611,604 | |
San Diego County Regional Transportation Commission RB BAB | | | | | | | | |
5.91%, 04/01/48 | | | 300 | | | | 403,599 | |
San Diego County Water Authority Financing Corp. RB BAB | | | | | | | | |
6.14%, 05/01/49 | | | 400 | | | | 538,384 | |
State of California GO BAB | | | | | | | | |
7.30%, 10/01/39 | | | 820 | | | | 1,167,377 | |
7.35%, 11/01/39 | | | 700 | | | | 1,003,884 | |
7.50%, 04/01/34 | | | 2,450 | | | | 3,515,529 | |
7.55%, 04/01/39 | | | 900 | | | | 1,335,888 | |
7.60%, 11/01/40 | | | 600 | | | | 905,502 | |
7.95%, 03/01/36 (Call 03/01/20) | | | 600 | | | | 723,546 | |
University of California RB | | | | | | | | |
Series AD | | | | | | | | |
4.86%, 05/15/12 | | | 380 | | | | 389,846 | |
Series AN | | | | | | | | |
4.77%, 05/15/44 (Call 05/15/24) | | | 650 | | | | 680,543 | |
University of California RB BAB | | | | | | | | |
5.77%, 05/15/43 | | | 200 | | | | 255,526 | |
5.95%, 05/15/45 | | | 700 | | | | 889,378 | |
| | | | | | | | |
| | | | 21,657,606 | |
COLORADO — 0.13% | | | | | |
Colorado Bridge Enterprise RB BAB
Series A | | | | | | | | |
6.08%, 12/01/40 | | | 300 | | | | 392,493 | |
Denver City & County School District No. 1 COP
Series B | | | | | | | | |
7.02%, 12/15/37 | | | 435 | | | | 599,043 | |
| | | | | | | | |
| | | | 991,536 | |
CONNECTICUT — 0.17% | | | | | |
State of Connecticut GO
Series A | | | | | | | | |
5.85%, 03/15/32 | | | 200 | | | | 247,988 | |
| | | | | | | | |
Security | | Principal
(000s) | | | Value | |
State of Connecticut GO BAB | | | | | | | | |
5.09%, 10/01/30 | | $ | 200 | | | $ | 231,622 | |
5.63%, 12/01/29 | | | 720 | | | | 862,870 | |
| | | | | | | | |
| | | | 1,342,480 | |
DISTRICT OF COLUMBIA — 0.03% | | | | | |
District of Columbia Water & Sewer Authority RB | | | | | | | | |
4.81%, 10/01/14 | | | 200 | | | | 212,662 | |
| | | | | | | | |
| | | | 212,662 | |
GEORGIA — 0.19% | | | | | |
Municipal Electric Authority of Georgia RB BAB | | | | | | | | |
Project J, Series 2010A | | | | | | | | |
6.64%, 04/01/57 | | | 250 | | | | 303,585 | |
Project P, Series 2010A | | | | | | | | |
7.06%, 04/01/57 | | | 1,025 | | | | 1,205,687 | |
| | | | | | | | |
| | | | 1,509,272 | |
ILLINOIS — 0.96% | | | | | |
Chicago Transit Authority RB | | | | | | | | |
Series A | | | | | | | | |
6.90%, 12/01/40 | | | 650 | | | | 769,249 | |
Series B | | | | | | | | |
6.90%, 12/01/40 | | | 225 | | | | 266,681 | |
Chicago Transit Authority RB BAB
Series B | | | | | | | | |
6.20%, 12/01/40 | | | 120 | | | | 133,621 | |
City of Chicago IL GO
Series C | | | | | | | | |
7.78%, 01/01/35 | | | 810 | | | | 878,623 | |
County of Cook IL GO BAB | | | | | | | | |
6.23%, 11/15/34 | | | 100 | | | | 109,769 | |
Illinois State Toll Highway Authority RB BAB | | | | | | | | |
6.18%, 01/01/34 | | | 580 | | | | 752,324 | |
Metropolitan Water Reclamation District of Greater Chicago GOL BAB | | | | | | | | |
5.72%, 12/01/38 | | | 500 | | | | 605,575 | |
State of Illinois GO | | | | | | | | |
5.10%, 06/01/33a | | | 3,265 | | | | 3,035,503 | |
5.65%, 12/01/38 | | | 725 | | | | 703,504 | |
| | | | |
SCHEDULEOF INVESTMENTS | | | 99 | |
Schedule of Investments (Continued)
iSHARES® 10+ YEAR CREDIT BOND ETF
February 29, 2016
| | | | | | | | |
Security | | Principal
(000s) | | | Value | |
State of Illinois GO BAB
Series 3 | | | | | | | | |
6.73%, 04/01/35 | | $ | 300 | | | $ | 328,692 | |
| | | | | | | | |
| | | | 7,583,541 | |
KANSAS — 0.04% | | | | | |
State of Kansas Department of Transportation RB BAB | | | | | | | | |
4.60%, 09/01/35 | | | 300 | | | | 340,014 | |
| | | | | | | | |
| | | | 340,014 | |
KENTUCKY — 0.02% | | | | | |
Louisville & Jefferson County Metropolitan Sewer District RB BAB | | | | | | | | |
6.25%, 05/15/43 | | | 145 | | | | 190,732 | |
| | | | | | | | |
| | | | 190,732 | |
MARYLAND — 0.03% | | | | | |
Maryland State Transportation Authority RB BAB | | | | | | | | |
5.89%, 07/01/43 | | | 200 | | | | 257,154 | |
| | | | | | | | |
| | | | 257,154 | |
MASSACHUSETTS — 0.37% | | | | | |
Commonwealth of Massachusetts GOL BAB | | | | | | | | |
4.91%, 05/01/29 | | | 240 | | | | 289,814 | |
Series E | | | | | | | | |
5.46%, 12/01/39 | | | 745 | | | | 950,747 | |
Commonwealth of Massachusetts Transportation Fund Revenue RB BAB
Series A | | | | | | | | |
5.73%, 06/01/40 | | | 300 | | | | 386,178 | |
Massachusetts Clean Water Trust (The) RB BAB
Series B | | | | | | | | |
5.19%, 08/01/40 | | | 550 | | | | 668,844 | |
Massachusetts School Building Authority RB BAB | | | | | | | | |
5.72%, 08/15/39 | | | 450 | | | | 577,287 | |
| | | | | | | | |
| | | | 2,872,870 | |
MISSOURI — 0.15% | | | | | |
Missouri Highway & Transportation Commission RB BAB | | | | | | | | |
5.45%, 05/01/33 | | | 500 | | | | 615,170 | |
| | | | | | | | |
Security | | Principal
(000s) | | | Value | |
University of Missouri RB BAB | | | | | | | | |
5.79%, 11/01/41 | | $ | 400 | | | $ | 542,100 | |
| | | | | | | | |
| | | | 1,157,270 | |
NEW JERSEY — 0.57% | | | | | |
New Jersey Economic Development Authority RB
Series A | | | | | | | | |
7.43%, 02/15/29 (NPFGC) | | | 675 | | | | 808,684 | |
New Jersey State Turnpike Authority RB BAB | | | | | | | | |
7.10%, 01/01/41 | | | 1,275 | | | | 1,815,524 | |
Series F | | | | | | | | |
7.41%, 01/01/40 | | | 250 | | | | 368,180 | |
New Jersey Transportation Trust Fund Authority RB BAB
Series C | | | | | | | | |
5.75%, 12/15/28 | | | 1,020 | | | | 1,065,971 | |
Rutgers The State University of New Jersey RB BAB | | | | | | | | |
5.67%, 05/01/40 | | | 350 | | | | 430,339 | |
| | | | | | | | |
| | | | 4,488,698 | |
NEW YORK — 1.45% | | | | | |
City of New York NY GO BAB | | | | | | | | |
5.85%, 06/01/40 | | | 330 | | | | 429,172 | |
5.99%, 12/01/36 | | | 145 | | | | 185,425 | |
6.27%, 12/01/37 | | | 625 | | | | 844,325 | |
Housing Development Corp./NY RB | | | | | | | | |
3.71%, 02/15/48 | | | 500 | | | | 532,945 | |
Metropolitan Transportation Authority RB BAB | | | | | | | | |
6.09%, 11/15/40 | | | 250 | | | | 330,080 | |
6.67%, 11/15/39 | | | 385 | | | | 519,192 | |
Series A | | | | | | | | |
5.87%, 11/15/39 | | | 100 | | | | 122,540 | |
Series B | | | | | | | | |
6.65%, 11/15/39 | | | 100 | | | | 133,374 | |
Series C-1 | | | | | | | | |
6.69%, 11/15/40 | | | 275 | | | | 378,158 | |
Series E | | | | | | | | |
6.81%, 11/15/40 | | | 450 | | | | 627,349 | |
New York City Transitional Finance Authority Future Tax Secured Revenue RB | | | | | | | | |
5.27%, 05/01/27 | | | 500 | | | | 596,875 | |
| | |
| 100 | | 2016 iSHARES ANNUAL REPORTTO SHAREHOLDERS |
Schedule of Investments (Continued)
iSHARES® 10+ YEAR CREDIT BOND ETF
February 29, 2016
| | | | | | | | |
Security | | Principal
(000s) | | | Value | |
New York City Transitional Finance Authority Future Tax Secured Revenue RB BAB | | | | | | | | |
5.51%, 08/01/37 | | $ | 200 | | | $ | 248,716 | |
5.57%, 11/01/38 | | | 250 | | | | 311,865 | |
New York City Water & Sewer System RB BAB | | | | | | | | |
5.44%, 06/15/43 | | | 475 | | | | 596,956 | |
5.75%, 06/15/41 | | | 275 | | | | 360,220 | |
5.88%, 06/15/44 | | | 350 | | | | 468,157 | |
6.01%, 06/15/42 | | | 200 | | | | 270,410 | |
New York State Dormitory Authority RB BAB | | | | | | | | |
5.39%, 03/15/40 | | | 625 | | | | 785,462 | |
5.50%, 03/15/30 | | | 200 | | | | 244,988 | |
5.63%, 03/15/39 | | | 200 | | | | 248,538 | |
Port Authority of New York & New Jersey RB | | | | | | | | |
4.46%, 10/01/62 | | | 835 | | | | 845,638 | |
4.82%, 06/01/45 (Call 06/01/25) | | | 100 | | | | 105,017 | |
4.93%, 10/01/51 | | | 750 | | | | 837,862 | |
Series 182 | | | | | | | | |
5.31%, 08/01/46 (Call 08/01/24) | | | 1,250 | | | | 1,345,287 | |
| | | | | | | | |
| | | | 11,368,551 | |
OHIO — 0.31% | | | | | |
American Municipal Power Inc. RB BAB | | | | | | | | |
7.50%, 02/15/50 | | | 570 | | | | 799,453 | |
8.08%, 02/15/50 | | | 500 | | | | 761,705 | |
Ohio State University (The) RB
Series A | | | | | | | | |
4.80%, 06/01/11 | | | 200 | | | | 208,112 | |
Ohio State University (The) RB BAB | | | | | | | | |
4.91%, 06/01/40 | | | 550 | | | | 648,483 | |
| | | | | | | | |
| | | | 2,417,753 | |
OREGON — 0.15% | | | | | |
Oregon School Boards Association GOL | | | | | | | | |
Series B | | | | | | | | |
5.55%, 06/30/28 (NPFGC) | | | 250 | | | | 299,342 | |
5.68%, 06/30/28 (NPFGC) | | | 500 | | | | 619,995 | |
| | | | | | | | |
Security | | Principal
(000s) | | | Value | |
State of Oregon Department of Transportation RB BAB
Series 2010A | | | | | | | | |
5.83%, 11/15/34 | | $ | 175 | | | $ | 230,764 | |
| | | | | | | | |
| | | | 1,150,101 | |
PENNSYLVANIA — 0.14% | | | | | |
Commonwealth of Pennsylvania GO BAB | | | | | | | | |
5.45%, 02/15/30 | | | 300 | | | | 357,219 | |
Series B | | | | | | | | |
4.65%, 02/15/26 | | | 100 | | | | 112,730 | |
Pennsylvania Turnpike Commission RB BAB
Series B | | | | | | | | |
5.56%, 12/01/49 | | | 480 | | | | 601,550 | |
| | | | | | | | |
| | | | 1,071,499 | |
TEXAS — 0.90% | | | | | |
City of Houston TX Combined Utility System Revenue RB
Series B | | | | | | | | |
3.83%, 05/15/28 | | | 300 | | | | 327,144 | |
City of Houston TX GOL
Series A | | | | | | | | |
6.29%, 03/01/32 | | | 400 | | | | 496,152 | |
City Public Service Board of San Antonio TX RB BAB | | | | | | | | |
5.81%, 02/01/41 | | | 550 | | | | 710,562 | |
Dallas Area Rapid Transit RB BAB | | | | | | | | |
6.00%, 12/01/44 | | | 425 | | | | 589,207 | |
Dallas Convention Center Hotel Development Corp. RB BAB | | | | | | | | |
7.09%, 01/01/42 | | | 340 | | | | 455,233 | |
Dallas County Hospital District GOL BAB
Series C | | | | | | | | |
5.62%, 08/15/44 | | | 150 | | | | 185,898 | |
Dallas Independent School District GO BAB | | | | | | | | |
6.45%, 02/15/35 (Call 02/15/21) (PSF) | | | 550 | | | | 655,710 | |
North Texas Tollway Authority RB BAB | | | | | | | | |
8.91%, 02/01/30 (Call 02/01/20) | | | 550 | | | | 665,561 | |
| | | | |
SCHEDULEOF INVESTMENTS | | | 101 | |
Schedule of Investments (Continued)
iSHARES® 10+ YEAR CREDIT BOND ETF
February 29, 2016
| | | | | | | | |
Security | | Principal or Shares (000s) | | | Value | |
State of Texas GO BAB | | | | | | | | |
5.52%, 04/01/39 | | $ | 425 | | | $ | 557,281 | |
Series A | | | | | | | | |
4.63%, 04/01/33 | | | 500 | | | | 568,880 | |
4.68%, 04/01/40 | | | 100 | | | | 117,073 | |
Texas Transportation Commission State Highway Fund RB BAB
Series B | | | | | | | | |
5.18%, 04/01/30 | | | 825 | | | | 1,008,232 | |
University of Texas System (The) RB BAB | | | | | | | | |
Series B | | | | | | | | |
6.28%, 08/15/41 (Call 08/15/19) | | | 370 | | | | 421,278 | |
Series D | | | | | | | | |
5.13%, 08/15/42 | | | 250 | | | | 310,678 | |
| | | | | | | | |
| | | | | | | 7,068,889 | |
UTAH — 0.05% | | | | | | | | |
Utah Transit Authority RB BAB
Series B | | | | | | | | |
5.94%, 06/15/39 | | | 300 | | | | 397,155 | |
| | | | | | | | |
| | | | | | | 397,155 | |
VIRGINIA — 0.05% | | | | | | | | |
University of Virginia RB BAB | | | | | | | | |
6.20%, 09/01/39 | | | 300 | | | | 430,296 | |
| | | | | | | | |
| | | | | | | 430,296 | |
WASHINGTON — 0.11% | | | | | | | | |
Central Puget Sound Regional Transit Authority RB BAB | | | | | | | | |
5.49%, 11/01/39 | | | 150 | | | | 194,003 | |
State of Washington GO BAB | | | | | | | | |
5.14%, 08/01/40 | | | 550 | | | | 685,267 | |
| | | | | | | | |
| | | | | | | 879,270 | |
| | | | | | | | |
TOTAL MUNICIPAL DEBT OBLIGATIONS
(Cost: $67,093,989) | | | | 67,387,349 | |
|
SHORT-TERM INVESTMENTS — 8.25% | |
|
MONEY MARKET FUNDS — 8.25% | |
BlackRock Cash Funds: Institutional,
SL Agency Shares | | | | | | | | |
0.50%f,g,h | | | 45,983 | | | | 45,982,563 | |
BlackRock Cash Funds: Prime,
SL Agency Shares | | | | | | | | |
0.49%f,g,h | | | 4,073 | | | | 4,072,556 | |
| | | | | | | | |
Security | | Shares (000s) | | | Value | |
BlackRock Cash Funds: Treasury,
SL Agency Shares | | | | | | | | |
0.27%f,g | | | 14,782 | | | $ | 14,782,171 | |
| | | | | | | | |
| | | | | | | 64,837,290 | |
| | | | | | | | |
TOTAL SHORT-TERM INVESTMENTS | | | | | |
(Cost: $64,837,290) | | | | | | | 64,837,290 | |
| | | | | | | | |
TOTAL INVESTMENTS
IN SECURITIES — 105.72%
(Cost: $875,892,998) | | | | 830,450,575 | |
Other Assets, Less Liabilities — (5.72)% | | | | (44,902,658 | ) |
| | | | | | | | |
NET ASSETS — 100.00% | | | | | | $ | 785,547,917 | |
| | | | | | | | |
BAB — Build America Bond
COP — Certificates of Participation
GO — General Obligation
GOL — General Obligation Limited
GTD — Guaranteed by the Commonwealth, County or State
PSF — Permanent School Fund
RB — Revenue Bond
Insured by:
NPFGC — National Public Finance Guarantee Corp.
| a | All or a portion of this security represents a security on loan. See Note 1. |
| b | This security may be resold to qualified institutional buyers under Rule 144A of the Securities Act of 1933. |
| c | Variable rate security. Rate shown is as of report date. |
| d | Step coupon security. Coupon rate will either increase (step-up bond) or decrease (step-down bond) at regular intervals until maturity. Interest rate shown reflects the rate currently in effect. |
| e | Investments are denominated in U.S. dollars. |
| f | Affiliated issuer. See Note 2. |
| g | The rate quoted is the annualized seven-day yield of the fund at period end. |
| h | All or a portion of this security represents an investment of securities lending collateral. See Note 1. |
See notes to financial statements.
| | |
| 102 | | 2016 iSHARES ANNUAL REPORTTO SHAREHOLDERS |
Statement of Assets and Liabilities
iSHARES® 10+ YEAR CREDIT BOND ETF
February 29, 2016
| | | | |
| | |
ASSETS | | | | |
Investments, at cost: | | | | |
Unaffiliated | | $ | 811,055,708 | |
Affiliated (Note 2) | | | 64,837,290 | |
| | | | |
Total cost of investments | | $ | 875,892,998 | |
| | | | |
Investments in securities, at fair value (including securities on loana) (Note 1): | | | | |
Unaffiliated | | $ | 765,613,285 | |
Affiliated (Note 2) | | | 64,837,290 | |
| | | | |
Total fair value of investments | | | 830,450,575 | |
Receivables: | | | | |
Investment securities sold | | | 2,866,416 | |
Due from custodian (Note 4) | | | 598,991 | |
Interest | | | 10,551,259 | |
| | | | |
Total Assets | | | 844,467,241 | |
| | | | |
| |
LIABILITIES | | | | |
Payables: | | | | |
Investment securities purchased | | | 8,743,621 | |
Collateral for securities on loan (Note 1) | | | 50,055,119 | |
Investment advisory fees (Note 2) | | | 120,584 | |
| | | | |
Total Liabilities | | | 58,919,324 | |
| | | | |
| |
NET ASSETS | | $ | 785,547,917 | |
| | | | |
| |
Net assets consist of: | | | | |
Paid-in capital | | $ | 839,498,015 | |
Undistributed net investment income | | | 2,730,710 | |
Accumulated net realized loss | | | (11,238,385 | ) |
Net unrealized depreciation | | | (45,442,423 | ) |
| | | | |
NET ASSETS | | $ | 785,547,917 | |
| | | | |
| |
Shares outstandingb | | | 13,900,000 | |
| | | | |
| |
Net asset value per share | | $ | 56.51 | |
| | | | |
| a | Securities on loan with a value of $48,524,688. See Note 1. |
| b | No par value, unlimited number of shares authorized. |
See notes to financial statements.
Statement of Operations
iSHARES® 10+ YEAR CREDIT BOND ETF
Year ended February 29, 2016
| | | | |
| | |
NET INVESTMENT INCOME | | | | |
Interest — unaffiliated | | $ | 36,162,288 | |
Interest — affiliated (Note 2) | | | 10,248 | |
Securities lending income — affiliated — net (Note 2) | | | 106,050 | |
| | | | |
Total investment income | | | 36,278,586 | |
| | | | |
| |
EXPENSES | | | | |
Investment advisory fees (Note 2) | | | 1,577,656 | |
| | | | |
Total expenses | | | 1,577,656 | |
| | | | |
Net investment income | | | 34,700,930 | |
| | | | |
| |
NET REALIZED AND UNREALIZED GAIN (LOSS) | | | | |
Net realized gain (loss) from: | | | | |
Investments — unaffiliated | | | (10,263,816 | ) |
Investments — affiliated (Note 2) | | | 6,566 | |
In-kind redemptions — unaffiliated | | | (3,001,580 | ) |
| | | | |
Net realized loss | | | (13,258,830 | ) |
| | | | |
Net change in unrealized appreciation/depreciation | | | (71,068,547 | ) |
| | | | |
Net realized and unrealized loss | | | (84,327,377 | ) |
| | | | |
NET DECREASE IN NET ASSETS RESULTING FROM OPERATIONS | | $ | (49,626,447 | ) |
| | | | |
See notes to financial statements.
| | |
| 104 | | 2016 iSHARES ANNUAL REPORTTO SHAREHOLDERS |
Statements of Changes in Net Assets
iSHARES® 10+ YEAR CREDIT BOND ETF
| | | | | | | | |
| | | Year ended February 29, 2016 | | | Year ended February 28, 2015 | |
| | |
INCREASE (DECREASE) IN NET ASSETS | | | | | | | | |
| | |
OPERATIONS: | | | | | | | | |
Net investment income | | $ | 34,700,930 | | | $ | 22,474,702 | |
Net realized gain (loss) | | | (13,258,830 | ) | | | 6,029,769 | |
Net change in unrealized appreciation/depreciation | | | (71,068,547 | ) | | | 32,857,194 | |
| | | | | | | | |
Net increase (decrease) in net assets resulting from operations | | | (49,626,447 | ) | | | 61,361,665 | |
| | | | | | | | |
| | |
DISTRIBUTIONS TO SHAREHOLDERS: | | | | | | | | |
From net investment income | | | (34,627,351 | ) | | | (20,884,615 | ) |
| | | | | | | | |
Total distributions to shareholders | | | (34,627,351 | ) | | | (20,884,615 | ) |
| | | | | | | | |
| | |
CAPITAL SHARE TRANSACTIONS: | | | | | | | | |
Proceeds from shares sold | | | 256,417,622 | | | | 637,059,987 | |
Cost of shares redeemed | | | (236,992,062 | ) | | | (110,709,066 | ) |
| | | | | | | | |
Net increase in net assets from capital share transactions | | | 19,425,560 | | | | 526,350,921 | |
| | | | | | | | |
INCREASE (DECREASE) IN NET ASSETS | | | (64,828,238 | ) | | | 566,827,971 | |
| | |
NET ASSETS | | | | | | | | |
Beginning of year | | | 850,376,155 | | | | 283,548,184 | |
| | | | | | | | |
End of year | | $ | 785,547,917 | | | $ | 850,376,155 | |
| | | | | | | | |
Undistributed net investment income included in net assets at end of year | | $ | 2,730,710 | | | $ | 2,657,131 | |
| | | | | | | | |
| | |
SHARES ISSUED AND REDEEMED | | | | | | | | |
Shares sold | | | 4,400,000 | | | | 10,500,000 | |
Shares redeemed | | | (4,100,000 | ) | | | (1,800,000 | ) |
| | | | | | | | |
Net increase in shares outstanding | | | 300,000 | | | | 8,700,000 | |
| | | | | | | | |
See notes to financial statements.
Financial Highlights
iSHARES® 10+ YEAR CREDIT BOND ETF
(For a share outstanding throughout each period)
| | | | | | | | | | | | | | | | | | | | |
| | | Year ended
Feb. 29, 2016 | | | Year ended
Feb. 28, 2015 | | | Year ended
Feb. 28, 2014 | | | Year ended
Feb. 28, 2013 | | | Year ended
Feb. 29, 2012 | |
Net asset value, beginning of year | | $ | 62.53 | | | $ | 57.87 | | | $ | 61.05 | | | $ | 59.51 | | | $ | 52.53 | |
| | | | | | | | | | | | | | | | | | | | |
Income from investment operations: | | | | | | | | | | | | | | | | | | | | |
Net investment incomea | | | 2.55 | | | | 2.59 | | | | 2.68 | | | | 2.65 | | | | 2.72 | |
Net realized and unrealized gain (loss)b | | | (6.02 | ) | | | 4.59 | | | | (3.03 | ) | | | 1.59 | | | | 6.88 | |
| | | | | | | | | | | | | | | | | | | | |
Total from investment operations | | | (3.47 | ) | | | 7.18 | | | | (0.35 | ) | | | 4.24 | | | | 9.60 | |
| | | | | | | | | | | | | | | | | | | | |
Less distributions from: | | | | | | | | | | | | | | | | | | | | |
Net investment income | | | (2.55 | ) | | | (2.52 | ) | | | (2.74 | ) | | | (2.70 | ) | | | (2.62 | ) |
Net realized gain | | | — | | | | — | | | | (0.09 | ) | | | — | | | | — | |
| | | | | | | | | | | | | | | | | | | | |
Total distributions | | | (2.55 | ) | | | (2.52 | ) | | | (2.83 | ) | | | (2.70 | ) | | | (2.62 | ) |
| | | | | | | | | | | | | | | | | | | | |
Net asset value, end of year | | $ | 56.51 | | | $ | 62.53 | | | $ | 57.87 | | | $ | 61.05 | | | $ | 59.51 | |
| | | | | | | | | | | | | | | | | | | | |
| | | | | |
Total return | | | (5.53 | )% | | | 12.64 | % | | | (0.41 | )%c | | | 7.22 | % | | | 18.81 | % |
| | | | | | | | | | | | | | | | | | | | |
| | | | | |
Ratios/Supplemental data: | | | | | | | | | | | | | | | | | | | | |
Net assets, end of year (000s) | | $ | 785,548 | | | $ | 850,376 | | | $ | 283,548 | | | $ | 421,254 | | | $ | 196,391 | |
Ratio of expenses to average net assets | | | 0.20 | % | | | 0.20 | % | | | 0.20 | % | | | 0.20 | % | | | 0.20 | % |
Ratio of net investment income to average net assets | | | 4.40 | % | | | 4.28 | % | | | 4.67 | % | | | 4.33 | % | | | 4.79 | % |
Portfolio turnover rated | | | 11 | % | | | 23 | % | | | 12 | % | | | 10 | % | | | 6 | % |
| a | Based on average shares outstanding throughout each period. |
| b | The amounts reported for a share outstanding may not accord with the change in aggregate gains and losses in securities for the fiscal period due to the timing of capital share transactions in relation to the fluctuating market values of the Fund’s underlying securities. |
| c | Includes payment from an affiliate. Not including these proceeds, the Fund’s total return would have been -0.43%. |
| d | Portfolio turnover rates exclude portfolio securities received or delivered as a result of processing capital share transactions in Creation Units. |
See notes to financial statements.
| | |
| 106 | | 2016 iSHARES ANNUAL REPORTTO SHAREHOLDERS |
Notes to Financial Statements
iSHARES® 10+ YEAR CREDIT BOND ETF
iShares Trust (the “Trust”) is registered under the Investment Company Act of 1940, as amended (the “1940 Act”), as an open-end management investment company. The Trust was established as a Delaware statutory trust pursuant to an Agreement and Declaration of Trust dated December 16, 1999.
These financial statements relate only to the following fund (the “Fund”):
| | |
| iShares ETF | | Diversification
Classification |
10+ Year Credit Bond | | Diversified |
The investment objective of the Fund is to seek investment results that correspond generally to the price and yield performance, before fees and expenses, of its underlying index. The investment adviser uses a “passive” or index approach to try to achieve the Fund’s investment objective.
Pursuant to the Trust’s organizational documents, the Fund’s officers and trustees are indemnified against certain liabilities that may arise out of the performance of their duties to the Fund. Additionally, in the normal course of business, the Fund enters into contracts with service providers that contain general indemnification clauses. The Fund’s maximum exposure under these arrangements is unknown as this would involve future claims that may be made against the Fund that have not yet occurred.
| 1. | SIGNIFICANT ACCOUNTING POLICIES |
The following significant accounting policies are consistently followed by the Fund in the preparation of its financial statements in conformity with accounting principles generally accepted in the United States of America (“U.S. GAAP”). The preparation of financial statements in conformity with U.S. GAAP requires management to make certain estimates and assumptions that affect the reported amounts of assets and liabilities and disclosures of contingent assets and liabilities at the date of the financial statements and the reported amounts of revenue and expenses during the reporting period. Actual results could differ from those estimates. The Fund is considered an investment company under U.S. GAAP and follows the accounting and reporting guidance applicable to investment companies.
SECURITY VALUATION
The Fund’s investments are valued at fair value each day that the Fund’s listing exchange is open and, for financial reporting purposes, as of the report date should the reporting period end on a day that the Fund’s listing exchange is not open. U.S. GAAP defines fair value as the price a fund would receive to sell an asset or pay to transfer a liability in an orderly transaction between market participants at the measurement date. The BlackRock Global Valuation Methodologies Committee (the “Global Valuation Committee”) provides oversight of the valuation of investments for the Fund. The investments of the Fund are valued pursuant to policies and procedures developed by the Global Valuation Committee and approved by the Board of Trustees of the Trust (the “Board”).
| | • | | Fixed income investments are valued using the last available bid price or current market quotations provided by dealers or prices (including evaluated prices) supplied by approved independent third-party pricing services. The pricing services may use matrix pricing or valuation models that utilize certain inputs and assumptions to derive values, including transaction data, credit quality information, perceived market movements, news, and other relevant information and by other methods, which may include consideration of: yields or prices of securities of comparable quality, coupon, maturity and type; indications as to values from dealers; general market conditions; and/or other factors and assumptions. Pricing services generally value fixed income securities assuming orderly transactions of an institutional round lot size, but a fund may hold or transact in such securities in smaller odd lot sizes. |
| | • | | Open-end U.S. mutual funds are valued at that day’s published net asset value (“NAV”). |
| | | | |
NOTESTO FINANCIAL STATEMENTS | | | 107 | |
Notes to Financial Statements (Continued)
iSHARES® 10+ YEAR CREDIT BOND ETF
In the event that application of these methods of valuation results in a price for an investment which is deemed not to be representative of the fair value of such investment or if a price is not available, the investment will be valued based upon other available factors deemed relevant by the Global Valuation Committee, in accordance with policies approved by the Board. These factors include but are not limited to (i) attributes specific to the investment; (ii) the principal market for the investment; (iii) the customary participants in the principal market for the investment; (iv) data assumptions by market participants for the investment, if reasonably available; (v) quoted prices for similar investments in active markets; and (vi) other factors, such as future cash flows, interest rates, yield curves, volatilities, prepayment speeds, loss severities, credit risks and/or default rates. Valuations based on such factors are reported to the Board on a quarterly basis.
The Global Valuation Committee employs various methods for calibrating valuation approaches for investments where an active market does not exist, including regular due diligence of the Trust’s pricing vendors, a regular review of key inputs and assumptions, transactional back-testing or disposition analysis to compare unrealized gains and losses to realized gains and losses, reviews of missing or stale prices, reviews of large movements in market values, and reviews of market related activity.
Fair value pricing could result in a difference between the prices used to calculate the Fund’s NAV and the prices used by the Fund’s underlying index, which in turn could result in a difference between the Fund’s performance and the performance of the Fund’s underlying index.
Various inputs are used in determining the fair value of financial instruments. Inputs may be based on independent market data (“observable inputs”) or they may be internally developed (“unobservable inputs”). These inputs are categorized into a disclosure hierarchy consisting of three broad levels for financial reporting purposes. The level of a value determined for a financial instrument within the fair value hierarchy is based on the lowest level of any input that is significant to the fair value measurement in its entirety. The categorization of a value determined for a financial instrument within the hierarchy is based upon the pricing transparency of the instrument and is not necessarily an indication of the risk associated with investing in the instrument. The three levels of the fair value hierarchy are as follows:
| | • | | Level 1 — Unadjusted quoted prices in active markets for identical assets or liabilities; |
| | • | | Level 2 — Inputs other than quoted prices included within Level 1 that are observable for the asset or liability either directly or indirectly, including quoted prices for similar assets or liabilities in active markets, quoted prices for identical or similar assets or liabilities in markets that are not considered to be active, inputs other than quoted prices that are observable for the asset or liability (such as exchange rates, financing terms, interest rates, yield curves, volatilities, prepayment speeds, loss severities, credit risks and default rates) or other market-corroborated inputs; and |
| | • | | Level 3 — Unobservable inputs for the asset or liability, including the Global Valuation Committee’s assumptions used in determining the fair value of investments. |
Changes in valuation techniques may result in transfers in or out of an assigned level within the disclosure hierarchy. In accordance with the Trust’s policy, transfers between different levels of the fair value hierarchy are deemed to have occurred as of the beginning of the reporting period.
| | |
| 108 | | 2016 iSHARES ANNUAL REPORTTO SHAREHOLDERS |
Notes to Financial Statements (Continued)
iSHARES® 10+ YEAR CREDIT BOND ETF
The following table summarizes the value of each of the Fund’s investments according to the fair value hierarchy as of February 29, 2016. The breakdown of the Fund’s investments into major categories is disclosed in its schedule of investments.
| | | | | | | | | | | | | | | | |
| | | Level 1 | | | Level 2 | | | Level 3 | | | Total | |
Investments: | | | | | | | | | | | | | | | | |
Assets: | | | | | | | | | | | | | | | | |
Corporate Bonds & Notes | | $ | — | | | $ | 645,987,939 | | | $ | — | | | $ | 645,987,939 | |
Foreign Government Obligations | | | — | | | | 52,237,997 | | | | — | | | | 52,237,997 | |
Municipal Debt Obligations | | | — | | | | 67,387,349 | | | | — | | | | 67,387,349 | |
Money Market Funds | | | 64,837,290 | | | | — | | | | — | | | | 64,837,290 | |
| | | | | | | | | | | | | | | | |
Total | | $ | 64,837,290 | | | $ | 765,613,285 | | | $ | — | | | $ | 830,450,575 | |
| | | | | | | | | | | | | | | | |
| | | | | | | | | | | | | | | | | |
SECURITY TRANSACTIONS AND INCOME RECOGNITION
Security transactions are accounted for on trade date. Realized gains and losses on investment transactions are determined using the specific identification method. Interest income, including amortization and accretion of premiums and discounts on debt securities, is recognized daily on the accrual basis.
DISTRIBUTIONS TO SHAREHOLDERS
Dividends and distributions paid by the Fund are recorded on the ex-dividend dates. Distributions are determined on a tax basis and may differ from net investment income and net realized capital gains for financial reporting purposes. Dividends and distributions are paid in U.S. dollars and cannot be automatically reinvested in additional shares of the Fund.
LOANS OF PORTFOLIO SECURITIES
The Fund may lend its investment securities to approved borrowers, such as brokers, dealers and other financial institutions. The borrower pledges and maintains with the Fund collateral consisting of cash, an irrevocable letter of credit issued by a bank, or securities issued or guaranteed by the U.S. government. The initial collateral received by the Fund is required to have a value of at least 102% of the current value of the loaned securities plus the interest accrued on such securities, if any, for securities traded on U.S. exchanges and a value of at least 105% for all other securities. The collateral is maintained thereafter at a value equal to at least 100% of the current value of the securities on loan plus accrued interest, if any. The market value of the loaned securities is determined at the close of each business day of the Fund. Any additional required collateral is delivered to the Fund and any excess collateral is returned by the Fund on the next business day. During the term of the loan, the Fund is entitled to all distributions made on or in respect of the loaned securities. Loans of securities are terminable at any time and the borrower, after notice, is required to return borrowed securities within the standard time period for settlement of securities transactions.
Any cash received as collateral for securities on loan may be reinvested in certain short-term instruments either directly on behalf of a fund or through one or more joint accounts or money market funds, including those managed by BlackRock Fund Advisors (“BFA”), the Fund’s investment adviser, or its affiliates. As of February 29, 2016, any securities on loan were collateralized by cash. The cash collateral received was invested in money market funds managed by BFA and is disclosed in the schedule of investments. The securities on loan for the Fund are also disclosed in its schedule of investments. The total value of any securities on loan as of February 29, 2016 and the total value of the related collateral are disclosed in the statement of assets and liabilities. Income earned by the Fund from securities lending is disclosed in the statement of operations.
The risks of securities lending include the risk that the borrower may not provide additional collateral when required or may not return the securities when due. To mitigate these risks, the Fund benefits from a borrower default indemnity provided by
| | | | |
NOTESTO FINANCIAL STATEMENTS | | | 109 | |
Notes to Financial Statements (Continued)
iSHARES® 10+ YEAR CREDIT BOND ETF
BlackRock, Inc. (“BlackRock”). BlackRock’s indemnity allows for full replacement of securities lent. The Fund could suffer a loss if the value of the investments purchased with cash collateral falls below the value of the cash collateral received.
Securities lending transactions are entered into by the Fund under Master Securities Lending Agreements (“MSLA”) which provide the right, in the event of default (including bankruptcy or insolvency) for the non-defaulting party to liquidate the collateral and calculate a net exposure to the defaulting party or request additional collateral. In the event that a borrower defaults, the Fund, as lender, would offset the market value of the collateral received against the market value of the securities loaned. The value of the collateral is typically greater than that of the market value of the securities loaned, leaving the lender with a net amount payable to the defaulting party. However, bankruptcy or insolvency laws of a particular jurisdiction may impose restrictions on or prohibitions against such a right of offset in the event of an MSLA counterparty’s bankruptcy or insolvency. Under the MSLA, the borrower can resell or re-pledge the loaned securities, and the Fund can reinvest cash collateral, or, upon an event of default, resell or re-pledge the collateral.
The following table is a summary of securities lending agreements which are subject to offset under an MSLA as of February 29, 2016:
| | | | | | | | | | | | |
| Counterparty | | Market Value of
Securities on Loan | | | Cash Collateral
Received a | | | Net
Amount | |
BNP Paribas Prime Brokerage Inc. | | $ | 680,662 | | | $ | 680,662 | | | $ | — | |
Citigroup Global Markets Inc. | | | 10,247,423 | | | | 10,247,423 | | | | — | |
Credit Suisse Securities (USA) LLC | | | 2,877,981 | | | | 2,877,981 | | | | — | |
Deutsche Bank Securities Inc. | | | 3,177,766 | | | | 3,177,766 | | | | — | |
Goldman Sachs & Co. | | | 11,975,533 | | | | 11,975,533 | | | | — | |
HSBC Securities (USA) Inc. | | | 1,084,520 | | | | 1,084,520 | | | | — | |
JPMorgan Clearing Corp. | | | 4,169,192 | | | | 4,169,192 | | | | — | |
Merrill Lynch, Pierce, Fenner & Smith | | | 4,139,725 | | | | 4,139,725 | | | | — | |
Morgan Stanley & Co. LLC | | | 4,187,080 | | | | 4,187,080 | | | | — | |
SG Americas Securities LLC | | | 451,483 | | | | 451,483 | | | | — | |
Wells Fargo Securities LLC | | | 5,533,323 | | | | 5,533,323 | | | | — | |
| | | | | | | | | | | | |
| | $ | 48,524,688 | | | $ | 48,524,688 | | | $ | — | |
| | | | | | | | | | | | |
| | | | | | | | | | | | | |
| | a | | Collateral received in excess of the market value of securities on loan is not presented in this table. The total cash collateral received was in excess of the market value of securities loaned at year end and is disclosed in the Fund’s statement of assets and liabilities. |
| 2. | INVESTMENT ADVISORY AGREEMENT AND OTHER TRANSACTIONS WITH AFFILIATES |
Pursuant to an Investment Advisory Agreement with the Trust, BFA manages the investment of the Fund’s assets. BFA is a California corporation indirectly owned by BlackRock. Under the Investment Advisory Agreement, BFA is responsible for substantially all expenses of the Fund, except interest, taxes, brokerage commissions and other expenses connected with the execution of portfolio transactions, distribution fees, litigation expenses and any extraordinary expenses.
For its investment advisory services to the Fund, BFA is entitled to an annual investment advisory fee of 0.20% based on the average daily net assets of the Fund.
The U.S. Securities and Exchange Commission has issued an exemptive order which permits BlackRock Institutional Trust Company, N.A. (“BTC”), an affiliate of BFA, to serve as securities lending agent for the Fund, subject to applicable conditions. As securities lending agent, BTC bears all operational costs directly related to securities lending. The Fund is responsible for fees in connection with the investment of cash collateral received for securities on loan in a money market fund managed by BFA,
| | |
| 110 | | 2016 iSHARES ANNUAL REPORTTO SHAREHOLDERS |
Notes to Financial Statements (Continued)
iSHARES® 10+ YEAR CREDIT BOND ETF
however, BTC has agreed to reduce the amount of securities lending income it receives in order to effectively limit the collateral investment fees the Fund bears to an annual rate of 0.04% (the “collateral investment fees”). Securities lending income is equal to the total of income earned from the reinvestment of cash collateral, net of fees and other payments to and from borrowers of securities, and less the collateral investment fees. The Fund retains a portion of securities lending income and remits the remaining portion to BTC as compensation for its services as securities lending agent.
Pursuant to a securities lending agreement, the Fund retains 80% of securities lending income and the amount retained can never be less than 70% of the total of securities lending income plus the collateral investment fees. In addition, commencing the business day following the date that the aggregate securities lending income plus the collateral investment fees generated across all 1940 Act iShares exchange-traded funds (the “iShares ETF Complex”) in a given calendar year exceeds the aggregate securities lending income generated across the iShares ETF Complex in the calendar year 2013, the Fund, pursuant to a securities lending agreement, will retain for the remainder of that calendar year 85% of securities lending income and the amount retained can never be less than 70% of the total of securities lending income plus the collateral investment fees.
For the year ended February 29, 2016, the Fund paid to BTC securities lending agent services and collateral investment fees in the amount of $43,685.
BlackRock Investments, LLC, an affiliate of BFA, is the distributor for the Fund. Pursuant to the distribution agreement, BFA is responsible for any fees or expenses for distribution services provided to the Fund.
Cross trading is the buying or selling of portfolio securities between funds to which BFA (or an affiliate) serves as investment adviser. At its regularly scheduled quarterly meetings, the Board reviews such transactions as of the most recent calendar quarter for compliance with the requirements and restrictions set forth by Rule 17a-7.
For the year ended February 29, 2016, the purchase and sales transactions executed by the Fund pursuant to Rule 17a-7 under the 1940 Act were $320,710 and $1,283,829, respectively.
The Fund may invest its positive cash balances in certain money market funds managed by BFA or an affiliate. The income earned on these temporary cash investments is included in “Interest – affiliated” in the statement of operations.
The PNC Financial Services Group, Inc. is the largest stockholder of BlackRock and is considered an affiliate of the Fund for 1940 Act purposes.
Investments in issuers considered to be affiliates of the Fund (excluding money market funds) during the year ended February 29, 2016 , for purposes of Section 2(a)(3) of the 1940 Act, were as follows:
| | | | | | | | | | | | | | | | | | | | | | | | | | | | |
| Name of Affiliated Issuer | | Principal
Held
at Beginning
of Year
(000s) | | | Principal
Purchased
(000s) | | | Principal
Sold
(000s) | | | Principal
Held
at End
of Year (000s) | | | Value at
End
of Year | | | Interest
Income | | | Net
Realized
Gain (Loss) | |
PNC Bank N.A. | | | | | | | | | | | | | | | | | | | | | | | | | | | | |
4.20%, 11/01/25 | | $ | — | | | $ | 600 | | | $ | (600 | ) | | $ | — | | | $ | — | | | $ | 2,971 | | | $ | 6,566 | |
| | | | | | | | | | | | | | | | | | | | | | | | | | | | |
| | | | | | | | | | | | | | | | | | | | | | | | | | | | | |
Certain trustees and officers of the Trust are also officers of BTC and/or BFA.
| | | | |
NOTESTO FINANCIAL STATEMENTS | | | 111 | |
Notes to Financial Statements (Continued)
iSHARES® 10+ YEAR CREDIT BOND ETF
| 3. | INVESTMENT PORTFOLIO TRANSACTIONS |
Purchases and sales of investments (excluding in-kind transactions and short-term investments) for the year ended February 29, 2016 were as follows:
| | | | | | | | | | | | | | |
| U.S. Government Obligations | | | Other Securities | |
| Purchases | | | Sales | | | Purchases | | | Sales | |
| $ | 1,518,108 | | | $ | 3,083,197 | | | $ | 106,882,756 | | | $ | 85,226,923 | |
In-kind transactions (see Note 4) for the year ended February 29, 2016 were as follows:
| | | | | | |
In-kind
Purchases | | | In-kind
Sales | |
| | $231,002,510 | | | $ | 230,005,442 | |
| 4. | CAPITAL SHARE TRANSACTIONS |
Capital shares are issued and redeemed by the Fund only in aggregations of a specified number of shares or multiples thereof (“Creation Units”) at NAV. Except when aggregated in Creation Units, shares of the Fund are not redeemable. Transactions in capital shares for the Fund are disclosed in detail in the statements of changes in net assets.
The consideration for the purchase of Creation Units of a fund in the Trust generally consists of the in-kind deposit of a designated portfolio of securities and a specified amount of cash. Certain funds in the Trust may be offered in Creation Units solely or partially for cash in U.S. dollars. Investors purchasing and redeeming Creation Units may pay a purchase transaction fee and a redemption transaction fee directly to State Street Bank and Trust Company, the Trust’s administrator, to offset transfer and other transaction costs associated with the issuance and redemption of Creation Units, including Creation Units for cash. Investors transacting in Creation Units for cash may also pay an additional variable charge to compensate the relevant fund for certain transaction costs (i.e., stamp taxes, taxes on currency or other financial transactions, and brokerage costs) and market impact expenses relating to investing in portfolio securities. Such variable charges, if any, are included in “Proceeds from shares sold” in the statement of changes in net assets.
From time to time, settlement of securities related to in-kind contributions or in-kind redemptions may be delayed. In such cases, securities related to in-kind contributions are reflected as “Due from custodian” and securities related to in-kind redemptions are reflected as “Securities related to in-kind transactions” in the statement of assets and liabilities.
In the normal course of business, the Fund’s investment activities expose it to various types of risk associated with the financial instruments and markets in which it invests. The significant types of financial risks the Fund is exposed to include market risk and credit risk. The Fund’s prospectus provides details of these and other types of risk.
BFA uses a “passive” or index approach to try to achieve the Fund’s investment objective following the securities included in its underlying index during upturns as well as downturns. BFA does not take steps to reduce market exposure or to lessen the effects of a declining market. Divergence from the underlying index and the composition of the portfolio is monitored by BFA.
| | |
| 112 | | 2016 iSHARES ANNUAL REPORTTO SHAREHOLDERS |
Notes to Financial Statements (Continued)
iSHARES® 10+ YEAR CREDIT BOND ETF
MARKET RISK
Market risk arises mainly from uncertainty about future values of financial instruments influenced by price, currency and interest rate movements. It represents the potential loss the Fund may suffer through holding market positions in the face of market movements. The Fund is exposed to market risk by virtue of its investment in fixed income instruments. The fair value of securities held by the Fund may decline due to general market conditions, economic trends or events that are not specifically related to the issuers of the securities including local, regional or global political, social or economic instability or to factors that affect a particular industry or group of industries. The extent of the Fund’s exposure to market risk is the market value of the investments held as shown in the Fund’s schedule of investments.
A diversified portfolio, where this is appropriate and consistent with a fund’s objectives, minimizes the risk that a price change of a particular investment will have a material impact on the NAV of a fund. The investment concentrations within the Fund’s portfolio are disclosed in its schedule of investments.
The Fund invests a substantial amount of its assets in securities of non-U.S. issuers that trade in non-U.S. markets. This involves certain considerations and risks not typically associated with securities of U.S. issuers. Such risks include, but are not limited to: generally less liquid and less efficient securities markets; generally greater price volatility; exchange rate fluctuations and exchange controls; imposition of restrictions on the expatriation of funds or other assets of the Fund; less publicly available information about issuers; the imposition of withholding or other taxes; higher transaction and custody costs; settlement delays and risk of loss attendant in settlement procedures; difficulties in enforcing contractual obligations; less regulation of securities markets; different accounting, disclosure and reporting requirements; more substantial governmental involvement in the economy; higher inflation rates; greater social, economic and political uncertainties; the risk of nationalization or expropriation of assets; and the risk of war. These risks are heightened for investments in issuers from countries with less developed markets.
The Fund invests a substantial amount of its assets in fixed-income securities. Changes in market interest rates or economic conditions, may affect the value and/or liquidity of such investments. Interest rate risk is the risk that prices of bonds and other fixed-income securities will decrease as interest rates rise and increase as interest rates fall. Securities with longer durations tend to be more sensitive to interest rate changes, usually making them more volatile than securities with shorter durations. Given the environment of historically low interest rates, the Fund may be subject to a greater risk of price losses if interest rates rise.
CREDIT RISK
Credit risk is the risk that an issuer or guarantor of debt instruments or the counterparty to a financial transaction, including derivatives contracts, repurchase agreements or loans of portfolio securities, is unable or unwilling to make timely interest and/or principal payments or to otherwise honor its obligations. BFA and its affiliates manage counterparty credit risk by entering into transactions only with counterparties that they believe have the financial resources to honor their obligations and by monitoring the financial stability of those counterparties. Financial assets, which potentially expose the Fund to issuer and counterparty credit risks, consist principally of financial instruments and receivables due from counterparties. The extent of the Fund’s exposure to credit and counterparty risks with respect to those financial assets is approximated by their value recorded in its statement of assets and liabilities.
The Fund is treated as an entity separate from the Trust’s other funds for federal income tax purposes. It is the policy of the Fund to qualify as a regulated investment company by complying with the provisions applicable to regulated investment companies, as defined under Subchapter M of the Internal Revenue Code of 1986, as amended, and to annually distribute substantially all of its ordinary income and any net capital gains (taking into account any capital loss carryforwards) sufficient to relieve it from all, or substantially all, federal income and excise taxes. Accordingly, no provision for federal income taxes is required.
| | | | |
NOTESTO FINANCIAL STATEMENTS | | | 113 | |
Notes to Financial Statements (Continued)
iSHARES® 10+ YEAR CREDIT BOND ETF
U.S. GAAP requires that certain components of net assets be adjusted to reflect permanent differences between financial and tax reporting. These reclassifications have no effect on net assets or NAV per share. The following permanent differences as of February 29, 2016, attributable to realized gains (losses) from in-kind redemptions, were reclassified to the following accounts:
| | | | | | | | | | |
Paid-in
Capital | | | Undistributed Net Investment Income/Distributions in Excess of Net Investment Income | | | Undistributed
Net Realized
Gain/Accumulated
Net Realized Loss | |
| | $(3,125,136) | | | | $— | | | | $3,125,136 | |
The tax character of distributions paid during the years ended February 29, 2016 and February 28, 2015 was as follows:
| | | | | | | | |
| | | 2016 | | | 2015 | |
Ordinary income | | $ | 34,627,351 | | | $ | 20,884,615 | |
| | | | | | | | |
| | | | | | | | | |
As of February 29, 2016, the tax components of accumulated net earnings (losses) were as follows:
| | | | | | | | | | | | | | | | | | |
Undistributed
Ordinary
Income | | | Capital Loss
Carryforwards | | | Net
Unrealized
Gains (Losses) a | | | Qualified
Late-Year
Losses b | | | Total | |
| $ | 2,730,710 | | | $ | (5,025,605 | ) | | $ | (45,682,458 | ) | | $ | (5,972,745 | ) | | $ | (53,950,098 | ) |
| | a | | The difference between book-basis and tax-basis unrealized gains (losses) was attributable primarily to the tax deferral of losses on wash sales. |
| | b | | The Fund has elected to defer certain qualified late-year losses and recognize such losses in the next taxable year. |
As of February 29, 2016, the Fund had non-expiring capital loss carryforwards in the amount of $5,025,605 available to offset future realized capital gains.
As of February 29, 2016, the cost of investments for federal income tax purposes was $876,133,033. Net unrealized depreciation was $45,682,458, of which $6,463,875 represented gross unrealized appreciation on securities and $52,146,333 represented gross unrealized depreciation on securities.
Management has analyzed tax laws and regulations and their application to the Fund as of February 29, 2016, inclusive of the open tax return years, and does not believe there are any uncertain tax positions that require recognition of a tax liability in the Fund’s financial statements.
Management has evaluated the impact of all subsequent events on the Fund through the date the financial statements were available to be issued and has determined that there were no subsequent events requiring adjustment or disclosure in the financial statements.
| | |
| 114 | | 2016 iSHARES ANNUAL REPORTTO SHAREHOLDERS |
Report of Independent Registered Public Accounting Firm
To the Shareholders and Board of Trustees of
iShares Trust:
In our opinion, the accompanying statement of assets and liabilities, including the schedule of investments, and the related statements of operations and of changes in net assets and the financial highlights present fairly, in all material respects, the financial position of iShares 10+ Year Credit Bond ETF (the “Fund”) at February 29, 2016, the results of its operations, the changes in its net assets and its financial highlights for each of the periods presented, in conformity with accounting principles generally accepted in the United States of America. These financial statements and financial highlights (hereafter referred to as “financial statements”) are the responsibility of the Fund’s management. Our responsibility is to express an opinion on these financial statements based on our audits. We conducted our audits of these financial statements in accordance with the standards of the Public Company Accounting Oversight Board (United States). Those standards require that we plan and perform the audit to obtain reasonable assurance about whether the financial statements are free of material misstatement. An audit includes examining, on a test basis, evidence supporting the amounts and disclosures in the financial statements, assessing the accounting principles used and significant estimates made by management, and evaluating the overall financial statement presentation. We believe that our audits, which included confirmation of securities at February 29, 2016 by correspondence with the custodian, transfer agent and brokers, provide a reasonable basis for our opinion.
PricewaterhouseCoopers LLP
San Francisco, California
April 20, 2016
| | | | |
REPORTOF INDEPENDENT REGISTERED PUBLIC ACCOUNTING FIRM | | | 115 | |
Notes:
| | |
| 116 | | 2016 iSHARES ANNUAL REPORTTO SHAREHOLDERS |
Notes:
Notes:
| | |
| 118 | | 2016 iSHARES ANNUAL REPORTTO SHAREHOLDERS |
For more information visit www.iShares.com or call 1-800-474-2737
This report is intended for the Fund’s shareholders. It may not be distributed to prospective investors unless it is preceded or accompanied by the current prospectus.
Investing involves risk, including possible loss of principal.
The iShares Funds are distributed by BlackRock Investments, LLC (together with its affiliates, “BlackRock”).
A description of the policies that the Fund uses to determine how to vote proxies relating to portfolio securities and information about how the Fund voted proxies relating to portfolio securities during the most recent twelve-month period ending June 30 is available without charge, upon request, by calling toll-free 1-800-474-2737; on the Fund’s website at www.iShares.com; and on the U.S. Securities and Exchange Commission (SEC) website at www.sec.gov.
The Fund files its complete schedule of portfolio holdings with the SEC for the first and third quarters of each fiscal year on Form N-Q. The Fund’s Forms N-Q are available on the SEC’s website or may be reviewed and copied at the SEC’s Public Reference Room in Washington, D.C. Information on the operation of the Public Reference Room may be obtained by calling 1-800-SEC-0330. The Fund also discloses its complete schedule of portfolio holdings on a daily basis on the Fund’s website.
©2016 BlackRock, Inc. All rights reserved. iSHARES and BLACKROCK are registered trademarks of BlackRock, Inc. or its subsidiaries. All other marks are the property of their respective owners.
iS-AR-1018-1016
OCTOBER 31, 2016
| | | | |
2016 ANNUAL REPORT | | | |  |
iShares U.S. ETF Trust
| Ø | | iShares Interest Rate Hedged Emerging Markets Bond ETF | EMBH | NYSE Arca |
Table of Contents
Management’s Discussion of Fund Performance
iSHARES® INTEREST RATE HEDGED EMERGING MARKETS BOND ETF
GLOBAL BOND MARKET OVERVIEW
Global investment-grade bonds posted positive returns in U.S. dollar terms for the 12-month period ended October 31, 2016 (the “reporting period”). The Bloomberg Barclays Global Aggregate Index returned 5.59% for the reporting period.
High-quality bonds benefited from solid investor demand, as generally poor global economic growth, low inflation, and stimulative monetary policies meant bond yields in many countries fell to record low, negative levels. Returns in U.S. dollar terms were mixed, however, reflecting the varied performance of the dollar relative to other developed market currencies.
In terms of growth, the U.S. economy improved over the course of the reporting period, expanding at a 0.8% annual rate in the first quarter of 2016 before reaching a 2.9% annual growth rate in the third quarter. Meanwhile, growth in much of the rest of the developed world was barely positive. The U.K. and Eurozone expanded by 0.5% and 0.3%, respectively, in the third quarter of 2016. Similarly, Australia and Japan grew by 0.5% and 0.2%, respectively, in the second quarter of 2016, the latest period for which data were available. Meanwhile, the Chinese economy grew at an annual rate of 6.7% in the third quarter of 2016; however, that was down from 6.9% a year earlier, which was the slowest growth since 1990.
Modest global growth meant inflation remained low. In the U.S., U.K., and the Eurozone, consumer prices increased over the course of the reporting period, reaching the highest levels since 2014, but remained at just 1.6%, 0.9%, and 0.5%, respectively, for the 12 months ended October 2016. In Japan, however, consumer prices were nearly unchanged, gaining by 0.1% for the same period.
To encourage growth and guard against deflation, many central banks around the world took further stimulus measures. Central banks from the U.K., Japan, Eurozone, and Australia all cut interest rates during the period to historic lows. One notable exception was the United States, where the U.S. Federal Reserve Bank (the “Fed”) raised rates in December 2015 for the first time in almost seven years.
Against that backdrop, Japanese long-term bond yields turned negative in early 2016, while bond yields in the Eurozone reached a record low of -0.47% in September 2016; similarly, German and French bonds set their all-time low negative yields in July 2016. The U.S., U.K. and Australia also saw long-term government bond yields reach historic lows during the reporting period, but their yields remained positive.
From a sector perspective, global Treasury bonds performed best, reflecting the sharp decline in long-term bond yields during the period. Other government-related securities also performed well, followed by investment-grade corporate bonds.
In terms of currency effects, the U.S. dollar appreciated by approximately 21% relative to the British pound, and 7% against the Chinese yuan for the reporting period. The U.S. dollar was little changed against the euro and Swiss franc. The Japanese yen and Australian dollar gained 13% and 6%, respectively, against the U.S. dollar. The U.S. dollar’s mixed performance reflects differences in expectations for economic growth and monetary policies between the U.S. and other regions.
On a country basis, U.K. bonds were the strongest performers among developed countries in local currency terms, but performed the worst in U.S. dollar terms. Benefiting from the strength of the yen and positive local currency returns, Japanese bonds performed the best in U.S. dollar terms. Australian bonds also performed very well in both Australian and U.S. dollar terms.
| | | | |
MANAGEMENT’S DISCUSSIONOF FUND PERFORMANCE | | | 5 | |
Management’s Discussion of Fund Performance
iSHARES® INTEREST RATE HEDGED EMERGING MARKETS BOND ETF
Performance as of October 31, 2016
| | | | | | | | | | | | | | | | | | | | |
| | | Average Annual Total Returns | | | | | | Cumulative Total Returns | |
| | | 1 Year | | | Since Inception | | | | | | 1 Year | | | Since Inception | |
Fund NAV | | | 7.49% | | | | 3.79% | | | | | | | | 7.49% | | | | 4.88% | |
Fund Market | | | 7.44% | | | | 3.79% | | | | | | | | 7.44% | | | | 4.88% | |
J.P. Morgan EMBI Global Core Swap Hedged Index | | | 7.88% | | | | 4.03% | | | | | | | | 7.88% | | | | 5.17% | |
GROWTH OF $10,000 INVESTMENT
(SINCE INCEPTION AT NET ASSET VALUE)
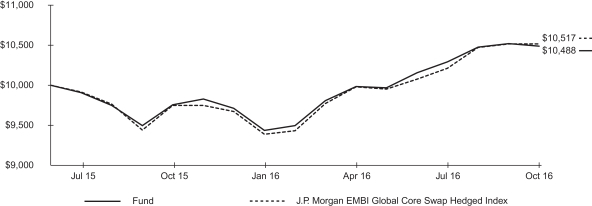
The inception date of the Fund was 7/22/15. The first day of secondary market trading was 7/23/15.
The J.P. Morgan EMBI Global Core Swap Hedged Index is an unmanaged index that consists of the J.P. Morgan EMBISM Global Core Index plus interest rate swaps that intend to hedge the interest rate exposure of the J.P. Morgan EMBISM Global Core Index.
Past performance is no guarantee of future results. Performance results do not reflect the deduction of taxes that a shareholder would pay on fund distributions or on the redemption or sale of fund shares. See “About Fund Performance” on page 8 for more information.
| | | | | | | | | | | | | | | | | | | | | | | | | | |
| Shareholder Expenses | |
| Actual | | | Hypothetical 5% Return | | | | |
Beginning
Account Value
(5/1/16) | | | Ending
Account Value
(10/31/16) | | | Expenses Paid
During Period a,b | | | Beginning
Account Value
(5/1/16) | | | Ending
Account Value
(10/31/16) | | | Expenses Paid
During Period a,b | | | Annualized
Expense Ratio a | |
| $ | 1,000.00 | | | $ | 1,050.50 | | | $ | 0.46 | | | $ | 1,000.00 | | | $ | 1,024.70 | | | $ | 0.46 | | | | 0.09% | |
| a | Annualized expense ratio and expenses paid during the period do not include fees and expenses of the underlying fund in which the Fund invests. | |
| b | Expenses are calculated using the Fund’s annualized expense ratio (as disclosed in the table), multiplied by the average account value for the period, multiplied by the number of days in the period (184 days) and divided by the number of days in the year (366 days). See “Shareholder Expenses” on page 8 for more information. | |
| | |
| 6 | | 2016 iSHARES ANNUAL REPORTTO SHAREHOLDERS |
Management’s Discussion of Fund Performance (Continued)
iSHARES® INTEREST RATE HEDGED EMERGING MARKETS BOND ETF
The iShares Interest Rate Hedged Emerging Markets Bond ETF (the “Fund”) seeks to mitigate the interest rate risk of a portfolio composed of U.S. dollar-denominated, emerging market bonds. The Fund is an actively managed exchange-traded fund that does not seek to replicate the performance of a specified index.
The Fund currently seeks to achieve its investment objective by investing a substantial portion of its assets in one underlying fund, the iShares J.P. Morgan USD Emerging Markets Bond ETF. The Fund attempts to mitigate the interest rate risk of the underlying fund by holding short positions in U.S. Treasury futures or interest rate swaps. For the 12-month reporting period ended October 31, 2016, the total return for the Fund was 7.49%, net of fees.
The Fund generated a positive return for the reporting period as strong investor demand for yield coupled with modest global growth and low interest rates benefited the Fund’s performance.
The Fund’s Latin American bonds, which represented approximately 35% of the Fund on average during the reporting period, contributed the most to Index performance, led by Venezuela, Brazil, and Argentina. Venezuelan securities carried yields significantly higher than the Fund as a whole because the economic crisis affecting the country increased the likelihood of a bond default. Demand for those higher yields, along with investor belief that the recovery value of the bonds in default would exceed prevailing prices, helped Venezuelan securities during the reporting period. Brazilian bonds benefited from the resolution of impeachment proceedings against Brazil’s president and the initiation of much-anticipated financial reform. Argentina issued bonds for the first time in 15 years, attracting strong demand after resolving a lengthy standoff with creditors over a past debt default.
Emerging market bonds from Eastern Europe and Asia also made significant contributions to the Fund’s return, led by the Russian Federation and Indonesia, respectively. Africa and the Middle East also contributed to performance for the reporting period.
By maturity, longer-term bonds contributed to the Fund’s performance the most due to their higher yields. From a credit perspective, lower-quality bonds outperformed higher-rated securities, reflecting strong investor demand for yield.
The Fund’s interest rate hedging activity detracted from Fund performance for the reporting period. Hedging against interest rate risk can improve returns when bond yields rise, but it can be a drag on performance when bond yields decline, as was the case during the reporting period.
ALLOCATION BY CREDIT QUALITY1
As of 10/31/16
| | | | |
| Moody’s Credit Rating 2 | | Percentage of
Total Investments 3 | |
Aa | | | 4.11 | % |
A | | | 15.58 | |
Baa | | | 30.94 | |
Ba | | | 23.21 | |
B | | | 14.69 | |
Caa | | | 5.34 | |
Not Rated | | | 6.13 | |
| | | | |
TOTAL | | | 100.00 | % |
| | | | |
TEN LARGEST COUNTRIES1
As of 10/31/16
| | | | |
| Country | | Percentage of
Total Investments 3 | |
Mexico | | | 6.39 | % |
Indonesia | | | 5.08 | |
Russia | | | 4.93 | |
Turkey | | | 4.74 | |
Philippines | | | 4.66 | |
Brazil | | | 4.17 | |
China | | | 4.08 | |
Argentina | | | 3.96 | |
Colombia | | | 3.76 | |
Hungary | | | 3.68 | |
| | | | |
TOTAL | | | 45.45 | % |
| | | | |
| | 1 | Table shown is for the iShares J.P. Morgan USD Emerging Markets Bond ETF, the underlying fund in which the Fund invests. |
| | 2 | Credit quality ratings shown reflect the ratings assigned by Moody’s Investors Service (“Moody’s”), a widely used independent, nationally recognized statistical rating organization. Moody’s credit ratings are opinions of the credit quality of individual obligations or of an issuer’s general creditworthiness. Investment grade ratings are credit ratings of Baa or higher. Below investment grade ratings are credit ratings of Ba or lower. Unrated investments do not necessarily indicate low credit quality. Credit quality ratings are subject to change. |
| | 3 | Excludes money market funds. |
| | | | |
MANAGEMENT’S DISCUSSIONOF FUND PERFORMANCE | | | 7 | |
About Fund Performance
Past performance is no guarantee of future results. Current performance may be lower or higher than the performance data quoted. Performance data current to the most recent month-end is available at www.ishares.com. Performance results assume reinvestment of all dividends and capital gain distributions and do not reflect the deduction of taxes that a shareholder would pay on fund distributions or on the redemption or sale of fund shares. The investment return and principal value of shares will vary with changes in market conditions. Shares may be worth more or less than their original cost when they are redeemed or sold in the market. Performance for certain funds may reflect a waiver of a portion of investment advisory fees. Without such a waiver, performance would have been lower.
Net asset value or “NAV” is the value of one share of a fund as calculated in accordance with the standard formula for valuing mutual fund shares. The price used to calculate market return (“Market Price”) is determined by using the midpoint between the highest bid and the lowest offer on the primary stock exchange on which shares of a fund are listed for trading, as of the time that such fund’s NAV is calculated. Certain funds may have a NAV which is determined prior to the opening of regular trading on its listed exchange and their market returns are calculated using the midpoint of the bid/ask spread as of the opening of regular trading on the exchange. Market and NAV returns assume that dividends and capital gain distributions have been reinvested at Market Price and NAV, respectively.
An index is a statistical composite that tracks a specified financial market or sector. Unlike a fund, an index does not actually hold a portfolio of securities and therefore does not incur the expenses incurred by a fund. These expenses negatively impact fund performance. Also, market returns do not include brokerage commissions that may be payable on secondary market transactions. If brokerage commissions were included, market returns would be lower.
Shareholder Expenses
As a shareholder of the Fund, you incur two types of costs: (1) transaction costs, including brokerage commissions on purchases and sales of fund shares and (2) ongoing costs, including management fees and other fund expenses. The expense example, which is based on an investment of $1,000 invested on May 1, 2016 and held through October 31, 2016, is intended to help you understand your ongoing costs (in dollars and cents) of investing in the Fund and to compare these costs with the ongoing costs of investing in other funds.
Actual Expenses — The table provides information about actual account values and actual expenses. Annualized expense ratios reflect contractual and voluntary fee waivers, if any. To estimate the expenses that you paid on your account over the period, simply divide your account value by $1,000 (for example, an $8,600 account value divided by $1,000 = 8.6), then multiply the result by the number corresponding to your Fund under the heading entitled “Expenses Paid During Period.”
Hypothetical Example for Comparison Purposes — The table also provides information about hypothetical account values and hypothetical expenses based on the Fund’s actual expense ratio and an assumed rate of return of 5% per year before expenses. You may use this information to compare the ongoing costs of investing in your Fund and other funds. To do so, compare this 5% hypothetical example with the 5% hypothetical examples that appear in the shareholder reports of the other funds.
Please note that the expenses shown in the table are meant to highlight your ongoing costs only and do not reflect any transactional costs, such as brokerage commissions paid on purchases and sales of fund shares. Therefore, the hypothetical examples are useful in comparing ongoing costs only and will not help you determine the relative total costs of owning different funds. In addition, if these transactional costs were included, your costs would have been higher.
| | |
| 8 | | 2016 iSHARES ANNUAL REPORTTO SHAREHOLDERS |
Schedule of Investments
iSHARES® INTEREST RATE HEDGED EMERGING MARKETS BOND ETF
October 31, 2016
| | | | | | | | |
| Security | | Shares | | | Value | |
INVESTMENT COMPANIES — 94.05% | |
| |
EXCHANGE-TRADED FUNDS — 94.05% | | | | | |
iShares J.P. Morgan USD Emerging Markets Bond ETFa | | | 20,552 | | | $ | 2,357,109 | |
| | | | | | | | |
| | | | | | | 2,357,109 | |
| | | | | | | | |
TOTAL INVESTMENT COMPANIES | | | | | |
(Cost: $2,257,244) | | | | 2,357,109 | |
|
SHORT-TERM INVESTMENTS — 3.70% | |
| |
MONEY MARKET FUNDS — 3.70% | | | | | |
BlackRock Cash Funds: Treasury,
SL Agency Shares | | | | | | | | |
0.29%b,c | | | 92,850 | | | | 92,850 | |
| | | | | | | | |
| | | | | | | 92,850 | |
| | | | | | | | |
TOTAL SHORT-TERM INVESTMENTS | | | | | |
(Cost: $92,850) | | | | 92,850 | |
| | | | | | | | |
| | | | | | | | |
| | | | | | Value | |
TOTAL INVESTMENTS
IN SECURITIES — 97.75% | | | | | |
(Cost: $2,350,094)d | | | $ | 2,449,959 | |
Other Assets, Less Liabilities — 2.25% | | | | 56,272 | |
| | | | | | | | |
NET ASSETS—100.00% | | | | | | $ | 2,506,231 | |
| | | | | | | | |
| a | Affiliated issuer. See Schedule 1. |
| b | Affiliated money market fund. |
| c | The rate quoted is the annualized seven-day yield of the fund at period end. |
| d | The cost of investments for federal income tax purposes was $2,350,094. Net unrealized appreciation was $99,865, of which $99,865 represented gross unrealized appreciation on securities and $—represented gross unrealized depreciation on securities. |
Schedule 1 — Affiliates (Note 2)
Investments in issuers considered to be affiliates of the Fund (excluding affiliated money market funds) during the year ended October 31, 2016, for purposes of Section 2(a)(3) of the 1940 Act, were as follows:
| | | | | | | | | | | | | | | | | | | | | | | | | | | | |
| Affiliated issuer | | Shares
held at
beginning
of year | | | Shares
purchased | | | Shares sold | | | Shares
held at end
of year | | | Value at end
of year | | | Dividend
income | | | Net realized
gain (loss) | |
iShares J.P. Morgan USD Emerging Markets Bond ETF | | | 21,302 | | | | 500 | | | | (1,250 | ) | | | 20,552 | | | $ | 2,357,109 | | | $ | 116,101 | | | $ | 923 | |
| | | | | | | | | | | | | | | | | | | | | | | | | | | | |
| | | | | | | | | | | | | | | | | | | | | | | | | | | | | |
Schedule 2 — Swaps Contracts (Note 5)
Centrally cleared short interest rate swaps outstanding as of October 31, 2016 were as follows:
| | | | | | | | | | | | | | | | | | | | | | | | | | | | |
| Fixed rate a | | Floating rate a | | | Clearinghouse | | | Expiration
date | | | Notional
amount | | | Value | | | Premiums
paid
(received) | | | Unrealized
appreciation
(depreciation) | |
1.01% | | | 3-month LIBOR | | | | Chicago Mercantile | | | | 12/08/2018 | | | $ | (150,000 | ) | | $ | 301 | | | $ | 19 | | | $ | 282 | |
1.17% | | | 3-month LIBOR | | | | Chicago Mercantile | | | | 12/08/2021 | | | | (1,350,000 | ) | | | 13,426 | | | | 837 | | | | 12,589 | |
1.44% | | | 3-month LIBOR | | | | Chicago Mercantile | | | | 12/08/2026 | | | | (925,000 | ) | | | 25,701 | | | | (704 | ) | | | 26,405 | |
1.77% | | | 3-month LIBOR | | | | Chicago Mercantile | | | | 12/08/2046 | | | | (75,000 | ) | | | 5,710 | | | | (661 | ) | | | 6,371 | |
| | | | | | | | | | | | | | | | | | | | | | | | | | | | |
| | | | | | | | | | | | | | | Net unrealized appreciation | | | $ | 45,647 | |
| | | | | | | | | | | | | | | | | | | | | | | | | | | | |
| | | | | | | | | | | | | | | | | | | | | | | | | | | | | |
| | a | | The Fund pays the fixed rate and receives the floating rate. |
Schedule of Investments (Continued)
iSHARES® INTEREST RATE HEDGED EMERGING MARKETS BOND ETF
October 31, 2016
Schedule 3 — Fair Value Measurements
Various inputs are used in determining the fair value of financial instruments. For description of the input levels and information about the Fund’s policy regarding valuation of financial instruments, see Note 1.
The following table summarizes the value of the Fund’s investments according to the fair value hierarchy as of October 31, 2016. The breakdown of the Fund’s investments into major categories is disclosed in the schedule of investments above.
| | | | | | | | | | | | | | | | |
| | | Level 1 | | | Level 2 | | | Level 3 | | | Total | |
Investments: | | | | | | | | | | | | | | | | |
Assets: | | | | | | | | | | | | | | | | |
Exchange-traded funds | | $ | 2,357,109 | | | $ | — | | | $ | — | | | $ | 2,357,109 | |
Money market funds | | | 92,850 | | | | — | | | | — | | | | 92,850 | |
| | | | | | | | | | | | | | | | |
Total | | $ | 2,449,959 | | | $ | — | | | $ | — | | | $ | 2,449,959 | |
| | | | | | | | | | | | | | | | |
Derivative financial instrumentsa: | | | | | | | | | | | | | | | | |
Assets: | | | | | | | | | | | | | | | | |
Centrally cleared interest rate swaps | | $ | — | | | $ | 45,647 | | | $ | — | | | $ | 45,647 | |
| | | | | | | | | | | | | | | | |
Total | | $ | — | | | $ | 45,647 | | | $ | — | | | $ | 45,647 | |
| | | | | | | | | | | | | | | | |
| | | | | | | | | | | | | | | | | |
| | a | | Shown at the unrealized appreciation (depreciation) on the contracts. |
See notes to financial statements.
| | |
| 10 | | 2016 iSHARES ANNUAL REPORTTO SHAREHOLDERS |
Statement of Assets and Liabilities
iSHARES® INTEREST RATE HEDGED EMERGING MARKETS BOND ETF
October 31, 2016
| | | | |
| | |
ASSETS | | | | |
Investments, at cost: | | | | |
Affiliated (Note 2) | | $ | 2,350,094 | |
| | | | |
Total cost of investments | | $ | 2,350,094 | |
| | | | |
Investments in securities, at fair value (Note 1): | | | | |
Affiliated (Note 2) | | $ | 2,449,959 | |
| | | | |
Total fair value of investments | | | 2,449,959 | |
Cash | | | 1,000 | |
Cash pledged for centrally cleared swaps | | | 58,000 | |
Receivables: | | | | |
Dividends | | | 19 | |
| | | | |
Total Assets | | | 2,508,978 | |
| | | | |
| |
LIABILITIES | | | | |
Payables: | | | | |
Investment advisory fees (Note 2) | | | 213 | |
Variation margin on centrally cleared swaps | | | 2,534 | |
| | | | |
Total Liabilities | | | 2,747 | |
| | | | |
| |
NET ASSETS | | $ | 2,506,231 | |
| | | | |
| |
Net assets consist of: | | | | |
Paid-in capital | | $ | 2,502,012 | |
Accumulated net realized loss | | | (141,292 | ) |
Net unrealized appreciation | | | 145,511 | |
| | | | |
NET ASSETS | | $ | 2,506,231 | |
| | | | |
| |
Shares outstandinga | | | 100,000 | |
| | | | |
| |
Net asset value per share | | $ | 25.06 | |
| | | | |
| a | No par value, unlimited number of shares authorized. |
See notes to financial statements.
Statement of Operations
iSHARES® INTEREST RATE HEDGED EMERGING MARKETS BOND ETF
Year ended October 31, 2016
| | | | |
| | |
NET INVESTMENT INCOME | | | | |
Dividends — affiliated (Note 2) | | $ | 116,271 | |
Securities lending income — affiliated — net (Note 2) | | | 3,505 | |
| | | | |
Total investment income | | | 119,776 | |
| | | | |
| |
EXPENSES | | | | |
Investment advisory fees (Note 2) | | | 18,209 | |
| | | | |
Total expenses | | | 18,209 | |
Less investment advisory fees waived (Note 2) | | | (15,770 | ) |
| | | | |
Net expenses | | | 2,439 | |
| | | | |
Net investment income | | | 117,337 | |
| | | | |
| |
NET REALIZED AND UNREALIZED GAIN (LOSS) | | | | |
Net realized gain (loss) from: | | | | |
Investments — affiliated (Note 2) | | | 923 | |
Swap agreements | | | (150,069 | ) |
| | | | |
Net realized loss | | | (149,146 | ) |
| | | | |
Net change in unrealized appreciation/depreciation on: | | | | |
Investments — affiliated (Note 2) | | | 124,788 | |
Swap agreements | | | 85,316 | |
| | | | |
Net change in unrealized appreciation/depreciation | | | 210,104 | |
| | | | |
Net realized and unrealized gain | | | 60,958 | |
| | | | |
NET INCREASE IN NET ASSETS RESULTING FROM OPERATIONS | | $ | 178,295 | |
| | | | |
See notes to financial statements.
| | |
| 12 | | 2016 iSHARES ANNUAL REPORTTO SHAREHOLDERS |
Statements of Changes in Net Assets
iSHARES® INTEREST RATE HEDGED EMERGING MARKETS BOND ETF
| | | | | | | | |
| | | Year ended October 31, 2016 | | | Period from
July 22, 2015a to
October 31, 2015 | |
| | |
INCREASE (DECREASE) IN NET ASSETS | | | | | | | | |
| | |
OPERATIONS: | | | | | | | | |
Net investment income | | $ | 117,337 | | | $ | 32,665 | |
Net realized loss | | | (149,146 | ) | | | (30,617 | ) |
Net change in unrealized appreciation/depreciation | | | 210,104 | | | | (64,593 | ) |
| | | | | | | | |
Net increase (decrease) in net assets resulting from operations | | | 178,295 | | | | (62,545 | ) |
| | | | | | | | |
| | |
DISTRIBUTIONS TO SHAREHOLDERS: | | | | | | | | |
From net investment income | | | (88,749 | ) | | | (22,782 | ) |
Return of capital | | | (2,962 | ) | | | (84 | ) |
| | | | | | | | |
Total distributions to shareholders | | | (91,711 | ) | | | (22,866 | ) |
| | | | | | | | |
| | |
CAPITAL SHARE TRANSACTIONS: | | | | | | | | |
Proceeds from shares sold | | | — | | | | 2,505,058 | |
| | | | | | | | |
Net increase in net assets from capital share transactions | | | — | | | | 2,505,058 | |
| | | | | | | | |
INCREASE IN NET ASSETS | | | 86,584 | | | | 2,419,647 | |
| | |
NET ASSETS | | | | | | | | |
Beginning of period | | | 2,419,647 | | | | — | |
| | | | | | | | |
End of period | | $ | 2,506,231 | | | $ | 2,419,647 | |
| | | | | | | | |
| | |
SHARES ISSUED | | | | | | | | |
Shares sold | | | — | | | | 100,000 | |
| | | | | | | | |
Net increase in shares outstanding | | | — | | | | 100,000 | |
| | | | | | | | |
| a | Commencement of operations. |
See notes to financial statements.
Financial Highlights
iSHARES® INTEREST RATE HEDGED EMERGING MARKETS BOND ETF
(For a share outstanding throughout each period)
| | | | | | | | |
| | | Year ended
Oct. 31, 2016 | | | Period from
Jul. 22, 2015a to
Oct. 31, 2015 | |
Net asset value, beginning of period | | $ | 24.20 | | | $ | 25.05 | |
| | | | | | | | |
Income from investment operations: | | | | | | | | |
Net investment incomeb | | | 1.17 | | | | 0.33 | |
Net realized and unrealized gain (loss)c | | | 0.61 | | | | (0.95 | ) |
| | | | | | | | |
Total from investment operations | | | 1.78 | | | | (0.62 | ) |
| | | | | | | | |
Less distributions from: | | | | | | | | |
Net investment income | | | (0.89 | ) | | | (0.23 | ) |
Return of capital | | | (0.03 | ) | | | (0.00 | )d |
| | | | | | | | |
Total distributions | | | (0.92 | ) | | | (0.23 | ) |
| | | | | | | | |
Net asset value, end of period | | $ | 25.06 | | | $ | 24.20 | |
| | | | | | | | |
| | |
Total return | | | 7.49 | % | | | (2.43 | )%e |
| | | | | | | | |
| | |
Ratios/Supplemental data: | | | | | | | | |
Net assets, end of period (000s) | | $ | 2,506 | | | $ | 2,420 | |
Ratio of expenses to average net assetsf,g | | | 0.10 | % | | | 0.12 | % |
Ratio of expenses to average net assets prior to waived feesf,g | | | 0.75 | % | | | 0.75 | % |
Ratio of net investment income to average net assetsf | | | 4.82 | % | | | 4.86 | % |
Portfolio turnover rateh,i | | | 3 | % | | | 0 | % |
| a | Commencement of operations. |
| b | Based on average shares outstanding throughout each period. |
| c | The amounts reported for a share outstanding may not accord with the change in aggregate gains and losses in securities for the fiscal period due to the timing of capital share transactions in relation to the fluctuating market values of the Fund’s underlying securities. |
| d | Rounds to less than $0.01. |
| f | Annualized for periods of less than one year. |
| g | The Fund indirectly bears its proportionate share of fees and expenses incurred by the underlying fund in which the Fund is invested. These ratios do not include these indirect fees and expenses. |
| h | Portfolio turnover rates exclude portfolio securities received or delivered as a result of processing capital share transactions in Creation Units. |
| i | Portfolio turnover rates exclude the portfolio activity of the underlying fund in which the Fund is invested. See page 48 for the portfolio turnover rates of the underlying fund. |
See notes to financial statements.
| | |
| 14 | | 2016 iSHARES ANNUAL REPORTTO SHAREHOLDERS |
Notes to Financial Statements
iSHARES® INTEREST RATE HEDGED EMERGING MARKETS BOND ETF
iShares U.S. ETF Trust (the “Trust”) is registered under the Investment Company Act of 1940, as amended (the “1940 Act”), as an open-end management investment company. The Trust was established as a Delaware statutory trust pursuant to an Agreement and Declaration of Trust dated June 21, 2011.
These financial statements relate only to the following fund (the “Fund”):
| | |
| iShares ETF | | Diversification Classification |
Interest Rate Hedged Emerging Markets Bond | | Non-diversified |
Currently the Fund seeks to achieve its investment objective by investing a substantial portion of its assets in an exchange-traded fund of iShares Trust (an “underlying fund”), an affiliate of the Fund. The financial statements and schedules of investments for the underlying fund can be found elsewhere in this report and should be read in conjunction with the Fund’s financial statements.
Pursuant to the Trust’s organizational documents, the Fund’s officers and trustees are indemnified against certain liabilities that may arise out of the performance of their duties to the Fund. Additionally, in the normal course of business, the Fund enters into contracts with service providers that contain general indemnification clauses. The Fund’s maximum exposure under these arrangements is unknown as this would involve future claims that may be made against the Fund that have not yet occurred.
| 1. | SIGNIFICANT ACCOUNTING POLICIES |
The following significant accounting policies are consistently followed by the Fund in the preparation of its financial statements in conformity with accounting principles generally accepted in the United States of America (“U.S. GAAP”). The preparation of financial statements in conformity with U.S. GAAP requires management to make certain estimates and assumptions that affect the reported amounts of assets and liabilities and disclosures of contingent assets and liabilities at the date of the financial statements and the reported amounts of revenue and expenses during the reporting period. Actual results could differ from those estimates. The Fund is considered an investment company under U.S. GAAP and follows the accounting and reporting guidance applicable to investment companies.
SECURITY VALUATION
The Fund’s investments are valued at fair value each day that the Fund’s listing exchange is open and, for financial reporting purposes, as of the report date should the reporting period end on a day that the Fund’s listing exchange is not open. U.S. GAAP defines fair value as the price a fund would receive to sell an asset or pay to transfer a liability in an orderly transaction between market participants at the measurement date. The BlackRock Global Valuation Methodologies Committee (the “Global Valuation Committee”) provides oversight of the valuation of investments for the Fund. The investments of the Fund are valued pursuant to policies and procedures developed by the Global Valuation Committee and approved by the Board of Trustees of the Trust (the “Board”).
| | • | | Exchange-traded funds and closed-end funds traded on a recognized securities exchange are valued at that day’s last reported trade price or the official closing price, as applicable, on the exchange where the fund is primarily traded. Funds traded on a recognized exchange for which there were no sales on that day are valued at the last traded price. |
| | • | | Open-end U.S. mutual funds (including money market funds) are valued at that day’s published net asset value (“NAV”). |
| | • | | Swap agreements are valued utilizing quotes received daily by independent pricing services or through brokers, which are derived using daily swap curves and models that incorporate a number of market data factors, such as discounted cash flows, trades and values of the underlying reference instruments. |
| | | | |
NOTESTO FINANCIAL STATEMENTS | | | 15 | |
Notes to Financial Statements (Continued)
iSHARES® INTEREST RATE HEDGED EMERGING MARKETS BOND ETF
In the event that application of these methods of valuation results in a price for an investment which is deemed not to be representative of the fair value of such investment or if a price is not available, the investment will be valued based upon other available factors deemed relevant by the Global Valuation Committee, in accordance with policies approved by the Board. These factors include but are not limited to (i) attributes specific to the investment; (ii) the principal market for the investment; (iii) the customary participants in the principal market for the investment; (iv) data assumptions by market participants for the investment, if reasonably available; (v) quoted prices for similar investments in active markets; and (vi) other factors, such as future cash flows, interest rates, yield curves, volatilities, prepayment speeds, loss severities, credit risks and/or default rates. Valuations based on such factors are reported to the Board on a quarterly basis.
The Global Valuation Committee employs various methods for calibrating valuation approaches for investments where an active market does not exist, including regular due diligence of the Trust’s pricing vendors, a regular review of key inputs and assumptions, transactional back-testing or disposition analysis to compare unrealized gains and losses to realized gains and losses, reviews of missing or stale prices, reviews of large movements in market values, and reviews of market related activity.
Various inputs are used in determining the fair value of financial instruments. Inputs may be based on independent market data (“observable inputs”) or they may be internally developed (“unobservable inputs”). These inputs are categorized into a disclosure hierarchy consisting of three broad levels for financial reporting purposes as follows:
| | • | | Level 1 — Unadjusted quoted prices in active markets for identical assets or liabilities; |
| | • | | Level 2 — Inputs other than quoted prices included within Level 1 that are observable for the asset or liability either directly or indirectly, including quoted prices for similar assets or liabilities in active markets, quoted prices for identical or similar assets or liabilities in markets that are not considered to be active, inputs other than quoted prices that are observable for the asset or liability (such as exchange rates, financing terms, interest rates, yield curves, volatilities, prepayment speeds, loss severities, credit risks and default rates) or other market-corroborated inputs; and |
| | • | | Level 3 — Unobservable inputs for the asset or liability based on the best information available in the circumstances, to the extent observable inputs are not available, including the Global Valuation Committee’s assumptions used in determining the fair value of investments. |
The hierarchy gives the highest priority to unadjusted quoted prices in active markets for identical assets or liabilities (Level 1 measurements) and the lowest priority to unobservable inputs (Level 3 measurements). Accordingly, the degree of judgement exercised in determining fair value is greatest for instruments categorized in Level 3. The inputs used to measure fair value may fall into different levels of the fair value hierarchy. In such cases, for disclosure purposes, the fair value hierarchy classification is determined based on the lowest level input that is significant to the fair value measurement in its entirety. The fair value hierarchy for the Fund’s investments is included in its schedule of investments.
Changes in valuation techniques may result in transfers in or out of an assigned level within the fair value hierarchy. In accordance with the Trust’s policy, transfers between different levels of the fair value hierarchy are deemed to have occurred as of the beginning of the reporting period. The categorization of values determined for financial instruments are based on the pricing transparency of the financial instruments and are not necessarily an indication of the risks associated with investing in those securities.
SECURITY TRANSACTIONS AND INCOME RECOGNITION
Security transactions are accounted for on trade date. Dividend income and capital gain distributions from underlying funds, if any, are recognized on the ex-dividend date. Interest income is accrued daily. Realized gains and losses on investment transactions are determined using the specific identification method.
| | |
| 16 | | 2016 iSHARES ANNUAL REPORTTO SHAREHOLDERS |
Notes to Financial Statements (Continued)
iSHARES® INTEREST RATE HEDGED EMERGING MARKETS BOND ETF
DISTRIBUTIONS TO SHAREHOLDERS
Dividends and distributions paid by the Fund are recorded on the ex-dividend dates. Distributions are determined on a tax basis and may differ from net investment income and net realized capital gains for financial reporting purposes. Dividends and distributions are paid in U.S. dollars and cannot be automatically reinvested in additional shares of the Fund.
LOANS OF PORTFOLIO SECURITIES
The Fund may lend its investment securities to approved borrowers, such as brokers, dealers and other financial institutions. The borrower pledges and maintains with the Fund collateral consisting of cash, an irrevocable letter of credit issued by a bank, or securities issued or guaranteed by the U.S. government. The initial collateral received by the Fund is required to have a value of at least 102% of the current value of the loaned securities for securities traded on U.S. exchanges and a value of at least 105% for all other securities. The collateral is maintained thereafter at a value equal to at least 100% of the current value of the securities on loan. The market value of the loaned securities is determined at the close of each business day of the Fund. Any additional required collateral is delivered to the Fund and any excess collateral is returned by the Fund on the next business day. During the term of the loan, the Fund is entitled to all distributions made on or in respect of the loaned securities but does not receive interest income on securities received as collateral. Loans of securities are terminable at any time and the borrower, after notice, is required to return borrowed securities within the standard time period for settlement of securities transactions.
On October 11, 2016, BlackRock, Inc. (“BlackRock”) implemented changes required by amendments to Rule 2a-7 under the 1940 Act, which governs the operations of U.S. money market funds. The Fund may be exposed to additional risks when reinvesting the cash collateral in money market funds that do not seek to maintain a stable NAV per share of $1.00 and which may be subject to redemption gates or liquidity fees under certain circumstances.
Cash received as collateral for securities on loan may be reinvested in certain short-term instruments either directly on behalf of a fund or through one or more joint accounts or money market funds, including those managed by BlackRock Fund Advisors (“BFA”), the Fund’s investment adviser, or its affiliates. As of October 31, 2016, any securities on loan were collateralized by cash and/or U.S. government obligations. Cash collateral received was invested in money market funds managed by BFA and is disclosed in the schedule of investments. The securities on loan for the Fund are also disclosed in its schedule of investments. The total value of any securities on loan as of October 31, 2016 and the total value of the related cash collateral are disclosed in the statement of assets and liabilities. Income earned by the Fund from securities lending is disclosed in the statement of operations.
The risks of securities lending include the risk that the borrower may not provide additional collateral when required or may not return the securities when due. To mitigate these risks, the Fund benefits from a borrower default indemnity provided by BlackRock. BlackRock’s indemnity allows for full replacement of securities lent. The Fund could suffer a loss if the value of the investments purchased with cash collateral falls below the value of the cash collateral received.
Securities lending transactions are entered into by the Fund under Master Securities Lending Agreements (“MSLA”) which provide the right, in the event of default (including bankruptcy or insolvency) for the non-defaulting party to liquidate the collateral and calculate a net exposure to the defaulting party or request additional collateral. In the event that a borrower defaults, the Fund, as lender, would offset the market value of the collateral received against the market value of the securities loaned. The value of the collateral is typically greater than that of the market value of the securities loaned, leaving the lender with a net amount payable to the defaulting party. However, bankruptcy or insolvency laws of a particular jurisdiction may impose restrictions on or prohibitions against such a right of offset in the event of an MSLA counterparty’s bankruptcy or insolvency. Under the MSLA, the borrower can resell or re-pledge the loaned securities, and the Fund can reinvest cash collateral, or, upon an event of default, resell or re-pledge the collateral.
| | | | |
NOTESTO FINANCIAL STATEMENTS | | | 17 | |
Notes to Financial Statements (Continued)
iSHARES® INTEREST RATE HEDGED EMERGING MARKETS BOND ETF
| 2. | INVESTMENT ADVISORY AGREEMENT AND OTHER TRANSACTIONS WITH AFFILIATES |
Pursuant to an Investment Advisory Agreement with the Trust, BFA manages the investment of the Fund’s assets. BFA is a California corporation indirectly owned by BlackRock. Under the Investment Advisory Agreement, BFA is responsible for substantially all expenses of the Fund, except interest, taxes, brokerage commissions and other expenses connected with the execution of portfolio transactions, distribution fees, litigation expenses and any extraordinary expenses.
For its investment advisory services to the Fund, BFA is entitled to an annual investment advisory fee of 0.75% based on the average daily net assets of the Fund. In addition, the Fund indirectly pays its pro rata share of fees and expenses attributable to its investments in other investment companies (“acquired fund fees and expenses”). BFA has contractually agreed to reduce its investment advisory fee for the Fund through February 28, 2022 so that the investment advisory fee is equal to the acquired fund fees and expenses that would have been experienced by the Fund related to its investments in the iShares J.P. Morgan USD Emerging Markets Bond ETF (“EMB”), after taking into account any fee waivers by EMB, plus 0.10%.
The U.S. Securities and Exchange Commission (the “SEC”) has issued an exemptive order which permits BlackRock Institutional Trust Company, N.A. (“BTC”), an affiliate of BFA, to serve as securities lending agent for the Fund, subject to applicable conditions. As securities lending agent, BTC bears all operational costs directly related to securities lending. The Fund is responsible for fees in connection with the investment of cash collateral received for securities on loan in a money market fund managed by BFA, however, BTC has agreed to reduce the amount of securities lending income it receives in order to effectively limit the collateral investment fees the Fund bears to an annual rate of 0.04% (the “collateral investment fees”). Securities lending income is equal to the total of income earned from the reinvestment of cash collateral, net of fees and other payments to and from borrowers of securities, and less the collateral investment fees. The Fund retains a portion of securities lending income and remits the remaining portion to BTC as compensation for its services as securities lending agent.
Pursuant to a securities lending agreement, the Fund retains 80% of securities lending income and the amount retained can never be less than 70% of the total of securities lending income plus the collateral investment fees. In addition, commencing the business day following the date that the aggregate securities lending income plus the collateral investment fees generated across all 1940 Act iShares exchange-traded funds (the “iShares ETF Complex”) in a given calendar year exceeds the aggregate securities lending income generated across the iShares ETF Complex in the calendar year 2013, the Fund, pursuant to a securities lending agreement, will retain for the remainder of that calendar year 85% of securities lending income and the amount retained can never be less than 70% of the total of securities lending income plus the collateral investment fees.
For the year ended October 31, 2016, the Fund paid to BTC securities lending agent services and collateral investment fees in the amount of $706.
BlackRock Investments, LLC, an affiliate of BFA, is the distributor for the Fund. Pursuant to the distribution agreement, BFA is responsible for any fees or expenses for distribution services provided to the Fund.
The Fund may invest its positive cash balances in certain money market funds managed by BFA or an affiliate. The income earned on these temporary cash investments is included in “Dividends – affiliated” in the statement of operations.
The PNC Financial Services Group, Inc. is the largest stockholder of BlackRock and is considered to be an affiliate of the Fund for 1940 Act purposes.
Certain trustees and officers of the Trust are also officers of BTC and/or BFA.
| | |
| 18 | | 2016 iSHARES ANNUAL REPORTTO SHAREHOLDERS |
Notes to Financial Statements (Continued)
iSHARES® INTEREST RATE HEDGED EMERGING MARKETS BOND ETF
| 3. | INVESTMENT PORTFOLIO TRANSACTIONS |
Purchases and sales of investments (excluding in-kind transactions and short-term investments) for the year ended October 31, 2016, were $58,141 and $138,010, respectively.
There were no in-kind transactions (see Note 4) for the year ended October 31, 2016.
| 4. | CAPITAL SHARE TRANSACTIONS |
Capital shares are issued and redeemed by the Fund only in aggregations of a specified number of shares or multiples thereof (“Creation Units”) at NAV. Except when aggregated in Creation Units, shares of the Fund are not redeemable. Transactions in capital shares for the Fund are disclosed in detail in the statements of changes in net assets.
The consideration for the purchase of Creation Units of a fund in the Trust generally consists of the in-kind deposit of a designated portfolio of securities and a specified amount of cash. Certain funds in the Trust may be offered in Creation Units solely or partially for cash in U.S. dollars. Investors purchasing and redeeming Creation Units may pay a purchase transaction fee and a redemption transaction fee directly to State Street Bank and Trust Company, the Trust’s administrator, to offset transfer and other transaction costs associated with the issuance and redemption of Creation Units, including Creation Units for cash. Investors transacting in Creation Units for cash may also pay an additional variable charge to compensate the relevant fund for certain transaction costs (i.e., stamp taxes, taxes on currency or other financial transactions, and brokerage costs) and market impact expenses relating to investing in portfolio securities. Such variable charges, if any, are included in “Proceeds from shares sold” in the statement of changes in net assets.
The Fund may enter into short positions in interest rate swaps in an attempt to mitigate interest rate risk by economically hedging the value of fixed rate bonds, which may decrease when interest rates rise (interest rate risk). Interest rate swaps are agreements in which one party pays a stream of interest payments, either fixed or floating, for another party’s stream of interest payments, either fixed or floating, on the same notional amount for a specified period of time. Interest rate swaps are marked-to-market daily and changes in value are recorded as unrealized appreciation (depreciation). Swap agreements are privately negotiated in the over-the-counter market. The Fund enters into centrally cleared interest rate swaps.
In a centrally cleared swap, immediately following execution of the swap agreement, the swap agreement is novated to a central counterparty (“CCP”) and the CCP becomes the Fund’s counterparty on the swap. The Fund is required to interface with the CCP through a broker. Upon entering into a centrally cleared swap, the Fund is required to deposit initial margin with the broker in the form of cash or securities in an amount that varies depending on the size and risk profile of the particular swap. Securities deposited as initial margin are designated on the schedule of investments and cash deposited is recorded on the statement of assets and liabilities as cash pledged for centrally cleared swaps. The daily change in valuation of centrally cleared swaps is recorded as a receivable or payable for variation margin in the statement of assets and liabilities. Payments received from (paid to) the CCP, including at termination, are recorded as realized gain (loss) in the statement of operations.
Swap transactions involve, to varying degrees, elements of interest rate, credit and market risks in excess of the amounts recognized in the statement of assets and liabilities. Such risks involve the possibility that there will be no liquid market for these agreements, that the counterparty to the agreements may default on its obligation to perform or disagree as to the meaning of the contractual terms in the agreements, and that there may be unfavorable changes in interest rates and/or market values associated with these transactions.
| | | | |
NOTESTO FINANCIAL STATEMENTS | | | 19 | |
Notes to Financial Statements (Continued)
iSHARES® INTEREST RATE HEDGED EMERGING MARKETS BOND ETF
The following table shows the value of interest rate swaps held by the Fund as of October 31, 2016 and the related locations in the statement of assets and liabilities, presented by risk exposure category:
| | | | |
| Assets | |
Centrally cleared interest rate swaps: | | | | |
Variation margin/Net assets consist of – net unrealized appreciationa | | $ | 45,647 | |
| | | | |
| | | | | |
| | a | | Represents cumulative appreciation of centrally cleared interest rate swaps as reported in the schedule of investments. Only current day’s variation margin is reported separately within the statement of assets and liabilities. |
The following table shows the realized and unrealized gains (losses) on interest rate swaps held by the Fund during the year ended October 31, 2016 and the related locations in the statement of operations, presented by risk exposure category:
| | | | | | | | |
| | | Net Realized
Gain (Loss) | | | Net Change in
Unrealized
Appreciation/Depreciation | |
Centrally cleared interest rate swaps: | | | | | | | | |
Swap agreements | | $ | (150,069 | ) | | $ | 85,316 | |
| | | | | | | | |
| | | | | | | | | |
For the year ended October 31, 2016, the average quarter-end notional amount of open interest rate swaps for the Fund (where the Fund pays the fixed rate) was $2,599,000.
In the normal course of business, the Fund’s investment activities expose it to various types of risk associated with the financial instruments and markets in which it invests. The significant types of financial risks the Fund is exposed to include market risk and credit risk. The Fund’s prospectus provides details of these and other types of risk.
MARKET RISK
Market risk arises mainly from uncertainty about future values of financial instruments influenced by price, currency and interest rate movements. It represents the potential loss a fund may suffer through holding market positions in the face of market movements. A fund is exposed to market risk by virtue of its investment in equity, fixed income and/or financial derivative instruments or indirectly by virtue of its investment in underlying funds. The fair value of securities held by a fund may decline due to general market conditions, economic trends or events that are not specifically related to the issuers of the securities including local, regional or global political, social or economic instability or to factors that affect a particular industry or group of industries. The extent of a fund’s exposure to market risk is the market value of the investments held as shown in the fund’s schedule of investments.
A diversified portfolio, where this is appropriate and consistent with a fund’s objectives, minimizes the risk that a price change of a particular investment will have a material impact on the NAV of a fund. The investment concentrations within the Fund’s portfolio are disclosed in its schedule of investments.
| | |
| 20 | | 2016 iSHARES ANNUAL REPORTTO SHAREHOLDERS |
Notes to Financial Statements (Continued)
iSHARES® INTEREST RATE HEDGED EMERGING MARKETS BOND ETF
CREDIT RISK
Credit risk is the risk that an issuer or guarantor of debt instruments or the counterparty to a financial transaction, including derivatives contracts, repurchase agreements or loans of portfolio securities, is unable or unwilling to make timely interest and/or principal payments or to otherwise honor its obligations. BFA and its affiliates manage counterparty credit risk by entering into transactions only with counterparties that they believe have the financial resources to honor their obligations and by monitoring the financial stability of those counterparties. Financial assets, which potentially expose a fund to issuer and counterparty credit risks, consist principally of financial instruments and receivables due from counterparties. The extent of a fund’s exposure to credit and counterparty risks with respect to those financial assets is approximated by their value recorded in its statement of assets and liabilities.
The Fund is treated as an entity separate from the Trust’s other funds for federal income tax purposes. It is the policy of the Fund to qualify as a regulated investment company by complying with the provisions applicable to regulated investment companies, as defined under Subchapter M of the Internal Revenue Code of 1986, as amended, and to annually distribute substantially all of its ordinary income and any net capital gains (taking into account any capital loss carryforwards) sufficient to relieve it from all, or substantially all, federal income and excise taxes. Accordingly, no provision for federal income taxes is required.
U.S. GAAP requires that certain components of net assets be adjusted to reflect permanent differences between financial and tax reporting. These reclassifications have no effect on net assets or NAV per share. The following permanent differences as of October 31, 2016, attributable to the accounting for swap agreements, were reclassified to the following accounts:
| | | | |
Undistributed
Net Investment
Income/Distributions in Excess of Net
Investment Income | | Undistributed
Net Realized
Gain/Accumulated
Net Realized Loss | |
$(28,588) | | $ | 28,588 | |
The tax character of distributions paid during the years ended October 31, 2016 and October 31, 2015 was as follows:
| | | | | | | | |
| | | 2016 | | | 2015 | |
Ordinary income | | $ | 88,749 | | | $ | 22,782 | |
Return of capital | | | 2,962 | | | | 84 | |
| | | | | | | | |
| | $ | 91,711 | | | $ | 22,866 | |
| | | | | | | | |
| | | | | | | | | |
As of October 31, 2016, the tax components of accumulated net earnings (losses) were as follows:
| | | | | | | | |
Capital
Loss
Carryforwards | | Net
Unrealized
Gains (Losses) | | | Total | |
$(141,292) | | $ | 145,511 | | | $ | 4,219 | |
| | | | |
NOTESTO FINANCIAL STATEMENTS | | | 21 | |
Notes to Financial Statements (Continued)
iSHARES® INTEREST RATE HEDGED EMERGING MARKETS BOND ETF
As of October 31, 2016, the Fund had non-expiring capital loss carryforwards in the amount of $141,292 available to offset future realized capital gains.
Management has analyzed tax laws and regulations and their application to the Fund as of October 31, 2016, inclusive of the open tax return years, and does not believe there are any uncertain tax positions that require recognition of a tax liability in the Fund’s financial statements.
Management has evaluated the impact of all subsequent events on the Fund through the date the financial statements were available to be issued and has determined that there were no subsequent events requiring adjustment or disclosure in the financial statements.
| | |
| 22 | | 2016 iSHARES ANNUAL REPORTTO SHAREHOLDERS |
Report of Independent Registered Public Accounting Firm
To the Shareholders and Board of Trustees of
iShares U.S. ETF Trust:
In our opinion, the accompanying statement of assets and liabilities, including the schedule of investments, and the related statements of operations and of changes in net assets and the financial highlights present fairly, in all material respects, the financial position of iShares Interest Rate Hedged Emerging Markets Bond ETF (the “Fund”) at October 31, 2016, the results of its operations, the changes in its net assets and its financial highlights for each of the periods presented, in conformity with accounting principles generally accepted in the United States of America. These financial statements and financial highlights (hereafter referred to as “financial statements”) are the responsibility of the Fund’s management. Our responsibility is to express an opinion on these financial statements based on our audits. We conducted our audits of these financial statements in accordance with the standards of the Public Company Accounting Oversight Board (United States). Those standards require that we plan and perform the audit to obtain reasonable assurance about whether the financial statements are free of material misstatement. An audit includes examining, on a test basis, evidence supporting the amounts and disclosures in the financial statements, assessing the accounting principles used and significant estimates made by management, and evaluating the overall financial statement presentation. We believe that our audits, which included confirmation of securities at October 31, 2016 by correspondence with the custodian, transfer agent and brokers, provide a reasonable basis for our opinion.
PricewaterhouseCoopers LLP
San Francisco, California
December 21, 2016
| | | | |
REPORTOF INDEPENDENT REGISTERED PUBLIC ACCOUNTING FIRM | | | 23 | |
Tax Information (Unaudited)
iSHARES® INTEREST RATE HEDGED EMERGING MARKETS BOND ETF
For the fiscal year ended October 31, 2016, the Fund intends to pass through to its shareholders foreign source income of $116,271 earned by the underlying fund.
| | |
| 24 | | 2016 iSHARES ANNUAL REPORTTO SHAREHOLDERS |
Board Review and Approval of Investment Advisory
Contract
iSHARES® INTEREST RATE HEDGED EMERGING MARKETS BOND ETF
Under Section 15(c) of the Investment Company Act of 1940 (the “1940 Act”), the Trust’s Board of Trustees (the “Board”), including a majority of Trustees who are not “interested persons” of the Trust (as that term is defined in the 1940 Act) (the “Independent Trustees”), is required annually to consider and approve the Investment Advisory Contract between the Trust and BFA (the “Advisory Contract”) on behalf of the Fund. The Independent Trustees requested, and BFA provided, such information as the Independent Trustees, with advice from independent counsel, deemed reasonably necessary to evaluate the Advisory Contract. A committee of all of the Independent Trustees (the “15(c) Committee”), with independent counsel, met with management on April 28, 2016 and May 9, 2016. At these meetings, the 15(c) Committee reviewed and discussed information provided in response to the 15(c) Committee’s initial requests, and requested certain additional information, which management agreed to provide. At a meeting held on May 17, 2016, management presented information to the Board relating to the continuance of the Advisory Contract, including information requested by the 15(c) Committee during its meetings. The Board, including the Independent Trustees, reviewed and discussed such information at length. The Independent Trustees requested from management certain additional information, which management agreed to provide. At a meeting held on June 21-23, 2016, the Board, including the Independent Trustees, reviewed the additional information provided by management in response to these requests. After extensive discussions, the Board, including all of the Independent Trustees, approved the continuance of the Advisory Contract for the Fund, based on a review of qualitative and quantitative information provided by BFA, including the additional information management provided at the request of the Independent Trustees. The Board noted its satisfaction with the extent and quality of information provided and its frequent interactions with management, as well as the detailed responses and other information provided by BFA. The Board also noted that the Board and BFA agreed to discuss potential enhancements and adjustments to the 15(c) process for the coming year. The Independent Trustees were advised by their independent counsel throughout the process, including about the legal standards applicable to their review. In approving the Advisory Contract for the Fund, the Board, including the Independent Trustees, considered the following factors, no one of which was controlling, and reached the following conclusions:
Expenses and Performance of the Fund — The Board reviewed statistical information prepared by Broadridge Financial Solutions Inc. (“Broadridge”), an independent provider of investment company data, regarding the expense ratio components, including gross and net total expenses, waivers/reimbursements (if any), and underlying fund fees and expenses (if any) of the Fund in comparison with the same information for other exchange traded funds (including, where applicable, funds sponsored by an “at cost” service provider) and, in the limited instances where no comparable ETFs existed and the comparison group would not otherwise be reasonable in Broadridge’s judgment, pure index institutional mutual funds, objectively selected by Broadridge as comprising the Fund’s applicable peer group pursuant to Broadridge’s proprietary ETF methodology (the “Peer Group”). The Board was provided with a detailed description of Broadridge’s proprietary ETF methodology used by Broadridge to determine the Fund’s Peer Group. The Board further noted that due to the limitations in providing comparable funds in the Peer Group, the statistical information provided in Broadridge’s report may or may not provide meaningful direct comparisons to the Fund in all instances.
The Board also noted that the investment advisory fee rate and overall expenses (net of waivers and reimbursements) for the Fund were within range of the median of the investment advisory fee rates and overall expenses (net of waivers and reimbursements) of the funds in its Peer Group, excluding iShares funds.
In addition, to the extent that any of the comparison funds included in the Peer Group, excluding iShares funds, track the same index as the Fund, Broadridge also provided, and the Board reviewed, a comparison of the Fund’s performance for the one-, three-, five-, ten-year, and since inception periods, as applicable, and for the “last quarter” period ended December 31, 2015, to that of such relevant comparison funds for the same periods.
The Board noted that the Fund is an actively managed ETF that does not seek to track the performance of a specified index and that the management team for the Fund manages the Fund’s portfolio in accordance with its investment objective. The Board further noted that during the prior year, the Board received periodic reports on the Fund’s short- and longer-term performance in
| | | | |
BOARD REVIEWAND APPROVALOF INVESTMENT ADVISORY CONTRACT | | | 25 | |
Board Review and Approval of Investment Advisory
Contract (Continued)
iSHARES® INTEREST RATE HEDGED EMERGING MARKETS BOND ETF
comparison with its peer group and benchmark index. Such periodic comparative performance information, including additional detailed information on certain specific iShares funds requested by the Board, was also considered. The Board noted that the Fund generally performed in line with expectations relative to the Fund’s peer group and benchmark index over the relevant periods.
Based on this review, the other factors considered at the meeting, and their general knowledge of ETF pricing, the Board concluded that the investment advisory fee rate and expense level and the historical performance of the Fund supported the Board’s approval of the continuance of the Advisory Contract for the coming year.
Nature, Extent and Quality of Services Provided by BFA — Based on management’s representations, including information about recent and proposed enhancements to the iShares business, including with respect to capital markets support and analysis, product design and other services, the Board expected that there would be no diminution in the scope of services required of or provided by BFA under the Advisory Contract for the coming year as compared to the scope of services provided by BFA during prior years. In reviewing the scope of these services, the Board considered BFA’s investment philosophy and experience, noting that BFA and its affiliates have committed significant resources over time, including during the past year, to supporting the iShares funds and their shareholders. The Board also considered BFA’s compliance program and its compliance record with respect to the Fund. In that regard, the Board noted that BFA reports to the Board about portfolio management and compliance matters on a periodic basis in connection with regularly scheduled meetings of the Board, and on other occasions as necessary and appropriate, and has provided information and made appropriate officers available as needed to provide further assistance with these matters. The Board also reviewed the background and experience of the persons responsible for the day-to-day management of the Fund, as well as the resources available to them in managing the Fund. In addition to the above considerations, the Board reviewed and considered detailed presentations regarding BFA’s investment performance, investment and risk management processes and strategies provided at the June 21-23, 2016 meeting and throughout the previous year, and matters related to BFA’s portfolio compliance policies and procedures. The Board noted that the Fund had met its investment objective consistently since its inception date.
Based on review of this information, and the performance information discussed above, the Board concluded that the nature, extent and quality of services provided by BFA to the Fund under the Advisory Contract supported the Board’s approval of the continuance of the Advisory Contract for the coming year.
Costs of Services Provided to the Fund and Profits Realized by BFA and its Affiliates — The Board reviewed information about the profitability to BlackRock of the Fund, based on the fees payable to BFA and its affiliates (including fees under the Advisory Contract), and all other sources of revenue and expense to BFA and its affiliates from the Funds’ operations for the last calendar year. The Board reviewed BlackRock’s profitability methodology for the iShares funds, noting that the 15(c) Committee had focused on the methodology and profitability presentation during its meetings. The Board discussed the sources of direct and ancillary revenue with management, including the revenues to BTC from securities lending by the Fund. The Board also discussed BFA’s profit margin as reflected in the Fund’s profitability analysis and reviewed information regarding potential economies of scale (as discussed below). Based on this review, the Board concluded that the profits realized by BFA and its affiliates under the Advisory Contract and from other relationships between the Fund and BFA and/or its affiliates, if any, were within a reasonable range in light of the factors considered.
Economies of Scale — The Board reviewed information regarding potential economies of scale or other efficiencies that may result from increases in the Fund’s assets, noting that the issue of economies of scale had been focused on extensively by the 15(c) Committee during its meetings and addressed by management. The Board and the 15(c) Committee reviewed information provided by BFA regarding scale benefits shared with the iShares funds through relatively low fee rates established at inception, breakpoints, waivers, or other fee reductions, as well as through additional investment in the iShares business and the provision of improved or additional infrastructure and services to the iShares funds and their shareholders. The Board and the 15(c) Committee received information regarding BlackRock’s historical profitability, including BFA’s and its affiliates’ costs in
| | |
| 26 | | 2016 iSHARES ANNUAL REPORTTO SHAREHOLDERS |
Board Review and Approval of Investment Advisory
Contract (Continued)
iSHARES® INTEREST RATE HEDGED EMERGING MARKETS BOND ETF
providing services. The cost information distinguished, among other things, between fixed and variable costs, and explained how the level of fixed and variable costs, as well as the nature of such costs, may impact the existence or size of scale benefits. The Board noted that the Advisory Contract for the Fund did not provide for any breakpoints in the Fund’s investment advisory fee rate as the assets of the Fund increase. However, the Board noted that should material economies of scale exist in the future that are not otherwise shared, a breakpoint structure for the Fund may be appropriate, and that it would continue to monitor the sharing of economies of scale to determine the appropriateness of adding breakpoints in the future.
Based on this review, as well as the other factors considered at the meeting, the Board, recognizing its responsibility to consider this issue periodically, determined to approve the continuance of the Advisory Contract for the coming year.
Fees and Services Provided for Other Comparable Funds/Accounts Managed by BFA and its Affiliates — The Board received and considered information regarding the investment advisory/management fee rates for other funds/accounts in the U.S. for which BFA (or its affiliates) provides investment advisory/management services, including open-end funds registered under the 1940 Act (including sub-advised funds), collective trust funds, and institutional separate accounts (together, the “Other Accounts”), and acknowledged BFA’s assertion that the iShares funds are fundamentally different investment vehicles from the Other Accounts. The Board noted that BFA and its affiliates do not manage Other Accounts with a similar investment strategy or investment mandate as the Fund. The Board further noted that BFA provided the Board with detailed information regarding how the Other Accounts (particularly institutional clients) generally differ from the Fund, including in terms of the different and generally more extensive services provided to the Fund, as well as other significant differences. In that regard, the Board considered that the pricing of services to institutional clients is typically based on a number of factors beyond the nature and extent of the specific services to be provided and often depends on the overall relationship between the client and its affiliates and the adviser and its affiliates. In addition, the Board considered the relative complexity and inherent risks and challenges of managing and providing other services to the Fund, as a publicly traded exchange traded fund, as compared to the Other Accounts that are institutional clients in light of differing regulatory requirements and client-imposed mandates. The Board also considered the “all-inclusive” nature of the Fund’s advisory fee structure, and the Fund expenses borne by BFA under this arrangement. The Board noted that the investment advisory fee rate under the Advisory Contract for the Fund was generally higher than the investment advisory/management fee rates for certain of the Other Accounts (particularly institutional clients) and concluded that the differences appeared to be consistent with the factors discussed.
Other Benefits to BFA and/or its Affiliates — The Board reviewed the “fallout” benefits or ancillary revenue received by BFA and/or its affiliates in connection with the services provided to the Fund by BFA, such as payment of revenue to BTC, the Fund’s securities lending agent, for loaning portfolio securities (which was included in the profit margins reviewed by the Board pursuant to BFA’s profitability methodology), and payment of advisory fees and/or administration fees to BFA and BTC (or their affiliates) in connection with any investments by the Fund in other funds for which BFA (or its affiliates) provides investment advisory services and/or administration services. The Board noted that BFA generally does not use soft dollars or consider the value of research or other services that may be provided to BFA (including its affiliates) in selecting brokers for portfolio transactions for the Fund. The Board further noted that any portfolio transactions on behalf of the Fund placed through a BFA affiliate or purchased from an underwriting syndicate in which a BFA affiliate participates, are reported to the Board pursuant to Rule 17e-1 or Rule 10f-3, as applicable, under the 1940 Act. The Board concluded that any such ancillary benefits would not be disadvantageous to the Fund’s shareholders and thus would not alter the Board’s conclusion with respect to the appropriateness of approving the continuance of the Advisory Contract for the coming year.
Based on the considerations described above, the Board determined that the Fund’s investment advisory fee rate under the Advisory Contract does not constitute a fee that is so disproportionately large as to bear no reasonable relationship to the services rendered and that could not have been the product of arm’s-length bargaining, and concluded that it is in the best interest of the Fund and its shareholders to approve the continuance of the Advisory Contract for the coming year.
| | | | |
BOARD REVIEWAND APPROVALOF INVESTMENT ADVISORY CONTRACT | | | 27 | |
Supplemental Information (Unaudited)
iSHARES® INTEREST RATE HEDGED EMERGING MARKETS BOND ETF
Section 19(a) Notices
The amounts and sources of distributions reported are estimates and are provided pursuant to regulatory requirements and are not being provided for tax reporting purposes. The actual amounts and sources for tax reporting purposes will depend upon the Fund’s investment experience during the year and may be subject to changes based on the tax regulations. Shareholders will receive a Form 1099-DIV each calendar year that will inform them how to report these distributions for federal income tax purposes.
| | | | | | | | | | | | | | | | | | | | | | | | | | | | | | |
Total Cumulative Distributions
for the Fiscal Year | | | % Breakdown of the Total Cumulative
Distributions for the Fiscal Year | |
Net
Investment
Income | | | Net
Realized
Capital
Gains | | | Return
of
Capital | | | Total
Per
Share | | | Net
Investment
Income | | | Net
Realized
Capital
Gains | | | Return
of
Capital | | | Total
Per
Share | |
| $ | 0.859055 | | | $ | — | | | $ | 0.058051 | | | $ | 0.917106 | | | | 94 | % | | | — | % | | | 6 | % | | | 100 | % |
Premium/Discount Information
The Premium/Discount Information section is intended to present information about the differences between the daily market price on secondary markets for shares of a fund and that fund’s NAV. NAV is the price at which a fund issues and redeems shares. It is calculated in accordance with the standard formula for valuing mutual fund shares. The “Market Price” of a fund generally is determined using the midpoint between the highest bid and the lowest offer on the primary stock exchange on which the shares of such fund are listed for trading, as of the time that the fund’s NAV is calculated. A fund’s Market Price may be at, above or below its NAV. The NAV of a fund will fluctuate with changes in the fair value of its portfolio holdings. The Market Price of a fund will fluctuate in accordance with changes in its NAV, as well as market supply and demand.
Premiums or discounts are the differences (expressed as a percentage) between the NAV and Market Price of a fund on a given day, generally at the time the NAV is calculated. A premium is the amount that a fund is trading above the reported NAV, expressed as a percentage of the NAV. A discount is the amount that a fund is trading below the reported NAV, expressed as a percentage of the NAV.
The following information shows the frequency of distributions of premiums and discounts for the Fund. The information shown for the Fund is for five calendar years (or from the inception date of the Fund if less than five years) through the date of the most recent calendar quarter-end. The specific periods covered for the Fund are disclosed in the table for the Fund.
| | |
| 28 | | 2016 iSHARES ANNUAL REPORTTO SHAREHOLDERS |
Supplemental Information (Unaudited) (Continued)
iSHARES® INTEREST RATE HEDGED EMERGING MARKETS BOND ETF
Each line in the table shows the number of trading days in which the Fund traded within the premium/discount range indicated. The number of trading days in each premium/discount range is also shown as a percentage of the total number of trading days in the period covered by each table. All data presented here represents past performance, which cannot be used to predict future results.
Period Covered: July 22, 2015 through September 30, 2016
| | | | | | | | |
Premium/Discount Range | | Number
of Days | | | Percentage of
Total Days | |
Greater than 1.0% and Less than 1.5% | | | 1 | | | | 0.33 | % |
Greater than 0.5% and Less than 1.0% | | | 10 | | | | 3.30 | |
Between 0.5% and –0.5% | | | 291 | | | | 96.04 | |
Less than –0.5% | | | 1 | | | | 0.33 | |
| | | | | | | | |
| | | 303 | | | | 100.00 | % |
| | | | | | | | |
| | | | |
SUPPLEMENTAL INFORMATION | | | 29 | |
Trustee and Officer Information
iSHARES® U.S. ETF TRUST
The Board of Trustees has responsibility for the overall management and operations of the Fund, including general supervision of the duties performed by BFA and other service providers. Each Trustee serves until he or she resigns, is removed, dies, retires or becomes incapacitated. The President, Chief Compliance Officer, Treasurer and Secretary shall each hold office until their successors are chosen and qualify, and all other officers shall hold office until he or she resigns or is removed. Trustees who are not “interested persons” (as defined in the 1940 Act) of the Trust are referred to as independent trustees (“Independent Trustees”).
The registered investment companies advised by BFA or its affiliates (the “BlackRock-advised Funds”) are organized into one complex of closed-end funds, two complexes of open-end funds and one complex of exchange-traded funds (“Exchange-Traded Fund Complex”) (each, a “BlackRock Fund Complex”). The Fund is included in the BlackRock Fund Complex referred to as the Exchange-Traded Fund Complex. Each Trustee also serves as a Director of iShares, Inc. and a Trustee of iShares Trust, and, as a result, oversees a total of 333 funds (as of October 31, 2016) within the Exchange-Traded Fund Complex. Mr. Lawton also serves as an Advisory Board Member for iShares, Inc. and iShares Trust with respect to 333 funds (as of October 31, 2016) within the Exchange-Traded Fund Complex. With the exception of Robert S. Kapito, Mark Wiedman and Benjamin Archibald, the address of each Trustee, Advisory Board Member and officer is c/o BlackRock, Inc., 400 Howard Street, San Francisco, CA 94105. The address of Mr. Kapito, Mr. Wiedman, and Mr. Archibald is c/o BlackRock, Inc., Park Avenue Plaza, 55 East 52nd Street, New York, NY 10055. The Board has designated Cecilia H. Herbert as its Independent Board Chair. Additional information about the Fund’s Trustees and officers may be found in the Fund’s combined Statement of Additional Information, which is available without charge, upon request, by calling toll-free 1-800-iShares (1-800-474-2737).
Interested Trustees
| | | | | | |
| | | | |
| Name (Age) | | Position(s) | | Principal Occupation(s) During the Past 5 Years | | Other Directorships Held by Trustee
During the Past 5 Years |
Robert S. Kapitoa (59) | | Trustee
(since 2011). | | President and Director, BlackRock, Inc. (since 2006); Vice Chairman of BlackRock, Inc. and Head of BlackRock, Inc.’s Portfolio Management Group (since its formation in 1998) and BlackRock, Inc.’s predecessor entities (since 1988); Trustee, University of Pennsylvania (since 2009); President of Board of Directors, Hope & Heroes Children’s Cancer Fund (since 2002); President of the Board of Directors, Periwinkle Theatre for Youth (since 1983). | | Director of iShares, Inc. (since 2009); Trustee of iShares Trust (since 2009). |
| | | |
Mark Wiedmanb (45) | | Trustee
(since 2013) | | Managing Director, BlackRock, Inc. (since 2007); Global Head of iShares (since 2011); Head of Corporate Strategy, BlackRock, Inc. (2009-2011). | | Director of iShares, Inc. (since 2013); Trustee of iShares Trust (since 2013); Director of PennyMac Financial Services, Inc. (since 2008). |
| a | Robert S. Kapito is deemed to be an “interested person” (as defined in the 1940 Act) of the Trust due to his affiliations with BlackRock, Inc. |
| b | Mark Wiedman is deemed to be an “interested person” (as defined in the 1940 Act) of the Trust due to his affiliations with BlackRock, Inc. and its affiliates. |
| | |
| 30 | | 2016 iSHARES ANNUAL REPORTTO SHAREHOLDERS |
Trustee and Officer Information (Continued)
iSHARES® U.S. ETF TRUST
Independent Trusteesc
| | | | | | |
| | | | |
| Name (Age) | | Position(s) | | Principal Occupation(s) During the Past 5 Years | | Other Directorships Held by Trustee
During the Past 5 Years |
Cecilia H. Herbert (67) | | Trustee (since 2011);
Independent Board Chair (since 2016); Nominating and Governance Committee Chair (since 2016). | | Director (1998-2013) and President (2007-2011) of the Board of Directors, Catholic Charities CYO; Trustee (2002-2011) and Chair of the Finance and Investment Committee (2006-2010) of the Thacher School; Member (since 1992) and Chair (1994-2005) of the Investment Committee, Archdiocese of San Francisco; Trustee and Member of the Investment Committee, WNET, the New York public media company (since 2011). | | Director of iShares, Inc. (since 2005); Trustee of iShares Trust (since 2005); Independent Board Chair of iShares Inc. and iShares Trust (since 2016); Director of Forward Funds (23 portfolios) (since 2009); Trustee of Salient MF Trust (4 portfolios) (since 2015). |
| | | |
Jane D. Carlin (60) | | Trustee (since 2015); Risk Committee Chair
(since 2016). | | Managing Director and Global Head of Financial Holding Company Governance & Assurance and the Global Head of Operational Risk Management of Morgan Stanley (2006-2012). | | Director of iShares, Inc. (since 2015); Trustee of iShares Trust (since 2015); Director of PHH Corporation (mortgage solutions) (since 2012). |
| | | |
Charles A. Hurty (73) | | Trustee (since 2011); Audit Committee Chair (since 2011). | | Retired; Partner, KPMG LLP (1968-2001). | | Director of iShares, Inc. (since 2005); Trustee of iShares Trust (since 2005); Director of GMAM Absolute Return Strategy Fund (1 portfolio) (since 2002); Director of SkyBridge Alternative Investments Multi-Adviser Hedge Fund Portfolios LLC (2 portfolios) (since 2002). |
| | | |
John E. Kerrigan (61) | | Trustee (since 2011); Securities Lending Committee Chair (since 2016). | | Chief Investment Officer, Santa Clara University (since 2002). | | Director of iShares, Inc. (since 2005); Trustee of iShares Trust (since 2005). |
| | | |
John E. Martinez (55) | | Trustee (since 2011); Fixed Income Plus Committee Chair (since 2016). | | Director of FirstREX Agreement Corp. (formerly EquityRock, Inc.) (since 2005). | | Director of iShares, Inc. (since 2003); Trustee of iShares Trust (since 2003). |
| | | | |
TRUSTEEAND OFFICER INFORMATION | | | 31 | |
Trustee and Officer Information (Continued)
iSHARES® U.S. ETF TRUST
Independent Trusteesc (Continued)
| | | | | | |
| | | | |
| Name (Age) | | Position(s) | | Principal Occupation(s) During the Past 5 Years | | Other Directorships Held by Trustee
During the Past 5 Years |
Madhav V. Rajan (52) | | Trustee (since 2011); Equity Plus Committee Chair and 15(c) Committee Chair (since 2016). | | Robert K. Jaedicke Professor of Accounting and Senior Associate Dean for Academic Affairs and Head of MBA Program, Stanford University Graduate School of Business (since 2001); Professor of Law (by courtesy), Stanford Law School (since 2005); Visiting Professor, University of Chicago (2007-2008). | | Director of iShares, Inc. (since 2011); Trustee of iShares Trust (since 2011); Director, Cavium, Inc. (since 2013). |
| c | Robert H. Silver served as an Independent Trustee until March 31, 2016. |
| | |
| 32 | | 2016 iSHARES ANNUAL REPORTTO SHAREHOLDERS |
Trustee and Officer Information (Continued)
iSHARES® U.S. ETF TRUST
Officersd
| | | | |
| | | |
| Name (Age) | | Position(s) | | Principal Occupation(s) During the Past 5 Years |
Martin Small (41) | | President
(since 2016). | | Managing Director, BlackRock, Inc. (since 2010); Head of U.S. iShares (since 2015); Co-Head of the U.S. Financial Markets Advisory Group, BlackRock, Inc. (2008-2014). |
| | |
Jack Gee (57) | | Treasurer and Chief Financial Officer (since 2011). | | Managing Director, BlackRock, Inc. (since 2009); Senior Director of Fund Administration of Intermediary Investor Business, BGI (2009). |
| | |
Benjamin Archibald (41) | | Secretary
(since 2015). | | Managing Director, BlackRock, Inc. (since 2014); Director, BlackRock, Inc. (2010-2013); Secretary of the BlackRock-advised Mutual Funds (since 2012). |
| | |
Steve Messinger (54) | | Executive Vice President (since 2016). | | Managing Director, BlackRock, Inc. (2007-2014 and since 2016); Managing Director, Beacon Consulting Group (2014-2016). |
| | |
Charles Park (49) | | Chief Compliance Officer (since 2011). | | Chief Compliance Officer of BlackRock Advisors, LLC and the BlackRock-advised Funds in the Equity-Bond Complex, the Equity-Liquidity Complex and the Closed-End Complex (since 2014); Chief Compliance Officer, BFA (since 2006). |
| | |
Scott Radell (47) | | Executive Vice President (since 2012). | | Managing Director, BlackRock, Inc. (since 2009); Head of Portfolio Solutions, BlackRock, Inc. (since 2009); Head of Portfolio Solutions, BGI (2007-2009); Credit Portfolio Manager, BGI (2005-2007); Credit Research Analyst, BGI (2003-2005). |
| | |
Amy Schioldager (54) | | Executive Vice President (since 2011). | | Senior Managing Director, BlackRock, Inc. (since 2009); Global Head of Index Equity, BGI (2008-2009); Global Head of U.S. Indexing, BGI (2006-2008); Head of Domestic Equity Portfolio Management, BGI (2001-2006). |
| d | Manish Mehta served as President until October 15, 2016. |
| | | | |
TRUSTEEAND OFFICER INFORMATION | | | 33 | |
Trustee and Officer Information (Continued)
iSHARES® U.S. ETF TRUST
Advisory Board Member
| | | | | | |
| | | | |
| Name (Age) | | Position(s) | | Principal Occupation(s)
During the Past 5 Years | | Other Directorships
Held by Advisory Board Member
During the Past 5 Years |
Drew E. Lawton (57) | | Advisory Board Member (since 2016). | | Senior Managing Director of New York Life Insurance Company (2010-2015). | | Advisory Board Member of iShares, Inc. (since 2016); Advisory Board Member of iShares Trust (since 2016); Director of Principal Funds, Inc., Principal Variable Contracts Funds, Inc. and Principal Exchange-Traded Funds (124 portfolios) (March 2016-October 2016). |
| | |
| 34 | | 2016 iSHARES ANNUAL REPORTTO SHAREHOLDERS |
Additional Financial Information
Audited Financial Statements
October 31, 2016
iShares Trust
iShares J.P. Morgan USD Emerging Markets Bond ETF | EMB | NYSE Arca
Schedule of Investments
iSHARES® J.P. MORGAN USD EMERGING MARKETS BOND ETF
October 31, 2016
| | | | | | | | |
| Security | |
Principal
(000s) | | | Value | |
CORPORATE BONDS & NOTESa — 16.21% | |
| | |
AZERBAIJAN — 0.52% | | | | | | | | |
Southern Gas Corridor CJSC | | | | | | | | |
6.88%, 03/24/26b | | $ | 22,400 | | | $ | 25,200,000 | |
| | | | | | | | |
| | | | 25,200,000 | |
BRAZIL — 0.15% | |
Caixa Economica Federal | | | | | | | | |
4.25%, 05/13/19b | | | 14,660 | | | | 14,755,290 | |
| | | | | | | | |
| | | | 14,755,290 | |
CHILE — 1.41% | |
Corp. Nacional del Cobre de Chile | | | | | | | | |
3.00%, 07/17/22b | | | 37,451 | | | | 36,985,484 | |
3.75%, 11/04/20b | | | 21,824 | | | | 22,878,318 | |
3.88%, 11/03/21b | | | 31,418 | | | | 32,619,110 | |
4.50%, 09/16/25b | | | 41,680 | | | | 43,321,775 | |
| | | | | | | | |
| | | | 135,804,687 | |
CHINA — 3.32% | |
Amber Circle Funding Ltd. | | | | | | | | |
3.25%, 12/04/22b | | | 11,430 | | | | 11,885,185 | |
Charming Light Investments Ltd. | | | | | | | | |
3.75%, 09/03/19b | | | 17,285 | | | | 17,919,330 | |
China Development Bank Corp. | | | | | | | | |
1.63%, 06/22/19b | | | 5,300 | | | | 5,275,784 | |
2.13%, 06/01/21b | | | 14,240 | | | | 14,311,414 | |
2.50%, 10/09/20b | | | 29,600 | | | | 30,078,890 | |
CNOOC Curtis Funding No. 1 Pty Ltd. | | | | | | | | |
4.50%, 10/03/23b | | | 15,876 | | | | 17,346,435 | |
Sinochem Overseas Capital Co. Ltd. | | | | | | | | |
4.50%, 11/12/20b | | | 12,786 | | | | 13,763,490 | |
Sinopec Group Overseas Development 2012 Ltd. | | | | | | | | |
3.90%, 05/17/22b | | | 26,340 | | | | 28,133,838 | |
4.88%, 05/17/42b | | | 12,809 | | | | 14,282,837 | |
Sinopec Group Overseas Development 2013 Ltd. | | | | | | | | |
4.38%, 10/17/23b | | | 17,210 | | | | 18,798,681 | |
Sinopec Group Overseas Development 2014 Ltd. | | | | | | | | |
4.38%, 04/10/24b | | | 10,336 | | | | 11,255,386 | |
| | | | | | | | |
| Security | |
Principal
(000s) | | | Value | |
Sinopec Group Overseas Development 2015 Ltd. | | | | | | | | |
2.50%, 04/28/20b | | $ | 54,823 | | | $ | 55,609,628 | |
3.25%, 04/28/25b | | | 18,320 | | | | 18,409,911 | |
Sinopec Group Overseas Development 2016 Ltd. | | | | | | | | |
2.13%, 05/03/19b | | | 2,500 | | | | 2,508,022 | |
State Grid Overseas Investment 2013 Ltd. | | | | | | | | |
3.13%, 05/22/23b | | | 14,010 | | | | 14,458,950 | |
State Grid Overseas Investment 2014 Ltd. | | | | | | | | |
2.75%, 05/07/19b | | | 13,042 | | | | 13,360,126 | |
4.13%, 05/07/24b | | | 21,532 | | | | 23,437,638 | |
Three Gorges Finance I Cayman Islands Ltd. | | | | | | | | |
3.15%, 06/02/26b | | | 8,895 | | | | 8,974,384 | |
| | | | | | | | |
| | | | 319,809,929 | |
INDONESIA — 1.32% | |
Majapahit Holding BV | | | | | | | | |
7.75%, 01/20/20b | | | 10,038 | | | | 11,491,402 | |
Pelabuhan Indonesia II PT | | | | | | | | |
4.25%, 05/05/25b | | | 13,000 | | | | 13,048,750 | |
Pertamina Persero PT | | | | | | | | |
4.30%, 05/20/23b | | | 14,769 | | | | 15,309,250 | |
4.88%, 05/03/22b | | | 10,896 | | | | 11,616,444 | |
5.25%, 05/23/21b | | | 4,527 | | | | 4,885,810 | |
5.63%, 05/20/43b | | | 18,703 | | | | 18,731,522 | |
6.00%, 05/03/42b | | | 13,530 | | | | 14,238,769 | |
6.45%, 05/30/44b | | | 16,122 | | | | 17,761,769 | |
Perusahaan Listrik Negara PT | | | | | | | | |
5.25%, 10/24/42b | | | 9,860 | | | | 9,805,770 | |
5.50%, 11/22/21b | | | 9,380 | | | | 10,363,774 | |
| | | | | | | | |
| | | | 127,253,260 | |
KAZAKHSTAN — 1.30% | |
Development Bank of Kazakhstan JSC | | | | | | | | |
4.13%, 12/10/22b | | | 32,645 | | | | 31,828,875 | |
Kazakhstan Temir Zholy Finance BV | | | | | | | | |
6.95%, 07/10/42b | | | 28,375 | | | | 29,297,187 | |
| | |
| 36 | | 2016 iSHARES ANNUAL REPORTTO SHAREHOLDERS |
Schedule of Investments (Continued)
iSHARES® J.P. MORGAN USD EMERGING MARKETS BOND ETF
October 31, 2016
| | | | | | | | |
| Security | |
Principal
(000s) | | | Value | |
KazMunayGas National Co. JSC | | | | | | | | |
6.38%, 04/09/21b | | $ | 25,236 | | | $ | 27,760,736 | |
7.00%, 05/05/20b | | | 32,824 | | | | 36,434,640 | |
| | | | | | | | |
| | | | 125,321,438 | |
MALAYSIA — 1.99% | |
Petronas Capital Ltd. | | | | | | | | |
3.50%, 03/18/25b | | | 27,400 | | | | 28,906,866 | |
4.50%, 03/18/45b | | | 36,956 | | | | 40,171,061 | |
5.25%, 08/12/19b | | | 75,322 | | | | 82,325,439 | |
7.88%, 05/22/22b | | | 31,599 | | | | 40,576,927 | |
| | | | | | | | |
| | | | 191,980,293 | |
MEXICO — 3.16% | |
Banco Nacional de Comercio Exterior SNC | | | | | | | | |
4.38%, 10/14/25b | | | 7,324 | | | | 7,580,340 | |
Comision Federal de Electricidad | | | | | | | | |
4.88%, 05/26/21b | | | 6,086 | | | | 6,435,945 | |
4.88%, 01/15/24b | | | 9,400 | | | | 9,834,750 | |
Mexico City Airport Trust | | | | | | | | |
4.25%, 10/31/26 (Call 07/31/26)c | | | 6,500 | | | | 6,597,500 | |
5.50%, 10/31/46 (Call 04/30/46)c | | | 6,500 | | | | 6,342,700 | |
Petroleos Mexicanos | | | | | | | | |
3.50%, 07/23/20 | | | 10,630 | | | | 10,628,831 | |
3.50%, 01/30/23 | | | 15,703 | | | | 14,831,484 | |
4.25%, 01/15/25 | | | 2,226 | | | | 2,142,525 | |
4.50%, 01/23/26 | | | 12,480 | | | | 12,005,760 | |
4.63%, 09/21/23c | | | 2,500 | | | | 2,481,950 | |
4.88%, 01/24/22 | | | 19,355 | | | | 19,740,164 | |
4.88%, 01/18/24 | | | 11,384 | | | | 11,403,694 | |
5.50%, 01/21/21 | | | 24,806 | | | | 26,232,345 | |
5.50%, 06/27/44 | | | 29,672 | | | | 25,485,281 | |
5.63%, 01/23/46 | | | 24,939 | | | | 21,472,479 | |
6.38%, 02/04/21b | | | 9,500 | | | | 10,369,250 | |
6.38%, 01/23/45 | | | 26,876 | | | | 25,357,506 | |
6.50%, 06/02/41 | | | 22,967 | | | | 22,323,924 | |
6.63%, 06/15/35 | | | 17,729 | | | | 17,755,593 | |
6.75%, 09/21/47c | | | 2,000 | | | | 1,980,000 | |
6.75%, 09/21/47b | | | 8,000 | | | | 7,920,000 | |
6.88%, 08/04/26b | | | 20,285 | | | | 22,605,604 | |
8.00%, 05/03/19 | | | 11,777 | | | | 13,179,641 | |
| | | | | | | | |
| | | | 304,707,266 | |
| | | | | | | | |
| Security | |
Principal
(000s) | | | Value | |
OMAN — 0.28% | |
Lamar Funding Ltd. | | | | | | | | |
3.96%, 05/07/25b | | $ | 28,713 | | | $ | 27,420,915 | |
| | | | | | | | |
| | | | 27,420,915 | |
PHILIPPINES — 0.46% | |
Power Sector Assets & Liabilities Management Corp. | | | | | | | | |
7.25%, 05/27/19b | | | 19,348 | | | | 21,806,163 | |
7.39%, 12/02/24b | | | 16,876 | | | | 22,612,153 | |
| | | | | | | | |
| | | | 44,418,316 | |
RUSSIA — 0.74% | |
Russian Railways via RZD Capital PLC | | | | | | | | |
5.70%, 04/05/22b | | | 12,899 | | | | 13,769,682 | |
Vnesheconombank Via VEB Finance PLC | | | | | | | | |
5.94%, 11/21/23b | | | 15,800 | | | | 16,293,750 | |
6.03%, 07/05/22b | | | 11,200 | | | | 11,678,800 | |
6.80%, 11/22/25b | | | 11,358 | | | | 12,138,863 | |
6.90%, 07/09/20b | | | 16,378 | | | | 17,626,822 | |
| | | | | | | | |
| | | | 71,507,917 | |
SOUTH AFRICA — 0.96% | |
Eskom Holdings SOC Ltd. | | | | | | | | |
5.75%, 01/26/21b | | | 29,947 | | | | 30,059,301 | |
6.75%, 08/06/23b | | | 20,038 | | | | 20,689,235 | |
7.13%, 02/11/25b | | | 22,189 | | | | 22,910,142 | |
Transnet SOC Ltd. | | | | | | | | |
4.00%, 07/26/22b | | | 19,791 | | | | 19,345,703 | |
| | | | | | | | |
| | | | 93,004,381 | |
VENEZUELA — 0.85% | |
Petroleos de Venezuela SA | | | | | | | | |
5.38%, 04/12/27b | | | 25,397 | | | | 9,238,232 | |
5.50%, 04/12/37b | | | 15,363 | | | | 5,529,144 | |
6.00%, 05/16/24b | | | 40,453 | | | | 15,169,791 | |
6.00%, 11/15/26b | | | 38,503 | | | | 14,167,179 | |
9.00%, 11/17/21b | | | 22,686 | | | | 11,229,570 | |
9.75%, 05/17/35b | | | 26,314 | | | | 11,617,733 | |
12.75%, 02/17/22b | | | 26,264 | | | | 15,430,100 | |
| | | | | | | | |
| | | | | | | 82,381,749 | |
| | | | | | | | |
TOTAL CORPORATE BONDS & NOTES | |
(Cost: $1,565,827,402) | | | | | | | 1,563,565,441 | |
| | | | |
SCHEDULEOF INVESTMENTS | | | 37 | |
Schedule of Investments (Continued)
iSHARES® J.P. MORGAN USD EMERGING MARKETS BOND ETF
October 31, 2016
| | | | | | | | |
| Security | |
Principal
(000s) | | | Value | |
FOREIGN GOVERNMENT OBLIGATIONSa — 81.58% | |
| | |
ANGOLA — 0.38% | | | | | | | | |
Angolan Government International Bond | | | | | | | | |
9.50%, 11/12/25b | | $ | 37,000 | | | $ | 36,213,750 | |
| | | | | | | | |
| | | | 36,213,750 | |
ARGENTINA — 3.87% | |
Argentine Republic Government International Bond | | | | | | | | |
2.50%, 12/31/38d | | | 61,793 | | | | 42,019,240 | |
6.25%, 04/22/19b | | | 34,382 | | | | 36,462,111 | |
6.63%, 07/06/28b | | | 12,452 | | | | 12,775,752 | |
6.88%, 04/22/21b | | | 52,401 | | | | 56,593,080 | |
7.13%, 07/06/36b | | | 22,080 | | | | 22,720,320 | |
7.50%, 04/22/26b | | | 77,767 | | | | 84,960,448 | |
7.63%, 04/22/46b | | | 34,186 | | | | 37,262,740 | |
8.28%, 12/31/33 | | | 20,366 | | | | 22,097,114 | |
8.28%, 12/31/33 | | | 52,330 | | | | 58,609,679 | |
| | | | | | | | |
| | | | 373,500,484 | |
AZERBAIJAN — 0.61% | |
Republic of Azerbaijan International Bond | | | | | | | | |
4.75%, 03/18/24b | | | 32,835 | | | | 33,934,973 | |
State Oil Co. of the Azerbaijan Republic | | | | | | | | |
4.75%, 03/13/23b | | | 24,845 | | | | 24,782,887 | |
| | | | | | | | |
| | | | 58,717,860 | |
BRAZIL — 3.93% | |
Banco Nacional de Desenvolvimento Economico e Social | | | | | | | | |
5.75%, 09/26/23b | | | 19,523 | | | | 20,377,131 | |
6.50%, 06/10/19b | | | 11,985 | | | | 12,879,201 | |
Brazil Minas SPE via State of Minas Gerais | | | | | | | | |
5.33%, 02/15/28b | | | 14,481 | | | | 14,155,178 | |
Brazilian Government International Bond | | | | | | | | |
2.63%, 01/05/23 | | | 25,664 | | | | 23,713,536 | |
4.25%, 01/07/25 | | | 54,112 | | | | 53,489,712 | |
4.88%, 01/22/21 | | | 37,251 | | | | 39,411,558 | |
5.00%, 01/27/45 | | | 41,639 | | | | 36,746,417 | |
| | | | | | | | |
| Security | |
Principal
(000s) | | | Value | |
5.63%, 01/07/41 | | $ | 26,483 | | | $ | 25,489,888 | |
5.63%, 02/21/47 | | | 18,700 | | | | 17,905,250 | |
5.88%, 01/15/19 | | | 22,537 | | | | 24,368,131 | |
6.00%, 04/07/26 | | | 18,710 | | | | 20,618,420 | |
7.13%, 01/20/37 | | | 23,542 | | | | 26,896,735 | |
8.25%, 01/20/34 | | | 20,921 | | | | 26,255,855 | |
8.88%, 04/15/24 | | | 12,081 | | | | 15,569,389 | |
10.13%, 05/15/27 | | | 14,252 | | | | 20,914,810 | |
| | | | | | | | |
| | | | 378,791,211 | |
CHILE — 0.35% | |
Chile Government International Bond | | | | | | | | |
3.13%, 01/21/26 | | | 32,927 | | | | 34,202,921 | |
| | | | | | | | |
| | | | 34,202,921 | |
CHINA — 0.67% | |
Export-Import Bank of China (The) | | | | | | | | |
2.00%, 04/26/21b | | | 16,050 | | | | 16,043,342 | |
2.50%, 07/31/19b | | | 16,140 | | | | 16,462,800 | |
2.88%, 04/26/26b | | | 13,650 | | | | 13,547,625 | |
3.63%, 07/31/24b | | | 17,954 | | | | 18,950,447 | |
| | | | | | | | |
| | | | 65,004,214 | |
COLOMBIA — 3.67% | |
Colombia Government International Bond | | | | | | | | |
2.63%, 03/15/23 (Call 12/15/22) | | | 15,695 | | | | 15,169,218 | |
4.00%, 02/26/24 (Call 11/26/23) | | | 39,041 | | | | 40,505,037 | |
4.38%, 07/12/21 | | | 33,214 | | | | 35,406,124 | |
4.50%, 01/28/26 (Call 10/28/25) | | | 26,753 | | | | 28,558,828 | |
5.00%, 06/15/45 (Call 12/15/44) | | | 38,352 | | | | 38,927,280 | |
5.63%, 02/26/44 (Call 08/26/43) | | | 42,905 | | | | 46,873,712 | |
6.13%, 01/18/41 | | | 42,695 | | | | 48,779,037 | |
7.38%, 03/18/19 | | | 31,794 | | | | 35,768,250 | |
7.38%, 09/18/37 | | | 32,167 | | | | 41,173,760 | |
8.13%, 05/21/24 | | | 18,118 | | | | 23,372,220 | |
| | | | | | | | |
| | | | 354,533,466 | |
COSTA RICA — 0.78% | |
Costa Rica Government International Bond | | | | | | | | |
4.25%, 01/26/23b | | | 27,084 | | | | 26,203,770 | |
| | |
| 38 | | 2016 iSHARES ANNUAL REPORTTO SHAREHOLDERS |
Schedule of Investments (Continued)
iSHARES® J.P. MORGAN USD EMERGING MARKETS BOND ETF
October 31, 2016
| | | | | | | | |
| Security | |
Principal
(000s) | | | Value | |
7.00%, 04/04/44b | | $ | 26,759 | | | $ | 27,963,155 | |
7.16%, 03/12/45b | | | 20,485 | | | | 21,509,250 | |
| | | | | | | | |
| | | | 75,676,175 | |
CROATIA — 2.10% | |
Croatia Government International Bond | | | | | | | | |
5.50%, 04/04/23b | | | 32,046 | | | | 34,930,140 | |
6.00%, 01/26/24b | | | 48,814 | | | | 54,964,564 | |
6.38%, 03/24/21b | | | 38,531 | | | | 42,769,410 | |
6.63%, 07/14/20b | | | 3,300 | | | | 3,654,750 | |
6.63%, 07/14/20b | | | 21,114 | | | | 23,383,755 | |
6.75%, 11/05/19b | | | 39,143 | | | | 42,959,442 | |
| | | | | | | | |
| | | | 202,662,061 | |
DOMINICAN REPUBLIC — 2.46% | |
Dominican Republic International Bond | | | | | | | | |
5.50%, 01/27/25b | | | 37,479 | | | | 37,947,488 | |
5.88%, 04/18/24b | | | 24,164 | | | | 25,070,150 | |
6.85%, 01/27/45b | | | 51,107 | | | | 53,151,280 | |
6.88%, 01/29/26b | | | 39,597 | | | | 43,655,692 | |
7.45%, 04/30/44b | | | 34,046 | | | | 37,961,290 | |
7.50%, 05/06/21b | | | 35,853 | | | | 39,617,565 | |
| | | | | | | | |
| | | | 237,403,465 | |
ECUADOR — 1.33% | |
Ecuador Government International Bond | | | | | | | | |
7.95%, 06/20/24b | | | 64,032 | | | | 60,190,080 | |
10.50%, 03/24/20b | | | 33,386 | | | | 35,222,230 | |
10.75%, 03/28/22b | | | 31,098 | | | | 32,886,135 | |
| | | | | | | | |
| | | | 128,298,445 | |
EGYPT — 0.63% | |
Egypt Government International Bond | | | | | | | | |
5.75%, 04/29/20b | | | 24,754 | | | | 25,280,023 | |
5.88%, 06/11/25b | | | 38,264 | | | | 35,202,880 | |
| | | | | | | | |
| | | | 60,482,903 | |
EL SALVADOR — 0.27% | |
El Salvador Government International Bond | | | | | | | | |
7.65%, 06/15/35b | | | 25,538 | | | | 26,495,675 | |
| | | | | | | | |
| | | | 26,495,675 | |
| | | | | | | | |
| Security | |
Principal
(000s) | | | Value | |
ETHIOPIA — 0.24% | |
Ethiopia International Bond | | | | | | | | |
6.63%, 12/11/24b | | $ | 24,240 | | | $ | 22,906,800 | |
| | | | | | | | |
| | | | 22,906,800 | |
GABON — 0.34% | |
Gabon Government International Bond | | | | | | | | |
6.38%, 12/12/24b | | | 36,134 | | | | 32,972,275 | |
| | | | | | | | |
| | | | 32,972,275 | |
GHANA — 0.50% | |
Ghana Government International Bond | | | | | | | | |
7.88%, 08/07/23b | | | 25,243 | | | | 24,170,173 | |
8.13%, 01/18/26b | | | 24,712 | | | | 23,661,740 | |
| | | | | | | | |
| | | | 47,831,913 | |
HUNGARY — 3.60% | |
Hungary Government International Bond | | | | | | | | |
5.38%, 02/21/23 | | | 53,230 | | | | 60,416,050 | |
5.38%, 03/25/24 | | | 47,790 | | | | 54,958,500 | |
5.75%, 11/22/23 | | | 44,356 | | | | 51,674,740 | |
6.25%, 01/29/20 | | | 49,410 | | | | 55,302,143 | |
6.38%, 03/29/21 | | | 67,498 | | | | 77,707,072 | |
7.63%, 03/29/41 | | | 30,924 | | | | 47,004,480 | |
| | | | | | | | |
| | | | 347,062,985 | |
INDIA — 0.27% | |
Export-Import Bank of India | | | | | | | | |
3.38%, 08/05/26b | | | 26,700 | | | | 26,447,570 | |
| | | | | | | | |
| | | | 26,447,570 | |
INDONESIA — 3.65% | |
Indonesia Government International Bond | | | | | | | | |
3.38%, 04/15/23b | | | 15,020 | | | | 15,161,639 | |
3.75%, 04/25/22b | | | 22,336 | | | | 23,129,486 | |
4.13%, 01/15/25b | | | 16,111 | | | | 16,886,261 | |
4.63%, 04/15/43b | | | 12,632 | | | | 13,013,297 | |
4.75%, 01/08/26b | | | 21,470 | | | | 23,402,300 | |
4.88%, 05/05/21b | | | 23,207 | | | | 25,233,667 | |
5.13%, 01/15/45b | | | 14,429 | | | | 15,710,151 | |
5.25%, 01/17/42b | | | 16,612 | | | | 18,227,185 | |
5.38%, 10/17/23b | | | 12,434 | | | | 14,045,198 | |
5.88%, 03/13/20b | | | 17,149 | | | | 19,088,380 | |
| | | | |
SCHEDULEOF INVESTMENTS | | | 39 | |
Schedule of Investments (Continued)
iSHARES® J.P. MORGAN USD EMERGING MARKETS BOND ETF
October 31, 2016
| | | | | | | | |
| Security | |
Principal
(000s) | | | Value | |
5.88%, 01/15/24b | | $ | 21,416 | | | $ | 24,840,847 | |
5.95%, 01/08/46b | | | 14,597 | | | | 17,654,780 | |
6.63%, 02/17/37b | | | 13,226 | | | | 16,637,514 | |
6.75%, 01/15/44b | | | 21,271 | | | | 28,049,111 | |
7.75%, 01/17/38b | | | 19,501 | | | | 27,349,956 | |
8.50%, 10/12/35b | | | 16,703 | | | | 24,701,564 | |
11.63%, 03/04/19b | | | 17,504 | | | | 21,263,859 | |
Perusahaan Penerbit SBSN Indonesia III | | | | | | | | |
4.35%, 09/10/24b | | | 7,471 | | | | 7,872,790 | |
| | | | | | | | |
| | | | 352,267,985 | |
IRAQ — 0.58% | |
Iraq International Bond | | | | | | | | |
5.80%, 01/15/28b (Call 12/15/16) | | | 69,364 | | | | 55,838,020 | |
| | | | | | | | |
| | | | 55,838,020 | |
IVORY COAST — 0.88% | |
Ivory Coast Government International Bond | | | | | | | | |
5.75%, 12/31/32 (Call 12/31/16)b,d | | | 61,279 | | | | 60,053,440 | |
6.38%, 03/03/28b | | | 24,300 | | | | 25,357,050 | |
| | | | | | | | |
| | | | 85,410,490 | |
JAMAICA — 0.77% | |
Jamaica Government International Bond | | | | | | | | |
6.75%, 04/28/28 | | | 32,699 | | | | 36,868,123 | |
8.00%, 03/15/39 | | | 32,000 | | | | 37,320,000 | |
| | | | | | | | |
| | | | 74,188,123 | |
KAZAKHSTAN — 1.83% | |
Kazakhstan Government International Bond | | | | | | | | |
3.88%, 10/14/24b | | | 35,816 | | | | 37,069,560 | |
4.88%, 10/14/44b | | | 25,969 | | | | 26,163,768 | |
5.13%, 07/21/25b | | | 61,170 | | | | 67,822,237 | |
6.50%, 07/21/45b | | | 38,092 | | | | 45,519,940 | |
| | | | | | | | |
| | | | 176,575,505 | |
KENYA — 0.50% | |
Kenya Government International Bond | | | | | | | | |
6.88%, 06/24/24b | | | 48,240 | | | | 48,059,100 | |
| | | | | | | | |
| | | | 48,059,100 | |
| | | | | | | | |
| Security | |
Principal
(000s) | | | Value | |
LEBANON — 2.42% | |
Lebanon Government International Bond | | | | | | | | |
6.00%, 01/27/23b | | $ | 27,215 | | | $ | 26,330,513 | |
6.10%, 10/04/22b | | | 39,133 | | | | 38,252,507 | |
6.38%, 03/09/20 | | | 29,983 | | | | 30,132,915 | |
6.60%, 11/27/26b | | | 37,765 | | | | 36,679,256 | |
6.65%, 02/26/30b | | | 37,250 | | | | 35,946,250 | |
6.75%, 11/29/27b | | | 24,971 | | | | 24,534,008 | |
8.25%, 04/12/21b | | | 38,507 | | | | 41,202,490 | |
| | | | | | | | |
| | | | 233,077,939 | |
LITHUANIA — 1.52% | |
Lithuania Government International Bond | | | | | | | | |
6.13%, 03/09/21b | | | 36,580 | | | | 42,591,191 | |
6.63%, 02/01/22b | | | 38,114 | | | | 46,321,088 | |
7.38%, 02/11/20b | | | 48,907 | | | | 57,467,192 | |
| | | | | | | | |
| | | | 146,379,471 | |
MALAYSIA — 0.73% | |
1MDB Global Investments Ltd. | | | | | | | | |
4.40%, 03/09/23b | | | 76,200 | | | | 66,103,500 | |
Malaysia Sukuk Global Bhd | | | | | | | | |
3.18%, 04/27/26b | | | 4,507 | | | | 4,630,943 | |
| | | | | | | | |
| | | | 70,734,443 | |
MEXICO — 3.09% | |
Mexico Government International Bond | | | | | | | | |
3.50%, 01/21/21 | | | 11,070 | | | | 11,612,430 | |
3.60%, 01/30/25 | | | 15,141 | | | | 15,405,967 | |
3.63%, 03/15/22 | | | 19,452 | | | | 20,307,888 | |
4.00%, 10/02/23 | | | 33,038 | | | | 34,656,862 | |
4.13%, 01/21/26 | | | 25,128 | | | | 26,510,040 | |
4.35%, 01/15/47 | | | 12,940 | | | | 12,241,240 | |
4.60%, 01/23/46 | | | 17,964 | | | | 17,559,810 | |
4.75%, 03/08/44 | | | 31,004 | | | | 30,848,980 | |
5.13%, 01/15/20 | | | 14,094 | | | | 15,524,541 | |
5.55%, 01/21/45 | | | 21,702 | | | | 24,306,240 | |
5.75%, 10/12/49 | | | 20,852 | | | | 21,321,170 | |
5.95%, 03/19/19 | | | 11,650 | | | | 12,844,125 | |
6.05%, 01/11/40 | | | 23,086 | | | | 27,414,625 | |
6.75%, 09/27/34 | | | 13,005 | | | | 16,776,450 | |
8.30%, 08/15/31 | | | 7,078 | | | | 11,218,630 | |
| | | | | | | | |
| | | | 298,548,998 | |
| | |
| 40 | | 2016 iSHARES ANNUAL REPORTTO SHAREHOLDERS |
Schedule of Investments (Continued)
iSHARES® J.P. MORGAN USD EMERGING MARKETS BOND ETF
October 31, 2016
| | | | | | | | |
| Security | |
Principal
(000s) | | | Value | |
MONGOLIA — 0.20% | |
Mongolia Government International Bond | | | | | | | | |
5.13%, 12/05/22b | | $ | 22,215 | | | $ | 19,543,979 | |
| | | | | | | | |
| | | | 19,543,979 | |
MOROCCO — 0.38% | |
Morocco Government International Bond | | | | | | | | |
4.25%, 12/11/22b | | | 34,303 | | | | 36,532,695 | |
| | | | | | | | |
| | | | 36,532,695 | |
OMAN — 0.98% | |
Oman Government International Bond | | | | | | | | |
3.63%, 06/15/21b | | | 32,900 | | | | 33,105,625 | |
4.75%, 06/15/26b | | | 60,965 | | | | 61,346,031 | |
| | | | | | | | |
| | | | 94,451,656 | |
PAKISTAN — 0.68% | |
Pakistan Government International Bond | | | | | | | | |
7.25%, 04/15/19b | | | 25,978 | | | | 27,540,187 | |
8.25%, 04/15/24b | | | 33,683 | | | | 37,883,439 | |
| | | | | | | | |
| | | | 65,423,626 | |
PANAMA — 2.04% | |
Panama Government International Bond | | | | | | | | |
3.75%, 03/16/25 (Call 12/16/24) | | | 27,711 | | | | 29,304,383 | |
3.88%, 03/17/28 (Call 12/17/27) | | | 31,800 | | | | 33,708,000 | |
4.00%, 09/22/24 (Call 06/22/24) | | | 26,025 | | | | 27,944,344 | |
5.20%, 01/30/20 | | | 36,210 | | | | 39,966,787 | |
6.70%, 01/26/36 | | | 49,999 | | | | 66,186,176 | |
| | | | | | | | |
| | | | 197,109,690 | |
PARAGUAY — 0.28% | |
Paraguay Government International Bond | | | | | | | | |
6.10%, 08/11/44b | | | 24,616 | | | | 27,108,370 | |
| | | | | | | | |
| | | | 27,108,370 | |
| | | | | | | | |
| Security | |
Principal
(000s) | | | Value | |
PERU — 3.09% | |
Peruvian Government International Bond | | | | | | | | |
4.13%, 08/25/27 | | $ | 32,057 | | | $ | 35,623,341 | |
5.63%, 11/18/50 | | | 62,726 | | | | 79,348,390 | |
6.55%, 03/14/37 | | | 1,500 | | | | 2,058,750 | |
6.55%, 03/14/37 | | | 27,113 | | | | 37,212,593 | |
7.35%, 07/21/25 | | | 43,492 | | | | 59,301,342 | |
8.75%, 11/21/33 | | | 700 | | | | 1,100,750 | |
8.75%, 11/21/33 | | | 53,250 | | | | 83,735,625 | |
| | | | | | | | |
| | | | 298,380,791 | |
PHILIPPINES — 4.10% | |
Philippine Government International Bond | | | | | | | | |
3.70%, 03/01/41 | | | 32,211 | | | | 33,660,495 | |
3.95%, 01/20/40 | | | 29,774 | | | | 31,980,849 | |
4.00%, 01/15/21 | | | 22,903 | | | | 24,751,959 | |
4.20%, 01/21/24 | | | 22,543 | | | | 25,229,449 | |
5.00%, 01/13/37 | | | 22,466 | | | | 27,478,839 | |
5.50%, 03/30/26 | | | 19,432 | | | | 23,832,765 | |
6.38%, 01/15/32 | | | 18,230 | | | | 24,848,949 | |
6.38%, 10/23/34 | | | 32,920 | | | | 45,817,394 | |
7.75%, 01/14/31 | | | 2,000 | | | | 3,015,180 | |
7.75%, 01/14/31 | | | 30,075 | | | | 45,340,769 | |
8.38%, 06/17/19 | | | 17,243 | | | | 20,234,661 | |
9.50%, 02/02/30 | | | 32,242 | | | | 53,699,370 | |
10.63%, 03/16/25 | | | 22,196 | | | | 35,387,973 | |
| | | | | | | | |
| | | | 395,278,652 | |
POLAND — 3.45% | |
Republic of Poland Government International Bond | | | | | | | | |
3.00%, 03/17/23 | | | 36,737 | | | | 37,712,000 | |
3.25%, 04/06/26 | | | 38,986 | | | | 40,411,328 | |
4.00%, 01/22/24 | | | 47,264 | | | | 51,593,855 | |
5.00%, 03/23/22 | | | 66,230 | | | | 75,187,608 | |
5.13%, 04/21/21 | | | 40,723 | | | | 45,942,467 | |
6.38%, 07/15/19 | | | 72,837 | | | | 82,026,116 | |
| | | | | | | | |
| | | | 332,873,374 | |
ROMANIA — 1.71% | |
Romanian Government International Bond | | | | | | | | |
4.38%, 08/22/23b | | | 38,002 | | | | 41,279,672 | |
4.88%, 01/22/24b | | | 23,464 | | | | 26,250,350 | |
| | | | |
SCHEDULEOF INVESTMENTS | | | 41 | |
Schedule of Investments (Continued)
iSHARES® J.P. MORGAN USD EMERGING MARKETS BOND ETF
October 31, 2016
| | | | | | | | |
| Security | |
Principal
(000s) | | | Value | |
6.13%, 01/22/44b | | $ | 25,986 | | | $ | 33,749,318 | |
6.75%, 02/07/22b | | | 53,417 | | | | 63,432,687 | |
| | | | | | | | |
| | | | 164,712,027 | |
RUSSIA — 4.08% | |
Russian Foreign Bond-Eurobond | | | | | | | | |
3.50%, 01/16/19b | | | 17,000 | | | | 17,318,750 | |
4.50%, 04/04/22b | | | 17,600 | | | | 18,532,800 | |
4.75%, 05/27/26b | | | 4,600 | | | | 4,876,000 | |
4.88%, 09/16/23b | | | 39,400 | | | | 42,305,750 | |
5.00%, 04/29/20b | | | 36,400 | | | | 38,811,500 | |
5.63%, 04/04/42b | | | 33,600 | | | | 37,077,600 | |
5.88%, 09/16/43b | | | 19,600 | | | | 22,344,000 | |
7.50%, 03/31/30b,d | | | 135,260 | | | | 163,664,969 | |
12.75%, 06/24/28b | | | 27,939 | | | | 48,788,479 | |
| | | | | | | | |
| | | | 393,719,848 | |
SERBIA — 1.24% | |
Serbia International Bond | | | | | | | | |
4.88%, 02/25/20b | | | 35,928 | | | | 37,140,570 | |
5.88%, 12/03/18b | | | 25,055 | | | | 26,495,662 | |
7.25%, 09/28/21b | | | 49,194 | | | | 56,450,115 | |
| | | | | | | | |
| | | | 120,086,347 | |
SLOVAKIA — 0.42% | |
Slovakia Government International Bond | | | | | | | | |
4.38%, 05/21/22b | | | 35,589 | | | | 40,200,267 | |
| | | | | | | | |
| | | | 40,200,267 | |
SOUTH AFRICA — 2.54% | |
Republic of South Africa Government International Bond | | | | | | | | |
4.30%, 10/12/28 | | | 16,373 | | | | 15,881,810 | |
4.67%, 01/17/24 | | | 29,655 | | | | 31,026,544 | |
4.88%, 04/14/26 | | | 21,320 | | | | 22,092,850 | |
5.00%, 10/12/46 | | | 17,800 | | | | 17,221,500 | |
5.38%, 07/24/44 | | | 20,846 | | | | 21,679,840 | |
5.50%, 03/09/20 | | | 33,560 | | | | 36,412,600 | |
5.88%, 05/30/22 | | | 19,878 | | | | 22,412,445 | |
5.88%, 09/16/25 | | | 36,630 | | | | 41,025,600 | |
6.88%, 05/27/19 | | | 33,755 | | | | 37,257,081 | |
| | | | | | | | |
| | | | 245,010,270 | |
| | | | | | | | |
| Security | |
Principal
(000s) | | | Value | |
SRI LANKA — 1.77% | |
Sri Lanka Government International Bond | | | | | | | | |
5.88%, 07/25/22b | | $ | 26,772 | | | $ | 27,353,220 | |
6.00%, 01/14/19b | | | 25,884 | | | | 26,728,465 | |
6.25%, 10/04/20b | | | 20,783 | | | | 21,693,088 | |
6.25%, 07/27/21b | | | 24,348 | | | | 25,392,529 | |
6.83%, 07/18/26b | | | 19,600 | | | | 20,674,962 | |
6.85%, 11/03/25b | | | 46,690 | | | | 49,267,288 | |
| | | | | | | | |
| | | | 171,109,552 | |
TRINIDAD AND TOBAGO — 0.25% | |
Trinidad & Tobago Government International Bond | | | | | | | | |
4.50%, 08/04/26b | | | 1,240 | | | | 1,261,700 | |
4.50%, 08/04/26c | | | 22,400 | | | | 22,792,000 | |
| | | | | | | | |
| | | | 24,053,700 | |
TUNISIA — 0.24% | |
Banque Centrale de Tunisie International Bond | | | | | | | | |
5.75%, 01/30/25b | | | 24,335 | | | | 23,452,856 | |
| | | | | | | | |
| | | | 23,452,856 | |
TURKEY — 4.64% | |
Hazine Mustesarligi Varlik Kiralama AS | | | | | | | | |
4.49%, 11/25/24b | | | 1,000 | | | | 986,250 | |
Turkey Government International Bond | | | | | | | | |
3.25%, 03/23/23 | | | 12,501 | | | | 11,641,556 | |
4.25%, 04/14/26 | | | 18,611 | | | | 17,843,296 | |
4.88%, 10/09/26 | | | 21,215 | | | | 21,135,444 | |
4.88%, 04/16/43 | | | 29,234 | | | | 25,945,175 | |
5.13%, 03/25/22 | | | 9,026 | | | | 9,296,780 | |
5.63%, 03/30/21 | | | 16,205 | | | | 17,096,275 | |
5.75%, 03/22/24 | | | 27,601 | | | | 29,326,062 | |
6.00%, 01/14/41 | | | 26,299 | | | | 27,087,970 | |
6.25%, 09/26/22 | | | 27,423 | | | | 29,856,791 | |
6.63%, 02/17/45 | | | 29,900 | | | | 33,488,000 | |
6.75%, 05/30/40 | | | 21,452 | | | | 24,213,945 | |
6.88%, 03/17/36 | | | 32,946 | | | | 37,393,710 | |
7.00%, 03/11/19 | | | 18,053 | | | | 19,497,240 | |
7.00%, 06/05/20 | | | 20,787 | | | | 22,813,733 | |
7.25%, 03/05/38 | | | 10,920 | | | | 12,967,500 | |
| | |
| 42 | | 2016 iSHARES ANNUAL REPORTTO SHAREHOLDERS |
Schedule of Investments (Continued)
iSHARES® J.P. MORGAN USD EMERGING MARKETS BOND ETF
October 31, 2016
| | | | | | | | |
| Security | |
Principal
(000s) | | | Value | |
7.38%, 02/05/25 | | $ | 36,759 | | | $ | 43,008,030 | |
7.50%, 11/07/19 | | | 14,744 | | | | 16,347,410 | |
8.00%, 02/14/34 | | | 17,960 | | | | 22,607,150 | |
11.88%, 01/15/30 | | | 15,404 | | | | 25,070,010 | |
| | | | | | | | |
| | | | 447,622,327 | |
UKRAINE — 2.96% | |
Ukraine Government International Bond | | | | | | | | |
7.75%, 09/01/19b | | | 38,037 | | | | 38,037,000 | |
7.75%, 09/01/20b | | | 39,662 | | | | 39,265,380 | |
7.75%, 09/01/21b | | | 26,992 | | | | 26,620,860 | |
7.75%, 09/01/22b | | | 31,856 | | | | 31,179,060 | |
7.75%, 09/01/23b | | | 33,704 | | | | 32,777,140 | |
7.75%, 09/01/24b | | | 28,770 | | | | 27,691,125 | |
7.75%, 09/01/25b | | | 34,528 | | | | 33,060,560 | |
7.75%, 09/01/26b | | | 30,049 | | | | 28,696,795 | |
7.75%, 09/01/27b | | | 29,530 | | | | 28,090,412 | |
| | | | | | | | |
| | | | 285,418,332 | |
URUGUAY — 2.39% | |
Uruguay Government International Bond | | | | | | | | |
4.38%, 10/27/27 | | | 51,519 | | | | 54,610,090 | |
4.50%, 08/14/24 | | | 38,481 | | | | 42,040,263 | |
5.10%, 06/18/50 | | | 96,884 | | | | 96,399,864 | |
7.63%, 03/21/36 | | | 27,111 | | | | 37,243,736 | |
| | | | | | | | |
| | | | 230,293,953 | |
VENEZUELA — 1.38% | |
Venezuela Government International Bond | | | | | | | | |
6.00%, 12/09/20b | | | 9,394 | | | | 4,227,300 | |
7.00%, 12/01/18b | | | 10,036 | | | | 6,084,325 | |
7.00%, 03/31/38b | | | 14,546 | | | | 6,127,503 | |
7.65%, 04/21/25b | | | 23,889 | | | | 10,212,548 | |
7.75%, 10/13/19b | | | 21,990 | | | | 11,270,080 | |
8.25%, 10/13/24b | | | 20,489 | | | | 8,989,549 | |
9.00%, 05/07/23b | | | 19,641 | | | | 8,912,104 | |
9.25%, 09/15/27 | | | 35,226 | | | | 17,524,935 | |
9.25%, 05/07/28b | | | 16,657 | | | | 7,683,041 | |
9.38%, 01/13/34 | | | 15,101 | | | | 6,965,336 | |
11.75%, 10/21/26b | | | 22,181 | | | | 12,338,181 | |
11.95%, 08/05/31b | | | 34,328 | | | | 19,137,971 | |
12.75%, 08/23/22b | | | 22,875 | | | | 13,267,558 | |
| | | | | | | | |
| | | | 132,740,431 | |
| | | | | | | | |
| Security | |
Principal
(000s) | | | Value | |
VIETNAM — 0.25% | |
Vietnam Government International Bond | | | | | | | | |
4.80%, 11/19/24b | | $ | 22,812 | | | $ | 24,140,799 | |
| | | | | | | | |
| | | | 24,140,799 | |
ZAMBIA — 0.55% | |
Zambia Government International Bond | | | | | | | | |
8.50%, 04/14/24b | | | 25,863 | | | | 25,151,768 | |
8.97%, 07/30/27b | | | 28,039 | | | | 27,443,171 | |
| | | | | | | | |
| | | | | | | 52,594,939 | |
| | | | | | | | |
TOTAL FOREIGN GOVERNMENT OBLIGATIONS | |
(Cost: $7,831,991,695) | | | | 7,872,142,728 | |
|
SHORT-TERM INVESTMENTS — 0.29% | |
|
MONEY MARKET FUNDS — 0.29% | |
BlackRock Cash Funds: Treasury,
SL Agency Shares | | | | | |
0.29%e,f | | | 27,984 | | | | 27,984,356 | |
| | | | | | | | |
| | | | | | | 27,984,356 | |
| | | | | | | | |
TOTAL SHORT-TERM INVESTMENTS | | | | | |
(Cost: $27,984,356) | | | | 27,984,356 | |
| | | | | | | | |
TOTAL INVESTMENTS
IN SECURITIES — 98.08% | | | | | |
(Cost: $9,425,803,453)g | | | | | | | 9,463,692,525 | |
Other Assets, Less Liabilities — 1.92% | | | | 185,603,039 | |
| | | | | | | | |
NET ASSETS — 100.00% | | | | | | $ | 9,649,295,564 | |
| | | | | | | | |
| a | Investments are denominated in U.S. dollars. |
| b | This security may be resold to qualified foreign investors and foreign institutional buyers under Regulation S of the Securities Act of 1933. |
| c | This security may be resold to qualified institutional buyers under Rule 144A of the Securities Act of 1933. |
| d | Step coupon security. Coupon rate will either increase (step-up bond) or decrease (step-down bond) at regular intervals until maturity. Interest rate shown reflects the rate currently in effect. |
| e | Affiliated money market fund. |
| f | The rate quoted is the annualized seven-day yield of the fund at period end. |
| g | The cost of investments for federal income tax purposes was $9,461,646,001. Net unrealized appreciation was $2,046,524, of which $140,533,275 represented gross unrealized appreciation on securities and $138,486,751 represented gross unrealized depreciation on securities. |
| | | | |
SCHEDULEOF INVESTMENTS | | | 43 | |
Schedule of Investments (Continued)
iSHARES® J.P. MORGAN USD EMERGING MARKETS BOND ETF
October 31, 2016
Schedule 1 — Fair Value Measurements
Various inputs are used in determining the fair value of financial instruments. For description of the input levels and information about the Fund’s policy regarding valuation of financial instruments, see Note 1.
The following table summarizes the value of the Fund’s investments according to the fair value hierarchy as of October 31, 2016. The breakdown of the Fund’s investments into major categories is disclosed in the schedule of investments above.
| | | | | | | | | | | | | | | | |
| | | Level 1 | | | Level 2 | | | Level 3 | | | Total | |
Investments: | | | | | | | | | | | | | | | | |
Assets: | | | | | | | | | | | | | | | | |
Corporate bonds & notes | | $ | — | | | $ | 1,563,565,441 | | | $ | — | | | $ | 1,563,565,441 | |
Foreign government obligations | | | — | | | | 7,872,142,728 | | | | — | | | | 7,872,142,728 | |
Money market funds | | | 27,984,356 | | | | — | | | | — | | | | 27,984,356 | |
| | | | | | | | | | | | | | | | |
Total | | $ | 27,984,356 | | | $ | 9,435,708,169 | | | $ | — | | | $ | 9,463,692,525 | |
| | | | | | | | | | | | | | | | |
| | | | | | | | | | | | | | | | | |
See notes to financial statements.
| | |
| 44 | | 2016 iSHARES ANNUAL REPORTTO SHAREHOLDERS |
Statement of Assets and Liabilities
iSHARES® J.P. MORGAN USD EMERGING MARKETS BOND ETF
October 31, 2016
| | | | |
| | |
ASSETS | | | | |
Investments, at cost: | | | | |
Unaffiliated | | $ | 9,397,819,097 | |
Affiliated (Note 2) | | | 27,984,356 | |
| | | | |
Total cost of investments | | $ | 9,425,803,453 | |
| | | | |
Investments in securities, at fair value (Note 1): | | | | |
Unaffiliated | | $ | 9,435,708,169 | |
Affiliated (Note 2) | | | 27,984,356 | |
| | | | |
Total fair value of investments | | | 9,463,692,525 | |
Cash | | | 1,456,262 | |
Receivables: | | | | |
Investment securities sold | | | 194,457,646 | |
Due from custodian (Note 4) | | | 83,425,352 | |
Interest | | | 127,500,173 | |
Capital shares sold | | | 271,599 | |
| | | | |
Total Assets | | | 9,870,803,557 | |
| | | | |
| |
LIABILITIES | | | | |
Payables: | | | | |
Investment securities purchased | | | 217,940,706 | |
Capital shares redeemed | | | 359,343 | |
Investment advisory fees (Note 2) | | | 3,207,944 | |
| | | | |
Total Liabilities | | | 221,507,993 | |
| | | | |
| |
NET ASSETS | | $ | 9,649,295,564 | |
| | | | |
| |
Net assets consist of: | | | | |
Paid-in capital | | $ | 9,743,126,455 | |
Undistributed net investment income | | | 23,062,495 | |
Accumulated net realized loss | | | (154,782,458 | ) |
Net unrealized appreciation | | | 37,889,072 | |
| | | | |
NET ASSETS | | $ | 9,649,295,564 | |
| | | | |
| |
Shares outstandinga | | | 84,100,000 | |
| | | | |
| |
Net asset value per share | | $ | 114.74 | |
| | | | |
| a | No par value, unlimited number of shares authorized. |
See notes to financial statements.
Statement of Operations
iSHARES® J.P. MORGAN USD EMERGING MARKETS BOND ETF
Year ended October 31, 2016
| | | | |
| | |
NET INVESTMENT INCOME | | | | |
Dividends — affiliated (Note 2) | | $ | 39,521 | |
Interest — unaffiliated | | | 342,328,200 | |
Miscellaneous income | | | 3,258 | |
| | | | |
Total investment income | | | 342,370,979 | |
| | | | |
| |
EXPENSES | | | | |
Investment advisory fees (Note 2) | | | 39,064,694 | |
| | | | |
Total expenses | | | 39,064,694 | |
Less investment advisory fees waived (Note 2) | | | (12,802,052 | ) |
| | | | |
Net expenses | | | 26,262,642 | |
| | | | |
Net investment income | | | 316,108,337 | |
| | | | |
| |
NET REALIZED AND UNREALIZED GAIN (LOSS) | | | | |
Net realized gain (loss) from: | | | | |
Investments — unaffiliated | | | (48,027,199 | ) |
In-kind redemptions — unaffiliated | | | 128,965,529 | |
Realized gain distributions from affiliated funds | | | 46 | |
| | | | |
Net realized gain | | | 80,938,376 | |
| | | | |
Net change in unrealized appreciation/depreciation | | | 255,360,546 | |
| | | | |
Net realized and unrealized gain | | | 336,298,922 | |
| | | | |
NET INCREASE IN NET ASSETS RESULTING FROM OPERATIONS | | $ | 652,407,259 | |
| | | | |
See notes to financial statements.
| | |
| 46 | | 2016 iSHARES ANNUAL REPORTTO SHAREHOLDERS |
Statements of Changes in Net Assets
iSHARES® J.P. MORGAN USD EMERGING MARKETS BOND ETF
| | | | | | | | |
| | | Year ended October 31, 2016 | | | Year ended October 31, 2015 | |
| | |
INCREASE (DECREASE) IN NET ASSETS | | | | | | | | |
| | |
OPERATIONS: | | | | | | | | |
Net investment income | | $ | 316,108,337 | | | $ | 217,885,277 | |
Net realized gain (loss) | | | 80,938,376 | | | | (60,077,612 | ) |
Net change in unrealized appreciation/depreciation | | | 255,360,546 | | | | (222,657,001 | ) |
| | | | | | | | |
Net increase (decrease) in net assets resulting from operations | | | 652,407,259 | | | | (64,849,336 | ) |
| | | | | | | | |
| | |
DISTRIBUTIONS TO SHAREHOLDERS: | | | | | | | | |
From net investment income | | | (321,652,097 | ) | | | (220,652,648 | ) |
| | | | | | | | |
Total distributions to shareholders | | | (321,652,097 | ) | | | (220,652,648 | ) |
| | | | | | | | |
| | |
CAPITAL SHARE TRANSACTIONS: | | | | | | | | |
Proceeds from shares sold | | | 9,405,191,061 | | | | 2,970,814,249 | |
Cost of shares redeemed | | | (4,551,094,063 | ) | | | (3,368,836,785 | ) |
| | | | | | | | |
Net increase (decrease) in net assets from capital share transactions | | | 4,854,096,998 | | | | (398,022,536 | ) |
| | | | | | | | |
INCREASE (DECREASE) IN NET ASSETS | | | 5,184,852,160 | | | | (683,524,520 | ) |
| | |
NET ASSETS | | | | | | | | |
Beginning of year | | | 4,464,443,404 | | | | 5,147,967,924 | |
| | | | | | | | |
End of year | | $ | 9,649,295,564 | | | $ | 4,464,443,404 | |
| | | | | | | | |
Undistributed net investment income included in net assets at end of year | | $ | 23,062,495 | | | $ | 14,319,993 | |
| | | | | | | | |
| | |
SHARES ISSUED AND REDEEMED | | | | | | | | |
Shares sold | | | 84,000,000 | | | | 26,900,000 | |
Shares redeemed | | | (41,100,000 | ) | | | (30,800,000 | ) |
| | | | | | | | |
Net increase (decrease) in shares outstanding | | | 42,900,000 | | | | (3,900,000 | ) |
| | | | | | | | |
See notes to financial statements.
Financial Highlights
iSHARES® J.P. MORGAN USD EMERGING MARKETS BOND ETF
(For a share outstanding throughout each period)
| | | | | | | | | | | | | | | | | | | | |
| | | Year ended
Oct. 31, 2016 | | | Year ended
Oct. 31, 2015 | | | Year ended
Oct. 31, 2014 | | | Year ended
Oct. 31, 2013 | | | Year ended
Oct. 31, 2012 | |
Net asset value, beginning of year | | $ | 108.36 | | | $ | 114.15 | | | $ | 110.96 | | | $ | 120.81 | | | $ | 109.56 | |
| | | | | | | | | | | | | | | | | | | | |
Income from investment operations: | | | | | | | | | | | | | | | | | | | | |
Net investment incomea | | | 5.39 | | | | 5.08 | | | | 4.86 | | | | 5.00 | | | | 5.25 | |
Net realized and unrealized gain (loss)b | | | 6.57 | | | | (5.75 | ) | | | 3.17 | | | | (9.77 | ) | | | 11.23 | |
| | | | | | | | | | | | | | | | | | | | |
Total from investment operations | | | 11.96 | | | | (0.67 | ) | | | 8.03 | | | | (4.77 | ) | | | 16.48 | |
| | | | | | | | | | | | | | | | | | | | |
Less distributions from: | | | | | | | | | | | | | | | | | | | | |
Net investment income | | | (5.58 | ) | | | (5.12 | ) | | | (4.84 | ) | | | (5.08 | ) | | | (5.23 | ) |
| | | | | | | | | | | | | | | | | | | | |
Total distributions | | | (5.58 | ) | | | (5.12 | ) | | | (4.84 | ) | | | (5.08 | ) | | | (5.23 | ) |
| | | | | | | | | | | | | | | | | | | | |
Net asset value, end of year | | $ | 114.74 | | | $ | 108.36 | | | $ | 114.15 | | | $ | 110.96 | | | $ | 120.81 | |
| | | | | | | | | | | | | | | | | | | | |
| | | | | |
Total return | | | 11.35 | % | | | (0.55 | )% | | | 7.45 | % | | | (4.01 | )% | | | 15.50 | % |
| | | | | | | | | | | | | | | | | | | | |
| | | | | |
Ratios/Supplemental data: | | | | | | | | | | | | | | | | | | | | |
Net assets, end of year (000s) | | $ | 9,649,296 | | | $ | 4,464,443 | | | $ | 5,147,968 | | | $ | 3,850,273 | | | $ | 6,185,433 | |
Ratio of expenses to average net assets | | | 0.40 | % | | | 0.40 | % | | | 0.59 | % | | | 0.60 | % | | | 0.60 | % |
Ratio of expenses to average net assets prior to waived fees | | | 0.59 | % | | | 0.60 | % | | | 0.60 | % | | | n/a | | | | n/a | |
Ratio of net investment income to average net assets | | | 4.81 | % | | | 4.61 | % | | | 4.35 | % | | | 4.30 | % | | | 4.61 | % |
Portfolio turnover ratec | | | 32 | % | | | 24 | % | | | 52 | % | | | 32 | % | | | 30 | % |
| a | Based on average shares outstanding throughout each period. |
| b | The amounts reported for a share outstanding may not accord with the change in aggregate gains and losses in securities for the fiscal period due to the timing of capital share transactions in relation to the fluctuating market values of the Fund’s underlying securities. |
| c | Portfolio turnover rates exclude portfolio securities received or delivered as a result of processing capital share transactions in Creation Units. |
See notes to financial statements.
| | |
| 48 | | 2016 iSHARES ANNUAL REPORTTO SHAREHOLDERS |
Notes to Financial Statements
iSHARES® J.P. MORGAN USD EMERGING MARKETS BOND ETF
iShares Trust (the “Trust”) is registered under the Investment Company Act of 1940, as amended (the “1940 Act”), as an open-end management investment company. The Trust was established as a Delaware statutory trust pursuant to an Agreement and Declaration of Trust dated December 16, 1999.
These financial statements relate only to the following fund (the “Fund”):
| | |
| iShares ETF | | Diversification Classification |
J.P. Morgan USD Emerging Markets Bond | | Non-diversified |
The investment objective of the Fund is to seek investment results that correspond generally to the price and yield performance, before fees and expenses, of its underlying index. The investment adviser uses a “passive” or index approach to try to achieve the Fund’s investment objective.
Pursuant to the Trust’s organizational documents, the Fund’s officers and trustees are indemnified against certain liabilities that may arise out of the performance of their duties to the Fund. Additionally, in the normal course of business, the Fund enters into contracts with service providers that contain general indemnification clauses. The Fund’s maximum exposure under these arrangements is unknown as this would involve future claims that may be made against the Fund that have not yet occurred.
| 1. | SIGNIFICANT ACCOUNTING POLICIES |
The following significant accounting policies are consistently followed by the Fund in the preparation of its financial statements in conformity with accounting principles generally accepted in the United States of America (“U.S. GAAP”). The preparation of financial statements in conformity with U.S. GAAP requires management to make certain estimates and assumptions that affect the reported amounts of assets and liabilities and disclosures of contingent assets and liabilities at the date of the financial statements and the reported amounts of revenue and expenses during the reporting period. Actual results could differ from those estimates. The Fund is considered an investment company under U.S. GAAP and follows the accounting and reporting guidance applicable to investment companies.
SECURITY VALUATION
The Fund’s investments are valued at fair value each day that the Fund’s listing exchange is open and, for financial reporting purposes, as of the report date should the reporting period end on a day that the Fund’s listing exchange is not open. U.S. GAAP defines fair value as the price a fund would receive to sell an asset or pay to transfer a liability in an orderly transaction between market participants at the measurement date. The BlackRock Global Valuation Methodologies Committee (the “Global Valuation Committee”) provides oversight of the valuation of investments for the Fund. The investments of the Fund are valued pursuant to policies and procedures developed by the Global Valuation Committee and approved by the Board of Trustees of the Trust (the “Board”).
| | • | | Fixed income investments are valued using the last available bid price or current market quotations provided by dealers or prices (including evaluated prices) supplied by approved independent third-party pricing services. The pricing services may use matrix pricing or valuation models that utilize certain inputs and assumptions to derive values, including transaction data, credit quality information, perceived market movements, news, and other relevant information and by other methods, which may include consideration of: yields or prices of securities of comparable quality, coupon, maturity and type; indications as to values from dealers; general market conditions; and/or other factors and assumptions. Pricing services generally value fixed income securities assuming orderly transactions of an institutional round lot size, but a fund may hold or transact in such securities in smaller odd lot sizes. |
| | • | | Open-end U.S. mutual funds (including money market funds) are valued at that day’s published net asset value (“NAV”). |
| | | | |
NOTESTO FINANCIAL STATEMENTS | | | 49 | |
Notes to Financial Statements (Continued)
iSHARES® J.P. MORGAN USD EMERGING MARKETS BOND ETF
In the event that application of these methods of valuation results in a price for an investment which is deemed not to be representative of the fair value of such investment or if a price is not available, the investment will be valued based upon other available factors deemed relevant by the Global Valuation Committee, in accordance with policies approved by the Board. These factors include but are not limited to (i) attributes specific to the investment; (ii) the principal market for the investment; (iii) the customary participants in the principal market for the investment; (iv) data assumptions by market participants for the investment, if reasonably available; (v) quoted prices for similar investments in active markets; and (vi) other factors, such as future cash flows, interest rates, yield curves, volatilities, prepayment speeds, loss severities, credit risks and/or default rates. Valuations based on such factors are reported to the Board on a quarterly basis.
The Global Valuation Committee employs various methods for calibrating valuation approaches for investments where an active market does not exist, including regular due diligence of the Trust’s pricing vendors, a regular review of key inputs and assumptions, transactional back-testing or disposition analysis to compare unrealized gains and losses to realized gains and losses, reviews of missing or stale prices, reviews of large movements in market values, and reviews of market related activity.
Fair value pricing could result in a difference between the prices used to calculate the Fund’s NAV and the prices used by the Fund’s underlying index, which in turn could result in a difference between the Fund’s performance and the performance of the Fund’s underlying index.
Various inputs are used in determining the fair value of financial instruments. Inputs may be based on independent market data (“observable inputs”) or they may be internally developed (“unobservable inputs”). These inputs are categorized into a disclosure hierarchy consisting of three broad levels for financial reporting purposes as follows:
| | • | | Level 1 — Unadjusted quoted prices in active markets for identical assets or liabilities; |
| | • | | Level 2 — Inputs other than quoted prices included within Level 1 that are observable for the asset or liability either directly or indirectly, including quoted prices for similar assets or liabilities in active markets, quoted prices for identical or similar assets or liabilities in markets that are not considered to be active, inputs other than quoted prices that are observable for the asset or liability (such as exchange rates, financing terms, interest rates, yield curves, volatilities, prepayment speeds, loss severities, credit risks and default rates) or other market-corroborated inputs; and |
| | • | | Level 3 — Unobservable inputs for the asset or liability based on the best information available in the circumstances, to the extent observable inputs are not available, including the Global Valuation Committee’s assumptions used in determining the fair value of investments. |
The hierarchy gives the highest priority to unadjusted quoted prices in active markets for identical assets or liabilities (Level 1 measurements) and the lowest priority to unobservable inputs (Level 3 measurements). Accordingly, the degree of judgement exercised in determining fair value is greatest for instruments categorized in Level 3. The inputs used to measure fair value may fall into different levels of the fair value hierarchy. In such cases, for disclosure purposes, the fair value hierarchy classification is determined based on the lowest level input that is significant to the fair value measurement in its entirety. The fair value hierarchy for the Fund’s investments is included in its schedule of investments.
Changes in valuation techniques may result in transfers in or out of an assigned level within the fair value hierarchy. In accordance with the Trust’s policy, transfers between different levels of the fair value hierarchy are deemed to have occurred as of the beginning of the reporting period. The categorization of values determined for financial instruments are based on the pricing transparency of the financial instruments and are not necessarily an indication of the risks associated with investing in those securities.
| | |
| 50 | | 2016 iSHARES ANNUAL REPORTTO SHAREHOLDERS |
Notes to Financial Statements (Continued)
iSHARES® J.P. MORGAN USD EMERGING MARKETS BOND ETF
SECURITY TRANSACTIONS AND INCOME RECOGNITION
Security transactions are accounted for on trade date. Realized gains and losses on investment transactions are determined using the specific identification method. Interest income, including amortization and accretion of premiums and discounts on debt securities, is recognized daily on the accrual basis. Dividend income and capital gain distributions, if any, are recognized on the ex-dividend date, net of any foreign taxes withheld at source.
FOREIGN CURRENCY TRANSLATION
The accounting records of the Fund are maintained in U.S. dollars. Foreign currencies, as well as investment securities and other assets and liabilities denominated in foreign currencies, are translated into U.S. dollars using exchange rates deemed appropriate by the investment adviser. Purchases and sales of securities, income receipts and expense payments are translated into U.S. dollars on the respective dates of such transactions.
The Fund does not isolate the effect of fluctuations in foreign exchange rates from the effect of fluctuations in the market prices of securities. Such fluctuations are reflected by the Fund as a component of realized and unrealized gains and losses from investments for financial reporting purposes.
FOREIGN TAXES
The Fund may be subject to foreign taxes (a portion of which may be reclaimable) on income, stock dividends, capital gains on investments, or certain foreign currency transactions. All foreign taxes are recorded in accordance with the applicable foreign tax regulations and rates that exist in the foreign jurisdictions in which the Fund invests. These foreign taxes, if any, are paid by the Fund and are reflected in its statement of operations as follows: foreign taxes withheld at source are presented as a reduction of income, foreign taxes on securities lending income are presented as a reduction of securities lending income, foreign taxes on stock dividends are presented as “other foreign taxes”, and foreign taxes on capital gains from sales of investments and foreign taxes on foreign currency transactions are included in their respective net realized gain (loss) categories. Foreign taxes payable or deferred as of October 31, 2016, if any, are disclosed in the Fund’s statement of assets and liabilities.
DISTRIBUTIONS TO SHAREHOLDERS
Dividends and distributions paid by the Fund are recorded on the ex-dividend dates. Distributions are determined on a tax basis and may differ from net investment income and net realized capital gains for financial reporting purposes. Dividends and distributions are paid in U.S. dollars and cannot be automatically reinvested in additional shares of the Fund.
| 2. | INVESTMENT ADVISORY AGREEMENT AND OTHER TRANSACTIONS WITH AFFILIATES |
Pursuant to an Investment Advisory Agreement with the Trust, BlackRock Fund Advisors (“BFA”) manages the investment of the Fund’s assets. BFA is a California corporation indirectly owned by BlackRock, Inc. (“BlackRock”). Under the Investment Advisory Agreement, BFA is responsible for substantially all expenses of the Fund, except interest, taxes, brokerage commissions and other expenses connected with the execution of portfolio transactions, distribution fees, litigation expenses and any extraordinary expenses.
| | | | |
NOTESTO FINANCIAL STATEMENTS | | | 51 | |
Notes to Financial Statements (Continued)
iSHARES® J.P. MORGAN USD EMERGING MARKETS BOND ETF
For its investment advisory services to the Fund, BFA is entitled to an annual investment advisory fee based on the Fund’s allocable portion of the aggregate of the average daily net assets of the Fund and certain other iShares funds, as follows:
| | | | | |
| Investment Advisory Fee | | Aggregate Average Daily Net Assets |
| | | 0.6000 | % | | First $19 billion |
| | | 0.5700 | a | | Over $19 billion, up to and including $33 billion |
| | | 0.5415 | a | | Over $33 billion, up to and including $47 billionb |
| | | 0.5145 | a | | Over $47 billionb |
| | a | | Investment advisory fee level reflects a 5% reduction (rounded to the fourth decimal place) from the investment advisory fee at the prior aggregate average daily net asset level. |
| | b | | Breakpoint level was amended effective July 1, 2016. |
The total of the investment advisory fee and any other fund expenses are a fund’s total annual operating expenses. BFA has contractually agreed to waive a portion of its investment advisory fee for the Fund through February 28, 2018 in order to limit total annual operating expenses after fee waiver to 0.40% of average daily net assets.
BlackRock Investments, LLC, an affiliate of BFA, is the distributor for the Fund. Pursuant to the distribution agreement, BFA is responsible for any fees or expenses for distribution services provided to the Fund.
Cross trading is the buying or selling of portfolio securities between funds to which BFA (or an affiliate) serves as investment adviser. At its regularly scheduled quarterly meetings, the Board reviews such transactions as of the most recent calendar quarter for compliance with the requirements and restrictions set forth by Rule 17a-7.
For the year ended October 31, 2016, the purchases and sales transactions executed by the Fund, pursuant to Rule 17a-7 under the 1940 Act were $49,154,283 and $57,042,502, respectively.
The Fund may invest its positive cash balances in certain money market funds managed by BFA or an affiliate. The income earned on these temporary cash investments is included in “Dividends – affiliated” in the statement of operations.
The PNC Financial Services Group, Inc. is the largest stockholder of BlackRock and is considered to be an affiliate of the Fund for 1940 Act purposes.
Certain trustees and officers of the Trust are also officers of BlackRock Institutional Trust Company, N.A. and/or BFA.
| 3. | INVESTMENT PORTFOLIO TRANSACTIONS |
Purchases and sales of investments (excluding in-kind transactions and short-term investments) for the year ended October 31, 2016, were $2,284,016,435 and $ 2,040,605,263, respectively.
In-kind purchases and sales (see Note 4) for the year ended October 31, 2016, were $8,957,789,636 and $4,446,849,699, respectively.
| 4. | CAPITAL SHARE TRANSACTIONS |
Capital shares are issued and redeemed by the Fund only in aggregations of a specified number of shares or multiples thereof (“Creation Units”) at NAV. Except when aggregated in Creation Units, shares of the Fund are not redeemable. Transactions in capital shares for the Fund are disclosed in detail in the statements of changes in net assets.
| | |
| 52 | | 2016 iSHARES ANNUAL REPORTTO SHAREHOLDERS |
Notes to Financial Statements (Continued)
iSHARES® J.P. MORGAN USD EMERGING MARKETS BOND ETF
The consideration for the purchase of Creation Units of a fund in the Trust generally consists of the in-kind deposit of a designated portfolio of securities and a specified amount of cash. Certain funds in the Trust may be offered in Creation Units solely or partially for cash in U.S. dollars. Investors purchasing and redeeming Creation Units may pay a purchase transaction fee and a redemption transaction fee directly to State Street Bank and Trust Company, the Trust’s administrator, to offset transfer and other transaction costs associated with the issuance and redemption of Creation Units, including Creation Units for cash. Investors transacting in Creation Units for cash may also pay an additional variable charge to compensate the relevant fund for certain transaction costs (i.e., stamp taxes, taxes on currency or other financial transactions, and brokerage costs) and market impact expenses relating to investing in portfolio securities. Such variable charges, if any, are included in “Proceeds from shares sold” in the statement of changes in net assets.
From time to time, settlement of securities related to in-kind contributions or in-kind redemptions may be delayed. In such cases, securities related to in-kind contributions are reflected as “Due from custodian” and securities related to in-kind redemptions are reflected as “Securities related to in-kind transactions” in the statement of assets and liabilities.
In the normal course of business, the Fund’s investment activities expose it to various types of risk associated with the financial instruments and markets in which it invests. The significant types of financial risks the Fund is exposed to include market risk and credit risk. The Fund’s prospectus provides details of these and other types of risk.
BFA uses a “passive” or index approach to try to achieve the Fund’s investment objective following the securities included in its underlying index during upturns as well as downturns. BFA does not take steps to reduce market exposure or to lessen the effects of a declining market. Divergence from the underlying index and the composition of the portfolio is monitored by BFA.
MARKET RISK
Market risk arises mainly from uncertainty about future values of financial instruments influenced by price, currency and interest rate movements. It represents the potential loss a fund may suffer through holding market positions in the face of market movements. A fund is exposed to market risk by virtue of its investment in equity, fixed income and/or financial derivative instruments or indirectly by virtue of its investment in underlying funds. The fair value of securities held by a fund may decline due to general market conditions, economic trends or events that are not specifically related to the issuers of the securities including local, regional or global political, social or economic instability or to factors that affect a particular industry or group of industries. The extent of a fund’s exposure to market risk is the market value of the investments held as shown in the fund’s schedule of investments.
A diversified portfolio, where this is appropriate and consistent with a fund’s objectives, minimizes the risk that a price change of a particular investment will have a material impact on the NAV of a fund. The investment concentrations within the Fund’s portfolio are disclosed in its schedule of investments.
Investing in the securities of non-U.S. issuers involves certain considerations and risks not typically associated with securities of U.S. issuers. Such risks include, but are not limited to: generally less liquid and less efficient securities markets; generally greater price volatility; exchange rate fluctuations and exchange controls; imposition of restrictions on the expatriation of funds or other assets of the Fund; less publicly available information about issuers; the imposition of withholding or other taxes; higher transaction and custody costs; settlement delays and risk of loss attendant in settlement procedures; difficulties in enforcing contractual obligations; less regulation of securities markets; different accounting, disclosure and reporting requirements; more substantial governmental involvement in the economy; higher inflation rates; greater social, economic and political uncertainties; the risk of nationalization or expropriation of assets; and the risk of war. These risks are heightened for investments in issuers from countries with less developed markets.
| | | | |
NOTESTO FINANCIAL STATEMENTS | | | 53 | |
Notes to Financial Statements (Continued)
iSHARES® J.P. MORGAN USD EMERGING MARKETS BOND ETF
The United States and the European Union, along with the regulatory bodies of a number of countries including Japan, Australia and Canada (collectively, “Sanctioning Bodies”), have imposed sectorial economic sanctions on certain Russian individuals and Russian corporate entities which include prohibitions on transacting in or dealing in new debt of longer than 30 or 90 days maturity or new equity of such issuers. Securities held by a fund issued prior to the date of the sanctions being imposed are not currently subject to any restrictions under the sanctions. However, compliance with each of these sanctions may impair the ability of a fund to buy, sell, hold, receive or deliver the affected securities or other securities of such issuers. The Sanctioning Bodies could also institute broader sanctions on Russia. These sanctions, or even the threat of further sanctions, may result in the decline of the value and liquidity of Russian securities, a weakening of the ruble or other adverse consequences to the Russian economy. Current or future sanctions may result in Russia taking counter measures or retaliatory actions, which may further impair the value and liquidity of Russian securities. These retaliatory measures may include the immediate freeze of Russian assets held by a fund.
Changes in market interest rates or economic conditions may affect the value and/or liquidity of fixed income investments. Interest rate risk is the risk that prices of bonds and other fixed-income securities will decrease as interest rates rise and increase as interest rates fall. Mortgage-backed securities and securities with longer durations tend to be more sensitive to interest rate changes, usually making them more volatile than other types of bonds or securities with shorter durations. Given the environment of historically low interest rates, a fund may be subject to a greater risk of price losses if interest rates rise.
CREDIT RISK
Credit risk is the risk that an issuer or guarantor of debt instruments or the counterparty to a financial transaction, including derivatives contracts, repurchase agreements or loans of portfolio securities, is unable or unwilling to make timely interest and/or principal payments or to otherwise honor its obligations. BFA and its affiliates manage counterparty credit risk by entering into transactions only with counterparties that they believe have the financial resources to honor their obligations and by monitoring the financial stability of those counterparties. Financial assets, which potentially expose a fund to issuer and counterparty credit risks, consist principally of financial instruments and receivables due from counterparties. The extent of a fund’s exposure to credit and counterparty risks with respect to those financial assets is approximated by their value recorded in its statement of assets and liabilities.
High yield securities that are rated below investment-grade (including those bonds rated lower than “BBB-” by Standard & Poor’s Ratings Services and Fitch or “Baa3” by Moody’s) or are unrated, may be more volatile than higher-rated securities of similar maturity. High yield securities may also be subject to greater levels of credit or default risk than higher-rated securities and high yield securities may be less liquid and more difficult to sell at an advantageous time or price or to value than higher-rated securities. In particular, high yield securities are often issued by smaller, less creditworthy companies or by highly leveraged (indebted) companies, which are generally less able than more financially stable companies to make scheduled payments of interest and principal.
The Fund is treated as an entity separate from the Trust’s other funds for federal income tax purposes. It is the policy of the Fund to qualify as a regulated investment company by complying with the provisions applicable to regulated investment companies, as defined under Subchapter M of the Internal Revenue Code of 1986, as amended, and to annually distribute substantially all of its ordinary income and any net capital gains (taking into account any capital loss carryforwards) sufficient to relieve it from all, or substantially all, federal income and excise taxes. Accordingly, no provision for federal income taxes is required.
U.S. GAAP requires that certain components of net assets be adjusted to reflect permanent differences between financial and tax reporting. These reclassifications have no effect on net assets or NAV per share. The following permanent differences as of
| | |
| 54 | | 2016 iSHARES ANNUAL REPORTTO SHAREHOLDERS |
Notes to Financial Statements (Continued)
iSHARES® J.P. MORGAN USD EMERGING MARKETS BOND ETF
October 31, 2016, attributable to interest accruals on defaulted bonds and realized gains (losses) from in-kind redemptions, were reclassified to the following accounts:
| | | | | | | | |
Paid-in
Capital | | Undistributed
Net Investment
Income/Distributions
in Excess of Net
Investment Income | | | Undistributed Net Realized Gain/Accumulated
Net Realized Loss | |
| $102,751,738 | | $ | 14,286,262 | | | $ | (117,038,000) | |
The tax character of distributions paid during the years ended October 31, 2016 and October 31, 2015 was as follows:
| | | | | | | | |
| | | 2016 | | | 2015 | |
Ordinary income | | $ | 321,652,097 | | | $ | 220,652,648 | |
| | | | | | | | |
| | | | | | | | | |
As of October 31, 2016, the tax components of accumulated net earnings (losses) were as follows:
| | | | | | | | | | | | |
Undistributed
Ordinary
Income | | Capital
Loss
Carryforwards | | | Net
Unrealized
Gains (Losses) a | | | Total | |
| $23,062,495 | | $ | (118,939,910) | | | $ | 2,046,524 | | | $ | (93,830,891) | |
| | a | | The difference between book-basis and tax-basis unrealized gains (losses) was attributable primarily to the tax deferral of losses on wash sales. |
As of October 31, 2016, the Fund had capital loss carryforwards available to offset future realized capital gains through the indicated expiration dates as follows:
| | | | | | | | | | |
Non-
Expiring a | | | Expiring
2018 | | | Total | |
| $ | 118,843,880 | | | $ | 96,030 | | | $ | 118,939,910 | |
| | a | | Must be utilized prior to losses subject to expiration. |
Management has analyzed tax laws and regulations and their application to the Fund as of October 31, 2016, inclusive of the open tax return years, and does not believe there are any uncertain tax positions that require recognition of a tax liability in the Fund’s financial statements.
Management has evaluated the impact of all subsequent events on the Fund through the date the financial statements were available to be issued and has determined that there were no subsequent events requiring adjustment or disclosure in the financial statements.
| | | | |
NOTESTO FINANCIAL STATEMENTS | | | 55 | |
Report of Independent Registered Public Accounting Firm
To the Shareholders and Board of Trustees of
iShares Trust:
In our opinion, the accompanying statement of assets and liabilities, including the schedule of investments, and the related statements of operations and of changes in net assets and the financial highlights present fairly, in all material respects, the financial position of iShares J.P. Morgan USD Emerging Markets Bond ETF (the “Fund”) at October 31, 2016, the results of its operations, the changes in its net assets and its financial highlights for each of the periods presented, in conformity with accounting principles generally accepted in the United States of America. These financial statements and financial highlights (hereafter referred to as “financial statements”) are the responsibility of the Fund’s management. Our responsibility is to express an opinion on these financial statements based on our audits. We conducted our audits of these financial statements in accordance with the standards of the Public Company Accounting Oversight Board (United States). Those standards require that we plan and perform the audit to obtain reasonable assurance about whether the financial statements are free of material misstatement. An audit includes examining, on a test basis, evidence supporting the amounts and disclosures in the financial statements, assessing the accounting principles used and significant estimates made by management, and evaluating the overall financial statement presentation. We believe that our audits, which included confirmation of securities at October 31, 2016 by correspondence with the custodian, transfer agent and brokers, provide a reasonable basis for our opinion.
PricewaterhouseCoopers LLP
San Francisco, California
December 21, 2016
| | |
| 56 | | 2016 iSHARES ANNUAL REPORTTO SHAREHOLDERS |
Notes:
Notes:
| | |
| 58 | | 2016 iSHARES ANNUAL REPORTTO SHAREHOLDERS |
For more information visit www.iShares.com or call 1-800-474-2737
This report is intended for the Fund’s shareholders. It may not be distributed to prospective investors unless it is preceded or accompanied by the current prospectus.
Investing involves risk, including possible loss of principal.
The iShares Funds are distributed by BlackRock Investments, LLC (together with its affiliates, “BlackRock”).
A description of the policies that the Fund uses to determine how to vote proxies relating to portfolio securities and information about how the Fund voted proxies relating to portfolio securities during the most recent twelve-month period ending June 30 is available without charge, upon request, by calling toll-free 1-800-474-2737; on the Fund’s website at www.iShares.com; and on the U.S. Securities and Exchange Commission (SEC) website at www.sec.gov.
The Fund files its complete schedule of portfolio holdings with the SEC for the first and third quarters of each fiscal year on Form N-Q. The Fund’s Forms N-Q are available on the SEC’s website or may be reviewed and copied at the SEC’s Public Reference Room in Washington, D.C. Information on the operation of the Public Reference Room may be obtained by calling 1-800-SEC-0330. The Fund also discloses its complete schedule of portfolio holdings on a daily basis on the Fund’s website.
©2016 BlackRock, Inc. All rights reserved. iSHARES and BLACKROCK are registered trademarks of BlackRock, Inc. or its subsidiaries. All other marks are the property of their respective owners.
iS-AR-1019-1016
OCTOBER 31, 2016
| | | | |
2016 ANNUAL REPORT | | | |  |
iShares U.S. ETF Trust
| Ø | | iShares Commodities Select Strategy ETF | COMT | NASDAQ |
Table of Contents
Management’s Discussion of Fund Performance
iSHARES® COMMODITIES SELECT STRATEGY ETF
GLOBAL EQUITY MARKET OVERVIEW
Global equity markets advanced modestly for the 12 months ended October 31, 2016 (the “reporting period”). The MSCI ACWI, a broad global equity index that includes both developed and emerging markets, returned 2.05% for the reporting period.
Early in the reporting period, global stock markets declined broadly amid lower energy prices and weaker global economic growth, including slowdowns in stronger developed economies such as the U.S. and U.K. In response, many of the world’s central banks took more aggressive actions to stimulate economic activity, including expanded quantitative easing measures and negative interest rates.
In the U.S., the Federal Reserve Bank (the “Fed”) ended a seven-year period of near-zero interest rates by raising its short-term interest rate target in December 2015. The Fed’s first interest rate hike since June 2006 increased the federal funds target rate from a range of 0%-0.25% to a range of 0.25%-0.50%.
After bottoming in mid-February 2016, global equity markets reversed course, rallying sharply over the ensuing six months. Central bank stimulus activity and a recovery in energy prices helped global equity markets rebound, as did signs of stabilization in China, which had experienced a marked economic slowdown that put downward pressure on its currency. Despite the overall upward trend, geopolitical factors — including the “Brexit” referendum (an affirmative vote for the U.K. to leave the European Union), terrorist attacks in France, and an attempted coup in Turkey — contributed to increased equity market volatility.
Global equity markets gave back some gains over the last two months of the reporting period amid uncertainty about Fed interest rate policy, the outcome of the U.S. presidential election, and growth prospects for the global economy.
Among developed markets, the Asia/Pacific region delivered the best returns, gaining approximately 6% overall for the reporting period. New Zealand and Australia were the leading markets in the region, benefiting from improving economic growth during the reporting period, while the laggards included Singapore and Japan. In particular, the Japanese equity market declined by approximately 10%, but a strong rally in the Japanese yen (which appreciated by 15% against the U.S. dollar) helped offset the overall market decline, resulting in a 3% gain in U.S. dollar terms.
The U.S. equity market returned approximately 4% for the reporting period. Although employment growth remained robust, other segments of the U.S. economy struggled, leading to three consecutive quarters of growth below a 1.5% annual rate. As a result, the Fed — which was expected to raise short-term interest rates further in 2016 — held rates steady through the first 10 months of the year. However, improving economic activity late in the reporting period led to expectations of another Fed rate hike before the end of the year.
European stock markets declined by approximately 7% for the reporting period. Markets in Italy and Spain, which were adversely affected by political instability and struggling banking sectors, declined the most, while Austria and Portugal performed the best. In the U.K., the equity market advanced by about 13%, but a sharp decline in the British pound in the wake of the Brexit vote in June led to negative returns in U.S. dollar terms.
Emerging markets stocks outperformed developed markets, advancing by more than 9% for the reporting period in U.S. dollar terms. Latin American equity markets generated the best returns, led by rebounding markets in Peru and Brazil, while emerging markets in Europe and the Middle East lagged.
| | | | |
MANAGEMENT’S DISCUSSIONOF FUND PERFORMANCE | | | 5 | |
Management’s Discussion of Fund Performance
iSHARES® COMMODITIES SELECT STRATEGY ETF
Performance as of October 31, 2016
| | | | | | | | | | | | | | | | | | | | |
| | | Average Annual Total Returns | | | | | | Cumulative Total Returns | |
| | | 1 Year | | | Since Inception | | | | | | 1 Year | | | Since Inception | |
Fund NAV | | | (1.23)% | | | | (18.29)% | | | | | | | | (1.23)% | | | | (33.86)% | |
Fund Market | | | (1.20)% | | | | (18.30)% | | | | | | | | (1.20)% | | | | (33.88)% | |
S&P GSCI Commodity Total Return Index | | | (13.73)% | | | | (25.93)% | | | | | | | | (13.73)% | | | | (45.81)% | |
GROWTH OF $10,000 INVESTMENT
(SINCE INCEPTION AT NET ASSET VALUE)
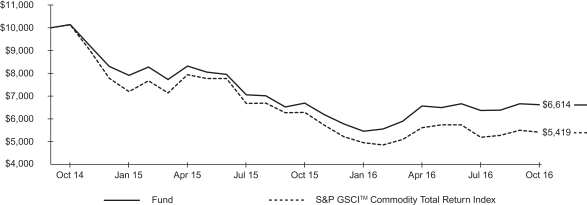
The inception date of the Fund was 10/15/14. The first day of secondary market trading was 10/16/14.
The S&P GSCITM Commodity Total Return Index is an unmanaged index that measures the performance of general commodity price movements and inflation in the world economy.
Past performance is no guarantee of future results. Performance results do not reflect the deduction of taxes that a shareholder would pay on fund distributions or on the redemption or sale of fund shares. See “About Fund Performance” on page 8 for more information.
| | | | | | | | | | | | | | | | | | | | | | | | | | |
| Shareholder Expenses | |
| Actual | | | Hypothetical 5% Return | | | | |
Beginning
Account Value
(5/1/16) | | | Ending
Account Value
(10/31/16) | | | Expenses Paid
During Period a | | | Beginning
Account Value
(5/1/16) | | | Ending
Account Value
(10/31/16) | | | Expenses Paid
During Period a | | | Annualized
Expense Ratio | |
| $ | 1,000.00 | | | $ | 1,008.70 | | | $ | 2.42 | | | $ | 1,000.00 | | | $ | 1,022.70 | | | $ | 2.44 | | | | 0.48% | |
| a | Expenses are calculated using the Fund’s annualized expense ratio (as disclosed in the table), multiplied by the average account value for the period, multiplied by the number of days in the period (184 days) and divided by the number of days in the year (366 days). See “Shareholder Expenses” on page 8 for more information. | |
| | |
| 6 | | 2016 iSHARES ANNUAL REPORTTO SHAREHOLDERS |
Management’s Discussion of Fund Performance (Continued)
iSHARES® COMMODITIES SELECT STRATEGY ETF
The iShares Commodities Select Strategy ETF (the “Fund”) seeks total return by providing investors with broad commodity exposure. The Fund is an actively managed exchange-traded fund that does not seek to replicate the performance of a specified index. For the 12-month reporting period ended October 31, 2016, the total return for the Fund was -1.23%, net of fees.
The Fund declined slightly overall in a volatile period for commodities and commodity-related investments. The Fund maintained its broad commodities exposure by investing approximately 70% in commodity-linked futures contracts and 30% in commodity-related stocks during the reporting period. While the equity component rose for the reporting period, largely due to positive results from metals and mining stocks, the futures portion of the Fund declined, resulting in a negative overall return.
Commodity prices generally fell in late 2015, reflecting a marked slowdown in global economic activity. After bottoming in early 2016, however, commodity prices staged a broad recovery over the remainder of the reporting period in response to increased economic stimulus efforts and improving global economic growth.
Futures in the energy sector, which represented more than 60% of the total futures exposure at the end of the reporting period, detracted the most from the Fund’s performance. Although energy prices stabilized during the reporting period, they declined overall as a result of continued excess supply and weak demand. Agricultural and livestock futures, which represented more than a quarter of the Fund at the end of the reporting period, benefited from changing consumption patterns, rising demand in China and other emerging markets, and increased investment demand.
In the equity component, commodity-related stocks from the United Kingdom, Australia, the United States, and Canada contributed the most to Fund performance. By industry segment, diversified metals and mining companies were the leading contributors, followed by paper and packaging companies and gold miners. On the downside, energy stocks were the largest detractors from the Fund’s performance for the reporting period.
ALLOCATION BY SECTOR
As of 10/31/16
| | |
| Sector/Investment Type | | % of
Net Assets |
| | | | |
Base Metal Equities | | | 10.51 | % |
Agriculture Equities | | | 7.42 | |
Precious Metals Equities | | | 5.90 | |
Timber Equities | | | 5.05 | |
Energy Equities | | | 2.12 | |
Short-term | | | 67.03 | |
Cash | | | 3.96 | |
Other Assets, Less Liabilities | | | (1.99 | ) |
| | | | |
TOTAL | | | 100.00 | % |
| | | | |
COMMODITY-LINKED FUTURES
As of 10/31/16
| | |
| Sector Exposure1 | | % of
Net Assets |
| | | | |
Energy Futures | | | 41.61 | % |
Agriculture Futures | | | 15.64 | |
Base Metals Futures | | | 7.02 | |
Livestock Futures | | | 3.57 | |
Precious Metals Futures | | | 1.13 | |
| | | | |
TOTAL | | | 68.97 | % |
| | | | |
| | 1 | Exposures are calculated as the current notional value of the futures contracts as a percentage of net assets. |
| | | | |
MANAGEMENT’S DISCUSSIONOF FUND PERFORMANCE | | | 7 | |
About Fund Performance
Past performance is no guarantee of future results. Current performance may be lower or higher than the performance data quoted. Performance data current to the most recent month-end is available at www.ishares.com. Performance results assume reinvestment of all dividends and capital gain distributions and do not reflect the deduction of taxes that a shareholder would pay on fund distributions or on the redemption or sale of fund shares. The investment return and principal value of shares will vary with changes in market conditions. Shares may be worth more or less than their original cost when they are redeemed or sold in the market. Performance for certain funds may reflect a waiver of a portion of investment advisory fees. Without such a waiver, performance would have been lower.
Net asset value or “NAV” is the value of one share of a fund as calculated in accordance with the standard formula for valuing mutual fund shares. The price used to calculate market return (“Market Price”) is determined by using the midpoint between the highest bid and the lowest offer on the primary stock exchange on which shares of a fund are listed for trading, as of the time that such fund’s NAV is calculated. Certain funds may have a NAV which is determined prior to the opening of regular trading on its listed exchange and their market returns are calculated using the midpoint of the bid/ask spread as of the opening of regular trading on the exchange. Market and NAV returns assume that dividends and capital gain distributions have been reinvested at Market Price and NAV, respectively.
An index is a statistical composite that tracks a specified financial market or sector. Unlike a fund, an index does not actually hold a portfolio of securities and therefore does not incur the expenses incurred by a fund. These expenses negatively impact fund performance. Also, market returns do not include brokerage commissions that may be payable on secondary market transactions. If brokerage commissions were included, market returns would be lower.
Shareholder Expenses
As a shareholder of the Fund, you incur two types of costs: (1) transaction costs, including brokerage commissions on purchases and sales of fund shares and (2) ongoing costs, including management fees and other fund expenses. The expense example, which is based on an investment of $1,000 invested on May 1, 2016 and held through October 31, 2016, is intended to help you understand your ongoing costs (in dollars and cents) of investing in the Fund and to compare these costs with the ongoing costs of investing in other funds.
Actual Expenses — The table provides information about actual account values and actual expenses. Annualized expense ratios reflect contractual and voluntary fee waivers, if any. To estimate the expenses that you paid on your account over the period, simply divide your account value by $1,000 (for example, an $8,600 account value divided by $1,000 = 8.6), then multiply the result by the number under the heading entitled “Expenses Paid During Period.”
Hypothetical Example for Comparison Purposes — The table also provides information about hypothetical account values and hypothetical expenses based on the Fund’s actual expense ratio and an assumed rate of return of 5% per year before expenses. You may use this information to compare the ongoing costs of investing in your Fund and other funds. To do so, compare this 5% hypothetical example with the 5% hypothetical examples that appear in the shareholder reports of the other funds.
Please note that the expenses shown in the table are meant to highlight your ongoing costs only and do not reflect any transactional costs, such as brokerage commissions paid on purchases and sales of fund shares. Therefore, the hypothetical examples are useful in comparing ongoing costs only and will not help you determine the relative total costs of owning different funds. In addition, if these transactional costs were included, your costs would have been higher.
| | |
| 8 | | 2016 iSHARES ANNUAL REPORTTO SHAREHOLDERS |
Consolidated Schedule of Investments
iSHARES® COMMODITIES SELECT STRATEGY ETF
October 31, 2016
| | | | | | | | |
| Security | |
Shares | | | Value | |
COMMON STOCKS — 30.97% | |
|
AEROSPACE & DEFENSE — 0.91% | |
Alcoa Inc.a | | | 101,349 | | | $ | 2,910,743 | |
| | | | | | | | |
| | | | | | | 2,910,743 | |
AGRICULTURAL & FARM MACHINERY — 1.40% | |
AGCO Corp. | | | 8,325 | | | | 425,241 | |
CNH Industrial NV | | | 121,395 | | | | 944,453 | |
Deere & Co. | | | 35,342 | | | | 3,120,699 | |
| | | | | | | | |
| | | | | | | 4,490,393 | |
AGRICULTURAL PRODUCTS — 1.23% | |
Archer-Daniels-Midland Co. | | | 63,637 | | | | 2,772,664 | |
Bunge Ltd. | | | 15,253 | | | | 945,839 | |
Fresh Del Monte Produce Inc. | | | 3,589 | | | | 216,596 | |
| | | | | | | | |
| | | | | | | 3,935,099 | |
ALUMINUM — 0.14% | |
Aluminum Corp. of China Ltd.a,b | | | 37,115 | | | | 349,623 | |
Constellium NVa | | | 21,850 | | | | 114,713 | |
| | | | | | | | |
| | | | | | | 464,336 | |
COAL & CONSUMABLE FUELS — 0.01% | |
Cameco Corp. | | | 2,371 | | | | 18,257 | |
Yanzhou Coal Mining Co. Ltd. | | | 1,549 | | | | 11,493 | |
| | | | | | | | |
| | | | | | | 29,750 | |
COPPER — 0.67% | |
Freeport-McMoRan Inc. | | | 179,722 | | | | 2,009,292 | |
Nevsun Resources Ltd. | | | 44,524 | | | | 129,565 | |
| | | | | | | | |
| | | | | | | 2,138,857 | |
DIVERSIFIED METALS & MINING — 8.78% | |
BHP Billiton Ltd. ADR | | | 299,480 | | | | 10,487,790 | |
BHP Billiton PLC | | | 197,185 | | | | 5,962,874 | |
HudBay Minerals Inc.b | | | 46,393 | | | | 197,170 | |
Rio Tinto PLC ADR | | | 238,251 | | | | 8,303,047 | |
Teck Resources Ltd. Class Bb | | | 91,668 | | | | 1,978,196 | |
Turquoise Hill Resources Ltd.a | | | 193,645 | | | | 600,300 | |
Vedanta Ltd. ADR | | | 53,856 | | | | 649,503 | |
| | | | | | | | |
| | | | | | | 28,178,880 | |
FERTILIZERS & AGRICULTURAL CHEMICALS — 4.79% | |
Agrium Inc. | | | 16,060 | | | | 1,474,629 | |
CF Industries Holdings Inc. | | | 26,982 | | | | 647,838 | |
FMC Corp. | | | 15,488 | | | | 726,232 | |
Israel Chemicals Ltd.a,b | | | 60,685 | | | | 214,218 | |
Monsanto Co. | | | 50,646 | | | | 5,103,597 | |
Mosaic Co. (The) | | | 40,533 | | | | 953,741 | |
Potash Corp. of Saskatchewan Inc. | | | 97,538 | | | | 1,587,919 | |
| | | | | | | | |
| Security | |
Shares | | | Value | |
Sociedad Quimica y Minera de Chile SA ADR | | | 10,729 | | | $ | 313,931 | |
Syngenta AG ADR | | | 53,964 | | | | 4,339,785 | |
| | | | | | | | |
| | | | | | | 15,361,890 | |
FOREST PRODUCTS — 0.04% | |
Deltic Timber Corp. | | | 2,381 | | | | 133,765 | |
| | | | | | | | |
| | | | | | | 133,765 | |
GOLD — 5.33% | |
Agnico Eagle Mines Ltd. | | | 32,220 | | | | 1,636,776 | |
Alamos Gold Inc. Class A | | | 38,916 | | | | 305,491 | |
AngloGold Ashanti Ltd.a | | | 58,769 | | | | 807,486 | |
B2Gold Corp.a,b | | | 135,668 | | | | 392,080 | |
Barrick Gold Corp. | | | 166,512 | | | | 2,928,946 | |
Cia. de Minas Buenaventura SA ADRa | | | 26,898 | | | | 357,474 | |
Eldorado Gold Corp.a,b | | | 68,482 | | | | 216,403 | |
Franco-Nevada Corp. | | | 25,498 | | | | 1,669,099 | |
Gold Fields Ltd. | | | 108,271 | | | | 449,325 | |
Goldcorp Inc. | | | 121,940 | | | | 1,853,488 | |
IAMGOLD Corp.a | | | 64,395 | | | | 258,224 | |
Kinross Gold Corp.a | | | 179,623 | | | | 693,345 | |
New Gold Inc.a | | | 73,280 | | | | 290,189 | |
Newmont Mining Corp. | | | 75,815 | | | | 2,808,187 | |
NovaGold Resources Inc.a,b | | | 31,094 | | | | 155,470 | |
Pretium Resources Inc.a | | | 21,928 | | | | 214,675 | |
Randgold Resources Ltd. ADR | | | 8,781 | | | | 779,138 | |
Sibanye Gold Ltd. | | | 23,733 | | | | 265,810 | |
Tahoe Resources Inc. | | | 44,983 | | | | 542,495 | |
Yamana Gold Inc. | | | 137,071 | | | | 487,973 | |
| | | | | | | | |
| | | | | | | 17,112,074 | |
INTEGRATED OIL & GAS — 1.19% | |
BP PLC ADR | | | 9,730 | | | | 345,901 | |
Cenovus Energy Inc. | | | 2,954 | | | | 42,656 | |
Chevron Corp. | | | 5,767 | | | | 604,093 | |
China Petroleum & Chemical Corp. | | | 780 | | | | 56,488 | |
Ecopetrol SA ADRa | | | 762 | | | | 6,622 | |
Eni SpA | | | 4,110 | | | | 119,519 | |
Exxon Mobil Corp. | | | 12,675 | | | | 1,056,081 | |
Imperial Oil Ltd. | | | 967 | | | | 31,408 | |
Occidental Petroleum Corp. | | | 2,335 | | | | 170,245 | |
Petrobras Argentina SA ADRa | | | 202 | | | | 1,341 | |
PetroChina Co. Ltd. | | | 732 | | | | 49,578 | |
Petroleo Brasileiro SA ADRa,b | | | 4,550 | | | | 53,099 | |
Royal Dutch Shell PLC Class A ADR | | | 6,730 | | | | 335,221 | |
| | | | |
CONSOLIDATED SCHEDULEOF INVESTMENTS | | | 9 | |
Consolidated Schedule of Investments (Continued)
iSHARES® COMMODITIES SELECT STRATEGY ETF
October 31, 2016
| | | | | | | | |
| Security | |
Shares | | | Value | |
Royal Dutch Shell PLC Class B ADR | | | 5,839 | | | $ | 305,438 | |
Sasol Ltd. | | | 1,773 | | | | 48,775 | |
Statoil ASA | | | 3,217 | | | | 52,244 | |
Suncor Energy Inc. | | | 5,088 | | | | 152,742 | |
Total SA ADR | | | 7,703 | | | | 367,741 | |
YPF SA ADR | | | 838 | | | | 14,883 | |
| | | | | | | | |
| | | | | | | 3,814,075 | |
OIL & GAS DRILLING — 0.03% | |
Ensco PLC Class A | | | 1,070 | | | | 8,367 | |
Helmerich & Payne Inc. | | | 464 | | | | 29,283 | |
Nabors Industries Ltd. | | | 933 | | | | 11,103 | |
Noble Corp. PLC | | | 813 | | | | 4,016 | |
Precision Drilling Corp. | | | 2,379 | | | | 10,587 | |
Rowan Companies PLC Class A | | | 427 | | | | 5,666 | |
Seadrill Ltd.a,b | | | 3,493 | | | | 7,440 | |
Transocean Ltd.a | | | 1,161 | | | | 11,157 | |
| | | | | | | | |
| | | | | | | 87,619 | |
OIL & GAS EQUIPMENT & SERVICES — 0.20% | |
Amec Foster Wheeler PLC ADR | | | 1,091 | | | | 5,881 | |
Baker Hughes Inc. | | | 1,193 | | | | 66,092 | |
Core Laboratories NV | | | 178 | | | | 17,261 | |
FMC Technologies Inc.a | | | 827 | | | | 26,687 | |
Frank’s International NVb | | | 96 | | | | 1,080 | |
Halliburton Co. | | | 2,394 | | | | 110,124 | |
McDermott International Inc.a | | | 1,838 | | | | 9,447 | |
National Oilwell Varco Inc. | | | 1,223 | | | | 39,258 | |
Oceaneering International Inc. | | | 495 | | | | 11,781 | |
Schlumberger Ltd. | | | 3,877 | | | | 303,298 | |
Tenaris SA ADR | | | 672 | | | | 18,950 | |
Weatherford International PLCa | | | 3,535 | | | | 17,039 | |
| | | | | | | | |
| | | | | | | 626,898 | |
OIL & GAS EXPLORATION & PRODUCTION — 0.36% | |
Advantage Oil & Gas Ltd.a | | | 1,303 | | | | 8,795 | |
Anadarko Petroleum Corp. | | | 1,504 | | | | 89,398 | |
Antero Resources Corp.a | | | 369 | | | | 9,767 | |
Apache Corp. | | | 977 | | | | 58,112 | |
Baytex Energy Corp.a | | | 1,952 | | | | 7,515 | |
Cabot Oil & Gas Corp. | | | 1,198 | | | | 25,014 | |
Canadian Natural Resources Ltd. | | | 3,050 | | | | 96,716 | |
Chesapeake Energy Corp.a | | | 1,798 | | | | 9,907 | |
Cimarex Energy Co. | | | 292 | | | | 37,706 | |
CNOOC Ltd. | | | 461 | | | | 57,846 | |
Concho Resources Inc.a | | | 361 | | | | 45,825 | |
ConocoPhillips | | | 3,327 | | | | 144,558 | |
| | | | | | | | |
| Security | |
Shares | | | Value | |
Continental Resources Inc./OKa,b | | | 337 | | | $ | 16,483 | |
Crescent Point Energy Corp. | | | 1,393 | | | | 16,605 | |
Devon Energy Corp. | | | 1,348 | | | | 51,076 | |
Encana Corp. | | | 2,452 | | | | 23,392 | |
Energen Corp. | | | 356 | | | | 17,846 | |
Enerplus Corp. | | | 1,454 | | | | 9,771 | |
EOG Resources Inc. | | | 1,481 | | | | 133,912 | |
EQT Corp. | | | 528 | | | | 34,848 | |
Hess Corp. | | | 808 | | | | 38,760 | |
Kosmos Energy Ltd.a | | | 1,362 | | | | 7,096 | |
Marathon Oil Corp. | | | 2,182 | | | | 28,759 | |
Murphy Oil Corp. | | | 623 | | | | 16,117 | |
Noble Energy Inc. | | | 1,107 | | | | 38,158 | |
Pioneer Natural Resources Co. | | | 468 | | | | 83,781 | |
Range Resources Corp. | | | 468 | | | | 15,814 | |
Southwestern Energy Co.a | | | 1,710 | | | | 17,767 | |
Vermilion Energy Inc. | | | 454 | | | | 17,833 | |
Whiting Petroleum Corp.a,b | | | 1,390 | | | | 11,454 | |
| | | | | | | | |
| | | | | | | 1,170,631 | |
OIL & GAS REFINING & MARKETING — 0.13% | |
Cosan Ltd. | | | 661 | | | | 5,883 | |
HollyFrontier Corp. | | | 946 | | | | 23,602 | |
Marathon Petroleum Corp. | | | 2,122 | | | | 92,498 | |
Phillips 66 | | | 1,785 | | | | 144,853 | |
Tesoro Corp. | | | 475 | | | | 40,361 | |
Valero Energy Corp. | | | 1,963 | | | | 116,288 | |
| | | | | | | | |
| | | | | | | 423,485 | |
OIL & GAS STORAGE & TRANSPORTATION — 0.18% | |
Cheniere Energy Inc.a | | | 551 | | | | 20,773 | |
DHT Holdings Inc. | | | 226 | | | | 920 | |
Dorian LPG Ltd.a,b | | | 980 | | | | 5,517 | |
Enbridge Inc. | | | 2,185 | | | | 94,326 | |
Euronav SAa | | | 1,028 | | | | 8,070 | |
Frontline Ltd./Bermudab | | | 957 | | | | 6,862 | |
GasLog Ltd. | | | 504 | | | | 7,736 | |
Gener8 Maritime Inc.a | | | 1,349 | | | | 5,693 | |
Golar LNG Ltd. | | | 476 | | | | 10,420 | |
Kinder Morgan Inc./DE | | | 4,776 | | | | 97,574 | |
Navigator Holdings Ltd.a | | | 88 | | | | 669 | |
Nordic American Tankers Ltd.b | | | 264 | | | | 2,157 | |
ONEOK Inc. | | | 492 | | | | 23,827 | |
Pembina Pipeline Corp. | | | 1,118 | | | | 34,390 | |
Scorpio Tankers Inc. | | | 1,624 | | | | 6,220 | |
Ship Finance International Ltd. | | | 557 | | | | 7,046 | |
| | |
| 10 | | 2016 iSHARES ANNUAL REPORTTO SHAREHOLDERS |
Consolidated Schedule of Investments (Continued)
iSHARES® COMMODITIES SELECT STRATEGY ETF
October 31, 2016
| | | | | | | | |
| Security | |
Shares | | | Value | |
Spectra Energy Corp. | | | 1,639 | | | $ | 68,526 | |
Teekay Corp. | | | 838 | | | | 5,472 | |
Teekay Tankers Ltd. Class A | | | 2,476 | | | | 5,274 | |
TransCanada Corp. | | | 2,001 | | | | 90,605 | |
Tsakos Energy Navigation Ltd. | | | 203 | | | | 913 | |
Ultrapar Participacoes SA ADR | | | 991 | | | | 22,397 | |
Williams Companies Inc. (The) | | | 1,783 | | | | 52,064 | |
| | | | | | | | |
| | | | | | | 577,451 | |
PAPER PACKAGING — 2.90% | |
International Paper Co. | | | 89,097 | | | | 4,012,038 | |
Packaging Corp. of America | | | 20,418 | | | | 1,684,485 | |
Sonoco Products Co. | | | 21,837 | | | | 1,098,183 | |
WestRock Co. | | | 54,493 | | | | 2,517,031 | |
| | | | | | | | |
| | | | | | | 9,311,737 | |
PAPER PRODUCTS — 0.26% | |
Fibria Celulose SA ADR | | | 49,210 | | | | 392,696 | |
KapStone Paper and Packaging Corp. | | | 19,042 | | | | 345,422 | |
Resolute Forest Products Inc.a | | | 20,656 | | | | 98,116 | |
| | | | | | | | |
| | | | | | | 836,234 | |
PRECIOUS METALS & MINERALS — 0.06% | |
Dominion Diamond Corp. | | | 23,770 | | | | 202,283 | |
| | | | | | | | |
| | | | | | | 202,283 | |
SILVER — 0.51% | |
First Majestic Silver Corp.a,b | | | 18,465 | | | | 148,643 | |
Pan American Silver Corp. | | | 17,177 | | | | 275,347 | |
Silver Wheaton Corp. | | | 49,685 | | | | 1,197,906 | |
| | | | | | | | |
| | | | | | | 1,621,896 | |
SPECIALIZED REITS — 1.85% | | | | | | | | |
Potlatch Corp. | | | 8,946 | | | | 343,526 | |
Rayonier Inc. | | | 26,622 | | | | 714,002 | |
Weyerhaeuser Co. | | | 162,428 | | | | 4,861,470 | |
| | | | | | | | |
| | | | | | | 5,918,998 | |
| | | | | | | | |
TOTAL COMMON STOCKS | | | | | | | | |
(Cost: $97,634,391) | | | | | | | 99,347,094 | |
|
PREFERRED STOCKS — 0.02% | |
|
INTEGRATED OIL & GAS — 0.02% | |
Petroleo Brasileiro SA ADRa | | | 6,911 | | | | 76,436 | |
| | | | | | | | |
| | | | | | | 76,436 | |
| | | | | | | | |
TOTAL PREFERRED STOCKS | | | | | |
(Cost: $52,080) | | | | | | | 76,436 | |
| | | | | | | | |
| Security | |
Principal | | | Value | |
SHORT-TERM INVESTMENTS — 67.03% | |
|
CERTIFICATES OF DEPOSIT — 3.43% | |
Cooperatieve Centrale Raiffeisen-Boerenleenbank BA | | | | | | | | |
1.20%, 03/16/17 | | $ | 6,000,000 | | | $ | 6,005,660 | |
DG Bank/NY | | | | | | | | |
0.95%, 12/06/16 | | | 5,000,000 | | | | 5,001,054 | |
| | | | | | | | |
TOTAL CERTIFICATES OF DEPOSIT | | | | | |
(Cost: $11,000,000) | | | | | | | 11,006,714 | |
|
COMMERCIAL PAPERc — 50.28% | |
ABN AMRO Funding USA LLC | | | | | | | | |
0.91%, 01/09/17 | | | 6,250,000 | | | | 6,242,623 | |
Alpine Securitization Ltd. | | | | | | | | |
1.08%, 02/03/17 | | | 5,000,000 | | | | 4,986,806 | |
American Honda Finance Corp. | | | | | | | | |
0.50%, 11/16/16 | | | 3,650,000 | | | | 3,649,346 | |
Antalis SA Antalis Sa | | | | | | | | |
1.05%, 12/28/16 | | | 4,000,000 | | | | 3,995,225 | |
ANZ National International Ltd. | | | | | | | | |
0.88%, 02/24/17 | | | 3,100,000 | | | | 3,090,111 | |
Atlantic Asset Securitization LLC Atlantic Asset Securitization | | | | | | | | |
1.05%, 02/21/17 | | | 5,000,000 | | | | 4,983,741 | |
AutoZone Inc. | | | | | | | | |
0.71%, 11/14/16 | | | 8,600,000 | | | | 8,597,498 | |
Barton Capital Corp. | | | | | | | | |
0.95%, 11/04/16 | | | 5,000,000 | | | | 4,999,751 | |
BPCE SA | | | | | | | | |
0.94%, 01/09/17 | | | 7,000,000 | | | | 6,991,602 | |
CAFCO LLC | | | | | | | | |
0.91%, 12/07/16 | | | 7,000,000 | | | | 6,995,417 | |
Caisse des Depots et Consignations | | | | | | | | |
0.93%, 02/16/17 | | | 5,000,000 | | | | 4,986,170 | |
Coca-Cola Co. (The) | | | | | | | | |
1.02%, 09/25/17 | | | 2,000,000 | | | | 1,980,095 | |
Collateralized Commercial Paper Co., LLC | | | | | | | | |
1.00%, 01/10/17 | | | 3,000,000 | | | | 2,995,042 | |
Crown Point Cap Co. | | | | | | | | |
1.12%, 01/04/17 | | | 2,000,000 | | | | 1,997,147 | |
Gotham Funding Corp. | | | | | | | | |
1.03%, 12/16/16 | | | 6,000,000 | | | | 5,994,748 | |
1.07%, 02/03/17 | | | 2,000,000 | | | | 1,994,722 | |
| | | | |
CONSOLIDATED SCHEDULEOF INVESTMENTS | | | 11 | |
Consolidated Schedule of Investments (Continued)
iSHARES® COMMODITIES SELECT STRATEGY ETF
October 31, 2016
| | | | | | | | |
| Security | |
Principal | | | Value | |
Macquarie Bank Ltd. | | | | | | | | |
1.03%, 12/13/16 | | $ | 5,200,000 | | | $ | 5,194,851 | |
0.97%, 01/06/17 | | | 3,500,000 | | | | 3,493,675 | |
Manhattan Asset Funding Co., LLC | | | | | | | | |
0.94%, 11/16/16 | | | 5,000,000 | | | | 4,998,829 | |
Matchpoint Finance PLC | | | | | | | | |
1.02%, 12/14/16 | | | 5,000,000 | | | | 4,995,969 | |
Medtronic Global Holdings SCA | | | | | | | | |
0.70%, 11/02/16 | | | 2,700,000 | | | | 2,699,901 | |
0.74%, 11/08/16 | | | 6,000,000 | | | | 5,999,104 | |
Mizuho Bank Ltd./NY | | | | | | | | |
0.89%, 01/17/17 | | | 2,600,000 | | | | 2,595,674 | |
Mont Blanc Capital Corp. | | | | | | | | |
0.92%, 11/10/16 | | | 5,000,000 | | | | 4,999,312 | |
National Australia Bank Ltd. | | | | | | | | |
1.16%, 07/28/17 | | | 1,700,000 | | | | 1,685,392 | |
NBCUniversal Enterprise Inc. | | | | | | | | |
0.80%, 12/08/16 | | | 8,000,000 | | | | 7,992,898 | |
Omnicom Group Inc. | | | | | | | | |
0.80%, 11/08/16 | | | 2,000,000 | | | | 1,999,675 | |
0.79%, 11/28/16 | | | 6,300,000 | | | | 6,295,997 | |
Oversea-Chinese Banking Corp. Ltd. Oversea-Chinese Banking Corp. Ltd | | | | | | | | |
0.90%, 12/12/16 | | | 7,000,000 | | | | 6,996,031 | |
Starbird Funding Corp. | | | | | | | | |
1.33%, 03/06/17 | | | 6,000,000 | | | | 5,977,614 | |
United Technologies Corp. | | | | | | | | |
0.77%, 11/17/16 | | | 2,300,000 | | | | 2,299,178 | |
Versailles CDS LLC | | | | | | | | |
0.95%, 11/15/16 | | | 5,000,000 | | | | 4,998,917 | |
1.00%, 01/17/17 | | | 3,000,000 | | | | 2,994,189 | |
Victory Receivables Corp. | | | | | | | | |
1.01%, 12/14/16 | | | 6,000,000 | | | | 5,995,050 | |
0.65%, 11/07/16 | | | 2,600,000 | | | | 2,599,757 | |
Xcel Energy Inc. | | | | | | | | |
0.78%, 11/03/16 | | | 2,000,000 | | | | 1,999,880 | |
| | | | | | | | |
TOTAL COMMERCIAL PAPER | | | | | | | | |
(Cost: $161,261,546) | | | | | | | 161,291,937 | |
| | | | | | | | |
| Security | | Shares or
Principal | | | Value | |
MONEY MARKET FUNDS — 5.78% | |
BlackRock Cash Funds: Institutional,
SL Agency Shares | | | | | |
0.72%d,e,f | | | 862,973 | | | $ | 863,059 | |
BlackRock Cash Funds: Treasury,
SL Agency Shares | | | | | |
0.29%d,e,g | | | 17,693,533 | | | | 17,693,533 | |
| | | | | | | | |
| | | | | | | 18,556,592 | |
U.S. GOVERNMENT OBLIGATIONS — 7.54% | |
U.S. Treasury Billc | | | | | | | | |
0.27%, 11/10/16 | | $ | 800,000 | | | | 799,975 | |
0.34%, 12/08/16 | | | 23,400,000 | | | | 23,395,928 | |
| | | | | | | | |
TOTAL U.S. GOVERNMENT OBLIGATIONS | | | | | |
(Cost: $24,191,889) | | | | | | | 24,195,903 | |
| | | | | | | | |
TOTAL SHORT-TERM INVESTMENTS | | | | | |
(Cost: $215,009,942) | | | | | | | 215,051,146 | |
| | | | | | | | |
TOTAL INVESTMENTS
IN SECURITIES — 98.02% | | | | | |
(Cost: $312,696,413)h | | | | | | | 314,474,676 | |
Other Assets, Less Liabilities — 1.98% | | | | 6,345,138 | |
| | | | | | | | |
NET ASSETS — 100.00% | | | | | | $ | 320,819,814 | |
| | | | | | | | |
ADR — American Depositary Receipts
| a | Non-income earning security. |
| b | All or a portion of this security represents a security on loan. See Note 1. |
| c | Rates shown are discount rates paid at the time of purchase. |
| d | Affiliated money market fund. |
| e | The rate quoted is the annualized seven-day yield of the fund at period end. |
| f | All or a portion of this security represents an investment of securities lending collateral. See Note 1. |
| g | Includes portion held by the Subsidiary in the amount of $17,545,046. |
| h | The cost of investments for federal income tax purposes was $315,756,881. Net unrealized depreciation was $1,282,205, of which $7,598,808 represented gross unrealized appreciation on securities and $8,881,013 represented gross unrealized depreciation on securities. |
| | |
| 12 | | 2016 iSHARES ANNUAL REPORTTO SHAREHOLDERS |
Consolidated Schedule of Investments (Continued)
iSHARES® COMMODITIES SELECT STRATEGY ETF
October 31, 2016
Schedule 1 — Futures Contracts (Note 5)
Futures contracts outstanding as of October 31, 2016 were as follows:i
| | | | | | | | | | | | | | | | | | | | | | | | |
| Issue | | Number of
long (short)
contracts | | | Expiration
date | | | Exchange | | | Initial notional
value | | | Current notional
value | | | Unrealized
appreciation
(depreciation) | |
| Aluminum | | | 172 | | | | Jan. 2017 | | | | London Metal | | | $ | 6,906,042 | | | $ | 7,461,575 | | | $ | 555,533 | |
| Brent Crude Oil | | | 798 | | | | Aug. 2017 | | | | ICE Futures U.S. | | | | 44,183,077 | | | | 41,456,100 | | | | (2,726,977 | ) |
| Cattle Feeder | | | 33 | | | | Jan. 2017 | | | | Chicago Mercantile Exchange | | | | 1,898,691 | | | | 1,914,000 | | | | 15,309 | |
| Cocoa | | | 49 | | | | Mar. 2017 | | | | ICE Futures U.S. | | | | 1,432,560 | | | | 1,295,070 | | | | (137,490 | ) |
| Coffee | | | 55 | | | | May. 2017 | | | | ICE Futures U.S. | | | | 3,233,140 | | | | 3,500,063 | | | | 266,923 | |
| Copper | | | 72 | | | | May. 2017 | | | | London Metal | | | | 8,662,472 | | | | 8,759,250 | | | | 96,778 | |
| Corn | | | 694 | | | | Mar. 2017 | | | | Chicago Board of Trade | | | | 11,952,758 | | | | 12,587,425 | | | | 634,667 | |
| Cotton | | | 110 | | | | Dec. 2016 | | | | NYCE - New York Cotton Exchange | | | | 3,737,390 | | | | 3,787,300 | | | | 49,910 | |
| Gasoline RBOB | | | 188 | | | | Dec. 2016 | | | | New York Mercantile | | | | 10,579,460 | | | | 11,208,372 | | | | 628,912 | |
| Gold | | | 24 | | | | Jun. 2017 | | | | COMEX | | | | 3,037,998 | | | | 3,080,160 | | | | 42,162 | |
| KC HRW Wheat | | | 98 | | | | May. 2017 | | | | Chicago Board of Trade | | | | 2,166,316 | | | | 2,179,275 | | | | 12,959 | |
| Lead | | | 36 | | | | Jun. 2017 | | | | London Metal | | | | 1,852,343 | | | | 1,871,100 | | | | 18,757 | |
| Lean Hogs | | | 148 | | | | Dec. 2016 | | | | Chicago Mercantile | | | | 3,107,767 | | | | 2,838,640 | | | | (269,127 | ) |
| Live Cattle | | | 175 | | | | Jun. 2017 | | | | Chicago Mercantile | | | | 6,584,208 | | | | 6,695,500 | | | | 111,292 | |
| Low Sulphur Gasoil | | | 261 | | | | Dec. 2016 | | | | ICE Futures U.S. | | | | 12,269,411 | | | | 11,516,625 | | | | (752,786 | ) |
| Natural Gas | | | 280 | | | | Apr. 2017 | | | | New York Mercantile | | | | 8,561,139 | | | | 8,604,400 | | | | 43,261 | |
| Nickel | | | 24 | | | | Jun. 2017 | | | | London Metal | | | | 1,511,556 | | | | 1,518,480 | | | | 6,924 | |
| NY Harbor ULSD | | | 168 | | | | Apr. 2017 | | | | New York Mercantile | | | | 10,895,296 | | | | 10,903,637 | | | | 8,341 | |
| Silver | | | 6 | | | | Mar. 2017 | | | | COMEX | | | | 527,518 | | | | 537,420 | | | | 9,902 | |
| Soybean | | | 194 | | | | Jan. 2017 | | | | Chicago Board of Trade | | | | 9,319,114 | | | | 9,813,975 | | | | 494,861 | |
| Sugar | | | 346 | | | | Jul. 2017 | | | | ICE Futures U.S. | | | | 8,413,286 | | | | 7,967,411 | | | | (445,875 | ) |
| Wheat | | | 403 | | | | May. 2017 | | | | Chicago Board of Trade | | | | 8,832,074 | | | | 9,032,237 | | | | 200,163 | |
| WTI Crude Oil | | | 993 | | | | Jul. 2017 | | | | New York Mercantile | | | | 53,164,518 | | | | 49,808,880 | | | | (3,355,638 | ) |
| Zinc | | | 47 | | | | Jun. 2017 | | | | London Metal | | | | 2,689,058 | | | | 2,901,369 | | | | 212,311 | |
| | | | | | | | | | | | | | | | | | | | | | | | |
| Net unrealized depreciation | | | $ | (4,278,928 | ) |
| | | | | | | | | | | | | | | | | | | | | | | | |
| | | | | | | | | | | | | | | | | | | | | | | | | |
| i | Represents positions held in the Subsidiary. |
Schedule 2 — Fair Value Measurements
Various inputs are used in determining the fair value of financial instruments. For description of the input levels and information about the Fund’s policy regarding valuation of financial instruments, see Note 1.
The following table summarizes the value of the Fund’s investments according to the fair value hierarchy as of October 31, 2016. The breakdown of the Fund’s investments into major categories is disclosed in the schedule of investments above.
| | | | | | | | | | | | | | | | |
| | | Level 1 | | | Level 2 | | | Level 3 | | | Total | |
Investments: | | | | | | | | | | | | | | | | |
Assets: | | | | | | | | | | | | | | | | |
Common stocks | | $ | 99,347,094 | | | $ | — | | | $ | — | | | $ | 99,347,094 | |
Preferred stocks | | | 76,436 | | | | — | | | | — | | | | 76,436 | |
Certificates of deposit | | | — | | | | 11,006,714 | | | | — | | | | 11,006,714 | |
Commercial paper | | | — | | | | 161,291,937 | | | | — | | | | 161,291,937 | |
U.S. government obligations | | | — | | | | 24,195,903 | | | | — | | | | 24,195,903 | |
Money market funds | | | 18,556,592 | | | | — | | | | — | | | | 18,556,592 | |
| | | | | | | | | | | | | | | | |
Total | | $ | 117,980,122 | | | $ | 196,494,554 | | | $ | — | | | $ | 314,474,676 | |
| | | | | | | | | | | | | | | | |
Derivative financial instrumentsa: | | | | | | | | | | | | | | | | |
Assets: | | | | | | | | | | | | | | | | |
Futures contracts | | $ | 3,408,965 | | | $ | — | | | $ | — | | | $ | 3,408,965 | |
Liabilities: | | | | | | | | | | | | | | | | |
Futures contracts | | | (7,687,893 | ) | | | — | | | | — | | | | (7,687,893 | ) |
| | | | | | | | | | | | | | | | |
Total | | $ | (4,278,928 | ) | | $ | — | | | $ | — | | | $ | (4,278,928 | ) |
| | | | | | | | | | | | | | | | |
| | | | | | | | | | | | | | | | | |
| | a | | Shown at the unrealized appreciation (depreciation) on the contracts. |
See notes to consolidated financial statements.
| | | | |
CONSOLIDATED SCHEDULEOF INVESTMENTS | | | 13 | |
Consolidated Statement of Assets and Liabilities
iSHARES® COMMODITIES SELECT STRATEGY ETF
October 31, 2016
| | | | |
| | |
ASSETS | | | | |
Investments, at cost: | | | | |
Unaffiliated | | $ | 294,139,906 | |
Affiliated (Note 2) | | | 18,556,507 | |
| | | | |
Total cost of investments | | $ | 312,696,413 | |
| | | | |
Investments in securities, at fair value (including securities on loana) (Note 1): | | | | |
Unaffiliated | | $ | 295,918,084 | |
Affiliated (Note 2) | | | 18,556,592 | |
| | | | |
Total fair value of investments | | | 314,474,676 | |
Foreign currency, at valueb | | | 90 | |
Cash pledged to brokerc | | | 12,964,603 | |
Receivables: | | | | |
Dividends and interest | | | 93,096 | |
Futures variation marginc | | | 891,438 | |
Tax reclaims | | | 18,768 | |
| | | | |
Total Assets | | | 328,442,671 | |
| | | | |
| |
LIABILITIES | | | | |
Payables: | | | | |
Investment securities purchased | | | 1,685,392 | |
Collateral for securities on loan (Note 1) | | | 862,972 | |
Futures variation marginc | | | 4,696,826 | |
Due to custodian | | | 244,389 | |
Deferred foreign capital gains taxes (Note 1) | | | 25 | |
Investment advisory fees (Note 2) | | | 133,253 | |
| | | | |
Total Liabilities | | | 7,622,857 | |
| | | | |
| |
NET ASSETS | | $ | 320,819,814 | |
| | | | |
| |
Net assets consist of: | | | | |
Paid-in capital | | $ | 343,238,657 | |
Distributions in excess of net investment income | | | (852,987 | ) |
Accumulated net realized loss | | | (19,066,299 | ) |
Net unrealized depreciation | | | (2,499,557 | ) |
| | | | |
NET ASSETS | | $ | 320,819,814 | |
| | | | |
| |
Shares outstandingd | | | 9,900,000 | |
| | | | |
| |
Net asset value per share | | $ | 32.41 | |
| | | | |
| a | Securities on loan with a value of $813,925. See Note 1. |
| b | Cost of foreign currency: $90. |
| c | Represents assets or liabilities held in the Subsidiary. |
| d | No par value, unlimited number of shares authorized. |
See notes to consolidated financial statements.
| | |
| 14 | | 2016 iSHARES ANNUAL REPORTTO SHAREHOLDERS |
Consolidated Statement of Operations
iSHARES® COMMODITIES SELECT STRATEGY ETF
Year ended October 31, 2016
| | | | |
| | |
NET INVESTMENT INCOME | | | | |
Dividends — unaffiliateda | | $ | 1,996,963 | |
Dividends — affiliated (Note 2) | | | 45,372 | |
Interest — unaffiliated | | | 480,661 | |
Miscellaneous income | | | 57,792 | |
Securities lending income — affiliated — net (Note 2) | | | 66,689 | |
| | | | |
Total investment income | | | 2,647,477 | |
| | | | |
| |
EXPENSES | | | | |
Investment advisory fees (Note 2) | | | 1,286,752 | |
| | | | |
Total expenses | | | 1,286,752 | |
Less investment advisory fees waived (Note 2) | | | (4,684 | ) |
| | | | |
Net expenses | | | 1,282,068 | |
| | | | |
Net investment income | | | 1,365,409 | �� |
| | | | |
| |
NET REALIZED AND UNREALIZED GAIN (LOSS) | | | | |
Net realized gain (loss) from: | | | | |
Investments — unaffiliated | | | (16,622,844 | ) |
Investments — affiliated (Note 2) | | | 3 | |
In-kind redemptions — unaffiliated | | | 971,195 | |
Futures contracts | | | (7,159,652 | ) |
Foreign currency transactions | | | (495 | ) |
Realized gain distributions from affiliated funds | | | 138 | |
| | | | |
Net realized loss | | | (22,811,655 | ) |
| | | | |
Net change in unrealized appreciation/depreciation on: | | | | |
Investmentsb | | | 25,687,788 | |
Futures contracts | | | 1,373,103 | |
Translation of assets and liabilities in foreign currencies | | | (3 | ) |
| | | | |
Net change in unrealized appreciation/depreciation | | | 27,060,888 | |
| | | | |
Net realized and unrealized gain | | | 4,249,233 | |
| | | | |
NET INCREASE IN NET ASSETS RESULTING FROM OPERATIONS | | $ | 5,614,642 | |
| | | | |
| a | Net of foreign withholding tax of $77,867. |
| b | Net of deferred foreign capital gains taxes of $25. |
See notes to consolidated financial statements.
| | | | |
CONSOLIDATED FINANCIAL STATEMENTS | | | 15 | |
Consolidated Statements of Changes in Net Assets
iSHARES® COMMODITIES SELECT STRATEGY ETF
| | | | | | | | |
| | | Year ended October 31, 2016 | | | Year ended October 31, 2015 | |
| | |
INCREASE (DECREASE) IN NET ASSETS | | | | | | | | |
| | |
OPERATIONS: | | | | | | | | |
Net investment income | | $ | 1,365,409 | | | $ | 1,440,157 | |
Net realized loss | | | (22,811,655 | ) | | | (40,320,094 | ) |
Net change in unrealized appreciation/depreciation | | | 27,060,888 | | | | (29,819,254 | ) |
| | | | | | | | |
Net increase (decrease) in net assets resulting from operations | | | 5,614,642 | | | | (68,699,191 | ) |
| | | | | | | | |
| | |
DISTRIBUTIONS TO SHAREHOLDERS: | | | | | | | | |
From net investment income | | | (1,347,562 | ) | | | (3,140,724 | ) |
Return of capital | | | — | | | | (31,122 | ) |
| | | | | | | | |
Total distributions to shareholders | | | (1,347,562 | ) | | | (3,171,846 | ) |
| | | | | | | | |
| | |
CAPITAL SHARE TRANSACTIONS: | | | | | | | | |
Proceeds from shares sold | | | 110,450,896 | | | | 323,459,573 | |
Cost of shares redeemed | | | (47,754,983 | ) | | | (18,004,803 | ) |
| | | | | | | | |
Net increase in net assets from capital share transactions | | | 62,695,913 | | | | 305,454,770 | |
| | | | | | | | |
INCREASE IN NET ASSETS | | | 66,962,993 | | | | 233,583,733 | |
| | |
NET ASSETS | | | | | | | | |
Beginning of year | | | 253,856,821 | | | | 20,273,088 | |
| | | | | | | | |
End of year | | $ | 320,819,814 | | | $ | 253,856,821 | |
| | | | | | | | |
Distributions in excess of net investment income included in net assets at end of year | | $ | (852,987 | ) | | $ | (1,548,514 | ) |
| | | | | | | | |
| | |
SHARES ISSUED AND REDEEMED | | | | | | | | |
Shares sold | | | 3,800,000 | | | | 7,800,000 | |
Shares redeemed | | | (1,600,000 | ) | | | (500,000 | ) |
| | | | | | | | |
Net increase in shares outstanding | | | 2,200,000 | | | | 7,300,000 | |
| | | | | | | | |
See notes to consolidated financial statements.
| | |
| 16 | | 2016 iSHARES ANNUAL REPORTTO SHAREHOLDERS |
Consolidated Financial Highlights
iSHARES® COMMODITIES SELECT STRATEGY ETF
(For a share outstanding throughout each period)
| | | | | | | | | | | | |
| | | Year ended
Oct. 31, 2016 | | | Year ended
Oct. 31, 2015 | | | Period from
Oct. 15, 2014a to
Oct. 31, 2014 | |
Net asset value, beginning of period | | $ | 32.97 | | | $ | 50.68 | | | $ | 50.04 | |
| | | | | | | | | | | | |
Income from investment operations: | | | | | | | | | | | | |
Net investment income (loss)b | | | 0.16 | | | | 0.26 | | | | (0.01 | ) |
Net realized and unrealized gain (loss)c | | | (0.57 | ) | | | (17.35 | ) | | | 0.65 | |
| | | | | | | | | | | | |
Total from investment operations | | | (0.41 | ) | | | (17.09 | ) | | | 0.64 | |
| | | | | | | | | | | | |
Less distributions from: | | | | | | | | | | | | |
Net investment income | | | (0.15 | ) | | | (0.61 | ) | | | — | |
Return of capital | | | — | | | | (0.01 | ) | | | — | |
| | | | | | | | | | | | |
Total distributions | | | (0.15 | ) | | | (0.62 | ) | | | — | |
| | | | | | | | | | | | |
Net asset value, end of period | | $ | 32.41 | | | $ | 32.97 | | | $ | 50.68 | |
| | | | | | | | | | | | |
| | | |
Total return | | | (1.23 | )% | | | (33.88 | )% | | | 1.28 | %d |
| | | | | | | | | | | | |
| | | |
Ratios/Supplemental data: | | | | | | | | | | | | |
Net assets, end of period (000s) | | $ | 320,820 | | | $ | 253,857 | | | $ | 20,273 | |
Ratio of expenses to average net assetse | | | 0.48 | % | | | 0.48 | % | | | 0.48 | % |
Ratio of expenses to average net assets prior to waived feese | | | 0.48 | % | | | 0.48 | % | | | n/a | |
Ratio of net investment income (loss) to average net assetse | | | 0.51 | % | | | 0.68 | % | | | (0.23 | )% |
Portfolio turnover ratef | | | 43 | % | | | 76 | % | | | 0 | % |
| a | Commencement of operations. |
| b | Based on average shares outstanding throughout each period. |
| c | The amounts reported for a share outstanding may not accord with the change in aggregate gains and losses in securities for the fiscal period due to the timing of capital share transactions in relation to the fluctuating market values of the Fund’s underlying securities. |
| e | Annualized for periods of less than one year. |
| f | Portfolio turnover rates exclude portfolio securities received or delivered as a result of processing capital share transactions in Creation Units. |
See notes to consolidated financial statements.
| | | | |
CONSOLIDATED FINANCIAL HIGHLIGHTS | | | 17 | |
Notes to Consolidated Financial Statements
iSHARES® COMMODITIES SELECT STRATEGY ETF
iShares U.S. ETF Trust (the “Trust”) is registered under the Investment Company Act of 1940, as amended (the “1940 Act”), as an open-end management investment company. The Trust was established as a Delaware statutory trust pursuant to an Agreement and Declaration of Trust dated June 21, 2011.
These consolidated financial statements relate only to the following fund (the “Fund”):
| | |
| iShares ETF | | Diversification Classification |
Commodities Select Strategy | | Non-diversified |
The Fund carries out its investment strategies associated with investment in commodity-linked futures contracts and other derivatives (“commodity-linked investments”) by investing up to 25% of its total assets in iShares Commodities Strategy Cayman Ltd., a wholly-owned subsidiary organized in the Cayman Islands (the “Subsidiary”). The investment adviser of the Fund also serves as the investment adviser to the Subsidiary. Investments in the Subsidiary enable the Fund to hold the commodity-linked investments and satisfy regulated investment company tax requirements. The accompanying consolidated schedule of investments and consolidated financial statements for the Fund include the positions and accounts, respectively, of its Subsidiary. Intercompany accounts and transactions, if any, have been eliminated.
The following table shows a summary of selected financial information of the Subsidiary included in the consolidated financial statements of the Fund, as of and for the year ended October 31, 2016:
| | | | |
| Consolidated Statement of Assets and Liabilities | |
Total Assets | | $ | 31,405,902 | |
Total Liabilities | | | 4,696,826 | |
| | | | |
Net Assets | | $ | 26,709,076 | |
| | | | |
| | | | |
| Consolidated Statement of Operations | |
Net investment income | | $ | 102,648 | |
Net realized gain (loss) from: | | | | |
Futures contracts | | | (7,159,652 | ) |
Net change in unrealized appreciation/depreciation on: | | | | |
Futures contracts | | | 1,373,102 | |
| | | | |
Net increase (decrease) in net assets resulting from operations | | $ | (5,683,902 | ) |
| | | | |
| | | | | |
Pursuant to the Trust’s organizational documents, the Fund’s officers and trustees are indemnified against certain liabilities that may arise out of the performance of their duties to the Fund. Additionally, in the normal course of business, the Fund enters into contracts with service providers that contain general indemnification clauses. The Fund’s maximum exposure under these arrangements is unknown as this would involve future claims that may be made against the Fund that have not yet occurred.
| 1. | SIGNIFICANT ACCOUNTING POLICIES |
The following significant accounting policies are consistently followed by the Fund in the preparation of its financial statements in conformity with accounting principles generally accepted in the United States of America (“U.S. GAAP”). The preparation of financial statements in conformity with U.S. GAAP requires management to make certain estimates and assumptions that affect
| | |
| 18 | | 2016 iSHARES ANNUAL REPORTTO SHAREHOLDERS |
Notes to Consolidated Financial Statements (Continued)
iSHARES® COMMODITIES SELECT STRATEGY ETF
the reported amounts of assets and liabilities and disclosures of contingent assets and liabilities at the date of the financial statements and the reported amounts of revenue and expenses during the reporting period. Actual results could differ from those estimates. The Fund is considered an investment company under U.S. GAAP and follows the accounting and reporting guidance applicable to investment companies.
SECURITY VALUATION
The Fund’s investments are valued at fair value each day that the Fund’s listing exchange is open and, for financial reporting purposes, as of the report date should the reporting period end on a day that the Fund’s listing exchange is not open. U.S. GAAP defines fair value as the price a fund would receive to sell an asset or pay to transfer a liability in an orderly transaction between market participants at the measurement date. The BlackRock Global Valuation Methodologies Committee (the “Global Valuation Committee”) provides oversight of the valuation of investments for the Fund. The investments of the Fund are valued pursuant to policies and procedures developed by the Global Valuation Committee and approved by the Board of Trustees of the Trust (the “Board”).
| | • | | Equity investments traded on a recognized securities exchange are valued at that day’s last reported trade price or the official closing price, as applicable, on the exchange where the stock is primarily traded. Equity investments traded on a recognized exchange for which there were no sales on that day are valued at the last traded price. |
| | • | | Fixed income investments are valued using the last available bid price or current market quotations provided by dealers or prices (including evaluated prices) supplied by approved independent third-party pricing services. The pricing services may use matrix pricing or valuation models that utilize certain inputs and assumptions to derive values, including transaction data, credit quality information, perceived market movements, news, and other relevant information and by other methods, which may include consideration of: yields or prices of securities of comparable quality, coupon, maturity and type; indications as to values from dealers; general market conditions; and/or other factors and assumptions. Pricing services generally value fixed income securities assuming orderly transactions of an institutional round lot size, but a fund may hold or transact in such securities in smaller odd lot sizes. |
| | • | | Open-end U.S. mutual funds (including money market funds) are valued at that day’s published net asset value (“NAV”). |
| | • | | Futures contracts are valued at that day’s last reported settlement price on the exchange where the contract is traded. |
In the event that application of these methods of valuation results in a price for an investment which is deemed not to be representative of the fair value of such investment or if a price is not available, the investment will be valued based upon other available factors deemed relevant by the Global Valuation Committee, in accordance with policies approved by the Board. These factors include but are not limited to (i) attributes specific to the investment; (ii) the principal market for the investment; (iii) the customary participants in the principal market for the investment; (iv) data assumptions by market participants for the investment, if reasonably available; (v) quoted prices for similar investments in active markets; and (vi) other factors, such as future cash flows, interest rates, yield curves, volatilities, prepayment speeds, loss severities, credit risks and/or default rates. Valuations based on such factors are reported to the Board on a quarterly basis.
The Global Valuation Committee employs various methods for calibrating valuation approaches for investments where an active market does not exist, including regular due diligence of the Trust’s pricing vendors, a regular review of key inputs and assumptions, transactional back-testing or disposition analysis to compare unrealized gains and losses to realized gains and losses, reviews of missing or stale prices, reviews of large movements in market values, and reviews of market related activity.
Various inputs are used in determining the fair value of financial instruments. Inputs may be based on independent market data (“observable inputs”) or they may be internally developed (“unobservable inputs”). These inputs are categorized into a disclosure
| | | | |
NOTESTO CONSOLIDATED FINANCIAL STATEMENTS | | | 19 | |
Notes to Consolidated Financial Statements (Continued)
iSHARES® COMMODITIES SELECT STRATEGY ETF
hierarchy consisting of three broad levels for financial reporting as follows:
| | • | | Level 1 — Unadjusted quoted prices in active markets for identical assets or liabilities; |
| | • | | Level 2 — Inputs other than quoted prices included within Level 1 that are observable for the asset or liability either directly or indirectly, including quoted prices for similar assets or liabilities in active markets, quoted prices for identical or similar assets or liabilities in markets that are not considered to be active, inputs other than quoted prices that are observable for the asset or liability (such as exchange rates, financing terms, interest rates, yield curves, volatilities, prepayment speeds, loss severities, credit risks and default rates) or other market-corroborated inputs; and |
| | • | | Level 3 — Unobservable inputs for the asset or liability based on the best information available in the circumstances, to the extent observable inputs are not available, including the Global Valuation Committee’s assumptions used in determining the fair value of investments. |
The hierarchy gives the highest priority to unadjusted quoted prices in active markets for identical assets or liabilities (Level 1 measurements) and the lowest priority to unobservable inputs (Level 3 measurements). Accordingly, the degree of judgement exercised in determining fair value is greatest for instruments categorized in Level 3. The inputs used to measure fair value may fall into different levels of the fair value hierarchy. In such cases, for disclosure purposes, the fair value hierarchy classification is determined based on the lowest level input that is significant to the fair value measurement in its entirety. The fair value hierarchy for the Fund’s investments is included in its consolidated schedule of investments.
Changes in valuation techniques may result in transfers in or out of an assigned level within the fair value hierarchy. In accordance with the Trust’s policy, transfers between different levels of the fair value hierarchy are deemed to have occurred as of the beginning of the reporting period. The categorization of values determined for financial instruments are based on the pricing transparency of the financial instruments and are not necessarily an indication of the risks associated with investing in those securities.
SECURITY TRANSACTIONS AND INCOME RECOGNITION
Security transactions are accounted for on trade date. Dividend income and capital gain distributions, if any, are recognized on the ex-dividend date, net of any foreign taxes withheld at source. Any taxes withheld that are reclaimable from foreign tax authorities as of October 31, 2016 are reflected in tax reclaims receivable. Non-cash dividends received in the form of stock in an elective dividend, if any, are recorded as dividend income at fair value. Distributions received by the Fund may include a return of capital that is estimated by management. Such amounts are recorded as a reduction of the cost of investments or reclassified to capital gains. Interest income, including amortization and accretion of premiums and discounts on debt securities, is recognized daily on the accrual basis. Realized gains and losses on investment transactions are determined using the specific identification method.
FOREIGN CURRENCY TRANSLATION
The accounting records of the Fund are maintained in U.S. dollars. Foreign currencies, as well as investment securities and other assets and liabilities denominated in foreign currencies, are translated into U.S. dollars using exchange rates deemed appropriate by the investment adviser. Purchases and sales of securities, income receipts and expense payments are translated into U.S. dollars on the respective dates of such transactions.
The Fund does not isolate the effect of fluctuations in foreign exchange rates from the effect of fluctuations in the market prices of securities. Such fluctuations are reflected by the Fund as a component of realized and unrealized gains and losses from investments for financial reporting purposes.
| | |
| 20 | | 2016 iSHARES ANNUAL REPORTTO SHAREHOLDERS |
Notes to Consolidated Financial Statements (Continued)
iSHARES® COMMODITIES SELECT STRATEGY ETF
FOREIGN TAXES
The Fund may be subject to foreign taxes (a portion of which may be reclaimable) on income, stock dividends, capital gains on investments, or certain foreign currency transactions. All foreign taxes are recorded in accordance with the applicable foreign tax regulations and rates that exist in the foreign jurisdictions in which the Fund invests. These foreign taxes, if any, are paid by the Fund and are reflected in its consolidated statement of operations as follows: foreign taxes withheld at source are presented as a reduction of income, foreign taxes on securities lending income are presented as a reduction of securities lending income, foreign taxes on stock dividends are presented as “other foreign taxes”, and foreign taxes on capital gains from sales of investments and foreign taxes on foreign currency transactions are included in their respective net realized gain (loss) categories. Foreign taxes payable or deferred as of October 31, 2016, if any, are disclosed in the Fund’s consolidated statement of assets and liabilities.
DISTRIBUTIONS TO SHAREHOLDERS
Dividends and distributions paid by the Fund are recorded on the ex-dividend dates. Distributions are determined on a tax basis and may differ from net investment income and net realized capital gains for financial reporting purposes. Dividends and distributions are paid in U.S. dollars and cannot be automatically reinvested in additional shares of the Fund.
LOANS OF PORTFOLIO SECURITIES
The Fund may lend its investment securities to approved borrowers, such as brokers, dealers and other financial institutions. The borrower pledges and maintains with the Fund collateral consisting of cash, an irrevocable letter of credit issued by a bank, or securities issued or guaranteed by the U.S. government. The initial collateral received by the Fund is required to have a value of at least 102% of the current value of the loaned securities for securities traded on U.S. exchanges and a value of at least 105% for all other securities. The collateral is maintained thereafter at a value equal to at least 100% of the current value of the securities on loan. The market value of the loaned securities is determined at the close of each business day of the Fund. Any additional required collateral is delivered to the Fund and any excess collateral is returned by the Fund on the next business day. During the term of the loan, the Fund is entitled to all distributions made on or in respect of the loaned securities but does not receive interest income on securities received as collateral. Loans of securities are terminable at any time and the borrower, after notice, is required to return borrowed securities within the standard time period for settlement of securities transactions.
On October 11, 2016, BlackRock, Inc. (“BlackRock”) implemented changes required by amendments to Rule 2a-7 under the 1940 Act, which governs the operations of U.S. money market funds. The Fund may be exposed to additional risks when reinvesting the cash collateral in money market funds that do not seek to maintain a stable NAV per share of $1.00 and which may be subject to redemption gates or liquidity fees under certain circumstances.
Cash received as collateral for securities on loan may be reinvested in certain short-term instruments either directly on behalf of a fund or through one or more joint accounts or money market funds, including those managed by BlackRock Fund Advisors (“BFA”), the Fund’s investment adviser, or its affiliates. As of October 31, 2016, any securities on loan were collateralized by cash and/or U.S. government obligations. Cash collateral received was invested in money market funds managed by BFA and is disclosed in the consolidated schedule of investments. The securities on loan for the Fund are also disclosed in its consolidated schedule of investments. The total value of any securities on loan as of October 31, 2016 and the total value of the related cash collateral are disclosed in the consolidated statement of assets and liabilities. Income earned by the Fund from securities lending is disclosed in the consolidated statement of operations.
The risks of securities lending include the risk that the borrower may not provide additional collateral when required or may not return the securities when due. To mitigate these risks, the Fund benefits from a borrower default indemnity provided by BlackRock. BlackRock’s indemnity allows for full replacement of securities lent. The Fund could suffer a loss if the value of the investments purchased with cash collateral falls below the value of the cash collateral received.
| | | | |
NOTESTO CONSOLIDATED FINANCIAL STATEMENTS | | | 21 | |
Notes to Consolidated Financial Statements (Continued)
iSHARES® COMMODITIES SELECT STRATEGY ETF
Securities lending transactions are entered into by the Fund under Master Securities Lending Agreements (“MSLA”) which provide the right, in the event of default (including bankruptcy or insolvency) for the non-defaulting party to liquidate the collateral and calculate a net exposure to the defaulting party or request additional collateral. In the event that a borrower defaults, the Fund, as lender, would offset the market value of the collateral received against the market value of the securities loaned. The value of the collateral is typically greater than that of the market value of the securities loaned, leaving the lender with a net amount payable to the defaulting party. However, bankruptcy or insolvency laws of a particular jurisdiction may impose restrictions on or prohibitions against such a right of offset in the event of an MSLA counterparty’s bankruptcy or insolvency. Under the MSLA, the borrower can resell or re-pledge the loaned securities, and the Fund can reinvest cash collateral, or, upon an event of default, resell or re-pledge the collateral.
The following table is a summary of securities lending agreements which are subject to offset under an MSLA as of October 31, 2016:
| | | | | | | | | | | | |
| Counterparty | | Market Value of
Securities on Loan | | | Cash Collateral
Received a | | | Net
Amount b | |
Citigroup Global Markets Inc. | | $ | 50,323 | | | $ | 50,323 | | | $ | — | |
Credit Suisse Securities (USA) LLC | | | 101,762 | | | | 100,533 | | | | (1,229 | ) |
Deutsche Bank Securities Inc. | | | 254,870 | | | | 254,870 | | | | — | |
Jefferies LLC | | | 380,226 | | | | 380,226 | | | | — | |
JPMorgan Securities LLC | | | 18,484 | | | | 18,484 | | | | — | |
Merrill Lynch, Pierce, Fenner & Smith | | | 8,260 | | | | 8,260 | | | | — | |
| | | | | | | | | | | | |
| | $ | 813,925 | | | $ | 812,696 | | | $ | (1,229 | ) |
| | | | | | | | | | | | |
| | | | | | | | | | | | | |
| | a | | Collateral received in excess of the market value of securities on loan is not presented in this table. The total cash collateral received by the Fund is disclosed in the Fund’s consolidated statement of assets and liabilities. |
| | b | | Additional collateral is delivered to the Fund on the next business day in accordance with the MSLA. The net amount would be subject to the borrower default indemnity in the event of default by a counterparty. |
| 2. | INVESTMENT ADVISORY AGREEMENT AND OTHER TRANSACTIONS WITH AFFILIATES |
Pursuant to an Investment Advisory Agreement with the Trust, BFA manages the investment of the Fund’s assets. BFA is a California corporation indirectly owned by BlackRock. Under the Investment Advisory Agreement, BFA is responsible for substantially all expenses of the Fund, except interest, taxes, brokerage commissions and other expenses connected with the execution of portfolio transactions, distribution fees, litigation expenses and any extraordinary expenses.
The Subsidiary has entered into a separate contract with BFA under which BFA provides investment advisory services to the Subsidiary but does not receive separate compensation from the Subsidiary for providing it with such services. The Subsidiary has also entered into separate arrangements that provide for the provision of other services to the Subsidiary (including administrative, custody, transfer agency and other services), and BFA pays the costs and expenses related to the provision of those services.
BFA has entered into a sub-advisory agreement with BlackRock International Limited (the “Sub-Adviser”), an affiliate of BFA, under which BFA pays the Sub-Adviser for services it provides to the Fund and the Subsidiary.
For its investment advisory services to the Fund, BFA is entitled to an annual investment advisory fee of 0.48% based on the average daily net assets of the Fund. In addition, the Fund indirectly pays its pro rata share of fees and expenses attributable to its investments in other investment companies (“acquired fund fees and expenses”). BFA has contractually agreed to waive a portion of its investment advisory fees for the Fund through February 28, 2019 in an amount equal to the acquired fund fees and expenses attributable to the Fund’s investments in other registered investment companies advised by BFA or its affiliates, if any.
| | |
| 22 | | 2016 iSHARES ANNUAL REPORTTO SHAREHOLDERS |
Notes to Consolidated Financial Statements (Continued)
iSHARES® COMMODITIES SELECT STRATEGY ETF
The U.S. Securities and Exchange Commission (the “SEC”) has issued an exemptive order which permits BlackRock Institutional Trust Company, N.A. (“BTC”), an affiliate of BFA, to serve as securities lending agent for the Fund, subject to applicable conditions. As securities lending agent, BTC bears all operational costs directly related to securities lending. The Fund is responsible for fees in connection with the investment of cash collateral received for securities on loan in a money market fund managed by BFA, however, BTC has agreed to reduce the amount of securities lending income it receives in order to effectively limit the collateral investment fees the Fund bears to an annual rate of 0.04% (the “collateral investment fees”). Securities lending income is equal to the total of income earned from the reinvestment of cash collateral, net of fees and other payments to and from borrowers of securities, and less the collateral investment fees. The Fund retains a portion of securities lending income and remits the remaining portion to BTC as compensation for its services as securities lending agent.
Pursuant to a securities lending agreement, the Fund retains 80% of securities lending income and the amount retained can never be less than 70% of the total of securities lending income plus the collateral investment fees. In addition, commencing the business day following the date that the aggregate securities lending income plus the collateral investment fees generated across all 1940 Act iShares exchange-traded funds (the “iShares ETF Complex”) in a given calendar year exceeds the aggregate securities lending income generated across the iShares ETF Complex in the calendar year 2013, the Fund, pursuant to a securities lending agreement, will retain for the remainder of that calendar year 85% of securities lending income and the amount retained can never be less than 70% of the total of securities lending income plus the collateral investment fees.
For the year ended October 31, 2016, the Fund paid to BTC securities lending agent services and collateral investment fees in the amount of $18,576.
BlackRock Investments, LLC, an affiliate of BFA, is the distributor for the Fund. Pursuant to the distribution agreement, BFA is responsible for any fees or expenses for distribution services provided to the Fund.
The Fund may invest its positive cash balances in certain money market funds managed by BFA or an affiliate. The income earned on these temporary cash investments is included in “Dividends – affiliated” in the consolidated statement of operations.
The PNC Financial Services Group, Inc. is the largest stockholder of BlackRock and is considered to be an affiliate of the Fund for 1940 Act purposes.
Certain trustees and officers of the Trust are also officers of BTC and/or BFA.
| 3. | INVESTMENT PORTFOLIO TRANSACTIONS |
Purchases and sales of investments (excluding in-kind transactions and short-term investments) for the year ended October 31, 2016, were $35,868,302 and $42,729,759, respectively.
In-kind purchases and sales (see Note 4) for the year ended October 31, 2016, were $33,782,920 and $14,401,362, respectively.
| 4. | CAPITAL SHARE TRANSACTIONS |
Capital shares are issued and redeemed by the Fund only in aggregations of a specified number of shares or multiples thereof (“Creation Units”) at NAV. Except when aggregated in Creation Units, shares of the Fund are not redeemable. Transactions in capital shares for the Fund are disclosed in detail in the consolidated statements of changes in net assets.
The consideration for the purchase of Creation Units of a fund in the Trust generally consists of the in-kind deposit of a designated portfolio of securities and a specified amount of cash. Certain funds in the Trust may be offered in Creation Units solely or partially for cash in U.S. dollars. Investors purchasing and redeeming Creation Units may pay a purchase transaction fee
| | | | |
NOTESTO CONSOLIDATED FINANCIAL STATEMENTS | | | 23 | |
Notes to Consolidated Financial Statements (Continued)
iSHARES® COMMODITIES SELECT STRATEGY ETF
and a redemption transaction fee directly to State Street Bank and Trust Company, the Trust’s administrator, to offset transfer and other transaction costs associated with the issuance and redemption of Creation Units, including Creation Units for cash. Investors transacting in Creation Units for cash may also pay an additional variable charge to compensate the relevant fund for certain transaction costs (i.e., stamp taxes, taxes on currency or other financial transactions, and brokerage costs) and market impact expenses relating to investing in portfolio securities. Such variable charges, if any, are included in “Proceeds from shares sold” in the consolidated statements of changes in net assets.
The Fund may purchase or sell futures contracts as part of its investment strategy. A futures contract is a standardized, exchange-traded agreement to buy or sell a financial instrument at a set price on a future date. Upon entering into a futures contract, the Fund is required to pledge to the executing broker which holds segregated from its own assets, an amount of cash, U.S. government securities or other high-quality debt and equity securities equal to the minimum initial margin requirements of the exchange on which the contract is traded. Pursuant to the contract, the Fund agrees to receive from or pay to the broker an amount of cash equal to the daily fluctuation in value of the contract. Such receipts or payments are known as margin variation and are recorded by the Fund as unrealized appreciation or depreciation. When the contract is closed, the Fund records a realized gain or loss equal to the difference between the value of the contract at the time it was opened and the value at the time it was closed. Losses may arise if the value of a futures contract decreases due to an unfavorable change in the market rates or values of the underlying instrument during the term of the contract or if the counterparty does not perform under the contract. The use of futures contracts also involves the risk of an imperfect correlation in the movements in the price of futures contracts and the assets underlying such contracts.
The following table shows the value of futures contracts held as of October 31, 2016 and the related locations in the consolidated statement of assets and liabilities, presented by risk exposure category:
| | | | |
| Assets | |
Commodity contracts: | | | | |
Variation margin/Net assets consist of – net unrealized depreciationa | | $ | 3,408,965 | |
| | | | |
| | | | | |
| | a | | Represents cumulative appreciation of futures contracts as reported in the consolidated schedule of investments. Only current day’s variation margin is reported separately within the consolidated statement of assets and liabilities. |
| | | | |
| Liabilities | |
Commodity contracts: | | | | |
Variation margin/Net assets consist of – net unrealized depreciationb | | $ | 7,687,893 | |
| | | | |
| | | | | |
| | b | | Represents cumulative depreciation of futures contracts as reported in the consolidated schedule of investments. Only current day’s variation margin is reported separately within the consolidated statement of assets and liabilities. |
The following table shows the realized and unrealized gains (losses) on futures contracts held during the year ended October 31, 2016 and the related locations in the consolidated statement of operations, presented by risk exposure category:
| | | | | | | | |
| | | Net Realized
Gain (Loss) | | | Net Change in
Unrealized
Appreciation/Depreciation | |
Commodity contracts: | | | | | | | | |
Futures contracts | | $ | (7,159,652 | ) | | $ | 1,373,103 | |
| | | | | | | | |
| | | | | | | | | |
| | |
| 24 | | 2016 iSHARES ANNUAL REPORTTO SHAREHOLDERS |
Notes to Consolidated Financial Statements (Continued)
iSHARES® COMMODITIES SELECT STRATEGY ETF
The following table shows the average quarter-end balances of open futures contracts for the year ended October 31, 2016:
| | | | |
Average value of contracts purchased | | $ | 185,937,450 | |
| | | | |
| | | | | |
In the normal course of business, the Fund’s investment activities expose it to various types of risk associated with the financial instruments and markets in which it invests. The significant types of financial risks the Fund is exposed to include market risk and credit risk. The Fund’s prospectus provides details of these and other types of risk.
MARKET RISK
Market risk arises mainly from uncertainty about future values of financial instruments influenced by price, currency and interest rate movements. It represents the potential loss a fund may suffer through holding market positions in the face of market movements. A fund is exposed to market risk by virtue of its investment in equity, fixed income and/or financial derivative instruments or indirectly by virtue of its investment in underlying funds. The fair value of securities held by a fund may decline due to general market conditions, economic trends or events that are not specifically related to the issuers of the securities including local, regional or global political, social or economic instability or to factors that affect a particular industry or group of industries. The extent of a fund’s exposure to market risk is the market value of the investments held as shown in the fund’s schedule of investments.
A diversified portfolio, where this is appropriate and consistent with a fund’s objectives, minimizes the risk that a price change of a particular investment will have a material impact on the NAV of a fund. The investment concentrations within the Fund’s portfolio are disclosed in its consolidated schedule of investments.
Investing in the securities of non-U.S. issuers involves certain considerations and risks not typically associated with securities of U.S. issuers. Such risks include, but are not limited to: generally less liquid and less efficient securities markets; generally greater price volatility; exchange rate fluctuations and exchange controls; imposition of restrictions on the expatriation of funds or other assets of the Fund; less publicly available information about issuers; the imposition of withholding or other taxes; higher transaction and custody costs; settlement delays and risk of loss attendant in settlement procedures; difficulties in enforcing contractual obligations; less regulation of securities markets; different accounting, disclosure and reporting requirements; more substantial governmental involvement in the economy; higher inflation rates; greater social, economic and political uncertainties; the risk of nationalization or expropriation of assets; and the risk of war. These risks are heightened for investments in issuers from countries with less developed markets.
The Fund concentrates its investments in securities and derivatives linked to commodities or commodities markets. Commodity prices may be influenced or characterized by unpredictable factors, including, where applicable, high volatility, changes in supply and demand relationships, weather, agriculture, trade, pestilence, political instability, changes in interest rates and monetary and other governmental policies. Securities of companies held by the Fund that are dependent on a single commodity, or are concentrated in a single commodity sector, may typically exhibit volatility attributable to commodity prices.
CREDIT RISK
Credit risk is the risk that an issuer or guarantor of debt instruments or the counterparty to a financial transaction, including derivatives contracts, repurchase agreements or loans of portfolio securities, is unable or unwilling to make timely interest and/or principal payments or to otherwise honor its obligations. BFA and its affiliates manage counterparty credit risk by entering into transactions only with counterparties that they believe have the financial resources to honor their obligations and by monitoring
| | | | |
NOTESTO CONSOLIDATED FINANCIAL STATEMENTS | | | 25 | |
Notes to Consolidated Financial Statements (Continued)
iSHARES® COMMODITIES SELECT STRATEGY ETF
the financial stability of those counterparties. Financial assets, which potentially expose a fund to issuer and counterparty credit risks, consist principally of financial instruments and receivables due from counterparties. The extent of a fund’s exposure to credit and counterparty risks with respect to those financial assets is approximated by their value recorded in its statement of assets and liabilities.
The Fund is treated as an entity separate from the Trust’s other funds for federal income tax purposes. It is the policy of the Fund to qualify as a regulated investment company by complying with the provisions applicable to regulated investment companies, as defined under Subchapter M of the Internal Revenue Code of 1986, as amended, and to annually distribute substantially all of its ordinary income and any net capital gains (taking into account any capital loss carryforwards) sufficient to relieve it from all, or substantially all, federal income and excise taxes. Accordingly, no provision for federal income taxes is required.
Net income and realized gains from investments held by the Subsidiary are treated as ordinary income for tax purposes and any net income or net gains will pass through to the Fund as such. Accordingly, the net investment income (loss) and realized gains (losses) reported in the Fund’s financial statements for such investments held by the Subsidiary may differ significantly from distributions. In addition, if a net loss is realized by the Subsidiary in any taxable year, the loss will not be available to offset the Fund’s ordinary income and/or capital gains for that year.
U.S. GAAP requires that certain components of net assets be adjusted to reflect permanent differences between financial and tax reporting. These reclassifications have no effect on net assets or NAV per share. The following permanent differences as of October 31, 2016, attributable to the characterization of corporate actions, passive foreign investment companies, foreign currency transactions, the character of income (losses) from a wholly-owned foreign subsidiary and realized gains (losses) from in-kind redemptions, were reclassified to the following accounts:
| | | | | | | | |
Paid-in
Capital | | Undistributed
Net Investment
Income/Distributions
in Excess of Net
Investment Income | | | Undistributed
Net Realized
Gain/Accumulated
Net Realized Loss | |
| $(7,601,716) | | $ | 677,680 | | | $ | 6,924,036 | |
The tax character of distributions paid during the years ended October 31, 2016 and October 31, 2015 were as follows:
| | | | | | | | |
| | | 2016 | | | 2015 | |
Ordinary income | | $ | 1,347,562 | | | $ | 3,140,724 | |
Return of capital | | | — | | | | 31,122 | |
| | | | | | | | |
| | $ | 1,347,562 | | | $ | 3,171,846 | |
| | | | | | | | |
| | | | | | | | | |
As of October 31, 2016, the tax components of accumulated net earnings (losses) were as follows:
| | | | | | | | | | | | | | |
Undistributed
Ordinary
Income | | | Capital
Loss
Carryforwards | | | Net
Unrealized
Gains (Losses) a | | | Total | |
| $ | 6,157 | | | $ | (16,864,975) | | | $ | (5,560,025) | | | $ | (22,418,843) | |
| | a | | The difference between book-basis and tax-basis unrealized gains (losses) was attributable primarily to the tax deferral of losses on wash sales, the characterization of corporate actions and the realization for tax purposes of unrealized gains on investments in passive foreign investment companies. |
| | |
| 26 | | 2016 iSHARES ANNUAL REPORTTO SHAREHOLDERS |
Notes to Consolidated Financial Statements (Continued)
iSHARES® COMMODITIES SELECT STRATEGY ETF
As of October 31, 2016, the Fund had non-expiring capital loss carryforwards in the amount of $16,864,975 available to offset future realized capital gains.
The Fund may own shares in certain foreign investment entities, referred to, under U.S. tax law, as “passive foreign investment companies.” The Fund may elect to mark-to-market annually the shares of each passive foreign investment company and would be required to distribute to shareholders any such marked-to-market gains.
Management has analyzed tax laws and regulations and their application to the Fund as of October 31, 2016, inclusive of the open tax return years, and does not believe there are any uncertain tax positions that require recognition of a tax liability in the Fund’s consolidated financial statements.
Management has evaluated the impact of all subsequent events on the Fund through the date the consolidated financial statements were available to be issued and has determined that there were no subsequent events requiring adjustment or disclosure in the consolidated financial statements.
| | | | |
NOTESTO CONSOLIDATED FINANCIAL STATEMENTS | | | 27 | |
Report of Independent Registered Public Accounting Firm
To the Shareholders and Board of Trustees of
iShares U.S. ETF Trust:
In our opinion, the accompanying consolidated statement of assets and liabilities, including the consolidated schedule of investments, and the related consolidated statements of operations and of changes in net assets and the consolidated financial highlights present fairly, in all material respects, the financial position of iShares Commodities Select Strategy ETF and its subsidiary (collectively, the “Fund”) at October 31, 2016, the results of their operations, the changes in their net assets and their financial highlights for each of the periods presented, in conformity with accounting principles generally accepted in the United States of America. These consolidated financial statements and consolidated financial highlights (hereafter referred to as “financial statements”) are the responsibility of the Fund’s management. Our responsibility is to express an opinion on these financial statements based on our audits. We conducted our audits of these financial statements in accordance with the standards of the Public Company Accounting Oversight Board (United States). Those standards require that we plan and perform the audit to obtain reasonable assurance about whether the financial statements are free of material misstatement. An audit includes examining, on a test basis, evidence supporting the amounts and disclosures in the financial statements, assessing the accounting principles used and significant estimates made by management, and evaluating the overall financial statement presentation. We believe that our audits, which included confirmation of securities at October 31, 2016 by correspondence with the custodian, transfer agent and brokers, provide a reasonable basis for our opinion.
PricewaterhouseCoopers LLP
San Francisco, California
December 21, 2016
| | |
| 28 | | 2016 iSHARES ANNUAL REPORTTO SHAREHOLDERS |
Tax Information (Unaudited)
iSHARES® COMMODITIES SELECT STRATEGY ETF
The Fund hereby designates the maximum amount of $1,347,562 as qualified dividend income for individuals for the fiscal year ended October 31, 2016.
For corporate shareholders, the percentage of income dividends paid by the by the Fund during the fiscal year ended October 31, 2016 that qualified for the dividends-received deduction was 51.27%.
The Fund hereby designates $205,007 as the amount of distributions from direct federal obligation interest for the fiscal year ended October 31, 2016. The law varies in each state as to whether and what percentage of ordinary income dividends attributable to federal obligations is exempt from state income tax. Shareholders are advised to check with their tax advisers to determine if any portion of the dividends received is exempt from state income tax.
Board Review and Approval of Investment Advisory
Contract
iSHARES® COMMODITIES SELECT STRATEGY ETF
Under Section 15(c) of the Investment Company Act of 1940 (the “1940 Act”), the Trust’s Board of Trustees (the “Board”), including a majority of Trustees who are not “interested persons” of the Trust (as that term is defined in the 1940 Act) (the “Independent Trustees”), is required annually to consider and approve the Investment Advisory Contract between the Trust and BFA (the “Advisory Contract”), and the Sub-Advisory Agreement between BFA and BlackRock International Limited (“BIL”) (the “Sub-Advisory Agreement”), on behalf of the Fund. The Advisory Contract and the Sub-Advisory Agreement are referred to hereafter as the “Advisory Agreements”. The Independent Trustees requested, and BFA provided, such information as the Independent Trustees, with advice from independent counsel, deemed reasonably necessary to evaluate the Advisory Agreements. A committee of all of the Independent Trustees (the “15(c) Committee”), with independent counsel, met with management on April 28, 2016 and May 9, 2016. At these meetings, the 15(c) Committee reviewed and discussed information provided in response to the 15(c) Committee’s initial requests, and requested certain additional information, which management agreed to provide. At a meeting held on May 17, 2016, management presented information to the Board relating to the continuance of the Advisory Agreements, including information requested by the 15(c) Committee during its meetings. The Board, including the Independent Trustees, reviewed and discussed such information at length. The Independent Trustees requested from management certain additional information, which management agreed to provide. At a meeting held on June 21-23, 2016, the Board, including the Independent Trustees, reviewed the additional information provided by management in response to these requests. After extensive discussions, the Board, including all of the Independent Trustees, approved the continuance of the Advisory Agreements for the Fund, based on a review of qualitative and quantitative information provided by BFA, including the additional information management provided at the request of the Independent Trustees. The Board noted its satisfaction with the extent and quality of information provided and its frequent interactions with management, as well as the detailed responses and other information provided by BFA. The Board also noted that the Board and BFA agreed to discuss potential enhancements and adjustments to the 15(c) process for the coming year. The Independent Trustees were advised by their independent counsel throughout the process, including about the legal standards applicable to their review. In approving the Advisory Agreements for the Fund, the Board, including the Independent Trustees, considered the following factors, no one of which was controlling, and reached the following conclusions:
Expenses and Performance of the Fund — The Board reviewed statistical information prepared by Broadridge Financial Solutions Inc. (“Broadridge”), an independent provider of investment company data, regarding the expense ratio components, including gross and net total expenses, waivers/reimbursements (if any), and underlying fund fees and expenses (if any) of the Fund in comparison with the same information for other exchange traded funds (including, where applicable, funds sponsored by an “at cost” service provider) and, in the limited instances where no comparable ETFs existed and the comparison group would not otherwise be reasonable in Broadridge’s judgment, pure index institutional mutual funds, objectively selected by Broadridge as comprising the Fund’s applicable peer group pursuant to Broadridge’s proprietary ETF methodology (the “Peer Group”). The Board was provided with a detailed description of Broadridge’s proprietary ETF methodology used by Broadridge to determine the Fund’s Peer Group. The Board further noted that due to the limitations in providing comparable funds in the Peer Group, the statistical information provided in Broadridge’s report may or may not provide meaningful direct comparisons to the Fund in all instances.
The Board also noted that the investment advisory fee rate and overall expenses (net of waivers and reimbursements) for the Fund were lower than the median of the investment advisory fee rates and overall expenses (net of waivers and reimbursements) of the funds in its Peer Group, excluding iShares funds. The Board also noted that BFA pays BIL for its sub-advisory services, and that there are no additional fees imposed on the Fund in respect of the services provided under the Sub-Advisory Agreement.
In addition, to the extent that any of the comparison funds included in the Peer Group, excluding iShares funds, track the same index as the Fund, Broadridge also provided, and the Board reviewed, a comparison of the Fund’s performance for the one-, three-, five-, ten-year, and since inception periods, as applicable, and for the “last quarter” period ended December 31, 2015, to that of such relevant comparison funds for the same periods.
| | |
| 30 | | 2016 iSHARES ANNUAL REPORTTO SHAREHOLDERS |
Board Review and Approval of Investment Advisory
Contract (Continued)
iSHARES® COMMODITIES SELECT STRATEGY ETF
The Board noted that the Fund is an actively managed ETF that does not seek to track the performance of a specified index and that the management team for the Fund manages the Fund’s portfolio in accordance with its investment objective. The Board further noted that during the prior year, the Board received periodic reports on the Fund’s short- and longer-term performance in comparison with its peer group and benchmark index. Such periodic comparative performance information, including additional detailed information on certain specific iShares funds requested by the Board, was also considered. The Board noted that the Fund generally performed in line with expectations relative to the Fund’s peer group and benchmark index over the relevant periods.
Based on this review, the other factors considered at the meeting, and their general knowledge of ETF pricing, the Board concluded that the investment advisory fee rate and expense level and the historical performance of the Fund supported the Board’s approval of the continuance of the Advisory Agreements for the coming year.
Nature, Extent and Quality of Services Provided by BFA and BIL or their Affiliates — Based on management’s representations, including information about recent and proposed enhancements to the iShares business, including with respect to capital markets support and analysis, product design and other services, the Board expected that there would be no diminution in the scope of services required of or provided by BFA (and any services provided by BIL on BFA’s behalf or at BFA’s direction) under the Advisory Agreements for the coming year as compared to the scope of services provided by BFA and BIL during prior years. In reviewing the scope of these services, the Board considered the investment philosophy and experience of BFA and BIL, noting that BFA and its affiliates have committed significant resources over time, including during the past year, to supporting the iShares funds and their shareholders. The Board also considered the compliance program of BFA and BIL and their compliance record with respect to the Fund. In that regard, the Board noted that BFA reports to the Board about portfolio management and compliance matters on a periodic basis in connection with regularly scheduled meetings of the Board, and on other occasions as necessary and appropriate, and has provided information and made appropriate officers available as needed to provide further assistance with these matters. The Board also reviewed the background and experience of the persons responsible for the day-to-day management of the Fund, as well as the resources available to them in managing the Fund. In addition to the above considerations, the Board reviewed and considered detailed presentations regarding BFA’s investment performance, investment and risk management processes and strategies provided at the June 21-23, 2016 meeting and throughout the previous year, and matters related to BFA’s and BIL’s portfolio compliance policies and procedures, and BFA’s oversight of the services provided by BIL. The Board noted that the Fund had met its investment objective consistently since its inception date.
Based on review of this information, and the performance information discussed above, the Board concluded that the nature, extent and quality of services provided by BFA and BIL to the Fund under the Advisory Agreements supported the Board’s approval of the continuance of the Advisory Agreements for the coming year.
Costs of Services Provided to the Fund and Profits Realized by BFA and its Affiliates — The Board reviewed information about the profitability to BlackRock of the Fund, based on the fees payable to BFA and its affiliates (including fees under the Advisory Contract), and all other sources of revenue and expense to BFA and its affiliates from the Fund’s operations for the last calendar year. The Board reviewed BlackRock’s profitability methodology for the iShares funds, noting that the 15(c) Committee had focused on the methodology and profitability presentation during its meetings. The Board discussed the sources of direct and ancillary revenue with management, including the revenues to BTC from securities lending by the Fund. The Board also discussed BFA’s profit margin as reflected in the Fund’s profitability analysis and reviewed information regarding potential economies of scale (as discussed below). Based on this review, the Board concluded that the profits realized by BFA and its affiliates under the Advisory Agreements and from other relationships between the Fund and BFA and/or its affiliates, if any, were within a reasonable range in light of the factors considered.
| | | | |
BOARD REVIEWAND APPROVALOF INVESTMENT ADVISORY CONTRACT | | | 31 | |
Board Review and Approval of Investment Advisory
Contract (Continued)
iSHARES® COMMODITIES SELECT STRATEGY ETF
Economies of Scale — The Board reviewed information regarding potential economies of scale or other efficiencies that may result from increases in the Fund’s assets, noting that the issue of economies of scale had been focused on extensively by the 15(c) Committee during its meetings and addressed by management. The Board and the 15(c) Committee reviewed information provided by BFA regarding scale benefits shared with the iShares funds through relatively low fee rates established at inception, breakpoints, waivers, or other fee reductions, as well as through additional investment in the iShares business and the provision of improved or additional infrastructure and services to the iShares funds and their shareholders. The Board and the 15(c) Committee received information regarding BlackRock’s historical profitability, including BFA’s and its affiliates’ costs in providing services. The cost information distinguished, among other things, between fixed and variable costs, and explained how the level of fixed and variable costs, as well as the nature of such costs, may impact the existence or size of scale benefits. The Board noted that the Advisory Contract for the Fund did not provide for any breakpoints in the Fund’s investment advisory fee rate as the assets of the Fund increase. However, the Board noted that should material economies of scale exist in the future that are not otherwise shared, a breakpoint structure for the Fund may be appropriate, and that it would continue to monitor the sharing of economies of scale to determine the appropriateness of adding breakpoints in the future.
Based on this review, as well as the other factors considered at the meeting, the Board, recognizing its responsibility to consider this issue periodically, determined to approve the continuance of the Advisory Agreements for the coming year.
Fees and Services Provided for Other Comparable Funds/Accounts Managed by BFA and its Affiliates — The Board received and considered information regarding the investment advisory/management fee rates for other funds/accounts in the U.S. for which BFA (or its affiliates) provides investment advisory/management services, including open-end funds registered under the 1940 Act (including sub-advised funds), collective trust funds, and institutional separate accounts (together, the “Other Accounts”), and acknowledged BFA’s assertion that the iShares funds are fundamentally different investment vehicles from the Other Accounts. The Board noted that BFA and its affiliates do not manage Other Accounts with a similar investment strategy or investment mandate as the Fund. The Board further noted that BFA provided the Board with detailed information regarding how the Other Accounts (particularly institutional clients) generally differ from the Fund, including in terms of the different and generally more extensive services provided to the Fund, as well as other significant differences. In that regard, the Board considered that the pricing of services to institutional clients is typically based on a number of factors beyond the nature and extent of the specific services to be provided and often depends on the overall relationship between the client and its affiliates and the adviser and its affiliates. In addition, the Board considered the relative complexity and inherent risks and challenges of managing and providing other services to the Fund, as a publicly traded exchange traded fund, as compared to the Other Accounts that are institutional clients in light of differing regulatory requirements and client-imposed mandates. The Board also considered the “all-inclusive” nature of the Fund’s advisory fee structure, and the Fund expenses borne by BFA under this arrangement. The Board noted that the investment advisory fee rate under the Advisory Contract for the Fund was generally higher than the investment advisory/management fee rates for certain of the Other Accounts (particularly institutional clients) and concluded that the differences appeared to be consistent with the factors discussed.
Other Benefits to BFA and/or its Affiliates — The Board reviewed the “fallout” benefits or ancillary revenue received by BFA and/or its affiliates in connection with the services provided to the Fund by BFA, such as payment of revenue to BTC, the Fund’s securities lending agent, for loaning portfolio securities (which was included in the profit margins reviewed by the Board pursuant to BFA’s profitability methodology), and payment of advisory fees and/or administration fees to BFA and BTC (or their affiliates) in connection with any investments by the Fund in other funds for which BFA (or its affiliates) provides investment advisory services and/or administration services. The Board noted that BFA and BIL generally do not use soft dollars or consider the value of research or other services that may be provided to BFA and BIL (including their affiliates) in selecting brokers for portfolio transactions for the Fund. The Board further noted that any portfolio transactions on behalf of the Fund placed through a BFA affiliate or purchased from an underwriting syndicate in which a BFA affiliate participates, are reported to the Board pursuant to Rule 17e-1 or Rule 10f-3, as applicable, under the 1940 Act. The Board concluded that any such ancillary benefits would not be
| | |
| 32 | | 2016 iSHARES ANNUAL REPORTTO SHAREHOLDERS |
Board Review and Approval of Investment Advisory
Contract (Continued)
iSHARES® COMMODITIES SELECT STRATEGY ETF
disadvantageous to the Fund’s shareholders and thus would not alter the Board’s conclusion with respect to the appropriateness of approving the continuance of the Advisory Agreements for the coming year.
Based on the considerations described above, the Board determined that the Fund’s investment advisory fee rate under the Advisory Contract does not constitute a fee that is so disproportionately large as to bear no reasonable relationship to the services rendered and that could not have been the product of arm’s-length bargaining, and concluded that it is in the best interest of the Fund and its shareholders to approve the continuance of the Advisory Agreements for the coming year.
| | | | |
BOARD REVIEWAND APPROVALOF INVESTMENT ADVISORY CONTRACT | | | 33 | |
Supplemental Information (Unaudited)
iSHARES® COMMODITIES SELECT STRATEGY ETF
Section 19(a) Notices
The amounts and sources of distributions reported are estimates and are provided pursuant to regulatory requirements and are not being provided for tax reporting purposes. The actual amounts and sources for tax reporting purposes will depend upon the Fund’s investment experience during the year and may be subject to changes based on the tax regulations. Shareholders will receive a Form 1099-DIV each calendar year that will inform them how to report these distributions for federal income tax purposes.
| | | | | | | | | | | | | | | | | | | | | | | | | | | | | | |
Total Cumulative Distributions
for the Fiscal Year | | | % Breakdown of the Total Cumulative
Distributions for the Fiscal Year | |
Net
Investment
Income | | | Net
Realized
Capital
Gains | | | Return
of
Capital | | | Total
Per
Share | | | Net
Investment
Income | | | Net
Realized
Capital
Gains | | | Return
of
Capital | | | Total
Per
Share | |
| $ | 0.145454 | | | $ | — | | | $ | — | | | $ | 0.145454 | | | | 100 | % | | | — | % | | | — | % | | | 100 | % |
Premium/Discount Information
The Premium/Discount Information section is intended to present information about the differences between the daily market price on secondary markets for shares of a fund and that fund’s NAV. NAV is the price at which a fund issues and redeems shares. It is calculated in accordance with the standard formula for valuing mutual fund shares. The “Market Price” of a fund generally is determined using the midpoint between the highest bid and the lowest offer on the primary stock exchange on which the shares of such fund are listed for trading, as of the time that the fund’s NAV is calculated. A fund’s Market Price may be at, above or below its NAV. The NAV of a fund will fluctuate with changes in the fair value of its portfolio holdings. The Market Price of a fund will fluctuate in accordance with changes in its NAV, as well as market supply and demand.
Premiums or discounts are the differences (expressed as a percentage) between the NAV and Market Price of a fund on a given day, generally at the time the NAV is calculated. A premium is the amount that a fund is trading above the reported NAV, expressed as a percentage of the NAV. A discount is the amount that a fund is trading below the reported NAV, expressed as a percentage of the NAV.
The following information shows the frequency of distributions of premiums and discounts for the Fund. The information shown for the Fund is for five calendar years (or from the inception date of the Fund if less than five years) through the date of the most recent calendar quarter-end. The specific periods covered for the Fund are disclosed in the table for the Fund.
| | |
| 34 | | 2016 iSHARES ANNUAL REPORTTO SHAREHOLDERS |
Supplemental Information (Unaudited) (Continued)
iSHARES® COMMODITIES SELECT STRATEGY ETF
Each line in the table shows the number of trading days in which the Fund traded within the premium/discount range indicated. The number of trading days in each premium/discount range is also shown as a percentage of the total number of trading days in the period covered by each table. All data presented here represents past performance, which cannot be used to predict future results.
Period Covered: October 15, 2014 through September 30, 2016
| | | | | | | | |
Premium/Discount Range | | Number
of Days | | | Percentage of
Total Days | |
Greater than 1.5% | | | 1 | | | | 0.20 | % |
Greater than 1.0% and Less than 1.5% | | | 1 | | | | 0.20 | |
Greater than 0.5% and Less than 1.0% | | | 5 | | | | 1.01 | |
Between 0.5% and –0.5% | | | 461 | | | | 93.14 | |
Less than –0.5% and Greater than –1.0% | | | 26 | | | | 5.25 | |
Less than –1.0% and Greater than –1.5% | | | 1 | | | | 0.20 | |
| | | | | | | | |
| | | 495 | | | | 100.00 | % |
| | | | | | | | |
| | | | |
SUPPLEMENTAL INFORMATION | | | 35 | |
Trustee and Officer Information
iSHARES® U.S. ETF TRUST
The Board of Trustees has responsibility for the overall management and operations of the Funds, including general supervision of the duties performed by BFA and other service providers. Each Trustee serves until he or she resigns, is removed, dies, retires or becomes incapacitated. The President, Chief Compliance Officer, Treasurer and Secretary shall each hold office until their successors are chosen and qualify, and all other officers shall hold office until he or she resigns or is removed. Trustees who are not “interested persons” (as defined in the 1940 Act) of the Trust are referred to as independent trustees (“Independent Trustees”).
The registered investment companies advised by BFA or its affiliates (the “BlackRock-advised Funds”) are organized into one complex of closed-end funds, two complexes of open-end funds and one complex of exchange-traded funds (“Exchange-Traded Fund Complex”) (each, a “BlackRock Fund Complex”). Each Fund is included in the BlackRock Fund Complex referred to as the Exchange-Traded Fund Complex. Each Trustee also serves as a Director of iShares, Inc. and a Trustee of iShares Trust, and, as a result, oversees a total of 333 funds (as of October 31, 2016) within the Exchange-Traded Fund Complex. Mr. Lawton also serves as an Advisory Board Member for iShares, Inc. and iShares Trust with respect to 333 funds (as of October 31, 2016) within the Exchange-Traded Fund Complex. With the exception of Robert S. Kapito, Mark Wiedman and Benjamin Archibald, the address of each Trustee, Advisory Board Member and officer is c/o BlackRock, Inc., 400 Howard Street, San Francisco, CA 94105. The address of Mr. Kapito, Mr. Wiedman, and Mr. Archibald is c/o BlackRock, Inc., Park Avenue Plaza, 55 East 52nd Street, New York, NY 10055. The Board has designated Cecilia H. Herbert as its Independent Board Chair. Additional information about the Funds’ Trustees and officers may be found in the Funds’ combined Statement of Additional Information, which is available without charge, upon request, by calling toll-free 1-800-iShares (1-800-474-2737).
Interested Trustees
| | | | | | |
| | | | |
| Name (Age) | | Position(s) | | Principal Occupation(s) During the Past 5 Years | | Other Directorships Held by Trustee During the Past 5 Years |
Robert S. Kapitoa (59) | | Trustee
(since 2011). | | President and Director, BlackRock, Inc. (since 2006); Vice Chairman of BlackRock, Inc. and Head of BlackRock, Inc.’s Portfolio Management Group (since its formation in 1998) and BlackRock, Inc.’s predecessor entities (since 1988); Trustee, University of Pennsylvania (since 2009); President of Board of Directors, Hope & Heroes Children’s Cancer Fund (since 2002); President of the Board of Directors, Periwinkle Theatre for Youth (since 1983). | | Director of iShares, Inc. (since 2009); Trustee of iShares Trust (since 2009). |
| | | |
Mark Wiedmanb (45) | | Trustee
(since 2013) | | Managing Director, BlackRock, Inc. (since 2007); Global Head of iShares (since 2011); Head of Corporate Strategy, BlackRock, Inc. (2009-2011). | | Director of iShares, Inc. (since 2013); Trustee of iShares Trust (since 2013); Director of PennyMac Financial Services, Inc. (since 2008). |
| a | Robert S. Kapito is deemed to be an “interested person” (as defined in the 1940 Act) of the Trust due to his affiliations with BlackRock, Inc. |
| b | Mark Wiedman is deemed to be an “interested person” (as defined in the 1940 Act) of the Trust due to his affiliations with BlackRock, Inc. and its affiliates. |
| | |
| 36 | | 2016 iSHARES ANNUAL REPORTTO SHAREHOLDERS |
Trustee and Officer Information (Continued)
iSHARES® U.S. ETF TRUST
Independent Trusteesc
| | | | | | |
| | | | |
| Name (Age) | | Position(s) | | Principal Occupation(s) During the Past 5 Years | | Other Directorships Held by Trustee During the Past 5 Years |
Cecilia H. Herbert (67) | | Trustee
(since 2011); Independent Board Chair (since 2016); Nominating and Governance Committee Chair (since 2016). | | Director (1998-2013) and President (2007-2011) of the Board of Directors, Catholic Charities CYO; Trustee (2002-2011) and Chair of the Finance and Investment Committee (2006-2010) of the Thacher School; Member (since 1992) and Chair (1994-2005) of the Investment Committee, Archdiocese of San Francisco; Trustee and Member of the Investment Committee, WNET, the New York public media company (since 2011). | | Director of iShares, Inc. (since 2005); Trustee of iShares Trust (since 2005); Independent Board Chair of iShares Inc. and iShares Trust (since 2016); Director of Forward Funds (23 portfolios) (since 2009); Trustee of Salient MF Trust (4 portfolios) (since 2015). |
| | | |
Jane D. Carlin (60) | | Trustee
(since 2015); Risk Committee Chair (since 2016). | | Managing Director and Global Head of Financial Holding Company Governance & Assurance and the Global Head of Operational Risk Management of Morgan Stanley (2006-2012). | | Director of iShares, Inc. (since 2015); Trustee of iShares Trust (since 2015); Director of PHH Corporation (mortgage solutions) (since 2012). |
| | | |
Charles A. Hurty (73) | | Trustee
(since 2011); Audit Committee Chair (since 2011). | | Retired; Partner, KPMG LLP (1968-2001). | | Director of iShares, Inc. (since 2005); Trustee of iShares Trust (since 2005); Director of GMAM Absolute Return Strategy Fund (1 portfolio) (since 2002); Director of SkyBridge Alternative Investments Multi-Adviser Hedge Fund Portfolios LLC (2 portfolios) (since 2002). |
| | | |
John E. Kerrigan (61) | | Trustee
(since 2011); Securities Lending Committee Chair (since 2016). | | Chief Investment Officer, Santa Clara University (since 2002). | | Director of iShares, Inc. (since 2005); Trustee of iShares Trust (since 2005). |
| | | |
John E. Martinez (55) | | Trustee
(since 2011); Fixed Income Plus Committee Chair (since 2016). | | Director of FirstREX Agreement Corp. (formerly EquityRock, Inc.) (since 2005). | | Director of iShares, Inc. (since 2003); Trustee of iShares Trust (since 2003). |
| | | | |
TRUSTEEAND OFFICER INFORMATION | | | 37 | |
Trustee and Officer Information (Continued)
iSHARES® U.S. ETF TRUST
Independent Trusteesc (Continued)
| | | | | | |
| | | | |
| Name (Age) | | Position(s) | | Principal Occupation(s) During the Past 5 Years | | Other Directorships Held by Trustee During the Past 5 Years |
Madhav V. Rajan (52) | | Trustee
(since 2011); Equity Plus Committee Chair and 15(c) Committee Chair (since 2016). | | Robert K. Jaedicke Professor of Accounting and Senior Associate Dean for Academic Affairs and Head of MBA Program, Stanford University Graduate School of Business (since 2001); Professor of Law (by courtesy), Stanford Law School (since 2005); Visiting Professor, University of Chicago (2007-2008). | | Director of iShares, Inc. (since 2011); Trustee of iShares Trust (since 2011); Director, Cavium, Inc. (since 2013). |
| c | Robert H. Silver served as an Independent Trustee until March 31, 2016. |
| | |
| 38 | | 2016 iSHARES ANNUAL REPORTTO SHAREHOLDERS |
Trustee and Officer Information (Continued)
iSHARES® U.S. ETF TRUST
Officersd
| | | | |
| | | |
| Name (Age) | | Position(s) | | Principal Occupation(s) During the Past 5 Years |
Martin Small (41) | | President
(since 2016). | | Managing Director, BlackRock, Inc. (since 2010); Head of U.S. iShares (since 2015); Co-Head of the U.S. Financial Markets Advisory Group, BlackRock, Inc. (2008-2014). |
| | |
Jack Gee (57) | | Treasurer and Chief Financial Officer (since 2011). | | Managing Director, BlackRock, Inc. (since 2009); Senior Director of Fund Administration of Intermediary Investor Business, BGI (2009). |
| | |
Benjamin Archibald (41) | | Secretary
(since 2015). | | Managing Director, BlackRock, Inc. (since 2014); Director, BlackRock, Inc. (2010-2013); Secretary of the BlackRock-advised Mutual Funds (since 2012). |
| | |
Steve Messinger (54) | | Executive Vice President
(since 2016). | | Managing Director, BlackRock, Inc. (2007-2014 and since 2016); Managing Director, Beacon Consulting Group (2014-2016). |
| | |
Charles Park (49) | | Chief Compliance Officer
(since 2011). | | Chief Compliance Officer of BlackRock Advisors, LLC and the BlackRock-advised Funds in the Equity-Bond Complex, the Equity-Liquidity Complex and the Closed-End Complex (since 2014); Chief Compliance Officer, BFA (since 2006). |
| | |
Scott Radell (47) | | Executive Vice President (since 2012). | | Managing Director, BlackRock, Inc. (since 2009); Head of Portfolio Solutions, BlackRock, Inc. (since 2009); Head of Portfolio Solutions, BGI (2007-2009); Credit Portfolio Manager, BGI (2005-2007); Credit Research Analyst, BGI (2003-2005). |
| | |
Amy Schioldager (54) | | Executive Vice President (since 2011). | | Senior Managing Director, BlackRock, Inc. (since 2009); Global Head of Index Equity, BGI (2008-2009); Global Head of U.S. Indexing, BGI (2006-2008); Head of Domestic Equity Portfolio Management, BGI (2001-2006). |
| d | Manish Mehta served as President until October 15, 2016. |
| | | | |
TRUSTEEAND OFFICER INFORMATION | | | 39 | |
Trustee and Officer Information (Continued)
iSHARES® U.S. ETF TRUST
Advisory Board Member
| | | | | | |
| | | | |
| Name (Age) | | Position(s) | | Principal Occupation(s)
During the Past 5 Years | | Other Directorships
Held by Advisory Board Member
During the Past 5 Years |
| | | |
Drew E. Lawton (57) | | Advisory Board Member
(since 2016). | | Senior Managing Director of New York Life Insurance Company (2010-2015). | | Advisory Board Member of iShares, Inc. (since 2016); Advisory Board Member of iShares Trust (since 2016); Director of Principal Funds, Inc., Principal Variable Contracts Funds, Inc. and Principal Exchange-Traded Funds (124 portfolios) (March 2016-October 2016). |
| | |
| 40 | | 2016 iSHARES ANNUAL REPORTTO SHAREHOLDERS |
Notes:
Notes:
| | |
| 42 | | 2016 iSHARES ANNUAL REPORTTO SHAREHOLDERS |
For more information visit www.iShares.com or call 1-800-iShares (1-800-474-2737)
This report is intended for the Fund’s shareholders. It may not be distributed to prospective investors unless it is preceded or accompanied by the current prospectus.
Investing involves risk, including possible loss of principal.
The iShares Funds are distributed by BlackRock Investments, LLC (together with its affiliates, “BlackRock”).
A description of the policies that the Fund uses to determine how to vote proxies relating to portfolio securities and information about how the Fund voted proxies relating to portfolio securities during the most recent twelve-month period ending June 30 is available without charge, upon request, by calling toll-free 1-800-474-2737; on the Fund’s website at www.iShares.com; and on the U.S. Securities and Exchange Commission (SEC) website at www.sec.gov.
The Fund files its complete schedule of portfolio holdings with the SEC for the first and third quarters of each fiscal year on Form N-Q. The Fund’s Forms N-Q are available on the SEC’s website or may be reviewed and copied at the SEC’s Public Reference Room in Washington, D.C. Information on the operation of the Public Reference Room may be obtained by calling 1-800-SEC-0330. The Fund also discloses its complete schedule of portfolio holdings on a daily basis on the Fund’s website.
©2016 BlackRock, Inc. All rights reserved. iSHARES and BLACKROCK are registered trademarks of BlackRock, Inc. or its subsidiaries. All other marks are the property of their respective owners.
iS-AR-1011-1016
OCTOBER 31, 2016
| | | | |
2016 ANNUAL REPORT | | | |  |
iShares U.S. ETF Trust
| Ø | | iShares Edge U.S. Fixed Income Balanced Risk ETF | FIBR | BATS |
Table of Contents
Management’s Discussion of Fund Performance
iSHARES® EDGE U.S. FIXED INCOME BALANCED RISK ETF
U.S. BOND MARKET OVERVIEW
The U.S. bond market posted positive returns for the 12-month period ended October 31, 2016 (the “reporting period”). The Bloomberg Barclays U.S. Aggregate Bond Index, a broad measure of U.S. bond performance, returned 4.37% for the reporting period.
The bond market’s advance reflected continued uncertainty regarding the economic environment. Overall, the U.S. economy grew by 1.5% for the 12 months ended September 30, 2016 (the most recent data available), decelerating from 2.2% for the 12 months ended September 30, 2015. Although employment growth remained robust, other segments of the economy struggled. For example, industrial production contracted during the reporting period, while consumer spending increased by just 2.2%. As a result, the economy generated three consecutive quarters of anemic growth before rebounding in the final quarter of the reporting period.
Inflation generally remained muted as the consumer price index (“CPI”) rose by 1.6% for the reporting period. Although low by historical standards, the increase in the CPI was notably higher than the 0.2% increase for the 12 months ended October 31, 2015, reflecting a recovery in energy prices after they bottomed in February 2016.
In this environment, the U.S. Federal Reserve Bank (the “Fed”) ended a seven-year period of near-zero interest rates by raising its short-term interest rate target in December 2015. The Fed’s first interest rate hike since June 2006 increased the federal funds target rate from a range of 0%-0.25% to a range of 0.25%-0.50%. Despite expectations of more Fed rate increases in 2016, the slowing economic environment and lack of inflationary pressure led the Fed to hold rates steady for the remainder of the reporting period.
The combination of decelerating economic growth and low inflation pushed most U.S. bond yields lower and bond prices higher for the reporting period. Longer-term bonds fared best as long-term yields declined the most, while short-term bond yields rose slightly, reflecting the Fed rate hike in late 2015.
Sector performance was driven by strong investor demand for yield in a low interest rate environment. Consequently, corporate bonds — which offer the highest yields in the U.S. bond market — delivered the best returns for the reporting period. Lower-quality corporate bonds outperformed as the search for yield led investors to seek out riskier segments of the corporate bond market. In particular, high-yield corporate bonds (those with credit ratings below investment grade) returned more than 10% for the reporting period. Within the corporate sector, bonds issued by utility companies produced the highest returns. Industrial bonds also fared well, led by the strong performance of energy and commodity-related securities, while financial bonds lagged.
U.S. Treasury inflation-protected securities (“TIPS”) were also among the leading performers for the reporting period. The rebound in energy prices led to increased investor demand for inflation protection, which aided performance in the TIPS market.
Mortgage-backed securities posted positive returns for the reporting period but trailed the performance of the overall U.S. bond market. Mortgage-backed securities were held in check by prepayment fears as declining interest rates led to concerns about a renewed wave of mortgage refinancing.
U.S. Treasury and government agency bonds posted the lowest returns among U.S. bonds for the reporting period. Limited demand for the relatively low yields of Treasury and agency bonds weighed on their performance, as did the general underperformance of higher-quality securities.
| | | | |
MANAGEMENT’S DISCUSSIONOF FUND PERFORMANCE | | | 5 | |
Management’s Discussion of Fund Performance
iSHARES® EDGE U.S. FIXED INCOME BALANCED RISK ETF
Performance as of October 31, 2016
| | | | | | | | | | | | | | | | | | | | |
| | | Average Annual Total Returns | | | | | | Cumulative Total Returns | |
| | | 1 Year | | | Since Inception | | | | | | 1 Year | | | Since Inception | |
Fund NAV | | | 5.32% | | | | 3.41% | | | | | | | | 5.32% | | | | 5.81% | |
Fund Market | | | 5.36% | | | | 3.51% | | | | | | | | 5.36% | | | | 5.99% | |
Bloomberg Barclays U.S. Aggregate Bond Index | | | 4.37% | | | | 2.56% | | | | | | | | 4.37% | | | | 4.35% | |
GROWTH OF $10,000 INVESTMENT
(SINCE INCEPTION AT NET ASSET VALUE)
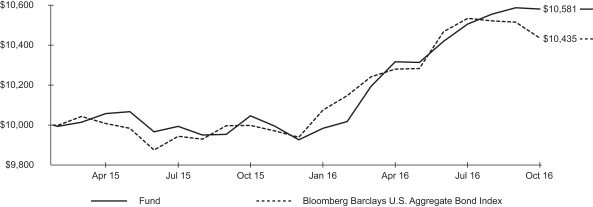
The inception date of the Fund was 2/24/15. The first day of secondary market trading was 2/26/15.
The Bloomberg Barclays U.S. Aggregate Bond Index (formerly the Barclays U.S. Aggregate Bond Index) is a widely recognized unmanaged market-weighted index, comprised of investment-grade corporate bonds rated BBB or better, mortgages and U.S. Treasury and U.S. Government agency issues with at least one year to maturity.
Past performance is no guarantee of future results. Performance results do not reflect the deduction of taxes that a shareholder would pay on fund distributions or on the redemption or sale of fund shares. See “About Fund Performance” on page 8 for more information.
| | | | | | | | | | | | | | | | | | | | | | | | | | |
| Shareholder Expenses | |
| Actual | | | Hypothetical 5% Return | | | | |
Beginning
Account Value
(5/1/16) | | | Ending Account Value (10/31/16) | | | Expenses Paid During Period a | | | Beginning Account Value (5/1/16) | | | Ending Account Value (10/31/16) | | | Expenses Paid During Period a | | | Annualized Expense Ratio | |
| $ | 1,000.00 | | | $ | 1,025.60 | | | $ | 1.22 | | | $ | 1,000.00 | | | $ | 1,023.90 | | | $ | 1.22 | | | | 0.24% | |
| a | Expenses are calculated using the Fund’s annualized expense ratio (as disclosed in the table), multiplied by the average account value for the period, multiplied by the number of days in the period (184 days) and divided by the number of days in the year (366 days). See “Shareholder Expenses” on page 8 for more information. | |
| | |
| 6 | | 2016 iSHARES ANNUAL REPORTTO SHAREHOLDERS |
Management’s Discussion of Fund Performance (Continued)
iSHARES® EDGE U.S. FIXED INCOME BALANCED RISK ETF
The iShares Edge U.S. Fixed Income Balanced Risk ETF (the “Fund”) (formerly the iShares U.S. Fixed Income Balanced Risk ETF) seeks total return and preservation of capital by investing, under normal circumstances, at least 80% of its net assets in U.S. dollar denominated investment-grade and high-yield fixed-income securities that in the aggregate has approximately equal exposure to credit spread risk and interest rate risk. The Fund is an actively managed exchange-traded fund that does not seek to replicate the performance of a specified index. For the 12-month reporting period ended October 31, 2016, the total return for the Fund was 5.32%, net of fees.
The Fund posted a positive return for the reporting period and outpaced the broad U.S. fixed-income market due to a larger allocation to investment-grade and high-yield corporate securities relative to the Bloomberg Barclays U.S. Aggregate Bond Index. The interest rate hedge component detracted from performance as interest rates declined overall during the reporting period. Similarly, the Fund had a shorter duration (less price sensitivity to interest rate changes) relative to the broader U.S. bond market, which detracted from performance compared with the Bloomberg Barclays U.S. Aggregate Bond Index.
Within the corporate bond allocation, the Fund benefited significantly from an overweight position in financial and industrial securities relative to the Bloomberg Barclays U.S. Aggregate Bond Index. These bonds performed well due to sustained investor demand for higher-yielding securities in an environment of record low interest rates available on U.S. Treasury securities.
An overweight position in government agency mortgage-backed securities (“MBS”) detracted slightly from Fund performance as this segment of the bond market underperformed the Bloomberg Barclays U.S. Aggregate Bond Index. In addition, the Fund’s lower interest rate sensitivity detracted from relative performance.
During the reporting period, risk decreased for MBS and increased for both high-yield and intermediate-term investment-grade corporate securities. Because the managers allocate equal risk among each credit sector, the Fund’s allocation to high-yield and intermediate-term investment-grade corporate bonds declined, while the allocation to MBS increased for the reporting period.
ALLOCATION BY SECTOR As of 10/31/16
| | | | |
| Sector/Investment Type | | Percentage of Total Investments1 | |
Mortgage-Backed Securities | | | 36.49 | % |
Financial | | | 23.26 | |
Consumer Non-Cyclical | | | 11.87 | |
Communications | | | 7.94 | |
Consumer Cyclical | | | 4.87 | |
Energy | | | 4.83 | |
Industrial | | | 3.34 | |
Utilities | | | 2.98 | |
Technology | | | 2.92 | |
Basic Materials | | | 1.38 | |
Diversified | | | 0.12 | |
| | | | |
TOTAL | | | 100.00 | % |
| | | | |
ALLOCATION BY CREDIT QUALITY As of 10/31/16
| | | | |
| Moody’s Credit Rating2 | | Percentage of Total Investments1 | |
Aaa | | | 36.98 | % |
Aa | | | 4.23 | |
A | | | 17.21 | |
Baa | | | 26.14 | |
Ba | | | 9.41 | |
B | | | 4.38 | |
Caa | | | 1.26 | |
Not Rated | | | 0.39 | |
| | | | |
TOTAL | | | 100.00 | % |
| | | | |
| 1 | Excludes money market funds. |
| 2 | Credit quality ratings shown reflect the ratings assigned by Moody’s Investors Service (“Moody’s”), a widely used independent, nationally recognized statistical rating organization. Moody’s credit ratings are opinions of the credit quality of individual obligations or of an issuer’s general creditworthiness. Investment grade ratings are credit ratings of Baa or higher. Below investment grade ratings are credit ratings of Ba or lower. Unrated investments do not necessarily indicate low credit quality. Credit quality ratings are subject to change. |
| | | | |
MANAGEMENT’S DISCUSSIONOF FUND PERFORMANCE | | | 7 | |
About Fund Performance
Past performance is no guarantee of future results. Current performance may be lower or higher than the performance data quoted. Performance data current to the most recent month-end is available at www.ishares.com. Performance results assume reinvestment of all dividends and capital gain distributions and do not reflect the deduction of taxes that a shareholder would pay on fund distributions or on the redemption or sale of fund shares. The investment return and principal value of shares will vary with changes in market conditions. Shares may be worth more or less than their original cost when they are redeemed or sold in the market. Performance for certain funds may reflect a waiver of a portion of investment advisory fees. Without such a waiver, performance would have been lower.
Net asset value or “NAV” is the value of one share of a fund as calculated in accordance with the standard formula for valuing mutual fund shares. The price used to calculate market return (“Market Price”) is determined by using the midpoint between the highest bid and the lowest offer on the primary stock exchange on which shares of a fund are listed for trading, as of the time that such fund’s NAV is calculated. Certain funds may have a NAV which is determined prior to the opening of regular trading on its listed exchange and their market returns are calculated using the midpoint of the bid/ask spread as of the opening of regular trading on the exchange. Market and NAV returns assume that dividends and capital gain distributions have been reinvested at Market Price and NAV, respectively.
An index is a statistical composite that tracks a specified financial market or sector. Unlike a fund, an index does not actually hold a portfolio of securities and therefore does not incur the expenses incurred by a fund. These expenses negatively impact fund performance. Also, market returns do not include brokerage commissions that may be payable on secondary market transactions. If brokerage commissions were included, market returns would be lower.
Shareholder Expenses
As a shareholder of the Fund, you incur two types of costs: (1) transaction costs, including brokerage commissions on purchases and sales of fund shares and (2) ongoing costs, including management fees and other fund expenses. The expense example, which is based on an investment of $1,000 invested on May 1, 2016 and held through October 31, 2016, is intended to help you understand your ongoing costs (in dollars and cents) of investing in the Fund and to compare these costs with the ongoing costs of investing in other funds.
Actual Expenses — The table provides information about actual account values and actual expenses. Annualized expense ratios reflect contractual and voluntary fee waivers, if any. To estimate the expenses that you paid on your account over the period, simply divide your account value by $1,000 (for example, an $8,600 account value divided by $1,000 = 8.6), then multiply the result by the number under the heading entitled “Expenses Paid During Period.”
Hypothetical Example for Comparison Purposes — The table also provides information about hypothetical account values and hypothetical expenses based on the Fund’s actual expense ratio and an assumed rate of return of 5% per year before expenses. You may use this information to compare the ongoing costs of investing in your Fund and other funds. To do so, compare this 5% hypothetical example with the 5% hypothetical examples that appear in the shareholder reports of the other funds.
Please note that the expenses shown in the table are meant to highlight your ongoing costs only and do not reflect any transactional costs, such as brokerage commissions paid on purchases and sales of fund shares. Therefore, the hypothetical examples are useful in comparing ongoing costs only and will not help you determine the relative total costs of owning different funds. In addition, if these transactional costs were included, your costs would have been higher.
| | |
| 8 | | 2016 iSHARES ANNUAL REPORTTO SHAREHOLDERS |
Schedule of Investments
iSHARES® EDGE U.S. FIXED INCOME BALANCED RISK ETF
October 31, 2016
| | | | | | | | |
Security | |
Principal
(000s) | | | Value | |
CORPORATE BONDS & NOTES — 81.18% | |
| |
ADVERTISING — 0.15% | | | | | |
Omnicom Group Inc. | | | | | | | | |
3.63%, 05/01/22 | | $ | 100 | | | $ | 106,574 | |
| | | | | | | | |
| | | | | | | 106,574 | |
AEROSPACE & DEFENSE — 1.32% | |
L-3 Communications Corp. | | | | | | | | |
4.95%, 02/15/21 (Call 11/15/20) | | | 200 | | | | 218,330 | |
5.20%, 10/15/19 | | | 100 | | | | 108,860 | |
Lockheed Martin Corp. | | | | | | | | |
2.50%, 11/23/20 (Call 10/23/20) | | | 40 | | | | 41,002 | |
Northrop Grumman Corp. | | | | | | | | |
1.75%, 06/01/18 | | | 200 | | | | 201,226 | |
StandardAero Aviation Holdings Inc. | | | | | | | | |
10.00%, 07/15/23 (Call 07/15/18)a | | | 35 | | | | 37,100 | |
TransDigm Inc. | | | | | | | | |
7.50%, 07/15/21 (Call 12/01/16) | | | 100 | | | | 105,750 | |
United Technologies Corp. | | | | | | | | |
4.50%, 04/15/20 | | | 200 | | | | 218,954 | |
| | | | | | | | |
| | | | | | | 931,222 | |
AGRICULTURE — 1.56% | | | | | |
Altria Group Inc. | | | | | | | | |
2.63%, 01/14/20 (Call 12/14/19) | | | 150 | | | | 154,331 | |
2.85%, 08/09/22 | | | 150 | | | | 154,215 | |
9.25%, 08/06/19 | | | 150 | | | | 180,691 | |
Philip Morris International Inc. | | | | | | | | |
2.13%, 05/10/23 (Call 03/10/23) | | | 70 | | | | 69,046 | |
2.75%, 02/25/26 (Call 11/25/25) | | | 70 | | | | 70,597 | |
Reynolds American Inc. | | | | | | | | |
2.30%, 06/12/18 | | | 140 | | | | 141,791 | |
4.00%, 06/12/22 | | | 100 | | | | 107,706 | |
8.13%, 06/23/19 | | | 100 | | | | 116,263 | |
Vector Group Ltd. | | | | | | | | |
7.75%, 02/15/21 (Call 12/01/16) | | | 100 | | | | 104,750 | |
| | | | | | | | |
| | | | | | | 1,099,390 | |
APPAREL — 0.15% | | | | | |
Levi Strauss & Co. | | | | | | | | |
6.88%, 05/01/22 (Call 05/01/17) | | | 100 | | | | 105,000 | |
| | | | | | | | |
| | | | | | | 105,000 | |
AUTO MANUFACTURERS — 1.61% | | | | | |
Ford Motor Credit Co. LLC | | | | | | | | |
2.46%, 03/27/20 | | | 200 | | | | 200,568 | |
| | | | | | | | |
Security | |
Principal
(000s) | | | Value | |
General Motors Co. | | | | | | | | |
4.00%, 04/01/25b | | $ | 100 | | | $ | 100,750 | |
General Motors Financial Co. Inc. | | | | | | | | |
2.40%, 05/09/19 | | | 65 | | | | 65,081 | |
3.20%, 07/06/21 (Call 06/06/21)b | | | 55 | | | | 55,550 | |
3.45%, 04/10/22 (Call 02/10/22) | | | 100 | | | | 101,125 | |
3.50%, 07/10/19 | | | 150 | | | | 154,313 | |
4.00%, 01/15/25 (Call 10/15/24)b | | | 100 | | | | 100,375 | |
4.20%, 03/01/21 (Call 02/01/21) | | | 100 | | | | 105,125 | |
5.25%, 03/01/26 (Call 12/01/25) | | | 60 | | | | 65,325 | |
Toyota Motor Credit Corp. | | | | | | | | |
2.15%, 03/12/20 | | | 180 | | | | 182,801 | |
| | | | | | | | |
| | | | | | | 1,131,013 | |
AUTO PARTS & EQUIPMENT — 0.22% | | | | | |
ZF North America Capital Inc. | | | | | | | | |
4.75%, 04/29/25a | | | 150 | | | | 158,250 | |
| | | | | | | | |
| | | | | | | 158,250 | |
BANKS — 17.96% | | | | | |
American Express Credit Corp. | | | | | | | | |
1.80%, 07/31/18 (Call 06/30/18) | | | 85 | | | | 85,384 | |
Bank of America Corp. | | | | | | | | |
1.70%, 08/25/17 | | | 100 | | | | 100,229 | |
5.65%, 05/01/18 | | | 250 | | | | 264,325 | |
5.88%, 01/05/21 | | | 250 | | | | 284,533 | |
7.63%, 06/01/19 | | | 400 | | | | 456,128 | |
Bank of Montreal | | | | | | | | |
1.50%, 07/18/19 | | | 140 | | | | 139,405 | |
1.90%, 08/27/21 | | | 100 | | | | 99,147 | |
Bank of New York Mellon Corp. (The) | | | | | | | | |
2.30%, 09/11/19 (Call 08/11/19)b | | | 250 | | | | 254,972 | |
2.60%, 08/17/20 (Call 07/17/20) | | | 120 | | | | 123,190 | |
Bank of Nova Scotia (The) | | | | | | | | |
1.45%, 04/25/18b | | | 250 | | | | 249,998 | |
2.45%, 03/22/21 | | | 100 | | | | 101,674 | |
BB&T Corp. | | | | | | | | |
2.05%, 06/19/18 (Call 05/15/18) | | | 200 | | | | 201,922 | |
BNP Paribas SA | | | | | | | | |
2.40%, 12/12/18 | | | 100 | | | | 101,321 | |
Capital One N.A./Mclean VA | | | | | | | | |
1.50%, 09/05/17 (Call 08/05/17) | | | 250 | | | | 250,138 | |
CIT Group Inc. | | | | | | | | |
3.88%, 02/19/19 | | | 100 | | | | 101,531 | |
Schedule of Investments (Continued)
iSHARES® EDGE U.S. FIXED INCOME BALANCED RISK ETF
October 31, 2016
| | | | | | | | |
Security | |
Principal
(000s) | | | Value | |
Citigroup Inc. | | | | | | | | |
1.70%, 04/27/18 | | $ | 100 | | | $ | 100,034 | |
2.05%, 12/07/18 | | | 100 | | | | 100,552 | |
2.05%, 06/07/19b | | | 100 | | | | 100,504 | |
2.50%, 09/26/18 | | | 250 | | | | 253,452 | |
4.50%, 01/14/22 | | | 100 | | | | 109,653 | |
Credit Suisse AG/New York NY | | | | | | | | |
2.30%, 05/28/19 | | | 250 | | | | 252,585 | |
Credit Suisse Group Funding Guernsey Ltd. | | | | | | | | |
3.45%, 04/16/21a | | | 250 | | | | 254,590 | |
Discover Bank/Greenwood DE | | | | | | | | |
2.00%, 02/21/18 | | | 250 | | | | 250,733 | |
Fifth Third Bancorp. | | | | | | | | |
5.45%, 01/15/17 | | | 200 | | | | 201,812 | |
Fifth Third Bank/Cincinnati OH | | | | | | | | |
2.15%, 08/20/18 (Call 07/20/18) | | | 200 | | | | 201,928 | |
Goldman Sachs Group Inc. (The) | | | | | | | | |
2.35%, 11/15/21 (Call 11/15/20) | | | 45 | | | | 44,747 | |
2.55%, 10/23/19 | | | 250 | | | | 254,727 | |
2.63%, 01/31/19 | | | 250 | | | | 254,522 | |
2.75%, 09/15/20 (Call 08/15/20) | | | 130 | | | | 132,816 | |
3.50%, 01/23/25 (Call 10/23/24)b | | | 300 | | | | 307,524 | |
5.25%, 07/27/21 | | | 200 | | | | 224,632 | |
5.95%, 01/18/18 | | | 250 | | | | 262,952 | |
HSBC Holdings PLC | | | | | | | | |
3.40%, 03/08/21b | | | 400 | | | | 413,116 | |
3.90%, 05/25/26 | | | 200 | | | | 206,896 | |
HSBC USA Inc. | | | | | | | | |
1.50%, 11/13/17 | | | 200 | | | | 199,972 | |
1.70%, 03/05/18 | | | 180 | | | | 180,063 | |
JPMorgan Chase & Co. | | | | | | | | |
1.63%, 05/15/18 | | | 350 | | | | 350,536 | |
2.55%, 03/01/21 (Call 02/01/21) | | | 100 | | | | 101,516 | |
3.13%, 01/23/25 (Call 10/23/24) | | | 350 | | | | 353,332 | |
3.88%, 09/10/24 | | | 100 | | | | 104,160 | |
4.63%, 05/10/21 | | | 100 | | | | 109,985 | |
6.30%, 04/23/19 | | | 350 | | | | 387,824 | |
JPMorgan Chase Bank N.A. | | | | | | | | |
6.00%, 10/01/17 | | | 250 | | | | 260,320 | |
Lloyds Bank PLC | | | | | | | | |
1.75%, 05/14/18 | | | 200 | | | | 199,998 | |
| | | | | | | | |
Security | |
Principal
(000s) | | | Value | |
Mitsubishi UFJ Financial Group Inc. | | | | | | | | |
2.19%, 09/13/21 | | $ | 200 | | | $ | 198,532 | |
Morgan Stanley | | | | | | | | |
2.20%, 12/07/18 | | | 50 | | | | 50,464 | |
2.38%, 07/23/19 | | | 300 | | | | 304,122 | |
3.13%, 07/27/26b | | | 285 | | | | 284,621 | |
3.75%, 02/25/23 | | | 200 | | | | 211,154 | |
4.88%, 11/01/22 | | | 150 | | | | 164,582 | |
Series F | | | | | | | | |
5.55%, 04/27/17b | | | 300 | | | | 306,511 | |
Royal Bank of Scotland Group PLC | | | | | | | | |
6.13%, 12/15/22 | | | 100 | | | | 105,584 | |
State Street Corp. | | | | | | | | |
4.96%, 03/15/18 | | | 100 | | | | 104,087 | |
Sumitomo Mitsui Financial Group Inc. | | | | | | | | |
2.44%, 10/19/21 | | | 100 | | | | 100,392 | |
Svenska Handelsbanken AB | | | | | | | | |
1.50%, 09/06/19 | | | 250 | | | | 248,483 | |
1.88%, 09/07/21 | | | 250 | | | | 247,643 | |
U.S. Bancorp. | | | | | | | | |
3.00%, 03/15/22 (Call 02/15/22) | | | 100 | | | | 104,863 | |
Wells Fargo & Co. | | | | | | | | |
2.15%, 01/15/19 | | | 250 | | | | 252,655 | |
2.50%, 03/04/21b | | | 100 | | | | 101,189 | |
3.00%, 01/22/21 | | | 100 | | | | 103,063 | |
4.48%, 01/16/24 | | | 100 | | | | 107,947 | |
Wells Fargo Bank N.A. | | | | | | | | |
1.75%, 05/24/19 | | | 500 | | | | 501,645 | |
Westpac Banking Corp. | | | | | | | | |
1.60%, 08/19/19 | | | 100 | | | | 99,779 | |
1.65%, 05/13/19b | | | 60 | | | | 59,973 | |
| | | | | | | | |
| | | | | | | 12,646,667 | |
BEVERAGES — 0.69% | | | | | |
Anheuser-Busch InBev Finance Inc. | | | | | | | | |
2.63%, 01/17/23 | | | 125 | | | | 126,175 | |
2.65%, 02/01/21 (Call 01/01/21) | | | 65 | | | | 66,456 | |
3.30%, 02/01/23 (Call 12/01/22) | | | 100 | | | | 104,459 | |
3.65%, 02/01/26 (Call 11/01/25) | | | 50 | | | | 52,585 | |
Constellation Brands Inc. | | | | | | | | |
4.75%, 12/01/25b | | | 35 | | | | 38,281 | |
Molson Coors Brewing Co. | | | | | | | | |
3.00%, 07/15/26 (Call 04/15/26) | | | 100 | | | | 99,056 | |
| | | | | | | | |
| | | | | | | 487,012 | |
| | |
| 10 | | 2016 iSHARES ANNUAL REPORTTO SHAREHOLDERS |
Schedule of Investments (Continued)
iSHARES® EDGE U.S. FIXED INCOME BALANCED RISK ETF
October 31, 2016
| | | | | | | | |
Security | |
Principal
(000s) | | | Value | |
BIOTECHNOLOGY — 0.74% | | | | | |
Amgen Inc. | | | | | | | | |
2.20%, 05/22/19 (Call 04/22/19) | | $ | 100 | | | $ | 101,526 | |
Biogen Inc. | | | | | | | | |
2.90%, 09/15/20 | | | 30 | | | | 30,937 | |
Celgene Corp. | | | | | | | | |
2.88%, 08/15/20 | | | 200 | | | | 206,392 | |
Gilead Sciences Inc. | | | | | | | | |
2.35%, 02/01/20 | | | 100 | | | | 101,934 | |
2.55%, 09/01/20 | | | 75 | | | | 76,867 | |
| | | | | | | | |
| | | | | | | 517,656 | |
BUILDING MATERIALS — 0.73% | | | | | |
Masco Corp. | | | | | | | | |
3.50%, 04/01/21 (Call 03/01/21) | | | 40 | | | | 40,960 | |
Owens Corning | | | | | | | | |
3.40%, 08/15/26 (Call 05/15/26) | | | 100 | | | | 98,808 | |
Standard Industries Inc./NJ | | | | | | | | |
5.38%, 11/15/24 (Call 11/15/19)a | | | 100 | | | | 103,375 | |
Summit Materials LLC/Summit Materials Finance Corp. | | | | | | | | |
6.13%, 07/15/23 (Call 07/15/18) | | | 15 | | | | 15,375 | |
Vulcan Materials Co. | | | | | | | | |
4.50%, 04/01/25 (Call 01/01/25) | | | 125 | | | | 135,181 | |
7.50%, 06/15/21 | | | 100 | | | | 120,864 | |
| | | | | | | | |
| | | | | | | 514,563 | |
CHEMICALS — 0.62% | | | | | |
Monsanto Co. | | | | | | | | |
2.75%, 07/15/21 | | | 200 | | | | 203,740 | |
PolyOne Corp. | | | | | | | | |
5.25%, 03/15/23 | | | 100 | | | | 102,350 | |
RPM International Inc. | | | | | | | | |
6.13%, 10/15/19 | | | 100 | | | | 111,500 | |
Tronox Finance LLC | | | | | | | | |
7.50%, 03/15/22 (Call 03/15/18)a | | | 25 | | | | 22,375 | |
| | | | | | | | |
| | | | | | | 439,965 | |
COMMERCIAL SERVICES — 1.17% | | | | | |
ADT Corp. (The) | | | | | | | | |
5.25%, 03/15/20 | | | 100 | | | | 107,750 | |
Live Nation Entertainment Inc. | | | | | | | | |
4.88%, 11/01/24 (Call 11/01/19)a | | | 40 | | | | 39,900 | |
7.00%, 09/01/20 (Call 12/01/16)a | | | 100 | | | | 103,820 | |
| | | | | | | | |
Security | |
Principal
(000s) | | | Value | |
RR Donnelley & Sons Co. | | | | | | | | |
6.00%, 04/01/24 | | $ | 100 | | | $ | 95,500 | |
S&P Global Inc. | | | | | | | | |
2.95%, 01/22/27 (Call 10/22/26)a | | | 25 | | | | 24,670 | |
Service Corp. International/U.S. | | | | | | | | |
5.38%, 05/15/24 (Call 05/15/19) | | | 35 | | | | 36,750 | |
Synchrony Financial | | | | | | | | |
1.88%, 08/15/17 (Call 07/15/17) | | | 200 | | | | 200,487 | |
Total System Services Inc. | | | | | | | | |
3.80%, 04/01/21 (Call 03/01/21) | | | 25 | | | | 26,377 | �� |
United Rentals North America Inc. | | | | | | | | |
5.50%, 05/15/27 (Call 05/15/22) | | | 30 | | | | 29,850 | |
Verisk Analytics Inc. | | | | | | | | |
4.00%, 06/15/25 (Call 03/15/25)b | | | 150 | | | | 155,789 | |
| | | | | | | | |
| | | | | | | 820,893 | |
COMPUTERS — 1.60% | | | | | |
Apple Inc. | | | | | | | | |
2.25%, 02/23/21 (Call 01/23/21) | | | 95 | | | | 96,770 | |
2.85%, 02/23/23 (Call 12/23/22) | | | 75 | | | | 77,847 | |
Diamond 1 Finance Corp./Diamond 2 Finance Corp. | | | | | | | | |
3.48%, 06/01/19a | | | 50 | | | | 51,353 | |
6.02%, 06/15/26 (Call 03/15/26)a,b | | | 25 | | | | 27,196 | |
7.13%, 06/15/24 (Call 06/15/19)a,b | | | 50 | | | | 54,773 | |
Everi Payments Inc. | | | | | | | | |
10.00%, 01/15/22 (Call 01/15/18) | | | 65 | | | | 61,994 | |
Hewlett Packard Enterprise Co. | | | | | | | | |
2.85%, 10/05/18a,b | | | 150 | | | | 153,562 | |
3.85%, 10/15/20 (Call 09/15/20)a | | | 100 | | | | 105,121 | |
4.90%, 10/15/25 (Call 07/15/25)a,b | | | 100 | | | | 105,899 | |
International Business Machines Corp. | | | | | | | | |
7.63%, 10/15/18 | | | 250 | | | | 279,523 | |
Western Digital Corp. | | | | | | | | |
10.50%, 04/01/24 (Call 04/01/19)a | | | 95 | | | | 109,725 | |
| | | | | | | | |
| | | | | | | 1,123,763 | |
DISTRIBUTION & WHOLESALE — 0.15% | | | | | |
HD Supply Inc. | | | | | | | | |
5.25%, 12/15/21 (Call 12/15/17)a | | | 100 | | | | 106,250 | |
| | | | | | | | |
| | | | | | | 106,250 | |
| | | | |
SCHEDULEOF INVESTMENTS | | | 11 | |
Schedule of Investments (Continued)
iSHARES® EDGE U.S. FIXED INCOME BALANCED RISK ETF
October 31, 2016
| | | | | | | | |
Security | |
Principal
(000s) | | | Value | |
DIVERSIFIED FINANCIAL SERVICES — 4.72% | |
AerCap Ireland Capital Ltd./AerCap Global Aviation Trust | | | | | | | | |
5.00%, 10/01/21b | | $ | 150 | | | $ | 159,188 | |
Ally Financial Inc. | | | | | | | | |
5.13%, 09/30/24 | | | 150 | | | | 158,250 | |
American Express Credit Corp. | | | | | | | | |
2.25%, 08/15/19 | | | 200 | | | | 203,276 | |
Capital One Bank USA N.A. | | | | | | | | |
2.25%, 02/13/19 (Call 01/13/19) | | | 250 | | | | 252,920 | |
Ford Motor Credit Co. LLC | | | | | | | | |
1.72%, 12/06/17 | | | 250 | | | | 250,042 | |
5.00%, 05/15/18 | | | 450 | | | | 470,961 | |
GE Capital International Funding Co. Unlimited Co. | | | | | | | | |
2.34%, 11/15/20 | | | 200 | | | | 203,856 | |
Intercontinental Exchange Inc. | | | | | | | | |
3.75%, 12/01/25 (Call 09/01/25) | | | 35 | | | | 37,308 | |
4.00%, 10/15/23b | | | 150 | | | | 162,586 | |
Nasdaq Inc. | | | | | | | | |
3.85%, 06/30/26 (Call 03/30/26) | | | 40 | | | | 41,343 | |
4.25%, 06/01/24 (Call 03/01/24) | | | 100 | | | | 106,040 | |
5.25%, 01/16/18 | | | 200 | | | | 208,448 | |
National Rural Utilities Cooperative Finance Corp. | | | | | | | | |
10.38%, 11/01/18 | | | 200 | | | | 234,534 | |
Nationstar Mortgage LLC/Nationstar Capital Corp. | | | | | | | | |
6.50%, 06/01/22 (Call 12/01/17) | | | 50 | | | | 48,625 | |
Navient Corp. | | | | | | | | |
5.00%, 10/26/20b | | | 100 | | | | 98,750 | |
NFP Corp. | | | | | | | | |
9.00%, 07/15/21 (Call 12/01/16)a | | | 100 | | | | 102,000 | |
Quicken Loans Inc. | | | | | | | | |
5.75%, 05/01/25 (Call 05/01/20)a | | | 40 | | | | 39,500 | |
Synchrony Financial | | | | | | | | |
2.70%, 02/03/20 (Call 01/03/20) | | | 150 | | | | 152,040 | |
TD Ameritrade Holding Corp. | | | | | | | | |
2.95%, 04/01/22 (Call 02/01/22) | | | 100 | | | | 103,368 | |
Visa Inc. | | | | | | | | |
2.80%, 12/14/22 (Call 10/14/22) | | | 75 | | | | 78,018 | |
3.15%, 12/14/25 (Call 09/14/25) | | | 205 | | | | 213,604 | |
| | | | | | | | |
| | | | | | | 3,324,657 | |
| | | | | | | | |
Security | |
Principal
(000s) | | | Value | |
ELECTRIC — 3.75% | | | | | |
AES Corp./VA | | | | | | | | |
7.38%, 07/01/21 (Call 06/01/21) | | $ | 200 | | | $ | 225,500 | |
Baltimore Gas & Electric Co. | | | | | | | | |
2.80%, 08/15/22 (Call 05/15/22) | | | 100 | | | | 103,144 | |
Berkshire Hathaway Energy Co. | | | | | | | | |
3.75%, 11/15/23 (Call 08/15/23) | | | 50 | | | | 54,016 | |
Black Hills Corp. | | | | | | | | |
2.50%, 01/11/19 | | | 45 | | | | 45,562 | |
3.95%, 01/15/26 (Call 07/15/25)b | | | 50 | | | | 53,003 | |
Consolidated Edison Inc. | | | | | | | | |
2.00%, 05/15/21 (Call 04/15/21) | | | 100 | | | | 100,272 | |
Dominion Resources Inc./VA | | | | | | | | |
5.20%, 08/15/19 | | | 100 | | | | 109,019 | |
Series A | | | | | | | | |
1.40%, 09/15/17 | | | 100 | | | | 100,041 | |
Series B | | | | | | | | |
1.60%, 08/15/19 | | | 55 | | | | 54,892 | |
Duke Energy Corp. | | | | | | | | |
2.10%, 06/15/18 (Call 05/15/18) | | | 200 | | | | 201,796 | |
3.55%, 09/15/21 (Call 06/15/21) | | | 100 | | | | 106,714 | |
Dynegy Inc. | | | | | | | | |
7.38%, 11/01/22 (Call 11/01/18) | | | 100 | | | | 96,437 | |
Exelon Corp. | | | | | | | | |
1.55%, 06/09/17 | | | 30 | | | | 30,026 | |
Exelon Generation Co. LLC | | | | | | | | |
2.95%, 01/15/20 (Call 12/15/19) | | | 100 | | | | 102,631 | |
MidAmerican Energy Co. | | | | | | | | |
2.40%, 03/15/19 (Call 02/15/19) | | | 100 | | | | 102,161 | |
NextEra Energy Capital Holdings Inc. | | | | | | | | |
1.65%, 09/01/18 | | | 90 | | | | 90,211 | |
Ohio Power Co. | | | | | | | | |
Series M | | | | | | | | |
5.38%, 10/01/21 | | | 100 | | | | 114,118 | |
Pacific Gas & Electric Co. | | | | | | | | |
2.45%, 08/15/22 (Call 05/15/22)b | | | 100 | | | | 101,462 | |
PPL Electric Utilities Corp. | | | | | | | | |
2.50%, 09/01/22 (Call 06/01/22) | | | 100 | | | | 101,425 | |
PSEG Power LLC | | | | | | | | |
3.00%, 06/15/21 (Call 05/15/21)b | | | 150 | | | | 153,142 | |
Public Service Electric & Gas Co. | | | | | | | | |
2.00%, 08/15/19 (Call 07/15/19) | | | 150 | | | | 152,389 | |
| | |
| 12 | | 2016 iSHARES ANNUAL REPORTTO SHAREHOLDERS |
Schedule of Investments (Continued)
iSHARES® EDGE U.S. FIXED INCOME BALANCED RISK ETF
October 31, 2016
| | | | | | | | |
Security | |
Principal
(000s) | | | Value | |
Southern Co. (The) | | | | | | | | |
2.45%, 09/01/18 | | $ | 150 | | | $ | 152,651 | |
Southern Power Co. | | | | | | | | |
1.85%, 12/01/17 | | | 100 | | | | 100,484 | |
4.15%, 12/01/25 (Call 09/01/25)b | | | 50 | | | | 53,563 | |
Talen Energy Supply LLC | | | | | | | | |
4.63%, 07/15/19 (Call 12/01/16)a | | | 100 | | | | 95,000 | |
6.50%, 06/01/25 (Call 06/01/20)b | | | 45 | | | | 37,575 | |
| | | | | | | | |
| | | | | | | 2,637,234 | |
ELECTRICAL COMPONENTS & EQUIPMENT — 0.21% | |
Energizer Holdings Inc. | | | | | | | | |
5.50%, 06/15/25 (Call 06/15/20)a,b | | | 50 | | | | 50,625 | |
General Cable Corp. | | | | | | | | |
5.75%, 10/01/22 (Call 10/01/17)b | | | 100 | | | | 94,500 | |
| | | | | | | | |
| | | | | | | 145,125 | |
ELECTRONICS — 0.33% | | | | | |
Amphenol Corp. | | | | | | | | |
2.55%, 01/30/19 (Call 12/30/18) | | | 100 | | | | 101,968 | |
Flex Ltd. | | | | | | | | |
4.75%, 06/15/25 (Call 03/15/25) | | | 90 | | | | 97,185 | |
Fortive Corp. | | | | | | | | |
1.80%, 06/15/19a | | | 35 | | | | 35,013 | |
| | | | | | | | |
| | | | | | | 234,166 | |
ENTERTAINMENT — 0.52% | | | | | |
GLP Capital LP/GLP Financing II Inc. | | | | | | | | |
4.88%, 11/01/20 (Call 08/01/20) | | | 100 | | | | 106,625 | |
International Game Technology PLC | | | | | | | | |
6.50%, 02/15/25 (Call 08/15/24)a,b | | | 200 | | | | 216,460 | |
Scientific Games International Inc. | | | | | | | | |
10.00%, 12/01/22 (Call 12/01/18) | | | 50 | | | | 46,250 | |
| | | | | | | | |
| | | | | | | 369,335 | |
ENVIRONMENTAL CONTROL — 0.23% | | | | | |
Waste Management Inc. | | | | | | | | |
6.10%, 03/15/18 | | | 150 | | | | 159,562 | |
| | | | | | | | |
| | | | | | | 159,562 | |
FOOD — 3.31% | | | | | |
B&G Foods Inc. | | | | | | | | |
4.63%, 06/01/21 (Call 12/01/16)b | | | 100 | | | | 102,750 | |
ConAgra Foods Inc. | | | | | | | | |
3.20%, 01/25/23 (Call 10/25/22) | | | 79 | | | | 80,935 | |
| | | | | | | | |
Security | |
Principal
(000s) | | | Value | |
JBS USA LUX SA/JBS USA Finance Inc. | | | | | | | | |
5.88%, 07/15/24 (Call 07/15/19)a | | $ | 100 | | | $ | 100,500 | |
JM Smucker Co. (The) | | | | | | | | |
1.75%, 03/15/18 | | | 125 | | | | 125,508 | |
Kellogg Co. | | | | | | | | |
3.25%, 04/01/26 | | | 50 | | | | 51,087 | |
Kraft Heinz Foods Co. | | | | | | | | |
2.00%, 07/02/18 | | | 250 | | | | 251,828 | |
2.25%, 06/05/17 | | | 100 | | | | 100,528 | |
2.80%, 07/02/20 (Call 06/02/20) | | | 250 | | | | 257,127 | |
3.00%, 06/01/26 (Call 03/01/26) | | | 150 | | | | 148,503 | |
3.95%, 07/15/25 (Call 04/15/25) | | | 100 | | | | 106,722 | |
Kroger Co. (The) | | | | | | | | |
2.30%, 01/15/19 (Call 12/15/18) | | | 150 | | | | 152,211 | |
Mondelez International Inc. | | | | | | | | |
2.25%, 02/01/19 (Call 01/01/19) | | | 150 | | | | 152,131 | |
Pilgrim’s Pride Corp. | | | | | | | | |
5.75%, 03/15/25 (Call 03/15/20)a | | | 100 | | | | 102,250 | |
Post Holdings Inc. | | | | | | | | |
7.75%, 03/15/24 (Call 09/15/18)a | | | 25 | | | | 27,630 | |
8.00%, 07/15/25 (Call 07/15/20)a | | | 25 | | | | 28,500 | |
Sysco Corp. | | | | | | | | |
2.50%, 07/15/21 (Call 06/15/21) | | | 150 | | | | 152,157 | |
2.60%, 10/01/20 (Call 09/01/20) | | | 190 | | | | 194,632 | |
3.30%, 07/15/26 (Call 04/15/26) | | | 55 | | | | 56,101 | |
3.75%, 10/01/25 (Call 07/01/25) | | | 55 | | | | 57,919 | |
Tyson Foods Inc. | | | | | | | | |
3.95%, 08/15/24 (Call 05/15/24)b | | | 75 | | | | 79,219 | |
| | | | | | | | |
| | | | | | | 2,328,238 | |
FOOD SERVICE — 0.05% | | | | | |
Aramark Services Inc. | | | | | | | | |
5.13%, 01/15/24 (Call 01/15/19)a | | | 35 | | | | 36,663 | |
| | | | | | | | |
| | | | | | | 36,663 | |
FOREST PRODUCTS & PAPER — 0.14% | | | | | |
Clearwater Paper Corp. | | | | | | | | |
5.38%, 02/01/25a,b | | | 100 | | | | 101,000 | |
| | | | | | | | |
| | | | | | | 101,000 | |
GAS — 0.07% | | | | | |
AmeriGas Partners LP/AmeriGas Finance Corp. | | | | | | | | |
5.63%, 05/20/24 (Call 03/20/24) | | | 45 | | | | 47,138 | |
| | | | | | | | |
| | | | | | | 47,138 | |
| | | | |
SCHEDULEOF INVESTMENTS | | | 13 | |
Schedule of Investments (Continued)
iSHARES® EDGE U.S. FIXED INCOME BALANCED RISK ETF
October 31, 2016
| | | | | | | | |
Security | |
Principal
(000s) | | | Value | |
HEALTH CARE – PRODUCTS — 2.82% | | | | | |
Abbott Laboratories | | | | | | | | |
2.00%, 03/15/20 | | $ | 175 | | | $ | 175,910 | |
2.55%, 03/15/22 | | | 90 | | | | 91,688 | |
Baxter International Inc. | | | | | | | | |
2.60%, 08/15/26 (Call 05/15/26) | | | 50 | | | | 48,401 | |
Becton Dickinson and Co. | | | | | | | | |
1.80%, 12/15/17 | | | 150 | | | | 150,678 | |
Boston Scientific Corp. | | | | | | | | |
2.85%, 05/15/20 | | | 25 | | | | 25,634 | |
3.38%, 05/15/22 | | | 150 | | | | 156,106 | |
DJO Finco Inc./DJO Finance LLC/DJO Finance Corp. | | | | | | | | |
8.13%, 06/15/21 (Call 06/15/18)a | | | 50 | | | | 45,875 | |
Greatbatch Ltd. | | | | | | | | |
9.13%, 11/01/23 (Call 11/01/18)a | | | 45 | | | | 43,200 | |
Hill-Rom Holdings Inc. | | | | | | | | |
5.75%, 09/01/23 (Call 09/01/18)a | | | 85 | | | | 89,250 | |
Kinetic Concepts Inc./KCI USA Inc. | | | | | | | | |
9.63%, 10/01/21 (Call 10/01/18)a | | | 100 | | | | 96,625 | |
Ortho-Clinical Diagnostics Inc./Ortho-Clinical Diagnostics SA | | | | | | | | |
6.63%, 05/15/22 (Call 05/15/17)a | | | 50 | | | | 42,875 | |
St. Jude Medical Inc. | | | | | | | | |
2.00%, 09/15/18 | | | 35 | | | | 35,305 | |
Stryker Corp. | | | | | | | | |
1.30%, 04/01/18 | | | 150 | | | | 149,991 | |
2.00%, 03/08/19 | | | 175 | | | | 176,687 | |
Thermo Fisher Scientific Inc. | | | | | | | | |
3.00%, 04/15/23 (Call 02/15/23) | | | 165 | | | | 167,749 | |
Universal Hospital Services Inc. | | | | | | | | |
7.63%, 08/15/20 (Call 12/01/16)b | | | 50 | | | | 48,000 | |
Zimmer Biomet Holdings Inc. | | | | | | | | |
1.45%, 04/01/17 | | | 55 | | | | 55,027 | |
2.00%, 04/01/18 | | | 150 | | | | 150,720 | |
2.70%, 04/01/20 (Call 03/01/20) | | | 230 | | | | 233,526 | |
| | | | | | | | |
| | | | | | | 1,983,247 | |
HEALTH CARE – SERVICES — 1.79% | | | | | |
Aetna Inc. | | | | | | | | |
1.90%, 06/07/19 | | | 55 | | | | 55,384 | |
2.40%, 06/15/21 (Call 05/15/21) | | | 225 | | | | 227,430 | |
Anthem Inc. | | | | | | | | |
2.30%, 07/15/18 | | | 100 | | | | 101,062 | |
| | | | | | | | |
Security | |
Principal
(000s) | | | Value | |
Centene Corp. | | | | | | | | |
4.75%, 01/15/25 (Call 01/15/20) | | $ | 25 | | | $ | 24,891 | |
5.63%, 02/15/21 (Call 02/15/18) | | | 30 | | | | 31,470 | |
Fresenius Medical Care U.S. Finance II Inc. | | | | | | | | |
5.63%, 07/31/19a | | | 100 | | | | 108,250 | |
HCA Inc. | | | | | | | | |
3.75%, 03/15/19 | | | 100 | | | | 102,250 | |
5.38%, 02/01/25 | | | 100 | | | | 102,070 | |
Humana Inc. | | | | | | | | |
2.63%, 10/01/19 | | | 50 | | | | 50,964 | |
Laboratory Corp. of America Holdings | | | | | | | | |
2.63%, 02/01/20 | | | 100 | | | | 101,517 | |
Quest Diagnostics Inc. | | | | | | | | |
2.50%, 03/30/20 (Call 02/29/20) | | | 145 | | | | 147,426 | |
UnitedHealth Group Inc. | | | | | | | | |
2.13%, 03/15/21 | | | 75 | | | | 75,635 | |
2.88%, 03/15/22 (Call 12/15/21) | | | 100 | | | | 103,845 | |
3.10%, 03/15/26 | | | 25 | | | | 25,718 | |
| | | | | | | | |
| | | | | | | 1,257,912 | |
HOLDING COMPANIES – DIVERSIFIED — 0.15% | |
PetSmart Inc. | | | | | | | | |
7.13%, 03/15/23 (Call 03/15/18)a | | | 100 | | | | 104,625 | |
| | | | | | | | |
| | | | | | | 104,625 | |
HOME BUILDERS — 0.39% | | | | | |
Brookfield Residential Properties Inc. | | | | | | | | |
6.38%, 05/15/25 (Call 05/15/20)a | | | 100 | | | | 99,750 | |
Lennar Corp. | | | | | | | | |
4.50%, 06/15/19 (Call 04/16/19) | | | 100 | | | | 104,750 | |
Shea Homes LP/Shea Homes Funding Corp. | | | | | | | | |
5.88%, 04/01/23 (Call 04/01/18)a,b | | | 45 | | | | 44,212 | |
6.13%, 04/01/25 (Call 04/01/20)a | | | 25 | | | | 24,625 | |
| | | | | | | | |
| | | | | | | 273,337 | |
HOUSEHOLD PRODUCTS & WARES — 0.37% | |
ACCO Brands Corp. | | | | | | | | |
6.75%, 04/30/20 (Call 04/30/17)b | | | 100 | | | | 105,250 | |
Reynolds Group Issuer Inc./Reynolds Group Issuer LLC | | | | | | | | |
6.88%, 02/15/21 (Call 12/01/16) | | | 150 | | | | 155,250 | |
| | | | | | | | |
| | | | | | | 260,500 | |
| | |
| 14 | | 2016 iSHARES ANNUAL REPORTTO SHAREHOLDERS |
Schedule of Investments (Continued)
iSHARES® EDGE U.S. FIXED INCOME BALANCED RISK ETF
October 31, 2016
| | | | | | | | |
Security | |
Principal
(000s) | | | Value | |
HOUSEWARES — 0.29% | | | | | |
Newell Brands Inc. | | | | | | | | |
2.15%, 10/15/18 | | $ | 150 | | | $ | 151,752 | |
RSI Home Products Inc. | | | | | | | | |
6.50%, 03/15/23 (Call 03/15/18)a | | | 50 | | | | 53,000 | |
| | | | | | | | |
| | | | | | | 204,752 | |
INSURANCE — 3.69% | | | | | |
Aflac Inc. | | | | | | | | |
2.40%, 03/16/20 | | | 300 | | | | 306,828 | |
2.88%, 10/15/26 (Call 07/15/26) | | | 100 | | | | 99,631 | |
Allstate Corp. (The)
VRN, (3 mo. LIBOR US + 2.938%) | | | | | | | | |
5.75%, 08/15/53 (Call 08/15/23) | | | 25 | | | | 26,825 | |
American Financial Group Inc./OH | | | | | | | | |
3.50%, 08/15/26 (Call 05/15/26) | | | 100 | | | | 99,388 | |
American International Group Inc. | | | | | | | | |
3.30%, 03/01/21 (Call 02/01/21) | | | 30 | | | | 31,370 | |
5.85%, 01/16/18 | | | 250 | | | | 262,785 | |
Aon PLC | | | | | | | | |
2.80%, 03/15/21 (Call 02/15/21) | | | 100 | | | | 101,871 | |
Berkshire Hathaway Finance Corp. | | | | | | | | |
4.25%, 01/15/21 | | | 150 | | | | 164,734 | |
Berkshire Hathaway Inc. | | | | | | | | |
2.20%, 03/15/21 (Call 02/15/21) | | | 25 | | | | 25,544 | |
Chubb INA Holdings Inc. | | | | | | | | |
3.35%, 05/15/24 | | | 75 | | | | 79,217 | |
CNO Financial Group Inc. | | | | | | | | |
4.50%, 05/30/20 | | | 25 | | | | 25,656 | |
First American Financial Corp. | | | | | | | | |
4.60%, 11/15/24 | | | 50 | | | | 50,993 | |
Markel Corp. | | | | | | | | |
3.63%, 03/30/23b | | | 50 | | | | 51,217 | |
Marsh & McLennan Companies Inc. | | | | | | | | |
2.35%, 09/10/19 (Call 08/10/19) | | | 150 | | | | 151,897 | |
2.35%, 03/06/20 (Call 02/06/20) | | | 200 | | | | 202,320 | |
3.75%, 03/14/26 (Call 12/14/25) | | | 100 | | | | 106,743 | |
MetLife Inc. | | | | | | | | |
4.75%, 02/08/21 | | | 150 | | | | 166,769 | |
Old Republic International Corp. | | | | | | | | |
3.88%, 08/26/26 (Call 07/26/26) | | | 95 | | | | 93,517 | |
Progressive Corp. (The) | | | | | | | | |
2.45%, 01/15/27 | | | 80 | | | | 78,058 | |
| | | | | | | | |
Security | |
Principal
(000s) | | | Value | |
Radian Group Inc. | | | | | | | | |
5.25%, 06/15/20 | | $ | 100 | | | $ | 105,125 | |
Trinity Acquisition PLC | | | | | | | | |
4.40%, 03/15/26 (Call 12/15/25) | | | 100 | | | | 103,759 | |
Unum Group | | | | | | | | |
3.00%, 05/15/21 (Call 04/15/21) | | | 40 | | | | 40,768 | |
Willis Towers Watson PLC | | | | | | | | |
5.75%, 03/15/21 | | | 100 | | | | 111,674 | |
XLIT Ltd. | | | | | | | | |
5.75%, 10/01/21 | | | 100 | | | | 113,909 | |
| | | | | | | | |
| | | | | | | 2,600,598 | |
INTERNET — 1.88% | | | | | |
Alibaba Group Holding Ltd. | | | | | | | | |
1.63%, 11/28/17 | | | 200 | | | | 199,951 | |
3.60%, 11/28/24 (Call 08/28/24) | | | 200 | | | | 206,151 | |
Baidu Inc. | | | | | | | | |
2.75%, 06/09/19 | | | 250 | | | | 254,813 | |
eBay Inc. | | | | | | | | |
1.35%, 07/15/17 | | | 100 | | | | 100,056 | |
2.20%, 08/01/19 (Call 07/01/19) | | | 100 | | | | 100,964 | |
2.50%, 03/09/18 | | | 100 | | | | 101,208 | |
Expedia Inc. | | | | | | | | |
4.50%, 08/15/24 (Call 05/15/24) | | | 100 | | | | 103,919 | |
Priceline Group Inc. (The) | | | | | | | | |
3.60%, 06/01/26 (Call 03/01/26) | | | 70 | | | | 72,625 | |
VeriSign Inc. | | | | | | | | |
4.63%, 05/01/23 (Call 05/01/18) | | | 100 | | | | 103,000 | |
Zayo Group LLC/Zayo Capital Inc. | | | | | | | | |
6.38%, 05/15/25 (Call 05/15/20)b | | | 80 | | | | 84,226 | |
| | | | | | | | |
| | | | | | | 1,326,913 | |
IRON & STEEL — 0.27% | | | | | |
ArcelorMittal | | | | | | | | |
10.85%, 06/01/19 | | | 75 | | | | 89,812 | |
U.S. Steel Corp. | | | | | | | | |
7.38%, 04/01/20b | | | 48 | | | | 47,760 | |
8.38%, 07/01/21 (Call 07/01/18)a | | | 50 | | | | 53,125 | |
| | | | | | | | |
| | | | | | | 190,697 | |
LODGING — 0.05% | | | | | |
MGM Resorts International | | | | | | | | |
4.63%, 09/01/26 (Call 06/01/26) | | | 35 | | | | 33,688 | |
| | | | | | | | |
| | | | | | | 33,688 | |
| | | | |
SCHEDULEOF INVESTMENTS | | | 15 | |
Schedule of Investments (Continued)
iSHARES® EDGE U.S. FIXED INCOME BALANCED RISK ETF
October 31, 2016
| | | | | | | | |
Security | |
Principal
(000s) | | | Value | |
MACHINERY — 0.34% | | | | | |
Case New Holland Industrial Inc. | | | | | | | | |
7.88%, 12/01/17b | | $ | 50 | | | $ | 52,938 | |
Caterpillar Financial Services Corp. | | | | | | | | |
2.00%, 03/05/20 | | | 150 | | | | 151,252 | |
Roper Technologies Inc. | | | | | | | | |
3.85%, 12/15/25 (Call 09/15/25) | | | 35 | | | | 36,570 | |
| | | | | | | | |
| | | | | | | 240,760 | |
MANUFACTURING — 0.93% | | | | | |
General Electric Co. | | | | | | | | |
4.38%, 09/16/20 | | | 200 | | | | 219,752 | |
Ingersoll-Rand Global Holding Co. Ltd. | | | | | | | | |
6.88%, 08/15/18 | | | 300 | | | | 327,864 | |
Tyco Electronics Group SA | | | | | | | | |
6.55%, 10/01/17 | | | 100 | | | | 104,768 | |
| | | | | | | | |
| | | | | | | 652,384 | |
MEDIA — 3.08% | | | | | |
Altice U.S. Finance I Corp. | | | | | | | | |
5.50%, 05/15/26 (Call 05/15/21)a | | | 200 | | | | 204,000 | |
Charter Communications Operating LLC/Charter Communications Operating Capital | | | | | | | | |
3.58%, 07/23/20 (Call 06/23/20)a | | | 345 | | | | 357,727 | |
4.91%, 07/23/25 (Call 04/23/25)a | | | 200 | | | | 215,772 | |
Clear Channel Worldwide Holdings Inc. | | | | | | | | |
6.50%, 11/15/22 (Call 11/15/17) | | | 50 | | | | 50,925 | |
Comcast Corp. | | | | | | | | |
1.63%, 01/15/22 (Call 12/15/21) | | | 25 | | | | 24,537 | |
CSC Holdings LLC | | | | | | | | |
5.25%, 06/01/24 | | | 300 | | | | 280,500 | |
DISH DBS Corp. | | | | | | | | |
5.00%, 03/15/23 | | | 100 | | | | 98,500 | |
7.75%, 07/01/26 | | | 100 | | | | 109,813 | |
Nielsen Finance LLC/Nielsen Finance Co. | | | | | | | | |
5.00%, 04/15/22 (Call 04/15/17)a | | | 50 | | | | 51,000 | |
SFR Group SA | | | | | | | | |
6.00%, 05/15/22 (Call 05/15/17)a | | | 200 | | | | 205,064 | |
Starz LLC/Starz Finance Corp. | | | | | | | | |
5.00%, 09/15/19 (Call 12/01/16) | | | 100 | | | | 101,250 | |
Time Warner Cable LLC | | | | | | | | |
4.00%, 09/01/21 (Call 06/01/21) | | | 50 | | | | 52,341 | |
6.75%, 07/01/18 | | | 100 | | | | 108,065 | |
| | | | | | | | |
Security | |
Principal
(000s) | | | Value | |
Time Warner Inc. | | | | | | | | |
2.10%, 06/01/19 | | $ | 150 | | | $ | 151,074 | |
Univision Communications Inc. | | | | | | | | |
5.13%, 02/15/25 (Call 02/15/20)a | | | 50 | | | | 50,125 | |
WideOpenWest Finance LLC/WideOpenWest Capital Corp. | | | | | | | | |
10.25%, 07/15/19 (Call 12/01/16) | | | 100 | | | | 105,000 | |
| | | | | | | | |
| | | | | | | 2,165,693 | |
MINING — 0.73% | | | | | |
Aleris International Inc. | | | | | | | | |
7.88%, 11/01/20 (Call 12/01/16)b | | | 42 | | | | 42,000 | |
Arconic Inc. | | | | | | | | |
5.13%, 10/01/24 (Call 07/01/24)b | | | 100 | | | | 104,252 | |
Freeport-McMoRan Inc. | | | | | | | | |
3.88%, 03/15/23 (Call 12/15/22) | | | 150 | | | | 135,375 | |
Southern Copper Corp. | | | | | | | | |
3.88%, 04/23/25 | | | 100 | | | | 100,886 | |
Teck Resources Ltd. | | | | | | | | |
4.75%, 01/15/22 (Call 10/15/21) | | | 100 | | | | 99,438 | |
8.00%, 06/01/21 (Call 06/01/18)a | | | 30 | | | | 32,775 | |
| | | | | | | | |
| | | | | | | 514,726 | |
OIL & GAS — 3.98% | | | | | |
Antero Resources Corp. | | | | | | | | |
5.13%, 12/01/22 (Call 06/01/17) | | | 100 | | | | 100,750 | |
BP Capital Markets PLC | | | | | | | | |
1.85%, 05/05/17 | | | 200 | | | | 200,706 | |
2.52%, 01/15/20 | | | 150 | | | | 152,996 | |
Canadian Natural Resources Ltd. | | | | | | | | |
3.90%, 02/01/25 (Call 11/01/24) | | | 100 | | | | 101,966 | |
Chevron Corp. | | | | | | | | |
1.96%, 03/03/20 (Call 02/03/20) | | | 150 | | | | 151,245 | |
Cimarex Energy Co. | | | | | | | | |
4.38%, 06/01/24 (Call 03/01/24) | | | 100 | | | | 105,588 | |
ConocoPhillips | | | | | | | | |
5.75%, 02/01/19 | | | 150 | | | | 163,054 | |
Denbury Resources Inc. | | | | | | | | |
9.00%, 05/15/21 (Call 12/15/18)a | | | 50 | | | | 51,500 | |
Ensco PLC | | | | | | | | |
4.50%, 10/01/24 (Call 07/01/24) | | | 100 | | | | 80,000 | |
Exxon Mobil Corp. | | | | | | | | |
2.22%, 03/01/21 (Call 02/01/21) | | | 55 | | | | 55,791 | |
2.73%, 03/01/23 (Call 01/01/23) | | | 70 | | | | 71,680 | |
3.04%, 03/01/26 (Call 12/01/25) | | | 50 | | | | 51,721 | |
| | |
| 16 | | 2016 iSHARES ANNUAL REPORTTO SHAREHOLDERS |
Schedule of Investments (Continued)
iSHARES® EDGE U.S. FIXED INCOME BALANCED RISK ETF
October 31, 2016
| | | | | | | | |
Security | |
Principal
(000s) | | | Value | |
Gulfport Energy Corp. | | | | | | | | |
6.00%, 10/15/24 (Call 10/15/19)a | | $ | 25 | | | $ | 25,469 | |
Marathon Petroleum Corp. | | | | | | | | |
2.70%, 12/14/18 | | | 100 | | | | 101,677 | |
3.40%, 12/15/20 (Call 11/15/20) | | | 95 | | | | 98,799 | |
Newfield Exploration Co. | | | | | | | | |
5.63%, 07/01/24 | | | 50 | | | | 52,000 | |
5.75%, 01/30/22 | | | 50 | | | | 52,125 | |
Occidental Petroleum Corp. | | | | | | | | |
2.60%, 04/15/22 (Call 03/15/22) | | | 85 | | | | 86,836 | |
3.40%, 04/15/26 (Call 01/15/26)b | | | 155 | | | | 161,642 | |
3.50%, 06/15/25 (Call 03/15/25) | | | 60 | | | | 63,208 | |
Parsley Energy LLC/Parsley Finance Corp. | | | | | | | | |
7.50%, 02/15/22 (Call 02/15/17)a,b | | | 35 | | | | 37,231 | |
QEP Resources Inc. | | | | | | | | |
5.25%, 05/01/23 (Call 02/01/23) | | | 50 | | | | 49,125 | |
Sanchez Energy Corp. | | | | | | | | |
6.13%, 01/15/23 (Call 07/15/18)b | | | 50 | | | | 42,750 | |
Shell International Finance BV | | | | | | | | |
1.38%, 05/10/19 | | | 100 | | | | 99,447 | |
2.13%, 05/11/20 | | | 40 | | | | 40,339 | |
4.30%, 09/22/19 | | | 250 | | | | 268,395 | |
Total Capital SA | | | | | | | | |
2.13%, 08/10/18 | | | 250 | | | | 253,172 | |
Transocean Inc. | | | | | | | | |
8.13%, 12/15/21b | | | 50 | | | | 48,260 | |
WPX Energy Inc. | | | | | | | | |
7.50%, 08/01/20 (Call 07/01/20) | | | 35 | | | | 36,881 | |
| | | | | | | | |
| | | | | | | 2,804,353 | |
OIL & GAS SERVICES — 0.15% | | | | | |
Halliburton Co. | | | | | | | | |
3.25%, 11/15/21 (Call 08/15/21) | | | 100 | | | | 103,848 | |
| | | | | | | | |
| | | | | | | 103,848 | |
PACKAGING & CONTAINERS — 0.11% | | | | | |
Ball Corp. | | | | | | | | |
4.00%, 11/15/23 | | | 50 | | | | 50,575 | |
PaperWorks Industries Inc. | | | | | | | | |
9.50%, 08/15/19 (Call 12/01/16)a | | | 30 | | | | 27,675 | |
| | | | | | | | |
| | | | | | | 78,250 | |
| | | | | | | | |
Security | |
Principal
(000s) | | | Value | |
PHARMACEUTICALS — 2.74% | | | | | |
AbbVie Inc. | | | | | | | | |
1.75%, 11/06/17 | | $ | 150 | | | $ | 150,513 | |
1.80%, 05/14/18 | | | 50 | | | | 50,167 | |
2.30%, 05/14/21 (Call 04/14/21) | | | 55 | | | | 54,959 | |
2.50%, 05/14/20 (Call 04/14/20) | | | 30 | | | | 30,427 | |
Actavis Funding SCS | | | | | | | | |
3.00%, 03/12/20 (Call 02/12/20)b | | | 185 | | | | 190,715 | |
AmerisourceBergen Corp. | | | | | | | | |
4.88%, 11/15/19b | | | 100 | | | | 108,837 | |
Baxalta Inc. | | | | | | | | |
2.88%, 06/23/20 (Call 05/23/20)b | | | 45 | | | | 45,860 | |
Cardinal Health Inc. | | | | | | | | |
1.95%, 06/15/18 | | | 75 | | | | 75,377 | |
Express Scripts Holding Co. | | | | | | | | |
3.30%, 02/25/21 (Call 01/25/21) | | | 25 | | | | 26,167 | |
McKesson Corp. | | | | | | | | |
1.40%, 03/15/18 | | | 150 | | | | 149,679 | |
Mead Johnson Nutrition Co. | | | | | | | | |
3.00%, 11/15/20 | | | 55 | | | | 56,791 | |
Novartis Capital Corp. | | | | | | | | |
3.40%, 05/06/24 | | | 150 | | | | 161,799 | |
Pfizer Inc. | | | | | | | | |
6.20%, 03/15/19 | | | 250 | | | | 276,842 | |
Shire Acquisitions Investments Ireland DAC | | | | | | | | |
1.90%, 09/23/19 | | | 200 | | | | 199,486 | |
2.40%, 09/23/21 (Call 08/23/21) | | | 95 | | | | 94,244 | |
Teva Pharmaceutical Finance IV BV | | | | | | | | |
3.65%, 11/10/21 | | | 46 | | | | 48,404 | |
Teva Pharmaceutical Finance Netherlands III BV | | | | | | | | |
1.40%, 07/20/18 | | | 50 | | | | 49,786 | |
1.70%, 07/19/19 | | | 25 | | | | 24,842 | |
Zoetis Inc. | | | | | | | | |
3.45%, 11/13/20 (Call 10/13/20) | | | 130 | | | | 134,919 | |
| | | | | | | | |
| | | | | | | 1,929,814 | |
PIPELINES — 2.04% | | | | | |
Boardwalk Pipelines LP | | | | | | | | |
5.95%, 06/01/26 (Call 03/01/26) | | | 80 | | | | 88,688 | |
Buckeye Partners LP | | | | | | | | |
3.95%, 12/01/26 (Call 09/01/26) | | | 35 | | | | 34,996 | |
4.15%, 07/01/23 (Call 04/01/23) | | | 50 | | | | 51,193 | |
| | | | |
SCHEDULEOF INVESTMENTS | | | 17 | |
Schedule of Investments (Continued)
iSHARES® EDGE U.S. FIXED INCOME BALANCED RISK ETF
October 31, 2016
| | | | | | | | |
Security | |
Principal
(000s) | | | Value | |
Energy Transfer Partners LP | | | | | | | | |
4.15%, 10/01/20 (Call 08/01/20) | | $ | 100 | | | $ | 104,585 | |
9.00%, 04/15/19 | | | 100 | | | | 113,713 | |
Enterprise Products Operating LLC | | | | | | | | |
3.70%, 02/15/26 (Call 11/15/25) | | | 100 | | | | 102,082 | |
Kinder Morgan Inc./DE | | | | | | | | |
3.05%, 12/01/19 (Call 11/01/19) | | | 100 | | | | 102,463 | |
Magellan Midstream Partners LP | | | | | | | | |
5.00%, 03/01/26 (Call 12/01/25) | | | 100 | | | | 113,658 | |
ONEOK Inc. | | | | | | | | |
7.50%, 09/01/23 (Call 06/01/23) | | | 100 | | | | 114,500 | |
ONEOK Partners LP | | | | | | | | |
3.20%, 09/15/18 (Call 08/15/18) | | | 100 | | | | 102,677 | |
PBF Logistics LP/PBF Logistics Finance Corp. | | | | | | | | |
6.88%, 05/15/23 (Call 05/15/18) | | | 35 | | | | 33,950 | |
Sabine Pass Liquefaction LLC | | | | | | | | |
5.63%, 03/01/25 (Call 12/01/24) | | | 100 | | | | 105,815 | |
Tesoro Logistics LP/Tesoro Logistics Finance Corp. | | | | | | | | |
6.13%, 10/15/21 (Call 11/16/16) | | | 100 | | | | 104,625 | |
TransCanada PipeLines Ltd. | | | | | | | | |
3.13%, 01/15/19 | | | 60 | | | | 61,745 | |
Western Gas Partners LP | | | | | | | | |
4.65%, 07/01/26 (Call 04/01/26)b | | | 100 | | | | 104,875 | |
Williams Partners LP | | | | | | | | |
4.00%, 09/15/25 (Call 06/15/25) | | | 100 | | | | 100,231 | |
| | | | | | | | |
| | | | | | | 1,439,796 | |
REAL ESTATE INVESTMENT TRUSTS — 3.35% | |
American Tower Corp. | | | | | | | | |
2.80%, 06/01/20 (Call 05/01/20) | | | 100 | | | | 101,982 | |
3.38%, 10/15/26 (Call 07/15/26) | | | 90 | | | | 89,554 | |
3.40%, 02/15/19 | | | 100 | | | | 103,577 | |
3.50%, 01/31/23 | | | 100 | | | | 103,227 | |
5.90%, 11/01/21 | | | 100 | | | | 115,448 | |
Boston Properties LP | | | | | | | | |
5.88%, 10/15/19 (Call 07/17/19) | | | 100 | | | | 110,702 | |
Communications Sales & Leasing Inc./CSL Capital LLC | | | | | | | | |
6.00%, 04/15/23 (Call 04/15/18)a | | | 45 | | | | 46,687 | |
Crown Castle International Corp. | | | | | | | | |
3.40%, 02/15/21 (Call 01/15/21) | | | 100 | | | | 104,268 | |
4.88%, 04/15/22 | | | 100 | | | | 110,301 | |
| | | | | | | | |
Security | |
Principal
(000s) | | | Value | |
Digital Realty Trust LP | | | | | | | | |
3.40%, 10/01/20 (Call 09/01/20) | | $ | 200 | | | $ | 207,508 | |
DuPont Fabros Technology LP | | | | | | | | |
5.63%, 06/15/23 (Call 06/15/18)b | | | 30 | | | | 31,575 | |
ERP Operating LP | | | | | | | | |
2.85%, 11/01/26 (Call 08/01/26)b | | | 80 | | | | 79,250 | |
HCP Inc. | | | | | | | | |
2.63%, 02/01/20 (Call 11/01/19) | | | 250 | | | | 252,890 | |
Hospitality Properties Trust | | | | | | | | |
5.00%, 08/15/22 (Call 02/15/22) | | | 200 | | | | 216,204 | |
Simon Property Group LP | | | | | | | | |
2.50%, 09/01/20 (Call 06/01/20) | | | 100 | | | | 102,488 | |
4.38%, 03/01/21 (Call 12/01/20) | | | 150 | | | | 164,176 | |
Ventas Realty LP/Ventas Capital Corp. | | | | | | | | |
4.00%, 04/30/19 (Call 01/30/19) | | | 200 | | | | 209,760 | |
Vereit Operating Partnership LP | | | | | | | | |
4.88%, 06/01/26 (Call 03/01/26) | | | 40 | | | | 42,043 | |
Welltower Inc. | | | | | | | | |
5.25%, 01/15/22 (Call 10/15/21) | | | 150 | | | | 169,719 | |
| | | | | | | | |
| | | | | | | 2,361,359 | |
RETAIL — 2.73% | | | | | |
1011778 BC ULC/New Red Finance Inc. | | | | | | | | |
4.63%, 01/15/22 (Call 10/01/17)a | | | 100 | | | | 103,250 | |
Advance Auto Parts Inc. | | | | | | | | |
5.75%, 05/01/20 | | | 200 | | | | 220,142 | |
AmeriGas Finance LLC/AmeriGas Finance Corp. | | | | | | | | |
7.00%, 05/20/22 (Call 05/20/17) | | | 100 | | | | 105,250 | |
AutoZone Inc. | | | | | | | | |
2.50%, 04/15/21 (Call 03/15/21) | | | 230 | | | | 233,013 | |
CVS Health Corp. | | | | | | | | |
4.13%, 05/15/21 (Call 02/15/21) | | | 200 | | | | 216,362 | |
Home Depot Inc. (The) | | | | | | | | |
2.13%, 09/15/26 (Call 06/15/26) | | | 50 | | | | 48,178 | |
3.35%, 09/15/25 (Call 06/15/25) | | | 35 | | | | 37,351 | |
L Brands Inc. | | | | | | | | |
6.63%, 04/01/21b | | | 150 | | | | 172,500 | |
McDonald’s Corp. | | | | | | | | |
3.63%, 05/20/21 | | | 100 | | | | 106,637 | |
Michaels Stores Inc. | | | | | | | | |
5.88%, 12/15/20 (Call 12/15/16)a | | | 100 | | | | 102,875 | |
| | |
| 18 | | 2016 iSHARES ANNUAL REPORTTO SHAREHOLDERS |
Schedule of Investments (Continued)
iSHARES® EDGE U.S. FIXED INCOME BALANCED RISK ETF
October 31, 2016
| | | | | | | | |
Security | |
Principal
(000s) | | | Value | |
O’Reilly Automotive Inc. | | | | | | | | |
3.55%, 03/15/26 (Call 12/15/25)b | | $ | 60 | | | $ | 62,329 | |
Party City Holdings Inc. | | | | | | | | |
6.13%, 08/15/23 (Call 08/15/18)a | | | 45 | | | | 47,756 | |
QVC Inc. | | | | | | | | |
3.13%, 04/01/19 | | | 250 | | | | 255,312 | |
Rite Aid Corp. | | | | | | | | |
6.75%, 06/15/21 (Call 12/01/16) | | | 100 | | | | 105,000 | |
Sally Holdings LLC/Sally Capital Inc. | | | | | | | | |
5.75%, 06/01/22 (Call 06/01/17)b | | | 50 | | | | 52,000 | |
Suburban Propane Partners LP/Suburban Energy Finance Corp. | | | | | | | | |
5.50%, 06/01/24 (Call 06/01/19)b | | | 50 | | | | 51,000 | |
| | | | | | | | |
| | | | | | | 1,918,955 | |
SEMICONDUCTORS — 0.44% | | | | | |
Applied Materials Inc. | | | | | | | | |
2.63%, 10/01/20 (Call 09/01/20) | | | 50 | | | | 51,453 | |
Micron Technology Inc. | | | | | | | | |
5.25%, 08/01/23 (Call 02/01/18)a | | | 100 | | | | 98,000 | |
NVIDIA Corp. | | | | | | | | |
2.20%, 09/16/21 (Call 08/16/21) | | | 35 | | | | 34,959 | |
3.20%, 09/16/26 (Call 06/16/26) | | | 40 | | | | 39,978 | |
QUALCOMM Inc. | | | | | | | | |
3.00%, 05/20/22 | | | 85 | | | | 88,573 | |
| | | | | | | | |
| | | | | | | 312,963 | |
SOFTWARE — 1.70% | | | | | |
Activision Blizzard Inc. | | | | | | | | |
2.30%, 09/15/21 (Call 08/15/21)a,b | | | 25 | | | | 24,915 | |
3.40%, 09/15/26 (Call 06/15/26)a | | | 60 | | | | 59,550 | |
Autodesk Inc. | | | | | | | | |
3.13%, 06/15/20 (Call 05/15/20) | | | 30 | | | | 30,793 | |
BMC Software Finance Inc. | | | | | | | | |
8.13%, 07/15/21 (Call 12/01/16)a | | | 50 | | | | 45,750 | |
Electronic Arts Inc. | | | | | | | | |
3.70%, 03/01/21 (Call 02/01/21) | | | 30 | | | | 31,682 | |
Fidelity National Information Services Inc. | | | | | | | | |
2.00%, 04/15/18 | | | 200 | | | | 201,408 | |
First Data Corp. | | | | | | | | |
5.00%, 01/15/24 (Call 01/15/19)a | | | 95 | | | | 96,425 | |
6.75%, 11/01/20 (Call 12/01/16)a | | | 100 | | | | 103,500 | |
7.00%, 12/01/23 (Call 12/01/18)a | | | 80 | | | | 83,800 | |
| | | | | | | | |
Security | |
Principal
(000s) | | | Value | |
Fiserv Inc. | | | | | | | | |
3.85%, 06/01/25 (Call 03/01/25) | | $ | 50 | | | $ | 53,219 | |
Microsoft Corp. | | | | | | | | |
2.00%, 08/08/23 (Call 06/08/23) | | | 175 | | | | 172,305 | |
2.40%, 08/08/26 (Call 05/08/26)b | | | 95 | | | | 93,176 | |
Oracle Corp. | | | | | | | | |
1.90%, 09/15/21 (Call 08/15/21) | | | 200 | | | | 199,250 | |
| | | | | | | | |
| | | | | | | 1,195,773 | |
TELECOMMUNICATIONS — 5.03% | | | | | |
AT&T Inc. | | | | | | | | |
1.70%, 06/01/17b | | | 350 | | | | 351,278 | |
2.80%, 02/17/21 (Call 01/17/21) | | | 100 | | | | 101,385 | |
3.00%, 06/30/22 (Call 04/30/22) | | | 50 | | | | 50,610 | |
3.40%, 05/15/25 (Call 02/15/25) | | | 200 | | | | 199,572 | |
3.90%, 03/11/24 (Call 12/11/23) | | | 150 | | | | 156,316 | |
5.80%, 02/15/19 | | | 100 | | | | 108,621 | |
5.88%, 10/01/19 | | | 300 | | | | 332,205 | |
CC Holdings GS V LLC/Crown Castle GS III Corp. | | | | | | | | |
3.85%, 04/15/23b | | | 100 | | | | 105,601 | |
CenturyLink Inc. | | | | | | | | |
6.45%, 06/15/21 | | | 150 | | | | 160,125 | |
Cisco Systems Inc. | | | | | | | | |
1.85%, 09/20/21 (Call 08/20/21) | | | 100 | | | | 99,749 | |
Frontier Communications Corp. | | | | | | | | |
6.88%, 01/15/25 (Call 10/15/24) | | | 100 | | | | 83,750 | |
8.50%, 04/15/20 | | | 100 | | | | 106,750 | |
Harris Corp. | | | | | | | | |
2.00%, 04/27/18 | | | 45 | | | | 45,209 | |
Hughes Satellite Systems Corp. | | | | | | | | |
5.25%, 08/01/26a | | | 35 | | | | 34,475 | |
6.63%, 08/01/26a | | | 80 | | | | 79,200 | |
Intelsat Jackson Holdings SA | | | | | | | | |
7.25%, 10/15/20 (Call 12/01/16) | | | 100 | | | | 75,813 | |
Juniper Networks Inc. | | | | | | | | |
3.30%, 06/15/20 (Call 05/15/20) | | | 30 | | | | 30,852 | |
Motorola Solutions Inc. | | | | | | | | |
3.50%, 03/01/23 | | | 150 | | | | 150,160 | |
Plantronics Inc. | | | | | | | | |
5.50%, 05/31/23 (Call 05/15/18)a,b | | | 50 | | | | 50,875 | |
Qwest Corp. | | | | | | | | |
6.75%, 12/01/21b | | | 100 | | | | 110,750 | |
| | | | |
SCHEDULEOF INVESTMENTS | | | 19 | |
Schedule of Investments (Continued)
iSHARES® EDGE U.S. FIXED INCOME BALANCED RISK ETF
October 31, 2016
| | | | | | | | |
Security | |
Principal
(000s) | | | Value | |
Sprint Communications Inc. | | | | | | | | |
9.00%, 11/15/18a | | $ | 100 | | | $ | 110,000 | |
Sprint Corp. | | | | | | | | |
7.88%, 09/15/23 | | | 125 | | | | 123,750 | |
T-Mobile USA Inc. | | | | | | | | |
6.50%, 01/15/26 (Call 01/15/21)b | | | 45 | | | | 49,329 | |
6.63%, 04/01/23 (Call 04/01/18) | | | 150 | | | | 159,402 | |
6.73%, 04/28/22 (Call 04/28/17) | | | 100 | | | | 104,500 | |
Verizon Communications Inc. | | | | | | | | |
1.38%, 08/15/19b | | | 40 | | | | 39,669 | |
3.50%, 11/01/21 | | | 100 | | | | 105,621 | |
4.50%, 09/15/20 | | | 100 | | | | 108,810 | |
5.15%, 09/15/23 | | | 100 | | | | 114,458 | |
Vodafone Group PLC | | | | | | | | |
1.63%, 03/20/17 | | | 150 | | | | 150,207 | |
Windstream Services LLC | | | | | | | | |
6.38%, 08/01/23 (Call 02/01/18) | | | 50 | | | | 44,250 | |
| | | | | | | | |
| | | | | | | 3,543,292 | |
TOYS, GAMES & HOBBIES — 0.06% | | | | | |
Mattel Inc. | | | | | | | | |
2.35%, 08/15/21 (Call 07/15/21) | | | 45 | | | | 45,103 | |
| | | | | | | | |
| | | | | | | 45,103 | |
TRANSPORTATION — 0.07% | | | | | |
OPE KAG Finance Sub Inc. | | | | | | | | |
7.88%, 07/31/23 (Call 07/31/18)a | | | 35 | | | | 33,075 | |
XPO Logistics Inc. | | | | | | | | |
6.50%, 06/15/22 (Call 06/15/18)a,b | | | 15 | | | | 15,600 | |
| | | | | | | | |
| | | | | | | 48,675 | |
| | | | | | | | |
TOTAL CORPORATE BONDS & NOTES | |
(Cost: $56,471,446) | | | | 57,163,349 | |
|
U.S. GOVERNMENT & AGENCY OBLIGATIONS — 46.63% | |
|
MORTGAGE-BACKED SECURITIES — 46.63% | |
Federal Home Loan Mortgage Corp. | | | | | | | | |
2.50%, 11/01/31c | | | 925 | | | | 951,738 | |
2.50%, 11/01/46c | | | 25 | | | | 24,926 | |
3.00%, 11/01/31c | | | 825 | | | | 863,285 | |
3.00%, 11/01/46c | | | 2,300 | | | | 2,367,203 | |
3.50%, 11/01/31c | | | 425 | | | | 448,375 | |
3.50%, 01/01/46 | | | 1,034 | | | | 1,084,611 | |
| | | | | | | | |
Security | |
Principal
(000s) | | | Value | |
3.50%, 03/01/46 | | $ | 512 | | | $ | 537,544 | |
3.50%, 07/01/46 | | | 123 | | | | 128,785 | |
3.50%, 09/01/46 | | | 30 | | | | 31,268 | |
3.50%, 11/01/46c | | | 401 | | | | 420,799 | |
4.00%, 11/01/31c | | | 25 | | | | 25,816 | |
4.00%, 11/01/45 | | | 407 | | | | 435,436 | |
4.00%, 04/01/46 | | | 329 | | | | 355,648 | |
4.00%, 11/01/46c | | | 461 | | | | 493,054 | |
4.50%, 11/01/31c | | | 25 | | | | 25,609 | |
4.50%, 11/01/46c | | | 575 | | | | 628,277 | |
5.00%, 11/01/46c | | | 350 | | | | 386,969 | |
Federal National Mortgage Association | | | | | | | | |
2.50%, 11/01/31c | | | 1,020 | | | | 1,049,644 | |
2.50%, 11/01/46c | | | 100 | | | | 99,750 | |
3.00%, 02/01/31 | | | 1,015 | | | | 1,061,987 | |
3.00%, 11/01/31c | | | 84 | | | | 87,898 | |
3.00%, 11/01/46c | | | 2,775 | | | | 2,856,516 | |
3.50%, 11/01/31c | | | 529 | | | | 557,268 | |
3.50%, 11/01/45 | | | 185 | | | | 194,109 | |
3.50%, 02/01/46 | | | 727 | | | | 763,418 | |
3.50%, 11/01/46c | | | 2,614 | | | | 2,744,292 | |
4.00%, 11/01/31c | | | 325 | | | | 336,324 | |
4.00%, 01/01/46 | | | 991 | | | | 1,061,082 | |
4.00%, 02/01/46 | | | 87 | | | | 92,958 | |
4.00%, 03/01/46 | | | 169 | | | | 181,279 | |
4.00%, 04/01/46 | | | 213 | | | | 228,334 | |
4.00%, 11/01/46c | | | 963 | | | | 1,031,162 | |
4.50%, 11/01/31c | | | 125 | | | | 128,281 | |
4.50%, 11/01/46c | | | 975 | | | | 1,065,492 | |
5.00%, 11/01/31c | | | 25 | | | | 25,602 | |
5.00%, 11/01/46c | | | 200 | | | | 221,313 | |
5.50%, 11/01/46c | | | 1,025 | | | | 1,155,367 | |
Government National Mortgage Association | | | | | | | | |
2.50%, 11/01/46c | | | 25 | | | | 25,227 | |
3.00%, 11/01/46c | | | 1,950 | | | | 2,030,492 | |
3.50%, 03/20/46 | | | 259 | | | | 274,827 | |
3.50%, 11/01/46c | | | 2,993 | | | | 3,169,416 | |
4.00%, 01/20/46 | | | 114 | | | | 122,576 | |
4.00%, 09/20/46 | | | 265 | | | | 284,949 | |
4.00%, 11/01/46c | | | 1,094 | | | | 1,172,044 | |
4.50%, 11/20/45 | | | 42 | | | | 45,113 | |
| | |
| 20 | | 2016 iSHARES ANNUAL REPORTTO SHAREHOLDERS |
Schedule of Investments (Continued)
iSHARES® EDGE U.S. FIXED INCOME BALANCED RISK ETF
October 31, 2016
| | | | | | | | |
Security | | Principal or Shares (000s) | | | Value | |
4.50%, 11/01/46c | | $ | 820 | | | $ | 888,881 | |
5.00%, 11/01/46c | | | 625 | | | | 674,023 | |
| | | | | | | | |
| | | | | | | 32,838,967 | |
| | | | | | | | |
TOTAL U.S. GOVERNMENT & AGENCY OBLIGATIONS | |
(Cost: $32,843,427) | | | | 32,838,967 | |
|
SHORT-TERM INVESTMENTS — 17.98% | |
|
MONEY MARKET FUNDS — 17.98% | |
BlackRock Cash Funds: Institutional,
SL Agency Shares | | | | | |
0.72%d,e,f | | | 12,559 | | | | 12,559,972 | |
BlackRock Cash Funds: Treasury,
SL Agency Shares | | | | | |
0.29%d,e | | | 100 | | | | 100,000 | |
| | | | | | | | |
| | | | | | | 12,659,972 | |
| | | | | | | | |
| |
TOTAL SHORT-TERM INVESTMENTS | | | | | |
(Cost: $12,658,783) | | | | 12,659,972 | |
| | | | | | | | |
TOTAL INVESTMENTS
IN SECURITIES — 145.79% | | | | | | | | |
(Cost: $101,973,656)g | | | | 102,662,288 | |
Other Assets, Less Liabilities — (45.79)% | | | | (32,244,635 | ) |
| | | | | | | | |
NET ASSETS — 100.00% | | | | | | $ | 70,417,653 | |
| | | | | | | | |
VRN — Variable Rate Note
| a | This security may be resold to qualified institutional buyers under Rule 144A of the Securities Act of 1933. |
| b | All or a portion of this security represents a security on loan. See Note 1. |
| c | To-be-announced (TBA). See Note 1. |
| d | Affiliated money market fund. |
| e | The rate quoted is the annualized seven-day yield of the fund at period end. |
| f | All or a portion of this security represents an investment of securities lending collateral. See Note 1. |
| g | The cost of investments for federal income tax purposes was $101,974,467. Net unrealized appreciation was $687,821, of which $931,964 represented gross unrealized appreciation on securities and $244,143 represented gross unrealized depreciation on securities. |
Schedule 1 — Futures Contracts (Note 5)
Futures contracts outstanding as of October 31, 2016 were as follows:
| | | | | | | | | | | | | | | | | | | | | | | | |
| Issue | | Number of long (short) contracts | | | Expiration date | | | Exchange | | | Initial notional value | | | Current notional value | | | Unrealized appreciation (depreciation) | |
2-Year U.S. Treasury Note | | | (1 | ) | | | Dec. 2016 | | | | Chicago Board of Trade | | | $ | (218,296 | ) | | $ | (218,141 | ) | | $ | 155 | |
5-Year U.S. Treasury Note | | | 1 | | | | Dec. 2016 | | | | Chicago Board of Trade | | | | 120,830 | | | | 120,797 | | | | (33 | ) |
10-Year U.S. Treasury Note | | | (3 | ) | | | Dec. 2016 | | | | Chicago Board of Trade | | | | (393,162 | ) | | | (388,875 | ) | | | 4,287 | |
Ultra Long U.S. Treasury Bond | | | (11 | ) | | | Dec. 2016 | | | | Chicago Board of Trade | | | | (2,051,497 | ) | | | (1,935,312 | ) | | | 116,185 | |
U.S. Treasury Long Bond | | | (1 | ) | | | Dec. 2016 | | | | Chicago Board of Trade | | | | (170,389 | ) | | | (162,719 | ) | | | 7,670 | |
| | | | | | | | | | | | | | | | | | | | | | | | |
| Net unrealized appreciation | | | $ | 128,264 | |
| | | | | | | | | | | | | | | | | | | | | | | | |
| | | | | | | | | | | | | | | | | | | | | | | | | |
| | | | |
SCHEDULEOF INVESTMENTS | | | 21 | |
Schedule of Investments (Continued)
iSHARES® EDGE U.S. FIXED INCOME BALANCED RISK ETF
October 31, 2016
Schedule 2 — Fair Value Measurements
Various inputs are used in determining the fair value of financial instruments. For description of the input levels and information about the Fund’s policy regarding valuation of financial instruments, see Note 1.
The following table summarizes the value of the Fund’s investments according to the fair value hierarchy as of October 31, 2016. The breakdown of the Fund’s investments into major categories is disclosed in the schedule of investments above.
| | | | | | | | | | | | | | | | |
| | | Level 1 | | | Level 2 | | | Level 3 | | | Total | |
Investments: | | | | | | | | | | | | | | | | |
Assets: | | | | | | | | | | | | | | | | |
Corporate bonds & notes | | $ | — | | | $ | 57,163,349 | | | $ | — | | | $ | 57,163,349 | |
U.S. government & agency obligations | | | — | | | | 32,838,967 | | | | — | | | | 32,838,967 | |
Money market funds | | | 12,659,972 | | | | — | | | | — | | | | 12,659,972 | |
| | | | | | | | | | | | | | | | |
Total | | $ | 12,659,972 | | | $ | 90,002,316 | | | $ | — | | | $ | 102,662,288 | |
| | | | | | | | | | | | | | | | |
Derivative financial instrumentsa: | | | | | | | | | | | | | | | | |
Assets: | | | | | | | | | | | | | | | | |
Futures contracts | | $ | 128,297 | | | $ | — | | | $ | — | | | $ | 128,297 | |
Liabilities: | | | | | | | | | | | | | | | | |
Futures contracts | | | (33 | ) | | | — | | | | — | | | | (33 | ) |
| | | | | | | | | | | | | | | | |
Total | | $ | 128,264 | | | $ | — | | | $ | — | | | $ | 128,264 | |
| | | | | | | | | | | | | | | | |
| | | | | | | | | | | | | | | | | |
| | a | | Shown at the unrealized appreciation (depreciation) on the contracts. |
See notes to financial statements.
| | |
| 22 | | 2016 iSHARES ANNUAL REPORTTO SHAREHOLDERS |
Statement of Assets and Liabilities
iSHARES® EDGE U.S. FIXED INCOME BALANCED RISK ETF
October 31, 2016
| | | | |
| | |
ASSETS | | | | |
Investments, at cost: | | | | |
Unaffiliated | | $ | 89,314,873 | |
Affiliated (Note 2) | | | 12,658,783 | |
| | | | |
Total cost of investments | | $ | 101,973,656 | |
| | | | |
Investments in securities, at fair value (including securities on loana) (Note 1): | | | | |
Unaffiliated | | $ | 90,002,316 | |
Affiliated (Note 2) | | | 12,659,972 | |
| | | | |
Total fair value of investments | | | 102,662,288 | |
Cash pledged to broker | | | 72,980 | |
Receivables: | | | | |
Investment securities sold | | | 833,072 | |
Dividends and interest | | | 610,163 | |
| | | | |
Total Assets | | | 104,178,503 | |
| | | | |
| |
LIABILITIES | | | | |
Payables: | | | | |
Investment securities purchased | | | 26,882,113 | |
Collateral for securities on loan (Note 1) | | | 6,852,075 | |
Futures variation margin | | | 12,136 | |
Investment advisory fees (Note 2) | | | 14,526 | |
| | | | |
Total Liabilities | | | 33,760,850 | |
| | | | |
| |
NET ASSETS | | $ | 70,417,653 | |
| | | | |
| |
Net assets consist of: | | | | |
Paid-in capital | | $ | 69,990,544 | |
Accumulated net realized loss | | | (389,787 | ) |
Net unrealized appreciation | | | 816,896 | |
| | | | |
NET ASSETS | | $ | 70,417,653 | |
| | | | |
| |
Shares outstandingb | | | 700,000 | |
| | | | |
| |
Net asset value per share | | $ | 100.60 | |
| | | | |
| a | Securities on loan with a value of $6,632,444. See Note 1. |
| b | No par value, unlimited number of shares authorized. |
See notes to financial statements.
Statement of Operations
iSHARES® EDGE U.S. FIXED INCOME BALANCED RISK ETF
Year ended October 31, 2016
| | | | |
| | |
NET INVESTMENT INCOME | | | | |
Dividends — affiliated (Note 2) | | $ | 11,736 | |
Interest — unaffiliated | | | 2,080,758 | |
Securities lending income — affiliated — net (Note 2) | | | 18,703 | |
| | | | |
Total investment income | | | 2,111,197 | |
| | | | |
| |
EXPENSES | | | | |
Investment advisory fees (Note 2) | | | 174,198 | |
| | | | |
Total expenses | | | 174,198 | |
Less investment advisory fees waived (Note 2) | | | (2,180 | ) |
| | | | |
Net expenses | | | 172,018 | |
| | | | |
Net investment income | | | 1,939,179 | |
| | | | |
| |
NET REALIZED AND UNREALIZED GAIN (LOSS) | | | | |
Net realized gain (loss) from: | | | | |
Investments — unaffiliated | | | 57,798 | |
Investments — affiliated (Note 2) | | | 100 | |
Futures contracts | | | (433,770 | ) |
Realized gain distributions from affiliated funds | | | 461 | |
| | | | |
Net realized loss | | | (375,411 | ) |
| | | | |
Net change in unrealized appreciation/depreciation on: | | | | |
Investments | | | 1,883,990 | |
Futures contracts | | | 113,924 | |
| | | | |
Net change in unrealized appreciation/depreciation | | | 1,997,914 | |
| | | | |
Net realized and unrealized gain | | | 1,622,503 | |
| | | | |
NET INCREASE IN NET ASSETS RESULTING FROM OPERATIONS | | $ | 3,561,682 | |
| | | | |
See notes to financial statements.
| | |
| 24 | | 2016 iSHARES ANNUAL REPORTTO SHAREHOLDERS |
Statements of Changes in Net Assets
iSHARES® EDGE U.S. FIXED INCOME BALANCED RISK ETF
| | | | | | | | |
| | | Year ended October 31, 2016 | | | Period from
February 24, 2015a to October 31, 2015 | |
| | |
INCREASE (DECREASE) IN NET ASSETS | | | | | | | | |
| | |
OPERATIONS: | | | | | | | | |
Net investment income | | $ | 1,939,179 | | | $ | 1,302,726 | |
Net realized gain (loss) | | | (375,411 | ) | | | 29,720 | |
Net change in unrealized appreciation/depreciation | | | 1,997,914 | | | | (1,181,018 | ) |
| | | | | | | | |
Net increase in net assets resulting from operations | | | 3,561,682 | | | | 151,428 | |
| | | | | | | | |
| | |
DISTRIBUTIONS TO SHAREHOLDERS: | | | | | | | | |
From net investment income | | | (1,954,073 | ) | | | (1,287,832 | ) |
Return of capital | | | (64,951 | ) | | | — | |
| | | | | | | | |
Total distributions to shareholders | | | (2,019,024 | ) | | | (1,287,832 | ) |
| | | | | | | | |
| | |
CAPITAL SHARE TRANSACTIONS: | | | | | | | | |
Proceeds from shares sold | | | 10,007,595 | | | | 74,886,750 | |
Cost of shares redeemed | | | (14,882,946 | ) | | | — | |
| | | | | | | | |
Net increase (decrease) in net assets from capital share transactions | | | (4,875,351 | ) | | | 74,886,750 | |
| | | | | | | | |
INCREASE (DECREASE) IN NET ASSETS | | | (3,332,693 | ) | | | 73,750,346 | |
| | |
NET ASSETS | | | | | | | | |
Beginning of period | | | 73,750,346 | | | | — | |
| | | | | | | | |
End of period | | $ | 70,417,653 | | | $ | 73,750,346 | |
| | | | | | | | |
Undistributed net investment income included in net assets at end of period | | $ | — | | | $ | 14,894 | |
| | | | | | | | |
| | |
SHARES ISSUED AND REDEEMED | | | | | | | | |
Shares sold | | | 100,000 | | | | 750,000 | |
Shares redeemed | | | (150,000 | ) | | | — | |
| | | | | | | | |
Net increase (decrease) in shares outstanding | | | (50,000 | ) | | | 750,000 | |
| | | | | | | | |
| a | Commencement of operations. |
See notes to financial statements.
Financial Highlights
iSHARES® EDGE U.S. FIXED INCOME BALANCED RISK ETF
(For a share outstanding throughout each period)
| | | | | | | | |
| | | Year ended
Oct. 31, 2016 | | | Period from
Feb. 24, 2015a to
Oct. 31, 2015 | |
Net asset value, beginning of period | | $ | 98.33 | | | $ | 99.60 | |
| | | | | | | | |
Income from investment operations: | | | | | | | | |
Net investment incomeb | | | 2.75 | | | | 1.74 | |
Net realized and unrealized gain (loss)c | | | 2.40 | | | | (1.29 | ) |
| | | | | | | | |
Total from investment operations | | | 5.15 | | | | 0.45 | |
| | | | | | | | |
Less distributions from: | | | | | | | | |
Net investment income | | | (2.79 | ) | | | (1.72 | ) |
Return of capital | | | (0.09 | ) | | | — | |
| | | | | | | | |
Total distributions | | | (2.88 | ) | | | (1.72 | ) |
| | | | | | | | |
Net asset value, end of period | | $ | 100.60 | | | $ | 98.33 | |
| | | | | | | | |
| | |
Total return | | | 5.32 | % | | | 0.46 | %d |
| | | | | | | | |
| | |
Ratios/Supplemental data: | | | | | | | | |
Net assets, end of period (000s) | | $ | 70,418 | | | $ | 73,750 | |
Ratio of expenses to average net assetse | | | 0.25 | % | | | 0.25 | % |
Ratio of expenses to average net assets prior to waived feese | | | 0.25 | % | | | 0.26 | % |
Ratio of net investment income to average net assetse | | | 2.78 | % | | | 2.58 | % |
Portfolio turnover ratef,g | | | 569 | % | | | 362 | % |
| a | Commencement of operations. |
| b | Based on average shares outstanding throughout each period. |
| c | The amounts reported for a share outstanding may not accord with the change in aggregate gains and losses in securities for the fiscal period due to the timing of capital share transactions in relation to the fluctuating market values of the Fund’s underlying securities. |
| e | Annualized for periods of less than one year. |
| f | Portfolio turnover rates exclude portfolio securities received or delivered as a result of processing capital share transactions in Creation Units. |
| g | Portfolio turnover rates include to-be-announced (TBA) transactions. See Note 1. |
See notes to financial statements.
| | |
| 26 | | 2016 iSHARES ANNUAL REPORTTO SHAREHOLDERS |
Notes to Financial Statements
iSHARES® EDGE U.S. FIXED INCOME BALANCED RISK ETF
iShares U.S. ETF Trust (the “Trust”) is registered under the Investment Company Act of 1940, as amended (the “1940 Act”), as an open-end management investment company. The Trust was established as a Delaware statutory trust pursuant to an Agreement and Declaration of Trust dated June 21, 2011.
These financial statements relate only to the following fund (the “Fund”):
| | |
| iShares ETF | | Diversification Classification |
Edge U.S. Fixed Income Balanced Riska | | Non-diversified |
| | a | | Formerly the iShares U.S. Fixed Income Balanced Risk ETF. |
Pursuant to the Trust’s organizational documents, the Fund’s officers and trustees are indemnified against certain liabilities that may arise out of the performance of their duties to the Fund. Additionally, in the normal course of business, the Fund enters into contracts with service providers that contain general indemnification clauses. The Fund’s maximum exposure under these arrangements is unknown as this would involve future claims that may be made against the Fund that have not yet occurred.
| 1. | SIGNIFICANT ACCOUNTING POLICIES |
The following significant accounting policies are consistently followed by the Fund in the preparation of its financial statements in conformity with accounting principles generally accepted in the United States of America (“U.S. GAAP”). The preparation of financial statements in conformity with U.S. GAAP requires management to make certain estimates and assumptions that affect the reported amounts of assets and liabilities and disclosures of contingent assets and liabilities at the date of the financial statements and the reported amounts of revenue and expenses during the reporting period. Actual results could differ from those estimates. The Fund is considered an investment company under U.S. GAAP and follows the accounting and reporting guidance applicable to investment companies.
SECURITY VALUATION
The Fund’s investments are valued at fair value each day that the Fund’s listing exchange is open and, for financial reporting purposes, as of the report date should the reporting period end on a day that the Fund’s listing exchange is not open. U.S. GAAP defines fair value as the price a fund would receive to sell an asset or pay to transfer a liability in an orderly transaction between market participants at the measurement date. The BlackRock Global Valuation Methodologies Committee (the “Global Valuation Committee”) provides oversight of the valuation of investments for the Fund. The investments of the Fund are valued pursuant to policies and procedures developed by the Global Valuation Committee and approved by the Board of Trustees of the Trust (the “Board”).
| | • | | Fixed income investments are valued using the last available bid price or current market quotations provided by dealers or prices (including evaluated prices) supplied by approved independent third-party pricing services. The pricing services may use matrix pricing or valuation models that utilize certain inputs and assumptions to derive values, including transaction data, credit quality information, perceived market movements, news, and other relevant information and by other methods, which may include consideration of: yields or prices of securities of comparable quality, coupon, maturity and type; indications as to values from dealers; general market conditions; and/or other factors and assumptions. Pricing services generally value fixed income securities assuming orderly transactions of an institutional round lot size, but a fund may hold or transact in such securities in smaller odd lot sizes. |
| | • | | Open-end U.S. mutual funds (including money market funds) are valued at that day’s published net asset value (“NAV”). |
| | • | | Futures contracts are valued at that day’s last reported settlement price on the exchange where the contract is traded. |
| | | | |
NOTESTO FINANCIAL STATEMENTS | | | 27 | |
Notes to Financial Statements (Continued)
iSHARES® EDGE U.S. FIXED INCOME BALANCED RISK ETF
In the event that application of these methods of valuation results in a price for an investment which is deemed not to be representative of the fair value of such investment or if a price is not available, the investment will be valued based upon other available factors deemed relevant by the Global Valuation Committee, in accordance with policies approved by the Board. These factors include but are not limited to (i) attributes specific to the investment; (ii) the principal market for the investment; (iii) the customary participants in the principal market for the investment; (iv) data assumptions by market participants for the investment, if reasonably available; (v) quoted prices for similar investments in active markets; and (vi) other factors, such as future cash flows, interest rates, yield curves, volatilities, prepayment speeds, loss severities, credit risks and/or default rates. Valuations based on such factors are reported to the Board on a quarterly basis.
The Global Valuation Committee employs various methods for calibrating valuation approaches for investments where an active market does not exist, including regular due diligence of the Trust’s pricing vendors, a regular review of key inputs and assumptions, transactional back-testing or disposition analysis to compare unrealized gains and losses to realized gains and losses, reviews of missing or stale prices, reviews of large movements in market values, and reviews of market related activity.
Various inputs are used in determining the fair value of financial instruments. Inputs may be based on independent market data (“observable inputs”) or they may be internally developed (“unobservable inputs”). These inputs are categorized into a disclosure hierarchy consisting of three broad levels for financial reporting purposes as follows:
| | • | | Level 1 — Unadjusted quoted prices in active markets for identical assets or liabilities; |
| | • | | Level 2 — Inputs other than quoted prices included within Level 1 that are observable for the asset or liability either directly or indirectly, including quoted prices for similar assets or liabilities in active markets, quoted prices for identical or similar assets or liabilities in markets that are not considered to be active, inputs other than quoted prices that are observable for the asset or liability (such as exchange rates, financing terms, interest rates, yield curves, volatilities, prepayment speeds, loss severities, credit risks and default rates) or other market-corroborated inputs; and |
| | • | | Level 3 — Unobservable inputs for the asset or liability based on the best information available in the circumstances, to the extent observable inputs are not available, including the Global Valuation Committee’s assumptions used in determining the fair value of investments. |
The hierarchy gives the highest priority to unadjusted quoted prices in active markets for identical assets or liabilities (Level 1 measurements) and the lowest priority to unobservable inputs (Level 3 measurements). Accordingly, the degree of judgement exercised in determining fair value is greatest for instruments categorized in Level 3. The inputs used to measure fair value may fall into different levels of the fair value hierarchy. In such cases, for disclosure purposes, the fair value hierarchy classification is determined based on the lowest level input that is significant to the fair value measurement in its entirety. The fair value hierarchy for the Fund’s investments is included in its schedule of investments.
Changes in valuation techniques may result in transfers in or out of an assigned level within the fair value hierarchy. In accordance with the Trust’s policy, transfers between different levels of the fair value hierarchy are deemed to have occurred as of the beginning of the reporting period. The categorization of values determined for financial instruments are based on the pricing transparency of the financial instruments and are not necessarily an indication of the risks associated with investing in those securities.
SECURITY TRANSACTIONS AND INCOME RECOGNITION
Security transactions are accounted for on trade date. Realized gains and losses on investment transactions are determined using the specific identification method. Interest income, including amortization and accretion of premiums and discounts on debt securities, is recognized daily on the accrual basis. Dividend income and capital gain distributions, if any, are recognized on the ex-dividend date, net of any foreign taxes withheld at source.
| | |
| 28 | | 2016 iSHARES ANNUAL REPORTTO SHAREHOLDERS |
Notes to Financial Statements (Continued)
iSHARES® EDGE U.S. FIXED INCOME BALANCED RISK ETF
WHEN-ISSUED/TBA TRANSACTIONS
The Fund may purchase mortgage pass-through securities on a when-issued or to-be-announced (“TBA”) basis, with payment and delivery scheduled for a future date. The Fund may enter into a TBA agreement, sell the obligation to purchase the pools stipulated in the TBA agreement prior to the stipulated settlement date and enter into a new TBA agreement for future delivery of pools of mortgage pass-through securities (a “TBA roll”). A TBA roll is treated by the Fund as a purchase transaction and a sale transaction in which the Fund realizes a gain or loss. The Fund’s use of TBA rolls may cause the Fund to experience higher portfolio turnover and higher transaction costs. The Fund could be exposed to possible risk if there are adverse market actions, expenses or delays in connection with the TBA transactions, or if the counterparty fails to complete the transaction.
To mitigate counterparty risk, the Fund has entered into a two-way collateral agreement for TBA transactions with certain counterparties. Under such agreement, the “in-the-money” party of a TBA transaction may at any time require the other party to pledge collateral assets (in the form of cash or securities) to offset any loss the in-the-money party would incur upon cancellation of the TBA transaction. A party is in-the-money if they are the buyer and the market value of the TBA transaction increases or if they are the seller and the market value of the TBA transaction decreases. Cash received as collateral from the counterparty may be reinvested in money market funds, including those managed by the Fund’s investment adviser, or its affiliates. Such collateral, if any, is presented in the statement of assets and liabilities as “Investments in securities – affiliated” and “Payable due to broker for TBA collateral.” Securities pledged as collateral by the Fund, if any, are noted in the schedule of investments.
DISTRIBUTIONS TO SHAREHOLDERS
Dividends and distributions paid by the Fund are recorded on the ex-dividend dates. Distributions are determined on a tax basis and may differ from net investment income and net realized capital gains for financial reporting purposes. Dividends and distributions are paid in U.S. dollars and cannot be automatically reinvested in additional shares of the Fund.
LOANS OF PORTFOLIO SECURITIES
The Fund may lend its investment securities to approved borrowers, such as brokers, dealers and other financial institutions. The borrower pledges and maintains with the Fund collateral consisting of cash, an irrevocable letter of credit issued by a bank, or securities issued or guaranteed by the U.S. government. The initial collateral received by the Fund is required to have a value of at least 102% of the current value of the loaned securities plus the interest accrued on such securities, if any, for securities traded on U.S. exchanges and a value of at least 105% for all other securities. The collateral is maintained thereafter at a value equal to at least 100% of the current value of the securities on loan plus accrued interest, if any. The market value of the loaned securities is determined at the close of each business day of the Fund. Any additional required collateral is delivered to the Fund and any excess collateral is returned by the Fund on the next business day. During the term of the loan, the Fund is entitled to all distributions made on or in respect of the loaned securities but does not receive interest income on securities received as collateral. Loans of securities are terminable at any time and the borrower, after notice, is required to return borrowed securities within the standard time period for settlement of securities transactions.
On October 11, 2016, BlackRock, Inc. (“BlackRock”) implemented changes required by amendments to Rule 2a-7 under the 1940 Act, which governs the operations of U.S. money market funds. The Fund may be exposed to additional risks when reinvesting the cash collateral in money market funds that do not seek to maintain a stable NAV per share of $1.00 and which may be subject to redemption gates or liquidity fees under certain circumstances.
Cash received as collateral for securities on loan may be reinvested in certain short-term instruments either directly on behalf of a fund or through one or more joint accounts or money market funds, including those managed by BlackRock Fund Advisors (“BFA”), the Fund’s investment adviser, or its affiliates. As of October 31, 2016, any securities on loan were collateralized by cash and/or U.S. government obligations. Cash collateral received was invested in money market funds managed by BFA and is
| | | | |
NOTESTO FINANCIAL STATEMENTS | | | 29 | |
Notes to Financial Statements (Continued)
iSHARES® EDGE U.S. FIXED INCOME BALANCED RISK ETF
disclosed in the schedule of investments. The securities on loan for the Fund are also disclosed in its schedule of investments. The total value of any securities on loan as of October 31, 2016 and the total value of the related cash collateral are disclosed in the statement of assets and liabilities. Income earned by the Fund from securities lending is disclosed in the statement of operations.
The risks of securities lending include the risk that the borrower may not provide additional collateral when required or may not return the securities when due. To mitigate these risks, the Fund benefits from a borrower default indemnity provided by BlackRock. BlackRock’s indemnity allows for full replacement of securities lent. The Fund could suffer a loss if the value of the investments purchased with cash collateral falls below the value of the cash collateral received.
Securities lending transactions are entered into by the Fund under Master Securities Lending Agreements (“MSLA”) which provide the right, in the event of default (including bankruptcy or insolvency) for the non-defaulting party to liquidate the collateral and calculate a net exposure to the defaulting party or request additional collateral. In the event that a borrower defaults, the Fund, as lender, would offset the market value of the collateral received against the market value of the securities loaned. The value of the collateral is typically greater than that of the market value of the securities loaned, leaving the lender with a net amount payable to the defaulting party. However, bankruptcy or insolvency laws of a particular jurisdiction may impose restrictions on or prohibitions against such a right of offset in the event of an MSLA counterparty’s bankruptcy or insolvency. Under the MSLA, the borrower can resell or re-pledge the loaned securities, and the Fund can reinvest cash collateral, or, upon an event of default, resell or re-pledge the collateral.
The following table is a summary of securities lending agreements which are subject to offset under an MSLA as of October 31, 2016:
| | | | | | | | | | | | |
| Counterparty | | Market Value of
Securities on Loan | | | Cash Collateral
Received a | | | Net
Amount | |
BNP Paribas Prime Brokerage Inc. | | $ | 924,125 | | | $ | 924,125 | | | $ | — | |
BNP Paribas Prime Brokerage International Ltd. | | | 232,469 | | | | 232,469 | | | | — | |
Citigroup Global Markets Inc. | | | 628,314 | | | | 628,314 | | | | — | |
Credit Suisse Securities (USA) LLC | | | 209,387 | | | | 209,387 | | | | — | |
Deutsche Bank Securities Inc. | | | 338,284 | | | | 338,284 | | | | — | |
HSBC Securities (USA) Inc. | | | 93,176 | | | | 93,176 | | | | — | |
Jefferies LLC | | | 132,325 | | | | 132,325 | | | | — | |
JPMorgan Securities LLC | | | 3,156,899 | | | | 3,156,899 | | | | — | |
Merrill Lynch, Pierce, Fenner & Smith | | | 284,542 | | | | 284,542 | | | | — | |
Wells Fargo Securities LLC | | | 632,923 | | | | 632,923 | | | | — | |
| | | | | | | | | | | | |
| | $ | 6,632,444 | | | $ | 6,632,444 | | | $ | — | |
| | | | | | | | | | | | |
| | | | | | | | | | | | | |
| | a | | Collateral received in excess of the market value of securities on loan is not presented in this table. The total cash collateral received by the Fund is disclosed in the Fund’s statement of assets and liabilities. |
| | |
| 30 | | 2016 iSHARES ANNUAL REPORTTO SHAREHOLDERS |
Notes to Financial Statements (Continued)
iSHARES® EDGE U.S. FIXED INCOME BALANCED RISK ETF
| 2. | INVESTMENT ADVISORY AGREEMENT AND OTHER TRANSACTIONS WITH AFFILIATES |
Pursuant to an Investment Advisory Agreement with the Trust, BFA manages the investment of the Fund’s assets. BFA is a California corporation indirectly owned by BlackRock. Under the Investment Advisory Agreement, BFA is responsible for substantially all expenses of the Fund, except interest, taxes, brokerage commissions and other expenses connected with the execution of portfolio transactions, distribution fees, litigation expenses and any extraordinary expenses.
For its investment advisory services to the Fund, BFA is entitled to an annual investment advisory fee of 0.25% based on the average daily net assets of the Fund. In addition, the Fund indirectly pays its pro rata share of fees and expenses attributable to its investments in other investment companies (“acquired fund fees and expenses”). BFA has contractually agreed to waive a portion of its investment advisory fees for the Fund through February 28, 2019 in an amount equal to the acquired fund fees and expenses attributable to the Fund’s investments in other registered investment companies advised by BFA or its affiliates, if any.
The U.S. Securities and Exchange Commission (the “SEC”) has issued an exemptive order which permits BlackRock Institutional Trust Company, N.A. (“BTC”), an affiliate of BFA, to serve as securities lending agent for the Fund, subject to applicable conditions. As securities lending agent, BTC bears all operational costs directly related to securities lending. The Fund is responsible for fees in connection with the investment of cash collateral received for securities on loan in a money market fund managed by BFA, however, BTC has agreed to reduce the amount of securities lending income it receives in order to effectively limit the collateral investment fees the Fund bears to an annual rate of 0.04% (the “collateral investment fees”). Securities lending income is equal to the total of income earned from the reinvestment of cash collateral, net of fees and other payments to and from borrowers of securities, and less the collateral investment fees. The Fund retains a portion of securities lending income and remits the remaining portion to BTC as compensation for its services as securities lending agent.
Pursuant to a securities lending agreement, the Fund retains 80% of securities lending income and the amount retained can never be less than 70% of the total of securities lending income plus the collateral investment fees. In addition, commencing the business day following the date that the aggregate securities lending income plus the collateral investment fees generated across all 1940 Act iShares exchange-traded funds (the “iShares ETF Complex”) in a given calendar year exceeds the aggregate securities lending income generated across the iShares ETF Complex in the calendar year 2013, the Fund, pursuant to a securities lending agreement, will retain for the remainder of that calendar year 85% of securities lending income and the amount retained can never be less than 70% of the total of securities lending income plus the collateral investment fees.
For the year ended October 31, 2016, the Fund paid to BTC securities lending agent services and collateral investment fees in the amount of $6,782.
BlackRock Investments, LLC, an affiliate of BFA, is the distributor for the Fund. Pursuant to the distribution agreement, BFA is responsible for any fees or expenses for distribution services provided to the Fund.
The Fund may invest its positive cash balances in certain money market funds managed by BFA or an affiliate. The income earned on these temporary cash investments is included in “Dividends – affiliated” in the statement of operations.
The PNC Financial Services Group, Inc. is the largest stockholder of BlackRock and is considered to be an affiliate of the Fund for 1940 Act purposes.
Certain trustees and officers of the Trust are also officers of BTC and/or BFA.
| | | | |
NOTESTO FINANCIAL STATEMENTS | | | 31 | |
Notes to Financial Statements (Continued)
iSHARES® EDGE U.S. FIXED INCOME BALANCED RISK ETF
| 3. | INVESTMENT PORTFOLIO TRANSACTIONS |
Purchases and sales of investments (excluding in-kind transactions and short-term investments) for the year ended October 31, 2016 were as follows:
| | | | | | | | | | | | | | |
| U.S. Government Obligations | | | Other Securities | |
| Purchases | | | Sales | | | Purchases | | | Sales | |
| $ | 479,970,718 | | | $ | 475,661,303 | | | $ | 25,842,010 | | | $ | 36,883,532 | |
There were no in-kind transactions (see Note 4) for the year ended October 31, 2016.
| 4. | CAPITAL SHARE TRANSACTIONS |
Capital shares are issued and redeemed by the Fund only in aggregations of a specified number of shares or multiples thereof (“Creation Units”) at NAV. Except when aggregated in Creation Units, shares of the Fund are not redeemable. Transactions in capital shares for the Fund are disclosed in detail in the statements of changes in net assets.
The consideration for the purchase of Creation Units of a fund in the Trust generally consists of the in-kind deposit of a designated portfolio of securities and a specified amount of cash. Certain funds in the Trust may be offered in Creation Units solely or partially for cash in U.S. dollars. Investors purchasing and redeeming Creation Units may pay a purchase transaction fee and a redemption transaction fee directly to State Street Bank and Trust Company, the Trust’s administrator, to offset transfer and other transaction costs associated with the issuance and redemption of Creation Units, including Creation Units for cash. Investors transacting in Creation Units for cash may also pay an additional variable charge to compensate the relevant fund for certain transaction costs (i.e., stamp taxes, taxes on currency or other financial transactions, and brokerage costs) and market impact expenses relating to investing in portfolio securities. Such variable charges, if any, are included in “Proceeds from shares sold” in the statement of changes in net assets.
The Fund may purchase or sell futures contracts as part of its investment strategy. A futures contract is a standardized, exchange-traded agreement to buy or sell a financial instrument at a set price on a future date. Upon entering into a futures contract, the Fund is required to pledge to the executing broker which holds segregated from its own assets, an amount of cash, U.S. government securities or other high-quality debt and equity securities equal to the minimum initial margin requirements of the exchange on which the contract is traded. Pursuant to the contract, the Fund agrees to receive from or pay to the broker an amount of cash equal to the daily fluctuation in value of the contract. Such receipts or payments are known as margin variation and are recorded by the Fund as unrealized appreciation or depreciation. When the contract is closed, the Fund records a realized gain or loss equal to the difference between the value of the contract at the time it was opened and the value at the time it was closed. Losses may arise if the value of a futures contract decreases due to an unfavorable change in the market rates or values of the underlying instrument during the term of the contract or if the counterparty does not perform under the contract. The use of futures contracts also involves the risk of an imperfect correlation in the movements in the price of futures contracts and the assets underlying such contracts.
| | |
| 32 | | 2016 iSHARES ANNUAL REPORTTO SHAREHOLDERS |
Notes to Financial Statements (Continued)
iSHARES® EDGE U.S. FIXED INCOME BALANCED RISK ETF
The following table shows the value of futures contracts held by the Fund as of October 31, 2016 and the related locations in the statement of assets and liabilities, presented by risk exposure category:
| | | | |
| Assets | |
Interest rate contracts: | | | | |
Variation margin/Net assets consist of – net unrealized appreciationa | | $ | 128,297 | |
| | | | |
| | | | | |
| | a | | Represents cumulative appreciation of futures contracts as reported in the schedule of investments. Only current day’s variation margin is reported separately within the statement of assets and liabilities. |
| | | | |
| | | | |
| Liabilities | |
Interest rate contracts: | | | | |
Variation margin/Net assets consist of – net unrealized appreciationb | | $ | (33 | ) |
| | | | |
| | | | | |
| | b | | Represents cumulative depreciation of futures contracts as reported in the schedule of investments. Only current day’s variation margin is reported separately within the statement of assets and liabilities. |
The following table shows the realized and unrealized gains (losses) on futures contracts held by the Fund during the year ended October 31, 2016 and the related locations in the statement of operations, presented by risk exposure category:
| | | | | | | | |
| | | Net Realized
Gain (Loss) | | | Net Change in
Unrealized
Appreciation/Depreciation | |
Interest rate contracts: | | | | | | | | |
Futures contracts | | $ | (433,770 | ) | | $ | 113,924 | |
| | | | | | | | |
| | | | | | | | | |
The following table shows the average quarter-end balances of open futures contracts for the Fund for the year ended October 31, 2016 :
| | | | |
Average value of contracts purchased | | $ | 445,172 | |
Average value of contracts sold | | | 4,946,653 | |
In the normal course of business, the Fund’s investment activities expose it to various types of risk associated with the financial instruments and markets in which it invests. The significant types of financial risks the Fund is exposed to include market risk and credit risk. The Fund’s prospectus provides details of these and other types of risk.
MARKET RISK
Market risk arises mainly from uncertainty about future values of financial instruments influenced by price, currency and interest rate movements. It represents the potential loss a fund may suffer through holding market positions in the face of market movements. A fund is exposed to market risk by virtue of its investment in equity, fixed income and/or financial derivative instruments or indirectly by virtue of its investment in underlying funds. The fair value of securities held by a fund may decline due to general market conditions, economic trends or events that are not specifically related to the issuers of the securities including local, regional or global political, social or economic instability or to factors that affect a particular industry or group of industries. The extent of a fund’s exposure to market risk is the market value of the investments held as shown in the fund’s schedule of investments.
| | | | |
NOTESTO FINANCIAL STATEMENTS | | | 33 | |
Notes to Financial Statements (Continued)
iSHARES® EDGE U.S. FIXED INCOME BALANCED RISK ETF
A diversified portfolio, where this is appropriate and consistent with a fund’s objectives, minimizes the risk that a price change of a particular investment will have a material impact on the NAV of a fund. The investment concentrations within the Fund’s portfolio are disclosed in its schedule of investments.
Changes in market interest rates or economic conditions may affect the value and/or liquidity of fixed income investments. Interest rate risk is the risk that prices of bonds and other fixed-income securities will decrease as interest rates rise and increase as interest rates fall. Mortgage-backed securities and securities with longer durations, tend to be more sensitive to interest rate changes, usually making them more volatile than other types of bonds or securities with shorter durations. Given the environment of historically low interest rates, a fund may be subject to a greater risk of price losses if interest rates rise.
CREDIT RISK
Credit risk is the risk that an issuer or guarantor of debt instruments or the counterparty to a financial transaction, including derivatives contracts, repurchase agreements or loans of portfolio securities, is unable or unwilling to make timely interest and/or principal payments or to otherwise honor its obligations. BFA and its affiliates manage counterparty credit risk by entering into transactions only with counterparties that they believe have the financial resources to honor their obligations and by monitoring the financial stability of those counterparties. Financial assets, which potentially expose a fund to issuer and counterparty credit risks, consist principally of financial instruments and receivables due from counterparties. The extent of a fund’s exposure to credit and counterparty risks with respect to those financial assets is approximated by their value recorded in its statement of assets and liabilities.
High yield securities that are rated below investment-grade (including those bonds rated lower than “BBB-” by Standard & Poor’s Ratings Services and Fitch or “Baa3” by Moody’s) or are unrated, may be more volatile than higher-rated securities of similar maturity. High yield securities may also be subject to greater levels of credit or default risk than higher-rated securities and high yield securities may be less liquid and more difficult to sell at an advantageous time or price or to value than higher-rated securities. In particular, high yield securities are often issued by smaller, less creditworthy companies or by highly leveraged (indebted) companies, which are generally less able than more financially stable companies to make scheduled payments of interest and principal.
The Fund is treated as an entity separate from the Trust’s other funds for federal income tax purposes. It is the policy of the Fund to qualify as a regulated investment company by complying with the provisions applicable to regulated investment companies, as defined under Subchapter M of the Internal Revenue Code of 1986, as amended, and to annually distribute substantially all of its ordinary income and any net capital gains (taking into account any capital loss carryforwards) sufficient to relieve it from all, or substantially all, federal income and excise taxes. Accordingly, no provision for federal income taxes is required.
U.S. GAAP requires that certain components of net assets be adjusted to reflect permanent differences between financial and tax reporting. These reclassifications have no effect on net assets or NAV per share. The following permanent differences as of October 31, 2016, attributable to undistributed gains were reclassified to the following accounts:
| | | | | | | | |
Paid-in Capital | | Undistributed
Net Investment Income/Distributions
in Excess of Net
Investment Income | | | Undistributed
Net Realized
Gain/Accumulated
Net Realized Loss | |
| $44,096 | | | | | | $ | (44,096) | |
| | |
| 34 | | 2016 iSHARES ANNUAL REPORTTO SHAREHOLDERS |
Notes to Financial Statements (Continued)
iSHARES® EDGE U.S. FIXED INCOME BALANCED RISK ETF
The tax character of distributions paid during the years ended October 31, 2016 and October 31, 2015 was as follows:
| | | | | | | | |
| | | 2016 | | | 2015 | |
Ordinary income | | $ | 1,954,073 | | | $ | 1,287,832 | |
Return of capital | | | 64,951 | | | | — | |
| | | | | | | | |
| | $ | 2,019,024 | | | $ | 1,287,832 | |
| | | | | | | | |
| | | | | | | | | |
As of October 31, 2016, the tax components of accumulated net earnings (losses) were as follows:
| | | | | | | | |
Capital
Loss
Carryforwards | | Net
Unrealized
Gains (Losses) a | | | Total | |
| $(260,711) | | $ | 687,820 | | | $ | 427,109 | |
| | a | | The difference between book-basis and tax-basis unrealized gains (losses) was attributable primarily to the tax deferral of losses on wash sales and the realization for tax purposes of unrealized gains (losses) on certain futures contracts. |
As of October 31, 2016, the Fund had non-expiring capital loss carryforwards in the amount of $260,711 available to offset future realized capital gain.
Management has analyzed tax laws and regulations and their application to the Fund as of October 31, 2016, inclusive of the open tax return years, and does not believe there are any uncertain tax positions that require recognition of a tax liability in the Fund’s financial statements.
Management has evaluated the impact of all subsequent events on the Fund through the date the financial statements were available to be issued and has determined that there were no subsequent events requiring adjustment or disclosure in the financial statements.
| | | | |
NOTESTO FINANCIAL STATEMENTS | | | 35 | |
Report of Independent Registered Public Accounting Firm
To the Shareholders and Board of Trustees of
iShares U.S. ETF Trust:
In our opinion, the accompanying statement of assets and liabilities, including the schedule of investments, and the related statements of operations and of changes in net assets and the financial highlights present fairly, in all material respects, the financial position of iShares Edge U.S. Fixed Income Balanced Risk ETF (the “Fund”) at October 31, 2016, the results of its operations, the changes in its net assets and its financial highlights for each of the periods presented, in conformity with accounting principles generally accepted in the United States of America. These financial statements and financial highlights (hereafter referred to as “financial statements”) are the responsibility of the Fund’s management. Our responsibility is to express an opinion on these financial statements based on our audits. We conducted our audits of these financial statements in accordance with the standards of the Public Company Accounting Oversight Board (United States). Those standards require that we plan and perform the audit to obtain reasonable assurance about whether the financial statements are free of material misstatement. An audit includes examining, on a test basis, evidence supporting the amounts and disclosures in the financial statements, assessing the accounting principles used and significant estimates made by management, and evaluating the overall financial statement presentation. We believe that our audits, which included confirmation of securities at October 31, 2016 by correspondence with the custodian, transfer agent and brokers, provide a reasonable basis for our opinion.
PricewaterhouseCoopers LLP
San Francisco, California
December 21, 2016
| | |
| 36 | | 2016 iSHARES ANNUAL REPORTTO SHAREHOLDERS |
Tax Information (Unaudited)
iSHARES® EDGE U.S. FIXED INCOME BALANCED RISK ETF
For the fiscal year ended October 31, 2016, the Fund hereby designates $1,506,314 as the maximum amount allowable as interest-related dividends eligible for exemption from U.S. withholding tax for nonresident aliens and foreign corporations.
The Fund hereby designates $112 as the amount of distributions from direct federal obligation interest for the fiscal year ended October 31, 2016. The law varies in each state as to whether and what percentage of ordinary income dividends attributable to federal obligations is exempt from state income tax. Shareholders are advised to check with their tax advisers to determine if any portion of the dividends received is exempt from state income tax.
Board Review and Approval of Investment Advisory
Contract
iSHARES® EDGE U.S. FIXED INCOME BALANCED RISK ETF
Under Section 15(c) of the Investment Company Act of 1940 (the ���1940 Act”), the Trust’s Board of Trustees (the “Board”), including a majority of Trustees who are not “interested persons” of the Trust (as that term is defined in the 1940 Act) (the “Independent Trustees”), is required annually to consider and approve the Investment Advisory Contract between the Trust and BFA (the “Advisory Contract”) on behalf of the Fund. The Independent Trustees requested, and BFA provided, such information as the Independent Trustees, with advice from independent counsel, deemed reasonably necessary to evaluate the Advisory Contract. A committee of all of the Independent Trustees (the “15(c) Committee”), with independent counsel, met with management on April 28, 2016 and May 9, 2016. At these meetings, the 15(c) Committee reviewed and discussed information provided in response to the 15(c) Committee’s initial requests, and requested certain additional information, which management agreed to provide. At a meeting held on May 17, 2016, management presented information to the Board relating to the continuance of the Advisory Contract, including information requested by the 15(c) Committee during its meetings. The Board, including the Independent Trustees, reviewed and discussed such information at length. The Independent Trustees requested from management certain additional information, which management agreed to provide. At a meeting held on June 21-23, 2016, the Board, including the Independent Trustees, reviewed the additional information provided by management in response to these requests. After extensive discussions, the Board, including all of the Independent Trustees, approved the continuance of the Advisory Contract for the Fund, based on a review of qualitative and quantitative information provided by BFA, including the additional information management provided at the request of the Independent Trustees. The Board noted its satisfaction with the extent and quality of information provided and its frequent interactions with management, as well as the detailed responses and other information provided by BFA. The Board also noted that the Board and BFA agreed to discuss potential enhancements and adjustments to the 15(c) process for the coming year. The Independent Trustees were advised by their independent counsel throughout the process, including about the legal standards applicable to their review. In approving the Advisory Contract for the Fund, the Board, including the Independent Trustees, considered the following factors, no one of which was controlling, and reached the following conclusions:
Expenses and Performance of the Fund — The Board reviewed statistical information prepared by Broadridge Financial Solutions Inc. (“Broadridge”), an independent provider of investment company data, regarding the expense ratio components, including gross and net total expenses, waivers/reimbursements (if any), and underlying fund fees and expenses (if any) of the Fund in comparison with the same information for other exchange traded funds (including, where applicable, funds sponsored by an “at cost” service provider) and, in the limited instances where no comparable ETFs existed and the comparison group would not otherwise be reasonable in Broadridge’s judgment, pure index institutional mutual funds, objectively selected by Broadridge as comprising the Fund’s applicable peer group pursuant to Broadridge’s proprietary ETF methodology (the “Peer Group”). The Board was provided with a detailed description of Broadridge’s proprietary ETF methodology used by Broadridge to determine the Fund’s Peer Group. The Board further noted that due to the limitations in providing comparable funds in the Peer Group, the statistical information provided in Broadridge’s report may or may not provide meaningful direct comparisons to the Fund in all instances.
The Board also noted that the investment advisory fee rate and overall expenses (net of waivers and reimbursements) for the Fund were lower than the median of the investment advisory fee rates and overall expenses (net of waivers and reimbursements) of the funds in its Peer Group, excluding iShares funds.
In addition, to the extent that any of the comparison funds included in the Peer Group, excluding iShares funds, track the same index as the Fund, Broadridge also provided, and the Board reviewed, a comparison of the Fund’s performance for the one-, three-, five-, ten-year, and since inception periods, as applicable, and for the “last quarter” period ended December 31, 2015, to that of such relevant comparison funds for the same periods.
| | |
| 38 | | 2016 iSHARES ANNUAL REPORTTO SHAREHOLDERS |
Board Review and Approval of Investment Advisory
Contract (Continued)
iSHARES® EDGE U.S. FIXED INCOME BALANCED RISK ETF
The Board noted that the Fund is an actively managed ETF that does not seek to track the performance of a specified index and that the management team for the Fund manages the Fund’s portfolio in accordance with its investment objective. The Board further noted that during the prior year, the Board received periodic reports on the Fund’s short- and longer-term performance in comparison with its peer group and benchmark index. Such periodic comparative performance information, including additional detailed information on certain specific iShares funds requested by the Board, was also considered. The Board noted that the Fund generally performed in line with expectations relative to the Fund’s peer group and benchmark index over the relevant periods.
Based on this review, the other factors considered at the meeting, and their general knowledge of ETF pricing, the Board concluded that the investment advisory fee rate and expense level and the historical performance of the Fund supported the Board’s approval of the continuance of the Advisory Contract for the coming year.
Nature, Extent and Quality of Services Provided by BFA — Based on management’s representations, including information about recent and proposed enhancements to the iShares business, including with respect to capital markets support and analysis, product design and other services, the Board expected that there would be no diminution in the scope of services required of or provided by BFA under the Advisory Contract for the coming year as compared to the scope of services provided by BFA during prior years. In reviewing the scope of these services, the Board considered BFA’s investment philosophy and experience, noting that BFA and its affiliates have committed significant resources over time, including during the past year, to supporting the iShares funds and their shareholders. The Board also considered BFA’s compliance program and its compliance record with respect to the Fund. In that regard, the Board noted that BFA reports to the Board about portfolio management and compliance matters on a periodic basis in connection with regularly scheduled meetings of the Board, and on other occasions as necessary and appropriate, and has provided information and made appropriate officers available as needed to provide further assistance with these matters. The Board also reviewed the background and experience of the persons responsible for the day-to-day management of the Fund, as well as the resources available to them in managing the Fund. In addition to the above considerations, the Board reviewed and considered detailed presentations regarding BFA’s investment performance, investment and risk management processes and strategies provided at the June 21-23, 2016 meeting and throughout the previous year, and matters related to BFA’s portfolio compliance policies and procedures. The Board noted that the Fund had met its investment objective consistently since its inception date.
Based on review of this information, and the performance information discussed above, the Board concluded that the nature, extent and quality of services provided by BFA to the Fund under the Advisory Contract supported the Board’s approval of the continuance of the Advisory Contract for the coming year.
Costs of Services Provided to the Fund and Profits Realized by BFA and its Affiliates — The Board reviewed information about the profitability to BlackRock of the Fund, based on the fees payable to BFA and its affiliates (including fees under the Advisory Contract), and all other sources of revenue and expense to BFA and its affiliates from the Funds’ operations for the last calendar year. The Board reviewed BlackRock’s profitability methodology for the iShares funds, noting that the 15(c) Committee had focused on the methodology and profitability presentation during its meetings. The Board discussed the sources of direct and ancillary revenue with management, including the revenues to BTC from securities lending by the Fund. The Board also discussed BFA’s profit margin as reflected in the Fund’s profitability analysis and reviewed information regarding potential economies of scale (as discussed below). Based on this review, the Board concluded that the profits realized by BFA and its affiliates under the Advisory Contract and from other relationships between the Fund and BFA and/or its affiliates, if any, were within a reasonable range in light of the factors considered.
| | | | |
BOARD REVIEWAND APPROVALOF INVESTMENT ADVISORY CONTRACT | | | 39 | |
Board Review and Approval of Investment Advisory
Contract (Continued)
iSHARES® EDGE U.S. FIXED INCOME BALANCED RISK ETF
Economies of Scale — The Board reviewed information regarding potential economies of scale or other efficiencies that may result from increases in the Fund’s assets, noting that the issue of economies of scale had been focused on extensively by the 15(c) Committee during its meetings and addressed by management. The Board and the 15(c) Committee reviewed information provided by BFA regarding scale benefits shared with the iShares funds through relatively low fee rates established at inception, breakpoints, waivers, or other fee reductions, as well as through additional investment in the iShares business and the provision of improved or additional infrastructure and services to the iShares funds and their shareholders. The Board and the 15(c) Committee received information regarding BlackRock’s historical profitability, including BFA’s and its affiliates’ costs in providing services. The cost information distinguished, among other things, between fixed and variable costs, and explained how the level of fixed and variable costs, as well as the nature of such costs, may impact the existence or size of scale benefits. The Board noted that the Advisory Contract for the Fund did not provide for any breakpoints in the Fund’s investment advisory fee rate as the assets of the Fund increase. However, the Board noted that should material economies of scale exist in the future that are not otherwise shared, a breakpoint structure for the Fund may be appropriate, and that it would continue to monitor the sharing of economies of scale to determine the appropriateness of adding breakpoints in the future.
Based on this review, as well as the other factors considered at the meeting, the Board, recognizing its responsibility to consider this issue periodically, determined to approve the continuance of the Advisory Contract for the coming year.
Fees and Services Provided for Other Comparable Funds/Accounts Managed by BFA and its Affiliates — The Board received and considered information regarding the investment advisory/management fee rates for other funds/accounts in the U.S. for which BFA (or its affiliates) provides investment advisory/management services, including open-end funds registered under the 1940 Act (including sub-advised funds), collective trust funds, and institutional separate accounts (together, the “Other Accounts”), and acknowledged BFA’s assertion that the iShares funds are fundamentally different investment vehicles from the Other Accounts. The Board noted that BFA and its affiliates do manage Other Accounts with a similar investment strategy or investment mandate as the Fund. The Board further noted that BFA provided the Board with detailed information regarding how the Other Accounts (particularly institutional clients) generally differ from the Fund, including in terms of the different and generally more extensive services provided to the Fund, as well as other significant differences. In that regard, the Board considered that the pricing of services to institutional clients is typically based on a number of factors beyond the nature and extent of the specific services to be provided and often depends on the overall relationship between the client and its affiliates and the adviser and its affiliates. In addition, the Board considered the relative complexity and inherent risks and challenges of managing and providing other services to the Fund, as a publicly traded exchange traded fund, as compared to the Other Accounts that are institutional clients in light of differing regulatory requirements and client-imposed mandates. The Board also considered the “all-inclusive” nature of the Fund’s advisory fee structure, and the Fund expenses borne by BFA under this arrangement. The Board noted that the investment advisory fee rate under the Advisory Contract for the Fund was generally higher than the investment advisory/management fee rates for certain of the Other Accounts (particularly institutional clients) and concluded that the differences appeared to be consistent with the factors discussed.
Other Benefits to BFA and/or its Affiliates — The Board reviewed the “fallout” benefits or ancillary revenue received by BFA and/or its affiliates in connection with the services provided to the Fund by BFA, such as payment of revenue to BTC, the Fund’s securities lending agent, for loaning portfolio securities (which was included in the profit margins reviewed by the Board pursuant to BFA’s profitability methodology), and payment of advisory fees and/or administration fees to BFA and BTC (or their affiliates) in connection with any investments by the Fund in other funds for which BFA (or its affiliates) provides investment advisory services and/or administration services. The Board noted that BFA generally does not use soft dollars or consider the value of research or other services that may be provided to BFA (including its affiliates) in selecting brokers for portfolio transactions for the Fund. The Board further noted that any portfolio transactions on behalf of the Fund placed through a BFA affiliate or purchased from an underwriting syndicate in which a BFA affiliate participates, are reported to the Board pursuant to Rule 17e-1 or Rule 10f-3, as applicable, under the 1940 Act. The Board concluded that any such ancillary benefits would not be disadvantageous to the Fund’s
| | |
| 40 | | 2016 iSHARES ANNUAL REPORTTO SHAREHOLDERS |
Board Review and Approval of Investment Advisory
Contract (Continued)
iSHARES® EDGE U.S. FIXED INCOME BALANCED RISK ETF
shareholders and thus would not alter the Board’s conclusion with respect to the appropriateness of approving the continuance of the Advisory Contract for the coming year.
Based on the considerations described above, the Board determined that the Fund’s investment advisory fee rate under the Advisory Contract does not constitute a fee that is so disproportionately large as to bear no reasonable relationship to the services rendered and that could not have been the product of arm’s-length bargaining, and concluded that it is in the best interest of the Fund and its shareholders to approve the continuance of the Advisory Contract for the coming year.
| | | | |
BOARD REVIEWAND APPROVALOF INVESTMENT ADVISORY CONTRACT | | | 41 | |
Supplemental Information (Unaudited)
iSHARES® EDGE U.S. FIXED INCOME BALANCED RISK ETF
Section 19(a) Notices
The amounts and sources of distributions reported are estimates and are provided pursuant to regulatory requirements and are not being provided for tax reporting purposes. The actual amounts and sources for tax reporting purposes will depend upon the Fund’s investment experience during the year and may be subject to changes based on the tax regulations. Shareholders will receive a Form 1099-DIV each calendar year that will inform them how to report these distributions for federal income tax purposes.
| | | | | | | | | | | | | | | | | | | | | | | | | | | | | | |
Total Cumulative Distributions
for the Fiscal Year | | | % Breakdown of the Total Cumulative
Distributions for the Fiscal Year | |
Net
Investment
Income | | | Net
Realized
Capital
Gains | | | Return of
Capital | | | Total
Per
Share | | | Net
Investment
Income | | | Net
Realized
Capital
Gains | | | Return
of
Capital | | | Total
Per
Share | |
| $ | 2.620347 | | | $ | — | | | $ | 0.255305 | | | $ | 2.875652 | | | | 91% | | | | — % | | | | 9% | | | | 100% | |
Premium/Discount Information
The Premium/Discount Information section is intended to present information about the differences between the daily market price on secondary markets for shares of a fund and that fund’s NAV. NAV is the price at which a fund issues and redeems shares. It is calculated in accordance with the standard formula for valuing mutual fund shares. The “Market Price” of a fund generally is determined using the midpoint between the highest bid and the lowest offer on the primary stock exchange on which the shares of such fund are listed for trading, as of the time that the fund’s NAV is calculated. A fund’s Market Price may be at, above or below its NAV. The NAV of a fund will fluctuate with changes in the fair value of its portfolio holdings. The Market Price of a fund will fluctuate in accordance with changes in its NAV, as well as market supply and demand.
Premiums or discounts are the differences (expressed as a percentage) between the NAV and Market Price of a fund on a given day, generally at the time the NAV is calculated. A premium is the amount that a fund is trading above the reported NAV, expressed as a percentage of the NAV. A discount is the amount that a fund is trading below the reported NAV, expressed as a percentage of the NAV.
The following information shows the frequency of distributions of premiums and discounts for the Fund. The information shown for the Fund is for five calendar years (or from the inception date of the Fund if less than five years) through the date of the most recent calendar quarter-end. The specific periods covered for the Fund are disclosed in the table for the Fund.
| | |
| 42 | | 2016 iSHARES ANNUAL REPORTTO SHAREHOLDERS |
Supplemental Information (Unaudited) (Continued)
iSHARES® EDGE U.S. FIXED INCOME BALANCED RISK ETF
Each line in the table shows the number of trading days in which the Fund traded within the premium/discount range indicated. The number of trading days in each premium/discount range is also shown as a percentage of the total number of trading days in the period covered by each table. All data presented here represents past performance, which cannot be used to predict future results.
Period Covered: February 24, 2015 through September 30, 2016
| | | | | | | | |
Premium/Discount Range | | Number
of Days | | | Percentage of
Total Days | |
Greater than 1.5% | | | 6 | | | | 1.48 | % |
Greater than 1.0% and Less than 1.5% | | | 2 | | | | 0.49 | |
Greater than 0.5% and Less than 1.0% | | | 23 | | | | 5.67 | |
Between 0.5% and –0.5% | | | 373 | | | | 91.87 | |
Less than –0.5% | | | 2 | | | | 0.49 | |
| | | | | | | | |
| | | 406 | | | | 100.00 | % |
| | | | | | | | |
| | | | |
SUPPLEMENTAL INFORMATION | | | 43 | |
Trustee and Officer Information
iSHARES® U.S. ETF TRUST
The Board of Trustees has responsibility for the overall management and operations of the Funds, including general supervision of the duties performed by BFA and other service providers. Each Trustee serves until he or she resigns, is removed, dies, retires or becomes incapacitated. The President, Chief Compliance Officer, Treasurer and Secretary shall each hold office until their successors are chosen and qualify, and all other officers shall hold office until he or she resigns or is removed. Trustees who are not “interested persons” (as defined in the 1940 Act) of the Trust are referred to as independent trustees (“Independent Trustees”).
The registered investment companies advised by BFA or its affiliates (the “BlackRock-advised Funds”) are organized into one complex of closed-end funds, two complexes of open-end funds and one complex of exchange-traded funds (“Exchange-Traded Fund Complex”) (each, a “BlackRock Fund Complex”). Each Fund is included in the BlackRock Fund Complex referred to as the Exchange-Traded Fund Complex. Each Trustee also serves as a Director of iShares, Inc. and a Trustee of iShares Trust, and, as a result, oversees a total of 333 funds (as of October 31, 2016) within the Exchange-Traded Fund Complex. Mr. Lawton also serves as an Advisory Board Member for iShares, Inc. and iShares Trust with respect to 333 funds (as of October 31, 2016) within the Exchange-Traded Fund Complex. With the exception of Robert S. Kapito, Mark Wiedman and Benjamin Archibald, the address of each Trustee, Advisory Board Member and officer is c/o BlackRock, Inc., 400 Howard Street, San Francisco, CA 94105. The address of Mr. Kapito, Mr. Wiedman, and Mr. Archibald is c/o BlackRock, Inc., Park Avenue Plaza, 55 East 52nd Street, New York, NY 10055. The Board has designated Cecilia H. Herbert as its Independent Board Chair. Additional information about the Funds’ Trustees and officers may be found in the Funds’ combined Statement of Additional Information, which is available without charge, upon request, by calling toll-free 1-800-iShares (1-800-474-2737).
Interested Trustees
| | | | | | |
| | | | |
| Name (Age) | | Position(s) | | Principal Occupation(s) During the Past 5 Years | | Other Directorships Held by Trustee
During the Past 5 Years |
Robert S. Kapitoa (59) | | Trustee
(since 2011). | | President and Director, BlackRock, Inc. (since 2006); Vice Chairman of BlackRock, Inc. and Head of BlackRock, Inc.’s Portfolio Management Group (since its formation in 1998) and BlackRock, Inc.’s predecessor entities (since 1988); Trustee, University of Pennsylvania (since 2009); President of Board of Directors, Hope & Heroes Children’s Cancer Fund (since 2002); President of the Board of Directors, Periwinkle Theatre for Youth (since 1983). | | Director of iShares, Inc. (since 2009); Trustee of iShares Trust (since 2009). |
| | | |
Mark Wiedmanb (45) | | Trustee
(since 2013) | | Managing Director, BlackRock, Inc. (since 2007); Global Head of iShares (since 2011); Head of Corporate Strategy, BlackRock, Inc. (2009-2011). | | Director of iShares, Inc. (since 2013); Trustee of iShares Trust (since 2013); Director of PennyMac Financial Services, Inc. (since 2008). |
| a | Robert S. Kapito is deemed to be an “interested person” (as defined in the 1940 Act) of the Trust due to his affiliations with BlackRock, Inc. |
| b | Mark Wiedman is deemed to be an “interested person” (as defined in the 1940 Act) of the Trust due to his affiliations with BlackRock, Inc. and its affiliates. |
| | |
| 44 | | 2016 iSHARES ANNUAL REPORTTO SHAREHOLDERS |
Trustee and Officer Information (Continued)
iSHARES® U.S. ETF TRUST
Independent Trusteesc
| | | | | | |
| | | | |
| Name (Age) | | Position(s) | | Principal Occupation(s) During the Past 5 Years | | Other Directorships Held by Trustee
During the Past 5 Years |
Cecilia H. Herbert (67) | | Trustee (since 2011); Independent Board Chair (since 2016); Nominating and Governance Committee Chair (since 2016). | | Director (1998-2013) and President (2007-2011) of the Board of Directors, Catholic Charities CYO; Trustee (2002-2011) and Chair of the Finance and Investment Committee (2006-2010) of the Thacher School; Member (since 1992) and Chair (1994-2005) of the Investment Committee, Archdiocese of San Francisco; Trustee and Member of the Investment Committee, WNET, the New York public media company (since 2011). | | Director of iShares, Inc. (since 2005); Trustee of iShares Trust (since 2005); Independent Board Chair of iShares Inc. and iShares Trust (since 2016); Director of Forward Funds (23 portfolios) (since 2009); Trustee of Salient MF Trust (4 portfolios) (since 2015). |
| | | |
Jane D. Carlin (60) | | Trustee (since 2015); Risk Committee Chair (since 2016). | | Managing Director and Global Head of Financial Holding Company Governance & Assurance and the Global Head of Operational Risk Management of Morgan Stanley (2006-2012). | | Director of iShares, Inc. (since 2015); Trustee of iShares Trust (since 2015);
Director of PHH Corporation (mortgage solutions) (since 2012). |
| | | |
Charles A. Hurty (73) | | Trustee (since 2011); Audit Committee Chair (since 2011). | | Retired; Partner, KPMG LLP (1968-2001). | | Director of iShares, Inc. (since 2005); Trustee of iShares Trust (since 2005); Director of GMAM Absolute Return Strategy Fund (1 portfolio) (since 2002); Director of SkyBridge Alternative Investments Multi-Adviser Hedge Fund Portfolios LLC (2 portfolios) (since 2002). |
| | | |
John E. Kerrigan (61) | | Trustee (since 2011); Securities Lending Committee Chair (since 2016). | | Chief Investment Officer, Santa Clara University (since 2002). | | Director of iShares, Inc. (since 2005); Trustee of iShares Trust (since 2005). |
| | | |
John E. Martinez (55) | | Trustee (since 2011); Fixed Income Plus Committee Chair (since 2016). | | Director of FirstREX Agreement Corp. (formerly EquityRock, Inc.) (since 2005). | | Director of iShares, Inc. (since 2003); Trustee of iShares Trust (since 2003). |
| | | | |
TRUSTEEAND OFFICER INFORMATION | | | 45 | |
Trustee and Officer Information (Continued)
iSHARES® U.S. ETF TRUST
Independent Trusteesc (Continued)
| | | | | | |
| | | | |
| Name (Age) | | Position(s) | | Principal Occupation(s) During the Past 5 Years | | Other Directorships Held by Trustee
During the Past 5 Years |
| | | |
Madhav V. Rajan (52) | | Trustee (since 2011); Equity Plus Committee Chair and 15(c) Committee Chair (since 2016). | | Robert K. Jaedicke Professor of Accounting and Senior Associate Dean for Academic Affairs and Head of MBA Program, Stanford University Graduate School of Business (since 2001); Professor of Law (by courtesy), Stanford Law School (since 2005); Visiting Professor, University of Chicago (2007-2008). | | Director of iShares, Inc. (since 2011); Trustee of iShares Trust (since 2011); Director, Cavium, Inc. (since 2013). |
| c | Robert H. Silver served as an Independent Trustee until March 31, 2016. |
| | |
| 46 | | 2016 iSHARES ANNUAL REPORTTO SHAREHOLDERS |
Trustee and Officer Information (Continued)
iSHARES® U.S. ETF TRUST
Officersd
| | | | |
| | | |
| Name (Age) | | Position(s) | | Principal Occupation(s) During the Past 5 Years |
Martin Small (41) | | President (since 2016). | | Managing Director, BlackRock, Inc. (since 2010); Head of U.S. iShares (since 2015); Co-Head of the U.S. Financial Markets Advisory Group, BlackRock, Inc. (2008-2014). |
| | |
Jack Gee (57) | | Treasurer and Chief Financial Officer (since 2011). | | Managing Director, BlackRock, Inc. (since 2009); Senior Director of Fund Administration of Intermediary Investor Business, BGI (2009). |
| | |
Benjamin Archibald (41) | | Secretary (since 2015). | | Managing Director, BlackRock, Inc. (since 2014); Director, BlackRock, Inc. (2010-2013); Secretary of the BlackRock-advised Mutual Funds (since 2012). |
| | |
Steve Messinger (54) | | Executive Vice President (since 2016). | | Managing Director, BlackRock, Inc. (2007-2014 and since 2016); Managing Director, Beacon Consulting Group (2014-2016). |
| | |
Charles Park (49) | | Chief Compliance Officer (since 2011). | | Chief Compliance Officer of BlackRock Advisors, LLC and the BlackRock-advised Funds in the Equity-Bond Complex, the Equity-Liquidity Complex and the Closed-End Complex (since 2014); Chief Compliance Officer, BFA (since 2006). |
| | |
Scott Radell (47) | | Executive Vice President (since 2012). | | Managing Director, BlackRock, Inc. (since 2009); Head of Portfolio Solutions, BlackRock, Inc. (since 2009); Head of Portfolio Solutions, BGI (2007-2009); Credit Portfolio Manager, BGI (2005-2007); Credit Research Analyst, BGI (2003-2005). |
| | |
Amy Schioldager (54) | | Executive Vice President (since 2011). | | Senior Managing Director, BlackRock, Inc. (since 2009); Global Head of Index Equity, BGI (2008-2009); Global Head of U.S. Indexing, BGI (2006-2008); Head of Domestic Equity Portfolio Management, BGI (2001-2006). |
| d | Manish Mehta served as President until October 15, 2016. |
| | | | |
TRUSTEEAND OFFICER INFORMATION | | | 47 | |
Trustee and Officer Information (Continued)
iSHARES® U.S. ETF TRUST
Advisory Board Member
| | | | | | |
| | | | |
| Name (Age) | | Position(s) | | Principal Occupation(s)
During the Past 5 Years | | Other Directorships
Held by Advisory Board Member
During the Past 5 Years |
Drew E. Lawton (57) | | Advisory Board Member (since 2016). | | Senior Managing Director of New York Life Insurance Company (2010-2015). | | Advisory Board Member of iShares, Inc. (since 2016); Advisory Board Member of iShares Trust (since 2016); Director of Principal Funds, Inc., Principal Variable Contracts Funds, Inc. and Principal Exchange-Traded Funds (124 portfolios) (March 2016-October 2016). |
| | |
| 48 | | 2016 iSHARES ANNUAL REPORTTO SHAREHOLDERS |
Notes:
Notes:
| | |
| 50 | | 2016 iSHARES ANNUAL REPORTTO SHAREHOLDERS |
For more information visit www.iShares.com or call 1-800-474-2737
This report is intended for the Fund’s shareholders. It may not be distributed to prospective investors unless it is preceded or accompanied by the current prospectus.
Investing involves risk, including possible loss of principal.
The iShares Funds are distributed by BlackRock Investments, LLC (together with its affiliates, “BlackRock”).
A description of the policies that the Fund uses to determine how to vote proxies relating to portfolio securities and information about how the Fund voted proxies relating to portfolio securities during the most recent twelve-month period ending June 30 is available without charge, upon request, by calling toll-free 1-800-474-2737; on the Fund’s website at www.iShares.com; and on the U.S. Securities and Exchange Commission (SEC) website at www.sec.gov.
The Fund files its complete schedule of portfolio holdings with the SEC for the first and third quarters of each fiscal year on Form N-Q. The Fund’s Forms N-Q are available on the SEC’s website or may be reviewed and copied at the SEC’s Public Reference Room in Washington, D.C. Information on the operation of the Public Reference Room may be obtained by calling 1-800-SEC-0330. The Fund also discloses its complete schedule of portfolio holdings on a daily basis on the Fund’s website.
©2016 BlackRock, Inc. All rights reserved. iSHARES and BLACKROCK are registered trademarks of BlackRock, Inc. or its subsidiaries. All other marks are the property of their respective owners.
iS-AR-1013-1016
Item 2. Code of Ethics.
iShares U.S. ETF Trust (the “Registrant”) adopted a new code of ethics on July 1, 2016 that applies to persons appointed by the Registrant’s Board of Trustees as the President and/or Chief Financial Officer, and any persons performing similar functions. For the fiscal year ended October 31, 2016, there were no amendments to any provision of the former and new codes of ethics, nor were there any waivers granted from any provision of the former and new codes of ethics. A copy of the new code of ethics is filed with this Form N-CSR under Item 12(a)(1).
Item 3. Audit Committee Financial Expert.
The Registrant’s Board of Trustees has determined that the Registrant has more than one audit committee financial expert, as that term is defined under Item 3(b) and 3(c), serving on its audit committee. The audit committee financial experts serving on the Registrant’s audit committee are Charles A. Hurty, John E. Kerrigan and Madhav V. Rajan, all of whom are independent, as that term is defined under Item 3(a)(2). Robert H. Silver resigned from the Board of Trustees effective March 31, 2016.
Item 4. Principal Accountant Fees and Services.
The principal accountant fees disclosed in items 4(a), 4(b), 4(c), 4(d) and 4(g) are for the nine series of the Registrant for which the fiscal year-end is October 31, 2016 (the “Funds”), and whose annual financial statements are reported in Item 1.
| | (a) | Audit Fees – The aggregate fees billed for each of the last two fiscal years for professional services rendered by the principal accountant for the audit of the Funds’ annual financial statements or services that are normally provided by the accountant in connection with statutory and regulatory filings or engagements for those fiscal years were $113,240 for the fiscal year ended October 31, 2015 and $121,700 for the fiscal year ended October 31, 2016. |
| | (b) | Audit-Related Fees – There were no fees billed for the fiscal years ended October 31, 2015 and October 31, 2016 for assurance and related services by the principal accountant that were reasonably related to the performance of the audit of the Fund’s financial statements and are not reported under (a) of this Item. |
| | (c) | Tax Fees – The aggregate fees billed in each of the last two fiscal years for professional services rendered by the principal accountant for the review of the Funds’ tax returns and excise tax calculations, were $33,093 for the fiscal year ended October 31, 2015 and $34,029 for the fiscal year ended October 31, 2016. |
| | (d) | All Other Fees – There were no other fees billed for the fiscal years ended October 31, 2015 and October 31, 2016 for products and services provided by the principal accountant, other than the services reported in (a) through (c) of this Item. |
| | (e) | (1) The Registrant’s audit committee charter, as amended, provides that the audit committee is responsible for the approval, prior to appointment, of the engagement of the principal accountant to annually audit and provide their opinion on the Registrant’s financial statements. The audit committee must also approve, prior to appointment, the engagement of the principal accountant to provide non-audit services to the Registrant or to any entity controlling, controlled by or under common control with the Registrant’s investment adviser (“Adviser Affiliate”) that provides ongoing services to the Registrant, if the engagement relates directly to the operations and financial reporting of the Registrant. |
| | | (2) There were no services described in (b) through (d) above (including services required by the audit committee pursuant to paragraph (c)(7)(ii) of Rule 2-01 of Regulation S-X) that were approved by the audit committee pursuant to paragraph (c)(7)(i)(C) of Rule 2-01 of Regulation S-X. |
| | (f) | None of the hours expended on the principal accountant’s engagement to audit the Funds’ financial statements for the fiscal year ended October 31, 2016 were attributable to work performed by persons other than the principal accountant’s full-time, permanent employees. |
| | (g) | The aggregate non-audit fees billed by the Registrant’s principal accountant for services rendered to the Funds, and rendered to the Registrant’s investment adviser, and any Adviser Affiliate that provides ongoing services to the Registrant for the last two fiscal years were $3,548,374 for the fiscal year ended October 31, 2015 and $5,698,275 for the fiscal year ended October 31, 2016. |
| | (h) | The Registrant’s audit committee has considered whether the provision of non-audit services rendered to the Registrant’s investment adviser and any Adviser Affiliate that were not pre-approved pursuant to paragraph (c)(7)(ii) of Rule 2-01 of Regulation S-X, if any, are compatible with maintaining the principal accountant’s independence, and has determined that the provision of these services do not compromise the principal accountant’s independence. |
Item 5. Audit Committee of Listed Registrants.
The Registrant is a listed issuer as defined in Rule 10A-3 under the Exchange Act and has a separately-designated standing audit committee established in accordance with Section 3(a)(58)(A) of the Exchange Act. The Registrant’s audit committee members are Charles A. Hurty, John E. Kerrigan and Madhav V. Rajan. Robert H. Silver resigned from the Board of Trustees effective March 31, 2016.
Item 6. Investments.
| | (a) | Schedules of investments are included as part of the reports to shareholders filed under Item 1 of this Form. |
Item 7. Disclosure of Proxy Voting Policies and Procedures for Closed-End Management Investment Companies.
Not applicable to the Registrant.
Item 8. Portfolio Managers of Closed-End Management Investment Companies.
Not applicable to the Registrant.
Item 9. Purchases of Equity Securities by Closed-End Management Investment Company and Affiliated Purchasers.
Not applicable to the Registrant.
Item 10. Submission of Matters to a Vote of Security Holders.
There were no material changes to the procedures by which shareholders may recommend nominees to the Registrant’s Board of Trustees.
Item 11. Controls and Procedures.
(a) The President (the Registrant’s Principal Executive Officer) and Chief Financial Officer (the Registrant’s Principal Financial Officer) have concluded that, based on their evaluation as of a date within 90 days of the filing date of this report, the disclosure controls and procedures of the Registrant (as defined in Rule 30a-3(c) under the Investment Company Act of 1940) are reasonably designed to achieve the purposes described in Section 4(a) of the attached certification.
(b) There were no changes in the Registrant’s internal control over financial reporting (as defined in Rule 30a-3(d) under the Investment Company Act of 1940) that occurred during the second fiscal quarter of the period covered by this report that have materially affected, or are reasonably likely to materially affect, the Registrant’s internal control over financial reporting.
Item 12. Exhibits.
(a) (1) Code of Ethics for Senior Officers that is the subject of Item 2 is attached.
(a) (2) Section 302 Certifications are attached.
(a) (3) Not applicable to the Registrant.
(b) Section 906 Certifications are attached.
SIGNATURES
Pursuant to the requirements of the Securities Exchange Act of 1934 and the Investment Company Act of 1940, the Registrant has duly caused this report to be signed on its behalf by the undersigned, thereunto duly authorized.
iShares U.S. ETF Trust
| | |
By: /s/ Martin Small |
| Martin Small, President (Principal Executive Officer) |
| |
| Date: | | December 29, 2016 |
Pursuant to the requirements of the Securities Exchange Act of 1934 and the Investment Company Act of 1940, this report has been signed below by the following persons on behalf of the Registrant and in the capacities and on the dates indicated.
| | |
By: /s/ Martin Small |
| Martin Small, President (Principal Executive Officer) |
| |
| Date: | | December 29, 2016 |
| | |
|
By: /s/ Jack Gee |
| Jack Gee, Treasurer and Chief Financial Officer (Principal Financial Officer) |
| |
| Date: | | December 29, 2016 |