UNITED STATES
SECURITIES AND EXCHANGE COMMISSION
Washington, DC 20549
FORMN-CSR
CERTIFIED SHAREHOLDER REPORT OF REGISTERED MANAGEMENT INVESTMENT COMPANIES
Investment Company Act file number number 811-22641
Franklin Alternative Strategies Funds
(Exact name of registrant as specified in charter)
One Franklin Parkway, San Mateo, CA 94403-1906
(Address of principal executive offices) (Zip code)
Craig S. Tyle, One Franklin Parkway, San Mateo, CA 94403-1906
(Name and address of agent for service)
Registrant’s telephone number, including area code:650312-2000
Date of fiscal year end:5/31
Date of reporting period:5/31/19
| Item 1. | Reports to Stockholders. |
ANNUAL REPORT AND SHAREHOLDER LETTER
FRANKLIN K2 ALTERNATIVE STRATEGIES FUND
A Series of Franklin Alternative Strategies Funds
May 31, 2019


Sign up for electronic delivery at franklintempleton.com/edelivery
Internet Delivery of Fund Reports Unless You Request Paper Copies: Effective January 1, 2021, as permitted by the SEC, paper copies of the Fund’s shareholder reports will no longer be sent by mail, unless you specifically request them from the Fund or your financial intermediary. Instead, the reports will be made available on a website, and you will be notified by mail each time a report is posted and provided with a website link to access the report.
If you already elected to receive shareholder reports electronically, you will not be affected by this change and you need not take any action. If you have not signed up for electronic delivery, we would encourage you to join fellow shareholders who have. You may elect to receive shareholder reports and other communications electronically from the Fund by calling(800) 632-2301 or by contacting your financial intermediary.
You may elect to continue to receive paper copies of all your future shareholder reports free of charge by contacting your financial intermediary or, if you invest directly with a Fund, calling(800) 632-2301 to let the Fund know of your request. Your election to receive reports in paper will apply to all funds held in your account.
FRANKLIN TEMPLETON
Successful investing begins with ambition. And achievement only comes when you reach for it. That’s why we continually strive to deliver better outcomes for investors. No matter what your goals are, our deep, global investment expertise allows us to offer solutions that can help.
During our more than 70 years of experience, we’ve managed through all kinds of markets—up, down and those in between. We’re always preparing for what may come next. It’s because of this, combined with our strength as one of the world’s largest asset managers that we’ve earned the trust of millions of investors around the world.
Dear Fellow Shareholder:
During the 12 months ended May 31, 2019, global markets benefited from upbeat economic data in certain regions, encouraging corporate earnings reports, the U.S. Federal Reserve’s (Fed’s) recent indications of a patient approach to its monetary policy, and periods of optimism about a potential U.S.-China trade deal. However, global markets also reflected investor concerns about the escalation of U.S.-China and U.S.-Mexico trade tensions nearperiod-end, the Fed’s interest-rate hikes and the European Central Bank’s unwinding of its bond purchase program in 2018, political uncertainties in the U.S. and the European Union, and slower global economic growth. In this environment, global developed market stocks, as measured by the MSCI World Index, posted a +0.27% total return for the period.1 Global emerging market stocks, as measured by the MSCI Emerging Markets Index, posted a-8.34% total return.1 Global government bonds, as measured by the FTSE World Government Bond Index, posted a +2.79% total return.1
We are committed to our long-term perspective and disciplined investment approach as we conduct a rigorous, fundamental analysis of securities with a regular emphasis on investment risk management.
We believe active, professional investment management serves investors well. We also recognize the important role of financial advisors in today’s markets and encourage investors to continue to seek their advice. Amid changing markets and economic conditions, we are confident investors with a well-diversified portfolio and a patient, long-term outlook should be well positioned for the years ahead.
CFA® is a trademark owned by CFA Institute.
1. Source: Morningstar.
See www.franklintempletondatasources.com for additional data provider information.
On the following pages, the Fund’s portfolio management team reviews investment decisions that pertain to performance during the past 12 months in light of the economic environment and other factors. Please remember all securities markets fluctuate, as do mutual fund share prices.
We thank you for investing with Franklin Templeton, welcome your questions and comments, and look forward to continuing to serve your investment needs in the years ahead.
Sincerely,

Madison S. Gulley, CFA
President and Chief Executive Officer – Investment Management
Franklin Alternative Strategies Funds
This letter reflects our analysis and opinions as of May 31, 2019, unless otherwise indicated. The information is not a complete analysis of every aspect of any market, country, industry, security or fund. Statements of fact are from sources considered reliable.
| | | | | | | | |
| Not FDIC Insured | | | | | May Lose Value | | | | | No Bank Guarantee |
| | | | | | |
| | | |
| franklintempleton.com | | Not part of the annual report | | | 1 | |
Visitfranklintempleton.comfor fund
updates, to access your account, or to find helpful financial planning tools.
| | | | | | |
| | | |
| | 2 | | | Annual Report | | franklintempleton.com |
ANNUAL REPORT
Franklin K2 Alternative Strategies Fund
This annual report for Franklin K2 Alternative Strategies Fund covers the fiscal year ended May 31, 2019.
Your Fund’s Goal and Main Investments
The Fund seeks capital appreciation with lower volatility relative to the broad equity markets. The Fund seeks to achieve its investment goal by allocating its assets across multiple nontraditional or alternative strategies, including, but not limited to, some or all of the following strategies: long short equity, relative value, event driven and global macro. The Fund is structured as a multi-manager fund, meaning the Fund’s assets are independently managed by multiple subadvisors, while the Fund’s investment manager retains overall responsibility for the Fund’s investments. The Fund may invest in a wide range of securities and other investments including, but not limited to: equity securities including common stocks, preferred stocks, convertible securities, rights and warrants, private and registered investment vehicles and exchange-traded funds (ETFs); debt securities including bonds, notes, debentures, banker’s acceptances and commercial paper; loans and loan participations; and mortgage-backed or other asset-backed securities, including collateralized debt obligations; as well as derivatives, commodities and currencies.
Performance Overview
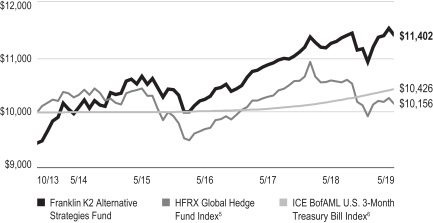
The Fund’s Class A shares posted a +1.35% cumulative total return for the 12 months under review. For comparison, the Fund’s primary benchmark, the HFRX Global Hedge Fund Index, which is designed to be representative of the overall composition of the hedge fund universe, posted a-4.01% total return for the same period.1 Also for comparison, the Fund’s secondary benchmark, the ICE BofAML U.S.3-Month Treasury Bill Index, which tracks the performance of short-term U.S. government securities with a remaining term to final maturity of less than three months, posted a +2.26% total return for the same period.2You can find more of the Fund’s performance data in the Performance Summary beginning on page 7.
Performance data represent past performance, which does not guarantee future results. Investment return and principal value will fluctuate, and you may have a gain or loss when you sell your shares. Current performance may differ from figures shown. For most recentmonth-end performance, go tofranklintempleton.comorcall(800)342-5236.
Economic and Market Overview
The global economy expanded during the 12 months ended May 31, 2019, despite weakness in certain regions. Global developed and emerging market stocks were aided by upbeat economic data in some regions, encouraging corporate earnings reports, the U.S. Federal Reserve’s (Fed’s) recent indications of a patient approach to its monetary policy and periods of optimism about a potential U.S.-China trade deal.
However, various factors weighed on global markets, notably the escalation of U.S.-China trade tensions, as the U.S. raised tariffs on Chinese goods in May and China announced higher tariffs on U.S. goods effective in June. Markets were further pressured atperiod-end when President Trump threatened to impose tariffs on Mexico due to immigration disputes. Concerns about political uncertainties in the U.S. and the European Union, the Fed’s interest-rate hikes in 2018 and the European Central Bank’s (ECB’s) unwinding of its bond purchase program also hurt investor confidence. In this environment, global developed and emerging market stocks, as measured by the MSCI All Country World Index, posted a-0.75% total return for the12-month period.2
The U.S. economy grew during the12-month period. After moderating for two consecutive quarters, the economy grew significantly faster in 2019’s first quarter, driven by growth in consumer spending, inventory investment, exports, business investment, and state and local government spending. The manufacturing and services sectors expanded during the period. The unemployment rate decreased from 3.8% in May 2018 to 3.6% atperiod-end.3 The annual inflation rate, as measured by the Consumer Price Index, decreased from 2.8% in May 2018 to 1.8% atperiod-end.3
1. Source: FactSet. Hedge Fund Research, Inc. – www.hedgefundresearch.com. The HFRX Global Hedge Fund Index is being used under license from Hedge Fund Research, Inc., which does not endorse or approve of any of the contents of this report.
2. Source: Morningstar.
The indexes are unmanaged and include reinvestment of any income or distributions. They do not reflect any fees, expenses or sales charges. One cannot invest directly in an index, and an index is not representative of the Fund’s portfolio. Unlike most asset class indexes, HFR Index returns reflect fees and expenses.
3. Source: U.S. Bureau of Labor Statistics.
See www.franklintempletondatasources.com for additional data provider information.
The dollar value, number of shares or principal amount, and names of all portfolio holdings are listed in the Fund’s Consolidated Statement of Investments (SOI). The Consolidated SOI begins on page 16.
| | | | | | |
| | | |
| franklintempleton.com | | Annual Report | | | 3 | |
FRANKLIN ALTERNATIVE STRATEGIES FUNDS
The Fed raised its target range for the federal funds rate by 0.25% three times during the period, to 2.25%–2.50%, and continued reducing its balance sheet as part of its plan to normalize monetary policy. At its March 2019 meeting, the Fed held its target range for the federal funds rate unchanged and signaled no rate hike in 2019. Furthermore, the Fed mentioned it would end its balance sheet normalization by the end of September 2019. At its April/May meeting, the Fed reiterated its patient approach to future rate adjustments.
In Europe, the U.K.’s quarterly gross domestic product (GDP) growth accelerated in 2018’s third quarter, moderated in the fourth quarter and accelerated again in 2019’s first quarter. The Bank of England raised its key policy rate once during the period. The eurozone’s quarterly GDP growth moderated in 2018’s third quarter before accelerating in the next two quarters. However, the bloc’s annual inflation rate decreased during the period. The ECB kept its benchmark interest rate unchanged during the period and concluded its bond purchase program at the end of 2018. At its April meeting, the ECB reiterated its expectation to keep its benchmark interest rate unchanged through at least the end of 2019 and stated it would provide details of its new monetary stimulus program at upcoming meetings.
In Asia, Japan’s quarterly GDP growth contracted in 2018’s third quarter, but accelerated in the next two quarters. The Bank of Japan left its benchmark interest rate unchanged and indicated it would keep the rate unchanged through the spring of 2020, while continuing its monetary stimulus measures.
In larger emerging markets, Brazil’s quarterly GDP growth accelerated in 2018’s third quarter, slowed in the fourth quarter and contracted in 2019’s first quarter. The Central Bank of Brazil left its benchmark interest rate unchanged during the period. Russia’s annual GDP growth held steady in 2018’s third quarter, accelerated in the fourth quarter and then moderated in 2019’s first quarter. The Bank of Russia increased its key rate twice during the period. China’s annual GDP growth rate stabilized in 2019’s first quarter after moderating for three consecutive quarters. The People’s Bank of China left its benchmark interest rate unchanged, but it took measures to improve financial liquidity to mitigate the effects of the U.S.-China trade dispute and support economic growth. Overall, global emerging market stocks, as measured by the MSCI Emerging Markets Index, posted a-8.34% total return during the12-month period.2
Investment Strategy
We manage the Fund using a multi-manager approach. While we are responsible for the Fund’s overall investments, we allocate assets to multiple subadvisors, each of whom
independently manages a separate portion of the Fund’s portfolio in accordance with some or all of the following strategies: long short equity, relative value, event driven and global macro. We allocate the Fund’s assets among these strategies utilizing atop-down approach, generating the Fund’s strategy weightings by taking into account market conditions, risk factors, diversification, liquidity, transparency, and availability of various subadvisors and other investment options, among other things. We allocate the Fund’s assets to specific subadvisors utilizing abottom-up approach, selecting subadvisors and their weighting within the Fund’s portfolio by taking into account their correlations to various markets and to each other, their risk profiles and their return expectations. Long short equity strategies generally seek to produce returns from investments in the equity markets by taking long and short positions in stocks and stock indexes (through the use of derivatives or through a position in an ETF). Relative value strategies encompass a wide range of investment techniques that are intended to profit from pricing inefficiencies. Event driven strategies generally invest in securities of companies undergoing significant corporate events. Global macro strategies generally focus on broad-based economic opportunities across numerous markets and investments. In addition, the debt securities in which the Fund may invest may have variable or fixed interest rates, may be of any maturity or credit rating, and may include sovereign debt, high yield (“junk”) bonds and distressed debt securities (securities of companies that are, or are about to be, involved in reorganizations, financial restructurings, or bankruptcy) and securities that are in default.
The Fund may take long and/or short positions in a wide range of asset classes, including equities, fixed income, commodities and currencies, among others. Long positions benefit from an increase in the price of the underlying instrument or asset class, while short positions benefit from a decrease in that price. The Fund may use derivatives for hedging andnon-hedging (investment) purposes, although no subadvisor is required to hedge any of the Fund’s positions or to use derivatives. Such derivative investments may include futures contracts, swaps, options and currency forward contracts. As a result of the Fund’s use of derivatives, the Fund may have economic leverage, which means the sum of the Fund’s investment exposures through its use of derivatives may significantly exceed the amount of assets invested in the Fund, although these exposures may vary over time. The Fund may engage in active and frequent trading as part of its investment strategies.
| | | | |
| | | |
| 4 | | Annual Report | | franklintempleton.com |
FRANKLIN K2 ALTERNATIVE STRATEGIES FUND
What is a futures contract?
A futures contract is an agreement between the Fund and a counterparty made through a U.S. or foreign futures exchange to buy or sell an underlying instrument or asset at a specific price on a future date.
What are swap agreements?
Swap agreements, such as interest rate, currency and credit default swaps, are contracts between the Fund and another party (the swap counterparty). In a basic swap transaction, the Fund agrees with the swap counterparty to exchange the returns (or differentials in rates of return) earned or realized on a particular “notional amount” of underlying instruments. The notional amount is the set amount selected by the parties as the basis on which to calculate the obligations that they have agreed to exchange. The parties typically do not actually exchange the notional amount. Instead, they agree to exchange the returns that would be earned or realized if the notional amount were invested in given instruments or at given interest rates.
What is an option?
An option is a contract to buy or sell a specific financial product known as the option’s underlying instrument at a specific price. The buyer of an option has the right, but not the obligation, to buy or sell the underlying instrument at or until a specified expiration date. Conversely, the seller (“writer”) of an option who opens a transaction is obligated to buy or sell the underlying instrument should the option holder exercise that right.
What is a currency forward contract?
A currency forward contract is an agreement between the Fund and a counterparty to buy or sell a foreign currency in exchange for another currency at a specific exchange rate on a future date. Currency forward contracts are privately traded in the interbank market, not on a centralized exchange.
| | | | | | | | |
| Strategy Allocation* | | | | | | |
| | |
| Based on Total Net Assets as of 5/31/19 | | | | | | |
| | |
| Strategy | | Long
Positions | | | Short
Positions | |
Relative Value | | | 21.9% | | | | -13.8% | |
Long Short Equity | | | 33.6% | | | | -20.5% | |
Event Driven | | | 22.0% | | | | -10.7% | |
Global Macro | | | 145.8% | | | | -46.0% | |
Risk Overlay | | | 0.0% | | | | -7.7% | |
| | |
| Total | | | 223.3% | | | | -98.7% | |
*Figures include the effect of gross notional exposure of derivatives.
| | | | |
| Subadvisors | | | |
| |
| 5/31/19 | | | |
| |
| Long Short Equity | | | | |
| |
Chilton Investment Company, LLC | | | | |
| |
Impala Asset Management LLC | | | | |
| |
Jennison Associates, LLC | | | | |
| |
Portland Hill Asset Management Limited | | | | |
| |
Wellington Management Company, LLP | | | | |
| |
| Relative Value | | | | |
| |
Chatham Asset Management, LLC | | | | |
| |
Lazard Asset Management, LLC | | | | |
| |
Loomis Sayles & Company, L.P. | | | | |
| |
| Event Driven | | | | |
| |
Bardin Hill Arbitrage IC Management LP | | | | |
| |
P. Schoenfeld Asset Management L.P. | | | | |
| |
| Global Macro | | | | |
| |
Emso Asset Management Limited | | | | |
| |
Graham Capital Management, L.P. | | | | |
| |
Grantham, Mayo, Van Otterloo & Co. LLC | | | | |
| |
H2O AM LLP | | | | |
Manager’s Discussion
During the 12 months under review, all of the four underlying strategies in which we allocated assets contributed to the Fund’s positive performance—in order of contribution, event driven, relative value, long short equity and global macro. A conditional risk overlay (CRO), which we implemented for part of the review period to help mitigate downside risk, also benefited returns, particularly in the challenging fourth quarter of 2018 and May 2019. The CRO strategy was active atperiod-end. The allocation percentages for each strategy are listed in the Strategy Allocation table on this page.
What is the conditional risk overlay (CRO) strategy?
From time to time, the Fund’s investment manager may implement its CRO strategy, which seeks to neutralize certain market sensitivities that may exist in the Fund. The CRO strategy involves investing in derivatives or other instruments in an effort to reduce volatility and provide a hedge against market declines. When implemented, the strategy will reduce the Fund’s ability to benefit from positive market movements.
The Fund’s event driven strategy subadvisors were Bardin Hill Arbitrage IC Management (formerly Halcyon Arbitrage IC Management) and P. Schoenfeld Asset Management. Both subadvisors delivered positive returns, benefiting from a healthy volume ofmergers-and-acquisitions activity. By asset class, the top contributors to the strategy’s aggregate performance were equity and credit, followed by currency exposures. In terms of aggregate sector exposures, the top performance drivers were health care, utilities and consumer
| | | | | | |
| | | |
| franklintempleton.com | | Annual Report | | | 5 | |
FRANKLIN K2 ALTERNATIVE STRATEGIES FUND
discretionary. Conversely, the top sector detractors from the strategy’s aggregate performance were materials and equity index hedges.
The Fund’s relative value strategy subadvisors atperiod-end were Chatham Asset Management, Lazard Asset Management and Loomis Sayles & Company. All of these subadvisors strengthened performance during the period, led by Chatham. During the fourth quarter of 2018, the Fund withdrew all assets from one of the strategy’s subadvisors, Basso Capital Management, which detracted slightly from returns. All asset classes represented in the strategy contributed to positive performance, led by credit and equity. In terms of aggregate sector exposures, consumer discretionary, communication services and information technology (IT) were the top contributors. Conversely, equity index hedges and consumer staples were overall detractors.
The Fund’s long short equity strategy subadvisors were Chilton Investment, Impala Asset Management, Jennison Associates, Portland Hill Asset Management and Wellington Management. Two of the five subadvisors contributed to gains for the period—Chilton and Wellington. Conversely, Impala, Portland Hill and Jennison experienced negative returns. In aggregate, all asset classes represented in the strategy made positive contributions, led by equity and currency exposures. In terms of aggregate sector exposures, net long positions in IT and communication services contributed to positive returns, while net long positions in consumer discretionary detracted. Equity index hedges had a negative impact on performance.
The Fund allocated assets to two new global macro strategy subadvisors during the period: discretionary subadvisor H2O AM and systematic subadvisor Grantham, Mayo, Van Otterloo & Co. They joined existing subadvisors Graham Capital Management and Emso Asset Management.
Three of the four subadvisors had positive performance for the12-month period, led by Emso. Graham was the only subadvisor in the strategy that experienced negative results. By asset class, currency exposures and credit contributed to positive performance, while equity and commodities weakened returns. In terms of aggregate sector exposures, long positioning in the U.S. dollar and short positioning in interest rates proved beneficial to performance, while long positioning on energy futures and European financials had a negative impact on performance.
Thank you for your participation in Franklin K2 Alternative Strategies Fund. We look forward to continuing to serve your investment needs.
| | |
 | | 
Brooks Ritchey Co-Lead Portfolio Manager |
| | |
 | | 
Robert Christian Co-Lead Portfolio Manager |
| | |
 | | 
Anthony Zanolla, CFA Portfolio Manager |
The foregoing information reflects our analysis, opinions and portfolio holdings as of May 31, 2019, the end of the reporting period. The way we implement our main investment strategies and the resulting portfolio holdings may change depending on factors such as market and economic conditions. These opinions may not be relied upon as investment advice or an offer for a particular security. The information is not a complete analysis of every aspect of any market, country, industry, security or the Fund. Statements of fact are from sources considered reliable, but the investment manager makes no representation or warranty as to their completeness or accuracy. Although historical performance is no guarantee of future results, these insights may help you understand our investment management philosophy.
| | | | |
| | | |
| 6 | | Annual Report | | franklintempleton.com |
FRANKLIN K2 ALTERNATIVE STRATEGIES FUND
Performance Summary as of May 31, 2019
The performance table and graphs do not reflect any taxes that a shareholder would pay on Fund dividends, capital gain distributions, if any, or any realized gains on the sale of Fund shares. Total return reflects reinvestment of the Fund’s dividends and capital gain distributions, if any, and any unrealized gains or losses. Your dividend income will vary depending on dividends or interest paid by securities in the Fund’s portfolio, adjusted for operating expenses of each class. Capital gain distributions are net profits realized from the sale of portfolio securities.
Performance as of 5/31/191
Cumulative total return excludes sales charges. Average annual total return includes maximum sales charges. Sales charges will vary depending on the size of the investment and the class of share purchased. The maximum is 5.50% and the minimum is 0%.Class A: 5.50% maximum initial sales charge;Advisor Class: no sales charges. For other share classes, visit franklintempleton.com.
| | | | | | | | |
| | |
| Share Class | | Cumulative
Total Return2 | | | Average Annual
Total Return3 | |
| | |
| A4 | | | | | | | | |
1-Year | | | +1.35% | | | | -4.20% | |
5-Year | | | +12.93% | | | | +1.31% | |
Since Inception (10/11/13) | | | +20.63% | | | | +2.35% | |
| | |
| Advisor | | | | | | | | |
1-Year | | | +1.61% | | | | +1.61% | |
5-Year | | | +14.39% | | | | +2.73% | |
Since Inception (10/11/13) | | | +22.30% | | | | +3.64% | |
Performance data represent past performance, which does not guarantee future results. Investment return and principal value will fluctuate, and you may have a gain or loss when you sell your shares. Current performance may differ from figures shown. For most recentmonth-end performance, go tofranklintempleton.comor call(800)342-5236.
See page 9 for Performance Summary footnotes.
| | | | | | |
| | | |
| franklintempleton.com | | Annual Report | | | 7 | |
FRANKLIN K2 ALTERNATIVE STRATEGIES FUND
PERFORMANCE SUMMARY
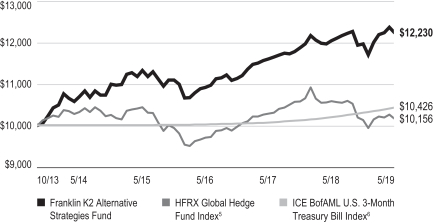
Total Return Index Comparison for a Hypothetical $10,000 Investment1
Total return represents the change in value of an investment over the periods shown. It includes any applicable maximum sales charge, Fund expenses, account fees and reinvested distributions. The unmanaged indexes include reinvestment of any income or distributions. These differ from the Fund in composition and, except for the HFR Index, do not pay management fees or expenses. Unlike most asset class indexes, HFR Index returns reflect management fees and expenses. One cannot invest directly in an index.
Class A(10/11/13–5/31/19)
Advisor Class(10/11/13–5/31/19)
See page 9 for Performance Summary footnotes.
| | | | |
| | | |
| 8 | | Annual Report | | franklintempleton.com |
FRANKLIN K2 ALTERNATIVE STRATEGIES FUND
PERFORMANCE SUMMARY
Distributions(6/1/18–5/31/19)
| | | | |
| |
| Share Class | | Long-Term
Capital Gain | |
A | | | $0.2519 | |
C | | | $0.2519 | |
R | | | $0.2519 | |
R6 | | | $0.2519 | |
Advisor | | | $0.2519 | |
Total Annual Operating Expenses7
| | | | | | | | |
| | |
| Share Class | | With Fee
Waiver | | | Without
Fee Waiver | |
A | | | 2.61% | | | | 2.82% | |
Advisor | | | 2.36% | | | | 2.57% | |
Each class of shares is available to certain eligible investors and has different annual fees and expenses, as described in the prospectus.
All investments involve risks, including possible loss of principal. The market values of securities owned by the Fund will go up or down, sometimes rapidly or unpredictably. The Fund’s performance depends on the manager’s skill in selecting, overseeing and allocating Fund assets to the subadvisors. The Fund is actively managed and could experience losses if the investment manager’s and subadvisors’ judgment about particular investments made for the Fund’s portfolio prove to be incorrect. Some subadvisors may have little or no experience managing the assets of a registered investment company. Foreign investments are subject to greater investment risk such as political, economic, credit and information risks as well as risk of currency fluctuations. Investments in derivatives involve costs and create economic leverage, which may result in significant volatility and cause the Fund to participate in losses (as well as gains) that significantly exceed the Fund’s initial investment. Lower-rated or high-yield debt securities involve greater credit risk, including the possibility of default or bankruptcy. Currency management strategies could result in losses to the Fund if currencies do not perform as the investment manager or subadvisor expects. The Fund may make short sales of securities, which involves the risk that losses may exceed the original amount invested. Merger arbitrage investments risk loss if a proposed reorganization in which the Fund invests is renegotiated or terminated. Liquidity risk exists when securities have become more difficult to sell, or are unable to be sold, at the price at which they have been valued. The Fund’s prospectus also includes a description of the main investment risks.
1. The Fund has an expense reduction contractually guaranteed through 9/30/19 and a fee waiver related to the management fee paid by a subsidiary. The Fund also has a fee waiver associated with any investments it makes in a Franklin Templeton money fund and/or other Franklin Templeton fund contractually guaranteed through 9/30/19. Fund investment results reflect the expense reduction and fee waivers; without these reductions, the results would have been lower.
2. Cumulative total return represents the change in value of an investment over the periods indicated.
3. Average annual total return represents the average annual change in value of an investment over the periods indicated. Return for less than one year, if any, has not been annualized.
4. Prior to 9/10/18, these shares were offered at a higher initial sales charge of 5.75%, thus actual returns (with sales charges) would have differed. Average annual total returns (with sales charges) have been restated to reflect the current maximum initial sales charge of 5.50%.
5. Source: FactSet. Hedge Fund Research, Inc. – www.hedgefundresearch.com. The HFRX Global Hedge Fund Index is being used under license from Hedge Fund Research, Inc., which does not endorse or approve of any of the contents of this report. The HFRX Global Hedge Fund Index is designed to be representative of the overall composition of the hedge fund universe. It is composed of all eligible hedge fund strategies, including but not limited to convertible arbitrage, distressed securities, equity hedge, equity market neutral, event driven, macro, merger arbitrage and relative value arbitrage. The strategies are asset weighted based on the distribution of assets in the hedge fund industry.
6. Source: Morningstar. The ICE BofAML U.S.3-Month Treasury Bill Index is an index of short-term U.S. government securities with a remaining term to final maturity of less than three months.
7. Figures are as stated in the Fund’s current prospectus and may differ from the expense ratios disclosed in the Your Fund’s Expenses and Consolidated Financial Highlights sections in this report. In periods of market volatility, assets may decline significantly, causing total annual Fund operating expenses to become higher than the figures shown.
See www.franklintempletondatasources.com for additional data provider information.
| | | | | | |
| | | |
| franklintempleton.com | | Annual Report | | | 9 | |
FRANKLIN K2 ALTERNATIVE STRATEGIES FUND
Your Fund’s Expenses
As a Fund shareholder, you can incur two types of costs: (1) transaction costs, including sales charges (loads) on Fund purchases and redemptions; and (2) ongoing Fund costs, including management fees, distribution and service(12b-1) fees, and other Fund expenses. All mutual funds have ongoing costs, sometimes referred to as operating expenses. The table below shows ongoing costs of investing in the Fund and can help you understand these costs and compare them with those of other mutual funds. The table assumes a $1,000 investment held for the six months indicated.
Actual Fund Expenses
The table below provides information about actual account values and actual expenses in the columns under the heading “Actual.” In these columns the Fund’s actual return, which includes the effect of Fund expenses, is used to calculate the “Ending Account Value” for each class of shares. You can estimate the expenses you paid during the period by following these steps (of course, your account value and expenses will differ from those in this illustration): Divide your account value by $1,000 (if your account had an $8,600 value, then $8,600÷ $1,000 = 8.6). Then multiply the result by the number in the row for your class of shares under the headings “Actual” and “Expenses Paid During Period” (if Actual Expenses Paid During Period were $7.50, then 8.6 x $7.50 =$64.50). In this illustration, the actual expenses paid this period are $64.50.
Hypothetical Example for Comparison with Other Funds
Under the heading “Hypothetical” in the table, information is provided about hypothetical account values and hypothetical expenses based on the Fund’s actual expense ratio and an assumed rate of return of 5% per year before expenses, which is not the Fund’s actual return. This information may not be used to estimate the actual ending account balance or expenses you paid for the period, but it can help you compare ongoing costs of investing in the Fund with those of other funds. To do so, compare this 5% hypothetical example for the class of shares you hold with the 5% hypothetical examples that appear in the shareholder reports of other funds.
Please note that expenses shown in the table are meant to highlight ongoing costs and do not reflect any transactional costs. Therefore, information under the heading “Hypothetical” is useful in comparing ongoing costs only, and will not help you compare total costs of owning different funds. In addition, if transactional costs were included, your total costs would have been higher.
| | | | | | | | | | | | | | | | | | | | | | | | |
| | | | |
| | | | | | Actual
(actual return after expenses) | | | Hypothetical
(5% annual return before expenses) | | | | |
Share
Class | | Beginning
Account
Value 12/1/18 | | | Ending
Account
Value 5/31/19 | | | Expenses
Paid During
Period
12/1/18–5/31/191,2 | | | Ending
Account
Value 5/31/19 | | | Expenses
Paid During
Period
12/1/18–5/31/191,2 | | | Net
Annualized
Expense
Ratio2 | |
| A | | $ | 1,000 | | | $ | 1,022.50 | | | $ | 12.76 | | | $ | 1,012.32 | | | $ | 12.69 | | | | 2.53 | % |
| C | | $ | 1,000 | | | $ | 1,018.30 | | | $ | 16.50 | | | $ | 1,008.58 | | | $ | 16.43 | | | | 3.28 | % |
| R | | $ | 1,000 | | | $ | 1,020.60 | | | $ | 14.00 | | | $ | 1,011.07 | | | $ | 13.94 | | | | 2.78 | % |
| R6 | | $ | 1,000 | | | $ | 1,023.30 | | | $ | 11.10 | | | $ | 1,013.96 | | | $ | 11.05 | | | | 2.20 | % |
| Advisor | | $ | 1,000 | | | $ | 1.022.40 | | | $ | 11.50 | | | $ | 1,013.56 | | | $ | 11.45 | | | | 2.28 | % |
1. Expenses are equal to the annualized expense ratio for thesix-month period as indicated above—in the far right column—multiplied by the simple average account value over the period indicated, and then multiplied by 182/365 to reflect theone-half year period.
2. Reflects expenses after fee waivers and expense reimbursements. Does not include acquired fund fees and expenses.
| | | | |
| | | |
| 10 | | Annual Report | | franklintempleton.com |
FRANKLIN ALTERNATIVE STRATEGIES FUNDS
Consolidated Financial Highlights
Franklin K2 Alternative Strategies Fund
| | | | | | | | | | | | | | | | | | | | |
| |
| | | Year Ended May 31, | |
| | | | | |
| | | 2019 | | | 2018 | | | 2017 | | | 2016 | | | 2015 | |
| | | | | |
| Class A | | | | | | | | | | | | | | | | | | | | |
Per share operating performance
(for a share outstanding throughout the year) | | | | | | | | | | | | | | | | | | | | |
| | | | | |
Net asset value, beginning of year | | $ | 11.38 | | | $ | 11.14 | | | $ | 10.55 | | | $ | 11.16 | | | $ | 10.64 | |
| | | | |
| | | | | |
| Income from investment operationsa: | | | | | | | | | | | | | | | | | | | | |
| | | | | |
Net investment income (loss)b | | | 0.04 | | | | 0.01 | | | | 0.03 | | | | (0.05 | ) | | | (0.11 | ) |
| | | | | |
Net realized and unrealized gains (losses) | | | 0.11 | | | | 0.38 | | | | 0.61 | | | | (0.38 | ) | | | 0.70 | |
| | | | |
| | | | | |
Total from investment operations | | | 0.15 | | | | 0.39 | | | | 0.64 | | | | (0.43 | ) | | | 0.59 | |
| | | | |
| | | | | |
| Less distributions from: | | | | | | | | | | | | | | | | | | | | |
| | | | | |
Net investment income | | | — | | | | (0.15 | ) | | | (0.05 | ) | | | (0.14 | ) | | | (0.07 | ) |
| | | | | |
Net realized gains | | | (0.25 | ) | | | — | | | | — | | | | (0.04 | ) | | | — | |
| | | | |
| | | | | |
Total distributions | | | (0.25 | ) | | | (0.15 | ) | | | (0.05 | ) | | | (0.18 | ) | | | (0.07 | ) |
| | | | |
| | | | | |
Net asset value, end of year | | $ | 11.28 | | | $ | 11.38 | | | $ | 11.14 | | | $ | 10.55 | | | $ | 11.16 | |
| | | | |
| | | | | |
Total returnc | | | 1.35% | | | | 3.57% | | | | 6.07% | | | | (3.89)% | | | | 5.53% | |
| | | | | |
| Ratios to average net assets | | | | | | | | | | | | | | | | | | | | |
| | | | | |
Expenses before waiver, payments by affiliates and expense reductiond | | | 2.73% | | | | 2.81% | | | | 3.07% | | | | 3.22% | | | | 3.40% | |
| | | | | |
Expenses net of waiver, payments by affiliates and expense reductiond | | | 2.56% | | | | 2.59% | | | | 2.73% | | | | 2.88% | e | | | 2.99% | e |
| | | | | |
Expenses incurred in connection with securities sold short | | | 0.36% | | | | 0.39% | | | | 0.53% | | | | 0.67% | | | | 0.65% | |
| | | | | |
Net investment income (loss) | | | 0.36% | | | | 0.06% | | | | 0.10% | | | | (0.44)% | | | | (0.95)% | |
| | | | | |
| Supplemental data | | | | | | | | | | | | | | | | | | | | |
| | | | | |
Net assets, end of year (000’s) | | | $104,452 | | | | $119,214 | | | | $119,385 | | | | $177,412 | | | | $148,991 | |
| | | | | |
Portfolio turnover rate | | | 235.47% | | | | 234.77% | | | | 209.45% | | | | 229.90% | | | | 295.81% | |
aThe amount shown for a share outstanding throughout the period may not correlate with the Consolidated Statement of Operations for the period due to the timing of sales and repurchases of the Fund’s shares in relation to income earned and/or fluctuating fair value of the investments of the Fund.
bBased on average daily shares outstanding.
cTotal return does not reflect sales commissions or contingent deferred sales charges, if applicable.
dIncludes dividend and/or interest expense on securities sold short and security borrowing fees, if any. See below for the ratios of such expenses to average net assets for the periods presented. See Note 1(h).
eBenefit of expense reduction rounds to less than 0.01%.
| | | | | | |
| | | |
| franklintempleton.com | | The accompanying notes are an integral part of these consolidated financial statements. | Annual Report | | | 11 | |
FRANKLIN ALTERNATIVE STRATEGIES FUNDS
CONSOLIDATED FINANCIAL HIGHLIGHTS
Franklin K2 Alternative Strategies Fund(continued)
| | | | | | | | | | | | | | | | | | | | |
| |
| | | Year Ended May 31, | |
| | | | | |
| | | 2019 | | | 2018 | | | 2017 | | | 2016 | | | 2015 | |
| | | | | |
| Class C | | | | | | | | | | | | | | | | | | | | |
Per share operating performance
(for a share outstanding throughout the year) | | | | | | | | | | | | | | | | | | | | |
| | | | | |
Net asset value, beginning of year | | $ | 11.25 | | | $ | 11.00 | | | $ | 10.45 | | | $ | 11.09 | | | $ | 10.60 | |
| | | | |
| | | | | |
| Income from investment operationsa: | | | | | | | | | | | | | | | | | | | | |
| | | | | |
Net investment income (loss)b | | | (0.05 | ) | | | (0.08 | ) | | | (0.04 | ) | | | (0.12 | ) | | | (0.17 | ) |
| | | | | |
Net realized and unrealized gains (losses) | | | 0.10 | | | | 0.39 | | | | 0.59 | | | | (0.39 | ) | | | 0.69 | |
| | | | |
| | | | | |
Total from investment operations | | | 0.05 | | | | 0.31 | | | | 0.55 | | | | (0.51 | ) | | | 0.52 | |
| | | | |
| | | | | |
| Less distributions from: | | | | | | | | | | | | | | | | | | | | |
| | | | | |
Net investment income | | | — | | | | (0.06 | ) | | | — | | | | (0.09 | ) | | | (0.03 | ) |
| | | | | |
Net realized gains | | | (0.25 | ) | | | — | | | | — | | | | (0.04 | ) | | | — | |
| | | | |
| | | | | |
Total distributions | | | (0.25 | ) | | | (0.06 | ) | | | — | | | | (0.13 | ) | | | (0.03 | ) |
| | | | |
| | | | | |
Net asset value, end of year | | $ | 11.05 | | | $ | 11.25 | | | $ | 11.00 | | | $ | 10.45 | | | $ | 11.09 | |
| | | | |
| | | | | |
Total returnc | | | 0.56% | | | | 2.82% | | | | 5.26% | | | | (4.62)% | | | | 4.87% | |
| | | | | |
| Ratios to average net assets | | | | | | | | | | | | | | | | | | | | |
| | | | | |
Expenses before waiver, payments by affiliates and expense reductiond | | | 3.48% | | | | 3.56% | | | | 3.79% | | | | 3.96% | | | | 4.04% | |
| | | | | |
Expenses net of waiver, payments by affiliates and expense reductiond | | | 3.31% | | | | 3.34% | | | | 3.45% | | | | 3.62% | e | | | 3.63% | e |
| | | | | |
Expenses incurred in connection with securities sold short | | | 0.36% | | | | 0.39% | | | | 0.53% | | | | 0.67% | | | | 0.65% | |
| | | | | |
Net investment income (loss) | | | (0.39)% | | | | (0.69)% | | | | (0.62)% | | | | (1.18)% | | | | (1.59)% | |
| | | | | |
| Supplemental data | | | | | | | | | | | | | | | | | | | | |
| | | | | |
Net assets, end of year (000’s) | | | $44,897 | | | | $53,196 | | | | $55,496 | | | | $71,154 | | | | $37,937 | |
| | | | | |
Portfolio turnover rate | | | 235.47% | | | | 234.77% | | | | 209.45% | | | | 229.90% | | | | 295.81% | |
aThe amount shown for a share outstanding throughout the period may not correlate with the Consolidated Statement of Operations for the period due to the timing of sales and repurchases of the Fund’s shares in relation to income earned and/or fluctuating fair value of the investments of the Fund.
bBased on average daily shares outstanding.
cTotal return does not reflect sales commissions or contingent deferred sales charges, if applicable.
dIncludes dividend and/or interest expense on securities sold short and security borrowing fees, if any. See below for the ratios of such expenses to average net assets for the periods presented. See Note 1(h).
eBenefit of expense reduction rounds to less than 0.01%.
| | | | |
| | | |
| 12 | | Annual Report | The accompanying notes are an integral part of these consolidated financial statements. | | franklintempleton.com |
FRANKLIN ALTERNATIVE STRATEGIES FUNDS
CONSOLIDATED FINANCIAL HIGHLIGHTS
Franklin K2 Alternative Strategies Fund(continued)
| | | | | | | | | | | | | | | | | | | | |
| |
| | | Year Ended May 31, | |
| | | | | |
| | | 2019 | | | 2018 | | | 2017 | | | 2016 | | | 2015 | |
| | | | | |
| Class R | | | | | | | | | | | | | | | | | | | | |
Per share operating performance
(for a share outstanding throughout the year) | | | | | | | | | | | | | | | | | | | | |
| | | | | |
Net asset value, beginning of year | | $ | 11.42 | | | $ | 11.17 | | | $ | 10.61 | | | $ | 11.15 | | | $ | 10.62 | |
| | | | |
| | | | | |
| Income from investment operationsa: | | | | | | | | | | | | | | | | | | | | |
| | | | | |
Net investment income (loss)b | | | 0.02 | | | | (0.02 | ) | | | (0.25 | ) | | | (0.10 | ) | | | (0.16 | ) |
| | | | | |
Net realized and unrealized gains (losses) | | | 0.09 | | | | 0.39 | | | | 0.86 | | | | (0.40 | ) | | | 0.73 | |
| | | | |
| | | | | |
Total from investment operations | | | 0.11 | | | | 0.37 | | | | 0.61 | | | | (0.50 | ) | | | 0.57 | |
| | | | |
| | | | | |
| Less distributions from: | | | | | | | | | | | | | | | | | | | | |
| | | | | |
Net investment income | | | — | | | | (0.12 | ) | | | (0.05 | ) | | | — | | | | (0.04 | ) |
| | | | | |
Net realized gains | | | (0.25 | ) | | | — | | | | — | | | | (0.04 | ) | | | — | |
| | | | |
| | | | | |
Total distributions | | | (0.25 | ) | | | (0.12 | ) | | | (0.05 | ) | | | (0.04 | ) | | | (0.04 | ) |
| | | | |
| | | | | |
Net asset value, end of year | | $ | 11.28 | | | $ | 11.42 | | | $ | 11.17 | | | $ | 10.61 | | | $ | 11.15 | |
| | | | |
| | | | | |
Total return | | | 1.08% | | | | 3.28% | | | | 5.79% | | | | (4.51)% | | | | 5.39% | |
| | | | | |
| Ratios to average net assets | | | | | | | | | | | | | | | | | | | | |
| | | | | |
Expenses before waiver, payments by affiliates and expense reductionc | | | 2.98% | | | | 3.06% | | | | 3.32% | | | | 3.46% | | | | 3.57% | |
| | | | | |
Expenses net of waiver, payments by affiliates and expense reductionc | | | 2.81% | | | | 2.84% | | | | 2.98% | | | | 3.12% | d | | | 3.16% | d |
| | | | | |
Expenses incurred in connection with securities sold short | | | 0.36% | | | | 0.39% | | | | 0.53% | | | | 0.67% | | | | 0.65% | |
| | | | | |
Net investment income (loss) | | | 0.11% | | | | (0.19)% | | | | (0.15)% | | | | (0.68)% | | | | (1.12)% | |
| | | | | |
| Supplemental data | | | | | | | | | | | | | | | | | | | | |
| | | | | |
Net assets, end of year (000’s) | | | $844 | | | | $648 | | | | $597 | | | | $341 | | | | $9,173 | |
| | | | | |
Portfolio turnover rate | | | 235.47% | | | | 234.77% | | | | 209.45% | | | | 229.90% | | | | 295.81% | |
aThe amount shown for a share outstanding throughout the period may not correlate with the Consolidated Statement of Operations for the period due to the timing of sales and repurchases of the Fund’s shares in relation to income earned and/or fluctuating fair value of the investments of the Fund.
bBased on average daily shares outstanding.
cIncludes dividend and/or interest expense on securities sold short and security borrowing fees, if any. See below for the ratios of such expenses to average net assets for the periods presented. See Note 1(h).
dBenefit of expense reduction rounds to less than 0.01%.
| | | | | | |
| | | |
| franklintempleton.com | | The accompanying notes are an integral part of these consolidated financial statements. | Annual Report | | | 13 | |
FRANKLIN ALTERNATIVE STRATEGIES FUNDS
CONSOLIDATED FINANCIAL HIGHLIGHTS
Franklin K2 Alternative Strategies Fund(continued)
| | | | | | | | | | | | | | | | | | | | |
| |
| | | Year Ended May 31, | |
| | | | | |
| | | 2019 | | | 2018 | | | 2017 | | | 2016 | | | 2015 | |
| | | | | |
| Class R6 | | | | | | | | | | | | | | | | | | | | |
Per share operating performance
(for a share outstanding throughout the year) | | | | | | | | | | | | | | | | | | | | |
| | | | | |
Net asset value, beginning of year | | $ | 11.41 | | | $ | 11.17 | | | $ | 10.59 | | | $ | 11.18 | | | $ | 10.66 | |
| | | | |
| | | | | |
| Income from investment operationsa: | | | | | | | | | | | | | | | | | | | | |
| | | | | |
Net investment income (loss)b | | | 0.08 | | | | 0.03 | | | | 0.02 | | | | (0.01 | ) | | | (0.08 | ) |
| | | | | |
Net realized and unrealized gains (losses) | | | 0.10 | | | | 0.40 | | | | 0.65 | | | | (0.37 | ) | | | 0.70 | |
| | | | |
| | | | | |
Total from investment operations | | | 0.18 | | | | 0.43 | | | | 0.67 | | | | (0.38 | ) | | | 0.62 | |
| | | | |
| | | | | |
| Less distributions from: | | | | | | | | | | | | | | | | | | | | |
| | | | | |
Net investment income | | | — | | | | (0.19 | ) | | | (0.09 | ) | | | (0.17 | ) | | | (0.10 | ) |
| | | | | |
Net realized gains | | | (0.25 | ) | | | — | | | | — | | | | (0.04 | ) | | | — | |
| | | | |
| | | | | |
Total distributions | | | (0.25 | ) | | | (0.19 | ) | | | (0.09 | ) | | | (0.21 | ) | | | (0.10 | ) |
| | | | |
| | | | | |
Net asset value, end of year | | $ | 11.34 | | | $ | 11.41 | | | $ | 11.17 | | | $ | 10.59 | | | $ | 11.18 | |
| | | | |
| | | | | |
Total return | | | 1.70% | | | | 3.83% | | | | 6.40% | | | | (3.45)% | | | | 5.80% | |
| | | | | |
| Ratios to average net assets | | | | | | | | | | | | | | | | | | | | |
| | | | | |
Expenses before waiver, payments by affiliates and expense reductionc | | | 2.41% | | | | 2.46% | | | | 2.73% | | | | 2.87% | | | | 2.98% | |
| | | | | |
Expenses net of waiver, payments by affiliates and expense reductionc | | | 2.23% | | | | 2.24% | | | | 2.39% | | | | 2.53% | d | | | 2.60% | d |
| | | | | |
Expenses incurred in connection with securities sold short | | | 0.36% | | | | 0.39% | | | | 0.53% | | | | 0.67% | | | | 0.65% | |
| | | | | |
Net investment income (loss) | | | 0.69% | | | | 0.41% | | | | 0.44% | | | | (0.09)% | | | | (0.56)% | |
| | | | | |
| Supplemental data | | | | | | | | | | | | | | | | | | | | |
| | | | | |
Net assets, end of year (000’s) | | | $42,842 | | | | $31,805 | | | | $265,247 | | | | $265,517 | | | | $239,754 | |
| | | | | |
Portfolio turnover rate | | | 235.47% | | | | 234.77% | | | | 209.45% | | | | 229.90% | | | | 295.81% | |
aThe amount shown for a share outstanding throughout the period may not correlate with the Consolidated Statement of Operations for the period due to the timing of sales and repurchases of the Fund’s shares in relation to income earned and/or fluctuating fair value of the investments of the Fund.
bBased on average daily shares outstanding.
cIncludes dividend and/or interest expense on securities sold short and security borrowing fees, if any. See below for the ratios of such expenses to average net assets for the periods presented. See Note 1(h).
dBenefit of expense reduction rounds to less than 0.01%.
| | | | |
| | | |
| 14 | | Annual Report | The accompanying notes are an integral part of these consolidated financial statements. | | franklintempleton.com |
FRANKLIN ALTERNATIVE STRATEGIES FUNDS
CONSOLIDATED FINANCIAL HIGHLIGHTS
Franklin K2 Alternative Strategies Fund(continued)
| | | | | | | | | | | | | | | | | | | | |
| |
| | | Year Ended May 31, | |
| | | | | |
| | | 2019 | | | 2018 | | | 2017 | | | 2016 | | | 2015 | |
| | | | | |
| Advisor Class | | | | | | | | | | | | | | | | | | | | |
Per share operating performance
(for a share outstanding throughout the year) | | | | | | | | | | | | | | | | | | | | |
| | | | | |
Net asset value, beginning of year | | $ | 11.40 | | | $ | 11.16 | | | $ | 10.58 | | | $ | 11.18 | | | $ | 10.65 | |
| | | | |
| | | | | |
| Income from investment operationsa: | | | | | | | | | | | | | | | | | | | | |
| | | | | |
Net investment income (loss)b | | | 0.07 | | | | 0.04 | | | | 0.04 | | | | (0.02 | ) | | | (0.02 | ) |
| | | | | |
Net realized and unrealized gains (losses) | | | 0.11 | | | | 0.38 | | | | 0.62 | | | | (0.38 | ) | | | 0.64 | |
| | | | |
| | | | | |
Total from investment operations | | | 0.18 | | | | 0.42 | | | | 0.66 | | | | (0.40 | ) | | | 0.62 | |
| | | | |
| | | | | |
| Less distributions from: | | | | | | | | | | | | | | | | | | | | |
| | | | | |
Net investment income | | | — | | | | (0.18 | ) | | | (0.08 | ) | | | (0.16 | ) | | | (0.09 | ) |
| | | | | |
Net realized gains | | | (0.25 | ) | | | — | | | | — | | | | (0.04 | ) | | | — | |
| | | | |
| | | | | |
Total distributions | | | (0.25 | ) | | | (0.18 | ) | | | (0.08 | ) | | | (0.20 | ) | | | (0.09 | ) |
| | | | |
| | | | | |
Net asset value, end of year | | $ | 11.33 | | | $ | 11.40 | | | $ | 11.16 | | | $ | 10.58 | | | $ | 11.18 | |
| | | | |
| | | | | |
Total return | | | 1.61% | | | | 3.75% | | | | 6.29% | | | | (3.58)% | | | | 5.88% | |
| | | | | |
| Ratios to average net assets | | | | | | | | | | | | | | | | | | | | |
| | | | | |
Expenses before waiver, payments by affiliates and expense reductionc | | | 2.48% | | | | 2.56% | | | | 2.82% | | | | 2.96% | | | | 3.07% | |
| | | | | |
Expenses net of waiver, payments by affiliates and expense reductionc | | | 2.31% | | | | 2.34% | | | | 2.48% | | | | 2.62% | d | | | 2.66% | d |
| | | | | |
Expenses incurred in connection with securities sold short | | | 0.36% | | | | 0.39% | | | | 0.53% | | | | 0.67% | | | | 0.65% | |
| | | | | |
Net investment income (loss) | | | 0.61% | | | | 0.31% | | | | 0.35% | | | | (0.18)% | | | | (0.62)% | |
| | | | | |
| Supplemental data | | | | | | | | | | | | | | | | | | | | |
| | | | | |
Net assets, end of year (000’s) | | | $1,046,252 | | | | $896,278 | | | | $674,828 | | | | $722,216 | | | | $329,139 | |
| | | | | |
Portfolio turnover rate | | | 235.47% | | | | 234.77% | | | | 209.45% | | | | 229.90% | | | | 295.81% | |
aThe amount shown for a share outstanding throughout the period may not correlate with the Consolidated Statement of Operations for the period due to the timing of sales and repurchases of the Fund’s shares in relation to income earned and/or fluctuating fair value of the investments of the Fund.
bBased on average daily shares outstanding.
cIncludes dividend and/or interest expense on securities sold short and security borrowing fees, if any. See below for the ratios of such expenses to average net assets for the periods presented. See Note 1(h).
dBenefit of expense reduction rounds to less than 0.01%.
| | | | | | |
| | | |
| franklintempleton.com | | The accompanying notes are an integral part of these consolidated financial statements. | Annual Report | | | 15 | |
FRANKLIN ALTERNATIVE STRATEGIES FUNDS
Consolidated Statement of Investments, May 31, 2019
Franklin K2 Alternative Strategies Fund
| | | | | | | | | | | | | | | | | | |
| | | | | |
| | | | | Country | | | Shares/
Warrants | | | | | | Value | |
| | | Common Stocks and Other Equity Interests 39.3% | | | | | | | | | | |
| | | Aerospace & Defense 1.7% | |
| a,b | | The Boeing Co. | | | United States | | | | 7,713 | | | | | | | $ | 2,634,838 | |
| | General Dynamics Corp. | | | United States | | | | 6,337 | | | | | | | | 1,019,116 | |
| | Harris Corp. | | | United States | | | | 8,657 | | | | | | | | 1,620,504 | |
| a | | Heico Corp. | | | United States | | | | 23,807 | | | | | | | | 2,894,693 | |
| c | | Kratos Defense & Security Solutions Inc. | | | United States | | | | 31,380 | | | | | | | | 691,929 | |
| a | | L3 Technologies Inc. | | | United States | | | | 52,156 | | | | | | | | 12,624,882 | |
| | | | | | | | | | | | | | | | | | |
| | | | | |
| | | | | | | | | | | | | | | | | 21,485,962 | |
| | | | | | | | | | | | | | | | | | |
| | | Air Freight & Logistics 0.0%† | |
| | United Parcel Service Inc., B | | | United States | | | | 253 | | | | | | | | 23,509 | |
| | | | | | | | | | | | | | | | | | |
| | | Airlines 0.3% | |
| | Delta Air Lines Inc. | | | United States | | | | 24,880 | | | | | | | | 1,281,320 | |
| b | | Southwest Airlines Co. | | | United States | | | | 1,081 | | | | | | | | 51,456 | |
| | WestJet Airlines Ltd. | | | Canada | | | | 126,395 | | | | | | | | 2,823,220 | |
| | | | | | | | | | | | | | | | | | |
| | | | | |
| | | | | | | | | | | | | | | | | 4,155,996 | |
| | | | | | | | | | | | | | | | | | |
| | | Auto Components 0.0%† | |
| | Brembo SpA | | | Italy | | | | 3,598 | | | | | | | | 38,628 | |
| | | | | | | | | | | | | | | | | | |
| | | Banks 0.9% | |
| a | | Bank of America Corp. | | | United States | | | | 114,228 | | | | | | | | 3,038,465 | |
| | Barclays PLC | | | United Kingdom | | | | 108,406 | | | | | | | | 204,675 | |
| | Cadence Bancorp, A | | | United States | | | | 41,002 | | | | | | | | 758,537 | |
| b | | Citigroup Inc. | | | United States | | | | 862 | | | | | | | | 53,573 | |
| a,b | | JPMorgan Chase & Co. | | | United States | | | | 25,391 | | | | | | | | 2,690,430 | |
| | SunTrust Banks Inc. | | | United States | | | | 79,000 | | | | | | | | 4,740,790 | |
| | | | | | | | | | | | | | | | | | |
| | | | | |
| | | | | | | | | | | | | | | | | 11,486,470 | |
| | | | | | | | | | | | | | | | | | |
| | | Beverages 0.3% | |
| a | | Brown-Forman Corp., B | | | United States | | | | 836 | | | | | | | | 41,783 | |
| | Davide Campari-Milano SpA | | | Italy | | | | 320,814 | | | | | | | | 3,134,202 | |
| b | | Molson Coors Brewing Co., B | | | United States | | | | 901 | | | | | | | | 49,537 | |
| | | | | | | | | | | | | | | | | | |
| | | | | |
| | | | | | | | | | | | | | | | | 3,225,522 | |
| | | | | | | | | | | | | | | | | | |
| | | Biotechnology 3.5% | |
| b | | AbbVie Inc. | | | United States | | | | 710 | | | | | | | | 54,464 | |
| c | | Agios Pharmaceuticals Inc. | | | United States | | | | 8,738 | | | | | | | | 403,433 | |
| c,d | | Aileron Therapeutics Inc. | | | United States | | | | 6,656 | | | | | | | | 6,656 | |
| c | | Alexion Pharmaceuticals Inc. | | | United States | | | | 13,854 | | | | | | | | 1,574,923 | |
| c,d | | Allogene Therapeutics Inc. | | | United States | | | | 11,567 | | | | | | | | 303,402 | |
| b | | Amgen Inc. | | | United States | | | | 312 | | | | | | | | 52,010 | |
| c | | Amicus Therapeutics Inc. | | | United States | | | | 103,605 | | | | | | | | 1,167,628 | |
| c | | AnaptysBio Inc. | | | United States | | | | 3,565 | | | | | | | | 259,568 | |
| c | | Apellis Pharmaceuticals Inc. | | | United States | | | | 12,174 | | | | | | | | 244,576 | |
| c | | Argenx SE, ADR | | | Netherlands | | | | 5,689 | | | | | | | | 703,331 | |
| c,e | | Ascletis Pharma Inc., 144A | | | China | | | | 144,430 | | | | | | | | 118,093 | |
| c | | Assembly Biosciences Inc. | | | United States | | | | 60,844 | | | | | | | | 854,250 | |
| c | | Audentes Therapeutics Inc. | | | United States | | | | 14,794 | | | | | | | | 519,565 | |
| a,c | | BioMarin Pharmaceutical Inc. | | | United States | | | | 36,574 | | | | | | | | 3,007,846 | |
| c | | Bluebird Bio Inc. | | | United States | | | | 7,050 | | | | | | | | 845,436 | |
| c | | Blueprint Medicines Corp. | | | United States | | | | 4,592 | | | | | | | | 348,992 | |
| a,c | | Celgene Corp. | | | United States | | | | 130,954 | | | | | | | | 12,282,176 | |
| c,e | | CStone Pharmaceuticals, 144A | | | China | | | | 166,367 | | | | | | | | 244,047 | |
| c,d | | DBV Technologies SA, ADR | | | France | | | | 13,159 | | | | | | | | 118,694 | |
| a,c | | Exact Sciences Corp. | | | United States | | | | 19,058 | | | | | | | | 1,974,981 | |
| c | | Fate Therapeutics Inc. | | | United States | | | | 12,176 | | | | | | | | 234,753 | |
| b | | Gilead Sciences Inc. | | | United States | | | | 856 | | | | | | | | 53,286 | |
| | | | |
| | | |
| 16 | | Annual Report | | franklintempleton.com |
FRANKLIN ALTERNATIVE STRATEGIES FUNDS
CONSOLIDATED STATEMENT OF INVESTMENTS
Franklin K2 Alternative Strategies Fund(continued)
| | | | | | | | | | | | | | | | | | |
| | | | | |
| | | | | Country | | | Shares/
Warrants | | | | | | Value | |
| | | Common Stocks and Other Equity Interests (continued) | | | | | | | | | | |
| | | Biotechnology (continued) | |
| c | | GlycoMimetics Inc. | | | United States | | | | 33,890 | | | | | | | $ | 401,258 | |
| c | | Gossamer Bio Inc. | | | United States | | | | 16,762 | | | | | | | | 306,912 | |
| c | | Immunomedics Inc. | | | United States | | | | 66,092 | | | | | | | | 863,822 | |
| c,e | | Innovent Biologics Inc., 144A | | | China | | | | 19,588 | | | | | | | | 59,842 | |
| c | | Intercept Pharmaceuticals Inc. | | | United States | | | | 3,125 | | | | | | | | 258,812 | |
| c | | Invitae Corp. | | | United States | | | | 8,635 | | | | | | | | 150,681 | |
| c | | Madrigal Pharmaceuticals Inc. | | | United States | | | | 4,719 | | | | | | | | 436,036 | |
| c | | Mirati Therapeutics Inc. | | | United States | | | | 11,190 | | | | | | | | 758,570 | |
| c | | Natera Inc. | | | United States | | | | 58,987 | | | | | | | | 1,350,802 | |
| c | | Neurocrine Biosciences Inc. | | | United States | | | | 12,892 | | | | | | | | 1,092,984 | |
| c,d | | ProQR Therapeutics NV | | | Netherlands | | | | 46,914 | | | | | | | | 569,067 | |
| c | | Repligen Corp. | | | United States | | | | 5,221 | | | | | | | | 362,703 | |
| c,d | | Rubius Therapeutics Inc. | | | United States | | | | 11,880 | | | | | | | | 171,785 | |
| c | | Sage Therapeutics Inc. | | | United States | | | | 18,506 | | | | | | | | 3,180,626 | |
| a,c | | Sarepta Therapeutics Inc. | | | United States | | | | 22,774 | | | | | | | | 2,592,820 | |
| c,e | | Shanghai Junshi Biosciences Co. Ltd., H, 144A | | | China | | | | 33,161 | | | | | | | | 121,400 | |
| c | | Spark Therapeutics Inc. | | | United States | | | | 30,341 | | | | | | | | 3,307,169 | |
| c | | Sutro Biopharma Inc. | | | United States | | | | 3,932 | | | | | | | | 45,021 | |
| c | | Turning Point Therapeutics Inc. | | | United States | | | | 5,350 | | | | | | | | 186,287 | |
| c | | Vertex Pharmaceuticals Inc. | | | United States | | | | 8,170 | | | | | | | | 1,357,691 | |
| c,d | | Viking Therapeutics Inc. | | | United States | | | | 10,962 | | | | | | | | 84,298 | |
| c | | Zai Lab Ltd., ADR | | | China | | | | 5,100 | | | | | | | | 133,671 | |
| | | | | | | | | | | | | | | | | | |
| | | | | |
| | | | | | | | | | | | | | | | | 43,164,367 | |
| | | | | | | | | | | | | | | | | | |
| | | Building Products 0.1% | |
| c | | Builders FirstSource Inc. | | | United States | | | | 20,843 | | | | | | | | 293,469 | |
| c | | Johnson Controls International PLC | | | United States | | | | 31,126 | | | | | | | | 1,198,974 | |
| | | | | | | | | | | | | | | | | | |
| | | | | |
| | | | | | | | | | | | | | | | | 1,492,443 | |
| | | | | | | | | | | | | | | | | | |
| | | Capital Markets 0.3% | |
| e | | Amundi SA, 144A | | | France | | | | 27,598 | | | | | | | | 1,791,297 | |
| e | | Anima Holding SpA, 144A | | | Italy | | | | 102,616 | | | | | | | | 310,669 | |
| b | | LPL Financial Holdings Inc. | | | United States | | | | 683 | | | | | | | | 54,790 | |
| | Moody’s Corp. | | | United States | | | | 10,197 | | | | | | | | 1,864,828 | |
| b | | Morgan Stanley | | | United States | | | | 169 | | | | | | | | 6,877 | |
| | | | | | | | | | | | | | | | | | |
| | | | | |
| | | | | | | | | | | | | | | | | 4,028,461 | |
| | | | | | | | | | | | | | | | | | |
| | | Chemicals 0.8% | |
| a,c | | DowDuPont Inc. | | | United States | | | | 69,380 | | | | | | | | 2,117,478 | |
| c | | Ingevity Corp. | | | United States | | | | 20,733 | | | | | | | | 1,818,284 | |
| b | | LyondellBasell Industries NV, A | | | United States | | | | 694 | | | | | | | | 51,530 | |
| | The Sherwin-Williams Co. | | | United States | | | | 15,603 | | | | | | | | 6,544,678 | |
| c,g,h | | TerraVia Holdings Inc., Contingent Distribution | | | United States | | | | 1,117,000 | | | | | | | | — | |
| | | | | | | | | | | | | | | | | | |
| | | | | |
| | | | | | | | | | | | | | | | | 10,531,970 | |
| | | | | | | | | | | | | | | | | | |
| | | Commercial Services & Supplies 0.7% | |
| c | | Advanced Disposal Services Inc. | | | United States | | | | 37,657 | | | | | | | | 1,210,296 | |
| c | | Atento SA | | | Spain | | | | 72,806 | | | | | | | | 193,664 | |
| | Cintas Corp. | | | United States | | | | 15,123 | | | | | | | | 3,354,735 | |
| | Edenred | | | France | | | | 17,027 | | | | | | | | 777,993 | |
| | Republic Services Inc., A | | | United States | | | | 32,764 | | | | | | | | 2,771,507 | |
| | Waste Management Inc. | | | United States | | | | 6,567 | | | | | | | | 718,101 | |
| | | | | | | | | | | | | | | | | | |
| | | | | |
| | | | | | | | | | | | | | | | | 9,026,296 | |
| | | | | | | | | | | | | | | | | | |
| | | Communications Equipment 0.2% | |
| b | | Cisco Systems Inc. | | | United States | | | | 737 | | | | | | | | 38,346 | |
| c | | Commscope Holding Co. Inc. | | | United States | | | | 75,967 | | | | | | | | 1,226,867 | |
| | | | | | |
| | | |
| franklintempleton.com | | Annual Report | | | 17 | |
FRANKLIN ALTERNATIVE STRATEGIES FUNDS
CONSOLIDATED STATEMENT OF INVESTMENTS
Franklin K2 Alternative Strategies Fund(continued)
| | | | | | | | | | | | | | | | | | |
| | | | | |
| | | | | Country | | | Shares/
Warrants | | | | | | Value | |
| | | Common Stocks and Other Equity Interests (continued) | | | | | | | | | | |
| | | Communications Equipment (continued) | |
| c | | Lumentum Holdings Inc. | | | United States | | | | 25,457 | | | | | | | $ | 1,030,245 | |
| | | | | | | | | | | | | | | | | | |
| | | | | |
| | | | | | | | | | | | | | | | | 2,295,458 | |
| | | | | | | | | | | | | | | | | | |
| | | Construction Materials 0.2% | |
| | Cemex SAB de CV, ADR | | | Mexico | | | | 72,599 | | | | | | | | 299,108 | |
| | Vulcan Materials Co. | | | United States | | | | 14,016 | | | | | | | | 1,750,738 | |
| | | | | | | | | | | | | | | | | | |
| | | | | |
| | | | | | | | | | | | | | | | | 2,049,846 | |
| | | | | | | | | | | | | | | | | | |
| | | Containers & Packaging 0.5% | |
| a | | Ball Corp. | | | United States | | | | 103,438 | | | | | | | | 6,350,059 | |
| | | | | | | | | | | | | | | | | | |
| | | Distributors 0.1% | |
| | Pool Corp. | | | United States | | | | 7,884 | | | | | | | | 1,417,385 | |
| | | | | | | | | | | | | | | | | | |
| | | Diversified Consumer Services 0.1% | |
| c | | Frontdoor Inc. | | | United States | | | | 37,341 | | | | | | | | 1,501,482 | |
| b | | H&R Block Inc. | | | United States | | | | 2,062 | | | | | | | | 54,127 | |
| | | | | | | | | | | | | | | | | | |
| | | | | |
| | | | | | | | | | | | | | | | | 1,555,609 | |
| | | | | | | | | | | | | | | | | | |
| | | Diversified Financial Services 0.0%† | |
| c | | ARYA Sciences Acquisition Corp. | | | United States | | | | 20,099 | | | | | | | | 212,748 | |
| | | | | | | | | | | | | | | | | | |
| | | Diversified Telecommunication Services 0.4% | |
| c | | Bandwidth Inc., A | | | United States | | | | 5,000 | | | | | | | | 362,850 | |
| e | | China Tower Corp. Ltd., H, 144A | | | China | | | | 4,382,000 | | | | | | | | 983,771 | |
| | China Unicom Hong Kong Ltd., ADR | | | China | | | | 32,547 | | | | | | | | 341,744 | |
| | Inmarsat PLC | | | United Kingdom | | | | 107,013 | | | | | | | | 738,963 | |
| c | | ORBCOMM Inc. | | | United States | | | | 34,432 | | | | | | | | 230,006 | |
| b | | Verizon Communications Inc. | | | United States | | | | 647 | | | | | | | | 35,164 | |
| c | | Zayo Group Holdings Inc. | | | United States | | | | 74,580 | | | | | | | | 2,438,766 | |
| | | | | | | | | | | | | | | | | | |
| | | | | |
| | | | | | | | | | | | | | | | | 5,131,264 | |
| | | | | | | | | | | | | | | | | | |
| | | Electric Utilities 0.2% | |
| | Edp - Energias de Portugal SA | | | Portugal | | | | 627,796 | | | | | | | | 2,285,687 | |
| b | | FirstEnergy Corp. | | | United States | | | | 1,338 | | | | | | | | 55,179 | |
| a,b,c | | PG&E Corp. | | | United States | | | | 16,758 | | | | | | | | 286,562 | |
| b | | PPL Corp. | | | United States | | | | 1,869 | | | | | | | | 55,621 | |
| b | | The Southern Co. | | | United States | | | | 391 | | | | | | | | 20,919 | |
| | | | | | | | | | | | | | | | | | |
| | | | | |
| | | | | | | | | | | | | | | | | 2,703,968 | |
| | | | | | | | | | | | | | | | | | |
| | | Electrical Equipment 0.0%† | |
| b | | Eaton Corp. PLC | | | United States | | | | 712 | | | | | | | | 53,037 | |
| | | | | | | | | | | | | | | | | | |
| | | Electronic Equipment, Instruments & Components 0.3% | |
| b | | CDW Corp. | | | United States | | | | 539 | | | | | | | | 53,059 | |
| c | | Coherent Inc. | | | United States | | | | 5,776 | | | | | | | | 635,533 | |
| c | | Flex Ltd. | | | Singapore | | | | 192,421 | | | | | | | | 1,720,244 | |
| c | | Itron Inc. | | | United States | | | | 10,011 | | | | | | | | 567,123 | |
| c | | Zebra Technologies Corp., A | | | United States | | | | 1,229 | | | | | | | | 210,700 | |
| | | | | | | | | | | | | | | | | | |
| | | | | |
| | | | | | | | | | | | | | | | | 3,186,659 | |
| | | | | | | | | | | | | | | | | | |
| | | Entertainment 0.4% | |
| | Entertainment One Ltd. | | | Canada | | | | 43,368 | | | | | | | | 239,599 | |
| c | | NetFlix Inc. | | | United States | | | | 2,776 | | | | | | | | 952,945 | |
| c | | Nexon Co. Ltd. | | | Japan | | | | 28,060 | | | | | | | | 418,706 | |
| c | | Sciplay Corp., A | | | United States | | | | 6,200 | | | | | | | | 99,200 | |
| c | | Spotify Technology SA | | | United States | | | | 5,514 | | | | | | | | 692,448 | |
| | The Walt Disney Co. | | | United States | | | | 20,483 | | | | | | | | 2,704,575 | |
| | | | | | | | | | | | | | | | | | |
| | | | | |
| | | | | | | | | | | | | | | | | 5,107,473 | |
| | | | | | | | | | | | | | | | | | |
| | | | |
| | | |
| 18 | | Annual Report | | franklintempleton.com |
FRANKLIN ALTERNATIVE STRATEGIES FUNDS
CONSOLIDATED STATEMENT OF INVESTMENTS
Franklin K2 Alternative Strategies Fund(continued)
| | | | | | | | | | | | | | | | | | |
| | | | | |
| | | | | Country | | | Shares/
Warrants | | | | | | Value | |
| | | Common Stocks and Other Equity Interests (continued) | | | | | | | | | | |
| | | Equity Real Estate Investment Trusts (REITs) 0.0%† | |
| b | | EPR Properties | | | United States | | | | 719 | | | | | | | $ | 56,154 | |
| | Iron Mountain Inc. | | | United States | | | | 845 | | | | | | | | 25,899 | |
| b | | Lamar Advertising Co., A | | | United States | | | | 689 | | | | | | | | 53,887 | |
| | | | | | | | | | | | | | | | | | |
| | | | | |
| | | | | | | | | | | | | | | | | 135,940 | |
| | | | | | | | | | | | | | | | | | |
| | | Food & Staples Retailing 0.3% | |
| | Costco Wholesale Corp. | | | United States | | | | 12,902 | | | | | | | | 3,091,061 | |
| b | | Walgreens Boots Alliance Inc. | | | United States | | | | 1,075 | | | | | | | | 53,041 | |
| | | | | | | | | | | | | | | | | | |
| | | | | |
| | | | | | | | | | | | | | | | | 3,144,102 | |
| | | | | | | | | | | | | | | | | | |
| | | Food Products 0.1% | |
| | Chocoladefabriken Lindt & Spruengli AG | | | Switzerland | | | | 10 | | | | | | | | 749,064 | |
| | | | | | | | | | | | | | | | | | |
| | | Health Care Equipment & Supplies 1.1% | |
| | Abbott Laboratories | | | United States | | | | 19,906 | | | | | | | | 1,515,444 | |
| c | | ABIOMED Inc. | | | United States | | | | 1,254 | | | | | | | | 328,448 | |
| c | | Align Technology Inc. | | | United States | | | | 3,440 | | | | | | | | 978,164 | |
| c | | Avedro Inc. | | | United States | | | | 6,165 | | | | | | | | 112,573 | |
| c | | Boston Scientific Corp. | | | United States | | | | 44,647 | | | | | | | | 1,714,891 | |
| | Danaher Corp. | | | United States | | | | 5,988 | | | | | | | | 790,476 | |
| c | | DexCom Inc. | | | United States | | | | 10,720 | | | | | | | | 1,300,336 | |
| c | | Edwards Lifesciences Corp. | | | United States | | | | 8,452 | | | | | | | | 1,442,756 | |
| c | | IDEXX Laboratories Inc. | | | United States | | | | 8,767 | | | | | | | | 2,189,733 | |
| c | | Insulet Corp. | | | United States | | | | 1,773 | | | | | | | | 194,658 | |
| c | | Intuitive Surgical Inc. | | | United States | | | | 3,987 | | | | | | | | 1,853,357 | |
| c | | iRhythm Technologies Inc. | | | United States | | | | 3,743 | | | | | | | | 256,246 | |
| c | | Shockwave Medical Inc. | | | United States | | | | 3,430 | | | | | | | | 205,080 | |
| c | | Silk Road Medical Inc. | | | United States | | | | 6,605 | | | | | | | | 281,769 | |
| | Teleflex Inc. | | | United States | | | | 1,812 | | | | | | | | 522,399 | |
| | | | | | | | | | | | | | | | | | |
| | | | | |
| | | | | | | | | | | | | | | | | 13,686,330 | |
| | | | | | | | | | | | | | | | | | |
| | | Health Care Providers & Services 0.8% | |
| b | | AmerisourceBergen Corp., A | | | United States | | | | 728 | | | | | | | | 56,682 | |
| | Anthem Inc. | | | United States | | | �� | 5,242 | | | | | | | | 1,457,171 | |
| c | | Centene Corp. | | | United States | | | | 6,570 | | | | | | | | 379,418 | |
| | Cigna Corp. | | | United States | | | | 6,309 | | | | | | | | 933,858 | |
| c | | Guardant Health Inc. | | | United States | | | | 8,061 | | | | | | | | 619,730 | |
| c | | Healthequity Inc. | | | United States | | | | 3,031 | | | | | | | | 198,106 | |
| | Humana Inc. | | | United States | | | | 5,151 | | | | | | | | 1,261,274 | |
| b | | McKesson Corp. | | | United States | | | | 372 | | | | | | | | 45,436 | |
| | UnitedHealth Group Inc. | | | United States | | | | 9,650 | | | | | | | | 2,333,370 | |
| a,c | | WellCare Health Plans Inc. | | | United States | | | | 10,894 | | | | | | | | 3,008,814 | |
| | | | | | | | | | | | | | | | | | |
| | | | | |
| | | | | | | | | | | | | | | | | 10,293,859 | |
| | | | | | | | | | | | | | | | | | |
| | | Health Care Technology 0.1% | |
| c | | Evolent Health Inc., A | | | United States | | | | 700 | | | | | | | | 7,448 | |
| c | | Tabula Rasa HealthCare Inc. | | | United States | | | | 10,392 | | | | | | | | 469,407 | |
| c | | Teladoc Health Inc. | | | United States | | | | 4,810 | | | | | | | | 279,557 | |
| | | | | | | | | | | | | | | | | | |
| | | | | |
| | | | | | | | | | | | | | | | | 756,412 | |
| | | | | | | | | | | | | | | | | | |
| | | Hotels, Restaurants & Leisure 0.2% | |
| | Domino’s Pizza Inc. | | | United States | | | | 6,915 | | | | | | | | 1,932,743 | |
| | Las Vegas Sands Corp. | | | United States | | | | 894 | | | | | | | | 49,170 | |
| b | | Starbucks Corp. | | | United States | | | | 720 | | | | | | | | 54,763 | |
| | | | | | | | | | | | | | | | | | |
| | | | | |
| | | | | | | | | | | | | | | | | 2,036,676 | |
| | | | | | | | | | | | | | | | | | |
| | | Household Durables 1.0% | |
| a | | D.R. Horton Inc. | | | United States | | | | 122,714 | | | | | | | | 5,247,251 | |
| | | | | | |
| | | |
| franklintempleton.com | | Annual Report | | | 19 | |
FRANKLIN ALTERNATIVE STRATEGIES FUNDS
CONSOLIDATED STATEMENT OF INVESTMENTS
Franklin K2 Alternative Strategies Fund(continued)
| | | | | | | | | | | | | | | | | | |
| | | | | |
| | | | | Country | | | Shares/
Warrants | | | | | | Value | |
| | | Common Stocks and Other Equity Interests (continued) | | | | | | | | | | |
| | | Household Durables (continued) | |
| a,c | | Mohawk Industries Inc. | | | United States | | | | 38,431 | | | | | | | $ | 5,209,322 | |
| a,c | | NVR Inc. | | | United States | | | | 637 | | | | | | | | 2,039,400 | |
| | | | | | | | | | | | | | | | | | |
| | | | | |
| | | | | | | | | | | | | | | | | 12,495,973 | |
| | | | | | | | | | | | | | | | | | |
| | | Independent Power & Renewable Electricity Producers 0.1% | |
| | Uniper SE | | | Germany | | | | 29,917 | | | | | | | | 839,225 | |
| | | | | | | | | | | | | | | | | | |
| | | Industrial Conglomerates 0.0%† | |
| | Honeywell International Inc. | | | United States | | | | 95 | | | | | | | | 15,609 | |
| | Smiths Group PLC | | | United Kingdom | | | | 17,888 | | | | | | | | 325,769 | |
| | | | | | | | | | | | | | | | | | |
| | | | | |
| | | | | | | | | | | | | | | | | 341,378 | |
| | | | | | | | | | | | | | | | | | |
| | | Insurance 0.3% | |
| b | | Aflac Inc. | | | United States | | | | 1,090 | | | | | | | | 55,917 | |
| b | | Fidelity National Financial Inc. | | | United States | | | | 932 | | | | | | | | 35,929 | |
| | Kemper Corp. | | | United States | | | | 26,294 | | | | | | | | 2,182,139 | |
| b | | MetLife Inc. | | | United States | | | | 1,173 | | | | | | | | 54,204 | |
| b | | Prudential Financial Inc. | | | United States | | | | 545 | | | | | | | | 50,347 | |
| | RSA Insurance Group PLC | | | United Kingdom | | | | 44,331 | | | | | | | | 309,708 | |
| c,d | | Trupanion Inc. | | | United States | | | | 43,545 | | | | | | | | 1,277,175 | |
| | | | | | | | | | | | | | | | | | |
| | | | | |
| | | | | | | | | | | | | | | | | 3,965,419 | |
| | | | | | | | | | | | | | | | | | |
| | | Interactive Media & Services 1.2% | |
| a,c | | Alphabet Inc., A | | | United States | | | | 3,808 | | | | | | | | 4,213,553 | |
| c | | Alphabet Inc., C | | | United States | | | | 1,202 | | | | | | | | 1,326,563 | |
| a,c | | Facebook Inc., A | | | United States | | | | 22,624 | | | | | | | | 4,015,081 | |
| | Tencent Holdings Ltd. | | | China | | | | 100,410 | | | | | | | | 4,175,451 | |
| c | | Yandex NV, A | | | Russia | | | | 29,249 | | | | | | | | 1,050,624 | |
| c | | Zillow Group Inc., C | | | United States | | | | 600 | | | | | | | | 25,812 | |
| | | | | | | | | | | | | | | | | | |
| | | | | |
| | | | | | | | | | | | | | | | | 14,807,084 | |
| | | | | | | | | | | | | | | | | | |
| | | Internet & Direct Marketing Retail 0.9% | |
| a,c | | Alibaba Group Holding Ltd., ADR | | | China | | | | 28,652 | | | | | | | | 4,276,598 | |
| c | | Amazon.com Inc. | | | United States | | | | 1,492 | | | | | | | | 2,648,404 | |
| c | | Booking Holdings Inc. | | | United States | | | | 505 | | | | | | | | 836,391 | |
| c,e | | Delivery Hero AG, 144A | | | Germany | | | | 13,672 | | | | | | | | 588,803 | |
| a | | eBay Inc. | | | United States | | | | 34,878 | | | | | | | | 1,253,167 | |
| a | | Expedia Group Inc. | | | United States | | | | 9,405 | | | | | | | | 1,081,575 | |
| c | | Just Eat PLC | | | United Kingdom | | | | 67,910 | | | | | | | | 516,850 | |
| | | | | | | | | | | | | | | | | | |
| | | | | |
| | | | | | | | | | | | | | | | | 11,201,788 | |
| | | | | | | | | | | | | | | | | | |
| | | IT Services 4.7% | |
| b | | Accenture PLC, A | | | United States | | | | 3,995 | | | | | | | | 711,389 | |
| b | | Automatic Data Processing Inc. | | | United States | | | | 4,024 | | | | | | | | 644,322 | |
| b | | Broadridge Financial Solutions Inc. | | | United States | | | | 461 | | | | | | | | 57,565 | |
| c | | EPAM Systems Inc. | | | United States | | | | 7,619 | | | | | | | | 1,314,963 | |
| c | | ExlService Holdings Inc. | | | United States | | | | 26,239 | | | | | | | | 1,554,923 | |
| c | | First Data Corp., A | | | United States | | | | 246,913 | | | | | | | | 6,276,528 | |
| c | | FleetCor Technologies Inc. | | | United States | | | | 14,928 | | | | | | | | 3,854,559 | |
| b,c | | GDS Holdings Ltd., ADR | | | China | | | | 734 | | | | | | | | 23,848 | |
| | Genpact Ltd. | | | United States | | | | 83,845 | | | | | | | | 3,030,997 | |
| | Global Payments Inc. | | | United States | | | | 27,061 | | | | | | | | 4,168,476 | |
| c | | GoDaddy Inc., A | | | United States | | | | 19,004 | | | | | | | | 1,413,898 | |
| a | | MasterCard Inc., A | | | United States | | | | 27,696 | | | | | | | | 6,965,267 | |
| b | | Paychex Inc. | | | United States | | | | 657 | | | | | | | | 56,364 | |
| a,c | | PayPal Holdings Inc. | | | United States | | | | 56,398 | | | | | | | | 6,189,681 | |
| | Safecharge International Group Ltd. | | | United Kingdom | | | | 100,974 | | | | | | | | 552,754 | |
| | | | |
| | | |
| 20 | | Annual Report | | franklintempleton.com |
FRANKLIN ALTERNATIVE STRATEGIES FUNDS
CONSOLIDATED STATEMENT OF INVESTMENTS
Franklin K2 Alternative Strategies Fund(continued)
| | | | | | | | | | | | | | | | | | |
| | | | | |
| | | | | Country | | | Shares/
Warrants | | | | | | Value | |
| | | Common Stocks and Other Equity Interests (continued) | | | | | | | | | | |
| | | IT Services (continued) | |
| c | | StoneCo. Ltd. | | | Brazil | | | | 14,799 | | | | | | | $ | 372,935 | |
| | Total System Services Inc. | | | United States | | | | 33,299 | | | | | | | | 4,113,426 | |
| a,c | | VeriSign Inc. | | | United States | | | | 8,726 | | | | | | | | 1,701,395 | |
| b | | Visa Inc., A | | | United States | | | | 16,115 | | | | | | | | 2,599,833 | |
| c | | WEX Inc. | | | United States | | | | 18,088 | | | | | | | | 3,417,547 | |
| | Wirecard AG | | | Germany | | | | 14,200 | | | | | | | | 2,222,493 | |
| c | | Worldpay Inc., A | | | United States | | | | 55,729 | | | | | | | | 6,778,876 | |
| | | | | | | | | | | | | | | | | | |
| | | | | |
| | | | | | | | | | | | | | | | | 58,022,039 | |
| | | | | | | | | | | | | | | | | | |
| | | Leisure Products 0.1% | |
| | Hasbro Inc. | | | United States | | | | 6,847 | | | | | | | | 651,424 | |
| | | | | | | | | | | | | | | | | | |
| | | Life Sciences Tools & Services 1.4% | |
| c | | Avantor Inc. | | | United States | | | | 72,028 | | | | | | | | 1,260,490 | |
| | Eurofins Scientific SE | | | Luxembourg | | | | 4,033 | | | | | | | | 1,834,636 | |
| c | | Gerresheimer AG | | | Germany | | | | 58,747 | | | | | | | | 4,187,167 | |
| a,c | | Illumina Inc. | | | United States | | | | 10,497 | | | | | | | | 3,221,634 | |
| c | | Iqvia Holdings Inc. | | | United States | | | | 19,928 | | | | | | | | 2,707,219 | |
| c | | Mettler-Toledo International Inc. | | | United States | | | | 1,665 | | | | | | | | 1,203,945 | |
| a,c | | Pacific Biosciences of California Inc. | | | United States | | | | 9,346 | | | | | | | | 62,618 | |
| c | | PRA Health Sciences Inc. | | | United States | | | | 3,329 | | | | | | | | 288,724 | |
| b | | Thermo Fisher Scientific Inc. | | | United States | | | | 8,887 | | | | | | | | 2,372,651 | |
| c,e | | Wuxi Biologics Cayman Inc., 144A | | | China | | | | 38,199 | | | | | | | | 361,060 | |
| | | | | | | | | | | | | | | | | | |
| | | | | |
| | | | | | | | | | | | | | | | | 17,500,144 | |
| | | | | | | | | | | | | | | | | | |
| | | Machinery 0.9% | |
| | Altra Industrial Motion Corp., W | | | United States | | | | 13,819 | | | | | | | | 433,502 | |
| b | | Cummins Inc. | | | United States | | | | 350 | | | | | | | | 52,766 | |
| | Deere & Co. | | | United States | | | | 12,440 | | | | | | | | 1,743,715 | |
| b | | Illinois Tool Works Inc. | | | United States | | | | 365 | | | | | | | | 50,969 | |
| c | | Navistar International Corp. | | | United States | | | | 36,331 | | | | | | | | 1,130,257 | |
| b | | PACCAR Inc. | | | United States | | | | 804 | | | | | | | | 52,919 | |
| | Toro Co. | | | United States | | | | 6,220 | | | | | | | | 405,295 | |
| a | | Trinity Industries Inc. | | | United States | | | | 83,952 | | | | | | | | 1,618,595 | |
| c | | Wabco Holdings Inc. | | | United States | | | | 27,138 | | | | | | | | 3,552,636 | |
| | Wabtec Corp. | | | United States | | | | 9,380 | | | | | | | | 585,124 | |
| | Xylem Inc. | | | United States | | | | 25,877 | | | | | | | | 1,920,591 | |
| | | | | | | | | | | | | | | | | | |
| | | | | |
| | | | | | | | | | | | | | | | | 11,546,369 | |
| | | | | | | | | | | | | | | | | | |
| | | Marine 0.2% | |
| c | | Kirby Corp. | | | United States | | | | 7,474 | | | | | | | | 578,338 | |
| c | | Star Bulk Carriers Corp. | | | Greece | | | | 169,425 | | | | | | | | 1,296,101 | |
| | | | | | | | | | | | | | | | | | |
| | | | | |
| | | | | | | | | | | | | | | | | 1,874,439 | |
| | | | | | | | | | | | | | | | | | |
| | | Media 2.2% | |
| | Axel Springer SE | | | Germany | | | | 3,356 | | | | | | | | 208,267 | |
| | CBS Corp., B | | | United States | | | | 20,779 | | | | | | | | 1,003,210 | |
| b | | Comcast Corp., A | | | United States | | | | 1,234 | | | | | | | | 50,594 | |
| a | | Fox Corp. | | | United States | | | | 127,804 | | | | | | | | 4,502,535 | |
| | ITV PLC | | | United Kingdom | | | | 293,248 | | | | | | | | 397,619 | |
| c | | Liberty Global PLC, C | | | United Kingdom | | | | 53,723 | | | | | | | | 1,302,245 | |
| b | | Nexstar Media Group Inc., A | | | United States | | | | 476 | | | | | | | | 47,671 | |
| b | | Omnicom Group Inc. | | | United States | | | | 688 | | | | | | | | 53,224 | |
| c | | Postmedia Network Canada Corp., B | | | Canada | | | | 666,338 | | | | | | | | 663,084 | |
| b | | Sinclair Broadcast Group Inc., A | | | United States | | | | 961 | | | | | | | | 51,586 | |
| b | | Sirius XM Holdings, Inc. | | | United States | | | | 5,286 | | | | | | | | 28,069 | |
| | Stroeer SE & Co. KGaA | | | Germany | | | | 9,563 | | | | | | | | 639,934 | |
| | | | | | |
| | | |
| franklintempleton.com | | Annual Report | | | 21 | |
FRANKLIN ALTERNATIVE STRATEGIES FUNDS
CONSOLIDATED STATEMENT OF INVESTMENTS
Franklin K2 Alternative Strategies Fund(continued)
| | | | | | | | | | | | | | | | | | |
| | | | | |
| | | | | Country | | | Shares/
Warrants | | | | | | Value | |
| | | Common Stocks and Other Equity Interests (continued) | | | | | | | | | | |
| | | Media (continued) | |
| a | | Tribune Media Co., A | | | United States | | | | 382,863 | | | | | | | $ | 17,726,557 | |
| | | | | | | | | | | | | | | | | | |
| | | | | |
| | | | | | | | | | | | | | | | | 26,674,595 | |
| | | | | | | | | | | | | | | | | | |
| | | Metals & Mining 0.3% | |
| c | | B2Gold Corp. | | | Canada | | | | 21,486 | | | | | | | | 58,659 | |
| a | | Rio Tinto PLC, ADR | | | Australia | | | | 20,396 | | | | | | | | 1,181,540 | |
| | Teck Resources Ltd., B | | | Canada | | | | 103,745 | | | | | | | | 2,107,061 | |
| a | | Warrior Met Coal Inc. | | | United States | | | | 30,735 | | | | | | | | 793,270 | |
| | | | | | | | | | | | | | | | | | |
| | | | | |
| | | | | | | | | | | | | | | | | 4,140,530 | |
| | | | | | | | | | | | | | | | | | |
| | | Multiline Retail 0.0%† | |
| b | | Kohl’s Corp. | | | United States | | | | 890 | | | | | | | | 43,895 | |
| | | | | | | | | | | | | | | | | | |
| | | Multi-Utilities 0.2% | |
| b | | Dominion Energy Inc. | | | United States | | | | 761 | | | | | | | | 57,212 | |
| | Innogy SE | | | Germany | | | | 55,778 | | | | | | | | 2,314,918 | |
| | | | | | | | | | | | | | | | | | |
| | | | | |
| | | | | | | | | | | | | | | | | 2,372,130 | |
| | | | | | | | | | | | | | | | | | |
| | | Oil, Gas & Consumable Fuels 1.3% | |
| b | | Anadarko Petroleum Corp. | | | United States | | | | 177,402 | | | | | | | | 12,483,778 | |
| b | | ConocoPhillips | | | United States | | | | 897 | | | | | | | | 52,887 | |
| b | | CVR Energy Inc. | | | United States | | | | 1,229 | | | | | | | | 52,196 | |
| | EnCana Corp. | | | Canada | | | | 6,937 | | | | | | | | 36,558 | |
| a | | Equitrans Midstream Corp. | | | United States | | | | 91,004 | | | | | | | | 1,807,340 | |
| | Frontera Energy Corp. | | | Colombia | | | | 614 | | | | | | | | 6,110 | |
| c | | Halcon Resources Corp., wts., 9/09/20 | | | United States | | | | 2,159 | | | | | | | | 16 | |
| a | | Hess Corp. | | | United States | | | | 31,943 | | | | | | | | 1,784,336 | |
| b | | Occidental Petroleum Corp. | | | United States | | | | 762 | | | | | | | | 37,925 | |
| b,c | | Plains GP Holdings LP, A | | | United States | | | | 2,155 | | | | | | | | 48,531 | |
| c | | Ship Finance International Ltd. | | | Norway | | | | 3,267 | | | | | | | | 40,446 | |
| c | | Whiting Petroleum Corp. | | | United States | | | | 4,509 | | | | | | | | 82,875 | |
| | | | | | | | | | | | | | | | | | |
| | | | | |
| | | | | | | | | | | | | | | | | 16,432,998 | |
| | | | | | | | | | | | | | | | | | |
| | | Paper & Forest Products 0.0%† | |
| b | | Domtar Corp. | | | United States | | | | 628 | | | | | | | | 26,407 | |
| | | | | | | | | | | | | | | | | | |
| | | Pharmaceuticals 1.2% | |
| c,d | | Aerie Pharmaceuticals Inc. | | | United States | | | | 18,085 | | | | | | | | 658,656 | |
| b | | Allergan PLC | | | United States | | | | 21,494 | | | | | | | | 2,620,333 | |
| | AstraZeneca PLC, ADR | | | United Kingdom | | | | 35,603 | | | | | | | | 1,330,840 | |
| b | | Bristol-Myers Squibb Co. | | | United States | | | | 27,295 | | | | | | | | 1,238,374 | |
| c,e | | Cansino Biologics Inc., H, 144A | | | China | | | | 9,415 | | | | | | | | 40,532 | |
| c | | Charlottes Web Holdings Inc. | | | United States | | | | 13,116 | | | | | | | | 173,508 | |
| c | | Cymabay Therapeutics Inc. | | | United States | | | | 10,410 | | | | | | | | 125,753 | |
| | Eli Lilly & Co., W | | | United States | | | | 14,291 | | | | | | | | 1,656,899 | |
| c | | GW Pharmaceuticals PLC, ADR | | | United Kingdom | | | | 4,074 | | | | | | | | 705,780 | |
| | Hikma Pharmaceuticals PLC | | | Jordan | | | | 16,874 | | | | | | | | 337,062 | |
| c,e | | Hua Medicine, 144A | | | China | | | | 114,314 | | | | | | | | 102,218 | |
| b | | Johnson & Johnson | | | United States | | | | 412 | | | | | | | | 54,034 | |
| c,d | | Marinus Pharmaceuticals Inc. | | | United States | | | | 86,592 | | | | | | | | 373,212 | |
| b | | Merck & Co. Inc. | | | United States | | | | 22,461 | | | | | | | | 1,779,135 | |
| | Novo Nordisk AS, ADR | | | Denmark | | | | 28,364 | | | | | | | | 1,338,781 | |
| | Pfizer Inc. | | | United States | | | | 12,858 | | | | | | | | 533,864 | |
| c | | Restorbio Inc. | | | United States | | | | 46,665 | | | | | | | | 336,455 | |
| | Takeda Pharmaceutical Co. Ltd. | | | Japan | | | | 9,439 | | | | | | | | 319,584 | |
| | Zoetis Inc., A | | | United States | | | | 7,690 | | | | | | | | 777,074 | |
| | | | | | | | | | | | | | | | | | |
| | | | | |
| | | | | | | | | | | | | | | | | 14,502,094 | |
| | | | | | | | | | | | | | | | | | |
| | | | |
| | | |
| 22 | | Annual Report | | franklintempleton.com |
FRANKLIN ALTERNATIVE STRATEGIES FUNDS
CONSOLIDATED STATEMENT OF INVESTMENTS
Franklin K2 Alternative Strategies Fund(continued)
| | | | | | | | | | | | | | | | | | |
| | | | | |
| | | | | Country | | | Shares/
Warrants | | | | | | Value | |
| | | Common Stocks and Other Equity Interests (continued) | | | | | | | | | | |
| | | Professional Services 1.1% | |
| c | | CoStar Group Inc. | | | United States | | | | 1,904 | | | | | | | $ | 970,354 | |
| | Equifax Inc. | | | United States | | | | 15,307 | | | | | | | | 1,850,616 | |
| | Experian PLC | | | United Kingdom | | | | 41,887 | | | | | | | | 1,264,056 | |
| c | | Huron Consulting Group Inc. | | | United States | | | | 23,809 | | | | | | | | 1,172,117 | |
| e | | Intertrust NV, 144A | | | Netherlands | | | | 226,926 | | | | | | | | 4,299,560 | |
| | TransUnion | | | United States | | | | 21,980 | | | | | | | | 1,440,569 | |
| c | | TriNet Group Inc. | | | United States | | | | 39,891 | | | | | | | | 2,528,292 | |
| | | | | | | | | | | | | | | | | | |
| | | | | |
| | | | | | | | | | | | | | | | | 13,525,564 | |
| | | | | | | | | | | | | | | | | | |
| | | Real Estate Management & Development 0.1% | |
| | Savills PLC | | | United Kingdom | | | | 69,124 | | | | | | | | 740,196 | |
| | | | | | | | | | | | | | | | | | |
| | | Road & Rail 1.4% | |
| a | | CSX Corp. | | | United States | | | | 58,782 | | | | | | | | 4,377,495 | |
| | DSV A/S | | | Denmark | | | | 59,746 | | | | | | | | 5,339,396 | |
| a | | Norfolk Southern Corp. | | | United States | | | | 25,474 | | | | | | | | 4,970,996 | |
| c | | Uber Technologies Inc. | | | United States | | | | 7,400 | | | | | | | | 299,034 | |
| | Union Pacific Corp. | | | United States | | | | 13,138 | | | | | | | | 2,191,156 | |
| | | | | | | | | | | | | | | | | | |
| | | | | |
| | | | | | | | | | | | | | | | | 17,178,077 | |
| | | | | | | | | | | | | | | | | | |
| | | Semiconductors & Semiconductor Equipment 1.9% | |
| a,c | | Advanced Micro Devices Inc. | | | United States | | | | 57,140 | | | | | | | | 1,566,207 | |
| | ASML Holding NV, N.Y. shares, G | | | Netherlands | | | | 501 | | | | | | | | 94,213 | |
| | Broadcom Inc. | | | United States | | | | 190 | | | | | | | | 47,812 | |
| c | | First Solar Inc. | | | United States | | | | 33,693 | | | | | | | | 1,955,542 | |
| c | | FormFactor Inc. | | | United States | | | | 25,526 | | | | | | | | 366,553 | |
| | KLA-Tencor Corp. | | | United States | | | | 8,161 | | | | | | | | 841,154 | |
| c | | Lattice Semiconductor Corp. | | | United States | | | | 43,034 | | | | | | | | 550,835 | |
| | Marvell Technology Group Ltd. | | | Bermuda | | | | 184,189 | | | | | | | | 4,107,415 | |
| | Mediatek Inc. | | | Taiwan | | | | 106,000 | | | | | | | | 1,042,815 | |
| c | | Mellanox Technologies Ltd. | | | United States | | | | 10,142 | | | | | | | | 1,113,389 | |
| c | | Micron Technology Inc. | | | United States | | | | 19,786 | | | | | | | | 645,222 | |
| b | | QUALCOMM Inc. | | | United States | | | | 25,039 | | | | | | | | 1,673,106 | |
| c,e,h | | SunEdison Inc., Contingent Distribution, 144A | | | United States | | | | 35,000 | | | | | | | | 809 | |
| b | | Texas Instruments Inc. | | | United States | | | | 203 | | | | | | | | 21,175 | |
| a | | Versum Materials Inc. | | | United States | | | | 191,851 | | | | | | | | 9,851,549 | |
| | | | | | | | | | | | | | | | | | |
| | | | | |
| | | | | | | | | | | | | | | | | 23,877,796 | |
| | | | | | | | | | | | | | | | | | |
| | | Software 2.9% | |
| c | | Adobe Inc. | | | United States | | | | 3,670 | | | | | | | | 994,203 | |
| c | | Atlassian Corp. PLC, A | | | United States | | | | 10,041 | | | | | | | | 1,263,961 | |
| | Blackbaud Inc. | | | United States | | | | 9,722 | | | | | | | | 747,816 | |
| c | | Ceridian Hcm Holding Inc. | | | United States | | | | 19,364 | | | | | | | | 952,322 | |
| c | | Guidewire Software Inc. | | | United States | | | | 17,551 | | | | | | | | 1,764,227 | |
| c | | HubSpot Inc. | | | United States | | | | 5,020 | | | | | | | | 869,866 | |
| b | | Intuit Inc. | | | United States | | | | 11,568 | | | | | | | | 2,832,424 | |
| a,b | | Microsoft Corp. | | | United States | | | | 53,962 | | | | | | | | 6,674,020 | |
| b | | Oracle Corp. | | | United States | | | | 1,035 | | | | | | | | 52,371 | |
| a,c | | Red Hat Inc. | | | United States | | | | 77,128 | | | | | | | | 14,214,690 | |
| c | | Salesforce.com Inc. | | | United States | | | | 10,447 | | | | | | | | 1,581,780 | |
| c | | ServiceNow Inc. | | | United States | | | | 6,709 | | | | | | | | 1,757,289 | |
| c | | Splunk Inc. | | | United States | | | | 5,372 | | | | | | | | 612,354 | |
| c | | Workday Inc., A | | | United States | | | | 7,926 | | | | | | | | 1,617,855 | |
| c | | Zscaler Inc. | | | United States | | | | 7,466 | | | | | | | | 512,392 | |
| | | | | | | | | | | | | | | | | | |
| | | | | |
| | | | | | | | | | | | | | | | | 36,447,570 | |
| | | | | | | | | | | | | | | | | | |
| | | Specialty Retail 0.8% | |
| b | | Best Buy Co. Inc. | | | United States | | | | 766 | | | | | | | | 48,005 | |
| | | | | | |
| | | |
| franklintempleton.com | | Annual Report | | | 23 | |
FRANKLIN ALTERNATIVE STRATEGIES FUNDS
CONSOLIDATED STATEMENT OF INVESTMENTS
Franklin K2 Alternative Strategies Fund(continued)
| | | | | | | | | | | | | | | | | | |
| | | | | |
| | | | | Country | | | Shares/
Warrants | | | | | | Value | |
| | | Common Stocks and Other Equity Interests (continued) | | | | | | | | | | |
| | | Specialty Retail (continued) | |
| c | | Carmax Inc. | | | United States | | | | 16,587 | | | | | | | $ | 1,298,430 | |
| b | | Dick’s Sporting Goods Inc. | | | United States | | | | 1,441 | | | | | | | | 49,729 | |
| b | | Foot Locker Inc. | | | United States | | | | 1,024 | | | | | | | | 40,295 | |
| b | | The Home Depot Inc. | | | United States | | | | 37,731 | | | | | | | | 7,163,230 | |
| | Pets at Home Group PLC | | | United Kingdom | | | | 166,908 | | | | | | | | 388,055 | |
| c | | Sports Direct International PLC | | | United Kingdom | | | | 180,900 | | | | | | | | 657,294 | |
| | Tractor Supply Co. | | | United States | | | | 5,996 | | | | | | | | 604,277 | |
| | | | | | | | | | | | | | | | | | |
| | | | | |
| | | | | | | | | | | | | | | | | 10,249,315 | |
| | | | | | | | | | | | | | | | | | |
| | | Technology Hardware, Storage & Peripherals 0.3% | |
| | Apple Inc. | | | United States | | | | 3,854 | | | | | | | | 674,720 | |
| c | | Cray Inc. | | | United States | | | | 19,877 | | | | | | | | 695,894 | |
| a,b,c | | Dell Technologies Inc., C | | | United States | | | | 18,926 | | | | | | | | 1,127,043 | |
| b | | Hewlett Packard Enterprise Co. | | | United States | | | | 3,388 | | | | | | | | 46,483 | |
| b | | HP Inc. | | | United States | | | | 3,002 | | | | | | | | 56,077 | |
| c | | Pure Storage Inc., A | | | United States | | | | 10,926 | | | | | | | | 173,287 | |
| | Western Digital Corp. | | | United States | | | | 34,722 | | | | | | | | 1,292,353 | |
| | | | | | | | | | | | | | | | | | |
| | | | | |
| | | | | | | | | | | | | | | | | 4,065,857 | |
| | | | | | | | | | | | | | | | | | |
| | | Textiles, Apparel & Luxury Goods 0.2% | |
| c | | Capri Holdings Ltd. | | | United States | | | | 42,766 | | | | | | | | 1,389,039 | |
| a | | Tapestry Inc. | | | United States | | | | 39,805 | | | | | | | | 1,136,831 | |
| | | | | | | | | | | | | | | | | | |
| | | | | |
| | | | | | | | | | | | | | | | | 2,525,870 | |
| | | | | | | | | | | | | | | | | | |
| | | Tobacco 0.0%† | |
| b | | Altria Group Inc. | | | United States | | | | 1,087 | | | | | | | | 53,328 | |
| | | | | | | | | | | | | | | | | | |
| | | Trading Companies & Distributors 0.7% | |
| | Brenntag AG | | | Germany | | | | 94,223 | | | | | | | | 4,376,786 | |
| a,c | | Herc Holdings Inc. | | | United States | | | | 66,698 | | | | | | | | 2,269,733 | |
| a,c | | United Rentals Inc. | | | United States | | | | 19,823 | | | | | | | | 2,182,512 | |
| | | | | | | | | | | | | | | | | | |
| | | | | |
| | | | | | | | | | | | | | | | | 8,829,031 | |
| | | | | | | | | | | | | | | | | | |
| | | Wireless Telecommunication Services 0.2% | |
| | Millicom International Cellular SA, IDR | | | Colombia | | | | 31,532 | | | | | | | | 1,769,986 | |
| a | | Vodafone Group PLC, ADR | | | United Kingdom | | | | 5,878 | | | | | | | | 95,282 | |
| | | | | | | | | | | | | | | | | | |
| | | | | |
| | | | | | | | | | | | | | | | | 1,865,268 | |
| | | | | | | | | | | | | | | | | | |
| | Total Common Stocks and Other Equity Interests
(Cost $398,617,244) | | | | | | | | | | | | | | | 486,321,316 | |
| | | | | | | | | | | | | | | | | | |
| | | Management Investment Companies
(Cost $1,044,189) 0.1% | | | |
| | | Diversified Financial Services 0.1% | |
| c | | Altaba Inc. | | | United States | | | | 13,818 | | | | | | | | 818,026 | |
| | | | | | | | | | | | | | | | | | |
| | | Exchange Traded Funds 0.1% | | | |
| | Invesco QQQ Series 1 ETF | | | United States | | | | 2,179 | | | | | | | | 379,037 | |
| | iShares China Large-Capital ETF | | | United States | | | | 7,525 | | | | | | | | 303,784 | |
| | | | | | | | | | | | | | | | | | |
| | Total Exchange Traded Funds (Cost $654,184) | | | | | | | | | | | | | | | 682,821 | |
| | | | | | | | | | | | | | | | | | |
| | | Convertible Preferred Stocks 0.0%† | | | |
| | | Gas Utilities 0.0%† | |
| c | | El Paso Energy Capital Trust I, 4.75%, cvt. pfd. | | | United States | | | | 114 | | | | | | | | 5,769 | |
| | | | | | | | | | | | | | | | | | |
| | | Oil, Gas & Consumable Fuels 0.0%† | |
| c | | Chesapeake Energy Corp., 5.75%, cvt. pfd. | | | United States | | | | 139 | | | | | | | | 69,500 | |
| | | | | | | | | | | | | | | | | | |
| | Total Convertible Preferred Stocks (Cost $91,234) | | | | | | | | | | | | | | | 75,269 | |
| | | | | | | | | | | | | | | | | | |
| | | | |
| | | |
| 24 | | Annual Report | | franklintempleton.com |
FRANKLIN ALTERNATIVE STRATEGIES FUNDS
CONSOLIDATED STATEMENT OF INVESTMENTS
Franklin K2 Alternative Strategies Fund(continued)
| | | | | | | | | | | | | | | | | | |
| | | | | |
| | | | | Country | | | Shares/
Warrants | | | | | | Value | |
| | | Preferred Stocks 0.1% | | | |
| | | Food Products 0.0%† | |
| c | | Bunge Ltd., 4.875%, pfd. | | | United States | | | | 2,819 | | | | | | | $ | 273,668 | |
| | | | | | | | | | | | | | | | | | |
| | | Thrifts & Mortgage Finance 0.1% | |
| c,d | | FHLMC, 8.375%, pfd., Z | | | United States | | | | 45,425 | | | | | | | | 615,509 | |
| | | | | | | | | | | | | | | | | | |
| | Total Preferred Stocks (Cost $688,811) | | | | | | | | | | | | | | | 889,177 | |
| | | | | | | | | | | | | | | | | | |
| | | | |
| | | | | | | | Principal Amount* | | | | |
| | | Convertible Bonds 8.6% | | | |
| | | Air Freight & Logistics 0.2% | |
| a | | Air Transport Services Group Inc., senior note, 1.125%, 10/15/24 | | | United States | | | | 732,000 | | | | | | | | 710,062 | |
| a | | Atlas Air Worldwide Holdings Inc., senior note, 1.875%, 6/01/24 | | | United States | | | | 1,081,000 | | | | | | | | 1,009,795 | |
| | | | | | | | | | | | | | | | | | |
| | | | | |
| | | | | | | | | | | | | | | | | 1,719,857 | |
| | | | | | | | | | | | | | | | | | |
| | | Auto Components 0.0%† | |
| | Veoneer Inc., senior note, 4.00%, 6/01/24 | | | Sweden | | | | 180,000 | | | | | | | | 175,918 | |
| | | | | | | | | | | | | | | | | | |
| | | Banks 0.1% | |
| e | | Hope Bancorp Inc., senior bond, 144A, 2.00%, 5/15/38 | | | United States | | | | 1,212,000 | | | | | | | | 1,070,347 | |
| | | | | | | | | | | | | | | | | | |
| | | Biotechnology 0.8% | |
| | Alder Biopharmaceuticals Inc., senior note, 2.50%, 2/01/25 | | | United States | | �� | | 722,000 | | | | | | | | 636,714 | |
| | BioMarin Pharmaceutical Inc., senior sub. note, 0.599%, 8/01/24 | | | United States | | | | 325,000 | | | | | | | | 329,451 | |
| | Flexion Therapeutics Inc., senior note, 3.375%, 5/01/24 | | | United States | | | | 50,000 | | | | | | | | 42,417 | |
| | Intercept Pharmaceuticals Inc., senior note, | | | | | | | | | | | | | | | | |
| | 3.25%, 7/01/23 | | | United States | | | | 1,284,000 | | | | | | | | 1,180,287 | |
| | 2.00%, 5/15/26 | | | United States | | | | 734,000 | | | | | | | | 745,566 | |
| a | | Ionis Pharmaceuticals Inc., senior note, 1.00%, 11/15/21 | | | United States | | | | 1,365,000 | | | | | | | | 1,635,469 | |
| e | | Karyopharm Therapeutics Inc., senior note, 144A, 3.00%, 10/15/25 | | | United States | | | | 1,131,000 | | | | | | | | 723,840 | |
| a | | Ligand Pharmaceuticals Inc., senior note, 0.75%, 5/15/23 | | | United States | | | | 1,190,000 | | | | | | | | 1,002,575 | |
| a | | Neurocrine Biosciences Inc., senior note, 2.25%, 5/15/24 | | | United States | | | | 1,019,000 | | | | | | | | 1,343,806 | |
| | OPKO Health Inc., senior note, 4.50%, 2/15/25 | | | United States | | | | 725,000 | | | | | | | | 575,503 | |
| a | | PDL BioPharma Inc., senior note, 2.75%, 12/01/21 | | | United States | | | | 1,321,000 | | | | | | | | 1,318,254 | |
| | Retrophin Inc., senior note, 2.50%, 9/15/25 | | | United States | | | | 977,000 | | | | | | | | 854,875 | |
| | | | | | | | | | | | | | | | | | |
| | | | | |
| | | | | | | | | | | | | | | | | 10,388,757 | |
| | | | | | | | | | | | | | | | | | |
| | | Building Products 0.1% | |
| d | | Patrick Industries Inc., senior note, 1.00%, 2/01/23 | | | United States | | | | 852,000 | | | | | | | | 740,431 | |
| | | | | | | | | | | | | | | | | | |
| | | Capital Markets 0.1% | |
| | Cowen Inc., senior note, 3.00%, 12/15/22 | | | United States | | | | 915,000 | | | | | | | | 983,972 | |
| | | | | | | | | | | | | | | | | | |
| | | Commercial Services & Supplies 0.2% | |
| | RWT Holdings Inc., senior note, 5.625%, 11/15/19 | | | United States | | | | 876,000 | | | | | | | | 882,609 | |
| | Team Inc., senior note, 5.00%, 8/01/23 | | | United States | | | | 1,131,000 | | | | | | | | 1,129,429 | |
| | | | | | | | | | | | | | | | | | |
| | | | | |
| | | | | | | | | | | | | | | | | 2,012,038 | |
| | | | | | | | | | | | | | | | | | |
| | | Communications Equipment 0.1% | |
| e | | CalAmp Corp., senior note, 144A, 2.00%, 8/01/25 | | | United States | | | | 907,000 | | | | | | | | 701,111 | |
| | Infinera Corp., senior note, 2.125%, 9/01/24 | | | United States | | | | 870,000 | | | | | | | | 605,631 | |
| | | | | | | | | | | | | | | | | | |
| | | | | |
| | | | | | | | | | | | | | | | | 1,306,742 | |
| | | | | | | | | | | | | | | | | | |
| | | Construction Materials 0.2% | |
| | Cemex SAB de CV, sub. note, 3.72%, 3/15/20 | | | Mexico | | | | 2,846,000 | | | | | | | | 2,844,382 | |
| | | | | | | | | | | | | | | | | | |
| | | Consumer Finance 0.5% | |
| a | | Encore Capital Group Inc., senior note, 3.25%, 3/15/22 | | | United States | | | | 1,415,000 | | | | | | | | 1,421,191 | |
| | EZCORP Inc., senior note, | | | | | | | | | | | | | | | | |
| | a 2.125%, 6/15/19 | | | United States | | | | 2,010,000 | | | | | | | | 2,017,482 | |
| | 2.375%, 5/01/25 | | | United States | | | | 1,083,000 | | | | | | | | 927,589 | |
| | | | | | |
| | | |
| franklintempleton.com | | Annual Report | | | 25 | |
FRANKLIN ALTERNATIVE STRATEGIES FUNDS
CONSOLIDATED STATEMENT OF INVESTMENTS
Franklin K2 Alternative Strategies Fund(continued)
| | | | | | | | | | | | | | | | | | |
| | | | |
| | | | | Country | | | Principal Amount* | | | Value | |
| | | Convertible Bonds (continued) | | | |
| | | Consumer Finance (continued) | |
| | PRA Group Inc., senior note, | | | | | | | | | | | | | | | | |
| | a 3.00%, 8/01/20 | | | United States | | | | 977,000 | | | | | | | $ | 954,143 | |
| | 3.50%, 6/01/23 | | | United States | | | | 1,109,000 | | | | | | | | 1,021,992 | |
| | | | | | | | | | | | | | | | | | |
| | | | | |
| | | | | | | | | | | | | | | | | 6,342,397 | |
| | | | | | | | | | | | | | | | | | |
| | | Diversified Consumer Services 0.2% | |
| | Chegg Inc., senior note, | | | | | | | | | | | | | | | | |
| | 0.25%, 5/15/23 | | | United States | | | | 869,000 | | | | | | | | 1,301,871 | |
| | e 144A, 0.125%, 3/15/25 | | | United States | | | | 796,000 | | | | | | | | 778,302 | |
| | | | | | | | | | | | | | | | | | |
| | | | | |
| | | | | | | | | | | | | | | | | 2,080,173 | |
| | | | | | | | | | | | | | | | | | |
| | | Diversified Financial Services 0.1% | |
| | Element Fleet Management Corp., sub. note, | | | | | | | | | | | | | | | | |
| | e 144A, 5.125%, 6/30/19 | | | Canada | | | | 1,062,000 | | | | CAD | | | | 786,199 | |
| | 4.25%, 6/30/20 | | | Canada | | | | 331,000 | | | | CAD | | | | 245,240 | |
| | 4.25%, 6/30/24 | | | Canada | | | | 811,000 | | | | CAD | | | | 642,152 | |
| | | | | | | | | | | | | | | | | | |
| | | | | |
| | | | | | | | | | | | | | | | | 1,673,591 | |
| | | | | | | | | | | | | | | | | | |
| | | Diversified Telecommunication Services 0.1% | |
| e | | IAC Financeco 3 Inc., senior bond, 144A, 2.00%, 1/15/30 | | | United States | | | | 1,081,000 | | | | | | | | 1,099,914 | |
| e | | Intelsat SA, senior note, 144A, 4.50%, 6/15/25 | | | United States | | | | 226,000 | | | | | | | | 296,841 | |
| | | | | | | | | | | | | | | | | | |
| | | | | |
| | | | | | | | | | | | | | | | | 1,396,755 | |
| | | | | | | | | | | | | | | | | | |
| | | Electrical Equipment 0.0%† | |
| e | | Enphase Energy Inc., senior note, 144A, 1.00%, 6/01/24 | | | United States | | | | 217,000 | | | | | | | | 219,141 | |
| | | | | | | | | | | | | | | | | | |
| | | Electronic Equipment, Instruments & Components 0.4% | |
| | II-VI Inc., senior note, 0.25%, 9/01/22 | | | United States | | | | 798,000 | | | | | | | | 788,410 | |
| a | | Knowles Corp., senior note, 3.25%, 11/01/21 | | | United States | | | | 1,236,000 | | | | | | | | 1,372,702 | |
| | OSI Systems Inc., senior note, 1.25%, 9/01/22 | | | United States | | | | 974,000 | | | | | | | | 1,095,866 | |
| e | | PAR Technology Corp., senior note, 144A, 4.50%, 4/15/24 | | | United States | | | | 543,000 | | | | | | | | 658,446 | |
| a,e | | Vishay Intertechnology Inc., senior note, 144A, 2.25%, 6/15/25 | | | United States | | | | 1,592,000 | | | | | | | | 1,415,410 | |
| | | | | | | | | | | | | | | | | | |
| | | | | |
| | | | | | | | | | | | | | | | | 5,330,834 | |
| | | | | | | | | | | | | | | | | | |
| | | Energy Equipment & Services 0.1% | |
| i | | Fugro NV, sub. note, Reg S, | | | | | | | | | | | | | | | | |
| | 4.00%, 10/26/21 | | | Netherlands | | | | 600,000 | | | | EUR | | | | 579,363 | |
| | 4.50%, 11/02/24 | | | Netherlands | | | | 300,000 | | | | EUR | | | | 286,994 | |
| | Nabors Industries Inc., senior note, 0.75%, 1/15/24 | | | United States | | | | 145,000 | | | | | | | | 99,943 | |
| | | | | | | | | | | | | | | | | | |
| | | | | |
| | | | | | | | | | | | | | | | | 966,300 | |
| | | | | | | | | | | | | | | | | | |
| | | Entertainment 0.3% | |
| e | | Bilibili Inc., senior note, 144A, 1.375%, 4/01/26 | | | China | | | | 325,000 | | | | | | | | 272,462 | |
| e | | iQIYI Inc., senior note, 144A, 2.00%, 4/01/25 | | | China | | | | 362,000 | | | | | | | | 330,238 | |
| | Liberty Media Corp., senior bond, | | | | | | | | | | | | | | | | |
| | 2.25%, 9/30/46 | | | United States | | | | 50,000 | | | | | | | | 25,625 | |
| | a,e 144A, 2.25%, 12/01/48 | | | United States | | | | 1,427,000 | | | | | | | | 1,544,141 | |
| e | | Sea Ltd., senior note, 144A, 2.25%, 7/01/23 | | | Thailand | | | | 732,000 | | | | | | | | 1,174,833 | |
| | | | | | | | | | | | | | | | | | |
| | | | | |
| | | | | | | | | | | | | | | | | 3,347,299 | |
| | | | | | | | | | | | | | | | | | |
| | | Equity Real Estate Investment Trusts (REITs) 0.5% | |
| | IH Merger Sub LLC, senior note, 3.50%, 1/15/22 | | | United States | | | | 1,011,000 | | | | | | | | 1,198,885 | |
| e | | IIP Operating Partnership LP, senior note, 144A, 3.75%, 2/21/24 | | | United States | | | | 1,013,000 | | | | | | | | 1,323,048 | |
| | iStar Inc., senior note, 3.125%, 9/15/22 | | | United States | | | | 250,000 | | | | | | | | 245,041 | |
| a | | Starwood Waypoint Homes, senior note, 3.00%, 7/01/19 | | | United States | | | | 1,991,000 | | | | | | | | 2,789,889 | |
| | | | | | | | | | | | | | | | | | |
| | | | | |
| | | | | | | | | | | | | | | | | 5,556,863 | |
| | | | | | | | | | | | | | | | | | |
| | | Health Care Equipment & Supplies 0.0%† | |
| e | | CONMED Corp., senior note, 144A, 2.625%, 2/01/24 | | | United States | | | | 290,000 | | | | | | | | 316,901 | |
| | | | | | | | | | | | | | | | | | |
| | | | |
| | | |
| 26 | | Annual Report | | franklintempleton.com |
FRANKLIN ALTERNATIVE STRATEGIES FUNDS
CONSOLIDATED STATEMENT OF INVESTMENTS
Franklin K2 Alternative Strategies Fund(continued)
| | | | | | | | | | | | | | | | | | |
| | | | |
| | | | | Country | | | Principal Amount* | | | Value | |
| | | Convertible Bonds (continued) | | | |
| | | Health Care Technology 0.3% | |
| a | | Allscripts Healthcare Solutions Inc., senior note, 1.25%, 7/01/20 | | | United States | | | | 1,888,000 | | | | | | | $ | 1,864,535 | |
| | Evolent Health Inc., senior note, | | | | | | | | | | | | | | | | |
| | 2.00%, 12/01/21 | | | United States | | | | 603,000 | | | | | | | | 566,100 | |
| | e 144A, 1.50%, 10/15/25 | | | United States | | | | 755,000 | | | | | | | | 547,016 | |
| e | | Tabula Rasa Healthcare Inc., senior sub. note, 144A, 1.75%, 2/15/26 | | | United States | | | | 988,000 | | | | | | | | 944,887 | |
| | | | | | | | | | | | | | | | | | |
| | | | | |
| | | | | | | | | | | | | | | | | 3,922,538 | |
| | | | | | | | | | | | | | | | | | |
| | | Hotels, Restaurants & Leisure 0.1% | |
| a | | Huazhu Group Ltd., senior note, 0.375%, 11/01/22 | | | China | | | | 362,000 | | | | | | | | 368,012 | |
| | Marriott Vacations Worldwide Corp., senior note, 1.50%, 9/15/22 | | | United States | | | | 1,313,000 | | | | | | | | 1,241,907 | |
| | | | | | | | | | | | | | | | | | |
| | | | | |
| | | | | | | | | | | | | | | | | 1,609,919 | |
| | | | | | | | | | | | | | | | | | |
| | | Independent Power & Renewable Electricity Producers 0.1% | |
| | NRG Energy Inc., 2.75%, 6/01/48 | | | United States | | | | 1,533,000 | | | | | | | | 1,587,138 | |
| | | | | | | | | | | | | | | | | | |
| | | Interactive Media & Services 0.2% | |
| | Twitter Inc., senior note, | | | | | | | | | | | | | | | | |
| | 1.00%, 9/15/21 | | | United States | | | | 319,000 | | | | | | | | 305,632 | |
| | e 144A, 0.25%, 6/15/24 | | | United States | | | | 638,000 | | | | | | | | 624,709 | |
| | Zillow Group Inc., senior note, 2.00%, 12/01/21 | | | United States | | | | 1,160,000 | | | | | | | | 1,277,450 | |
| | | | | | | | | | | | | | | | | | |
| | | | | |
| | | | | | | | | | | | | | | | | 2,207,791 | |
| | | | | | | | | | | | | | | | | | |
| | | Internet & Direct Marketing Retail 0.1% | |
| | Booking Holdings Inc., senior note, 0.35%, 6/15/20 | | | United States | | | | 315,000 | | | | | | | | 407,284 | |
| d | | Wayfair Inc., senior note, 0.375%, 9/01/22 | | | United States | | | | 548,000 | | | | | | | | 821,907 | |
| | | | | | | | | | | | | | | | | | |
| | | | | |
| | | | | | | | | | | | | | | | | 1,229,191 | |
| | | | | | | | | | | | | | | | | | |
| | | IT Services 0.8% | |
| a | | Carbonite Inc., senior note, 2.50%, 4/01/22 | | | United States | | | | 762,000 | | | | | | | | 872,249 | |
| | CSG Systems International Inc., senior bond, 4.25%, 3/15/36 | | | United States | | | | 891,000 | | | | | | | | 958,051 | |
| e | | GDS Holdings Ltd., senior note, 144A, 2.00%, 6/01/25 | | | China | | | | 360,000 | | | | | | | | 325,062 | |
| e | | KBR Inc., senior note, 144A, 2.50%, 11/01/23 | | | United States | | | | 798,000 | | | | | | | | 872,620 | |
| a,e | | MongoDB Inc., senior note, 144A, 0.75%, 6/15/24 | | | United States | | | | 1,009,000 | | | | | | | | 2,146,017 | |
| a | | Okta Inc., senior note, 0.25%, 2/15/23 | | | United States | | | | 925,000 | | | | | | | | 2,222,335 | |
| e | | Perficient Inc., senior note, 144A, 2.375%, 9/15/23 | | | United States | | | | 970,000 | | | | | | | | 1,000,745 | |
| a | | Twilio Inc., senior note, 0.25%, 6/01/23 | | | United States | | | | 740,000 | | | | | | | | 1,447,163 | |
| | | | | | | | | | | | | | | | | | |
| | | | | |
| | | | | | | | | | | | | | | | | 9,844,242 | |
| | | | | | | | | | | | | | | | | | |
| | | Machinery 0.0%† | |
| | The Greenbrier Cos. Inc., senior note, 2.875%, 2/01/24 | | | United States | | | | 428,000 | | | | | | | | 407,192 | |
| | | | | | | | | | | | | | | | | | |
| | | Media 0.2% | |
| | DISH Network Corp., | | | | | | | | | | | | | | | | |
| | senior bond, 3.375%, 8/15/26 | | | United States | | | | 325,000 | | | | | | | | 299,448 | |
| | senior note, 2.375%, 3/15/24 | | | United States | | | | 280,000 | | | | | | | | 243,967 | |
| | Liberty Interactive LLC, | | | | | | | | | | | | | | | | |
| | senior bond, 4.00%, 11/15/29 | | | United States | | | | 1,122,000 | | | | | | | | 788,205 | |
| | senior note, 3.75%, 2/15/30 | | | United States | | | | 949,000 | | | | | | | | 648,879 | |
| | | | | | | | | | | | | | | | | | |
| | | | | |
| | | | | | | | | | | | | | | | | 1,980,499 | |
| | | | | | | | | | | | | | | | | | |
| | | Metals & Mining 0.2% | |
| a | | Cleveland-Cliffs Inc., senior note, 1.50%, 1/15/25 | | | United States | | | | 1,134,000 | | | | | | | | 1,406,647 | |
| | First Majestic Silver Corp., senior note, 1.875%, 3/01/23 | | | Canada | | | | 770,000 | | | | | | | | 728,131 | |
| e | | SSR Mining Inc., senior bond, 144A, 2.50%, 4/01/39 | | | Canada | | | | 552,000 | | | | | | | | 535,095 | |
| | | | | | | | | | | | | | | | | | |
| | | | | |
| | | | | | | | | | | | | | | | | 2,669,873 | |
| | | | | | | | | | | | | | | | | | |
| | | Mortgage Real Estate Investment Trusts (REITs) 0.1% | |
| | Redwood Trust Inc., senior note, 4.75%, 8/15/23 | | | United States | | | | 714,000 | | | | | | | | 686,592 | |
| | | | | | | | | | | | | | | | | | |
| | | | | | |
| | | |
| franklintempleton.com | | Annual Report | | | 27 | |
FRANKLIN ALTERNATIVE STRATEGIES FUNDS
CONSOLIDATED STATEMENT OF INVESTMENTS
Franklin K2 Alternative Strategies Fund(continued)
| | | | | | | | | | | | | | | | | | |
| | | | |
| | | | | Country | | | Principal Amount* | | | Value | |
| | | Convertible Bonds (continued) | | | |
| | | Oil, Gas & Consumable Fuels 0.3% | |
| | Chesapeake Energy Corp., senior note, 5.50%, 9/15/26 | | | United States | | | | 95,000 | | | | | | | $ | 77,187 | |
| | Golar LNG Ltd., senior note, 2.75%, 2/15/22 | | | Bermuda | | | | 458,000 | | | | | | | | 424,749 | |
| | Green Plains Inc., senior note, | | | | | | | | | | | | | | | | |
| | 3.25%, 10/01/19 | | | United States | | | | 1,379,000 | | | | | | | | 1,385,895 | |
| | 4.125%, 9/01/22 | | | United States | | | | 522,000 | | | | | | | | 475,699 | |
| a | | Ship Finance International Ltd., 5.75%, 10/15/21 | | | Norway | | | | 1,009,000 | | | | | | | | 1,001,475 | |
| | SM Energy Co., senior note, 1.50%, 7/01/21 | | | United States | | | | 30,000 | | | | | | | | 27,148 | |
| | Teekay Corp., senior note, 5.00%, 1/15/23 | | | Canada | | | | 659,000 | | | | | | | | 523,905 | |
| | Whiting Petroleum Corp., senior note, 1.25%, 4/01/20 | | | United States | | | | 45,000 | | | | | | | | 43,679 | |
| | | | | | | | | | | | | | | | | | |
| | | | | |
| | | | | | | | | | | | | | | | | 3,959,737 | |
| | | | | | | | | | | | | | | | | | |
| | | Personal Products 0.1% | |
| | Herbalife Nutrition Ltd., senior note, 2.625%, 3/15/24 | | | United States | | | | 1,011,000 | | | | | | | | 951,720 | |
| | | | | | | | | | | | | | | | | | |
| | | Pharmaceuticals 0.7% | |
| e | | Aphria Inc., senior note, 144A, 5.25%, 6/01/24 | | | Canada | | | | 942,000 | | | | | | | | 831,904 | |
| a,e | | Aurora Cannabis Inc., senior note, 144A, 5.50%, 2/28/24 | | | Canada | | | | 1,377,000 | | | | | | | | 1,624,860 | |
| e | | Canopy Growth Corp., senior note, 144A, 4.25%, 7/15/23 | | | Canada | | | | 1,235,000 | | | | CAD | | | | 1,238,107 | |
| a | | Innoviva Inc., sub. note, 2.125%, 1/15/23 | | | United States | | | | 1,047,000 | | | | | | | | 1,067,020 | |
| | Jazz Investments I Ltd., senior note, 1.50%, 8/15/24 | | | United States | | | | 875,000 | | | | | | | | 830,121 | |
| e | | The Medicines Co., senior note, 144A, 3.50%, 1/15/24 | | | United States | | | | 462,000 | | | | | | | | 731,404 | |
| e | | Omeros Corp., senior note, 144A, 6.25%, 11/15/23 | | | United States | | | | 200,000 | | | | | | | | 220,893 | |
| | Pacira Biosciences Inc., senior note, 2.375%, 4/01/22 | | | United States | | | | 1,281,000 | | | | | | | | 1,310,623 | |
| e | | Tilray Inc., senior note, 144A, 5.00%, 10/01/23 | | | Canada | | | | 1,194,000 | | | | | | | | 996,225 | |
| | | | | | | | | | | | | | | | | | |
| | | | | |
| | | | | | | | | | | | | | | | | 8,851,157 | |
| | | | | | | | | | | | | | | | | | |
| | | Professional Services 0.1% | |
| e | | FTI Consulting Inc., senior note, 144A, 2.00%, 8/15/23 | | | United States | | | | 1,526,000 | | | | | | | | 1,630,912 | |
| | | | | | | | | | | | | | | | | | |
| | | Real Estate Management & Development 0.1% | |
| | Forestar Group Inc., senior note, 3.75%, 3/01/20 | | | United States | | | | 356,000 | | | | | | | | 356,563 | |
| | Redfin Corp., senior note, 1.75%, 7/15/23 | | | United States | | | | 1,526,000 | | | | | | | | 1,343,536 | |
| | | | | | | | | | | | | | | | | | |
| | | | | |
| | | | | | | | | | | | | | | | | 1,700,099 | |
| | | | | | | | | | | | | | | | | | |
| | | Semiconductors & Semiconductor Equipment 0.3% | |
| | Inphi Corp., senior note, 0.75%, 9/01/21 | | | United States | | | | 907,000 | | | | | | | | 958,709 | |
| a | | Microchip Technology Inc., senior sub. bond, 1.625%, 2/15/27 | | | United States | | | | 900,000 | | | | | | | | 983,709 | |
| | Silicon Laboratories Inc., senior note, 1.375%, 3/01/22 | | | United States | | | | 615,000 | | | | | | | | 721,087 | |
| | Synaptics Inc., senior note, 0.50%, 6/15/22 | | | United States | | | | 650,000 | | | | | | | | 573,160 | |
| | | | | | | | | | | | | | | | | | |
| | | | | |
| | | | | | | | | | | | | | | | | 3,236,665 | |
| | | | | | | | | | | | | | | | | | |
| | | Software 0.8% | |
| e | | Benefitfocus Inc., senior note, 144A, 1.25%, 12/15/23 | | | United States | | | | 1,098,000 | | | | | | | | 996,606 | |
| a | | Five9 Inc., senior note, 0.125%, 5/01/23 | | | United States | | | | 949,000 | | | | | | | | 1,315,978 | |
| | Nuance Communications Inc., senior bond, 1.00%, 12/15/35 | | | United States | | | | 1,217,000 | | | | | | | | 1,149,444 | |
| | Nutanix Inc., senior note, zero cpn., 1/15/23 | | | United States | | | | 765,000 | | | | | | | | 729,415 | |
| e | | Palo Alto Networks Inc., senior note, 144A, 0.75%, 7/01/23 | | | United States | | | | 712,000 | | | | | | | | 739,937 | |
| e | | Pluralsight Inc., senior note, 144A, 0.375%, 3/01/24 | | | United States | | | | 1,268,000 | | | | | | | | 1,372,723 | |
| | PROS Holdings Inc., | | | | | | | | | | | | | | | | |
| | senior bond, 2.00%, 6/01/47 | | | United States | | | | 1,076,000 | | | | | | | | 1,357,901 | |
| | e senior note, 144A, 1.00%, 5/15/24 | | | United States | | | | 435,000 | | | | | | | | 469,844 | |
| a,e | | Rapid7 Inc., senior note, 144A, 1.25%, 8/01/23 | | | United States | | | | 930,000 | | | | | | | | 1,317,679 | |
| | | | | | | | | | | | | | | | | | |
| | | | | |
| | | | | | | | | | | | | | | | | 9,449,527 | |
| | | | | | | | | | | | | | | | | | |
| | | Specialty Retail 0.0%† | |
| e | | Restoration Hardware Holdings Inc., senior note, 144A, zero cpn., 6/15/23 | | | United States | | | | 421,000 | | | | | | | | 335,221 | |
| | | | | | | | | | | | | | | | | | |
| | | Trading Companies & Distributors 0.0%† | |
| | Kaman Corp., senior note, 3.25%, 5/01/24 | | | United States | | | | 398,000 | | | | | | | | 426,040 | |
| | | | | | | | | | | | | | | | | | |
| | | | |
| | | |
| 28 | | Annual Report | | franklintempleton.com |
FRANKLIN ALTERNATIVE STRATEGIES FUNDS
CONSOLIDATED STATEMENT OF INVESTMENTS
Franklin K2 Alternative Strategies Fund(continued)
| | | | | | | | | | | | | | | | | | |
| | | | |
| | | | | Country | | | Principal Amount* | | | Value | |
| | | Convertible Bonds (continued) | | | |
| | | Wireless Telecommunication Services 0.1% | |
| e | | Boingo Wireless Inc., senior note, 144A, 1.00%, 10/01/23 | | | United States | | | | 930,000 | | | | | | | $ | 791,221 | |
| | | | | | | | | | | | | | | | | | |
| | Total Convertible Bonds (Cost $103,900,313) | | | | | | | | | | | | | | | 105,949,972 | |
| | | | | | | | | | | | | | | | | | |
| | | Corporate Bonds and Notes 9.9% | | | |
| | | Aerospace & Defense 0.1% | |
| | The Boeing Co., senior note, 2.70%, 5/01/22 | | | United States | | | | 375,000 | | | | | | | | 377,966 | |
| e | | Leonardo US Holdings Inc., senior bond, 144A, 6.25%, 1/15/40 | | | Italy | | | | 236,000 | | | | | | | | 227,740 | |
| e | | Rolls-Royce PLC, senior note, 144A, 2.375%, 10/14/20 | | | United Kingdom | | | | 400,000 | | | | | | | | 398,825 | |
| | | | | | | | | | | | | | | | | | |
| | | | | |
| | | | | | | | | | | | | | | | | 1,004,531 | |
| | | | | | | | | | | | | | | | | | |
| | | Air Freight & Logistics 0.0%† | |
| | FedEx Corp., senior note, 3.40%, 1/14/22 | | | United States | | | | 170,000 | | | | | | | | 173,706 | |
| | | | | | | | | | | | | | | | | | |
| | | Automobiles 0.2% | |
| e,j | | BMW US Capital LLC, senior note, 144A, FRN, 3.014%,(3-Month USD LIBOR + 0.41%), 4/12/21 | | | Germany | | | | 465,000 | | | | | | | | 465,958 | |
| e | | Daimler Finance North America LLC, senior note, 144A, 3.40%, 2/22/22 | | | Germany | | | | 385,000 | | | | | | | | 390,153 | |
| | General Motors Financial Co. Inc., senior note, | | | | | | | | | | | | | | | | |
| | 3.70%, 11/24/20 | | | United States | | | | 155,000 | | | | | | | | 156,298 | |
| | j FRN, 3.442%,(3-Month USD LIBOR + 0.85%), 4/09/21 | | | United States | | | | 275,000 | | | | | | | | 275,015 | |
| e | | Hyundai Capital America, senior note, 144A, 3.95%, 2/01/22 | | | United States | | | | 375,000 | | | | | | | | 383,552 | |
| e | | Nissan Motor Acceptance Corp., senior note, 144A, 3.65%, 9/21/21 | | | United States | | | | 375,000 | | | | | | | | 380,943 | |
| | Toyota Motor Credit Corp., G, senior note, 3.05%, 1/08/21 | | | United States | | | | 325,000 | | | | | | | | 328,144 | |
| | | | | | | | | | | | | | | | | | |
| | | | | |
| | | | | | | | | | | | | | | | | 2,380,063 | |
| | | | | | | | | | | | | | | | | | |
| | | Banks 0.5% | |
| e | | Banco Macro SA, senior note, 144A, 17.50%, 5/08/22 | | | Argentina | | | | 1,740,000 | | | | ARS | | | | 24,388 | |
| | Citibank NA, senior note, | | | | | | | | | | | | | | | | |
| | 3.05%, 5/01/20 | | | United States | | | | 435,000 | | | | | | | | 436,712 | |
| | j FRN, 3.165%,(3-Month USD LIBOR + 0.53%), 2/19/22 | | | United States | | | | 250,000 | | | | | | | | 251,607 | |
| j | | HSBC Holdings PLC, senior note, FRN, 3.247%,(3-Month USD LIBOR + 0.65%), 9/11/21 | | | United Kingdom | | | | 375,000 | | | | | | | | 375,627 | |
| j | | JPMorgan Chase & Co., senior note, FRN, 3.20%,(3-Month USD LIBOR + 0.68%), 6/01/21 | | | United States | | | | 140,000 | | | | | | | | 140,584 | |
| j | | JPMorgan Chase Bank NA, senior note, FRN, 2.75%,(3-Month USD LIBOR + 0.23%), 9/01/20 | | | United States | | | | 755,000 | | | | | | | | 755,049 | |
| | Keybank NA, senior note, 3.30%, 2/01/22 | | | United States | | | | 250,000 | | | | | | | | 255,526 | |
| | Mitsubishi UFJ Financial Group Inc., senior note, | | | | | | | | | | | | | | | | |
| | j FRN, 3.236%,(3-Month USD LIBOR + 0.65%), 7/26/21 | | | Japan | | | | 380,000 | | | | | | | | 381,523 | |
| | 3.535%, 7/26/21 | | | Japan | | | | 380,000 | | | | | | | | 387,436 | |
| e,j | | Standard Chartered PLC, 144A, FRN, senior note, | | | | | | | | | | | | | | | | |
| | 3.742%,(3-Month USD LIBOR + 1.15%), 1/20/23 | | | United Kingdom | | | | 200,000 | | | | | | | | 200,007 | |
| | 4.247%,(3-Month USD LIBOR + 1.15%), 1/20/23 | | | United Kingdom | | | | 200,000 | | | | | | | | 203,829 | |
| j | | Sumitomo Mitsui Financial Group Inc., senior note, FRN, 3.551%,(3-Month USD LIBOR + 0.97%), 1/11/22 | | | Japan | | | | 115,000 | | | | | | | | 116,197 | |
| | US Bank NA, senior note, | | | | | | | | | | | | | | | | |
| | 3.00%, 2/04/21 | | | United States | | | | 375,000 | | | | | | | | 378,681 | |
| | d,j FRN, 2.905%,(3-Month USD LIBOR + 0.38%), 11/16/21 | | | United States | | | | 380,000 | | | | | | | | 381,537 | |
| i,o | | VTB Capital SA, loan participation, sub. senior note, Reg S, 6.95%, 10/17/22 | | | Russia | | | | 486,000 | | | | | | | | 512,564 | |
| j | | Wells Fargo & Co., senior note, FRN, | | | | | | | | | | | | | | | | |
| | 3.843%,(3-Month USD LIBOR + 1.34%), 3/04/21 | | | United States | | | | 230,000 | | | | | | | | 233,717 | |
| | 3.465%,(3-Month USD LIBOR + 0.93%), 2/11/22 | | | United States | | | | 495,000 | | | | | | | | 498,017 | |
| | Wells Fargo Bank NA, senior note, 3.625%, 10/22/21 | | | United States | | | | 250,000 | | | | | | | | 255,736 | |
| | | | | | | | | | | | | | | | | | |
| | | | | |
| | | | | | | | | | | | | | | | | 5,788,737 | |
| | | | | | | | | | | | | | | | | | |
| | | | | | |
| | | |
| franklintempleton.com | | Annual Report | | | 29 | |
FRANKLIN ALTERNATIVE STRATEGIES FUNDS
CONSOLIDATED STATEMENT OF INVESTMENTS
Franklin K2 Alternative Strategies Fund(continued)
| | | | | | | | | | | | | | | | | | |
| | | | |
| | | | | Country | | | Principal Amount* | | | Value | |
| | | Corporate Bonds and Notes (continued) | | | |
| | | Biotechnology 0.0%† | |
| | Celgene Corp., senior note, 2.875%, 8/15/20 | | | United States | | | | 195,000 | | | | | | | $ | 196,034 | |
| | | | | | | | | | | | | | | | | | |
| | | Capital Markets 0.2% | |
| a,e | | Adient Global Holdings Ltd., senior note, 144A, 4.875%, 8/15/26 | | | United States | | | | 1,400,000 | | | | | | | | 1,046,500 | |
| j | | Bank of America NA, senior note, FRN, 2.771%,(3-Month USD LIBOR + 0.25%), 8/28/20 | | | United States | | | | 755,000 | | | | | | | | 755,213 | |
| j | | The Bank of New York Mellon, senior note, FRN, 2.803%,(3-Month USD LIBOR + 0.30%), 12/04/20 | | | United States | | | | 385,000 | | | | | | | | 385,329 | |
| | | | | | | | | | | | | | | | | | |
| | | | | |
| | | | | | | | | | | | | | | | | 2,187,042 | |
| | | | | | | | | | | | | | | | | | |
| | | Chemicals 0.5% | |
| | Momentive Performance Materials Inc., senior secured note, 3.88%, 10/24/21 | | | United States | | | | 5,379,000 | | | | | | | | 6,075,580 | |
| | | | | | | | | | | | | | | | | | |
| | | Commercial Services & Supplies 1.8% | |
| e | | Harland Clarke Holdings Corp., 144A, | | | | | | | | | | | | | | | | |
| | a senior note, 9.25%, 3/01/21 | | | United States | | | | 13,051,500 | | | | | | | | 12,806,784 | |
| | senior secured note, 8.375%, 8/15/22 | | | United States | | | | 3,207,000 | | | | | | | | 2,741,985 | |
| | R.R. Donnelley & Sons Co., | | | | | | | | | | | | | | | | |
| | senior bond, 8.875%, 4/15/21 | | | United States | | | | 141,000 | | | | | | | | 146,288 | |
| | senior bond, 6.50%, 11/15/23 | | | United States | | | | 2,416,000 | | | | | | | | 2,391,840 | |
| | senior bond, 6.00%, 4/01/24 | | | United States | | | | 2,744,000 | | | | | | | | 2,719,990 | |
| | senior bond, 6.625%, 4/15/29 | | | United States | | | | 300,000 | | | | | | | | 283,500 | |
| | senior note, 7.00%, 2/15/22 | | | United States | | | | 1,338,000 | | | | | | | | 1,351,380 | |
| | | | | | | | | | | | | | | | | | |
| | | | | |
| | | | | | | | | | | | | | | | | 22,441,767 | |
| | | | | | | | | | | | | | | | | | |
| | | Consumer Finance 0.1% | |
| | American Express Co., senior note, | | | | | | | | | | | | | | | | |
| | 3.00%, 2/22/21 | | | United States | | | | 165,000 | | | | | | | | 166,121 | |
| | j FRN, 3.165%,(3-Month USD LIBOR + 0.60%), 11/05/21 | | | United States | | | | 260,000 | | | | | | | | 261,305 | |
| | Paccar Financial Corp., senior note, 2.65%, 5/10/22 | | | United States | | | | 420,000 | | | | | | | | 424,340 | |
| | Synchrony Financial, senior bond, 5.15%, 3/19/29 | | | United States | | | | 215,000 | | | | | | | | 223,294 | |
| | | | | | | | | | | | | | | | | | |
| | | | | |
| | | | | | | | | | | | | | | | | 1,075,060 | |
| | | | | | | | | | | | | | | | | | |
| | | Distributors 0.1% | |
| e,k | | American News Co. LLC, secured note, senior note, 144A, PIK, 8.50%, (all cash), 9/01/26 | | | United States | | | | 1,426,629 | | | | | | | | 1,469,428 | |
| | | | | | | | | | | | | | | | | | |
| | | Diversified Financial Services 0.8% | |
| e,j | | Banco Supervielle SA, senior note, 144A, FRN, 47.667%, (ARS Badlar + 4.50%), 8/09/20 | | | Argentina | | | | 3,800,000 | | | | ARS | | | | 75,752 | |
| | Citizens Bank NA, senior note, 3.25%, 2/14/22 | | | United States | | | | 390,000 | | | | | | | | 396,056 | |
| e | | Financiera de Desarrollo Territorial SA Findeter, senior bond, 144A, 7.875%, 8/12/24 | | | Colombia | | | | 795,000,000 | | | | COP | | | | 247,405 | |
| i | | MDC-GMTN BV, senior bond, Reg S, 4.50%, 11/07/28 | | | United Arab Emirates | | | | 261,000 | | | | | | | | 284,653 | |
| e | | Mitsubishi UFJ Lease & Finance Co. Ltd., senior note, 144A, 3.406%, 2/28/22 | | | Japan | | | | 320,000 | | | | | | | | 325,463 | |
| e | | One Call Corp., 144A, | | | | | | | | | | | | | | | | |
| | secured note, second lien, 10.00%, 10/01/24 | | | United States | | | | 3,001,000 | | | | | | | | 2,580,860 | |
| | senior secured note, first lien, 7.50%, 7/01/24 | | | United States | | | | 5,619,000 | | | | | | | | 5,029,005 | |
| e | | Topaz Solar Farms LLC, senior secured bond, 144A, 5.75%, 9/30/39 | | | United States | | | | 415,044 | | | | | | | | 434,669 | |
| e | | USAA Capital Corp., senior note, 144A, 2.625%, 6/01/21 | | | United States | | | | 180,000 | | | | | | | | 180,902 | |
| | | | | | | | | | | | | | | | | | |
| | | | | |
| | | | | | | | | | | | | | | | | 9,554,765 | |
| | | | | | | | | | | | | | | | | | |
| | | Diversified Telecommunication Services 0.1% | |
| | AT&T Inc., senior note, | | | | | | | | | | | | | | | | |
| | j FRN, 3.27%,(3-Month USD LIBOR + 0.75%), 6/01/21 | | | United States | | | | 155,000 | | | | | | | | 155,997 | |
| | 3.80%, 3/15/22 | | | United States | | | | 530,000 | | | | | | | | 545,971 | |
| | | | | | | | | | | | | | | | | | |
| | | | | |
| | | | | | | | | | | | | | | | | 701,968 | |
| | | | | | | | | | | | | | | | | | |
| | | | |
| | | |
| 30 | | Annual Report | | franklintempleton.com |
FRANKLIN ALTERNATIVE STRATEGIES FUNDS
CONSOLIDATED STATEMENT OF INVESTMENTS
Franklin K2 Alternative Strategies Fund(continued)
| | | | | | | | | | | | | | | | | | |
| | | | |
| | | | | Country | | | Principal Amount* | | | Value | |
| | | Corporate Bonds and Notes (continued) | | | |
| | | Electric Utilities 0.3% | |
| i | | 1MDB Energy Ltd., senior note, Reg S, 5.99%, 5/11/22 | | | Malaysia | | | | 1,300,000 | | | | | | | $ | 1,356,764 | |
| e | | Enel SpA, sub. bond, 144A, 8.75% to 9/24/23, FRN thereafter | | | Italy | | | | 545,000 | | | | | | | | 609,746 | |
| i | | Eskom Holdings SOC Ltd., senior bond, Reg S, | | | | | | | | | | | | | | | | |
| | 5.75%, 1/26/21 | | | South Africa | | | | 414,000 | | | | | | | | 414,017 | |
| | 8.45%, 8/10/28 | | | South Africa | | | | 894,000 | | | | | | | | 981,091 | |
| j | | Florida Power & Light Co., senior note, FRN, 2.965%,(3-Month USD LIBOR + 0.40%), 5/06/22 | | | United States | | | | 415,000 | | | | | | | | 415,162 | |
| | | | | | | | | | | | | | | | | | |
| | | | | |
| | | | | | | | | | | | | | | | | 3,776,780 | |
| | | | | | | | | | | | | | | | | | |
| | | Electronic Equipment, Instruments & Components 0.0%† | |
| | Flex Ltd., senior bond, 4.875%, 6/15/29 | | | Singapore | | | | 415,000 | | | | | | | | 411,605 | |
| | | | | | | | | | | | | | | | | | |
| | | Energy Equipment & Services 0.0%† | |
| e | | Transocean Sentry Ltd., senior secured note, 144A, 5.375%, 5/15/23 | | | United States | | | | 120,000 | | | | | | | | 119,100 | |
| | | | | | | | | | | | | | | | | | |
| | | Entertainment 0.0%† | |
| e | | NetFlix Inc., senior bond, 144A, 5.375%, 11/15/29 | | | United States | | | | 440,000 | | | | | | | | 447,700 | |
| | | | | | | | | | | | | | | | | | |
| | | Equity Real Estate Investment Trusts (REITs) 0.2% | |
| e | | AHP Health Partners Inc., senior note, 144A, 9.75%, 7/15/26 | | | United States | | | | 2,195,000 | | | | | | | | 2,332,187 | |
| | | | | | | | | | | | | | | | | | |
| | | Food & Staples Retailing 0.1% | |
| e,j | | Alimentation Couche-Tard Inc., senior note, 144A, FRN, 3.108%,(3-Month USD LIBOR + 0.50%), 12/13/19 | | | Canada | | | | 123,000 | | | | | | | | 123,003 | |
| e | | NBM US Holdings Inc., senior note, 144A, 7.00%, 5/14/26 | | | Brazil | | | | 325,000 | | | | | | | | 335,969 | |
| | Unilever Capital Corp., senior note, 3.00%, 3/07/22 | | | United Kingdom | | | | 380,000 | | | | | | | | 386,301 | |
| | | | | | | | | | | | | | | | | | |
| | | | | |
| | | | | | | | | | | | | | | | | 845,273 | |
| | | | | | | | | | | | | | | | | | |
| | | Food Products 0.0%† | |
| j | | Campbell Soup Co., senior note, FRN, 3.115%,(3-Month USD LIBOR + 0.50%), 3/16/20 | | | United States | | | | 235,000 | | | | | | | | 234,818 | |
| e | | JBS USA LUX SA / Food Co. / Finance Inc., senior bond, 144A, 6.50%, 4/15/29 | | | United States | | | | 180,000 | | | | | | | | 189,450 | |
| | | | | | | | | | | | | | | | | | |
| | | | | |
| | | | | | | | | | | | | | | | | 424,268 | |
| | | | | | | | | | | | | | | | | | |
| | | Health Care Providers & Services 0.1% | |
| e | | Cigna Corp., senior note, 144A, 3.40%, 9/17/21 | | | United States | | | | 380,000 | | | | | | | | 385,498 | |
| | CVS Health Corp., senior note, | | | | | | | | | | | | | | | | |
| | 2.80%, 7/20/20 | | | United States | | | | 390,000 | | | | | | | | 390,571 | |
| | d 2.125%, 6/01/21 | | | United States | | | | 400,000 | | | | | | | | 395,190 | |
| | | | | | | | | | | | | | | | | | |
| | | | | |
| | | | | | | | | | | | | | | | | 1,171,259 | |
| | | | | | | | | | | | | | | | | | |
| | | Hotels, Restaurants & Leisure 0.7% | |
| e | | MGM China Holdings Ltd., senior note, 144A, 5.375%, 5/15/24 | | | Hong Kong | | | | 200,000 | | | | | | | | 204,250 | |
| e | | Mohegan Gaming & Entertainment, senior note, 144A, 7.875%, 10/15/24 | | | United States | | | | 8,656,000 | | | | | | | | 8,353,040 | |
| | | | | | | | | | | | | | | | | | |
| | | | | |
| | | | | | | | | | | | | | | | | 8,557,290 | |
| | | | | | | | | | | | | | | | | | |
| | | Independent Power & Renewable Electricity Producers 0.0%† | |
| e | | Adani Green Energy Up Ltd. / Prayatna Developers Pvt Ltd. / Parampujya Solar Energy Ltd., senior secured note, 144A, 6.25%, 12/10/24 | | | India | | | | 200,000 | | | | | | | | 200,000 | |
| | | | | | | | | | | | | | | | | | |
| | | Insurance 0.2% | |
| | AEGON Funding Co. LLC, senior bond, 5.75%, 12/15/20 | | | Netherlands | | | | 220,000 | | | | | | | | 230,776 | |
| e,j | | AIA Group Ltd., senior note, 144A, FRN, 3.153%,(3-Month USD LIBOR + 0.52%), 9/20/21 | | | Hong Kong | | | | 200,000 | | | | | | | | 200,034 | |
| j | | Genworth Holdings Inc., senior bond, FRN, 4.521%,(3-Month USD LIBOR + 2.00%), 11/15/36 | | | United States | | | | 577,000 | | | | | | | | 297,155 | |
| e | | Jackson National Life Global Funding, secured note, 144A, 3.30%, 2/01/22 | | | United States | | | | 375,000 | | | | | | | | 381,985 | |
| | Marsh & McLennan Cos. Inc., senior note, 3.50%, 12/29/20 | | | United States | | | | 185,000 | | | | | | | | 187,774 | |
| | | | | | |
| | | |
| franklintempleton.com | | Annual Report | | | 31 | |
FRANKLIN ALTERNATIVE STRATEGIES FUNDS
CONSOLIDATED STATEMENT OF INVESTMENTS
Franklin K2 Alternative Strategies Fund(continued)
| | | | | | | | | | | | | | | | | | |
| | | | |
| | | | | Country | | | Principal Amount* | | | Value | |
| | | Corporate Bonds and Notes (continued) | | | |
| | | Insurance (continued) | |
| e | | Metropolitan Life Global Funding I, secured note, 144A, 3.375%, 1/11/22 | | | United States | | | | 210,000 | | | | | | | $ | 214,880 | |
| e | | New York Life Global Funding, secured note, 144A, | | | | | | | | | | | | | | | | |
| | 2.95%, 1/28/21 | | | United States | | | | 230,000 | | | | | | | | 232,247 | |
| | j FRN, 2.885%,(3-Month USD LIBOR + 0.32%), 8/06/21 | | | United States | | | | 380,000 | | | | | | | | 380,752 | |
| | | | | | | | | | | | | | | | | | |
| | | | | |
| | | | | | | | | | | | | | | | | 2,125,603 | |
| | | | | | | | | | | | | | | | | | |
| | | Interactive Media & Services 0.2% | |
| e | | Rackspace Hosting Inc., senior note, 144A, 8.625%, 11/15/24 | | | United States | | | | 3,273,000 | | | | | | | | 2,855,692 | |
| | | | | | | | | | | | | | | | | | |
| | | IT Services 0.1% | |
| | International Business Machines Corp., senior note, 2.50%, 1/27/22 | | | United States | | | | 785,000 | | | | | | | | 784,206 | |
| | | | | | | | | | | | | | | | | | |
| | | Machinery 0.1% | |
| | Caterpillar Financial Services Corp., senior note, 3.15%, 9/07/21 | | | United States | | | | 265,000 | | | | | | | | 268,834 | |
| | John Deere Capital Corp., senior note, 3.125%, 9/10/21 | | | United States | | | | 750,000 | | | | | | | | 761,096 | |
| | | | | | | | | | | | | | | | | | |
| | | | | |
| | | | | | | | | | | | | | | | | 1,029,930 | |
| | | | | | | | | | | | | | | | | | |
| | | Media 2.2% | |
| e | | Fox Corp., senior note, 144A, 3.666%, 1/25/22 | | | United States | | | | 230,000 | | | | | | | | 235,937 | |
| | iHeartCommunications Inc., senior note, 8.375%, 5/01/27 | | | United States | | | | 100,000 | | | | | | | | 105,125 | |
| e | | The McClatchy Co., 144A, | | | | | | | | | | | | | | | | |
| | senior secured bond, 6.875%, 7/15/31 | | | United States | | | | 4,095,000 | | | | | | | | 4,729,725 | |
| | senior secured note, 9.00%, 7/15/26 | | | United States | | | | 8,088,000 | | | | | | | | 7,986,900 | |
| e,k | | Postmedia Network Inc., secured note, second lien, 144A, PIK, 10.25%, 7/15/23 | | | Canada | | | | 5,264,856 | | | | | | | | 5,528,099 | |
| e | | Worldwide Media Services Group Inc., sub. note, 144A, zero cpn., 12/01/24 | | | United States | | | | 12,601,854 | | | | | | | | 8,947,316 | |
| | | | | | | | | | | | | | | | | | |
| | | | | |
| | | | | | | | | | | | | | | | | 27,533,102 | |
| | | | | | | | | | | | | | | | | | |
| | | Metals & Mining 0.0%† | |
| e | | First Quantum Minerals Ltd., senior note, 144A, 7.50%, 4/01/25 | | | Zambia | | | | 205,000 | | | | | | | | 183,988 | |
| e | | Glencore Funding LLC, senior note, 144A, 4.125%, 3/12/24 | | | Switzerland | | | | 170,000 | | | | | | | | 173,240 | |
| | | | | | | | | | | | | | | | | | |
| | | | | |
| | | | | | | | | | | | | | | | | 357,228 | |
| | | | | | | | | | | | | | | | | | |
| | | Multiline Retail 0.1% | |
| e | | Neiman Marcus Group Ltd. LLC, senior note, 144A, 8.00%, 10/15/21 | | | United States | | | | 2,317,000 | | | | | | | | 1,204,840 | |
| | | | | | | | | | | | | | | | | | |
| | | Oil, Gas & Consumable Fuels 0.8% | |
| e,g | | Bellatrix Exploration Ltd., senior note, 144A, 8.50%, 5/15/20 | | | Canada | | | | 410,000 | | | | | | | | 210,535 | |
| e | | Bruin E&P Partners LLC, senior note, 144A, 8.875%, 8/01/23 | | | United States | | | | 590,000 | | | | | | | | 532,475 | |
| d,e | | California Resources Corp., secured note, second lien, 144A, 8.00%, 12/15/22 | | | United States | | | | 1,025,000 | | | | | | | | 720,062 | |
| i,j | | EP PetroEcuador via Noble Sovereign Funding I Ltd., secured note, Reg S, FRN, 8.227%,(3-Month USD LIBOR + 5.63%), 9/24/19 | | | Ecuador | | | | 84,947 | | | | | | | | 85,372 | |
| e | | Gran Tierra Energy International Holdings Ltd., senior note, 144A, 6.25%, 2/15/25 | | | Canada | | | | 200,000 | | | | | | | | 190,252 | |
| | Gulfport Energy Corp., senior note, 6.00%, 10/15/24 | | | United States | | | | 505,000 | | | | | | | | 419,150 | |
| d | | Halcon Resources Corp., senior note, 6.75%, 2/15/25 | | | United States | | | | 645,000 | | | | | | | | 282,187 | |
| | Jagged Peak Energy LLC, senior note, 5.875%, 5/01/26 | | | United States | | | | 115,000 | | | | | | | | 112,844 | |
| e | | Kosmos Energy Ltd., senior note, 144A, 7.125%, 4/04/26 | | | Ghana | | | | 255,000 | | | | | | | | 252,450 | |
| e | | Lonestar Resources America Inc., senior note, 144A, 11.25%, 1/01/23 | | | United States | | | | 95,000 | | | | | | | | 92,862 | |
| | Montage Resources Corp., senior note, 8.875%, 7/15/23 | | | United States | | | | 195,000 | | | | | | | | 172,575 | |
| | Petrobras Global Finance BV, | | | | | | | | | | | | | | | | |
| | senior bond, 5.75%, 2/01/29 | | | Brazil | | | | 270,000 | | | | | | | | 272,859 | |
| | senior bond, 5.625%, 5/20/43 | | | Brazil | | | | 90,000 | | | | | | | | 82,462 | |
| | senior bond, 6.90%, 3/19/49 | | | Brazil | | | | 545,000 | | | | | | | | 545,545 | |
| | senior note, 6.25%, 3/17/24 | | | Brazil | | | | 284,000 | | | | | | | | 308,816 | |
| | senior note, 8.75%, 5/23/26 | | | Brazil | | | | 509,000 | | | | | | | | 614,541 | |
| | | | |
| | | |
| 32 | | Annual Report | | franklintempleton.com |
FRANKLIN ALTERNATIVE STRATEGIES FUNDS
CONSOLIDATED STATEMENT OF INVESTMENTS
Franklin K2 Alternative Strategies Fund(continued)
| | | | | | | | | | | | | | | | | | |
| | | | |
| | | | | Country | | | Principal Amount* | | | Value | |
| | | Corporate Bonds and Notes (continued) | | | |
| | | Oil, Gas & Consumable Fuels (continued) | |
| | Petroleos Mexicanos, | | | | | | | | | | | | | | | | |
| | senior bond, 5.50%, 1/21/21 | | | Mexico | | | | 1,152,000 | | | | | | | $ | 1,185,984 | |
| | senior note, 4.875%, 1/24/22 | | | Mexico | | | | 712,000 | | | | | | | | 722,965 | |
| | senior note, 3.50%, 1/30/23 | | | Mexico | | | | 535,000 | | | | | | | | 515,794 | |
| | senior note, 4.625%, 9/21/23 | | | Mexico | | | | 850,000 | | | | | | | | 848,619 | |
| e | | Saudi Arabian Oil Co., senior bond, 144A, | | | | | | | | | | | | | | | | |
| | 3.50%, 4/16/29 | | | Saudi Arabia | | | | 200,000 | | | | | | | | 199,869 | |
| | 4.25%, 4/16/39 | | | Saudi Arabia | | | | 231,000 | | | | | | | | 231,088 | |
| | 4.375%, 4/16/49 | | | Saudi Arabia | | | | 200,000 | | | | | | | | 198,800 | |
| e | | Transportadora de Gas del Sur SA, senior note, 144A, 6.75%, 5/02/25 | | | Argentina | | | | 155,000 | | | | | | | | 144,538 | |
| e | | Ultrapar International SA, senior bond, 144A, 5.25%, 6/06/29 | | | Brazil | | | | 205,000 | | | | | | | | 204,283 | |
| e | | Vine Oil & Gas LP / Vine Oil & Gas Finance Corp., senior note, 144A, | | | | | | | | | | | | | | | | |
| | 8.75%, 4/15/23 | | | United States | | | | 415,000 | | | | | | | | 297,763 | |
| | 9.75%, 4/15/23 | | | United States | | | | 190,000 | | | | | | | | 139,650 | |
| e | | YPF Sociedad Anonima, 144A | | | | | | | | | | | | | | | | |
| | senior bond, 6.95%, 7/21/27 | | | Argentina | | | | 220,000 | | | | | | | | 189,728 | |
| | j senior note, FRN, 48.75%, (ARS Badlar + 4.00%), 7/07/20 | | | Argentina | | | | 245,000 | | | | | | | | 68,692 | |
| | | | | | | | | | | | | | | | | | |
| | | | | |
| | | | | | | | | | | | | | | | | 9,842,760 | |
| | | | | | | | | | | | | | | | | | |
| | | Pharmaceuticals 0.2% | |
| e | | Bristol-Myers Squibb Co., senior note, 144A, 2.60%, 5/16/22 | | | United States | | | | 830,000 | | | | | | | | 836,226 | |
| | Mylan Inc., senior bond, 5.20%, 4/15/48 | | | United States | | | | 50,000 | | | | | | | | 45,019 | |
| | Mylan NV, senior bond, 5.25%, 6/15/46 | | | United States | | | | 135,000 | | | | | | | | 123,098 | |
| | Pfizer Inc., senior note, 3.00%, 9/15/21 | | | United States | | | | 755,000 | | | | | | | | 767,687 | |
| | Teva Pharmaceutical Finance Netherlands III BV, senior bond, 4.10%, 10/01/46 | | | Israel | | | | 435,000 | | | | | | | | 283,294 | |
| | | | | | | | | | | | | | | | | | |
| | | | | |
| | | | | | | | | | | | | | | | | 2,055,324 | |
| | | | | | | | | | | | | | | | | | |
| | | Road & Rail 0.1% | |
| e | | Penske Truck Leasing Co. LP / PTL Finance Corp., senior note, 144A, 3.65%, 7/29/21 | | | United States | | | | 285,000 | | | | | | | | 290,096 | |
| e | | Uber Technologies Inc., senior note, 144A, | | | | | | | | | | | | | | | | |
| | d 7.50%, 11/01/23 | | | United States | | | | 370,000 | | | | | | | | 387,575 | |
| | 8.00%, 11/01/26 | | | United States | | | | 240,000 | | | | | | | | 254,700 | |
| | Union Pacific Corp., senior note, 2.95%, 3/01/22 | | | United States | | | | 230,000 | | | | | | | | 232,943 | |
| | | | | | | | | | | | | | | | | | |
| | | | | |
| | | | | | | | | | | | | | | | | 1,165,314 | |
| | | | | | | | | | | | | | | | | | |
| | | Semiconductors & Semiconductor Equipment 0.0%† | |
| e | | Broadcom Inc., senior bond, 144A, 4.75%, 4/15/29 | | | United States | | | | 590,000 | | | | | | | | 582,721 | |
| | | | | | | | | | | | | | | | | | |
| | | Specialty Retail 0.0%† | |
| j | | The Home Depot Inc., senior note, FRN, 2.83%,(3-Month USD LIBOR + 0.31%), 3/01/22 | | | United States | | | | 310,000 | | | | | | | | 310,633 | |
| | | | | | | | | | | | | | | | | | |
| | | Technology Hardware, Storage & Peripherals 0.1% | |
| e | | Dell International LLC / EMC Corp., senior secured note, 144A, 4.90%, 10/01/26 | | | United States | | | | 570,000 | | | | | | | | 583,876 | |
| | Western Digital Corp., senior note, 4.75%, 2/15/26 | | | United States | | | | 250,000 | | | | | | | | 237,588 | |
| | | | | | | | | | | | | | | | | | |
| | | | | |
| | | | | | | | | | | | | | | | | 821,464 | |
| | | | | | | | | | | | | | | | | | |
| | | Wireless Telecommunication Services 0.0%† | |
| e | | Millicom International Cellular SA, senior bond, 144A, 6.25%, 3/25/29 | | | Colombia | | | | 200,000 | | | | | | | | 209,832 | |
| | | | | | | | | | | | | | | | | | |
| | Total Corporate Bonds and Notes
(Cost $117,239,548) | | | | | | | | | | | | | | | 122,212,792 | |
| | | | | | | | | | | | | | | | | | |
| | | Corporate Bonds and Notes in Reorganization 0.8% | | | |
| | | Chemicals 0.0%† | |
| d,e,f | | Hexion Inc., senior secured note, 144A, 10.375%, 2/01/22 | | | United States | | | | 403,000 | | | | | | | | 320,385 | |
| | | | | | | | | | | | | | | | | | |
| | | | | | |
| | | |
| franklintempleton.com | | Annual Report | | | 33 | |
FRANKLIN ALTERNATIVE STRATEGIES FUNDS
CONSOLIDATED STATEMENT OF INVESTMENTS
Franklin K2 Alternative Strategies Fund(continued)
| | | | | | | | | | | | | | | | | | |
| | | | |
| | | | | Country | | | Principal Amount* | | | Value | |
| | | Corporate Bonds and Notes in Reorganization
(continued) | | | |
| | | Electric Utilities 0.8% | |
| f | | Bruce Mansfield Unit 1 2007 Pass-Through Trust, secured bond, 6.85%, 6/01/34 | | | United States | | | | 4,278,603 | | | | | | | $ | 4,080,249 | |
| f | | Pacific Gas & Electric Co., senior bond, | | | | | | | | | | | | | | | | |
| | 5.80%, 3/01/37 | | | United States | | | | 1,458,000 | | | | | | | | 1,454,355 | |
| | 5.40%, 1/15/40 | | | United States | | | | 597,000 | | | | | | | | 586,179 | |
| | d 4.75%, 2/15/44 | | | United States | | | | 3,640,000 | | | | | | | | 3,414,775 | |
| | | | | | | | | | | | | | | | | | |
| | | | | |
| | | | | | | | | | | | | | | | | 9,535,558 | |
| | | | | | | | | | | | | | | | | | |
| | | Metals & Mining 0.0%† | |
| e,f | | Samarco Mineracao SA, senior bond, 144A, 4.125%, 11/01/22 | | | Brazil | | | | 600,000 | | | | | | | | 445,506 | |
| | | | | | | | | | | | | | | | | | |
| | | Oil, Gas & Consumable Fuels 0.0%† | |
| f,i | | Petroleos de Venezuela SA, senior note, Reg S, 6.00%, 10/28/22 | | | Venezuela | | | | 506,036 | | | | | | | | 91,087 | |
| | | | | | | | | | | | | | | | | | |
| | Total Corporate Bonds and Notes in Reorganization
(Cost $7,298,908) | | | | | | | | | | | | | | | 10,392,536 | |
| | | | | | | | | | | | | | | | | | |
| j,l | | Senior Floating Rate Interests 0.4% | | | |
| | | Auto Components 0.0%† | |
| | Tectum Holdings, Term Loan, 6.189%,(1-Month USD LIBOR + 3.75%), 4/22/24 | | | United States | | | | 179,725 | | | | | | | | 171,637 | |
| | | | | | | | | | | | | | | | | | |
| | | Automobiles 0.0%† | |
| | SAIC Motor Corp. Ltd., Term Loan, 4.189%,(1-Month USD LIBOR + 1.75%), 10/31/25 | | | United States | | | | 109,400 | | | | | | | | 108,896 | |
| | | | | | | | | | | | | | | | | | |
| | | Building Products 0.0%† | |
| | Jeld-Wen Inc., Term Loan, 4.601%,(3-Month USD LIBOR + 2.00%), 12/14/24 | | | United States | | | | 189,039 | | | | | | | | 188,212 | |
| | | | | | | | | | | | | | | | | | |
| | | Chemicals 0.0%† | |
| | Axalta Coating Systems Dutch Holding BV, Term Loan B, 4.351%,(3-Month USD LIBOR + 1.75%), 6/01/24 | | | United States | | | | 147,205 | | | | | | | | 144,997 | |
| | | | | | | | | | | | | | | | | | |
| | | Construction Materials 0.0%† | |
| | ABC Supply, Term Loan B, 4.439%,(1-Month USD LIBOR + 2.00%), 10/31/23 | | | United States | | | | 114,337 | | | | | | | | 112,988 | |
| | Summit Materials LLC, Term Loan, 4.439%,(1-Month USD LIBOR + 2.00%), 11/21/24 | | | United States | | | | 189,043 | | | | | | | | 188,363 | |
| | | | | | | | | | | | | | | | | | |
| | | | | |
| | | | | | | | | | | | | | | | | 301,351 | |
| | | | | | | | | | | | | | | | | | |
| | | Diversified Financial Services 0.1% | |
| | The AES Corp., Term Loan, 4.272%,(3-Month USD LIBOR + 1.75%), 5/31/22 | | | United States | | | | 203,700 | | | | | | | | 203,827 | |
| | B.C. Unlimited Liability Co., Term LoanB-3, 4.689%,(1-Month USD LIBOR + 2.25%), 2/16/24 | | | United States | | | | 274,972 | | | | | | | | 272,509 | |
| | Ziggo BV, Term Loan E, 4.94%,(1-Month USD LIBOR + 2.50%), 4/15/25 | | | United States | | | | 200,522 | | | | | | | | 199,360 | |
| | | | | | | | | | | | | | | | | | |
| | | | | |
| | | | | | | | | | | | | | | | | 675,696 | |
| | | | | | | | | | | | | | | | | | |
| | | Equity Real Estate Investment Trusts (REITs) 0.0%† | |
| | Iron Mountain Inc., Term Loan B, 4.189%,(1-Month USD LIBOR + 1.75%), 1/02/26 | | | United States | | | | 217,800 | | | | | | | | 211,538 | |
| | | | | | | | | | | | | | | | | | |
| | | Food & Staples Retailing 0.0%† | |
| | ARAMARK Services Inc., Term LoanB-3, 4.189%,(1-Month USD LIBOR + 1.75%), 3/11/25 | | | United States | | | | 189,226 | | | | | | | | 188,600 | |
| | | | | | | | | | | | | | | | | | |
| | | Food Products 0.0%† | |
| | Post Holdings Inc., Term Loan B, 4.44%,(1-Month USD LIBOR + 2.00%), 5/24/24 | | | United States | | | | 113,257 | | | | | | | | 113,116 | |
| | | | | | | | | | | | | | | | | | |
| | | | |
| | | |
| 34 | | Annual Report | | franklintempleton.com |
FRANKLIN ALTERNATIVE STRATEGIES FUNDS
CONSOLIDATED STATEMENT OF INVESTMENTS
Franklin K2 Alternative Strategies Fund(continued)
| | | | | | | | | | | | | | | | | | |
| | | | |
| | | | | Country | | | Principal Amount* | | | Value | |
| j,l | | Senior Floating Rate Interests (continued) | | | |
| | | Health Care Providers & Services 0.0%† | |
| | Catalent Pharma Solutions Inc., Term Loan B, 4.682%,(1-Month USD LIBOR + 2.25%), 5/18/26 | | | United States | | | | 60,000 | | | | | | | $ | 60,000 | |
| | | | | | | | | | | | | | | | | | |
| | | Health Care Technology 0.0%† | |
| | Quintiles IMS Inc., Term LoanB-2, 4.601%,(3-Month USD LIBOR + 2.00%), 1/17/25 | | | United States | | | | 78,800 | | | | | | | | 78,735 | |
| | | | | | | | | | | | | | | | | | |
| | | Hotels, Restaurants & Leisure 0.0%† | |
| | Wyndham Hotels, Term Loan, 4.189%,(1-Month USD LIBOR + 1.75%), 5/30/25 | | | United States | | | | 64,675 | | | | | | | | 64,502 | |
| | | | | | | | | | | | | | | | | | |
| | | Independent Power & Renewable Electricity Producers 0.0%† | |
| | Vistra Energy Corp., Term LoanB-3, | | | | | | | | | | | | | | | | |
| | 4.432%,(1-Month USD LIBOR + 2.00%), 12/31/25 | | | United States | | | | 148,202 | | | | | | | | 147,879 | |
| | 4.439%,(1-Month USD LIBOR + 2.00%), 12/31/25 | | | United States | | | | 52,822 | | | | | | | | 52,706 | |
| | | | | | | | | | | | | | | | | | |
| | | | | |
| | | | | | | | | | | | | | | | | 200,585 | |
| | | | | | | | | | | | | | | | | | |
| | | IT Services 0.0%† | |
| | First Data Corp., Term Loan B, 4.437%,(1-Month USD LIBOR + 2.00%), 7/08/22 | | | United States | | | | 151,472 | | | | | | | | 151,437 | |
| | | | | | | | | | | | | | | | | | |
| | | Life Sciences Tools & Services 0.0%† | |
| | Iqvia Holdings Inc., Term Loan B, 4.189%,(1-Month USD LIBOR + 1.75%), 6/11/25 | | | United States | | | | 203,463 | | | | | | | | 202,572 | |
| | | | | | | | | | | | | | | | | | |
| | | Media 0.0%† | |
| | UPC Financing Partnership, Term Loan, 4.94%,(1-Month USD LIBOR + 2.50%), 1/15/26 | | | United States | | | | 96,442 | | | | | | | | 96,356 | |
| | | | | | | | | | | | | | | | | | |
| | | Oil, Gas & Consumable Fuels 0.1% | |
| | California Resources Corp., Initial Term Loan, 7.178%,(1-Month USD LIBOR + 4.75%), 12/31/22 | | | United States | | | | 873,000 | | | | | | | | 839,171 | |
| | Gavilan Resources LLC, Initial Term Loan, second lien, 8.43%,(1-Month USD LIBOR + 6.00%), 3/01/24 | | | United States | | | | 200,000 | | | | | | | | 146,000 | |
| | | | | | | | | | | | | | | | | | |
| | | | | |
| | | | | | | | | | | | | | | | | 985,171 | |
| | | | | | | | | | | | | | | | | | |
| | | Pharmaceuticals 0.0%† | |
| | Grifols Worldwide Operations USA Inc., Term Loan, 4.637%,(1-Week USD LIBOR + 2.25%), 1/31/25 | | | United States | | | | 194,314 | | | | | | | | 193,751 | |
| | | | | | | | | | | | | | | | | | |
| | | Road & Rail 0.0%† | |
| | Uber Technologies Inc., Term Loan, Term Loan, 5.93%,(1-Month USD LIBOR + 3.50%), 7/13/23 | | | United States | | | | 292,795 | | | | | | | | 292,703 | |
| | | | | | | | | | | | | | | | | | |
| | | Semiconductors & Semiconductor Equipment 0.0%† | |
| | Microchip Technology Inc., Term Loan B, 4.44%,(1-Month USD LIBOR + 2.00%), 5/29/25 | | | United States | | | | 63,238 | | | | | | | | 63,159 | |
| | | | | | | | | | | | | | | | | | |
| | | Trading Companies & Distributors 0.1% | |
| | Reece Ltd., Term Loan B, 4.61%,(3-Month USD LIBOR + 2.00%), 7/02/25 | | | United States | | | | 210,670 | | | | | | | | 209,617 | |
| | United Rentals Inc., Term Loan, 4.189%,(1-Month USD LIBOR + 1.75%), 10/31/25 | | | United States | | | | 109,450 | | | | | | | | 109,557 | |
| | | | | | | | | | | | | | | | | | |
| | | | | |
| | | | | | | | | | | | | | | | | 319,174 | |
| | | | | | | | | | | | | | | | | | |
| | | Wireless Telecommunication Services 0.1% | |
| | Unitymedia Hessen GmbH & Co. KG, Term Loan B, | | | | | | | | | | | | | | | | |
| | 4.44%,(1-Month USD LIBOR + 2.00%), 6/01/23 | | | United States | | | | 80,000 | | | | | | | | 79,657 | |
| | 4.69%,(1-Month USD LIBOR + 2.25%), 9/30/25 | | | United States | | | | 301,134 | | | | | | | | 299,785 | |
| | | | | | | | | | | | | | | | | | |
| | | | | |
| | | | | | | | | | | | | | | | | 379,442 | |
| | | | | | | | | | | | | | | | | | |
| | Total Senior Floating Rate Interests
(Cost $5,258,419) | | | | | | | | | | | | | | | 5,191,630 | |
| | | | | | | | | | | | | | | | | | |
| | | | | | |
| | | |
| franklintempleton.com | | Annual Report | | | 35 | |
FRANKLIN ALTERNATIVE STRATEGIES FUNDS
CONSOLIDATED STATEMENT OF INVESTMENTS
Franklin K2 Alternative Strategies Fund(continued)
| | | | | | | | | | | | | | | | | | |
| | | | |
| | | | | Country | | | Principal Amount* | | | Value | |
| | | Foreign Government and Agency Securities 2.1% | | | |
| | Argentina Treasury Bill, Strip, | | | | | | | | | | | | | | | | |
| | 4/30/20 | | | Argentina | | | | 21,502,465 | | | | ARS | | | $ | 504,309 | |
| | 7/31/20 | | | Argentina | | | | 10,826,261 | | | | ARS | | | | 220,709 | |
| | Government of Argentina, | | | | | | | | | | | | | | | | |
| | 3.38% to 3/31/29, 4.74% thereafter, 12/31/38 | | | Argentina | | | | 1,325,000 | | | | EUR | | | | 781,044 | |
| | senior bond, 3.38%, 12/31/38 | | | Argentina | | | | 319,071 | | | | EUR | | | | 184,678 | |
| | j senior note, FRN, 68.805%, (ARLLMONP), 6/21/20 | | | Argentina | | | | 10,866,182 | | | | ARS | | | | 244,117 | |
| | senior note, 6.875%, 4/22/21 | | | Argentina | | | | 979,000 | | | | | | | | 813,059 | |
| | i senior note, Reg S, 3.875%, 1/15/22 | | | Argentina | | | | 1,171,000 | | | | EUR | | | | 998,165 | |
| | senior note, 5.625%, 1/26/22 | | | Argentina | | | | 2,711,000 | | | | | | | | 2,099,670 | |
| i | | Government of Bahrain, senior bond, Reg S, 7.00%, 1/26/26 | | | Bahrain | | | | 467,000 | | | | | | | | 496,099 | |
| | Government of Brazil, senior bond, 4.875%, 1/22/21 | | | Brazil | | | | 640,000 | | | | | | | | 661,760 | |
| i | | Government of Ecuador, senior note, Reg S, 10.75%, 3/28/22 | | | Ecuador | | | | 316,000 | | | | | | | | 351,945 | |
| | Government of Indonesia, senior note, 4.45%, 2/11/24 | | | Indonesia | | | | 240,000 | | | | | | | | 251,573 | |
| i | | Government of Nigeria, senior note, Reg S, 7.625%, 11/21/25 | | | Nigeria | | | | 363,000 | | | | | | | | 381,114 | |
| i | | Government of Paraguay, senior bond, Reg S, 4.625%, 1/25/23 | | | Paraguay | | | | 945,000 | | | | | | | | 982,020 | |
| e | | Government of Qatar, senior bond, 144A, | | | | | | | | | | | | | | | | |
| | 4.00%, 3/14/29 | | | Qatar | | | | 420,000 | | | | | | | | 442,906 | |
| | 4.817%, 3/14/49 | | | Qatar | | | | 530,000 | | | | | | | | 584,325 | |
| | Government of Russia, | | | | | | | | | | | | | | | | |
| | senior bond, 7.25%, 5/10/34 | | | Russia | | | | 306,742,000 | | | | RUB | | | | 4,401,397 | |
| | e senior bond, 144A, 5.10%, 3/28/35 | | | Russia | | | | 200,000 | | | | | | | | 209,129 | |
| | i senior note, Reg S, 5.00%, 4/29/20 | | | Russia | | | | 400,000 | | | | | | | | 408,106 | |
| | i senior note, Reg S, 4.50%, 4/04/22 | | | Russia | | | | 400,000 | | | | | | | | 415,941 | |
| i | | Government of Saudi Arabia, Reg S, | | | | | | | | | | | | | | | | |
| | senior bond, 5.25%, 1/16/50 | | | Saudi Arabia | | | | 903,000 | | | | | | | | 996,497 | |
| | senior note, 2.375%, 10/26/21 | | | Saudi Arabia | | | | 800,000 | | | | | | | | 791,206 | |
| | Government of South Africa, senior bond, | | | | | | | | | | | | | | | | |
| | 5.50%, 3/09/20 | | | South Africa | | | | 746,000 | | | | | | | | 757,824 | |
| | 8.75%, 1/31/44 | | | South Africa | | | | 24,725,000 | | | | ZAR | | | | 1,531,389 | |
| | 8.75%, 2/28/48 | | | South Africa | | | | 7,720,000 | | | | ZAR | | | | 476,993 | |
| | R186, 10.50%, 12/21/26 | | | South Africa | | | | 38,895,296 | | | | ZAR | | | | 2,965,295 | |
| | Government of Turkey, senior bond, | | | | | | | | | | | | | | | | |
| | 7.00%, 6/05/20 | | | Turkey | | | | 1,124,000 | | | | | | | | 1,139,921 | |
| | 5.625%, 3/30/21 | | | Turkey | | | | 203,000 | | | | | | | | 200,184 | |
| | Indonesia Treasury Bond, senior note, 8.125%, 5/15/24 | | | Indonesia | | | | 2,795,000,000 | | | | IDR | | | | 200,825 | |
| i | | National Highways Authority of India, senior note, Reg S, 7.30%, 5/18/22 | | | India | | | | 50,000,000 | | | | INR | | | | 702,870 | |
| | Provincia de Buenos Aires, | | | | | | | | | | | | | | | | |
| | j FRN, 56.73%, (ARS Badlar + 3.83%), 5/31/22 | | | Argentina | | | | 18,295,000 | | | | ARS | | | | 326,285 | |
| | i,j Reg S, FRN, 45.741%, (ARS Badlar + 3.75%), 4/12/25 | | | Argentina | | | | 3,670,000 | | | | ARS | | | | 65,158 | |
| | e senior note, 144A, 6.50%, 2/15/23 | | | Argentina | | | | 185,000 | | | | | | | | 139,675 | |
| i | | ZAR Sovereign Capital Fund Property Ltd., senior note, Reg S, 3.903%, 6/24/20 | | | South Africa | | | | 573,000 | | | | | | | | 574,475 | |
| | | | | | | | | | | | | | | | | | |
| | Total Foreign Government and Agency Securities
(Cost $28,858,577) | | | | | | | | | | | | | | | 26,300,663 | |
| | | | | | | | | | | | | | | | | | |
| | | Asset-Backed Securities and Commercial
Mortgage-Backed Securities 2.1% | | | |
| | | Airlines 0.0%† | |
| | Latam Airlines Pass ThroughTrust, 2015-1, B, secured note, 4.50%, 8/15/25 | | | Chile | | | | 537,066 | | | | | | | | 530,782 | |
| | | | | | | | | | | | | | | | | | |
| | | Banks 0.0%† | |
| e,m | | Banco Hipotecario SA, senior note, 144A, FRN, | | | | | | | | | | | | | | | | |
| | 50.417%, (ARS Badlar + 2.50%), 1/12/20 | | | Argentina | | | | 3,890,000 | | | | ARS | | | | 79,368 | |
| | 56.688%, (ARS Badlar + 4.00%), 11/07/22 | | | Argentina | | | | 3,160,000 | | | | ARS | | | | 58,668 | |
| | | | | | | | | | | | | | | | | | |
| | | | | |
| | | | | | | | | | | | | | | | | 138,036 | |
| | | | | | | | | | | | | | | | | | |
| | | | |
| | | |
| 36 | | Annual Report | | franklintempleton.com |
FRANKLIN ALTERNATIVE STRATEGIES FUNDS
CONSOLIDATED STATEMENT OF INVESTMENTS
Franklin K2 Alternative Strategies Fund(continued)
| | | | | | | | | | | | | | | | | | |
| | | | |
| | | | | Country | | | Principal Amount* | | | Value | |
| | | Asset-Backed Securities and Commercial
Mortgage-Backed Securities (continued) | | | |
| | | Capital Markets 0.0%† | |
| | Citigroup Mortgage Loan Trust, | | | | | | | | | | | | | | | | |
| | n 2005-3, 2A3, FRN, 4.627%, 8/25/35 | | | United States | | | | 46,286 | | | | | | | $ | 46,384 | |
| | e,n 2009-10, 6A2, 144A, FRN, 4.75%, 9/25/34 | | | United States | | | | 36,884 | | | | | | | | 37,482 | |
| | e,n 2018-A, A1, 144A, FRN, 4.00%, 1/25/68 | | | United States | | | | 97,131 | | | | | | | | 98,470 | |
| | e 2018-C, A1, 144A, 4.125%, 3/25/59 | | | United States | | | | 160,492 | | | | | | | | 162,346 | |
| | | | | | | | | | | | | | | | | | |
| | | | | |
| | | | | | | | | | | | | | | | | 344,682 | |
| | | | | | | | | | | | | | | | | | |
| | | Consumer Finance 0.1% | |
| | American Express Credit Account Master Trust, | | | | | | | | | | | | | | | | |
| | m 2017-8, A, FRN, 2.56%,(1-Month USD LIBOR + 0.12%), 5/16/22 | | | United States | | | | 210,000 | | | | | | | | 210,066 | |
| | 2019-1, A, 2.87%, 10/15/24 | | | United States | | | | 115,000 | | | | | | | | 117,338 | |
| | Capital One Multi-Asset ExecutionTrust, 2019-A1, A1, 2.84%, 12/15/24 | | | United States | | | | 165,000 | | | | | | | | 167,780 | |
| | Citibank Credit Card IssuanceTrust, 2017-A8, A8, 1.86%, 8/08/22 | | | United States | | | | 425,000 | | | | | | | | 423,067 | |
| | Discover Card Execution Note Trust, | | | | | | | | | | | | | | | | |
| | m 2018-A3, A3, FRN, 2.67%,(1-Month USD LIBOR + 0.23%), 12/15/23 | | | United States | | | | 345,000 | | | | | | | | 345,362 | |
| | 2019-A1, A1, 3.04%, 7/15/24 | | | United States | | | | 155,000 | | | | | | | | 158,337 | |
| | | | | | | | | | | | | | | | | | |
| | | | | |
| | | | | | | | | | | | | | | | | 1,421,950 | |
| | | | | | | | | | | | | | | | | | |
| | | Diversified Financial Services 1.3% | |
| e | | Accelerated AssetsLLC, 2018-1, B, 144A, 4.51%, 12/02/33 | | | United States | | �� | | 82,972 | | | | | | | | 84,779 | |
| e | | Adams Outdoor AdvertisingLP, 2018-1, A, 144A, 4.81%, 11/15/48 | | | United States | | | | 188,640 | | | | | | | | 199,445 | |
| e | | AIM Aviation FinanceLtd., 2015-1A, B1, 144A, 5.072%, 2/15/40 | | | Cayman Islands | | | | 216,143 | | | | | | | | 218,804 | |
| | Ally Auto ReceivablesTrust, 2016-3, A3, 1.44%, 8/17/20 | | | United States | | | | 5,487 | | | | | | | | 5,484 | |
| e | | Ascentium Equipment ReceivablesTrust, 2017-2A, C, 144A, 2.87%, 8/10/22 | | | United States | | | | 25,000 | | | | | | | | 25,153 | |
| e | | Bayview Opportunity Master Fund IIBTrust, 2018-RN5, A1, 144A, 3.82%, 4/28/33 | | | United States | | | | 11,173 | | | | | | | | 11,233 | |
| e | | Bayview Opportunity Master Fund IVATrust, 2019-RN2, A1, 144A, 3.967%, 3/28/34 | | | United States | | | | 158,693 | | | | | | | | 159,603 | |
| e | | Bayview Opportunity Master Fund IVB Trust, 144A, | | | | | | | | | | | | | | | | |
| | 2018-RN9, A1, 4.213%, 10/29/33 | | | United States | | | | 85,340 | | | | | | | | 86,024 | |
| | 2019-RN1, A1, 4.09%, 2/28/34 | | | United States | | | | 113,232 | | | | | | | | 114,891 | |
| e | | Blackbird Capital Aircraft Lease SecuritizationLtd., 2016-1A, A, 144A, 4.213%, 12/16/41 | | | United States | | | | 217,813 | | | | | | | | 224,486 | |
| | California Republic Auto ReceivablesTrust, 2018-1, D, 4.33%, 4/15/25 | | | United States | | | | 115,000 | | | | | | | | 119,512 | |
| | Carmax Auto Owner Trust, | | | | | | | | | | | | | | | | |
| | m 2017-4, A2B, FRN, 2.57%,(1-Month USD LIBOR + 0.13%), 4/15/21 | | | United States | | | | 57,670 | | | | | | | | 57,665 | |
| | 2018-2, D, 3.99%, 4/15/25 | | | United States | | | | 100,000 | | | | | | | | 102,939 | |
| | 2018-4, D, 4.15%, 4/15/25 | | | United States | | | | 60,000 | | | | | | | | 62,384 | |
| | 2019-1, A3, 3.05%, 3/15/24 | | | United States | | | | 355,000 | | | | | | | | 361,804 | |
| | | | | |
| e | | Chesapeake Funding II LLC, 144A, | | | | | | | | | | | | | | | | |
| | m 2017-4A, A2, FRN, 2.78%,(1-Month USD LIBOR + 0.34%), 11/15/29 | | | Canada | | | | 123,841 | | | | | | | | 123,999 | |
| | 2018-1A, D, 3.92%, 4/15/30 | | | Canada | | | | 115,000 | | | | | | | | 117,495 | |
| e | | Cig Auto ReceivablesTrust, 2017-1A, A, 144A, 2.71%, 5/15/23 | | | United States | | | | 13,577 | | | | | | | | 13,557 | |
| e | | Coinstar FundingLLC, 2017-1A, A2, 144A, 5.216%, 4/25/47 | | | United States | | | | 240,100 | | | | | | | | 246,541 | |
| e,m | | Colony Starwood HomesTrust, 2016-2A, E, 144A, FRN, 5.79%,(1-Month USD LIBOR + 3.35%), 12/17/33 | | | United States | | | | 62,391 | | | | | | | | 63,064 | |
| e | | CPS Auto Receivables Trust, 144A, | | | | | | | | | | | | | | | | |
| | 2014-B, D, 4.62%, 5/15/20 | | | United States | | | | 110,000 | | | | | | | | 110,051 | |
| | 2018-D, C, 3.83%, 9/15/23 | | | United States | | | | 100,000 | | | | | | | | 102,242 | |
| | | | | | |
| | | |
| franklintempleton.com | | Annual Report | | | 37 | |
FRANKLIN ALTERNATIVE STRATEGIES FUNDS
CONSOLIDATED STATEMENT OF INVESTMENTS
Franklin K2 Alternative Strategies Fund(continued)
| | | | | | | | | | | | | | | | | | |
| | | | |
| | | | | Country | | | Principal Amount* | | | Value | |
| | | Asset-Backed Securities and Commercial
Mortgage-Backed Securities (continued) | | | |
| | | Diversified Financial Services (continued) | |
| e | | CSMC Trust, 2018-RPL2, A1, 144A, 4.03%, 8/25/62 | | | United States | | | | 215,681 | | | | | | | $ | 216,311 | |
| e,m | | CVP CascadeLtd., 2017-2A, A1R, 144A, FRN, 3.801%,(3-Month USD LIBOR + 1.20%), 7/18/26 | | | United States | | | | 232,834 | | | | | | | | 233,360 | |
| e | | Diamond Resorts Owner Trust, 144A, | | | | | | | | | | | | | | | | |
| | 2017-1A, C, 6.07%, 10/22/29 | | | United States | | | | 43,766 | | | | | | | | 44,853 | |
| | 2018-1, C, 4.53%, 1/21/31 | | | United States | | | | 121,290 | | | | | | | | 123,593 | |
| | Drive Auto Receivables Trust, | | | | | | | | | | | | | | | | |
| | 2018-1, D, 3.81%, 5/15/24 | | | United States | | | | 220,000 | | | | | | | | 223,460 | |
| | m 2018-5, A2B, FRN, 2.76%,(1-Month USD LIBOR + 0.32%), 7/15/21 | | | United States | | | | 149,053 | | | | | | | | 149,092 | |
| | 2018-5, D, 4.30%, 4/15/26 | | | United States | | | | 125,000 | | | | | | | | 130,432 | |
| e | | Driven Brands FundingLLC, 2018-1A, A2, 144A, 4.739%, 4/20/48 | | | United States | | | | 59,400 | | | | | | | | 62,264 | |
| e | | DT Auto Owner Trust, 144A, | | | | | | | | | | | | | | | | |
| | 2016-1A, D, 4.66%, 12/15/22 | | | United States | | | | 133,071 | | | | | | | | 134,131 | |
| | 2016-2A, D, 5.43%, 11/15/22 | | | United States | | | | 204,393 | | | | | | | | 206,676 | |
| | 2018-2A, D, 4.15%, 3/15/24 | | | United States | | | | 90,000 | | | | | | | | 92,351 | |
| | 2018-3A, C, 3.79%, 7/15/24 | | | United States | | | | 120,000 | | | | | | | | 122,075 | |
| e | | Fairstone Financial Issuance TrustI, 2019-1A, A, 144A, 3.948%, 3/21/33 | | | Canada | | | | 150,000 | | | | CAD | | | | 112,148 | |
| e | | First Investors Auto OwnerTrust, 2016-1A, D, 144A, 4.70%, 4/18/22 | | | United States | | | | 110,000 | | | | | | | | 111,661 | |
| e | | Five Guys FundingLLC, 2017-1A, A2, 144A, 4.60%, 7/25/47 | | | United States | | | | 129,025 | | | | | | | | 135,723 | |
| e | | Flagship Credit AutoTrust, 2019-2, D, 144A, 3.53%, 5/15/25 | | | United States | | | | 165,000 | | | | | | | | 167,191 | |
| | Ford Credit Auto Owner Trust, | | | | | | | | | | | | | | | | |
| | e 2014-2, A, 144A, 2.31%, 4/15/26 | | | United States | | | | 100,000 | | | | | | | | 99,882 | |
| | m 2017-C, A2B, FRN, 2.56%,(1-Month USD LIBOR + 0.12%), 9/15/20 | | | United States | | | | 45,649 | | | | | | | | 45,703 | |
| e | | GCAT LLC, 144A, | | | | | | | | | | | | | | | | |
| | 2017-2, A1, 3.50%, 4/25/47 | | | United States | | | | 25,871 | | | | | | | | 25,910 | |
| | 2018-1, A1, 3.844%, 6/25/48 | | | United States | | | | 63,641 | | | | | | | | 63,944 | |
| | 2018-2, A1, 4.09%, 6/26/23 | | | United States | | | | 99,844 | | | | | | | | 100,376 | |
| e | | GLS Auto Receivables Trust, 144A, | | | | | | | | | | | | | | | | |
| | 2018-3A, B, 3.78%, 8/15/23 | | | United States | | | | 70,000 | | | | | | | | 71,150 | |
| | 2019-2A, C, 3.54%, 2/18/25 | | | United States | | | | 255,000 | | | | | | | | 258,464 | |
| e,m | | Gosforth FundingPLC, 2018-1A, A1, 144A, FRN, 2.971%,(3-Month USD LIBOR + 0.45%), 8/25/60 | | | United Kingdom | | | | 162,224 | | | | | | | | 162,426 | |
| e,m | | Halcyon Loan Advisors FundingLtd., 2017-2A, A1BR, 144A, FRN, 3.762%,(3-Month USD LIBOR + 1.18%), 4/28/25 | | | United States | | | | 270,225 | | | | | | | | 270,767 | |
| e | | Hertz Vehicle Financing IILP, 2017-2A, A, 144A, 3.29%, 10/25/23 | | | United States | | | | 100,000 | | | | | | | | 101,353 | |
| e,m | | Home Partners of America Trust, 144A, FRN, | | | | | | | | | | | | | | | | |
| | 2016-2, E, 6.212%,(1-Month USD LIBOR + 3.78%), 10/17/33 | | | United States | | | | 100,000 | | | | | | | | 100,502 | |
| | 2016-2, F, 7.132%,(1-Month USD LIBOR + 4.70%), 10/17/33 | | | United States | | | | 100,000 | | | | | | | | 100,670 | |
| | Honda Auto Receivables Owner Trust, | | | | | | | | | | | | | | | | |
| | 2017-3, A3, 1.79%, 9/20/21 | | | United States | | | | 107,911 | | | | | | | | 107,509 | |
| | 2019-1, A3, 2.83%, 3/20/23 | | | United States | | | | 150,000 | | | | | | | | 152,170 | |
| e | | Horizon Aircraft Finance ILtd., 2018-1, A, 144A, 4.458%, 12/15/38 | | | United States | | | | 253,664 | | | | | | | | 262,436 | |
| e,m | | Jamestown CLO VIILtd., 2017-7A, A1R, 144A, FRN, 3.41%,(3-Month USD LIBOR + 0.83%), 7/25/27 | | | United States | | | | 250,000 | | | | | | | | 249,548 | |
| e | | Kestrel Aircraft FundingLtd., 2018-1A, A, 144A, 4.25%, 12/15/38 | | | United States | | | | 241,918 | | | | | | | | 246,283 | |
| e | | Legacy Mortgage AssetTrust, 2019-GS3, A1, 144A, 3.75%, 4/25/59 | | | United States | | | | 128,471 | | | | | | | | 130,185 | |
| e,m | | Navistar Financial Dealer Note Master Owner TrustII, 2018-1, A, 144A, FRN, 3.06%,(1-Month USD LIBOR + 0.63%), 9/25/23 | | | United States | | | | 60,000 | | | | | | | | 60,141 | |
| | | | |
| | | |
| 38 | | Annual Report | | franklintempleton.com |
FRANKLIN ALTERNATIVE STRATEGIES FUNDS
CONSOLIDATED STATEMENT OF INVESTMENTS
Franklin K2 Alternative Strategies Fund(continued)
| | | | | | | | | | | | | | | | | | |
| | | | |
| | | | | Country | | | Principal Amount* | | | Value | |
| | | Asset-Backed Securities and Commercial
Mortgage-Backed Securities (continued) | | | |
| | | Diversified Financial Services (continued) | |
| e,m | | NextGear Floorplan Master Owner Trust, 144A, FRN, | | | | | | | | | | | | | | | | |
| | 2017-1A, A1, 3.29%,(1-Month USD LIBOR + 0.85%), 4/18/22 | | | United States | | | | 240,000 | | | | | | | $ | 241,064 | |
| | 2017-2A, A1, 3.12%,(1-Month USD LIBOR + 0.68%), 10/17/22 | | | United States | | | | 220,000 | | | | | | | | 220,871 | |
| | 2018-1A, A1, 3.08%,(1-Month USD LIBOR + 0.64%), 2/15/23 | | | United States | | | | 500,000 | | | | | | | | 501,654 | |
| m | | Nissan Auto LeaseTrust, 2017-B, A2B, FRN, 2.65%,(1-Month USD LIBOR + 0.21%), 12/16/19 | | | United States | | | | 43,136 | | | | | | | | 43,140 | |
| | | | | |
| | Nissan Auto Receivables Owner Trust, | | | | | | | | | | | | | | | | |
| | 2016-C, A3, 1.18%, 1/15/21 | | | United States | | | | 29,811 | | | | | | | | 29,670 | |
| | m 2017-C, A2B, FRN, 2.51%,(1-Month USD LIBOR + 0.07%), 10/15/20 | | | United States | | | | 115,435 | | | | | | | | 115,411 | |
| | 2018-A, A3, 2.65%, 5/16/22 | | | United States | | | | 250,000 | | | | | | | | 251,182 | |
| | m 2018-C, A2B, FRN, 2.61%,(1-Month USD LIBOR + 0.17%), 10/15/21 | | | United States | | | | 335,000 | | | | | | | | 335,216 | |
| | | | | |
| e | | OneMain Financial Issuance Trust, 144A, | | | | | | | | | | | | | | | | |
| | 2015-2A, D, 5.64%, 7/18/25 | | | United States | | | | 285,000 | | | | | | | | 286,346 | |
| | 2015-3A, B, 4.16%, 11/20/28 | | | United States | | | | 155,000 | | | | | | | | 158,736 | |
| | 2016-2A, B, 5.94%, 3/20/28 | | | United States | | | | 335,000 | | | | | | | | 336,503 | |
| e | | Oxford Finance FundingLLC, 2019-1A, A2, 144A, 4.459%, 2/15/27 | | | United States | | | | 50,000 | | | | | | | | 51,161 | |
| e | | Planet Fitness Master IssuerLLC, 2018-1A, A2I, 144A, 4.262%, 9/05/48 | | | United States | | | | 169,150 | | | | | | | | 174,759 | |
| e | | Progress Residential Trust, 2019-SFR1, E, 144A, 4.466%, 8/17/35 | | | United States | | | | 115,000 | | | | | | | | 117,785 | |
| e | | RCO V MortgageLLC, 2019-1, A1, 144A, 3.721%, 5/24/24 | | | United States | | | | 185,000 | | | | | | | | 185,000 | |
| e | | RMAT LP, 2018-NPL1, A1, 144A, 4.09%, 5/25/48 | | | United States | | | | 100,237 | | | | | | | | 100,953 | |
| | | | | |
| | Santander Drive Auto Receivables Trust, | | | | | | | | | | | | | | | | |
| | 2018-2, D, 3.88%, 2/15/24 | | | United States | | | | 275,000 | | | | | | | | 281,313 | |
| | 2018-3, D, 4.07%, 8/15/24 | | | United States | | | | 210,000 | | | | | | | | 215,886 | |
| | m 2018-5, A2B, FRN, 2.67%,(1-Month USD LIBOR + 0.23%), 7/15/21 | | | United States | | | | 196,697 | | | | | | | | 196,719 | |
| | 2018-5, C, 3.81%, 12/16/24 | | | United States | | | | 150,000 | | | | | | | | 153,597 | |
| | 2019-2, D, 3.22%, 7/15/25 | | | United States | | | | 210,000 | | | | | | | | 212,326 | |
| e | | SCF Equipment LeasingLLC, 2018-1A, C, 144A, 4.21%, 4/20/27 | | | United States | | | | 255,000 | | | | | | | | 267,606 | |
| e | | Shenton Aircraft Investment ILtd., 2015-1A, A, 144A, 4.75%, 10/15/42 | | | United States | | | | 101,197 | | | | | | | | 103,762 | |
| e | | S-JetsLtd., 2017-1, A, 144A, 3.967%, 8/15/42 | | | Bermuda | | | | 251,750 | | | | | | | | 256,905 | |
| | | | | |
| m | | SLM Private Credit Student Loan Trust,2003-B, FRN, | | | | | | | | | | | | | | | | |
| | A3, 5.29%,(28-DayT-Bill), 3/15/33 | | | United States | | | | 300,000 | | | | | | | | 299,372 | |
| | A4, 5.06%,(28-DayT-Bill), 3/15/33 | | | United States | | | | 50,000 | | | | | | | | 49,895 | |
| e,m | | SMB Private Education LoanTrust, 2017-B, A2B, 144A, FRN, 3.19%,(1-Month USD LIBOR + 0.75%), 10/15/35 | | | United States | | | | 100,000 | | | | | | | | 99,852 | |
| e | | Sofi Consumer Loan ProgramTrust, 2018-2, A2, 144A, 3.35%, 4/26/27 | | | United States | | | | 155,000 | | | | | | | | 156,493 | |
| e | | Sofi Professional Loan ProgramLLC, 2016-A, B, 144A, 3.57%, 1/26/38 | | | United States | | | | 85,215 | | | | | | | | 84,385 | |
| e | | SpriteLtd., 2017-1, B, 144A, 5.75%, 12/15/37 | | | Cayman Islands | | | | 216,794 | | | | | | | | 223,214 | |
| e | | Stack Infrastructure IssuerLLC, 2019-1A, A2, 144A, 4.54%, 2/25/44 | | | United States | | | | 124,688 | | | | | | | | 129,616 | |
| e,m | | Staniford Street CLOLtd., 2017-1A, AR, 144A, FRN, 3.791%,(3-Month USD LIBOR + 1.18%), 6/15/25 | | | United States | | | | 175,124 | | | | | | | | 175,221 | |
| e | | Stanwich Mortgage Loan Trust, 2018-NPB1, A1, 144A, 4.016%, 5/16/23 | | | United States | | | | 119,915 | | | | | | | | 120,654 | |
| e,m | | Starwood Retail Property Trust, 2014-STAR, E, 144A, FRN, 6.59%,(1-Month USD LIBOR + 4.15%), 11/15/27 | | | United States | | | | 200,000 | | | | | | | | 154,901 | |
| e | | TAL Advantage VLLC, 2013-2A, A, 144A, 3.55%, 11/20/38 | | | United States | | | | 45,000 | | | | | | | | 45,419 | |
| e | | Thunderbolt Aircraft LeaseLtd., 2017-A, B, 144A, 5.75%, 5/17/32 | | | United States | | | | 201,171 | | | | | | | | 209,768 | |
| | | | | |
| | Toyota Auto Receivables Owner Trust, | | | | | | | | | | | | | | | | |
| | 2016-C, A3, 1.14%, 8/17/20 | | | United States | | | | 13,029 | | | | | | | | 12,997 | |
| | m 2017-D, A2B, FRN, 2.49%,(1-Month USD LIBOR + 0.05%), 8/17/20 | | | United States | | | | 103,344 | | | | | | | | 103,337 | |
| | | | | | |
| | | |
| franklintempleton.com | | Annual Report | | | 39 | |
FRANKLIN ALTERNATIVE STRATEGIES FUNDS
CONSOLIDATED STATEMENT OF INVESTMENTS
Franklin K2 Alternative Strategies Fund(continued)
| | | | | | | | | | | | | | | | | | |
| | | | |
| | | | | Country | | | Principal Amount* | | | Value | |
| | | Asset-Backed Securities and Commercial
Mortgage-Backed Securities (continued) | | | |
| | | Diversified Financial Services (continued) | |
| e | | United Auto Credit SecuritizationTrust, 2019-1, C, 144A, 3.16%, 8/12/24 | | | United States | | | | 155,000 | | | | | | | $ | 155,702 | |
| e | | Vericrest Opportunity Loan Trust, 2019-NPL3, A1, 144A, 3.967%, 3/25/49 | | | United States | | | | 118,901 | | | | | | | | 119,743 | |
| | | | | |
| e,m | | Verizon Owner Trust, 144A, FRN, | | | | | | | | | | | | | | | | |
| | 2017-3A, A1B, 2.711%,(1-Month USD LIBOR + 0.27%), 4/20/22 | | | United States | | | | 295,000 | | | | | | | | 295,656 | |
| | 2018-1A, A1B, 2.701%,(1-Month USD LIBOR + 0.26%), 9/20/22 | | | United States | | | | 175,000 | | | | | | | | 175,272 | |
| e | | Veros Automobile ReceivablesTrust, 2017-1, A, 144A, 2.84%, 4/17/23 | | | United States | | | | 14,559 | | | | | | | | 14,544 | |
| e | | VOLT LXIII LLC, 2018-NPL4, A1A, 144A, 4.336%, 7/27/48 | | | United States | | | | 85,501 | | | | | | | | 86,113 | |
| e | | VOLT LXX LLC, 2018-NPL6, A1A, 144A, 4.115%, 9/25/48 | | | United States | | | | 98,577 | | | | | | | | 99,405 | |
| e | | VOLT LXXII LLC, 2018-NPL8, A1A, 144A, 4.213%, 10/26/48 | | | United States | | | | 473,985 | | | | | | | | 480,353 | |
| e | | VOLT LXXV LLC, 2019-NPL1, A1A, 144A, 4.336%, 1/25/49 | | | United States | | | | 174,438 | | | | | | | | 176,558 | |
| | | | | |
| e | | Westlake Automobile Receivables Trust, 144A, | | | | | | | | | | | | | | | | |
| | 2018-1A, D, 3.41%, 5/15/23 | | | United States | | | | 60,000 | | | | | | | | 60,567 | |
| | 2018-2A, D, 4.00%, 1/16/24 | | | United States | | | | 50,000 | | | | | | | | 51,102 | |
| | m 2018-3A, A2B, FRN, 2.79%,(1-Month USD LIBOR + 0.35%), 1/18/22 | | | United States | | | | 271,339 | | | | | | | | 271,367 | |
| | | | | | | | | | | | | | | | | | |
| | | | | |
| | | | | | | | | | | | | | | | | 16,174,966 | |
| | | | | | | | | | | | | | | | | | |
| | | Equity Real Estate Investment Trusts (REITs) 0.1% | |
| | | | | |
| e | | American Homes 4 Rent, 144A, | | | | | | | | | | | | | | | | |
| | 2014-SFR2, E, 6.231%, 10/17/36 | | | United States | | | | 250,000 | | | | | | | | 278,926 | |
| | 2014-SFR3, E, 6.418%, 12/17/36 | | | United States | | | | 100,000 | | | | | | | | 112,180 | |
| | 2015-SFR1, E, 5.639%, 4/17/52 | | | United States | | | | 210,000 | | | | | | | | 228,377 | |
| e | | Colony American FinanceLtd., 2015-1, D, 144A, 5.649%, 10/15/47 | | | United States | | | | 115,000 | | | | | | | | 118,769 | |
| e | | Oak Hill Advisors Residential Loan Trust, 2017-NPL2, A1, 144A, 3.00%, 7/25/57 | | | United States | | | | 95,971 | | | | | | | | 95,880 | |
| | | | | | | | | | | | | | | | | | |
| | | | | |
| | | | | | | | | | | | | | | | | 834,132 | |
| | | | | | | | | | | | | | | | | | |
| | | Mortgage Real Estate Investment Trusts (REITs) 0.5% | |
| e,n | | Ajax Mortgage LoanTrust, 2017-B, A, 144A, FRN, 3.163%, 9/25/56 | | | United States | | | | 115,577 | | | | | | | | 116,266 | |
| | | | | |
| | American Home Mortgage Investment Trust, FRN, | | | | | | | | | | | | | | | | |
| | n 2004-2, 5A, 5.50%, 2/25/44 | | | United States | | | | 8,533 | | | | | | | | 8,757 | |
| | m 2006-1, 11A1, 2.71%,(1-Month USD LIBOR + 0.28%), 3/25/46 | | | United States | | | | 249,013 | | | | | | | | 241,721 | |
| n | | ARMTrust, 2005-1, 3A1, FRN, 4.413%, 5/25/35 | | | United States | | | | 72,806 | | | | | | | | 75,047 | |
| | Banc of America Alternative LoanTrust, 2003-8, 1CB1, 5.50%, 10/25/33 | | | United States | | | | 7,145 | | | | | | | | 7,479 | |
| | | | | |
| | Banc of America Funding Trust, | | | | | | | | | | | | | | | | |
| | 2005-5, 1A1, 5.50%, 9/25/35 | | | United States | | | | 10,285 | | | | | | | | 11,271 | |
| | 2007-4, 5A1, 5.50%, 11/25/34 | | | United States | | | | 110,350 | | | | | | | | 109,106 | |
| | | | | |
| n | | Banc of America Mortgage Trust, FRN, | | | | | | | | | | | | | | | | |
| | 2005-A, 2A1, 4.494%, 2/25/35 | | | United States | | | | 6,202 | | | | | | | | 6,304 | |
| | 2005-I, 4A1, 3.428%, 10/25/35 | | | United States | | | | 69,351 | | | | | | | | 67,428 | |
| | BCAP LLCTrust, 2007-AA2, 22A1, 6.00%, 3/25/22 | | | United States | | | | 67,985 | | | | | | | | 67,642 | |
| e,n | | CCRESG Commercial Mortgage Trust, 2016-HEAT, D, 144A, FRN, 5.488%, 4/10/29 | | | United States | | | | 100,000 | | | | | | | | 102,284 | |
| | | | | |
| | Countrywide Alternative Loan Trust, | | | | | | | | | | | | | | | | |
| | 2003-22CB, 1A1, 5.75%, 12/25/33 | | | United States | | | | 46,436 | | | | | | | | 48,213 | |
| | 2004-16CB, 1A1, 5.50%, 7/25/34 | | | United States | | | | 30,613 | | | | | | | | 32,023 | |
| | 2004-16CB, 3A1, 5.50%, 8/25/34 | | | United States | | | | 34,252 | | | | | | | | 35,783 | |
| | 2004-28CB, 5A1, 5.75%, 1/25/35 | | | United States | | | | 5,407 | | | | | | | | 5,514 | |
| | 2004-J3, 1A1, 5.50%, 4/25/34 | | | United States | | | | 26,851 | | | | | | | | 27,681 | |
| | 2004-J10, 2CB1, 6.00%, 9/25/34 | | | United States | | | | 89,551 | | | | | | | | 95,344 | |
| | 2005-J1, 2A1, 5.50%, 2/25/25 | | | United States | | | | 5,422 | | | | | | | | 5,565 | |
| | | | |
| | | |
| 40 | | Annual Report | | franklintempleton.com |
FRANKLIN ALTERNATIVE STRATEGIES FUNDS
CONSOLIDATED STATEMENT OF INVESTMENTS
Franklin K2 Alternative Strategies Fund(continued)
| | | | | | | | | | | | | | | | | | |
| | | | |
| | | | | Country | | | Principal Amount* | | | Value | |
| | | Asset-Backed Securities and Commercial
Mortgage-Backed Securities (continued) | | | |
| | | Mortgage Real Estate Investment Trusts (REITs) (continued) | |
| | | | | |
| n | | Countrywide Home Loans Mortgage Pass-Through Trust, FRN, | | | | | | | | | | | | | | | | |
| | 2004-12, 8A1, 4.567%, 8/25/34 | | | United States | | | | 5,952 | | | | | | | $ | 5,952 | |
| | 2004-HYB4, 2A1, 4.209%, 9/20/34 | | | United States | | | | 67,651 | | | | | | | | 66,904 | |
| | | | | |
| | Credit Suisse First Boston Mortgage Securities Corp., | | | | | | | | | | | | | | | | |
| | 2003-27, 4A4, 5.75%, 11/25/33 | | | United States | | | | 19,321 | | | | | | | | 20,160 | |
| | n 2003-AR26, 7A1, FRN, 4.395%, 11/25/33 | | | United States | | | | 6,275 | | | | | | | | 6,436 | |
| | n 2003-AR28, 4A1, FRN, 4.65%, 12/25/33 | | | United States | | | | 2,999 | | | | | | | | 3,083 | |
| e | | CSMC OALLC, 2014-USA, E, 144A, 4.373%, 9/15/37 | | | United States | | | | 400,000 | | | | | | | | 374,761 | |
| m | | Deutsche Mortgage Securities Inc. Mortgage LoanTrust, 2004-4, 7AR1, FRN, 2.78%,(1-Month USD LIBOR + 0.35%), 6/25/34 | | | United States | | | | 61,509 | | | | | | | | 60,906 | |
| m | | DSLA Mortgage LoanTrust, 2005-AR5, 2A1A, FRN, 2.771%,(1-Month USD LIBOR + 0.33%), 9/19/45 | | | United States | | | | 45,682 | | | | | | | | 37,799 | |
| i,m | | Dukinfield IIPLC, 2016-2, A, Reg S, FRN, 2.087%,(3-Month GBP LIBOR + 1.25%), 12/20/52 | | | United Kingdom | | | | 173,225 | | | | GBP | | | | 221,582 | |
| i,m | | Eurosail-UK PLC, 2007-2X, A3C, Reg S, FRN, 0.993%,(3-Month GBP LIBOR + 0.15%), 3/13/45 | | | United Kingdom | | | | 48,628 | | | | GBP | | | | 60,421 | |
| m | | FHLMC Structured Agency Credit Risk Debt Notes, FRN, | | | | | | | | | | | | | | | | |
| | 2015-DNA1, M2, 4.28%,(1-Month USD LIBOR + 1.85%), 10/25/27 | | | United States | | | | 172,219 | | | | | | | | 174,521 | |
| | 2015-DNA1, M3, 5.73%,(1-Month USD LIBOR + 3.30%), 10/25/27 | | | United States | | | | 250,000 | | | | | | | | 272,561 | |
| | | | | |
| n | | GMACM Mortgage Loan Trust, FRN, | | | | | | | | | | | | | | | | |
| | 2005-AR1, 3A, 4.72%, 3/18/35 | | | United States | | | | 69,343 | | | | | | | | 71,992 | |
| | 2005-AR4, 3A1, 4.124%, 7/19/35 | | | United States | | | | 90,683 | | | | | | | | 87,431 | |
| e,n | | GS Mortgage SecuritiesTrust, 2011-GC5, D, 144A, FRN, 5.39%, 8/10/44 | | | United States | | | | 195,000 | | | | | | | | 191,388 | |
| | | | | |
| | GSR Mortgage Loan Trust, | | | | | | | | | | | | | | | | |
| | 2005-4F, 6A1, 6.50%, 2/25/35 | | | United States | | | | 10,339 | | | | | | | | 10,476 | |
| | n 2005-AR6, 4A5, FRN, 4.403%, 9/25/35 | | | United States | | | | 69,547 | | | | | | | | 71,345 | |
| | | | | |
| m | | Harborview Mortgage Loan Trust, FRN, | | | | | | | | | | | | | | | | |
| | 2003-2, 1A, 3.181%,(1-Month USD LIBOR + 0.74%), 10/19/33 | | | United States | | | | 55,571 | | | | | | | | 54,726 | |
| | 2004-11, 2A2A, 3.081%,(1-Month USD LIBOR + 0.64%), 1/19/35 | | | United States | | | | 108,305 | | | | | | | | 105,558 | |
| | 2004-2, 1A1, 2.961%,(1-Month USD LIBOR + 0.52%), 6/19/34 | | | United States | | | | 92,245 | | | | | | | | 92,219 | |
| | | | | |
| | IndyMac Index Mortgage Loan Trust, FRN, | | | | | | | | | | | | | | | | |
| | m 2004-AR12, A1, 3.21%,(1-Month USD LIBOR + 0.78%), 12/25/34 | | | United States | | | | 162,273 | | | | | | | | 143,926 | |
| | n 2004-AR6, 4A, 4.711%, 10/25/34 | | | United States | | | | 162,599 | | | | | | | | 171,131 | |
| | m 2004-AR7, A5, 3.65%,(1-Month USD LIBOR + 1.22%), 9/25/34 | | | United States | | | | 53,789 | | | | | | | | 50,799 | |
| | n 2005-AR11, A3, 3.938%, 8/25/35 | | | United States | | | | 61,331 | | | | | | | | 55,882 | |
| | m 2006-AR2, 2A1, 2.64%,(1-Month USD LIBOR + 0.21%), 2/25/46 | | | United States | | | | 256,436 | | | | | | | | 219,827 | |
| | | | | |
| e,m | | Invitation Homes Trust, 144A, FRN, | | | | | | | | | | | | | | | | |
| | 2018-SFR1, E, 4.432%,(1-Month USD LIBOR + 2.00%), 3/17/37 | | | United States | | | | 100,000 | | | | | | | | 99,966 | |
| | 2018-SFR2, E, 4.44%,(1-Month USD LIBOR + 2.00%), 6/17/37 | | | United States | | | | 200,000 | | | | | | | | 199,936 | |
| n | | JP Morgan Chase Commercial Mortgage Securities Trust,2007-LDPX, AM, FRN, 5.464%, 1/15/49 | | | United States | | | | 7,700 | | | | | | | | 7,714 | |
| | | | | |
| | JP Morgan Mortgage Trust, | | | | | | | | | | | | | | | | |
| | n 2003-A2, 3A1, FRN, 4.323%, 11/25/33 | | | United States | | | | 8,628 | | | | | | | | 8,924 | |
| | 2004-S1, 2A1, 6.00%, 9/25/34 | | | United States | | | | 103,839 | | | | | | | | 110,659 | |
| | n 2005-A1, 6T1, FRN, 4.685%, 2/25/35 | | | United States | | | | 14,985 | | | | | | | | 15,226 | |
| | n 2005-A3, 4A1, FRN, 4.841%, 6/25/35 | | | United States | | | | 3,259 | | | | | | | | 3,378 | |
| | n 2006-A1, 1A2, FRN, 4.688%, 2/25/36 | | | United States | | | | 49,436 | | | | | | | | 46,075 | |
| | n 2007-A1, 4A2, FRN, 4.56%, 7/25/35 | | | United States | | | | 3,927 | | | | | | | | 4,091 | |
| m | | Lehman XS TrustSeries, 2006-2N, 1A1, FRN, 2.69%,(1-Month USD LIBOR + 0.26%), 2/25/46 | | | United States | | | | 48,664 | | | | | | | | 46,784 | |
| | | | | | |
| | | |
| franklintempleton.com | | Annual Report | | | 41 | |
FRANKLIN ALTERNATIVE STRATEGIES FUNDS
CONSOLIDATED STATEMENT OF INVESTMENTS
Franklin K2 Alternative Strategies Fund(continued)
| | | | | | | | | | | | | | | | | | |
| | | | |
| | | | | Country | | | Principal Amount* | | | Value | |
| | | Asset-Backed Securities and Commercial
Mortgage-Backed Securities (continued) | | | |
| | | Mortgage Real Estate Investment Trusts (REITs) (continued) | |
| | | | | |
| i,m | | Ludgate Funding PLC, Reg S, FRN, | | | | | | | | | | | | | | | | |
| | 2007-1, A2B, 0.665%,(3-Month EURIBOR + 0.16%), 1/01/61 | | | United Kingdom | | | | 30,884 | | | | EUR | | | $ | 32,887 | |
| | 2008-W1X, A1, 1.441%,(3-Month GBP LIBOR + 0.60%), 1/01/61 | | | United Kingdom | | | | 139,319 | | | | GBP | | | | 172,569 | |
| n | | MASTR Adjustable Rate MortgagesTrust, 2004-7, 3A1, FRN, 4.22%, 7/25/34 | | | United States | | | | 33,591 | | | | | | | | 33,639 | |
| | MASTR Alternative Loan Trust, | | | | | | | | | | | | | | | | |
| | 2004-2, 8A4, 5.50%, 3/25/34 | | | United States | | | | 175,259 | | | | | | | | 182,368 | |
| | 2004-8, 2A1, 6.00%, 9/25/34 | | | United States | | | | 59,346 | | | | | | | | 65,260 | |
| n | | Merrill Lynch Mortgage InvestorsMLCC, 2006-2, 2A, FRN, 4.419%, 5/25/36 | | | United States | | | | 5,942 | | | | | | | | 6,099 | |
| e,n | | Morgan Stanley Capital ITrust, 2011-C2, E, 144A, FRN, 5.485%, 6/15/44 | | | United States | | | | 150,000 | | | | | | | | 147,727 | |
| i,m | | Newgate FundingPLC, 2007-3X, A2B, Reg S, FRN, 0.291%,(3-Month EURIBOR + 0.60%), 12/15/50 | | | United Kingdom | | | | 65,447 | | | | EUR | | | | 71,567 | |
| e | | PRPM LLC, 144A, | | | | | | | | | | | | | | | | |
| | 2017-2A, A1, 3.47%, 9/25/22 | | | United States | | | | 155,038 | | | | | | | | 155,541 | |
| | 2017-2A, A2, 5.00%, 9/25/22 | | | United States | | | | 100,000 | | | | | | | | 100,534 | |
| | n 2017-3A, A1, FRN, 3.47%, 11/25/22 | | | United States | | | | 78,124 | | | | | | | | 78,298 | |
| m | | RALITrust, 2006-QO4, 2A1, FRN, 2.62%,(1-Month USD LIBOR + 0.19%), 4/25/46 | | | United States | | | | 69,043 | | | | | | | | 66,390 | |
| | Residential Asset SecuritizationTrust, 2003-A9, A2, 4.00%, 8/25/33 | | | United States | | | | 122,323 | | | | | | | | 121,291 | |
| n | | RFMSI Trust, FRN, | | | | | | | | | | | | | | | | |
| | 2005-SA1, 1A1, 4.991%, 3/25/35 | | | United States | | | | 113,779 | | | | | | | | 89,290 | |
| | 2006-SA2, 3A1, 5.235%, 8/25/36 | | | United States | | | | 117,963 | | | | | | | | 111,807 | |
| i,m | | RMAC Securities PLC, 2006-NS1X, A2C, Reg S, FRN, 0.229%,(3-Month EURIBOR + 0.15%), 6/12/44 | | | United Kingdom | | | | 42,927 | | | | EUR | | | | 46,283 | |
| | Structured ARM Loan Trust, FRN, | | | | | | | | | | | | | | | | |
| | n 2004-12, 7A3, 4.448%, 9/25/34 | | | United States | | | | 10,875 | | | | | | | | 11,086 | |
| | m 2005-14, A1, 2.74%,(1-Month USD LIBOR + 0.31%), 7/25/35 | | | United States | | | | 280,525 | | | | | | | | 226,207 | |
| | Structured Asset Securities Corp.Trust, 2005-1, 7A7, 5.50%, 2/25/35 | | | United States | | | | 11,009 | | | | | | | | 11,230 | |
| n | | Wells Fargo Bank, N.A., Adjustable Rate MortgageTrust, 2004-4, 3A1, FRN, 4.255%, 3/25/35 | | | United States | | | | 31,807 | | | | | | | | 32,347 | |
| | Wells Fargo Mortgage Backed Securities Trust, | | | | | | | | | | | | | | | | |
| | n 2003-M, A1, FRN, 4.901%, 12/25/33 | | | United States | | | | 17,749 | | | | | | | | 18,601 | |
| | n 2004-I, 2A1, FRN, 4.928%, 7/25/34 | | | United States | | | | 80,636 | | | | | | | | 84,318 | |
| | n 2004-O, A1, FRN, 4.682%, 8/25/34 | | | United States | | | | 6,217 | | | | | | | | 6,515 | |
| | 2005-16, A18, 6.00%, 12/25/35 | | | United States | | | | 3,383 | | | | | | | | 3,439 | |
| | n 2005-AR10, 2A4, FRN, 4.904%, 5/01/35 | | | United States | | | | 8,699 | | | | | | | | 9,099 | |
| | n 2005-AR12, 2A5, FRN, 4.976%, 6/25/35 | | | United States | | | | 25,960 | | | | | | | | 27,063 | |
| | n 2005-AR2, 3A1, FRN, 5.139%, 3/25/35 | | | United States | | | | 30,357 | | | | | | | | 31,402 | |
| | 2006-3, A11, 5.50%, 3/25/36 | | | United States | | | | 32,541 | | | | | | | | 33,043 | |
| n | | WF-RBS Commercial Mortgage Trust, FRN, | | | | | | | | | | | | | | | | |
| | e 2011-C2, D, 144A, 5.652%, 2/15/44 | | | United States | | | | 35,000 | | | | | | | | 35,719 | |
| | e 2011-C3, D, 144A, 5.683%, 3/15/44 | | | United States | | | | 90,000 | | | | | | | | 80,932 | |
| | e 2012-C6, D, 144A, 5.582%, 4/15/45 | | | United States | | | | 150,000 | | | | | | | | 156,629 | |
| | 2012-C7, C, 4.815%, 6/15/45 | | | United States | | | | 25,000 | | | | | | | | 25,494 | |
| | e 2012-C7, E, 144A, 4.815%, 6/15/45 | | | United States | | | | 75,000 | | | | | | | | 65,932 | |
| | | | | | | | | | | | | | | | | | |
| | | | | |
| | | | | | | | | | | | | | | | | 6,578,573 | |
| | | | | | | | | | | | | | | | | | |
| | | Thrifts & Mortgage Finance 0.1% | |
| | AmeriCredit Automobile Receivables Trust, | | | | | | | | | | | | | | | | |
| | m 2017-3, A2B, FRN, 2.681%,(1-Month USD LIBOR + 0.24%), 12/18/20 | | | United States | | | | 16,670 | | | | | | | | 16,671 | |
| | | | |
| | | |
| 42 | | Annual Report | | franklintempleton.com |
FRANKLIN ALTERNATIVE STRATEGIES FUNDS
CONSOLIDATED STATEMENT OF INVESTMENTS
Franklin K2 Alternative Strategies Fund(continued)
| | | | | | | | | | | | | | | | | | |
| | | | |
| | | | | Country | | | Principal Amount* | | | Value | |
| | | Asset-Backed Securities and Commercial
Mortgage-Backed Securities (continued) | | | |
| | | Thrifts & Mortgage Finance (continued) | |
| | 2018-2, D, 4.01%, 7/18/24 | | | United States | | | | 155,000 | | | | | | | $ | 161,142 | |
| | m 2018-3, A2B, FRN, 2.691%,(1-Month USD LIBOR + 0.25%), 1/18/22 | | | United States | | | | 208,119 | | | | | | | | 208,143 | |
| | 2018-3, D, 4.04%, 11/18/24 | | | United States | | | | 205,000 | | | | | | | | 213,737 | |
| | | | | | | | | | | | | | | | | | |
| | | | | |
| | | | | | | | | | | | | | | | | 599,693 | |
| | | | | | | | | | | | | | | | | | |
| | Total Asset-Backed Securities and Commercial Mortgage-Backed Securities (Cost $26,294,621) | | | | | | | | | | | | | | | 26,622,814 | |
| | | | | | | | | | | | | | | | | | |
| | | Municipal Bonds in Reorganization 0.5% | | | | | | | | | | | | |
| | | Puerto Rico 0.5% | |
| f | | Puerto Rico Commonwealth GO, Public Improvement, Refunding, Series A, | | | | | | | | | | | | | | | | |
| | 5.50%, 7/01/39 | | | United States | | | | 1,115,000 | | | | | | | | 623,006 | |
| | 5.00%, 7/01/41 | | | United States | | | | 1,000,000 | | | | | | | | 558,750 | |
| f | | Puerto Rico Commonwealth GO, Refunding, Series A, 8.00%, 7/01/35 | | | United States | | | | 4,015,000 | | | | | | | | 1,967,350 | |
| f | | Puerto Rico Electric Power Authority Power Revenue, Refunding, Series A, 5.00%, 7/01/42 | | | United States | | | | 775,000 | | | | | | | | 620,000 | |
| f | | Puerto Rico Electric Power Authority Power Revenue, Series TT, 5.00%, 7/01/37 | | | United States | | | | 865,000 | | | | | | | | 692,000 | |
| f | | Puerto Rico Electric Power Authority Power Revenue, Series WW, 5.25%, 7/01/33 | | | United States | | | | 20,000 | | | | | | | | 16,050 | |
| a,f | | Puerto Rico Electric Power Authority Power Revenue, Series XX, 5.25%, 7/01/40 | | | United States | | | | 2,180,000 | | | | | | | | 1,749,450 | |
| | | | | | | | | | | | | | | | | | |
| | Total Municipal Bonds in Reorganization (Cost $6,033,879) | | | | | | | | | | | | | | | 6,226,606 | |
| | | | | | | | | | | | | | | | | | |
| | | | |
| | | | | Number of
Contracts | | | Notional Amount# | | | | |
| | | Options Purchased 0.2% | | | |
| | Calls – Exchange-Traded 0.0%† | | | | | | | | | | | | | | | | |
| | Alder Biopharmaceuticals Inc., July Strike Price $15.00, Expires 7/19/19 | | | 60 | | | | 6,000 | | | | | | | | 750 | |
| | Allergan PLC, August Strike Price $160.00, Expires 8/16/19 | | | 17 | | | | 1,700 | | | | | | | | 510 | |
| | Allergan PLC, August Strike Price $165.00, Expires 8/16/19 | | | 385 | | | | 38,500 | | | | | | | | 7,315 | |
| | Carbonite Inc., June Strike Price $35.00, Expires 6/21/19 | | | 29 | | | | 2,900 | | | | | | | | 290 | |
| | Cemex SAB de CV, ADR, July Strike Price $7.00, Expires 7/19/19 | | | 33 | | | | 3,300 | | | | | | | | 198 | |
| | Dell Technologies Inc., July Strike Price $60.00, Expires 7/19/19 | | | 385 | | | | 38,500 | | | | | | | | 109,725 | |
| | Dell Technologies Inc., July Strike Price $62.50, Expires 7/19/19 | | | 58 | | | | 5,800 | | | | | | | | 11,078 | |
| | Dell Technologies Inc., July Strike Price $65.00, Expires 7/19/19 | | | 84 | | | | 8,400 | | | | | | | | 9,660 | |
| | DJ EURO STOXX 50 Index, December Strike Price 3,700.00 EUR, Expires 12/20/19 | | | 350 | | | | 3,500 | | | | | | | | 38,710 | |
| | DJ EURO STOXX Banks, June Strike Price 100.00 EUR, Expires 6/21/19 | | | 250 | | | | 12,500 | | | | | | | | 698 | |
| | DJ EURO STOXX Banks, December Strike Price 105.00 EUR, Expires 12/20/19 | | | 200 | | | | 10,000 | | | | | | | | 8,937 | |
| | DJ EURO STOXX Banks, December Strike Price 115.00 EUR, Expires 12/20/19 | | | 600 | | | | 30,000 | | | | | | | | 6,703 | |
| | DJ EURO STOXX Banks, December Strike Price 120.00 EUR, Expires 12/20/19 | | | 137 | | | | 6,850 | | | | | | | | 765 | |
| | Golar LNG Ltd., June Strike Price $25.00, Expires 6/21/19 | | | 41 | | | | 4,100 | | | | | | | | 123 | |
| | Health Care Select Sector SPDR Fund, June Strike Price $90.00, Expires 6/21/19 | | | 159 | | | | 15,900 | | | | | | | | 5,406 | |
| | Infinera Corp., June Strike Price $5.00, Expires 6/21/19 | | | 73 | | | | 7,300 | | | | | | | | 292 | |
| | Innoviva Inc., June Strike Price $17.50, Expires 6/21/19 | | | 53 | | | | 5,300 | | | | | | | | 530 | |
| | | | | | |
| | | |
| franklintempleton.com | | Annual Report | | | 43 | |
FRANKLIN ALTERNATIVE STRATEGIES FUNDS
CONSOLIDATED STATEMENT OF INVESTMENTS
Franklin K2 Alternative Strategies Fund(continued)
| | | | | | | | | | | | | | | | | | |
| | | | |
| | | | | Number of
Contracts | | | Notional Amount# | | | Value | |
| | | Options Purchased (continued) | | | |
| | Calls – Exchange-Traded(continued) | | | | | | | | | | | | | | | | |
| | Koninklijke KPN NV, June Strike Price 2.80 EUR, Expires 6/21/19 | | | 4,236 | | | | 423,600 | | | | | | | $ | 18,929 | |
| | Newpark Resources Inc., June Strike Price $10.00, Expires 6/21/19 | | | 165 | | | | 16,500 | | | | | | | | 660 | |
| | NII Holdings Inc., June Strike Price $5.00, Expires 6/21/19 | | | 50 | | | | 5,000 | | | | | | | | 250 | |
| | NII Holdings Inc., June Strike Price $7.50, Expires 6/21/19 | | | 73 | | | | 7,300 | | | | | | | | 292 | |
| | Occidental Petroleum Corp., June Strike Price $65.00, Expires 6/21/19 | | | 82 | | | | 8,200 | | | | | | | | 328 | |
| | Technology Select Sector SPDR Fund, June Strike Price $77.00, Expires 6/21/19 | | | 137 | | | | 13,700 | | | | | | | | 1,096 | |
| | Technology Select Sector SPDR Fund, June Strike Price $80.00, Expires 6/21/19 | | | 198 | | | | 19,800 | | | | | | | | 198 | |
| | Telecom Italia SpA, June Strike Price 0.54 EUR, Expires 6/21/19 | | | 5,832 | | | | 5,832,000 | | | | | | | | 1,303 | |
| | Telecom Italia SpA, June Strike Price 0.64 EUR, Expires 6/21/19 | | | 1,078 | | | | 1,078,000 | | | | | | | | 120 | |
| | thyssenkrupp AG, June Strike Price 18.00 EUR, Expires 6/21/19 | | | 745 | | | | 74,500 | | | | | | | | 832 | |
| | thyssenkrupp AG, June Strike Price 22.00 EUR, Expires 6/21/19 | | | 1,090 | | | | 109,000 | | | | | | | | 1,218 | |
| | T-Mobile US Inc., August Strike Price $85.00, Expires 8/16/19 | | | 275 | | | | 27,500 | | | | | | | | 20,350 | |
| | Vodafone Group PLC, ADR, September Strike Price 135.00 GBP, Expires 9/20/19 | | | 368 | | | | 368,000 | | | | | | | | 15,121 | |
| | Vodafone Group PLC, ADR, September Strike Price 170.00 GBP, Expires 9/20/19 | | | 1,010 | | | | 1,010,000 | | | | | | | | 3,192 | |
| | Vodafone Group PLC, ADR, January Strike Price $18.00, Expires 1/17/20 | | | 282 | | | | 28,200 | | | | | | | | 12,831 | |
| | Vodafone Group PLC, ADR, January Strike Price $20.00, Expires 1/17/20 | | | 120 | | | | 12,000 | | | | | | | | 1,800 | |
| | | | | | | | | | | | | | | | | | |
| | | | | |
| | | | | | | | | | | | | | | | | 280,210 | |
| | | | | | | | | | | | | | | | | | |
| | Calls –Over-the-Counter 0.0%† | | | | |
| | | Currency Options 0.0%† | | | | | | | | | | | | |
| | EUR/CHF, Counterparty JPHQ, July Strike Price 1.16 CHF, Expires 7/09/19 | | | 1 | | | | 2,000,000 | | | | EUR | | | | 241 | |
| | EUR/USD, Counterparty JPHQ, June Strike Price $1.18, Expires 6/25/19 | | | 1 | | | | 2,200,000 | | | | EUR | | | | 225 | |
| | EUR/USD, Counterparty JPHQ, July Strike Price $1.17, Expires 7/11/19 | | | 1 | | | | 700,000 | | | | EUR | | | | 126 | |
| | EUR/USD, Counterparty JPHQ, July Strike Price $1.15, Expires 7/15/19 | | | 1 | | | | 1,500,000 | | | | EUR | | | | 1,756 | |
| | EUR/USD, Counterparty JPHQ, September Strike Price $1.17, Expires 9/12/19 | | | 1 | | | | 4,000,000 | | | | EUR | | | | 7,878 | |
| | GBP/USD, Counterparty JPHQ, July Strike Price $1.34, Expires 7/05/19 | | | 1 | | | | 1,000,000 | | | | GBP | | | | 266 | |
| | USD/HKD, Counterparty JPHQ, July Strike Price 7.93 HKD, Expires 7/18/19 | | | 1 | | | | 2,000,000 | | | | | | | | 303 | |
| | USD/HKD, Counterparty JPHQ, September Strike Price 7.95 HKD, Expires 9/16/19 | | | 1 | | | | 2,000,000 | | | | | | | | 1,081 | |
| | USD/HKD, Counterparty JPHQ, September Strike Price 7.95 HKD, Expires 9/18/19 | | | 1 | | | | 3,000,000 | | | | | | | | 1,638 | |
| | USD/HKD, Counterparty JPHQ, September Strike Price 7.95 HKD, Expires 9/19/19 | | | 1 | | | | 2,000,000 | | | | | | | | 1,097 | |
| | USD/HKD, Counterparty JPHQ, January Strike Price 7.98 HKD, Expires 1/20/20 | | | 1 | | | | 2,000,000 | | | | | | | | 2,987 | |
| | USD/ILS, Counterparty JPHQ, August Strike Price 3.71 ILS, Expires 8/28/19 | | | 1 | | | | 1,200,000 | | | | | | | | 2,363 | |
| | USD/ILS, Counterparty JPHQ, September Strike Price 3.70 ILS, Expires 9/12/19 | | | 1 | | | | 750,000 | | | | | | | | 2,039 | |
| | USD/ILS, Counterparty JPHQ, September Strike Price 3.68 ILS, Expires 9/23/19 | | | 1 | | | | 1,050,000 | | | | | | | | 4,148 | |
| | USD/TRY, Counterparty JPHQ, June Strike Price 7.50 TRY, Expires 6/26/19 | | | 1 | | | | 500,000 | | | | | | | �� | 871 | |
| | | | |
| | | |
| 44 | | Annual Report | | franklintempleton.com |
FRANKLIN ALTERNATIVE STRATEGIES FUNDS
CONSOLIDATED STATEMENT OF INVESTMENTS
Franklin K2 Alternative Strategies Fund(continued)
| | | | | | | | | | | | | | | | | | |
| | | | |
| | | | | Number of
Contracts | | | Notional Amount# | | | Value | |
| | | Options Purchased (continued) | | | |
| | Calls –Over-the-Counter(continued) | | | | |
| | | Currency Options(continued) | | | | | | | | | | | | |
| | USD/TWD, Counterparty JPHQ, June Strike Price 31.50 TWD, Expires 6/06/19 | | | 1 | | | | 4,000,000 | | | | | | | $ | 11,512 | |
| | USD/TWD, Counterparty JPHQ, June Strike Price 32.00 TWD, Expires 6/06/19 | | | 1 | | | | 3,500,000 | | | | | | | | 799 | |
| | USD/TWD, Counterparty JPHQ, July Strike Price 31.75 TWD, Expires 7/19/19 | | | 1 | | | | 3,500,000 | | | | | | | | 14,894 | |
| | | | | | | | | | | | | | | | | | |
| | | | | |
| | | | | | | | | | | | | | | | | 54,224 | |
| | | | | | | | | | | | | | | | | | |
| | Puts – Exchange-Traded 0.2% | | | | |
| | Aeroports de Paris, December Strike Price 130.00 EUR, Expires 12/20/19 | | | 14 | | | | 1,400 | | | | | | | | 5,803 | |
| | Anadarko Petroleum Corp., June Strike Price $70.00, Expires 6/21/19 | | | 46 | | | | 4,600 | | | | | | | | 4,600 | |
| | Anadarko Petroleum Corp., August Strike Price $70.00, Expires 8/16/19 | | | 710 | | | | 71,000 | | | | | | | | 166,850 | |
| | Bristol-Myers Squibb Co., June Strike Price $47.00, Expires 6/21/19 | | | 377 | | | | 37,700 | | | | | | | | 81,432 | |
| | Celgene Corp., June Strike Price $80.00, Expires 6/21/19 | | | 91 | | | | 9,100 | | | | | | | | 1,365 | |
| | Celgene Corp., June Strike Price $85.00, Expires 6/21/19 | | | 483 | | | | 48,300 | | | | | | | | 14,490 | |
| | Centene Corp., July Strike Price $55.00, Expires 7/19/19 | | | 56 | | | | 5,600 | | | | | | | | 13,552 | |
| | Centene Corp., September Strike Price $45.00, Expires 9/20/19 | | | 196 | | | | 19,600 | | | | | | | | 19,208 | |
| | Centene Corp., September Strike Price $50.00, Expires 9/20/19 | | | 64 | | | | 6,400 | | | | | | | | 12,288 | |
| | DJ EURO STOXX 50 Index, June Strike Price 3,175.00 EUR, Expires 6/21/19 | | | 16 | | | | 160 | | | | | | | | 3,664 | |
| | DJ EURO STOXX 50 Index, June Strike Price 3,275.00 EUR, Expires 6/21/19 | | | 31 | | | | 310 | | | | | | | | 17,593 | |
| | DJ EURO STOXX 50 Index, July Strike Price 3,100.00 EUR, Expires 7/19/19 | | | 120 | | | | 1,200 | | | | | | | | 38,609 | |
| | Edison International, October Strike Price $55.00, Expires 10/18/19 | | | 127 | | | | 12,700 | | | | | | | | 37,465 | |
| | GDS Holdings Ltd., ADR, June Strike Price $20.00, Expires 6/21/19 | | | 15 | | | | 1,500 | | | | | | | | 75 | |
| | Genworth Financial Inc., July Strike Price $3.50, Expires 7/19/19 | | | 201 | | | | 20,100 | | | | | | | | 16,422 | |
| | Invesco QQQ Series 1 ETF, July Strike Price $163.00, Expires 7/19/19 | | | 640 | | | | 64,000 | | | | | | | | 140,800 | |
| | Invesco QQQ Series 1 ETF, July Strike Price $173.00, Expires 7/19/19 | | | 1,070 | | | | 107,000 | | | | | | | | 558,540 | |
| | The Medicines Co., January Strike Price $20.00, Expires 1/17/20 | | | 41 | | | | 4,100 | | | | | | | | 15,170 | |
| | S&P 500 Index, June Strike Price $2,400.00, Expires 6/21/19 | | | 14 | | | | 1,400 | | | | | | | | 1,820 | |
| | S&P 500 Index, June Strike Price $2,600.00, Expires 6/21/19 | | | 379 | | | | 37,900 | | | | | | | | 341,100 | |
| | S&P 500 Index, July Strike Price $2,550.00, Expires 7/19/19 | | | 60 | | | | 6,000 | | | | | | | | 105,780 | |
| | S&P 500 Index, July Strike Price $2,650.00, Expires 7/19/19 | | | 15 | | | | 1,500 | | | | | | | | 51,000 | |
| | STOXX Europe 600 Food & Beverage Index, December Strike Price 740.00 EUR, Expires 12/20/19 | | | 100 | | | | 5,000 | | | | | | | | 155,843 | |
| | VMware Inc., July Strike Price $170.00, Expires 7/19/19 | | | 80 | | | | 8,000 | | | | | | | | 40,800 | |
| | | | | | | | | | | | | | | | | | |
| | | | | |
| | | | | | | | | | | | | | | | | 1,844,269 | |
| | | | | | | | | | | | | | | | | | |
| | Total Options Purchased (Cost $3,444,140) | | | | | | | | | | | | | | | 2,178,703 | |
| | | | | | | | | | | | | | | | | | |
| | Total Investments before Short Term Investments
(Cost $699,424,067) | | | | | | | | | | | | | | | 793,862,325 | |
| | | | | | | | | | | | | | | | | | |
| | | | |
| | | | | Country | | | Principal Amount* | | | | |
| | | Short Term Investments 27.3% | | | | | | | | | | | | |
| | | Foreign Government and Agency Securities (Cost $885,253) 0.1% | | | |
| p | | Argentina Treasury Bill, 6/28/19 | | | Argentina | | | | 36,717,605 | | | | ARS | | | | 977,209 | |
| | | | | | | | | | | | | | | | | | |
| | | | | | |
| | | |
| franklintempleton.com | | Annual Report | | | 45 | |
FRANKLIN ALTERNATIVE STRATEGIES FUNDS
CONSOLIDATED STATEMENT OF INVESTMENTS
Franklin K2 Alternative Strategies Fund(continued)
| | | | | | | | | | | | | | | | | | |
| | | | |
| | | | | Country | | | Principal Amount* | | | Value | |
| | | Short Term Investments(continued) | | | | | | | | | | | | |
| | | Convertible Bonds 0.3% | | | |
| | | Aerospace & Defense 0.1% | |
| | Arconic Inc., senior note, 1.625%, 10/15/19 | | | United States | | | | 743,000 | | | | | | | $ | 741,142 | |
| | | | | | | | | | | | | | | | | | |
| | | Interactive Media & Services 0.1% | |
| | Twitter Inc., senior note, 0.25%, 9/15/19 | | | United States | | | | 763,000 | | | | | | | | 756,643 | |
| | | | | | | | | | | | | | | | | | |
| | | Metals & Mining 0.0%† | |
| | Royal Gold Inc., senior note, 2.875%, 6/15/19 | | | United States | | | | 330,000 | | | | | | | | 330,017 | |
| | | | | | | | | | | | | | | | | | |
| | | Semiconductors & Semiconductor Equipment 0.0%† | |
| | NXP Semiconductors NV, senior note, 1.00%, 12/01/19 | | | Netherlands | | | | 491,000 | | | | | | | | 503,889 | |
| | | | | | | | | | | | | | | | | | |
| | | Specialty Retail 0.1% | |
| | Restoration Hardware Holdings Inc., senior note, zero cpn., 6/15/19 | | | United States | | | | 1,226,000 | | | | | | | | 1,223,827 | |
| | | | | | | | | | | | | | | | | | |
| | | Technology Hardware, Storage & Peripherals 0.0%† | |
| | Electronics For Imaging Inc., senior note, 0.75%, 9/01/19 | | | United States | | | | 577,000 | | | | | | | | 572,797 | |
| | | | | | | | | | | | | | | | | | |
| | Total Convertible Bonds (Cost $4,159,618) | | | | | | | | | | | | | | | 4,128,315 | |
| | | | | | | | | | | | | | | | | | |
| q | | Credit-Linked Notes 0.1% | | | |
| | Goldman Sachs International, senior note, (Nigeria OMO Bill), zero cpn., 9/30/19 | | | United States | | | | 166,466,000 | | | | NGN | | | | 444,480 | |
| e | | HSBC Bank PLC, (Egypt Treasury Bill), 144A, zero cpn., 11/07/19 | | | United Kingdom | | | | 15,550,000 | | | | EGP | | | | 864,753 | |
| e | | Citigroup Global Markets Holdings Inc., senior note, (The Federal Republic of Nigeria), 144A, zero cpn., 12/03/19 | | | United States | | | | 194,077,440 | | | | NGN | | | | 510,088 | |
| | | | | | | | | | | | | | | | | | |
| | Total Credit-Linked Notes
(Cost $1,795,178) | | | | | | | | | | | | | | | 1,819,321 | |
| | | | | | | | | | | | | | | | | | |
| | | | | |
| | | | | | | | Shares | | | | | | | |
| |
| | | Money Market Funds 23.1% | | | |
| r,s | | Dreyfus Government Cash Management, Institutional, 2.28% | | | United States | | | | 17,015,625 | | | | | | | | 17,015,625 | |
| r | | Fidelity Investments Money Market Government Portfolio, Institutional, 2.27% | | | United States | | | | 269,168,672 | | | | | | | | 269,168,672 | |
| | | | | | | | | | | | | | | | | | |
| | Total Money Market Funds (Cost $286,184,297) | | | | | | | | | | | | | | | 286,184,297 | |
| | | | | | | | | | | | | | | | | | |
| | | | |
| | | | | | | | Principal Amount* | | | | |
| |
| | | Repurchase Agreements (Cost $21,518,574) 1.7% | | | |
| t | | Joint Repurchase Agreement, 2.480%, 6/03/19 (Maturity Value $21,523,021) | | | United States | | | | 21,518,574 | | | | | | | | 21,518,574 | |
| | | | | | | | | | | | | | | | | | |
| | BNP Paribas Securities Corp. (Maturity Value $18,613,539) Deutsche Bank Securities Inc. (Maturity Value $2,288,973) | | | | | | | | | | | | | | | | |
| | HSBC Securities (USA) Inc. (Maturity Value $620,509)
Collateralized by U.S. Government Agency Securities, 4.50%,
1/20/40; and U.S. Treasury Notes, 2.00%–3.125%, 5/15/21–7/31/22; (valued at $21,956,775)
| | | | | | | | | | | | | | | | |
| | | | | |
| | | | | | | | Shares | | | | | | | |
| |
| u | | Investments from Cash Collateral Received for
Loaned Securities 0.5% | | | |
| | | Money Market Funds 0.4% | | | | | | | | | | | | |
| r,v | | Institutional Fiduciary Trust Money Market Portfolio, 2.08% | | | United States | | | | 4,871,000 | | | | | | | | 4,871,000 | |
| | | | | | | | | | | | | | | | | | |
| | | | |
| | | |
| 46 | | Annual Report | | franklintempleton.com |
FRANKLIN ALTERNATIVE STRATEGIES FUNDS
CONSOLIDATED STATEMENT OF INVESTMENTS
Franklin K2 Alternative Strategies Fund(continued)
| | | | | | | | | | | | | | | | | | |
| | | | |
| | | | | Country | | | Principal Amount* | | | Value | |
| | | Short Term Investments(continued) | | | | | | | | | | | | |
| u | | Investments from Cash Collateral Received for
Loaned Securities(continued) | | | | | | | | | | | | |
| | | Repurchase Agreements 0.1% | | | | | | | | | | | | |
| t | | Joint Repurchase Agreement, 2.48%, 6/03/19 (Maturity Value $1,200,309) | | | United States | | | | 1,200,061 | | | | | | | $ | 1,200,061 | |
| | | | | | | | | | | | | | | | | | |
| | J.P. Morgan Securities LLC
Collateralized by various U.S. Government Agency Obligations, 0.00%–2.88%, 6/13/19–5/31/24, (valued at $1,224,044) | | | | | | | | | | | | | | | | |
| | Total Investments from Cash Collateral Received for Loaned Securities (Cost $6,071,061) | | | | | | | | | | | | | | | 6,071,061 | |
| | | | | | | | | | | | | | | | | | |
| | | U.S. Government and Agency Securities 1.5% | |
| p | | U.S. Treasury Bill, | | | | | | | | | | | | | | | | |
| | 6/20/19–3/26/20 | | | United States | | | | 5,020,000 | | | | | | | | 4,943,404 | |
| | a 8/15/19 | | | United States | | | | 13,140,000 | | | | | | | | 13,079,349 | |
| | | | | | | | | | | | | | | | | | |
| | Total U.S. Government and Agency Securities
(Cost $18,012,119) | | | | | | | | | | | | | | | 18,022,753 | |
| | | | | | | | | | | | | | | | | | |
| | Total Investments (Cost $1,038,050,167) 91.4% | | | | | | | | | | | | | | | 1,132,583,855 | |
| | Options Written (0.0)%† | | | | | | | | | | | | | | | (378,169 | ) |
| | Securities Sold Short (18.2)% | | | | | | | | | | | | | | | (225,752,061 | ) |
| | Other Assets, less Liabilities 26.8% | | | | | | | | | | | | | | | 332,833,551 | |
| | | | | | | | | | | | | | | | | | |
| | Net Assets 100.0% | | | | | | | | | | | | | | $ | 1,239,287,176 | |
| | | | | | | | | | | | | | | | | | |
| | | | |
| | | | | Number of
Contracts | | | Notional Amount# | | | | |
| w | | Options Written (0.0)%† | | | |
| | Calls – Exchange-Traded (0.0)%† | | | | |
| | AbbVie Inc., June Strike Price $82.50, Expires 6/21/19 | | | 2 | | | | 200 | | | | | | | | (42 | ) |
| | AbbVie Inc., June Strike Price $85.00, Expires 6/21/19 | | | 2 | | | | 200 | | | | | | | | (14 | ) |
| | AbbVie Inc., June Strike Price $87.50, Expires 6/21/19 | | | 2 | | | | 200 | | | | | | | | (8 | ) |
| | Accenture PLC, A, June Strike Price $175.00, Expires 6/21/19 | | | 1 | | | | 100 | | | | | | | | (550 | ) |
| | Accenture PLC, A, June Strike Price $190.00, Expires 6/21/19 | | | 1 | | | | 100 | | | | | | | | (16 | ) |
| | Accenture PLC, A, August Strike Price $190.00, Expires 8/16/19 | | | 1 | | | | 100 | | | | | | | | (240 | ) |
| | Aeroports de Paris, December Strike Price 180.00 EUR, Expires 12/20/19 | | | 14 | | | | 1,400 | | | | | | | | (3,425 | ) |
| | Aflac Inc., August Strike Price $52.50, Expires 8/16/19 | | | 3 | | | | 300 | | | | | | | | (414 | ) |
| | Aflac Inc., August Strike Price $55.00, Expires 8/16/19 | | | 7 | | | | 700 | | | | | | | | (301 | ) |
| | Allergan PLC, June Strike Price $150.00, Expires 6/21/19 | | | 1 | | | | 100 | | | | | | | | (4 | ) |
| | Allergan PLC, August Strike Price $150.00, Expires 8/16/19 | | | 2 | | | | 200 | | | | | | | | (135 | ) |
| | Altria Group Inc., June Strike Price $55.00, Expires 6/21/19 | | | 8 | | | | 800 | | | | | | | | (32 | ) |
| | Altria Group Inc., June Strike Price $60.00, Expires 6/21/19 | | | 2 | | | | 200 | | | | | | | | (2 | ) |
| | AmerisourceBergen Corp., A, June Strike Price $82.50, Expires 6/21/19 | | | 2 | | | | 200 | | | | | | | | (140 | ) |
| | AmerisourceBergen Corp., A, July Strike Price $82.50, Expires 7/19/19 | | | 2 | | | | 200 | | | | | | | | (315 | ) |
| | AmerisourceBergen Corp., A, August Strike Price $85.00, Expires 8/16/19 | | | 2 | | | | 200 | | | | | | | | (380 | ) |
| | Amgen Inc., June Strike Price $180.00, Expires 6/21/19 | | | 1 | | | | 100 | | | | | | | | (50 | ) |
| | Amgen Inc., July Strike Price $185.00, Expires 7/19/19 | | | 1 | | | | 100 | | | | | | | | (83 | ) |
| | Anadarko Petroleum Corp., August Strike Price $80.00, Expires 8/16/19 | | | 120 | | | | 12,000 | | | | | | | | (600 | ) |
| | Automatic Data Processing Inc., June Strike Price $165.00, Expires 6/21/19 | | | 1 | | | | 100 | | | | | | | | (115 | ) |
| | Automatic Data Processing Inc., August Strike Price $170.00, Expires 8/16/19 | | | 1 | | | | 100 | | | | | | | | (265 | ) |
| | Best Buy Co. Inc., June Strike Price $75.00, Expires 6/21/19 | | | 2 | | | | 200 | | | | | | | | (4 | ) |
| | Best Buy Co. Inc., June Strike Price $80.00, Expires 6/21/19 | | | 2 | | | | 200 | | | | | | | | (4 | ) |
| | Best Buy Co. Inc., July Strike Price $75.00, Expires 7/19/19 | | | 2 | | | | 200 | | | | | | | | (30 | ) |
| | The Boeing Co., June Strike Price $375.00, Expires 6/21/19 | | | 1 | | | | 100 | | | | | | | | (79 | ) |
| | Bristol-Myers Squibb Co., June Strike Price $45.00, Expires 6/21/19 | | | 18 | | | | 1,800 | | | | | | | | (2,412 | ) |
| | | | | | |
| | | |
| franklintempleton.com | | Annual Report | | | 47 | |
FRANKLIN ALTERNATIVE STRATEGIES FUNDS
CONSOLIDATED STATEMENT OF INVESTMENTS
Franklin K2 Alternative Strategies Fund(continued)
| | | | | | | | | | | | | | | | | | |
| | | | |
| | | | | Number of
Contracts | | | Notional Amount# | | | Value | |
| w | | Options Written(continued) | | | |
| | Calls – Exchange-Traded(continued) | | | | |
| | Bristol-Myers Squibb Co., June Strike Price $46.00, Expires 6/21/19 | | | 55 | | | | 5,500 | | | | | | | $ | (4,730 | ) |
| | Bristol-Myers Squibb Co., June Strike Price $47.00, Expires 6/21/19 | | | 14 | | | | 1,400 | | | | | | | | (700 | ) |
| | Bristol-Myers Squibb Co., June Strike Price $48.00, Expires 6/21/19 | | | 151 | | | | 15,100 | | | | | | | | (4,681 | ) |
| | Bristol-Myers Squibb Co., June Strike Price $49.00, Expires 6/21/19 | | | 3 | | | | 300 | | | | | | | | (60 | ) |
| | Bristol-Myers Squibb Co., June Strike Price $50.00, Expires 6/21/19 | | | 3 | | | | 300 | | | | | | | | (33 | ) |
| | Bristol-Myers Squibb Co., September Strike Price $52.50, Expires 9/20/19 | | | 3 | | | | 300 | | | | | | | | (138 | ) |
| | Broadridge Financial Solutions Inc., June Strike Price $110.00, Expires 6/21/19 | | | 1 | | | | 100 | | | | | | | | (1,530 | ) |
| | Broadridge Financial Solutions Inc., June Strike Price $115.00, Expires 6/21/19 | | | 1 | | | | 100 | | | | | | | | (1,053 | ) |
| | Broadridge Financial Solutions Inc., September Strike Price $130.00, Expires 9/20/19 | | | 1 | | | | 100 | | | | | | | | (375 | ) |
| | CDW Corp., June Strike Price $105.00, Expires 6/21/19 | | | 2 | | | | 200 | | | | | | | | (112 | ) |
| | CDW Corp., June Strike Price $110.00, Expires 6/21/19 | | | 2 | | | | 200 | | | | | | | | (24 | ) |
| | Cisco Systems Inc., June Strike Price $57.50, Expires 6/21/19 | | | 2 | | | | 200 | | | | | | | | (8 | ) |
| | Cisco Systems Inc., June Strike Price $60.00, Expires 6/21/19 | | | 4 | | | | 400 | | | | | | | | (8 | ) |
| | Citigroup Inc., September Strike Price $70.00, Expires 9/20/19 | | | 2 | | | | 200 | | | | | | | | (190 | ) |
| | Citigroup Inc., September Strike Price $72.50, Expires 9/20/19 | | | 2 | | | | 200 | | | | | | | | (102 | ) |
| | Comcast Corp., A, June Strike Price $45.00, Expires 6/21/19 | | | 12 | | | | 1,200 | | | | | | | | (36 | ) |
| | ConocoPhillips, June Strike Price $67.50, Expires 6/21/19 | | | 4 | | | | 400 | | | | | | | | (24 | ) |
| | ConocoPhillips, June Strike Price $72.50, Expires 6/21/19 | | | 4 | | | | 400 | | | | | | | | (4 | ) |
| | Cummins Inc., June Strike Price $170.00, Expires 6/21/19 | | | 1 | | | | 100 | | | | | | | | (10 | ) |
| | Cummins Inc., June Strike Price $180.00, Expires 6/21/19 | | | 1 | | | | 100 | | | | | | | | (5 | ) |
| | Cummins Inc., September Strike Price $175.00, Expires 9/20/19 | | | 1 | | | | 100 | | | | | | | | (125 | ) |
| | CVR Energy Inc., June Strike Price $50.00, Expires 6/21/19 | | | 6 | | | | 600 | | | | | | | | (135 | ) |
| | Dell Technologies Inc., July Strike Price $70.00, Expires 7/19/19 | | | 191 | | | | 19,100 | | | | | | | | (6,876 | ) |
| | Dick’s Sporting Goods Inc., June Strike Price $40.00, Expires 6/21/19 | | | 9 | | | | 900 | | | | | | | | (45 | ) |
| | Dick’s Sporting Goods Inc., June Strike Price $44.00, Expires 6/21/19 | | | 4 | | | | 400 | | | | | | | | (4 | ) |
| | DJ EURO STOXX 50 Index, December Strike Price 3,750.00 EUR, Expires 12/20/19 | | | 350 | | | | 3,500 | | | | | | | | (25,024 | ) |
| | DJ EURO STOXX Banks, June Strike Price 105.00 EUR, Expires 6/21/19 | | | 250 | | | | 12,500 | | | | | | | | (698 | ) |
| | DJ EURO STOXX Banks, December Strike Price 125.00 EUR, Expires 12/20/19 | | | 937 | | | | 46,850 | | | | | | | | (2,617 | ) |
| | Dominion Energy Inc., June Strike Price $77.50, Expires 6/21/19 | | | 2 | | | | 200 | | | | | | | | (50 | ) |
| | Dominion Energy Inc., July Strike Price $80.00, Expires 7/19/19 | | | 4 | | | | 400 | | | | | | | | (100 | ) |
| | Domtar Corp., June Strike Price $47.50, Expires 6/21/19 | | | 6 | | | | 600 | | | | | | | | (60 | ) |
| | Eaton Corp. PLC, June Strike Price $82.50, Expires 6/21/19 | | | 2 | | | | 200 | | | | | | | | (16 | ) |
| | Eaton Corp. PLC, July Strike Price $87.50, Expires 7/19/19 | | | 2 | | | | 200 | | | | | | | | (20 | ) |
| | Eaton Corp. PLC, July Strike Price $90.00, Expires 7/19/19 | | | 2 | | | | 200 | | | | | | | | (6 | ) |
| | EPR Properties, June Strike Price $80.00, Expires 6/21/19 | | | 2 | | | | 200 | | | | | | | | (100 | ) |
| | Fidelity National Financial Inc., June Strike Price $41.00, Expires 6/21/19 | | | 4 | | | | 400 | | | | | | | | (40 | ) |
| | Fidelity National Financial Inc., September Strike Price $43.00, Expires 9/20/19 | | | 3 | | | | 300 | | | | | | | | (120 | ) |
| | FirstEnergy Corp., June Strike Price $44.00, Expires 6/21/19 | | | 4 | | | | 400 | | | | | | | | (8 | ) |
| | FirstEnergy Corp., July Strike Price $43.00, Expires 7/19/19 | | | 4 | | | | 400 | | | | | | | | (168 | ) |
| | FirstEnergy Corp., July Strike Price $44.00, Expires 7/19/19 | | | 4 | | | | 400 | | | | | | | | (80 | ) |
| | Foot Locker Inc., June Strike Price $60.00, Expires 6/21/19 | | | 6 | | | | 600 | | | | | | | | (12 | ) |
| | Foot Locker Inc., June Strike Price $67.50, Expires 6/21/19 | | | 3 | | | | 300 | | | | | | | | (6 | ) |
| | GDS Holdings Ltd., ADR, June Strike Price $35.00, Expires 6/21/19 | | | 15 | | | | 1,500 | | | | | | | | (1,163 | ) |
| | Gilead Sciences Inc., June Strike Price $70.00, Expires 6/21/19 | | | 4 | | | | 400 | | | | | | | | (20 | ) |
| | Gilead Sciences Inc., July Strike Price $72.50, Expires 7/19/19 | | | 4 | | | | 400 | | | | | | | | (44 | ) |
| | H&R Block Inc., June Strike Price $30.00, Expires 6/21/19 | | | 6 | | | | 600 | | | | | | | | (75 | ) |
| | H&R Block Inc., July Strike Price $27.00, Expires 7/19/19 | | | 13 | | | | 1,300 | | | | | | | | (1,300 | ) |
| | Hewlett Packard Enterprise Co., June Strike Price $16.00, Expires 6/21/19 | | | 22 | | | | 2,200 | | | | | | | | (66 | ) |
| | | | |
| | | |
| 48 | | Annual Report | | franklintempleton.com |
FRANKLIN ALTERNATIVE STRATEGIES FUNDS
CONSOLIDATED STATEMENT OF INVESTMENTS
Franklin K2 Alternative Strategies Fund(continued)
| | | | | | | | | | | | | | | | | | |
| | | | |
| | | | | Number of
Contracts | | | Notional Amount# | | | Value | |
| w | | Options Written(continued) | | | |
| | Calls – Exchange-Traded(continued) | | | | |
| | Hewlett Packard Enterprise Co., August Strike Price $18.00, Expires 8/16/19 | | | 11 | | | | 1,100 | | | | | | | $ | (55 | ) |
| | The Home Depot Inc., June Strike Price $195.00, Expires 6/21/19 | | | 1 | | | | 100 | | | | | | | | (135 | ) |
| | The Home Depot Inc., June Strike Price $220.00, Expires 6/21/19 | | | 1 | | | | 100 | | | | | | | | (2 | ) |
| | HP Inc., June Strike Price $21.00, Expires 6/21/19 | | | 19 | | | | 1,900 | | | | | | | | (38 | ) |
| | HP Inc., June Strike Price $22.00, Expires 6/21/19 | | | 9 | | | | 900 | | | | | | | | (18 | ) |
| | Illinois Tool Works Inc., June Strike Price $155.00, Expires 6/21/19 | | | 1 | | | | 100 | | | | | | | | (10 | ) |
| | Illinois Tool Works Inc., June Strike Price $170.00, Expires 6/21/19 | | | 1 | | | | 100 | | | | | | | | (2 | ) |
| | Illinois Tool Works Inc., September Strike Price $170.00, Expires 9/20/19 | | | 1 | | | | 100 | | | | | | | | (42 | ) |
| | Intuit Inc., June Strike Price $260.00, Expires 6/21/19 | | | 1 | | | | 100 | | | | | | | | (127 | ) |
| | Johnson & Johnson, June Strike Price $145.00, Expires 6/21/19 | | | 2 | | | | 200 | | | | | | | | (8 | ) |
| | Johnson & Johnson, July Strike Price $145.00, Expires 7/19/19 | | | 1 | | | | 100 | | | | | | | | (31 | ) |
| | JPMorgan Chase & Co., June Strike Price $110.00, Expires 6/21/19 | | | 1 | | | | 100 | | | | | | | | (68 | ) |
| | JPMorgan Chase & Co., June Strike Price $120.00, Expires 6/21/19 | | | 1 | | | | 100 | | | | | | | | (2 | ) |
| | JPMorgan Chase & Co., July Strike Price $120.00, Expires 7/19/19 | | | 1 | | | | 100 | | | | | | | | (15 | ) |
| | Kohl’s Corp., June Strike Price $70.00, Expires 6/21/19 | | | 5 | | | | 500 | | | | | | | | (20 | ) |
| | Kohl’s Corp., July Strike Price $77.50, Expires 7/19/19 | | | 2 | | | | 200 | | | | | | | | (6 | ) |
| | Koninklijke KPN NV, June Strike Price 3.20 EUR, Expires 6/21/19 | | | 4,236 | | | | 423,600 | | | | | | | | (4,732 | ) |
| | Lamar Advertising Co., A, June Strike Price $85.00, Expires 6/21/19 | | | 3 | | | | 300 | | | | | | | | (30 | ) |
| | LPL Financial Holdings Inc., July Strike Price $90.00, Expires 7/19/19 | | | 3 | | | | 300 | | | | | | | | (135 | ) |
| | LyondellBasell Industries NV, A, June Strike Price $85.00, Expires 6/21/19 | | | 2 | | | | 200 | | | | | | | | (10 | ) |
| | LyondellBasell Industries NV, A, September Strike Price $90.00, Expires 9/20/19 | | | 4 | | | | 400 | | | | | | | | (192 | ) |
| | McKesson Corp., June Strike Price $130.00, Expires 6/21/19 | | | 1 | | | | 100 | | | | | | | | (70 | ) |
| | McKesson Corp., June Strike Price $135.00, Expires 6/21/19 | | | 1 | | | | 100 | | | | | | | | (20 | ) |
| | McKesson Corp., August Strike Price $140.00, Expires 8/16/19 | | | 1 | | | | 100 | | | | | | | | (128 | ) |
| | Merck & Co Inc., June Strike Price $82.50, Expires 6/21/19 | | | 2 | | | | 200 | | | | | | | | (60 | ) |
| | Merck & Co Inc., June Strike Price $85.00, Expires 6/21/19 | | | 2 | | | | 200 | | | | | | | | (12 | ) |
| | Merck & Co Inc., July Strike Price $85.00, Expires 7/19/19 | | | 2 | | | | 200 | | | | | | | | (54 | ) |
| | MetLife Inc., June Strike Price $50.00, Expires 6/21/19 | | | 7 | | | | 700 | | | | | | | | (70 | ) |
| | MetLife Inc., July Strike Price $50.00, Expires 7/19/19 | | | 3 | | | | 300 | | | | | | | | (126 | ) |
| | Microsoft Corp., June Strike Price $130.00, Expires 6/21/19 | | | 1 | | | | 100 | | | | | | | | (68 | ) |
| | Microsoft Corp., June Strike Price $135.00, Expires 6/21/19 | | | 1 | | | | 100 | | | | | | | | (13 | ) |
| | Microsoft Corp., July Strike Price $135.00, Expires 7/19/19 | | | 1 | | | | 100 | | | | | | | | (93 | ) |
| | Molson Coors Brewing Co., B, July Strike Price $62.50, Expires 7/19/19 | | | 8 | | | | 800 | | | | | | | | (96 | ) |
| | Morgan Stanley, June Strike Price $47.00, Expires 6/21/19 | | | 1 | | | | 100 | | | | | | | | (4 | ) |
| | Nexstar Media Group Inc., A, June Strike Price $115.00, Expires 6/21/19 | | | 2 | | | | 200 | | | | | | | | (30 | ) |
| | Nexstar Media Group Inc., A, August Strike Price $130.00, Expires 8/16/19 | | | 2 | | | | 200 | | | | | | | | (35 | ) |
| | Occidental Petroleum Corp., August Strike Price $60.00, Expires 8/16/19 | | | 3 | | | | 300 | | | | | | | | (129 | ) |
| | Omnicom Group Inc., June Strike Price $82.50, Expires 6/21/19 | | | 2 | | | | 200 | | | | | | | | (20 | ) |
| | Omnicom Group Inc., July Strike Price $87.50, Expires 7/19/19 | | | 2 | | | | 200 | | | | | | | | (30 | ) |
| | Omnicom Group Inc., July Strike Price $90.00, Expires 7/19/19 | | | 2 | | | | 200 | | | | | | | | (45 | ) |
| | Oracle Corp., June Strike Price $57.50, Expires 6/21/19 | | | 10 | | | | 1,000 | | | | | | | | (30 | ) |
| | PACCAR Inc., June Strike Price $72.50, Expires 6/21/19 | | | 4 | | | | 400 | | | | | | | | (36 | ) |
| | PACCAR Inc., August Strike Price $75.00, Expires 8/16/19 | | | 3 | | | | 300 | | | | | | | | (159 | ) |
| | Paychex Inc., June Strike Price $85.00, Expires 6/21/19 | | | 4 | | | | 400 | | | | | | | | (808 | ) |
| | Paychex Inc., June Strike Price $90.00, Expires 6/21/19 | | | 2 | | | | 200 | | | | | | | | (52 | ) |
| | PG&E Corp., July Strike Price $21.00, Expires 7/19/19 | | | 81 | | | | 8,100 | | | | | | | | (8,019 | ) |
| | Plains GP Holdings LP, A, June Strike Price $26.00, Expires 6/21/19 | | | 10 | | | | 1,000 | | | | | | | | (100 | ) |
| | Plains GP Holdings LP, A, August Strike Price $27.00, Expires 8/16/19 | | | 10 | | | | 1,000 | | | | | | | | (100 | ) |
| | PPL Corp., June Strike Price $31.00, Expires 6/21/19 | | | 6 | | | | 600 | | | | | | | | (30 | ) |
| | PPL Corp., July Strike Price $33.00, Expires 7/19/19 | | | 6 | | | | 600 | | | | | | | | (30 | ) |
| | PPL Corp., July Strike Price $34.00, Expires 7/19/19 | | | 5 | | | | 500 | | | | | | | | (15 | ) |
| | Prudential Financial Inc., June Strike Price $105.00, Expires 6/21/19 | | | 2 | | | | 200 | | | | | | | | (22 | ) |
| | | | | | |
| | | |
| franklintempleton.com | | Annual Report | | | 49 | |
FRANKLIN ALTERNATIVE STRATEGIES FUNDS
CONSOLIDATED STATEMENT OF INVESTMENTS
Franklin K2 Alternative Strategies Fund(continued)
| | | | | | | | | | | | | | | | | | |
| | | | |
| | | | | Number of
Contracts | | | Notional Amount# | | | Value | |
| w | | Options Written(continued) | | | |
| | Calls – Exchange-Traded(continued) | | | | |
| | Prudential Financial Inc., June Strike Price $115.00, Expires 6/21/19 | | | 2 | | | | 200 | | | | | | | $ | (10 | ) |
| | QUALCOMM Inc., June Strike Price $87.50, Expires 6/21/19 | | | 2 | | | | 200 | | | | | | | | (6 | ) |
| | Sinclair Broadcast Group Inc., A, June Strike Price $65.00, Expires 6/21/19 | | | 9 | | | | 900 | | | | | | | | (315 | ) |
| | Sirius XM Holdings Inc., June Strike Price $6.00, Expires 6/21/19 | | | 52 | | | | 5,200 | | | | | | | | (156 | ) |
| | The Southern Co., August Strike Price $55.00, Expires 8/16/19 | | | 2 | | | | 200 | | | | | | | | (180 | ) |
| | Southwest Airlines Co., June Strike Price $55.00, Expires 6/21/19 | | | 5 | | | | 500 | | | | | | | | (10 | ) |
| | Starbucks Corp., June Strike Price $82.50, Expires 6/21/19 | | | 2 | | | | 200 | | | | | | | | (14 | ) |
| | Starbucks Corp., July Strike Price $85.00, Expires 7/19/19 | | | 2 | | | | 200 | | | | | | | | (22 | ) |
| | STOXX Europe 600 Food & Beverage Index, December Strike Price 740.00 EUR, Expires 12/20/19 | | | 100 | | | | 5,000 | | | | | | | | (124,004 | ) |
| | Texas Instruments Inc., June Strike Price $115.00, Expires 6/21/19 | | | 1 | | | | 100 | | | | | | | | (17 | ) |
| | Thermo Fisher Scientific Inc., June Strike Price $280.00, Expires 6/21/19 | | | 2 | | | | 200 | | | | | | | | (300 | ) |
| | Verizon Communications Inc., September Strike Price $62.50, Expires 9/20/19 | | | 4 | | | | 400 | | | | | | | | (88 | ) |
| | Visa Inc., A, June Strike Price $165.00, Expires 6/21/19 | | | 1 | | | | 100 | | | | | | | | (150 | ) |
| | Visa Inc., A, June Strike Price $170.00, Expires 6/21/19 | | | 1 | | | | 100 | | | | | | | | (36 | ) |
| | Walgreens Boots Alliance Inc., July Strike Price $57.50, Expires 7/19/19 | | | 7 | | | | 700 | | | | | | | | (147 | ) |
| | | | | | | | | | | | | | | | | | |
| | | | | |
| | | | | | | | | | | | | | | | | (204,098 | ) |
| | | | | | | | | | | | | | | | | | |
| | Calls –Over-the-Counter (0.0)%† | | | | |
| | | Currency Options (0.0)%† | | | | | | | | | | | | |
| | USD/HKD, Counterparty JPHQ, July Strike Price 7.85 HKD, Expires 7/18/19 | | | 1 | | | | 1,000,000 | | | | | | | | (528 | ) |
| | USD/HKD, Counterparty JPHQ, September Strike Price 7.85 HKD, Expires 9/16/19 | | | 1 | | | | 1,000,000 | | | | | | | | (1,248 | ) |
| | USD/HKD, Counterparty JPHQ, September Strike Price 7.85 HKD, Expires 9/18/19 | | | 1 | | | | 1,500,000 | | | | | | | | (1,930 | ) |
| | USD/HKD, Counterparty JPHQ, September Strike Price 7.85 HKD, Expires 9/19/19 | | | 1 | | | | 1,000,000 | | | | | | | | (1,304 | ) |
| | USD/HKD, Counterparty JPHQ, January Strike Price 7.85 HKD, Expires 1/20/20 | | | 1 | | | | 1,000,000 | | | | | | | | (3,066 | ) |
| | USD/JPY, Counterparty JPHQ, August Strike Price 112.50 JPY, Expires 8/08/19 | | | 1 | | | | 300,000 | | | | | | | | (195 | ) |
| | USD/TRY, Counterparty JPHQ, October Strike Price 7.50 TRY, Expires 10/17/19 | | | 1 | | | | 250,000 | | | | | | | | (4,519 | ) |
| | USD/TWD, Counterparty JPHQ, June Strike Price 31.50 TWD, Expires 6/06/19 | | | 1 | | | | 3,500,000 | | | | | | | | (10,073 | ) |
| | USD/TWD, Counterparty JPHQ, June Strike Price 32.00 TWD, Expires 6/06/19 | | | 1 | | | | 4,000,000 | | | | | | | | (914 | ) |
| | USD/TWD, Counterparty JPHQ, September Strike Price 33.05 TWD, Expires 9/19/19 | | | 1 | | | | 3,500,000 | | | | | | | | (5,708 | ) |
| | EUR/CHF, Counterparty JPHQ, July Strike Price 1.20 CHF, Expires 7/09/19 | | | 1 | | | | 4,000,000 | | | | EUR | | | | (46 | ) |
| | EUR/USD, Counterparty JPHQ, July Strike Price $1.16, Expires 7/30/19 | | | 1 | | | | 1,000,000 | | | | EUR | | | | (748 | ) |
| | GBP/USD, Counterparty JPHQ, October Strike Price $1.43, Expires 10/07/19 | | | 1 | | | | 1,250,000 | | | | GBP | | �� | | (718 | ) |
| | | | | | | | | | | | | | | | | | |
| | | | | | | | | | | | | | | | | (30,997 | ) |
| | | | | | | | | | | | | | | | | | |
| | Puts – Exchange-Traded (0.0)%† | | | | | | | | | | | | | | | | |
| | Anadarko Petroleum Corp., August Strike Price $65.00, Expires 8/16/19 | | | 139 | | | | 13,900 | | | | | | | | (20,850 | ) |
| | Celgene Corp., June Strike Price $70.00, Expires 6/21/19 | | | 95 | | | | 9,500 | | | | | | | | (570 | ) |
| | Celgene Corp., June Strike Price $75.00, Expires 6/21/19 | | | 358 | | | | 35,800 | | | | | | | | (2,506 | ) |
| | Centene Corp., July Strike Price $47.50, Expires 7/19/19 | | | 56 | | | | 5,600 | | | | | | | | (3,024 | ) |
| | | | |
| | | |
| 50 | | Annual Report | | franklintempleton.com |
FRANKLIN ALTERNATIVE STRATEGIES FUNDS
CONSOLIDATED STATEMENT OF INVESTMENTS
Franklin K2 Alternative Strategies Fund(continued)
| | | | | | | | | | | | | | | | | | |
| | | | |
| | | | | Number of
Contracts | | | Notional Amount# | | | Value | |
| w | | Options Written(continued) | | | |
| | Puts – Exchange-Traded(continued) | | | | | | | | | | | | | | | | |
| | Centene Corp., September Strike Price $37.50, Expires 9/20/19 | | | 260 | | | | 26,000 | | | | | | | $ | (11,050 | ) |
| | DJ EURO STOXX 50 Index, July Strike Price 2,900.00 EUR, Expires 7/19/19 | | | 120 | | | | 1,200 | | | | | | | | (11,663 | ) |
| | DJ EURO STOXX Banks, December Strike Price 65.00 EUR, Expires 12/20/19 | | | 80 | | | | 4,000 | | | | | | | | (4,692 | ) |
| | DJ EURO STOXX Banks, December Strike Price 70.00 EUR, Expires 12/20/19 | | | 40 | | | | 2,000 | | | | | | | | (3,687 | ) |
| | Edison International, October Strike Price $45.00, Expires 10/18/19 | | | 127 | | | | 12,700 | | | | | | | | (13,653 | ) |
| | S&P 500 Index, July Strike Price $2,350.00, Expires 7/19/19 | | | 60 | | | | 6,000 | | | | | | | | (25,800 | ) |
| | S&P 500 Index, July Strike Price $2,450.00, Expires 7/19/19 | | | 15 | | | | 1,500 | | | | | | | | (13,050 | ) |
| | | | | | | | | | | | | | | | | | |
| | | | | |
| | | | | | | | | | | | | | | | | (110,545 | ) |
| | | | | | | | | | | | | | | | | | |
| | Puts –Over-the-Counter (0.0)%† | | | | |
| | | Currency Options (0.0)%† | |
| | EUR/USD, Counterparty JPHQ, June Strike Price $1.11, Expires 6/25/19 | | | 1 | | | | 2,200,000 | | | | EUR | | | | (6,411 | ) |
| | EUR/USD, Counterparty JPHQ, July Strike Price $1.10, Expires 7/11/19 | | | 1 | | | | 700,000 | | | | EUR | | | | (1,278 | ) |
| | EUR/USD, Counterparty JPHQ, July Strike Price $1.11, Expires 7/15/19 | | | 1 | | | | 1,500,000 | | | | EUR | | | | (3,880 | ) |
| | EUR/USD, Counterparty JPHQ, July Strike Price $1.10, Expires 7/30/19 | | | 1 | | | | 1,000,000 | | | | EUR | | | | (2,218 | ) |
| | EUR/USD, Counterparty JPHQ, September Strike Price $1.10, Expires 9/12/19 | | | 1 | | | | 4,000,000 | | | | EUR | | | | (14,948 | ) |
| | GBP/USD, Counterparty JPHQ, July Strike Price $1.20, Expires 7/05/19 | | | 1 | | | | 500,000 | | | | GBP | | | | (250 | ) |
| | USD/ILS, Counterparty JPHQ, August Strike Price 3.45 ILS, Expires 8/28/19 | | | 1 | | | | 1,200,000 | | | | | | | | (1,041 | ) |
| | USD/ILS, Counterparty JPHQ, September Strike Price 3.45 ILS, Expires 9/12/19 | | | 1 | | | | 750,000 | | | | | | | | (920 | ) |
| | USD/ILS, Counterparty JPHQ, September Strike Price 3.45 ILS, Expires 9/23/19 | | | 1 | | | | 1,050,000 | | | | | | | | (1,583 | ) |
| | | | | | | | | | | | | | | | | | |
| | | | | |
| | | | | | | | | | | | | | | | | (32,529 | ) |
| | | | | | | | | | | | | | | | | | |
| | Total Options Written
(Premiums Received $635,119) | | | | | | | | | | | | | | | (378,169 | ) |
| | | | | | | | | | | | | | | | | | |
| | | | | |
| | | | | Country | | | Shares/Rights | | | | | | | |
| x | | Securities Sold Short (18.2)% | | | | | | | | | | | | |
| | Common Stocks (8.7)% | | | | | | | | | | | | | | | | |
| | | Aerospace & Defense (1.4)% | |
| | The Boeing Co. | | | United States | | | | 2,886 | | | | | | | | (985,886 | ) |
| | Harris Corp. | | | United States | | | | 67,803 | | | | | | | | (12,692,044 | ) |
| | Huntington Ingalls Industries Inc. | | | United States | | | | 7,083 | | | | | | | | (1,452,865 | ) |
| | Northrop Grumman Corp. | | | United States | | | | 8,154 | | | | | | | | (2,472,701 | ) |
| | | | | | | | | | | | | | | | | | |
| | | | | |
| | | | | | | | | | | | | | | | | (17,603,496 | ) |
| | | | | | | | | | | | | | | | | | |
| | | Air Freight & Logistics (0.2)% | |
| | Air Transport Services Group Inc. | | | United States | | | | 13,718 | | | | | | | | (300,973 | ) |
| | Atlas Air Worldwide Holdings Inc. | | | United States | | | | 9,590 | | | | | | | | (339,390 | ) |
| | XPO Logistics Inc. | | | United States | | | | 40,221 | | | | | | | | (2,095,112 | ) |
| | | | | | | | | | | | | | | | | | |
| | | | | |
| | | | | | | | | | | | | | | | | (2,735,475 | ) |
| | | | | | | | | | | | | | | | | | |
| | | Airlines (0.1)% | |
| | American Airlines Group Inc. | | | United States | | | | 37,965 | | | | | | | | (1,033,787 | ) |
| | | | | | | | | | | | | | | | | | |
| | | | | | |
| | | |
| franklintempleton.com | | Annual Report | | | 51 | |
FRANKLIN ALTERNATIVE STRATEGIES FUNDS
CONSOLIDATED STATEMENT OF INVESTMENTS
Franklin K2 Alternative Strategies Fund(continued)
| | | | | | | | | | | | | | | | | | |
| | | | | |
| | | | | Country | | | Shares/Rights | | | | | | Value | |
| | | | | | | | | | | | | | | | | | |
| x | | Securities Sold Short (continued) | | | | | | | | | | | | |
| | Common Stocks (continued) | | | | | | | | | | | | | | | | |
| | | Auto Components (0.0)%† | |
| | Veoneer Inc. | | | Sweden | | | | 4,843 | | | | | | | $ | (77,149 | ) |
| | | | | | | | | | | | | | | | | | |
| | | Automobiles (0.0)%† | |
| | Ferrari N.V. | | | Italy | | | | 1,809 | | | | | | | | (257,871 | ) |
| | | | | | | | | | | | | | | | | | |
| | | Banks (0.4)% | |
| | BB&T Corp. | | | United States | | | | 102,305 | | | | | | | | (4,782,759 | ) |
| | Hope Bancorp Inc. | | | United States | | | | 16,385 | | | | | | | | (210,875 | ) |
| | | | | | | | | | | | | | | | | | |
| | | | | |
| | | | | | | | | | | | | | | | | (4,993,634 | ) |
| | | | | | | | | | | | | | | | | | |
| | | Biotechnology (0.4)% | |
| | Alder Biopharmaceuticals Inc. | | | United States | | | | 23,807 | | | | | | | | (257,592 | ) |
| | Amgen Inc. | | | United States | | | | 1,297 | | | | | | | | (216,210 | ) |
| g,y | | Celgene Corp., rts, 2/20/49, when-issued | | | United States | | | | 109,328 | | | | | | | | (273,320 | ) |
| | Intercept Pharmaceuticals Inc. | | | United States | | | | 8,347 | | | | | | | | (691,299 | ) |
| | Ionis Pharmaceuticals Inc. | | | United States | | | | 14,177 | | | | | | | | (930,011 | ) |
| | Karyopharm Therapeutics Inc. | | | United States | | | | 60,640 | | | | | | | | (342,010 | ) |
| | Ligand Pharmaceuticals Inc. | | | United States | | | | 1,721 | | | | | | | | (184,801 | ) |
| | Neurocrine Biosciences Inc. | | | United States | | | | 10,630 | | | | | | | | (901,211 | ) |
| | OPKO Health Inc. | | | United States | | | | 136,884 | | | | | | | | (245,022 | ) |
| | PDL BioPharma Inc. | | | United States | | | | 209,726 | | | | | | | | (591,427 | ) |
| | Retrophin Inc. | | | United States | | | | 14,455 | | | | | | | | (267,851 | ) |
| | | | | | | | | | | | | | | | | | |
| | | | | |
| | | | | | | | | | | | | | | | | (4,900,754 | ) |
| | | | | | | | | | | | | | | | | | |
| | | Building Products (0.0)%† | |
| | Patrick Industries Inc. | | | United States | | | | 3,358 | | | | | | | | (136,973 | ) |
| | | | | | | | | | | | | | | | | | |
| | | Capital Markets (0.1)% | |
| | Cowen Inc., A | | | United States | | | | 36,662 | | | | | | | | (555,429 | ) |
| | Partners Group Holding AG | | | Switzerland | | | | 551 | | | | | | | | (386,870 | ) |
| | | | | | | | | | | | | | | | | | |
| | | | | |
| | | | | | | | | | | | | | | | | (942,299 | ) |
| | | | | | | | | | | | | | | | | | |
| | | Chemicals (0.0)%† | |
| | Dow Inc. | | | United States | | | | 3,148 | | | | | | | | (147,201 | ) |
| | The ScottsMiracle-GRO Co. | | | United States | | | | 2,195 | | | | | | | | (196,518 | ) |
| | | | | | | | | | | | | | | | | | |
| | | | | |
| | | | | | | | | | | | | | | | | (343,719 | ) |
| | | | | | | | | | | | | | | | | | |
| | | Commercial Services & Supplies (0.1)% | |
| | Team Inc. | | | United States | | | | 34,395 | | | | | | | | (499,415 | ) |
| | | | | | | | | | | | | | | | | | |
| | | Communications Equipment (0.0)%† | |
| | CalAmp Corp. | | | United States | | | | 8,773 | | | | | | | | (89,134 | ) |
| | Infinera Corp. | | | United States | | | | 58,956 | | | | | | | | (183,353 | ) |
| | | | | | | | | | | | | | | | | | |
| | | | | |
| | | | | | | | | | | | | | | | | (272,487 | ) |
| | | | | | | | | | | | | | | | | | |
| | | Consumer Finance (0.1)% | |
| | Encore Capital Group Inc. | | | United States | | | | 18,234 | | | | | | | | (626,155 | ) |
| | EZCORP Inc., A | | | United States | | | | 44,211 | | | | | | | | (388,173 | ) |
| | PRA Group Inc. | | | United States | | | | 14,230 | | | | | | | | (392,890 | ) |
| | | | | | | | | | | | | | | | | | |
| | | | | |
| | | | | | | | | | | | | | | | | (1,407,218 | ) |
| | | | | | | | | | | | | | | | | | |
| | | Diversified Consumer Services (0.1)% | |
| | Chegg Inc. | | | United States | | | | 37,349 | | | | | | | | (1,399,094 | ) |
| | | | | | | | | | | | | | | | | | |
| | | Diversified Financial Services (0.0)%† | |
| | Element Fleet Management Corp. | | | Canada | | | | 26,100 | | | | | | | | (188,856 | ) |
| | | | | | | | | | | | | | | | | | |
| | | Diversified Telecommunication Services (0.0)%† | |
| | Intelsat SA | | | United States | | | | 10,317 | | | | | | | | (186,222 | ) |
| | | | | | | | | | | | | | | | | | |
| | | | |
| | | |
| 52 | | Annual Report | | franklintempleton.com |
FRANKLIN ALTERNATIVE STRATEGIES FUNDS
CONSOLIDATED STATEMENT OF INVESTMENTS
Franklin K2 Alternative Strategies Fund(continued)
| | | | | | | | | | | | | | | | | | |
| | | | | |
| | | | | Country | | | Shares/Rights | | | | | | Value | |
| | | | | | | | | | | | | | | | | | |
| x | | Securities Sold Short (continued) | | | | | | | | | | | | |
| | Common Stocks (continued) | | | | | | | | | | | | | | | | |
| | | Electrical Equipment (0.0)%† | |
| | Enphase Energy Inc. | | | United States | | | | 7,303 | | | | | | | $ | (110,787 | ) |
| | | | | | | | | | | | | | | | | | |
| | | Electronic Equipment, Instruments & Components (0.2)% | |
| | II-VI Inc. | | | United States | | | | 9,150 | | | | | | | | (287,585 | ) |
| | Knowles Corp. | | | United States | | | | 39,885 | | | | | | | | (627,391 | ) |
| | OSI Systems Inc. | | | United States | | | | 6,286 | | | | | | | | (651,167 | ) |
| | PAR Technology Corp. | | | United States | | | | 14,531 | | | | | | | | (408,466 | ) |
| | Vishay Intertechnology Inc. | | | United States | | | | 18,493 | | | | | | | | (281,833 | ) |
| | | | | | | | | | | | | | | | | | |
| | | | | |
| | | | | | | | | | | | | | | | | (2,256,442 | ) |
| | | | | | | | | | | | | | | | | | |
| | | Energy Equipment & Services (0.1)% | |
| | Fugro NV, IDR, CVA | | | Netherlands | | | | 24,386 | | | | | | | | (201,598 | ) |
| | Tenaris SA | | | Luxembourg | | | | 29,393 | | | | | | | | (346,426 | ) |
| | | | | | | | | | | | | | | | | | |
| | | | | |
| | | | | | | | | | | | | | | | | (548,024 | ) |
| | | | | | | | | | | | | | | | | | |
| | | Entertainment (0.2)% | |
| | Bilibili Inc., ADR | | | China | | | | 8,900 | | | | | | | | (120,150 | ) |
| | iQIYI Inc., ADR | | | China | | | | 8,066 | | | | | | | | (147,043 | ) |
| | Live Nation Entertainment Inc. | | | United States | | | | 12,627 | | | | | | | | (767,974 | ) |
| | Sea Ltd., ADR | | | Thailand | | | | 32,654 | | | | | | | | (928,680 | ) |
| | | | | | | | | | | | | | | | | | |
| | | | | |
| | | | | | | | | | | | | | | | | (1,963,847 | ) |
| | | | | | | | | | | | | | | | | | |
| | | Equity Real Estate Investment Trusts (REITs) (0.4)% | |
| | Innovative Industrial Properties Inc., A | | | United States | | | | 11,938 | | | | | | | | (1,003,150 | ) |
| | Invitation Homes Inc. | | | United States | | | | 137,931 | | | | | | | | (3,535,179 | ) |
| | | | | | | | | | | | | | | | | | |
| | | | | |
| | | | | | | | | | | | | | | | | (4,538,329 | ) |
| | | | | | | | | | | | | | | | | | |
| | | Food Products (0.0)%† | |
| | Mondelez International Inc., A | | | United States | | | | 8,225 | | | | | | | | (418,241 | ) |
| | | | | | | | | | | | | | | | | | |
| | | Health Care Equipment & Supplies (0.0)%† | |
| | CONMED Corp. | | | United States | | | | 2,000 | | | | | | | | (160,960 | ) |
| | | | | | | | | | | | | | | | | | |
| | | Health Care Technology (0.1)% | |
| | Allscripts Healthcare Solutions Inc. | | | United States | | | | 12,872 | | | | | | | | (125,245 | ) |
| | Evolent Health Inc., A | | | United States | | | | 17,434 | | | | | | | | (185,498 | ) |
| | Tabula Rasa HealthCare Inc. | | | United States | | | | 10,260 | | | | | | | | (463,444 | ) |
| | | | | | | | | | | | | | | | | | |
| | | | | |
| | | | | | | | | | | | | | | | | (774,187 | ) |
| | | | | | | | | | | | | | | | | | |
| | | Hotels, Restaurants & Leisure (0.1)% | |
| | Huazhu Group Ltd., ADR | | | China | | | | 3,878 | | | | | | | | (118,667 | ) |
| | Marriott Vacations Worldwide Corp. | | | United States | | | | 2,788 | | | | | | | | (250,641 | ) |
| | Yum China Holdings Inc. | | | China | | | | 7,422 | | | | | | | | (296,954 | ) |
| | | | | | | | | | | | | | | | | | |
| | | | | |
| | | | | | | | | | | | | | | | | (666,262 | ) |
| | | | | | | | | | | | | | | | | | |
| | | Household Durables (0.0)%† | |
| | Toll Brothers Inc. | | | United States | | | | 5,781 | | | | | | | | (201,005 | ) |
| | | | | | | | | | | | | | | | | | |
| | | Independent Power & Renewable Electricity Producers (0.1)% | |
| | NRG Energy Inc. | | | United States | | | | 17,531 | | | | | | | | (596,755 | ) |
| | | | | | | | | | | | | | | | | | |
| | | Interactive Media & Services (0.1)% | |
| | IAC/InterActiveCorp | | | United States | | | | 1,727 | | | | | | | | (381,408 | ) |
| | Pinterest Inc., A | | | United States | | | | 7,537 | | | | | | | | (187,822 | ) |
| | Twitter Inc. | | | United States | | | | 7,096 | | | | | | | | (258,578 | ) |
| | Zillow Group Inc., C | | | United States | | | | 11,044 | | | | | | | | (475,113 | ) |
| | | | | | | | | | | | | | | | | | |
| | | | | |
| | | | | | | | | | | | | | | | | (1,302,921 | ) |
| | | | | | | | | | | | | | | | | | |
| | | Internet & Direct Marketing Retail (0.2)% | |
| | Alibaba Group Holding Ltd., ADR | | | China | | | | 10,590 | | | | | | | | (1,580,663 | ) |
| | | | | | |
| | | |
| franklintempleton.com | | Annual Report | | | 53 | |
FRANKLIN ALTERNATIVE STRATEGIES FUNDS
CONSOLIDATED STATEMENT OF INVESTMENTS
Franklin K2 Alternative Strategies Fund(continued)
| | | | | | | | | | | | | | | | | | |
| | | | | |
| | | | | Country | | | Shares/Rights | | | | | | Value | |
| | | | | | | | | | | | | | | | | | |
| x | | Securities Sold Short (continued) | | | | | | | | | | | | |
| | Common Stocks (continued) | | | | | | | | | | | | | | | | |
| | | Internet & Direct Marketing Retail (continued) | |
| | Wayfair Inc., A | | | United States | | | | 6,100 | | | | | | | $ | (878,461 | ) |
| | | | | | | | | | | | | | | | | | |
| | | | | |
| | | | | | | | | | | | | | | | | (2,459,124 | ) |
| | | | | | | | | | | | | | | | | | |
| | | IT Services (1.7)% | |
| | Carbonite Inc. | | | United States | | | | 18,809 | | | | | | | | (445,209 | ) |
| | CSG Systems International Inc. | | | United States | | | | 5,472 | | | | | | | | (245,419 | ) |
| | Fidelity National Information Services Inc. | | | United States | | | | 51,755 | | | | | | | | (6,226,127 | ) |
| | Fiserv Inc. | | | United States | | | | 74,814 | | | | | | | | (6,423,530 | ) |
| | GDS Holdings Ltd., ADR | | | China | | | | 4,950 | | | | | | | | (160,825 | ) |
| | Global Payments Inc. | | | United States | | | | 8,189 | | | | | | | | (1,261,434 | ) |
| | KBR Inc. | | | United States | | | | 20,644 | | | | | | | | (458,710 | ) |
| | MongoDB Inc., A | | | United States | | | | 13,713 | | | | | | | | (1,924,482 | ) |
| | Okta Inc., A | | | United States | | | | 17,913 | | | | | | | | (2,028,110 | ) |
| | Perficient Inc. | | | United States | | | | 16,752 | | | | | | | | (509,763 | ) |
| | Twilio Inc., A | | | United States | | | | 9,306 | | | | | | | | (1,228,299 | ) |
| | | | | | | | | | | | | | | | | | |
| | | | | |
| | | | | | | | | | | | | | | | | (20,911,908 | ) |
| | | | | | | | | | | | | | | | | | |
| | | Machinery (0.5)% | |
| | Cummins Inc. | | | United States | | | | 3,990 | | | | | | | | (601,533 | ) |
| | Epiroc AB, A | | | Sweden | | | | 12,897 | | | | | | | | (120,264 | ) |
| | Flowserve Corp. | | | United States | | | | 1,572 | | | | | | | | (73,019 | ) |
| | The Greenbrier Cos. Inc. | | | United States | | | | 2,106 | | | | | | | | (57,304 | ) |
| | Illinois Tool Works Inc. | | | United States | | | | 12,817 | | | | | | | | (1,789,766 | ) |
| | Lincoln Electric Holdings Inc. | | | United States | | | | 10,495 | | | | | | | | (796,990 | ) |
| | Parker-Hannifin Corp. | | | United States | | | | 3,734 | | | | | | | | (568,763 | ) |
| | Stadler Rail AG | | | Switzerland | | | | 14,687 | | | | | | | | (643,074 | ) |
| | Trinity Industries Inc. | | | United States | | | | 15,224 | | | | | | | | (293,519 | ) |
| | Wabtec Corp. | | | United States | | | | 11,543 | | | | | | | | (720,052 | ) |
| | | | | | | | | | | | | | | | | | |
| | | | | |
| | | | | | | | | | | | | | | | | (5,664,284 | ) |
| | | | | | | | | | | | | | | | | | |
| | | Marine (0.0)%† | |
| | Scorpio Bulkers Inc. | | | United States | | | | 10,934 | | | | | | | | (46,251 | ) |
| | | | | | | | | | | | | | | | | | |
| | | Metals & Mining (0.1)% | |
| | Cleveland-Cliffs Inc. | | | United States | | | | 116,236 | | | | | | | | (1,011,253 | ) |
| | First Majestic Silver Corp. | | | Canada | | | | 50,423 | | | | | | | | (306,572 | ) |
| | SSR Mining Inc. | | | Canada | | | | 18,187 | | | | | | | | (212,424 | ) |
| | | | | | | | | | | | | | | | | | |
| | | | | |
| | | | | | | | | | | | | | | | | (1,530,249 | ) |
| | | | | | | | | | | | | | | | | | |
| | | Mortgage Real Estate Investment Trusts (REITs) (0.0)%† | |
| | Redwood Trust Inc. | | | United States | | | | 18,191 | | | | | | | | (289,783 | ) |
| | | | | | | | | | | | | | | | | | |
| | | Oil, Gas & Consumable Fuels (0.2)% | |
| | Golar LNG Ltd. | | | Bermuda | | | | 4,233 | | | | | | | | (76,998 | ) |
| | Green Plains Inc. | | | United States | | | | 12,145 | | | | | | | | (158,492 | ) |
| | Occidental Petroleum Corp. | | | United States | | | | 43,556 | | | | | | | | (2,167,782 | ) |
| | Ship Finance International Ltd. | | | Norway | | | | 19,694 | | | | | | | | (243,812 | ) |
| | Teekay Corp. | | | Canada | | | | 23,889 | | | | | | | | (76,684 | ) |
| | | | | | | | | | | | | | | | | | |
| | | | | |
| | | | | | | | | | | | | | | | | (2,723,768 | ) |
| | | | | | | | | | | | | | | | | | |
| | | Personal Products (0.0)%† | |
| | Herbalife Nutrition Ltd. | | | United States | | | | 8,614 | | | | | | | | (359,893 | ) |
| | | | | | | | | | | | | | | | | | |
| | | Pharmaceuticals (0.6)% | |
| | Aphria Inc. | | | Canada | | | | 65,636 | | | | | | | | (432,541 | ) |
| | Aurora Cannabis Inc. | | | Canada | | | | 126,299 | | | | | | | | (958,609 | ) |
| | Bristol-Myers Squibb Co. | | | United States | | | | 61,484 | | | | | | | | (2,789,529 | ) |
| | Canopy Growth Corp. | | | Canada | | | | 18,033 | | | | | | | | (726,870 | ) |
| | Innoviva Inc. | | | United States | | | | 30,340 | | | | | | | | (414,748 | ) |
| | | | |
| | | |
| 54 | | Annual Report | | franklintempleton.com |
FRANKLIN ALTERNATIVE STRATEGIES FUNDS
CONSOLIDATED STATEMENT OF INVESTMENTS
Franklin K2 Alternative Strategies Fund(continued)
| | | | | | | | | | | | | | | | | | |
| | | | | |
| | | | | Country | | | Shares/Rights | | | | | | Value | |
| | | | | | | | | | | | | | | | | | |
| x | | Securities Sold Short (continued) | | | | | | | | | | | | |
| | Common Stocks (continued) | | | | | | | | | | | | | | | | |
| | | Pharmaceuticals (continued) | |
| | Jazz Pharmaceuticals PLC | | | United States | | | | 1,699 | | | | | | | $ | (213,310 | ) |
| | Johnson & Johnson | | | United States | | | | 1,736 | | | | | | | | (227,676 | ) |
| | The Medicines Co. | | | United States | | | | 16,411 | | | | | | | | (585,052 | ) |
| | Merck & Co. Inc. | | | United States | | | | 2,960 | | | | | | | | (234,462 | ) |
| | Omeros Corp. | | | United States | | | | 7,019 | | | | | | | | (124,798 | ) |
| | Pacira Biosciences Inc. | | | United States | | | | 9,571 | | | | | | | | (416,434 | ) |
| | Pfizer Inc. | | | United States | | | | 5,582 | | | | | | | | (231,765 | ) |
| | Tilray Inc. | | | Canada | | | | 1,851 | | | | | | | | (70,357 | ) |
| | | | | | | | | | | | | | | | | | �� |
| | | | | |
| | | | | | | | | | | | | | | | | (7,426,151 | ) |
| | | | | | | | | | | | | | | | | | |
| | | Professional Services (0.0)%† | |
| | FTI Consulting Inc. | | | United States | | | | 5,299 | | | | | | | | (444,692 | ) |
| | | | | | | | | | | | | | | | | | |
| | | Real Estate Management & Development (0.0)%† | |
| | Redfin Corp. | | | United States | | | | 24,927 | | | | | | | | (392,850 | ) |
| | | | | | | | | | | | | | | | | | |
| | | Road & Rail (0.3)% | |
| | Avis Budget Group Inc. | | | United States | | | | 44,193 | | | | | | | | (1,253,313 | ) |
| | Old Dominion Freight Line Inc. | | | United States | | | | 8,552 | | | | | | | | (1,132,627 | ) |
| | Ryder System Inc. | | | United States | | | | 11,563 | | | | | | | | (583,931 | ) |
| | Schneider National Inc., B | | | United States | | | | 50,347 | | | | | | | | (845,830 | ) |
| | | | | | | | | | | | | | | | | | |
| | | | | |
| | | | | | | | | | | | | | | | | (3,815,701 | ) |
| | | | | | | | | | | | | | | | | | |
| | | Semiconductors & Semiconductor Equipment (0.1)% | |
| | Inphi Corp. | | | United States | | | | 8,279 | | | | | | | | (363,282 | ) |
| | Microchip Technology Inc. | | | United States | | | | 9,873 | | | | | | | | (790,136 | ) |
| | NXP Semiconductors NV | | | Netherlands | | | | 1,435 | | | | | | | | (126,510 | ) |
| | Silicon Laboratories Inc. | | | United States | | | | 4,221 | | | | | | | | (394,959 | ) |
| | Synaptics Inc. | | | United States | | | | 2,306 | | | | | | | | (60,994 | ) |
| | | | | | | | | | | | | | | | | | |
| | | | | |
| | | | | | | | | | | | | | | | | (1,735,881 | ) |
| | | | | | | | | | | | | | | | | | |
| | | Software (0.4)% | |
| | Benefitfocus Inc. | | | United States | | | | 10,636 | | | | | | | | (301,637 | ) |
| | Five9 Inc. | | | United States | | | | 19,162 | | | | | | | | (983,969 | ) |
| | Nuance Communications Inc. | | | United States | | | | 16,189 | | | | | | | | (277,965 | ) |
| | Nutanix Inc., A | | | United States | | | | 8,481 | | | | | | | | (238,061 | ) |
| | Palo Alto Networks Inc. | | | United States | | | | 1,500 | | | | | | | | (300,210 | ) |
| | Pluralsight Inc., A | | | United States | | | | 22,159 | | | | | | | | (705,986 | ) |
| | PROS Holdings Inc. | | | United States | | | | 22,241 | | | | | | | | (1,261,065 | ) |
| | Rapid7 Inc. | | | United States | | | | 18,307 | | | | | | | | (956,541 | ) |
| | Salesforce.com Inc. | | | United States | | | | 2,006 | | | | | | | | (303,728 | ) |
| | | | | | | | | | | | | | | | | | |
| | | | | |
| | | | | | | | | | | | | | | | | (5,329,162 | ) |
| | | | | | | | | | | | | | | | | | |
| | | Specialty Retail (0.1)% | |
| | Floor & Decor Holdings Inc., A | | | United States | | | | 5,095 | | | | | | | | (180,974 | ) |
| | Lowe’s Cos. Inc. | | | United States | | | | 6,473 | | | | | | | | (603,802 | ) |
| | Monro Inc. | | | United States | | | | 1,889 | | | | | | | | (150,572 | ) |
| | Restoration Hardware Holdings Inc. | | | United States | | | | 1,032 | | | | | | | | (87,875 | ) |
| | | | | | | | | | | | | | | | | | |
| | | | | |
| | | | | | | | | | | | | | | | | (1,023,223 | ) |
| | | | | | | | | | | | | | | | | | |
| | | Technology Hardware, Storage & Peripherals (0.1)% | |
| | Apple Inc. | | | United States | | | | 4,563 | | | | | | | | (798,844 | ) |
| | | | | | | | | | | | | | | | | | |
| | | Trading Companies & Distributors (0.1)% | |
| | Fastenal Co. | | | United States | | | | 18,011 | | | | | | | | (550,957 | ) |
| | Kaman Corp. | | | United States | | | | 1,829 | | | | | | | | (101,711 | ) |
| | SiteOne Landscape Supply Inc. | | | United States | | | | 2,566 | | | | | | | | (166,456 | ) |
| | | | | | | | | | | | | | | | | | |
| | | | | |
| | | | | | | | | | | | | | | | | (819,124 | ) |
| | | | | | | | | | | | | | | | | | |
| | | | | | |
| | | |
| franklintempleton.com | | Annual Report | | | 55 | |
FRANKLIN ALTERNATIVE STRATEGIES FUNDS
CONSOLIDATED STATEMENT OF INVESTMENTS
Franklin K2 Alternative Strategies Fund(continued)
| | | | | | | | | | | | | | | | | | |
| | | | | |
| | | | | Country | | | Shares/Rights | | | | | | Value | |
| | | | | | | | | | | | | | | | | | |
| x | | Securities Sold Short (continued) | | | | | | | | | | | | |
| | Common Stocks (continued) | | | | | | | | | | | | | | | | |
| | | Transportation Infrastructure (0.0)%† | |
| | Westshore Terminals Investment Corp. | | | Canada | | | | 20,034 | | | | | | | $ | (328,613 | ) |
| | | | | | | | | | | | | | | | | | |
| | | Water Utilities (0.1)% | |
| | American Water Works Co. Inc. | | | United States | | | | 5,048 | | | | | | | | (570,525 | ) |
| | | | | | | | | | | | | | | | | | |
| | | Wireless Telecommunication Services (0.0)%† | |
| | Boingo Wireless Inc. | | | United States | | | | 10,419 | | | | | | | | (196,919 | ) |
| | | | | | | | | | | | | | | | | | |
| | Total Common Stocks (Proceeds $110,554,360) | | | | | | | | | | | | | | | (107,383,154 | ) |
| | | | | | | | | | | | | | | | | | |
| | | Exchange Traded Funds (9.1)% | | | |
| | Consumer Discretionary Select Sector SPDR Fund | | | United States | | | | 5,736 | | | | | | | | (636,352 | ) |
| | ETFMG Prime Cyber Security ETF | | | United States | | | | 61,267 | | | | | | | | (2,341,012 | ) |
| | Health Care Select Sector SPDR Fund | | | United States | | | | 105,131 | | | | | | | | (9,175,834 | ) |
| | Invesco QQQ Series 1 ETF | | | United States | | | | 20,535 | | | | | | | | (3,572,063 | ) |
| | iShares Core S&PSmall-Cap ETF | | | United States | | | | 34,684 | | | | | | | | (2,537,828 | ) |
| | iShares MSCI Japan ETF | | | Japan | | | | 11,784 | | | | | | | | (621,252 | ) |
| | iShares MSCI Taiwan ETF | | | Taiwan | | | | 27,621 | | | | | | | | (913,703 | ) |
| | iShares NASDAQ Biotechnology ETF | | | United States | | | | 70,133 | | | | | | | | (7,011,897 | ) |
| | iShares North American Tech ETF | | | United States | | | | 23,258 | | | | | | | | (4,677,649 | ) |
| | iShares North American Tech-Multimedia Networking ETF | | | United States | | | | 125,800 | | | | | | | | (6,389,382 | ) |
| | iShares North American Tech-Software ETF | | | United States | | | | 21,449 | | | | | | | | (4,423,856 | ) |
| | iShares PHLX Semiconductor ETF | | | United States | | | | 31,718 | | | | | | | | (5,598,861 | ) |
| | iShares Russell 2000 Growth ETF | | | United States | | | | 17,852 | | | | | | | | (3,348,500 | ) |
| | iShares RussellMid-Cap Growth ETF | | | United States | | | | 9,562 | | | | | | | | (1,276,336 | ) |
| | iShares S&PSmall-Cap 600 Growth ETF | | | United States | | | | 8,140 | | | | | | | | (1,389,417 | ) |
| | iShares U.S. Technology ETF | | | United States | | | | 18,456 | | | | | | | | (3,393,136 | ) |
| | SPDR S&P 500 ETF Trust | | | United States | | | | 183,796 | | | | | | | | (50,593,525 | ) |
| | SPDR S&P MidCap 400 ETF Trust | | | United States | | | | 4,786 | | | | | | | | (1,580,002 | ) |
| | VanguardSmall-Cap Growth ETF | | | United States | | | | 20,072 | | | | | | | | (3,488,112 | ) |
| | | | | | | | | | | | | | | | | | |
| | Total Exchange Traded Funds
(Proceeds $116,133,298) | | | | | | | | | | | | | | | (112,968,717 | ) |
| | | | | | | | | | | | | | | | | | |
| | | | |
| | | | | | | | Principal Amount* | | | | |
| |
| | | Corporate Bonds and Notes (0.3)% | | | |
| | | IT Services (0.1)% | |
| e | | GTT Communications Inc., senior note, 144A, 7.875%, 12/31/24 | | | United States | | | | 1,572,000 | | | | | | | | (1,328,340 | ) |
| | | | | | | | | | | | | | | | | | |
| | | Media (0.2)% | |
| e | | MDC Partners Inc., senior note, 144A, 6.50%, 5/01/24 | | | United States | | | | 2,319,000 | | | | | | | | (2,133,480 | ) |
| | | | | | | | | | | | | | | | | | |
| | Total Corporate Bonds and Notes
(Proceeds $3,631,754) | | | | | | | | | | | | | | | (3,461,820 | ) |
| | | | | | | | | | | | | | | | | | |
| | U.S. Government and Agency Securities
(Proceeds $1,893,813) (0.1)% | | | | | | | | | | | | | | | | |
| | U.S. Treasury Note, 2.625%, 2/15/29 | | | United States | | | | 1,859,000 | | | | | | | | (1,938,370 | ) |
| | | | | | | | | | | | | | | | | | |
| | Total Securities Sold Short
(Proceeds $232,213,225) | | | | | | | | | | | | | | $ | (225,752,061 | ) |
| | | | | | | | | | | | | | | | | | |
| | | | |
| | | |
| 56 | | Annual Report | | franklintempleton.com |
FRANKLIN ALTERNATIVE STRATEGIES FUNDS
CONSOLIDATED STATEMENT OF INVESTMENTS
Franklin K2 Alternative Strategies Fund(continued)
*The principal amount is stated in U.S. dollars unless otherwise indicated.
#Notional amount is the number of units specified in the contract, and can include currency units, bushels, shares, pounds, barrels or other units. Currency units are stated in U.S. dollars unless otherwise indicated.
†Rounds to less than 0.1% of net assets.
aA portion or all of the security has been segregated as collateral for securities sold short, open swap contracts, open forward exchange contracts, open futures contracts and/or open written option contracts. At May 31, 2019, the aggregate value of these securities and/or cash pledged amounted to $192,731,772, representing 15.6% of net assets.
bA portion or all of the security is held in connection with written option contracts open at year end.
cNon-income producing.
dA portion or all of the security is on loan at May 31, 2019. See Note 1(i).
eSecurity was purchased pursuant to Rule 144A under the Securities Act of 1933 and may be sold in transactions exempt from registration only to qualified institutional buyers or in public offering registered under the Securities Act of 1933. These securities have been deemed liquid under guidelines approved by the Trust’s Board of Trustees. At May 31, 2019, the net value of these securities was $140,602,838, representing 11.3% of net assets.
fSee Note 7 regarding defaulted securities.
gFair valued using significant unobservable inputs. See Note 11 regarding fair value measurements.
hContingent distributions represent the right to receive additional distributions, if any, during the reorganization of the underlying company.
iSecurity was purchased pursuant to Regulation S under the Securities Act of 1933, which exempts from registration securities offered and sold outside of the United States. Such a security cannot be sold in the United States without either an effective registration statement filed pursuant to the Securities Act of 1933, or pursuant to an exemption from registration. These securities have been deemed liquid under guidelines approved by the Trust’s Board of Trustees. At May 31, 2019, the aggregate value of these securities was $12,360,810, representing 1.0% of net assets.
jThe coupon rate shown represents the rate at period end.
kIncome may be received in additional securities and/or cash.
lSee Note 1(k) regarding senior floating rate interests.
mThe coupon rate shown represents the rate inclusive of any caps or floors, if applicable, in effect at period end.
nAdjustable rate security with an interest rate that is not based on a published reference index and spread. The rate is based on the structure of the agreement and current market conditions. The coupon rate shown represents the rate at period end.
oSee Note 1(f) regarding loan participation notes.
pThe security was issued on a discount basis with no stated coupon rate.
qSee Note 1(g) regarding credit-linked notes.
rThe rate shown is the annualizedseven-day yield at period end.
sA portion or all of the security is owned by K2 Holdings Investment Corp., a wholly-owned subsidiary of the Fund. See Note 1(j).
tSee Note 1(c) regarding joint repurchase agreement.
uSee Note 1(i) regarding securities on loan.
vSee Note 3(f) regarding investments in affiliated management investment companies.
wSee Note 1(d) regarding written options.
xSee Note 1(h) regarding securities sold short.
ySecurity sold on a when-issued basis resulting in a short position. As such, the Fund is not subject to the deposit requirement or fees and expenses associated with short sale transactions. See Note 1(h).
At May 31, 2019, the Fund had the following futures contracts outstanding. See Note 1(d).
| | | | | | | | | | | | | | | | | | | | |
| Futures Contracts | | | | | | | | | | | | | | | |
| | | | | |
| Description | | Type | | | Number of
Contracts | | | Notional
Amount* | | | Expiration
Date | | | Value/Unrealized
Appreciation
(Depreciation) | |
| Commodity Contractsa | | | | | | | | | | | | | | | | | | | | |
Aluminum | | | Long | | | | 46 | | | $ | 2,044,125 | | | | 6/17/19 | | | $ | (80,702 | ) |
Aluminum | | | Short | | | | 46 | | | | 2,044,125 | | | | 6/17/19 | | | | 97,667 | |
Aluminum | | | Long | | | | 1 | | | | 45,025 | | | | 9/16/19 | | | | (397 | ) |
Aluminum | | | Short | | | | 28 | | | | 1,260,700 | | | | 9/16/19 | | | | 15,531 | |
Brent Crude Oil | | | Long | | | | 79 | | | | 4,897,210 | | | | 6/28/19 | | | | (706,440 | ) |
Cocoa | | | Long | | | | 7 | | | | 157,969 | | | | 7/16/19 | | | | (739 | ) |
Coffee | | | Short | | | | 16 | | | | 642,600 | | | | 9/18/19 | | | | (55,864 | ) |
Copper | | | Long | | | | 12 | | | | 1,746,000 | | | | 6/17/19 | | | | (194,210 | ) |
Copper | | | Short | | | | 12 | | | | 1,746,000 | | | | 6/17/19 | | | | 112,336 | |
Copper | | | Long | | | | 2 | | | | 291,625 | | | | 9/16/19 | | | | (23,643 | ) |
Copper | | | Short | | | | 5 | | | | 729,062 | | | | 9/16/19 | | | | 29,636 | |
Cotton No.2 | | | Short | | | | 29 | | | | 972,515 | | | | 12/06/19 | | | | 6,633 | |
Gasoline RBOB | | | Long | | | | 5 | | | | 371,994 | | | | 6/28/19 | | | | (35,224 | ) |
Gasoline RBOB | | | Long | | | | 3 | | | | 219,139 | | | | 7/31/19 | | | | (5,236 | ) |
Hard Red Winter Wheat | | | Short | | | | 65 | | | | 1,537,250 | | | | 7/12/19 | | | | (1,540 | ) |
Low Sulphur Gas Oil | | | Long | | | | 13 | | | | 750,750 | | | | 7/11/19 | | | | (86,145 | ) |
| | | | | | |
| | | |
| franklintempleton.com | | Annual Report | | | 57 | |
FRANKLIN ALTERNATIVE STRATEGIES FUNDS
CONSOLIDATED STATEMENT OF INVESTMENTS
Franklin K2 Alternative Strategies Fund(continued)
| | | | | | | | | | | | | | | | | | | | |
| Futures Contracts | | | | | | | | | | | | | | | |
| | | | | |
| Description | | Type | | | Number of
Contracts | | | Notional
Amount* | | | Expiration
Date | | | Value/Unrealized
Appreciation
(Depreciation) | |
| Commodity Contracts(continued) | | | | | | | | | | | | | | | | | | | | |
Natural Gas | | | Short | | | | 21 | | | $ | 515,340 | | | | 6/26/19 | | | $ | 34,152 | |
Natural Gas | | | Short | | | | 12 | | | | 295,200 | | | | 7/29/19 | | | | 10,543 | |
Silver | | | Short | | | | 4 | | | | 291,340 | | | | 7/29/19 | | | | 151 | |
Soybean | | | Short | | | | 26 | | | | 1,141,075 | | | | 7/12/19 | | | | 1,479 | |
Soybean Meal | | | Short | | | | 41 | | | | 1,317,330 | | | | 7/12/19 | | | | (25,222 | ) |
Wheat | | | Short | | | | 34 | | | | 855,100 | | | | 7/12/19 | | | | (55,992 | ) |
Zinc | | | Long | | | | 25 | | | | 1,643,750 | | | | 6/17/19 | | | | (123,179 | ) |
Zinc | | | Short | | | | 25 | | | | 1,643,750 | | | | 6/17/19 | | | | 72,903 | |
Zinc | | | Long | | | | 4 | | | | 250,950 | | | | 9/16/19 | | | | (8,212 | ) |
Zinc | | | Short | | | | 4 | | | | 250,950 | | | | 9/16/19 | | | | 8,038 | |
| | | | | | | | | | | | | | | | | | | | |
| | | | | | | | | | | | | | | | | | | (1,013,676 | ) |
| | | | | | | | | | | | | | | | | | | | |
| Equity Contracts | | | | | | | | | | | | | | | | | | | | |
Amsterdam Index | | | Short | | | | 1 | | | | 120,715 | | | | 6/21/19 | | | | 1,771 | |
CAC 40 10 Euro Indexa | | | Long | | | | 154 | | | | 8,920,381 | | | | 6/21/19 | | | | (134,805 | ) |
CMEE-Mini Russell 2000 Indexa | | | Short | | | | 188 | | | | 13,785,100 | | | | 6/21/19 | | | | 746,004 | |
DAX Index | | | Long | | | | 23 | | | | 7,532,370 | | | | 6/21/19 | | | | (73,072 | ) |
DAX Indexa | | | Short | | | | 1 | | | | 327,494 | | | | 6/21/19 | | | | 9,412 | |
DJ EURO STOXX 50 Indexa | | | Long | | | | 332 | | | | 12,146,839 | | | | 6/21/19 | | | | 44,378 | |
DJ EURO STOXX 50 Index | | | Short | | | | 317 | | | | 11,598,036 | | | | 6/21/19 | | | | (41,953 | ) |
DJIA MiniE-CBOT Indexa | | | Short | | | | 43 | | | | 5,336,300 | | | | 6/21/19 | | | | 318,026 | |
FTSE 100 Indexa | | | Long | | | | 204 | | | | 18,442,995 | | | | 6/21/19 | | | | 56,126 | |
FTSE 100 Index | | | Short | | | | 81 | | | | 7,322,954 | | | | 6/21/19 | | | | (103,328 | ) |
FTSE/JSE Top 40 Index | | | Short | | | | 40 | | | | 1,364,222 | | | | 6/20/19 | | | | 46,284 | |
FTSE/MIB Index | | | Short | | | | 4 | | | | 442,304 | | | | 6/21/19 | | | | 8,063 | |
Hang Seng Indexa | | | Long | | | | 55 | | | | 9,371,935 | | | | 6/27/19 | | | | (171,770 | ) |
JPX-Nikkei 400 Index | | | Long | | | | 49 | | | | 606,367 | | | | 6/13/19 | | | | (38,420 | ) |
MSCI Emerging Market Index | | | Long | | | | 191 | | | | 9,551,910 | | | | 6/21/19 | | | | (359,154 | ) |
MSCI Singapore Index | | | Long | | | | 64 | | | | 1,625,741 | | | | 6/27/19 | | | | (32,485 | ) |
MSCI Taiwan Index | | | Short | | | | 20 | | | | 759,800 | | | | 6/27/19 | | | | (10,735 | ) |
NASDAQ 100E-Mini Indexa | | | Long | | | | 70 | | | | 9,986,900 | | | | 6/21/19 | | | | (28,158 | ) |
NASDAQ 100E-Mini Index | | | Short | | | | 1 | | | | 142,670 | | | | 6/21/19 | | | | 2,030 | |
Nikkei 225 Indexa | | | Short | | | | 6 | | | | 758,547 | | | | 6/13/19 | | | | 30,019 | |
S&P 500E-Mini Indexa | | | Long | | | | 2 | | | | 275,260 | | | | 6/21/19 | | | | (6,944 | ) |
S&P 500E-Mini Index | | | Short | | | | 933 | | | | 128,408,790 | | | | 6/21/19 | | | | 3,251,689 | |
SPI 200 Index | | | Long | | | | 9 | | | | 999,237 | | | | 6/20/19 | �� | | | 35,094 | |
STOXX 600 Banks Index | | | Long | | | | 1,396 | | | | 10,254,041 | | | | 6/21/19 | | | | (537,045 | ) |
STOXX 600 Banks Index | | | Short | | | | 129 | | | | 1,026,907 | | | | 6/21/19 | | | | 33,307 | |
TOPIX Index | | | Long | | | | 22 | | | | 3,057,445 | | | | 6/13/19 | | | | (197,676 | ) |
TOPIX Indexa | | | Short | | | | 30 | | | | 4,169,243 | | | | 6/13/19 | | | | 110,025 | |
Yen Denominated Nikkei 225 Index | | | Long | | | | 5 | | | | 471,208 | | | | 6/13/19 | | | | (22,460 | ) |
| | | | | | | | | | | | | | | | | | | | |
| | | | | | | | | | | | | | | | | | | 2,934,223 | |
| | | | | | | | | | | | | | | | | | | | |
| Interest Rate Contracts | | | | | | | | | | | | | | | | | | | | |
3 Month EURIBORa | | | Long | | | | 340 | | | | 95,309,620 | | | | 6/15/20 | | | | 247,862 | |
10 Yr. Japanese Government Bond | | | Short | | | | 10 | | | | 14,137,406 | | | | 6/13/19 | | | | (45,254 | ) |
90 Day Eurodollara | | | Long | | | | 681 | | | | 167,236,575 | | | | 6/15/20 | | | | 1,255,896 | |
90 Day Sterlinga | | | Long | | | | 510 | | | | 79,967,572 | | | | 6/17/20 | | | | 262,360 | |
Australian 10 Yr. Bonda | | | Long | | | | 110 | | | | 10,839,835 | | | | 6/17/19 | | | | 418,573 | |
Canadian 10 Yr. Bonda | | | Long | | | | 57 | | | | 6,024,305 | | | | 9/19/19 | | | | 63,812 | |
Canadian 10 Yr. Bond | | | Short | | | | 52 | | | | 5,495,857 | | | | 9/19/19 | | | | (56,543 | ) |
Euro BUXL 30 Yr. Bond | | | Long | | | | 3 | | | | 656,821 | | | | 6/06/19 | | | | 37,593 | |
Euro BUXL 30 Yr. Bond | | | Short | | | | 3 | | | | 656,821 | | | | 6/06/19 | | | | (46,543 | ) |
Euro-BOBL | | | Short | | | | 25 | | | | 3,740,239 | | | | 6/06/19 | | | | (41,597 | ) |
Euro-BTP | | | Long | | | | 130 | | | | 18,891,557 | | | | 6/06/19 | | | | 445,408 | |
Euro-BTP | | | Long | | | | 85 | | | | 12,180,298 | | | | 9/06/19 | | | | 4,766 | |
Euro-Bund | | | Short | | | | 96 | | | | 18,053,959 | | | | 6/06/19 | | | | (303,105 | ) |
Euro-Bund | | | Short | | | | 83 | | | | 15,835,398 | | | | 9/06/19 | | | | (14,291 | ) |
Euro-SCHATZ | | | Short | | | | 105 | | | | 13,148,900 | | | | 6/06/19 | | | | (18,214 | ) |
Euro-SCHATZ | | | Short | | | | 300 | | | | 37,569,962 | | | | 9/06/19 | | | | (6,824 | ) |
| | | | |
| | | |
| 58 | | Annual Report | | franklintempleton.com |
FRANKLIN ALTERNATIVE STRATEGIES FUNDS
CONSOLIDATED STATEMENT OF INVESTMENTS
Franklin K2 Alternative Strategies Fund(continued)
| | | | | | | | | | | | | | | | | | | | |
| Futures Contracts | | | | | | | | | | | | | | | |
| | | | | |
| Description | | Type | | | Number of
Contracts | | | Notional
Amount* | | | Expiration
Date | | | Value/Unrealized
Appreciation
(Depreciation) | |
| Interest Rate Contracts(continued) | | | | | | | | | | | | | | | | | | | | |
Long Gilta | | | Long | | | | 5 | | | $ | 819,553 | | | | 9/26/19 | | | $ | 2,646 | |
Long Gilt | | | Short | | | | 97 | | | | 15,899,327 | | | | 9/26/19 | | | | (65,483 | ) |
U.S. Treasury 5 Yr. Note | | | Short | | | | 382 | | | | 44,834,266 | | | | 9/30/19 | | | | (287,631 | ) |
U.S. Treasury 10 Yr. Note | | | Short | | | | 59 | | | | 7,478,250 | | | | 9/19/19 | | | | (75,997 | ) |
U.S. Treasury 10 Yr. Ultra Note | | | Short | | | | 17 | | | | 2,321,297 | | | | 9/19/19 | | | | (75 | ) |
U.S. Treasury Long Bonda | | | Long | | | | 150 | | | | 23,057,812 | | | | 9/19/19 | | | | 686,661 | |
U.S. Treasury Long Bond | | | Short | | | | 19 | | | | 2,920,656 | | | | 9/19/19 | | | | (39,013 | ) |
U.S. Treasury Ultra Bond | | | Long | | | | 19 | | | | 3,339,844 | | | | 9/19/19 | | | | 62,074 | |
U.S. Treasury Ultra Bond | | | Short | | | | 6 | | | | 1,054,687 | | | | 9/19/19 | | | | 521 | |
| | | | | | | | | | | | | | | | | | | | |
| | | | | | | | | | | | | | | | | | | 2,487,602 | |
| | | | | | | | | | | | | | | | | | | | |
Total Futures Contracts | | | $ | 4,408,149 | |
| | | | | |
*As of period end.
aA portion or all of the contracts are owned by K2 Holdings Investment Corp., a wholly-owned subsidiary of the Fund. See Note 1(j).
At May 31, 2019, the Fund had the following forward exchange contracts outstanding. See Note 1(d).
| | | | | | | | | | | | | | | | | | | | | | | | | | | | | | | | |
| Forward Exchange Contracts | |
| | | | | | | | |
| Currency | | Counterpartya | | | Type | | | Quantity | | | Contract
Amount* | | | | | | Settlement
Date | | | Unrealized
Appreciation | | | Unrealized
Depreciation | |
| OTC Forward Exchange Contracts | |
Philippine Peso | | | BOFA | | | | Buy | | | | 3,010,000 | | | | 57,890 | | | | | | | | 6/03/19 | | | $ | — | | | $ | (197 | ) |
Philippine Peso | | | BOFA | | | | Sell | | | | 860,000 | | | | 16,564 | | | | | | | | 6/03/19 | | | | 80 | | | | — | |
Turkish Lira | | | BZWS | | | | Buy | | | | 245,000 | | | | 40,349 | | | | | | | | 6/03/19 | | | | 1,633 | | | | — | |
Brazilian Real | | | JPHQ | | | | Buy | | | | 21,968,258 | | | | 5,556,221 | | | | | | | | 6/04/19 | | | | 40,207 | | | | — | |
Brazilian Real | | | JPHQ | | | | Sell | | | | 21,968,258 | | | | 5,512,945 | | | | | | | | 6/04/19 | | | | — | | | | (83,483 | ) |
Canadian Dollar | | | BOFA | | | | Buy | | | | 795,521 | | | | 591,582 | | | | | | | | 6/04/19 | | | | — | | | | (2,943 | ) |
Colombian Peso | | | JPHQ | | | | Buy | | | | 2,592,800,000 | | | | 786,084 | | | | | | | | 6/04/19 | | | | — | | | | (18,730 | ) |
Colombian Peso | | | JPHQ | | | | Sell | | | | 2,592,800,000 | | | | 770,938 | | | | | | | | 6/04/19 | | | | 3,584 | | | | — | |
Mexican Peso | | | JPHQ | | | | Buy | | | | 13,808,939 | | | | 700,000 | | | | | | | | 6/04/19 | | | | 4,073 | | | | — | |
Argentine Peso | | | MSCS | | | | Buy | | | | 695,000 | | | | 15,050 | | | | | | | | 6/06/19 | | | | 324 | | | | — | |
Brazilian Real | | | MSCS | | | | Buy | | | | 65,000 | | | | 16,472 | | | | | | | | 6/06/19 | | | | 84 | | | | — | |
Brazilian Real | | | MSCS | | | | Sell | | | | 65,000 | | | | 16,437 | | | | | | | | 6/06/19 | | | | — | | | | (119 | ) |
Chilean Peso | | | MSCS | | | | Sell | | | | 39,360,000 | | | | 57,964 | | | | | | | | 6/06/19 | | | | 2,497 | | | | — | |
Czech Koruna | | | BOFA | | | | Sell | | | | 955,000 | | | | 41,564 | | | | | | | | 6/06/19 | | | | 268 | | | | — | |
Euro | | | BZWS | | | | Buy | | | | 140,000 | | | | 157,082 | | | | | | | | 6/06/19 | | | | — | | | | (598 | ) |
Indian Rupee | | | BOFA | | | | Buy | | | | 7,510,000 | | | | 107,410 | | | | | | | | 6/06/19 | | | | 311 | | | | (31 | ) |
Indian Rupee | | | BOFA | | | | Sell | | | | 7,510,000 | | | | 107,470 | | | | | | | | 6/06/19 | | | | — | | | | (219 | ) |
Norwegian Krone | | | UBSW | | | | Sell | | | | 2,835,000 | | | | 324,619 | | | | | | | | 6/06/19 | | | | 619 | | | | (12 | ) |
Peruvian Nuevo Sol | | | BOFA | | | | Buy | | | | 305,000 | | | | 92,248 | | | | | | | | 6/06/19 | | | | — | | | | (2,082 | ) |
Peruvian Nuevo Sol | | | BOFA | | | | Sell | | | | 60,000 | | | | 18,061 | | | | | | | | 6/06/19 | | | | 323 | | | | — | |
Swiss Franc | | | UBSW | | | | Buy | | | | 105,000 | | | | 103,579 | | | | | | | | 6/06/19 | | | | 1,353 | | | | — | |
Swiss Franc | | | UBSW | | | | Sell | | | | 210,000 | | | | 206,626 | | | | | | | | 6/06/19 | | | | — | | | | (3,237 | ) |
Argentine Peso | | | JPHQ | | | | Buy | | | | 17,824,192 | | | | 381,756 | | | | | | | | 6/07/19 | | | | 11,876 | | | | — | |
Argentine Peso | | | JPHQ | | | | Sell | | | | 17,824,192 | | | | 397,861 | | | | | | | | 6/07/19 | | | | 4,229 | | | | — | |
British Pound | | | BZWS | | | | Buy | | | | 95,000 | | | | 124,141 | | | | | | | | 6/07/19 | | | | — | | | | (3,992 | ) |
British Pound | | | BZWS | | | | Sell | | | | 50,000 | | | | 64,968 | | | | | | | | 6/07/19 | | | | 1,732 | | | | — | |
Colombian Peso | | | BOFA | | | | Buy | | | | 53,725,000 | | | | 16,547 | | | | | | | | 6/07/19 | | | | — | | | | (650 | ) |
Malaysian Ringgit | | | MSCS | | | | Buy | | | | 105,000 | | | | 25,037 | | | | | | | | 6/07/19 | | | | 17 | | | | — | |
Malaysian Ringgit | | | MSCS | | | | Sell | | | | 105,000 | | | | 25,332 | | | | | | | | 6/07/19 | | | | 278 | | | | — | |
South Korean Won | | | BOFA | | | | Sell | | | | 48,510,000 | | | | 41,630 | | | | | | | | 6/07/19 | | | | 885 | | | | — | |
Swedish Krona | | | CITI | | | | Buy | | | | 630,000 | | | | 65,974 | | | | | | | | 6/07/19 | | | | 474 | | | | — | |
Chinese Yuan | | | MSCS | | | | Sell | | | | 170,000 | | | | 25,143 | | | | | | | | 6/10/19 | | | | 517 | | | | — | |
Indonesian Rupiah | | | BOFA | | | | Buy | | | | 896,650,000 | | | | 62,593 | | | | | | | | 6/10/19 | | | | 147 | | | | — | |
Indonesian Rupiah | | | BOFA | | | | Sell | | | | 896,650,000 | | | | 62,379 | | | | | | | | 6/10/19 | | | | — | | | | (361 | ) |
Japanese Yen | | | BZWS | | | | Buy | | | | 9,230,000 | | | | 83,109 | | | | | | | | 6/10/19 | | | | 2,138 | | | | — | |
Russian Ruble | | | MSCS | | | | Buy | | | | 1,020,000 | | | | 15,729 | | | | | | | | 6/10/19 | | | | — | | | | (157 | ) |
| | | | | | |
| | | |
| franklintempleton.com | | Annual Report | | | 59 | |
FRANKLIN ALTERNATIVE STRATEGIES FUNDS
CONSOLIDATED STATEMENT OF INVESTMENTS
Franklin K2 Alternative Strategies Fund(continued)
| | | | | | | | | | | | | | | | | | | | | | | | | | | | | | | | |
| Forward Exchange Contracts | |
| | | | | | | | |
| Currency | | Counterpartya | | | Type | | | Quantity | | | Contract
Amount* | | | | | | Settlement
Date | | | Unrealized
Appreciation | | | Unrealized
Depreciation | |
| OTC Forward Exchange Contracts(continued) | |
Russian Ruble | | | MSCS | | | | Sell | | | | 1,020,000 | | | | 15,589 | | | | | | | | 6/10/19 | | | $ | 17 | | | $ | — | |
Hungarian Forint | | | UBSW | | | | Sell | | | | 4,800,000 | | | | 16,675 | | | | | | | | 6/13/19 | | | | 160 | | | | — | |
Argentine Peso | | | JPHQ | | | | Buy | | | | 17,824,192 | | | | 393,557 | | | | | | | | 6/14/19 | | | | — | | | | (4,427 | ) |
British Pound | | | BNYM | | | | Sell | | | | 2,457,591 | | | | 3,158,521 | | | | | | | | 6/14/19 | | | | 49,169 | | | | — | |
Euro | | | BNYM | | | | Sell | | | | 22,087,408 | | | | 24,835,082 | | | | | | | | 6/14/19 | | | | 129,688 | | | | — | |
Hong Kong Dollar | | | BNYM | | | | Sell | | | | 21,201,000 | | | | 2,702,916 | | | | | | | | 6/14/19 | | | | — | | | | (1,754 | ) |
Swiss Franc | | | BNYM | | | | Sell | | | | 208,093 | | | | 206,921 | | | | | | | | 6/14/19 | | | | — | | | | (1,203 | ) |
Brazilian Real | | | BOFA | | | | Sell | | | | 100,000 | | | | 25,075 | | | | | | | | 6/17/19 | | | | — | | | | (369 | ) |
Chilean Peso | | | JPHQ | | | | Buy | | | | 277,156,000 | | | | 400,000 | | | | | | | | 6/17/19 | | | | — | | | | (9,491 | ) |
New Zealand Dollar | | | GSCO | | | | Sell | | | | 4,277,481 | | | | 2,821,436 | | | | | | | | 6/17/19 | | | | 22,010 | | | | — | |
New Zealand Dollar | | | MSCO | | | | Buy | | | | 45,319 | | | | 29,724 | | | | | | | | 6/17/19 | | | | — | | | | (65 | ) |
Australian Dollar | | | JPHQ | | | | Sell | | | | 9,958,078 | | | | 6,918,769 | | | | | | | | 6/18/19 | | | | 20,205 | | | | (13,275 | ) |
British Pound | | | JPHQ | | | | Buy | | | | 1,000,000 | | | | 1,303,939 | | | | | | | | 6/18/19 | | | | — | | | | (38,465 | ) |
Canadian Dollar | | | BOFA | | | | Sell | | | | 145,000 | | | | 108,933 | | | | | | | | 6/18/19 | | | | 1,602 | | | | — | |
Canadian Dollar | | | JPHQ | | | | Buy | | | | 1,485,935 | | | | 1,100,917 | | | | | | | | 6/18/19 | | | | — | | | | (1,005 | ) |
Canadian Dollar | | | JPHQ | | | | Sell | | | | 3,877,180 | | | | 2,880,912 | | | | | | | | 6/18/19 | | | | 10,963 | | | | — | |
Czech Koruna | | | JPHQ | | | | Sell | | | | 32,455,884 | | | | 1,418,310 | | | | | | | | 6/18/19 | | | | 14,433 | | | | — | |
Euro | | | JPHQ | | | | Buy | | | | 717,525 | | | | 805,767 | | | | | | | | 6/18/19 | | | | 547 | | | | (3,460 | ) |
Euro | | | JPHQ | | | | Sell | | | | 200,000 | | | | 223,553 | | | | | | | | 6/18/19 | | | | — | | | | (231 | ) |
Hong Kong Dollar | | | JPHQ | | | | Sell | | | | 31,053,045 | | | | 3,959,775 | | | | | | | | 6/18/19 | | | | — | | | | (1,876 | ) |
Hungarian Forint | | | JPHQ | | | | Buy | | | | 130,668,969 | | | | 446,837 | | | | | | | | 6/18/19 | | | | 2,917 | | | | — | |
Japanese Yen | | | JPHQ | | | | Buy | | | | 11,746,878 | | | | 107,781 | | | | | | | | 6/18/19 | | | | 784 | | | | — | |
Japanese Yen | | | JPHQ | | | | Sell | | | | 119,719,845 | | | | 1,090,920 | | | | | | | | 6/18/19 | | | | — | | | | (15,538 | ) |
Mexican Peso | | | JPHQ | | | | Buy | | | | 259,084,870 | | | | 13,436,825 | | | | | | | | 6/18/19 | | | | — | | | | (260,434 | ) |
New Zealand Dollar | | | JPHQ | | | | Buy | | | | 400,000 | | | | 260,314 | | | | | | | | 6/18/19 | | | | 1,475 | | | | — | |
New Zealand Dollar | | | JPHQ | | | | Sell | | | | 12,735,660 | | | | 8,368,848 | | | | | | | | 6/18/19 | | | | 43,364 | | | | (9,646 | ) |
Norwegian Krone | | | JPHQ | | | | Buy | | | | 35,561,710 | | | | 4,077,180 | | | | | | | | 6/18/19 | | | | 1,187 | | | | (12,113 | ) |
Singapore Dollar | | | JPHQ | | | | Buy | | | | 1,684,191 | | | | 1,229,725 | | | | | | | | 6/18/19 | | | | — | | | | (3,394 | ) |
Singapore Dollar | | | JPHQ | | | | Sell | | | | 1,679,802 | | | | 1,224,922 | | | | | | | | 6/18/19 | | | | 3,397 | | | | (1,610 | ) |
South African Rand | | | JPHQ | | | | Sell | | | | 25,755,701 | | | | 1,795,713 | | | | | | | | 6/18/19 | | | | 31,585 | | | | — | |
Swedish Krona | | | JPHQ | | | | Buy | | | | 15,410,132 | | | | 1,606,310 | | | | | | | | 6/18/19 | | | | 20,457 | | | | — | |
Swiss Franc | | | JPHQ | | | | Sell | | | | 8,532,890 | | | | 8,509,681 | | | | | | | | 6/18/19 | | | | — | | | | (27,872 | ) |
Turkish Lira | | | JPHQ | | | | Buy | | | | 11,819,480 | | | | 1,914,490 | | | | | | | | 6/18/19 | | | | 92,979 | | | | — | |
Canadian Dollar | | | BNYM | | | | Sell | | | | 3,790,000 | | | | 2,848,687 | | | | | | | | 6/19/19 | | | | 43,195 | | | | — | |
Colombian Peso | | | JPHQ | | | | Buy | | | | 8,551,587,030 | | | | 2,752,213 | | | | | | | | 6/19/19 | | | | — | | | | (223,705 | ) |
Colombian Peso | | | JPHQ | | | | Sell | | | | 8,551,587,030 | | | | 2,515,913 | | | | | | | | 6/19/19 | | | | — | | | | (12,595 | ) |
Euro | | | BNYM | | | | Buy | | | | 1,451,029 | | | | 1,643,100 | | | | | | | | 6/19/19 | | | | — | | | | (19,372 | ) |
Euro | | | BNYM | | | | Sell | | | | 5,218,502 | | | | 5,956,086 | | | | | | | | 6/19/19 | | | | 116,554 | | | | (68 | ) |
Hungarian Forint | | | JPHQ | | | | Buy | | | | 407,675,159 | | | | 1,485,706 | | | | | | | | 6/19/19 | | | | — | | | | (82,413 | ) |
Hungarian Forint | | | JPHQ | | | | Sell | | | | 167,276,659 | | | | 533,073 | | | | EUR | | | | 6/19/19 | | | | 38,549 | | | | (17,828 | ) |
Euro | | | JPHQ | | | | Buy | | | | 4,620,829 | | | | 5,195,675 | | | | | | | | 6/19/19 | | | | 8,261 | | | | (33,142 | ) |
Euro | | | JPHQ | | | | Sell | | | | 4,624,964 | | | | 5,294,167 | | | | | | | | 6/19/19 | | | | 118,746 | | | | — | |
Euro | | | JPHQ | | | | Sell | | | | 528,938 | | | | 167,276,659 | | | | HUF | | | | 6/19/19 | | | | 13,694 | | | | (29,788 | ) |
Hungarian Forint | | | JPHQ | | | | Sell | | | | 407,675,159 | | | | 1,460,428 | | | | | | | | 6/19/19 | | | | 57,134 | | | | — | |
Indian Rupee | | | JPHQ | | | | Buy | | | | 50,915,148 | | | | 727,567 | | | | | | | | 6/19/19 | | | | 1,476 | | | | — | |
Indian Rupee | | | JPHQ | | | | Sell | | | | 50,915,148 | | | | 705,905 | | | | | | | | 6/19/19 | | | | — | | | | (23,138 | ) |
Indonesian Rupiah | | | JPHQ | | | | Buy | | | | 58,821,738,732 | | | | 4,100,864 | | | | | | | | 6/19/19 | | | | 11,107 | | | | (1,096 | ) |
Indonesian Rupiah | | | JPHQ | | | | Sell | | | | 58,821,738,732 | | | | 4,112,823 | | | | | | | | 6/19/19 | | | | 2,029 | | | | (81 | ) |
Japanese Yen | | | BNYM | | | | Buy | | | | 57,802,000 | | | | 525,925 | | | | | | | | 6/19/19 | | | | 8,330 | | | | — | |
Japanese Yen | | | BNYM | | | | Sell | | | | 57,802,000 | | | | 521,222 | | | | | | | | 6/19/19 | | | | — | | | | (13,033 | ) |
Mexican Peso | | | JPHQ | | | | Buy | | | | 35,887,476 | | | | 1,817,452 | | | | | | | | 6/19/19 | | | | 7,361 | | | | — | |
Mexican Peso | | | JPHQ | | | | Sell | | | | 35,887,476 | | | | 1,848,260 | | | | | | | | 6/19/19 | | | | 23,447 | | | | — | |
Russian Ruble | | | JPHQ | | | | Buy | | | | 155,117,931 | | | | 2,365,425 | | | | | | | | 6/19/19 | | | | 203 | | | | (696 | ) |
Russian Ruble | | | JPHQ | | | | Sell | | | | 155,117,931 | | | | 2,349,355 | | | | | | | | 6/19/19 | | | | 4,358 | | | | (19,935 | ) |
South African Rand | | | JPHQ | | | | Buy | | | | 55,184,992 | | | | 3,785,818 | | | | | | | | 6/19/19 | | | | 11,891 | | | | (18,314 | ) |
South African Rand | | | JPHQ | | | | Sell | | | | 55,184,992 | | | | 3,826,536 | | | | | | | | 6/19/19 | | | | 47,724 | | | | (583 | ) |
Swiss Franc | | | BNYM | | | | Buy | | | | 235,629 | | | | 231,880 | | | | | | | | 6/19/19 | | | | 3,902 | | | | — | |
Swiss Franc | | | BNYM | | | | Sell | | | | 966,171 | | | | 972,092 | | | | | | | | 6/19/19 | | | | 5,297 | | | | — | |
| | | | |
| | | |
| 60 | | Annual Report | | franklintempleton.com |
FRANKLIN ALTERNATIVE STRATEGIES FUNDS
CONSOLIDATED STATEMENT OF INVESTMENTS
Franklin K2 Alternative Strategies Fund(continued)
| | | | | | | | | | | | | | | | | | | | | | | | | | | | | | | | |
| Forward Exchange Contracts(continued) | |
| | | | | | | | |
| Currency | | Counterpartya | | | Type | | | Quantity | | | Contract
Amount* | | | | | | Settlement
Date | | | Unrealized
Appreciation | | | Unrealized
Depreciation | |
| OTC Forward Exchange Contracts(continued) | |
Turkish Lira | | | JPHQ | | | | Buy | | | | 6,855,197 | | | | 1,147,097 | | | | | | | | 6/19/19 | | | $ | 16,526 | | | $ | — | |
Turkish Lira | | | JPHQ | | | | Sell | | | | 9,641,679 | | | | 1,611,223 | | | | | | | | 6/19/19 | | | | 10,614 | | | | (36,000 | ) |
British Pound | | | DBAB | | | | Buy | | | | 649,000 | | | | 853,693 | | | | | | | | 6/20/19 | | | | 33 | | | | (32,344 | ) |
British Pound | | | DBAB | | | | Sell | | | | 848,000 | | | | 1,121,769 | | | | | | | | 6/20/19 | | | | 48,539 | | | | (6 | ) |
Canadian Dollar | | | DBAB | | | | Sell | | | | 3,425,000 | | | | 2,548,737 | | | | | | | | 6/20/19 | | | | 13,364 | | | | — | |
Euro | | | DBAB | | | | Buy | | | | 1,994,000 | | | | 2,246,158 | | | | | | | | 6/20/19 | | | | 261 | | | | (14,903 | ) |
Euro | | | DBAB | | | | Sell | | | | 4,900,000 | | | | 5,570,766 | | | | | | | | 6/20/19 | | | | 87,149 | | | | (48 | ) |
Japanese Yen | | | DBAB | | | | Buy | | | | 40,646,000 | | | | 369,546 | | | | | | | | 6/20/19 | | | | 6,171 | | | | — | |
Japanese Yen | | | DBAB | | | | Sell | | | | 76,127,000 | | | | 688,555 | | | | | | | | 6/20/19 | | | | — | | | | (15,133 | ) |
Swiss Franc | | | DBAB | | | | Buy | | | | 4,000,000 | | | | 3,962,247 | | | | | | | | 6/20/19 | | | | 40,790 | | | | (53 | ) |
Swiss Franc | | | DBAB | | | | Sell | | | | 4,000,000 | | | | 4,025,214 | | | | | | | | 6/20/19 | | | | 22,230 | | | | — | |
Australian Dollarb | | | MSCO | | | | Buy | | | | 10,743,000 | | | | 7,568,717 | | | | | | | | 6/21/19 | | | | 7,251 | | | | (118,610 | ) |
Australian Dollarb | | | MSCO | | | | Sell | | | | 18,201,000 | | | | 12,871,345 | | | | | | | | 6/21/19 | | | | 237,421 | | | | (477 | ) |
British Poundb | | | MSCO | | | | Buy | | | | 16,680,000 | | | | 21,891,582 | | | | | | | | 6/21/19 | | | | — | | | | (780,079 | ) |
British Poundb | | | MSCO | | | | Sell | | | | 21,224,000 | | | | 27,549,456 | | | | | | | | 6/21/19 | | | | 691,108 | | | | (4,399 | ) |
Canadian Dollarb | | | MSCO | | | | Buy | | | | 3,633,000 | | | | 2,710,460 | | | | | | | | 6/21/19 | | | | — | | | | (21,044 | ) |
Canadian Dollarb | | | MSCO | | | | Sell | | | | 24,684,000 | | | | 18,512,621 | | | | | | | | 6/21/19 | | | | 239,692 | | | | — | |
Colombian Peso | | | JPHQ | | | | Buy | | | | 763,600,000 | | | | 230,000 | | | | | | | | 6/21/19 | | | | — | | | | (4,249 | ) |
Eurob | | | MSCO | | | | Buy | | | | 12,946,000 | | | | 14,576,795 | | | | | | | | 6/21/19 | | | | 3,123 | | | | (90,564 | ) |
Eurob | | | MSCO | | | | Sell | | | | 29,263,000 | | | | 33,201,393 | | | | | | | | 6/21/19 | | | | 463,800 | | | | (13,983 | ) |
Japanese Yenb | | | MSCO | | | | Buy | | | | 3,129,584,000 | | | | 28,462,264 | | | | | | | | 6/21/19 | | | | 468,841 | | | | — | |
Japanese Yenb | | | MSCO | | | | Sell | | | | 1,939,550,000 | | | | 17,594,721 | | | | | | | | 6/21/19 | | | | — | | | | (335,241 | ) |
Mexican Pesob | | | MSCO | | | | Buy | | | | 68,054,000 | | | | 3,499,118 | | | | | | | | 6/21/19 | | | | — | | | | (39,953 | ) |
Mexican Pesob | | | MSCO | | | | Sell | | | | 20,267,000 | | | | 1,053,948 | | | | | | | | 6/21/19 | | | | 23,781 | | | | — | |
New Zealand Dollarb | | | MSCO | | | | Buy | | | | 11,999,000 | | | | 8,177,482 | | | | | | | | 6/21/19 | | | | 1,114 | | | | (325,050 | ) |
New Zealand Dollarb | | | MSCO | | | | Sell | | | | 16,435,000 | | | | 11,085,720 | | | | | | | | 6/21/19 | | | | 330,500 | | | | (1,768 | ) |
Swiss Francb | | | MSCO | | | | Buy | | | | 4,750,000 | | | | 4,721,451 | | | | | | | | 6/21/19 | | | | 46,858 | | | | (14,291 | ) |
Swiss Francb | | | MSCO | | | | Sell | | | | 10,323,000 | | | | 10,332,368 | | | | | | | | 6/21/19 | | | | 23,943 | | | | (23,306 | ) |
Australian Dollar | | | BOFA | | | | Sell | | | | 8,087,977 | | | | 5,683,640 | | | | | | | | 6/24/19 | | | | 68,759 | | | | — | |
Euro | | | DBAB | | | | Sell | | | | 14,813,314 | | | | 16,665,467 | | | | | | | | 6/24/19 | | | | 81,834 | | | | — | |
Euro | | | JPHQ | | | | Buy | | | | 298,656 | | | | 334,009 | | | | | | | | 6/24/19 | | | | 383 | | | | (44 | ) |
Euro | | | MSCO | | | | Buy | | | | 145,622 | | | | 163,749 | | | | | | | | 6/24/19 | | | | — | | | | (724 | ) |
Colombian Peso | | | JPHQ | | | | Buy | | | | 1,296,400,000 | | | | 384,353 | | | | | | | | 6/25/19 | | | | — | | | | (1,183 | ) |
Colombian Peso | | | JPHQ | | | | Sell | | | | 7,146,596,964 | | | | 2,237,684 | | | | | | | | 6/25/19 | | | | 125,400 | | | | — | |
Australian Dollar | | | MSCO | | | | Buy | | | | 584,765 | | | | 405,741 | | | | | | | | 6/28/19 | | | | 1,561 | | | | (1,292 | ) |
Australian Dollar | | | MSCO | | | | Sell | | | | 369,090 | | | | 257,766 | | | | | | | | 6/28/19 | | | | 2,335 | | | | (834 | ) |
British Pound | | | BNYM | | | | Sell | | | | 252,000 | | | | 334,973 | | | | | | | | 6/28/19 | | | | 15,903 | | | | — | |
British Pound | | | MSCO | | | | Buy | | | | 419,233 | | | | 546,734 | | | | | | | | 6/28/19 | | | | — | | | | (15,921 | ) |
British Pound | | | MSCO | | | | Sell | | | | 465,680 | | | | 606,194 | | | | | | | | 6/28/19 | | | | 16,573 | | | | — | |
British Pound | | | MSCS | | | | Sell | | | | 100,000 | | | | 126,705 | | | | | | | | 6/28/19 | | | | 90 | | | | — | |
Canadian Dollar | | | BNYM | | | | Sell | | | | 478,000 | | | | 355,861 | | | | | | | | 6/28/19 | | | | 1,945 | | | | — | |
Canadian Dollar | | | MSCO | | | | Buy | | | | 5,687,118 | | | | 4,239,979 | | | | | | | | 6/28/19 | | | | — | | | | (29,176 | ) |
Canadian Dollar | | | MSCO | | | | Sell | | | | 5,335,072 | | | | 3,995,491 | | | | | | | | 6/28/19 | | | | 45,345 | | | | — | |
Danish Krone | | | MSCO | | | | Buy | | | | 5,067,425 | | | | 764,117 | | | | | | | | 6/28/19 | | | | 313 | | | | (4,368 | ) |
Danish Krone | | | MSCO | | | | Sell | | | | 40,759,685 | | | | 6,161,800 | | | | | | | | 6/28/19 | | | | 49,129 | | | | (872 | ) |
Euro | | | BNYM | | | | Sell | | | | 4,210,000 | | | | 4,774,970 | | | | | | | | 6/28/19 | | | | 60,188 | | | | — | |
Euro | | | MSCO | | | | Buy | | | | 1,430,930 | | | | 1,610,827 | | | | | | | | 6/28/19 | | | | — | | | | (8,327 | ) |
Euro | | | MSCO | | | | Sell | | | | 849,230 | | | | 956,928 | | | | | | | | 6/28/19 | | | | 5,875 | | | | — | |
Japanese Yen | | | MSCO | | | | Buy | | | | 121,771,380 | | | | 1,119,627 | | | | | | | | 6/28/19 | | | | 6,738 | | | | — | |
Japanese Yen | | | MSCO | | | | Sell | | | | 121,771,380 | | | | 1,100,444 | | | | | | | | 6/28/19 | | | | — | | | | (25,921 | ) |
Singapore Dollar | | | UBSW | | | | Sell | | | | 35,000 | | | | 25,399 | | | | | | | | 6/28/19 | | | | — | | | | (89 | ) |
Swedish Krona | | | MSCO | | | | Buy | | | | 1,153,725 | | | | 120,821 | | | | | | | | 6/28/19 | | | | 1,068 | | | | — | |
Swiss Franc | | | BOFA | | | | Sell | | | | 731,630 | | | | 726,808 | | | | | | | | 6/28/19 | | | | — | | | | (5,952 | ) |
Swiss Franc | | | DBAB | | | | Sell | | | | 11,493,513 | | | | 11,331,015 | | | | | | | | 6/28/19 | | | | — | | | | (180,239 | ) |
Swiss Franc | | | MSCO | | | | Buy | | | | 1,094,839 | | | | 1,083,252 | | | | | | | | 6/28/19 | | | | 13,277 | | | | — | |
Swiss Franc | | | MSCO | | | | Sell | | | | 1,229,692 | | | | 1,220,425 | | | | | | | | 6/28/19 | | | | — | | | | (11,165 | ) |
Brazilian Real | | | JPHQ | | | | Buy | | | | 10,984,129 | | | | 2,718,911 | | | | | | | | 7/02/19 | | | | 72,102 | | | | — | |
| | | | | | |
| | | |
| franklintempleton.com | | Annual Report | | | 61 | |
FRANKLIN ALTERNATIVE STRATEGIES FUNDS
CONSOLIDATED STATEMENT OF INVESTMENTS
Franklin K2 Alternative Strategies Fund(continued)
| | | | | | | | | | | | | | | | | | | | | | | | | | | | | | | | |
| Forward Exchange Contracts(continued) | |
| | | | | | | | |
| Currency | | Counterpartya | | | Type | | | Quantity | | | Contract
Amount* | | | | | | Settlement
Date | | | Unrealized
Appreciation | | | Unrealized
Depreciation | |
| OTC Forward Exchange Contracts(continued) | |
Colombian Peso | | | MSCS | | | | Sell | | | | 780,000,000 | | | | 230,913 | | | | | | | | 7/02/19 | | | $ | 469 | | | $ | — | |
Philippine Peso | | | BOFA | | | | Buy | | | | 2,150,000 | | | | 41,101 | | | | | | | | 7/03/19 | | | | 12 | | | | — | |
Turkish Lira | | | BZWS | | | | Buy | | | | 245,000 | | | | 40,732 | | | | | | | | 7/03/19 | | | | 503 | | | | — | |
Indian Rupee | | | BOFA | | | | Buy | | | | 7,510,000 | | | | 107,072 | | | | | | | | 7/08/19 | | | | 236 | | | | — | |
Indian Rupee | | | JPHQ | | | | Sell | | | | 62,881,562 | | | | 888,509 | | | | | | | | 7/08/19 | | | | 617 | | | | (10,601 | ) |
Malaysian Ringgit | | | MSCS | | | | Sell | | | | 105,000 | | | | 25,021 | | | | | | | | 7/08/19 | | | | — | | | | (21 | ) |
Taiwan Dollar | | | JPHQ | | | | Sell | | | | 61,540,395 | | | | 1,996,456 | | | | | | | | 7/08/19 | | | | 45,452 | | | | — | |
Indonesian Rupiah | | | BOFA | | | | Buy | | | | 828,170,000 | | | | 57,226 | | | | | | | | 7/10/19 | | | | 500 | | | | — | |
Hungarian Forint | | | UBSW | | | | Buy | | | | 104,925,000 | | | | 369,752 | | | | | | | | 7/15/19 | | | | — | | | | (7,907 | ) |
Malaysian Ringgit | | | MSCS | | | | Buy | | | | 2,305,000 | | | | 560,282 | | | | | | | | 7/15/19 | | | | — | | | | (10,618 | ) |
Norwegian Krone | | | BOFA | | | | Buy | | | | 4,795,000 | | | | 564,625 | | | | | | | | 7/15/19 | | | | — | | | | (15,823 | ) |
Indian Rupee | | | JPHQ | | | | Sell | | | | 2,137,500 | | | | 30,000 | | | | | | | | 7/18/19 | | | | — | | | | (508 | ) |
South Korean Won | | | JPHQ | | | | Sell | | | | 1,975,102,356 | | | | 1,716,233 | | | | | | | | 7/18/19 | | | | 54,723 | | | | — | |
Brazilian Real | | | JPHQ | | | | Sell | | | | 6,702,929 | | | | 1,690,129 | | | | | | | | 7/22/19 | | | | — | | | | (10,302 | ) |
British Pound | | | BZWS | | | | Buy | | | | 587,282 | | | | 747,651 | | | | | | | | 7/22/19 | | | | — | | | | (3,167 | ) |
British Pound | | | BZWS | | | | Sell | | | | 1,419,587 | | | | 1,827,453 | | | | | | | | 7/22/19 | | | | 27,875 | | | | — | |
Chilean Peso | | | JPHQ | | | | Sell | | | | 539,167,575 | | | | 801,008 | | | | | | | | 7/25/19 | | | | 41,711 | | | | — | |
British Pound | | | DBAB | | | | Sell | | | | 481,000 | | | | 624,016 | | | | | | | | 7/31/19 | | | | 13,993 | | | | — | |
Euro | | | DBAB | | | | Sell | | | | 183,000 | | | | 205,556 | | | | | | | | 7/31/19 | | | | 39 | | | | — | |
South African Rand | | | MSCS | | | | Sell | | | | 30,985,000 | | | | 2,137,250 | | | | | | | | 7/31/19 | | | | 26,356 | | | | — | |
South Korean Won | | | JPHQ | | | | Sell | | | | 3,315,885,591 | | | | 2,927,007 | | | | | | | | 8/05/19 | | | | 135,741 | | | | — | |
Canadian Dollar | | | MSCO | | | | Buy | | | | 795,521 | | | | 588,774 | | | | | | | | 8/06/19 | | | | 796 | | | | — | |
Brazilian Real | | | JPHQ | | | | Sell | | | | 6,546,279 | | | | 1,640,137 | | | | | | | | 8/07/19 | | | | — | | | | (18,283 | ) |
Peruvian Nuevo Sol | | | JPHQ | | | | Sell | | | | 422,382 | | | | 127,231 | | | | | | | | 8/09/19 | | | | 2,810 | | | | — | |
Taiwan Dollar | | | JPHQ | | | | Sell | | | | 82,638,439 | | | | 2,700,071 | | | | | | | | 8/13/19 | | | | 74,181 | | | | — | |
Singapore Dollar | | | CITI | | | | Sell | | | | 2,275,000 | | | | 1,662,222 | | | | | | | | 8/15/19 | | | | 4,378 | | | | — | |
Polish Zloty | | | BZWS | | | | Buy | | | | 1,405,000 | | | | 364,678 | | | | | | | | 8/23/19 | | | | 2,764 | | | | — | |
Indian Rupee | | | JPHQ | | | | Sell | | | | 27,826,000 | | | | 389,785 | | | | | | | | 8/26/19 | | | | — | | | | (5,703 | ) |
Colombian Peso | | | JPHQ | | | | Buy | | | | 8,551,587,030 | | | | 2,503,758 | | | | | | | | 9/18/19 | | | | 11,871 | | | | — | |
Euro | | | JPHQ | | | | Sell | | | | 2,669,982 | | | | 3,001,871 | | | | | | | | 9/18/19 | | | | — | | | | (8,319 | ) |
Indian Rupee | | | JPHQ | | | | Sell | | | | 50,915,148 | | | | 719,445 | | | | | | | | 9/18/19 | | | | — | | | | (2,436 | ) |
Indonesian Rupiah | | | JPHQ | | | | Buy | | | | 13,975,220,160 | | | | 961,289 | | | | | | | | 9/18/19 | | | | 4,119 | | | | — | |
Indonesian Rupiah | | | JPHQ | | | | Sell | | | | 39,411,528,082 | | | | 2,710,932 | | | | | | | | 9/18/19 | | | | — | | | | (11,616 | ) |
Russian Ruble | | | JPHQ | | | | Sell | | | | 138,373,351 | | | | 2,084,062 | | | | | | | | 9/18/19 | | | | 1,395 | | | | — | |
South African Rand | | | JPHQ | | | | Sell | | | | 46,009,190 | | | | 3,104,566 | | | | | | | | 9/18/19 | | | | — | | | | (11,022 | ) |
| | | | | | | | | | | | | | | | | | | | | | | | | | | | |
Total Forward Exchange Contracts | | | $ | 4,850,314 | | | $ | (3,292,760 | ) |
| | | | | | | | | | | | | | | | | | | | | | | | | | | | |
Net unrealized appreciation (depreciation) | | | $ | 1,557,554 | | | | | |
| | | | | | | | | | | | | | | | | | | | | | | | | | | | | | | | |
*In U.S. dollars unless otherwise indicated.
aMay be comprised of multiple contracts with the same counterparty, currency and settlement date.
bA portion or all of the contracts are owned by K2 Holdings Investment Corp., a wholly-owned subsidiary of the Fund. See Note 1(j).
At May 31, 2019, the Fund had the following credit default swap contracts outstanding. See Note 1(d).
| | | | | | | | | | | | | | | | | | | | | | | | | | | | | | | | | | | | | | |
| Credit Default Swap Contracts | | | | | | | | | | | | | | | |
| | | | | | | | | | |
| Description | | Periodic
Payment
Rate
Received
(Paid) | | | Payment
Frequency | | | | | | Maturity
Date | | | Notional
Amounta | | | | | | Value | | | Unamortized
Upfront
Payments
(Receipts) | | | Unrealized
Appreciation
(Depreciation) | | | Ratingb |
| Centrally Cleared Swap Contracts | | | | | | | | | | | | | | | | | | | | | | | | | | | |
| Contracts to Buy Protectionc | | | | | | | | | | | | | | | | | | | | | | | | | | | |
| Single Name | | | | | | | | | | | | | | | | | | | | | | | |
Government of Mexico | | | (1.00)% | | | | Quarterly | | | | | | | | 6/20/23 | | | | 1,763,000 | | | | | | | $ | 2,827 | | | $ | (441 | ) | | $ | 3,268 | | | |
Government of Mexico | | | (1.00)% | | | | Quarterly | | | | | | | | 12/20/23 | | | | 1,931,000 | | | | | | | | 15,323 | | | | 23,146 | | | | (7,823 | ) | | |
Government of South Africa | | | (1.00)% | | | | Quarterly | | | | | | | | 6/20/24 | | | | 4,478,000 | | | | | | | | 210,992 | | | | 196,353 | | | | 14,639 | | | |
Government of South Africa | | | (1.00)% | | | | Quarterly | | | | | | | | 6/20/22 | | | | 1,047,000 | | | | | | | | 15,078 | | | | 53,152 | | | | (38,074 | ) | | |
| | | | |
| | | |
| 62 | | Annual Report | | franklintempleton.com |
FRANKLIN ALTERNATIVE STRATEGIES FUNDS
CONSOLIDATED STATEMENT OF INVESTMENTS
Franklin K2 Alternative Strategies Fund(continued)
| | | | | | | | | | | | | | | | | | | | | | | | | | | | | | | | | | | | | | | | |
| Credit Default Swap Contracts(continued) | | | | | | | | | | | | | | | | |
| | | | | | | | | | |
| Description | | Periodic
Payment
Rate
Received
(Paid) | | | Payment
Frequency | | | | | | Maturity
Date | | | Notional
Amounta | | | | | | Value | | | Unamortized
Upfront
Payments
(Receipts) | | | Unrealized
Appreciation
(Depreciation) | | | Ratingb | |
| Centrally Cleared Swap Contracts(continued) | | | | | | | | | | | | | | | | | | | | | | | | | | | | | |
| Contracts to Buy Protection(continued) | | | | | | | | | | | | | | | | | | | | | | | | | |
| Single Name(continued) | | | | | | | | | | | | | | | | | | | | | | | | | | | | | | | | | | | | | | | | |
Government of South Korea | | | (1.00)% | | | | Quarterly | | | | | | | | 6/20/24 | | | | 1,991,054 | | | | | | | $ | (60,112 | ) | | $ | (67,537 | ) | | $ | 7,425 | | | | | |
Government of Turkey | | | (1.00)% | | | | Quarterly | | | | | | | | 6/20/24 | | | | 141,000 | | | | | | | | 22,649 | | | | 14,153 | | | | 8,496 | | | | | |
Government of Turkey | | | (1.00)% | | | | Quarterly | | | | | | | | 9/20/20 | | | | 1,976,000 | | | | | | | | 82,825 | | | | 157,717 | | | | (74,892 | ) | | | | |
| Contracts to Sell Protectionc,d | | | | | | | | | | | | | | | | | | | | | | | | | |
| Single Name | | | | | | | | | | | | | | | | | | | | | | | | | | | | | | | | | | | | | | | | |
Government of Russia | | | 1.00% | | | | Quarterly | | | | | | | | 6/20/24 | | | | 4,150,000 | | | | | | | | (58,637 | ) | | | (64,467 | ) | | | 5,830 | | | | BBB- | |
Government of South Africa | | | 1.00% | | | | Quarterly | | | | | | | | 12/20/22 | | | | 874,000 | | | | | | | | (18,756 | ) | | | (17,002 | ) | | | (1,754 | ) | | | BB+ | |
Government of Turkey | | | 1.00% | | | | Quarterly | | | | | | | | 12/20/22 | | | | 826,000 | | | | | | | | (97,271 | ) | | | (37,352 | ) | | | (59,919 | ) | | | B+ | |
| | | | | | | | | | | | | | | | | | | | | | | | | | | | | | | | |
Total Centrally Cleared Swap Contracts | | | | | | | | | | | $ | 114,918 | | | $ | 257,722 | | | $ | (142,804 | ) | | | | |
| | | | | | | | | | | | | | | | | | | | | | | | | | | | | | | | |
| OTC Swap Contracts | |
| Contracts to Buy Protectionc | |
| Single Name | | | | | | | | | | | Counterparty | | | | | | | | | | | | | | | | | | | | | | | | | | | | | |
Enel SpA | | | (1.00)% | | | | Quarterly | | | | BOFA | | | | 6/20/23 | | | | 550,000 | | | | EUR | | | | (8,103 | ) | | | (255 | ) | | | (7,848 | ) | | | | |
Enel SpA | | | (1.00)% | | | | Quarterly | | | | MSCS | | | | 12/20/23 | | | | 330,000 | | | | EUR | | | | (3,353 | ) | | | 1,997 | | | | (5,350 | ) | | | | |
| Traded Index | | | | | | | | | | | | | | | | | | | | | | | | | | | | | | | | | | | | | | | | |
CDX.EM.31 | | | (1.00)% | | | | Quarterly | | | | BOFA | | | | 6/20/24 | | | | 1,650,000 | | | | | | | | 76,552 | | | | 78,774 | | | | (2,222 | ) | | | | |
CDX.EM.31 | | | (1.00)% | | | | Quarterly | | | | BZWS | | | | 6/20/24 | | | | 828,580 | | | | | | | | 38,980 | | | | 40,660 | | | | (1,680 | ) | | | | |
| | | | | | | | | | | | | | | | | | | | | | | | | | | | | | | | |
Total OTC Swap Contracts | | | | | | | | | | | $ | 104,076 | | | $ | 121,176 | | | $ | (17,100 | ) | | | | |
| | | | | | | | | | | | | | | | | | | | | | | | | | | | | | | | |
Total Credit Default Swap Contracts | | | | | | | | | | | $ | 218,994 | | | $ | 378,898 | | | $ | (159,904 | ) | | | | |
| | | | | | | | | | | | | | | | | | | | | | | | | | | | | | | | |
aIn U.S. dollars unless otherwise indicated. For contracts to sell protection, the notional amount is equal to the maximum potential amount of the future payments and no recourse provisions have been entered into in association with the contracts.
bBased on Standard and Poor’s (S&P) Rating for single name swaps.
cPerformance triggers for settlement of contract include default, bankruptcy or restructuring for single name swaps and failure to pay or bankruptcy of the underlying securities for traded index swaps.
dThe Fund enters contracts to sell protection to create a long credit position.
At May 31, 2019, the Fund had the following interest rate swap contracts outstanding. See Note 1(d).
| | | | | | | | | | | | | | | | |
| Interest Rate Swap Contracts | |
| | | | |
| Description | | Payment
Frequency | | | Maturity
Date | | | Notional
Amount | | | Value/Unrealized
Appreciation
(Depreciation) | |
| Centrally Cleared Swap Contracts | | | | | | | | | | | | | |
Receive Fixed rate 8.33%
Pay Floating rateBRL-BRLCDI | | | Annually | | | | 1/02/23 | | | | 20,823,071 | BRL | | $ | 180,967 | |
Receive Fixed rate 8.36%
Pay Floating rateBRL-BRLCDI | | | Annually | | | | 1/02/23 | | | | 15,895,971 | BRL | | | 141,131 | |
Receive Floating rate MIBOR
Pay Fixed rate 6.67% | | | Annually | | | | 6/20/23 | | | | 68,165,992 | INR | | | (36,325 | ) |
Receive Floating rate 6 MonthGBP-LIBOR
Pay Fixed rate 1.41% | | | Semi-Annually | | | | 8/04/67 | | | | 133,000 | GBP | | | (8,010 | ) |
Receive Floating rate 6 MonthGBP-LIBOR
Pay Fixed rate 1.47% | | | Semi-Annually | | | | 9/18/69 | | | | 1,791,234 | GBP | | | (199,023 | ) |
| | | | | | | | | | | | | | | | |
Total Interest Rate Swap Contracts | | | $ | 78,740 | |
| | | | | | | | | | | | | | | | |
| | | | | | |
| | | |
| franklintempleton.com | | Annual Report | | | 63 | |
FRANKLIN ALTERNATIVE STRATEGIES FUNDS
CONSOLIDATED STATEMENT OF INVESTMENTS
Franklin K2 Alternative Strategies Fund(continued)
At May 31, 2019, the Fund had the following total return swap contracts outstanding. See Note 1(d).
| | | | | | | | | | | | | | | | | | | | | | |
| Total Return Swap Contracts | | | | |
| | | | | | |
| Underlying Instrument | | Financing Rate | | Payment
Frequency | | | Counter-
party | | | Maturity
Date | | | Notional
Value* | | | Value/Unrealized
Appreciation
(Depreciation) | |
| OTC Swap Contracts | | | | | | | | | | | | | | | | | | | | | | |
| Commodity Contracts – Shorta | | | | | | | | | | | | | | | | | | | | | | |
Bloomberg Commodity Indexb | | 0.15% | | | Monthly | | | | MSCI | | | | 6/10/19 | | | | 973,204 | | | $ | 11,846 | |
| | | | | | | | | | | | | | | | | | | | | | |
| Credit Contracts – Shorta | | | | | | | | | | | | | | | | | | | | | | |
iBoxx USD Liquid High Yield Index | | 1-Month LIBOR | | | Monthly | | | | JPHQ | | | | 6/20/19 | | | | 1,347,000 | | | | 5,696 | |
iBoxx USD Liquid High Yield Index | | 1-Month LIBOR | | | Monthly | | | | JPHQ | | | | 6/20/19 | | | | 53,000 | | | | 345 | |
iBoxx USD Liquid High Yield Index | | 1-Month LIBOR | | | Quarterly | | | | MSCS | | | | 6/20/19 | | | | 1,448,000 | | | | (34,962 | ) |
iBoxx USD Liquid High Yield Index | | 1-Month LIBOR | | | Monthly | | | | MSCS | | | | 6/20/19 | | | | 151,000 | | | | 665 | |
iBoxx USD Liquid High Yield Index | | 1-Month LIBOR | | | Monthly | | | | MSCS | | | | 6/20/19 | | | | 604,000 | | | | 2,712 | |
| | | | | | | | | | | | | | | | | | | | | | |
| | | | | | |
| | | | | | | | | | | | | | | | | | | | | (25,544 | ) |
| | | | | | | | | | | | | | | | | | | | | | |
| Equity Contracts – Longc | | | | | | | | | | | | | | | | | | | | | | |
Aeroports de Paris | | 1-Day EONIA + 0.65% | | | Monthly | | | | MSCS | | | | 9/04/19 | | | | 417,283 | EUR | | | (63,458 | ) |
Altaba Inc. | | 1-Day FEDEF + 0.40% | | | Monthly | | | | MSCS | | | | 12/20/19 | | | | 3,265,538 | | | | (259,231 | ) |
Anglo American PLC | | 1-Month LIBOR + 0.50% | | | Monthly | | | | MSCS | | | | 1/20/20 | | | | 696,860 | GBP | | | (66,066 | ) |
Anima Holding SpA | | 1-Month LIBOR + 0.40% | | | Monthly | | | | MSCS | | | | 12/19/19 | | | | 702,604 | EUR | | | (116,863 | ) |
Antofagasta PLC | | 1-Month LIBOR + 0.50% | | | Monthly | | | | MSCS | | | | 1/20/20 | | | | 40,859 | GBP | | | (2,856 | ) |
Barclays PLC | | 1-Month LIBOR + 0.40% | | | Monthly | | | | MSCS | | | | 4/16/20 | | | | 771,073 | GBP | | | (51,167 | ) |
BHP Group PLC | | 1-Day FEDEF + 0.40% | | | Monthly | | | | MSCS | | | | 12/23/20 | | | | 1,539,875 | | | | (25,262 | ) |
BNP Paribas SA | | 1-Month LIBOR + 0.40% | | | Monthly | | | | MSCS | | | | 12/19/19 | | | | 1,629,588 | EUR | | | (184,722 | ) |
BTG PLC | | 1-Day SONIA + 0.65% | | | Monthly | | | | MSCS | | | | 2/06/20 | | | | 678,065 | GBP | | | 7,951 | |
Carnival PLC | | 1-Day FEDEF + 0.65% | | | Monthly | | | | MSCS | | | | 3/17/21 | | | | 831,419 | | | | (59,829 | ) |
Caterpillar Inc. | | 1-Month LIBOR + 0.50% | | | Monthly | | | | MSCS | | | | 9/22/20 | | | | 1,685,072 | | | | (229,021 | ) |
Celesio AG | | 1-Day EONIA + 0.65% | | | Monthly | | | | MSCS | | | | 11/04/19 | | | | 3,160,765 | EUR | | | 64,610 | |
Cie Plastic Omnium SA | | 1-Month EURIBOR + 0.50% | | | Monthly | | | | MSCS | | | | 1/10/20 | | | | 657,150 | EUR | | | (103,158 | ) |
CSX Corp. | | 1-Month LIBOR + 0.50% | | | Monthly | | | | MSCS | | | | 9/22/20 | | | | 4,750,708 | | | | 6,515 | |
Danone SA | | 1-Month LIBOR + 0.40% | | | Monthly | | | | MSCS | | | | 12/19/19 | | | | 3,366,022 | EUR | | | 85,033 | |
EDP Renovaveis SA | | 1-Day EONIA + 0.65% | | | Monthly | | | | MSCS | | | | 9/04/19 | | | | 797,888 | EUR | | | 165,394 | |
Eurofins Scientific SE | | 1-Month EURIBOR + 0.40% | | | Monthly | | | | MSCS | | | | 12/19/19 | | | | 836,876 | EUR | | | 24,005 | |
Fortescue Metals Group Ltd. | | 1-Month BBSW + 0.55% | | | Monthly | | | | MSCS | | | | 1/29/21 | | | | 5,720,496 | AUD | | | (2,034 | ) |
HeidelbergCement AG | | 1-Month EURIBOR + 0.40% | | | Monthly | | | | MSCS | | | | 12/19/19 | | | | 2,146,837 | EUR | | | (71,361 | ) |
Hikma Pharmaceuticals PLC | | 1-Month LIBOR + 0.40% | | | Monthly | | | | MSCS | | | | 4/16/20 | | | | 81,486 | GBP | | | (10,091 | ) |
Iliad SA | | 1-Month LIBOR + 0.40% | | | Monthly | | | | MSCS | | | | 12/19/19 | | | | 2,405,894 | EUR | | | (34,667 | ) |
Inmarsat PLC | | 1-Month LIBOR + 0.45% | | | Monthly | | | | DBAB | | | | 10/21/19 | | | | 1,667,748 | | | | (254 | ) |
Inmarsat PLC | | 1-Day FEDEF + 0.65% | | | Monthly | | | | MSCS | | | | 3/17/21 | | | | 1,925,456 | | | | (31,558 | ) |
Innogy SE | | 1-Day EONIA + 0.65% | | | Monthly | | | | MSCS | | | | 9/04/19 | | | | 4,098,502 | EUR | | | 373,551 | |
ITV PLC | | 1-Month LIBOR + 0.40% | | | Monthly | | | | MSCS | | | | 4/16/20 | | | | 1,507,833 | GBP | | | (194,327 | ) |
Knight-Swift Transportation Holdings Inc. | | 1-Month LIBOR + 0.55% | | | Monthly | | | | MSCS | | | | 9/22/20 | | | | 5,113,509 | | | | (768,428 | ) |
L3 Technologies Inc. | | 1-Day FEDEF + 0.40% | | | Monthly | | | | MSCS | | | | 12/23/20 | | | | 2,314,732 | | | | 623,993 | |
LafargeHolcim Ltd. | | 1-Month LIBOR + 0.40% | | | Monthly | | | | MSCS | | | | 7/26/19 | | | | 3,451,611 | CHF | | | (105,424 | ) |
Nexi SpA | | 1-Month EURIBOR + 0.40% | | | Monthly | | | | MSCS | | | | 12/19/19 | | | | 386,458 | EUR | | | 13,556 | |
NVR Inc. | | 1-Month LIBOR + 0.50% | | | Monthly | | | | MSCS | | | | 9/22/20 | | | | 2,823,414 | | | | 739,933 | |
OneMarket Ltd. | | 1-Month LIBOR + 0.55% | | | Monthly | | | | MSCS | | | | 2/20/20 | | | | — | | | | 11,919 | |
Pets at Home Group PLC | | 1-Month LIBOR + 0.40% | | | Monthly | | | | MSCS | | | | 4/16/20 | | | | 648,889 | GBP | | | 167,160 | |
Renault SA | | 1-Day EONIA + 0.65% | | | Monthly | | | | MSCS | | | | 9/04/19 | | | | 490,982 | EUR | | | (37,813 | ) |
Rio Tinto PLC | | 1-Month LIBOR + 0.50% | | | Monthly | | | | MSCS | | | | 1/20/20 | | | | 410,647 | GBP | | | 1,488 | |
Rio Tinto PLC | | 1-Month LIBOR + 0.50% | | | Monthly | | | | MSCS | | | | 9/22/20 | | | | 2,266,704 | | | | 292,238 | |
RPC Group PLC | | 1-Month LIBOR + 0.45% | | | Monthly | | | | DBAB | | | | 7/17/19 | | | | 2,793,365 | GBP | | | (6,411 | ) |
RPC Group PLC | | 1-Day SONIA + 0.65% | | | Monthly | | | | MSCS | | | | 2/06/20 | | | | 1,395,228 | GBP | | | (5,848 | ) |
RSA Insurance Group PLC | | 1-Month LIBOR + 0.40% | | | Monthly | | | | MSCS | | | | 4/16/20 | | | | 1,109,375 | GBP | | | (4,831 | ) |
RWE AG | | 1-Day EONIA + 0.65% | | | Monthly | | | | MSCS | | | | 10/30/19 | | | | 2,688,879 | EUR | | | 303,478 | |
Ryanair Holdings PLC | | 1-Month EURIBOR + 0.40% | | | Monthly | | | | MSCS | | | | 12/19/19 | | | | 618,361 | EUR | | | (46,065 | ) |
Smiths Group PLC | | 1-Month LIBOR + 0.40% | | | Monthly | | | | MSCS | | | | 4/16/20 | | | | 900,703 | GBP | | | (44,710 | ) |
| | | | |
| | | |
| 64 | | Annual Report | | franklintempleton.com |
FRANKLIN ALTERNATIVE STRATEGIES FUNDS
CONSOLIDATED STATEMENT OF INVESTMENTS
Franklin K2 Alternative Strategies Fund(continued)
| | | | | | | | | | | | | | | | | | | | | | |
| Total Return Swap Contracts(continued) | | | | |
| | | | | | |
| Underlying Instrument | | Financing Rate | | Payment
Frequency | | | Counter-
party | | | Maturity
Date | | | Notional
Value* | | | Value/Unrealized
Appreciation
(Depreciation) | |
| OTC Swap Contracts(continued) | | | | | | | | | | | | | | | | | | | | | | |
| Equity Contracts – Longc(continued) | | | | | | | | | | | | | | | | | | | | | | |
Societe Generale SA | | 1-Month LIBOR + 0.40% | | | Monthly | | | | MSCS | | | | 12/19/19 | | | | 1,250,337 | EUR | | $ | (94,251 | ) |
Sports Direct International PLC | | 1-Month LIBOR + 0.40% | | | Monthly | | | | MSCS | | | | 4/16/20 | | | | 1,346,871 | GBP | | | (41,164 | ) |
Stroeer SE & Co KGaA | | 1-Month EURIBOR + 0.40% | | | Monthly | | | | MSCS | | | | 12/19/19 | | | | 3,215,315 | EUR | | | (50,318 | ) |
Suntrust Banks Inc. | | 1-Day FEDEF + 0.40% | | | Monthly | | | | MSCS | | | | 12/23/20 | | | | 3,740,131 | | | | (106,082 | ) |
Vodafone Group PLC | | 1-Day SONIA + 0.65% | | | Monthly | | | | MSCS | | | | 2/06/20 | | | | 1,398,034 | GBP | | | (271,363 | ) |
Worldpay Inc. | | 1-Day FEDEF + 0.40% | | | Monthly | | | | MSCS | | | | 12/23/20 | | | | 5,307,380 | | | | 357,273 | |
| | | | | | | | | | | | | | | | | | | | | | |
| | | | | | | | 149,464 | |
| | | | | | | | | | | | | | | | | | | | | | |
| Equity Contracts – Shorta | | | | | | | | | | | | | | | | | | | | | | |
Alibaba Group Holding Ltd | | 1-Day FEDEF - 0.35% | | | Monthly | | | | MSCS | | | | 12/20/19 | | | | 2,688,544 | | | | 357,497 | |
BB&T Corp. | | 1-Day FEDEF - 0.35% | | | Monthly | | | | MSCS | | | | 2/04/21 | | | | 3,758,162 | | | | 114,666 | |
BHP Group Ltd. | | 1-Day RBACR - 0.50% | | | Monthly | | | | MSCS | | | | 1/29/21 | | | | 154,962 | AUD | | | (9,931 | ) |
BHP Group Ltd. | | 1-DayRBACR - 0.50% | | | Monthly | | | | MSCS | | | | 2/04/21 | | | | 1,689,670 | | | | 1,920 | |
Carnival Corp. | | 1-Day FEDEF - 0.35% | | | Monthly | | | | MSCS | | | | 2/04/21 | | | | 827,498 | | | | 44,033 | |
Colruyt SA | | 1-Day EONIA - 0.40% | | | Monthly | | | | MSCS | | | | 12/19/19 | | | | 2,007,563 | EUR | | | (71,219 | ) |
Fiat Chrysler Automobiles N.V. | | 1-Day EONIA - 0.50% | | | Monthly | | | | MSCS | | | | 10/30/19 | | | | 528,954 | EUR | | | 13,729 | |
Fidelity National Information Services Inc | | 1-Day FEDEF - 0.35% | | | Monthly | | | | MSCS | | | | 2/04/21 | | | | 4,906,517 | | | | (296,338 | ) |
Harris Corp. | | 1-Day FEDEF - 0.35% | | | Monthly | | | | MSCS | | | | 2/04/21 | | | | 2,360,569 | | | | (594,141 | ) |
Hermes International | | 1-Day EONIA - 0.40% | | | Monthly | | | | MSCS | | | | 1/10/20 | | | | 191,577 | EUR | | | 57 | |
JD Sports Fashion PLC | | 1-Day SONIA - 0.30% | | | Monthly | | | | MSCS | | | | 4/16/20 | | | | 323,894 | GBP | | | 2,202 | |
LVMH Moet Hennessy Louis Vuitton SE | | 1-Day EONIA - 0.40% | | | Monthly | | | | MSCS | | | | 1/10/20 | | | | 624,957 | EUR | | | (9,189 | ) |
Marks & Spencer Group PLC | | 1-Day SONIA - 0.30% | | | Monthly | | | | MSCS | | | | 4/16/20 | | | | 434,736 | GBP | | | 78,954 | |
Marks & Spencer Group PLC | | 1-Day SONIA - 0.30% | | | Monthly | | | | MSCS | | | | 4/16/20 | | | | — | GBP | | | (15,807 | ) |
Morgan Stanley MSPSAGNH Index | | 1-Day FEDEF - 0.45% | | | Monthly | | | | MSCS | | | | 9/22/20 | | | | 2,356,842 | | | | 109,170 | |
Morgan Stanley MSPSDWD2 Index | | 1-Day FEDEF - 0.40% | | | Monthly | | | | MSCS | | | | 9/22/20 | | | | 1,421,432 | | | | (63,654 | ) |
Morgan Stanley MSPSMLP Index | | 1-Day FEDEF - 0.35% | | | Monthly | | | | MSCS | | | | 9/22/20 | | | | 472,247 | | | | (59,002 | ) |
Next PLC | | 1-Day SONIA - 0.30% | | | Monthly | | | | MSCS | | | | 4/16/20 | | | | 427,970 | GBP | | | (12,962 | ) |
Partners Group Holding AG | | 1-Day SARON - 0.40% | | | Monthly | | | | MSCS | | | | 3/29/21 | | | | 52,526 | CHF | | | 1,205 | |
S&P High Beta Total Return Index | | 1-Month LIBOR - 0.22% | | | Monthly | | | | BOFA | | | | 4/30/20 | | | | 182,956 | | | | 17,423 | |
S&P High Beta Total Return Index | | 1-Month LIBOR | | | Monthly | | | | BZWS | | | | 4/30/20 | | | | 2,948,988 | | | | 274,995 | |
Safran SA | | 1-Day EONIA - 0.40% | | | Monthly | | | | MSCS | | | | 1/10/20 | | | | 110,516 | EUR | | | 4,991 | |
Technology Select Sector SPDR Index | | 1-Day FEDEF - 0.35% | | | Monthly | | | | MSCS | | | | 9/22/20 | | | | 1,257,545 | | | | 19,622 | |
Unilever NV | | 1-Day EONIA - 0.35% | | | Monthly | | | | MSCS | | | | 12/19/19 | | | | 379,769 | EUR | | | (12,287 | ) |
Valeo SA | | 1-Day EONIA - 0.40% | | | Monthly | | | | MSCS | | | | 1/10/20 | | | | 381,051 | EUR | | | 20,153 | |
| | | | | | | | | | | | | | | | | | | | | | |
| | | | | | | | (83,913 | ) |
| | | | | | | | | | | | | | | | | | | | | | |
| Interest Rate Contracts – Longc | | | | | | | | | | | | | | | | | | | | | | |
Egyptian Treasury Bill | | — | | | Monthly | | | | DBAB | | | | 8/13/19 | | | | 486,408 | | | $ | 52,019 | |
Egyptian Treasury Bill | | 3-Month LIBOR + 0.50% | | | Monthly | | | | GSCO | | | | 8/13/19 | | | | 484,298 | | | | 51,242 | |
Government of Indonesia | | 3-Month LIBOR + 0.60% | | | Monthly | | | | BOFA | | | | 4/15/20 | | | | 1,784,968 | | | | (104,519 | ) |
Government of Indonesia | | 3-Month LIBOR + 0.60% | | | Monthly | | | | DBAB | | | | 6/15/32 | | | | 1,929,619 | | | | (111,187 | ) |
| | | | | | | | | | | | | | | | | | | | | | |
| | | | | | | | | | | | | | | | | | | | | (112,445 | ) |
| | | | | | | | | | | | | | | | | | | | | | |
Total Total Return Swap Contracts | | | $ | (60,592 | ) |
| | | | | | | | | | | | | | | | | | | | | | |
*In U.S. dollars unless otherwise indicated.
aThe Fund receives the variable financing rate and pays the total return on the underlying instrument.
bA portion or all of the contracts are owned by K2 Holdings Investment Corp., a wholly-owned subsidiary of the Fund. See Note 1(j).
cThe Fund receives the total return on the underlying instrument and pays a variable financing rate.
See Note 9 regarding other derivative information.
See Abbreviations on page 86.
| | | | | | |
| | | |
| franklintempleton.com | | The accompanying notes are an integral part of these consolidated financial statements. | Annual Report | | | 65 | |
FRANKLIN ALTERNATIVE STRATEGIES FUNDS
CONSOLIDATED FINANCIAL STATEMENTS
Consolidated Statement of Assets and Liabilities
May 31, 2019
Franklin K2 Alternative Strategies Fund
| | | | |
| |
Assets: | | | | |
Investments in securities: | | | | |
Cost – Unaffiliated issuers | | $ | 1,010,460,532 | |
Cost –Non-controlled affiliates (Note 3f) | | | 4,871,000 | |
Cost – Unaffiliated repurchase agreements | | | 22,718,635 | |
| | | | |
Value – Unaffiliated issuers† | | $ | 1,104,994,220 | |
Value –Non-controlled affiliates (Note 3f) | | | 4,871,000 | |
Value – Unaffiliated repurchase agreements | | | 22,718,635 | |
Cash | | | 81,784,543 | |
Restricted cash for OTC derivatives (Note 1e) | | | 160,000 | |
Foreign currency, at value (cost $4,801,621) | | | 4,794,960 | |
Receivables: | | | | |
Investment securities sold | | | 15,486,721 | |
Capital shares sold | | | 2,336,934 | |
Dividends and interest | | | 4,400,406 | |
Deposits with brokers for: | | | | |
Exchange traded options written | | | 979,618 | |
Securities sold short | | | 213,817,025 | |
OTC derivative contracts | | | 9,864,515 | |
Futures contracts | | | 18,920,786 | |
Centrally cleared swap contracts | | | 4,752,442 | |
Due from brokers | | | 7,670,766 | |
Variation margin on futures contracts | | | 1,456,866 | |
Variation margin on centrally cleared swap contracts | | | 25,751 | |
OTC swap contracts (upfront payments $121,985) | | | 121,431 | |
Unrealized appreciation on OTC forward exchange contracts | | | 4,850,314 | |
Unrealized appreciation on OTC swap contracts | | | 4,423,239 | |
Other assets | | | 23,851 | |
| | | | |
Total assets | | | 1,508,454,023 | |
| | | | |
Liabilities: | | | | |
Payables: | | | | |
Investment securities purchased | | | 16,854,469 | |
Capital shares redeemed | | | 5,695,891 | |
Management fees | | | 1,897,859 | |
Distribution fees | | | 61,637 | |
Transfer agent fees | | | 147,958 | |
Deposits from brokers for: | | | | |
OTC derivative contracts | | | 160,000 | |
Due to brokers | | | 3,909,204 | |
OTC swap contracts (upfront receipts $288) | | | 255 | |
Options written, at value (premiums received $635,119) | | | 378,169 | |
Securities sold short, at value (proceeds $232,213,225) | | | 225,752,061 | |
Payable upon return of securities loaned | | | 6,071,061 | |
Unrealized depreciation on OTC forward exchange contracts | | | 3,292,760 | |
Unrealized depreciation on OTC swap contracts | | | 4,500,931 | |
Unrealized depreciation on unfunded loan commitments (Note 8) | | | 289 | |
Accrued expenses and other liabilities | | | 444,303 | |
| | | | |
Total liabilities | | | 269,166,847 | |
| | | | |
Net assets, at value | | $ | 1,239,287,176 | |
| | | | |
Net assets consist of: | | | | |
Paid-in capital | | $ | 1,172,311,742 | |
Total distributable earnings (loss) | | | 66,975,434 | |
| | | | |
Net assets, at value | | $ | 1,239,287,176 | |
| | | | |
†Includes securities loaned | | $ | 5,759,766 | |
| | | | |
| | | |
| 66 | | Annual Report | The accompanying notes are an integral part of these consolidated financial statements. | | franklintempleton.com |
FRANKLIN ALTERNATIVE STRATEGIES FUNDS
CONSOLIDATED FINANCIAL STATEMENTS
Consolidated Statement of Assets and Liabilities(continued)
May 31, 2019
Franklin K2 Alternative Strategies Fund
| | | | |
| |
Class A: | | | | |
Net assets, at value | | | $104,452,283 | |
| | | | |
Shares outstanding | | | 9,262,488 | |
| | | | |
Net asset value per sharea | | | $11.28 | |
| | | | |
Maximum offering price per share (net asset value per share ÷ 94.50%) | | | $11.94 | |
| | | | |
Class C: | | | | |
Net assets, at value | | | $44,897,136 | |
| | | | |
Shares outstanding | | | 4,062,334 | |
| | | | |
Net asset value and maximum offering price per sharea | | | $11.05 | |
| | | | |
Class R: | | | | |
Net assets, at value | | | $843,757 | |
| | | | |
Shares outstanding | | | 74,800 | |
| | | | |
Net asset value and maximum offering price per share | | | $11.28 | |
| | | | |
Class R6: | | | | |
Net assets, at value | | | $42,841,514 | |
| | | | |
Shares outstanding | | | 3,776,547 | |
| | | | |
Net asset value and maximum offering price per share | | | $11.34 | |
| | | | |
Advisor Class: | | | | |
Net assets, at value | | | $1,046,252,486 | |
| | | | |
Shares outstanding | | | 92,381,081 | |
| | | | |
Net asset value and maximum offering price per share | | | $11.33 | |
| | | | |
aRedemption price is equal to net asset value less contingent deferred sales charges, if applicable.
| | | | | | |
| | | |
| franklintempleton.com | | The accompanying notes are an integral part of these consolidated financial statements. | Annual Report | | | 67 | |
FRANKLIN ALTERNATIVE STRATEGIES FUNDS
CONSOLIDATED FINANCIAL STATEMENTS
Consolidated Statement of Operations
for the year ended May 31, 2019
Franklin K2 Alternative Strategies Fund
| | | | |
| |
Investment income: | | | | |
Dividends: (net of foreign taxes)* | | | | |
Unaffiliated issuers | | $ | 9,445,030 | |
Interest: (net of foreign taxes)~ | | | | |
Unaffiliated issuers | | | 24,984,102 | |
Income from securities loaned: | | | | |
Unaffiliated issuers (net of fees and rebates) | | | 74,024 | |
Non-controlled affiliates (Note 3f) | | | 117,650 | |
| | | | |
Total investment income | | | 34,620,806 | |
| | | | |
Expenses: | | | | |
Management fees (Note 3a) | | | 22,528,344 | |
Distribution fees: (Note 3c) | | | | |
Class A | | | 270,736 | |
Class C | | | 493,567 | |
Class R | | | 4,684 | |
Transfer agent fees: (Note 3e) | | | | |
Class A | | | 108,459 | |
Class C | | | 49,392 | |
Class R | | | 939 | |
Class R6 | | | 9,997 | |
Advisor Class | | | 992,195 | |
Custodian fees (Note 4) . | | | 245,681 | |
Reports to shareholders | | | 126,097 | |
Registration and filing fees | | | 139,601 | |
Professional fees | | | 474,003 | |
Trustees’ fees and expenses | | | 395,835 | |
Dividends and interest on securities sold short | | | 4,243,266 | |
Other | | | 116,267 | |
| | | | |
Total expenses | | | 30,199,063 | |
Expense reductions (Note 4) | | | (258,750 | ) |
Expenses waived/paid by affiliates (Note 3f and 3g) | | | (1,842,967 | ) |
| | | | |
Net expenses | | | 28,097,346 | |
| | | | |
Net investment income | | | 6,523,460 | |
| | | | |
Realized and unrealized gains (losses): | | | | |
Net realized gain (loss) from: | | | | |
Investments: | | | | |
Unaffiliated issuers | | | 13,197,981 | |
Written options | | | 872,242 | |
Foreign currency transactions | | | (151,799 | ) |
Forward exchange contracts | | | 7,194,420 | |
Futures contracts | | | (3,406,370 | ) |
Securities sold short | | | (13,802,807 | ) |
Swap contracts | | | 4,901,744 | |
| | | | |
Net realized gain (loss) | | | 8,805,411 | |
| | | | |
Net change in unrealized appreciation (depreciation) on: | | | | |
Investments: | | | | |
Unaffiliated issuers | | | (8,466,026 | ) |
Translation of other assets and liabilities denominated in foreign currencies | | | 74,636 | |
Forward exchange contracts | | | (61,035 | ) |
Written options | | | 123,456 | |
Futures contracts | | | 4,986,205 | |
Securities sold short | | | 11,318,766 | |
Swap contracts | | | (7,335,250 | ) |
| | | | |
Net change in unrealized appreciation (depreciation) | | | 640,752 | |
| | | | |
Net realized and unrealized gain (loss) | | | 9,446,163 | |
| | | | |
Net increase (decrease) in net assets resulting from operations | | $ | 15,969,623 | |
| | | | |
* Foreign taxes withheld on dividends | | $ | 146,234 | |
~ Foreign taxes withheld on interest | | $ | 1,790 | |
| | | | |
| | | |
| 68 | | Annual Report | The accompanying notes are an integral part of these consolidated financial statements. | | franklintempleton.com |
FRANKLIN ALTERNATIVE STRATEGIES FUNDS
CONSOLIDATED FINANCIAL STATEMENTS
Consolidated Statements of Changes in Net Assets
Franklin K2 Alternative Strategies Fund
| | | | | | | | |
| |
| | | Year Ended May 31, | |
| | |
| | | 2019 | | | 2018 | |
Increase (decrease) in net assets: | | | | | | | | |
Operations: | | | | | | | | |
Net investment income | | $ | 6,523,460 | | | $ | 2,548,305 | |
Net realized gain (loss) | | | 8,805,411 | | | | 17,117,174 | |
Net change in unrealized appreciation (depreciation) | | | 640,752 | | | | 20,905,020 | |
| | | | |
Net increase (decrease) in net assets resulting from operations | | | 15,969,623 | | | | 40,570,499 | |
| | | | |
Distributions to shareholders: (Note 1m) | | | | | | | | |
Class A | | | (2,359,116 | ) | | | (1,546,194 | ) |
Class C | | | (1,085,438 | ) | | | (285,639 | ) |
Class R | | | (16,101 | ) | | | (5,635 | ) |
Class R6 | | | (817,934 | ) | | | (2,505,528 | ) |
Advisor Class | | | (21,685,004 | ) | | | (11,772,288 | ) |
| | | | |
Total distributions to shareholders | | | (25,963,593 | ) | | | (16,115,284 | ) |
| | | | |
Capital share transactions: (Note 2) | | | | | | | | |
Class A | | | (13,877,422 | ) | | | (2,755,965 | ) |
Class C | | | (7,442,314 | ) | | | (3,461,065 | ) |
Class R | | | 189,631 | | | | 38,619 | |
Class R6 | | | 11,235,421 | | | | (238,755,438 | ) |
Advisor Class | | | 158,034,578 | | | | 206,066,759 | |
| | | | |
Total capital share transactions | | | 148,139,894 | | | | (38,867,090 | ) |
| | | | |
Net increase (decrease) in net assets | | | 138,145,924 | | | | (14,411,875 | ) |
Net assets: | | | | | | | | |
Beginning of year | | | 1,101,141,252 | | | | 1,115,553,127 | |
| | | | |
End of year (Note 1m) | | $ | 1,239,287,176 | | | $ | 1,101,141,252 | |
| | | | |
| | | | | | |
| | | |
| franklintempleton.com | | The accompanying notes are an integral part of these consolidated financial statements. | Annual Report | | | 69 | |
FRANKLIN ALTERNATIVE STRATEGIES FUNDS
Notes to Consolidated Financial Statements
Franklin K2 Alternative Strategies Fund
1. Organization and Significant Accounting Policies
Franklin Alternative Strategies Funds (Trust) is registered under the Investment Company Act of 1940 (1940 Act) as anopen-end management investment company, consisting of four separate funds and applies the specialized accounting and reporting guidance in U.S. Generally Accepted Accounting Principles (U.S. GAAP). Franklin K2 Alternative Strategies Fund (Fund) is included in this report. The Fund offers five classes of shares: Class A, Class C, Class R, Class R6 and Advisor Class. Beginning on October 19, 2018, Class C shares automatically convert to Class A shares after they have been held for 10 years. Each class of shares may differ by its initial sales load, contingent deferred sales charges, voting rights on matters affecting a single class, its exchange privilege and fees due to differing arrangements for distribution and transfer agent fees.
The following summarizes the Fund’s significant accounting policies.
a. Financial Instrument Valuation
The Fund’s investments in financial instruments are carried at fair value daily. Fair value is the price that would be received to sell an asset or paid to transfer a liability in an orderly transaction between market participants on the measurement date. The Fund calculates the net asset value (NAV) per share each business day as of 4 p.m. Eastern time or the regularly scheduled close of the New York Stock Exchange (NYSE), whichever is earlier. Under compliance policies and procedures approved by the Trust’s Board of Trustees (the Board), the Fund’s administrator has responsibility for oversight of valuation, including leading the cross-functional Valuation Committee (VC). The Fund may utilize independent pricing services, quotations from securities and financial instrument dealers, and other market sources to determine fair value.
Equity securities, exchange traded funds and derivative financial instruments listed on an exchange or on the NASDAQ National Market System are valued at the last quoted sale price or the official closing price of the day, respectively. Foreign equity securities are valued as of the close of trading on the foreign stock exchange on which the security is primarily traded or as of 4 p.m. Eastern time. The value is then converted into its U.S. dollar equivalent at the foreign exchange rate in effect at 4 p.m. Eastern time on the day that the value of the security is determined.Over-the-counter (OTC) securities are valued within the range of the most recent quoted bid
and ask prices. Securities that trade in multiple markets or on multiple exchanges are valued according to the broadest and most representative market. Certain equity securities are valued based upon fundamental characteristics or relationships to similar securities.
Debt securities generally trade in the OTC market rather than on a securities exchange. The Fund’s pricing services use multiple valuation techniques to determine fair value. In instances where sufficient market activity exists, the pricing services may utilize a market-based approach through which quotes from market makers are used to determine fair value. In instances where sufficient market activity may not exist or is limited, the pricing services also utilize proprietary valuation models which may consider market characteristics such as benchmark yield curves, credit spreads, estimated default rates, anticipated market interest rate volatility, coupon rates, anticipated timing of principal repayments, underlying collateral, and other unique security features in order to estimate the relevant cash flows, which are then discounted to calculate the fair value. Securities denominated in a foreign currency are converted into their U.S. dollar equivalent at the foreign exchange rate in effect at 4 p.m. Eastern time on the date that the values of the foreign debt securities are determined.
Investments inopen-end mutual funds are valued at the closing NAV. Investments in repurchase agreements are valued at cost, which approximates fair value.
Certain derivative financial instruments are centrally cleared or trade in the OTC market. The Fund’s pricing services use various techniques including industry standard option pricing models and proprietary discounted cash flow models to determine the fair value of those instruments. The Fund’s net benefit or obligation under the derivative contract, as measured by the fair value of the contract, is included in net assets.
The Fund has procedures to determine the fair value of financial instruments for which market prices are not reliable or readily available. Under these procedures, the Fund primarily employs a market-based approach which may use related or comparable assets or liabilities, recent transactions, market multiples, book values, and other relevant information for the investment to determine the fair value of the investment. An income-based valuation approach may also be used in which the anticipated future cash flows of the investment are discounted to calculate fair value. Discounts may also be applied due to the nature or duration of any restrictions on
| | | | |
| | | |
| 70 | | Annual Report | | franklintempleton.com |
FRANKLIN ALTERNATIVE STRATEGIES FUNDS
NOTES TO CONSOLIDATED FINANCIAL STATEMENTS
Franklin K2 Alternative Strategies Fund(continued)
the disposition of the investments. Due to the inherent uncertainty of valuations of such investments, the fair values may differ significantly from the values that would have been used had an active market existed.
Trading in securities on foreign securities stock exchanges and OTC markets may be completed before 4 p.m. Eastern time. In addition, trading in certain foreign markets may not take place on every Fund’s business day. Occasionally, events occur between the time at which trading in a foreign security is completed and 4 p.m. Eastern time that might call into question the reliability of the value of a portfolio security held by the Fund. As a result, differences may arise between the value of the Fund’s portfolio securities as determined at the foreign market close and the latest indications of value at 4 p.m. Eastern time. In order to minimize the potential for these differences, the VC monitors price movements following the close of trading in foreign stock markets through a series of country specific market proxies (such as baskets of American Depositary Receipts, futures contracts and exchange traded funds). These price movements are measured against established trigger thresholds for each specific market proxy to assist in determining if an event has occurred that may call into question the reliability of the values of the foreign securities held by the Fund. If such an event occurs, the securities may be valued using fair value procedures, which may include the use of independent pricing services.
When the last day of the reporting period is anon-business day, certain foreign markets may be open on those days that the Fund’s NAV is not calculated, which could result in differences between the value of the Fund’s portfolio securities on the last business day and the last calendar day of the reporting period. Any significant security valuation changes due to an open foreign market are adjusted and reflected by the Fund for financial reporting purposes.
b. Foreign Currency Translation
Portfolio securities and other assets and liabilities denominated in foreign currencies are translated into U.S. dollars based on the exchange rate of such currencies against U.S. dollars on the date of valuation. The Fund may enter into foreign currency exchange contracts to facilitate transactions denominated in a foreign currency. Purchases and sales of securities, income and expense items denominated in foreign currencies are translated into U.S. dollars at the exchange rate in effect on the transaction date. Portfolio securities and assets and liabilities denominated in foreign currencies
contain risks that those currencies will decline in value relative to the U.S. dollar. Occasionally, events may impact the availability or reliability of foreign exchange rates used to convert the U.S. dollar equivalent value. If such an event occurs, the foreign exchange rate will be valued at fair value using procedures established and approved by the Board.
The Fund does not separately report the effect of changes in foreign exchange rates from changes in market prices on securities held. Such changes are included in net realized and unrealized gain or loss from investments in the Consolidated Statement of Operations.
Realized foreign exchange gains or losses arise from sales of foreign currencies, currency gains or losses realized between the trade and settlement dates on securities transactions and the difference between the recorded amounts of dividends, interest, and foreign withholding taxes and the U.S. dollar equivalent of the amounts actually received or paid. Net unrealized foreign exchange gains and losses arise from changes in foreign exchange rates on foreign denominated assets and liabilities other than investments in securities held at the end of the reporting period.
c. Joint Repurchase Agreement
The Fund enters into a joint repurchase agreement whereby its uninvested cash balance is deposited into a joint cash account with other funds managed by the investment manager or an affiliate of the investment manager and is used to invest in one or more repurchase agreements. The value and face amount of the joint repurchase agreement are allocated to the funds based on theirpro-rata interest. A repurchase agreement is accounted for as a loan by the Fund to the seller, collateralized by securities which are delivered to the Fund’s custodian. The fair value, including accrued interest, of the initial collateralization is required to be at least 102% of the dollar amount invested by the funds, with the value of the underlying securities marked to market daily to maintain coverage of at least 100%. Repurchase agreements are subject to the terms of Master Repurchase Agreements (MRAs) with approved counterparties (sellers). The MRAs contain various provisions, including but not limited to events of default and maintenance of collateral for repurchase agreements. In the event of default by either the seller or the Fund, certain MRAs may permit thenon-defaulting party to net andclose-out all transactions, if any, traded under such agreements. The Fund may sell securities it holds as collateral and apply the proceeds towards the repurchase price and any other
| | | | | | |
| | | |
| franklintempleton.com | | Annual Report | | | 71 | |
FRANKLIN ALTERNATIVE STRATEGIES FUNDS
NOTES TO CONSOLIDATED FINANCIAL STATEMENTS
Franklin K2 Alternative Strategies Fund(continued)
1. Organization and Significant Accounting Policies(continued)
c. Joint Repurchase Agreement(continued)
amounts owed by the seller to the Fund in the event of default by the seller. This could involve costs or delays in addition to a loss on the securities if their value falls below the repurchase price owed by the seller. The joint repurchase agreement held by the Fund at year end, as indicated in the Consolidated Statement of Investments, had been entered into on May 31, 2019.
d. Derivative Financial Instruments
The Fund invested in derivative financial instruments in order to manage risk or gain exposure to various other investments or markets. Derivatives are financial contracts based on an underlying or notional amount, require no initial investment or an initial net investment that is smaller than would normally be required to have a similar response to changes in market factors, and require or permit net settlement. Derivatives contain various risks including the potential inability of the counterparty to fulfill their obligations under the terms of the contract, the potential for an illiquid secondary market, and/or the potential for market movements which expose the Fund to gains or losses in excess of the amounts shown in the Consolidated Statement of Assets and Liabilities. Realized gain and loss and unrealized appreciation and depreciation on these contracts for the period are included in the Consolidated Statement of Operations.
Derivative counterparty credit risk is managed through a formal evaluation of the creditworthiness of all potential counterparties. The Fund attempts to reduce its exposure to counterparty credit risk on OTC derivatives, whenever possible, by entering into International Swaps and Derivatives Association (ISDA) master agreements with certain counterparties. These agreements contain various provisions, including but not limited to collateral requirements, events of default, or early termination. Termination events applicable to the counterparty include certain deteriorations in the credit quality of the counterparty. Termination events applicable to the Fund include failure of the Fund to maintain certain net asset levels and/or limit the decline in net assets over various periods of time. In the event of default or early termination, the ISDA master agreement gives thenon-defaulting party the right to net andclose-out all transactions traded, whether or not arising under the ISDA agreement, to one net amount payable by one counterparty to the other. However, absent
an event of default or early termination, OTC derivative assets and liabilities are presented gross and not offset in the Consolidated Statement of Assets and Liabilities. Early termination by the counterparty may result in an immediate payment by the Fund of any net liability owed to that counterparty under the ISDA agreement.
Collateral requirements differ by type of derivative. Collateral or initial margin requirements are set by the broker or exchange clearing house for exchange traded and centrally cleared derivatives. Initial margin deposited is held at the exchange and can be in the form of cash and/or securities. For OTC derivatives traded under an ISDA master agreement, posting of collateral is required by either the Fund or the applicable counterparty if the total net exposure of all OTC derivatives with the applicable counterparty exceeds the minimum transfer amount, which typically ranges from $100,000 to $250,000, and can vary depending on the counterparty and the type of the agreement. Generally, collateral is determined at the close of Fund business each day and any additional collateral required due to changes in derivative values may be delivered by the Fund or the counterparty the next business day, or within a few business days. Collateral pledged and/or received by the Fund for OTC derivatives, if any, is held in segregated accounts with the Fund’s custodian/counterparty broker and can be in the form of cash and/or securities. Unrestricted cash may be invested according to the Fund’s investment objectives. To the extent that the amounts due to the Fund from its counterparties are not subject to collateralization or are not fully collateralized, the Fund bears the risk of loss from counterpartynon-performance.
The Fund entered into exchange traded futures contracts primarily to manage and/or gain exposure to commodity price, interest rate, equity price risk and certain foreign currencies. A futures contract is an agreement between the Fund and a counterparty to buy or sell an asset at a specified price on a future date. Required initial margins are pledged by the Fund, and the daily change in fair value is accounted for as a variation margin payable or receivable in the Consolidated Statement of Assets and Liabilities.
The Fund entered into OTC forward exchange contracts primarily to manage and/or gain exposure to certain foreign currencies. A forward exchange contract is an agreement between the Fund and a counterparty to buy or sell a foreign currency at a specific exchange rate on a future date.
| | | | |
| | | |
| 72 | | Annual Report | | franklintempleton.com |
FRANKLIN ALTERNATIVE STRATEGIES FUNDS
NOTES TO CONSOLIDATED FINANCIAL STATEMENTS
Franklin K2 Alternative Strategies Fund(continued)
The Fund entered into credit default swap contracts primarily to manage and/or gain exposure to credit risk. A credit default swap is an agreement between the Fund and a counterparty whereby the buyer of the contract receives credit protection and the seller of the contract guarantees the credit worthiness of a referenced debt obligation. These agreements may be privately negotiated in theover-the-counter market (OTC credit default swaps) or may be executed in a multilateral trade facility platform, such as a registered exchange (centrally cleared credit default swaps). The underlying referenced debt obligation may be a single issuer of corporate or sovereign debt, a credit index, a basket of issuers or indices, or a tranche of a credit index or basket of issuers or indices. In the event of a default of the underlying referenced debt obligation, the buyer is entitled to receive the notional amount of the credit default swap contract from the seller in exchange for the referenced debt obligation, a net settlement amount equal to the notional amount of the credit default swap less the recovery value of the referenced debt obligation, or other agreed upon amount. For centrally cleared credit default swaps, required initial margins are pledged by the Fund, and the daily change in fair value is accounted for as a variation margin payable or receivable in the Consolidated Statement of Assets and Liabilities. Over the term of the contract, the buyer pays the seller a periodic stream of payments, provided that no event of default has occurred. Such periodic payments are accrued daily as an unrealized appreciation or depreciation until the payments are made, at which time they are realized. Upfront payments and receipts are reflected in the Consolidated Statement of Assets and Liabilities and represent compensating factors between stated terms of the credit default swap agreement and prevailing market conditions (credit spreads and other relevant factors). These upfront payments and receipts are amortized over the term of the contract as a realized gain or loss in the Consolidated Statement of Operations.
The Fund entered into interest rate swap contracts primarily to manage interest rate risk. An interest rate swap is an agreement between the Fund and a counterparty to exchange cash flows based on the difference between two interest rates, applied to a notional amount. These agreements may be privately negotiated in theover-the-counter market (OTC interest rate swaps) or may be executed on a registered exchange (centrally cleared interest rate swaps). For centrally cleared interest rate swaps, required initial margins are pledged by the Fund, and the daily change in fair value is accounted for as a variation margin payable or receivable in the Consolidated
Statement of Assets and Liabilities. Over the term of the contract, contractually required payments to be paid and to be received are accrued daily and recorded as unrealized depreciation and appreciation until the payments are made, at which time they are realized.
The Fund entered into OTC total return swap contracts primarily to manage and/or gain exposure to interest rate, equity price, commodity price and credit risk of an underlying instrument such as a stock, bond, index or basket of securities or indices. A total return swap is an agreement between the Fund and a counterparty to exchange a return linked to an underlying instrument for a floating or fixed rate payment, both based upon a notional amount. Over the term of the contract, contractually required payments to be paid or received are accrued daily and recorded as unrealized appreciation or depreciation until the payments are made, at which time they are recognized as realized gain or loss.
The Fund purchased or wrote exchange traded and/or OTC option contracts primarily to manage and/or gain exposure to interest rate, equity price and foreign exchange rate risk. An option is a contract entitling the holder to purchase or sell a specific amount of shares or units of an asset or notional amount of a swap (swaption), at a specified price. When an option is purchased or written, an amount equal to the premium paid or received is recorded as an asset or liability, respectively. Upon exercise of an option, the acquisition cost or sales proceeds of the underlying investment is adjusted by any premium received or paid. Upon expiration of an option, any premium received or paid is recorded as a realized gain or loss. Upon closing an option other than through expiration or exercise, the difference between the premium received or paid and the cost to close the position is recorded as a realized gain or loss.
See Notes 6 and 9 regarding investment transactions and other derivative information, respectively.
e. Restricted Cash
At May 31, 2019, the Fund held restricted cash in connection with investments in certain derivative securities. Restricted cash is held in a segregated account with the Fund’s custodian/counterparty broker and is reflected in the Consolidated Statement of Assets and Liabilities.
f. Loan Participation Notes
The Fund invests in loan participation notes (Participations). Participations are loans originally issued to a borrower by one
| | | | | | |
| | | |
| franklintempleton.com | | Annual Report | | | 73 | |
FRANKLIN ALTERNATIVE STRATEGIES FUNDS
NOTES TO CONSOLIDATED FINANCIAL STATEMENTS
Franklin K2 Alternative Strategies Fund(continued)
1. Organization and Significant Accounting Policies(continued)
f. Loan Participation Notes(continued)
or more financial institutions (the Lender) and subsequently sold to other investors, such as the Fund. Participations typically result in the Fund having a contractual relationship only with the Lender and not with the borrower. The Fund has the right to receive from the Lender any payments of principal, interest and fees which the Lender received from the borrower. The Fund generally has no rights to either enforce compliance by the borrower with the terms of the loan agreement or to any collateral relating to the original loan. As a result, the Fund assumes the credit risk of both the borrower and the Lender that is selling the Participation. The Participations may also involve interest rate risk and liquidity risk, including the potential default or insolvency of the borrower and/or the Lender.
g. Credit-Linked Notes
The Fund purchases credit-linked notes. Credit-linked notes are intended to replicate the economic effects that would apply had the Fund directly purchased the underlying reference asset. The risks of credit-linked notes include the potential default of the underlying reference asset, the movement in the value of the currency of the underlying reference asset relative to the credit-linked note, the potential inability of the Fund to dispose of the credit-linked note in the normal course of business, and the possible inability of the counterparties to fulfill their obligations under the contracts.
h. Securities Sold Short
The Fund is engaged in selling securities short, which obligates the Fund to replace a borrowed security with the same security at current fair value. The Fund incurs a loss if the price of the security increases between the date of the short sale and the date on which the Fund replaces the borrowed security. The Fund realizes a gain if the price of the security declines between those dates. Gains are limited to the price at which the Fund sold the security short, while losses are potentially unlimited in size.
The Fund is required to establish a margin account with the broker lending the security sold short. While the short sale is outstanding, the broker retains the proceeds of the short sale to the extent necessary to meet margin requirements until the short position is closed out. A deposit must also be maintained with the Fund’s custodian/counterparty broker consisting of cash and/or securities having a value equal to a
specified percentage of the value of the securities sold short. The Fund is obligated to pay fees for borrowing the securities sold short and is required to pay the counterparty any dividends and/or interest due on securities sold short. Such dividends and/or interest and any security borrowing fees are recorded as an expense to the Fund.
i. Securities Lending
The Fund participates in an agency based securities lending program to earn additional income. The Fund receives cash collateral against the loaned securities in an amount equal to at least 102% of the fair value of the loaned securities. Collateral is maintained over the life of the loan in an amount not less than 100% of the fair value of loaned securities, as determined at the close of Fund business each day; any additional collateral required due to changes in security values is delivered to the Fund on the next business day. The collateral is deposited into a joint cash account with other funds and is used to invest in a money market fund managed by Franklin Advisers, Inc., an affiliate of the Fund, and/or a joint repurchase agreement. The Fund may receive income from the investment cash collateral, in addition to lending fees and rebates paid by the borrower. Income from securities loaned, net of fees paid to the securities lending agent and/or third party vendor, is reported separately in the Consolidated Statement of Operations. The Fund bears the market risk with respect to the collateral investment, securities loaned, and the risk that the agent may default on its obligations to the Fund. If the borrower defaults on its obligations to return the securities loaned, the Fund has the right to repurchase the securities in the open market using the collateral received. The securities lending agent has agreed to indemnify the Fund in the event of default by a third party borrower.
j. Investments in K2 Holdings Investment Corp. (K2 Subsidiary)
The Fund invests in certain financial instruments and commodity-linked derivative investments through its investment in the K2 Subsidiary. The K2 Subsidiary is a Cayman Islands exempted company with limited liability, is a wholly-owned subsidiary of the Fund, and is able to invest in certain financial instruments and commodity-linked derivative investments consistent with the investment objective of the Fund. At May 31, 2019, the K2 Subsidiary’s investments, as well as any other assets and liabilities of the K2 Subsidiary, are reflected in the Fund’s Consolidated Statement of Investments and Consolidated Statement of Assets and Liabilities.
| | | | |
| | | |
| 74 | | Annual Report | | franklintempleton.com |
FRANKLIN ALTERNATIVE STRATEGIES FUNDS
NOTES TO CONSOLIDATED FINANCIAL STATEMENTS
Franklin K2 Alternative Strategies Fund(continued)
All intercompany transactions and balances have been eliminated. For tax purposes, the Fund is required to increase its taxable income by its share of the K2 Subsidiary’s income. Net losses incurred by the K2 Subsidiary cannot offset income earned by the Fund and cannot be carried back or forward by the K2 Subsidiary to offset income from prior or future years. At May 31, 2019, the net assets of the K2 Subsidiary were $19,024,756, representing 1.5% of the Fund’s consolidated net assets. The Fund’s investment in the K2 Subsidiary is limited to 25% of consolidated assets.
k. Senior Floating Rate Interests
The Fund invests in senior secured corporate loans that pay interest at rates which are periodically reset by reference to a base lending rate plus a spread. These base lending rates are generally the prime rate offered by a designated U.S. bank or the London InterBank Offered Rate (LIBOR). Senior secured corporate loans often require prepayment of principal from excess cash flows or at the discretion of the borrower. As a result, actual maturity may be substantially less than the stated maturity. Senior secured corporate loans in which the Fund invests are generally readily marketable, but may be subject to certain restrictions on resale.
l. Income and Deferred Taxes
It is the Fund’s policy to qualify as a regulated investment company under the Internal Revenue Code. The Fund intends to distribute to shareholders substantially all of its taxable income and net realized gains to relieve it from federal income and excise taxes. As a result, no provision for U.S. federal income taxes is required.
The Fund may be subject to foreign taxation related to income received, capital gains on the sale of securities and certain foreign currency transactions in the foreign jurisdictions in which it invests. Foreign taxes, if any, are recorded based on the tax regulations and rates that exist in the foreign markets in which the Fund invests. When a capital gain tax is determined to apply, the Fund records an estimated deferred tax liability in an amount that would be payable if the securities were disposed of on the valuation date.
The Fund may recognize an income tax liability related to its uncertain tax positions under U.S. GAAP when the uncertain tax position has a less than 50% probability that it will be sustained upon examination by the tax authorities based on its technical merits. As of May 31, 2019, the Fund has determined that no tax liability is required in its consolidated
financial statements related to uncertain tax positions for any open tax years (or expected to be taken in future tax years). Open tax years are those that remain subject to examination and are based on the statute of limitations in each jurisdiction in which the Fund invests.
m. Security Transactions, Investment Income, Expenses and Distributions
Security transactions are accounted for on trade date. Realized gains and losses on security transactions are determined on a specific identification basis. Interest income and estimated expenses are accrued daily. Amortization of premium and accretion of discount on debt securities are included in interest income. Facility fees are recognized as income over the expected term of the loan. Dividend income and dividends declared on securities sold short are recorded on theex-dividend date except for certain dividends from securities where the dividend rate is not available. In such cases, the dividend is recorded as soon as the information is received by the Fund. Distributions to shareholders are recorded on theex-dividend date. Distributable earnings are determined according to income tax regulations (tax basis) and may differ from earnings recorded in accordance with U.S. GAAP. These differences may be permanent or temporary. Permanent differences are reclassified among capital accounts to reflect their tax character. These reclassifications have no impact on net assets or the results of operations. Temporary differences are not reclassified, as they may reverse in subsequent periods.*
Common expenses incurred by the Trust are allocated among the Funds based on the ratio of net assets of each Fund to the combined net assets of the Trust or based on the ratio of number of shareholders of each Fund to the combined number of shareholders of the Trust. Fund specific expenses are charged directly to the Fund that incurred the expense.
Realized and unrealized gains and losses and net investment income, excluding class specific expenses, are allocated daily to each class of shares based upon the relative proportion of net assets of each class. Differences in per share distributions by class are generally due to differences in class specific expenses.
n. Accounting Estimates
The preparation of financial statements in accordance with U.S. GAAP requires management to make estimates and assumptions that affect the reported amounts of assets and liabilities at the date of the financial statements and the
| | | | | | |
| | | |
| franklintempleton.com | | Annual Report | | | 75 | |
FRANKLIN ALTERNATIVE STRATEGIES FUNDS
NOTES TO CONSOLIDATED FINANCIAL STATEMENTS
Franklin K2 Alternative Strategies Fund(continued)
1. Organization and Significant Accounting Policies(continued)
n. Accounting Estimates(continued)
amounts of income and expenses during the reporting period. Actual results could differ from those estimates.
o. Guarantees and Indemnifications
Under the Trust’s organizational documents, its officers and trustees are indemnified by the Trust against certain liabilities arising out of the performance of their duties to the Trust. Additionally, in the normal course of business, the Trust, on behalf of the Fund, enters into contracts with service providers that contain general indemnification clauses. The
Trust’s maximum exposure under these arrangements is unknown as this would involve future claims that may be made against the Trust that have not yet occurred. Currently, the Trust expects the risk of loss to be remote.
* Effective during the current reporting period, it is no longer required to present certain line items in the Consolidated Statements of Changes in Net Assets. The below prior period amounts affected by this change are shown as they were in the prior year Consolidated Statements of Changes in Net Assets.
For the year ended May 31, 2018, distributions to shareholders were as follows:
| | | | |
| Distributions from net investment income: | | | | |
Class A | | $ | (1,546,194 | ) |
Class C | | | (285,639 | ) |
Class R | | | (5,635 | ) |
Class R6 | | | (2,505,528 | ) |
Advisor Class | | | (11,772,288 | ) |
For the year ended May 31, 2018, distributions in excess of net investment income included in net assets was $(14,677,700).
2. Shares of Beneficial Interest
At May 31, 2019, there were an unlimited number of shares authorized (without par value). Transactions in the Fund’s shares were as follows:
| | | | | | | | | | | | | | | | | | | | |
| |
| | | Year Ended May 31, | |
| | | |
| | | 2019 | | | | | | 2018 | |
| | | | | |
| | | Shares | | | Amount | | | | | | Shares | | | Amount | |
| | | | | |
| Class A Shares: | | | | | | | | | | | | | | | | | | | | |
Shares sold a | | | 2,351,885 | | | $ | 26,666,136 | | | | | | | | 3,176,630 | | | $ | 35,979,221 | |
Shares issued in reinvestment of distributions | | | 207,339 | | | | 2,233,039 | | | | | | | | 129,508 | | | | 1,467,319 | |
Shares redeemed | | | (3,768,289 | ) | | | (42,776,597 | ) | | | | | | | (3,551,224 | ) | | | (40,202,505 | ) |
| | | | |
Net increase (decrease) | | | (1,209,065 | ) | | $ | (13,877,422 | ) | | | | | | | (245,086 | ) | | $ | (2,755,965 | ) |
| | | | |
| | | | | |
| Class C Shares: | | | | | | | | | | | | | | | | | | | | |
Shares sold | | | 660,253 | | | $ | 7,380,998 | | | | | | | | 1,190,986 | | | $ | 13,334,868 | |
Shares issued in reinvestment of distributions | | | 93,730 | | | | 992,601 | | | | | | | | 23,870 | | | | 268,067 | |
Shares redeemeda | | | (1,421,875 | ) | | | (15,815,913 | ) | | | | | | | (1,527,860 | ) | | | (17,064,000 | ) |
| | | | |
Net increase (decrease) | | | (667,892 | ) | | $ | (7,442,314 | ) | | | | | | | (313,004 | ) | | $ | (3,461,065 | ) |
| | | | |
| | | | | |
| Class R Shares: | | | | | | | | | | | | | | | | | | | | |
Shares sold | | | 128,380 | | | $ | 1,438,887 | | | | | | | | 13,905 | | | $ | 158,094 | |
Shares issued in reinvestment of distributions | | | 1,492 | | | | 16,101 | | | | | | | | 496 | | | | 5,635 | |
Shares redeemed | | | (111,838 | ) | | | (1,265,357 | ) | | | | | | | (11,085 | ) | | | (125,110 | ) |
| | | | |
Net increase (decrease) | | | 18,034 | | | $ | 189,631 | | | | | | | | 3,316 | | | $ | 38,619 | |
| | | | |
| | | | |
| | | |
| 76 | | Annual Report | | franklintempleton.com |
FRANKLIN ALTERNATIVE STRATEGIES FUNDS
NOTES TO CONSOLIDATED FINANCIAL STATEMENTS
Franklin K2 Alternative Strategies Fund(continued)
| | | | | | | | | | | | | | | | | | | | |
| |
| | | Year Ended May 31, | |
| | | |
| | | 2019 | | | | | | 2018 | |
| | | | | |
| | | Shares | | | Amount | | | | | | Shares | | | Amount | |
| | | | | |
| Class R6 Shares: | | | | | | | | | | | | | | | | | | | | |
Shares sold | | | 1,328,232 | | | $ | 15,139,519 | | | | | | | | 532,029 | | | $ | 6,021,672 | |
Shares issued in reinvestment of distributions | | | 74,668 | | | | 807,913 | | | | | | | | 220,254 | | | | 2,497,684 | |
Shares redeemed | | | (412,633 | ) | | | (4,712,011 | ) | | | | | | | (21,717,786 | ) | | | (247,274,794 | ) |
| | | | |
Net increase (decrease) | | | 990,267 | | | $ | 11,235,421 | | | | | | | | (20,965,503 | ) | | $ | (238,755,438 | ) |
| | | | |
| | | | | |
| Advisor Class Shares: | | | | | | | | | | | | | | | | | | | | |
Shares sold | | | 38,287,620 | | | $ | 435,094,092 | | | | | | | | 32,825,857 | | | $ | 372,819,294 | |
Shares issued in reinvestment of distributions | | | 1,729,893 | | | | 18,700,140 | | | | | | | | 757,060 | | | | 8,585,060 | |
Shares redeemed | | | (26,229,040 | ) | | | (295,759,654 | ) | | | | | | | (15,458,901 | ) | | | (175,337,595 | ) |
| | | | |
Net increase (decrease) | | | 13,788,473 | | | $ | 158,034,578 | | | | | | | | 18,124,016 | | | $ | 206,066,759 | |
| | | | |
aMay include a portion of Class C shares that were automatically converted to Class A.
3. Transactions with Affiliates
Franklin Resources, Inc. is the holding company for various subsidiaries that together are referred to as Franklin Templeton. Certain officers and trustees of the Trust are also officers and/or directors of the following subsidiaries:
| | |
| |
| Subsidiary | | Affiliation |
K2/D&S Management Co., L.L.C. (K2 Advisors) | | Investment manager |
Franklin Templeton Services, LLC (FT Services) | | Administrative manager |
Franklin Templeton Distributors, Inc. (Distributors) | | Principal underwriter |
Franklin Templeton Investor Services, LLC (Investor Services) | | Transfer agent |
a. Management Fees
The Fund and K2 Subsidiary pay an investment management fee to K2 Advisors of 1.90% per year of the average daily net assets of the Fund and K2 Subsidiary. Management fees paid by the Fund are reduced on assets invested in the K2 Subsidiary, in an amount not to exceed the management fees paid by the K2 Subsidiary.
Under each subadvisory agreement, the below entities provide subadvisory services to the Fund or K2 Subsidiary. The subadvisory fees are paid by K2 Advisors based on the Fund and K2 Subsidiary average daily net assets, and are not an additional expense of the Fund or K2 Subsidiary.
|
|
| Subadvisors |
Bardin Hill Arbitrage IC Management LP |
Chatham Asset Management, LLC |
Chilton Investment Company, LLC |
Emso Asset Management Limited |
Graham Capital Management, L.P. |
Grantham, Mayo, Van Otterloo & Co. LLC |
H2O AM LLP |
Impala Asset Management, LLC |
Jennison Associates, LLC |
Lazard Asset Management, LLC |
| | | | | | |
| | | |
| franklintempleton.com | | Annual Report | | | 77 | |
FRANKLIN ALTERNATIVE STRATEGIES FUNDS
NOTES TO CONSOLIDATED FINANCIAL STATEMENTS
Franklin K2 Alternative Strategies Fund(continued)
3. Transactions with Affiliates(continued)
a. Management Fees(continued)
|
|
| Subadvisors |
Loomis Sayles & Company, L.P. |
P. Schoenfeld Asset Management L.P. |
Portland Hill Asset Management Limited |
Wellington Management Company, LLP |
b. Administrative Fees
Under an agreement with K2 Advisors, FT Services provides administrative services to the Fund and K2 Subsidiary. The fee is paid by K2 Advisors based on the Fund and K2 Subsidiary average daily net assets, and is not an additional expense of the Fund or K2 Subsidiary.
c. Distribution Fees
The Board has adopted distribution plans for each share class, with the exception of Class R6 and Advisor Class shares, pursuant to Rule12b-1 under the 1940 Act. Under the Fund’s Class A reimbursement distribution plan, the Fund reimburses Distributors for costs incurred in connection with the servicing, sale and distribution of the Fund’s shares up to the maximum annual plan rate. Under the Class A reimbursement distribution plan, costs exceeding the maximum for the current plan year cannot be reimbursed in subsequent periods. In addition, under the Fund’s Class C and R compensation distribution plans, the Fund pays Distributors for costs incurred in connection with the servicing, sale and distribution of the Fund’s shares up to the maximum annual plan rate for each class. The plan year, for purposes of monitoring compliance with the maximum annual plan rates, is February 1 through January 31.
The maximum annual plan rates, based on the average daily net assets, for each class, are as follows:
| | | | |
Class A | | | 0.30% | |
Class C | | | 1.00% | |
Class R | | | 0.50% | |
The Board has set the current rate at 0.25% per year for Class A shares until further notice and approval by the Board.
d. Sales Charges/Underwriting Agreements
Front-end sales charges and contingent deferred sales charges (CDSC) do not represent expenses of the Fund. These charges are deducted from the proceeds of sales of Fund shares prior to investment or from redemption proceeds prior to remittance, as applicable. Distributors has advised the Fund of the following commission transactions related to the sales and redemptions of the Fund’s shares for the year:
| | | | |
Sales charges retained net of commissions paid to unaffiliated brokers/dealers | | $ | 24,527 | |
CDSC retained | | $ | 6,737 | |
Effective September 10, 2018, the Board approved changes to certainfront-end sales charges and dealer commissions on Class A shares. Further details are disclosed in the Fund’s Prospectus.
e. Transfer Agent Fees
Each class of shares pays transfer agent fees to Investor Services for its performance of shareholder servicing obligations. The fees are based on an annualized asset based fee of 0.02% plus a transaction based fee. In addition, each class reimburses Investor Services for out of pocket expenses incurred and, except for Class R6, reimburses shareholder servicing fees paid to third parties. These fees are allocated daily based upon their relative proportion of such classes’ aggregate net assets. Class R6 pays Investor Services transfer agent fees specific to that class.
| | | | |
| | | |
| 78 | | Annual Report | | franklintempleton.com |
FRANKLIN ALTERNATIVE STRATEGIES FUNDS
NOTES TO CONSOLIDATED FINANCIAL STATEMENTS
Franklin K2 Alternative Strategies Fund(continued)
For the year ended May 31, 2019, the Fund paid transfer agent fees of $1,160,982, of which $384,397 was retained by Investor Services.
f. Investments in Affiliated Management Investment Companies
The Fund invests in one or more affiliated management investment companies for purposes other than exercising a controlling influence over the management or policies. Management fees paid by the Fund are waived on assets invested in the affiliated management investment companies, as noted in the Consolidated Statement of Operations, in an amount not to exceed the management and administrative fees paid directly or indirectly by each affiliate. During the year ended May 31, 2019, the Fund held investments in affiliated management investment companies as follows:
| | | | | | | | | | | | | | | | | | | | | | | | | | | | | | | | |
| | | | | | | | |
| | | Number of Shares
Held at
Beginning
of Year | | | Gross
Additions | | | Gross
Reductions | | | Number of Shares
Held at
End of Year | | | Value at End of Year | | | Income
from
Securities
Loaned | | | Realized
Gain
(Loss) | | | Net Change in
Unrealized
Appreciation
(Depreciation) | |
| Non-Controlled Affiliates | | | | | | | | | | | | | | | | | | | | | | | | | | | | | | | | |
Institutional Fiduciary Trust Money Market Portfolio, 2.08% | | | 10,700,000 | | | | 70,667,000 | | | | (76,496,000 | ) | | | 4,871,000 | | | $ | 4,871,000 | | | $ | 117,650 | | | $ | — | | | $ | — | |
| | | | | | | | | | | | | | | | | | | | |
g. Waiver and Expense Reimbursements
K2 Advisors and Investor Services have contractually agreed in advance to waive or limit their respective fees and to assume as their own expense certain expenses otherwise payable by the Fund so that the expenses (excluding distribution fees, acquired fund fees and expenses, expenses related to securities sold short and certainnon-routine expenses or costs, including those relating to litigation, indemnification, reorganizations and liquidations) for each class of the Fund do not exceed 1.95%, and Class R6 does not exceed 1.87% based on the average net assets of each class until September 30, 2019. Total expenses waived or paid are not subject to recapture subsequent to the Fund’s fiscal year end.
Prior to October 1, 2018, expenses (excluding certain fees and expenses as previously disclosed) for Class R6 were limited to 1.85% based on the average net assets of the class.
4. Expense Offset Arrangement
The Fund has entered into an arrangement with its custodian whereby credits realized as a result of uninvested cash balances are used to reduce a portion of the Fund’s custodian expenses. During the year ended May 31, 2019, the custodian fees were reduced as noted in the Consolidated Statement of Operations.
5. Income Taxes
The tax character of distributions paid during the years ended May 31, 2019 and 2018, was as follows:
| | | | | | | | |
| | |
| | | 2019 | | | 2018 | |
Distributions paid from: | | | | | | | | |
Ordinary income | | $ | — | | | $ | 16,115,284 | |
Long term capital gains | | | 25,963,593 | | | | — | |
| | | | |
Total distributions paid | | $ | 25,963,593 | | | $ | 16,115,284 | |
| | | | |
At May 31, 2019, the cost of investments, net unrealized appreciation (depreciation) and undistributed ordinary income for income tax purposes were as follows:
| | | | |
Cost of investments | | $ | 846,388,371 | |
| | | | |
Unrealized appreciation | | $ | 117,616,405 | |
Unrealized depreciation | | | (50,926,061 | ) |
| | | | |
Net unrealized appreciation (depreciation) | | $ | 66,690,344 | |
| | | | |
| Distributable earnings | | | | |
Undistributed ordinary income | | $ | 428,863 | |
| | | | |
| | | | | | |
| | | |
| franklintempleton.com | | Annual Report | | | 79 | |
FRANKLIN ALTERNATIVE STRATEGIES FUNDS
NOTES TO CONSOLIDATED FINANCIAL STATEMENTS
Franklin K2 Alternative Strategies Fund(continued)
5. Income Taxes(continued)
Differences between income and/or capital gains as determined on a book basis and a tax basis are primarily due to differing treatments of wash sales and investments in the K2 Subsidiary.
The Fund utilized a tax accounting practice to treat a portion of the proceeds from the capital shares redeemed as a distribution from realized capital gains.
6. Investment Transactions
Purchases and sales of investments and securities sold short (excluding short term securities) for the year ended May 31, 2019, aggregated $2,581,209,693 and $2,636,218,614, respectively.
At May 31, 2019, in connection with securities lending transactions, the Fund loaned equity investments and corporate bonds and notes and received $6,071,061 of cash collateral. The gross amounts of recognized liability for such transactions is included in payable upon return of securities loaned in the Consolidated Statement of Assets and Liabilities. The agreements can be terminated at any time.
The Fund sold certain long positions held in the portfolio and simultaneously entered into total return swaps on the positions, retaining substantially all of the exposure to the economic return and the related risks on the long positions. At May 31, 2019, the transfers of financial assets accounted for as sales were as follows:
| | | | | | | | | | | | | | | | | | | | |
| | | At Original Transactions Dates | | | At Year EndedMay 31, 2019 | |
| | | | | |
| | | Cost Basis of Positions Sold | | | Gross
Cash Received
for Positions Sold | | | Fair Value of Transferred Assetsa | | | Gross
Derivative Assets
Recordedb | | | Gross
Derivative Liabilities
Recordedb | |
Sales and total return swaps | | $ | 1,855,453 | | | $ | 2,014,929 | | | $ | 2,763 | | | $ | 2,017,692 | | | $ | (2,014,929 | ) |
| | | | | | | | |
a $2,763 of gross assets are included as unrealized appreciation on OTC swap contracts in the Consolidated Statement of Assets and Liabilities.
b Balances are presented on a gross basis, based on each leg of the swap contract, before the application of counterparty and cash collateral offsetting.
See Notes 1(d) and 9 regarding derivative financial instruments and other derivative information, respectively.
7. Credit Risk and Defaulted Securities
The Fund may purchase thepre-default or defaulted debt of distressed companies. Distressed companies are financially troubled and could be or are already involved in financial restructuring or bankruptcy. Risks associated with purchasing these securities include the possibility that the bankruptcy or other restructuring process takes longer than expected, or that distributions in restructuring are less than anticipated, either or both of which may result in unfavorable consequences to the Fund. If it becomes probable that the income on debt securities, including those of distressed companies, will not be collected, the Fund discontinues accruing income and recognizes an adjustment for uncollectible interest.
At May 31, 2019, the aggregate long value of distressed company securities for which interest recognition has been discontinued was $16,619,142, representing 1.3% of the Fund’s net assets. For information as to specific securities, see the accompanying Consolidated Statement of Investments.
8. Unfunded Loan Commitments
The Fund enters into certain credit agreements, all or a portion of which may be unfunded. The Fund is obligated to fund these loan commitments at the borrowers’ discretion. Unfunded loan commitments and funded portions of credit agreements are marked to market daily and any unrealized appreciation or depreciation is included in the Consolidated Statement of Assets and Liabilities and the Consolidated Statement of Operations. Funded portions of credit agreements are presented in the Consolidated Statement of Investments.
| | | | |
| | | |
| 80 | | Annual Report | | franklintempleton.com |
FRANKLIN ALTERNATIVE STRATEGIES FUNDS
NOTES TO CONSOLIDATED FINANCIAL STATEMENTS
Franklin K2 Alternative Strategies Fund(continued)
At May 31, 2019, unfunded commitments were as follows:
| | | | |
| |
| Borrower | | Unfunded
Commitment | |
Berry Global Inc., Term Loan, 5/15/26 | | $ | 210,000 | |
| | | | |
9. Other Derivative Information
At May 31, 2019, the investments in derivative contracts are reflected in the Consolidated Statement of Assets and Liabilities as follows:
| | | | | | | | | | | | |
| | |
| | | Asset Derivatives | | | Liability Derivatives | |
| | | | |
Derivative Contracts
Not Accounted for as
Hedging Instruments | | Consolidated Statement of
Assets and Liabilities
Location | | Fair Value | | | Consolidated Statement of
Assets and Liabilities
Location | | Fair Value | |
| | | | |
Interest rate contracts | | Variation margin on futures contracts | | $ | 3,488,172 | a | | Variation margin on futures contracts | | $ | 1,000,570 | a |
| | | | |
| | Variation margin on centrally cleared swap contracts | | | 322,098 | a | | Variation margin on centrally cleared swap contracts | | | 243,358 | a |
| | | | |
| | Unrealized appreciation on OTC swap contracts | | | 103,261 | | | Unrealized depreciation on OTC swap contracts | | | 215,706 | |
| | | | |
Foreign exchange contracts | | Investments in securities, at value | | | 54,224 | b | | Options written, at value | | | 63,526 | |
| | | | |
| | Unrealized appreciation on OTC forward exchange contracts | | | 4,850,314 | | | Unrealized depreciation on OTC forward exchange contracts | | | 3,292,760 | |
| | | | |
Credit contracts | | Variation margin on centrally cleared swap contracts | | | 39,658 | a | | Variation margin on centrally cleared swap contracts | | | 182,462 | a |
| | | | |
| | OTC swap contracts (upfront payments) | | | 121,431 | | | OTC swap contracts (upfront receipts) | | | 255 | |
| | | | |
| | Unrealized appreciation on OTC swap contracts | | | 9,418 | | | Unrealized depreciation on OTC swap contracts | | | 52,062 | |
| | | | |
Equity contracts | | Investments in securities, at value | | | 2,124,479 | b | | Options written, at value | | | 314,643 | |
| | | | |
| | Variation margin on futures contracts | | | 4,692,228 | a | | Variation margin on futures contracts | | | 1,758,005 | a |
| | | | |
| | Unrealized appreciation on OTC swap contracts | | | 4,298,714 | | | Unrealized depreciation on OTC swap contracts | | | 4,233,163 | |
| | | | |
Commodity contracts | | Variation margin on futures contracts | | | 389,069 | a | | Variation margin on futures contracts | | | 1,402,745 | a |
| | | | |
| | Unrealized appreciation on OTC swap contracts | | | 11,846 | | | | | | | |
| | | | | | | | | | | | |
Totals | | | | $ | 20,504,912 | | | | | $ | 12,759,255 | |
| | | | | | | | | | | | |
a This amount reflects the cumulative appreciation (depreciation) of futures contracts and centrally cleared swap contracts as reported in the Consolidated Statement of Investments. Only the variation margin receivable/payable at year end is separately reported within the Consolidated Statement of Assets and Liabilities. Prior variation margin movements were recorded to cash upon receipt or payment.
b Purchased option contracts are included in investments in securities, at value in the Consolidated Statement of Assets and Liabilities.
| | | | | | |
| | | |
| franklintempleton.com | | Annual Report | | | 81 | |
FRANKLIN ALTERNATIVE STRATEGIES FUNDS
NOTES TO CONSOLIDATED FINANCIAL STATEMENTS
Franklin K2 Alternative Strategies Fund(continued)
9. Other Derivative Information(continued)
For the year ended May 31, 2019, the effect of derivative contracts in the Consolidated Statement of Operations was as follows:
| | | | | | | | | | | | |
| | | | |
Derivative Contracts Not Accounted for as Hedging Instruments | | Consolidated Statement of
Operations Location | | Net Realized Gain (Loss)
for the Year | | | Consolidated Statement of Operations Location | | Net Change in Unrealized
Appreciation
(Depreciation)
for the Year | |
| | Net realized gain (loss) from: | | | | | | Net change in unrealized appreciation (depreciation) on: | | | | |
| | | | |
Interest rate contracts | | Investments | | $ | (158,469 | )a | | Investments | | $ | 76,237 | a |
| | | | |
| | Written options | | | 46,707 | | | Written options | | | (18,653 | ) |
| | | | |
| | Futures contracts | | | (488,022 | ) | | Futures contracts | | | 1,672,977 | |
| | | | |
| | Swap contracts | | | (882,999 | ) | | Swap contracts | | | (307,691 | ) |
| | | | |
Foreign exchange contracts | | Investments | | | (103,066 | )a | | Investments | | | (72,791 | )a |
| | | | |
| | Written options | | | 122,657 | | | Written options | | | 60,360 | |
| | | | |
| | Foreign exchange contracts | | | 7,194,420 | | | Forward exchange contracts | | | (61,035 | ) |
| | | | |
| | Futures contracts | | | 350,931 | | | | | | | |
| | | | |
Credit contracts | | Swap contracts | | | 1,090,095 | | | Swap contracts | | | (123,316 | ) |
| | | | |
Equity contracts | | Investments | | | (7,348,496 | )a | | Investments | | | 508,781 | a |
| | | | |
| | Written options | | | 702,878 | | | Written options | | | 81,749 | |
| | | | |
| | Futures contracts | | | 488,418 | | | Futures contracts | | | 3,358,297 | |
| | | | |
| | Swap contracts | | | 4,703,297 | | | Swap contracts | | | (6,916,089 | ) |
| | | | |
Commodity contracts | | Futures contracts | | | (3,757,697 | ) | | Futures contracts | | | (45,069 | ) |
| | | | |
| | Swap contracts | | | (8,649 | ) | | Swap contracts | | | 11,846 | |
| | | | | | | | | | | | |
Totals | | | | $ | 1,952,005 | | | | | $ | (1,774,397 | ) |
| | | | | | | | | | | | |
a Purchased option contracts are included in net realized gain (loss) from investments and net change in unrealized appreciation (depreciation) on investments in the Consolidated Statement of Operations.
For the year ended May 31, 2019, the average month end notional amount of futures contracts, options and swap contracts represented $662,293,192, 46,518,328 shares/units and $280,213,915, respectively. The average month end contract value of forward exchange contracts was $345,957,172.
At May 31, 2019, OTC derivative assets and liabilities are as follows:
| | | | | | | | |
| |
| | | Gross Amounts of Assets
and Liabilities Presented in
the Consolidated Statement
of Assets and Liabilities | |
| | |
| | | Assetsa | | | Liabilitiesa | |
| Derivatives | | | | | | | | |
Forward Exchange Contracts | | $ | 4,850,314 | | | $ | 3,292,760 | |
Options Purchased | | | 54,224 | | | | — | |
Options Written | | | — | | | | 63,526 | |
Swap Contracts | | | 4,544,670 | | | | 4,501,186 | |
| | | | |
Total | | $ | 9,449,208 | | | $ | 7,857,472 | |
| | | | |
a Absent an event of default or early termination, OTC derivative assets and liabilities are presented gross and not offset in the Consolidated Statement of Assets and Liabilities.
| | | | |
| | | |
| 82 | | Annual Report | | franklintempleton.com |
FRANKLIN ALTERNATIVE STRATEGIES FUNDS
NOTES TO CONSOLIDATED FINANCIAL STATEMENTS
Franklin K2 Alternative Strategies Fund(continued)
At May 31, 2019, OTC derivative assets, which may be offset against OTC derivative liabilities and collateral received from the counterparty, are as follows:
| | | | | | | | | | | | | | | | | | | | |
| | | |
| | | | | | Amounts Not Offset in the Consolidated
Statement of Assets and Liabilities | | | | |
| | | | | |
| | | Gross Amounts of Assets
Presented in the
Consolidated Statement of
Assets and Liabilities | | | Financial Instruments
Available for Offset | | | Financials
Instruments
Collateral
Receiveda | | | Cash Collateral
Receiveda | | | Net Amount (Not
Less than Zero) | |
| Counterparty | | | | | | | | | | | | | | | | | | | | |
BNYM | | $ | 434,171 | | | $ | (35,430 | ) | | $ | (398,741 | ) | | $ | — | | | $ | — | |
BOFA | | | 169,320 | | | | (143,471 | ) | | | — | | | | (25,849 | ) | | | — | |
BZWS | | | 352,300 | | | | (9,437 | ) | | | — | | | | — | | | | 342,863 | |
CITI | | | 4,852 | | | | — | | | | — | | | | — | | | | 4,852 | |
DBAB | | | 366,422 | | | | (360,578 | ) | | | — | | | | — | | | | 5,844 | |
GSCO | | | 73,252 | | | | — | | | | — | | | | — | | | | 73,252 | |
JPHQ | | | 60,648 | | | | (60,648 | ) | | | — | | | | — | | | | — | |
JPHQc | | | 1,251,504 | | | | — | | | | — | | | | — | | | | 1,251,504 | |
MSCI | | | 11,846 | | | | — | | | | — | | | | — | | | | 11,846 | |
MSCO | | | 143,010 | | | | (98,665 | ) | | | — | | | | — | | | | 44,345 | |
MSCOd | | | 2,537,432 | | | | (1,768,765 | ) | | | — | | | | — | | | | 768,667 | |
MSCS | | | 32,646 | | | | (16,265 | ) | | | — | | | | — | | | | 16,381 | |
MSCSc | | | 4,009,673 | | | | — | | | | — | | | | — | | | | 4,009,673 | |
UBSW | | | 2,132 | | | | (2,132 | ) | | | — | | | | — | | | | — | |
| | | | |
Total | | $ | 9,449,208 | | | $ | (2,495,391 | ) | | $ | (398,741 | ) | | $ | (25,849 | ) | | $ | 6,529,227 | |
| | | | |
At May 31, 2019, OTC derivative liabilities, which may be offset against OTC derivative assets and collateral pledged to the counterparty, are as follows:
| | | | | | | | | | | | | | | | | | | | |
| | | |
| | | | | | Amounts Not Offset in the Consolidated
Statement of Assets and Liabilities | | | | |
| | | | | |
| | | Gross Amounts of Liabilities
Presented in the
Consolidated Statement of
Assets and Liabilities | | | Financial
Instruments
Available for Offset | | | Financials
Instruments
Collateral
Pledgeda,b | | | Cash
Collateral
Pledgeda | | | Net Amount (Not
Less than Zero) | |
| Counterparty | | | | | | | | | | | | | | | | | | | | |
BNYM | | $ | 35,430 | | | $ | (35,430 | ) | | $ | — | | | $ | — | | | $ | — | |
BOFA | | | 143,471 | | | | (143,471 | ) | | | — | | | | — | | | | — | |
BZWS | | | 9,437 | | | | (9,437 | ) | | | — | | | | — | | | | — | |
CITI | | | — | | | | — | | | | — | | | | — | | | | — | |
DBAB | | | 360,578 | | | | (360,578 | ) | | | — | | | | — | | | | — | |
GSCO | | | — | | | | — | | | | — | | | | — | | | | — | |
JPHQ | | | 63,570 | | | | (60,648 | ) | | | — | | | | — | | | | 2,922 | |
JPHQc | | | 1,088,586 | | | | — | | | | — | | | | — | | | | 1,088,586 | |
MSCI | | | — | | | | — | | | | — | | | | — | | | | — | |
MSCO | | | 98,665 | | | | (98,665 | ) | | | — | | | | — | | | | — | |
MSCOd | | | 1,768,765 | | | | (1,768,765 | ) | | | — | | | | — | | | | — | |
MSCS | | | 16,265 | | | | (16,265 | ) | | | — | | | | — | | | | — | |
MSCSc | | | 4,261,460 | | | | — | | | | — | | | | — | | | | 4,261,460 | |
UBSW | | | 11,245 | | | | (2,132 | ) | | | — | | | | — | | | | 9,113 | |
| | | | |
Total | | $ | 7,857,472 | | | $ | (2,495,391 | ) | | $ | — | | | $ | — | | | $ | 5,362,081 | |
| | | | |
| | | | | | |
| | | |
| franklintempleton.com | | Annual Report | | | 83 | |
FRANKLIN ALTERNATIVE STRATEGIES FUNDS
NOTES TO CONSOLIDATED FINANCIAL STATEMENTS
Franklin K2 Alternative Strategies Fund(continued)
9. Other Derivative Information(continued)
a In some instances, the collateral amounts disclosed in the table above were adjusted due to the requirement to limit the collateral amounts to avoid the effect of overcollateralization. Actual collateral received and/or pledged may be more than the amounts disclosed herein.
b See the accompanying Consolidated Statement of Investments for securities pledged as collateral for derivatives.
c Represents derivatives not subject to an ISDA master agreement.
d Represents derivatives owned by the K2 Holdings Investment Corp., a wholly-owned subsidiary of the Fund. See Note 1(j).
See Notes 1(d) and 6 regarding derivative financial instruments and investment transactions, respectively.
See Abbreviations on page 86.
10. Credit Facility
The Fund, together with other U.S. registered and foreign investment funds (collectively, Borrowers), managed by Franklin Templeton, are borrowers in a joint syndicated senior unsecured credit facility totaling $2 billion (Global Credit Facility) which matures on February 7, 2020. This Global Credit Facility provides a source of funds to the Borrowers for temporary and emergency purposes, including the ability to meet future unanticipated or unusually large redemption requests.
Under the terms of the Global Credit Facility, the Fund shall, in addition to interest charged on any borrowings made by the Fund and other costs incurred by the Fund, pay its share of fees and expenses incurred in connection with the implementation and maintenance of the Global Credit Facility, based upon its relative share of the aggregate net assets of all of the Borrowers, including an annual commitment fee of 0.15% based upon the unused portion of the Global Credit Facility. These fees are reflected in other expenses in the Consolidated Statement of Operations. During the year ended May 31, 2019, the Fund did not use the Global Credit Facility.
11. Fair Value Measurements
The Fund follows a fair value hierarchy that distinguishes between market data obtained from independent sources (observable inputs) and the Fund’s own market assumptions (unobservable inputs). These inputs are used in determining the value of the Fund’s financial instruments and are summarized in the following fair value hierarchy:
| | • | | Level 1 – quoted prices in active markets for identical financial instruments |
| | • | | Level 2 – other significant observable inputs (including quoted prices for similar financial instruments, interest rates, prepayment speed, credit risk, etc.) |
| | • | | Level 3 – significant unobservable inputs (including the Fund’s own assumptions in determining the fair value of financial instruments) |
The input levels are not necessarily an indication of the risk or liquidity associated with financial instruments at that level.
| | | | |
| | | |
| 84 | | Annual Report | | franklintempleton.com |
FRANKLIN ALTERNATIVE STRATEGIES FUNDS
NOTES TO CONSOLIDATED FINANCIAL STATEMENTS
Franklin K2 Alternative Strategies Fund(continued)
A summary of inputs used as of May 31, 2019, in valuing the Fund’s assets and liabilities carried at fair value, is as follows:
| | | | | | | | | | | | | | | | |
| | | | |
| | | Level 1 | | | Level 2 | | | Level 3 | | | Total | |
| | | | |
| Assets: | | | | | | | | | | | | | | | | |
Investments in Securities:a | | | | | | | | | | | | | | | | |
Equity Investmentsb | | $ | 488,785,800 | | | $ | 809 | | | $ | — | c | | $ | 488,786,609 | |
Convertible Bonds | | | — | | | | 105,949,972 | | | | — | | | | 105,949,972 | |
Corporate Bonds and Notes | | | — | | | | 122,002,257 | | | | 210,535 | | | | 122,212,792 | |
Corporate Bonds and Notes in Reorganization | | | — | | | | 10,392,536 | | | | — | | | | 10,392,536 | |
Senior Floating Rate Interests | | | — | | | | 5,191,630 | | | | — | | | | 5,191,630 | |
Foreign Government and Agency Securities | | | — | | | | 26,300,663 | | | | — | | | | 26,300,663 | |
Asset-Backed Securities and Commercial Mortgage-Backed Securities | | | — | | | | 26,622,814 | | | | — | | | | 26,622,814 | |
Municipal Bonds in Reorganization | | | — | | | | 6,226,606 | | | | — | | | | 6,226,606 | |
Options Purchased | | | 2,108,057 | | | | 70,646 | | | | — | | | | 2,178,703 | |
Short Term Investments | | | 309,078,050 | | | | 29,643,480 | | | | — | | | | 338,721,530 | |
| | | | |
Total Investments in Securities | | $ | 799,971,907 | | | $ | 332,401,413 | | | $ | 210,535 | | | $ | 1,132,583,855 | |
| | | | |
Other Financial Instruments: | | | | | | | | | | | | | | | | |
Futures Contracts | | $ | 8,569,469 | | | $ | — | | | $ | — | | | $ | 8,569,469 | |
Forward Exchange Contracts | | | — | | | | 4,850,314 | | | | — | | | | 4,850,314 | |
Swap Contracts | | | — | | | | 4,784,995 | | | | — | | | | 4,784,995 | |
| | | | |
Total Other Financial Instruments | | $ | 8,569,469 | | | $ | 9,635,309 | | | $ | — | | | $ | 18,204,778 | |
| | | | |
| | | | |
| Liabilities: | | | | | | | | | | | | | | | | |
Other Financial Instruments: | | | | | | | | | | | | | | | | |
Options Written | | $ | 314,643 | | | $ | 63,526 | | | $ | — | | | $ | 378,169 | |
Securities Sold Shorta | | | 220,078,551 | | | | 5,400,190 | | | | 273,320 | | | | 225,752,061 | |
Futures Contracts | | | 4,161,320 | | | | — | | | | — | | | | 4,161,320 | |
Forward Exchange Contracts | | | — | | | | 3,292,760 | | | | — | | | | 3,292,760 | |
Swap Contracts | | | — | | | | 4,926,751 | | | | — | | | | 4,926,751 | |
Unfunded Loan Commitments | | | — | | | | 289 | | | | — | | | | 289 | |
| | | | |
Total Other Financial Instruments | | $ | 224,554,514 | | | $ | 13,683,516 | | | $ | 273,320 | | | $ | 238,511,350 | |
| | | | |
aFor detailed categories, see the accompanying Consolidated Statement of Investments.
bIncludes common, preferred and convertible preferred stocks and management investment companies as well as other equity interests.
cIncludes securities determined to have no value At May 31, 2019.
A reconciliation of assets in which Level 3 inputs are used in determining fair value is presented when there are significant Level 3 financial instruments at the beginning and/or end of the year.
12. Subsequent Events
The Fund has evaluated subsequent events through the issuance of the consolidated financial statements and determined that no events have occurred that require disclosure.
| | | | | | |
| | | |
| franklintempleton.com | | Annual Report | | | 85 | |
FRANKLIN ALTERNATIVE STRATEGIES FUNDS
NOTES TO CONSOLIDATED FINANCIAL STATEMENTS
Franklin K2 Alternative Strategies Fund(continued)
Abbreviations
| | | | | | | | | | |
| Counterparty/Exchange | | Currency | | Selected Portfolio |
| BNYM | | The Bank of New York Mellon Corp. | | ARS | | Argentine Peso | | ADR | | American Depositary Receipt |
| BOFA | | Bank of America, N.A. | | AUD | | Australian Dollar | | ARLLMONP | | Argentina Blended Policy Rate |
| BZWS | | Barclays Bank PLC | | BRL | | Brazilian Real | | ARM | | Adjustable Rate Mortgage |
| CITI | | Citigroup, Inc. | | CAD | | Canadian Dollar | | BADLAR | | Argentina Deposit Rates Badlar Private Banks ARS |
| DBAB | | Deutsche Bank, AG | | CHF | | Swiss Franc | | BBSW | | Bank Bill Swap Rate |
| GSCO | | Goldman Sachs International | | COP | | Colombian Peso | | BRLCDI | | Brazil Cetip DI Interbank Deposit Rate |
| HSBC | | HSBC Bank USA, N.A. | | EGP | | Egyptian Pound | | CAC | | Cotation Assistee en Continu |
| JPHQ | | JP Morgan Chase Bank, N.A. | | EUR | | Euro | | CBOT | | Chicago Board of Trade |
| MSCO | | Morgan Stanley & Co., LLC | | GBP | | British Pound | | CLO | | Collateralized Loan Obligation |
| MSCS | | Morgan Stanley Capital Services LLC | | HKD | | Hong Kong Dollar | | CME | | Chicago Mercantile Exchange |
| UBSW | | UBS AG | | HUF | | Hungarian Forint | | DAX | | Deutscher Aktienindex |
| | | | ILS | | New Israeli Shekel | | DJIA | | Dow Jones Industrial Average |
| | | | IDR | | Indonesian Rupiah | | EONIA | | Euro OverNight Index Average |
| | | | INR | | Indian Rupee | | ETF | | Exchange Traded Fund |
| | | | JPY | | Japanese Yen | | EURIBOR | | Euro Interbank Offered Rate |
| | | | NGN | | Nigerian Naira | | FEDEF | | Federal Funds Effective Rate |
| | | | RUB | | Russian Ruble | | FHLMC | | Federal Home Loan Mortgage Corp. |
Index | | TRY | | Turkish Lira | | FRN | | Floating Rate Note |
| | TWD | | Taiwan Dollar | | FTSE | | Financial Times Stock Exchange |
| CDX.EM | | CDX Emerging Markets Index | | USD | | United States Dollar | | GO | | General Obligation |
| | | | ZAR | | South African Rand | | IDR | | International Depositary Receipt |
| | | | | | | | LIBOR | | London InterBank Offered Rate |
| | | | | | | | MIB | | Milano Italia Borsa |
| | | | | | | | MIBOR | | Mumbai Interbank Offered Rate |
| | | | | | | | MSCI | | Morgan Stanley Capital International |
| | | | | | | | OMO | | Open Market Operations |
| | | | | | | | PIK | | Payment In-Kind |
| | | | | | | | RBACR | | Reserve Bank of Australia Cash Rate |
| | | | | | | | REIT | | Real Estate Investment Trust |
| | | | | | | | SARON | | Swiss Average Rate Overnight |
| | | | | | | | SONIA | | Sterling Overnight Index Average |
| | | | | | | | SPDR | | Standard & Poor’s Depositary Receipt |
| | | | | | | | SPI | | Swiss Performance Index |
| | | | | | | | TOPIX | | Tokyo Price Index |
| | | | |
| | | |
| 86 | | Annual Report | | franklintempleton.com |
FRANKLIN ALTERNATIVE STRATEGIES FUNDS
Report of Independent Registered Public Accounting Firm
To the Board of Trustees of Franklin Alternative Strategies Funds
and Shareholders of Franklin K2 Alternative Strategies Fund:
Opinion on the Financial Statements
We have audited the accompanying consolidated statement of assets and liabilities of Franklin K2 Alternative Strategies Fund (the “Fund”) (one of the funds constituting the Franklin Alternative Strategies Funds), including the consolidated statement of investments, as of May 31, 2019, and the related consolidated statement of operations for the year then ended, the consolidated statements of changes in net assets for each of the two years in the period then ended, the consolidated financial highlights for each of the five years in the period then ended, and the related notes (collectively referred to as the “financial statements”). In our opinion, the financial statements present fairly, in all material respects, the consolidated financial position of Franklin K2 Alternative Strategies Fund (one of the funds constituting the Franklin Alternative Strategies Funds) at May 31, 2019, the consolidated results of its operations for the year then ended, the consolidated changes in its net assets for each of the two years in the period then ended and its consolidated financial highlights for each of the five years in the period then ended, in conformity with U.S. generally accepted accounting principles.
Basis for Opinion
These financial statements are the responsibility of the Fund’s management. Our responsibility is to express an opinion on the Fund’s financial statements based on our audits. We are a public accounting firm registered with the Public Company Accounting Oversight Board (United States) (“PCAOB”) and are required to be independent with respect to the Fund in accordance with the U.S. federal securities laws and the applicable rules and regulations of the Securities and Exchange Commission and the PCAOB.
We conducted our audits in accordance with the standards of the PCAOB. Those standards require that we plan and perform the audit to obtain reasonable assurance about whether the financial statements are free of material misstatement, whether due to error or fraud. The Fund is not required to have, nor were we engaged to perform, an audit of the Fund’s internal control over financial reporting. As part of our audits, we are required to obtain an understanding of internal control over financial reporting, but not for the purpose of expressing an opinion on the effectiveness of the Fund’s internal control over financial reporting. Accordingly, we express no such opinion.
Our audits included performing procedures to assess the risks of material misstatement of the financial statements, whether due to error or fraud, and performing procedures that respond to those risks. Such procedures included examining, on a test basis, evidence regarding the amounts and disclosures in the financial statements. Our procedures included confirmation of securities owned as of May 31, 2019, by correspondence with the custodian and brokers, or by other appropriate auditing procedures where replies from brokers were not received. Our audits also included evaluating the accounting principles used and significant estimates made by management, as well as evaluating the overall presentation of the financial statements. We believe that our audits provide a reasonable basis for our opinion.

We have served as the auditor of one or more Franklin investment companies since 1987.
Boston, Massachusetts
July 25, 2019
| | | | | | |
| | | |
| franklintempleton.com | | Annual Report | | | 87 | |
FRANKLIN ALTERNATIVE STRATEGIES FUNDS
FRANKLIN K2 ALTERNATIVE STRATEGIES FUND
Tax Information (unaudited)
Under Section 852(b)(3)(C) of the Internal Revenue Code, the Fund hereby reports the maximum amount allowable but no less than $29,768,556 as long term capital gain dividend for the fiscal year ended May 31, 2019.
Under Section 854(b)(1)(B) of the Internal Revenue Code, the Fund hereby reports the maximum amount allowable but no less than $4,447,181 as qualified dividends for purposes of the maximum rate under Section 1(h)(11) of the Internal Revenue Code for the fiscal year ended May 31, 2019. Distributions, including qualified dividend income, paid during calendar year 2019 will be reported to shareholders on Form 1099-DIV by mid-February 2020. Shareholders are advised to check with their tax advisors for information on the treatment of these amounts on their individual income tax returns.
| | | | |
| | | |
| 88 | | Annual Report | | franklintempleton.com |
FRANKLIN ALTERNATIVE STRATEGIES FUNDS
Board Members and Officers
The name, year of birth and address of the officers and board members, as well as their affiliations, positions held with the Funds, principal occupations during at least the past five years and number of U.S. registered portfolios overseen in the Franklin Templeton fund complex, are shown below. Generally, each board member serves until that person’s successor is elected and qualified.
Independent Board Members
| | | | | | | | |
| | | | |
Name, Year of Birth
and Address | | Position | | Length of
Time Served | | Number of Portfolios in
Fund Complex Overseen
by Board Member* | | Other Directorships Held During
at Least the Past 5 Years |
| | | | |
Edward I. Altman, Ph.D. (1941)
c/o Franklin Mutual Advisers, LLC
101 John F. Kennedy Parkway
Short Hills, NJ 07078-2716 | | Trustee | | Since 2011 | | 14 | | None |
|
| Principal Occupation During at Least the Past 5 Years: |
| Max L. Heine Professor of Finance, Emeritus and Director of The Credit and Debt Markets Research Program, Salomon Center, Stern School of Business, New York University; editor and author of numerous financial publications; financial consultant; an adviser to numerous financial and publishing organizations; andformerly, Vice Director, Salomon Center, Stern School of Business, New York University. |
| | | | |
Ann Torre Bates (1958)
c/o Franklin Mutual Advisers, LLC
101 John F. Kennedy Parkway
Short Hills, NJ 07078-2716 | | Trustee | | Since 2011 | | 38 | | Ares Capital Corporation (specialty finance company) (2010-present), United Natural Foods, Inc. (distributor of natural, organic and specialty foods) (2013-present), Allied Capital Corporation (financial services) (2003-2010), SLM Corporation (Sallie Mae) (1997-2014) and Navient Corporation (loan management, servicing and asset recovery) (2014-2016). |
|
| Principal Occupation During at Least the Past 5 Years: |
| Director of various companies; andformerly, Executive Vice President and Chief Financial Officer, NHP Incorporated (manager of multifamily housing) (1995-1997); and Vice President and Treasurer, US Airways, Inc. (until 1995). |
| | | | |
Burton J. Greenwald (1929)
c/o Franklin Mutual Advisers, LLC
101 John F. Kennedy Parkway
Short Hills, NJ 07078-2716 | | Trustee and Vice
Chairman of the Board | | Trustee since
2011 and Vice
Chairman of the
Board since 2015 | | 14 | | Franklin Templeton Emerging Markets Debt Opportunities Fund PLC (1999-present) and Fiduciary International Ireland Limited (1999-2015). |
|
| Principal Occupation During at Least the Past 5 Years: |
| Managing Director, B.J. Greenwald Associates (management consultants to the financial services industry); andformerly, Chairman, Fiduciary Trust International Funds; Executive Vice President, L.F. Rothschild Fund Management, Inc.; President and Director, Merit Mutual Funds; President, Underwriting Division and Director, National Securities & Research Corporation; Governor, Investment Company Institute; and Chairman, ICI Public Information Committee. |
| | | | |
Jan Hopkins Trachtman (1947)
c/o Franklin Mutual Advisers, LLC
101 John F. Kennedy Parkway
Short Hills, NJ 07078-2716 | | Trustee | | Since 2011 | | 14 | | FinTech Acquisition Corp. III (special purpose fintech acquisition company) (2018-present) |
|
| Principal Occupation During at Least the Past 5 Years: |
| President and Founder, The Jan Hopkins Group (communications consulting firm); serves on Advisory Board of Knight Bagehot Fellowship; andformerly,President, Economic Club of New York (2007-2015);Anchor/Correspondent, CNN Financial News (until 2003); Managing Director and Head of Client Communications, Citigroup Private Bank (until 2005);Off-Air Reporter, ABC News’ World News Tonight; and Editor, CBS Network News. |
| | | | | | |
| | | |
| franklintempleton.com | | Annual Report | | | 89 | |
FRANKLIN ALTERNATIVE STRATEGIES FUNDS
Independent Board Members(continued)
| | | | | | | | |
| | | | |
Name, Year of Birth
and Address | | Position | | Length of
Time Served | | Number of Portfolios in
Fund Complex Overseen
by Board Member* | | Other Directorships Held During
at Least the Past 5 Years |
| | | | |
Keith E. Mitchell (1954)
c/o Franklin Mutual Advisers, LLC
101 John F. Kennedy Parkway
Short Hills, NJ 07078-2716 | | Trustee | | Since 2011 | | 14 | | None |
|
| Principal Occupation During at Least the Past 5 Years: |
| Director of various boards of asset management firms; andformerly, Managing Member, Mitchell, Hartley & Bechtel Advisers, LLC (formerly, Mitchell Advisers, LLC) (advisory firm) (2003-2015) and Managing Director, Putman Lovell NBF. |
| | | | |
David W. Niemiec (1949)
c/o Franklin Mutual Advisers, LLC
101 John F. Kennedy Parkway
Short Hills, NJ 07078-2716 | | Trustee | | Since 2015 | | 38 | | Hess Midstream Partners LP (oil and gas midstream infrastructure) (2017-present). |
|
| Principal Occupation During at Least the Past 5 Years: |
| Advisor, Saratoga Partners (private equity fund); andformerly, Managing Director, Saratoga Partners (1998-2001) and SBC Warburg Dillon Read (investment banking) (1997-1998); Vice Chairman, Dillon, Read & Co. Inc. (investment banking) (1991-1997); and Chief Financial Officer, Dillon, Read & Co. Inc. (1982-1997). |
| | | | |
Charles Rubens II (1930)
c/o Franklin Mutual Advisers, LLC
101 John F. Kennedy Parkway
Short Hills, NJ 07078-2716 | | Trustee | | Since 2011 | | 14 | | None |
|
| Principal Occupation During at Least the Past 5 Years: |
| Private investor and president ofnon-profit organizations; andformerly, an executive of Time, Inc.; and Trustee of Colorado College. |
| | | | |
Robert E. Wade (1946)
c/o Franklin Mutual Advisers, LLC
101 John F. Kennedy Parkway
Short Hills, NJ 07078-2716 | | Trustee and
Chairman of
the Board | | Since 2011 | | 38 | | El Oro Ltd (investments) (2003-June 2019). |
|
| Principal Occupation During at Least the Past 5 Years: |
| Attorney at law engaged in private practice as a sole practitioner (1972-2008) and member of various boards. |
| | | | |
Gregory H. Williams (1943)
c/o Franklin Mutual Advisers, LLC
101 John F. Kennedy Parkway
Short Hills, NJ 07078-2716 | | Trustee | | Since 2015 | | 14 | | None |
|
| Principal Occupation During at Least the Past 5 Years: |
| Private investor; Consultant; andformerly, President, University of Cincinnati (2009-2012); President, The City College of New York (2001-2009); Dean, College of Law, Ohio State University (1993-2001); and Associate Vice President, Academic Affairs and Professor of Law, University of Iowa (1977-1993). |
Interested Board Members and Officers
| | | | | | | | |
| | | | |
Name, Year of Birth
and Address | | Position | | Length of
Time Served | | Number of Portfolios in
Fund Complex Overseen
by Board Member* | | Other Directorships Held During
at Least the Past 5 Years |
| | | | |
**Gregory E. Johnson (1961)
One Franklin Parkway
San Mateo, CA 94403-1906 | | Trustee | | Since 2011 | | 152 | | None |
|
| Principal Occupation During at Least the Past 5 Years: |
| Chairman of the Board, Member – Office of the Chairman, Director and Chief Executive Officer, Franklin Resources, Inc.; officer and/or director or trustee, as the case may be, of some of the other subsidiaries of Franklin Resources, Inc. and of 42 of the investment companies in Franklin Templeton; Vice Chairman, Investment Company Institute; andformerly, President, Franklin Resources, Inc. (1994-2015). |
| | | | |
| | | |
| 90 | | Annual Report | | franklintempleton.com |
FRANKLIN ALTERNATIVE STRATEGIES FUNDS
Interested Board Members and Officers(continued)
| | | | | | | | |
| | | | |
Name, Year of Birth
and Address | | Position | | Length of
Time Served | | Number of Portfolios in
Fund Complex Overseen
by Board Member* | | Other Directorships Held During
at Least the Past 5 Years |
| | | | |
**Jennifer M. Johnson (1964)
One Franklin Parkway
San Mateo, CA 94403-1906 | | Trustee | | Since 2015 | | 46 | | None |
|
| Principal Occupation During at Least the Past 5 Years: |
| President and Chief Operating Officer, Franklin Resources, Inc.; officer and/or director or trustee, as the case may be, of some of the other subsidiaries of Franklin Resources, Inc. and of four of the investment companies in Franklin Templeton; andformerly, Chief Operating Officer and Executive Vice President, Franklin Resources, Inc. (1994-2015); Executive Vice President of Operations and Technology, Franklin Resources, Inc. (2005-2010); and Senior Vice President, Franklin Resources, Inc. (2003-2005). |
| | | | |
Alison E. Baur (1964)
One Franklin Parkway
San Mateo, CA 94403-1906 | | Vice President | | Since 2012 | | Not Applicable | | Not Applicable |
|
| Principal Occupation During at Least the Past 5 Years: |
| Deputy General Counsel, Franklin Templeton; and officer of some of the other subsidiaries of Franklin Resources, Inc. and of 44 of the investment companies in Franklin Templeton. |
| | | | |
Aliya S. Gordon (1973)
One Franklin Parkway
San Mateo, CA 94403-1906 | | Vice President | | Since 2011 | | Not Applicable | | Not Applicable |
|
| Principal Occupation During at Least the Past 5 Years: |
| Senior Associate General Counsel and officer of 44 of the investment companies in Franklin Templeton. |
| | | | |
Steven J. Gray (1955)
One Franklin Parkway
San Mateo, CA 94403-1906 | | Secretary and Vice President | | Since 2011 | | Not Applicable | | Not Applicable |
|
| Principal Occupation During at Least the Past 5 Years: |
| Senior Associate General Counsel, Franklin Templeton; Vice President, Franklin Templeton Distributors, Inc. and FASA, LLC; and officer of 44 of the investment companies in Franklin Templeton. |
| | | | |
Madison S. Gulley (1964)
300 S.E. 2nd Street
Fort Lauderdale, FL 33301-1923 | | President and Chief Executive Officer – Investment Management | | Since 2017 | | Not Applicable | | Not Applicable |
|
| Principal Occupation During at Least the Past 5 Years: |
| President, FASA, LLC; Executive Vice President, Franklin Advisers, Inc., Franklin Templeton Institutional, LLC, Templeton Global Advisors Limited and Templeton Investment Counsel, LLC; Executive Vice President, Head of Alternatives, K2 Advisors, LLC and K2/D&S Management Co., LLC; Senior Vice President, Franklin Templeton Companies, LLC; officer and/or director or trustee, as the case may be, of some of the other subsidiaries of Franklin Resources, Inc. and of one of the investment companies in Franklin Templeton. |
| | | | |
Matthew T. Hinkle (1971)
One Franklin Parkway
San Mateo, CA 94403-1906 | | Chief Executive
Officer –
Finance and
Administration | | Since 2017 | | Not Applicable | | Not Applicable |
|
| Principal Occupation During at Least the Past 5 Years: |
| Senior Vice President, Franklin Templeton Services, LLC; officer of 44 of the investment companies in Franklin Templeton; andformerly, Vice President, Global Tax (2012-April 2017) and Treasurer/Assistant Treasurer, Franklin Templeton (2009-2017). |
| | | | | | |
| | | |
| franklintempleton.com | | Annual Report | | | 91 | |
FRANKLIN ALTERNATIVE STRATEGIES FUNDS
Interested Board Members and Officers(continued)
| | | | | | | | |
| | | | |
Name, Year of Birth
and Address | | Position | | Length of
Time Served | | Number of Portfolios in
Fund Complex Overseen
by Board Member* | | Other Directorships Held During
at Least the Past 5 Years |
| | | | |
Robert G. Kubilis (1973)
300 S.E. 2nd Street
Fort Lauderdale, FL 33301-1923 | | Chief Financial
Officer, Chief
Accounting Officer and Treasurer | | Since 2015 | | Not Applicable | | Not Applicable |
|
| Principal Occupation During at Least the Past 5 Years: |
| Treasurer, U.S. Fund Administration & Reporting and officer of 16 of the investment companies in Franklin Templeton. |
| | | | |
Robert Lim (1948)
One Franklin Parkway
San Mateo, CA 94403-1906 | | Vice President – AML Compliance | | Since 2016 | | Not Applicable | | Not Applicable |
|
| Principal Occupation During at Least the Past 5 Years: |
| Vice President, Franklin Templeton Companies, LLC; Chief Compliance Officer, Franklin Templeton Distributors, Inc. and Franklin Templeton Investor Services, LLC; and officer of 44 of the investment companies in Franklin Templeton. |
| | | | |
Kimberly H. Novotny (1972)
300 S.E. 2nd Street
Fort Lauderdale, FL 33301-1923 | | Vice President | | Since 2013 | | Not Applicable | | Not Applicable |
|
| Principal Occupation During at Least the Past 5 Years: |
| Associate General Counsel, Franklin Templeton; Vice President and Corporate Secretary, Fiduciary Trust International of the South; Vice President, Templeton Investment Counsel, LLC; Assistant Secretary, Franklin Resources, Inc.; and officer of 44 of the investment companies in Franklin Templeton. |
| | | | |
Robert C. Rosselot (1960)
300 S.E. 2nd Street
Fort Lauderdale, FL 33301-1923 | | Chief
Compliance
Officer | | Since 2013 | | Not Applicable | | Not Applicable |
|
| Principal Occupation During at Least the Past 5 Years: |
| Director, Global Compliance, Franklin Templeton; Vice President, Franklin Templeton Companies, LLC; officer of 44 of the investment companies in Franklin Templeton; andformerly, Senior Associate General Counsel, Franklin Templeton (2007-2013); and Secretary and Vice President, Templeton Group of Funds (2004-2013). |
| | | | |
Navid J. Tofigh (1972)
One Franklin Parkway
San Mateo, CA 94403-1906 | | Vice President | | Since 2015 | | Not Applicable | | Not Applicable |
|
| Principal Occupation During at Least the Past 5 Years: |
| Associate General Counsel and officer of 44 of the investment companies in Franklin Templeton. |
| | | | |
Craig S. Tyle (1960)
One Franklin Parkway
San Mateo, CA 94403-1906 | | Vice President | | Since 2011 | | Not Applicable | | Not Applicable |
|
| Principal Occupation During at Least the Past 5 Years: |
| General Counsel, Executive Vice President and Secretary, Franklin Resources, Inc.; and officer of some of the other subsidiaries of Franklin Resources, Inc. and of 44 of the investment companies in Franklin Templeton. |
| | | | |
| | | |
| 92 | | Annual Report | | franklintempleton.com |
FRANKLIN ALTERNATIVE STRATEGIES FUNDS
Interested Board Members and Officers(continued)
| | | | | | | | |
| | | | |
Name, Year of Birth
and Address | | Position | | Length of
Time Served | | Number of Portfolios in
Fund Complex Overseen
by Board Member* | | Other Directorships Held During
at Least the Past 5 Years |
| | | | |
Lori A. Weber (1964)
300 S.E. 2nd Street
Fort Lauderdale, FL 33301-1923 | | Vice President | | Since 2011 | | Not Applicable | | Not Applicable |
|
| Principal Occupation During at Least the Past 5 Years: |
| Senior Associate General Counsel, Franklin Templeton; Assistant Secretary, Franklin Resources, Inc.; Vice President and Secretary, Templeton Investment Counsel, LLC; and officer of 44 of the investment companies in Franklin Templeton. |
*We base the number of portfolios on each separate series of the U.S. registered investment companies within the Franklin Templeton fund complex. These portfolios have a common investment manager or affiliated investment managers.
**Gregory E. Johnson is considered to be an interested person of the Fund under the federal securities laws due to his position as an officer and director of Franklin Resources, Inc. (Resources), which is the parent company of the Fund’s investment manager and distributor. Jennifer M. Johnson is considered to be an interested person of the Fund under the federal securities laws due to her position as an officer of Resources.
Note 1: Gregory E. Johnson and Jennifer M. Johnson are siblings.
Note 2: Officer information is current as of the date of this report. It is possible that after this date, information about officers may change.
The Sarbanes-Oxley Act of 2002 and Rules adopted by the U.S. Securities and Exchange Commission require the Fund to disclose whether the Fund’s Audit Committee includes at least one member who is an audit committee financial expert within the meaning of such Act and Rules. The Fund’s Board has determined that there is at least one such financial expert on the Audit Committee and has designated each of Edward I. Altman, Ph.D., Ann Torre Bates and David W. Niemiec as an audit committee financial expert. The Board believes that Messrs. Altman and Niemiec and Ms. Bates qualify as such an expert in view of their extensive business background and experience. Mr. Altman has served as a member of the Fund Audit Committee since 2011. He currently serves as a Max L. Heine Professor of Finance, Emeritus and Director of The Credit and Debt Markets Research Program, Salomon Center, Stern School of Business, New York University. Ms. Bates has served as a member of the Fund Audit Committee since 2011. She currently serves as a director of Ares Capital Corporation (2010-present) and United Natural Foods, Inc. (2013-present) and was formerly a director of Navient Corporation from 2014 to 2016, SLM Corporation from 1997 to 2014 and Allied Capital Corporation from 2003 to 2010, Executive Vice President and Chief Financial Officer of NHP Incorporated from 1995 to 1997 and Vice President and Treasurer of US Airways, Inc. until 1995. Mr. Niemiec has served as a member of the Fund Audit Committee since 2015, currently serves as an Advisor to Saratoga Partners and was formerly its Managing Director from 1998 to 2001 and serves as a director of Hess Midstream Partners LP (2017-present). Mr. Niemiec was formerly a director of Emeritus Corporation from 1999 to 2010 and OSI Pharmaceuticals, Inc. from 2006 to 2010, Managing Director of SBC Warburg Dillon Read from 1997 to 1998, and was Vice Chairman from 1991 to 1997 and Chief Financial Officer from 1982 to 1997 of Dillon, Read & Co. Inc. As a result of such background and experience, the Board believes that Messrs. Altman and Niemiec and Ms. Bates have each acquired an understanding of generally accepted accounting principles and financial statements, the general application of such principles in connection with the accounting estimates, accruals and reserves, and analyzing and evaluating financial statements that present a breadth and level of complexity of accounting issues generally comparable to those of the Fund, as well as an understanding of internal controls and procedures for financial reporting and an understanding of audit committee functions. Messrs. Altman and Niemiec and Ms. Bates are independent Board members as that term is defined under the applicable U.S. Securities and Exchange Commission Rules and Releases.
The Statement of Additional Information (SAI) includes additional information about the board members and is available, without charge, upon request. Shareholders may call (800) DIAL BEN/342-5236 to request the SAI.
| | | | | | |
| | | |
| franklintempleton.com | | Annual Report | | | 93 | |
FRANKLIN ALTERNATIVE STRATEGIES FUNDS
FRANKLIN K2 ALTERNATIVE STRATEGIES FUND
Shareholder Information
Board Approval of Investment Management Agreement andSub-Advisory Agreements
FRANKLIN ALTERNATIVE STRATEGIES FUNDS
Franklin K2 Alternative Strategies Fund
(Fund)
The Board of Trustees (Board) of Franklin Alternative Strategies Funds (the Trust), including a majority of trustees that are not “interested persons” as such term is defined in section 2(a)(19) of the Investment Company Act of 1940 (hereinafter referred to as “independent trustees”), at anin-person meeting held on May 22, 2019, unanimously approved the renewal of the Fund’s investment management agreement with K2/D&S Management Co., L.L.C. (K2 Advisors), and of each sub-advisory agreement between K2 Advisors and each of following sub-advisors(the Sub-Advisors):
Bardin Hill Investment Partners L.P.
Chatham Asset Management, LLC
Chilton Investment Company, LLC
EMSO Asset Management Limited
Graham Capital Management, L.P.
Grantham Mayo Van Otterloo & Co LLC
H2O AM LLP
Impala Asset Management LLC
Jennison Associates, LLC
Lazard Asset Management, LLC
Loomis Sayles & Company, L.P.
P. Schoenfeld Asset Management LP
Portland Hill Asset Management Limited
Wellington Management Company, LLP
Prior to a meeting of all of the trustees for the purpose of considering such renewal, the independent trustees participated in two other meetings held in connection with the renewal process. Throughout the process, the independent trustees received assistance and advice from and met separately with independent counsel. The independent trustees met with and interviewed officers of K2 Advisors and certain Sub-Advisors (including portfolio managers), the transfer agent and shareholder services group and the distributor. In approving the renewal of the investment management agreement and the sub-advisory agreements for the Fund, the Board, including the independent trustees, determined that the investment management fee structure was fair and reasonable and that continuance of the agreement was in the best interests of the Fund and its shareholders.
In making the foregoing approvals, the Board considered various materials related to the investment management agreement and the sub-advisory agreements including: (1) a copy of the investment management agreement andsub-advisory agreements; (2) information describing the nature, quality and extent of services that K2 Advisors and each Sub-Advisor provided, and are expected to provide, to the Fund, and the investment management fees andsub-advisory fees payable to K2 Advisors and eachSub-Advisor; (3) reports from K2 Advisors on the continued diligence conducted on each Sub-Advisor and the reasons for recommending renewal of each of the sub-advisory agreements, including, but not limited to, each Sub-Advisor’s background, experience, personnel, operations, policies, procedures and compliance functions; and (4) a report from the Trust’s Chief Compliance Officer regarding K2 Advisors’ and each Sub-Advisor’s compliance program and capabilities, including policies and procedures in place to address potential conflicts of interest, and the diligence undertaken by the Trust’s Chief Compliance Officer with respect thereto. The Board also noted that it received an annual report on all payments made by Franklin Templeton Investments (FTI) or the Fund to financial intermediaries engaged in the sale of Fund shares, as well as a memorandum relating to third-party servicing arrangements in response to a Guidance Update from the U.S. Securities and Exchange Commission (SEC) relating to mutual fund distribution and sub- accounting fees.
The Board also took into account information furnished throughout the year at regular Board meetings, as well as information specifically requested and furnished for the renewal process, which culminated in the meetings referred to above for the specific purpose of considering such agreements. Information furnished throughout the year included, among others, reports on the Fund’s investment performance, expenses, portfolio composition, derivatives, asset segregation, portfolio turnover, Rule 12b-1 plan, distribution, shareholder servicing, legal and compliance matters, pricing of securities, sales and redemptions, and marketing support payments made to financial intermediaries, as well as a third-party survey of transfer agent fees charged to funds within the FTI complex in comparison with those charged to other fund complexes deemed comparable. Also, related financial statements and other information about the scope and quality of services provided by K2 Advisors and its affiliates and enhancements to such services over the past year were provided. In addition, the trustees received periodic reports throughout the year and during the renewal process relating to compliance with the Fund’s investment policies and
| | | | |
| | | |
| 94 | | Annual Report | | franklintempleton.com |
FRANKLIN ALTERNATIVE STRATEGIES FUNDS
FRANKLIN K2 ALTERNATIVE STRATEGIES FUND
SHAREHOLDER INFORMATION
restrictions. During the renewal process, the independent trustees considered K2 Advisors’ methods of operation within the Franklin Templeton group and its activities on behalf of other clients.
The information obtained by the trustees during the renewal process also included a special report prepared by Broadridge Financial Solutions, Inc., an independentthird-party analyst that utilizes data from Lipper, Inc. (“Lipper”), comparing the Fund’s investment performance and expenses with those of other mutual funds deemed comparable to such Fund as selected by Lipper (Broadridge Section 15(c) Report). The trustees reviewed the Broadridge Section 15(c) Report and its usefulness in the renewal process with respect to matters such as comparative fees, expenses, expense ratios and performance. The Board considered K2 Advisors’ views that the peer group determined by Lipper for comparison purposes may not be an entirely appropriate representation of the Fund’s peer universe. K2 Advisors explained that the universe of funds that are managed using multi-manager, multi- strategy structures, like the Fund, continues to evolve, and has presented challenges in identifying an appropriate set of peers for the Fund. It was noted by K2 Advisors that the peer group compiled by Lipper includes single-manager funds which, due to their nature and relative simplicity, have lower expense ratios and are not true peers for fee comparison purposes (“Base Expense Group”). Because some of the sponsors of funds with multi-manager strategies that K2 Advisors considers to be peers were excluded from the peer group determined by Lipper, K2 Advisors requested a second peer group including funds that K2 Advisors considers to be peer funds (“Alternate Expense Group”). K2 Advisors believes that the Fund’s expenses are in line with the second peer group. While noting the limitations of the Broadridge Section 15(c) Report, the Board concluded that the Broadridge Section 15(c) Report was helpful in the performance of its duties.
In addition, the trustees received a Profitability Study (Profitability Study) prepared by management discussing the profitability to FTI from its overall U.S. fund operations, as well as on an individual fund-by-fund basis. Over the past year, the Board and counsel to the independent trustees continued to receive reports on management’s handling of recent regulatory inquiries and pending legal actions against K2 Advisors and its affiliates. The independent trustees were satisfied with the actions taken to date by management in response to such regulatory and legal matters. The independent trustees also received reports from the Trust’s Chief Compliance Officer on regulatory inquiries and pending legal actions against the
Sub-Advisors applicable to the services provided by theSub-Advisors to the Fund and noted that there were not any issues in this regard that should prevent the renewal of the sub-advisory agreements.
The trustees reviewed the personnel, operations, financial condition, and investment management capabilities, methodologies and resources of K2 Advisors and eachSub-Advisor, including each management team’s expertise in the management of other alternative strategies funds. As part of this review, particular attention was given to (1) the diligent risk management program of K2 Advisors and its parent, including those aspects of the program related to selecting and overseeing sub-advisors to the Fund and continual monitoring and management of cybersecurity, liquidity and counterparty credit risk, (2) each Sub-Advisor’s risk management program, and (3) derivatives and other complex instruments that are held and expected to be held by the Fund and how such instruments are used to carry out the Fund’s investment goal.
The Board also took into account, among other things, management’s efforts in establishing a global credit facility for the benefit of the Fund and other accounts managed by FTI to provide a source of cash for temporary and emergency purposes or to meet unusual redemption requests as well as the strong financial position of K2 Advisors’ parent company and its commitment to the mutual fund business. The Board noted management’s continuing efforts and expenditures in establishing effective business continuity plans and developing strategies to address areas of heightened concern in the mutual fund industry, such as cybersecurity and liquidity risk management. The Board also recognized management’s commitment to facilitating Board oversight of particular areas, including derivatives and payments to intermediaries, by enhanced reporting. In addition, the Board received updates from management on the compliance of the investment manager with comprehensive rules and regulations promulgated by the SEC and the U.S. Commodity Futures Trading Commission.
In addition to the above and other matters considered by the trustees throughout the course of the year, the following discussion relates to certain primary factors relevant to the Board’s decision. This discussion of the information and factors considered by the Board (including the information and factors discussed above) is not intended to be exhaustive, but rather summarizes certain factors considered by the Board. In view of the wide variety of factors considered, the Board did not, unless otherwise noted, find it practicable to quantify or otherwise assign relative weights to the foregoing factors. In addition, individual trustees may have assigned different weights to various factors.
| | | | | | |
| | | |
| franklintempleton.com | | Annual Report | | | 95 | |
FRANKLIN ALTERNATIVE STRATEGIES FUNDS
FRANKLIN K2 ALTERNATIVE STRATEGIES FUND
SHAREHOLDER INFORMATION
NATURE, EXTENT AND QUALITY OF SERVICES. The trustees reviewed the nature, extent and quality of the services provided, and to be provided, by K2 Advisors and each Sub- Advisor. In this regard, they reviewed the Fund’s investment goal and K2 Advisors’ and each Sub-Advisor’s investment strategy and sub-strategy, and K2 Advisors’ and each Sub-Advisor’s ability to implement such investment strategy and/or sub-strategy, including, but not limited to, K2 Advisors’ and each Sub-Advisor’s trading practices, investment decision processes and reputation. The Board also considered the investment management services that the investment manager provides to the Cayman Islands-based company, which is wholly owned by the Fund (Cayman Subsidiary).
The Board noted that the Fund employs a “manager of managers” structure, whereby K2 Advisors is responsible for selecting sub-advisors (subject to Board approval), allocating the Fund’s assets among them, and overseeing thesub-advisors’ day-to-day management of the Fund’s assets. The Board noted the responsibilities that K2 Advisors has as the Fund’s investment manager, including (1) due diligence on the Sub-Advisors and any potential new sub-advisors to the Fund, their respective trading strategies, risk management, operations and businesses, (2) on-going oversight and monitoring of the day-to-day investment activities of Sub-Advisors and other service providers, including their respective compliance with the investment mandate and restrictions, compliance policies and procedures and federal securities laws, and K2 Advisors’ ongoing assessment of their performance, (3) portfolio construction with respect to the allocation of assets among Sub-Advisors, investment funds, cash and other investments, (4) risk management, (5) preparing quarterly reports to the Board, and (6) the implementation of Board directives as they relate to the Fund. The Trustees also considered the successful performance of K2 Advisors in managing the Fund and other investment products with similar investment strategies to the investment strategies of the Fund that are not subject to the Investment Company Act of 1940.
With respect to the sub-advisory services provided, and to be provided, by each Sub-Advisor, the Board noted the responsibilities that each Sub-Advisor has with respect to the portion of the Fund’s assets allocated to the Sub-Advisor by K2 Advisors (Sub-Advised Portion), including, among others, implementing the investment strategies with respect to the Sub-Advised Portion and ensuring compliance with the investment strategies, policies and limitations of theSub-Advised Portion. The trustees considered the successful performance of each Sub-Advisor in managing the Fund and other investment products with similar investment strategies
to the investment strategies of its Sub-Advised Portion of the Fund, including, with respect to certain Sub-Advisors, mutual funds with similar investment strategies. The Board considered K2 Advisors’ rationale for recommending the continued retention of each Sub-Advisor.
The trustees reviewed the Fund’s portfolio management teams at K2 Advisors and each Sub- Advisor, including each such team’s performance, staffing, skills and compensation program. With respect to portfolio manager compensation, management assured the trustees that the Fund’s long-term performance is a significant component of incentive-based compensation for K2 Advisors’ portfolio management team and noted that a portion of a K2 Advisors’ portfolio manager’s incentive-based compensation is paid in shares ofpre-designated funds from the portfolio manager’s fund management area. The trustees noted that the portfolio manager compensation program aligned the interests of the portfolio managers with that of Fund shareholders. During regular Board meetings and the aforementioned meetings of the independent trustees, the trustees considered periodic reports provided to them showing that K2 Advisors and the Sub-Advisors complied with the investment policies and restrictions of the Fund as well as other reports periodically furnished to the Board covering matters such as the compliance of portfolio managers and other management personnel with the code of ethics covering the investment management personnel, the adherence to fair value pricing procedures established by the Board and the accuracy of net asset value calculations. The Board noted the extent of the benefits provided to Fund shareholders from being part of the Franklin Templeton group of funds, including the right to exchange investments between funds (same class) without a sales charge, the ability to reinvest Fund dividends into other funds and the right to combine holdings of other funds to obtain reduced sales charges.
The trustees discussed with management various other products, portfolios and entities that are advised by K2 Advisors and each Sub-Advisor and the allocation of assets and expenses among and within them, as well as their relative fees and reasons for differences with respect thereto and any potential conflicts.
The Board also considered a report from the Trust’s Chief Compliance Officer regarding K2 Advisors’ and eachSub-Advisor’s compliance programs and capabilities as such programs and capabilities relate to the operations of the Fund and the monitoring and testing of such program undertaken by the Trust’s Chief Compliance Officer. The Board considered the selection and due diligence process
| | | | |
| | | |
| 96 | | Annual Report | | franklintempleton.com |
FRANKLIN ALTERNATIVE STRATEGIES FUNDS
FRANKLIN K2 ALTERNATIVE STRATEGIES FUND
SHAREHOLDER INFORMATION
employed by K2 Advisors in selecting and deciding to retain each Sub-Advisor as a sub-advisor to the Fund, including the
due diligence undertaken with respect to the Sub-Advisor’s compliance and risk management capabilities. The trustees considered K2 Advisors’ significant efforts in developing and implementing compliance procedures established in accordance with SEC and other requirements.
The Board also considered the nature, extent and quality of the services to be provided under the Fund’s other service agreements to determine that, on an overall basis, Fund shareholders were well served. In this connection, the Board also took into account transfer agent and shareholder services provided to Fund shareholders by an affiliate of K2 Advisors, noting continuing expenditures by management to increase and improve the scope of such services and favorable periodic reports on shareholder services conducted by independent third parties. While such considerations directly affected the trustees’ decision in renewing the Fund’s transfer agent and shareholder services agreement, the Board also considered these commitments as incidental benefits to Fund shareholders deriving from the investment management relationship.
Based on their review, the trustees were satisfied with the nature and quality of the overall services provided, and to be provided, by K2 Advisors and its affiliates and each Sub Advisor to the Fund and its shareholders and were confident in the abilities of K2 Advisors and each Sub- Advisor to implement their respective investment strategy and/orsub-strategy and to provide quality services to the Fund and its shareholders.
INVESTMENT PERFORMANCE. As the Fund commenced operations in October 2013, the trustees reviewed the investment performance of the Fund for the one-, three-, and five-year periods ended December 31, 2018.
As part of their review, they inquired of management regarding benchmark and hedging activities. Consideration was also given to performance in the context of available levels of cash, including as affected by net flows, during the periods. The trustees had meetings during the year, including the meetings referred to above held in connection with the renewal process, with the Fund’s portfolio managers to discuss performance and the management of the Fund and each Sub-Advisor.
In addition, attention in assessing performance was given to the Broadridge Section 15(c) Report. That report showed the investment performance of the Fund (Advisor Class shares)
in comparison to other funds determined comparable by Lipper.
The comparable funds to the Fund, as chosen by Lipper, included all retail and institutional alternative multi-strategy funds. The Fund had total returns in the best performing quintile for the one- and five-year periods ended December 31, 2018 and total returns in the second-best performing quintile for the three-year period ended December 31, 2018. The Board was satisfied with such performance.
The trustees also compared Fund performance to other industry benchmarks, including measures of risk-adjusted performance of a fund, as part of their evaluation of investment performance. The trustees concluded that the Fund had continued to perform well in comparison to its various benchmarks and in the context of the Fund’s investment goal.
COMPARATIVE EXPENSES AND PROFITABILITY. The trustees considered the cost of the services provided, and to be provided, by K2 Advisors and each Sub-Advisor and the profits realized by K2 Advisors and its affiliates from their relationships with the Fund. As part of the renewal process, they explored with management the trends in expense ratios over the past three fiscal years (or, if earlier, inception) and the reasons for any increases in the Fund’s expense ratios (or components thereof). In considering the appropriateness of the management fee and other expenses charged to the Fund, the Board took into account various factors including investment performance and matters relating to Fund operations, including, but not limited to, the quality and experience of K2 Advisors personnel. The Board also reviewed and considered the investment management fees in light of the nature, extent and quality of the investment management services provided, and to be provided, by K2 Advisors and each Sub-Advisor, as more fully discussed above. The Board noted that the sub-advisory fees are paid by K2 Advisors to each Sub-Advisor and are not additional fees borne by the Fund. The Board also noted that thesub-advisory fees paid, and to be paid, by K2 Advisors to each Sub-Advisor were the product of arms-length negotiations between K2 Advisors and each Sub-Advisor.
Furthermore, the Board took into account that information regarding Sub-Advisor profitability is not legally required to be provided. Accordingly, profitability information of thesub-advisors was given lesser weight than other factors. In addition, the Board considered the allocation of the investment management fee charged to the Fund between K2 Advisors and each Sub-Advisor in light of the nature,
| | | | | | |
| | | |
| franklintempleton.com | | Annual Report | | | 97 | |
FRANKLIN ALTERNATIVE STRATEGIES FUNDS
FRANKLIN K2 ALTERNATIVE STRATEGIES FUND
SHAREHOLDER INFORMATION
extent and quality of the investment management services provided, and to be provided, by K2 Advisors and eachSub-Advisor. As part of this discussion, the Board took into account the fee waiver and expense limitation arrangement in effect, and the amount of Fund expenses that were absorbed since inception of the Fund by K2 Advisors through such waivers and arrangements. The Board also considered the investment management services that the investment manager provides to the Cayman Subsidiary and the related fee waivers that were in place.
Consideration was also given to a comparative analysis in the Broadridge Section 15(c) Report of the investment management fee and total expense ratio of the Fund in comparison with those of a group of other funds selected by Lipper as its appropriate Lipper expense group.
Lipper expense data is based upon information taken from each fund’s most recent annual report, which reflects historical asset levels that may be quite different from those currently existing, particularly in a period of market volatility.
In reviewing comparative costs, emphasis was given to the Fund’s contractual management fee in comparison with the contractual management fee that would have been charged by other funds within its Lipper expense group assuming they were similar in size to the Fund, as well as the actual total expenses of the Fund in comparison with those of its Lipper expense group. The Lipper contractual management fee analysis includes administrative charges as being part of the management fee, and total expenses, for comparative consistency, are shown by Lipper for Fund Advisor Class shares. The Fund’s contractual management fee rate was in the most expensive quintile of both its Base Expense Group and Alternate Expense Group. The Fund’s total expenses were in the second-most expensive quintile of its Alternate Expense Group and the most expensive quintile of its Base Expense Group.
Noting the factors and limitations with respect to the Broadridge Section 15(c) Report (including the inclusion of single-manager funds in both peer groups) and factors relating to the Fund’s operations, such as the quality and experience of K2 Advisors and the Sub-Advisors and the nature and quality of the services provided and to be provided by K2 Advisors and the Sub-Advisors, the Board found such comparative fees and expenses to be acceptable.
The trustees also reviewed the Profitability Study addressing profitability of Franklin Resources, Inc., from its overall U.S. fund business, as well as profitability to K2 Advisors and its
affiliates, from providing investment management and other services to the Fund during the 12-month period ended September 30, 2018, the most recent fiscal year-end of Franklin Resources, Inc. The trustees reviewed the basis on which such reports are prepared and the cost allocation methodology utilized in the Profitability Study, it being recognized that allocation methodologies may each be reasonable while producing different results. In this respect, the Board noted that the reasonableness of the cost allocation methodologies was reviewed by independent accountants on an every other year basis.
The independent trustees met with management to discuss the Profitability Study. This included, among other things, a comparison of investment management income with investment management expenses of the Fund; comparison of underwriting revenues and expenses; the relative relationship of investment management and underwriting expenses; shareholder servicing profitability; economies of scale; and the relative contribution of the Fund to the profitability of K2 Advisors and its parent. In discussing the Profitability Study with the Board, K2 Advisors stated its belief that the costs incurred in establishing the infrastructure necessary to operate the type of mutual fund operations conducted by it and its affiliates may not be fully reflected in the expenses allocated to the Fund in determining its profitability.
The Board also took into account management’s expenditures in improving shareholder services provided to the Fund, as well as the need to meet additional regulatory and compliance requirements. The trustees also considered the extent to which K2 Advisors and the Sub-Advisors may derive ancillary benefits from Fund operations, including those derived from the allocation of Fund brokerage and the use of commission dollars to pay for research and other similar services.
Based upon their consideration of all these factors, the trustees determined that the level of profits realized by K2 Advisors and its affiliates in providing services to the Fund was not excessive in view of the nature, quality and extent of services provided. In addition, the Board noted that shareholders are able to redeem their Fund shares at any time if shareholders believe that Fund fees and expenses are too high or if they are dissatisfied with the performance of the Fund.
ECONOMIES OF SCALE. The Board considered economies of scale realized by K2 Advisors and its affiliates and the Sub-Advisors as the Fund grows larger and the extent to which they are shared with Fund shareholders, as for
| | | | |
| | | |
| 98 | | Annual Report | | franklintempleton.com |
FRANKLIN ALTERNATIVE STRATEGIES FUNDS
FRANKLIN K2 ALTERNATIVE STRATEGIES FUND
SHAREHOLDER INFORMATION
example, in the level of the investment management fees charged, in the quality and efficiency of services rendered and in increased capital commitments benefiting the Fund directly or indirectly. The Board also considered the fee waiver and expense limitation arrangement in effect, and the amount of Fund expenses that were absorbed since inception of the Fund by K2 Advisors through such waiver and arrangement. The Board concluded that economies of scale were deemed not to be a significant factor at that time in light of, among other matters, the fee waiver and expense limitation arrangement in effect and the fact that the Fund had less than six complete years of operating results.
Board Approval of Sub-Advisory Agreements
FRANKLIN ALTERNATIVE STRATEGIES FUNDS
Franklin K2 Alternative Strategies Fund
(Fund)
The Board of Trustees (Board) of Franklin Alternative Strategies Funds (the Trust), including a majority of trustees that are not “interested persons” as such term is defined in section 2(a)(19) of the Investment Company Act of 1940 (hereinafter referred to as “independent trustees”), at an in-person meeting held on May 22, 2019, unanimously approved sub-advisory agreements (each, a “New Sub-Advisory Agreement”) with the following sub-advisors (each a “Sub-Advisor”): Apollo Credit Management, LLC, Aspect Capital Limited, Ellington Global Asset Management, L.L.C., Medalist Partners, LP, EMSO Asset Management Limited, P/E Global, LLC, and RV Capital Management Private Ltd. (“RV Capital”). It was noted that each Sub-Advisor currently serves as a sub-advisor for either the Franklin K2 Long Short Credit Fund or Franklin K2 Global Macro Opportunities Fund.
In approving each New Sub-Advisory Agreement, the Board, including the independent trustees, determined that fees to be paid under each New Sub-Advisory Agreement were fair and reasonable and that approval of each New Sub-Advisory Agreement was in the best interests of the Fund and its shareholders. As part of the approval process, the trustees considered the process undertaken and information provided during their consideration and approval on May 22, 2019 of the sub-advisory agreements between K2/D&S Management Co., L.L.C., the Fund’s investment manager (“K2 Advisors”), and the Sub-Advisers (other than RV Capital) with respect to the investment management services they provide to Franklin K2 Long Short Credit Fund or Franklin K2 Global Macro Opportunities Fund, as applicable. With respect to RV Capital, because the Sub-Advisory Agreement with RV Capital for
Franklin K2 Global Macro Opportunities Fund is still within its initial two-year term, such agreement was not renewed at the May 22, 2019 meeting. The Board, however, considered the materials and information that had been included in the materials provided for the July 2018 Board meeting, at which time RV Capital had been approved as a Sub-Advisor of Franklin K2 Global Macro Opportunities Fund and a memorandum from management that provided certain information related to RV Capital, including a statement that there had been no material changes to any of the information included in the July 2018 Board meeting materials related to RV Capital other than those items previously reported to the Board.
In making the foregoing approvals, the independent trustees received assistance and advice from their independent counsel and, in addition to the materials provided at prior meetings, considered various matters related to each New Sub-Advisory Agreement including: (1) the proposed form of New Sub-Advisory Agreement; (2) information describing the nature, quality and extent of services that each Sub-Advisor would provide to the Fund, and the proposed sub-advisory fees payable to each Sub-Advisor; (3) a report (written or oral) from K2 Advisors on the diligence conducted on each Sub-Advisor and the reasons for recommending each Sub-Advisor for the Fund, including, but not limited to, each Sub-Advisor’s background, experience, personnel, operations, policies, procedures and compliance functions; and (4) a report (written or oral) from the Fund’s Chief Compliance Officer regarding each Sub-Advisor’s compliance program and capabilities, including each Sub-Advisor’s policies and procedures in place to address potential conflicts of interest, and the diligence undertaken by the Fund’s Chief Compliance Officer with respect thereto. The Board noted that the terms of each New Sub-Advisory Agreement were substantially similar to the terms of the sub-advisory agreements with the Fund’s existing sub-advisors and to the terms of the sub-advisory agreements each Sub-Advisor has with respect to the Franklin K2 Long Short Credit Fund or Franklin K2 Global Macro Opportunities Fund, as applicable.
The Board’s consideration of whether to approve each New Sub-Advisory Agreement on behalf of the Fund took into account several factors including, but not limited to, the following: (1) the nature and quality of the services to be provided by each Sub-Advisor to the Fund under the respective New Sub-Advisory Agreement; (2) each Sub-Advisor’s experience as a sub-advisor of Franklin K2 Long Short Credit Fund or Franklin K2 Global Macro Opportunities Fund, as applicable, and a manager of other accounts; (3) each Sub-Advisor’s strength and reputation within the industry; (4) the
| | | | | | |
| | | |
| franklintempleton.com | | Annual Report | | | 99 | |
FRANKLIN ALTERNATIVE STRATEGIES FUNDS
CONSOLIDATED STATEMENT OF INVESTMENTS
SHAREHOLDER INFORMATION
fairness of the compensation under each New Sub-Advisory Agreement; (5) the personnel, operations, financial condition, and investment management capabilities, methodologies and resources of each Sub-Advisor; (6) profitability matters; (7) reports (written or oral) from K2 Advisors on the diligence conducted on each Sub-Advisor and the reasons for recommending each Sub-Advisor as a sub-advisor for the Fund, including, but not limited to, each Sub-Advisor’s background, experience, personnel, operations, policies, procedures and compliance functions; and (8) a report (written or oral) from the Trust’s Chief Compliance Officer regarding each compliance program and capabilities, including each Sub-Advisor’s policies and procedures in place to address potential conflicts of interest, and the diligence undertaken by the Trust’s Chief Compliance Officer with respect thereto. Particular attention was given to the due diligence and risk management procedures of K2 Advisors with respect to selecting and overseeing sub-advisors of the Fund, as well as each Sub-Advisor’s risk management program and to derivatives and other complex instruments that are expected to be held by the Fund and how such instruments are expected to be used to pursue the Fund’s investment goals.
The following discussion relates to certain primary factors relevant to the Board’s decision to approve each New Sub-Advisory Agreement. This discussion of the information and factors considered by the Board (including the information and factors discussed above) is not intended to be exhaustive, but rather summarizes certain factors considered by the Board. In view of the wide variety of factors considered, the Board did not, unless otherwise noted, find it practicable to quantify or otherwise assign relative weights to the following factors. In addition, individual trustees may have assigned different weights to various factors.
NATURE, EXTENT AND QUALITY OF SERVICES. The trustees reviewed the nature, extent and quality of the services to be provided by each Sub-Advisor. In this regard, they reviewed the Fund’s investment goal and each Sub-Advisor’s proposed investment strategy, and each Sub-Advisor’s ability to implement such investment goal and/or investment strategy, including, but not limited to, each Sub-Advisor’s trading practices and investment decision processes.
With respect to the sub-advisory services to be provided by each Sub-Advisor, the Board noted the responsibilities that each Sub-Advisor would have with respect to the Fund’s assets to be allocated to each Sub-Advisor by K2-Advisors (the “Sub-Advised Portion”), including, among others, implementing the investment strategies with respect to the Sub-Advised Portion and ensuring compliance with the investment strategies,
policies, and limitations of the Sub-Advised Portion. The trustees considered the successful performance of each Sub-Advisor in serving as a sub-advisor for the Franklin K2 Long Short Credit Fund or Franklin K2 Global Macro Opportunities Fund, as applicable, and in managing other investment products with investment strategies similar to the investment strategies of the Sub-Advised Portion of the Fund.
The trustees reviewed the portfolio management team at each Sub-Advisor that would be responsible for managing the Sub-Advised Portion, including the team’s performance, staffing, skills and compensation program. The trustees considered various other products, portfolios and entities that are advised by each Sub-Advisor, their relative fees and reasons for differences with respect thereto and any potential conflicts. The Board also considered a report (written or oral) from the Trust’s Chief Compliance Officer regarding each Sub-Advisor’s compliance program as such policies relate to the operations of the Fund. The Board considered the selection and due diligence process employed by K2 Advisors in proposing each Sub-Advisor as a sub-advisor to the Fund, including the due diligence undertaken with respect to each Sub-Advisor’s compliance capabilities.
Based on their review, the trustees were satisfied with the nature and quality of the overall services to be provided by each Sub-Advisor to the Fund and its shareholders and were confident in the abilities of each Sub-Advisor to implement its proposed investment strategy, and to provide quality services to the Fund and its shareholders.
INVESTMENT PERFORMANCE. The Board noted that, as each Sub-Advisor had not provided any services to the Fund, there was no investment performance of each Sub-Advisor with respect to the Fund. The Board considered the investment performance of each Sub-Advisor in serving as a sub-advisor for the Franklin K2 Long Short Credit Fund or Franklin K2 Global Macro Opportunities Fund, as applicable, and in managing other investment products with similar investment strategies to the investment strategies of the Sub-Advised Portion. The Board also considered the performance benchmarks for the Fund and how such benchmarks would be utilized to measure the performance of each Sub-Advisor in managing the Sub-Advised Portion.
COMPARATIVE EXPENSES AND PROFITABILITY. The Board considered the cost of the services to be provided by each Sub-Advisor. The Board also noted that it could not evaluate each Sub-Advisor’s profitability with respect to the Fund since no assets had yet been allocated to each Sub-Advisor.
| | | | |
| | | |
| 100 | | Annual Report | | franklintempleton.com |
FRANKLIN ALTERNATIVE STRATEGIES FUNDS
FRANKLIN K2 ALTERNATIVE STRATEGIES FUND
SHAREHOLDER INFORMATION
The Board noted that the sub-advisory fees would be paid by K2 Advisors to each Sub-Advisor and would not be additional fees to be borne by the Fund. The Board also noted that the sub-advisory fees to be paid by K2 Advisors to each Sub-Advisor were the product of arms-length negotiations between K2 Advisors and each Sub-Advisor and the Board considered the allocation of the investment management fee charged to the Fund between K2 Advisors and each Sub-Advisor in light of the nature, extent and quality of the investment management services expected to be provided by K2 Advisors and each Sub-Advisor. The trustees considered various other products, portfolios and entities that are advised by each Sub-Advisor (including Franklin K2 Long Short Credit Fund or Franklin K2 Global Macro Opportunities Fund, as applicable), and the allocation of assets and expenses among and within them, as well as their relative fees and reasons for differences with respect thereto and any potential conflicts. The Board considered the extent to which each Sub-Advisor may derive ancillary benefits from the Fund’s operations.
With respect to the impact on K2 Advisors’ and its affiliates’ profitability as a result of hiring each Sub-Advisor as a sub-advisor to the Fund, the Board considered the following: (1) the fee waiver and expense limitation arrangements in effect, and the amount of Fund expenses that were absorbed since the inception of the Fund by K2 Advisors through such arrangements, (2) the sub-advisory fees to be paid to each Sub-Advisor are the same as the fees charged by all of the Fund’s existing sub-advisors (with the exception of one other sub-advisor), and (3) K2 Advisors’ belief that the hiring of each Sub-Advisor as a sub-advisor will not have any demonstrable impact on K2 Advisors’ profitability.
Based upon its consideration of all these factors, the Board determined that the sub-advisory fee structure for each Sub-Advisor was fair and reasonable.
ECONOMIES OF SCALE. The Board considered economies of scale that may be realized by each Sub-Advisor as the Fund grows larger and the extent to which such economies of scale may be shared with Fund shareholders, as for example, in the level of the sub-advisory fees charged, in the quality and efficiency of services rendered and in increased capital commitments benefiting the Fund directly or indirectly. The Board concluded that economies of scale were deemed not to be a significant factor at that time in light of, among other matters, the fee waiver and expense limitation arrangement in effect.
CONCLUSION. After consideration of the foregoing factors, and such other matters as were deemed relevant, and with no single factor being determinative to their decision, the
trustees—including a majority of the independent trustees—with the assistance of independent counsel approved each New Sub-Advisory Agreement, including the fees payable thereunder, with each Sub-Advisor for the Fund.
Proxy Voting Policies and Procedures
The Fund’s investment manager has established Proxy Voting Policies and Procedures (Policies) that the Fund uses to determine how to vote proxies relating to portfolio securities. Shareholders may view the Fund’s complete Policies online at franklintempleton.com. Alternatively, shareholders may request copies of the Policies free of charge by calling the Proxy Group collect at (954)527-7678 or by sending a written request to: Franklin Templeton Companies, LLC, 300 S.E. 2nd Street, Fort Lauderdale, FL 33301, Attention: Proxy Group. Copies of the Fund’s proxy voting records are also made available online at franklintempleton.com and posted on the U.S. Securities and Exchange Commission’s website at sec.gov and reflect the most recent12-month period ended June 30.
Quarterly Consolidated Statement of Investments
The Trust, on behalf of the Fund, files a complete statement of investments with the U.S. Securities and Exchange Commission for the first and third quarters for each fiscal year as an exhibit to its report on FormN-PORT. Shareholders may view the filed FormN-PORT by visiting the Commission’s website at sec.gov. The filed form may also be viewed and copied at the Commission’s Public Reference Room in Washington, DC. Information regarding the operations of the Public Reference Room may be obtained by calling(800) SEC-0330.
Householding of Reports and Prospectuses
You will receive the Fund’s financial reports every six months as well as an annual updated summary prospectus (prospectus available upon request). To reduce Fund expenses, we try to identify related shareholders in a household and send only one copy of the financial reports and summary prospectus. This process, called “householding,” will continue indefinitely unless you instruct us otherwise. If you prefer not to have these documents householded, please call us at (800)632-2301. At any time you may view current prospectuses/summary prospectuses and financial reports on our website. If you choose, you may receive these documents through electronic delivery.
| | | | | | |
| | | |
| franklintempleton.com | | Annual Report | | | 101 | |
Authorized for distribution only when accompanied or preceded by a summary prospectus and/or prospectus. Investors should carefully consider a fund’s investment goals, risks, charges and expenses before investing. A prospectus contains this and other information; please read it carefully before investing.
To help ensure we provide you with quality service, all calls to and from our service areas are monitored and/or recorded.
| | | | | | |
 | | Annual Report and Shareholder Letter Franklin K2 Alternative Strategies Fund | | |
| | | |
| | Investment Manager | | Distributor | | Shareholder Services |
| | K2/D&S Management Co., L.L.C. | | Franklin Templeton Distributors, Inc. (800) DIAL BEN®/342-5236 franklintempleton.com | | (800) 632-2301 |
| © 2019 Franklin Templeton Investments. All rights reserved. | | | | 068 A 07/19 |
| | |
ANNUAL REPORT AND SHAREHOLDER LETTER | | |
FRANKLIN PELAGOS COMMODITIES STRATEGY FUND A Series of Franklin Alternative Strategies Funds May 31, 2019 
|

Sign up for electronic delivery at franklintempleton.com/edelivery
Internet Delivery of Fund Reports Unless You Request Paper Copies: Effective January 1, 2021, as permitted by the SEC, paper copies of the Fund’s shareholder reports will no longer be sent by mail, unless you specifically request them from the Fund or your financial intermediary. Instead, the reports will be made available on a website, and you will be notified by mail each time a report is posted and provided with a website link to access the report.
If you already elected to receive shareholder reports electronically, you will not be affected by this change and you need not take any action. If you have not signed up for electronic delivery, we would encourage you to join fellow shareholders who have. You may elect to receive shareholder reports and other communications electronically from the Fund by calling (800)632-2301 or by contacting your financial intermediary.
You may elect to continue to receive paper copies of all your future shareholder reports free of charge by contacting your financial intermediary or, if you invest directly with a Fund, calling (800)632-2301 to let the Fund know of your request. Your election to receive reports in paper will apply to all funds held in your account.
FRANKLIN TEMPLETON
Successful investing begins with ambition. And achievement only comes when you reach for it. That’s why we continually strive to deliver better outcomes for investors. No matter what your goals are, our deep, global investment expertise allows us to offer solutions that can help.
During our more than 70 years of experience, we’ve managed through all kinds of markets—up, down and those in between. We’re always preparing for what may come next. It’s because of this, combined with our strength as one of the world’s largest asset managers that we’ve earned the trust of millions of investors around the world.
Dear Fellow Shareholder:
During the 12 months ended May 31, 2019, U.S. markets benefited from upbeat economic data, encouraging corporate earnings reports, the U.S. Federal Reserve’s (Fed’s) recent indications of a patient approach to its monetary policy, and periods of optimism about a potential U.S.-China trade deal.
However, markets also reflected investor concerns about the Fed’s interest-rate hikes in 2018 and the impact of ongoing trade tensions on global economic growth and corporate earnings. In this environment, U.S. stocks, as measured by the Standard & Poor’s 500® Index, posted a positive total return for the12-month period. The10-year U.S. Treasury yield, which moves inversely to its price, rose to multi-year highs in October and November 2018 amid investor concerns about inflation and Fed actions in 2018. However, the10-year Treasury yield subsequently declined largely due to ongoing concerns about political tensions and economic growth in the U.S. and other countries, as well as escalating U.S.-China trade tensions and President Trump’s threat to impose tariffs on Mexico. Overall, the10-year Treasury yield declined from 2.83% at the beginning of the period to 2.14% atperiod-end. Commodities, as measured by the Bloomberg Commodity Index, posted a-12.37% total return during the12-month period, largely due to a stronger U.S. dollar, ongoing trade tensions and global growth concerns.1
We are committed to our long-term perspective and disciplined investment approach as we conduct a rigorous, fundamental analysis of securities with a regular emphasis on investment risk management.
We believe active, professional investment management serves investors well. We also recognize the important role of financial advisors in today’s markets and encourage investors to continue to seek their advice. Amid changing markets and economic conditions, we are confident investors with a well-diversified portfolio and a patient, long-term outlook should be well positioned for the years ahead.
On the following pages, the Fund’s portfolio management team reviews investment decisions that pertain to performance during the past 12 months in light of the economic environment and other factors. Please remember all securities markets fluctuate, as do mutual fund share prices.
As previously communicated, the Fund is anticipated to be liquidated on or about August 23, 2019, but may be delayed if unforeseen circumstances arise.
We thank you for your trust and participation in Franklin Pelagos Commodities Strategy Fund. It has been our privilege to serve you.
1. Source: Morningstar.
See www.franklintempletondatasources.com for additional data provider information.
|
| Not FDIC Insured | May Lose Value | No Bank Guarantee |
| | | | | | |
| | | |
| franklintempleton.com | | Not part of the annual report | | | 1 | |
Sincerely,

Madison S. Gulley, CFA
President and Chief Executive Officer –
Investment Management
Franklin Alternative Strategies Funds
This letter reflects our analysis and opinions as of May 31, 2019, unless otherwise indicated. The information is not a complete analysis of every aspect of any market, country, industry, security or fund. Statements of fact are from sources considered reliable.
|
| Visitfranklintempleton.comfor fund updates, to access your account, or to find helpful financial planning tools. |
CFA® is a trademark owned by CFA Institute.
| | | | |
| | | |
| 2 | | Not part of the annual report | | franklintempleton.com |
ANNUAL REPORT
Franklin Pelagos Commodities Strategy Fund
This annual report for Franklin Pelagos Commodities Strategy Fund covers the fiscal year ended May 31, 2019. As previously communicated, the Fund is anticipated to be liquidated on or about August 23, 2019 (Liquidation Date), but may be delayed if unforeseen circumstances arise. Effective at the close of market on June 3, 2019, the Fund closed to all new investors, with limited exceptions. The Fund will not accept any additional purchases after the close of market on or about August 20, 2019. The Fund reserves the right to change this policy at any time. Shareholders of the Fund on the Liquidation Date will have their accounts liquidated and the proceeds will be delivered to them.
Your Fund’s Goal and Main Investments
The Fund seeks long-term total return by providing exposure to the commodities markets. It invests mainly in commodity-linked derivative instruments and securities of the U.S. government, its agencies and instrumentalities and other fixed income securities.
Performance Overview
The Fund’s Class A shares posted a-16.33% cumulative total return for the 12 months under review. In comparison, the benchmark Bloomberg Commodity Index, which measures performance of exchange-traded futures contracts on physical commodities, posted a-12.37% total return for the same period.1 You can find more of the Fund’s performance data in the Performance Summary beginning on page 8.
Performance data represent past performance, which does not guarantee future results. Investment return and principal value will fluctuate, and you may have a gain or loss when you sell your shares. Current performance may differ from figures shown. For most recentmonth-end performance, go tofranklintempleton.comor call(800)342-5236.
Economic and Market Overview
The U.S. economy grew during the 12 months ended May 31, 2019. After moderating for two consecutive quarters, the economy grew significantly faster in 2019’s first
Portfolio Composition*
5/31/19
| | | | |
| | | % of Consolidated Net Assets | |
U.S. Treasury Bill | | | 93.3% | |
FHLMC | | | 6.2% | |
FFCB | | | 2.7% | |
Institutional Fiduciary Trust Money Market Portfolio | | | 0.7% | |
Other Assets, less Liabilities** | | | -2.9% | |
See abbreviations on page 35.
*Figures reflect certain derivatives held in the portfolio (or their underlying reference assets) and may not total 100% or may be negative due to rounding, use of any derivatives, unsettled trades or other factors.
**Includes unrealized appreciation/depreciation on open commodity futures contracts, as well as other assets and liabilities. See supplementary commodity exposure tables on page 6 for additional information related to the Fund’s economic exposure to commodities.
What is a futures contract?
A futures contract is an agreement between the Fund and a counterparty made through a US or foreign futures exchange to buy or sell an underlying instrument or asset at a specific price on a future date.
quarter, driven by growth in consumer spending, inventory investment, exports, business investment, and state and local government spending. The manufacturing and services sectors expanded during the period. The unemployment rate decreased from 3.8% in May 2018 to 3.6% atperiod-end.1 The annual inflation rate, as measured by the Consumer Price Index, decreased from 2.8% in May 2018 to 1.8% atperiod-end.1
The U.S. Federal Reserve (Fed) raised its target range for the federal funds rate by 0.25% three times during the period, to 2.25%–2.50%, and continued reducing its balance sheet as part of its plan to normalize monetary policy. At its March 2019 meeting, the Fed held its target range for the federal funds rate unchanged and signaled no rate hike in 2019. Furthermore, the Fed mentioned it would end its balance sheet normalization by the end of September 2019.
1. Source: Morningstar.
The index is unmanaged and includes reinvestment of any income or distributions. It does not reflect any fees, expenses or sales charges. One cannot invest directly in an index, and an index is not representative of the Fund’s portfolio.
The dollar value, number of shares or principal amount, and names of all portfolio holdings are listed in the Fund’s Consolidated Statement of Investments (SOI). The Consolidated SOI begins on page 17.
| | | | | | |
| | | |
| franklintempleton.com | | Annual Report | | | 3 | |
FRANKLIN PELAGOS COMMODITIES STRATEGY FUND
At its April/May meeting, the Fed reiterated its patient approach to future rate adjustments.
U.S. equity markets overall rose during the period, benefiting from upbeat economic data and U.S. corporate earnings. However, markets reflected concerns about tighter regulation of technology companies, the Fed’s 2018 interest-rate path, U.S. political uncertainties, and the impact of U.S. trade disputes with China and other trading partners on global growth and corporate earnings. These concerns were partially alleviated in 2019’s first four months by easing trade tensions and optimism about a potential U.S.-China trade deal. Furthermore, markets benefited from the Fed’s indications of a patient approach to its monetary policy decisions. The broad U.S. stock market, as measured by the Standard & Poor’s 500 Index (S&P 500®), sold off sharply in 2018’s fourth quarter, but rallied in 2019’s first four months, reaching a newall-time high in April 2019. However, stocks declined in May due to escalating U.S.-China trade tensions and President Trump’s threat to impose tariffs on Mexico because of immigration disputes. Overall, the S&P 500 posted a +3.78% total return for the12-month period.2
Despite a rally in 2019’s first quarter, commodity prices, as measured by the Bloomberg Commodity Index, posted a-12.37% total return during the period, largely due to a stronger U.S. dollar and investor concerns about a global economic slowdown amid continued trade tensions.2 Oil prices declined amid signs of weaker demand growth, rising U.S. supply and exports by the Organization of the Petroleum Exporting Countries (OPEC). However, oil prices were supported at certain times during the period by U.S. sanctions against Iran, declining U.S. stockpiles, geopolitical unrest in majoroil-producing countries, and supply cuts by OPEC and somenon-OPEC producers. Meanwhile, gold prices increased slightly as the effects of rising U.S. Treasury yields in the period’s first half and a strengthening U.S. dollar were largely offset by heightened volatility in global equities and a partial U.S. government shutdown. Industrial metals prices, with the notable exception of iron, generally declined, hurt by slower global growth and weaker economic indicators from China, the largest consumer of base metals. Among agricultural commodities, corn prices rose, while soybeans, wheat and sugar prices declined.
Investment Strategy
We utilize an actively managed fundamental and quantitative investment process to provide exposure to a variety of
commodity sectors and indexes by investing in commodity-linked derivative instruments including commodity-linked total return swaps, commodity futures, commodity index futures and options on commodity futures and commodity index futures, which may provide exposure to foreign and emerging markets. By investing in these derivative instruments, we seek to gain exposure to the returns of real assets that trade in the commodities markets without direct investment in physical commodities. Real assets include such things as industrial and precious metals, gas, oil, livestock, agricultural or meat products and other items.
What is a swap agreement?
A swap agreement, such as a commodity-linked total return swap, is a contract between the Fund and a counterparty to exchange on a future date the returns, or differentials in return, that would have been earned or realized if a notional amount were invested in specific instruments.
What is an option?
An option is a contract to buy or sell a specific financial product known as the option’s underlying instrument at a specific price. The buyer of an option has the right, but not the obligation, to buy or sell the underlying instrument at or until a specified expiration date. Conversely, the seller (“writer”) of an option who opens a transaction is obligated to buy or sell the underlying instrument should the option holder exercise that right.
Manager’s Discussion
During its fiscal year, the Fund obtained its commodities exposure through swaps on commodities indexes and through commodities futures. The asset coverage for this exposure was met by the Fund’s investments in U.S. Treasury bills and other fixed income securities. The Fund’s investments are summarized in the Portfolio Composition table on page 3, and the Fund’s commodities exposure is summarized in the Fund Exposure to Commodities section on page 6.
During the period, every Bloomberg commodity sectorsub-index except livestock, the smallest sector, experienced negative returns. Energy, industrial metals and agriculture had large negative returns. Precious metals recorded smaller declines, while livestock returns were slightly positive for the year. Overall, the only contributor to Fund returns came from livestock, whereas the energy and agriculture sectors were
2. Source: Bureau of Labor Statistics.
See www.franklintempletondatasources.com for additional data provider information.
| | | | |
| | | |
| 4 | | Annual Report | | franklintempleton.com |
FRANKLIN PELAGOS COMMODITIES STRATEGY FUND
the largest detractors. Industrial and precious metals also detracted from Fund returns. The Fund underperformed its benchmark, the Bloomberg Commodity Index, during the period. The Fund’s positions in industrial metals outperformed the benchmark, while those in energy, agriculture, precious metals and livestock detracted from relative performance. Within the energy sector, positions in gasoline aided relative returns, while natural gas, crude oil, ULSD(ultra-low-sulfur diesel), and gas oil hindered results. Nickel, zinc and copper positions benefited relative returns while aluminum detracted within the industrial metals sector. Silver and gold both hindered relative returns, but platinum aided return results. In agriculture, sugar, Kansas wheat, Chicago wheat and soybean oil provided positive relative returns, while cotton, soybean meal, coffee, corn and soybeans hindered returns.
Within the energy sector, the petroleum subsector posted weak returns for the period as theone-month futures price for West Texas intermediate crude oil declined. The petroleum weakness was partially driven by waivers granted to buyers of Iranian oil, economic deceleration, increased U.S. production, and investors generally avoiding assets perceived as subject to economic and political risks, particularly in the fourth quarter of 2018. These factors eventually led to abuild-up of both crude oil and motor gas in the U.S. above five-year averages byperiod-end. This occurred despite continued turmoil in Venezuela, an OPEC member that experienced a large drop in production, and U.S. crude oil production increased even though the rig count dropped during the period. In the U.S. natural gas market, storage levels remained consistently below five-year averages. A brief cold spell early in the winter was the impetus for a spike in natural gas prices, but prices fell overall for the period.
Industrial metals posted weak returns over the period due to supply and demand issues. All posted double-digit losses as trade and tariff issues raised concerns about economic growth in China and economic data showed signs of weakness. Nickel prices were the weakest of the industrial metals. Stainless steel, still the largest use of nickel, experienced weaker demand during the period as some overstocking occurred. Although demand for nickel in batteries increased due to the growth of the electric vehicle market, the demand was relatively small compared with stainless steel and required higher purity nickel than stainless. Aluminum prices experienced large losses during the period due to trade and tariff issues and as a result of Russian aluminum producer Rusal resuming shipments following sanctions against the company. Precious metals prices were mixed during the period. Gold spot prices were
slightly positive, while silver spot prices dropped. Exchange-traded vehicle holdings of both precious metals declined.
Agriculture returns were mostly negative during the period. Growing conditions for major crops in the U.S. were favorable during the 2018 season, but trade and tariff issues put additional downward pressure on prices. Soybeans, especially, experienced weak prices. In addition to the trade issues, the African Swine Fever outbreak in China forced a dramatic culling of herds, leading to less demand for soybean meal. The same factors that depressed soybeans, contributed to gains for the active lean hogs contract. Although prices were down for the entire reporting period, corn, wheat and soybeans exhibited significant price gains towardperiod-end as wet weather in the Midwest and Plains flooded fields, slowed the planting season, and stalled barge traffic that was needed to transport crops and farm supplies.
| | | | | | |
| | | |
| franklintempleton.com | | Annual Report | | | 5 | |
FRANKLIN PELAGOS COMMODITIES STRATEGY FUND
Fund Exposure to Commodities
The following table summarizes the Fund’s economic exposure to commodities derived through its investment in commodity-linked total return swap contracts. At May 31, 2019, the Fund’s exposure based on notional value represented 81.5% of consolidated net assets.
| | | | |
| Commodity-Linked Total Return Swap Exposure* | |
| |
| | | % of Consolidated Net Assets
Long | |
Gold | | | 8.7% | |
Brent Crude Oil | | | 8.2% | |
Soybeans | | | 5.7% | |
Corn | | | 5.5% | |
WTI Crude Oil | | | 4.5% | |
Natural Gas | | | 4.3% | |
Aluminum | | | 4.1% | |
Silver | | | 3.6% | |
Live Cattle | | | 3.5% | |
Soybean Meal | | | 3.5% | |
Zinc | | | 3.3% | |
Unleaded Gasoline | | | 3.1% | |
Soybean Oil | | | 3.0% | |
Nickel | | | 2.9% | |
Sugar | | | 2.9% | |
Gas Oil | | | 2.9% | |
Lean Hogs | | | 2.6% | |
Coffee | | | 2.4% | |
Heating Oil | | | 2.4% | |
Wheat | | | 2.0% | |
Copper | | | 1.2% | |
Kansas Wheat | | | 1.2% | |
*Figures are stated as a percentage of total and may not equal 100% or may be negative due to rounding, use of any derivatives, unsettled trades or other factors. The Fund’s exposure was calculated using the commodity sector weightings of the FP Custom Master Index multiplied by the Fund’s percentage notional exposure.
The following table summarizes the Fund’s economic exposure to commodities derived through its investment in futures contracts. At May 31, 2019, the Fund’s exposure based on notional value represented 19.1% of consolidated net assets.
| | | | |
| Commodity Futures Exposure* | |
| |
| | | % of Consolidated Net Assets
Long | |
Copper | | | 4.0% | |
WTI Crude Oil | | | 4.0% | |
Gold 100 Oz | | | 3.5% | |
Natural Gas | | | 2.8% | |
Sugar | | | 1.4% | |
Coffee | | | 1.4% | |
Wheat | | | 1.0% | |
Corn | | | 1.0% | |
*Figures are stated as a percentage of total and may not equal 100% or may be negative due to rounding, use of any derivatives, unsettled trades or other factors.
Thank you for your participation in Franklin Pelagos Commodities Strategy Fund. It has been our privilege to serve you.
| | |
 | | 
Stephen P. Burke |
| | |
 | | 
John C. Pickart, CFA |
| | Portfolio Management Team |
| | | | |
| | | |
| 6 | | Annual Report | | franklintempleton.com |
FRANKLIN PELAGOS COMMODITIES STRATEGY FUND
The foregoing information reflects our analysis, opinions and portfolio holdings as of May 31, 2019, the end of the reporting period. The way we implement our main investment strategies and the resulting portfolio holdings may change depending on factors such as market and economic conditions. These opinions may not be relied upon as investment advice or an offer for a particular security. The information is not a complete analysis of every aspect of any market, country, industry, security or the Fund. Statements of fact are from sources considered reliable, but the investment manager makes no representation or warranty as to their completeness or accuracy. Although historical performance is no guarantee of future results, these insights may help you understand our investment management philosophy.
| | | | | | |
| | | |
| franklintempleton.com | | Annual Report | | | 7 | |
FRANKLIN PELAGOS COMMODITIES STRATEGY FUND
Performance Summary as of May 31, 2019
The performance table and graphs do not reflect any taxes that a shareholder would pay on Fund dividends, capital gain distributions, if any, or any realized gains on the sale of Fund shares. Total return reflects reinvestment of the Fund’s dividends and capital gain distributions, if any, and any unrealized gains or losses. Your dividend income will vary depending on dividends or interest paid by securities in the Fund’s portfolio, adjusted for operating expenses of each class. Capital gain distributions are net profits realized from the sale of portfolio securities.
Performance as of 5/31/191
Cumulative total return excludes sales charges. Average annual total return includes maximum sales charges. Sales charges will vary depending on the size of the investment and the class of share purchased. The maximum is 5.50% and the minimum is 0%.Class A:5.50% maximum initial sales charge;Advisor Class:no sales charges. For other share classes, visitfranklintempleton.com.
| | | | | | | | |
| Share Class | | Cumulative
Total Return2 | | | Average Annual
Total Return3 | |
| A4 | | | | | | | | |
1-Year | | | -16.33% | | | | -20.97% | |
5-Year | | | -39.64% | | | | -10.62% | |
Since Inception (1/10/14) | | | -35.83% | | | | -8.87% | |
| | |
| Advisor | | | | | | | | |
1-Year | | | -16.18% | | | | -16.18% | |
5-Year | | | -38.93% | | | | -9.39% | |
Since Inception (12/7/11) | | | -41.49% | | | | -6.91% | |
Performance data represent past performance, which does not guarantee future results. Investment return and principal value will fluctuate, and you may have a gain or loss when you sell your shares. Current performance may differ from figures shown. For most recentmonth-end performance, go tofranklintempleton.comor call(800)342-5236.
See page 10 for Performance Summary footnotes.
| | | | |
| | | |
| 8 | | Annual Report | | franklintempleton.com |
FRANKLIN PELAGOS COMMODITIES STRATEGY FUND
PERFORMANCE SUMMARY
Total Return Index Comparison for a Hypothetical $10,000 Investment1
Total return represents the change in value of an investment over the periods shown. It includes any applicable maximum sales charge, Fund expenses, account fees and reinvested distributions. The unmanaged index includes reinvestment of any income or distributions. It differs from the Fund in composition and does not pay management fees or expenses. One cannot invest directly in an index.
Class A(1/10/14–5/31/19)
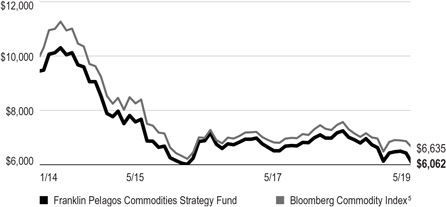
Advisor Class(12/7/11–5/31/19)
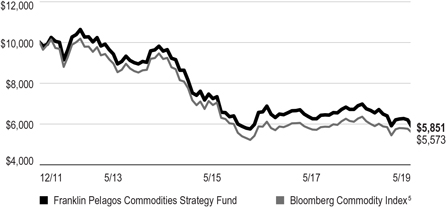
See page 10 for Performance Summary footnotes.
| | | | | | |
| | | |
| franklintempleton.com | | Annual Report | | | 9 | |
FRANKLIN PELAGOS COMMODITIES STRATEGY FUND
PERFORMANCE SUMMARY
Distributions(6/1/18–5/31/19)
| | | | |
| |
| Share Class | | Net Investment
Income | |
A | | | $0.4078 | |
C | | | $0.3222 | |
R | | | $0.3810 | |
R6 | | | $0.4390 | |
Advisor | | | $0.4207 | |
Total Annual Operating Expenses6
| | | | | | | | |
| | |
| Share Class | | With Fee
Waiver | | | Without Fee
Waiver | |
A | | | 1.20% | | | | 1.86% | |
Advisor | | | 0.95% | | | | 1.61% | |
Each class of shares is available to certain eligible investors and has different annual fees and expenses, as described in the prospectus.
All investments involve risks, including possible loss of principal. Investing in physical commodities, either directly or through derivative instruments such as commodity-linked total return swaps, commodity futures, commodity index futures and options on commodity futures and commodities index futures, presents unique risks, is speculative and can be extremely volatile. Market prices of commodities may fluctuate rapidly based on numerous factors, including: changes in supply and demand relationships; weather; agriculture; trade; domestic and foreign political and economic events and policies; diseases; pestilence; technological developments; currency exchange rate fluctuations; and monetary and other governmental policies, action and inaction. Derivative instruments involve costs and can create leverage in the Fund’s portfolio, which may result in significant volatility and cause the Fund to participate in losses (as well as gains) in an amount that significantly exceeds the Fund’s initial investment. The Fund may not achieve the anticipated benefits and may realize losses, which could be significant. Bond prices generally move in the opposite direction of interest rates. Thus, as prices of bonds in the Fund adjust to a rise in interest rates, the Fund’s share price may decline. Foreign investing carries additional risks such as currency and market volatility and political, social and economic instability, risks which are heightened in less developed or emerging market countries. The Fund is actively managed but there is no guarantee that the manager’s investment decisions will produce the desired results. The Fund’s prospectus also includes a description of the main investment risks.
1. The Fund has an expense reduction contractually guaranteed through 9/30/19 and a fee waiver related to the management fee paid by a subsidiary. The Fund also has a fee waiver associated with any investments it makes in a Franklin Templeton money fund and/or other Franklin Templeton fund. Fund investment results reflect the expense reduction and fee waivers; without these reductions, the results would have been lower.
2. Cumulative total return represents the change in value of an investment over the periods indicated.
3. Average annual total return represents the average annual change in value of an investment over the periods indicated. Return for less than one year, if any, has not been annualized.
4. Prior to 9/10/18, these shares were offered at a higher initial sales charge of 5.75%, thus actual returns (with sales charges) would have differed. Average annual total returns (with sales charges) have been restated to reflect the current maximum initial sales charge of 5.50%.
5. Source: Morningstar. The Bloomberg Commodity Index comprises exchange-traded futures on physical commodities, which are weighted to account for economic significance and market liquidity.
6. Figures are as stated in the Fund’s current prospectus and may differ from the expense ratios disclosed in the Your Fund’s Expenses and Consolidated Financial Highlights sections in this report. In periods of market volatility, assets may decline significantly, causing total annual Fund operating expenses to become higher than the figures shown.
See www.franklintempletondatasources.com for additional data provider information.
| | | | |
| | | |
| 10 | | Annual Report | | franklintempleton.com |
FRANKLIN PELAGOS COMMODITIES STRATEGY FUND
Your Fund’s Expenses
As a Fund shareholder, you can incur two types of costs: (1) transaction costs, including sales charges (loads) on Fund purchases and redemptions; and (2) ongoing Fund costs, including management fees, distribution and service(12b-1) fees, and other Fund expenses. All mutual funds have ongoing costs, sometimes referred to as operating expenses. The table below shows ongoing costs of investing in the Fund and can help you understand these costs and compare them with those of other mutual funds. The table assumes a $1,000 investment held for the six months indicated.
Actual Fund Expenses
The table below provides information about actual account values and actual expenses in the columns under the heading “Actual.” In these columns the Fund’s actual return, which includes the effect of Fund expenses, is used to calculate the “Ending Account Value” for each class of shares. You can estimate the expenses you paid during the period by following these steps (of course, your account value and expenses will differ from those in this illustration): Divide your account value by $1,000 (if your account had an $8,600 value, then $8,600 ÷ $1,000 = 8.6). Then multiply the result by the number in the row for your class of shares under the headings “Actual” and “Expenses Paid During Period” (if Actual Expenses Paid During Period were $7.50, then 8.6 x $7.50 = $64.50). In this illustration, the actual expenses paid this period are $64.50.
Hypothetical Example for Comparison with Other Funds
Under the heading “Hypothetical” in the table, information is provided about hypothetical account values and hypothetical expenses based on the Fund’s actual expense ratio and an assumed rate of return of 5% per year before expenses, which is not the Fund’s actual return. This information may not be used to estimate the actual ending account balance or expenses you paid for the period, but it can help you compare ongoing costs of investing in the Fund with those of other funds. To do so, compare this 5% hypothetical example for the class of shares you hold with the 5% hypothetical examples that appear in the shareholder reports of other funds.
Please note that expenses shown in the table are meant to highlight ongoing costs and do not reflect any transactional costs. Therefore, information under the heading “Hypothetical” is useful in comparing ongoing costs only, and will not help you compare total costs of owning different funds. In addition, if transactional costs were included, your total costs would have been higher.
| | | | | | | | | | | | | | | | | | |
| | | | | | | |
| | | | | | | Actual
(actual return after expenses) | | | | Hypothetical
(5% annual return before expenses) | | | | |
| | | | | | | | | |
Share
Class | | Beginning
Account
Value 12/1/18 | | | | Ending
Account
Value 5/31/19 | | Expenses
Paid During
Period
12/1/18–5/31/191, 2 | | | | Ending
Account
Value 5/31/19 | | Expenses
Paid During
Period
12/1/18–5/31/191, 2 | | | | Net
Annualized
Expense
Ratio2 |
| A | | $1,000 | | | | $914.60 | | $5.73 | | | | $1,018.95 | | $6.04 | | | | 1.20% |
| C | | $1,000 | | | | $910.80 | | $9.29 | | | | $1,015.21 | | $9.80 | | | | 1.95% |
| R | | $1,000 | | | | $914.40 | | $6.92 | | | | $1,017.70 | | $7.29 | | | | 1.45% |
| R6 | | $1,000 | | | | $916.70 | | $2.77 | | | | $1,022.04 | | $2.92 | | | | 0.58% |
| Advisor | | $1,000 | | | | $914.20 | | $4.53 | | | | $1,020.19 | | $4.78 | | | | 0.95% |
1. Expenses are equal to the annualized expense ratio for thesix-month period as indicated above—in the far right column—multiplied by the simple average account value over the period indicated, and then multiplied by 182/365 to reflect theone-half year period.
2. Reflects expenses after fee waivers and expense reimbursements. Does not include acquired fund fees and expenses.
| | | | | | |
| | | |
| franklintempleton.com | | Annual Report | | | 11 | |
FRANKLIN ALTERNATIVE STRATEGIES FUNDS
Consolidated Financial Highlights
Franklin Pelagos Commodities Strategy Fund
| | | | | | | | | | | | | | | | | | | | |
| |
| | | Year Ended May 31, | |
| | | | | |
| | | 2019 | | | 2018 | | | 2017 | | | 2016 | | | 2015 | |
| | | | | |
| Class A | | | | | | | | | | | | | | | | | | | | |
| | | | | |
Per share operating performance
(for a share outstanding throughout the year) | | | | | | | | | | | | | | | | | | | | |
| | | | | |
Net asset value, beginning of year | | | $ 6.81 | | | | $ 6.12 | | | | $ 6.47 | | | | $ 7.12 | | | | $ 9.44 | |
| | | | |
| | | | | |
| Income from investment operationsa: | | | | | | | | | | | | | | | | | | | | |
| | | | | |
Net investment income (loss)b | | | 0.07 | | | | (— | )c | | | (0.04 | ) | | | (0.08 | ) | | | (0.09 | ) |
| | | | | |
Net realized and unrealized gains (losses) | | | (1.17 | ) | | | 0.69 | | | | (0.31 | ) | | | (0.57 | ) | | | (2.23 | ) |
| | | | |
| | | | | |
Total from investment operations | | | (1.10 | ) | | | 0.69 | | | | (0.35 | ) | | | (0.65 | ) | | | (2.32 | ) |
| | | | |
| | | | | |
| Less distributions from: | | | | | | | | | | | | | | | | | | | | |
| | | | | |
Net investment income | | | (0.41 | ) | | | — | | | | — | | | | — | | | | — | |
| | | | |
| | | | | |
Net asset value, end of year | | | $ 5.30 | | | | $ 6.81 | | | | $ 6.12 | | | | $ 6.47 | | | | $ 7.12 | |
| | | | |
| | | | | |
Total returnd | | | (16.33)% | | | | 11.27% | | | | (5.41)% | | | | (9.13)% | | | | (24.58)% | |
| | | | | |
| Ratios to average net assets | | | | | | | | | | | | | | | | | | | | |
| | | | | |
Expenses before waiver and payments by affiliates | | | 1.68% | | | | 1.65% | | | | 1.71% | | | | 2.14% | | | | 2.05% | |
| | | | | |
Expenses net of waiver and payments by affiliatese | | | 1.20% | | | | 1.20% | | | | 1.20% | | | | 1.21% | | | | 1.25% | |
| | | | | |
Net investment income (loss) | | | 0.95% | | | | 0.06% | f | | | (0.61)% | | | | (0.79)% | | | | (0.94)% | |
| | | | | |
| Supplemental data | | | | | | | | | | | | | | | | | | | | |
| | | | | |
Net assets, end of year (000’s) | | | $7,353 | | | | $6,549 | | | | $4,846 | | | | $3,814 | | | | $2,080 | |
| | | | | |
Portfolio turnover rate | | | —% | | | | —% | | | | 42.22% | | | | 28.03% | | | | 62.10% | |
aThe amount shown for a share outstanding throughout the period may not correlate with the Consolidated Statement of Operations for the period due to the timing of sales and repurchases of the Fund’s shares in relation to income earned and/or fluctuating fair value of the investments of the Fund.
bBased on average daily shares outstanding.
cAmount rounds to less than $0.01 per share.
dTotal return does not reflect sales commissions or contingent deferred sales charges, if applicable.
eBenefit of expense reduction rounds to less than 0.01%.
fRatio is calculated based on the Fund level net investment income, as reflected in the Consolidated Statement of Operations, and adjusted for class specific expenses. The amount may not correlate with the per share amount due to the timing of income earned and/or fluctuating fair value of the investments of the Fund in relation to the timing of sales and repurchases of Fund shares.
| | | | |
| | | |
| 12 | | Annual Report | The accompanying notes are an integral part of these consolidated financial statements. | | franklintempleton.com |
FRANKLIN ALTERNATIVE STRATEGIES FUNDS
CONSOLIDATED FINANCIAL HIGHLIGHTS
Franklin Pelagos Commodities Strategy Fund(continued)
| | | | | | | | | | | | | | | | | | | | |
| |
| | | Year Ended May 31, | |
| | | | | |
| | | 2019 | | | 2018 | | | 2017 | | | 2016 | | | 2015 | |
| | | | | |
| Class C | | | | | | | | | | | | | | | | | | | | |
| | | | | |
Per share operating performance
(for a share outstanding throughout the year) | | | | | | | | | | | | | | | | | | | | |
| | | | | |
Net asset value, beginning of year | | | $ 6.59 | | | | $ 5.97 | | | | $ 6.36 | | | | $ 7.05 | | | | $ 9.41 | |
| | | | |
| | | | | |
| Income from investment operationsa: | | | | | | | | | | | | | | | | | | | | |
| | | | | |
Net investment income (loss)b | | | 0.01 | | | | (0.04 | ) | | | (0.10 | ) | | | (0.16 | ) | | | (0.15 | ) |
| | | | | |
Net realized and unrealized gains (losses) | | | (1.12 | ) | | | 0.66 | | | | (0.29 | ) | | | (0.53 | ) | | | (2.21 | ) |
| | | | |
| | | | | |
Total from investment operations | | | (1.11 | ) | | | 0.62 | | | | (0.39 | ) | | | (0.69 | ) | | | (2.36 | ) |
| | | | |
| | | | | |
| Less distributions from: | | | | | | | | | | | | | | | | | | | | |
| | | | | |
Net investment income | | | (0.32 | ) | | | — | | | | — | | | | — | | | | — | |
| | | | |
| | | | | |
Net asset value, end of year | | | $ 5.16 | | | | $ 6.59 | | | | $ 5.97 | | | | $ 6.36 | | | | $ 7.05 | |
| | | | |
| | | | | |
Total returnc | | | (16.94)% | | | | 10.39% | | | | (6.13)% | | | | (9.79)% | | | | (25.08)% | |
| | | | | |
| Ratios to average net assets | | | | | | | | | | | | | | | | | | | | |
| | | | | |
Expenses before waiver and payments by affiliates | | | 2.43% | | | | 2.40% | | | | 2.46% | | | | 2.88% | | | | 2.75% | |
| | | | | |
Expenses net of waiver and payments by affiliatesd | | | 1.95% | | | | 1.95% | | | | 1.95% | | | | 1.95% | | | | 1.95% | |
| | | | | |
Net investment income (loss) | | | 0.20% | | | | (0.69)% | | | | (1.36)% | | | | (1.53)% | | | | (1.64)% | |
| | | | | |
| Supplemental data | | | | | | | | | | | | | | | | | | | | |
| | | | | |
Net assets, end of year (000’s) | | | $497 | | | | $1,162 | | | | $963 | | | | $862 | | | | $377 | |
| | | | | |
Portfolio turnover rate | | | —% | | | | —% | | | | 42.22% | | | | 28.03% | | | | 62.10% | |
aThe amount shown for a share outstanding throughout the period may not correlate with the Consolidated Statement of Operations for the period due to the timing of sales and repurchases of the Fund’s shares in relation to income earned and/or fluctuating fair value of the investments of the Fund.
bBased on average daily shares outstanding.
cTotal return does not reflect sales commissions or contingent deferred sales charges, if applicable.
dBenefit of expense reduction rounds to less than 0.01%.
| | | | | | |
| | | |
| franklintempleton.com | | The accompanying notes are an integral part of these consolidated financial statements. | Annual Report | | | 13 | |
FRANKLIN ALTERNATIVE STRATEGIES FUNDS
CONSOLIDATED FINANCIAL HIGHLIGHTS
Franklin Pelagos Commodities Strategy Fund(continued)
| | | | | | | | | | | | | | | | | | | | |
| |
| | | Year Ended May 31, | |
| | | | | |
| | | 2019 | | | 2018 | | | 2017 | | | 2016 | | | 2015 | |
| | | | | |
| Class R | | | | | | | | | | | | | | | | | | | | |
| | | | | |
Per share operating performance
(for a share outstanding throughout the year) | | | | | | | | | | | | | | | | | | | | |
| | | | | |
Net asset value, beginning of year | | | $ 6.75 | | | | $ 6.08 | | | | $ 6.44 | | | | $ 7.10 | | | | $ 9.44 | |
| | | | |
| | | | | |
| Income from investment operationsa: | | | | | | | | | | | | | | | | | | | | |
| | | | | |
Net investment income (loss)b | | | 0.05 | | | | (0.02 | ) | | | (0.05 | ) | | | (0.06 | ) | | | (0.10 | ) |
| | | | | |
Net realized and unrealized gains (losses) | | | (1.15 | ) | | | 0.69 | | | | (0.31 | ) | | | (0.60 | ) | | | (2.24 | ) |
| | | | |
| | | | | |
Total from investment operations | | | (1.10 | ) | | | 0.67 | | | | (0.36 | ) | | | (0.66 | ) | | | (2.34 | ) |
| | | | |
| | | | | |
| Less distributions from: | | | | | | | | | | | | | | | | | | | | |
| | | | | |
Net investment income | | | (0.38 | ) | | | — | | | | — | | | | — | | | | — | |
| | | | |
| | | | | |
Net asset value, end of year | | | $ 5.27 | | | | $ 6.75 | | | | $ 6.08 | | | | $ 6.44 | | | | $ 7.10 | |
| | | | |
| | | | | |
Total return | | | (16.42)% | | | | 11.02% | | | | (5.59)% | | | | (9.30)% | | | | (24.79)% | |
| | | | | |
| Ratios to average net assets | | | | | | | | | | | | | | | | | | | | |
| | | | | |
Expenses before waiver and payments by affiliates | | | 1.91% | | | | 1.86% | | | | 1.85% | | | | 2.34% | | | | 2.27% | |
| | | | | |
Expenses net of waiver and payments by affiliatesc | | | 1.43% | | | | 1.41% | | | | 1.34% | | | | 1.41% | | | | 1.47% | |
| | | | | |
Net investment income (loss) | | | 0.72% | | | | (0.15)% | | | | (0.75)% | | | | (0.99)% | | | | (1.16)% | |
| | | | | |
| Supplemental data | | | | | | | | | | | | | | | | | | | | |
| | | | | |
Net assets, end of year (000’s) | | | $17 | | | | $26 | | | | $23 | | | | $9 | | | | $4 | |
| | | | | |
Portfolio turnover rate | | | —% | | | | —% | | | | 42.22% | | | | 28.03% | | | | 62.10% | |
aThe amount shown for a share outstanding throughout the period may not correlate with the Consolidated Statement of Operations for the period due to the timing of sales and repurchases of the Fund’s shares in relation to income earned and/or fluctuating fair value of the investments of the Fund.
bBased on average daily shares outstanding.
cBenefit of expense reduction rounds to less than 0.01%.
| | | | |
| | | |
| 14 | | Annual Report | The accompanying notes are an integral part of these consolidated financial statements. | | franklintempleton.com |
FRANKLIN ALTERNATIVE STRATEGIES FUNDS
CONSOLIDATED FINANCIAL HIGHLIGHTS
Franklin Pelagos Commodities Strategy Fund(continued)
| | | | | | | | | | | | | | | | | | | | |
| |
| | | Year Ended May 31, | |
| | | | | |
| | | 2019 | | | 2018 | | | 2017 | | | 2016 | | | 2015 | |
| | | | | |
| Class R6 | | | | | | | | | | | | | | | | | | | | |
| | | | | |
Per share operating performance
(for a share outstanding throughout the year) | | | | | | | | | | | | | | | | | | | | |
| | | | | |
Net asset value, beginning of year | | | $ 6.94 | | | | $ 6.21 | | | | $ 6.53 | | | | $ 7.16 | | | | $ 9.46 | |
| | | | |
| | | | | |
| Income from investment operationsa: | | | | | | | | | | | | | | | | | | | | |
| | | | | |
Net investment income (loss)b | | | 0.10 | | | | 0.04 | | | | (0.01 | ) | | | (0.02 | ) | | | (0.04 | ) |
| | | | | |
Net realized and unrealized gains (losses) | | | (1.19 | ) | | | 0.70 | | | | (0.31 | ) | | | (0.61 | ) | | | (2.26 | ) |
| | | | |
| | | | | |
Total from investment operations | | | (1.09 | ) | | | 0.74 | | | | (0.32 | ) | | | (0.63 | ) | | | (2.30 | ) |
| | | | |
| | | | | |
| Less distributions from: | | | | | | | | | | | | | | | | | | | | |
| | | | | |
Net investment income | | | (0.44 | ) | | | (0.01 | ) | | | — | | | | — | | | | — | |
| | | | |
| | | | | |
Net asset value, end of year | | | $ 5.41 | | | | $ 6.94 | | | | $ 6.21 | | | | $ 6.53 | | | | $ 7.16 | |
| | | | |
| | | | | |
Total return | | | (15.86)% | | | | 11.89% | | | | (4.90)% | | | | (8.80)% | | | | (24.31)% | |
| | | | | |
| Ratios to average net assets | | | | | | | | | | | | | | | | | | | | |
| | | | | |
Expenses before waiver and payments by affiliates | | | 1.02% | | | | 1.02% | | | | 1.02% | | | | 1.10% | | | | 1.53% | |
| | | | | |
Expenses net of waiver and payments by affiliatesc | | | 0.59% | | | | 0.65% | | | | 0.70% | | | | 0.76% | | | | 0.86% | |
| | | | | |
Net investment income (loss) | | | 1.56% | | | | 0.61% | | | | (0.11)% | | | | (0.34)% | | | | (0.55)% | |
| | | | | |
| Supplemental data | | | | | | | | | | | | | | | | | | | | |
| | | | | |
Net assets, end of year (000’s) | | | $148,604 | | | | $288,037 | | | | $118,839 | | | | $131,500 | | | | $53,068 | |
| | | | | |
Portfolio turnover rate | | | —% | | | | —% | | | | 42.22% | | | | 28.03% | | | | 62.10% | |
aThe amount shown for a share outstanding throughout the period may not correlate with the Consolidated Statement of Operations for the period due to the timing of sales and repurchases of the Fund’s shares in relation to income earned and/or fluctuating fair value of the investments of the Fund.
bBased on average daily shares outstanding.
cBenefit of expense reduction rounds to less than 0.01%.
| | | | | | |
| | | |
| franklintempleton.com | | The accompanying notes are an integral part of these consolidated financial statements. | Annual Report | | | 15 | |
FRANKLIN ALTERNATIVE STRATEGIES FUNDS
CONSOLIDATED FINANCIAL HIGHLIGHTS
Franklin Pelagos Commodities Strategy Fund(continued)
| | | | | | | | | | | | | | | | | | | | |
| |
| | | Year Ended May 31, | |
| | | | | |
| | | 2019 | | | 2018 | | | 2017 | | | 2016 | | | 2015 | |
| | | | | |
| Advisor Class | | | | | | | | | | | | | | | | | | | | |
| | | | | |
Per share operating performance
(for a share outstanding throughout the year) | | | | | | | | | | | | | | | | | | | | |
| | | | | |
Net asset value, beginning of year | | | $ 6.98 | | | | $ 6.26 | | | | $ 6.60 | | | | $ 7.25 | | | | $ 9.58 | |
| | | | |
| | | | | |
| Income from investment operationsa: | | | | | | | | | | | | | | | | | | | | |
| | | | | |
Net investment income (loss)b | | | 0.08 | | | | — | c | | | (0.03 | ) | | | (0.09 | ) | | | (0.07 | ) |
| | | | | |
Net realized and unrealized gains (losses) | | | (1.20 | ) | | | 0.72 | | | | (0.31 | ) | | | (0.56 | ) | | | (2.26 | ) |
| | | | |
| | | | | |
Total from investment operations | | | (1.12 | ) | | | 0.72 | | | | (0.34 | ) | | | (0.65 | ) | | | (2.33 | ) |
| | | | |
| | | | | |
| Less distributions from: | | | | | | | | | | | | | | | | | | | | |
| | | | | |
Net investment income | | | (0.42 | ) | | | — | | | | — | | | | — | | | | — | |
| | | | |
| | | | | |
Net asset value, end of year | | | $ 5.44 | | | | $ 6.98 | | | | $ 6.26 | | | | $ 6.60 | | | | $ 7.25 | |
| | | | |
| | | | | |
Total return | | | (16.18)% | | | | 11.50% | | | | (5.15)% | | | | (8.97)% | | | | (24.32)% | |
| | | | | |
| Ratios to average net assets | | | | | | | | | | | | | | | | | | | | |
| | | | | |
Expenses before waiver and payments by affiliates | | | 1.43% | | | | 1.40% | | | | 1.46% | | | | 1.88% | | | | 1.75% | |
| | | | | |
Expenses net of waiver and payments by affiliatesd | | | 0.95% | | | | 0.95% | | | | 0.95% | | | | 0.95% | | | | 0.95% | |
| | | | | |
Net investment income (loss) | | | 1.20% | | | | 0.31% | | | | (0.36)% | | | | (0.53)% | | | | (0.64)% | |
| | | | | |
| Supplemental data | | | | | | | | | | | | | | | | | | | | |
| | | | | |
Net assets, end of year (000’s) | | | $1,879 | | | | $1,736 | | | | $2,062 | | | | $675 | | | | $248 | |
| | | | | |
Portfolio turnover rate | | | —% | | | | —% | | | | 42.22% | | | | 28.03% | | | | 62.10% | |
aThe amount shown for a share outstanding throughout the period may not correlate with the Consolidated Statement of Operations for the period due to the timing of sales and repurchases of the Fund’s shares in relation to income earned and/or fluctuating fair value of the investments of the Fund.
bBased on average daily shares outstanding.
cAmount rounds to less than $0.01 per share.
dBenefit of expense reduction rounds to less than 0.01%.
| | | | |
| | | |
| 16 | | Annual Report | The accompanying notes are an integral part of these consolidated financial statements. | | franklintempleton.com |
FRANKLIN ALTERNATIVE STRATEGIES FUNDS
Consolidated Statement of Investments, May 31, 2019
| | | | | | | | |
| Franklin Pelagos Commodities Strategy Fund | |
| | |
| | | Principal
Amount | | | Value | |
| U.S. Government and Agency Securities (Cost $10,000,000) 6.2% | | | | | | |
�� FHLMC, 1.25%, 7/26/19 | | $ | 10,000,000 | | | $ | 9,878,231 | |
| | | | | | | | |
| | |
| Short Term Investments 96.7% | | | | | | |
| U.S. Government and Agency Securities 96.0% | | | | | | |
a,b FFCB, 6/03/19 | | | 4,290,000 | | | | 4,290,000 | |
b U.S. Treasury Bill, | | | | | | | | |
a,c 7/05/19 | | | 15,000,000 | | | | 14,969,367 | |
7/18/19 | | | 33,000,000 | | | | 32,905,692 | |
8/15/19 | | | 39,000,000 | | | | 38,819,987 | |
a 10/03/19 | | | 17,000,000 | | | | 16,866,621 | |
10/10/19 | | | 44,500,000 | | | | 44,134,016 | |
| | | | | | | | |
| | |
Total U.S. Government and Agency Securities (Cost $151,899,417) | | | | | | | 151,985,683 | |
| | | | | | | | |
| | |
Total Investments before Money Market Funds
(Cost $161,899,417) | | | | | | | 161,863,914 | |
| | | | | | | | |
| | |
| | | Shares | | | | |
| | |
| Money Market Funds (Cost $1,128,771) 0.7% | | | | | | |
d,e Institutional Fiduciary Trust Money Market Portfolio, 2.08% | | | 1,128,771 | | | | 1,128,771 | |
| | | | | | | | |
| | |
Total Investments (Cost $163,028,188) 102.9% | | | | | | | 162,992,685 | |
| | |
f Other Assets, less Liabilities (2.9)% | | | | | | | (4,642,835 | ) |
| | | | | | | | |
| | |
Net Assets 100.0% | | | | | | $ | 158,349,850 | |
| | |
| | | | | | | | |
aA portion or all of the security is owned by FPC Holdings Corp., a wholly-owned subsidiary of the Fund. See Note 1(c).
bThe security was issued on a discount basis with no stated coupon rate.
cA portion or all of the security has been segregated as collateral for open futures and/or swap contracts. At May 31, 2019, the value of this security and/or cash pledged amounted to $6,003,715, representing 3.8% of net assets.
dSee Note 3(f) regarding investments in affiliated management investment companies.
eThe rate shown is the annualizedseven-day effective yield at period end.
fIncludes unrealized appreciation/depreciation on open commodity futures contracts, as well as other assets and liabilities.
| | | | | | |
| | | |
| franklintempleton.com | | Annual Report | | | 17 | |
FRANKLIN ALTERNATIVE STRATEGIES FUNDS
CONSOLIDATED STATEMENT OF INVESTMENTS
Franklin Pelagos Commodities Strategy Fund(continued)
At May 31, 2019, the Fund had the following futures contracts outstanding. See Note 1(b).
| | | | | | | | | | | | | | | | | | | | |
| Futures Contractsa | |
| | | | | |
| Description | | Type | | | Number of
Contracts | | | Notional
Amount* | | | Expiration
Date | | | Value/
Unrealized
Appreciation
(Depreciation) | |
| | | | | |
| Commodity Contracts | | | | | | | | | | | | | | | | | | | | |
| | | | | |
Coffee | | | Long | | | | 55 | | | $ | 2,157,375 | | | | 7/19/19 | | | | $ (180) | |
| | | | | |
Copper | | | Long | | | | 97 | | | | 6,402,000 | | | | 7/29/19 | | | | (475,537 | ) |
| | | | | |
Corn | | | Long | | | | 75 | | | | 1,601,250 | | | | 7/12/19 | | | | (226 | ) |
| | | | | |
Gold 100 Oz | | | Long | | | | 42 | | | | 5,506,620 | | | | 8/28/19 | | | | 30,552 | |
| | | | | |
Natural Gas | | | Long | | | | 180 | | | | 4,417,200 | | | | 6/26/19 | | | | (412,263 | ) |
| | | | | |
Sugar | | | Long | | | | 165 | | | | 2,236,080 | | | | 6/28/19 | | | | (540 | ) |
| | | | | |
Wheat | | | Long | | | | 65 | | | | 1,634,750 | | | | 7/12/19 | | | | (196 | ) |
| | | | | |
WTI Crude Oil | | | Long | | | | 117 | | | | 6,259,500 | | | | 6/20/19 | | | | (1,120,184 | ) |
| | | | | | | | | | | | | | | | | | | | |
| | | | | |
Total Futures Contracts | | | | | | | | | | | | | | | | | | | $(1,978,574 | ) |
| | | | | | | | | | | | | | | | | | | | |
*As of period end.
At May 31, 2019, the Fund had the following commodity-linked total return swap contracts outstanding. See Note 1(b).
| | | | | | | | | | | | | | | | | | | | | | | | |
| Commodity-Linked Total Return Swap Contractsa | |
| | | | | | |
| Underlying Instruments | | Pay
Fixed
Rate | | | Payment
Frequency | | | Counter-
party | | | Maturity
Date | | | Notional
Value | | | Value/
Unrealized
Appreciation
(Depreciation) | |
| | | | | | |
| OTC Swap Contracts | | | | | | | | | | | | | | | | | | | | | | | | |
| | | | | | |
| Longb | | | | | | | | | | | | | | | | | | | | | | | | |
| | | | | | |
FP Custom Master Indexc | | | 0.22 | % | | | At maturity | | | | MSCS | | | | 7/02/19 | | | | $129,100,000 | | | | $ — | |
| | | | | | |
Morgan Stanley MSCBBCV3 Indexc | | | 0.00 | % | | | At maturity | | | | MSCS | | | | 6/28/19 | | | | 19,300,000 | | | | — | |
| | | | | | |
Morgan Stanley MSCBBE03 Indexc | | | 0.00 | % | | | At maturity | | | | MSCS | | | | 6/28/19 | | | | 12,900,000 | | | | — | |
| | | | | | |
Morgan Stanley MSCBBEA1 Indexc | | | 0.60 | % | | | At maturity | | | | MSCS | | | | 7/02/19 | | | | 8,100,000 | | | | — | |
| | | | | | | | | | | | | | | | | | | | | | | | |
aA portion or all of the contract is owned by FPC Holdings Corp., a wholly-owned subsidiary of the Fund. See Note 1(c).
bThe Fund receives the total return on the underlying instrument and pays a fixed financing rate.
cRepresents a custom index comprised of a basket of underlying instruments. Additional information regarding the underlying instruments and their respective values including fees are as follows:
| | | | | | | | | | | | |
| | | |
| Underlying Instruments | | Notional Valued | | | Value/
Unrealized
Appreciation
(Depreciation) | | | Percentage of
Net Assets
(%) | |
| | | |
| FP Custom Master Index | | | | | | | | | | | | |
| | | |
Bloomberg Commodity Aluminum Subindex | | | $ 6,455,000 | | | | $ — | | | | — | |
| | | |
Bloomberg Commodity Brent Crude Oil Subindex | | | 13,039,100 | | | | — | | | | — | |
| | | |
Bloomberg Commodity Coffee Subindex | | | 3,873,000 | | | | — | | | | — | |
| | | |
Bloomberg Commodity Copper Subindex | | | 1,936,500 | | | | — | | | | — | |
| | | |
Bloomberg Commodity Corn Subindex | | | 8,778,800 | | | | — | | | | — | |
| | | |
Bloomberg Commodity Gas Oil Subindex | | | 4,518,500 | | | | — | | | | — | |
| | | |
Bloomberg Commodity Gold Subindex | | | 13,813,700 | | | | — | | | | — | |
| | | |
Bloomberg Commodity Heating Oil Subindex | | | 3,743,900 | | | | — | | | | — | |
| | | | |
| | | |
| 18 | | Annual Report | | franklintempleton.com |
FRANKLIN ALTERNATIVE STRATEGIES FUNDS
CONSOLIDATED STATEMENT OF INVESTMENTS
Franklin Pelagos Commodities Strategy Fund(continued)
Commodity-Linked Total Return Swap Contractsa(continued)
| | | | | | | | | | | | |
| | | |
| Underlying Instruments | | Notional Valued | | | Value/ Unrealized Appreciation (Depreciation) | | | Percentage of Net Assets (%) | |
| | | |
| FP Custom Master Index(continued) | | | | | | | | | | | | |
| | | |
Bloomberg Commodity Kansas Wheat Subindex | | | $ 1,936,500 | | | | $ — | | | | — | |
| | | |
Bloomberg Commodity Lean Hogs Subindex | | | 4,131,200 | | | | — | | | | — | |
| | | |
Bloomberg Commodity Live Cattle Subindex | | | 5,422,200 | | | | — | | | | — | |
| | | |
Bloomberg Commodity Natural Gas Subindex | | | 6,842,300 | | | | — | | | | — | |
| | | |
Bloomberg Commodity Nickel Subindex | | | 4,647,600 | | | | — | | | | — | |
| | | |
Bloomberg Commodity Silver Subindex | | | 5,680,400 | | | | — | | | | — | |
| | | |
Bloomberg Commodity Soybean Meal Subindex | | | 5,422,200 | | | | — | | | | — | |
| | | |
Bloomberg Commodity Soybean Oil Subindex | | | 4,776,700 | | | | — | | | | — | |
| | | |
Bloomberg Commodity Soybeans Subindex | | | 9,037,000 | | | | — | | | | — | |
| | | |
Bloomberg Commodity Sugar Subindex | | | 4,647,600 | | | | — | | | | — | |
| | | |
Bloomberg Commodity Unleaded Gasoline Subindex | | | 4,905,800 | | | | — | | | | — | |
| | | |
Bloomberg Commodity Wheat Subindex | | | 3,098,400 | | | | — | | | | — | |
| | | |
Bloomberg Commodity WTI Crude Oil Subindex | | | 7,100,500 | | | | — | | | | — | |
| | | |
Bloomberg Commodity Zinc Subindex | | | 5,293,100 | | | | — | | | | — | |
| | | |
| Morgan Stanley MSCBBCV3 Index | | | | | | | | | | | | |
| | | |
Bloomberg Commodity Aluminum Subindex | | | 2,171,250 | | | | — | | | | — | |
| | | |
Bloomberg Commodity Aluminum Subindex 3 Month Forward | | | (2,171,250 | ) | | | — | | | | — | |
| | | |
Bloomberg Commodity Brent Crude Oil Subindex | | | (2,171,250 | ) | | | — | | | | — | |
| | | |
Bloomberg Commodity Brent Crude Oil Subindex 3 Month Forward | | | 2,171,250 | | | | — | | | | — | |
| | | |
Bloomberg Commodity Coffee Subindex | | | (1,688,750 | ) | | | — | | | | — | |
| | | |
Bloomberg Commodity Coffee Subindex 3 Month Forward | | | 1,688,750 | | | | — | | | | — | |
| | | |
Bloomberg Commodity Corn Subindex | | | (2,171,250 | ) | | | — | | | | — | |
| | | |
Bloomberg Commodity Corn Subindex 3 Month Forward | | | 2,171,250 | | | | — | | | | — | |
| | | |
Bloomberg Commodity Cotton Subindex | | | 965,000 | | | | — | | | | — | |
| | | |
Bloomberg Commodity Cotton Subindex 3 Month Forward | | | (965,000 | ) | | | — | | | | — | |
| | | |
Bloomberg Commodity Live Cattle Subindex | | | 1,930,000 | | | | — | | | | — | |
| | | |
Bloomberg Commodity Live Cattle Subindex 3 Month Forward | | | (1,930,000 | ) | | | — | | | | — | |
| | | |
Bloomberg Commodity Soybean Oil Subindex | | | 965,000 | | | | — | | | | — | |
| | | |
Bloomberg Commodity Soybean Oil Subindex 3 Month Forward | | | (965,000 | ) | | | — | | | | — | |
| | | |
Bloomberg Commodity Sugar Subindex | | | 1,688,750 | | | | — | | | | — | |
| | | |
Bloomberg Commodity Sugar Subindex 3 Month Forward | | | (1,688,750 | ) | | | — | | | | — | |
| | | |
Bloomberg Commodity Unleaded Gasoline Subindex | | | (1,206,250 | ) | | | — | | | | — | |
| | | |
Bloomberg Commodity Unleaded Gasoline Subindex 3 Month Forward | | | 1,206,250 | | | | — | | | | — | |
| | | |
Bloomberg Commodity Wheat Subindex | | | (2,171,250 | ) | | | — | | | | — | |
| | | |
Bloomberg Commodity Wheat Subindex 3 Month Forward | | | 2,171,250 | | | | — | | | | — | |
| | | |
Bloomberg Commodity Zinc Subindex | | | (2,171,250 | ) | | | — | | | | — | |
| | | |
Bloomberg Commodity Zinc Subindex 3 Month Forward | | | 2,171,250 | | | | — | | | | — | |
| | | |
| Morgan Stanley MSCBBE03 Index | | | | | | | | | | | | |
| | | |
Bloomberg Commodity Brent Crude Oil Subindex | | | (2,902,500 | ) | | | — | | | | — | |
| | | |
Bloomberg Commodity Brent Crude Oil Subindex 3 Month Forward | | | 1,290,000 | | | | — | | | | — | |
| | | |
Bloomberg Commodity Brent Crude Oil Subindex 6 Month Forward | | | 1,612,500 | | | | — | | | | — | |
| | | |
Bloomberg Commodity Copper Subindex | | | (645,000 | ) | | | — | | | | — | |
| | | |
Bloomberg Commodity Copper Subindex 6 Month Forward | | | 645,000 | | | | — | | | | — | |
| | | |
Bloomberg Commodity Natural Gas Subindex | | | 1,612,500 | | | | — | | | | — | |
| | | | | | |
| | | |
| franklintempleton.com | | Annual Report | | | 19 | |
FRANKLIN ALTERNATIVE STRATEGIES FUNDS
CONSOLIDATED STATEMENT OF INVESTMENTS
Franklin Pelagos Commodities Strategy Fund(continued)
Commodity-Linked Total Return Swap Contractsa(continued)
| | | | | | | | | | | | |
| | | |
| Underlying Instruments | | Notional Valued | | | Value/
Unrealized
Appreciation
(Depreciation) | | | Percentage of Net Assets (%) | |
| | | |
| Morgan Stanley MSCBBE03 Index(continued) | | | | | | | | | | | | |
| | | |
Bloomberg Commodity Natural Gas Subindex 3 Month Forward | | | $ (645,000 | ) | | | $ — | | | | — | |
| | | |
Bloomberg Commodity Natural Gas Subindex 6 Month Forward | | | (967,500 | ) | | | — | | | | — | |
| | | |
Bloomberg Commodity Nickel Subindex | | | (3,547,500 | ) | | | — | | | | — | |
| | | |
Bloomberg Commodity Nickel Subindex 3 Month Forward | | | 1,612,500 | | | | — | | | | — | |
| | | |
Bloomberg Commodity Nickel Subindex 6 Month Forward | | | 1,935,000 | | | | — | | | | — | |
| | | |
Bloomberg Commodity Sugar Subindex | | | 3,225,000 | | | | — | | | | — | |
| | | |
Bloomberg Commodity Sugar Subindex 3 Month Forward | | | (1,935,000 | ) | | | — | | | | — | |
| | | |
Bloomberg Commodity Sugar Subindex 6 Month Forward | | | (1,290,000 | ) | | | — | | | | — | |
| | | |
Bloomberg Commodity Wheat Subindex | | | 967,500 | | | | — | | | | — | |
| | | |
Bloomberg Commodity Wheat Subindex 3 Month Forward | | | (967,500 | ) | | | — | | | | — | |
| | | |
| Morgan Stanley MSCBBEA1 Index | | | | | | | | | | | | |
| | | |
Bloomberg Commodity Brent Crude Oil Subindex | | | 1,620,000 | | | | — | | | | — | |
| | | |
Bloomberg Commodity Copper Subindex | | | (1,620,000 | ) | | | — | | | | — | |
| | | |
Bloomberg Commodity Cotton Subindex | | | (1,620,000 | ) | | | — | | | | — | |
| | | |
Bloomberg Commodity Gas Oil Subindex | | | 1,620,000 | | | | — | | | | — | |
| | | |
Bloomberg Commodity Gold Subindex | | | 1,620,000 | | | | — | | | | — | |
| | | |
Bloomberg Commodity Soybeans Subindex | | | 1,620,000 | | | | — | | | | — | |
| | | |
Bloomberg Commodity Sugar Subindex | | | 1,620,000 | | | | — | | | | — | |
| | | |
Bloomberg Commodity Unleaded Gasoline Subindex | | | (1,620,000 | ) | | | — | | | | — | |
| | | |
Bloomberg Commodity Wheat Subindex | | | (1,620,000 | ) | | | — | | | | — | |
| | | |
Bloomberg Commodity WTI Crude Oil Subindex | | | (1,620,000 | ) | | | — | | | | — | |
| | | | |
dNotional value represents the fair value at period end of each underlying instrument (including the financing rate fee which is calculated based on the swap contract’s original notional value of $129,100,000 for the FP Custom Master Index, $19,300,000 for the Morgan Stanley MSCBBCV3 Index, $12,900,000 for the Morgan Stanley MSCBBE03 Index and $8,100,000 for the Morgan Stanley MSCBBEA1 Index, allocated to each underlying instrument on apro-rata basis).
See Note 7 regarding other derivative information.
See Abbreviations on page 35.
| | | | |
| | | |
| 20 | | Annual Report | The accompanying notes are an integral part of these consolidated financial statements. | | franklintempleton.com |
FRANKLIN ALTERNATIVE STRATEGIES FUNDS
CONSOLIDATED FINANCIAL STATEMENTS
Consolidated Statement of Assets and Liabilities
May 31, 2019
Franklin Pelagos Commodities Strategy Fund
| | | | |
Assets: | | | | |
Investments in securities: | | | | |
Cost - Unaffiliated issuers | | $ | 161,899,417 | |
Cost -Non-controlled affiliates (Note 3f) | | | 1,128,771 | |
| | | | |
Value - Unaffiliated issuers | | $ | 161,863,914 | |
Value -Non-controlled affiliates (Note 3f) | | | 1,128,771 | |
Cash | | | 656,018 | |
Receivables: | | | | |
Capital shares sold | | | 16,007 | |
Interest. | | | 43,056 | |
Affiliates | | | 18,142 | |
Other assets | | | 123 | |
| | | | |
Total assets | | | 163,726,031 | |
| | | | |
Liabilities: | | | | |
Payables: | | | | |
Capital shares redeemed | | | 133,483 | |
Management fees | | | 25,240 | |
Distribution fees | | | 2,096 | |
Variation margin on futures contracts | | | 521,037 | |
Due to brokers | | | 4,639,992 | |
Accrued expenses and other liabilities | | | 54,333 | |
| | | | |
Total liabilities | | | 5,376,181 | |
| | | | |
Net assets, at value | | $ | 158,349,850 | |
| | | | |
Net assets consist of: | | | | |
Paid-in capital | | $ | 175,384,546 | |
Total distributable earnings (loss) | | | (17,034,696 | ) |
| | | | |
Net assets, at value | | $ | 158,349,850 | |
| | | | |
| | | | | | |
| | | |
| franklintempleton.com | | The accompanying notes are an integral part of these consolidated financial statements. | Annual Report | | | 21 | |
FRANKLIN ALTERNATIVE STRATEGIES FUNDS
CONSOLIDATED FINANCIAL STATEMENTS
Consolidated Statement of Assets and Liabilities(continued)
May 31, 2019
Franklin Pelagos Commodities Strategy Fund
| | | | |
| |
| Class A: | | | | |
Net assets, at value | | $ | 7,352,571 | |
| | | | |
Shares outstanding | | | 1,386,785 | |
| | | | |
Net asset value per sharea | | | $5.30 | |
| | | | |
Maximum offering price per share (net asset value per share ÷ 94.50%) | | | $5.61 | |
| | | | |
| |
| Class C: | | | | |
Net assets, at value | | $ | 496,831 | |
| | | | |
Shares outstanding | | | 96,264 | |
| | | | |
Net asset value and maximum offering price per sharea | | | $5.16 | |
| | | | |
| |
| Class R: | | | | |
Net assets, at value | | $ | 17,278 | |
| | | | |
Shares outstanding | | | 3,281 | |
| | | | |
Net asset value and maximum offering price per share | | | $5.27 | |
| | | | |
| |
| Class R6: | | | | |
Net assets, at value | | $ | 148,604,381 | |
| | | | |
Shares outstanding | | | 27,448,274 | |
| | | | |
Net asset value and maximum offering price per share | | | $5.41 | |
| | | | |
| |
| Advisor Class: | | | | |
Net assets, at value | | $ | 1,878,789 | |
| | | | |
Shares outstanding | | | 345,156 | |
| | | | |
Net asset value and maximum offering price per share | | | $5.44 | |
| | | | |
aRedemption price is equal to net asset value less contingent deferred sales charges, if applicable.
| | | | |
| | | |
| 22 | | Annual Report | The accompanying notes are an integral part of these consolidated financial statements. | | franklintempleton.com |
FRANKLIN ALTERNATIVE STRATEGIES FUNDS
CONSOLIDATED FINANCIAL STATEMENTS
Consolidated Statement of Operations
for the year ended May 31, 2019
Franklin Pelagos Commodities Strategy Fund
| | | | |
Investment income: | | | | |
Dividends: | | | | |
Non-controlled affiliates (Note 3f) | | | $ 87,260 | |
Interest: | | | | |
Unaffiliated issuers | | | 5,132,935 | |
| | | | |
Total investment income | | | 5,220,195 | |
| | | | |
Expenses: | | | | |
Management fees (Note 3a) | | | 2,056,643 | |
Distribution fees: (Note 3c) | | | | |
Class A | | | 17,765 | |
Class C | | | 8,051 | |
Class R | | | 102 | |
Transfer agent fees: (Note 3e) | | | | |
Class A | | | 30,563 | |
Class C | | | 3,462 | |
Class R | | | 91 | |
Class R6 | | | 50,937 | |
Advisor Class | | | 9,028 | |
Custodian fees (Note 4) | | | 3,239 | |
Reports to shareholders | | | 24,491 | |
Registration and filing fees | | | 85,464 | |
Professional fees | | | 111,975 | |
Trustees’ fees and expenses | | | 86,684 | |
Other | | | 49,473 | |
| | | | |
Total expenses | | | 2,537,968 | |
Expense reductions (Note 4) | | | (2,315 | ) |
Expenses waived/paid by affiliates (Note 3f and 3g) | | | (1,021,316 | ) |
| | | | |
Net expenses | | | 1,514,337 | |
| | | | |
Net investment income. | | | 3,705,858 | |
| | | | |
Realized and unrealized gains (losses): | | | | |
Net realized gain (loss) from: | | | | |
Investments: | | | | |
Unaffiliated issuers | | | (70,495 | ) |
Futures contracts | | | (8,200,990 | ) |
Swap contracts. | | | (30,674,721 | ) |
| | | | |
Net realized gain (loss) | | | (38,946,206 | ) |
| | | | |
Net change in unrealized appreciation (depreciation) on: | | | | |
Investments: | | | | |
Unaffiliated issuers | | | 247,754 | |
Futures contracts | | | (2,839,935 | ) |
Swap contracts. | | | (3,786,623 | ) |
| | | | |
Net change in unrealized appreciation (depreciation) | | | (6,378,804 | ) |
| | | | |
Net realized and unrealized gain (loss) | | | (45,325,010 | ) |
| | | | |
Net increase (decrease) in net assets resulting from operations | | | $(41,619,152 | ) |
| | | | |
| | | | | | |
| | | |
| franklintempleton.com | | The accompanying notes are an integral part of these consolidated financial statements. | Annual Report | | | 23 | |
FRANKLIN ALTERNATIVE STRATEGIES FUNDS
CONSOLIDATED FINANCIAL STATEMENTS
Consolidated Statements of Changes in Net Assets
Franklin Pelagos Commodities Strategy Fund
| | | | | | | | | | |
| |
| | | Year Ended May 31, |
| | |
| | | 2019 | | 2018 |
| | |
Increase (decrease) in net assets: | | | | | | | | | | |
| | |
Operations: | | | | | | | | | | |
| | |
Net investment income | | | | $ 3,705,858 | | | | | $ 978,846 | |
| | |
Net realized gain (loss) | | | | (38,946,206 | ) | | | | 14,266,808 | |
| | |
Net change in unrealized appreciation (depreciation) | | | | (6,378,804 | ) | | | | 5,347,829 | |
| |
| | | | | |
| | |
Net increase (decrease) in net assets resulting from operations | | | | (41,619,152 | ) | | | | 20,593,483 | |
| |
| | | | | |
| | |
Distributions to shareholders: (Note 1e) | | | | | | | | | | |
| | |
Class A | | | | (488,795 | ) | | | | — | |
| | |
Class C | | | | (36,578 | ) | | | | — | |
| | |
Class R | | | | (1,248 | ) | | | | — | |
| | |
Class R6 | | | | (17,701,479 | ) | | | | (155,612 | ) |
| | |
Advisor Class | | | | (120,404 | ) | | | | — | |
| |
| | | | | |
| | |
Total distributions to shareholders | | | | (18,348,504 | ) | | | | (155,612 | ) |
| |
| | | | | |
| | |
Capital share transactions: (Note 2) | | | | | | | | | | |
| | |
Class A | | | | 2,567,293 | | | | | 1,120,485 | |
| | |
Class C | | | | (481,809 | ) | | | | 96,764 | |
| | |
Class R | | | | (3,480 | ) | | | | 184 | |
| | |
Class R6 | | | | (81,855,345 | ) | | | | 149,683,677 | |
| | |
Advisor Class | | | | 580,738 | | | | | (560,990 | ) |
| |
| | | | | |
| | |
Total capital share transactions | | | | (79,192,603 | ) | | | | 150,340,120 | |
| |
| | | | | |
| | |
Net increase (decrease) in net assets | | | | (139,160,259 | ) | | | | 170,777,991 | |
| | |
Net assets: | | | | | | | | | | |
| | |
Beginning of year | | | | 297,510,109 | | | | | 126,732,118 | |
| |
| | | | | |
| | |
End of year (Note 1e) | | | | $ 158,349,850 | | | | | $297,510,109 | |
| |
| | | | | |
| | | | |
| | | |
| 24 | | Annual Report | The accompanying notes are an integral part of these consolidated financial statements. | | franklintempleton.com |
FRANKLIN ALTERNATIVE STRATEGIES FUNDS
Notes to Consolidated Financial Statements
Franklin Pelagos Commodities Strategy Fund
1. Organization and Significant Accounting Policies
Franklin Alternative Strategies Funds (Trust) is registered under the Investment Company Act of 1940 (1940 Act) as anopen-end management investment company, consisting of four separate funds and applies the specialized accounting and reporting guidance in U.S. Generally Accepted Accounting Principles (U.S. GAAP). Franklin Pelagos Commodities Strategy Fund (Fund) is included in this report. The Fund offers five classes of shares: Class A, Class C, Class R, Class R6 and Advisor Class. Beginning on October 19, 2018, Class C shares automatically convert to Class A shares after they have been held for 10 years. Each class of shares may differ by its initial sales load, contingent deferred sales charges, voting rights on matters affecting a single class, its exchange privilege and fees due to differing arrangements for distribution and transfer agent fees.
The following summarizes the Fund’s significant accounting policies.
a. Financial Instrument Valuation
The Fund’s investments in financial instruments are carried at fair value daily. Fair value is the price that would be received to sell an asset or paid to transfer a liability in an orderly transaction between market participants on the measurement date. The Fund calculates the net asset value (NAV) per share each business day as of 4 p.m. Eastern time or the regularly scheduled close of the New York Stock Exchange (NYSE), whichever is earlier. Under compliance policies and procedures approved by the Trust’s Board of Trustees (the Board), the Fund’s administrator has responsibility for oversight of valuation, including leading the cross-functional Valuation Committee (VC). The Fund may utilize independent pricing services, quotations from securities and financial instrument dealers, and other market sources to determine fair value.
Debt securities generally trade in theover-the-counter (OTC) market rather than on a securities exchange. The Fund’s pricing services use multiple valuation techniques to determine fair value. In instances where sufficient market activity exists, the pricing services may utilize a market-based approach through which quotes from market makers are used to determine fair value. In instances where sufficient market activity may not exist or is limited, the pricing services also utilize proprietary valuation models which may consider market characteristics such as benchmark yield curves, credit spreads, estimated default rates, anticipated market interest
rate volatility, coupon rates, anticipated timing of principal repayments, underlying collateral, and other unique security features in order to estimate the relevant cash flows, which are then discounted to calculate the fair value.
Investments inopen-end mutual funds are valued at the closing NAV.
Derivative financial instruments listed on an exchange are valued at the official closing price of the day. Certain derivative financial instruments are centrally cleared or trade in the OTC market. The Fund’s pricing services use various techniques including industry standard option pricing models and proprietary discounted cash flow models to determine the fair value of those instruments. The Fund’s net benefit or obligation under the derivative contract, as measured by the fair value of the contract, is included in net assets.
The Fund has procedures to determine the fair value of financial instruments for which market prices are not reliable or readily available. Under these procedures, the Fund primarily employs a market-based approach which may use related or comparable assets or liabilities, recent transactions, market multiples, book values, and other relevant information for the investment to determine the fair value of the investment. An income-based valuation approach may also be used in which the anticipated future cash flows of the investment are discounted to calculate fair value. Discounts may also be applied due to the nature or duration of any restrictions on the disposition of the investments. Due to the inherent uncertainty of valuations of such investments, the fair values may differ significantly from the values that would have been used had an active market existed.
b. Derivative Financial Instruments
The Fund invested in derivative financial instruments in order to manage risk or gain exposure to various other investments or markets. Derivatives are financial contracts based on an underlying or notional amount, require no initial investment or an initial net investment that is smaller than would normally be required to have a similar response to changes in market factors, and require or permit net settlement. Derivatives contain various risks including the potential inability of the counterparty to fulfill their obligations under the terms of the contract, the potential for an illiquid secondary market, and/or the potential for market movements which expose the Fund to gains or losses in excess of the amounts shown in the Consolidated Statement of Assets and Liabilities. Realized
| | | | | | |
| | | |
| franklintempleton.com | | Annual Report | | | 25 | |
FRANKLIN ALTERNATIVE STRATEGIES FUNDS
NOTES TO CONSOLIDATED FINANCIAL STATEMENTS
Franklin Pelagos Commodities Strategy Fund(continued)
1. Organization and Significant Accounting Policies (continued)
b. Derivative Financial Instruments(continued)
gain and loss and unrealized appreciation and depreciation on these contracts for the period are included in the Consolidated Statement of Operations.
Derivative counterparty credit risk is managed through a formal evaluation of the creditworthiness of all potential counterparties. The Fund attempts to reduce its exposure to counterparty credit risk on OTC derivatives, whenever possible, by entering into International Swaps and Derivatives Association (ISDA) master agreements with certain counterparties. These agreements contain various provisions, including but not limited to collateral requirements, events of default, or early termination. Termination events applicable to the counterparty include certain deteriorations in the credit quality of the counterparty. Termination events applicable to the Fund include failure of the Fund to maintain certain net asset levels and/or limit the decline in net assets over various periods of time. In the event of default or early termination, the ISDA master agreement gives thenon-defaulting party the right to net andclose-out all transactions traded, whether or not arising under the ISDA agreement, to one net amount payable by one counterparty to the other. However, absent an event of default or early termination, OTC derivative assets and liabilities are presented gross and not offset in the Consolidated Statement of Assets and Liabilities. Early termination by the counterparty may result in an immediate payment by the Fund of any net liability owed to that counterparty under the ISDA agreement.
At May 31, 2019, the Fund had no OTC derivatives in a net liability position for such contracts.
Collateral requirements differ by type of derivative. Collateral or initial margin requirements are set by the broker or exchange clearing house for exchange traded and centrally cleared derivatives. Initial margin deposited is held at the exchange and can be in the form of cash and/or securities. For OTC derivatives traded under an ISDA master agreement, posting of collateral is required by either the Fund or the applicable counterparty if the total net exposure of all OTC derivatives with the applicable counterparty exceeds the minimum transfer amount, which typically ranges from $100,000 to $250,000, and can vary depending on the counterparty and the type of the agreement. Generally, collateral is determined at the close of Fund business each
day and any additional collateral required due to changes in derivative values may be delivered by the Fund or the counterparty the next business day, or within a few business days. Collateral pledged and/or received by the Fund for OTC derivatives, if any, is held in segregated accounts with the Fund’s custodian/counterparty broker and can be in the form of cash and/or securities. Unrestricted cash may be invested according to the Fund’s investment objectives. To the extent that the amounts due to the Fund from its counterparties are not subject to collateralization or are not fully collateralized, the Fund bears the risk of loss from counterpartynon-performance.
The Fund entered into exchange traded futures contracts primarily to gain exposure to commodity price risk. A futures contract is an agreement between the Fund and a counterparty to buy or sell an asset at a specified price on a future date. Required initial margins are pledged by the Fund, and the daily change in fair value is accounted for as a variation margin payable or receivable in the Consolidated Statement of Assets and Liabilities.
The Fund entered into OTC commodity-linked total return swap contracts primarily to gain exposure to commodity price risk of an underlying instrument such as a stock, bond, index or basket of securities or indices. A total return swap is an agreement between the Fund and a counterparty to exchange a return linked to an underlying instrument for a floating or fixed rate payment, both based upon a notional amount. Over the term of the contract, contractually required payments to be paid or received are accrued daily and recorded as unrealized appreciation or depreciation until the payments are made, at which time they are recognized as realized gain or loss.
See Note 7 regarding other derivative information.
c. Investments in FPC Holdings Corp. (FP Subsidiary)
The Fund invests in certain financial instruments and commodity-linked derivative investments through its investment in the FP Subsidiary. The FP Subsidiary is a Cayman Islands exempted company with limited liability, is a wholly-owned subsidiary of the Fund, and is able to invest in certain financial instruments and commodity-linked derivative investments consistent with the investment objective of the Fund. At May 31, 2019, the FP Subsidiary’s investments as well as any other assets and liabilities of the FP Subsidiary
| | | | |
| | | |
| 26 | | Annual Report | | franklintempleton.com |
FRANKLIN ALTERNATIVE STRATEGIES FUNDS
NOTES TO CONSOLIDATED FINANCIAL STATEMENTS
Franklin Pelagos Commodities Strategy Fund(continued)
are reflected in the Fund’s Consolidated Statement of Investments and Consolidated Statement of Assets and Liabilities.
All intercompany transactions and balances have been eliminated. For tax purposes, the Fund is required to increase its taxable income by its share of the FP Subsidiary’s income. Net losses incurred by the FP Subsidiary cannot offset income earned by the Fund and cannot be carried back or forward by the FP Subsidiary to offset income from prior or future years. At May 31, 2019, the net assets of the FP Subsidiary were $31,593,086, representing 20.0% of the Fund’s consolidated net assets. The Fund’s investment in the FP Subsidiary is limited to 25% of consolidated assets.
d. Income Taxes
It is the Fund’s policy to qualify as a regulated investment company under the Internal Revenue Code. The Fund intends to distribute to shareholders substantially all of its taxable income and net realized gains to relieve it from federal income and excise taxes. As a result, no provision for U.S. federal income taxes is required.
The Fund may recognize an income tax liability related to its uncertain tax positions under U.S. GAAP when the uncertain tax position has a less than 50% probability that it will be sustained upon examination by the tax authorities based on its technical merits. As of May 31, 2019, the Fund has determined that no tax liability is required in its consolidated financial statements related to uncertain tax positions for any open tax years (or expected to be taken in future tax years). Open tax years are those that remain subject to examination and are based on the statute of limitations in each jurisdiction in which the Fund invests.
e. Security Transactions, Investment Income, Expenses and Distributions
Security transactions are accounted for on trade date. Realized gains and losses on security transactions are determined on a specific identification basis. Interest income and estimated expenses are accrued daily. Amortization of premium and accretion of discount on debt securities are included in interest income. Dividend income is recorded on theex-dividend date. Distributions to shareholders are recorded on theex-dividend date. Distributable earnings are determined according to income tax regulations (tax basis) and may differ from earnings recorded in accordance with U.S. GAAP. These differences may be permanent or
temporary. Permanent differences are reclassified among capital accounts to reflect their tax character. These reclassifications have no impact on net assets or the results of operations. Temporary differences are not reclassified, as they may reverse in subsequent periods.*
Common expenses incurred by the Trust are allocated among the Funds based on the ratio of net assets of each Fund to the combined net assets of the Trust or based on the ratio of number of shareholders of each Fund to the combined number of shareholders of the Trust. Fund specific expenses are charged directly to the Fund that incurred the expense.
Realized and unrealized gains and losses and net investment income, excluding class specific expenses, are allocated daily to each class of shares based upon the relative proportion of net assets of each class. Differences in per share distributions by class are generally due to differences in class specific expenses.
f. Accounting Estimates
The preparation of financial statements in accordance with U.S. GAAP requires management to make estimates and assumptions that affect the reported amounts of assets and liabilities at the date of the financial statements and the amounts of income and expenses during the reporting period. Actual results could differ from those estimates.
g. Guarantees and Indemnifications
Under the Trust’s organizational documents, its officers and trustees are indemnified by the Trust against certain liabilities arising out of the performance of their duties to the Trust. Additionally, in the normal course of business, the Trust, on behalf of the Fund, enters into contracts with service providers that contain general indemnification clauses. The Trust’s maximum exposure under these arrangements is unknown as this would involve future claims that may be made against the Trust that have not yet occurred. Currently, the Trust expects the risk of loss to be remote.
| | | | | | |
| | | |
| franklintempleton.com | | Annual Report | | | 27 | |
FRANKLIN ALTERNATIVE STRATEGIES FUNDS
NOTES TO CONSOLIDATED FINANCIAL STATEMENTS
Franklin Pelagos Commodities Strategy Fund(continued)
1. Organization and Significant Accounting Policies(continued)
*Effective during the current reporting period, it is no longer required to present certain line items in the Consolidated Statements of Changes in Net Assets. The below prior period amounts affected by this change are shown as they were in the prior year Consolidated Statements of Changes in Net Assets.
For the year ended May 31, 2018, distributions to shareholders were as follows:
| | | | |
Distributions from net investment income: | | | | |
| |
Class R6 | | | $(155,612 | ) |
For the year ended May 31, 2018, undistributed net investment income included in net assets was $630,716.
2. Shares of Beneficial Interest
At May 31, 2019, there were an unlimited number of shares authorized (without par value). Transactions in the Fund’s shares were as follows:
| | | | | | | | | | | | | | | | | | | | | | | | | |
| |
| | | Year Ended May 31, |
| | | |
| | | 2019 | | | | 2018 |
| | | | | |
| | | Shares | | Amount | | | | Shares | | Amount |
| | | | | |
| Class A Shares: | | | | | | | | | | | | | | | | | | | | | | | | | |
| | | | | |
| Shares solda | | | | 687,977 | | | | $ | 4,172,835 | | | | | | | | | | 397,914 | | | | $ | 2,583,465 | |
| | | | | |
| Shares issued in reinvestment of distributions | | | | 89,860 | | | | | 487,940 | | | | | | | | | | — | | | | | — | |
| | | | | |
| Shares redeemed | | | | (352,527 | ) | | | | (2,093,482 | ) | | | | | | | | | (227,728 | ) | | | | (1,462,980 | ) |
| |
| | | | | |
| | | | | |
| Net increase (decrease) | | | | 425,310 | | | | $ | 2,567,293 | | | | | | | | | | 170,186 | | | | $ | 1,120,485 | |
| |
| | | | | |
| | | | | |
| Class C Shares: | | | | | | | | | | | | | | | | | | | | | | | | | |
| | | | | |
| Shares sold | | | | 19,518 | | | | $ | 117,196 | | | | | | | | | | 66,363 | | | | $ | 417,943 | |
| | | | | |
| Shares issued in reinvestment of distributions | | | | 6,852 | | | | | 36,316 | | | | | | | | | | — | | | | | — | |
| | | | | |
| Shares redeemeda | | | | (106,409 | ) | | | | (635,321 | ) | | | | | | | | | (51,364 | ) | | | | (321,179 | ) |
| |
| | | | | |
| | | | | |
| Net increase (decrease) | | | | (80,039 | ) | | | $ | (481,809 | ) | | | | | | | | | 14,999 | | | | $ | 96,764 | |
| |
| | | | | |
| | | | | |
| Class R Shares: | | | | | | | | | | | | | | | | | | | | | | | | | |
| | | | | |
| Shares sold | | | | 26 | | | | $ | 160 | | | | | | | | | | 47 | | | | $ | 306 | |
| | | | | |
| Shares issued in reinvestment of distributions | | | | 231 | | | | | 1,248 | | | | | | | | | | — | | | | | — | |
| | | | | |
| Shares redeemed | | | | (794 | ) | | | | (4,888 | ) | | | | | | | | | (18 | ) | | | | (122 | ) |
| |
| | | | | |
| | | | | |
| Net increase (decrease) | | | | (537 | ) | | | $ | (3,480 | ) | | | | | | | | | 29 | | | | $ | 184 | |
| |
| | | | | |
| | | | | |
| Class R6 Shares: | | | | | | | | | | | | | | | | | | | | | | | | | |
| | | | | |
| Shares sold | | | | 2,267,579 | | | | $ | 13,993,884 | | | | | | | | | | 23,421,423 | | | | $ | 156,598,917 | |
| | | | | |
| Shares issued in reinvestment of distributions | | | | 3,200,991 | | | | | 17,701,479 | | | | | | | | | | 23,435 | | | | | 155,612 | |
| | | | | |
| Shares redeemed | | | | (19,494,493 | ) | | | | (113,550,708 | ) | | | | | | | | | (1,097,586 | ) | | | | (7,070,852 | ) |
| |
| | | | | |
| | | | | |
| Net increase (decrease) | | | | (14,025,923 | ) | | | $ | (81,855,345 | ) | | | | | | | | | 22,347,272 | | | | $ | 149,683,677 | |
| |
| | | | | |
| | | | |
| | | |
| 28 | | Annual Report | | franklintempleton.com |
FRANKLIN ALTERNATIVE STRATEGIES FUNDS
NOTES TO CONSOLIDATED FINANCIAL STATEMENTS
Franklin Pelagos Commodities Strategy Fund(continued)
| | | | | | | | | | | | | | | | | | | | | | | | | |
| |
| | | Year Ended May 31, |
| | | |
| | | 2019 | | | | 2018 |
| | | | | |
| | | Shares | | Amount | | | | Shares | | Amount |
| | | | | |
| Advisor Class Shares: | | | | | | | | | | | | | | | | | | | | | | | | | |
| | | | | |
| Shares sold | | | | 322,678 | | | | | $ 1,909,451 | | | | | | | | | | 222,426 | | | | | $ 1,453,033 | |
| | | | | |
| Shares issued in reinvestment of distributions | | | | 21,370 | | | | | 119,032 | | | | | | | | | | — | | | | | — | |
| | | | | |
| Shares redeemed. | | | | (247,556 | ) | | | | (1,447,745 | ) | | | | | | | | | (303,092 | ) | | | | (2,014,023 | ) |
| |
| | | | | |
| | | | | |
| Net increase (decrease) | | | | 96,492 | | | | | $ 580,738 | | | | | | | | | | (80,666 | ) | | | | $ (560,990 | ) |
| |
| | | | | |
aMay include a portion of Class C shares that were automatically converted to Class A.
3. Transactions with Affiliates
Franklin Resources, Inc. is the holding company for various subsidiaries that together are referred to as Franklin Templeton. Certain officers and trustees of the Trust are also officers and/or directors of the following subsidiaries:
| | |
| |
| Subsidiary | | Affiliation |
FASA, LLC (FASA) | | Investment manager |
Franklin Templeton Services, LLC (FT Services) | | Administrative manager |
Franklin Templeton Distributors, Inc. (Distributors) | | Principal underwriter |
Franklin Templeton Investor Services, LLC (Investor Services) | | Transfer agent |
a. Management Fees
The Fund and FP Subsidiary pay an investment management fee to FASA of 0.85% per year of the average daily net assets of the Fund and FP Subsidiary. Management fees paid by the Fund are reduced on assets invested in the FP Subsidiary, in an amount not to exceed the management fees paid by the FP Subsidiary.
b. Administrative Fees
Under an agreement with FASA, FT Services provides administrative services to the Fund and FP Subsidiary. The fee is paid by FASA based on the Fund and FP Subsidiary average daily net assets, and is not an additional expense of the Fund or FP Subsidiary.
c. Distribution Fees
The Board has adopted distribution plans for each share class, with the exception of Class R6 and Advisor Class shares, pursuant to Rule12b-1 under the 1940 Act. Under the Fund’s Class A reimbursement distribution plan, the Fund reimburses Distributors for costs incurred in connection with the servicing, sale and distribution of the Fund’s shares up to the maximum annual plan rate. Under the Class A reimbursement distribution plan, costs exceeding the maximum for the current plan year cannot be reimbursed in subsequent periods. In addition, under the Fund’s Class C and R compensation distribution plans, the Fund pays Distributors for costs incurred in connection with the servicing, sale and distribution of the Fund’s shares up to the maximum annual plan rate for each class. The plan year, for purposes of monitoring compliance with the maximum annual plan rates, is February 1 through January 31.
| | | | | | |
| | | |
| franklintempleton.com | | Annual Report | | | 29 | |
FRANKLIN ALTERNATIVE STRATEGIES FUNDS
NOTES TO CONSOLIDATED FINANCIAL STATEMENTS
Franklin Pelagos Commodities Strategy Fund(continued)
3. Transactions with Affiliates(continued)
c. Distribution Fees(continued)
The maximum annual plan rates, based on the average daily net assets, for each class, are as follows:
| | | | |
Class A | | | 0.30% | |
| |
Class C | | | 1.00% | |
| |
Class R | | | 0.50% | |
The Board has set the current rate at 0.25% per year for Class A shares until further notice and approval by the Board.
d. Sales Charges/Underwriting Agreements
Front-end sales charges and contingent deferred sales charges (CDSC) do not represent expenses of the Fund. These charges are deducted from the proceeds of sales of Fund shares prior to investment or from redemption proceeds prior to remittance, as applicable. Distributors has advised the Fund of the following commission transactions related to the sales and redemptions of the Fund’s shares for the year:
| | | | |
Sales charges retained net of commissions paid to unaffiliated brokers/dealers | | $ | 4,372 | |
| |
CDSC retained | | $ | 73 | |
Effective September 10, 2018, the Board approved changes to certainfront-end sales charges and dealer commissions on Class A shares. Further details are disclosed in the Fund’s Prospectus.
e. Transfer Agent Fees
Each class of shares pays transfer agent fees to Investor Services for its performance of shareholder servicing obligations. The fees are based on an annualized asset based fee of 0.02% plus a transaction based fee. In addition, each class reimburses Investor Services for out of pocket expenses incurred and, except for Class R6, reimburses shareholder servicing fees paid to third parties. These fees are allocated daily based upon their relative proportion of such classes’ aggregate net assets. Class R6 pays Investor Services transfer agent fees specific to that class.
For the year ended May 31, 2019, the Fund paid transfer agent fees of $94,081, of which $68,908 was retained by Investor Services.
f. Investments in Affiliated Management Investment Companies
The Fund invests in one or more affiliated management investment companies for purposes other than exercising a controlling influence over the management or policies. Management fees paid by the Fund are waived on assets invested in the affiliated management investment companies, as noted in the Consolidated Statement of Operations, in an amount not to exceed the management and administrative fees paid directly or indirectly by each affiliate. During the year ended May 31, 2019, the Fund held investments in affiliated management investment companies as follows:
| | | | | | | | | | | | | | | | | | | | | | | | | | | | | | | | |
| | | | | | | | |
| | | Number of
Shares Held
at Beginning
of Year | | | Gross
Additions | | | Gross
Reductions | | | Number of
Shares
Held at End
of Year | | | Value at End
of Year | | | Dividend
Income | | | Realized
Gain (Loss) | | | Net Change in
Unrealized
Appreciation
(Depreciation) | |
| Non-Controlled Affiliates | | | | | | | | | | | | | | | | | | | | | | | | | | | | | | | | |
| | | | | | | | |
Institutional Fiduciary Trust Money Market Portfolio, 2.08% | | | 556,761 | | | | 226,341,005 | | | | (225,768,995 | ) | | | 1,128,771 | | | | $1,128,771 | | | | $87,260 | | | | $ — | | | | $ — | |
| | | | | | | | | | | | | | | | | | | | |
| | | | |
| | | |
| 30 | | Annual Report | | franklintempleton.com |
FRANKLIN ALTERNATIVE STRATEGIES FUNDS
NOTES TO CONSOLIDATED FINANCIAL STATEMENTS
Franklin Pelagos Commodities Strategy Fund(continued)
g. Waiver and Expense Reimbursements
FASA and Investor Services have contractually agreed in advance to waive or limit their respective fees and to assume as their own expense certain expenses otherwise payable by the Fund so that the expenses (excluding distribution fees, acquired fund fees and expenses and certainnon-routine expenses or costs, including those relating to litigation, indemnification, reorganizations, and liquidations) for each class of the Fund do not exceed 0.95% and Class R6 does not exceed 0.58% based on the average net assets of each class until September 30, 2019. Total expenses waived or paid are not subject to recapture subsequent to the Fund’s fiscal year end.
Prior to October 1, 2018, expenses (excluding certain fees and expenses as previously disclosed) for Class R6 were limited to 0.63% based on the average net assets of the class.
h. Other Affiliated Transactions
At May 31, 2019, the shares of the Fund were owned by the following entities:
| | | | | | | | |
| | |
| | | Shares | | | Percentage of
Outstanding Sharesa | |
| | |
Franklin Moderate Allocation Fund | | | 10,274,103 | | | | 35.1% | |
| | |
Franklin Growth Allocation Fund | | | 6,680,357 | | | | 22.8% | |
| | |
Franklin Conservative Allocation Fund | | | 6,414,209 | | | | 21.9% | |
| | |
Franklin Real Return Fund | | | 969,029 | | | | 3.3% | |
| | |
Franklin LifeSmart 2025 Retirement Target Fund | | | 669,836 | | | | 2.3% | |
| | |
Franklin LifeSmart 2035 Retirement Target Fund | | | 630,137 | | | | 2.2% | |
| | |
Franklin LifeSmart 2045 Retirement Target Fund | | | 439,425 | | | | 1.5% | |
| | |
Franklin LifeSmart 2030 Retirement Target Fund | | | 284,944 | | | | 1.0% | |
| | |
Franklin LifeSmart 2040 Retirement Target Fund | | | 236,060 | | | | 0.8% | |
| | |
Franklin LifeSmart 2020 Retirement Target Fund | | | 230,930 | | | | 0.8% | |
| | |
Franklin LifeSmart 2050 Retirement Target Fund | | | 213,886 | | | | 0.7% | |
| | |
Franklin LifeSmart 2055 Retirement Target Fund | | | 77,127 | | | | 0.3% | |
| | |
Franklin NextStep Moderate Fund | | | 46,097 | | | | 0.2% | |
| | |
Franklin NextStep Growth Fund | | | 26,530 | | | | 0.1% | |
| |
| | | | |
| | |
| | | 27,192,670 | | | | 93.0% | |
| |
| | | | |
aInvestment activities of significant shareholders could have a material impact on the Fund.
4. Expense Offset Arrangement
The Fund has entered into an arrangement with its custodian whereby credits realized as a result of uninvested cash balances are used to reduce a portion of the Fund’s custodian expenses. During the year ended May 31, 2019, the custodian fees were reduced as noted in the Consolidated Statement of Operations.
| | | | | | |
| | | |
| franklintempleton.com | | Annual Report | | | 31 | |
FRANKLIN ALTERNATIVE STRATEGIES FUNDS
NOTES TO CONSOLIDATED FINANCIAL STATEMENTS
Franklin Pelagos Commodities Strategy Fund(continued)
5. Income Taxes
For tax purposes, capital losses may be carried over to offset future capital gains, if any. At May 31, 2019, the capital loss carryforwards were as follows:
| | | | | |
| Capital loss carryforwards not subject to expiration: | | | | | |
Short term | | | $ | 75,253 | |
Long term | | | | 221,851 | |
| | | | | |
Total capital loss carryforwards | | | $ | 297,104 | |
| | | | | |
The tax character of distributions paid during the years ended May 31, 2019 and 2018, was as follows:
| | | | | | | | | | |
| | |
| | | 2019 | | 2018 |
Distributions paid from ordinary income | | | $ | 18,348,504 | | | | $ | 155,612 | |
| | | | | |
At May 31, 2019, the cost of investments, net unrealized appreciation (depreciation) and undistributed ordinary income for income tax purposes were as follows:
| | | | | |
Cost of investments | | | $ | 179,112,852 | |
| | | | | |
Unrealized appreciation | | | $ | 116,818 | |
Unrealized depreciation | | | | (18,213,296 | ) |
| | | | | |
Net unrealized appreciation (depreciation) | | | $ | (18,096,478 | ) |
| | | | | |
| Distributable earnings: | | | | | |
Undistributed ordinary income | | | $ | 1,402,265 | |
| | | | | |
Differences between income and/or capital gains as determined on a book basis and a tax basis are primarily due to differing treatment of investments in the FP Subsidiary.
6. Investment Transactions
Sales of investments (excluding short term securities) for the year ended May 31, 2019, aggregated $10,000,000. There were no purchases of investments (other than short term securities) for the year ended May 31, 2019.
| | | | |
| | | |
| 32 | | Annual Report | | franklintempleton.com |
FRANKLIN ALTERNATIVE STRATEGIES FUNDS
NOTES TO CONSOLIDATED FINANCIAL STATEMENTS
Franklin Pelagos Commodities Strategy Fund(continued)
7. Other Derivative Information
At May 31, 2019, the investments in derivative contracts are reflected in the Consolidated Statement of Assets and Liabilities as follows:
| | | | | | | | | | | | |
| | |
| | | Asset Derivatives | | | Liability Derivatives | |
| | | | |
Derivative Contracts
Not Accounted for as
Hedging Instruments | | Consolidated Statement of
Assets and Liabilities
Location | | Fair Value | | | Consolidated Statement of
Assets and Liabilities
Location | | Fair Value | |
| | | | |
Commodity contracts | | Variation margin on futures contracts | | $ | 30,552 | a | | Variation margin on futures contracts | | $ | 2,009,126 | a |
| | | | |
| | | | | | | | | | | | |
aThis amount reflects the cumulative appreciation (depreciation) of futures contracts as reported in the Consolidated Statement of Investments. Only the variation margin receivable/payable at year end is separately reported within the Consolidated Statement of Assets and Liabilities. Prior variation margin movements were recorded to cash upon receipt or payment.
For the year ended May 31, 2019, the effect of derivative contracts in the Consolidated Statement of Operations was as follows:
| | | | | | | | | | | | |
| | | | |
Derivative Contracts
Not Accounted for as
Hedging Instruments | | Consolidated Statement of
Operations Location | | Net Realized
Gain (Loss) for
the Year | | | Consolidated Statement of
Operations Location | | Net Change in
Unrealized
Appreciation
(Depreciation)
for the Year | |
| | | | |
| | Net realized gain (loss) from: | | | | | | Net change in unrealized appreciation (depreciation) on: | | | | |
| | | | |
Commodity contracts | | Futures contracts | | | $ (8,200,990 | ) | | Futures contracts | | | $(2,839,935 | ) |
| | | | |
| | Swap contracts | | | (30,674,721 | ) | | Swap contracts | | | (3,786,623 | ) |
| | | | |
| | | | | | | | | | | | |
| | | | |
Totals | | | | | $(38,875,711 | ) | | | | | $(6,626,558 | ) |
| | | | |
| | | | | | | | | | | | |
For the year ended May 31, 2019, the average month end notional amount of futures contracts and swap contracts represented $46,002,231 and $236,001,033, respectively.
See Note 1(b) regarding derivative financial instruments.
8. Upcoming Liquidation
On April 29, 2019, the Board approved a proposal to liquidate the Fund. Effective June 3, 2019, the Fund was closed to all new investors. The Fund is scheduled to liquidate on or about August 23, 2019.
9. Credit Facility
The Fund, together with other U.S. registered and foreign investment funds (collectively, Borrowers), managed by Franklin Templeton, are borrowers in a joint syndicated senior unsecured credit facility totaling $2 billion (Global Credit Facility) which matures on February 7, 2020. This Global Credit Facility provides a source of funds to the Borrowers for temporary and emergency purposes, including the ability to meet future unanticipated or unusually large redemption requests.
Under the terms of the Global Credit Facility, the Fund shall, in addition to interest charged on any borrowings made by the Fund and other costs incurred by the Fund, pay its share of fees and expenses incurred in connection with the implementation and maintenance of the Global Credit Facility, based upon its relative share of the aggregate net assets of all of the
| | | | | | |
| | | |
| franklintempleton.com | | Annual Report | | | 33 | |
FRANKLIN ALTERNATIVE STRATEGIES FUNDS
NOTES TO CONSOLIDATED FINANCIAL STATEMENTS
Franklin Pelagos Commodities Strategy Fund(continued)
9. Credit Facility(continued)
Borrowers, including an annual commitment fee of 0.15% based upon the unused portion of the Global Credit Facility. These fees are reflected in other expenses in the Consolidated Statement of Operations. During the year ended May 31, 2019, the Fund did not use the Global Credit Facility.
10. Fair Value Measurements
The Fund follows a fair value hierarchy that distinguishes between market data obtained from independent sources (observable inputs) and the Fund’s own market assumptions (unobservable inputs). These inputs are used in determining the value of the Fund’s financial instruments and are summarized in the following fair value hierarchy:
| | • | | Level 1 – quoted prices in active markets for identical financial instruments |
| | • | | Level 2 – other significant observable inputs (including quoted prices for similar financial instruments, interest rates, prepayment speed, credit risk, etc.) |
| | • | | Level 3 – significant unobservable inputs (including the Fund’s own assumptions in determining the fair value of financial instruments) |
The input levels are not necessarily an indication of the risk or liquidity associated with financial instruments at that level.
A summary of inputs used as of May 31, 2019, in valuing the Fund’s assets and liabilities carried at fair value, is as follows:
| | | | | | | | | | | | | | | | | | | | |
| | | | |
| | | Level 1 | | Level 2 | | Level 3 | | Total |
| | | | |
| Assets: | | | | | | | | | | | | | | | | | | | | |
| | | | |
Investments in Securities:a | | | | | | | | | | | | | | | | | | | | |
| | | | |
U.S. Government and Agency Securities | | | $ | — | | | | $ | 9,878,231 | | | | $ | — | | | | $ | 9,878,231 | |
| | | | |
Short Term Investments | | | | 148,824,454 | | | | | 4,290,000 | | | | | — | | | | | 153,114,454 | |
| |
| | | | | |
| | | | |
Total Investments in Securities | | | $ | 148,824,454 | | | | $ | 14,168,231 | | | | $ | — | | | | $ | 162,992,685 | |
| |
| | | | | |
| | | | |
Other Financial Instruments: | | | | | | | | | | | | | | | | | | | | |
| | | | |
Futures Contracts | | | $ | 30,552 | | | | $ | — | | | | $ | — | | | | $ | 30,552 | |
| |
| | | | | |
| | | | |
| Liabilities: | | | | | | | | | | | | | | | | | | | | |
| | | | |
Other Financial Instruments: | | | | | | | | | | | | | | | | | | | | |
| | | | |
Futures Contracts | | | $ | 2,009,126 | | | | $ | — | | | | $ | — | | | | $ | 2,009,126 | |
| |
| | | | | |
aFor detailed categories, see the accompanying Consolidated Statement of Investments.
11. Subsequent Events
The Fund has evaluated subsequent events through the issuance of the consolidated financial statements and determined that no events have occurred that require disclosure other than those already disclosed in the consolidated financial statements.
| | | | |
| | | |
| 34 | | Annual Report | | franklintempleton.com |
FRANKLIN ALTERNATIVE STRATEGIES FUNDS
NOTES TO CONSOLIDATED FINANCIAL STATEMENTS
Franklin Pelagos Commodities Strategy Fund(continued)
Abbreviations
| | |
| Counterparty | | Selected Portfolio |
| MSCS Morgan Stanley Capital Services LLC | | FFCB Federal Farm Credit Bank |
| | FHLMC Federal Home Loan Mortgage Corp. |
| | | | | | |
| | | |
| franklintempleton.com | | Annual Report | | | 35 | |
FRANKLIN ALTERNATIVE STRATEGIES FUNDS
Report of Independent Registered Public Accounting Firm
To the Board of Trustees of Franklin Alternative Strategies Funds
and Shareholders of Franklin Pelagos Commodities Strategy Fund:
Opinion on the Financial Statements
We have audited the accompanying consolidated statement of assets and liabilities of Franklin Pelagos Commodities Strategy Fund (the “Fund”) (one of the funds constituting the Franklin Alternative Strategies Funds), including the consolidated statement of investments, as of May 31, 2019, and the related consolidated statement of operations for the year then ended, the consolidated statements of changes in net assets for each of the two years in the period then ended, the consolidated financial highlights for each of the five years in the period then ended and the related notes (collectively referred to as the “financial statements”). In our opinion, the financial statements present fairly, in all material respects, the consolidated financial position of Franklin Pelagos Commodities Strategy Fund (one of the funds constituting the Franklin Alternative Strategies Funds) at May 31, 2019, the consolidated results of its operations for the year then ended, the consolidated changes in its net assets for each of the two years in the period then ended and its consolidated financial highlights for each of the five years in the period then ended, in conformity with U.S. generally accepted accounting principles.
Basis for Opinion
These financial statements are the responsibility of the Fund’s management. Our responsibility is to express an opinion on the Fund’s financial statements based on our audits. We are a public accounting firm registered with the Public Company Accounting Oversight Board (United States) (“PCAOB”) and are required to be independent with respect to the Fund in accordance with the U.S. federal securities laws and the applicable rules and regulations of the Securities and Exchange Commission and the PCAOB.
We conducted our audits in accordance with the standards of the PCAOB. Those standards require that we plan and perform the audit to obtain reasonable assurance about whether the financial statements are free of material misstatement, whether due to error or fraud. The Fund is not required to have, nor were we engaged to perform, an audit of the Fund’s internal control over financial reporting. As part of our audits, we are required to obtain an understanding of internal control over financial reporting, but not for the purpose of expressing an opinion on the effectiveness of the Fund’s internal control over financial reporting. Accordingly, we express no such opinion.
Our audits included performing procedures to assess the risks of material misstatement of the financial statements, whether due to error or fraud, and performing procedures that respond to those risks. Such procedures included examining, on a test basis, evidence regarding the amounts and disclosures in the financial statements. Our procedures included confirmation of securities owned as of May 31, 2019, by correspondence with the custodian and brokers. Our audits also included evaluating the accounting principles used and significant estimates made by management, as well as evaluating the overall presentation of the financial statements. We believe that our audits provide a reasonable basis for our opinion.

We have served as the auditor of one or more Franklin investment companies since 1987.
Boston, Massachusetts
July 25, 2019
| | | | |
| | | |
| 36 | | Annual Report | | franklintempleton.com |
FRANKLIN ALTERNATIVE STRATEGIES FUNDS
Board Members and Officers
The name, year of birth and address of the officers and board members, as well as their affiliations, positions held with the Funds, principal occupations during at least the past five years and number of U.S. registered portfolios overseen in the Franklin Templeton fund complex, are shown below. Generally, each board member serves until that person’s successor is elected and qualified.
Independent Board Members
| | | | | | | | |
| | | | |
Name, Year of Birth
and Address | | Position | | Length of
Time Served | | Number of Portfolios in
Fund Complex Overseen
by Board Member* | | Other Directorships Held
During at Least the Past 5 Years |
| | | | |
Edward I. Altman, Ph.D. (1941) c/o Franklin Mutual Advisers, LLC 101 John F. Kennedy Parkway Short Hills, NJ 07078-2716 | | Trustee | | Since 2011 | | 14 | | None |
|
| Principal Occupation During at Least the Past 5 Years: |
Max L. Heine Professor of Finance, Emeritus and Director of The Credit and Debt Markets Research Program, Salomon Center, Stern School of Business, New York University; editor and author of numerous financial publications; financial consultant; an adviser to numerous financial and publishing organizations; andformerly, Vice Director, Salomon Center, Stern School of Business, New York University. |
| | | | |
Ann Torre Bates (1958) c/o Franklin Mutual Advisers, LLC 101 John F. Kennedy Parkway Short Hills, NJ 07078-2716 | | Trustee | | Since 2011 | | 38 | | Ares Capital Corporation (specialty finance company) (2010-present), United Natural Foods, Inc. (distributor of natural, organic and specialty foods)(2013-present), Allied Capital Corporation (financial services)(2003-2010), SLM Corporation (Sallie Mae) (1997-2014) and Navient Corporation (loan management, servicing and asset recovery) (2014-2016). |
|
| Principal Occupation During at Least the Past 5 Years: |
Director of various companies; andformerly, Executive Vice President and Chief Financial Officer, NHP Incorporated (manager of multifamily housing) (1995-1997); and Vice President and Treasurer, US Airways, Inc. (until 1995). |
| | | | |
Burton J. Greenwald (1929) c/o Franklin Mutual Advisers, LLC 101 John F. Kennedy Parkway Short Hills, NJ 07078-2716 | | Trustee and Vice Chairman of the Board | | Trustee since 2011 and Vice Chairman of the Board since 2015 | | 14 | | Franklin Templeton Emerging Markets Debt Opportunities Fund PLC(1999-present) and Fiduciary International Ireland Limited(1999-2015). |
|
| Principal Occupation During at Least the Past 5 Years: |
Managing Director, B.J. Greenwald Associates (management consultants to the financial services industry); andformerly, Chairman, Fiduciary Trust International Funds; Executive Vice President, L.F. Rothschild Fund Management, Inc.; President and Director, Merit Mutual Funds; President, Underwriting Division and Director, National Securities & Research Corporation; Governor, Investment Company Institute; and Chairman, ICI Public Information Committee. |
| | | | |
Jan Hopkins Trachtman (1947) c/o Franklin Mutual Advisers, LLC 101 John F. Kennedy Parkway Short Hills, NJ 07078-2716 | | Trustee | | Since 2011 | | 14 | | FinTech Acquisition Corp. III (special purpose fintech acquisition company) (2018-present) |
|
| Principal Occupation During at Least the Past 5 Years: |
President and Founder, The Jan Hopkins Group (communications consulting firm); serves on Advisory Board of Knight Bagehot Fellowship; andformerly, President, Economic Club of New York (2007-2015); Anchor/Correspondent, CNN Financial News (until 2003); Managing Director and Head of Client Communications, Citigroup Private Bank (until 2005); Off-Air Reporter, ABC News’ World News Tonight; and Editor, CBS Network News. |
| | | | | | |
| | | |
| franklintempleton.com | | Annual Report | | | 37 | |
FRANKLIN ALTERNATIVE STRATEGIES FUNDS
Independent Board Members(continued)
| | | | | | | | |
| | | | |
Name, Year of Birth and Address | | Position | | Length of Time Served | | Number of Portfolios in Fund Complex Overseen by Board Member* | | Other Directorships Held During at Least the Past 5 Years |
| | | | |
Keith E. Mitchell (1954) c/o Franklin Mutual Advisers, LLC 101 John F. Kennedy Parkway Short Hills, NJ 07078-2716 | | Trustee | | Since 2011 | | 14 | | None |
|
| Principal Occupation During at Least the Past 5 Years: |
Director of various boards of asset management firms; andformerly, Managing Member, Mitchell, Hartley & Bechtel Advisers, LLC (formerly, Mitchell Advisers, LLC) (advisory firm) (2003-2015) and Managing Director, Putman Lovell NBF. |
| | | | |
David W. Niemiec (1949) c/o Franklin Mutual Advisers, LLC 101 John F. Kennedy Parkway Short Hills, NJ 07078-2716 | | Trustee | | Since 2015 | | 38 | | Hess Midstream Partners LP (oil and gas midstream infrastructure) (2017-present). |
|
| Principal Occupation During at Least the Past 5 Years: |
Advisor, Saratoga Partners (private equity fund); andformerly, Managing Director, Saratoga Partners (1998-2001) and SBC Warburg Dillon Read (investment banking) (1997-1998); Vice Chairman, Dillon, Read & Co. Inc. (investment banking) (1991-1997); and Chief Financial Officer, Dillon, Read & Co. Inc. (1982-1997). |
| | | | |
Charles Rubens II (1930) c/o Franklin Mutual Advisers, LLC 101 John F. Kennedy Parkway Short Hills, NJ 07078-2716 | | Trustee | | Since 2011 | | 14 | | None |
|
| Principal Occupation During at Least the Past 5 Years: |
Private investor and president ofnon-profit organizations; andformerly, an executive of Time, Inc.; and Trustee of Colorado College. |
| | | | |
Robert E. Wade (1946) c/o Franklin Mutual Advisers, LLC 101 John F. Kennedy Parkway Short Hills, NJ 07078-2716 | | Trustee and Chairman of the Board | | Since 2011 | | 38 | | El Oro Ltd (investments) (2003-June 2019). |
|
| Principal Occupation During at Least the Past 5 Years: |
Attorney at law engaged in private practice as a sole practitioner (1972-2008) and member of various boards. |
| | | | |
Gregory H. Williams (1943) c/o Franklin Mutual Advisers, LLC 101 John F. Kennedy Parkway Short Hills, NJ 07078-2716 | | Trustee | | Since 2015 | | 14 | | None |
|
| Principal Occupation During at Least the Past 5 Years: |
Private investor; Consultant; andformerly, President, University of Cincinnati (2009-2012); President, The City College of New York (2001-2009); Dean, College of Law, Ohio State University (1993-2001); and Associate Vice President, Academic Affairs and Professor of Law, University of Iowa (1977-1993). |
Interested Board Members and Officers
| | | | | | | | |
| | | | |
Name, Year of Birth and Address | | Position | | Length of Time Served | | Number of Portfolios in Fund Complex Overseen by Board Member* | | Other Directorships Held During at Least the Past 5 Years |
| | | | |
**Gregory E. Johnson (1961) One Franklin Parkway San Mateo, CA 94403-1906 | | Trustee | | Since 2011 | | 152 | | None |
|
| Principal Occupation During at Least the Past 5 Years: |
Chairman of the Board, Member – Office of the Chairman, Director and Chief Executive Officer, Franklin Resources, Inc.; officer and/or director or trustee, as the case may be, of some of the other subsidiaries of Franklin Resources, Inc. and of 42 of the investment companies in Franklin Templeton; Vice Chairman, Investment Company Institute; andformerly, President, Franklin Resources, Inc. (1994-2015). |
| | | | |
| | | |
| 38 | | Annual Report | | franklintempleton.com |
FRANKLIN ALTERNATIVE STRATEGIES FUNDS
Interested Board Members and Officers(continued)
| | | | | | | | |
| | | | |
Name, Year of Birth and Address | | Position | | Length of Time Served | | Number of Portfolios in Fund Complex Overseen by Board Member* | | Other Directorships Held During at Least the Past 5 Years |
| | | | |
**Jennifer M. Johnson (1964) One Franklin Parkway San Mateo, CA 94403-1906 | | Trustee | | Since 2015 | | 46 | | None |
|
| Principal Occupation During at Least the Past 5 Years: |
President and Chief Operating Officer, Franklin Resources, Inc.; officer and/or director or trustee, as the case may be, of some of the other subsidiaries of Franklin Resources, Inc. and of four of the investment companies in Franklin Templeton; andformerly, Chief Operating Officer and Executive Vice President, Franklin Resources, Inc. (1994-2015); Executive Vice President of Operations and Technology, Franklin Resources, Inc. (2005-2010); and Senior Vice President, Franklin Resources, Inc. (2003-2005). |
| | | | |
Alison E. Baur (1964) One Franklin Parkway San Mateo, CA 94403-1906 | | Vice President | | Since 2012 | | Not Applicable | | Not Applicable |
|
| Principal Occupation During at Least the Past 5 Years: |
Deputy General Counsel, Franklin Templeton; and officer of some of the other subsidiaries of Franklin Resources, Inc. and of 44 of the investment companies in Franklin Templeton. |
| | | | |
Aliya S. Gordon (1973) One Franklin Parkway San Mateo, CA 94403-1906 | | Vice President | | Since 2011 | | Not Applicable | | Not Applicable |
|
| Principal Occupation During at Least the Past 5 Years: |
Senior Associate General Counsel and officer of 44 of the investment companies in Franklin Templeton. |
| | | | |
Steven J. Gray (1955) One Franklin Parkway San Mateo, CA 94403-1906 | | Secretary and Vice President | | Since 2011 | | Not Applicable | | Not Applicable |
|
| Principal Occupation During at Least the Past 5 Years: |
Senior Associate General Counsel, Franklin Templeton; Vice President, Franklin Templeton Distributors, Inc. and FASA, LLC; and officer of 44 of the investment companies in Franklin Templeton. |
| | | | |
Madison S. Gulley (1964) 300 S.E. 2nd Street Fort Lauderdale, FL 33301-1923 | | President and Chief Executive Officer – Investment Management | | Since 2017 | | Not Applicable | | Not Applicable |
|
| Principal Occupation During at Least the Past 5 Years: |
President, FASA, LLC; Executive Vice President, Franklin Advisers, Inc., Franklin Templeton Institutional, LLC, Templeton Global Advisors Limited and Templeton Investment Counsel, LLC; Executive Vice President, Head of Alternatives, K2 Advisors, LLC and K2/D&S Management Co., LLC; Senior Vice President, Franklin Templeton Companies, LLC; officer and/or director or trustee, as the case may be, of some of the other subsidiaries of Franklin Resources, Inc. and of one of the investment companies in Franklin Templeton. |
| | | | |
Matthew T. Hinkle (1971) One Franklin Parkway San Mateo, CA 94403-1906 | | Chief Executive Officer - Finance and Administration | | Since 2017 | | Not Applicable | | Not Applicable |
|
| Principal Occupation During at Least the Past 5 Years: |
Senior Vice President, Franklin Templeton Services, LLC; officer of 44 of the investment companies in Franklin Templeton; andformerly, Vice President, Global Tax (2012-April 2017) and Treasurer/Assistant Treasurer, Franklin Templeton (2009-2017). |
| | | | | | |
| | | |
| franklintempleton.com | | Annual Report | | | 39 | |
FRANKLIN ALTERNATIVE STRATEGIES FUNDS
Interested Board Members and Officers(continued)
| | | | | | | | |
| | | | |
Name, Year of Birth and Address | | Position | | Length of Time Served | | Number of Portfolios in Fund Complex Overseen by Board Member* | | Other Directorships Held During at Least the Past 5 Years |
| | | | |
Robert G. Kubilis (1973) 300 S.E. 2nd Street Fort Lauderdale, FL 33301-1923 | | Chief Financial Officer, Chief Accounting Officer and Treasurer | | Since 2015 | | Not Applicable | | Not Applicable |
|
| Principal Occupation During at Least the Past 5 Years: |
Treasurer, U.S. Fund Administration & Reporting and officer of 16 of the investment companies in Franklin Templeton. |
| | | | |
Robert Lim (1948) One Franklin Parkway San Mateo, CA 94403-1906 | | Vice President – AML Compliance | | Since 2016 | | Not Applicable | | Not Applicable |
|
| Principal Occupation During at Least the Past 5 Years: |
Vice President, Franklin Templeton Companies, LLC; Chief Compliance Officer, Franklin Templeton Distributors, Inc. and Franklin Templeton Investor Services, LLC; and officer of 44 of the investment companies in Franklin Templeton. |
| | | | |
Kimberly H. Novotny (1972) 300 S.E. 2nd Street Fort Lauderdale, FL 33301-1923 | | Vice President | | Since 2013 | | Not Applicable | | Not Applicable |
|
| Principal Occupation During at Least the Past 5 Years: |
Associate General Counsel, Franklin Templeton; Vice President and Corporate Secretary, Fiduciary Trust International of the South; Vice President, Templeton Investment Counsel, LLC; Assistant Secretary, Franklin Resources, Inc.; and officer of 44 of the investment companies in Franklin Templeton. |
| | | | |
Robert C. Rosselot (1960) 300 S.E. 2nd Street Fort Lauderdale, FL 33301-1923 | | Chief Compliance Officer | | Since 2013 | | Not Applicable | | Not Applicable |
|
| Principal Occupation During at Least the Past 5 Years: |
Director, Global Compliance, Franklin Templeton; Vice President, Franklin Templeton Companies, LLC; officer of 44 of the investment companies in Franklin Templeton; andformerly, Senior Associate General Counsel, Franklin Templeton (2007-2013); and Secretary and Vice President, Templeton Group of Funds (2004-2013). |
| | | | |
Navid J. Tofigh (1972) One Franklin Parkway San Mateo, CA 94403-1906 | | Vice President | | Since 2015 | | Not Applicable | | Not Applicable |
|
| Principal Occupation During at Least the Past 5 Years: |
Associate General Counsel and officer of 44 of the investment companies in Franklin Templeton. |
| | | | |
Craig S. Tyle (1960) One Franklin Parkway San Mateo, CA 94403-1906 | | Vice President | | Since 2011 | | Not Applicable | | Not Applicable |
|
| Principal Occupation During at Least the Past 5 Years: |
General Counsel, Executive Vice President and Secretary, Franklin Resources, Inc.; and officer of some of the other subsidiaries of Franklin Resources, Inc. and of 44 of the investment companies in Franklin Templeton. |
| | | | |
Lori A. Weber (1964) 300 S.E. 2nd Street Fort Lauderdale, FL 33301-1923 | | Vice President | | Since 2012 | | Not Applicable | | Not Applicable |
|
| Principal Occupation During at Least the Past 5 Years: |
Senior Associate General Counsel, Franklin Templeton; Assistant Secretary, Franklin Resources, Inc.; Vice President and Secretary, Templeton Investment Counsel, LLC; and officer of 44 of the investment companies in Franklin Templeton. |
| | | | |
| | | |
| 40 | | Annual Report | | franklintempleton.com |
FRANKLIN ALTERNATIVE STRATEGIES FUNDS
*We base the number of portfolios on each separate series of the U.S. registered investment companies within the Franklin Templeton fund complex. These portfolios have a common investment manager or affiliated investment managers.
**Gregory E. Johnson is considered to be an interested person of the Fund under the federal securities laws due to his position as an officer and director of Franklin Resources, Inc. (Resources), which is the parent company of the Fund’s investment manager and distributor. Jennifer M. Johnson is considered to be an interested person of the Fund under the federal securities laws due to her position as an officer of Resources.
Note 1: Gregory E. Johnson and Jennifer M. Johnson are siblings.
Note 2: Officer information is current as of the date of this report. It is possible that after this date, information about officers may change.
The Sarbanes-Oxley Act of 2002 and Rules adopted by the U.S. Securities and Exchange Commission require the Fund to disclose whether the Fund’s Audit Committee includes at least one member who is an audit committee financial expert within the meaning of such Act and Rules. The Fund’s Board has determined that there is at least one such financial expert on the Audit Committee and has designated each of Edward I. Altman, Ph.D., Ann Torre Bates and David W. Niemiec as an audit committee financial expert. The Board believes that Messrs. Altman and Niemiec and Ms. Bates qualify as such an expert in view of their extensive business background and experience. Mr. Altman has served as a member of the Fund Audit Committee since 2011. He currently serves as a Max L. Heine Professor of Finance, Emeritus and Director of The Credit and Debt Markets Research Program, Salomon Center, Stern School of Business, New York University. Ms. Bates has served as a member of the Fund Audit Committee since 2011. She currently serves as a director of Ares Capital Corporation (2010-present) and United Natural Foods, Inc. (2013-present) and was formerly a director of Navient Corporation from 2014 to 2016, SLM Corporation from 1997 to 2014 and Allied Capital Corporation from 2003 to 2010, Executive Vice President and Chief Financial Officer of NHP Incorporated from 1995 to 1997 and Vice President and Treasurer of US Airways, Inc. until 1995. Mr. Niemiec has served as a member of the Fund Audit Committee since 2015, currently serves as an Advisor to Saratoga Partners and was formerly its Managing Director from 1998 to 2001 and serves as a director of Hess Midstream Partners LP (2017-present). Mr. Niemiec was formerly a director of Emeritus Corporation from 1999 to 2010 and OSI Pharmaceuticals, Inc. from 2006 to 2010, Managing Director of SBC Warburg Dillon Read from 1997 to 1998, and was Vice Chairman from 1991 to 1997 and Chief Financial Officer from 1982 to 1997 of Dillon, Read & Co. Inc. As a result of such background and experience, the Board believes that Messrs. Altman and Niemiec and Ms. Bates have each acquired an understanding of generally accepted accounting principles and financial statements, the general application of such principles in connection with the accounting estimates, accruals and reserves, and analyzing and evaluating financial statements that present a breadth and level of complexity of accounting issues generally comparable to those of the Fund, as well as an understanding of internal controls and procedures for financial reporting and an understanding of audit committee functions. Messrs. Altman and Niemiec and Ms. Bates are independent Board members as that term is defined under the applicable U.S. Securities and Exchange Commission Rules and Releases.
The Statement of Additional Information (SAI) includes additional information about the board members and is available, without charge, upon request. Shareholders may call (800) DIALBEN/342-5236 to request the SAI.
| | | | | | |
| | | |
| franklintempleton.com | | Annual Report | | | 41 | |
FRANKLIN ALTERNATIVE STRATEGIES FUNDS
FRANKLIN PELAGOS COMMODITIES STRATEGY FUND
Shareholder Information
Board Approval of Investment Management Agreements
FRANKLIN ALTERNATIVE STRATEGIES FUNDS
Franklin Pelagos Commodities Strategy Fund
(Fund)
On April 29, 2019, the Board of Trustees of the Fund (Board), on behalf of the Fund, approved a proposal to liquidate and dissolve the Fund. The liquidation is anticipated to occur on or about August 23, 2019 (Liquidation Date), but may be delayed if unforeseen circumstances arise. As the term of the existing investment management agreement ends prior to the Liquidation Date, the Board, including a majority of trustees that are not “interested persons” as such term is defined in section 2(a)(19) of the Investment Company Act of 1940 (hereinafter referred to as “independent trustees”), at anin-person meeting held on May 22, 2019, unanimously approved the renewal of the Fund’s investment management agreement.
Prior to a meeting of all of the trustees for the purpose of considering such renewal, the independent trustees participated in two other meetings held in connection with the renewal process. Throughout the process, the independent trustees received assistance and advice from and met separately with independent counsel. The independent trustees met with and interviewed officers of the investment manager, the transfer agent and shareholder services group and the distributor. In approving the renewal of the investment management agreement for the Fund, the Board, including the independent trustees, determined that the investment management fee structure was fair and reasonable and that continuance of the agreement was in the best interests of the Fund and its shareholders.
In reaching their decision on the investment management agreement, the trustees took into account information furnished throughout the year at regular Board meetings, as well as information specifically requested and furnished for the renewal process, which culminated in the meetings referred to above for the specific purpose of considering such agreement. Information furnished throughout the year included, among others, reports on the Fund’s investment performance, expenses, portfolio composition, derivatives, asset segregation, portfolio turnover, Rule12b-1 plan, distribution, shareholder servicing, legal and compliance matters, pricing of securities, sales and redemptions, and marketing support payments made to financial intermediaries, as well as a third-party survey of transfer agent fees
charged to funds within the Franklin Templeton Investments (FTI) complex in comparison with those charged to other fund complexes deemed comparable. Also, related financial statements and other information about the scope and quality of services provided by the investment manager and its affiliates and enhancements to such services over the past year were provided. In addition, the trustees received periodic reports throughout the year and during the renewal process relating to compliance with the Fund’s investment policies and restrictions. During the renewal process, the independent trustees considered the investment manager’s methods of operation within the Franklin Templeton group and its activities on behalf of other clients. The Board also noted that it received an annual report on all payments made by FTI or the Fund to financial intermediaries engaged in the sale of Fund shares, as well as a memorandum relating to third-party servicing arrangements in response to a Guidance Update from the U.S. Securities and Exchange Commission (SEC) relating to mutual fund distribution andsub-accounting fees.
The information obtained by the trustees during the renewal process also included a special report prepared by Broadridge Financial Solutions, Inc., an independent third-party analyst that utilizes data from Lipper, Inc. (“Lipper”), comparing the Fund’s investment performance and expenses with those of other mutual funds deemed comparable to the Fund as selected by Lipper (Broadridge Section 15(c) Report). The trustees reviewed the Broadridge Section 15(c) Report and its usefulness in the renewal process with respect to matters such as comparative fees, expenses, expense ratios and performance. They concluded that the report continues to be a reliable resource in the performance of their duties.
In addition, the trustees received a Profitability Study (Profitability Study) prepared by management discussing the profitability to FTI from its overall U.S. fund operations, as well as on an individualfund-by-fund basis. Over the past year, the Board and counsel to the independent trustees continued to receive reports on management’s handling of recent regulatory inquiries and pending legal actions against the investment manager and its affiliates. The independent trustees were satisfied with the actions taken to date by management in response to such regulatory and legal matters.
The trustees reviewed the personnel, operations, financial condition, and investment management capabilities, methodologies and resources of the investment manager. As
| | | | |
| | | |
| 42 | | Annual Report | | franklintempleton.com |
FRANKLIN ALTERNATIVE STRATEGIES FUNDS
FRANKLIN PELAGOS COMMODITIES STRATEGY FUND
SHAREHOLDER INFORMATION
part of this review, particular attention was given to the diligent risk management program of the investment manager and its parent, including continual monitoring and management of cybersecurity, liquidity and counterparty credit risk, and attention given to derivatives and other complex instruments that are held and expected to be held by the Fund and how such instruments are used to carry out the Fund’s investment goal. The Board also took into account, among other things, management’s efforts in establishing a global credit facility for the benefit of the Fund and other accounts managed by FTI to provide a source of cash for temporary and emergency purposes or to meet unusual redemption requests as well as the strong financial position of the investment manager’s parent company and its commitment to the mutual fund business. The Board noted management’s continuing efforts and expenditures in establishing effective business continuity plans and developing strategies to address areas of heightened concern in the mutual fund industry, such as cybersecurity and liquidity risk management. The Board also recognized management’s commitment to facilitating Board oversight of particular areas, including derivatives and payments to intermediaries, by enhanced reporting. In addition, the Board received updates from management on the compliance of the investment manager with comprehensive rules and regulations promulgated by the SEC and the U.S. Commodity Futures Trading Commission.
In addition to the above and other matters considered by the trustees throughout the course of the year, the following discussion relates to certain primary factors relevant to the Board’s decision. This discussion of the information and factors considered by the Board (including the information and factors discussed above) is not intended to be exhaustive, but rather summarizes certain factors considered by the Board. In view of the wide variety of factors considered, the Board did not, unless otherwise noted, find it practicable to quantify or otherwise assign relative weights to the foregoing factors. In addition, individual trustees may have assigned different weights to various factors.
NATURE, EXTENT AND QUALITY OF SERVICES.The trustees reviewed the nature, extent and quality of the services provided, and to be provided until the Fund is liquidated, by the investment manager. In this regard, they reviewed the Fund’s actively managed fundamental and quantitative investment philosophy and process and the investment manager’s ability to implement such philosophy and process, including, but not limited to, the investment manager’s trading practices and investment decision
processes and efforts to ensure compliance with the Fund’s investment goals, policies, and limitations. The Board also considered the investment management services that the investment manager provides to the Cayman Islands-based company, which is wholly owned by the Fund (Cayman Subsidiary). The trustees reviewed the Fund’s portfolio management team, including its performance, staffing, skills and compensation program.
The trustees discussed with management various other products, portfolios and entities that are advised by the investment manager and the allocation of assets and expenses among and within them, as well as their relative fees and reasons for differences with respect thereto and any potential conflicts. During regular Board meetings and the aforementioned meetings of the independent trustees, the trustees considered periodic reports provided to them showing that the investment manager complied with the investment policies and restrictions of the Fund as well as other reports periodically furnished to the Board covering matters such as the compliance of portfolio managers and other management personnel with the code of ethics covering the investment management personnel, the adherence to fair value pricing procedures established by the Board and the accuracy of net asset value calculations. The Board noted the extent of the benefits provided to Fund shareholders from being part of the Franklin Templeton group of funds, including the right to exchange investments between funds (same class) without a sales charge, the ability to reinvest Fund dividends into other funds and the right to combine holdings of other funds to obtain reduced sales charges. The Board considered the investment manager’s significant efforts in developing and implementing compliance procedures established in accordance with SEC and other requirements.
The Board also considered the nature, extent and quality of the services to be provided until the Fund is liquidated under the Fund’s other service agreements to determine that, on an overall basis, Fund shareholders were well served. In this connection, the Board also took into account transfer agent and shareholder services provided to Fund shareholders by an affiliate of the investment manager, noting continuing expenditures by management to increase and improve the scope of such services and favorable periodic reports on shareholder services conducted by independent third parties. While such considerations directly affected the trustees’ decision in renewing the Fund’s transfer agent and shareholder services agreement, the Board also considered these commitments as incidental benefits to Fund
| | | | | | |
| | | |
| franklintempleton.com | | Annual Report | | | 43 | |
FRANKLIN ALTERNATIVE STRATEGIES FUNDS
FRANKLIN PELAGOS COMMODITIES STRATEGY FUND
SHAREHOLDER INFORMATION
shareholders deriving from the investment management relationship. Based on their review, the trustees were satisfied with the nature and quality of the overall services provided, and to be provided until the Fund is liquidated, by the investment manager and its affiliates to the Fund and its shareholders and were confident in the abilities of the management team to continue to implement the Fund’s actively managed fundamental and quantitative investment philosophy and process and to provide quality services to the Fund and its shareholders.
INVESTMENT PERFORMANCE.As the Fund commenced operations in December 2011, the trustees reviewed the investment performance of the Fund for theone-, three- and five-year periods ended December 31, 2018. The trustees had meetings during the year with the Fund’s portfolio managers to discuss performance and the management of the Fund. In addition, particular attention in assessing performance was given to the Broadridge Section 15(c) Report. That report showed the investment performance of the Fund (Advisor Class shares) in comparison to other funds determined comparable by Lipper. The comparable funds to the Fund, as chosen by Lipper, included all retail and institutional commodities general funds. The Fund had total returns in the second-best performing quintile for theone- and five-year periods ended December 31, 2018, and had annualized total returns for the three-year period in the middle performing quintile. The Board was satisfied with such comparative performance.
COMPARATIVE EXPENSES AND PROFITABILITY.The trustees considered the cost of the services provided and to be provided and the losses incurred by the investment manager and its affiliates from their respective relationships with the Fund. The Board also considered the investment management services that the investment manager provides to the Cayman Subsidiary and the related fee waivers that were in place. Consideration was also given to a comparative analysis in the Broadridge Section 15(c) Report of the investment management fee and total expense ratio of the Fund in comparison with those of a group of other funds selected by Lipper as its appropriate Lipper expense group. Lipper expense data is based upon information taken from each fund’s most recent annual report, which reflects historical asset levels that may be quite different from those currently existing, particularly in a period of market volatility. While recognizing such inherent limitation and the fact that expense ratios generally increase as assets decline and decrease as assets grow, the Board believed the
independent analysis conducted by Lipper to be an appropriate measure of comparative expenses.
In reviewing comparative costs, emphasis was given to the Fund’s contractual management fee in comparison with the contractual management fee that would have been charged by other funds within its Lipper expense group assuming they were similar in size to the Fund, as well as the actual total expenses of the Fund in comparison with those of its Lipper expense group. The Lipper contractual management fee analysis includes administrative charges as being part of the management fee, and total expenses, for comparative consistency, are shown by Lipper for Fund Advisor Class shares. The Fund’s contractual management fee rate was in the middle quintile of its Lipper expense group and its total expenses (including Rule12b-1 fees) were in the middle quintile of such group. The Board was satisfied with such comparative fees and expenses.
The trustees also reviewed the Profitability Study addressing profitability of Franklin Resources, Inc., from its overall U.S. fund business, as well as profitability to the Fund’s investment manager and its affiliates, from providing investment management and other services to the Fund during the12-month period ended September 30, 2018, the most recent fiscal year end of Franklin Resources, Inc. The trustees reviewed the basis on which such reports are prepared and the cost allocation methodology utilized in the Profitability Study, it being recognized that allocation methodologies may each be reasonable while producing different results. In this respect, the Board noted that the reasonableness of the cost allocation methodologies was reviewed by independent accountants on an every other year basis.
The independent trustees met with management to discuss the Profitability Study. This included, among other things, a comparison of investment management income with investment management expenses of the Fund; comparison of underwriting revenues and expenses; the relative relationship of investment management and underwriting expenses; shareholder servicing profitability; economies of scale; and the relative contribution of the Fund to the profitability of the investment manager and its parent. In discussing the Profitability Study with the Board, the investment manager stated its belief that the costs incurred in establishing the infrastructure necessary to operate the type of mutual fund operations conducted by it and its affiliates may not be fully reflected in the expenses allocated to the Fund in determining its profitability. The Board also
| | | | |
| | | |
| 44 | | Annual Report | | franklintempleton.com |
FRANKLIN ALTERNATIVE STRATEGIES FUNDS
FRANKLIN PELAGOS COMMODITIES STRATEGY FUND
SHAREHOLDER INFORMATION
took into account management’s expenditures in improving shareholder services provided to the Fund, as well as the need to meet additional regulatory and compliance requirements. The trustees also considered the extent to which the investment manager may derive ancillary benefits from Fund operations.
ECONOMIES OF SCALE.The Board considered economies of scale realized by the investment manager and its affiliates as the Fund grows larger and the extent to which they are shared with Fund shareholders, as for example, in the level of the investment management fees charged, in the quality and efficiency of services rendered and in increased capital commitments benefiting the Fund directly or indirectly. The Board also considered the fee waiver and expense limitation arrangement in effect, and the amount of Fund expenses that were absorbed since inception of the Fund by the investment manager through such waiver and arrangement. The Board concluded that economies of scale were deemed not to be a significant factor at that time in light of, among other matters, the planned liquidation of the fund and the fee waiver and expense limitation arrangement in effect.
Proxy Voting Policies and Procedures
The Fund’s investment manager has established Proxy Voting Policies and Procedures (Policies) that the Fund uses to determine how to vote proxies relating to portfolio securities. Shareholders may view the Fund’s complete Policies online at franklintempleton.com. Alternatively, shareholders may request copies of the Policies free of charge by calling the Proxy Group collect at (954)527-7678 or by sending a written request to: Franklin Templeton Companies, LLC, 300 S.E. 2nd Street, Fort Lauderdale, FL 33301, Attention: Proxy Group. Copies of the Fund’s proxy voting records are also made available online at franklintempleton.com and posted on the U.S. Securities and Exchange Commission’s website at sec.gov and reflect the most recent12-month period ended June 30.
Quarterly Consolidated Statement of Investments
The Trust, on behalf of the Fund, files a complete consolidated statement of investments with the U.S. Securities and Exchange Commission for the first and third quarters for each fiscal year as an exhibit to its report on FormN-PORT. Shareholders may view the filed FormN-PORT by visiting the Commission’s website at sec.gov. The filed form may also be viewed and copied at the
Commission’s Public Reference Room in Washington, DC. Information regarding the operations of the Public Reference Room may be obtained by calling(800) SEC-0330.
Householding of Reports and Prospectuses
You will receive the Fund’s financial reports every six months as well as an annual updated summary prospectus (prospectus available upon request). To reduce Fund expenses, we try to identify related shareholders in a household and send only one copy of the financial reports and summary prospectus. This process, called “householding,” will continue indefinitely unless you instruct us otherwise. If you prefer not to have these documents householded, please call us at (800)632-2301. At any time you may view current prospectuses/summary prospectuses and financial reports on our website. If you choose, you may receive these documents through electronic delivery.
| | | | | | |
| | | |
| franklintempleton.com | | Annual Report | | | 45 | |
This page intentionally left blank.
This page intentionally left blank.
This page intentionally left blank.
Authorized for distribution only when accompanied or preceded by a summary prospectus and/or prospectus. Investors should carefully consider a fund’s investment goals, risks, charges and expenses before investing. A prospectus contains this and other information; please read it carefully before investing.
To help ensure we provide you with quality service, all calls to and from our service areas are monitored and/or recorded.
| | | | | | |
 | | Annual Report and Shareholder Letter Franklin Pelagos Commodities Strategy Fund | | |
| | | |
| | Investment Manager | | Distributor | | Shareholder Services |
| | FASA, LLC | | Franklin Templeton Distributors, Inc. (800) DIAL BEN® / 342-5236 franklintempleton.com | | (800) 632-2301 |
| © 2019 Franklin Templeton Investments. All rights reserved. | | | | 995 A 07/19 |
ANNUAL REPORT AND SHAREHOLDER LETTER
FRANKLIN K2 LONG SHORT CREDIT FUND
A Series of Franklin Alternative Strategies Funds
May 31, 2019


Sign up for electronic delivery at franklintempleton.com/edelivery
Internet Delivery of Fund Reports Unless You Request Paper Copies: Effective January 1, 2021, as permitted by the SEC, paper copies of the Fund’s shareholder reports will no longer be sent by mail, unless you specifically request them from the Fund or your financial intermediary. Instead, the reports will be made available on a website, and you will be notified by mail each time a report is posted and provided with a website link to access the report.
If you already elected to receive shareholder reports electronically, you will not be affected by this change and you need not take any action. If you have not signed up for electronic delivery, we would encourage you to join fellow shareholders who have. You may elect to receive shareholder reports and other communications electronically from the Fund by calling(800) 632-2301 or by contacting your financial intermediary.
You may elect to continue to receive paper copies of all your future shareholder reports free of charge by contacting your financial intermediary or, if you invest directly with a Fund, calling(800) 632-2301 to let the Fund know of your request. Your election to receive reports in paper will apply to all funds held in your account.
FRANKLIN TEMPLETON
Successful investing begins with ambition. And achievement only comes when you reach for it. That’s why we continually strive to deliver better outcomes for investors. No matter what your goals are, our deep, global investment expertise allows us to offer solutions that can help.
During our more than 70 years of experience, we’ve managed through all kinds of markets—up, down and those in between. We’re always preparing for what may come next. It’s because of this, combined with our strength as one of the world’s largest asset managers that we’ve earned the trust of millions of investors around the world.
Dear Fellow Shareholder:
During the 12 months ended May 31, 2019, global markets benefited from upbeat economic data in certain regions, encouraging corporate earnings reports, the U.S. Federal Reserve’s (Fed’s) recent indications of a patient approach to its monetary policy, and periods of optimism about a potential U.S.-China trade deal. However, global markets also reflected investor concerns about the escalation of U.S.-China and U.S.-Mexico trade tensions nearperiod-end, the Fed’s interest-rate hikes and the European Central Bank’s unwinding of its bond purchase program in 2018, political uncertainties in the U.S. and the European Union, and slower global economic growth. In this environment, global developed market stocks, as measured by the MSCI World Index, posted a +0.27% total return for the period.1 Global emerging market stocks, as measured by the MSCI Emerging Markets Index, posted a-8.34% total return.1 Global government bonds, as measured by the FTSE World Government Bond Index, posted a +2.79% total return.1
We are committed to our long-term perspective and disciplined investment approach as we conduct a rigorous, fundamental analysis of securities with a regular emphasis on investment risk management.
We believe active, professional investment management serves investors well. We also recognize the important role of financial advisors in today’s markets and encourage investors to continue to seek their advice. Amid changing markets and economic conditions, we are confident investors with a well-diversified portfolio and a patient, long-term outlook should be well positioned for the years ahead.
CFA® is a trademark owned by CFA Institute.
1. Source: Morningstar.
See www.franklintempletondatasources.com for additional data provider information.
On the following pages, the Fund’s portfolio management team reviews investment decisions that pertain to performance during the past 12 months in light of the economic environment and other factors. Please remember all securities markets fluctuate, as do mutual fund share prices.
We thank you for investing with Franklin Templeton, welcome your questions and comments, and look forward to continuing to serve your investment needs in the years ahead.
Sincerely,

Madison S. Gulley, CFA
President and Chief Executive Officer – Investment Management
Franklin Alternative Strategies Funds
This letter reflects our analysis and opinions as of May 31, 2019, unless otherwise indicated. The information is not a complete analysis of every aspect of any market, country, industry, security or fund. Statements of fact are from sources considered reliable.
| | | | | | | | |
| Not FDIC Insured | | | | | May Lose Value | | | | | No Bank Guarantee |
| | | | | | |
| | | |
| franklintempleton.com | | Not part of the annual report | | | 1 | |
Visitfranklintempleton.comfor fund
updates, to access your account, or to find helpful financial planning tools.
| | | | | | |
| | | |
| | 2 | | | Annual Report | | franklintempleton.com |
ANNUAL REPORT
Franklin K2 Long Short Credit Fund
This annual report for Franklin K2 Long Short Credit Fund covers the fiscal year ended May 31, 2019.
Your Fund’s Goal and Main Investments
The Fund seeks total return through a combination of current income, capital preservation and capital appreciation. The Fund seeks to achieve its investment goal by allocating its assets across multiplenon-traditional or alternative strategies in the fixed income and credit areas, including, but not limited to, some or all of the following: credit long short, structured credit and emerging market fixed income. The Fund is structured as a multi-manager fund, meaning the Fund’s assets are managed by multiple subadvisors, and the Fund’s investment manager has overall responsibility for the Fund’s investments.
Under normal market conditions, the Fund invests at least 80% of its net assets, plus the amount of any borrowings for investment purposes, in credit-related investments. The Fund invests in a wide range of securities and other investments including, but not limited to: corporate bonds, mortgage-backed securities (MBS) and asset-backed securities (ABS), U.S. government and agency securities, collateralized debt and loan obligations, foreign government and supranational debt securities, loans and loan participations and derivatives with similar economic characteristics. The Fund may also invest in repurchase agreements, reverse repurchase agreements, mortgage real estate investment trusts (REITs) and other similar transactions.
Performance Overview
The Fund’s Class A shares posted a +3.42% cumulative total return for the 12 months under review. For comparison, the Fund’s primary benchmark, the HFRX Fixed Income-Credit Index, which measures performance of strategies with exposure to credit across a broad continuum of credit substrategies, posted a-1.20% total return for the same period.1 Also for comparison, the Fund’s secondary benchmark, the ICE BofAML U.S.3-Month Treasury Bill Index, which is an index of short-term U.S. government securities with a remaining term to final maturity of less than three
|
| Portfolio Composition* |
|
| Based on Total Net Assets as of 5/31/19 |
|
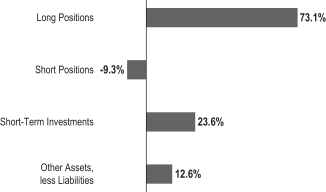 |
*Figures represent the net Fund exposure and include certain derivatives held in the portfolio (or their underlying reference assets) or unsettled trades and may not total 100% or may be negative due to rounding, use of any derivatives or other factors.
months, posted a +2.26% total return.2 You can find more of the Fund’s performance data in the Performance Summary beginning on page 7.
Performance data represent past performance, which does not guarantee future results. Investment return and principal value will fluctuate, and you may have a gain or loss when you sell your shares. Current performance may differ from figures shown. For most recentmonth-end performance, go tofranklintempleton.com or call(800)342-5236.
Economic and Market Overview
The global economy expanded during the 12 months ended May 31, 2019, despite weakness in certain regions. Global developed and emerging market stocks were aided by upbeat economic data in some regions, encouraging corporate earnings reports, the U.S. Federal Reserve’s (Fed’s) recent indications of a patient approach to its monetary policy and periods of optimism about a potential U.S.-China trade deal.
However, various factors weighed on global markets, notably the escalation of U.S.-China trade tensions, as the U.S. raised tariffs on Chinese goods in May and China announced higher tariffs on U.S. goods effective in June. Markets were
1. Source: FactSet. Hedge Fund Research, Inc. – www.hedgefundresearch.com. The HFRX Fixed Income-Credit Index is being used under license from Hedge Fund Research, Inc., which does not endorse or approve of any of the contents of this report.
2. Source: Morningstar.
The indexes are unmanaged and include reinvestment of any income or distributions. They do not reflect any fees, expenses or sales charges. One cannot invest directly in an index, and an index is not representative of the Fund’s portfolio. Unlike most asset class indexes, HFR Index returns reflect fees and expenses.
The dollar value, number of shares or principal amount, and names of all portfolio holdings are listed in the Fund’s Statement of Investments (SOI). The SOI begins on page 16.
| | | | | | |
| | | |
| franklintempleton.com | | Annual Report | | | 3 | |
FRANKLIN K2 LONG SHORT CREDIT FUND
further pressured atperiod-end when President Trump threatened to impose tariffs on Mexico due to immigration disputes. Concerns about political uncertainties in the U.S. and the European Union, the Fed’s interest-rate hikes in 2018 and the European Central Bank’s (ECB’s) unwinding of its bond purchase program also hurt investor confidence. In this environment, global developed and emerging market stocks, as measured by the MSCI All Country World Index, posted a-0.75% total return for the12-month period.2
The U.S. economy grew during the12-month period. After moderating for two consecutive quarters, the economy grew significantly faster in 2019’s first quarter, driven by growth in consumer spending, inventory investment, exports, business investment, and state and local government spending. The manufacturing and services sectors expanded during the period. The unemployment rate decreased from 3.8% in May 2018 to 3.6% atperiod-end.3 The annual inflation rate, as measured by the Consumer Price Index, decreased from 2.8% in May 2018 to 1.8% atperiod-end.3
The Fed raised its target range for the federal funds rate by 0.25% three times during the period, to 2.25%–2.50%, and continued reducing its balance sheet as part of its plan to normalize monetary policy. At its March 2019 meeting, the Fed held its target range for the federal funds rate unchanged and signaled no rate hike in 2019. Furthermore, the Fed mentioned it would end its balance sheet normalization by the end of September 2019. At its April/May meeting, the Fed reiterated its patient approach to future rate adjustments.
In Europe, the U.K.’s quarterly gross domestic product (GDP) growth accelerated in 2018’s third quarter, moderated in the fourth quarter and accelerated again in 2019’s first quarter. The Bank of England raised its key policy rate once during the period. The eurozone’s quarterly GDP growth moderated in 2018’s third quarter before accelerating in the next two quarters. However, the bloc’s annual inflation rate decreased during the period. The ECB kept its benchmark interest rate unchanged during the period and concluded its bond purchase program at the end of 2018. At its April meeting, the ECB reiterated its expectation to keep its benchmark interest rate unchanged through at least the end of 2019 and stated it would provide details of its new monetary stimulus program at upcoming meetings.
In Asia, Japan’s quarterly GDP growth contracted in 2018’s third quarter, but accelerated in the next two quarters. The Bank of Japan left its benchmark interest rate unchanged
and indicated it would keep the rate unchanged through the spring of 2020, while continuing its monetary stimulus measures.
In larger emerging markets, Brazil’s quarterly GDP growth accelerated in 2018’s third quarter, slowed in the fourth quarter and contracted in 2019’s first quarter. The Central Bank of Brazil left its benchmark interest rate unchanged during the period. Russia’s annual GDP growth held steady in 2018’s third quarter, accelerated in the fourth quarter and then moderated in 2019’s first quarter. The Bank of Russia increased its key rate twice during the period. China’s annual GDP growth rate stabilized in 2019’s first quarter after moderating for three consecutive quarters. The People’s Bank of China left its benchmark interest rate unchanged, but it took measures to improve financial liquidity to mitigate the effects of the U.S.-China trade dispute and support economic growth. Overall, global emerging market stocks, as measured by the MSCI Emerging Markets Index, posted a-8.34% total return during the12-month period.2
Investment Strategy
We manage the Fund using a multi-manager approach. While we have overall responsibility for the Fund’s investments, we allocate the Fund’s assets to multiple subadvisors, each of whom independently manages a separate portion of the Fund’s portfolio in accordance with some or all of the following strategies: credit long short, structured credit and emerging market fixed income. We allocate the Fund’s assets among these strategies utilizing atop-down approach, generating the Fund’s strategy and subadvisor weightings by taking into account market conditions, risk factors, diversification, liquidity, transparency, and other investment options, among other things. We allocate the Fund’s assets to specific subadvisors utilizing abottom-up approach, selecting subadvisors and their weighting within the Fund’s portfolio by taking into account their correlation to various markets and to each other, risk profiles and their return expectations.
Credit long short strategies seek to isolate issuer-specific exposure, while limiting general market risks, by taking long and/or short positions in debt securities and other related instruments. Structured credit strategies aim to profit from trading in interest-rate sensitive securities such as residential and commercial MBS, REITs, credit default swaps on various indexes, collateralized loan obligations (CLOs) and ABS. Emerging market fixed income strategies invest in corporate and/or sovereign securities in emerging markets countries
3. Source: U.S. Bureau of Labor Statistics.
See www.franklintempletondatasources.com for additional data provider information.
| | | | |
| | | |
| 4 | | Annual Report | | franklintempleton.com |
FRANKLIN K2 LONG SHORT CREDIT FUND
with a focus on fixed income. The Fund may invest in debt securities of any credit quality or rating, including high-yield (“junk”) bonds, distressed debt securities (securities of companies that are, or are about to be, involved in reorganizations, financial restructurings, or bankruptcy) and securities that are in default. The Fund may engage in active and frequent trading as part of its investment strategies.
What are swap agreements?
Swap agreements, such as interest rate, currency and credit default swaps, are contracts between the Fund and another party (the swap counterparty). In a basic swap transaction, the Fund agrees with the swap counterparty to exchange the returns (or differentials in rates of return) earned or realized on a particular “notional amount” of underlying instruments. The notional amount is the set amount selected by the parties as the basis on which to calculate the obligations that they have agreed to exchange. The parties typically do not actually exchange the notional amount. Instead, they agree to exchange the returns that would be earned or realized if the notional amount were invested in given instruments or at given interest rates.
The Fund takes long and/or short positions in a wide range of asset classes, including credit, fixed income, equities and currencies, among others. The Fund may gain long or short exposure to select instruments by utilizing derivatives, engaging in short sales or entering into a series of purchase and sale contracts or repurchase agreements. Long positions benefit from an increase in the price of the underlying instrument, while short positions benefit from a decrease in that price. The Fund may also use derivatives for hedging and nonhedging (investment) purposes, although no subadvisor is required to hedge any of the Fund’s positions or to use derivatives. Such derivative investments may include currency forward contracts; futures contracts; put and call options on currencies, securities, indexes and exchange-traded funds; and swaps. The Fund may engage in active and frequent trading as part of its investment strategies.
What is a currency forward contract?
A currency forward contract is an agreement between the Fund and a counterparty to buy or sell a foreign currency in exchange for another currency at a specific exchange rate on a future date. Currency forward contracts are privately traded in the interbank market, not on a centralized exchange.
What is a futures contract?
A futures contract is an agreement between the Fund and a counterparty made through a U.S. or foreign futures exchange to buy or sell an underlying instrument or asset at a specific price on a future date.
| | | | |
| Subadvisors | | | |
| |
| 5/31/19 | | | |
| |
| Credit Long Short | | | | |
| |
Apollo Credit Management LLC | | | | |
| |
Chatham Asset Management, LLC | | | | |
| |
| Structured Credit | | | | |
| |
Ellington Global Asset Management, L.L.C. | | | | |
| |
Medalist Partners, LP | | | | |
| |
| Emerging Markets Fixed Income | | | | |
| |
Emso Asset Management Limited | | | | |
What is an option?
An option is a contract to buy or sell a specific financial product known as the option’s underlying instrument at a specific price. The buyer of an option has the right, but not the obligation, to buy or sell the underlying instrument at or until a specified expiration date. Conversely, the seller (“writer”) of an option who opens a transaction is obligated to buy or sell the underlying instrument should the option holder exercise that right.
Manager’s Discussion
The Fund’s subadvisors for the 12 months under review were Apollo Credit Management, Chatham Asset Management, Ellington Global Asset Management, Emso Asset Management and Medalist Partners. These subadvisors are also listed in the Subadvisors table on this page. All subadvisors benefited performance for the12-month period. Apollo was the top contributor among subadvisors, followed by Medalist, Ellington, Chatham and Emso.
In terms of strategy performance, the largest contributors to the Fund’s performance were credit long short and structured credit, followed by emerging markets fixed income.
By asset class, the top contributors to the Fund’s aggregate returns were credit, currency exposures and equity. All asset classes represented in the Fund’s overall portfolio made positive contributions to performance during the period.
In terms of aggregate sector exposures, the top performance drivers for the Fund were MBS, consumer discretionary and ABS. In contrast, equity index hedges and energy hindered returns.
The credit long short strategy benefited from long positions in corporate bonds, notably in the consumer discretionary, communication services and real estate sectors. Conversely, equity index hedges and long positions in the energy sector detracted from strategy results.
| | | | | | |
| | | |
| franklintempleton.com | | Annual Report | | | 5 | |
FRANKLIN K2 LONG SHORT CREDIT FUND
In the structured credit strategy, long positions in MBS, CLOs and other ABS supported performance, while a short position on a three-month U.S. interest-rate derivative hurt performance.
The emerging markets fixed income strategy benefited from solid performance in most emerging market hard currency sovereign bonds, as well as from currency positioning. In contrast, detracting from returns were certain emerging market sovereign bonds, particularly in Argentina.
Thank you for your participation in Franklin K2 Long Short Credit Fund. We look forward to continuing to serve your future investment needs.
| | |
 | | 
Charmaine Chin |
| | Co-Lead Portfolio Manager |
| | |
 | | 
Jeff Schmidt |
| | Co-Lead Portfolio Manager |
| | |
 | | 
Robert Christian |
| | Co-Lead Portfolio Manager |
The foregoing information reflects our analysis, opinions and portfolio holdings as of May 31, 2019, the end of the reporting period. The way we implement our main investment strategies and the resulting portfolio holdings may change depending on factors such as market and economic conditions. These opinions may not be relied upon as investment advice or an offer for a particular security. The information is not a complete analysis of every aspect of any market, country, industry, security or the Fund. Statements of fact are from sources considered reliable, but the investment manager makes no representation or warranty as to their completeness or accuracy. Although historical performance is no guarantee of future results, these insights may help you understand our investment management philosophy.
| | | | |
| | | |
| 6 | | Annual Report | | franklintempleton.com |
FRANKLIN K2 LONG SHORT CREDIT FUND
Performance Summary as of May 31, 2019
The performance table and graphs do not reflect any taxes that a shareholder would pay on Fund dividends, capital gain distributions, if any, or any realized gains on the sale of Fund shares. Total return reflects reinvestment of the Fund’s dividends and capital gain distributions, if any, and any unrealized gains or losses. Your dividend income will vary depending on dividends or interest paid by securities in the Fund’s portfolio, adjusted for operating expenses of each class. Capital gain distributions are net profits realized from the sale of portfolio securities.
Performance as of 5/31/191
Cumulative total return excludes sales charges. Average annual total return includes maximum sales charges. Sales charges will vary depending on the size of the investment and the class of share purchased. The maximum is 5.50% and the minimum is 0%.Class A: 5.50% maximum initial sales charge;Advisor Class: no sales charges. For other share classes, visitfranklintempleton.com.
| | | | | | | | |
| Share Class | | Cumulative
Total Return2 | | | Average Annual
Total Return3 | |
| | |
| A4 | | | | | | | | |
1-Year | | | +3.42% | | | | -2.26% | |
3-Year | | | +15.30% | | | | +2.90% | |
Since Inception (9/8/15) | | | +18.74% | | | | +3.14% | |
| | |
| Advisor | | | | | | | | |
1-Year | | | +3.60% | | | | +3.60% | |
3-Year | | | +15.76% | | | | +5.00% | |
Since Inception (9/8/15) | | | +19.22% | | | | +4.83% | |
Performance data represent past performance, which does not guarantee future results. Investment return and principal value will fluctuate, and you may have a gain or loss when you sell your shares. Current performance may differ from figures shown. For most recentmonth-end performance, go tofranklintempleton.comor call(800)342-5236.
See page 9 for Performance Summary footnotes.
| | | | | | |
| | | |
| franklintempleton.com | | Annual Report | | | 7 | |
FRANKLIN K2 LONG SHORT CREDIT FUND
PERFORMANCE SUMMARY
Total Return Index Comparison for a Hypothetical $10,000 Investment1
Total return represents the change in value of an investment over the periods shown. It includes any applicable maximum sales charge, Fund expenses, account fees and reinvested distributions. The unmanaged indexes include reinvestment of any income or distributions. These differ from the Fund in composition and, except for the HFR Index, do not pay management fees or expenses. Unlike most asset class indexes, HFR Index returns reflect management fees and expenses. One cannot invest directly in an index.
Class A(9/8/15–5/31/19)
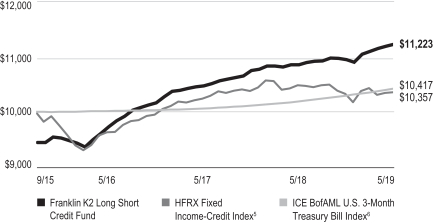
Advisor Class(9/8/15–5/31/19)
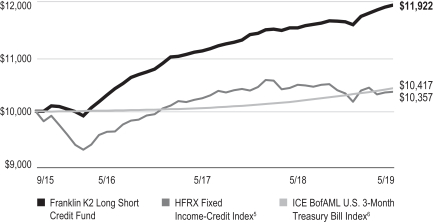
See page 9 for Performance Summary footnotes.
| | | | |
| | | |
| 8 | | Annual Report | | franklintempleton.com |
FRANKLIN K2 LONG SHORT CREDIT FUND
PERFORMANCE SUMMARY
Distributions(6/1/18–5/31/19)
| | | | | | | | | | | | | | | | |
| | | | |
| Share Class | | Net Investment
Income | | | Short-Term
Capital Gain | | | Long-Term
Capital Gain | | | Total | |
A | | | $0.3118 | | | | $0.0310 | | | | $0.0636 | | | | $0.4064 | |
C | | | $0.2460 | | | | $0.0310 | | | | $0.0636 | | | | $0.3406 | |
R | | | $0.2787 | | | | $0.0310 | | | | $0.0636 | | | | $0.3733 | |
R6 | | | $0.3325 | | | | $0.0310 | | | | $0.0636 | | | | $0.4271 | |
Advisor | | | $0.3299 | | | | $0.0310 | | | | $0.0636 | | | | $0.4245 | |
Total Annual Operating Expenses7
| | | | | | | | |
| | |
| Share Class | | With Fee Waiver | | | Without Fee Waiver | |
A | | | 3.11% | | | | 3.59% | |
Advisor | | | 2.86% | | | | 3.34% | |
Each class of shares is available to certain eligible investors and has different annual fees and expenses, as described in the prospectus.
All investments involve risks, including possible loss of principal. The market values of securities owned by the Fund will go up or down, sometimes rapidly or unpredictably. The Fund’s performance depends on the manager’s skill in selecting, overseeing and allocating Fund assets to the subadvisors. The Fund is actively managed and could experience losses if the manager’s and subadvisors’ judgment about particular Fund portfolio investments prove to be incorrect. Some subadvisors may have little or no experience managing the assets of a registered investment company. Bond prices generally move in the opposite direction of interest rates. Changes in the financial strength of a bond issuer or in a bond’s credit rating may affect its value. Lower-rated or high-yield debt securities (junk bonds) involve greater credit risk, including the possibility of default or bankruptcy. Liquidity risk exists when securities become more difficult to sell, or are unable to be sold, at the price at which they’ve been valued. Investments in derivatives involve costs and create economic leverage, which may result in significant volatility and cause the Fund to participate in losses (as well as gains) that significantly exceed the Fund’s initial investment. The Fund may make short sales of securities, which involves the risk that losses may exceed the original amount invested. The Fund’s prospectus also includes a description of the main investment risks.
1. The Fund has an expense reduction contractually guaranteed through 9/30/19. Fund investment results reflect the expense reduction; without this reduction, the results would have been lower.
2. Cumulative total return represents the change in value of an investment over the periods indicated.
3. Average annual total return represents the average annual change in value of an investment over the periods indicated. Return for less than one year, if any, has not been annualized.
4. Prior to 9/10/18, these shares were offered at a higher initial sales charge of 5.75%, thus actual returns (with sales charges) would have differed. Average annual total returns (with sales charges) have been restated to reflect the current maximum initial sales charge of 5.50%.
5. Source: FactSet. Hedge Fund Research, Inc. – www.hedgefundresearch.com. The HFRX Fixed Income-Credit Index measures performance of strategies with exposure to credit across a broad continuum of credit substrategies, including corporate, sovereign, distressed, convertible, asset backed, capital structure arbitrage, multi-strategy and other relative value and event driven substrategies. Investment thesis across all strategies is predicated on realization of a valuation discrepancy between the related credit instruments. Strategies may also include and utilize equity securities, credit derivatives, government fixed income, commodities, currencies or other hybrid securities.
6. Source: Morningstar. The ICE BofAML U.S.3-Month Treasury Bill Index is an index of short-term U.S. government securities with a remaining term to final maturity of less than three months.
7. Figures are as stated in the Fund’s current prospectus and may differ from the expense ratios disclosed in the Your Fund’s Expenses and Financial Highlights sections in this report. In periods of market volatility, assets may decline significantly, causing total annual Fund operating expenses to become higher than the figures shown.
See www.franklintempletondatasources.com for additional data provider information.
| | | | | | |
| | | |
| franklintempleton.com | | Annual Report | | | 9 | |
FRANKLIN K2 LONG SHORT CREDIT FUND
Your Fund’s Expenses
As a Fund shareholder, you can incur two types of costs: (1) transaction costs, including sales charges (loads) on Fund purchases and redemptions; and (2) ongoing Fund costs, including management fees, distribution and service(12b-1) fees, and other Fund expenses. All mutual funds have ongoing costs, sometimes referred to as operating expenses. The table below shows ongoing costs of investing in the Fund and can help you understand these costs and compare them with those of other mutual funds. The table assumes a $1,000 investment held for the six months indicated.
Actual Fund Expenses
The table below provides information about actual account values and actual expenses in the columns under the heading “Actual.” In these columns the Fund’s actual return, which includes the effect of Fund expenses, is used to calculate the “Ending Account Value” for each class of shares. You can estimate the expenses you paid during the period by following these steps (of course, your account value and expenses will differ from those in this illustration): Divide your account value by $1,000 (if your account had an $8,600 value, then $8,600÷ $1,000 = 8.6). Then multiply the result by the number in the row for your class of shares under the headings “Actual” and “Expenses Paid During Period” (if Actual Expenses Paid During Period were $7.50, then 8.6 x $7.50 =$64.50). In this illustration, the actual expenses paid this period are $64.50.
Hypothetical Example for Comparison with Other Funds
Under the heading “Hypothetical” in the table, information is provided about hypothetical account values and hypothetical expenses based on the Fund’s actual expense ratio and an assumed rate of return of 5% per year before expenses, which is not the Fund’s actual return. This information may not be used to estimate the actual ending account balance or expenses you paid for the period, but it can help you compare ongoing costs of investing in the Fund with those of other funds. To do so, compare this 5% hypothetical example for the class of shares you hold with the 5% hypothetical examples that appear in the shareholder reports of other funds.
Please note that expenses shown in the table are meant to highlight ongoing costs and do not reflect any transactional costs. Therefore, information under the heading “Hypothetical” is useful in comparing ongoing costs only, and will not help you compare total costs of owning different funds. In addition, if transactional costs were included, your total costs would have been higher.
| | | | | | | | | | | | | | | | | | | | | | | | |
| | | | |
| | | | | | Actual
(actual return after expenses) | | | Hypothetical
(5% annual return before expenses) | | | | |
Share
Class | | Beginning
Account
Value 12/1/18 | | | Ending
Account
Value 5/31/19 | | | Expenses
Paid During
Period
12/1/18–5/31/191,2 | | | Ending
Account
Value 5/31/19 | | | Expenses
Paid During
Period
12/1/18–5/31/191,2 | | | Net
Annualized
Expense
Ratio2 | |
| A | | $ | 1,000 | | | $ | 1,025.40 | | | $ | 12.47 | | | $ | 1,012.62 | | | $ | 12.39 | | | | 2.47 | % |
| C | | $ | 1,000 | | | $ | 1,021.20 | | | $ | 16.98 | | | $ | 1,008.13 | | | $ | 16.87 | | | | 3.37 | % |
| R | | $ | 1,000 | | | $ | 1,024.30 | | | $ | 14.28 | | | $ | 1,010.82 | | | $ | 14.19 | | | | 2.83 | % |
| R6 | | $ | 1,000 | | | $ | 1,025.50 | | | $ | 11.82 | | | $ | 1,013.26 | | | $ | 11.75 | | | | 2.34 | % |
| Advisor | | $ | 1,000 | | | $ | 1,026.20 | | | $ | 11.97 | | | $ | 1,013.11 | | | $ | 11.90 | | | | 2.37 | % |
1. Expenses are equal to the annualized expense ratio for the six-month period as indicated above—in the far right column—multiplied by the simple average account value over the period indicated, and then multiplied by 182/365 to reflect the one-half year period.
2. Reflects expenses after fee waivers and expense reimbursements. Does not include acquired fund fees and expenses.
| | | | |
| | | |
| 10 | | Annual Report | | franklintempleton.com |
FRANKLIN ALTERNATIVE STRATEGIES FUNDS
Financial Highlights
Franklin K2 Long Short Credit Fund
| | | | | | | | | | | | | | | | |
| |
| | | Year Ended May 31, | |
| | | | |
| | | 2019 | | | 2018 | | | 2017 | | | 2016a | |
| | | | |
| Class A | | | | | | | | | | | | | | | | |
Per share operating performance
(for a share outstanding throughout the year) | | | | | | | | | | | | | | | | |
| | | | |
Net asset value, beginning of year | | $ | 10.50 | | | $ | 10.49 | | | $ | 10.15 | | | $ | 10.00 | |
| | | | |
| | | | |
| Income from investment operationsb: | | | | | | | | | | | | | | | | |
| | | | |
Net investment incomec | | | 0.37 | | | | 0.29 | | | | 0.23 | | | | 0.21 | |
| | | | |
Net realized and unrealized gains (losses) | | | (0.02 | ) | | | 0.08 | | | | 0.53 | | | | 0.08 | |
| | | | |
| | | | |
Total from investment operations | | | 0.35 | | | | 0.37 | | | | 0.76 | | | | 0.29 | |
| | | | |
| | | | |
| Less distributions from: | | | | | | | | | | | | | | | | |
| | | | |
Net investment income | | | (0.31 | ) | | | (0.19 | ) | | | (0.32 | ) | | | (0.08 | ) |
| | | | |
Net realized gains | | | (0.09 | ) | | | (0.17 | ) | | | (0.10 | ) | | | (0.06 | ) |
| | | | |
| | | | |
Total distributions | | | (0.40 | ) | | | (0.36 | ) | | | (0.42 | ) | | | (0.14 | ) |
| | | | |
| | | | |
Net asset value, end of year | | $ | 10.45 | | | $ | 10.50 | | | $ | 10.49 | | | $ | 10.15 | |
| | | | |
| | | | |
Total returnd | | | 3.42% | | | | 3.63% | | | | 7.58% | | | | 2.99% | |
| | | | |
| Ratios to average net assetse | | | | | | | | | | | | | | | | |
| | | | |
Expenses before waiver, payments by affiliates and expense reductionsf | | | 3.15% | | | | 3.51% | | | | 3.50% | | | | 3.37% | |
| | | | |
Expenses net of waiver, payments by affiliates and expense reductionsf | | | 2.69% | | | | 2.98% | g | | | 2.75% | | | | 2.30% | g |
| | | | |
Expenses incurred in connection with securities sold short | | | 0.62% | | | | 0.89% | | | | 0.76% | | | | 0.40% | |
| | | | |
Net investment income | | | 3.49% | | | | 2.71% | | | | 2.24% | | | | 2.85% | |
| | | | |
| Supplemental data | | | | | | | | | | | | | | | | |
| | | | |
Net assets, end of year (000’s) | | | $27,870 | | | | $45,088 | | | | $41,001 | | | | $28,198 | |
| | | | |
Portfolio turnover rate | | | 158.66% | | | | 251.81% | | | | 317.70% | | | | 511.62% | |
aFor the period September 8, 2015 (commencement of operations) to May 31, 2016.
bThe amount shown for a share outstanding throughout the period may not correlate with the Statement of Operations for the period due to the timing of sales and repurchases of the Fund’s shares in relation to income earned and/or fluctuating fair value of the investments of the Fund.
cBased on average daily shares outstanding.
dTotal return does not reflect sales commissions or contingent deferred sales charges, if applicable, and is not annualized for periods less than one year.
eRatios are annualized for periods less than one year.
fIncludes dividend and/or interest expense on securities sold short and security borrowing fees, if any. See below for the ratios of such expenses to average net assets for the periods presented. See Note 1(g).
gBenefit of expense reduction rounds to less than 0.01%.
| | | | | | |
| | | |
| franklintempleton.com | | The accompanying notes are an integral part of these financial statements. | Annual Report | | | 11 | |
FRANKLIN ALTERNATIVE STRATEGIES FUNDS
FINANCIAL HIGHLIGHTS
Franklin K2 Long Short Credit Fund(continued)
| | | | | | | | | | | | | | | | |
| |
| | | Year Ended May 31, | |
| | | | |
| | | 2019 | | | 2018 | | | 2017 | | | 2016a | |
| | | | |
| Class C | | | | | | | | | | | | | | | | |
Per share operating performance
(for a share outstanding throughout the year) | | | | | | | | | | | | | | | | |
| | | | |
Net asset value, beginning of year | | $ | 10.34 | | | $ | 10.35 | | | $ | 10.07 | | | $ | 10.00 | |
| | | | |
| | | | |
| Income from investment operationsb: | | | | | | | | | | | | | | | | |
| | | | |
Net investment incomec | | | 0.27 | | | | 0.19 | | | | 0.14 | | | | 0.09 | |
| | | | |
Net realized and unrealized gains (losses) | | | (0.01 | ) | | | 0.07 | | | | 0.52 | | | | 0.12 | |
| | | | |
| | | | |
Total from investment operations | | | 0.26 | | | | 0.26 | | | | 0.66 | | | | 0.21 | |
| | | | |
| | | | |
| Less distributions from: | | | | | | | | | | | | | | | | |
| | | | |
Net investment income | | | (0.25 | ) | | | (0.10 | ) | | | (0.28 | ) | | | (0.08 | ) |
| | | | |
Net realized gains | | | (0.09 | ) | | | (0.17 | ) | | | (0.10 | ) | | | (0.06 | ) |
| | | | |
| | | | |
Total distributions | | | (0.34 | ) | | | (0.27 | ) | | | (0.38 | ) | | | (0.14 | ) |
| | | | |
| | | | |
Net asset value, end of year | | $ | 10.26 | | | $ | 10.34 | | | $ | 10.35 | | | $ | 10.07 | |
| | | | |
| | | | |
Total returnd | | | 2.61% | | | | 2.70% | | | | 6.56% | | | | 2.20% | |
| | | | |
| Ratios to average net assetse | | | | | | | | | | | | | | | | |
| | | | |
Expenses before waiver, payments by affiliates and expense reductionsf | | | 4.03% | | | | 4.37% | | | | 4.44% | | | | 3.62% | |
| | | | |
Expenses net of waiver, payments by affiliates and expense reductionsf | | | 3.57% | | | | 3.84% | g | | | 3.69% | | | | 2.55% | g |
| | | | |
Expenses incurred in connection with securities sold short | | | 0.62% | | | | 0.89% | | | | 0.76% | | | | 0.40% | |
| | | | |
Net investment income | | | 2.61% | | | | 1.85% | | | | 1.30% | | | | 2.60% | |
| | | | |
| Supplemental data | | | | | | | | | | | | | | | | |
| | | | |
Net assets, end of year (000’s) | | | $2,893 | | | | $2,503 | | | | $1,507 | | | | $270 | |
| | | | |
Portfolio turnover rate | | | 158.66% | | | | 251.81% | | | | 317.70% | | | | 511.62% | |
aFor the period September 8, 2015 (commencement of operations) to May 31, 2016.
bThe amount shown for a share outstanding throughout the period may not correlate with the Statement of Operations for the period due to the timing of sales and repurchases of the Fund’s shares in relation to income earned and/or fluctuating fair value of the investments of the Fund.
cBased on average daily shares outstanding.
dTotal return does not reflect sales commissions or contingent deferred sales charges, if applicable, and is not annualized for periods less than one year.
eRatios are annualized for periods less than one year.
fIncludes dividend and/or interest expense on securities sold short and security borrowing fees, if any. See below for the ratios of such expenses to average net assets for the periods presented. See Note 1(g).
gBenefit of expense reduction rounds to less than 0.01%.
| | | | |
| | | |
| 12 | | Annual Report | The accompanying notes are an integral part of these financial statements. | | franklintempleton.com |
FRANKLIN ALTERNATIVE STRATEGIES FUNDS
FINANCIAL HIGHLIGHTS
Franklin K2 Long Short Credit Fund(continued)
| | | | | | | | | | | | | | | | |
| |
| | | Year Ended May 31, | |
| | | | |
| | | 2019 | | | 2018 | | | 2017 | | | 2016a | |
| | | | |
| Class R | | | | | | | | | | | | | | | | |
Per share operating performance
(for a share outstanding throughout the year) | | | | | | | | | | | | | | | | |
| | | | |
Net asset value, beginning of year | | $ | 10.41 | | | $ | 10.41 | | | $ | 10.10 | | | $ | 10.00 | |
| | | | |
| | | | |
| Income from investment operationsb: | | | | | | | | | | | | | | | | |
| | | | |
Net investment incomec | | | 0.33 | | | | 0.25 | | | | 0.20 | | | | 0.08 | |
| | | | |
Net realized and unrealized gains (losses) | | | (0.01 | ) | | | 0.09 | | | | 0.53 | | | | 0.16 | |
| | | | |
| | | | |
Total from investment operations | | | 0.32 | | | | 0.34 | | | | 0.73 | | | | 0.24 | |
| | | | |
| | | | |
| Less distributions from: | | | | | | | | | | | | | | | | |
| | | | |
Net investment income | | | (0.28 | ) | | | (0.17 | ) | | | (0.32 | ) | | | (0.08 | ) |
| | | | |
Net realized gains | | | (0.09 | ) | | | (0.17 | ) | | | (0.10 | ) | | | (0.06 | ) |
| | | | |
| | | | |
Total distributions | | | (0.37 | ) | | | (0.34 | ) | | | (0.42 | ) | | | (0.14 | ) |
| | | | |
| | | | |
Net asset value, end of year | | $ | 10.36 | | | $ | 10.41 | | | $ | 10.41 | | | $ | 10.10 | |
| | | | |
| | | | |
Total returnd | | | 3.12% | | | | 3.29% | | | | 7.29% | | | | 2.48% | |
| | | | |
| Ratios to average net assetse | | | | | | | | | | | | | | | | |
| | | | |
Expenses before waiver, payments by affiliates and expense reductionsf | | | 3.50% | | | | 3.82% | | | | 3.83% | | | | 3.37% | |
| | | | |
Expenses net of waiver, payments by affiliates and expense reductionsf | | | 3.04% | | | | 3.29% | g | | | 3.08% | | | | 2.30% | g |
| | | | |
Expenses incurred in connection with securities sold short | | | 0.62% | | | | 0.89% | | | | 0.76% | | | | 0.40% | |
| | | | |
Net investment income | | | 3.14% | | | | 2.40% | | | | 1.91% | | | | 2.85% | |
| | | | |
| Supplemental data | | | | | | | | | | | | | | | | |
| | | | |
Net assets, end of year (000’s) | | | $166 | | | | $162 | | | | $127 | | | | $12 | |
| | | | |
Portfolio turnover rate | | | 158.66% | | | | 251.81% | | | | 317.70% | | | | 511.62% | |
aFor the period September 8, 2015 (commencement of operations) to May 31, 2016.
bThe amount shown for a share outstanding throughout the period may not correlate with the Statement of Operations for the period due to the timing of sales and repurchases of the Fund’s shares in relation to income earned and/or fluctuating fair value of the investments of the Fund.
cBased on average daily shares outstanding.
dTotal return is not annualized for periods less than one year.
eRatios are annualized for periods less than one year.
fIncludes dividend and/or interest expense on securities sold short and security borrowing fees, if any. See below for the ratios of such expenses to average net assets for the periods presented. See Note 1(g).
gBenefit of expense reduction rounds to less than 0.01%.
| | | | | | |
| | | |
| franklintempleton.com | | The accompanying notes are an integral part of these financial statements. | Annual Report | | | 13 | |
FRANKLIN ALTERNATIVE STRATEGIES FUNDS
FINANCIAL HIGHLIGHTS
Franklin K2 Long Short Credit Fund(continued)
| | | | | | | | | | | | | | | | |
| |
| | | Year Ended May 31, | |
| | | | |
| | | 2019 | | | 2018 | | | 2017 | | | 2016a | |
| | | | |
| Class R6 | | | | | | | | | | | | | | | | |
Per share operating performance
(for a share outstanding throughout the year) | | | | | | | | | | | | | | | | |
| | | | |
Net asset value, beginning of year | | $ | 10.51 | | | $ | 10.50 | | | $ | 10.15 | | | $ | 10.00 | |
| | | | |
| | | | |
| Income from investment operationsb: | | | | | | | | | | | | | | | | |
| | | | |
Net investment incomec | | | 0.36 | | | | 0.31 | | | | 0.24 | | | | 0.23 | |
| | | | |
Net realized and unrealized gains (losses) | | | — | g | | | 0.08 | | | | 0.53 | | | | 0.06 | |
| | | | |
| | | | |
Total from investment operations | | | 0.36 | | | | 0.39 | | | | 0.77 | | | | 0.29 | |
| | | | |
| | | | |
| Less distributions from: | | | | | | | | | | | | | | | | |
| | | | |
Net investment income | | | (0.33 | ) | | | (0.21 | ) | | | (0.32 | ) | | | (0.08 | ) |
| | | | |
Net realized gains | | | (0.09 | ) | | | (0.17 | ) | | | (0.10 | ) | | | (0.06 | ) |
| | | | |
| | | | |
Total distributions | | | (0.42 | ) | | | (0.38 | ) | | | (0.42 | ) | | | (0.14 | ) |
| | | | |
| | | | |
Net asset value, end of year | | $ | 10.45 | | | $ | 10.51 | | | $ | 10.50 | | | $ | 10.15 | |
| | | | |
| | | | |
Total returnd | | | 3.53% | | | | 3.76% | | | | 7.71% | | | | 3.01% | |
| | | | |
| Ratios to average net assetse | | | | | | | | | | | | | | | | |
| | | | |
Expenses before waiver, payments by affiliates and expense reductionsf | | | 3.10% | | | | 3.35% | | | | 3.43% | | | | 3.35% | |
| | | | |
Expenses net of waiver, payments by affiliates and expense reductionsf | | | 2.55% | | | | 2.83% | h | | | 2.68% | | | | 2.28% | h |
| | | | |
Expenses incurred in connection with securities sold short | | | 0.62% | | | | 0.89% | | | | 0.76% | | | | 0.40% | |
| | | | |
Net investment income | | | 3.63% | | | | 2.86% | | | | 2.31% | | | | 2.87% | |
| | | | |
| Supplemental data | | | | | | | | | | | | | | | | |
| | | | |
Net assets, end of year (000’s) | | | $233 | | | | $13 | | | | $13,052 | | | | $12,384 | |
| | | | |
Portfolio turnover rate | | | 158.66% | | | | 251.81% | | | | 317.70% | | | | 511.62% | |
aFor the period September 8, 2015 (commencement of operations) to May 31, 2016.
bThe amount shown for a share outstanding throughout the period may not correlate with the Statement of Operations for the period due to the timing of sales and repurchases of the Fund’s shares in relation to income earned and/or fluctuating fair value of the investments of the Fund.
cBased on average daily shares outstanding.
dTotal return is not annualized for periods less than one year.
eRatios are annualized for periods less than one year.
fIncludes dividend and/or interest expense on securities sold short and security borrowing fees, if any. See below for the ratios of such expenses to average net assets for the periods presented. See Note 1(g).
gAmount rounds to less than $0.01 per share.
hBenefit of expense reduction rounds to less than 0.01%.
| | | | |
| | | |
| 14 | | Annual Report | The accompanying notes are an integral part of these financial statements. | | franklintempleton.com |
FRANKLIN ALTERNATIVE STRATEGIES FUNDS
FINANCIAL HIGHLIGHTS
Franklin K2 Long Short Credit Fund(continued)
| | | | | | | | | | | | | | | | |
| |
| | | Year Ended May 31, | |
| | | | |
| | | 2019 | | | 2018 | | | 2017 | | | 2016a | |
| | | | |
| Advisor Class | | | | | | | | | | | | | | | | |
Per share operating performance
(for a share outstanding throughout the year) | | | | | | | | | | | | | | | | |
| | | | |
Net asset value, beginning of year | | $ | 10.51 | | | $ | 10.50 | | | $ | 10.15 | | | $ | 10.00 | |
| | | | |
| | | | |
| Income from investment operationsb: | | | | | | | | | | | | | | | | |
| | | | |
Net investment incomec | | | 0.38 | | | | 0.30 | | | | 0.24 | | | | 0.20 | |
| | | | |
Net realized and unrealized gains (losses) | | | (0.01 | ) | | | 0.09 | | | | 0.53 | | | | 0.09 | |
| | | | |
| | | | |
Total from investment operations | | | 0.37 | | | | 0.39 | | | | 0.77 | | | | 0.29 | |
| | | | |
| | | | |
| Less distributions from: | | | | | | | | | | | | | | | | |
| | | | |
Net investment income | | | (0.33 | ) | | | (0.21 | ) | | | (0.32 | ) | | | (0.08 | ) |
| | | | |
Net realized gains | | | (0.09 | ) | | | (0.17 | ) | | | (0.10 | ) | | | (0.06 | ) |
| | | | |
| | | | |
Total distributions | | | (0.42 | ) | | | (0.38 | ) | | | (0.42 | ) | | | (0.14 | ) |
| | | | |
| | | | |
Net asset value, end of year | | $ | 10.46 | | | $ | 10.51 | | | $ | 10.50 | | | $ | 10.15 | |
| | | | |
| | | | |
Total returnd | | | 3.60% | | | | 3.75% | | | | 7.70% | | | | 2.99% | |
| | | | |
| Ratios to average net assetse | | | | | | | | | | | | | | | | |
| | | | |
Expenses before waiver, payments by affiliates and expense reductionsf | | | 3.03% | | | | 3.37% | | | | 3.44% | | | | 3.36% | |
| | | | |
Expenses net of waiver, payments by affiliates and expense reductionsf | | | 2.57% | | | | 2.84% | g | | | 2.69% | | | | 2.29% | g |
| | | | |
Expenses incurred in connection with securities sold short | | | 0.62% | | | | 0.89% | | | | 0.76% | | | | 0.40% | |
| | | | |
Net investment income | | | 3.61% | | | | 2.85% | | | | 2.30% | | | | 2.86% | |
| | | | |
| Supplemental data | | | | | | | | | | | | | | | | |
| | | | |
Net assets, end of year (000’s) | | | $86,868 | | | | $45,514 | | | | $25,125 | | | | $23,058 | |
| | | | |
Portfolio turnover rate | | | 158.66% | | | | 251.81% | | | | 317.70% | | | | 511.62% | |
aFor the period September 8, 2015 (commencement of operations) to May 31, 2016.
bThe amount shown for a share outstanding throughout the period may not correlate with the Statement of Operations for the period due to the timing of sales and repurchases of the Fund’s shares in relation to income earned and/or fluctuating fair value of the investments of the Fund.
cBased on average daily shares outstanding.
dTotal return is not annualized for periods less than one year.
eRatios are annualized for periods less than one year.
fIncludes dividend and/or interest expense on securities sold short and security borrowing fees, if any. See below for the ratios of such expenses to average net assets for the periods presented. See Note 1(g).
gBenefit of expense reduction rounds to less than 0.01%.
| | | | | | |
| | | |
| franklintempleton.com | | The accompanying notes are an integral part of these financial statements. | Annual Report | | | 15 | |
FRANKLIN ALTERNATIVE STRATEGIES FUNDS
Statement of Investments, May 31, 2019
Franklin K2 Long Short Credit Fund
| | | | | | | | | | | | | | | | | | |
| | | | | |
| | | | | Country | | | Shares/
Rights | | | | | | Value | |
| | | Common Stocks and Other Equity Interests 1.3% | | | |
| | | Automobiles 0.0%† | |
| a | | Tesla Inc. | | | United States | | | | 183 | | | | | | | $ | 33,884 | |
| | | | | | | | | | | | | | | | | | |
| | | Capital Markets 0.1% | |
| a | | Gores Holdings III Inc. | | | United States | | | | 3,614 | | | | | | | | 37,857 | |
| | | | | | | | | | | | | | | | | | |
| | | Diversified Telecommunication Services 0.0%† | |
| a | | Frontier Communications Corp. | | | United States | | | | 7,180 | | | | | | | | 13,498 | |
| | | | | | | | | | | | | | | | | | |
| | | Energy Equipment & Services 0.0%† | |
| a | | Weatherford International PLC | | | United States | | | | 602,724 | | | | | | | | 28,027 | |
| | | | | | | | | | | | | | | | | | |
| | | Equity Real Estate Investment Trusts (REITs) 0.5% | |
| b | | Vici Properties Inc. | | | United States | | | | 23,321 | | | | | | | | 517,260 | |
| | | | | | | | | | | | | | | | | | |
| | | Independent Power & Renewable Electricity Producers 0.5% | |
| | Atlantica Yield PLC | | | Spain | | | | 5,207 | | | | | | | | 111,690 | |
| | Clearway Energy Inc., A | | | United States | | | | 21,640 | | | | | | | | 310,101 | |
| | Clearway Energy Inc., C | | | United States | | | | 13,373 | | | | | | | | 200,595 | |
| | | | | | | | | | | | | | | | | | |
| | | | | |
| | | | | | | | | | | | | | | | | 622,386 | |
| | | | | | | | | | | | | | | | | | |
| | | Media 0.2% | |
| a | | Altice Europe NV, A | | | Netherlands | | | | 24,110 | | | | | | | | 74,259 | |
| a | | Liberty Global PLC, C | | | United Kingdom | | | | 3,816 | | | | | | | | 92,500 | |
| a | | Postmedia Network Canada Corp., B | | | Canada | | | | 56,068 | | | | | | | | 55,794 | |
| | | | | | | | | | | | | | | | | | |
| | | | | |
| | | | | | | | | | | | | | | | | 222,553 | |
| | | | | | | | | | | | | | | | | | |
| | | Metals & Mining 0.0%† | |
| | Vedanta Ltd., ADR | | | India | | | | 3,457 | | | | | | | | 31,943 | |
| | | | | | | | | | | | | | | | | | |
| | | Pharmaceuticals 0.0%† | |
| a | | Mallinckrodt PLC | | | United States | | | | 2,554 | | | | | | | | 22,194 | |
| a | | Sanofi, Contingent Value, rts., 12/31/20 | | | France | | | | 26,594 | | | | | | | | 13,297 | |
| | | | | | | | | | | | | | | | | | |
| | | | | |
| | | | | | | | | | | | | | | | | 35,491 | |
| | | | | | | | | | | | | | | | | | |
| | Total Common Stocks and Other Equity Interests
(Cost $1,429,029) | | | | | | | | | | | | | | | 1,542,899 | |
| | | | | | | | | | | | | | | | | | |
| | | Preferred Stocks 0.2% | | | |
| | | Electric Utilities 0.2% | |
| | SCE Trust II, 5.10%, pfd. | | | United States | | | | 2,127 | | | | | | | | 45,156 | |
| | SCE Trust III, 5.75%, pfd., H | | | United States | | | | 1,674 | | | | | | | | 40,460 | |
| | SCE Trust IV, 5.375%, pfd., J | | | United States | | | | 3,753 | | | | | | | | 87,070 | |
| | SCE Trust V, 5.45%, pfd., K | | | United States | | | | 1,849 | | | | | | | | 43,193 | |
| | SCE Trust VI, 5.00%, pfd. | | | United States | | | | 2,440 | | | | | | | | 50,874 | |
| | | | | | | | | | | | | | | | | | |
| | Total Preferred Stocks (Cost $238,730) | | | | | | | | | | | | | | | 266,753 | |
| | | | | | | | | | | | | | | | | | |
| | | | |
| | | | | | | | Principal Amount* | | | | |
| | | Convertible Bonds 1.4% | | | |
| | | Automobiles 0.2% | |
| | Tesla Inc., senior note, 2.00%, 5/15/24 | | | United States | | | | 276,000 | | | | | | | | 242,346 | |
| | | | | | | | | | | | | | | | | | |
| | | Equity Real Estate Investment Trusts (REITs) 0.2% | |
| | iStar Inc., senior note, 3.125%, 9/15/22 | | | United States | | | | 283,000 | | | | | | | | 277,386 | |
| | | | | | | | | | | | | | | | | | |
| | | Independent Power & Renewable Electricity Producers 0.3% | |
| | Pattern Energy Group Inc., senior note, 4.00%, 7/15/20 | | | United States | | | | 359,000 | | | | | | | | 358,577 | |
| | | | | | | | | | | | | | | | | | |
| | | Internet & Direct Marketing Retail 0.2% | |
| | Wayfair Inc., senior note, 0.375%, 9/01/22 | | | United States | | | | 144,000 | | | | | | | | 215,975 | |
| | | | | | | | | | | | | | | | | | |
| | | | |
| | | |
| 16 | | Annual Report | | franklintempleton.com |
FRANKLIN ALTERNATIVE STRATEGIES FUNDS
STATEMENT OF INVESTMENTS
Franklin K2 Long Short Credit Fund(continued)
| | | | | | | | | | | | | | | | | | |
| | | | |
| | | | | Country | | | Principal Amount* | | | Value | |
| | | Convertible Bonds (continued) | | | |
| | | Media 0.5% | |
| | Gannett Co. Inc., senior note, 4.75%, 4/15/24 | | | United States | | | | 539,000 | | | | | | | $ | 536,947 | |
| | | | | | | | | | | | | | | | | | |
| | Total Convertible Bonds (Cost $1,564,496) | | | | | | | | | | | | | | | 1,631,231 | |
| | | | | | | | | | | | | | | | | | |
| | | Corporate Bonds and Notes 22.8% | | | |
| | | Aerospace & Defense 0.4% | |
| | Triumph Group Inc., senior note, | | | | | | | | | | | | | | | | |
| | 4.875%, 4/01/21 | | | United States | | | | 192,000 | | | | | | | | 189,120 | |
| | 5.25%, 6/01/22 | | | United States | | | | 314,000 | | | | | | | | 304,580 | |
| | | | | | | | | | | | | | | | | | |
| | | | | | | | | | | | | | | | | 493,700 | |
| | | | | | | | | | | | | | | | | | |
| | | Automobiles 0.5% | |
| c | | Tesla Inc., senior note, 144A, 5.30%, 8/15/25 | | | United States | | | | 690,000 | | | | | | | | 564,951 | |
| | | | | | | | | | | | | | | | | | |
| | | Capital Markets 0.4% | |
| c | | eG Global Finance PLC, 144A, | | | | | | | | | | | | | | | | |
| | senior secured note, 4.375%, 2/07/25 | | | United Kingdom | | | | 192,000 | | | | EUR | | | | 210,875 | |
| | senior secured note, 6.75%, 2/07/25 | | | United Kingdom | | | | 327,000 | | | | | | | | 321,686 | |
| | | | | | | | | | | | | | | | | | |
| | | | | | | | | | | | | | | | | 532,561 | |
| | | | | | | | | | | | | | | | | | |
| | | Commercial Services & Supplies 3.6% | |
| c | | Harland Clarke Holdings Corp., 144A, | | | | | | | | | | | | | | | | |
| | senior note, 9.25%, 3/01/21 | | | United States | | | | 2,495,500 | | | | | | | | 2,448,709 | |
| | senior secured note, 8.375%, 8/15/22 | | | United States | | | | 533,000 | | | | | | | | 455,715 | |
| | R.R. Donnelley & Sons Co., | | | | | | | | | | | | | | | | |
| | senior bond, 8.875%, 4/15/21 | | | United States | | | | 21,000 | | | | | | | | 21,788 | |
| | senior bond, 6.50%, 11/15/23 | | | United States | | | | 559,000 | | | | | | | | 553,410 | |
| | senior bond, 6.00%, 4/01/24 | | | United States | | | | 447,000 | | | | | | | | 443,089 | |
| | senior bond, 6.625%, 4/15/29 | | | United States | | | | 52,000 | | | | | | | | 49,140 | |
| | senior note, 7.00%, 2/15/22 | | | United States | | | | 241,000 | | | | | | | | 243,410 | |
| | | | | | | | | | | | | | | | | | |
| | | | | | | | | | | | | | | | | 4,215,261 | |
| | | | | | | | | | | | | | | | | | |
| | | Communications Equipment 0.4% | |
| c | | Riverbed Technology Inc., senior note, 144A, 8.875%, 3/01/23 | | | United States | | | | 396,000 | | | | | | | | 261,360 | |
| c | | Viasat Inc., senior secured note, 144A, 5.625%, 4/15/27 | | | United States | | | | 192,000 | | | | | | | | 195,262 | |
| | | | | | | | | | | | | | | | | | |
| | | | | | | | | | | | | | | | | 456,622 | |
| | | | | | | | | | | | | | | | | | |
| | | Distributors 0.2% | |
| c,d | | American News Co. LLC, senior note, 144A, PIK, 8.50%, 9/01/26 | | | United States | | | | 236,675 | | | | | | | | 243,775 | |
| | | | | | | | | | | | | | | | | | |
| | | Diversified Financial Services 0.9% | |
| c | | One Call Corp., 144A, | | | | | | | | | | | | | | | | |
| | secured note, second lien, 10.00%, 10/01/24 | | | United States | | | | 572,000 | | | | | | | | 491,920 | |
| | senior secured note, first lien, 7.50%, 7/01/24 | | | United States | | | | 644,000 | | | | | | | | 576,380 | |
| | | | | | | | | | | | | | | | | | |
| | | | | | | | | | | | | | | | | 1,068,300 | |
| | | | | | | | | | | | | | | | | | |
| | | Diversified Telecommunication Services 2.2% | |
| e | | Digicel Group One Ltd., senior secured note, Reg S, 8.25%, 12/30/22 | | | Jamaica | | | | 112,089 | | | | | | | | 70,865 | |
| c | | Digicel International Finance Ltd., senior secured note, 144A, 8.75%, 5/25/24 | | | Saint Lucia | | | | 162,000 | | | | | | | | 160,380 | |
| | Frontier Communications Corp., | | | | | | | | | | | | | | | | |
| | senior note, 10.50%, 9/15/22 | | | United States | | | | 375,000 | | | | | | | | 273,289 | |
| | senior note, 11.00%, 9/15/25 | | | United States | | | | 297,000 | | | | | | | | 188,595 | |
| | c senior secured note, 144A, 8.00%, 4/01/27 | | | United States | | | | 338,000 | | | | | | | | 351,520 | |
| | Hughes Satellite Systems Corp., senior secured note, 5.25%, 8/01/26 | | | United States | | | | 183,000 | | | | | | | | 182,822 | |
| c | | Intelsat Jackson Holdings SA, senior secured note, 144A, | | | | | | | | | | | | | | | | |
| | b 9.50%, 9/30/22 | | | Luxembourg | | | | 1,046,000 | | | | | | | | 1,213,360 | |
| | 8.00%, 2/15/24 | | | Luxembourg | | | | 190,000 | | | | | | | | 198,265 | |
| | | | | | | | | | | | | | | | | | |
| | | | | | | | | | | | | | | | | 2,639,096 | |
| | | | | | | | | | | | | | | | | | |
| | | | | | |
| | | |
| franklintempleton.com | | Annual Report | | | 17 | |
FRANKLIN ALTERNATIVE STRATEGIES FUNDS
STATEMENT OF INVESTMENTS
Franklin K2 Long Short Credit Fund(continued)
| | | | | | | | | | | | | | | | | | |
| | | | |
| | | | | Country | | | Principal Amount* | | | Value | |
| | | Corporate Bonds and Notes (continued) | | | |
| | | Electric Utilities 0.2% | |
| e | | Eskom Holdings SOC Ltd., senior bond, Reg S, 8.45%, 8/10/28 | | | South Africa | | | | 200,000 | | | | | | | $ | 219,483 | |
| | | | | | | | | | | | | | | | | | |
| | | Energy Equipment & Services 1.0% | |
| c | | Transocean Inc., senior note, 144A, | | | | | | | | | | | | | | | | |
| | 9.00%, 7/15/23 | | | United States | | | | 153,000 | | | | | | | | 157,774 | |
| | 7.50%, 1/15/26 | | | United States | | | | 705,000 | | | | | | | | 661,819 | |
| c | | Vantage Drilling International, senior secured note, 144A, 9.25%, 11/15/23 | | | United States | | | | 371,000 | | | | | | | | 373,782 | |
| | | | | | | | | | | | | | | | | | |
| | | | | |
| | | | | | | | | | | | | | | | | 1,193,375 | |
| | | | | | | | | | | | | | | | | | |
| | | Equity Real Estate Investment Trusts (REITs) 0.3% | |
| c | | AHP Health Partners Inc., senior note, 144A, 9.75%, 7/15/26 | | | United States | | | | 366,000 | | | | | | | | 388,875 | |
| | | | | | | | | | | | | | | | | | |
| | | Food Products 1.0% | |
| b,c | | JBS USA LLC / Finance Inc., senior bond, 144A, 6.75%, 2/15/28 | | | United States | | | | 735,000 | | | | | | | | 779,100 | |
| c | | JBS USA LUX SA / Food Co. / Finance Inc., senior bond, 144A, 6.50%, 4/15/29 | | | United States | | | | 368,000 | | | | | | | | 387,320 | |
| | | | | | | | | | | | | | | | | | |
| | | | | |
| | | | | | | | | | | | | | | | | 1,166,420 | |
| | | | | | | | | | | | | | | | | | |
| | | Health Care Providers & Services 0.1% | |
| c | | Mallinckrodt International Finance SA / Mallinckrodt CB LLC, senior bond, 144A, 5.50%, 4/15/25 | | | United States | | | | 103,000 | | | | | | | | 66,113 | |
| | | | | | | | | | | | | | | | | | |
| | | Hotels, Restaurants & Leisure 1.2% | |
| c | | Mohegan Gaming & Entertainment, senior note, 144A, 7.875%, 10/15/24 | | | United States | | | | 1,488,000 | | | | | | | | 1,435,920 | |
| | | | | | | | | | | | | | | | | | |
| | | Household Durables 1.1% | |
| | Beazer Homes USA Inc., senior note, 5.875%, 10/15/27 | | | United States | | | | 84,000 | | | | | | | | 69,121 | |
| | K Hovnanian Enterprises Inc., | | | | | | | | | | | | | | | | |
| | senior secured bond, 2.00%, 11/01/21 | | | United States | | | | 65,000 | | | | | | | | 57,200 | |
| | senior secured bond, 5.00%, 11/01/21 | | | United States | | | | 270,000 | | | | | | | | 245,700 | |
| | c secured note, 144A, 10.00%, 7/15/22 | | | United States | | | | 1,167,000 | | | | | | | | 977,363 | |
| | | | | | | | | | | | | | | | | | |
| | | | | |
| | | | | | | | | | | | | | | | | 1,349,384 | |
| | | | | | | | | | | | | | | | | | |
| | | Insurance 0.0%† | |
| c | | Ambac Assurance Corp., sub. bond, 144A, 5.10%, 6/07/20 | | | United States | | | | 2 | | | | | | | | 4 | |
| c,f | | Ambac LSNI LLC, senior secured note, 144A, FRN, 7.592%,(3-Month USD LIBOR + 5.00%), 2/12/23 | | | Cayman Islands | | | | 8 | | | | | | | | 8 | |
| | | | | | | | | | | | | | | | | | |
| | | | | |
| | | | | | | | | | | | | | | | | 12 | |
| | | | | | | | | | | | | | | | | | |
| | | Interactive Media & Services 0.5% | |
| c | | Rackspace Hosting Inc., senior note, 144A, 8.625%, 11/15/24 | | | United States | | | | 666,000 | | | | | | | | 581,085 | |
| | | | | | | | | | | | | | | | | | |
| | | Leisure Products 0.6% | |
| | Mattel Inc., | | | | | | | | | | | | | | | | |
| | senior bond, 6.20%, 10/01/40 | | | United States | | | | 70,000 | | | | | | | | 56,350 | |
| | senior bond, 5.45%, 11/01/41 | | | United States | | | | 181,000 | | | | | | | | 133,940 | |
| | b,c senior note, 144A, 6.75%, 12/31/25 | | | United States | | | | 517,000 | | | | | | | | 510,388 | |
| | | | | | | | | | | | | | | | | | |
| | | | | |
| | | | | | | | | | | | | | | | | 700,678 | |
| | | | | | | | | | | | | | | | | | |
| | | Media 4.5% | |
| c | | The McClatchy Co., 144A, | | | | | | | | | | | | | | | | |
| | senior secured bond, 6.875%, 7/15/31 | | | United States | | | | 566,000 | | | | | | | | 653,730 | |
| | b senior secured note, 9.00%, 7/15/26 | | | United States | | | | 1,485,000 | | | | | | | | 1,466,437 | |
| c,d | | Postmedia Network Inc., secured note, second lien, 144A, PIK, 10.25%, 7/15/23 | | | Canada | | | | 537,147 | | | | | | | | 564,004 | |
| b,c | | Univision Communications Inc., senior secured note, 144A, 5.125%, 2/15/25 | | | United States | | | | 819,000 | | | | | | | | 754,111 | |
| c | | Worldwide Media Services Group Inc., sub. note, 144A, zero cpn., 12/01/24 | | | United States | | | | 2,564,883 | | | | | | | | 1,821,067 | |
| | | | | | | | | | | | | | | | | | |
| | | | | |
| | | | | | | | | | | | | | | | | 5,259,349 | |
| | | | | | | | | | | | | | | | | | |
| | | | |
| | | |
| 18 | | Annual Report | | franklintempleton.com |
FRANKLIN ALTERNATIVE STRATEGIES FUNDS
STATEMENT OF INVESTMENTS
Franklin K2 Long Short Credit Fund(continued)
| | | | | | | | | | | | | | | | | | |
| | | | |
| | | | | Country | | | Principal Amount* | | | Value | |
| | | Corporate Bonds and Notes (continued) | | | |
| | | Oil, Gas & Consumable Fuels 2.2% | |
| e,f | | EP PetroEcuador via Noble Sovereign Funding I Ltd., secured note, FRN, Reg S, 8.227%,(3-Month USD LIBOR + 5.63%), 9/24/19 | | | Ecuador | | | | 26,316 | | | | | | | $ | 26,447 | |
| c | | Moss Creek Resources Holdings Inc., senior note, 144A, 10.50%, 5/15/27 | | | United States | | | | 447,000 | | | | | | | | 414,593 | |
| | Petrobras Global Finance BV, | | | | | | | | | | | | | | | | |
| | senior bond, 6.90%, 3/19/49 | | | Brazil | | | | 117,000 | | | | | | | | 117,117 | |
| | senior note, 6.25%, 3/17/24 | | | Brazil | | | | 61,000 | | | | | | | | 66,330 | |
| | senior note, 8.75%, 5/23/26 | | | Brazil | | | | 109,000 | | | | | | | | 131,601 | |
| | Petroleos Mexicanos, | | | | | | | | | | | | | | | | |
| | senior bond, 5.50%, 1/21/21 | | | Mexico | | | | 234,000 | | | | | | | | 240,903 | |
| | senior note, 4.875%, 1/24/22 | | | Mexico | | | | 181,000 | | | | | | | | 183,787 | |
| | senior note, 3.50%, 1/30/23 | | | Mexico | | | | 136,000 | | | | | | | | 131,118 | |
| | senior note, 4.625%, 9/21/23 | | | Mexico | | | | 226,000 | | | | | | | | 225,633 | |
| c | | Sable Permian Resources Land LLC / AEPB Finance Corp., 144A, | | | | | | | | | | | | | | | | |
| | secured note, 8.00%, 6/15/20 | | | United States | | | | 290,000 | | | | | | | | 242,150 | |
| | b senior secured note, first lien, 13.00%, 11/30/20 | | | United States | | | | 800,000 | | | | | | | | 768,000 | |
| | | | | | | | | | | | | | | | | | |
| | | | | |
| | | | | | | | | | | | | | | | | 2,547,679 | |
| | | | | | | | | | | | | | | | | | |
| | | Specialty Retail 1.5% | |
| | Bed Bath & Beyond Inc., senior bond, 5.165%, 8/01/44 | | | United States | | | | 448,000 | | | | | | | | 321,164 | |
| c | | Carvana Co., senior note, 144A, 8.875%, 10/01/23 | | | United States | | | | 731,000 | | | | | | | | 726,892 | |
| c | | PetSmart Inc., senior note, 144A, 7.125%, 3/15/23 | | | United States | | | | 300,000 | | | | | | | | 270,000 | |
| c | | Staples Inc., senior secured note, 144A, 7.50%, 4/15/26 | | | United States | | | | 476,000 | | | | | | | | 455,770 | |
| | | | | | | | | | | | | | | | | | |
| | | | | |
| | | | | | | | | | | | | | | | | 1,773,826 | |
| | | | | | | | | | | | | | | | | | |
| | Total Corporate Bonds and Notes (Cost $26,184,799) | | | | | | | | | | | | | | | 26,896,465 | |
| | | | | | | | | | | | | | | | | | |
| | | Corporate Bonds and Notes in Reorganization 1.1% | | | |
| | | Electric Utilities 1.1% | |
| g | | Pacific Gas & Electric Co., | | | | | | | | | | | | | | | | |
| | senior bond, 2.95%, 3/01/26 | | | United States | | | | 152,000 | | | | | | | | 134,900 | |
| | senior bond, 3.30%, 3/15/27 | | | United States | | | | 107,000 | | | | | | | | 95,230 | |
| | senior bond, 5.80%, 3/01/37 | | | United States | | | | 21,000 | | | | | | | | 20,947 | |
| | senior bond, 5.40%, 1/15/40 | | | United States | | | | 324,000 | | | | | | | | 318,128 | |
| | senior bond, 4.45%, 4/15/42 | | | United States | | | | 35,000 | | | | | | | | 32,200 | |
| | senior note, 2.45%, 8/15/22 | | | United States | | | | 62,000 | | | | | | | | 57,040 | |
| | c senior note, 144A, 4.25%, 8/01/23 | | | United States | | | | 73,000 | | | | | | | | 69,350 | |
| | senior note, 3.30%, 12/01/27 | | | United States | | | | 389,000 | | | | | | | | 344,265 | |
| | c senior note, 144A, 4.65%, 8/01/28 | | | United States | | | | 163,000 | | | | | | | | 156,480 | |
| | | | | | | | | | | | | | | | | | |
| | | | | |
| | | | | | | | | | | | | | | | | 1,228,540 | |
| | | | | | | | | | | | | | | | | | |
| | | Oil, Gas & Consumable Fuels 0.0%† | |
| e,g | | Petroleos de Venezuela SA, senior note, Reg S, 6.00%, 10/28/22 | | | Venezuela | | | | 98,020 | | | | | | | | 17,644 | |
| | | | | | | | | | | | | | | | | | |
| | Total Corporate Bonds and Notes in Reorganization
(Cost $1,182,756) | | | | | | | | | | | | | | | 1,246,184 | |
| | | | | | | | | | | | | | | | | | |
| f,h | | Senior Floating Rate Interests 2.4% | | | |
| | | Communications Equipment 0.1% | |
| | Riverbed Technology Inc., Term Loan B, 5.69%,(1-Month USD LIBOR + 3.25%), 4/24/22 | | | United States | | | | 181,693 | | | | | | | | 151,486 | |
| | | | | | | | | | | | | | | | | | |
| | | Containers & Packaging 0.1% | |
| i | | Flex Acquisition Co. Inc., Term Loan B, 5.876%,(1-Month USD LIBOR + 3.25%), 6/29/25 | | | United States | | | | 78,908 | | | | | | | | 76,107 | |
| | | | | | | | | | | | | | | | | | |
| | | Diversified Consumer Services 0.2% | |
| | Advantage Sales & Marketing Inc., | | | | | | | | | | | | | | | | |
| | Term Loan, 5.689%,(1-Month USD LIBOR + 3.25%), 7/23/21 | | | United States | | | | 150,836 | | | | | | | | 130,662 | |
| | Term Loan B2, 5.689%,(1-Month USD LIBOR + 3.25%), 7/23/21 | | | United States | | | | 109,391 | | | | | | | | 94,760 | |
| | | | | | | | | | | | | | | | | | |
| | | | | |
| | | | | | | | | | | | | | | | | 225,422 | |
| | | | | | | | | | | | | | | | | | |
| | | | | | |
| | | |
| franklintempleton.com | | Annual Report | | | 19 | |
FRANKLIN ALTERNATIVE STRATEGIES FUNDS
STATEMENT OF INVESTMENTS
Franklin K2 Long Short Credit Fund(continued)
| | | | | | | | | | | | | | | | | | |
| | | | |
| | | | | Country | | | Principal Amount* | | | Value | |
| f,h | | Senior Floating Rate Interests (continued) | | | |
| | | Diversified Telecommunication Services 1.1% | |
| i | | CenturyLink Inc., Term Loan B, 5.189%,(3-Month USD LIBOR + 2.75%), 1/31/25 | | | United States | | | | 511,754 | | | | | | | $ | 498,694 | |
| | Digicel International Finance Ltd., Term Loan B, 5.78%,(1-Month USD LIBOR + 3.25%), 5/27/24 | | | Saint Lucia | | | | 167,174 | | | | | | | | 150,457 | |
| | Frontier Communications Corp., Term Loan B1, 6.19%,(1-Month USD LIBOR + 3.75%), 6/15/24 | | | United States | | | | 331,723 | | | | | | | | 326,332 | |
| | Intelsat Jackson Holdings SA, Term Loan, 6.625%, 1/02/24 | | | United States | | | | 347,489 | | | | | | | | 348,683 | |
| | | | | | | | | | | | | | | | | | |
| | | | | |
| | | | | | | | | | | | | | | | | 1,324,166 | |
| | | | | | | | | | | | | | | | | | |
| | | IT Services 0.1% | |
| i | | GTT Communications Inc., Term Loan, 5.19%,(1-Month USD LIBOR + 2.75%), 5/31/25 | | | United States | | | | 116,070 | | | | | | | | 107,771 | |
| | | | | | | | | | | | | | | | | | |
| | | Multiline Retail 0.4% | |
| i | | The Neiman Marcus Group LLC, Term Loan, 5.717%,(1-Month USD LIBOR + 3.25%), 10/25/20 | | | United States | | | | 437,684 | | | | | | | | 396,980 | |
| | | | | | | | | | | | | | | | | | |
| | | Specialty Retail 0.4% | |
| | Staples Inc., Term Loan B, 7.601%,(1-Month USD LIBOR + 5.00%), 4/16/26 | | | United States | | | | 562,666 | | | | | | | | 546,138 | |
| | | | | | | | | | | | | | | | | | |
| | Total Senior Floating Rate Interests
(Cost $2,834,955) | | | | | | | | | | | | | | | 2,828,070 | |
| | | | | | | | | | | | | | | | | | |
| | | Foreign Government and Agency Securities 4.7% | | | |
| | Argentina Treasury Bill, Strip, | | | | | | | | | | | | | | | | |
| | 4/30/20 | | | Argentina | | | | 4,350,070 | | | | ARS | | | | 102,025 | |
| | 7/31/20 | | | Argentina | | | | 2,733,783 | | | | ARS | | | | 55,732 | |
| | Government of Argentina, | | | | | | | | | | | | | | | | |
| | 3.38% to 3/31/29, 4.74% thereafter, 12/31/38 | | | Argentina | | | | 268,000 | | | | EUR | | | | 157,977 | |
| | senior bond, 3.38%, 12/31/38 | | | Argentina | | | | 45,282 | | | | EUR | | | | 26,209 | |
| | f senior note, FRN, 68.805%, (ARLLMONP), 6/21/20 | | | Argentina | | | | 1,733,578 | | | | ARS | | | | 38,946 | |
| | senior note, 6.875%, 4/22/21 | | | Argentina | | | | 275,000 | | | | | | | | 228,387 | |
| | e senior note, Reg S, 3.875%, 1/15/22 | | | Argentina | | | | 200,000 | | | | EUR | | | | 170,481 | |
| | senior note, 5.625%, 1/26/22 | | | Argentina | | | | 568,000 | | | | | | | | 439,916 | |
| | senior note, 4.625%, 1/11/23 | | | Argentina | | | | 113,000 | | | | | | | | 83,621 | |
| e | | Government of Bahrain, senior bond, Reg S, 7.00%, 1/26/26 | | | Bahrain | | | | 200,000 | | | | | | | | 212,462 | |
| | Government of Brazil, senior bond, 4.875%, 1/22/21 | | | Brazil | | | | 200,000 | | | | | | | | 206,800 | |
| e | | Government of Ecuador, senior note, Reg S, 10.75%, 3/28/22 | | | Ecuador | | | | 200,000 | | | | | | | | 222,750 | |
| e | | Government of Paraguay, senior bond, Reg S, 4.625%, 1/25/23 | | | Paraguay | | | | 200,000 | | | | | | | | 207,835 | |
| c | | Government of Qatar, senior bond, 144A, 4.817%, 3/14/49 | | | Qatar | | | | 200,000 | | | | | | | | 220,500 | |
| | Government of Russia, | | | | | | | | | | | | | | | | |
| | senior bond, 7.25%, 5/10/34 | | | Russia | | | | 72,300,000 | | | | RUB | | | | 1,037,422 | |
| | e senior note, Reg S, 5.00%, 4/29/20 | | | Russia | | | | 100,000 | | | | | | | | 102,026 | |
| | e senior note, Reg S, 4.50%, 4/04/22 | | | Russia | | | | 200,000 | | | | | | | | 207,971 | |
| e | | Government of Saudi Arabia, Reg S, | | | | | | | | | | | | | | | | |
| | senior bond, 5.25%, 1/16/50 | | | Saudi Arabia | | | | 200,000 | | | | | | | | 220,708 | |
| | senior note, 2.375%, 10/26/21 | | | Saudi Arabia | | | | 200,000 | | | | | | | | 197,802 | |
| | Government of South Africa, senior bond, | | | | | | | | | | | | | | | | |
| | 5.50%, 3/09/20 | | | South Africa | | | | 215,000 | | | | | | | | 218,408 | |
| | R186, 10.50%, 12/21/26 | | | South Africa | | | | 8,454,562 | | | | ZAR | | | | 644,558 | |
| | Government of Turkey, senior bond, 7.00%, 6/05/20 | | | Turkey | | | | 335,000 | | | | | | | | 339,745 | |
| e | | National Highways Authority of India, senior note, Reg S, 7.30%, 5/18/22 | | | India | | | | 10,000,000 | | | | INR | | | | 140,574 | |
| | | | | | | | | | | | | | | | | | |
| | Total Foreign Government and Agency Securities
(Cost $5,768,875) | | | | | | | | | | | | | | | 5,482,855 | |
| | | | | | | | | | | | | | | | | | |
| | | U.S. Government and Agency Securities 0.7% | | | |
| | U.S. Treasury Bond, 3.00%, 2/15/48 | | | United States | | | | 291,000 | | | | | | | | 315,940 | |
| | U.S. Treasury Note, 2.25%, 4/30/24 | | | United States | | | | 539,000 | | | | | | | | 547,106 | |
| | | | | | | | | | | | | | | | | | |
| | Total U.S. Government and Agency Securities
(Cost $830,017) | | | | | | | | | | | | | | | 863,046 | |
| | | | | | | | | | | | | | | | | | |
| | | | |
| | | |
| 20 | | Annual Report | | franklintempleton.com |
FRANKLIN ALTERNATIVE STRATEGIES FUNDS
STATEMENT OF INVESTMENTS
Franklin K2 Long Short Credit Fund(continued)
| | | | | | | | | | | | | | | | | | |
| | | | |
| | | | | Country | | | Principal Amount* | | | Value | |
| | | Asset-Backed Securities and Commercial Mortgage-Backed
Securities 37.7% | | | | | | | | | | | | |
| | | Capital Markets 1.5% | |
| | Citigroup Mortgage Loan Trust, | | | | | | | | | | | | | | | | |
| | j 2004-OPT1, M4, FRN, 3.435%,(1-Month USD LIBOR + 1.01%), 10/25/34 | | | United States | | | | 588,602 | | | | | | | $ | 559,536 | |
| | 2006-WF1, A2E, 4.894%, 3/25/36 | | | United States | | | | 491,659 | | | | | | | | 330,828 | |
| | k 2007-AR5, 2A1A, FRN, 4.606%, 4/25/37 | | | United States | | | | 144,182 | | | | | | | | 139,783 | |
| | c,j 2008-RR1, A1A1, 144A, FRN, 2.50%,(1-Month USD LIBOR + 0.07%), 1/25/37 | | | United States | | | | 763,697 | | | | | | | | 710,395 | |
| | | | | | | | | | | | | | | | | | |
| | | | | | | | | | | | | | | | | 1,740,542 | |
| | | | | | | | | | | | | | | | | | |
| | | Diversified Financial Services 17.7% | |
| k | | Adjustable Rate MortgageTrust, 2005-4, 3A1, FRN, 5.116%, 8/25/35 | | | United States | | | | 87,926 | | | | | | | | 88,071 | |
| | Alternative LoanTrust, 2005-J10, 2A4, 6.00%, 10/25/35 | | | United States | | | | 471,879 | | | | | | | | 368,341 | |
| c,j | | Ashford Hospitality Trust, 2018-ASHF, E, 144A, FRN, 5.54%,(1-Month USD LIBOR + 3.10%), 4/15/35 | | | United States | | | | 750,000 | | | | | | | | 756,698 | |
| j | | Asset Backed Securities Corp. Home Equity LoanTrust, 2001-HE1, M2, FRN, 4.165%,(1-Month USD LIBOR + 1.73%), 4/15/31 | | | United States | | | | 421,674 | | | | | | | | 428,050 | |
| | Bear StearnsALT-A Trust, FRN, | | | | | | | | | | | | | | | | |
| | k2004-12, 2A4, 4.175%, 1/25/35 | | | United States | | | | 351,900 | | | | | | | | 346,015 | |
| | j 2004-6, B1, 5.28%,(1-Month USD LIBOR + 2.85%), 7/25/34 | | | United States | | | | 346,495 | | | | | | | | 371,518 | |
| c,j | | Carlyle Global Market Strategies CLOLtd., 2018-1A, CR, 144A, FRN, 5.342%,(3-Month USD LIBOR + 2.75%), 4/20/27 | | | United States | | | | 2,500,000 | | | | | | | | 2,494,283 | |
| c | | Castlelake Aircraft SecuritizationTrust, 2018-1, A, 144A, 4.125%, 6/15/43 | | | United States | | | | 640,572 | | | | | | | | 653,447 | |
| | ChaseflexTrust, 2005-2, 1A1, 6.00%, 6/25/35 | | | United States | | | | 536,179 | | | | | | | | 515,641 | |
| | Citimortgage Alternative LoanTrust, 2007-A1, 2A1, 5.50%, 1/25/22 | | | United States | | | | 43,831 | | | | | | | | 43,582 | |
| c,j | | Connecticut Avenue SecuritiesTrust, 2019-R01, 2M2, 144A, FRN, 4.88%,(1-Month USD LIBOR + 2.45%), 7/25/31 | | | United States | | | | 500,000 | | | | | | | | 511,196 | |
| j,l | | FNMA, 2011-11, SA, IO, FRN, 4.02%, (6.45% –1-Month USD LIBOR), 11/25/41 | | | United States | | | | 2,548,819 | | | | | | | | 506,817 | |
| c,j | | Freddie Mac Stacr Trust, 2019-FTR1, B2, 144A, FRN, 10.788%,(1-Month USD LIBOR + 8.35%), 1/25/48 | | | United States | | | | 350,000 | | | | | | | | 362,596 | |
| c,j | | Goldentree Loan Management US CLO 1Ltd., 2017-1A, D, 144A, FRN, 5.942%,(3-Month USD LIBOR + 3.35%), 4/20/29 | | | United States | | | | 1,000,000 | | | | | | | | 1,002,598 | |
| c,j | | GPMTLtd., 2019-FL2, D, 144A, FRN, 5.39%,(1-Month USD LIBOR + 2.95%), 2/22/36 | | | United States | | | | 1,000,000 | | | | | | | | 1,008,500 | |
| c,j | | Grippen Park CLOLtd., 2017-1A, D, 144A, FRN, 5.892%,(3-Month USD LIBOR + 3.30%), 1/20/30 | | | United States | | | | 500,000 | | | | | | | | 501,907 | |
| j | | GSAMPTrust, 2004-HE2, M2, FRN, 3.849%,(1-Month USD LIBOR + 1.65%), 9/25/34 | | | United States | | | | 151,063 | | | | | | | | 151,260 | |
| c | | GSMSC Pass-Through Trust, 144A, FRN, | | | | | | | | | | | | | | | | |
| | j 2009-4R, 2A3, 2.927%,(1-Month USD LIBOR + 0.45%), 12/26/36 | | | United States | | | | 840,741 | | | | | | | | 463,721 | |
| | k 2009-5R, 3A2, 5.50%, 10/26/35 | | | United States | | | | 301,853 | | | | | | | | 264,751 | |
| c,j | | Home Partners of America Trust, 144A, FRN, | | | | | | | | | | | | | | | | |
| | 2017-1, F, 5.971%,(1-Month USD LIBOR + 3.54%), 7/17/34 | | | United States | | | | 500,000 | | | | | | | | 502,367 | |
| | 2018-1, E, 4.282%,(1-Month USD LIBOR + 1.85%), 7/17/37 | | | United States | | | | 1,200,000 | | | | | | | | 1,196,511 | |
| | JPMorgan Mortgage AcquisitionTrust, 2007-CH2, AF2, 4.695%, 1/25/37 | | | United States | | | | 190,128 | | | | | | | | 138,029 | |
| c,j | | KREFLtd., 2018-FL1, D, 144A, FRN, 4.982%,(1-Month USD LIBOR + 2.55%), 6/15/36 | | | United States | | | | 500,000 | | | | | | | | 502,812 | |
| c,j | | Madison Park Funding XXILtd., 2016-21A, B, 144A, FRN, 5.33%,(3-Month USD LIBOR + 2.75%), 7/25/29 | | | United States | | | | 500,000 | | | | | | | | 500,303 | |
| c,j | | Madison Park Funding XXIIILtd., 2017-23A, C, 144A, FRN, 4.932%,(3-Month USD LIBOR + 2.35%), 7/27/30 | | | United States | | | | 500,000 | | | | | | | | 500,691 | |
| | MASTR Adjustable Rate Mortgages Trust, FRN, | | | | | | | | | | | | | | | | |
| | k 2004-10, B1, 4.408%, 10/25/34 | | | United States | | | | 561,309 | | | | | | | | 347,878 | |
| | j 2006-OA1, 1A1, 2.64%,(1-Month USD LIBOR + 0.21%), 4/25/46 | | | United States | | | | 429,275 | | | | | | | | 397,507 | |
| j | | Morgan Stanley ABS Capital I Inc.Trust, 2004-NC6, M3, FRN, 4.605%,(1-Month USD LIBOR + 2.18%), 7/25/34 | | | United States | | | | 179,520 | | | | | | | | 179,788 | |
| | | | | | |
| | | |
| franklintempleton.com | | Annual Report | | | 21 | |
FRANKLIN ALTERNATIVE STRATEGIES FUNDS
STATEMENT OF INVESTMENTS
Franklin K2 Long Short Credit Fund(continued)
| | | | | | | | | | | | | | | | | | |
| | | | |
| | | | | Country | | | Principal Amount* | | | Value | |
| | | Asset-Backed Securities and Commercial Mortgage-Backed
Securities (continued) | | | | | | | | | | | | |
| | | Diversified Financial Services (continued) | |
| c,j | | Morgan StanleyRE-REMICTrust, 2013-R8, 2B2, 144A, FRN, 3.317%,(1-Month USD LIBOR + 0.42%), 9/26/36 | | | United States | | | | 984,488 | | | | | | | $ | 691,153 | |
| j | | National Collegiate Student Loan Trust, FRN, | | | | | | | | | | | | | | | | |
| | 2006-1, A5, 2.78%,(1-Month USD LIBOR + 0.35%), 3/25/33 | | | United States | | | | 169,764 | | | | | | | | 162,983 | |
| | 2006-4, A4, 2.74%,(1-Month USD LIBOR + 0.31%), 5/25/32 | | | United States | | | | 250,000 | | | | | | | | 236,874 | |
| c | | Sapphire Aviation Finance ILtd., 2018-1A, B, 144A, 5.926%, 3/15/40 | | | United States | | | | 893,085 | | | | | | | | 930,577 | |
| c,k | | Seasoned Credit Risk TransferTrust, 2016-1, M2, 144A, FRN, 3.75%, 9/25/55 | | | United States | | | | 500,000 | | | | | | | | 459,307 | |
| c | | S-JetsLtd., 2017-1, A, 144A, 3.967%, 8/15/42 | | | Bermuda | | | | 883,333 | | | | | | | | 901,421 | |
| k | | STARM Mortgage LoanTrust, 2007-2, 4A1, FRN, 4.878%, 4/25/37 | | | United States | | | | 110,635 | | | | | | | | 90,908 | |
| j | | Suntrust Alternative LoanTrust, 2005-1F, 1A1, FRN, 3.08%,(1-Month USD LIBOR + 0.65%), 12/25/35 | | | United States | | | | 262,149 | | | | | | | | 219,772 | |
| j | | Terwin MortgageTrust, 2003-6HE, M2, FRN, 5.055%,(1-Month USD LIBOR + 2.63%), 11/25/33 | | | United States | | | | 156,271 | | | | | | | | 141,239 | |
| c,j | | TPG Real Estate Finance IssuerLtd., 2018-FL2, D, 144A, FRN, 5.132%,(1-Month USD LIBOR + 2.70%), 11/15/37 | | | United States | | | | 300,000 | | | | | | | | 300,937 | |
| | Wells Fargo Alternative LoanTrust, 2007-PA3, 2A2, 6.00%, 7/25/37 | | | United States | | | | 216,577 | | | | | | | | 215,139 | |
| c | | Wendys FundingLLC, 2018-1A, A2I, 144A, 3.573%, 3/15/48 | | | United States | | | | 493,750 | | | | | | | | 498,051 | |
| c,j | | Westchester CLOLtd., 2007-1A, E, 144A, FRN, 6.879%,(3-Month USD LIBOR + 4.30%), 8/01/22 | | | United States | | | | 949,582 | | | | | | | | 949,768 | |
| | | | | | | | | | | | | | | | | | |
| | | | | |
| | | | | | | | | | | | | | | | | 20,903,007 | |
| | | | | | | | | | | | | | | | | | |
| | | Mortgage Real Estate Investment Trusts (REITs) 18.5% | |
| k | | American Home Mortgage AssetsTrust, 2005-1, 1A1, FRN, 4.357%, 11/25/35 | | | United States | | | | 173,258 | | | | | | | | 154,837 | |
| k | | Banc of America Mortgage Trust, FRN, | | | | | | | | | | | | | | | | |
| | 2005-K, 2A1, 4.489%, 12/25/35 | | | United States | | | | 267,444 | | | | | | | | 265,900 | |
| | 2005-L, 1A1, 4.373%, 1/25/36 | | | United States | | | | 236,747 | | | | | | | | 220,246 | |
| | 2005-L, 3A1, 4.648%, 1/25/36 | | | United States | | | | 320,785 | | | | | | | | 311,338 | |
| c,k | | BCAP LLCTrust, 2010-RR1, 1A4, 144A, FRN, 4.179%, 3/26/37 | | | United States | | | | 366,373 | | | | | | | | 326,044 | |
| k | | Bear Stearns ARM Trust, FRN, | | | | | | | | | | | | | | | | |
| | 2002-11, 1A2, 4.438%, 2/25/33 | | | United States | | | | 4,843 | | | | | | | | 4,611 | |
| | 2006-2, 4A1, 3.971%, 7/25/36 | | | United States | | | | 66,093 | | | | | | | | 61,207 | |
| c,j | | BX Trust, 144A, FRN, | | | | | | | | | | | | | | | | |
| | 2017-APPL, 5.59%,(1-Month USD LIBOR + 3.15%), 7/15/34 | | | United States | | | | 1,530,000 | | | | | | | | 1,538,676 | |
| | 2017-SLCT, 5.59%,(1-Month USD LIBOR + 3.15%), 7/15/34 | | | United States | | | | 637,500 | | | | | | | | 641,890 | |
| | Countrywide Alternative Loan Trust, | | | | | | | | | | | | | | | | |
| | 2005-73CB, 1A2, 6.25%, 1/25/36 | | | United States | | | | 204,228 | | | | | | | | 211,209 | |
| | j 2005-IM1, A1, FRN, 3.03%,(1-Month USD LIBOR + 0.60%), 1/25/36 | | | United States | | | | 176,240 | | | | | | | | 174,051 | |
| | 2006-4CB, 2A3, 5.50%, 4/25/36 | | | United States | | | | 96,669 | | | | | | | | 96,294 | |
| | CS First Boston Mortgage Securities Corp., | | | | | | | | | | | | | | | | |
| | 2002-9, 1A2, 7.50%, 3/25/32 | | | United States | | | | 502,748 | | | | | | | | 577,177 | |
| | k2004-AR3, CB2, FRN, 4.739%, 4/25/34 | | | United States | | | | 155,064 | | | | | | | | 147,318 | |
| | c,j 2004-CF2, 2M2, 144A, FRN, 3.83%,(1-Month USD LIBOR + 1.40%), 5/25/44 | | | United States | | | | 297,275 | | | | | | | | 287,590 | |
| | CSMC Mortgage-BackedTrust, 2006-4, 9A1, 6.50%, 5/25/36 | | | United States | | | | 856,087 | | | | | | | | 494,533 | |
| c,k | | FHLMC Seasoned Credit Risk TransferTrust, 2017-2, M1, 144A, FRN, 4.00%, 8/25/56 | | | United States | | | | 2,000,000 | | | | | | | | 1,989,275 | |
| c,k | | FHLMC Structured Agency Credit Risk Debt Notes, 144A, FRN, | | | | | | | | | | | | | | | | |
| | 2017-SPI1, M2, 3.982%, 9/25/47 | | | United States | | | | 150,000 | | | | | | | | 144,627 | |
| | 2018-SPI1, M2, 3.744%, 2/25/48 | | | United States | | | | 693,000 | | | | | | | | 648,466 | |
| | 2018-SPI2, M2, 3.818%, 5/25/48 | | | United States | | | | 350,000 | | | | | | | | 333,514 | |
| | 2018-SPI3, M2, 4.165%, 8/25/48 | | | United States | | | | 400,000 | | | | | | | | 389,773 | |
| | 2018-SPI4, M2, 4.46%, 11/25/48 | | | United States | | | | 850,000 | | | | | | | | 840,480 | |
| k | | First Horizon Alternative Mortgage SecuritiesTrust, 2004-AA2, 2A1, FRN, 4.58%, 8/25/34 | | | United States | | | | 423,744 | | | | | | | | 425,913 | |
| | | | |
| | | |
| 22 | | Annual Report | | franklintempleton.com |
FRANKLIN ALTERNATIVE STRATEGIES FUNDS
STATEMENT OF INVESTMENTS
Franklin K2 Long Short Credit Fund(continued)
| | | | | | | | | | | | | | | | | | |
| | | | |
| | | | | Country | | | Principal Amount* | | | Value | |
| | | Asset-Backed Securities and CommercialMortgage-Backed
Securities (continued) | | | | | | | | | | | | |
| | | Mortgage Real Estate Investment Trusts (REITs) (continued) | |
| | GSR Mortgage Loan Trust, | | | | | | | | | | | | | | | | |
| | 2004-6F, 2A4, 5.50%, 5/25/34 | | | United States | | | | 210,786 | | | | | | | $ | 218,467 | |
| | k 2004-9, B1, FRN, 4.299%, 8/25/34 | | | United States | | | | 161,766 | | | | | | | | 157,673 | |
| | k 2005-AR6, B1, FRN, 4.679%, 9/25/35 | | | United States | | | | 644,356 | | | | | | | | 590,905 | |
| | 2007-1F, 1A1, 5.00%, 12/25/35 | | | United States | | | | 233,456 | | | | | | | | 256,907 | |
| | Home Equity MortgageTrust, 2004-6, M2, 5.821%, 4/25/35 | | | United States | | | | 89,067 | | | | | | | | 89,013 | |
| | Impac CMB Trust, | | | | | | | | | | | | | | | | |
| | 2004-4, 2A2, 4.639%, 9/25/34 | | | United States | | | | 178,430 | | | | | | | | 194,698 | |
| | j 2004-8, 3B, FRN, 5.055%,(1-Month USD LIBOR + 2.63%), 8/25/34 | | | United States | | | | 170,830 | | | | | | | | 169,249 | |
| | j 2005-2, 2B, FRN, 4.905%,(1-Month USD LIBOR + 2.48%), 4/25/35 | | | United States | | | | 123,602 | | | | | | | | 120,055 | |
| | j 2005-4, 2B1, FRN, 4.905%,(1-Month USD LIBOR + 2.48%), 5/25/35 | | | United States | | | | 149,334 | | | | | | | | 147,298 | |
| | j 2005-4, 2M1, FRN, 3.18%,(1-Month USD LIBOR + 0.75%), 5/25/35 | | | United States | | | | 174,223 | | | | | | | | 164,364 | |
| | j 2005-8, 2B, FRN, 4.68%,(1-Month USD LIBOR + 2.25%), 2/25/36 | | | United States | | | | 147,856 | | | | | | | | 145,227 | |
| | IndyMac INDX Mortgage Loan Trust, FRN, | | | | | | | | | | | | | | | | |
| | j 2004-AR14, 2A1A, 3.15%,(1-Month USD LIBOR + 0.72%), 1/25/35 | | | United States | | | | 790,147 | | | | | | | | 680,179 | |
| | j 2005-16IP, A1, 3.07%,(1-Month USD LIBOR + 0.64%), 7/25/45 | | | United States | | | | 238,937 | | | | | | | | 230,730 | |
| | k 2005-AR21, 4A1, 4.199%, 10/25/35 | | | United States | | | | 446,647 | | | | | | | | 429,105 | |
| | j 2006-AR12, A1, 2.62%,(1-Month USD LIBOR + 0.19%), 9/25/46 | | | United States | | | | 129,379 | | | | | | | | 123,236 | |
| | j 2006-AR29, A2, 2.51%,(1-Month USD LIBOR + 0.08%), 11/25/36 | | | United States | | | | 181,629 | | | | | | | | 175,005 | |
| k | | J.P. Morgan Mortgage Trust, | | | | | | | | | | | | | | | | |
| | 2006-A5, 6A1, FRN, 3.898%, 8/25/36 | | | United States | | | | 382,112 | | | | | | | | 351,707 | |
| | 2006-A7, 2A3, FRN, 4.204%, 1/25/37 | | | United States | | | | 162,529 | | | | | | | | 157,737 | |
| | 2007-A2, 2A1, FRN, 4.477%, 4/25/37 | | | United States | | | | 243,139 | | | | | | | | 229,630 | |
| | c 2019-2, B4, 144A, FRN, 4.689%, 8/25/49 | | | United States | | | | 598,229 | | | | | | | | 577,650 | |
| c,j | | JPMorgan Chase Commercial Mortgage Securities Trust, 2018-ASH8, F, 144A, FRN, 6.44%,(1-Month USD LIBOR + 4.00%), 2/15/35 | | | United States | | | | 1,000,000 | | | | | | | | 1,012,208 | |
| | Lehman MortgageTrust, 2005-3, 2A3, 5.50%, 1/25/36 | | | United States | | | | 102,335 | | | | | | | | 102,381 | |
| k | | MASTR Seasoned SecuritizationTrust, 2004-1, 4A1, FRN, 4.625%, 10/25/32 | | | United States | | | | 65,274 | | | | | | | | 67,623 | |
| c,j | | Motel 6 Trust, 2017-MTL6, E, 144A, FRN, 5.69%,(1-Month USD LIBOR + 3.25%), 8/15/34 | | | United States | | | | 397,546 | | | | | | | | 400,347 | |
| j | | New Century Home Equity LoanTrust, 2003-4, M1, FRN, 3.555%,(1-Month USD LIBOR + 1.13%), 10/25/33 | | | United States | | | | 622,612 | | | | | | | | 626,734 | |
| k | | Provident Funding Mortgage Loan Trust, FRN, | | | | | | | | | | | | | | | | |
| | 2003-1, B1, 4.652%, 8/25/33 | | | United States | | | | 73,525 | | | | | | | | 71,550 | |
| | 2004-1, B1, 4.858%, 4/25/34 | | | United States | | | | 36,871 | | | | | | | | 35,596 | |
| k | | RALI Trust, FRN, | | | | | | | | | | | | | | | | |
| | 2005-QA2, NB1, 4.281%, 2/25/35 | | | United States | | | | 29,175 | | | | | | | | 26,691 | |
| | 2005-QA8, NB2, 4.105%, 7/25/35 | | | United States | | | | 95,507 | | | | | | | | 86,223 | |
| | 2005-QA8, NB3, 5.054%, 7/25/35 | | | United States | | | | 27,861 | | | | | | | | 22,792 | |
| | Residential Asset SecuritizationTrust, 2006-A1, 1A1, 6.00%, 4/25/36 | | | United States | | | | 436,379 | | | | | | | | 320,308 | |
| k | | RFMSITrust, 2007-SA2, 3A, FRN, 5.138%, 4/25/37 | | | United States | | | | 1,374,903 | | | | | | | | 693,650 | |
| j | | Securitized Asset Backed Receivables LLCTrust, 2004-OP2, A2, FRN,3.13%, (1-Month USD LIBOR + 0.70%), 8/25/34 | | | United States | | | | 199,024 | | | | | | | | 193,754 | |
| k | | Structured ARM Loan Trust, FRN, | | | | | | | | | | | | | | | | |
| | 2004-2, 1A1, 5.218%, 3/25/34 | | | United States | | | | 135,644 | | | | | | | | 137,562 | |
| | 2004-4, B1, 4.656%, 4/25/34 | | | United States | | | | 454,608 | | | | | | | | 422,700 | |
| k | | Wachovia Mortgage Loan TrustLLC, 2005-B, 1A1, FRN, 4.533%, 10/20/35 | | | United States | | | | 558,636 | | | | | | | | 555,355 | |
| j | | WaMu Mortgage Pass-Through CertificatesTrust, 2007-OA3, 2A1A, FRN, 3.241%, (1 Year CMT + 0.76%), 4/25/47 | | | United States | | | | 68,656 | | | | | | | | 69,125 | |
| j | | Washington Mutual Mortgage Pass-ThroughCertificates, 2006-4, 3A2B, FRN, 2.51%,(1-Month USD LIBOR + 0.08%), 5/25/36 | | | United States | | | | 341,426 | | | | | | | | 246,769 | |
| k | | Washington Mutual MSC Mortgage Pass-Through Certificates Series Trust, FRN, | | | | | | | | | | | | | |
| | 2003-AR2, M, 3.878%, 5/25/33 | | | United States | | | | 142,172 | | | | | | | | 128,868 | |
| | 2003-AR3, B1, 4.268%, 6/25/33 | | | United States | | | | 313,682 | | | | | | | | 292,899 | |
| | | | | | |
| | | |
| franklintempleton.com | | Annual Report | | | 23 | |
FRANKLIN ALTERNATIVE STRATEGIES FUNDS
STATEMENT OF INVESTMENTS
Franklin K2 Long Short Credit Fund(continued)
| | | | | | | | | | | | | | | | | | |
| | | | |
| | | | | Country | | | Principal Amount* | | | Value | |
| | | Asset-Backed Securities and Commercial Mortgage-Backed
Securities (continued) | | | | | | | | | | | | |
| | | Mortgage Real Estate Investment Trusts (REITs) (continued) | |
| | Wells Fargo Mortgage Backed Securities Trust, | | | | | | | | | | | | | | | | |
| | k 2004-G, B1, FRN, 4.792%, 6/25/34 | | | United States | | | | 203,707 | | | | | | | $ | 193,426 | |
| | k 2005-AR2, 2A2, FRN, 5.147%, 3/25/35 | | | United States | | | | 72,514 | | | | | | | | 75,356 | |
| | 2006-19, A4, 5.25%, 12/26/36 | | | United States | | | | 222,501 | | | | | | | | 223,527 | |
| | 2007-3, 3B1, 5.50%, 4/25/22 | | | United States | | | | 258,240 | | | | | | | | 243,281 | |
| | | | | | | | | | | | | | | | | | |
| | | | | |
| | | | | | | | | | | | | | | | | 21,742,529 | |
| | | | | | | | | | | | | | | | | | |
| | Total Asset-Backed Securities and Commercial Mortgage-Backed Securities (Cost $43,047,895) | | | | | | | | | | | | | | | 44,386,078 | |
| | | | | | | | | | | | | | | | | | |
| | | Municipal Bonds in Reorganization 0.6% | | | |
| | | Puerto Rico 0.6% | |
| g | | Puerto Rico Commonwealth GO, Public Improvement, Refunding, Series A, | |
| | 5.50%, 7/01/39 | | | United States | | | | 230,000 | | | | | | | | 128,512 | |
| | 5.00%, 7/01/41 | | | United States | | | | 225,000 | | | | | | | | 125,719 | |
| g | | Puerto Rico Commonwealth GO, Refunding, Series A, 8.00%, 7/01/35 | | | United States | | | | 1,005,000 | | | | | | | | 492,450 | |
| | | | | | | | | | | | | | | | | | |
| | Total Municipal Bonds in Reorganization (Cost $737,388) | | | | | | | | | | | | | | | 746,681 | |
| | | | | | | | | | | | | | | | | | |
| | | | |
| | | | | Number of
Contracts | | | Notional Amount# | | | | |
| | | Options Purchased 0.2% | | | |
| | | Calls – Exchange-Traded 0.0%† | | | |
| | Beazer Homes USA Inc., November Strike Price $11.00, Expires 11/15/19 | | | 120 | | | | 12,000 | | | | | | | | 8,640 | |
| | Centene Corp., June Strike Price $60.00, Expires 6/21/19 | | | 24 | | | | 2,400 | | | | | | | | 4,920 | |
| | Centene Corp., June Strike Price $65.00, Expires 6/21/19 | | | 49 | | | | 4,900 | | | | | | | | 4,018 | |
| | Clearway Energy Inc., August Strike Price $17.50, Expires 8/16/19 | | | 160 | | | | 16,000 | | | | | | | | 1,600 | |
| | Tenneco Inc., A, January Strike Price $13.00, Expires 1/17/20 | | | 85 | | | | 8,500 | | | | | | | | 7,650 | |
| | | | | | | | | | | | | | | | | | |
| | | | | |
| | | | | | | | | | | | | | | | | 26,828 | |
| | | | | | | | | | | | | | | | | | |
| | | Puts – Exchange-Traded 0.2% | | | |
| | Carvana Co., August Strike Price $50.00, Expires 8/16/19 | | | 39 | | | | 3,900 | | | | | | | | 15,600 | |
| | CNX Resources Corp., July Strike Price $10.00, Expires 7/19/19 | | | 90 | | | | 9,000 | | | | | | | | 20,745 | |
| | Edison International, June Strike Price $55.00, Expires 6/21/19 | | | 42 | | | | 4,200 | | | | | | | | 1,680 | |
| | Edison International, October Strike Price $50.00, Expires 10/18/19 | | | 35 | | | | 3,500 | | | | | | | | 5,845 | |
| | iShares 20+ Year Treasury Bond ETF, June Strike Price $114.00, Expires 6/21/19 | | | 169 | | | | 16,900 | | | | | | | | 169 | |
| | S&P 500 Index, June Strike Price $2,600.00, Expires 6/21/19 | | | 72 | | | | 7,200 | | | | | | | | 64,800 | |
| | Southwestern Energy Co., June Strike Price $4.00, Expires 6/21/19 | | | 148 | | | | 14,800 | | | | | | | | 6,956 | |
| | SPDR S&P 500 ETF Trust, July Strike Price $280.00, Expires 7/19/19 | | | 91 | | | | 9,100 | | | | | | | | 84,630 | |
| | Sprint Corp., August Strike Price $7.00, Expires 8/16/19 | | | 59 | | | | 5,900 | | | | | | | | 6,225 | |
| | Sprint Corp., January Strike Price $5.00, Expires 1/17/20 | | | 179 | | | | 17,900 | | | | | | | | 10,740 | |
| | | | | | | | | | | | | | | | | | |
| | | | | |
| | | | | | | | | | | | | | | | | 217,390 | |
| | | | | | | | | | | | | | | | | | |
| | Total Options Purchased (Cost $194,615) | | | | | | | | | | | | | | | 244,218 | |
| | | | | | | | | | | | | | | | | | |
| | Total Investments before Short Term Investments
(Cost $84,013,555) | | | | | | | | | | | | | | | 86,134,480 | |
| | | | | | | | | | | | | | | | | | |
| | | | |
| | | | | Country | | | Principal Amount* | | | | |
| | | Short Term Investments 23.6% | | | | | | | | | |
| | | Foreign Government and Agency Securities
(Cost $191,935) 0.2% | | | | | | | | | | | | |
| m | | Argentina Treasury Bill, 6/28/19 | | | Argentina | | | | 7,960,873 | | | | ARS | | | | 211,872 | |
| | | | | | | | | | | | | | | | | | |
| | | | |
| | | |
| 24 | | Annual Report | | franklintempleton.com |
FRANKLIN ALTERNATIVE STRATEGIES FUNDS
STATEMENT OF INVESTMENTS
Franklin K2 Long Short Credit Fund(continued)
| | | | | | | | | | | | | | | | | | |
| | | | |
| | | | | Country | | | Principal Amount* | | | Value | |
| | | Short Term Investments(continued) | | | |
| | | Convertible Bonds (Cost $557,136) 0.4% | | | |
| | | Metals & Mining 0.4% | |
| | Royal Gold Inc., senior note, 2.875%, 6/15/19 | | | United States | | | | 555,000 | | | | | | | $ | 555,028 | |
| | | | | | | | | | | | | | | | | | |
| n | | Credit-Linked Notes 0.4% | | | |
| c | | HSBC Bank PLC, (Egypt Treasury Bill), 144A, zero cpn., 11/07/19 | | | United Kingdom | | | | 4,450,000 | | | | EGP | | | | 247,470 | |
| | Goldman Sachs International, senior note, (Nigeria OMO Bill), zero cpn., 9/30/19 | | | United States | | | | 84,967,000 | | | | NGN | | | | 226,870 | |
| | | | | | | | | | | | | | | | | | |
| | Total Credit-Linked Notes (Cost $468,468) | | | | | | | | | | | | | | | 474,340 | |
| | | | | | | | | | | | | | | | | | |
| | Total Investments before Money Market Funds and Repurchase Agreements (Cost $85,231,094) | | | | | | | | | | | | | | | 87,375,720 | |
| | | | | | | | | | | | | | | | | | |
| | | | | |
| | | | | | | | Shares | | | | | | | |
| | | Money Market Funds (Cost $23,296,955) 19.7% | | | |
| o | | Fidelity Investments Money Market Government Portfolio, Institutional, 2.27% | | | United States | | | | 23,296,955 | | | | | | | | 23,296,955 | |
| | | | |
| | | | | | | | Principal Amount* | | | | |
| | | Repurchase Agreements (Cost $3,412,487) 2.9% | | | |
| p | | Joint Repurchase Agreement, 2.480%, 6/03/19 (Maturity Value $3,413,193) | | | United States | | | | 3,412,487 | | | | | | | | 3,412,487 | |
| | BNP Paribas Securities Corp. (Maturity Value $2,951,798) Deutsche Bank Securities Inc. (Maturity Value $362,993) HSBC Securities (USA) Inc. (Maturity Value $98,402)
Collateralized by U.S. Government Agency Securities, 4.50%, 1/20/40; and U.S. Treasury Notes, 2.00% – 3.125%, 5/15/21 – 7/31/22; (valued at $3,481,979) | | | | | | | | | | | | | | | | |
| | | | | | | | | | | | | | | | | | |
| | Total Investments (Cost $111,940,536) 96.7% | | | | | | | | | | | | | | $ | 114,085,162 | |
| | Options Written (0.0)%† | | | | | | | | | | | | | | | (55,169 | ) |
| | Securities Sold Short (9.3)% | | | | | | | | | | | | | | | (10,915,280 | ) |
| | Other Assets, less Liabilities 12.6% | | | | | �� | | | | | | | | | | 14,916,317 | |
| | | | | | | | | | | | | | | | | | |
| | Net Assets 100.0% | | | | | | | | | | | | | | $ | 118,031,030 | |
| | | | | | | | | | | | | | | | | | |
| | | | |
| | | | | Number of
Contracts | | | Notional Amount# | | | | |
| q | | Options Written (0.0)%† | | | |
| | | Puts – Exchange-Traded (0.0)%† | | | |
| | Edison International, June Strike Price $47.50, Expires 6/21/19 | | | 42 | | | | 4,200 | | | | | | | | (525 | ) |
| | Edison International, October Strike Price $40.00, Expires 10/18/19 | | | 35 | | | | 3,500 | | | | | | | | (1,820 | ) |
| | SPDR S&P 500 ETF Trust, July Strike Price $265.00, Expires 7/19/19 | | | 142 | | | | 14,200 | | | | | | | | (52,824 | ) |
| | | | | | | | | | | | | | | | | | |
| | Total Options Written
(Premiums Received $48,144) | | | | | | | | | | | | | | | (55,169 | ) |
| | | | | | | | | | | | | | | | | | |
| | | | | |
| | | | | Country | | | Shares | | | | | | | |
| r | | Securities Sold Short (9.3)% | | | |
| | Common Stocks (0.3)% | | | | |
| | | Equity Real Estate Investment Trusts (REITs) (0.1)% | |
| | Seritage Growth Properties, A | | | United States | | | | 3,271 | | | | | | | | (136,793 | ) |
| | | | | | | | | | | | | | | | | | |
| | | Internet & Direct Marketing Retail (0.2)% | |
| | Wayfair Inc., A | | | United States | | | | 1,423 | | | | | | | | (204,926 | ) |
| | | | | | | | | | | | | | | | | | |
| | Total Common Stocks (Proceeds $284,558) | | | | | | | | | | | | | | | (341,719 | ) |
| | | | | | | | | | | | | | | | | | |
| | | | | | |
| | | |
| franklintempleton.com | | Annual Report | | | 25 | |
FRANKLIN ALTERNATIVE STRATEGIES FUNDS
STATEMENT OF INVESTMENTS
Franklin K2 Long Short Credit Fund(continued)
| | | | | | | | | | | | | | | | | | |
| | | | | |
| | | | | Country | | | Shares | | | | | | Value | |
| r | | Securities Sold Short(continued) | | | | | | | | | | | | |
| | | Exchange Traded Funds (Proceeds $2,341,774) (2.0)% | | | |
| | Invesco Senior Loan ETF | | | United States | | | | 103,510 | | | | | | | $ | (2,343,466 | ) |
| | | | | | | | | | | | | | | | | | |
| | | |
| | | | | | Principal Amount* | | | | |
| | | Corporate Bonds and Notes (6.4)% | | | |
| | | Aerospace & Defense (0.0)%† | |
| | Triumph Group Inc., senior note, 7.75%, 8/15/25 | | | United States | | | | 25,000 | | | | | | | | (24,250 | ) |
| | | | | | | | | | | | | | | | | | |
| | | Auto Components (0.2)% | |
| c | | Drivetime Automotive Group Inc. / Bridgecrest Acceptance Corp., senior secured note, 144A, 8.00%, 6/01/21 | | | United States | | | | 179,000 | | | | | | | | (181,685 | ) |
| | | | | | | | | | | | | | | | | | |
| | | Automobiles (0.1)% | |
| e | | Jaguar Land Rover Automotive PLC, Reg S, 5.625%, 2/01/23 | | | United Kingdom | | | | 150,000 | | | | | | | | (146,063 | ) |
| | | | | | | | | | | | | | | | | | |
| | | Banks (0.1)% | |
| e,f,s | | China Minsheng Banking Corp. Ltd., junior sub. note, Reg S, FRN, 4.95%, (US 5 Year CMTT-Note + 3.15%), Perpetual | | | China | | | | 88,000 | | | | | | | | (85,159 | ) |
| e,f,s | | China Zheshang Bank Co. Ltd., junior sub. note, Reg S, FRN, 5.45%, (US 5 Year CMTT-Note + 3.52%), Perpetual | | | China | | | | 72,000 | | | | | | | | (68,527 | ) |
| | | | | | | | | | | | | | | | | | |
| | | | | |
| | | | | | | | | | | | | | | | | (153,686 | ) |
| | | | | | | | | | | | | | | | | | |
| | | Commercial Services & Supplies (0.2)% | |
| e | | Intrum AB, senior note, Reg S, 3.125%, 7/15/24 | | | Sweden | | | | 200,000 | | | | EUR | | | | (218,379 | ) |
| | | | | | | | | | | | | | | | | | |
| | | Communications Equipment (0.1)% | |
| c | | Viasat Inc., senior note, 144A, 5.625%, 9/15/25 | | | United States | | | | 127,000 | | | | | | | | (123,825 | ) |
| | | | | | | | | | | | | | | | | | |
| | | Containers & Packaging (0.0)%† | |
| c | | Flex Acquisition Co. Inc., senior note, 144A, 7.875%, 7/15/26 | | | United States | | | | 23,000 | | | | | | | | (20,758 | ) |
| | | | | | | | | | | | | | | | | | |
| | | Diversified Telecommunication Services (0.2)% | |
| | Hughes Satellite Systems Corp., senior note, 6.625%, 8/01/26 | | | United States | | | | 183,000 | | | | | | | | (183,000 | ) |
| | | | | | | | | | | | | | | | | | |
| | | Energy Equipment & Services (0.3)% | |
| | Precision Drilling Corp., senior note, | | | | | | | | | | | | | | | | |
| | 5.25%, 11/15/24 | | | Canada | | | | 364,000 | | | | | | | | (325,780 | ) |
| | c 144A, 7.125%, 1/15/26 | | | Canada | | | | 10,000 | | | | | | | | (9,550 | ) |
| | | | | | | | | | | | | | | | | | |
| | | | | |
| | | | | | | | | | | | | | | | | (335,330 | ) |
| | | | | | | | | | | | | | | | | | |
| | | Health Care Providers & Services (0.6)% | |
| c | | Mallinckrodt International Finance SA / Mallinckrodt CB LLC, senior note, 144A, 5.75%, 8/01/22 | | | United States | | | | 896,000 | | | | | | | | (734,451 | ) |
| | | | | | | | | | | | | | | | | | |
| | | Hotels, Restaurants & Leisure (0.1)% | |
| e | | Thomas Cook Group PLC, senior note, Reg S, 6.25%, 6/15/22 | | | United Kingdom | | | | 200,000 | | | | EUR | | | | (82,406 | ) |
| | | | | | | | | | | | | | | | | | |
| | | Independent Power & Renewable Electricity Producers (0.4)% | |
| | NRG Energy Inc., | | | | | | | | | | | | | | | | |
| | c senior bond, 144A, 5.25%, 6/15/29 | | | United States | | | | 66,000 | | | | | | | | (67,909 | ) |
| | senior note, 5.75%, 1/15/28 | | | United States | | | | 438,000 | | | | | | | | (459,873 | ) |
| | | | | | | | | | | | | | | | | | |
| | | | | |
| | | | | | | | | | | | | | | | | (527,782 | ) |
| | | | | | | | | | | | | | | | | | |
| | | IT Services (0.4)% | |
| c | | GTT Communications Inc., senior note, 144A, 7.875%, 12/31/24 | | | United States | | | | 551,000 | | | | | | | | (465,595 | ) |
| | | | | | | | | | | | | | | | | | |
| | | Machinery (0.2)% | |
| e | | Loxam SAS, senior sub. note, Reg S, 6.00%, 4/15/25 | | | France | | | | 151,000 | | | | EUR | | | | (178,618 | ) |
| e | | Tereos Finance Groupe I SA, senior note, Reg S, 4.125%, 6/16/23 | | | France | | | | 100,000 | | | | EUR | | | | (92,358 | ) |
| | | | | | | | | | | | | | | | | | |
| | | | | |
| | | | | | | | | | | | | | | | | (270,976 | ) |
| | | | | | | | | | | | | | | | | | |
| | | Media (1.3)% | |
| | Altice Luxembourg SA, senior bond, | | | | | | | | | | | | | | | | |
| | e Reg S, 6.25%, 2/15/25 | | | Luxembourg | | | | 525,000 | | | | EUR | | | | (565,305 | ) |
| | c 144A, 7.625%, 2/15/25 | | | Luxembourg | | | | 358,000 | | | | | | | | (330,953 | ) |
| | | | |
| | | |
| 26 | | Annual Report | | franklintempleton.com |
FRANKLIN ALTERNATIVE STRATEGIES FUNDS
STATEMENT OF INVESTMENTS
Franklin K2 Long Short Credit Fund(continued)
| | | | | | | | | | | | | | | | | | |
| | | | |
| | | | | Country | | | Principal Amount* | | | Value | |
| r | | Securities Sold Short(continued) | | | | | | | | | | | | |
| | | Corporate Bonds and Notes (continued) | | | |
| | | Media (continued) | |
| c | | MDC Partners Inc., senior note, 144A, 6.50%, 5/01/24 | | | United States | | | | 385,000 | | | | | | | $ | (354,200 | ) |
| e | | Virgin Media Finance PLC, senior note, Reg S, 4.50%, 1/15/25 | | | United Kingdom | | | | 255,000 | | | | EUR | | | | (294,426 | ) |
| | | | | | | | | | | | | | | | | | |
| | | | | |
| | | | | | | | | | | | | | | | | (1,544,884 | ) |
| | | | | | | | | | | | | | | | | | |
| | | Metals & Mining (0.1)% | |
| c | | First Quantum Minerals Ltd., senior note, 144A, | | | | | | | | | | | | | | | | |
| | 7.25%, 5/15/22 | | | Zambia | | | | 60,000 | | | | | | | | (57,225 | ) |
| | 7.25%, 4/01/23 | | | Zambia | | | | 72,000 | | | | | | | | (65,970 | ) |
| | | | | | | | | | | | | | | | | | |
| | | | | |
| | | | | | | | | | | | | | | | | (123,195 | ) |
| | | | | | | | | | | | | | | | | | |
| | | Multiline Retail (0.1)% | |
| | Kohl’s Corp., senior bond, 4.25%, 7/17/25 | | | United States | | | | 89,000 | | | | | | | | (92,129 | ) |
| | | | | | | | | | | | | | | | | | |
| | | Oil, Gas & Consumable Fuels (1.7)% | |
| | Antero Resources Corp., senior note, 5.00%, 3/01/25 | | | United States | | | | 411,000 | | | | | | | | (391,477 | ) |
| | Chesapeake Energy Corp., senior note, 8.00%, 6/15/27 | | | United States | | | | 746,000 | | | | | | | | (663,940 | ) |
| | Southwestern Energy Co., | | | | | | | | | | | | | | | | |
| | senior bond, 7.75%, 10/01/27 | | | United States | | | | 853,000 | | | | | | | | (818,880 | ) |
| | senior note, 7.50%, 4/01/26 | | | United States | | | | 72,000 | | | | | | | | (69,480 | ) |
| | | | | | | | | | | | | | | | | | |
| | | | | |
| | | | | | | | | | | | | | | | | (1,943,777 | ) |
| | | | | | | | | | | | | | | | | | |
| | | Specialty Retail (0.0)%† | |
| | Bed Bath & Beyond Inc., senior bond, 3.749%, 8/01/24 | | | United States | | | | 55,000 | | | | | | | | (50,822 | ) |
| | | | | | | | | | | | | | | | | | |
| | | Wireless Telecommunication Services (0.3)% | |
| e | | Softbank Group Corp., senior bond, Reg S, 5.125%, 9/19/27 | | | Japan | | | | 300,000 | | | | | | | | (297,819 | ) |
| | | | | | | | | | | | | | | | | | |
| | Total Corporate Bonds and Notes
(Proceeds $7,941,186) | | | | | | | | | | | | | | | (7,520,812 | ) |
| | | | | | | | | | | | | | | | | | |
| | | Foreign Government and Agency Securities
(Proceeds $563,723) (0.5)% | | | |
| e | | Italian Treasury Bond, senior bond, Reg S, 3.00%, 8/01/29 | | | Italy | | | | 491,000 | | | | EUR | | | | (566,959 | ) |
| | | | | | | | | | | | | | | | | | |
| | | U.S. Government and Agency Securities (0.1)% | | | |
| | U.S. Treasury Bond, 3.00%, 2/15/49 | | | United States | | | | 1,000 | | | | | | | | (1,089 | ) |
| | U.S. Treasury Note, 2.875%, 5/15/28 | | | United States | | | | 133,000 | | | | | | | | (141,235 | ) |
| | | | | | | | | | | | | | | | | | |
| | Total U.S. Government and Agency Securities
(Proceeds $134,886) | | | | | | | | | | | | | | | (142,324 | ) |
| | | | | | | | | | | | | | | | | | |
| | Total Securities Sold Short (Proceeds $11,266,127) | | | | | | | | | | | | | | $ | (10,915,280 | ) |
| | | | | | | | | | | | | | | | | | |
†Rounds to less than 0.1% of net assets.
*The principal amount is stated in U.S. dollars unless otherwise indicated.
#Notional amount is the number of units specified in the contract, and can include currency units, bushels, shares, pounds, barrels or other units. Currency units are stated in U.S. dollars unless otherwise indicated.
aNon-income producing.
bA portion or all of the security has been segregated as collateral for securities sold short, open swap contracts, open forward exchange contracts, open futures contracts and/or open written option contracts. At May 31, 2019, the aggregate value of these securities and/or cash pledged amounted to $6,242,663, representing 5.3% of net assets.
cSecurity was purchased pursuant to Rule 144A under the Securities Act of 1933 and may be sold in transactions exempt from registration only to qualified institutional buyers or in public offering registered under the Securities Act of 1933. These securities have been deemed liquid under guidelines approved by the Trust’s Board of Trustees. At May 31, 2019, the net value of these securities was $46,226,672, representing 39.2% of net assets.
dIncome may be received in additional securities and/or cash.
eSecurity was purchased pursuant to Regulation S under the Securities Act of 1933, which exempts from registration securities offered and sold outside of the United States. Such a security cannot be sold in the United States without either an effective registration statement filed pursuant to the Securities Act of 1933, or pursuant to an exemption from registration. These securities have been deemed liquid under guidelines approved by the Trust’s Board of Trustees. At May 31, 2019, the net value of these securities was $(578,971), representing (0.5)% of net assets.
fThe coupon rate shown represents the rate at period end.
gSee Note 7 regarding defaulted securities.
| | | | | | |
| | | |
| franklintempleton.com | | Annual Report | | | 27 | |
FRANKLIN ALTERNATIVE STRATEGIES FUNDS
STATEMENT OF INVESTMENTS
Franklin K2 Long Short Credit Fund(continued)
hSee Note 1(h) regarding senior floating rate interests.
iSee Note 8 regarding unfunded loan commitments.
jThe coupon rate shown represents the rate inclusive of any caps or floors, if applicable, in effect at period end.
kAdjustable rate security with an interest rate that is not based on a published reference index and spread. The rate is based on the structure of the agreement and current market conditions. The coupon rate shown represents the rate at period end.
lInvestment in an interest-only security entitles holders to receive only the interest payment on the underlying instruments. The principal amount shown is the notional amount of the underlying instruments.
mThe security was issued on a discount basis with no stated coupon rate.
nSee Note 1(f) regarding credit-linked notes.
oThe rate shown is the annualizedseven-day yield at period end.
pSee Note 1(c) regarding joint repurchase agreement.
qSee Note 1(d) regarding written options.
rSee Note 1(g) regarding securities sold short.
sPerpetual security with no stated maturity date.
At May 31, 2019, the Fund had the following futures contracts outstanding. See Note 1(d).
| | | | | | | | | | | | | | | | | | | | |
| Futures Contracts | | | | | | | | | | | | | | | |
| | | | | |
| Description | | Type | | | Number of
Contracts | | | Notional
Amount* | | | Expiration
Date | | | Value/Unrealized
Appreciation
(Depreciation) | |
| Equity Contracts | | | | | | | | | | | | | | | | | | | | |
S&P 500E-Mini Index | | | Short | | | | 2 | | | $ | 275,260 | | | | 6/21/19 | | | $ | 236 | |
| Interest Rate Contracts | | | | | | | | | | | | | | | | | | | | |
Euro BUXL 30 Yr. Bond | | | Short | | | | 1 | | | | 218,940 | | | | 6/06/19 | | | | (15,514 | ) |
U.S. Treasury Long Bond | | | Long | | | | 1 | | | | 153,719 | | | | 9/19/19 | | | | 2,623 | |
| | | | | | | | | | | | | | | | | | | | |
| | | | | | | | | | | | | | | | | | | (12,891 | ) |
| | | | | | | | | | | | | | | | | | | | |
Total Futures Contracts | | | $ | (12,655 | ) |
| | | | | |
*As of period end.
At May 31, 2019, the Fund had the following forward exchange contracts outstanding. See Note 1(d).
| | | | | | | | | | | | | | | | | | | | | | | | | | | | | | | | |
| Forward Exchange Contracts | | | | | | | |
| | | | | | | | |
| Currency | | Counterpartya | | | Type | | | Quantity | | | Contract
Amount* | | | | | | Settlement
Date | | | Unrealized
Appreciation | | | Unrealized
Depreciation | |
| OTC Forward Exchange Contracts | | | | | | | | | | | | | | | | | | | | | | | | | | | | | |
Brazilian Real | | | JPHQ | �� | | | Buy | | | | 5,180,134 | | | | 1,308,430 | | | | | | | | 6/04/19 | | | $ | 11,212 | | | $ | — | |
Brazilian Real | | | JPHQ | | | | Sell | | | | 5,180,134 | | | | 1,299,958 | | | | | | | | 6/04/19 | | | | — | | | | (19,684 | ) |
Argentine Peso | | | JPHQ | | | | Buy | | | | 6,980,876 | | | | 149,515 | | | | | | | | 6/07/19 | | | | 4,652 | | | | — | |
Argentine Peso | | | JPHQ | | | | Sell | | | | 6,980,876 | | | | 155,823 | | | | | | | | 6/07/19 | | | | 1,656 | | | | — | |
Argentine Peso | | | JPHQ | | | | Buy | | | | 6,980,876 | | | | 154,137 | | | | | | | | 6/14/19 | | | | — | | | | (1,733 | ) |
Colombian Peso | | | JPHQ | | | | Buy | | | | 1,808,749,152 | | | | 582,140 | | | | | | | | 6/19/19 | | | | — | | | | (47,335 | ) |
Colombian Peso | | | JPHQ | | | | Sell | | | | 1,808,749,152 | | | | 532,142 | | | | | | | | 6/19/19 | | | | — | | | | (2,664 | ) |
Hungarian Forint | | | JPHQ | | | | Sell | | | | 32,828,256 | | | | 104,616 | | | | EUR | | | | 6/19/19 | | | | 7,565 | | | | (3,500 | ) |
Euro | | | JPHQ | | | | Buy | | | | 920,470 | | | | 1,035,446 | | | | | | | | 6/19/19 | | | | 1,564 | | | | (6,988 | ) |
Euro | | | JPHQ | | | | Sell | | | | 921,281 | | | | 1,054,303 | | | | | | | | 6/19/19 | | | | 23,373 | | | | — | |
Euro | | | JPHQ | | | | Sell | | | | 103,805 | | | | 32,828,256 | | | | HUF | | | | 6/19/19 | | | | 2,688 | | | | (5,846 | ) |
Hungarian Forint | | | JPHQ | | | | Buy | | | | 87,466,508 | | | | 318,772 | | | | | | | | 6/19/19 | | | | — | | | | (17,696 | ) |
Hungarian Forint | | | JPHQ | | | | Sell | | | | 87,466,508 | | | | 313,371 | | | | | | | | 6/19/19 | | | | 12,295 | | | | — | |
Indian Rupee | | | JPHQ | | | | Buy | | | | 10,211,266 | | | | 145,917 | | | | | | | | 6/19/19 | | | | 296 | | | | — | |
Indian Rupee | | | JPHQ | | | | Sell | | | | 10,211,266 | | | | 141,572 | | | | | | | | 6/19/19 | | | | — | | | | (4,641 | ) |
Indonesian Rupiah | | | JPHQ | | | | Buy | | | | 12,655,836,324 | | | | 882,089 | | | | | | | | 6/19/19 | | | | 2,389 | | | | — | |
Indonesian Rupiah | | | JPHQ | | | | Sell | | | | 12,655,836,324 | | | | 884,898 | | | | | | | | 6/19/19 | | | | 437 | | | | (17 | ) |
Mexican Peso | | | JPHQ | | | | Buy | | | | 7,827,021 | | | | 396,239 | | | | | | | | 6/19/19 | | | | 1,751 | | | | — | |
Mexican Peso | | | JPHQ | | | | Sell | | | | 7,827,021 | | | | 403,491 | | | | | | | | 6/19/19 | | | | 5,501 | | | | — | |
Russian Ruble | | | JPHQ | | | | Buy | | | | 34,516,686 | | | | 526,352 | | | | | | | | 6/19/19 | | | | 48 | | | | (157 | ) |
Russian Ruble | | | JPHQ | | | | Sell | | | | 34,516,686 | | | | 523,028 | | | | | | | | 6/19/19 | | | | 1,028 | | | | (4,242 | ) |
South African Rand | | | JPHQ | | | | Buy | | | | 11,652,449 | | | | 798,805 | | | | | | | | 6/19/19 | | | | 2,584 | | | | (3,360 | ) |
South African Rand | | | JPHQ | | | | Sell | | | | 11,652,449 | | | | 808,585 | | | | | | | | 6/19/19 | | | | 10,673 | | | | (117 | ) |
Turkish Lira | | | JPHQ | | | | Buy | | | | 1,427,888 | | | | 238,928 | | | | | | | | 6/19/19 | | | | 3,447 | | | | — | |
| | | | |
| | | |
| 28 | | Annual Report | | franklintempleton.com |
FRANKLIN ALTERNATIVE STRATEGIES FUNDS
STATEMENT OF INVESTMENTS
Franklin K2 Long Short Credit Fund(continued)
| | | | | | | | | | | | | | | | | | | | | | | | | | | | | | | | |
| Forward Exchange Contracts(continued) | | | | | | | |
| | | | | | | | |
| Currency | | Counterpartya | | | Type | | | Quantity | | | Contract
Amount* | | | | | | Settlement
Date | | | Unrealized
Appreciation | | | Unrealized
Depreciation | |
| OTC Forward Exchange Contracts(continued) | | | | | | | | | | | | | | | | | | | | | | | | | | | | | |
Turkish Lira | | | JPHQ | | | | Sell | | | | 2,111,171 | | | | 351,740 | | | | | | | | 6/19/19 | | | $ | 2,211 | | | $ | (8,828 | ) |
Euro | | | JPHQ | | | | Sell | | | | 300,000 | | | | 338,098 | | | | | | | | 6/28/19 | | | | 2,152 | | | | (24 | ) |
Brazilian Real | | | JPHQ | | | | Buy | | | | 2,590,067 | | | | 641,122 | | | | | | | | 7/02/19 | | | | 17,001 | | | | — | |
Colombian Peso | | | JPHQ | | | | Buy | | | | 1,808,749,152 | | | | 529,571 | | | | | | | | 9/18/19 | | | | 2,511 | | | | — | |
Euro | | | JPHQ | | | | Sell | | | | 509,093 | | | | 572,400 | | | | | | | | 9/18/19 | | | | — | | | | (1,561 | ) |
Indian Rupee | | | JPHQ | | | | Sell | | | | 10,211,266 | | | | 144,288 | | | | | | | | 9/18/19 | | | | — | | | | (489 | ) |
Indonesian Rupiah | | | JPHQ | | | | Buy | | | | 2,997,688,158 | | | | 206,197 | | | | | | | | 9/18/19 | | | | 883 | | | | — | |
Indonesian Rupiah | | | JPHQ | | | | Sell | | | | 9,658,148,166 | | | | 664,338 | | | | | | | | 9/18/19 | | | | — | | | | (2,847 | ) |
Russian Ruble | | | JPHQ | | | | Sell | | | | 32,432,494 | | | | 488,471 | | | | | | | | 9/18/19 | | | | 327 | | | | — | |
South African Rand | | | JPHQ | | | | Sell | | | | 10,004,091 | | | | 675,047 | | | | | | | | 9/18/19 | | | | — | | | | (2,397 | ) |
| | | | | | | | | | | | | | | | | | | | | | | | | | | | | | | | |
Total Forward Exchange Contracts | | | $ | 118,244 | | | $ | (134,126 | ) |
| | | | | | | | | | | | | | | | | |
Net unrealized appreciation (depreciation) | | | | | | | $ | (15,882 | ) |
| | | | | | | | | | | | | | | | | |
*In U.S. dollars unless otherwise indicated.
aMay be comprised of multiple contracts with the same counterparty, currency and settlement date.
At May 31, 2019, the Fund had the following credit default swap contracts outstanding. See Note 1(d).
| | | | | | | | | | | | | | | | | | | | | | | | | | | | | | | | | | | | | | | | |
| Credit Default Swap Contracts | | | | | | | | | | | | | | | | |
| | | | | | | | | |
| Description | | Periodic
Payment
Rate
Received
(Paid) | | | Payment
Frequency | | | | | | Maturity
Date | | | Notional
Amounta | | | Value | | | Unamortized
Upfront
Payments
(Receipts) | | | Unrealized
Appreciation
(Depreciation) | | | Ratingb | |
| Centrally Cleared Swap Contracts | | | | | | | | | | | | | | | | | | | | | | | | | | | | | |
| Contracts to Buy Protectionc | | | | | | | | | | | | | | | | | | | | | | | | | | | | | |
| Single Name | | | | | | | | | | | | | | | | | | | | | | | | | |
Government of Mexico | | | (1.00)% | | | | Quarterly | | | | | | | | 6/20/23 | | | $ | 449,000 | | | | | | | $ | 720 | | | $ | (63 | ) | | $ | 783 | | | | | |
Government of Mexico | | | (1.00)% | | | | Quarterly | | | | | | | | 12/20/23 | | | | 436,000 | | | | | | | | 3,460 | | | | 5,228 | | | | (1,768 | ) | | | | |
Government of South Africa | | | (1.00)% | | | | Quarterly | | | | | | | | 6/20/24 | | | | 900,000 | | | | | | | | 42,406 | | | | 39,510 | | | | 2,896 | | | | | |
Government of South Africa | | | (1.00)% | | | | Quarterly | | | | | | | | 6/20/22 | | | | 376,000 | | | | | | | | 5,415 | | | | 19,788 | | | | (14,373 | ) | | | | |
Government of South Korea | | | (1.00)% | | | | Quarterly | | | | | | | | 6/20/24 | | | | 405,474 | | | | | | | | (12,242 | ) | | | (13,756 | ) | | | 1,514 | | | | | |
Government of Turkey | | | (1.00)% | | | | Quarterly | | | | | | | | 6/20/24 | | | | 462,000 | | | | | | | | 74,210 | | | | 46,375 | | | | 27,835 | | | | | |
Government of Turkey | | | (1.00)% | | | | Quarterly | | | | | | | | 6/20/22 | | | | 6,000 | | | | | | | | 616 | | | | 316 | | | | 300 | | | | | |
| Traded Index | | | | | | | | | | | | | | | | | | | | | | | | | |
CDX.NA.HY.25 | | | (5.00)% | | | | Quarterly | | | | | | | | 12/20/20 | | | | 1,357,800 | | | | | | | | (62,202 | ) | | | 13,578 | | | | (75,780 | ) | | | | |
CDX.NA.HY.31 | | | (5.00)% | | | | Quarterly | | | | | | | | 12/20/23 | | | | 2,211,600 | | | | | | | | (122,471 | ) | | | (161,100 | ) | | | 38,629 | | | | | |
| Contracts to Sell Protectionc,d | | | | | | | | | | | | | | | | | | | | | | | | | | | | | |
| Single Name | | | | | | | | | | | | | | | | | | | | | | | | | |
Government of Russia | | | 1.00% | | | | Quarterly | | | | | | | | 6/20/24 | | | | 865,000 | | | | | | | | (12,222 | ) | | | (13,426 | ) | | | 1,204 | | | | BBB- | |
Government of South Africa | | | 1.00% | | | | Quarterly | | | | | | | | 12/20/22 | | | | 184,000 | | | | | | | | (3,949 | ) | | | (3,412 | ) | | | (537 | ) | | | BB | |
Government of Turkey | | | 1.00% | | | | Quarterly | | | | | | | | 12/20/22 | | | | 136,000 | | | | | | | | (16,016 | ) | | | (6,150 | ) | | | (9,866 | ) | | | B+ | |
| | | | | | | | | | | | | | | | | | | | | | | | | | | | | | | | |
Total Centrally Cleared Swap Contracts | | | | | | | | | | | | | | | | | | | $ | (102,275 | ) | | $ | (73,112 | ) | | $ | (29,163 | ) | | | | |
| | | | | | | | | | | | | | | | | | | | | | | | | | | | | | | | |
| OTC Swap Contracts | | | | | | | | | | | | | | | | | | | | | | | | | | | | | |
| Contracts to Buy Protectionc | | | | | | | | | | | | | | | | | | | | | | | | | | | | | |
| Single Name | | | | | | | | | | | Counterparty | | | | | | | | | | | | | | | | | | | | | | | | | | | | | |
Altice Luxembourg S.A. | | | (5.00)% | | | | Quarterly | | | | BZWS | | | | 12/20/22 | | | | 18,000 | | | | EUR | | | | (952 | ) | | | 251 | | | | (1,203 | ) | | | | |
Altice Luxembourg S.A. | | | (5.00)% | | | | Quarterly | | | | BZWS | | | | 12/20/22 | | | | 74,000 | | | | EUR | | | | (3,914 | ) | | | 779 | | | | (4,693 | ) | | | | |
Altice Luxembourg S.A. | | | (5.00)% | | | | Quarterly | | | | CITI | | | | 6/20/24 | | | | 66,000 | | | | EUR | | | | 119 | | | | 1,808 | | | | (1,689 | ) | | | | |
Altice Luxembourg S.A. | | | (5.00)% | | | | Quarterly | | | | GSCO | | | | 6/20/24 | | | | 66,000 | | | | EUR | | | | 119 | | | | 1,808 | | | | (1,689 | ) | | | | |
Altice Luxembourg S.A. | | | (5.00)% | | | | Quarterly | | | | JPHQ | | | | 12/20/22 | | | | 94,000 | | | | EUR | | | | (4,972 | ) | | | 1,629 | | | | (6,601 | ) | | | | |
| | | | | | |
| | | |
| franklintempleton.com | | Annual Report | | | 29 | |
FRANKLIN ALTERNATIVE STRATEGIES FUNDS
STATEMENT OF INVESTMENTS
Franklin K2 Long Short Credit Fund(continued)
| | | | | | | | | | | | | | | | | | | | | | | | | | | | | | | | | | | | | | | | |
| Credit Default Swap Contracts(continued) | | | | | | | | | | | | | | | | |
| | | | | | | | | |
| Description | | Periodic
Payment
Rate
Received
(Paid) | | | Payment
Frequency | | | Counterparty | | | Maturity
Date | | | Notional
Amounta | | | Value | | | Unamortized
Upfront
Payments
(Receipts) | | | Unrealized
Appreciation
(Depreciation) | | | Ratingb | |
| OTC Swap Contracts(continued) | | | | | | | | | | | | | | | | | | | | | | | | | | | | | |
| Contracts to Buy Protectionc(continued) | | | | | | | | | | | | | | | | | | | | | | | | | | | | | |
| Single Name(continued) | | | | | | | | | | | | | | | | | | | | | | | | | | | | | |
Avis Budget Group Inc. | | | (5.00)% | | | | Quarterly | | | | GSCO | | | | 12/20/22 | | | | 10,000 | | | | | | | $ | (1,139 | ) | | $ | (522 | ) | | $ | (617 | ) | | | | |
Avis Budget Group Inc. | | | (5.00)% | | | | Quarterly | | | | JPHQ | | | | 12/20/22 | | | | 78,000 | | | | | | | | (8,888 | ) | | | (5,406 | ) | | | (3,482 | ) | | | | |
Avis Budget Group Inc. | | | (5.00)% | | | | Quarterly | | | | JPHQ | | | | 12/20/22 | | | | 75,000 | | | | | | | | (8,546 | ) | | | (3,091 | ) | | | (5,455 | ) | | | | |
Casino Guichard-Perrachon | | | (1.00)% | | | | Quarterly | | | | GSCO | | | | 6/20/24 | | | | 24,000 | | | | EUR | | | | 5,600 | | | | 4,943 | | | | 657 | | | | | |
Caterpillar Financial Services Corp. | | | (1.00)% | | | | Quarterly | | | | JPHQ | | | | 6/20/21 | | | | 618,000 | | | | | | | | (11,606 | ) | | | 1,076 | | | | (12,682 | ) | | | | |
CenturyLink Inc. | | | (1.00)% | | | | Quarterly | | | | BZWS | | | | 12/20/23 | | | | 63,000 | | | | | | | | 6,004 | | | | 6,305 | | | | (301 | ) | | | | |
CenturyLink Inc. | | | (1.00)% | | | | Quarterly | | | | BZWS | | | | 12/20/23 | | | | 63,000 | | | | | | | | 6,004 | | | | 6,366 | | | | (362 | ) | | | | |
CenturyLink Inc. | | | (1.00)% | | | | Quarterly | | | | CITI | | | | 12/20/23 | | | | 38,000 | | | | | | | | 3,622 | | | | 3,736 | | | | (114 | ) | | | | |
CenturyLink Inc. | | | (1.00)% | | | | Quarterly | | | | CITI | | | | 12/20/23 | | | | 63,000 | | | | | | | | 6,004 | | | | 6,413 | | | | (409 | ) | | | | |
CenturyLink Inc. | | | (1.00)% | | | | Quarterly | | | | GSCO | | | | 12/20/23 | | | | 63,000 | | | | | | | | 6,004 | | | | 6,242 | | | | (238 | ) | | | | |
CenturyLink Inc. | | | (1.00)% | | | | Quarterly | | | | JPHQ | | | | 12/20/23 | | | | 89,000 | | | | | | | | 8,483 | | | | 8,939 | | | | (456 | ) | | | | |
Dean Foods Co. | | | (5.00)% | | | | Quarterly | | | | GSCO | | | | 12/20/19 | | | | 125,000 | | | | | | | | 8,079 | | | | 9,217 | | | | (1,138 | ) | | | | |
Dean Foods Co. | | | (5.00)% | | | | Quarterly | | | | GSCO | | | | 3/20/20 | | | | 37,000 | | | | | | | | 3,391 | | | | 3,762 | | | | (371 | ) | | | | |
Frontier Communications Corp. | | | (5.00)% | | | | Quarterly | | | | BZWS | | | | 12/20/21 | | | | 232,000 | | | | | | | | 65,285 | | | | 64,583 | | | | 702 | | | | | |
Frontier Communications Corp. | | | (5.00)% | | | | Quarterly | | | | GSCO | | | | 12/20/21 | | | | 65,000 | | | | | | | | 18,291 | | | | 18,532 | | | | (241 | ) | | | | |
Frontier Communications Corp. | | | (5.00)% | | | | Quarterly | | | | GSCO | | | | 12/20/22 | | | | 2,000 | | | | | | | | 713 | | | | 514 | | | | 199 | | | | | |
Frontier Communications Corp. | | | (5.00)% | | | | Quarterly | | | | GSCO | | | | 12/20/22 | | | | 56,000 | | | | | | | | 19,953 | | | | 13,152 | | | | 6,801 | | | | | |
Frontier Communications Corp. | | | (5.00)% | | | | Quarterly | | | | GSCO | | | | 12/20/22 | | | | 94,000 | | | | | | | | 33,493 | | | | 22,426 | | | | 11,067 | | | | | |
Frontier Communications Corp. | | | (5.00)% | | | | Quarterly | | | | JPHQ | | | | 12/20/21 | | | | 26,000 | | | | | | | | 7,316 | | | | 7,267 | | | | 49 | | | | | |
Frontier Communications Corp. | | | (5.00)% | | | | Quarterly | | | | JPHQ | | | | 12/20/22 | | | | 10,000 | | | | | | | | 3,563 | | | | 2,107 | | | | 1,456 | | | | | |
Frontier Communications Corp. | | | (5.00)% | | | | Quarterly | | | | JPHQ | | | | 12/20/22 | | | | 49,000 | | | | | | | | 17,459 | | | | 10,916 | | | | 6,543 | | | | | |
Frontier Communications Corp. | | | (5.00)% | | | | Quarterly | | | | JPHQ | | | | 12/20/22 | | | | 94,000 | | | | | | | | 33,493 | | | | 22,339 | | | | 11,154 | | | | | |
Frontier Communications Corp. | | | (5.00)% | | | | Quarterly | | | | MSCS | | | | 12/20/22 | | | | 82,000 | | | | | | | | 29,218 | | | | 23,600 | | | | 5,618 | | | | | |
The Hertz Corp. | | | (5.00)% | | | | Quarterly | | | | BZWS | | | | 6/20/20 | | | | 62,000 | | | | | | | | (3,272 | ) | | | (165 | ) | | | (3,107 | ) | | | | |
The Hertz Corp. | | | (5.00)% | | | | Quarterly | | | | BZWS | | | | 12/20/21 | | | | 27,000 | | | | | | | | (1,146 | ) | | | 121 | | | | (1,267 | ) | | | | |
The Hertz Corp. | | | (5.00)% | | | | Quarterly | | | | BZWS | | | | 12/20/21 | | | | 68,000 | | | | | | | | (2,885 | ) | | | 757 | | | | (3,642 | ) | | | | |
The Hertz Corp. | | | (5.00)% | | | | Quarterly | | | | BZWS | | | | 6/20/22 | | | | 102,000 | | | | | | | | (2,038 | ) | | | 9,187 | | | | (11,225 | ) | | | | |
The Hertz Corp. | | | (5.00)% | | | | Quarterly | | | | GSCO | | | | 6/20/20 | | | | 59,000 | | | | | | | | (3,114 | ) | | | — | | | | (3,114 | ) | | | | |
The Hertz Corp. | | | (5.00)% | | | | Quarterly | | | | GSCO | | | | 12/20/20 | | | | 138,000 | | | | | | | | (8,312 | ) | | | (376 | ) | | | (7,936 | ) | | | | |
The Hertz Corp. | | | (5.00)% | | | | Quarterly | | | | GSCO | | | | 12/20/20 | | | | 96,000 | | | | | | | | (5,782 | ) | | | (263 | ) | | | (5,519 | ) | | | | |
The Hertz Corp. | | | (5.00)% | | | | Quarterly | | | | GSCO | | | | 12/20/20 | | | | 41,000 | | | | | | | | (2,469 | ) | | | (112 | ) | | | (2,357 | ) | | | | |
The Hertz Corp. | | | (5.00)% | | | | Quarterly | | | | GSCO | | | | 12/20/21 | | | | 68,000 | | | | | | | | (2,885 | ) | | | (1,230 | ) | | | (1,655 | ) | | | | |
The Hertz Corp. | | | (5.00)% | | | | Quarterly | | | | GSCO | | | | 12/20/21 | | | | 68,000 | | | | | | | | (2,885 | ) | | | 1,204 | | | | (4,089 | ) | | | | |
The Hertz Corp. | | | (5.00)% | | | | Quarterly | | | | GSCO | | | | 12/20/21 | | | | 68,000 | | | | | | | | (2,885 | ) | | | 1,352 | | | | (4,237 | ) | | | | |
The Hertz Corp. | | | (5.00)% | | | | Quarterly | | | | GSCO | | | | 12/20/21 | | | | 136,000 | | | | | | | | (5,771 | ) | | | 1,512 | | | | (7,283 | ) | | | | |
The Hertz Corp. | | | (5.00)% | | | | Quarterly | | | | GSCO | | | | 6/20/22 | | | | 68,000 | | | | | | | | (1,359 | ) | | | 2,549 | | | | (3,908 | ) | | | | |
The Hertz Corp. | | | (5.00)% | | | | Quarterly | | | | GSCO | | | | 6/20/22 | | | | 69,000 | | | | | | | | (1,379 | ) | | | 3,650 | | | | (5,029 | ) | | | | |
The Hertz Corp. | | | (5.00)% | | | | Quarterly | | | | GSCO | | | | 6/20/22 | | | | 42,000 | | | | | | | | (839 | ) | | | 3,781 | | | | (4,620 | ) | | | | |
The Hertz Corp. | | | (5.00)% | | | | Quarterly | | | | GSCO | | | | 6/20/24 | | | | 274,000 | | | | | | | | 25,773 | | | | 25,773 | | | | — | | | | | |
The Hertz Corp. | | | (5.00)% | | | | Quarterly | | | | JPHQ | | | | 12/20/20 | | | | 98,000 | | | | | | | | (5,903 | ) | | | (1,851 | ) | | | (4,052 | ) | | | | |
The Hertz Corp. | | | (5.00)% | | | | Quarterly | | | | MSCS | | | | 6/20/22 | | | | 22,000 | | | | | | | | (440 | ) | | | 2,634 | | | | (3,074 | ) | | | | |
Intrum AB | | | (5.00)% | | | | Quarterly | | | | BZWS | | | | 6/20/24 | | | | 65,000 | | | | EUR | | | | (3,762 | ) | | | (5,449 | ) | | | 1,687 | | | | | |
Intrum AB | | | (5.00)% | | | | Quarterly | | | | BZWS | | | | 6/20/24 | | | | 25,000 | | | | EUR | | | | (1,447 | ) | | | (1,677 | ) | | | 230 | | | | | |
| | | | |
| | | |
| 30 | | Annual Report | | franklintempleton.com |
FRANKLIN ALTERNATIVE STRATEGIES FUNDS
STATEMENT OF INVESTMENTS
Franklin K2 Long Short Credit Fund(continued)
| | | | | | | | | | | | | | | | | | | | | | | | | | | | | | | | | | | | | | | | |
| Credit Default Swap Contracts(continued) | | | | | | | | | | | | | | | | |
| | | | | | | | | |
| Description | | Periodic
Payment
Rate
Received
(Paid) | | | Payment
Frequency | | | Counterparty | | | Maturity
Date | | | Notional
Amounta | | | Value | | | Unamortized
Upfront
Payments
(Receipts) | | | Unrealized
Appreciation
(Depreciation) | | | Ratingb | |
| OTC Swap Contracts(continued) | | | | | | | | | | | | | | | | | | | | | | | | | | | | | |
| Contracts to Buy Protectionc(continued) | | | | | | | | | | | | | | | | | | | | | | | | | | | | | |
| Single Name(continued) | | | | | | | | | | | | | | | | | | | | | | | | | | | | | |
Intrum AB | | | (5.00)% | | | | Quarterly | | | | CITI | | | | 6/20/24 | | | | 38,000 | | | | EUR | | | $ | (2,200 | ) | | $ | (2,644 | ) | | $ | 444 | | | | | |
Itochu Corp. | | | (1.00)% | | | | Quarterly | | | | GSCO | | | | 6/20/22 | | | | 17,300,000 | | | | JPY | | | | (4,066 | ) | | | (3,166 | ) | | | (900 | ) | | | | |
Itochu Corp. | | | (1.00)% | | | | Quarterly | | | | JPHQ | | | | 6/20/22 | | | | 4,307,000 | | | | JPY | | | | (1,012 | ) | | | (813 | ) | | | (199 | ) | | | | |
Jaguar Land Rover Automotive PLC | | | (5.00)% | | | | Quarterly | | | | BZWS | | | | 12/20/23 | | | | 60,000 | | | | EUR | | | | 1,753 | | | | 5,360 | | | | (3,607 | ) | | | | |
Jaguar Land Rover Automotive PLC | | | (5.00)% | | | | Quarterly | | | | JPHQ | | | | 12/20/23 | | | | 60,000 | | | | EUR | | | | 1,753 | | | | 8,367 | | | | (6,614 | ) | | | | |
JFE Holdings Inc. | | | (1.00)% | | | | Quarterly | | | | GSCO | | | | 6/20/22 | | | | 5,746,000 | | | | JPY | | | | (1,207 | ) | | | (1,085 | ) | | | (122 | ) | | | | |
JFE Holdings Inc. | | | (1.00)% | | | | Quarterly | | | | JPHQ | | | | 6/20/22 | | | | 3,802,000 | | | | JPY | | | | (799 | ) | | | (729 | ) | | | (70 | ) | | | | |
K. Hovnanian Enterprises Inc. | | | (5.00)% | | | | Quarterly | | | | BZWS | | | | 12/20/22 | | | | 64,000 | | | | | | | | 22,010 | | | | 26,822 | | | | (4,812 | ) | | | | |
K. Hovnanian Enterprises Inc. | | | (5.00)% | | | | Quarterly | | | | BZWS | | | | 6/20/24 | | | | 38,000 | | | | | | | | 16,072 | | | | 16,314 | | | | (242 | ) | | | | |
K. Hovnanian Enterprises Inc. | | | (5.00)% | | | | Quarterly | | | | GSCO | | | | 6/20/23 | | | | 24,000 | | | | | | | | 9,154 | | | | 3,467 | | | | 5,687 | | | | | |
K. Hovnanian Enterprises Inc. | | | (5.00)% | | | | Quarterly | | | | GSCO | | | | 6/20/23 | | | | 62,000 | | | | | | | | 23,648 | | | | 10,504 | | | | 13,144 | | | | | |
K. Hovnanian Enterprises Inc. | | | (5.00)% | | | | Quarterly | | | | GSCO | | | | 6/20/23 | | | | 99,000 | | | | | | | | 37,760 | | | | 14,188 | | | | 23,572 | | | | | |
K. Hovnanian Enterprises Inc. | | | (5.00)% | | | | Quarterly | | | | JPHQ | | | | 12/20/22 | | | | 12,000 | | | | | | | | 4,127 | | | | 2,876 | | | | 1,251 | | | | | |
K. Hovnanian Enterprises Inc. | | | (5.00)% | | | | Quarterly | | | | MSCS | | | | 12/20/19 | | | | 32,000 | | | | | | | | 1,682 | | | | 2,150 | | | | (468 | ) | | | | |
K. Hovnanian Enterprises Inc. | | | (5.00)% | | | | Quarterly | | | | MSCS | | | | 12/20/19 | | | | 42,000 | | | | | | | | 2,207 | | | | 2,505 | | | | (298 | ) | | | | |
K. Hovnanian Enterprises Inc. | | | (5.00)% | | | | Quarterly | | | | MSCS | | | | 12/20/23 | | | | 21,000 | | | | | | | | 8,489 | | | | 6,060 | | | | 2,429 | | | | | |
Kimco Realty Corp. | | | (1.00)% | | | | Quarterly | | | | JPHQ | | | | 6/20/24 | | | | 121,000 | | | | | | | | (159 | ) | | | 279 | | | | (438 | ) | | | | |
Kohl’s Corp. | | | (1.00)% | | | | Quarterly | | | | GSCO | | | | 6/20/24 | | | | 1,051,000 | | | | | | | | 36,943 | | | | 12,070 | | | | 24,873 | | | | | |
Lloyds Bank PLC | | | (1.00)% | | | | Quarterly | | | | BOFA | | | | 12/20/22 | | | | 196,000 | | | | EUR | | | | (1,784 | ) | | | (1,723 | ) | | | (61 | ) | | | | |
Lloyds Bank PLC | | | (1.00)% | | | | Quarterly | | | | GSCO | | | | 12/20/23 | | | | 210,000 | | | | EUR | | | | (256 | ) | | | 324 | | | | (580 | ) | | | | |
Lloyds Bank PLC | | | (1.00)% | | | | Quarterly | | | | GSCO | | | | 6/20/24 | | | | 127,000 | | | | EUR | | | | (3,336 | ) | | | 999 | | | | (4,335 | ) | | | | |
Lloyds Bank PLC | | | (1.00)% | | | | Quarterly | | | | JPHQ | | | | 12/20/22 | | | | 196,000 | | | | EUR | | | | (1,784 | ) | | | (1,877 | ) | | | 93 | | | | | |
Lloyds Bank PLC | | | (1.00)% | | | | Quarterly | | | | JPHQ | | | | 12/20/23 | | | | 67,000 | | | | EUR | | | | (82 | ) | | | 1,007 | | | | (1,089 | ) | | | | |
Lloyds Bank PLC | | | (1.00)% | | | | Quarterly | | | | JPHQ | | | | 6/20/24 | | | | 121,000 | | | | EUR | | | | 7,169 | | | | 7,169 | | | | — | | | | | |
Marubeni Corp. | | | (1.00)% | | | | Quarterly | | | | GSCO | | | | 6/20/22 | | | | 27,269,000 | | | | JPY | | | | (5,599 | ) | | | (4,128 | ) | | | (1,471 | ) | | | | |
Marubeni Corp. | | | (1.00)% | | | | Quarterly | | | | JPHQ | | | | 6/20/22 | | | | 6,291,000 | | | | JPY | | | | (1,292 | ) | | | (1,006 | ) | | | (286 | ) | | | | |
MBIA Inc. | | | (5.00)% | | | | Quarterly | | | | GSCO | | | | 12/20/23 | | | | 116,000 | | | | | | | | (13,560 | ) | | | (4,368 | ) | | | (9,192 | ) | | | | |
MBIA Inc. | | | (5.00)% | | | | Quarterly | | | | GSCO | | | | 12/20/23 | | | | 35,000 | | | | | | | | (4,091 | ) | | | (1,560 | ) | | | (2,531 | ) | | | | |
MBIA Inc. | | | (5.00)% | | | | Quarterly | | | | JPHQ | | | | 6/20/21 | | | | 269,000 | | | | | | | | (23,971 | ) | | | (17,579 | ) | | | (6,392 | ) | | | | |
MBIA Inc. | | | (5.00)% | | | | Quarterly | | | | JPHQ | | | | 12/20/23 | | | | 23,000 | | | | | | | | (2,689 | ) | | | (848 | ) | | | (1,841 | ) | | | | |
Mitsui O.S.K. Lines Ltd. | | | (1.00)% | | | | Quarterly | | | | JPHQ | | | | 6/20/22 | | | | 9,678,000 | | | | JPY | | | | (612 | ) | | | (455 | ) | | | (157 | ) | | | | |
Mitsui O.S.K. Lines Ltd. | | | (1.00)% | | | | Quarterly | | | | JPHQ | | | | 6/20/22 | | | | 3,618,000 | | | | JPY | | | | (229 | ) | | | (171 | ) | | | (58 | ) | | | | |
Nordstrom Inc. | | | (1.00)% | | | | Quarterly | | | | BOFA | | | | 6/20/24 | | | | 61,000 | | | | | | | | 3,492 | | | | 3,369 | | | | 123 | | | | | |
Nordstrom Inc. | | | (1.00)% | | | | Quarterly | | | | CITI | | | | 6/20/24 | | | | 61,000 | | | | | | | | 3,492 | | | | 3,164 | | | | 328 | | | | | |
Nordstrom Inc. | | | (1.00)% | | | | Quarterly | | | | GSCO | | | | 6/20/24 | | | | 61,000 | | | | | | | | 3,492 | | | | 3,241 | | | | 251 | | | | | |
Nordstrom Inc. | | | (1.00)% | | | | Quarterly | | | | GSCO | | | | 6/20/24 | | | | 60,800 | | | | | | | | 3,481 | | | | 3,439 | | | | 42 | | | | | |
Nordstrom Inc. | | | (1.00)% | | | | Quarterly | | | | GSCO | | | | 6/20/24 | | | | 121,000 | | | | | | | | 6,927 | | | | 6,413 | | | | 514 | | | | | |
Novafives SAS | | | (5.00)% | | | | Quarterly | | | | BZWS | | | | 12/20/23 | | | | 100,000 | | | | EUR | | | | 508 | | | | 6,826 | | | | (6,318 | ) | | | | |
NRG Energy Inc. | | | (5.00)% | | | | Quarterly | | | | GSCO | | | | 6/20/24 | | | | 24,000 | | | | | | | | (4,180 | ) | | | (4,230 | ) | | | 50 | | | | | |
Pizzaexpress Financing 1 PLC | | | (5.00)% | | | | Quarterly | | | | GSCO | | | | 12/20/20 | | | | 61,000 | | | | EUR | | | | 18,499 | | | | 13,909 | | | | 4,590 | | | | | |
Simon Property Group LP | | | (1.00)% | | | | Quarterly | | | | JPHQ | | | | 6/20/24 | | | | 301,000 | | | | | | | | (4,965 | ) | | | (4,231 | ) | | | (734 | ) | | | | |
| | | | | | |
| | | |
| franklintempleton.com | | Annual Report | | | 31 | |
FRANKLIN ALTERNATIVE STRATEGIES FUNDS
STATEMENT OF INVESTMENTS
Franklin K2 Long Short Credit Fund(continued)
| | | | | | | | | | | | | | | | | | | | | | | | | | | | | | | | | | | | | | | | |
| Credit Default Swap Contracts(continued) | | | | | | | | | | | | | | | | |
| | | | | | | | | |
| Description | | Periodic
Payment
Rate
Received
(Paid) | | | Payment
Frequency | | | Counterparty | | | Maturity
Date | | | Notional
Amounta | | | Value | | | Unamortized
Upfront
Payments
(Receipts) | | | Unrealized
Appreciation
(Depreciation) | | | Ratingb | |
| OTC Swap Contracts(continued) | | | | | | | | | | | | | | | | | | | | | | | | | | | | | |
| Contracts to Buy Protectionc(continued) | | | | | | | | | | | | | | | | | | | | | | | | | | | | | |
| Single Name(continued) | | | | | | | | | | | | | | | | | | | | | | | | | | | | | |
Simon Property Group LP | | | (1.00)% | | | | Quarterly | | | | JPHQ | | | | 6/20/24 | | | | 181,000 | | | | | | | $ | (2,985 | ) | | $ | (2,544 | ) | | $ | (441 | ) | | | | |
Simon Property Group LP | | | (1.00)% | | | | Quarterly | | | | JPHQ | | | | 6/20/24 | | | | 60,000 | | | | | | | | (990 | ) | | | (931 | ) | | | (59 | ) | | | | |
Softbank Group Corp. | | | (1.00)% | | | | Quarterly | | | | BZWS | | | | 12/20/23 | | | | 12,747,000 | | | | JPY | | | | 3,345 | | | | 4,827 | | | | (1,482 | ) | | | | |
Softbank Group Corp. | | | (1.00)% | | | | Quarterly | | | | BZWS | | | | 12/20/23 | | | | 12,747,000 | | | | JPY | | | | 3,345 | | | | 5,126 | | | | (1,781 | ) | | | | |
Softbank Group Corp. | | | (1.00)% | | | | Quarterly | | | | BZWS | | | | 6/20/24 | | | | 12,747,000 | | | | JPY | | | | 4,414 | | | | 5,039 | | | | (625 | ) | | | | |
Softbank Group Corp. | | | (1.00)% | | | | Quarterly | | | | BZWS | | | | 6/20/24 | | | | 25,494,000 | | | | JPY | | | | 8,827 | | | | 8,302 | | | | 525 | | | | | |
Softbank Group Corp. | | | (1.00)% | | | | Quarterly | | | | GSCO | | | | 12/20/23 | | | | 12,747,000 | | | | JPY | | | | 3,345 | | | | 5,030 | | | | (1,685 | ) | | | | |
Sprint Corp. | | | (5.00)% | | | | Quarterly | | | | JPHQ | | | | 12/20/23 | | | | 90,000 | | | | | | | | (9,252 | ) | | | (7,894 | ) | | | (1,358 | ) | | | | |
Staples Inc. | | | (5.00)% | | | | Quarterly | | | | BOFA | | | | 6/20/24 | | | | 39,000 | | | | | | | | 2,078 | | | | 1,423 | | | | 655 | | | | | |
Staples Inc. | | | (5.00)% | | | | Quarterly | | | | BZWS | | | | 6/20/24 | | | | 39,000 | | | | | | | | 2,078 | | | | 152 | | | | 1,926 | | | | | |
Staples Inc. | | | (5.00)% | | | | Quarterly | | | | BZWS | | | | 6/20/24 | | | | 25,000 | | | | | | | | 1,332 | | | | 804 | | | | 528 | | | | | |
Staples Inc. | | | (5.00)% | | | | Quarterly | | | | BZWS | | | | 6/20/24 | | | | 65,000 | | | | | | | | 3,464 | | | | 3,560 | | | | (96 | ) | | | | |
Staples Inc. | | | (5.00)% | | | | Quarterly | | | | CITI | | | | 6/20/24 | | | | 25,000 | | | | | | | | 1,332 | | | | 985 | | | | 347 | | | | | |
Staples Inc. | | | (5.00)% | | | | Quarterly | | | | CITI | | | | 6/20/24 | | | | 38,000 | | | | | | | | 2,025 | | | | 1,479 | | | | 546 | | | | | |
Staples Inc. | | | (5.00)% | | | | Quarterly | | | | CITI | | | | 6/20/24 | | | | 125,000 | | | | | | | | 6,661 | | | | 3,790 | | | | 2,871 | | | | | |
Staples Inc. | | | (5.00)% | | | | Quarterly | | | | JPHQ | | | | 6/20/24 | | | | 61,000 | | | | | | | | 3,250 | | | | (1,090 | ) | | | 4,340 | | | | | |
Staples Inc. | | | (5.00)% | | | | Quarterly | | | | JPHQ | | | | 6/20/24 | | | | 25,000 | | | | | | | | 1,332 | | | | 912 | | | | 420 | | | | | |
Thomas Cook Group PLC | | | (5.00)% | | | | Quarterly | | | | BZWS | | | | 12/20/20 | | | | 42,000 | | | | EUR | | | | 23,650 | | | | 3,602 | | | | 20,048 | | | | | |
Thomas Cook Group PLC | | | (5.00)% | | | | Quarterly | | | | CITI | | | | 12/20/20 | | | | 36,000 | | | | EUR | | | | 20,272 | | | | 2,977 | | | | 17,295 | | | | | |
Transocean Inc. | | | (5.00)% | | | | Quarterly | | | | BZWS | | | | 6/20/22 | | | | 2,000 | | | | | | | | (24 | ) | | | 48 | | | | (72 | ) | | | | |
Transocean Inc. | | | (5.00)% | | | | Quarterly | | | | BZWS | | | | 12/20/23 | | | | 17,000 | | | | | | | | 685 | | | | 2,020 | | | | (1,335 | ) | | | | |
Transocean Inc. | | | (1.00)% | | | | Quarterly | | | | BZWS | | | | 6/20/24 | | | | 17,000 | | | | | | | | 3,831 | | | | 2,409 | | | | 1,422 | | | | | |
Transocean Inc. | | | (5.00)% | | | | Quarterly | | | | GSCO | | | | 6/20/22 | | | | 43,000 | | | | | | | | (518 | ) | | | 1,288 | | | | (1,806 | ) | | | | |
Transocean Inc. | | | (5.00)% | | | | Quarterly | | | | GSCO | | | | 6/20/23 | | | | 98,000 | | | | | | | | 1,878 | | | | (2,656 | ) | | | 4,534 | | | | | |
Transocean Inc. | | | (5.00)% | | | | Quarterly | | | | GSCO | | | | 6/20/23 | | | | 109,000 | | | | | | | | 2,089 | | | | (2,104 | ) | | | 4,193 | | | | | |
Transocean Inc. | | | (5.00)% | | | | Quarterly | | | | GSCO | | | | 6/20/23 | | | | 34,000 | | | | | | | | 652 | | | | (1,807 | ) | | | 2,459 | | | | | |
Transocean Inc. | | | (5.00)% | | | | Quarterly | | | | GSCO | | | | 12/20/23 | | | | 60,000 | | | | | | | | 2,418 | | | | (5,219 | ) | | | 7,637 | | | | | |
Transocean Inc. | | | (5.00)% | | | | Quarterly | | | | GSCO | | | | 12/20/23 | | | | 60,000 | | | | | | | | 2,418 | | | | (4,837 | ) | | | 7,255 | | | | | |
| Contracts to Sell Protectionc,d | | | | | | | | | | | | | | | | | | | | | | | | | | | | | |
| Single Name | | | | | | | | | | | | | | | | | | | | | | | | | |
Avis Budget Group Inc. | | | 5.00% | | | | Quarterly | | | | BZWS | | | | 12/20/22 | | | | 27,000 | | | | | | | | 3,077 | | | | 1,878 | | | | 1,199 | | | | BB | |
Frontier Communications Corp. | | | 5.00% | | | | Quarterly | | | | GSCO | | | | 6/20/21 | | | | 80,000 | | | | | | | | (18,099 | ) | | | (20,105 | ) | | | 2,006 | | | | CCC+ | |
Frontier Communications Corp. | | | 5.00% | | | | Quarterly | | | | GSCO | | | | 12/20/23 | | | | 65,000 | | | | | | | | (26,301 | ) | | | (25,187 | ) | | | (1,114 | ) | | | CCC+ | |
Frontier Communications Corp. | | | 5.00% | | | | Quarterly | | | | GSCO | | | | 12/20/23 | | | | 26,000 | | | | | | | | (10,521 | ) | | | (9,897 | ) | | | (624 | ) | | | CCC+ | |
Jaguar Land Rover Automotive PLC | | | 5.00% | | | | Quarterly | | | | BZWS | | | | 12/20/21 | | | | 60,000 | | | | EUR | | | | 1,774 | | | | (3,110 | ) | | | 4,884 | | | | B+ | |
Jaguar Land Rover Automotive PLC | | | 5.00% | | | | Quarterly | | | | JPHQ | | | | 12/20/21 | | | | 60,000 | | | | EUR | | | | 1,774 | | | | (1,494 | ) | | | 3,268 | | | | B+ | |
K. Hovnanian Enterprises Inc. | | | 5.00% | | | | Quarterly | | | | BZWS | | | | 12/20/20 | | | | 63,000 | | | | | | | | (9,988 | ) | | | (13,021 | ) | | | 3,033 | | | | CC | |
K. Hovnanian Enterprises Inc. | | | 5.00% | | | | Quarterly | | | | BZWS | | | | 12/20/20 | | | | 53,000 | | | | | | | | (8,402 | ) | | | (7,909 | ) | | | (493 | ) | | | CC | |
K. Hovnanian Enterprises Inc. | | | 5.00% | | | | Quarterly | | | | BZWS | | | | 12/20/23 | | | | 9,000 | | | | | | | | (3,638 | ) | | | (4,264 | ) | | | 626 | | | | CC | |
K. Hovnanian Enterprises Inc. | | | 5.00% | | | | Quarterly | | | | GSCO | | | | 12/20/19 | | | | 53,000 | | | | | | | | (2,785 | ) | | | (3,443 | ) | | | 658 | | | | CC | |
K. Hovnanian Enterprises Inc. | | | 5.00% | | | | Quarterly | | | | GSCO | | | | 12/20/20 | | | | 32,000 | | | | | | | | (5,073 | ) | | | (3,484 | ) | | | (1,589 | ) | | | CC | |
| | | | |
| | | |
| 32 | | Annual Report | | franklintempleton.com |
FRANKLIN ALTERNATIVE STRATEGIES FUNDS
STATEMENT OF INVESTMENTS
Franklin K2 Long Short Credit Fund(continued)
| | | | | | | | | | | | | | | | | | | | | | | | | | | | | | | | | | | | | | | | |
| Credit Default Swap Contracts(continued) | | | | | | | | | | | | | | | | |
| | | | | | | | | |
| Description | | Periodic
Payment
Rate
Received
(Paid) | | | Payment
Frequency | | | Counterparty | | | Maturity
Date | | | Notional
Amounta | | | Value | | | Unamortized
Upfront
Payments
(Receipts) | | | Unrealized
Appreciation
(Depreciation) | | | Ratingb | |
| OTC Swap Contracts(continued) | | | | | | | | | | | | | | | | | | | | | | | | | | | | | | | | | | | | | |
| Contracts to Sell Protectionc,d(continued) | | | | | | | | | | | | | | | | | | | | | | | | | | | | | |
| Single Name(continued) | | | | | | | | | | | | | | | | | | | | | | | | | |
K. Hovnanian Enterprises Inc. | | | 5.00% | | | | Quarterly | | | | GSCO | | | | 12/20/23 | | | | 12,000 | | | | | | | $ | (4,851 | ) | | $ | (4,788 | ) | | $ | (63 | ) | | | CC | |
K. Hovnanian Enterprises Inc. | | | 5.00% | | | | Quarterly | | | | MSCS | | | | 12/20/19 | | | | 21,000 | | | | | | | | (1,104 | ) | | | (1,767 | ) | | | 663 | | | | CC | |
K. Hovnanian Enterprises Inc. | | | 5.00% | | | | Quarterly | | | | MSCS | | | | 12/20/22 | | | | 17,000 | | | | | | | | (5,846 | ) | | | (6,677 | ) | | | 831 | | | | CC | |
Thomas Cook Group PLC | | | 5.00% | | | | Quarterly | | | | CITI | | | | 6/20/24 | | | | 200,000 | | | | EUR | | | | (138,343 | ) | | | (57,261 | ) | | | (81,082 | ) | | | CCC+ | |
Thomas Cook Group PLC | | | 5.00% | | | | Quarterly | | | | CITI | | | | 6/20/24 | | | | 26,000 | | | | EUR | | | | (17,985 | ) | | | (6,863 | ) | | | (11,122 | ) | | | CCC+ | |
| | | | | | | | | | | | | | | | | | | | | | | | | | | | | | | | |
Total OTC Swap Contracts | | | | | | | | | | | $ | 188,822 | | | $ | 248,596 | | | $ | (59,774 | ) | | | | |
| | | | | | | | | | | | | | | | | | | | | | | | | | | | | | | | |
Total Credit Default Swap Contracts | | | | | | | | | | | $ | 86,547 | | | $ | 175,484 | | | $ | (88,937 | ) | | | | |
| | | | | | | | | | | | | | | | | | | | | | | | | | | | | | | | |
aIn U.S. dollars unless otherwise indicated. For contracts to sell protection, the notional amount is equal to the maximum potential amount of the future payments and no recourse provisions have been entered into in association with the contracts.
bBased on Standard and Poor’s (S&P) Rating for single name swaps.
cPerformance triggers for settlement of contract include default, bankruptcy or restructuring for single name swaps and failure to pay or bankruptcy of the underlying securities for traded index swaps.
dThe Fund enters contracts to sell protection to create a long credit position.
At May 31, 2019, the Fund had the following interest rate swap contracts outstanding. See Note 1(d).
| | | | | | | | | | | | | | | | |
| Interest Rate Swap Contracts | |
| | | | |
| Description | | Payment
Frequency | | | Maturity
Date | | | Notional
Amount* | | | Value/Unrealized
Appreciation
(Depreciation) | |
| Centrally Cleared Swap Contracts | | | | | | | | | | | | | |
Receive Floating rate 3 MonthGBP-LIBOR
Pay Fixed rate 1.75% | | | Semi-Annually | | | | 3/21/20 | | | | 1,012,000 | | | $ | (2,039 | ) |
Receive Floating rate 3 MonthUSD-LIBOR
Pay Fixed rate 1.75% | | | Semi-Annually | | | | 6/20/20 | | | | 1,500,000 | | | | (24,146 | ) |
Receive Fixed rate 8.33%
Pay Floating rateBRL-BRLCDI | | | Annually | | | | 1/02/23 | | | | 4,462,618 | BRL | | | 38,784 | |
Receive Fixed rate 8.36%
Pay Floating rateBRL-BRLCDI | | | Annually | | | | 1/02/23 | | | | 4,338,150 | BRL | | | 38,515 | |
Receive Floating rate MIBOR
Pay Fixed rate 6.67% | | | Annually | | | | 6/20/23 | | | | 13,265,333 | INR | | | (7,069 | ) |
Receive Floating rate 3 MonthUSD-LIBOR
Pay Fixed rate 2.25% | | | Semi-Annually | | | | 6/20/28 | | | | 1,100,000 | | | | (92,241 | ) |
Receive Floating rate 6 MonthGBP-LIBOR
Pay Fixed rate 1.41% | | | Semi-Annually | | | | 8/04/67 | | | | 108,000 | GBP | | | (6,504 | ) |
Receive Floating rate 6 MonthGBP-LIBOR
Pay Fixed rate 1.47% | | | Semi-Annually | | | | 9/18/69 | | | | 253,637 | GBP | | | (28,181 | ) |
| | | | | | | | | | | | | | | | |
Total Interest Rate Swap Contracts | | | $ | (82,881 | ) |
| | | | | | | | | | | | | | | | |
*In U.S. dollars unless otherwise indicated.
| | | | | | |
| | | |
| franklintempleton.com | | Annual Report | | | 33 | |
FRANKLIN ALTERNATIVE STRATEGIES FUNDS
STATEMENT OF INVESTMENTS
Franklin K2 Long Short Credit Fund(continued)
At May 31, 2019, the Fund had the following total return swap contracts outstanding. See Note 1(d).
| | | | | | | | | | | | | | | | | | | | | | |
| Total Return Swap Contracts | | | | |
| | | | | | |
| Underlying Instrument | | Financing Rate | | Payment
Frequency | | | Counterparty | | | Maturity
Date | | | Notional
Value | | | Value/Unrealized
Appreciation
(Depreciation) | |
| OTC Swap Contracts | | | | | | | | | | | | | | | | | | | | | | |
| Credit Contracts – Shorta | | | | | | | | | | | | | | | | | | | | | | |
iBoxx USD Liquid High Yield Index | | 1-Month LIBOR | | | Monthly | | | | JPHQ | | | | 6/20/19 | | | $ | 268,000 | | | $ | 2,302 | |
iBoxx USD Liquid High Yield Index | | 1-Month LIBOR | | | Monthly | | | | JPHQ | | | | 6/20/19 | | | | 113,000 | | | | 736 | |
iBoxx USD Liquid High Yield Index | | 1-Month LIBOR | | | Monthly | | | | JPHQ | | | | 6/20/19 | | | | 274,000 | | | | 1,159 | |
iBoxx USD Liquid High Yield Index | | 1-Month LIBOR | | | Quarterly | | | | MSCS | | | | 6/20/19 | | | | 160,000 | | | | (3,863 | ) |
iBoxx USD Liquid High Yield Index | | 1-Month LIBOR | | | Monthly | | | | MSCS | | | | 6/20/19 | | | | 31,000 | | | | 136 | |
iBoxx USD Liquid Leveraged Loan Index | | 1-Month LIBOR | | | Monthly | | | | GSCO | | | | 6/03/20 | | | | 608,718 | | | | (3,556 | ) |
| | | | | | | | | | | | | | | | | | | | | | |
| | | | | | | | | | | | | | | | | | | | | (3,086 | ) |
| | | | | | | | | | | | | | | | | | | | | | |
| Equity Contracts – Longb | | | | | | | | | | | | | | | | | | | | | | |
CNX Resources Corp. | | 1-Month LIBOR + 0.40% | | | Monthly | | | | GSCO | | | | 5/06/20 | | | | 26,161 | | | | (3,057 | ) |
CNX Resources Corp. | | 1-Month LIBOR + 0.40% | | | Monthly | | | | GSCO | | | | 5/27/20 | | | | 47,071 | | | | (756 | ) |
Energy Transfer Equity LP | | 1-Month LIBOR + 0.65% | | | Monthly | | | | JPHQ | | | | 1/28/20 | | | | 80,403 | | | | (11,076 | ) |
Energy Transfer Equity LP | | 1-Month LIBOR + 0.65% | | | Monthly | | | | JPHQ | | | | 1/28/20 | | | | 27,738 | | | | (6,094 | ) |
Energy Transfer Equity LP | | 1-Month LIBOR + 0.65% | | | Monthly | | | | JPHQ | | | | 1/28/20 | | | | 164,869 | | | | 8,981 | |
Energy Transfer Equity LP | | 1-Month LIBOR + 0.65% | | | Monthly | | | | JPHQ | | | | 1/28/20 | | | | 31,865 | | | | 4,145 | |
Energy Transfer Equity LP | | 1-Month LIBOR + 0.65% | | | Monthly | | | | JPHQ | | | | 5/25/20 | | | | 33,168 | | | | (1,761 | ) |
Energy Transfer Equity LP | | 1-Month LIBOR + 0.65% | | | Monthly | | | | JPHQ | | | | 6/29/20 | | | | 59,665 | | | | (6,026 | ) |
Suncoke Energy Partners LP | | 1-Month LIBOR + 2.50% | | | Monthly | | | | MSCS | | | | 6/02/20 | | | | 31,628 | | | | (7,963 | ) |
Suncoke Energy Partners LP | | 1-Month LIBOR + 2.50% | | | Monthly | | | | MSCS | | | | 6/02/20 | | | | 1,133 | | | | (415 | ) |
Suncoke Energy Partners LP | | 1-Month LIBOR + 2.50% | | | Monthly | | | | MSCS | | | | 6/02/20 | | | | 2,728 | | | | (999 | ) |
Suncoke Energy Partners LP | | 1-Month LIBOR + 2.50% | | | Monthly | | | | MSCS | | | | 6/02/20 | | | | 4,886 | | | | (1,896 | ) |
Suncoke Energy Partners LP | | 1-Month LIBOR + 2.50% | | | Monthly | | | | MSCS | | | | 6/02/20 | | | | 10,918 | | | | (4,192 | ) |
Suncoke Energy Partners LP | | 1-Month LIBOR + 2.50% | | | Monthly | | | | MSCS | | | | 6/02/20 | | | | 3,783 | | | | (1,471 | ) |
Suncoke Energy Partners LP | | 1-Month LIBOR + 2.50% | | | Monthly | | | | MSCS | | | | 6/02/20 | | | | 2,132 | | | | (829 | ) |
Suncoke Energy Partners LP | | 1-Month LIBOR + 2.50% | | | Monthly | | | | MSCS | | | | 6/02/20 | | | | 5,866 | | | | (2,210 | ) |
Suncoke Energy Partners LP | | 1-Month LIBOR + 2.50% | | | Monthly | | | | MSCS | | | | 6/02/20 | | | | 8,328 | | | | (3,235 | ) |
Suncoke Energy Partners LP | | 1-Month LIBOR + 2.50% | | | Monthly | | | | MSCS | | | | 6/02/20 | | | | 7,989 | | | | (3,009 | ) |
Suncoke Energy Partners LP | | 1-Month LIBOR + 2.50% | | | Monthly | | | | MSCS | | | | 6/02/20 | | | | 449 | | | | 8 | |
Suncoke Energy Partners LP | | 1-Month LIBOR + 2.50% | | | Monthly | | | | MSCS | | | | 6/02/20 | | | | 6,397 | | | | (2,397 | ) |
Suncoke Energy Partners LP | | 1-Month LIBOR + 2.50% | | | Monthly | | | | MSCS | | | | 6/02/20 | | | | 4,171 | | | | (1,532 | ) |
Suncoke Energy Partners LP | | 1-Month LIBOR + 2.50% | | | Monthly | | | | MSCS | | | | 6/02/20 | | | | 11,495 | | | | (4,034 | ) |
Suncoke Energy Partners LP | | 1-Month LIBOR + 2.50% | | | Monthly | | | | MSCS | | | | 6/02/20 | | | | 3,193 | | | | (1,133 | ) |
Suncoke Energy Partners LP | | 1-Month LIBOR + 2.50% | | | Monthly | | | | MSCS | | | | 6/02/20 | | | | 1,475 | | | | (575 | ) |
Suncoke Energy Partners LP | | 1-Month LIBOR + 2.50% | | | Monthly | | | | MSCS | | | | 6/02/20 | | | | 109 | | | | 6 | |
| | | | | | | | | | | | | | | | | | | | | | |
| | | | | | |
| | | | | | | | | | | | | | | | | | | | | (51,520 | ) |
| | | | | | | | | | | | | | | | | | | | | | |
| Equity Contracts – Shorta | | | | | | | | | | | | | | | | | | | | | | |
Tesla Inc. | | 1-Day OBFR | | | Monthly | | | | GSCO | | | | 6/11/19 | | | | 44,469 | | | | 10,661 | |
| | | | | | | | | | | | | | | | | | | | | | |
| Interest Rate Contracts – Longb | | | | | | | | | | | | | | | | | | | | | | |
Egyptian Treasury Bill | | — | | | Monthly | | | | DBAB | | | | 8/13/19 | | | | 103,019 | | | | 11,018 | |
Egyptian Treasury Bill | | 3-Month LIBOR + 0.50% | | | Monthly | | | | GSCO | | | | 8/13/19 | | | | 101,820 | | | | 10,773 | |
Government of Indonesia | | 3-Month LIBOR + 0.60% | | | Monthly | | | | BOFA | | | | 4/15/20 | | | | 437,914 | | | | (25,642 | ) |
Government of Indonesia | | 3-Month LIBOR + 0.60% | | | Monthly | | | | DBAB | | | | 6/15/32 | | | | 472,635 | | | | (27,234 | ) |
| | | | | | | | | | | | | | | | | | | | | | |
| | | | | | |
| | | | | | | | | | | | | | | | | | | | | (31,085 | ) |
| | | | | | | | | | | | | | | | | | | | | | |
Total Total Return Swap Contracts | | | | | | | $ | (75,030 | ) |
| | | | | | | | | | | | | | | | | | | | | | |
aThe Fund receives the variable financing rate and pays the total return on the underlying instrument.
bThe Fund receives the total return on the underlying instrument and pays a variable financing rate.
See Note 9 regarding other derivative information.
See Abbreviations on page 52.
| | | | |
| | | |
| 34 | | Annual Report | The accompanying notes are an integral part of these financial statements. | | franklintempleton.com |
FRANKLIN ALTERNATIVE STRATEGIES FUNDS
FINANCIAL STATEMENTS
Statement of Assets and Liabilities
May 31, 2019
Franklin K2 Long Short Credit Fund
| | | | |
| |
Assets: | | | | |
Investments in securities: | | | | |
Cost – Unaffiliated issuers | | $ | 108,528,049 | |
Cost – Unaffiliated repurchase agreements | | | 3,412,487 | |
| | | | |
Value – Unaffiliated issuers | | $ | 110,672,675 | |
Value – Unaffiliated repurchase agreements | | | 3,412,487 | |
Cash | | | 1,902,487 | |
Restricted cash for OTC derivatives (Note 1e) | | | 110,000 | |
Foreign currency, at value (cost $124,070) | | | 173,626 | |
Receivables: | | | | |
Investment securities sold | | | 3,979,772 | |
Capital shares sold | | | 169,526 | |
Dividends and interest | | | 699,258 | |
Affiliates | | | 48,546 | |
Deposits with brokers for: | | | | |
Securities sold short | | | 8,597,628 | |
OTC derivative contracts | | | 103,413 | |
Futures contracts | | | 22,039 | |
Centrally cleared swap contracts | | | 1,146,623 | |
Due from brokers | | | 629,996 | |
Variation margin on futures contracts | | | 5,061 | |
Variation margin on centrally cleared swap contracts | | | 13,341 | |
OTC swap contracts (upfront payments $594,284) | | | 517,703 | |
Unrealized appreciation on OTC forward exchange contracts | | | 118,244 | |
Unrealized appreciation on OTC swap contracts | | | 267,648 | |
Unrealized appreciation on unfunded loan commitments (Note 8) | | | 149,096 | |
Other assets | | | 91 | |
| | | | |
Total assets | | | 132,739,260 | |
| | | | |
Liabilities: | | | | |
Payables: | | | | |
Investment securities purchased | | | 2,372,875 | |
Capital shares redeemed | | | 33,297 | |
Management fees | | | 177,228 | |
Distribution fees | | | 5,784 | |
Deposits from brokers for: | | | | |
OTC derivative contracts | | | 110,000 | |
Due to brokers | | | 93,370 | |
OTC swap contracts (upfront receipts $300,900) | | | 269,107 | |
Options written, at value (premiums received $48,144) | | | 55,169 | |
Securities sold short, at value (proceeds $11,266,127) | | | 10,915,280 | |
Unrealized depreciation on OTC forward exchange contracts | | | 134,126 | |
Unrealized depreciation on OTC swap contracts | | | 402,452 | |
Accrued expenses and other liabilities | | | 139,542 | |
| | | | |
Total liabilities | | | 14,708,230 | |
| | | | |
Net assets, at value | | $ | 118,031,030 | |
| | | | |
Net assets consist of: | | | | |
Paid-in capital | | $ | 115,115,128 | |
Total distributable earnings (loss) | | | 2,915,902 | |
| | | | |
Net assets, at value | | $ | 118,031,030 | |
| | | | |
| | | | | | |
| | | |
| franklintempleton.com | | The accompanying notes are an integral part of these financial statements. | Annual Report | | | 35 | |
FRANKLIN ALTERNATIVE STRATEGIES FUNDS
FINANCIAL STATEMENTS
Statement of Assets and Liabilities(continued)
May 31, 2019
Franklin K2 Long Short Credit Fund
| | | | |
| |
Class A: | | | | |
Net assets, at value | | | $27,870,319 | |
| | | | |
Shares outstanding | | | 2,665,826 | |
| | | | |
Net asset value per sharea | | | $10.45 | |
| | | | |
Maximum offering price per share (net asset value per share ÷ 94.50%) | | | $11.06 | |
| | | | |
Class C: | | | | |
Net assets, at value | | | $2,893,217 | |
| | | | |
Shares outstanding | | | 281,859 | |
| | | | |
Net asset value and maximum offering price per sharea | | | $10.26 | |
| | | | |
Class R: | | | | |
Net assets, at value | | | $166,469 | |
| | | | |
Shares outstanding | | | 16,075 | |
| | | | |
Net asset value and maximum offering price per share | | | $10.36 | |
| | | | |
Class R6: | | | | |
Net assets, at value | | | $233,404 | |
| | | | |
Shares outstanding | | | 22,328 | |
| | | | |
Net asset value and maximum offering price per share | | | $10.45 | |
| | | | |
Advisor Class: | | | | |
Net assets, at value | | | $86,867,621 | |
| | | | |
Shares outstanding | | | 8,305,353 | |
| | | | |
Net asset value and maximum offering price per share | | | $10.46 | |
| | | | |
aRedemption price is equal to net asset value less contingent deferred sales charges, if applicable.
| | | | |
| | | |
| 36 | | Annual Report | The accompanying notes are an integral part of these financial statements. | | franklintempleton.com |
FRANKLIN ALTERNATIVE STRATEGIES FUNDS
FINANCIAL STATEMENTS
Statement of Operations
for the year ended May 31, 2019
Franklin K2 Long Short Credit Fund
| | | | |
| |
Investment income: | | | | |
Dividends: (net of foreign taxes)* | | | | |
Unaffiliated issuers: | | | | |
Paid in cash | | $ | 468,911 | |
Non-cash dividends | | | 363,131 | |
Interest: | | | | |
Unaffiliated issuers: | | | | |
Paydown gain (loss) | | | 303,123 | |
Paid in cash | | | 5,439,437 | |
| | | | |
Total investment income | | | 6,574,602 | |
| | | | |
Expenses: | | | | |
Management fees (Note 3a) | | | 2,021,634 | |
Distribution fees: (Note 3c) | | | | |
Class A | | | 48,160 | |
Class C | | | 28,901 | |
Class R | | | 771 | |
Transfer agent fees: (Note 3e) | | | | |
Class A | | | 32,705 | |
Class C | | | 2,422 | |
Class R | | | 138 | |
Class R6 | | | 241 | |
Advisor Class | | | 53,708 | |
Custodian fees (Note 4) | | | 83,719 | |
Reports to shareholders | | | 35,787 | |
Registration and filing fees | | | 86,441 | |
Professional fees | | | 172,795 | |
Trustees’ fees and expenses | | | 33,828 | |
Dividends and interest on securities sold short | | | 535,738 | |
Security borrowing fees | | | 123,413 | |
Other | | | 49,779 | |
| | | | |
Total expenses | | | 3,310,180 | |
Expense reductions (Note 4) | | | (12,386 | ) |
Expenses waived/paid by affiliates (Note 3f) | | | (485,969 | ) |
| | | | |
Net expenses | | | 2,811,825 | |
| | | | |
Net investment income | | | 3,762,777 | |
| | | | |
Realized and unrealized gains (losses): | | | | |
Net realized gain (loss) from: | | | | |
Investments: | | | | |
Unaffiliated issuers | | | (815,900 | ) |
Written options | | | 64,261 | |
Foreign currency transactions | | | (33,685 | ) |
Forward exchange contracts | | | 408,428 | |
Futures contracts | | | (28,411 | ) |
Securities sold short | | | 832,877 | |
Swap contracts | | | (120,737 | ) |
| | | | |
Net realized gain (loss) | | | 306,833 | |
| | | | |
Net change in unrealized appreciation (depreciation) on: | | | | |
Investments: | | | | |
Unaffiliated issuers | | | 32,561 | |
Translation of other assets and liabilities denominated in foreign currencies | | | (94,500 | ) |
Forward exchange contracts | | | (226,770 | ) |
Written options | | | (13,737 | ) |
Futures contracts | | | (510 | ) |
Securities sold short | | | (15,363 | ) |
Swap contracts | | | 119,020 | |
| | | | |
Net change in unrealized appreciation (depreciation) | | | (199,299 | ) |
| | | | |
Net realized and unrealized gain (loss) | | | 107,534 | |
| | | | |
Net increase (decrease) in net assets resulting from operations | | $ | 3,870,311 | |
| | | | |
| |
* Foreign taxes withheld on dividends | | $ | 13 | |
| | | | | | |
| | | |
| franklintempleton.com | | The accompanying notes are an integral part of these financial statements. | Annual Report | | | 37 | |
FRANKLIN ALTERNATIVE STRATEGIES FUNDS
FINANCIAL STATEMENTS
Statements of Changes in Net Assets
Franklin K2 Long Short Credit Fund
| | | | | | | | |
| |
| | | Year Ended May 31, | |
| | |
| | | 2019 | | | 2018 | |
Increase (decrease) in net assets: | | | | | | | | |
Operations: | | | | | | | | |
Net investment income | | $ | 3,762,777 | | | $ | 2,327,629 | |
Net realized gain (loss) | | | 306,833 | | | | 481,921 | |
Net change in unrealized appreciation (depreciation) | | | (199,299 | ) | | | 206,551 | |
| | | | |
Net increase (decrease) in net assets resulting from operations | | | 3,870,311 | | | | 3,016,101 | |
| | | | |
Distributions to shareholders: (Note 1j) | | | | | | | | |
Class A | | | (1,424,776 | ) | | | (1,512,713 | ) |
Class C | | | (100,011 | ) | | | (44,183 | ) |
Class R | | | (5,804 | ) | | | (5,125 | ) |
Class R6 | | | (7,008 | ) | | | (420,793 | ) |
Advisor Class | | | (2,656,330 | ) | | | (1,068,736 | ) |
| | | | |
Total distributions to shareholders | | | (4,193,929 | ) | | | (3,051,550 | ) |
| | | | |
Capital share transactions: (Note 2) | | | | | | | | |
Class A | | | (17,059,204 | ) | | | 4,137,021 | |
Class C | | | 409,512 | | | | 996,451 | |
Class R | | | 5,307 | | | | 34,638 | |
Class R6 | | | 221,435 | | | | (13,046,394 | ) |
Advisor Class | | | 41,498,540 | | | | 20,379,574 | |
| | | | |
Total capital share transactions | | | 25,075,590 | | | | 12,501,290 | |
| | | | |
Net increase (decrease) in net assets | | | 24,751,972 | | | | 12,465,841 | |
Net assets: | | | | | | | | |
Beginning of year | | | 93,279,058 | | | | 80,813,217 | |
| | | | |
End of year (Note 1j) | | $ | 118,031,030 | | | $ | 93,279,058 | |
| | | | |
| | | | |
| | | |
| 38 | | Annual Report | The accompanying notes are an integral part of these financial statements. | | franklintempleton.com |
FRANKLIN ALTERNATIVE STRATEGIES FUNDS
FRANKLIN K2 LONG SHORT CREDIT FUND
Notes to Financial Statements
1. Organization and Significant Accounting Policies
Franklin Alternative Strategies Funds (Trust) is registered under the Investment Company Act of 1940 (1940 Act) as anopen-end management investment company, consisting of four separate funds and applies the specialized accounting and reporting guidance in U.S. Generally Accepted Accounting Principles (U.S. GAAP). Franklin K2 Long Short Credit Fund (Fund) is included in this report. The Fund offers five classes of shares: Class A, Class C, Class R, Class R6 and Advisor Class. Beginning on October 19, 2018, Class C shares automatically convert to Class A shares after they have been held for 10 years. Each class of shares may differ by its initial sales load, contingent deferred sales charges, voting rights on matters affecting a single class, its exchange privilege and fees due to differing arrangements for distribution and transfer agent fees.
The following summarizes the Fund’s significant accounting policies.
a. Financial Instrument Valuation
The Fund’s investments in financial instruments are carried at fair value daily. Fair value is the price that would be received to sell an asset or paid to transfer a liability in an orderly transaction between market participants on the measurement date. The Fund calculates the net asset value (NAV) per share each business day as of 4 p.m. Eastern time or the regularly scheduled close of the New York Stock Exchange (NYSE), whichever is earlier. Under compliance policies and procedures approved by the Trust’s Board of Trustees (the Board), the Fund’s administrator has responsibility for oversight of valuation, including leading the cross-functional Valuation Committee (VC). The Fund may utilize independent pricing services, quotations from securities and financial instrument dealers, and other market sources to determine fair value.
Equity securities, exchange traded funds and derivative financial instruments listed on an exchange or on the NASDAQ National Market System are valued at the last quoted sale price or the official closing price of the day, respectively. Foreign equity securities are valued as of the close of trading on the foreign stock exchange on which the security is primarily traded or as of 4 p.m. Eastern time. The value is then converted into its U.S. dollar equivalent at the foreign exchange rate in effect at 4 p.m. Eastern time on the day that the value of the security is determined.Over-the-counter (OTC) securities are valued within the
range of the most recent quoted bid and ask prices. Securities that trade in multiple markets or on multiple exchanges are valued according to the broadest and most representative market. Certain equity securities are valued based upon fundamental characteristics or relationships to similar securities.
Debt securities generally trade in the OTC market rather than on a securities exchange. The Fund’s pricing services use multiple valuation techniques to determine fair value. In instances where sufficient market activity exists, the pricing services may utilize a market-based approach through which quotes from market makers are used to determine fair value. In instances where sufficient market activity may not exist or is limited, the pricing services also utilize proprietary valuation models which may consider market characteristics such as benchmark yield curves, credit spreads, estimated default rates, anticipated market interest rate volatility, coupon rates, anticipated timing of principal repayments, underlying collateral, and other unique security features in order to estimate the relevant cash flows, which are then discounted to calculate the fair value. Securities denominated in a foreign currency are converted into their U.S. dollar equivalent at the foreign exchange rate in effect at 4 p.m. Eastern time on the date that the values of the foreign debt securities are determined.
Investments inopen-end mutual funds are valued at the closing NAV. Investments in repurchase agreements are valued at cost, which approximates fair value.
Certain derivative financial instruments are centrally cleared or trade in the OTC market. The Fund’s pricing services use various techniques including industry standard option pricing models and proprietary discounted cash flow models to determine the fair value of those instruments. The Fund’s net benefit or obligation under the derivative contract, as measured by the fair value of the contract, is included in net assets.
The Fund has procedures to determine the fair value of financial instruments for which market prices are not reliable or readily available. Under these procedures, the Fund primarily employs a market-based approach which may use related or comparable assets or liabilities, recent transactions, market multiples, book values, and other relevant information for the investment to determine the fair value of the investment. An income-based valuation approach may also be used in which the anticipated future cash flows of the investment are discounted to calculate fair value. Discounts may also be applied due to the nature or duration of any restrictions on
the disposition of the investments. Due to the inherent
| | | | | | |
| | | |
| franklintempleton.com | | Annual Report | | | 39 | |
FRANKLIN ALTERNATIVE STRATEGIES FUNDS
NOTES TO FINANCIAL STATEMENTS
Franklin K2 Long Short Credit Fund(continued)
uncertainty of valuations of such investments, the fair values may differ significantly from the values that would have been used had an active market existed.
Trading in securities on foreign securities stock exchanges and OTC markets may be completed before 4 p.m. Eastern time. In addition, trading in certain foreign markets may not take place on every Fund’s business day. Occasionally, events occur between the time at which trading in a foreign security is completed and 4 p.m. Eastern time that might call into question the reliability of the value of a portfolio security held by the Fund. As a result, differences may arise between the value of the Fund’s portfolio securities as determined at the foreign market close and the latest indications of value at 4 p.m. Eastern time. In order to minimize the potential for these differences, the VC monitors price movements following the close of trading in foreign stock markets through a series of country specific market proxies (such as baskets of American Depositary Receipts, futures contracts and exchange traded funds). These price movements are measured against established trigger thresholds for each specific market proxy to assist in determining if an event has occurred that may call into question the reliability of the values of the foreign securities held by the Fund. If such an event occurs, the securities may be valued using fair value procedures, which may include the use of independent pricing services.
When the last day of the reporting period is anon-business day, certain foreign markets may be open on those days that the Fund’s NAV is not calculated, which could result in differences between the value of the Fund’s portfolio securities on the last business day and the last calendar day of the reporting period. Any significant security valuation changes due to an open foreign market are adjusted and reflected by the Fund for financial reporting purposes.
b. Foreign Currency Translation
Portfolio securities and other assets and liabilities denominated in foreign currencies are translated into U.S. dollars based on the exchange rate of such currencies against U.S. dollars on the date of valuation. The Fund may enter into foreign currency exchange contracts to facilitate transactions denominated in a foreign currency. Purchases and sales of securities, income and expense items denominated in foreign currencies are translated into U.S. dollars at the exchange rate in effect on the transaction date. Portfolio securities and assets and liabilities denominated in foreign currencies
contain risks that those currencies will decline in value relative to the U.S. dollar. Occasionally, events may impact the availability or reliability of foreign exchange rates used to convert the U.S. dollar equivalent value. If such an event occurs, the foreign exchange rate will be valued at fair value using procedures established and approved by the Board.
The Fund does not separately report the effect of changes in foreign exchange rates from changes in market prices on securities held. Such changes are included in net realized and unrealized gain or loss from investments in the Statement of Operations.
Realized foreign exchange gains or losses arise from sales of foreign currencies, currency gains or losses realized between the trade and settlement dates on securities transactions and the difference between the recorded amounts of dividends, interest, and foreign withholding taxes and the U.S. dollar equivalent of the amounts actually received or paid. Net unrealized foreign exchange gains and losses arise from changes in foreign exchange rates on foreign denominated assets and liabilities other than investments in securities held at the end of the reporting period.
c. Joint Repurchase Agreement
The Fund enters into a joint repurchase agreement whereby its uninvested cash balance is deposited into a joint cash account with other funds managed by the investment manager or an affiliate of the investment manager and is used to invest in one or more repurchase agreements. The value and face amount of the joint repurchase agreement are allocated to the funds based on theirpro-rata interest. A repurchase agreement is accounted for as a loan by the Fund to the seller, collateralized by securities which are delivered to the Fund’s custodian. The fair value, including accrued interest, of the initial collateralization is required to be at least 102% of the dollar amount invested by the funds, with the value of the underlying securities marked to market daily to maintain coverage of at least 100%. Repurchase agreements are subject to the terms of Master Repurchase Agreements (MRAs) with approved counterparties (sellers). The MRAs contain various provisions, including but not limited to events of default and maintenance of collateral for repurchase agreements. In the event of default by either the seller or the Fund, certain MRAs may permit thenon-defaulting party to net andclose-out all transactions, if any, traded under such agreements. The Fund may sell securities it holds as collateral and apply the proceeds towards the repurchase price and any
| | | | |
| | | |
| 40 | | Annual Report | | franklintempleton.com |
FRANKLIN ALTERNATIVE STRATEGIES FUNDS
NOTES TO FINANCIAL STATEMENTS
Franklin K2 Long Short Credit Fund(continued)
other amounts owed by the seller to the Fund in the event of default by the seller. This could involve costs or delays in addition to a loss on the securities if their value falls below the repurchase price owed by the seller. The joint repurchase agreement held by the Fund at period end, as indicated in the Statement of Investments, had been entered into on May 31, 2019.
d. Derivative Financial Instruments
The Fund invested in derivative financial instruments in order to manage risk or gain exposure to various other investments or markets. Derivatives are financial contracts based on an underlying or notional amount, require no initial investment or an initial net investment that is smaller than would normally be required to have a similar response to changes in market factors, and require or permit net settlement. Derivatives contain various risks including the potential inability of the counterparty to fulfill their obligations under the terms of the contract, the potential for an illiquid secondary market, and/or the potential for market movements which expose the Fund to gains or losses in excess of the amounts shown in the Statement of Assets and Liabilities. Realized gain and loss and unrealized appreciation and depreciation on these contracts for the period are included in the Statement of Operations.
Derivative counterparty credit risk is managed through a formal evaluation of the creditworthiness of all potential counterparties. The Fund attempts to reduce its exposure to counterparty credit risk on OTC derivatives, whenever possible, by entering into International Swaps and Derivatives Association (ISDA) master agreements with certain counterparties. These agreements contain various provisions, including but not limited to collateral requirements, events of default, or early termination. Termination events applicable to the counterparty include certain deteriorations in the credit quality of the counterparty. Termination events applicable to the Fund include failure of the Fund to maintain certain net asset levels and/or limit the decline in net assets over various periods of time. In the event of default or early termination, the ISDA master agreement gives thenon-defaulting party the right to net andclose-out all transactions traded, whether or not arising under the ISDA agreement, to one net amount payable by one counterparty to the other. However, absent an event of default or early termination, OTC derivative assets and liabilities are presented gross and not offset in the Statement of Assets and Liabilities. Early termination by the
counterparty may result in an immediate payment by the Fund of any net liability owed to that counterparty under the ISDA agreement.
Collateral requirements differ by type of derivative. Collateral or initial margin requirements are set by the broker or exchange clearing house for exchange traded and centrally cleared derivatives. Initial margin deposited is held at the exchange and can be in the form of cash and/or securities. For OTC derivatives traded under an ISDA master agreement, posting of collateral is required by either the Fund or the applicable counterparty if the total net exposure of all OTC derivatives with the applicable counterparty exceeds the minimum transfer amount, which typically ranges from $100,000 to $250,000, and can vary depending on the counterparty and the type of the agreement. Generally, collateral is determined at the close of Fund business each day and any additional collateral required due to changes in derivative values may be delivered by the Fund or the counterparty the next business day, or within a few business days. Collateral pledged and/or received by the Fund for OTC derivatives, if any, is held in segregated accounts with the Fund’s custodian/counterparty broker and can be in the form of cash and/or securities. Unrestricted cash may be invested according to the Fund’s investment objectives. To the extent that the amounts due to the Fund from its counterparties are not subject to collateralization or are not fully collateralized, the Fund bears the risk of loss from counterpartynon-performance.
The Fund entered into exchange traded futures contracts primarily to manage and/or gain exposure to interest rate and equity price risk. A futures contract is an agreement between the Fund and a counterparty to buy or sell an asset at a specified price on a future date. Required initial margins are pledged by the Fund, and the daily change in fair value is accounted for as a variation margin payable or receivable in the Statement of Assets and Liabilities.
The Fund entered into OTC forward exchange contracts primarily to manage and/or gain exposure to certain foreign currencies. A forward exchange contract is an agreement between the Fund and a counterparty to buy or sell a foreign currency at a specific exchange rate on a future date.
The Fund entered into credit default swap contracts primarily to manage and/or gain exposure to credit risk. A credit default swap is an agreement between the Fund and a counterparty whereby the buyer of the contract receives credit protection and the seller of the contract guarantees the credit
| | | | | | |
| | | |
| franklintempleton.com | | Annual Report | | | 41 | |
FRANKLIN ALTERNATIVE STRATEGIES FUNDS
NOTES TO FINANCIAL STATEMENTS
Franklin K2 Long Short Credit Fund(continued)
worthiness of a referenced debt obligation. These agreements may be privately negotiated in theover-the-counter market (OTC credit default swaps) or may be executed in a multilateral trade facility platform, such as a registered exchange (centrally cleared credit default swaps). The underlying referenced debt obligation may be a single issuer of corporate or sovereign debt, a credit index, a basket of issuers or indices, or a tranche of a credit index or basket of issuers or indices. In the event of a default of the underlying referenced debt obligation, the buyer is entitled to receive the notional amount of the credit default swap contract from the seller in exchange for the referenced debt obligation, a net settlement amount equal to the notional amount of the credit default swap less the recovery value of the referenced debt obligation, or other agreed upon amount. For centrally cleared credit default swaps, required initial margins are pledged by the Fund, and the daily change in fair value is accounted for as a variation margin payable or receivable in the Statement of Assets and Liabilities. Over the term of the contract, the buyer pays the seller a periodic stream of payments, provided that no event of default has occurred. Such periodic payments are accrued daily as an unrealized appreciation or depreciation until the payments are made, at which time they are realized. Upfront payments and receipts are reflected in the Statement of Assets and Liabilities and represent compensating factors between stated terms of the credit default swap agreement and prevailing market conditions (credit spreads and other relevant factors). These upfront payments and receipts are amortized over the term of the contract as a realized gain or loss in the Statement of Operations.
The Fund entered into interest rate swap contracts primarily to manage interest rate risk. An interest rate swap is an agreement between the Fund and a counterparty to exchange cash flows based on the difference between two interest rates, applied to a notional amount. These agreements may be privately negotiated in theover-the-counter market (OTC interest rate swaps) or may be executed on a registered exchange (centrally cleared interest rate swaps). For centrally cleared interest rate swaps, required initial margins are pledged by the Fund, and the daily change in fair value is accounted for as a variation margin payable or receivable in the Statement of Assets and Liabilities. Over the term of the contract, contractually required payments to be paid and to be received are accrued daily and recorded as unrealized depreciation and appreciation until the payments are made, at which time they are realized.
The Fund entered into OTC total return swap contracts primarily to manage and/or gain exposure to interest rate, equity price and credit risk of an underlying instrument such as a stock, bond, index or basket of securities or indices. A total return swap is an agreement between the Fund and a counterparty to exchange a return linked to an underlying instrument for a floating or fixed rate payment, both based upon a notional amount. Over the term of the contract, contractually required payments to be paid or received are accrued daily and recorded as unrealized appreciation or depreciation until the payments are made, at which time they are recognized as realized gain or loss.
The Fund purchased or wrote exchange traded and/or OTC option contracts primarily to manage and/or gain exposure to equity price risk. An option is a contract entitling the holder to purchase or sell a specific amount of shares or units of an asset or notional amount of a swap (swaption), at a specified price. When an option is purchased or written, an amount equal to the premium paid or received is recorded as an asset or liability, respectively. Upon exercise of an option, the acquisition cost or sales proceeds of the underlying investment is adjusted by any premium received or paid. Upon expiration of an option, any premium received or paid is recorded as a realized gain or loss. Upon closing an option other than through expiration or exercise, the difference between the premium received or paid and the cost to close the position is recorded as a realized gain or loss.
See Note 9 regarding other derivative information.
e. Restricted Cash
At May 31, 2019, the Fund held restricted cash in connection with investments in certain derivative securities. Restricted cash is held in a segregated account with the Fund’s custodian/counterparty broker and is reflected in the Statement of Assets and Liabilities.
f. Credit-Linked Notes
The Fund purchases credit-linked notes. Credit-linked notes are intended to replicate the economic effects that would apply had the Fund directly purchased the underlying reference asset. The risks of credit-linked notes include the potential default of the underlying reference asset, the movement in the value of the currency of the underlying reference asset relative to the credit-linked note, the potential inability of the Fund to dispose of the credit-linked note in the normal course of business, and the possible inability of the counterparties to fulfill their obligations under the contracts.
| | | | |
| | | |
| 42 | | Annual Report | | franklintempleton.com |
FRANKLIN ALTERNATIVE STRATEGIES FUNDS
NOTES TO FINANCIAL STATEMENTS
Franklin K2 Long Short Credit Fund(continued)
g. Securities Sold Short
The Fund is engaged in selling securities short, which obligates the Fund to replace a borrowed security with the same security at current fair value. The Fund incurs a loss if the price of the security increases between the date of the short sale and the date on which the Fund replaces the borrowed security. The Fund realizes a gain if the price of the security declines between those dates. Gains are limited to the price at which the Fund sold the security short, while losses are potentially unlimited in size.
The Fund is required to establish a margin account with the broker lending the security sold short. While the short sale is outstanding, the broker retains the proceeds of the short sale to the extent necessary to meet margin requirements until the short position is closed out. A deposit must also be maintained with the Fund’s custodian/counterparty broker consisting of cash and/or securities having a value equal to a specified percentage of the value of the securities sold short. The Fund is obligated to pay fees for borrowing the securities sold short and is required to pay the counterparty any dividends and/or interest due on securities sold short. Such dividends and/or interest and any security borrowing fees are recorded as an expense to the Fund.
h. Senior Floating Rate Interests
The Fund invests in senior secured corporate loans that pay interest at rates which are periodically reset by reference to a base lending rate plus a spread. These base lending rates are generally the prime rate offered by a designated U.S. bank or the London InterBank Offered Rate (LIBOR). Senior secured corporate loans often require prepayment of principal from excess cash flows or at the discretion of the borrower. As a result, actual maturity may be substantially less than the stated maturity. Senior secured corporate loans in which the Fund invests are generally readily marketable, but may be subject to certain restrictions on resale.
i. Income and Deferred Taxes
It is the Fund’s policy to qualify as a regulated investment company under the Internal Revenue Code. The Fund intends to distribute to shareholders substantially all of its taxable income and net realized gains to relieve it from federal income and excise taxes. As a result, no provision for U.S. federal income taxes is required.
The Fund may be subject to foreign taxation related to income received, capital gains on the sale of securities and certain foreign currency transactions in the foreign jurisdictions in which it invests. Foreign taxes, if any, are recorded based on the tax regulations and rates that exist in the foreign markets in which the Fund invests. When a capital gain tax is determined to apply, the Fund records an estimated deferred tax liability in an amount that would be payable if the securities were disposed of on the valuation date.
The Fund may recognize an income tax liability related to its uncertain tax positions under U.S. GAAP when the uncertain tax position has a less than 50% probability that it will be sustained upon examination by the tax authorities based on its technical merits. As of May 31, 2019, the Fund has determined that no tax liability is required in its financial statements related to uncertain tax positions for any open tax years (or expected to be taken in future tax years). Open tax years are those that remain subject to examination and are based on the statute of limitations in each jurisdiction in which the Fund invests.
j. Security Transactions, Investment Income, Expenses and Distributions
Security transactions are accounted for on trade date. Realized gains and losses on security transactions are determined on a specific identification basis. Interest income and estimated expenses are accrued daily. Amortization of premium and accretion of discount on debt securities are included in interest income. Paydown gains and losses are recorded as an adjustment to interest income separately on the Statement of Operations. Facility fees are recognized as income over the expected term of the loan. Dividend income and dividends declared on securities sold short are recorded on theex-dividend date except for certain dividends from securities where the dividend rate is not available. In such cases, the dividend is recorded as soon as the information is received by the Fund. Distributions to shareholders are recorded on theex-dividend date. Distributable earnings are determined according to income tax regulations (tax basis) and may differ from earnings recorded in accordance with U.S. GAAP. These differences may be permanent or temporary. Permanent differences are reclassified among capital accounts to reflect their tax character. These reclassifications have no impact on net assets or the results of operations. Temporary differences are not reclassified, as they may reverse in subsequent periods.*
| | | | | | |
| | | |
| franklintempleton.com | | Annual Report | | | 43 | |
FRANKLIN ALTERNATIVE STRATEGIES FUNDS
NOTES TO FINANCIAL STATEMENTS
Franklin K2 Long Short Credit Fund(continued)
j. Security Transactions, Investment Income, Expenses and Distributions(continued)
Common expenses incurred by the Trust are allocated among the Funds based on the ratio of net assets of each Fund to the combined net assets of the Trust or based on the ratio of number of shareholders of each Fund to the combined number of shareholders of the Trust. Fund specific expenses are charged directly to the Fund that incurred the expense.
Realized and unrealized gains and losses and net investment income, excluding class specific expenses, are allocated daily to each class of shares based upon the relative proportion of net assets of each class. Differences in per share distributions by class are generally due to differences in class specific expenses.
k. Accounting Estimates
The preparation of financial statements in accordance with U.S. GAAP requires management to make estimates and
assumptions that affect the reported amounts of assets and liabilities at the date of the financial statements and the amounts of income and expenses during the reporting period. Actual results could differ from those estimates.
l. Guarantees and Indemnifications
Under the Trust’s organizational documents, its officers and trustees are indemnified by the Trust against certain liabilities arising out of the performance of their duties to the Trust. Additionally, in the normal course of business, the Trust, on behalf of the Fund, enters into contracts with service providers that contain general indemnification clauses. The Trust’s maximum exposure under these arrangements is unknown as this would involve future claims that may be made against the Trust that have not yet occurred. Currently, the Trust expects the risk of loss to be remote.
*Effective during the current reporting period, it is no longer required to present certain line items in the Statements of Changes in Net Assets. The below prior period amounts affected by this change are shown as they were in the prior year Statements of Changes in Net Assets.
For the year ended May 31, 2018, distributions to shareholders were as follows:
| | | | |
| Distributions from net investment income: | | | | |
Class A | | $ | (798,159 | ) |
Class C | | | (16,539 | ) |
Class R | | | (2,505 | ) |
Class R6 | | | (229,423 | ) |
Advisor Class | | | (581,543 | ) |
| Distributions from net realized gains: | | | | |
Class A | | | (714,554 | ) |
Class C | | | (27,644 | ) |
Class R | | | (2,620 | ) |
Class R6 | | | (191,370 | ) |
Advisor Class | | | (487,193 | ) |
For the year ended May 31, 2018, undistributed net investment income included in net assets was $496,750.
2. Shares of Beneficial Interest
At May 31, 2019, there were an unlimited number of shares authorized (without par value). Transactions in the Fund’s shares were as follows:
| | | | | | | | | | | | | | | | | | | | |
| |
| | | Year Ended May 31, | |
| | | |
| | | 2019 | | | | | | 2018 | |
| | | | | |
| | | Shares | | | Amount | | | | | | Shares | | | Amount | |
|
| Class A Shares: | |
Shares solda | | | 518,127 | | | $ | 5,443,153 | | | | | | | | 1,068,222 | | | $ | 11,330,973 | |
Shares issued in reinvestment of distributions | | | 49,211 | | | | 498,509 | | | | | | | | 48,302 | | | | 502,336 | |
Shares redeemed | | | (2,195,001 | ) | | | (23,000,866 | ) | | | | | | | (730,238 | ) | | | (7,696,288 | ) |
| | | | |
Net increase (decrease) | | | (1,627,663 | ) | | $ | (17,059,204 | ) | | | | | | | 386,286 | | | $ | 4,137,021 | |
| | | | |
| | | | |
| | | |
| 44 | | Annual Report | | franklintempleton.com |
FRANKLIN ALTERNATIVE STRATEGIES FUNDS
NOTES TO FINANCIAL STATEMENTS
Franklin K2 Long Short Credit Fund(continued)
| | | | | | | | | | | | | | | | | | | | |
| |
| | | Year Ended May 31, | |
| | | |
| | | 2019 | | | | | | 2018 | |
| | | | | |
| | | Shares | | | Amount | | | | | | Shares | | | Amount | |
|
| Class C Shares: | |
Shares sold | | | 176,881 | | | $ | 1,824,644 | | | | | | | | 156,509 | | | $ | 1,621,784 | |
Shares issued in reinvestment of distributions | | | 10,021 | | | | 100,011 | | | | | | | | 4,283 | | | | 44,033 | |
Shares redeemeda | | | (147,058 | ) | | | (1,515,143 | ) | | | | | | | (64,430 | ) | | | (669,366 | ) |
| | | | |
Net increase (decrease) | | | 39,844 | | | $ | 409,512 | | | | | | | | 96,362 | | | $ | 996,451 | |
| | | | |
|
| Class R Shares: | |
Shares sold | | | 1,059 | | | $ | 10,958 | | | | | | | | 2,884 | | | $ | 30,055 | |
Shares issued in reinvestment of distributions | | | 533 | | | | 5,358 | | | | | | | | 457 | | | | 4,720 | |
Shares redeemed | | | (1,066 | ) | | | (11,009 | ) | | | | | | | (13 | ) | | | (137 | ) |
| | | | |
Net increase (decrease) | | | 526 | | | $ | 5,307 | | | | | | | | 3,328 | | | $ | 34,638 | |
| | | | |
|
| Class R6 Shares: | |
Shares sold | | | 22,273 | | | $ | 233,301 | | | | | | | | 90,935 | | | $ | 964,819 | |
Shares issued in reinvestment of distributions | | | 642 | | | | 6,497 | | | | | | | | 40,378 | | | | 420,337 | |
Shares redeemed | | | (1,782 | ) | | | (18,363 | ) | | | | | | | (1,373,217 | ) | | | (14,431,550 | ) |
| | | | |
Net increase (decrease) | | | 21,133 | | | $ | 221,435 | | | | | | | | (1,241,904 | ) | | $ | (13,046,394 | ) |
| | | | |
|
| Advisor Class Shares: | |
Shares sold | | | 5,072,991 | | | $ | 52,995,139 | | | | | | | | 2,309,752 | | | $ | 24,300,041 | |
Shares issued in reinvestment of distributions | | | 166,635 | | | | 1,688,016 | | | | | | | | 20,313 | | | | 211,456 | |
Shares redeemed | | | (1,263,815 | ) | | | (13,184,615 | ) | | | | | | | (392,942 | ) | | | (4,131,923 | ) |
| | | | |
Net increase (decrease) | | | 3,975,811 | | | $ | 41,498,540 | | | | | | | | 1,937,123 | | | $ | 20,379,574 | |
| | | | |
aMay include a portion of Class C shares that were automatically converted to Class A.
3. Transactions with Affiliates
Franklin Resources, Inc. is the holding company for various subsidiaries that together are referred to as Franklin Templeton. Certain officers and trustees of the Trust are also officers and/or directors of the following subsidiaries:
| | |
| |
| Subsidiary | | Affiliation |
K2/D&S Management Co., L.L.C. (K2 Advisors) | | Investment manager |
Franklin Templeton Services, LLC (FT Services) | | Administrative manager |
Franklin Templeton Distributors, Inc. (Distributors) | | Principal underwriter |
Franklin Templeton Investor Services, LLC (Investor Services) | | Transfer agent |
a. Management Fees
The Fund pays an investment management fee to K2 Advisors of 1.90% per year of the average daily net assets of the Fund.
Under each subadvisory agreement, the below entities provide subadvisory services to the Fund. The subadvisory fees are paid by K2 Advisors based on the Fund’s average daily net assets, and is not an additional expense of the Fund.
|
|
| Subadvisors |
Apollo Credit Management LLC |
Chatham Asset Management, LLC |
Ellington Global Asset Management, L.L.C. |
Emso Asset Management Limited |
Medalist Partners, L.P. |
| | | | | | |
| | | |
| franklintempleton.com | | Annual Report | | | 45 | |
FRANKLIN ALTERNATIVE STRATEGIES FUNDS
NOTES TO FINANCIAL STATEMENTS
Franklin K2 Long Short Credit Fund(continued)
b. Administrative Fees
Under an agreement with K2 Advisors, FT Services provides administrative services to the Fund. The fee is paid by K2 Advisors based on the Fund’s average daily net assets, and is not an additional expense of the Fund.
c. Distribution Fees
The Board has adopted distribution plans for each share class, with the exception of Class R6 and Advisor Class shares, pursuant to Rule12b-1 under the 1940 Act. Under the Fund’s Class A reimbursement distribution plan, the Fund reimburses Distributors for costs incurred in connection with the servicing, sale and distribution of the Fund’s shares up to the maximum annual plan rate. Under the Class A reimbursement distribution plan, costs exceeding the maximum for the current plan year cannot be reimbursed in subsequent periods. In addition, under the Fund’s Class C and R compensation distribution plans, the Fund pays Distributors for costs incurred in connection with the servicing, sale and distribution of the Fund’s shares up to the maximum annual plan rate for each class. The plan year, for purposes of monitoring compliance with the maximum annual plan rates, is February 1 through January 31.
The maximum annual plan rates, based on the average daily net assets, for each class, are as follows:
| | | | |
Class A | | | 0.25% | |
Class C | | | 1.00% | |
Class R | | | 0.50% | |
d. Sales Charges/Underwriting Agreements
Front-end sales charges and contingent deferred sales charges (CDSC) do not represent expenses of the Fund. These charges are deducted from the proceeds of sales of Fund shares prior to investment or from redemption proceeds prior to remittance, as applicable. Distributors has advised the Fund of the following commission transactions related to the sales and redemptions of the Fund’s shares for the year:
| | | | |
Sales charges retained net of commissions paid to unaffiliated brokers/dealers | | $ | 3,018 | |
CDSC retained | | $ | 5,434 | |
Effective September 10, 2018, the Board approved changes to certainfront-end sales charges and dealer commissions on Class A shares. Further details are disclosed in the Fund’s Prospectus.
e. Transfer Agent Fees
Each class of shares pays transfer agent fees to Investor Services for its performance of shareholder servicing obligations. The fees are based on an annualized asset based fee of 0.02% plus a transaction based fee. In addition, each class reimburses Investor Services for out of pocket expenses incurred and, except for Class R6, reimburses shareholder servicing fees paid to third parties. These fees are allocated daily based upon their relative proportion of such classes’ aggregate net assets. Class R6 pays Investor Services transfer agent fees specific to that class.
For the year ended May 31, 2019, the Fund paid transfer agent fees of $89,214, of which $40,621 was retained by Investor Services.
f. Waiver and Expense Reimbursements
K2 Advisors and Investor Services have contractually agreed in advance to waive or limit their respective fees and to assume as their own expense certain expenses otherwise payable by the Fund so that the expenses (excluding distribution fees, acquired fund fees and expenses, expenses related to securities sold short, and certainnon-routine expenses or costs, including those related to litigation, indemnification, reorganizations and liquidations) for each class of the Fund do not exceed 1.95%, and Class R6 does not exceed 1.93% based on the average net assets of each class until September 30, 2019. Total expenses waived or paid are not subject to recapture subsequent to the Fund’s fiscal year end.
Prior to October 1, 2018, expenses (excluding certain fees and expenses as previously disclosed) for Class R6 were limited to 1.94% based on the average net assets of the class.
| | | | |
| | | |
| 46 | | Annual Report | | franklintempleton.com |
FRANKLIN ALTERNATIVE STRATEGIES FUNDS
NOTES TO FINANCIAL STATEMENTS
Franklin K2 Long Short Credit Fund(continued)
g. Other Affiliated Transactions
At May 31, 2019, Franklin Resources, Inc. owned 33.0% of the Fund’s outstanding shares. Investment activities of this shareholder could have a material impact on the Fund.
4. Expense Offset Arrangement
The Fund has entered into an arrangement with its custodian whereby credits realized as a result of uninvested cash balances are used to reduce a portion of the Fund’s custodian expenses. During the year ended May 31, 2019, the custodian fees were reduced as noted in the Statement of Operations.
5. Income Taxes
The tax character of distributions paid during the years ended May 31, 2019 and 2018, was as follows:
| | | | | | | | |
| | |
| | | 2019 | | | 2018 | |
| Distributions paid from: | | | | | | | | |
Ordinary income | | $ | 3,552,269 | | | $ | 2,560,135 | |
Long term capital gains | | | 641,660 | | | | 491,415 | |
| | | | |
Total distributions paid | | $ | 4,193,929 | | | $ | 3,051,550 | |
| | | | |
At May 31, 2019, the cost of investments, net unrealized appreciation (depreciation) and undistributed ordinary income for income tax purposes were as follows:
| | | | |
Cost of investments | | $ | 101,336,794 | |
| | | | |
Unrealized appreciation | | $ | 4,287,571 | |
Unrealized depreciation | | | (2,365,234 | ) |
| | | | |
Net unrealized appreciation (depreciation) | | $ | 1,922,337 | |
| | | | |
| Distributable earnings | | | | |
Undistributed ordinary income | | $ | 902,986 | |
| | | | |
Differences between income and/or capital gains as determined on a book basis and a tax basis are primarily due to differing treatments of bond discounts and premiums, foreign currency transactions, paydown losses and wash sales.
The Fund utilized a tax accounting practice to treat a portion of the proceeds from the capital shares redeemed as a distribution from realized capital gains.
6. Investment Transactions
Purchases and sales of investments and securities sold short (excluding short term securities) for the year ended May 31, 2019, aggregated $151,166,135 and $143,078,386, respectively.
7. Credit Risk and Defaulted Securities
At May 31, 2019, the Fund had 19.6% of its portfolio invested in high yield, senior secured floating rate loans, or other securities rated below investment grade and unrated securities, if any. These securities may be more sensitive to economic conditions causing greater price volatility and are potentially subject to a greater risk of loss due to default than higher rated securities.
The Fund may purchase thepre-default or defaulted debt of distressed companies. Distressed companies are financially troubled and could be or are already involved in financial restructuring or bankruptcy. Risks associated with purchasing these securities include the possibility that the bankruptcy or other restructuring process takes longer than expected, or that distributions in restructuring are less than anticipated, either or both of which may result in unfavorable consequences to the Fund. If it becomes probable that the income on debt securities, including those of distressed companies, will not be collected, the Fund discontinues accruing income and recognizes an adjustment for uncollectible interest.
| | | | | | |
| | | |
| franklintempleton.com | | Annual Report | | | 47 | |
FRANKLIN ALTERNATIVE STRATEGIES FUNDS
NOTES TO FINANCIAL STATEMENTS
Franklin K2 Long Short Credit Fund(continued)
At May 31, 2019, the aggregate long value of distressed company securities for which interest recognition has been discontinued was $1,992,865, representing 1.7% of the Fund’s net assets. For information as to specific securities, see the accompanying Statement of Investments.
8. Unfunded Loan Commitments
The Fund enters into certain credit agreements, all or a portion of which may be unfunded. The Fund is obligated to fund these loan commitments at the borrowers’ discretion. Unfunded loan commitments and funded portions of credit agreements are marked to market daily and any unrealized appreciation or depreciation is included in the Statement of Assets and Liabilities and Statement of Operations. Funded portions of credit agreements are presented in the Statement of Investments.
At May 31, 2019, unfunded commitments were as follows:
| | | | |
| |
| Borrower | | Unfunded
Commitment | |
CenturyLink Inc., Term Loan B | | $ | 64,307 | |
Flex Acquisition Co. Inc., Term Loan B | | | 132,888 | |
GTT Communications Inc., Term Loan | | | 71,966 | |
The Neiman Marcus Group LLC, Term Loan | | | 38,035 | |
Pacific Gas & Electric Co., Term Loan | | | 379,207 | |
PetSmart Inc., Term Loan B2 | | | 1,444,427 | |
| | | | |
| | $ | 2,130,830 | |
| | | | |
9. Other Derivative Information
At May 31, 2019, the investments in derivative contracts are reflected in the Statement of Assets and Liabilities as follows:
| | | | | | | | | | | | |
| | |
Derivative Contracts
Not Accounted for as
Hedging Instruments | | Asset Derivatives | | | Liability Derivatives | |
| | Statement of Assets and
Liabilities Location | | Fair Value | | | Statement of Assets and
Liabilities Location | | Fair Value | |
Interest rate contracts | | Variation margin on futures contracts | | $ | 2,623 | a | | Variation margin on futures contracts | | $ | 15,514 | a |
| | Variation margin on centrally cleared swap contracts | | | 77,299 | a | | Variation margin on centrally cleared swap contracts | | | 160,180 | a |
| | Unrealized appreciation on OTC swap contracts | | | 21,791 | | | Unrealized depreciation on OTC swap contracts | | | 52,876 | |
| | | | |
Foreign exchange contracts | | Unrealized appreciation on OTC forward exchange contracts | | | 118,244 | | | Unrealized depreciation on OTC forward exchange contracts | | | 134,126 | |
| | | | |
Credit contracts | | Variation margin centrally cleared swap contracts | | | 73,161 | a | | Variation margin centrally cleared swap contracts | | | 102,324 | a |
| | OTC swap contracts (upfront payments) | | | 517,703 | | | OTC swap contracts (upfront receipts) | | | 269,107 | |
| | Unrealized appreciation on OTC swap contracts | | | 222,056 | | | Unrealized depreciation on OTC swap contracts | | | 284,916 | |
| | | | |
Equity contracts | | Investments in securities, at value | | | 244,218 | b | | Options written, at value | | | 55,169 | |
| | Unrealized appreciation on OTC swap contracts | | | 23,801 | | | Unrealized depreciation on OTC swap contracts | | | 64,660 | |
| | Variation margin on futures contracts | | | 236 | a | | | | | | |
| | | | | | | | | | | | |
Totals | | | | $ | 1,301,132 | | | | | $ | 1,138,872 | |
| | | | | | | | | | | | |
aThis amount reflects the cumulative appreciation (depreciation) of futures contracts and centrally cleared swap contracts as reported in the Statement of Investments. Only the variation margin receivable/payable at period end is separately reported within the Statement of Assets and Liabilities. Prior variation margin movements were recorded to cash upon receipt or payment.
bPurchased option contracts are included in investments in securities, at value in the Statement of Assets and Liabilities.
| | | | |
| | | |
| 48 | | Annual Report | | franklintempleton.com |
FRANKLIN ALTERNATIVE STRATEGIES FUNDS
NOTES TO FINANCIAL STATEMENTS
Franklin K2 Long Short Credit Fund(continued)
For the year ended May 31, 2019, the effect of derivative contracts in the Statement of Operations was as follows:
| | | | | | | | | | | | |
| | | | |
Derivative Contracts
Not Accounted for as
Hedging Instruments | | Statement of
Operations Location | | Net Realized
Gain (Loss)
for the Year | | | Statement of
Operations Location | | Net Change in
Unrealized
Appreciation
(Depreciation)
for the Year | |
| | Net realized gain (loss) from: | | | | | | Net change in unrealized appreciation (depreciation) on: | | | | |
| | | | |
Interest rate contracts | | Futures contracts | | $ | (7,007 | ) | | Futures contracts | | $ | (6,122 | ) |
| | | | |
| | Swap contracts | | | 37,763 | | | Swap contracts | | | (100,984 | ) |
| | | | |
Foreign exchange contracts | | Forward exchange contracts | | | 408,428 | | | Forward exchange contracts | | | (226,770 | ) |
| | | | |
Credit contracts | | Swap contracts | | | (229,259 | ) | | Swap contracts | | | 207,306 | |
| | | | |
Equity contracts | | Investments | | | (380,165 | )a | | Investments | | | 152,664 | a |
| | | | |
| | Written options | | | 64,261 | | | Written options | | | (13,737 | ) |
| | | | |
| | Futures contracts | | | (21,404 | ) | | Futures contracts | | | 5,612 | |
| | | | |
| | Swap contracts | | | 70,759 | | | Swap contracts | | | 12,698 | |
| | | | | | | | | | | | |
Totals | | | | $ | (56,624 | ) | | | | $ | 30,667 | |
| | | | | | | | | | | | |
aPurchased option contracts are included in net realized gain (loss) from investments and net change in unrealized appreciation (depreciation) on investments in the Statement of Operations.
For the year ended May 31, 2019, the average month end notional amount of futures contracts, options and swap contracts represented $645,930, 156,333 shares and $26,957,616, respectively. The average month end contract value of forward exchange contracts was $10,032,219.
At May 31, 2019, OTC derivative assets and liabilities are as follows:
| | | | | | | | |
| |
| | | Gross Amounts of
Assets and Liabilities
Presented in the
Statement of
Assets and Liabilities | |
| | |
| | | Assetsa | | | Liabilitiesa | |
| Derivatives | | | | | | | | |
Forward Exchange Contracts | | $ | 118,244 | | | $ | 134,126 | |
Swap Contracts | | | 785,351 | | | | 671,559 | |
| | | | |
Total | | $ | 903,595 | | | $ | 805,685 | |
| | | | |
aAbsent an event of default or early termination, OTC derivative assets and liabilities are presented gross and not offset in the Statement of Assets and Liabilities.
| | | | | | |
| | | |
| franklintempleton.com | | Annual Report | | | 49 | |
FRANKLIN ALTERNATIVE STRATEGIES FUNDS
NOTES TO FINANCIAL STATEMENTS
Franklin K2 Long Short Credit Fund(continued)
At May 31, 2019, OTC derivative assets, which may be offset against OTC derivative liabilities, and collateral received from the counterparty, are as follows:
| | | | | | | | | | | | | | | | | | | | |
| | | |
| | | | | | Amounts Not Offset in the
Statement of Assets and Liabilities | | | | |
| | | | | |
| | | Gross Amounts
of Assets Presented
in the Statement of
Assets and Liabilities | | | Financial
Instruments
Available for Offset | | | Financial
Instruments
Collateral
Receiveda,b | | | Cash
Collateral
Received | | | Net Amount (Not
less than zero) | |
| Counterparty | | | | | | | | | | | | | | | | | | | | |
BOFA | | $ | 5,570 | | | $ | (5,570 | ) | | $ | — | | | $ | — | | | $ | — | |
BZWS | | | 218,248 | | | | (82,258 | ) | | | — | | | | — | | | | 135,990 | |
CITI | | | 46,183 | | | | (46,183 | ) | | | — | | | | — | | | | — | |
DBAB | | | 11,018 | | | | (11,018 | ) | | | — | | | | — | | | | — | |
GSCO | | | 336,912 | | | | (191,989 | ) | | | — | | | | — | | | | 144,923 | |
JPHQ | | | 2,152 | | | | (24 | ) | | | (2,128 | ) | | | — | | | | — | |
JPHQd | | | 236,872 | | | | — | | | | — | | | | — | | | | 236,872 | |
MSCS | | | 46,640 | | | | (46,640 | ) | | | — | | | | — | | | | — | |
| | | | |
Total | | $ | 903,595 | | | $ | (383,682 | ) | | $ | (2,128 | ) | | $ | — | | | $ | 517,785 | |
| | | | |
At May 31, 2019, OTC derivative liabilities, which may be offset against OTC derivative assets, and collateral pledged to the counterparty, are as follows:
| | | | | | | | | | | | | | | | | | | | |
| | | |
| | | | | | Amounts Not Offset in the
Statement of Assets and Liabilities | | | | |
| | | | | |
| | | Gross Amounts
of Liabilities Presented
in the Statement of
Assets and Liabilities | | | Financial
Instruments
Available for Offset | | | Financial
Instruments
Collateral
Pledgedc | | | Cash
Collateral
Pledgeda | | | Net Amount (Not
less than zero) | |
| Counterparty | | | | | | | | | | | | | | | | | | | | |
BOFA | | $ | 27,426 | | | $ | (5,570 | ) | | $ | — | | | $ | (21,856 | ) | | $ | — | |
BZWS | | | 82,258 | | | | (82,258 | ) | | | — | | | | — | | | | — | |
CITI | | | 161,184 | | | | (46,183 | ) | | | — | | | | — | | | | 115,001 | |
DBAB | | | 27,234 | | | | (11,018 | ) | | | — | | | | — | | | | 16,216 | |
GSCO | | | 191,989 | | | | (191,989 | ) | | | — | | | | — | | | | — | |
JPHQ | | | 24 | | | | (24 | ) | | | — | | | | — | | | | — | |
JPHQd | | | 263,533 | | | | — | | | | — | | | | — | | | | 263,533 | |
MSCS | | | 52,037 | | | | (46,640 | ) | | | — | | | | — | | | | 5,397 | |
| | | | |
Total | | $ | 805,685 | | | $ | (383,682 | ) | | $ | — | | | $ | (21,856 | ) | | $ | 400,147 | |
| | | | |
aIn some instances, the collateral amounts disclosed in the table above were adjusted due to the requirement to limit the collateral amounts to avoid the effect of over collateralization. Actual collateral received and/or pledged may be more than the amounts disclosed herein.
bAt May 31, 2019, the Fund received U.S. Treasury Bonds and Notes as collateral for derivatives.
cSee the accompanying Statement of Investments for securities pledged as collateral for derivatives.
dRepresents derivatives not subject to an ISDA master agreement.
See Note 1(d) regarding derivative financial instruments.
See Abbreviations on page 52.
10. Credit Facility
The Fund, together with other U.S. registered and foreign investment funds (collectively, Borrowers), managed by Franklin Templeton, are borrowers in a joint syndicated senior unsecured credit facility totaling $2 billion (Global Credit Facility) which matures on February 7, 2020. This Global Credit Facility provides a source of funds to the Borrowers for temporary and emergency purposes, including the ability to meet future unanticipated or unusually large redemption requests.
| | | | |
| | | |
| 50 | | Annual Report | | franklintempleton.com |
FRANKLIN ALTERNATIVE STRATEGIES FUNDS
NOTES TO FINANCIAL STATEMENTS
Franklin K2 Long Short Credit Fund(continued)
Under the terms of the Global Credit Facility, the Fund shall, in addition to interest charged on any borrowings made by the Fund and other costs incurred by the Fund, pay its share of fees and expenses incurred in connection with the implementation and maintenance of the Global Credit Facility, based upon its relative share of the aggregate net assets of all of the Borrowers, including an annual commitment fee of 0.15% based upon the unused portion of the Global Credit Facility. These fees are reflected in other expenses in the Statement of Operations. During the year ended May 31, 2019, the Fund did not use the Global Credit Facility.
11. Fair Value Measurements
The Fund follows a fair value hierarchy that distinguishes between market data obtained from independent sources (observable inputs) and the Fund’s own market assumptions (unobservable inputs). These inputs are used in determining the value of the Fund’s financial instruments and are summarized in the following fair value hierarchy:
| | • | | Level 1 – quoted prices in active markets for identical financial instruments |
| | • | | Level 2 – other significant observable inputs (including quoted prices for similar financial instruments, interest rates, prepayment speed, credit risk, etc.) |
| | • | | Level 3 – significant unobservable inputs (including the Fund’s own assumptions in determining the fair value of financial instruments) |
The input levels are not necessarily an indication of the risk or liquidity associated with financial instruments at that level.
A summary of inputs used as of May 31, 2019, in valuing the Fund’s assets and liabilities carried at fair value, is as follows:
| | | | | | | | | | | | | | | | |
| | | | |
| | | Level 1 | | | Level 2 | | | Level 3 | | | Total | |
| | | | |
| Assets: | | | | | | | | | | | | | | | | |
Investments in Securities:a | | | | | | | | | | | | | | | | |
Equity Investmentsb | | $ | 1,809,652 | | | $ | — | | | $ | — | | | $ | 1,809,652 | |
Convertible Bonds | | | — | | | | 1,631,231 | | | | — | | | | 1,631,231 | |
Corporate Bonds and Notes | | | — | | | | 26,896,465 | | | | — | | | | 26,896,465 | |
Corporate Bonds and Notes in Reorganization | | | — | | | | 1,246,184 | | | | — | | | | 1,246,184 | |
Senior Floating Rate Interests | | | — | | | | 2,828,070 | | | | — | | | | 2,828,070 | |
Foreign Government and Agency Securities | | | — | | | | 5,482,855 | | | | — | | | | 5,482,855 | |
U.S. Government and Agency Securities | | | — | | | | 863,046 | | | | — | | | | 863,046 | |
Asset-Backed Securities and Commercial Mortgage-Backed Securities | | | — | | | | 44,386,078 | | | | — | | | | 44,386,078 | |
Municipal Bonds in Reorganization | | | — | | | | 746,681 | | | | — | | | | 746,681 | |
Options Purchased | | | 244,218 | | | | — | | | | — | | | | 244,218 | |
Short Term Investments | | | 23,296,955 | | | | 4,653,727 | | | | — | | | | 27,950,682 | |
| | | | |
Total Investments in Securities | | $ | 25,350,825 | | | $ | 88,734,337 | | | $ | — | | | $ | 114,085,162 | |
| | | | |
Other Financial Instruments: | | | | | | | | | | | | | | | | |
Futures Contracts | | $ | 2,859 | | | $ | — | | | $ | — | | | $ | 2,859 | |
Forward Exchange Contracts | | | — | | | | 118,244 | | | | — | | | | 118,244 | |
Swap Contracts | | | — | | | | 418,108 | | | | — | | | | 418,108 | |
Unfunded Loan Commitments | | | — | | | | 149,096 | | | | — | | | | 149,096 | |
| | | | |
Total Other Financial Instruments | | $ | 2,859 | | | $ | 685,448 | | | $ | — | | | $ | 688,307 | |
| | | | |
| | | | |
| Liabilities: | | | | | | | | | | | | | | | | |
Other Financial Instruments: | | | | | | | | | | | | | | | | |
Options Written | | $ | 55,169 | | | $ | — | | | $ | — | | | $ | 55,169 | |
Securities Sold Shorta | | | 2,685,185 | | | | 8,230,095 | | | | — | | | | 10,915,280 | |
Futures Contracts | | | 15,514 | | | | — | | | | — | | | | 15,514 | |
Forward Exchange Contracts | | | — | | | | 134,126 | | | | — | | | | 134,126 | |
Swap Contracts | | | — | | | | 664,956 | | | | — | | | | 664,956 | |
| | | | |
Total Other Financial Instruments | | $ | 2,755,868 | | | $ | 9,029,177 | | | $ | — | | | $ | 11,785,045 | |
| | | | |
aFor detailed categories, see the accompanying Statement of Investments.
bIncludes common and preferred stocks as well as other equity interests.
| | | | | | |
| | | |
| franklintempleton.com | | Annual Report | | | 51 | |
FRANKLIN ALTERNATIVE STRATEGIES FUNDS
NOTES TO FINANCIAL STATEMENTS
Franklin K2 Long Short Credit Fund(continued)
A reconciliation of assets in which Level 3 inputs are used in determining fair value is presented when there are significant Level 3 financial instruments at the beginning and/or end of the year. At May 31, 2019, the reconciliation of assets, is as follows:
| | | | | | | | | | | | | | | | | | | | | | | | | | | | | | | | | | | | |
| | | | | | | | | |
| | | Balance at
Beginning of
Year | | | Purchases | | | Sales | | | Transfer
Into
(Out of)
Level 3a | | | Cost Basis
Adjustments | | | Net
Realized
Gain (Loss) | | | Net
Unrealized
Appreciation
(Depreciation) | | | Balance at
End of Year | | | Net Change
in Unrealized
Appreciation
(Depreciation) on
Assets Held at
Year End | |
| | | | | | | | | |
| Assets: | | | | | | | | | | | | | | | | | | | | | | | | | | | | | | | | | | | | |
Investments in Securities: | | | | | | | | | | | | | | | | | | | | | | | | | | | | | | | | | | | | |
Equity Investmentsb | | $ | 1,048,870 | | | $ | — | | | $ | (679,501 | ) | | $ | (313,233 | ) | | $ | — | | | $ | 193,865 | | | $ | (250,001 | ) | | $ | — | | | $ | — | |
Asset-Backed Securities and Commercial Mortgage-Backed Securities | | | 421,168 | | | | — | | | | — | | | | (389,536 | ) | | | — | | | | (5,796 | ) | | | (25,836 | ) | | | — | | | | — | |
Total Investments in Securities | | $ | 1,470,038 | | | $ | — | | | $ | (679,501 | ) | | $ | (702,769 | ) | | $ | — | | | $ | 188,069 | | | $ | (275,837 | ) | | $ | — | | | $ | — | |
aThe investments were transferred out of Level 3 as a result of the availability of other significant observable valuation inputs. May include amounts related to a corporate action.
bIncludes common and preferred stocks as well as other equity interests.
12. Subsequent Events
The Fund has evaluated subsequent events through the issuance of the financial statements and determined that no events have occurred that require disclosure.
Abbreviations
| | | | | | | | | | | | | | |
| Counterparty | | Currency | | Selected Portfolio | | Index |
| BOFA | | Bank of America, N.A. | | ARS | | Argentine Peso | | ADR | | American Depositary Receipt | | CDX.NA.HY | | CDX North America High Yield |
| BZWS | | Barclays Bank PLC | | BRL | | Brazilian Real | | ARLLMONP | | Argentina Blended Policy Rate | | |
| CITI | | Citigroup, Inc. | | EGP | | Egyptian Pound | | ARM | | Adjustable Rate Mortgage | | |
| DBAB | | Deutsche Bank AG | | EUR | | Euro | | BRLCDI | | Brazil Cetip Di Interbank Deposit Rate | | | | |
| GSCO | | Goldman Sachs International | | GBP | | British Pound | | CLO | | Collateralized Loan Obligation | | |
| JPHQ | | JP Morgan Chase Bank, N.A. | | HUF | | Hungarian Forint | | CMT | | 1 year Constant Maturity Treasury Index | | | | |
| MSCS | | Morgan Stanley Capital Services LLC | | INR | | Indian Rupee | | ETF | | Exchange Traded Fund | | | | |
| | JPY | | Japanese Yen | | FHLMC | | Federal Home Loan Mortgage Corp. | | |
| | | | NGN | | Nigerian Naira | | FNMA | | Federal National Mortgage Association | | | | |
| | | | RUB | | Russian Ruble | | FRN | | Floating Rate Note | | | | |
| | | | USD | | United States Dollar | | GO | | General Obligation | | | | |
| | | | ZAR | | South African Rand | | IO | | Interest-Only | | | | |
| | | | | | | | LIBOR | | London InterBank Offered Rate | | | | |
| | | | | | | | MIBOR | | Mumbai InterBank Offered Rate | | | | |
| | | | | | | | OBFR | | Overnight Bank Funding Rate | | | | |
| | | | | | | | OMO | | Open Market Operations | | | | |
| | | | | | | | PIK | | PaymentIn-Kind | | | | |
| | | | | | | | REIT | | Real Estate Investment Trust | | | | |
| | | | | | | | REMIC | | Real Estate Mortgage Investment Conduit | | | | |
| | | | | | | | SPDR | | Standard & Poor Depositary Receipt | | |
| | | | |
| | | |
| 52 | | Annual Report | | franklintempleton.com |
FRANKLIN ALTERNATIVE STRATEGIES FUNDS
Report of Independent Registered Public Accounting Firm
To the Board of Trustees of Franklin Alternative Strategies Funds
and Shareholders of Franklin K2 Long Short Credit Fund:
Opinion on the Financial Statements
We have audited the accompanying statement of assets and liabilities of Franklin K2 Long Short Credit Fund (the “Fund”) (one of the funds constituting the Franklin Alternative Strategies Funds), including the statement of investments, as of May 31, 2019, and the related statement of operations for the year then ended, the statements of changes in net assets for each of the two years in the period then ended, the financial highlights for each of the three years in the period then ended and the period from September 8, 2015 (commencement of operations) through May 31, 2016 and the related notes (collectively referred to as the “financial statements”). In our opinion, the financial statements present fairly, in all material respects, the financial position of Franklin K2 Long Short Credit Fund (one of the funds constituting the Franklin Alternative Strategies Funds) at May 31, 2019, the results of its operations for the year then ended, the changes in its net assets for each of the two years in the period then ended and its financial highlights for each of the three years in the period then ended and the period from September 8, 2015 (commencement of operations) through May 31, 2016, in conformity with U.S. generally accepted accounting principles.
Basis for Opinion
These financial statements are the responsibility of the Fund’s management. Our responsibility is to express an opinion on the Fund’s financial statements based on our audits. We are a public accounting firm registered with the Public Company Accounting Oversight Board (United States) (“PCAOB”) and are required to be independent with respect to the Fund in accordance with the U.S. federal securities laws and the applicable rules and regulations of the Securities and Exchange Commission and the PCAOB.
We conducted our audits in accordance with the standards of the PCAOB. Those standards require that we plan and perform the audit to obtain reasonable assurance about whether the financial statements are free of material misstatement, whether due to error or fraud. The Fund is not required to have, nor were we engaged to perform, an audit of the Fund’s internal control over financial reporting. As part of our audits, we are required to obtain an understanding of internal control over financial reporting, but not for the purpose of expressing an opinion on the effectiveness of the Fund’s internal control over financial reporting. Accordingly, we express no such opinion.
Our audits included performing procedures to assess the risks of material misstatement of the financial statements, whether due to error or fraud, and performing procedures that respond to those risks. Such procedures included examining, on a test basis, evidence regarding the amounts and disclosures in the financial statements. Our procedures included confirmation of securities owned as of May 31, 2019, by correspondence with the custodian and brokers,or by other appropriate auditing procedures where replies from brokers were not received. Our audits also included evaluating the accounting principles used and significant estimates made by management, as well as evaluating the overall presentation of the financial statements. We believe that our audits provide a reasonable basis for our opinion.

We have served as the auditor of one or more Franklin investment companies since 1987.
Boston, Massachusetts
July 25, 2019
| | | | | | |
| | | |
| franklintempleton.com | | Annual Report | | | 53 | |
FRANKLIN ALTERNATIVE STRATEGIES FUNDS
FRANKLIN K2 LONG SHORT CREDIT FUND
Tax Information (unaudited)
Under Section 852(b)(3)(C) of the Internal Revenue Code, the Fund hereby reports the maximum amount allowable but no less than $961,420 as long term capital gain dividend for the fiscal year ended May 31, 2019.
Under Section 871(k)(2)(C) of the Internal Revenue Code, the Fund hereby reports the maximum amount allowable but no less than $410,210 as short term capital gain dividend for purposes of the tax imposed under Section 871(a)(1)(A) of the Internal Revenue Code for the fiscal year ended May 31, 2019.
| | | | |
| | | |
| 54 | | Annual Report | | franklintempleton.com |
FRANKLIN ALTERNATIVE STRATEGIES FUNDS
Board Members and Officers
The name, year of birth and address of the officers and board members, as well as their affiliations, positions held with the Trust, principal occupations during at least the past five years and number of U.S. registered portfolios overseen in the Franklin Templeton fund complex are shown below. Generally, each board member serves until that person’s successor is elected and qualified.
Independent Board Members
| | | | | | | | |
| | | | |
Name, Year of Birth
and Address | | Position | | Length of
Time Served | | Number of Portfolios in
Fund Complex Overseen
by Board Member* | | Other Directorships Held During
at Least the Past 5 Years |
| | | | |
Edward I. Altman, Ph.D. (1941)
c/o Franklin Mutual Advisers, LLC
101 John F. Kennedy Parkway
Short Hills, NJ 07078-2716 | | Trustee | | Since 2011 | | 14 | | None |
|
| Principal Occupation During at Least the Past 5 Years: |
| Max L. Heine Professor of Finance, Emeritus and Director of The Credit and Debt Markets Research Program, Salomon Center, Stern School of Business, New York University; editor and author of numerous financial publications; financial consultant; an adviser to numerous financial and publishing organizations; andformerly, Vice Director, Salomon Center, Stern School of Business, New York University. |
| | | | |
Ann Torre Bates (1958)
c/o Franklin Mutual Advisers, LLC
101 John F. Kennedy Parkway
Short Hills, NJ 07078-2716 | | Trustee | | Since 2011 | | 38 | | Ares Capital Corporation (specialty finance company) (2010-present), United Natural Foods, Inc. (distributor of natural, organic and specialty foods) (2013-present), Allied Capital Corporation (financial services) (2003-2010), SLM Corporation (Sallie Mae) (1997-2014) and Navient Corporation (loan management, servicing and asset recovery) (2014-2016). |
|
| Principal Occupation During at Least the Past 5 Years: |
| Director of various companies; andformerly, Executive Vice President and Chief Financial Officer, NHP Incorporated (manager of multifamily housing) (1995-1997); and Vice President and Treasurer, US Airways, Inc. (until 1995). |
| | | | |
Burton J. Greenwald (1929)
c/o Franklin Mutual Advisers, LLC
101 John F. Kennedy Parkway
Short Hills, NJ 07078-2716 | | Trustee and Vice
Chairman of the Board | | Trustee since
2011 and Vice
Chairman of the
Board since 2015 | | 14 | | Franklin Templeton Emerging Markets Debt Opportunities Fund PLC (1999-present) and Fiduciary International Ireland Limited (1999-2015). |
|
| Principal Occupation During at Least the Past 5 Years: |
| Managing Director, B.J. Greenwald Associates (management consultants to the financial services industry); andformerly, Chairman, Fiduciary Trust International Funds; Executive Vice President, L.F. Rothschild Fund Management, Inc.; President and Director, Merit Mutual Funds; President, Underwriting Division and Director, National Securities & Research Corporation; Governor, Investment Company Institute; and Chairman, ICI Public Information Committee. |
| | | | |
Jan Hopkins Trachtman (1947)
c/o Franklin Mutual Advisers, LLC
101 John F. Kennedy Parkway
Short Hills, NJ 07078-2716 | | Trustee | | Since 2011 | | 14 | | FinTech Acquisition Corp. III (special purpose fintech acquisition company) (2018-present) |
|
| Principal Occupation During at Least the Past 5 Years: |
| President and Founder, The Jan Hopkins Group (communications consulting firm); serves on Advisory Board of Knight Bagehot Fellowship; andformerly,President, Economic Club of New York (2007-2015);Anchor/Correspondent, CNN Financial News (until 2003); Managing Director and Head of Client Communications, Citigroup Private Bank (until 2005);Off-Air Reporter, ABC News’ World News Tonight; and Editor, CBS Network News. |
| | | | | | |
| | | |
| franklintempleton.com | | Annual Report | | | 55 | |
FRANKLIN ALTERNATIVE STRATEGIES FUNDS
Independent Board Members(continued)
| | | | | | | | |
| | | | |
Name, Year of Birth
and Address | | Position | | Length of
Time Served | | Number of Portfolios in
Fund Complex Overseen
by Board Member* | | Other Directorships Held During
at Least the Past 5 Years |
| | | | |
Keith E. Mitchell (1954)
c/o Franklin Mutual Advisers, LLC
101 John F. Kennedy Parkway
Short Hills, NJ 07078-2716 | | Trustee | | Since 2011 | | 14 | | None |
|
| Principal Occupation During at Least the Past 5 Years: |
| Director of various boards of asset management firms; andformerly, Managing Member, Mitchell, Hartley & Bechtel Advisers, LLC (formerly, Mitchell Advisers, LLC) (advisory firm) (2003-2015) and Managing Director, Putman Lovell NBF. |
| | | | |
David W. Niemiec (1949)
c/o Franklin Mutual Advisers, LLC
101 John F. Kennedy Parkway
Short Hills, NJ 07078-2716 | | Trustee | | Since 2015 | | 38 | | Hess Midstream Partners LP (oil and gas midstream infrastructure) (2017-present). |
|
| Principal Occupation During at Least the Past 5 Years: |
| Advisor, Saratoga Partners (private equity fund); andformerly, Managing Director, Saratoga Partners (1998-2001) and SBC Warburg Dillon Read (investment banking) (1997-1998); Vice Chairman, Dillon, Read & Co. Inc. (investment banking) (1991-1997); and Chief Financial Officer, Dillon, Read & Co. Inc. (1982-1997). |
| | | | |
Charles Rubens II (1930)
c/o Franklin Mutual Advisers, LLC
101 John F. Kennedy Parkway
Short Hills, NJ 07078-2716 | | Trustee | | Since 2011 | | 14 | | None |
|
| Principal Occupation During at Least the Past 5 Years: |
| Private investor and president ofnon-profit organizations; andformerly, an executive of Time, Inc.; and Trustee of Colorado College. |
| | | | |
Robert E. Wade (1946)
c/o Franklin Mutual Advisers, LLC
101 John F. Kennedy Parkway
Short Hills, NJ 07078-2716 | | Trustee and
Chairman of
the Board | | Since 2011 | | 38 | | El Oro Ltd (investments) (2003-June 2019). |
|
| Principal Occupation During at Least the Past 5 Years: |
| Attorney at law engaged in private practice as a sole practitioner (1972-2008) and member of various boards. |
| | | | |
Gregory H. Williams (1943)
c/o Franklin Mutual Advisers, LLC
101 John F. Kennedy Parkway
Short Hills, NJ 07078-2716 | | Trustee | | Since 2015 | | 14 | | None |
|
| Principal Occupation During at Least the Past 5 Years: |
| Private investor; Consultant; andformerly, President, University of Cincinnati (2009-2012); President, The City College of New York (2001-2009); Dean, College of Law, Ohio State University (1993-2001); and Associate Vice President, Academic Affairs and Professor of Law, University of Iowa (1977-1993). |
Interested Board Members and Officers
| | | | | | | | |
| | | | |
Name, Year of Birth
and Address | | Position | | Length of
Time Served | | Number of Portfolios in
Fund Complex Overseen
by Board Member* | | Other Directorships Held During
at Least the Past 5 Years |
| | | | |
**Gregory E. Johnson (1961)
One Franklin Parkway
San Mateo, CA 94403-1906 | | Trustee | | Since 2011 | | 152 | | None |
|
| Principal Occupation During at Least the Past 5 Years: |
| Chairman of the Board, Member – Office of the Chairman, Director and Chief Executive Officer, Franklin Resources, Inc.; officer and/or director or trustee, as the case may be, of some of the other subsidiaries of Franklin Resources, Inc. and of 42 of the investment companies in Franklin Templeton; Vice Chairman, Investment Company Institute; andformerly, President, Franklin Resources, Inc. (1994-2015). |
| | | | |
| | | |
| 56 | | Annual Report | | franklintempleton.com |
FRANKLIN ALTERNATIVE STRATEGIES FUNDS
Interested Board Members and Officers(continued)
| | | | | | | | |
| | | | |
Name, Year of Birth
and Address | | Position | | Length of
Time Served | | Number of Portfolios in
Fund Complex Overseen
by Board Member* | | Other Directorships Held During
at Least the Past 5 Years |
| | | | |
**Jennifer M. Johnson (1964)
One Franklin Parkway
San Mateo, CA 94403-1906 | | Trustee | | Since 2015 | | 46 | | None |
|
| Principal Occupation During at Least the Past 5 Years: |
| President and Chief Operating Officer, Franklin Resources, Inc.; officer and/or director or trustee, as the case may be, of some of the other subsidiaries of Franklin Resources, Inc. and of four of the investment companies in Franklin Templeton; andformerly, Chief Operating Officer and Executive Vice President, Franklin Resources, Inc. (1994-2015); Executive Vice President of Operations and Technology, Franklin Resources, Inc. (2005-2010); and Senior Vice President, Franklin Resources, Inc. (2003-2005). |
| | | | |
Alison E. Baur (1964)
One Franklin Parkway
San Mateo, CA 94403-1906 | | Vice President | | Since 2012 | | Not Applicable | | Not Applicable |
|
| Principal Occupation During at Least the Past 5 Years: |
| Deputy General Counsel, Franklin Templeton; and officer of some of the other subsidiaries of Franklin Resources, Inc. and of 44 of the investment companies in Franklin Templeton. |
| | | | |
Aliya S. Gordon (1973)
One Franklin Parkway
San Mateo, CA 94403-1906 | | Vice President | | Since 2011 | | Not Applicable | | Not Applicable |
|
| Principal Occupation During at Least the Past 5 Years: |
| Senior Associate General Counsel and officer of 44 of the investment companies in Franklin Templeton. |
| | | | |
Steven J. Gray (1955)
One Franklin Parkway
San Mateo, CA 94403-1906 | | Secretary and Vice President | | Since 2011 | | Not Applicable | | Not Applicable |
|
| Principal Occupation During at Least the Past 5 Years: |
| Senior Associate General Counsel, Franklin Templeton; Vice President, Franklin Templeton Distributors, Inc. and FASA, LLC; and officer of 44 of the investment companies in Franklin Templeton. |
| | | | |
Madison S. Gulley (1964)
300 S.E. 2nd Street
Fort Lauderdale, FL 33301-1923 | | President and Chief Executive Officer – Investment Management | | Since 2017 | | Not Applicable | | Not Applicable |
|
| Principal Occupation During at Least the Past 5 Years: |
| President, FASA, LLC; Executive Vice President, Franklin Advisers, Inc., Franklin Templeton Institutional, LLC, Templeton Global Advisors Limited and Templeton Investment Counsel, LLC; Executive Vice President, Head of Alternatives, K2 Advisors, LLC and K2/D&S Management Co., LLC; Senior Vice President, Franklin Templeton Companies, LLC; officer and/or director or trustee, as the case may be, of some of the other subsidiaries of Franklin Resources, Inc. and of one of the investment companies in Franklin Templeton. |
| | | | |
Matthew T. Hinkle (1971)
One Franklin Parkway
San Mateo, CA 94403-1906 | | Chief Executive
Officer –
Finance and
Administration | | Since 2017 | | Not Applicable | | Not Applicable |
|
| Principal Occupation During at Least the Past 5 Years: |
| Senior Vice President, Franklin Templeton Services, LLC; officer of 44 of the investment companies in Franklin Templeton; andformerly, Vice President, Global Tax (2012-April 2017) and Treasurer/Assistant Treasurer, Franklin Templeton (2009-2017). |
| | | | | | |
| | | |
| franklintempleton.com | | Annual Report | | | 57 | |
FRANKLIN ALTERNATIVE STRATEGIES FUNDS
Interested Board Members and Officers(continued)
| | | | | | | | |
| | | | |
Name, Year of Birth
and Address | | Position | | Length of
Time Served | | Number of Portfolios in
Fund Complex Overseen
by Board Member* | | Other Directorships Held During
at Least the Past 5 Years |
| | | | |
Robert G. Kubilis (1973)
300 S.E. 2nd Street
Fort Lauderdale, FL 33301-1923 | | Chief Financial
Officer, Chief
Accounting Officer and Treasurer | | Since 2015 | | Not Applicable | | Not Applicable |
|
| Principal Occupation During at Least the Past 5 Years: |
| Treasurer, U.S. Fund Administration & Reporting and officer of 16 of the investment companies in Franklin Templeton. |
| | | | |
Robert Lim (1948)
One Franklin Parkway
San Mateo, CA 94403-1906 | | Vice President – AML Compliance | | Since 2016 | | Not Applicable | | Not Applicable |
|
| Principal Occupation During at Least the Past 5 Years: |
| Vice President, Franklin Templeton Companies, LLC; Chief Compliance Officer, Franklin Templeton Distributors, Inc. and Franklin Templeton Investor Services, LLC; and officer of 44 of the investment companies in Franklin Templeton. |
| | | | |
Kimberly H. Novotny (1972)
300 S.E. 2nd Street
Fort Lauderdale, FL 33301-1923 | | Vice President | | Since 2013 | | Not Applicable | | Not Applicable |
|
| Principal Occupation During at Least the Past 5 Years: |
| Associate General Counsel, Franklin Templeton; Vice President and Corporate Secretary, Fiduciary Trust International of the South; Vice President, Templeton Investment Counsel, LLC; Assistant Secretary, Franklin Resources, Inc.; and officer of 44 of the investment companies in Franklin Templeton. |
| | | | |
Robert C. Rosselot (1960)
300 S.E. 2nd Street
Fort Lauderdale, FL 33301-1923 | | Chief
Compliance
Officer | | Since 2013 | | Not Applicable | | Not Applicable |
|
| Principal Occupation During at Least the Past 5 Years: |
| Director, Global Compliance, Franklin Templeton; Vice President, Franklin Templeton Companies, LLC; officer of 44 of the investment companies in Franklin Templeton; andformerly, Senior Associate General Counsel, Franklin Templeton (2007-2013); and Secretary and Vice President, Templeton Group of Funds (2004-2013). |
| | | | |
Navid J. Tofigh (1972)
One Franklin Parkway
San Mateo, CA 94403-1906 | | Vice President | | Since 2015 | | Not Applicable | | Not Applicable |
|
| Principal Occupation During at Least the Past 5 Years: |
| Associate General Counsel and officer of 44 of the investment companies in Franklin Templeton. |
| | | | |
Craig S. Tyle (1960)
One Franklin Parkway
San Mateo, CA 94403-1906 | | Vice President | | Since 2011 | | Not Applicable | | Not Applicable |
|
| Principal Occupation During at Least the Past 5 Years: |
| General Counsel, Executive Vice President and Secretary, Franklin Resources, Inc.; and officer of some of the other subsidiaries of Franklin Resources, Inc. and of 44 of the investment companies in Franklin Templeton. |
| | | | |
| | | |
| 58 | | Annual Report | | franklintempleton.com |
FRANKLIN ALTERNATIVE STRATEGIES FUNDS
Interested Board Members and Officers(continued)
| | | | | | | | |
| | | | |
Name, Year of Birth
and Address | | Position | | Length of
Time Served | | Number of Portfolios in
Fund Complex Overseen
by Board Member* | | Other Directorships Held During
at Least the Past 5 Years |
| | | | |
Lori A. Weber (1964)
300 S.E. 2nd Street
Fort Lauderdale, FL 33301-1923 | | Vice President | | Since 2011 | | Not Applicable | | Not Applicable |
|
| Principal Occupation During at Least the Past 5 Years: |
| Senior Associate General Counsel, Franklin Templeton; Assistant Secretary, Franklin Resources, Inc.; Vice President and Secretary, Templeton Investment Counsel, LLC; and officer of 44 of the investment companies in Franklin Templeton. |
*We base the number of portfolios on each separate series of the U.S. registered investment companies within the Franklin Templeton fund complex. These portfolios have a common investment manager or affiliated investment managers.
**Gregory E. Johnson is considered to be an interested person of the Fund under the federal securities laws due to his position as an officer and director of Franklin Resources, Inc. (Resources), which is the parent company of the Fund’s investment manager and distributor. Jennifer M. Johnson is considered to be an interested person of the Fund under the federal securities laws due to her position as an officer of Resources.
Note 1: Gregory E. Johnson and Jennifer M. Johnson are siblings.
Note 2: Officer information is current as of the date of this report. It is possible that after this date, information about officers may change.
The Sarbanes-Oxley Act of 2002 and Rules adopted by the U.S. Securities and Exchange Commission require the Fund to disclose whether the Fund’s Audit Committee includes at least one member who is an audit committee financial expert within the meaning of such Act and Rules. The Fund’s Board has determined that there is at least one such financial expert on the Audit Committee and has designated each of Edward I. Altman, Ph.D., Ann Torre Bates and David W. Niemiec as an audit committee financial expert. The Board believes that Messrs. Altman and Niemiec and Ms. Bates qualify as such an expert in view of their extensive business background and experience. Mr. Altman has served as a member of the Fund Audit Committee since 2011. He currently serves as a Max L. Hines Professor of Finance, Emeritus and Director of The Credit and Debt Markets Research Program, Salomon Center, Stern School of Business, New York University. Ms. Bates has served as a member of the Fund Audit Committee since 2011. She currently serves as a director of Ares Capital Corporation (2010-present) and United Natural Foods, Inc. (2013-present) and was formerly a director of Navient Corporation from 2014 to 2016, SLM Corporation from 1997 to 2014 and Allied Capital Corporation from 2003 to 2010, Executive Vice President and Chief Financial Officer of NHP Incorporated from 1995 to 1997 and Vice President and Treasurer of US Airways, Inc. until 1995. Mr. Niemiec has served as a member of the Fund Audit Committee since 2015, currently serves as an Advisor to Saratoga Partners and was formerly its Managing Director from 1998 to 2001 and serves as a director of Hess Midstream Partners LP (2017-present). Mr. Niemiec was formerly a director of Emeritus Corporation from 1999 to 2010 and OSI Pharmaceuticals, Inc. from 2006 to 2010, Managing Director of SBC Warburg Dillon Read from 1997 to 1998, and was Vice Chairman from 1991 to 1997 and Chief Financial Officer from 1982 to 1997 of Dillon, Read & Co. Inc. As a result of such background and experience, the Board believes that Messrs. Altman and Niemiec and Ms. Bates have each acquired an understanding of generally accepted accounting principles and financial statements, the general application of such principles in connection with the accounting estimates, accruals and reserves, and analyzing and evaluating financial statements that present a breadth and level of complexity of accounting issues generally comparable to those of the Fund, as well as an understanding of internal controls and procedures for financial reporting and an understanding of audit committee functions. Messrs. Altman and Niemiec and Ms. Bates are independent Board members as that term is defined under the applicable U.S. Securities and Exchange Commission Rules and Releases.
The Statement of Information (SAI) includes additional information about board members and is available, without charge, upon request. Shareholders may call (800) DIALBEN/342-5236 to request the SAI.
| | | | | | |
| | | |
| franklintempleton.com | | Annual Report | | | 59 | |
FRANKLIN ALTERNATIVE STRATEGIES FUNDS
FRANKLIN K2 LONG SHORT CREDIT FUND
Shareholder Information
Board Approval of Investment Management Agreement andSub-Advisory Agreements
FRANKLIN ALTERNATIVE STRATEGIES FUNDS
Franklin K2 Long Short Credit Fund
(Fund)
The Board of Trustees (Board) of Franklin Alternative Strategies Funds (the Trust), including a majority of trustees that are not “interested persons” as such term is defined in section 2(a)(19) of the Investment Company Act of 1940 (hereinafter referred to as “independent trustees”), at anin-person meeting held on May 22, 2019, unanimously approved the renewal of the Fund’s investment management agreement with K2/D&S Management Co., L.L.C. (K2 Advisors), and of eachsub-advisory agreement between K2 Advisors and each of followingsub-advisors(the Sub-Advisors):
Apollo Credit Management, LLC
Medalist Partners, LP
Chatham Asset Management, LLC
Ellington Global Asset Management, L.L.C.
EMSO Asset Management Limited
Prior to a meeting of all of the trustees for the purpose of considering such renewal, the independent trustees participated in two other meetings held in connection with the renewal process. Throughout the process, the independent trustees received assistance and advice from and met separately with independent counsel. The independent trustees met with and interviewed officers of K2 Advisors and certainSub-Advisors (including portfolio managers), the transfer agent and shareholder services group and the distributor. In approving the renewal of the investment management agreement and thesub-advisory agreements for the Fund, the Board, including the independent trustees, determined that the investment management fee structure was fair and reasonable and that continuance of the agreement was in the best interests of the Fund and its shareholders.
In making the foregoing approvals, the Board considered various materials related to the investment management agreement and thesub-advisory agreements including: (1) a copy of the investment management agreement andsub-advisory agreements; (2) information describing the nature, quality and extent of services that K2 Advisors and eachSub-Advisor provided, and are expected to provide, to the Fund, and the investment management fees and
sub-advisory fees payable to K2 Advisors and eachSub-Advisor; (3) reports from K2 Advisors on the continued diligence conducted on eachSub-Advisor and the reasons for recommending renewal of each of thesub-advisory agreements, including, but not limited to, eachSub-Advisor’s background, experience, personnel, operations, policies, procedures and compliance functions; and (4) a report from the Trust’s Chief Compliance Officer regarding K2 Advisors’ and eachSub-Advisor’s compliance program and capabilities, including policies and procedures in place to address potential conflicts of interest, and the diligence undertaken by the Trust’s Chief Compliance Officer with respect thereto. The Board also noted that it received an annual report on all payments made by Franklin Templeton Investments (FTI) or the Fund to financial intermediaries engaged in the sale of Fund shares, as well as a memorandum relating to third-party servicing arrangements in response to a Guidance Update from the U.S. Securities and Exchange Commission (SEC) relating to mutual fund distribution andsub- accounting fees. The Board also took into account information furnished throughout the year at regular Board meetings, as well as information specifically requested and furnished for the renewal process, which culminated in the meetings referred to above for the specific purpose of considering such agreements. Information furnished throughout the year included, among others, reports on the Fund’s investment performance, expenses, portfolio composition, derivatives, asset segregation, portfolio turnover, Rule12b-1 plan, distribution, shareholder servicing, legal and compliance matters, pricing of securities, sales and redemptions, and marketing support payments made to financial intermediaries, as well as a third-party survey of transfer agent fees charged to funds within the FTI complex in comparison with those charged to other fund complexes deemed comparable. Also, related financial statements and other information about the scope and quality of services provided by K2 Advisors and its affiliates and enhancements to such services over the past year were provided. In addition, the trustees received periodic reports throughout the year and during the renewal process relating to compliance with the Fund’s investment policies and restrictions. During the renewal process, the independent trustees considered K2 Advisors’ methods of operation within the Franklin Templeton group and its activities on behalf of other clients.
The information obtained by the trustees during the renewal process also included a special report prepared by Broadridge Financial Solutions, Inc., an independent third-party analyst that utilizes data from Lipper, Inc. (“Lipper”), comparing the Fund’s investment performance and expenses with those of
| | | | |
| | | |
| 60 | | Annual Report | | franklintempleton.com |
FRANKLIN ALTERNATIVE STRATEGIES FUNDS
FRANKLIN K2 LONG SHORT CREDIT FUND
SHAREHOLDER INFORMATION
other mutual funds deemed comparable to such Fund as selected by Lipper (Broadridge Section 15(c) Report). The trustees reviewed the Broadridge Section 15(c) Report and its usefulness in the renewal process with respect to matters such as comparative fees, expenses, expense ratios and performance. The Board considered K2 Advisors’ views that the peer group determined by Lipper for comparison purposes may not be an entirely appropriate representation of the Fund’s peer universe. K2 Advisors explained that the universe of funds that are managed using multi-manager, multi- strategy structures, like the Fund, continues to evolve, and has presented challenges in identifying an appropriate set of peers for the Fund. It was noted by K2 Advisors that the peer group compiled by Lipper includes single-manager funds which, due to their nature and relative simplicity, have lower expense ratios and are not true peers for fee comparison purposes (“Base Expense Group”). Because some of the sponsors of funds with multi-manager strategies that K2 Advisors considers to be peers were excluded from the peer group determined by Lipper, K2 Advisors requested a second peer group including funds that K2 Advisors considers to be peer funds (“Alternate Expense Group”). K2 Advisors believes that the Fund’s expenses are in line with the second peer group. While noting the limitations of the Broadridge Section 15(c) Report, the Board concluded that the Broadridge Section 15(c) Report was helpful in the performance of its duties.
In addition, the trustees received a Profitability Study (Profitability Study) prepared by management discussing the profitability to FTI from its overall U.S. fund operations, as well as on an individualfund-by-fund basis. Over the past year, the Board and counsel to the independent trustees continued to receive reports on management’s handling of recent regulatory inquiries and pending legal actions against K2 Advisors and its affiliates. The independent trustees were satisfied with the actions taken to date by management in response to such regulatory and legal matters. The independent trustees also received reports from the Trust’s Chief Compliance Officer on regulatory inquiries and pending legal actions against theSub-Advisors applicable to the services provided by theSub-Advisors to the Fund and noted that there were not any issues in this regard that should prevent the renewal of thesub-advisory agreements.
The trustees reviewed the personnel, operations, financial condition, and investment management capabilities, methodologies and resources of K2 Advisors and eachSub-Advisor, including each management team’s expertise in the management of other alternative strategies funds. As part of this
review, particular attention was given to (1) the diligent risk management program of K2 Advisors and its parent, including those aspects of the program related to selecting and overseeingsub-advisors to the Fund and continual monitoring and management of cybersecurity, liquidity and counterparty credit risk, (2) eachSub-Advisor’s risk management program, and (3) derivatives and other complex instruments that are held and expected to be held by the Fund and how such instruments are used to carry out the Fund’s investment goal.
The Board also took into account, among other things, management’s efforts in establishing a global credit facility for the benefit of the Fund and other accounts managed by FTI to provide a source of cash for temporary and emergency purposes or to meet unusual redemption requests as well as the strong financial position of K2 Advisors’ parent company and its commitment to the mutual fund business. The Board noted management’s continuing efforts and expenditures in establishing effective business continuity plans and developing strategies to address areas of heightened concern in the mutual fund industry, such as cybersecurity and liquidity risk management. The Board also recognized management’s commitment to facilitating Board oversight of particular areas, including derivatives and payments to intermediaries, by enhanced reporting. In addition, the Board received updates from management on the compliance of the investment manager with comprehensive rules and regulations promulgated by the SEC and the U.S. Commodity Futures Trading Commission.
In addition to the above and other matters considered by the trustees throughout the course of the year, the following discussion relates to certain primary factors relevant to the Board’s decision. This discussion of the information and factors considered by the Board (including the information and factors discussed above) is not intended to be exhaustive, but rather summarizes certain factors considered by the Board. In view of the wide variety of factors considered, the Board did not, unless otherwise noted, find it practicable to quantify or otherwise assign relative weights to the foregoing factors. In addition, individual trustees may have assigned different weights to various factors.
NATURE, EXTENT AND QUALITY OF SERVICES. The trustees reviewed the nature, extent and quality of the services provided, and to be provided, by K2 Advisors and eachSub- Advisor. In this regard, they reviewed the Fund’s investment goal and K2 Advisors’ and eachSub-Advisor’s investment strategy andsub-strategy, and K2 Advisors’ and
| | | | | | |
| | | |
| franklintempleton.com | | Annual Report | | | 61 | |
FRANKLIN ALTERNATIVE STRATEGIES FUNDS
FRANKLIN K2 LONG SHORT CREDIT FUND
SHAREHOLDER INFORMATION
eachSub-Advisor’s ability to implement such investment strategy and/orsub-strategy, including, but not limited to, K2 Advisors’ and eachSub-Advisor’s trading practices, investment decision processes and reputation.
The Board noted that the Fund employs a “manager of managers” structure, whereby K2 Advisors is responsible for selectingsub-advisors (subject to Board approval), allocating the Fund’s assets among them, and overseeing thesub-advisors’day-to-day management of the Fund’s assets. The Board noted the responsibilities that K2 Advisors has as the Fund’s investment manager, including (1) due diligence on theSub-Advisors and any potential newsub-advisors to the Fund, their respective trading strategies, risk management, operations and businesses,(2) on-going oversight and monitoring of theday-to-day investment activities ofSub-Advisors and other service providers, including their respective compliance with the investment mandate and restrictions, compliance policies and procedures and federal securities laws, and K2 Advisors’ ongoing assessment of their performance, (3) portfolio construction with respect to the allocation of assets amongSub-Advisors, investment funds, cash and other investments, (4) risk management, (5) preparing quarterly reports to the Board, and (6) the implementation of Board directives as they relate to the Fund. The Trustees also considered the successful performance of K2 Advisors in managing the Fund and other investment products with similar investment strategies to the investment strategies of the Fund that are not subject to the Investment Company Act of 1940.
With respect to thesub-advisory services provided, and to be provided, by eachSub-Advisor, the Board noted the responsibilities that eachSub-Advisor has with respect to the portion of the Fund’s assets allocated to theSub-Advisor by K2 Advisors(Sub-Advised Portion), including, among others, implementing the investment strategies with respect to theSub-Advised Portion and ensuring compliance with the investment strategies, policies and limitations of theSub- Advised Portion. The trustees considered the successful performance of eachSub-Advisor in managing the Fund and other investment products with similar investment strategies to the investment strategies of itsSub-Advised Portion of the Fund, including, with respect to certainSub-Advisors, mutual funds with similar investment strategies. The Board considered K2 Advisors’ rationale for recommending the continued retention of eachSub-Advisor.
The trustees reviewed the Fund’s portfolio management teams at K2 Advisors and eachSub- Advisor, including each
such team’s performance, staffing, skills and compensation program. With respect to portfolio manager compensation, management assured the trustees that the Fund’s long-term performance is a significant component of incentive-based compensation for K2 Advisors’ portfolio management team and noted that a portion of a K2 Advisors’ portfolio manager’s incentive-based compensation is paid in shares ofpre-designated funds from the portfolio manager’s fund management area. The trustees noted that the portfolio manager compensation program aligned the interests of the portfolio managers with that of Fund shareholders. During regular Board meetings and the aforementioned meetings of the independent trustees, the trustees considered periodic reports provided to them showing that K2 Advisors and theSub-Advisors complied with the investment policies and restrictions of the Fund as well as other reports periodically furnished to the Board covering matters such as the compliance of portfolio managers and other management personnel with the code of ethics covering the investment management personnel, the adherence to fair value pricing procedures established by the Board and the accuracy of net asset value calculations. The Board noted the extent of the benefits provided to Fund shareholders from being part of the Franklin Templeton group of funds, including the right to exchange investments between funds (same class) without a sales charge, the ability to reinvest Fund dividends into other funds and the right to combine holdings of other funds to obtain reduced sales charges.
The trustees discussed with management various other products, portfolios and entities that are advised by K2 Advisors and eachSub-Advisor and the allocation of assets and expenses among and within them, as well as their relative fees and reasons for differences with respect thereto and any potential conflicts.
The Board also considered a report from the Trust’s Chief Compliance Officer regarding K2 Advisors’ and eachSub-Advisor’s compliance programs and capabilities as such programs and capabilities relate to the operations of the Fund and the monitoring and testing of such program undertaken by the Trust’s Chief Compliance Officer. The Board considered the selection and due diligence process employed by K2 Advisors in selecting and deciding to retain eachSub-Advisor as asub-advisor to the Fund, including the due diligence undertaken with respect to theSub-Advisor’s compliance and risk management capabilities. The trustees considered K2 Advisors’ significant efforts in developing and implementing compliance procedures established in accordance with SEC and other requirements.
| | | | |
| | | |
| 62 | | Annual Report | | franklintempleton.com |
FRANKLIN ALTERNATIVE STRATEGIES FUNDS
FRANKLIN K2 LONG SHORT CREDIT FUND
SHAREHOLDER INFORMATION
The Board also considered the nature, extent and quality of the services to be provided under the Fund’s other service agreements to determine that, on an overall basis, Fund shareholders were well served. In this connection, the Board also took into account transfer agent and shareholder services provided to Fund shareholders by an affiliate of K2 Advisors, noting continuing expenditures by management to increase and improve the scope of such services and favorable periodic reports on shareholder services conducted by independent third parties. While such considerations directly affected the trustees’ decision in renewing the Fund’s transfer agent and shareholder services agreement, the Board also considered these commitments as incidental benefits to Fund shareholders deriving from the investment management relationship.
Based on their review, the trustees were satisfied with the nature and quality of the overall services provided, and to be provided, by K2 Advisors and its affiliates and each Sub Advisor to the Fund and its shareholders and were confident in the abilities of K2 Advisors and eachSub- Advisor to implement their respective investment strategy and/orsub-strategy and to provide quality services to the Fund and its shareholders.
INVESTMENT PERFORMANCE. As the Fund commenced operations in September 2015, the trustees reviewed the investment performance of the Fund for the one– through three-year periods ended December 31, 2018.
As part of their review, they inquired of management regarding benchmark and hedging activities. Consideration was also given to performance in the context of available levels of cash, including as affected by net flows, during the periods. The trustees had meetings during the year, including the meetings referred to above held in connection with the renewal process, with the Fund’s portfolio managers to discuss performance and the management of the Fund and eachSub-Advisor.
In addition, attention in assessing performance was given to the Broadridge Section 15(c) Report. That report showed the investment performance of the Fund (Advisor Class shares) in comparison to other funds determined comparable by Lipper.
The comparable funds to the Fund, as chosen by Lipper, included all retail and institutional specialty fixed income funds. The Fund had total returns in the second-best performing quintile for theone-year period ended December 31, 2018 and total returns in the best performing quintile for the
two- and three-year periods ended December 31, 2018. The Board was satisfied with such performance.
The trustees also compared Fund performance to other industry benchmarks, including measures of risk-adjusted performance of a fund, as part of their evaluation of investment performance. The trustees concluded that the Fund had continued to perform well in comparison to its various benchmarks and in the context of the Fund’s investment goal.
COMPARATIVE EXPENSES AND PROFITABILITY. The trustees considered the cost of the services provided, and to be provided, by K2 Advisors and eachSub-Advisor and the losses realized by K2 Advisors and its affiliates from their relationships with the Fund. As part of the renewal process, they explored with management the trends in expense ratios over the past three fiscal years (or, if earlier, inception) and the reasons for any increases in the Fund’s expense ratios (or components thereof). In considering the appropriateness of the management fee and other expenses charged to the Fund, the Board took into account various factors including investment performance and matters relating to Fund operations, including, but not limited to, the quality and experience of K2 Advisors personnel. The Board also reviewed and considered the investment management fees in light of the nature, extent and quality of the investment management services provided, and to be provided, by K2 Advisors and eachSub-Advisor, as more fully discussed above. The Board noted that thesub-advisory fees are paid by K2 Advisors to eachSub-Advisor and are not additional fees borne by the Fund. The Board also noted that thesub-advisory fees paid, and to be paid, by K2 Advisors to eachSub-Advisor were the product of arms-length negotiations between K2 Advisors and eachSub-Advisor.
Furthermore, the Board took into account that information regardingSub-Advisor profitability is not legally required to be provided. Accordingly, profitability information of thesub- advisors was given lesser weight than other factors. In addition, the Board considered the allocation of the investment management fee charged to the Fund between K2 Advisors and eachSub-Advisor in light of the nature, extent and quality of the investment management services provided, and to be provided, by K2 Advisors and eachSub-Advisor. As part of this discussion, the Board took into account the fee waiver and expense limitation arrangement in effect, and the amount of Fund expenses that were absorbed since inception of the Fund by K2 Advisors through such waivers and arrangements.
Consideration was also given to a comparative analysis in the Broadridge Section 15(c) Report of the investment
| | | | | | |
| | | |
| franklintempleton.com | | Annual Report | | | 63 | |
FRANKLIN ALTERNATIVE STRATEGIES FUNDS
FRANKLIN K2 LONG SHORT CREDIT FUND
SHAREHOLDER INFORMATION
management fee and total expense ratio of the Fund in comparison with those of a group of other funds selected by Lipper as its appropriate Lipper expense group.
Lipper expense data is based upon information taken from each fund’s most recent annual report, which reflects historical asset levels that may be quite different from those currently existing, particularly in a period of market volatility.
In reviewing comparative costs, emphasis was given to the Fund’s contractual management fee in comparison with the contractual management fee that would have been charged by other funds within its Lipper expense group assuming they were similar in size to the Fund, as well as the actual total expenses of the Fund in comparison with those of its Lipper expense group. The Lipper contractual management fee analysis includes administrative charges as being part of the management fee, and total expenses, for comparative consistency, are shown by Lipper for Fund Advisor Class shares. The Fund’s contractual management fee rate was in the most expensive quintile of both its Base Expense Group and Alternate Expense Group. The Fund’s total expenses were also in the most expensive quintile of both its Base Expense Group and Alternate Expense Group.
Noting the factors and limitations with respect to the Broadridge Section 15(c) Report (including the inclusion of single-manager funds in both peer groups) and factors relating to the Fund’s operations, such as the quality and experience of K2 Advisors and theSub-Advisors and the nature and quality of the services provided and to be provided by K2 Advisors and theSub-Advisors, the Board found such comparative fees and expenses to be acceptable.
The trustees also reviewed the Profitability Study addressing profitability of Franklin Resources, Inc., from its overall U.S. fund business, as well as profitability to K2 Advisors and its affiliates, from providing investment management and other services to the Fund during the12-month period ended September 30, 2018, the most recent fiscalyear-end of Franklin Resources, Inc. The trustees reviewed the basis on which such reports are prepared and the cost allocation methodology utilized in the Profitability Study, it being recognized that allocation methodologies may each be reasonable while producing different results. In this respect, the Board noted that the reasonableness of the cost allocation methodologies was reviewed by independent accountants on an every other year basis.
The independent trustees met with management to discuss the Profitability Study. This included, among other things, a
comparison of investment management income with investment management expenses of the Fund; comparison of underwriting revenues and expenses; the relative relationship of investment management and underwriting expenses; shareholder servicing profitability; economies of scale; and the relative contribution of the Fund to the profitability of K2 Advisors and its parent. In discussing the Profitability Study with the Board, K2 Advisors stated its belief that the costs incurred in establishing the infrastructure necessary to operate the type of mutual fund operations conducted by it and its affiliates may not be fully reflected in the expenses allocated to the Fund in determining its profitability.
The Board also took into account management’s expenditures in improving shareholder services provided to the Fund, as well as the need to meet additional regulatory and compliance requirements. The trustees also considered the extent to which K2 Advisors and theSub-Advisors may derive ancillary benefits from Fund operations, including those derived from the allocation of Fund brokerage and the use of commission dollars to pay for research and other similar services.
The Board noted that shareholders are able to redeem their Fund shares at any time if shareholders believe that Fund fees and expenses are too high or if they are dissatisfied with the performance of the Fund.
ECONOMIES OF SCALE. The Board considered economies of scale realized by K2 Advisors and its affiliates and theSub-Advisors as the Fund grows larger and the extent to which they are shared with Fund shareholders, as for example, in the level of the investment management fees charged, in the quality and efficiency of services rendered and in increased capital commitments benefiting the Fund directly or indirectly. The Board also considered the fee waiver and expense limitation arrangement in effect, and the amount of Fund expenses that were absorbed since inception of the Fund by K2 Advisors through such waiver and arrangement. The Board concluded that economies of scale were deemed not to be a significant factor at that time in light of, among other matters, the fee waiver and expense limitation arrangement in effect and the fact that the Fund had less than four complete years of operating results.
Proxy Voting Policies and Procedures
The Fund’s investment manager has established Proxy Voting Policies and Procedures (Policies) that the Fund uses to determine how to vote proxies relating to portfolio securities. Shareholders may view the Fund’s complete Policies online at franklintempleton.com. Alternatively, shareholders may
| | | | |
| | | |
| 64 | | Annual Report | | franklintempleton.com |
FRANKLIN ALTERNATIVE STRATEGIES FUNDS
FRANKLIN K2 LONG SHORT CREDIT FUND
SHAREHOLDER INFORMATION
request copies of the Policies free of charge by calling the Proxy Group collect at (954)527-7678 or by sending a written request to: Franklin Templeton Companies, LLC, 300 S.E. 2nd Street, Fort Lauderdale, FL 33301, Attention: Proxy Group. Copies of the Fund’s proxy voting records are also made available online at franklintempleton.com and posted on the U.S. Securities and Exchange Commission’s website at sec.gov and reflect the most recent12-month period ended June 30.
Quarterly Statement of Investments
The Trust, on behalf of the Fund, files a complete statement of investments with the U.S. Securities and Exchange Commission for the first and third quarters for each fiscal year as an exhibit to its report on FormN-PORT. Shareholders may view the filed FormN-PORT by visiting the Commission’s website at sec.gov. The filed form may also be viewed and copied at the Commission’s Public Reference Room in Washington, DC. Information regarding the operations of the Public Reference Room may be obtained by calling(800) SEC-0330.
Householding of Reports and Prospectuses
You will receive the Fund’s financial reports every six months as well as an annual updated summary prospectus (prospectus available upon request). To reduce Fund expenses, we try to identify related shareholders in a household and send only one copy of the financial reports and summary prospectus. This process, called “householding,” will continue indefinitely unless you instruct us otherwise. If you prefer not to have these documents householded, please call us at(800) 632-2301. At any time you may view current prospectuses/summary prospectuses and financial reports on our website. If you choose, you may receive these documents through electronic delivery.
| | | | | | |
| | | |
| franklintempleton.com | | Annual Report | | | 65 | |
Authorized for distribution only when accompanied or preceded by a summary prospectus and/or prospectus. Investors should carefully consider a fund’s investment goals, risks, charges and expenses before investing. A prospectus contains this and other information; please read it carefully before investing.
To help ensure we provide you with quality service, all calls to and from our service areas are monitored and/or recorded.
| | | | | | |
 | | Annual Report and Shareholder Letter Franklin K2 Long Short Credit Fund | | |
| | | |
| | Investment Manager | | Distributor | | Shareholder Services |
| | K2/D&S Management Co., L.L.C. | | Franklin Templeton Distributors, Inc. (800) DIAL BEN®/342-5236 franklintempleton.com | | (800) 632-2301 |
| © 2019 Franklin Templeton Investments. All rights reserved. | | | | 948 A 07/19 |
ANNUAL REPORT AND SHAREHOLDER LETTER
FRANKLIN K2 GLOBAL MACRO OPPORTUNITIES FUND
A Series of Franklin Alternative Strategies Funds
May 31, 2019


Sign up for electronic delivery at franklintempleton.com/edelivery
Internet Delivery of Fund Reports Unless You Request Paper Copies: Effective January 1, 2021, as permitted by the SEC, paper copies of the Fund’s shareholder reports will no longer be sent by mail, unless you specifically request them from the Fund or your financial intermediary. Instead, the reports will be made available on a website, and you will be notified by mail each time a report is posted and provided with a website link to access the report.
If you already elected to receive shareholder reports electronically, you will not be affected by this change and you need not take any action. If you have not signed up for electronic delivery, we would encourage you to join fellow shareholders who have. You may elect to receive shareholder reports and other communications electronically from the Fund by calling(800) 632-2301 or by contacting your financial intermediary.
You may elect to continue to receive paper copies of all your future shareholder reports free of charge by contacting your financial intermediary or, if you invest directly with a Fund, calling(800) 632-2301 to let the Fund know of your request. Your election to receive reports in paper will apply to all funds held in your account.
FRANKLIN TEMPLETON
Successful investing begins with ambition. And achievement only comes when you reach for it. That’s why we continually strive to deliver better outcomes for investors. No matter what your goals are, our deep, global investment expertise allows us to offer solutions that can help.
During our more than 70 years of experience, we’ve managed through all kinds of markets—up, down and those in between. We’re always preparing for what may come next. It’s because of this, combined with our strength as one of the world’s largest asset managers that we’ve earned the trust of millions of investors around the world.
Dear Fellow Shareholder:
During the 12 months ended May 31, 2019, global markets benefited from upbeat economic data in certain regions, encouraging corporate earnings reports, the U.S. Federal Reserve’s (Fed’s) recent indications of a patient approach to its monetary policy, and periods of optimism about a potential U.S.-China trade deal. However, global markets also reflected investor concerns about the escalation of U.S.-China and U.S.-Mexico trade tensions nearperiod-end, the Fed’s interest-rate hikes and the European Central Bank’s unwinding of its bond purchase program in 2018, political uncertainties in the U.S. and the European Union, and slower global economic growth. In this environment, global developed market stocks, as measured by the MSCI World Index, posted a +0.27% total return for the period.1 Global emerging market stocks, as measured by the MSCI Emerging Markets Index, posted a-8.34% total return.1 Global government bonds, as measured by the FTSE World Government Bond Index, posted a +2.79% total return.1
We are committed to our long-term perspective and disciplined investment approach as we conduct a rigorous, fundamental analysis of securities with a regular emphasis on investment risk management.
We believe active, professional investment management serves investors well. We also recognize the important role of financial advisors in today’s markets and encourage investors to continue to seek their advice. Amid changing markets and economic conditions, we are confident investors with a well-diversified portfolio and a patient, long-term outlook should be well positioned for the years ahead.
CFA® is a trademark owned by CFA Institute.
1. Source: Morningstar.
See www.franklintempletondatasources.com for additional data provider information.
On the following pages, the Fund’s portfolio management team reviews investment decisions that pertain to performance during the past 12 months in light of the economic environment and other factors. Please remember all securities markets fluctuate, as do mutual fund share prices.
As previously communicated, Franklin K2 Global Macro Opportunities Fund is anticipated to be liquidated on or about September 11, 2019, but may be delayed if unforeseen circumstances arise.
We thank you for your trust and participation in Franklin K2 Global Macro Opportunities Fund. It has been our privilege to serve you.
Sincerely,

Madison S. Gulley, CFA
President and Chief Executive Officer – Investment Management
Franklin Alternative Strategies Funds
This letter reflects our analysis and opinions as of May 31, 2019, unless otherwise indicated. The information is not a complete analysis of every aspect of any market, country, industry, security or fund. Statements of fact are from sources considered reliable.
| | | | | | | | |
| Not FDIC Insured | | | | | May Lose Value | | | | | No Bank Guarantee |
| | | | | | |
| | | |
| franklintempleton.com | | Not part of the annual report | | | 1 | |
Visitfranklintempleton.comfor fund
updates, to access your account, or to find helpful financial planning tools.
| | | | | | |
| | | |
| | 2 | | | Annual Report | | franklintempleton.com |
ANNUAL REPORT
Franklin K2 Global Macro Opportunities Fund
This annual report for Franklin K2 Global Macro Opportunities Fund covers the fiscal year ended May 31, 2019. As previously communicated, the Fund is anticipated to be liquidated on or about September 11, 2019 (Liquidation Date), but may be delayed if unforeseen circumstances arise. Effective at the close of market on June 24, 2019, the Fund closed to all new investors, with limited exceptions. The Fund will not accept any additional purchases after the close of market on or about September 9, 2019. The Fund reserves the right to change this policy at any time. Shareholders of the Fund on the Liquidation Date will have their accounts liquidated and the proceeds will be delivered to them.
Your Fund’s Goal and Main Investments
The Fund seeks capital appreciation over a full business and economic cycle, which may include periods of rising and declining interest rates. The Fund seeks to achieve this goal by allocating its assets across global macro-focused investment strategies, which arenon-traditional or alternative strategies that generally focus on macroeconomic opportunities across numerous markets and investments. Macroeconomic refers to economic factors such as changes in unemployment, national income, gross domestic product, and inflation and price levels. The Fund is structured as a multi-manager fund, meaning the Fund’s assets are managed by multiple subadvisors, and the Fund’s investment manager has overall responsibility for the Fund’s investments. The Fund’s principal investments include both U.S. and foreign (including emerging markets) securities and exchange-traded andover-the-counter (OTC) derivative instruments, and may include asset classes such as equities, fixed income, interest rates, currencies or commodities. The Fund invests primarily in a wide range of derivative instruments that provide the Fund with broad exposure, either long or short, to these various asset classes. Long positions benefit from an increase in the price of the underlying instrument or asset class, while short positions benefit from a decrease in that price.
|
| Portfolio Composition* |
|
| Based on Total Net Assets as of 5/31/19 |
|
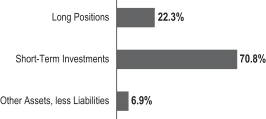 |
*Figures represent the net Fund exposure and include certain derivatives held in the portfolio (or their underlying reference assets) or unsettled trades and may not total 100% or may be negative due to rounding, use of any derivatives or other factors.
Performance Overview
The Fund’s Class A shares posted a +3.75% cumulative total return for the 12 months under review. For comparison, the Fund’s primary benchmark, the HFRX Macro/CTA Index, which measures performance of global macro strategies with exposure to equity, fixed income, hard currency and commodity markets, posted a-1.34% total return for the same period.1 Also for comparison, the Fund’s secondary benchmark, the ICE BofAML U.S.3-Month Treasury Bill Index, which is an index of short-term U.S. government securities with a remaining term to final maturity of less than three months, posted a +2.26% total return for the same period.2 You can find more of the Fund’s performance data in the Performance Summary beginning on page 7.
Performance data represent past performance, which does not guarantee future results. Investment return and principal value will fluctuate, and you may have a gain or loss when you sell your shares. Current performance may differ from figures shown. For most recentmonth-end performance, go tofranklintempleton.com or call(800)342-5236.
Economic and Market Overview
The global economy expanded during the 12 months ended May 31, 2019, despite weakness in certain regions. Global developed and emerging market stocks were aided by upbeat economic data in some regions, encouraging corporate earnings reports, the U.S. Federal Reserve’s (Fed’s)
1. Source: FactSet. Hedge Fund Research, Inc. – www.hedgefundresearch.com. The HFRX Macro/CTA Index is being used under license from Hedge Fund Research, Inc., which does not endorse or approve of any of the contents of this report.
2. Source: Morningstar.
The indexes are unmanaged and include reinvestment of any income or distributions. They do not reflect any fees, expenses or sales charges. One cannot invest directly in an index, and an index is not representative of the Fund’s portfolio. Unlike most asset class indexes, HFR Index returns reflect fees and expenses.
The dollar value, number of shares or principal amount, and names of all portfolio holdings are listed in the Fund’s Consolidated Statement of Investments (SOI). The Consolidated SOI begins on page 16.
| | | | | | |
| | | |
| franklintempleton.com | | Annual Report | | | 3 | |
FRANKLIN K2 GLOBAL MACRO OPPORTUNITIES FUND
recent indications of a patient approach to its monetary policy and periods of optimism about a potential U.S.-China trade deal.
However, various factors weighed on global markets, notably the escalation of U.S.-China trade tensions, as the U.S. raised tariffs on Chinese goods in May and China announced higher tariffs on U.S. goods effective in June. Markets were further pressured atperiod-end when President Trump threatened to impose tariffs on Mexico due to immigration disputes. Concerns about political uncertainties in the U.S. and the European Union, the Fed’s interest-rate hikes in 2018 and the European Central Bank’s (ECB’s) unwinding of its bond purchase program also hurt investor confidence. In this environment, global developed and emerging market stocks, as measured by the MSCI All Country World Index, posted a-0.75% total return for the12-month period.2
The U.S. economy grew during the12-month period. After moderating for two consecutive quarters, the economy grew significantly faster in 2019’s first quarter, driven by growth in consumer spending, inventory investment, exports, business investment, and state and local government spending. The manufacturing and services sectors expanded during the period. The unemployment rate decreased from 3.8% in May 2018 to 3.6% atperiod-end.3 The annual inflation rate, as measured by the Consumer Price Index, decreased from 2.8% in May 2018 to 1.8% atperiod-end.3
The Fed raised its target range for the federal funds rate by 0.25% three times during the period, to 2.25%–2.50%, and continued reducing its balance sheet as part of its plan to normalize monetary policy. At its March 2019 meeting, the Fed held its target range for the federal funds rate unchanged and signaled no rate hike in 2019. Furthermore, the Fed mentioned it would end its balance sheet normalization by the end of September 2019. At its April/May meeting, the Fed reiterated its patient approach to future rate adjustments.
In Europe, the U.K.’s quarterly gross domestic product (GDP) growth accelerated in 2018’s third quarter, moderated in the fourth quarter and accelerated again in 2019’s first quarter. The Bank of England raised its key policy rate once during the period. The eurozone’s quarterly GDP growth moderated in 2018’s third quarter before accelerating in the next two quarters. However, the bloc’s annual inflation rate decreased
during the period. The ECB kept its benchmark interest rate unchanged during the period and concluded its bond purchase program at the end of 2018. At its April meeting, the ECB reiterated its expectation to keep its benchmark interest rate unchanged through at least the end of 2019 and stated it would provide details of its new monetary stimulus program at upcoming meetings.
In Asia, Japan’s quarterly GDP growth contracted in 2018’s third quarter, but accelerated in the next two quarters. The Bank of Japan left its benchmark interest rate unchanged and indicated it would keep the rate unchanged through the spring of 2020, while continuing its monetary stimulus measures.
In larger emerging markets, Brazil’s quarterly GDP growth accelerated in 2018’s third quarter, slowed in the fourth quarter and contracted in 2019’s first quarter. The Central Bank of Brazil left its benchmark interest rate unchanged during the period. Russia’s annual GDP growth held steady in 2018’s third quarter, accelerated in the fourth quarter and then moderated in 2019’s first quarter. The Bank of Russia increased its key rate twice during the period. China’s annual GDP growth rate stabilized in 2019’s first quarter after moderating for three consecutive quarters. The People’s Bank of China left its benchmark interest rate unchanged, but it took measures to improve financial liquidity to mitigate the effects of the U.S.-China trade dispute and support economic growth. Overall, global emerging market stocks, as measured by the MSCI Emerging Markets Index, posted a-8.34% total return during the12-month period.2
Investment Strategy
We manage the Fund using a multi-manager approach. We have overall responsibility for the Fund’s investments and principally allocate assets among multiple subadvisors, each of whom independently manages a separate portion of the Fund’s portfolio in accordance with discretionary and systematic focused global macro strategies. We allocate the Fund’s assets among these strategies utilizing atop-down approach, generating the Fund’s strategy weightings by taking into account market conditions, risk factors, diversification, liquidity, and availability of various subadvisors and other investment options, among other things. We allocate the Fund’s assets to specific subadvisors utilizing abottom-up approach, selecting subadvisors and their weighting within
3. Source: U.S. Bureau of Labor Statistics.
See www.franklintempletondatasources.com for additional data provider information.
| | | | |
| | | |
| 4 | | Annual Report | | franklintempleton.com |
FRANKLIN K2 GLOBAL MACRO OPPORTUNITIES FUND
the Fund’s portfolio by taking into account their correlation to various markets and to each other, risk profiles and their return expectations.
Discretionary global macro strategies seek to profit by tactically investing across different asset classes, markets (including emerging markets) and investment opportunities through a combination of fundamental market analysis and quantitative modeling. Systematic global macro strategies seek to profit by utilizing quantitative models to identify investment opportunities across different asset classes and markets in order to construct a portfolio of investments. Quantitative trading models are proprietary systems that rely on mathematical computations to identify trading opportunities. Subadvisors may use strategies which include a combination of discretionary and systematic focused strategies.
The Fund may invest in equities and various debt instruments, such as securities of the U.S. government, its agencies and instrumentalities and sovereign, quasi-sovereign and corporate bonds. Such debt instruments may have variable or fixed interest rates, may be of any maturity, duration or credit rating and may include high-yield (junk) bonds and distressed debt securities (securities of companies that are, or are about to be, involved in reorganizations, financial restructurings or bankruptcy). The Fund may use derivatives for both hedging andnon-hedging (investment) purposes, although no subadvisor is required to hedge any of the Fund’s positions or to use derivatives. The subadvisors will use a variety of derivatives to implement their respective investment strategies, which may include futures contracts, swaps, currency forward contracts and options. As a result of the Fund’s use of derivatives, the Fund may have economic leverage, which means the sum of the Fund’s investment exposures through its use of derivatives may significantly exceed the amount of assets invested in the Fund, although these exposures may vary over time. The Fund may engage in active and frequent trading as part of its investment strategies.
What is duration?
Duration is a measure of a bond’s price sensitivity to interest-rate changes. In general, a portfolio of securities with a lower duration can be expected to be less sensitive to interest-rate changes than a portfolio with a higher duration.
What is a futures contract?
A futures contract is an agreement between the Fund and a counterparty made through a U.S. or foreign futures exchange to buy or sell an underlying instrument or asset at a specific price on a future date.
| | | | |
| Subadvisors | | | |
| 5/31/19 | | | |
| |
| Discretionary Macro | | | | |
| |
Emso Asset Management Limited | | | | |
| |
RV Capital Management Private Ltd | | | | |
| |
| Systematic Macro | | | | |
| |
Aspect Capital Limited | | | | |
| |
Graham Capital Management, L.P. | | | | |
| |
P/E GLOBAL LLC | | | | |
What are swap agreements?
Swap agreements, such as interest rate, currency and credit default swaps, are contracts between the Fund and another party (the swap counterparty). In a basic swap transaction, the Fund agrees with the swap counterparty to exchange the returns (or differentials in rates of return) earned or realized on a particular “notional amount” of underlying instruments. The notional amount is the set amount selected by the parties as the basis on which to calculate the obligations that they have agreed to exchange. The parties typically do not actually exchange the notional amount. Instead, they agree to exchange the returns that would be earned or realized if the notional amount were invested in given instruments or at given interest rates.
What is a currency forward contract?
A currency forward contract is an agreement between the Fund and a counterparty to buy or sell a foreign currency in exchange for another currency at a specific exchange rate on a future date. Currency forward contracts are privately traded in the interbank market, not on a centralized exchange.
What is an option?
An option is a contract to buy or sell a specific financial product known as the option’s underlying instrument at a specific price. The buyer of an option has the right, but not the obligation, to buy or sell the underlying instrument at or until a specified expiration date. Conversely, the seller (“writer”) of an option who opens a transaction is obligated to buy or sell the underlying instrument should the option holder exercise that right.
Manager’s Discussion
The Fund’s subadvisors for the period were P/E GLOBAL, Aspect Capital, Emso Asset Management, Graham Capital Management and RV Capital Management Private (added in July 2018 and allocated assets in February 2019). These subadvisors are also listed in the Subadvisors table on this page. Four of the five subadvisors posted gains for the review period, led by P/E GLOBAL and Graham. Aspect was the only manager that had a negative impact on performance.
| | | | | | |
| | | |
| franklintempleton.com | | Annual Report | | | 5 | |
FRANKLIN K2 GLOBAL MACRO OPPORTUNITIES FUND
On a broad basis, interest rate derivatives, currency positioning and credit strengthened returns. Conversely, commodities and equities detracted in aggregate. In terms of geographic exposures, European countries (namely, short positioning in the euro), Australia and Germany benefited results, while the U. K., Japan and Argentina dampened performance.
Performance drivers varied across subadvisors, reflecting their different investment themes and regional exposures. P/E GLOBAL benefited from short euro positioning versus the U.S. dollar. Graham’s performance was supported by exposures to longer-duration global bonds, which strengthened returns in the U.S. and Canada. RV Capital’s performance was aided by yield-spread tightening for corporate bonds in India. Emso benefited from solid performance in most emerging market hard currency sovereign bonds, as well as from currency positioning, but it was negatively affected by certain emerging market sovereign bonds, particularly in Argentina. In contrast, for Aspect, long positioning in crude oil and gasoline hindered results for the12-month period.
Thank you for your participation in Franklin K2 Global Macro Opportunities Fund. It has been a pleasure serving your investment needs.
| | |
 | | 
Robert Christian |
| | |
 | | 
Brooks Ritchey |
| | |
 | | 
Anthony Zanolla, CFA |
| |
| | Portfolio Management Team |
The foregoing information reflects our analysis, opinions and portfolio holdings as of May 31, 2019, the end of the reporting period. The way we implement our main investment strategies and the resulting portfolio holdings may change depending on factors such as market and economic conditions. These opinions may not be relied upon as investment advice or an offer for a particular security. The information is not a complete analysis of every aspect of any market, country, industry, security or the Fund. Statements of fact are from sources considered reliable, but the investment manager makes no representation or warranty as to their completeness or accuracy. Although historical performance is no guarantee of future results, these insights may help you understand our investment management philosophy.
| | | | |
| | | |
| 6 | | Annual Report | | franklintempleton.com |
FRANKLIN K2 GLOBAL MACRO OPPORTUNITIES FUND
Performance Summary as of May 31, 2019
The performance table and graphs do not reflect any taxes that a shareholder would pay on Fund dividends, capital gain distributions, if any, or any realized gains on the sale of Fund shares. Total return reflects reinvestment of the Fund’s dividends and capital gain distributions, if any, and any unrealized gains or losses. Your dividend income will vary depending on dividends or interest paid by securities in the Fund’s portfolio, adjusted for operating expenses of each class. Capital gain distributions are net profits realized from the sale of portfolio securities.
Performance as of 5/31/191
Cumulative total return excludes sales charges. Average annual total return includes maximum sales charges. Sales charges will vary depending on the size of the investment and the class of share purchased. The maximum is 5.50% and the minimum is 0%.Class A: 5.50% maximum initial sales charge;Advisor Class: no sales charges. For other share classes, visitfranklintempleton.com.
| | | | | | | | |
| Share Class | | Cumulative
Total Return2 | | | Average Annual
Total Return3 | |
| | |
| A4 | | | | | | | | |
1-Year | | | +3.75% | | | | -2.00% | |
Since Inception (7/11/16) | | | -5.74% | | | | -3.92% | |
| | |
| Advisor | | | | | | | | |
1-Year | | | +4.00% | | | | +4.00% | |
Since Inception (7/11/16) | | | -5.19% | | | | -1.83% | |
Performance data represent past performance, which does not guarantee future results. Investment return and principal value will fluctuate, and you may have a gain or loss when you sell your shares. Current performance may differ from figures shown. For most recentmonth-end performance, go tofranklintempleton.comor call(800)342-5236.
See page 9 for Performance Summary footnotes.
| | | | | | |
| | | |
| franklintempleton.com | | Annual Report | | | 7 | |
FRANKLIN K2 GLOBAL MACRO OPPORTUNITIES FUND
PERFORMANCE SUMMARY
Total Return Index Comparison for a Hypothetical $10,000 Investment1
Total return represents the change in value of an investment over the periods shown. It includes any applicable maximum sales charge, Fund expenses, account fees and reinvested distributions. The unmanaged indexes include reinvestment of any income or distributions. These differ from the Fund in composition and, except for the HFR Index, do not pay management fees or expenses. Unlike most asset class indexes, HFR Index returns reflect management fees and expenses. One cannot invest directly in an index.
Class A(7/11/16–5/31/19)
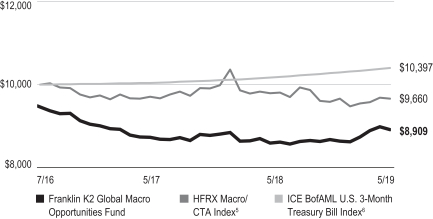
Advisor Class(7/11/16–5/31/19)
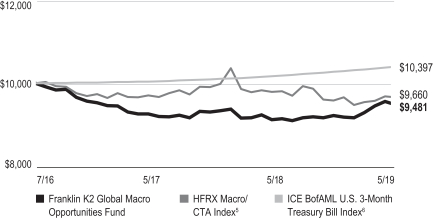
See page 9 for Performance Summary footnotes.
| | | | |
| | | |
| 8 | | Annual Report | | franklintempleton.com |
FRANKLIN K2 GLOBAL MACRO OPPORTUNITIES FUND
PERFORMANCE SUMMARY
Distributions(6/1/18–5/31/19)
| | | | |
| |
| Share Class | | Net Investment
Income | |
A | | | $0.0085 | |
C | | | $— | |
R | | | $0.0075 | |
R6 | | | $0.0315 | |
Advisor | | | $0.0310 | |
Total Annual Operating Expenses7
| | | | | | | | |
| | |
| Share Class | | With Fee
Waiver | | | Without Fee
Waiver | |
A | | | 2.27% | | | | 4.31% | |
Advisor | | | 2.02% | | | | 4.06% | |
Each class of shares is available to certain eligible investors and has different annual fees and expenses, as described in the prospectus.
All investments involve risks, including possible loss of principal. The Fund is actively managed and could experience losses if the investment manager’s or subadvisors’ judgment about particular investments made for the Fund prove to be incorrect. Investments in derivatives involve costs and create economic leverage, which may result in significant volatility and cause the Fund to participate in losses (as well as gains) that significantly exceed the Fund’s initial investment. The market values of securities owned by the Fund will go up or down, sometimes rapidly or unpredictably. Liquidity risk may exist when securities have become more difficult to sell, or are unable to be sold, at the price at which they have been valued. The subadvisors may not be successful in maintaining effective and operational trading models used to implement systematic strategies. An issuer of debt securities may fail to make interest payments or repay principal when due. Lower- rated or high-yield debt securities involve greater credit risk, including the possibility of default or bankruptcy. When interest rates rise, debt security prices tend to fall. Foreign investments are subject to greater investment risk such as political, economic, credit, information and currency fluctuation risks. Investments in emerging markets are subject to the risks of foreign investing and have additional heightened risks. Commodity and commodity-linked investments present unique risks, are speculative and can be extremely volatile. The Fund’s prospectus also includes a description of the main investment risks.
1. The Fund has an expense reduction contractually guaranteed through 9/30/19 and a fee waiver related to the management fee paid by a subsidiary. Fund investment results reflect the expense reduction and fee waiver; without these reductions, the results would have been lower.
2. Cumulative total return represents the change in value of an investment over the periods indicated.
3. Average annual total return represents the average annual change in value of an investment over the periods indicated. Return for less than one year, if any, has not been annualized.
4. Prior to 9/10/18, these shares were offered at a higher initial sales charge of 5.75%, thus actual returns (with sales charges) would have differed. Average annual total returns (with sales charges) have been restated to reflect the current maximum initial sales charge of 5.50%.
5. Source: FactSet. Hedge Fund Research, Inc. – www.hedgefundresearch.com. The HFRX Macro/CTA Index is being used under license from Hedge Fund Research, Inc., which does not endorse or approve of any of the contents of this report. The HFRX Macro/CTA Index measures performance of global macro strategies with exposure to equity, fixed income, hard currency and commodity markets.
6. Source: Morningstar. The ICE BofAML U.S.3-Month Treasury Bill Index is an index of short-term U.S. government securities with a remaining term to final maturity of less than three months.
7. Figures are as stated in the Fund’s current prospectus and may differ from the expense ratios disclosed in the Your Fund’s Expenses and Consolidated Financial Highlights sections in this report. In periods of market volatility, assets may decline significantly, causing total annual Fund operating expenses to become higher than the figures shown.
See www.franklintempletondatasources.com for additional data provider information.
| | | | | | |
| | | |
| franklintempleton.com | | Annual Report | | | 9 | |
FRANKLIN K2 GLOBAL MACRO OPPORTUNITIES FUND
Your Fund’s Expenses
As a Fund shareholder, you can incur two types of costs: (1) transaction costs, including sales charges (loads) on Fund purchases and redemptions; and (2) ongoing Fund costs, including management fees, distribution and service(12b-1) fees, and other Fund expenses. All mutual funds have ongoing costs, sometimes referred to as operating expenses. The table below shows ongoing costs of investing in the Fund and can help you understand these costs and compare them with those of other mutual funds. The table assumes a $1,000 investment held for the six months indicated.
Actual Fund Expenses
The table below provides information about actual account values and actual expenses in the columns under the heading “Actual.” In these columns the Fund’s actual return, which includes the effect of Fund expenses, is used to calculate the “Ending Account Value” for each class of shares. You can estimate the expenses you paid during the period by following these steps (of course, your account value and expenses will differ from those in this illustration): Divide your account value by $1,000 (if your account had an $8,600 value, then $8,600÷ $1,000 = 8.6). Then multiply the result by the number in the row for your class of shares under the headings “Actual” and “Expenses Paid During Period” (if Actual Expenses Paid During Period were $7.50, then 8.6 x $7.50 =$64.50). In this illustration, the actual expenses paid this period are $64.50.
Hypothetical Example for Comparison with Other Funds
Under the heading “Hypothetical” in the table, information is provided about hypothetical account values and hypothetical expenses based on the Fund’s actual expense ratio and an assumed rate of return of 5% per year before expenses, which is not the Fund’s actual return. This information may not be used to estimate the actual ending account balance or expenses you paid for the period, but it can help you compare ongoing costs of investing in the Fund with those of other funds. To do so, compare this 5% hypothetical example for the class of shares you hold with the 5% hypothetical examples that appear in the shareholder reports of other funds.
Please note that expenses shown in the table are meant to highlight ongoing costs and do not reflect any transactional costs. Therefore, information under the heading “Hypothetical” is useful in comparing ongoing costs only, and will not help you compare total costs of owning different funds. In addition, if transactional costs were included, your total costs would have been higher.
| | | | | | | | | | | | | | | | | | | | | | | | |
| | | | |
| | | | | | Actual
(actual return after expenses) | | | Hypothetical
(5% annual return before expenses) | | | | |
Share
Class | | Beginning
Account
Value 12/1/18 | | | Ending
Account
Value 5/31/19 | | | Expenses
Paid During
Period
12/1/18–5/31/181,2 | | | Ending
Account
Value 5/31/19 | | | Expenses
Paid During
Period
12/1/18–5/31/191,2 | | | Net
Annualized
Expense
Ratio2 | |
| A | | $ | 1,000 | | | $ | 1,027.30 | | | $ | 11.12 | | | $ | 1,013.96 | | | $ | 11.05 | | | | 2.20 | % |
| C | | $ | 1,000 | | | $ | 1,024.60 | | | $ | 14.69 | | | $ | 1,010.42 | | | $ | 14.59 | | | | 2.91 | % |
| R | | $ | 1,000 | | | $ | 1,028.30 | | | $ | 11.13 | | | $ | 1,013.96 | | | $ | 11.05 | | | | 2.20 | % |
| R6 | | $ | 1,000 | | | $ | 1,029.80 | | | $ | 9.87 | | | $ | 1,015.21 | | | $ | 9.80 | | | | 1.95 | % |
| Advisor | | $ | 1,000 | | | $ | 1,028.60 | | | $ | 9.86 | | | $ | 1,015.21 | | | $ | 9.80 | | | | 1.95 | % |
1. Expenses are equal to the annualized expense ratio for thesix-month period as indicated above—in the far right column—multiplied by the simple average account value over the period indicated, and then multiplied by 182/365 to reflect theone-half year period.
2. Reflects expenses after fee waivers and expense reimbursements. Does not include acquired fund fees and expenses.
| | | | |
| | | |
| 10 | | Annual Report | | franklintempleton.com |
FRANKLIN ALTERNATIVE STRATEGIES FUNDS
Consolidated Financial Highlights
Franklin K2 Global Macro Opportunities Fund
| | | | | | | | | | | | |
| |
| | | Year Ended May 31, | |
| | | |
| | | 2019 | | | 2018 | | | 2017a | |
| | | |
| Class A | | | | | | | | | | | | |
Per share operating performance
(for a share outstanding throughout the year) | | | | | | | | | | | | |
| | | |
Net asset value, beginning of year | | $ | 9.03 | | | $ | 9.19 | | | $ | 10.00 | |
| | | | |
| | | |
| Income from investment operationsb: | | | | | | | | | | | | |
| | | |
Net investment income (loss)c | | | 0.03 | | | | 0.01 | | | | (0.09 | ) |
| | | |
Net realized and unrealized gains (losses) | | | 0.32 | | | | (0.17 | ) | | | (0.66 | ) |
| | | | |
| | | |
Total from investment operations | | | 0.35 | | | | (0.16 | ) | | | (0.75 | ) |
| | | | |
| | | |
Less distributions from net investment income | | | (0.01 | ) | | | — | | | | (0.06 | ) |
| | | | |
| | | |
Net asset value, end of year | | $ | 9.37 | | | $ | 9.03 | | | $ | 9.19 | |
| | | | |
| | | |
Total returnd | | | 3.75% | | | | (1.74)% | | | | (7.64)% | |
| | | |
| Ratios to average net assetse | | | | | | | | | | | | |
| | | |
Expenses before waiver and payments by affiliates | | | 3.97% | | | | 3.84% | | | | 4.22% | |
| | | |
Expenses net of waiver and payments by affiliatesf | | | 2.20% | | | | 2.20% | | | | 2.16% | |
| | | |
Net investment income (loss) | | | 0.34% | | | | 0.14% | | | | (1.04)% | |
| | | |
| Supplemental data | | | | | | | | | | | | |
| | | |
Net assets, end of year (000’s) | | | $143 | | | | $161 | | | | $90 | |
| | | |
Portfolio turnover rate | | | 132.88% | | | | 240.21% | | | | 239.84% | |
aFor the period July 11, 2016 (commencement of operations) to May 31, 2017.
bThe amount shown for a share outstanding throughout the period may not correlate with the Consolidated Statement of Operations for the period due to the timing of sales and repurchases of the Fund’s shares in relation to income earned and/or fluctuating fair value of the investments of the Fund.
cBased on average daily shares outstanding.
dTotal return does not reflect sales commissions or contingent deferred sales charges, if applicable, and is not annualized for periods less than one year.
eRatios are annualized for periods less than one year, except fornon-recurring expenses, if any.
fBenefit of expense reduction rounds to less than 0.01%.
| | | | | | |
| | | |
| franklintempleton.com | | The accompanying notes are an integral part of these consolidated financial statements. | Annual Report | | | 11 | |
FRANKLIN ALTERNATIVE STRATEGIES FUNDS
CONSOLIDATED FINANCIAL HIGHLIGHTS
Franklin K2 Global Macro Opportunities Fund(continued)
| | | | | | | | | | | | |
| |
| | | Year Ended May 31, | |
| | | |
| | | 2019 | | | 2018 | | | 2017a | |
| | | |
| Class C | | | | | | | | | | | | |
Per share operating performance (for a share outstanding throughout the year) | | | | | | | | | | | | |
| | | |
Net asset value, beginning of year | | $ | 8.90 | | | $ | 9.13 | | | $ | 10.00 | |
| | | | |
| | | |
| Income from investment operationsb: | | | | | | | | | | | | |
| | | |
Net investment income (loss)c | | | (0.03 | ) | | | (0.06 | ) | | | (0.15 | ) |
| | | |
Net realized and unrealized gains (losses) | | | 0.31 | | | | (0.17 | ) | | | (0.68 | ) |
| | | | |
| | | |
Total from investment operations | | | 0.28 | | | | (0.23 | ) | | | (0.83 | ) |
| | | | |
| | | |
Less distributions from net investment income | | | — | | | | — | | | | (0.04 | ) |
| | | | |
| | | |
Net asset value, end of year | | $ | 9.18 | | | $ | 8.90 | | | $ | 9.13 | |
| | | | |
| | | |
Total returnd | | | 3.15% | | | | (2.52)% | | | | (8.27)% | |
| | | |
| Ratios to average net assetse | | | | | | | | | | | | |
| | | |
Expenses before waiver and payments by affiliates | | | 4.66% | | | | 4.59% | | | | 4.98% | |
| | | |
Expenses net of waiver and payments by affiliatesf | | | 2.89% | | | | 2.95% | | | | 2.92% | |
| | | |
Net investment income (loss) | | | (0.35)% | | | | (0.61)% | | | | (1.80)% | |
| | | |
| Supplemental data | | | | | | | | | | | | |
| | | |
Net assets, end of year (000’s) | | | $138 | | | | $147 | | | | $188 | |
| | | |
Portfolio turnover rate | | | 132.88% | | | | 240.21% | | | | 239.84% | |
aFor the period July 11, 2016 (commencement of operations) to May 31, 2017.
bThe amount shown for a share outstanding throughout the period may not correlate with the Consolidated Statement of Operations for the period due to the timing of sales and repurchases of the Fund’s shares in relation to income earned and/or fluctuating fair value of the investments of the Fund.
cBased on average daily shares outstanding.
dTotal return does not reflect sales commissions or contingent deferred sales charges, if applicable, and is not annualized for periods less than one year.
eRatios are annualized for periods less than one year, except fornon-recurring expenses, if any.
fBenefit of expense reduction rounds to less than 0.01%.
| | | | |
| | | |
| 12 | | Annual Report | The accompanying notes are an integral part of these consolidated financial statements. | | franklintempleton.com |
FRANKLIN ALTERNATIVE STRATEGIES FUNDS
CONSOLIDATED FINANCIAL HIGHLIGHTS
Franklin K2 Global Macro Opportunities Fund(continued)
| | | | | | | | | | | | |
| |
| | | Year Ended May 31, | |
| | | |
| | | 2019 | | | 2018 | | | 2017a | |
| | | |
| Class R | | | | | | | | | | | | |
Per share operating performance (for a share outstanding throughout the year) | | | | | | | | | | | | |
| | | |
Net asset value, beginning of year | | $ | 9.02 | | | $ | 9.18 | | | $ | 10.00 | |
| | | | |
| | | |
| Income from investment operationsb: | | | | | | | | | | | | |
| | | |
Net investment income (loss)c | | | 0.03 | | | | 0.01 | | | | (0.08 | ) |
| | | |
Net realized and unrealized gains (losses) | | | 0.31 | | | | (0.17 | ) | | | (0.68 | ) |
| | | | |
| | | |
Total from investment operations | | | 0.34 | | | | (0.16 | ) | | | (0.76 | ) |
| | | | |
| | | |
Less distributions from net investment income | | | (0.01 | ) | | | — | | | | (0.06 | ) |
| | | | |
| | | |
Net asset value, end of year | | $ | 9.35 | | | $ | 9.02 | | | $ | 9.18 | |
| | | | |
| | | |
Total returnd | | | 3.74% | | | | (1.74)% | | | | (7.63)% | |
| | | |
| Ratios to average net assetse | | | | | | | | | | | | |
| | | |
Expenses before waiver and payments by affiliates | | | 3.97% | | | | 3.86% | | | | 4.18% | |
| | | |
Expenses net of waiver and payments by affiliatesf | | | 2.20% | | | | 2.22% | | | | 2.12% | |
| | | |
Net investment income (loss) | | | 0.34% | | | | 0.12% | | | | (1.00)% | |
| | | |
| Supplemental data | | | | | | | | | | | | |
| | | |
Net assets, end of year (000’s) | | | $9 | | | | $9 | | | | $9 | |
| | | |
Portfolio turnover rate | | | 132.88% | | | | 240.21% | | | | 239.84% | |
aFor the period July 11, 2016 (commencement of operations) to May 31, 2017.
bThe amount shown for a share outstanding throughout the period may not correlate with the Consolidated Statement of Operations for the period due to the timing of sales and repurchases of the Fund’s shares in relation to income earned and/or fluctuating fair value of the investments of the Fund.
cBased on average daily shares outstanding.
dTotal return is not annualized for periods less than one year.
eRatios are annualized for periods less than one year, except fornon-recurring expenses, if any.
fBenefit of expense reduction rounds to less than 0.01%.
| | | | | | |
| | | |
| franklintempleton.com | | The accompanying notes are an integral part of these consolidated financial statements. | Annual Report | | | 13 | |
FRANKLIN ALTERNATIVE STRATEGIES FUNDS
CONSOLIDATED FINANCIAL HIGHLIGHTS
Franklin K2 Global Macro Opportunities Fund(continued)
| | | | | | | | | | | | |
| |
| | | Year Ended May 31, | |
| | | |
| | | 2019 | | | 2018 | | | 2017a | |
| | | |
| Class R6 | | | | | | | | | | | | |
Per share operating performance
(for a share outstanding throughout the year) | | | | | | | | | | | | |
| | | |
Net asset value, beginning of year | | $ | 9.05 | | | $ | 9.19 | | | $ | 10.00 | |
| | | | |
| | | |
| Income from investment operationsb: | | | | | | | | | | | | |
| | | |
Net investment income (loss)c | | | 0.05 | | | | 0.03 | | | | (0.07 | ) |
| | | |
Net realized and unrealized gains (losses) | | | 0.32 | | | | (0.17 | ) | | | (0.68 | ) |
| | | | |
| | | |
Total from investment operations | | | 0.37 | | | | (0.14 | ) | | | (0.75 | ) |
| | | | |
| | | |
Less distributions from net investment income | | | (0.03 | ) | | | — | | | | (0.06 | ) |
| | | | |
| | | |
Net asset value, end of year | | $ | 9.39 | | | $ | 9.05 | | | $ | 9.19 | |
| | | | |
| | | |
Total returnd | | | 4.12% | | | | (1.52)% | | | | (7.52)% | |
| | | |
| Ratios to average net assetse | | | | | | | | | | | | |
| | | |
Expenses before waiver and payments by affiliates | | | 3.94% | | | | 4.84% | | | | 4.30% | |
| | | |
Expenses net of waiver and payments by affiliatesf | | | 1.95% | | | | 1.95% | | | | 1.94% | |
| | | |
Net investment income (loss) | | | 0.59% | | | | 0.39% | | | | (0.82)% | |
| | | |
| Supplemental data | | | | | | | | | | | | |
| | | |
Net assets, end of year (000’s) | | | $9 | | | | $9 | | | | $9 | |
| | | |
Portfolio turnover rate | | | 132.88% | | | | 240.21% | | | | 239.84% | |
aFor the period July 11, 2016 (commencement of operations) to May 31, 2017.
bThe amount shown for a share outstanding throughout the period may not correlate with the Consolidated Statement of Operations for the period due to the timing of sales and repurchases of the Fund’s shares in relation to income earned and/or fluctuating fair value of the investments of the Fund.
cBased on average daily shares outstanding.
dTotal return is not annualized for periods less than one year.
eRatios are annualized for periods less than one year, except fornon-recurring expenses, if any.
fBenefit of expense reduction rounds to less than 0.01%.
| | | | |
| | | |
| 14 | | Annual Report | The accompanying notes are an integral part of these consolidated financial statements. | | franklintempleton.com |
FRANKLIN ALTERNATIVE STRATEGIES FUNDS
CONSOLIDATED FINANCIAL HIGHLIGHTS
Franklin K2 Global Macro Opportunities Fund(continued)
| | | | | | | | | | | | |
| |
| | | Year Ended May 31, | |
| | | |
| | | 2019 | | | 2018 | | | 2017a | |
| | | |
| Advisor Class | | | | | | | | | | | | |
Per share operating performance
(for a share outstanding throughout the year) | | | | | | | | | | | | |
| | | |
Net asset value, beginning of year | | $ | 9.06 | | | $ | 9.19 | | | $ | 10.00 | |
| | | | |
| | | |
| Income from investment operationsb: | | | | | | | | | | | | |
| | | |
Net investment income (loss)c | | | 0.05 | | | | 0.04 | | | | (0.07 | ) |
| | | |
Net realized and unrealized gains (losses) | | | 0.31 | | | | (0.17 | ) | | | (0.68 | ) |
| | | | |
| | | |
Total from investment operations | | | 0.36 | | | | (0.13 | ) | | | (0.75 | ) |
| | | | |
| | | |
Less distributions from net investment income | | | (0.03 | ) | | | — | | | | (0.06 | ) |
| | | | |
| | | |
Net asset value, end of year | | $ | 9.39 | | | $ | 9.06 | | | $ | 9.19 | |
| | | | |
| | | |
Total returnd | | | 4.00% | | | | (1.41)% | | | | (7.42)% | |
| | | |
| Ratios to average net assetse | | | | | | | | | | | | |
| | | |
Expenses before waiver and payments by affiliates | | | 3.72% | | | | 3.59% | | | | 3.99% | |
| | | |
Expenses net of waiver and payments by affiliatesf | | | 1.95% | | | | 1.95% | | | | 1.93% | |
| | | |
Net investment income (loss) | | | 0.59% | | | | 0.39% | | | | (0.81)% | |
| | | |
| Supplemental data | | | | | | | | | | | | |
| | | |
Net assets, end of year (000’s) | | | $23,550 | | | | $22,744 | | | | $22,975 | |
| | | |
Portfolio turnover rate | | | 132.88% | | | | 240.21% | | | | 239.84% | |
aFor the period July 11, 2016 (commencement of operations) to May 31, 2017.
bThe amount shown for a share outstanding throughout the period may not correlate with the Consolidated Statement of Operations for the period due to the timing of sales and repurchases of the Fund’s shares in relation to income earned and/or fluctuating fair value of the investments of the Fund.
cBased on average daily shares outstanding.
dTotal return is not annualized for periods less than one year.
eRatios are annualized for periods less than one year, except fornon-recurring expenses, if any.
fBenefit of expense reduction rounds to less than 0.01%.
| | | | | | |
| | | |
| franklintempleton.com | | The accompanying notes are an integral part of these consolidated financial statements. | Annual Report | | | 15 | |
FRANKLIN ALTERNATIVE STRATEGIES FUNDS
Consolidated Statement of Investments, May 31, 2019
Franklin K2 Global Macro Opportunities Fund
| | | | | | | | | | | | | | | | | | |
| | | | |
| | | | | Country | | | Principal Amount* | | | Value | |
| | | Corporate Bonds and Notes 16.5% | | | |
| | | Banks 6.7% | |
| a | | Axis Bank Ltd., senior note, Reg S, 3.25%, 5/21/20 | | | India | | | | 200,000 | | | | | | | $ | 200,429 | |
| a | | Bank of India, Reg S,
senior bond, 6.25%, 2/16/21 | | | India | | | | 200,000 | | | | | | | | 209,587 | |
| | senior note, 3.125%, 5/06/20 | | | India | | | | 400,000 | | | | | | | | 399,480 | |
| b,c | | HSBC Holdings PLC, junior sub. bond, FRN, 6.00%, (USD 5 Year Swap + 3.75%), Perpetual | | | United Kingdom | | | | 200,000 | | | | | | | | 197,393 | |
| a | | Industrial and Commercial Bank of China (Asia) Ltd., senior note, Reg S, 5.125%, 11/30/20 | | | Hong Kong | | | | 200,000 | | | | | | | | 206,632 | |
| a,b,c | | Postal Savings Bank of China Co. Ltd., junior sub. bond, Reg S, 4.50%, FRN, (US 5 Year CMTT-Note + 2.63%), Perpetual | | | China | | | | 200,000 | | | | | | | | 196,250 | |
| c | | Westpac Banking Corp., junior sub. bond, 5.00% to 9/21/27, FRN thereafter, Perpetual | | | Australia | | | | 200,000 | | | | | | | | 179,436 | |
| | | | | | | | | | | | | | | | | | |
| | | | | |
| | | | | | | | | | | | | | | | | 1,589,207 | |
| | | | | | | | | | | | | | | | | | |
| | | Building Products 0.7% | |
| a | | GMR Hyderabad International Airport Ltd., senior secured note, Reg S, 4.25%, 10/27/27 | | | India | | | | 200,000 | | | | | | | | 177,285 | |
| | | | | | | | | | | | | | | | | | |
| | | Chemicals 1.9% | |
| a | | Bluestar Finance Holdings Ltd., senior note, Reg S, 4.375%, 6/11/20 | | | China | | | | 260,000 | | | | | | | | 263,402 | |
| a | | CNAC HK Finbridge Co. Ltd., senior note, Reg S, 4.125%, 3/14/21 | | | China | | | | 200,000 | | | | | | | | 203,132 | |
| | | | | | | | | | | | | | | | | | |
| | | | | |
| | | | | | | | | | | | | | | | | 466,534 | |
| | | | | | | | | | | | | | | | | | |
| | | Communications Equipment 0.8% | |
| a | | Proven Glory Capital Ltd., senior note, Reg S, 4.00%, 2/21/27 | | | China | | | | 200,000 | | | | | | | | 187,842 | |
| | | | | | | | | | | | | | | | | | |
| | | Construction & Engineering 1.9% | |
| a,c | | CCCI Treasure Ltd., senior bond, Reg S, 3.50% to 4/21/20, FRN thereafter, Perpetual | | | China | | | | 250,000 | | | | | | | | 249,992 | |
| a,c | | Dianjian Haixing Ltd., senior bond, Reg S, 4.05% to 10/21/19, FRN thereafter, Perpetual | | | China | | | | 200,000 | | | | | | | | 200,300 | |
| | | | | | | | | | | | | | | | | | |
| | | | | |
| | | | | | | | | | | | | | | | | 450,292 | |
| | | | | | | | | | | | | | | | | | |
| | | Diversified Telecommunication Services 0.8% | |
| a | | Axiata SPV2 Bhd, senior note, Reg S, 3.466%, 11/19/20 | | | Malaysia | | | | 200,000 | | | | | | | | 202,015 | |
| | | | | | | | | | | | | | | | | | |
| | | Electronic Equipment, Instruments & Components 0.8% | |
| a | | Tsinghua Unic Ltd., senior note, Reg S, 5.375%, 1/31/23 | | | China | | | | 200,000 | | | | | | | | 191,833 | |
| | | | | | | | | | | | | | | | | | |
| | | Metals & Mining 0.8% | |
| a | | ABJA Investment Co. Pte Ltd., senior note, Reg S, 5.45%, 1/24/28 | | | India | | | | 200,000 | | | | | | | | 184,777 | |
| | | | | | | | | | | | | | | | | | |
| | | Oil, Gas & Consumable Fuels 1.2% | |
| | Petrobras Global Finance BV,
senior bond, 6.90%, 3/19/49 | | | Brazil | | | | 31,000 | | | | | | | | 31,031 | |
| | senior note, 6.25%, 3/17/24 | | | Brazil | | | | 16,000 | | | | | | | | 17,398 | |
| | senior note, 8.75%, 5/23/26 | | | Brazil | | | | 29,000 | | | | | | | | 35,013 | |
| | Petroleos Mexicanos,
senior bond, 5.50%, 1/21/21 | | | Mexico | | | | 39,000 | | | | | | | | 40,150 | |
| | senior note, 4.875%, 1/24/22 | | | Mexico | | | | 73,000 | | | | | | | | 74,124 | |
| | senior note, 3.50%, 1/30/23 | | | Mexico | | | | 55,000 | | | | | | | | 53,026 | |
| | senior note, 4.625%, 9/21/23 | | | Mexico | | | | 36,000 | | | | | | | | 35,942 | |
| | | | | | | | | | | | | | | | | | |
| | | | | |
| | | | | | | | | | | | | | | | | 286,684 | |
| | | | | | | | | | | | | | | | | | |
| | | Real Estate Management & Development 0.9% | |
| a | | Powerchina Real Estate Group Ltd., senior note, Reg S, 4.50%, 12/06/21 | | | China | | | | 200,000 | | | | | | | | 204,908 | |
| | | | | | | | | | | | | | | | | | |
| | Total Corporate Bonds and Notes
(Cost $3,908,622) | | | | | | | | | | | | | | | 3,941,377 | |
| | | | | | | | | | | | | | | | | | |
| | | | |
| | | |
| 16 | | Annual Report | | franklintempleton.com |
FRANKLIN ALTERNATIVE STRATEGIES FUNDS
CONSOLIDATED STATEMENT OF INVESTMENTS
Franklin K2 Global Macro Opportunities Fund(continued)
| | | | | | | | | | | | | | | | | | |
| | | | |
| | | | | Country | | | Principal Amount* | | | Value | |
| | | Corporate Bonds and Notes in Reorganization
(Cost $5,704) 0.0%† | | | | | | | | | | | | |
| | | Oil, Gas & Consumable Fuels 0.0%† | |
| a,d | | Petroleos de Venezuela SA, senior note, Reg S, 6.00%, 10/28/22 | | | Venezuela | | | | 40,143 | | | | | | | $ | 7,226 | |
| | | | | | | | | | | | | | | | | | |
| | | Foreign Government and Agency Securities 4.8% | | | |
| | Argentina Treasury Bill, Strip,
4/30/20 | | | Argentina | | | | 682,788 | | | | ARS | | | | 16,014 | |
| | 7/31/20 | | | Argentina | | | | 1,100,673 | | | | ARS | | | | 22,439 | |
| | Government of Argentina,
3.38% to 3/31/29, 4.74% thereafter, 12/31/38 | | | Argentina | | | | 61,000 | | | | EUR | | | | 35,958 | |
| | senior bond, 3.38%, 12/31/38 | | | Argentina | | | | 31,585 | | | | EUR | | | | 18,281 | |
| | b senior note, FRN, 68.805%, (ARLLMONP), 6/21/20 | | | Argentina | | | | 713,967 | | | | ARS | | | | 16,040 | |
| | a senior note, Reg S, 3.875%, 1/15/22 | | | Argentina | | | | 100,000 | | | | EUR | | | | 85,240 | |
| | senior note, 5.625%, 1/26/22 | | | Argentina | | | | 207,000 | | | | | | | | 160,321 | |
| | Government of Brazil, senior bond, 4.875%, 1/22/21 | | | Brazil | | | | 100,000 | | | | | | | | 103,400 | |
| | Government of Russia, senior bond, 7.25%, 5/10/34 | | | Russia | | | | 19,490,000 | | | | RUB | | | | 279,659 | |
| | Government of South Africa, senior bond,
5.50%, 3/09/20 | | | South Africa | | | | 100,000 | | | | | | | | 101,585 | |
| | R186, 10.50%, 12/21/26 | | | South Africa | | | | 2,238,294 | | | | ZAR | | | | 170,643 | |
| | Government of Turkey, senior bond, 7.00%, 6/05/20 | | | Turkey | | | | 135,000 | | | | | | | | 136,912 | |
| | | | | | | | | | | | | | | | | | |
| | Total Foreign Government and Agency Securities
(Cost $1,248,438) | | | | | | | | | | | | | | | 1,146,492 | |
| | | | | | | | | | | | | | | | | | |
| | | Municipal Bonds in Reorganization 1.0% | | | |
| | | Puerto Rico 1.0% | |
| d | | Puerto Rico Commonwealth GO, Public Improvement, Refunding, Series A,
5.50%, 7/01/39 | | | United States | | | | 160,000 | | | | | | | | 89,400 | |
| | 5.00%, 7/01/41 | | | United States | | | | 70,000 | | | | | | | | 39,113 | |
| d | | Puerto Rico Commonwealth GO, Refunding, Series A, 8.00%, 7/01/35 | | | United States | | | | 200,000 | | | | | | | | 98,000 | |
| | | | | | | | | | | | | | | | | | |
| | Total Municipal Bonds in Reorganization
(Cost $223,106) | | | | | | | | | | | | | | | 226,513 | |
| | | | | | | | | | | | | | | | | | |
| | Total Investments before Short Term Investments
(Cost $5,385,870) | | | | | | | | | | | | | | | 5,321,608 | |
| | | | | | | | | | | | | | | | | | |
| | | Short Term Investments 70.8% | | | | | | | | | |
| | | | | |
| | Foreign Government and Agency Securities
(Cost $46,687) 0.2% | | | | | | | | | | | | | | | | |
| e | | Argentina Treasury Bill, 6/28/19 | | | Argentina | | | | 1,936,456 | | | | ARS | | | | 51,537 | |
| | | | | | | | | | | | | | | | | | |
| | | Corporate Bonds and Notes 3.4% | | | |
| | | Chemicals 0.8% | |
| a | | Bluestar Finance Holdings Ltd., senior note, Reg S, 3.125%, 9/30/19 | | | China | | | | 200,000 | | | | | | | | 200,240 | |
| | | | | | | | | | | | | | | | | | |
| | | Diversified Telecommunication Services 0.9% | |
| a | | Axiata SPV1 Labuan Ltd., senior note, Reg S, 5.375%, 4/28/20 | | | Malaysia | | | | 200,000 | | | | | | | | 205,032 | |
| | | | | | | | | | | | | | | | | | |
| | | Oil, Gas & Consumable Fuels 0.8% | |
| a | | ONGC Videsh Ltd., senior note, Reg S, 3.25%, 7/15/19 | | | India | | | | 200,000 | | | | | | | | 200,296 | |
| | | | | | | | | | | | | | | | | | |
| | | Real Estate Management & Development 0.9% | |
| a | | Vanke Real Estate Hong Kong Co. Ltd., senior note, Reg S, 3.95%, 12/23/19 | | | China | | | | 204,000 | | | | | | | | 205,097 | |
| | | | | | | | | | | | | | | | | | |
| | Total Corporate Bonds and Notes
(Cost $808,674) | | | | | | | | | | | | | | | 810,665 | |
| | | | | | | | | | | | | | | | | | |
| | | Credit-Linked Notes (Cost $106,716) 0.5% | | | | | | | | | | | | |
| f | | Goldman Sachs International, senior note, (Nigeria OMO Bill), zero cpn., 9/30/19 | | | United States | | | | 40,000,000 | | | | NGN | | | | 106,804 | |
| | | | | | | | | | | | | | | | | | |
| | | | | | |
| | | |
| franklintempleton.com | | Annual Report | | | 17 | |
FRANKLIN ALTERNATIVE STRATEGIES FUNDS
CONSOLIDATED STATEMENT OF INVESTMENTS
Franklin K2 Global Macro Opportunities Fund(continued)
| | | | | | | | | | | | | | | | | | |
| | | | | |
| | | | | Country | | | Shares | | | | | | Value | |
| | | Short Term Investments(continued) | | | | | | | | | | | | |
| | | Money Market Funds 66.7% | | | |
| g,h | | Dreyfus Government Cash Management, Institutional, 2.28% | | | United States | | | | 5,125,325 | | | | | | | $ | 5,125,325 | |
| g | | Fidelity Investments Money Market Government Portfolio, Institutional, 2.27% | | | United States | | | | 10,785,901 | | | | | | | | 10,785,901 | |
| | | | | | | | | | | | | | | | | | |
| | Total Money Market Funds (Cost $15,911,226) | | | | | | | | | | | | | | | 15,911,226 | |
| | | | | | | | | | | | | | | | | | |
| | Total Investments (Cost $22,259,173) 93.1% | | | | | | | | | | | | | | | 22,201,840 | |
| | Other Assets, less Liabilities 6.9% | | | | | | | | | | | | | | | 1,647,302 | |
| | | | | | | | | | | | | | | | | | |
| | Net Assets 100.0% | | | | | | | | | | | | | | $ | 23,849,142 | |
| | | | | | | | | | | | | | | | | | |
*The principal amount is stated in U.S. dollars unless otherwise indicated.
†Rounds to less than 0.1% of net assets.
aSecurity was purchased pursuant to Regulation S under the Securities Act of 1933, which exempts from registration securities offered and sold outside of the United States. Such a security cannot be sold in the United States without either an effective registration statement filed pursuant to the Securities Act of 1933, or pursuant to an exemption from registration. These securities have been deemed liquid under guidelines approved by the Trust’s Board of Trustees. At May 31, 2019, the aggregate value of these securities was $4,180,995, representing 17.5% of net assets.
bThe coupon rate shown represents the rate at period end.
cPerpetual security with no stated maturity date.
dSee Note 7 regarding defaulted securities.
eThe security was issued on a discount basis with no stated coupon rate.
fSee Note 1(e) regarding credit-linked notes.
gThe rate shown is the annualizedseven-day yield at period end.
hA portion or all of the security is owned by K2 GMOF Holdings Corp., a wholly-owned subsidiary of the Fund. See Note 1(f).
At May 31, 2019, the Fund had the following futures contracts outstanding. See Note 1(c).
| | | | | | | | | | | | | | | | | | | | |
| Futures Contracts | | | | | | | | | | | | | | | |
| | | | | |
| Description | | Type | | | Number of
Contracts | | | Notional
Amount* | | | Expiration
Date | | | Value/Unrealized
Appreciation
(Depreciation) | |
| Commodity Contractsa | | | | | | | | | | | | | | | | | | | | |
Aluminum | | | Long | | | | 4 | | | $ | 177,750 | | | | 6/17/19 | | | $ | (1,829 | ) |
Aluminum | | | Short | | | | 4 | | | | 177,750 | | | | 6/17/19 | | | | 8,683 | |
Aluminum | | | Long | | | | 1 | | | | 45,025 | | | | 9/16/19 | | | | (315 | ) |
Aluminum | | | Short | | | | 5 | | | | 225,125 | | | | 9/16/19 | | | | 3,398 | |
Brent Crude Oil | | | Long | | | | 4 | | | | 247,960 | | | | 6/28/19 | | | | (25,356 | ) |
Cocoa | | | Long | | | | 2 | | | | 45,134 | | | | 7/16/19 | | | | 1,274 | |
Coffee | | | Short | | | | 1 | | | | 39,225 | | | | 7/19/19 | | | | 9,315 | |
Coffee | | | Short | | | | 3 | | | | 120,488 | | | | 9/18/19 | | | | (4,415 | ) |
Coffee | | | Short | | | | 1 | | | | 41,494 | | | | 12/18/19 | | | | (2,741 | ) |
Copper | | | Long | | | | 8 | | | | 1,164,000 | | | | 6/17/19 | | | | (109,154 | ) |
Copper | | | Short | | | | 8 | | | | 1,164,000 | | | | 6/17/19 | | | | 104,769 | |
Copper | | | Short | | | | 3 | | | | 437,437 | | | | 9/16/19 | | | | 24,429 | |
Corn | | | Short | | | | 3 | | | | 64,050 | | | | 7/12/19 | | | | (7,996 | ) |
Cotton No.2 | | | Short | | | | 1 | | | | 33,535 | | | | 12/06/19 | | | | 287 | |
Gasoline RBOB | | | Long | | | | 4 | | | | 297,595 | | | | 6/28/19 | | | | (34,117 | ) |
Gasoline RBOB | | | Long | | | | 1 | | | | 73,046 | | | | 7/31/19 | | | | (1,850 | ) |
Gold 100 Oz | | | Short | | | | 3 | | | | 393,330 | | | | 8/28/19 | | | | (8,067 | ) |
Hard Red Winter Wheat | | | Short | | | | 4 | | | | 94,600 | | | | 7/12/19 | | | | 1,263 | |
Low Sulphur Gas Oil | | | Long | | | | 2 | | | | 115,500 | | | | 7/11/19 | | | | (12,428 | ) |
Natural Gas | | | Short | | | | 1 | | | | 24,540 | | | | 6/26/19 | | | | 1,038 | |
Natural Gas | | | Short | | | | 1 | | | | 24,600 | | | | 7/29/19 | | | | 238 | |
Silver | | | Short | | | | 2 | | | | 145,670 | | | | 7/29/19 | | | | (49 | ) |
Soybean | | | Short | | | | 5 | | | | 219,438 | | | | 7/12/19 | | | | 3,848 | |
Soybean Meal | | | Short | | | | 4 | | | | 128,520 | | | | 7/12/19 | | | | (4,562 | ) |
Soybean Oil | | | Short | | | | 1 | | | | 16,554 | | | | 7/12/19 | | | | 1,155 | |
Sugar | | | Short | | | | 1 | | | | 13,552 | | | | 6/28/19 | | | | 109 | |
Sugar | | | Short | | | | 3 | | | | 41,765 | | | | 9/30/19 | | | | (1,061 | ) |
Wheat | | | Short | | | | 4 | | | | 100,600 | | | | 7/12/19 | | | | (5,261 | ) |
| | | | |
| | | |
| 18 | | Annual Report | | franklintempleton.com |
FRANKLIN ALTERNATIVE STRATEGIES FUNDS
CONSOLIDATED STATEMENT OF INVESTMENTS
Franklin K2 Global Macro Opportunities Fund(continued)
| | | | | | | | | | | | | | | | | | | | |
| Futures Contracts | | | | | | | | | | | | | | | |
| | | | | |
| Description | | Type | | | Number of
Contracts | | | Notional
Amount* | | | Expiration
Date | | | Value/Unrealized
Appreciation
(Depreciation) | |
| Commodity Contractsa(continued) | | | | | | | | | | | | | | | | | | | | |
Wheat | | | Short | | | | 1 | | | $ | 25,488 | | | | 9/13/19 | | | $ | (1,915 | ) |
Zinc | | | Long | | | | 2 | | | | 131,500 | | | | 6/17/19 | | | | 2,132 | |
Zinc | | | Short | | | | 2 | | | | 131,500 | | | | 6/17/19 | | | | 994 | |
Zinc | | | Long | | | | 3 | | | | 188,212 | | | | 9/16/19 | | | | (5,346 | ) |
Zinc | | | Short | | | | 1 | | | | 62,737 | | | | 9/16/19 | | | | 1,285 | |
| | | | | | | | | | | | | | | | | | | | |
| | | | | | | | | | | | | | | | | | | (62,245 | ) |
| | | | | | | | | | | | | | | | | | | | |
| Currency Contracts | | | | | | | | | | | | | | | | | | | | |
AUD/USD | | | Short | | | | 18 | | | | 1,249,740 | | | | 6/17/19 | | | | 18,322 | |
CAD/USD | | | Short | | | | 6 | | | | 443,910 | | | | 6/18/19 | | | | 6,820 | |
CHF/USD | | | Short | | | | 2 | | | | 250,225 | | | | 6/17/19 | | | | (541 | ) |
EUR/USD | | | Short | | | | 42 | | | | 5,873,175 | | | | 6/17/19 | | | | 102,488 | |
GBP/USD | | | Short | | | | 12 | | | | 948,225 | | | | 6/17/19 | | | | 10,919 | |
JPY/USD | | | Long | | | | 1 | | | | 115,456 | | | | 6/17/19 | | | | 1,036 | |
MXN/USD | | | Long | | | | 7 | | | | 177,590 | | | | 6/17/19 | | | | (727 | ) |
MXN/USD | | | Short | | | | 4 | | | | 101,480 | | | | 6/17/19 | | | | (96 | ) |
NZD/USD | | | Short | | | | 8 | | | | 523,680 | | | | 6/17/19 | | | | 9,912 | |
ZAR/USD | | | Short | | | | 2 | | | | 68,475 | | | | 6/17/19 | | | | 97 | |
| | | | | | | | | | | | | | | | | | | | |
| | | | | | | | | | | | | | | | | | | 148,230 | |
| | | | | | | | | | | | | | | | | | | | |
| Equity Contracts | | | | | | | | | | | | | | | | | | | | |
Amsterdam Index | | | Long | | | | 1 | | | | 120,715 | | | | 6/21/19 | | | | (1,190 | ) |
CAC 40 10 Euro Index | | | Long | | | | 2 | | | | 115,850 | | | | 6/21/19 | | | | (1,791 | ) |
CMEE-Mini Russell 2000 Index | | | Long | | | | 3 | | | | 219,975 | | | | 6/21/19 | | | | (7,840 | ) |
DJ EURO STOXX 50 Index | | | Long | | | | 20 | | | | 731,738 | | | | 6/21/19 | | | | 11,575 | |
DJIA MiniE-CBOT Index | | | Short | | | | 4 | | | | 496,400 | | | | 6/21/19 | | | | 13,497 | |
FTSE 100 Index | | | Long | | | | 13 | | | | 1,175,289 | | | | 6/21/19 | | | | (2,931 | ) |
FTSE/MIB Index | | | Long | | | | 1 | | | | 110,576 | | | | 6/21/19 | | | | (1,689 | ) |
Hang Seng China Enterprises Index | | | Short | | | | 1 | | | | 65,361 | | | | 6/27/19 | | | | 99 | |
Hang Seng Index | | | Long | | | | 3 | | | | 511,196 | | | | 6/27/19 | | | | (8,927 | ) |
MSCI Emerging Market Index | | | Long | | | | 1 | | | | 50,010 | | | | 6/21/19 | | | | (2,607 | ) |
NASDAQ 100E-Mini Index | | | Short | | | | 2 | | | | 285,340 | | | | 6/21/19 | | | | 6,541 | |
Nikkei 225 Index | | | Long | | | | 4 | | | | 758,178 | | | | 6/13/19 | | | | (42,866 | ) |
OMX Stockholm 30 Index | | | Long | | | | 6 | | | | 95,489 | | | | 6/20/19 | | | | (4,741 | ) |
S&P 500E-Mini Index | | | Short | | | | 1 | | | | 137,630 | | | | 6/21/19 | | | | 118 | |
S&P/TSX 60 Index | | | Long | | | | 1 | | | | 142,202 | | | | 6/20/19 | | | | 1,712 | |
SPI 200 Index | | | Long | | | | 1 | | | | 111,026 | | | | 6/20/19 | | | | 3,864 | |
TOPIX Index | | | Long | | | | 5 | | | | 694,874 | | | | 6/13/19 | | | | (38,955 | ) |
| | | | | | | | | | | | | | | | | | | | |
| | | | | | | | | | | | | | | | | | | (76,131 | ) |
| | | | | | | | | | | | | | | | | | | | |
| Interest Rate Contracts | | | | | | | | | | | | | | | | | | | | |
3 Month EURIBOR | | | Long | | | | 1 | | | | 279,945 | | | | 9/13/21 | | | | 881 | |
10 Yr. Mini Japanese Government Bond | | | Long | | | | 1 | | | | 141,365 | | | | 6/12/19 | | | | 676 | |
90 Day Bank Bill | | | Long | | | | 1 | | | | 691,600 | | | | 9/12/19 | | | | 699 | |
90 Day Bank Bill | | | Long | | | | 2 | | | | 1,383,370 | | | | 12/13/19 | | | | 2,751 | |
90 Day Bank Bill | | | Long | | | | 2 | | | | 1,383,541 | | | | 3/12/20 | | | | 1,722 | |
90 Day Bank Bill | | | Long | | | | 1 | | | | 691,804 | | | | 6/11/20 | | | | 1,598 | |
90 Day Bank Bill | | | Long | | | | 2 | | | | 1,383,575 | | | | 9/10/20 | | | | 1,647 | |
90 Day Bank Bill | | | Long | | | | 1 | | | | 691,770 | | | | 12/10/20 | | | | 1,008 | |
90 Day Eurodollar | | | Long | | | | 1 | | | | 244,763 | | | | 12/16/19 | | | | 1,036 | |
90 Day Eurodollar | | | Long | | | | 1 | | | | 245,287 | | | | 3/16/20 | | | | 1,286 | |
90 Day Eurodollar | | | Long | | | | 13 | | | | 3,192,475 | | | | 6/15/20 | | | | 8,624 | |
90 Day Eurodollar | | | Long | | | | 1 | | | | 245,763 | | | | 9/14/20 | | | | 2,098 | |
90 Day Eurodollar | | | Long | | | | 2 | | | | 491,550 | | | | 12/14/20 | | | | 2,546 | |
90 Day Eurodollar | | | Long | | | | 1 | | | | 245,825 | | | | 3/15/21 | | | | 2,123 | |
90 Day Eurodollar | | | Long | | | | 1 | | | | 245,737 | | | | 6/14/21 | | | | 1,911 | |
90 Day Eurodollar | | | Long | | | | 1 | | | | 245,675 | | | | 9/13/21 | | | | 1,886 | |
| | | | | | |
| | | |
| franklintempleton.com | | Annual Report | | | 19 | |
FRANKLIN ALTERNATIVE STRATEGIES FUNDS
CONSOLIDATED STATEMENT OF INVESTMENTS
Franklin K2 Global Macro Opportunities Fund(continued)
| | | | | | | | | | | | | | | | | | | | |
| Futures Contracts | | | | | | | | | | | | | | | |
| | | | | |
| Description | | Type | | | Number of
Contracts | | | Notional
Amount* | | | Expiration
Date | | | Value/Unrealized
Appreciation
(Depreciation) | |
| Interest Rate Contracts(continued) | | | | | | | | | | | | | | | | | | | | |
90 Day Sterling | | | Long | | | | 1 | | | $ | 156,768 | | | | 9/18/19 | | | $ | 15 | |
90 Day Sterling | | | Long | | | | 1 | | | | 156,712 | | | | 12/18/19 | | | | 86 | |
90 Day Sterling | | | Long | | | | 1 | | | | 156,783 | | | | 3/18/20 | | | | 31 | |
90 Day Sterling | | | Long | | | | 3 | | | | 470,397 | | | | 6/17/20 | | | | 556 | |
90 Day Sterling | | | Long | | | | 3 | | | | 470,303 | | | | 9/16/20 | | | | 655 | |
90 Day Sterling | | | Long | | | | 3 | | | | 470,160 | | | | 12/16/20 | | | | 439 | |
90 Day Sterling | | | Long | | | | 2 | | | | 313,456 | | | | 3/17/21 | | | | 330 | |
90 Day Sterling | | | Long | | | | 2 | | | | 313,393 | | | | 6/16/21 | | | | 377 | |
90 Day Sterling | | | Long | | | | 2 | | | | 313,330 | | | | 9/15/21 | | | | 434 | |
Australian 3 Yr. Bond | | | Long | | | | 18 | | | | 1,428,969 | | | | 6/17/19 | | | | 14,997 | |
Australian 10 Yr. Bond | | | Long | | | | 10 | | | | 985,440 | | | | 6/17/19 | | | | 41,591 | |
Canadian 10 Yr. Bond | | | Long | | | | 17 | | | | 1,796,722 | | | | 9/19/19 | | | | 20,716 | |
Euro BUXL 30 Yr. Bond | | | Long | | | | 1 | | | | 218,940 | | | | 6/06/19 | | | | 14,970 | |
Euro-BOBL | | | Long | | | | 3 | | | | 448,829 | | | | 6/06/19 | | | | 6,386 | |
Euro-BOBL | | | Long | | | | 1 | | | | 149,543 | | | | 9/06/19 | | | | (79 | ) |
Euro-BTP | | | Long | | | | 1 | | | | 145,320 | | | | 6/06/19 | | | | 4,233 | |
Euro-Bund | | | Long | | | | 2 | | | | 376,124 | | | | 6/06/19 | | | | 12,607 | |
Euro-Bund | | | Long | | | | 5 | | | | 953,940 | | | | 9/06/19 | | | | (306 | ) |
Euro-OAT | | | Long | | | | 3 | | | | 551,049 | | | | 6/06/19 | | | | 18,473 | |
Long Gilt | | | Long | | | | 10 | | | | 1,639,106 | | | | 9/26/19 | | | | 6,889 | |
U.S. Treasury 2 Yr. Note | | | Long | | | | 1 | | | | 214,712 | | | | 9/30/19 | | | | 1,195 | |
U.S. Treasury 5 Yr. Note | | | Long | | | | 4 | | | | 469,469 | | | | 9/30/19 | | | | 3,221 | |
U.S. Treasury 10 Yr. Note | | | Long | | | | 19 | | | | 2,408,250 | | | | 9/19/19 | | | | 29,494 | |
U.S. Treasury 10 Yr. Ultra Note | | | Short | | | | 1 | | | | 136,547 | | | | 9/19/19 | | | | (2,127 | ) |
U.S. Treasury Long Bond | | | Long | | | | 14 | | | | 2,152,062 | | | | 9/19/19 | | | | 52,650 | |
U.S. Treasury Ultra Bond | | | Long | | | | 1 | | | | 175,781 | | | | 9/19/19 | | | | 2,670 | |
| | | | | | | | | | | | | | | | | | | | |
| | | | | | | | | | | | | | | | | | | 262,995 | |
| | | | | | | | | | | | | | | | | | | | |
Total Futures Contracts | | | $ | 272,849 | |
| | | | | | | | | | | | | | | | | | | | |
*As of period end.
aA portion or all of the contracts are owned by K2 GMOF Holdings Corp., a wholly-owned subsidiary of the Fund. See Note 1(f).
At May 31, 2019, the Fund had the following forward exchange contracts outstanding. See Note 1(c).
| | | | | | | | | | | | | | | | | | | | | | | | | | | | | | | | |
| Forward Exchange Contracts | | | | | | | |
| | | | | | | | |
| Currency | | Counterpartya | | | Type | | | Quantity | | | Contract
Amount* | | | | | | Settlement
Date | | | Unrealized
Appreciation | | | Unrealized
Depreciation | |
| OTC Forward Exchange Contracts | | | | | | | | | | | | | | | | | | | | | | | | | | | | | |
Brazilian Real | | | JPHQ | | | | Buy | | | | 1,397,933 | | | | 353,070 | | | | | | | | 6/04/19 | | | $ | 3,055 | | | $ | — | |
Brazilian Real | | | JPHQ | | | | Sell | | | | 1,397,933 | | | | 350,812 | | | | | | | | 6/04/19 | | | | — | | | | (5,313 | ) |
Argentine Peso | | | JPHQ | | | | Buy | | | | 1,772,051 | | | | 37,954 | | | | | | | | 6/07/19 | | | | 1,180 | | | | — | |
Argentine Peso | | | JPHQ | | | | Sell | | | | 1,772,051 | | | | 39,555 | | | | | | | | 6/07/19 | | | | 421 | | | | — | |
Argentine Peso | | | JPHQ | | | | Buy | | | | 1,772,051 | | | | 39,127 | | | | | | | | 6/14/19 | | | | — | | | | (440 | ) |
Brazilian Real | | | JPHQ | | | | Buy | | | | 598,769 | | | | 150,000 | | | | | | | | 6/19/19 | | | | 2,325 | | | | — | |
Brazilian Real | | | JPHQ | | | | Sell | | | | 598,769 | | | | 152,068 | | | | | | | | 6/19/19 | | | | 2,001 | | | | (2,257 | ) |
Chilean Peso | | | JPHQ | | | | Buy | | | | 138,833,275 | | | | 200,000 | | | | | | | | 6/19/19 | | | | 10 | | | | (4,402 | ) |
Chilean Peso | | | JPHQ | | | | Sell | | | | 138,833,275 | | | | 206,527 | | | | | | | | 6/19/19 | | | | 10,927 | | | | (8 | ) |
Chinese Yuan | | | JPHQ | | | | Buy | | | | 335,077 | | | | 50,000 | | | | | | | | 6/19/19 | | | | — | | | | (1,682 | ) |
Chinese Yuan | | | JPHQ | | | | Sell | | | | 1,355,858 | | | | 200,000 | | | | | | | | 6/19/19 | | | | 4,486 | | | | — | |
Colombian Peso | | | JPHQ | | | | Buy | | | | 1,215,848,108 | | | | 382,049 | | | | | | | | 6/19/19 | | | | 72 | | | | (22,623 | ) |
Colombian Peso | | | JPHQ | | | | Sell | | | | 1,215,848,108 | | | | 371,877 | | | | | | | | 6/19/19 | | | | 13,160 | | | | (783 | ) |
Czech Koruna | | | JPHQ | | | | Sell | | | | 1,294,857 | | | | 50,000 | | | | EUR | | | | 6/19/19 | | | | 426 | | | | (485 | ) |
Euro | | | JPHQ | | | | Buy | | | | 323,717 | | | | 364,159 | | | | | | | | 6/19/19 | | | | 558 | | | | (2,472 | ) |
Euro | | | JPHQ | | | | Sell | | | | 324,051 | | | | 371,168 | | | | | | | | 6/19/19 | | | | 8,549 | | | | — | |
Euro | | | JPHQ | | | | Sell | | | | 100,000 | | | | 2,575,071 | | | | CZK | | | | 6/19/19 | | | | 1,927 | | | | (2,442 | ) |
| | | | |
| | | |
| 20 | | Annual Report | | franklintempleton.com |
FRANKLIN ALTERNATIVE STRATEGIES FUNDS
CONSOLIDATED STATEMENT OF INVESTMENTS
Franklin K2 Global Macro Opportunities Fund(continued)
| | | | | | | | | | | | | | | | | | | | | | | | | | | | | | | | |
| Forward Exchange Contracts(continued) | | | | | | | |
| | | | | | | | |
| Currency | | Counterpartya | | | Type | | | Quantity | | | Contract
Amount* | | | | | | Settlement
Date | | | Unrealized
Appreciation | | | Unrealized
Depreciation | |
| OTC Forward Exchange Contracts(continued) | | | | | | | | | | | | | | | | | | | | | |
Euro | | | JPHQ | | | | Sell | | | | 242,803 | | | | 77,567,050 | | | | HUF | | | | 6/19/19 | | | $ | 1,798 | | | $ | (6,515 | ) |
Euro | | | JPHQ | | | | Sell | | | | 300,000 | | | | 2,909,354 | | | | NOK | | | | 6/19/19 | | | | 2,288 | | | | (5,316 | ) |
Euro | | | JPHQ | | | | Sell | | | | 100,000 | | | | 430,646 | | | | PLN | | | | 6/19/19 | | | | 1,909 | | | | (1,390 | ) |
Euro | | | JPHQ | | | | Sell | | | | 1,000,000 | | | | 10,598,120 | | | | SEK | | | | 6/19/19 | | | | 15,012 | | | | (15,152 | ) |
Hungarian Forint | | | JPHQ | | | | Buy | | | | 23,473,710 | | | | 85,527 | | | | | | | | 6/19/19 | | | | — | | | | (4,726 | ) |
Hungarian Forint | | | JPHQ | | | | Sell | | | | 23,473,710 | | | | 84,101 | | | | | | | | 6/19/19 | | | | 3,300 | | | | — | |
Hungarian Forint | | | JPHQ | | | | Sell | | | | 78,128,052 | | | | 243,137 | | | | EUR | | | | 6/19/19 | | | | 6,270 | | | | (3,126 | ) |
Indian Rupee | | | JPHQ | | | | Buy | | | | 10,493,570 | | | | 150,000 | | | | | | | | 6/19/19 | | | | 465 | | | | (209 | ) |
Indian Rupee | | | JPHQ | | | | Sell | | | | 10,493,570 | | | | 150,002 | | | | | | | | 6/19/19 | | | | 6 | | | | (258 | ) |
Indonesian Rupiah | | | JPHQ | | | | Buy | | | | 3,306,356,915 | | | | 230,430 | | | | | | | | 6/19/19 | | | | 641 | | | | — | |
Indonesian Rupiah | | | JPHQ | | | | Sell | | | | 3,306,356,915 | | | | 231,181 | | | | | | | | 6/19/19 | | | | 114 | | | | (4 | ) |
Mexican Peso | | | JPHQ | | | | Buy | | | | 2,606,438 | | | | 132,047 | | | | | | | | 6/19/19 | | | | 486 | | | | — | |
Mexican Peso | | | JPHQ | | | | Sell | | | | 2,606,438 | | | | 134,105 | | | | | | | | 6/19/19 | | | | 1,572 | | | | — | |
New Israeli Shekel | | | JPHQ | | | | Buy | | | | 356,807 | | | | 100,000 | | | | | | | | 6/19/19 | | | | — | | | | (1,447 | ) |
New Israeli Shekel | | | JPHQ | | | | Sell | | | | 359,980 | | | | 100,000 | | | | | | | | 6/19/19 | | | | 571 | | | | — | |
Norwegian Krone | | | JPHQ | | | | Sell | | | | 2,933,221 | | | | 300,000 | | | | EUR | | | | 6/19/19 | | | | 1,908 | | | | (1,610 | ) |
Philippine Peso | | | JPHQ | | | | Buy | | | | 10,528,349 | | | | 200,000 | | | | | | | | 6/19/19 | | | | 1,546 | | | | — | |
Philippine Peso | | | JPHQ | | | | Sell | | | | 10,528,349 | | | | 200,814 | | | | | | | | 6/19/19 | | | | — | | | | (732 | ) |
Polish Zloty | | | JPHQ | | | | Sell | | | | 430,380 | | | | 100,000 | | | | EUR | | | | 6/19/19 | | | | 181 | | | | (631 | ) |
Russian Ruble | | | JPHQ | | | | Buy | | | | 22,370,667 | | | | 341,315 | | | | | | | | 6/19/19 | | | | 896 | | | | (1,149 | ) |
Russian Ruble | | | JPHQ | | | | Sell | | | | 22,370,667 | | | | 340,671 | | | | | | | | 6/19/19 | | | | 1,043 | | | | (1,434 | ) |
Singapore Dollar | | | JPHQ | | | | Buy | | | | 69,064 | | | | 50,000 | | | | | | | | 6/19/19 | | | | 289 | | | | — | |
Singapore Dollar | | | JPHQ | | | | Sell | | | | 68,873 | | | | 50,000 | | | | | | | | 6/19/19 | | | | — | | | | (150 | ) |
South African Rand | | | JPHQ | | | | Buy | | | | 5,059,853 | | | | 351,677 | | | | | | | | 6/19/19 | | | | 685 | | | | (5,834 | ) |
South African Rand | | | JPHQ | | | | Sell | | | | 4,370,810 | | | | 303,178 | | | | | | | | 6/19/19 | | | | 3,880 | | | | (41 | ) |
South Korean Won | | | JPHQ | | | | Buy | | | | 238,082,240 | | | | 200,000 | | | | | | | | 6/19/19 | | | | 176 | | | | (114 | ) |
South Korean Won | | | JPHQ | | | | Sell | | | | 238,082,240 | | | | 205,332 | | | | | | | | 6/19/19 | | | | 5,273 | | | | — | |
Swedish Krona | | | JPHQ | | | | Sell | | | | 11,694,204 | | | | 1,100,000 | | | | EUR | | | | 6/19/19 | | | | 21,001 | | | | (24,674 | ) |
Taiwan Dollar | | | JPHQ | | | | Buy | | | | 4,683,678 | | | | 150,000 | | | | | | | | 6/19/19 | | | | — | | | | (1,684 | ) |
Taiwan Dollar | | | JPHQ | | | | Sell | | | | 4,683,678 | | | | 150,313 | | | | | | | | 6/19/19 | | | | 1,996 | | | | — | |
Thai Baht | | | JPHQ | | | | Buy | | | | 4,770,106 | | | | 150,000 | | | | | | | | 6/19/19 | | | | 797 | | | | — | |
Thai Baht | | | JPHQ | | | | Sell | | | | 4,764,999 | | | | 150,000 | | | | | | | | 6/19/19 | | | | — | | | | (635 | ) |
Turkish Lira | | | JPHQ | | | | Buy | | | | 945,884 | | | | 164,050 | | | | | | | | 6/19/19 | | | | 922 | | | | (4,415 | ) |
Turkish Lira | | | JPHQ | | | | Sell | | | | 1,128,779 | | | | 193,347 | | | | | | | | 6/19/19 | | | | 4,033 | | | | (2,289 | ) |
Australian Dollar | | | MSCO | | | | Buy | | | | 1,770,000 | | | | 1,252,575 | | | | | | | | 6/21/19 | | | | 1,639 | | | | (25,555 | ) |
Australian Dollar | | | MSCO | | | | Sell | | | | 2,487,000 | | | | 1,755,791 | | | | | | | | 6/21/19 | | | | 30,060 | | | | (643 | ) |
British Pound | | | MSCO | | | | Buy | | | | 1,206,000 | | | | 1,587,004 | | | | | | | | 6/21/19 | | | | — | | | | (60,596 | ) |
British Pound | | | MSCO | | | | Sell | | | | 1,344,000 | | | | 1,749,639 | | | | | | | | 6/21/19 | | | | 48,827 | | | | (259 | ) |
Canadian Dollar | | | MSCO | | | | Buy | | | | 1,422,000 | | | | 1,058,311 | | | | | | | | 6/21/19 | | | | 169 | | | | (5,810 | ) |
Canadian Dollar | | | MSCO | | | | Sell | | | | 1,535,000 | | | | 1,153,596 | | | | | | | | 6/21/19 | | | | 17,273 | | | | — | |
Euro | | | MSCO | | | | Buy | | | | 567,000 | | | | 644,226 | | | | | | | | 6/21/19 | | | | 62 | | | | (9,694 | ) |
Euro | | | MSCO | | | | Sell | | | | 3,044,000 | | | | 3,440,771 | | | | | | | | 6/21/19 | | | | 35,106 | | | | (1,221 | ) |
Japanese Yen | | | MSCO | | | | Buy | | | | 418,533,000 | | | | 3,797,508 | | | | | | | | 6/21/19 | | | | 71,576 | | | | — | |
Japanese Yen | | | MSCO | | | | Sell | | | | 461,929,000 | | | | 4,174,058 | | | | | | | | 6/21/19 | | | | — | | | | (96,194 | ) |
Mexican Peso | | | MSCO | | | | Buy | | | | 5,602,000 | | | | 287,884 | | | | | | | | 6/21/19 | | | | — | | | | (3,133 | ) |
Mexican Peso | | | MSCO | | | | Sell | | | | 5,602,000 | | | | 292,756 | | | | | | | | 6/21/19 | | | | 8,008 | | | | — | |
New Zealand Dollar | | | MSCO | | | | Buy | | | | 818,000 | | | | 554,900 | | | | | | | | 6/21/19 | | | | 202 | | | | (19,706 | ) |
New Zealand Dollar | | | MSCO | | | | Sell | | | | 1,306,000 | | | | 872,857 | | | | | | | | 6/21/19 | | | | 18,352 | | | | (297 | ) |
Swiss Franc | | | MSCO | | | | Buy | | | | 692,000 | | | | 686,844 | | | | | | | | 6/21/19 | | | | 5,839 | | | | (97 | ) |
Swiss Franc | | | MSCO | | | | Sell | | | | 887,000 | | | | 888,011 | | | | | | | | 6/21/19 | | | | 2,784 | | | | (2,522 | ) |
Brazilian Real | | | JPHQ | | | | Buy | | | | 698,966 | | | | 173,016 | | | | | | | | 7/02/19 | | | | 4,588 | | | | — | |
Chinese Yuan | | | JPHQ | | | | Buy | | | | 1,242,644 | | | | 180,000 | | | | | | | | 7/12/19 | | | | — | | | | (864 | ) |
South Korean Won | | | JPHQ | | | | Buy | | | | 213,535,800 | | | | 180,000 | | | | | | | | 7/12/19 | | | | — | | | | (409 | ) |
Brazilian Real | | | JPHQ | | | | Buy | | | | 201,248 | | | | 50,000 | | | | | | | | 9/18/19 | | | | 798 | | | | — | |
Brazilian Real | | | JPHQ | | | | Sell | | | | 203,497 | | | | 50,000 | | | | | | | | 9/18/19 | | | | — | | | | (1,366 | ) |
Colombian Peso | | | JPHQ | | | | Buy | | | | 523,794,575 | | | | 153,358 | | | | | | | | 9/18/19 | | | | 727 | | | | — | |
| | | | | | |
| | | |
| franklintempleton.com | | Annual Report | | | 21 | |
FRANKLIN ALTERNATIVE STRATEGIES FUNDS
CONSOLIDATED STATEMENT OF INVESTMENTS
Franklin K2 Global Macro Opportunities Fund(continued)
| | | | | | | | | | | | | | | | | | | | | | | | | | | | | | | | |
| Forward Exchange Contracts(continued) | | | | | | | |
| | | | | | | | |
| Currency | | Counterpartya | | | Type | | | Quantity | | | Contract
Amount* | | | | | | Settlement
Date | | | Unrealized
Appreciation | | | Unrealized
Depreciation | |
| OTC Forward Exchange Contracts(continued) | | | | | | | | | | | | | | | | | | | | | |
Colombian Peso | | | JPHQ | | | | Sell | | | | 339,242,850 | | | | 100,000 | | | | | | | | 9/18/19 | | | $ | 269 | | | $ | (64 | ) |
Euro | | | JPHQ | | | | Sell | | | | 179,133 | | | | 201,390 | | | | | | | | 9/18/19 | | | | — | | | | (568 | ) |
Euro | | | JPHQ | | | | Sell | | | | 50,000 | | | | 215,699 | | | | PLN | | | | 9/18/19 | | | | 287 | | | | (213 | ) |
Hungarian Forint | | | JPHQ | | | | Sell | | | | 32,535,100 | | | | 100,000 | | | | EUR | | | | 9/18/19 | | | | 345 | | | | (266 | ) |
Indian Rupee | | | JPHQ | | | | Buy | | | | 10,618,493 | | | | 150,000 | | | | | | | | 9/18/19 | | | | 551 | | | | — | |
Indonesian Rupiah | | | JPHQ | | | | Buy | | | | 806,004,203 | | | | 55,441 | | | | | | | | 9/18/19 | | | | 238 | | | | — | |
Indonesian Rupiah | | | JPHQ | | | | Sell | | | | 2,500,352,712 | | | | 171,987 | | | | | | | | 9/18/19 | | | | — | | | | (737 | ) |
Norwegian Krone | | | JPHQ | | | | Sell | | | | 490,927 | | | | 50,000 | | | | EUR | | | | 9/18/19 | | | | 184 | | | | (103 | ) |
Philippine Peso | | | JPHQ | | | | Buy | | | | 5,279,237 | | | | 100,000 | | | | | | | | 9/18/19 | | | | 408 | | | | — | |
Russian Ruble | | | JPHQ | | | | Buy | | | | 9,910,850 | | | | 150,000 | | | | | | | | 9/18/19 | | | | — | | | | (831 | ) |
Russian Ruble | | | JPHQ | | | | Sell | | | | 8,704,712 | | | | 131,103 | | | | | | | | 9/18/19 | | | | 88 | | | | — | |
Singapore Dollar | | | JPHQ | | | | Sell | | | | 68,963 | | | | 50,000 | | | | | | | | 9/18/19 | | | | — | | | | (280 | ) |
South African Rand | | | JPHQ | | | | Sell | | | | 2,641,372 | | | | 178,232 | | | | | | | | 9/18/19 | | | | — | | | | (633 | ) |
South Korean Won | | | JPHQ | | | | Sell | | | | 237,340,260 | | | | 200,000 | | | | | | | | 9/18/19 | | | | 80 | | | | (205 | ) |
Swedish Krona | | | JPHQ | | | | Sell | | | | 4,280,662 | | | | 400,000 | | | | EUR | | | | 9/18/19 | | | | 353 | | | | (4,337 | ) |
Taiwan Dollar | | | JPHQ | | | | Sell | | | | 3,138,065 | | | | 100,000 | | | | | | | | 9/18/19 | | | | 63 | | | | — | |
Chilean Peso | | | JPHQ | | | | Sell | | | | 140,311,225 | | | | 200,000 | | | | | | | | 9/23/19 | | | | 2,443 | | | | (1 | ) |
Taiwan Dollar | | | JPHQ | | | | Buy | | | | 6,016,600 | | | | 200,000 | | | | | | | | 3/23/20 | | | | — | | | | (6,170 | ) |
Taiwan Dollar | | | JPHQ | | | | Sell | | | | 6,141,200 | | | | 200,000 | | | | | | | | 3/23/20 | | | | 2,156 | | | | — | |
| | | | | | | | | | | | | | | | | | | | | | | | | | | | |
Total Forward Exchange Contracts | | | $ | 381,630 | | | $ | (369,216 | ) |
| | | | | | | | | | | | | | | | | | | | | | | | | | | | |
Net unrealized appreciation (depreciation) | | | $ | 12,414 | | | | | |
| | | | | | | | | | | | | | | | | | | | | | | | | | | | | | | | |
*In U.S. dollars unless otherwise indicated.
aMay be comprised of multiple contracts with the same counterparty, currency and settlement date.
At May 31, 2019, the Fund had the following credit default swap contracts outstanding. See Note 1(c).
| | | | | | | | | | | | | | | | | | | | | | | | | | | | | | | | |
| Credit Default Swap Contracts | | | | | | | | | | | | | |
| | | | | | | | |
| Description | | Periodic
Payment
Rate
Received
(Paid) | | | Payment
Frequency | | | Maturity
Date | | | Notional
Amounta | | | Value | | | Unamortized
Upfront
Payments
(Receipts) | | | Unrealized
Appreciation
(Depreciation) | | | Ratingb | |
| Centrally Cleared Swap Contracts | | | | | | | | | | | | | | | | | | | | | | | | | |
| | | | | | |
| Contracts to Buy Protectionc | | | | | | | | | | | | | | | | | | | | | | | | | |
| | | | | |
| Single Name | | | | | | | | | | | | | | | | | | | | | |
Government of Mexico | | | (1.00 | )% | | | Quarterly | | | | 6/20/23 | | | $ | 175,000 | | | $ | 281 | | | $ | 265 | | | $ | 16 | | | | | |
Government of Mexico | | | (1.00 | )% | | | Quarterly | | | | 12/20/23 | | | | 56,000 | | | | 444 | | | | 957 | | | | (513 | ) | | | | |
Government of South Africa | | | (1.00 | )% | | | Quarterly | | | | 6/20/24 | | | | 275,000 | | | | 12,957 | | | | 12,020 | | | | 937 | | | | | |
Government of South Africa | | | (1.00 | )% | | | Quarterly | | | | 6/20/22 | | | | 131,000 | | | | 1,887 | | | | 6,804 | | | | (4,917 | ) | | | | |
Government of South Korea | | | (1.00 | )% | | | Quarterly | | | | 6/20/24 | | | | 111,558 | | | | (3,368 | ) | | | (3,783 | ) | | | 415 | | | | | |
Government of Turkey | | | (1.00 | )% | | | Quarterly | | | | 6/20/24 | | | | 196,000 | | | | 31,483 | | | | 19,769 | | | | 11,714 | | | | | |
| | | | | | |
| Contracts to Sell Protectionc,d | | | | | | | | | | | | | | | | | | | | | | | | | |
| | | | | |
| Single Name | | | | | | | | | | | | | | | | | | | | | |
Government of Russia | | | 1.00 | % | | | Quarterly | | | | 6/20/24 | | | | 290,000 | | | | (4,098 | ) | | | (4,466 | ) | | | 368 | | | | BBB- | |
Government of South Africa | | | 1.00 | % | | | Quarterly | | | | 12/20/22 | | | | 111,000 | | | | (2,382 | ) | | | (2,056 | ) | | | (326 | ) | | | BB | |
Government of Turkey | | | 1.00 | % | | | Quarterly | | | | 12/20/22 | | | | 105,000 | | | | (12,365 | ) | | | (4,748 | ) | | | (7,617 | ) | | | B+ | |
| | | | | | | | | | | | | | | | | | | | | | | | |
Total Credit Default Swap Contracts | | | $ | 24,839 | | | $ | 24,762 | | | $ | 77 | | | | | |
| | | | | | | | | | | | | |
aFor contracts to sell protection, the notional amount is equal to the maximum potential amount of the future payments and no recourse provisions have been entered into in association with the contracts.
bBased on Standard and Poor’s (S&P) Rating for single name swaps.
cPerformance triggers for settlement of contract include default, bankruptcy or restructuring for single name swaps.
dThe Fund enters contracts to sell protection to create a long credit position.
| | | | |
| | | |
| 22 | | Annual Report | | franklintempleton.com |
FRANKLIN ALTERNATIVE STRATEGIES FUNDS
CONSOLIDATED STATEMENT OF INVESTMENTS
Franklin K2 Global Macro Opportunities Fund(continued)
At May 31, 2019, the Fund had the following interest rate swap contracts outstanding. See Note 1(c).
| | | | | | | | | | | | | | | | | | | | | | | | |
| Interest Rate Swap Contracts | | | | | | | | | | | | | | | | |
| | | | | | |
| Description | | Payment
Frequency | | | | | | Maturity
Date | | | Notional
Amount | | | | | | Value/Unrealized
Appreciation
(Depreciation) | |
| Centrally Cleared Swap Contracts | | | | | | | | | | | | | | | | | | | | | |
Receive Fixed rate 1.93% | | | | | | | | | | | | | | | | | | | | | | | | |
Pay Floating rate 6 MonthSGD-SIBOR | | | Semi-Annually | | | | | | | | 2/20/20 | | | | 13,720,000 | | | | SGD | | | $ | (2,256 | ) |
Receive Fixed rate 1.93% | | | | | | | | | | | | | | | | | | | | | | | | |
Pay Floating rate 6 MonthSGD-SIBOR | | | Semi-Annually | | | | | | | | 2/20/20 | | | | 13,720,000 | | | | SGD | | | | (2,257 | ) |
Receive Fixed rate 2.05% | | | | | | | | | | | | | | | | | | | | | | | | |
Pay Floating rate 3 MonthHKD-HIBOR | | | Quarterly | | | | | | | | 8/14/20 | | | | 80,000,000 | | | | HKD | | | | (2,715 | ) |
Receive Floating rate 6 MonthSGD-SIBOR | | | | | | | | | | | | | | | | | | | | | | | | |
Pay Fixed rate 1.94% | | | Semi-Annually | | | | | | | | 2/20/21 | | | | 5,134,608 | | | | SGD | | | | (5,686 | ) |
Receive Fixed rate 1.62% | | | | | | | | | | | | | | | | | | | | | | | | |
Pay Floating rate 3 MonthKRW-KORIBOR | | | Quarterly | | | | | | | | 11/19/21 | | | | 10,100,000,000 | | | | KRW | | | | 24,302 | |
Receive Fixed rate 8.33% | | | | | | | | | | | | | | | | | | | | | | | | |
Pay Floating rateBRL-BRLCDI | | | Annually | | | | | | | | 1/02/23 | | | | 1,164,967 | | | | BRL | | | | 10,124 | |
Receive Fixed rate 8.36% | | | | | | | | | | | | | | | | | | | | | | | | |
Pay Floating rateBRL-BRLCDI | | | Annually | | | | | | | | 1/02/23 | | | | 1,162,163 | | | | BRL | | | | 10,318 | |
Receive Floating rate MIBOR | | | | | | | | | | | | | | | | | | | | | | | | |
Pay Fixed rate 6.67% | | | Annually | | | | | | | | 6/20/23 | | | | 6,471,391 | | | | INR | | | | (3,449 | ) |
Receive Fixed rate 2.10% | | | | | | | | | | | | | | | | | | | | | | | | |
Pay Floating rate 3 MonthNZD-LIBOR | | | Semi-Annually | | | | | | | | 2/20/24 | | | | 1,520,000 | | | | NZD | | | | 26,016 | |
Receive Floating rate 3 MonthHKD-HIBOR | | | | | | | | | | | | | | | | | | | | | | | | |
Pay Fixed rate 2.27% | | | Quarterly | | | | | | | | 5/14/24 | | | | 17,500,000 | | | | HKD | | | | (41,542 | ) |
Receive Floating rate 3 MonthKRW-KORIBOR | | | | | | | | | | | | | | | | | | | | | | | | |
Pay Fixed rate 1.62% | | | Quarterly | | | | | | | | 11/19/24 | | | | 4,100,000,000 | | | | KRW | | | | (32,420 | ) |
Receive Floating rate 6 MonthGBP-LIBOR | | | | | | | | | | | | | | | | | | | | | | | | |
Pay Fixed rate 1.41% | | | Semi-Annually | | | | | | | | 8/04/67 | | | | 27,000 | | | | GBP | | | | (1,633 | ) |
Receive Floating rate 6 MonthGBP-LIBOR | | | | | | | | | | | | | | | | | | | | | | | | |
Pay Fixed rate 1.47% | | | Semi-Annually | | | | | | | | 9/18/69 | | | | 84,596 | | | | GBP | | | | (9,399 | ) |
| | | | | | | | | | | | | | | | | | | | | | | | |
Total Centrally Cleared Swap Contracts | | | | (30,597 | ) |
| | | | | |
| OTC Swap Contracts | | | | | | | Counterparty | | | | | | | | | | | | | | | | | |
Receive Fixed rate 1.73% | | | | | | | | | | | | | | | | | | | | | | | | |
Pay Floating rate 6 MonthTHB-BBG | | | Semi-Annually | | | | JPHQ | | | | 8/23/21 | | | | 57,500,000 | | | | THB | | | | 1,145 | |
Receive Floating rate 6 MonthTHB-BBG | | | | | | | | | | | | | | | | | | | | | | | | |
Pay Fixed rate 1.86% | | | Semi-Annually | | | | JPHQ | | | | 8/21/24 | | | | 23,000,000 | | | | THB | | | | (2,801 | ) |
| | | | | | | | | | | | | | | | | | | | | | | | |
Total OTC Swap Contracts | | | | (1,656 | ) |
| | | | | |
Total Interest Rate Swap Contracts | | | $ | (32,253 | ) |
| | | | | |
At May 31, 2019, the Fund had the following total return swap contracts outstanding. See Note 1(c).
| | | | | | | | | | | | | | | | | | | | | | |
| Total Return Swap Contracts | | | | |
| | | | | | |
| Underlying Instrument | | Financing Rate | | Payment
Frequency | | | Counter-
party | | | Maturity
Date | | | Notional
Value | | | Value/Unrealized
Appreciation
(Depreciation) | |
| OTC Swap Contracts | | | | | | | | | | | | | | | | | | | | | | |
| | | | | | |
| Interest Rate Contracts – Longa | | | | | | | | | | | | | | | | | | | | | | |
Egyptian Treasury Bill | | — | | | Monthly | | | | DBAB | | | | 8/13/19 | | | $ | 57,378 | | | $ | 6,136 | |
Government of Indonesia | | 3-Month LIBOR + 0.60% | | | Monthly | | | | BOFA | | | | 4/15/20 | | | | 113,395 | | | | (6,639 | ) |
Government of Indonesia | | 3-Month LIBOR + 0.60% | | | Monthly | | | | DBAB | | | | 6/15/32 | | | | 122,333 | | | | (7,049 | ) |
| | | | | | | | | | | | | | | | | | | | | | |
Total Total Return Swap Contracts | | | $ | (7,552 | ) |
| | | | | |
aThe Fund receives the total return on the underlying instrument and pays a variable financing rate.
See Note 8 regarding other derivative information.
See Abbreviations on page 40.
| | | | | | |
| | | |
| franklintempleton.com | | The accompanying notes are an integral part of these consolidated financial statements. | Annual Report | | | 23 | |
FRANKLIN ALTERNATIVE STRATEGIES FUNDS
CONSOLIDATED FINANCIAL STATEMENTS
Consolidated Statement of Assets and Liabilities
May 31, 2019
Franklin K2 Global Macro Opportunities Fund
| | | | |
| |
Assets: | | | | |
Investments in securities: | | | | |
Cost – Unaffiliated issuers | | $ | 22,259,173 | |
| | | | |
Value – Unaffiliated issuers | | $ | 22,201,840 | |
Cash | | | 2,176 | |
Restricted cash for OTC derivatives (Note 1d) | | | 70,000 | |
Foreign currency, at value (cost $7,912) | | | 7,655 | |
Receivables: | | | | |
Investment securities sold | | | 20,990 | |
Capital shares sold | | | 2 | |
Dividends and interest | | | 101,748 | |
Affiliates | | | 73,301 | |
Deposits with brokers for: | | | | |
OTC derivative contracts | | | 410,000 | |
Futures contracts | | | 854,702 | |
Centrally cleared swap contracts | | | 428,034 | |
Due from brokers | | | 108,968 | |
Unrealized appreciation on OTC forward exchange contracts | | | 381,630 | |
Unrealized appreciation on OTC swap contracts | | | 7,281 | |
Other assets | | | 14 | |
| | | | |
Total assets | | | 24,668,341 | |
| | | | |
Liabilities: | | | | |
Payables: | | | | |
Investment securities purchased | | | 78,932 | |
Distribution fees | | | 124 | |
Variation margin on futures contracts | | | 48,253 | |
Variation margin on centrally cleared swap contracts | | | 5,285 | |
Deposits from brokers for: | | | | |
OTC derivative contracts | | | 70,000 | |
Due to brokers | | | 122,154 | |
Unrealized depreciation on OTC forward exchange contracts | | | 369,216 | |
Unrealized depreciation on OTC swap contracts | | | 16,489 | |
Accrued expenses and other liabilities | | | 108,746 | |
| | | | |
Total liabilities | | | 819,199 | |
| | | | |
Net assets, at value | | $ | 23,849,142 | |
| | | | |
Net assets consist of: | | | | |
Paid-in capital | | $ | 24,223,165 | |
Total distributable earnings (loss) | | | (374,023 | ) |
| | | | |
Net assets, at value | | $ | 23,849,142 | |
| | | | |
| | | | |
| | | |
| 24 | | Annual Report | The accompanying notes are an integral part of these consolidated financial statements. | | franklintempleton.com |
FRANKLIN ALTERNATIVE STRATEGIES FUNDS
CONSOLIDATED FINANCIAL STATEMENTS
Consolidated Statement of Assets and Liabilities(continued)
May 31, 2019
Franklin K2 Global Macro Opportunities Fund
| | | | |
| |
Class A: | | | | |
Net assets, at value | | | $142,697 | |
| | | | |
Shares outstanding | | | 15,236 | |
| | | | |
Net asset value per sharea | | | $9.37 | |
| | | | |
Maximum offering price per share (net asset value per share ÷ 94.50%) | | | $9.92 | |
| | | | |
Class C: | | | | |
Net assets, at value | | | $137,879 | |
| | | | |
Shares outstanding | | | 15,018 | |
| | | | |
Net asset value and maximum offering price per sharea | | | $9.18 | |
| | | | |
Class R: | | | | |
Net assets, at value | | | $9,351 | |
| | | | |
Shares outstanding | | | 1,000 | |
| | | | |
Net asset value and maximum offering price per share | | | $9.35 | |
| | | | |
Class R6: | | | | |
Net assets, at value | | | $9,387 | |
| | | | |
Shares outstanding | | | 1,000 | |
| | | | |
Net asset value and maximum offering price per share | | | $9.39 | |
| | | | |
Advisor Class: | | | | |
Net assets, at value | | | $23,549,828 | |
| | | | |
Shares outstanding | | | 2,507,309 | |
| | | | |
Net asset value and maximum offering price per share | | | $9.39 | |
| | | | |
aRedemption price is equal to net asset value less contingent deferred sales charges, if applicable.
| | | | | | |
| | | |
| franklintempleton.com | | The accompanying notes are an integral part of these consolidated financial statements. | Annual Report | | | 25 | |
FRANKLIN ALTERNATIVE STRATEGIES FUNDS
CONSOLIDATED FINANCIAL STATEMENTS
Consolidated Statement of Operations
for the year ended May 31, 2019
Franklin K2 Global Macro Opportunities Fund
| | | | |
| |
Investment income: | | | | |
Dividends: | | | | |
Unaffiliated issuers | | $ | 267,277 | |
Interest: (net of foreign taxes)~ | | | | |
Unaffiliated issuers | | | 324,898 | |
| | | | |
Total investment income | | | 592,175 | |
| | | | |
Expenses: | | | | |
Management fees (Note 3a) | | | 442,790 | |
Distribution fees: (Note 3c) | | | | |
Class A | | | 380 | |
Class C | | | 1,279 | |
Class R | | | 23 | |
Transfer agent fees: (Note 3e) | | | | |
Class A | | | 40 | |
Class C | | | 35 | |
Class R | | | 2 | |
Class R6 | | | 23 | |
Advisor Class | | | 5,950 | |
Custodian fees (Note 4) . | | | 67,540 | |
Reports to shareholders | | | 17,864 | |
Registration and filing fees | | | 82,846 | |
Professional fees | | | 223,277 | |
Other | | | 25,654 | |
| | | | |
Total expenses | | | 867,703 | |
Expense reductions (Note 4) | | | (246 | ) |
Expenses waived/paid by affiliates (Note 3f) | | | (411,329 | ) |
| | | | |
Net expenses | | | 456,128 | |
| | | | |
Net investment income | | | 136,047 | |
| | | | |
Realized and unrealized gains (losses): | | | | |
Net realized gain (loss) from: | | | | |
Investments: | | | | |
Unaffiliated issuers | | | (154,065 | ) |
Foreign currency transactions | | | (5,348 | ) |
Forward exchange contracts | | | (3,953 | ) |
Futures contracts | | | 722,465 | |
Swap contracts | | | (36,100 | ) |
| | | | |
Net realized gain (loss) | | | 522,999 | |
| | | | |
Net change in unrealized appreciation (depreciation) on: | | | | |
Investments: | | | | |
Unaffiliated issuers | | | 91,381 | |
Translation of other assets and liabilities denominated in foreign currencies | | | 1,931 | |
Forward exchange contracts | | | 98,669 | |
Futures contracts | | | 104,826 | |
Swap contracts | | | (21,767 | ) |
| | | | |
Net change in unrealized appreciation (depreciation) | | | 275,040 | |
| | | | |
Net realized and unrealized gain (loss) | | | 798,039 | |
| | | | |
Net increase (decrease) in net assets resulting from operations | | $ | 934,086 | |
| | | | |
| |
~ Foreign taxes withheld on interest | | $ | 1,737 | |
| | | | |
| | | |
| 26 | | Annual Report | The accompanying notes are an integral part of these consolidated financial statements. | | franklintempleton.com |
FRANKLIN ALTERNATIVE STRATEGIES FUNDS
CONSOLIDATED FINANCIAL STATEMENTS
Consolidated Statements of Changes in Net Assets
Franklin K2 Global Macro Opportunities Fund
| | | | | | | | |
| |
| | | Year Ended May 31, | |
| | 2019 | | | 2018 | |
Increase (decrease) in net assets: | | | | | | | | |
Operations: | | | | | | | | |
Net investment income | | $ | 136,047 | | | $ | 88,360 | |
Net realized gain (loss) | | | 522,999 | | | | (628,111 | ) |
Net change in unrealized appreciation (depreciation) | | | 275,040 | | | | 185,110 | |
| | | | |
Net increase (decrease) in net assets resulting from operations | | | 934,086 | | | | (354,641 | ) |
| | | | |
Distributions to shareholders: (Note 1h) | | | | | | | | |
Class A | | | (141 | ) | | | — | |
Class R | | | (8 | ) | | | — | |
Class R6 | | | (32 | ) | | | — | |
Advisor Class | | | (77,871 | ) | | | — | |
| | | | |
Total distributions to shareholders | | | (78,052 | ) | | | — | |
| | | | |
Capital share transactions: (Note 2) | | | | | | | | |
Class A | | | (23,519 | ) | | | 73,777 | |
Class C | | | (13,453 | ) | | | (36,491 | ) |
Advisor Class | | | (40,040 | ) | | | 116,163 | |
| | | | |
Total capital share transactions | | | (77,012 | ) | | | 153,449 | |
| | | | |
Net increase (decrease) in net assets | | | 779,022 | | | | (201,192 | ) |
Net assets: | | | | | | | | |
Beginning of year | | | 23,070,120 | | | | 23,271,312 | |
| | | | |
End of year (Note 1h) | | $ | 23,849,142 | | | $ | 23,070,120 | |
| | | | |
| | | | | | |
| | | |
| franklintempleton.com | | The accompanying notes are an integral part of these consolidated financial statements. | Annual Report | | | 27 | |
FRANKLIN ALTERNATIVE STRATEGIES FUNDS
FRANKLIN K2 GLOBAL MACRO OPPORTUNITIES FUND
Notes to Consolidated Financial Statements
1. Organization and Significant Accounting Policies
Franklin Alternative Strategies Funds (Trust) is registered under the Investment Company Act of 1940 (1940 Act) as anopen-end management investment company, consisting of four separate funds and applies the specialized accounting and reporting guidance in U.S. Generally Accepted Accounting Principles (U.S. GAAP). Franklin K2 Global Macro Opportunities Fund (Fund) is included in this report. The Fund offers five classes of shares: Class A, Class C, Class R, Class R6 and Advisor Class. Beginning on October 19, 2018, Class C shares automatically convert to Class A shares after they have been held for 10 years. Each class of shares may differ by its initial sales load, contingent deferred sales charges, voting rights on matters affecting a single class, its exchange privilege and fees due to differing arrangements for distribution and transfer agent fees.
The following summarizes the Fund’s significant accounting policies.
a. Financial Instrument Valuation
The Fund’s investments in financial instruments are carried at fair value daily. Fair value is the price that would be received to sell an asset or paid to transfer a liability in an orderly transaction between market participants on the measurement date. The Fund calculates the net asset value (NAV) per share each business day as of 4 p.m. Eastern time or the regularly scheduled close of the New York Stock Exchange (NYSE), whichever is earlier. Under compliance policies and procedures approved by the Trust’s Board of Trustees (the Board), the Fund’s administrator has responsibility for oversight of valuation, including leading the cross-functional Valuation Committee (VC). The Fund may utilize independent pricing services, quotations from securities and financial instrument dealers, and other market sources to determine fair value.
Debt securities generally trade in theover-the-counter (OTC) market rather than on a securities exchange. The Fund’s pricing services use multiple valuation techniques to determine fair value. In instances where sufficient market activity exists, the pricing services may utilize a market-based approach through which quotes from market makers are used to determine fair value. In instances where sufficient market activity may not exist or is limited, the pricing services also utilize proprietary valuation models which may consider market characteristics such as benchmark yield curves, credit spreads, estimated default rates, anticipated market interest rate volatility, coupon rates, anticipated timing of
principal repayments, underlying collateral, and other unique security features in order to estimate the relevant cash flows, which are then discounted to calculate the fair value. Securities denominated in a foreign currency are converted into their U.S. dollar equivalent at the foreign exchange rate in effect at 4 p.m. Eastern time on the date that the values of the foreign debt securities are determined.
Investments inopen-end mutual funds are valued at the closing NAV.
Derivative financial instruments listed on an exchange are valued at the official closing price of the day. Certain derivative financial instruments are centrally cleared or trade in the OTC market. The Fund’s pricing services use various techniques including industry standard option pricing models and proprietary discounted cash flow models to determine the fair value of those instruments. The Fund’s net benefit or obligation under the derivative contract, as measured by the fair value of the contract, is included in net assets.
The Fund has procedures to determine the fair value of financial instruments for which market prices are not reliable or readily available. Under these procedures, the Fund primarily employs a market-based approach which may use related or comparable assets or liabilities, recent transactions, market multiples, book values, and other relevant information for the investment to determine the fair value of the investment. An income-based valuation approach may also be used in which the anticipated future cash flows of the investment are discounted to calculate fair value. Discounts may also be applied due to the nature or duration of any restrictions on the disposition of the investments. Due to the inherent uncertainty of valuations of such investments, the fair values may differ significantly from the values that would have been used had an active market existed.
b. Foreign Currency Translation
Portfolio securities and other assets and liabilities denominated in foreign currencies are translated into U.S. dollars based on the exchange rate of such currencies against U.S. dollars on the date of valuation. The Fund may enter into foreign currency exchange contracts to facilitate transactions denominated in a foreign currency. Purchases and sales of securities, income and expense items denominated in foreign currencies are translated into U.S. dollars at the exchange rate in effect on the transaction date. Portfolio securities and assets and liabilities denominated in foreign currencies contain risks that those currencies will decline in value relative to
| | | | |
| | | |
| 28 | | Annual Report | | franklintempleton.com |
FRANKLIN ALTERNATIVE STRATEGIES FUNDS
NOTES TO CONSOLIDATED FINANCIAL STATEMENTS
Franklin K2 Global Macro Opportunities Fund(continued)
the U.S. dollar. Occasionally, events may impact the availability or reliability of foreign exchange rates used to convert the U.S. dollar equivalent value. If such an event occurs, the foreign exchange rate will be valued at fair value using procedures established and approved by the Board.
The Fund does not separately report the effect of changes in foreign exchange rates from changes in market prices on securities held. Such changes are included in net realized and unrealized gain or loss from investments in the Consolidated Statement of Operations.
Realized foreign exchange gains or losses arise from sales of foreign currencies, currency gains or losses realized between the trade and settlement dates on securities transactions and the difference between the recorded amounts of dividends, interest, and foreign withholding taxes and the U.S. dollar equivalent of the amounts actually received or paid. Net unrealized foreign exchange gains and losses arise from changes in foreign exchange rates on foreign denominated assets and liabilities other than investments in securities held at the end of the reporting period.
c. Derivative Financial Instruments
The Fund invested in derivative financial instruments in order to manage risk or gain exposure to various other investments or markets. Derivatives are financial contracts based on an underlying or notional amount, require no initial investment or an initial net investment that is smaller than would normally be required to have a similar response to changes in market factors, and require or permit net settlement. Derivatives contain various risks including the potential inability of the counterparty to fulfill their obligations under the terms of the contract, the potential for an illiquid secondary market, and/or the potential for market movements which expose the Fund to gains or losses in excess of the amounts shown in the Consolidated Statement of Assets and Liabilities. Realized gain and loss and unrealized appreciation and depreciation on these contracts for the period are included in the Consolidated Statement of Operations.
Derivative counterparty credit risk is managed through a formal evaluation of the creditworthiness of all potential counterparties. The Fund attempts to reduce its exposure to counterparty credit risk on OTC derivatives, whenever possible, by entering into International Swaps and Derivatives Association (ISDA) master agreements with certain counterparties. These agreements contain various provisions,
including but not limited to collateral requirements, events of default, or early termination. Termination events applicable to the counterparty include certain deteriorations in the credit quality of the counterparty. Termination events applicable to the Fund include failure of the Fund to maintain certain net asset levels and/or limit the decline in net assets over various periods of time. In the event of default or early termination, the ISDA master agreement gives thenon-defaulting party the right to net andclose-out all transactions traded, whether or not arising under the ISDA agreement, to one net amount payable by one counterparty to the other. However, absent an event of default or early termination, OTC derivative assets and liabilities are presented gross and not offset in the Consolidated Statement of Assets and Liabilities. Early termination by the counterparty may result in an immediate payment by the Fund of any net liability owed to that counterparty under the ISDA agreement.
Collateral requirements differ by type of derivative. Collateral or initial margin requirements are set by the broker or exchange clearing house for exchange traded and centrally cleared derivatives. Initial margin deposited is held at the exchange and can be in the form of cash and/or securities. For OTC derivatives traded under an ISDA master agreement, posting of collateral is required by either the Fund or the applicable counterparty if the total net exposure of all OTC derivatives with the applicable counterparty exceeds the minimum transfer amount, which typically ranges from $100,000 to $250,000, and can vary depending on the counterparty and the type of the agreement. Generally, collateral is determined at the close of Fund business each day and any additional collateral required due to changes in derivative values may be delivered by the Fund or the counterparty the next business day, or within a few business days. Collateral pledged and/or received by the Fund for OTC derivatives, if any, is held in segregated accounts with the Fund’s custodian/counterparty broker and can be in the form of cash and/or securities. Unrestricted cash may be invested according to the Fund’s investment objectives. To the extent that the amounts due to the Fund from its counterparties are not subject to collateralization or are not fully collateralized, the Fund bears the risk of loss from counterpartynon-performance.
The Fund entered into exchange traded futures contracts primarily to manage and/or gain exposure to commodity price, interest rate, certain foreign currencies and equity price risk. A futures contract is an agreement between the Fund and a counterparty to buy or sell an asset at a specified price on a
| | | | | | |
| | | |
| franklintempleton.com | | Annual Report | | | 29 | |
FRANKLIN ALTERNATIVE STRATEGIES FUNDS
NOTES TO CONSOLIDATED FINANCIAL STATEMENTS
Franklin K2 Global Macro Opportunities Fund(continued)
1. Organization and Significant Accounting Policies(continued)
c. Derivative Financial Instruments(continued)
future date. Required initial margins are pledged by the Fund, and the daily change in fair value is accounted for as a variation margin payable or receivable in the Consolidated Statement of Assets and Liabilities.
The Fund entered into OTC forward exchange contracts primarily to manage and/or gain exposure to certain foreign currencies. A forward exchange contract is an agreement between the Fund and a counterparty to buy or sell a foreign currency at a specific exchange rate on a future date.
The Fund entered into credit default swap contracts primarily to manage and/or gain exposure to credit risk. A credit default swap is an agreement between the Fund and a counterparty whereby the buyer of the contract receives credit protection and the seller of the contract guarantees the credit worthiness of a referenced debt obligation. These agreements may be privately negotiated in theover-the-counter market (OTC credit default swaps) or may be executed in a multilateral trade facility platform, such as a registered exchange (centrally cleared credit default swaps). The underlying referenced debt obligation may be a single issuer of corporate or sovereign debt, a credit index, a basket of issuers or indices, or a tranche of a credit index or basket of issuers or indices. In the event of a default of the underlying referenced debt obligation, the buyer is entitled to receive the notional amount of the credit default swap contract from the seller in exchange for the referenced debt obligation, a net settlement amount equal to the notional amount of the credit default swap less the recovery value of the referenced debt obligation, or other agreed upon amount. For centrally cleared credit default swaps, required initial margins are pledged by the Fund, and the daily change in fair value is accounted for as a variation margin payable or receivable in the Consolidated Statement of Assets and Liabilities. Over the term of the contract, the buyer pays the seller a periodic stream of payments, provided that no event of default has occurred. Such periodic payments are accrued daily as an unrealized appreciation or depreciation until the payments are made, at which time they are realized. Upfront payments and receipts are reflected in the Consolidated Statement of Assets and Liabilities and represent compensating factors between stated terms of the credit default swap agreement and prevailing market conditions (credit spreads and other
relevant factors). These upfront payments and receipts are amortized over the term of the contract as a realized gain or loss in the Consolidated Statement of Operations.
The Fund entered into interest rate swap contracts primarily to manage interest rate risk. An interest rate swap is an agreement between the Fund and a counterparty to exchange cash flows based on the difference between two interest rates, applied to a notional amount. These agreements may be privately negotiated in theover-the-counter market (OTC interest rate swaps) or may be executed on a registered exchange (centrally cleared interest rate swaps). For centrally cleared interest rate swaps, required initial margins are pledged by the Fund, and the daily change in fair value is accounted for as a variation margin payable or receivable in the Consolidated Statement of Assets and Liabilities. Over the term of the contract, contractually required payments to be paid and to be received are accrued daily and recorded as unrealized depreciation and appreciation until the payments are made, at which time they are realized.
The Fund entered into OTC total return swap contracts primarily to manage and/or gain exposure to interest rate risk. A total return swap is an agreement between the Fund and a counterparty to exchange a return linked to an underlying instrument for a floating or fixed rate payment, both based upon a notional amount. Over the term of the contract, contractually required payments to be paid or received are accrued daily and recorded as unrealized appreciation or depreciation until the payments are made, at which time they are recognized as realized gain or loss.
See Note 8 regarding other derivative information.
d. Restricted Cash
At May 31, 2019, the Fund held restricted cash in connection with investments in certain derivative securities. Restricted cash is held in a segregated account with the Fund’s custodian/counterparty broker and is reflected in the Consolidated Statement of Assets and Liabilities.
e. Credit-Linked Notes
The Fund purchases credit-linked notes. Credit-linked notes are intended to replicate the economic effects that would apply had the Fund directly purchased the underlying reference asset. The risks of credit-linked notes include the potential default of the underlying reference asset, the movement in the value of the currency of the underlying reference
| | | | |
| | | |
| 30 | | Annual Report | | franklintempleton.com |
FRANKLIN ALTERNATIVE STRATEGIES FUNDS
NOTES TO CONSOLIDATED FINANCIAL STATEMENTS
Franklin K2 Global Macro Opportunities Fund(continued)
asset relative to the credit-linked note, the potential inability of the Fund to dispose of the credit-linked note in the normal course of business, and the possible inability of the counterparties to fulfill their obligations under the contracts.
f. Investments in K2 GMOF Holdings Corp. (K2 Subsidiary)
The Fund invests in certain financial instruments and commodity-linked derivative investments through its investment in the K2 Subsidiary. The K2 Subsidiary is a Cayman Islands exempted company with limited liability, is a wholly-owned subsidiary of the Fund, and is able to invest in certain financial instruments and commodity-linked derivative investments consistent with the investment objective of the Fund. At May 31, 2019, the K2 Subsidiary’s investments, as well as any other assets and liabilities of the K2 Subsidiary, are reflected in the Fund’s Consolidated Statement of Investments and Consolidated Statement of Assets and Liabilities.
All intercompany transactions and balances have been eliminated. For tax purposes, the Fund is required to increase its taxable income by its share of the K2 Subsidiary’s income. Net losses incurred by the K2 Subsidiary cannot offset income earned by the Fund and cannot be carried back or forward by the K2 Subsidiary to offset income from prior or future years. At May 31, 2019, the net assets of the K2 Subsidiary were $5,274,483, representing 22.1% of the Fund’s consolidated net assets. The Fund’s investment in the K2 Subsidiary is limited to 25% of consolidated assets.
g. Income and Deferred Taxes
It is the Fund’s policy to qualify as a regulated investment company under the Internal Revenue Code. The Fund intends to distribute to shareholders substantially all of its taxable income and net realized gains to relieve it from federal income and excise taxes. As a result, no provision for U.S. federal income taxes is required.
The Fund may be subject to foreign taxation related to income received, capital gains on the sale of securities and certain foreign currency transactions in the foreign jurisdictions in which it invests. Foreign taxes, if any, are recorded based on the tax regulations and rates that exist in the foreign markets in which the Fund invests. When a capital gain tax is determined to apply, the Fund records an estimated deferred tax liability in an amount that would be payable if the securities were disposed of on the valuation date.
The Fund may recognize an income tax liability related to its uncertain tax positions under U.S. GAAP when the uncertain tax position has a less than 50% probability that it will be sustained upon examination by the tax authorities based on its technical merits. As of May 31, 2019, the Fund has determined that no tax liability is required in its consolidated financial statements related to uncertain tax positions for any open tax years (or expected to be taken in future tax years). Open tax years are those that remain subject to examination and are based on the statute of limitations in each jurisdiction in which the Fund invests.
h. Security Transactions, Investment Income, Expenses and Distributions
Security transactions are accounted for on trade date. Realized gains and losses on security transactions are determined on a specific identification basis. Interest income and estimated expenses are accrued daily. Amortization of premium and accretion of discount on debt securities are included in interest income. Dividend income is recorded on theex-dividend date. Distributions to shareholders are recorded on theex-dividend date. Distributable earnings are determined according to income tax regulations (tax basis) and may differ from earnings recorded in accordance with U.S. GAAP. These differences may be permanent or temporary. Permanent differences are reclassified among capital accounts to reflect their tax character. These reclassifications have no impact on net assets or the results of operations. Temporary differences are not reclassified, as they may reverse in subsequent periods.*
Common expenses incurred by the Trust are allocated among the Funds based on the ratio of net assets of each Fund to the combined net assets of the Trust or based on the ratio of number of shareholders of each Fund to the combined number of shareholders of the Trust. Fund specific expenses are charged directly to the Fund that incurred the expense.
Realized and unrealized gains and losses and net investment income, excluding class specific expenses, are allocated daily to each class of shares based upon the relative proportion of net assets of each class. Differences in per share distributions by class are generally due to differences in class specific expenses.
i. Accounting Estimates
The preparation of financial statements in accordance with U.S. GAAP requires management to make estimates and
| | | | | | |
| | | |
| franklintempleton.com | | Annual Report | | | 31 | |
FRANKLIN ALTERNATIVE STRATEGIES FUNDS
NOTES TO CONSOLIDATED FINANCIAL STATEMENTS
Franklin K2 Global Macro Opportunities Fund(continued)
1. Organization and Significant Accounting Policies(continued)
i. Accounting Estimates(continued)
assumptions that affect the reported amounts of assets and liabilities at the date of the financial statements and the amounts of income and expenses during the reporting period. Actual results could differ from those estimates.
j. Guarantees and Indemnifications
Under the Trust’s organizational documents, its officers and trustees are indemnified by the Trust against certain liabilities
arising out of the performance of their duties to the Trust. Additionally, in the normal course of business, the Trust, on behalf of the Fund, enters into contracts with service providers that contain general indemnification clauses. The Trust’s maximum exposure under these arrangements is unknown as this would involve future claims that may be made against the Trust that have not yet occurred. Currently, the Trust expects the risk of loss to be remote.
*Effective during the current reporting period, it is no longer required to present certain line items in the Consolidated Statements of Changes in Net Assets. The below prior period amounts affected by this change are shown as they were in the prior year Consolidated Statements of Changes in Net Assets.
For the year ended May 31, 2018, there were no distributions to shareholders.
For the year ended May 31, 2018, accumulated net investment loss included in net assets was $(160,830).
2. Shares of Beneficial Interest
At May 31, 2019, there were an unlimited number of shares authorized (without par value). Transactions in the Fund’s shares were as follows:
| | | | | | | | | | | | | | | | | | | | |
| |
| | | Year Ended May 31,a | |
| | | |
| | | 2019 | | | | | | 2018 | |
| | | | | |
| | | Shares | | | Amount | | | | | | Shares | | | Amount | |
|
| Class A Shares: | |
Shares soldb | | | 453 | | | $ | 4,245 | | | | | | | | 8,179 | | | $ | 74,787 | |
Shares issued in reinvestment of distributions | | | 15 | | | | 133 | | | | | | | | — | | | | — | |
Shares redeemed | | | (3,052 | ) | | | (27,897 | ) | | | | | | | (111 | ) | | | (1,010 | ) |
| | | | |
Net increase (decrease) | | | (2,584 | ) | | $ | (23,519 | ) | | | | | | | 8,068 | | | $ | 73,777 | |
| | | | |
|
| Class C Shares: | |
Shares sold | | | 6,544 | | | $ | 59,532 | | | | | | | | 5,335 | | | $ | 48,630 | |
Shares redeemedb | | | (8,091 | ) | | | (72,985 | ) | | | | | | | (9,405 | ) | | | (85,121 | ) |
| | | | |
Net increase (decrease) | | | (1,547 | ) | | $ | (13,453 | ) | | | | | | | (4,070 | ) | | $ | (36,491 | ) |
| | | | |
|
| Advisor Class Shares: | |
Shares sold | | | 2,077 | | | $ | 18,897 | | | | | | | | 14,058 | | | $ | 129,263 | |
Shares issued in reinvestment of distributions | | | 55 | | | | 496 | | | | | | | | — | | | | — | |
Shares redeemed | | | (6,476 | ) | | | (59,433 | ) | | | | | | | (1,424 | ) | | | (13,100 | ) |
| | | | |
Net increase (decrease) | | | (4,344 | ) | | $ | (40,040 | ) | | | | | | | 12,634 | | | $ | 116,163 | |
| | | | |
aDuring the year Class R and Class R6 did not report any share transactions.
bMay include a portion of Class C shares that were automatically converted to Class A.
| | | | |
| | | |
| 32 | | Annual Report | | franklintempleton.com |
FRANKLIN ALTERNATIVE STRATEGIES FUNDS
NOTES TO CONSOLIDATED FINANCIAL STATEMENTS
Franklin K2 Global Macro Opportunities Fund(continued)
3. Transactions with Affiliates
Franklin Resources, Inc. is the holding company for various subsidiaries that together are referred to as Franklin Templeton. Certain officers and trustees of the Trust are also officers and/or directors of the following subsidiaries:
| | |
| |
| Subsidiary | | Affiliation |
K2/D&S Management Co., L.L.C. (K2 Advisors) | | Investment manager |
Franklin Templeton Services, LLC (FT Services) | | Administrative manager |
Franklin Templeton Distributors, Inc. (Distributors) | | Principal underwriter |
Franklin Templeton Investor Services, LLC (Investor Services) | | Transfer agent |
a. Management Fees
The Fund and K2 Subsidiary pay an investment management fee to K2 Advisors of 1.90% per year of the average daily net assets of the Fund and K2 Subsidiary. Management fees paid by the Fund are reduced on assets invested in the K2 Subsidiary, in an amount not to exceed the management fees paid by the K2 Subsidiary.
Under each subadvisory agreement, the below entities provide subadvisory services to the Fund or K2 Subsidiary. The subadvisory fees are paid by K2 Advisors based on the Fund and K2 Subsidiary average daily net assets, and are not an additional expense of the Fund or K2 Subsidiary.
|
|
| Subadvisors |
Aspect Capital Limited |
Emso Asset Management Limited |
Graham Capital Management L.P. |
P/E GLOBAL LLC |
RV Capital Management Private Ltd |
b. Administrative Fees
Under an agreement with K2 Advisors, FT Services provides administrative services to the Fund and K2 Subsidiary. The fee is paid by K2 Advisors based on the Fund and K2 Subsidiary average daily net assets, and is not an additional expense of the Fund or K2 Subsidiary.
c. Distribution Fees
The Board has adopted distribution plans for each share class, with the exception of Class R6 and Advisor Class shares, pursuant to Rule12b-1 under the 1940 Act. Under the Fund’s Class A reimbursement distribution plan, the Fund reimburses Distributors for costs incurred in connection with the servicing, sale and distribution of the Fund’s shares up to the maximum annual plan rate. Under the Class A reimbursement distribution plan, costs exceeding the maximum for the current plan year cannot be reimbursed in subsequent periods. In addition, under the Fund’s Class C and R compensation distribution plans, the Fund pays Distributors for costs incurred in connection with the servicing, sale and distribution of the Fund’s shares up to the maximum annual plan rate for each class. The plan year, for purposes of monitoring compliance with the maximum annual plan rates, is February 1 through January 31.
The maximum annual plan rates, based on the average daily net assets, for each class, are as follows:
| | | | |
Class A | | | 0.25% | |
Class C | | | 1.00% | |
Class R | | | 0.50% | |
| | | | | | |
| | | |
| franklintempleton.com | | Annual Report | | | 33 | |
FRANKLIN ALTERNATIVE STRATEGIES FUNDS
NOTES TO CONSOLIDATED FINANCIAL STATEMENTS
Franklin K2 Global Macro Opportunities Fund(continued)
3. Transactions with Affiliates(continued)
d. Sales Charges/Underwriting Agreements
Front-end sales charges and contingent deferred sales charges (CDSC) do not represent expenses of the Fund. These charges are deducted from the proceeds of sales of Fund shares prior to investment or from redemption proceeds prior to remittance, as applicable. Distributors has advised the Fund of the following commission transactions related to the sales and redemptions of the Fund’s shares for the year:
| | | | |
Sales charges retained net of commissions paid to unaffiliated brokers/dealers | | $ | 19 | |
CDSC retained | | $ | — | |
Effective September 10, 2018, the Board approved changes to certainfront-end sales charges and dealer commissions on Class A shares. Further details are disclosed in the Fund’s Prospectus.
e. Transfer Agent Fees
Each class of shares pays transfer agent fees to Investor Services for its performance of shareholder servicing obligations. The fees are based on an annualized asset based fee of 0.02% plus a transaction based fee. In addition, each class reimburses Investor Services for out of pocket expenses incurred and, except for Class R6, reimburses shareholder servicing fees paid to third parties. These fees are allocated daily based upon their relative proportion of such classes’ aggregate net assets. Class R6 pays Investor Services transfer agent fees specific to that class.
For the year ended May 31, 2019, the Fund paid transfer agent fees of $6,050, of which $5,152 was retained by Investor Services.
f. Waiver and Expense Reimbursements
K2 Advisors and Investor Services have contractually agreed in advance to waive or limit their respective fees and to assume as their own expense certain expenses otherwise payable by the Fund so that the expenses (excluding distribution fees, acquired fund fees and expenses, expenses related to securities sold short and certainnon-routine expenses or costs, including those relating to litigation, indemnification, reorganizations and liquidations) for each class of the Fund do not exceed 1.95% based on the average net assets of each class until September 30, 2019. Total expenses waived or paid are not subject to recapture subsequent to the Fund’s fiscal year end.
g. Other Affiliated Transactions
At May 31, 2019, Franklin Resources, Inc. owned 98.4% of the Fund’s outstanding shares. Investment activities of this shareholder could have a material impact on the Fund.
4. Expense Offset Arrangement
The Fund has entered into an arrangement with its custodian whereby credits realized as a result of uninvested cash balances are used to reduce a portion of the Fund’s custodian expenses. During the year ended May 31, 2019, the custodian fees were reduced as noted in the Consolidated Statement of Operations.
5. Income Taxes
During the year ended May 31, 2019, the Fund utilized $899,398 of capital loss carryforwards.
The tax character of distributions paid during the years ended May 31, 2019 and 2018, was as follows:
| | | | | | | | |
| | |
| | | 2019 | | | 2018 | |
Distributions paid from ordinary income | | $ | 78,052 | | | $ | — | |
| | | | |
| | | |
| 34 | | Annual Report | | franklintempleton.com |
FRANKLIN ALTERNATIVE STRATEGIES FUNDS
NOTES TO CONSOLIDATED FINANCIAL STATEMENTS
Franklin K2 Global Macro Opportunities Fund(continued)
At May 31, 2019, the cost of investments, net unrealized appreciation (depreciation) and undistributed ordinary income for income tax purposes were as follows:
| | | | |
Cost of investments | | $ | 22,984,899 | |
| | | | |
Unrealized appreciation | | $ | 812,347 | |
Unrealized depreciation | | | (1,324,502 | ) |
| | | | |
Net unrealized appreciation (depreciation) | | $ | (512,155 | ) |
| | | | |
Distributable earnings Undistributed ordinary income | | $ | 141,079 | |
| | | | |
Differences between income and/or capital gains as determined on a book basis and a tax basis are primarily due to differing treatments of foreign currency transactions and investments in the K2 Subsidiary.
6. Investment Transactions
Purchases and sales of investments (excluding short term securities) for the year ended May 31, 2019, aggregated $6,816,730 and $3,875,776, respectively.
7. Credit Risk and Defaulted Securities
The Fund may purchase thepre-default or defaulted debt of distressed companies. Distressed companies are financially troubled and could be or are already involved in financial restructuring or bankruptcy. Risks associated with purchasing these securities include the possibility that the bankruptcy or other restructuring process takes longer than expected, or that distributions in restructuring are less than anticipated, either or both of which may result in unfavorable consequences to the Fund. If it becomes probable that the income on debt securities, including those of distressed companies, will not be collected, the Fund discontinues accruing income and recognizes an adjustment for uncollectible interest.
At May 31, 2019, the aggregate long value of distressed company securities for which interest recognition has been discontinued was $233,739, representing 1.0% of the Fund’s net assets. For information as to specific securities, see the accompanying Consolidated Statement of Investments.
| | | | | | |
| | | |
| franklintempleton.com | | Annual Report | | | 35 | |
FRANKLIN ALTERNATIVE STRATEGIES FUNDS
NOTES TO CONSOLIDATED FINANCIAL STATEMENTS
Franklin K2 Global Macro Opportunities Fund(continued)
8. Other Derivative Information
At May 31, 2019, the investments in derivative contracts are reflected in the Consolidated Statement of Assets and Liabilities as follows:
| | | | | | | | | | | | |
| | |
| | | Asset Derivatives | | | Liability Derivatives | |
| | | | |
Derivative Contracts
Not Accounted for as
Hedging Instruments | | Consolidated Statement of
Assets and Liabilities Location | | Fair Value | | | Consolidated Statement of
Assets and Liabilities Location | | Fair Value | |
Interest rate contracts | | Variation margin on futures contracts | | $ | 265,507 | a | | Variation margin on futures contracts | | $ | 2,512 | a |
| | | | |
| | Variation margin on centrally cleared swap contracts | | | 70,760 | a | | Variation margin on centrally cleared swap contracts | | | 101,357 | a |
| | | | |
| | Unrealized appreciation on OTC swap contracts | | | 7,281 | | | Unrealized depreciation on OTC swap contracts | | | 16,489 | |
| | | | |
Foreign exchange contracts | | Variation margin on futures contracts | | | 149,594 | a | | Variation margin on futures contracts | | | 1,364 | a |
| | | | |
| | Unrealized appreciation on OTC forward exchange contracts | | | 381,630 | | | Unrealized depreciation on OTC forward exchange contracts | | | 369,216 | |
| | | | |
Credit contracts | | Variation margin on centrally cleared swap contracts | | | 13,450 | a | | Variation margin on centrally cleared swap contracts | | | 13,373 | a |
| | | | |
Equity contracts | | Variation margin on futures contracts | | | 37,406 | a | | Variation margin on futures contracts | | | 113,537 | a |
| | | | |
Commodity contracts | | Variation margin on futures contracts | | | 164,217 | a | | Variation margin on futures contracts | | | 226,462 | a |
| | | | | | | | | | | | |
Totals | | | | $ | 1,089,845 | | | | | $ | 844,310 | |
| | | | | | | | | | | | |
aThis amount reflects the cumulative appreciation (depreciation) of futures contracts and centrally cleared swap contracts as reported in the Consolidated Statement of Investments. Only the variation margin receivable/payable at year end is separately reported within the Consolidated Statement of Assets and Liabilities. Prior variation margin movements were recorded to cash upon receipt or payment.
For the year ended May 31, 2019, the effect of derivative contracts in the Consolidated Statement of Operations was as follows:
| | | | | | | | | | | | |
| | | | |
Derivative Contracts
Not Accounted for as
Hedging Instruments | | Consolidated Statement of
Operations Location | | Net Realized
Gain (Loss)
for the Year | | | Consolidated Statement of
Operations Location | | Net Change in
Unrealized
Appreciation
(Depreciation)
for the Year | |
| | Net realized gain (loss) from: | | | | | | Net change in unrealized appreciation (depreciation) on: | | | | |
| | | | |
Interest rate contracts | | Futures contracts | | $ | 422,544 | | | Futures contracts | | $ | 328,877 | |
| | | | |
| | Swap contracts | | | 4,946 | | | Swap contracts | | | (41,077 | ) |
| | | | |
Foreign exchange contracts | | Forward exchange contracts | | | (3,953 | ) | | Forward exchange contracts | | | 98,669 | |
| | | | |
| | Futures contracts | | | 765,735 | | | Futures contracts | | | (220,801 | ) |
| | | | |
Credit contracts | | Swap contracts | | | (41,046 | ) | | Swap contracts | | | 19,310 | |
| | | | |
Equity contracts | | Futures contracts | | | (160,826 | ) | | Futures contracts | | | (55,452 | ) |
| | | | |
Commodity contracts | | Futures contracts | | | (304,988 | ) | | Futures contracts | | | 52,202 | |
| | | | | | | | | | | | |
Totals | | | | $ | 682,412 | | | | | $ | 181,728 | |
| | | | | | | | | | | | |
| | | | |
| | | |
| 36 | | Annual Report | | franklintempleton.com |
FRANKLIN ALTERNATIVE STRATEGIES FUNDS
NOTES TO CONSOLIDATED FINANCIAL STATEMENTS
Franklin K2 Global Macro Opportunities Fund(continued)
For the year ended May 31, 2019, the average month end notional amount of futures contracts and swap contracts represented $55,783,551 and $21,157,756, respectively. The average month end contract value of forward exchange contracts was $24,317,631.
At May 31, 2019, OTC derivative assets and liabilities are as follows:
| | | | | | | | |
| |
| | | Gross Amounts of
Assets and Liabilities
Presented in the
Consolidated
Statement of
Assets and Liabilities | |
| | |
| | | Assetsa | | | Liabilitiesa | |
| Derivatives | | | | | | | | |
Forward Exchange Contracts | | $ | 381,630 | | | $ | 369,216 | |
Swap Contracts | | | 7,281 | | | | 16,489 | |
| | | | |
Total | | $ | 388,911 | | | $ | 385,705 | |
| | | | |
aAbsent an event of default or early termination, OTC derivative assets and liabilities are presented gross and not offset in the Consolidated Statement of Assets and Liabilities.
At May 31, 2019, OTC derivative assets, which may be offset against OTC derivative liabilities and collateral received from the counterparty, are as follows:
| | | | | | | | | | | | | | | | | | | | |
| | | |
| | | | | | Amounts Not Offset in the
Consolidated Statement of Assets and Liabilities | | | | |
| | | | | |
| | | Gross Amounts
of Assets Presented
in the Consolidated
Statement of
Assets and Liabilities | | | Financial
Instruments
Available for Offset | | | Financials
Instruments
Collateral
Received | | | Cash
Collateral
Receiveda | | | Net Amount (Not
Less than Zero) | |
| Counterparty | | | | | | | | | | | | | | | | | | | | |
BOFA | | $ | — | | | $ | — | | | $ | — | | | $ | — | | | $ | — | |
DBAB | | | 6,136 | | | | (6,136 | ) | | | — | | | | — | | | | — | |
JPHQ | | | 1,145 | | | | (1,145 | ) | | | — | | | | — | | | | — | |
JPHQb | | | 141,733 | | | | — | | | | — | | | | — | | | | 141,733 | |
MSCO | | | 239,897 | | | | (225,727 | ) | | | — | | | | — | | | | 14,170 | |
| | | | |
Total | | $ | 388,911 | | | $ | (233,008 | ) | | $ | — | | | $ | — | | | $ | 155,903 | |
| | | | |
| | | | | | |
| | | |
| franklintempleton.com | | Annual Report | | | 37 | |
FRANKLIN ALTERNATIVE STRATEGIES FUNDS
NOTES TO CONSOLIDATED FINANCIAL STATEMENTS
Franklin K2 Global Macro Opportunities Fund(continued)
8. Other Derivative Information(continued)
At May 31, 2019, OTC derivative liabilities, which may be offset against OTC derivative assets and collateral pledged to the counterparty, are as follows:
| | | | | | | | | | | | | | | | | | | | |
| | | |
| | | | | | Amounts Not Offset in the
Consolidated Statement of Assets and Liabilities | | | | |
| | | | | |
| | | Gross Amounts
of Liabilities Presented
in the Consolidated
Statement of
Assets and Liabilities | | | Financial
Instruments
Available for Offset | | | Financials
Instruments
Collateral
Pledged | | | Cash
Collateral
Pledgeda | | | Net Amount (Not
Less than Zero) | |
| Counterparty | | | | | | | | | | | | | | | | | | | | |
BOFA | | $ | 6,639 | | | $ | — | | | $ | — | | | $ | — | | | $ | 6,639 | |
DBAB | | | 7,049 | | | | (6,136 | ) | | | — | | | | — | | | | 913 | |
JPHQ | | | 2,801 | | | | (1,145 | ) | | | — | | | | — | | | | 1,656 | |
JPHQb | | | 143,489 | | | | — | | | | — | | | | — | | | | 143,489 | |
MSCO | | | 225,727 | | | | (225,727 | ) | | | — | | | | — | | | | — | |
| | | | |
Total | | $ | 385,705 | | | $ | (233,008 | ) | | $ | — | | | $ | — | | | $ | 152,697 | |
| | | | |
aIn some instances, the collateral amounts disclosed in the table above were adjusted due to the requirement to limit the collateral amounts to avoid the effect of overcollateralization. Actual collateral received and/or pledged may be more than the amounts disclosed herein.
bRepresents derivatives not subject to an ISDA master agreement.
See Note 1(c) regarding derivative financial instruments.
See Abbreviations on page 40.
9. Upcoming Liquidation
On May 22, 2019, the Board approved a proposal to liquidate the Fund. Effective June 24, 2019, the Fund was closed to all new investors. The Fund is scheduled to liquidate on or about September 11, 2019.
10. Credit Facility
The Fund, together with other U.S. registered and foreign investment funds (collectively, Borrowers), managed by Franklin Templeton, are borrowers in a joint syndicated senior unsecured credit facility totaling $2 billion (Global Credit Facility) which matures on February 7, 2020. This Global Credit Facility provides a source of funds to the Borrowers for temporary and emergency purposes, including the ability to meet future unanticipated or unusually large redemption requests.
Under the terms of the Global Credit Facility, the Fund shall, in addition to interest charged on any borrowings made by the Fund and other costs incurred by the Fund, pay its share of fees and expenses incurred in connection with the implementation and maintenance of the Global Credit Facility, based upon its relative share of the aggregate net assets of all of the Borrowers, including an annual commitment fee of 0.15% based upon the unused portion of the Global Credit Facility. These fees are reflected in other expenses in the Consolidated Statement of Operations. During the year ended May 31, 2019, the Fund did not use the Global Credit Facility.
| | | | |
| | | |
| 38 | | Annual Report | | franklintempleton.com |
FRANKLIN ALTERNATIVE STRATEGIES FUNDS
NOTES TO CONSOLIDATED FINANCIAL STATEMENTS
Franklin K2 Global Macro Opportunities Fund(continued)
11. Fair Value Measurements
The Fund follows a fair value hierarchy that distinguishes between market data obtained from independent sources (observable inputs) and the Fund’s own market assumptions (unobservable inputs). These inputs are used in determining the value of the Fund’s financial instruments and are summarized in the following fair value hierarchy:
| | • | | Level 1 – quoted prices in active markets for identical financial instruments |
| | • | | Level 2 – other significant observable inputs (including quoted prices for similar financial instruments, interest rates, prepayment speed, credit risk, etc.) |
| | • | | Level 3 – significant unobservable inputs (including the Fund’s own assumptions in determining the fair value of financial instruments) |
The input levels are not necessarily an indication of the risk or liquidity associated with financial instruments at that level.
A summary of inputs used as of May 31, 2019, in valuing the Fund’s assets and liabilities carried at fair value, is as follows:
| | | | | | | | | | | | | | | | |
| | | | |
| | | Level 1 | | | Level 2 | | | Level 3 | | | Total | |
|
| Assets: | |
Investments in Securities:a | |
Corporate Bonds and Notes | | $ | — | | | $ | 3,941,377 | | | $ | — | | | $ | 3,941,377 | |
Corporate Bonds and Notes in Reorganization | | | — | | | | 7,226 | | | | — | | | | 7,226 | |
Foreign Government and Agency Securities | | | — | | | | 1,146,492 | | | | — | | | | 1,146,492 | |
Municipal Bonds in Reorganization | | | — | | | | 226,513 | | | | — | | | | 226,513 | |
Short Term Investments | | | 15,911,226 | | | | 969,006 | | | | — | | | | 16,880,232 | |
| | | | |
Total Investments in Securities | | $ | 15,911,226 | | | $ | 6,290,614 | | | $ | — | | | $ | 22,201,840 | |
| | | | |
Other Financial Instruments: | |
Futures Contracts | | $ | 616,724 | | | $ | — | | | $ | — | | | $ | 616,724 | |
Forward Exchange Contracts | | | — | | | | 381,630 | | | | — | | | | 381,630 | |
Swap Contracts | | | — | | | | 91,491 | | | | — | | | | 91,491 | |
| | | | |
Total Other Financial Instruments | | $ | 616,724 | | | $ | 473,121 | | | $ | — | | | $ | 1,089,845 | |
| | | | |
|
| Liabilities: | |
Other Financial Instruments: | |
Futures Contracts | | $ | 343,875 | | | $ | — | | | $ | — | | | $ | 343,875 | |
Forward Exchange Contracts | | | — | | | | 369,216 | | | | — | | | | 369,216 | |
Swap Contracts | | | — | | | | 131,219 | | | | — | | | | 131,219 | |
| | | | |
Total Other Financial Instruments | | $ | 343,875 | | | $ | 500,435 | | | $ | — | | | $ | 844,310 | |
| | | | |
aFor detailed categories, see the accompanying Consolidated Statement of Investments.
12. Subsequent Events
The Fund has evaluated subsequent events through the issuance of the consolidated financial statements and determined that no events have occurred that require disclosure other than those already disclosed in the consolidated financial statements.
| | | | | | |
| | | |
| franklintempleton.com | | Annual Report | | | 39 | |
FRANKLIN ALTERNATIVE STRATEGIES FUNDS
NOTES TO CONSOLIDATED FINANCIAL STATEMENTS
Franklin K2 Global Macro Opportunities Fund(continued)
Abbreviations
| | | | | | | | | | |
| Counterparty | | Currency | | Selected Portfolio |
| BOFA | | Bank of America, N.A. | | ARS | | Argentine Peso | | ARLLMONP | | Argentina Blended Historical Policy Rate |
| DBAB | | Deutsche Bank AG | | AUD | | Australian Dollar | | BBG | | Bloomberg |
| JPHQ | | JP Morgan Chase Bank, N.A. | | BRL | | Brazilian Real | | BRLCDI | | Brazil Cetip Di Interbank Deposit Rate |
| MSCO | | Morgan Stanley & Co., LLC | | CAD | | Canadian Dollar | | CAC | | Cotation Assistée en Continu |
| | | | CHF | | Swiss Franc | | CBOT | | Chicago Board of Trade |
| | | | CZK | | Czech Koruna | | CME | | Chicago Mercantile Exchange |
| | | | EUR | | Euro | | CMT | | Constant Maturity Treasury Index |
| | | | GBP | | British Pound | | DJIA | | Dow Jones Industrial Average |
| | | | HKD | | Hong Kong Dollar | | EURIBOR | | Euro Interbank Offered Rate |
| | | | HUF | | Hungarian Forint | | FRN | | Floating Rate Note |
| | | | INR | | Indian Rupee | | FTSE | | Financial Times Stock Exchange |
| | | | JPY | | Japanese Yen | | GO | | General Obligation |
| | | | KRW | | South Korean Won | | HIBOR | | Hong Kong InterBank Offered Rate |
| | | | MXN | | Mexican Peso | | KORIBOR | | Korean InterBank Offered Rate |
| | | | NGN | | Nigerian Naira | | LIBOR | | London InterBank Offered Rate |
| | | | NOK | | Norwegian Krone | | MIB | | Milano Italia Borsa |
| | | | NZD | | New Zealand Dollar | | MIBOR | | Mumbai Interbank Offered Rate |
| | | | PLN | | Polish Zloty | | MSCI | | Morgan Stanley Capital International PLC |
| | | | RUB | | Russian Ruble | | OAT | | Obligations Assimilables du Tresor |
| | | | SEK | | Swedish Krona | | OMO | | Open Market Operations |
| | | | SGD | | Singapore Dollar | | OMX | | Stockholm Stock Exchange |
| | | | THB | | Thai Baht | | SIBOR | | Singapore Interbank Offered Rate |
| | | | USD | | United States Dollar | | SPI | | Swiss Performance Index |
| | | | ZAR | | South African Rand | | TOPIX | | Tokyo Price Index |
| | | | | | | | TSX | | Toronto Stock Exchange |
| | | | |
| | | |
| 40 | | Annual Report | | franklintempleton.com |
FRANKLIN ALTERNATIVE STRATEGIES FUNDS
Report of Independent Registered Public Accounting Firm
To the Board of Trustees of Franklin Alternative Strategies Funds
and Shareholders of Franklin K2 Global Macro Opportunities Fund:
Opinion on the Financial Statements
We have audited the accompanying consolidated statement of assets and liabilities of Franklin K2 Global Macro Opportunities Fund (the “Fund”) (one of the funds constituting the Franklin Alternative Strategies Funds), including the consolidated statement of investments, as of May 31, 2019, and the related consolidated statement of operations for the year then ended, the consolidated statements of changes in net assets for each of the two years in the period then ended, and the consolidated financial highlights for each of the two years in the period then ended and the period from July 11, 2016 (commencement of operations) through May 31, 2017 and the related notes (collectively referred to as the “financial statements”). In our opinion, the financial statements present fairly, in all material respects, the consolidated financial position of Franklin K2 Global Macro Opportunities Fund (one of the funds constituting the Franklin Alternative Strategies Funds) at May 31, 2019, the consolidated results of its operations for the year then ended, the consolidated changes in its net assets for each of the two years in the period then ended, and its consolidated financial highlights for each of the two years in the period then ended and the period from July 11, 2016 (commencement of operations) through May 31, 2017, in conformity with U.S. generally accepted accounting principles.
Basis for Opinion
These financial statements are the responsibility of the Fund’s management. Our responsibility is to express an opinion on the Fund’s financial statements based on our audits. We are a public accounting firm registered with the Public Company Accounting Oversight Board (United States) (“PCAOB”) and are required to be independent with respect to the Fund in accordance with the U.S. federal securities laws and the applicable rules and regulations of the Securities and Exchange Commission and the PCAOB.
We conducted our audits in accordance with the standards of the PCAOB. Those standards require that we plan and perform the audit to obtain reasonable assurance about whether the financial statements are free of material misstatement, whether due to error or fraud. The Fund is not required to have, nor were we engaged to perform, an audit of the Fund’s internal control over financial reporting. As part of our audits, we are required to obtain an understanding of internal control over financial reporting, but not for the purpose of expressing an opinion on the effectiveness of the Fund’s internal control over financial reporting. Accordingly, we express no such opinion.
Our audits included performing procedures to assess the risks of material misstatement of the financial statements, whether due to error or fraud, and performing procedures that respond to those risks. Such procedures included examining, on a test basis, evidence regarding the amounts and disclosures in the financial statements. Our procedures included confirmation of securities owned as of May 31, 2019, by correspondence with the custodian and brokers,or by other appropriate auditing procedures where replies from brokers were not received. Our audits also included evaluating the accounting principles used and significant estimates made by management, as well as evaluating the overall presentation of the financial statements. We believe that our audits provide a reasonable basis for our opinion.

We have served as the auditor of one or more Franklin investment companies since 1987.
Boston, Massachusetts
July 25, 2019
| | | | | | |
| | | |
| franklintempleton.com | | Annual Report | | | 41 | |
FRANKLIN ALTERNATIVE STRATEGIES FUNDS
Board Members and Officers
The name, year of birth and address of the officers and board members, as well as their affiliations, positions held with the Trust, principal occupations during at least the past five years and number of U.S. registered portfolios overseen in the Franklin Templeton fund complex are shown below. Generally, each board member serves until that person’s successor is elected and qualified.
Independent Board Members
| | | | | | | | |
| | | | |
Name, Year of Birth
and Address | | Position | | Length of
Time Served | | Number of Portfolios in
Fund Complex Overseen
by Board Member* | | Other Directorships Held During
at Least the Past 5 Years |
| | | | |
Edward I. Altman, Ph.D. (1941)
c/o Franklin Mutual Advisers, LLC
101 John F. Kennedy Parkway
Short Hills, NJ 07078-2716 | | Trustee | | Since 2011 | | 14 | | None |
|
| Principal Occupation During at Least the Past 5 Years: |
| Max L. Heine Professor of Finance, Emeritus and Director of The Credit and Debt Markets Research Program, Salomon Center, Stern School of Business, New York University; editor and author of numerous financial publications; financial consultant; an adviser to numerous financial and publishing organizations; andformerly, Vice Director, Salomon Center, Stern School of Business, New York University. |
| | | | |
Ann Torre Bates (1958)
c/o Franklin Mutual Advisers, LLC
101 John F. Kennedy Parkway
Short Hills, NJ 07078-2716 | | Trustee | | Since 2011 | | 38 | | Ares Capital Corporation (specialty finance company) (2010-present), United Natural Foods, Inc. (distributor of natural, organic and specialty foods) (2013-present), Allied Capital Corporation (financial services) (2003-2010), SLM Corporation (Sallie Mae) (1997-2014) and Navient Corporation (loan management, servicing and asset recovery) (2014-2016). |
|
| Principal Occupation During at Least the Past 5 Years: |
| Director of various companies; andformerly, Executive Vice President and Chief Financial Officer, NHP Incorporated (manager of multifamily housing) (1995-1997); and Vice President and Treasurer, US Airways, Inc. (until 1995). |
| | | | |
Burton J. Greenwald (1929)
c/o Franklin Mutual Advisers, LLC
101 John F. Kennedy Parkway
Short Hills, NJ 07078-2716 | | Trustee and Vice
Chairman of the Board | | Trustee since
2011 and Vice
Chairman of the
Board since 2015 | | 14 | | Franklin Templeton Emerging Markets Debt Opportunities Fund PLC (1999-present) and Fiduciary International Ireland Limited (1999-2015). |
|
| Principal Occupation During at Least the Past 5 Years: |
| Managing Director, B.J. Greenwald Associates (management consultants to the financial services industry); andformerly, Chairman, Fiduciary Trust International Funds; Executive Vice President, L.F. Rothschild Fund Management, Inc.; President and Director, Merit Mutual Funds; President, Underwriting Division and Director, National Securities & Research Corporation; Governor, Investment Company Institute; and Chairman, ICI Public Information Committee. |
| | | | |
Jan Hopkins Trachtman (1947)
c/o Franklin Mutual Advisers, LLC
101 John F. Kennedy Parkway
Short Hills, NJ 07078-2716 | | Trustee | | Since 2011 | | 14 | | FinTech Acquisition Corp. III (special purpose fintech acquisition company) (2018-present) |
|
| Principal Occupation During at Least the Past 5 Years: |
| President and Founder, The Jan Hopkins Group (communications consulting firm); serves on Advisory Board of Knight Bagehot Fellowship; andformerly,President, Economic Club of New York (2007-2015);Anchor/Correspondent, CNN Financial News (until 2003); Managing Director and Head of Client Communications, Citigroup Private Bank (until 2005);Off-Air Reporter, ABC News’ World News Tonight; and Editor, CBS Network News. |
| | | | |
| | | |
| 42 | | Annual Report | | franklintempleton.com |
FRANKLIN ALTERNATIVE STRATEGIES FUNDS
Independent Board Members(continued)
| | | | | | | | |
| | | | |
Name, Year of Birth
and Address | | Position | | Length of
Time Served | | Number of Portfolios in
Fund Complex Overseen
by Board Member* | | Other Directorships Held During
at Least the Past 5 Years |
| | | | |
Keith E. Mitchell (1954)
c/o Franklin Mutual Advisers, LLC
101 John F. Kennedy Parkway
Short Hills, NJ 07078-2716 | | Trustee | | Since 2011 | | 14 | | None |
|
| Principal Occupation During at Least the Past 5 Years: |
| Director of various boards of asset management firms; andformerly, Managing Member, Mitchell, Hartley & Bechtel Advisers, LLC (formerly, Mitchell Advisers, LLC) (advisory firm) (2003-2015) and Managing Director, Putman Lovell NBF. |
| | | | |
David W. Niemiec (1949)
c/o Franklin Mutual Advisers, LLC
101 John F. Kennedy Parkway
Short Hills, NJ 07078-2716 | | Trustee | | Since 2015 | | 38 | | Hess Midstream Partners LP (oil and gas midstream infrastructure) (2017-present). |
|
| Principal Occupation During at Least the Past 5 Years: |
| Advisor, Saratoga Partners (private equity fund); andformerly, Managing Director, Saratoga Partners (1998-2001) and SBC Warburg Dillon Read (investment banking) (1997-1998); Vice Chairman, Dillon, Read & Co. Inc. (investment banking) (1991-1997); and Chief Financial Officer, Dillon, Read & Co. Inc. (1982-1997). |
| | | | |
Charles Rubens II (1930)
c/o Franklin Mutual Advisers, LLC
101 John F. Kennedy Parkway
Short Hills, NJ 07078-2716 | | Trustee | | Since 2011 | | 14 | | None |
|
| Principal Occupation During at Least the Past 5 Years: |
| Private investor and president ofnon-profit organizations; andformerly, an executive of Time, Inc.; and Trustee of Colorado College. |
| | | | |
Robert E. Wade (1946)
c/o Franklin Mutual Advisers, LLC
101 John F. Kennedy Parkway
Short Hills, NJ 07078-2716 | | Trustee and
Chairman of
the Board | | Since 2011 | | 38 | | El Oro Ltd (investments) (2003-June 2019). |
|
| Principal Occupation During at Least the Past 5 Years: |
| Attorney at law engaged in private practice as a sole practitioner (1972-2008) and member of various boards. |
| | | | |
Gregory H. Williams (1943)
c/o Franklin Mutual Advisers, LLC
101 John F. Kennedy Parkway
Short Hills, NJ 07078-2716 | | Trustee | | Since 2015 | | 14 | | None |
|
| Principal Occupation During at Least the Past 5 Years: |
| Private investor; Consultant; andformerly, President, University of Cincinnati (2009-2012); President, The City College of New York (2001-2009); Dean, College of Law, Ohio State University (1993-2001); and Associate Vice President, Academic Affairs and Professor of Law, University of Iowa (1977-1993). |
Interested Board Members and Officers
| | | | | | | | |
| | | | |
Name, Year of Birth
and Address | | Position | | Length of
Time Served | | Number of Portfolios in
Fund Complex Overseen
by Board Member* | | Other Directorships Held During
at Least the Past 5 Years |
| | | | |
**Gregory E. Johnson (1961)
One Franklin Parkway
San Mateo, CA 94403-1906 | | Trustee | | Since 2011 | | 152 | | None |
|
| Principal Occupation During at Least the Past 5 Years: |
| Chairman of the Board, Member – Office of the Chairman, Director and Chief Executive Officer, Franklin Resources, Inc.; officer and/or director or trustee, as the case may be, of some of the other subsidiaries of Franklin Resources, Inc. and of 42 of the investment companies in Franklin Templeton; Vice Chairman, Investment Company Institute; andformerly, President, Franklin Resources, Inc. (1994-2015). |
| | | | | | |
| | | |
| franklintempleton.com | | Annual Report | | | 43 | |
FRANKLIN ALTERNATIVE STRATEGIES FUNDS
Interested Board Members and Officers(continued)
| | | | | | | | |
| | | | |
Name, Year of Birth
and Address | | Position | | Length of
Time Served | | Number of Portfolios in
Fund Complex Overseen
by Board Member* | | Other Directorships Held During
at Least the Past 5 Years |
| | | | |
**Jennifer M. Johnson (1964)
One Franklin Parkway
San Mateo, CA 94403-1906 | | Trustee | | Since 2015 | | 46 | | None |
|
| Principal Occupation During at Least the Past 5 Years: |
| President and Chief Operating Officer, Franklin Resources, Inc.; officer and/or director or trustee, as the case may be, of some of the other subsidiaries of Franklin Resources, Inc. and of four of the investment companies in Franklin Templeton; andformerly, Chief Operating Officer and Executive Vice President, Franklin Resources, Inc. (1994-2015); Executive Vice President of Operations and Technology, Franklin Resources, Inc. (2005-2010); and Senior Vice President, Franklin Resources, Inc. (2003-2005). |
| | | | |
Alison E. Baur (1964)
One Franklin Parkway
San Mateo, CA 94403-1906 | | Vice President | | Since 2012 | | Not Applicable | | Not Applicable |
|
| Principal Occupation During at Least the Past 5 Years: |
| Deputy General Counsel, Franklin Templeton; and officer of some of the other subsidiaries of Franklin Resources, Inc. and of 44 of the investment companies in Franklin Templeton. |
| | | | |
Aliya S. Gordon (1973)
One Franklin Parkway
San Mateo, CA 94403-1906 | | Vice President | | Since 2011 | | Not Applicable | | Not Applicable |
|
| Principal Occupation During at Least the Past 5 Years: |
| Senior Associate General Counsel and officer of 44 of the investment companies in Franklin Templeton. |
| | | | |
Steven J. Gray (1955)
One Franklin Parkway
San Mateo, CA 94403-1906 | | Secretary and Vice President | | Since 2011 | | Not Applicable | | Not Applicable |
|
| Principal Occupation During at Least the Past 5 Years: |
| Senior Associate General Counsel, Franklin Templeton; Vice President, Franklin Templeton Distributors, Inc. and FASA, LLC; and officer of 44 of the investment companies in Franklin Templeton. |
| | | | |
Madison S. Gulley (1964)
300 S.E. 2nd Street
Fort Lauderdale, FL 33301-1923 | | President and Chief Executive Officer – Investment Management | | Since 2017 | | Not Applicable | | Not Applicable |
|
| Principal Occupation During at Least the Past 5 Years: |
| President, FASA, LLC; Executive Vice President, Franklin Advisers, Inc., Franklin Templeton Institutional, LLC, Templeton Global Advisors Limited and Templeton Investment Counsel, LLC; Executive Vice President, Head of Alternatives, K2 Advisors, LLC and K2/D&S Management Co., LLC; Senior Vice President, Franklin Templeton Companies, LLC; officer and/or director or trustee, as the case may be, of some of the other subsidiaries of Franklin Resources, Inc. and of one of the investment companies in Franklin Templeton. |
| | | | |
Matthew T. Hinkle (1971)
One Franklin Parkway
San Mateo, CA 94403-1906 | | Chief Executive
Officer –
Finance and
Administration | | Since 2017 | | Not Applicable | | Not Applicable |
|
| Principal Occupation During at Least the Past 5 Years: |
| Senior Vice President, Franklin Templeton Services, LLC; officer of 44 of the investment companies in Franklin Templeton; andformerly, Vice President, Global Tax (2012-April 2017) and Treasurer/Assistant Treasurer, Franklin Templeton (2009-2017). |
| | | | |
| | | |
| 44 | | Annual Report | | franklintempleton.com |
FRANKLIN ALTERNATIVE STRATEGIES FUNDS
Interested Board Members and Officers(continued)
| | | | | | | | |
| | | | |
Name, Year of Birth
and Address | | Position | | Length of
Time Served | | Number of Portfolios in
Fund Complex Overseen
by Board Member* | | Other Directorships Held During
at Least the Past 5 Years |
| | | | |
Robert G. Kubilis (1973)
300 S.E. 2nd Street
Fort Lauderdale, FL 33301-1923 | | Chief Financial
Officer, Chief
Accounting Officer and Treasurer | | Since 2015 | | Not Applicable | | Not Applicable |
|
| Principal Occupation During at Least the Past 5 Years: |
| Treasurer, U.S. Fund Administration & Reporting and officer of 16 of the investment companies in Franklin Templeton. |
| | | | |
Robert Lim (1948)
One Franklin Parkway
San Mateo, CA 94403-1906 | | Vice President – AML Compliance | | Since 2016 | | Not Applicable | | Not Applicable |
|
| Principal Occupation During at Least the Past 5 Years: |
| Vice President, Franklin Templeton Companies, LLC; Chief Compliance Officer, Franklin Templeton Distributors, Inc. and Franklin Templeton Investor Services, LLC; and officer of 44 of the investment companies in Franklin Templeton. |
| | | | |
Kimberly H. Novotny (1972)
300 S.E. 2nd Street
Fort Lauderdale, FL 33301-1923 | | Vice President | | Since 2013 | | Not Applicable | | Not Applicable |
|
| Principal Occupation During at Least the Past 5 Years: |
| Associate General Counsel, Franklin Templeton; Vice President and Corporate Secretary, Fiduciary Trust International of the South; Vice President, Templeton Investment Counsel, LLC; Assistant Secretary, Franklin Resources, Inc.; and officer of 44 of the investment companies in Franklin Templeton. |
| | | | |
Robert C. Rosselot (1960)
300 S.E. 2nd Street
Fort Lauderdale, FL 33301-1923 | | Chief
Compliance
Officer | | Since 2013 | | Not Applicable | | Not Applicable |
|
| Principal Occupation During at Least the Past 5 Years: |
| Director, Global Compliance, Franklin Templeton; Vice President, Franklin Templeton Companies, LLC; officer of 44 of the investment companies in Franklin Templeton; andformerly, Senior Associate General Counsel, Franklin Templeton (2007-2013); and Secretary and Vice President, Templeton Group of Funds (2004-2013). |
| | | | |
Navid J. Tofigh (1972)
One Franklin Parkway
San Mateo, CA 94403-1906 | | Vice President | | Since 2015 | | Not Applicable | | Not Applicable |
|
| Principal Occupation During at Least the Past 5 Years: |
| Associate General Counsel and officer of 44 of the investment companies in Franklin Templeton. |
| | | | |
Craig S. Tyle (1960)
One Franklin Parkway
San Mateo, CA 94403-1906 | | Vice President | | Since 2011 | | Not Applicable | | Not Applicable |
|
| Principal Occupation During at Least the Past 5 Years: |
| General Counsel, Executive Vice President and Secretary, Franklin Resources, Inc.; and officer of some of the other subsidiaries of Franklin Resources, Inc. and of 44 of the investment companies in Franklin Templeton. |
| | | | | | |
| | | |
| franklintempleton.com | | Annual Report | | | 45 | |
FRANKLIN ALTERNATIVE STRATEGIES FUNDS
Interested Board Members and Officers(continued)
| | | | | | | | |
| | | | |
Name, Year of Birth
and Address | | Position | | Length of
Time Served | | Number of Portfolios in
Fund Complex Overseen
by Board Member* | | Other Directorships Held During
at Least the Past 5 Years |
| | | | |
Lori A. Weber (1964)
300 S.E. 2nd Street
Fort Lauderdale, FL 33301-1923 | | Vice President | | Since 2011 | | Not Applicable | | Not Applicable |
|
| Principal Occupation During at Least the Past 5 Years: |
| Senior Associate General Counsel, Franklin Templeton; Assistant Secretary, Franklin Resources, Inc.; Vice President and Secretary, Templeton Investment Counsel, LLC; and officer of 44 of the investment companies in Franklin Templeton. |
*We base the number of portfolios on each separate series of the U.S. registered investment companies within the Franklin Templeton fund complex. These portfolios have a common investment manager or affiliated investment managers.
**Gregory E. Johnson is considered to be an interested person of the Fund under the federal securities laws due to his position as an officer and director of Franklin Resources, Inc. (Resources), which is the parent company of the Fund’s investment manager and distributor. Jennifer M. Johnson is considered to be an interested person of the Fund under the federal securities laws due to her position as an officer of Resources.
Note 1: Gregory E. Johnson and Jennifer M. Johnson are siblings.
Note 2: Officer information is current as of the date of this report. It is possible that after this date, information about officers may change.
The Sarbanes-Oxley Act of 2002 and Rules adopted by the U.S. Securities and Exchange Commission require the Fund to disclose whether the Fund’s Audit Committee includes at least one member who is an audit committee financial expert within the meaning of such Act and Rules. The Fund’s Board has determined that there is at least one such financial expert on the Audit Committee and has designated each of Edward I. Altman, Ph.D., Ann Torre Bates and David W. Niemiec as an audit committee financial expert. The Board believes that Messrs. Altman and Niemiec and Ms. Bates qualify as such an expert in view of their extensive business background and experience. Mr. Altman has served as a member of the Fund Audit Committee since 2011. He currently serves as a Max L. Hines Professor of Finance, Emeritus and Director of The Credit and Debt Markets Research Program, Salomon Center, Stern School of Business, New York University. Ms. Bates has served as a member of the Fund Audit Committee since 2011. She currently serves as a director of Ares Capital Corporation (2010-present) and United Natural Foods, Inc. (2013-present) and was formerly a director of Navient Corporation from 2014 to 2016, SLM Corporation from 1997 to 2014 and Allied Capital Corporation from 2003 to 2010, Executive Vice President and Chief Financial Officer of NHP Incorporated from 1995 to 1997 and Vice President and Treasurer of US Airways, Inc. until 1995. Mr. Niemiec has served as a member of the Fund Audit Committee since 2015, currently serves as an Advisor to Saratoga Partners and was formerly its Managing Director from 1998 to 2001 and serves as a director of Hess Midstream Partners LP (2017-present). Mr. Niemiec was formerly a director of Emeritus Corporation from 1999 to 2010 and OSI Pharmaceuticals, Inc. from 2006 to 2010, Managing Director of SBC Warburg Dillon Read from 1997 to 1998, and was Vice Chairman from 1991 to 1997 and Chief Financial Officer from 1982 to 1997 of Dillon, Read & Co. Inc. As a result of such background and experience, the Board believes that Messrs. Altman and Niemiec and Ms. Bates have each acquired an understanding of generally accepted accounting principles and financial statements, the general application of such principles in connection with the accounting estimates, accruals and reserves, and analyzing and evaluating financial statements that present a breadth and level of complexity of accounting issues generally comparable to those of the Fund, as well as an understanding of internal controls and procedures for financial reporting and an understanding of audit committee functions. Messrs. Altman and Niemiec and Ms. Bates are independent Board members as that term is defined under the applicable U.S. Securities and Exchange Commission Rules and Releases.
The Statement of Information (SAI) includes additional information about board members and is available, without charge, upon request. Shareholders may call (800) DIALBEN/342-5236 to request the SAI.
| | | | |
| | | |
| 46 | | Annual Report | | franklintempleton.com |
FRANKLIN ALTERNATIVE STRATEGIES FUNDS
FRANKLIN K2 GLOBAL MACRO OPPORTUNITIES FUND
Shareholder Information
Board Approval of Investment Management Agreement andSub-Advisory Agreements
FRANKLIN ALTERNATIVE STRATEGIES FUNDS
Franklin K2 Global Macro Opportunities Fund
(Fund)
On May 22, 2019, the Board of Trustees of the Fund (Board), on behalf of the Fund, approved a proposal to liquidate and dissolve the Fund. The liquidation is anticipated to occur on or about September 11, 2019 (Liquidation Date), but may be delayed if unforeseen circumstances arise. As the term of the existing investment management agreement ends prior to the Liquidation Date, the Board, including a majority of trustees that are not “interested persons” as such term is defined in section 2(a)(19) of the Investment Company Act of 1940 (hereinafter referred to as “independent trustees”), at anin-person meeting held on May 22, 2019, unanimously approved the renewal of the Fund’s investment management agreement with K2/D&S Management Co., L.L.C. (K2 Advisors), and of eachsub-advisory agreement between K2 Advisors and each of followingsub-advisors (theSub-Advisors):
Aspect Capital Limited
Emso Asset Management Limited
Graham Capital Management, L.P.
P/E Global, LLC
Prior to a meeting of all of the trustees for the purpose of considering such renewal, the independent trustees participated in two other meetings held in connection with the renewal process. Throughout the process, the independent trustees received assistance and advice from and met separately with independent counsel. The independent trustees met with and interviewed officers of K2 Advisors and certainSub-Advisors (including portfolio managers), the transfer agent and shareholder services group and the distributor. In approving the renewal of the investment management agreement and thesub-advisory agreements for the Fund, the Board, including the independent trustees, determined that the investment management fee structure was fair and reasonable and that continuance of the agreement was in the best interests of the Fund and its shareholders.
In making the foregoing approvals, the Board considered various materials related to the investment management agreement and thesub-advisory agreements including: (1) a copy of the investment management agreement andsub-advisory agreements; (2) information describing the
nature, quality and extent of services that K2 Advisors and eachSub-Advisor provided, and are expected to provide, to the Fund, and the investment management fees andsub-advisory fees payable to K2 Advisors and eachSub-Advisor; (3) reports from K2 Advisors on the continued diligence conducted on eachSub-Advisor and the reasons for recommending renewal of each of thesub-advisory agreements, including, but not limited to, eachSub-Advisor’s background, experience, personnel, operations, policies, procedures and compliance functions; and (4) a report from the Trust’s Chief Compliance Officer regarding K2 Advisors’ and eachSub-Advisor’s compliance program and capabilities, including policies and procedures in place to address potential conflicts of interest, and the diligence undertaken by the Trust’s Chief Compliance Officer with respect thereto. The Board also noted that it received an annual report on all payments made by Franklin Templeton Investments (FTI) or the Fund to financial intermediaries engaged in the sale of Fund shares, as well as a memorandum relating to third-party servicing arrangements in response to a Guidance Update from the U.S. Securities and Exchange Commission (SEC) relating to mutual fund distribution andsub- accounting fees.
The Board also took into account information furnished throughout the year at regular Board meetings, as well as information specifically requested and furnished for the renewal process, which culminated in the meetings referred to above for the specific purpose of considering such agreements. Information furnished throughout the year included, among others, reports on the Fund’s investment performance, expenses, portfolio composition, derivatives, asset segregation, portfolio turnover, Rule12b-1 plan, distribution, shareholder servicing, legal and compliance matters, pricing of securities, sales and redemptions, and marketing support payments made to financial intermediaries, as well as a third-party survey of transfer agent fees charged to funds within the FTI complex in comparison with those charged to other fund complexes deemed comparable. Also, related financial statements and other information about the scope and quality of services provided by K2 Advisors and its affiliates and enhancements to such services over the past year were provided. In addition, the trustees received periodic reports throughout the year and during the renewal process relating to compliance with the Fund’s investment policies and restrictions. During the renewal process, the independent trustees considered K2 Advisors’ methods of operation within the Franklin Templeton group and its activities on behalf of other clients.
The information obtained by the trustees during the renewal process also included a special report prepared by Broadridge
| | | | | | |
| | | |
| franklintempleton.com | | Annual Report | | | 47 | |
FRANKLIN ALTERNATIVE STRATEGIES FUNDS
FRANKLIN K2 GLOBAL MACRO OPPORTUNITIES FUND
SHAREHOLDER INFORMATION
Financial Solutions, Inc., an independent third-party analyst that utilizes data from Lipper, Inc. (“Lipper”), comparing the Fund’s investment performance and expenses with those of other mutual funds deemed comparable to such Fund as selected by Lipper (Broadridge Section 15(c) Report). The trustees reviewed the Broadridge Section 15(c) Report and its usefulness in the renewal process with respect to matters such as comparative fees, expenses, expense ratios and performance. The Board considered K2 Advisors’ views that the peer group determined by Lipper for comparison purposes may not be an entirely appropriate representation of the Fund’s peer universe. K2 Advisors explained that the universe of funds that are managed using multi-manager, multi- strategy structures, like the Fund, continues to evolve, and has presented challenges in identifying an appropriate set of peers for the Fund. It was noted by K2 Advisors that the peer group compiled by Lipper includes single-manager funds which, due to their nature and relative simplicity, have lower expense ratios and are not true peers for fee comparison purposes (“Base Expense Group”). While noting the limitations of the Broadridge Section 15(c) Report, the Board concluded that the Broadridge Section 15(c) Report was helpful in the performance of its duties.
In addition, the trustees received a Profitability Study (Profitability Study) prepared by management discussing the profitability to FTI from its overall U.S. fund operations, as well as on an individualfund-by-fund basis. Over the past year, the Board and counsel to the independent trustees continued to receive reports on management’s handling of recent regulatory inquiries and pending legal actions against K2 Advisors and its affiliates. The independent trustees were satisfied with the actions taken to date by management in response to such regulatory and legal matters. The independent trustees also received reports from the Trust’s Chief Compliance Officer on regulatory inquiries and pending legal actions against theSub-Advisors applicable to the services provided by theSub-Advisors to the Fund and noted that there were not any issues in this regard that should prevent the renewal of thesub-advisory agreements.
The trustees reviewed the personnel, operations, financial condition, and investment management capabilities, methodologies and resources of K2 Advisors and eachSub-Advisor, including each management team’s expertise in the management of other alternative strategies funds. As part of this review, particular attention was given to (1) the diligent risk management program of K2 Advisors and its parent, including those aspects of the program related to selecting and overseeingsub-advisors to the Fund and continual monitoring and management of cybersecurity, liquidity and counterparty
credit risk, (2) eachSub-Advisor’s risk management program, and (3) derivatives and other complex instruments that are held and expected to be held by the Fund and how such instruments are used to carry out the Fund’s investment goal.
The Board also took into account, among other things, management’s efforts in establishing a global credit facility for the benefit of the Fund and other accounts managed by FTI to provide a source of cash for temporary and emergency purposes or to meet unusual redemption requests as well as the strong financial position of K2 Advisors’ parent company and its commitment to the mutual fund business. The Board noted management’s continuing efforts and expenditures in establishing effective business continuity plans and developing strategies to address areas of heightened concern in the mutual fund industry, such as cybersecurity and liquidity risk management. The Board also recognized management’s commitment to facilitating Board oversight of particular areas, including derivatives and payments to intermediaries, by enhanced reporting. In addition, the Board received updates from management on the compliance of the investment manager with comprehensive rules and regulations promulgated by the SEC and the U.S. Commodity Futures Trading Commission.
In addition to the above and other matters considered by the trustees throughout the course of the year, the following discussion relates to certain primary factors relevant to the Board’s decision. This discussion of the information and factors considered by the Board (including the information and factors discussed above) is not intended to be exhaustive, but rather summarizes certain factors considered by the Board. In view of the wide variety of factors considered, the Board did not, unless otherwise noted, find it practicable to quantify or otherwise assign relative weights to the foregoing factors. In addition, individual trustees may have assigned different weights to various factors.
NATURE, EXTENT AND QUALITY OF SERVICES. The trustees reviewed the nature, extent and quality of the services provided, and to be provided, by K2 Advisors and eachSub- Advisor. In this regard, they reviewed the Fund’s investment goal and K2 Advisors’ and eachSub-Advisor’s investment strategy andsub-strategy, and K2 Advisors’ and eachSub-Advisor’s ability to implement such investment strategy and/orsub-strategy, including, but not limited to, K2 Advisors’ and eachSub-Advisor’s trading practices, investment decision processes and reputation. The Board also considered the investment management services that the investment manager provides to the Cayman Islands-based company, which is wholly owned by the Fund (Cayman Subsidiary).
| | | | |
| | | |
| 48 | | Annual Report | | franklintempleton.com |
FRANKLIN ALTERNATIVE STRATEGIES FUNDS
FRANKLIN K2 GLOBAL MACRO OPPORTUNITIES FUND
SHAREHOLDER INFORMATION
The Board noted that the Fund employs a “manager of managers” structure, whereby K2 Advisors is responsible for selectingsub-advisors (subject to Board approval), allocating the Fund’s assets among them, and overseeing thesub-advisors’day-to-day management of the Fund’s assets. The Board noted the responsibilities that K2 Advisors has as the Fund’s investment manager, including (1) due diligence on theSub-Advisors and any potential newsub-advisors to the Fund, their respective trading strategies, risk management, operations and businesses,(2) on-going oversight and monitoring of theday-to-day investment activities ofSub-Advisors and other service providers, including their respective compliance with the investment mandate and restrictions, compliance policies and procedures and federal securities laws, and K2 Advisors’ ongoing assessment of their performance, (3) portfolio construction with respect to the allocation of assets amongSub-Advisors, investment funds, cash and other investments, (4) risk management, (5) preparing quarterly reports to the Board, and (6) the implementation of Board directives as they relate to the Fund. The Trustees also considered the successful performance of K2 Advisors in managing the Fund and other investment products with similar investment strategies to the investment strategies of the Fund that are not subject to the Investment Company Act of 1940.
With respect to thesub-advisory services provided, and to be provided, by eachSub-Advisor, the Board noted the responsibilities that eachSub-Advisor has with respect to the portion of the Fund’s assets allocated to theSub-Advisor by K2 Advisors(Sub-Advised Portion), including, among others, implementing the investment strategies with respect to theSub-Advised Portion and ensuring compliance with the investment strategies, policies and limitations of theSub- Advised Portion. The trustees considered the successful performance of eachSub-Advisor in managing the Fund and other investment products with similar investment strategies to the investment strategies of itsSub-Advised Portion of the Fund, including, with respect to certainSub-Advisors, mutual funds with similar investment strategies. The Board considered K2 Advisors’ rationale for recommending the continued retention of eachSub-Advisor.
The trustees reviewed the Fund’s portfolio management teams at K2 Advisors and eachSub- Advisor, including each such team’s performance, staffing, skills and compensation program. With respect to portfolio manager compensation, management assured the trustees that the Fund’s long-term performance is a significant component of incentive-based compensation for K2 Advisors’ portfolio management team and noted that a portion of a K2 Advisors’ portfolio manager’s
incentive-based compensation is paid in shares ofpre-designated funds from the portfolio manager’s fund management area. The trustees noted that the portfolio manager compensation program aligned the interests of the portfolio managers with that of Fund shareholders. During regular Board meetings and the aforementioned meetings of the independent trustees, the trustees considered periodic reports provided to them showing that K2 Advisors and theSub-Advisors complied with the investment policies and restrictions of the Fund as well as other reports periodically furnished to the Board covering matters such as the compliance of portfolio managers and other management personnel with the code of ethics covering the investment management personnel, the adherence to fair value pricing procedures established by the Board and the accuracy of net asset value calculations. The Board noted the extent of the benefits provided to Fund shareholders from being part of the Franklin Templeton group of funds, including the right to exchange investments between funds (same class) without a sales charge, the ability to reinvest Fund dividends into other funds and the right to combine holdings of other funds to obtain reduced sales charges.
The trustees discussed with management various other products, portfolios and entities that are advised by K2 Advisors and eachSub-Advisor and the allocation of assets and expenses among and within them, as well as their relative fees and reasons for differences with respect thereto and any potential conflicts.
The Board also considered a report from the Trust’s Chief Compliance Officer regarding K2 Advisors’ and eachSub-Advisor’s compliance programs and capabilities as such programs and capabilities relate to the operations of the Fund and the monitoring and testing of such program undertaken by the Trust’s Chief Compliance Officer. The Board considered the selection and due diligence process employed by K2 Advisors in selecting and deciding to retain eachSub-Advisor as asub-advisor to the Fund, including the due diligence undertaken with respect to theSub-Advisor’s compliance and risk management capabilities. The trustees considered K2 Advisors’ significant efforts in developing and implementing compliance procedures established in accordance with SEC and other requirements.
The Board also considered the nature, extent and quality of the services to be provided under the Fund’s other service agreements to determine that, on an overall basis, Fund shareholders were well served. In this connection, the Board also took into account transfer agent and shareholder services provided to Fund shareholders by an affiliate of
| | | | | | |
| | | |
| franklintempleton.com | | Annual Report | | | 49 | |
FRANKLIN ALTERNATIVE STRATEGIES FUNDS
FRANKLIN K2 GLOBAL MACRO OPPORTUNITIES FUND
SHAREHOLDER INFORMATION
K2 Advisors, noting continuing expenditures by management to increase and improve the scope of such services and favorable periodic reports on shareholder services conducted by independent third parties. While such considerations directly affected the trustees’ decision in renewing the Fund’s transfer agent and shareholder services agreement, the Board also considered these commitments as incidental benefits to Fund shareholders deriving from the investment management relationship.
Based on their review, the trustees were satisfied with the nature and quality of the overall services provided, and to be provided, by K2 Advisors and its affiliates and each Sub Advisor to the Fund and its shareholders and were confident in the abilities of K2 Advisors and eachSub-Advisor to implement their respective investment strategy and/orsub-strategy and to provide quality services to the Fund and its shareholders.
INVESTMENT PERFORMANCE.As the Fund commenced operations in July 2016, the trustees reviewed the investment performance of the Fund for theone- andtwo-year periods ended December 31, 2018.
As part of their review, they inquired of management regarding benchmark and hedging activities. Consideration was also given to performance in the context of available levels of cash, including as affected by net flows, during the periods. The trustees had meetings during the year, including the meetings referred to above held in connection with the renewal process, with the Fund’s portfolio managers to discuss performance and the management of the Fund and eachSub-Advisor.
In addition, attention in assessing performance was given to the Broadridge Section 15(c) Report. That report showed the investment performance of the Fund (Advisor Class shares) in comparison to other funds determined comparable by Lipper.
The comparable funds to the Fund, as chosen by Lipper, included all retail and institutional alternative global macro funds. The Fund had total returns in the best performing quintile for theone-year period ended December 31, 2018 and total returns in the lowest performing quintile for thetwo-year period ended December 31, 2018. The trustees noted that the Fund exhibited improved relative performance in 2018 and discussed with management the reasons for the relative underperformance for thetwo-year period ended December 31, 2018. In light of the improved performance and planned liquidation of the Fund, the Board concluded that further action was not warranted.
The trustees also compared Fund performance to other industry benchmarks, including measures of risk-adjusted performance of a fund, as part of their evaluation of investment performance. The trustees concluded that the Fund had continued to perform well in comparison to its various benchmarks and in the context of the Fund’s investment goal.
COMPARATIVE EXPENSES AND PROFITABILITY. The trustees considered the cost of the services provided, and to be provided, by K2 Advisors and eachSub-Advisor and the losses realized by K2 Advisors and its affiliates from their relationships with the Fund. As part of the renewal process, they explored with management the trends in expense ratios over the past three fiscal years (or, if earlier, inception) and the reasons for any increases in the Fund’s expense ratios (or components thereof). In considering the appropriateness of the management fee and other expenses charged to the Fund, the Board took into account various factors including investment performance and matters relating to Fund operations, including, but not limited to, the quality and experience of K2 Advisors personnel. The Board also reviewed and considered the investment management fees in light of the nature, extent and quality of the investment management services provided, and to be provided, by K2 Advisors and eachSub-Advisor, as more fully discussed above. The Board noted that thesub-advisory fees are paid by K2 Advisors to eachSub-Advisor and are not additional fees borne by the Fund. The Board also noted that thesub-advisory fees paid, and to be paid, by K2 Advisors to eachSub-Advisor were the product of arms-length negotiations between K2 Advisors and eachSub-Advisor.
Furthermore, the Board took into account that information regardingSub-Advisor profitability is not legally required to be provided. Accordingly, profitability information of thesub- advisors was given lesser weight than other factors. In addition, the Board considered the allocation of the investment management fee charged to the Fund between K2 Advisors and eachSub-Advisor in light of the nature, extent and quality of the investment management services provided, and to be provided, by K2 Advisors and eachSub-Advisor. As part of this discussion, the Board took into account the fee waiver and expense limitation arrangement in effect, and the amount of Fund expenses that were absorbed since inception of the Fund by K2 Advisors through such waivers and arrangements. The Board also considered the investment management services that the investment manager provides to the Cayman Subsidiary and the related fee waivers that were in place.
| | | | |
| | | |
| 50 | | Annual Report | | franklintempleton.com |
FRANKLIN ALTERNATIVE STRATEGIES FUNDS
FRANKLIN K2 GLOBAL MACRO OPPORTUNITIES FUND
SHAREHOLDER INFORMATION
Consideration was also given to a comparative analysis in the Broadridge Section 15(c) Report of the investment management fee and total expense ratio of the Fund in comparison with those of a group of other funds selected by Lipper as its appropriate Lipper expense group.
Lipper expense data is based upon information taken from each fund’s most recent annual report, which reflects historical asset levels that may be quite different from those currently existing, particularly in a period of market volatility.
In reviewing comparative costs, emphasis was given to the Fund’s contractual management fee in comparison with the contractual management fee that would have been charged by other funds within its Lipper expense group assuming they were similar in size to the Fund, as well as the actual total expenses of the Fund in comparison with those of its Lipper expense group. The Lipper contractual management fee analysis includes administrative charges as being part of the management fee, and total expenses, for comparative consistency, are shown by Lipper for Fund Advisor Class shares. The Fund’s contractual management fee rate was in the most expensive quintile of its Base Expense Group and its total expenses were also in the most expensive quintile of its Base Expense Group.
Noting the factors and limitations with respect to the Broadridge Section 15(c) Report and factors relating to the Fund’s operations, such as the quality and experience of K2 Advisors and theSub-Advisors and the nature and quality of the services provided and to be provided by K2 Advisors and theSub-Advisors, the Board found such comparative fees and expenses to be acceptable.
The trustees also reviewed the Profitability Study addressing profitability of Franklin Resources, Inc., from its overall U.S. fund business, as well as profitability to K2 Advisors and its affiliates, from providing investment management and other services to the Fund during the12-month period ended September 30, 2018, the most recent fiscalyear-end of Franklin Resources, Inc. The trustees reviewed the basis on which such reports are prepared and the cost allocation methodology utilized in the Profitability Study, it being recognized that allocation methodologies may each be reasonable while producing different results. In this respect, the Board noted that the reasonableness of the cost allocation methodologies was reviewed by independent accountants on an every other year basis.
The independent trustees met with management to discuss the Profitability Study. This included, among other things, a
comparison of investment management income with investment management expenses of the Fund; comparison of underwriting revenues and expenses; the relative relationship of investment management and underwriting expenses; shareholder servicing profitability; economies of scale; and the relative contribution of the Fund to the profitability of K2 Advisors and its parent. In discussing the Profitability Study with the Board, K2 Advisors stated its belief that the costs incurred in establishing the infrastructure necessary to operate the type of mutual fund operations conducted by it and its affiliates may not be fully reflected in the expenses allocated to the Fund in determining its profitability.
The Board also took into account management’s expenditures in improving shareholder services provided to the Fund, as well as the need to meet additional regulatory and compliance requirements. The trustees also considered the extent to which K2 Advisors and theSub-Advisors may derive ancillary benefits from Fund operations, including those derived from the allocation of Fund brokerage and the use of commission dollars to pay for research and other similar services.
The Board noted that shareholders are able to redeem their Fund shares at any time if shareholders believe that Fund fees and expenses are too high or if they are dissatisfied with the performance of the Fund.
ECONOMIES OF SCALE.The Board considered economies of scale realized by K2 Advisors and its affiliates and theSub-Advisors as the Fund grows larger and the extent to which they are shared with Fund shareholders, as for example, in the level of the investment management fees charged, in the quality and efficiency of services rendered and in increased capital commitments benefiting the Fund directly or indirectly. The Board also considered the fee waiver and expense limitation arrangement in effect, and the amount of Fund expenses that were absorbed since inception of the Fund by K2 Advisors through such waiver and arrangement. The Board concluded that economies of scale were deemed not to be a significant factor at that time in light of, among other matters, the fee waiver and expense limitation arrangement in effect and the fact that the Fund had less than three complete years of operating results.
Proxy Voting Policies and Procedures
The Fund’s investment manager has established Proxy Voting Policies and Procedures (Policies) that the Fund uses to determine how to vote proxies relating to portfolio securities. Shareholders may view the Fund’s complete Policies online at franklintempleton.com. Alternatively, shareholders may
| | | | | | |
| | | |
| franklintempleton.com | | Annual Report | | | 51 | |
FRANKLIN ALTERNATIVE STRATEGIES FUNDS
FRANKLIN K2 GLOBAL MACRO OPPORTUNITIES FUND
SHAREHOLDER INFORMATION
request copies of the Policies free of charge by calling the Proxy Group collect at (954)527-7678 or by sending a written request to: Franklin Templeton Companies, LLC, 300 S.E. 2nd Street, Fort Lauderdale, FL 33301, Attention: Proxy Group. Copies of the Fund’s proxy voting records are also made available online at franklintempleton.com and posted on the U.S. Securities and Exchange Commission’s website at sec.gov and reflect the most recent12-month period ended June 30.
Quarterly Consolidated Statement of Investments
The Trust, on behalf of the Fund, files a complete statement of investments with the U.S. Securities and Exchange Commission for the first and third quarters for each fiscal year as an exhibit to its report on FormN-PORT. Shareholders may view the filed FormN-PORT by visiting the Commission’s website at sec.gov. The filed form may also be viewed and copied at the Commission’s Public Reference Room in Washington, DC. Information regarding the operations of the Public Reference Room may be obtained by calling(800) SEC-0330.
Householding of Reports and Prospectuses
You will receive the Fund’s financial reports every six months as well as an annual updated summary prospectus (prospectus available upon request). To reduce Fund expenses, we try to identify related shareholders in a household and send only one copy of the financial reports and summary prospectus. This process, called “householding,” will continue indefinitely unless you instruct us otherwise. If you prefer not to have these documents householded, please call us at (800)632-2301. At any time you may view current prospectuses/summary prospectuses and financial reports on our website. If you choose, you may receive these documents through electronic delivery.
| | | | |
| | | |
| 52 | | Annual Report | | franklintempleton.com |
Authorized for distribution only when accompanied or preceded by a summary prospectus and/or prospectus. Investors should carefully consider a fund’s investment goals, risks, charges and expenses before investing. A prospectus contains this and other information; please read it carefully before investing.
To help ensure we provide you with quality service, all calls to and from our service areas are monitored and/or recorded.
| | | | | | |
 | | Annual Report and Shareholder Letter Franklin K2 Global Macro Opportunities Fund | | |
| | | |
| | Investment Manager | | Distributor | | Shareholder Services |
| | K2/D&S Management Co., L.L.C. | | Franklin Templeton Distributors, Inc. (800) DIAL BEN®/342-5236 franklintempleton.com | | (800) 632-2301 |
| © 2019 Franklin Templeton Investments. All rights reserved. | | | | 973 A 07/19 |
Item 2. Code of Ethics.
(a) The Registrant has adopted a code of ethics that applies to its principal executive officers and principal financial and accounting officer.
(c) N/A
(d) N/A
(f) Pursuant to Item 13 (a) (1), the Registrant is attaching as an exhibit a copy of its code of ethics that applies to its principal executive officers and principal financial and accounting officer.
Item 3. Audit Committee Financial Expert.
(a) (1) The Registrant has an audit committee financial expert serving on its audit committee.
((2) The audit committee financial expert are Edward I. Altman, Ann Torre Bates and David W. Niemiec and they are “independent” as defined under the relevant Securities and Exchange Commission Rules and Releases.
Item 4. Principal Accountant Fees and Services.
(a) Audit Fees
The aggregate fees paid to the principal accountant for professional services rendered by the principal accountant for the audit of the registrant’s annual financial statements or for services that are normally provided by the principal accountant in connection with statutory and regulatory filings or engagements were $328,925 for the fiscal year ended May 31, 2019 and $323,667 for the fiscal year ended May 31, 2018.
(b) Audit-Related Fees
There were no fees paid to the principal accountant for assurance and related services rendered by the principal accountant to the registrant that are reasonably related to the performance of the audit of the registrant’s financial statements and are not reported under paragraph (a) of Item 4.
There were no fees paid to the principal accountant for assurance and related services rendered by the principal accountant to the registrant’s investment adviser and any entity controlling, controlled by or under common control with the investment adviser that provides ongoing services to the registrant that are reasonably related to the performance of the audit of their financial statements.
(c) Tax Fees
The aggregate fees paid to the principal accountant for professional services rendered by the principal accountant to the registrant for tax compliance, tax advice and tax planning were $9,827 for the fiscal year ended May 31, 2019 and $10,575 for the fiscal year ended May 31, 2018.
The services for which these fees were paid include identifying passive foreign investment companies to manage exposure to tax liabilities.
The aggregate fees paid to the principal accountant for professional services rendered by the principal accountant to the registrant’s investment adviser and any entity controlling, controlled by or under common control with the investment adviser that provides ongoing services to the registrant for tax compliance, tax advice and tax planning were $89,484 for the fiscal year ended May 31, 2019 and $81,210 for the fiscal year ended May 31, 2018. The services for which these fees were paid included technical tax consultation for withholding tax report to foreign governments, application of local country tax laws and tax advice.
(d) All Other Fees
There were no fees paid to the principal accountant for products and services rendered by the principal accountant to the registrant not reported in paragraphs (a) - (c) of Item 4.
There were no fees paid to the principal accountant for products and services rendered by the principal accountant to the registrant’s investment adviser and any entity controlling, controlled by or under common control with the investment adviser that provides ongoing services to the registrant other than the services reported in paragraphs (a) - (c) of Item 4.
(e) (1) The registrant’s audit committee is directly responsible for approving the services to be provided by the auditors, including:
(i) pre-approval of all audit and audit related services;
(ii) pre-approval of allnon-audit related services to be provided to the Fund by the auditors;
(iii) pre-approval of allnon-audit related services to be provided to the registrant by the auditors to the registrant’s investment adviser or to any entity that controls, is controlled by or is under common control with the registrant’s investment adviser and that provides ongoing services to the registrant where thenon-audit services relate directly to the operations or financial reporting of the registrant; and
(iv) establishment by the audit committee, if deemed necessary or appropriate, as an alternative to committeepre-approval of services to be provided by the auditors, as required by paragraphs (ii) and (iii) above, of policies and procedures to permit such services to bepre-approved by other means, such as through establishment of guidelines or by action of a designated member or members of the committee; provided the policies and procedures are detailed as to the particular service and the committee is informed of each service and such policies and procedures do not include delegation of audit committee responsibilities, as contemplated under the Securities Exchange Act of 1934, to management; subject, in the case of (ii) through (iv), to any waivers, exceptions or exemptions that may be available under applicable law or rules.
(e) (2) None of the services provided to the registrant described in paragraphs (b) - (d) of Item 4 were approved by the audit committee pursuant to paragraph (c) (7) (i) (C) of Rule2-01 of regulationS-X.
(f) No disclosures are required by this Item 4 (f).
(g) The aggregatenon-audit fees paid to the principal accountant for services rendered by the principal accountant to the registrant and the registrant’s investment adviser and any entity controlling, controlled by or under common control with the investment adviser that provides ongoing services to the registrant were $99,311 for the fiscal year ended May 31, 2019 and $91,785 for the fiscal year ended May 31, 2018.
(h) The registrant’s audit committee of the board has considered whether the provision ofnon-audit services that were rendered to the registrant’s investment adviser (not including anysub-adviser whose role is primarily portfolio management and is subcontracted with or overseen by another investment adviser), and any entity controlling, controlled by, or under common control with the investment adviser that provides ongoing services to the registrant that were notpre-approved pursuant to paragraph (c) (7) (ii) of Rule2-01 of RegulationS-X is compatible with maintaining the principal accountant’s independence.
| | |
Item 5. Audit Committee of Listed Registrants. | | N/A |
| |
Item 6. Schedule of Investments. | | N/A |
| |
Item 7. Disclosure of Proxy Voting Policies and Procedures forClosed-End Management Investment Companies. | | N/A |
| |
Item 8. Portfolio Managers ofClosed-End Management Investment Companies. | | N/A |
| |
Item 9. Purchases of Equity Securities byClosed-End Management Investment Company and Affiliated Purchasers. | | N/A |
| |
Item 10. Submission of Matters to a Vote of Security Holders. | | |
There have been no changes to the procedures by which shareholders may recommend nominees to the Registrant’s Board of Trustees that would require disclosure herein.
Item 11. Controls and Procedures.
(a) Evaluation of Disclosure Controls and Procedures. The Registrant maintains disclosure controls and procedures that are designed to provide reasonable assurance that information required to be disclosed in the Registrant’s filings under the Securities Exchange Act of 1934, as amended, and the Investment Company Act of 1940 is recorded, processed, summarized and reported within the periods specified in the rules and forms of the Securities and Exchange Commission. Such information is accumulated and communicated to the Registrant’s management, including its principal executive officer and principal financial officer, as appropriate, to allow timely decisions regarding required disclosure. The Registrant’s management, including the principal executive officer and the principal financial officer, recognizes that any set of controls and procedures, no matter how well designed and operated, can provide only reasonable assurance of achieving the desired control objectives.
Within 90 days prior to the filing date of this Shareholder Report onForm N-CSR, the Registrant had carried out an evaluation, under the supervision and with the participation of the Registrant’s management, including the Registrant’s principal executive officer and the Registrant’s principal financial officer, of the effectiveness of the design and operation of the Registrant’s disclosure controls and procedures. Based on such evaluation, the Registrant’s principal executive officer and principal financial officer concluded that the Registrant’s disclosure controls and procedures are effective.
(b) Changes in Internal Controls. There have been no changes in the Registrant’s internal control over financial reporting that occurred during the period covered by this report that has materially affected, or is reasonably likely to materially affect the internal control over financial reporting.
Item 12. Disclosure of Securities Lending Activities forClosed-End Management Investment Company. N/A
Item 13. Exhibits.
(a) (1) Code of Ethics
(a) (2) Certifications pursuant to Section 302 of the Sarbanes-Oxley Act of 2002 of Matthew T. Hinkle, Chief Executive Officer - Finance and Administration, and Robert G. Kubilis, Chief Financial Officer and Chief Accounting Officer
(b) Certifications pursuant to Section 906 of the Sarbanes-Oxley Act of 2002 of Matthew T. Hinkle, Chief Executive Officer - Finance and Administration, and Robert G. Kubilis, Chief Financial Officer and Chief Accounting Officer
SIGNATURES
Pursuant to the requirements of the Securities Exchange Act of 1934 and the Investment Company Act of 1940, the registrant has duly caused this report to be signed on its behalf by the undersigned, thereunto duly authorized.
FRANKLIN ALTERNATIVE STRATEGIES FUNDS
| | |
| By | | S\MATTHEW T. HINKLE |
| | Matthew T. Hinkle |
| | Chief Executive Officer - Finance and Administration |
Date July 31, 2019
Pursuant to the requirements of the Securities Exchange Act of 1934 and the Investment Company Act of 1940, this report has been signed below by the following persons on behalf of the registrant and in the capacities and on the dates indicated.
| | |
| By | | S\MATTHEW T. HINKLE |
| | Matthew T. Hinkle |
| | Chief Executive Officer - Finance and Administration |
Date July 31, 2019
| | |
| By | | S\ROBERT G. KUBILIS |
| | Robert G. Kubilis |
| | Chief Financial Officer and Chief Accounting Officer |
Date July 31, 2019