UNITED STATES
SECURITIES AND EXCHANGE COMMISSION
Washington, DC 20549
FORM N-CSR
CERTIFIED SHAREHOLDER REPORT OF REGISTERED MANAGEMENT INVESTMENT COMPANIES
Investment Company Act file number_811-22641
__Franklin Alternative Strategies Funds
(Exact name of registrant as specified in charter)
One Franklin Parkway, San Mateo, CA 94403-1906
(Address of principal executive offices) (Zip code)
Craig S. Tyle, One Franklin Parkway, San Mateo, CA 94403-1906
(Name and address of agent for service)
Registrant's telephone number, including area code: _650 312-2000
Date of fiscal year end: 5/31
Date of reporting period: _5/31/16
Item 1. Reports to Stockholders.

Annual Report
and Shareholder Letter
May 31, 2016
Franklin K2 Alternative Strategies Fund
A SERIES OF FRANKLIN ALTERNATIVE STRATEGIES FUNDS

Sign up for electronic delivery at franklintempleton.com/edelivery
| |
| Contents | |
| Annual Report | |
| Franklin K2 Alternative Strategies Fund | 3 |
| Performance Summary | 7 |
| Your Fund’s Expenses | 12 |
| Consolidated Financial Highlights and Consolidated | |
| Statement of Investments | 14 |
| Consolidated Financial Statements | 75 |
| Notes to Consolidated Financial Statements | 79 |
| Report of Independent Registered | |
| Public Accounting Firm | 95 |
| Tax Information | 96 |
| Board Members and Officers | 97 |
| Shareholder Information | 102 |
Visit franklintempleton.com for fund updates, to access your account, or to find helpful financial planning tools.
2 Annual Report
franklintempleton.com
Annual Report
Franklin K2 Alternative Strategies Fund
This annual report for Franklin K2 Alternative Strategies Fund covers the fiscal year ended May 31, 2016.
Your Fund’s Goal and Main Investments
The Fund seeks capital appreciation with lower volatility relative to the broad equity markets. The Fund seeks to achieve its investment goal by allocating its assets across multiple non-traditional or “alternative” strategies, including but not limited to relative value, long short equity, global macro and event driven. The Fund is structured as a multi-manager fund, meaning the Fund’s assets are managed by multiple investment managers (subadvisors), while the Fund’s investment manager retains overall responsibility for the Fund’s investments. The Fund may invest in a wide range of securities and other investments including, but not limited to: equity securities including common stocks, preferred stocks, convertible securities, rights and warrants, private and registered investment vehicles and exchange-traded funds (ETFs); and debt securities including bonds, notes, debentures, banker’s acceptances and commercial paper; loans and loan participations; and mortgage-backed or other asset-backed securities, including collateralized debt obligations; as well as derivatives, commodities and currencies.
Performance Overview
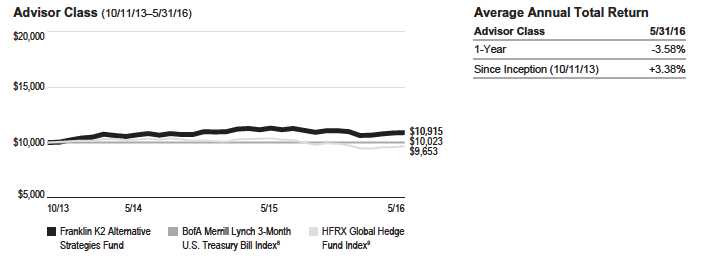
The Fund’s Class A shares had a -3.89% cumulative total return for the 12 months under review. For comparison, the Fund’s primary benchmark, the BofA Merrill Lynch 3-Month U.S. Treasury Bill (T-Bill) Index, which tracks the performance of short-term U.S. government securities with a remaining term to final maturity of less than three months, posted a +0.15% total return.1 Also for comparison, the Fund’s secondary benchmark, the HFRX Global Hedge Fund Index, which is designed to be representative of the overall composition of the hedge fund universe, had a -7.08% total return.2 You can find more of the Fund’s performance data in the Performance Summary beginning on page 7.
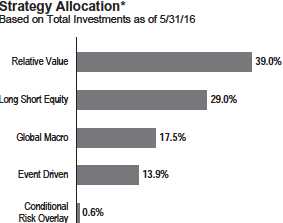
*Figures reflect certain derivatives held in the portfolio (or their underlying reference assets) and may not total 100% or may be negative due to rounding, use of any derivatives, unsettled trades or other factors.
Performance data represent past performance, which does not guarantee future results. Investment return and principal value will fluctuate, and you may have a gain or loss when you sell your shares. Current performance may differ from figures shown. For most recent month-end performance, go to franklintempleton.com or call (800) 342-5236.
Economic and Market Overview
The global economy expanded moderately during the 12 months under review. Concerns about global economic growth, China’s slowing economy and tumbling stock market, declining commodity prices, geopolitical tensions in several regions, fear of the U.K.’s potential exit from the European Union (commonly referred to as Brexit) and uncertainty about the U.S. Federal Reserve’s (Fed’s) timing for raising interest rates contributed to stock market volatility. However, toward period-end, equity markets strengthened after the Fed’s decision to leave its federal funds target rate unchanged after raising it for the first time in nine years in December. Further helping global stocks were the Bank of Japan’s (BOJ’s) decision to cut interest rates, hopes of additional stimulus measures by global central banks, and finalization of a new debt deal for Greece.
1. Source: Morningstar.
2. Source: FactSet. Hedge Fund Research, Inc. – www.hedgefundresearch.com. The HFRX Global Hedge Fund Index is being used under license from Hedge Fund
Research, Inc., which does not endorse or approve of any of the contents of this report.
The indexes are unmanaged and include reinvestment of any income or distributions. They do not reflect any fees, expenses or sales charges. One cannot invest directly in an
index, and an index is not representative of the Fund’s portfolio.
See www.franklintempletondatasources.com for additional data provider information.
The dollar value, number of shares or principal amount, and names of all portfolio holdings are listed in the Fund’s Consolidated Statement of Investments (SOI).
The Consolidated SOI begins on page 19.
franklintempleton.com
Annual Report 3
FRANKLIN K2 ALTERNATIVE STRATEGIES FUND
An improvement in metal prices and signs of stabilization in crude oil prices also improved investor sentiment. For the reporting period, oil prices declined sharply, largely due to strong global supply, and other commodity prices also witnessed a fall for most of the period but partially recovered toward period-end. In this environment, global developed market stocks, as measured by the MSCI World Index, declined during the period.
U.S. economic growth was mixed during the 12 months under review. After strengthening in 2015’s second quarter, the economy moderated in the third and fourth quarters. Growth slowed further in 2016’s first quarter as non-residential investments, private inventory investments and federal government spending declined, although the impact was partially offset by healthy consumer spending. After maintaining a near-zero interest rate for seven years to support the U.S. economy’s recovery, the Fed raised its target range for the federal funds rate to 0.25%–0.50% at its December meeting but kept interest rates unchanged through period-end. At its April meeting, the Fed indicated that its monetary policy remained accommodative, thus supporting further labor market improvement and progress toward its 2.0% inflation objective.
In Europe, U.K. economic growth moderated in 2016’s first quarter as production, construction and agriculture slowed, while services continued to grow. In the eurozone, stocks declined mainly due to China’s moderating economy, geopolitical tensions between Russia and Turkey, weak trade data and Brexit fears toward period-end. However, the region generally benefited during the period from lower oil prices, a weaker euro that supported exports, the European Central Bank’s (ECB’s) ongoing accommodative policy and Greece’s debt deal settlement. Also boosting investor sentiments were comments by the ECB in May about its work on new proposals for dealing with non-performing loans. The eurozone’s annual inflation rate rose for most of the period but declined toward period-end.
Japan’s economy contracted in 2015’s fourth quarter as private consumption and housing investment declined. However, the economy grew in 2016’s first quarter as government and private consumption rebounded. The BOJ took several actions during the period, including lowering its inflation forecasts and reorganizing its stimulus program to increase exposure to long-term government bonds and exchange-traded funds. In January, the BOJ introduced a negative interest rate on excess reserves kept by financial institutions with the central bank in an effort to boost lending and support inflation. However, toward the period-end, it decided against further stimulus measures and kept interest rates unchanged. In April, the BOJ further reduced its gross domestic product and inflation forecasts for fiscal year 2016.
In emerging markets, economic growth generally moderated while retreating in some countries. China’s economy grew in the fourth quarter of 2015 and the first quarter of 2016 at an annual rate that was largely in line with the government’s target. Russia’s 2015 economic growth contracted because of declining oil prices and a weakening Russian ruble. Brazil’s economy shrank during the reporting period amid lower oil prices, weakness in the mining and services sectors, and the country’s ongoing political turmoil, including the temporary suspension of its president in May pending an impeachment trial. The People’s Bank of China cut its benchmark interest rate and the cash reserve requirement ratio for the country’s banks several times and lowered its currency valuation in May to the lowest level since March 2011. Elsewhere, the Reserve Bank of India slashed interest rates to the lowest in five years and took steps to increase monetary liquidity. In the recent global environment, emerging market stocks overall, as measured by the MSCI Emerging Markets Index, fell significantly during the 12-month period.
Investment Strategy
We manage the Fund using a multi-manager approach. While we are responsible for the Fund’s overall investments, we allocate assets to multiple subadvisors, each of whom independently manages a separate portion of the Fund’s portfolio in accordance with some or all of the following strategies: long short equity, relative value, event driven and global macro. We allocate the Fund’s assets among these strategies utilizing a top-down approach, generating the Fund’s strategy weightings by taking into account market conditions, risk factors, diversification, liquidity, transparency, and availability of various subadvisors and other investment options, among other things. The allocations to specific subadvisors may change from time to time based upon our assessment of their correlations to various markets and to each other, their risk profiles and return expectations. Long short equity strategies generally seek to produce returns from investments in the equity markets by taking long and short positions in stocks and common stock indexes (through the use of derivatives or ETFs). Relative value strategies encompass a wide range of investment techniques that are intended to profit from pricing inefficiencies. Event driven strategies generally invest in securities of companies undergoing significant corporate events. Global macro strategies generally focus on macroeconomic opportunities across numerous markets and investments.
The Fund may take long and/or short positions in a wide range of asset classes, including equities, fixed income, commodities and currencies, among others. Long positions benefit from an increase in the price of the underlying instrument or asset class, while short positions benefit from a decrease in that price. The Fund may use derivatives for hedging and nonhedging (investment) purposes. Such derivative investments may
4 Annual Report
franklintempleton.com
| F R A N K L I N K 2 A L T E R N A T I V E S T R A T E G I E S F U N D |
include futures contracts, swaps, options and currency forward contracts. The Fund may engage in active and frequent trading as part of its investment strategies.
What is a futures contract?
A futures contract is an agreement between the Fund and a
counterparty made through a U.S. or foreign futures exchange to
buy or sell an underlying instrument or asset at a specific price
on a future date. |
What is a swap agreement?
A swap agreement, such as an equity total return swap, is a
contract between the Fund and a counterparty to exchange on a
future date the returns, or differentials in return, that would have
been earned or realized if a notional amount were invested in
specific instruments.
A credit default swap, or CDS, is an agreement between two
parties whereby the buyer receives credit protection from the
seller. The buyer makes periodic payments over the term of the
agreement in return for a payment by the seller in the event of a
default or other credit event.
An interest rate swap is an agreement between two parties to
exchange interest rate payment obligations, generally one
based on an interest rate fixed to maturity and the other based
on an interest rate that changes in accordance with changes in a
designated benchmark (for example, LIBOR, prime, commercial
paper or other benchmarks). |
What is an option?
An option is a contract to buy or sell a specific financial product
known as the option s underlying instrument at a specific price.
The buyer of an option has the right, but not the obligation, to
buy or sell the underlying instrument at or until a specified
expiration date. Conversely, the seller (writer) of an option who
opens a transaction is obligated to buy or sell the underlying
instrument should the option holder exercise that right. |
What is a currency forward contract?
A currency forward contract is an agreement between the Fund
and a counterparty to buy or sell a foreign currency in exchange
for another currency at a specific exchange rate on a
future date. |
Manager s Discussion
During a challenging period for hedge fund managers, three of the four strategies in which the Fund s assets were allocated, long short equity, event driven and global macro, detracted from results for the period. In contrast, the relative value strategy helped returns. The Fund s overall performance was negative. In mid-May 2016, we implemented a conditional risk overlay strategy to seek to reduce downside equity exposure.
Subadvisors
5/31/16
Long Short Equity
| Chilton Investment Company, LLC |
| Impala Asset Management, LLC |
| Jennison Associates, LLC |
| Portland Hill Capital LLP |
| Wellington Management Company, LLP |
| Relative Value |
|
| Basso Capital Management, L. P. |
| Chatham Asset Management, LLC |
| Lazard Asset Management, LLC |
| Loomis Sayles & Company, L. P. |
| Event Driven |
|
| P. Schoenfeld Asset Management, L. P. |
| York Registered Holdings, L. P. |
| Global Macro |
|
| Emso Asset Management Limited |
| Graham Capital Management, L. P. |
What is a conditional risk overlay (CRO) strategy?
From time to time, the Fund s Investment Manager may imple-
ment its CRO Strategy, which seeks to neutralize certain market
sensitivities that may exist in the Fund. The CRO Strategy
involves investing in derivatives or other instruments in an effort
to provide a hedge against negative market events. When
implemented, the strategy will reduce the Fund s ability to bene-
fit from positive market movements. |
The Fund s long short equity strategy subadvisors were Chilton Investment Company, Impala Asset Management, Jennison Associates, Portland Hill Capital and Wellington Management Company. Portland Hill was added to the Fund in April. Performance among subadvisors was spread out, as Wellington and Chilton generated gains, Jennison and Impala posted declines and Portland Hill had relatively flat performance.
Strengthening performance for technology-focused subadvisor Wellington was a long position in a developer of payment technology services, which reported above-expectation quarterly results. After previously completing an acquisition of an Australian-based payments company, the payment services provider started to record significant earnings growth within the Asia-Pacific region. For Chilton, a long position in an online-based furniture retailer helped performance, as the retailer disclosed a significant year-over-year improvement in direct retail gross sales during the post-Thanksgiving holiday period. Health-care focused subadvisor Jennison s performance was challenged by positions in several pharmaceutical and biotechnology companies, including a long position in a company whose application for a new muscular dystrophy
FRANKLIN K2 ALTERNATIVE STRATEGIES FUND
treatment was rejected by the U.S. Food and Drug Administration. Industrials and basic materials positions tended to weigh on Impala. In industrials, one example was a long position in a European manufacturer of passenger cars and light commercial vehicles, which sold off along with industry peers on concerns relating to the outlook for global growth. The release of soft manufacturing data in China sparked fears relating to the extent of the slowdown in China, as the country remains a key market for European automotive companies. For Portland Hill, contributions from financial positions tended to be offset by negative results for communications holdings.
Our relative value strategy subadvisors were Basso Capital Management, Chatham Asset Management, Lazard Asset Management and Loomis Sayles & Company. The strategy’s positive performance reflected contributions from Basso, Chatham and Loomis, while Lazard had negative returns in the review period. In general, communications and health care positions tended to contribute to returns, while energy holdings weighed on results. One contributor for Basso was a copper producer, where the subadvisor holds a long convertible bond/ short stock position. This position benefited from the short stock side as the company downplayed a potential takeover, while the credit price was relatively unmoved. For Chatham, an American publishing company announced strong performance from some of its subsidiaries. Many short sellers in the issuer also were forced to cover their positions. Communications companies were a source of positive performance for Loomis. A position in direct-broadcast satellite services provider added value as the company reached an agreement in late 2015 with several major television affiliates. In contrast, a computer data storage manufacturer weighed on returns for Lazard. The stock was repriced with lower quality credit markets, and had an issue in early 2016 with its New York Stock Exchange listing.
The Fund’s event driven strategy subadvisors were P. Schoenfeld Asset Management (PSAM) and York Registered Holdings. York posted a decline in the review period, while PSAM provided a slight gain. Performance drivers for both subadvisors were diverse, with special situations equity positions suffering from increased equity market volatility over the period. Energy sector concerns weighed on several York positions. For example, a U.S. finance and leasing firm’s stock declined in January amid investor worries about the company’s exposure to oil and gas markets. However, both subadvisors benefited from successful completion of several merger situations. For PSAM, a position in a health care company focused on renal and hospital products benefited from news that the company had named a new chief executive officer. In February, the company announced fourth-quarter 2015 income that exceeded the company’s previous guidance.
Graham Capital Management and Emso Asset Management represented our global macro exposure. Although Emso provided positive results, Graham declined in the period, and the strategy overall had negative performance. Graham’s returns were challenged by long U.S. dollar positioning against European currencies. For Emso, credit securities rallied in emerging markets for much of year-to-date 2016. Argentinian sovereign government debt benefited returns as the country reached a resolution in February with holdout bondholders from the country’s 2001 bond default. Following the agreement, Argentina issued new government bonds across maturities, and investor appetite led to an over-subscribed bond auction.
Thank you for your participation in Franklin K2 Alternative Strategies Fund. We look forward to continuing to serve your investment needs.
Portfolio Management Team
The foregoing information reflects our analysis, opinions and portfolio holdings as of May 31, 2016, the end of the reporting period. The way we implement our main investment strategies and the resulting portfolio holdings may change depending on factors such as market and economic conditions. These opinions may not be relied upon as investment advice or an offer for a particular security. The information is not a complete analysis of every aspect of any market, country, industry, security or the Fund. Statements of fact are from sources considered reliable, but the investment manager makes no representation or warranty as to their completeness or accuracy. Although historical performance is no guarantee of future results, these insights may help you understand our investment management philosophy.
6 Annual Report
franklintempleton.com
FRANKLIN K2 ALTERNATIVE STRATEGIES FUND
Performance Summary as of May 31, 2016
Your dividend income will vary depending on dividends or interest paid by securities in the Fund’s portfolio, adjusted for operating expenses of each class. Capital gain distributions are net profits realized from the sale of portfolio securities. The performance table and graphs do not reflect any taxes that a shareholder would pay on Fund dividends, capital gain distributions, if any, or any realized gains on the sale of Fund shares. Total return reflects reinvestment of the Fund’s dividends and capital gain distributions, if any, and any unrealized gains or losses.
| | | | | | |
| Net Asset Value | | | | | | |
| |
| Share Class (Symbol) | | 5/31/16 | | 5/31/15 | | Change |
| A (FAAAX) | $ | 10.55 | $ | 11.16 | -$ | 0.61 |
| C (FASCX) | $ | 10.45 | $ | 11.09 | -$ | 0.64 |
| R (FSKKX) | $ | 10.61 | $ | 11.15 | -$ | 0.54 |
| R6 (FASRX) | $ | 10.59 | $ | 11.18 | -$ | 0.59 |
| Advisor (FABZX) | $ | 10.58 | $ | 11.18 | -$ | 0.60 |
| |
| |
| Distributions1 (6/1/15–5/31/16) | | | | | | |
| |
| | | Dividend | | Long-Term | | |
| Share Class | | Income | | Capital Gain | | Total |
| A | $ | 0.1396 | $ | 0.0375 | $ | 0.1771 |
| C | $ | 0.0921 | $ | 0.0375 | $ | 0.1296 |
| R | | — | $ | 0.0375 | $ | 0.0375 |
| R6 | $ | 0.1684 | $ | 0.0375 | $ | 0.2059 |
| Advisor | $ | 0.1637 | $ | 0.0375 | $ | 0.2012 |
See page 11 for Performance Summary footnotes.
franklintempleton.com
Annual Report 7
FRANKLIN K2 ALTERNATIVE STRATEGIES FUND
PERFORMANCE SUMMARY
Performance as of 5/31/162
Cumulative total return excludes sales charges. Average annual total returns and value of $10,000 investment include maximum
sales charges. Class A: 5.75% maximum initial sales charge; Class C: 1% contingent deferred sales charge in first year only;
Class R/R6/Advisor Class: no sales charges.
| | | | | | | | | | | | |
| | | | | | | | Average Annual | | | | | |
| | Cumulative | | Average Annual | | | Value of $10,000 | Total Return | | Total Annual Operating Expenses7 | |
| Share Class | Total Return3 | | Total Return4 | | | Investment5 | (6/30/16 | )6 | (with waiver) | | (without waiver) | |
| A | | | | | | | | | 2.85 | % | 3.49 | % |
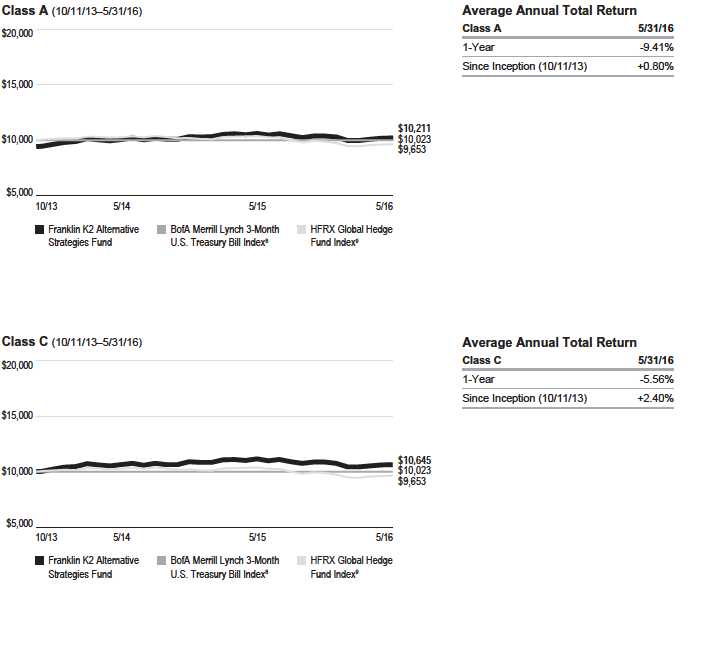
| 1-Year | -3.89 | % | -9.41 | % | $ | 9,059 | -7.65 | % | | | | |
| Since Inception (10/11/13) | +8.34 | % | +0.80 | % | $ | 10,211 | +2.69 | % | | | | |
| C | | | | | | | | | 3.60 | % | 4.24 | % |
| 1-Year | -4.62 | % | -5.56 | % | $ | 9,444 | -3.72 | % | | | | |
| Since Inception (10/11/13) | +6.45 | % | +2.40 | % | $ | 10,645 | +6.96 | % | | | | |
| R | | | | | | | | | 3.10 | % | 3.74 | % |
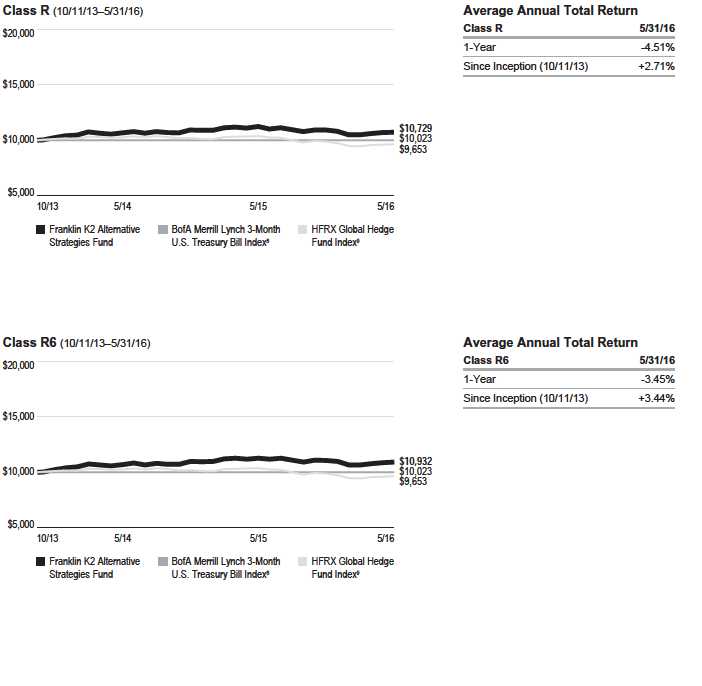
| 1-Year | -4.51 | % | -4.51 | % | $ | 9,549 | -2.31 | % | | | | |
| Since Inception (10/11/13) | +7.29 | % | +2.71 | % | $ | 10,729 | +7.80 | % | | | | |
| R6 | | | | | | | | | 2.51 | % | 3.15 | % |
| 1-Year | -3.45 | % | -3.45 | % | $ | 9,655 | -1.76 | % | | | | |
| Since Inception (10/11/13) | +9.32 | % | +3.44 | % | $ | 10,932 | +9.84 | % | | | | |
| Advisor | | | | | | | | | 2.60 | % | 3.24 | % |
| 1-Year | -3.58 | % | -3.58 | % | $ | 9,642 | -1.90 | % | | | | |
| Since Inception (10/11/13) | +9.15 | % | +3.38 | % | $ | 10,915 | +9.66 | % | | | | |
Performance data represent past performance, which does not guarantee future results. Investment return and principal value will
fluctuate, and you may have a gain or loss when you sell your shares. Current performance may differ from figures shown. For
most recent month-end performance, go to franklintempleton.com or call (800) 342-5236.
See page 11 for Performance Summary footnotes.
8 Annual Report
franklintempleton.com
FRANKLIN K2 ALTERNATIVE STRATEGIES FUND
PERFORMANCE SUMMARY
Total Return Index Comparison for a Hypothetical $10,000 Investment2
Total return represents the change in value of an investment over the periods shown. It includes any applicable maximum sales charge, Fund expenses, account fees and reinvested distributions. The unmanaged indexes include reinvestment of any income or distributions. These differ from the Fund in composition and do not pay management fees or expenses. One cannot invest directly in an index.
See page 11 for Performance Summary footnotes.
franklintempleton.com Annual Report 9
FRANKLIN K2 ALTERNATIVE STRATEGIES FUND
PERFORMANCE SUMMARY
Total Return Index Comparison for a Hypothetical $10,000 Investment2 (continued)
See page 11 for Performance Summary footnotes.
10 Annual Report franklintempleton.com
FRANKLIN K2 ALTERNATIVE STRATEGIES FUND
PERFORMANCE SUMMARY
Total Return Index Comparison for a Hypothetical $10,000 Investment2 (continued)
All investments involve risks, including possible loss of principal. The market values of securities owned by the Fund will go up or down, sometimes rapidly or
unpredictably. The Fund’s performance depends on the manager’s skill in selecting, overseeing, and allocating Fund assets to the subadvisors. The Fund is
actively managed and could experience losses if the investment manager’s and subadvisors’ judgment about particular investments made for the Fund’s
portfolio prove to be incorrect. Some subadvisors may have little or no experience managing the assets of a registered investment company. Foreign invest-
ments are subject to greater investment risk such as political, economic, credit and information risks as well as risk of currency fluctuations. Investments in
derivatives involve costs and create economic leverage, which may result in significant volatility and cause the Fund to participate in losses (as well as gains)
that significantly exceed the Fund’s initial investment. Lower rated or high yield debt securities involve greater credit risk, including the possibility of default or
bankruptcy. Currency management strategies could result in losses to the Fund if currencies do not perform as the investment manager or subadvisor expects.
The Fund may make short sales of securities, which involves the risk that losses may exceed the original amount invested. Merger arbitrage investments risk
loss if a proposed reorganization in which the Fund invests is renegotiated or terminated. Liquidity risk exists when securities have become more difficult to sell,
or are unable to be sold, at the price at which they have been valued. The Fund’s prospectus also includes a description of the main investment risks.
| |
| Class C: | These shares have higher annual fees and expenses than Class A shares. |
| Class R: | Shares are available to certain eligible investors as described in the prospectus. These shares have higher annual fees and expenses than Class A shares. |
| Class R6: | Shares are available to certain eligible investors as described in the prospectus. |
| Advisor Class: | Shares are available to certain eligible investors as described in the prospectus. |
1. The distribution amount is the sum of the dividend payments to shareholders for the period shown and includes only estimated tax-basis net investment income and
capital gain.
2. The Fund has an expense reduction contractually guaranteed through at least 9/30/16 and a fee waiver related to the management fee paid by a subsidiary. The transfer
agent has contractually agreed to waive or limit its transfer agency fees for Class R6 shares of the Fund so that transfer agency fees for that class do not exceed 0.01% until
9/30/16. Fund investment results reflect the expense reduction, fee waiver and fee cap, to the extent applicable; without these reductions, the results would have been lower.
3. Cumulative total return represents the change in value of an investment over the periods indicated.
4. Average annual total return represents the average annual change in value of an investment over the periods indicated. Return for less than one year, if any, has not
been annualized.
5. These figures represent the value of a hypothetical $10,000 investment in the Fund over the periods indicated.
6. In accordance with SEC rules, we provide standardized average annual total return information through the latest calendar quarter.
7. Figures are as stated in the Fund’s current prospectus and may differ from the expense ratios disclosed in the Consolidated Financial Highlights in this report. In periods of
market volatility, assets may decline significantly, causing total annual Fund operating expenses to become higher than the figures shown.
8. Source: Morningstar. The BofA Merrill Lynch 3-Month U.S. T-Bill Index is an index of short-term U.S. government securities with a remaining term to final maturity of less
than three months.
9. Source: Factset. Hedge Fund Research, Inc. – www.hedgefundresearch.com. The HFRX Global Hedge Fund Index is being used under license from Hedge Fund
Research, Inc., which does not endorse or approve of any of the contents of this report. The HFRX Global Hedge Fund Index is designed to be representative of the overall
composition of the hedge fund universe. It is composed of all eligible hedge fund strategies, including but not limited to convertible arbitrage, distressed securities, equity
hedge, equity market neutral, event driven, macro, merger arbitrage and relative value arbitrage. The strategies are asset weighted based on the distribution of assets in the
hedge fund industry.
See www.franklintempletondatasources.com for additional data provider information.
franklintempleton.com
Annual Report
11
FRANKLIN K2 ALTERNATIVE STRATEGIES FUND
Your Fund’s Expenses
As a Fund shareholder, you can incur two types of costs:
- Transaction costs, including sales charges (loads) on Fund purchases; and
- Ongoing Fund costs, including management fees, distribution and service (12b-1) fees, and other Fund expenses. All mutual funds have ongoing costs, sometimes referred to as operating expenses.
The following table shows ongoing costs of investing in the Fund and can help you understand these costs and compare them with those of other mutual funds. The table assumes a $1,000 investment held for the six months indicated.
Actual Fund Expenses
The first line (Actual) for each share class listed in the table provides actual account values and expenses. The “Ending Account Value” is derived from the Fund’s actual return, which includes the effect of Fund expenses.
You can estimate the expenses you paid during the period by following these steps. Of course, your account value and expenses will differ from those in this illustration:
1. Divide your account value by $1,000.
If an account had an $8,600 value, then $8,600 ÷ $1,000 = 8.6.
2. Multiply the result by the number under the heading “Expenses Paid During Period.”
If Expenses Paid During Period were $7.50, then 8.6 × $7.50 = $64.50.
In this illustration, the estimated expenses paid this period are $64.50.
Hypothetical Example for Comparison with Other Funds
Information in the second line (Hypothetical) for each class in the table can help you compare ongoing costs of investing in the Fund with those of other mutual funds. This information may not be used to estimate the actual ending account balance or expenses you paid during the period. The hypothetical “Ending Account Value” is based on the actual expense ratio for each class and an assumed 5% annual rate of return before expenses, which does not represent the Fund’s actual return. The figure under the heading “Expenses Paid During Period” shows the hypothetical expenses your account would have incurred under this scenario. You can compare this figure with the 5% hypothetical examples that appear in shareholder reports of other funds.
Please note that expenses shown in the table are meant to highlight ongoing costs and do not reflect any transaction costs, such as sales charges. Therefore, the second line for each class is useful in comparing ongoing costs only, and will not help you compare total costs of owning different funds. In addition, if transaction costs were included, your total costs would have been higher. Please refer to the Fund prospectus for additional information on operating expenses.
12 Annual Report
franklintempleton.com
FRANKLIN K2 ALTERNATIVE STRATEGIES FUND
YOUR FUND’S EXPENSES
| | | | | | |
| | | Beginning Account | | Ending Account | | Expenses Paid During |
| Share Class | | Value 12/1/15 | | Value 5/31/16 | | Period* 12/1/15–5/31/16 |
| A | | | | | | |
| Actual | $ | 1,000 | $ | 983.10 | $ | 14.28 |
| Hypothetical (5% return before expenses) | $ | 1,000 | $ | 1,010.60 | $ | 14.48 |
| C | | | | | | |
| Actual | $ | 1,000 | $ | 979.50 | $ | 17.91 |
| Hypothetical (5% return before expenses) | $ | 1,000 | $ | 1,006.90 | $ | 18.16 |
| R | | | | | | |
| Actual | $ | 1,000 | $ | 982.20 | $ | 15.46 |
| Hypothetical (5% return before expenses) | $ | 1,000 | $ | 1,009.40 | $ | 15.67 |
| R6 | | | | | | |
| Actual | $ | 1,000 | $ | 985.80 | $ | 12.56 |
| Hypothetical (5% return before expenses) | $ | 1,000 | $ | 1,012.35 | $ | 12.73 |
| Advisor | | | | | | |
| Actual | $ | 1,000 | $ | 984.40 | $ | 13.00 |
| Hypothetical (5% return before expenses) | $ | 1,000 | $ | 1,011.90 | $ | 13.18 |
*Expenses are calculated using the most recent six-month expense ratio, net of expense waivers, annualized for each class (A: 2.88%;
C: 3.62%; R: 3.12%; R6: 2.53% and Advisor: 2.62%), multiplied by the average account value over the period, multiplied by 183/366 to reflect
the one-half year period.
franklintempleton.com
Annual Report
13
FRANKLIN ALTERNATIVE STRATEGIES FUNDS
| | | | | | | | | |
| Consolidated Financial Highlights | | | | | | | | | |
| Franklin K2 Alternative Strategies Fund | | | | | | | | | |
| | | Year Ended May 31, | |
| | | 2016 | | | 2015 | | | 2014 | a |
| Class A | | | | | | | | | |
| Per share operating performance | | | | | | | | | |
| (for a share outstanding throughout the year) | | | | | | | | | |
| Net asset value, beginning of year | $ | 11.16 | | $ | 10.64 | | $ | 10.00 | |
| Income from investment operationsb: | | | | | | | | | |
| Net investment income (loss)c | | (0.05 | ) | | (0.11 | ) | | (0.02 | ) |
| Net realized and unrealized gains (losses) | | (0.38 | ) | | 0.70 | | | 0.70 | |
| Total from investment operations | | (0.43 | ) | | 0.59 | | | 0.68 | |
| Less distributions from: | | | | | | | | | |
| Net investment income | | (0.14 | ) | | (0.07 | ) | | (0.04 | ) |
| Net realized gains | | (0.04 | ) | | — | | | — | |
| Total distributions | | (0.18 | ) | | (0.07 | ) | | (0.04 | ) |
| Net asset value, end of year | $ | 10.55 | | $ | 11.16 | | $ | 10.64 | |
| |
| Total returnd | | (3.89 | )% | | 5.53 | % | | 6.82 | % |
| |
| Ratios to average net assetse | | | | | | | | | |
| Expenses before waiver, payments by affiliates and expense reductionf | | 3.22 | % | | 3.40 | % | | 3.33 | % |
| Expenses net of waiver, payments by affiliates and expense reductionf | | 2.88 | %g | | 2.99 | %g | | 2.83 | % |
| Expenses incurred in connection with securities sold short | | 0.67 | % | | 0.65 | % | | 0.56 | % |
| Net investment income (loss) | | (0.44 | )% | | (0.95 | )% | | (0.35 | )% |
| |
| Supplemental data | | | | | | | | | |
| Net assets, end of year (000’s) | $ | 177,412 | | $ | 148,991 | | $ | 96,889 | |
| Portfolio turnover rate | | 229.90 | % | | 295.81 | % | | 181.06 | % |
a For the period October 11, 2013 (commencement of operations) to May 31, 2014.
b The amount shown for a share outstanding throughout the period may not correlate with the Consolidated Statement of Operations for the period due to the timing of sales
and repurchases of Fund’s shares in relation to income earned and/or fluctuating fair value of the investments of the Fund.
c Based on average daily shares outstanding.
d Total return does not reflect sales commissions or contingent deferred sales charges, if applicable, and is not annualized for periods less than one year.
e Ratios are annualized for periods less than one year.
f Includes dividend and/or interest expense on securities sold short and security borrowing fees, if any. See below for the ratios of such expenses to average net assets for the
periods presented. See Note 1(f).
g Benefit of expense reduction rounds to less than 0.01%.
14 Annual Report | The accompanying notes are an integral part of these financial statements.
franklintempleton.com
FRANKLIN ALTERNATIVE STRATEGIES FUNDS
CONSOLIDATED FINANCIAL HIGHLIGHTS
| | | | | | | | | |
| Franklin K2 Alternative Strategies Fund (continued) | | | | | | | | | |
| | | Year Ended May 31, | |
| | | 2016 | | | 2015 | | | 2014 | a |
| Class C | | | | | | | | | |
| Per share operating performance | | | | | | | | | |
| (for a share outstanding throughout the year) | | | | | | | | | |
| Net asset value, beginning of year | $ | 11.09 | | $ | 10.60 | | $ | 10.00 | |
| Income from investment operationsb: | | | | | | | | | |
| Net investment income (loss)c | | (0.12 | ) | | (0.17 | ) | | (0.08 | ) |
| Net realized and unrealized gains (losses) | | (0.39 | ) | | 0.69 | | | 0.72 | |
| Total from investment operations | | (0.51 | ) | | 0.52 | | | 0.64 | |
| Less distributions from: | | | | | | | | | |
| Net investment income | | (0.09 | ) | | (0.03 | ) | | (0.04 | ) |
| Net realized gains | | (0.04 | ) | | — | | | — | |
| Total distributions | | (0.13 | ) | | (0.03 | ) | | (0.04 | ) |
| Net asset value, end of year | $ | 10.45 | | $ | 11.09 | | $ | 10.60 | |
| |
| Total returnd | | (4.62 | )% | | 4.87 | % | | 6.42 | % |
| |
| Ratios to average net assetse | | | | | | | | | |
| Expenses before waiver, payments by affiliates and expense reductionf | | 3.96 | % | | 4.04 | % | | 4.03 | % |
| Expenses net of waiver, payments by affiliates and expense reductionf | | 3.62 | %g | | 3.63 | %g | | 3.53 | % |
| Expenses incurred in connection with securities sold short | | 0.67 | % | | 0.65 | % | | 0.56 | % |
| Net investment income (loss) | | (1.18 | )% | | (1.59 | )% | | (1.05 | )% |
| |
| Supplemental data | | | | | | | | | |
| Net assets, end of year (000’s) | $ | 71,154 | | $ | 37,937 | | $ | 16,618 | |
| Portfolio turnover rate | | 229.90 | % | | 295.81 | % | | 181.06 | % |
a For the period October 11, 2013 (commencement of operations) to May 31, 2014.
b The amount shown for a share outstanding throughout the period may not correlate with the Consolidated Statement of Operations for the period due to the timing of sales
and repurchases of Fund’s shares in relation to income earned and/or fluctuating fair value of the investments of the Fund.
c Based on average daily shares outstanding.
d Total return does not reflect sales commissions or contingent deferred sales charges, if applicable, and is not annualized for periods less than one year.
e Ratios are annualized for periods less than one year.
f Includes dividend and/or interest expense on securities sold short and security borrowing fees, if any. See below for the ratios of such expenses to average net assets for the
periods presented. See Note 1(f).
g Benefit of expense reduction rounds to less than 0.01%.
franklintempleton.com
The accompanying notes are an integral part of these financial statements. | Annual Report 15
| | | | | | | | | |
| Franklin K2 Alternative Strategies Fund (continued) | | | | | | | | | |
| �� | | Year Ended May 31, | |
| | | 2016 | | | 2015 | | | 2014 | a |
| Class R | | | | | | | | | |
| Per share operating performance | | | | | | | | | |
| (for a share outstanding throughout the year) | | | | | | | | | |
| Net asset value, beginning of year | $ | 11.15 | | $ | 10.62 | | $ | 10.00 | |
| Income from investment operationsb: | | | | | | | | | |
| Net investment income (loss)c | | (0.10 | ) | | (0.16 | ) | | (0.05 | ) |
| Net realized and unrealized gains (losses) | | (0.40 | ) | | 0.73 | | | 0.71 | |
| Total from investment operations | | (0.50 | ) | | 0.57 | | | 0.66 | |
| Less distributions from: | | | | | | | | | |
| Net investment income | | — | | | (0.04 | ) | | (0.04 | ) |
| Net realized gains | | (0.04 | ) | | — | | | — | |
| Total distributions | | (0.04 | ) | | (0.04 | ) | | (0.04 | ) |
| Net asset value, end of year | $ | 10.61 | | $ | 11.15 | | $ | 10.62 | |
| |
| Total returnd | | (4.51 | )% | | 5.39 | % | | 6.62 | % |
| |
| Ratios to average net assetse | | | | | | | | | |
| Expenses before waiver, payments by affiliates and expense reductionf | | 3.46 | % | | 3.57 | % | | 3.63 | % |
| Expenses net of waiver, payments by affiliates and expense reductionf | | 3.12 | %g | | 3.16 | %g | | 3.13 | % |
| Expenses incurred in connection with securities sold short | | 0.67 | % | | 0.65 | % | | 0.56 | % |
| Net investment income (loss) | | (0.68 | )% | | (1.12 | )% | | (0.65 | )% |
| |
| Supplemental data | | | | | | | | | |
| Net assets, end of year (000’s) | $ | 341 | | $ | 9,173 | | $ | 11,660 | |
| Portfolio turnover rate | | 229.90 | % | | 295.81 | % | | 181.06 | % |
FRANKLIN ALTERNATIVE STRATEGIES FUNDS
CONSOLIDATED FINANCIAL HIGHLIGHTS
a For the period October 11, 2013 (commencement of operations) to May 31, 2014.
b The amount shown for a share outstanding throughout the period may not correlate with the Consolidated Statement of Operations for the period due to the timing of sales
and repurchases of Fund’s shares in relation to income earned and/or fluctuating fair value of the investments of the Fund.
c Based on average daily shares outstanding.
d Total return is not annualized for periods less than one year.
e Ratios are annualized for periods less than one year.
f Includes dividend and/or interest expense on securities sold short and security borrowing fees, if any. See below for the ratios of such expenses to average net assets for the
periods presented. See Note 1(f).
g Benefit of expense reduction rounds to less than 0.01%.
16 Annual Report | The accompanying notes are an integral part of these financial statements.
franklintempleton.com
FRANKLIN ALTERNATIVE STRATEGIES FUNDS
CONSOLIDATED FINANCIAL HIGHLIGHTS
| | | | | | | | | |
| Franklin K2 Alternative Strategies Fund (continued) | | | | | | | | | |
| | | Year Ended May 31, | |
| | | 2016 | | | 2015 | | | 2014 | a |
| Class R6 | | | | | | | | | |
| Per share operating performance | | | | | | | | | |
| (for a share outstanding throughout the year) | | | | | | | | | |
| Net asset value, beginning of year | $ | 11.18 | | $ | 10.66 | | $ | 10.00 | |
| Income from investment operationsb: | | | | | | | | | |
| Net investment income (loss)c | | (0.01 | ) | | (0.08 | ) | | (0.01 | ) |
| Net realized and unrealized gains (losses) | | (0.37 | ) | | 0.70 | | | 0.71 | |
| Total from investment operations | | (0.38 | ) | | 0.62 | | | 0.70 | |
| Less distributions from: | | | | | | | | | |
| Net investment income | | (0.17 | ) | | (0.10 | ) | | (0.04 | ) |
| Net realized gains | | (0.04 | ) | | — | | | — | |
| Total distributions | | (0.21 | ) | | (0.10 | ) | | (0.04 | ) |
| Net asset value, end of year | $ | 10.59 | | $ | 11.18 | | $ | 10.66 | |
| |
| Total returnd | | (3.45 | )% | | 5.80 | % | | 7.02 | % |
| |
| Ratios to average net assetse | | | | | | | | | |
| Expenses before waiver, payments by affiliates and expense reductionf | | 2.87 | % | | 2.98 | % | | 3.19 | % |
| Expenses net of waiver, payments by affiliates and expense reductionf | | 2.53 | %g | | 2.60 | %g | | 2.69 | % |
| Expenses incurred in connection with securities sold short | | 0.67 | % | | 0.65 | % | | 0.56 | % |
| Net investment income (loss) | | (0.09 | )% | | (0.56 | )% | | (0.21 | )% |
| |
| Supplemental data | | | | | | | | | |
| Net assets, end of year (000’s) | $ | 265,517 | | $ | 239,754 | | $ | 215,526 | |
| Portfolio turnover rate | | 229.90 | % | | 295.81 | % | | 181.06 | % |
a For the period October 11, 2013 (commencement of operations) to May 31, 2014.
b The amount shown for a share outstanding throughout the period may not correlate with the Consolidated Statement of Operations for the period due to the timing of sales
and repurchases of Fund’s shares in relation to income earned and/or fluctuating fair value of the investments of the Fund.
c Based on average daily shares outstanding.
d Total return is not annualized for periods less than one year.
e Ratios are annualized for periods less than one year.
f Includes dividend and/or interest expense on securities sold short and security borrowing fees, if any. See below for the ratios of such expenses to average net assets for the
periods presented. See Note 1(f).
g Benefit of expense reduction rounds to less than 0.01%.
franklintempleton.com
The accompanying notes are an integral part of these financial statements. | Annual Report 17
FRANKLIN ALTERNATIVE STRATEGIES FUNDS
CONSOLIDATED FINANCIAL HIGHLIGHTS
| | | | | | | | | |
| Franklin K2 Alternative Strategies Fund (continued) | | | | | | | | | |
| | | Year Ended May 31, | |
| | | 2016 | | | 2015 | | | 2014 | a |
| Advisor Class | | | | | | | | | |
| Per share operating performance | | | | | | | | | |
| (for a share outstanding throughout the year) | | | | | | | | | |
| Net asset value, beginning of year | $ | 11.18 | | $ | 10.65 | | $ | 10.00 | |
| Income from investment operationsb: | | | | | | | | | |
| Net investment income (loss)c | | (0.02 | ) | | (0.02 | ) | | (0.02 | ) |
| Net realized and unrealized gains (losses) | | (0.38 | ) | | 0.64 | | | 0.71 | |
| Total from investment operations | | (0.40 | ) | | 0.62 | | | 0.69 | |
| Less distributions from: | | | | | | | | | |
| Net investment income | | (0.16 | ) | | (0.09 | ) | | (0.04 | ) |
| Net realized gains | | (0.04 | ) | | — | | | — | |
| Total distributions | | (0.20 | ) | | (0.09 | ) | | (0.04 | ) |
| Net asset value, end of year | $ | 10.58 | | $ | 11.18 | | $ | 10.65 | |
| |
| Total returnd | | (3.58 | )% | | 5.88 | % | | 6.92 | % |
| |
| Ratios to average net assetse | | | | | | | | | |
| Expenses before waiver, payments by affiliates and expense reductionf | | 2.96 | % | | 3.07 | % | | 3.21 | % |
| Expenses net of waiver, payments by affiliates and expense reductionf | | 2.62 | %g | | 2.66 | %g | | 2.71 | % |
| Expenses incurred in connection with securities sold short | | 0.67 | % | | 0.65 | % | | 0.56 | % |
| Net investment income (loss) | | (0.18 | )% | | (0.62 | )% | | (0.23 | )% |
| |
| Supplemental data | | | | | | | | | |
| Net assets, end of year (000’s) | $ | 722,216 | | $ | 329,139 | | $ | 54,593 | |
| Portfolio turnover rate | | 229.90 | % | | 295.81 | % | | 181.06 | % |
a For the period October 11, 2013 (commencement of operations) to May 31, 2014.
b The amount shown for a share outstanding throughout the period may not correlate with the Consolidated Statement of Operations for the period due to the timing of sales
and repurchases of Fund’s shares in relation to income earned and/or fluctuating fair value of the investments of the Fund.
c Based on average daily shares outstanding.
d Total return is not annualized for periods less than one year.
e Ratios are annualized for periods less than one year.
f Includes dividend and/or interest expense on securities sold short and security borrowing fees, if any. See below for the ratios of such expenses to average net assets for the
periods presented. See Note 1(f).
g Benefit of expense reduction rounds to less than 0.01%.
18 Annual Report | The accompanying notes are an integral part of these financial statements.
franklintempleton.com
FRANKLIN ALTERNATIVE STRATEGIES FUNDS
| | | | |
| Consolidated Statement of Investments, May 31, 2016 | | | | |
| |
| Franklin K2 Alternative Strategies Fund | | | | |
| | Country | Shares/Warrants | | Value |
| Common Stocks and Other Equity Interests 33.4% | | | | |
| Aerospace & Defense 0.0%† | | | | |
| United Technologies Corp | United States | 807 | $ | 81,168 |
| Air Freight & Logistics 0.4% | | | | |
| a FedEx Corp | United States | 27,085 | | 4,468,212 |
| Airlines 0.3% | | | | |
| a Delta Air Lines Inc | United States | 62,015 | | 2,695,172 |
| b Spirit Airlines Inc | United States | 6,700 | | 291,249 |
| b,c Wizz Air Holdings PLC, 144A | Switzerland | 4,266 | | 119,557 |
| | | | | 3,105,978 |
| Auto Components 0.3% | | | | |
| b,c Europcar Groupe SA, 144A | France | 36,544 | | 376,394 |
| Johnson Controls Inc | United States | 47,440 | | 2,094,476 |
| Tung Thih Electronic Co. Ltd | Taiwan | 20,000 | | 279,647 |
| a Visteon Corp | United States | 17,923 | | 1,343,867 |
| | | | | 4,094,384 |
| Automobiles 0.1% | | | | |
| General Motors Co | United States | 1,544 | | 48,296 |
| b Peugeot SA | France | 66,092 | | 1,040,179 |
| | | | | 1,088,475 |
| Banks 0.1% | | | | |
| BB&T Corp | United States | 1,665 | | 60,556 |
| ING Groep NV, IDR | Netherlands | 10,296 | | 128,248 |
| d JPMorgan Chase & Co | United States | 2,656 | | 173,357 |
| PacWest Bancorp | United States | 744 | | 31,010 |
| The PNC Financial Services Group Inc | United States | 794 | | 71,254 |
| US Bancorp | United States | 1,400 | | 59,948 |
| d Wells Fargo & Co | United States | 3,534 | | 179,244 |
| | | | | 703,617 |
| Beverages 1.2% | | | | |
| a Anheuser-Busch InBev SA/NV, ADR | Belgium | 12,825 | | 1,618,771 |
| a Brown-Forman Corp., B | United States | 31,494 | | 3,088,616 |
| d The Coca-Cola Co | United States | 72,766 | | 3,245,364 |
| Constellation Brands Inc., A | United States | 319 | | 48,855 |
| Heineken NV | Netherlands | 47,903 | | 4,448,867 |
| a,b Monster Beverage Corp | United States | 15,038 | | 2,255,700 |
| PepsiCo Inc | United States | 1,266 | | 128,081 |
| | | | | 14,834,254 |
| Biotechnology 3.2% | | | | |
| AbbVie Inc | United States | 1,286 | | 80,928 |
| b Acorda Therapeutics Inc | United States | 5,251 | | 149,391 |
| b Adaptimmune Therapeutics PLC, ADR | United States | 8,201 | | 84,388 |
| b Aduro Biotech Inc | United States | 6,038 | | 74,207 |
| b Aeglea BioTherapeutics Inc | United States | 13,407 | | 100,553 |
| a,b Agios Pharmaceuticals Inc | United States | 7,518 | | 420,632 |
| b Alexion Pharmaceuticals Inc | United States | 12,524 | | 1,889,872 |
| a,b Alnylam Pharmaceuticals Inc | United States | 16,783 | | 1,203,677 |
| b Amicus Therapeutics Inc | United States | 38,111 | | 269,826 |
| b Applied Genetic Technologies Corp | United States | 14,201 | | 244,257 |
| b Avexis Inc | United States | 3,226 | | 138,653 |
franklintempleton.com
Annual Report
19
FRANKLIN ALTERNATIVE STRATEGIES FUNDS
CONSOLIDATED STATEMENT OF INVESTMENTS
| | | | |
| Franklin K2 Alternative Strategies Fund (continued) | | | | |
| |
| | Country | Shares/Warrants | | Value |
| Common Stocks and Other Equity Interests (continued) | | | | |
| Biotechnology (continued) | | | | |
| a,d Baxalta Inc | United States | 226,783 | $ | 10,257,395 |
| b BioCryst Pharmaceuticals Inc | United States | 18,918 | | 64,132 |
| b Biogen Idec Inc | United States | 9,979 | | 2,891,216 |
| a,b BioMarin Pharmaceutical Inc | United States | 38,830 | | 3,481,109 |
| b Bluebird Bio Inc | United States | 15,568 | | 704,452 |
| b Celgene Corp | United States | 30,591 | | 3,227,962 |
| b Chimerix Inc | United States | 21,745 | | 106,550 |
| b Corvus Pharmaceuticals Inc | United States | 4,423 | | 62,143 |
| a,b DBV Technologies SA, ADR | France | 7,806 | | 261,735 |
| b Dimension Therapeutics Inc | United States | 7,067 | | 56,536 |
| b EPIRUS Biopharmaceuticals Inc | United States | 28,159 | | 17,222 |
| b Epizyme Inc | United States | 28,240 | | 312,334 |
| b Exelixis Inc | United States | 110,468 | | 716,937 |
| b Fibrocell Science Inc | United States | 39,509 | | 91,266 |
| b Global Blood Therapeutics Inc | United States | 5,039 | | 120,533 |
| b Immune Design Corp | United States | 3,386 | | 42,494 |
| b Incyte Corp. Ltd | United States | 19,736 | | 1,665,916 |
| b Inotek Pharmaceuticals Corp | United States | 24,483 | | 225,244 |
| b Insmed Inc | United States | 18,257 | | 215,433 |
| b Intellia Therapeutics Inc | United States | 901 | | 26,643 |
| b MacroGenics Inc | United States | 4,014 | | 102,598 |
| b Medgenics Inc | Israel | 27,311 | | 155,673 |
| a,b Medivation Inc | United States | 61,163 | | 3,697,915 |
| b Mirati Therapeutics Inc | United States | 1,129 | | 20,469 |
| b Natera Inc | United States | 10,748 | | 148,215 |
| b Neurocrine Biosciences Inc | United States | 6,345 | | 315,029 |
| b Nivalis Therapeutics Inc | United States | 3,452 | | 17,225 |
| b Otonomy Inc | United States | 19,497 | | 286,411 |
| a,b OvaScience Inc | United States | 32,834 | | 242,643 |
| b ProQR Therapeutics NV | Netherlands | 36,423 | | 177,016 |
| b Proteostasis Therapeutics Inc | United States | 15,055 | | 248,709 |
| b Prothena Corp. PLC | Ireland | 8,418 | | 408,610 |
| b PTC Therapeutics Inc | United States | 4,139 | | 33,774 |
| b Radius Health Inc | United States | 4,144 | | 150,261 |
| b Regeneron Pharmaceuticals Inc | United States | 3,337 | | 1,331,229 |
| b REGENXBIO Inc | United States | 2,633 | | 32,544 |
| b Retrophin Inc | United States | 12,056 | | 214,356 |
| b Sage Therapeutics Inc | United States | 6,594 | | 217,009 |
| b Sarepta Therapeutics Inc | United States | 9,059 | | 189,605 |
| b Seres Therapeutics Inc | United States | 5,605 | | 170,560 |
| b Syndax Pharmaceuticals Inc | United States | 3,233 | | 44,421 |
| b Tesaro Inc | United States | 13,774 | | 637,736 |
| b Trevena Inc | United States | 10,390 | | 76,055 |
| b Ultragenyx Pharmaceutical Inc | United States | 10,799 | | 789,407 |
| b Vertex Pharmaceuticals Inc | United States | 5,391 | | 502,172 |
| | | | | 39,413,278 |
| Capital Markets 0.3% | | | | |
| SEI Investments Co | United States | 80,544 | | 4,143,183 |
| Chemicals 1.8% | | | | |
| a Air Products & Chemicals Inc | United States | 20,176 | | 2,877,905 |
| Akzo Nobel NV | Netherlands | 13,057 | | 886,195 |
20 Annual Report
franklintempleton.com
FRANKLIN ALTERNATIVE STRATEGIES FUNDS
CONSOLIDATED STATEMENT OF INVESTMENTS
| | | | |
| Franklin K2 Alternative Strategies Fund (continued) | | | | |
| |
| | Country | Shares/Warrants | | Value |
| Common Stocks and Other Equity Interests (continued) | | | | |
| Chemicals (continued) | | | | |
| Axalta Coating Systems Ltd | United States | 36,714 | $ | 1,033,499 |
| a Axiall Corp | United States | 89,588 | | 2,086,504 |
| The Dow Chemical Co | United States | 948 | | 48,689 |
| Eastman Chemical Co | United States | 16,796 | | 1,232,155 |
| b Ingevity Corp | United States | 6,681 | | 194,684 |
| d Monsanto Co | United States | 22,736 | | 2,557,118 |
| PPG Industries Inc | United States | 473 | | 50,933 |
| a The Sherwin-Williams Co | United States | 21,716 | | 6,321,310 |
| Syngenta AG | Switzerland | 5,924 | | 2,327,286 |
| a WR Grace & Co | United States | 30,081 | | 2,335,489 |
| | | | | 21,951,767 |
| Commercial Services & Supplies 0.2% | | | | |
| b Atento SA | Spain | 79,355 | | 708,640 |
| Edenred | France | 14,315 | | 265,193 |
| b Spotless Group Holdings Ltd | Australia | 76,960 | | 64,523 |
| Tyco International PLC | United States | 30,081 | | 1,282,052 |
| West Corp | United States | 21,310 | | 449,641 |
| | | | | 2,770,049 |
| Communications Equipment 0.1% | | | | |
| a,b Arista Networks Inc | United States | 9,811 | | 719,048 |
| b Lumentum Holdings Inc | United States | 27,050 | | 685,447 |
| b Oclaro Inc | United States | 89,641 | | 449,102 |
| | | | | 1,853,597 |
| Construction Materials 0.5% | | | | |
| Buzzi Unicem SpA | Italy | 22,417 | | 445,467 |
| HeidelbergCement AG | Germany | 7,995 | | 683,982 |
| b Italcementi SpA | Italy | 164,252 | | 1,915,262 |
| b LafargeHolcim Ltd., B | Switzerland | 30,283 | | 1,361,821 |
| a Martin Marietta Materials Inc | United States | 12,101 | | 2,287,573 |
| | | | | 6,694,105 |
| Consumer Finance 0.0%† | | | | |
| b Encore Capital Group Inc | United States | 539 | | 14,494 |
| a,b Synchrony Financial | United States | 11,000 | | 343,200 |
| | | | | 357,694 |
| Containers & Packaging 0.0%† | | | | |
| International Paper Co | United States | 533 | | 22,471 |
| Diversified Financial Services 0.3% | | | | |
| a Moody’s Corp | United States | 39,834 | | 3,929,226 |
| Diversified Telecommunication Services 0.1% | | | | |
| CenturyLink Inc | United States | 909 | | 24,652 |
| Swisscom AG | Switzerland | 1,271 | | 605,579 |
| Verizon Communications Inc | United States | 5,034 | | 256,231 |
| | | | | 886,462 |
| Electric Utilities 0.3% | | | | |
| Exelon Corp | United States | 939 | | 32,180 |
| a ITC Holdings Corp | United States | 73,009 | | 3,250,361 |
franklintempleton.com
Annual Report
21
FRANKLIN ALTERNATIVE STRATEGIES FUNDS
CONSOLIDATED STATEMENT OF INVESTMENTS
| | | | |
| Franklin K2 Alternative Strategies Fund (continued) | | | | |
| |
| | Country | Shares/Warrants | | Value |
| Common Stocks and Other Equity Interests (continued) | | | | |
| Electric Utilities (continued) | | | | |
| d NextEra Energy Inc | United States | 1,423 | $ | 170,931 |
| PG&E Corp | United States | 1,944 | | 116,795 |
| | | | | 3,570,267 |
| Electrical Equipment 0.1% | | | | |
| Eaton Corp. PLC | United States | 1,110 | | 68,409 |
| Emerson Electric Co | United States | 13,792 | | 717,460 |
| Rockwell Automation Inc | United States | 2,697 | | 312,987 |
| b SolarCity Corp | United States | 5,992 | | 134,161 |
| | | | | 1,233,017 |
| Electronic Equipment, Instruments & Components 0.4% | | | | |
| b Coherent Inc | United States | 2,100 | | 198,702 |
| a Ingram Micro Inc., A | United States | 65,022 | | 2,251,712 |
| a,b VeriFone Systems Inc | United States | 81,650 | | 2,155,560 |
| | | | | 4,605,974 |
| Energy Equipment & Services 0.0%† | | | | |
| Halliburton Co | United States | 991 | | 41,800 |
| Food & Staples Retailing 0.7% | | | | |
| Casey’s General Stores Inc | United States | 17,956 | | 2,158,491 |
| a Costco Wholesale Corp | United States | 36,449 | | 5,422,517 |
| CVS Health Corp | United States | 15,193 | | 1,465,365 |
| The Kroger Co | United States | 1,675 | | 59,898 |
| | | | | 9,106,271 |
| Food Products 0.7% | | | | |
| Greencore Group PLC | Ireland | 52,664 | | 262,924 |
| a The Kraft Heinz Co | United States | 27,838 | | 2,315,843 |
| Lindt & Spruengli AG | Switzerland | 73 | | 5,397,887 |
| Mead Johnson Nutrition Co | United States | 618 | | 50,849 |
| Mondelez International Inc | United States | 672 | | 29,897 |
| b The WhiteWave Foods Co | United States | 24,692 | | 1,102,498 |
| | | | | 9,159,898 |
| Health Care Equipment & Supplies 0.8% | | | | |
| a Becton Dickinson and Co | United States | 20,927 | | 3,483,299 |
| a,b Derma Sciences Inc | United States | 15,328 | | 62,078 |
| b DexCom Inc | United States | 10,142 | | 654,058 |
| b GenMark Diagnostics Inc | United States | 29,621 | | 223,046 |
| a,b IDEXX Laboratories Inc | United States | 35,937 | | 3,147,003 |
| Innocoll Holdings PLC | Ireland | 4,533 | | 43,517 |
| Medtronic PLC | United States | 13,158 | | 1,058,956 |
| b Novadaq Technologies Inc | Canada | 18,095 | | 174,798 |
| St. Jude Medical Inc | United States | 10,443 | | 818,313 |
| a,b TearLab Corp | United States | 61,823 | | 47,604 |
| | | | | 9,712,672 |
| Health Care Providers & Services 1.0% | | | | |
| b Acadia Healthcare Co. Inc | United States | 12,192 | | 717,743 |
| Aetna Inc | United States | 16,596 | | 1,879,165 |
| Celesio AG | Germany | 61,856 | | 1,745,713 |
| b Centene Corp | United States | 21,974 | | 1,370,079 |
22 Annual Report
franklintempleton.com
FRANKLIN ALTERNATIVE STRATEGIES FUNDS
CONSOLIDATED STATEMENT OF INVESTMENTS
| | | | |
| Franklin K2 Alternative Strategies Fund (continued) | | | | |
| |
| | Country | Shares/Warrants | | Value |
| Common Stocks and Other Equity Interests (continued) | | | | |
| Health Care Providers & Services (continued) | | | | |
| a Cigna Corp | United States | 11,789 | $ | 1,510,289 |
| Humana Inc | United States | 8,261 | | 1,425,105 |
| b Laboratory Corp. of America Holdings | United States | 1,240 | | 158,658 |
| a UnitedHealth Group Inc | United States | 16,247 | | 2,171,737 |
| a Universal Health Services Inc., B | United States | 7,370 | | 993,918 |
| | | | | 11,972,407 |
| Health Care Technology 0.0%† | | | | |
| b athenahealth Inc | United States | 1,288 | | 163,409 |
| Hotels, Restaurants & Leisure 1.1% | | | | |
| a,b Buffalo Wild Wings Inc | United States | 2,873 | | 417,705 |
| a Domino’s Pizza Inc | United States | 25,041 | | 3,026,956 |
| a Hilton Worldwide Holdings Inc | United States | 138,534 | | 2,878,737 |
| Marriott International Inc., A | United States | 5,400 | | 356,616 |
| McDonald’s Corp | United States | 631 | | 77,020 |
| a Sonic Corp | United States | 158,342 | | 4,717,008 |
| Starwood Hotels & Resorts Worldwide Inc | United States | 20,479 | | 1,503,773 |
| Wyndham Worldwide Corp | United States | 6,625 | | 446,459 |
| | | | | 13,424,274 |
| Household Durables 0.3% | | | | |
| CalAtlantic Group Inc | United States | 59,461 | | 2,199,462 |
| a,b Mohawk Industries Inc | United States | 6,881 | | 1,353,424 |
| Whirlpool Corp | United States | 213 | | 37,194 |
| | | | | 3,590,080 |
| Industrial Conglomerates 0.0%† | | | | |
| Danaher Corp | United States | 578 | | 56,852 |
| General Electric Co | United States | 9,678 | | 292,566 |
| | | | | 349,418 |
| Insurance 0.2% | | | | |
| AmTrust Financial Services Inc | United States | 382 | | 10,131 |
| MetLife Inc | United States | 933 | | 42,498 |
| Prudential Financial Inc | United States | 415 | | 32,889 |
| W.R. Berkley Corp | United States | 24,075 | | 1,372,997 |
| a Willis Towers Watson PLC | United States | 6,500 | | 832,130 |
| | | | | 2,290,645 |
| Internet & Catalog Retail 0.7% | | | | |
| a,b Amazon.com Inc | United States | 3,820 | | 2,761,058 |
| Expedia Inc | United States | 11,315 | | 1,258,681 |
| b The Priceline Group Inc | United States | 97 | | 122,640 |
| a,b TripAdvisor Inc | United States | 16,565 | | 1,122,113 |
| a,b Wayfair Inc., A | United States | 73,402 | | 3,022,694 |
| | | | | 8,287,186 |
| Internet Software & Services 1.7% | | | | |
| a,b Akamai Technologies Inc | United States | 27,105 | | 1,479,391 |
| a,b Alibaba Group Holding Ltd., ADR | China | 18,675 | | 1,531,350 |
| a,b Alphabet Inc., A | United States | 3,824 | | 2,863,602 |
| a,b Alphabet Inc., C | United States | 1,251 | | 920,386 |
| a,b Benefitfocus Inc | United States | 17,610 | | 646,463 |
franklintempleton.com
Annual Report
23
FRANKLIN ALTERNATIVE STRATEGIES FUNDS
CONSOLIDATED STATEMENT OF INVESTMENTS
| | | | |
| Franklin K2 Alternative Strategies Fund (continued) | | | | |
| |
| | Country | Shares/Warrants | | Value |
| Common Stocks and Other Equity Interests (continued) | | | | |
| Internet Software & Services (continued) | | | | |
| a,b CoStar Group Inc | United States | 2,495 | $ | 515,442 |
| b Demandware Inc | United States | 3,700 | | 177,563 |
| a,b eBay Inc | United States | 29,343 | | 717,730 |
| a,b Facebook Inc | United States | 31,755 | | 3,772,812 |
| Naver Corp | South Korea | 299 | | 180,634 |
| Tencent Holdings Ltd | China | 19,300 | | 430,421 |
| a,b VeriSign Inc | United States | 12,055 | | 1,030,220 |
| a,b Yahoo! Inc | United States | 166,995 | | 6,335,790 |
| b Zillow Group Inc., A | United States | 4,740 | | 138,598 |
| b Zillow Group Inc., C | United States | 14,280 | | 409,550 |
| | | | | 21,149,952 |
| IT Services 3.1% | | | | |
| Accenture PLC, A | United States | 12,060 | | 1,434,778 |
| a,b Alliance Data Systems Corp | United States | 12,145 | | 2,698,498 |
| Automatic Data Processing Inc | United States | 30,010 | | 2,636,078 |
| a,b Cardtronics Inc | United States | 30,810 | | 1,210,525 |
| a,b Cognizant Technology Solutions Corp., A | United States | 25,550 | | 1,569,792 |
| a,b EPAM Systems Inc | United States | 14,300 | | 1,094,093 |
| EVERTEC Inc | Puerto Rico | 43,675 | | 668,664 |
| a,b ExlService Holdings Inc | United States | 71,460 | | 3,701,628 |
| b Gartner Inc | United States | 2,700 | | 274,374 |
| b Genpact Ltd | United States | 136,675 | | 3,852,868 |
| a Global Payments Inc | United States | 59,037 | | 4,586,584 |
| a MasterCard Inc., A | United States | 33,542 | | 3,216,678 |
| b PayPal Holdings Inc | United States | 59,463 | | 2,247,107 |
| b Syntel Inc | United States | 12,735 | | 586,829 |
| a,b Vantiv Inc., A | United States | 25,775 | | 1,385,922 |
| Visa Inc., A | United States | 46,802 | | 3,694,550 |
| a,b WEX Inc | United States | 30,297 | | 2,795,201 |
| b,c Worldpay Group PLC, 144A | United Kingdom | 106,785 | | 428,569 |
| | | | | 38,082,738 |
| Leisure Products 0.0%† | | | | |
| b JAKKS Pacific Inc | United States | 965 | | 7,199 |
| Life Sciences Tools & Services 0.5% | | | | |
| Gerresheimer AG | Germany | 23,576 | | 1,876,616 |
| a,b Illumina Inc | United States | 7,343 | | 1,063,487 |
| b Sequenom Inc | United States | 65,989 | | 67,309 |
| a Thermo Fisher Scientific Inc | United States | 20,841 | | 3,163,038 |
| | | | | 6,170,450 |
| Machinery 0.0%† | | | | |
| Caterpillar Inc | United States | 650 | | 47,131 |
| Trinity Industries Inc | United States | 2,694 | | 48,654 |
| | | | | 95,785 |
| Marine 0.4% | | | | |
| Irish Continental Group PLC | Ireland | 389,101 | | 2,337,827 |
| a,b Kirby Corp | United States | 19,033 | | 1,333,833 |
| b Neptune Orient Lines Ltd | Singapore | 1,905,361 | | 1,791,767 |
| | | | | 5,463,427 |
24 Annual Report
franklintempleton.com
FRANKLIN ALTERNATIVE STRATEGIES FUNDS
CONSOLIDATED STATEMENT OF INVESTMENTS
| | | | |
| Franklin K2 Alternative Strategies Fund (continued) | | | | |
| |
| | Country | Shares/Warrants | | Value |
| Common Stocks and Other Equity Interests (continued) | | | | |
| Media 1.0% | | | | |
| CBS Corp., B | United States | 38,558 | $ | 2,128,402 |
| b Charter Communications Inc | United States | 2,409 | | 527,426 |
| a Comcast Corp., A | United States | 27,075 | | 1,713,847 |
| a,b Dish Network Corp., A | United States | 36,758 | | 1,834,224 |
| b Liberty Global PLC LiLAC, A | United Kingdom | 6,908 | | 283,781 |
| a,b Liberty Global PLC, A | United Kingdom | 6,533 | | 244,008 |
| b Liberty Global PLC, C | United Kingdom | 17,615 | | 636,430 |
| b Liberty SiriusXM Group | United States | 34,847 | | 1,095,938 |
| SES SA, IDR | Luxembourg | 24,396 | | 546,410 |
| a The Walt Disney Co | United States | 37,766 | | 3,747,143 |
| | | | | 12,757,609 |
| Metals & Mining 0.6% | | | | |
| Alcoa Inc | United States | 9,284 | | 86,063 |
| Boliden AB | Sweden | 27,287 | | 482,843 |
| Freeport-McMoRan Inc | United States | 53,595 | | 593,833 |
| b Impala Platinum Holdings Ltd | South Africa | 106,154 | | 303,948 |
| Newmont Mining Corp | United States | 43,194 | | 1,399,917 |
| Nucor Corp | United States | 460 | | 22,315 |
| a Rio Tinto PLC, ADR | United Kingdom | 32,319 | | 906,225 |
| Teck Resources Ltd | Canada | 214,414 | | 2,064,807 |
| ThyssenKrupp AG | Germany | 51,931 | | 1,143,191 |
| United States Steel Corp | United States | 59,302 | | 858,100 |
| | | | | 7,861,242 |
| Multi-Utilities 0.0%† | | | | |
| Sempra Energy | United States | 1,004 | | 107,548 |
| Multiline Retail 0.1% | | | | |
| Macy’s Inc | United States | 21,702 | | 720,723 |
| Oil, Gas & Consumable Fuels 1.2% | | | | |
| d Chevron Corp | United States | 1,030 | | 104,030 |
| Columbia Pipeline Group Inc | United States | 34,753 | | 887,592 |
| a,b Continental Resources Inc | United States | 62,258 | | 2,618,571 |
| Delek U.S. Holdings Inc | United States | 2,355 | | 32,452 |
| Devon Energy Corp | United States | 5,525 | | 199,397 |
| d Exxon Mobil Corp | United States | 2,434 | | 216,675 |
| Golar LNG Ltd | Bermuda | 1,384 | | 24,082 |
| Hess Corp | United States | 1,033 | | 61,908 |
| b Kinder Morgan Inc., wts., 5/25/17 | United States | 52,317 | | 1,344 |
| Marathon Oil Corp | United States | 3,028 | | 39,576 |
| b Newfield Exploration Co | United States | 34,666 | | 1,413,333 |
| a Occidental Petroleum Corp | United States | 28,890 | | 2,179,462 |
| Scorpio Tankers Inc | Monaco | 8,167 | | 48,022 |
| TransCanada Corp | Canada | 115,379 | | 4,750,305 |
| Valero Energy Corp | United States | 322 | | 17,613 |
| a The Williams Cos Inc | United States | 102,378 | | 2,268,696 |
| | | | | 14,863,058 |
| Paper & Forest Products 0.2% | | | | |
| b Canfor Corp | Canada | 141,570 | | 1,694,932 |
| West Fraser Timber Co. Ltd | Canada | 25,980 | | 887,562 |
| | | | | 2,582,494 |
franklintempleton.com
Annual Report
25
FRANKLIN ALTERNATIVE STRATEGIES FUNDS
CONSOLIDATED STATEMENT OF INVESTMENTS
| | | | |
| Franklin K2 Alternative Strategies Fund (continued) | | | | |
| |
| | Country | Shares/Warrants | | Value |
| Common Stocks and Other Equity Interests (continued) | | | | |
| Pharmaceuticals 1.9% | | | | |
| b Aerie Pharmaceuticals Inc | United States | 40,618 | $ | 725,844 |
| b,d Allergan PLC | United States | 37,283 | | 8,789,467 |
| a,b Aratana Therapeutics Inc | United States | 19,668 | | 140,233 |
| b Assembly Biosciences Inc | United States | 28,503 | | 162,752 |
| AstraZeneca PLC, ADR | United Kingdom | 18,409 | | 546,747 |
| a,d Bristol-Myers Squibb Co | United States | 41,166 | | 2,951,602 |
| b,c Cassiopea SpA, 144A | Italy | 4,138 | | 147,786 |
| b Dermira Inc | United States | 13,175 | | 418,174 |
| Eli Lilly & Co | United States | 21,526 | | 1,615,096 |
| b Flex Pharma Inc | United States | 4,363 | | 54,581 |
| Innoviva Inc | United States | 18,430 | | 207,890 |
| b Intra-Cellular Therapies Inc | United States | 21,789 | | 843,234 |
| b Jazz Pharmaceuticals PLC | United States | 3,769 | | 571,230 |
| d Johnson & Johnson | United States | 1,756 | | 197,884 |
| b The Medicines Co | United States | 16,856 | | 633,954 |
| Novo Nordisk AS, ADR | Denmark | 5,066 | | 283,899 |
| b Ocular Therapeutix Inc | United States | 9,512 | | 114,144 |
| b Pacira Pharmaceuticals Inc | United States | 15,973 | | 742,904 |
| Pfizer Inc | United States | 4,507 | | 156,393 |
| b SCYNEXIS Inc | United States | 6,453 | | 25,489 |
| Shire PLC, ADR | United States | 21,131 | | 3,933,747 |
| b Steadymed Ltd | Israel | 7,372 | | 25,655 |
| | | | | 23,288,705 |
| Professional Services 1.0% | | | | |
| Equifax Inc | United States | 11,585 | | 1,456,582 |
| Experian PLC | Ireland | 73,606 | | 1,392,292 |
| b FTI Consulting Inc | United States | 16,550 | | 692,618 |
| a,b Huron Consulting Group Inc | United States | 42,430 | | 2,483,852 |
| a ManpowerGroup Inc | United States | 13,070 | | 1,042,332 |
| Robert Half International Inc | United States | 17,525 | | 728,865 |
| SThree PLC | United Kingdom | 43,159 | | 204,718 |
| b TransUnion | United States | 35,400 | | 1,171,740 |
| b TriNet Group Inc | United States | 50,810 | | 1,023,822 |
| a,b WageWorks Inc | United States | 29,435 | | 1,649,832 |
| | | | | 11,846,653 |
| Real Estate Investment Trusts (REITs) 0.0%† | | | | |
| Redwood Trust Inc | United States | 4,391 | | 62,572 |
| Road & Rail 0.8% | | | | |
| CSX Corp | United States | 40,127 | | 1,060,557 |
| Kansas City Southern | United States | 26,148 | | 2,434,379 |
| b Old Dominion Freight Line Inc | United States | 12,718 | | 818,403 |
| Ryder System Inc | United States | 14,018 | | 975,933 |
| a,b Swift Transportation Co | United States | 85,518 | | 1,332,370 |
| a Union Pacific Corp | United States | 42,958 | | 3,616,634 |
| | | | | 10,238,276 |
| Semiconductors & Semiconductor Equipment 1.0% | | | | |
| b Acacia Communications Inc | United States | 6,400 | | 251,392 |
| Advanced Semiconductor Engineering Inc | Taiwan | 187,000 | | 211,585 |
| a Applied Materials Inc | United States | 65,569 | | 1,601,195 |
26 Annual Report
franklintempleton.com
FRANKLIN ALTERNATIVE STRATEGIES FUNDS
CONSOLIDATED STATEMENT OF INVESTMENTS
| | | | |
| Franklin K2 Alternative Strategies Fund (continued) | | | | |
| |
| | Country | Shares/Warrants | | Value |
| Common Stocks and Other Equity Interests (continued) | | | | |
| Semiconductors & Semiconductor Equipment (continued) | | | | |
| Broadcom Ltd | Singapore | 9,701 | $ | 1,497,446 |
| b Cavium Inc | United States | 5,180 | | 257,705 |
| b Cirrus Logic Inc | United States | 7,211 | | 259,596 |
| Cypress Semiconductor Corp | United States | 5,949 | | 63,238 |
| a,b First Solar Inc | United States | 14,096 | | 699,866 |
| a,b Inphi Corp | United States | 10,836 | | 337,975 |
| Intel Corp | United States | 1,247 | | 39,393 |
| Intersil Corp | United States | 5,900 | | 79,768 |
| a Lam Research Corp | United States | 8,758 | | 725,250 |
| a,b M/A-COM Technology Solutions Holdings Inc | United States | 6,681 | | 240,516 |
| Mellanox Technologies Ltd | Israel | 10,600 | | 502,440 |
| a Microchip Technology Inc | United States | 20,565 | | 1,062,799 |
| a,b NeoPhotonics Corp | United States | 33,166 | | 298,826 |
| NVIDIA Corp | United States | 5,452 | | 254,717 |
| b NXP Semiconductors NV | Netherlands | 15,893 | | 1,501,730 |
| a,b ON Semiconductor Corp | United States | 26,783 | | 261,670 |
| QUALCOMM Inc | United States | 2,320 | | 127,414 |
| Silicon Motion Technology Corp., ADR | Taiwan | 20,292 | | 901,979 |
| b Siltronic AG | Germany | 1,871 | | 32,132 |
| a Skyworks Solutions Inc | United States | 8,048 | | 537,284 |
| b SunEdison Semiconductor Ltd | United States | 29,935 | | 170,630 |
| a Taiwan Semiconductor Manufacturing Co. Ltd., ADR | Taiwan | 27,700 | | 684,744 |
| Texas Instruments Inc | United States | 1,373 | | 83,204 |
| Win Semiconductors Corp | Taiwan | 135,000 | | 265,757 |
| | | | | 12,950,251 |
| Software 0.9% | | | | |
| a Activision Blizzard Inc | United States | 40,192 | | 1,577,938 |
| a,b Adobe Systems Inc | United States | 6,270 | | 623,677 |
| a,b Guidewire Software Inc | United States | 15,075 | | 884,902 |
| b HubSpot Inc | United States | 5,085 | | 242,860 |
| Intuit Inc | United States | 7,345 | | 783,418 |
| d Microsoft Corp | United States | 24,347 | | 1,290,391 |
| Mobileye NV | United States | 10,819 | | 410,797 |
| Oracle Corp | United States | 1,479 | | 59,456 |
| b Paylocity Holding Corp | United States | 14,000 | | 513,940 |
| b Red Hat Inc | United States | 9,057 | | 701,555 |
| a,b Salesforce.com Inc | United States | 11,605 | | 971,455 |
| b ServiceNow Inc | United States | 3,100 | | 222,053 |
| SS&C Technologies Holdings Inc | United States | 4,085 | | 251,595 |
| b Take-Two Interactive Software Inc | United States | 45,088 | | 1,754,374 |
| b Verint Systems Inc | United States | 25,555 | | 843,059 |
| | | | | 11,131,470 |
| Specialty Retail 1.7% | | | | |
| a,b AutoNation Inc | United States | 110,827 | | 5,590,114 |
| a,b Autozone Inc | United States | 6,882 | | 5,245,460 |
| a The Home Depot Inc | United States | 61,069 | | 8,068,436 |
| Inditex SA | Spain | 36,884 | | 1,245,937 |
| a,b MarineMax Inc | United States | 23,513 | | 399,251 |
| | | | | 20,549,198 |
franklintempleton.com
Annual Report
27
FRANKLIN ALTERNATIVE STRATEGIES FUNDS
CONSOLIDATED STATEMENT OF INVESTMENTS
| | | | |
| Franklin K2 Alternative Strategies Fund (continued) | | | | |
| |
| | Country | Shares/Warrants | | Value |
| Common Stocks and Other Equity Interests (continued) | | | | |
| Technology Hardware, Storage & Peripherals 1.5% | | | | |
| Apple Inc | United States | 472 | $ | 47,134 |
| Catcher Technology Co. Ltd | Taiwan | 27,000 | | 205,320 |
| a,d EMC Corp | United States | 366,279 | | 10,237,498 |
| Hewlett Packard Enterprise Co | United States | 124,615 | | 2,301,639 |
| Lexmark International Inc | United States | 12,774 | | 483,624 |
| a,b,d NCR Corp | United States | 94,236 | | 2,910,008 |
| b Pure Storage Inc., A | United States | 59,555 | | 701,558 |
| Samsung Electronics Co. Ltd | South Korea | 960 | | 1,040,711 |
| b Violin Memory Inc | United States | 19,835 | | 11,262 |
| | | | | 17,938,754 |
| Textiles, Apparel & Luxury Goods 0.5% | | | | |
| Coach Inc | United States | 21,063 | | 830,304 |
| Michael Kors Holdings Ltd | United States | 17,688 | | 755,631 |
| Moncler SpA | Italy | 37,696 | | 628,714 |
| a NIKE Inc., B | United States | 64,213 | | 3,545,842 |
| | | | | 5,760,491 |
| Tobacco 0.0%† | | | | |
| Altria Group Inc | United States | 787 | | 50,085 |
| Philip Morris International Inc | United States | 692 | | 68,287 |
| Reynolds American Inc | United States | 1,525 | | 75,792 |
| | | | | 194,164 |
| Wireless Telecommunication Services 0.1% | | | | |
| NTT DoCoMo Inc | Japan | 36,700 | | 921,021 |
| b T-Mobile U.S. Inc | United States | 20,189 | | 863,282 |
| | | | | 1,784,303 |
| Total Common Stocks and Other Equity Interests | | | | |
| (Cost $382,297,916) | | | | 413,512,300 |
| Exchange Traded Funds 0.1% | | | | |
| Health Care Select Sector SPDR ETF | United States | 5,966 | | 425,614 |
| iShares iBoxx USD High Yield Corporate Bond ETF | United States | 11,200 | | 936,432 |
| Technology Select Sector SPDR Fund | United States | 5,275 | | 233,208 |
| Total Exchange Traded Funds (Cost $1,566,743) | | | | 1,595,254 |
| Convertible Preferred Stocks 0.2% | | | | |
| Food Products 0.2% | | | | |
| Bunge Ltd., cvt. pfd., 4.875% | United States | 4,462 | | 429,467 |
| a Post Holdings Inc., cvt. pfd., 2.50% | United States | 12,573 | | 1,827,800 |
| | | | | 2,257,267 |
| Health Care Providers & Services 0.0%† | | | | |
| Amsurg Corp., cvt. pfd., Series A-1, 5.25% | United States | 615 | | 87,330 |
| Real Estate Investment Trusts (REITs) 0.0%† | | | | |
| e Welltower Inc., cvt. pfd., Series I, 6.50% | United States | 2,088 | | 130,792 |
| Tobacco 0.0%† | | | | |
| a Universal Corp., cvt. pfd., 6.75% | United States | 330 | | 406,189 |
| Total Convertible Preferred Stocks (Cost $2,132,961) | | | | 2,881,578 |
28 Annual Report
franklintempleton.com
FRANKLIN ALTERNATIVE STRATEGIES FUNDS
CONSOLIDATED STATEMENT OF INVESTMENTS
| | | | | |
| Franklin K2 Alternative Strategies Fund (continued) | | | | | |
| |
| | Country | Shares/Warrants | | | Value |
| Preferred Stocks 0.2% | | | | | |
| Chemicals 0.0%† | | | | | |
| Henkel AG & Co. KGaA, pfd | Germany | 1,295 | | $ | 150,931 |
| Diversified Telecommunication Services 0.0%† | | | | | |
| Iridium Communications Inc., pfd., 7.00% | United States | 1,979 | | | 206,558 |
| Machinery 0.0%† | | | | | |
| b MAN SE, pfd | Germany | 3,186 | | | 332,510 |
| Pharmaceuticals 0.2% | | | | | |
| Allergan PLC, pfd., 5.50% | United States | 2,357 | | | 1,990,864 |
| Total Preferred Stocks (Cost $3,078,653) | | | | | 2,680,863 |
| |
| | | Principal | | | |
| | | Amount* | | | |
| Convertible Bonds 14.0% | | | | | |
| Banks 0.6% | | | | | |
| f The Oita Bank Ltd., senior note, Reg S, zero cpn., 12/18/19 | Japan | 1,300,000 | | | 1,205,750 |
| The Yamagata Bank Ltd., senior note, zero cpn., 4/22/19 | Japan | 2,000,000 | | | 1,930,000 |
| f Yamaguchi Financial Group Inc., senior note, Reg S, | | | | | |
| zero cpn., 12/20/18 | Japan | 4,000,000 | | | 4,230,000 |
| | | | | | 7,365,750 |
| Biotechnology 0.6% | | | | | |
| f Ablynx NV, senior note, Reg S, Series ABLX, 3.25%, 5/27/20 | Belgium | 200,000 | EUR | | 283,891 |
| Acorda Therapeutics Inc., senior note, 1.75%, 6/15/21 | United States | 679,000 | | | 626,378 |
| a AMAG Pharmaceuticals Inc., senior note, 2.50%, 2/15/19 | United States | 1,175,000 | | | 1,233,016 |
| c Anacor Pharmaceuticals Inc., senior note, 144A, 2.00%, 4/15/23 | United States | 517,000 | | | 781,639 |
| BioMarin Pharmaceutical Inc., senior sub. note, 1.50%, 10/15/20 | United States | 70,000 | | | 87,150 |
| a Exelixis Inc., senior sub. note, 4.25%, 8/15/19 | United States | 1,312,000 | | | 1,716,260 |
| Ligand Pharmaceuticals Inc., senior note, 0.75%, 8/15/19 | United States | 1,368,000 | | | 2,298,240 |
| PDL BioPharma Inc., senior note, 4.00%, 2/01/18 | United States | 670,000 | | | 629,800 |
| c PTC Therapeutics Inc., senior note, 144A, 3.00%, 8/15/22 | United States | 328,000 | | | 156,210 |
| | | | | | 7,812,584 |
| Building Products 0.1% | | | | | |
| c Griffon Corp., sub. note, 144A, 4.00%, 1/15/17 | United States | 801,000 | | | 983,728 |
| Capital Markets 0.3% | | | | | |
| Ares Capital Corp., senior note, 5.125%, 6/01/16 | United States | 968,000 | | | 968,000 |
| f Cahaya Capital Ltd., senior note, Reg S, zero cpn., 9/18/21 | Malaysia | 2,400,000 | | | 2,355,000 |
| a Cowen Group Inc., senior note, 3.00%, 3/15/19 | United States | 615,000 | | | 564,262 |
| a FXCM Inc., senior note, 2.25%, 6/15/18 | United States | 592,000 | | | 254,560 |
| | | | | | 4,141,822 |
| Chemicals 0.1% | | | | | |
| a Solazyme Inc., senior sub. note, 5.00%, 10/01/19 | United States | 1,390,000 | | | 667,200 |
| Commercial Services & Supplies 0.0%† | | | | | |
| RWT Holdings Inc., senior note, 5.625%, 11/15/19 | United States | 204,000 | | | 199,410 |
| Communications Equipment 0.4% | | | | | |
| Brocade Communications Systems Inc., senior note, 1.375%, 1/01/20 | United States | 245,000 | | | 238,109 |
| Ciena Corp., | | | | | |
| senior bond, 0.875%, 6/15/17 | United States | 565,000 | | | 558,291 |
| csenior note, 144A, 3.75%, 10/15/18 | United States | 55,000 | | | 63,181 |
franklintempleton.com
Annual Report
29
FRANKLIN ALTERNATIVE STRATEGIES FUNDS
CONSOLIDATED STATEMENT OF INVESTMENTS
| | | | | |
| Franklin K2 Alternative Strategies Fund (continued) | | | | | |
| |
| | | Principal | | | |
| | Country | Amount* | | | Value |
| Convertible Bonds (continued) | | | | | |
| Communications Equipment (continued) | | | | | |
| a Palo Alto Networks Inc., senior note, zero cpn., 7/01/19 | United States | 2,889,000 | $ | | 3,858,621 |
| | | | | | 4,718,202 |
| Construction & Engineering 0.2% | | | | | |
| c Dycom Industries Inc., senior note, 144A, 0.75%, 9/15/21 | United States | 977,000 | | | 1,100,957 |
| f Larsen & Toubro Ltd., senior note, Reg S, 0.675%, 10/22/19 | India | 1,600,000 | | | 1,536,000 |
| | | | | | 2,636,957 |
| Construction Materials 0.2% | | | | | |
| a Cemex SAB de CV, sub. note, | | | | | |
| 3.75%, 3/15/18 | Mexico | 1,324,000 | | | 1,373,650 |
| 3.72%, 3/15/20 | Mexico | 1,258,000 | | | 1,183,306 |
| | | | | | 2,556,956 |
| Consumer Finance 0.4% | | | | | |
| Encore Capital Group Inc., senior note, | | | | | |
| 3.00%, 11/27/17 | United States | 780,000 | | | 812,662 |
| a2.875%, 3/15/21 | United States | 700,000 | | | 531,125 |
| a PRA Group Inc., senior note, 3.00%, 8/01/20 | United States | 789,000 | | | 629,721 |
| f Siemens Financieringsmaatschappij NV, senior note, Reg S, Series SIE, | | | | | |
| 1.05%, 8/16/17 | Germany | 3,000,000 | | | 3,193,500 |
| | | | | | 5,167,008 |
| Diversified Consumer Services 0.3% | | | | | |
| Ascent Capital Group Inc., senior note, 4.00%, 7/15/20 | United States | 725,000 | | | 466,266 |
| a Carriage Services Inc., sub. note, 2.75%, 3/15/21 | United States | 1,064,000 | | | 1,252,195 |
| TAL Education Group, senior note, 2.50%, 5/15/19 | China | 696,000 | | | 1,441,590 |
| | | | | | 3,160,051 |
| Diversified Financial Services 0.1% | | | | | |
| c Element Financial Corp., sub. note, 144A, | | | | | |
| 5.125%, 6/30/19 | Canada | 536,000 | CAD | 455,744 |
| 4.25%, 6/30/20 | Canada | 1,205,000 | CAD | 946,467 |
| | | | | | 1,402,211 |
| Electric Utilities 0.1% | | | | | |
| Emera Inc., sub. bond, 4.00%, 9/29/25 | Canada | 1,595,000 | CAD | 526,051 |
| Electrical Equipment 0.1% | | | | | |
| General Cable Corp., sub. bond, 4.50%, 11/15/29 | United States | 1,110,000 | | | 670,162 |
| a SolarCity Corp., senior note, 2.75%, 11/01/18 | United States | 285,000 | | | 187,922 |
| | | | | | 858,084 |
| Electronic Equipment, Instruments & Components 0.3% | | | | | |
| c Knowles Corp., senior note, 144A, 3.25%, 11/01/21 | United States | 604,000 | | | 633,067 |
| f TPK Holding Co. Ltd., senior note, Reg S, zero cpn., 4/08/20 | Taiwan | 1,500,000 | | | 1,321,875 |
| a Vishay Intertechnology Inc., senior bond, 2.25%, 11/15/40 | United States | 1,930,000 | | | 2,010,819 |
| | | | | | 3,965,761 |
| Energy Equipment & Services 0.1% | | | | | |
| a Hornbeck Offshore Services Inc., senior note, 1.50%, 9/01/19 | United States | 1,126,000 | | | 658,006 |
| Health Care Equipment & Supplies 0.5% | | | | | |
| a Hologic Inc., senior bond, zero cpn., 12/15/43 | United States | 929,000 | | | 1,142,670 |
30 Annual Report
franklintempleton.com
FRANKLIN ALTERNATIVE STRATEGIES FUNDS
CONSOLIDATED STATEMENT OF INVESTMENTS
| | | | | |
| Franklin K2 Alternative Strategies Fund (continued) | | | | | |
| |
| | | Principal | | | |
| | Country | Amount* | | | Value |
| Convertible Bonds (continued) | | | | | |
| Health Care Equipment & Supplies (continued) | | | | | |
| a Integra LifeSciences Holdings Corp., senior note, 1.625%, 12/15/16 | United States | 1,027,000 | | $ | 1,468,610 |
| c Invacare Corp., senior note, 144A, 5.00%, 2/15/21 | United States | 367,000 | | | 342,228 |
| f Nipro Corp., senior note, Reg S, zero cpn., 1/29/21 | Japan | 30,000,000 | JPY | | 295,300 |
| c NuVasive Inc., senior note, 144A, 2.25%, 3/15/21 | United States | 992,000 | | | 1,126,540 |
| Quidel Corp., senior note, 3.25%, 12/15/20 | United States | 480,000 | | | 435,600 |
| a Wright Medical Group Inc., senior note, 2.00%, 2/15/20 | United States | 1,358,000 | | | 1,301,982 |
| c Wright Medical Group NV, senior note, 144A, 2.25%, 11/15/21 | United States | 382,000 | | | 423,781 |
| | | | | | 6,536,711 |
| Health Care Providers & Services 0.5% | | | | | |
| c Aceto Corp., senior note, 144A, 2.00%, 11/01/20 | United States | 810,000 | | | 760,387 |
| Brookdale Senior Living Inc., senior note, 2.75%, 6/15/18 | United States | 55,000 | | | 54,519 |
| a HealthSouth Corp., senior sub. bond, 2.00%, 12/01/43 | United States | 2,320,000 | | | 2,762,250 |
| Molina Healthcare Inc., | | | | | |
| asenior bond, 1.625%, 8/15/44 | United States | 1,287,000 | | | 1,402,830 |
| senior note, 1.125%, 1/15/20 | United States | 1,054,000 | | | 1,399,185 |
| | | | | | 6,379,171 |
| Health Care Technology 0.1% | | | | | |
| a Allscripts Healthcare Solutions Inc., senior note, 1.25%, 7/01/20 | United States | 954,000 | | | 989,775 |
| Household Durables 0.4% | | | | | |
| CalAtlantic Group Inc., | | | | | |
| asenior bond, 1.25%, 8/01/32 | United States | 987,000 | | | 1,075,830 |
| senior note, 0.25%, 6/01/19 | United States | 1,056,000 | | | 975,480 |
| KB Home, senior note, 1.375%, 2/01/19 | United States | 45,000 | | | 42,441 |
| a LGI Homes Inc., sub. note, 4.25%, 11/15/19 | United States | 610,000 | | | 836,463 |
| M/I Homes Inc., senior sub. note, 3.25%, 9/15/17 | United States | 600,000 | | | 609,750 |
| Meritage Homes Corp., senior bond, 1.875%, 9/15/32 | United States | 1,123,000 | | | 1,120,192 |
| a Toll Brothers Finance Corp., senior bond, 0.50%, 9/15/32 | United States | 649,000 | | | 640,076 |
| | | | | | 5,300,232 |
| Household Products 0.0%† | | | | | |
| f Unicharm Corp., senior note, Reg S, zero cpn., 9/25/20 | Japan | 40,000,000 | JPY | | 409,988 |
| Independent Power & Renewable Electricity Producers 0.1% | | | | | |
| a,c Pattern Energy Group Inc., senior note, 144A, 4.00%, 7/15/20 | United States | 1,788,000 | | | 1,747,770 |
| Industrial Conglomerates 0.0%† | | | | | |
| f Keihan Holdings Co. Ltd., senior note, Reg S, zero cpn., 3/30/21 | Japan | 30,000,000 | JPY | | 279,383 |
| Insurance 0.1% | | | | | |
| a AmTrust Financial Services Inc., senior bond, 2.75%, 12/15/44 | United States | 1,234,000 | | | 974,860 |
| Internet & Catalog Retail 0.7% | | | | | |
| a Ctrip.com International Ltd., senior note, 1.25%, 10/15/18 | China | 1,508,000 | | | 1,971,710 |
| a Priceline Group Inc., senior note, 1.00%, 3/15/18 | United States | 2,847,000 | | | 4,012,491 |
| a Shutterfly Inc., senior note, 0.25%, 5/15/18 | United States | 2,357,000 | | | 2,392,355 |
| | | | | | 8,376,556 |
| Internet Software & Services 2.2% | | | | | |
| Akamai Technologies Inc., senior note, zero cpn., 2/15/19 | United States | 795,000 | | | 780,595 |
| a Blucora Inc., senior note, 4.25%, 4/01/19 | United States | 142,000 | | | 125,670 |
| a j2 Global Inc., senior bond, 3.25%, 6/15/29 | United States | 874,000 | | | 1,016,025 |
| a LinkedIn Corp., senior note, 0.50%, 11/01/19 | United States | 1,351,000 | | | 1,269,096 |
franklintempleton.com
Annual Report
31
FRANKLIN ALTERNATIVE STRATEGIES FUNDS
CONSOLIDATED STATEMENT OF INVESTMENTS
| | | | |
| Franklin K2 Alternative Strategies Fund (continued) | | | | |
| |
| | | Principal | | |
| | Country | Amount* | | Value |
| Convertible Bonds (continued) | | | | |
| Internet Software & Services (continued) | | | | |
| a MercadoLibre Inc., senior note, 2.25%, 7/01/19 | Argentina | 2,288,000 | $ | 2,845,700 |
| Monster Worldwide Inc., senior note, 3.50%, 10/15/19 | United States | 468,000 | | 415,935 |
| SINA Corp., senior note, 1.00%, 12/01/18 | China | 1,882,000 | | 1,864,356 |
| Twitter Inc., senior note, | | | | |
| 0.25%, 9/15/19 | United States | 2,194,000 | | 1,943,061 |
| a1.00%, 9/15/21 | United States | 1,410,000 | | 1,189,688 |
| VeriSign Inc., junior sub. bond, 4.345%, 8/15/37 | United States | 3,902,000 | | 9,750,123 |
| Web.com Group Inc., senior note, 1.00%, 8/15/18 | United States | 1,045,000 | | 967,931 |
| WebMD Health Corp., senior note, | | | | |
| 2.50%,1/31/18 | United States | 523,000 | | 616,159 |
| a1.50%, 12/01/20 | United States | 904,000 | | 1,262,210 |
| c144A, 2.625%, 6/15/23 | United States | 593,000 | | 619,314 |
| Yahoo! Inc., senior note, zero cpn., 12/01/18 | United States | 2,986,000 | | 3,017,726 |
| | | | | 27,683,589 |
| IT Services 0.2% | | | | |
| a,c CSG Systems International Inc., 144A, | | | | |
| senior bond, 4.25%, 3/15/36 | United States | 988,000 | | 1,049,132 |
| senior sub. note, 3.00%, 3/01/17 | United States | 476,000 | | 895,475 |
| c Unisys Corp., senior note, 144A, 5.50%, 3/01/21 | United States | 444,000 | | 482,573 |
| | | | | 2,427,180 |
| Leisure Products 0.0%† | | | | |
| c JAKKS Pacific Inc., senior note, 144A, 4.25%, 8/01/18 | United States | 494,000 | | 504,806 |
| Life Sciences Tools & Services 0.1% | | | | |
| Albany Molecular Research Inc., senior note, 2.25%, 11/15/18 | United States | 597,000 | | 641,775 |
| Illumina Inc., senior note, 0.50%, 6/15/21 | United States | 671,000 | | 696,163 |
| Sequenom Inc., senior note, 5.00%, 1/01/18 | United States | 500,000 | | 305,000 |
| | | | | 1,642,938 |
| Machinery 0.5% | | | | |
| a Altra Industrial Motion Corp., senior bond, 2.75%, 3/01/31 | United States | 810,000 | | 935,044 |
| a The Greenbrier Cos Inc., senior note, 3.50%, 4/01/18 | United States | 1,113,000 | | 1,201,344 |
| f Hyundai Heavy Industries Co. Ltd., senior note, Reg S, zero cpn., 6/29/20 | South Korea | 1,400,000 | | 1,328,250 |
| a Navistar International Corp., senior sub. note, 4.75%, 4/15/19 | United States | 498,000 | | 278,258 |
| a Trinity Industries Inc., senior sub. bond, 3.875%, 6/01/36 | United States | 1,873,000 | | 2,005,281 |
| a Wabash National Corp., senior note, 3.375%, 5/01/18 | United States | 661,000 | | 880,782 |
| | | | | 6,628,959 |
| Media 0.1% | | | | |
| c Liberty Interactive LLC, senior bond, 144A, 1.00%, 9/30/43 | United States | 847,000 | | 740,066 |
| a Liberty Media Corp., senior bond, 1.375%, 10/15/23 | United States | 895,000 | | 893,322 |
| | | | | 1,633,388 |
| Metals & Mining 0.2% | | | | |
| AK Steel Corp., senior note, 5.00%, 11/15/19 | United States | 397,000 | | 422,805 |
| a Newmont Mining Corp., senior note, Series B, 1.625%, 7/15/17 | United States | 906,000 | | 971,119 |
| RTI International Metals Inc., senior note, 1.625%, 10/15/19 | United States | 341,000 | | 366,362 |
| | | | | 1,760,286 |
| Oil, Gas & Consumable Fuels 0.4% | | | | |
| Aegean Marine Petroleum Network Inc., senior note, 4.00%, 11/01/18 | Greece | 1,129,000 | | 926,486 |
| Chesapeake Energy Corp., senior bond, 2.50%, 5/15/37 | United States | 435,000 | | 406,725 |
32 Annual Report
franklintempleton.com
FRANKLIN ALTERNATIVE STRATEGIES FUNDS
CONSOLIDATED STATEMENT OF INVESTMENTS
| | | | |
| Franklin K2 Alternative Strategies Fund (continued) | | | | |
| |
| | | Principal | | |
| | Country | Amount* | | Value |
| Convertible Bonds (continued) | | | | |
| Oil, Gas & Consumable Fuels (continued) | | | | |
| Cobalt International Energy Inc., senior note, 2.625%, 12/01/19 | United States | 587,000 | $ | 248,007 |
| f Golar LNG Ltd., secured note, Reg S, 3.75%, 3/07/17 | Bermuda | 1,200,000 | | 1,155,960 |
| a Green Plains Inc., senior note, 3.25%, 10/01/18 | United States | 753,000 | | 824,064 |
| f Paladin Energy Ltd., senior note, Reg S, 6.00%, 4/30/17 | Australia | 400,000 | | 376,000 |
| c Renewable Energy Group Inc., senior bond, 144A, 4.00%, 6/15/36 | United States | 355,000 | | 365,430 |
| c Scorpio Tankers Inc., senior note, 144A, 2.375%, 7/01/19 | Monaco | 239,000 | | 201,059 |
| a,c Whiting Petroleum Corp., senior note, 144A, 1.25%, 4/01/20 | United States | 1,261,000 | | 964,665 |
| | | | | 5,468,396 |
| Pharmaceuticals 0.3% | | | | |
| a Medicines Co., senior note, | | | | |
| 1.375%, 6/01/17 | United States | 351,000 | | 506,756 |
| 2.50%, 1/15/22 | United States | 2,181,000 | | 2,783,501 |
| a Theravance Inc., senior note, 2.125%, 1/15/23 | United States | 1,055,000 | | 854,550 |
| | | | | 4,144,807 |
| Professional Services 0.0%† | | | | |
| a 51job Inc., senior note, 3.25%, 4/15/19 | China | 253,000 | | 261,381 |
| Real Estate Investment Trusts (REITs) 1.2% | | | | |
| a,c American Residential Properties Inc., senior note, 144A, 3.25%, 11/15/18 | United States | 1,160,000 | | 1,295,575 |
| Colony Capital Inc., senior note, 3.875%, 1/15/21 | United States | 1,271,000 | | 1,220,160 |
| Colony Starwood Homes, senior note, 4.50%, 10/15/17 | United States | 628,000 | | 666,073 |
| a Forest City Enterprises Inc., senior note, 3.625%, 8/15/20 | United States | 1,447,000 | | 1,596,222 |
| Forest City Realty Trust Inc., senior note, 4.25%, 8/15/18 | United States | 290,000 | | 337,850 |
| a,c GPT Property Trust LP, senior note, 144A, 3.75%, 3/15/19 | United States | 2,575,000 | | 3,160,812 |
| a National Health Investors Inc., senior note, 3.25%, 4/01/21 | United States | 1,097,000 | | 1,173,104 |
| Redwood Trust Inc., senior note, 4.625%, 4/15/18 | United States | 570,000 | | 559,313 |
| Spirit Realty Capital Inc., senior note, 2.875%, 5/15/19 | United States | 387,000 | | 403,933 |
| a Starwood Property Trust Inc., senior note, | | | | |
| 3.75%, 10/15/17 | United States | 2,353,000 | | 2,370,648 |
| 4.55%, 3/01/18 | United States | 646,000 | | 675,070 |
| a Starwood Waypoint Residential Trust, senior note, 3.00%, 7/01/19 | United States | 982,000 | | 1,023,121 |
| | | | | 14,481,881 |
| Real Estate Management & Development 0.1% | | | | |
| f AYC Finance Ltd., senior note, Reg S, 0.50%, 5/02/19 | Philippines | 200,000 | | 211,000 |
| f Cosmos Boom Investment Ltd., senior note, Reg S, 0.50%, 6/23/20 | China | 400,000 | | 378,500 |
| | | | | 589,500 |
| Semiconductors & Semiconductor Equipment 0.8% | | | | |
| f Advanced Semiconductor Engineering Inc., senior note, Reg S, | | | | |
| zero cpn., 3/27/18 | Taiwan | 1,200,000 | | 1,135,500 |
| a Intel Corp., junior sub. bond, 3.25%, 8/01/39 | United States | 1,274,000 | | 2,015,315 |
| a Microchip Technology Inc., junior sub. bond, 2.125%, 12/15/37 | United States | 749,000 | | 1,609,882 |
| Micron Technology Inc., senior bond, 3.00%, 11/15/43 | United States | 682,000 | | 499,565 |
| NVIDIA Corp., senior note, 1.00%, 12/01/18 | United States | 1,562,000 | | 3,638,484 |
| Trina Solar Ltd., senior note, 3.50%, 6/15/19 | China | 341,000 | | 281,112 |
| | | | | 9,179,858 |
| Software 1.1% | | | | |
| a Bottomline Technologies de Inc., senior note, 1.50%, 12/01/17 | United States | 988,000 | | 1,034,312 |
| a,c BroadSoft Inc., senior note, 144A, 1.00%, 9/01/22 | United States | 881,000 | | 1,129,332 |
franklintempleton.com
Annual Report
33
FRANKLIN ALTERNATIVE STRATEGIES FUNDS
CONSOLIDATED STATEMENT OF INVESTMENTS
Franklin K2 Alternative Strategies Fund (continued)
| | | | | |
| | | | Principal | | |
| | | Country | Amount* | | Value |
| | Convertible Bonds (continued) | | | | |
| | Software (continued) | | | | |
| | c FireEye Inc., senior bond, 144A, 1.625%, 6/01/35 | United States | 466,000 | $ | 385,324 |
| | a NetSuite Inc., senior note, 0.25%, 6/01/18 | United States | 1,861,000 | | 1,852,858 |
| | Nuance Communications Inc., senior bond, | | | | |
| | 2.75%, 11/01/31 | United States | 557,000 | | 563,614 |
| | c144A, 1.00%, 12/15/35 | United States | 1,203,000 | | 1,081,948 |
| | a Red Hat Inc., senior note, 0.25%, 10/01/19 | United States | 837,000 | | 1,061,944 |
| | a Salesforce.com Inc., senior note, 0.25%, 4/01/18 | United States | 1,021,000 | | 1,382,179 |
| a Take-Two Interactive Software Inc., senior note, 1.00%, 7/01/18 | United States | 2,385,000 | | 4,389,891 |
| | a Workday Inc., senior note, 0.75%, 7/15/18 | United States | 992,000 | | 1,125,300 |
| | | | | | 14,006,702 |
| | Specialty Retail 0.1% | | | | |
| | a,c Restoration Hardware Holdings Inc., senior note, 144A, | | | | |
| | zero cpn., 7/15/20 | United States | 955,000 | | 684,019 |
| | c Vitamin Shoppe Inc., senior note, 144A, 2.25%, 12/01/20 | United States | 344,000 | | 339,915 |
| | | | | | 1,023,934 |
| | Technology Hardware, Storage & Peripherals 0.0%† | | | | |
| | Violin Memory Inc., senior note, 4.25%, 10/01/19 | United States | 99,000 | | 27,968 |
| | Textiles, Apparel & Luxury Goods 0.1% | | | | |
| | a Iconix Brand Group Inc., senior sub. note, 1.50%, 3/15/18 | United States | 1,483,000 | | 1,079,809 |
| | Trading Companies & Distributors 0.1% | | | | |
| | c Kaman Corp., senior note, 144A, 3.25%, 11/15/17 | United States | 397,000 | | 524,288 |
| | Transportation Infrastructure 0.2% | | | | |
| | f DP World Ltd., senior bond, Reg S, 1.75%, 6/19/24 | United Arab Emirates | 1,800,000 | | 1,788,750 |
| | Total Convertible Bonds (Cost $167,131,678) | | | | 172,672,647 |
| | Convertible Bonds in Reorganization 0.0%† | | | | |
| | Semiconductors & Semiconductor Equipment 0.0%† | | | | |
| | g SunEdison Inc., senior note, | | | | |
| | a,c144A, 0.25%, 1/15/20 | United States | 126,000 | | 8,190 |
| | 2.375%, 4/15/22 | United States | 247,000 | | 16,055 |
| | Total Convertible Bonds in Reorganization | | | | |
| | (Cost $341,877) | | | | 24,245 |
| | Corporate Bonds and Notes 17.9% | | | | |
| | Aerospace & Defense 0.1% | | | | |
| | Embraer Netherlands Finance BV, senior bond, 5.05%, 6/15/25 | Brazil | 95,000 | | 94,406 |
| | c Embraer Overseas Ltd., senior bond, 144A, 5.696%, 9/16/23 | Brazil | 90,000 | | 93,038 |
| | c Meccanica Holdings USA Inc., senior bond, 144A, 6.25%, 1/15/40 | Italy | 555,000 | | 541,125 |
| | h Rockwell Collins Inc., senior note, FRN, 0.984%, 12/15/16 | United States | 40,000 | | 40,026 |
| | | | | | 768,595 |
| | Auto Components 0.0%† | | | | |
| | c,h Daimler Finance North America LLC, senior note, 144A, FRN, | | | | |
| | 0.985%, 3/10/17 | Germany | 150,000 | | 149,938 |
| | c Midas Intermediate Holdco II LLC / Midas Intermediate Holdco II Finance | | | | |
| | Inc., senior note, 144A, 7.875%, 10/01/22 | United States | 170,000 | | 163,642 |
| | | | | | 313,580 |
34 Annual Report
franklintempleton.com
FRANKLIN ALTERNATIVE STRATEGIES FUNDS
CONSOLIDATED STATEMENT OF INVESTMENTS
Franklin K2 Alternative Strategies Fund (continued)
| | | | |
| | | Principal | | |
| | Country | Amount* | | Value |
| Corporate Bonds and Notes (continued) | | | | |
| Banks 0.3% | | | | |
| Bank of America Corp., | | | | |
| hsenior note, FRN, 1.668%, 1/15/19 | United States | 20,000 | $ | 20,091 |
| sub. bond, 4.20%, 8/26/24 | United States | 135,000 | | 138,093 |
| sub. bond, Series L, 3.95%, 4/21/25 | United States | 335,000 | | 335,122 |
| c,h,i Credit Agricole SA, junior sub., 144A, FRN, 7.875%, Perpetual | France | 400,000 | | 393,530 |
| HSBC Holdings PLC, senior bond, 4.30%, 3/08/26 | United Kingdom | 350,000 | | 366,687 |
| c Intesa Sanpaolo SpA, sub. bond, 144A, | | | | |
| 5.017%, 6/26/24 | Italy | 955,000 | | 906,455 |
| 5.71%, 1/15/26 | Italy | 460,000 | | 453,053 |
| i Royal Bank of Scotland Group PLC, 8.00% to 8/10/25, FRN | | | | |
| thereafter, Perpetual | United Kingdom | 410,000 | | 404,363 |
| c Santander UK Group Holdings PLC, sub. bond, 144A, 4.75%, 9/15/25 | United Kingdom | 270,000 | | 266,828 |
| c,h,i Societe Generale SA, junior sub., 144A, FRN, 7.875%, Perpetual | France | 750,000 | | 725,274 |
| h Toyota Motor Credit Corp., senior note, FRN, 1.023%, 1/17/19 | United States | 40,000 | | 40,033 |
| | | | | 4,049,529 |
| Beverages 0.0%† | | | | |
| h Anheuser-Busch InBev Finance Inc., senior note, FRN, 0.824%, 1/27/17 | Belgium | 45,000 | | 44,998 |
| h The Coca-Cola Co., senior note, FRN, 0.737%, 11/01/16 | United States | 80,000 | | 80,039 |
| | | | | 125,037 |
| Biotechnology 0.0%† | | | | |
| AbbVie Inc., senior note, 3.60%, 5/14/25 | United States | 315,000 | | 323,373 |
| h Amgen Inc., senior note, FRN, 1.034%, 5/22/17 | United States | 125,000 | | 125,047 |
| | | | | 448,420 |
| Building Products 0.0%† | | | | |
| Owens Corning, senior bond, 4.20%, 12/01/24 | United States | 165,000 | | 169,354 |
| Capital Markets 0.0%† | | | | |
| Brixmor Operating Partnership LP, senior bond, 3.85%, 2/01/25 | United States | 265,000 | | 257,645 |
| Morgan Stanley, sub. bond, 4.35%, 9/08/26 | United States | 150,000 | | 154,928 |
| | | | | 412,573 |
| Chemicals 0.0%† | | | | |
| Albemarle Corp., senior bond, 4.15%, 12/01/24 | United States | 141,000 | | 143,782 |
| c Solvay Finance America LLC, senior bond, 144A, 4.45%, 12/03/25 | Belgium | 200,000 | | 205,385 |
| | | | | 349,167 |
| Commercial Services & Supplies 0.4% | | | | |
| RR Donnelley & Sons Co., | | | | |
| senior bond, 6.00%, 4/01/24 | United States | 3,814,000 | | 3,413,530 |
| senior note, 7.00%, 2/15/22 | United States | 1,565,000 | | 1,521,962 |
| | | | | 4,935,492 |
| Communications Equipment 0.1% | | | | |
| Alcatel-Lucent USA Inc., senior bond, | | | | |
| 6.50%, 1/15/28 | France | 150,000 | | 156,750 |
| 6.45%, 3/15/29 | France | 495,000 | | 527,175 |
| h Cisco Systems Inc., senior note, FRN, 0.966%, 3/03/17 | United States | 100,000 | | 100,188 |
| | | | | 784,113 |
| Construction Materials 0.1% | | | | |
| c Cemex SAB de CV, senior secured bond, 144A, | | | | |
| 7.75%, 4/16/26 | Mexico | 300,000 | | 316,125 |
| first lien, 6.125%, 5/05/25 | Mexico | 365,000 | | 355,875 |
| | | | | 672,000 |
franklintempleton.com
Annual Report
35
FRANKLIN ALTERNATIVE STRATEGIES FUNDS
CONSOLIDATED STATEMENT OF INVESTMENTS
Franklin K2 Alternative Strategies Fund (continued)
| | | | | |
| | | Principal | | | |
| | Country | Amount* | | | Value |
| Corporate Bonds and Notes (continued) | | | | | |
| Consumer Finance 0.0%† | | | | | |
| h Caterpillar Financial Services Corp., senior note, FRN, | | | | | |
| 0.916%, 3/03/17 | United States | 110,000 | | $ | 110,103 |
| 0.806%, 6/09/17 | United States | 300,000 | | | 300,079 |
| c,h Nissan Motor Acceptance Corp., senior note, 144A, FRN, 1.236%, 3/03/17 | Japan | 105,000 | | | 105,064 |
| | | | | | 515,246 |
| Diversified Financial Services 3.4% | | | | | |
| Ally Financial Inc., | | | | | |
| senior note, 4.25%, 4/15/21 | United States | 245,000 | | | 246,225 |
| sub. bond, 5.75%, 11/20/25 | United States | 245,000 | | | 248,981 |
| h American Honda Finance Corp., senior note, FRN, 1.073%, 9/20/17 | United States | 180,000 | | | 180,544 |
| c,h The Bank of Tokyo-Mitsubishi UFJ Ltd., senior note, 144A, FRN, | | | | | |
| 1.652%, 9/14/18 | Japan | 335,000 | | | 335,564 |
| Everi Payments Inc., senior note, 10.00%, 1/15/22 | United States | 8,667,000 | | | 7,193,610 |
| c Financiera de Desarrollo Territorial SA Findeter, senior bond, 144A, | | | | | |
| 7.875%, 8/12/24 | Colombia | 795,000,000 | COP | | 226,978 |
| h Ford Motor Credit Co. LLC, senior note, FRN, 1.413%, 1/17/17 | United States | 40,000 | | | 40,065 |
| General Motors Financial Co. Inc., senior note, 3.70%, 5/09/23 | United States | 220,000 | | | 217,925 |
| c,h Hyundai Capital Services Inc., senior note, 144A, FRN, 1.439%, 3/18/17 | South Korea | 200,000 | | | 199,922 |
| c iPayment Inc., senior note, 144A, 9.50%, 12/15/19 | United States | 10,199,166 | | | 10,301,158 |
| c Ladder Capital Finance Holdings LLP, senior note, 144A, 5.875%, 8/01/21 | United States | 225,000 | | | 198,844 |
| c,j Marfrig Holdings Europe BV, senior note, 144A, 8.00%, 6/08/23 | Brazil | 245,000 | | | 246,642 |
| a NewStar Financial Inc., senior note, 7.25%, 5/01/20 | United States | 3,820,000 | | | 3,566,925 |
| c Opal Acquisition Inc., senior note, 144A, 8.875%, 12/15/21 | United States | 5,541,000 | | | 4,363,537 |
| c Quicken Loans Inc., senior note, 144A, 5.75%, 5/01/25 | United States | 580,000 | | | 552,450 |
| a,c ROC Finance LLC / ROC Finance 1 Corp., secured note, second lien, 144A, | | | | | |
| 12.125%, 9/01/18 | United States | 12,840,000 | | | 13,482,000 |
| h Shell International Finance BV, senior note, FRN, | | | | | |
| 0.836%, 11/15/16 | Netherlands | 80,000 | | | 80,047 |
| 0.95%, 5/10/17 | Netherlands | 390,000 | | | 390,470 |
| | | | | | 42,071,887 |
| Diversified Telecommunication Services 0.1% | | | | | |
| a,c Frontier Communications Corp., senior note, 144A, 11.00%, 9/15/25 | United States | 640,000 | | | 653,600 |
| c Oi SA, senior note, 144A, 9.75%, 9/15/16 | Brazil | 300,000 | BRL | | 21,170 |
| a Sprint Capital Corp., senior bond, 8.75%, 3/15/32 | United States | 1,106,000 | | | 898,625 |
| h Verizon Communications Inc., senior note, FRN, 1.036%, 6/09/17 | United States | 125,000 | | | 125,094 |
| | | | | | 1,698,489 |
| Electric Utilities 0.5% | | | | | |
| h Duke Energy Corp., senior note, FRN, 1.009%, 4/03/17 | United States | 100,000 | | | 99,887 |
| h Duke Energy Progress Inc., secured note, FRN, 0.836%, 3/06/17 | United States | 50,000 | | | 49,906 |
| c Enel SpA, sub. bond, 144A, 8.75% to 9/24/23, FRN thereafter, 9/24/73 | Italy | 745,000 | | | 860,475 |
| GenOn Americas Generation LLC, senior bond, 9.125%, 5/01/31 | United States | 840,000 | | | 596,400 |
| c Real Alloy Holding Inc., senior note, 144A, 10.00%, 1/15/19 | United States | 4,448,000 | | | 4,448,000 |
| | | | | | 6,054,668 |
| Electronic Equipment, Instruments & Components 0.1% | | | | | |
| Avnet Inc., senior bond, 4.625%, 4/15/26 | United States | 100,000 | | | 101,443 |
| Flextronics International Ltd., senior note, 4.75%, 6/15/25 | United States | 235,000 | | | 237,056 |
| Keysight Technologies Inc., senior note, 4.55%, 10/30/24 | United States | 400,000 | | | 399,431 |
| | | | | | 737,930 |
36 Annual Report
franklintempleton.com
FRANKLIN ALTERNATIVE STRATEGIES FUNDS
CONSOLIDATED STATEMENT OF INVESTMENTS
Franklin K2 Alternative Strategies Fund (continued)
| | | | | |
| | | Principal | | | |
| | Country | Amount* | | | Value |
| Corporate Bonds and Notes (continued) | | | | | |
| Energy Equipment & Services 0.3% | | | | | |
| Diamond Offshore Drilling Inc., senior bond, 4.875%, 11/01/43 | United States | 60,000 | | $ | 42,939 |
| Noble Holding International Ltd., senior bond, | | | | | |
| 5.25%, 3/15/42 | United Kingdom | 190,000 | | | 100,225 |
| 7.95%, 4/01/45 | United Kingdom | 270,000 | | | 178,568 |
| Petroleos Mexicanos, | | | | | |
| fsenior bond, Reg S, 6.875%, 8/04/26 | Mexico | 1,007,000 | | | 1,096,724 |
| fsenior note, Reg S, 3.75%, 3/15/19 | Mexico | 217,000 | EUR | | 249,180 |
| senior note, 4.25%, 1/15/25 | Mexico | 581,000 | | | 544,745 |
| Targa Resources Partners LP / Targa Resources Partners Finance Corp., | | | | | |
| senior bond, 6.375%, 8/01/22 | United States | 25,000 | | | 24,937 |
| senior bond, 5.25%, 5/01/23 | United States | 15,000 | | | 14,175 |
| senior bond, 4.25%, 11/15/23 | United States | 350,000 | | | 315,000 |
| csenior note, 144A, 6.75%, 3/15/24 | United States | 590,000 | | | 585,575 |
| Western Refining Logistics LP / WNRL Finance Corp., senior note, | | | | | |
| 7.50%, 2/15/23 | United States | 80,000 | | | 78,200 |
| | | | | | 3,230,268 |
| Food & Staples Retailing 0.2% | | | | | |
| New Albertsons Inc., senior bond, 7.45%, 8/01/29 | United States | 669,000 | | | 648,930 |
| Tesco PLC, senior bond, 5.125%, 4/10/47 | United Kingdom | 1,400,000 | EUR | | 1,487,533 |
| | | | | | 2,136,463 |
| Food Products 0.0%† | | | | | |
| c JBS USA LLC / JBS USA Finance Inc., senior bond, 144A, | | | | | |
| 7.25%, 6/01/21 | United States | 10,000 | | | 10,350 |
| 5.75%, 6/15/25 | United States | 65,000 | | | 62,400 |
| | | | | | 72,750 |
| Gas Utilities 0.0%† | | | | | |
| NGL Energy Partners LP / NGL Energy Finance Corp., senior note, | | | | | |
| 5.125%, 7/15/19 | United States | 230,000 | | | 208,150 |
| 6.875%, 10/15/21 | United States | 30,000 | | | 25,950 |
| | | | | | 234,100 |
| Health Care Equipment & Supplies 0.6% | | | | | |
| Universal Hospital Services Inc., senior note, 7.625%, 8/15/20 | United States | 7,661,000 | | | 7,191,764 |
| Health Care Providers & Services 0.7% | | | | | |
| CHS / Community Health Systems Inc., senior note, 6.875%, 2/01/22 | United States | 3,759,000 | | | 3,249,242 |
| Express Scripts Holding Co., senior bond, 4.50%, 2/25/26 | United States | 370,000 | | | 396,834 |
| IASIS Healthcare LLC / IASIS Capital Corp., senior note, 8.375%, 5/15/19 | United States | 1,702,000 | | | 1,642,430 |
| a Kindred Healthcare Inc., senior note, 8.75%, 1/15/23 | United States | 3,399,000 | | | 3,339,517 |
| c,j MPH Acquisition Holdings LLC, senior note, 144A, 7.125%, 6/01/24 | United States | 270,000 | | | 278,100 |
| | | | | | 8,906,123 |
| Hotels, Restaurants & Leisure 1.3% | | | | | |
| a Caesars Entertainment Resort Properties LLC / Caesars Entertainment Resort | | | | | |
| Properties, secured note, second lien, 11.00%, 10/01/21 | United States | 1,892,000 | | | 1,821,050 |
| Choice Hotels International Inc., senior bond, 5.70%, 8/28/20 | United States | 125,000 | | | 135,000 |
| c Downstream Development Authority of the Quapaw Tribe of Oklahoma, secured | | | | | |
| note, 144A, 10.50%, 7/01/19 | United States | 7,196,000 | | | 6,764,240 |
| c Golden Nugget Escrow Inc., senior note, 144A, 8.50%, 12/01/21 | United States | 4,224,000 | | | 4,403,520 |
| Mohegan Tribal Gaming Authority, senior note, 9.75%, 9/01/21 | United States | 1,853,000 | | | 1,961,864 |
franklintempleton.com
Annual Report
37
FRANKLIN ALTERNATIVE STRATEGIES FUNDS
CONSOLIDATED STATEMENT OF INVESTMENTS
Franklin K2 Alternative Strategies Fund (continued)
| | | | | |
| | | Principal | | | |
| | Country | Amount* | | | Value |
| Corporate Bonds and Notes (continued) | | | | | |
| Hotels, Restaurants & Leisure (continued) | | | | | |
| Wyndham Worldwide Corp., senior bond, 5.10%, 10/01/25 | United States | 400,000 | | $ | 425,707 |
| | | | | | 15,511,381 |
| Household Durables 0.1% | | | | | |
| Sharp Corp., senior note, 1.604%, 9/13/19 | Japan | 100,000,000 | JPY | | 813,945 |
| Household Products 0.0%† | | | | | |
| h The Procter & Gamble Co., senior note, FRN, 0.717%, 11/04/16 | United States | 80,000 | | | 80,027 |
| Independent Power & Renewable Electricity Producers 0.1% | | | | | |
| AES Corp., senior note, 6.00%, 5/15/26 | United States | 285,000 | | | 289,275 |
| GenOn Energy Inc., senior note, | | | | | |
| 9.50%, 10/15/18 | United States | 187,000 | | | 148,198 |
| 9.875%, 10/15/20 | United States | 210,000 | | | 151,725 |
| | | | | | 589,198 |
| Insurance 0.1% | | | | | |
| American International Group Inc., senior bond, 3.90%, 4/01/26 | United States | 475,000 | | | 481,841 |
| f,h Assicurazioni Generali SpA, senior sub. bond, FRN, Reg S, 7.75%, 12/12/42 | Italy | 100,000 | EUR | | 134,421 |
| Old Republic International Corp., senior bond, 4.875%, 10/01/24 | United States | 415,000 | | | 443,997 |
| | | | | | 1,060,259 |
| Life Sciences Tools & Services 1.1% | | | | | |
| inVentiv Health Inc., senior note, | | | | | |
| 10.00%, 8/15/18 | United States | 8,456,000 | | | 8,434,860 |
| 10.00%, 8/15/18 | United States | 995,000 | | | 980,075 |
| c,k 144A, PIK, 10.00%, 8/15/18 | United States | 3,747,626 | | | 3,831,948 |
| | | | | | 13,246,883 |
| Marine 0.0%† | | | | | |
| f PB Issuer No. 3 Ltd., Reg S, 1.875%, 10/22/18 | Hong Kong | 400,000 | | | 389,500 |
| Media 3.7% | | | | | |
| American Media Inc., | | | | | |
| csecured note, second lien, 144A, 7.00%, 7/15/20 | United States | 16,025,058 | | | 17,908,002 |
| senior secured note, first lien, 11.50%, 12/15/17 | United States | 395,000 | | | 404,875 |
| c CCO Holdings LLC / CCO Holdings Capital Corp., senior note, 144A, | | | | | |
| 5.125%, 5/01/23 | United States | 35,000 | | | 35,525 |
| Clear Channel Worldwide Holdings Inc., senior sub. note, Series B, | | | | | |
| 7.625%, 3/15/20 | United States | 1,095,000 | | | 1,056,675 |
| c Cox Communications Inc., senior bond, 144A, | | | | | |
| 4.70%, 12/15/42 | United States | 120,000 | | | 103,636 |
| 4.50%, 6/30/43 | United States | 220,000 | | | 185,336 |
| CSC Holdings LLC, senior bond, 7.625%, 7/15/18 | United States | 245,000 | | | 266,438 |
| DISH DBS Corp., senior note, 5.875%, 11/15/24 | United States | 510,000 | | | 474,619 |
| c Lee Enterprises Inc., senior secured note, first lien, 144A, 9.50%, 3/15/22 | United States | 6,710,000 | | | 6,710,000 |
| The McClatchy Co., senior secured note, first lien, 9.00%, 12/15/22 | United States | 7,751,000 | | | 7,402,205 |
| Postmedia Network Inc., secured note, second lien, 12.50%, 7/15/18 | Canada | 5,922,000 | | | 2,383,605 |
| c Time Inc., senior note, 144A, 5.75%, 4/15/22 | United States | 8,822,000 | | | 8,447,065 |
| Time Warner Cable Inc., senior bond, 4.50%, 9/15/42 | United States | 240,000 | | | 214,631 |
| | | | | | 45,592,612 |
38 Annual Report
franklintempleton.com
FRANKLIN ALTERNATIVE STRATEGIES FUNDS
CONSOLIDATED STATEMENT OF INVESTMENTS
| | | | |
| Franklin K2 Alternative Strategies Fund (continued) | | | | |
| |
| | | Principal | | |
| | Country | Amount* | | Value |
| Corporate Bonds and Notes (continued) | | | | |
| Metals & Mining 0.8% | | | | |
| AK Steel Corp., | | | | |
| senior bond, 7.625%, 5/15/20 | United States | 3,722,000 | $ | 3,005,515 |
| senior bond, 8.375%, 4/01/22 | United States | 3,817,000 | | 2,953,404 |
| senior note, 7.625%, 10/01/21 | United States | 4,977,000 | | 3,838,511 |
| United States Steel Corp., | | | | |
| senior bond, 7.375%, 4/01/20 | United States | 233,000 | | 203,292 |
| senior bond, 7.50%, 3/15/22 | United States | 150,000 | | 117,750 |
| senior note, 6.875%, 4/01/21 | United States | 293,000 | | 228,540 |
| | | | | 10,347,012 |
| Oil, Gas & Consumable Fuels 2.6% | | | | |
| Anadarko Petroleum Corp., senior bond, 4.50%, 7/15/44 | United States | 370,000 | | 315,721 |
| Antero Resources Corp., senior note, | | | | |
| 5.375%, 11/01/21 | United States | 85,000 | | 83,300 |
| 5.125%, 12/01/22 | United States | 345,000 | | 332,063 |
| c Baytex Energy Corp., senior note, 144A, | | | | |
| 5.125%, 6/01/21 | Canada | 10,000 | | 8,150 |
| 5.625%, 6/01/24 | Canada | 495,000 | | 386,100 |
| c Bellatrix Exploration Ltd., senior note, 144A, 8.50%, 5/15/20 | Canada | 150,000 | | 87,000 |
| Bonanza Creek Energy Inc., senior note, | | | | |
| 6.75%, 4/15/21 | United States | 115,000 | | 44,275 |
| 5.75%, 2/01/23 | United States | 415,000 | | 155,625 |
| h BP Capital Markets PLC, senior note, FRN, 1.052%, 11/07/16 | United Kingdom | 80,000 | | 80,055 |
| California Resources Corp., senior note, | | | | |
| 5.50%, 9/15/21 | United States | 85,000 | | 46,325 |
| 6.00%, 11/15/24 | United States | 1,055,000 | | 573,656 |
| c144A, 8.00%, 12/15/22 | United States | 135,000 | | 98,381 |
| Chesapeake Energy Corp., | | | | |
| senior bond, 6.625%, 8/15/20 | United States | 5,000 | | 3,300 |
| senior bond, 6.125%, 2/15/21 | United States | 20,000 | | 12,700 |
| senior note, 5.375%, 6/15/21 | United States | 5,000 | | 3,138 |
| senior note, 4.875%, 4/15/22 | United States | 170,000 | | 102,850 |
| h Chevron Corp., senior note, FRN, 0.796%, 11/15/17 | United States | 145,000 | | 144,650 |
| Concho Resources Inc., senior bond, | | | | |
| 5.50%, 10/01/22 | United States | 75,000 | | 75,375 |
| 5.50%, 4/01/23 | United States | 565,000 | | 567,825 |
| ConocoPhillips, senior bond, 6.50%, 2/01/39 | United States | 325,000 | | 401,343 |
| ConocoPhillips Co., senior bond, 4.95%, 3/15/26 | United States | 310,000 | | 339,939 |
| Continental Resources Inc., | | | | |
| senior bond, 5.00%, 9/15/22 | United States | 1,535,000 | | 1,458,250 |
| senior bond, 4.90%, 6/01/44 | United States | 335,000 | | 277,213 |
| senior note, 4.50%, 4/15/23 | United States | 35,000 | | 32,047 |
| senior note, 3.80%, 6/01/24 | United States | 405,000 | | 355,388 |
| Devon Energy Corp., senior bond, 5.00%, 6/15/45 | United States | 427,000 | | 361,614 |
| c Eclipse Resources Corp., senior note, 144A, 8.875%, 7/15/23 | United States | 335,000 | | 266,325 |
| Enable Midstream Partners LP, senior bond, 5.00%, 5/15/44 | United States | 400,000 | | 299,744 |
| Energy Transfer Equity LP, secured bond, first lien, 7.50%, 10/15/20 | United States | 200,000 | | 205,000 |
| Energy Transfer Partners LP, senior bond, | | | | |
| 5.15%, 3/15/45 | United States | 230,000 | | 195,981 |
| 6.125%, 12/15/45 | United States | 540,000 | | 509,008 |
franklintempleton.com
Annual Report
39
FRANKLIN ALTERNATIVE STRATEGIES FUNDS
CONSOLIDATED STATEMENT OF INVESTMENTS
Franklin K2 Alternative Strategies Fund (continued)
| | | | | |
| | | Principal | | | |
| | Country | Amount* | | | Value |
| Corporate Bonds and Notes (continued) | | | | | |
| Oil, Gas & Consumable Fuels (continued) | | | | | |
| EnLink Midstream Partners LP, senior bond, | | | | | |
| 5.60%, 4/01/44 | United States | 145,000 | | $ | 111,047 |
| 5.05%, 4/01/45 | United States | 245,000 | | | 181,331 |
| Enterprise Products Operating LLC, senior bond, 3.70%, 2/15/26 | United States | 35,000 | | | 35,500 |
| f,h EP PetroEcuador via Noble Sovereign Funding I Ltd., secured note, FRN, Reg S, | | | | | |
| 6.258%, 9/24/19 | Ecuador | 594,632 | | | 566,387 |
| h Exxon Mobil Corp., senior note, FRN, 0.674%, 3/15/17 | United States | 110,000 | | | 109,966 |
| Halcon Resources Corp., | | | | | |
| csecured note, second lien, 144A, 8.625%, 2/01/20 | United States | 410,000 | | | 389,500 |
| senior note, 9.75%, 7/15/20 | United States | 370,000 | | | 74,925 |
| Kinder Morgan Energy Partners LP, senior bond, | | | | | |
| 3.45%, 2/15/23 | United States | 70,000 | | | 65,805 |
| 3.50%, 9/01/23 | United States | 100,000 | | | 93,492 |
| 5.625%, 9/01/41 | United States | 130,000 | | | 116,091 |
| 5.00%, 8/15/42 | United States | 300,000 | | | 253,922 |
| 4.70%, 11/01/42 | United States | 150,000 | | | 123,050 |
| 5.00%, 3/01/43 | United States | 30,000 | | | 25,772 |
| a Kinder Morgan Inc., senior bond, 8.05%, 10/15/30 | United States | 3,439,000 | | | 3,757,902 |
| Marathon Oil Corp., senior bond, 5.20%, 6/01/45 | United States | 345,000 | | | 290,358 |
| Matador Resources Co., senior note, 6.875%, 4/15/23 | United States | 497,000 | | | 501,970 |
| c MEG Energy Corp., 144A, | | | | | |
| senior bond, 6.375%, 1/30/23 | Canada | 180,000 | | | 138,600 |
| senior bond, 7.00%, 3/31/24 | Canada | 425,000 | | | 329,375 |
| senior note, 6.50%, 3/15/21 | Canada | 230,000 | | | 182,275 |
| MPLX LP, | | | | | |
| senior bond, 4.00%, 2/15/25 | United States | 30,000 | | | 26,970 |
| csenior note, 144A, 4.50%, 7/15/23 | United States | 55,000 | | | 52,163 |
| csenior note, 144A, 4.875%, 12/01/24 | United States | 960,000 | | | 908,611 |
| Noble Energy Inc., | | | | | |
| senior bond, 5.25%, 11/15/43 | United States | 255,000 | | | 243,443 |
| senior bond, 5.05%, 11/15/44 | United States | 295,000 | | | 281,240 |
| senior note, 5.625%, 5/01/21 | United States | 50,000 | | | 52,033 |
| Oasis Petroleum Inc., | | | | | |
| senior bond, 6.875%, 1/15/23 | United States | 70,000 | | | 63,525 |
| senior note, 7.25%, 2/01/19 | United States | 10,000 | | | 9,650 |
| senior note, 6.875%, 3/15/22 | United States | 510,000 | | | 471,750 |
| c Pacific Exploration and Production Corp., 144A, | | | | | |
| senior bond, 5.125%, 3/28/23 | Colombia | 200,000 | | | 31,500 |
| senior bond, 5.625%, 1/19/25 | Colombia | 515,000 | | | 81,113 |
| senior note, 5.375%, 1/26/19 | Colombia | 175,000 | | | 27,563 |
| c Parsley Energy LLC / Parsley Finance Corp., senior note, 144A, 6.25%, 6/01/24 | United States | 195,000 | | | 199,388 |
| Petrobras Global Finance BV, | | | | | |
| senior bond, 5.75%, 1/20/20 | Brazil | 240,000 | | | 225,780 |
| senior bond, 5.375%, 1/27/21 | Brazil | 745,000 | | | 660,256 |
| senior bond, 8.75%, 5/23/26 | Brazil | 766,000 | | | 728,849 |
| senior bond, 6.85%, 6/05/15 | Brazil | 3,042,000 | | | 2,068,560 |
| senior note, 4.875%, 3/07/18 | Brazil | 963,000 | EUR | | 1,065,581 |
| senior note, 4.875%, 3/17/20 | Brazil | 3,069,000 | | | 2,779,593 |
| senior note, 8.375%, 5/23/21 | Brazil | 385,000 | | | 381,997 |
| f Petroleos de Venezuela SA, senior bond, Reg S, | | | | | |
| 6.00%, 5/16/24 | Venezuela | 995,000 | | | 328,947 |
| 6.00%, 11/15/26 | Venezuela | 4,735,000 | | | 1,538,401 |
40 Annual Report
franklintempleton.com
FRANKLIN ALTERNATIVE STRATEGIES FUNDS
CONSOLIDATED STATEMENT OF INVESTMENTS
Franklin K2 Alternative Strategies Fund (continued)
| | | | | |
| | | Principal | | | |
| | Country | Amount* | | | Value |
| Corporate Bonds and Notes (continued) | | | | | |
| Oil, Gas & Consumable Fuels (continued) | | | | | |
| Plains All American Pipeline LP / PAA Finance Corp., senior bond, | | | | | |
| 4.70%, 6/15/44 | United States | 464,000 | | $ | 366,119 |
| 4.90%, 2/15/45 | United States | 315,000 | | | 257,834 |
| Regency Energy Partners LP / Regency Energy Finance Corp., senior note, | | | | | |
| 5.75%, 9/01/20 | United States | 75,000 | | | 77,067 |
| Rice Energy Inc., senior note, 6.25%, 5/01/22 | United States | 300,000 | | | 297,000 |
| RSP Permian Inc., senior note, 6.625%, 10/01/22 | United States | 1,250,000 | | | 1,296,875 |
| Sabine Pass Liquefaction LLC, senior secured note, first lien, 5.625%, 3/01/25 | United States | 455,000 | | | 456,706 |
| SM Energy Co., | | | | | |
| senior bond, 6.50%, 1/01/23 | United States | 60,000 | | | 54,913 |
| senior bond, 5.625%, 6/01/25 | United States | 10,000 | | | 8,650 |
| senior note, 6.50%, 11/15/21 | United States | 10,000 | | | 9,400 |
| senior note, 6.125%, 11/15/22 | United States | 220,000 | | | 202,400 |
| senior note, 5.00%, 1/15/24 | United States | 230,000 | | | 197,825 |
| Whiting Petroleum Corp., senior note, | | | | | |
| 6.50%, 10/01/18 | United States | 145,000 | | | 134,850 |
| 5.00%, 3/15/19 | United States | 25,000 | | | 22,625 |
| 5.75%, 3/15/21 | United States | 570,000 | | | 485,925 |
| The Williams Cos Inc., senior bond, 5.75%, 6/24/44 | United States | 605,000 | | | 496,100 |
| Williams Partners LP, senior bond, | | | | | |
| 4.00%, 9/15/25 | United States | 125,000 | | | 108,075 |
| 5.10%, 9/15/45 | United States | 615,000 | | | 498,118 |
| | | | | | 32,367,004 |
| Paper & Forest Products 0.3% | | | | | |
| Resolute Forest Products Inc., senior note, 5.875%, 5/15/23 | United States | 4,346,000 | | | 3,243,202 |
| Pharmaceuticals 0.3% | | | | | |
| c Greatbatch Ltd., senior note, 144A, 9.125%, 11/01/23 | United States | 320,000 | | | 323,200 |
| h Johnson & Johnson, senior note, FRN, 0.744%, 11/28/16 | United States | 20,000 | | | 20,006 |
| h Merck & Co. Inc., senior note, FRN, 0.755%, 2/10/17 | United States | 165,000 | | | 165,056 |
| c Valeant Pharmaceuticals International Inc., senior note, 144A, | | | | | |
| 6.75%, 8/15/18 | United States | 260,000 | | | 255,450 |
| 5.625%, 12/01/21 | United States | 115,000 | | | 97,750 |
| 5.50%, 3/01/23 | United States | 385,000 | | | 321,475 |
| 4.50%, 5/15/23 | United States | 640,000 | EUR | | 551,871 |
| 5.875%, 5/15/23 | United States | 2,150,000 | | | 1,818,094 |
| | | | | | 3,552,902 |
| Professional Services 0.2% | | | | | |
| a,c Altegrity Inc., senior note, first lien, 144A, 9.50%, 7/01/19 | United States | 3,047,000 | | | 2,635,655 |
| Verisk Analytics Inc., senior bond, 5.50%, 6/15/45 | United States | 390,000 | | | 381,225 |
| | | | | | 3,016,880 |
| Real Estate Investment Trusts (REITs) 0.0%† | | | | | |
| Healthcare Realty Trust Inc., senior bond, 3.875%, 5/01/25 | United States | 75,000 | | | 73,378 |
| Host Hotels & Resorts LP, senior bond, 4.00%, 6/15/25 | United States | 175,000 | | | 174,137 |
| | | | | | 247,515 |
franklintempleton.com
Annual Report
41
FRANKLIN ALTERNATIVE STRATEGIES FUNDS
CONSOLIDATED STATEMENT OF INVESTMENTS
Franklin K2 Alternative Strategies Fund (continued)
| | | | |
| | | Principal | | |
| | Country | Amount* | | Value |
| Corporate Bonds and Notes (continued) | | | | |
| Real Estate Management & Development 0.0%† | | | | |
| c Interval Acquisition Corp., senior note, 144A, 5.625%, 4/15/23 | United States | 205,000 | $ | 210,125 |
| c Rialto Holdings LLC / Rialto Corp., senior note, 144A, 7.00%, 12/01/18 | United States | 178,000 | | 176,665 |
| | | | | 386,790 |
| Semiconductors & Semiconductor Equipment 0.1% | | | | |
| Micron Technology Inc., | | | | |
| senior bond, 5.50%, 2/01/25 | United States | 235,000 | | 197,988 |
| csenior bond, 144A, 5.625%, 1/15/26 | United States | 455,000 | | 373,100 |
| csenior note, 144A, 5.25%, 8/01/23 | United States | 270,000 | | 230,175 |
| csenior note, 144A, 5.25%, 1/15/24 | United States | 375,000 | | 316,875 |
| | | | | 1,118,138 |
| Software 0.1% | | | | |
| c Open Text Corp., senior bond, 144A, 5.875%, 6/01/26 | Canada | 1,110,000 | | 1,115,550 |
| h Oracle Corp., senior note, FRN, 0.827%, 7/07/17 | United States | 135,000 | | 135,259 |
| | | | | 1,250,809 |
| Specialty Retail 0.0%† | | | | |
| h Lowe’s Cos. Inc., senior note, FRN, 1.232%, 9/14/18 | United States | 255,000 | | 257,429 |
| Technology Hardware, Storage & Peripherals 0.2% | | | | |
| c,j Diamond 1 Finance Corp. / Diamond 2 Finance Corp., senior secured bond, | | | | |
| first lien, 144A, 6.02%, 6/15/26 | United States | 1,105,000 | | 1,117,036 |
| c Western Digital Corp., senior note, 144A, 10.50%, 4/01/24 | United States | 725,000 | | 752,187 |
| | | | | 1,869,223 |
| Thrifts & Mortgage Finance 0.0%† | | | | |
| Santander Holdings USA Inc., senior bond, 4.50%, 7/17/25 | United States | 475,000 | | 489,912 |
| Trading Companies & Distributors 0.0%† | | | | |
| Air Lease Corp., | | | | |
| senior bond, 4.25%, 9/15/24 | United States | 170,000 | | 172,030 |
| senior note, 3.75%, 2/01/22 | United States | 90,000 | | 91,423 |
| | | | | 263,453 |
| Total Corporate Bonds and Notes (Cost $212,463,093) | | | | 221,571,622 |
| Corporate Bonds and Notes in Reorganization 0.3% | | | | |
| Electric Utilities 0.2% | | | | |
| c,g Energy Future Intermediate Holding Co. LLC / EFIH Finance Inc., senior | | | | |
| note, 144A, 11.25%, 12/01/18 | United States | 3,097,000 | | 2,949,892 |
| Energy Equipment & Services 0.1% | | | | |
| c,g Paragon Offshore PLC, 144A, | | | | |
| senior bond, 7.25%, 8/15/24 | United States | 1,423,000 | | 394,883 |
| senior note, 6.75%, 7/15/22 | United States | 1,841,000 | | 510,877 |
| | | | | 905,760 |
| Oil, Gas & Consumable Fuels 0.0%† | | | | |
| g Linn Energy LLC / Linn Energy Finance Corp., senior bond, 7.75%, 2/01/21 | United States | 895,000 | | 145,438 |
| c,g Ultra Petroleum Corp., 144A, | | | | |
| senior bond, 6.125%, 10/01/24 | United States | 50,000 | | 27,000 |
| senior note, 5.75%, 12/15/18 | United States | 20,000 | | 10,800 |
| | | | | 183,238 |
| Total Corporate Bonds and Notes in Reorganization | | | | |
| (Cost $3,913,093) | | | | 4,038,890 |
42 Annual Report
franklintempleton.com
FRANKLIN ALTERNATIVE STRATEGIES FUNDS
CONSOLIDATED STATEMENT OF INVESTMENTS
Franklin K2 Alternative Strategies Fund (continued)
| | | | | |
| | | Principal | | | |
| | Country | Amount* | | | Value |
| h,l Senior Floating Rate Interests 0.1% | | | | | |
| Auto Components 0.0%† | | | | | |
| Gates Global Inc., Term Loan B, 4.25%, 7/06/21 | United States | 179,361 | $ | | 173,532 |
| Building Products 0.0%† | | | | | |
| Continental Building Products Inc., Term Loan, first lien, 4.00%, 8/28/20 | United States | 45,477 | | | 45,288 |
| Ply Gem Holdings Inc., Term Loan, 4.00%, 2/01/21 | United States | 41,459 | | | 41,520 |
| | | | | | 86,808 |
| Chemicals 0.0%† | | | | | |
| Emerald Performance Materials LLC, Term Loan, first lien, 4.50%, 7/30/21 | United States | 30,938 | | | 30,861 |
| Communications Equipment 0.0%† | | | | | |
| Presidio Holdings, Term Loan B, 5.25%, 2/02/22 | United States | 188,100 | | | 187,600 |
| Diversified Telecommunication Services 0.0%† | | | | | |
| Integra Telecom, Term Loan, 5.25%, 8/14/20 | United States | 223,247 | | | 216,132 |
| Electric Utilities 0.0%† | | | | | |
| Power Buyer LLC, Delayed Draw, Term Loan, 4.25%, 5/06/20 | United States | 66,599 | | | 66,599 |
| Health Care Providers & Services 0.0%† | | | | | |
| Universal Services, Delayed Draw, Term Loan, 4.75%, 7/28/22 | United States | 119,700 | | | 117,705 |
| Insurance 0.0%† | | | | | |
| Hyperion Insurance Group Ltd., Term Loan B, 5.50%, 4/29/22 | United States | 44,550 | | | 43,436 |
| IT Services 0.0%† | | | | | |
| Aptean Inc., Term Loan, first lien, 5.25%, 2/26/20 | United States | 49,000 | | | 48,755 |
| Leisure Products 0.0%† | | | | | |
| SRAM LLC, Term Loan, first lien guaranteed, senior secured, 5.50%, 4/10/20 | United States | 34,762 | | | 30,851 |
| Machinery 0.0%† | | | | | |
| North American Lifting Holdings Inc., Initial Term Loan, 5.50%, 11/27/20 | United States | 15,657 | | | 11,703 |
| Onsite Rental Group Ltd., Term Loan B, 5.50%, 7/30/21 | United States | 117,202 | | | 88,488 |
| | | | | | 100,191 |
| Oil, Gas & Consumable Fuels 0.0%† | | | | | |
| Energy Transfer Equity LP, Term Loan 2013, 3.25%, 12/02/19 | United States | 33,128 | | | 32,093 |
| Energy Transfer Partners LP, Term Loan C, 4.00%, 12/02/19 | United States | 39,998 | | | 39,048 |
| OSG Bulk Ships, Term Loan B, 5.25%, 8/05/19 | United States | 9,462 | | | 9,450 |
| Southcross Energy Partners LP, senior secured, Term Loan B, first lien | | | | | |
| guaranteed, 5.25%, 8/04/21 | United States | 29,623 | | | 24,272 |
| | | | | | 104,863 |
| Retailing 0.0%† | | | | | |
| Talbots Inc., Initial Term Loan, first lien, 5.50%, 3/19/20 | United States | 66,882 | | | 65,084 |
| Technology Hardware, Storage & Peripherals 0.1% | | | | | |
| Western Digital Corp., Term Loan, 6.25%, 4/29/23 | United States | 420,000 | | | 419,935 |
| Total Senior Floating Rate Interests (Cost $1,732,915) | | | | | 1,692,352 |
| Foreign Government and Agency Securities 2.3% | | | | | |
| Government of Argentina, | | | | | |
| fsenior bond, Reg S, 6.875%, 4/22/21 | Argentina | 230,000 | | | 241,500 |
| csenior bond, 144A, 6.875%, 4/22/21 | Argentina | 250,000 | | | 262,625 |
| fsenior bond, Reg S, 7.50%, 4/22/26 | Argentina | 273,000 | | | 287,196 |
| senior bond, 7.82%, 12/31/33 | Argentina | 3,700,343 | EUR | 4,179,117 |
| fsenior bond, Reg S, 7.625%, 4/22/46 | Argentina | 213,000 | | | 218,325 |
franklintempleton.com
Annual Report
43
FRANKLIN ALTERNATIVE STRATEGIES FUNDS
CONSOLIDATED STATEMENT OF INVESTMENTS
Franklin K2 Alternative Strategies Fund (continued)
| | | | | |
| | | Principal | | | |
| | Country | Amount* | | | Value |
| Foreign Government and Agency Securities (continued) | | | | | |
| Government of Argentina, (continued) | | | | | |
| senior note, 8.75%, 6/02/17 | Argentina | 2,083,173 | | $ | 2,197,747 |
| f Government of Bahrain, senior note, Reg S, 7.00%, 1/26/26 | Bahrain | 543,000 | | | 543,067 |
| Government of Brazil, senior bond, 6.00%, 4/07/26 | Brazil | 1,521,000 | | | 1,543,815 |
| f Government of Cyprus, senior note, Reg S, 3.875%, 5/06/22 | Cyprus | 942,000 | EUR | | 1,078,087 |
| Government of Hellenic Republic, | | | | | |
| fsenior bond, Reg S, 3.00% to 2/24/20, 3.65% to 2/24/21, 4.30% thereafter, | | | | | |
| 2/24/42 | Greece | 4,602,800 | EUR | | 3,501,104 |
| csenior note, 144A, 3.375%, 7/17/17 | Greece | 4,306,000 | EUR | | 4,606,399 |
| csenior note, 144A, 4.75%, 4/17/19 | Greece | 2,779,000 | EUR | | 2,891,773 |
| Government of Hungary, senior bond, 5.375%, 2/21/23 | Hungary | 972,000 | | | 1,071,091 |
| f Government of Iraq, senior bond, Reg S, 5.80%, 1/15/28 | Iraq | 1,064,000 | | | 778,050 |
| Government of Mexico, senior bond, 4.00%, 10/02/23 | Mexico | 1,140,000 | | | 1,191,300 |
| f Government of Pakistan, senior note, Reg S, 6.75%, 12/03/19 | Pakistan | 1,392,000 | | | 1,460,401 |
| f Government of Paraguay, senior note, Reg S, 4.625%, 1/25/23 | Paraguay | 945,000 | | | 970,987 |
| f Government of Sri Lanka, senior note, Reg S, 6.85%, 11/03/25 | Sri Lanka | 1,072,000 | | | 1,032,077 |
| Total Foreign Government and Agency Securities | | | | | |
| (Cost $25,213,272) | | | | | 28,054,661 |
| Asset-Backed Securities and Commercial | | | | | |
| Mortgage-Backed Securities 1.9% | | | | | |
| Airlines 0.1% | | | | | |
| c Air Canada 2015-2 Class B Pass Through Trust, third lien note, 144A, | | | | | |
| 5.00%, 6/15/25 | Canada | 505,000 | | | 493,006 |
| c Latam Airlines, 2015-1 Pass Through Trust B, 144A, 4.50%, 11/15/23 | Chile | 953,254 | | | 843,630 |
| | | | | | 1,336,636 |
| Banks 0.1% | | | | | |
| Capital One Multi-Asset Execution Trust, | | | | | |
| 2013-A3, 0.96%, 9/16/19 | United States | 100,000 | | | 100,073 |
| 2014-A2, 1.26%, 1/15/20 | United States | 40,000 | | | 40,080 |
| 2014-A5, 1.48%, 7/15/20 | United States | 90,000 | | | 90,462 |
| 2015-A7, 1.45%, 8/16/21 | United States | 400,000 | | | 401,714 |
| h Wells Fargo Mortgage Backed Securities 2003-M Trust, A1, FRN, | | | | | |
| 2.787%, 12/25/33 | United States | 35,285 | | | 35,362 |
| h Wells Fargo Mortgage Backed Securities 2004-0 Trust, A1, FRN, | | | | | |
| 2.743%, 8/25/34 | United States | 14,437 | | | 14,345 |
| Wells Fargo Mortgage Backed Securities 2005-16 Trust, A18, 6.00%, 1/25/36 | United States | 7,253 | | | 7,182 |
| h Wells Fargo Mortgage Backed Securities 2005-AR10 Trust, 2A4, FRN, | | | | | |
| 2.849%, 6/25/35 | United States | 21,720 | | | 21,757 |
| | | | | | 710,975 |
| Commercial Services & Supplies 0.0%† | | | | | |
| c Shenton Aircraft Investment I Ltd., Series 2015-A, 144A, 4.75%, 10/15/42 | Cayman Islands | 333,514 | | | 326,844 |
| Consumer Finance 0.1% | | | | | |
| American Express Credit Account Master Trust, | | | | | |
| hSeries 2012-A, FRN, 0.704%, 1/15/20 | United States | 100,000 | | | 100,146 |
| Series 2013-A, 0.98%, 5/15/19 | United States | 100,000 | | | 100,065 |
| Series 2014-A, 1.26%, 1/15/20 | United States | 100,000 | | | 100,269 |
| Series 2014-A, 1.49%, 4/15/20 | United States | 100,000 | | | 100,527 |
| hSeries 2014-A, FRN, 0.724%, 5/15/20 | United States | 100,000 | | | 100,211 |
44 Annual Report
franklintempleton.com
FRANKLIN ALTERNATIVE STRATEGIES FUNDS
CONSOLIDATED STATEMENT OF INVESTMENTS
Franklin K2 Alternative Strategies Fund (continued)
| | | | | |
| | | | Principal | | |
| | | Country | Amount* | | Value |
| Asset-Backed Securities and Commercial | | | | | |
| Mortgage-Backed Securities (continued) | | | | | |
| Consumer Finance (continued) | | | | | |
| h Bank of America Credit Card Trust, FRN, | | | | | |
| A, 0.704%, 9/16/19 | | United States | 120,000 | $ | 120,179 |
| A, 0.814%, 6/15/21 | | United States | 100,000 | | 100,240 |
| A3, 0.724%, 1/15/20 | | United States | 100,000 | | 100,192 |
| | | | | | 821,829 |
| Diversified Financial Services 1.4% | | | | | |
| c AIM Aviation Finance Ltd., Series 2015-B1, 144A, 5.072%, 2/15/40 | | Cayman Islands | 341,518 | | 322,094 |
| h Alliance Bancorp 2007-OA1 Trust, A1, FRN, 0.686%, 7/25/37 | | United States | 360,686 | | 256,385 |
| Ally Auto Receivables 2016-3 Trust, A3, 1.44%, 8/17/20 | | United States | 180,000 | | 180,072 |
| h American Home Mortgage Investment 2006-1 Trust, 11A1, FRN, | | | | | |
| 0.726%, 3/25/46 | | United States | 351,776 | | 283,321 |
| Banc of America Alternative Loan 2003-10 Trust, 3A1, 5.50%, 12/25/33 | | United States | 193,834 | | 196,152 |
| Banc of America Alternative Loan 2003-8 Trust, 1CB1, 5.50%, 10/25/33 | | United States | 11,943 | | 12,085 |
| Banc of America Alternative Loan 2004-9 Trust, 2CB1, 6.00%, 10/25/34 | | United States | 12,683 | | 12,764 |
| Banc of America Alternative Loan 2005-6 Trust, CB7, 5.25%, 7/25/35 | | United States | 23,570 | | 21,465 |
| h Banc of America Funding 2004-B Trust, 1A2, FRN, 2.907%, 12/20/34 | | United States | 84,821 | | 78,404 |
| Banc of America Funding 2005-5 Trust, 1A1, 5.50%, 9/25/35 | | United States | 21,929 | | 22,817 |
| Banc of America Funding 2007-4 Trust, 5A1, 5.50%, 11/25/34 | | United States | 210,528 | | 209,162 |
| h Banc of America Mortgage 2005-A Trust, 2A1, FRN, 2.949%, 2/25/35 | | United States | 13,114 | | 12,674 |
| h Bear Stearns ARM 2004-6 Trust, 2A1, FRN, 3.027%, 9/25/34 | | United States | 86,826 | | 80,128 |
| h Bear Stearns ARM 2005-12 Trust, 11A1, FRN, 2.816%, 2/25/36 | | United States | 26,867 | | 20,808 |
| c,h BLCP Hotel Trust 2014-CLRN, E, 144A, FRN, 4.104%, 8/15/29 | | United States | 100,000 | | 96,451 |
| BMW Vehicle Owner Trust, | | | | | |
| 2013-A3, 0.67%, 11/27/17 | | United States | 13,428 | | 13,419 |
| 2014-A3, 0.97%, 11/26/18 | | United States | 65,618 | | 65,619 |
| BXHT 2015-DRMZ Mortgage Trust, 8.634%, 7/15/29 | | United States | 239,031 | | 235,370 |
| c CAM Mortgage 2016-1 Trust, 144A, | | | | | |
| A, 4.00%, 1/15/56 | | United States | 97,612 | | 97,543 |
| hM, FRN, 5.00%, 1/15/56 | | United States | 150,000 | | 145,862 |
| c CAM Mortgage LLC, 144A, | | | | | |
| h2015-1, M, FRN, 4.75%, 7/15/64 | | United States | 100,000 | | 97,255 |
| 2015-A, 3.50%, 7/15/64 | | United States | 94,813 | | 95,127 |
| c CCRESG Commercial Mortgage 2016-HEAT Trust, D, 144A, 5.488%, 4/10/29 | | United States | 100,000 | | 100,262 |
| Chase Issuance Trust, | | | | | |
| hA5, FRN, 0.804%, 4/15/21 | | United States | 120,000 | | 120,077 |
| A8, 1.01%, 10/15/18 | | United States | 100,000 | | 100,076 |
| Series 2014-A6, 1.26%, 7/15/19 | | United States | 100,000 | | 100,243 |
| hSeries 2014-A8, FRN, 0.684%, 11/15/18 | | United States | 85,000 | | 85,064 |
| hSeries 2015-A1, FRN, 0.754%, 2/18/20 | | United States | 110,000 | | 110,249 |
| Series 2015-A2, 1.59%, 2/18/20 | | United States | 135,000 | | 135,946 |
| Series 2015-A7, 1.62%, 7/15/20 | | United States | 300,000 | | 302,504 |
| c CLI Funding LLC, 2014-2A, 144A, 3.38%, 10/18/29 | | United States | 84,111 | | 80,256 |
| c Colony American Homes, 144A, | | | | | |
| h2014-1, FRN, 2.584%, 5/17/31 | | United States | 110,000 | | 107,687 |
| h2014-2, FRN, 2.793%, 7/17/31 | | United States | 300,000 | | 296,029 |
| h2014-2, FRN, 3.64%, 7/17/31 | | United States | 100,000 | | 95,535 |
| 2015-1, D, 5.649%, 10/15/47 | | Cayman Islands | 115,000 | | 112,263 |
| h2015-D, FRN, 2.584%, 7/17/32 | | United States | 200,000 | | 193,316 |
| c,h COMM 2014-SAVA Mortgage Trust, 2014-C, 144A, FRN, 2.835%, 6/15/34 | | United States | 100,000 | | 98,221 |
franklintempleton.com
Annual Report
45
F R A N K L I N A L T E R N A T I V E S T R A T E G I E S F U N D S
C O N S O L I D A T E D S T A T E M E N T O F I N V E S T M E N T S |
| Franklin K2 Alternative Strategies Fund (continued) |
| | | | | Principal | | | | |
| | | Country | | Amount* | | | | Value |
| |
| |
| |
| |
|
| Asset-Backed Securities and Commercial | | | | | | | | |
| Mortgage-Backed Securities (continued) | | | | | | | | |
| Diversified Financial Services (continued) | | | | | | | | |
| Countrywide Alternative Loan Trust, | | | | | | | | |
| 2003-2A1, 5.75%, 10/25/33 | | United States | | 24,957 | | $ | | 25,838 |
| 2003-A7, 5.50%, 7/25/33 | | United States | | 25,310 | | | | 25,146 |
| 2004-1A1, 5.50%, 4/25/34 | | United States | | 58,058 | | | | 59,168 |
| 2004-5A1, 5.75%, 1/25/35 | | United States | | 10,834 | | | | 10,958 |
| 2005-2A1, 5.50%, 2/25/25 | | United States | | 11,279 | | | | 11,525 |
| h 2005-2A1, FRN, 0.656%, 5/25/35 | | United States | | 64,576 | | | | 52,254 |
| h Countrywide Home Loans Mortgage Pass-Through 2004-12 Trust, 8A1, FRN, | | | | | | | | |
| 2.969%, 8/25/34 | | United States | | 18,967 | | | | 16,775 |
| h Countrywide Home Loans Mortgage Pass-Through 2004-HYB4 Trust, 2A1, FRN, | | | | | | | | |
| 2.712%, 9/20/34 | | United States | | 148,360 | | | | 142,987 |
| Countrywide Home Loans Mortgage Pass-Through 2005-21 Trust, A17, | | | | | | | | |
| 5.50%, 10/25/35 | | United States | | 18,387 | | | | 17,150 |
| c CPS Auto Receivables 2014-B Trust, D, 144A, 4.62%, 5/15/20, B | | United States | | 110,000 | | | | 104,325 |
| c CPS Auto Receivables 2016-B Trust, E, 144A, 8.14%, 5/15/23, B | | United States | | 500,000 | | | | 499,763 |
| c,h Credit Suisse Mortgage Capital Certificates, 2015-A, 144A, FRN, | | | | | | | | |
| 1.684%, 3/15/17 | | United States | | 110,000 | | | | 109,523 |
| Deutsche Alt-A Securities Inc. Mortgage Loan 2005-3 Trust, 4A4, | | | | | | | | |
| 5.25%, 6/25/35 | | United States | | 883 | | | | 883 |
| h Deutsche Alt-A Securities Inc. Mortgage Loan 2005-5 Trust, 1A4, FRN, | | | | | | | | |
| 5.50%, 11/25/35 | | United States | | 13,028 | | | | 12,421 |
| h Discover Card Execution Note Trust, A1, FRN, 0.784%, 8/17/20 | | United States | | 210,000 | | | | 210,583 |
| h DSLA Mortgage Loan 2005-AR5 Trust, 2A1A, FRN, 0.769%, 9/19/45 | | United States | | 71,247 | | | | 51,759 |
| c DT Auto Owner 2014-3 Trust, D, 144A, 4.47%, 11/15/21 | | United States | | 50,000 | | | | 50,518 |
| c DT Auto Owner 2016-1 Trust, D, 144A, 4.66%, 12/15/22 | | United States | | 180,000 | | | | 175,958 |
| c DT Auto Owner 2016-2 Trust, D, 144A, 5.43%, 11/15/22 | | United States | | 240,000 | | | | 238,993 |
| c,h Extended Stay America 2013-ESH Trust, D7, 144A, FRN, 4.036%, 12/05/31 | | United States | | 220,000 | | | | 221,583 |
| c First Investors Auto Owner 2016-1 Trust, D, 144A, 4.70%, 4/18/22 | | United States | | 110,000 | | | | 107,410 |
| Ford Credit Auto Owner Trust, | | | | | | | | |
| c 2014-A, 144A, 2.31%, 4/15/26 | | United States | | 100,000 | | | | 101,548 |
| 2014-A3, 0.90%, 10/15/18 | | United States | | 83,179 | | | | 83,162 |
| 2014-A3, 1.06%, 5/15/19 | | United States | | 55,000 | | | | 55,014 |
| 2015-A3, 1.28%, 9/15/19 | | United States | | 85,000 | | | | 85,199 |
| 2015-A3, 1.41%, 2/15/20 | | United States | | 396,000 | | | | 397,261 |
| h Freddie Mac Structured Agency Credit Risk Debt Notes, FRN, | | | | | | | | |
| 2013-M2, 4.696%, 11/25/23 | | United States | | 250,000 | | | | 253,386 |
| 2015-M2, 2.296%, 10/25/27 | | United States | | 250,000 | | | | 249,629 |
| 2015-M3, 3.746%, 10/25/27 | | United States | | 250,000 | | | | 244,820 |
| h GMACM Mortgage Loan 2005-AR4 Trust, 3A1, FRN, 3.223%, 7/19/35 | | United States | | 241,164 | | | | 219,514 |
| c,h GP Portfolio 2014-GGP Trust, A, 144A, FRN, 1.384%, 2/15/27 | | United States | | 75,976 | | | | 75,438 |
| GSR Mortgage Loan 2005-4F Trust, 6A1, 6.50%, 2/25/35 | | United States | | 35,789 | | | | 35,992 |
| h GSR Mortgage Loan 2005-AR6 Trust, 4A5, FRN, 2.806%, 9/25/35 | | United States | | 210,072 | | | | 209,704 |
| h Harborview Mortgage Loan 2004-2 Trust, 1A1, FRN, 0.959%, 6/19/34 | | United States | | 190,013 | | | | 162,659 |
| h Harborview Mortgage Loan Trust, 1A, FRN, 0.809%, 10/19/33 | | United States | | 139,535 | | | | 130,807 |
| c Hilton USA 2013-HLT Trust, CFX, 144A, 3.714%, 11/05/30 | | United States | | 100,000 | | | | 100,486 |
| Honda Auto Receivables 2013-4 Owner Trust, A3, 0.69%, 9/18/17 | | United States | | 10,803 | | | | 10,798 |
| Honda Auto Receivables 2014-2 Owner Trust, A3, 0.77%, 3/19/18 | | United States | | 58,259 | | | | 58,213 |
| Honda Auto Receivables 2014-3 Owner Trust, | | | | | | | | |
| A3, 0.88%, 6/15/18 | | United States | | 37,262 | | | | 37,252 |
| A4, 1.31%, 10/15/20 | | United States | | 30,000 | | | | 30,054 |
| Honda Auto Receivables 2014-4 Owner Trust, A3, 0.99%, 9/17/18 | | United States | | 52,446 | | | | 52,448 |
F R A N K L I N A L T E R N A T I V E S T R A T E G I E S F U N D S
C O N S O L I D A T E D S T A T E M E N T O F I N V E S T M E N T S |
Franklin K2 Alternative Strategies Fund (continued)
| | | | | Principal | | | | |
| | | Country | | Amount* | | | | Value |
| |
| |
| |
| |
|
| Asset-Backed Securities and Commercial | | | | | | | | |
| Mortgage-Backed Securities (continued) | | | | | | | | |
| Diversified Financial Services (continued) | | | | | | | | |
| Honda Auto Receivables 2015-1 Owner Trust, A3, 1.05%, 10/15/18 | | United States | | 60,000 | | $ | | 60,011 |
| Honda Auto Receivables 2015-2 Owner Trust, A3, 1.04%, 2/21/19 | | United States | | 400,000 | | | | 399,939 |
| Honda Auto Receivables 2015-3 Owner Trust, A3, 1.27%, 4/18/19 | | United States | | 135,000 | | | | 135,210 |
| Honda Auto Receivables 2015-4 Owner Trust, A3, 1.23%, 9/23/19 | | United States | | 390,000 | | | | 389,973 |
| Honda Auto Receivables 2016-2 Owner Trust, A3, 1.39%, 4/15/20 | | United States | | 180,000 | | | | 179,997 |
| Hyundai Auto Receivables 2014-4 Owner Trust, A3, 0.79%, 7/16/18 | | United States | | 57,108 | | | | 57,076 |
| Hyundai Auto Receivables 2015-A Owner Trust, A3, 1.05%, 4/15/19 | | United States | | 55,000 | | | | 55,008 |
| Hyundai Auto Receivables 2015-B Owner Trust, A3, 1.12%, 11/15/19 | | United States | | 230,000 | | | | 229,863 |
| h IndyMac Mortgage Loan 2005-AR11 Trust, A3, FRN, 2.718%, 8/25/35 | | United States | | 99,215 | | | | 82,102 |
| c,h Invitation Homes 2014-SFR1 Trust, D, 144A, FRN, 3.034%, 6/17/31 | | United States | | 160,000 | | | | 158,419 |
| c,h Invitation Homes Trust, B, 144A, FRN, 1.934%, 6/17/31 | | United States | | 100,000 | | | | 98,609 |
| h JP Morgan Alternative Loan 2006-A1 Trust, 3A1, FRN, 2.747%, 3/25/36 | | United States | | 85,888 | | | | 71,598 |
| c,h JP Morgan Chase Commercial Mortgage Securities 2015-SGP Trust, D, 144A, | | | | | | | | |
| FRN, 4.934%, 7/15/36 | | United States | | 180,000 | | | | 176,848 |
| h JP Morgan Mortgage 2003-A2 Trust, 3A1, FRN, 2.468%, 11/25/33 | | United States | | 17,955 | | | | 17,095 |
| JP Morgan Mortgage 2004-S1 Trust, 2A1, 6.00%, 9/25/34 | | United States | | 195,148 | | | | 197,587 |
| h JP Morgan Mortgage 2005-A1 Trust, 6T1, FRN, 2.873%, 2/25/35 | | United States | | 31,670 | | | | 30,122 |
| h JP Morgan Mortgage 2005-A3 Trust, 4A1, FRN, 2.816%, 6/25/35 | | United States | | 14,333 | | | | 14,386 |
| JP Morgan Mortgage 2005-S3 Trust, 1A11, 6.00%, 1/25/36 | | United States | | 208,516 | | | | 167,421 |
| h JP Morgan Mortgage 2006-A1 Trust, 1A2, FRN, 2.669%, 2/25/36 | | United States | | 52,551 | | | | 46,607 |
| h JP Morgan Mortgage 2006-A7 Trust, 2A4, FRN, 2.791%, 1/25/37 | | United States | | 42,631 | | | | 37,846 |
| h JP Morgan Mortgage 2007-A1 Trust, 4A2, FRN, 2.714%, 7/25/35 | | United States | | 10,348 | | | | 10,348 |
| JP Morgan Mortgage 2007-S1 Trust, 2A22, 5.75%, 3/25/37 | | United States | | 64,283 | | | | 52,041 |
| h Lehman XS Trust Series, A2A, FRN, 0.666%, 4/25/46 | | United States | | 98,454 | | | | 68,680 |
| h Merrill Lynch Mortgage Investors MLCC, FRN, | | | | | | | | |
| 2006-1A, 2.677%, 2/25/36 | | United States | | 155,649 | | | | 144,023 |
| 2006-2A, 2.515%, 5/25/36 | | United States | | 14,874 | | | | 14,386 |
| c,h Morgan Stanley Capital I 2011-C2 Trust, E, 144A, FRN, 5.465%, 6/15/44 | | United States | | 150,000 | | | | 152,009 |
| c Motel 6 2015-M6MZ Trust, M, 144A, 8.23%, 2/05/20 | | United States | | 996,109 | | | | 953,874 |
| National City Mortgage Capital 2008-1 Trust, 2A1, 6.00%, 3/25/38 | | United States | | 71,617 | | | | 74,743 |
| h New York Mortgage 2006-1 Trust, 2A2, FRN, 2.952%, 5/25/36 | | United States | | 36,293 | | | | 32,659 |
| Nissan Auto Lease 2014-B Trust, A3, 1.12%, 9/15/17 | | United States | | 45,000 | | | | 45,036 |
| Nissan Auto Receivables 2013-C Owner Trust, A3, 0.67%, 8/15/18 | | United States | | 11,623 | | | | 11,607 |
| Nissan Auto Receivables 2015-C Owner Trust, A3, 1.37%, 5/15/20 | | United States | | 400,000 | | | | 401,005 |
| h Ocwen Loan Servicing LLC, MASTR Adjustable Rate Mortgages 2004-7 Trust, | | | | | | | | |
| 3A1, FRN, 2.644%, 7/25/34 | | United States | | 54,562 | | | | 52,919 |
| Ocwen Loan Servicing LLC, MASTR Alternative Loan 2004-8 Trust, 2A1, | | | | | | | | |
| 6.00%, 9/25/34 | | United States | | 107,142 | | | | 111,259 |
| c OneMain Financial Issuance 2015-1 Trust, A, 144A, 3.19%, 3/18/26 | | United States | | 150,000 | | | | 151,136 |
| c OneMain Financial Issuance 2015-3 Trust, B, 144A, 4.16%, 11/20/28 | | United States | | 155,000 | | | | 145,980 |
| c OneMain Financial Issuance 2016-2 Trust, B, 144A, 5.94%, 3/20/28 | | United States | | 235,000 | | | | 239,616 |
| c Prestige Auto Receivables 2016-1 Trust, E, 144A, 7.69%, 3/15/23 | | United States | | 200,000 | | | | 200,970 |
| c,h RCO Depositor II LLC 2015-2A Trust, FRN, 144A, | | | | | | | | |
| A, 4.50%, 11/25/45 | | United States | | 156,001 | | | | 156,374 |
| M, 5.00%, 11/25/45 | | United States | | 213,000 | | | | 204,106 |
| h RFMSI Series 2005-SA1 Trust, 1A1, FRN, 3.793%, 3/25/35 | | United States | | 151,857 | | | | 116,678 |
| c,h SCG Trust 2013-SRP1, FRN, 144A, | | | | | | | | |
| A, 1.834%, 11/15/26 | | United States | | 100,000 | | | | 99,889 |
| B, 2.934%, 11/15/26 | | United States | | 100,000 | | | | 98,140 |
| C, 3.684%, 11/15/26 | | United States | | 100,000 | | | | 97,315 |
| D, 3.778%, 11/15/26 | | United States | | 245,000 | | | | 230,358 |
F R A N K L I N A L T E R N A T I V E S T R A T E G I E S F U N D S
C O N S O L I DAT E D S T A T E M E N T O F I N V E S T M E N T S |
| Franklin K2 Alternative Strategies Fund (continued) | | | | | | | | |
| |
| | | | | Principal | | | | |
| | | Country | | Amount* | | | | Value |
| |
| |
| |
| |
|
| Asset-Backed Securities and Commercial | | | | | | | | |
| Mortgage-Backed Securities (continued) | | | | | | | | |
| Diversified Financial Services (continued) | | | | | | | | |
| c Sierra Timeshare 2013-3 Receivables Funding LLC, A, 144A, 2.20%, 10/20/30 | | United States | | 53,907 | | $ | | 53,836 |
| c Sofi Professional Loan Program 2016-A LLC, B, 144A, 3.57%, 1/26/38 | | United States | | 230,000 | | | | 225,246 |
| h Structured Adjustable Rate Mortgage Loan Trust, FRN, | | | | | | | | |
| 1A, 2.638%, 6/25/34 | | United States | | 25,118 | | | | 24,518 |
| 7A3, 2.838%, 9/25/34 | | United States | | 46,192 | | | | 45,864 |
| Structured Asset Securities Corp. 2005-1 Trust, 7A7, 5.50%, 2/25/35 | | United States | | 21,608 | | | | 21,979 |
| c TAL Advantage V LLC, A, 144A, 3.55%, 11/20/38 | | United States | | 75,000 | | | | 72,272 |
| Toyota Auto Receivables 2014-C Owner Trust, A3, 0.93%, 7/16/18 | | United States | | 36,108 | | | | 36,110 |
| Toyota Auto Receivables 2015-B Owner Trust, A3, 1.27%, 5/15/19 | | United States | | 255,000 | | | | 255,379 |
| Toyota Auto Receivables 2015-C Owner Trust, A3, 1.34%, 6/17/19 | | United States | | 135,000 | | | | 135,388 |
| USAA Auto Owner 2015-1 Trust, A3, 1.20%, 6/17/19 | | United States | | 150,000 | | | | 150,222 |
| c VOLT LLC, 2015-NPL2 A1, 144A, 3.375%, 2/25/55 | | United States | | 77,622 | | | | 76,765 |
| h WaMu Mortgage Pass-Through Certificates Series 2007-HY5 Trust, 2A3, FRN, | | | | | | | | |
| 2.30%, 5/25/37 | | United States | | 159,520 | | | | 132,692 |
| h Wells Fargo Bank, N. A. , Adjustable Rate Mortgage 2004-4 Trust, 3A1, FRN, | | | | | | | | |
| 3.008%, 3/25/35 | | United States | | 55,052 | | | | 53,592 |
| c,h WF-RBS Commercial Mortgage 2012-C6 Trust, D, 144A, FRN, 5.56%, 4/15/45 | | United States | | 150,000 | | | | 151,580 |
| World Financial Network Credit Card Master Trust, | | | | | | | | |
| h 2015-A, FRN, 0.914%, 2/15/22 | | United States | | 120,000 | | | | 119,981 |
| 2015-C, 1.26%, 3/15/21 | | United States | | 400,000 | | | | 399,967 |
| | | | | | |
| |
|
| | | | | | | | | 17,757,868 |
| | | | | | |
| |
|
| Other ABS 0.0% | | | | | | | | |
| c Oak Hill Advisors Residential Loan 2015-NPL2 Trust, A1, 144A, | | | | | | | | |
| 3.721%, 7/25/55 | | United States | | 99,503 | | | | 98,880 |
| | | | | | |
| |
|
| Real Estate Investment Trusts (REITs) 0.1% | | | | | | | | |
| c American Homes 4 Rent, 144A, | | | | | | | | |
| h 2014-E, FRN, 2.934%, 6/17/31 | | United States | | 100,000 | | | | 96,434 |
| 2014-E, 6.231%, 10/17/36 | | United States | | 250,000 | | | | 254,217 |
| 2014-E, 6.418%, 12/17/36 | | United States | | 100,000 | | | | 106,952 |
| 2015-E, 5.639%, 4/17/52 | | United States | | 210,000 | | | | 211,177 |
| h Citigroup Mortgage Loan 2005-2 Trust, 1A4, FRN, 2.946%, 5/25/35 | | United States | | 25,355 | | | | 23,740 |
| c,h Citigroup Mortgage Loan 2009-10 Trust, 6A2, 144A, FRN, 2.938%, 9/25/34 | | United States | | 120,000 | | | | 110,208 |
| c,h Citigroup Mortgage Loan 2015-2 Trust, 1A1, 144A, FRN, 0.639%, 6/25/47 | | United States | | 94,928 | | | | 83,314 |
| h Citigroup Mortgage Loan Trust Inc. , FRN, | | | | | | | | |
| c 2A1, 144A, 0.579%, 8/25/36 | | United States | | 81,697 | | | | 71,853 |
| 2A3, 2.766%, 8/25/35 | | United States | | 127,006 | | | | 118,123 |
| | | | | | |
| |
|
| | | | | | | | | 1,076,018 |
| | | | | | |
| |
|
| Thrifts & Mortgage Finance 0.1% | | | | | | | | |
| Citibank Credit Card Issuance Trust, | | | | | | | | |
| h 2013-A2, FRN, 0.723%, 5/26/20 | | United States | | 125,000 | | | | 125,206 |
| h 2013-A7, FRN, 0.868%, 9/10/20 | | United States | | 200,000 | | | | 200,718 |
| 2014-A2, 1.02%, 2/22/19 | | United States | | 100,000 | | | | 100,065 |
| 2014-A4, 1.23%, 4/24/19 | | United States | | 100,000 | | | | 100,227 |
| h 2014-A7, FRN, 0.643%, 8/24/18 | | United States | | 100,000 | | | | 100,023 |
| 2014-A8, 1.73%, 4/09/20 | | United States | | 100,000 | | | | 100,935 |
| Credit Suisse First Boston Mortgage Securities Corp. , | | | | | | | | |
| h 2003-4A1, FRN, 2.833%, 12/25/33 | | United States | | 6,439 | | | | 6,336 |
| 2003-4A4, 5.75%, 11/25/33 | | United States | | 3,690 | | | | 3,865 |
F R A N K L I N A L T E R N A T I V E S T R A T E G I E S F U N D S
C O N S O L I D A T E D S T A T E M E N T O F I N V E S T M E N T S |
| Franklin K2 Alternative Strategies Fund (continued) | | | | | | | | |
| |
| | | | | Principal | | | | |
| | | Country | | Amount* | | | | Value |
| |
| |
| | | |
|
| Asset-Backed Securities and Commercial | | | | | | | | |
| Mortgage-Backed Securities (continued) | | | | | | | | |
| Thrifts & Mortgage Finance (continued) | | | | | | | | |
| Credit Suisse First Boston Mortgage Securities Corp. , | | | | | | | | |
| h 2003-7A1, FRN, 2.755%, 11/25/33 | | United States | | 10,060 | | | $ | 9,721 |
| h 2004-3A1, FRN, 2.972%, 5/25/34 | | United States | | 25,741 | | | | 24,214 |
| 2005-2A1, 5.25%, 11/25/20 | | United States | | 61,545 | | | | 60,545 |
| h GS Mortgage Securities 2007-GG10 Trust, AM, FRN, 5.794%, 8/10/45 | | United States | | 510,000 | | | | 486,974 |
| | | | | | | | |
|
| | | | | | | | | 1,318,829 |
| | | | | | | | |
|
| Total Asset-Backed Securities and Commercial | | | | | | | | |
| Mortgage-Backed Securities (Cost $23,558,556) | | | | | | | | 23,447,879 |
| | | | | | | | |
|
| |
| | | | | Number of | | | | |
| | | | | Contracts | | | | |
| | | | |
| | | | |
| Options Purchased 0.5% | | | | | | | | |
| Calls Exchange-Traded | | | | | | | | |
| Air Freight & Logistics 0.0% | | | | | | | | |
| Atlas Air Worldwide Holdings Inc. , November Strike Price $55.00, | | | | | | | | |
| Expires 11/18/16 | | United States | | 57 | | | | 10,402 |
| | | | | | | | |
|
| Biotechnology 0.0% | | | | | | | | |
| Array BioPharma Inc. , June Strike Price $4.00, Expires 6/17/16 | | United States | | 75 | | | | 1,125 |
| Baxalta Inc. , June Strike Price $35.00, Expires 6/17/16 | | United States | | 93 | | | | 95,325 |
| | | | | | | | |
|
| | | | | | | | | 96,450 |
| | | | | | | | |
|
| Chemicals 0.0% | | | | | | | | |
| Monsanto Co. , October Strike Price $110.00, Expires 10/21/16 | | United States | | 80 | | | | 65,600 |
| | | | | | | | |
|
| Construction Materials 0.0% | | | | | | | | |
| Cemex SAB de CV, ADR, June Strike Price $5.77, Expires 6/17/16 | | Mexico | | 166 | | | | 12,689 |
| | | | | | | | |
|
| Consumer Finance 0.0% | | | | | | | | |
| Encore Capital Group Inc. , June Strike Price $30.00, Expires 6/17/16 | | United States | | 14 | | | | 315 |
| Encore Capital Group Inc. , September Strike Price $35.00, Expires 9/16/16 | | United States | | 39 | | | | 3,120 |
| | | | | | | | |
|
| | | | | | | | | 3,435 |
| | | | | | | | |
|
| Diversified Consumer Services 0.0% | | | | | | | | |
| Ascent Capital Group Inc. , July Strike Price $17.50, Expires 7/15/16 | | United States | | 26 | | | | 8,710 |
| | | | | | | | |
|
| Diversified Financial Services 0.0% | | | | | | | | |
| Nikkei 225 Index, September Strike Price 17,500.00 JPY, Expires 9/09/16 | | Japan | | 15 | | | | 88,725 |
| | | | | | | | |
|
| Electrical Equipment 0.0% | | | | | | | | |
| SolarCity Corp. , October Strike Price $22.00, Expires 10/21/16 | | United States | | 13 | | | | 4,875 |
| | | | | | | | |
|
| Exchange Traded Funds 0.0% | | | | | | | | |
| iShares Russell 2000 ETF, June Strike Price $116.00, Expires 6/17/16 | | United States | | 345 | | | | 33,465 |
| SPDR Barclays High Yield Bond ETF, June Strike Price $34.00, | | | | | | | | |
| Expires 6/17/16 | | United States | | 148 | | | | 19,240 |
| SPDR S&P500 ETF Trust, June Strike Price $212.00, Expires 6/17/16 | | United States | | 371 | | | | 32,648 |
| SPDR S&P500 ETF Trust, August Strike Price $224.00, Expires 8/19/16 | | United States | | 329 | | | | 6,909 |
| | | | | | | | |
|
| | | | | | | | | 92,262 |
| | | | | | | | |
|
| Food Products 0.0% | | | | | | | | |
| Bunge Ltd. , July Strike Price $67.50, Expires 7/15/16 | | United States | | 15 | | | | 2,130 |
| | | | | | | | |
|
FRANKLIN ALTERNATIVE STRATEGIES FUNDS
CONSOLIDATED STATEMENT OF INVESTMENTS
| | | | |
| Franklin K2 Alternative Strategies Fund (continued) | | | | |
| |
| | | Number of | | |
| | Country | Contracts | | Value |
| Options Purchased (continued) | | | | |
| Calls – Exchange-Traded (continued) | | | | |
| Health Care Technology 0.0%† | | | | |
| Allscripts Healthcare Solutions Inc., June Strike Price $15.00, Expires 6/17/16 | United States | 88 | $ | 880 |
| Household Durables 0.0%† | | | | |
| Meritage Homes Corp., June Strike Price $37.50, Expires 6/17/16 | United States | 22 | | 1,342 |
| Toll Brothers Inc., June Strike Price $32.00, Expires 6/17/16 | United States | 14 | | 126 |
| Toll Brothers Inc., June Strike Price $33.00, Expires 6/17/16 | United States | 22 | | 132 |
| | | | | 1,600 |
| Insurance 0.0%† | | | | |
| AmTrust Financial Services Inc., September Strike Price $28.75, | | | | |
| Expires 9/16/16 | United States | 41 | | 3,075 |
| Internet & Catalog Retail 0.0%† | | | | |
| Shutterfly Inc., June Strike Price $50.00, Expires 6/17/16 | United States | 26 | | 910 |
| Internet Software & Services 0.0%† | | | | |
| Blucora Inc., July Strike Price $10.00, Expires 7/15/16 | United States | 39 | | 780 |
| MercadoLibre Inc., July Strike Price $145.00, Expires 7/15/16 | Argentina | 43 | | 11,395 |
| Monster Worldwide Inc., June Strike Price $3.00, Expires 6/17/16 | United States | 236 | | 2,360 |
| Twitter Inc., September Strike Price $17.00, Expires 9/16/16 | United States | 45 | | 5,130 |
| Web.com Group Inc., September Strike Price $22.50, Expires 9/16/16 | United States | 36 | | 540 |
| Web.com Group Inc., June Strike Price $22.50, Expires 6/17/16 | United States | 36 | | 1,710 |
| WebMD Health Corp., June Strike Price $65.00, Expires 6/17/16 | United States | 26 | | 5,460 |
| WebMD Health Corp., September Strike Price $70.00, Expires 9/16/16 | United States | 45 | | 14,400 |
| Yahoo! Inc., June Strike Price $35.00, Expires 6/17/16 | United States | 96 | | 31,680 |
| | | | | 73,455 |
| Machinery 0.0%† | | | | |
| The Greenbrier Cos Inc., September Strike Price $35.00, Expires 9/16/16 | United States | 53 | | 4,346 |
| Trinity Industries Inc., July Strike Price $22.00, Expires 7/15/16 | United States | 27 | | 135 |
| | | | | 4,481 |
| Media 0.1% | | | | |
| Charter Communications Inc., January Strike Price $220.00, Expires 1/20/17 | United States | 333 | | 306,360 |
| Charter Communications Inc., January Strike Price $250.00, Expires 1/20/17 | United States | 107 | | 23,005 |
| Dish Network Corp., A, September Strike Price $50.00, Expires 9/16/16 | United States | 132 | | 55,440 |
| Time Warner Inc., July Strike Price $75.00, Expires 7/15/16 | United States | 144 | | 35,568 |
| | | | | 420,373 |
| Metals & Mining 0.0%† | | | | |
| AK Steel Holding Corp., July Strike Price $4.50, Expires 7/15/16 | United States | 60 | | 2,100 |
| Newmont Mining Corp., June Strike Price $41.00, Expires 6/17/16 | United States | 29 | | 116 |
| | | | | 2,216 |
| Oil, Gas & Consumable Fuels 0.0%† | | | | |
| Aegean Marine Petroleum Network Inc., September Strike Price $10.00, | | | | |
| Expires 9/16/16 | Greece | 54 | | 864 |
| Energy Transfer Equity LP, October Strike Price $11.00, Expires 10/21/16 | United States | 252 | | 75,600 |
| Energy Transfer Equity LP, October Strike Price $12.00, Expires 10/21/16 | United States | 272 | | 65,552 |
| | | | | 142,016 |
| Pharmaceuticals 0.0%† | | | | |
| Allergan PLC, January Strike Price $210.00, Expires 1/20/17 | United States | 26 | | 105,612 |
| Allergan PLC, September Strike Price $310.00, Expires 9/16/16 | United States | 25 | | 1,375 |
50 Annual Report
franklintempleton.com
FRANKLIN ALTERNATIVE STRATEGIES FUNDS
CONSOLIDATED STATEMENT OF INVESTMENTS
| | | | | | |
| Franklin K2 Alternative Strategies Fund (continued) | | | | | | |
| |
| | | | | Number of | | |
| | Country | | | Contracts | | Value |
| Options Purchased (continued) | | | | | | |
| Calls – Exchange-Traded (continued) | | | | | | |
| Pharmaceuticals (continued) | | | | | | |
| Allergan PLC, September Strike Price $325.00, Expires | | | | | | |
| 9/16/16 | United States | | | 54 | $ | 1,350 |
| Innoviva Inc., September Strike Price $12.50, Expires 9/16/16 | United States | | | 30 | | 1,950 |
| | | | | | | 110,287 |
| Real Estate Investment Trusts (REITs) 0.0%† | | | | | | |
| Starwood Property Trust Inc., June Strike Price $20.00, | | | | | | |
| Expires 6/17/16 | United States | | | 83 | | 5,810 |
| Semiconductors & Semiconductor Equipment 0.0%† | | | | | | |
| Micron Technology Inc., July Strike Price $15.00, | | | | | | |
| Expires 7/01/16 | United States | | | 15 | | 240 |
| Software 0.0%† | | | | | | |
| NetSuite Inc., July Strike Price $90.00, Expires 7/15/16 | United States | | | 11 | | 1,595 |
| Red Hat Inc., July Strike Price $80.00, Expires 7/15/16 | United States | | | 36 | | 7,200 |
| | | | | | | 8,795 |
| Technology Hardware, Storage & Peripherals 0.0%† | | | | | | |
| NCR Corp., July Strike Price $34.00, Expires 7/15/16 | United States | | | 60 | | 1,050 |
| Textiles, Apparel & Luxury Goods 0.0%† | | | | | | |
| Iconix Brand Group Inc., August Strike Price $10.00, | | | | | | |
| Expires 8/19/16 | United States | | | 54 | | 1,350 |
| Wireless Telecommunication Services 0.0%† | | | | | | |
| Vodafone Group PLC, ADR, January Strike Price $40.00, | | | | | | |
| Expires 1/19/18 | United Kingdom | | | 36 | | 2,808 |
| Vodafone Group PLC, ADR, January Strike Price $40.00, | | | | | | |
| Expires 1/20/17 | United Kingdom | | | 79 | | 1,383 |
| | | | | | | 4,191 |
| |
| | | | | Notional | | |
| | | Counterparty | | Amount | | |
| Calls – Over-the-Counter | | | | | | |
| Currency Options 0.0%† | | | | | | |
| USD/CAD, July Strike Price $1.41, Expires 7/08/16 | United States | MSCO | $ | 1,000,000 | | 411 |
| Payer Swaptions – Over-the-Counter | | | | | | |
| Interest Rate 0.0%† | | | | | | |
| Pay fixed 10 year 2.57%, receive float 3-month USD LIBOR, | | | | | | |
| Expires 9/19/16 | United States | BOFA | | 6,200,000 | | 3,532 |
| |
| | | | | Number of | | |
| | | | | Contracts | | |
| Puts – Exchange-Traded | | | | | | |
| Diversified Financial Services 0.4% | | | | | | |
| CAC 40 Index, June Strike Price 4,050.00 EUR, Expires | | | | | | |
| 6/17/16 | France | | | 12 | | 497 |
| EURO STOXX 50 Price EUR, June Strike Price 2,750.00 EUR, | | | | | | |
| Expires 6/17/16 | Germany | | | 105 | | 3,388 |
| S&P 500 Index, June Strike Price $1,950.00, Expires 6/17/16 | United States | | | 251 | | 31,375 |
| S&P 500 Index, June Strike Price $2,025.00, Expires 6/17/16 | United States | | | 22 | | 9,790 |
| S&P 500 Index, June Strike Price $2,050.00, Expires 6/17/16 | United States | | | 31 | | 25,110 |
| S&P 500 Index, June Strike Price $2,000.00, Expires 6/30/16 | United States | | | 199 | | 167,160 |
franklintempleton.com
Annual Report
51
FRANKLIN ALTERNATIVE STRATEGIES FUNDS
CONSOLIDATED STATEMENT OF INVESTMENTS
| | | | |
| Franklin K2 Alternative Strategies Fund (continued) | | | | |
| |
| | | Number of | | |
| | Country | Contracts | | Value |
| Options Purchased (continued) | | | | |
| Puts – Exchange-Traded (continued) | | | | |
| Diversified Financial Services (continued) | | | | |
| S&P 500 Index, July Strike Price $2,000.00, Expires 7/15/16 | United States | 108 | $ | 151,200 |
| S&P 500 Index, September Strike Price $1,750.00, Expires 9/16/16 | United States | 4 | | 4,000 |
| S&P 500 Index, December Strike Price $2,050.00, Expires 12/16/16 | United States | 504 | | 4,193,280 |
| S&P 500 Index, December Strike Price $2,075.00, Expires 12/16/16 | United States | 24 | | 228,960 |
| STOXX Europe 600 Basic Resources Price EUR, September Strike Price 250.00 | | | | |
| EUR, Expires 9/16/16 | Germany | 74 | | 59,281 |
| | | | | 4,874,041 |
| Exchange Traded Funds 0.0%† | | | | |
| Health Care Select Sector SPDR ETF, September Strike Price $68.00, | | | | |
| Expires 9/16/16 | United States | 211 | | 30,595 |
| Industrial Select Sector SPDR Fund, September Strike Price $54.00, | | | | |
| Expires 9/16/16 | United States | 665 | | 91,770 |
| iShares iBoxx USD High Yield Corporate Bond ETF, September Strike Price | | | | |
| $80.00, Expires 9/16/16 | United States | 481 | | 52,910 |
| iShares JP Morgan USD Emerging Markets Bond ETF, June Strike Price $110.00, | | | | |
| Expires 6/17/16 | United States | 63 | | 3,150 |
| iShares MSCI Emerging Markets ETF, June Strike Price $31.00, Expires 6/30/16 | United States | 263 | | 6,575 |
| iShares MSCI Emerging Markets ETF, July Strike Price $32.00, Expires 7/15/16 | United States | 158 | | 10,112 |
| iShares Russell 2000 ETF, June Strike Price $100.00, Expires 6/30/16 | United States | 526 | | 6,312 |
| iShares U.S. Real Estate ETF, June Strike Price $74.00, Expires 6/17/16 | United States | 243 | | 3,402 |
| iShares U.S. Real Estate ETF, July Strike Price $75.00, Expires 7/15/16 | United States | 242 | | 17,908 |
| SPDR S&P Metals & Mining ETF, September Strike Price $19.00, | | | | |
| Expires 9/16/16 | United States | 308 | | 26,488 |
| Utilities Select Sector SPDR Fund, September Strike Price $45.00, | | | | |
| Expires 9/16/16 | United States | 396 | | 24,948 |
| VanEck Vectors Steel ETF, September Strike Price $25.00, Expires 9/16/16 | United States | 51 | | 11,985 |
| | | | | 286,155 |
| Internet Software & Services 0.0%† | | | | |
| Alibaba Group Holding Ltd., ADR, July Strike Price $72.50, Expires 7/15/16 | China | 518 | | 39,368 |
| Yahoo! Inc., October Strike Price $32.00, Expires 10/21/16 | United States | 1,277 | | 137,916 |
| | | | | 177,284 |
| Leisure Products 0.0%† | | | | |
| JAKKS Pacific Inc., June Strike Price $5.00, Expires 6/17/16 | United States | 112 | | 1,120 |
| Media 0.0%† | | | | |
| Charter Communications Inc., July Strike Price $180.00, Expires 7/15/16 | United States | 57 | | 3,420 |
| Vivendi SA, July Strike Price 16.00 EUR, Expires 7/15/16 | France | 715 | | 7,160 |
| | | | | 10,580 |
| Oil, Gas & Consumable Fuels 0.0%† | | | | |
| Golar LNG Ltd., January Strike Price $10.00, Expires 1/20/17 | Bermuda | 100 | | 11,250 |
| Scorpio Tankers Inc., July Strike Price $5.00, Expires 7/15/16 | Monaco | 124 | | 1,240 |
| Southwestern Energy Co., June Strike Price $5.00, Expires 6/17/16 | United States | 100 | | 100 |
| WPX Energy Inc., August Strike Price $5.00, Expires 8/19/16 | United States | 65 | | 1,138 |
| | | | | 13,728 |
| Professional Services 0.0%† | | | | |
| ManpowerGroup Inc., September Strike Price $65.00, Expires 9/16/16 | United States | 16 | | 1,120 |
| Robert Half International Inc., September Strike Price $35.00, Expires 9/16/16 | United States | 27 | | 1,485 |
| | | | | 2,605 |
52 Annual Report
franklintempleton.com
F R A N K L I N A L T E R N A T I V E S T R A T E G I E S F U N D S
C O N S O L I D A T E D S T A T E M E N T O F I N V E S T M E N T S |
| Franklin K2 Alternative Strategies Fund (continued) | | | | | | | | | | |
| |
| | | | | | | Number of | | | | |
| | | Country | | | | Contracts | | | | Value |
| |
| |
| |
| |
| |
|
| Options Purchased (continued) | | | | | | | | | | |
| Puts Exchange-Traded (continued) | | | | | | | | | | |
| Real Estate Investment Trusts (REITs) 0.0% | | | | | | | | | | |
| Spirit Realty Capital Inc. , July Strike Price $10.00, Expires 7/15/16 | | United States | | | | 73 | | $ | | 2,555 |
| | | | | | | | |
| |
|
| Specialty Retail 0.0% | | | | | | | | | | |
| Restoration Hardware Holdings Inc. , August Strike Price $20.00, | | | | | | | | | | |
| Expires 8/19/16 | | United States | | | | 68 | | | | 1,530 |
| | | | | | | | |
| |
|
| Technology Hardware, Storage & Peripherals 0.0% | | | | | | | | | | |
| EMC Corp. , June Strike Price $25.00, Expires 6/17/16 | | United States | | | | 245 | | | | 2,940 |
| NCR Corp. , July Strike Price $27.00, Expires 7/15/16 | | United States | | | | 337 | | | | 5,897 |
| NCR Corp. , July Strike Price $28.00, Expires 7/15/16 | | United States | | | | 358 | | | | 11,635 |
| | | | | | | | |
| |
|
| | | | | | | | | | | 20,472 |
| | | | | | | | |
| |
|
| |
| | | | | | | Notional | | | | |
| | | | | Counterparty | | Amount* | | | | |
| | | | |
| |
| | | | |
| Puts Over-the-Counter | | | | | | | | | | |
| Currency Options 0.0% | | | | | | | | | | |
| EUR/NOK, July Strike Price 9.76 EUR, Expires 7/08/16 | | Norway | | BOFA | | 740,000 EUR | | 40,190 |
| | | | | | | | |
|
| Receiver Swaptions Over-the-Counter | | | | | | | | | | |
| Interest Rate 0.0% | | | | | | | | | | |
| Receive fixed 1 year 4.89%, pay float 28 Day TIIE, Expires 8/17/16 | | Mexico | | DBAB | | 45,000,000 MXN | | 3,837 |
| Receive fixed 1 year 8.48%, pay float 28 Day TIIE, Expires 1/09/17 | | South Africa | | DBAB | | 98,700,000 ZAR | | 31,090 |
| | | | | | | | |
|
| | | | | | | | | | | 34,927 |
| | | | | | | | |
| |
|
| Total Options Purchased (Cost $9,729,993) | | | | | | | | | | 6,635,137 |
| | | | | | | | |
| |
|
| Total Investments before Short Term Investments | | | | | | | | | | |
| (Cost $833,160,750) | | | | | | | | | | 878,807,428 |
| | | | | | | | |
| |
|
| |
| | | | | | | Principal | | | | |
| | | | | | | Amount* | | | | |
| | | | | | |
| | | | |
| Short Term Investments 3.6% | | | | | | | | | | |
| U. S. Government and Agency Securities 3.6% | | | | | | | | | | |
| m U. S. Treasury Bill, | | | | | | | | | | |
| 6/23/16 | | United States | | | | 15,000,000 | | | | 14,998,365 |
| a 7/14/16 - 5/25/17 | | United States | | | | 10,250,000 | | | | 10,209,171 |
| a 8/25/16 | | United States | | | | 19,000,000 | | | | 18,987,194 |
| | | | | | | | |
| |
|
| Total U. S. Government and Agency Securities | | | | | | | | | | |
| (Cost $44,195,710) | | | | | | | | | | 44,194,730 |
| | | | | | | | |
| |
|
| Total Investments before Money Market Funds and | | | | | | | | | | |
| Repurchase Agreements (Cost $877,356,460) | | | | | | | | | | 923,002,158 |
| | | | | | | | |
| |
|
| |
| | | | | | | Shares | | | | |
| | | | | | |
| | | | |
| Money Market Funds 22.3% | | | | | | | | | | |
| n,o Dreyfus Government Cash Management, Institutional Shares, | | | | | | | | | | |
| 0.21% | | United States | | | | 112,500,978 | | | | 112,500,978 |
| o Fidelity Institutional Money Market Funds, Money Market Portfolio, | | | | | | | | | | |
| Class I, 0.234% | | United States | | | | 162,744,301 | | | | 162,744,301 |
| | | | | | | | |
| |
|
| Total Money Market Funds (Cost $275,245,279) | | | | | | | | | | 275,245,279 |
| | | | | | | | |
| |
|
F R A N K L I N A L T E R N A T I V E S T R A T E G I E S F U N D S
C O N S O L I D A T E D S T A T E M E N T O F I N V E S T M E N T S |
| Franklin K2 Alternative Strategies Fund (continued) | | | | | | |
| |
| | | | | Principal | | |
| | | Country | | Amount* | | Value |
| |
| |
| |
|
| Repurchase Agreements (Cost $52,451,581) 4.3% | | | | | | |
| p Joint Repurchase Agreement, 0.281%, 6/01/16 | | | | | | |
| (Maturity Value $52,451,990) | | United States | | 52,451,581 | | $ 52,451,581 |
| BNP Paribas Securities Corp. (Maturity Value $20,887,956) | | | | | | |
| Deutsche Bank Securities Inc. (Maturity Value $4,931,536) | | | | | | |
| HSBC Securities (USA) Inc. (Maturity Value $26,110,076) | | | | | | |
| Merrill Lynch, Pierce, Fenner & Smith Inc. (Maturity Value $522,422) | | | | | | |
| Collateralized by U. S. Government Agency Securities, 0.00% - 5.50%, | | | | | | |
| 6/10/16 - 2/01/20; U. S. Government Agency Securities, Strips, 6/01/17; | | | | | | |
| m U. S. Treasury Bill, 5/25/17; and U. S. Treasury Note, 0.875%, | | | | | | |
| 10/15/17 - 4/15/19 (valued at $53,504,497) | | | | | | |
| | | | | | |
|
| Total Investments (Cost $1,205,053,320) 101.1% | | | | | | 1,250,699,018 |
| Options Written (0.1)% | | | | | | (781,661) |
| Securities Sold Short (20.4)% | | | | | | (252,329,246) |
| Other Assets, less Liabilities 19.4% | | | | | | 239,051,931 |
| | | | | | |
|
| Net Assets 100.0% | | | | | | $1,236,640,042 |
| | | | | | |
|
| |
| | | | | Number of | | |
| | | | | Contracts | | |
| | | | |
| | |
| q Options Written (0.1%) | | | | | | |
| Calls Exchange-Traded | | | | | | |
| Banks (0.0)% | | | | | | |
| JPMorgan Chase & Co. , June Strike Price $65.00, Expires 6/17/16 | | United States | | 13 | | (1,599) |
| Wells Fargo & Co. , June Strike Price $50.00, Expires 6/17/16 | | United States | | 17 | | (1,989) |
| | | | | | |
|
| | | | | | | (3,588) |
| | | | | | |
|
| Beverages (0.0)% | | | | | | |
| The Coca-Cola Co. , June Strike Price $46.00, Expires 6/17/16 | | United States | | 12 | | (48) |
| The Coca-Cola Co. , July Strike Price $48.00, Expires 7/15/16 | | United States | | 15 | | (30) |
| | | | | | |
|
| | | | | | | (78) |
| | | | | | |
|
| Biotechnology (0.0)% | | | | | | |
| Baxalta Inc. , June Strike Price $40.00, Expires 6/17/16 | | United States | | 93 | | (50,220) |
| | | | | | |
|
| Chemicals (0.0)% | | | | | | |
| Monsanto Co. , October Strike Price $125.00, Expires 10/21/16 | | United States | | 80 | | (11,200) |
| | | | | | |
|
| Diversified Financial Services (0.0)% | | | | | | |
| Nikkei 225 Index, September Strike Price 19,000.00 JPY, Expires 9/09/16 | | Japan | | 15 | | (29,801) |
| | | | | | |
|
| Electric Utilities (0.0)% | | | | | | |
| NextEra Energy Inc. , June Strike Price $125.00, Expires 6/17/16 | | United States | | 7 | | (140) |
| | | | | | |
|
| Oil, Gas & Consumable Fuels (0.0)% | | | | | | |
| Chevron Corp. , June Strike Price $105.00, Expires 6/17/16 | | United States | | 5 | | (125) |
| Energy Transfer Equity LP, October Strike Price $16.00, Expires 10/21/16 | | United States | | 437 | | (41,952) |
| Exxon Mobil Corp. , June Strike Price $90.00, Expires 6/17/16 | | United States | | 12 | | (876) |
| Ship Finance International Ltd. , November Strike Price $15.00, Expires 11/18/16 | | Norway | | 167 | | (22,962) |
| | | | | | |
|
| | | | | | | (65,915) |
| | | | | | |
|
| Pharmaceuticals (0.0)% | | | | | | |
| Allergan PLC, January Strike Price $300.00, Expires 1/20/17 | | United States | | 27 | | (10,530) |
| Bristol-Myers Squibb Co. , June Strike Price $72.50, Expires 6/17/16 | | United States | | 6 | | (636) |
| Johnson & Johnson, June Strike Price $115.00, Expires 6/17/16 | | United States | | 9 | | (216) |
| | | | | | |
|
| | | | | | | (11,382) |
| | | | | | |
|
F R A N K L I N A L T E R N A T I V E S T R A T E G I E S F U N D S
C O N S O L I D A T E D S T A T E M E N T O F I N V E S T M E N T S |
| Franklin K2 Alternative Strategies Fund (continued) | | | | | | |
| |
| | | | | Number of | | |
| | | Country | | Contracts | | Value |
| |
| |
| |
|
| q Options Written (continued) | | | | | | |
| Calls Exchange-Traded (continued) | | | | | | |
| Software (0.0)% | | | | | | |
| Microsoft Corp. , July Strike Price $55.00, Expires 7/15/16 | | United States | | 19 | | $ (912) |
| | | | | | |
|
| Technology Hardware, Storage & Peripherals (0.0)% | | | | | | |
| EMC Corp. , July Strike Price $28.00, Expires 7/15/16 | | United States | | 1,329 | | (126,255) |
| NCR Corp. , October Strike Price $34.00, Expires 10/21/16 | | United States | | 647 | | (67,935) |
| NCR Corp. , October Strike Price $36.00, Expires 10/21/16 | | United States | | 48 | | (3,600) |
| | | | | | |
|
| | | | | | | (197,790) |
| | | | | | |
|
| Puts Exchange-Traded | | | | | | |
| Air Freight & Logistics (0.0%) | | | | | | |
| Atlas Air Worldwide Holdings Inc. , November Strike Price $40.00, | | | | | | |
| Expires 11/18/16 | | United States | | 57 | | (18,810) |
| | | | | | |
|
| Chemicals (0.0%) | | | | | | |
| Monsanto Co. , October Strike Price $92.50, Expires 10/21/16 | | United States | | 80 | | (16,000) |
| | | | | | |
|
| Consumer Finance (0.0%) | | | | | | |
| Encore Capital Group Inc. , June Strike Price $25.00, Expires 6/17/16 | | United States | | 14 | | (875) |
| Encore Capital Group Inc. , September Strike Price $20.00, Expires 9/16/16 | | United States | | 1 | | (88) |
| Encore Capital Group Inc. , September Strike Price $22.50, Expires 9/16/16 | | United States | | 38 | | (5,130) |
| | | | | | |
|
| | | | | | | (6,093) |
| | | | | | |
|
| Diversified Consumer Services (0.0%) | | | | | | |
| Ascent Capital Group Inc. , July Strike Price $12.50, Expires 7/15/16 | | United States | | 26 | | (4,485) |
| | | | | | |
|
| Diversified Financial Services (0.0%) | | | | | | |
| EURO STOXX 50 Price EUR, June Strike Price 2,550.00 EUR, Expires 6/17/16 | | Germany | | 94 | | (941) |
| S&P 500 Index, July Strike Price $1,875.00, Expires 7/15/16 | | United States | | 28 | | (11,480) |
| S&P 500 Index, September Strike Price $1,550.00, Expires 9/16/16 | | United States | | 4 | | (1,380) |
| STOXX Europe 600 Basic Resources Price EUR, September Strike Price 200.00 | | | | | | |
| EUR, Expires 9/16/16 | | Germany | | 74 | | (16,467) |
| | | | | | |
|
| | | | | | | (30,268) |
| | | | | | |
|
| Electrical Equipment (0.0%) | | | | | | |
| SolarCity Corp. , October Strike Price $17.00, Expires 10/21/16 | | United States | | 13 | | (3,906) |
| | | | | | |
|
| Exchange Traded Funds (0.0%) | | | | | | |
| Health Care Select Sector SPDR ETF, September Strike Price $62.00, | | | | | | |
| Expires 9/16/16 | | United States | | 211 | | (10,128) |
| Industrial Select Sector SPDR Fund, September Strike Price $50.00, | | | | | | |
| Expires 9/16/16 | | United States | | 665 | | (38,570) |
| iShares iBoxx USD High Yield Corporate Bond ETF, September Strike Price $75.00, | | | | | | |
| Expires 9/16/16 | | United States | | 481 | | (12,506) |
| iShares MSCI Emerging Markets ETF, June Strike Price $31.00, Expires 6/10/16 | | United States | | 263 | | (1,184) |
| iShares Russell 2000 ETF, June Strike Price $100.00, Expires 6/17/16 | | United States | | 526 | | (2,104) |
| iShares U. S. Real Estate ETF, June Strike Price $66.00, Expires 6/17/16 | | United States | | 485 | | (1,455) |
| Utilities Select Sector SPDR Fund, September Strike Price $40.00, | | | | | | |
| Expires 9/16/16 | | United States | | 396 | | (6,336) |
| | | | | | |
|
| | | | | | | (72,283) |
| | | | | | |
|
| Food Products (0.0%) | | | | | | |
| Bunge Ltd. , July Strike Price $52.50, Expires 7/15/16 | | United States | | 9 | | (90) |
| Bunge Ltd. , July Strike Price $57.50, Expires 7/15/16 | | United States | | 14 | | (385) |
| | | | | | |
|
| | | | | | | (475) |
| | | | | | |
|
F R A N K L I N A L T E R N A T I V E S T R A T E G I E S F U N D S
C O N S O L I D A T E D S T A T E M E N T O F I N V E S T M E N T S |
| Franklin K2 Alternative Strategies Fund (continued) | | | | | | | | |
| |
| | | | | Number of | | | | |
| | | Country | | Contracts | | | | Value |
| |
| |
| |
| |
|
| q Options Written (continued) | | | | | | | | |
| Puts Exchange-Traded (continued) | | | | | | | | |
| Health Care Technology (0.0%) | | | | | | | | |
| Allscripts Healthcare Solutions Inc. , June Strike Price $12.00, Expires 6/17/16 | | United States | | 88 | | $ | | (880) |
| | | | | | |
| |
|
| Household Durables (0.0%) | | | | | | | | |
| Meritage Homes Corp. , June Strike Price $30.00, Expires 6/17/16 | | United States | | 22 | | | | (330) |
| Toll Brothers Inc. , June Strike Price $26.00, Expires 6/17/16 | | United States | | 37 | | | | (277) |
| | | | | | |
| |
|
| | | | | | | | | (607) |
| | | | | | |
| |
|
| Insurance (0.0%) | | | | | | | | |
| AmTrust Financial Services Inc. , September Strike Price $23.75, Expires 9/16/16 | | United States | | 28 | | | | (2,450) |
| AmTrust Financial Services Inc. , September Strike Price $25.00, Expires 9/16/16 | | United States | | 13 | | | | (1,528) |
| | | | | | |
| |
|
| | | | | | | | | (3,978) |
| | | | | | |
| |
|
| Internet & Catalog Retail (0.0%) | | | | | | | | |
| Shutterfly Inc. , June Strike Price $42.50, Expires 6/17/16 | | United States | | 26 | | | | (780) |
| | | | | | |
| |
|
| Internet Software & Services (0.0%) | | | | | | | | |
| Blucora Inc. , July Strike Price $7.50, Expires 7/15/16 | | United States | | 39 | | | | (585) |
| MercadoLibre Inc. , June Strike Price $115.00, Expires 6/17/16 | | Argentina | | 44 | | | | (1,320) |
| MercadoLibre Inc. , July Strike Price $125.00, Expires 7/15/16 | | Argentina | | 43 | | | | (9,245) |
| Twitter Inc. , September Strike Price $13.00, Expires 9/16/16 | | United States | | 45 | | | | (3,600) |
| Web. com Group Inc. , June Strike Price $17.50, Expires 6/17/16 | | United States | | 36 | | | | (3,240) |
| Web. com Group Inc. , September Strike Price $15.00, Expires 9/16/16 | | United States | | 36 | | | | (2,160) |
| WebMD Health Corp. , June Strike Price $60.00, Expires 6/17/16 | | United States | | 14 | | | | (280) |
| WebMD Health Corp. , September Strike Price $60.00, Expires 9/16/16 | | United States | | 45 | | | | (11,025) |
| Yahoo! Inc. , October Strike Price $25.00, Expires 10/21/16 | | United States | | 671 | | | | (15,433) |
| | | | | | |
| |
|
| | | | | | | | | (46,888) |
| | | | | | |
| |
|
| Machinery (0.0%) | | | | | | | | |
| The Greenbrier Cos Inc. , September Strike Price $25.00, Expires 9/16/16 | | United States | | 53 | | | | (7,950) |
| Trinity Industries Inc. , July Strike Price $18.00, Expires 7/15/16 | | United States | | 27 | | | | (2,565) |
| | | | | | |
| |
|
| | | | | | | | | (10,515) |
| | | | | | |
| |
|
| Media (0.1%) | | | | | | | | |
| Charter Communications Inc. , July Strike Price $165.00, Expires 7/15/16 | | United States | | 57 | | | | (8,550) |
| Charter Communications Inc. , January Strike Price $145.00, Expires 1/20/17 | | United States | | 297 | | | | (114,345) |
| | | | | | |
| |
|
| | | | | | | | | (122,895) |
| | | | | | |
| |
|
| Metals & Mining (0.0%) | | | | | | | | |
| AK Steel Holding Corp. , July Strike Price $3.50, Expires 7/15/16 | | United States | | 60 | | | | (1,080) |
| Newmont Mining Corp. , June Strike Price $28.00, Expires 6/17/16 | | United States | | 29 | | | | (522) |
| | | | | | |
| |
|
| | | | | | | | | (1,602) |
| | | | | | |
| |
|
| Oil, Gas & Consumable Fuels (0.0%) | | | | | | | | |
| Aegean Marine Petroleum Network Inc. , September Strike Price $7.50, | | | | | | | | |
| Expires 9/16/16 | | Greece | | 54 | | | | (5,940) |
| Energy Transfer Equity LP, October Strike Price $7.00, Expires 10/21/16 | | United States | | 545 | | | | (21,800) |
| | | | | | |
| |
|
| | | | | | | | | (27,740) |
| | | | | | |
| |
|
| Pharmaceuticals (0.0%) | | | | | | | | |
| Allergan PLC, January Strike Price $200.00, Expires 1/20/17 | | United States | | 27 | | | | (28,080) |
| Innoviva Inc. , September Strike Price $10.00, Expires 9/16/16 | | United States | | 30 | | | | (2,850) |
| | | | | | |
| |
|
| | | | | | | | | (30,930) |
| | | | | | |
| |
|
F R A N K L I N A L T E R N A T I V E S T R A T E G I E S F U N D S
C O N S O L I D A T E D S T A T E M E N T O F I N V E S T M E N T S |
| Franklin K2 Alternative Strategies Fund (continued) | | | | | | | | | | |
| |
| | | | | | | Number of | | | | |
| | | Country | | | | Contracts | | | | Value |
| |
| |
| |
| |
| |
|
| q Options Written (continued) | | | | | | | | | | |
| Puts Exchange-Traded (continued) | | | | | | | | | | |
| Semiconductors & Semiconductor Equipment (0.0%) | | | | | | | | | | |
| Micron Technology Inc. , July Strike Price $10.00, Expires 7/01/16 | | United States | | | | 15 | | $ | | (150) |
| | | | | | | | |
| |
|
| Software (0.0%) | | | | | | | | | | |
| NetSuite Inc. , June Strike Price $65.00, Expires 6/17/16 | | United States | | | | 11 | | | | (303) |
| NetSuite Inc. , July Strike Price $70.00, Expires 7/15/16 | | United States | | | | 11 | | | | (1,485) |
| Red Hat Inc. , June Strike Price $65.00, Expires 6/17/16 | | United States | | | | 36 | | | | (360) |
| Red Hat Inc. , July Strike Price $70.00, Expires 7/15/16 | | United States | | | | 36 | | | | (4,140) |
| | | | | | | | |
| |
|
| | | | | | | | | | | (6,288) |
| | | | | | | | |
| |
|
| Textiles, Apparel & Luxury Goods (0.0%) | | | | | | | | | | |
| Iconix Brand Group Inc. , August Strike Price $7.50, Expires 8/19/16 | | United States | | | | 54 | | | | (4,590) |
| | | | | | | | |
| |
|
| |
| | | | | | | Notional | | | | |
| | | | | Counterparty | | Amount* | | | | |
| | |
| |
| |
| | | | |
| Receiver Swaptions Over-the-Counter | | | | | | | | | | |
| Interest Rate (0.0%) | | | | | | | | | | |
| Receive fixed 10 year 3.07%, pay float 3-month USD LIBOR, | | | | | | | | | | |
| Expires 9/19/16 | | United States | | BOFA | | 6,200,000 | | | | (472) |
| | | | | | | | |
| |
|
| Total Options Written | | | | | | | | | | |
| (Premiums Received $1,021,236) | | | | | | | | | | (781,661) |
| | | | | | | | |
| |
|
| |
| | | | | | | Shares | | | | |
| | | | | | |
| | | | |
| r Securities Sold Short (20.4)% | | | | | | | | | | |
| Common Stocks (9.2)% | | | | | | | | | | |
| Aerospace & Defense (0.0)% | | | | | | | | | | |
| The Boeing Co | | United States | | | | 2,751 | | | | (347,039) |
| | | | | | | | |
| |
|
| Air Freight & Logistics (0.1)% | | | | | | | | | | |
| CH Robinson Worldwide Inc | | United States | | | | 7,721 | | | | (578,921) |
| XPO Logistics Inc | | United States | | | | 8,754 | | | | (256,142) |
| | | | | | | | |
| |
|
| | | | | | | | | | | (835,063) |
| | | | | | | | |
| |
|
| Airlines (0.1)% | | | | | | | | | | |
| American Airlines Group Inc | | United States | | | | 17,633 | | | | (562,669) |
| ANA Holdings Inc | | Japan | | | | 152,235 | | | | (445,288) |
| Deutsche Lufthansa AG | | Germany | | | | 28 | | | | (392) |
| | | | | | | | |
| |
|
| | | | | | | | | | | (1,008,349) |
| | | | | | | | |
| |
|
| Auto Components (0.0)% | | | | | | | | | | |
| Borgwarner Inc | | United States | | | | 2,508 | | | | (85,347) |
| Lear Corp | | United States | | | | 709 | | | | (84,201) |
| Magna International Inc | | Canada | | | | 2,508 | | | | (101,649) |
| | | | | | | | |
| |
|
| | | | | | | | | | | (271,197) |
| | | | | | | | |
| |
|
| Automobiles (0.0)% | | | | | | | | | | |
| Fiat Chrysler Automobiles NV | | United Kingdom | | | | 21,727 | | | | (155,079) |
| General Motors Co | | United States | | | | 2,510 | | | | (78,513) |
| Tesla Motors Inc | | United States | | | | 491 | | | | (109,606) |
| | | | | | | | |
| |
|
| | | | | | | | | | | (343,198) |
| | | | | | | | |
| |
|
| Beverages (0.0)% | | | | | | | | | | |
| Anheuser-Busch InBev SA/NV, ADR | | Belgium | | | | 2,241 | | | | (282,859) |
| Brown-Forman Corp. , B | | United States | | | | 2,340 | | | | (229,484) |
| | | | | | | | |
| |
|
| | | | | | | | | | | (512,343) |
| | | | | | | | |
| |
|
FRANKLIN ALTERNATIVE STRATEGIES FUNDS
CONSOLIDATED STATEMENT OF INVESTMENTS
| | | | | |
| Franklin K2 Alternative Strategies Fund (continued) | | | | | |
| |
| | Country | Shares | | Value | |
| r Securities Sold Short (continued) | | | | | |
| Common Stocks (continued) | | | | | |
| Biotechnology (0.5)% | | | | | |
| Ablynx NV | Belgium | 11,489 | $ | (183,119 | ) |
| Acorda Therapeutics Inc | United States | 10,286 | | (292,637 | ) |
| AMAG Pharmaceuticals Inc | United States | 30,836 | | (661,124 | ) |
| Anacor Pharmaceuticals Inc | United States | 6,058 | | (601,559 | ) |
| Exelixis Inc | United States | 270,995 | | (1,758,758 | ) |
| Ligand Pharmaceuticals Inc | United States | 16,045 | | (1,918,822 | ) |
| PDL BioPharma Inc | United States | 10,211 | | (36,657 | ) |
| PTC Therapeutics Inc | United States | 8,870 | | (72,379 | ) |
| | | | | (5,525,055 | ) |
| Building Products (0.1)% | | | | | |
| Griffon Corp | United States | 39,446 | | (664,665 | ) |
| Capital Markets (0.0)%† | | | | | |
| Cowen Group Inc., A | United States | 69,770 | | (233,729 | ) |
| FXCM Inc | United States | 2,338 | | (24,105 | ) |
| | | | | (257,834 | ) |
| Chemicals (0.2)% | | | | | |
| The Mosaic Co | United States | 53,393 | | (1,347,105 | ) |
| Potash Corp. of Saskatchewan Inc | Canada | 26,383 | | (430,835 | ) |
| TerraVia Holdings Inc | United States | 61,229 | | (151,848 | ) |
| Westlake Chemical Corp | United States | 17,694 | | (780,836 | ) |
| | | | | (2,710,624 | ) |
| Communications Equipment (0.2)% | | | | | |
| ARRIS International PLC | United States | 7,788 | | (187,691 | ) |
| Palo Alto Networks Inc | United States | 20,295 | | (2,647,686 | ) |
| | | | | (2,835,377 | ) |
| Construction & Engineering (0.0)%† | | | | | |
| Dycom Industries Inc | United States | 5,826 | | (494,569 | ) |
| Construction Materials (0.1)% | | | | | |
| Cemex SAB de CV, ADR | Mexico | 169,578 | | (1,078,517 | ) |
| LafargeHolcim Ltd., B | Switzerland | 5,687 | | (255,743 | ) |
| | | | | (1,334,260 | ) |
| Consumer Finance (0.1)% | | | | | |
| Encore Capital Group Inc | United States | 22,853 | | (614,517 | ) |
| PRA Group Inc | United States | 5,880 | | (161,759 | ) |
| | | | | (776,276 | ) |
| Diversified Consumer Services (0.2)% | | | | | |
| Ascent Capital Group Inc | United States | 13,719 | | (257,094 | ) |
| Carriage Services Inc | United States | 35,365 | | (832,492 | ) |
| TAL Education Group, ADR | China | 26,508 | | (1,416,058 | ) |
| | | | | (2,505,644 | ) |
| Diversified Financial Services (0.0)%† | | | | | |
| Element Financial Corp | Canada | 25,627 | | (300,563 | ) |
| Diversified Telecommunication Services (0.0)%† | | | | | |
| CenturyLink Inc | United States | 5,770 | | (156,482 | ) |
| Iridium Communications Inc | United States | 17,930 | | (156,529 | ) |
58 Annual Report
franklintempleton.com
FRANKLIN ALTERNATIVE STRATEGIES FUNDS
CONSOLIDATED STATEMENT OF INVESTMENTS
| | | | | |
| Franklin K2 Alternative Strategies Fund (continued) | | | | | |
| |
| | Country | Shares | | Value | |
| r Securities Sold Short (continued) | | | | | |
| Common Stocks (continued) | | | | | |
| Diversified Telecommunication Services (continued) | | | | | |
| Verizon Communications Inc | United States | 3,563 | $ | (181,357 | ) |
| | | | | (494,368 | ) |
| Electric Utilities (0.3)% | | | | | |
| Emera Inc | Canada | 38,119 | | (1,343,256 | ) |
| Fortis Inc | Canada | 54,914 | | (1,735,283 | ) |
| | | | | (3,078,539 | ) |
| Electrical Equipment (0.1)% | | | | | |
| General Cable Corp | United States | 29,295 | | (400,170 | ) |
| Rockwell Automation Inc | United States | 1,269 | | (147,267 | ) |
| SolarCity Corp | United States | 8,872 | | (198,644 | ) |
| | | | | (746,081 | ) |
| Electronic Equipment, Instruments & Components (0.2)% | | | | | |
| Knowles Corp | United States | 14,852 | | (217,136 | ) |
| Vishay Intertechnology Inc | United States | 121,082 | | (1,569,223 | ) |
| | | | | (1,786,359 | ) |
| Energy Equipment & Services (0.0)%† | | | | | |
| Hornbeck Offshore Services Inc | United States | 12,533 | | (104,149 | ) |
| Food & Staples Retailing (0.1)% | | | | | |
| Wal-Mart Stores Inc | United States | 9,421 | | (666,819 | ) |
| Whole Foods Market Inc | United States | 18,286 | | (591,552 | ) |
| | | | | (1,258,371 | ) |
| Food Products (0.3)% | | | | | |
| Bunge Ltd | United States | 3,974 | | (266,536 | ) |
| Campbell Soup Co | United States | 3,164 | | (191,644 | ) |
| The Hershey Co | United States | 7,677 | | (712,809 | ) |
| The JM Smucker Co | United States | 8,160 | | (1,053,864 | ) |
| Post Holdings Inc | United States | 22,062 | | (1,676,933 | ) |
| | | | | (3,901,786 | ) |
| Health Care Equipment & Supplies (0.3)% | | | | | |
| Abbott Laboratories | United States | 9,094 | | (360,395 | ) |
| Integra LifeSciences Holdings Corp | United States | 16,809 | | (1,255,800 | ) |
| Invacare Corp | United States | 18,948 | | (202,744 | ) |
| Nipro Corp | Japan | 3,600 | | (40,638 | ) |
| NuVasive Inc | United States | 9,031 | | (491,015 | ) |
| Quidel Corp | United States | 9,064 | | (150,553 | ) |
| Wright Medical Group NV | United States | 35,478 | | (686,145 | ) |
| | | | | (3,187,290 | ) |
| Health Care Providers & Services (0.3)% | | | | | |
| Aceto Corp | United States | 15,320 | | (341,789 | ) |
| Aetna Inc | United States | 2,857 | | (323,498 | ) |
| Amsurg Corp | United States | 1,014 | | (75,837 | ) |
| HealthSouth Corp | United States | 38,122 | | (1,537,079 | ) |
| Molina Healthcare Inc | United States | 31,490 | | (1,525,061 | ) |
| | | | | (3,803,264 | ) |
franklintempleton.com
Annual Report
59
FRANKLIN ALTERNATIVE STRATEGIES FUNDS
CONSOLIDATED STATEMENT OF INVESTMENTS
| | | | | |
| Franklin K2 Alternative Strategies Fund (continued) | | | | | |
| |
| | Country | Shares | | Value | |
| r Securities Sold Short (continued) | | | | | |
| Common Stocks (continued) | | | | | |
| Health Care Technology (0.0)%† | | | | | |
| Allscripts Healthcare Solutions Inc | United States | 30,643 | $ | (413,374 | ) |
| Hotels, Restaurants & Leisure (0.2)% | | | | | |
| Chipotle Mexican Grill Inc | United States | 331 | | (146,289 | ) |
| Hilton Worldwide Holdings Inc | United States | 52,664 | | (1,094,358 | ) |
| Marriott International Inc., A | United States | 11,309 | | (746,846 | ) |
| | | | | (1,987,493 | ) |
| Household Durables (0.1)% | | | | | |
| CalAtlantic Group Inc | United States | 11,949 | | (441,993 | ) |
| LGI Homes Inc | United States | 22,752 | | (614,759 | ) |
| M/I Homes Inc | United States | 7,112 | | (134,275 | ) |
| Meritage Homes Corp | United States | 2,981 | | (108,777 | ) |
| | | | | (1,299,804 | ) |
| Household Products (0.0)%† | | | | | |
| Unicharm Corp | Japan | 8,400 | | (164,495 | ) |
| Independent Power & Renewable Electricity Producers (0.1)% | | | | | |
| Pattern Energy Group Inc | United States | 31,612 | | (688,509 | ) |
| Industrial Conglomerates (0.0)%† | | | | | |
| 3M Co | United States | 989 | | (166,469 | ) |
| Keihan Holdings Co. Ltd | Japan | 2,700 | | (18,238 | ) |
| | | | | (184,707 | ) |
| Insurance (0.2)% | | | | | |
| AmTrust Financial Services Inc | United States | 20,125 | | (533,715 | ) |
| CNP Assurances | France | 89,924 | | (1,525,814 | ) |
| | | | | (2,059,529 | ) |
| Internet & Catalog Retail (0.5)% | | | | | |
| Ctrip.com International Ltd., ADR | China | 27,639 | | (1,264,760 | ) |
| HSN Inc | United States | 1,319 | | (69,076 | ) |
| Netflix Inc | United States | 11,426 | | (1,171,965 | ) |
| Priceline Group Inc | United States | 2,494 | | (3,153,239 | ) |
| Shutterfly Inc | United States | 10,833 | | (523,234 | ) |
| | | | | (6,182,274 | ) |
| Internet Software & Services (1.2)% | | | | | |
| Akamai Technologies Inc | United States | 1,956 | | (106,758 | ) |
| Blucora Inc | United States | 2,001 | | (17,969 | ) |
| j2 Global Inc | United States | 9,323 | | (624,361 | ) |
| Linkedin Corp | United States | 530 | | (72,345 | ) |
| MercadoLibre Inc | Argentina | 12,240 | | (1,670,760 | ) |
| Monster Worldwide Inc | United States | 64,185 | | (170,090 | ) |
| Twitter Inc | United States | 33 | | (502 | ) |
| VeriSign Inc | United States | 113,436 | | (9,694,241 | ) |
| Web.com Group Inc | United States | 10,450 | | (177,337 | ) |
| WebMD Health Corp | United States | 22,585 | | (1,484,964 | ) |
| Yahoo! Inc | United States | 8,746 | | (331,823 | ) |
| | | | | (14,351,150 | ) |
| IT Services (0.1)% | | | | | |
| CSG Systems International Inc | United States | 29,322 | | (1,246,478 | ) |
60 Annual Report
franklintempleton.com
FRANKLIN ALTERNATIVE STRATEGIES FUNDS
CONSOLIDATED STATEMENT OF INVESTMENTS
| | | | | |
| Franklin K2 Alternative Strategies Fund (continued) | | | | | |
| |
| | Country | Shares | | Value | |
| r Securities Sold Short (continued) | | | | | |
| Common Stocks (continued) | | | | | |
| IT Services (continued) | | | | | |
| International Business Machines Corp | United States | 1,311 | $ | (201,553 | ) |
| Unisys Corp | United States | 31,415 | | (265,143 | ) |
| | | | | (1,713,174 | ) |
| Leisure Products (0.0)%† | | | | | |
| JAKKS Pacific Inc | United States | 42,245 | | (315,148 | ) |
| Life Sciences Tools & Services (0.1)% | | | | | |
| Albany Molecular Research Inc | United States | 26,718 | | (387,945 | ) |
| Illumina Inc | United States | 961 | | (139,182 | ) |
| Sequenom Inc | United States | 151,018 | | (154,038 | ) |
| | | | | (681,165 | ) |
| Machinery (0.3)% | | | | | |
| Altra Industrial Motion Corp | United States | 24,856 | | (672,106 | ) |
| Caterpillar Inc | United States | 2,309 | | (167,426 | ) |
| Deere & Co | United States | 3,055 | | (251,396 | ) |
| Dover Corp | United States | 3,036 | | (202,653 | ) |
| Flowserve Corp | United States | 6,262 | | (301,390 | ) |
| The Greenbrier Cos Inc | United States | 14,931 | | (428,520 | ) |
| Navistar International Corp | United States | 11,225 | | (126,281 | ) |
| PACCAR Inc | United States | 15,031 | | (837,978 | ) |
| Trinity Industries Inc | United States | 35,158 | | (634,954 | ) |
| Wabash National Corp | United States | 43,367 | | (614,944 | ) |
| | | | | (4,237,648 | ) |
| Media (0.2)% | | | | | |
| Comcast Corp., A | United States | 17,585 | | (1,113,131 | ) |
| Liberty Braves Group | United States | 1,020 | | (15,871 | ) |
| Liberty Media Group | United States | 2,735 | | (53,278 | ) |
| Liberty SiriusXM Group | United States | 10,326 | | (329,296 | ) |
| Rizzoli Corriere Della Sera Mediagroup SpA | Italy | 1,471 | | (1,247 | ) |
| Sirius XM Holdings Inc | United States | 320,619 | | (1,288,888 | ) |
| The Walt Disney Co | United States | 1,573 | | (156,073 | ) |
| | | | | (2,957,784 | ) |
| Metals & Mining (0.0)%† | | | | | |
| AK Steel Holding Corp | United States | 65,530 | | (280,468 | ) |
| Alcoa Inc | United States | 11,146 | | (103,324 | ) |
| Newmont Mining Corp | United States | 5,057 | | (163,897 | ) |
| | | | | (547,689 | ) |
| Oil, Gas & Consumable Fuels (0.6)% | | | | | |
| Aegean Marine Petroleum Network Inc | Greece | 42,684 | | (284,275 | ) |
| Cobalt International Energy Inc | United States | 28,787 | | (64,483 | ) |
| Energy Transfer Equity LP | United States | 87,752 | | (1,109,185 | ) |
| Exxon Mobil Corp | United States | 3,119 | | (277,653 | ) |
| Golar LNG Ltd | Bermuda | 4,563 | | (79,396 | ) |
| Green Plains Inc | United States | 31,458 | | (583,860 | ) |
| Renewable Energy Group Inc | United States | 21,360 | | (196,726 | ) |
| Scorpio Tankers Inc | Monaco | 6,010 | | (35,339 | ) |
| Ship Finance International Ltd | Norway | 6,392 | | (102,464 | ) |
| TransCanada Corp | Canada | 115,379 | | (4,781,100 | ) |
franklintempleton.com
Annual Report
61
FRANKLIN ALTERNATIVE STRATEGIES FUNDS
CONSOLIDATED STATEMENT OF INVESTMENTS
| | | | | |
| Franklin K2 Alternative Strategies Fund (continued) | | | | | |
| |
| | Country | Shares | | Value | |
| r Securities Sold Short (continued) | | | | | |
| Common Stocks (continued) | | | | | |
| Oil, Gas & Consumable Fuels (continued) | | | | | |
| Whiting Petroleum Corp | United States | 10,216 | $ | (126,168 | ) |
| WPX Energy Inc | United States | 12,000 | | (123,480 | ) |
| | | | | (7,764,129 | ) |
| Pharmaceuticals (0.5)% | | | | | |
| Allergan PLC | United States | 87 | | (20,510 | ) |
| Innoviva Inc | United States | 49,896 | | (562,827 | ) |
| The Medicines Co | United States | 57,426 | | (2,159,792 | ) |
| Shire PLC, ADR | United States | 16,021 | | (2,982,469 | ) |
| | | | | (5,725,598 | ) |
| Professional Services (0.0)%† | | | | | |
| 51job Inc., ADR | China | 3,004 | | (93,154 | ) |
| Real Estate Investment Trusts (REITs) (0.4)% | | | | | |
| American Homes 4 Rent | United States | 35,548 | | (651,949 | ) |
| Colony Capital Inc | United States | 16,135 | | (295,593 | ) |
| Colony Starwood Homes | United States | 24,674 | | (671,626 | ) |
| Forest City Realty Trust Inc | United States | 21,097 | | (481,223 | ) |
| Gramercy Property Trust | United States | 240,124 | | (2,144,305 | ) |
| National Health Investors Inc | United States | 7,249 | | (506,198 | ) |
| Spirit Realty Capital Inc | United States | 9,896 | | (113,309 | ) |
| Starwood Property Trust Inc | United States | 13,410 | | (276,514 | ) |
| Welltower Inc | United States | 3,307 | | (227,885 | ) |
| | | | | (5,368,602 | ) |
| Road & Rail (0.0)%† | | | | | |
| Norfolk Southern Corp | United States | 3,261 | | (274,119 | ) |
| SAIA Inc | United States | 8,782 | | (228,947 | ) |
| | | | | (503,066 | ) |
| Semiconductors & Semiconductor Equipment (0.6)% | | | | | |
| Intel Corp | United States | 47,844 | | (1,511,392 | ) |
| Microchip Technology Inc | United States | 30,552 | | (1,578,927 | ) |
| Micron Technology Inc | United States | 12,284 | | (156,253 | ) |
| NVIDIA Corp | United States | 74,577 | | (3,484,237 | ) |
| Trina Solar Ltd., ADR | China | 17,403 | | (139,746 | ) |
| | | | | (6,870,555 | ) |
| Software (0.7)% | | | | | |
| Bottomline Technologies de Inc | United States | 11,545 | | (289,318 | ) |
| BroadSoft Inc | United States | 18,273 | | (796,703 | ) |
| FireEye Inc | United States | 3,166 | | (50,403 | ) |
| NetSuite Inc | United States | 4,537 | | (359,829 | ) |
| Nuance Communications Inc | United States | 21,638 | | (361,787 | ) |
| Red Hat Inc | United States | 7,464 | | (578,161 | ) |
| Salesforce.com Inc | United States | 11,308 | | (946,593 | ) |
| Take-Two Interactive Software Inc | United States | 99,619 | | (3,876,175 | ) |
| VMware Inc., A | United States | 4,944 | | (299,409 | ) |
| Workday Inc., A | United States | 7,912 | | (600,046 | ) |
| | | | | (8,158,424 | ) |
62 Annual Report
franklintempleton.com
FRANKLIN ALTERNATIVE STRATEGIES FUNDS
CONSOLIDATED STATEMENT OF INVESTMENTS
| | | | | |
| Franklin K2 Alternative Strategies Fund (continued) | | | | | |
| |
| | Country | Shares | | Value | |
| r Securities Sold Short (continued) | | | | | |
| Common Stocks (continued) | | | | | |
| Specialty Retail (0.1)% | | | | | |
| AutoNation Inc | United States | 1,799 | $ | (90,742 | ) |
| Dick’s Sporting Goods Inc | United States | 4,363 | | (187,173 | ) |
| Restoration Hardware Holdings Inc | United States | 2,821 | | (93,826 | ) |
| Vitamin Shoppe Inc | United States | 7,627 | | (230,641 | ) |
| Williams-Sonoma Inc | United States | 4,032 | | (213,857 | ) |
| | | | | (816,239 | ) |
| Technology Hardware, Storage & Peripherals (0.0)%† | | | | | |
| Violin Memory Inc | United States | 35,018 | | (19,883 | ) |
| Textiles, Apparel & Luxury Goods (0.0)%† | | | | | |
| Iconix Brand Group Inc | United States | 30,078 | | (231,901 | ) |
| Tobacco (0.0)%† | | | | | |
| Universal Corp | United States | 5,983 | | (327,270 | ) |
| Trading Companies & Distributors (0.1)% | | | | | |
| Air Lease Corp | United States | 11,923 | | (358,286 | ) |
| Kaman Corp | United States | 8,295 | | (354,280 | ) |
| | | | | (712,566 | ) |
| Wireless Telecommunication Services (0.0)%† | | | | | |
| T-Mobile U.S. Inc | United States | 140 | | (5,986 | ) |
| Vodafone Group PLC, ADR | United Kingdom | 850 | | (28,892 | ) |
| | | | | (34,878 | ) |
| Total Common Stocks (Proceeds $111,018,866) | | | | (113,492,471 | ) |
| Exchange Traded Funds (10.8)% | | | | | |
| Consumer Discretionary Select Sector SPDR Fund | United States | 37,020 | | (2,933,465 | ) |
| Health Care Select Sector SPDR ETF | United States | 79,208 | | (5,650,699 | ) |
| iShares Core S&P Small-Cap ETF | United States | 30,875 | | (3,573,781 | ) |
| iShares iBoxx USD High Yield Corporate Bond ETF | United States | 1,369 | | (114,463 | ) |
| iShares Micro-Cap ETF | United States | 20,086 | | (1,428,516 | ) |
| iShares MSCI Emerging Markets ETF | United States | 16,850 | | (558,241 | ) |
| iShares MSCI Japan ETF | Japan | 116,395 | | (1,371,133 | ) |
| iShares Nasdaq Biotechnology ETF | United States | 16,797 | | (4,699,297 | ) |
| iShares North American Tech ETF | United States | 12,451 | | (1,404,846 | ) |
| iShares North American Tech-Multimedia Networking ETF | United States | 72,564 | | (2,603,669 | ) |
| iShares North American Tech-Software ETF | United States | 16,292 | | (1,730,048 | ) |
| iShares PHLX Semiconductor ETF | United States | 5,252 | | (498,782 | ) |
| iShares Russell 2000 ETF | United States | 33,385 | | (3,838,607 | ) |
| iShares Russell 2000 Growth ETF | United States | 22,207 | | (3,059,681 | ) |
| iShares Russell Mid-Cap Growth ETF | United States | 14,355 | | (1,343,628 | ) |
| iShares S&P Small-Cap 600 Growth ETF | United States | 11,255 | | (1,441,090 | ) |
| iShares Transportation Average ETF | United States | 12,000 | | (1,679,040 | ) |
| iShares U.S. Consumer Goods ETF | United States | 18,060 | | (2,032,111 | ) |
| iShares U.S. Technology ETF | United States | 12,921 | | (1,396,631 | ) |
| iShares U.S. Telecommunications ETF | United States | 22,402 | | (707,903 | ) |
| Powershares Dynamic Media Portfolio | United States | 80,190 | | (2,023,996 | ) |
| Powershares Dynamic Retail Portfolio | United States | 53,700 | | (1,863,927 | ) |
| PureFunds ISE Cyber Security ETF | United States | 129,940 | | (3,148,446 | ) |
| SPDR Barclays High Yield Bond ETF | United States | 15,096 | | (531,832 | ) |
| SPDR S&P 500 ETF Trust | United States | 336,391 | | (70,669,021 | ) |
franklintempleton.com
Annual Report
63
FRANKLIN ALTERNATIVE STRATEGIES FUNDS
CONSOLIDATED STATEMENT OF INVESTMENTS
| | | | | |
| Franklin K2 Alternative Strategies Fund (continued) | | | | | |
| |
| | Country | Shares | | Value | |
| r Securities Sold Short (continued) | | | | | |
| Exchange Traded Funds (continued) | | | | | |
| SPDR S&P MidCap 400 ETF Trust | United States | 8,292 | $ | (2,254,097 | ) |
| SPDR S&P Retail ETF | United States | 61,382 | | (2,597,072 | ) |
| SPDR S&P Transportation ETF | United States | 55,890 | | (2,506,667 | ) |
| Technology Select Sector SPDR Fund | United States | 12,609 | | (557,444 | ) |
| Utilities Select Sector SPDR Fund | United States | 28,211 | | (1,386,571 | ) |
| Vanguard Consumer Staples ETF | United States | 15,265 | | (2,060,775 | ) |
| Vanguard Small-Cap Growth ETF | United States | 13,920 | | (1,720,651 | ) |
| Total Exchange Traded Funds (Proceeds $134,310,533) | | | | (133,386,130 | ) |
| |
| | | Principal | | | |
| | | Amount* | | | |
| Convertible Bonds and Notes (0.1)% | | | | | |
| Internet & Catalog Retail (0.0)%† | | | | | |
| The Priceline Group Inc., senior note, 0.90%, 9/15/21 | United States | 484,000 | | (495,798 | ) |
| Metals & Mining (0.0)%† | | | | | |
| RTI International Metals Inc., senior note, 1.625%, 10/15/19 | United States | 267,000 | | (286,858 | ) |
| Semiconductors & Semiconductor Equipment (0.0)%† | | | | | |
| NXP Semiconductors NV, senior note, 1.00%, 12/01/19 | Netherlands | 267,000 | | (316,562 | ) |
| Software (0.1)% | | | | | |
| Red Hat Inc., senior note, 0.25%, 10/01/19 | United States | 535,000 | | (678,781 | ) |
| Total Convertible Bonds and Notes | | | | | |
| (Proceeds $1,757,674) | | | | (1,777,999 | ) |
| Corporate Bonds and Notes (0.2)% | | | | | |
| Diversified Telecommunication Services (0.1)% | | | | | |
| c Frontier Communications Corp., senior note, 144A, 11.00%, 9/15/25 | United States | 1,681,000 | | (1,716,721 | ) |
| Hotels, Restaurants & Leisure (0.0)%† | | | | | |
| Caesars Entertainment Resort Properties LLC / Caesars Entertainment Resort | | | | | |
| Properties, senior secured note, first lien, 8.00%, 10/01/20 | United States | 179,000 | | (181,238 | ) |
| Independent Power & Renewable Electricity Producers (0.0)%† | | | | | |
| NRG Energy Inc., senior note, | | | | | |
| 7.875%, 5/15/21 | United States | 78,000 | | (81,315 | ) |
| 6.25%, 7/15/22 | United States | 181,000 | | (178,681 | ) |
| | | | | (259,996 | ) |
| Media (0.1)% | | | | | |
| c CCO Holdings LLC / CCO Holdings Capital Corp., senior note, 144A, | | | | | |
| 5.875%, 4/01/24 | United States | 843,000 | | (880,935 | ) |
| Total Corporate Bonds and Notes (Proceeds $2,949,752) | | | | (3,038,890 | ) |
| U.S. Government and Agency Securities (Proceeds $629,868) (0.1)% | | | | | |
| U.S. Treasury Note, 1.625%, 2/15/26 | United States | 647,000 | | (633,756 | ) |
| Total Securities Sold Short (Proceeds $250,666,693) | | | $ | (252,329,246 | ) |
64 Annual Report
franklintempleton.com
F R A N K L I N A L T E R N A T I V E S T R A T E G I E S F U N D S
C O N S O L I D A T E D S T A T E M E N T O F I N V E S T M E N T S |
| Franklin K2 Alternative Strategies Fund (continued) |
Rounds to less than 0.1% of net assets.
*The principal/notional amount is stated in U.S. dollars unless otherwise indicated. |
a A portion or all of the security has been segregated as collateral for securities sold short, open swap, forward, futures and written options contracts. At May 31, 2016, the
aggregate value of these securities and/or cash pledged amounted to $475,149,464, representing 38.42% of net assets.
b Non-income producing.
c Security was purchased pursuant to Rule 144A under the Securities Act of 1933 and may be sold in transactions exempt from registration only to qualified institutional buyers
or in public offering registered under the Securities Act of 1933. These securities have been deemed liquid under guidelines approved by the Trust s Board of Trustees. At
May 31, 2016, the net value of these securities was $147,618,445, representing 11.94% of net assets.
d A portion or all of the security is held in connection with written option contracts open at period end.
e Variable rate security. The rate shown represents the yield at period end.
f Security was purchased pursuant to Regulation S under the Securities Act of 1933, which exempts from registration securities offered and sold outside of the United States.
Such a security cannot be sold in the United States without either an effective registration statement filed pursuant to the Securities Act of 1933, or pursuant to an exemption
from registration. These securities have been deemed liquid under guidelines approved by the Trust s Board of Trustees. At May 31, 2016, the aggregate value of these secu-
rities was $35,899,001, representing 2.90% of net assets.
g See Note 7 regarding credit risk and defaulted securities.
h The coupon rate shown represents the rate at period end.
i Perpetual security with no stated maturity date.
j A portion or all of the security purchased on a delayed delivery basis. See Note 1(d).
k Income may be received in additional securities and/or cash.
l See Note 1(i) regarding senior floating rate interests.
m The security is traded on a discount basis with no stated coupon rate.
n A portion or all of the security is owned by K2 Holdings Investment Corp., a wholly-owned subsidiary of the Fund. See Note 1(g).
o The rate shown is the annualized seven-day yield at period end.
p See Note 1(c) regarding joint repurchase agreement.
q See Note 1(e) regarding written options.
r See Note 1(f) regarding securities sold short. |
FRANKLIN ALTERNATIVE STRATEGIES FUNDS
CONSOLIDATED STATEMENT OF INVESTMENTS
| | | | | | | | | | |
| Franklin K2 Alternative Strategies Fund (continued) | | | | | | | | | |
| At May 31, 2016, the Fund had the following futures contracts outstanding. See Note 1(e). | | | | | | |
| |
| Futures Contracts | | | | | | | | | | |
| | | Number of | | Notional | Expiration | | Unrealized | | Unrealized | |
| Description | Type | Contracts | | Value | Date | | Appreciation | | Depreciation | |
| Commodity Contractsa | | | | | | | | | | |
| Aluminum | Long | 245 | $ | 9,467,719 | 6/13/16 | $ | — | $ | (217,867 | ) |
| Aluminum | Short | 245 | | 9,467,719 | 6/13/16 | | — | | (187,523 | ) |
| Aluminum | Long | 15 | | 584,438 | 9/19/16 | | — | | (16,206 | ) |
| Aluminum | Short | 15 | | 584,438 | 9/19/16 | | — | | (17,793 | ) |
| Brent Crude Oil | Long | 155 | | 7,732,950 | 6/30/16 | | 116,564 | | — | |
| Cocoa | Long | 71 | | 2,301,402 | 7/14/16 | | 113,379 | | — | |
| Coffee | Short | 25 | | 1,157,344 | 9/20/16 | | 1,432 | | — | |
| Copper | Long | 89 | | 10,413,556 | 6/13/16 | | — | | (555,112 | ) |
| Copper | Short | 89 | | 10,413,556 | 6/13/16 | | — | | (148,849 | ) |
| Copper | Long | 9 | | 1,051,087 | 9/19/16 | | — | | (69,176 | ) |
| Copper | Short | 9 | | 1,051,087 | 9/19/16 | | — | | (1,426 | ) |
| Corn | Short | 92 | | 1,861,850 | 7/14/16 | | — | | (191,363 | ) |
| Gold 100 Oz | Long | 111 | | 13,514,250 | 8/29/16 | | — | | (327,200 | ) |
| Kansas City Wheat | Short | 62 | | 1,386,475 | 7/14/16 | | 87,021 | | — | |
| Low Sulfur Gas Oil | Long | 47 | | 2,132,625 | 7/12/16 | | 57,729 | | — | |
| Natural Gas | Short | 81 | | 1,853,280 | 6/28/16 | | — | | (39,619 | ) |
| NY Harbor Ultra-Low Sulfur Diesel | Long | 18 | | 1,131,808 | 6/30/16 | | 8,701 | | — | |
| RBOB Gasoline | Long | 66 | | 4,472,345 | 6/30/16 | | 290,040 | | — | |
| Silver | Long | 60 | | 4,798,200 | 7/27/16 | | — | | (353,579 | ) |
| Soybean Meal | Long | 71 | | 2,815,860 | 7/14/16 | | 363,447 | | — | |
| Soybean Oil | Long | 42 | | 801,864 | 7/14/16 | | — | | (66,923 | ) |
| Soybeans | Long | 84 | | 4,529,700 | 7/14/16 | | 600,688 | | — | |
| Sugar | Long | 73 | | 1,443,882 | 9/30/16 | | 6,108 | | — | |
| Wheat | Short | 124 | | 2,879,900 | 7/14/16 | | 108,120 | | — | |
| Zinc | Long | 80 | | 3,839,500 | 6/13/16 | | 206,368 | | — | |
| Zinc | Short | 80 | | 3,839,500 | 6/13/16 | | — | | (302,351 | ) |
| Zinc | Long | 37 | | 1,780,856 | 9/19/16 | | 26,811 | | — | |
| Zinc | Short | 5 | | 240,656 | 9/19/16 | | — | | (4,277 | ) |
| | | | | 107,547,847 | | | 1,986,408 | | (2,499,264 | ) |
| Equity Contracts | | | | | | | | | | |
| CAC 40 10 Euroa | Long | 66 | | 3,289,866 | 6/17/16 | | 35,468 | | — | |
| DAX Indexa | Long | 9 | | 2,569,415 | 6/17/16 | | 45,190 | | — | |
| DJIA Mini E-CBOT Indexa | Long | 201 | | 17,862,870 | 6/17/16 | | 407,867 | | — | |
| EURO STOXX 50 Price EURa | Short | 95 | | 3,227,057 | 6/17/16 | | — | | (110,595 | ) |
| FTSE 100 Indexa | Long | 10 | | 900,802 | 6/17/16 | | — | | (3,135 | ) |
| FTSE 100 Index | Short | 52 | | 4,684,173 | 6/17/16 | | 41,914 | | — | |
| Hang Seng Indexa | Short | 34 | | 4,479,079 | 6/29/16 | | — | | (215,856 | ) |
| Nasdaq 100 E-Mini Indexa | Long | 125 | | 11,310,625 | 6/17/16 | | 238,054 | | — | |
| Nikkei 225 Indexa | Short | 24 | | 3,734,321 | 6/09/16 | | — | | (72,069 | ) |
| Russell 2000 Mini Indexa | Long | 118 | | 13,610,120 | 6/17/16 | | 484,263 | | — | |
| Russell 2000 Mini Index | Short | 27 | | 3,114,180 | 6/17/16 | | — | | (101,740 | ) |
| S&P 500 E-Mini Indexa | Long | 129 | | 13,512,105 | 6/17/16 | | 433,249 | | — | |
| S&P 500 E-Mini Index | Short | 329 | | 34,461,105 | 6/17/16 | | — | | (917,080 | ) |
| STOXX 600 Bank Index | Short | 81 | | 685,845 | 6/17/16 | | — | | (38,990 | ) |
| TOPIX Indexa | Short | 39 | | 4,849,686 | 6/09/16 | | — | | (119,220 | ) |
| | | | | 122,291,249 | | | 1,686,005 | | (1,578,685 | ) |
| Interest Rate Contracts | | | | | | | | | | |
| 3 Month Euribora | Long | 844 | | 235,472,206 | 6/19/17 | | 214,851 | | — | |
| 90 Day Eurodollara | Long | 277 | | 68,498,637 | 6/19/17 | | 27,206 | | — | |
| 90 Day Eurodollar | Short | 162 | | 40,001,850 | 12/18/17 | | — | | (74,573 | ) |
| 90 Day Sterlinga | Long | 1,267 | | 227,731,157 | 6/21/17 | | 447,754 | | — | |
| Australian 10 Yr. Bonda | Long | 233 | | 22,378,075 | 6/15/16 | | 137,484 | | — | |
| Euro-Bunda | Long | 125 | | 22,805,031 | 6/08/16 | | 111,796 | | — | |
66 Annual Report
franklintempleton.com
FRANKLIN ALTERNATIVE STRATEGIES FUNDS
CONSOLIDATED STATEMENT OF INVESTMENTS
| | | | | | | | | | | | | |
| Franklin K2 Alternative Strategies Fund (continued) | | | | | | | | | | |
| |
| Futures Contracts (continued) | | | | | | | | | | | | | |
| | | | | Number of | | Notional Expiration | | Unrealized | | Unrealized | |
| Description | | Type Contracts | | Value | | Date | | Appreciation | | Depreciation | |
| Interest Rate Contracts (continued) | | | | | | | | | | | | | |
| Euro-Bund | | Short | 133 | $ | 24,264,553 | | 6/08/16 | $ | — | $ | (65,235 | ) |
| Long Gilta | | Long | 3 | | 533,356 | | 9/28/16 | | 852 | | — | |
| U.S. Treasury 10 Yr. Note | | Short | 70 | | 9,078,125 | | 9/21/16 | | — | | (23,697 | ) |
| U.S. Treasury Long Bonda | | Long | 165 | | 26,946,563 | | 9/21/16 | | 38,423 | | — | |
| U.S. Treasury Long Bond | | Short | 17 | | 2,776,313 | | 9/21/16 | | — | | (21,157 | ) |
| | | | | | | 680,485,866 | | | | 978,366 | | (184,662 | ) |
| Total Futures Contracts | | | | | $ | 910,324,962 | | | $ | 4,650,779 | $ | (4,262,611 | ) |
| Net unrealized appreciation (depreciation) | | | | | | | | $ | 388,168 | | | |
| |
| aA portion or all of the contract is owned by K2 Holdings Investment Corp., a wholly-owned subsidiary of the Fund. See Note 1(g). | | | | | |
| |
| At May 31, 2016, the Fund had the following forward exchange contracts outstanding. See Note 1(e). | | | | | |
| |
| Forward Exchange Contracts | | | | | | | | | | | | | |
| | | | | | | Contract | | Settlement | | Unrealized | | Unrealized | |
| Currency | Counterpartya Type | | Quantity | | Amount* | | Date | | Appreciation | | Depreciation | |
| OTC Forward Exchange Contracts | | | | | | | | | | | | | |
| Brazilian Real | BOFA | Buy | | 7,135,000 | | 1,987,465 | | 6/02/16 | $ | — | $ | (12,980 | ) |
| Brazilian Real | BOFA | Sell | | 7,135,000 | | 2,006,780 | | 6/02/16 | | 32,295 | | — | |
| Euro | BOFA | Sell | | 1,740,000 | | 1,996,646 | | 6/03/16 | | 60,420 | | — | |
| Hungarian Forint | BOFA | Buy | | 538,400,000 | | 1,978,239 | | 6/03/16 | | — | | (67,933 | ) |
| New Zealand Dollar | DBAB | Sell | | 2,848,040 | | 1,887,302 | AUD | 6/07/16 | | — | | (47,625 | ) |
| Euro | BNYM | Sell | | 2,246,953 | | 2,567,144 | | 6/09/16 | | 66,208 | | — | |
| New Zealand Dollar | CBOA | Sell | | 1,300,000 | | 894,576 | | 6/09/16 | | 15,424 | | — | |
| New Zealand Dollar | DBAB | Sell | | 805,000 | | 554,598 | | 6/09/16 | | 10,201 | | — | |
| Swiss Franc | BNYM | Sell | | 1,863,736 | | 1,921,377 | | 6/09/16 | | 45,558 | | — | |
| Turkish Lira | DBAB | Sell | | 4,200,000 | | 1,425,962 | | 6/09/16 | | 6,634 | | — | |
| Brazilian Real | BOFA | Sell | | 275,000 | | 73,308 | | 6/10/16 | | — | | (2,557 | ) |
| Japanese Yen | MSCS | Buy | | 160,250,000 | | 1,479,584 | | 6/10/16 | | — | | (31,866 | ) |
| Chilean Peso | MSCS | Sell | 1,000,000,000 | | 1,479,290 | | 6/13/16 | | 37,794 | | — | |
| Euro | BNYM | Sell | | 10,000 | | 11,401 | | 6/13/16 | | 269 | | — | |
| South Korean Won | BOFA | Sell | 1,710,000,000 | | 1,465,170 | | 6/13/16 | | 30,757 | | — | |
| British Pound | BNYM | Buy | | 50,000 | | 72,432 | | 6/15/16 | | — | | (6 | ) |
| British Pound | BNYM | Sell | | 335,000 | | 475,514 | | 6/15/16 | | 38 | | (9,782 | ) |
| Chinese Yuan | MSCO | Sell | | 3,140,715 | | 480,541 | | 6/15/16 | | 4,009 | | — | |
| Euro | BNYM | Buy | | 759,105 | | 862,355 | | 6/15/16 | | — | | (17,247 | ) |
| Euro | BNYM | Sell | | 7,730,049 | | 8,594,024 | | 6/15/16 | | 13,405 | | (25,203 | ) |
| Euro | MSCO | Buy | | 5,635,168 | | 6,360,715 | | 6/15/16 | | — | | (87,111 | ) |
| Euro | MSCO | Sell | | 21,270,969 | | 23,774,111 | | 6/15/16 | | 93,255 | | — | |
| Japanese Yen | MSCO | Sell | | 188,316,736 | | 1,660,918 | | 6/15/16 | | — | | (40,692 | ) |
| Mexican Peso | MSCO | Buy | | 52,378,177 | | 2,927,573 | | 6/15/16 | | — | | (94,764 | ) |
| Mexican Peso | MSCO | Sell | | 52,378,177 | | 3,023,717 | | 6/15/16 | | 190,908 | | — | |
| South Korean Won | MSCO | Sell | 2,556,880,299 | | 2,169,865 | | 6/15/16 | | 25,146 | | — | |
| Swiss Franc | BNYM | Buy | | 508,766 | | 534,974 | | 6/15/16 | | — | | (22,758 | ) |
| Swiss Franc | BNYM | Sell | | 6,685,600 | | 6,807,843 | | 6/15/16 | | 76,907 | | — | |
| Australian Dollarb | MSCO | Buy | | 29,967,000 | | 22,362,854 | | 6/17/16 | | — | | (718,933 | ) |
| Australian Dollarb | MSCO | Sell | | 32,297,000 | | 23,529,588 | | 6/17/16 | | 267,082 | | (64,271 | ) |
| British Poundb | MSCO | Buy | | 8,976,000 | | 12,922,712 | | 6/17/16 | | 129,109 | | (49,600 | ) |
| British Poundb | MSCO | Sell | | 23,016,000 | | 32,970,250 | | 6/17/16 | | 12,250 | | (381,917 | ) |
| Canadian Dollarb | MSCO | Buy | | 33,986,000 | | 25,792,050 | | 6/17/16 | | 271,259 | | (146,840 | ) |
| Canadian Dollarb | MSCO | Sell | | 24,814,000 | | 18,923,095 | | 6/17/16 | | 54,193 | | (53,337 | ) |
| Eurob | MSCO | Buy | | 42,290,000 | | 47,636,029 | | 6/17/16 | | 33,482 | | (584,607 | ) |
| Eurob | MSCO | Sell | | 39,706,000 | | 44,642,322 | | 6/17/16 | | 435,194 | | (801 | ) |
| Japanese Yenb | MSCO | Buy | 5,463,293,000 | | 49,421,094 | | 6/17/16 | | 327,599 | | (379,096 | ) |
| Japanese Yenb | MSCO | Sell | 2,649,474,000 | | 24,267,621 | | 6/17/16 | | 352,662 | | (27,283 | ) |
| Mexican Pesob | MSCO | Buy | | 26,142,000 | | 1,466,742 | | 6/17/16 | | — | | (53,223 | ) |
franklintempleton.com
Annual Report
67
F R A N K L I N A L T E R N A T I V E S T R A T E G I E S F U N D S
C O N S O L I D A T E D S T A T E M E N T O F I N V E S T M E N T S |
| Franklin K2 Alternative Strategies Fund (continued) | | | | | | | | | | |
| |
| Forward Exchange Contracts (continued) | | | | | | | | | | | | | | |
| | | | | | | | | Contract | | Settlement | | Unrealized | | Unrealized |
| Currency | | Counterparty a Type | | Quantity | | Amount* | | Date | | Appreciation | | Depreciation |
| |
| |
| |
| |
| |
| |
|
| OTC Forward Exchange Contracts (continued) | | | | | | | | | | | | | | |
| Mexican Peso b | | MSCO | | Sell | | 186,222,000 | | 10,391,403 | | 6/17/16 | | $ 322,226 | | $ | | |
| New Zealand Dollar b | | MSCO | | Buy | | 25,470,000 | | 17,300,723 | | 6/17/16 | | 98,073 | | | | (181,647) |
| New Zealand Dollar b | | MSCO | | Sell | | 18,577,000 | | 12,530,665 | | 6/17/16 | | 61,700 | | | | (88,670) |
| Swiss Franc b | | MSCO | | Buy | | 25,744,000 | | 26,803,080 | | 6/17/16 | | 73 | | | | (882,023) |
| Swiss Franc b | | MSCO | | Sell | | 39,568,000 | | 40,563,225 | | 6/17/16 | | 722,974 | | | | |
| Canadian Dollar | | MSCS | | Sell | | 2,600,000 | | 1,994,416 | | 6/20/16 | | 11,756 | | | | |
| Mexican Peso | | MSCS | | Buy | | 36,800,000 | | 1,987,417 | | 6/20/16 | | 1,676 | | | | |
| Colombian Peso | | CSFB | | Sell | | 780,000,000 | | 255,236 | | 6/23/16 | | 4,103 | | | | |
| Indonesian Rupiah | | CSFB | | Sell | | 11,300,000,000 | | 837,658 | | 6/23/16 | | 14,272 | | | | |
| Indonesian Rupiah | | MSCS | | Sell | | 1,500,000,000 | | 111,152 | | 6/23/16 | | 1,853 | | | | |
| Australian Dollar | | BNYM | | Sell | | 186,000 | | 140,690 | | 6/30/16 | | 6,421 | | | | |
| Australian Dollar | | MSCO | | Buy | | 25,567 | | 19,048 | | 6/30/16 | | | | | | (592) |
| Australian Dollar | | MSCO | | Sell | | 25,567 | | 19,695 | | 6/30/16 | | 1,238 | | | | |
| British Pound | | BNYM | | Sell | | 121,000 | | 177,834 | | 6/30/16 | | 2,540 | | | | |
| British Pound | | MSCO | | Buy | | 624,909 | | 906,050 | | 6/30/16 | | 900 | | | | (1,639) |
| British Pound | | MSCO | | Sell | | 656,590 | | 952,571 | | 6/30/16 | | 2,282 | | | | (918) |
| Canadian Dollar | | BNYM | | Buy | | 300,000 | | 233,918 | | 6/30/16 | | | | | | (5,151) |
| Canadian Dollar | | BNYM | | Sell | | 567,000 | | 432,735 | | 6/30/16 | | 366 | | | | |
| Canadian Dollar | | MSCO | | Buy | | 1,517,664 | | 1,175,291 | | 6/30/16 | | | | | | (17,988) |
| Canadian Dollar | | MSCO | | Sell | | 4,913,218 | | 3,861,316 | | 6/30/16 | | 115,134 | | | | (419) |
| Canadian Dollar | | MSCS | | Sell | | 3,150,000 | | 2,492,503 | | 6/30/16 | | 90,453 | | | | |
| Euro | | BNYM | | Buy | | 1,305,000 | | 1,488,114 | | 6/30/16 | | | | | | (34,415) |
| Euro | | BNYM | | Sell | | 7,424,909 | | 8,387,337 | | 6/30/16 | | 116,392 | | | | |
| Euro | | CSFB | | Sell | | 130,000 | | 145,630 | | 6/30/16 | | 817 | | | | |
| Euro | | DBAB | | Sell | | 613,000 | | 686,511 | | 6/30/16 | | 3,662 | | | | |
| Euro | | MSCO | | Buy | | 564,029 | | 648,288 | | 6/30/16 | | | | | | (19,991) |
| Euro | | MSCO | | Sell | | 2,597,408 | | 2,939,205 | | 6/30/16 | | 45,868 | | | | (35) |
| Hong Kong Dollar | | BNYM | | Buy | | 9,000,000 | | 1,160,324 | | 6/30/16 | | | | | | (1,606) |
| Hong Kong Dollar | | BNYM | | Sell | | 10,293,000 | | 1,327,483 | | 6/30/16 | | 2,295 | | | | |
| Japanese Yen | | BNYM | | Sell | | 90,184,000 | | 801,137 | | 6/30/16 | | | | | | (14,236) |
| Japanese Yen | | MSCO | | Buy | | 46,797,039 | | 422,472 | | 6/30/16 | | 630 | | | | |
| Mexican Peso | | MSCS | | Sell | | 335,125 | | 18,128 | | 6/30/16 | | 36 | | | | |
| Norwegian Krone | | MSCS | | Buy | | 20,300,000 | | 2,489,774 | | 6/30/16 | | | | | | (63,379) |
| Singapore Dollar | | BNYM | | Buy | | 360,000 | | 264,706 | | 6/30/16 | | | | | | (3,425) |
| Singapore Dollar | | BNYM | | Sell | | 2,769,000 | | 2,036,928 | | 6/30/16 | | 27,246 | | | | |
| South African Rand | | MSCO | | Buy | | 9,067,517 | | 582,606 | | 6/30/16 | | 2,725 | | | | (12,197) |
| South African Rand | | MSCO | | Sell | | 14,324,263 | | 969,386 | | 6/30/16 | | 63,988 | | | | |
| South African Rand | | MSCS | | Sell | | 15,000,000 | | 957,854 | | 6/30/16 | | 9,744 | | | | |
| Swedish Krona | | MSCO | | Sell | | 3,948,429 | | 485,322 | | 6/30/16 | | 11,327 | | | | |
| Swiss Franc | | MSCO | | Buy | | 273,772 | | 282,406 | | 6/30/16 | | | | | | (6,573) |
| Brazilian Real | | BOFA | | Sell | | 7,135,000 | | 1,968,276 | | 7/05/16 | | 14,947 | | | | |
| Colombian Peso | | MSCS | | Buy | | 3,100,000,000 | | 1,032,817 | | 7/29/16 | | | | | | (41,431) |
| Colombian Peso | | MSCS | | Sell | | 3,100,000,000 | | 1,054,063 | | 7/29/16 | | 62,677 | | | | |
| Chinese Yuan | | MSCO | | Sell | | 38,445,840 | | 5,738,379 | | 8/22/16 | | 1,902 | | | | (78,477) |
| Taiwan Dollar | | BOFA | | Sell | | 78,550,000 | | 2,405,819 | | 8/23/16 | | | | | | (6,984) |
| Chinese Yuan | | MLCO | | Sell | | 11,100,000 | | 1,682,838 | | 9/19/16 | | 6,729 | | | | |
| Chinese Yuan | | MSCS | | Sell | | 4,300,000 | | 637,320 | | 9/19/16 | | | | | | (11,983) |
| Turkish Lira | | MLCO | | Sell | | 5,652,374 | | 1,864,916 | | 9/21/16 | | 4,296 | | | | |
| Taiwan Dollar | | DBAB | | Sell | | 48,000,000 | | 1,489,758 | | 10/06/16 | | 13,983 | | | | |
| Saudi Riyal | | MSCO | | Sell | | 13,022,466 | | 3,391,267 | | 1/19/17 | | | | | | (50,851) |
| | | | | | | | | | | | |
| |
| |
|
| Total Forward Exchange Contracts | | | | | | | | | | $4,439,362 | | $(4,445,062) |
| | | | | | | | | | |
| |
|
| Net unrealized appreciation (depreciation) | | | | | | | | | | | | $ | | (5,700) |
| | | | | | | | | | | | |
| |
|
*In U.S. dollars unless otherwise indicated.
a May be comprised of multiple contracts with the same counterparty, currency and settlement date.
b A portion or all of the contract is owned by K2 Holdings Investment Corp., a wholly-owned subsidiary of the Fund. See Note 1(g). |
F R A N K L I N A L T E R N A T I V E S T R A T E G I E S F U N D S
C O N S O L I D A T E D S T A T E M E N T O F I N V E S T M E N T S |
| Franklin K2 Alternative Strategies Fund (continued) | | | | | | | | | | | | |
| At May 31, 2016, the Fund had the following credit default swap contracts outstanding. See Note 1(e) . | | | | | | |
| |
| Credit Default Swap Contracts | | | | | | | | | | | | | | | | | | |
| | | | | | | | | | | Unamortized | | | | | | | | |
| | | Periodic | | | | | | | | Upfront | | | | | | | | |
| | | Payment Counterparty/ | | Notional | | Expiration | | Payments | | Unrealized | | Unrealized | | | | |
| Description | | Rate | | Exchange | | Amount a | | Date | | (Receipts) | | Appreciation | | Depreciation | | Value | | Rating b |
| |
| |
| |
| |
| |
| |
| |
| |
| |
|
| Centrally Cleared Swap Contracts | | | | | | | | | | | | | | | | | | |
| Contracts to Buy Protection | | | | | | | | | | | | | | | | | | �� |
| Single Name | | | | | | | | | | | | | | | | | | |
| Government of Brazil | | 1.00% | | ICE | | 423,000 | | 6/20/20 | | $ 26,854 | | $ 6,029 | | $ | | $ 32,883 | | |
| Government of Russia | | 1.00% | | ICE | | 631,000 | | 9/20/20 | | 52,695 | | | | (19,721) | | 32,974 | | |
| Government of Russia | | 1.00% | | ICE | | 486,000 | | 9/20/20 | | 43,032 | | | | (17,635) | | 25,397 | | |
| Government of South Africa | | 1.00% | | ICE | | 1,617,000 | | 6/20/21 | | 148,020 | | 9,645 | | | | 157,665 | | |
| Government of South Africa | | 1.00% | | ICE | | 1,310,000 | | 6/20/21 | | 126,444 | | 1,288 | | | | 127,732 | | |
| Government of Turkey | | 1.00% | | ICE | | 1,976,000 | | 9/20/20 | | 157,717 | | | | (46,930) | | 110,787 | | |
| Government of Turkey | | 1.00% | | ICE | | 1,286,000 | | 12/20/20 | | 93,791 | | | | (12,278) | | 81,513 | | |
| Government of Turkey | | 1.00% | | ICE | | 448,000 | | 12/20/20 | | 39,795 | | | | (11,398) | | 28,397 | | |
| Government of Turkey | | 1.00% | | ICE | | 1,721,000 | | 12/20/20 | | 104,376 | | 4,710 | | | | 109,086 | | |
| Government of Turkey | | 1.00% | | ICE | | 629,000 | | 6/20/21 | | 50,876 | | | | (2,069) | | 48,807 | | |
| Traded Index | | | | | | | | | | | | | | | | | | |
| CDX. NA. HY. 26 | | 5.00% | | ICE | | 4,850,000 | | 6/20/21 | | (85,845) | | | | (46,047) | | (131,892) | | |
| iTraxx Europe Crossover | | 5.00% | | ICE | | 697,000 EUR | | 12/20/20 | | (43,995) | | | | (7,976) | | (51,971) | | |
| Contracts to Sell Protection c | | | | | | | | | | | | | | | | | | |
| Single Name | | | | | | | | | | | | | | | | | | |
| Government of Brazil | | 1.00% | | ICE | | 89,000 | | 6/20/20 | | (10,805) | | 3,887 | | | | (6,918) | | BB |
| Government of Brazil | | 1.00% | | ICE | | 334,000 | | 6/20/20 | | (47,199) | | 21,236 | | | | (25,963) | | BB |
| Government of Brazil | | 1.00% | | ICE | | 5,222,000 | | 6/20/21 | | (594,435) | | | | (15,115) | | (609,550) | | BB |
| Government of Russia | | 1.00% | | ICE | | 1,868,856 | | 9/20/20 | | (219,442) | | 121,781 | | | | (97,661) | | BB+ |
| Government of Russia | | 1.00% | | ICE | | 1,333,073 | | 9/20/20 | | (158,959) | | 89,296 | | | | (69,663) | | BB+ |
| Government of Russia | | 1.00% | | ICE | | 715,202 | | 9/20/20 | | (91,902) | | 54,527 | | | | (37,375) | | BB+ |
| Government of Turkey | | 1.00% | | ICE | | 387,000 | | 12/20/20 | | (35,846) | | 11,316 | | | | (24,530) | | BB+ |
| | | | | | | | | | |
| |
| |
| |
| | |
| Total Centrally Cleared Swap Contracts | | | | | | | | $(444,828) | | $323,715 | | $(179,169) | | $(300,282) | | |
| | | | | | | | |
| |
| |
| |
| | |
| |
| OTC Swap Contracts | | | | | | | | | | | | | | | | | | |
| Contracts to Buy Protection | | | | | | | | | | | | | | | | | | |
| Single Name | | | | | | | | | | | | | | | | | | |
| Deutsche Bank AG | | 1.00% | | BZWS | | 120,000 EUR | | 6/20/21 | | 5,743 | | | | (1,559) | | 4,184 | | |
| Government of Turkey | | 1.00% | | BZWS | | 325,000 | | 6/20/21 | | 22,511 | | 2,057 | | | | 24,568 | | |
| Traded Index | | | | | | | | | | | | | | | | | | |
| iTraxx Asia Ex Japan | | 1.00% | | BZWS | | 310,000 | | 6/20/21 | | 6,101 | | | | (705) | | 5,396 | | |
| iTraxx Asia Ex Japan | | 1.00% | | MSCS | | 635,000 | | 6/20/21 | | 12,935 | | | | (1,881) | | 11,054 | | |
| Contracts to Sell Protection c | | | | | | | | | | �� | | | | | | | | |
| Single Name | | | | | | | | | | | | | | | | | | |
| Deutsche Bank AG | | 1.00% | | BZWS | | 120,000 EUR | | 6/20/21 | | (17,177) | | 2,606 | | | | (14,571) | | BBB+ |
| | | | | | | | | | |
| |
| |
| |
| | |
| Total OTC Swap Contracts | | | | | | | | | | $ 30,113 | | $ 4,663 | | $ (4,145) | | $ 30,631 | | |
| | | | | | |
| | | |
| |
| |
| |
| | |
| Total Credit Default Swap Contracts | | | | | | 27,533,131 | | | | $(414,715) | | $328,378 | | $(183,314) | | $(269,651) | | |
| | | | | | |
| | | |
| |
| |
| |
| | |
| Net unrealized appreciation (depreciation) | | | | | | | | | | $145,064 | | | | | | |
| | | | | | | | | | |
| | | | | | |
See Notes 1(e) and 8 regarding derivative financial instruments and other derivative information, respectively.
a In U.S. dollars unless otherwise indicated. For contracts to sell protection, the notional amount is equal to the maximum potential amount of the future payments and no
recourse provisions have been entered into in association with the contracts.
b Based on Standard and Poor s (S&P) Rating for single name swaps.
c The Fund enters contracts to sell protection to create a long credit position. Performance triggers include default, bankruptcy or restructuring for single name swaps and fail-
ure to pay or bankruptcy of the underlying securities for traded index swaps. |
F R A N K L I N A L T E R N A T I V E S T R A T E G I E S F U N D S
C O N S O L I D A T E D S T A T E M E N T O F I N V E S T M E N T S |
| Franklin K2 Alternative Strategies Fund (continued) | | | | | | | | | | | | |
| At May 31, 2016, the Fund had the following interest rate swap contracts outstanding. See Note 1(e) . | | | | | | |
| |
| Interest Rate Swap Contracts | | | | | | | | | | | | | | |
| | | | | Counterparty/ | | Notional Expiration | | Unrealized | | Unrealized |
| Description | | | | Exchange | | Amount | | Date Appreciation Depreciation |
| |
| |
| |
| |
|
| OTC Swap Contracts | | | | | | | | | | | | | | |
| Receive Floating rate 3 Month ZAR-JIBAR-SAFEX | | | | | | | | | | | | |
| Pay Fixed rate 7.95% | | | | BZWS | | 12,500,000 ZAR 5/05/25 | | $48,852 | | | | $ |
| | | | | | | | |
| |
| |
|
| Net unrealized appreciation (depreciation) | | | | | | | | | | $48,852 | | | | |
| | | | | | | | | | |
| | | | |
| |
| At May 31, 2016, the Fund had the following total return swap contracts outstanding. See Note 1(e) . | | | | | | | | |
| |
| Total Return Swap Contracts | | | | | | | | | | | | | | |
| | | | | Counter- | | | | Expiration | | Unrealized | | Unrealized |
| Underlying Instrument | | Financing Rate | | Party Notional Value* | | Date | | Appreciation | | Depreciation |
| |
| |
| |
| |
| |
|
| OTC Swap Contracts | | | | | | | | | | | | | | |
| Long | | | | | | | | | | | | | | |
| Allergan PLC | | LIBOR + 75 | | DBAB | | 1,953,810 | | 6/30/16 | | $109,947 | | $ | | |
| Amsurg Corp | | LIBOR + 75 | | DBAB | | 1,165,386 | | 6/30/16 | | 2,489 | | | | |
| Black Hills Corp | | LIBOR + 75 | | DBAB | | 4,487,678 | | 6/30/16 | | 42,178 | | | | |
| Frontier Communications Corp | | LIBOR + 75 | | DBAB | | 3,043,542 | | 6/30/16 | | | | | | (40,381) |
| Health Care REIT Inc | | LIBOR + 75 | | DBAB | | 1,379,694 | | 6/30/16 | | | | | | (44,550) |
| Liberty Interactive LLC | | LIBOR + 75 | | DBAB | | 1,328,124 | | 6/30/16 | | 14,238 | | | | |
| NextEra Energy Inc | | LIBOR + 75 | | DBAB | | 2,540,087 | | 6/30/16 | | 18,041 | | | | |
| Scorpio Tankers Inc | | LIBOR + 75 | | DBAB | | 1,108,514 | | 6/30/16 | | 10,303 | | | | |
| Ship Finance International Ltd | | LIBOR + 75 | | DBAB | | 5,213,187 | | 6/30/16 | | 264,090 | | | | |
| Siliconware Precision Industries Co. Ltd | | LIBOR + 35 | | DBAB | | 56,946 | | 6/30/16 | | 3,841 | | | | |
| Spirit Realty Capital Inc | | LIBOR + 75 | | DBAB | | 323,211 | | 6/30/16 | | | | | | (5,660) |
| T-Mobile U. S. Inc | | LIBOR + 75 | | DBAB | | 336,146 | | 6/30/16 | | 16,321 | | | | |
| WPX Energy Inc | | LIBOR + 75 | | DBAB | | 1,098,576 | | 6/30/16 | | 56,746 | | | | |
| Aabar Investments PJSC | | LIBOR + 100 | | DBAB | | 856,996 EUR | | 7/18/16 | | 9,947 | | | | |
| Aabar Investments PJSC | | LIBOR + 100 | | DBAB | | 466,192 EUR | | 7/18/16 | | 2,480 | | | | |
| Inmarsat PLC | | LIBOR + 75 | | DBAB | | 2,153,889 | | 7/18/16 | | | | | | (5,716) |
| Alstria Office REIT AG | | LIBOR + 75 | | DBAB | | 2,383,993 EUR | | 7/19/16 | | | | | | (1,487) |
| Aroundtown Property Holdings PLC | | LIBOR + 75 | | DBAB | | 663,238 EUR | | 7/19/16 | | 26,328 | | | | |
| British Land White 2015 Ltd | | LIBOR + 75 | | DBAB | | 860,718 GBP | | 7/19/16 | | 10,016 | | | | |
| Carillion Finance Jersey Ltd | | LIBOR + 75 | | DBAB | | 1,454,551 GBP | | 7/19/16 | | 18,206 | | | | |
| Drillisch AG | | LIBOR + 75 | | DBAB | | 3,563,571 EUR | | 7/19/16 | | | | | | (9,576) |
| Enterprise Funding Corp | | LIBOR + 75 | | DBAB | | 156,246 GBP | | 7/19/16 | | 7,180 | | | | |
| Great Portland Estates Capital Jersey Ltd | | LIBOR + 75 | | DBAB | | 1,881,968 GBP | | 7/19/16 | | | | | | (61,511) |
| Helical Bar Jersey Ltd | | LIBOR + 75 | | DBAB | | 416,472 GBP | | 7/19/16 | | 3,805 | | | | |
| PHP Finance Jersey Ltd | | LIBOR + 75 | | DBAB | | 564,465 GBP | | 7/19/16 | | | | | | (8,598) |
| Salzgitter Finance BV | | LIBOR + 75 | | DBAB | | 447,503 EUR | | 7/19/16 | | 4,729 | | | | |
| St. Modwen Properties Securities Jersey Ltd | | LIBOR + 75 | | DBAB | | 296,423 GBP | | 7/19/16 | | 3,798 | | | | |
| Unite Jersey Issuer Ltd | | LIBOR + 75 | | DBAB | | 1,999,018 GBP | | 7/19/16 | | 95,544 | | | | |
| BW Group Ltd | | LIBOR + 75 | | DBAB | | 683,007 | | 7/20/16 | | 1,884 | | | | |
| Hansteen Jersey Securities Ltd | | LIBOR + 75 | | DBAB | | 1,682,689 EUR | | 7/29/16 | | 56,538 | | | | |
| Cahaya Capital Ltd | | LIBOR + 100 | | DBAB | | 316,736 | | 8/17/16 | | 30 | | | | |
| Indah Capital Ltd | | LIBOR + 100 | | DBAB | | 938,357 SGD | | 8/22/16 | | | | | | (8,744) |
| Advanced Semiconductor Engineering Inc | | LIBOR + 100 | | DBAB | | 2,351,738 | | 8/24/16 | | 297,949 | | | | |
| Siliconware Precision Industries Co. Ltd | | LIBOR + 100 | | DBAB | | 781,735 | | 8/24/16 | | | | | | (7,670) |
| Marine Harvest | | LIBOR + 75 | | DBAB | | 5,698,456 EUR | | 9/19/16 | | 364,526 | | | | |
| Ebara Corp | | LIBOR + 85 | | DBAB | | 181,679,702 JPY | | 11/17/16 | | 57,139 | | | | |
| EDION Corp | | LIBOR + 85 | | DBAB | | 157,500,000 JPY | | 11/17/16 | | 33,430 | | | | |
| Japan Airport Terminal Co. Ltd | | LIBOR + 85 | | DBAB | | 90,045,000 JPY | | 11/17/16 | | 7,473 | | | | |
| Japan Airport Terminal Co. Ltd | | LIBOR + 85 | | DBAB | | 200,740,000 JPY | | 11/17/16 | | 13,083 | | | | |
| K s Holdings Corp | | LIBOR + 85 | | DBAB | | 573,450,715 JPY | | 11/17/16 | | | | | | (60,964) |
| Kawasaki Kisen Kaisha Ltd | | LIBOR + 85 | | DBAB | | 38,354,200 JPY | | 11/17/16 | | 14,305 | | | | |
| LIXIL Group Corp | | LIBOR + 85 | | DBAB | | 78,461,733 JPY | | 11/17/16 | | 129 | | | | |
| LIXIL Group Corp | | LIBOR + 85 | | DBAB | | 116,166,600 JPY | | 11/17/16 | | | | | | (3,044) |
70 Annual Report franklintempleton.com
FRANKLIN ALTERNATIVE STRATEGIES FUNDS
CONSOLIDATED STATEMENT OF INVESTMENTS
| | | | | | | | | | |
| Franklin K2 Alternative Strategies Fund (continued) | | | | | | | | | |
| |
| Total Return Swap Contracts (continued) | | | | | | | | | | |
| | | Counter- | | | Expiration | | Unrealized | | Unrealized | |
| Underlying Instrument | Financing Rate | Party | Notional Value* | | Date | | Appreciation | | Depreciation | |
| OTC Swap Contracts (continued) | | | | | | | | | | |
| Long (continued) | | | | | | | | | | |
| Maeda Corp | LIBOR + 85 | DBAB | 193,088,940 | JPY | 11/17/16 | $ | 21,467 | $ | — | |
| Nagoya Railroad Co. Ltd | LIBOR + 85 | DBAB | 22,285,867 | JPY | 11/17/16 | | 6,026 | | — | |
| Nippon Ceramic Co. Ltd | LIBOR + 85 | DBAB | 30,937,500 | JPY | 11/17/16 | | — | | (1,214 | ) |
| Nippon Light Metal Holdings Co. Ltd | LIBOR + 85 | DBAB | 412,888,011 | JPY | 11/17/16 | | 102,031 | | — | |
| OSG Corp | LIBOR + 85 | DBAB | 156,648,000 | JPY | 11/17/16 | | 17,015 | | — | |
| Sankyo Co. Ltd | LIBOR + 85 | DBAB | 111,784,861 | JPY | 11/17/16 | | 4,682 | | — | |
| SBI Holdings Inc | LIBOR + 85 | DBAB | 20,893,686 | JPY | 11/17/16 | | — | | (858 | ) |
| Shionogi & Co. Ltd | LIBOR + 85 | DBAB | 90,075,400 | JPY | 11/17/16 | | 21,421 | | — | |
| Sony Corp | LIBOR + 85 | DBAB | 216,935,780 | JPY | 11/17/16 | | 55,222 | | — | |
| Taiyo Yuden Co. Ltd | LIBOR + 85 | DBAB | 120,238,400 | JPY | 11/17/16 | | 26,504 | | — | |
| Takashimaya Co Ltd | LIBOR + 85 | DBAB | 39,921,771 | JPY | 11/17/16 | | 1,499 | | — | |
| Teijin Ltd | LIBOR + 85 | DBAB | 251,329,885 | JPY | 11/17/16 | | 73,991 | | — | |
| Toho Holdings Co. Ltd | LIBOR + 85 | DBAB | 163,054,579 | JPY | 11/17/16 | | 81,123 | | — | |
| Tohoku Electric Power Co Inc | LIBOR + 85 | DBAB | 256,699,645 | JPY | 11/17/16 | | 12,164 | | — | |
| Tohoku Electric Power Co Inc | LIBOR + 85 | DBAB | 213,875,101 | JPY | 11/17/16 | | 4,715 | | — | |
| Toppan Printing Co | LIBOR + 85 | DBAB | 30,330,471 | JPY | 11/17/16 | | 996 | | — | |
| Unicharm Corp | LIBOR + 85 | DBAB | 139,292,599 | JPY | 11/17/16 | | — | | (28,312 | ) |
| Yamada Denki Co. Ltd | LIBOR + 85 | DBAB | 619,495,250 | JPY | 11/17/16 | | 31,917 | | — | |
| Bank of Nagoya Ltd | LIBOR + 85 | DBAB | 288,550 | | 12/19/16 | | 11,306 | | — | |
| Gunma Bank Ltd | LIBOR + 85 | DBAB | 93,001 | | 12/19/16 | | 952 | | — | |
| Oita Bank Ltd | LIBOR + 85 | DBAB | 1,202,988 | | 12/19/16 | | 2,161 | | — | |
| Yamagata Bank Ltd | LIBOR + 85 | DBAB | 750,110 | | 12/19/16 | | 21,515 | | — | |
| Yamaguchi Financial Group Inc | LIBOR + 85 | DBAB | 2,404,972 | | 12/19/16 | | 25,918 | | — | |
| APERAM SA | LIBOR + 75 | DBAB | 1,829,939 | | 1/18/17 | | 79,715 | | — | |
| Dana Gas Sukuk Ltd | LIBOR + 75 | DBAB | 115,764 | | 1/18/17 | | 3,778 | | — | |
| Magyar Nemzeti Vagyonkezelo Zrt | LIBOR + 75 | DBAB | 2,283,696 | EUR | 1/18/17 | | 20,893 | | — | |
| Anglo American PLC | LIBOR + 50 | MSCS | 410,563 | GBP | 1/18/17 | | — | | (92,319 | ) |
| ANTOFAGASTA PLC | LIBOR + 50 | MSCS | 871,918 | GBP | 1/18/17 | | — | | (123,034 | ) |
| Rio Tinto PLC | LIBOR + 50 | MSCS | 979,033 | GBP | 1/18/17 | | 39,791 | | — | |
| Wizz Air Holdings PLC | LIBOR + 50 | MSCS | 558,138 | GBP | 1/18/17 | | 93,232 | | — | |
| Worldpay Group PLC | LIBOR + 100 | DBAB | 95,852 | GBP | 2/02/17 | | 3,953 | | — | |
| Telepizza Group SA | LIBOR + 100 | DBAB | 182,233 | EUR | 2/02/17 | | — | | (25,764 | ) |
| ACS Actividades Finance BV | LIBOR + 75 | DBAB | 1,852,480 | EUR | 2/09/17 | | — | | (881 | ) |
| Ascent Capital Group Inc | LIBOR + 100 | DBAB | 100,874 | | 2/09/17 | | — | | (38,456 | ) |
| Bunge Ltd | LIBOR + 100 | DBAB | 73,500 | | 2/09/17 | | — | | (5,355 | ) |
| Green Plains Inc | LIBOR + 100 | DBAB | 290,973 | | 2/09/17 | | — | | (10,853 | ) |
| Nyrstar NV | LIBOR + 75 | DBAB | 269,659 | EUR | 2/09/17 | | 15,474 | | — | |
| OCI NV | LIBOR + 75 | DBAB | 1,642,856 | EUR | 2/09/17 | | — | | (106,768 | ) |
| Shenzhou International Group Holdings Ltd | LIBOR + 100 | DBAB | 6,860,580 | HKD | 2/17/17 | | 19,924 | | — | |
| Industrivarden AB | LIBOR + 90 | DBAB | 988,981 | EUR | 2/27/17 | | — | | (3,573 | ) |
| PT Jersey Ltd | LIBOR + 75 | DBAB | 1,403,567 | EUR | 2/27/17 | | 87,912 | | — | |
| BT Group PLC | LIBOR + 40 | MSCS | 106,395 | GBP | 2/28/17 | | — | | (594 | ) |
| SABMiller PLC | LIBOR + 40 | MSCS | 3,288,352 | GBP | 2/28/17 | | 274,550 | | — | |
| Vodafone Group PLC | LIBOR + 40 | MSCS | 58,491 | GBP | 2/28/17 | | 3,412 | | — | |
| Fonciere Des Regions | LIBOR + 75 | DBAB | 902,749 | EUR | 3/15/17 | | — | | (2,643 | ) |
| Orpar SA | LIBOR + 75 | DBAB | 306,513 | EUR | 3/15/17 | | 4,417 | | — | |
| ASM Pacific Technology Ltd | LIBOR + 90 | DBAB | 8,035,222 | HKD | 3/17/17 | | 7,639 | | — | |
| Nyrstar NV | LIBOR + 75 | DBAB | 238,871 | EUR | 3/17/17 | | 17,188 | | — | |
| Premier Oil Finance Jersey Ltd | LIBOR + 75 | DBAB | 446,679 | | 3/17/17 | | 38,670 | | — | |
| Johnson Electric Holdings Ltd | LIBOR + 90 | DBAB | 1,563,964 | | 3/20/17 | | — | | (21,271 | ) |
| OSIM International Ltd | LIBOR + 100 | DBAB | 406,523 | SGD | 3/20/17 | | 4,573 | | — | |
| Coach Inc | LIBOR + 50 | MSCS | 732,645 | | 4/17/17 | | — | | (21,831 | ) |
| Mead Johnson Nutrition Co | LIBOR + 50 | MSCS | 799,312 | | 4/17/17 | | — | | (35,326 | ) |
| Aroundtown Property Holdings PLC | LIBOR + 100 | DBAB | 6,749 | EUR | 4/18/17 | | 299 | | — | |
| Barclays PLC | LIBOR + 50 | MSCS | 442,568 | GBP | 4/18/17 | | 74,617 | | — | |
| BNP Paribas SA | LIBOR + 50 | MSCS | 876,029 | EUR | 4/18/17 | | 105,832 | | — | |
franklintempleton.com
Annual Report
71
F R A N K L I N A L T E R N A T I V E S T R A T E G I E S F U N D S
C O N S O L I D A T E D S T A T E M E N T O F I N V E S T M E N T S |
| Franklin K2 Alternative Strategies Fund (continued) | | | | | | | | | | | | |
| |
| Total Return Swap Contracts (continued) | | | | | | | | | | | | | | |
| | | | | Counter- | | | | Expiration | | Unrealized | | Unrealized |
| Underlying Instrument | | Financing Rate | | Party | | Notional Value* | | Date | | Appreciation | | Depreciation |
| |
| |
| |
| |
| |
| |
|
| OTC Swap Contracts (continued) | | | | | | | | | | | | | | |
| Long (continued) | | | | | | | | | | | | | | |
| Croda International PLC | | LIBOR + 50 | | MSCS | | 1,267,659 GBP | | 4/18/17 | | $ 6,533 | | $ | | |
| Iliad SA | | LIBOR + 50 | | MSCS | | 1,837,413 EUR | | 4/18/17 | | 24,519 | | | | |
| ITV PLC | | LIBOR + 50 | | MSCS | | 1,326,111 GBP | | 4/18/17 | | | | | | (31,859) |
| Remy Cointreau SA | | LIBOR + 50 | | MSCS | | 2,093,202 EUR | | 4/18/17 | | 52,130 | | | | |
| Rexam PLC | | LIBOR + 50 | | MSCS | | 2,273,305 GBP | | 4/18/17 | | | | | | (9,664) |
| RSA Insurance Group PLC | | LIBOR + 50 | | MSCS | | 531,748 GBP | | 4/18/17 | | 15,946 | | | | |
| Smith & Nephew PLC | | LIBOR + 50 | | MSCS | | 870,432 GBP | | 4/18/17 | | 16,319 | | | | |
| Smiths Group PLC | | LIBOR + 50 | | MSCS | | 488,790 GBP | | 4/18/17 | | 18,391 | | | | |
| Societe Generale SA | | LIBOR + 50 | | MSCS | | 966,855 EUR | | 4/18/17 | | 106,090 | | | | |
| Sports Direct International PLC | | LIBOR + 50 | | MSCS | | 1,030,626 GBP | | 4/18/17 | | | | | | (21,249) |
| Acciona SA | | LIBOR + 75 | | DBAB | | 494,728 EUR | | 4/25/17 | | 6,365 | | | | |
| NH Hotel Group SA | | LIBOR + 75 | | DBAB | | 782,637 EUR | | 4/25/17 | | 34,591 | | | | |
| China Overseas Finance Investment | | | | | | | | | | | | | | |
| Cayman V Ltd | | LIBOR + 90 | | DBAB | | 598,950 | | 5/17/17 | | 1,939 | | | | |
| ENN Energy Holdings Ltd | | LIBOR + 90 | | DBAB | | 264,635 | | 5/17/17 | | 540 | | | | |
| TPK Holding Co. Ltd | | LIBOR + 90 | | DBAB | | 215,625 | | 5/17/17 | | 4,575 | | | | |
| Alaska Air Group Inc | | LIBOR + 50 | | MSCS | | 2,319,081 | | 5/25/17 | | | | | | (53,931) |
| Brunswick Corp | | LIBOR + 50 | | MSCS | | 1,825,894 | | 5/25/17 | | 59,132 | | | | |
| Constellation Brands Inc | | LIBOR + 50 | | MSCS | | 2,412,591 | | 5/25/17 | | 264,165 | | | | |
| Louisiana-Pacific Corp | | LIBOR + 50 | | MSCS | | 865,052 | | 5/25/17 | | 58,398 | | | | |
| NVR Inc | | LIBOR + 50 | | MSCS | | 3,600,886 | | 5/25/17 | | 731,613 | | | | |
| Resorttrust Inc | | LIBOR + 85 | | DBAB | | 10,450,000 JPY | | 6/19/17 | | 437 | | | | |
| America Movil SAB de CV | | LIBOR + 75 | | DBAB | | 3,808,950 EUR | | 7/25/17 | | 27,502 | | | | |
| OHL Investments SA | | LIBOR + 75 | | DBAB | | 92,301 EUR | | 7/25/17 | | | | | | (2,129) |
| Air France | | EURIBOR + 50 | | MSCS | | 882,237 EUR | | 8/23/17 | | | | | | (35,396) |
| Meda AB | | STIBOR + 65 | | MSCS | | 36,220,040 SEK | | 8/23/17 | | | | | | |
| Peugeot SA | | EURIBOR + 50 | | MSCS | | 580,755 EUR | | 8/23/17 | | | | | | (22,148) |
| Plastic Omnium SA | | EURIBOR + 50 | | MSCS | | 1,002,021 EUR | | 8/23/17 | | 25,739 | | | | |
| St. Jude Medical Inc | | LIBOR + 35 | | MSCS | | 2,461,790 | | 10/11/17 | | 94,136 | | | | |
| Starwood Hotels & Resorts Worldwide Inc | | LIBOR + 35 | | MSCS | | 2,480,909 | | 10/11/17 | | | | | | (70,456) |
| Tyco International PLC | | LIBOR + 35 | | MSCS | | 1,225,660 | | 10/11/17 | | 76,402 | | | | |
| Rexam PLC | | SONIA + 65 | | MSCS | | 842,247 GBP | | 10/26/17 | | | | | | |
| SABMiller PLC | | SONIA + 65 | | MSCS | | 3,321,366 GBP | | 10/26/17 | | | | | | |
| Vivendi SA | | EONIA + 65 | | MSCS | | 2,199,117 EUR | | 10/30/17 | | | | | | |
| Celesio AG | | EONIA + 65 | | MSCS | | 1,116,085 EUR | | 11/02/17 | | | | | | |
| ThyssenKrupp AG | | EONIA + 65 | | MSCS | | 1,112,906 EUR | | 11/02/17 | | | | | | |
| Wincor Nixdorf AG | | EONIA + 65 | | MSCS | | 779,154 EUR | | 11/02/17 | | | | | | |
| Wincor Nixdorf AG | | EONIA + 65 | | MSCS | | 197,478 EUR | | 11/02/17 | | | | | | |
| Asciano Ltd | | RBACR + 54 | | MSCS | | 5,610,195 AUD | | 12/05/17 | | | | | | |
| NCR Corp | | FEDEF + 40 | | MSCS | | 689,149 | | 12/21/17 | | | | | | |
| Moncler SpA | | EURIBOR + 50 | | MSCS | | 144,550 EUR | | 1/10/18 | | 18,464 | | | | |
| Ryanair Holdings PLC | | EURIBOR + 50 | | MSCS | | 947,230 EUR | | 1/10/18 | | 29,344 | | | | |
| Home Retail Group PLC | | SONIA + 65 | | MSCS | | 1,817,325 GBP | | 2/06/18 | | 44,585 | | | | |
| Vinci SA | | EURIBOR + 40 | | MSCS | | 175,246 EUR | | 5/08/18 | | 8,285 | | | | |
| Janus Capital Group Inc | | LIBOR | | CITI | | 784,088 | | 5/29/18 | | 34,460 | | | | |
| OTC Swap Contracts | | | | | | | | | | | | | | |
| Short | | | | | | | | | | | | | | |
| iBoxx USD Liquid High Yield Index | | LIBOR | | JPHQ | | 4,872,000 | | 6/20/16 | | | | | | (21,370) |
| iBoxx USD Liquid High Yield Index | | LIBOR | | MSCS | | 277,000 | | 6/20/16 | | | | | | (1,855) |
| Advanced Semiconductor Engineering Inc | | LIBOR - 35 | | DBAB | | 270,959 | | 6/30/16 | | | | | | (41,473) |
| Allergan PLC | | LIBOR - 35 | | DBAB | | 1,308,041 | | 6/30/16 | | | | | | (62,362) |
| Amsurg Corp | | LIBOR - 35 | | DBAB | | 1,056,318 | | 6/30/16 | | 2,686 | | | | |
| Black Hills Corp | | LIBOR - 35 | | DBAB | | 3,978,621 | | 6/30/16 | | | | | | (52,203) |
| Frontier Communications Corp | | LIBOR - 35 | | DBAB | | 2,482,707 | | 6/30/16 | | 33,187 | | | | |
| HSN Inc | | LIBOR - 35 | | DBAB | | 45,374 | | 6/30/16 | | | | | | (3,128) |
F R A N K L I N A L T E R N A T I V E S T R A T E G I E S F U N D S
C O N S O L I D A T E D S T A T E M E N T O F I N V E S T M E N T S |
| Franklin K2 Alternative Strategies Fund (continued) | | | | | | | | | | | | |
| |
| Total Return Swap Contracts (continued) | | | | | | | | | | | | | | |
| | | | | Counter- | | | | Expiration | | Unrealized | | Unrealized |
| Underlying Instrument | | Financing Rate | | Party | | Notional Value* | | Date | | Appreciation | | Depreciation |
| |
| |
| |
| |
| |
| |
|
| OTC Swap Contracts (continued) | | | | | | | | | | | | | | |
| Short (continued) | | | | | | | | | | | | | | |
| NextEra Energy Inc | | LIBOR - 35 | | DBAB | | 2,431,665 | | 6/30/16 | | $ 9,829 | | $ | | |
| Scorpio Tankers Inc | | LIBOR - 35 | | DBAB | | 329,750 | | 6/30/16 | | | | | | (13,123) |
| Ship Finance International Ltd | | LIBOR - 125 | | DBAB | | 3,452,071 | | 6/30/16 | | | | | | (73,436) |
| Spirit Realty Capital Inc | | LIBOR - 35 | | DBAB | | 93,707 | | 6/30/16 | | 3,997 | | | | |
| T-Mobile U. S. Inc | | LIBOR - 35 | | DBAB | | 281,862 | | 6/30/16 | | | | | | (14,847) |
| Welltower Inc | | LIBOR - 35 | | DBAB | | 901,680 | | 6/30/16 | | 46,309 | | | | |
| WPX Energy Inc | | LIBOR - 35 | | DBAB | | 772,810 | | 6/30/16 | | | | | | (52,102) |
| Inmarsat PLC | | LIBOR - 40 | | DBAB | | 151,912 | | 7/18/16 | | 4,740 | | | | |
| Alstria office REIT-AG | | LIBOR - 40 | | DBAB | | 1,592,502 EUR | | 7/19/16 | | | | | | (5,055) |
| Aroundtown Property Holdings PLC | | LIBOR - 439 | | DBAB | | 438,603 EUR | | 7/19/16 | | | | | | (18,222) |
| ASM Pacific Technology Ltd | | LIBOR - 100 | | DBAB | | 350,460 HKD | | 7/19/16 | | | | | | (3,411) |
| Aurubis AG | | LIBOR - 40 | | DBAB | | 188,560 EUR | | 7/19/16 | | | | | | (5,141) |
| China Overseas Land & Investment Ltd | | LIBOR - 40 | | DBAB | | 439,066 HKD | | 7/19/16 | | | | | | (3,599) |
| Drillisch AG | | LIBOR - 40 | | DBAB | | 2,998,154 EUR | | 7/19/16 | | 157,626 | | | | |
| ENN Energy Holdings Ltd | | LIBOR - 40 | | DBAB | | 602,400 HKD | | 7/19/16 | | | | | | (1,859) |
| Fonciere Des Regions | | LIBOR - 40 | | DBAB | | 456,442 EUR | | 7/19/16 | | | | | | (4,099) |
| Hansteen Holdings PLC | | LIBOR - 40 | | DBAB | | 1,023,154 EUR | | 7/19/16 | | | | | | (44,527) |
| Johnson Electric Holdings Ltd | | LIBOR - 40 | | DBAB | | 861,900 HKD | | 7/19/16 | | 15,751 | | | | |
| Playtech PLC | | LIBOR - 40 | | DBAB | | 903,368 EUR | | 7/19/16 | | | | | | (82,369) |
| Shenzhou International Group Holdings Ltd | | LIBOR - 40 | | DBAB | | 3,240,750 HKD | | 7/19/16 | | | | | | (20,743) |
| Siemens AG | | LIBOR - 40 | | DBAB | | 1,033,003 EUR | | 7/19/16 | | | | | | (32,968) |
| Acciona SA | | LIBOR - 40 | | DBAB | | 305,138 EUR | | 7/20/16 | | | | | | (5,518) |
| Iberdrola SA | | LIBOR - 40 | | DBAB | | 1,008,541 EUR | | 7/20/16 | | 2,632 | | | | |
| Koninklijke KPN NV | | LIBOR - 40 | | DBAB | | 745,768 EUR | | 7/20/16 | | | | | | (17,760) |
| NH Hotel Group SA | | LIBOR - 40 | | DBAB | | 257,285 EUR | | 7/20/16 | | | | | | (28,441) |
| OCI NV | | LIBOR - 40 | | DBAB | | 151,596 EUR | | 7/20/16 | | 12,716 | | | | |
| Advanced Semiconductor Engineering Inc | | LIBOR - 125 | | DBAB | | 789,954 | | 8/24/16 | | | | | | (203,046) |
| IHH Healthcare Bhd | | LIBOR - 309 | | DBAB | | 844,701 SGD | | 8/25/16 | | 20,989 | | | | |
| Marine Harvest ASA | | LIBOR - 40 | | DBAB | | 4,875,400 EUR | | 10/19/16 | | | | | | (295,044) |
| Tenaga Nasional Bhd | | LIBOR - 50 | | DBAB | | 606,229 | | 10/19/16 | | 15,325 | | | | |
| Abbott Laboratories | | LIBOR - 35 | | MSCS | | 1,075,849 | | 10/25/16 | | | | | | (50,081) |
| Consumer Staples Select Sector | | | | | | | | | | | | | | |
| SPDR Fund | | LIBOR - 78 | | MSCS | | 300,717 | | 10/25/16 | | | | | | (9,847) |
| Industrial Select Sector SPDR Fund | | LIBOR - 77 | | MSCS | | 155,063 | | 10/25/16 | | | | | | (144) |
| Johnson Controls Inc | | LIBOR - 35 | | MSCS | | 1,487,328 | | 10/25/16 | | | | | | (64,150) |
| Marriott International Inc | | LIBOR - 250 | | MSCS | | 2,890,652 | | 10/25/16 | | 67,794 | | | | |
| Shire PLC | | LIBOR - 77 | | MSCS | | 2,779,817 | | 10/25/16 | | | | | | (267,493) |
| Teva Pharmaceutical Industries Ltd | | LIBOR - 30 | | MSCS | | 459,958 | | 10/25/16 | | | | | | (2,973) |
| VMware Inc. , A | | LIBOR - 175 | | MSCS | | 568,123 | | 10/25/16 | | | | | | (60,748) |
| BW LPG Ltd | | LIBOR - 40 | | DBAB | | 125,981 | | 11/09/16 | | 17,701 | | | | |
| Bank of Nagoya Ltd | | LIBOR - 150 | | DBAB | | 112,400 | | 11/18/16 | | | | | | (6,964) |
| Ebara Corp | | LIBOR - 40 | | DBAB | | 113,935,950 JPY | | 11/18/16 | | | | | | (61,916) |
| EDION Corp | | LIBOR - 350 | | DBAB | | 57,786,600 JPY | | 11/18/16 | | | | | | (19,160) |
| Gunma Bank Ltd | | LIBOR - 40 | | DBAB | | 14,698 | | 11/18/16 | | | | | | (1,340) |
| Japan Airport Terminal Co. Ltd | | LIBOR - 300 | | DBAB | | 22,661,000 JPY | | 11/18/16 | | | | | | (11,532) |
| K s Holdings Corp | | LIBOR - 100 | | DBAB | | 260,686,437 JPY | | 11/18/16 | | 33,774 | | | | |
| Kawasaki Kisen Kaisha Ltd | | LIBOR - 100 | | DBAB | | 5,242,800 JPY | | 11/18/16 | | | | | | (9,440) |
| LIXIL Group Corp | | LIBOR - 40 | | DBAB | | 19,239,800 JPY | | 11/18/16 | | 161 | | | | |
| Maeda Corp | | LIBOR - 100 | | DBAB | | 101,925,399 JPY | | 11/18/16 | | | | | | (29,169) |
| Nagoya Railroad Co. Ltd | | LIBOR - 40 | | DBAB | | 9,486,000 JPY | | 11/18/16 | | | | | | (5,053) |
| Nippon Ceramic Co. Ltd | | LIBOR - 600 | | DBAB | | 29,819,509 JPY | | 11/18/16 | | | | | | (1,029) |
| Nippon Light Metal Holdings Co. Ltd | | LIBOR - 40 | | DBAB | | 204,824,618 JPY | | 11/18/16 | | | | | | (110,826) |
| Oita Bank Ltd | | LIBOR - 40 | | DBAB | | 507,553 | | 11/18/16 | | | | | | (3,899) |
| OSG Corp | | LIBOR - 40 | | DBAB | | 97,794,256 JPY | | 11/18/16 | | | | | | (14,830) |
| Resorttrust Inc | | LIBOR - 40 | | DBAB | | 2,112,300 JPY | | 11/18/16 | | 120 | | | | |
FRANKLIN ALTERNATIVE STRATEGIES FUNDS
CONSOLIDATED STATEMENT OF INVESTMENTS
| | | | | | | | | | |
| Franklin K2 Alternative Strategies Fund (continued) | | | | | | | | | |
| |
| Total Return Swap Contracts (continued) | | | | | | | | | | |
| | | Counter- | | | Expiration | | Unrealized | | Unrealized | |
| Underlying Instrument | Financing Rate | Party | Notional Value* | | Date | | Appreciation | | Depreciation | |
| OTC Swap Contracts (continued) | | | | | | | | | | |
| Short (continued) | | | | | | | | | | |
| Sankyo Co. Ltd | LIBOR - 40 | DBAB | 31,503,061 | JPY | 11/18/16 | $ | — | $ | (11,887 | ) |
| SBI Holdings Inc | LIBOR - 40 | DBAB | 5,399,915 | JPY | 11/18/16 | | 1,646 | | — | |
| Shionogi & Co. Ltd | LIBOR - 40 | DBAB | 72,844,059 | JPY | 11/18/16 | | — | | (27,233 | ) |
| Sony Corp | LIBOR - 40 | DBAB | 40,946,365 | JPY | 11/18/16 | | — | | (25,025 | ) |
| Taiyo Yuden Co. Ltd | LIBOR - 40 | DBAB | 18,651,935 | JPY | 11/18/16 | | — | | (26,336 | ) |
| Teijin Ltd | LIBOR - 40 | DBAB | 107,888,599 | JPY | 11/18/16 | | — | | (72,560 | ) |
| Toho Holdings Co. Ltd | LIBOR - 40 | DBAB | 104,963,643 | JPY | 11/18/16 | | — | | (75,921 | ) |
| Tohoku Electric Power Co Inc | LIBOR - 40 | DBAB | 106,095,208 | JPY | 11/18/16 | | — | | (19,319 | ) |
| Toppan Printing Co. Ltd | LIBOR - 40 | DBAB | 5,790,000 | JPY | 11/18/16 | | — | | (4,695 | ) |
| Unicharm Corp | LIBOR - 40 | DBAB | 50,826,668 | JPY | 11/18/16 | | 24,176 | | — | |
| Yamada Denki Co. Ltd | LIBOR - 100 | DBAB | 276,877,541 | JPY | 11/18/16 | | — | | (89,955 | ) |
| Yamagata Bank Ltd | LIBOR - 150 | DBAB | 483,946 | | 11/18/16 | | — | | (54,742 | ) |
| Yamaguchi Financial Group Inc | LIBOR - 40 | DBAB | 3,200,228 | | 11/18/16 | | 14,902 | | — | |
| British Land Co. PLC | LIBOR - 40 | DBAB | 64,350 | GBP | 1/18/17 | | — | | (3,255 | ) |
| Carillion PLC | LIBOR - 250 | DBAB | 406,727 | GBP | 1/18/17 | | — | | (43,290 | ) |
| Enterprise Inns PLC | LIBOR - 40 | DBAB | 46,879 | GBP | 1/18/17 | | — | | (6,617 | ) |
| Great Portland Estates PLC | LIBOR - 40 | DBAB | 1,007,894 | GBP | 1/18/17 | | 52,532 | | — | |
| Primary Health Properties PLC | LIBOR - 300 | DBAB | 274,449 | GBP | 1/18/17 | | — | | (2,243 | ) |
| Richter Gedeon Nyrt | LIBOR - 40 | DBAB | 789,212 | EUR | 1/18/17 | | — | | (19,001 | ) |
| St. Modwen Properties PLC | LIBOR - 40 | DBAB | 13,789 | GBP | 1/18/17 | | — | | (1,185 | ) |
| UNITE Group PLC | LIBOR - 40 | DBAB | 1,522,307 | GBP | 1/18/17 | | — | | (42,701 | ) |
| Ball Corp | SONIA - 35 | MSCS | 304,836 | GBP | 1/18/17 | | — | | (737 | ) |
| Burberry Group PLC | SONIA - 35 | MSCS | 63,135 | GBP | 1/18/17 | | 8,656 | | — | |
| APERAM SA | LIBOR - 40 | DBAB | 1,586,325 | | 2/01/17 | | — | | (73,053 | ) |
| Larsen & Toubro Ltd | LIBOR + 150 | DBAB | 74,748 | | 2/20/17 | | 828 | | — | |
| Sky PLC | LIBOR - 35 | MSCS | 115,193 | GBP | 2/28/17 | | 8,771 | | — | |
| OHL Mexico SAB de CV | LIBOR - 50 | DBAB | 17,901 | EUR | 3/14/17 | | — | | (7,057 | ) |
| Larsen & Toubro Ltd | LIBOR - 200 | DBAB | 241,211 | | 3/17/17 | | — | | (32,643 | ) |
| Nyrstar NV | LIBOR - 550 | DBAB | 29,621 | EUR | 3/17/17 | | 898 | | — | |
| Ball Corp | FEDEF - 35 | MSCS | 427,548 | | 4/17/17 | | — | | (1,595 | ) |
| Industrivarden AB | LIBOR - 40 | DBAB | 190,708 | EUR | 4/21/17 | | — | | (2,431 | ) |
| Swire Pacific Ltd | HONIX - 50 | MSCS | 2,217,274 | HKD | 7/13/17 | | — | | (5,951 | ) |
| Sandvik AB | STIBOR - 82 | MSCS | 1,508,920 | SEK | 8/23/17 | | — | | — | |
| J Sainsbury PLC | SONIA - 188 | MSCS | 947,566 | GBP | 10/26/17 | | — | | (41,402 | ) |
| Altice NV | EONIA - 40 | MSCS | 146,907 | EUR | 10/30/17 | | — | | — | |
| Faurecia | EONIA - 40 | MSCS | 74,539 | EUR | 10/30/17 | | — | | — | |
| Kone OYJ | EONIA - 50 | MSCS | 1,420,361 | EUR | 10/30/17 | | — | | — | |
| Bayerische Motoren Werke AG | EONIA - 40 | MSCS | 67,390 | EUR | 11/02/17 | | — | | — | |
| Daimler AG | EONIA - 40 | MSCS | 63,723 | EUR | 11/02/17 | | — | | — | |
| Volkswagen AG | EONIA - 40 | MSCS | 88,268 | EUR | 11/02/17 | | — | | — | |
| STOXX Europe 600 Index | EURIBOR - 45 | MSCS | 571,579 | EUR | 11/22/17 | | 55,483 | | — | |
| Alibaba Group Holding Ltd | LIBOR - 30 | MSCS | 725,982 | | 12/14/17 | | — | | (81,436 | ) |
| Diebold Inc | EONIA - 35 | MSCS | 162,923 | EUR | 1/31/18 | | — | | (1,484 | ) |
| Weir Group PLC | SONIA - 35 | MSCS | 108,905 | GBP | 2/06/18 | | — | | (5,157 | ) |
| Mylan NV | STIBOR - 35 | MSCS | 3,960,527 | SEK | 2/15/18 | | — | | (157 | ) |
| SPDR S&P500 ETF Trust | FEDEF - 35 | MSCS | 807,389 | | 2/27/18 | | — | | (61,922 | ) |
| America Movil SAB de CV | MXONBR - 50 | MSCS | 2,503,433 | MXN | 3/06/18 | | — | | (481 | ) |
| Williams Partners LP | FEDEF - 35 | MSCS | 51,423 | | 4/24/18 | | — | | — | |
| Janus Capital Group Inc | LIBOR | CITI | 645,149 | | 5/29/18 | | — | | (30,255 | ) |
| Total Return Swap Contracts | | | | | | $ | 5,359,036 | $ | (3,733,806 | ) |
| Net unrealized appreciation (depreciation) | | | | | | $ | 1,625,230 | | | |
| |
| *In U.S. dollars unless otherwise indicated. | | | | | | | | | | |
| |
| |
| |
| See Abbreviations on page 94. | | | | | | | | | | |
74 Annual Report | The accompanying notes are an integral part of these financial statements.
franklintempleton.com
| F R A N K L I N A L T E R N A T I V E S T R A T E G I E S F U N D S |
Consolidated Financial Statements
Consolidated Statement of Assets and Liabilities
May 31, 2016 |
| Franklin K2 Alternative Strategies Fund | | |
| |
| Assets: | | |
| Investments in securities: | | |
| Cost - Unaffiliated issuers | | $1,152,601,739 |
| Cost - Repurchase agreements | | 52,451,581 |
| | |
|
| Total cost of investments | | $1,205,053,320 |
| | |
|
| Value - Unaffiliated issuers | | $1,198,247,437 |
| Value - Repurchase agreements | | 52,451,581 |
| | |
|
| Total value of investments | | 1,250,699,018 |
| Cash | | 38,853,159 |
| Foreign currency, at value (cost $4,397,854) | | 4,411,390 |
| Receivables: | | |
| Investment securities sold | | 23,559,625 |
| Capital shares sold | | 688,034 |
| Dividends and interest | | 7,786,780 |
| Due from brokers | | 213,365,350 |
| OTC swap contracts (upfront payments $48,520) | | 47,290 |
| Unrealized appreciation on OTC forward exchange contracts | | 4,439,362 |
| Unrealized appreciation on OTC swap contracts | | 5,412,551 |
| Other assets | | 640 |
| | |
|
| Total assets | | 1,549,263,199 |
| | |
|
| Liabilities: | | |
| Payables: | | |
| Investment securities purchased | | 35,837,269 |
| Capital shares redeemed | | 2,058,482 |
| Management fees | | 1,896,590 |
| Distribution fees | | 99,001 |
| Transfer agent fees | | 84,766 |
| Variation margin | | 298,199 |
| OTC swap contracts (upfront receipts $17,278) | | 17,177 |
| Options written, at value (premiums received $1,021,236) | | 781,661 |
| Securities sold short, at value (proceeds $250,666,693) | | 252,329,246 |
| Due to brokers | | 10,532,196 |
| Unrealized depreciation on OTC forward exchange contracts | | 4,445,062 |
| Unrealized depreciation on OTC swap contracts | | 3,737,951 |
| Accrued expenses and other liabilities | | 505,557 |
| | |
|
| Total liabilities | | 312,623,157 |
| | |
|
| Net assets, at value | | $1,236,640,042 |
| | |
|
| Net assets consist of: | | |
| Paid-in capital | | $1,249,367,286 |
| Undistributed net investment income | | 2,947,721 |
| Net unrealized appreciation (depreciation) | | 46,430,604 |
| Accumulated net realized gain (loss) | | (62,105,569) |
| | |
|
| Net assets, at value | | $1,236,640,042 |
| | |
|
The accompanying notes are an integral part of these financial statements. | Annual Report 75
FRANKLIN ALTERNATIVE STRATEGIES FUNDS
CONSOLIDATED FINANCIAL STATEMENTS
Consolidated Statement of Assets and Liabilities (continued)
May 31, 2016
| | |
| Franklin K2 Alternative Strategies Fund | | |
| |
| Class A: | | |
| Net assets, at value | $ | 177,412,256 |
| Shares outstanding | | 16,811,534 |
| Net asset value per sharea | $ | 10.55 |
| Maximum offering price per share (net asset value per share ÷ 94.25%) | $ | 11.19 |
| Class C: | | |
| Net assets, at value | $ | 71,154,106 |
| Shares outstanding | | 6,807,724 |
| Net asset value and maximum offering price per sharea | $ | 10.45 |
| Class R: | | |
| Net assets, at value | $ | 341,147 |
| Shares outstanding | | 32,149 |
| Net asset value and maximum offering price per share | $ | 10.61 |
| Class R6: | | |
| Net assets, at value | $ | 265,516,807 |
| Shares outstanding | | 25,078,664 |
| Net asset value and maximum offering price per share | $ | 10.59 |
| Advisor Class: | | |
| Net assets, at value | $ | 722,215,726 |
| Shares outstanding | | 68,270,344 |
| Net asset value and maximum offering price per share | $ | 10.58 |
| |
| aRedemption price is equal to net asset value less contingent deferred sales charges, if applicable. | | |
76 Annual Report | The accompanying notes are an integral part of these financial statements.
franklintempleton.com
F R A N K L I N A L T E R N A T I V E S T R A T E G I E S F U N D S
C O N S O L I D A T E D F I N A N C I A L S T A T E M E N T S |
Consolidated Statement of Operations
for the year ended May 31, 2016 |
| Franklin K2 Alternative Strategies Fund | | |
| |
| Investment income: | | |
| Dividends | | $ 4,644,737 |
| Interest | | 21,892,135 |
| | |
|
| Total investment income | | 26,536,872 |
| | |
|
| Expenses: | | |
| Management fees (Note 3a) | | 22,239,457 |
| Distribution fees: (Note 3c) | | |
| Class A | | 452,515 |
| Class C | | 653,269 |
| Class R | | 2,026 |
| Transfer agent fees: (Note 3e) | | |
| Class A | | 158,193 |
| Class C | | 58,727 |
| Class R | | 364 |
| Class R6 | | 882 |
| Advisor Class | | 530,788 |
| Custodian fees (Note 4) | | 188,774 |
| Reports to shareholders | | 144,805 |
| Registration and filing fees | | 237,446 |
| Professional fees | | 450,129 |
| Trustees fees and expenses | | 575,412 |
| Dividends and/or interest on securities sold short | | 4,658,416 |
| Security borrowing fees | | 2,592,051 |
| Other | | 108,241 |
| | |
|
| Total expenses | | 33,051,495 |
| Expense reductions (Note 4) | | (20,293) |
| Expenses waived/paid by affiliates (Note 3f) | | (3,695,122) |
| | |
|
| Net expenses | | 29,336,080 |
| | |
|
| Net investment income (loss) | | (2,799,208) |
| | |
|
| Realized and unrealized gains (losses): | | |
| Net realized gain (loss) from: | | |
| Investments | | (43,440,368) |
| Written options | | 521,714 |
| Foreign currency transactions | | (2,491,308) |
| Futures contracts | | (5,429,267) |
| Securities sold short | | (1,348,197) |
| Swap contracts | | (1,172,359) |
| | |
|
| Net realized gain (loss) | | (53,359,785) |
| | |
|
| Net change in unrealized appreciation (depreciation) on: | | |
| Investments | | 16,280,460 |
| Translation of other assets and liabilities denominated in foreign currencies | | 510,070 |
| Written options | | 341,679 |
| Futures contracts | | (134,549) |
| Swap contracts | | 1,803,640 |
| | |
|
| Net change in unrealized appreciation (depreciation) | | 18,801,300 |
| | |
|
| Net realized and unrealized gain (loss) | | (34,558,485) |
| | |
|
| Net increase (decrease) in net assets resulting from operations | | $(37,357,693) |
| | |
|
The accompanying notes are an integral part of these financial statements. | Annual Report 77
F R A N K L I N A L T E R N A T I V E S T R A T E G I E S F U N D S
C O N S O L I D A T E D F I N A N C I A L S T A T E M E N T S |
| Consolidated Statements of Changes in Net Assets | | | | |
| |
| Franklin K2 Alternative Strategies Fund | | | | |
| |
| | | Year Ended May 31, |
| | |
|
| | | 2016 | | 2015 |
| |
| |
|
| Increase (decrease) in net assets: | | | | |
| Operations: | | | | |
| Net investment income (loss) | | $ (2,799,208) | | $ (3,810,717) |
| Net realized gain (loss) | | (53,359,785) | | 18,827,021 |
| Net change in unrealized appreciation (depreciation) | | 18,801,300 | | 16,163,590 |
| | |
| |
|
| Net increase (decrease) in net assets resulting from operations | | (37,357,693) | | 31,179,894 |
| | |
| |
|
| Distributions to shareholders from: | | | | |
| Net investment income: | | | | |
| Class A | | (2,592,416) | | (612,244) |
| Class C | | (644,384) | | (65,590) |
| Class R | | | | (45,777) |
| Class R6 | | (4,016,413) | | (1,926,596) |
| Advisor Class | | (10,110,090) | | (1,393,965) |
| Net realized gains: | | | | |
| Class A | | (696,387) | | |
| Class C | | (262,371) | | |
| Class R | | (1,174) | | |
| Class R6 | | (894,391) | | |
| Advisor Class | | (2,315,995) | | |
| | |
| |
|
| Total distributions to shareholders | | (21,533,621) | | (4,044,172) |
| | |
| |
|
| Capital share transactions: (Note 2) | | | | |
| Class A | | 38,612,258 | | 46,690,910 |
| Class C | | 37,013,071 | | 20,037,814 |
| Class R | | (8,810,100) | | (3,054,919) |
| Class R6 | | 39,418,868 | | 13,262,210 |
| Advisor Class | | 424,302,558 | | 265,636,309 |
| | |
| |
|
| Total capital share transactions | | 530,536,655 | | 342,572,324 |
| | |
| |
|
| Net increase (decrease) in net assets | | 471,645,341 | | 369,708,046 |
| Net assets: | | | | |
| Beginning of year | | 764,994,701 | | 395,286,655 |
| | |
| |
|
| End of year | | $1,236,640,042 | | $764,994,701 |
| | |
| |
|
| Undistributed net investment income included in net assets: | | | | |
| End of year | | $ 2,947,721 | | $ 15,818,264 |
| | |
| |
|
78 Annual Report | The accompanying notes are an integral part of these financial statements.
F R A N K L I N A L T E R N A T I V E S T R A T E G I E S F U N D S
Notes to Consolidated Financial Statements
Franklin K2 Alternative Strategies Fund
1. Organization and Significant Accounting Policies
Franklin Alternative Strategies Funds (Trust) is registered under the Investment Company Act of 1940 (1940 Act) as an open-end management investment company, consisting of three separate funds and applies the specialized accounting and reporting guidance in U.S. Generally Accepted Accounting Principles (U.S. GAAP). Franklin K2 Alternative Strategies Fund (Fund) is included in this report. The financial statements of the remaining funds in the Trust are presented separately. The Fund offers five classes of shares: Class A, Class C, Class R, Class R6 and Advisor Class. Each class of shares differs by its initial sales load, contingent deferred sales charges, voting rights on matters affecting a single class, its exchange privilege and fees primarily due to differing arrangements for distribution and transfer agent fees.
The following summarizes the Fund s significant accounting policies.
a. Financial Instrument Valuation
The Fund s investments in financial instruments are carried at fair value daily. Fair value is the price that would be received to sell an asset or paid to transfer a liability in an orderly transaction between market participants on the measurement date. The Fund calculates the net asset value (NAV) per share as of 4 p.m. Eastern time each day the New York Stock Exchange (NYSE) is open for trading. Under compliance policies and procedures approved by the Trust s Board of Trustees (the Board), the Fund s administrator has responsibility for oversight of valuation, including leading the cross-functional Valuation Committee (VC). The VC provides administration and oversight of the Fund s valuation policies and procedures, which are approved annually by the Board. Among other things, these procedures allow the Fund to utilize independent pricing services, quotations from securities and financial instrument dealers, and other market sources to determine fair value.
Equity securities, exchange traded funds and derivative financial instruments (derivatives) listed on an exchange or on the NASDAQ National Market System are valued at the last quoted sale price or the official closing price of the day, respectively. Foreign equity securities are valued as of the close of trading on the foreign stock exchange on which the security is primarily traded or as of 4 p.m. Eastern time whichever is earlier. The value is then converted into its U.S. dollar equivalent at the foreign exchange rate in effect at 4 p.m. Eastern time on the day
that the value of the security is determined. Over-the-counter (OTC) securities are valued within the range of the most recent quoted bid and ask prices. Securities that trade in multiple markets or on multiple exchanges are valued according to the broadest and most representative market. Certain equity securities are valued based upon fundamental characteristics or relationships to similar securities.
Debt securities generally trade in the OTC market rather than on a securities exchange. The Fund s pricing services use multiple valuation techniques to determine fair value. In instances where sufficient market activity exists, the pricing services may utilize a market-based approach through which quotes from market makers are used to determine fair value. In instances where sufficient market activity may not exist or is limited, the pricing services also utilize proprietary valuation models which may consider market characteristics such as benchmark yield curves, credit spreads, estimated default rates, anticipated market interest rate volatility, coupon rates, anticipated timing of principal repayments, underlying collateral, and other unique security features in order to estimate the relevant cash flows, which are then discounted to calculate the fair value. Securities denominated in a foreign currency are converted into their U.S. dollar equivalent at the foreign exchange rate in effect at the NYSE close on the date that the values of the foreign debt securities are determined.
Investments in open-end mutual funds are valued at the closing NAV. Repurchase agreements are valued at cost, which approximates fair value.
Certain derivatives trade in the OTC market. The Fund s pricing services use various techniques including industry standard option pricing models and proprietary discounted cash flow models to determine the fair value of those instruments. The Fund s net benefit or obligation under the derivative contract, as measured by the fair value of the contract, is included in net assets.
The Fund has procedures to determine the fair value of financial instruments for which market prices are not reliable or readily available. Under these procedures, the VC convenes on a regular basis to review such financial instruments and considers a number of factors, including significant unobservable valuation inputs, when arriving at fair value. The VC primarily employs a market-based approach which may use related or comparable assets or liabilities, recent transactions, market multiples, book values, and other relevant information for the investment to
F R A N K L I N A L T E R N A T I V E S T R A T E G I E S F U N D S
N O T E S T O C O N S O L I D A T E D F I N A N C I A L S T A T E M E N T S |
Franklin K2 Alternative Strategies Fund (continued)
1. Organization and Significant Accounting
Policies (continued)
a. Financial Instrument Valuation (continued)
determine the fair value of the investment. An income-based valuation approach may also be used in which the anticipated future cash flows of the investment are discounted to calculate fair value. Discounts may also be applied due to the nature or duration of any restrictions on the disposition of the investments. Due to the inherent uncertainty of valuations of such investments, the fair values may differ significantly from the values that would have been used had an active market existed. The VC employs various methods for calibrating these valuation approaches including a regular review of key inputs and assumptions, transactional back-testing or disposition analysis, and reviews of any related market activity.
Trading in securities on foreign securities stock exchanges and OTC markets may be completed before 4 p.m. Eastern time. In addition, trading in certain foreign markets may not take place on every NYSE business day. Occasionally, events occur between the time at which trading in a foreign security is completed and the close of the NYSE that might call into question the reliability of the value of a portfolio security held by the Fund. As a result, differences may arise between the value of the Fund s portfolio securities as determined at the foreign market close and the latest indications of value at the close of the NYSE. In order to minimize the potential for these differences, the VC monitors price movements following the close of trading in foreign stock markets through a series of country specific market proxies (such as baskets of American Depositary Receipts, futures contracts and exchange traded funds). These price movements are measured against established trigger thresholds for each specific market proxy to assist in determining if an event has occurred that may call into question the reliability of the values of the foreign securities held by the Fund. If such an event occurs, the securities may be valued using fair value procedures, which may include the use of independent pricing services.
When the last day of the reporting period is a non-business day, certain foreign markets may be open on those days that the NYSE is closed, which could result in differences between the value of the Fund s portfolio securities on the last business day and the last calendar day of the reporting period. Any significant security valuation changes due to an open foreign market are adjusted and reflected by the Fund for financial reporting purposes.
b. Foreign Currency Translation
Portfolio securities and other assets and liabilities denominated in foreign currencies are translated into U.S. dollars based on the exchange rate of such currencies against U.S. dollars on the date of valuation. The Fund may enter into foreign currency exchange contracts to facilitate transactions denominated in a foreign currency. Purchases and sales of securities, income and expense items denominated in foreign currencies are translated into U.S. dollars at the exchange rate in effect on the transaction date. Portfolio securities and assets and liabilities denominated in foreign currencies contain risks that those currencies will decline in value relative to the U.S. dollar. Occasionally, events may impact the availability or reliability of foreign exchange rates used to convert the U.S. dollar equivalent value. If such an event occurs, the foreign exchange rate will be valued at fair value using procedures established and approved by the Board.
The Fund does not separately report the effect of changes in foreign exchange rates from changes in market prices on securities held. Such changes are included in net realized and unrealized gain or loss from investments in the Consolidated Statement of Operations.
Realized foreign exchange gains or losses arise from sales of foreign currencies, currency gains or losses realized between the trade and settlement dates on securities transactions and the difference between the recorded amounts of dividends, interest, and foreign withholding taxes and the U.S. dollar equivalent of the amounts actually received or paid. Net unrealized foreign exchange gains and losses arise from changes in foreign exchange rates on foreign denominated assets and liabilities other than investments in securities held at the end of the reporting period.
c. Joint Repurchase Agreement
The Fund enters into a joint repurchase agreement whereby its uninvested cash balance is deposited into a joint cash account with other funds managed by the investment manager or an affiliate of the investment manager and is used to invest in one or more repurchase agreements. The value and face amount of the joint repurchase agreement are allocated to the funds based on their pro-rata interest. A repurchase agreement is accounted for as a loan by the Fund to the seller, collateralized by securities which are delivered to the Fund s custodian. The fair value, including accrued interest, of the initial collateralization is required to be at least 102% of the dollar amount invested by the funds, with the value of the underlying securities marked to
F R A N K L I N A L T E R N A T I V E S T R A T E G I E S F U N D S
N O T E S T O C O N S O L I D A T E D F I N A N C I A L S T A T E M E N T S
Franklin K2 Alternative Strategies Fund (continued)
market daily to maintain coverage of at least 100%. Repurchase agreements are subject to the terms of Master Repurchase Agreements (MRAs) with approved counterparties (sellers). The MRAs contain various provisions, including but not limited to events of default and maintenance of collateral for repurchase agreements. In the event of default by either the seller or the Fund, certain MRAs may permit the non-defaulting party to net and close-out all transactions, if any, traded under such agree -ments. The Fund may sell securities it holds as collateral and apply the proceeds towards the repurchase price and any other amounts owed by the seller to the Fund in the event of default by the seller. This could involve costs or delays in addition to a loss on the securities if their value falls below the repurchase price owed by the seller. The joint repurchase agreement held by the Fund at year end, as indicated in the Consolidated Statement of Investments, had been entered into on May 31, 2016.
d. Securities Purchased on a Delayed Delivery Basis
The Fund purchases securities on a delayed delivery basis, with payment and delivery scheduled for a future date. These transactions are subject to market fluctuations and are subject to the risk that the value at delivery may be more or less than the trade date purchase price. Although the Fund will generally purchase these securities with the intention of holding the securities, it may sell the securities before the settlement date. Sufficient assets have been segregated for these securities.
e. Derivative Financial Instruments
The Fund invested in derivatives in order to manage risk or gain exposure to various other investments or markets. Derivatives are financial contracts based on an underlying or notional amount, require no initial investment or an initial net investment that is smaller than would normally be required to have a similar response to changes in market factors, and require or permit net settlement. Derivatives contain various risks including the potential inability of the counterparty to fulfill their obligations under the terms of the contract, the potential for an illiquid secondary market, and/or the potential for market movements which expose the Fund to gains or losses in excess of the amounts shown in the Consolidated Statement of Assets and Liabilities. Realized gain and loss and unrealized appreciation and depreciation on these contracts for the period are included in the Consolidated Statement of Operations.
Derivative counterparty credit risk is managed through a formal evaluation of the creditworthiness of all potential counterparties. The Fund attempts to reduce its exposure to
counterparty credit risk on OTC derivatives, whenever possible, by entering into International Swaps and Derivatives Association (ISDA) master agreements with certain counterparties. These agreements contain various provisions, including but not limited to collateral requirements, events of default, or early termination. Termination events applicable to the counterparty include certain deteriorations in the credit quality of the counterparty. Termination events applicable to the Fund include failure of the Fund to maintain certain net asset levels and/or limit the decline in net assets over various periods of time. In the event of default or early termination, the ISDA master agreement gives the non-defaulting party the right to net and close-out all transactions traded, whether or not arising under the ISDA agreement, to one net amount payable by one counterparty to the other. However, absent an event of default or early termination, OTC derivative assets and liabilities are presented gross and not offset in the Consolidated Statement of Assets and Liabilities. Early termination by the counterparty may result in an immediate payment by the Fund of any net liability owed to that counterparty under the ISDA agreement.
Collateral requirements differ by type of derivative. Collateral or initial margin requirements are set by the broker or exchange clearing house for exchange traded and centrally cleared derivatives. Initial margin deposited is held at the exchange and can be in the form of cash and/or securities. For OTC derivatives traded under an ISDA master agreement, posting of collateral is required by either the Fund or the applicable coun-terparty if the total net exposure of all OTC derivatives with the applicable counterparty exceeds the minimum transfer amount, which typically ranges from $100,000 to $250,000, and can vary depending on the counterparty and the type of the agreement. Generally, collateral is determined at the close of fund business each day and any additional collateral required due to changes in derivative values may be delivered by the Fund or the counterparty within a few business days. Collateral pledged and/or received by the Fund for OTC derivatives, if any, is held in segregated accounts with the Fund s custodian/counterparty broker and can be in the form of cash and/or securities. Unrestricted cash may be invested according to the Fund s investment objectives. To the extent that the amounts due to the Fund from its counterparties are not subject to collateralization or are not fully collateralized, the Fund bears the risk of loss from counterparty non-performance.
The Fund entered into exchange traded futures contracts primarily to manage and/or gain exposure to commodity price, interest rate and equity price risk. A futures contract is an agreement
FRANKLIN ALTERNATIVE STRATEGIES FUNDS
NOTES TO CONSOLIDATED FINANCIAL STATEMENTS
Franklin K2 Alternative Strategies Fund (continued)
1. Organization and Significant Accounting
Policies (continued)
e. Derivative Financial Instruments (continued)
between the Fund and a counterparty to buy or sell an asset for a specified price on a future date. Required initial margins are pledged by the Fund, and the daily change in fair value is accounted for as a variation margin payable or receivable in the Consolidated Statement of Assets and Liabilities.
The Fund entered into OTC forward exchange contracts primarily to manage and/or gain exposure to certain foreign currencies. A forward exchange contract is an agreement between the Fund and a counterparty to buy or sell a foreign currency at a specific exchange rate on a future date.
The Fund entered into credit default swap contracts primarily to manage and/or gain exposure to credit risk. A credit default swap is an agreement between the Fund and a counterparty whereby the buyer of the contract receives credit protection and the seller of the contract guarantees the credit worthiness of a referenced debt obligation. These agreements may be privately negotiated in the over-the-counter market (OTC credit default swaps) or may be executed in a multilateral trade facility platform, such as a registered exchange (centrally cleared credit default swaps). The underlying referenced debt obligation may be a single issuer of corporate or sovereign debt, a credit index, a basket of issuers or indices, or a tranche of a credit index or basket of issuers or indices. In the event of a default of the underlying referenced debt obligation, the buyer is entitled to receive the notional amount of the credit default swap contract from the seller in exchange for the referenced debt obligation, a net settlement amount equal to the notional amount of the credit default swap less the recovery value of the referenced debt obligation, or other agreed upon amount. For centrally cleared credit default swaps, required initial margins are pledged by the Fund, and the daily change in fair value is accounted for as a variation margin payable or receivable in the Consolidated Statement of Assets and Liabilities. Over the term of the contract, the buyer pays the seller a periodic stream of payments, provided that no event of default has occurred. Such periodic payments are accrued daily as an unrealized appreciation or depreciation until the payments are made, at which time they are realized. Upfront payments and receipts are reflected in the Consolidated Statement of Assets and Liabilities and represent compensating factors between stated terms of the credit default swap agreement and prevailing market conditions (credit spreads and other relevant factors). These upfront payments and
receipts are amortized over the term of the contract as a realized gain or loss in the Consolidated Statement of Operations.
The Fund entered into interest rate swap contracts primarily to manage interest rate risk. An interest rate swap is an agreement between the Fund and a counterparty to exchange cash flows based on the difference between two interest rates, applied to a notional amount. These agreements may be privately negotiated in the over-the-counter market (OTC interest rate swaps) or may be executed on a registered exchange (centrally cleared interest rate swaps). For centrally cleared interest rate swaps, required initial margins are pledged by the Fund, and the daily change in fair value is accounted for as a variation margin payable or receivable in the Consolidated Statement of Assets and Liabilities. Over the term of the contract, contractually required payments to be paid and to be received are accrued daily and recorded as unrealized depreciation and appreciation until the payments are made, at which time they are realized.
The Fund entered into OTC total return swap contracts primarily to manage and/or gain exposure to interest rate, equity price and credit risk of an underlying instrument such as a stock, bond, index or basket of securities or indices. A total return swap is an agreement between the Fund and a counterparty to exchange a return linked to an underlying instrument for a floating or fixed rate payment, both based upon a notional amount. Over the term of the contract, contractually required payments to be paid or received are accrued daily and recorded as unrealized appreciation or depreciation until the payments are made, at which time they are recognized as realized gain or loss.
The Fund purchased or wrote exchange traded and/or OTC option contracts primarily to manage and/or gain exposure to equity price, interest rate and foreign exchange rate risk. An option is a contract entitling the holder to purchase or sell a specific amount of shares or units of an asset or notional amount of a swap (swaption), at a specified price. When an option is purchased or written, an amount equal to the premium paid or received is recorded as an asset or liability, respectively. Upon exercise of an option, the acquisition cost or sales proceeds of the underlying investment is adjusted by any premium received or paid. Upon expiration of an option, any premium received or paid is recorded as a realized gain or loss. Upon closing an option other than through expiration or exercise, the difference between the premium received or paid and the cost to close the position is recorded as a realized gain or loss.
See Notes 6 and 8 regarding investment transactions and other derivative information, respectively.
82 Annual Report
franklintempleton.com
F R A N K L I N A L T E R N A T I V E S T R A T E G I E S F U N D S
N O T E S T O C O N S O L I D A T E D F I N A N C I A L S T A T E M E N T S
Franklin K2 Alternative Strategies Fund (continued)
f. Securities Sold Short
The Fund is engaged in selling securities short, which obligates the Fund to replace a borrowed security with the same security at current fair value. The Fund incurs a loss if the price of the security increases between the date of the short sale and the date on which the Fund replaces the borrowed security. The Fund realizes a gain if the price of the security declines between those dates. Gains are limited to the price at which the Fund sold the security short, while losses are potentially unlimited in size.
The Fund is required to establish a margin account with the broker lending the security sold short. While the short sale is outstanding, the broker retains the proceeds of the short sale to the extent necessary to meet margin requirements until the short position is closed out. A deposit must also be maintained with the Fund s custodian/counterparty broker consisting of cash and/or securities having a value equal to a specified percentage of the value of the securities sold short. The Fund is obligated to pay fees for borrowing the securities sold short and is required to pay the counterparty any dividends and/or interest due on securities sold short. Such dividends and/or interest and any security borrowing fees are recorded as an expense to the Fund.
g. Investments in K2 Holdings Investment Corp. (K2 Subsidiary)
The Fund invests in certain financial instruments and commodity-linked derivative investments through its investment in the K2 Subsidiary. The K2 Subsidiary is a Cayman Islands exempted company with limited liability, is a wholly-owned subsidiary of the Fund, and is able to invest in certain financial instruments and commodity-linked derivative investments consistent with the investment objective of the Fund. At May 31, 2016, the K2 Subsidiary s investments, as well as any other assets and liabilities of the K2 Subsidiary, are reflected in the Fund s Consolidated Statement of Investments and Consolidated Statement of Assets and Liabilities. The financial statements have been consolidated and include the accounts of the Fund and the K2 Subsidiary. All intercompany transactions and balances have been eliminated. At May 31, 2016, the net assets of the K2 Subsidiary were $112,591,405, representing 9.10% of the Fund s consolidated net assets. The Fund s investment in the K2 Subsidiary is limited to 25% of consolidated assets.
h. Senior Floating Rate Interests
The Fund invests in senior secured corporate loans that pay interest at rates which are periodically reset by reference to a base lending rate plus a spread. These base lending rates are generally the prime rate offered by a designated U.S. bank or the London InterBank Offered Rate (LIBOR). Senior secured corporate loans often require prepayment of principal from excess cash flows or at the discretion of the borrower. As a result, actual maturity may be substantially less than the stated maturity. Senior secured corporate loans in which the Fund invests are generally readily marketable, but may be subject to certain restrictions on resale.
i. Income and Deferred Taxes
It is the Fund s policy to qualify as a regulated investment company under the Internal Revenue Code. The Fund intends to distribute to shareholders substantially all of its taxable income and net realized gains to relieve it from federal income and excise taxes. As a result, no provision for U.S. federal income taxes is required.
The Fund may be subject to foreign taxation related to income received, capital gains on the sale of securities and certain foreign currency transactions in the foreign jurisdictions in which it invests. Foreign taxes, if any, are recorded based on the tax regulations and rates that exist in the foreign markets in which the Fund invests. When a capital gain tax is determined to apply, the Fund records an estimated deferred tax liability in an amount that would be payable if the securities were disposed of on the valuation date.
The Fund may recognize an income tax liability related to its uncertain tax positions under U.S. GAAP when the uncertain tax position has a less than 50% probability that it will be sustained upon examination by the tax authorities based on its technical merits. As of May 31, 2016, the Fund has determined that no tax liability is required in its consolidated financial statements related to uncertain tax positions for any open tax years (or expected to be taken in future tax years). Open tax years are those that remain subject to examination and are based on each tax jurisdiction s statute of limitation.
j. Security Transactions, Investment Income, Expenses and Distributions
Security transactions are accounted for on trade date. Realized gains and losses on security transactions are determined on a specific identification basis. Interest income and estimated
F R A N K L I N A L T E R N A T I V E S T R A T E G I E S F U N D S
N O T E S T O C O N S O L I D A T E D F I N A N C I A L S T A T E M E N T S
Franklin K2 Alternative Strategies Fund (continued)
1. Organization and Significant Accounting
Policies (continued)
j. Security Transactions, Investment Income, Expenses and Distributions (continued)
expenses are accrued daily. Amortization of premium and accretion of discount on debt securities are included in interest income. Dividend income and dividends declared on securities sold short are recorded on the ex-dividend date except for certain dividends from foreign securities where the dividend rate is not available. In such cases, the dividend is recorded as soon as the information is received by the Fund. Distributions to shareholders are recorded on the ex-dividend date and are determined according to income tax regulations (tax basis). Distributable earnings determined on a tax basis may differ from earnings recorded in accordance with U.S. GAAP. These differences may be permanent or temporary. Permanent differences are reclassified among capital accounts to reflect their tax character. These reclassifications have no impact on net assets or the results of operations. Temporary differences are not reclassified, as they may reverse in subsequent periods.
Common expenses incurred by the Trust are allocated among the funds based on the ratio of net assets of each fund to the combined net assets of the Trust. Fund specific expenses are charged directly to the fund that incurred the expense.
Realized and unrealized gains and losses and net investment income, not including class specific expenses, are allocated daily to each class of shares based upon the relative proportion
of net assets of each class. Differences in per share distributions, by class, are generally due to differences in class specific expenses.
Inflation-indexed bonds are adjusted for inflation through periodic increases or decreases in the security s interest accruals, face amount, or principal redemption value, by amounts corresponding to the rate of inflation as measured by an index. Any increase or decrease in the face amount or principal redemption value will be included as interest income on the Consolidated Statement of Operations.
k. Accounting Estimates
The preparation of financial statements in accordance with U.S. GAAP requires management to make estimates and assumptions that affect the reported amounts of assets and liabilities at the date of the financial statements and the amounts of income and expenses during the reporting period. Actual results could differ from those estimates.
l. Guarantees and Indemnifications
Under the Trust s organizational documents, its officers and trustees are indemnified by the Trust against certain liabilities arising out of the performance of their duties to the Trust. Additionally, in the normal course of business, the Trust, on behalf of the Fund, enters into contracts with service providers that contain general indemnification clauses. The Trust s maximum exposure under these arrangements is unknown as this would involve future claims that may be made against the Trust that have not yet occurred. Currently, the Trust expects the risk of loss to be remote.
2. Shares of Beneficial Interest
At May 31, 2016, there were an unlimited number of shares authorized (without par value). Transactions in the Fund s shares were as follows:
| | | | | Year Ended May 31, | | |
| | |
| |
| |
|
| | | | | 2016 | | | | 2015 |
| | |
| |
| |
| |
|
| | | Shares | | Amount | | Shares | | Amount |
| |
| |
| |
| |
|
| Class A Shares: | | | | | | | | |
| Shares sold | | 13,295,280 | | $ 143,673,278 | | 11,313,392 | | $123,061,270 |
| Shares issued in reinvestment of distributions | | 298,189 | | 3,172,727 | | 49,813 | | 539,977 |
| Shares redeemed | | (10,133,166) | | (108,233,747) | | (7,114,359) | | (76,910,337) |
| | |
| |
| |
| |
|
| Net increase (decrease) | | 3,460,303 | | $ 38,612,258 | | 4,248,846 | | $ 46,690,910 |
| | |
| |
| |
| |
|
F R A N K L I N A L T E R N A T I V E S T R A T E G I E S F U N D S
N O T E S T O C O N S O L I D A T E D F I N A N C I A L S T A T E M E N T S |
| Franklin K2 Alternative Strategies Fund (continued) | | | | | | | | | | | | |
| |
| | | | | | | Year Ended May 31, | | | | |
| |
|
|
|
|
|
|
|
|
|
| |
| | | | | 2016 | | | | | | 2015 | | |
| |
| |
| |
| |
| |
| |
|
| | | Shares | | | | Amount | | Shares | | | | Amount |
| |
| |
| |
| |
| |
| |
|
| Class C Shares: | | | | | | | | | | | | |
| Shares sold | | 5,119,256 | | $ | | 55,145,221 | | 3,173,984 | | $ | | 34,546,633 |
| Shares issued in reinvestment of distributions | | 79,128 | | | | 836,381 | | 3,444 | | | | 37,196 |
| Shares redeemed | | (1,811,936) | | | | (18,968,531) | | (1,323,981) | | | | (14,546,015) |
| | |
| |
| |
| |
| |
| |
|
| Net increase (decrease) | | 3,386,448 | | $ | | 37,013,071 | | 1,853,447 | | $ | | 20,037,814 |
| | |
| |
| |
| |
| |
| |
|
| Class R Shares: | | | | | | | | | | | | |
| Shares sold | | 13,984 | | $ | | 149,262 | | 28,828 | | $ | | 310,648 |
| Shares issued in reinvestment of distributions | | 106 | | | | 1,140 | | 92 | | | | 1,001 |
| Shares redeemed | | (804,855) | | | | (8,960,502) | | (303,567) | | | | (3,366,568) |
| | |
| |
| |
| |
| |
| |
|
| Net increase (decrease) | | (790,765) | | $ | | (8,810,100) | | (274,647) | | $ | | (3,054,919) |
| | |
| |
| |
| |
| |
| |
|
| Class R6 Shares: | | | | | | | | | | | | |
| Shares sold | | 5,337,514 | | $ | | 57,004,431 | | 3,740,127 | | $ | | 41,206,775 |
| Shares issued in reinvestment of distributions | | 459,924 | | | | 4,902,787 | | 167,937 | | | | 1,822,117 |
| Shares redeemed | | (2,155,223) | | | | (22,488,350) | | (2,694,521) | | | | (29,766,682) |
| | |
| |
| |
| |
| |
| |
|
| Net increase (decrease) | | 3,642,215 | | $ | | 39,418,868 | | 1,213,543 | | $ | | 13,262,210 |
| | |
| |
| |
| |
| |
| |
|
| Advisor Class Shares: | | | | | | | | | | | | |
| Shares sold | | 64,566,684 | | $ 695,799,599 | | 30,206,978 | | $329,751,933 |
| Shares issued in reinvestment of distributions | | 966,546 | | | | 10,303,451 | | 106,628 | | | | 1,156,912 |
| Shares redeemed | | (26,703,118) | | | | (281,800,492) | | (5,999,090) | | | | (65,272,536) |
| | |
| |
| |
| |
| |
| |
|
| Net increase (decrease) | | 38,830,112 | | $ 424,302,558 | | 24,314,516 | | $265,636,309 |
| | |
| |
| |
| |
|
3. Transactions with Affiliates
Franklin Resources, Inc. is the holding company for various subsidiaries that together are referred to as Franklin Templeton Investments. Certain officers and trustees of the Trust are also officers and/or directors of the following subsidiaries:
| Subsidiary | | Affiliation |
| |
|
| K2/D&S Management Co. , L. L. C. (K2 Advisors) | | Investment manager |
| |
|
| Franklin Templeton Services, LLC (FT Services) | | Administrative manager |
| |
|
| Franklin Templeton Distributors, Inc. (Distributors) | | Principal underwriter |
| |
|
| Franklin Templeton Investor Services, LLC (Investor Services) | | Transfer agent |
| |
|
a. Management Fees
The Fund and K2 Subsidiary pay an investment management fee to K2 Advisors of 2.05% per year of the average daily net assets of the Fund and K2 Subsidiary. Management fees paid by the Fund are reduced on assets invested in the K2 Subsidiary, in an amount not to exceed the management fees paid by K2 Subsidiary.
Under each subadvisory agreement, the below entities provide subadvisory services to the Fund or K2 Subsidiary. The subadvisory fees are paid by K2 Advisors based on the Fund and K2 Subsidiary average daily net assets, and is not an additional expense of the Fund or K2 Subsidiary.
| Subadvisors |
|
| Basso Capital Management, L. P. |
|
| Chatham Asset Management, LLC |
|
| Chilton Investment Company, LLC |
|
F R A N K L I N A L T E R N A T I V E ST R A T E G I E S F U N D S
N O T E S T O C O N S O L I D A T E D F I N A N C I A L S T A T E M E N T S |
| Franklin K2 Alternative Strategies Fund (continued) |
| |
| 3. Transactions with Affiliates (continued) |
| |
| a. Management Fees (continued) |
| Subadvisors (continued) |
|
| Emso Asset Management Limited |
|
| Graham Capital Management, L. P. |
|
| Impala Asset Management, LLC |
|
| Jennison Associates, LLC |
|
| Lazard Asset Management, LLC |
|
| Loomis Sayles & Company, L. P. |
|
| P. Schoenfeld Asset Management L. P. |
|
| Portland Hill Capital LLP |
|
| Wellington Management Company, LLP |
|
| York Registered Holdings, L. P. |
|
b. Administrative Fees
Under an agreement with K2 Advisors, FT Services provides administrative services to the Fund and K2 Subsidiary. The fee is paid by K2 Advisors based on the Fund and K2 Subsidiary average daily net assets, and is not an additional expense of the Fund or K2 Subsidiary.
c. Distribution Fees
The Board has adopted distribution plans for each share class, with the exception of Class R6 and Advisor Class shares, pursuant to Rule 12b-1 under the 1940 Act. Under the Fund s Class A reimbursement distribution plan, the Fund reimburses Distributors for costs incurred in connection with the servicing, sale and distribution of the Fund s shares up to the maximum annual plan rate. Under the Class A reimbursement distribution plan, costs exceeding the maximum for the current plan year cannot be reimbursed in subsequent periods. In addition, under the Fund s Class C and R compensation distribution plans, the Fund pays Distributors for costs incurred in connection with the servicing, sale and distribution of the Fund s shares up to the maximum annual plan rate for each class. The plan year, for purposes of monitoring compliance with the maximum annual plan rates, is February 1 through January 31 for each fund.
The maximum annual plan rates, based on the average daily net assets, for each class, are as follows:
| Class A | | 0.30% |
| Class C | | 1.00% |
| Class R | | 0.50% |
Effective August 1, 2015, the Board has set the current rate at 0.25% per year for Class A shares until further notice and approval by the Board.
d. Sales Charges/Underwriting Agreements
Front-end sales charges and contingent deferred sales charges (CDSC) do not represent expenses of the Fund. These charges are deducted from the proceeds of sales of Fund shares prior to investment or from redemption proceeds prior to remittance, as applicable. Distributors has advised the Fund of the following commission transactions related to the sales and redemptions of the Fund s shares for the year:
| Sales charges retained net of commissions paid to unaffiliated broker/dealers | | $168,709 |
| CDSC retained | | $ 26,681 |
F R A N K L I N A L T E R N A T I V E S T R A T E G I E S F U N D S
N O T E S T O C O N S O L I D A T E D F I N A N C I A L S T A T E M E N T S |
Franklin K2 Alternative Strategies Fund (continued)
e. Transfer Agent Fees |
Each class of shares, except for Class R6, pays transfer agent fees to Investor Services for its performance of shareholder servicing obligations and reimburses Investor Services for out of pocket expenses incurred, including shareholder servicing fees paid to third parties. These fees are allocated daily based upon their relative proportion of such classes aggregate net assets. Class R6 pays Investor Services transfer agent fees specific to that class.
For the year ended May 31, 2016, the Fund paid transfer agent fees of $748,954, of which $241,624 was retained by Investor Services.
f. Waiver and Expense Reimbursements
K2 Advisors has contractually agreed in advance to waive or limit its fees and to assume as its own expense certain expenses otherwise payable by the Fund so that the expenses (excluding distribution fees, acquired fund fees and expenses, and dividend expense on securities sold short) for each class of the Fund do not exceed 1.95%, and Class R6 does not exceed 1.86% based on the average net assets of each class (other than certain non-routine expenses or costs, including those relating to litigation, indemnification, reorganizations, and liquidations) until September 30, 2016. Total expenses waived or paid are not subject to recapture subsequent to the Fund s fiscal year end. Prior to October 1, 2015, expenses for Class R6 were limited to 1.88%.
| g. Other Affiliated Transactions | | | | |
| At May 31, 2016, the shares of the Fund were owned by the following entities: | | |
| | | | | Percentage of |
| | | | | Outstanding |
| | | Shares | | Shares |
| |
| |
|
| Franklin Moderate Allocation Fund | | 9,471,811 | | 8.09% |
| |
| |
|
| Franklin Conservative Allocation Fund | | 6,250,790 | | 5.34% |
| |
| |
|
| Franklin Growth Allocation Fund | | 5,328,337 | | 4.55% |
| |
| |
|
| Franklin LifeSmart 2025 Retirement Target Fund | | 360,753 | | 0.31% |
| |
| |
|
| Franklin LifeSmart 2035 Retirement Target Fund | | 280,062 | | 0.24% |
| |
| |
|
| Franklin LifeSmart 2045 Retirement Target Fund | | 190,719 | | 0.16% |
| |
| |
|
| Franklin LifeSmart 2020 Retirement Target Fund | | 93,750 | | 0.08% |
| |
| |
|
| Franklin LifeSmart 2030 Retirement Target Fund | | 92,595 | | 0.08% |
| |
| |
|
| Franklin LifeSmart 2040 Retirement Target Fund | | 66,979 | | 0.06% |
| |
| |
|
| Franklin LifeSmart 2050 Retirement Target Fund | | 62,135 | | 0.05% |
| |
| |
|
| Franklin NextStep Moderate Fund | | 8,672 | | 0.01% |
| |
| |
|
| Franklin LifeSmart 2055 Retirement Target Fund | | 6,949 | | 0.01% |
| |
| |
|
| Franklin NextStep Growth Fund | | 3,278 | | 0.00%* |
| |
| |
|
| | | 22,216,830 | | 18.98% |
| | |
| |
|
| *Rounds to less than 0.01%. | | | | |
4. Expense Offset Arrangement
The Fund has entered into an arrangement with its custodian whereby credits realized as a result of uninvested cash balances are
used to reduce a portion of the Fund s custodian expenses. During the year ended May 31, 2016, the custodian fees were reduced as
noted in the Consolidated Statement of Operations. |
FRANKLIN ALTERNATIVE STRATEGIES FUNDS
NOTES TO CONSOLIDATED FINANCIAL STATEMENTS
Franklin K2 Alternative Strategies Fund (continued)
5. Income Taxes
For tax purposes, capital losses may be carried over to offset future capital gains, if any. At May 31, 2016, the capital loss carryfor-wards were as follows:
| | |
| Capital loss carryforwards: | | |
| Short term | $ | 35,428,734 |
| Long term | | 6,268,117 |
| Total capital loss carryforwards | $ | 41,696,851 |
The tax character of distributions paid during the years ended May 31, 2016 and 2015 was as follows:
| | | | |
| | | 2016 | | 2015 |
| Distributions paid from: | | | | |
| Ordinary income | $ | 17,363,303 | $ | 4,044,172 |
| Long term capital gain | | 4,170,318 | | — |
| Total distributions paid | $ | 21,533,621 | $ | 4,044,172 |
At May 31, 2016, the cost of investments, net unrealized appreciation (depreciation) and undistributed ordinary income for income tax purposes were as follows:
| | | |
| Cost of investments | $ | 1,228,537,026 | |
| Unrealized appreciation | $ | 51,377,099 | |
| Unrealized depreciation | | (29,215,107 | ) |
| Net unrealized appreciation (depreciation) | $ | 22,161,992 | |
| Distributable earnings - undistributed ordinary income | $ | 7,202,192 | |
The difference between income and/or capital gains as determined on a book basis and a tax basis are primarily due to differing treatments of foreign currency transactions, passive foreign investment company shares, bond discounts and premiums, commodity-based derivatives, investments in the K2 Subsidiary and wash sales.
6. Investment Transactions
Purchases and sales of investments and securities sold short (excluding short term securities) for the year ended May 31, 2016, aggregated $2,491,376,328 and $2,258,965,710, respectively.
| | | | | | | | | | | | | | | | | | | | | | |
| Transactions in options written during the year ended May 31, 2016, were as follows: | | | | | | | | | |
| |
| | | | | | | Options | | | | | | | | | Swaptions | | | | | |
| |
| | Number of | | | | | Notional | | | | | | | Notional | | | | Notional | | | | | |
| | Contracts | | | Premiums | | Amount | | | Premiums | | | Amount | | Premiums | | Amount | | | | Premiums | |
| Options outstanding | | | | | | | | | | | | | | | | | | | | | | |
| at May 31, 2015 | 3,168 | | $ | 395,803 | | 2,438,000,000 | KRW | $ | 33,740 | | $ | — | $ | — | | 50,000,000 | | MXN | $ | 3,293 | |
| Options written | 37,778 | | | 5,840,136 | | — | | | | — | | | 6,200,000 | | 84,940 | | — | | | | — | |
| Options expired | (5,263 | ) | | (422,450) (2,438,000,000) KRW | | | (33,740 | ) | | — | | — | | — | | | | — | |
| Options exercised | (320 | ) | | (56,070 | ) | — | | | | — | | | — | | — | | — | | | | — | |
| Options closed | (26,397 | ) | | (4,821,123 | ) | — | | | | — | | | — | | — | | (50,000,000 | ) | MXN | | (3,293 | ) |
| Options outstanding | | | | | | | | | | | | | | | | | | | | | | |
| at May 31, 2016 | 8,966 | | | 936,296 | | — | | | $ | — | | $ | 6,200,000 | $ | 84,940 | $ | — | | | $ | — | |
See Notes 1(e) and 8 regarding derivative financial instruments and other derivative information, respectively.
88 Annual Report
franklintempleton.com
F R A N K L I N A L T E R N A T I V E S T R A T E G I E S F U N D S
N O T E S T O C O N S O L I D A T E D F I N A N C I A L S T A T E M E N T S |
Franklin K2 Alternative Strategies Fund (continued)
The Fund sold certain long positions held in the portfolio and simultaneously entered into total return swaps on the positions, retaining substantially all of the exposure to the economic return and the related risks on the long positions. At May 31, 2016, the transfers of financial assets accounted for as sales were as follows:
| | | | | | | | | At Year Ended | | |
| | | At Original Transactions Dates | | | | May 31, 2016 | | |
| | |
| |
| |
| |
|
| |
| | | | | Gross | | Fair Value of | | Gross | | Gross |
| | | Cost Basis | | Cash Received | | Transferred | | Derivative Assets | | Derivative Liabilities |
| | | of Positions Sold | | for Positions Sold | | Assets a | | Recorded b | | Recorded b |
| |
| |
| |
| |
| |
|
| Sales and total return swaps | | $1,336,321 | | $1,561,793 | | $114,311 | | $1,676,104 | | $1,561,793 |
| | |
| |
| |
| |
| |
|
a $114,311 of gross derivative assets is included as unrealized appreciation on OTC swap contracts in the Consolidated Statement of Assets and Liabilities. See Note 8 regard-
ing other derivative information.
b Balances are presented on a gross basis, based on each leg of the swap contract, before the application of counterparty and cash collateral offsetting. |
7. Credit Risk and Defaulted Securities
The Fund may purchase the pre-default or defaulted debt of distressed companies. Distressed companies are financially troubled and are about to be or are already involved in financial restructuring or bankruptcy. Risks associated with purchasing these securities include the possibility that the bankruptcy or other restructuring process takes longer than expected, or that distributions in restructuring are less than anticipated, either or both of which may result in unfavorable consequences to the Fund. If it becomes probable that the income on debt securities, including those of distressed companies, will not be collected, the Fund discontinues accruing income and recognizes an adjustment for uncollectible interest.
At May 31, 2016, the aggregate long value of distressed company securities for which interest recognition has been discontinued was $4,038,890 representing 0.33% of the Fund s net assets. For information as to specific securities, see the accompanying Consolidated Statement of Investments.
8. Other Derivative Information
At May 31, 2016, the Fund s investments in derivative contracts are reflected in the Consolidated Statement of Assets and Liabilities as follows:
| | | Asset Derivatives | | | | Liability Derivatives | | |
| | |
| |
| |
| |
|
| |
| Derivative Contracts | | Consolidated Statement | | | | Consolidated Statement | | |
| Not Accounted for as | | of Assets and | | | | of Assets and | | |
| Hedging Instruments | | Liabilities Location | | Fair Value | | Liabilities Location | | Fair Value |
| |
| |
| |
| |
|
| Interest rate contracts | | Investments in securities, at | | $ 38,459a | | Options written, at value | | $ 472 |
| | | value | | | | | | |
| | | Variation margin | | 978,366b | | Variation margin | | 184,662b |
| | | Unrealized appreciation on | | 2,300,048 | | Unrealized depreciation on | | 387,285 |
| | | OTC swap contracts | | | | OTC swap contracts | | |
| Foreign exchange contracts | | Investments in securities, at | | 40,601a | | | | |
| | | value | | | | | | |
| | | Unrealized appreciation on | | 4,439,362 | | Unrealized depreciation on | | 4,445,062 |
| | | OTC forward exchange | | | | OTC forward exchange | | |
| | | contracts | | | | contracts | | |
| Credit contracts | | Variation margin | | 323,715b | | Variation margin | | 179,169b |
| | | OTC swap contracts (upfront | | 47,290 | | OTC swap contracts (upfront | | 17,177 |
| | | payments) | | | | receipts) | | |
| | | Unrealized appreciation on | | 4,663 | | Unrealized depreciation on | | 27,370 |
| | | OTC swap contracts | | | | OTC swap contracts | | |
F R A N K L I N A L T E R N A T I V E S T R A T E G I E S F U N D S
N O T E S T O C O N S O L I D A T E D F I N A N C I A L S T A T E M E N T S |
| Franklin K2 Alternative Strategies Fund (continued) | | | | | | |
| |
| 8. Other Derivative Information (continued) | | | | | | |
| | | Asset Derivatives | | | | Liability Derivatives | | |
| | |
| |
| |
| |
|
| Derivative Contracts | | Consolidated Statement | | | | Consolidated Statement | | |
| Not Accounted for as | | of Assets and | | | | of Assets and | | |
| Hedging Instruments | | Liabilities Location | | Fair Value | | Liabilities Location | | Fair Value |
| |
| |
| |
| |
|
| Equity contracts | | Investments in securities, at | | $ 6,556,077a | | Options written, at value | | $ 781,189 |
| | | value | | | | | | |
| | | Variation margin | | 1,686,005b | | Variation margin | | 1,578,685b |
| | | Unrealized appreciation on | | 3,107,840 | | Unrealized depreciation on | | 3,323,296 |
| | | OTC swap contracts | | | | OTC swap contracts | | |
| Commodity contracts | | Variation margin | | 1,986,408b | | Variation margin | | 2,499,264b |
| | | | |
| | | |
|
| Totals | | | | $21,508,834 | | | | $13,423,631 |
| | | | |
| | | |
|
a Purchased option contracts are included in investments in securities, at value in the Consolidated Statement of Assets and Liabilities. b This amount reflects the cumulative appreciation (depreciation) of futures contracts and centrally cleared swaps contracts as reported in the Consolidated Statement of Investments. Only the variation margin receivable/payable at period end is separately reported within the Consolidated Statement of Assets and Liabilities. Prior variation margin movements were recorded to cash upon receipt or payment.
For the year ended May 31, 2016, the effect of derivative contracts in the Fund s Consolidated Statement of Operations was as follows:
| | | | | | | | | Net Change in |
| | | | | | | | | Unrealized |
| Derivative Contracts | | | | Net Realized | | | | Appreciation |
| Not Accounted for as | | Consolidated Statement of | | Gain (Loss) | | Consolidated Statement of | | (Depreciation) |
| Hedging Instruments | | Operations Locations | | for the Year | | Operations Locations | | for the Year |
| |
| |
| |
| |
|
| | | Net realized gain (loss) from: | | | | Net change in unrealized | | |
| | | | | | | appreciation (depreciation) on: | | |
| Interest rate contracts | | Investments | | $ (45,503)a | | Investments | | $ (150,866)a |
| | | Written options | | 3,114 | | Written options | | 83,525 |
| | | Futures contracts | | (893,064) | | Futures contracts | | 644,247 |
| | | Swap contracts | | (8,994,941) | | Swap contracts | | 1,902,366 |
| Foreign exchange contracts | | Investments | | 102,224 a | | Investments | | 7,500 a |
| | | Written options | | 201 | | Written options | | 1,832 |
| | | Foreign currency transactions | | (2,583,230)b | | Translation of other assets and | | 526,101b |
| | | | | | | liabilities denominated in | | |
| | | | | | | foreign currencies | | |
| | | Futures contracts | | 2,109 | | | | |
| Credit contracts | | Swap contracts | | 1,199,667 | | Swap contracts | | 164,811 |
| Equity contracts | | Investments | | (4,083,058)a | | Investments | | (2,547,211)a |
| | | Written options | | 518,399 | | Written options | | 256,322 |
| | | Futures contracts | | (7,969,266) | | Futures contracts | | (328,069) |
| | | Swap contracts | | 6,622,915 | | Swap contracts | | (263,537) |
| Commodity contracts | | Futures contracts | | 3,430,954 | | Futures contracts | | (450,727) |
| | | | |
| | | |
|
| Totals | | | | $(12,689,479) | | | | $ (153,706) |
| | | | |
| | | |
|
a Purchased option contracts are included in net realized gain (loss) from investments and net change in unrealized appreciation (depreciation) on investments in the Consolidated Statement of Operations. b Forward exchange contracts are included in net realized gain (loss) from foreign currency transactions and net change in unrealized appreciation (depreciation) translation of other assets and liabilities denominated in foreign currencies in the Consolidated Statement of Operations.
F R A N K L I N A L T E R N A T I V E S T R A T E G I E S F U N D S
N O T E S T O C O N S O L I D A T E D F I N A N C I A L S T A T E M E N T S |
Franklin K2 Alternative Strategies Fund (continued)
For the year ended May 31, 2016, the average month end fair value of derivatives represented 2.45% of average month end net assets. The average month end number of open derivative contracts for the year was 814.
At May 31, 2016, the Fund s OTC derivative assets and liabilities are as follows:
| | | Gross and Net Amounts |
| | | of Assets and Liabilities |
| | | Presented in the |
| | | Consolidated Statement of |
| | | Assets and Liabilities |
| | |
|
| |
| | | Assets a | | Liabilitiesa |
| |
| |
|
| Derivatives | | | | |
| Forward Exchange Contracts | | $4,439,362 | | $4,445,062 |
| Options Purchased | | 79,060 | | |
| Options Written | | | | 472 |
| Swap Contracts | | 5,459,841 | | 3,755,128 |
| | |
| |
|
| Total | | $9,978,263 | | $8,200,662 |
| | |
| |
|
a Absent an event of default or early termination, OTC derivative assets and liabilities are presented gross and not offset in the Consolidated Statement of Assets and Liabilities.
At May 31, 2016, the Fund s OTC derivative assets, which may be offset against the Fund s OTC derivative liabilities and collateral received from the counterparty, are as follows:
| | | | | Amounts Not Offset in the Consolidated | | |
| | | | | Statement of Assets and Liabilities | | | | |
| | | | |
| |
| | |
| |
| | | Gross and Net | | | | | | | | | | | | |
| | | Amounts of Assets | | | | | | Financials | | | | | | |
| | | Presented in the | | | | Financial | | Instruments | | | | Cash | | |
| | | Consolidated Statement of | | Instruments | | Collateral | | Collateral | | Net Amount (Not |
| | | Assets and Liabilities | | Available for Offset | | Received a | | Received a | | Less than Zero) |
| |
| |
| |
| |
| |
|
| Counterparty | | | | | | | | | | | | | | |
| BNYM | | $ 357,645 | | $ | | | | $ | | $ | | | | $ 357,645 |
| BOFA | | 182,141 | | | | (90,926) | | | | | | | | 91,215 |
| BZWS | | 87,870 | | | | (19,441) | | | | | | | | 68,429 |
| CBOA | | 15,424 | | | | | | | | | | | | 15,424 |
| CITI | | 34,460 | | | | (30,255) | | | | | | | | 4,205 |
| CSFB | | 19,192 | | | | | | | | | | | | 19,192 |
| DBAB | | 3,011,654 | | | | (2,554,386) | | | | | | (30,000) | | 427,268 |
| JPHQ | | | | | | | | | | | | | | |
| MLCO | | 11,025 | | | | | | | | | | | | 11,025 |
| MSCO | | 559,723 | | | | (412,247) | | | | | | | | 147,476 |
| MSCOc | | 3,087,876 | | | | (3,087,876) | | | | | | | | |
| MSCS | | 2,611,253 | | | | (1,325,960) | | | | | | | | 1,285,293 |
| | |
| |
| |
| |
| |
| |
| |
|
| Total | | $9,978,263 | | $(7,521,091) | | $ | | $(30,000) | | $2,427,172 |
| | |
| |
| |
| |
| |
|
F R A N K L I N A L T E R N A T I V E S T R A T E G I E S F U N D S
N O T E S T O C O N S O L I D A T E D F I N A N C I A L S T A T E M E N T S |
Franklin K2 Alternative Strategies Fund (continued)
8. Other Derivative Information (continued) |
At May 31, 2016, the Fund s OTC derivative liabilities, which may be offset against the Fund s OTC derivative assets and collateral pledged to the counterparty, are as follows:
| | | | | Amounts Not Offset in the Consolidated | | |
| | | | | Statement of Assets and Liabilities | | | | |
| | | | |
| |
| | |
| |
| | | Gross and Net | | | | | | | | | | | | |
| | | Amounts of Liabilities | | | | | | Financials | | | | | | |
| | | Presented in the | | | | Financial | | Instruments | | | | Cash | | |
| | | Consolidated Statement of | | Instruments | | Collateral | | Collateral | | Net Amount (Not |
| | | Assets and Liabilities | | Available for Offset | | Pledged a | | Pledged a | | Less than Zero) |
| |
| |
| |
| |
| |
|
| Counterparty | | | | | | | | | | | | | | |
| BNYM | | $ 133,829 | | $ | | | | $ | | $ | | | | $133,829 |
| BOFA | | 90,926 | | | | (90,926) | | | | | | | | |
| BZWS | | 19,441 | | | | (19,441) | | | | | | | | |
| CBOA | | | | | | | | | | | | | | |
| CITI | | 30,255 | | | | (30,255) | | | | | | | | |
| CSFB | | | | | | | | | | | | | | |
| DBAB | | 2,554,386 | | | | (2,554,386) | | | | | | | | |
| JPHQ | | 21,370 | | | | | | | | | | | | 21,370 |
| MLCO | | | | | | | | | | | | | | |
| MSCO | | 412,247 | | | | (412,247) | | | | | | | | |
| MSCOb | | 3,612,248 | | | | (3,087,876) | | | | (524,372) | | |
| MSCS | | 1,325,960 | | | | (1,325,960) | | | | | | | | |
| | |
| |
| |
| |
| |
| |
| |
|
| Total | | $8,200,662 | | $(7,521,091) | | $ | | $(524,372) | | $155,199 |
| | |
| |
| |
| |
| |
|
a In some instances, the collateral amounts disclosed in the table above were adjusted due to the requirement to limit collateral amounts to avoid the effect of over-
collateralization. Actual collateral received and/or pledged may be more than the amounts disclosed herein.
b Represents derivatives owned by the K2 Holdings Investment Corp., a wholly-owned subsidiary of the Fund. See Note 1(g).
See Notes 1(e) and 6 regarding derivative financial instruments and investment transactions, respectively.
See Abbreviations on page 94. |
9. Credit Facility
The Fund, together with other U.S. registered and foreign investment funds (collectively, Borrowers), managed by Franklin Templeton Investments, are borrowers in a joint syndicated senior unsecured credit facility totaling $2 billion (Global Credit Facility) which matures on February 10, 2017. This Global Credit Facility provides a source of funds to the Borrowers for temporary and emergency purposes, including the ability to meet future unanticipated or unusually large redemption requests.
Under the terms of the Global Credit Facility, the Fund shall, in addition to interest charged on any borrowings made by the Fund and other costs incurred by the Fund, pay its share of fees and expenses incurred in connection with the implementation and maintenance of the Global Credit Facility, based upon its relative share of the aggregate net assets of all of the Borrowers, including an annual commitment fee of 0.07% based upon the unused portion of the Global Credit Facility. Effective February 12, 2016, the annual commitment fee is 0.15%. These fees are reflected in other expenses in the Consolidated Statement of Operations. During the year ended May 31, 2016, the Fund did not use the Global Credit Facility.
F R A N K L I N A L T E R N A T I V E S T R A T E G I E S F U N D S
N O T E S T O C O N S O L I D A T E D F I N A N C I A L S T A T E M E N T S |
Franklin K2 Alternative Strategies Fund (continued)
10. Fair Value Measurements |
The Fund follows a fair value hierarchy that distinguishes between market data obtained from independent sources (observable inputs) and the Fund s own market assumptions (unobservable inputs). These inputs are used in determining the value of the Fund s financial instruments and are summarized in the following fair value hierarchy:
- Level 1 quoted prices in active markets for identical financial instruments
- Level 2 other significant observable inputs (including quoted prices for similar financial instruments, interest rates, prepay- ment speed, credit risk, etc. )
- Level 3 significant unobservable inputs (including the Fund s own assumptions in determining the fair value of financial instruments)
The input levels are not necessarily an indication of the risk or liquidity associated with financial instruments at that level.
For movements between the levels within the fair value hierarchy, the Fund has adopted a policy of recognizing the transfers as of the date of the underlying event which caused the movement.
A summary of inputs used as of May 31, 2016, in valuing the Fund s assets and liabilities carried at fair value, is as follows:
| | | Level 1 | | Level 2 | | Level 3 | | Total |
| |
| |
| |
| |
|
| |
| Assets: | | | | | | | | |
| Investments in Securities: | | | | | | | | |
| Common Stocks and Other Equity Interestsa | | $413,512,300 | | $ | | $ | | $ 413,512,300 |
| Exchange Traded Funds | | 1,595,254 | | | | | | 1,595,254 |
| Convertible Preferred Stocks | | 1,053,778 | | 1,827,800 | | | | 2,881,578 |
| Preferred Stocks | | 2,680,863 | | | | | | 2,680,863 |
| Convertible Bonds | | | | 172,672,647 | | | | 172,672,647 |
| Convertible Bonds in Reorganization | | | | 24,245 | | | | 24,245 |
| Corporate Bonds and Notes | | | | 221,571,622 | | | | 221,571,622 |
| Corporate Bonds and Notes in Reorganization | | | | 4,038,890 | | | | 4,038,890 |
| Senior Floating Rate Interests | | | | 1,692,352 | | | | 1,692,352 |
| Foreign Government and Agency Securities | | | | 28,054,661 | | | | 28,054,661 |
| Asset-Backed Securities and Commercial Mortgage-Backed | | | | | | | | |
| Securities | | | | 23,447,879 | | | | 23,447,879 |
| Options Purchased | | 6,556,077 | | 79,060 | | | | 6,635,137 |
| U. S. Government and Agency Securities | | 44,194,730 | | | | | | 44,194,730 |
| Short Term Investments | | 275,245,279 | | 52,451,581 | | | | 327,696,860 |
| | |
| |
| |
| |
|
| Total Investments in Securities | | $744,838,281 | | $505,860,737 | | $ | | $1,250,699,018 |
| | |
| |
| |
| |
|
| Other Financial Instruments: | | | | | | | | |
| Futures Contracts | | $ 4,650,779 | | $ | | $ | | $ 4,650,779 |
| Forward Exchange Contracts | | | | 4,439,362 | | | | 4,439,362 |
| Swap Contracts | | | | 5,736,266 | | | | 5,736,266 |
| | |
| |
| |
| |
|
| Total Other Financial Instruments | | $ 4,650,779 | | $ 10,175,628 | | $ | | $ 14,826,407 |
| | |
| |
| |
| |
|
| |
| Liabilities: | | | | | | | | |
| Other Financial Instruments: | | | | | | | | |
| Options Written | | $ 781,189 | | $ 472 | | $ | | $ 781,661 |
| Securities Sold Shorta | | 246,878,601 | | 5,450,645 | | | | 252,329,246 |
| Futures Contracts | | 4,262,611 | | | | | | 4,262,611 |
| Forward Exchange Contracts | | | | 4,445,062 | | | | 4,445,062 |
| Swap Contracts | | | | 3,917,120 | | | | 3,917,120 |
| | |
| |
| |
| |
|
| Total Other Financial Instruments | | $251,922,401 | | $ 13,813,299 | | $ | | $ 265,735,700 |
| | |
| |
| |
| |
|
| a For detailed categories, see the accompanying Consolidated Statement of Investments. | | | | | | | | |
| | |
| |
| |
| |
|
FRANKLIN ALTERNATIVE STRATEGIES FUNDS
NOTES TO CONSOLIDATED FINANCIAL STATEMENTS
Franklin K2 Alternative Strategies Fund (continued)
10. Fair Value Measurements (continued)
A reconciliation of assets in which Level 3 inputs are used in determining fair value is presented when there are significant Level 3 financial instruments at the end of the year.
11. Subsequent Events
The Fund has evaluated subsequent events through the issuance of the consolidated financial statements and determined that no events have occurred that require disclosure.
| | | | | |
| Abbreviations | | | | |
| Counterparty/Exchange | Currency | Selected Portfolio |
| BNYM | The Bank of New York Mellon | AUD | Australian Dollar | ABS | Asset Backed Security |
| BOFA | Bank of America Corp | BRL | Brazilian Real | ADR | American Depositary Receipt |
| BZWS | Barclays Bank PLC | CAD | Canadian Dollar | ARM | Adjustable Rate Mortgage |
| CBOA | Commonwealth Bank of Australia | COP | Colombian Peso | ETF | Exchange Traded Fund |
| CITI | Citigroup, Inc. | EUR | Euro | EONIA | Euro Overnight Index Average |
| CSFB | Credit Suisse First Boston | GBP | British Pound | EURIBOR | Euro Interbank Offered Rate |
| DBAB | Deutsche Bank AG | HKD | Hong Kong Dollar | FEDEF | Federal Funds Effective Rate |
| ICE | Intercontinental Exchange, Inc. | JPY | Japanese Yen | FRN | Floating Rate Note |
| JPHQ | JP Morgan Chase & Co. | KRW | Korean Won | HONIX | Hong Kong Overnight Index Rate |
| MLCO | Merrill Lynch & Co., Inc. | MXN | Mexican Peso | IDR | International Depositary Receipt |
| MSCO | Morgan Stanley & Co., Inc. | SEK | Swedish Krona | JIBAR | Johannesburg Interbank Agreed Rate |
| MSCS | Morgan Stanley Capital Services | SGD | Singapore Dollar | LIBOR | London InterBank Offered Rate |
| | | USD | United States Dollar | MXONBR | Bank of Mexico Official Overnight Rate |
| | | ZAR | South African Rand | PIK | Payment In-Kind |
| | | | | RBACR | Reserve Bank of Australia Cash Rate |
| | | | | REIT | Real Estate Investment Trust |
| | | | | SAFEX | South African Futures Exchange |
| | | | | SONIA | Sterling Overnight Index Average |
| | | | | SPDR | Standard & Poor’s Depositary Receipt |
| | | | | STIBOR | Stockholm Interbank Offered Rate |
94 Annual Report
franklintempleton.com
FRANKLIN ALTERNATIVE STRATEGIES FUNDS
Report of Independent Registered Public Accounting Firm
To the Board of Trustees of Franklin Alternative Strategies Funds and Shareholders of Franklin K2 Alternative Strategies Fund:
We have audited the accompanying consolidated statement of assets and liabilities, including the consolidated statement of investments, of Franklin K2 Alternative Strategies Fund (the “Fund”) (one of the funds constituting the Franklin Alternative Strategies Funds), as of May 31, 2016, and the related consolidated statement of operations for the year then ended, the consolidated statement of changes in net assets for each of the two years in the period then ended and the financial highlights for each of the periods indicated therein. These financial statements and financial highlights are the responsibility of the Fund’s management. Our responsibility is to express an opinion on these financial statements and financial highlights based on our audits.
We conducted our audits in accordance with the standards of the Public Company Accounting Oversight Board (United States). Those standards require that we plan and perform the audit to obtain reasonable assurance about whether the financial statements and financial highlights are free of material misstatement. We were not engaged to perform an audit of the Fund’s internal control over financial reporting. Our audit included consideration of internal control over financial reporting as a basis for designing audit procedures that are appropriate in the circumstances, but not for the purpose of expressing an opinion on the effectiveness of the Fund’s internal control over financial reporting. Accordingly, we express no such opinion. An audit also includes examining, on a test basis, evidence supporting the amounts and disclosures in the financial statements and financial highlights, assessing the accounting principles used and significant estimates made by management, and evaluating the overall financial statement presentation. Our procedures included confirmation of securities owned as of May 31, 2016, by correspondence with the custodian and brokers or by other appropriate auditing procedures where replies from the brokers were not received. We believe that our audits provide a reasonable basis for our opinion.
In our opinion, the financial statements and financial highlights referred to above present fairly, in all material respects, the consolidated financial position of Franklin K2 Alternative Strategies Fund (one of the funds constituting the Franklin Alternative Strategies Funds) at May 31, 2016, the consolidated results of its operations for the year then ended, the consolidated changes in its net assets for each of the two years in the period then ended and the financial highlights for each of the periods indicated therein, in conformity with U.S. generally accepted accounting principles.

Boston, Massachusetts
July 26, 2016
franklintempleton.com
Annual Report
95
FRANKLIN ALTERNATIVE STRATEGIES FUNDS
Tax Information (unaudited)
Under Section 852(b)(3)(C) of the Internal Revenue Code (Code), the Fund hereby reports the maximum amount allowable but no less than $4,170,318 as a long term capital gain dividend for the fiscal year ended May 31, 2016.
Under Section 854(b)(1)(A) of the Code, the Fund hereby reports 11.99% of the ordinary income dividends as income qualifying for the dividends deduction for the fiscal year ended May 31, 2016.
Under Section 854(b)(1)(B) of the Code, the Fund hereby reports the maximum amount allowable but no less than $4,002,303 as qualified dividends for purposes of the maximum rate under Section 1(h)(11) of the Code for the fiscal year ended May 31, 2016. Distributions, including qualified dividend income, paid during calendar year 2016 will be reported to shareholders on Form 1099-DIV by mid-February 2017. Shareholders are advised to check with their tax advisors for information on the treatment of these amounts on their individual income tax returns.
96 Annual Report
franklintempleton.com
| F R A N K L I N A L T E R N A T I V E S T R A T E G I E S F U N D S |
Board Members and Officers
The name, year of birth and address of the officers and board members, as well as their affiliations, positions held with the Trust,
principal occupations during at least the past five years and number of U.S. registered portfolios overseen in the Franklin Templeton
Investments fund complex are shown below. Generally, each board member serves until that person s successor is elected
and qualified. |
| Independent Board Members | | | | | | |
| |
| | | | | | | Number of Portfolios in | | |
| Name, Year of Birth | | | | Length of | | Fund Complex Overseen | | Other Directorships Held During |
| and Address | | Position | | Time Served | | by Board Member* | | at Least the Past 5 Years |
| |
| |
| |
| |
|
| |
| Edward I. Altman, Ph. D. (1941) | | Trustee | | Since 2011 | | 15 | | None |
| c/o Franklin Mutual Advisers, LLC | | | | | | | | |
| 101 John F. Kennedy Parkway | | | | | | | | |
| Short Hills, NJ 07078-2789 | | | | | | | | |
Principal Occupation During at Least the Past 5 Years: | | | | |
| Max L. Heine Professor of Finance, Emeritus and Director of The Credit and Debt Markets Research Program, Salomon Center, Stern School |
| of Business, New York University; editor and author of numerous financial publications; financial consultant; an adviser to numerous financial |
| and publishing organizations; and formerly, Vice Director, Salomon Center, Stern School of Business, New York University. |
|
| |
| Ann Torre Bates (1958) | | Trustee | | Since 2011 | | 39 | | Navient Corporation (loan |
| c/o Franklin Mutual Advisers, LLC | | | | | | | | management, servicing and asset |
| 101 John F. Kennedy Parkway | | | | | | | | recovery) (2014-present), Ares Capital |
| Short Hills, NJ 07078-2789 | | | | | | | | Corporation (specialty finance |
| | | | | | | | | company) (2010-present), United |
| | | | | | | | | Natural Foods, Inc. (distributor of |
| | | | | | | | | natural, organic and specialty foods) |
| | | | | | | | | (2013-present), Allied Capital |
| | | | | | | | | Corporation (financial services) (2003- |
| | | | | | | | | 2010) and SLM Corporation (Sallie |
| | | | | | | | | Mae) (1997-2014) . |
| Principal Occupation During at Least the Past 5 Years: | | | | |
| Director of various companies; and formerly, Executive Vice President and Chief Financial Officer, NHP Incorporated (manager of multifamily |
| housing) (1995-1997); and Vice President and Treasurer, US Airways, Inc. (until 1995) . | | |
| |
|
| |
| Burton J. Greenwald (1929) | | Trustee | | Trustee since | | 15 | | Franklin Templeton Emerging Markets |
| c/o Franklin Mutual Advisers, LLC | | and Vice | | 2011 and Vice | | | | Debt Opportunities Fund PLC and |
| 101 John F. Kennedy Parkway | | Chairman of | | Chairman since | | | | Fiduciary International Ireland Limited |
| Short Hills, NJ 07078-2789 | | the Board | | 2015 | | | | (1999-2015) . |
Principal Occupation During at Least the Past 5 Years: | | | | |
| Managing Director, B. J. Greenwald Associates (management consultants to the financial services industry); and formerly, Chairman, |
| Fiduciary Trust International Funds; Executive Vice President, L. F. Rothschild Fund Management, Inc. ; President and Director, Merit Mutual |
| Funds; President, Underwriting Division and Director, National Securities & Research Corporation; Governor, Investment Company Institute; |
| and Chairman, ICI Public Information Committee. | | | | | | |
| |
| |
| |
|
| |
| Keith E. Mitchell (1954) | | Trustee | | Since 2011 | | 15 | | None |
| c/o Franklin Mutual Advisers, LLC | | | | | | | | |
| 101 John F. Kennedy Parkway | | | | | | | | |
| Short Hills, NJ 07078-2789 | | | | | | | | |
Principal Occupation During at Least the Past 5 Years: | | | | |
| Director of various boards of asset management firms; and formerly, Managing Member, Mitchell, Hartley & Bechtel Advisers, LLC (formerly, |
| Mitchell Advisers, LLC) (advisory firm) (2003-2015) and Managing Director, Putman Lovell NBF. | | |
| F R A N K L I N A L T E R N A T I V E S T R A T E G I E S F U N D S |
| Independent Board Members (continued) | | | | |
| |
| | | | | | | Number of Portfolios in | | |
| Name, Year of Birth | | | | Length of | | Fund Complex Overseen | | Other Directorships Held During |
| and Address | | Position | | Time Served | | by Board Member* | | at Least the Past 5 Years |
| |
| |
| |
| |
|
| |
| David W. Niemiec (1949) | | Trustee | | Since 2015 | | 39 | | Emeritus Corporation (assisted living) |
| c/o Franklin Mutual Advisers, LLC | | | | | | | | (1999-2010) and OSI Pharmaceuticals, |
| 101 John F. Kennedy Parkway | | | | | | | | Inc. (pharmaceutical products) |
| Short Hills, NJ 07078-2789 | | | | | | | | (2006-2010) . |
Principal Occupation During at Least the Past 5 Years: | | | | |
| Advisor, Saratoga Partners (private equity fund); and formerly, Managing Director, Saratoga Partners (1998-2001) and SBC Warburg Dillon |
| Read (investment banking) (1997-1998); Vice Chairman, Dillon, Read & Co. Inc. (investment banking) (1991-1997); and Chief Financial |
| Officer, Dillon, Read & Co. Inc. (1982-1997) . | | | | | | |
| |
| |
| |
|
| |
| Charles Rubens II (1930) | | Trustee | | Since 2011 | | 15 | | None |
| c/o Franklin Mutual Advisers, LLC | | | | | | | | |
| 101 John F. Kennedy Parkway | | | | | | | | |
| Short Hills, NJ 07078-2789 | | | | | | | | |
Principal Occupation During at Least the Past 5 Years: | | | | |
| Private investor and president of non-profit organizations; and formerly, an executive of Time, Inc. ; and Trustee of Colorado College. |
|
| |
| Jan Hopkins Trachtman (1947) | | Trustee | | Since 2011 | | 15 | | None |
| c/o Franklin Mutual Advisers, LLC | | | | | | | | |
| 101 John F. Kennedy Parkway | | | | | | | | |
| Short Hills, NJ 07078-2789 | | | | | | | | |
Principal Occupation During at Least the Past 5 Years: | | | | |
| President and Founder, The Jan Hopkins Group (communications consulting firm); serves on Advisory Board of Knight Bagehot Fellowship; |
| and formerly, President, Economic Club of New York (2001-2015); Anchor/Correspondent, CNN Financial News (until 2003); Managing |
| Director and Head of Client Communications, Citigroup Private Bank (until 2005); Off-Air Reporter, ABC News World News Tonight; and |
| Editor, CBS Network News. | | | | | | | | |
| |
| |
| |
| |
|
| |
| Robert E. Wade (1946) | | Trustee and | | Trustee and | | 39 | | El Oro Ltd (investments) |
| c/o Franklin Mutual Advisers, LLC | | Chairman of | | Chairman of the | | | | (2003-present) . |
| 101 John F. Kennedy Parkway | | the Board | | Board since | | | | |
| Short Hills, NJ 07078-2789 | | | | 2011 | | | | |
| Principal Occupation During at Least the Past 5 Years: | | | | |
| Attorney at law engaged in private practice (1972-2008) and member of various boards. | | |
| |
|
| |
| Gregory H. Williams (1943) | | Trustee | | Since 2015 | | 15 | | None |
| c/o Franklin Mutual Advisers, LLC | | | | | | | | |
| 101 John F. Kennedy Parkway | | | | | | | | |
| Short Hills, NJ 07078-2789 | | | | | | | | |
Principal Occupation During at Least the Past 5 Years: | | | | |
| Private investor; Consultant; and formerly, President, University of Cincinnati (2009-2012); President, The City College of New York (2001- |
| 2009); Dean, College of Law, Ohio State University (1993-2001); and Associate Vice President, Academic Affairs and Professor of Law, |
| University of Iowa (1977-1993) . | | | | | | | | |
| F R A N K L I N A L T E R N A T I V E S T R A T E G I E S F U N D S |
| Interested Board Members and Officers | | | | |
| |
| | | | | | | Number of Portfolios in | | |
| Name, Year of Birth | | | | Length of | | Fund Complex Overseen | | Other Directorships Held During |
| and Address | | Position | | Time Served | | by Board Member* | | at Least the Past 5 Years |
| |
| |
| |
| |
|
| |
| **Gregory E. Johnson (1961) | | Trustee | | Since 2011 | | 160 | | None |
| One Franklin Parkway | | | | | | | | |
| San Mateo, CA 94403-1906 | | | | | | | | |
| Principal Occupation During at Least the Past 5 Years: | | | | |
| Chairman of the Board, Member Office of the Chairman, Director and Chief Executive Officer, Franklin Resources, Inc. ; officer and/or director |
| or trustee, as the case may be, of some of the other subsidiaries of Franklin Resources, Inc. and of 44 of the investment companies in Franklin |
| Templeton Investments; Vice Chairman, Investment Company Institute; and formerly, President, Franklin Resources, Inc. (1994-2015) . |
|
| |
| **Jennifer M. Johnson (1964) | | Trustee | | Since 2015 | | 12 | | None |
| One Franklin Parkway | | | | | | | | |
| San Mateo, CA 94403-1906 | | | | | | | | |
| Principal Occupation During at Least the Past 5 Years: | | | | |
| Co-President, Franklin Resources, Inc. ; officer and/or director or trustee, as the case may be, of some of the other subsidiaries of Franklin |
| Resources, Inc. and of four of the investment companies in Franklin Templeton Investments; and formerly, Chief Operating Officer and |
| Executive Vice President, Franklin Resources, Inc. (1994-2015); Executive Vice President of Operations and Technology, Franklin Resources, |
| Inc. (2005-2010); and Senior Vice President, Franklin Resources, Inc. (2003-2005) . | | |
| |
|
| |
| Alison E. Baur (1964) | | Vice | | Since 2012 | | Not Applicable | | Not Applicable |
| One Franklin Parkway | | President | | | | | | |
| San Mateo, CA 94403-1906 | | | | | | | | |
| Principal Occupation During at Least the Past 5 Years: | | | | |
| Deputy General Counsel, Franklin Templeton Investments; and officer of some of the other subsidiaries of Franklin Resources, Inc. and of 45 |
| of the investment companies in Franklin Templeton Investments. | | | | |
| |
| |
|
| |
| Laura F. Fergerson (1962) | | Chief | | Since 2011 | | Not Applicable | | Not Applicable |
| One Franklin Parkway | | Executive | | | | | | |
| San Mateo, CA 94403-1906 | | Officer | | | | | | |
| | | Finance and | | | | | | |
| | | Administration | | | | | | |
| Principal Occupation During at Least the Past 5 Years: | | | | |
| Senior Vice President, Franklin Templeton Services, LLC; Vice President, Franklin Advisers, Inc. and Franklin Templeton Institutional, LLC; |
| and officer of 45 of the investment companies in Franklin Templeton Investments. | | |
| |
|
| |
| Aliya S. Gordon (1973) | | Vice | | Since 2011 | | Not Applicable | | Not Applicable |
| One Franklin Parkway | | President | | | | | | |
| San Mateo, CA 94403-1906 | | | | | | | | |
| Principal Occupation During at Least the Past 5 Years: | | | | |
| Senior Associate General Counsel, Franklin Templeton Investments; and officer of 45 of the investment companies in Franklin Templeton Investments. |
|
| |
| Steven J. Gray (1955) | | Secretary | | Secretary and | | Not Applicable | | Not Applicable |
| One Franklin Parkway | | and Vice | | Vice President | | | | |
| San Mateo, CA 94403-1906 | | President | | since 2011 | | | | |
| Principal Occupation During at Least the Past 5 Years: | | | | |
| Senior Associate General Counsel, Franklin Templeton Investments; Vice President, Franklin Templeton Distributors, Inc. and Franklin |
| Alternative Strategies Advisers, LLC; and officer of 45 of the investment companies in Franklin Templeton Investments. |
| franklintempleton.com Annual Report 99 |
| F R A N K L I N A L T E R N A T I V E S T R A T E G I E S F U N D S |
| Interested Board Members and Officers (continued) | | |
| |
| | | | | | | Number of Portfolios in | | |
| Name, Year of Birth | | | | Length of | | Fund Complex Overseen | | Other Directorships Held During |
| and Address | | Position | | Time Served | | by Board Member* | | at Least the Past 5 Years |
| |
| |
| |
| |
|
| |
| Robert G. Kubilis (1973) | | Treasurer, | | Since 2015 | | Not Applicable | | Not Applicable |
| 300 S. E. 2nd Street | | Chief | | | | | | |
| Fort Lauderdale, FL 33301-1923 | | Financial | | | | | | |
| | | Officer and | | | | | | |
| | | Chief | | | | | | |
| | | Accounting | | | | | | |
| | | Officer | | | | | | |
| Principal Occupation During at Least the Past 5 Years: | | | | |
| Treasurer, U. S. Fund Administration & Reporting, Franklin Templeton Investments; and officer of four of the investment companies in Franklin |
| Templeton Investments. | | | | | | | | |
| |
| |
| |
| |
|
| |
| Robert Lim (1948) | | Vice | | Since May 2016 | | Not Applicable | | Not Applicable |
| One Franklin Parkway | | President | | | | | | |
| San Mateo, CA 94403-1906 | | AML | | | | | | |
| | | Compliance | | | | | | |
| Principal Occupation During at Least the Past 5 Years: | | | | |
| Vice President, Franklin Templeton Companies, LLC; Chief Compliance Officer, Franklin Templeton Distributors, Inc. and Franklin Templeton |
| Investor Services, LLC; and officer of 45 of the investment companies in Franklin Templeton Investments |
|
| |
| Kimberly H. Novotny (1972) | | Vice | | Since 2013 | | Not Applicable | | Not Applicable |
| 300 S. E. 2nd Street | | President | | | | | | |
| Fort Lauderdale, FL 33301-1923 | | | | | | | | |
| Principal Occupation During at Least the Past 5 Years: | | | | |
| Associate General Counsel, Franklin Templeton Investments; Vice President and Corporate Secretary, Fiduciary Trust International of the |
| South; Vice President, Templeton Investment Counsel, LLC; Assistant Secretary, Franklin Resources, Inc. ; and officer of 45 of the investment |
| companies in Franklin Templeton Investments. | | | | | | |
| |
| |
| |
|
| |
| Robert C. Rosselot (1960) | | Chief | | Since 2013 | | Not Applicable | | Not Applicable |
| 300 S. E. 2nd Street | | Compliance | | | | | | |
| Fort Lauderdale, FL 33301-1923 | | Officer | | | | | | |
| Principal Occupation During at Least the Past 5 Years: | | | | |
| Director, Global Compliance, Franklin Templeton Investments; Vice President, Franklin Templeton Companies, LLC; officer of 45 of the |
| investment companies in Franklin Templeton Investments; and formerly, Senior Associate General Counsel, Franklin Templeton Investments |
| (2007-2013); and Secretary and Vice President, Templeton Group of Funds (2004-2013) . | | |
| |
|
| |
| Karen L. Skidmore (1952) | | Vice | | Since 2011 | | Not Applicable | | Not Applicable |
| One Franklin Parkway | | President | | | | | | |
| San Mateo, CA 94403-1906 | | | | | | | | |
| Principal Occupation During at Least the Past 5 Years: | | | | |
| Senior Associate General Counsel, Franklin Templeton Investments; and officer of 45 of the investment companies in Franklin Templeton Investments. |
|
| |
| Navid Tofigh (1972) | | Vice | | Since | | Not Applicable | | Not Applicable |
| One Franklin Parkway | | President | | November 2015 | | | | |
| San Mateo, CA 94403-1906 | | | | | | | | |
| Principal Occupation During at Least the Past 5 Years: | | | | |
| Associate General Counsel, Franklin Templeton Investments; and officer of 45 of the investment companies in Franklin Templeton Investments. |
| F R A N K L I N A L T E R N A T I V E S T R A T E G I E S F U N D S |
| Interested Board Members and Officers (continued) | | |
| |
| | | | | | | Number of Portfolios in | | |
| Name, Year of Birth | | | | Length of | | Fund Complex Overseen | | Other Directorships Held During |
| and Address | | Position | | Time Served | | by Board Member* | | at Least the Past 5 Years |
| |
| |
| |
| |
|
| |
| Craig S. Tyle (1960) | | Vice | | Since 2011 | | Not Applicable | | Not Applicable |
| One Franklin Parkway | | President | | | | | | |
| San Mateo, CA 94403-1906 | | | | | | | | |
| Principal Occupation During at Least the Past 5 Years: | | | | |
| General Counsel and Executive Vice President, Franklin Resources, Inc. ; and officer of some of the other subsidiaries of Franklin Resources, |
| Inc. and of 45 of the investment companies in Franklin Templeton Investments. | | |
| |
|
| |
| Lori A. Weber (1964) | | Vice | | Since 2011 | | Not Applicable | | Not Applicable |
| 300 S. E. 2nd Street | | President | | | | | | |
| Fort Lauderdale, FL 33301-1923 | | | | | | | | |
| Principal Occupation During at Least the Past 5 Years: | | | | |
| Senior Associate General Counsel, Franklin Templeton Investments; Assistant Secretary, Franklin Resources, Inc. ; Vice President and |
| Secretary, Templeton Investment Counsel, LLC; and officer of 45 of the investment companies in Franklin Templeton Investments. |
|
| |
| William Y. Yun (1959) | | President | | Since 2011 | | Not Applicable | | Not Applicable |
| 600 Fifth Avenue | | and Chief | | | | | | |
| New York, NY 10020 | | Executive | | | | | | |
| | | Officer | | | | | | |
| | | Investment | | | | | | |
| | | Management | | | | | | |
| Principal Occupation During at Least the Past 5 Years: | | | | |
| Executive Vice President, Franklin Advisers, Inc. and Franklin Templeton Institutional, LLC; Chief Executive Officer, Franklin Alternative |
| Strategies Advisers, LLC; Director, Fiduciary Investments Corporation and K2 Advisors Holdings, LLC; officer and/or director or trustee, as the |
| case may be, of some of the other subsidiaries of Franklin Resources, Inc. and of one of the investment companies in Franklin Templeton |
| Investments; and formerly, Executive Vice President Alternative Strategies, Franklin Resources, Inc. (2005-2015) . |
*We base the number of portfolios on each separate series of the U.S. registered investment companies within the Franklin Templeton Investments fund complex. These
portfolios have a common investment manager or affiliated investment managers.
**Gregory E. Johnson is considered to be an interested person of the Fund under the federal securities laws due to his position as an officer and director of Franklin
Resources, Inc., which is the parent company of the Fund s investment manager and distributor. Jennifer M. Johnson is considered to be an interested person of the Fund
under the federal securities laws due to her position as officer and director of Resources.
Note 1: Gregory E. Johnson and Jennifer M. Johnson are siblings.
Note 2: Officer information is current as of the date of this report. It is possible that after this date, information about officers may change.
The Fund s Board has determined that certain of the members of the Audit Committee, including Ann Torre Bates, are audit committee financial experts, and
independent, under those provisions of the Sarbanes-Oxley Act of 2002, and the rules and form amendments adopted by the Securities and Exchange
Commission, relating to audit committee financial experts.
The Statement of Information (SAI) include additional information about board members and is available, without charge, upon request. Shareholders may
call (800) DIAL BEN/342-5236 to request the SAI. |
| |
FRANKLIN FRANKLIN | ALTERNATIVE STRATEGIES FUNDS K2 ALTERNATIVE STRATEGIES FUND |
Shareholder Information
Board Review of Investment Management Agreement and Sub-Advisory Agreements
The Board of Trustees (Board), including a majority of trustees that are not “interested persons” as such term is defined in section 2(a)(19) of the Investment Company Act of 1940 (hereinafter referred to as “independent Trustees”), at a Board meeting held on May 16, 2016, unanimously approved the renewal of the Fund’s investment management agreement with K2/D&S Management Co., L.L.C. (K2 Advisors), and of each sub-advisory agreement between K2 Advisors and each of Basso Capital Management, L.P. (Basso), Chatham Asset Management, LLC (Chatham), Chilton Investment Company, LLC (Chilton), Graham Capital Management, L.P. (Graham), Impala Asset Management, LLC (Impala), Jennison Associates, LLC (Jennison), Lazard Asset Management, LLC (Lazard), Loomis Sayles & Company, L.P. (Loomis), P. Schoenfeld Asset Management L.P. (PSAM), Wellington Management Company LLP (Wellington) and York Registered Holdings, L.P. (together with Basso, Chatham, Chilton, Graham, Impala, Jennison, Lazard, Loomis, PSAM and Wellington, the Sub-Advisors).
Prior to a meeting of all of the trustees for the purpose of considering such renewal, the independent trustees held two other meetings dedicated to the renewal process (those trustees unable to attend in person were present by telephonic conference means). Throughout the process, the independent trustees received assistance and advice from and met separately with independent counsel. The independent trustees met with and interviewed officers of K2 Advisors and certain Sub-Advisors (including portfolio managers), the transfer agent and shareholder services group and the distributor. In approving the renewal of the investment management agreement and the sub-advisory agreements for the Fund, the Board, including the independent trustees, determined that the investment management fee structure was fair and reasonable and that continuance of the agreement was in the best interests of the Fund and its shareholders.
In making the foregoing approvals, the Board considered various materials related to the investment management agreement and the sub-advisory agreements including: (1) a copy of the investment management agreement and sub-advisory agreements; (2) information describing the nature, quality and extent of services that K2 Advisors and each Sub-Advisor provided, and is expected to provide, to the Fund, and the investment management fees and sub-advisory fees payable to K2 Advisors and each Sub-Advisor; (3) reports from K2 Advisors on the
continued diligence conducted on each Sub-Advisor and the reasons for recommending renewal of each of the sub-advisory agreements, including, but not limited to, each Sub-Advisor’s background, experience, personnel, operations, policies, procedures and compliance functions; and (4) a report from the Fund’s Chief Compliance Officer regarding K2 Advisors’ and each Sub-Advisor’s compliance program and capabilities, including policies and procedures in place to address potential conflicts of interest, and the diligence undertaken by the Fund’s Chief Compliance Officer with respect thereto. The Board also noted that they received an annual report on all marketing support payments made by Franklin Templeton Investments (FTI) to financial intermediaries, as well as a memorandum relating to third-party servicing arrangements in response to a Guidance Update from the U.S. Securities and Exchange Commission (SEC) relating to mutual fund distribution and sub accounting fees.
The Board also took into account information furnished throughout the year at regular Board meetings, as well as information specifically requested and furnished for the renewal process, which culminated in the meetings referred to above for the specific purpose of considering such agreements. Information furnished throughout the year included, among others, reports on the Fund’s investment performance, expenses, portfolio composition, derivatives, asset segregation, portfolio turnover, Rule 12b-1 plans, distribution, shareholder servicing, legal and compliance matters, pricing of securities and sales and redemptions, and marketing support payments made to financial intermediaries, as well as a third-party survey of transfer agent fees charged funds within the FTI complex in comparison with those charged other fund complexes deemed comparable. Also, related financial statements and other information about the scope and quality of services provided by K2 Advisors and its affiliates and enhancements to such services over the past year were provided. In addition, the trustees received periodic reports throughout the year and during the renewal process relating to compliance with the Fund’s investment policies and restrictions. During the renewal process, the independent trustees considered K2 Advisors’ methods of operation within the Franklin Templeton group and its activities on behalf of other clients.
The information obtained by the trustees during the renewal process also included a special report prepared by Broadridge Financial Solutions, Inc. (Broadridge), an independent third-party analyst, comparing the Fund’s investment performance and expenses with those of other mutual funds deemed comparable to such Fund as selected by Broadridge (Broadridge
102 Annual Report
franklintempleton.com
F R A N K L I N A L T E R N A T I V E S T R A T E G I E S F U N D S
F R A N K L I N K 2 A L T E R N A T I V E S T R A T E G I E S F U N D
S H A R E H O L D E R I N F O R M A T I O N
Section 15(c) Report). The trustees reviewed this information and its usefulness in the renewal process with respect to matters such as comparative fees, expenses, expense ratios and performance. The Board considered K2 Advisors views that the peer group determined by Broadridge for comparison purposes may not be an entirely appropriate representation of the Fund s peer universe. K2 Advisors explained that the universe of funds that are managed using multi-manager, multi-strategy structures, like the Fund, is still evolving, and has presented challenges in identifying an appropriate set of peers for the Fund. It was noted by K2 Advisors that the peer group compiled by Broadridge includes several single-manager funds which, due to their nature and relative simplicity, have lower expense ratios and are not very useful for comparison purposes. In addition, many of the sponsors of funds with multi-manager strategies that K2 Advisors considers to be peers were excluded from the peer group and K2 Advisors believes that the Fund s expenses are consistent with those funds. It was noted that as more funds are launched that are managed similarly to the Fund, the peer group likely will become larger, and may also be sub-divided so that a peer group is available that is comprised of funds that provide a more meaningful comparison. While noting the limitations of the Broadridge Section 15(c) Report, the Board concluded that the Broadridge Section 15(c) Report was helpful in the performance of its duties.
In addition, the trustees received a Profitability Study (Profitability Study) prepared by management discussing the profitability to FTI from its overall U.S. Fund operations, as well as on an individual fund-by-fund basis. Over the past year, the Board and counsel to the independent trustees continued to receive reports on management s handling of recent regulatory inquiries and pending legal actions against K2 Advisors and its affiliates. The independent trustees were satisfied with the actions taken to date by management in response to such regulatory and legal matters. The independent trustees also received reports from the Trust s Chief Compliance Officer on regulatory inquiries and pending legal actions against the Sub-Advisors applicable to the services provided by the Sub-Advisors to the Fund and noted that there were not any issues in this regard that should prevent the renewal of the sub-advisory agreements.
The trustees reviewed the personnel, operations, financial condition, and investment management capabilities, methodologies and resources of K2 Advisors and each Sub-Advisor, including each management team s expertise in the management of other alternative strategies funds. As part of this review, particular attention was given to (1) the diligent risk management program
of K2 Advisors and its parent, including those aspects of the program related to selecting and overseeing sub-advisors to the Fund and continual monitoring and management of counter-party credit risk and collateral, (2) each Sub-Advisor s risk management program, and (3) derivatives and other complex instruments that are held and expected to be held by the Fund and how such instruments are used to carry out the Fund s investment objectives.
The Board also took into account, among other things, manage-ment s efforts in establishing a global credit facility for the benefit of the Fund and other accounts managed by FTI to provide a source of cash for temporary and emergency purposes or to meet unusual redemption requests as well as the strong financial position of K2 Advisors parent company and its commitment to the mutual fund business. In addition, the Board received updates from management on the SEC s progress in implementing the rule-making requirements established by the Dodd-Frank Wall Street Reform and Consumer Protection Act (Dodd-Frank Act), which was enacted July 21, 2010, and K2 Advisors and its affiliates compliance with rules and regulations already promulgated by the SEC under such act.
In addition to the above and other matters considered by the trustees throughout the course of the year, the following sets forth some of the primary information and factors relevant to the Board s decisions. This discussion of the information and factors considered by the Board (including the information and factors discussed above) is not intended to be exhaustive, but rather summarizes certain factors considered by the Board. In view of the wide variety of factors considered, the Board did not, unless otherwise noted, find it practicable to quantify or otherwise assign relative weights to the foregoing factors. In addition, individual trustees may have assigned different weights to various factors.
NATURE, EXTENT AND QUALITY OF SERVICES. The trustees reviewed the nature, extent and quality of the services provided, and to be provided, by K2 Advisors and each Sub-Advisor. In this regard, they reviewed the Fund s investment goal and K2 Advisors and each Sub-Advisor s investment strategy and sub-strategy, and K2 Advisors and each Sub-Advisor s ability to implement such investment strategy and/or sub-strategy, including, but not limited to, K2 Advisors and each Sub-Advisor s trading practices, investment decision processes and reputation.
The Board noted that the Fund employs a manager of manag-ers structure, whereby K2 Advisors is responsible for selecting sub-advisors (subject to Board approval), allocating the Fund s
F R A N K L I N A L T E R N A T I V E S T R A T E G I E S F U N D S
F R A N K L I N K 2 A L T E R N A T I V E S T R A T E G I E S F U N D
S H A R E H O L D E R I N F O R M A T I O N |
assets among them, and overseeing the sub-advisors day-today management of the Fund s assets. The Board noted the responsibilities that K2 Advisors has as the Fund s investment manager, including (1) due diligence on the Sub-Advisors and any potential new sub-advisors to the Fund, their respective trading strategies, risk management, operations and businesses, (2) on-going oversight and monitoring of the day-to-day investment activities of Sub-Advisors and other service providers, including their respective compliance with the investment mandate and restrictions, compliance policies and procedures and federal securities laws, and K2 Advisors ongoing assessment of their performance, (3) portfolio construction with respect to the allocation of assets among Sub-Advisors, investment funds, cash and other investments, (4) risk management, (5) preparing quarterly reports to the Board, and (6) the implementation of Board directives as they relate to the Fund. The Trustees also considered the successful performance of K2 Advisors in managing the Fund and other investment products with similar investment strategies to the investment strategies of the Fund that are not subject to the Investment Company Act of 1940, as amended.
With respect to the sub-advisory services provided, and to be provided, by each Sub-Advisor, the Board noted the responsibilities that each Sub-Advisor has with respect to the portion of the Fund s assets allocated to the Sub-Advisor by K2 Advisors (Sub-Advised Portion), including, among others, implementing the investment strategies with respect to the Sub-Advised Portion and ensuring compliance with the investment strategies, policies and limitations of the Sub-Advised Portion. The trustees considered the successful performance of each Sub-Advisor in managing the Fund and other investment products with similar investment strategies to the investment strategies of its Sub-Advised Portion of the Fund, including, with respect to certain Sub-Advisors, mutual funds with similar investment strategies. The Board considered K2 Advisors rationale for recommending the continued retention of each Sub-Advisor.
The trustees reviewed the Fund s portfolio management teams at K2 Advisors and each Sub-Advisor, including each such team s performance, staffing, skills and compensation program. With respect to portfolio manager compensation, management assured the trustees that the Fund s long-term performance is a significant component of incentive-based compensation for K2 Advisors portfolio management team and noted that a portion of a K2 Advisors portfolio manager s incentive-based compensation is paid in shares of predesignated funds from the portfolio manager s fund management area. The trustees noted
that the portfolio manager compensation program aligned the interests of the portfolio managers with that of Fund shareholders. During regular Board meetings and the aforementioned meetings of the independent trustees, the trustees considered periodic reports provided to them showing that K2 Advisors and the Sub-Advisors complied with the investment policies and restrictions of the Fund as well as other reports periodically furnished to the Board covering matters such as the compliance of portfolio managers and other management personnel with the code of ethics covering the investment management personnel, the adherence to fair value pricing procedures established by the Board and the accuracy of net asset value calculations. The Board noted the extent of the benefits provided to Fund shareholders from being part of the Franklin Templeton group, including the right to exchange investments between funds (same class) without a sales charge, the ability to reinvest Fund dividends into other funds and the right to combine holdings of other funds to obtain reduced sales charges.
The trustees considered various other products, portfolios and entities that are advised by K2 Advisors and each Sub-Advisor and the allocation of assets and expenses among and within them, as well as their relative fees and reasons for differences with respect thereto and any potential conflicts.
The Board also considered a report from the Trust s Chief Compliance Officer regarding K2 Advisors and each Sub-Advisor s compliance programs and capabilities as such programs and capabilities relate to the operations of the Fund and the monitoring and testing of such program undertaken by the Trust s Chief Compliance Officer. The Board considered the selection and due diligence process employed by K2 Advisors in selecting and deciding to retain each Sub-Advisor as a sub-advisor to the Fund, including the due diligence undertaken with respect to the Sub-Advisor s compliance and risk management capabilities. The trustees considered K2 Advisors significant efforts in developing and implementing compliance procedures established in accordance with Securities and Exchange Commission and other requirements.
The Board also considered the nature, extent and quality of the services to be provided under the Fund s other service agreements to determine that, on an overall basis, Fund shareholders were well served. In this connection, the Board also took into account transfer agent and shareholder services provided to Fund shareholders by an affiliate of K2 Advisors, noting continuing expenditures by management to increase and improve the scope of such services and favorable periodic reports on shareholder services conducted by independent third
F R A N K L I N A L T E R N A T I V E S T R A T E G I E S F U N D S
F R A N K L I N K 2 A L T E R N A T I V E S T R A T E G I E S F U N D
S H A R E H O L D E R I N F O R M A T I O N
parties. While such considerations directly affected the trustees decision in renewing the Fund s transfer agent and shareholder services agreement, the Board also considered these commitments as incidental benefits to Fund shareholders deriving from the investment management relationship.
Based on their review, the trustees were satisfied with the nature and quality of the overall services provided, and to be provided, by K2 Advisors and its affiliates and each Sub-Advisor to the Fund and its shareholders and were confident in the abilities of K2 Advisors and each Sub-Advisor to implement their respective investment strategy and/or sub-strategy and to provide quality services to the Fund and its shareholders.
INVESTMENT PERFORMANCE. As the Fund commenced operations in October 2013, the trustees reviewed the investment performance of the Fund and each Sub-Advisor for the one- and two-year periods ended December 31, 2015. As part of their review, they inquired of management regarding benchmark and hedging activities. Consideration was also given to performance in the context of available levels of cash, including as affected by net flows, during the periods. The trustees had meetings during the year, including the meetings referred to above held in connection with the renewal process, with the Fund s portfolio managers to discuss performance and the management of the Fund and each Sub-Advisor.
In addition, attention in assessing performance was given to the Broadridge Section 15(c) Report. That report showed the investment performance of the Fund (Class A shares) in comparison to other funds determined comparable by Broad-ridge. The comparable funds to the Fund, as chosen by Broadridge, included a representative class/fund from each retail portfolio in the alternative multi-strategy classification, excluding outliers. The Fund had total returns in the second-best performing quintile for the one-year period ended December 31, 2015 and total returns in the best performing quintile for the two-year period ended December 31, 2015. The Board was satisfied with such performance.
The trustees also compared Fund performance to other industry benchmarks, including measures of risk-adjusted performance of a fund, as part of their evaluation of investment performance. The trustees concluded that the Fund had performed well in comparison to its various benchmarks and in the context of the Fund s objectives.
COMPARATIVE EXPENSES AND PROFITABILITY.
The Board considered the cost of the services provided, and to be provided, by K2 Advisors and each Sub-Advisor and the
profits realized by K2 Advisors and its affiliates from their rela -tionships with the Fund. In considering the appropriateness of the management fee and other expenses charged to the Fund, the Board took into account various factors including investment performance and matters relating to Fund operations, including, but not limited to, the quality and experience of K2 Advisors personnel. The Board also reviewed and considered the investment management fees in light of the nature, extent and quality of the investment management services provided, and to be provided, by K2 Advisors and each Sub-Advisor, as more fully discussed above. The Board noted that the sub-advisory fees are paid by K2 Advisors to each Sub-Advisor and are not additional fees borne by the Fund. The Board also noted that the sub-advisory fees paid, and to be paid, by K2 Advisors to each Sub-Advisor were the product of arms-length negotiations between K2 Advisors and each Sub-Advisor. Furthermore, the Board took into account that information regarding Sub-Advisor profitability is not legally required to be provided and noted that, despite requests by K2 Advisors of such information, the Sub-Advisors had not provided profitability information. Accordingly, profitability information of the sub-advisors was given lesser weight than other factors. In addition, the Board considered the allocation of the investment management fee charged to the Fund between K2 Advisors and each Sub-Advisor in light of the nature, extent and quality of the investment management services provided, and to be provided, by K2 Advisors and each Sub-Advisor. As part of this discussion, the Board took into account the fee waiver and expense limitation arrangement in effect, and the amount of Fund expenses that were absorbed since inception of the Fund by K2 Advisors through such waivers and arrangements.
Consideration was also given to a comparative analysis in the Broadridge Section 15(c) Report of the investment management fee and total expense ratio of the Fund in comparison with those of a group of other funds selected by Broadridge as its appropriate Broadridge expense group. Broadridge expense data is based upon information taken from the Fund s most recent annual report, which reflects historical asset levels that may be quite different from those currently existing, particularly in a period of market volatility.
In reviewing comparative costs, emphasis was given to the Fund s contractual management fee in comparison with the contractual management fee that would have been charged by other funds within its Broadridge expense group assuming they were similar in size to the Fund, as well as the actual total expenses of the Fund in comparison with those of its Broad-ridge expense group. The Broadridge contractual management
F R A N K L I N A L T E R N A T I V E S T R A T E G I E S F U N D S
F R A N K L I N K 2 A L T E R N A T I V E S T R A T E G I E S F U N D
S H A R E H O L D E R I N F O R M A T I O N |
fee analysis includes administrative charges as being part of the management fee, and total expenses, for comparative consistency, are shown by Broadridge for Fund Class A shares. The Fund s contractual management fee rate was in the most expensive quintile of its Broadridge expense group and its total expenses were in the middle quintile of such group. Noting the factors and limitations noted above with respect to the Broad-ridge Section 15(c) Report and factors relating to the Fund s operations, such as the quality and experience of K2 Advisors and the Sub-Advisors and the nature and quality of the services provided and to be provided by K2 Advisors and the Sub-Advisors, the Board found such comparative fees and expenses to be acceptable.
The trustees also reviewed the Profitability Study addressing profitability of Franklin Resources, Inc., from its overall U.S. fund business, as well as profitability to K2 Advisors and its affiliates, from providing investment management and other services to the Fund during the 12-month period ended September 30, 2015, the most recent fiscal year-end of Franklin Resources, Inc. The trustees reviewed the basis on which such reports are prepared and the cost allocation methodology utilized in the Profitability Study, it being recognized that allocation methodologies may each be reasonable while producing different results. In this respect, the Board noted that the reasonableness of the cost allocation methodologies was reviewed by independent accountants on an every other year basis.
The independent trustees met with management to discuss the Profitability Study. This included, among other things, a comparison of investment management income with investment management expenses of the Fund; comparison of underwriting revenues and expenses; the relative relationship of investment management and underwriting expenses; shareholder servicing profitability; economies of scale; and the relative contribution of the Fund to the profitability of K2 Advisors and its parent. In discussing the Profitability Study with the Board, K2 Advisors stated its belief that the costs incurred in establishing the infrastructure necessary to operate the type of mutual fund
operations conducted by it and its affiliates may not be fully reflected in the expenses allocated to the Fund in determining its profitability.
The Board also took into account management s expenditures in improving shareholder services provided to the Fund, as well as the need to meet additional regulatory and compliance requirements resulting from the Sarbanes-Oxley Act, the Dodd-Frank Act and recent SEC and other regulatory requirements. The trustees also considered the extent to which K2 Advisors and the Sub-Advisors may derive ancillary benefits from Fund operations, including those derived from the allocation of Fund brokerage and the use of commission dollars to pay for research and other similar services.
Based upon their consideration of all these factors, the trustees determined that the level of profits realized by K2 Advisors and its affiliates in providing services to the Fund was not excessive in view of the nature, quality and extent of services provided. In addition, the Board noted that shareholders are able to redeem their Fund shares at any time if shareholders believe that Fund fees and expenses are too high or if they are dissatisfied with the performance of the Fund.
ECONOMIES OF SCALE. The Board considered economies of scale realized by K2 Advisors and its affiliates and the Sub-Advisors as the Fund grows larger and the extent to which they are shared with Fund shareholders, as for example, in the level of the investment management fees charged, in the quality and efficiency of services rendered and in increased capital commitments benefiting the Fund directly or indirectly. The Board also considered the fee waiver and expense limitation arrangement in effect, and the amount of Fund expenses that were absorbed since inception of the Fund by K2 Advisors through such waiver and arrangement. The Board concluded that economies of scale were deemed not to be a significant factor at that time in light of, among other matters, the fee waiver and expense limitation arrangement in effect and the fact that the Fund had less than three complete years of operating results.
F R A N K L I N A L T E R N A T I V E S T R A T E G I E S F U N D S
F R A N K L I N K 2 A L T E R N A T I V E S T R A T E G I E S F U N D
S H A R E H O L D E R I N F O R M A T I O N
Proxy Voting Policies and Procedures
The Fund s investment manager has established Proxy Voting Policies and Procedures (Policies) that the Fund uses to determine how to vote proxies relating to portfolio securities. Shareholders may view the Fund s complete Policies online at franklintempleton.com. Alternatively, shareholders may request copies of the Policies free of charge by calling the Proxy Group collect at (954) 527-7678 or by sending a written request to: Franklin Templeton Companies, LLC, 300 S.E. 2nd Street, Fort Lauderdale, FL 33301, Attention: Proxy Group. Copies of the Fund s proxy voting records are also made available online at franklintempleton.com and posted on the U.S. Securities and Exchange Commission s website at sec.gov and reflect the most recent 12-month period ended June 30.
Quarterly Statement of Investments
The Trust, on behalf of the Fund, files a complete statement of investments with the U.S. Securities and Exchange Commission for the first and third quarters for each fiscal year on Form N-Q. Shareholders may view the filed Form N-Q by visiting the Commission s website at sec.gov. The filed form may also be viewed and copied at the Commission s Public Reference Room in Washington, DC. Information regarding the operations of the Public Reference Room may be obtained by calling (800) SEC-0330.
Householding of Reports and Prospectuses
You will receive the Fund s financial reports every six months as well as an annual updated summary prospectus (prospectus available upon request). To reduce Fund expenses, we try to identify related shareholders in a household and send only one copy of the financial reports and summary prospectus. This process, called householding, will continue indefinitely unless you instruct us otherwise. If you prefer not to have these documents householded, please call us at (800) 632-2301. At any time you may view current prospectuses/summary prospectuses and financial reports on our website. If you choose, you may receive these documents through electronic delivery.
This page intentionally left blank

Annual Report and Shareholder Letter
Franklin K2 Alternative Strategies Fund
Investment Manager
K2/D&S Management Co., L.L.C.
Distributor
Franklin Templeton Distributors, Inc.
(800) DIAL BEN® / 342-5236
franklintempleton.com
Shareholder Services
(800) 632-2301
Authorized for distribution only when accompanied or preceded by a summary prospectus and/or prospectus. Investors should carefully consider a fund’s investment goals, risks, charges and expenses before investing. A prospectus contains this and other information; please read it carefully before investing.
To help ensure we provide you with quality service, all calls to and from our service areas are monitored and/or recorded.
| |
| © 2016 Franklin Templeton Investments. All rights reserved. | 068 A 07/16 |

Annual Report
and Shareholder Letter
May 31, 2016
Franklin K2 Long Short Credit Fund
A SERIES OF FRANKLIN ALTERNATIVE STRATEGIES FUNDS

Sign up for electronic delivery at franklintempleton.com/edelivery
.
| |
| Contents | |
| Annual Report | |
| Franklin K2 Long Short Credit Fund | 3 |
| Performance Summary | 7 |
| Your Fund’s Expenses | 12 |
| Financial Highlights and Statement of Investments | 14 |
| Financial Statements | 29 |
| Notes to Financial Statements | 33 |
| Report of Independent Registered | |
| Public Accounting Firm | 46 |
| Tax Information | 47 |
| Board Members and Officers | 48 |
| Shareholder Information | 53 |
2
franklintempleton.com
Annual Report
Franklin K2 Long Short Credit Fund
We are pleased to bring you Franklin K2 Long Short Credit Fund’s annual report for the period since the Fund’s inception on September 8, 2015, through May 31, 2016.
Your Fund’s Goal and Main Investments
The Fund seeks total return over a complete market cycle through a combination of current income, capital preservation and capital appreciation. The Fund seeks to achieve its investment goal by allocating its assets across multiple non-traditional or “alternative” strategies, including but not limited to credit long short, structured credit and emerging market credit. The Fund is structured as a multi-manager fund, meaning the Fund’s assets are managed by multiple investment advisors (subadvisors), while the Fund’s investment manager has overall responsibility for the Fund’s investments.
Under normal market conditions, the Fund invests at least 80% of its net assets, plus the amount of any borrowings for investment purposes, in credit-related investments. The Fund invests in a wide range of securities and other investments including, but not limited to: corporate bonds, mortgage-backed securities and asset-backed securities, U.S. government and agency securities, collateralized debt and loan obligations, foreign government and supranational debt securities, loans and loan participations and derivatives with similar economic characteristics. The Fund may also invest in mortgage dollar rolls, repurchase agreements, reverse repurchase agreements, mortgage real estate investment trusts (REITs) and other similar transactions.
Performance Overview
The Fund’s Class A shares posted a +2.99% cumulative total return for period since the Fund’s inception on September 8, 2015, through May 31, 2016. For comparison, the Fund’s primary benchmark, the BofA Merrill Lynch 3-Month U.S. Treasury Bill Index, which is an index of short-term U.S. government securities with a remaining term to final maturity of less than three months, produced a +0.15% total return for the same period.1 Also for comparison, the Fund’s secondary benchmark, the HFRX Fixed Income-Credit Index, which
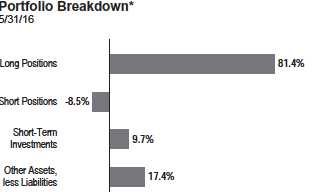
*Figures reflect certain derivatives held in the portfolio (or their underlying reference assets) and may not total 100% or may be negative due to rounding, use of any derivatives, unsettled trades or other factors.
measures performance of strategies with exposure to credit across a broad continuum of credit substrategies, had a -3.42% total return for the same period.2 You can find more of the Fund’s performance data in the Performance Summary beginning on page 7.
Performance data represent past performance, which does not guarantee future results. Investment return and principal value will fluctuate, and you may have a gain or loss when you sell your shares. Current performance may differ from figures shown. For most recent month-end performance, go to franklintempleton.com or call (800) 342-5236.
Economic and Market Overview
The global economy expanded moderately during the period under review. Concerns about global economic growth, China’s slowing economy and tumbling stock market, declining commodity prices, geopolitical tensions in several regions, fear of the U.K.’s potential exit from the European Union (commonly referred to as Brexit) and uncertainty about the U.S. Federal Reserve’s (Fed’s) timing for raising interest rates contributed to stock market volatility. However, toward period-end, equity markets strengthened after the Fed’s decision to leave its federal funds target rate unchanged after raising it for the first time in nine years in December. Further helping
1. Source: Morningstar.
2. Source: FactSet. Hedge Fund Research, Inc. – www.hedgefundresearch.com. The HFRX Fixed Income-Credit Index is being used under license from Hedge Fund
Research, Inc., which does not endorse or approve of any of the contents of this report.
The indexes are unmanaged and include reinvestment of any income or distributions. They do not reflect any fees, expenses or sales charges. One cannot invest directly in an
index, and an index is not representative of the Fund’s portfolio.
See www.franklintempletondatasources.com for additional data provider information.
The dollar value, number of shares or principal amount, and names of all portfolio holdings are listed in the Fund’s Statement of Investments (SOI). The SOI
begins on page 19.
franklintempleton.com
Annual Report
3
FRANKLIN K2 LONG SHORT CREDIT FUND
global stocks were the Bank of Japan’s (BOJ’s) decision to cut interest rates, hopes of additional stimulus measures by global central banks, and finalization of a new debt deal for Greece. An improvement in metal prices and signs of stabilization in crude oil prices also improved investor sentiment. During much of the reporting period, oil prices declined, largely due to strong global supply, but lower output expectations resulted in a small gain by period-end. Prices of many other commodities also fell for much of the period but partially recovered toward period-end.
U.S. economic growth moderated in the third and fourth quarters of 2015. Growth slowed further in 2016’s first quarter as non-residential investments, private inventory investments and federal government spending declined, although the impact was partially offset by healthy consumer spending. After maintaining a near-zero interest rate for seven years to support the U.S. economy’s recovery, the Fed raised its target range for the federal funds rate to 0.25%–0.50% at its December meeting but kept interest rates unchanged through period-end. At its April meeting, the Fed indicated that its monetary policy remained accommodative, thus supporting further labor market improvement and progress toward its 2.0% inflation objective.
In Europe, U.K. economic growth moderated in 2016’s first quarter as production, construction and agriculture slowed, while services continued to grow. In the eurozone, stocks declined mainly due to China’s moderating economy, geopolitical tensions between Russia and Turkey, weak trade data and Brexit fears toward period-end. However, the region generally benefited during the period from lower oil prices, a weaker euro that supported exports, the European Central Bank’s (ECB’s) ongoing accommodative policy and Greece’s debt deal settlement. Also boosting investor sentiments were comments by the ECB in May about its work on new proposals for dealing with non-performing loans. The eurozone’s annual inflation rate rose for much of the period but declined in the second half.
Japan’s economy contracted in 2015’s fourth quarter as private consumption and housing investment declined. However, the economy grew in 2016’s first quarter as government and private consumption rebounded. The BOJ took several actions during the period, including lowering its inflation forecasts and reorganizing its stimulus program to increase exposure to long-term government bonds and exchange-traded funds. In January, the BOJ introduced a negative interest rate on excess reserves kept by financial institutions with the central bank in an effort to boost lending and support inflation. However, toward the period-end, it decided against further stimulus measures and kept interest rates unchanged. In April, the BOJ further reduced its gross domestic product and inflation forecasts for fiscal year 2016.
In emerging markets, economic growth generally moderated while retreating in some countries. China’s economy grew in
the fourth quarter of 2015 and the first quarter of 2016 at an annual rate that was largely in line with the government’s target. Russia’s 2015 economic growth contracted because of declining oil prices and a weakening Russian ruble. Brazil’s economy shrank during the reporting period amid lower oil prices, weakness in the mining and services sectors, and the country’s ongoing political turmoil, including the temporary suspension of its president in May pending an impeachment trial. The People’s Bank of China cut its benchmark interest rate and the cash reserve requirement ratio for the country’s banks and lowered its currency valuation in May to the lowest level since March 2011. Elsewhere, the Reserve Bank of India slashed interest rates to the lowest in five years and took steps to increase monetary liquidity. In the recent global environment, emerging market stocks overall, as measured by the MSCI Emerging Markets Index, were relatively flat over the reporting period.
Investment Strategy
We manage the Fund using a multi-manager approach. While we are responsible for the Fund’s overall investments, we allocate assets to multiple subadvisors, each of whom independently manages a separate portion of the Fund’s portfolio in accordance with some or all of the following strategies: credit long short, structured credit and emerging market credit. We allocate the Fund’s assets among these strategies utilizing a top-down approach, generating the Fund’s strategy weightings by taking into account market conditions, risk factors, diversification, liquidity, transparency, and availability of various subadvisors and other investment options, among other things.
Credit long short strategies seek to isolate issuer-specific exposure, while limiting general market risks, by taking long and/or short positions in debt securities and other related instruments. Structured credit strategies aim to profit from trading in interest-rate sensitive securities such as residential and commercial mortgage-backed securities, credit default swaps on various indexes, collateralized loan obligations and asset-backed securities. Emerging market credit strategies invest in corporate and sovereign securities in emerging markets countries with a focus on fixed income.
The Fund may take long and/or short positions in a wide range of asset classes, including credit, fixed income and currencies, among others. The Fund may gain long or short exposure to select instruments by utilizing derivatives, engaging in short sales or entering into a series of purchase and sale contracts or repurchase agreements. Long positions benefit from an increase in the price of the underlying instrument, while short positions benefit from a decrease in that price. The Fund may also use
4 Annual Report
franklintempleton.com
FRANKLIN K2 LONG SHORT CREDIT FUND
derivatives for hedging and nonhedging (investment) purposes. Such derivative investments may include currency forward contracts; futures contracts; put and call options on currencies, securities and indexes; and swaps. The Fund may engage in active and frequent trading as part of its investment strategies.
What is a currency forward contract?
A currency forward contract is an agreement between the Fund
and a counterparty to buy or sell a foreign currency in exchange
for another currency at a specific exchange rate on a future date.
What is a futures contract?
A futures contract is an agreement between the Fund and a
counterparty made through a U.S. or foreign futures exchange to
buy or sell an underlying instrument or asset at a specific price
on a future date.
What is an option?
An option is a contract to buy or sell a specific financial product
known as the option’s underlying instrument at a specific price.
The buyer of an option has the right, but not the obligation, to
buy or sell the underlying instrument at or until a specified
expiration date. Conversely, the seller (“writer”) of an option who
opens a transaction is obligated to buy or sell the underlying
instrument should the option holder exercise that right.
What are swap agreements?
Swap agreements, such as interest rate, currency and credit
default swaps, are contracts between the Fund and another
party (the swap counterparty). In a basic swap transaction, the
Fund agrees with the swap counterparty to exchange the returns
(or differentials in rates of return) earned or realized on a partic-
ular “notional amount” of underlying instruments. The notional
amount is the set amount selected by the parties as the basis on
which to calculate the obligations that they have agreed to
exchange. The parties typically do not actually exchange the
notional amount. Instead, they agree to exchange the returns
that would be earned or realized if the notional amount were
invested in given instruments or at given interest rates.
Manager’s Discussion
The Fund’s subadvisors for the review period covering September 8, 2015, to May 31, 2016, were Apollo Credit Management, Candlewood Investment Group, Chatham Asset Management, Ellington Global Asset Management and Emso Asset Management.
All three strategies—credit long short, emerging market credit and structured credit—generated positive absolute performance. On a subadvisor level, four of the five subadvisors contributed to absolute performance for the period. The only subadvisor with modest negative performance was Candlewood, in the structured credit strategy.
Subadvisors
5/31/16
Credit Long Short
Apollo Credit Management LLC Chatham Asset Management, LLC
Emerging Market Credit
Emso Asset Management Limited
Structured Credit
Candlewood Investment Group, L.P. Ellington Global Asset Management, L.L.C.
Apollo led subadvisor performance in the credit long short strategy as the subadvisor effectively managed long and short exposures during a volatile period in the credit markets. Contributors were widespread across long and short positions in consumer cyclical, consumer non-cyclical, industrial and communications issuers. Investments in technology and energy also benefited returns, while utilities had a minor negative impact on performance. A short position in a communication services provider was a key contributor. In late 2015, the company’s pending acquisition by a European telecommunications firm caused the existing bonds to trade down as investors worried that the company’s bond offering to finance the transaction would add a significant amount of leverage to the capital structure. The subadvisor later purchased the new bond issue related to the acquisition and sold it into the secondary market for a gain. On the other hand, a long convertible bond position in a real estate developer declined in February as the subadvisor noted investors seemed to be broadly negative about the real estate sector. Although the position detracted from returns, the company completed an unsecured deal in March to refinance some of the front-end bonds.
Chatham, the other subadvisor in the long short strategy, provided modest positive returns as strong gains between mid-February and May 2016 (when high yield bonds rallied) were offset by losses earlier in the period. A long position in a U.S. magazine publisher contributed to performance as the company announced strong results from some of its subsidiaries. The company also successfully exchanged lien notes in the review period. In early 2016, a short-term trading position in a high yield exchange-traded index benefited performance. Also contributing to returns was a long position in a gaming company, as the company’s high yield bonds rallied in March. A short position in a petroleum company’s high yield securities also strengthened results, particularly in early 2016, as the energy sector faced volatility and pessimism. In January, returns were curbed by a security from a natural gas pipeline company amid sector pessimism. S&P Index options also detracted from performance as a robust market rally began in mid-February.
franklintempleton.com
Annual Report 5
FRANKLIN K2 LONG SHORT CREDIT FUND
Both structured credit subadvisors enjoyed solid performance near period-end, and overall for the period, healthy performance for Ellington more than offset a modest decline for Candlewood.
The structured credit market was muted during the period, but subadvisors were able to benefit from carry, or yield, from the mortgage-backed securities in their portfolios. Ellington also enjoyed a large price gain in one of their residential mortgage-backed security (RMBS) positions, which they exited. The subadvisor believed RMBS would enjoy lower volatility relative to high yield bonds and equities during periods of market unrest, and this thesis was rewarded during the review period. Conversely, detracting from performance were shorts in commercial mortgage backed index credit-default swaps and short exposure to the high yield bond credit index. The subadvisor remained defensively positioned, waiting for what the sub-advisor believes will be better entry points in the market.
For Candlewood, the other structured credit subadvisor, long positions in securitized bonds backed by private student loans and hedges in the high yield credit index weighed on returns, particularly in February. In contrast, mortgage-backed securities generally added value.
Emso was added to the Fund in late January, and credit securities rallied in emerging markets for much of the period between February and May. Argentinian sovereign government debt benefited returns as the country reached a resolution in February with holdout bondholders from the country’s 2001 bond default. Following the agreement, Argentina issued new government bonds across maturities, and investor appetite led to an over-subscribed bond auction. Likewise, Greek sovereign government debt contributed to gains as investors began to anticipate a favorable review with creditors. Near period-end, eurozone finance ministers and the International Monetary Fund reached an agreement that resulted in a new series of financial aid for Greece. In contrast, short exposure in the Chinese yuan relative to the U.S. dollar weighed on returns. A combination of U.S. dollar weakness and a generally stabilizing environment in China during the past few months provided a tailwind for the yuan. A short position in the euro also curbed returns as investors grew more skeptical of the Fed’s ability to raise interest rates in the near term.
Thank you for your participation in Franklin K2 Long Short Credit Fund. We look forward to continuing to serve your future investment needs.

Portfolio Management Team
The foregoing information reflects our analysis, opinions and portfolio holdings as of May 31, 2016, the end of the reporting period. The way we implement our main investment strategies and the resulting portfolio holdings may change depending on factors such as market and economic conditions. These opinions may not be relied upon as investment advice or an offer for a particular security. The information is not a complete analysis of every aspect of any market, country, industry, security or the Fund. Statements of fact are from sources considered reliable, but the investment manager makes no representation or warranty as to their completeness or accuracy. Although historical performance is no guarantee of future results, these insights may help you understand our investment management philosophy.
6 Annual Report
franklintempleton.com
FRANKLIN K2 LONG SHORT CREDIT FUND
Performance Summary as of May 31, 2016
Your dividend income will vary depending on dividends or interest paid by securities in the Fund’s portfolio, adjusted for operating expenses of each class. Capital gain distributions are net profits realized from the sale of portfolio securities. The performance table and graphs do not reflect any taxes that a shareholder would pay on Fund dividends, capital gain distributions, if any, or any realized gains on the sale of Fund shares. Total return reflects reinvestment of the Fund’s dividends and capital gain distributions, if any, and any unrealized gains or losses.
| | | | | | |
| Net Asset Value | | | | | | |
| |
| Share Class (Symbol) | | 5/31/16 | | 9/8/15 | | Change |
| A (FKLSX) | $ | 10.15 | $ | 10.00 | +$ | 0.15 |
| C (FKLCX) | $ | 10.07 | $ | 10.00 | +$ | 0.07 |
| R (FKLRX) | $ | 10.10 | $ | 10.00 | +$ | 0.10 |
| R6 (FKLQX) | $ | 10.15 | $ | 10.00 | +$ | 0.15 |
| Advisor (FKLZX) | $ | 10.15 | $ | 10.00 | +$ | 0.15 |
| |
| |
| Distributions1 (9/8/15–5/31/16) | | | | | | |
| |
| | | Dividend | | Short-Term | | |
| Share Class | | Income | | Capital Gain | | Total |
| A | $ | 0.0812 | $ | 0.0637 | $ | 0.1449 |
| C | $ | 0.0827 | $ | 0.0637 | $ | 0.1464 |
| R | $ | 0.0813 | $ | 0.0637 | $ | 0.1450 |
| R6 | $ | 0.0830 | $ | 0.0637 | $ | 0.1467 |
| Advisor | $ | 0.0813 | $ | 0.0637 | $ | 0.1450 |
See page 11 for Performance Summary footnotes.
franklintempleton.com
Annual Report
7
|
| F R A N K L I N K 2 L O N G S H O R T C R E D I T F U N D |
| P E R F O R M A N C E S U M M A R Y |
Performance as of 5/31/162
Cumulative total return excludes sales charges. Average annual total returns and value of $10,000 investment include maximum
sales charges. Class A: 5.75% maximum initial sales charge; Class C: 1% contingent deferred sales charge in first year only;
Class R/R6/Advisor Class: no sales charges.
| | | | | | | | | | | | |
| | | | | | | | Average Annual | | | | | |
| | Cumulative | | Average Annual | | | Value of $10,000 | Total Return | | Total Annual Operating Expenses7 | |
| Share Class | Total Return3 | | Total Return4 | | | Investment5 | (6/30/16 | )6 | (with waiver) | | (without waiver) | |
| |
| A | | | | | | | | | 2.72 | % | 3.80 | % |
| Since Inception (9/8/15) | +2.99 | % | -2.93 | % | $ | 9,707 | -1.88 | % | | | | |
| |
| C | | | | | | | | | 3.47 | % | 4.55 | % |
| Since Inception (9/8/15) | +2.20 | % | +1.20 | % | $ | 10,120 | +2.21 | % | | | | |
| |
| R | | | | | | | | | 2.97 | % | 4.05 | % |
| Since Inception (9/8/15) | +2.48 | % | +2.48 | % | $ | 10,248 | +3.50 | % | | | | |
| |
| R6 | | | | | | | | | 2.41 | % | 3.49 | % |
| Since Inception (9/8/15) | +3.01 | % | +3.01 | % | $ | 10,301 | +4.12 | % | | | | |
| |
| Advisor | | | | | | | | | 2.47 | % | 3.55 | % |
| Since Inception (9/8/15) | +2.99 | % | +2.99 | % | $ | 10,299 | +4.10 | % | | | | |
Performance data represent past performance, which does not guarantee future results. Investment return and principal value will
fluctuate, and you may have a gain or loss when you sell your shares. Current performance may differ from figures shown. For
most recent month-end performance, go to franklintempleton.com or call (800) 342-5236.
See page 11 for Performance Summary footnotes.
8 Annual Report
franklintempleton.com
F R A N K L I N K 2 L O N G S H O R T C R E D I T F U N D
P E R F O R M A N C E S U M M A R Y |
Total Return Index Comparison for a Hypothetical $10,000 Investment 2
Total return represents the change in value of an investment over the periods shown. It includes any applicable maximum sales
charge, Fund expenses, account fees and reinvested distributions. The unmanaged indexes include reinvestment of any income or
distributions. These differ from the Fund in composition and do not pay management fees or expenses. One cannot invest directly in
an index. |
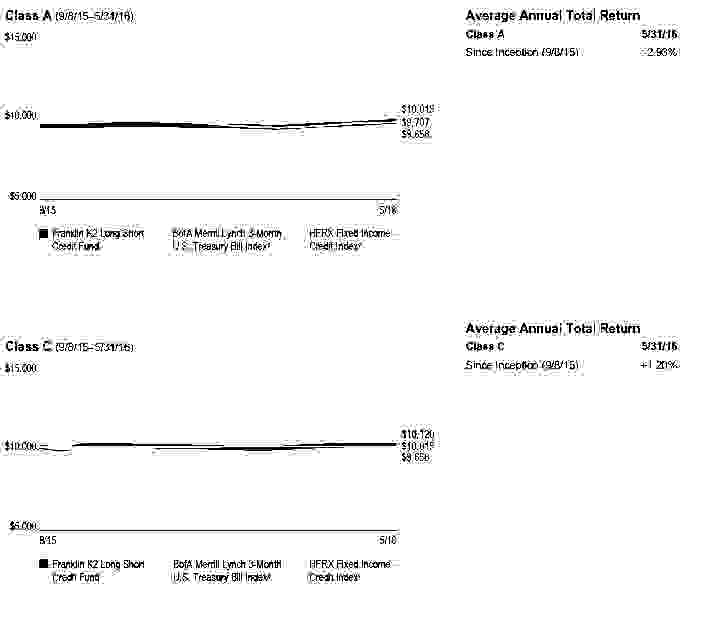
See page 11 for Performance Summary footnotes.
franklintempleton.com Annual Report 9 |
F R A N K L I N K 2 L O N G S H O R T C R E D I T F U N D
P E R F O R M A N C E S U M M A R Y |
Total Return Index Comparison for a Hypothetical $10,000 Investment 2 (continued)
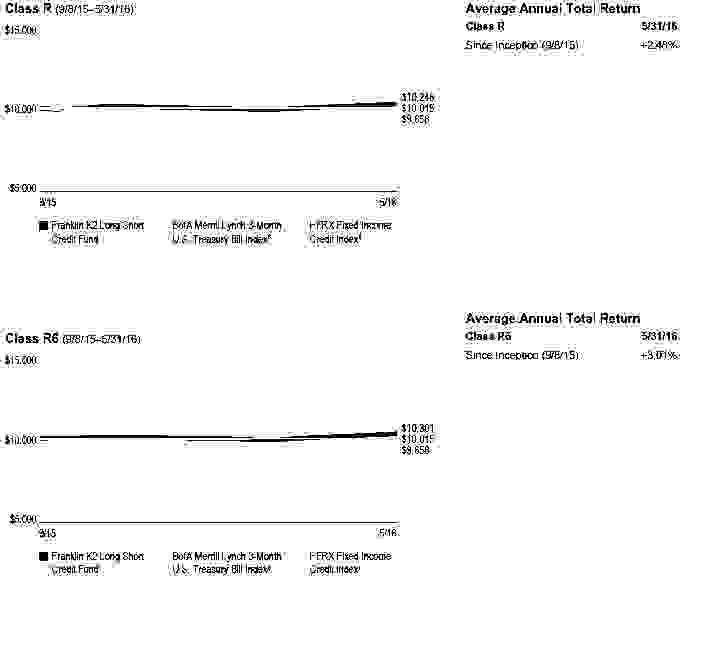
See page 11 for Performance Summary footnotes.
10 Annual Report franklintempleton.com |
FRANKLIN K2 LONG SHORT CREDIT FUND
PERFORMANCE SUMMARY
| | | | |
| | Total Return Index Comparison for a Hypothetical $10,000 Investment2 (continued) | | |
| | Advisor Class (9/8/15–5/31/16) | Average Annual Total Return | | |
| $ | 15,000 | Advisor Class | 5/31/16 | |
| | | Since Inception (9/8/15) | +2.99 | % |

| | | | |
| $ | 5,000 | | | |
| | | 9/15 | | 5/16 |
| |
| | | Franklin K2 Long Short | BofA Merrill Lynch 3-Month | HFRX Fixed Income - |
| | | Credit Fund | U.S. Treasury Bill Index8 | Credit Index9 |
All investments involve risks, including possible loss of principal. The market values of securities owned by the Fund will go up or down, sometimes rapidly or unpredictably. The Fund’s performance depends on the manager’s skill in selecting, overseeing, and allocating Fund assets to the subadvisors. The Fund is actively managed and could experience losses if the manager’s and subadvisors’ judgment about particular Fund portfolio investments prove to be incorrect. Some subadvisors may have little or no experience managing the assets of a registered investment company. Bond prices generally move in the opposite direction of interest rates. Changes in the financial strength of a bond issuer or in a bond’s credit rating may affect its value. Lower rated or high yield debt securities (junk bonds) involve greater credit risk, including the possibility of default or bankruptcy. Liquidity risk exists when securities become more difficult to sell, or are unable to be sold, at the price at which they’ve been valued. Investments in derivatives involve costs and create economic leverage, which may result in significant volatility and cause the Fund to participate in losses (as well as gains) that significantly exceed the Fund’s initial investment. The Fund may make short sales of securities, which involves the risk that losses may exceed the original amount invested. The Fund’s prospectus also includes a description of the main investment risks.
| |
| Class C: | These shares have higher annual fees and expenses than Class A shares. |
| Class R: | Shares are available to certain eligible investors as described in the prospectus. These shares have higher annual fees and expenses than Class A shares. |
| Class R6: | Shares are available to certain eligible investors as described in the prospectus. |
| Advisor Class: | Shares are available to certain eligible investors as described in the prospectus. |
1. The distribution amount is the sum of the dividend payments to shareholders for the period shown and includes only estimated tax-basis net investment income
and capital gain.
2. The Fund has an expense reduction contractually guaranteed through at least 9/30/16. The transfer agent has contractually agreed to waive or limit its transfer agency fees
for Class R6 shares of the Fund so that transfer agency fees for that class do not exceed 0.01% until 9/30/16. Fund investment results reflect the expense reduction and fee
cap, to the extent applicable; without these reductions, the results would have been lower.
3. Cumulative total return represents the change in value of an investment over the periods indicated.
4. Average annual total return represents the average annual change in value of an investment over the periods indicated. Return for less than one year, if any, has not
been annualized.
5. These figures represent the value of a hypothetical $10,000 investment in the Fund over the periods indicated.
6. In accordance with SEC rules, we provide standardized average annual total return information through the latest calendar quarter.
7. Figures are as stated in the Fund’s current prospectus and may differ from the expense ratios disclosed in the Financial Highlights in this report. In periods of market vola-
tility, assets may decline significantly, causing total annual Fund operating expenses to become higher than the figures shown.
8. Source: Morningstar. The BofA Merrill Lynch 3-Month U.S. T-Bill Index is an index of short-term U.S. government securities with a remaining term to final maturity of less
than three months.
9. Source: Factset. Hedge Fund Research, Inc. – www.hedgefundresearch.com. The HFRX Global Hedge Fund Index is being used under license from Hedge Fund
Research, Inc., which does not endorse or approve of any of the contents of this report. The HFRX Global Hedge Fund Index is designed to be representative of the overall
composition of the hedge fund universe. It is composed of all eligible hedge fund strategies, including but not limited to convertible arbitrage, distressed securities, equity
hedge, equity market neutral, event driven, macro, merger arbitrage and relative value arbitrage. The strategies are asset weighted based on the distribution of assets in the
hedge fund industry.
See www.franklintempletondatasources.com for additional data provider information.
franklintempleton.com
Annual Report
11
FRANKLIN K2 LONG SHORT CREDIT FUND
Your Fund’s Expenses
As a Fund shareholder, you can incur two types of costs:
- Transaction costs, including sales charges (loads) on Fund purchases; and
- Ongoing Fund costs, including management fees, distribution and service (12b-1) fees, and other Fund expenses. All mutual funds have ongoing costs, sometimes referred to as operating expenses.
The following table shows ongoing costs of investing in the Fund and can help you understand these costs and compare them with those of other mutual funds. The table assumes a $1,000 investment held for the six months indicated.
Actual Fund Expenses
The first line (Actual) for each share class listed in the table provides actual account values and expenses. The “Ending Account Value” is derived from the Fund’s actual return, which includes the effect of Fund expenses.
You can estimate the expenses you paid during the period by following these steps. Of course, your account value and expenses will differ from those in this illustration:
1. Divide your account value by $1,000.
If an account had an $8,600 value, then $8,600 ÷ $1,000 = 8.6.
2. Multiply the result by the number under the heading “Expenses Paid During Period.”
If Expenses Paid During Period were $7.50, then 8.6 × $7.50 = $64.50.
In this illustration, the estimated expenses paid this period are $64.50.
Hypothetical Example for Comparison with Other Funds
Information in the second line (Hypothetical) for each class in the table can help you compare ongoing costs of investing in the Fund with those of other mutual funds. This information may not be used to estimate the actual ending account balance or expenses you paid during the period. The hypothetical “Ending Account Value” is based on the actual expense ratio for each class and an assumed 5% annual rate of return before expenses, which does not represent the Fund’s actual return. The figure under the heading “Expenses Paid During Period” shows the hypothetical expenses your account would have incurred under this scenario. You can compare this figure with the 5% hypothetical examples that appear in shareholder reports of other funds.
Please note that expenses shown in the table are meant to highlight ongoing costs and do not reflect any transaction costs, such as sales charges. Therefore, the second line for each class is useful in comparing ongoing costs only, and will not help you compare total costs of owning different funds. In addition, if transaction costs were included, your total costs would have been higher. Please refer to the Fund prospectus for additional information on operating expenses.
12 Annual Report
franklintempleton.com
FRANKLIN K2 LONG SHORT CREDIT FUND
YOUR FUND’S EXPENSES
| | | | | | |
| | | Beginning Account | | Ending Account | | Expenses Paid During |
| Share Class | | Value 12/1/15 | | Value 5/31/16 | | Period* 12/1/15–5/31/16 |
| A | | | | | | |
| Actual | $ | 1,000 | $ | 1,021.70 | $ | 10.87 |
| Hypothetical (5% return before expenses) | $ | 1,000 | $ | 1,014.25 | $ | 10.83 |
| C | | | | | | |
| Actual | $ | 1,000 | $ | 1,015.90 | $ | 16.28 |
| Hypothetical (5% return before expenses) | $ | 1,000 | $ | 1,008.85 | $ | 16.22 |
| R | | | | | | |
| Actual | $ | 1,000 | $ | 1,017.70 | $ | 13.77 |
| Hypothetical (5% return before expenses) | $ | 1,000 | $ | 1,011.35 | $ | 13.73 |
| R6 | | | | | | |
| Actual | $ | 1,000 | $ | 1,021.90 | $ | 11.37 |
| Hypothetical (5% return before expenses) | $ | 1,000 | $ | 1,013.75 | $ | 11.33 |
| Advisor | | | | | | |
| Actual | $ | 1,000 | $ | 1,020.70 | $ | 11.27 |
| Hypothetical (5% return before expenses) | $ | 1,000 | $ | 1,013.85 | $ | 11.23 |
*Expenses are calculated using the most recent six-month expense ratio, net of expense waivers, annualized for each class (A: 2.15%;
C: 3.23%; R: 2.73%; R6: 2.25% and Advisor: 2.23%), multiplied by the average account value over the period, multiplied by 183/366 to reflect
the one-half year period for Hypothetical expenses.
franklintempleton.com
Annual Report
13
FRANKLIN ALTERNATIVE STRATEGIES FUNDS
| | | |
| Financial Highlights | | | |
| Franklin K2 Long Short Credit Fund | | | |
| | | Period Ended | |
| | | May 31, 2016a | |
| Class A | | | |
| Per share operating performance | | | |
| (for a share outstanding throughout the period) | | | |
| Net asset value, beginning of period | $ | 10.00 | |
| Income from investment operationsb: | | | |
| Net investment incomec | | 0.21 | |
| Net realized and unrealized gains (losses) | | 0.08 | |
| Total from investment operations | | 0.29 | |
| Less distributions from: | | | |
| Net investment income | | (0.08 | ) |
| Net realized gains | | (0.06 | ) |
| Total distributions | | (0.14 | ) |
| Net asset value, end of period | $ | 10.15 | |
| |
| Total returnd | | 2.99 | % |
| |
| Ratios to average net assetse | | | |
| Expenses before waiver, payments by affiliates and expense reductionf,g | | 3.37 | % |
| Expenses net of waiver, payments by affiliates and expense reductionf,h | | 2.30 | % |
| Expenses incurred in connection with securities sold short | | 0.40 | % |
| Net investment income | | 2.85 | % |
| |
| Supplemental data | | | |
| Net assets, end of period (000’s) | $ | 28,198 | |
| Portfolio turnover rate | | 511.62 | % |
aFor the period September 8, 2015 (commencement of operations) to May 31, 2016.
bThe amount shown for a share outstanding throughout the period may not correlate with the Statement of Operations for the period due to the timing of sales and repurchases
of Fund’s shares in relation to income earned and/or fluctuating fair value of the investments of the Fund.
cBased on average daily shares outstanding.
dTotal return does not reflect sales commissions or contingent deferred sales charges, if applicable, and is not annualized for periods less than one year.
eRatios are annualized for periods less than one year.
fIncludes dividend and/or interest expense on securities sold short and security borrowing fees, if any. See below for the ratios of such expenses to average net assets for the
periods presented. See Note 1(e).
gRatios are adjusted to exclude the effects of annualization for non-recurring expenses.
hBenefit of expense reduction rounds to less than 0.01%.
14 Annual Report | The accompanying notes are an integral part of these financial statements.
franklintempleton.com
FRANKLIN ALTERNATIVE STRATEGIES FUNDS
FINANCIAL H IGHLIGHTS
| | | |
| Franklin K2 Long Short Credit Fund (continued) | | | |
| | | Period Ended | |
| | | May 31, 2016a | |
| Class C | | | |
| Per share operating performance | | | |
| (for a share outstanding throughout the period) | | | |
| Net asset value, beginning of period | $ | 10.00 | |
| Income from investment operationsb: | | | |
| Net investment incomec | | 0.09 | |
| Net realized and unrealized gains (losses) | | 0.12 | |
| Total from investment operations | | 0.21 | |
| Less distributions from: | | | |
| Net investment income | | (0.08 | ) |
| Net realized gains | | (0.06 | ) |
| Total distributions | | (0.14 | ) |
| Net asset value, end of period | $ | 10.07 | |
| |
| Total returnd | | 2.20 | % |
| |
| Ratios to average net assetse | | | |
| Expenses before waiver, payments by affiliates and expense reductionf,g | | 3.62 | % |
| Expenses net of waiver, payments by affiliates and expense reductionf,h | | 2.55 | % |
| Expenses incurred in connection with securities sold short | | 0.40 | % |
| Net investment income | | 2.60 | % |
| |
| Supplemental data | | | |
| Net assets, end of period (000’s) | $ | 270 | |
| Portfolio turnover rate | | 511.62 | % |
aFor the period September 8, 2015 (commencement of operations) to May 31, 2016.
bThe amount shown for a share outstanding throughout the period may not correlate with the Statement of Operations for the period due to the timing of sales and repurchases
of Fund’s shares in relation to income earned and/or fluctuating fair value of the investments of the Fund.
cBased on average daily shares outstanding.
dTotal return does not reflect sales commissions or contingent deferred sales charges, if applicable, and is not annualized for periods less than one year.
eRatios are annualized for periods less than one year.
fIncludes dividend and/or interest expense on securities sold short and security borrowing fees, if any. See below for the ratios of such expenses to average net assets for the
periods presented. See Note 1(e).
gRatios are adjusted to exclude the effects of annualization for non-recurring expenses.
hBenefit of expense reduction rounds to less than 0.01%.
franklintempleton.com
The accompanying notes are an integral part of these financial statements. | Annual Report 15
FRANKLIN ALTERNATIVE STRATEGIES FUNDS
FINANCIAL H IGHLIGHTS
| | | |
| Franklin K2 Long Short Credit Fund (continued) | | | |
| | | Period Ended | |
| | | May 31, 2016a | |
| Class R | | | |
| Per share operating performance | | | |
| (for a share outstanding throughout the period) | | | |
| Net asset value, beginning of period | $ | 10.00 | |
| Income from investment operationsb: | | | |
| Net investment incomec | | 0.08 | |
| Net realized and unrealized gains (losses) | | 0.16 | |
| Total from investment operations | | 0.24 | |
| Less distributions from: | | | |
| Net investment income | | (0.08 | ) |
| Net realized gains | | (0.06 | ) |
| Total distributions | | (0.14 | ) |
| Net asset value, end of period | $ | 10.10 | |
| |
| Total returnd | | 2.48 | % |
| |
| Ratios to average net assetse | | | |
| Expenses before waiver, payments by affiliates and expense reductionf,g | | 3.37 | % |
| Expenses net of waiver, payments by affiliates and expense reductionf,h | | 2.30 | % |
| Expenses incurred in connection with securities sold short | | 0.40 | % |
| Net investment income | | 2.85 | % |
| |
| Supplemental data | | | |
| Net assets, end of period (000’s) | $ | 12 | |
| Portfolio turnover rate | | 511.62 | % |
aFor the period September 8, 2015 (commencement of operations) to May 31, 2016.
bThe amount shown for a share outstanding throughout the period may not correlate with the Statement of Operations for the period due to the timing of sales and repurchases
of Fund’s shares in relation to income earned and/or fluctuating fair value of the investments of the Fund.
cBased on average daily shares outstanding.
dTotal return is not annualized for periods less than one year.
eRatios are annualized for periods less than one year.
fIncludes dividend and/or interest expense on securities sold short and security borrowing fees, if any. See below for the ratios of such expenses to average net assets for the
periods presented. See Note 1(e).
gRatios are adjusted to exclude the effects of annualization for non-recurring expenses.
hBenefit of expense reduction rounds to less than 0.01%.
16 Annual Report | The accompanying notes are an integral part of these financial statements.
franklintempleton.com
FRANKLIN ALTERNATIVE STRATEGIES FUNDS
FINANCIAL H IGHLIGHTS
| | | |
| Franklin K2 Long Short Credit Fund (continued) | | | |
| | | Period Ended | |
| | | May 31, 2016a | |
| Class R6 | | | |
| Per share operating performance | | | |
| (for a share outstanding throughout the period) | | | |
| Net asset value, beginning of period | $ | 10.00 | |
| Income from investment operationsb: | | | |
| Net investment incomec | | 0.23 | |
| Net realized and unrealized gains (losses) | | 0.06 | |
| Total from investment operations | | 0.29 | |
| Less distributions from: | | | |
| Net investment income | | (0.08 | ) |
| Net realized gains | | (0.06 | ) |
| Total distributions | | (0.14 | ) |
| Net asset value, end of period | $ | 10.15 | |
| |
| Total returnd | | 3.01 | % |
| |
| Ratios to average net assetse | | | |
| Expenses before waiver, payments by affiliates and expense reductionf,g | | 3.35 | % |
| Expenses net of waiver, payments by affiliates and expense reductionf,h | | 2.28 | % |
| Expenses incurred in connection with securities sold short | | 0.40 | % |
| Net investment income | | 2.87 | % |
| |
| Supplemental data | | | |
| Net assets, end of period (000’s) | $ | 12,384 | |
| Portfolio turnover rate | | 511.62 | % |
aFor the period September 8, 2015 (commencement of operations) to May 31, 2016.
bThe amount shown for a share outstanding throughout the period may not correlate with the Statement of Operations for the period due to the timing of sales and repurchases
of Fund’s shares in relation to income earned and/or fluctuating fair value of the investments of the Fund.
cBased on average daily shares outstanding.
dTotal return is not annualized for periods less than one year.
eRatios are annualized for periods less than one year.
fIncludes dividend and/or interest expense on securities sold short and security borrowing fees, if any. See below for the ratios of such expenses to average net assets for the
periods presented. See Note 1(e).
gRatios are adjusted to exclude the effects of annualization for non-recurring expenses.
hBenefit of expense reduction rounds to less than 0.01%.
franklintempleton.com
The accompanying notes are an integral part of these financial statements. | Annual Report 17
FRANKLIN ALTERNATIVE STRATEGIES FUNDS
FINANCIAL H IGHLIGHTS
| | | |
| Franklin K2 Long Short Credit Fund (continued) | | | |
| | | Period Ended | |
| | | May 31, 2016a | |
| Advisor Class | | | |
| Per share operating performance | | | |
| (for a share outstanding throughout the period) | | | |
| Net asset value, beginning of period | $ | 10.00 | |
| Income from investment operationsb: | | | |
| Net investment incomec | | 0.20 | |
| Net realized and unrealized gains (losses) | | 0.09 | |
| Total from investment operations | | 0.29 | |
| Less distributions from: | | | |
| Net investment income | | (0.08 | ) |
| Net realized gains | | (0.06 | ) |
| Total distributions | | (0.14 | ) |
| Net asset value, end of period | $ | 10.15 | |
| |
| Total returnd | | 2.99 | % |
| |
| Ratios to average net assetse | | | |
| Expenses before waiver, payments by affiliates and expense reductionf,g | | 3.36 | % |
| Expenses net of waiver, payments by affiliates and expense reductionf,h | | 2.29 | % |
| Expenses incurred in connection with securities sold short | | 0.40 | % |
| Net investment income | | 2.86 | % |
| |
| Supplemental data | | | |
| Net assets, end of period (000’s) | $ | 23,058 | |
| Portfolio turnover rate | | 511.62 | % |
aFor the period September 8, 2015 (commencement of operations) to May 31, 2016.
bThe amount shown for a share outstanding throughout the period may not correlate with the Statement of Operations for the period due to the timing of sales and repurchases
of Fund’s shares in relation to income earned and/or fluctuating fair value of the investments of the Fund.
cBased on average daily shares outstanding.
dTotal return is not annualized for periods less than one year.
eRatios are annualized for periods less than one year.
fIncludes dividend and/or interest expense on securities sold short and security borrowing fees, if any. See below for the ratios of such expenses to average net assets for the
periods presented. See Note 1(e).
gRatios are adjusted to exclude the effects of annualization for non-recurring expenses.
hBenefit of expense reduction rounds to less than 0.01%.
18 Annual Report | The accompanying notes are an integral part of these financial statements.
franklintempleton.com
FRANKLIN ALTERNATIVE STRATEGIES FUNDS
| | | | |
| Statement of Investments, May 31, 2016 | | | | |
| Franklin K2 Long Short Credit Fund | | | | |
| | Country | Shares | | Value |
| Common Stocks 0.2% | | | | |
| Health Care Providers & Services 0.1% | | | | |
| a Community Health Systems Inc | United States | 3,352 | $ | 45,051 |
| Hotels, Restaurants & Leisure 0.1% | | | | |
| a Pinnacle Entertainment Inc | United States | 2,960 | | 33,329 |
| Independent Power & Renewable Electricity Producers 0.0%† | | | | |
| NRG Yield Inc., A | United States | 1,513 | | 21,939 |
| NRG Yield Inc., C | United States | 720 | | 11,131 |
| | | | | 33,070 |
| Total Common Stocks (Cost $109,328) | | | | 111,450 |
| b Preferred Stocks (Cost $255,772) 0.5% | | | | |
| Thrifts & Mortgage Finance 0.5% | | | | |
| a FHLMC, pfd., Series Z, 0.00% | United States | 67,844 | | 302,584 |
| |
| | | Principal | | |
| | | Amount* | | |
| Convertible Bonds 3.4% | | | | |
| Health Care Providers & Services 0.8% | | | | |
| c Brookdale Senior Living Inc., senior note, 2.75%, 6/15/18 | United States | 530,000 | | 525,362 |
| Independent Power & Renewable Electricity Producers 1.1% | | | | |
| d NRG Yield Inc., senior note, 144A, 3.50%, 2/01/19 | United States | 175,000 | | 169,313 |
| d Pattern Energy Group Inc., senior note, 144A, 4.00%, 7/15/20 | United States | 543,000 | | 530,782 |
| | | | | 700,095 |
| Real Estate Investment Trusts (REITs) 1.5% | | | | |
| American Realty Capital Properties Inc., 3.00%, 8/01/18 | United States | 403,000 | | 398,466 |
| c iStar Inc., senior note, 3.00%, 11/15/16 | United States | 500,000 | | 520,938 |
| | | | | 919,404 |
| Total Convertible Bonds (Cost $2,197,826) | | | | 2,144,861 |
Corporate Bonds and Notes 37.5%
Auto Components 0.8%
| | | |
| d Herc Spinoff Escrow Issuer LLC / Herc Spinoff Escrow Issuer Corp., secured note, | | | |
| second lien, 144A, | | | |
| 7.50%, 6/01/22 | United States | 251,000 | 252,883 |
| 7.75%, 6/01/24 | United States | 252,000 | 253,260 |
| | | | 506,143 |
| Chemicals 1.2% | | | |
| d GCP Applied Technologies Inc., senior note, 144A, 9.50%, 2/01/23 | United States | 370,000 | 411,625 |
| d TPC Group Inc., secured, first lien note, 144A, 8.75%, 12/15/20 | United States | 425,000 | 329,375 |
| | | | 741,000 |
| Commercial Services & Supplies 0.5% | | | |
| RR Donnelley & Sons Co., | | | |
| senior bond, 6.00%, 4/01/24 | United States | 253,000 | 226,435 |
| senior note, 7.00%, 2/15/22 | United States | 104,000 | 101,140 |
| | | | 327,575 |
| Construction Materials 0.5% | | | |
| c,d Standard Industries Inc., senior note, 144A, 5.125%, 2/15/21 | United States | 286,000 | 298,155 |
franklintempleton.com
Annual Report
19
FRANKLIN ALTERNATIVE STRATEGIES FUNDS
STATEMENT O F INVESTMENTS
| | | | | |
| Franklin K2 Long Short Credit Fund (continued) | | | | | |
| |
| | | Principal | | | |
| | Country | Amount* | | | Value |
| Corporate Bonds and Notes (continued) | | | | | |
| Containers & Packaging 1.2% | | | | | |
| c Reynolds Group Issuer Inc. / Reynolds Group Issuer LLC, senior secured note, | | | | | |
| first lien, 6.875%, 2/15/21 | United States | 750,000 | $ | | 778,087 |
| Diversified Financial Services 4.8% | | | | | |
| c Everi Payments Inc., senior note, 10.00%, 1/15/22 | United States | 576,000 | | | 478,080 |
| d Garfunkelux Holdco 3 SA, senior note, 144A, 8.50%, 11/01/22 | Luxembourg | 339,000 | GBP | 499,191 |
| d iPayment Inc., senior note, 144A, 9.50%, 12/15/19 | United States | 677,673 | | | 684,450 |
| NewStar Financial Inc., senior note, 7.25%, 5/01/20 | United States | 254,000 | | | 237,172 |
| d Opal Acquisition Inc., senior note, 144A, 8.875%, 12/15/21 | United States | 368,000 | | | 289,800 |
| d ROC Finance LLC / ROC Finance 1 Corp., secured note, second lien, 144A, | | | | | |
| 12.125%, 9/01/18 | United States | 853,000 | | | 895,650 |
| | | | | | 3,084,343 |
| Diversified Telecommunication Services 2.6% | | | | | |
| d Intelsat Jackson Holdings SA, senior secured note, first lien, 144A, 8.00%, 2/15/24 | Luxembourg | 407,000 | | | 416,666 |
| c,d Level 3 Financing Inc., senior note, 144A, 5.25%, 3/15/26 | United States | 576,000 | | | 576,000 |
| c,d Numericable-SFR SA, secured bond, 144A, 7.375%, 5/01/26 | France | 679,000 | | | 684,517 |
| | | | | | 1,677,183 |
| Electric Utilities 0.5% | | | | | |
| c,d Real Alloy Holding Inc., senior note, 144A, 10.00%, 1/15/19 | United States | 296,000 | | | 296,000 |
| Energy Equipment & Services 0.7% | | | | | |
| e Petroleos Mexicanos, senior bond, Reg S, 6.875%, 8/04/26 | Mexico | 409,000 | | | 445,442 |
| Health Care Equipment & Supplies 0.7% | | | | | |
| Universal Hospital Services Inc., senior note, 7.625%, 8/15/20 | United States | 509,000 | | | 477,824 |
| Health Care Providers & Services 0.9% | | | | | |
| Community Health Systems Inc., senior note, 6.875%, 2/01/22 | United States | 250,000 | | | 216,098 |
| IASIS Healthcare LLC / IASIS Capital Corp., senior note, 8.375%, 5/15/19 | United States | 113,000 | | | 109,045 |
| Kindred Healthcare Inc., senior note, 8.75%, 1/15/23 | United States | 226,000 | | | 222,045 |
| | | | | | 547,188 |
| Hotels, Restaurants & Leisure 3.6% | | | | | |
| d Downstream Development Authority of the Quapaw Tribe of Oklahoma, secured note, | | | | | |
| 144A, 10.50%, 7/01/19 | United States | 478,000 | | | 449,320 |
| d Golden Nugget Escrow Inc., senior note, 144A, 8.50%, 12/01/21 | United States | 281,000 | | | 292,943 |
| Mohegan Tribal Gaming Authority, senior note, 9.75%, 9/01/21 | United States | 123,000 | | | 130,226 |
| d Pizzaexpress Financing 2 PLC, senior secured note, first lien, 144A, | | | | | |
| 6.625%, 8/01/21 | United Kingdom | 543,000 | GBP | 788,959 |
| c Scientific Games International Inc., senior note, 10.00%, 12/01/22 | United States | 770,000 | | | 627,550 |
| | | | | | 2,288,998 |
| Independent Power & Renewable Electricity Producers 0.6% | | | | | |
| d TerraForm Power Operating LLC, senior note, 144A, 5.875%, 2/01/23 | United States | 407,000 | | | 362,230 |
| IT Services 0.9% | | | | | |
| c,d First Data Corp., secured note, first lien, 144A, 5.00%, 1/15/24 | United States | 576,000 | | | 577,797 |
| Life Sciences Tools & Services 2.3% | | | | | |
| inVentiv Health Inc., | | | | | |
| c,d secured note, first lien, 144A, 9.00%, 1/15/18 | United States | 573,000 | | | 588,757 |
| senior note, 10.00%, 8/15/18 | United States | 562,000 | | | 560,595 |
| senior note, 10.00%, 8/15/18 | United States | 66,000 | | | 65,010 |
| d,f senior note, 144A, PIK, 10.00%, 8/15/18 | United States | 249,000 | | | 254,603 |
| | | | | | 1,468,965 |
20 Annual Report
franklintempleton.com
FRANKLIN ALTERNATIVE STRATEGIES FUNDS
STATEMENT O F INVESTMENTS
| | | | | |
| Franklin K2 Long Short Credit Fund (continued) | | | | | |
| |
| | | Principal | | | |
| | Country | Amount* | | | Value |
| Corporate Bonds and Notes (continued) | | | | | |
| Media 5.6% | | | | | |
| American Media Inc., | | | | | |
| d secured note, second lien, 144A, 7.00%, 7/15/20 | United States | 1,064,631 | | $ | 1,189,725 |
| senior secured note, first lien, 11.50%, 12/15/17 | United States | 26,000 | | | 26,650 |
| d Lee Enterprises Inc., senior secured note, first lien, 144A, 9.50%, 3/15/22 | United States | 446,000 | | | 446,000 |
| The McClatchy Co., senior secured note, first lien, 9.00%, 12/15/22 | United States | 515,000 | | | 491,825 |
| c Postmedia Network Inc., secured note, second lien, 12.50%, 7/15/18 | Canada | 393,000 | | | 158,183 |
| d Time Inc., senior note, 144A, 5.75%, 4/15/22 | United States | 586,000 | | | 561,095 |
| WideOpenWest Finance LLC / Capital Corp., senior note, 10.25%, 7/15/19 | United States | 701,000 | | | 733,421 |
| | | | | | 3,606,899 |
| Metals & Mining 1.1% | | | | | |
| AK Steel Corp., | | | | | |
| senior bond, 7.625%, 5/15/20 | United States | 247,000 | | | 199,452 |
| senior bond, 8.375%, 4/01/22 | United States | 254,000 | | | 196,533 |
| senior note, 7.625%, 10/01/21 | United States | 331,000 | | | 255,284 |
| d Teck Resources Ltd., senior note, 144A, 8.50%, 6/01/24 | Canada | 46,000 | | | 47,265 |
| United States Steel Corp., | | | | | |
| senior bond, 7.375%, 4/01/20 | United States | 16,000 | | | 13,960 |
| senior bond, 7.50%, 3/15/22 | United States | 10,000 | | | 7,850 |
| senior note, 6.875%, 4/01/21 | United States | 20,000 | | | 15,600 |
| | | | | | 735,944 |
| Multiline Retail 0.9% | | | | | |
| J.C. Penney Corp. Inc., senior bond, 7.95%, 4/01/17 | United States | 543,000 | | | 561,326 |
| Oil, Gas & Consumable Fuels 4.9% | | | | | |
| Kinder Morgan Inc., senior bond, 8.05%, 10/15/30 | United States | 228,000 | | | 249,143 |
| d NGPL PipeCo LLC, secured note, 144A, | | | | | |
| 7.119%, 12/15/17 | United States | 421,000 | | | 444,155 |
| 9.625%, 6/01/19 | United States | 430,000 | | | 450,962 |
| Petrobras Global Finance BV, | | | | | |
| senior bond, 5.75%, 1/20/20 | Brazil | 33,000 | | | 31,045 |
| senior bond, 8.75%, 5/23/26 | Brazil | 89,000 | | | 84,683 |
| senior bond, 6.85%, 6/05/15 | Brazil | 315,000 | | | 214,200 |
| senior note, 4.875%, 3/07/18 | Brazil | 100,000 | EUR | | 110,652 |
| senior note, 4.875%, 3/17/20 | Brazil | 498,000 | | | 451,038 |
| senior note, 8.375%, 5/23/21 | Brazil | 53,000 | | | 52,587 |
| e Petroleos de Venezuela SA, senior bond, Reg S, | | | | | |
| 6.00%, 5/16/24 | Venezuela | 163,000 | | | 53,888 |
| 6.00%, 11/15/26 | Venezuela | 633,000 | | | 205,662 |
| Southwestern Energy Co., senior bond, 7.50%, 2/01/18 | United States | 756,000 | | | 763,560 |
| | | | | | 3,111,575 |
| Paper & Forest Products 0.3% | | | | | |
| Resolute Forest Products Inc., senior note, 5.875%, 5/15/23 | United States | 289,000 | | | 215,666 |
| Pharmaceuticals 0.9% | | | | | |
| d ConvaTec Healthcare SA, senior note, 144A, 10.50%, 12/15/18 | Luxembourg | 543,000 | | | 559,969 |
| Real Estate Investment Trusts (REITs) 0.4% | | | | | |
| d Communications Sales & Leasing Inc., secured note, first lien, 144A, 6.00%, 4/15/23 | United States | 271,000 | | | 270,323 |
| Semiconductors & Semiconductor Equipment 1.1% | | | | | |
| d Micron Technology Inc., senior secured note, 144A, 7.50%, 9/15/23 | United States | 677,000 | | | 712,542 |
franklintempleton.com
Annual Report
21
FRANKLIN ALTERNATIVE STRATEGIES FUNDS
STATEMENT O F INVESTMENTS
| | | | | | |
| Franklin K2 Long Short Credit Fund (continued) | | | | | | |
| |
| | | | Principal | | | |
| | | Country | Amount* | | | Value |
| Corporate Bonds and Notes (continued) | | | | | | |
| Software 0.3% | | | | | | |
| d Open Text Corp., senior bond, 144A, 5.875%, 6/01/26 | | Canada | 201,000 | $ | | 202,005 |
| Technology Hardware, Storage & Peripherals 0.2% | | | | | | |
| d Diamond 1 Finance Corp. / Diamond 2 Finance Corp., senior secured note, first lien, | | | | | | |
| 144A, | | | | | | |
| 4.42%, 6/15/21 | | United States | 51,000 | | | 52,128 |
| 5.45%, 6/15/23 | | United States | 99,000 | | | 100,758 |
| | | | | | | 152,886 |
| Total Corporate Bonds and Notes (Cost $23,272,061) | | | | | | 24,006,065 |
| |
| Foreign Government and Agency Securities 5.5% | | | | | | |
| Government of Argentina, | | | | | | |
| e senior bond, Reg S, 7.50%, 4/22/26 | | Argentina | 150,000 | | | 157,800 |
| senior bond, 7.82%, 12/31/33 | | Argentina | 499,525 | EUR | 563,833 |
| senior note, 8.75%, 6/02/17 | | Argentina | 300,000 | | | 316,500 |
| Government of Brazil, senior bond, 6.00%, 4/07/26 | | Brazil | 200,000 | | | 203,000 |
| Government of Hellenic Republic, | | | | | | |
| e senior bond, Reg S, 3.00% to 2/24/20, 3.65% to 2/24/21, 4.30% thereafter, | | | | | | |
| 2/24/42 | | Greece | 606,400 | EUR | 461,884 |
| d senior note, 144A, 3.375%, 7/17/17 | | Greece | 974,000 | EUR | 1,041,949 |
| d senior note, 144A, 4.75%, 4/17/19 | | Greece | 25,000 | EUR | 26,015 |
| Government of Hungary, senior bond, 5.375%, 2/21/23 | | Hungary | 140,000 | | | 154,272 |
| e Government of Iraq, senior bond, Reg S, 5.80%, 1/15/28 | | Iraq | 250,000 | | | 182,813 |
| e Government of Paraguay, senior note, Reg S, 4.625%, 1/25/23 | | Paraguay | 200,000 | | | 205,500 |
| e Government of Sri Lanka, senior note, Reg S, 6.85%, 11/03/25 | | Sri Lanka | 209,000 | | | 201,216 |
| Total Foreign Government and Agency Securities | | | | | | |
| (Cost $3,189,388) | | | | | | 3,514,782 |
| Asset-Backed Securities and Commercial Mortgage-Backed | | | | | | |
| Securities 31.3% | | | | | | |
| Banks 7.3% | | | | | | |
| g Wachovia Bank Commercial Mortgage 2007-C30 Trust, AJ, FRN, | | | | | | |
| 5.413%, 12/15/43 | | United States | 1,750,000 | | | 1,745,236 |
| g Wachovia Bank Commercial Mortgage 2007-C31 Trust, AJ, FRN, 5.66%, 4/15/47 | | United States | 2,610,000 | | | 2,618,357 |
| g Washington Mutual Mortgage Pass-Through Certificates, 2006-4, 3A2B, FRN, | | | | | | |
| 0.526%, 5/25/36 | | United States | 552,413 | | | 291,518 |
| | | | | | | 4,655,111 |
| Consumer Finance 0.4% | | | | | | |
| g Impac CMB 2004-11 Trust, 1A2, FRN, 0.966%, 3/25/35 | | United States | 316,802 | | | 235,755 |
| Diversified Financial Services 18.3% | | | | | | |
| d,g Anchorage Capital CLO Ltd. 2013-1A Trust, C, 144A, FRN, 4.13%, 7/13/25 | | Cayman Islands | 1,000,000 | | | 913,993 |
| d Avant Loans Funding 2016-B Trust, A, 144A, 3.92%, 8/15/19 | | United States | 750,000 | | | 753,257 |
| g Banc of America Funding 2006-G Trust, M1, FRN, 0.738%, 7/20/36 | | United States | 3,500,000 | | | 2,300,649 |
| g Bear Stearns ARM 2006-2 Trust, 4A1, FRN, 3.997%, 7/25/36 | | United States | 134,598 | | | 116,920 |
| g Bear Stearns ARM 2007-4 Trust, 22A1, FRN, 4.798%, 6/25/47 | | United States | 118,290 | | | 105,371 |
| d,g Cornerstone CLO Ltd. 2007-C Trust, 144A, FRN, 3.028%, 7/15/21 | | United States | 1,000,000 | | | 938,987 |
| Credit Suisse First Boston Mortgage Securities Corp., 1A2, 7.50%, 3/25/32 | | United States | 665,836 | | | 671,919 |
| g Home Equity Mortgage Loan Asset-Backed 2001-A Trust, AV, FRN, | | | | | | |
| 0.966%, 3/25/31 | | United States | 112,515 | | | 100,964 |
| g IndyMac Index Mortgage Loan 2005-AR13 Trust, 4A1, FRN, 2.72%, 8/25/35 | | United States | 614,796 | | | 534,653 |
22 Annual Report
franklintempleton.com
FRANKLIN ALTERNATIVE STRATEGIES FUNDS
STATEMENT O F INVESTMENTS
| | | | | |
| Franklin K2 Long Short Credit Fund (continued) | | | | | |
| |
| | | | Principal | | |
| | Country | | Amount* | | Value |
| Asset-Backed Securities and Commercial | | | | | |
| Mortgage-Backed Securities (continued) | | | | | |
| Diversified Financial Services (continued) | | | | | |
| g IndyMac Index Mortgage Loan 2007-AR7 Trust, 1A1, FRN, | | | | | |
| 0.746%, 6/25/37 | United States | | 2,938,610 | $ | 1,440,360 |
| g JP Morgan Mortgage 2007-A2 Trust, 2A1, FRN, | | | | | |
| 2.813%, 4/25/37 | United States | | 482,841 | | 426,691 |
| d,g Katonah Ltd. 2007-B1L Trust, 144A, FRN, 3.638%, 4/23/22 | United States | | 1,000,000 | | 958,038 |
| d OneMain Financial Issuance Trust, 2014-1A, A, 144A, | | | | | |
| 2.43%, 6/18/24 | United States | | 115,613 | | 115,733 |
| d,g Sound Point CLO Ltd., 2013-1A, B1L, 144A, FRN, | | | | | |
| 4.386%, 4/26/25 | Cayman Islands | | 1,000,000 | | 959,069 |
| g Structured Asset Mortgage Investments 2003-AR2 Trust, A1, | | | | | |
| FRN, 1.179%, 12/19/33 | United States | | 32,071 | | 30,858 |
| g WaMu Mortgage Pass-Through Certificates 2007-OA3 Trust, | | | | | |
| 2A1A, FRN, 1.17%, 4/25/47 | United States | | 102,250 | | 91,532 |
| d,g Waterfall Commercial Mortgage 2015-SBC5 Trust, A, 144A, | | | | | |
| FRN, 4.104%, 9/14/22 | United States | | 1,291,889 | | 1,270,747 |
| | | | | | 11,729,741 |
| Thrifts & Mortgage Finance 5.3% | | | | | |
| Banc of America Commercial Mortgage 2006-6 Trust, AJ, | | | | | |
| 5.421%, 10/10/45 | United States | | 900,000 | | 896,754 |
| g National Collegiate Student Loan 2007-4 Trust, FRN, | | | | | |
| A3A1, 3.682%, 3/25/38 | United States | | 950,000 | | 945,742 |
| A3A2, 6.50%, 3/25/38 | United States | | 2,000,000 | | 1,571,442 |
| | | | | | 3,413,938 |
| Total Asset-Backed Securities and Commercial | | | | | |
| Mortgage-Backed Securities | | | | | |
| (Cost $19,837,476) | | | | | 20,034,545 |
| |
| | | | Number of | | |
| | | | Contracts | | |
| Options Purchased 0.1% | | | | | |
| Calls – Exchange-Traded | | | | | |
| Health Care Providers & Services 0.0%† | | | | | |
| Community Health Systems Inc., September Strike Price $16.00, | | | | | |
| Expires 9/16/16 | United States | | 34 | | 2,295 |
| |
| | | | Notional | | |
| | | Counterparty | Amount* | | |
| Payer Swaptions – Over-the-Counter | | | | | |
| Interest Rate 0.0%† | | | | | |
| Pay fixed 10 year 2.00%, receive float 6-month USD LIBOR, | �� | | | | |
| Expires 10/21/16 | United States | JPHQ | 678,000 | | 5,735 |
| |
| | | | Number of | | |
| | | | Contracts | | |
| Puts – Exchange-Traded | | | | | |
| Diversified Financial Services 0.0%† | | | | | |
| S&P 500 Index, June Strike Price $1,950.00, Expires 6/17/16 | United States | | 17 | | 2,125 |
| S&P 500 Index, June Strike Price $2,000.00, Expires 6/30/16 | United States | | 13 | | 10,920 |
| | | | | | 13,045 |
franklintempleton.com
Annual Report
23
FRANKLIN ALTERNATIVE STRATEGIES FUNDS
STATEMENT O F INVESTMENTS
| | | | |
| Franklin K2 Long Short Credit Fund (continued) | | | | |
| |
| | | Number of | | |
| | Country | Contracts | | Value |
| |
| Options Purchased (continued) | | | | |
| Exchange Traded Funds 0.1% | | | | |
| iShares iBoxx USD High Yield Corporate Bond ETF, July Strike Price $81.00, | | | | |
| Expires 7/15/16 | United States | 147 | $ | 7,497 |
| SPDR S&P 500 ETF Trust, July Strike Price $205.00, Expires 7/15/16 | United States | 106 | | 24,804 |
| | | | | 32,301 |
| Oil, Gas & Consumable Fuels 0.0%† | | | | |
| Southwestern Energy Co., June Strike Price $12.00, Expires 6/17/16 | United States | 30 | | 870 |
| Total Options Purchased (Cost $74,807) | | | | 54,246 |
| |
| | | Principal | | |
| | | Amount* | | |
| U.S. | Government and Agency Securities 2.9% |
U.S. | Treasury Note, |
| | | | | |
| 1.25%, 3/31/21 | United States | 581,000 | | 577,527 | |
| 1.625%, 2/15/26 | United States | 1,284,000 | | 1,257,718 | |
| Total U.S. Government and Agency Securities | | | | | |
| (Cost $1,850,783) | | | | 1,835,245 | |
| Total Investments before Short Term Investments | | | | | |
| (Cost $50,787,441) | | | | 52,003,778 | |
| |
| | | Shares | | | |
| Short Term Investments 9.7% | | | | | |
| Money Market Funds (Cost $5,185,565) 8.1% | | | | | |
| h Fidelity Institutional Money Market Funds, Money Market Portfolio, Class I, 0.234% | United States | 5,185,565 | | 5,185,565 | |
| |
| | | Principal | | | |
| | | Amount* | | | |
| Repurchase Agreements (Cost $1,037,523) 1.6% | | | | | |
| i Joint Repurchase Agreement, 0.281%, 6/01/16 | | | | | |
| (Maturity Value $1,037,531), | United States | 1,037,523 | | 1,037,523 | |
| BNP Paribas Securities Corp. (Maturity Value $413,176) | | | | | |
| Deutsche Bank Securities Inc. (Maturity Value $97,549) | | | | | |
| HSBC Securities (USA) Inc. (Maturity Value $516,472) | | | | | |
| Merrill Lynch, Pierce, Fenner & Smith Inc. (Maturity Value $10,334) | | | | | |
| Collateralized by U.S. Government Agency Securities, 0.00% - 5.50%, | | | | | |
| 6/10/16 - 2/01/20; U.S. Government Agency Securities, Strips, 6/01/17; | | | | | |
| jU.S. Treasury Bill, 5/25/17; and U.S. Treasury Note, 0.875%, | | | | | |
| 10/15/17 - 4/15/19 (valued at $1,058,350) | | | | | |
| Total Investments (Cost $57,010,529) 91.1% | | | | 58,226,866 | |
| Options Written (0.0)%† | | | | (10,643 | ) |
| Securities Sold Short (8.5)% | | | | (5,422,676 | ) |
| Other Assets, less Liabilities 17.4% | | | | 11,128,222 | |
| Net Assets 100.0% | | | $ | 63,921,769 | |
24 Annual Report
franklintempleton.com
FRANKLIN ALTERNATIVE STRATEGIES FUNDS
STATEMENT O F INVESTMENTS
| | | | | |
| Franklin K2 Long Short Credit Fund (continued) | | | | | |
| |
| | | Number of | | | |
| | Country | Contracts | | Value | |
| Options Written (0.0%)† | | | | | |
| Puts – Exchange-Traded | | | | | |
| Exchange Traded Funds (0.0%)† | | | | | |
| SPDR S&P 500 ETF Trust, July Strike Price $195.00, Expires 7/15/16 | United States | 106 | $ | (9,328 | ) |
| Health Care Providers & Services (0.0%)† | | | | | |
| Community Health Systems Inc., September Strike Price $9.00, Expires 9/16/16 | United States | 34 | | (1,105 | ) |
| Oil, Gas & Consumable Fuels (0.0%)† | | | | | |
| Southwestern Energy Co., June Strike Price $10.00, Expires 6/17/16 | United States | 30 | | (210 | ) |
| Total Options Written (Premiums Received $9,583) | | | | (10,643 | ) |
| |
| | | Principal | | | |
| | | Amount* | | | |
| k Securities Sold Short (8.5)% | | | | | |
| Corporate Bonds and Notes (8.0)% | | | | | |
| Auto Components (1.8)% | | | | | |
| Dana Holding Corp., senior bond, 5.50%, 12/15/24 | United States | 576,000 | | (554,400 | ) |
| MPG Holdco I Inc., senior note, 7.375%, 10/15/22 | United States | 576,000 | | (573,120 | ) |
| | | | | (1,127,520 | ) |
| Chemicals (2.5)% | | | | | |
| CF Industries Inc., senior bond, 3.45%, 6/01/23 | United States | 575,000 | | (566,257 | ) |
| The Mosaic Co., senior bond, 4.25%, 11/15/23 | United States | 500,000 | | (532,650 | ) |
| Potash Corp. of Saskatchewan Inc., senior bond, 3.00%, 4/01/25 | Canada | 500,000 | | (493,468 | ) |
| | | | | (1,592,375 | ) |
| Commercial Services & Supplies (0.5)% | | | | | |
| United Rentals North America Inc., senior bond, 5.50%, 7/15/25 | United States | 326,000 | | (321,110 | ) |
| Diversified Telecommunication Services (0.2)% | | | | | |
| d Frontier Communications Corp., senior note, 144A, 11.00%, 9/15/25 | United States | 112,000 | | (114,380 | ) |
| Hotels, Restaurants & Leisure (1.0)% | | | | | |
| d Scientific Games International Inc., senior secured note, first lien, 144A, | | | | | |
| 7.00%, 1/01/22 | United States | 662,000 | | (671,930 | ) |
| Media (0.1)% | | | | | |
| d CCO Holdings LLC / CCO Holdings Capital Corp., senior note, 144A, | | | | | |
| 5.875%, 4/01/24 | United States | 56,000 | | (58,520 | ) |
| Road & Rail (0.9)% | | | | | |
| Hertz Corp., senior note, 6.75%, 4/15/19 | United States | 576,000 | | (584,854 | ) |
| Trading Companies & Distributors (1.0)% | | | | | |
| GATX Corp., senior bond, 4.85%, 6/01/21 | United States | 576,000 | | (611,476 | ) |
| Total Corporate Bonds and Notes (Proceeds $5,010,775) | | | | (5,082,165 | ) |
| U. | S. Government and Agency Securities (0.5)% |
| U. | S. Treasury Note, |
| | | | | |
| 1.375%, 4/30/21 | United States | 48,000 | | (47,989 | ) |
| 1.625%, 4/30/23 | United States | 88,000 | | (87,800 | ) |
| 1.625%, 2/15/26 | United States | 209,000 | | (204,722 | ) |
| Total U.S. Government and Agency Securities | | | | | |
| (Proceeds $343,070) | | | | (340,511 | ) |
| Total Securities Sold Short (Proceeds $5,353,845) | | | $ | (5,422,676 | ) |
franklintempleton.com
Annual Report
25
FRANKLIN ALTERNATIVE STRATEGIES FUNDS
STATEMENT O F INVESTMENTS
Franklin K2 Long Short Credit Fund (continued)
†Rounds to less than 0.1% of net assets.
*The principal/notional amount is stated in U.S. dollars unless otherwise indicated.
aNon-income producing.
bVariable rate security. The rate shown represents the yield at period end.
cA portion or all of the security has been segregated as collateral for securities sold short and open written option contracts. At May 31, 2016, the aggregate value of these securities and/or cash pledged amounted to $9,540,115, representing 14.92% of net assets. dSecurity was purchased pursuant to Rule 144A under the Securities Act of 1933 and may be sold in transactions exempt from registration only to qualified institutional buyers or in public offering registered under the Securities Act of 1933. These securities have been deemed liquid under guidelines approved by the Trust’s Board of Trustees. At May 31, 2016, the net value of these securities was $21,072,161, representing 32.97% of net assets. eSecurity was purchased pursuant to Regulation S under the Securities Act of 1933, which exempts from registration securities offered and sold outside of the United States. Such a security cannot be sold in the United States without either an effective registration statement filed pursuant to the Securities Act of 1933, or pursuant to an exemption from registration. These securities have been deemed liquid under guidelines approved by the Trust’s Board of Trustees. At May 31, 2016, the aggregate value of these securities was $1,914,205, representing 2.99% of net assets. fIncome may be received in additional securities and/or cash. gThe coupon rate shown represents the rate at period end. hThe rate shown is the annualized seven-day yield at period end. iSee Note 1(c) regarding joint repurchase agreement. jThe security is traded on a discount basis with no stated coupon rate. kSee Note 1(e) regarding securities sold short.
| | | | | | | | | | | |
| At May 31, 2016, the Fund had the following futures contracts outstanding. See Note 1(d). | | | | | | |
| |
| Futures Contracts | | | | | | | | | | | |
| | | | Number of | | Notional | Expiration | | Unrealized | | Unrealized | |
| Description | | Type | Contracts | | Value | Date | | Appreciation | | Depreciation | |
| Equity Contracts | | | | | | | | | | | |
| S&P 500 E-Mini Index | | Short | 2 | $ | 209,490 | 6/17/16 | $ | — | $ | (8,594 | ) |
| Interest Rate Contracts | | | | | | | | | | | |
| 90 Day Eurodollar | | Short | 7 | | 1,728,475 | 12/18/17 | | — | | (276 | ) |
| U.S. Treasury 10 Yr. Note | | Short | 1 | | 129,688 | 9/21/16 | | — | | (439 | ) |
| U.S. Treasury Long Bond | | Short | 3 | | 489,937 | 9/21/16 | | — | | (3,733 | ) |
| | | | | | 2,348,100 | | | — | | (4,448 | ) |
| Total Futures Contracts | | | | $ | 2,557,590 | | $ | — | $ | (13,042 | ) |
| Net unrealized appreciation (depreciation) | | | | | | | | $ | (13,042 | ) |
| |
| At May 31, 2016, the Fund had the following forward exchange contracts outstanding. See Note 1(d). | | | | | |
| |
| Forward Exchange Contracts | | | | | | | | | | | |
| | | | | | Contract | Settlement | | Unrealized | | Unrealized | |
| Currency | Counterpartya Type | Quantity | | Amount | Date | | Appreciation | | Depreciation | |
| OTC Forward Exchange Contracts | | | | | | | | | | | |
| Chinese Yuan | MSCO | Sell | 5,321,200 | $ | 814,164 | 6/15/16 | $ | 6,793 | $ | — | |
| Euro | MSCO | Buy | 1,033,853 | | 1,168,776 | 6/15/16 | | — | | (17,796 | ) |
| Euro | MSCO | Sell | 3,016,843 | | 3,371,007 | 6/15/16 | | 12,371 | | — | |
| Japanese Yen | MSCO | Sell | 25,231,430 | | 222,536 | 6/15/16 | | — | | (5,452 | ) |
| Mexican Peso | MSCO | Buy | 7,009,291 | | 390,207 | 6/15/16 | | — | | (11,118 | ) |
| Mexican Peso | MSCO | Sell | 7,009,291 | | 404,636 | 6/15/16 | | 25,548 | | — | |
| South Korean Won | MSCO | Sell | 339,815,557 | | 288,380 | 6/15/16 | | 3,342 | | — | |
| British Pound | JPHQ | Sell | 930,000 | | 1,356,413 | 6/30/16 | | 9,114 | | — | |
| Turkish Lira | MLCO | Sell | 785,511 | | 259,168 | 9/21/16 | | 597 | | — | |
| Total Forward Exchange Contracts | | | | | | | $ | 57,765 | $ | (34,366 | ) |
| Net unrealized appreciation (depreciation) | | | | | | $ | 23,399 | | | |
| |
| aMay be comprised of multiple contracts with the same counterparty, currency and settlement date. | | | | | | | | |
26 Annual Report
franklintempleton.com
FRANKLIN ALTERNATIVE STRATEGIES FUNDS
STATEMENT O F INVESTMENTS
| | | | | | | | | | | | | | | | | | | | |
| Franklin K2 Long Short Credit Fund (continued) | | | | | | | | | | | | | | | | | |
| At May 31, 2016, the Fund had the following credit default swap contracts outstanding. See Note 1(d). | | | | | | | |
| |
| Credit Default Swap Contracts | | | | | | | | | | | | | | | | | | | | |
| | | | | | | | | | Unamortized | | | | | | | | | | |
| | Periodic | | | | | | | | Upfront | | | | | | | | | | |
| | Payment Counterparty/ | Notional | Expiration | | Payments | | | Unrealized | | Unrealized | | | | |
| Description | Rate | | Exchange | Amounta | | | Date | | (Receipts) | | | Appreciation | | Depreciation | | Value | | Ratingb |
| Centrally Cleared Swap Contracts | | | | | | | | | | | | | | | | | | | | |
| Contracts to Buy Protection | | | | | | | | | | | | | | | | | | | | |
| Traded Index | | | | | | | | | | | | | | | | | | | | |
| CDX.NA.HY.25 | 5.00 | % | ICE | 1,445,400 | | | 12/20/20 | | $ | 14,454 | | | $ | — | $ | (67,821) $(53,367) |
| Single Name | | | | | | | | | | | | | | | | | | | | |
| Government of Turkey | 1.00 | % | ICE | 504,000 | | | 12/20/20 | | | 41,464 | | | | — | | (9,518 | ) | 31,946 | | |
| Government of South Africa | 1.00 | % | ICE | 235,000 | | | 6/12/21 | | | 21,512 | | | | 1,402 | | — | | 22,914 | | |
| Government of Turkey | 1.00 | % | ICE | 149,000 | | | 6/12/21 | | | 10,088 | | | | 1,473 | | — | | 11,561 | | |
| Government of South Africa | 1.00 | % | ICE | 172,000 | | | 6/20/21 | | | 16,602 | | | | 169 | | — | | 16,771 | | |
| Government of Turkey | 1.00 | % | ICE | 141,000 | | | 6/20/21 | | | 11,405 | | | | — | | (464 | ) | 10,941 | | |
| Contracts to Sell Protectionc | | | | | | | | | | | | | | | | | | | | |
| Single Name | | | | | | | | | | | | | | | | | | | | |
| Government of Brazil | 1.00 | % | ICE | 701,000 | | | 6/20/21 | | | (79,797 | ) | | | — | | (2,028 | ) | (81,825) | | BB |
| Government of Russia | 1.00 | % | ICE | 395,000 | | | 6/20/21 | | | (28,844 | ) | | | 113 | | — | | (28,731) | | BB+ |
| Total Centrally Cleared Swap Contracts | | | | | | | | | $ | 6,884 | | $ | 3,157 | $ | (79,831) $(69,790) |
| OTC Swap Contracts | | | | | | | | | | | | | | | | | | | | |
| Contracts to Buy Protection | | | | | | | | | | | | | | | | | | | | |
| Single Name | | | | | | | | | | | | | | | | | | | | |
| American Axle & Manufacturing Inc | 5.00 | % | JPHQ | 570,000 | | | 6/20/21 | | | (29,064 | ) | | | — | | (23,053 | ) | (52,117 | ) | |
| Catepillar Financial Services Corp | 1.00 | % | JPHQ | 882,000 | | | 6/20/21 | | | 3,777 | | | | — | | (7,000 | ) | (3,223 | ) | |
| Domtar Corp | 1.00 | % | JPHQ | 679,000 | | | 6/20/21 | | | 31,090 | | | | — | | (18,090 | ) | 13,000 | | |
| Eastman Chemical Co | 1.00 | % | JPHQ | 543,000 | | | 6/20/21 | | | (519 | ) | | | — | | (5,855 | ) | (6,374 | ) | |
| Expedia Inc | 1.00 | % | JPHQ | 597,000 | | | 6/20/21 | | | 7,596 | | | | — | | (8,850 | ) | (1,254 | ) | |
| Marubeni Corp | 1.00 | % | GSCO | 62,079,000 | JPY | 6/20/21 | | | 3,888 | | | | — | | (8,190 | ) | (4,302 | ) | |
| Pizzaexpress Financing 1 PLC | 5.00 | % | JPHQ | 651,000 | EUR | 6/20/21 | | | (33,731 | ) | | | 25,740 | | — | | (7,991 | ) | |
| Sprint Nextel | 5.00 | % | JPHQ | 217,000 | | | 6/20/19 | | | 25,424 | | | | — | | (8,231 | ) | 17,193 | | |
| Sprint Nextel | 5.00 | % | JPHQ | 217,000 | | | 6/20/21 | | | 49,190 | | | | — | | (10,749 | ) | 38,441 | | |
| Transocean Inc | 5.00 | % | JPHQ | 271,000 | | | 6/20/21 | | | 58,541 | | | | 2,880 | | — | | 61,421 | | |
| Whirlpool Corp | 1.00 | % | JPHQ | 746,000 | | | 6/20/21 | | | (7,165 | ) | | | 20 | | — | | (7,145 | ) | |
| Windstream Corp | 5.00 | % | JPHQ | 271,000 | | | 6/20/21 | | | 27,275 | | | | — | | (4,580 | ) | 22,695 | | |
| Total OTC Swap Contracts | | | | | | | | $ | 136,302 | | $ | 28,640 | $ | (94,598) $ 70,344 | | |
| Total Credit Default Swap Contracts | | | | 71,465,400 | | | | $ | 143,186 | | $ | 31,797 | $ | (174,429 | ) $ | 554 | | |
| Net unrealized appreciation (depreciation) | | | | | | | | | | | | | | | $ | (142,632 | ) | | | |
aIn U.S. dollars unless otherwise indicated. For contracts to sell protection, the notional amount is equal to the maximum potential amount of the future payments and no
recourse provisions have been entered into in association with the contracts.
bBased on Standard and Poor’s (S&P) Rating for single name swaps.
cThe Fund enters contracts to sell protection to create a long credit position. Performance triggers include default, bankruptcy or restructuring for single name swaps and fail-
ure to pay or bankruptcy of the underlying securities for traded index swaps.
See Notes 1(d) and 8 regarding derivative financial instruments and other derivative information, respectively.
franklintempleton.com
Annual Report
27
FRANKLIN ALTERNATIVE STRATEGIES FUNDS
STATEMENT O F INVESTMENTS
| | | | | | | | | | |
| Franklin K2 Long Short Credit Fund (continued) | | | | | | | | | |
| At May 31, 2016, the Fund had the following total return swap contracts outstanding. See Note 1(d). | | | | | |
| Total Return Swap Contracts | | | | | | | | | | |
| | | Counter- | | | Expiration | | Unrealized | | Unrealized | |
| Underlying Instrument | Financing Rate | party | | Notional Value | Date | | Appreciation | | Depreciation | |
| OTC Swap Contracts | | | | | | | | | | |
| Short | | | | | | | | | | |
| iBoxx USD Liquid High Yield Index | LIBOR | JPHQ | $ | 328,000 | 6/20/16 | $ | — | $ | (1,449) | |
| iBoxx USD Liquid High Yield Index | LIBOR | MSCS | | 18,000 | 6/20/16 | | — | | (120) | |
| Total Return Swap Contracts | | | | | | $ | — | $ | (1,569) | |
| Net unrealized appreciation (depreciation) | | | | | | | | $ | (1,569) | |
| |
| See Abbreviations on page 45. | | | | | | | | | | |
28 Annual Report | The accompanying notes are an integral part of these financial statements.
franklintempleton.com
FRANKLIN ALTERNATIVE STRATEGIES FUNDS
Financial Statements
Statement of Assets and Liabilities
May 31, 2016
| | | |
| Franklin K2 Long Short Credit Fund | | | |
| |
| Assets: | | | |
| Investments in securities: | | | |
| Cost - Unaffiliated issuers | $ | 55,973,006 | |
| Cost - Repurchase agreements | | 1,037,523 | |
| Total cost of investments | $ | 57,010,529 | |
| Value - Unaffiliated issuers | $ | 57,189,343 | |
| Value - Repurchase agreements | | 1,037,523 | |
| Total value of investments | | 58,226,866 | |
| Cash | | 4,035,978 | |
| Foreign currency, at value (cost $61,104) | | 59,806 | |
| Receivables: | | | |
| Investment securities sold | | 7,122,056 | |
| Dividends and interest | | 688,455 | |
| Due from brokers | | 4,548,808 | |
| Offering costs | | 116,489 | |
| OTC swap contracts (upfront payments $210,820) | | 206,781 | |
| Unrealized appreciation on OTC forward exchange contracts | | 57,765 | |
| Unrealized appreciation on OTC swap contracts | | 28,640 | |
| Other assets | | 7 | |
| Total assets | | 75,091,651 | |
| Liabilities: | | | |
| Payables: | | | |
| Investment securities purchased | | 5,349,823 | |
| Management fees | | 76,156 | |
| Distribution fees | | 589 | |
| Transfer agent fees | | 485 | |
| Variation margin | | 3,365 | |
| OTC swap contracts (upfront receipts $71,302) | | 70,479 | |
| Options written, at value (premiums received $9,583) | | 10,643 | |
| Securities sold short, at value (proceeds $5,353,845) | | 5,422,676 | |
| Due to brokers | | 896 | |
| Unrealized depreciation on OTC forward exchange contracts | | 34,366 | |
| Unrealized depreciation on OTC swap contracts | | 96,167 | |
| Accrued expenses and other liabilities | | 104,237 | |
| Total liabilities | | 11,169,882 | |
| Net assets, at value | $ | 63,921,769 | |
| Net assets consist of: | | | |
| Paid-in capital | $ | 62,617,210 | |
| Undistributed net investment income | | 498,976 | |
| Net unrealized appreciation (depreciation) | | 1,010,861 | |
| Accumulated net realized gain (loss) | | (205,278 | ) |
| Net assets, at value | $ | 63,921,769 | |
franklintempleton.com
The accompanying notes are an integral part of these financial statements. | Annual Report 29
FRANKLIN ALTERNATIVE STRATEGIES FUNDS
FINANCIAL STATEMENTS
| | |
| Statement of Assets and Liabilities (continued) | | |
| May 31, 2016 | | |
| |
| Franklin K2 Long Short Credit Fund | | |
| |
| Class A: | | |
| Net assets, at value | $ | 28,197,685 |
| Shares outstanding | | 2,777,822 |
| Net asset value per sharea | $ | 10.15 |
| Maximum offering price per share (net asset value per share ÷ 94.25%) | $ | 10.77 |
| Class C: | | |
| Net assets, at value | $ | 270,043 |
| Shares outstanding | | 26,807 |
| Net asset value and maximum offering price per sharea | $ | 10.07 |
| Class R: | | |
| Net assets, at value | $ | 12,067 |
| Shares outstanding | | 1,195 |
| Net asset value and maximum offering price per share | $ | 10.10 |
| Class R6: | | |
| Net assets, at value | $ | 12,384,402 |
| Shares outstanding | | 1,219,926 |
| Net asset value and maximum offering price per share | $ | 10.15 |
| Advisor Class: | | |
| Net assets, at value | $ | 23,057,572 |
| Shares outstanding | | 2,270,909 |
| Net asset value and maximum offering price per share | $ | 10.15 |
| |
| aRedemption price is equal to net asset value less contingent deferred sales charges, if applicable. | | |
30 Annual Report | The accompanying notes are an integral part of these financial statements.
franklintempleton.com
FRANKLIN ALTERNATIVE STRATEGIES FUNDS
FINANCIAL STATEMENTS
Statement of Operations
for the period ended May 31, 2016a
| | | |
| Franklin K2 Long Short Credit Fund | | | |
| |
| Investment income: | | | |
| Dividends | $ | 61,199 | |
| Interest | | 1,673,212 | |
| Paydown gain (loss) | | 436,385 | |
| Total investment income | | 2,170,796 | |
| Expenses: | | | |
| Management fees (Note 3a) | | 864,522 | |
| Distribution fees: (Note 3c) | | | |
| Class A | | 1,160 | |
| Class C | | 899 | |
| Class R | | 40 | |
| Transfer agent fees: (Note 3e) | | | |
| Class A | | 1,102 | |
| Class C | | 20 | |
| Class R | | 15 | |
| Class R6 | | 52 | |
| Advisor Class | | 960 | |
| Custodian fees (Note 4) | | 42,309 | |
| Reports to shareholders | | 15,569 | |
| Registration and filing fees | | 9,952 | |
| Professional fees | | 72,222 | |
| Trustees’ fees and expenses | | 10,402 | |
| Amortization of offering costs | | 309,861 | |
| Interest on securities sold short | | 157,950 | |
| Security borrowing fees | | 9,695 | |
| Other | | 5,759 | |
| Total expenses | | 1,502,489 | |
| Expense reductions (Note 4) | | (861 | ) |
| Expenses waived/paid by affiliates (Note 3f) | | (535,116 | ) |
| Net expenses | | 966,512 | |
| Net investment income | | 1,204,284 | |
| Realized and unrealized gains (losses): | | | |
| Net realized gain (loss) from: | | | |
| Investments | | (314,645 | ) |
| Written options | | 45,054 | |
| Foreign currency transactions | | (94,505 | ) |
| Futures contracts | | (7,200 | ) |
| Securities sold short | | 224,334 | |
| Swap contracts | | (111,686 | ) |
| Net realized gain (loss) | | (258,648 | ) |
| Net change in unrealized appreciation (depreciation) on: | | | |
| Investments | | 1,147,506 | |
| Translation of other assets and liabilities denominated in foreign currencies | | 21,658 | |
| Written options | | (1,060 | ) |
| Futures contracts | | (13,042 | ) |
| Swap contracts | | (144,201 | ) |
| Net change in unrealized appreciation (depreciation) | | 1,010,861 | |
| Net realized and unrealized gain (loss) | | 752,213 | |
| Net increase (decrease) in net assets resulting from operations | $ | 1,956,497 | |
aFor the period September 8, 2015 (commencement of operations) to May 31, 2016.
franklintempleton.com
The accompanying notes are an integral part of these financial statements. | Annual Report 31
FRANKLIN ALTERNATIVE STRATEGIES FUNDS
FINANCIAL STATEMENTS
| | | |
| Statement of Changes in Net Assets | | | |
| |
| Franklin K2 Long Short Credit Fund | | | |
| |
| | | Period Ended | |
| | | May 31, 2016a | |
| Increase (decrease) in net assets: | | | |
| Operations: | | | |
| Net investment income | $ | 1,204,284 | |
| Net realized gain (loss) | | (258,648 | ) |
| Net change in unrealized appreciation (depreciation) | | 1,010,861 | |
| Net increase (decrease) in net assets resulting from operations | | 1,956,497 | |
| Distributions to shareholders from: | | | |
| Net investment income: | | | |
| Class A | | (223,550 | ) |
| Class C | | (748 | ) |
| Class R | | (97 | ) |
| Class R6 | | (99 | ) |
| Advisor Class | | (199,097 | ) |
| Net realized gains: | | | |
| Class A | | (175,371 | ) |
| Class C | | (576 | ) |
| Class R | | (76 | ) |
| Class R6 | | (76 | ) |
| Advisor Class | | (155,996 | ) |
| Total distributions to shareholders | | (755,686 | ) |
| Capital share transactions: (Note 2) | | | |
| Class A | | 27,777,884 | |
| Class C | | 262,842 | |
| Class R | | 10,000 | |
| Class R6 | | 11,915,470 | |
| Advisor Class | | 22,754,762 | |
| Total capital share transactions | | 62,720,958 | |
| Net increase (decrease) in net assets | | 63,921,769 | |
| Net assets: | | | |
| End of period | $ | 63,921,769 | |
| Undistributed net investment income included in net assets: | | | |
| End of period | $ | 498,976 | |
| |
| aFor the period September 8, 2015 (commencement of operations) to May 31, 2016. | | | |
32 Annual Report | The accompanying notes are an integral part of these financial statements.
franklintempleton.com
FRANKLIN ALTERNATIVE STRATEGIES FUNDS
Notes to Financial Statements
Franklin K2 Long Short Credit Fund
1. Organization and Significant Accounting Policies
Franklin Alternative Strategies Funds (Trust) is registered under the Investment Company Act of 1940 (1940 Act) as an open-end management investment company, consisting of three separate funds and applies the specialized accounting and reporting guidance in U.S. Generally Accepted Accounting Principles (U.S. GAAP). Franklin K2 Long Short Credit Fund (Fund) is included in this report. The financial statements of the remaining funds in the Trust are presented separately. The Fund commenced operations on September 8, 2015, with five classes of shares: Class A, Class C, Class R, Class R6 and Advisor Class. Effective September 28, 2015, the Fund began publicly offering its shares. Each class of shares differs by its initial sales load, contingent deferred sales charges, voting rights on matters affecting a single class, its exchange privilege and fees primarily due to differing arrangements for distribution and transfer agent fees.
The following summarizes the Fund’s significant accounting policies.
a. Financial Instrument Valuation
The Fund’s investments in financial instruments are carried at fair value daily. Fair value is the price that would be received to sell an asset or paid to transfer a liability in an orderly transaction between market participants on the measurement date. The Fund calculates the net asset value (NAV) per share as of 4 p.m. Eastern time each day the New York Stock Exchange (NYSE) is open for trading. Under compliance policies and procedures approved by the Trust’s Board of Trustees (the Board), the Fund’s administrator has responsibility for oversight of valuation, including leading the cross-functional Valuation Committee (VC). The VC provides administration and oversight of the Fund’s valuation policies and procedures, which are approved annually by the Board. Among other things, these procedures allow the Fund to utilize independent pricing services, quotations from securities and financial instrument dealers, and other market sources to determine fair value.
Equity securities and derivative financial instruments (derivatives) listed on an exchange or on the NASDAQ National Market System are valued at the last quoted sale price or the official closing price of the day, respectively. Over-the-counter (OTC) securities are valued within the range of the most recent quoted bid and ask prices. Securities that trade in multiple markets or on multiple exchanges are valued according
to the broadest and most representative market. Certain equity securities are valued based upon fundamental characteristics or relationships to similar securities.
Debt securities generally trade in the OTC market rather than on a securities exchange. The Fund’s pricing services use multiple valuation techniques to determine fair value. In instances where sufficient market activity exists, the pricing services may utilize a market-based approach through which quotes from market makers are used to determine fair value. In instances where sufficient market activity may not exist or is limited, the pricing services also utilize proprietary valuation models which may consider market characteristics such as benchmark yield curves, credit spreads, estimated default rates, anticipated market interest rate volatility, coupon rates, anticipated timing of principal repayments, underlying collateral, and other unique security features in order to estimate the relevant cash flows, which are then discounted to calculate the fair value. Securities denominated in a foreign currency are converted into their U.S. dollar equivalent at the foreign exchange rate in effect at the NYSE close on the date that the values of the foreign debt securities are determined.
Investments in open-end mutual funds are valued at the closing NAV. Repurchase agreements are valued at cost, which approximates fair value.
Certain derivatives trade in the OTC market. The Fund’s pricing services use various techniques including industry standard option pricing models and proprietary discounted cash flow models to determine the fair value of those instruments. The Fund’s net benefit or obligation under the derivative contract, as measured by the fair value of the contract, is included in net assets.
The Fund has procedures to determine the fair value of financial instruments for which market prices are not reliable or readily available. Under these procedures, the VC convenes on a regular basis to review such financial instruments and considers a number of factors, including significant unobservable valuation inputs, when arriving at fair value. The VC primarily employs a market-based approach which may use related or comparable assets or liabilities, recent transactions, market multiples, book values, and other relevant information for the investment to determine the fair value of the investment. An income-based valuation approach may also be used in which the anticipated future cash flows of the investment are discounted to calculate fair value. Discounts may also be applied due to the nature or
franklintempleton.com
Annual Report
33
FRANKLIN ALTERNATIVE STRATEGIES FUNDS
NOTES TO FINANCIAL STATEMENTS
Franklin K2 Long Short Credit Fund (continued)
1. Organization and Significant Accounting
Policies (continued)
a. Financial Instrument Valuation (continued)
duration of any restrictions on the disposition of the investments. Due to the inherent uncertainty of valuations of such investments, the fair values may differ significantly from the values that would have been used had an active market existed. The VC employs various methods for calibrating these valuation approaches including a regular review of key inputs and assumptions, transactional back-testing or disposition analysis, and reviews of any related market activity.
Trading in securities on foreign securities stock exchanges and OTC markets may be completed before 4 p.m. Eastern time. In addition, trading in certain foreign markets may not take place on every NYSE business day. Occasionally, events occur between the time at which trading in a foreign security is completed and the close of the NYSE that might call into question the reliability of the value of a portfolio security held by the Fund. As a result, differences may arise between the value of the Fund’s portfolio securities as determined at the foreign market close and the latest indications of value at the close of the NYSE. In order to minimize the potential for these differences, the VC monitors price movements following the close of trading in foreign stock markets through a series of country specific market proxies (such as baskets of American Depositary Receipts, futures contracts and exchange traded funds). These price movements are measured against established trigger thresholds for each specific market proxy to assist in determining if an event has occurred that may call into question the reliability of the values of the foreign securities held by the Fund. If such an event occurs, the securities may be valued using fair value procedures, which may include the use of independent pricing services.
When the last day of the reporting period is a non-business day, certain foreign markets may be open on those days that the NYSE is closed, which could result in differences between the value of the Fund’s portfolio securities on the last business day and the last calendar day of the reporting period. Any significant security valuation changes due to an open foreign market are adjusted and reflected by the Fund for financial reporting purposes.
b. Foreign Currency Translation
Portfolio securities and other assets and liabilities denominated in foreign currencies are translated into U.S. dollars based on
the exchange rate of such currencies against U.S. dollars on the date of valuation. The Fund may enter into foreign currency exchange contracts to facilitate transactions denominated in a foreign currency. Purchases and sales of securities, income and expense items denominated in foreign currencies are translated into U.S. dollars at the exchange rate in effect on the transaction date. Portfolio securities and assets and liabilities denominated in foreign currencies contain risks that those currencies will decline in value relative to the U.S. dollar. Occasionally, events may impact the availability or reliability of foreign exchange rates used to convert the U.S. dollar equivalent value. If such an event occurs, the foreign exchange rate will be valued at fair value using procedures established and approved by the Board.
The Fund does not separately report the effect of changes in foreign exchange rates from changes in market prices on securities held. Such changes are included in net realized and unrealized gain or loss from investments in the Statement of Operations.
Realized foreign exchange gains or losses arise from sales of foreign currencies, currency gains or losses realized between the trade and settlement dates on securities transactions and the difference between the recorded amounts of dividends, interest, and foreign withholding taxes and the U.S. dollar equivalent of the amounts actually received or paid. Net unrealized foreign exchange gains and losses arise from changes in foreign exchange rates on foreign denominated assets and liabilities other than investments in securities held at the end of the reporting period.
c. Joint Repurchase Agreement
The Fund enters into a joint repurchase agreement whereby its uninvested cash balance is deposited into a joint cash account with other funds managed by the investment manager or an affiliate of the investment manager and is used to invest in one or more repurchase agreements. The value and face amount of the joint repurchase agreement are allocated to the funds based on their pro-rata interest. A repurchase agreement is accounted for as a loan by the Fund to the seller, collateralized by securities which are delivered to the Fund’s custodian. The fair value, including accrued interest, of the initial collateralization is required to be at least 102% of the dollar amount invested by the funds, with the value of the underlying securities marked to market daily to maintain coverage of at least 100%. Repurchase agreements are subject to the terms of Master Repurchase Agreements (MRAs) with approved counterparties (sellers).
34 Annual Report
franklintempleton.com
FRANKLIN ALTERNATIVE STRATEGIES FUNDS
NOTES TO FINANCIAL STATEMENTS
Franklin K2 Long Short Credit Fund (continued)
The MRAs contain various provisions, including but not limited to events of default and maintenance of collateral for repurchase agreements. In the event of default by either the seller or the Fund, certain MRAs may permit the non-defaulting party to net and close-out all transactions, if any, traded under such agreements. The Fund may sell securities it holds as collateral and apply the proceeds towards the repurchase price and any other amounts owed by the seller to the Fund in the event of default by the seller. This could involve costs or delays in addition to a loss on the securities if their value falls below the repurchase price owed by the seller. The joint repurchase agreement held by the Fund at period end, as indicated in the Statement of Investments, had been entered into on May 31, 2016.
d. Derivative Financial Instruments
The Fund invested in derivatives in order to manage risk or gain exposure to various other investments or markets. Derivatives are financial contracts based on an underlying or notional amount, require no initial investment or an initial net investment that is smaller than would normally be required to have a similar response to changes in market factors, and require or permit net settlement. Derivatives contain various risks including the potential inability of the counterparty to fulfill their obligations under the terms of the contract, the potential for an illiquid secondary market, and/or the potential for market movements which expose the Fund to gains or losses in excess of the amounts shown in the Statement of Assets and Liabilities. Realized gain and loss and unrealized appreciation and depreciation on these contracts for the period are included in the Statement of Operations.
Derivative counterparty credit risk is managed through a formal evaluation of the creditworthiness of all potential counter-parties. The Fund attempts to reduce its exposure to counterparty credit risk on OTC derivatives, whenever possible, by entering into International Swaps and Derivatives Association (ISDA) master agreements with certain counterparties. These agreements contain various provisions, including but not limited to collateral requirements, events of default, or early termination. Termination events applicable to the counterparty include certain deteriorations in the credit quality of the counterparty. Termination events applicable to the Fund include failure of the Fund to maintain certain net asset levels and/or limit the decline in net assets over various periods of time. In the event of default or early termination, the ISDA master agreement gives the non-defaulting party the right to net and close-out all transactions traded, whether or not arising under
the ISDA agreement, to one net amount payable by one counterparty to the other. However, absent an event of default or early termination, OTC derivative assets and liabilities are presented gross and not offset in the Statement of Assets and Liabilities. Early termination by the counterparty may result in an immediate payment by the Fund of any net liability owed to that counterparty under the ISDA agreement.
Collateral requirements differ by type of derivative. Collateral or initial margin requirements are set by the broker or exchange clearing house for exchange traded and centrally cleared derivatives. Initial margin deposited is held at the exchange and can be in the form of cash and/or securities. For OTC derivatives traded under an ISDA master agreement, posting of collateral is required by either the Fund or the applicable coun-terparty if the total net exposure of all OTC derivatives with the applicable counterparty exceeds the minimum transfer amount, which typically ranges from $100,000 to $250,000, and can vary depending on the counterparty and the type of the agreement. Generally, collateral is determined at the close of fund business each day and any additional collateral required due to changes in derivative values may be delivered by the Fund or the counterparty within a few business days. Collateral pledged and/or received by the Fund for OTC derivatives, if any, is held in segregated accounts with the Fund’s custodian/counterparty broker and can be in the form of cash and/or securities. Unrestricted cash may be invested according to the Fund’s investment objectives. To the extent that the amounts due to the Fund from its counterparties are not subject to collateralization or are not fully collateralized, the Fund bears the risk of loss from counterparty non-performance.
The Fund entered into exchange traded futures contracts primarily to manage and/or gain exposure to interest rate and equity price risk. A futures contract is an agreement between the Fund and a counterparty to buy or sell an asset for a specified price on a future date. Required initial margins are pledged by the Fund, and the daily change in fair value is accounted for as a variation margin payable or receivable in the Statement of Assets and Liabilities.
The Fund entered into OTC forward exchange contracts primarily to manage and/or gain exposure to certain foreign currencies. A forward exchange contract is an agreement between the Fund and a counterparty to buy or sell a foreign currency at a specific exchange rate on a future date.
franklintempleton.com
Annual Report
35
FRANKLIN ALTERNATIVE STRATEGIES FUNDS
NOTES TO FINANCIAL STATEMENTS
Franklin K2 Long Short Credit Fund (continued)
1. Organization and Significant Accounting
Policies (continued)
d. Derivative Financial Instruments (continued)
The Fund entered into credit default swap contracts primarily to manage and/or gain exposure to credit risk. A credit default swap is an agreement between the Fund and a counterparty whereby the buyer of the contract receives credit protection and the seller of the contract guarantees the credit worthiness of a referenced debt obligation. These agreements may be privately negotiated in the over-the-counter market (OTC credit default swaps) or may be executed in a multilateral trade facility platform, such as a registered exchange (centrally cleared credit default swaps). The underlying referenced debt obligation may be a single issuer of corporate or sovereign debt, a credit index, a basket of issuers or indices, or a tranche of a credit index or basket of issuers or indices. In the event of a default of the underlying referenced debt obligation, the buyer is entitled to receive the notional amount of the credit default swap contract from the seller in exchange for the referenced debt obligation, a net settlement amount equal to the notional amount of the credit default swap less the recovery value of the referenced debt obligation, or other agreed upon amount. For centrally cleared credit default swaps, required initial margins are pledged by the Fund, and the daily change in fair value is accounted for as a variation margin payable or receivable in the Statement of Assets and Liabilities. Over the term of the contract, the buyer pays the seller a periodic stream of payments, provided that no event of default has occurred. Such periodic payments are accrued daily as an unrealized appreciation or depreciation until the payments are made, at which time they are realized. Upfront payments and receipts are reflected in the Statement of Assets and Liabilities and represent compensating factors between stated terms of the credit default swap agreement and prevailing market conditions (credit spreads and other relevant factors). These upfront payments and receipts are amortized over the term of the contract as a realized gain or loss in the Statement of Operations.
The Fund entered into OTC total return swap contracts primarily to manage and/or gain exposure to credit risk of an underlying instrument such as a stock, bond, index or basket of securities or indices. A total return swap is an agreement between the Fund and a counterparty to exchange a return linked to an underlying instrument for a floating or fixed rate payment, both based upon a notional amount. Over the term of the contract, contractually required payments to be paid or
received are accrued daily and recorded as unrealized appreciation or depreciation until the payments are made, at which time they are recognized as realized gain or loss.
The Fund purchased or wrote exchange traded and/or OTC option contracts primarily to manage and/or gain exposure to equity price, interest rate and credit risk. An option is a contract entitling the holder to purchase or sell a specific amount of shares or units of an asset or notional amount of a swap (swaption), at a specified price. When an option is purchased or written, an amount equal to the premium paid or received is recorded as an asset or liability, respectively. Upon exercise of an option, the acquisition cost or sales proceeds of the underlying investment is adjusted by any premium received or paid. Upon expiration of an option, any premium received or paid is recorded as a realized gain or loss. Upon closing an option other than through expiration or exercise, the difference between the premium received or paid and the cost to close the position is recorded as a realized gain or loss.
See Notes 6 and 8 regarding investment transactions and other derivative information, respectively.
e. Securities Sold Short
The Fund is engaged in selling securities short, which obligates the Fund to replace a borrowed security with the same security at current fair value. The Fund incurs a loss if the price of the security increases between the date of the short sale and the date on which the Fund replaces the borrowed security. The Fund realizes a gain if the price of the security declines between those dates. Gains are limited to the price at which the Fund sold the security short, while losses are potentially unlimited in size.
The Fund is required to establish a margin account with the broker lending the security sold short. While the short sale is outstanding, the broker retains the proceeds of the short sale to the extent necessary to meet margin requirements until the short position is closed out. A deposit must also be maintained with the Fund’s custodian/counterparty broker consisting of cash and/or securities having a value equal to a specified percentage of the value of the securities sold short. The Fund is obligated to pay fees for borrowing the securities sold short and is required to pay the counterparty any dividends and/or interest due on securities sold short. Such dividends and/or interest and any security borrowing fees are recorded as an expense to the Fund.
36 Annual Report
franklintempleton.com
FRANKLIN ALTERNATIVE STRATEGIES FUNDS
NOTES TO FINANCIAL STATEMENTS
Franklin K2 Long Short Credit Fund (continued)
f. Income and Deferred Taxes
It is the Fund’s policy to qualify as a regulated investment company under the Internal Revenue Code. The Fund intends to distribute to shareholders substantially all of its taxable income and net realized gains to relieve it from federal income and excise taxes. As a result, no provision for U.S. federal income taxes is required.
The Fund may be subject to foreign taxation related to income received, capital gains on the sale of securities and certain foreign currency transactions in the foreign jurisdictions in which it invests. Foreign taxes, if any, are recorded based on the tax regulations and rates that exist in the foreign markets in which the Fund invests. When a capital gain tax is determined to apply, the Fund records an estimated deferred tax liability in an amount that would be payable if the securities were disposed of on the valuation date.
The Fund may recognize an income tax liability related to its uncertain tax positions under U.S. GAAP when the uncertain tax position has a less than 50% probability that it will be sustained upon examination by the tax authorities based on its technical merits. As of May 31, 2016, the Fund has determined that no tax liability is required in its financial statements related to uncertain tax positions (or expected to be taken in future tax years).
g. Security Transactions, Investment Income, Expenses and Distributions
Security transactions are accounted for on trade date. Realized gains and losses on security transactions are determined on a specific identification basis. Interest income and estimated expenses are accrued daily. Amortization of premium and accretion of discount on debt securities are included in interest income. Paydown gains and losses are recorded as an adjustment to interest income separately in the Statement of Operations. Dividend income is recorded on the ex-dividend date. Distributions to shareholders are recorded on the ex-dividend date and are determined according to income tax regulations (tax basis). Distributable earnings determined on a tax basis may differ from earnings recorded in accordance with U.S. GAAP. These differences may be permanent or temporary.
Permanent differences are reclassified among capital accounts to reflect their tax character. These reclassifications have no impact on net assets or the results of operations. Temporary differences are not reclassified, as they may reverse in subsequent periods.
Common expenses incurred by the Trust are allocated among the funds based on the ratio of net assets of each fund to the combined net assets of the Trust. Fund specific expenses are charged directly to the fund that incurred the expense.
Realized and unrealized gains and losses and net investment income, not including class specific expenses, are allocated daily to each class of shares based upon the relative proportion of net assets of each class. Differences in per share distributions, by class, are generally due to differences in class specific expenses.
h. Offering Costs
Offering costs are amortized on a straight line basis over twelve months.
i. Accounting Estimates
The preparation of financial statements in accordance with U.S. GAAP requires management to make estimates and assumptions that affect the reported amounts of assets and liabilities at the date of the financial statements and the amounts of income and expenses during the reporting period. Actual results could differ from those estimates.
j. Guarantees and Indemnifications
Under the Trust’s organizational documents, its officers and trustees are indemnified by the Trust against certain liabilities arising out of the performance of their duties to the Trust. Additionally, in the normal course of business, the Trust, on behalf of the Fund, enters into contracts with service providers that contain general indemnification clauses. The Trust’s maximum exposure under these arrangements is unknown as this would involve future claims that may be made against the Trust that have not yet occurred. Currently, the Trust expects the risk of loss to be remote.
franklintempleton.com
Annual Report
37
FRANKLIN ALTERNATIVE STRATEGIES FUNDS
NOTES TO FINANCIAL STATEMENTS
Franklin K2 Long Short Credit Fund (continued)
2. Shares of Beneficial Interest
At May 31, 2016, there were an unlimited number of shares authorized (without par value). Transactions in the Fund’s shares were as follows:
| | | | | |
| | Period Ended | |
| | May 31, 2016a | |
| | Shares | | | Amount | |
| |
| Class A Shares: | | | | | |
| Shares sold | 2,783,146 | | $ | 27,833,801 | |
| Shares issued in reinvestment of distributions | 74 | | | 736 | |
| Shares redeemed | (5,398 | ) | | (56,653 | ) |
| Net increase (decrease) | 2,777,822 | | $ | 27,777,884 | |
| Class C Shares: | | | | | |
| Shares sold | 526,223 | | $ | 5,258,893 | |
| Shares issued in reinvestment of distributions | 117 | | | 1,149 | |
| Shares redeemed | (499,533 | ) | | (4,997,200 | ) |
| Net increase (decrease) | 26,807 | | $ | 262,842 | |
| Class R Shares: | | | | | |
| Shares sold | 500,001 | | $ | 5,000,010 | |
| Shares redeemed | (498,806 | ) | | (4,990,010 | ) |
| Net increase (decrease) | 1,195 | | $ | 10,000 | |
| Class R6 Shares: | | | | | |
| Shares sold | 1,993,087 | | $ | 19,659,680 | |
| Shares redeemed | (773,161 | ) | | (7,744,210 | ) |
| Net increase (decrease) | 1,219,926 | | $ | 11,915,470 | |
| Advisor Class Shares: | | | | | |
| Shares sold | 2,506,772 | | $ | 25,097,674 | |
| Shares issued in reinvestment of distributions | 2,934 | | | 29,016 | |
| Shares redeemed | (238,797 | ) | | (2,371,928 | ) |
| Net increase (decrease) | 2,270,909 | | $ | 22,754,762 | |
aFor the period September 8, 2015 (commencement of operations) to May 31, 2016.
3. Transactions with Affiliates
Franklin Resources, Inc. is the holding company for various subsidiaries that together are referred to as Franklin Templeton
Investments. Certain officers and trustees of the Trust are also officers and/or directors of the following subsidiaries:
| | |
| Subsidiary | | Affiliation |
| K2/D&S Management Co., L.L.C. (K2 Advisors) | | Investment manager |
| Franklin Templeton Services, LLC (FT Services) | | Administrative manager |
| Franklin Templeton Distributors, Inc. (Distributors) | | Principal underwriter |
| Franklin Templeton Investor Services, LLC (Investor Services) | | Transfer agent |
a. Management Fees
The Fund pays an investment management fee to K2 Advisors of 2.05% per year of the average daily net assets of the Fund.
38 Annual Report
franklintempleton.com
FRANKLIN ALTERNATIVE STRATEGIES FUNDS
NOTES TO FINANCIAL STATEMENTS
Franklin K2 Long Short Credit Fund (continued)
Under each subadvisory agreement, the below entities provide subadvisory services to the Fund. The subadvisory fees are paid by
K2 Advisors based on the Fund’s average daily net assets, and is not an additional expense of the Fund.
|
| Subadvisors |
| Apollo Credit Management LLC |
| Candlewood Investment Group, L.P. |
| Chatham Asset Management, LLC |
| Ellington Global Asset Management, L.L.C. |
| Emso Asset Management Limited |
b. Administrative Fees
Under an agreement with K2 Advisors, FT Services provides administrative services to the Fund. The fee is paid by K2 Advisors based on the Fund’s average daily net assets, and is not an additional expense of the Fund.
c. Distribution Fees
The Board has adopted distribution plans for each share class, with the exception of Class R6 and Advisor Class shares, pursuant to Rule 12b-1 under the 1940 Act. Under the Fund’s Class A reimbursement distribution plan, the Fund reimburses Distributors for costs incurred in connection with the servicing, sale and distribution of the Fund’s shares up to the maximum annual plan rate. Under the Class A reimbursement distribution plan, costs exceeding the maximum for the current plan year cannot be reimbursed in subsequent periods. In addition, under the Fund’s Class C and R compensation distribution plans, the Fund pays Distributors for costs incurred in connection with the servicing, sale and distribution of the Fund’s shares up to the maximum annual plan rate for each class. The plan year, for purposes of monitoring compliance with the maximum annual plan rates, is February 1 through January 31 for each fund.
The maximum annual plan rates, based on the average daily net assets, for each class, are as follows:
| | |
| Class A | 0.25 | % |
| Class C | 1.00 | % |
| Class R | 0.50 | % |
d. Sales Charges/Underwriting Agreements
Front-end sales charges and contingent deferred sales charges (CDSC) do not represent expenses of the Fund. These charges are deducted from the proceeds of sales of Fund shares prior to investment or from redemption proceeds prior to remittance, as applicable. Distributors has advised the Fund of the following commission transactions related to the sales and redemptions of the Fund’s shares for the period:
| | |
| Sales charges retained net of commissions paid to unaffiliated broker/dealers | $ | 618 |
| CDSC retained | $ | 6 |
e. Transfer Agent Fees
Each class of shares, except for Class R6, pays transfer agent fees to Investor Services for its performance of shareholder servicing obligations and reimburses Investor Services for out of pocket expenses incurred, including shareholder servicing fees paid to third parties. These fees are allocated daily based upon their relative proportion of such classes’ aggregate net assets. Class R6 pays Investor Services transfer agent fees specific to that class.
For the period ended May 31, 2016, the Fund paid transfer agent fees of $2,149, of which $972 was retained by Investor Services.
franklintempleton.com
Annual Report
39
FRANKLIN ALTERNATIVE STRATEGIES FUNDS
NOTES TO FINANCIAL STATEMENTS
Franklin K2 Long Short Credit Fund (continued)
3. Transactions with Affiliates (continued)
f. Waiver and Expense Reimbursements
K2 Advisors has contractually agreed in advance to waive or limit its fees and to assume as its own expense certain expenses otherwise payable by the Fund so that the expenses (excluding distribution fees, acquired fund fees and expenses, and expenses related to securities sold short) for each class of the Fund do not exceed 1.95%, and Class R6 does not exceed 1.89% based on the average net assets of each class (other than certain non-routine expenses or costs, including those relating to litigation, indemnification, reorganizations, and liquidations) until September 30, 2016. Total expenses waived or paid are not subject to recapture subsequent to the Fund’s fiscal year end.
| | | |
| g. Other Affiliated Transactions | | | |
| At May 31, 2016, the shares of the Fund were owned by the following entities: | | |
| | | Percentage of | |
| | | Outstanding | |
| | Shares | Shares | |
| Franklin Resources, Inc | 5,000,389 | 79.41 | %a |
| Franklin LifeSmart 2025 Retirement Target Fund | 372,832 | 5.92 | % |
| Franklin LifeSmart 2035 Retirement Target Fund | 295,504 | 4.69 | % |
| Franklin LifeSmart 2045 Retirement Target Fund | 202,253 | 3.21 | % |
| Franklin LifeSmart 2030 Retirement Target Fund | 102,505 | 1.63 | % |
| Franklin LifeSmart 2020 Retirement Target Fund | 98,026 | 1.56 | % |
| Franklin LifeSmart 2040 Retirement Target Fund | 74,832 | 1.19 | % |
| Franklin LifeSmart 2050 Retirement Target Fund | 65,441 | 1.04 | % |
| Franklin LifeSmart 2055 Retirement Target Fund | 7,340 | 0.12 | % |
| | 6,219,122 | 98.77 | % |
| aInvestment activities of this shareholder could have a material impact on the Fund. | | | |
4. Expense Offset Arrangement
The Fund has entered into an arrangement with its custodian whereby credits realized as a result of uninvested cash balances are used to reduce a portion of the Fund’s custodian expenses. During the period ended May 31, 2016, the custodian fees were reduced as noted in the Statement of Operations.
5. Income Taxes
For tax purposes, capital losses may be carried over to offset future capital gains, if any. At May 31, 2016, the capital loss carryfor-wards were as follows:
| | |
| Capital loss carryforwards: | | |
| Short term | $ | 52,924 |
| Long term | | 9,129 |
| Total capital loss carryforwards | $ | 62,053 |
The tax character of distributions paid during the period ended May 31, 2016, was as follows:
Distributions paid from ordinary income
$755,686
40 Annual Report
franklintempleton.com
FRANKLIN ALTERNATIVE STRATEGIES FUNDS
NOTES TO FINANCIAL STATEMENTS
Franklin K2 Long Short Credit Fund (continued)
At May 31, 2016, the cost of investments, net unrealized appreciation (depreciation) and undistributed ordinary income for income tax purposes were as follows:
| | | |
| Cost of investments | $ | 57,166,796 | |
| Unrealized appreciation | $ | 1,922,858 | |
| Unrealized depreciation | | (862,788 | ) |
| Net unrealized appreciation (depreciation) | $ | 1,060,070 | |
| Distributable earnings - undistributed ordinary income | $ | 499,669 | |
Differences between income and/or capital gains as determined on a book basis and a tax basis are primarily due to differing treatments of bond discounts and premiums, swaps, offering costs and wash sales.
6. Investment Transactions
Purchases and sales of investments and securities sold short (excluding short term securities) for the period ended May 31, 2016, aggregated $279,101,174 and $235,026,991, respectively.
| | | | | | | | | | | | |
| Transactions in options written during the period ended May 31, 2016, were as follows: | | | | | | | | | | | |
| | Options | | | Swaptions | | |
| |
| | Number of | | | | | | Notional | | | | | |
| | Contracts | | | Premiums | | | Amount | | | Premiums | |
| Options written | 330 | | $ | 79,476 | | $ | 6,000,000 | | $ | 38,400 | |
| Options expired | (136 | ) | | (40,055 | ) | | (6,000,000 | ) | | (38,400 | ) |
| Options exercised | — | | | — | | | — | | | | — | |
| Options closed | (24 | ) | | (29,838 | ) | | — | | | | — | |
| Options outstanding at May 31, 2016 | 170 | | $ | 9,583 | | $ | — | | | $ | — | |
See Notes 1(d) and 8 regarding derivative financial instruments and other derivative information, respectively.
7. Credit Risk
At May 31, 2016, the Fund had 22.1% of its portfolio invested in high yield and other securities rated below investment grade. These securities may be more sensitive to economic conditions causing greater price volatility and are potentially subject to a greater risk of loss due to default than higher rated securities.
8. Other Derivative Information
At May 31, 2016, the Fund’s investments in derivative contracts are reflected in the Statement of Assets and Liabilities as follows:
| | | | | | | | |
| | Asset Derivatives | | | | Liability Derivatives | |
| |
| Derivative Contracts | | | | | | | | |
| Not Accounted for as | Statement of Assets and | | | | Statement of Assets and | | | |
| Hedging Instruments | Liabilities Location | | Fair Value | | Liabilities Location | | Fair Value | |
| Interest rate contracts | Investments in securities, at | $ | 5,735 | a | Variation margin | $ | 4,448 | b |
| | value | | | | | | | |
| Foreign exchange contracts | Unrealized appreciation on | | 57,765 | | Unrealized depreciation on | | 34,366 | |
| | OTC forward exchange | | | | OTC forward exchange | | | |
| | contracts | | | | contracts | | | |
franklintempleton.com
Annual Report
41
FRANKLIN ALTERNATIVE STRATEGIES FUNDS
NOTES TO FINANCIAL STATEMENTS
| | | | | | | | |
| Franklin K2 Long Short Credit Fund (continued) | | | | | | | |
| |
| 8. Other Derivative Information (continued) | | | | | | | |
| | Asset Derivatives | | | | Liability Derivatives | |
| Derivative Contracts | | | | | | | | |
| Not Accounted for as | Statement of Assets and | | | | Statement of Assets and | | | |
| Hedging Instruments | Liabilities Location | | Fair Value | | Liabilities Location | | Fair Value | |
| Credit contracts | Variation margin | $ | 3,157 | b | Variation margin | $ | 79,831 | b |
| | OTC swap contracts | | 206,781 | | OTC swap contracts (upfront | | 70,479 | |
| | (upfront payments) | | | | receipts) | | | |
| | Unrealized appreciation on | | 28,640 | | Unrealized depreciation on | | 96,167 | |
| | OTC swap contracts | | | | OTC swap contracts | | | |
| Equity contracts | Investments in securities, at | | 48,511 | a | Options written, at value | | 10,643 | |
| | value | | | | | | | |
| | | | | | Variation margin | | 8,594 | b |
| Totals | | $ | 350,589 | | | $ | 304,528 | |
aPurchased option contracts are included in investments in securities, at value in the Statement of Assets and Liabilities.
bThis amount reflects the cumulative appreciation (depreciation) of futures contracts and centrally cleared swaps contracts as reported in the Statement of Investments. Only
the variation margin receivable/payable at period end is separately reported within the Statement of Assets and Liabilities. Prior variation margin movements were recorded to
cash upon receipt or payment.
For the period ended May 31, 2016, the effect of derivative contracts in the Fund’s Statement of Operations was as follows:
| | | | | | | | |
| | | | | | | | Net Change in | |
| | | | | | | | Unrealized | |
| Derivative Contracts | | | Net Realized | | | | Appreciation | |
| Not Accounted for as | Statement of | | Gain (Loss) | | Statement of | | (Depreciation) | |
| Hedging Instruments | Operations Locations | | for the Period | | Operations Locations | | for the Period | |
| | Net realized gain (loss) | | | | Net change in unrealized | | | |
| | from: | | | | appreciation (depreciation) on: | | | |
| Interest rate contracts | Futures contracts | $ | 2,353 | | Investments | $ | (4,096 | )a |
| | | | | | Futures contracts | | (4,448 | ) |
| Foreign exchange contracts | Foreign currency | | (136,975 | ) | Translation of other assets and | | 23,399 | b |
| | transactions | | | | liabilities denominated in | | | |
| | | | | | foreign currencies | | | |
| Credit contracts | Written options | | 38,400 | | Swap contracts | | (144,201 | ) |
| | Swap contracts | | (111,686 | ) | | | | |
| Equity contracts | Investments | | (101,671 | )a | Investments | | (16,465 | )a |
| | Written options | | 6,654 | | Written options | | (1,060 | ) |
| | Futures contracts | | (9,553 | ) | Futures contracts | | (8,594 | ) |
| Totals | | $ | (312,478 | ) | | $ | (155,465 | ) |
aPurchased option contracts are included in net realized gain (loss) from investments and net change in unrealized appreciation (depreciation) on investments in the Statement
of Operations.
bForward exchange contracts are included in net realized gain (loss) from foreign currency transactions and net change in unrealized appreciation (depreciation) translation of
other assets and liabilities denominated in foreign currencies in the Statement of Operations.
For the period ended May 31, 2016, the average month end fair value of derivatives represented 0.34% of average month end net
assets. The average month end number of open derivative contracts for the period was 29.
42 Annual Report
franklintempleton.com
FRANKLIN ALTERNATIVE STRATEGIES FUNDS
NOTES TO FINANCIAL STATEMENTS
Franklin K2 Long Short Credit Fund (continued)
At May 31, 2016, the Fund’s OTC derivative assets and liabilities are as follows:
| | | | |
| | | Gross and Net Amounts |
| | | of Assets and Liabilities |
| | | Presented in the |
| | | Statement of |
| | | Assets and Liabilities |
| |
| | | Assetsa | | Liabilitiesa |
| Derivatives | | | | |
| Forward Exchange Contracts | $ | 57,765 | $ | 34,366 |
| Options Purchased | | 5,735 | | — |
| Swap Contracts | | 235,421 | | 166,646 |
| Total | $ | 298,921 | $ | 201,012 |
aAbsent an event of default or early termination, OTC derivative assets and liabilities are presented gross and not offset in the Statement of Assets and Liabilities.
At May 31, 2016, the Fund’s OTC derivative assets, which may be offset against the Fund’s OTC derivative liabilities and collateral received from the counterparty, are as follows:
| | | | | | | | | | | |
| | | | | Amounts Not Offset in the | | | | |
| | | | | Statement of Assets and Liabilities | | |
| |
| | | Gross and Net | | | | | | | | | |
| | | Amounts of Assets | | | | | Financial | | | | |
| | | Presented in the | | Financial | | | Instruments | | Cash | | |
| | | Statement of | | Instruments | | | Collateral | | Collateral | | Net Amount (Not |
| | | Assets and Liabilities | | Available for Offset | | | Received | | Received | | less than zero) |
| Counterparty | | | | | | | | | | | |
| JPHQ | $ | 246,382 | $ | (158,336 | ) | $ | — | $ | — | $ | 88,046 |
| GSCO | | 3,888 | | (3,888 | ) | | — | | — | | — |
| MLCO | | 597 | | — | | | — | | — | | 597 |
| MSCO | | 48,054 | | (34,366 | ) | | — | | — | | 13,688 |
| MSCS | | — | | — | | | — | | — | | — |
| Total | $ | 298,921 | $ | (196,590 | ) | $ | — | $ | — | $ | 102,331 |
At May 31, 2016, the Fund’s OTC derivative liabilities, which may be offset against the Fund’s OTC derivative assets and collateral pledged to the counterparty, are as follows:
| | | | | | | | | | | |
| | | | | Amounts Not Offset in the | | | | |
| | | | | Statement of Assets and Liabilities | | | | |
| |
| | | Gross and Net | | | | | | | | | |
| | | Amounts of Liabilities | | | | | Financial | | | | |
| | | Presented in the | | Financial | | | Instruments | | Cash | | |
| | | Statement of | | Instruments | | | Collateral | | Collateral | | Net Amount (Not |
| | | Assets and Liabilities | | Available for Offset | | | Pledgeda,b | | Pledgeda | | less than zero) |
| Counterparty | | | | | | | | | | | |
| JPHQ | $ | 158,336 | $ | (158,336 | ) | $ | — | $ | — | $ | — |
| GSCO | | 8,190 | | (3,888 | ) | | — | | — | | 4,302 |
| MLCO | | — | | — | | | — | | — | | — |
| MSCO | | 34,366 | | (34,366 | ) | | — | | — | | — |
| MSCS | | 120 | | — | | | — | | — | | 120 |
| Total | $ | 201,012 | $ | (196,590 | ) | $ | — | $ | — | $ | 4,422 |
aIn some instances, the collateral amounts disclosed in the table above were adjusted due to the requirement to limit collateral amounts to avoid the effect of over collateraliza-
tion. Actual collateral received and/or pledged may be more than the amounts disclosed herein.
bSee the accompanying Statement of Investments for securities pledged as collateral for derivatives.
See Notes 1(d) and 6 regarding derivative financial instruments and investment transactions, respectively.
See Abbreviations on page 45.
franklintempleton.com
Annual Report
43
FRANKLIN ALTERNATIVE STRATEGIES FUNDS
NOTES TO FINANCIAL STATEMENTS
Franklin K2 Long Short Credit Fund (continued)
9. Credit Facility
The Fund, together with other U.S. registered and foreign investment funds (collectively, Borrowers), managed by Franklin Templeton Investments, are borrowers in a joint syndicated senior unsecured credit facility totaling $2 billion (Global Credit Facility) which matures on February 10, 2017. This Global Credit Facility provides a source of funds to the Borrowers for temporary and emergency purposes, including the ability to meet future unanticipated or unusually large redemption requests. The Fund began participating in the Global Credit Facility on February 12, 2016.
Under the terms of the Global Credit Facility, the Fund shall, in addition to interest charged on any borrowings made by the Fund and other costs incurred by the Fund, pay its share of fees and expenses incurred in connection with the implementation and maintenance of the Global Credit Facility, based upon its relative share of the aggregate net assets of all of the Borrowers, including an annual commitment fee of 0.15% based upon the unused portion of the Global Credit Facility. These fees are reflected in other expenses in the Statement of Operations. During the period ended May 31, 2016, the Fund did not use the Global Credit Facility.
10. Fair Value Measurements
The Fund follows a fair value hierarchy that distinguishes between market data obtained from independent sources (observable inputs) and the Fund’s own market assumptions (unobservable inputs). These inputs are used in determining the value of the Fund’s financial instruments and are summarized in the following fair value hierarchy:
- Level 1 – quoted prices in active markets for identical financial instruments
- Level 2 – other significant observable inputs (including quoted prices for similar financial instruments, interest rates, prepay- ment speed, credit risk, etc.)
- Level 3 – significant unobservable inputs (including the Fund’s own assumptions in determining the fair value of financial instruments)
The input levels are not necessarily an indication of the risk or liquidity associated with financial instruments at that level.
For movements between the levels within the fair value hierarchy, the Fund has adopted a policy of recognizing the transfers as of the date of the underlying event which caused the movement.
A summary of inputs used as of May 31, 2016, in valuing the Fund’s assets and liabilities carried at fair value, is as follows:
| | | | | | | | |
| | | Level 1 | | Level 2 | | Level 3 | | Total |
| |
| Assets: | | | | | | | | |
| Investments in Securities:a | | | | | | | | |
| Common Stocks | $ | 111,450 | $ | — | $ | — | $ | 111,450 |
| Preferred Stocks | | 302,584 | | — | | — | | 302,584 |
| Convertible Bonds | | — | | 2,144,861 | | — | | 2,144,861 |
| Corporate Bonds and Notes | | — | | 24,006,065 | | — | | 24,006,065 |
| Foreign Government and Agency Securities | | — | | 3,514,782 | | — | | 3,514,782 |
| Asset-Backed Securities and Commercial Mortgage-Backed | | | | | | | | |
| Securities | | — | | 20,034,545 | | — | | 20,034,545 |
| Options Purchased | | 48,511 | | 5,735 | | — | | 54,246 |
| U.S. Government and Agency Securities | | — | | 1,835,245 | | — | | 1,835,245 |
| Short Term Investments | | 5,185,565 | | 1,037,523 | | — | | 6,223,088 |
| Total Investments in Securities | $ | 5,648,110 | $ | 52,578,756 | $ | — | $ | 58,226,866 |
44 Annual Report
franklintempleton.com
FRANKLIN ALTERNATIVE STRATEGIES FUNDS
NOTES TO FINANCIAL STATEMENTS
| | | | | | | | |
| Franklin K2 Long Short Credit Fund (continued) | | | | | | | | |
| |
| 10. Fair Value Measurements (continued) | | | | | | | | |
| |
| | | Level 1 | | Level 2 | | Level 3 | | Total |
| Other Financial Instruments | | | | | | | | |
| Forward Exchange Contracts | $ | — | $ | 57,765 | $ | — | $ | 57,765 |
| Swap Contracts | | — | | 31,797 | | — | | 31,797 |
| Total Other Financial Instruments | $ | — | $ | 89,562 | $ | — | $ | 89,562 |
| |
| Liabilities: | | | | | | | | |
| Other Financial Instruments | | | | | | | | |
| Options Written | $ | 10,643 | $ | — | $ | — | $ | 10,643 |
| Securities Sold Shorta | | — | | 5,422,676 | | — | | 5,422,676 |
| Futures Contracts | | 13,042 | | — | | — | | 13,042 |
| Forward Exchange Contracts | | — | | 34,366 | | — | | 34,366 |
| Swap Contracts | | — | | 175,998 | | — | | 175,998 |
| Total Other Financial Instruments | $ | 23,685 | $ | 5,633,040 | $ | — | $ | 5,656,725 |
aFor detailed categories, see the accompanying Statement of Investments.
A reconciliation of assets in which Level 3 inputs are used in determining fair value is presented when there are significant Level 3 financial instruments at the end of the period.
11. Subsequent Events
The Fund has evaluated subsequent events through the issuance of the financial statements and determined that no events have occurred that require disclosure.
| | | | | |
| Abbreviations | | | | |
| Counterparty/Exchange | Currency | Selected Portfolio |
| GSCO | The Goldman Sachs Group, Inc. | EUR | Euro | ARM | Adjustable Rate Mortgage |
| ICE | Intercontinental Exchange, Inc. | GBP | British Pound | CLO | Collateralized Loan Obligation |
| JPHQ | JP Morgan Chase & Co. | JPY | Japanese Yen | FHLMC | Federal Home Loan Mortgage Corp. |
| MLCO | Merrill Lynch & Co., Inc. | USD | United States Dollar | FRN | Floating Rate Note |
| MSCO | Morgan Stanley | | | LIBOR | London InterBank Offered Rate |
| MSCS | Morgan Stanley Capital Services | | | PIK | Payment In-Kind |
| | | | | REIT | Real Estate Investment Trust |
franklintempleton.com
Annual Report
45
FRANKLIN ALTERNATIVE STRATEGIES FUNDS
Report of Independent Registered Public Accounting Firm
To the Board of Trustees of Franklin Alternative Strategies Funds and Shareholders of Franklin K2 Long Short Credit Fund:
We have audited the accompanying statement of assets and liabilities, including the statement of investments, of Franklin K2 Long Short Credit Fund (the “Fund”) (one of the funds constituting the Franklin Alternative Strategies Funds), as of May 31, 2016, and the related statement of operations, the statement of changes in net assets and the financial highlights for the period from September 8, 2015 (commencement of operations) through May 31, 2016. These financial statements and financial highlights are the responsibility of the Fund’s management. Our responsibility is to express an opinion on these financial statements and financial highlights based on our audit.
We conducted our audit in accordance with the standards of the Public Company Accounting Oversight Board (United States). Those standards require that we plan and perform the audit to obtain reasonable assurance about whether the financial statements and financial highlights are free of material misstatement. We were not engaged to perform an audit of the Fund’s internal control over financial reporting. Our audit included consideration of internal control over financial reporting as a basis for designing audit procedures that are appropriate in the circumstances, but not for the purpose of expressing an opinion on the effectiveness of the Fund’s internal control over financial reporting. Accordingly, we express no such opinion. An audit also includes examining, on a test basis, evidence supporting the amounts and disclosures in the financial statements and financial highlights, assessing the accounting principles used and significant estimates made by management, and evaluating the overall financial statement presentation. Our procedures included confirmation of securities owned as of May 31, 2016, by correspondence with the custodian and brokers or by other appropriate auditing procedures where replies from the brokers were not received. We believe that our audit provides a reasonable basis for our opinion.
In our opinion, the financial statements and financial highlights referred to above present fairly, in all material respects, the financial position of Franklin K2 Long Short Credit Fund (one of the funds constituting the Franklin Alternative Strategies Funds) at May 31, 2016, the results of its operations, the changes in its net assets and the financial highlights for the period from September 8, 2015 (commencement of operations) through May 31, 2016, in conformity with U.S. generally accepted accounting principles.

Boston, Massachusetts
July 26, 2016
46 Annual Report
franklintempleton.com
FRANKLIN ALTERNATIVE STRATEGIES FUNDS
Tax Information (unaudited)
Under Section 871(k)(1)(C) of the Internal Revenue Code (Code), the Fund hereby reports the maximum amount allowable but no
less than $423,472 as interest related dividends for purposes of the tax imposed under Section 871(a)(1)(A) of the Code for the fis-
cal year ended May 31, 2016.
franklintempleton.com
Annual Report
47
FRANKLIN ALTERNATIVE STRATEGIES FUNDS
| | | | |
| Board Members and Officers | | |
| |
| |
| The name, year of birth and address of the officers and board members, as well as their affiliations, positions held with the Trust, |
| principal occupations during at least the past five years and number of U.S. registered portfolios overseen in the Franklin Templeton |
| Investments fund complex, are shown below. Generally, each board member serves until that person’s successor is elected |
| and qualified. | | | | |
| |
| |
| Independent Board Members | | | |
| |
| | | | Number of Portfolios in | |
| Name, Year of Birth | | Length of | Fund Complex Overseen | Other Directorships Held During |
| and Address | Position | Time Served | by Board Member* | at Least the Past 5 Years |
| |
| Edward I. Altman, Ph.D. (1941) | Trustee | Since 2011 | 15 | None |
| c/o Franklin Mutual Advisers, LLC | | | | |
| 101 John F. Kennedy Parkway | | | | |
| Short Hills, NJ 07078-2789 | | | | |
| Principal Occupation During at Least the Past 5 Years: | | |
| Max L. Heine Professor of Finance, Emeritus and Director of The Credit and Debt Markets Research Program, Salomon Center, Stern School |
| of Business, New York University; editor and author of numerous financial publications; financial consultant; an adviser to numerous financial |
| and publishing organizations; and formerly, Vice Director, Salomon Center, Stern School of Business, New York University. |
| |
| Ann Torre Bates (1958) | Trustee | Since 2011 | 39 | Navient Corporation (loan |
| c/o Franklin Mutual Advisers, LLC | | | | management, servicing and asset |
| 101 John F. Kennedy Parkway | | | | recovery) (2014-present), Ares Capital |
| Short Hills, NJ 07078-2789 | | | | Corporation (specialty finance |
| | | | | company) (2010-present), United |
| | | | | Natural Foods, Inc. (distributor of |
| | | | | natural, organic and specialty foods) |
| | | | | (2013-present), Allied Capital |
| | | | | Corporation (financial services) (2003- |
| | | | | 2010) and SLM Corporation (Sallie |
| | | | | Mae) (1997-2014). |
| Principal Occupation During at Least the Past 5 Years: | | |
| Director of various companies; and formerly, Executive Vice President and Chief Financial Officer, NHP Incorporated (manager of multifamily |
| housing) (1995-1997); and Vice President and Treasurer, US Airways, Inc. (until 1995). | |
| |
| Burton J. Greenwald (1929) | Trustee | Trustee since | 15 | Franklin Templeton Emerging Markets |
| c/o Franklin Mutual Advisers, LLC | and Vice | 2011 and Vice | | Debt Opportunities Fund PLC and |
| 101 John F. Kennedy Parkway | Chairman of | Chairman since | | Fiduciary International Ireland Limited |
| Short Hills, NJ 07078-2789 | the Board | 2015 | | (1999-2015). |
| Principal Occupation During at Least the Past 5 Years: | | |
| Managing Director, B.J. Greenwald Associates (management consultants to the financial services industry); and formerly, Chairman, |
| Fiduciary Trust International Funds; Executive Vice President, L.F. Rothschild Fund Management, Inc.; President and Director, Merit Mutual |
| Funds; President, Underwriting Division and Director, National Securities & Research Corporation; Governor, Investment Company Institute; |
| and Chairman, ICI Public Information Committee. | | | |
| |
| Keith E. Mitchell (1954) | Trustee | Since 2011 | 15 | None |
| c/o Franklin Mutual Advisers, LLC | | | | |
| 101 John F. Kennedy Parkway | | | | |
| Short Hills, NJ 07078-2789 | | | | |
| Principal Occupation During at Least the Past 5 Years: | | |
| Director of various boards of asset management firms; and formerly, Managing Member, Mitchell, Hartley & Bechtel Advisers, LLC (formerly, |
| Mitchell Advisers, LLC) (advisory firm) (2003-2015) and Managing Director, Putman Lovell NBF. | |
48 Annual Report
franklintempleton.com
FRANKLIN ALTERNATIVE STRATEGIES FUNDS
| | | | |
| Independent Board Members (continued) | | |
| |
| | | | Number of Portfolios in | |
| Name, Year of Birth | | Length of | Fund Complex Overseen | Other Directorships Held During |
| and Address | Position | Time Served | by Board Member* | at Least the Past 5 Years |
| |
| David W. Niemiec (1949) | Trustee | Since 2015 | 39 | Emeritus Corporation (assisted living) |
| c/o Franklin Mutual Advisers, LLC | | | | (1999-2010) and OSI Pharmaceuticals, |
| 101 John F. Kennedy Parkway | | | | Inc. (pharmaceutical products) |
| Short Hills, NJ 07078-2789 | | | | (2006-2010). |
| Principal Occupation During at Least the Past 5 Years: | | |
| Advisor, Saratoga Partners (private equity fund); and formerly, Managing Director, Saratoga Partners (1998-2001) and SBC Warburg Dillon |
| Read (investment banking) (1997-1998); Vice Chairman, Dillon, Read & Co. Inc. (investment banking) (1991-1997); and Chief Financial |
| Officer, Dillon, Read & Co. Inc. (1982-1997). | | | |
| |
| Charles Rubens II (1930) | Trustee | Since 2011 | 15 | None |
| c/o Franklin Mutual Advisers, LLC | | | | |
| 101 John F. Kennedy Parkway | | | | |
| Short Hills, NJ 07078-2789 | | | | |
| Principal Occupation During at Least the Past 5 Years: | | |
| Private investor and president of non-profit organizations; and formerly, an executive of Time, Inc.; and Trustee of Colorado College. |
| |
| Jan Hopkins Trachtman (1947) | Trustee | Since 2011 | 15 | None |
| c/o Franklin Mutual Advisers, LLC | | | | |
| 101 John F. Kennedy Parkway | | | | |
| Short Hills, NJ 07078-2789 | | | | |
| Principal Occupation During at Least the Past 5 Years: | | |
| President and Founder, The Jan Hopkins Group (communications consulting firm); serves on Advisory Board of Knight Bagehot Fellowship; |
| and formerly, President, Economic Club of New York (2001-2015); Anchor/Correspondent, CNN Financial News (until 2003); Managing |
| Director and Head of Client Communications, Citigroup Private Bank (until 2005); Off-Air Reporter, ABC News’ World News Tonight; and |
| Editor, CBS Network News. | | | | |
| |
| Robert E. Wade (1946) | Trustee and | Trustee and | 39 | El Oro Ltd (investments) |
| c/o Franklin Mutual Advisers, LLC | Chairman of | Chairman of the | | (2003-present). |
| 101 John F. Kennedy Parkway | the Board | Board since | | |
| Short Hills, NJ 07078-2789 | | 2011 | | |
| Principal Occupation During at Least the Past 5 Years: | | |
| Attorney at law engaged in private practice (1972-2008) and member of various boards. | |
| |
| Gregory H. Williams (1943) | Trustee | Since 2015 | 15 | None |
| c/o Franklin Mutual Advisers, LLC | | | | |
| 101 John F. Kennedy Parkway | | | | |
| Short Hills, NJ 07078-2789 | | | | |
| Principal Occupation During at Least the Past 5 Years: | | |
| Private investor; Consultant; and formerly, President, University of Cincinnati (2009-2012); President, The City College of New York (2001- |
| 2009); Dean, College of Law, Ohio State University (1993-2001); and Associate Vice President, Academic Affairs and Professor of Law, |
| University of Iowa (1977-1993). | | | | |
franklintempleton.com
Annual Report
49
FRANKLIN ALTERNATIVE STRATEGIES FUNDS
| | | | |
| Interested Board Members and Officers | | |
| |
| | | | Number of Portfolios in | |
| Name, Year of Birth | | Length of | Fund Complex Overseen | Other Directorships Held During |
| and Address | Position | Time Served | by Board Member* | at Least the Past 5 Years |
| |
| **Gregory E. Johnson (1961) | Trustee | Since 2011 | 160 | None |
| One Franklin Parkway | | | | |
| San Mateo, CA 94403-1906 | | | | |
| Principal Occupation During at Least the Past 5 Years: | | |
| Chairman of the Board, Member – Office of the Chairman, Director and Chief Executive Officer, Franklin Resources, Inc.; officer and/or director |
| or trustee, as the case may be, of some of the other subsidiaries of Franklin Resources, Inc. and of 44 of the investment companies in Franklin |
| Templeton Investments; Vice Chairman, Investment Company Institute; and formerly, President, Franklin Resources, Inc. (1994-2015). |
| |
| **Jennifer M. Johnson (1964) | Trustee | Since 2015 | 12 | None |
| One Franklin Parkway | | | | |
| San Mateo, CA 94403-1906 | | | | |
| Principal Occupation During at Least the Past 5 Years: | | |
| Co-President, Franklin Resources, Inc.; officer and/or director or trustee, as the case may be, of some of the other subsidiaries of Franklin |
| Resources, Inc. and of four of the investment companies in Franklin Templeton Investments; and formerly, Chief Operating Officer and |
| Executive Vice President, Franklin Resources, Inc. (1994-2015); Executive Vice President of Operations and Technology, Franklin Resources, |
| Inc. (2005-2010); and Senior Vice President, Franklin Resources, Inc. (2003-2005). | |
| |
| Alison E. Baur (1964) | Vice | Since 2012 | Not Applicable | Not Applicable |
| One Franklin Parkway | President | | | |
| San Mateo, CA 94403-1906 | | | | |
| Principal Occupation During at Least the Past 5 Years: | | |
| Deputy General Counsel, Franklin Templeton Investments; and officer of some of the other subsidiaries of Franklin Resources, Inc. and of 45 |
| of the investment companies in Franklin Templeton Investments. | | |
| |
| Laura F. Fergerson (1962) | Chief | Since 2011 | Not Applicable | Not Applicable |
| One Franklin Parkway | Executive | | | |
| San Mateo, CA 94403-1906 | Officer – | | | |
| | Finance and | | | |
| | Administration | | | |
| Principal Occupation During at Least the Past 5 Years: | | |
| Senior Vice President, Franklin Templeton Services, LLC; Vice President, Franklin Advisers, Inc. and Franklin Templeton Institutional, LLC; |
| and officer of 45 of the investment companies in Franklin Templeton Investments. | |
| |
| Aliya S. Gordon (1973) | Vice | Since 2011 | Not Applicable | Not Applicable |
| One Franklin Parkway | President | | | |
| San Mateo, CA 94403-1906 | | | | |
| Principal Occupation During at Least the Past 5 Years: | | |
| Senior Associate General Counsel, Franklin Templeton Investments; and officer of 45 of the investment companies in Franklin Templeton Investments. |
| |
| Steven J. Gray (1955) | Secretary | Secretary and | Not Applicable | Not Applicable |
| One Franklin Parkway | and Vice | Vice President | | |
| San Mateo, CA 94403-1906 | President | since 2011 | | |
| Principal Occupation During at Least the Past 5 Years: | | |
| Senior Associate General Counsel, Franklin Templeton Investments; Vice President, Franklin Templeton Distributors, Inc. and Franklin |
| Alternative Strategies Advisers, LLC; and officer of 45 of the investment companies in Franklin Templeton Investments. |
50 Annual Report
franklintempleton.com
FRANKLIN ALTERNATIVE STRATEGIES FUNDS
| | | | |
| Interested Board Members and Officers (continued) | |
| |
| | | | Number of Portfolios in | |
| Name, Year of Birth | | Length of | Fund Complex Overseen | Other Directorships Held During |
| and Address | Position | Time Served | by Board Member* | at Least the Past 5 Years |
| |
| Robert G. Kubilis (1973) | Treasurer, | Since 2015 | Not Applicable | Not Applicable |
| 300 S.E. 2nd Street | Chief | | | |
| Fort Lauderdale, FL 33301-1923 | Financial | | | |
| | Officer and | | | |
| | Chief | | | |
| | Accounting | | | |
| | Officer | | | |
| Principal Occupation During at Least the Past 5 Years: | | |
| Treasurer, U.S. Fund Administration & Reporting, Franklin Templeton Investments; and officer of four of the investment companies in Franklin |
| Templeton Investments. | | | | |
| |
| Robert Lim (1948) | Vice | Since May 2016 | Not Applicable | Not Applicable |
| One Franklin Parkway | President – | | | |
| San Mateo, CA 94403-1906 | AML | | | |
| | Compliance | | | |
| Principal Occupation During at Least the Past 5 Years: | | |
| Vice President, Franklin Templeton Companies, LLC; Chief Compliance Officer, Franklin Templeton Distributors, Inc. and Franklin Templeton |
| Investor Services, LLC; and officer of 45 of the investment companies in Franklin Templeton Investments |
| |
| Kimberly H. Novotny (1972) | Vice | Since 2013 | Not Applicable | Not Applicable |
| 300 S.E. 2nd Street | President | | | |
| Fort Lauderdale, FL 33301-1923 | | | | |
| Principal Occupation During at Least the Past 5 Years: | | |
| Associate General Counsel, Franklin Templeton Investments; Vice President and Corporate Secretary, Fiduciary Trust International of the |
| South; Vice President, Templeton Investment Counsel, LLC; Assistant Secretary, Franklin Resources, Inc.; and officer of 45 of the investment |
| companies in Franklin Templeton Investments. | | | |
| |
| Robert C. Rosselot (1960) | Chief | Since 2013 | Not Applicable | Not Applicable |
| 300 S.E. 2nd Street | Compliance | | | |
| Fort Lauderdale, FL 33301-1923 | Officer | | | |
| Principal Occupation During at Least the Past 5 Years: | | |
| Director, Global Compliance, Franklin Templeton Investments; Vice President, Franklin Templeton Companies, LLC; officer of 45 of the |
| investment companies in Franklin Templeton Investments; and formerly, Senior Associate General Counsel, Franklin Templeton Investments |
| (2007-2013); and Secretary and Vice President, Templeton Group of Funds (2004-2013). | |
| |
| Karen L. Skidmore (1952) | Vice | Since 2011 | Not Applicable | Not Applicable |
| One Franklin Parkway | President | | | |
| San Mateo, CA 94403-1906 | | | | |
| Principal Occupation During at Least the Past 5 Years: | | |
| Senior Associate General Counsel, Franklin Templeton Investments; and officer of 45 of the investment companies in Franklin Templeton Investments. |
| |
| Navid Tofigh (1972) | Vice | Since | Not Applicable | Not Applicable |
| One Franklin Parkway | President | November 2015 | | |
| San Mateo, CA 94403-1906 | | | | |
| Principal Occupation During at Least the Past 5 Years: | | |
| Associate General Counsel, Franklin Templeton Investments; and officer of 45 of the investment companies in Franklin Templeton Investments. |
franklintempleton.com
Annual Report
51
FRANKLIN ALTERNATIVE STRATEGIES FUNDS
| | | | |
| Interested Board Members and Officers (continued) | |
| |
| | | | Number of Portfolios in | |
| Name, Year of Birth | | Length of | Fund Complex Overseen | Other Directorships Held During |
| and Address | Position | Time Served | by Board Member* | at Least the Past 5 Years |
| |
| Craig S. Tyle (1960) | Vice | Since 2011 | Not Applicable | Not Applicable |
| One Franklin Parkway | President | | | |
| San Mateo, CA 94403-1906 | | | | |
| Principal Occupation During at Least the Past 5 Years: | | |
| General Counsel and Executive Vice President, Franklin Resources, Inc.; and officer of some of the other subsidiaries of Franklin Resources, |
| Inc. and of 45 of the investment companies in Franklin Templeton Investments. | |
| |
| Lori A. Weber (1964) | Vice | Since 2011 | Not Applicable | Not Applicable |
| 300 S.E. 2nd Street | President | | | |
| Fort Lauderdale, FL 33301-1923 | | | | |
| Principal Occupation During at Least the Past 5 Years: | | |
| Senior Associate General Counsel, Franklin Templeton Investments; Assistant Secretary, Franklin Resources, Inc.; Vice President and |
| Secretary, Templeton Investment Counsel, LLC; and officer of 45 of the investment companies in Franklin Templeton Investments. |
| |
| William Y. Yun (1959) | President | Since 2011 | Not Applicable | Not Applicable |
| 600 Fifth Avenue | and Chief | | | |
| New York, NY 10020 | Executive | | | |
| | Officer – | | | |
| | Investment | | | |
| | Management | | | |
| Principal Occupation During at Least the Past 5 Years: | | |
| Executive Vice President, Franklin Advisers, Inc. and Franklin Templeton Institutional, LLC; Chief Executive Officer, Franklin Alternative |
| Strategies Advisers, LLC; Director, Fiduciary Investments Corporation and K2 Advisors Holdings, LLC; officer and/or director or trustee, as the |
| case may be, of some of the other subsidiaries of Franklin Resources, Inc. and of one of the investment companies in Franklin Templeton |
| Investments; and formerly, Executive Vice President – Alternative Strategies, Franklin Resources, Inc. (2005-2015). |
*We base the number of portfolios on each separate series of the U.S. registered investment companies within the Franklin Templeton Investments fund complex. These
portfolios have a common investment manager or affiliated investment managers.
**Gregory E. Johnson is considered to be an interested person of the Fund under the federal securities laws due to his position as an officer and director of Franklin
Resources, Inc., which is the parent company of the Fund’s investment manager and distributor. Jennifer M. Johnson is considered to be an interested person of the Fund
under the federal securities laws due to her position as officer and director of Resources.
Note 1: Gregory E. Johnson and Jennifer M. Johnson are siblings.
Note 2: Officer information is current as of the date of this report. It is possible that after this date, information about officers may change.
The Fund’s Board has determined that certain of the members of the Audit Committee, including Ann Torre Bates, are audit committee financial experts, and
“independent,” under those provisions of the Sarbanes-Oxley Act of 2002, and the rules and form amendments adopted by the Securities and Exchange
Commission, relating to audit committee financial experts.
The Statement of Information (SAI) include additional information about board members and is available, without charge, upon request. Shareholders may call
(800) DIAL BEN/342-5236 to request the SAI.
52 Annual Report
franklintempleton.com
FRANKLIN ALTERNATIVE STRATEGIES FUNDS
FRANKLIN K2 LONG SHORT CREDIT FUND
Shareholder Information
Proxy Voting Policies and Procedures
The Fund’s investment manager has established Proxy Voting Policies and Procedures (Policies) that the Fund uses to determine how to vote proxies relating to portfolio securities. Shareholders may view the Fund’s complete Policies online at franklintempleton.com. Alternatively, shareholders may request copies of the Policies free of charge by calling the Proxy Group collect at (954) 527-7678 or by sending a written request to: Franklin Templeton Companies, LLC, 300 S.E. 2nd Street, Fort Lauderdale, FL 33301, Attention: Proxy Group. Copies of the Fund’s proxy voting records are also made available online at franklintempleton.com and posted on the U.S. Securities and Exchange Commission’s website at sec.gov and reflect the most recent 12-month period ended June 30.
Quarterly Statement of Investments
The Trust, on behalf of the Fund, files a complete statement of investments with the U.S. Securities and Exchange Commission for the first and third quarters for each fiscal year on Form N-Q. Shareholders may view the filed Form N-Q by visiting the Commission’s website at sec.gov. The filed form may also be viewed and copied at the Commission’s Public Reference Room in Washington, DC. Information regarding the operations of the Public Reference Room may be obtained by calling (800) SEC-0330.
Householding of Reports and Prospectuses
You will receive the Fund’s financial reports every six months as well as an annual updated summary prospectus (prospectus available upon request). To reduce Fund expenses, we try to identify related shareholders in a household and send only one copy of the financial reports and summary prospectus. This process, called “householding,” will continue indefinitely unless you instruct us otherwise. If you prefer not to have these documents householded, please call us at (800) 632-2301. At any time you may view current prospectuses/summary prospectuses and financial reports on our website. If you choose, you may receive these documents through electronic delivery.
franklintempleton.com
Annual Report
53
This page intentionally left blank
This page intentionally left blank
This page intentionally left blank

Annual Report and Shareholder Letter
Franklin K2 Long Short Credit Fund
Investment Manager
K2/D&S Management Co., L.L.C.
Distributor
Franklin Templeton Distributors, Inc.
(800) DIAL BEN® / 342-5236
franklintempleton.com
Shareholder Services
(800) 632-2301
Authorized for distribution only when accompanied or preceded by a summary prospectus and/or prospectus. Investors should carefully consider a fund’s investment goals, risks, charges and expenses before investing. A prospectus contains this and other information; please read it carefully before investing.
To help ensure we provide you with quality service, all calls to and from our service areas are monitored and/or recorded.
| |
| © 2016 Franklin Templeton Investments. All rights reserved. | 948 A 07/16 |

Annual Report
and Shareholder Letter
May 31, 2016
Franklin Pelagos Commodities Strategy Fund
A SERIES OF FRANKLIN ALTERNATIVE STRATEGIES FUNDS

Sign up for electronic delivery at franklintempleton.com/edelivery
| |
| Contents | |
| |
| Annual Report | |
| Franklin Pelagos Commodities Strategy Fund | 3 |
| Performance Summary | 7 |
| Your Fund’s Expenses | 12 |
| Consolidated Financial Highlights and Consolidated | |
| Statement of Investments | 14 |
| Consolidated Financial Statements | 21 |
| Notes to Consolidated Financial Statements | 25 |
| Report of Independent Registered | |
| Public Accounting Firm | 36 |
| Board Members and Officers | 37 |
| Shareholder Information | 42 |
2 Annual Report
franklintempleton.com
Annual Report
Franklin Pelagos Commodities Strategy Fund
This annual report for Franklin Pelagos Commodities Strategy Fund covers the fiscal year ended May 31, 2016.
Your Fund’s Goal and Main Investments
The Fund seeks long-term total return. It invests mainly in commodity-linked derivative instruments and securities of the U.S. government, its agencies and instrumentalities and other fixed income securities.
Performance Overview
The Fund’s Class A shares had a -9.13% cumulative total return for the 12 months under review. In comparison, the benchmark Bloomberg Commodity Index, which measures performance of exchange-traded futures contracts on physical commodities, had a -15.32% total return for the same period.1 You can find more of the Fund’s performance data in the Performance Summary beginning on page 7.
Performance data represent past performance, which does not guarantee future results. Investment return and principal value will fluctuate, and you may have a gain or loss when you sell your shares. Current performance may differ from figures shown. For most recent month-end performance, go to franklintempleton.com or call (800) 342-5236.
What is a futures contract?
A futures contract is an agreement between the Fund and a counterparty made through a U.S. or foreign futures exchange to buy or sell an underlying instrument or asset at a specific priceonafuturedate.
Economic and Market Overview
The U.S. economy moderated during the 12 months under review. After strengthening in 2015’s second quarter, the economy moderated in the third and fourth quarters. Growth slowed further in 2016’s first quarter as non-residential
investments, private inventory investments and federal government spending declined. The manufacturing sector expanded in May for the third consecutive month, while the services sector expanded throughout the 12-month period. Growth in services contributed to new jobs and helped the unemployment rate decrease from 5.5% in May 2015 to 4.7% at period-end.2 Home sales and prices rose amid relatively low mortgage rates. Monthly retail sales grew during most of the review period and rose to the highest level in April in more than a year, due to a broad-based increase across most retail categories, particularly in motor vehicle sales and non-store retail. Inflation, as measured by the Consumer Price Index, remained subdued due to low energy prices but recorded its strongest monthly reading in three years in April, mainly led by a rebound in energy prices and a higher cost of rent.
After maintaining a near-zero interest rate for seven years to support the U.S. economy’s recovery, the U.S. Federal Reserve (Fed) raised its target range for the federal funds rate to 0.25%–0.50% at its December meeting maintaining the rate through period-end. At its April meeting, the Fed indicated that its monetary policy remained accommodative, thus supporting further labor market improvement and progress toward its 2.0% inflation objective.
U.S. stock markets experienced sell-offs during the period under review, resulting from investor concerns about the timing of the Fed’s interest rate increases, global economic growth, China’s slowing economy and tumbling stock market and the geopolitical tensions in certain regions. Investors generally remained confident as the European Central Bank expanded its quantitative easing measures and cut its benchmark interest rate to zero, the People’s Bank of China introduced further easing measures and the Bank of Japan adopted a negative interest rate policy. The rally in crude oil prices toward period-end also boosted investor sentiment. Despite periods of volatility, the broad U.S. stock market ended the 12-month period with
1. Source: Morningstar.
The index is unmanaged and includes reinvestment of any income or distributions. It does not reflect any fees, expenses or sales charges. One cannot invest directly in an
index, and an index is not representative of the Fund’s portfolio.
2. Source: Bureau of Labor Statistics.
See www.franklintempletondatasources.com for additional data provider information.
The dollar value, number of shares or principal amount, and names of all portfolio holdings are listed in the Fund’s Consolidated Statement of
Investments (SOI). The Consolidated SOI begins on page 19.
franklintempleton.com
Annual Report
3
FRANKLIN PELAGOS COMMODITIES STRATEGY FUND
marginal gains, as measured by the Standard & Poor’s® 500 Index. Commodity prices, as measured by the Bloomberg Commodity Index, were sharply lower for the 12-month period despite a gain toward period-end. Oil prices fell sharply for most of the review period, largely due to strong global supply and ended lower overall, despite a recovery during period-end. In addition, gold and metal prices also fell in the beginning of the review period but recovered in the second half. Among agricultural commodities, sugar, cotton and soybeans rose in value, while wheat declined.
Investment Strategy
We utilize an actively managed fundamental and quantitative investment process to provide exposure to the commodities markets by investing in commodity-linked derivative instruments including commodity-linked total return swaps, commodity futures, commodity index futures and options on commodity futures and commodity index futures, which may provide exposure to foreign and emerging markets. By investing in these derivative instruments, we seek to gain exposure to the returns of real assets that trade in the commodities markets without direct investment in physical commodities. Real assets include such things as industrial and precious metals, gas, oil, livestock, agricultural or meat products and other items.
What is a swap agreement?
A swap agreement, such as a commodity-linked total return
swap, is a contract between the Fund and a counterparty to
exchange on a future date the returns, or differentials in return,
that would have been earned or realized if a notional amount
were invested in specific instruments.
What is an option?
An option is a contract to buy or sell a specific financial product
known as the option’s underlying instrument at a specific price.
The buyer of an option has the right, but not the obligation, to
buy or sell the underlying instrument at or until a specified
expiration date. Conversely, the seller (“writer”) of an option
who opens a transaction is obligated to buy or sell the
underlying instrument should the option holder exercise that
right.
Manager’s Discussion
During its fiscal year, the Fund obtained its commodities exposure through swaps on commodities indexes and through
| | |
| Portfolio Breakdown* | | |
| 5/31/16 | | |
| % of Consolidated | |
| | Net Assets | |
| U.S. Treasury Bill | 64.6 | % |
| U.S. Treasury Note | 16.8 | % |
| FFCB | 13.2 | % |
| FHLB | 3.3 | % |
| Institutional Fiduciary Trust Money Market Portfolio | 0.6 | % |
| Other Assets, less Liabilities** | 1.5 | % |
See Abbreviations on page 35.
*Portfolio breakdown figures are stated as a percentage of total and may not equal
100% or may be negative due to rounding, use of any derivatives, unsettled trades
or other factors.
**Includes unrealized appreciation/depreciation on open futures and swap
contracts, as well as other assets and liabilities. See supplementary commodity
exposure tables on page 5 for additional information related to the Fund’s economic
exposure to commodities.
commodities futures and options on commodities futures. These exposures were supported with U.S. Treasury bills and other fixed income securities.
During the period, commodity sector returns were mixed. For the first two thirds of the period, commodities had negative performance as global oversupply ran rampant across commodity sectors. However, commodities markets rebounded in the final third of the period as the outlook for production declines in oil and some industrial metals gained momentum and weather anomalies in key agricultural regions supported agriculture price levels. Overall contributors to Fund returns over the period came from precious metals, agriculture and livestock. The energy and industrial metals sectors, however, detracted. Within the commodity sectors, there were divergences in return that allowed the Fund’s active management to perform better than its benchmark. We believe active management helped the Fund perform better on a relative basis in all commodity sectors except agriculture.
During the period, a decline in U.S. production, oil outages in Nigeria and a disruption in a key Middle East pipeline supported crude oil prices as they rebounded from February lows. Back and forth discussions about a freeze in production levels dominated headlines. However, underneath the headlines, global refinery outputs and Chinese imports of crude oil remained strong. Within petroleum, gasoline had the strongest relative returns during the period as supply of gasoline blending components were tight and demand was robust. However, in the latter third of the period, refineries in the U.S. shifted to produce more gasoline and lowered their
4 Annual Report
franklintempleton.com
FRANKLIN PELAGOS COMMODITIES STRATEGY FUND
production of middle distillates (such as kerosene, jet fuel and diesel). Although natural gas production declined, mild winter weather led to below average demand for heating and an ensuing lackluster pace of inventory withdrawals. U.S. natural gas inventory levels reached a seasonal high at the end of March. The Fund sought to capitalize on a petroleum price recovery during the first five months of 2016, while managing the impact of natural gas price weakness.
Precious metals experienced renewed investor interest at the start of 2016, as evidenced by the pickup of exchange-traded product inflows after three years of outflows. In our opinion, investor uncertainty about central banks and currencies fueled a precious metals rally that pushed the ratio of gold to silver to levels not seen since 2008. Industrial metals felt the brunt of lowered Chinese economic growth prospects and a consumption growth decline across major industrial metals in non-Chinese markets. Suppliers responded in the form of commitments within China to manage metal production overcapacity. Elsewhere, major production companies announced curtailments as London Metal Exchange inventories fell and price levels stabilized later in the period. During the period, gold, silver and nickel contributed to Fund returns, while copper, aluminum and zinc detracted.
Although global grain stockpiles were ample during the period, global weather patterns supported corn and soybean price levels due to a strong El Niño pattern that challenged South American grain production. Asia also felt the influence of El Niño as investor expectations for a record Brazilian sugar crop were offset by dryer weather in Thailand and India, boosting price levels. Over the period, the agriculture sector’s contribution to Fund returns came from our positions in soybeans, soymeal, soybean oil and sugar. Livestock contributed to Fund returns as the positive effect of our positioning in lean hogs more than offset the negative effect of our positioning in live cattle.
Fund Exposure to Commodities
The following table summarizes the Fund’s economic exposure to commodities derived through its investment in commodity-linked total return swap contracts. At May 31, 2016, the Fund’s exposure based on notional value represented 79.7% of consolidated net assets.
Commodity-Linked Total Return Swap Exposure*
| | |
| | % of Consolidated Net Assets | |
| Gold | 10.8 | % |
| Brent Crude Oil | 9.3 | % |
| Copper | 8.5 | % |
| Soybeans | 8.3 | % |
| Sugar | 5.0 | % |
| Live Cattle | 4.9 | % |
| Heating Oil | 4.5 | % |
| Unleaded Gasoline | 4.4 | % |
| Aluminum | 4.1 | % |
| Kansas Wheat | 3.9 | % |
| Soybean Meal | 3.7 | % |
| Corn | 3.6 | % |
| Zinc | 2.7 | % |
| Soybean Oil | 2.6 | % |
| Coffee | 2.0 | % |
| Natural Gas | 1.4 | % |
*Figures are stated as a percentage of total and may not equal 100% or may be
negative due to rounding, use of any derivatives, unsettled trades or other factors.
The Fund’s exposure was calculated using the commodity sector weightings of the
FP Custom Master Index multiplied by the Fund’s percentage notional exposure.
The following table summarizes the Fund’s economic exposure
to commodities derived through its investment in futures
contracts. At May 31, 2016, the Fund’s exposure based on
notional value represented 19.2% of consolidated net assets.
| | |
| Commodity Futures Exposure* | |
| | % of Consolidated Net Assets | |
| | Long | |
| WTI Crude Oil | 8.6 | % |
| Natural Gas | 5.4 | % |
| Gold | 3.9 | % |
| Soybeans | 1.3 | % |
*Figures are stated as a percentage of total and may not equal 100% or may be negative due to rounding, use of any derivatives, unsettled trades or other factors.
franklintempleton.com
Annual Report
5
FRANKLIN PELAGOS COMMODITIES STRATEGY FUND
As fellow shareholders, we were disappointed with the Fund’s absolute performance in the recent challenging environment for commodities. However, we remain committed to our active investment process and long-term perspective, keeping in mind that volatility is not uncommon for commodities markets. Thank you for your continued participation in Franklin Pelagos Commodities Strategy Fund. We look forward to continuing to serve your financial needs.


Stephen P. Burke

John C. Pickart, CFA
Wayne D. Ryan, CAIA
Portfolio Management Team
The foregoing information reflects our analysis, opinions and portfolio holdings as of May 31, 2016, the end of the reporting period. The way we implement our main investment strategies and the resulting portfolio holdings may change depending on factors such as market and economic conditions. These opinions may not be relied upon as investment advice or an offer for a particular security. The information is not a complete analysis of every aspect of any market, country, industry, security or the Fund. Statements of fact are from sources considered reliable, but the investment manager makes no representation or warranty as to their completeness or accuracy. Although historical performance is no guarantee of future results, these insights may help you understand our investment management philosophy.
6 Annual Report
franklintempleton.com
FRANKLIN PELAGOS COMMODITIES STRATEGY FUND
Performance Summary as of May 31, 2016
Your dividend income will vary depending on dividends or interest paid by securities in the Fund’s portfolio, adjusted for operating expenses of each class. Capital gain distributions are net profits realized from the sale of portfolio securities. The performance table and graphs do not reflect any taxes that a shareholder would pay on Fund dividends, capital gain distributions, if any, or any realized gains on the sale of Fund shares. Total return reflects reinvestment of the Fund’s dividends and capital gain distributions, if any, and any unrealized gains or losses.
| | | | | | |
| Net Asset Value | | | | | | |
| Share Class (Symbol) | | 5/31/16 | | 5/31/15 | | Change |
| A (FLSQX) | $ | 6.47 | $ | 7.12 | -$ | 0.65 |
| C (FLSVX) | $ | 6.36 | $ | 7.05 | -$ | 0.69 |
| R (FLSWX) | $ | 6.44 | $ | 7.10 | -$ | 0.66 |
| R6 (FPELX) | $ | 6.53 | $ | 7.16 | -$ | 0.63 |
| Advisor (FSLPX) | $ | 6.60 | $ | 7.25 | -$ | 0.65 |
franklintempleton.com
Annual Report
7
FRANKLIN PELAGOS COMMODITIES STRATEGY FUND
PERFORMANCE SUMMARY
Performance as of 5/31/161
Cumulative total return excludes sales charges. Average annual total returns and value of $10,000 investment include maximum sales
charges. Class A: 5.75% maximum initial sales charge; Class C: 1% contingent deferred sales charge in first year only;
Class R/R6/Advisor Class: no sales charges.
| | | | | | | | | | | | |
| | | | | | | Value of | Average Annual | | Total Annual Operating Expenses6 | |
| | Cumulative | | Average Annual | | $ | 10,000 | Total Return | | | | | |
| Share Class | Total Return2 | | Total Return3 | | | Investment4 | (6/30/16 | )5 | (with waiver) | | (without waiver) | |
| A | | | | | | | | | 1.20 | % | 2.19 | % |
| 1-Year | -9.13 | % | -14.30 | % | $ | 8,570 | -11.90 | % | | | | |
| Since Inception (1/10/14) | -27.14 | % | -14.57 | % | $ | 6,868 | -12.68 | % | | | | |
| C | | | | | | | | | 1.95 | % | 2.94 | % |
| 1-Year | -9.79 | % | -10.56 | % | $ | 8,944 | -8.08 | % | | | | |
| Since Inception (1/10/14) | -28.38 | % | -13.05 | % | $ | 7,162 | -11.22 | % | | | | |
| R | | | | | | | | | 1.45 | % | 2.44 | % |
| 1-Year | -9.30 | % | -9.30 | % | $ | 9,070 | -6.68 | % | | | | |
| Since Inception (1/10/14) | -27.48 | % | -12.60 | % | $ | 7,252 | -10.73 | % | | | | |
| R6 | | | | | | | | | 0.73 | % | 1.72 | % |
| 1-Year | -8.80 | % | -8.80 | % | $ | 9,120 | -6.07 | % | | | | |
| Since Inception (1/10/14) | -26.46 | % | -12.09 | % | $ | 7,354 | -10.19 | % | | | | |
| Advisor | | | | | | | | | 0.95 | % | 1.94 | % |
| 1-Year | -8.97 | % | -8.97 | % | $ | 9,103 | -6.27 | % | | | | |
| 3-Year | -30.01 | % | -11.21 | % | $ | 6,999 | -8.39 | % | | | | |
| Since Inception (12/7/11) | -34.00 | % | -8.85 | % | $ | 6,600 | -7.87 | % | | | | |
Performance data represent past performance, which does not guarantee future results. Investment return and principal value will fluctuate, and you may have a gain or loss when you sell your shares. Current performance may differ from figures shown. For most recent month-end performance, go to franklintempleton.com or call (800) 342-5236.
See page 11 for Performance Summary footnotes.
8 Annual Report
franklintempleton.com
FRANKLIN PELAGOS COMMODITIES STRATEGY FUND
PERFORMANCE SUMMARY
Total Return Index Comparison for a Hypothetical $10,000 Investment1
Total return represents the change in value of an investment over the periods shown. It includes any applicable maximum sales charge, Fund expenses, account fees and reinvested distributions. The unmanaged index includes reinvestment of any income or distributions. It differs from the Fund in composition and does not pay management fees or expenses. One cannot invest directly in an index.
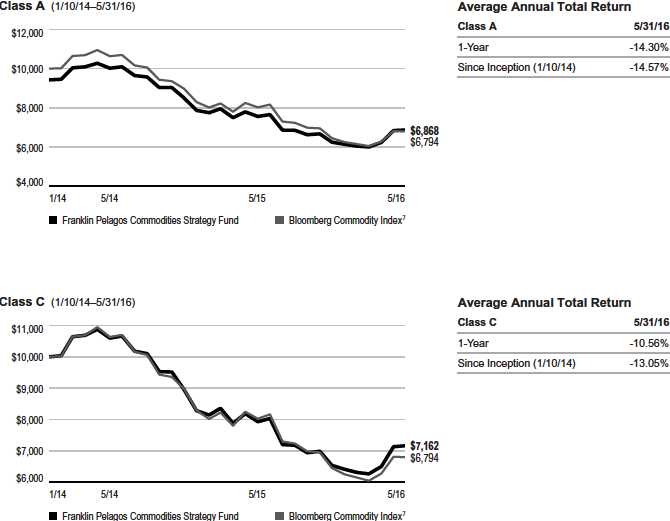
See page 11 for Performance Summary footnotes.
franklintempleton.com
Annual Report
9
FRANKLIN PELAGOS COMMODITIES STRATEGY FUND
PERFORMANCE SUMMARY
Total Return Index Comparison for a Hypothetical $10,000 Investment1 (continued)
Class R (1/10/14–5/31/16)
Average Annual Total Return
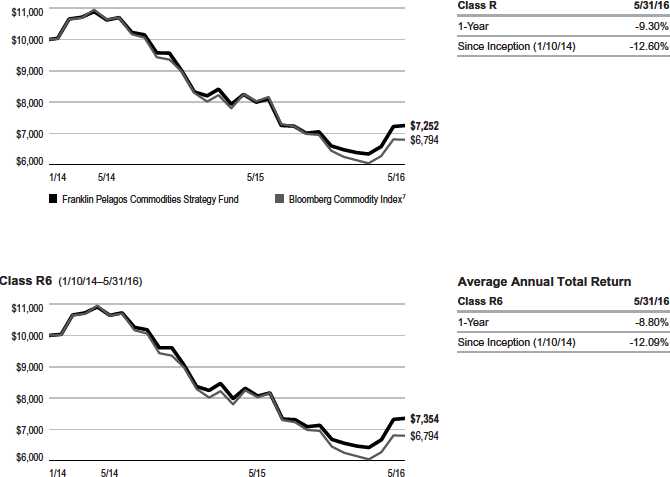
Franklin Pelagos Commodities Strategy Fund
Bloomberg Commodity Index7
10 Annual Report
franklintempleton.com
FRANKLIN PELAGOS COMMODITIES STRATEGY FUND
PERFORMANCE SUMMARY
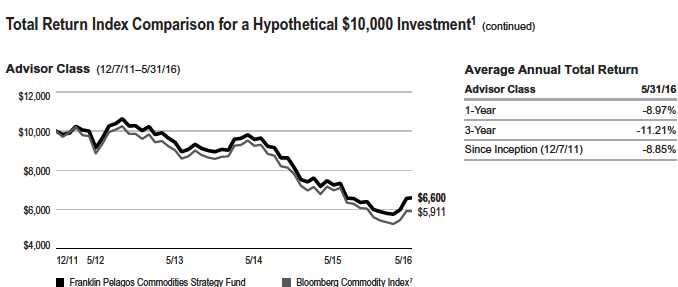
All investments involve risks, including possible loss of principal. Investing in physical commodities, either directly or through derivative instruments such as commodity-linked total return swaps, commodity futures, commodity index futures and options on commodity futures and commodities index futures, presents unique risks, is speculative and can be extremely volatile. Market prices of commodities may fluctuate rapidly based on numerous factors, including: changes in supply and demand relationships; weather; agriculture; trade; domestic and foreign political and economic events and policies; diseases; pestilence; technological developments; currency exchange rate fluctuations; and monetary and other governmental policies, action and inaction. Derivative instruments involve costs and can create leverage in the Fund’s portfolio, which may result in significant volatility and cause the Fund to participate in losses (as well as gains) in an amount that significantly exceeds the Fund’s initial investment. The Fund may not achieve the anticipated benefits and may realize losses, which could be significant. Bond prices generally move in the opposite direction of interest rates. Thus, as prices of bonds in the Fund adjust to a rise in interest rates, the Fund’s share price may decline. Foreign investing carries additional risks such as currency and market volatility and political, social and economic instability, risks which are heightened in less developed or emerging market countries. The Fund is actively managed but there is no guarantee that the manager’s investment decisions will produce the desired results. The Fund’s prospectus also includes a description of the main investment risks.
| |
| Class C: | These shares have higher annual fees and expenses than Class A shares. |
| Class R: | Shares are available to certain eligible investors as described in the prospectus. These shares have higher annual fees and expenses than Class A shares. |
| Class R6: | Shares are available to certain eligible investors as described in the prospectus. |
| Advisor Class: | Shares are available to certain eligible investors as described in the prospectus. |
1. The Fund has an expense reduction contractually guaranteed through at least 9/30/16, a fee waiver related to the management fee paid by a subsidiary, and a fee waiver
associated with any investment in a Franklin Templeton money fund and/or other Franklin Templeton fund, as applicable, contractually guaranteed through at least the Fund’s
current fiscal year-end. Fund investment results reflect the expense reduction and fee waivers, to the extent applicable; without these reductions, the results would have been
lower.
2. Cumulative total return represents the change in value of an investment over the periods indicated.
3. Average annual total return represents the average annual change in value of an investment over the periods indicated. Return for less than one year, ifany,hasnotbeen
annualized.
4. These figures represent the value of a hypothetical $10,000 investment in the Fund over the periods indicated.
5. In accordance with SEC rules, we provide standardized average annual total return information through the latest calendar quarter.
6. Figures are as stated in the Fund’s current prospectus and may differ from the expense ratios disclosed in the Consolidated Financial Highlights in this report. In periods of
market volatility, assets may decline significantly, causing total annual Fund operating expenses to become higher than the figures shown.
7. Source: Morningstar. The Bloomberg Commodity Index comprises exchange-traded futures on physical commodities, which are weighted to account for economic
significance and market liquidity.
See www.franklintempletondatasources.com for additional data provider information.
franklintempleton.com
Annual Report
11
FRANKLIN PELAGOS COMMODITIES STRATEGY FUND
Your Fund’s Expenses
As a Fund shareholder, you can incur two types of costs:
- Transaction costs, including sales charges (loads) on Fund purchases; and
- Ongoing Fund costs, including management fees, distribution and service (12b-1) fees, and other Fund expenses. All mutual funds have ongoing costs, sometimes referred to as operating expenses.
The following table shows ongoing costs of investing in the Fund and can help you understand these costs and compare them with those of other mutual funds. The table assumes a $1,000 investment held for the six months indicated.
Actual Fund Expenses
The first line (Actual) for each share class listed in the table provides actual account values and expenses. The “Ending Account Value” is derived from the Fund’s actual return, which includes the effect of Fund expenses.
You can estimate the expenses you paid during the period by following these steps. Of course, your account value and expenses will differ from those in this illustration:
| 1. | Divide your account value by $1,000. |
| | If an account had an $8,600 value, then $8,600 ÷ $1,000 = 8.6. |
| 2. | Multiply the result by the number under the heading “Expenses Paid During Period.” |
| | If Expenses Paid During Period were $7.50, then 8.6 x $7.50 = $64.50. |
In this illustration, the estimated expenses paid this period are $64.50.
Hypothetical Example for Comparison with Other Funds
Information in the second line (Hypothetical) for each class in the table can help you compare ongoing costs of investing in the Fund with those of other mutual funds. This information may not be used to estimate the actual ending account balance or expenses you paid during the period. The hypothetical “Ending Account Value” is based on the actual expense ratio for each class and an assumed 5% annual rate of return before expenses, which does not represent the Fund’s actual return. The figure under the heading “Expenses Paid During Period” shows the hypothetical expenses your account would have incurred under this scenario. You can compare this figure with the 5% hypothetical examples that appear in shareholder reports of other funds.
Please note that expenses shown in the table are meant to highlight ongoing costs and do not reflect any transaction costs, such as sales charges. Therefore, the second line for each class is useful in comparing ongoing costs only, and will not help you compare total costs of owning different funds. In addition, if transaction costs were included, your total costs would have been higher. Please refer to the Fund prospectus for additional information on operating expenses.
12 Annual Report
franklintempleton.com
FRANKLIN PELAGOS COMMODITIES STRATEGY FUND
YOUR FUND’S EXPENSES
| | | | | | |
| | | Beginning Account | | Ending Account | | Expenses Paid During |
| Share Class | | Value 12/1/15 | | Value 5/31/16 | | Period* 12/1/15–5/31/16 |
| A | | | | | | |
| Actual | $ | 1,000 | $ | 1,100.30 | $ | 6.35 |
| Hypothetical (5% return before expenses) | $ | 1,000 | $ | 1,018.95 | $ | 6.11 |
| C | | | | | | |
| Actual | $ | 1,000 | $ | 1,096.60 | $ | 10.22 |
| Hypothetical (5% return before expenses) | $ | 1,000 | $ | 1,015.25 | $ | 9.82 |
| R | | | | | | |
| Actual | $ | 1,000 | $ | 1,099.00 | $ | 7.50 |
| Hypothetical (5% return before expenses) | $ | 1,000 | $ | 1,017.85 | $ | 7.21 |
| R6 | | | | | | |
| Actual | $ | 1,000 | $ | 1,101.20 | $ | 3.83 |
| Hypothetical (5% return before expenses) | $ | 1,000 | $ | 1,021.35 | $ | 3.69 |
| Advisor | | | | | | |
| Actual | $ | 1,000 | $ | 1,100.00 | $ | 4.99 |
| Hypothetical (5% return before expenses) | $ | 1,000 | $ | 1,020.25 | $ | 4.80 |
*Expenses are calculated using the most recent six-month expense ratio, net of expense waivers, annualized for each class (A: 1.21%;
C: 1.95%; R: 1.43%; R6: 0.73%; and Advisor: 0.95%), multiplied by the average account value over the period, multiplied by 183/366 to reflect
the one-half year period.
franklintempleton.com
Annual Report
13
FRANKLIN ALTERNATIVE STRATEGIES FUNDS
| | | | | | | | | |
| Consolidated Financial Highlights | | | | | | | | | |
| Franklin Pelagos Commodities Strategy Fund | | | | | | | | | |
| | | Year Ended May 31, | | | | |
| | | 2016 | | | 2015 | | | 2014 | a |
| Class A | | | | | | | | | |
| Per share operating performance | | | | | | | | | |
| (for a share outstanding throughout the year) | | | | | | | | | |
| Net asset value, beginning of year | $ | 7.12 | | $ | 9.44 | | $ | 8.88 | |
| Income from investment operationsb: | | | | | | | | | |
| Net investment income (loss)c | | (0.08 | ) | | (0.09 | ) | | (0.08 | ) |
| Net realized and unrealized gains (losses) | | (0.57 | ) | | (2.23 | ) | | 0.64 | |
| Total from investment operations. | | (0.65 | ) | | (2.32 | ) | | 0.56 | |
| Net asset value, end of year | $ | 6.47 | | $ | 7.12 | | $ | 9.44 | |
| |
| Total returnd | | (9.13 | )% | | (24.58 | )% | | 6.31 | % |
| |
| Ratios to average net assetse | | | | | | | | | |
| Expenses before waiver, payments by affiliates and expense reduction | | 2.14 | % | | 2.05 | % | | 3.38 | % |
| Expenses net of waiver, payments by affiliates and expense reductionf | | 1.21 | % | | 1.25 | % | | 1.25 | % |
| Net investment income (loss) | | (0.79 | )% | | (0.94 | )% | | (0.94 | )% |
| |
| Supplemental data | | | | | | | | | |
| Net assets, end of year (000’s) | $ | 3,814 | | $ | 2,080 | | $ | 601 | |
| Portfolio turnover rate | | 28.03 | % | | 62.10 | % | | 34.28 | % |
aFor the period January 10, 2014 (commencement of operations) to May 31, 2014.
bThe amount shown for a share outstanding throughout the period may not correlate with the Consolidated Statement of Operations for the period due to the timing of sales
and repurchases of the Fund’s shares in relation to income earned and/or fluctuating fair value of the investments of the Fund.
cBased on average daily shares outstanding.
dTotal return does not reflect sales commissions or contingent deferred sales charges, if applicable, and is not annualized for periods less than one year.
eRatios are annualized for periods less than one year.
fBenefit of expense reduction rounds to less than 0.01%.
14 Annual Report | The accompanying notes are an integral part of these consolidated financial statements. franklintempleton.com
FRANKLIN ALTERNATIVE STRATEGIES FUNDS
CONSOLIDATED FINANCIAL HIGHLIGHTS
| | | | | | | | | |
| Franklin Pelagos Commodities Strategy Fund (continued) | | | | | | | | | |
| | | Year Ended May 31, | | | | |
| | | 2016 | | | 2015 | | | 2014 | a |
| Class C | | | | | | | | | |
| Per share operating performance | | | | | | | | | |
| (for a share outstanding throughout the year) | | | | | | | | | |
| Net asset value, beginning of year | $ | 7.05 | | $ | 9.41 | | $ | 8.88 | |
| Income from investment operationsb: | | | | | | | | | |
| Net investment income (loss)c | | (0.16 | ) | | (0.15 | ) | | (0.09 | ) |
| Net realized and unrealized gains (losses) | | (0.53 | ) | | (2.21 | ) | | 0.62 | |
| Total from investment operations. | | (0.69 | ) | | (2.36 | ) | | 0.53 | |
| Net asset value, end of year | $ | 6.36 | | $ | 7.05 | | $ | 9.41 | |
| |
| Total returnd | | (9.79 | )% | | (25.08 | )% | | 5.97 | % |
| |
| Ratios to average net assetse | | | | | | | | | |
| Expenses before waiver, payments by affiliates and expense reduction | | 2.88 | % | | 2.75 | % | | 4.08 | % |
| Expenses net of waiver, payments by affiliates and expense reductionf | | 1.95 | % | | 1.95 | % | | 1.95 | % |
| Net investment income (loss) | | (1.53 | )% | | (1.64 | )% | | (1.64 | )% |
| |
| Supplemental data | | | | | | | | | |
| Net assets, end of year (000’s) | $ | 862 | | $ | 377 | | $ | 60 | |
| Portfolio turnover rate | | 28.03 | % | | 62.10 | % | | 34.28 | % |
aFor the period January 10, 2014 (commencement of operations) to May 31, 2014.
bThe amount shown for a share outstanding throughout the period may not correlate with the Consolidated Statement of Operations for the period due to the timing of sales
and repurchases of the Fund’s shares in relation to income earned and/or fluctuating fair value of the investments of the Fund.
cBased on average daily shares outstanding.
dTotal return does not reflect sales commissions or contingent deferred sales charges, if applicable, and is not annualized for periods less than one year.
eRatios are annualized for periods less than one year.
fBenefit of expense reduction rounds to less than 0.01%.
franklintempleton.com The accompanying notes are an integral part of these consolidated financial statements. | Annual Report 15
FRANKLIN ALTERNATIVE STRATEGIES FUNDS
CONSOLIDATED FINANCIAL HIGHLIGHTS
| | | | | | | | | |
| Franklin Pelagos Commodities Strategy Fund (continued) | | | | | | | | | |
| | | Year Ended May 31, | | | | |
| | | 2016 | | | 2015 | | | 2014 | a |
| Class R | | | | | | | | | |
| Per share operating performance | | | | | | | | | |
| (for a share outstanding throughout the year) | | | | | | | | | |
| Net asset value, beginning of year | $ | 7.10 | | $ | 9.44 | | $ | 8.88 | |
| Income from investment operationsb: | | | | | | | | | |
| Net investment income (loss)c | | (0.06 | ) | | (0.10 | ) | | (0.06 | ) |
| Net realized and unrealized gains (losses) | | (0.60 | ) | | (2.24 | ) | | 0.62 | |
| Total from investment operations. | | (0.66 | ) | | (2.34 | ) | | 0.56 | |
| Net asset value, end of year | $ | 6.44 | | $ | 7.10 | | $ | 9.44 | |
| |
| Total returnd | | (9.30 | )% | | (24.79 | )% | | 6.31 | % |
| |
| Ratios to average net assetse | | | | | | | | | |
| Expenses before waiver, payments by affiliates and expense reduction | | 2.34 | % | | 2.27 | % | | 3.58 | % |
| Expenses net of waiver, payments by affiliates and expense reductionf | | 1.41 | % | | 1.47 | % | | 1.45 | % |
| Net investment income (loss) | | (0.99 | )% | | (1.16 | )% | | (1.14 | )% |
| |
| Supplemental data | | | | | | | | | |
| Net assets, end of year (000’s) | $ | 9 | | $ | 4 | | $ | 5 | |
| Portfolio turnover rate | | 28.03 | % | | 62.10 | % | | 34.28 | % |
aFor the period January 10, 2014 (commencement of operations) to May 31, 2014.
bThe amount shown for a share outstanding throughout the period may not correlate with the Consolidated Statement of Operations for the period due to the timing of sales
and repurchases of the Fund’s shares in relation to income earned and/or fluctuating fair value of the investments of the Fund.
cBased on average daily shares outstanding.
dTotal return is not annualized for periods less than one year.
eRatios are annualized for periods less than one year.
fBenefit of expense reduction rounds to less than 0.01%.
16 Annual Report | The accompanying notes are an integral part of these consolidated financial statements. franklintempleton.com
FRANKLIN ALTERNATIVE STRATEGIES FUNDS
CONSOLIDATED FINANCIAL HIGHLIGHTS
| | | | | | | | | |
| Franklin Pelagos Commodities Strategy Fund (continued) | | | | | | | | | |
| | | Year Ended May 31, | | | | |
| | | 2016 | | | 2015 | | | 2014 | a |
| Class R6 | | | | | | | | | |
| Per share operating performance | | | | | | | | | |
| (for a share outstanding throughout the year) | | | | | | | | | |
| Net asset value, beginning of year | $ | 7.16 | | $ | 9.46 | | $ | 8.88 | |
| Income from investment operationsb: | | | | | | | | | |
| Net investment income (loss)c | | (0.02 | ) | | (0.04 | ) | | (0.03 | ) |
| Net realized and unrealized gains (losses) | | (0.61 | ) | | (2.26 | ) | | 0.61 | |
| Total from investment operations. | | (0.63 | ) | | (2.30 | ) | | 0.58 | |
| Net asset value, end of year | $ | 6.53 | | $ | 7.16 | | $ | 9.46 | |
| |
| Total returnd | | (8.80 | )% | | (24.31 | )% | | 6.53 | % |
| |
| Ratios to average net assetse | | | | | | | | | |
| Expenses before waiver, payments by affiliates and expense reduction | | 1.10 | % | | 1.53 | % | | 1.58 | % |
| Expenses net of waiver, payments by affiliates and expense reductionf | | 0.76 | % | | 0.86 | % | | 0.86 | % |
| Net investment income (loss) | | (0.34 | )% | | (0.55 | )% | | (0.55 | )% |
| |
| Supplemental data | | | | | | | | | |
| Net assets, end of year (000’s) | $ | 131,500 | | $ | 53,068 | | $ | 67,732 | |
| Portfolio turnover rate | | 28.03 | % | | 62.10 | % | | 34.28 | % |
aFor the period January 10, 2014 (commencement of operations) to May 31, 2014.
bThe amount shown for a share outstanding throughout the period may not correlate with the Consolidated Statement of Operations for the period due to the timing of sales
and repurchases of the Fund’s shares in relation to income earned and/or fluctuating fair value of the investments of the Fund.
cBased on average daily shares outstanding.
dTotal return is not annualized for periods less than one year.
eRatios are annualized for periods less than one year.
fBenefit of expense reduction rounds to less than 0.01%.
franklintempleton.com The accompanying notes are an integral part of these consolidated financial statements. | Annual Report 17
FRANKLIN ALTERNATIVE STRATEGIES FUNDS
CONSOLIDATED FINANCIAL HIGHLIGHTS
| | | | | | | | | | | | | | | |
| Franklin Pelagos Commodities Strategy Fund (continued) | | | | | | | | | | | | | | | |
| | | | | | Year Ended May 31, | | | | | | | |
| | | 2016 | | | 2015 | | | 2014 | | | 2013 | | | 2012 | a |
| Advisor Class | | | | | | | | | | | | | | | |
| Per share operating performance | | | | | | | | | | | | | | | |
| (for a share outstanding throughout the year) | | | | | | | | | | | | | | | |
| Net asset value, beginning of year | $ | 7.25 | | $ | 9.58 | | $ | 9.43 | | $ | 9.15 | | $ | 10.00 | |
| Income from investment operationsb: | | | | | | | | | | | | | | | |
| Net investment income (loss)c | | (0.09 | ) | | (0.07 | ) | | (0.05 | ) | | (0.08 | ) | | (0.05 | ) |
| Net realized and unrealized gains (losses) | | (0.56 | ) | | (2.26 | ) | | 0.20 | | | 0.36 | | | (0.80 | ) |
| Total from investment operations | | (0.65 | ) | | (2.33 | ) | | 0.15 | | | 0.28 | | | (0.85 | ) |
| Less distributions from net investment income | | — | | | — | | | — | | | (—)d | | | — | |
| Net asset value, end of year. | $ | 6.60 | | $ | 7.25 | | $ | 9.58 | | $ | 9.43 | | $ | 9.15 | |
| |
| Total returne | | (8.97 | )% | | (24.32 | )% | | 1.59 | % | | 3.06 | % | | (8.50 | )% |
| |
| Ratios to average net assetsf | | | | | | | | | | | | | | | |
| Expenses before waiver, payments by affiliates and expense | | | | | | | | | | | | | | | |
| reduction | | 1.88 | % | | 1.75 | % | | 1.88 | % | | 1.14 | % | | 5.08 | % |
| Expenses net of waiver, payments by affiliates and expense | | | | | | | | | | | | | | | |
| reduction | | 0.95 | %g | | 0.95 | %g | | 1.04 | %g | | 1.10 | % | | 1.10 | % |
| Net investment income (loss) | | (0.53 | )% | | (0.64 | )% | | (0.70 | )% | | (0.76 | )% | | (1.07 | )% |
| |
| Supplemental data | | | | | | | | | | | | | | | |
| Net assets, end of year (000’s) | $ | 675 | | $ | 248 | | $ | 126 | | $ | 107,853 | | $ | 14,374 | |
| Portfolio turnover rate | | 28.03 | % | | 62.10 | % | | 34.28 | % | | 21.47 | % | | —%h | |
aFor the period December 7, 2011 (commencement of operations) to May 31, 2012.
bThe amount shown for a share outstanding throughout the period may not correlate with the Consolidated Statement of Operations for the period due to the timing of sales
and repurchases of the Fund’s shares in relation to income earned and/or fluctuating fair value of the investments of the Fund.
cBased on average daily shares outstanding.
dAmount rounds to less than $0.01 per share.
eTotal return is not annualized for periods less than one year.
fRatios are annualized for periods less than one year.
gBenefit of expense reduction rounds to less than 0.01%.
hFor the period there were no purchases or sales of investments (other than short term securities).
18 Annual Report | The accompanying notes are an integral part of these consolidated financial statements. franklintempleton.com
FRANKLIN ALTERNATIVE STRATEGIES FUNDS
| | | | |
| Consolidated Statement of Investments, May 31, 2016 | | | | |
| Franklin Pelagos Commodities Strategy Fund | | | | |
| | | Principal | | |
| | | Amount | | Value |
| U.S. Government and Agency Securities 30.0% | | | | |
| FFCB, 0.89%, 10/23/17 | $ | 18,000,000 | $ | 17,980,560 |
| U.S. Treasury Note, 0.75%, 10/31/17 | | 23,000,000 | | 22,980,242 |
| Total U.S. Government and Agency Securities (Cost $41,033,311) | | | | 40,960,802 |
| |
| Short Term Investments 68.5% | | | | |
| U.S. Government and Agency Securities 67.9% | | | | |
| a FHLB, 6/01/16 | | 4,564,000 | | 4,564,000 |
| b U.S. Treasury Bill, | | | | |
| a 6/23/16 | | 11,650,000 | | 11,648,730 |
| 7/21/16 | | 25,000,000 | | 24,991,500 |
| a,c 10/13/16 | | 36,900,000 | | 36,839,604 |
| 5/25/17 | | 15,000,000 | | 14,900,850 |
| Total U.S. Government and Agency Securities (Cost $92,972,487) | | | | 92,944,684 |
| Total Investments before Money Market Funds | | | | |
| (Cost $134,005,798) | | | | 133,905,486 |
| |
| |
| | | Shares | | |
| Money Market Funds (Cost $836,916) 0.6% | | | | |
| d,e Institutional Fiduciary Trust Money Market Portfolio | | 836,916 | | 836,916 |
| Total Investments (Cost $134,842,714) 98.5% | | | | 134,742,402 |
| f Other Assets, less Liabilities 1.5% | | | | 2,116,703 |
| Net Assets 100.0% | | | $ | 136,859,105 |
aA portion or all of the security is owned by FPC Holdings Corp., a wholly-owned subsidiary of the Fund. See Note 1(d).
bThe security is traded on a discount basis with no stated coupon rate.
cA portion or all of the security has been segregated as collateral for open futures contracts. At May 31, 2016, the value of this security and/or cash pledged amounted to
$2,416,310, representing 1.77% of net assets.
dNon-income producing.
eSee Note 3(f) regarding investments in affiliated management investment companies.
fIncludes unrealized appreciation/depreciation on open commodity futures and swap contracts, as well as other assets and liabilities.
franklintempleton.com
Annual Report
19
FRANKLIN ALTERNATIVE STRATEGIES FUNDS
CONSOLIDATED STATEMENT OF INVESTMENTS
Franklin Pelagos Commodities Strategy Fund (continued)
At May 31, 2016, the Fund had the following futures contracts outstanding. See Note 1(b).
| | | | | | | | | | | | | | |
| Futures Contractsa | | | | | | | | | | | | | | |
| | | | | Number of | | Notional | Expiration | | Unrealized | | Unrealized | |
| Description | | | Type | Contracts | | Value | Date | | Appreciation | | Depreciation | |
| Commodity Contracts | | | | | | | | | | | | | | |
| Gold | | | Long | 44 | $ | 5,357,000 | 8/29/16 | | $ | | — | $ | (75 | ) |
| Natural Gas | | | Long | 303 | | 7,387,140 | 8/29/16 | | | | 303,760 | | — | |
| Soybeans. | | | Long | 34 | | 1,794,775 | 11/14/16 | | | | — | | (734 | ) |
| WTI Crude Oil | | | Long | 236 | | 11,783,480 | 8/22/16 | | | | — | | (53,383 | ) |
| Total Futures Contracts | | | | | $ | 26,322,395 | | $ | 303,760 | $ | (54,192 | ) |
| Net unrealized appreciation (depreciation) | | | | | $ | 249,568 | | | |
| |
| |
| At May 31, 2016, the Fund had the following commodity-linked total return swap contracts outstanding. See Note 1(b). | | | |
| |
| Commodity-Linked Total Return Swap Contractsa | | | | | | | | | | |
| | Pays | | | | | Notional | Expiration | | Unrealized | | Unrealized | |
| Underlying Instruments | Fixed Rate | | Counterparty | | | Value | Date | | Appreciation | | Depreciation | |
| OTC Swap Contracts | | | | | | | | | | | | | | |
| Long | | | | | | | | | | | | | | |
| FP Custom Master Indexb | 0.22 | % | MSCS | | $ | 109,053,102 | 7/06/16 | | | $ | — | $ | (346,898 | ) |
| Net unrealized appreciation (depreciation) | | | | | | | | | $ | (346,898 | ) |
aA portion or all of the contract is owned by FPC Holdings Corp., a wholly-owned subsidiary of the Fund. See Note 1(d).
bRepresents a custom index comprised of a basket of underlying instruments. Additional information regarding the custom basket’s underlying instruments and their
respective values and fees are as follows:
| | | | | | | |
| | | | | Unrealized | | Unrealized | |
| Underlying Instruments | | Notional Valuec | | Appreciation | | Depreciation | |
| Bloomberg Commodity Aluminum Subindex 3 Month Forward | $ | 5,670,761 | $ | — | $ | (1,043 | ) |
| Bloomberg Commodity Brent Crude Oil Subindex. | | 12,759,213 | | — | | (13,023 | ) |
| Bloomberg Commodity Coffee Subindex | | 2,726,327 | | 5,575 | | — | |
| Bloomberg Commodity Copper Subindex | | 11,668,682 | | — | | (102,718 | ) |
| Bloomberg Commodity Corn Subindex 3 Month Forward | | 4,907,390 | | — | | (59,652 | ) |
| Bloomberg Commodity Gold Subindex | | 14,831,222 | | 9,432 | | — | |
| Bloomberg Commodity Heating Oil Subindex | | 6,106,974 | | — | | (18,102 | ) |
| Bloomberg Commodity Kansas Wheat Subindex 3 Month Forward | | 5,343,602 | | — | | (121,105 | ) |
| Bloomberg Commodity Live Cattle Subindex | | 6,761,292 | | 94,498 | | — | |
| Bloomberg Commodity Natural Gas Subindex 3 Month Forward | | 1,962,956 | | 38,305 | | — | |
| Bloomberg Commodity Soybean Meal Subindex | | 5,016,443 | | — | | (75,120 | ) |
| Bloomberg Commodity Soybean Oil Subindex | | 3,489,699 | | 37,728 | | — | |
| Bloomberg Commodity Soybeans Subindex | | 11,341,523 | | — | | (84,052 | ) |
| Bloomberg Commodity Sugar Subindex | | 6,870,345 | | — | | (11,966 | ) |
| Bloomberg Commodity Unleaded Gasoline Subindex | | 5,997,921 | | — | | (89,787 | ) |
| Bloomberg Commodity Zinc Subindex. | | 3,598,752 | | 44,132 | | — | |
| Total custom index | $ | 109,053,102 | $ | 229,670 | $ | (576,568 | ) |
| Net unrealized appreciation (depreciation) | | | | | $ | (346,898 | ) |
cNotional value represents the fair value of each underlying instrument (including the financing rate fee which is calculated based on the custom swap contract’s original
notional value of $109,400,000, allocated to each underlying instrument on a pro-rata basis).
See Abbreviations on page 35.
20 Annual Report | The accompanying notes are an integral part of these consolidated financial statements. franklintempleton.com
FRANKLIN ALTERNATIVE STRATEGIES FUNDS
Consolidated Financial Statements
Consolidated Statement of Assets and Liabilities
May 31, 2016
| | | |
| Franklin Pelagos Commodities Strategy Fund | | | |
| |
| Assets: | | | |
| Investments in securities: | | | |
| Cost - Unaffiliated issuers | $ | 134,005,798 | |
| Cost - Non-controlled affiliates (Note 3f) | | 836,916 | |
| Total cost of investments | $ | 134,842,714 | |
| Value - Unaffiliated issuers | $ | 133,905,486 | |
| Value - Non-controlled affiliates (Note 3f) | | 836,916 | |
| Total value of investments | | 134,742,402 | |
| Cash | | 1,760,239 | |
| Restricted Cash (Note 1c) | | 460,000 | |
| Receivables: | | | |
| Capital shares sold | | 4,422 | |
| Interest. | | 30,996 | |
| Affiliates | | 6,638 | |
| Due from brokers. | | 568,014 | |
| Variation margin | | 237,332 | |
| Other assets | | 47 | |
| Total assets | | 137,810,090 | |
| Liabilities: | | | |
| Payables: | | | |
| Capital shares redeemed | | 8,962 | |
| Management fees | | 75,713 | |
| Distribution fees | | 1,345 | |
| Professional fees | | 49,481 | |
| Due to brokers | | 460,000 | |
| Unrealized depreciation on OTC swap contracts | | 346,898 | |
| Accrued expenses and other liabilities | | 8,586 | |
| Total liabilities | | 950,985 | |
| Net assets, at value | $ | 136,859,105 | |
| Net assets consist of: | | | |
| Paid-in capital | $ | 137,386,430 | |
| Accumulated net investment loss | | (153,903 | ) |
| Net unrealized appreciation (depreciation) | | (197,642 | ) |
| Accumulated net realized gain (loss) | | (175,780 | ) |
| Net assets, at value | $ | 136,859,105 | |
franklintempleton.com The accompanying notes are an integral part of these consolidated financial statements. | Annual Report 21
FRANKLIN ALTERNATIVE STRATEGIES FUNDS
CONSOLIDATED FINANCIAL STATEMENTS
Consolidated Statement of Assets and Liabilities (continued) May 31, 2016
| | |
| Franklin Pelagos Commodities Strategy Fund | | |
| |
| Class A: | | |
| Net assets, at value | $ | 3,813,665 |
| Shares outstanding | | 589,136 |
| Net asset value per sharea | $ | 6.47 |
| Maximum offering price per share (net asset value per share ÷ 94.25%) | $ | 6.86 |
| Class C: | | |
| Net assets, at value | $ | 862,499 |
| Shares outstanding | | 135,697 |
| Net asset value and maximum offering price per sharea | $ | 6.36 |
| Class R: | | |
| Net assets, at value | $ | 8,724 |
| Shares outstanding | | 1,355 |
| Net asset value and maximum offering price per share | $ | 6.44 |
| Class R6: | | |
| Net assets, at value | $ | 131,499,710 |
| Shares outstanding | | 20,124,142 |
| Net asset value and maximum offering price per share | $ | 6.53 |
| Advisor Class: | | |
| Net assets, at value | $ | 674,507 |
| Shares outstanding | | 102,144 |
| Net asset value and maximum offering price per share | $ | 6.60 |
aRedemption price is equal to net asset value less contingent deferred sales charges, if applicable.
22 Annual Report | The accompanying notes are an integral part of these consolidated financial statements. franklintempleton.com
FRANKLIN ALTERNATIVE STRATEGIES FUNDS
CONSOLIDATED FINANCIAL STATEMENTS
Consolidated Statement of Operations
for the year ended May 31, 2016
| | | |
| Franklin Pelagos Commodities Strategy Fund | | | |
| |
| Investment income: | | | |
| Interest | $ | 417,399 | |
| Expenses: | | | |
| Management fees (Note 3a) | | 843,284 | |
| Distribution fees: (Note 3c) | | | |
| Class A | | 6,016 | |
| Class C | | 4,849 | |
| Class R | | 22 | |
| Transfer agent fees: (Note 3e) | | | |
| Class A | | 18,315 | |
| Class C | | 3,804 | |
| Class R | | 38 | |
| Class R6 | | 102 | |
| Advisor Class. | | 3,126 | |
| Custodian fees (Note 4) | | 1,019 | |
| Reports to shareholders | | 11,004 | |
| Registration and filing fees | | 80,907 | |
| Professional fees | | 101,878 | |
| Trustees’ fees and expenses | | 48,391 | |
| Other | | 4,311 | |
| Total expenses. | | 1,127,066 | |
| Expense reductions (Note 4) | | (134 | ) |
| Expenses waived/paid by affiliates (Note 3f and 3g) | | (362,409 | ) |
| Net expenses. | | 764,523 | |
| Net investment income (loss) | | (347,124 | ) |
| Realized and unrealized gains (losses): | | | |
| Net realized gain (loss) from: | | | |
| Investments | | (169,797 | ) |
| Written options | | 46,715 | |
| Futures contracts | | (771,972 | ) |
| Swap contracts | | (108,794 | ) |
| Net realized gain (loss) | | (1,003,848 | ) |
| Net change in unrealized appreciation (depreciation) on: | | | |
| Investments | | 59,810 | |
| Futures contracts | | 254,152 | |
| Swap contracts | | (960,591 | ) |
| Net change in unrealized appreciation (depreciation) | | (646,629 | ) |
| Net realized and unrealized gain (loss) | | (1,650,477 | ) |
| Net increase (decrease) in net assets resulting from operations | $ | (1,997,601 | ) |
franklintempleton.com The accompanying notes are an integral part of these consolidated financial statements. | Annual Report 23
FRANKLIN ALTERNATIVE STRATEGIES FUNDS
CONSOLIDATED FINANCIAL STATEMENTS
| | | | | | |
| Consolidated Statements of Changes in Net Assets | | | | | | |
| |
| Franklin Pelagos Commodities Strategy Fund | | | | | | |
| |
| | | Year Ended May 31, | |
| | | 2016 | | | 2015 | |
| Increase (decrease) in net assets: | | | | | | |
| Operations: | | | | | | |
| Net investment income (loss) | $ | (347,124 | ) | $ | (347,647 | ) |
| Net realized gain (loss) | | (1,003,848 | ) | | (17,829,683 | ) |
| Net change in unrealized appreciation (depreciation) | | (646,629 | ) | | 902,653 | |
| Net increase (decrease) in net assets resulting from operations | | (1,997,601 | ) | | (17,274,677 | ) |
| Capital share transactions: (Note 2) | | | | | | |
| Class A | | 1,805,061 | | | 1,790,679 | |
| Class C | | 495,022 | | | 355,889 | |
| Class R | | 4,615 | | | — | |
| Class R6 | | 80,347,873 | | | 2,216,679 | |
| Advisor Class. | | 427,868 | | | 163,257 | |
| Total capital share transactions | | 83,080,439 | | | 4,526,504 | |
| Net increase (decrease) in net assets | | 81,082,838 | | | (12,748,173 | ) |
| Net assets: | | | | | | |
| Beginning of year | | 55,776,267 | | | 68,524,440 | |
| End of year | $ | 136,859,105 | | $ | 55,776,267 | |
| Accumulated net investment loss included in net assets: | | | | | | |
| End of year | $ | (153,903 | ) | $ | (98,308 | ) |
24 Annual Report | The accompanying notes are an integral part of these consolidated financial statements. franklintempleton.com
FRANKLIN ALTERNATIVE STRATEGIES FUNDS
Notes to Consolidated Financial Statements
Franklin Pelagos Commodities Strategy Fund
1. Organization and Significant Accounting Policies
Franklin Alternative Strategies Funds (Trust) is registered under the Investment Company Act of 1940 (1940 Act) as an open-end management investment company, consisting of three separate funds and applies the specialized accounting and reporting guidance in U.S. Generally Accepted Accounting Principles (U.S. GAAP). Franklin Pelagos Commodities Strategy Fund (Fund) is included in this report. The financial statements of the remaining funds in the Trust are presented separately. The Fund offers five classes of shares: Class A, Class C, Class R, Class R6 and Advisor Class. Each class of shares differs by its initial sales load, contingent deferred sales charges, voting rights on matters affecting a single class, its exchange privilege and fees primarily due to differing arrangements for distribution and transfer agent fees.
The following summarizes the Fund’s significant accounting policies.
a. Financial Instrument Valuation
The Fund’s investments in financial instruments are carried at fair value daily. Fair value is the price that would be received to sell an asset or paid to transfer a liability in an orderly transaction between market participants on the measurement date. The Fund calculates the net asset value (NAV) per share as of 4 p.m. Eastern time each day the New York Stock Exchange (NYSE) is open for trading. Under compliance policies and procedures approved by the Trust’s Board of Trustees (the Board), the Fund’s administrator has responsibility for oversight of valuation, including leading the cross-functional Valuation Committee (VC). The VC provides administration and oversight of the Fund’s valuation policies and procedures, which are approved annually by the Board. Among other things, these procedures allow the Fund to utilize independent pricing services, quotations from securities and financial instrument dealers, and other market sources to determine fair value.
Debt securities generally trade in the over-the-counter (OTC) market rather than on a securities exchange. The Fund’s pricing services use multiple valuation techniques to determine fair value. In instances where sufficient market activity exists, the pricing services may utilize a market-based approach through which quotes from market makers are used to determine fair value. In instances where sufficient market activity may not exist or is limited, the pricing services also utilize proprietary
valuation models which may consider market characteristics such as benchmark yield curves, credit spreads, estimated default rates, anticipated market interest rate volatility, coupon rates, anticipated timing of principal repayments, underlying collateral, and other unique security features in order to estimate the relevant cash flows, which are then discounted to calculate the fair value.
Investments in open-end mutual funds are valued at the closing NAV.
Derivative financial instruments (derivatives) listed on an exchange are valued at the official closing price of the day. Certain derivatives trade in the OTC market. The Fund’s pricing services use various techniques including industry standard option pricing models and proprietary discounted cash flow models to determine the fair value of those instruments. The Fund’s net benefit or obligation under the derivative contract, as measured by the fair value of the contract, is included in net assets.
The Fund has procedures to determine the fair value of financial instruments for which market prices are not reliable or readily available. Under these procedures, the VC convenes on a regular basis to review such financial instruments and considers a number of factors, including significant unobservable valuation inputs, when arriving at fair value. The VC primarily employs a market-based approach which may use related or comparable assets or liabilities, recent transactions, market multiples, book values, and other relevant information for the investment to determine the fair value of the investment. An income-based valuation approach may also be used in which the anticipated future cash flows of the investment are discounted to calculate fair value. Discounts may also be applied due to the nature or duration of any restrictions on the disposition of the investments. Due to the inherent uncertainty of valuations of such investments, the fair values may differ significantly from the values that would have been used had an active market existed. The VC employs various methods for calibrating these valuation approaches including a regular review of key inputs and assumptions, transactional back-testing or disposition analysis, and reviews of any related market activity.
b. Derivative Financial Instruments
The Fund invested in derivatives in order to manage risk or gain exposure to various other investments or markets. Derivatives are financial contracts based on an underlying or notional
franklintempleton.com
Annual Report
25
FRANKLIN ALTERNATIVE STRATEGIES FUNDS
NOTES TO CONSOLIDATED FINANCIAL STATEMENTS
Franklin Pelagos Commodities Strategy Fund (continued)
1. Organization and Significant Accounting
Policies (continued)
b. Derivative Financial Instruments (continued)
amount, require no initial investment or an initial net investment that is smaller than would normally be required to have a similar response to changes in market factors, and require or permit net settlement. Derivatives contain various risks including the potential inability of the counterparty to fulfill their obligations under the terms of the contract, the potential for an illiquid secondary market, and/or the potential for market movements which expose the Fund to gains or losses in excess of the amounts shown in the Consolidated Statement of Assets and Liabilities. Realized gain and loss and unrealized appreciation and depreciation on these contracts for the period are included in the Consolidated Statement of Operations.
Derivative counterparty credit risk is managed through a formal evaluation of the creditworthiness of all potential counter-parties. The Fund attempts to reduce its exposure to counterparty credit risk on OTC derivatives, whenever possible, by entering into International Swaps and Derivatives Association (ISDA) master agreements with certain counterparties. These agreements contain various provisions, including but not limited to collateral requirements, events of default, or early termination. Termination events applicable to the counterparty include certain deteriorations in the credit quality of the counterparty. Termination events applicable to the Fund include failure of the Fund to maintain certain net asset levels and/or limit the decline in net assets over various periods of time. In the event of default or early termination, the ISDA master agreement gives the non-defaulting party the right to net and close-out all transactions traded, whether or not arising under the ISDA agreement, to one net amount payable by one counterparty to the other. However, absent an event of default or early termination, OTC derivative assets and liabilities are presented gross and not offset in the Consolidated Statement of Assets and Liabilities. Early termination by the counterparty may result in an immediate payment by the Fund of any net liability owed to that counterparty under the ISDA agreement.
Collateral requirements differ by type of derivative. Collateral or initial margin requirements are set by the broker or exchange clearing house for exchange traded and centrally cleared derivatives. Initial margin deposited is held at the exchange and can be in the form of cash and/or securities. For OTC derivatives traded under an ISDA master agreement, posting of
collateral is required by either the Fund or the applicable counterparty if the total net exposure of all OTC derivatives with the applicable counterparty exceeds the minimum transfer amount, which typically ranges from $100,000 to $250,000, and can vary depending on the counterparty and the type of the agreement. Generally, collateral is determined at the close of Fund business each day and any additional collateral required due to changes in derivative values may be delivered by the Fund or the counterparty within a few business days. Collateral pledged and/or received by the Fund for OTC derivatives, if any, is held in segregated accounts with the Fund’s custodian/counterparty broker and can be in the form of cash and/or securities. Unrestricted cash may be invested according to the Fund’s investment objectives. To the extent that the amounts due to the Fund from its counterparties are not subject to collateralization or are not fully collateralized, the Fund bears the risk of loss from counterparty non-performance.
The Fund entered into exchange traded futures contracts primarily to gain exposure to commodity price risk. A futures contract is an agreement between the Fund and a counterparty to buy or sell an asset for a specified price on a future date. Required initial margins are pledged by the Fund, and the daily change in fair value is accounted for as a variation margin payable or receivable in the Consolidated Statement of Assets and Liabilities.
The Fund entered into OTC commodity-linked total return swap contracts primarily to gain exposure to commodity price risk of an underlying instrument such as a stock, bond, index or basket of securities or indices. A total return swap is an agreement between the Fund and a counterparty to exchange a return linked to an underlying instrument for a floating or fixed rate payment, both based upon a notional amount. Over the term of the contract, contractually required payments to be paid or received are accrued daily and recorded as unrealized appreciation or depreciation until the payments are made, at which time they are recognized as realized gain or loss.
The Fund purchased or wrote exchange traded option contracts primarily to manage and/or gain exposure to commodity price risk. An option is a contract entitling the holder to purchase or sell a specific amount of shares or units of an asset or notional amount of a swap (swaption), at a specified price. When an option is purchased or written, an amount equal to the premium paid or received is recorded as an asset or liability, respectively. Upon exercise of an option, the acquisition cost or sales proceeds of the underlying investment is adjusted by any
26 Annual Report
franklintempleton.com
FRANKLIN ALTERNATIVE STRATEGIES FUNDS
NOTES TO CONSOLIDATED FINANCIAL STATEMENTS
Franklin Pelagos Commodities Strategy Fund (continued)
premium received or paid. Upon expiration of an option, any premium received or paid is recorded as a realized gain or loss. Upon closing an option other than through expiration or exercise, the difference between the premium received or paid and the cost to close the position is recorded as a realized gain or loss.
See Notes 6 and 7 regarding investment transactions and other derivative information, respectively.
c. Restricted Cash
At May 31, 2016, the Fund held restricted cash in connection with investments in certain derivative securities. Restricted cash is held in a segregated account with the Fund’s custodian and is reflected in the Consolidated Statement of Assets and Liabilities.
d. Investments in FPC Holdings Corp. (FP Subsidiary)
The Fund invests in certain financial instruments and commodity-linked derivative investments through its investment in the FP Subsidiary. The FP Subsidiary is a Cayman Islands exempted company with limited liability, is a wholly-owned subsidiary of the Fund, and is able to invest in certain financial instruments and commodity-linked derivative investments consistent with the investment objective of the Fund. At May 31, 2016, the FP Subsidiary’s investments, as well as any other assets and liabilities of the FP Subsidiary are reflected in the Fund’s Consolidated Statement of Investments and Consolidated Statement of Assets and Liabilities. The financial statements have been consolidated and include the accounts of the Fund and the FP Subsidiary. All intercompany transactions and balances have been eliminated. At May 31, 2016, the net assets of the FP Subsidiary were $31,379,451 representing 22.93% of the Fund’s consolidated net assets. The Fund’s investment in the FP Subsidiary is limited to 25% of consolidated assets.
e. Income Taxes
It is the Fund’s policy to qualify as a regulated investment company under the Internal Revenue Code. The Fund intends to distribute to shareholders substantially all of its taxable income and net realized gains to relieve it from federal income and excise taxes. As a result, no provision for U.S. federal income taxes is required.
The Fund may recognize an income tax liability related to its uncertain tax positions under U.S. GAAP when the uncertain tax position has a less than 50% probability that it will be sustained upon examination by the tax authorities based on its technical merits. As of May 31, 2016, the Fund has determined that no tax liability is required in its consolidated financial statements related to uncertain tax positions for any open tax years (or expected to be taken in future tax years). Open tax years are those that remain subject to examination and are based on each tax jurisdiction’s statute of limitation.
f. Security Transactions, Investment Income, Expenses and Distributions
Security transactions are accounted for on trade date. Realized gains and losses on security transactions are determined on a specific identification basis. Interest income and estimated expenses are accrued daily. Amortization of premium and accretion of discount on debt securities are included in interest income. Distributions to shareholders are recorded on the ex-dividend date and are determined according to income tax regulations (tax basis). Distributable earnings determined on a tax basis may differ from earnings recorded in accordance with U.S. GAAP. These differences may be permanent or temporary. Permanent differences are reclassified among capital accounts to reflect their tax character. These reclassifications have no impact on net assets or the results of operations. Temporary differences are not reclassified, as they may reverse in subsequent periods.
Common expenses incurred by the Trust are allocated among the funds based on the ratio of net assets of each fund to the combined net assets of the Trust. Fund specific expenses are charged directly to the fund that incurred the expense.
Realized and unrealized gains and losses and net investment income, not including class specific expenses, are allocated daily to each class of shares based upon the relative proportion of net assets of each class. Differences in per share distributions, by class, are generally due to differences in class specific expenses.
g. Accounting Estimates
The preparation of financial statements in accordance with U.S. GAAP requires management to make estimates and assumptions that affect the reported amounts of assets and
franklintempleton.com
Annual Report
27
FRANKLIN ALTERNATIVE STRATEGIES FUNDS
NOTES TO CONSOLIDATED FINANCIAL STATEMENTS
Franklin Pelagos Commodities Strategy Fund (continued)
1. Organization and Significant Accounting
Policies (continued)
g. Accounting Estimates (continued)
liabilities at the date of the financial statements and the amounts
of income and expenses during the reporting period. Actual
results could differ from those estimates.
h. Guarantees and Indemnifications
Under the Trust’s organizational documents, its officers and
trustees are indemnified by the Trust against certain liabilities
arising out of the performance of their duties to the Trust.
2. Shares of Beneficial Interest
Additionally, in the normal course of business, the Trust, on
behalf of the Fund, enters into contracts with service providers
that contain general indemnification clauses. The Trust’s
maximum exposure under these arrangements is unknown as
this would involve future claims that may be made against the
Trust that have not yet occurred. Currently, the Trust expects
the risk of loss to be remote.
At May 31, 2016, there were an unlimited number of shares authorized (without par value). Transactions in the Fund’s shares were as follows:
| | | | | | | | | | |
| | | | | Year Ended May 31, | | | | |
| | 2016 | | | | | 2015 | |
| | Shares | | | Amount | | Shares | | | Amount | |
| Class A Shares: | | | | | | | | | | |
| Shares sold | 410,630 | | $ | 2,517,563 | | 320,203 | | $ | 2,539,217 | |
| Shares redeemed. | (113,450 | ) | | (712,502 | ) | (91,847 | ) | | (748,538 | ) |
| Net increase (decrease) | 297,180 | | $ | 1,805,061 | | 228,356 | | $ | 1,790,679 | |
| Class C Shares: | | | | | | | | | | |
| Shares sold | 97,440 | | $ | 584,239 | | 50,914 | | $ | 386,347 | |
| Shares redeemed. | (15,208 | ) | | (89,217 | ) | (3,870 | ) | | (30,458 | ) |
| Net increase (decrease) | 82,232 | | $ | 495,022 | | 47,044 | | $ | 355,889 | |
| Class R Shares: | | | | | | | | | | |
| Shares sold | 792 | | $ | 4,615 | | — | | $ | — | |
| Class R6 Shares: | | | | | | | | | | |
| Shares sold | 14,259,716 | | $ | 89,857,489 | | 394,647 | | $ | 3,320,920 | |
| Shares redeemed. | (1,547,056 | ) | | (9,509,616 | ) | (145,850 | ) | | (1,104,241 | ) |
| Net increase (decrease) | 12,712,660 | | $ | 80,347,873 | | 248,797 | | $ | 2,216,679 | |
| Advisor Class Shares: | | | | | | | | | | |
| Shares sold | 75,153 | | $ | 475,789 | | 34,562 | | $ | 277,151 | |
| Shares redeemed. | (7,203 | ) | | (47,921 | ) | (13,531 | ) | | (113,894 | ) |
| Net increase (decrease) | 67,950 | | $ | 427,868 | | 21,031 | | $ | 163,257 | |
28 Annual Report
franklintempleton.com
FRANKLIN ALTERNATIVE STRATEGIES FUNDS
NOTES TO CONSOLIDATED FINANCIAL STATEMENTS
Franklin Pelagos Commodities Strategy Fund (continued)
3. Transactions with Affiliates
Franklin Resources, Inc. is the holding company for various subsidiaries that together are referred to as Franklin Templeton Investments. Certain officers and trustees of the Trust are also officers and/or directors of the following subsidiaries:
| |
| Subsidiary | Affiliation |
| Franklin Alternative Strategies Advisers, LLC (FASA) | |
| (formerly Pelagos Capital Management, LLC) | Investment manager |
| Franklin Templeton Services, LLC (FT Services) | Administrative manager |
| Franklin Templeton Distributors, Inc. (Distributors) | Principal underwriter |
| Franklin Templeton Investor Services, LLC (Investor Services) | Transfer agent |
| |
| a. Management Fees | |
The Fund and FP Subsidiary pay an investment management fee to FASA of 0.85% per year of the average daily net assets of the Fund and FP Subsidiary. Management fees paid by the Fund are reduced on assets invested in the FP Subsidiary, in an amount not to exceed the management fees paid by the FP Subsidiary.
b. Administrative Fees
Under an agreement with FASA, FT Services provides administrative services to the Fund and FP Subsidiary. The fee is paid by FASA based on the Fund and FP Subsidiary average daily net assets, and is not an additional expense of the Fund or FP Subsidiary.
c. Distribution Fees
The Board has adopted distribution plans for each share class, with the exception of Class R6 and Advisor Class shares, pursuant to Rule 12b-1 under the 1940 Act. Under the Fund’s Class A reimbursement distribution plan, the Fund reimburses Distributors for costs incurred in connection with the servicing, sale and distribution of the Fund’s shares up to the maximum annual plan rate. Under the Class A reimbursement distribution plan, costs exceeding the maximum for the current plan year cannot be reimbursed in subsequent periods. In addition, under the Fund’s Class C and R compensation distribution plans, the Fund pays Distributors for costs incurred in connection with the servicing, sale and distribution of the Fund’s shares up to the maximum annual plan rate for each class. The plan year, for purposes of monitoring compliance with the maximum annual plan rates, is February 1 through January 31 for each fund.
The maximum annual plan rates, based on the average daily net assets, for each class, are as follows:
| | |
| Class A | 0.30 | % |
| Class C | 1.00 | % |
| Class R | 0.50 | % |
Effective August 1, 2015, the Board has set the current rate at 0.25% per year for Class A shares until further notice and approval by the Board.
franklintempleton.com
Annual Report
29
FRANKLIN ALTERNATIVE STRATEGIES FUNDS
NOTES TO CONSOLIDATED FINANCIAL STATEMENTS
Franklin Pelagos Commodities Strategy Fund (continued)
|
| 3. Transactions with Affiliates (continued) |
| d. Sales Charges/Underwriting Agreements |
Front-end sales charges and contingent deferred sales charges (CDSC) do not represent expenses of the Fund. These charges are deducted from the proceeds of sales of Fund shares prior to investment or from redemption proceeds prior to remittance, as applicable. Distributors has advised the Fund of the following commission transactions related to the sales and redemptions of the Fund’s shares for the year:
| | |
| Sales charges retained net of commissions paid to unaffiliated | | |
| broker/dealers. | $ | 5,804 |
| CDSC retained | $ | 109 |
| |
| e. Transfer Agent Fees | | |
Each class of shares, except for Class R6, pays transfer agent fees to Investor Services for its performance of shareholder servicing obligations and reimburses Investor Services for out of pocket expenses incurred, including shareholder servicing fees paid to third parties. These fees are allocated daily based upon their relative proportion of such classes’ aggregate net assets. Class R6 pays Investor Services transfer agent fees specific to that class.
For the year ended May 31, 2016, the Fund paid transfer agent fees of $25,385, of which $12,154 was retained by Investor Services.
f. Investments in Affiliated Management Investment Companies
The Fund invests in one or more affiliated management investment companies for purposes other than exercising a controlling influence over the management or policies. Management fees paid by the Fund are waived on assets invested in the affiliated management investment companies, as noted in the Consolidated Statement of Operations, in an amount not to exceed the management and administrative fees paid directly or indirectly by each affiliate. Prior to June 1, 2013, the waiver was accounted for as a reduction to management fees.
| | | | | | | | | | |
| | | | | | | | | | | % of |
| | | | | | | | | | | Affiliated |
| | Number of | | | | Number of | | | | | Fund Shares |
| | Shares Held | | | | Shares | | Value | | | Outstanding |
| | at Beginning | Gross | Gross | | Held at End | | at End | Investment | Realized | Held at End |
| | of Year | Additions | Reductions | | of Year | | of Year | Income | Gain (Loss) | of Year |
| |
| Non-Controlled Affiliates | | | | | | | | | | |
| Institutional Fiduciary Trust Money Market | | | | | | | | | | |
| Portfolio | 787,280 | 57,625,344 | (57,575,708 | ) | 836,916 | $ | 836,916 | $— | $— | —%a |
aRounds to less than 0.01%.
g. Waiver and Expense Reimbursements
FASA has contractually agreed in advance to waive or limit its fees and to assume as its own expense certain expenses otherwise
payable by the Fund so that the expenses (excluding distribution fees, acquired fund fees and expenses) for each class of the Fund
do not exceed 0.95% and Class R6 does not exceed 0.73% based on the average net assets of each class (other than certain
non-routine expenses or costs, including those relating to litigation, indemnification, reorganizations, and liquidations) until
September 30, 2016. Total expenses waived or paid are not subject to recapture subsequent to the Fund’s fiscal year end. Prior to
October 1, 2015, expenses for Class R6 were limited to 0.86%.
30 Annual Report
franklintempleton.com
FRANKLIN ALTERNATIVE STRATEGIES FUNDS
NOTES TO CONSOLIDATED FINANCIAL STATEMENTS
| | | |
| Franklin Pelagos Commodities Strategy Fund (continued) | | | |
| |
| h. Other Affiliated Transactions | | | |
| |
| At May 31, 2016, the shares of the Fund were owned by the following entities: | | |
| |
| | | Percentage of | |
| | Shares | Outstanding Shares | |
| Franklin Moderate Allocation Fund | 8,448,086 | 40.32 | %a |
| Franklin Conservative Allocation Fund | 5,595,894 | 26.71 | % |
| Franklin Growth Allocation Fund | 4,744,341 | 22.64 | % |
| Franklin LifeSmart 2025 Retirement Target Fund | 416,245 | 1.99 | % |
| Franklin LifeSmart 2035 Retirement Target Fund | 323,621 | 1.54 | % |
| Franklin LifeSmart 2045 Retirement Target Fund | 220,224 | 1.05 | % |
| Franklin LifeSmart 2020 Retirement Target Fund | 112,259 | 0.54 | % |
| Franklin LifeSmart 2030 Retirement Target Fund | 106,801 | 0.51 | % |
| Franklin LifeSmart 2040 Retirement Target Fund | 77,346 | 0.37 | % |
| Franklin LifeSmart 2050 Retirement Target Fund | 71,606 | 0.34 | % |
| Franklin LifeSmart 2055 Retirement Target Fund | 7,719 | 0.04 | % |
| Franklin Resources, Inc | 563 | —%b | |
| | 20,124,705 | 96.05 | % |
| aInvestment activities of this investment company could have a material impact on the Fund. | | | |
| bRounds to less than 0.01% | | | |
4. Expense Offset Arrangement
The Fund has entered into an arrangement with its custodian whereby credits realized as a result of uninvested cash balances are
used to reduce a portion of the Fund’s custodian expenses. During the year ended May 31, 2016, the custodian fees were reduced as
noted in the Consolidated Statement of Operations.
5. Income Taxes
For tax purposes, capital losses may be carried over to offset future capital gains, if any. At May 31, 2016, the Fund had long-term capital loss carryforwards of $175,775.
During the year ended May 31, 2016, the Fund utilized $12,607 of capital loss carryforwards.
For tax purposes, the Fund may elect to defer any portion of a late-year ordinary loss to the first day of the following fiscal year. At May 31, 2016, the Fund deferred late-year ordinary losses of $72,053.
At May 31, 2016, the cost of investments and net unrealized appreciation (depreciation) for income tax purposes were as follows:
| | | |
| Cost of investments | $ | 134,857,019 | |
| |
| Unrealized appreciation | $ | 4,366 | |
| Unrealized depreciation | | (118,983 | ) |
| Net unrealized appreciation (depreciation) | $ | (114,617 | ) |
Differences between income and/or capital gains as determined on a book basis and a tax basis are primarily due to differing
treatments of bond discounts and premiums, investments in the FP Subsidiary and non-deductible expenses.
franklintempleton.com
Annual Report
31
FRANKLIN ALTERNATIVE STRATEGIES FUNDS
NOTES TO CONSOLIDATED FINANCIAL STATEMENTS
Franklin Pelagos Commodities Strategy Fund (continued)
6. Investment Transactions
Purchases and sales of investments (excluding short term securities) for the year ended May 31, 2016, aggregated $23,047,617 and $10,999,652, respectively.
Transactions in options written during the year ended May 31, 2016, were as follows:
| | | | | | | | | | |
| | | | | | Number of | | | | | |
| | | | | | Contracts | | | Premiums | |
| Options outstanding at May 31, 2015. | | | | | — | | | $ | — | |
| Options written | | | | | 212 | | | | 46,715 | |
| Options expired. | | | | | (212 | ) | | | (46,715 | ) |
| Options exercised | | | | | — | | | | — | |
| Options closed | | | | | — | | | | — | |
| Options outstanding at May 31, 2016. | | | | | — | | | $ | — | |
| |
| See Notes 1(b) and 7 regarding derivative financial instruments and other derivative information, respectively. | | | | | |
| |
| |
| 7. Other Derivative Information | | | | | | | | | |
| |
| At May 31, 2016, the Fund’s investments in derivative contracts are reflected in the Consolidated Statement of Assets and | | |
| Liabilities as follows: | | | | | | | | | | |
| |
| | Asset Derivatives | | | | Liability Derivatives | | | | | |
| Derivative Contracts | | | | | | | | | | |
| Not Accounted for as | Consolidated Statement of | | | | Consolidated Statement of | | | | | |
| Hedging Instruments | Assets and Liabilities Location | | Fair Value | | Assets and Liabilities Location | | | Fair Value | |
| Commodity contracts | Variation margin | $ | 303,760 | a | Variation margin | | $ | 54,192 | a |
| | Unrealized appreciation on OTC | | — | | Unrealized depreciation on OTC | | | | 346,898 | |
| | swap contracts | | | | swap contracts | | | | | |
| Totals | | $ | 303,760 | | | | $ | 401,090 | |
aThis amount reflects the cumulative appreciation (depreciation) of futures contracts as reported in the Consolidated Statement of Investments. Only the variation margin receivable/payable at year end is separately reported within the Consolidated Statement of Assets and Liabilities. Prior variation margin movements were recorded to cash upon receipt or payment.
For the year ended May 31, 2016, the effect of derivative contracts in the Fund’s Consolidated Statement of Operations was as follows:
| | | | | | | | |
| | | | | | | | Net Change in | |
| | | | | | | | Unrealized | |
| Derivative Contacts | Consolidated | | Net Realized | | Consolidated | | Appreciation | |
| Not Accounted for as | Statement of | | Gain (Loss) for the | | Statement of | | (Depreciation) | |
| Hedging Instruments | Operations Locations | | Year | | Operations Locations | | for the Year | |
| | Net realized gain (loss) from: | | | | Net change in unrealized | | | |
| | | | | | appreciation (depreciation) on: | | | |
| Commodity contracts | Investments | $ | (168,589 | ) | Investments | $ | 74,559 | a |
| | Written options | | 46,715 | | | | | |
| | Futures contracts | | (771,972 | ) | Futures contracts | | 254,152 | |
| | Swap contracts | | (108,794 | ) | Swap contracts | | (960,591 | ) |
| Totals | | $ | (1,002,640 | ) | | $ | (631,880 | ) |
aPurchased option contracts are included in net change in unrealized appreciation (depreciation) on investments in the Consolidated Statement of Operations.
32 Annual Report
franklintempleton.com
FRANKLIN ALTERNATIVE STRATEGIES FUNDS
NOTES TO CONSOLIDATED FINANCIAL STATEMENTS
Franklin Pelagos Commodities Strategy Fund (continued)
For the year ended May 31, 2016, the average month end fair value of derivatives represented 1.62% of average month end net assets. The average month end number of open derivative contracts for the year was 4.
At May 31, 2016, the Fund’s OTC derivative assets and liabilities are as follows:
| | | |
| | Gross and Net Amounts | | |
| | of Assets and Liabilities Presented in the |
| | Consolidated Statement of Assets and Liabilities |
| | Assetsa | | Liabilitiesa |
| Derivatives | | | |
| Swap contracts | $— | $ | 346,898 |
aAbsent an event of default or early termination, OTC derivative assets and liabilities are presented gross and not offset in the Consolidated Statement of Assets and Liabilities.
At May 31, 2016, the Fund’s OTC derivative assets, which may be offset against the Fund’s OTC derivative liabilities and collateral received from the counterparty, are as follows:
| | | | | |
| | | Amounts Not Offset in the | | |
| | | Consolidated Statement of Assets and Liabilities | |
| | Gross and | | | | |
| | Net Amounts of | Financial | Financial | | |
| | Assets Presented in the | Instruments | Instruments | Cash | Net Amount |
| | Consolidated Statement of | Available for | Collateral | Collateral | (Not less |
| | Assets and Liabilities | Offset | Received | Receiveda | than zero) |
| |
| Counterparty | | | | | |
| MSCS | $ — | $ — | $ — | $ — | $ — |
aIn some instances, the collateral amounts disclosed in the table above were adjusted due to the requirement to limit the collateral amounts to avoid the effect of over collateralization. Actual collateral received and/or pledged may be more than the amounts disclosed herein.
At May 31, 2016, the Fund’s OTC derivative liabilities, which may be offset against the Fund’s OTC derivative assets and collateral pledged to the counterparty, are as follows:
| | | | | | | |
| | | | Amounts Not Offset in the | | | |
| | | | Consolidated Statement of Assets and Liabilities | | |
| |
| | | Gross and | | | | | |
| | | Net Amounts of | Financial | Financial | | | |
| | | Liabilities Presented in the | Instruments | Instruments | Cash | | Net Amount |
| | | Consolidated Statement of | Available for | Collateral | Collateral | | (Not less |
| | | Assets and Liabilities | Offset | Pledged | Pledged | | than zero) |
| |
| Counterparty | | | | | | | |
| MSCS | $ | 346,898 | $ — | $ — | $ — | $ | 346,898 |
See Notes 1(b) and 6 regarding derivative financial instruments and investment transactions, respectively.
See Abbreviations on page 35.
8. Credit Facility
The Fund, together with other U.S. registered and foreign investment funds (collectively, Borrowers), managed by Franklin
Templeton Investments, are borrowers in a joint syndicated senior unsecured credit facility totaling $2 billion (Global Credit
Facility) which matures on February 10, 2017. This Global Credit Facility provides a source of funds to the Borrowers for
temporary and emergency purposes, including the ability to meet future unanticipated or unusually large redemption requests.
franklintempleton.com
Annual Report
33
FRANKLIN ALTERNATIVE STRATEGIES FUNDS
NOTES TO CONSOLIDATED FINANCIAL STATEMENTS
Franklin Pelagos Commodities Strategy Fund (continued)
8. Credit Facility (continued)
Under the terms of the Global Credit Facility, the Fund shall, in addition to interest charged on any borrowings made by the Fund and other costs incurred by the Fund, pay its share of fees and expenses incurred in connection with the implementation and maintenance of the Global Credit Facility, based upon its relative share of the aggregate net assets of all of the Borrowers, including an annual commitment fee of 0.07% based upon the unused portion of the Global Credit Facility. Effective February 12, 2016, the annual commitment fee is 0.15%. These fees are reflected in other expenses in the Consolidated Statement of Operations. During the year ended May 31, 2016, the Fund did not use the Global Credit Facility.
9. Fair Value Measurements
The Fund follows a fair value hierarchy that distinguishes between market data obtained from independent sources (observable inputs) and the Fund’s own market assumptions (unobservable inputs). These inputs are used in determining the value of the Fund’s financial instruments and are summarized in the following fair value hierarchy:
- Level 1 – quoted prices in active markets for identical financial instruments
- Level 2 – other significant observable inputs (including quoted prices for similar financial instruments, interest rates, prepayment speed, credit risk, etc.)
- Level 3 – significant unobservable inputs (including the Fund’s own assumptions in determining the fair value of financial instruments)
The input levels are not necessarily an indication of the risk or liquidity associated with financial instruments at that level.
For movements between the levels within the fair value hierarchy, the Fund has adopted a policy of recognizing the transfers as of the date of the underlying event which caused the movement.
A summary of inputs used as of May 31, 2016, in valuing the Fund’s assets and liabilities carried at fair value, is as follows:
| | | | | | | | |
| | | Level 1 | | Level 2 | | Level 3 | | Total |
| Assets: | | | | | | | | |
| Investments in Securities: | | | | | | | | |
| U.S. Government and Agency Securities | $ | — | $ | 40,960,802 | $ | — | $ | 40,960,802 |
| Short Term Investments | | 89,217,600 | | 4,564,000 | | — | | 93,781,600 |
| Total Investments in Securities | $ | 89,217,600 | $ | 45,524,802 | $ | — | $ | 134,742,402 |
| |
| Other Financial Instruments | | | | | | | | |
| Futures Contracts | $ | 303,760 | $ | — | $ | — | $ | 303,760 |
| |
| Liabilities: | | | | | | | | |
| Other Financial Instruments | | | | | | | | |
| Futures Contracts | $ | 54,192 | $ | — | $ | — | $ | 54,192 |
| Swap Contracts. | | — | | 346,898 | | — | | 346,898 |
| Total Other Financial Instruments | $ | 54,192 | $ | 346,898 | $ | — | $ | 401,090 |
A reconciliation of assets in which Level 3 inputs are used in determining fair value is presented when there are significant Level 3 financial instruments at the end of the year.
34 Annual Report
franklintempleton.com
FRANKLIN ALTERNATIVE STRATEGIES FUNDS
NOTES TO CONSOLIDATED FINANCIAL STATEMENTS
Franklin Pelagos Commodities Strategy Fund (continued)
10. Subsequent Events
The Fund has evaluated subsequent events through the issuance of the consolidated financial statements and determined that no events have occurred that require disclosure.
| | |
| Abbreviations | | |
| Counterparty | Selected Portfolio |
| MSCS Morgan Stanley Capital Services, LLC | FFCB | Federal Farm Credit Bank |
| | FHLB | Federal Home Loan Bank |
franklintempleton.com
Annual Report
35
FRANKLIN ALTERNATIVE STRATEGIES FUNDS
Report of Independent Registered Public Accounting Firm
To the Board of Trustees of Franklin Alternative Strategies Funds and Shareholders of Franklin Pelagos Commodities Strategy Fund:
We have audited the accompanying consolidated statement of assets and liabilities, including the consolidated statement of investments, of Franklin Pelagos Commodities Strategy Fund (the "Fund") (one of the funds constituting the Franklin Alternative Strategies Funds), as of May 31, 2016, and the related consolidated statement of operations for the year then ended, the consolidated statements of changes in net assets for each of the two years in the period then ended and the financial highlights for each of the periods indicated therein. These financial statements and financial highlights are the responsibility of the Fund’s management. Our responsibility is to express an opinion on these financial statements and financial highlights based on our audits.
We conducted our audits in accordance with the standards of the Public Company Accounting Oversight Board (United States). Those standards require that we plan and perform the audit to obtain reasonable assurance about whether the financial statements and financial highlights are free of material misstatement. We were not engaged to perform an audit of the Fund’s internal control over financial reporting. Our audits included consideration of internal control over financial reporting as a basis for designing audit procedures that are appropriate in the circumstances, but not for the purpose of expressing an opinion on the effectiveness of the Fund’s internal control over financial reporting. Accordingly, we express no such opinion. An audit also includes examining, on a test basis, evidence supporting the amounts and disclosures in the financial statements and financial highlights, assessing the accounting principles used and significant estimates made by management, and evaluating the overall financial statement presentation. Our procedures included confirmation of securities owned as of May 31, 2016, by correspondence with the custodian and brokers. We believe that our audits provide a reasonable basis for our opinion.
In our opinion, the financial statements and financial highlights referred to above present fairly, in all material respects, the consolidated financial position of Franklin Pelagos Commodities Strategy Fund (one of the funds constituting the Franklin Alternative Strategies Funds) at May 31, 2016, the consolidated results of its operations for the year then ended, the consolidated changes in its net assets for each of the two years in the period then ended and the financial highlights for each of the periods indicated therein, in conformity with U.S. generally accepted accounting principles.

36 Annual Report
franklintempleton.com
FRANKLIN ALTERNATIVE STRATEGIES FUNDS
Board Members and Officers
The name, year of birth and address of the officers and board members, as well as their affiliations, positions held with the Trust, principal occupations during at least the past five years and number of U.S. registered portfolios overseen in the Franklin Templeton Investments fund complex, are shown below. Generally, each board member serves until that person’s successor is elected and qualified.
| | | | |
| Independent Board Members | | | |
| |
| | | | Number of Portfolios in | |
| Name, Year of Birth | | Length of | Fund Complex Overseen | Other Directorships Held |
| and Address | Position | Time Served | by Board Member* | During at Least the Past 5 Years |
| |
| Edward I. Altman, Ph.D. (1941) | Trustee | Since 2011 | 15 | None |
| c/o Franklin Mutual Advisers, LLC | | | | |
| 101 John F. Kennedy Parkway | | | | |
| Short Hills, NJ 07078-2789 | | | | |
| Principal Occupation During at Least the Past 5 Years: | | |
| Max L. Heine Professor of Finance, Emeritus and Director of The Credit and Debt Markets Research Program, Salomon Center, Stern School |
| of Business, New York University; editor and author of numerous financial publications; financial consultant; an adviser to numerous financial |
| and publishing organizations; and formerly, Vice Director, Salomon Center, Stern School of Business, New York University. |
| |
| Ann Torre Bates (1958) | Trustee | Since 2011 | 39 | Navient Corporation (loan |
| c/o Franklin Mutual Advisers, LLC | | | | management, servicing and asset |
| 101 John F. Kennedy Parkway | | | | recovery) (2014-present), Ares Capital |
| Short Hills, NJ 07078-2789 | | | | Corporation (specialty finance |
| | | | | company) (2010-present), United |
| | | | | Natural Foods, Inc. (distributor of |
| | | | | natural, organic and specialty foods) |
| | | | | (2013-present), Allied Capital |
| | | | | Corporation (financial services) |
| | | | | (2003-2010) and SLM Corporation |
| | | | | (Sallie Mae) (1997-2014). |
| Principal Occupation During at Least the Past 5 Years: | | |
| Director of various companies; and formerly, Executive Vice President and Chief Financial Officer, NHP Incorporated (manager of multifamily |
| housing) (1995-1997); and Vice President and Treasurer, US Airways, Inc. (until 1995). | |
| |
| Burton J. Greenwald (1929) | Trustee | Since 2011 | 15 | Franklin Templeton Emerging Markets |
| c/o Franklin Mutual Advisers, LLC | | | | Debt Opportunities Fund PLC and |
| 101 John F. Kennedy Parkway | | | | Fiduciary International Ireland Limited |
| Short Hills, NJ 07078-2789 | | | | (1999-2015). |
| Principal Occupation During at Least the Past 5 Years: | | |
| Managing Director, B.J. Greenwald Associates (management consultants to the financial services industry); and formerly, Chairman, Fiduciary |
| Trust International Funds; Executive Vice President, L.F. Rothschild Fund Management, Inc.; President and Director, Merit Mutual Funds; |
| President, Underwriting Division and Director, National Securities & Research Corporation; Governor, Investment Company Institute; and |
| Chairman, ICI Public Information Committee. | | | |
| |
| Keith E. Mitchell (1954) | Trustee | Since 2011 | 15 | None |
| c/o Franklin Mutual Advisers, LLC | | | | |
| 101 John F. Kennedy Parkway | | | | |
| Short Hills, NJ 07078-2789 | | | | |
| Principal Occupation During at Least the Past 5 Years: | | |
| Director of various boards of asset management firms; and formerly, Managing Member, Mitchell, Hartley & Bechtel Advisers, LLC (formerly, |
| Mitchell Advisers, LLC) (advisory firm) (2003-2015) and Managing Director, Putman Lovell NBF. | |
| |
| David W. Niemiec (1949) | Trustee | Since 2015 | 39 | Emeritus Corporation (assisted living) |
| c/o Franklin Mutual Advisers, LLC | | | | (1999-2010) and OSI Pharmaceuticals, |
| 101 John F. Kennedy Parkway | | | | Inc. (pharmaceutical products) |
| Short Hills, NJ 07078-2789 | | | | (2006-2010). |
| Principal Occupation During at Least the Past 5 Years: | | |
| Advisor, Saratoga Partners (private equity fund); and formerly, Managing Director, Saratoga Partners (1998-2001) and SBC Warburg Dillon |
| Read (investment banking) (1997-1998); Vice Chairman, Dillon, Read & Co. Inc. (investment banking) (1991-1997); and Chief Financial Officer, |
| Dillon, Read & Co. Inc. (1982-1997). | | | |
franklintempleton.com
Annual Report
37
FRANKLIN ALTERNATIVE STRATEGIES FUNDS
| | | | |
| Independent Board Members (continued) | | |
| |
| |
| |
| | | | Number of Portfolios in | |
| Name, Year of Birth | | Length of | Fund Complex Overseen | Other Directorships Held |
| and Address | Position | Time Served | by Board Member* | During at Least the Past 5 Years |
| |
| Charles Rubens II (1930) | Trustee | Since 2011 | 15 | None |
| c/o Franklin Mutual Advisers, LLC | | | | |
| 101 John F. Kennedy Parkway | | | | |
| Short Hills, NJ 07078-2789 | | | | |
| Principal Occupation During at Least the Past 5 Years: | | |
| Private investor and president of non-profit organizations; and formerly, an executive of Time, Inc.; and Trustee of Colorado College. |
| |
| Jan Hopkins Trachtman (1947) | Trustee | Since 2011 | 15 | None |
| c/o Franklin Mutual Advisers, LLC | | | | |
| 101 John F. Kennedy Parkway | | | | |
| Short Hills, NJ 07078-2789 | | | | |
| Principal Occupation During at Least the Past 5 Years: | | |
| President and Founder, The Jan Hopkins Group (communications consulting firm); serves on Advisory Board of Knight Bagehot Fellowship; |
| and formerly, President, Economic Club of New York (2001-2015); Anchor/Correspondent, CNN Financial News (until 2003); Managing |
| Director and Head of Client Communications, Citigroup Private Bank (until 2005); Off-Air Reporter, ABC News’ World News Tonight; and Editor, |
| CBS Network News. | | | | |
| |
| Robert E. Wade (1946) | Trustee and | Trustee and | 39 | El Oro Ltd (investments) |
| c/o Franklin Mutual Advisers, LLC | Chairman of | Chairman of the | | (2003-present). |
| 101 John F. Kennedy Parkway | the Board | Board since 2011 | | |
| Short Hills, NJ 07078-2789 | | | | |
| Principal Occupation During at Least the Past 5 Years: | | |
| Attorney at law engaged in private practice (1972-2008) and member of various boards. | |
| |
| Gregory H. Williams (1943) | Trustee | Since 2015 | | None |
| c/o Franklin Mutual Advisers, LLC | | | | |
| 101 John F. Kennedy Parkway | | | | |
| Short Hills, NJ 07078-2789 | | | | |
| Principal Occupation During at Least the Past 5 Years: | | |
| Private investor; Consultant; and formerly, President, University of Cincinnati (2009-2012); President, The City College of New York |
| (2001-2009); Dean, College of Law, Ohio State University (1993-2001); and Associate Vice President, Academic Affairs and Professor of Law, |
| University of Iowa (1977-1993). | | | | |
| |
| |
| Interested Board Members and Officers | | |
| |
| | | | Number of Portfolios in | |
| Name, Year of Birth | | Length of | Fund Complex Overseen | Other Directorships Held |
| and Address | Position | Time Served | by Board Member* | During at Least the Past 5 Years |
| |
| **Gregory E. Johnson (1961) | Trustee | Since 2011 | 160 | None |
| One Franklin Parkway | | | | |
| San Mateo, CA 94403-1906 | | | | |
| Principal Occupation During at Least the Past 5 Years: | | |
| Chairman of the Board, Member – Office of the Chairman, Director and Chief Executive Officer, Franklin Resources, Inc.; officer and/or |
| director or trustee, as the case may be, of some of the other subsidiaries of Franklin Resources, Inc. and of 44 of the investment companies in |
| Franklin Templeton Investments; and Chairman, Investment Company Institute; and formerly, President, Franklin Resources, Inc. (1994-2015). |
| |
| **Jennifer M. Johnson (1964) | Trustee | Since 2015 | 12 | None |
| One Franklin Parkway | | | | |
| San Mateo, CA 94403-1906 | | | | |
| Principal Occupation During at Least the Past 5 Years: | | |
| Co-President, Franklin Resources, Inc.; officer and/or director or trustee, as the case may be, of some of the other subsidiaries of Franklin |
| Resources, Inc. and of four of the investment companies in Franklin Templeton Investments; and formerly, Chief Operating Officer and |
| Executive Vice President, Franklin Resources, Inc. (1994-2015); Executive Vice President of Operations and Technology, Franklin Resources, |
| Inc. (2005-2010); and Senior Vice President, Franklin Resources, Inc. (2003-2005). | |
38 Annual Report
franklintempleton.com
FRANKLIN ALTERNATIVE STRATEGIES FUNDS
| | | | |
| Interested Board Members and Officers (continued) | |
| |
| |
| |
| | | | Number of Portfolios in | |
| Name, Year of Birth | | Length of | Fund Complex Overseen | Other Directorships Held |
| and Address | Position | Time Served | by Board Member* | During at Least the Past 5 Years |
| |
| Alison E. Baur (1964) | Vice President | Since 2012 | Not Applicable | Not Applicable |
| One Franklin Parkway | | | | |
| San Mateo, CA 94403-1906 | | | | |
| Principal Occupation During at Least the Past 5 Years: | | |
| Deputy General Counsel, Franklin Templeton Investments; and officer of some of the other subsidiaries of Franklin Resources, Inc. and of 45 |
| of the investment companies in Franklin Templeton Investments. | | |
| |
| Laura F. Fergerson (1962) | Chief Executive Since 2011 | Not Applicable | Not Applicable |
| One Franklin Parkway | Officer – | | | |
| San Mateo, CA 94403-1906 | Finance and | | | |
| | Administration | | | |
| Principal Occupation During at Least the Past 5 Years: | | |
| Senior Vice President, Franklin Templeton Services, LLC; Vice President, Franklin Advisers, Inc. and Franklin Templeton Institutional, LLC; and |
| officer of 45 of the investment companies in Franklin Templeton Investments. | |
| |
| Aliya S. Gordon (1973) | Vice President | Since 2011 | Not Applicable | Not Applicable |
| One Franklin Parkway | | | | |
| San Mateo, CA 94403-1906 | | | | |
| Principal Occupation During at Least the Past 5 Years:and | | |
| formerly, Executive Vice President – Alternative Strategies, Franklin | | |
| Resources, Inc. (2005-2015). | | | | |
| Senior Associate General Counsel, Franklin Templeton Investments; and officer of 45 of the investment companies in Franklin Templeton |
| Investments. | | | | |
| |
| Steven J. Gray (1955) | Secretary and | Secretary and Vice | Not Applicable | Not Applicable |
| One Franklin Parkway | Vice President | President since | | |
| San Mateo, CA 94403-1906 | | 2011 | | |
| Principal Occupation During at Least the Past 5 Years: | | |
| Senior Associate General Counsel, Franklin Templeton Investments; Vice President, Franklin Templeton Distributors, Inc. and Franklin |
| Alternative Strategies Advisers, LLC; and officer of 45 of the investment companies in Franklin Templeton Investments. |
| |
| Robert G. Kubilis (1973) | Treasurer, | Since 2015 | Not Applicable | Not Applicable |
| 300 S.E. 2nd Street | Chief Financial | | | |
| Fort Lauderdale, FL 33301-1923 | Officer and | | | |
| | Chief | | | |
| | Accounting | | | |
| | Officer | | | |
| Principal Occupation During at Least the Past 5 Years: | | |
| Treasurer, U.S. Fund Administration & Reporting, Franklin Templeton Investments; and officer of four of the investment companies in Franklin |
| Templeton Investments. | | | | |
| |
| Robert Lim (1948) | Vice | Since May 2016 | Not Applicable | Not Applicable |
| One Franklin Parkway | President – | | | |
| San Mateo, CA 94403-1906 | AML | | | |
| | Compliance | | | |
| Principal Occupation During at Least the Past 5 Years: | | |
| Portfolio Manager, Franklin Advisers, Inc.; officer of one of the investment companies in Franklin Templeton Investments; and formerly, |
| Manager of Americas market specialist sales team, Bloomberg LP (1991-2007). | |
| |
| Kimberly H. Novotny (1972) | Vice President | Since 2013 | Not Applicable | Not Applicable |
| 300 S.E. 2nd Street | | | | |
| Fort Lauderdale, FL 33301-1923 | | | | |
| Principal Occupation During at | | | | |
| Least the Past 5 Years: | | | | |
| Associate General Counsel, Franklin Templeton Investments; Vice President and Corporate Secretary, Fiduciary Trust International of the |
| South; Vice President, Templeton Investment Counsel, LLC; Assistant Secretary, Franklin Resources, Inc.; and officer of 45 of the investment |
| companies in Franklin Templeton Investments. | | | |
franklintempleton.com
Annual Report
39
FRANKLIN ALTERNATIVE STRATEGIES FUNDS
| | | | |
| Interested Board Members and Officers (continued) | |
| |
| |
| |
| | | | Number of Portfolios in | |
| Name, Year of Birth | | Length of | Fund Complex Overseen | Other Directorships Held |
| and Address | Position | Time Served | by Board Member* | During at Least the Past 5 Years |
| |
| Robert C. Rosselot (1960) | Chief | Since 2013 | Not Applicable | Not Applicable |
| 300 S.E. 2nd Street | Compliance | | | |
| Fort Lauderdale, FL 33301-1923 | Officer | | | |
| Principal Occupation During at Least the Past 5 Years: | | |
| Director, Global Compliance, Franklin Templeton Investments; Vice President, Franklin Templeton Companies, LLC; officer of 45 of the |
| investment companies in Franklin Templeton Investments; and formerly, Senior Associate General Counsel, Franklin Templeton Investments |
| (2007-2013); and Secretary and Vice President, Templeton Group of Funds (2004-2013). | |
| |
| Karen L. Skidmore (1952) | Vice President | Since 2011 | Not Applicable | Not Applicable |
| One Franklin Parkway | | | | |
| San Mateo, CA 94403-1906 | | | | |
| Principal Occupation During at Least the Past 5 Years: | | |
| Senior Associate General Counsel, Franklin Templeton Investments; and officer of 45 of the investment companies in Franklin Templeton |
| Investments. | | | | |
| |
| Navid Tofigh (1972) | Vice President | Since | Not Applicable | Not Applicable |
| One Franklin Parkway | | November 2015 | | |
| San Mateo, CA 94403-1906 | | | | |
| Principal Occupation During at Least the Past 5 Years: | | |
| Associate General Counsel, Franklin Templeton Investments; and officer of 45 of the investment companies in Franklin Templeton Investments. |
| |
| Craig S. Tyle (1960) | Vice President | Since 2011 | Not Applicable | Not Applicable |
| One Franklin Parkway | | | | |
| San Mateo, CA 94403-1906 | | | | |
| Principal Occupation During at Least the Past 5 Years: | | |
| General Counsel and Executive Vice President, Franklin Resources, Inc.; and officer of some of the other subsidiaries of Franklin Resources, |
| Inc. and of 45 of the investment companies in Franklin Templeton Investments. | |
| |
| Lori A. Weber (1964) | Vice President | Since 2011 | Not Applicable | Not Applicable |
| 300 S.E. 2nd Street | | | | |
| Fort Lauderdale, FL 33301-1923 | | | | |
| Principal Occupation During at Least the Past 5 Years: | | |
| Senior Associate General Counsel, Franklin Templeton Investments; Assistant Secretary, Franklin Resources, Inc.; Vice President and |
| Secretary, Templeton Investment Counsel, LLC; and officer of 45 of the investment companies in Franklin Templeton Investments. |
| |
| William Y. Yun (1959) | President and | Since 2011 | Not Applicable | Not Applicable |
| 600 Fifth Avenue | Chief | | | |
| New York, NY 10020 | Executive | | | |
| | Officer – | | | |
| | Investment | | | |
| | Management | | | |
| Principal Occupation During at Least the Past 5 Years: | | |
| Executive Vice President, Franklin Advisers, Inc. and Franklin Templeton Institutional, LLC; Chief Executive Officer, Franklin Alternative |
| Strategies Advisers, LLC; Director, Fiduciary Investments Corporation and K2 Advisors Holdings, LLC; officer and/or director or trustee, as the |
| case may be, of some of the other subsidiaries of Franklin Resources, Inc. and of one of the investment companies in Franklin Templeton |
| Investments; and formerly, Executive Vice President – Alternative Strategies, Franklin Resources, Inc. (2005-2015). |
*We base the number of portfolios on each separate series of the U.S. registered investment companies within the Franklin Templeton Investments fund complex. These
portfolios have a common investment manager or affiliated investment managers.
**Gregory E. Johnson is considered to be an interested person of the Fund under the federal securities laws due to his position as an officer and director ofFranklin
Resources, Inc. (Resources), which is the parent company of the Fund’s investment manager and distributor. Rupert H. Johnson, Jr. is considered to be an interested person
of the Fund under the federal securities laws due to his position as officer and director and major shareholder of Resources.
Note 1: Rupert H. Johnson, Jr. is the uncle of Gregory E. Johnson.
40 Annual Report
franklintempleton.com
FRANKLIN ALTERNATIVE STRATEGIES FUNDS
Interested Board Members and Officers (continued)
Note 2: Officer information is current as of the date of this report. It is possible that after this date, information about officers may change.
The Fund’s Board has determined that certain of the members of the Audit Committee, including Ann Torre Bates, are audit committee financial experts, and “independent,” under those provisions of the Sarbanes-Oxley Act of 2002, and the rules and form amendments adopted by the Securities and Exchange Commission, relating to audit committee financial experts.
The Statement of Additional Information (SAI) includes additional information about the board members and is available, without charge, upon request.
Shareholders may call (800) DIAL BEN/342-5236 to request the SAI.
franklintempleton.com
Annual Report
41
FRANKLIN ALTERNATIVE STRATEGIES FUNDS FRANKLIN PELAGOS COMMODITIES STRATEGY FUND
Shareholder Information
Board Review of Investment Management Agreement
The Board of Trustees (Board), including a majority of trustees that are not “interested persons” as such term is defined in section 2(a)(19) of the Investment Company Act of 1940 (hereinafter referred to as “independent Trustees”), at an in-person meeting held on May 16, 2016, unanimously approved the renewal of the Fund’s investment management agreement. Prior to a meeting of all of the trustees for the purpose of considering such renewal, the independent trustees held two meetings dedicated to the renewal process (those trustees unable to attend in person were present by telephonic conference means). Throughout the process, the independent trustees received assistance and advice from and met separately with independent counsel. The independent trustees met with and interviewed officers of the investment manager (including portfolio managers), the transfer agent and shareholder services group and the distributor. In approving the renewal of the agreement, the Board, including the independent trustees, determined that the existing investment management fee structure was fair and reasonable and that continuance of the agreement was in the best interests of the Fund and its shareholders.
In reaching their decision on the agreement, the trustees took into account information furnished throughout the year at regular Board meetings, as well as information specifically requested and furnished for the renewal process, which culminated in the meetings referred to above for the specific purpose of considering such agreement. Information furnished included, among others, reports on the Fund’s investment performance, expenses, portfolio composition, derivatives, asset segregation, portfolio turnover, Rule 12b-1 plans, distribution, shareholder servicing, legal and compliance matters, pricing of securities, sales and redemptions, and marketing support payments made to financial intermediaries, as well as a third-party survey of transfer agent fees charged to funds within the Franklin Templeton Investments (FTI) complex in comparison with those charged to other fund complexes deemed comparable. Also, related financial statements and other information about the scope and quality of services provided by the investment manager and its affiliates and enhancements to such services over the past year were provided. In addition, the trustees received periodic reports throughout the year and during the renewal process relating to compliance with the Fund’s investment policies and restrictions. During the renewal process, the independent trustees considered the investment manager’s methods of
operation within the Franklin Templeton group and its activities on behalf of other clients. The Board also noted that they received an annual report on all marketing support payments made by FTI to financial intermediaries, as well as a memorandum relating to third-party servicing arrangements in response to a Guidance Update from the U.S. Securities and Exchange Commission (SEC) relating to mutual fund distribution and sub-accounting fees.
The information obtained by the trustees during the renewal process also included a special report prepared by Broadridge Financial Solutions, Inc. (Broadridge), an independent third-party analyst, comparing the Fund’s investment performance and expenses with those of other mutual funds deemed comparable to such Fund as selected by Broadridge (Broadridge Section 15(c) Report). The trustees reviewed the Broadridge Section 15(c) Report and its usefulness in the renewal process with respect to matters such as comparative fees, expenses, expense ratios and performance. They concluded that the report was a reliable resource in the performance of their duties.
In addition, the trustees received a Profitability Study (Profitability Study) prepared by management discussing the profitability to FTI from its overall U.S. fund operations, as well as on an individual fund-by-fund basis. Over the past year, the Board and counsel to the independent trustees continued to receive reports on management’s handling of recent regulatory inquiries and pending legal actions against the investment manager and its affiliates. The independent trustees were satisfied with the actions taken to date by management in response to such regulatory and legal matters.
Particular attention was given to the diligent risk management program of the investment manager, including continual monitoring and management of counterparty credit risk and collateral, and attention given to derivatives and other complex instruments that are held and expected to be held by the Fund and how such instruments are used to carry out the Fund’s investment objectives. The Board also took into account, among other things, management’s efforts in establishing a global credit facility for the benefit of the Fund and other accounts managed by FTI to provide a source of cash for temporary and emergency purposes or to meet unusual redemption requests as well as the strong financial position of the investment manager’s parent company and its commitment to the mutual fund business. In addition, the Board received updates from management on the SEC’s progress in implementing the rule-making requirements established by the
42 Annual Report
franklintempleton.com
FRANKLIN ALTERNATIVE STRATEGIES FUNDS
FRANKLIN PELAGOS COMMODITIES STRATEGY FUND
SHAREHOLDER INFORMATION
Dodd-Frank Wall Street Reform and Consumer Protection Act (Dodd-Frank Act), which was enacted July 21, 2010, and the compliance of the investment manager with rules and regulations already promulgated by the SEC under such act, as well as the compliance of the investment manager with new rules and regulations promulgated by the U.S. Commodity Futures Trading Commission.
In addition to the above and other matters considered by the trustees throughout the course of the year, the following discussion relates to certain primary factors relevant to the Board’s decision. This discussion of the information and factors considered by the Board (including the information and factors discussed above) is not intended to be exhaustive, but rather summarizes certain factors considered by the Board. In view of the wide variety of factors considered, the Board did not, unless otherwise noted, find it practicable to quantify or otherwise assign relative weights to the foregoing factors. In addition, individual trustees may have assigned different weights to various factors.
NATURE, EXTENT AND QUALITY OF SERVICES. The trustees reviewed the nature, extent and quality of the services provided, and to be provided, by the investment manager. In this regard, they reviewed the Fund’s actively managed fundamental and quantitative investment philosophy and process and the investment manager’s ability to implement such philosophy and process, including, but not limited to, the investment manager’s trading practices and investment decision processes and efforts to ensure compliance with the Fund’s investment goals, policies, and limitations. The Board also considered the investment management services that the investment manager provides to the Cayman Islands-based company, which is wholly owned by the Fund (Cayman Subsidiary).
The trustees reviewed the Fund’s portfolio management team, including its performance, staffing, skills and compensation program. With respect to portfolio manager compensation, management assured the trustees that the Fund’s long-term performance is a significant component of incentive-based compensation and noted that a portion of a portfolio manager’s incentive-based compensation is paid in shares of pre-designated funds from the portfolio manager’s fund management area. The trustees noted that the portfolio manager compensation program aligned the interests of the portfolio managers with that of shareholders of the Fund. The trustees considered various other products, portfolios and entities that are advised by the investment manager and the allocation of
assets and expenses among and within them, as well as their relative fees and reasons for differences with respect thereto and any potential conflicts.
During regular Board meetings and the aforementioned meetings of the independent trustees, the trustees considered periodic reports provided to them showing that the investment manager complied with the investment policies and restrictions of the Fund as well as other reports periodically furnished to the Board covering matters such as the compliance of portfolio managers and other management personnel with the code of ethics covering the investment management personnel, the adherence to fair value pricing procedures established by the Board and the accuracy of net asset value calculations. The Board noted the extent of the benefits provided to Fund shareholders from being part of the Franklin Templeton group, including the right to exchange investments between funds (same class) without a sales charge, the ability to reinvest Fund dividends into other funds and the right to combine holdings of other funds to obtain reduced sales charges.
The Board considered the investment manager’s significant efforts in developing and implementing compliance procedures established in accordance with SEC and other requirements. The Board also considered the nature, extent and quality of the services to be provided under the Fund’s other service agreements with affiliates of the investment manager and considered whether, on an overall basis, Fund shareholders were well served. In this connection, the Board also took into account transfer agent and shareholder services provided to Fund shareholders by an affiliate of the investment manager, noting continuing expenditures by management to increase and improve the scope of such services and favorable periodic reports on shareholder services conducted by independent third parties. While such considerations directly affected the trustees’ decision in renewing the Fund’s transfer agent and shareholder services agreement, the Board also considered these commitments as incidental benefits to Fund shareholders deriving from the investment management relationship.
Based on their review, the trustees were satisfied with the nature and quality of the overall services provided, and to be provided, by the investment manager and its affiliates to the Fund and its shareholders and were confident in the abilities of the management team to continue to implement the Fund’s actively managed fundamental and quantitative investment philosophy and process and to provide quality services to the Fund and its shareholders.
franklintempleton.com
Annual Report
43
FRANKLIN ALTERNATIVE STRATEGIES FUNDS FRANKLIN PELAGOS COMMODITIES STRATEGY FUND SHAREHOLDER INFORMATION
INVESTMENT PERFORMANCE. As the Fund commenced operations in December 2011, the trustees reviewed the investment performance of the Fund for the one-, three- and four-year periods ended December 31, 2015. As part of their review, they inquired of management regarding benchmark and hedging activities. Consideration was also given to performance in the context of available levels of cash, including as affected by net flows, during the periods. The trustees had meetings during the year, including the meetings referred to above held in connection with the renewal process, with the Fund’s portfolio managers to discuss performance and the management of the Fund.
In addition, attention in assessing performance was given to the Broadridge Section 15(c) Report. That report showed the investment performance of the Fund (Class A shares) in comparison to other funds determined comparable by Broadridge.
The comparable funds to the Fund, as chosen by Broadridge, included all retail and institutional commodities general funds. The Fund had total returns in the second-highest performing quintile for the one-year period ended December 31, 2015, and had annualized total returns for the three- and four-year periods in the middle and second-highest performing quintiles respectively. The Board found such comparative performance to be acceptable.
COMPARATIVE EXPENSES AND PROFITABILITY.
The trustees considered the cost of the services provided and to be provided and the losses incurred by the investment manager and its affiliates from their respective relationships with the Fund. As part of the approval process, they explored with management the trends in expense ratios over the past three fiscal years and the reasons for any increases in the Fund’s expense ratios (or components thereof). The Board considered the extent to which the investment manager may derive ancillary benefits from Fund operations. In considering the appropriateness of the management fee and other expenses charged to the Fund, the Board took into account various factors including investment performance and matters relating to Fund operations, including, but not limited to, the quality and experience of its portfolio managers and research staff. As part of this discussion, the Board took into account the fee waiver and expense limitation arrangement in effect. The Board also considered the investment management services that the investment manager provides to the Cayman Subsidiary and the related fee waivers that were in place. The Board considered the nature of the services provided by the investment manager
to the other mutual fund it subadvises with similar investment objectives as the Fund, the fees that it charges for such services and any potential conflicts.
Consideration was also given to a comparative analysis in the Broadridge Section 15(c) Report of the investment management fee and total expense ratio of the Fund in comparison with those of a group of other funds selected by Broadridge as its appropriate Broadridge expense group. Broadridge expense data is based upon information taken from the Fund’s most recent annual report, which reflects historical asset levels that may be quite different from those currently existing, particularly in a period of market volatility. While recognizing such inherent limitation and the fact that expense ratios generally increase as assets decline and decrease as assets grow, the Board believed the independent analysis conducted by Broadridge to be an appropriate measure of comparative expenses. In reviewing comparative costs, emphasis was given to the Fund’s contractual management fee in comparison with the contractual management fee that would have been charged by other funds within its Broadridge expense group assuming they were similar in size to the Fund, as well as the actual total expenses of the Fund in comparison with those of its Broadridge expense group. The Broadridge contractual management fee analysis includes administrative charges as being part of the management fee, and total expenses, for comparative consistency, are shown by Broadridge for Fund Class A shares. The Fund’s contractual management fee rate was in the least expensive quintile of its Broadridge expense group and its total expenses (including Rule 12b-1 fees) were in the second-least expensive quintile of such group. The Board was satisfied with such comparative fees and expenses.
The trustees also reviewed the Profitability Study addressing profitability of Franklin Resources, Inc., from its overall U.S. fund business, as well as profitability to the Fund’s investment manager and its affiliates, from providing investment management and other services to the Fund during the 12-month period ended September 30, 2015, the most recent fiscal year end of Franklin Resources, Inc. The trustees reviewed the basis on which such reports are prepared and the cost allocation methodology utilized in the Profitability Study, it being recognized that allocation methodologies may each be reasonable while producing different results. In this respect, the Board noted that the reasonableness of the cost allocation methodologies was reviewed by independent accountants on an every other year basis.
44 Annual Report
franklintempleton.com
FRANKLIN ALTERNATIVE STRATEGIES FUNDS
FRANKLIN PELAGOS COMMODITIES STRATEGY FUND
SHAREHOLDER INFORMATION
The independent trustees met with management to discuss the Profitability Study. This included, among other things, a comparison of investment management income with investment management expenses of the Fund; comparison of underwriting revenues and expenses; the relative relationship of investment management and underwriting expenses; shareholder servicing profitability; economies of scale; and the relative contribution of the Fund to the profitability of the investment manager and its parent. In discussing the Profitability Study with the Board, the investment manager stated its belief that the costs incurred in establishing the infrastructure necessary to operate the type of mutual fund operations conducted by it and its affiliates may not be fully reflected in the expenses allocated to the Fund in determining its profitability. The Board also took into account management’s expenditures in improving shareholder services provided to the Fund, as well as the need to meet additional regulatory and compliance requirements resulting from the Sarbanes-Oxley Act, the Dodd-Frank Act and recent SEC and other regulatory requirements. The trustees also considered the extent to which the investment manager may derive ancillary benefits from Fund operations.
ECONOMIES OF SCALE. The Board considered economies of scale realized by the investment manager and its affiliates as the Fund grows larger and the extent to which they are shared with Fund shareholders, as for example, in the level of the investment management fees charged, in the quality and efficiency of services rendered and in increased capital commitments benefiting the Fund directly or indirectly. The Board also considered the fee waiver and expense limitation arrangement in effect, and the amount of Fund expenses that were absorbed since inception of the Fund by the investment manager through such waiver and arrangement. The Board concluded that economies of scale were deemed not to be a significant factor at that time in light of, among other matters, the fee waiver and expense limitation arrangement in effect and the limited size of assets under management.
Proxy Voting Policies and Procedures
The Fund’s investment manager has established Proxy Voting Policies and Procedures (Policies) that the Fund uses to determine how to vote proxies relating to portfolio securities. Shareholders may view the Fund’s complete Policies online at franklintempleton.com. Alternatively, shareholders may request copies of the Policies free of charge by calling the Proxy Group collect at (954) 527-7678 or by sending a written request to: Franklin Templeton Companies, LLC, 300 S.E. 2nd Street, Fort Lauderdale, FL 33301, Attention: Proxy Group. Copies of the Fund’s proxy voting records are also made available online
at franklintempleton.com and posted on the U.S. Securities and Exchange Commission’s website at sec.gov and reflect the most recent 12-month period ended June 30.
Quarterly Statement of Investments
The Trust, on behalf of the Fund, files a complete statement of investments with the U.S. Securities and Exchange Commission for the first and third quarters for each fiscal year on Form N-Q. Shareholders may view the filed Form N-Q by visiting the Commission’s website at sec.gov. The filed form may also be viewed and copied at the Commission’s Public Reference Room in Washington, DC. Information regarding the operations of the Public Reference Room may be obtained by calling (800) SEC-0330.
Householding of Reports and Prospectuses
You will receive each Fund’s financial reports every six months as well as an annual updated summary prospectus (prospectus available upon request). To reduce Fund expenses, we try to identify related shareholders in a household and send only one copy of the financial reports and summary prospectus. This process, called “householding,” will continue indefinitely unless you instruct us otherwise. If you prefer not to have these documents householded, please call us at (800) 632-2301. At any time you may view current prospectuses/summary prospectuses and financial reports on our website. If you choose, you may receive these documents through electronic delivery.
franklintempleton.com
Annual Report
45
This page intentionally left blank.
This page intentionally left blank.
This page intentionally left blank.

Annual Report and Shareholder Letter
Franklin Pelagos Commodities Strategy Fund
Investment Manager
Franklin Alternative Strategies Advisers, LLC
Distributor
Franklin Templeton Distributors, Inc.
(800) DIAL BEN® / 342-5236
franklintempleton.com
Shareholder Services
(800) 632-2301
Authorized for distribution only when accompanied or preceded by a summary prospectus and/or prospectus. Investors should carefully consider a fund’s investment goals, risks, charges and expenses before investing. A prospectus contains this and other information; please read it carefully before investing.
To help ensure we provide you with quality service, all calls to and from our service areas are monitored and/or recorded.
| |
| © 2016 Franklin Templeton Investments. All rights reserved. | 995 A 07/16 |
Item 2. Code of Ethics.
(a) The Registrant has adopted a code of ethics that applies to its principal executive officers and principal financial and accounting officer.
(c) N/A
(d) N/A
(f) Pursuant to Item 12(a)(1), the Registrant is attaching as an exhibit a copy of its code of ethics that applies to its principal executive officers and principal financial and accounting officer.
Item 3. Audit Committee Financial Expert.
(a)(1) The Registrant has an audit committee financial expert serving on its audit committee.
(2) The audit committee financial expert is Ann Torre Bates and she is “independent” as defined under the relevant Securities and Exchange Commission Rules and Releases.
Item 4. Principal Accountant Fees and Services.
(a) Audit Fees
The aggregate fees paid to the principal accountant for professional services rendered by the principal accountant for the audit of the registrant’s annual financial statements or for services that are normally provided by the principal accountant in connection with statutory and regulatory filings or engagements were $221,182 for the fiscal year ended May 31, 2016 and $165,375 for the fiscal year ended May 31, 2015.
(b) Audit-Related Fees
There were no fees paid to the principal accountant for assurance and related services rendered by the principal accountant to the registrant that are reasonably related to the performance of the audit of the registrant's financial statements and are not reported under paragraph (a) of Item 4.
There were no fees paid to the principal accountant for assurance and related services rendered by the principal accountant to the registrant's investment adviser and any entity controlling, controlled by or under common control with the investment adviser that provides ongoing services to the registrant that are reasonably related to the performance of the audit of their financial statements.
(c) Tax Fees
The aggregate fees paid to the principal accountant for professional services rendered by the principal accountant to the registrant for tax compliance, tax advice and tax planning were $4,299 for the fiscal year ended May 31, 2016 and $3,103 for the fiscal year ended May 31, 2015. The services for which these fees were paid include identifying passive foreign investment companies to manage exposure to tax liabilities.
The aggregate fees paid to the principal accountant for professional services rendered by the principal accountant to the registrant’s investment adviser and any entity controlling, controlled by or under common control with the investment adviser that provides ongoing services to the registrant for tax compliance, tax advice and tax planning were $114,500 for the fiscal year ended May 31, 2016 and $77,000 for the fiscal year ended May 31, 2015. The services for which these fees were paid included technical tax consultation for withholding tax report to foreign governments, application of local country tax laws and tax advice.
(d) All Other Fees
There were no fees paid to the principal accountant for products and services rendered by the principal accountant to the registrant not reported in paragraphs (a)-(c) of Item 4.
There were no fees paid to the principal accountant for products and services rendered by the principal accountant to the registrant’s investment adviser and any entity controlling, controlled by or under common control with the investment adviser that provides ongoing services to the registrant other than the services reported in paragraphs (a)-(c) of Item 4.
(e) (1) The registrant’s audit committee is directly responsible for approving the services to be provided by the auditors, including:
(i) pre-approval of all audit and audit related services;
(ii) pre-approval of all non-audit related services to be provided to the Fund by the auditors;
(iii) pre-approval of all non-audit related services to be provided to the registrant by the auditors to the registrant’s investment adviser or to any entity that controls, is controlled by or is under common control with the registrant’s investment adviser and that provides ongoing services to the registrant where the non-audit services relate directly to the operations or financial reporting of the registrant; and
(iv) establishment by the audit committee, if deemed necessary or appropriate, as an alternative to committee pre-approval of services to be provided by the auditors, as required by paragraphs (ii) and (iii) above, of policies and procedures to permit such services to be pre-approved by other means, such as through establishment of guidelines or by action of a designated member or members of the committee; provided the policies and procedures are detailed as to the particular service and the committee is informed of each service and such policies and procedures do not include delegation of audit committee responsibilities, as contemplated under the Securities Exchange Act of 1934, to management; subject, in the case of (ii) through (iv), to any waivers, exceptions or exemptions that may be available under applicable law or rules.
(e) (2) None of the services provided to the registrant described in paragraphs (b)-(d) of Item 4 were approved by the audit committee pursuant to paragraph (c)(7)(i)(C) of Rule 2-01 of regulation S-X.
(f) No disclosures are required by this Item 4(f).
(g) The aggregate non-audit fees paid to the principal accountant for services rendered by the principal accountant to the registrant and the registrant’s investment adviser and any entity controlling, controlled by or under common control with the investment adviser that provides ongoing services to the registrant were $118,799 for the fiscal year ended May 31, 2016 and $80,103 for the fiscal year ended May 31, 2015.
(h) The registrant’s audit committee of the board has considered whether the provision of non-audit services that were rendered to the registrant’s investment adviser (not including any sub-adviser whose role is primarily portfolio management and is subcontracted with or overseen by another investment adviser), and any entity controlling, controlled by, or under common control with the investment adviser that provides ongoing services to the registrant that were not pre-approved pursuant to paragraph (c)(7)(ii) of Rule 2-01 of Regulation S-X is compatible with maintaining the principal accountant’s independence.
Item 5. Audit Committee of Listed Registrants. N/A
Item 6. Schedule of Investments. N/A
Item 7. Disclosure of Proxy Voting Policies and Procedures for Closed-
End Management Investment Companies. N/A
Item 8. Portfolio Managers of Closed-End Management Investment
Companies. N/A
Item 9. Purchases of Equity Securities by Closed-End Management
Investment Company and Affiliated Purchasers. N/A
Item 10. Submission of Matters to a Vote of Security Holders.
There have been no changes to the procedures by which shareholders may recommend nominees to the Registrant's Board of Trustees that would require disclosure herein.
Item 11. Controls and Procedures.
(a) Evaluation of Disclosure Controls and Procedures. The Registrant maintains disclosure controls and procedures that are designed to ensure that information required to be disclosed in the Registrant’s filings under the Securities Exchange Act of 1934 and the Investment Company Act of 1940 is recorded, processed, summarized and reported within the periods specified in the rules and forms of the Securities and Exchange Commission. Such information is accumulated and communicated to the Registrant’s management, including its principal executive officer and principal financial officer, as appropriate, to allow timely decisions regarding required disclosure. The Registrant’s management, including the principal executive officer and the principal financial officer, recognizes that any set of controls and procedures, no matter how well designed and operated, can provide only reasonable assurance of achieving the desired control objectives.
Within 90 days prior to the filing date of this Shareholder Report on Form N-CSR, the Registrant had carried out an evaluation, under the supervision and with the participation of the Registrant’s management, including the Registrant’s principal executive officer and the Registrant’s principal financial officer, of the effectiveness of the design and operation of the Registrant’s disclosure controls and procedures. Based on such evaluation, the Registrant’s principal executive officer and principal financial officer concluded that the Registrant’s disclosure controls and procedures are effective.
(b) Changes in Internal Controls. There have been no changes in the Registrant’s internal controls or in other factors that could materially affect the internal controls over financial reporting subsequent to the date of their evaluation in connection with the preparation of this Shareholder Report on Form N-CSR.
Item 12. Exhibits.
(a) (1) Code of Ethics
(a)(2) Certifications pursuant to Section 302 of the Sarbanes-Oxley Act of 2002 of Laura F. Fergerson, Chief Executive Officer - Finance and Administration, and Robert G. Kubilis, Chief Financial Officer and Chief Accounting Officer
(b) Certifications pursuant to Section 906 of the Sarbanes-Oxley Act of 2002 of Laura F. Fergerson, Chief Executive Officer - Finance and Administration, and Robert G. Kubilis, Chief Financial Officer and Chief Accounting Officer
SIGNATURES
Pursuant to the requirements of the Securities Exchange Act of 1934 and the Investment Company Act of 1940, the registrant has duly caused this report to be signed on its behalf by the undersigned, thereunto duly authorized.
FRANKLIN ALTERATIVE STRATEGIES FUNDS
By /s/ Laura F. Fergerson
Laura F. Fergerson
Chief Executive Officer –
Finance and Administration
Date July 27, 2016
Pursuant to the requirements of the Securities Exchange Act of 1934 and the Investment Company Act of 1940, this report has been signed below by the following persons on behalf of the registrant and in the capacities and on the dates indicated.
By /s/ Laura F. Fergerson
Laura F. Fergerson
Chief Executive Officer –
Finance and Administration
Date July 27, 2016
By /s/ Robert G. Kubilis
Robert G. Kubilis
Chief Financial Officer and
Chief Accounting Officer
Date July 27, 2016