UNITED STATES
SECURITIES AND EXCHANGE COMMISSION
Washington, DC 20549
FORM N-CSR
CERTIFIED SHAREHOLDER REPORT OF REGISTERED MANAGEMENT INVESTMENT
COMPANIES
Investment Company Act file number 811-22641
Franklin Alternative Strategies Funds
(Exact name of registrant as specified in charter)
One Franklin Parkway, San Mateo, CA 94403-1906
(Address of principal executive offices) (Zip code)
Craig S. Tyle, One Franklin Parkway, San Mateo, CA 94403-1906
(Name and address of agent for service)
Registrant’s telephone number, including area code: 650 312-2000
Date of fiscal year end: 5/31
Date of reporting period: 5/31/18
Item 1. Reports to Stockholders.
| | |
 | | Annual Report and Shareholder Letter May 31, 2018 |
Franklin K2 Alternative Strategies Fund
A SERIES OF FRANKLIN ALTERNATIVE STRATEGIES FUNDS

Sign up for electronic delivery at franklintempleton.com/edelivery
Franklin Templeton Investments
Why choose Franklin Templeton Investments?
Successful investing begins with ambition. And achievement only comes when you reach for it. That’s why we continually strive to deliver better outcomes for investors. No matter what your goals are, our deep, global investment expertise allows us to offer solutions that can help.
During our more than 70 years of experience, we’ve managed through all kinds of markets—up, down and those in between. We’re always preparing for what may come next. It’s because of this, combined with our strength as one of the world’s largest asset managers that we’ve earned the trust of millions of investors around the world.
Dear Fellow Shareholder:
During the 12 months ended May 31, 2018, global markets were aided by price gains in commodities, generally upbeat economic data across regions and encouraging corporate earnings reports. Markets were also supported by the European Central Bank’s extension of its monetary easing program and the passage of US tax reforms. However, investor sentiment was dampened by Korean peninsula tensions, protectionist US trade policies and US-China trade disputes, consumer data privacy concerns, and worries that central banks could raise interest rates in response to strong economic growth and rising inflation. In this environment, global developed stock markets, as measured by the MSCI World Index, generated a +12.18% total return for the period.1 Global emerging market stocks, as measured by the MSCI Emerging Markets Index, produced a +14.43% total return.1 Global government bonds, as measured by the Citigroup World Government Bond Index, posted a +2.06% total return.1
We are committed to our long-term perspective and disciplined investment approach as we conduct a rigorous, fundamental analysis of securities with a regular emphasis on investment risk management.
We believe active, professional investment management serves investors well. We also recognize the important role of financial advisors in today’s markets and encourage investors to continue to seek their advice. Amid changing markets and economic
conditions, we are confident investors with a well-diversified portfolio and a patient, long-term outlook should be well positioned for the years ahead.
On the following pages, the Fund’s portfolio management team reviews investment decisions that pertain to performance during the past 12 months in light of the economic environment and other factors. Please remember all securities markets fluctuate, as do mutual fund share prices.
We thank you for investing with Franklin Templeton, welcome your questions and comments, and look forward to continuing to serve your investment needs in the years ahead.
Sincerely,

Madison S. Gulley, CFA
President and Chief Executive Officer – Investment Management
Franklin Alternative Strategies Funds
This letter reflects our analysis and opinions as of May 31, 2018, unless otherwise indicated. The information is not a complete analysis of every aspect of any market, country, industry, security or fund. Statements of fact are from sources considered reliable.
CFA® is a trademark owned by CFA Institute.
1. Source: Morningstar.
See www.franklintempletondatasources.com for additional data provider information.
| | | | | | | | |
| Not FDIC Insured | | | | | May Lose Value | | | | | No Bank Guarantee |
| | | | | | |
| franklintempleton.com | | Not part of the annual report | | | 1 | |
Contents
Annual Report
Visit franklintempleton.com for fund updates, to access your account, or to find helpful financial planning tools.
| | | | | | |
| | 2 | | | Annual Report | | franklintempleton.com |
Annual Report
Franklin K2 Alternative Strategies Fund
We are pleased to bring you Franklin K2 Alternative Strategies Fund’s annual report for the fiscal year ended May 31, 2018.
Your Fund’s Goal and Main Investments
The Fund seeks capital appreciation with lower volatility relative to the broad equity markets. The Fund seeks to achieve its investment goal by allocating its assets across multiple nontraditional or “alternative” strategies, including, but not limited to, some or all of the following strategies: long short equity, relative value, event driven and global macro. The Fund is structured as a multi-manager fund, meaning the Fund’s assets are independently managed by multiple subadvisors, while the Fund’s investment manager retains overall responsibility for the Fund’s investments. The Fund may invest in a wide range of securities and other investments including, but not limited to: equity securities including common stocks, preferred stocks, convertible securities, rights and warrants, private and registered investment vehicles and exchange-traded funds (ETFs); debt securities including bonds, notes, debentures, banker’s acceptances and commercial paper; loans and loan participations; and mortgage-backed or other asset-backed securities, including collateralized debt obligations; as well as derivatives, commodities and currencies.
Performance Overview
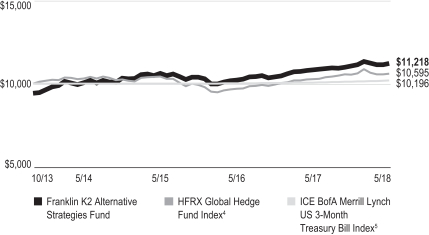
The Fund’s Class A shares delivered a +3.57% cumulative total return for the 12 months under review. For comparison, the Fund’s new primary and old secondary benchmark, the HFRX Global Hedge Fund Index, which is designed to be representative of the overall composition of the hedge fund universe, generated a +2.88% total return for the same period.1 As the investment manager believes the composition of the HFRX Global Hedge Fund Index more accurately reflects the Fund’s holdings, it has replaced the ICE BofA Merrill Lynch US 3-Month Treasury Bill Index as the Fund’s primary benchmark. Also for comparison, the Fund’s new secondary and old primary benchmark, the ICE BofA Merrill Lynch US 3-Month Treasury Bill Index, which tracks the performance of short-term US government securities with a remaining term to final maturity of less than three months, posted a +1.28% total return for
the same period.2 You can find more of the Fund’s performance data in the Performance Summary beginning on page 7.
Performance data represent past performance, which does not guarantee future results. Investment return and principal value will fluctuate, and you may have a gain or loss when you sell your shares. Current performance may differ from figures shown. For most recent month-end performance, go to franklintempleton.com or call (800) 342-5236.
Economic and Market Overview
The global economy expanded during the 12-month period under review amid generally upbeat economic data across regions. In this environment, global developed and emerging market stocks reached a new all-time high in January 2018 and generated a +12.43% total return for the period, as measured by the MSCI All Country World Index.2 Global markets were aided by price gains in oil and other commodities, as well as the European Central Bank’s (ECB’s) extension of its monetary easing program. Further supporting global stocks were the passage of the US tax reform bill and encouraging corporate earnings reports.
However, global markets reflected investor concerns about tensions in the Korean peninsula and political uncertainties in the US and the European Union, as well as worries that strong economic growth and rising inflation in some parts of the world, particularly in the US, would lead central banks to increase interest rates sooner than expected. Global markets were further pressured by the Trump administration’s protectionist trade policies, uncertainty surrounding the US-China trade relationship, and a broad sell-off in information technology stocks in March due to a potential for tighter regulation in the sector arising from concerns about consumer data privacy. However, an overall easing of tensions in the Korean peninsula and intermittent US-China trade negotiations partially offset some of these concerns during the period.
After accelerating in 2017’s third quarter, the US economy expanded at a slower pace in the fourth quarter. Growth continued to moderate in 2018’s first quarter due to a slowdown in
1. Source: FactSet. Hedge Fund Research, Inc. – www.hedgefundresearch.com. The HFRX Global Hedge Fund Index is being used under license from Hedge Fund Research, Inc., which does not endorse or approve of any of the contents of this report.
2. Source: Morningstar.
The indexes are unmanaged and include reinvestment of any income or distributions. They do not reflect any fees, expenses or sales charges. One cannot invest directly in an index, and an index is not representative of the Fund’s portfolio. Unlike most asset class indexes, HFR Index returns reflect fees and expenses.
The dollar value, number of shares or principal amount, and names of all portfolio holdings are listed in the Fund’s Consolidated Statement of Investments (SOI). The Consolidated SOI begins on page 16.
| | | | | | |
| franklintempleton.com | | Annual Report | | | 3 | |
FRANKLIN K2 ALTERNATIVE STRATEGIES FUND
consumer spending, exports, and state and local government spending, as well as a decline in residential fixed income investment. The unemployment rate declined from 4.3% in May 2017, as reported at the beginning of the 12-month period, to an 18-year low of 3.8% at period-end.3 Annual inflation, as measured by the Consumer Price Index, increased from 1.9% in May 2017, as reported at the beginning of the period, to 2.8% at period-end.3 The US Federal Reserve (Fed) raised its target range for the federal funds rate three times during the period and began reducing its balance sheet in October as part of its ongoing plan to normalize its monetary policy.
In Europe, the UK’s economic growth accelerated in 2017’s third quarter over the previous quarter and remained stable in the fourth quarter. However, growth moderated in 2018’s first quarter amid a decline in construction output. In November, the Bank of England raised its key policy rate for the first time in a decade. The eurozone’s quarterly growth held steady in 2017’s third and fourth quarters but moderated in 2018’s first quarter. The bloc’s annual inflation rate ended the period higher than in May 2017. The ECB kept its benchmark interest rate unchanged during the period. However, at its October meeting, the ECB extended the time frame for its massive bond-buying program from December 2017 to at least September 2018, while reducing the amount of monthly bond purchases in half beginning in January 2018.
In Asia, Japan’s quarterly gross domestic product (GDP) growth held steady in 2017’s third quarter but slowed in the fourth quarter. GDP growth in 2018’s first quarter declined, the country’s first contraction since 2015’s fourth quarter, mainly due to a decline in private residential investment. The Bank of Japan left its benchmark interest rate unchanged during the period and continued its monetary stimulus measures.
In emerging markets, Brazil’s quarterly GDP grew in 2017’s third and fourth quarters, although at a slower pace than the previous quarters. However, growth accelerated in 2018’s first quarter. The country’s central bank cut its benchmark interest rate several times during the period to spur economic growth. Russia’s annual GDP growth rate remained positive in 2017’s third and fourth quarters as well as 2018’s first quarter, amid the Bank of Russia’s continued policy support. China’s annual GDP moderated in 2017’s third quarter but grew at a stable rate in the following two quarters. The People’s Bank of China left its benchmark interest rate unchanged during the period. Overall, emerging market stocks, as measured by the MSCI Emerging Markets Index, rose during the period.
Investment Strategy
We manage the Fund using a multi-manager approach. While we are responsible for the Fund’s overall investments, we allocate assets to multiple subadvisors, each of whom independently manages a separate portion of the Fund’s portfolio in accordance with some or all of the following strategies: long short equity, relative value, event driven and global macro. We allocate the Fund’s assets among these strategies utilizing a top-down approach, generating the Fund’s strategy weightings by taking into account market conditions, risk factors, diversification, liquidity, transparency, and availability of various subadvisors and other investment options, among other things. The allocations to specific subadvisors may change from time to time based upon our assessment of their correlations to various markets and to each other, their risk profiles and return expectations. Long short equity strategies generally seek to produce returns from investments in the equity markets by taking long and short positions in stocks and stock indexes (through the use of derivatives or ETFs). Relative value strategies encompass a wide range of investment techniques that are intended to profit from pricing inefficiencies. Event driven strategies generally invest in securities of companies undergoing significant corporate events. Global macro strategies generally focus on broad-based economic opportunities across numerous markets and investments.
The Fund may take long and/or short positions in a wide range of asset classes, including equities, fixed income, commodities and currencies, among others. Long positions benefit from an increase in the price of the underlying instrument or asset class, while short positions benefit from a decrease in that price. The Fund may use derivatives for hedging and non-hedging (investment) purposes, although no subadvisor is required to hedge any of the Fund’s positions or to use derivatives. Such derivative investments may include futures contracts, swaps, options and currency forward contracts. As a result of the Fund’s use of derivatives, the Fund may have economic leverage, which means the sum of the Fund’s investment exposures through its use of derivatives may significantly exceed the amount of assets invested in the Fund, although these exposures may vary over time. The Fund may engage in active and frequent trading as part of its investment strategies.
What is a futures contract?
A futures contract is an agreement between the Fund and a counterparty made through a US or foreign futures exchange to buy or sell an underlying instrument or asset at a specific price on a future date.
3. Source: US Bureau of Labor Statistics.
See www.franklintempletondatasources.com for additional data provider information.
| | | | |
| 4 | | Annual Report | | franklintempleton.com |
FRANKLIN K2 ALTERNATIVE STRATEGIES FUND
What are swap agreements?
Swap agreements, such as interest rate, currency and credit default swaps, are contracts between the Fund and another party (the swap counterparty). In a basic swap transaction, the Fund agrees with the swap counterparty to exchange the returns (or differentials in rates of return) earned or realized on a particular “notional amount” of underlying instruments. The notional amount is the set amount selected by the parties as the basis on which to calculate the obligations that they have agreed to exchange. The parties typically do not actually exchange the notional amount. Instead, they agree to exchange the returns that would be earned or realized if the notional amount were invested in given instruments or at given interest rates.
What is an option?
An option is a contract to buy or sell a specific financial product known as the option’s underlying instrument at a specific price. The buyer of an option has the right, but not the obligation, to buy or sell the underlying instrument at or until a specified expiration date. Conversely, the seller (“writer”) of an option who opens a transaction is obligated to buy or sell the underlying instrument should the option holder exercise that right.
What is a currency forward contract?
A currency forward contract is an agreement between the Fund and a counterparty to buy or sell a foreign currency in exchange for another currency at a specific exchange rate on a future date. Currency forward contracts are privately traded in the interbank market, not on a centralized exchange.
Manager’s Discussion
The Fund’s positive performance for the period resulted from gains for three of the four underlying strategies in which assets were allocated—long short equity, event driven and relative value. Performance contribution was led by long short equity, followed by event driven and relative value. The fourth underlying strategy, global macro, had a slight decline. A conditional risk overlay (CRO) was implemented for part of the review period to help mitigate downside risk exposure, and this weighed on results. Volatility of returns was low during the period, averaging approximately one-fourth the volatility of the Standard & Poor’s® 500 during the one-year period ending May 31, 2018. The CRO strategy was not active at period-end. The allocation percentages for each strategy are listed in the Strategy Allocation table on this page.
What is a conditional risk overlay (CRO) strategy?
From time to time, the Fund’s investment manager may implement its CRO strategy, which seeks to neutralize certain market sensitivities that may exist in the Fund. The CRO strategy involves investing in derivatives or other instruments in an effort to reduce volatility and provide a hedge against market declines. When implemented, the strategy will reduce the Fund’s ability to benefit from positive market movements.
| | | | | | | | | | |
| Strategy Allocation* | |
| Based on Total Investments as of 5/31/18 | |
| | | Strategy Total | | Long
Positions | | | Short
Positions | |
Relative Value | | 30.2% | | | 35.5% | | | | -5.3% | |
Long Short Equity | | 38.0% | | | 56.2% | | | | -18.2% | |
Event Driven | | 18.4% | | | 21.5% | | | | -3.1% | |
Global Macro | | 13.4% | | | 15.5% | | | | -2.1% | |
*Figures represent the net Fund exposure and include certain derivatives held in the portfolio (or their underlying reference assets) or unsettled trades and may not total 100% or may be negative due to rounding, use of any derivatives or other factors.
| | | | |
| Subadvisors | | | |
| 5/31/18 | | | |
| |
| Long Short Equity | | | | |
Chilton Investment Company, LLC | | | | |
Impala Asset Management LLC | | | | |
Jennison Associates, LLC | | | | |
Portland Hill Asset Management Limited | | | | |
Wellington Management Company, LLP | | | | |
| |
| Relative Value | | | | |
Basso Capital Management, L.P. | | | | |
Chatham Asset Management, LLC | | | | |
Lazard Asset Management, LLC | | | | |
Loomis Sayles & Company, L.P. | | | | |
| |
| Event Driven | | | | |
Halcyon Arbitrage IC Management LP | | | | |
P. Schoenfeld Asset Management L.P. | | | | |
| |
| Global Macro | | | | |
Emso Asset Management Limited | | | | |
Graham Capital Management, L.P. | | | | |
Grantham, Mayo, Van Otterloo & Co. LLC | | | | |
H2O AM LLP | | | | |
The Fund’s long short equity strategy subadvisors were Chilton Investment Company, Impala Asset Management, Jennison Associates, Portland Hill Asset Management and Wellington Management Company. Four of the five subadvisors contributed to gains for the period, led by Impala Asset Management and Jennison Associates. In contrast, Portland Hill Asset Management experienced a small decline. On a sector level, performance drivers for the strategy included information technology (IT), health care and materials. Conversely, equity index hedges and telecommunication services dampened returns. In terms of geographical exposure, positions in US, Canadian and UK equities were the top contributors to gains, while exposure to France detracted.
P. Schoenfeld Asset Management and Halcyon were the Fund’s event driven strategy subadvisors. Both subadvisors enjoyed gains for the period. In aggregate, the top performance drivers for the strategy by asset class were equities, credit and cash. No asset class detracted from the strategy’s performance over the period. In terms of sectors, utilities, consumer discretionary and IT contributed to returns, while equity index hedges detracted.
| | | | | | |
| franklintempleton.com | | Annual Report | | | 5 | |
FRANKLIN K2 ALTERNATIVE STRATEGIES FUND
The Fund’s relative value strategy subadvisors were Basso Capital Management, Chatham Asset Management, Lazard Asset Management and Loomis Sayles & Company. Three of the four subadvisors benefited performance during the period, with Basso Capital Management the only exception. In aggregate, the top performance drivers for the strategy by asset class were credit and cash exposures, while currencies and equities were the largest detractors. In terms of aggregate sector performance, the top contributors were consumer discretionary, health care and IT. Conversely, short exposures to equity index hedges and long exposures to industrials detracted.
Graham Capital Management and Emso Asset Management represented the global macro strategy. Emso Asset Management’s gains for the 12-month period were more than offset by negative results for Graham Capital Management, and the strategy had a small decline. Currencies and government bonds detracted from performance, while long exposure to equity indexes, along with the energy and environment industry, benefited returns. The Fund added two global macro strategy subadvisors to the approved list in March—H2O AM and Grantham, Mayo, Van Otterloo & Co.—but the Fund had not allocated assets to these two subadvisors as of May 31, 2018.
Thank you for your participation in Franklin K2 Alternative Strategies Fund. We look forward to continuing to serve your investment needs.
| | |
 | | 
David C. Saunders |
| | |
 | | 
Brooks Ritchey |
| | |
 | | 
Robert Christian |
| | Portfolio Management Team |
The foregoing information reflects our analysis, opinions and portfolio holdings as of May 31, 2018, the end of the reporting period. The way we implement our main investment strategies and the resulting portfolio holdings may change depending on factors such as market and economic conditions. These opinions may not be relied upon as investment advice or an offer for a particular security. The information is not a complete analysis of every aspect of any market, country, industry, security or the Fund. Statements of fact are from sources considered reliable, but the investment manager makes no representation or warranty as to their completeness or accuracy. Although historical performance is no guarantee of future results, these insights may help you understand our investment management philosophy.
David C. Saunders is the founding managing director of K2 Advisors, which he co-founded in 1994. He has worked at Tucker Anthony & R.L. Day as an equity trader; First Boston Corp. as vice president on the equity block trading desk; WaterStreet Capital, a hedge fund, as head trader; Tiger Management, as head trader; WorldSec Securities as president and ABN Amro Inc. as a senior managing director. Mr. Saunders graduated from the University of Maryland, College Park, with a B.S. degree in business.
Brooks Ritchey is a senior managing director and head of portfolio construction for K2 Advisors. Since 1987 Mr. Ritchey has managed multi-asset mutual fund and hedge fund portfolios during his employment with organizations including Steinhardt Partners, Citibank, Finch Asset Management, Paribas, AIG and ING. Mr. Ritchey joined K2 Advisors in 2005. Mr. Ritchey graduated from Franklin & Marshall College in 1982 and holds a National Futures Association Series 3 license.
Robert Christian is a senior managing director and head of investment research for K2 Advisors, which he joined in 2010. Mr. Christian worked at Graham Capital Management LP from 1998 to 2003 as a portfolio manager and researcher of quantitative-based trading strategies. At Julius Baer Investment Management from 2003 to 2005, he was the head of macro strategies. From 2005 to 2010, he worked at FRM Americas LLC where he was the global head of directional trading strategies and portfolio advisor to numerous funds. Mr. Christian holds a Bachelor of Arts and Science in biology and economics from Stanford University (1985) and an M.B.A. in finance from Leonard N. Stern School of Business – New York University (1990).
| | | | |
| 6 | | Annual Report | | franklintempleton.com |
FRANKLIN K2 ALTERNATIVE STRATEGIES FUND
Performance Summary as of May 31, 2018
The performance table and graphs do not reflect any taxes that a shareholder would pay on Fund dividends, capital gain distributions, if any, or any realized gains on the sale of Fund shares. Total return reflects reinvestment of the Fund’s dividends and capital gain distributions, if any, and any unrealized gains or losses. Your dividend income will vary depending on dividends or interest paid by securities in the Fund’s portfolio, adjusted for operating expenses of each class. Capital gain distributions are net profits realized from the sale of portfolio securities.
Performance as of 5/31/181
Cumulative total return excludes sales charges. Average annual total return includes maximum sales charges. Sales charges will vary depending on the size of the investment and the class of share purchased. The maximum is 5.75% and the minimum is 0%. Class A: 5.75% maximum initial sales charge; Advisor Class: no sales charges. For other share classes, visit franklintempleton.com.
| | | | | | | | |
| Share Class | | Cumulative
Total Return2 | | | Average Annual
Total Return3 | |
| | |
| A | | | | | | | | |
1-Year | | | +3.57% | | | | -2.39% | |
3-Year | | | +5.58% | | | | -0.16% | |
Since Inception (10/11/13) | | | +19.02% | | | | +2.51% | |
| | |
| Advisor | | | | | | | | |
1-Year | | | +3.75% | | | | +3.75% | |
3-Year | | | +6.33% | | | | +2.07% | |
Since Inception (10/11/13) | | | +20.36% | | | | +4.08% | |
Performance data represent past performance, which does not guarantee future results. Investment return and principal value will fluctuate, and you may have a gain or loss when you sell your shares. Current performance may differ from figures shown. For most recent month-end performance, go to franklintempleton.com or call (800) 342-5236.
See page 9 for Performance Summary footnotes.
| | | | | | |
| franklintempleton.com | | Annual Report | | | 7 | |
FRANKLIN K2 ALTERNATIVE STRATEGIES FUND
PERFORMANCE SUMMARY
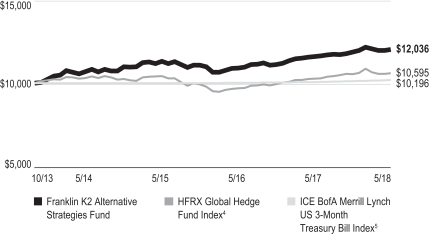
Total Return Index Comparison for a Hypothetical $10,000 Investment1
Total return represents the change in value of an investment over the periods shown. It includes any applicable maximum sales charge, Fund expenses, account fees and reinvested distributions. The unmanaged indexes include reinvestment of any income or distributions. These differ from the Fund in composition and, except for the HFR Index, do not pay management fees or expenses. Unlike most asset class indexes, HFR Index returns reflect management fees and expenses. One cannot invest directly in an index.
Class A (10/11/13–5/31/18)
Advisor Class (10/11/13–5/31/18)
See page 9 for Performance Summary footnotes.
| | | | |
| 8 | | Annual Report | | franklintempleton.com |
FRANKLIN K2 ALTERNATIVE STRATEGIES FUND
PERFORMANCE SUMMARY
Distributions (6/1/17–5/31/18)
| | | | |
| Share Class | | Dividend
Income | |
A | | | $0.1471 | |
C | | | $0.0602 | |
R | | | $0.1161 | |
R6 | | | $0.1865 | |
Advisor | | | $0.1773 | |
Total Annual Operating Expenses6
| | | | | | | | |
| Share Class | | With Waiver | | | Without Waiver | |
A | | | 2.76% | | | | 3.01% | |
Advisor | | | 2.51% | | | | 2.76% | |
Each class of shares is available to certain eligible investors and has different annual fees and expenses, as described in the prospectus.
All investments involve risks, including possible loss of principal. The market values of securities owned by the Fund will go up or down, sometimes rapidly or unpredictably. The Fund’s performance depends on the manager’s skill in selecting, overseeing and allocating Fund assets to the subadvisors. The Fund is actively managed and could experience losses if the investment manager’s and subadvisors’ judgment about particular investments made for the Fund’s portfolio prove to be incorrect. Some subadvisors may have little or no experience managing the assets of a registered investment company. Foreign investments are subject to greater investment risk such as political, economic, credit and information risks as well as risk of currency fluctuations. Investments in derivatives involve costs and create economic leverage, which may result in significant volatility and cause the Fund to participate in losses (as well as gains) that significantly exceed the Fund’s initial investment. Lower rated or high yield debt securities involve greater credit risk, including the possibility of default or bankruptcy. Currency management strategies could result in losses to the Fund if currencies do not perform as the investment manager or subadvisor expects. The Fund may make short sales of securities, which involves the risk that losses may exceed the original amount invested. Merger arbitrage investments risk loss if a proposed reorganization in which the Fund invests is renegotiated or terminated. Liquidity risk exists when securities have become more difficult to sell, or are unable to be sold, at the price at which they have been valued. The Fund’s prospectus also includes a description of the main investment risks.
1. The Fund has an expense reduction contractually guaranteed through 9/30/18 and a fee waiver related to the management fee paid by a subsidiary. The Fund also has a fee waiver associated with any investments it makes in a Franklin Templeton money fund and/or other Franklin Templeton fund contractually guaranteed through 9/30/18. Fund investment results reflect the expense reduction and fee waivers; without these reductions, the results would have been lower.
2. Cumulative total return represents the change in value of an investment over the periods indicated.
3. Average annual total return represents the average annual change in value of an investment over the periods indicated. Return for less than one year, if any, has not been annualized.
4. Source: FactSet. Hedge Fund Research, Inc. – www.hedgefundresearch.com. The HFRX Global Hedge Fund Index is being used under license from Hedge Fund Research, Inc., which does not endorse or approve of any of the contents of this report. The HFRX Global Hedge Fund Index is designed to be representative of the overall composition of the hedge fund universe. It is composed of all eligible hedge fund strategies, including but not limited to convertible arbitrage, distressed securities, equity hedge, equity market neutral, event driven, macro, merger arbitrage and relative value arbitrage. The strategies are asset weighted based on the distribution of assets in the hedge fund industry.
5. Source: Morningstar. The ICE BofA Merrill Lynch US 3-Month Treasury Bill Index is an index of short-term US government securities with a remaining term to final maturity of less than three months.
6. Figures are as stated in the Fund’s current prospectus and may differ from the expense ratios disclosed in the Your Fund’s Expenses and Consolidated Financial Highlights sections in this report. In periods of market volatility, assets may decline significantly, causing total annual Fund operating expenses to become higher than the figures shown.
See www.franklintempletondatasources.com for additional data provider information.
| | | | | | |
| franklintempleton.com | | Annual Report | | | 9 | |
FRANKLIN K2 ALTERNATIVE STRATEGIES FUND
Your Fund’s Expenses
As a Fund shareholder, you can incur two types of costs: (1) transaction costs, including sales charges (loads) on Fund purchases and redemptions; and (2) ongoing Fund costs, including management fees, distribution and service (12b-1) fees, and other Fund expenses. All mutual funds have ongoing costs, sometimes referred to as operating expenses. The table below shows ongoing costs of investing in the Fund and can help you understand these costs and compare them with those of other mutual funds. The table assumes a $1,000 investment held for the six months indicated.
Actual Fund Expenses
The table below provides information about actual account values and actual expenses in the columns under the heading “Actual.” In these columns the Fund’s actual return, which includes the effect of Fund expenses, is used to calculate the “Ending Account Value” for each class of shares. You can estimate the expenses you paid during the period by following these steps (of course, your account value and expenses will differ from those in this illustration): Divide your account value by $1,000 (if your account had an $8,600 value, then $8,600 ÷ $1,000 = 8.6). Then multiply the result by the number in the row for your class of shares under the headings “Actual” and “Expenses Paid During Period” (if Actual Expenses Paid During Period were $7.50, then 8.6 x $7.50 =$64.50). In this illustration, the actual expenses paid this period are $64.50.
Hypothetical Example for Comparison with Other Funds
Under the heading “Hypothetical” in the table, information is provided about hypothetical account values and hypothetical expenses based on the Fund’s actual expense ratio and an assumed rate of return of 5% per year before expenses, which is not the Fund’s actual return. This information may not be used to estimate the actual ending account balance or expenses you paid for the period, but it can help you compare ongoing costs of investing in the Fund with those of other funds. To do so, compare this 5% hypothetical example for the class of shares you hold with the 5% hypothetical examples that appear in the shareholder reports of other funds.
Please note that expenses shown in the table are meant to highlight ongoing costs and do not reflect any transactional costs. Therefore, information under the heading “Hypothetical” is useful in comparing ongoing costs only, and will not help you compare total costs of owning different funds. In addition, if transactional costs were included, your total costs would have been higher.
| | | | | | | | | | | | | | | | | | | | | | | | |
| | | | | | Actual
(actual return after expenses) | | | Hypothetical
(5% annual return before expenses) | | | | |
Share
Class | | Beginning
Account
Value 12/1/17 | | | Ending
Account
Value 5/31/18 | | | Expenses
Paid During
Period
12/1/17–5/31/181,2 | | | Ending
Account
Value 5/31/18 | | | Expenses
Paid During
Period
12/1/17–5/31/181,2 | | | Net
Annualized
Expense
Ratio2 | |
| A | | $ | 1,000 | | | $ | 1,013.90 | | | $ | 12.95 | | | $ | 1,012.07 | | | $ | 12.94 | | | | 2.58 | % |
| C | | $ | 1,000 | | | $ | 1,009.80 | | | $ | 16.69 | | | $ | 1,008.33 | | | $ | 16.67 | | | | 3.33 | % |
| R | | $ | 1,000 | | | $ | 1,012.00 | | | $ | 14.20 | | | $ | 1,010.82 | | | $ | 14.19 | | | | 2.83 | % |
| R6 | | $ | 1,000 | | | $ | 1,014.70 | | | $ | 11.20 | | | $ | 1,013.81 | | | $ | 11.20 | | | | 2.23 | % |
| Advisor | | $ | 1,000 | | | $ | 1,013.90 | | | $ | 11.70 | | | $ | 1,013.31 | | | $ | 11.70 | | | | 2.33 | % |
1. Expenses are equal to the annualized expense ratio for the six-month period as indicated above—in the far right column—multiplied by the simple average account value over the period indicated, and then multiplied by 182/365 to reflect the one-half year period.
2. Reflects expenses after fee waivers and expense reimbursements. Does not include acquired fund fees and expenses.
| | | | |
| 10 | | Annual Report | | franklintempleton.com |
FRANKLIN ALTERNATIVE STRATEGIES FUNDS
Consolidated Financial Highlights
Franklin K2 Alternative Strategies Fund
| | | | | | | | | | | | | | | | | | | | |
| | | Year Ended May 31, | |
| | | 2018 | | | 2017 | | | 2016 | | | 2015 | | | 2014a | |
| Class A | | | | | | | | | | | | | | | | | | | | |
Per share operating performance (for a share outstanding throughout the year) | | | | | | | | | | | | | | | | | | | | |
| | | | | |
Net asset value, beginning of year | | $ | 11.14 | | | $ | 10.55 | | | $ | 11.16 | | | $ | 10.64 | | | $ | 10.00 | |
| | | | |
| | | | | |
| Income from investment operationsb: | | | | | | | | | | | | | | | | | | | | |
| | | | | |
Net investment income (loss)c | | | 0.01 | | | | 0.03 | | | | (0.05 | ) | | | (0.11 | ) | | | (0.02 | ) |
| | | | | |
Net realized and unrealized gains (losses) | | | 0.38 | | | | 0.61 | | | | (0.38 | ) | | | 0.70 | | | | 0.70 | |
| | | | |
| | | | | |
Total from investment operations | | | 0.39 | | | | 0.64 | | | | (0.43 | ) | | | 0.59 | | | | 0.68 | |
| | | | |
| | | | | |
| Less distributions from: | | | | | | | | | | | | | | | | | | | | |
| | | | | |
Net investment income | | | (0.15 | ) | | | (0.05 | ) | | | (0.14 | ) | | | (0.07 | ) | | | (0.04 | ) |
| | | | | |
Net realized gains | | | — | | | | — | | | | (0.04 | ) | | | — | | | | — | |
| | | | |
| | | | | |
Total distributions | | | (0.15 | ) | | | (0.05 | ) | | | (0.18 | ) | | | (0.07 | ) | | | (0.04 | ) |
| | | | |
| | | | | |
Net asset value, end of year | | $ | 11.38 | | | $ | 11.14 | | | $ | 10.55 | | | $ | 11.16 | | | $ | 10.64 | |
| | | | |
| | | | | |
Total returnd | | | 3.57% | | | | 6.07% | | | | (3.89)% | | | | 5.53% | | | | 6.82% | |
| | | | | |
| Ratios to average net assetse | | | | | | | | | | | | | | | | | | | | |
| | | | | |
Expenses before waiver, payments by affiliates and expense reductionf | | | 2.81% | | | | 3.07% | | | | 3.22% | | | | 3.40% | | | | 3.33% | |
| | | | | |
Expenses net of waiver, payments by affiliates and expense reductionf | | | 2.59% | | | | 2.73% | | | | 2.88% | g | | | 2.99% | g | | | 2.83% | |
| | | | | |
Expenses incurred in connection with securities sold short | | | 0.39% | | | | 0.53% | | | | 0.67% | | | | 0.65% | | | | 0.56% | |
| | | | | |
Net investment income (loss) | | | 0.06% | | | | 0.10% | | | | (0.44)% | | | | (0.95)% | | | | (0.35)% | |
| | | | | |
| Supplemental data | | | | | | | | | | | | | | | | | | | | |
| | | | | |
Net assets, end of year (000’s) | | | $119,214 | | | | $119,385 | | | | $177,412 | | | | $148,991 | | | | $96,889 | |
| | | | | |
Portfolio turnover rate | | | 234.77% | | | | 209.45% | | | | 229.90% | | | | 295.81% | | | | 181.06% | |
aFor the period October 11, 2013 (commencement of operations) to May 31, 2014.
bThe amount shown for a share outstanding throughout the period may not correlate with the Consolidated Statement of Operations for the period due to the timing of sales and repurchases of the Fund’s shares in relation to income earned and/or fluctuating fair value of the investments of the Fund.
cBased on average daily shares outstanding.
dTotal return does not reflect sales commissions or contingent deferred sales charges, if applicable, and is not annualized for periods less than one year.
eRatios are annualized for periods less than one year.
fIncludes dividend and/or interest expense on securities sold short and security borrowing fees, if any. See below for the ratios of such expenses to average net assets for the periods presented. See Note 1(g).
gBenefit of expense reduction rounds to less than 0.01%.
| | | | | | |
| franklintempleton.com | | The accompanying notes are an integral part of these financial statements. | Annual Report | | | 11 | |
FRANKLIN ALTERNATIVE STRATEGIES FUNDS
CONSOLIDATED FINANCIAL HIGHLIGHTS
Franklin K2 Alternative Strategies Fund (continued)
| | | | | | | | | | | | | | | | | | | | |
| | | Year Ended May 31, | |
| | | 2018 | | | 2017 | | | 2016 | | | 2015 | | | 2014a | |
| Class C | | | | | | | | | | | | | | | | | | | | |
| Per share operating performance | | | | | | | | | | | | | | | | | | | | |
| | | | | |
Net asset value, beginning of year | | $ | 11.00 | | | $ | 10.45 | | | $ | 11.09 | | | $ | 10.60 | | | $ | 10.00 | |
| | | | |
| | | | | |
| Income from investment operationsb: | | | | | | | | | | | | | | | | | | | | |
| | | | | |
Net investment income (loss)c | | | (0.08 | ) | | | (0.04 | ) | | | (0.12 | ) | | | (0.17 | ) | | | (0.08 | ) |
| | | | | |
Net realized and unrealized gains (losses) | | | 0.39 | | | | 0.59 | | | | (0.39 | ) | | | 0.69 | | | | 0.72 | |
| | | | |
| | | | | |
Total from investment operations | | | 0.31 | | | | 0.55 | | | | (0.51 | ) | | | 0.52 | | | | 0.64 | |
| | | | |
| | | | | |
| Less distributions from: | | | | | | | | | | | | | | | | | | | | |
| | | | | |
Net investment income | | | (0.06 | ) | | | — | | | | (0.09 | ) | | | (0.03 | ) | | | (0.04 | ) |
| | | | | |
Net realized gains | | | — | | | | — | | | | (0.04 | ) | | | — | | | | — | |
| | | | |
| | | | | |
Total distributions | | | (0.06 | ) | | | — | | | | (0.13 | ) | | | (0.03 | ) | | | (0.04 | ) |
| | | | |
| | | | | |
Net asset value, end of year | | $ | 11.25 | | | $ | 11.00 | | | $ | 10.45 | | | $ | 11.09 | | | $ | 10.60 | |
| | | | |
| | | | | |
Total returnd | | | 2.82% | | | | 5.26% | | | | (4.62)% | | | | 4.87% | | | | 6.42% | |
| | | | | |
| Ratios to average net assetse | | | | | | | | | | | | | | | | | | | | |
| | | | | |
Expenses before waiver, payments by affiliates and expense reductionf | | | 3.56% | | | | 3.79% | | | | 3.96% | | | | 4.04% | | | | 4.03% | |
| | | | | |
Expenses net of waiver, payments by affiliates and expense reductionf | | | 3.34% | | | | 3.45% | | | | 3.62% | g | | | 3.63% | g | | | 3.53% | |
| | | | | |
Expenses incurred in connection with securities sold short | | | 0.39% | | | | 0.53% | | | | 0.67% | | | | 0.65% | | | | 0.56% | |
| | | | | |
Net investment income (loss) | | | (0.69)% | | | | (0.62)% | | | | (1.18)% | | | | (1.59)% | | | | (1.05)% | |
| | | | | |
| Supplemental data | | | | | | | | | | | | | | | | | | | | |
| | | | | |
Net assets, end of year (000’s) | | | $53,196 | | | | $55,496 | | | | $71,154 | | | | $37,937 | | | | $16,618 | |
| | | | | |
Portfolio turnover rate | | | 234.77% | | | | 209.45% | | | | 229.90% | | | | 295.81% | | | | 181.06% | |
aFor the period October 11, 2013 (commencement of operations) to May 31, 2014.
bThe amount shown for a share outstanding throughout the period may not correlate with the Consolidated Statement of Operations for the period due to the timing of sales and repurchases of the Fund’s shares in relation to income earned and/or fluctuating fair value of the investments of the Fund.
cBased on average daily shares outstanding.
dTotal return does not reflect sales commissions or contingent deferred sales charges, if applicable, and is not annualized for periods less than one year.
eRatios are annualized for periods less than one year.
fIncludes dividend and/or interest expense on securities sold short and security borrowing fees, if any. See below for the ratios of such expenses to average net assets for the periods presented. See Note 1(g).
gBenefit of expense reduction rounds to less than 0.01%.
| | | | |
| 12 | | Annual Report | The accompanying notes are an integral part of these financial statements. | | franklintempleton.com |
FRANKLIN ALTERNATIVE STRATEGIES FUNDS
CONSOLIDATED FINANCIAL HIGHLIGHTS
Franklin K2 Alternative Strategies Fund (continued)
| | | | | | | | | | | | | | | | | | | | |
| | | Year Ended May 31, | |
| | | 2018 | | | 2017 | | | 2016 | | | 2015 | | | 2014a | |
| Class R | | | | | | | | | | | | | | | | | | | | |
Per share operating performance (for a share outstanding throughout the year) | | | | | | | | | | | | | | | | | | | | |
| | | | | |
Net asset value, beginning of year | | $ | 11.17 | | | $ | 10.61 | | | $ | 11.15 | | | $ | 10.62 | | | $ | 10.00 | |
| | | | |
| | | | | |
| Income from investment operationsb: | | | | | | | | | | | | | | | | | | | | |
| | | | | |
Net investment income (loss)c | | | (0.02 | ) | | | (0.25 | ) | | | (0.10 | ) | | | (0.16 | ) | | | (0.05 | ) |
| | | | | |
Net realized and unrealized gains (losses) | | | 0.39 | | | | 0.86 | | | | (0.40 | ) | | | 0.73 | | | | 0.71 | |
| | | | |
| | | | | |
Total from investment operations | | | 0.37 | | | | 0.61 | | | | (0.50 | ) | | | 0.57 | | | | 0.66 | |
| | | | |
| | | | | |
| Less distributions from: | | | | | | | | | | | | | | | | | | | | |
| | | | | |
Net investment income | | | (0.12 | ) | | | (0.05 | ) | | | — | | | | (0.04 | ) | | | (0.04 | ) |
| | | | | |
Net realized gains | | | — | | | | — | | | | (0.04 | ) | | | — | | | | — | |
| | | | |
| | | | | |
Total distributions | | | (0.12 | ) | | | (0.05 | ) | | | (0.04 | ) | | | (0.04 | ) | | | (0.04 | ) |
| | | | |
| | | | | |
Net asset value, end of year | | $ | 11.42 | | | $ | 11.17 | | | $ | 10.61 | | | $ | 11.15 | | | $ | 10.62 | |
| | | | |
| | | | | |
Total returnd | | | 3.28% | | | | 5.79% | | | | (4.51)% | | | | 5.39% | | | | 6.62% | |
| | | | | |
| Ratios to average net assetse | | | | | | | | | | | | | | | | | | | | |
| | | | | |
Expenses before waiver, payments by affiliates and expense reductionf | | | 3.06% | | | | 3.32% | | | | 3.46% | | | | 3.57% | | | | 3.63% | |
| | | | | |
Expenses net of waiver, payments by affiliates and expense reductionf | | | 2.84% | | | | 2.98% | | | | 3.12% | g | | | 3.16% | g | | | 3.13% | |
| | | | | |
Expenses incurred in connection with securities sold short | | | 0.39% | | | | 0.53% | | | | 0.67% | | | | 0.65% | | | | 0.56% | |
| | | | | |
Net investment income (loss) | | | (0.19)% | | | | (0.15)% | | | | (0.68)% | | | | (1.12)% | | | | (0.65)% | |
| | | | | |
| Supplemental data | | | | | | | | | | | | | | | | | | | | |
| | | | | |
Net assets, end of year (000’s) | | | $648 | | | | $597 | | | | $341 | | | | $9,173 | | | | $11,660 | |
| | | | | |
Portfolio turnover rate | | | 234.77% | | | | 209.45% | | | | 229.90% | | | | 295.81% | | | | 181.06% | |
aFor the period October 11, 2013 (commencement of operations) to May 31, 2014.
bThe amount shown for a share outstanding throughout the period may not correlate with the Consolidated Statement of Operations for the period due to the timing of sales and repurchases of the Fund’s shares in relation to income earned and/or fluctuating fair value of the investments of the Fund.
cBased on average daily shares outstanding.
dTotal return is not annualized for periods less than one year.
eRatios are annualized for periods less than one year.
fIncludes dividend and/or interest expense on securities sold short and security borrowing fees, if any. See below for the ratios of such expenses to average net assets for the periods presented. See Note 1(g).
gBenefit of expense reduction rounds to less than 0.01%.
| | | | | | |
| franklintempleton.com | | The accompanying notes are an integral part of these financial statements. | Annual Report | | | 13 | |
FRANKLIN ALTERNATIVE STRATEGIES FUNDS
CONSOLIDATED FINANCIAL HIGHLIGHTS
Franklin K2 Alternative Strategies Fund (continued)
| | | | | | | | | | | | | | | | | | | | |
| | | Year Ended May 31, | |
| | | 2018 | | | 2017 | | | 2016 | | | 2015 | | | 2014a | |
| Class R6 | | | | | | | | | | | | | | | | | | | | |
Per share operating performance (for a share outstanding throughout the year) | | | | | | | | | | | | | | | | | | | | |
| | | | | |
Net asset value, beginning of year | | $ | 11.17 | | | $ | 10.59 | | | $ | 11.18 | | | $ | 10.66 | | | $ | 10.00 | |
| | | | |
| | | | | |
| Income from investment operationsb: | | | | | | | | | | | | | | | | | | | | |
| | | | | |
Net investment income (loss)c | | | 0.03 | | | | 0.02 | | | | (0.01 | ) | | | (0.08 | ) | | | (0.01 | ) |
| | | | | |
Net realized and unrealized gains (losses) | | | 0.40 | | | | 0.65 | | | | (0.37 | ) | | | 0.70 | | | | 0.71 | |
| | | | |
| | | | | |
Total from investment operations | | | 0.43 | | | | 0.67 | | | | (0.38 | ) | | | 0.62 | | | | 0.70 | |
| | | | |
| | | | | |
| Less distributions from: | | | | | | | | | | | | | | | | | | | | |
| | | | | |
Net investment income | | | (0.19 | ) | | | (0.09 | ) | | | (0.17 | ) | | | (0.10 | ) | | | (0.04 | ) |
| | | | | |
Net realized gains | | | — | | | | — | | | | (0.04 | ) | | | — | | | | — | |
| | | | |
| | | | | |
Total distributions | | | (0.19 | ) | | | (0.09 | ) | | | (0.21 | ) | | | (0.10 | ) | | | (0.04 | ) |
| | | | |
| | | | | |
Net asset value, end of year | | $ | 11.41 | | | $ | 11.17 | | | $ | 10.59 | | | $ | 11.18 | | | $ | 10.66 | |
| | | | |
| | | | | |
Total returnd | | | 3.83% | | | | 6.40% | | | | (3.45)% | | | | 5.80% | | | | 7.02% | |
| | | | | |
| Ratios to average net assetse | | | | | | | | | | | | | | | | | | | | |
| | | | | |
Expenses before waiver, payments by affiliates and expense reductionf | | | 2.46% | | | | 2.73% | | | | 2.87% | | | | 2.98% | | | | 3.19% | |
| | | | | |
Expenses net of waiver, payments by affiliates and expense reductionf | | | 2.24% | | | | 2.39% | | | | 2.53% | g | | | 2.60% | g | | | 2.69% | |
| | | | | |
Expenses incurred in connection with securities sold short | | | 0.39% | | | | 0.53% | | | | 0.67% | | | | 0.65% | | | | 0.56% | |
| | | | | |
Net investment income (loss) | | | 0.41% | | | | 0.44% | | | | (0.09)% | | | | (0.56)% | | | | (0.21)% | |
| | | | | |
| Supplemental data | | | | | | | | | | | | | | | | | | | | |
| | | | | |
Net assets, end of year (000’s) | | | $31,805 | | | | $265,247 | | | | $265,517 | | | | $239,754 | | | | $215,526 | |
| | | | | |
Portfolio turnover rate | | | 234.77% | | | | 209.45% | | | | 229.90% | | | | 295.81% | | | | 181.06% | |
aFor the period October 11, 2013 (commencement of operations) to May 31, 2014.
bThe amount shown for a share outstanding throughout the period may not correlate with the Consolidated Statement of Operations for the period due to the timing of sales and repurchases of the Fund’s shares in relation to income earned and/or fluctuating fair value of the investments of the Fund.
cBased on average daily shares outstanding.
dTotal return is not annualized for periods less than one year.
eRatios are annualized for periods less than one year.
fIncludes dividend and/or interest expense on securities sold short and security borrowing fees, if any. See below for the ratios of such expenses to average net assets for the periods presented. See Note 1(g).
gBenefit of expense reduction rounds to less than 0.01%.
| | | | |
| 14 | | Annual Report | The accompanying notes are an integral part of these financial statements. | | franklintempleton.com |
FRANKLIN ALTERNATIVE STRATEGIES FUNDS
CONSOLIDATED FINANCIAL HIGHLIGHTS
Franklin K2 Alternative Strategies Fund (continued)
| | | | | | | | | | | | | | | | | | | | |
| | | Year Ended May 31, | |
| | | 2018 | | | 2017 | | | 2016 | | | 2015 | | | 2014a | |
| Advisor Class | | | | | | | | | | | | | | | | | | | | |
Per share operating performance (for a share outstanding throughout the year) | | | | | | | | | | | | | | | | | | | | |
| | | | | |
Net asset value, beginning of year | | $ | 11.16 | | | $ | 10.58 | | | $ | 11.18 | | | $ | 10.65 | | | $ | 10.00 | |
| | | | |
| | | | | |
| Income from investment operationsb: | | | | | | | | | | | | | | | | | | | | |
| | | | | |
Net investment income (loss)c | | | 0.04 | | | | 0.04 | | | | (0.02 | ) | | | (0.02 | ) | | | (0.02 | ) |
| | | | | |
Net realized and unrealized gains (losses) | | | 0.38 | | | | 0.62 | | | | (0.38 | ) | | | 0.64 | | | | 0.71 | |
| | | | |
| | | | | |
Total from investment operations | | | 0.42 | | | | 0.66 | | | | (0.40 | ) | | | 0.62 | | | | 0.69 | |
| | | | |
| | | | | |
| Less distributions from: | | | | | | | | | | | | | | | | | | | | |
| | | | | |
Net investment income | | | (0.18 | ) | | | (0.08 | ) | | | (0.16 | ) | | | (0.09 | ) | | | (0.04 | ) |
| | | | | |
Net realized gains | | | — | | | | — | | | | (0.04 | ) | | | — | | | | — | |
| | | | |
| | | | | |
Total distributions | | | (0.18 | ) | | | (0.08 | ) | | | (0.20 | ) | | | (0.09 | ) | | | (0.04 | ) |
| | | | |
| | | | | |
Net asset value, end of year | | $ | 11.40 | | | $ | 11.16 | | | $ | 10.58 | | | $ | 11.18 | | | $ | 10.65 | |
| | | | |
| | | | | |
Total returnd | | | 3.75% | | | | 6.29% | | | | (3.58)% | | | | 5.88% | | | | 6.92% | |
| | | | | |
| Ratios to average net assetse | | | | | | | | | | | | | | | | | | | | |
| | | | | |
Expenses before waiver, payments by affiliates and expense reductionf | | | 2.56% | | | | 2.82% | | | | 2.96% | | | | 3.07% | | | | 3.21% | |
| | | | | |
Expenses net of waiver, payments by affiliates and expense reductionf | | | 2.34% | | | | 2.48% | | | | 2.62% | g | | | 2.66% | g | | | 2.71% | |
| | | | | |
Expenses incurred in connection with securities sold short | | | 0.39% | | | | 0.53% | | | | 0.67% | | | | 0.65% | | | | 0.56% | |
| | | | | |
Net investment income (loss) | | | 0.31% | | | | 0.35% | | | | (0.18)% | | | | (0.62)% | | | | (0.23)% | |
| | | | | |
| Supplemental data | | | | | | | | | | | | | | | | | | | | |
| | | | | |
Net assets, end of year (000’s) | | | $896,278 | | | | $674,828 | | | | $722,216 | | | | $329,139 | | | | $54,593 | |
| | | | | |
Portfolio turnover rate | | | 234.77% | | | | 209.45% | | | | 229.90% | | | | 295.81% | | | | 181.06% | |
aFor the period October 11, 2013 (commencement of operations) to May 31, 2014.
bThe amount shown for a share outstanding throughout the period may not correlate with the Consolidated Statement of Operations for the period due to the timing of sales and repurchases of the Fund’s shares in relation to income earned and/or fluctuating fair value of the investments of the Fund.
cBased on average daily shares outstanding.
dTotal return is not annualized for periods less than one year.
eRatios are annualized for periods less than one year.
fIncludes dividend and/or interest expense on securities sold short and security borrowing fees, if any. See below for the ratios of such expenses to average net assets for the periods presented. See Note 1(g).
gBenefit of expense reduction rounds to less than 0.01%.
| | | | | | |
| franklintempleton.com | | The accompanying notes are an integral part of these financial statements. | Annual Report | | | 15 | |
FRANKLIN ALTERNATIVE STRATEGIES FUNDS
Consolidated Statement of Investments, May 31, 2018
| | | | | | | | | | | | | | |
| Franklin K2 Alternative Strategies Fund | | | | | | | | | |
| | | | | Country | | | Shares/
Warrants | | | Value | |
| | | Common Stocks and Other Equity Interests 47.7% | | | | | | | | | |
| | | Aerospace & Defense 1.3% | | | | | | | | | |
| | Airbus SE | | | France | | | | 15,264 | | | $ | 1,736,427 | |
| a | | The Boeing Co. | | | United States | | | | 1,541 | | | | 542,678 | |
| | Harris Corp. | | | United States | | | | 9,578 | | | | 1,441,202 | |
| | Heico Corp. | | | United States | | | | 25,750 | | | | 2,365,395 | |
| a | | Lockheed Martin Corp. | | | United States | | | | 8,035 | | | | 2,527,329 | |
| b | | Mercury Systems Inc. | | | United States | | | | 8,110 | | | | 299,502 | |
| | Northrop Grumman Corp. | | | United States | | | | 178 | | | | 58,251 | |
| a | | Rockwell Collins Inc. | | | United States | | | | 37,410 | | | | 5,144,249 | |
| | United Technologies Corp. | | | United States | | | | 778 | | | | 97,110 | |
| | | | | | | | | | | | | | |
| | | | | | | | | | | | | 14,212,143 | |
| | | | | | | | | | | | | | |
| | | Air Freight & Logistics 0.4% | | | | | | | | | |
| a | | FedEx Corp. | | | United States | | | | 15,719 | | | | 3,915,917 | |
| | | | | | | | | | | | | | |
| | | Airlines 0.1% | | | | | | | | | |
| | Delta Air Lines Inc. | | | United States | | | | 722 | | | | 39,024 | |
| a | | Southwest Airlines Co. | | | United States | | | | 24,773 | | | | 1,265,405 | |
| | | | | | | | | | | | | | |
| | | | | | | | | | | | | 1,304,429 | |
| | | | | | | | | | | | | | |
| | | Auto Components 0.0%† | | | | | | | | | |
| | Aptiv PLC | | | United States | | | | 389 | | | | 37,927 | |
| | | | | | | | | | | | | | |
| | | Automobiles 0.4% | | | | | | | | | |
| | General Motors Co. | | | United States | | | | 1,267 | | | | 54,101 | |
| b,c | | Tesla Inc. | | | United States | | | | 5,101 | | | | 1,452,408 | |
| | Thor Industries Inc. | | | United States | | | | 31,137 | | | | 2,883,286 | |
| | | | | | | | | | | | | | |
| | | | | | | | | | | | | 4,389,795 | |
| | | | | | | | | | | | | | |
| | | Banks 0.5% | | | | | | | | | |
| | Bank of America Corp. | | | United States | | | | 3,223 | | | | 93,596 | |
| | Barclays PLC, ADR | | | United Kingdom | | | | 108,406 | | | | 284,241 | |
| | BB&T Corp. | | | United States | | | | 1,427 | | | | 74,917 | |
| a | | Citigroup Inc. | | | United States | | | | 67,540 | | | | 4,504,243 | |
| | JPMorgan Chase & Co. | | | United States | | | | 1,610 | | | | 172,286 | |
| | Pacwest Bancorp | | | United States | | | | 1,201 | | | | 63,725 | |
| | The PNC Financial Services Group Inc. | | | United States | | | | 581 | | | | 83,321 | |
| | Wells Fargo & Co. | | | United States | | | | 1,193 | | | | 64,410 | |
| | | | | | | | | | | | | | |
| | | | | | | | | | | | | 5,340,739 | |
| | | | | | | | | | | | | | |
| | | Beverages 0.5% | | | | | | | | | |
| a | | Brown-Forman Corp., B | | | United States | | | | 1,136 | | | | 64,252 | |
| a | | Constellation Brands Inc., A | | | United States | | | | 5,764 | | | | 1,285,833 | |
| | Davide Campari-Milano SpA | | | Italy | | | | 471,498 | | | | 3,522,180 | |
| | PepsiCo Inc. | | | United States | | | | 961 | | | | 96,340 | |
| | | | | | | | | | | | | | |
| | | | | | | | | | | | | 4,968,605 | |
| | | | | | | | | | | | | | |
| | | Biotechnology 3.3% | | | | | | | | | |
| | Abbvie Inc. | | | United States | | | | 2,513 | | | | 248,636 | |
| b | | Aeglea BioTherapeutics Inc. | | | United States | | | | 17,146 | | | | 183,119 | |
| b | | Agios Pharmaceuticals Inc. | | | United States | | | | 3,544 | | | | 331,364 | |
| b,c | | Aileron Therapeutics Inc. | | | United States | | | | 5,954 | | | | 30,723 | |
| b | | Aimmune Therapeutics Inc. | | | United States | | | | 8,546 | | | | 282,787 | |
| b | | Alexion Pharmaceuticals Inc. | | | United States | | | | 12,393 | | | | 1,439,199 | |
| b | | Amicus Therapeutics Inc. | | | United States | | | | 98,781 | | | | 1,669,399 | |
| | | | |
| 16 | | Annual Report | | franklintempleton.com |
FRANKLIN ALTERNATIVE STRATEGIES FUNDS
CONSOLIDATED STATEMENT OF INVESTMENTS
Franklin K2 Alternative Strategies Fund (continued)
| | | | | | | | | | | | | | |
| | | | | Country | | | Shares/
Warrants | | | Value | |
| | | Common Stocks and Other Equity Interests (continued) | | | | | | | | | |
| | | Biotechnology (continued) | | | | | | | | | |
| b | | Apellis Pharmaceuticals Inc. | | | United States | | | | 10,889 | | | $ | 222,244 | |
| b | | Argenx SE, ADR | | | Netherlands | | | | 5,908 | | | | 564,214 | |
| b | | Audentes Therapeutics Inc. | | | United States | | | | 20,098 | | | | 761,714 | |
| b | | BioCryst Pharmaceuticals Inc. | | | United States | | | | 63,655 | | | | 409,302 | |
| b | | Biogen Inc. | | | United States | | | | 2,879 | | | | 846,311 | |
| b | | BioMarin Pharmaceutical Inc. | | | United States | | | | 43,160 | | | | 3,899,074 | |
| b | | Bluebird Bio Inc. | | | United States | | | | 10,782 | | | | 1,930,517 | |
| b | | Blueprint Medicines Corp. | | | United States | | | | 4,108 | | | | 345,401 | |
| b | | Celgene Corp. | | | United States | | | | 15,159 | | | | 1,192,710 | |
| b | | Clovis Oncology Inc. | | | United States | | | | 13,576 | | | | 637,529 | |
| b | | DBV Technologies SA, ADR | | | France | | | | 23,073 | | | | 519,143 | |
| b | | Eiger Biopharmaceuticals Inc. | | | United States | | | | 18,528 | | | | 264,024 | |
| b,c | | Epizyme Inc. | | | United States | | | | 40,259 | | | | 702,520 | |
| b | | Exact Sciences Corp. | | | United States | | | | 19,744 | | | | 1,175,558 | |
| b | | Exelixis Inc. | | | United States | | | | 43,461 | | | | 900,947 | |
| b | | Fibrogen Inc. | | | United States | | | | 6,689 | | | | 360,537 | |
| b | | Foundation Medicine Inc. | | | United States | | | | 2,787 | | | | 276,331 | |
| b | | GlycoMimetics Inc. | | | United States | | | | 30,314 | | | | 541,711 | |
| b,c | | Immunomedics Inc. | | | United States | | | | 39,496 | | | | 871,282 | |
| a,b | | Incyte Corp. | | | United States | | | | 12,752 | | | | 870,579 | |
| b | | La Jolla Pharmaceutical Co. | | | United States | | | | 25,969 | | | | 810,233 | |
| a,b | | Madrigal Pharmaceuticals Inc. | | | United States | | | | 3,824 | | | | 1,015,693 | |
| b | | Mirati Therapeutics Inc. | | | United States | | | | 7,408 | | | | 314,840 | |
| b | | Natera Inc. | | | United States | | | | 41,228 | | | | 480,718 | |
| b | | Neurocrine Biosciences Inc. | | | United States | | | | 8,817 | | | | 848,724 | |
| b | | Ovid Therapeutics Inc. | | | United States | | | | 6,719 | | | | 53,013 | |
| b | | ProQR Therapeutics NV | | | Netherlands | | | | 41,964 | | | | 239,195 | |
| b | | Proteostasis Therapeutics Inc. | | | United States | | | | 65,507 | | | | 317,054 | |
| b | | Puma Biotechnology Inc. | | | United States | | | | 4,132 | | | | 218,789 | |
| b | | Retrophin Inc. | | | United States | | | | 15,417 | | | | 431,830 | |
| b | | Sage Therapeutics Inc. | | | United States | | | | 15,960 | | | | 2,436,932 | |
| b | | Sarepta Therapeutics Inc. | | | United States | | | | 25,776 | | | | 2,419,078 | |
| b | | Savara Inc. | | | United States | | | | 11,866 | | | | 120,084 | |
| b | | Savara Inc., wts., 6/14/18 | | | United States | | | | 68,920 | | | | — | |
| a | | Shire PLC, ADR | | | United Kingdom | | | | 15,044 | | | | 2,470,827 | |
| | Shire PLC | | | United States | | | | 22,284 | | | | 1,214,548 | |
| b | | Tesaro Inc. | | | United States | | | | 7,424 | | | | 339,796 | |
| b | | Unum Therapeutics Inc. | | | United States | | | | 13,080 | | | | 161,015 | |
| b | | Vertex Pharmaceuticals Inc. | | | United States | | | | 7,308 | | | | 1,125,432 | |
| | | | | | | | | | | | | | |
| | | | | | | | | | | | | 36,494,676 | |
| | | | | | | | | | | | | | |
| | | Building Products 0.4% | | | | | | | | | |
| a | | AO Smith Corp. | | | United States | | | | 6,371 | | | | 401,819 | |
| a,b | | Builders FirstSource Inc. | | | United States | | | | 17,693 | | | | 346,429 | |
| a | | Fortune Brands Home & Security Inc. | | | United States | | | | 37,850 | | | | 2,126,034 | |
| a,b | | USG Corp. | | | United States | | | | 31,519 | | | | 1,307,408 | |
| | | | | | | | | | | | | | |
| | | | | | | | | | | | | 4,181,690 | |
| | | | | | | | | | | | | | |
| | | Capital Markets 0.2% | | | | | | | | | |
| | Moody’s Corp. | | | United States | | | | 13,807 | | | | 2,355,060 | |
| | | | | | | | | | | | | | |
| | | | | | |
| franklintempleton.com | | Annual Report | | | 17 | |
FRANKLIN ALTERNATIVE STRATEGIES FUNDS
CONSOLIDATED STATEMENT OF INVESTMENTS
Franklin K2 Alternative Strategies Fund (continued)
| | | | | | | | | | | | | | |
| | | | | Country | | | Shares/
Warrants | | | Value | |
| | | Common Stocks and Other Equity Interests (continued) | | | | | | | | | |
| | | Chemicals 2.3% | | | | | | | | | |
| | Celanese Corp., A | | | United States | | | | 364 | | | $ | 41,103 | |
| a | | DowDuPont Inc. | | | United States | | | | 30,465 | | | | 1,953,111 | |
| | Huntsman Corp. | | | United States | | | | 1,374 | | | | 43,927 | |
| a,b | | Ingevity Corp. | | | United States | | | | 39,618 | | | | 3,016,515 | |
| a | | Monsanto Co. | | | United States | | | | 72,903 | | | | 9,292,217 | |
| a | | The Mosaic Co. | | | United States | | | | 17,929 | | | | 492,868 | |
| a | | Praxair Inc. | | | United States | | | | 14,917 | | | | 2,330,930 | |
| a | | The Sherwin-Williams Co. | | | United States | | | | 22,062 | | | | 8,367,013 | |
| b,d,e | | TerraVia Holdings Inc., Contingent Distribution | | | United States | | | | 1,117,000 | | | | — | |
| | | | | | | | | | | | | | |
| | | | | | | | | | | | | 25,537,684 | |
| | | | | | | | | | | | | | |
| | | Commercial Services & Supplies 0.6% | | | | | | | | | |
| | Atento SA | | | Spain | | | | 142,593 | | | | 1,076,577 | |
| | Cintas Corp. | | | United States | | | | 17,228 | | | | 3,139,803 | |
| | Edenred | | | France | | | | 35,790 | | | | 1,147,673 | |
| | Republic Services Inc., A | | | United States | | | | 21,190 | | | | 1,428,842 | |
| | | | | | | | | | | | | | |
| | | | | | | | | | | | | 6,792,895 | |
| | | | | | | | | | | | | | |
| | | Communications Equipment 0.2% | | | | | | | | | |
| | Cisco Systems Inc. | | | United States | | | | 6,559 | | | | 280,135 | |
| b | | Commscope Holding Co. Inc. | | | United States | | | | 50,312 | | | | 1,475,148 | |
| b,e | | Nortel Networks Capital Corp., Contingent Distribution | | | Canada | | | | 324,000 | | | | 10,530 | |
| b,e | | Nortel Networks Ltd., Contingent Distribution | | | Canada | | | | 5,031,000 | | | | 163,507 | |
| a,b | | Quantenna Communications Inc. | | | United States | | | | 10,202 | | | | 163,232 | |
| | | | | | | | | | | | | | |
| | | | | | | | | | | | | 2,092,552 | |
| | | | | | | | | | | | | | |
| | | Construction Materials 0.7% | | | | �� | | | | | |
| | Buzzi Unicem SpA | | | Italy | | | | 22,966 | | | | 554,685 | |
| b | | Cemex SAB de CV, ADR | | | Mexico | | | | 80,904 | | | | 482,188 | |
| | HeidelbergCement AG | | | Germany | | | | 29,195 | | | | 2,587,072 | |
| a | | Martin Marietta Materials Inc. | | | United States | | | | 14,382 | | | | 3,205,316 | |
| a,b | | Summit Materials Inc., A | | | United States | | | | 45,583 | | | | 1,295,469 | |
| | | | | | | | | | | | | | |
| | | | | | | | | | | | | 8,124,730 | |
| | | | | | | | | | | | | | |
| | | Consumer Finance 0.3% | | | | | | | | | |
| b,d | | iPayment Inc. | | | United States | | | | 4,383,614 | | | | 3,550,727 | |
| | | | | | | | | | | | | | |
| | | Containers & Packaging 0.6% | | | | | | | | | |
| a | | Ball Corp. | | | United States | | | | 189,079 | | | | 6,986,469 | |
| | WestRock Co. | | | United States | | | | 542 | | | | 31,913 | |
| | | | | | | | | | | | | | |
| | | | | | | | | | | | | 7,018,382 | |
| | | | | | | | | | | | | | |
| | | Diversified Consumer Services 0.1% | | | | | | | | | |
| b | | Bright Horizons Family Solutions Inc. | | | United States | | | | 7,890 | | | | 798,468 | |
| | | | | | | | | | | | | | |
| | | Diversified Financial Services 0.3% | | | | | | | | | |
| a,b | | Berkshire Hathaway Inc., B | | | United States | | | | 17,817 | | | | 3,412,490 | |
| | | | | | | | | | | | | | |
| | | Diversified Telecommunication Services 0.4% | | | | | | | | | |
| | AT&T Inc. | | | United States | | | | 758 | | | | 24,499 | |
| | CenturyLink Inc. | | | United States | | | | 2,761 | | | | 50,305 | |
| | China Unicom Hong Kong Ltd., ADR | | | China | | | | 48,546 | | | | 659,740 | |
| b | | ORBCOMM Inc. | | | United States | | | | 60,703 | | | | 586,391 | |
| | | | |
| 18 | | Annual Report | | franklintempleton.com |
FRANKLIN ALTERNATIVE STRATEGIES FUNDS
CONSOLIDATED STATEMENT OF INVESTMENTS
Franklin K2 Alternative Strategies Fund (continued)
| | | | | | | | | | | | | | |
| | | | | Country | | | Shares/
Warrants | | | Value | |
| | | Common Stocks and Other Equity Interests (continued) | | | | | | | | | |
| | | Diversified Telecommunication Services (continued) | | | | | | | | | |
| b,f | | Telecom Italia SpA | | | Italy | | | | 2,548,291 | | | $ | 2,047,213 | |
| a | | Verizon Communications Inc. | | | United States | | | | 16,082 | | | | 766,629 | |
| | | | | | | | | | | | | | |
| | | | | | | | | | | | | 4,134,777 | |
| | | | | | | | | | | | | | |
| | | Electric Utilities 0.0%† | | | | | | | | | |
| | American Electric Power Co. Inc. | | | United States | | | | 501 | | | | 34,043 | |
| | Exelon Corp. | | | United States | | | | 1,906 | | | | 78,889 | |
| | NextEra Energy Inc. | | | United States | | | | 704 | | | | 116,730 | |
| | | | | | | | | | | | | | |
| | | | | | | | | | | | | 229,662 | |
| | | | | | | | | | | | | | |
| | | Electrical Equipment 0.0%† | | | | | | | | | |
| | General Cable Corp. | | | United States | | | | 6,483 | | | | 192,221 | |
| | | | | | | | | | | | | | |
| | | Electronic Equipment, Instruments & Components 0.7% | |
| | Chroma Ate Inc. | | | Taiwan | | | | 84,000 | | | | 419,138 | |
| b | | Fabrinet | | | Thailand | | | | 22,024 | | | | 773,703 | |
| b | | Flex Ltd. | | | Singapore | | | | 193,718 | | | | 2,690,743 | |
| b | | II-VI Inc. | | | United States | | | | 38,595 | | | | 1,696,250 | |
| b | | IPG Photonics Corp. | | | United States | | | | 3,088 | | | | 745,042 | |
| b | | Itron Inc. | | | United States | | | | 5,811 | | | | 331,808 | |
| | Sunny Optical Technology Group Co. Ltd. | | | China | | | | 21,700 | | | | 441,570 | |
| b | | Zebra Technologies Corp., A | | | United States | | | | 4,747 | | | | 728,712 | |
| | | | | | | | | | | | | | |
| | | | | | | | | | | | | 7,826,966 | |
| | | | | | | | | | | | | | |
| | | Energy Equipment & Services 0.0%† | | | | | | | | | |
| | Patterson-UTI Energy Inc. | | | United States | | | | 2,175 | | | | 44,979 | |
| a,c | | RPC Inc. | | | United States | | | | 22,325 | | | | 366,576 | |
| | | | | | | | | | | | | | |
| | | | | | | | | | | | | 411,555 | |
| | | | | | | | | | | | | | |
| | | Equity Real Estate Investment Trusts (REITs) 0.0%† | | | | | | | | | |
| | Lasalle Hotel Properties | | | United States | | | | 12,913 | | | | 442,916 | |
| | | | | | | | | | | | | | |
| | | Food & Staples Retailing 0.3% | | | | | | | | | |
| a | | Costco Wholesale Corp. | | | United States | | | | 17,624 | | | | 3,493,782 | |
| | Wal-Mart Stores, Inc. | | | United States | | | | 532 | | | | 43,911 | |
| | | | | | | | | | | | | | |
| | | | | | | | | | | | | 3,537,693 | |
| | | | | | | | | | | | | | |
| | | Food Products 0.1% | | | | | | | | | |
| | Chocoladefabriken Lindt & Spruengli AG | | | Switzerland | | | | 13 | | | | 982,650 | �� |
| | The JM Smucker Co. | | | United States | | | | 4,160 | | | | 447,200 | |
| | Mondelez International Inc., A | | | United States | | | | 2,100 | | | | 82,467 | |
| | | | | | | | | | | | | | |
| | | | | | | | | | | | | 1,512,317 | |
| | | | | | | | | | | | | | |
| | | Health Care Equipment & Supplies 1.2% | | | | | | | | | |
| | Abbott Laboratories | | | United States | | | | 13,377 | | | | 823,087 | |
| b | | Align Technology Inc. | | | United States | | | | 2,265 | | | | 751,867 | |
| b | | Axogen Inc. | | | United States | | | | 7,495 | | | | 368,004 | |
| b | | Boston Scientific Corp. | | | United States | | | | 39,936 | | | | 1,213,655 | |
| b | | DexCom Inc. | | | United States | | | | 14,196 | | | | 1,249,106 | |
| b | | Edwards Lifesciences Corp. | | | United States | | | | 7,560 | | | | 1,038,064 | |
| b | | Haemonetics Corp. | | | United States | | | | 14,537 | | | | 1,313,418 | |
| b | | IDEXX Laboratories Inc. | | | United States | | | | 13,099 | | | | 2,727,343 | |
| b | | Inogen Inc. | | | United States | | | | 764 | | | | 139,575 | |
| | | | | | |
| franklintempleton.com | | Annual Report | | | 19 | |
FRANKLIN ALTERNATIVE STRATEGIES FUNDS
CONSOLIDATED STATEMENT OF INVESTMENTS
Franklin K2 Alternative Strategies Fund (continued)
| | | | | | | | | | | | | | |
| | | | | Country | | | Shares/
Warrants | | | Value | |
| | | Common Stocks and Other Equity Interests (continued) | | | | | | | | | |
| | | Health Care Equipment & Supplies (continued) | | | | | | | | | |
| b | | iRhythm Technologies Inc. | | | United States | | | | 1,840 | | | $ | 139,895 | |
| | Medtronic PLC | | | United States | | | | 1,230 | | | | 106,174 | |
| b | | Nevro Corp. | | | United States | | | | 15,727 | | | | 1,237,558 | |
| b,g | | Siemens Healthineers AG, 144A | | | Germany | | | | 7,564 | | | | 300,694 | |
| | Smith & Nephew PLC | | | United Kingdom | | | | 91,292 | | | | 1,660,792 | |
| | West Pharmaceutical Services Inc. | | | United States | | | | 3,921 | | | | 364,653 | |
| | | | | | | | | | | | | | |
| | | | | | | | | | | | | 13,433,885 | |
| | | | | | | | | | | | | | |
| | | Health Care Providers & Services 1.7% | | | | | | | | | |
| a | | Aetna Inc. | | | United States | | | | 38,147 | | | | 6,718,832 | |
| b | | Centene Corp. | | | United States | | | | 14,112 | | | | 1,653,362 | |
| | Cigna Corp. | | | United States | | | | 9,736 | | | | 1,648,986 | |
| b | | Express Scripts Holding Co. | | | United States | | | | 11,446 | | | | 867,721 | |
| b | | Healthequity Inc. | | | United States | | | | 3,875 | | | | 287,951 | |
| a | | Humana Inc. | | | United States | | | | 6,912 | | | | 2,011,254 | |
| b | | Laboratory Corp. of America Holdings | | | United States | | | | 205 | | | | 37,021 | |
| a | | UnitedHealth Group Inc. | | | United States | | | | 20,828 | | | | 5,030,170 | |
| | | | | | | | | | | | | | |
| | | | | | | | | | | | | 18,255,297 | |
| | | | | | | | | | | | | | |
| | | Health Care Technology 0.1% | | | | | | | | | |
| b | | Inspire Medical Systems Inc. | | | United States | | | | 1,670 | | | | 50,100 | |
| b | | Tabula Rasa HealthCare Inc. | | | United States | | | | 9,382 | | | | 511,788 | |
| b | | Teladoc Inc. | | | United States | | | | 5,924 | | | | 301,532 | |
| | | | | | | | | | | | | | |
| | | | | | | | | | | | | 863,420 | |
| | | | | | | | | | | | | | |
| | | Hotels, Restaurants & Leisure 1.3% | | | | | | | | | |
| | Carnival Corp. | | | United States | | | | 47,128 | | | | 2,935,132 | |
| a | | Domino’s Pizza Inc. | | | United States | | | | 9,285 | | | | 2,334,992 | |
| | Hilton Worldwide Holdings Inc. | | | United States | | | | 1,478 | | | | 119,289 | |
| a | | Marriott International Inc., A | | | United States | | | | 12,952 | | | | 1,753,183 | |
| | McDonald’s Corp. | | | United States | | | | 651 | | | | 104,166 | |
| b | | Norwegian Cruise Line Holdings Ltd. | | | United States | | | | 55,989 | | | | 2,930,464 | |
| | Restaurant Brands International Inc. | | | Canada | | | | 44,780 | | | | 2,642,916 | |
| | Royal Caribbean Cruises Ltd. | | | United States | | | | 5,168 | | | | 542,537 | |
| b,c | | Seaworld Entertainment Inc. | | | United States | | | | 77,587 | | | | 1,377,169 | |
| | | | | | | | | | | | | | |
| | | | | | | | | | | | | 14,739,848 | |
| | | | | | | | | | | | | | |
| | | Household Durables 0.3% | | | | | | | | | |
| a | | D.R. Horton Inc. | | | United States | | | | 23,436 | | | | 989,233 | |
| b,c | | iRobot Corp. | | | United States | | | | 6,161 | | | | 384,508 | |
| b | | NVR Inc. | | | United States | | | | 326 | | | | 974,916 | |
| b,c | | Roku Inc., A | | | United States | | | | 21,584 | | | | 808,537 | |
| | | | | | | | | | | | | | |
| | | | | | | | | | | | | 3,157,194 | |
| | | | | | | | | | | | | | |
| | | Household Products 0.5% | | | | | | | | | |
| b | | HRG Group Inc. | | | United States | | | | 394,467 | | | | 5,001,841 | |
| | The Procter & Gamble Co. | | | United States | | | | 1,217 | | | | 89,048 | |
| | | | | | | | | | | | | | |
| | | | | | | | | | | | | 5,090,889 | |
| | | | | | | | | | | | | | |
| | | Independent Power & Renewable Electricity Producers 0.0%† | | | | | | | | | |
| | NRG Energy Inc. | | | United States | | | | 1,360 | | | | 46,553 | |
| | | | | | | | | | | | | | |
| | | | |
| 20 | | Annual Report | | franklintempleton.com |
FRANKLIN ALTERNATIVE STRATEGIES FUNDS
CONSOLIDATED STATEMENT OF INVESTMENTS
Franklin K2 Alternative Strategies Fund (continued)
| | | | | | | | | | | | | | |
| | | | | Country | | | Shares/
Warrants | | | Value | |
| | | Common Stocks and Other Equity Interests (continued) | | | | | | | | | |
| | | Industrial Conglomerates 0.1% | | | | | | | | | |
| | Honeywell International Inc. | | | United States | | | | 736 | | | $ | 108,862 | |
| | Smiths Group PLC | | | United Kingdom | | | | 17,888 | | | | 418,635 | |
| | | | | | | | | | | | | | |
| | | | | | | | | | | | | 527,497 | |
| | | | | | | | | | | | | | |
| | | Insurance 1.2% | | | | | | | | | |
| | Chubb Ltd. | | | United States | | | | 712 | | | | 93,051 | |
| | Fnf Group | | | United States | | | | 1,369 | | | | 50,598 | |
| | Prudential Financial Inc. | | | United States | | | | 437 | | | | 42,319 | |
| | RSA Insurance Group PLC | | | United Kingdom | | | | 44,331 | | | | 384,114 | |
| b,c | | Trupanion Inc. | | | United States | | | | 29,413 | | | | 934,451 | |
| | Validus Holdings Ltd. | | | United States | | | | 59,048 | | | | 4,001,093 | |
| | XL Group Ltd. | | | Bermuda | | | | 133,981 | | | | 7,446,664 | |
| | | | | | | | | | | | | | |
| | | | | | | | | | | | | 12,952,290 | |
| | | | | | | | | | | | | | |
| | | Internet & Direct Marketing Retail 0.8% | | | | | | | | | |
| b | | Amazon.com Inc. | | | United States | | | | 1,843 | | | | 3,003,390 | |
| a,b | | Booking Holdings Inc. | | | United States | | | | 944 | | | | 1,990,820 | |
| b | | Ctrip.com International Ltd., ADR | | | China | | | | 5,816 | | | | 262,243 | |
| a | | Expedia Group Inc. | | | United States | | | | 11,088 | | | | 1,341,981 | |
| b | | NetFlix Inc. | | | United States | | | | 1,178 | | | | 414,185 | |
| a,b | | Qurate Retail Inc. QVC Group, A | | | United States | | | | 113,461 | | | | 2,306,662 | |
| | | | | | | | | | | | | | |
| | | | | | | | | | | | | 9,319,281 | |
| | | | | | | | | | | | | | |
| | | Internet Software & Services 3.0% | | | | | | | | | |
| b | | Akamai Technologies Inc. | | | United States | | | | 19,158 | | | | 1,444,130 | |
| a,b | | Alibaba Group Holding Ltd., ADR | | | China | | | | 26,591 | | | | 5,265,284 | |
| a,b | | Alphabet Inc., A | | | United States | | | | 4,180 | | | | 4,598,000 | |
| b | | Alphabet Inc., C | | | United States | | | | 1,463 | | | | 1,587,341 | |
| b | | Cafe24 Corp. | | | South Korea | | | | 2,974 | | | | 475,641 | |
| b | | Cloudera Inc. | | | United States | | | | 37,021 | | | | 600,481 | |
| b,g | | Delivery Hero AG, 144A | | | Germany | | | | 11,423 | | | | 525,079 | |
| a,b | | eBay Inc. | | | United States | | | | 52,688 | | | | 1,987,391 | |
| a,b | | Facebook Inc., A | | | United States | | | | 37,488 | | | | 7,189,449 | |
| b | | Five9 Inc. | | | United States | | | | 6,700 | | | | 233,763 | |
| a,b | | GoDaddy Inc., A | | | United States | | | | 22,726 | | | | 1,626,954 | |
| b | | Just Eat PLC | | | United Kingdom | | | | 79,365 | | | | 889,395 | |
| b | | New Relic Inc. | | | United States | | | | 1,009 | | | | 102,504 | |
| b | | Spotify Technology SA | | | United States | | | | 4,799 | | | | 756,850 | |
| | Tencent Holdings Ltd. | | | China | | | | 76,354 | | | | 3,886,235 | |
| a,b | | VeriSign Inc. | | | United States | | | | 11,737 | | | | 1,530,974 | |
| b | | Yandex NV, A | | | Russia | | | | 17,310 | | | | 580,231 | |
| | | | | | | | | | | | | | |
| | | | | | | | | | | | | 33,279,702 | |
| | | | | | | | | | | | | | |
| | | IT Services 4.1% | | | | | | | | | |
| | Accenture PLC, A | | | United States | | | | 5,148 | | | | 801,750 | |
| | Alliance Data Systems Corp. | | | United States | | | | 12,604 | | | | 2,657,175 | |
| a | | Automatic Data Processing Inc. | | | United States | | | | 5,474 | | | | 711,729 | |
| b | | Blackhawk Network Holdings Inc., A | | | United States | | | | 42,972 | | | | 1,933,740 | |
| a | | Cognizant Technology Solutions Corp., A | | | United States | | | | 6,073 | | | | 457,601 | |
| a,b | | Conduent Inc. | | | United States | | | | 95,890 | | | | 1,845,883 | |
| a,b | | EPAM Systems Inc. | | | United States | | | | 12,096 | | | | 1,489,985 | |
| b,c | | Evo Payments Inc., A | | | United States | | | | 1,900 | | | | 40,812 | |
| | | | | | |
| franklintempleton.com | | Annual Report | | | 21 | |
FRANKLIN ALTERNATIVE STRATEGIES FUNDS
CONSOLIDATED STATEMENT OF INVESTMENTS
Franklin K2 Alternative Strategies Fund (continued)
| | | | | | | | | | | | | | |
| | | | | Country | | | Shares/
Warrants | | | Value | |
| | | Common Stocks and Other Equity Interests (continued) | | | | | | | | | |
| | | IT Services (continued) | | | | | | | | | |
| b | | ExlService Holdings Inc. | | | United States | | | | 29,214 | | | $ | 1,656,142 | |
| b | | FleetCor Technologies Inc. | | | United States | | | | 16,225 | | | | 3,234,454 | |
| | Genpact Ltd. | | | United States | | | | 82,933 | | | | 2,490,478 | |
| | Global Payments Inc. | | | United States | | | | 31,804 | | | | 3,535,333 | |
| a | | MasterCard Inc., A | | | United States | | | | 40,038 | | | | 7,612,024 | |
| a,b | | PayPal Holdings Inc. | | | United States | | | | 94,347 | | | | 7,743,058 | |
| | Total System Services Inc. | | | United States | | | | 25,479 | | | | 2,170,556 | |
| | Visa Inc., A | | | United States | | | | 20,367 | | | | 2,662,374 | |
| b | | WEX Inc. | | | United States | | | | 21,109 | | | | 3,711,173 | |
| | | | | | | | | | | | | | |
| | | | | | | | | | | | | 44,754,267 | |
| | | | | | | | | | | | | | |
| | | Leisure Products 0.6% | | | | | | | | | |
| a | | Brunswick Corp. | | | United States | | | | 50,360 | | | | 3,202,896 | |
| | Hasbro Inc. | | | United States | | | | 37,337 | | | | 3,238,985 | |
| | | | | | | | | | | | | | |
| | | | | | | | | | | | | 6,441,881 | |
| | | | | | | | | | | | | | |
| | | Life Sciences Tools & Services 0.8% | | | | | | | | | |
| | Gerresheimer AG | | | Germany | | | | 53,121 | | | | 4,139,017 | |
| a,b | | Illumina Inc. | | | United States | | | | 9,389 | | | | 2,557,939 | |
| b | | Iqvia Holdings Inc. | | | United States | | | | 4,453 | | | | 440,535 | |
| a,b | | Mettler-Toledo International Inc. | | | United States | | | | 3,127 | | | | 1,722,164 | |
| b,c | | Quanterix Corp. | | | United States | | | | 6,901 | | | | 126,978 | |
| | | | | | | | | | | | | | |
| | | | | | | | | | | | | 8,986,633 | |
| | | | | | | | | | | | | | |
| | | Machinery 0.9% | | | | | | | | | |
| | Deere & Co. | | | United States | | | | 251 | | | | 37,527 | |
| | Fanuc Corp. | | | Japan | | | | 4,631 | | | | 990,609 | |
| | Fortive Corp. | | | United States | | | | 608 | | | | 44,195 | |
| b | | Gates Industrial Corp. PLC | | | United States | | | | 13,547 | | | | 201,308 | |
| a,b | | Navistar International Corp. | | | United States | | | | 54,731 | | | | 2,049,129 | |
| | Stanley Black & Decker Inc. | | | United States | | | | 4,017 | | | | 559,327 | |
| a | | Trinity Industries Inc. | | | United States | | | | 72,186 | | | | 2,489,695 | |
| a | | Xylem Inc. | | | United States | | | | 43,675 | | | | 3,074,720 | |
| | | | | | | | | | | | | | |
| | | | | | | | | | | | | 9,446,510 | |
| | | | | | | | | | | | | | |
| | | Marine 0.1% | | | | | | | | | |
| | Irish Continental Group PLC | | | Ireland | | | | 214,083 | | | | 1,363,984 | |
| | | | | | | | | | | | | | |
| | | Media 2.7% | | | | | | | | | |
| | CBS Corp., B | | | United States | | | | 17,010 | | | | 856,794 | |
| | Comcast Corp., A | | | United States | | | | 31,254 | | | | 974,500 | |
| b | | Discovery Inc., C | | | United States | | | | 81,458 | | | | 1,610,425 | |
| b | | DISH Network Corp., A | | | United States | | | | 2,500 | | | | 73,875 | |
| | Entertainment One Ltd. | | | Canada | | | | 64,424 | | | | 257,096 | |
| | Grupo Televisa SAB, ADR | | | Mexico | | | | 102,169 | | | | 1,712,352 | |
| | ITV PLC | | | United Kingdom | | | | 293,248 | | | | 633,860 | |
| b | | Liberty Global PLC, C | | | United Kingdom | | | | 50,120 | | | | 1,387,322 | |
| b | | Postmedia Network Canada Corp. | | | Canada | | | | 666,338 | | | | 513,912 | |
| | Stroeer SE & Co. KGaA | | | Germany | | | | 39,211 | | | | 2,518,873 | |
| a | | Time Warner Inc. | | | United States | | | | 75,903 | | | | 7,147,026 | |
| a | | Tribune Media Co., A | | | United States | | | | 47,501 | | | | 1,704,336 | |
| a | | Twenty-First Century Fox Inc., A | | | United States | | | | 47,023 | | | | 1,812,737 | |
| a | | Twenty-First Century Fox Inc., B | | | United States | | | | 80,794 | | | | 3,083,907 | |
| | | | |
| 22 | | Annual Report | | franklintempleton.com |
FRANKLIN ALTERNATIVE STRATEGIES FUNDS
CONSOLIDATED STATEMENT OF INVESTMENTS
Franklin K2 Alternative Strategies Fund (continued)
| | | | | | | | | | | | | | |
| | | | | Country | | | Shares/
Warrants | | | Value | |
| | | Common Stocks and Other Equity Interests (continued) | | | | | | | | | |
| | | Media (continued) | | | | | | | | | |
| | Vivendi SA | | | France | | | | 73,012 | | | $ | 1,836,823 | |
| | The Walt Disney Co. | | | United States | | | | 35,496 | | | | 3,530,787 | |
| | | | | | | | | | | | | | |
| | | | | | | | | | | | | 29,654,625 | |
| | | | | | | | | | | | | | |
| | | Metals & Mining 0.9% | | | | | | | | | |
| | First Quantum Minerals Ltd. | | | Zambia | | | | 205,559 | | | | 3,226,227 | |
| | Freeport-McMoRan Inc. | | | United States | | | | 36,022 | | | | 608,772 | |
| | Teck Resources Ltd., B | | | Canada | | | | 223,059 | | | | 6,060,513 | |
| | Vale SA, B, ADR | | | Brazil | | | | 38,001 | | | | 516,813 | |
| | | | | | | | | | | | | | |
| | | | | | | | | | | | | 10,412,325 | |
| | | | | | | | | | | | | | |
| | | Multiline Retail 0.0%† | | | | | | | | | |
| | Nordstrom Inc. | | | United States | | | | 6,122 | | | | 300,162 | |
| | | | | | | | | | | | | | |
| | | Oil, Gas & Consumable Fuels 1.3% | | | | | | | | | |
| | Altagas Ltd. | | | Canada | | | | 13,690 | | | | 267,549 | |
| | Anadarko Petroleum Corp. | | | United States | | | | 1,914 | | | | 133,597 | |
| | Andeavor | | | United States | | | | 32,013 | | | | 4,623,638 | |
| | Canadian Natural Resources Ltd. | | | Canada | | | | 4,103 | | | | 141,947 | |
| | Chevron Corp. | | | United States | | | | 564 | | | | 70,105 | |
| | Diamondback Energy Inc. | | | United States | | | | 247 | | | | 29,828 | |
| | EnCana Corp. | | | Canada | | | | 13,215 | | | | 167,830 | |
| | Exxon Mobil Corp. | | | United States | | | | 273 | | | | 22,179 | |
| b | | Halcon Resources Corp., wts., 9/09/20 | | | United States | | | | 2,159 | | | | 1,447 | |
| a | | Hess Corp. | | | United States | | | | 45,851 | | | | 2,770,317 | |
| a,b | | Laredo Petroleum Inc. | | | United States | | | | 31,075 | | | | 288,376 | |
| | Marathon Oil Corp. | | | United States | | | | 10,322 | | | | 221,200 | |
| | Marathon Petroleum Corp. | | | United States | | | | 230 | | | | 18,177 | |
| a,b | | Newfield Exploration Co. | | | United States | | | | 30,745 | | | | 898,984 | |
| b | | PDC Energy Inc. | | | United States | | | | 3,922 | | | | 237,242 | |
| b | | Premier Oil PLC | | | United Kingdom | | | | 73,513 | | | | 117,171 | |
| b | | Rsp Permian Inc. | | | United States | | | | 99,255 | | | | 4,341,414 | |
| | Valero Energy Corp. | | | United States | | | | 292 | | | | 35,390 | |
| b | | Whiting Petroleum Corp. | | | United States | | | | 7,979 | | | | 418,259 | |
| | The Williams Cos. Inc. | | | United States | | | | 903 | | | | 24,255 | |
| | | | | | | | | | | | | | |
| | | | | | | | | | | | | 14,828,905 | |
| | | | | | | | | | | | | | |
| | | Paper & Forest Products 0.5% | | | | | | | | | |
| b | | Canfor Corp. | | | Canada | | | | 98,007 | | | | 2,454,333 | |
| a | | Kapstone Paper And Packaging Corp. | | | United States | | | | 37,673 | | | | 1,295,951 | |
| | West Fraser Timber Co. Ltd. | | | Canada | | | | 18,846 | | | | 1,369,627 | |
| | | | | | | | | | | | | | |
| | | | | | | | | | | | | 5,119,911 | |
| | | | | | | | | | | | | | |
| | | Personal Products 0.0%† | | | | | | | | | |
| | The Estee Lauder Cos. Inc., A | | | United States | | | | 381 | | | | 56,937 | |
| | | | | | | | | | | | | | |
| | | Pharmaceuticals 1.1% | | | | | | | | | |
| b | | Aerie Pharmaceuticals Inc. | | | United States | | | | 24,218 | | | | 1,242,384 | |
| b | | Akorn Inc. | | | United States | | | | 19,994 | | | | 279,316 | |
| f | | Allergan PLC | | | United States | | | | 14,011 | | | | 2,112,859 | |
| b | | Assembly Biosciences Inc. | | | United States | | | | 43,761 | | | | 1,850,653 | |
| | AstraZeneca PLC, ADR | | | United Kingdom | | | | 37,842 | | | | 1,401,289 | |
| | Bristol-Myers Squibb Co. | | | United States | | | | 27,702 | | | | 1,457,679 | |
| b,g | | Cassiopea SpA, 144A | | | Italy | | | | 4,542 | | | | 163,597 | |
| | | | | | |
| franklintempleton.com | | Annual Report | | | 23 | |
FRANKLIN ALTERNATIVE STRATEGIES FUNDS
CONSOLIDATED STATEMENT OF INVESTMENTS
Franklin K2 Alternative Strategies Fund (continued)
| | | | | | | | | | | | | | |
| | | | | Country | | | Shares/
Warrants | | | Value | |
| | | Common Stocks and Other Equity Interests (continued) | | | | | | | | | |
| | | Pharmaceuticals (continued) | | | | | | | | | |
| | Eli Lilly & Co. | | | United States | | | | 9,554 | | | $ | 812,472 | |
| b | | GW Pharmaceuticals PLC, ADR | | | United Kingdom | | | | 6,988 | | | | 1,124,998 | |
| | Hikma Pharmaceuticals PLC | | | Jordan | | | | 10,168 | | | | 182,747 | |
| | Johnson & Johnson | | | United States | | | | 709 | | | | 84,811 | |
| b,c | | Marinus Pharmaceuticals Inc. | | | United States | | | | 24,320 | | | | 152,000 | |
| b | | Mylan NV | | | United States | | | | 8,711 | | | | 335,025 | |
| b,c | | Ocular Therapeutix Inc. | | | United States | | | | 41,503 | | | | 280,975 | |
| b,c | | Restorbio Inc. | | | United States | | | | 12,770 | | | | 125,018 | |
| a,b | | Revance Therapeutics Inc. | | | United States | | | | 13,041 | | | | 363,844 | |
| | Zoetis Inc. | | | United States | | | | 707 | | | | 59,176 | |
| | | | | | | | | | | | | | |
| | | | | | | | | | | | | 12,028,843 | |
| | | | | | | | | | | | | | |
| | | Professional Services 1.2% | | | | | | | | | |
| b | | CoStar Group Inc. | | | United States | | | | 2,932 | | | | 1,117,737 | |
| | Equifax Inc. | | | United States | | | | 19,471 | | | | 2,218,915 | |
| | Experian PLC | | | United Kingdom | | | | 59,580 | | | | 1,458,512 | |
| a,b | | Huron Consulting Group Inc. | | | United States | | | | 23,647 | | | | 957,704 | |
| g | | Intertrust NV, 144A | | | Netherlands | | | | 152,142 | | | | 2,863,556 | |
| | TransUnion | | | United States | | | | 25,028 | | | | 1,716,921 | |
| a,b | | TriNet Group Inc. | | | United States | | | | 44,222 | | | | 2,372,068 | |
| a,b | | WageWorks Inc. | | | United States | | | | 3,017 | | | | 143,157 | |
| | | | | | | | | | | | | | |
| | | | | | | | | | | | | 12,848,570 | |
| | | | | | | | | | | | | | |
| | | Road & Rail 0.9% | | | | | | | | | |
| | CSX Corp. | | | United States | | | | 77,871 | | | | 5,034,360 | |
| | Norfolk Southern Corp. | | | United States | | | | 1,835 | | | | 278,278 | |
| a | | Old Dominion Freight Line Inc. | | | United States | | | | 12,388 | | | | 1,932,033 | |
| a | | Union Pacific Corp. | | | United States | | | | 19,047 | | | | 2,719,149 | |
| | | | | | | | | | | | | | |
| | | | | | | | | | | | | 9,963,820 | |
| | | | | | | | | | | | | | |
| | | Semiconductors & Semiconductor Equipment 2.9% | | | | | | | | | |
| a,b | �� | Advanced Micro Devices Inc. | | | United States | | | | 56,163 | | | | 771,118 | |
| b | | AMS AG | | | Austria | | | | 12,462 | | | | 1,076,264 | |
| b | | Axcelis Technologies Inc. | | | United States | | | | 14,532 | | | | 308,805 | |
| | Broadcom Inc. | | | United States | | | | 8,356 | | | | 2,106,297 | |
| b | | Cavium Inc. | | | United States | | | | 10,098 | | | | 844,294 | |
| | Cypress Semiconductor Corp. | | | United States | | | | 4,771 | | | | 78,531 | |
| b | | First Solar Inc. | | | United States | | | | 4,835 | | | | 326,894 | |
| b | | FormFactor Inc. | | | United States | | | | 114,773 | | | | 1,555,174 | |
| b | | Inphi Corp. | | | United States | | | | 2,943 | | | | 99,415 | |
| a,b | | Integrated Device Technology Inc. | | | United States | | | | 28,771 | | | | 956,348 | |
| | KLA-Tencor Corp. | | | United States | | | | 17,181 | | | | 1,945,405 | |
| | Marvell Technology Group Ltd. | | | Bermuda | | | | 112,322 | | | | 2,419,416 | |
| b | | Maxlinear Inc., A | | | United States | | | | 12,590 | | | | 231,026 | |
| a | | Microchip Technology Inc. | | | United States | | | | 21,427 | | | | 2,086,561 | |
| a,b | | Micron Technology Inc. | | | United States | | | | 40,252 | | | | 2,318,113 | |
| | NVIDIA Corp. | | | United States | | | | 1,934 | | | | 487,735 | |
| a,b | | NXP Semiconductors NV | | | Netherlands | | | | 103,191 | | | | 11,763,774 | |
| | QUALCOMM Inc. | | | United States | | | | 7,360 | | | | 427,763 | |
| b | | Silicon Laboratories Inc. | | | United States | | | | 3,723 | | | | 393,149 | |
| b | | Sino-American Silicon Products Inc. | | | Taiwan | | | | 113,000 | | | | 531,782 | |
| b,e,g | | SunEdison Inc., Contingent Distribution, 144A | | | United States | | | | 35,000 | | | | 771 | |
| | | | |
| 24 | | Annual Report | | franklintempleton.com |
FRANKLIN ALTERNATIVE STRATEGIES FUNDS
CONSOLIDATED STATEMENT OF INVESTMENTS
Franklin K2 Alternative Strategies Fund (continued)
| | | | | | | | | | | | | | |
| | | | | Country | | | Shares/
Warrants | | | Value | |
| | | Common Stocks and Other Equity Interests (continued) | | | | | | | | | |
| | | Semiconductors & Semiconductor Equipment (continued) | | | | | | | | | |
| | Teradyne Inc. | | | United States | | | | 21,055 | | | $ | 798,195 | |
| b | | Tower Semiconductor Ltd. | | | Israel | | | | 11,985 | | | | 310,651 | |
| | | | | | | | | | | | | | |
| | | | | | | | | | | | | 31,837,481 | |
| | | | | | | | | | | | | | |
| | | Software 2.7% | | | | | | | | | |
| a,b | | Adobe Systems Inc. | | | United States | | | | 4,466 | | | | 1,113,285 | |
| b | | Atlassian Corp. PLC | | | Australia | | | | 17,815 | | | | 1,136,419 | |
| | Blackbaud Inc. | | | United States | | | | 7,782 | | | | 758,512 | |
| a,b | | Dell Technologies Inc., V | | | United States | | | | 32,424 | | | | 2,615,320 | |
| b | | Gemalto NV | | | Netherlands | | | | 88,338 | | | | 5,178,007 | |
| a,b | | Guidewire Software Inc. | | | United States | | | | 15,318 | | | | 1,422,123 | |
| b | | HubSpot Inc. | | | United States | | | | 10,691 | | | | 1,295,749 | |
| a | | Intuit Inc. | | | United States | | | | 9,552 | | | | 1,925,683 | |
| a | | Microsoft Corp. | | | United States | | | | 90,620 | | | | 8,956,880 | |
| b | | Nexon Co. Ltd. | | | Japan | | | | 17,060 | | | | 282,439 | |
| | Nintendo Co. Ltd. | | | Japan | | | | 2,020 | | | | 835,593 | |
| | Oracle Corp. | | | United States | | | | 3,622 | | | | 169,220 | |
| a,b | | Salesforce.com Inc. | | | United States | | | | 12,890 | | | | 1,667,064 | |
| a,b | | ServiceNow Inc. | | | United States | | | | 6,597 | | | | 1,171,693 | |
| b | | Workday Inc., A | | | United States | | | | 7,117 | | | | 932,042 | |
| | | | | | | | | | | | | | |
| | | | | | | | | | | | | 29,460,029 | |
| | | | | | | | | | | | | | |
| | | Specialty Retail 1.4% | | | | | | | | | |
| b | | At Home Group Inc. | | | United States | | | | 7,801 | | | | 269,993 | |
| a,b | | Carmax Inc. | | | United States | | | | 24,320 | | | | 1,676,134 | |
| a | | The Home Depot Inc. | | | United States | | | | 42,063 | | | | 7,846,853 | |
| b | | Hudson Ltd., A | | | United Kingdom | | | | 37,597 | | | | 658,699 | |
| | Inditex SA | | | Spain | | | | 6,302 | | | | 198,991 | |
| a,b | | MarineMax Inc. | | | United States | | | | 64,401 | | | | 1,510,204 | |
| b | | Sports Direct International PLC | | | United Kingdom | | | | 155,760 | | | | 842,108 | |
| | Tiffany & Co. | | | United States | | | | 4,912 | | | | 642,391 | |
| b | | Ulta Beauty Inc. | | | United States | | | | 5,692 | | | | 1,405,412 | |
| | | | | | | | | | | | | | |
| | | | | | | | | | | | | 15,050,785 | |
| | | | | | | | | | | | | | |
| | | Technology Hardware, Storage & Peripherals 0.5% | | | | | | | | | |
| a,f | | Apple Inc. | | | United States | | | | 14,225 | | | | 2,658,226 | |
| b | | Cray Inc. | | | United States | | | | 13,263 | | | | 330,249 | |
| b | | Electronics for Imaging Inc. | | | United States | | | | 1,289 | | | | 43,091 | |
| | Netapp Inc. | | | United States | | | | 11,421 | | | | 780,283 | |
| | Samsung Electronics Co. Ltd. | | | South Korea | | | | 28,980 | | | | 1,363,037 | |
| | | | | | | | | | | | | | |
| | | | | | | | | | | | | 5,174,886 | |
| | | | | | | | | | | | | | |
| | | Textiles, Apparel & Luxury Goods 0.7% | | | | | | | | | |
| b | | Lululemon Athletica Inc. | | | United States | | | | 1,985 | | | | 208,524 | |
| a,b | | Michael Kors Holdings Ltd. | | | United States | | | | 39,896 | | | | 2,289,632 | |
| | Moncler SpA | | | Italy | | | | 14,508 | | | | 666,038 | |
| a | | Nike Inc., B | | | United States | | | | 27,121 | | | | 1,947,288 | |
| | The Swatch Group AG | | | Switzerland | | | | 992 | | | | 481,305 | |
| a | | Tapestry Inc. | | | United States | | | | 37,132 | | | | 1,623,411 | |
| | | | | | | | | | | | | | |
| | | | | | | | | | | | | 7,216,198 | |
| | | | | | | | | | | | | | |
| | | | | | |
| franklintempleton.com | | Annual Report | | | 25 | |
FRANKLIN ALTERNATIVE STRATEGIES FUNDS
CONSOLIDATED STATEMENT OF INVESTMENTS
Franklin K2 Alternative Strategies Fund (continued)
| | | | | | | | | | | | | | |
| | | | | Country | | | Shares/
Warrants | | | Value | |
| | | Common Stocks and Other Equity Interests (continued) | | | | | | | | | |
| | | Tobacco 0.0%† | | | | | | | | | |
| | Altria Group Inc. | | | United States | | | | 1,795 | | | $ | 100,053 | |
| | | | | | | | | | | | | | |
| | | Trading Companies & Distributors 0.4% | | | | | | | | | |
| | Brenntag AG | | | Germany | | | | 78,812 | | | | 4,545,925 | |
| | | | | | | | | | | | | | |
| | | Transportation Infrastructure 0.0%† | | | | | | | | | |
| | BBA Aviation PLC | | | United Kingdom | | | | 31,300 | | | | 137,225 | |
| | | | | | | | | | | | | | |
| | | Wireless Telecommunication Services 0.1% | | | | | | | | | |
| a,b | | T-Mobile U.S. Inc. | | | United States | | | | 20,019 | | | | 1,115,058 | |
| | | | | | | | | | | | | | |
| | Total Common Stocks and Other Equity Interests
(Cost $438,498,415) | | | | | | | | | | | 525,327,885 | |
| | | | | | | | | | | | | | |
| | | Exchange Traded Funds 0.0%† | | | | | | | | | |
| | Financial Select Sector SPDR Fund | | | United States | | | | 10,235 | | | | 278,187 | |
| | PowerShares QQQ Trust Series 1 | | | United States | | | | 2,440 | | | | 414,971 | |
| | | | | | | | | | | | | | |
| | Total Exchange Traded Funds (Cost $621,981) | | | | | | | | | | | 693,158 | |
| | | | | | | | | | | | | | |
| | | Convertible Preferred Stocks (Cost $86,130) 0.0%† | | | |
| | | Oil, Gas & Consumable Fuels 0.0%† | | | | | | | | | |
| | Chesapeake Energy Corp., 5.75%, cvt. pfd. | | | United States | | | | 139 | | | | 85,114 | |
| | | | | | | | | | | | | | |
| | | Preferred Stocks 0.3% | | | |
| | | Consumer Finance 0.3% | | | | | | | | | |
| b,d | | iPayment Inc., pfd. | | | United States | | | | 28,073 | | | | 2,807,300 | |
| | | | | | | | | | | | | | |
| | | Diversified Financial Services 0.0%† | | | | | | | | | |
| b,d | | Aergen Structured Investments Cayman Blocker LLC, pfd. | | | Ireland | | | | 4,480 | | | | 4 | |
| | | | | | | | | | | | | | |
| | | Energy Equipment & Services 0.0%† | | | | | | | | | |
| | Nabors Industries Ltd., 6.00%, pfd. | | | Bermuda | | | | 10,019 | | | | 514,977 | |
| | | | | | | | | | | | | | |
| | | Food Products 0.0%† | | | | | | | | | |
| | Bunge Ltd., 4.875%, pfd. | | | United States | | | | 2,819 | | | | 299,491 | |
| | | | | | | | | | | | | | |
| | Total Preferred Stocks (Cost $3,590,169) | | | | | | | | | | | 3,621,772 | |
| | | | | | | | | | | | | | |
| | | | |
| | | | | | | | Principal
Amount* | | | | |
| | | Convertible Bonds 7.9% | | | | | | | | | |
| | | Air Freight & Logistics 0.1% | | | | | | | | | |
| | Atlas Air Worldwide Holdings Inc., senior note, 1.875%, 6/01/24 | | | United States | | | | 530,000 | | | | 683,854 | |
| | | | | | | | | | | | | | |
| | | Airlines 0.0%† | | | | | | | | | |
| h | | Ana Holdings Inc., senior note, Reg S, zero cpn., 9/16/22 | | | Japan | | | | 30,000,000 | JPY | | | 286,115 | |
| | | | | | | | | | | | | | |
| | | Automobiles 0.1% | | | | | | | | | |
| | Tesla Inc., senior note, 2.375%, 3/15/22 | | | United States | | | | 1,179,000 | | | | 1,267,276 | |
| | | | | | | | | | | | | | |
| | | Banks 0.1% | | | | | | | | | |
| g | | Hope Bancorp Inc., senior bond, 144A, 2.00%, 5/15/38 | | | United States | | | | 520,000 | | | | 519,692 | |
| | JPMorgan Chase Financial Co. LLC, senior note, 0.25%, 5/01/23 | | | United States | | | | 134,000 | | | | 133,315 | |
| | | | | | | | | | | | | | |
| | | | | | | | | | | | | 653,007 | |
| | | | | | | | | | | | | | |
| | | Biotechnology 0.5% | | | | | | | | | |
| c | | Alder Biopharmaceuticals Inc., senior note, 2.50%, 2/01/25 | | | United States | | | | 390,000 | | | | 430,602 | |
| g | | Amicus Therapeutics Inc., senior note, 144A, 3.00%, 12/15/23 | | | United States | | | | 963,000 | | | | 2,764,017 | |
| | | | |
| 26 | | Annual Report | | franklintempleton.com |
FRANKLIN ALTERNATIVE STRATEGIES FUNDS
CONSOLIDATED STATEMENT OF INVESTMENTS
Franklin K2 Alternative Strategies Fund (continued)
| | | | | | | | | | | | | | |
| | | | | Country | | | Principal
Amount* | | | Value | |
| | | Convertible Bonds (continued) | | | | | | | | | |
| | | Biotechnology (continued) | | | | | | | | | |
| | BioMarin Pharmaceutical Inc., senior sub. note, | | | | | | | | | | | | |
| | 1.50%, 10/15/20 | | | United States | | | | 80,000 | | | $ | 93,021 | |
| | 0.599%, 8/01/24 | | | United States | | | | 580,000 | | | | 576,264 | |
| | Flexion Therapeutics Inc., senior note, 3.375%, 5/01/24 | | | United States | | | | 50,000 | | | | 63,566 | |
| | Intercept Pharmaceuticals Inc., senior note, 3.25%, 7/01/23 | | | United States | | | | 145,000 | | | | 120,165 | |
| | Ionis Pharmaceuticals Inc., senior note, 1.00%, 11/15/21 | | | United States | | | | 160,000 | | | | 163,956 | |
| a | | PDL BioPharma Inc., senior note, 2.75%, 12/01/21 | | | United States | | | | 525,000 | | | | 507,281 | |
| | Radius Health Inc., senior note, 3.00%, 9/01/24 | | | United States | | | | 707,000 | | | | 648,694 | |
| | | | | | | | | | | | | | |
| | | | | | | | | | | | | 5,367,566 | |
| | | | | | | | | | | | | | |
| | | Capital Markets 0.1% | | | | | | | | | |
| a,g | | Cowen Inc., senior note, 144A, 3.00%, 12/15/22 | | | United States | | | | 531,000 | | | | 574,916 | |
| | GSV Capital Corp., senior note, 4.75%, 3/28/23 | | | United States | | | | 80,000 | | | | 76,110 | |
| | Hercules Capital Inc., senior note, 4.375%, 2/01/22 | | | United States | | | | 10,000 | | | | 10,051 | |
| | | | | | | | | | | | | | |
| | | | | | | | | | | | | 661,077 | |
| | | | | | | | | | | | | | |
| | | Chemicals 0.1% | | | | | | | | | |
| h | | Mitsubishi Chemical Holdings Corp., senior note, Reg S, zero cpn., | | | | | | | | | | | | |
| | 3/30/22 | | | Japan | | | | 30,000,000 | JPY | | | 290,596 | |
| | 3/29/24 | | | Japan | | | | 30,000,000 | JPY | | | 295,078 | |
| | | | | | | | | | | | | | |
| | | | | | | | | | | | | 585,674 | |
| | | | | | | | | | | | | | |
| | | Commercial Services & Supplies 0.1% | | | | | | | | | |
| a | | RWT Holdings Inc., senior note, 5.625%, 11/15/19 | | | United States | | | | 615,000 | | | | 626,778 | |
| g | | Team Inc., senior note, 144A, 5.00%, 8/01/23 | | | United States | | | | 582,000 | | | | 709,152 | |
| | | | | | | | | | | | | | |
| | | | | | | | | | | | | 1,335,930 | |
| | | | | | | | | | | | | | |
| | | Communications Equipment 0.2% | | | | | | | | | |
| | Calamp Corp., senior note, 1.625%, 5/15/20 | | | United States | | | | 547,000 | | | | 565,821 | |
| | Finisar Corp., senior bond, 0.50%, 12/15/36 | | | United States | | | | 941,000 | | | | 853,541 | |
| | Palo Alto Networks Inc., senior note, zero cpn., 7/01/19 | | | United States | | | | 672,000 | | | | 1,270,804 | |
| | | | | | | | | | | | | | |
| | | | | | | | | | | | | 2,690,166 | |
| | | | | | | | | | | | | | |
| | | Construction & Engineering 0.1% | | | | | | | | | |
| h | | Mirait Holdings Corp., senior note, Reg S, zero cpn., 12/30/21 | | | Japan | | | | 25,000,000 | JPY | | | 294,158 | |
| | Tutor Perini Corp., senior note, 2.875%, 6/15/21 | | | United States | | | | 605,000 | | | | 617,457 | |
| | | | | | | | | | | | | | |
| | | | | | | | | | | | | 911,615 | |
| | | | | | | | | | | | | | |
| | | Construction Materials 0.1% | | | | | | | | | |
| | Cemex SAB de CV, sub. note, 3.72%, 3/15/20 | | | Mexico | | | | 1,016,000 | | | | 1,012,358 | |
| | | | | | | | | | | | | | |
| | | Consumer Finance 0.4% | | | | | | | | | |
| | Encore Capital Group Inc., senior note, | | | | | | | | | | | | |
| | 2.875%, 3/15/21 | | | United States | | | | 405,000 | | | | 385,491 | |
| | a3.25%, 3/15/22 | | | United States | | | | 1,090,000 | | | | 1,154,139 | |
| | Ezcorp Inc., senior note, | | | | | | | | | | | | |
| | 2.125%, 6/15/19 | | | United States | | | | 1,165,000 | | | | 1,185,213 | |
| | g144A, 2.375%, 5/01/25 | | | United States | | | | 466,000 | | | | 466,724 | |
| | PRA Group Inc., senior note, | | | | | | | | | | | | |
| | a3.00%, 8/01/20 | | | United States | | | | 625,000 | | | | 609,782 | |
| | 3.50%, 6/01/23 | | | United States | | | | 654,000 | | | | 702,947 | |
| | | | | | | | | | | | | | |
| | | | | | | | | | | | | 4,504,296 | |
| | | | | | | | | | | | | | |
| | | | | | |
| franklintempleton.com | | Annual Report | | | 27 | |
FRANKLIN ALTERNATIVE STRATEGIES FUNDS
CONSOLIDATED STATEMENT OF INVESTMENTS
Franklin K2 Alternative Strategies Fund (continued)
| | | | | | | | | | | | | | |
| | | | | Country | | | Principal
Amount* | | | Value | |
| | | Convertible Bonds (continued) | | | | | | | | | |
| | | Diversified Financial Services 0.1% | | | | | | | | | |
| g | | Element Fleet Management Corp., sub. note, 144A, 5.125%, 6/30/19 | | | Canada | | | | 924,000 | CAD | | $ | 703,369 | |
| | | | | | | | | | | | | | |
| | | Electric Utilities 0.1% | | | | | | | | | |
| h | | Kyushu Electric Power Co. Inc., Reg S, zero cpn., | | | | | | | | | | | | |
| | secured note, 3/31/20 | | | Japan | | | | 40,000,000 | JPY | | | 381,486 | |
| | senior secured note, 3/31/22 | | | Japan | | | | 40,000,000 | JPY | | | 385,623 | |
| | | | | | | | | | | | | | |
| | | | | | | | | | | | | 767,109 | |
| | | | | | | | | | | | | | |
| | | Electrical Equipment 0.1% | | | | | | | | | |
| h | | Johnson Electric Holdings Ltd., senior note, Reg S, 1.00%, 4/02/21 | | | Hong Kong | | | | 750,000 | | | | 808,125 | |
| | | | | | | | | | | | | | |
| | | Electronic Equipment, Instruments & Components 0.3% | |
| g | | II-VI Inc., senior note, 144A, 0.25%, 9/01/22 | | | United States | | | | 322,000 | | | | 368,108 | |
| a | | Knowles Corp., senior note, 3.25%, 11/01/21 | | | United States | | | | 530,000 | | | | 582,843 | |
| | OSI Systems Inc., senior note, 1.25%, 9/01/22 | | | United States | | | | 148,000 | | | | 137,122 | |
| | Vishay Intertechnology Inc., senior bond, | | | | | | | | | | | | |
| | 2.25%, 11/15/40 | | | United States | | | | 129,000 | | | | 214,160 | |
| | a2.25%, 5/15/41 | | | United States | | | | 1,412,000 | | | | 1,765,101 | |
| | | | | | | | | | | | | | |
| | | | | | | | | | | | | 3,067,334 | |
| | | | | | | | | | | | | | |
| | | Energy Equipment & Services 0.1% | | | | | | | | | |
| h | | Fugro NV, sub. note, Reg S, 4.00%, 10/26/21 | | | Netherlands | | | | 500,000 | EUR | | | 592,413 | |
| | Nabors Industries Inc., senior note, 0.75%, 1/15/24 | | | United States | | | | 135,000 | | | | 107,017 | |
| | SEACOR Holdings Inc., senior bond, 3.00%, 11/15/28 | | | United States | | | | 585,000 | | | | 568,069 | |
| | | | | | | | | | | | | | |
| | | | | | | | | | | | | 1,267,499 | |
| | | | | | | | | | | | | | |
| | | Equity Real Estate Investment Trusts (REITs) 0.6% | | | | | | | | | |
| g | | American Residential Properties OP LP, senior note, 144A, 3.25%, 11/15/18 | | | United States | | | | 1,009,000 | | | | 1,148,154 | |
| a | | Colony NorthStar Inc., senior note, 3.875%, 1/15/21 | | | United States | | | | 641,000 | | | | 613,773 | |
| g | | Empire State Realty OP LP, senior note, 144A, 2.625%, 8/15/19 | | | United States | | | | 747,000 | | | | 762,739 | |
| | Forest City Enterprises Inc., senior note, 3.625%, 8/15/20 | | | United States | | | | 397,000 | | | | 417,124 | |
| | Forest City Realty Trust Inc., senior note, 4.25%, 8/15/18 | | | United States | | | | 808,000 | | | | 836,959 | |
| | IH Merger Sub LLC, senior note, 3.50%, 1/15/22 | | | United States | | | | 521,000 | | | | 571,093 | |
| g | | iStar Inc., senior note, 144A, 3.125%, 9/15/22 | | | United States | | | | 250,000 | | | | 244,283 | |
| | National Health Investors Inc., senior note, 3.25%, 4/01/21 | | | United States | | | | 371,000 | | | | 419,375 | |
| a | | Starwood Waypoint Homes, senior note, 3.00%, 7/01/19 | | | United States | | | | 1,337,000 | | | | 1,627,810 | |
| | | | | | | | | | | | | | |
| | | | | | | | | | | | | 6,641,310 | |
| | | | | | | | | | | | | | |
| | | Health Care Equipment & Supplies 0.2% | | | | | | | | | |
| g | | Insulet Corp., senior note, 144A, 1.375%, 11/15/24 | | | United States | | | | 15,000 | | | | 17,694 | |
| | Invacare Corp., senior note, 5.00%, 2/15/21 | | | United States | | | | 970,000 | | | | 1,175,899 | |
| h | | Nipro Corp., senior note, Reg S, zero cpn., 1/29/21 | | | Japan | | | | 40,000,000 | JPY | | | 398,952 | |
| | NuVasive Inc., senior note, 2.25%, 3/15/21 | | | United States | | | | 159,000 | | | | 173,255 | |
| | | | | | | | | | | | | | |
| | | | | | | | | | | | | 1,765,800 | |
| | | | | | | | | | | | | | |
| | | Health Care Technology 0.3% | | | | | | | | | |
| a | | Allscripts Healthcare Solutions Inc., senior note, 1.25%, 7/01/20 | | | United States | | | | 577,000 | | | | 587,922 | |
| | Evolent Health Inc., senior note, 2.00%, 12/01/21 | | | United States | | | | 50,000 | | | | 56,906 | |
| g | | Teladoc Inc., senior note, 144A, | | | | | | | | | | | | |
| | 3.00%, 12/15/22 | | | United States | | | | 290,000 | | | | 395,653 | |
| | 1.375%, 5/15/25 | | | United States | | | | 943,000 | | | | 1,075,976 | |
| g | | Vocera Communications Inc., senior note, 144A, 1.50%, 5/15/23 | | | United States | | | | 979,000 | | | | 1,033,297 | |
| | | | | | | | | | | | | | |
| | | | | | | | | | | | | 3,149,754 | |
| | | | | | | | | | | | | | |
| | | | |
| 28 | | Annual Report | | franklintempleton.com |
FRANKLIN ALTERNATIVE STRATEGIES FUNDS
CONSOLIDATED STATEMENT OF INVESTMENTS
Franklin K2 Alternative Strategies Fund (continued)
| | | | | | | | | | | | | | |
| | | | | Country | | | Principal
Amount* | | | Value | |
| | | Convertible Bonds (continued) | | | | | | | | | |
| | | Hotels, Restaurants & Leisure 0.0%† | | | | | | | | | |
| g | | China Lodging Group Ltd., senior note, 144A, 0.375%, 11/01/22 | | | China | | | | 351,000 | | | $ | 413,513 | |
| | | | | | | | | | | | | | |
| | | Independent Power & Renewable Electricity Producers 0.0%† | |
| g | | NRG Energy Inc., senior bond, 144A, 2.75%, 6/01/48 | | | United States | | | | 291,000 | | | | 298,524 | |
| | | | | | | | | | | | | | |
| | | Insurance 0.2% | | | | | | | | | |
| g | | AXA SA, senior note, 144A, 7.25%, 5/15/21 | | | France | | | | 1,983,000 | | | | 2,147,589 | |
| | | | | | | | | | | | | | |
| | | Internet & Direct Marketing Retail 0.1% | | | | | | | | | |
| | Ctrip.com International Ltd., senior note, 1.25%, 9/15/22 | | | China | | | | 379,000 | | | | 387,153 | |
| g | | Liberty Expedia Holdings Inc., senior bond, 144A, 1.00%, 6/30/47 | | | United States | | | | 260,000 | | | | 255,234 | |
| | Vipshop Holdings Ltd., senior note, 1.50%, 3/15/19 | | | China | | | | 75,000 | | | | 73,987 | |
| | | | | | | | | | | | | | |
| | | | | | | | | | | | | 716,374 | |
| | | | | | | | | | | | | | |
| | | Internet Software & Services 0.5% | | | | | | | | | |
| g | | Akamai Technologies Inc., senior note, 144A, 0.125%, 5/01/25 | | | United States | | | | 261,000 | | | | 265,892 | |
| | Carbonite Inc., senior note, 2.50%, 4/01/22 | | | United States | | | | 389,000 | | | | 629,607 | |
| g | | Coupa Software Inc., senior note, 144A, 0.375%, 1/15/23 | | | United States | | | | 78,000 | | | | 103,601 | |
| | Envestnet Inc., senior note, | | | | | | | | | | | | |
| | 1.75%, 12/15/19 | | | United States | | | | 208,000 | | | | 219,699 | |
| | g144A, 1.75%, 6/01/23 | | | United States | | | | 759,000 | | | | 769,510 | |
| g | | Five9 Inc., senior note, 144A, 0.125%, 5/01/23 | | | United States | | | | 260,000 | | | | 274,896 | |
| | j2 Global Inc., senior bond, 3.25%, 6/15/29 | | | United States | | | | 260,000 | | | | 348,002 | |
| g | | New Relic Inc., senior note, 144A, 0.50%, 5/01/23 | | | United States | | | | 260,000 | | | | 287,375 | |
| g | | Nutanix Inc., senior note, 144A, zero cpn., 1/15/23 | | | United States | | | | 412,000 | | | | 528,672 | |
| g | | Twilio Inc., senior note, 144A, 0.25%, 6/01/23 | | | United States | | | | 208,000 | | | | 213,568 | |
| | Twitter Inc., senior note, 1.00%, 9/15/21 | | | United States | | | | 780,000 | | | | 736,621 | |
| g | | Weibo Corp., senior note, 144A, 1.25%, 11/15/22 | | | China | | | | 518,000 | | | | 556,884 | |
| | Yandex NV, senior note, 1.125%, 12/15/18 | | | Russia | | | | 246,000 | | | | 241,625 | |
| | Zillow Group Inc., senior note, 2.00%, 12/01/21 | | | United States | | | | 129,000 | | | | 164,068 | |
| | | | | | | | | | | | | | |
| | | | | | | | | | | | | 5,340,020 | |
| | | | | | | | | | | | | | |
| | | IT Services 0.1% | | | | | | | | | |
| | CSG Systems International Inc., senior bond, 4.25%, 3/15/36 | | | United States | | | | 410,000 | | | | 433,684 | |
| g | | GDS Holdings Ltd., senior note, 144A, 2.00%, 6/01/25 | | | China | | | | 812,000 | | | | 812,000 | |
| g | | Square Inc., senior note, 144A, 0.50%, 5/15/23 | | | United States | | | | 260,000 | | | | 274,035 | |
| | | | | | | | | | | | | | |
| | | | | | | | | | | | | 1,519,719 | |
| | | | | | | | | | | | | | |
| | | Machinery 0.2% | | | | | | | | | |
| g | | Chart Industries Inc., senior sub. note, 144A, 1.00%, 11/15/24 | | | United States | | | | 379,000 | | | | 475,507 | |
| | The Greenbrier Cos. Inc., senior note, 2.875%, 2/01/24 | | | United States | | | | 105,000 | | | | 119,088 | |
| a | | Navistar International Corp., senior sub. note, | | | | | | | | | | | | |
| | c 4.50%, 10/15/18 | | | United States | | | | 742,000 | | | | 750,375 | |
| | 4.75%, 4/15/19 | | | United States | | | | 647,000 | | | | 669,635 | |
| | | | | | | | | | | | | | |
| | | | | | | | | | | | | 2,014,605 | |
| | | | | | | | | | | | | | |
| | | Media 0.3% | | | | | | | | | |
| | DISH Network Corp., | | | | | | | | | | | | |
| | senior bond, 3.375%, 8/15/26 | | | United States | | | | 325,000 | | | | 289,029 | |
| | senior note, 2.375%, 3/15/24 | | | United States | | | | 1,067,000 | | | | 897,192 | |
| g | | Gannett Co. Inc., senior note, 144A, 4.75%, 4/15/24 | | | United States | | | | 217,000 | | | | 234,855 | |
| | Liberty Interactive LLC, | | | | | | | | | | | | |
| | senior bond, 4.00%, 11/15/29 | | | United States | | | | 1,122,000 | | | | 778,388 | |
| | senior note, 3.75%, 2/15/30 | | | United States | | | | 811,000 | | | | 557,563 | |
| | | | | | |
| franklintempleton.com | | Annual Report | | | 29 | |
FRANKLIN ALTERNATIVE STRATEGIES FUNDS
CONSOLIDATED STATEMENT OF INVESTMENTS
Franklin K2 Alternative Strategies Fund (continued)
| | | | | | | | | | | | | | |
| | | | | Country | | | Principal
Amount* | | | Value | |
| | | Convertible Bonds (continued) | | | | | | | �� | | |
| | | Media (continued) | | | | | | | | | |
| | Liberty Interactive LLC, senior bond, (continued) | | | | | | | | | | | | |
| | g 144A, 1.75%, 9/30/46 | | | United States | | | | 80,000 | | | $ | 83,065 | |
| | Liberty Media Corp., senior bond, 2.25%, 9/30/46 | | | United States | | | | 50,000 | | | | 52,316 | |
| | | | | | | | | | | | | | |
| | | | | | | | | | | | | 2,892,408 | |
| | | | | | | | | | | | | | |
| | | Metals & Mining 0.2% | | | | | | | | | |
| | AK Steel Corp., senior note, 5.00%, 11/15/19 | | | United States | | | | 355,000 | | | | 415,065 | |
| | Cleveland-Cliffs Inc., senior note, 1.50%, 1/15/25 | | | United States | | | | 658,000 | | | | 803,464 | |
| g | | Endeavour Mining Corp., senior note, 144A, 3.00%, 2/15/23 | | | Ivory Coast | | | | 250,000 | | | | 253,125 | |
| g | | First Majestic Silver Corp., senior note, 144A, 1.875%, 3/01/23 | | | Canada | | | | 521,000 | | | | 528,971 | |
| | SSR Mining Inc., senior bond, 2.875%, 2/01/33 | | | Canada | | | | 371,000 | | | | 369,377 | |
| | | | | | | | | | | | | | |
| | | | | | | | | | | | | 2,370,002 | |
| | | | | | | | | | | | | | |
| | | Mortgage Real Estate Investment Trusts (REITs) 0.6% | | | | | | | | | |
| a | | Apollo Commercial Real Estate Finance Inc., senior note, | | | | | | | | | | | | |
| | 5.50%, 3/15/19 | | | United States | | | | 1,263,000 | | | | 1,355,155 | |
| | 4.75%, 8/23/22 | | | United States | | | | 1,482,000 | | | | 1,489,047 | |
| | Blackstone Mortgage Trust Inc., senior note, 4.75%, 3/15/23 | | | United States | | | | 1,172,000 | | | | 1,147,673 | |
| g | | KKR Real Estate Finance Trust Inc., senior note, 144A, 6.125%, 5/15/23 | | | United States | | | | 830,000 | | | | 835,279 | |
| | Redwood Trust Inc., senior note, 4.75%, 8/15/23 | | | United States | | | | 212,000 | | | | 207,445 | |
| | Two Harbors Investment Corp., senior note, 6.25%, 1/15/22 | | | United States | | | | 1,612,000 | | | | 1,666,002 | |
| | | | | | | | | | | | | | |
| | | | | | | | | | | | | 6,700,601 | |
| | | | | | | | | | | | | | |
| | | Oil, Gas & Consumable Fuels 0.5% | | | | | | | | | |
| | Chesapeake Energy Corp., senior note, 5.50%, 9/15/26 | | | United States | | | | 95,000 | | | | 92,156 | |
| | Golar LNG Ltd., senior note, 2.75%, 2/15/22 | | | Bermuda | | | | 390,000 | | | | 396,967 | |
| | Green Plains Inc., senior note, | | | | | | | | | | | | |
| | 3.25%, 10/01/18 | | | United States | | | | 1,506,000 | | | | 1,692,042 | |
| | 4.125%, 9/01/22 | | | United States | | | | 306,000 | | | | 323,358 | |
| | Oasis Petroleum Inc., senior note, 2.625%, 9/15/23 | | | United States | | | | 104,000 | | | | 134,592 | |
| | Ship Finance International Ltd., senior note, 4.875%, 5/01/23 | | | Norway | | | | 1,881,000 | | | | 1,884,557 | |
| c | | SM Energy Co., senior note, 1.50%, 7/01/21 | | | United States | | | | 160,000 | | | | 167,262 | |
| g | | Teekay Corp., senior note, 144A, 5.00%, 1/15/23 | | | Canada | | | | 347,000 | | | | 335,160 | |
| | Whiting Petroleum Corp., senior note, 1.25%, 4/01/20 | | | United States | | | | 45,000 | | | | 42,764 | |
| | | | | | | | | | | | | | |
| | | | | | | | | | | | | 5,068,858 | |
| | | | | | | | | | | | | | |
| | | Personal Products 0.1% | | | | | | | | | |
| | Herbalife Nutrition Ltd., senior note, | | | | | | | | | | | | |
| | a 2.00%, 8/15/19 | | | United States | | | | 250,000 | | | | 310,022 | |
| | g 144A, 2.625%, 3/15/24 | | | United States | | | | 1,158,000 | | | | 1,199,550 | |
| | | | | | | | | | | | | | |
| | | | | | | | | | | | | 1,509,572 | |
| | | | | | | | | | | | | | |
| | | Pharmaceuticals 0.4% | | | | | | | | | |
| g | | Corium International Inc., senior note, 144A, 5.00%, 3/15/25 | | | United States | | | | 290,000 | | | | 240,700 | |
| | Dermira Inc., senior note, 3.00%, 5/15/22 | | | United States | | | | 841,000 | | | | 668,424 | |
| a | | Innoviva Inc., sub. note, 2.125%, 1/15/23 | | | United States | | | | 1,770,000 | | | | 1,782,894 | |
| g | | Jazz Investments I Ltd., senior note, 144A, 1.50%, 8/15/24 | | | United States | | | | 536,000 | | | | 549,830 | |
| | The Medicines Co., senior note, | | | | | | | | | | | | |
| | 2.50%, 1/15/22 | | | United States | | | | 444,000 | | | | 518,594 | |
| | a 2.75%, 7/15/23 | | | United States | | | | 93,000 | | | | 90,574 | |
| | Pacira Pharmaceuticals Inc., senior note, 2.375%, 4/01/22 | | | United States | | | | 795,000 | | | | 754,507 | |
| g | | Supernus Pharmaceuticals Inc., senior note, 144A, 0.625%, 4/01/23 | | | United States | | | | 35,000 | | | | 41,244 | |
| | Theravance Biopharma Inc., senior note, 3.25%, 11/01/23 | | | Cayman Islands | | | | 318,000 | | | | 322,221 | |
| | | | | | | | | | | | | | |
| | | | | | | | | | | | | 4,968,988 | |
| | | | | | | | | | | | | | |
| | | | |
| 30 | | Annual Report | | franklintempleton.com |
FRANKLIN ALTERNATIVE STRATEGIES FUNDS
CONSOLIDATED STATEMENT OF INVESTMENTS
Franklin K2 Alternative Strategies Fund (continued)
| | | | | | | | | | | | | | |
| | | | | Country | | | Principal
Amount* | | | Value | |
| | | Convertible Bonds (continued) | | | | | | | | | |
| | | Semiconductors & Semiconductor Equipment 0.6% | | | | | | | | | |
| | Integrated Device Technology Inc., senior note, 0.875%, 11/15/22 | | | United States | | | | 895,000 | | | $ | 1,052,167 | |
| | Intel Corp., junior sub. bond, 3.25%, 8/01/39 | | | United States | | | | 165,000 | | | | 438,508 | |
| a | | Microchip Technology Inc., senior sub. bond, 1.625%, 2/15/27 | | | United States | | | | 647,000 | | | | 825,751 | |
| a | | ON Semiconductor Corp., senior note, 1.00%, 12/01/20 | | | United States | | | | 1,476,000 | | | | 2,171,689 | |
| | Silicon Laboratories Inc., senior note, 1.375%, 3/01/22 | | | United States | | | | 267,000 | | | | 343,596 | |
| | Teradyne Inc., senior note, 1.25%, 12/15/23 | | | United States | | | | 891,000 | | | | 1,196,552 | |
| | Veeco Instruments Inc., senior note, 2.70%, 1/15/23 | | | United States | | | | 1,117,000 | | | | 1,004,317 | |
| | | | | | | | | | | | | | |
| | | | | | | | | | | | | 7,032,580 | |
| | | | | | | | | | | | | | |
| | | Software 0.4% | | | | | | | | | |
| g | | Atlassian Inc., senior note, 144A, 0.625%, 5/01/23 | | | United States | | | | 556,000 | | | | 584,670 | |
| | Citrix Systems Inc., senior note, 0.50%, 4/15/19 | | | United States | | | | 417,000 | | | | 611,181 | |
| | FireEye Inc., | | | | | | | | | | | | |
| | senior bond, 1.625%, 6/01/35 | | | United States | | | | 481,000 | | | | 444,020 | |
| | g senior note, 144A, 0.875%, 6/01/24 | | | United States | | | | 415,000 | | | | 410,840 | |
| | Guidewire Software Inc., senior note, 1.25%, 3/15/25 | | | United States | | | | 325,000 | | | | 340,111 | |
| | HubSpot Inc., senior note, 0.25%, 6/01/22 | | | United States | | | | 260,000 | | | | 364,466 | |
| | RealPage Inc., senior note, 1.50%, 11/15/22 | | | United States | | | | 208,000 | | | | 312,416 | |
| | Rovi Corp., senior note, 0.50%, 3/01/20 | | | United States | | | | 55,000 | | | | 52,782 | |
| g | | ServiceNow Inc., senior note, 144A, zero cpn., 6/01/22 | | | United States | | | | 261,000 | | | | 368,168 | |
| | Verint Systems Inc., senior note, 1.50%, 6/01/21 | | | United States | | | | 70,000 | | | | 67,753 | |
| g | | Zendesk Inc., senior note, 144A, 0.25%, 3/15/23 | | | United States | | | | 817,000 | | | | 895,911 | |
| | | | | | | | | | | | | | |
| | | | | | | | | | | | | 4,452,318 | |
| | | | | | | | | | | | | | |
| | | Specialty Retail 0.0%† | | | | | | | | | |
| g | | Restoration Hardware Holdings Inc., senior note, 144A, zero cpn., 6/15/19 | | | United States | | | | 379,000 | | | | 395,952 | |
| | | | | | | | | | | | | | |
| | | Technology Hardware, Storage & Peripherals 0.0%† | | | | | | | | | |
| | Electronics for Imaging Inc., senior note, 0.75%, 9/01/19 | | | United States | | | | 26,000 | | | | 25,728 | |
| g | | Pure Storage Inc., senior note, 144A, 0.125%, 4/15/23 | | | United States | | | | 181,000 | | | | 191,039 | |
| | | | | | | | | | | | | | |
| | | | | | | | | | | | | 216,767 | |
| | | | | | | | | | | | | | |
| | | Thrifts & Mortgage Finance 0.0%† | | | | | | | | | |
| | LendingTree Inc., senior note, 0.625%, 6/01/22 | | | United States | | | | 129,000 | | | | 179,335 | |
| | | | | | | | | | | | | | |
| | | Trading Companies & Distributors 0.0%† | | | | | | | | | |
| | Kaman Corp., senior note, 3.25%, 5/01/24 | | | United States | | | | 462,000 | | | | 574,674 | |
| | | | | | | | | | | | | | |
| | | Transportation Infrastructure 0.0%† | | | | | | | | | |
| | Macquarie Infrastructure Corp., senior note, 2.00%, 10/01/23 | | | United States | | | | 40,000 | | | | 35,693 | |
| | | | | | | | | | | | | | |
| | Total Convertible Bonds (Cost $82,927,619) | | | | | | | | | | | 86,977,326 | |
| | | | | | | | | | | | | | |
| | | Corporate Bonds and Notes 14.2% | | | |
| | | Aerospace & Defense 0.1% | | | | | | | | | |
| | Embraer Netherlands Finance BV, senior bond, | | | | | | | | | | | | |
| | 5.05%, 6/15/25 | | | Brazil | | | | 95,000 | | | | 95,357 | |
| | 5.40%, 2/01/27 | | | Brazil | | | | 130,000 | | | | 133,231 | |
| g | | Embraer Overseas Ltd., senior bond, 144A, 5.696%, 9/16/23 | | | Brazil | | | | 90,000 | | | | 93,713 | |
| g | | Leonardo US Holdings Inc., senior bond, 144A, 6.25%, 1/15/40 | | | Italy | | | | 236,000 | | | | 258,420 | |
| g | | Transdigm UK Holdings PLC, senior note, 144A, 6.875%, 5/15/26 | | | United States | | | | 215,000 | | | | 220,375 | |
| | | | | | | | | | | | | | |
| | | | | | | | | | | | | 801,096 | |
| | | | | | | | | | | | | | |
| | | | | | |
| franklintempleton.com | | Annual Report | | | 31 | |
FRANKLIN ALTERNATIVE STRATEGIES FUNDS
CONSOLIDATED STATEMENT OF INVESTMENTS
Franklin K2 Alternative Strategies Fund (continued)
| | | | | | | | | | | | | | |
| | | | | Country | | | Principal
Amount* | | | Value | |
| | | Corporate Bonds and Notes (continued) | | | | | | | | | |
| | | Automobiles 0.3% | | | | | | | | | |
| g,i | | BMW US Capital LLC, senior note, 144A, FRN, 2.749%, (3-Month USD LIBOR + 0.41%), 4/12/21 | | | Germany | | | | 465,000 | | | $ | 466,748 | |
| i | | General Motors Financial Co. Inc., senior note, FRN, 3.188%, (3-Month USD LIBOR + 0.85%), 4/09/21 | | | United States | | | | 275,000 | | | | 276,696 | |
| g,i | | Nissan Motor Acceptance Corp., senior note, 144A, FRN, 2.72%, (3-Month USD LIBOR + 0.52%), 3/15/21 | | | United States | | | | 470,000 | | | | 471,269 | |
| i | | Toyota Motor Credit Corp., senior note, FRN, | | | | | | | | | | | | |
| | 2.743%, (3-Month USD LIBOR + 0.39%), 1/17/19 | | | United States | | | | 40,000 | | | | 40,092 | |
| | 2.438%, (3-Month USD LIBOR + 0.10%), 1/10/20 | | | United States | | | | 980,000 | | | | 979,914 | |
| | 2.622%, (3-Month USD LIBOR + 0.28%), 4/13/21 | | | United States | | | | 955,000 | | | | 957,041 | |
| | | | | | | | | | | | | | |
| | | | | | | | | | | | | 3,191,760 | |
| | | | | | | | | | | | | | |
| | | Banks 0.4% | | | | | | | | | |
| g | | Banco Macro SA, senior note, 144A, 17.50%, 5/08/22 | | | Argentina | | | | 1,740,000 | ARS | | | 65,178 | |
| i | | Bank of America Corp., senior note, FRN, 3.388%, (3-Month USD LIBOR + 1.04%), 1/15/19 | | | United States | | | | 20,000 | | | | 20,131 | |
| | Citibank NA, senior note, 3.05%, 5/01/20 | | | United States | | | | 435,000 | | | | 435,382 | |
| | JP Morgan Structured Products BV, senior note, zero cpn., 7/19/18 | | | Egypt | | | | 45,028,000 | EGP | | | 2,457,241 | |
| i | | JPMorgan Chase & Co., senior note, FRN, 2.98%, (3-Month USD LIBOR + 0.68%), 6/01/21 | | | United States | | | | 480,000 | | | | 482,846 | |
| i | | JPMorgan Chase Bank NA, senior note, FRN, 2.07%, (3-Month USD LIBOR + 0.25%), 2/13/20 | | | United States | | | | 440,000 | | | | 440,297 | |
| | Qwest Capital Funding Inc., senior bond, 6.875%, 7/15/28 | | | United States | | | | 260,000 | | | | 239,200 | |
| | | | | | | | | | | | | | |
| | | | | | | | | | | | | 4,140,275 | |
| | | | | | | | | | | | | | |
| | | Biotechnology 0.0%† | | | | | | | | | |
| i | | Gilead Sciences Inc., senior note, FRN, 2.422%, (3-Month USD LIBOR + 0.22%), 3/20/19 | | | United States | | | | 430,000 | | | | 430,522 | |
| | | | | | | | | | | | | | |
| | | Chemicals 0.1% | | | | | | | | | |
| c | | Hexion Inc. / Hexion Nova Scotia Finance ULC, secured note, 9.00%, 11/15/20 | | | United States | | | | 1,503,000 | | | | 1,262,520 | |
| g | | Mexichem SAB de CV, senior bond, 144A, 4.00%, 10/04/27 | | | Mexico | | | | 220,000 | | | | 199,430 | |
| | | | | | | | | | | | | | |
| | | | | | | | | | | | | 1,461,950 | |
| | | | | | | | | | | | | | |
| | | Commercial Services & Supplies 1.8% | | | | | | | | | |
| g | | Harland Clarke Holdings Corp., 144A, | | | | | | | | | | | | |
| | asenior note, 9.25%, 3/01/21 | | | United States | | | | 12,544,000 | | | | 12,575,360 | |
| | senior secured note, 8.375%, 8/15/22 | | | United States | | | | 994,000 | | | | 1,001,455 | |
| | R.R. Donnelley & Sons Co., | | | | | | | | | | | | |
| | senior bond, 6.50%, 11/15/23 | | | United States | | | | 2,194,000 | | | | 2,166,575 | |
| | asenior bond, 6.00%, 4/01/24 | | | United States | | | | 2,265,000 | | | | 2,165,906 | |
| | asenior note, 7.875%, 3/15/21 | | | United States | | | | 20,000 | | | | 20,700 | |
| | senior note, 7.00%, 2/15/22 | | | United States | | | | 1,375,000 | | | | 1,419,688 | |
| | | | | | | | | | | | | | |
| | | | | | | | | | | | | 19,349,684 | |
| | | | | | | | | | | | | | |
| | | Construction & Engineering 0.2% | | | | | | | | | |
| a | | Engility Corp., senior note, 8.875%, 9/01/24 | | | United States | | | | 2,063,000 | | | | 2,168,729 | |
| | Great Lakes Dredge & Dock Corp., senior note, 8.00%, 5/15/22 | | | United States | | | | 160,000 | | | | 163,200 | |
| | | | | | | | | | | | | | |
| | | | | | | | | | | | | 2,331,929 | |
| | | | | | | | | | | | | | |
| | | Consumer Finance 0.4% | | | | | | | | | |
| g | | Everi Payments Inc., senior note, 144A, 7.50%, 12/15/25 | | | United States | | | | 4,469,000 | | | | 4,541,621 | |
| | | | | | | | | | | | | | |
| | | | |
| 32 | | Annual Report | | franklintempleton.com |
FRANKLIN ALTERNATIVE STRATEGIES FUNDS
CONSOLIDATED STATEMENT OF INVESTMENTS
Franklin K2 Alternative Strategies Fund (continued)
| | | | | | | | | | | | | | |
| | | | | Country | | | Principal
Amount* | | | Value | |
| | | Corporate Bonds and Notes (continued) | | | | | | | | | |
| | | Diversified Financial Services 1.7% | | | | | | | | | |
| g,i | | Banco Supervielle SA, senior note, 144A, FRN, 27.271%, (ARS Badlar + 4.50%), 8/09/20 | | | Argentina | | | | 3,800,000 | ARS | | $ | 146,537 | |
| | Citigroup Global Markets Holdings Inc., zero cpn., | | | | | | | | | | | | |
| | 7/19/18 | | | Egypt | | | | 5,415,900 | EGP | | | 295,025 | |
| | hReg S, 8/02/18 | | | Egypt | | | | 9,243,759 | EGP | | | 499,943 | |
| | hReg S, 9/13/18 | | | Egypt | | | | 55,754,688 | EGP | | | 2,976,728 | |
| g | | Financiera de Desarrollo Territorial SA Findeter, senior bond, 144A, 7.875%, 8/12/24 | | | Colombia | | | | 795,000,000 | COP | | | 285,780 | |
| a | | Hexion Inc., senior secured note, first lien, 6.625%, 4/15/20 | | | United States | | | | 2,315,000 | | | | 2,190,569 | |
| c | | Monitronics International Inc., senior note, 9.125%, 4/01/20 | | | United States | | | | 615,000 | | | | 435,112 | |
| g | | Neiman Marcus Group Ltd. LLC, senior note, 144A, | | | | | | | | | | | | |
| | a8.00%, 10/15/21 | | | United States | | | | 1,722,000 | | | | 1,239,840 | |
| | jPIK, 8.75%, 10/15/21 | | | United States | | | | 542,000 | | | | 387,530 | |
| g | | One Call Corp., 144A, | | | | | | | | | | | | |
| | secured note, second lien, 10.00%, 10/01/24 | | | United States | | | | 3,573,000 | | | | 3,162,105 | |
| | senior secured note, first lien, 7.50%, 7/01/24 | | | United States | | | | 6,616,000 | | | | 6,516,760 | |
| | | | | | | | | | | | | | |
| | | | | | | | | | | | | 18,135,929 | |
| | | | | | | | | | | | | | |
| | | Diversified Telecommunication Services 0.1% | | | | | | | | | |
| g | | Telecom Italia Spa, senior bond, 144A, 5.303%, 5/30/24 | | | Italy | | | | 1,216,000 | | | | 1,214,480 | |
| | | | | | | | | | | | | | |
| | | Electric Utilities 0.2% | | | | | | | | | |
| h | | 1MDB Energy Ltd., senior note, Reg S, 5.99%, 5/11/22 | | | Malaysia | | | | 1,300,000 | | | | 1,343,505 | |
| g | | Empresas Publicas de Medellin Esp, senior bond, 144A, 8.375%, 11/08/27 | | | Colombia | | | | 665,000,000 | COP | | | 238,483 | |
| g | | Enel SpA, sub. bond, 144A, 8.75% to 9/24/23, FRN thereafter, 9/24/73 | | | Italy | | | | 545,000 | | | | 617,894 | |
| | | | | | | | | | | | | | |
| | | | | | | | | | | | | 2,199,882 | |
| | | | | | | | | | | | | | |
| | | Electronic Equipment, Instruments & Components 0.1% | |
| i | | IBM Credit LLC, senior note, FRN, 1.949%, (3-Month USD LIBOR + 0.16%), 2/05/21 | | | United States | | | | 435,000 | | | | 436,139 | |
| | | | | | | | | | | | | | |
| | | Energy Equipment & Services 0.0%† | | | | | | | | | |
| g | | USA Compression Partners LP / USA Compression Finance Corp., senior note, 144A, 6.875%, 4/01/26 | | | United States | | | | 383,000 | | | | 395,926 | |
| | | | | | | | | | | | | | |
| | | Food & Staples Retailing 0.1% | | | | | | | | | |
| g,i | | Alimentation Couche-Tard Inc., senior note, 144A, FRN, 2.589%, (3-Month USD LIBOR + 0.50%), 12/13/19 | | | Canada | | | | 245,000 | | | | 245,322 | |
| g | | BRF GmbH, senior bond, 144A, 4.35%, 9/29/26 | | | Brazil | | | | 530,000 | | | | 445,200 | |
| g | | Sigma Holdco BV, senior note, 144A, 7.875%, 5/15/26 | | | Netherlands | | | | 397,000 | | | | 382,113 | |
| | | | | | | | | | | | | | |
| | | | | | | | | | | | | 1,072,635 | |
| | | | | | | | | | | | | | |
| | | Food Products 0.7% | | | | | | | | | |
| i | | Campbell Soup Co., senior note, FRN, 2.645%, (3-Month USD LIBOR + 0.50%), 3/16/20 | | | United States | | | | 235,000 | | | | 234,521 | |
| g | | Dean Foods Co., senior note, 144A, 6.50%, 3/15/23 | | | United States | | | | 4,209,000 | | | | 4,135,342 | |
| | Deutsche Bank AG / London, zero cpn., | | | | | | | | | | | | |
| | 8/28/18 | | | Germany | | | | 27,950,000 | EGP | | | 1,503,483 | |
| | 8/30/18 | | | Germany | | | | 17,050,000 | EGP | | | 915,375 | |
| g | | Grupo Bimbo SAB de CV, senior bond, 144A, 4.70%, 11/10/47 | | | Mexico | | | | 470,000 | | | | 428,649 | |
| g | | JBS USA LLC / Finance Inc., senior bond, 144A, | | | | | | | | | | | | |
| | 7.25%, 6/01/21 | | | United States | | | | 190,000 | | | | 193,088 | |
| | 5.75%, 6/15/25 | | | United States | | | | 180,000 | | | | 168,750 | |
| | | | | | |
| franklintempleton.com | | Annual Report | | | 33 | |
FRANKLIN ALTERNATIVE STRATEGIES FUNDS
CONSOLIDATED STATEMENT OF INVESTMENTS
Franklin K2 Alternative Strategies Fund (continued)
| | | | | | | | | | | | | | |
| | | | | Country | | | Principal
Amount* | | | Value | |
| | | Corporate Bonds and Notes (continued) | | | | | | | | | |
| | | Food Products (continued) | | | | | | | | | |
| g | | Marb Bondco PLC, senior note, 144A, 6.875%, 1/19/25 | | | Brazil | | | | 265,000 | | | $ | 245,291 | |
| | | | | | | | | | | | | | |
| | | | | | | | | | | | | 7,824,499 | |
| | | | | | | | | | | | | | |
| | | Gas Utilities 0.0%† | | | | | | | | | |
| g | | Infraestructura Energetica Nova SAB de CV, senior bond, 144A, 3.75%, 1/14/28 | | | Mexico | | | | 200,000 | | | | 183,750 | |
| | | | | | | | | | | | | | |
| | | Health Care Providers & Services 0.2% | | | | | | | | | |
| g | | Centene Escrow I Corp., senior note, 144A, 5.375%, 6/01/26 | | | United States | | | | 1,328,000 | | | | 1,344,600 | |
| i | | CVS Health Corp., senior note, FRN, | | | | | | | | | | | | |
| | 2.687%, (3-Month USD LIBOR + 0.63%), 3/09/20 | | | United States | | | | 470,000 | | | | 472,241 | |
| | 2.777%, (3-Month USD LIBOR + 0.72%), 3/09/21 | | | United States | | | | 470,000 | | | | 473,258 | |
| g,j | | Polaris Intermediate Corp., senior note, 144A, PIK, 8.50%, 12/01/22 | | | United States | | | | 295,000 | | | | 305,694 | |
| | | | | | | | | | | | | | |
| | | | | | | | | | | | | 2,595,793 | |
| | | | | | | | | | | | | | |
| | | Hotels, Restaurants & Leisure 1.3% | | | | | | | | | |
| g | | Constellation Merger Sub Inc., senior note, 144A, 8.50%, 9/15/25 | | | United States | | | | 110,000 | | | | 106,150 | |
| g | | Golden Nugget Inc., senior note, 144A, | | | | | | | | | | | | |
| | 6.75%, 10/15/24 | | | United States | | | | 1,787,000 | | | | 1,811,571 | |
| | 8.75%, 10/01/25 | | | United States | | | | 3,081,000 | | | | 3,219,645 | |
| a,g | | Jack Ohio Finance LLC / Jack Ohio Finance 1 Corp., senior secured note, second lien, 144A, 10.25%, 11/15/22 | | | United States | | | | 1,183,000 | | | | 1,289,470 | |
| g | | Mohegan Gaming & Entertainment, senior note, 144A, 7.875%, 10/15/24 | | | United States | | | | 6,338,000 | | | | 6,052,790 | |
| g | | Rivers Pittsburgh Borrower LP/Rivers Pittsburgh Finance Corp., secured note, 144A, 6.125%, 8/15/21 | | | United States | | | | 1,802,000 | | | | 1,802,000 | |
| | | | | | | | | | | | | | |
| | | | | | | | | | | | | 14,281,626 | |
| | | | | | | | | | | | | | |
| | | Machinery 0.2% | | | | | | | | | |
| i | | Caterpillar Financial Services Corp., senior note, FRN, 2.355%, (3-Month USD LIBOR + 0.23%), 3/15/21 | | | United States | | | | 235,000 | | | | 235,248 | |
| i | | John Deere Capital Corp., senior note, FRN, 2.329%, (3-Month USD LIBOR + 0.24%), 3/12/21 | | | United States | | | | 485,000 | | | | 487,140 | |
| g | | Navistar International Corp., senior note, 144A, 6.625%, 11/01/25 | | | United States | | | | 1,095,000 | | | | 1,136,062 | |
| a,g | | Titan International Inc., senior secured note, 144A, 6.50%, 11/30/23 | | | United States | | | | 483,000 | | | | 486,623 | |
| | | | | | | | | | | | | | |
| | | | | | | | | | | | | 2,345,073 | |
| | | | | | | | | | | | | | |
| | | Media 3.6% | | | | | | | | | |
| g | | American Media Inc., 144A, | | | | | | | | | | | | |
| | secured note, second lien, 5.50%, 9/01/21 | | | United States | | | | 619,858 | | | | 603,587 | |
| | sub. note, zero cpn., 3/01/22 | | | United States | | | | 20,429,513 | | | | 17,645,992 | |
| | Clear Channel Worldwide Holdings Inc., B, senior note, 7.625%, 3/15/20 | | | United States | | | | 1,095,000 | | | | 1,095,000 | |
| g | | Lee Enterprises Inc., senior secured note, first lien, 144A, 9.50%, 3/15/22 | | | United States | | | | 3,644,000 | | | | 3,798,870 | |
| | The McClatchy Co., | | | | | | | | | | | | |
| | senior bond, 7.15%, 11/01/27 | | | United States | | | | 632,000 | | | | 761,560 | |
| | senior bond, 6.875%, 3/15/29 | | | United States | | | | 4,095,000 | | | | 5,292,787 | |
| | senior secured note, first lien, 9.00%, 12/15/22 | | | United States | | | | 318,000 | | | | 331,515 | |
| g | | Meredith Corp., senior note, 144A, 6.875%, 2/01/26 | | | United States | | | | 4,437,000 | | | | 4,492,463 | |
| g,j | | Postmedia Network Inc., secured note, second lien, 144A, PIK, 10.25%, 7/15/23 | | | Canada | | | | 4,748,613 | | | | 5,627,106 | |
| g | | Telenet Finance Luxembourg Notes Sarl, senior secured bond, 144A, 5.50%, 3/01/28 | | | Belgium | | | | 200,000 | | | | 195,034 | |
| | | | | | | | | | | | | | |
| | | | | | | | | | | | | 39,843,914 | |
| | | | | | | | | | | | | | |
| | | | |
| 34 | | Annual Report | | franklintempleton.com |
FRANKLIN ALTERNATIVE STRATEGIES FUNDS
CONSOLIDATED STATEMENT OF INVESTMENTS
Franklin K2 Alternative Strategies Fund (continued)
| | | | | | | | | | | | | | |
| | | | | Country | | | Principal
Amount* | | | Value | |
| | | Corporate Bonds and Notes (continued) | | | | | | | | | |
| | | Metals & Mining 0.1% | | | | | | | | | |
| c,g | | Gerdau Trade Inc., senior bond, 144A, 4.875%, 10/24/27 | | | Brazil | | | | 455,000 | | | $ | 433,547 | |
| | Vale Overseas Ltd., senior bond, 6.25%, 8/10/26 | | | Brazil | | | | 155,000 | | | | 167,787 | |
| | | | | | | | | | | | | | |
| | | | | | | | | | | | | 601,334 | |
| | | | | | | | | | | | | | |
| | | Oil, Gas & Consumable Fuels 1.2% | | | | | | | | | |
| c,g | | Bellatrix Exploration Ltd., senior note, 144A, 8.50%, 5/15/20 | | | Canada | | | | 625,000 | | | | 493,750 | |
| g | | California Resources Corp., secured note, second lien, 144A, 8.00%, 12/15/22 | | | United States | | | | 185,000 | | | | 164,188 | |
| | Calumet Specialty Products Partners LP / Calumet Finance Corp., senior note, | | | | | | | | | | | | |
| | 6.50%, 4/15/21 | | | United States | | | | 1,871,000 | | | | 1,849,951 | |
| | 7.75%, 4/15/23 | | | United States | | | | 1,549,000 | | | | 1,552,872 | |
| a | | Cheniere Corpus Christi Holdings LLC, senior secured bond, 5.125%, 6/30/27 | | | United States | | | | 1,853,000 | | | | 1,848,367 | |
| c | | Eclipse Resources Corp., senior note, 8.875%, 7/15/23 | | | United States | | | | 420,000 | | | | 396,900 | |
| g | | Endeavor Energy Resources LP / EER Finance Inc., senior note, 144A, 5.50%, 1/30/26 | | | United States | | | | 279,000 | | | | 274,118 | |
| h,i | | EP PetroEcuador via Noble Sovereign Funding I Ltd., FRN, Reg S, 7.925%, (3-Month USD LIBOR + 5.63%), 9/24/19 | | | Ecuador | | | | 254,842 | | | | 252,854 | |
| g | | Gran Tierra Energy International Holdings Ltd., senior note, 144A, 6.25%, 2/15/25 | | | Canada | | | | 200,000 | | | | 188,640 | |
| g | | Jagged Peak Energy LLC, senior note, 144A, 5.875%, 5/01/26 | | | United States | | | | 130,000 | | | | 128,700 | |
| g | | Jones Energy Holdings LLC / Jones Energy Finance Corp., senior secured note, 144A, 9.25%, 3/15/23 | | | United States | | | | 240,000 | | | | 235,200 | |
| g | | Lonestar Resources America Inc., senior note, 144A, 11.25%, 1/01/23 | | | United States | | | | 95,000 | | | | 98,800 | |
| g | | MEG Energy Corp., senior bond, 144A, 6.375%, 1/30/23 | | | Canada | | | | 180,000 | | | | 163,350 | |
| g | | NGPL PipeCo LLC, senior bond, 144A, 7.768%, 12/15/37 | | | United States | | | | 80,000 | | | | 94,400 | |
| g | | Par Petroleum LLC / Petroleum Finance Corp., first lien, 144A, 7.75%, 12/15/25 | | | United States | | | | 430,000 | | | | 439,675 | |
| | Petrobras Global Finance BV, | | | | | | | | | | | | |
| | gsenior bond, 144A, 5.999%, 1/27/28 | | | Brazil | | | | 350,000 | | | | 324,713 | |
| | senior bond, 5.625%, 5/20/43 | | | Brazil | | | | 380,000 | | | | 318,725 | |
| | senior bond, 7.25%, 3/17/44 | | | Brazil | | | | 165,000 | | | | 155,513 | |
| | senior note, 6.125%, 1/17/22 | | | Brazil | | | | 2,084,000 | | | | 2,188,200 | |
| | senior note, 6.25%, 3/17/24 | | | Brazil | | | | 822,000 | | | | 833,508 | |
| | gsenior note, 144A, 5.299%, 1/27/25 | | | Brazil | | | | 223,000 | | | | 209,620 | |
| g | | SRC Energy Inc., senior note, 144A, 6.25%, 12/01/25 | | | United States | | | | 230,000 | | | | 235,175 | |
| g | | Transportadora de Gas del Sur SA, senior note, 144A, 6.75%, 5/02/25 | | | Argentina | | | | 155,000 | | | | 149,381 | |
| g | | Vine Oil & Gas LP / Vine Oil & Gas Finance Corp., senior note, 144A, 8.75%, 4/15/23 | | | United States | | | | 220,000 | | | | 204,050 | |
| g | | YPF Sociedad Anonima, 144A, | | | | | | | | | | | | |
| | senior bond, 6.95%, 7/21/27 | | | Argentina | | | | 220,000 | | | | 204,600 | |
| | i senior note, FRN, 26.563%, (ARS Badlar + 4.00%), 7/07/20 | | | Argentina | | | | 245,000 | | | | 137,428 | |
| | | | | | | | | | | | | | |
| | | | | | | | | | | | | 13,142,678 | |
| | | | | | | | | | | | | | |
| | | Paper & Forest Products 1.3% | | | | | | | | | |
| | Fibria Overseas Finance Ltd., senior note, 4.00%, 1/14/25 | | | Brazil | | | | 200,000 | | | | 187,321 | |
| g | | Mercer International Inc., senior note, 144A, 5.50%, 1/15/26 | | | Canada | | | | 273,000 | | | | 268,222 | |
| | Resolute Forest Products Inc., senior note, 5.875%, 5/15/23 | | | United States | | | | 14,004,000 | | | | 14,144,040 | |
| | | | | | | | | | | | | | |
| | | | | | | | | | | | | 14,599,583 | |
| | | | | | | | | | | | | | |
| | | Pharmaceuticals 0.1% | | | | | | | | | |
| g | | Inretail Pharma SA, senior note, 144A, 5.375%, 5/02/23 | | | Peru | | | | 195,000 | | | | 197,681 | |
| | Teva Pharmaceutical Finance Co. BV, senior bond, 2.95%, 12/18/22 | | | Israel | | | | 315,000 | | | | 283,045 | |
| | | | | | |
| franklintempleton.com | | Annual Report | | | 35 | |
FRANKLIN ALTERNATIVE STRATEGIES FUNDS
CONSOLIDATED STATEMENT OF INVESTMENTS
Franklin K2 Alternative Strategies Fund (continued)
| | | | | | | | | | | | | | |
| | | | | Country | | | Principal
Amount* | | | Value | |
| | | Corporate Bonds and Notes (continued) | | | | | | | | | |
| | | Pharmaceuticals (continued) | | | | | | | | | |
| | Teva Pharmaceutical Finance Netherlands III BV, senior note, 2.80%, 7/21/23 | | | Israel | | | | 100,000 | | | $ | 85,665 | |
| | | | | | | | | | | | | | |
| | | | | | | | | | | | | 566,391 | |
| | | | | | | | | | | | | | |
| | | Software 0.0%† | | | | | | | | | |
| g | | Veritas US Inc. / Veritas Bermuda Ltd., senior note, 144A, 10.50%, 2/01/24 | | | United States | | | | 200,000 | | | | 171,500 | |
| | | | | | | | | | | | | | |
| | | Specialty Retail 0.0%† | | | | | | | | | |
| i | | Lowe’s Cos. Inc., senior note, FRN, 2.707%, (3-Month USD LIBOR + 0.60%), 9/14/18 | | | United States | | | | 255,000 | | | | 255,433 | |
| | | | | | | | | | | | | | |
| | Total Corporate Bonds and Notes (Cost $142,463,130) | | | | | | | | | | | 156,115,402 | |
| | | | | | | | | | | | | | |
| | | Corporate Bonds and Notes in Reorganization 0.9% | | | | | | | | | |
| | | Electric Utilities 0.3% | | | | | | | | | |
| k | | Bruce Mansfield Unit 1 2007 Pass-Through Trust, secured bond, 6.85%, 6/01/34 | | | United States | | | | 6,414,856 | | | | 3,175,353 | |
| | | | | | | | | | | | | | |
| | | Independent Power & Renewable Electricity Producers 0.4% | | | | | | | | | |
| k | | GenOn Energy Inc., | | | | | | | | | | | | |
| | senior bond, 7.875%, 6/15/17 | | | United States | | | | 395,000 | | | | 364,388 | |
| | c senior note, 9.50%, 10/15/18 | | | United States | | | | 2,113,000 | | | | 1,906,982 | |
| | c senior note, 9.875%, 10/15/20 | | | United States | | | | 2,855,000 | | | | 2,583,775 | |
| | | | | | | | | | | | | | |
| | | | | | | | | | | | | 4,855,145 | |
| | | | | | | | | | | | | | |
| | | Media 0.2% | | | | | | | | | |
| k | | IHeartcommunications Inc., senior secured note, 11.25%, 3/01/21 | | | United States | | | | 2,608,000 | | | | 2,066,840 | |
| | | | | | | | | | | | | | |
| | Total Corporate Bonds and Notes in Reorganization
(Cost $8,539,202) | | | | | | | | | | | 10,097,338 | |
| | | | | | | | | | | | | | |
| i,l | | Senior Floating Rate Interests 1.0% | | | |
| | | Aerospace & Defense 0.0%† | | | | | | | | | |
| | TransDigm Group Inc., Term Loan G, | | | | | | | | | | | | |
| | 4.48%, (3-Month USD LIBOR + 2.50%), 8/22/24 | | | United States | | | | 5,571 | | | | 5,569 | |
| | 4.802%, (3-Month USD LIBOR + 2.50%), 8/22/24 | | | United States | | | | 19,241 | | | | 19,232 | |
| | | | | | | | | | | | | | |
| | | | | | | | | | | | | 24,801 | |
| | | | | | | | | | | | | | |
| | | Auto Components 0.0%† | | | | | | | | | |
| | USS Ultimate Holdings Inc., Term Loan B, 5.73%, (1-Month USD LIBOR + 3.75%), 8/25/24 | | | United States | | | | 14,888 | | | | 15,006 | |
| | | | | | | | | | | | | | |
| | | Building Products 0.0%† | | | | | | | | | |
| | NCI Building Systems Inc., Term Loan, 3.98%, (1-Month USD LIBOR + 2.00%), 2/07/25 | | | United States | | | | 40,000 | | | | 40,100 | |
| | Quickrete Holdings Inc., Term Loan, 4.73%, (1-Month USD LIBOR + 2.75%), 11/15/23 | | | United States | | | | 274,219 | | | | 274,772 | |
| | | | | | | | | | | | | | |
| | | | | | | | | | | | | 314,872 | |
| | | | | | | | | | | | | | |
| | | Capital Markets 0.0%† | | | | | | | | | |
| | BCP Raptor LLC, Term Loan B, 6.306%, (1-Month USD LIBOR + 4.25%), 6/24/24 | | | United States | | | | 129,025 | | | | 126,122 | |
| | Donnelley Financial Solutions Inc., Term Loan, 4.976%, (1-Month USD LIBOR + 3.00%), 9/29/23 | | | United States | | | | 55,857 | | | | 56,067 | |
| | | | | | | | | | | | | | |
| | | | | | | | | | | | | 182,189 | |
| | | | | | | | | | | | | | |
| | | | |
| 36 | | Annual Report | | franklintempleton.com |
FRANKLIN ALTERNATIVE STRATEGIES FUNDS
CONSOLIDATED STATEMENT OF INVESTMENTS
Franklin K2 Alternative Strategies Fund (continued)
| | | | | | | | | | | | | | |
| | | | | Country | | | Principal
Amount* | | | Value | |
| i,l | | Senior Floating Rate Interests (continued) | | | |
| | | Chemicals 0.1% | | | | | | | | | |
| | Axalta Coating Systems Dutch Holding BV, Term Loan B, 4.052%, (3-Month USD LIBOR + 2.00%), 6/01/24 | | | United States | | | | 148,692 | | | $ | 148,971 | |
| | Consolidated Energy Ltd., Initial Term Loan, 4.417%, (3-Month USD LIBOR + 2.50%), 5/07/25 | | | United States | | | | 185,000 | | | | 185,925 | |
| | Plaskolite Inc., Term Loan, first lien, | | | | | | | | | | | | |
| | 5.802%, (3-Month USD LIBOR + 3.50%), 11/03/22 | | | United States | | | | 75,320 | | | | 75,414 | |
| | 5.825%, (3-Month USD LIBOR + 3.50%), 11/03/22 | | | United States | | | | 49,680 | | | | 49,742 | |
| | WR Grace & Co., Term Loan B-1, 4.058%, (3-Month USD LIBOR + 1.75%), 4/03/25 | | | United States | | | | 149,734 | | | | 150,233 | |
| | | | | | | | | | | | | | |
| | | | | | | | | | | | | 610,285 | |
| | | | | | | | | | | | | | |
| | | Commercial Services & Supplies 0.0%† | | | | | | | | | |
| | Camelot Finance LP, Term Loan, 5.23%, (1-Month USD LIBOR + 3.25%), 10/03/23 | | | United States | | | | 129,454 | | | | 129,873 | |
| | Presidio LLC, Term Loan B, | | | | | | | | | | | | |
| | 4.73%, (3-Month USD LIBOR + 2.75%), 2/02/24 | | | United States | | | | 3,117 | | | | 3,129 | |
| | 5.058%, (3-Month USD LIBOR + 2.75%), 2/02/24 | | | United States | | | | 135,397 | | | | 135,933 | |
| | 5.058%, (3-Month USD LIBOR + 2.75%), 2/02/25 | | | United States | | | | 5,195 | | | | 5,215 | |
| | | | | | | | | | | | | | |
| | | | | | | | | | | | | 274,150 | |
| | | | | | | | | | | | | | |
| | | Construction & Engineering 0.0%† | | | | | | | | | |
| | Engility Corp., Term Loan B, 4.73%, (3-Month USD LIBOR + 1.75%), 8/14/23 | | | United States | | | | 84,169 | | | | 83,732 | |
| | | | | | | | | | | | | | |
| | | Containers & Packaging 0.0%† | | | | | | | | | |
| | Crown Holdings Inc., Term Loan B, 4.312%, (3-Month USD LIBOR + 2.00%), 4/03/25 | | | United States | | | | 20,000 | | | | 20,139 | |
| | Plastipak Holdings Inc., Term Loan B, 4.49%, (1-Month USD LIBOR + 2.50%), 10/14/24 | | | United States | | | | 34,825 | | | | 34,961 | |
| | | | | | | | | | | | | | |
| | | | | | | | | | | | | 55,100 | |
| | | | | | | | | | | | | | |
| | | Diversified Consumer Services 0.0%† | | | | | | | | | |
| | Weight Watchers International Inc., Initial Term Loan, | | | | | | | | | | | | |
| | 6.66%, (3-Month USD LIBOR + 4.75%), 11/29/24 | | | United States | | | | 59,556 | | | | 60,256 | |
| | 7.06%, (3-Month USD LIBOR + 4.75%), 11/29/24 | | | United States | | | | 274,956 | | | | 278,186 | |
| | | | | | | | | | | | | | |
| | | | | | | | | | | | | 338,442 | |
| | | | | | | | | | | | | | |
| | | Diversified Financial Services 0.1% | | | | | | | | | |
| | The AES Corp., Term Loan, 4.069%, (3-Month USD LIBOR + 1.75%), 5/31/22 | | | United States | | | | 290,419 | | | | 290,419 | |
| | B.C. Unlimited Liability Co., Term Loan B-3, 4.23%, (1-Month USD LIBOR + 2.25%), 2/16/24 | | | United States | | | | 277,195 | | | | 277,453 | |
| | Cequel/SuddenLink, Term Loan, 4.23%, (1-Month USD LIBOR + 2.25%), 7/28/25 | | | United States | | | | 158,267 | | | | 155,992 | |
| | Klockner Pentaplast, Term Loan B, 6.23%, (1-Month USD LIBOR + 4.25%), 6/30/22 | | | United States | | | | 88,800 | | | | 85,886 | |
| | Ziggo BV, Term Loan E, 4.419%, (1-Month USD LIBOR + 2.50%), 4/15/25 | | | United States | | | | 343,079 | | | | 344,385 | |
| | | | | | | | | | | | | | |
| | | | | | | | | | | | | 1,154,135 | |
| | | | | | | | | | | | | | |
| | | | | | |
| franklintempleton.com | | Annual Report | | | 37 | |
FRANKLIN ALTERNATIVE STRATEGIES FUNDS
CONSOLIDATED STATEMENT OF INVESTMENTS
Franklin K2 Alternative Strategies Fund (continued)
| | | | | | | | | | | | | | |
| | | | | Country | | | Principal
Amount* | | | Value | |
| i,l | | Senior Floating Rate Interests (continued) | | | |
| | | Diversified Telecommunication Services 0.0%† | | | | | | | | | |
| | Consolidated Communications Inc., Term Loan B, 4.99%, (1-Month USD LIBOR + 3.00%), 10/05/23 | | | United States | | | | 94,406 | | | $ | 93,836 | |
| | Sprint Communications Inc., Term Loan B, 4.50%, (1-Month USD LIBOR + 2.50%), 2/02/24 | | | United States | | | | 222,751 | | | | 223,029 | |
| | | | | | | | | | | | | | |
| | | | | | | | | | | | | 316,865 | |
| | | | | | | | | | | | | | |
| | | Electrical Equipment 0.0%† | | | | | | | | | |
| | Graftech International Ltd., Initial Term Loan, 5.423%, (1-Month USD LIBOR + 3.50%), 2/12/25 | | | United States | | | | 131,000 | | | | 131,901 | |
| | | | | | | | | | | | | | |
| | | Electronic Equipment, Instruments & Components 0.0%† | |
| | Dell International LLC, Term Loan A-2, 3.74%, (1-Month USD LIBOR + 1.75%), 9/07/21 | | | United States | | | | 214,500 | | | | 214,607 | |
| | | | | | | | | | | | | | |
| | | Energy Equipment & Services 0.0%† | | | | | | | | | |
| | U.S. Silica Holdings Inc., Term Loan, 5.813%, (1-Week USD LIBOR + 4.00%), 5/01/25 | | | United States | | | | 220,000 | | | | 221,953 | |
| | | | | | | | | | | | | | |
| | | Equity Real Estate Investment Trusts (REITs) 0.0%† | | | | | | | | | |
| | Iron Mountain Inc., Term Loan B, 3.73%, (1-Month USD LIBOR + 1.75%), 1/02/26 | | | United States | | | | 220,000 | | | | 217,250 | |
| | | | | | | | | | | | | | |
| | | Food & Staples Retailing 0.0%† | | | | | | | | | |
| | ARAMARK Intermediate Holdco Corp., Term Loan B-1, 3.98%, (1-Month USD LIBOR + 2.00%), 3/11/25 | | | United States | | | | 159,600 | | | | 160,099 | |
| | Utz Quality Foods LLC, Term Loan B, 5.461%, (1-Month USD LIBOR + 3.50%), 11/21/24 | | | United States | | | | 104,738 | | | | 105,828 | |
| | | | | | | | | | | | | | |
| | | | | | | | | | | | | 265,927 | |
| | | | | | | | | | | | | | |
| | | Food Products 0.1% | | | | | | | | | |
| m | | JBS USA LLC / Finance Inc., Initial Term Loan, 4.678%, (3-Month USD LIBOR + 2.50%), 10/30/22 | | | United States | | | | 219,446 | | | | 219,191 | |
| | Post Holdings Inc., Term Loan B, 3.97%, (1-Month USD LIBOR + 2.00%), 5/24/24 | | | United States | | | | 228,849 | | | | 229,465 | |
| | | | | | | | | | | | | | |
| | | | | | | | | | | | | 448,656 | |
| | | | | | | | | | | | | | |
| | | Health Care Providers & Services 0.0%† | | | | | | | | | |
| | Surgery Partners LLC, Term Loan B, 5.35%, (1-Month USD LIBOR + 3.25%), 9/02/24 | | | United States | | | | 95,965 | | | | 95,965 | |
| | | | | | | | | | | | | | |
| | | Health Care Technology 0.0%† | | | | | | | | | |
| | Quintiles IMS Inc., Term Loan B-2, 4.302%, (3-Month USD LIBOR + 2.00%), 1/17/25 | | | United States | | | | 79,600 | | | | 79,840 | |
| | | | | | | | | | | | | | |
| | | Hotels, Restaurants & Leisure 0.0%† | | | | | | | | | |
| | IRB Holdings Corp., Term Loan B, | | | | | | | | | | | | |
| | 5.173%, (2-Month USD LIBOR + 3.25%), 2/05/25 | | | United States | | | | 37,778 | | | | 38,062 | |
| | 5.248%, (2-Month USD LIBOR + 3.25%), 2/05/25 | | | United States | | | | 47,222 | | | | 47,576 | |
| | | | | | | | | | | | | | |
| | | | | | | | | | | | | 85,638 | |
| | | | | | | | | | | | | | |
| | | Industrial Conglomerates 0.0%† | | | | | | | | | |
| | Duravant LLC, Term Loan B, 5.552%, (3-Month USD LIBOR + 3.25%), 7/19/24 | | | United States | | | | 76,211 | | | | 76,338 | |
| | | | | | | | | | | | | | |
| | | | |
| 38 | | Annual Report | | franklintempleton.com |
FRANKLIN ALTERNATIVE STRATEGIES FUNDS
CONSOLIDATED STATEMENT OF INVESTMENTS
Franklin K2 Alternative Strategies Fund (continued)
| | | | | | | | | | | | | | |
| | | | | Country | | | Principal
Amount* | | | Value | |
| i,l | | Senior Floating Rate Interests (continued) | | | |
| | | Insurance 0.1% | | | | | | | | | |
| | Hub International Ltd., Initial Term Loan, 5.36%, (2-Month USD LIBOR + 3.00%), 4/25/25 | | | United States | | | | 135,000 | | | $ | 135,000 | |
| | Hyperion Insurance Group Ltd., Initial Term Loan, 5.50%, (1-Month USD LIBOR + 3.50%), 12/20/24 | | | United Kingdom | | | | 96,824 | | | | 97,248 | |
| | U.S.I. Inc. / NY, Term Loan, 5.302%, (3-Month USD LIBOR + 3.00%), 5/16/24 | | | United States | | | | 244,473 | | | | 244,472 | |
| | | | | | | | | | | | | | |
| | | | | | | | | | | | | 476,720 | |
| | | | | | | | | | | | | | |
| | | Internet & Direct Marketing Retail 0.0%† | | | | | | | | | |
| | BWay, | | | | | | | | | | | | |
| | Initial Term Loan, 5.272%, (3-Month USD LIBOR + 3.25%), 4/03/24 | | | United States | | | | 600 | | | | 602 | |
| | Term Loan B, 5.588%, (3-Month USD LIBOR + 3.25%), 4/03/24 | | | United States | | | | 237,600 | | | | 238,467 | |
| | | | | | | | | | | | | | |
| | | | | | | | | | | | | 239,069 | |
| | | | | | | | | | | | | | |
| | | Internet Software & Services 0.1% | | | | | | | | | |
| | McAfee LLC, Term Loan B, 6.468%, (1-Month USD LIBOR + 4.50%), 9/30/24 | | | United States | | | | 293,737 | | | | 296,583 | |
| | Rackspace Hosting Inc., Term Loan B, first lien, | | | | | | | | | | | | |
| | 5.363%, (2-Month USD LIBOR + 3.00%), 11/03/23 | | | United States | | | | 238,550 | | | | 237,556 | |
| | 5.033%, (2-Month USD LIBOR + 3.00%), 11/03/24 | | | United States | | | | 602 | | | | 599 | |
| | Uber Technologies Inc., Term Loan, | | | | | | | | | | | | |
| | 5.98%, (1-Month USD LIBOR + 4.00%), 7/13/23 | | | United States | | | | 295,798 | | | | 297,509 | |
| | 5.917%, (1-Month USD LIBOR + 4.00%), 4/04/25 | | | United States | | | | 135,000 | | | | 135,991 | |
| | | | | | | | | | | | | | |
| | | | | | | | | | | | | 968,238 | |
| | | | | | | | | | | | | | |
| | | IT Services 0.1% | | | | | | | | | |
| | First Data Corp., Term Loan B, 3.965%, (1-Month USD LIBOR + 2.00%), 7/08/22 | | | United States | | | | 35,524 | | | | 35,551 | |
| | Micro Focus, Term Loan B, 4.73%, (1-Month USD LIBOR + 2.75%), 6/21/24 | | | United States | | | | 180,618 | | | | 180,311 | |
| | Neustar Inc., Term Loan B-4, first lien, 5.48%, (1-Month USD LIBOR + 3.50%), 8/08/24 | | | United States | | | | 109,450 | | | | 109,781 | |
| | Sedgwick CMS Holdings Inc., Initial Term Loan, first lien, 4.73%, (1-Month USD LIBOR + 2.75%), 3/01/21 | | | United States | | | | 245,000 | | | | 245,076 | |
| | | | | | | | | | | | | | |
| | | | | | | | | | | | | 570,719 | |
| | | | | | | | | | | | | | |
| | | Machinery 0.0%† | | | | | | | | | |
| | North American Lifting Holdings Inc., Initial Term Loan, 6.802%, (3-Month USD LIBOR + 4.50%), 11/27/20 | | | United States | | | | 15,337 | | | | 14,704 | |
| | | | | | | | | | | | | | |
| | | Media 0.1% | | | | | | | | | |
| | Cablevision SA, Term Loan B, 4.169%, (1-Month USD LIBOR + 2.25%), 7/17/25 | | | United States | | | | 243,508 | | | | 242,775 | |
| | CBS Radio Inc., Term Loan B, 4.698%, (1-Month USD LIBOR + 2.75%), 11/18/24 | | | United States | | | | 219,443 | | | | 219,123 | |
| | Lamar Media Corp., Term Loan B, 3.688%, (1-Month USD LIBOR + 1.75%), 3/14/25 | | | United States | | | | 40,000 | | | | 40,342 | |
| | Meredith Corp., Term Loan, 4.98%, (1-Month USD LIBOR + 3.00%), 1/31/25 | | | United States | | | | 85,000 | | | | 85,425 | |
| | RCN Corp., Term Loan B, 4.98%, (1-Month USD LIBOR + 3.00%), 2/01/24 | | | United States | | | | 294,903 | | | | 291,088 | |
| | UPC Financing Partnership, Term Loan, 4.419%, (1-Month USD LIBOR + 2.50%), 1/15/26 | | | United States | | | | 115,789 | | | | 115,599 | |
| | | | | | | | | | | | | | |
| | | | | | | | | | | | | 994,352 | |
| | | | | | | | | | | | | | |
| | | | | | |
| franklintempleton.com | | Annual Report | | | 39 | |
FRANKLIN ALTERNATIVE STRATEGIES FUNDS
CONSOLIDATED STATEMENT OF INVESTMENTS
Franklin K2 Alternative Strategies Fund (continued)
| | | | | | | | | | | | | | |
| | | | | Country | | | Principal
Amount* | | | Value | |
| i,l | | Senior Floating Rate Interests (continued) | | | |
| | | Metals & Mining 0.0%† | | | | | | | | | |
| | Atkore International Inc., Term Loan, first lien, 5.06%, (3-Month USD LIBOR + 2.75%), 12/22/23 | | | United States | | | | 28,928 | | | $ | 29,049 | |
| | | | | | | | | | | | | | |
| | | Oil, Gas & Consumable Fuels 0.0%† | | | | | | | | | |
| | California Resources Corp., Initial Term Loan, 6.698%, (1-Month USD LIBOR + 4.75%), 12/31/22 | | | United States | | | | 123,000 | | | | 124,999 | |
| m | | Gavilan Resources LLC, Initial Term Loan, second lien, 7.934%, (1-Month USD LIBOR + 6.00%), 3/01/24 | | | United States | | | | 85,000 | | | | 83,512 | |
| | | | | | | | | | | | | | |
| | | | | | | | | | | | | 208,511 | |
| | | | | | | | | | | | | | |
| | | Personal Products 0.0%† | | | | | | | | | |
| | Coty Inc., Term Loan B, 4.173%, (1-Month USD LIBOR + 2.25%), 4/07/25 | | | United States | | | | 220,000 | | | | 217,250 | |
| | | | | | | | | | | | | | |
| | | Pharmaceuticals 0.0%† | | | | | | | | | |
| | Amneal Pharmaceuticals LLC, Initial Term Loan, 5.625%, (3-Month USD LIBOR + 3.50%), 5/04/25 | | | United States | | | | 235,000 | | | | 234,853 | |
| | | | | | | | | | | | | | |
| | | Professional Services 0.0%† | | | | | | | | | |
| | On Assignment Inc., Term Loan B-2, 3.98%, (1-Month USD LIBOR + 2.00%), 4/02/25 | | | United States | | | | 43,084 | | | | 43,290 | |
| | | | | | | | | | | | | | |
| | | Semiconductors & Semiconductor Equipment 0.0%† | | | | | | | | | |
| | Cavium Inc., Term Loan B-1, 4.218%, (1-Month USD LIBOR + 2.25%), 8/16/22 | | | United States | | | | 65,106 | | | | 65,269 | |
| | | | | | | | | | | | | | |
| | | Software 0.1% | | | | | | | | | |
| | Change Healthcare Holdings Inc., Term Loan, 4.73%, (1-Month USD LIBOR + 2.75%), 3/01/24 | | | United States | | | | 158,220 | | | | 158,333 | |
| | Misys PLC, Term Loan, 5.807%, (3-Month USD LIBOR + 3.50%), 6/13/24 | | | United States | | | | 148,875 | | | | 146,817 | |
| | SS&C Technologies Inc., Term Loan B-3, 4.48%, (1-Month USD LIBOR + 2.50%), 4/16/25 | | | United States | | | | 73,071 | | | | 73,569 | |
| | | | | | | | | | | | | | |
| | | | | | | | | | | | | 378,719 | |
| | | | | | | | | | | | | | |
| | | Specialty Retail 0.1% | | | | | | | | | |
| | Belron SA, Term Loan, 4.863%, (3-Month USD LIBOR + 2.50%), 11/07/24 | | | Belgium | | | | 49,875 | | | | 50,171 | |
| | Harbor Freight Tools USA Inc., Initial Term Loan, 4.48%, (1-Month USD LIBOR + 2.50%), 8/18/23 | | | United States | | | | 116,498 | | | | 116,782 | |
| | Serta Simmons Holdings LLC, | | | | | | | | | | | | |
| | 5.423%, (3-Month USD LIBOR + 3.50%), 11/08/23 | | | United States | | | | 35,396 | | | | 31,380 | |
| | 5.808%, (3-Month USD LIBOR + 3.50%), 11/08/23 | | | United States | | | | 57,515 | | | | 50,991 | |
| | 10.331%, (3-Month USD LIBOR + 8.00%), 11/08/24 | | | United States | | | | 189,608 | | | | 146,472 | |
| | | | | | | | | | | | | | |
| | | | | | | | | | | | | 395,796 | |
| | | | | | | | | | | | | | |
| | | Textiles, Apparel & Luxury Goods 0.0%† | | | | | | | | | |
| | Hanesbrands Inc., Term Loan B, 3.73%, (1-Month USD LIBOR + 1.75%), 12/16/24 | | | United States | | | | 84,788 | | | | 85,494 | |
| | | | | | | | | | | | | | |
| | | Trading Companies & Distributors 0.0%† | | | | | | | | | |
| | HD Supply Inc., Term Loan B, 4.802%, (3-Month USD LIBOR + 2.50%), 10/17/23 | | | United States | | | | 143,193 | | | | 144,237 | |
| | | | | | | | | | | | | | |
| | | Wireless Telecommunication Services 0.1% | | | | | | | | | |
| | Telenet Financing USD LLC, Term Loan, 4.419%, (1-Month USD LIBOR + 2.50%), 3/01/26 | | | United States | | | | 128,182 | | | | 128,195 | |
| | Unitymedia Hessen GmbH & Co. KG, Term Loan, 4.169%, (1-Month USD LIBOR + 2.25%), 9/30/25 | | | United States | | | | 301,134 | | | | 301,369 | |
| | | | |
| 40 | | Annual Report | | franklintempleton.com |
FRANKLIN ALTERNATIVE STRATEGIES FUNDS
CONSOLIDATED STATEMENT OF INVESTMENTS
Franklin K2 Alternative Strategies Fund (continued)
| | | | | | | | | | | | | | |
| | | | | Country | | | Principal
Amount* | | | Value | |
| i,l | | Senior Floating Rate Interests (continued) | | | |
| | | Wireless Telecommunication Services (continued) | | | | | | | | | |
| | Virgin Media Talk, Term Loan I, 4.419%, (1-Month USD LIBOR + 2.50%), 1/15/26 | | | United States | | | | 210,000 | | | $ | 209,705 | |
| | | | | | | | | | | | | | |
| | | | | | | | | | | | | 639,269 | |
| | | | | | | | | | | | | | |
| | Total Senior Floating Rate Interests (Cost $10,920,496) | | | | | | | | | | | 10,913,191 | |
| | | | | | | | | | | | | | |
| | | Foreign Government and Agency Securities 3.3% | | | |
| | Government of Argentina, | | | | | | | | | | | | |
| | 3.75%, 2/08/19 | | | Argentina | | | | 33,537,000 | ARS | | | 1,411,539 | |
| | 7.82%, 12/31/33 | | | Argentina | | | | 460,995 | EUR | | | 565,584 | |
| | 2.26% to 3/31/19, 4.74% thereafter, 12/31/38 | | | Argentina | | | | 2,313,071 | EUR | | | 1,708,138 | |
| | i senior note, FRN, 33.206%, (ARPP7DRR), 6/21/20 | | | Argentina | | | | 2,275,000 | ARS | | | 96,118 | |
| | h senior note, Reg S, 3.875%, 1/15/22 | | | Argentina | | | | 1,171,000 | EUR | | | 1,340,716 | |
| | senior note, 5.625%, 1/26/22 | | | Argentina | | | | 1,546,000 | | | | 1,484,160 | |
| | senior note, 4.625%, 1/11/23 | | | Argentina | | | | 719,000 | | | | 655,106 | |
| | senior note, 5.875%, 1/11/28 | | | Argentina | | | | 657,000 | | | | 577,510 | |
| h | | Government of Ecuador, senior note, Reg S, | | | | | | | | | | | | |
| | 10.75%, 3/28/22 | | | Ecuador | | | | 316,000 | | | | 330,678 | |
| | 8.75%, 6/02/23 | | | Ecuador | | | | 200,000 | | | | 194,490 | |
| h | | Government of Hellenic Republic, senior bond, Reg S, 3.90%, 1/30/33 | | | Greece | | | | 1,353,993 | EUR | | | 1,432,702 | |
| | Government of Mexico, | | | | | | | | | | | | |
| | 8.50%, 11/18/38 | | | Mexico | | | | 6,377,100 | n MXN | | | 338,393 | |
| | senior note M, 5.75%, 3/05/26 | | | Mexico | | | | 10,000,000 | n MXN | | | 442,464 | |
| h | | Government of Paraguay, senior note, Reg S, 4.625%, 1/25/23 | | | Paraguay | | | | 945,000 | | | | 955,631 | |
| h | | Government of Peru, senior bond, Reg S, | | | | | | | | | | | | |
| | 8.20%, 8/12/26 | | | Peru | | | | 3,251,000 | PEN | | | 1,197,157 | |
| | 6.95%, 8/12/31 | | | Peru | | | | 3,898,000 | PEN | | | 1,312,244 | |
| | Government of Poland, senior bond, 2.50%, 7/25/27 | | | Poland | | | | 10,952,000 | PLN | | | 2,802,200 | |
| | Government of Russia, | | | | | | | | | | | | |
| | 7.75%, 9/16/26 | | | Russia | | | | 26,756,000 | RUB | | | 443,142 | |
| | 8.50%, 9/17/31 | | | Russia | | | | 171,733,000 | RUB | | | 3,015,283 | |
| | h senior bond, Reg S, 5.25%, 6/23/47 | | | Russia | | | | 800,000 | | | | 761,442 | |
| | h senior note, Reg S, 5.00%, 4/29/20 | | | Russia | | | | 400,000 | | | | 409,967 | |
| | h senior note, Reg S, 4.50%, 4/04/22 | | | Russia | | | | 400,000 | | | | 408,210 | |
| | Government of South Africa, | | | | | | | | | | | | |
| | 5.50%, 3/09/20 | | | South Africa | | | | 746,000 | | | | 769,949 | |
| | 8.75%, 1/31/44 | | | South Africa | | | | 24,725,000 | ZAR | | | 1,810,340 | |
| | 8.75%, 2/28/48 | | | South Africa | | | | 70,428,029 | ZAR | | | 5,152,920 | |
| | R186, 10.50%, 12/21/26 | | | South Africa | | | | 19,015,000 | ZAR | | | 1,666,688 | |
| | senior bond, 8.50%, 1/31/37 | | | South Africa | | | | 6,356,000 | ZAR | | | 463,090 | |
| | Government of Turkey, senior bond, 7.00%, 6/05/20 | | | Turkey | | | | 1,413,000 | | | | 1,459,625 | |
| h | | National Highways Authority of India, senior note, Reg S, 7.30%, 5/18/22 | | | India | | | | 50,000,000 | INR | | | 735,730 | |
| | Provincia de Buenos Aires, | | | | | | | | | | | | |
| | i FRN, 32.525%, (ARS Badlar + 3.83%), 5/31/22 | | | Argentina | | | | 18,295,000 | ARS | | | 689,527 | |
| | h Reg S, zero cpn., 4/12/25 | | | Argentina | | | | 3,670,000 | ARS | | | 139,898 | |
| | g senior bond, 144A, 7.875%, 6/15/27 | | | Argentina | | | | 240,000 | | | | 228,434 | |
| | g senior note, 144A, 5.75%, 6/15/19 | | | Argentina | | | | 250,000 | | | | 249,437 | |
| | g senior note, 144A, 6.50%, 2/15/23 | | | Argentina | | | | 185,000 | | | | 178,294 | |
| h | | ZAR Sovereign Capital Fund Property Ltd., senior note, Reg S, 3.903%, 6/24/20 | | | South Africa | | | | 573,000 | | | | 574,037 | |
| | | | | | | | | | | | | | |
| | Total Foreign Government and Agency Securities
(Cost $37,664,504) | | | | | | | | | | | 36,000,843 | |
| | | | | | | | | | | | | | |
| | | | | | |
| franklintempleton.com | | Annual Report | | | 41 | |
FRANKLIN ALTERNATIVE STRATEGIES FUNDS
CONSOLIDATED STATEMENT OF INVESTMENTS
Franklin K2 Alternative Strategies Fund (continued)
| | | | | | | | | | | | | | |
| | | | | Country | | | Principal
Amount* | | | Value | |
| | | Asset-Backed Securities and Commercial
Mortgage-Backed Securities 2.5% | | | | | | | | | |
| | | Airlines 0.1% | | | | | | | | | |
| | Latam Airlines Pass Through Trust, 2015-1, B, secured note,4.50%, 8/15/25 | | | Chile | | | | 619,997 | | | $ | 603,257 | |
| | | | | | | | | | | | | | |
| | | Banks 0.0%† | | | | | | | | | |
| g,o | | Banco Hipotecario SA, senior note, 144A, FRN, | | | | | | | | | | | | |
| | 25.229%, (ARS Badlar + 2.50%), 1/12/20 | | | Argentina | | | | 3,890,000 | ARS | | | 148,170 | |
| | 34.00%, (ARS Badlar + 4.00%), 11/07/22 | | | Argentina | | | | 3,160,000 | ARS | | | 121,066 | |
| | | | | | | | | | | | | | |
| | | | | | | | | | | | | 269,236 | |
| | | | | | | | | | | | | | |
| | | Consumer Finance 0.2% | | | | | | | | | |
| | American Express Credit Account Master Trust,
| | | | | | | | | | | | |
| | 2017-6, A, 2.04%, 5/15/23 | | | United States | | | | 415,000 | | | | 407,496 | |
| | o 2017-8, A, FRN, 2.017%, (1-Month USD LIBOR + 0.12%), 5/16/22 | | | United States | | | | 210,000 | | | | 210,109 | |
| | Bank of America Credit Card Trust, | | | | | | | | | | | | |
| | o 2014-A1, A, FRN, 2.277%, (1-Month USD LIBOR + 0.38%), 6/15/21 | | | United States | | | | 100,000 | | | | 100,188 | |
| | 2018-A1, A1, 2.70%, 7/17/23 | | | United States | | | | 440,000 | | | | 437,465 | |
| o | | Chase Issuance Trust, 2014-A5, A5, FRN, 2.267%, (1-Month USD
LIBOR + 0.37%), 4/15/21 | | | United States | | | | 120,000 | | | | 120,312 | |
| | Citibank Credit Card Issuance Trust, | | | | | | | | | | | | |
| | 2017-A8, A8, 1.86%, 8/08/22 | | | United States | | | | 425,000 | | | | 415,706 | |
| | 2018-A1, A1, 2.49%, 1/20/23 | | | United States | | | | 445,000 | | | | 440,589 | |
| | | | | | | | | | | | | | |
| | | | | | | | | | | | | 2,131,865 | |
| | | | | | | | | | | | | | |
| | | Diversified Financial Services 1.2% | | | | | | | | | |
| g | | AIM Aviation Finance Ltd., 2015-1A, B1, 144A, 5.072%, 2/15/40 | | | Cayman Islands | | | | 267,502 | | | | 265,667 | |
| | Ally Auto Receivables Trust, 2016-3, A3, 1.44%, 8/17/20 | | | United States | | | | 109,559 | | | | 109,066 | |
| g | | Ascentium Equipment Receivables Trust, 2017-2A, C, 144A,
2.87%, 8/10/22 | | | United States | | | | 25,000 | | | | 24,604 | |
| g | | Bayview Opportunity Master Fund IIB Trust, 2018-RN5, A1, 144A,
3.82%, 4/28/33 | | | United States | | | | 113,666 | | | | 113,666 | |
| g | | Bayview Opportunity Master Fund IIIA Trust, 144A, | | | | | | | | | | | | |
| | 2017-RN7, A1, 3.105%, 9/28/32 | | | United States | | | | 41,547 | | | | 41,483 | |
| | 2017-RN8, A1, 3.352%, 11/28/32 | | | United States | | | | 122,018 | | | | 121,865 | |
| g | | Bayview Opportunity Master Fund IV Trust, 2018-RN2, A1, 144A,
3.598%, 2/25/33 | | | United States | | | | 114,687 | | | | 114,687 | |
| g | | Bayview Opportunity Master Fund IVB Trust, 2017-NPL2, A1, 144A,
2.981%, 10/28/32 | | | United States | | | | 79,552 | | | | 79,347 | |
| g | | Blackbird Capital Aircraft Lease Securitization Ltd., 2016-1A, A, 144A, 4.213%, 12/16/41 | | | United States | | | | 233,750 | | | | 237,220 | |
| | Carmax Auto Owner Trust, | | | | | | | | | | | | |
| | o 2017-4, A2B, FRN, 2.027%, (1-Month USD LIBOR + 0.13%), 4/15/21 | | | United States | | | | 250,000 | | | | 249,907 | |
| | 2018-2, D, 3.99%, 4/15/25 | | | United States | | | | 100,000 | | | | 100,313 | |
| g | | Chesapeake Funding II LLC, 144A, | | | | | | | | | | | | |
| | o 2017-4A, A2, FRN, 2.237%, (1-Month USD LIBOR + 0.34%), 11/15/29 | | | United States | | | | 185,000 | | | | 185,065 | |
| | 2018-1A, D, 3.92%, 4/15/30 | | | United States | | | | 115,000 | | | | 114,975 | |
| g | | Cig Auto Receivables Trust, 2017-1A, A, 144A, 2.71%, 5/15/23 | | | United States | | | | 32,290 | | | | 32,102 | |
| g | | CLI Funding V LLC, 2014-2A, A, 144A, 3.38%, 10/18/29 | | | United States | | | | 62,502 | | | | 61,898 | |
| g | | Club Credit Trust, 2017-P1, A, 144A, 2.42%, 9/15/23 | | | United States | | | | 54,743 | | | | 54,614 | |
| g | | Coinstar Funding LLC, 2017-1A, A2, 144A, 5.216%, 4/25/47 | | | United States | | | | 242,550 | | | | 248,385 | |
| | | | |
| 42 | | Annual Report | | franklintempleton.com |
FRANKLIN ALTERNATIVE STRATEGIES FUNDS
CONSOLIDATED STATEMENT OF INVESTMENTS
Franklin K2 Alternative Strategies Fund (continued)
| | | | | | | | | | | | | | |
| | | | | Country | | | Principal
Amount* | | | Value | |
| | | Asset-Backed Securities and Commercial
Mortgage-Backed Securities (continued) | | | | | | | | | |
| | | Diversified Financial Services (continued) | | | | | | | | | |
| g,o | | Colony Starwood Homes Trust, 2016-2A, E, 144A, FRN, 5.127%, (1-Month USD LIBOR + 3.35%), 12/17/33 | | | United States | | | | 100,000 | | | $ | 101,826 | |
| g | | CPS Auto Receivables Trust, 144A, | | | | | | | | | | | | |
| | 2014-B, D, 4.62%, 5/15/20 | | | United States | | | | 110,000 | | | | 110,906 | |
| | 2016-B, E, 8.14%, 5/15/23 | | | United States | | | | 500,000 | | | | 537,023 | |
| g | | CSMC Trust, 2018-RPL2, A1, 144A, 4.03%, 8/25/62 | | | United States | | | | 237,114 | | | | 237,946 | |
| | Drive Auto Receivables Trust, 2018-1, D, 3.81%, 5/15/24 | | | United States | | | | 220,000 | | | | 220,055 | |
| g | | Driven Brands Funding LLC, 2018-1A, A2, 144A, 4.739%, 4/20/48 | | | United States | | | | 60,000 | | | | 60,989 | |
| g | | DT Auto Owner Trust, 144A, | | | | | | | | | | | | |
| | 2014-3A, D, 4.47%, 11/15/21 | | | United States | | | | 37,419 | | | | 37,636 | |
| | 2016-1A, D, 4.66%, 12/15/22 | | | United States | | | | 180,000 | | | | 182,585 | |
| | 2016-2A, D, 5.43%, 11/15/22 | | | United States | | | | 240,000 | | | | 245,544 | |
| o | | Fifth Third Auto Trust, 2017-1, A2B, FRN, 2.047%, (1-Month USD LIBOR + 0.15%), 4/15/20 | | | United States | | | | 98,821 | | | | 98,854 | |
| g | | First Investors Auto Owner Trust, 2016-1A, D, 144A, 4.70%, 4/18/22 | | | United States | | | | 110,000 | | | | 112,581 | |
| g | | Five Guys Funding LLC, 2017-1A, A2, 144A, 4.60%, 7/25/47 | | | United States | | | | 74,625 | | | | 75,485 | |
| | Ford Credit Auto Owner Trust, | | | | | | | | | | | | |
| | g 2014-2, A, 144A, 2.31%, 4/15/26 | | | United States | | | | 100,000 | | | | 99,431 | |
| | 2015-A, A3, 1.28%, 9/15/19 | | | United States | | | | 3,222 | | | | 3,220 | |
| | o 2017-C, A2B, FRN, 2.039%, (1-Month USD LIBOR + 0.12%), 9/15/20 | | | United States | | | | 399,056 | | | | 399,668 | |
| g | | GCAT LLC, 144A, | | | | | | | | | | | | |
| | 2017-2, A1, 3.50%, 4/25/47 | | | United States | | | | 95,233 | | | | 94,752 | |
| | 2017-3, A1, 3.352%, 4/25/47 | | | United States | | | | 33,247 | | | | 33,151 | |
| | 2017-5, A1, 3.228%, 7/25/47 | | | United States | | | | 27,189 | | | | 27,103 | |
| | p 2018-1, A1, 3.844%, 6/25/48 | | | United States | | | | 100,000 | | | | 100,000 | |
| o | | GM Financial Consumer Automobile Receivables Trust, 2018-1, A2B, FRN, 1.987%, (1-Month USD LIBOR + 0.09%), 1/19/21 | | | United States | | | | 605,000 | | | | 604,560 | |
| g | | Hertz Vehicle Financing II LP, 2017-2A, A, 144A, 3.29%, 10/25/23 | | | United States | | | | 100,000 | | | | 98,617 | |
| g,o | | Home Partners of America Trust, 144A, FRN, | | | | | | | | | | | | |
| | 2016-2, E, 5.588%, (1-Month USD LIBOR + 3.78%), 10/17/33 | | | United States | | | | 100,000 | | | | 101,252 | |
| | 2016-2, F, 6.596%, (1-Month USD LIBOR + 4.70%), 10/17/33 | | | United States | | | | 100,000 | | | | 102,100 | |
| | Honda Auto Receivables Owner Trust, | | | | | | | | | | | | |
| | 2015-3, A3, 1.27%, 4/18/19 | | | United States | | | | 5,529 | | | | 5,526 | |
| | 2017-3, A3, 1.79%, 9/20/21 | | | United States | | | | 115,000 | | | | 113,254 | |
| | 2018-1, A3, 2.64%, 2/15/22 | | | United States | | | | 395,000 | | | | 393,706 | |
| g,o | | Invitation Homes Trust, 144A, FRN, | | | | | | | | | | | | |
| | 2015-SFR3, E, 5.668%, (1-Month USD LIBOR + 3.75%), 8/17/32 | | | United States | | | | 110,000 | | | | 110,770 | |
| | 2018-SFR2, E, 3.896%, (1-Month USD LIBOR + 2.00%), 6/17/37 | | | United States | | | | 200,000 | | | | 201,630 | |
| g | | Merlin Aviation Holdings DAC, 2016-1, A, 144A, 4.50%, 12/15/32 | | | United States | | | | 173,750 | | | | 176,841 | |
| g,o | | NextGear Floorplan Master Owner Trust, 144A, FRN, | | | | | | | | | | | | |
| | 2017-1A, A1, 2.747%, (1-Month USD LIBOR + 0.85%), 4/18/22 | | | United States | | | | 240,000 | | | | 241,446 | |
| | 2018-1A, A1, 2.559%, (1-Month USD LIBOR + 0.64%), 2/15/23 | | | United States | | | | 200,000 | | | | 200,453 | |
| o | | Nissan Auto Lease Trust, 2017-B, A2B, FRN, 2.107%, (1-Month USD LIBOR + 0.21%), 12/16/19 | | | United States | | | | 291,834 | | | | 291,996 | |
| | Nissan Auto Receivables Owner Trust, | | | | | | | | | | | | |
| | 2016-C, A3, 1.18%, 1/15/21 | | | United States | | | | 85,000 | | | | 84,069 | |
| | o 2017-C, A2B, FRN, 1.967%, (1-Month USD LIBOR + 0.07%), 10/15/20 | | | United States | | | | 390,000 | | | | 390,031 | |
| | 2018-A, A3, 2.65%, 5/16/22 | | | United States | | | | 250,000 | | | | 249,327 | |
| g | | OneMain Financial Issuance Trust, 144A, | | | | | | | | | | | | |
| | 2015-1A, A, 3.19%, 3/18/26 | | | United States | | | | 96,743 | | | | 97,082 | |
| | 2015-2A, D, 5.64%, 7/18/25 | | | United States | | | | 285,000 | | | | 288,775 | |
| | | | | | |
| franklintempleton.com | | Annual Report | | | 43 | |
FRANKLIN ALTERNATIVE STRATEGIES FUNDS
CONSOLIDATED STATEMENT OF INVESTMENTS
Franklin K2 Alternative Strategies Fund (continued)
| | | | | | | | | | | | | | |
| | | | | Country | | | Principal
Amount* | | | Value | |
| | | Asset-Backed Securities and Commercial
Mortgage-Backed Securities (continued) | | | | | | | | | |
| | | Diversified Financial Services (continued) | | | | | | | | | |
| g | | OneMain Financial Issuance Trust, 144A, (continued) | | | | | | | | | | | | |
| | 2015-3A, B, 4.16%, 11/20/28 | | | United States | | | | 155,000 | | | $ | 157,245 | |
| | 2016-2A, B, 5.94%, 3/20/28 | | | United States | | | | 335,000 | | | | 338,716 | |
| | Santander Drive Auto Receivables Trust, 2018-2, D, 3.88%, 2/15/24 | | | United States | | | | 275,000 | | | | 274,704 | |
| g,o | | Santander Retail Auto Lease Trust, 2017-A, A2B, 144A, FRN, 2.167%, (1-Month USD LIBOR + 0.27%), 3/20/20 | | | United States | | | | 470,000 | | | | 470,072 | |
| g | | SCF Equipment Leasing 2018-1 LLC, 2018-1A, C, 144A, 4.21%, 4/20/27 | | | United States | | | | 255,000 | | | | 258,441 | |
| g | | Shenton Aircraft Investment I Ltd., 2015-1A, A, 144A, 4.75%, 10/15/42 | | | United States | | | | 259,949 | | | | 265,373 | |
| g | | Sierra Timeshare Receivables Funding LLC, 2013-3A, A, 144A, 2.20%, 10/20/30 | | | United States | | | | 22,065 | | | | 22,022 | |
| o | | SLM Private Credit Student Loan Trust, FRN, | | | | | | | | | | | | |
| | 2003-A, A3, 4.299%, (28-Day T-Bill), 6/15/32 | | | United States | | | | 65,000 | | | | 65,019 | |
| | 2003-B, A3, 4.28%, (28-Day T-Bill), 3/15/33 | | | United States | | | | 300,000 | | | | 299,894 | |
| g,o | | SMB Private Education Loan Trust, 2017-B, A2B, 144A, FRN, 2.647%, (1-Month USD LIBOR + 0.75%), 10/15/35 | | | United States | | | | 100,000 | | | | 100,405 | |
| g | | Sofi Consumer Loan Program Trust, 2018-2, A2, 144A, 3.35%, 4/26/27 | | | United States | | | | 155,000 | | | | 155,740 | |
| g | | Sofi Professional Loan Program LLC, 2016-A, B, 144A, 3.57%, 1/26/38 | | | United States | | | | 127,607 | | | | 125,218 | |
| g | | Sprite Ltd., 2017-1, B, 144A, 5.75%, 12/15/37 | | | Cayman Islands | | | | 243,368 | | | | 243,032 | |
| g | | Stanwich Mortgage Loan Trust, 2018-NPB1, A1, 144A, 4.016%, 5/16/23 | | | United States | | | | 250,000 | | | | 250,000 | |
| g | | TAL Advantage V LLC, 2013-2A, A, 144A, 3.55%, 11/20/38 | | | United States | | | | 55,000 | | | | 54,730 | |
| g | | Thunderbolt Aircraft Lease Ltd., 2017-A, B, 144A, 5.75%, 5/17/32 | | | United States | | | | 232,143 | | | | 237,845 | |
| | Toyota Auto Receivables Owner Trust, | | | | | | | | | | | | |
| | 2016-C, A3, 1.14%, 8/17/20 | | | United States | | | | 57,705 | | | | 57,228 | |
| | o 2017-D, A2B, FRN, 1.947%, (1-Month USD LIBOR + 0.05%), 8/17/20 | | | United States | | | | 430,000 | | | | 429,998 | |
| g,o | | Verizon Owner Trust, 144A, FRN, | | | | | | | | | | | | |
| | 2017-3A, A1B, 2.218%, (1-Month USD LIBOR + 0.27%), 4/20/22 | | | United States | | | | 165,000 | | | | 165,305 | |
| | 2018-1A, A1B, 2.01%, (1-Month USD LIBOR + 0.26%), 9/20/22 | | | United States | | | | 175,000 | | | | 174,970 | |
| g | | Veros Automobile Receivables Trust, 2017-1, A, 144A, 2.84%, 4/17/23 | | | United States | | | | 63,220 | | | | 62,978 | |
| g | | VOLT LIV LLC, 144A, | | | | | | | | | | | | |
| | 2017-NPL1, A1, 3.50%, 2/25/47 | | | United States | | | | 21,791 | | | | 21,829 | |
| | 2017-NPL1, A2, 5.875%, 2/25/47 | | | United States | | | | 100,000 | | | | 100,065 | |
| g | | VOLT LV LLC, 2017-NPL2, A1, 144A, 3.50%, 3/25/47 | | | United States | | | | 67,575 | | | | 67,575 | |
| g | | VOLT LVI LLC, 2017-NPL3, A2, 144A, 5.875%, 3/25/47 | | | United States | | | | 220,000 | | | | 220,433 | |
| g | | VOLT LXI LLC, 2017-NPL8, A1, 144A, 3.125%, 6/25/47 | | | United States | | | | 53,361 | | | | 53,144 | |
| g | | VOLT LXIII LLC, 2017-NP10, A1, 144A, 3.00%, 10/25/47 | | | United States | | | | 80,679 | | | | 80,233 | |
| g | | VOLT XL LLC, 2015-NP14, A2, 144A, 4.875%, 11/27/45 | | | United States | | | | 140,000 | | | | 140,367 | |
| g | | Westlake Automobile Receivables Trust, 144A, | | | | | | | | | | | | |
| | 2018-1A, D, 3.41%, 5/15/23 | | | United States | | | | 60,000 | | | | 59,763 | |
| | 2018-2A, D, 4.00%, 1/16/24 | | | United States | | | | 50,000 | | | | 50,275 | |
| | | | | | | | | | | | | | |
| | | | | | | | | | | | | 13,687,673 | |
| | | | | | | | | | | | | | |
| | | Equity Real Estate Investment Trusts (REITs) 0.2% | | | | | | | | | |
| g | | American Homes 4 Rent, 144A, | | | | | | | | | | | | |
| | 2014-SFR2, E, 6.231%, 10/17/36 | | | United States | | | | 250,000 | | | | 277,350 | |
| | 2014-SFR3, E, 6.418%, 12/17/36 | | | United States | | | | 100,000 | | | | 112,119 | |
| | 2015-SFR1, E, 5.639%, 4/17/52 | | | United States | | | | 210,000 | | | | 225,202 | |
| g | | Colony American Finance Ltd., 2015-1, D, 144A, 5.649%, 10/15/47 | | | United States | | | | 115,000 | | | | 117,937 | |
| g,o | | Colony American Homes, 144A, FRN | | | | | | | | | | | | |
| | 2015-1A, D, 4.048%, (1-Month USD LIBOR + 2.15%), 7/17/32 | | | United States | | | | 245,000 | | | | 245,246 | |
| | | | |
| 44 | | Annual Report | | franklintempleton.com |
FRANKLIN ALTERNATIVE STRATEGIES FUNDS
CONSOLIDATED STATEMENT OF INVESTMENTS
Franklin K2 Alternative Strategies Fund (continued)
| | | | | | | | | | | | | | |
| | | | | Country | | | Principal
Amount* | | | Value | |
| | | Asset-Backed Securities and Commercial
Mortgage-Backed Securities (continued) | | | | | | | | | |
| | | Equity Real Estate Investment Trusts (REITs) (continued) | | | | | | | | | |
| g,o | | Colony American Homes, 144A, FRN (continued) | | | | | | | | | | | | |
| | 2015-1A, E, 4.897%, (1-Month USD LIBOR + 3.00%), 7/17/32 | | | United States | | | | 100,000 | | | $ | 100,379 | |
| | 2015-1A, F, 5.547%, (1-Month USD LIBOR + 3.65%), 7/17/32 | | | United States | | | | 200,000 | | | | 200,886 | |
| g | | Diamond Resorts Owner Trust, 2017-1A, C, 144A, 6.07%, 10/22/29 | | | United States | | | | 72,313 | | | | 70,863 | |
| g | | Oak Hill Advisors Residential Loan Trust, 144A, | | | | | | | | | | | | |
| | 2017-NPL2, A1, 3.00%, 7/25/57 | | | United States | | | | 154,415 | | | | 153,365 | |
| | 2017-NPL2, A2, 4.875%, 7/25/57 | | | United States | | | | 115,000 | | | | 114,576 | |
| | | | | | | | | | | | | | |
| | | | | | | | | | | | | 1,617,923 | |
| | | | | | | | | | | | | | |
| | | Mortgage Real Estate Investment Trusts (REITs) 0.8% | | | | | | | | | |
| g | | Ajax Mortgage Loan Trust, 144A, | | | | | | | | | | | | |
| | 2016-B, A, 4.00%, 9/25/65 | | | United States | | | | 140,353 | | | | 141,160 | |
| | 2016-C, A, 4.00%, 10/25/57 | | | United States | | | | 122,011 | | | | 122,671 | |
| | q 2017-B, A, FRN, 3.163%, 9/25/56 | | | United States | | | | 132,335 | | | | 130,506 | |
| o | | American Home Mortgage Investment Trust, 2006-1, 11A1, FRN, 2.24%, (1-Month USD LIBOR + 0.28%), 3/25/46 | | | United States | | | | 285,901 | | | | 278,653 | |
| q | | ARM Trust, 2005-1, 3A1, FRN, 3.426%, 5/25/35 | | | United States | | | | 91,542 | | | | 92,847 | |
| | Banc of America Alternative Loan Trust, 2003-8, 1CB1, 5.50%, 10/25/33 | | | United States | | | | 8,077 | | | | 8,261 | |
| | Banc of America Funding Trust, | | | | | | | | | | | | |
| | 2005-5, 1A1, 5.50%, 9/25/35 | | | United States | | | | 12,876 | | | | 13,553 | |
| | 2007-4, 5A1, 5.50%, 11/25/34 | | | United States | | | | 128,236 | | | | 129,146 | |
| q | | Banc of America Mortgage Trust, FRN, | | | | | | | | | | | | |
| | 2005-A, 2A1, 3.711%, 2/25/35 | | | United States | | | | 8,090 | | | | 8,075 | |
| | 2005-I, 4A1, 3.369%, 10/25/35 | | | United States | | | | 102,730 | | | | 100,978 | |
| | BCAP LLC Trust, 2007-AA2, 22A1, 6.00%, 3/25/22 | | | United States | | | | 132,091 | | | | 131,747 | |
| g,q | | CAM Mortgage Trust, 2016-1, M, 144A, FRN, 5.00%, 1/15/56 | | | United States | | | | 65,791 | | | | 65,802 | |
| g,q | | CCRESG Commercial Mortgage Trust, 2016-HEAT, D, 144A, FRN, 5.488%, 4/10/29 | | | United States | | | | 100,000 | | | | 102,552 | |
| q | | Citigroup Mortgage Loan Trust, FRN, | | | | | | | | | | | | |
| | 2005-3, 2A3, 3.561%, 8/25/35 | | | United States | | | | 71,595 | | | | 71,755 | |
| | g 2009-10, 6A2, 144A, 3.75%, 9/25/34 | | | United States | | | | 43,516 | | | | 42,324 | |
| g,o | | Communication Mortgage Trust, 2016-SAVA, C, 144A, FRN, 4.897%, (1-Month USD LIBOR + 3.00%), 10/15/34 | | | United States | | | | 155,000 | | | | 155,386 | |
| | Countrywide Alternative Loan Trust, | | | | | | | | | | | | |
| | 2003-22CB, 1A1, 5.75%, 12/25/33 | | | United States | | | | 58,187 | | | | 59,894 | |
| | 2004-16CB, 1A1, 5.50%, 7/25/34 | | | United States | | | | 36,917 | | | | 38,039 | |
| | 2004-16CB, 3A1, 5.50%, 8/25/34 | | | United States | | | | 39,273 | | | | 40,397 | |
| | 2004-28CB, 5A1, 5.75%, 1/25/35 | | | United States | | | | 7,053 | | | | 7,074 | |
| | 2004-J10, 2CB1, 6.00%, 9/25/34 | | | United States | | | | 94,923 | | | | 98,730 | |
| | 2004-J3, 1A1, 5.50%, 4/25/34 | | | United States | | | | 36,576 | | | | 37,205 | |
| | 2005-J1, 2A1, 5.50%, 2/25/25 | | | United States | | | | 6,345 | | | | 6,458 | |
| q | | Countrywide Home Loans Mortgage Pass-Through Trust, FRN, | | | | | | | | | | | | |
| | 2004-12, 8A1, 3.747%, 8/25/34 | | | United States | | | | 9,912 | | | | 9,798 | |
| | 2004-HYB4, 2A1, 3.561%, 9/20/34 | | | United States | | | | 82,934 | | | | 81,127 | |
| | Credit Suisse First Boston Mortgage Securities Corp., | | | | | | | | | | | | |
| | 2003-27, 4A4, 5.75%, 11/25/33 | | | United States | | | | 22,416 | | | | 23,193 | |
| | q 2003-AR26, 7A1, FRN, 3.606%, 11/25/33 | | | United States | | | | 6,977 | | | | 7,050 | |
| | q 2003-AR28, 4A1, FRN, 3.665%, 12/25/33 | | | United States | | | | 4,607 | | | | 4,693 | |
| g | | CSMC OA LLC, 2014-USA, E, 144A, 4.373%, 9/15/37 | | | United States | | | | 300,000 | | | | 269,247 | |
| | | | | | |
| franklintempleton.com | | Annual Report | | | 45 | |
FRANKLIN ALTERNATIVE STRATEGIES FUNDS
CONSOLIDATED STATEMENT OF INVESTMENTS
Franklin K2 Alternative Strategies Fund (continued)
| | | | | | | | | | | | | | |
| | | | | Country | | | Principal
Amount* | | | Value | |
| | | Asset-Backed Securities and Commercial
Mortgage-Backed Securities (continued) | | | | | | | | | |
| | | Mortgage Real Estate Investment Trusts (REITs) (continued) | | | | | | | | | |
| o | | Deutsche Mortgage Securities Inc. Mortgage Loan Trust, 2004-4, 7AR1, FRN, 2.31%, (1-Month USD LIBOR + 0.35%), 6/25/34 | | | United States | | | | 68,802 | | | $ | 67,122 | |
| o | | DSLA Mortgage Loan Trust, 2005-AR5, 2A1A, FRN, 2.278%, (1-Month USD LIBOR + 0.33%), 9/19/45 | | | United States | | | | 52,137 | | | | 42,731 | |
| h,o | | Dukinfield 2 PLC, 2016-2, A, FRN, Reg S, 1.874%, (3-Month GBP LIBOR + 1.25%), 12/20/52 | | | United Kingdom | | | | 198,946 | GBP | | | 267,869 | |
| h,o | | Eurosail-UK PLC, 2007-2X, A3C, FRN, Reg S, 0.754%, (3-Month GBP LIBOR + 0.15%), 3/13/45 | | | United Kingdom | | | | 57,130 | GBP | | | 74,926 | |
| o | | FHLMC Structured Agency Credit Risk Debt Notes, FRN, | | | | | | | | | | | | |
| | 2015-DNA1, M2, 3.81%, (1-Month USD LIBOR + 1.85%), 10/25/27 | | | United States | | | | 250,000 | | | | 255,036 | |
| | 2015-DNA1, M3, 5.26%, (1-Month USD LIBOR + 3.30%), 10/25/27 | | | United States | | | | 250,000 | | | | 278,232 | |
| q | | GMACM Mortgage Loan Trust, FRN, | | | | | | | | | | | | |
| | 2005-AR1, 3A, 3.992%, 3/18/35 | | | United States | | | | 101,006 | | | | 102,025 | |
| | 2005-AR4, 3A1, 3.92%, 7/19/35 | | | United States | | | | 126,729 | | | | 121,495 | |
| g,o | | GP Portfolio Trust, 2014-GPP, A, 144A, FRN, 3.097%, (1-Month USD LIBOR + 1.20%), 2/15/27 | | | United States | | | | 16,348 | | | | 16,353 | |
| q | | GS Mortgage Securities Trust, 2007-GG10, AM, FRN, 5.832%, 8/10/45 | | | United States | | | | 67,900 | | | | 69,300 | |
| | GSR Mortgage Loan Trust, | | | | | | | | | | | | |
| | 2005-4F, 6A1, 6.50%, 2/25/35 | | | United States | | | | 10,952 | | | | 10,987 | |
| | q 2005-AR6, 4A5, FRN, 3.517%, 9/25/35 | | | United States | | | | 96,486 | | | | 97,738 | |
| o | | Harborview Mortgage Loan Trust, FRN, | | | | | | | | | | | | |
| | 2003-2, 1A, 2.688%, (1-Month USD LIBOR + 0.74%), 10/19/33 | | | United States | | | | 75,658 | | | | 73,963 | |
| | 2004-2, 1A1, 2.416%, (1-Month USD LIBOR + 0.52%), 6/19/34 | | | United States | | | | 115,643 | | | | 114,078 | |
| | 2004-11, 2A2A, 2.588%, (1-Month USD LIBOR + 0.64%), 1/19/35 | | | United States | | | | 123,167 | | | | 117,774 | |
| | IndyMac Index Mortgage Loan Trust, FRN, | | | | | | | | | | | | |
| | q 2004-AR6, 4A, 3.89%, 10/25/34 | | | United States | | | | 218,167 | | | | 223,765 | |
| | o 2004-AR7, A5, 3.18%, (1-Month USD LIBOR + 1.22%), 9/25/34 | | | United States | | | | 63,166 | | | | 57,871 | |
| | o 2004-AR12, A1, 2.74%, (1-Month USD LIBOR + 0.78%), 12/25/34 | | | United States | | | | 196,504 | | | | 180,445 | |
| | q 2005-AR11, A3, 3.477%, 8/25/35 | | | United States | | | | 69,513 | | | | 63,423 | |
| | o 2006-AR2, 2A1, 2.17%, (1-Month USD LIBOR + 0.21%), 2/25/46 | | | United States | | | | 291,037 | | | | 246,958 | |
| | JP Morgan Chase Commercial Mortgage Securities Trust, FRN, | | | | | | | | | | | | |
| | q 2007-LDPX, AM, 5.464%, 1/15/49 | | | United States | | | | 15,744 | | | | 15,804 | |
| | g,o 2015-SGP, D, 144A, 6.419%, (1-Month USD LIBOR + 4.50%), 7/15/36 | | | United States | | | | 180,000 | | | | 181,859 | |
| | JP Morgan Mortgage Trust, | | | | | | | | | | | | |
| | q 2003-A2, 3A1, FRN, 3.689%, 11/25/33 | | | United States | | | | 9,750 | | | | 9,882 | |
| | 2004-S1, 2A1, 6.00%, 9/25/34 | | | United States | | | | 127,664 | | | | 129,198 | |
| | q 2005-A1, 6T1, FRN, 3.844%, 2/25/35 | | | United States | | | | 17,043 | | | | 17,000 | |
| | q 2005-A3, 4A1, FRN, 3.704%, 6/25/35 | | | United States | | | | 5,858 | | | | 5,944 | |
| | q 2006-A1, 1A2, FRN, 3.644%, 2/25/36 | | | United States | | | | 64,809 | | | | 59,733 | |
| | q 2007-A1, 4A2, FRN, 3.739%, 7/25/35 | | | United States | | | | 5,842 | | | | 6,039 | |
| o | | Lehman XS Trust Series, 2006-2N, 1A1, FRN, 2.22%, (1-Month USD LIBOR + 0.26%), 2/25/46 | | | United States | | | | 58,156 | | | | 51,658 | |
| h,o | | Ludgate Funding PLC, FRN, Reg S, | | | | | | | | | | | | |
| | 2007-1, A2B, 0.681%, (3-Month EURIBOR + 0.16%), 1/01/61 | | | United Kingdom | | | | 34,047 | EUR | | | 38,489 | |
| | 2008-W1X, A1, 1.323%, (3-Month GBP LIBOR + 0.60%), 1/01/61 | | | United Kingdom | | | | 155,197 | GBP | | | 204,454 | |
| q | | MASTR Adjustable Rate Mortgages Trust, 2004-7, 3A1, FRN, 3.389%, 7/25/34 | | | United States | | | | 37,854 | | | | 37,271 | |
| | MASTR Alternative Loan Trust, | | | | | | | | | | | | |
| | 2004-2, 8A4, 5.50%, 3/25/34 | | | United States | | | | 202,210 | | | | 207,728 | |
| | 2004-8, 2A1, 6.00%, 9/25/34 | | | United States | | | | 73,031 | | | | 78,054 | |
| | | | |
| 46 | | Annual Report | | franklintempleton.com |
FRANKLIN ALTERNATIVE STRATEGIES FUNDS
CONSOLIDATED STATEMENT OF INVESTMENTS
Franklin K2 Alternative Strategies Fund (continued)
| | | | | | | | | | | | | | |
| | | | | Country | | | Principal
Amount* | | | Value | |
| | | Asset-Backed Securities and Commercial
Mortgage-Backed Securities (continued) | | | | | | | | | |
| | | Mortgage Real Estate Investment Trusts (REITs) (continued) | | | | | | | | | |
| q | | Merrill Lynch Mortgage Investors MLCC, 2006-2, 2A, FRN, 3.631%, 5/25/36 | | | United States | | | | 8,516 | | | $ | 8,631 | |
| g,q | | Morgan Stanley Capital I Trust, 2011-C2, E, 144A, FRN, 5.483%, 6/15/44 | | | United States | | | | 150,000 | | | | 141,942 | |
| h,o | | Newgate Funding PLC, 2007-3X, A2B, FRN, Reg S, 0.273%, (3-Month EURIBOR + 0.60%), 12/15/50 | | | United Kingdom | | | | 71,888 | EUR | | | 83,491 | |
| g | | PRPM LLC, 144A, | | | | | | | | | | | | |
| | 2017-2A, A1, 3.47%, 9/25/22 | | | United States | | | | 262,341 | | | | 261,677 | |
| | 2017-2A, A2, 5.00%, 9/25/22 | | | United States | | | | 100,000 | | | | 99,627 | |
| | q 2017-3A, A1, FRN, 3.47%, 11/25/22 | | | United States | | | | 107,134 | | | | 107,072 | |
| o | | Rali Trust, 2006-QO4, 2A1, FRN, 2.15%, (1-Month USD LIBOR + 0.19%), 4/25/46 | | | United States | | | | 83,185 | | | | 79,364 | |
| g | | RCO Mortgage LLC, 2017-1, A1, 144A, 3.375%, 8/25/22 | | | United States | | | | 165,699 | | | | 165,315 | |
| | Residential Asset Securitization Trust, 2003-A9, A2, 4.00%, 8/25/33 | | | United States | | | | 117,535 | | | | 117,931 | |
| q | | RFMSI Trust, FRN, | | | | | | | | | | | | |
| | 2005-SA1, 1A1, 4.588%, 3/25/35 | | | United States | | | | 124,195 | | | | 96,028 | |
| | 2006-SA2, 3A1, 4.761%, 8/25/36 | | | United States | | | | 152,186 | | | | 142,790 | |
| h,o | | RMAC Securities PLC, 2006-NS1X, A2C, FRN, Reg S, 0.236%, (3-Month EURIBOR + 0.15%), 6/12/44 | | | United Kingdom | | | | 47,219 | EUR | | | 54,054 | |
| g,o | | SCG Trust, 144A, FRN, | | | | | | | | | | | | |
| | 2013-SRP1, A, 3.547%, (1-Month USD LIBOR + 1.65%), 11/15/26 | | | United States | | | | 100,000 | | | | 100,013 | |
| | 2013-SRP1, B, 4.647%, (1-Month USD LIBOR + 2.50%), 11/15/26 | | | United States | | | | 100,000 | | | | 99,446 | |
| | 2013-SRP1, C, 5.397%, (1-Month USD LIBOR + 3.25%), 11/15/26 | | | United States | | | | 100,000 | | | | 99,196 | |
| | 2013-SRP1, D, 5.491%, (1-Month USD LIBOR + 3.34%), 11/15/26 | | | United States | | | | 245,000 | | | | 241,837 | |
| | Structured ARM Loan Trust, FRN, | | | | | | | | | | | | |
| | q 2004-12, 7A3, 3.764%, 9/25/34 | | | United States | | | | 20,932 | | | | 21,293 | |
| | o 2005-14, A1, 2.27%, (1-Month USD LIBOR + 0.31%), 7/25/35 | | | United States | | | | 305,371 | | | | 245,274 | |
| | Structured Asset Securities Corp. Trust, 2005-1, 7A7, 5.50%, 2/25/35 | | | United States | | | | 13,734 | | | | 13,962 | |
| h,o | | Towd Point Mortgage Funding 2016-Granite1 PLC, 2016-GR1X, B, FRN, Reg S, 2.154%, (3-Month GBP LIBOR + 1.40%), 7/20/46 | | | United Kingdom | | | | 100,000 | GBP | | | 134,248 | |
| q | | Wells Fargo Bank, N.A., Adjustable Rate Mortgage Trust, 2004-4, 3A1, FRN, 3.667%, 3/25/35 | | | United States | | | | 37,274 | | | | 36,752 | |
| | Wells Fargo Mortgage Backed Securities Trust, | | | | | | | | | | | | |
| | q 2003-M, A1, FRN, 3.734%, 12/25/33 | | | United States | | | | 21,116 | | | | 21,709 | |
| | q 2004-I, 2A1, FRN, 4.031%, 7/25/34 | | | United States | | | | 102,849 | | | | 104,815 | |
| | q 2004-O, A1, FRN, 3.556%, 8/25/34 | | | United States | | | | 8,226 | | | | 8,493 | |
| | 2005-16, A18, 6.00%, 1/25/36 | | | United States | | | | 4,115 | | | | 4,164 | |
| | q 2005-AR10, 2A4, FRN, 3.822%, 5/01/35 | | | United States | | | | 12,473 | | | | 12,866 | |
| | q 2005-AR12, 2A5, FRN, 3.86%, 6/25/35 | | | United States | | | | 36,122 | | | | 37,058 | |
| g,q | | WFRBS Commercial Mortgage Trust, 144A, FRN, | | | | | | | | | | | | |
| | 2012-C6, D, 5.582%, 4/15/45 | | | United States | | | | 150,000 | | | | 153,476 | |
| | 2012-C7, E, 4.824%, 6/15/45 | | | United States | | | | 75,000 | | | | 61,544 | |
| | | | | | | | | | | | | | |
| | | | | | | | | | | | | 8,557,593 | |
| | | | | | | | | | | | | | |
| | Total Asset-Backed Securities and Commercial Mortgage-Backed Securities (Cost $26,500,702) | | | | | | | | | | | 26,867,547 | |
| | | | | | | | | | | | | | |
| | | | | | |
| franklintempleton.com | | Annual Report | | | 47 | |
FRANKLIN ALTERNATIVE STRATEGIES FUNDS
CONSOLIDATED STATEMENT OF INVESTMENTS
Franklin K2 Alternative Strategies Fund (continued)
| | | | | | | | | | | | | | | | | | |
| | | | | Country | | | Number of
Contracts | | | Notional
Amount# | | | Value | |
| | | Options Purchased 0.2% | | | | | | | | | | | | |
| | | Calls – Exchange-Traded 0.1% | | | | | | | | | | | | |
| | AK Steel Holding Corp., June Strike Price $5.00, Expires 6/29/18 | | | United States | | | | 108 | | | | 10,800 | | | $ | 1,080 | |
| | Allergan PLC, August Strike Price $170.00, Expires 8/17/18 | | | United States | | | | 74 | | | | 7,400 | | | | 14,800 | |
| | Allergan PLC, January Strike Price $185.00, Expires 1/18/19 | | | United States | | | | 264 | | | | 26,400 | | | | 93,720 | |
| | AT&T Inc., July Strike Price $35.00, Expires 7/20/18 | | | United States | | | | 128 | | | | 12,800 | | | | 2,816 | |
| | AT&T Inc., July Strike Price $38.00, Expires 7/20/18 | | | United States | | | | 226 | | | | 22,600 | | | | 1,356 | |
| | AT&T Inc., September Strike Price $34.00, Expires 9/21/18 | | | United States | | | | 167 | | | | 16,700 | | | | 11,857 | |
| | Atlas Air Worldwide Holdings Inc., June Strike Price $70.00, Expires 6/15/18 | | | United States | | | | 22 | | | | 2,200 | | | | 2,200 | |
| | Bayer AG, June Strike Price 100.00 EUR, Expires 6/15/18 | | | Germany | | | | 86 | | | | 8,600 | | | | 29,558 | |
| | Bayer AG, September Strike Price 100.00 EUR, Expires 9/21/18 | | | Germany | | | | 159 | | | | 15,900 | | | | 104,092 | |
| | Bunge Ltd., July Strike Price $80.00, Expires 7/20/18 | | | Bermuda | | | | 38 | | | | 3,800 | | | | 494 | |
| | Chart Industries Inc., June Strike Price $70.00, Expires 6/15/18 | | | United States | | | | 106 | | | | 10,600 | | | | 1,060 | |
| | Cleveland-Cliffs Inc., June Strike Price $8.00, Expires 6/15/18 | | | United States | | | | 47 | | | | 4,700 | | | | 2,914 | |
| | DISH Network Corp., June Strike Price $50.00, Expires 6/15/18 | | | United States | | | | 302 | | | | 30,200 | | | | 3,020 | |
| | DISH Network Corp., June Strike Price $55.00, Expires 6/15/18 | | | United States | | | | 1,407 | | | | 140,700 | | | | 7,035 | |
| | Green Plains Inc., June Strike Price $22.00, Expires 6/15/18 | | | United States | | | | 23 | | | | 2,300 | | | | 863 | |
| | Herbalife Nutrition Ltd., June Strike Price $60.00, Expires 6/15/18 | | | United States | | | | 26 | | | | 2,600 | | | | 234 | |
| | Intel Corp., June Strike Price $55.50, Expires 6/08/18 | | | United States | | | | 27 | | | | 2,700 | | | | 1,863 | |
| | j2 Global Inc., July Strike Price $90.00, Expires 7/20/18 | | | United States | | | | 5 | | | | 500 | | | | 665 | |
| | ON Semiconductor Corp., June Strike Price $25.00, Expires 6/15/18 | | | United States | | | | 27 | | | | 2,700 | | | | 2,430 | |
| | ON Semiconductor Corp., July Strike Price $26.00, Expires 7/20/18 | | | United States | | | | 27 | | | | 2,700 | | | | 2,457 | |
| | QUALCOMM Inc., June Strike Price $70.00, Expires 6/15/18 | | | United States | | | | 38 | | | | 3,800 | | | | 114 | |
| | S&P 500 Index, June Strike Price $3,000.00, Expires 6/15/18 | | | United States | | | | 66 | | | | 6,600 | | | | 330 | |
| | S&P 500 Index, September Strike Price $3,200.00, Expires 9/21/18 | | | United States | | | | 152 | | | | 15,200 | | | | 7,600 | |
| | SPDR S&P 500 ETF Trust, June Strike Price $273.00, Expires 6/08/18 | | | United States | | | | 134 | | | | 13,400 | | | | 10,586 | |
| | Square Inc., June Strike Price $60.00, Expires 6/15/18 | | | United States | | | | 27 | | | | 2,700 | | | | 2,673 | |
| | Telecom Italia SpA, December Strike Price 0.74 EUR, Expires 12/21/18 | | | Italy | | | | 2,079 | | | | 2,079,000 | | | | 107,912 | |
| | thyssenkrupp AG, September Strike Price 25.50 EUR, Expires 9/21/18 | | | Germany | | | | 1,395 | | | | 139,500 | | | | 76,648 | |
| | Time Warner Inc., August Strike Price $95.00, Expires 8/17/18 | | | United States | | | | 235 | | | | 23,500 | | | | 92,825 | |
| | Trinity Industries Inc., June Strike Price $34.00, Expires 6/15/18 | | | United States | | | | 28 | | | | 2,800 | | | | 3,640 | |
| | | | |
| 48 | | Annual Report | | franklintempleton.com |
FRANKLIN ALTERNATIVE STRATEGIES FUNDS
CONSOLIDATED STATEMENT OF INVESTMENTS
Franklin K2 Alternative Strategies Fund (continued)
| | | | | | | | | | | | | | | | | | |
| | | | | Country | | | Number of
Contracts | | | Notional
Amount# | | | Value | |
| | | Options Purchased (continued) | | | | | | | | | | | | |
| | | Calls – Exchange-Traded (continued) | | | | | | | | | | | | |
| | Twenty-First Century Fox Inc., July Strike Price $35.00, Expires 7/20/18 | | | United States | | | | 720 | | | | 72,000 | | | $ | 288,000 | |
| | Vivendi SA, September Strike Price 23.00 EUR, Expires 9/21/18 | | | France | | | | 917 | | | | 91,700 | | | | 73,969 | |
| | Weibo Corp., ADR, June Strike Price $120.00, Expires 6/15/18 | | | China | | | | 13 | | | | 1,300 | | | | 286 | |
| | | | | | | | | | | | | | | | | | |
| | | | | | | | | | | | | | | | | 949,097 | |
| | | | | | | | | | | | | | | | | | |
| | | Calls – Over-the-Counter 0.0%† | | | | | | | | | | | | |
| | | Interest Rate Swaptions 0.0%† | | | | | | | | | | | | |
| | Receive fixed 10 year 2.80%, Counterparty MSCS, pay float 3-Month USD LIBOR, Expires 6/04/18 | | | United States | | | | 1 | | | | 8,110,000 | | | | 3,132 | |
| | | | | | | | | | | | | | | | | | |
| | | Puts – Exchange-Traded 0.1% | | | | | | | | | | | | |
| | AT&T Inc., September Strike Price $31.00, Expires 9/21/18 | | | United States | | | | 141 | | | | 14,100 | | | | 14,100 | |
| | CAC 40 Index, June Strike Price 5,000.00 EUR, Expires 6/15/18 | | | France | | | | 54 | | | | 540 | | | | 5,195 | |
| | Dermira Inc., June Strike Price $7.00, Expires 6/15/18 | | | United States | | | | 88 | | | | 8,800 | | | | 440 | |
| | Deutsche Bank AG German Stock Index DAX, June Strike Price 11,800.00 EUR, Expires 6/15/18 | | | Germany | | | | 51 | | | | 255 | | | | 6,081 | |
| | EURO STOXX 50, September Strike Price 3,400.00 EUR, Expires 9/21/18 | | | Germany | | | | 175 | | | | 1,750 | | | | 239,362 | |
| | EURO STOXX 600 Telecommunications, September Strike Price 260.00 EUR, Expires 9/21/18 | | | Germany | | | | 320 | | | | 16,000 | | | | 274,959 | |
| | FTSE MIB Index, September Strike Price 20,500.00 EUR, Expires 9/21/18 | | | Italy | | | | 51 | | | | 102 | | | | 104,188 | |
| | Hannon Armstrong Sustainable Infrastructure Capital Inc, June Strike Price $17.50, Expires 6/15/18 | | | United States | | | | 25 | | | | 2,500 | | | | 187 | |
| | Innoviva Inc., July Strike Price $12.50, Expires 7/20/18 | | | United States | | | | 68 | | | | 6,800 | | | | 1,020 | |
| | iShares iBoxx High Yield Corporate Bond ETF, June Strike Price $84.00, Expires 6/15/18 | | | United States | | | | 86 | | | | 8,600 | | | | 1,634 | |
| | iShares iBoxx High Yield Corporate Bond ETF, July Strike Price $84.00, Expires 7/20/18 | | | United States | | | | 267 | | | | 26,700 | | | | 16,821 | |
| | Jazz Pharmaceuticals PLC, June Strike Price $100.00, Expires 6/15/18 | | | United States | | | | 17 | | | | 1,700 | | | | 255 | |
| | PowerShares QQQ Trust Series 1, June Strike Price $155.00, Expires 6/15/18 | | | United States | | | | 341 | | | | 34,100 | | | | 5,115 | |
| | Redwood Trust Inc., October Strike Price $12.50, Expires 10/19/18 | | | United States | | | | 136 | | | | 13,600 | | | | 1,360 | |
| | S&P 500 Index, June Strike Price $2,400.00, Expires 6/15/18 | | | United States | | | | 6 | | | | 600 | | | | 810 | |
| | S&P 500 Index, June Strike Price $2,550.00, Expires 6/15/18 | | | United States | | | | 354 | | | | 35,400 | | | | 116,820 | |
| | S&P 500 Index, June Strike Price $2,600.00, Expires 6/15/18 | | | United States | | | | 199 | | | | 19,900 | | | | 108,853 | |
| | S&P 500 Index, June Strike Price $2,575.00, Expires 6/29/18 | | | United States | | | | 133 | | | | 13,300 | | | | 134,596 | |
| | S&P 500 Index, August Strike Price $2,650.00, Expires 8/17/18 | | | United States | | | | 17 | | | | 1,700 | | | | 74,273 | |
| | SPDR S&P 500 ETF Trust, June Strike Price $267.00, Expires 6/08/18 | | | United States | | | | 149 | | | | 14,900 | | | | 10,728 | |
| | Teladoc Inc., July Strike Price $30.00, Expires 7/20/18 | | | United States | | | | 42 | | | | 4,200 | | | | 420 | |
| | Tesla Inc., July Strike Price $200.00, Expires 7/20/18 | | | United States | | | | 10 | | | | 1,000 | | | | 1,380 | |
| | Time Warner Inc., July Strike Price $90.00, Expires 7/20/18 | | | United States | | | | 38 | | | | 3,800 | | | | 9,690 | |
| | Transocean Ltd., June Strike Price $12.00, Expires 6/04/18 | | | United States | | | | 105 | | | | 10,500 | | | | 105 | |
| | | | | | |
| franklintempleton.com | | Annual Report | | | 49 | |
FRANKLIN ALTERNATIVE STRATEGIES FUNDS
CONSOLIDATED STATEMENT OF INVESTMENTS
Franklin K2 Alternative Strategies Fund (continued)
| | | | | | | | | | | | | | | | | | |
| | | | | Country | | | Number of
Contracts | | | Notional
Amount# | | | Value | |
| | | Options Purchased (continued) | | | | | | | | | | | | |
| | | Puts – Exchange-Traded (continued) | | | | | | | | | | | | |
| | Two Harbors Investment Corp., June Strike Price $15.00, Expires 6/15/18 | | | United States | | | | 102 | | | | 10,200 | | | $ | 510 | |
| | U.S. Treasury 10 Yr. Note, June Strike Price $118.50, Expires 6/22/18 | | | United States | | | | 26 | | | | 26,000 | | | | 1,219 | |
| | VanEck Vectors Semiconductor ETF, August Strike Price $95.00, Expires 8/17/18 | | | United States | | | | 268 | | | | 26,800 | | | | 27,872 | |
| | Whiting Petroleum Corp., June Strike Price $37.00, Expires 6/15/18 | | | United States | | | | 53 | | | | 5,300 | | | | 344 | |
| | | | | | | | | | | | | | | | | | |
| | | | | | | | | | | | | | | | | 1,158,337 | |
| | | | | | | | | | | | | | | | | | |
| | | Puts – Over-the-Counter 0.0%† | | | | | | |
| | | Currency Options 0.0%† | | | |
| | EUR/GBP, Counterparty DBAB, January Strike Price 0.90 EUR, Expires 1/14/19 | | | United Kingdom | | | | 1 | | | | 837,000 | EUR | | | 30,634 | |
| | | | | | | | | | | | | | | | | | |
| | Total Options Purchased (Cost $3,918,864) | | | | | | | | | | | | | | | 2,141,200 | |
| | | | | | | | | | | | | | | | | | |
| | Total Investments before Short Term Investments (Cost $755,731,212) | | | | | | | | | | | | | | | 858,840,776 | |
| | | | | | | | | | | | | | | | | | |
| | | | |
| | | | | | | | | Principal
Amount* | | | | |
| | | Short Term Investments 17.1% | | | | | | | | | | | | |
| | | Foreign Government and Agency Securities
(Cost $651,948) 0.0%† | | | | | | | | | | | | |
| r | | Argentina Treasury Bill, 9/14/18 | | | Argentina | | | | | | | | 13,142,226 | ARS | | | 539,370 | |
| | | | | | | | | | | | | | | | | | |
| | | | | |
| | | | | | | | | | | Shares | | | | |
| | | Money Market Funds 14.1% | | | | | | | | | | | | |
| u,v | | Dreyfus Government Cash Management, Institutional Shares, 1.64% | | | United States | | | | | | | | 21,853,016 | | | | 21,853,016 | |
| u | | Fidelity Investments Money Market Funds, 1.68% | | | United States | | | | | | | | 133,945,359 | | | | 133,945,359 | |
| | | | | | | | | | | | | | | | | | |
| | Total Money Market Funds (Cost $155,798,375) | | | | | | | | | | | | | | | 155,798,375 | |
| | | | | | | | | | | | | | | | | | |
| | | | |
| | | | | | | | | Principal
Amount* | | | | |
| | | Repurchase Agreements (Cost $4,181,861) 0.4% | | | | | | | | | | |
| w | | Joint Repurchase Agreement, 1.76%, 6/01/18 (Maturity Value $4,182,065) | | | United States | | | | | | | | 4,181,861 | | | | 4,181,861 | |
| | | | | | | | | | | | | | | | | | |
| | BNP Paribas Securities Corp. (Maturity Value $1,839,439)
Deutsche Bank Securities Inc. (Maturity Value $273,257)
HSBC Securities (USA) Inc. (Maturity Value $1,839,439) Merrill Lynch, Pierce, Fenner & Smith Inc. (Maturity Value $229,930) | | | | | | | | | | | | | |
| | Collateralized by U.S. Government Agency Securities, 1.375% - 1.875%, 9/18/18 - 5/01/20; rU.S. Treasury Bill, 12/06/18 - 4/25/19; and U.S. Treasury Note, 0.875% - 3.50%, 10/31/18 - 10/31/21 (valued at $4,269,136) | | | | | | | | | | | | | |
| | | | |
| 50 | | Annual Report | | franklintempleton.com |
FRANKLIN ALTERNATIVE STRATEGIES FUNDS
CONSOLIDATED STATEMENT OF INVESTMENTS
Franklin K2 Alternative Strategies Fund (continued)
| | | | | | | | | | | | | | | | | | |
| | | | | Country | | | | | | Shares | | | Value | |
| s | | Investments from Cash Collateral Received for
Loaned Securities 1.1% | | | | | | | | | | | | |
| | | Money Market Funds 1.0% | | | | | | | | | | | | |
| t,u | | Institutional Fiduciary Trust Money Market Portfolio, 1.40% | | | United States | | | | | | | | 10,700,000 | | | $ | 10,700,000 | |
| | | | | | | | | | | | | | | | | | |
| | | | | | | | | | | Principal
Amount* | | | | |
| | | Repurchase Agreement 0.1% | | | | | | | | | | | | |
| w | | Joint Repurchase Agreement, 1.78%, 6/01/18 (Maturity Value $1,133,710) | | | United States | | | | | | | | 1,133,654 | | | | 1,133,654 | |
| | | | | | | | | | | | | | | | | | |
| | JP Morgan Securities LLC | | | | | | | | | | | | | | | | |
| | Collateralized by U.S. Government Agency Obligations, 0.13% - 1.188%, 7/15/19 - 7/15/22, (valued at $1,151,193) | | | | | | | | | | | | | | | | |
| | Total Investments from Cash Collateral Received for Loaned Securities
(Cost $11,833,654) | | | | | | | | | | | | | | | 11,833,654 | |
| | | | | | | | | | | | | | | | | | |
| | | U.S. Government and Agency Securities
(Cost $16,095,204) 1.5% | | | | | | | | | | | | |
| a,r | | U.S. Treasury Bill, 6/14/18 | | | United States | | | | | | | | 16,105,000 | | | | 16,095,899 | |
| | | | | | | | | | | | | | | | | | |
| | Total Investments (Cost $944,292,254) 95.1% | | | | | | | | | | | | | | | 1,047,289,935 | |
| | Options Written (0.0)%† | | | | | | | | | | | | | | | (428,343 | ) |
| | Securities Sold Short (21.6)% | | | | | | | | | | | | | | | (238,251,897 | ) |
| | Other Assets, less Liabilities 26.5% | | | | | | | | | | | | | | | 292,531,557 | |
| | | | | | | | | | | | | | | | | | |
| | Net Assets 100.0% | | | | | | | | | | | | | | $ | 1,101,141,252 | |
| | | | | | | | | | | | | | | | | | |
| | | | | | | | Number of
Contracts | | | Notional
Amount# | | | | |
| x | | Options Written (0.0)%† | | | | | | | | | | | | |
| | | Calls – Exchange-Traded (0.0)%† | | | | | | | | | | | | |
| | Allergan PLC, January Strike Price $210.00, Expires 1/18/19 | | | United States | | | | 260 | | | | 26,000 | | | | (24,700 | ) |
| | Apple Inc., August Strike Price $190.00, Expires 8/17/18 | | | United States | | | | 9 | | | | 900 | | | | (5,445 | ) |
| | Telecom Italia SpA, September Strike Price 0.85 EUR, Expires 9/21/18 | | | Italy | | | | 403 | | | | 403,000 | | | | (3,486 | ) |
| | | | | | | | | | | | | | | | | | |
| | | | | | | | | | | | | | | | | (33,631 | ) |
| | | | | | | | | | | | | | | | | | |
| | | Calls – Over-the-Counter (0.0)%† | | | | | | | | | | | | |
| | | Interest Rate Swaptions 0.0%† | | | | | | | | | | | | |
| | Pay fixed 10 year 2.50%, Counterparty MSCS, receive float 3-Month USD LIBOR, Expires 6/04/18 | | | United States | | | | 1 | | | | 8,110,000 | | | | — | |
| | | | | | | | | | | | | | | | | | |
| | | Puts – Exchange-Traded (0.0)%† | | | | | | | | | | | | |
| | Aerojet Rocketdyne Holdings Inc., June Strike Price $25.00, Expires 6/15/18 | | | United States | | | | 29 | | | | 2,900 | | | | (145 | ) |
| | Atlas Air Worldwide Holdings Inc., June Strike Price $65.00, Expires 6/15/18 | | | United States | | | | 22 | | | | 2,200 | | | | (880 | ) |
| | Bunge Ltd., July Strike Price $70.00, Expires 7/20/18 | | | Bermuda | | | | 66 | | | | 6,600 | | | | (16,170 | ) |
| | Chart Industries Inc., June Strike Price $60.00, Expires 6/15/18 | | | United States | | | | 53 | | | | 5,300 | | | | (1,060 | ) |
| | EURO STOXX 50, September Strike Price 3,200.00 EUR, Expires 9/21/18 | | | Germany | | | | 175 | | | | 1,750 | | | | (120,295 | ) |
| | EURO STOXX 600 Telecommunications, September Strike Price 240.00 EUR, Expires 9/21/18 | | | Germany | | | | 320 | | | | 16,000 | | | | (104,746 | ) |
| | FTSE MIB Index, September Strike Price 19,000.00 EUR, Expires 9/21/18 | | | Italy | | | | 51 | | | | 102 | | | | (57,385 | ) |
| | Green Plains Inc., June Strike Price $20.00, Expires 6/15/18 | | | United States | | | | 11 | | | | 1,100 | | | | (193 | ) |
| | Herbalife Nutrition Ltd., June Strike Price $52.50, Expires 6/15/18 | | | United States | | | | 26 | | | | 2,600 | | | | (5,512 | ) |
| | | | | | |
| franklintempleton.com | | Annual Report | | | 51 | |
FRANKLIN ALTERNATIVE STRATEGIES FUNDS
CONSOLIDATED STATEMENT OF INVESTMENTS
Franklin K2 Alternative Strategies Fund (continued)
| | | | | | | | | | | | | | | | | | |
| | | | | |
| | | | | Country | | | Number of
Contracts | | | Notional
Amount# | | | Value | |
| x | | Options Written (continued) | | | | | | | | | | | | |
| | | Puts – Exchange-Traded (continued) | | | | | | | | | | | | |
| | j2 Global Inc., July Strike Price $80.00, Expires 7/20/18 | | | United States | | | | 5 | | | | 500 | | | $ | (475 | ) |
| | ON Semiconductor Corp., July Strike Price $25.00, Expires 7/20/18 | | | United States | | | | 27 | | | | 2,700 | | | | (2,835 | ) |
| | S&P 500 Index, June Strike Price $2,400.00, Expires 6/15/18 | | | United States | | | | 17 | | | | 1,700 | | | | (2,159 | ) |
| | S&P 500 Index, August Strike Price $2,500.00, Expires 8/17/18 | | | United States | | | | 17 | | | | 1,700 | | | | (33,439 | ) |
| | SPDR S&P 500 ETF Trust, June Strike Price $271.00, Expires 6/08/18 | | | United States | | | | 149 | | | | 14,900 | | | | (26,820 | ) |
| | Time Warner Inc., July Strike Price $85.00, Expires 7/20/18 | | | United States | | | | 76 | | | | 7,600 | | | | (10,640 | ) |
| | Trinity Industries Inc., June Strike Price $31.00, Expires 6/15/18 | | | United States | | | | 31 | | | | 3,100 | | | | (310 | ) |
| | Weibo Corp., ADR, June Strike Price $110.00, Expires 6/15/18 | | | China | | | | 13 | | | | 1,300 | | | | (11,648 | ) |
| | | | | | | | | | | | | | | | | | |
| | | | | | | | | | | | | | | | | (394,712 | ) |
| | | | | | | | | | | | | | | | | | |
| | Total Options Written
(Premiums Received $561,837) | | | | | | | | | | | | | | | (428,343 | ) |
| | | | | | | | | | | | | | | |
| | | | | |
| | | | | | | | | | | Shares | | | | |
| y | | Securities Sold Short (21.6)% | | | | | | | | | | | | |
| | | Common Stocks (7.5)% | | | | | | | | | | | | |
| | | Aerospace & Defense (0.1)% | | | | | | | | | | | | |
| | United Technologies Corp. | | | United States | | | | | | | | 10,475 | | | | (1,307,490 | ) |
| | | | | | | | | | | | | | | | | | |
| | | Air Freight & Logistics (0.0)%† | | | | | | | | | | | | |
| | Atlas Air Worldwide Holdings Inc. | | | United States | | | | | | | | 3,060 | | | | (208,539 | ) |
| | | | | | | | | | | | | | | | | | |
| | | Airlines (0.1)% | | | | | | | | | | | | |
| | Ana Holdings Inc. | | | Japan | | | | | | | | 22,952 | | | | (924,536 | ) |
| | SAS AB | | | Sweden | | | | | | | | 73,680 | | | | (157,401 | ) |
| | United Continental Holdings Inc. | | | United States | | | | | | | | 4,006 | | | | (278,777 | ) |
| | | | | | | | | | | | | | | | | | |
| | | | | | | | | | | | | | | | | (1,360,714 | ) |
| | | | | | | | | | | | | | | | | | |
| | | Automobiles (0.2)% | | | | | | | | | | | | |
| | Ferrari NV | | | Italy | | | | | | | | 3,642 | | | | (478,377 | ) |
| | Tesla Inc. | | | United States | | | | | | | | 4,097 | | | | (1,166,539 | ) |
| | | | | | | | | | | | | | | | | | |
| | | | | | | | | | | | | | | | | (1,644,916 | ) |
| | | | | | | | | | | | | | | | | | |
| | | Banks (0.0)%† | | | | | | | | | | | | |
| | Hope Bancorp Inc. | | | United States | | | | | | | | 13,424 | | | | (241,498 | ) |
| | | | | | | | | | | | | | | | | | |
| | | Beverages (0.0)%† | | | | | | | | | | | | |
| | The Boston Beer Co. Inc., A | | | United States | | | | | | | | 500 | | | | (126,925 | ) |
| | | | | | | | | | | | | | | | | | |
| | | Biotechnology (0.3)% | | | | | | | | | | | | |
| | Alder Biopharmaceuticals Inc. | | | United States | | | | | | | | 13,623 | | | | (237,721 | ) |
| | Amicus Therapeutics Inc. | | | United States | | | | | | | | 145,562 | | | | (2,459,998 | ) |
| | PDL BioPharma Inc. | | | United States | | | | | | | | 99,983 | | | | (266,955 | ) |
| | Radius Health Inc. | | | United States | | | | | | | | 9,920 | | | | (282,720 | ) |
| | | | | | | | | | | | | | | | | | |
| | | | | | | | | | | | | | | | | (3,247,394 | ) |
| | | | | | | | | | | | | | | | | | |
| | | Capital Markets (0.2)% | | | | | | | | | | | | |
| | CME Group Inc., A | | | United States | | | | | | | | 11,687 | | | | (1,903,812 | ) |
| | Cowen Inc., A | | | United States | | | | | | | | 20,993 | | | | (313,845 | ) |
| | | | |
| 52 | | Annual Report | | franklintempleton.com |
FRANKLIN ALTERNATIVE STRATEGIES FUNDS
CONSOLIDATED STATEMENT OF INVESTMENTS
Franklin K2 Alternative Strategies Fund (continued)
| | | | | | | | | | | | | | |
| | | | |
| | | | | Country | | | Shares | | | Value | |
| y | | Securities Sold Short (continued) | | | | | | | | | |
| | | Common Stocks (continued) | | | | | | | | | |
| | | Capital Markets (continued) | | | | | | | | | |
| | GSV Capital Corp. | | | United States | | | | 3,708 | | | $ | (24,918 | ) |
| | | | | | | | | | | | | | |
| | | | | | | | | | | | | (2,242,575 | ) |
| | | | | | | | | | | | | | |
| | | Chemicals (0.1)% | | | | | | | | | |
| | Eastman Chemical Co. | | | United States | | | | 3,379 | | | | (352,463 | ) |
| | LyondellBasell Industries NV, A | | | United States | | | | 5,943 | | | | (666,329 | ) |
| | Mitsubishi Chemical Holdings Corp. | | | Japan | | | | 19,500 | | | | (180,687 | ) |
| | RPM International Inc. | | | United States | | | | 5,739 | | | | (284,081 | ) |
| | | | | | | | | | | | | | |
| | | | | | | | | | | | | (1,483,560 | ) |
| | | | | | | | | | | | | | |
| | | Commercial Services & Supplies (0.0)%† | | | | | | | | | |
| | Ritchie Bros Auctioneers Inc. | | | Canada | | | | 2,739 | | | | (93,345 | ) |
| | Team Inc. | | | United States | | | | 18,991 | | | | (403,559 | ) |
| | | | | | | | | | | | | | |
| | | | | | | | | | | | | (496,904 | ) |
| | | | | | | | | | | | | | |
| | | Communications Equipment (0.1)% | | | | | | | | | |
| | Calamp Corp. | | | United States | | | | 8,108 | | | | (172,052 | ) |
| | Finisar Corp. | | | United States | | | | 3,404 | | | | (55,179 | ) |
| | Palo Alto Networks Inc. | | | United States | | | | 6,025 | | | | (1,253,742 | ) |
| | | | | | | | | | | | | | |
| | | | | | | | | | | | | (1,480,973 | ) |
| | | | | | | | | | | | | | |
| | | Construction & Engineering (0.1)% | | | | | | | | | |
| | Mirait Holdings Corp. | | | Japan | | | | 14,800 | | | | (232,234 | ) |
| | Tutor Perini Corp. | | | United States | | | | 8,483 | | | | (167,963 | ) |
| | Valmont Industries Inc. | | | United States | | | | 4,911 | | | | (717,743 | ) |
| | | | | | | | | | | | | | |
| | | | | | | | | | | | | (1,117,940 | ) |
| | | | | | | | | | | | | | |
| | | Construction Materials (0.0)%† | | | | | | | | | |
| | Cemex SAB de CV, ADR | | | Mexico | | | | 11,567 | | | | (68,939 | ) |
| | | | | | | | | | | | | | |
| | | Consumer Finance (0.2)% | | | | | | | | | |
| | Encore Capital Group Inc. | | | United States | | | | 22,368 | | | | (882,418 | ) |
| | Ezcorp Inc., A | | | United States | | | | 41,640 | | | | (516,336 | ) |
| | PRA Group Inc. | | | United States | | | | 12,462 | | | | (481,033 | ) |
| | | | | | | | | | | | | | |
| | | | | | | | | | | | | (1,879,787 | ) |
| | | | | | | | | | | | | | |
| | | Containers & Packaging (0.0)%† | | | | | | | | | |
| | International Paper Co. | | | United States | | | | 2,636 | | | | (141,026 | ) |
| | | | | | | | | | | | | | |
| | | Diversified Financial Services (0.3)% | | | | | | | | | |
| | AXA Equitable Holdings Inc. | | | United States | | | | 72,339 | | | | (1,545,161 | ) |
| | Invitation Homes Inc. | | | United States | | | | 74,096 | | | | (1,630,860 | ) |
| | Voya Financial Inc. | | | United States | | | | 979 | | | | (50,849 | ) |
| | | | | | | | | | | | | | |
| | | | | | | | | | | | | (3,226,870 | ) |
| | | | | | | | | | | | | | |
| | | Diversified Telecommunication Services (0.2)% | | | | | | | | | |
| | AT&T Inc. | | | United States | | | | 68,813 | | | | (2,224,036 | ) |
| | | | | | | | | | | | | | |
| | | Electric Utilities (0.0)%† | | | | | | | | | |
| | Kyushu Electric Power Co. Inc. | | | Japan | | | | 24,900 | | | | (294,355 | ) |
| | | | | | | | | | | | | | |
| | | Electrical Equipment (0.1)% | | | | | | | | | |
| | Eaton Corp. PLC | | | United States | | | | 5,544 | | | | (424,559 | ) |
| | Regal Beloit Corp. | | | United States | | | | 13,631 | | | | (1,082,983 | ) |
| | | | | | | | | | | | | | |
| | | | | | | | | | | | | (1,507,542 | ) |
| | | | | | | | | | | | | | |
| | | | | | |
| franklintempleton.com | | Annual Report | | | 53 | |
FRANKLIN ALTERNATIVE STRATEGIES FUNDS
CONSOLIDATED STATEMENT OF INVESTMENTS
Franklin K2 Alternative Strategies Fund (continued)
| | | | | | | | | | | | | | |
| | | | |
| | | | | Country | | | Shares | | | Value | |
| y | | Securities Sold Short (continued) | | | | | | | | | |
| | | Common Stocks (continued) | | | | | | | | | |
| | | Electronic Equipment, Instruments & Components (0.2)% | | | | | | | | | |
| | II-VI Inc. | | | United States | | | | 4,971 | | | $ | (218,476 | ) |
| | Knowles Corp. | | | United States | | | | 15,016 | | | | (217,732 | ) |
| | OSI Systems Inc. | | | United States | | | | 776 | | | | (53,218 | ) |
| | Vishay Intertechnology Inc. | | | United States | | | | 78,815 | | | | (1,670,878 | ) |
| | | | | | | | | | | | | | |
| | | | | | | | | | | | | (2,160,304 | ) |
| | | | | | | | | | | | | | |
| | | Energy Equipment & Services (0.1)% | | | | | | | | | |
| | Fugro NV | | | Netherlands | | | | 13,116 | | | | (206,921 | ) |
| | Nabors Industries Ltd. | | | Bermuda | | | | 50,150 | | | | (374,620 | ) |
| | SEACOR Holdings Inc. | | | United States | | | | 1,433 | | | | (74,846 | ) |
| | | | | | | | | | | | | | |
| | | | | | | | | | | | | (656,387 | ) |
| | | | | | | | | | | | | | |
| | | Equity Real Estate Investment Trusts (REITs) (0.2)% | | | | | | | | | |
| | American Homes 4 Rent, A | | | United States | | | | 46,017 | | | | (916,659 | ) |
| | Camden Property Trust | | | United States | | | | 3,275 | | | | (288,200 | ) |
| | Empire State Realty Trust Inc., A | | | United States | | | | 7,107 | | | | (120,535 | ) |
| | Forest City Realty Trust Inc., A | | | United States | | | | 26,634 | | | | (542,534 | ) |
| | National Health Investors Inc. | | | United States | | | | 2,089 | | | | (154,210 | ) |
| | | | | | | | | | | | | | |
| | | | | | | | | | | | | (2,022,138 | ) |
| | | | | | | | | | | | | | |
| | | Food & Staples Retailing (0.0)%† | | | | | | | | | |
| | Koninklijke Ahold Delhaize NV | | | Netherlands | | | | 12,242 | | | | (281,277 | ) |
| | | | | | | | | | | | | | |
| | | Health Care Equipment & Supplies (0.1)% | | | | | | | | | |
| | Invacare Corp. | | | United States | | | | 47,952 | | | | (791,208 | ) |
| | Nipro Corp. | | | Japan | | | | 12,300 | | | | (149,475 | ) |
| | NuVasive Inc. | | | United States | | | | 1,256 | | | | (64,382 | ) |
| | | | | | | | | | | | | | |
| | | | | | | | | | | | | (1,005,065 | ) |
| | | | | | | | | | | | | | |
| | | Health Care Providers & Services (0.2)% | | | | | | | | | |
| | Cigna Corp. | | | United States | | | | 2,786 | | | | (471,865 | ) |
| | CVS Health Corp. | | | United States | | | | 27,382 | | | | (1,735,745 | ) |
| | | | | | | | | | | | | | |
| | | | | | | | | | | | | (2,207,610 | ) |
| | | | | | | | | | | | | | |
| | | Health Care Technology (0.1)% | | | | | | | | | |
| | Allscripts Healthcare Solutions Inc. | | | United States | | | | 11,386 | | | | (144,033 | ) |
| | Teladoc Inc. | | | United States | | | | 17,304 | | | | (880,773 | ) |
| | Vocera Communications Inc. | | | United States | | | | 15,038 | | | | (406,327 | ) |
| | | | | | | | | | | | | | |
| | | | | | | | | | | | | (1,431,133 | ) |
| | | | | | | | | | | | | | |
| | | Hotels, Restaurants & Leisure (0.2)% | | | | | | | | | |
| | China Lodging Group Ltd., ADR | | | China | | | | 6,008 | | | | (264,412 | ) |
| | Starbucks Corp. | | | United States | | | | 4,901 | | | | (277,740 | ) |
| | Vail Resorts Inc. | | | United States | | | | 4,994 | | | | (1,202,505 | ) |
| | | | | | | | | | | | | | |
| | | | | | | | | | | | | (1,744,657 | ) |
| | | | | | | | | | | | | | |
| | | Household Durables (0.0)%† | | | | | | | | | |
| | PulteGroup Inc. | | | United States | | | | 6,871 | | | | (207,848 | ) |
| | | | | | | | | | | | | | |
| | | Household Products (0.5)% | | | | | | | | | |
| | Church & Dwight Co. Inc. | | | United States | | | | 12,908 | | | | (606,030 | ) |
| | Kimberly-Clark Corp. | | | United States | | | | 2,702 | | | | (272,497 | ) |
| | Spectrum Brands Holdings Inc. | | | United States | | | | 63,549 | | | | (5,064,220 | ) |
| | | | | | | | | | | | | | |
| | | | | | | | | | | | | (5,942,747 | ) |
| | | | | | | | | | | | | | |
| | | | |
| 54 | | Annual Report | | franklintempleton.com |
FRANKLIN ALTERNATIVE STRATEGIES FUNDS
CONSOLIDATED STATEMENT OF INVESTMENTS
Franklin K2 Alternative Strategies Fund (continued)
| | | | | | | | | | | | | | |
| | | | |
| | | | | Country | | | Shares | | | Value | |
| y | | Securities Sold Short (continued) | | | | | | | | | |
| | | Common Stocks (continued) | | | | | | | | | |
| | | Independent Power & Renewable Electricity Producers (0.0)%† | | | | | | | | | |
| | NRG Energy Inc. | | | United States | | | | 3,971 | | | $ | (135,927 | ) |
| | | | | | | | | | | | | | |
| | | Internet & Direct Marketing Retail (0.0)%† | | | | | | | | | |
| | Ctrip.com International Ltd., ADR | | | China | | | | 2,021 | | | | (91,127 | ) |
| | Expedia Group Inc. | | | United States | | | | 390 | | | | (47,202 | ) |
| | Vipshop Holdings Ltd., ADR | | | China | | | | 1,005 | | | | (11,738 | ) |
| | | | | | | | | | | | | | |
| | | | | | | | | | | | | (150,067 | ) |
| | | | | | | | | | | | | | |
| | | Internet Software & Services (0.3)% | | | | | | | | | |
| | Alibaba Group Holding Ltd., ADR | | | China | | | | 5,512 | | | | (1,091,431 | ) |
| | Altaba Inc. | | | United States | | | | 1,307 | | | | (100,848 | ) |
| | Carbonite Inc. | | | United States | | | | 10,387 | | | | (403,016 | ) |
| | Coupa Software Inc. | | | United States | | | | 1,402 | | | | (74,839 | ) |
| | Envestnet Inc. | | | United States | | | | 8,747 | | | | (462,716 | ) |
| | Five9 Inc. | | | United States | | | | 3,063 | | | | (106,868 | ) |
| | j2 Global Inc. | | | United States | | | | 2,964 | | | | (250,280 | ) |
| | Nutanix Inc., A | | | United States | | | | 6,745 | | | | (360,520 | ) |
| | Twilio Inc., A | | | United States | | | | 1,847 | | | | (99,683 | ) |
| | Weibo Corp., ADR | | | China | | | | 3,836 | | | | (390,927 | ) |
| | Yandex NV, A | | | Russia | | | | 803 | | | | (26,916 | ) |
| | Zillow Group Inc., C | | | United States | | | | 1,109 | | | | (64,688 | ) |
| | | | | | | | | | | | | | |
| | | | | | | | | | | | | (3,432,732 | ) |
| | | | | | | | | | | | | | |
| | | IT Services (0.1)% | | | | | | | | | |
| | CSG Systems International Inc. | | | United States | | | | 2,511 | | | | (103,905 | ) |
| | GDS Holdings Ltd., ADR | | | China | | | | 11,300 | | | | (427,253 | ) |
| | Square Inc., A | | | United States | | | | 1,411 | | | | (82,191 | ) |
| | | | | | | | | | | | | | |
| | | | | | | | | | | | | (613,349 | ) |
| | | | | | | | | | | | | | |
| | | Machinery (0.2)% | | | | | | | | | |
| | Chart Industries Inc. | | | United States | | | | 4,637 | | | | (298,762 | ) |
| | Navistar International Corp. | | | United States | | | | 3,568 | | | | (133,586 | ) |
| | SKF AB, B | | | Sweden | | | | 6,726 | | | | (130,606 | ) |
| | Terex Corp. | | | United States | | | | 14,406 | | | | (570,189 | ) |
| | The Timken Co. | | | United States | | | | 8,792 | | | | (415,862 | ) |
| | Trinity Industries Inc. | | | United States | | | | 1,845 | | | | (63,634 | ) |
| | | | | | | | | | | | | | |
| | | | | | | | | | | | | (1,612,639 | ) |
| | | | | | | | | | | | | | |
| | | Marine (0.1)% | | | | | | | | | |
| | Kirby Corp. | | | United States | | | | 5,966 | | | | (541,116 | ) |
| | Kuehne + Nagel International AG | | | Switzerland | | | | 896 | | | | (135,091 | ) |
| | | | | | | | | | | | | | |
| | | | | | | | | | | | | (676,207 | ) |
| | | | | | | | | | | | | | |
| | | Media (0.4)% | | | | | | | | | |
| | AMC Networks Inc., A | | | United States | | | | 6,154 | | | | (351,824 | ) |
| | Discovery Inc., A | | | United States | | | | 81,458 | | | | (1,717,949 | ) |
| | DISH Network Corp., A | | | United States | | | | 3,591 | | | | (106,114 | ) |
| | Gannett Co. Inc. | | | United States | | | | 10,735 | | | | (113,469 | ) |
| | Sinclair Broadcast Group Inc., A | | | United States | | | | 10,925 | | | | (299,345 | ) |
| | The Walt Disney Co. | | | United States | | | | 22,178 | | | | (2,206,046 | ) |
| | | | | | | | | | | | | | |
| | | | | | | | | | | | | (4,794,747 | ) |
| | | | | | | | | | | | | | |
| | | | | | |
| franklintempleton.com | | Annual Report | | | 55 | |
FRANKLIN ALTERNATIVE STRATEGIES FUNDS
CONSOLIDATED STATEMENT OF INVESTMENTS
Franklin K2 Alternative Strategies Fund (continued)
| | | | | | | | | | | | | | |
| | | | |
| | | | | Country | | | Shares | | | Value | |
| y | | Securities Sold Short (continued) | | | | | | | | | |
| | | Common Stocks (continued) | | | | | | | | | |
| | | Metals & Mining (0.2)% | | | | | | | | | |
| | AK Steel Holding Corp. | | | United States | | | | 39,230 | | | $ | (177,320 | ) |
| | Cleveland-Cliffs Inc. | | | United States | | | | 64,603 | | | | (546,541 | ) |
| | Endeavour Mining Corp. | | | Ivory Coast | | | | 6,694 | | | | (116,110 | ) |
| | First Majestic Silver Corp. | | | Canada | | | | 33,699 | | | | (238,926 | ) |
| | Kaiser Aluminum Corp. | | | United States | | | | 4,731 | | | | (521,640 | ) |
| | | | | | | | | | | | | | |
| | | | | | | | | | | | | (1,600,537 | ) |
| | | | | | | | | | | | | | |
| | | Mortgage Real Estate Investment Trusts (REITs) (0.2)% | | | | | | | | | |
| | Apollo Commercial Real Estate Finance Inc. | | | United States | | | | 74,385 | | | | (1,382,817 | ) |
| | Blackstone Mortgage Trust Inc., A | | | United States | | | | 6,505 | | | | (205,493 | ) |
| | Hannon Armstrong Sustainable Infrastructure Capital Inc. | | | United States | | | | 4,767 | | | | (87,427 | ) |
| | KKR Real Estate Finance Trust Inc. | | | United States | | | | 5,729 | | | | (116,585 | ) |
| | Redwood Trust Inc. | | | United States | | | | 5,495 | | | | (89,898 | ) |
| | Two Harbors Investment Corp. | | | United States | | | | 40,956 | | | | (636,866 | ) |
| | | | | | | | | | | | | | |
| | | | | | | | | | | | | (2,519,086 | ) |
| | | | | | | | | | | | | | |
| | | Oil, Gas & Consumable Fuels (0.9)% | | | | | | | | | |
| | Altagas Ltd. | | | Canada | | | | 13,690 | | | | (268,711 | ) |
| | Concho Resources Inc. | | | United States | | | | 31,762 | | | | (4,361,240 | ) |
| | Golar LNG Ltd. | | | Bermuda | | | | 6,568 | | | | (170,637 | ) |
| | Green Plains Inc. | | | United States | | | | 45,564 | | | | (972,791 | ) |
| | Marathon Petroleum Corp. | | | United States | | | | 50,885 | | | | (4,021,442 | ) |
| | Oasis Petroleum Inc. | | | United States | | | | 3,899 | | | | (50,804 | ) |
| | Ship Finance International Ltd. | | | Norway | | | | 4,843 | | | | (69,013 | ) |
| | SM Energy Co. | | | United States | | | | 827 | | | | (21,667 | ) |
| | Teekay Corp. | | | Canada | | | | 17,916 | | | | (142,970 | ) |
| | | | | | | | | | | | | | |
| | | | | | | | | | | | | (10,079,275 | ) |
| | | | | | | | | | | | | | |
| | | Paper & Forest Products (0.1)% | | | | | | | | | |
| | Domtar Corp. | | | United States | | | | 9,454 | | | | (454,454 | ) |
| | Louisiana-Pacific Corp. | | | United States | | | | 15,341 | | | | (447,650 | ) |
| | | | | | | | | | | | | | |
| | | | | | | | | | | | | (902,104 | ) |
| | | | | | | | | | | | | | |
| | | Personal Products (0.1)% | | | | | | | | | |
| | Herbalife Nutrition Ltd. | | | United States | | | | 18,688 | | | | (948,790 | ) |
| | | | | | | | | | | | | | |
| | | Pharmaceuticals (0.3)% | | | | | | | | | |
| | Corium International Inc. | | | United States | | | | 12,439 | | | | (106,229 | ) |
| | Dermira Inc. | | | United States | | | | 9,457 | | | | (82,087 | ) |
| | Innoviva Inc. | | | United States | | | | 56,797 | | | | (840,027 | ) |
| | Jazz Pharmaceuticals PLC | | | United States | | | | 1,539 | | | | (260,091 | ) |
| | The Medicines Co. | | | United States | | | | 9,736 | | | | (329,661 | ) |
| | Pacira Pharmaceuticals Inc. | | | United States | | | | 5,947 | | | | (203,685 | ) |
| | Takeda Pharmaceutical Co. Ltd. | | | Japan | | | | 21,299 | | | | (871,657 | ) |
| | Theravance Biopharma Inc. | | | Cayman Islands | | | | 6,466 | | | | (157,382 | ) |
| | | | | | | | | | | | | | |
| | | | | | | | | | | | | (2,850,819 | ) |
| | | | | | | | | | | | | | |
| | | Road & Rail (0.0)%† | | | | | | | | | |
| | Canadian National Railway Co. | | | Canada | | | | 2,219 | | | | (185,242 | ) |
| | Schneider National Inc., B | | | United States | | | | 6,215 | | | | (183,218 | ) |
| | | | | | | | | | | | | | |
| | | | | | | | | | | | | (368,460 | ) |
| | | | | | | | | | | | | | |
| | | | |
| 56 | | Annual Report | | franklintempleton.com |
FRANKLIN ALTERNATIVE STRATEGIES FUNDS
CONSOLIDATED STATEMENT OF INVESTMENTS
Franklin K2 Alternative Strategies Fund (continued)
| | | | | | | | | | | | | | |
| | | | |
| | | | | Country | | | Shares | | | Value | |
| y | | Securities Sold Short (continued) | | | | | | | | | |
| | | Common Stocks (continued) | | | | | | | | | |
| | | Semiconductors & Semiconductor Equipment (0.5)% | | | | | | | | | |
| | Integrated Device Technology Inc. | | | United States | | | | 18,741 | | | $ | (622,951 | ) |
| | Intel Corp. | | | United States | | | | 8,009 | | | | (442,097 | ) |
| | Marvell Technology Group Ltd. | | | Bermuda | | | | 21,970 | | | | (473,234 | ) |
| | Microchip Technology Inc. | | | United States | | | | 6,504 | | | | (633,359 | ) |
| | ON Semiconductor Corp. | | | United States | | | | 64,136 | | | | (1,611,738 | ) |
| | Silicon Laboratories Inc. | | | United States | | | | 2,124 | | | | (224,294 | ) |
| | Teradyne Inc. | | | United States | | | | 21,828 | | | | (827,499 | ) |
| | Veeco Instruments Inc. | | | United States | | | | 7,817 | | | | (133,280 | ) |
| | | | | | | | | | | | | | |
| | | | | | | | | | | | | (4,968,452 | ) |
| | | | | | | | | | | | | | |
| | | Software (0.3)% | | | | | | | | | |
| | Atlassian Corp. PLC | | | Australia | | | | 1,653 | | | | (105,445 | ) |
| | Citrix Systems Inc. | | | United States | | | | 5,541 | | | | (585,241 | ) |
| | FireEye Inc. | | | United States | | | | 4,984 | | | | (83,183 | ) |
| | Guidewire Software Inc. | | | United States | | | | 1,785 | | | | (165,719 | ) |
| | HubSpot Inc. | | | United States | | | | 1,987 | | | | (240,824 | ) |
| | RealPage Inc. | | | United States | | | | 1,529 | | | | (89,829 | ) |
| | ServiceNow Inc. | | | United States | | | | 1,434 | | | | (254,693 | ) |
| | VMware Inc., A | | | United States | | | | 5,910 | | | | (812,507 | ) |
| | Zendesk Inc. | | | United States | | | | 8,434 | | | | (471,376 | ) |
| | | | | | | | | | | | | | |
| | | | | | | | | | | | | (2,808,817 | ) |
| | | | | | | | | | | | | | |
| | | Specialty Retail (0.1)% | | | | | | | | | |
| | Monro Inc. | | | United States | | | | 3,971 | | | | (222,773 | ) |
| | Penske Automotive Group Inc. | | | United States | | | | 10,959 | | | | (527,676 | ) |
| | RH | | | United States | | | | 1,536 | | | | (150,113 | ) |
| | | | | | | | | | | | | | |
| | | | | | | | | | | | | (900,562 | ) |
| | | | | | | | | | | | | | |
| | | Technology Hardware, Storage & Peripherals (0.0)%† | | | | | | | | | |
| | Pure Storage Inc., A | | | United States | | | | 3,546 | | | | (76,097 | ) |
| | | | | | | | | | | | | | |
| | | Thrifts & Mortgage Finance (0.0)%† | | | | | | | | | |
| | LendingTree Inc. | | | United States | | | | 535 | | | | (138,512 | ) |
| | | | | | | | | | | | | | |
| | | Trading Companies & Distributors (0.0)%† | | | | | | | | | |
| | Fastenal Co. | | | United States | | | | 2,221 | | | | (118,224 | ) |
| | Kaman Corp. | | | United States | | | | 4,601 | | | | (325,613 | ) |
| | | | | | | | | | | | | | |
| | | | | | | | | | | | | (443,837 | ) |
| | | | | | | | | | | | | | |
| | | Wireless Telecommunication Services (0.1)% | | | | | | | | | |
| | Sprint Corp. | | | United States | | | | 194,888 | | | | (1,001,724 | ) |
| | | | | | | | | | | | | | |
| | Total Common Stocks (Proceeds $84,409,642) | | | | | | | | | | | (82,983,889 | ) |
| | | | | | | | | | | | | | |
| | | Exchange Traded Funds (12.6)% | | | | | | | | | |
| | Consumer Discretionary Select Sector SPDR Fund | | | United States | | | | 6,971 | | | | (737,253 | ) |
| | ETFMG Prime Cyber Security ETF | | | United States | | | | 79,097 | | | | (2,966,137 | ) |
| | Health Care Select Sector SPDR Fund | | | United States | | | | 32,504 | | | | (2,678,655 | ) |
| | iShares Core S&P Small-Cap ETF | | | United States | | | | 42,156 | | | | (3,492,203 | ) |
| | iShares Edge MSCI USA Momentum Factor ETF | | | United States | | | | 34,501 | | | | (3,799,250 | ) |
| | iShares MSCI Taiwan ETF | | | Taiwan | | | | 40,008 | | | | (1,465,493 | ) |
| | iShares NASDAQ Biotechnology ETF | | | United States | | | | 23,964 | | | | (2,598,896 | ) |
| | iShares North American Tech ETF | | | United States | | | | 36,058 | | | | (6,955,588 | ) |
| | iShares North American Tech-Multimedia Networking ETF | | | United States | | | | 67,781 | | | | (3,471,065 | ) |
| | | | | | |
| franklintempleton.com | | Annual Report | | | 57 | |
FRANKLIN ALTERNATIVE STRATEGIES FUNDS
CONSOLIDATED STATEMENT OF INVESTMENTS
Franklin K2 Alternative Strategies Fund (continued)
| | | | | | | | | | | | | | |
| | | | |
| | | | | Country | | | Shares | | | Value | |
| y | | Securities Sold Short (continued) | | | | | | | | | |
| | | Exchange Traded Funds (continued) | | | | | | | | | |
| | iShares North American Tech-Software ETF | | | United States | | | | 27,799 | | | $ | (5,085,827 | ) |
| | iShares PHLX Semiconductor ETF | | | United States | | | | 59,434 | | | | (11,139,714 | ) |
| | iShares Russell 2000 Growth ETF | | | United States | | | | 21,960 | | | | (4,455,245 | ) |
| | iShares Russell Mid-Cap Growth ETF | | | United States | | | | 11,621 | | | | (1,467,965 | ) |
| | iShares S&P Small-Cap 600 Growth ETF | | | United States | | | | 9,895 | | | | (1,848,881 | ) |
| | iShares STOXX Europe 600 UCITS ETF | | | Germany | | | | 21,428 | | | | (960,678 | ) |
| | iShares U.S. Technology ETF | | | United States | | | | 26,530 | | | | (4,791,584 | ) |
| | PowerShares QQQ Trust Series 1 | | | United States | | | | 25,802 | | | | (4,388,146 | ) |
| | SPDR S&P 500 ETF Trust | | | United States | | | | 257,794 | | | | (69,846,706 | ) |
| | SPDR S&P MidCap 400 ETF Trust | | | United States | | | | 5,818 | | | | (2,062,714 | ) |
| | Vanguard Small-Cap Growth ETF | | | United States | | | | 24,396 | | | | (4,243,440 | ) |
| | | | | | | | | | | | | | |
| | Total Exchange Traded Funds (Proceeds $131,990,916) | | | | | | | | | | | (138,455,440 | ) |
| | | | | | | | | | | | | | |
| | | | |
| | | | | | | | Principal
Amount* | | | | |
| | | Convertible Bonds (Proceeds $238,695) (0.0)%† | | | | | | | | | |
| | | Internet & Direct Marketing Retail (0.0)%† | | | | | | | | | |
| | Booking Holdings Inc., senior note, 0.90%, 9/15/21 | | | United States | | | | 199,000 | | | | (244,173 | ) |
| | | | | | | | | | | | | | |
| | | Corporate Bonds and Notes (1.4)% | | | | | | | | | |
| | | Chemicals (0.3)% | | | | | | | | | |
| g | | CVR Partners LP / CVR Nitrogen Finance Corp., senior note, 144A, 9.25%, 6/15/23 | | | United States | | | | 3,068,000 | | | | (3,163,875 | ) |
| | | | | | | | | | | | | | |
| | | Commercial Services & Supplies (0.0)%† | | | | | | | | | |
| g | | West Corp., senior note, 144A, 8.50%, 10/15/25 | | | United States | | | | 505,000 | | | | (470,912 | ) |
| | | | | | | | | | | | | | |
| | | Communications Equipment (0.1)% | | | | | | | | | |
| g | | Plantronics Inc., senior note, 144A, 5.50%, 5/31/23 | | | United States | | | | 482,000 | | | | (480,795 | ) |
| | | | | | | | | | | | | | |
| | | Energy Equipment & Services (0.1)% | | | | | | | | | |
| g | | Precision Drilling Corp., senior note, 144A, 7.125%, 1/15/26 | | | Canada | | | | 797,000 | | | | (814,933 | ) |
| | | | | | | | | | | | | | |
| | | Equity Real Estate Investment Trusts (REITs) (0.0)%† | | | | | | | | | |
| g | | Rayonier AM Products Inc., senior bond, 144A, 5.50%, 6/01/24 | | | United States | | | | 176,000 | | | | (167,200 | ) |
| | | | | | | | | | | | | | |
| | | Health Care Providers & Services (0.1)% | | | | | | | | | |
| g | | West Street Merger Sub Inc., senior note, 144A, 6.375%, 9/01/25 | | | United States | | | | 564,000 | | | | (541,440 | ) |
| | | | | | | | | | | | | | |
| | | Hotels, Restaurants & Leisure (0.1)% | | | | | | | | | |
| g | | CRC Escrow Issuer LLC / CRC Finco Inc., senior note, 144A, 5.25%, 10/15/25 | | | United States | | | | 1,199,000 | | | | (1,151,040 | ) |
| | | | | | | | | | | | | | |
| | | Internet Software & Services (0.1)% | | | | | | | | | |
| g | | GTT Communications Inc., senior note, 144A, 7.875%, 12/31/24 | | | United States | | | | 1,354,000 | | | | (1,360,770 | ) |
| | | | | | | | | | | | | | |
| | | Pharmaceuticals (0.6)% | | | | | | | | | |
| | Mylan NV, senior note, 3.95%, 6/15/26 | | | United States | | | | 1,063,000 | | | | (1,015,183 | ) |
| | Teva Pharmaceutical Finance Netherlands III BV, | | | | | | | | | | | | |
| | senior bond, 3.15%, 10/01/26 | | | Israel | | | | 1,573,000 | | | | (1,272,579 | ) |
| | senior note, 6.75%, 3/01/28 | | | Israel | | | | 4,720,000 | | | | (4,789,001 | ) |
| | | | | | | | | | | | | | |
| | | | | | | | | | | | | (7,076,763 | ) |
| | | | | | | | | | | | | | |
| | Total Corporate Bonds and Notes (Proceeds $15,408,388) | | | | | | | | | | | (15,227,728 | ) |
| | | | | | | | | | | | | | |
| | | | |
| 58 | | Annual Report | | franklintempleton.com |
FRANKLIN ALTERNATIVE STRATEGIES FUNDS
CONSOLIDATED STATEMENT OF INVESTMENTS
Franklin K2 Alternative Strategies Fund (continued)
| | | | | | | | | | | | | | |
| | | | |
| | | | | Country | | | Principal
Amount* | | | Value | |
| | | U.S. Government and Agency Securities (0.1)% | | | |
| | U.S. Treasury Note, | | | | | | | | | | | | |
| | 2.75%, 2/15/28 | | | United States | | | | 808,000 | | | $ | (800,520 | ) |
| | 2.875%, 5/15/28 | | | United States | | | | 539,000 | | | | (540,147 | ) |
| | | | | | | | | | | | | | |
| | Total U.S. Government and Agency Securities
(Proceeds $1,346,654) | | | | | | | | | | | (1,340,667 | ) |
| | | | | | | | | | | | | | |
| | Total Securities Sold Short (Proceeds $233,394,295) | | | | | | | | | | $ | (238,251,897 | ) |
| | | | | | | | | | | | | | |
See Abbreviations on page 92.
*The principal amount is stated in U.S. dollars unless otherwise indicated.
#Notional amount is the number of units specified in the contract, and can include currency units, bushels, shares, pounds, barrels or other units. Currency units are stated in U.S. dollars unless otherwise indicated.
†Rounds to less than 0.1% of net assets.
aA portion or all of the security has been segregated as collateral for securities sold short, open swap contracts, open forward exchange contracts, open futures contracts and open written option contracts. At May 31, 2018, the aggregate value of these securities and/or cash pledged amounted to $226,045,133, representing 20.5% of net assets.
bNon-income producing.
cA portion or all of the security is on loan at May 31, 2018. See Note 1(h).
dSee Note 11 regarding fair value measurements.
eContingent distributions represent the right to receive additional distributions, if any, during the reorganization of the underlying company.
fA portion or all of the security is held in connection with written option contracts open at period end.
gSecurity was purchased pursuant to Rule 144A under the Securities Act of 1933 and may be sold in transactions exempt from registration only to qualified institutional buyers or in public offering registered under the Securities Act of 1933. These securities have been deemed liquid under guidelines approved by the Trust’s Board of Trustees. At May 31, 2018, the net value of these securities was $131,122,076, representing 11.9% of net assets.
hSecurity was purchased pursuant to Regulation S under the Securities Act of 1933, which exempts from registration securities offered and sold outside of the United States. Such a security cannot be sold in the United States without either an effective registration statement filed pursuant to the Securities Act of 1933, or pursuant to an exemption from registration. These securities have been deemed liquid under guidelines approved by the Trust’s Board of Trustees. At May 31, 2018, the aggregate value of these securities was $19,456,009, representing 1.8% of net assets.
iThe coupon rate shown represents the rate at period end.
jIncome may be received in additional securities and/or cash.
kDefaulted security or security for which income has been deemed uncollectible.
lSee Note 1(j) regarding senior floating rate interests.
mSee Note 8 regarding unfunded loan commitments.
nPrincipal amount is stated in 100 Mexican Peso Units.
oThe coupon rate shown represents the rate inclusive of any caps or floors, if applicable, in effect at period end.
pA portion or all of the security purchased on a delayed delivery basis. See Note 1(d).
qAdjustable rate security with an interest rate that is not based on a published reference index and spread. The rate is based on the structure of the agreement and current market conditions. The coupon rate shown represents the rate at period end.
rThe security was issued on a discount basis with no stated coupon rate.
sSee Note 1(h) regarding securities on loan.
tSee Note 3(f) regarding investments in affiliated management investment companies.
uThe rate shown is the annualized seven-day yield at period end.
vA portion or all of the security is owned by K2 Holdings Investment Corp., a wholly-owned subsidiary of the Fund. See Note 1(i).
wSee Note 1(c) regarding joint repurchase agreement.
xSee Note 1(e) regarding written options.
ySee Note 1(g) regarding securities sold short.
| | | | | | |
| franklintempleton.com | | Annual Report | | | 59 | |
FRANKLIN ALTERNATIVE STRATEGIES FUNDS
CONSOLIDATED STATEMENT OF INVESTMENTS
Franklin K2 Alternative Strategies Fund (continued)
At May 31, 2018, the Fund had the following futures contracts outstanding. See Note 1(e).
| | | | | | | | | | | | | | | | | | | | |
| Futures Contracts | | | | | | | | | | | | | | | |
| Description | | Type | | | Number of
Contracts | | | Notional
Amount* | | | Expiration
Date | | | Value/Unrealized
Appreciation
(Depreciation) | |
| Commodity Contractsa | | | | | | | | | | | | | | | | | | | | |
Aluminum | | | Long | | | | 72 | | | $ | 4,136,850 | | | | 6/18/18 | | | $ | 99,641 | |
Aluminum | | | Short | | | | 72 | | | | 4,136,850 | | | | 6/18/18 | | | | (345,640 | ) |
Aluminum | | | Long | | | | 8 | | | | 458,500 | | | | 9/17/18 | | | | (14,105 | ) |
Brent Crude Oil | | | Long | | | | 85 | | | | 6,592,600 | | | | 6/29/18 | | | | (127,999 | ) |
Cocoa | | | Long | | | | 23 | | | | 542,094 | | | | 7/16/18 | | | | (29,592 | ) |
Coffee | | | Short | | | | 13 | | | | 613,762 | | | | 9/18/18 | | | | (17,587 | ) |
Copper | | | Long | | | | 36 | | | | 6,162,750 | | | | 6/18/18 | | | | (157,198 | ) |
Copper | | | Short | | | | 36 | | | | 6,162,750 | | | | 6/18/18 | | | | 25,959 | |
Copper | | | Long | | | | 2 | | | | 342,925 | | | | 9/17/18 | | | | (3,681 | ) |
Copper | | | Short | | | | 2 | | | | 342,925 | | | | 9/17/18 | | | | 126 | |
Corn | | | Long | | | | 71 | | | | 1,398,700 | | | | 7/13/18 | | | | (18,244 | ) |
Cotton No.2 | | | Long | | | | 13 | | | | 595,660 | | | | 12/06/18 | | | | 40,338 | |
Gasoline RBOB | | | Long | | | | 37 | | | | 3,357,417 | | | | 6/29/18 | | | | 27,600 | |
Gold 100 Oz | | | Long | | | | 6 | | | | 782,820 | | | | 8/29/18 | | | | (553 | ) |
Hard Red Winter Wheat | | | Long | | | | 30 | | | | 813,750 | | | | 7/13/18 | | | | 46,507 | |
Low Sulphur Gas Oil | | | Long | | | | 53 | | | | 3,613,275 | | | | 7/12/18 | | | | 104,644 | |
Natural Gas | | | Short | | | | 57 | | | | 1,682,640 | | | | 6/27/18 | | | | (92,939 | ) |
NY Harbor ULSD | | | Long | | | | 25 | | | | 2,314,830 | | | | 6/29/18 | | | | 26,182 | |
Soybean Meal | | | Long | | | | 36 | | | | 1,351,080 | | | | 7/13/18 | | | | (40,428 | ) |
Soybean | | | Long | | | | 37 | | | | 1,884,225 | | | | 7/13/18 | | | | (37,287 | ) |
Sugar | | | Short | | | | 58 | | | | 845,779 | | | | 9/28/18 | | | | (17,389 | ) |
Wheat | | | Long | | | | 49 | | | | 1,289,313 | | | | 7/13/18 | | | | 39,132 | |
WTI Crude Oil | | | Long | | | | 31 | | | | 2,078,240 | | | | 6/20/18 | | | | (112,409 | ) |
Zinc | | | Long | | | | 41 | | | | 3,183,138 | | | | 6/18/18 | | | | (321,856 | ) |
Zinc | | | Short | | | | 41 | | | | 3,183,138 | | | | 6/18/18 | | | | (15,375 | ) |
Zinc | | | Long | | | | 32 | | | | 2,480,000 | | | | 9/17/18 | | | | 3,107 | |
Zinc | | | Short | | | | 32 | | | | 2,480,000 | | | | 9/17/18 | | | | (29,561 | ) |
| | | | | | | | | | | | | | | | | | | | |
| | | | | | | | | | | 62,826,011 | | | | | | | | (968,607 | ) |
| | | | | | | | | | | | | | | | | | | | |
| Equity Contracts | | | | | | | | | | | | | | | | | | | | |
CAC 40 10 Euro Indexa | | | Long | | | | 23 | | | | 1,446,037 | | | | 6/15/18 | | | | (33,368 | ) |
CME E-Mini Russell 2000 Indexa | | | Long | | | | 114 | | | | 9,314,940 | | | | 6/15/18 | | | | 294,548 | |
DAX Indexa | | | Long | | | | 4 | | | | 1,474,398 | | | | 6/15/18 | | | | 54,163 | |
DJIA Mini E-CBOT Indexa | | | Short | | | | 40 | | | | 4,883,400 | | | | 6/15/18 | | | | 40,367 | |
EURO STOXX 50 Indexa | | | Long | | | | 62 | | | | 2,469,418 | | | | 6/15/18 | | | | (92,682 | ) |
EURO STOXX 50 Indexa | | | Short | | | | 267 | | | | 10,634,428 | | | | 6/15/18 | | | | (294,324 | ) |
FTSE 100 Indexa | | | Long | | | | 53 | | | | 5,403,921 | | | | 6/15/18 | | | | 210,106 | |
FTSE 100 Indexa | | | Short | | | | 109 | | | | 11,113,725 | | | | 6/15/18 | | | | (911,345 | ) |
Hang Seng Indexa | | | Long | | | | 2 | | | | 388,834 | | | | 6/28/18 | | | | 2,282 | |
NASDAQ 100 E-Mini Indexa | | | Long | | | | 47 | | | | 6,558,380 | | | | 6/15/18 | | | | 24,518 | |
S&P 500 E-Mini Indexa | | | Short | | | | 64 | | | | 8,657,600 | | | | 6/15/18 | | | | 77,958 | |
SGX Nikkei 225 Stock Indexa | | | Long | | | | 18 | | | | 3,671,646 | | | | 6/07/18 | | | | 79,495 | |
SPI 200 Index | | | Short | | | | 3 | | | | 341,221 | | | | 6/21/18 | | | | (5,452 | ) |
STOXX 600 Banks Index | | | Short | | | | 166 | | | | 1,575,778 | | | | 6/15/18 | | | | 127,906 | |
TOPIX Indexa | | | Long | | | | 51 | | | | 8,178,471 | | | | 6/07/18 | | | | 1,754 | |
| | | | | | | | | | | | | | | | | | | | |
| | | | | | | | | | | 76,112,197 | | | | | | | | (424,074 | ) |
| | | | | | | | | | | | | | | | | | | | |
| Interest Rate Contracts | | | | | | | | | | | | | | | | | | | | |
3 Month Euribora | | | Long | | | | 407 | | | | 119,188,099 | | | | 6/17/19 | | | | 28,216 | |
90 Day Eurodollara | | | Short | | | | 815 | | | | 198,187,625 | | | | 6/17/19 | | | | 952,817 | |
90 Day Sterlinga | | | Long | | | | 318 | | | | 52,355,334 | | | | 6/19/19 | | | | 104,007 | |
Australian 10 Yr. Bonda | | | Long | | | | 20 | | | | 1,952,484 | | | | 6/15/18 | | | | 21,906 | |
Euro BUXL 30 Yr. Bond | | | Short | | | | 9 | | | | 1,796,633 | | | | 6/07/18 | | | | (92,887 | ) |
Euro-BOBL | | | Short | | | | 5 | | | | 774,667 | | | | 6/07/18 | | | | (13,911 | ) |
| | | | |
| 60 | | Annual Report | | franklintempleton.com |
FRANKLIN ALTERNATIVE STRATEGIES FUNDS
CONSOLIDATED STATEMENT OF INVESTMENTS
Franklin K2 Alternative Strategies Fund (continued)
| | | | | | | | | | | | | | | | | | | | |
| Futures Contracts (continued) | | | | | | | | | | | | | | | |
| Description | | Type | | | Number of
Contracts | | | Notional
Amount* | | | Expiration
Date | | | Value/Unrealized
Appreciation
(Depreciation) | |
| Interest Rate Contracts (continued) | | | | | | | | | | | | | | | | | | | | |
Euro-BTP | | | Short | | | | 2 | | | $ | 295,090 | | | | 6/07/18 | | | $ | 30,304 | |
Euro-Bunda | | | Long | | | | 30 | | | | 5,686,462 | | | | 6/07/18 | | | | 11,565 | |
Euro-Bund | | | Short | | | | 10 | | | | 1,895,488 | | | | 6/07/18 | | | | (32,202 | ) |
Euro-Bunda | | | Long | | | | 17 | | | | 3,221,136 | | | | 9/06/18 | | | | 7,186 | |
Long Gilta | | | Long | | | | 12 | | | | 1,969,452 | | | | 9/26/18 | | | | 34,611 | |
U.S. Treasury 5 Yr. Note | | | Short | | | | 62 | | | | 7,061,218 | | | | 9/28/18 | | | | (9,479 | ) |
U.S. Treasury 10 Yr. Note | | | Long | | | | 58 | | | | 6,985,375 | | | | 9/19/18 | | | | 31,982 | |
U.S. Treasury 10 Yr. Notea | | | Short | | | | 55 | | | | 6,624,063 | | | | 9/19/18 | | | | (52,580 | ) |
U.S. Treasury Long Bonda | | | Short | | | | 64 | | | | 9,288,000 | | | | 9/19/18 | | | | (196,672 | ) |
U.S. Treasury Ultra Bond | | | Short | | | | 18 | | | | 2,871,000 | | | | 9/19/18 | | | | (10,238 | ) |
| | | | | | | | | | | | | | | | | | | | |
| | | | | | | | | | | 420,152,126 | | | | | | | | 814,625 | |
| | | | | | | | | | | | | | | | | | | | |
Total Futures Contracts | | | $ | (578,056 | ) |
| | | | | | | | | | | | | | | | | | | | |
*As of period end.
aA portion or all of the contracts are owned by K2 Holdings Investment Corp., a wholly-owned subsidiary of the Fund. See Note 1(i).
At May 31, 2018, the Fund had the following forward exchange contracts outstanding. See Note 1(e).
| | | | | | | | | | | | | | | | | | | | | | | | | | | | | | | | |
| Forward Exchange Contracts | | | | | | | | | | | | | | | | | | | |
| Currency | | Counterpartya | | | Type | | | Quantity | | | Contract
Amount* | | | Settlement
Date | | | Unrealized
Appreciation | | | Unrealized
Depreciation | |
| OTC Forward Exchange Contracts | | | | | | | | | | | | | | | | | |
Argentine Peso | | | JPHQ | | | | Sell | | | | 20,633,151 | | | | 978,144 | | | | | | | | 6/04/18 | | | $ | 154,993 | | | $ | — | |
Brazilian Real | | | JPHQ | | | | Buy | | | | 12,241,954 | | | | 3,398,029 | | | | | | | | 6/04/18 | | | | 5,053 | | | | (117,098 | ) |
Brazilian Real | | | JPHQ | | | | Sell | | | | 12,241,954 | | | | 3,326,604 | | | | | | | | 6/04/18 | | | | 45,673 | | | | (5,053 | ) |
Brazilian Real | | | MSCS | | | | Buy | | | | 95,000 | | | | 26,077 | | | | | | | | 6/04/18 | | | | — | | | | (577 | ) |
Brazilian Real | | | MSCS | | | | Sell | | | | 95,000 | | | | 26,956 | | | | | | | | 6/04/18 | | | | 1,456 | | | | — | |
British Pound | | | UBSW | | | | Sell | | | | 793,920 | | | | 905,000 | | | | EUR | | | | 6/04/18 | | | | 6,207 | | | | (3,498 | ) |
Euro | | | UBSW | | | | Sell | | | | 905,000 | | | | 796,237 | | | | GBP | | | | 6/04/18 | | | | 23,447 | | | | (23,076 | ) |
Chinese Yuan | | | MSCS | | | | Buy | | | | 950,000 | | | | 149,721 | | | | | | | | 6/04/18 | | | | — | | | | (1,330 | ) |
Chinese Yuan | | | MSCS | | | | Sell | | | | 950,000 | | | | 147,975 | | | | | | | | 6/04/18 | | | | — | | | | (416 | ) |
Euro | | | GSCO | | | | Buy | | | | 60,000 | | | | 71,998 | | | | | | | | 6/04/18 | | | | — | | | | (1,832 | ) |
Euro | | | GSCO | | | | Sell | | | | 60,000 | | | | 71,985 | | | | | | | | 6/04/18 | | | | 1,819 | | | | — | |
New Israeli Shekel | | | DBAB | | | | Sell | | | | 130,000 | | | | 35,906 | | | | | | | | 6/04/18 | | | | — | | | | (573 | ) |
Philippine Peso | | | MSCS | | | | Buy | | | | 3,255,000 | | | | 62,753 | | | | | | | | 6/04/18 | | | | — | | | | (809 | ) |
South Korean Won | | | JPHQ | | | | Buy | | | | 957,764,722 | | | | 890,944 | | | | | | | | 6/04/18 | | | | — | | | | (2,317 | ) |
South Korean Won | | | JPHQ | | | | Sell | | | | 957,764,722 | | | | 892,106 | | | | | | | | 6/04/18 | | | | 3,479 | | | | — | |
Chinese Yuan | | | DBAB | | | | Buy | | | | 855,000 | | | | 133,871 | | | | | | | | 6/07/18 | | | | — | | | | (336 | ) |
Czech Koruna | | | GSCO | | | | Buy | | | | 1,070,000 | | | | 50,363 | | | | | | | | 6/07/18 | | | | — | | | | (1,901 | ) |
Czech Koruna | | | GSCO | | | | Sell | | | | 1,070,000 | | | | 49,663 | | | | | | | | 6/07/18 | | | | 1,201 | | | | — | |
Japanese Yen | | | HSBC | | | | Buy | | | | 6,690,000 | | | | 61,323 | | | | | | | | 6/07/18 | | | | 206 | | | | — | |
Malaysian Ringgit | | | MSCS | | | | Buy | | | | 270,000 | | | | 68,320 | | | | | | | | 6/07/18 | | | | — | | | | (494 | ) |
Peruvian Nuevo Sol | | | JPHQ | | | | Buy | | | | 2,764,571 | | | | 841,574 | | | | | | | | 6/07/18 | | | | 3,052 | | | | — | |
Peruvian Nuevo Sol | | | JPHQ | | | | Sell | | | | 8,376,372 | | | | 2,557,082 | | | | | | | | 6/07/18 | | | | 418 | | | | (2,468 | ) |
Philippine Peso | | | DBAB | | | | Buy | | �� | | 1,350,000 | | | | 26,062 | | | | | | | | 6/07/18 | | | | — | | | | (375 | ) |
Philippine Peso | | | DBAB | | | | Sell | | | | 1,350,000 | | | | 25,813 | | | | | | | | 6/07/18 | | | | 126 | | | | — | |
Swiss Franc | | | MSCS | | | | Sell | | | | 30,000 | | | | 30,100 | | | | | | | | 6/07/18 | | | | — | | | | (358 | ) |
Argentine Peso | | | MSCS | | | | Buy | | | | 580,000 | | | | 25,607 | | | | | | | | 6/08/18 | | | | — | | | | (2,566 | ) |
Brazilian Real | | | MSCS | | | | Buy | | | | 35,000 | | | | 9,580 | | | | | | | | 6/11/18 | | | | — | | | | (192 | ) |
Brazilian Real | | | MSCS | | | | Sell | | | | 35,000 | | | | 9,703 | | | | | | | | 6/11/18 | | | | 315 | | | | — | |
Canadian Dollar | | | MSCS | | | | Buy | | | | 35,000 | | | | 27,008 | | | | | | | | 6/11/18 | | | | — | | | | (5 | ) |
Canadian Dollar | | | MSCS | | | | Sell | | | | 35,000 | | | | 27,112 | | | | | | | | 6/11/18 | | | | 109 | | | | — | |
Chinese Yuan | | | MSCS | | | | Buy | | | | 235,000 | | | | 36,793 | | | | | | | | 6/11/18 | | | | — | | | | (96 | ) |
Chinese Yuan | | | MSCS | | | | Sell | | | | 235,000 | | | | 36,878 | | | | | | | | 6/11/18 | | | | 181 | | | | — | |
Euro | | | DBAB | | | | Sell | | | | 905,000 | | | | 21,000,887 | | | | MXN | | | | 6/11/18 | | | | 12,924 | | | | (20,982 | ) |
| | | | | | |
| franklintempleton.com | | Annual Report | | | 61 | |
FRANKLIN ALTERNATIVE STRATEGIES FUNDS
CONSOLIDATED STATEMENT OF INVESTMENTS
Franklin K2 Alternative Strategies Fund (continued)
| | | | | | | | | | | | | | | | | | | | | | | | | | | | | | | | |
| Forward Exchange Contracts (continued) | | | | | | | | | | | | | | | | | | | |
| Currency | | Counterpartya | | | Type | | | Quantity | | | Contract
Amount* | | | Settlement
Date | | | Unrealized
Appreciation | | | Unrealized
Depreciation | |
| OTC Forward Exchange Contracts (continued) | | | | | | | | | | | | | | | | | |
Euro | | | MSCS | | | | Buy | | | | 725,000 | | | | 837,350 | | | | | | | | 6/11/18 | | | $ | 10,968 | | | $ | — | |
Euro | | | MSCS | | | | Sell | | | | 725,000 | | | | 863,098 | | | | | | | | 6/11/18 | | | | 14,780 | | | | — | |
Mexican Peso | | | DBAB | | | | Sell | | | | 20,761,967 | | | | 905,000 | | | | EUR | | | | 6/11/18 | | | | 20,013 | | | | — | |
Philippine Peso | | | GSCO | | | | Buy | | | | 3,160,000 | | | | 60,734 | | | | | | | | 6/11/18 | | | | — | | | | (622 | ) |
Polish Zloty | | | MSCS | | | | Sell | | | | 10,305,000 | | | | 2,891,739 | | | | | | | | 6/11/18 | | | | 102,018 | | | | — | |
Chilean Peso | | | DBAB | | | | Buy | | | | 22,015,000 | | | | 35,162 | | | | | | | | 6/14/18 | | | | — | | | | (224 | ) |
Chilean Peso | | | DBAB | | | | Sell | | | | 22,015,000 | | | | 35,182 | | | | | | | | 6/14/18 | | | | 244 | | | | — | |
Indian Rupee | | | UBSW | | | | Buy | | | | 5,895,000 | | | | 87,369 | | | | | | | | 6/14/18 | | | | — | | | | (151 | ) |
Swedish Krona | | | MSCS | | | | Sell | | | | 305,000 | | | | 35,086 | | | | | | | | 6/14/18 | | | | 462 | | | | — | |
Canadian Dollar | | | BNYM | | | | Buy | | | | 1,035,000 | | | | 799,882 | | | | | | | | 6/15/18 | | | | — | | | | (1,283 | ) |
Canadian Dollar | | | BNYM | | | | Sell | | | | 2,415,000 | | | | 1,883,423 | | | | | | | | 6/15/18 | | | | 20,025 | | | | — | |
Colombian Peso | | | MSCS | | | | Buy | | | | 3,266,660,000 | | | | 1,137,852 | | | | | | | | 6/15/18 | | | | — | | | | (8,349 | ) |
Euro | | | BNYM | | | | Sell | | | | 396,000 | | | | 493,048 | | | | | | | | 6/15/18 | | | | 29,540 | | | | — | |
Japanese Yen | | | BNYM | | | | Sell | | | | 256,966,000 | | | | 2,418,572 | | | | | | | | 6/15/18 | | | | 53,845 | | | | — | |
Japanese Yen | | | GSCO | | | | Buy | | | | 2,870,000 | | | | 26,309 | | | | | | | | 6/15/18 | | | | 102 | | | | — | |
Japanese Yen | | | GSCO | | | | Sell | | | | 2,870,000 | | | | 26,053 | | | | | | | | 6/15/18 | | | | — | | | | (358 | ) |
New Zealand Dollar | | | UBSW | | | | Buy | | | | 40,000 | | | | 27,745 | | | | | | | | 6/15/18 | | | | 247 | | | | — | |
New Zealand Dollar | | | UBSW | | | | Sell | | | | 40,000 | | | | 27,453 | | | | | | | | 6/15/18 | | | | — | | | | (539 | ) |
Argentine Peso | | | JPHQ | | | | Sell | | | | 10,598,670 | | | | 403,759 | | | | | | | | 6/18/18 | | | | — | | | | (12,842 | ) |
Indian Rupee | | | JPHQ | | | | Sell | | | | 87,618,299 | | | | 1,287,085 | | | | | | | | 6/18/18 | | | | — | | | | (8,654 | ) |
Malaysian Ringgit | | | UBSW | | | | Buy | | | | 105,000 | | | | 26,478 | | | | | | | | 6/18/18 | | | | — | | | | (110 | ) |
Malaysian Ringgit | | | UBSW | | | | Sell | | | | 105,000 | | | | 26,405 | | | | | | | | 6/18/18 | | | | 37 | | | | — | |
Norwegian Krone | | | GSCO | | | | Sell | | | | 505,000 | | | | 63,296 | | | | | | | | 6/18/18 | | | | 1,534 | | | | — | |
Peruvian Nuevo Sol | | | JPHQ | | | | Sell | | | | 2,848,295 | | | | 867,721 | | | | | | | | 6/18/18 | | | | — | | | | (1,802 | ) |
Russian Ruble | | | MSCS | | | | Sell | | | | 2,060,000 | | | | 33,017 | | | | | | | | 6/18/18 | | | | 91 | | | | — | |
South African Rand | | | MSCS | | | | Buy | | | | 435,000 | | | | 35,342 | | | | | | | | 6/18/18 | | | | — | | | | (1,254 | ) |
South African Rand | | | MSCS | | | | Sell | | | | 435,000 | | | | 34,325 | | | | | | | | 6/18/18 | | | | 237 | | | | — | |
South Korean Won | | | MSCS | | | | Sell | | | | 68,695,000 | | | | 63,709 | | | | | | | | 6/18/18 | | | | — | | | | (57 | ) |
Turkish Lira | | | MSCS | | | | Sell | | | | 120,000 | | | | 26,784 | | | | | | | | 6/18/18 | | | | 473 | | | | — | |
Australian Dollar | | | DBAB | | | | Buy | | | | 1,111,000 | | | | 859,801 | | | | | | | | 6/20/18 | | | | — | | | | (19,504 | ) |
Australian Dollar | | | DBAB | | | | Sell | | | | 1,111,000 | | | | 874,436 | | | | | | | | 6/20/18 | | | | 34,138 | | | | — | |
British Pound | | | BNYM | | | | Sell | | | | 99,478 | | | | 139,867 | | | | | | | | 6/20/18 | | | | 7,484 | | | | — | |
British Pound | | | DBAB | | | | Buy | | | | 2,895,000 | | | | 3,966,479 | | | | | | | | 6/20/18 | | | | 2,622 | | | | (116,510 | ) |
British Pound | | | DBAB | | | | Sell | | | | 1,677,000 | | | | 2,345,277 | | | | | | | | 6/20/18 | | | | 113,841 | | | | (276 | ) |
Chinese Yuan | | | JPHQ | | | | Sell | | | | 7,741,610 | | | | 1,216,966 | | | | | | | | 6/20/18 | | | | 10,540 | | | | — | |
Danish Krone | | | DBAB | | | | Buy | | | | 25,308,000 | | | | 4,065,223 | | | | | | | | 6/20/18 | | | | — | | | | (83,537 | ) |
Danish Krone | | | DBAB | | | | Sell | | | | 25,308,000 | | | | 4,224,736 | | | | | | | | 6/20/18 | | | | 243,049 | | | | — | |
Euro | | | BNYM | | | | Buy | | | | 707,389 | | | | 829,767 | | | | | | | | 6/20/18 | | | | 716 | | | | (2,165 | ) |
Euro | | | BNYM | | | | Sell | | | | 5,083,815 | | | | 6,280,391 | | | | | | | | 6/20/18 | | | | 327,485 | | | | — | |
Euro | | | DBAB | | | | Buy | | | | 7,866,000 | | | | 9,337,997 | | | | | | | | 6/20/18 | | | | — | | | | (127,285 | ) |
Euro | | | DBAB | | | | Sell | | | | 12,225,000 | | | | 15,173,677 | | | | | | | | 6/20/18 | | | | 858,780 | | | | — | |
Euro | | | JPHQ | | | | Buy | | | | 4,741,995 | | | | 5,666,070 | | | | | | | | 6/20/18 | | | | 648 | | | | (114,068 | ) |
Euro | | | JPHQ | | | | Sell | | | | 1,451,911 | | | | 11,100,437 | | | | CNY | | | | 6/20/18 | | | | 42,210 | | | | (12,474 | ) |
Euro | | | JPHQ | | | | Sell | | | | 2,842,826 | | | | 72,303,094 | | | | CZK | | | | 6/20/18 | | | | 194,199 | | | | (245,462 | ) |
Euro | | | JPHQ | | | | Sell | | | | 1,280,664 | | | | 6,006,184 | | | | RON | | | | 6/20/18 | | | | 87,356 | | | | (81,099 | ) |
Euro | | | JPHQ | | | | Sell | | | | 9,159,834 | | | | 11,116,661 | | | | | | | | 6/20/18 | | | | 395,060 | | | | (4,132 | ) |
Indian Rupee | | | JPHQ | | | | Sell | | | | 57,409,428 | | | | 876,480 | | | | | | | | 6/20/18 | | | | 27,676 | | | | — | |
Japanese Yen | | | DBAB | | | | Buy | | | | 71,100,000 | | | | 649,719 | | | | | | | | 6/20/18 | | | | 4,816 | | | | — | |
Japanese Yen | | | DBAB | | | | Sell | | | | 226,700,000 | | | | 2,075,959 | | | | | | | | 6/20/18 | | | | — | | | | (11,004 | ) |
Japanese Yen | | | JPHQ | | | | Buy | | | | 5,899,329 | | | | 55,243 | | | | | | | | 6/20/18 | | | | — | | | | (935 | ) |
Japanese Yen | | | JPHQ | | | | Sell | | | | 5,899,329 | | | | 55,699 | | | | | | | | 6/20/18 | | | | 1,391 | | | | — | |
Mexican Peso | | | JPHQ | | | | Buy | | | | 50,566,601 | | | | 2,669,699 | | | | | | | | 6/20/18 | | | | — | | | | (143,464 | ) |
Mexican Peso | | | JPHQ | | | | Sell | | | | 50,566,601 | | | | 2,726,654 | | | | | | | | 6/20/18 | | | | 200,418 | | | | — | |
Romanian Leu | | | JPHQ | | | | Sell | | | | 9,991,172 | | | | 2,129,683 | | | | EUR | | | | 6/20/18 | | | | 109,148 | | | | (120,346 | ) |
Russian Ruble | | | JPHQ | | | | Buy | | | | 360,892,540 | | | | 5,814,675 | | | | | | | | 6/20/18 | | | | 5,296 | | | | (53,094 | ) |
Russian Ruble | | | JPHQ | | | | Sell | | | | 405,270,637 | | | | 6,817,869 | | | | | | | | 6/20/18 | | | | 341,854 | | | | — | |
Singapore Dollar | | | JPHQ | | | | Buy | | | | 960,175 | | | | 718,640 | | | | | | | | 6/20/18 | | | | — | | | | (1,208 | ) |
| | | | |
| 62 | | Annual Report | | franklintempleton.com |
FRANKLIN ALTERNATIVE STRATEGIES FUNDS
CONSOLIDATED STATEMENT OF INVESTMENTS
Franklin K2 Alternative Strategies Fund (continued)
| | | | | | | | | | | | | | | | | | | | | | | | | | | | | | | | |
| Forward Exchange Contracts (continued) | | | | | | | | | | | | | | | | | | | |
| Currency | | Counterpartya | | | Type | | | Quantity | | | Contract
Amount* | | | Settlement
Date | | | Unrealized
Appreciation | | | Unrealized
Depreciation | |
| OTC Forward Exchange Contracts (continued) | | | | | | | | | | | | | | | | | |
Singapore Dollar | | | JPHQ | | | | Sell | | | | 960,175 | | | | 719,125 | | | | | | | | 6/20/18 | | | $ | 1,693 | | | $ | — | |
South African Rand | | | JPHQ | | | | Buy | | | | 44,008,500 | | | | 3,636,889 | | | | | | | | 6/20/18 | | | | — | | | | (189,233 | ) |
South African Rand | | | JPHQ | | | | Sell | | | | 134,685,164 | | | | 10,908,370 | | | | | | | | 6/20/18 | | | | 367,382 | | | | (10,341 | ) |
Swiss Franc | | | BNYM | | | | Buy | | | | 1,080,066 | | | | 1,086,720 | | | | | | | | 6/20/18 | | | | 15,876 | | | | (4,690 | ) |
Swiss Franc | | | BNYM | | | | Sell | | | | 2,037,542 | | | | 2,141,462 | | | | | | | | 6/20/18 | | | | 71,262 | | | | (997 | ) |
Turkish Lira | | | JPHQ | | | | Buy | | | | 30,667,235 | | | | 7,171,997 | | | | | | | | 6/20/18 | | | | 2,100 | | | | (455,570 | ) |
Turkish Lira | | | JPHQ | | | | Sell | | | | 30,626,736 | | | | 7,219,860 | | | | | | | | 6/20/18 | | | | 510,205 | | | | — | |
British Pound | | | MSCS | | | | Sell | | | | 100,000 | | | | 135,124 | | | | | | | | 6/21/18 | | | | 2,040 | | | | — | |
Indian Rupee | | | JPHQ | | | | Buy | | | | 58,869,995 | | | | 860,195 | | | | | | | | 6/21/18 | | | | 10,105 | | | | — | |
Indian Rupee | | | JPHQ | | | | Sell | | | | 58,869,995 | | | | 863,893 | | | | | | | | 6/21/18 | | | | — | | | | (6,407 | ) |
Indonesian Rupiah | | | JPHQ | | | | Buy | | | | 24,187,817,884 | | | | 1,720,940 | | | | | | | | 6/21/18 | | | | 15,528 | | | | — | |
Taiwan Dollar | | | JPHQ | | | | Sell | | | | 59,392,298 | | | | 1,987,827 | | | | | | | | 6/21/18 | | | | 2,383 | | | | — | |
Australian Dollarb | | | MSCO | | | | Buy | | | | 6,486,000 | | | | 5,080,921 | | | | | | | | 6/22/18 | | | | 1,202 | | | | (176,418 | ) |
Australian Dollarb | | | MSCO | | | | Sell | | | | 18,231,000 | | | | 13,819,034 | | | | | | | | 6/22/18 | | | | 82,361 | | | | (52,400 | ) |
British Pound | | | BNYM | | | | Sell | | | | 4,503,591 | | | | 6,132,713 | | | | | | | | 6/22/18 | | | | 138,813 | | | | — | |
British Poundb | | | MSCO | | | | Buy | | | | 14,250,000 | | | | 19,967,404 | | | | | | | | 6/22/18 | | | | — | | | | (1,001,851 | ) |
British Poundb | | | MSCO | | | | Sell | | | | 8,343,000 | | | | 11,306,930 | | | | | | | | 6/22/18 | | | | 205,059 | | | | (1,959 | ) |
Canadian Dollarb | | | MSCO | | | | Buy | | | | 7,343,000 | | | | 5,731,370 | | | | | | | | 6/22/18 | | | | 2,443 | | | | (66,820 | ) |
Canadian Dollarb | | | MSCO | | | | Sell | | | | 22,533,000 | | | | 17,486,947 | | | | | | | | 6/22/18 | | | | 99,889 | | | | (2,880 | ) |
Czech Koruna | | | MSCS | | | | Buy | | | | 550,000 | | | | 25,232 | | | | | | | | 6/22/18 | | | | — | | | | (297 | ) |
Czech Koruna | | | MSCS | | | | Sell | | | | 550,000 | | | | 25,289 | | | | | | | | 6/22/18 | | | | 354 | | | | — | |
Euro | | | BNYM | | | | Sell | | | | 14,048,408 | | | | 16,741,079 | | | | | | | | 6/22/18 | | | | 288,378 | | | | — | |
Eurob | | | MSCO | | | | Buy | | | | 14,706,000 | | | | 18,278,762 | | | | | | | | 6/22/18 | | | | 1,536 | | | | (1,057,464 | ) |
Eurob | | | MSCO | | | | Sell | | | | 26,017,000 | | | | 31,120,097 | | | | | | | | 6/22/18 | | | | 662,581 | | | | (12,116 | ) |
Hong Kong Dollar | | | BNYM | | | | Sell | | | | 19,791,000 | | | | 2,524,114 | | | | | | | | 6/22/18 | | | | — | | | | (833 | ) |
Indian Rupee | | | JPHQ | | | | Buy | | | | 59,108,704 | | | | 863,746 | | | | | | | | 6/22/18 | | | | 9,984 | | | | — | |
Indian Rupee | | | JPHQ | | | | Sell | | | | 59,108,704 | | | | 863,973 | | | | | | | | 6/22/18 | | | | — | | | | (9,757 | ) |
Japanese Yenb | | | MSCO | | | | Buy | | | | 3,748,877,000 | | | | 34,923,252 | | | | | | | | 6/22/18 | | | | 55,092 | | | | (461,781 | ) |
Japanese Yenb | | | MSCO | | | | Sell | | | | 2,057,150,000 | | | | 18,921,363 | | | | | | | | 6/22/18 | | | | 111,999 | | | | (131,174 | ) |
Mexican Pesob | | | MSCO | | | | Buy | | | | 154,761,000 | | | | 8,298,375 | | | | | | | | 6/22/18 | | | | — | | | | (569,526 | ) |
Mexican Pesob | | | MSCO | | | | Sell | | | | 92,546,000 | | | | 4,834,185 | | | | | | | | 6/22/18 | | | | 212,540 | | | | (154 | ) |
New Zealand Dollarb | | | MSCO | | | | Buy | | | | 5,584,000 | | | | 4,074,309 | | | | | | | | 6/22/18 | | | | 44 | | | | (166,629 | ) |
New Zealand Dollarb | | | MSCO | | | | Sell | | | | 5,959,000 | | | | 4,138,577 | | | | | | | | 6/22/18 | | | | 6,724 | | | | (38,297 | ) |
Polish Zloty | | | UBSW | | | | Buy | | | | 95,000 | | | | 25,588 | | | | | | | | 6/22/18 | | | | 136 | | | | — | |
Polish Zloty | | | UBSW | | | | Sell | | | | 95,000 | | | | 26,037 | | | | | | | | 6/22/18 | | | | 313 | | | | — | |
South Korean Won | | | MSCS | | | | Buy | | | | 27,155,000 | | | | 25,146 | | | | | | | | 6/22/18 | | | | 64 | | | | — | |
South Korean Won | | | MSCS | | | | Sell | | | | 27,155,000 | | | | 25,113 | | | | | | | | 6/22/18 | | | | — | | | | (97 | ) |
Swiss Franc | | | BNYM | | | | Buy | | | | 693,907 | | | | 694,470 | | | | | | | | 6/22/18 | | | | 11,030 | | | | — | |
Swiss Franc | | | BNYM | | | | Sell | | | | 295,000 | | | | 298,637 | | | | | | | | 6/22/18 | | | | — | | | | (1,292 | ) |
Swiss Francb | | | MSCO | | | | Buy | | | | 4,409,000 | | | | 4,638,263 | | | | | | | | 6/22/18 | | | | 6,905 | | | | (162,504 | ) |
Swiss Francb | | | MSCO | | | | Sell | | | | 11,942,000 | | | | 12,290,288 | | | | | | | | 6/22/18 | | | | 173,219 | | | | (24,451 | ) |
British Pound | | | DBAB | | | | Sell | | | | 481,000 | | | | 646,955 | | | | | | | | 6/25/18 | | | | 6,681 | | | | — | |
Colombian Peso | | | MSCS | | | | Buy | | | | 95,935,000 | | | | 33,602 | | | | | | | | 6/25/18 | | | | — | | | | (444 | ) |
Japanese Yen | | | HSBC | | | | Sell | | | | 2,805,000 | | | | 25,523 | | | | | | | | 6/25/18 | | | | — | | | | (309 | ) |
Swiss Franc | | | MSCS | | | | Sell | | | | 60,000 | | | | 60,568 | | | | | | | | 6/25/18 | | | | — | | | | (452 | ) |
Euro | | | BOFA | | | | Buy | | | | 3,360,000 | | | | 3,884,714 | | | | | | | | 6/28/18 | | | | 52,252 | | | | — | |
Euro | | | BOFA | | | | Sell | | | | 3,360,000 | | | | 3,923,472 | | | | | | | | 6/28/18 | | | | — | | | | (13,494 | ) |
Euro | | | DBAB | | | | Sell | | | | 183,000 | | | | 213,762 | | | | | | | | 6/28/18 | | | | — | | | | (662 | ) |
Australian Dollar | | | BNYM | | | | Sell | | | | 60,000 | | | | 46,399 | | | | | | | | 6/29/18 | | | | 1,016 | | | | — | |
British Pound | | | BNYM | | | | Sell | | | | 1,297,000 | | | | 1,853,530 | | | | | | | | 6/29/18 | | | | 126,684 | | | | — | |
British Pound | | | MSCO | | | | Buy | | | | 68,879 | | | | 91,364 | | | | | | | | 6/29/18 | | | | 343 | | | | — | |
British Pound | | | MSCO | | | | Sell | | | | 386,358 | | | | 540,477 | | | | | | | | 6/29/18 | | | | 26,074 | | | | — | |
British Pound | | | MSCS | | | | Buy | | | | 20,000 | | | | 26,803 | | | | | | | | 6/29/18 | | | | — | | | | (175 | ) |
Canadian Dollar | | | BNYM | | | | Sell | | | | 484,000 | | | | 376,293 | | | | | | | | 6/29/18 | | | | 2,686 | | | | — | |
Canadian Dollar | | | MSCO | | | | Buy | | | | 1,416,370 | | | | 1,102,681 | | | | | | | | 6/29/18 | | | | 702 | | | | (10,067 | ) |
Canadian Dollar | | | MSCO | | | | Sell | | | | 10,565,789 | | | | 8,363,775 | | | | | | | | 6/29/18 | | | | 207,880 | | | | — | |
Colombian Peso | | | MSCS | | | | Sell | | | | 780,000,000 | | | | 272,251 | | | | | | | | 6/29/18 | | | | 2,706 | | | | — | |
| | | | | | |
| franklintempleton.com | | Annual Report | | | 63 | |
FRANKLIN ALTERNATIVE STRATEGIES FUNDS
CONSOLIDATED STATEMENT OF INVESTMENTS
Franklin K2 Alternative Strategies Fund (continued)
| | | | | | | | | | | | | | | | | | | | | | | | | | | | | | | | |
| Forward Exchange Contracts (continued) | | | | | | | | | | | | | | | | | | | |
| Currency | | Counterpartya | | | Type | | | Quantity | | | Contract
Amount* | | | Settlement
Date | | | Unrealized
Appreciation | | | Unrealized
Depreciation | |
| OTC Forward Exchange Contracts (continued) | | | | | | | | | | | | | | | | | |
Danish Krone | | | BNYM | | | | Sell | | | | 6,855,458 | | | | 1,152,436 | | | | | | | | 6/29/18 | | | $ | 73,068 | | | $ | — | |
Euro | | | BNYM | | | | Buy | | | | 1,329,307 | | | | 1,569,779 | | | | | | | | 6/29/18 | | | | — | | | | (12,082 | ) |
Euro | | | BNYM | | | | Sell | | | | 6,629,000 | | | | 8,271,466 | | | | | | | | 6/29/18 | | | | 503,526 | | | | — | |
Euro | | | DBAB | | | | Buy | | | | 25,000 | | | | 29,122 | | | | | | | | 6/29/18 | | | | 173 | | | | — | |
Euro | | | DBAB | | | | Sell | | | | 25,000 | | | | 29,417 | | | | | | | | 6/29/18 | | | | 122 | | | | — | |
Euro | | | MSCO | | | | Buy | | | | 129,098 | | | | 152,745 | | | | | | | | 6/29/18 | | | | — | | | | (1,466 | ) |
Euro | | | MSCO | | | | Sell | | | | 915,937 | | | | 1,116,520 | | | | | | | | 6/29/18 | | | | 43,216 | | | | — | |
Hong Kong Dollar | | | BNYM | | | | Buy | | | | 281,000 | | | | 35,913 | | | | | | | | 6/29/18 | | | | — | | | | (56 | ) |
Indian Rupee | | | DBAB | | | | Sell | | | | 5,210,000 | | | | 75,831 | | | | | | | | 6/29/18 | | | | — | | | | (1,121 | ) |
Indonesian Rupiah | | | DBAB | | | | Sell | | | | 352,660,000 | | | | 25,029 | | | | | | | | 6/29/18 | | | | — | | | | (265 | ) |
Japanese Yen | | | MSCO | | | | Buy | | | | 54,541,200 | | | | 498,699 | | | | | | | | 6/29/18 | | | | 3,727 | | | | — | |
Japanese Yen | | | MSCO | | | | Sell | | | | 47,629,376 | | | | 442,472 | | | | | | | | 6/29/18 | | | | 4,035 | | | | (318 | ) |
South African Rand | | | MSCS | | | | Sell | | | | 30,985,000 | | | | 2,442,707 | | | | | | | | 6/29/18 | | | | 18,303 | | | | — | |
South Korean Won | | | MSCO | | | | Buy | | | | 295,953,750 | | | | 278,475 | | | | | | | | 6/29/18 | | | | — | | | | (3,652 | ) |
South Korean Won | | | MSCO | | | | Sell | | | | 295,953,750 | | | | 276,467 | | | | | | | | 6/29/18 | | | | 1,643 | | | | — | |
Swedish Krona | | | MSCO | | | | Buy | | | | 4,368,836 | | | | 522,977 | | | | | | | | 6/29/18 | | | | — | | | | (26,403 | ) |
Swedish Krona | | | MSCO | | | | Sell | | | | 1,743,865 | | | | 198,091 | | | | | | | | 6/29/18 | | | | — | | | | (122 | ) |
Swiss Franc | | | MSCO | | | | Buy | | | | 99,898 | | | | 100,497 | | | | | | | | 6/29/18 | | | | 1,137 | | | | — | |
Swiss Franc | | | MSCO | | | | Sell | | | | 437,178 | | | | 452,622 | | | | | | | | 6/29/18 | | | | 7,848 | | | | — | |
Turkish Lira | | | MSCO | | | | Buy | | | | 1,796,562 | | | | 391,702 | | | | | | | | 6/29/18 | | | | 5,673 | | | | (5,239 | ) |
Norwegian Krone | | | MSCS | | | | Sell | | | | 210,000 | | | | 25,599 | | | | | | | | 7/02/18 | | | | — | | | | (99 | ) |
Peruvian Nuevo Sol | | | DBAB | | | | Buy | | | | 275,000 | | | | 83,995 | | | | | | | | 7/02/18 | | | | — | | | | (121 | ) |
Russian Ruble | | | MSCS | | | | Sell | | | | 1,800,000 | | | | 28,823 | | | | | | | | 7/02/18 | | | | 100 | | | | — | |
Brazilian Real | | | JPHQ | | | | Buy | | | | 3,064,102 | | | | 837,816 | | | | | | | | 7/03/18 | | | | — | | | | (17,680 | ) |
Euro | | | DBAB | | | | Buy | | | | 105,000 | | | | 130,360 | | | | | | | | 7/03/18 | | | | — | | | | (7,280 | ) |
Euro | | | DBAB | | | | Sell | | | | 105,000 | | | | 130,116 | | | | | | | | 7/03/18 | | | | 7,036 | | | | — | |
Chinese Yuan | | | MSCS | | | | Buy | | | | 950,000 | | | | 147,699 | | | | | | | | 7/05/18 | | | | 509 | | | | — | |
New Israeli Shekel | | | DBAB | | | | Sell | | | | 130,000 | | | | 36,523 | | | | | | | | 7/05/18 | | | | — | | | | (40 | ) |
Philippine Peso | | | MSCS | | | | Buy | | | | 3,255,000 | | | | 61,706 | | | | | | | | 7/05/18 | | | | 130 | | | | — | |
Taiwan Dollar | | | MSCS | | | | Sell | | | | 760,000 | | | | 25,384 | | | | | | | | 7/05/18 | | | | — | | | | (51 | ) |
Egyptian Pound | | | BZWS | | | | Sell | | | | 17,599,307 | | | | 953,498 | | | | | | | | 8/16/18 | | | | — | | | | (8,690 | ) |
Egyptian Pound | | | BZWS | | | | Sell | | | | 3,962,443 | | | | 215,116 | | | | | | | | 8/23/18 | | | | — | | | | (1,076 | ) |
Chinese Yuan | | | JPHQ | | | | Buy | | | | 4,755,624 | | | | 746,320 | | | | | | | | 8/24/18 | | | | — | | | | (7,401 | ) |
Taiwan Dollar | | | JPHQ | | | | Sell | | | | 22,139,573 | | | | 746,320 | | | | | | | | 8/24/18 | | | | 2,245 | | | | — | |
Egyptian Pound | | | JPHQ | | | | Sell | | | | 1,446,716 | | | | 77,780 | | | | | | | | 8/27/18 | | | | — | | | | (1,061 | ) |
Mexican Peso | | | MSCO | | | | Sell | | | | 33,864,000 | | | | 1,681,774 | | | | | | | | 8/31/18 | | | | 10,756 | | | | — | |
| | | | | | | | | | | | | | | | | | | | | | | | | | | | |
Total Forward Exchange Contracts | | | $ | 7,703,513 | | | $ | (6,084,924 | ) |
| | | | | | | | | | | | | |
Net unrealized appreciation (depreciation) | | | $ | 1,618,589 | | | | | |
| | | | | | | | | | | | | | | | | |
*In U.S. dollars unless otherwise indicated.
aMay be comprised of multiple contracts with the same counterparty, currency and settlement date.
bA portion or all of the contracts are owned by K2 Holdings Investment Corp., a wholly-owned subsidiary of the Fund. See Note 1(i).
| | | | |
| 64 | | Annual Report | | franklintempleton.com |
FRANKLIN ALTERNATIVE STRATEGIES FUNDS
CONSOLIDATED STATEMENT OF INVESTMENTS
Franklin K2 Alternative Strategies Fund (continued)
At May 31, 2018, the Fund had the following credit default swap contracts outstanding. See Note 1(e).
| | | | | | | | | | | | | | | | | | | | | | | | | | | | | | | | | | | | |
| Credit Default Swap Contracts | |
| Description | | Periodic
Payment
Rate
Received
(Paid) | | | Payment
Frequency | | | | | | Maturity
Date | | | Notional
Amounta | | | Value | | | Unamortized
Upfront
Payments
(Receipts) | | | Unrealized
Appreciation
(Depreciation) | | | Ratingb | |
| Centrally Cleared Swap Contracts | | | | | | | | | | | | | | | | | | | | | | | | | |
| | | | | | |
| Contracts to Buy Protectionc | | | | | | | | | | | | | | | | | | | | | | | | | |
| | | | |
| Single Name | | | | | | | | | | | | | | | | | |
Government of Mexico | | | (1.00 | %) | | | Quarterly | | | | | | | | 6/20/23 | | | | 1,744,000 | | | $ | 32,070 | | | $ | 3,310 | | | $ | 28,760 | | | | | |
Government of South Africa | | | (1.00 | %) | | | Quarterly | | | | | | | | 12/20/21 | | | | 2,644,000 | | | | 27,180 | | | | 181,272 | | | | (154,092 | ) | | | | |
Government of South Africa | | | (1.00 | %) | | | Quarterly | | | | | | | | 6/20/22 | | | | 1,495,000 | | | | 24,661 | | | | 77,628 | | | | (52,967 | ) | | | | |
Government of South Korea | | | (1.00 | %) | | | Quarterly | | | | | | | | 12/20/21 | | | | 1,947,567 | | | | (45,250 | ) | | | (56,447 | ) | | | 11,197 | | | | | |
Government of South Korea | | | (1.00 | %) | | | Quarterly | | | | | | | | 12/20/22 | | | | 262,074 | | | | (6,797 | ) | | | (6,260 | ) | | | (537 | ) | | | | |
Government of Turkey | | | (1.00 | %) | | | Quarterly | | | | | | | | 9/20/20 | | | | 1,976,000 | | | | 42,883 | | | | 157,717 | | | | (114,834 | ) | | | | |
Government of Turkey | | | (1.00 | %) | | | Quarterly | | | | | | | | 12/20/20 | | | | 1,723,000 | | | | 43,701 | | | | 104,521 | | | | (60,820 | ) | | | | |
Government of Turkey | | | (1.00 | %) | | | Quarterly | | | | | | | | 12/20/21 | | | | 429,000 | | | | 18,011 | | | | 26,236 | | | | (8,225 | ) | | | | |
| | | | |
| Traded Index | | | | | | | | | | | | | | | | | |
CDX.NA.HY.30 | | | (5.00 | %) | | | Quarterly | | | | | | | | 6/20/23 | | | | 1,875,000 | | | | (116,510 | ) | | | (107,484 | ) | | | (9,026 | ) | | | | |
CDX.NA.IG.30 | | | (1.00 | %) | | | Quarterly | | | | | | | | 6/20/23 | | | | 761,000 | | | | (11,736 | ) | | | 13,603 | | | | (25,339 | ) | | | | |
| | | | | | |
| Contracts to Sell Protectionc,d | | | | | | | | | | | | | | | | | | | | | | | | | |
| | | | | |
| Single Name | | | | | | | | | | | | | | | | | | | | | |
Government of Russia | | | 1.00 | % | | | Quarterly | | | | | | | | 9/20/20 | | | | 2,800,131 | | | | 7,450 | | | | (339,144 | ) | | | 346,594 | | | | BB+ | |
Government of Russia | | | 1.00 | % | | | Quarterly | | | | | | | | 6/20/21 | | | | 413,000 | | | | 240 | | | | (30,563 | ) | | | 30,803 | | | | BB+ | |
Government of Russia | | | 1.00 | % | | | Quarterly | | | | | | | | 12/20/21 | | | | 374,000 | | | | (910 | ) | | | (13,889 | ) | | | 12,979 | | | | BB+ | |
Government of South Africa | | | 1.00 | % | | | Quarterly | | | | | | | | 12/20/22 | | | | 874,000 | | | | (22,414 | ) | | | (17,002 | ) | | | (5,412 | ) | | | BB+ | |
Government of Turkey | | | 1.00 | % | | | Quarterly | | | | | | | | 12/20/22 | | | | 826,000 | | | | (52,059 | ) | | | (37,352 | ) | | | (14,707 | ) | | | BB+ | |
| | | | | | | | | | | | | | | | | | | | | | | | | | | | |
Total Centrally Cleared Swap Contracts | | | $ | (59,480 | ) | | $ | (43,854 | ) | | $ | (15,626 | ) | | | | |
| | | | | | | | | | | | | | | | | | | | | |
| OTC Swap Contracts | | | | | | | | | | | | | | | | | | | | | | | | | |
| | | | | | | | | |
| Contracts to Buy Protectionc | | | | | | | | | | | Counterparty | | | | | | | | | | | | | | | | | | | | | | | | | |
| | | | |
| Single Name | | | | | | | | | | | | | | | | | |
Enel SpA | | | (1.00 | %) | | | Quarterly | | | | BZWS | | | | 12/20/22 | | | | 320,000 | EUR | | | (3,256 | ) | | | (4,908 | ) | | | 1,652 | | | | | |
Government of Turkey | | | (1.00 | %) | | | Quarterly | | | | MSCS | | | | 6/20/23 | | | | 425,000 | | | | 30,772 | | | | 31,291 | | | | (519 | ) | | | | |
| | | | |
| Traded Index | | | | | | | | | | | | | | | | | |
CDX.EM.29 | | | (1.00 | %) | | | Quarterly | | | | MSCS | | | | 6/20/23 | | | | 290,000 | | | | 8,821 | | | | 5,303 | | | | 3,518 | | | | | |
CDX.EM.29 | | | (1.00 | %) | | | Quarterly | | | | MSCS | | | | 6/20/23 | | | | 450,000 | | | | 13,687 | | | | 14,210 | | | | (523 | ) | | | | |
CDX.EM.29 | | | (1.00 | %) | | | Quarterly | | | | MSCS | | | | 6/20/23 | | | | 1,140,000 | | | | 34,674 | | | | 22,766 | | | | 11,908 | | | | | |
iTraxx Asia Ex Japan | | | (1.00 | %) | | | Quarterly | | | | MSCS | | | | 6/20/23 | | | | 455,000 | | | | (5,889 | ) | | | (4,820 | ) | | | (1,069 | ) | | | | |
iTraxx Asia Ex Japan | | | (1.00 | %) | | | Quarterly | | | | MSCS | | | | 6/20/23 | | | | 480,000 | | | | (6,212 | ) | | | (4,751 | ) | | | (1,461 | ) | | | | |
iTraxx Asia Ex Japan | | | (1.00 | %) | | | Quarterly | | | | MSCS | | | | 6/20/23 | | | | 240,000 | | | | (3,106 | ) | | | (2,382 | ) | | | (724 | ) | | | | |
| | | | | | | | | | | | | | | | | | | | | | | | | | | | |
Total OTC Swap Contracts | | | $ | 69,491 | | | $ | 56,709 | | | $ | 12,782 | | | | | |
| | | | | | | | | | | | | | | | | | | | | |
Total Credit Default Swap Contracts | | | $ | 10,011 | | | $ | 12,855 | | | $ | (2,844 | ) | | | | |
| | | | | | | | | | | | | | | | | | | | | |
aIn U.S. dollars unless otherwise indicated. For contracts to sell protection, the notional amount is equal to the maximum potential amount of the future payments and no recourse provisions have been entered into in association with the contracts.
bBased on Standard and Poor’s (S&P) Rating for single name swaps.
cPerformance triggers for settlement of contract include default, bankruptcy or restructuring for single name swaps and failure to pay or bankruptcy of the underlying securities for traded index swaps.
dThe Fund enters contracts to sell protection to create a long credit position.
| | | | | | |
| franklintempleton.com | | Annual Report | | | 65 | |
FRANKLIN ALTERNATIVE STRATEGIES FUNDS
CONSOLIDATED STATEMENT OF INVESTMENTS
Franklin K2 Alternative Strategies Fund (continued)
At May 31, 2018, the Fund had the following interest rate swap contracts outstanding. See Note 1(e).
| | | | | | | | | | | | | | | | | | | | |
| Interest Rate Swap Contracts | | | | | | | | | | | | | | | |
| Description | | Payment
Frequency | | | | | | Maturity
Date | | | Notional
Amount* | | | Value/Unrealized
Appreciation
(Depreciation) | |
| Centrally Cleared Swap Contracts | | | | | | | | | | | | | | | | | |
Receive Fixed rate 2.11%
Pay Floating rate 3 Month USD-LIBOR | | | Quarterly | | | | | | | | 1/05/20 | | | | 57,430,000 | | | $ | (180,274 | ) |
Receive Fixed rate 2.61%
Pay Floating rate 3 Month USD-LIBOR | | | Quarterly | | | | | | | | 4/13/20 | | | | 7,740,000 | | | | (6,222 | ) |
Receive Fixed rate 8.09%
Pay Floating rate BRL-BRLCDI | | | Annually | | | | | | | | 1/04/21 | | | | 14,771,285 | BRL | | | (72,660 | ) |
Receive Fixed rate 8.95%
Pay Floating rate BRL-BRLCDI | | | Annually | | | | | | | | 1/04/21 | | | | 3,530,343 | BRL | | | 4,179 | |
Receive Floating rate 1 Month MXN TIIE
Pay Fixed rate 7.57% | | | Monthly | | | | | | | | 4/19/21 | | | | 44,073,840 | MXN | | | 27,990 | |
Receive Fixed rate 2.10%
Pay Floating rate 3 Month CABA | | | Semi-Annually | | | | | | | | 9/14/21 | | | | 2,900,000 | CAD | | | (20,388 | ) |
Receive Fixed rate 2.11%
Pay Floating rate 3 Month CABA | | | Semi-Annually | | | | | | | | 9/15/21 | | | | 7,000,000 | CAD | | | (46,296 | ) |
Receive Fixed rate 2.12%
Pay Floating rate 3 Month CABA | | | Semi-Annually | | | | | | | | 9/15/21 | | | | 7,000,000 | CAD | | | (45,321 | ) |
Receive Fixed rate 2.07%
Pay Floating rate 3 Month CABA | | | Semi-Annually | | | | | | | | 9/20/21 | | | | 5,360,000 | CAD | | | (41,938 | ) |
Receive Fixed rate 2.12%
Pay Floating rate 3 Month CABA | | | Semi-Annually | | | | | | | | 9/20/21 | | | | 7,000,000 | CAD | | | (44,986 | ) |
Receive Fixed rate 2.37%
Pay Floating rate 3 Month CABA | | | Semi-Annually | | | | | | | | 4/09/22 | | | | 9,077,000 | CAD | | | (12,733 | ) |
Receive Floating rate 6 Month CZK-PRIBOR
Pay Fixed rate 1.64% | | | Annually | | | | | | | | 3/21/23 | | | | 37,444,668 | CZK | | | 2,871 | |
Receive Floating rate 6 Month CZK-PRIBOR
Pay Fixed rate 1.67% | | | Annually | | | | | | | | 3/21/23 | | | | 18,133,702 | CZK | | | 92 | |
Receive Floating rate 6 Month CZK-PRIBOR
Pay Fixed rate 1.74% | | | Annually | | | | | | | | 3/21/23 | | | | 9,453,969 | CZK | | | (1,580 | ) |
Receive Floating rate 6 Month CZK-PRIBOR
Pay Fixed rate 1.80% | | | Annually | | | | | | | | 3/21/23 | | | | 10,930,064 | CZK | | | (3,309 | ) |
Receive Floating rate 6 Month CZK-PRIBOR
Pay Fixed rate 1.86% | | | Annually | | | | | | | | 3/21/23 | | | | 39,226,029 | CZK | | | (17,378 | ) |
Receive Floating rate 6 Month CZK-PRIBOR
Pay Fixed rate 1.84% | | | Annually | | | | | | | | 5/22/23 | | | | 52,105,922 | CZK | | | (18,571 | ) |
Receive Floating rate MIBOR
Pay Fixed rate 6.67% | | | Annually | | | | | | | | 6/20/23 | | | | 68,165,992 | INR | | | 14,995 | |
Receive Fixed rate 10.36%
Pay Floating rate BRL-BRLCDI | | | Annually | | �� | | | | | | 1/02/25 | | | | 9,935,233 | BRL | | | (53,000 | ) |
Receive Floating rate 3 Month CABA
Pay Fixed rate 2.35% | | | Semi-Annually | | | | | | | | 9/14/27 | | | | 1,200,000 | CAD | | | 18,027 | |
Receive Floating rate 3 Month CABA
Pay Fixed rate 2.37% | | | Semi-Annually | | | | | | | | 9/15/27 | | | | 2,800,000 | CAD | | | 40,301 | |
Receive Floating rate 3 Month CABA
Pay Fixed rate 2.37% | | | Semi-Annually | | | | | | | | 9/15/27 | | | | 2,800,000 | CAD | | | 39,300 | |
Receive Floating rate 3 Month CABA
Pay Fixed rate 2.36% | | | Semi-Annually | | | | | | | | 9/20/27 | | | | 2,290,000 | CAD | | | 32,774 | |
Receive Floating rate 3 Month CABA
Pay Fixed rate 2.39% | | | Semi-Annually | | | | | | | | 9/20/27 | | | | 2,800,000 | CAD | | | 35,426 | |
Receive Floating rate 3 Month USD-LIBOR
Pay Fixed rate 2.43% | | | Semi-Annually | | | | | | | | 1/05/28 | | | | 11,380,000 | | | | 349,162 | |
Receive Floating rate 3 Month CABA
Receive Fixed rate 2.56% | | | Semi-Annually | | | | | | | | 4/09/28 | | | | 3,069,000 | CAD | | | 4,554 | |
Receive Floating rate 3 Month USD-LIBOR
Pay Fixed rate 2.83% | | | Semi-Annually | | | | | | | | 4/11/28 | | | | 516,000 | | | | 1,629 | |
| | | | |
| 66 | | Annual Report | | franklintempleton.com |
FRANKLIN ALTERNATIVE STRATEGIES FUNDS
CONSOLIDATED STATEMENT OF INVESTMENTS
Franklin K2 Alternative Strategies Fund (continued)
| | | | | | | | | | | | | | | | | | | | |
| Interest Rate Swap Contracts (continued) | | | | | | | | | | | | | | | |
| Description | | Payment
Frequency | | | | | | Maturity
Date | | | Notional
Amount* | | | Value/Unrealized
Appreciation
(Depreciation) | |
| Centrally Cleared Swap Contracts (continued) | | | | | | | | | | | | | | | | | |
Receive Floating rate 6 Month GBP-LIBOR
Pay Fixed rate 1.56% | | | Semi-Annually | | | | | | | | 11/29/46 | | | | 761,018 | GBP�� | | $ | 11,330 | |
Receive Floating rate 6 Month GBP-LIBOR
Pay Fixed rate 1.60% | | | Semi-Annually | | | | | | | | 12/03/46 | | | | 399,138 | GBP | | | 1,213 | |
Receive Floating rate 6 Month GBP-LIBOR
Pay Fixed rate 1.44% | | | Semi-Annually | | | | | | | | 1/07/47 | | | | 688,548 | GBP | | | 33,833 | |
Receive Floating rate 6 Month GBP-LIBOR
Pay Fixed rate 1.41% | | | Semi-Annually | | | | | | | | 8/04/67 | | | | 133,000 | GBP | | | 4,260 | |
Receive Floating rate 6 Month GBP-LIBOR
Pay Fixed rate 1.34% | | | Semi-Annually | | | | | | | | 12/14/67 | | | | 431,352 | GBP | | | 27,988 | |
Receive Floating rate 6 Month GBP-LIBOR
Pay Fixed rate 1.37% | | | Semi-Annually | | | | | | | | 1/05/67 | | | | 800,000 | GBP | | | 44,065 | |
| | | | | | | | | | | | | | | | | | | | |
Total Centrally Cleared Swap Contracts | | | | 129,333 | |
| | | | | |
| | | | | |
| OTC Swap Contracts | | | | | | | Counterparty | | | | | | | | | | | | | |
Receive Floating rate 3 Month KLIBOR
Pay Fixed rate 4.14% | | | Quarterly | | | | MSCS | | | | 5/18/23 | | | | 2,611,289 | MYR | | | (8,145 | ) |
Receive Floating rate 3 Month KLIBOR
Pay Fixed rate 4.14% | | | Quarterly | | | | BOFA | | | | 5/21/23 | | | | 2,647,855 | MYR | | | (8,222 | ) |
| | | | | | | | | | | | | | | | | | | | |
Total OTC Swap Contracts | | | | (16,367 | ) |
| | | | | |
Total Interest Rate Swap Contracts | | | $ | 112,966 | |
| | | | | |
*In U.S. dollars unless otherwise indicated.
At May 31, 2018, the Fund had the following total return swap contracts outstanding. See Note 1(e).
| | | | | | | | | | | | | | | | | | | | | | | | |
| Total Return Swap Contracts | | | | |
| Underlying Instrument | | Financing Rate | | | Payment
Frequency | | | Counter- party | | | Maturity
Date | | | Notional
Value* | | | Value/Unrealized
Appreciation
(Depreciation) | |
| OTC Swap Contracts | | | | | | | | | | | | | | | | | | | | | | | | |
| Credit Contracts - Shorta | | | | | | | | | | | | | | | | | | | | | | | | |
iBoxx USD Liquid High Yield Index | | | 3-Month LIBOR | | | | Quarterly | | | | MSCS | | | | 6/20/18 | | | | 957,000 | | | $ | (3,026 | ) |
iBoxx USD Liquid High Yield Index | | | 3-Month LIBOR | | | | Quarterly | | | | MSCS | | | | 6/20/18 | | | | 964,000 | | | | 4,538 | |
iBoxx USD Liquid High Yield Index | | | 3-Month LIBOR | | | | Quarterly | | | | JPHQ | | | | 6/20/18 | | | | 629,000 | | | | 2,902 | |
iBoxx USD Liquid High Yield Index | | | 3-Month LIBOR | | | | Quarterly | | | | JPHQ | | | | 6/20/18 | | | | 904,000 | | | | (2,688 | ) |
iBoxx USD Liquid High Yield Index | | | 3-Month LIBOR | | | | Quarterly | | | | JPHQ | | | | 6/20/18 | | | | 742,000 | | | | (923 | ) |
iBoxx USD Liquid High Yield Index | | | 3-Month LIBOR | | | | Quarterly | | | | JPHQ | | | | 6/20/18 | | | | 3,441,000 | | | | (3,437 | ) |
iBoxx USD Liquid High Yield Index | | | 3-Month LIBOR | | | | Quarterly | | | | MSCS | | | | 6/20/18 | | | | 930,000 | | | | (1,893 | ) |
iBoxx USD Liquid High Yield Index | | | 3-Month LIBOR | | | | Quarterly | | | | MSCS | | | | 6/20/18 | | | | 158,000 | | | | (381 | ) |
iBoxx USD Liquid High Yield Index | | | 3-Month LIBOR | | | | Quarterly | | | | JPHQ | | | | 6/20/18 | | | | 1,527,000 | | | | (9,406 | ) |
iBoxx USD Liquid High Yield Index | | | 3-Month LIBOR | | | | Quarterly | | | | MSCS | | | | 6/20/18 | | | | 948,000 | | | | (1,935 | ) |
iBoxx USD Liquid High Yield Index | | | 3-Month LIBOR | | | | Quarterly | | | | JPHQ | | | | 6/20/18 | | | | 1,685,000 | | | | (11,562 | ) |
iBoxx USD Liquid High Yield Index | | | 3-Month LIBOR | | | | Quarterly | | | | JPHQ | | | | 6/20/18 | | | | 2,641,000 | | | | (7,617 | ) |
iBoxx USD Liquid High Yield Index | | | 3-Month LIBOR | | | | Quarterly | | | | JPHQ | | | | 6/20/18 | | | | 822,000 | | | | (8,613 | ) |
iBoxx USD Liquid High Yield Index | | | 3-Month LIBOR | | | | Quarterly | | | | GSCO | | | | 6/20/18 | | | | 858,000 | | | | (9,006 | ) |
iBoxx USD Liquid High Yield Index | | | 3-Month LIBOR | | | | Quarterly | | | | GSCO | | | | 6/20/18 | | | | 977,000 | | | | (6,241 | ) |
| | | | | | | | | | | | | | | | | | | | | | | | |
| | | | (59,288 | ) |
| | | | | |
| | | | | | |
| Equity Contracts - Longb | | | | | | | | | | | | | | | | | | | | | | | | |
Accor SA | | | 1-Month EURIBOR + 0.50% | | | | Monthly | | | | MSCS | | | | 1/10/19 | | | | 872,779 | EUR | | | 209,041 | |
Aetna Inc. | | | 1-Day FEDEF + 0.40% | | | | Monthly | | | | MSCS | | | | 12/20/18 | | | | 4,969,236 | | | | (9,952 | ) |
Air France-KLM | | | 1-Month EURIBOR + 0.50% | | | | Monthly | | | | MSCS | | | | 1/10/19 | | | | 41,078 | EUR | | | (10,215 | ) |
| | | | | | |
| franklintempleton.com | | Annual Report | | | 67 | |
FRANKLIN ALTERNATIVE STRATEGIES FUNDS
CONSOLIDATED STATEMENT OF INVESTMENTS
Franklin K2 Alternative Strategies Fund (continued)
| | | | | | | | | | | | | | | | | | | | | | | | |
| Total Return Swap Contracts (continued) | | | | |
| Underlying Instrument | | Financing Rate | | | Payment
Frequency | | | Counter- party | | | Maturity
Date | | | Notional
Value* | | | Value/Unrealized
Appreciation
(Depreciation) | |
| OTC Swap Contracts (continued) | | | | | | | | | | | | | | | | | | | | | |
| Equity Contracts - Longb (continued) | | | | | | | | | | | | | | | | | | | | | | | | |
Akzo Nobel | | | 1-Day EONIA + 0.65% | | | | Monthly | | | | MSCS | | | | 9/04/19 | | | | 96,454 | EUR | | $ | 132 | |
Alphabet Inc. | | | 1-Month LIBOR + 0.50% | | | | Monthly | | | | MSCS | | | | 9/20/18 | | | | 1,517,537 | | | | 425,418 | |
Altaba Inc. | | | 1-Day FEDEF + 0.40% | | | | Monthly | | | | MSCS | | | | 12/20/18 | | | | 3,132,522 | | | | 1,960,729 | |
AngloAmerican PLC | | | 1-Month LIBOR + 0.50% | | | | Monthly | | | | MSCS | | | | 1/18/19 | | | | 448,109 | GBP | | | 5,217 | |
Anima Holding SpA | | | 1-Month EURIBOR + 0.40% | | | | Monthly | | | | MSCS | | | | 12/19/18 | | | | 53,640 | EUR | | | (11,490 | ) |
Antofagasta PLC | | | 1-Month LIBOR + 0.50% | | | | Monthly | | | | MSCS | | | | 1/18/19 | | | | 403,533 | GBP | | | 235,255 | |
Barclays PLC | | | 1-Month EURIBOR + 0.40% | | | | Monthly | | | | MSCS | | | | 4/12/19 | | | | 960,794 | GBP | | | (99,495 | ) |
BNP Paribas SA | | | 1-Month LIBOR + 0.40% | | | | Monthly | | | | MSCS | | | | 12/19/18 | | | | 2,096,980 | EUR | | | (278,310 | ) |
Caterpillar Inc. | | | 1-Month LIBOR + 0.50% | | | | Monthly | | | | MSCS | | | | 9/20/18 | | | | 2,538,215 | | | | 435,728 | |
Celesio AG | | | 1-Day EONIA + 0.65% | | | | Monthly | | | | MSCS | | | | 11/02/18 | | | | 2,554,175 | EUR | | | 15,174 | |
Christian Dior SE | | | 1-Day EONIA + 0.65% | | | | Monthly | | | | MSCS | | | | 9/04/19 | | | | 1,199,485 | EUR | | | 308,565 | |
Cie Generale des Etablissements Michelin SCA | | | 1-Month EURIBOR + 0.50% | | | | Monthly | | | | MSCS | | | | 1/10/19 | | | | 358,451 | EUR | | | (46,507 | ) |
Croda International PLC | | | 1-Month LIBOR + 0.40% | | | | Monthly | | | | MSCS | | | | 4/12/19 | | | | 46 | GBP | | | — | |
Danone SA | | | 1-Month EURIBOR + 0.40% | | | | Monthly | | | | MSCS | | | | 12/19/18 | | | | 2,933,270 | EUR | | | 8,888 | |
Delta Air Lines Inc. | | | 1-Month LIBOR + 0.50% | | | | Monthly | | | | MSCS | | | | 9/20/18 | | | | 2,930,955 | | | | 88,376 | |
EDP Renovaveis SA | | | 1-Day EONIA + 0.65% | | | | Monthly | | | | MSCS | | | | 9/04/19 | | | | 567,633 | EUR | | | 78,341 | |
Gemalto NV | | | 1-Day EONIA + 0.65% | | | | Monthly | | | | MSCS | | | | 10/30/18 | | | | 997 | EUR | | | 6 | |
Hikma Pharmaceuticals PLC | | | 1-Month LIBOR + 0.40% | | | | Monthly | | | | MSCS | | | | 4/12/19 | | | | 563,559 | GBP | | | 8,072 | |
Iliad SA | | | 1-Month EURIBOR + 0.40% | | | | Monthly | | | | MSCS | | | | 12/19/18 | | | | 3,296,808 | EUR | | | (561,191 | ) |
Innogy SE | | | 1-Day EONIA + 0.65% | | | | Monthly | | | | MSCS | | | | 9/04/19 | | | | 1,622,376 | EUR | | | (14,290 | ) |
ITV PLC | | | 1-Month LIBOR + 0.40% | | | | Monthly | | | | MSCS | | | | 4/12/19 | | | | 1,949,287 | GBP | | | 35,210 | |
Kering | | | 1-Month EURIBOR + 0.50% | | | | Monthly | | | | MSCS | | | | 1/10/19 | | | | 216,169 | EUR | | | 215,552 | |
Knight-Swift Transportation Holdings Inc. | | | 1-Month LIBOR + 0.50% | | | | Monthly | | | | MSCS | | | | 9/20/18 | | | | 1,462,150 | | | | 338,573 | |
Ladbrokes Coral Group PLCc | | | 1-Day SONIA + 0.65% | | | | Monthly | | | | MSCS | | | | 2/06/19 | | | | 1 | GBP | | | 143,899 | |
LafargeHolcim Ltd. | | | 1-Month LIBOR + 0.40% | | | | Monthly | | | | MSCS | | | | 7/26/18 | | | | 3,293,570 | CHF | | | (151,177 | ) |
Las Vegas Sands Corp. | | | 1-Month LIBOR + 0.50% | | | | Monthly | | | | MSCS | | | | 9/20/18 | | | | 1,046,725 | | | | 269,298 | |
Melrose Industries PLC | | | 1-Day SONIA + 0.65% | | | | Monthly | | | | MSCS | | | | 2/06/19 | | | | 519,468 | GBP | | | (68,064 | ) |
Monster Beverage Corp. | | | 1-Month LIBOR + 0.50% | | | | Monthly | | | | MSCS | | | | 9/20/18 | | | | 1,281,524 | | | | 3,867 | |
Nestle SA | | | 1-Month LIBOR + 0.40% | | | | Monthly | | | | MSCS | | | | 7/26/18 | | | | 4,949,716 | CHF | | | (207,482 | ) |
NEX Group PLC | | | 1-Month LIBOR + 0.45% | | | | Monthly | | | | DBAB | | | | 7/03/18 | | | | 2,640,728 | GBP | | | 33,560 | |
NEX Group PLC | | | 1-Day SONIA + 0.65% | | | | Monthly | | | | MSCS | | | | 2/06/19 | | | | 1,082,928 | GBP | | | 25,920 | |
NVR Inc. | | | 1-Month LIBOR + 0.50% | | | | Monthly | | | | MSCS | | | | 9/20/18 | | | | 2,666,764 | | | | 1,780,975 | |
OneMarket Ltd. | | | 1-Month LIBOR + 0.55% | | | | Monthly | | | | MSCS | | | | 2/20/20 | | | | — | | | | 25,007 | |
Orient Overseas International Ltd. | | | 1-Month HIBOR + 0.65% | | | | Monthly | | | | MSCS | | | | 1/16/19 | | | | 8,012,363 | HKD | | | 2,959 | |
Plastic Omnium SA | | | 1-Month EURIBOR + 0.50% | | | | Monthly | | | | MSCS | | | | 1/10/19 | | | | 709,891 | EUR | | | 240,261 | |
Premier Oil PLC | | | 1-Month LIBOR + 0.40% | | | | Monthly | | | | DBAB | | | | 1/17/19 | | | | 32,637 | GBP | | | (462 | ) |
Premier Oil PLC | | | 1-Month LIBOR + 0.40% | | | | Monthly | | | | DBAB | | | | 1/17/19 | | | | 93,352 | GBP | | | (1,322 | ) |
Puma SE | | | 1-Month EURIBOR + 0.50% | | | | Monthly | | | | MSCS | | | | 1/10/19 | | | | — | EUR | | | 41,258 | |
Reckitt Benckiser Group PLC | | | 1-Month LIBOR + 0.40% | | | | Monthly | | | | MSCS | | | | 4/12/19 | | | | 1,354,770 | GBP | | | 8,375 | |
Rio Tinto PLC | | | 1-Month LIBOR + 0.50% | | | | Monthly | | | | MSCS | | | | 9/20/18 | | | | 2,735,536 | | | | 720,520 | |
Rio Tinto PLC | | | 1-Month LIBOR + 0.50% | | | | Monthly | | | | MSCS | | | | 1/18/19 | | | | 775,222 | GBP | | | 209,265 | |
RSA Insurance Group PLC | | | 1-Month LIBOR + 0.40% | | | | Monthly | | | | MSCS | | | | 4/12/19 | | | | 1,204,061 | GBP | | | (9,016 | ) |
RWE AG | | | 1-Day EONIA + 0.65% | | | | Monthly | | | | MSCS | | | | 10/30/18 | | | | 1,550,846 | EUR | | | (73,948 | ) |
Ryanair Holdings PLC | | | 1-Month EURIBOR + 0.40% | | | | Monthly | | | | MSCS | | | | 12/19/18 | | | | 1,301,181 | EUR | | | 80,837 | |
Shire PLC | | | 1-Day FEDEF + 1.25% | | | | Monthly | | | | MSCS | | | | 2/20/20 | | | | 3,232,598 | | | | (102,281 | ) |
Sky PLC | | | 1-Month LIBOR + 0.45% | | | | Monthly | | | | DBAB | | | | 7/03/18 | | | | 3,302,299 | GBP | | | (72,142 | ) |
Sky PLC | | | 1-Day SONIA + 0.65% | | | | Monthly | | | | MSCS | | | | 2/06/19 | | | | 2,717,636 | GBP | | | 1,414,329 | |
Smith & Nephew PLC | | | 1-Month LIBOR + 0.40% | | | | Monthly | | | | MSCS | | | | 4/12/19 | | | | 725,260 | GBP | | | 44,167 | |
Smiths Group PLC | | | 1-Month LIBOR + 0.40% | | | | Monthly | | | | MSCS | | | | 4/12/19 | | | | 1,239,821 | GBP | | | 86,506 | |
Smurfit Kappa Group PLC | | | 1-Month LIBOR + 0.45% | | | | Monthly | | | | DBAB | | | | 6/18/19 | | | | 586,048 | EUR | | | 35,451 | |
Societe Generale SA | | | 1-Month EURIBOR + 0.40% | | | | Monthly | | | | MSCS | | | | 12/19/18 | | | | 1,902,102 | EUR | | | (199,687 | ) |
Sports Direct International PLC | | | 1-Month LIBOR + 0.40% | | | | Monthly | | | | MSCS | | | | 4/12/19 | | | | 785,609 | GBP | | | (16,394 | ) |
Take-Two Interactive Software Inc. | | | 1-Month LIBOR + 0.50% | | | | Monthly | | | | MSCS | | | | 9/20/18 | | | | 1,585,413 | | | | 382,541 | |
| | | | |
| 68 | | Annual Report | | franklintempleton.com |
FRANKLIN ALTERNATIVE STRATEGIES FUNDS
CONSOLIDATED STATEMENT OF INVESTMENTS
Franklin K2 Alternative Strategies Fund (continued)
| | | | | | | | | | | | | | | | | | | | | | | | |
| Total Return Swap Contracts (continued) | | | | |
| Underlying Instrument | | Financing Rate | | | Payment
Frequency | | | Counter- party | | | Maturity
Date | | | Notional
Value* | | | Value/Unrealized
Appreciation
(Depreciation) | |
| OTC Swap Contracts (continued) | | | | | | | | | | | | | | | | | | | | | |
| Equity Contracts - Longb (continued) | | | | | | | | | | | | | | | | | | | | | | | | |
Tencent Holdings Ltd. | | | 1-Day HONIX + 0.95% | | | | Monthly | | | | MSCS | | | | 7/09/19 | | | | 7,362,131 | HKD | | $ | 42,550 | |
Tribune Media Co. | | | 1-Day FEDEF + 0.40% | | | | Monthly | | | | MSCS | | | | 12/21/18 | | | | 1,267,397 | | | | (48,143 | ) |
UBM PLC | | | 1-Month LIBOR + 0.45% | | | | Monthly | | | | DBAB | | | | 7/03/18 | | | | 3,103,328 | GBP | | | 173,195 | |
UBM PLC | | | 1-Day SONIA + 0.65% | | | | Monthly | | | | MSCS | | | | 2/06/19 | | | | 1,606,973 | GBP | | | 235,458 | |
Unibail-Rodamco SE | | | 1-Day FEDEF + 0.65% | | | | Monthly | | | | MSCS | | | | 2/20/20 | | | | — | | | | 400,955 | |
Vodafone Group PLC | | | 1-Day SONIA + 0.65% | | | | Monthly | | | | MSCS | | | | 2/06/19 | | | | 1,552,063 | GBP | | | (236,700 | ) |
| | | | | | | | | | | | | | | | | | | | | | | | |
| | | | 8,551,162 | |
| | | | | | | | | | | | | | | | | | | | | | | | |
| Equity Contracts - Shorta | | | | | | | | | | | | | | | | | | | | | | | | |
Adidas AG | | | 1-Day EONIA - 0.35% | | | | Monthly | | | | MSCS | | | | 12/19/18 | | | | 1,667,750 | EUR | | | (31,441 | ) |
Akamai Technologies Inc. | | | 1-Month LIBOR | | | | Monthly | | | | JPHQ | | | | 6/29/18 | | | | 723,523 | | | | (7,663 | ) |
Alibaba Group Holding Ltd. | | | 1-Day FEDEF - 0.35% | | | | Monthly | | | | MSCS | | | | 12/20/18 | | | | 2,958,816 | | | | (686,598 | ) |
Altaba Inc. | | | 1-Month LIBOR - 0.35% | | | | Monthly | | | | DBAB | | | | 6/15/19 | | | | 815,937 | | | | (7,065 | ) |
AMAG Pharmaceuticals Inc. | | | 1-Month LIBOR - 0.35% | | | | Monthly | | | | DBAB | | | | 6/15/19 | | | | 184,450 | | | | (10,044 | ) |
Apollo Commercial Real Estate Finance Inc. | | | 1-Month LIBOR - 0.35% | | | | Monthly | | | | DBAB | | | | 6/15/19 | | | | 458,808 | | | | (6,948 | ) |
ASM Pacific Technology Ltd. | | | 1-Month LIBOR - 1.00% | | | | Monthly | | | | DBAB | | | | 7/19/18 | | | | 4,545,100 | HKD | | | 14,801 | |
ASM Pacific Technology Ltd. | | | 1-Month HIBOR - 0.75% | | | | Monthly | | | | BNPP | | | | 7/27/18 | | | | 10,547,040 | HKD | | | 2,645 | |
AT&T Inc. | | | 1-Day FEDEF - 0.35% | | | | Monthly | | | | MSCS | | | | 12/20/18 | | | | 390,863 | | | | 50,542 | |
Atlassian Corp. PLC | | | 1-Day FEDEF | | | | Monthly | | | | MSCS | | | | 6/11/18 | | | | 92,918 | | | | (10,575 | ) |
Ayala Land Inc. | | | 1-Month LIBOR - 2.21% | | | | Monthly | | | | DBAB | | | | 7/20/18 | | | | 427,938 | | | | 25,768 | |
Ayala Land Inc. | | | 1-Month LIBOR - 0.40% | | | | Monthly | | | | BNPP | | | | 2/27/19 | | | | 168,568 | | | | 6,034 | |
CME Group Inc. | | | 1-Day SONIA - 0.35% | | | | Monthly | | | | MSCS | | | | 5/19/20 | | | | 569,716 | GBP | | | (23,137 | ) |
Consumer Discretionary Select Sector SPDR ETF | | | 1-Day FEDEF | | | | Monthly | | | | MSCS | | | | 11/08/19 | | | | 1,557,400 | | | | (234,952 | ) |
Consumer Staples Select Sector SPDR ETF | | | 1-Day FEDEF - 0.15% | | | | Monthly | | | | MSCS | | | | 11/08/19 | | | | 703,498 | | | | 17,851 | |
CP All PCL | | | 1-Month LIBOR - 1.00% | | | | Monthly | | | | DBAB | | | | 2/06/19 | | | | 320,388 | | | | 17,607 | |
CP All PCL | | | 1-Month LIBOR - 0.75% | | | | Monthly | | | | BNPP | | | | 3/27/19 | | | | 1,643,861 | | | | 4,680 | |
Ctrip.com International Ltd. | | | 1-Month LIBOR - 0.35% | | | | Monthly | | | | DBAB | | | | 6/15/19 | | | | 151,639 | | | | (7,804 | ) |
CVS Health Corp. | | | 1-Day FEDEF - 0.35% | | | | Monthly | | | | MSCS | | | | 12/20/18 | | | | 857,982 | | | | 18,339 | |
Dassault Aviation SA | | | 1-Month LIBOR - 0.50% | | | | Monthly | | | | DBAB | | | | 4/24/19 | | | | 328,337 | EUR | | | 5,688 | |
DHT Holdings Inc. | | | 1-Month LIBOR - 0.35% | | | | Monthly | | | | DBAB | | | | 6/15/19 | | | | 11,977 | | | | (1,310 | ) |
DISH Network Corp. | | | 1-Month LIBOR - 0.35% | | | | Monthly | | | | DBAB | | | | 6/15/19 | | | | 319,388 | | | | 24,601 | |
El Group PLC | | | 1-Month LIBOR - 0.40% | | | | Monthly | | | | BNPP | | | | 6/27/19 | | | | 199,660 | GBP | | | (10,585 | ) |
Envestnet Inc. | | | 1-Month LIBOR - 0.35% | | | | Monthly | | | | DBAB | | | | 6/15/19 | | | | 96,485 | | | | 2,801 | |
Five9 Inc. | | | 1-Month LIBOR | | | | Monthly | | | | JPHQ | | | | 6/26/18 | | | | 210,380 | | | | (23,383 | ) |
Haitian International Holdings Ltd. | | | 1-Month LIBOR - 0.40% | | | | Monthly | | | | DBAB | | | | 7/19/18 | | | | 2,301,001 | HKD | | | (18,133 | ) |
Haitian International Holdings Ltd. | | | 1-Month HIBOR - 0.40% | | | | Monthly | | | | BNPP | | | | 9/28/18 | | | | 1,096,950 | HKD | | | (6,231 | ) |
Hannon Armstrong Sustainable Infrastructure Capital Inc. | | | 1-Month LIBOR - 0.35% | | | | Monthly | | | | DBAB | | | | 6/15/19 | | | | 237,283 | | | | 7,286 | |
Hurricane Energy PLC | | | 1-Month LIBOR - 0.60% | | | | Monthly | | | | BNPP | | | | 12/31/18 | | | | 330,599 | | | | (10,930 | ) |
IHH Healthcare Bhd | | | 1-Month LIBOR - 3.11% | | | | Monthly | | | | DBAB | | | | 9/20/18 | | | | 212,521 | SGD | | | 796 | |
Informa PLC | | | 1-Month LIBOR - 0.40% | | | | Monthly | | | | DBAB | | | | 7/03/18 | | | | 2,580,233 | GBP | | | (172,260 | ) |
Informa PLC | | | 1-Day SONIA - 0.35% | | | | Monthly | | | | MSCS | | | | 9/04/19 | | | | 1,315,492 | GBP | | | (247,406 | ) |
Insulet Corp. | | | 1-Month LIBOR - 0.35% | | | | Monthly | | | | DBAB | | | | 6/15/19 | | | | 870,331 | | | | (68,328 | ) |
InterDigital Inc. | | | 1-Month LIBOR - 0.35% | | | | Monthly | | | | DBAB | | | | 6/15/19 | | | | 1,097,296 | | | | 6,156 | |
Invacare Corp. | | | 1-Month LIBOR - 0.35% | | | | Monthly | | | | DBAB | | | | 6/15/19 | | | | 743,730 | | | | 26,514 | |
iShares STOXX Europe 600 UCITS ETF | | | 1-Day EONIA - 0.63% | | | | Monthly | | | | MSCS | | | | 1/10/19 | | | | 16,928 | EUR | | | (312 | ) |
j2 Global Inc. | | | 1-Month LIBOR - 0.35% | | | | Monthly | | | | DBAB | | | | 6/15/19 | | | | 2,040,435 | | | | 17,961 | |
Larsen & Toubro Ltd. | | | 1-Month LIBOR - 2.50% | | | | Monthly | | | | DBAB | | | | 3/19/19 | | | | 182,066 | | | | (1,922 | ) |
Liberty Media Corp-Liberty Formula One | | | 1-Month LIBOR - 0.35% | | | | Monthly | | | | DBAB | | | | 6/15/19 | | | | 590,010 | | | | (24,989 | ) |
| | | | | | |
| franklintempleton.com | | Annual Report | | | 69 | |
FRANKLIN ALTERNATIVE STRATEGIES FUNDS
CONSOLIDATED STATEMENT OF INVESTMENTS
Franklin K2 Alternative Strategies Fund (continued)
| | | | | | | | | | | | | | | | | | | | | | | | |
| Total Return Swap Contracts (continued) | | | | |
| Underlying Instrument | | Financing Rate | | | Payment
Frequency | | | Counter- party | | | Maturity
Date | | | Notional
Value* | | | Value/Unrealized
Appreciation
(Depreciation) | |
| OTC Swap Contracts (continued) | | | | | | | | | | | | | | | | | | | | | |
| Equity Contracts - Shorta (continued) | | | | | | | | | | | | | | | | | | | | | |
LVMH Moet Hennessy Louis Vuitton SE | | | 1-Day EONIA - 0.40% | | | | Monthly | | | | MSCS | | | | 10/30/18 | | | | 1,141,677 | EUR | | $ | (273,971 | ) |
LVMH Moet Hennessy Louis Vuitton SE | | | 1-Day EONIA - 0.40% | | | | Monthly | | | | MSCS | | | | 12/19/18 | | | | 1,169,692 | EUR | | | (22,512 | ) |
Molina Healthcare Inc. | | | 1-Month LIBOR - 0.35% | | | | Monthly | | | | DBAB | | | | 6/15/19 | | | | 574,545 | | | | 1,598 | |
New Relic Inc. | | | 1-Day FEDEF | | | | Monthly | | | | MSCS | | | | 7/02/18 | | | | 217,200 | | | | (36,601 | ) |
Nice Ltd. | | | 1-Month LIBOR - 0.35% | | | | Monthly | | | | DBAB | | | | 6/15/19 | | | | 1,106,868 | | | | (36,991 | ) |
Nyrstar NV | | | 1-Month EURIBOR - 0.45% | | | | Monthly | | | | BNPP | | | | 11/28/18 | | | | 90,881 | EUR | | | 1,770 | |
Nyrstar NV | | | 1-Month LIBOR - 3.50% | | | | Monthly | | | | DBAB | | | | 1/17/19 | | | | 168,622 | EUR | | | 11,850 | |
Oita Bank Ltd. | | | 1-Month LIBOR - 0.40% | | | | Monthly | | | | DBAB | | | | 11/16/18 | | | | 192,516 | | | | 490 | |
Pacific Basin Shipping Ltd. | | | 1-Month LIBOR - 1.31% | | | | Monthly | | | | DBAB | | | | 7/19/18 | | | | 1,106,768 | HKD | | | (697 | ) |
Premier Oil PLC | | | 1-Month LIBOR - 7.00% | | | | Monthly | | | | DBAB | | | | 1/17/19 | | | | 75,164 | GBP | | | (8,752 | ) |
Premier Oil PLC | | | 1-Month LIBOR - 7.00% | | | | Monthly | | | | BNPP | | | | 5/30/19 | | | | 114,211 | GBP | | | (18,515 | ) |
Redwood Trust Inc. | | | 1-Month LIBOR - 0.35% | | | | Monthly | | | | DBAB | | | | 6/15/19 | | | | 574,601 | | | | 2,121 | |
S&P 500 Total Return Index | | | 1-Day FEDEF - 0.20% | | | | Monthly | | | | MSCS | | | | 11/08/19 | | | | 2,001,868 | | | | (122,944 | ) |
ServiceNow Inc. | | | 1-Month LIBOR - 0.35% | | | | Monthly | | | | DBAB | | | | 6/15/19 | | | | 535,001 | | | | (12,625 | ) |
Ship Finance International Ltd. | | | 1-Month LIBOR - 0.57% | | | | Monthly | | | | DBAB | | | | 6/15/19 | | | | 1,784,387 | | | | 25,557 | |
Sinclair Broadcast Group Inc. | | | 1-Day FEDEF - 0.35% | | | | Monthly | | | | MSCS | | | | 2/06/19 | | | | 236,148 | | | | 22,004 | |
SKF AB | | | 1-Week STIBOR - 0.50% | | | | Monthly | | | | MSCS | | | | 8/20/19 | | | | 45,806 | SEK | | | (402 | ) |
Starwood Property Trust Inc. | | | 1-Month LIBOR - 0.35% | | | | Monthly | | | | DBAB | | | | 6/15/19 | | | | 99,932 | | | | (920 | ) |
SubSea 7 SA | | | 1-Month EURIBOR - 0.65% | | | | Monthly | | | | BNPP | | | | 7/29/19 | | | | 645,249 | EUR | | | (20,569 | ) |
Suntec Real Estate Investment Trust | | | 1-Month SIBOR - 0.75% | | | | Monthly | | | | BNPP | | | | 2/27/19 | | | | 609,840 | SGD | | | 23 | |
Takeda Pharmaceutical Co. Ltd. | | | 1-Day FEDEF - 0.40% | | | | Monthly | | | | MSCS | | | | 5/21/20 | | | | 1,028,414 | | | | 43,807 | |
The Medicines Co. | | | 1-Month LIBOR - 0.35% | | | | Monthly | | | | DBAB | | | | 6/15/19 | | | | 1,380,279 | | | | (74,224 | ) |
The Walt Disney Co. | | | 1-Day FEDEF - 0.35% | | | | Monthly | | | | MSCS | | | | 12/20/18 | | | | 2,828,351 | | | | 142,788 | |
Toho Holdings Co. Ltd. | | | 1-Month LIBOR - 0.40% | | | | Monthly | | | | DBAB | | | | 11/16/18 | | | | 112,952,400 | JPY | | | 55,531 | |
Tohoku Electric Power Co. Inc. | | | 1-Month LIBOR - 0.40% | | | | Monthly | | | | DBAB | | | | 11/16/18 | | | | 1,771,200 | JPY | | | 955 | |
Tukey Hava Yollari AO | | | 1 Day FEDEF - 0.75% | | | | Monthly | | | | MSCS | | | | 5/19/20 | | | | 408,639 | | | | (13,414 | ) |
Unilever NV | | | 1-Day EONIA - 0.35% | | | | Monthly | | | | MSCS | | | | 12/19/18 | | | | 1,404,173 | EUR | | | (14,122 | ) |
UnitedHealth Group Inc. | | | 1-Day FEDEF - 0.35% | | | | Monthly | | | | MSCS | | | | 12/20/18 | | | | 726,136 | | | | (28,729 | ) |
Utilities Select Sector SPDR Fund | | | 1-Day FEDEF - 0.15% | | | | Monthly | | | | MSCS | | | | 11/08/19 | | | | 1,977,450 | | | | 102,026 | |
Vocera Communications Inc. | | | 1-Day FEDEF | | | | Monthly | | | | MSCS | | | | 7/11/18 | | | | 77,792 | | | | (8,606 | ) |
Weir Group PLC | | | 1-Day SONIA - 0.63% | | | | Monthly | | | | MSCS | | | | 1/18/19 | | | | 203,457 | GBP | | | (6,795 | ) |
Workday Inc. | | | 1-Month LIBOR - 0.35% | | | | Monthly | | | | DBAB | | | | 6/15/19 | | | | 588,960 | | | | 11,234 | |
Wright Medical Group Inc. | | | 1-Month LIBOR - 0.35% | | | | Monthly | | | | DBAB | | | | 6/15/19 | | | | 1,092,787 | | | | (45,024 | ) |
Yamada Denki Co. Ltd. | | | 1-Month LIBOR - 1.00% | | | | Monthly | | | | DBAB | | | | 11/16/18 | | | | 89,937,540 | JPY | | | (25,904 | ) |
Yamagata Bank Ltd. | | | 1-Month LIBOR - 1.50% | | | | Monthly | | | | DBAB | | | | 11/16/18 | | | | 267,610 | | | | (6,853 | ) |
Yamaguchi Financial Group Inc. | | | 1-Month LIBOR - 0.40% | | | | Monthly | | | | DBAB | | | | 11/16/18 | | | | 3,960,298 | | | | 184,853 | |
Yuexiu Transport Infrastructure Ltd. | | | 1-Month LIBOR - 1.88% | | | | Monthly | | | | DBAB | | | | 7/19/18 | | | | 4,951,836 | HKD | | | (15,934 | ) |
Yuexiu Transport Infrastructure Ltd | | | 1-Month HIBOR - 0.15% | | | | Monthly | | | | BNPP | | | | 4/29/19 | | | | 9,075,008 | HKD | | | (19,079 | ) |
| | | | | | | | | | | | | | | | | | | | | | | | |
| | | | (1,569,522 | ) |
| | | | | | | | | | | | | | | | | | | | | | | | |
| Fixed Income Contracts - Longb | | | | | | | | | | | | | | | | | | | | | | | | |
Airbus SE | | | 1-Month LIBOR + 1.00% | | | | Monthly | | | | DBAB | | | | 4/24/19 | | | | 389,850 | EUR | | | (9,210 | ) |
Altaba Inc. | | | 1-Month LIBOR + 0.75% | | | | Monthly | | | | DBAB | | | | 6/15/19 | | | | 943,013 | | | | 9,599 | |
AMAG Pharmaceuticals Inc. | | | 1-Month LIBOR + 0.75% | | | | Monthly | | | | DBAB | | | | 6/15/19 | | | | 378,470 | | | | 14,764 | |
Apollo Commercial Real Estate Finance Inc. | | | 1-Month LIBOR + 0.75% | | | | Monthly | | | | DBAB | | | | 6/15/19 | | | | 861,974 | | | | 6,890 | |
Asia View Ltd | | | 1-Month LIBOR + 0.90% | | | | Monthly | | | | BNPP | | | | 4/29/19 | | | | 856,153 | | | | 5,242 | |
Asia View Ltd. | | | 1-Month LIBOR + 0.90% | | | | Monthly | | | | DBAB | | | | 8/20/18 | | | | 1,150,177 | | | | (2,830 | ) |
ASM Pacific Technology Ltd. | | | 1-Month HIBOR + 0.90% | | | | Monthly | | | | BNPP | | | | 6/27/19 | | | | 13,885,847 | HKD | | | 1,784 | |
ASM Pacific Technology Ltd. | | | 1-Month LIBOR + 0.90% | | | | Monthly | | | | DBAB | | | | 5/20/19 | | | | 9,390,778 | HKD | | | (16,586 | ) |
| | | | |
| 70 | | Annual Report | | franklintempleton.com |
FRANKLIN ALTERNATIVE STRATEGIES FUNDS
CONSOLIDATED STATEMENT OF INVESTMENTS
Franklin K2 Alternative Strategies Fund (continued)
| | | | | | | | | | | | | | | | | | | | | | | | |
| Total Return Swap Contracts (continued) | | | | |
| Underlying Instrument | | Financing Rate | | | Payment
Frequency | | | Counter- party | | | Maturity
Date | | | Notional
Value* | | | Value/Unrealized
Appreciation
(Depreciation) | |
| OTC Swap Contracts (continued) | | | | | | | | | | | | | | | | | | | | | |
| Fixed Income Contracts - Longb (continued) | | | | | |
AYC Finance Ltd. | | | 1-Month LIBOR + 1.00% | | | | Monthly | | | | BNPP | | | | 2/27/19 | | | | 754,771 | | | $ | (10,939 | ) |
AYC Finance Ltd. | | | 1-Month LIBOR + 0.90% | | | | Monthly | | | | DBAB | | | | 5/20/19 | | | | 610,075 | | | | 7,446 | |
Carillion Finance White 2015 Ltd. | | | 1-Month LIBOR + 0.90% | | | | Monthly | | | | DBAB | | | | 7/19/18 | | | | 11,000 | GBP | | | 39,766 | |
CP Foods Holdings Ltd. | | | 1-Month LIBOR + 0.90% | | | | Monthly | | | | DBAB | | | | 8/20/18 | | | | 481,790 | | | | (22,976 | ) |
CP Foods Holdings Ltd. | | | 1-Month LIBOR + 0.75% | | | | Monthly | | | | BNPP | | | | 3/27/19 | | | | 1,830,103 | | | | 7,153 | |
Ctrip.com International Ltd. | | | 1-Month LIBOR + 0.75% | | | | Monthly | | | | DBAB | | | | 6/15/19 | | | | 569,561 | | | | 1,443 | |
DHT Holdings Inc. | | | 1-Month LIBOR + 0.75% | | | | Monthly | | | | DBAB | | | | 6/15/19 | | | | 308,459 | | | | 3,317 | |
DISH Network Corp. | | | 1-Month LIBOR + 0.75% | | | | Monthly | | | | DBAB | | | | 6/15/19 | | | | 833,528 | | | | 22,512 | |
Enterprise Funding Ltd | | | 1-Month LIBOR + 0.80% | | | | Monthly | | | | BNPP | | | | 6/27/19 | | | | 797,459 | GBP | | | 24,992 | |
Envestnet Inc. | | | 1-Month LIBOR + 0.75% | | | | Monthly | | | | DBAB | | | | 6/15/19 | | | | 198,839 | | | | (3,228 | ) |
Haitian International Holdings Ltd. | | | 1-Month LIBOR + 0.90% | | | | Monthly | | | | DBAB | | | | 5/20/19 | | | | 1,075,222 | | | | 7,006 | |
Hannon Armstrong Sustainable Infrastructure Capital Inc. | | | 1-Month LIBOR + 0.40% | | | | Monthly | | | | DBAB | | | | 6/15/19 | | | | 1,360,573 | | | | 2,189 | |
Hurricane Energy PLC | | | 1-Month LIBOR + 0.80% | | | | Monthly | | | | BNPP | | | | 11/28/18 | | | | 530,692 | | | | (691 | ) |
Indah Capital Ltd. | | | 1-Month LIBOR + 1.00% | | | | Monthly | | | | DBAB | | | | 9/19/18 | | | | 271,000 | SGD | | | (4,974 | ) |
Insulet Corp. | | | 1-Month LIBOR + 0.75% | | | | Monthly | | | | DBAB | | | | 6/15/19 | | | | 1,043,034 | | | | 71,516 | |
InterDigital Inc. | | | 1-Month LIBOR + 0.75% | | | | Monthly | | | | DBAB | | | | 6/15/19 | | | | 1,913,653 | | | | (9,883 | ) |
Invacare Corp. | | | 1-Month LIBOR + 0.75% | | | | Monthly | | | | DBAB | | | | 6/15/19 | | | | 1,203,795 | | | | (27,233 | ) |
j2 Global Inc. | | | 1-Month LIBOR + 0.75% | | | | Monthly | | | | DBAB | | | | 6/15/19 | | | | 2,765,490 | | | | (8,893 | ) |
Larsen & Toubro Ltd. | | | 1-Month LIBOR + 1.50% | | | | Monthly | | | | DBAB | | | | 2/20/19 | | | | 537,067 | | | | 232 | |
Liberty Media Corp-Liberty Formula One | | | 1-Month LIBOR + 0.75% | | | | Monthly | | | | DBAB | | | | 6/15/19 | | | | 1,182,915 | | | | 35,784 | |
Molina Healthcare Inc. | | | 1-Month LIBOR + 0.75% | | | | Monthly | | | | DBAB | | | | 6/15/19 | | | | 609,023 | | | | (289 | ) |
Nice Systems Inc. | | | 1-Month LIBOR + 0.75% | | | | Monthly | | | | DBAB | | | | 6/15/19 | | | | 1,496,997 | | | | 64,354 | |
Nyrstar NV | | | 1-Month EURIBOR + 0.80% | | | | Monthly | | | | BNPP | | | | 11/28/18 | | | | 714,764 | EUR | | | (2,989 | ) |
Nyrstar NV | | | 1-Month LIBOR + 0.90% | | | | Monthly | | | | DBAB | | | | 1/17/19 | | | | 508,702 | EUR | | | (83 | ) |
Oita Bank Ltd. | | | 1-Month LIBOR + 0.90% | | | | Monthly | | | | DBAB | | | | 12/19/18 | | | | 824,000 | | | | (32,437 | ) |
PB Issuer No. 4 Ltd. | | | 1-Month LIBOR + 0.90% | | | | Monthly | | | | DBAB | | | | 8/20/18 | | | | 1,008,347 | | | | 16,821 | |
Redwood Trust Inc | | | 1-Month LIBOR + 0.75% | | | | Monthly | | | | DBAB | | | | 6/15/19 | | | | 1,835,892 | | | | (2,882 | ) |
ServiceNow Inc. | | | 1-Month LIBOR + 0.75% | | | | Monthly | | | | DBAB | | | | 6/15/19 | | | | 698,098 | | | | 19,118 | |
Ship Finance International Ltd | | | 1-Month LIBOR + 0.75% | | | | Monthly | | | | DBAB | | | | 6/15/19 | | | | 1,506,912 | | | | (8,115 | ) |
Ship Finance International Ltd. | | | 1-Month LIBOR + 0.75% | | | | Monthly | | | | DBAB | | | | 6/15/19 | | | | 251,530 | | | | 312 | |
Siem Industries Inc | | | 1-Month EURIBOR + 0.80% | | | | Monthly | | | | BNPP | | | | 7/29/19 | | | | 891,713 | EUR | | | 30,731 | |
Starwood Property Trust Inc. | | | 1-Month LIBOR + 0.75% | | | | Monthly | | | | DBAB | | | | 6/15/19 | | | | 924,075 | | | | 5,605 | |
Suntec Real Estate Investment Trust | | | 1-Month SIBOR + 0.75% | | | | Monthly | | | | BNPP | | | | 2/27/19 | | | | 2,253,079 | SGD | | | 6,630 | |
The Medicines Co. | | | 1-Month LIBOR + 0.75% | | | | Monthly | | | | DBAB | | | | 6/15/19 | | | | 2,739,054 | | | | 84,931 | |
Toho Holdings Co. Ltd. | | | 1-Month LIBOR + 0.90% | | | | Monthly | | | | DBAB | | | | 11/16/18 | | | | 141,539,750 | JPY | | | (56,554 | ) |
Tohoku Electric Power Co. Inc. | | | 1-Month LIBOR + 0.90% | | | | Monthly | | | | DBAB | | | | 11/16/18 | | | | 49,607,500 | JPY | | | 345 | |
Workday Inc. | | | 1-Month LIBOR + 0.75% | | | | Monthly | | | | DBAB | | | | 6/15/19 | | | | 673,864 | | | | (7,830 | ) |
Wright Medical Group NV | | | 1-Month LIBOR + 0.75% | | | | Monthly | | | | DBAB | | | | 6/15/19 | | | | 1,704,463 | | | | 59,268 | |
Yamada Denki Co. Ltd. | | | 1-Month LIBOR + 0.90% | | | | Monthly | | | | DBAB | | | | 11/16/18 | | | | 120,622,337 | JPY | | | 1,816 | |
Yamagata Bank Ltd. | | | 1-Month LIBOR + 0.90% | | | | Monthly | | | | DBAB | | | | 12/19/18 | | | | 1,779,750 | | | | 24,895 | |
Yamaguchi Financial Group Inc. | | | 1-Month LIBOR + 0.90% | | | | Monthly | | | | DBAB | | | | 12/19/18 | | | | 4,159,050 | | | | (186,819 | ) |
| | | | | | | | | | | | | | | | | | | | | | | | |
| | | | | | | | | | | | | | | | | | | | | | | 161,020 | |
| | | | | | | | | | | | | | | | | | | | | | | | |
Total Return Swap Contracts | | | $ | 7,083,372 | |
| | | | | | | | | | | | | | | | | | | | | | | | |
*In U.S. dollars unless otherwise indicated.
aThe Fund receives the variable financing rate and pays the total return on the underlying instrument.
bThe Fund receives the total return on the underlying instrument and pays a variable financing rate.
cFair valued using significant unobservable inputs. See Note 11 regarding fair value measurements.
See Note 9 regarding other derivative information.
See Abbreviations on page 92.
| | | | | | |
| franklintempleton.com | | The accompanying notes are an integral part of these financial statements. | Annual Report | | | 71 | |
FRANKLIN ALTERNATIVE STRATEGIES FUNDS
Consolidated Financial Statements
Consolidated Statement of Assets and Liabilities
May 31, 2018
Franklin K2 Alternative Strategies Fund
| | | | |
Assets: | | | | |
*Investments in securities: | | | | |
Cost - Unaffiliated issuers | | $ | 928,276,739 | |
Cost - Non-controlled affiliates (Note 3f) | | | 10,700,000 | |
Cost - Unaffiliated repurchase agreements | | | 5,315,515 | |
| | | | |
Value - Unaffiliated issuers | | $ | 1,031,274,420 | |
Value - Non-controlled affiliates (Note 3f) | | | 10,700,000 | |
Value - Unaffiliated repurchase agreements | | | 5,315,515 | |
Cash | | | 36,936,374 | |
Restricted Cash for OTC derivative contracts (Note 1f) | | | 40,000 | |
Foreign currency, at value (cost $6,449,971) | | | 6,395,422 | |
Receivables: | | | | |
Investment securities sold | | | 15,249,480 | |
Capital shares sold | | | 6,826,742 | |
Dividends and interest | | | 4,968,882 | |
Deposits with brokers for: | | | | |
Exchange traded options written | | | 39,229 | |
Securities sold short | | | 223,833,812 | |
OTC derivative contracts | | | 20,057,850 | |
Futures contracts | | | 6,104,058 | |
Centrally cleared swap contracts | | | 5,099,703 | |
Due from brokers | | | 3,571,187 | |
Variation margin on centrally cleared swap contracts | | | 350,861 | |
OTC swap contracts (upfront payments $74,827) | | | 73,570 | |
Unrealized appreciation on OTC forward exchange contracts | | | 7,703,513 | |
Unrealized appreciation on OTC swap contracts | | | 12,227,086 | |
Unrealized appreciation on unfunded loan commitments (Note 8) | | | 1,744 | |
Other assets | | | 16,142 | |
| | | | |
Total assets | | | 1,396,785,590 | |
| | | | |
Liabilities: | | | | |
Payables: | | | | |
Investment securities purchased | | | 24,431,849 | |
Capital shares redeemed | | | 4,643,217 | |
Management fees | | | 1,588,472 | |
Distribution fees | | | 71,041 | |
Transfer agent fees | | | 95,890 | |
Variation margin on futures contracts | | | 437,953 | |
OTC swap contracts (upfront receipts $17,923) | | | 16,861 | |
Options written, at value (premiums received $561,837) | | | 428,343 | |
Securities sold short, at value (proceeds $233,394,295) | | | 238,251,897 | |
Payable upon return of securities loaned | | | 11,833,654 | |
Due to brokers | | | 2,174,777 | |
Unrealized depreciation on OTC forward exchange contracts | | | 6,084,924 | |
Unrealized depreciation on OTC swap contracts | | | 5,147,299 | |
Accrued expenses and other liabilities | | | 438,161 | |
| | | | |
Total liabilities | | | 295,644,338 | |
| | | | |
Net assets, at value | | $ | 1,101,141,252 | |
| | | | |
Net assets consist of: | | | | |
Paid-in capital | | $ | 1,025,994,820 | |
Distributions in excess of net investment income | | | (14,677,700 | ) |
Net unrealized appreciation (depreciation) | | | 106,416,341 | |
Accumulated net realized gain (loss) | | | (16,592,209 | ) |
| | | | |
Net assets, at value | | $ | 1,101,141,252 | |
| | | | |
*Includes securities loaned | | $ | 11,448,933 | |
| | | | |
| 72 | | Annual Report | The accompanying notes are an integral part of these financial statements. | | franklintempleton.com |
FRANKLIN ALTERNATIVE STRATEGIES FUNDS
CONSOLIDATED FINANCIAL STATEMENTS
Consolidated Statement of Assets and Liabilities (continued)
May 31, 2018
Franklin K2 Alternative Strategies Fund
| | | | |
| |
| Class A: | | | | |
Net assets, at value | | | $119,213,846 | |
| | | | |
Shares outstanding | | | 10,471,553 | |
| | | | |
Net asset value per sharea | | | $11.38 | |
| | | | |
Maximum offering price per share (net asset value per share ÷ 94.25%) | | | $12.07 | |
| | | | |
| |
| Class C: | | | | |
Net assets, at value | | | $53,196,252 | |
| | | | |
Shares outstanding | | | 4,730,226 | |
| | | | |
Net asset value and maximum offering price per sharea | | | $11.25 | |
| | | | |
| |
| Class R: | | | | |
Net assets, at value | | | $648,198 | |
| | | | |
Shares outstanding | | | 56,766 | |
| | | | |
Net asset value and maximum offering price per share | | | $11.42 | |
| | | | |
| |
| Class R6: | | | | |
Net assets, at value | | | $31,805,163 | |
| | | | |
Shares outstanding | | | 2,786,280 | |
| | | | |
Net asset value and maximum offering price per share | | | $11.41 | |
| | | | |
| |
| Advisor Class: | | | | |
Net assets, at value | | | $896,277,793 | |
| | | | |
Shares outstanding | | | 78,592,608 | |
| | | | |
Net asset value and maximum offering price per share | | | $11.40 | |
| | | | |
a Redemption price is equal to net asset value less contingent deferred sales charges, if applicable.
| | | | | | |
| franklintempleton.com | | The accompanying notes are an integral part of these financial statements. | Annual Report | | | 73 | |
FRANKLIN ALTERNATIVE STRATEGIES FUNDS
CONSOLIDATED FINANCIAL STATEMENTS
Consolidated Statement of Operations
for the year ended May 31, 2018
Franklin K2 Alternative Strategies Fund
| | | | |
Investment income: | | | | |
Dividends: (net of foreign taxes)* | | | | |
Unaffiliated issuers | | $ | 5,928,560 | |
Interest: | | | | |
Unaffiliated issuers | | | 22,209,684 | |
Income from securities loaned (net of fees and rebates) | | | 16,142 | |
| | | | |
Total investment income | | | 28,154,386 | |
| | | | |
Expenses: | | | | |
Management fees (Note 3a) | | | 20,726,857 | |
Distribution fees: (Note 3c) | | | | |
Class A | | | 298,451 | |
Class C | | | 535,543 | |
Class R | | | 2,960 | |
Transfer agent fees: (Note 3e) | | | | |
Class A | | | 116,708 | |
Class C | | | 52,344 | |
Class R | | | 579 | |
Class R6 | | | 16,363 | |
Advisor Class | | | 752,454 | |
Custodian fees (Note 4) . | | | 128,908 | |
Reports to shareholders | | | 68,323 | |
Registration and filing fees | | | 137,219 | |
Professional fees | | | 415,468 | |
Trustees fees and expenses | | | 399,782 | |
Dividends and interest on securities sold short | | | 4,156,544 | |
Other | | | 119,264 | |
| | | | |
Total expenses | | | 27,927,767 | |
Expense reductions (Note 4) | | | (211,884 | ) |
Expenses waived/paid by affiliates (Note 3g) | | | (2,109,802 | ) |
| | | | |
Net expenses | | | 25,606,081 | |
| | | | |
Net investment income | | | 2,548,305 | |
| | | | |
Realized and unrealized gains (losses): | | | | |
Net realized gain (loss) from: | | | | |
Investments: | | | | |
Unaffiliated issuers | | | 60,579,362 | |
Written options | | | 472,914 | |
Foreign currency transactions | | | 184,581 | |
Forward exchange contracts | | | (10,807,152 | ) |
Futures contracts | | | (6,973,071 | ) |
Securities sold short | | | (30,849,741 | ) |
Swap contracts | | | 4,510,281 | |
| | | | |
Net realized gain (loss) | | | 17,117,174 | |
| | | | |
Net change in unrealized appreciation (depreciation) on: | | | | |
Investments: | | | | |
Unaffiliated issuers | | | 10,599,614 | |
Translation of other assets and liabilities denominated in foreign currencies | | | (220,379 | ) |
Forward exchange contracts | | | 5,450,549 | |
Written options | | | 29,098 | |
Futures contracts | | | 2,089,115 | |
Securities sold short | | | 1,642,848 | |
Swap contracts | | | 1,314,175 | |
| | | | |
Net change in unrealized appreciation (depreciation) | | | 20,905,020 | |
| | | | |
Net realized and unrealized gain (loss) | | | 38,022,194 | |
| | | | |
Net increase (decrease) in net assets resulting from operations | | $ | 40,570,499 | |
| | | | |
*Foreign taxes witheld on dividends | | $ | 172,919 | |
| | | | |
| 74 | | Annual Report | The accompanying notes are an integral part of these financial statements. | | franklintempleton.com |
FRANKLIN ALTERNATIVE STRATEGIES FUNDS
CONSOLIDATED FINANCIAL STATEMENTS
Consolidated Statements of Changes in Net Assets
Franklin K2 Alternative Strategies Fund
| | | | | | | | |
| | | Year Ended May 31, | |
| | | 2018 | | | 2017 | |
Increase (decrease) in net assets: | | | | | | | | |
Operations: | | | | | | | | |
Net investment income | | $ | 2,548,305 | | | $ | 3,232,356 | |
Net realized gain (loss) | | | 17,117,174 | | | | 26,907,437 | |
Net change in unrealized appreciation (depreciation) | | | 20,905,020 | | | | 39,080,717 | |
| | | | |
Net increase (decrease) in net assets resulting from operations | | | 40,570,499 | | | | 69,220,510 | |
| | | | |
Distributions to shareholders from: | | | | | | | | |
Net investment income: | | | | | | | | |
Class A | | | (1,546,194 | ) | | | (630,342 | ) |
Class C | | | (285,639 | ) | | | — | |
Class R | | | (5,635 | ) | | | (2,647 | ) |
Class R6 | | | (2,505,528 | ) | | | (2,240,746 | ) |
Advisor Class | | | (11,772,288 | ) | | | (4,861,190 | ) |
| | | | |
Total distributions to shareholders | | | (16,115,284 | ) | | | (7,734,925 | ) |
| | | | |
Capital share transactions: (Note 2) | | | | | | | | |
Class A | | | (2,755,965 | ) | | | (65,872,266 | ) |
Class C | | | (3,461,065 | ) | | | (18,888,454 | ) |
Class R | | | 38,619 | | | | 231,379 | |
Class R6 | | | (238,755,438 | ) | | | (14,356,196 | ) |
Advisor Class | | | 206,066,759 | | | | (83,686,963 | ) |
| | | | |
Total capital share transactions | | | (38,867,090 | ) | | | (182,572,500 | ) |
| | | | |
Net increase (decrease) in net assets | | | (14,411,875 | ) | | | (121,086,915 | ) |
Net assets: | | | | | | | | |
Beginning of year | | | 1,115,553,127 | | | | 1,236,640,042 | |
| | | | |
End of year | | $ | 1,101,141,252 | | | $ | 1,115,553,127 | |
| | | | |
Undistributed net investment income included in net assets: | | | | | | | | |
End of year | | $ | — | | | $ | 6,072,954 | |
| | | | |
Distributions in excess of net investment income included in net assets: | | | | | | | | |
End of year | | $ | (14,677,700 | ) | | $ | — | |
| | | | |
| | | | | | |
| franklintempleton.com | | The accompanying notes are an integral part of these financial statements. | Annual Report | | | 75 | |
FRANKLIN ALTERNATIVE STRATEGIES FUNDS
Notes to Consolidated Financial Statements
Franklin K2 Alternative Strategies Fund
1. Organization and Significant Accounting Policies
Franklin Alternative Strategies Funds (Trust) is registered under the Investment Company Act of 1940 (1940 Act) as an open-end management investment company, consisting of four separate funds and applies the specialized accounting and reporting guidance in U.S. Generally Accepted Accounting Principles (U.S. GAAP). Franklin K2 Alternative Strategies Fund (Fund) is included in this report. The Fund offers five classes of shares: Class A, Class C, Class R, Class R6 and Advisor Class. Each class of shares may differ by its initial sales load, contingent deferred sales charges, voting rights on matters affecting a single class, its exchange privilege and fees due to differing arrangements for distribution and transfer agent fees.
The following summarizes the Fund’s significant accounting policies.
a. Financial Instrument Valuation
The Fund’s investments in financial instruments are carried at fair value daily. Fair value is the price that would be received to sell an asset or paid to transfer a liability in an orderly transaction between market participants on the measurement date. The Fund calculates the net asset value (NAV) per share as of 4 p.m. Eastern time each day the New York Stock Exchange (NYSE) is open for trading. Under compliance policies and procedures approved by the Trust’s Board of Trustees (the Board), the Fund’s administrator has responsibility for oversight of valuation, including leading the cross-functional Valuation Committee (VC). The VC provides administration and oversight of the Fund’s valuation policies and procedures, which are approved annually by the Board. Among other things, these procedures allow the Fund to utilize independent pricing services, quotations from securities and financial instrument dealers, and other market sources to determine fair value.
Equity securities, exchange traded funds and derivative financial instruments listed on an exchange or on the NASDAQ National Market System are valued at the last quoted sale price or the official closing price of the day, respectively. Foreign equity securities are valued as of the close of trading on the foreign stock exchange on which the security is primarily traded or as of 4 p.m. Eastern time. The value is then converted into its U.S. dollar equivalent at the foreign exchange rate in effect at 4 p.m. Eastern time on the day that the value of the security is determined. Over-the-counter (OTC) securities are valued
within the range of the most recent quoted bid and ask prices. Securities that trade in multiple markets or on multiple exchanges are valued according to the broadest and most representative market. Certain equity securities are valued based upon fundamental characteristics or relationships to similar securities.
Debt securities generally trade in the OTC market rather than on a securities exchange. The Fund’s pricing services use multiple valuation techniques to determine fair value. In instances where sufficient market activity exists, the pricing services may utilize a market-based approach through which quotes from market makers are used to determine fair value. In instances where sufficient market activity may not exist or is limited, the pricing services also utilize proprietary valuation models which may consider market characteristics such as benchmark yield curves, credit spreads, estimated default rates, anticipated market interest rate volatility, coupon rates, anticipated timing of principal repayments, underlying collateral, and other unique security features in order to estimate the relevant cash flows, which are then discounted to calculate the fair value. Securities denominated in a foreign currency are converted into their U.S. dollar equivalent at the foreign exchange rate in effect at 4 p.m. Eastern time on the date that the values of the foreign debt securities are determined.
Investments in open-end mutual funds are valued at the closing NAV. Investments in repurchase agreements are valued at cost, which approximates fair value.
Certain derivative financial instruments are centrally cleared or trade in the OTC market. The Fund’s pricing services use various techniques including industry standard option pricing models and proprietary discounted cash flow models to determine the fair value of those instruments. The Fund’s net benefit or obligation under the derivative contract, as measured by the fair value of the contract, is included in net assets.
The Fund has procedures to determine the fair value of financial instruments for which market prices are not reliable or readily available. Under these procedures, the VC convenes on a regular basis to review such financial instruments and considers a number of factors, including significant unobservable valuation inputs, when arriving at fair value. The VC primarily employs a market-based approach which may use related or comparable assets or liabilities, recent transactions, market multiples, book values, and other relevant information for the investment to determine the fair value of the investment. An income-based
| | | | |
| 76 | | Annual Report | | franklintempleton.com |
FRANKLIN ALTERNATIVE STRATEGIES FUNDS
NOTES TO CONSOLIDATED FINANCIAL STATEMENTS
Franklin K2 Alternative Strategies Fund (continued)
1. Organization and Significant Accounting Policies (continued)
a. Financial Instrument Valuation (continued)
valuation approach may also be used in which the anticipated future cash flows of the investment are discounted to calculate fair value. Discounts may also be applied due to the nature or duration of any restrictions on the disposition of the investments. Due to the inherent uncertainty of valuations of such investments, the fair values may differ significantly from the values that would have been used had an active market existed. The VC employs various methods for calibrating these valuation approaches including a regular review of key inputs and assumptions, transactional back-testing or disposition analysis, and reviews of any related market activity.
Trading in securities on foreign securities stock exchanges and OTC markets may be completed before 4 p.m. Eastern time. In addition, trading in certain foreign markets may not take place on every Fund’s business day. Occasionally, events occur between the time at which trading in a foreign security is completed and 4 p.m. Eastern time that might call into question the reliability of the value of a portfolio security held by the Fund. As a result, differences may arise between the value of the Fund’s portfolio securities as determined at the foreign market close and the latest indications of value at 4 p.m. Eastern time. In order to minimize the potential for these differences, the VC monitors price movements following the close of trading in foreign stock markets through a series of country specific market proxies (such as baskets of American Depositary Receipts, futures contracts and exchange traded funds). These price movements are measured against established trigger thresholds for each specific market proxy to assist in determining if an event has occurred that may call into question the reliability of the values of the foreign securities held by the Fund. If such an event occurs, the securities may be valued using fair value procedures, which may include the use of independent pricing services.
When the last day of the reporting period is a non-business day, certain foreign markets may be open on those days that the Fund’s NAV is not calculated, which could result in differences between the value of the Fund’s portfolio securities on the last business day and the last calendar day of the reporting period. Any significant security valuation changes due to an open foreign market are adjusted and reflected by the Fund for financial reporting purposes.
b. Foreign Currency Translation
Portfolio securities and other assets and liabilities denominated in foreign currencies are translated into U.S. dollars based on the exchange rate of such currencies against U.S. dollars on the date of valuation. The Fund may enter into foreign currency exchange contracts to facilitate transactions denominated in a foreign currency. Purchases and sales of securities, income and expense items denominated in foreign currencies are translated into U.S. dollars at the exchange rate in effect on the transaction date. Portfolio securities and assets and liabilities denominated in foreign currencies contain risks that those currencies will decline in value relative to the U.S. dollar. Occasionally, events may impact the availability or reliability of foreign exchange rates used to convert the U.S. dollar equivalent value. If such an event occurs, the foreign exchange rate will be valued at fair value using procedures established and approved by the Board.
The Fund does not separately report the effect of changes in foreign exchange rates from changes in market prices on securities held. Such changes are included in net realized and unrealized gain or loss from investments in the Consolidated Statement of Operations.
Realized foreign exchange gains or losses arise from sales of foreign currencies, currency gains or losses realized between the trade and settlement dates on securities transactions and the difference between the recorded amounts of dividends, interest, and foreign withholding taxes and the U.S. dollar equivalent of the amounts actually received or paid. Net unrealized foreign exchange gains and losses arise from changes in foreign exchange rates on foreign denominated assets and liabilities other than investments in securities held at the end of the reporting period.
c. Joint Repurchase Agreement
The Fund enters into a joint repurchase agreement whereby its uninvested cash balance is deposited into a joint cash account with other funds managed by the investment manager or an affiliate of the investment manager and is used to invest in one or more repurchase agreements. The value and face amount of the joint repurchase agreement are allocated to the funds based on their pro-rata interest. A repurchase agreement is accounted for as a loan by the Fund to the seller, collateralized by securities which are delivered to the Fund’s custodian. The fair value, including accrued interest, of the initial collateralization is required to be at least 102% of the dollar amount invested by the funds, with the value of the underlying securities marked to
| | | | | | |
| franklintempleton.com | | Annual Report | | | 77 | |
FRANKLIN ALTERNATIVE STRATEGIES FUNDS
NOTES TO CONSOLIDATED FINANCIAL STATEMENTS
Franklin K2 Alternative Strategies Fund (continued)
market daily to maintain coverage of at least 100%. Repurchase agreements are subject to the terms of Master Repurchase Agreements (MRAs) with approved counterparties (sellers). The MRAs contain various provisions, including but not limited to events of default and maintenance of collateral for repurchase agreements. In the event of default by either the seller or the Fund, certain MRAs may permit the non-defaulting party to net and close-out all transactions, if any, traded under such agreements. The Fund may sell securities it holds as collateral and apply the proceeds towards the repurchase price and any other amounts owed by the seller to the Fund in the event of default by the seller. This could involve costs or delays in addition to a loss on the securities if their value falls below the repurchase price owed by the seller. The joint repurchase agreement held by the Fund at year end, as indicated in the Consolidated Statement of Investments, had been entered into on May 31, 2018.
d. Securities Purchased on a Delayed Delivery Basis
The Fund purchases securities on a delayed delivery basis, with payment and delivery scheduled for a future date. These transactions are subject to market fluctuations and are subject to the risk that the value at delivery may be more or less than the trade date purchase price. Although the Fund will generally purchase these securities with the intention of holding the securities, it may sell the securities before the settlement date. Sufficient assets have been segregated for these securities.
e. Derivative Financial Instruments
The Fund invested in derivative financial instruments in order to manage risk or gain exposure to various other investments or markets. Derivatives are financial contracts based on an underlying or notional amount, require no initial investment or an initial net investment that is smaller than would normally be required to have a similar response to changes in market factors, and require or permit net settlement. Derivatives contain various risks including the potential inability of the counterparty to fulfill their obligations under the terms of the contract, the potential for an illiquid secondary market, and/or the potential for market movements which expose the Fund to gains or losses in excess of the amounts shown in the Consolidated Statement of Assets and Liabilities. Realized gain and loss and unrealized appreciation and depreciation on these contracts for the period are included in the Consolidated Statement of Operations.
Derivative counterparty credit risk is managed through a formal evaluation of the creditworthiness of all potential counterparties. The Fund attempts to reduce its exposure to counterparty credit risk on OTC derivatives, whenever possible, by entering
into International Swaps and Derivatives Association (ISDA) master agreements with certain counterparties. These agreements contain various provisions, including but not limited to collateral requirements, events of default, or early termination. Termination events applicable to the counterparty include certain deteriorations in the credit quality of the counterparty. Termination events applicable to the Fund include failure of the Fund to maintain certain net asset levels and/or limit the decline in net assets over various periods of time. In the event of default or early termination, the ISDA master agreement gives the non-defaulting party the right to net and close-out all transactions traded, whether or not arising under the ISDA agreement, to one net amount payable by one counterparty to the other. However, absent an event of default or early termination, OTC derivative assets and liabilities are presented gross and not offset in the Consolidated Statement of Assets and Liabilities. Early termination by the counterparty may result in an immediate payment by the Fund of any net liability owed to that counterparty under the ISDA agreement.
Collateral requirements differ by type of derivative. Collateral or initial margin requirements are set by the broker or exchange clearing house for exchange traded and centrally cleared derivatives. Initial margin deposited is held at the exchange and can be in the form of cash and/or securities. For OTC derivatives traded under an ISDA master agreement, posting of collateral is required by either the Fund or the applicable counterparty if the total net exposure of all OTC derivatives with the applicable counterparty exceeds the minimum transfer amount, which typically ranges from $100,000 to $250,000, and can vary depending on the counterparty and the type of the agreement. Generally, collateral is determined at the close of Fund business each day and any additional collateral required due to changes in derivative values may be delivered by the Fund or the counterparty the next business day, or within a few business days. Collateral pledged and/or received by the Fund for OTC derivatives, if any, is held in segregated accounts with the Fund’s custodian/counterparty broker and can be in the form of cash and/or securities. Unrestricted cash may be invested according to the Fund’s investment objectives. To the extent that the amounts due to the Fund from its counterparties are not subject to collateralization or are not fully collateralized, the Fund bears the risk of loss from counterparty non-performance.
The Fund entered into exchange traded futures contracts primarily to manage and/or gain exposure to commodity price, interest rate and equity price risk. A futures contract is an agreement between the Fund and a counterparty to buy or sell an asset at a specified price on a future date. Required initial
| | | | |
| 78 | | Annual Report | | franklintempleton.com |
FRANKLIN ALTERNATIVE STRATEGIES FUNDS
NOTES TO CONSOLIDATED FINANCIAL STATEMENTS
Franklin K2 Alternative Strategies Fund (continued)
1. Organization and Significant Accounting Policies (continued)
e. Derivative Financial Instruments (continued)
margins are pledged by the Fund, and the daily change in fair value is accounted for as a variation margin payable or receivable in the Consolidated Statement of Assets and Liabilities.
The Fund entered into OTC forward exchange contracts primarily to manage and/or gain exposure to certain foreign currencies. A forward exchange contract is an agreement between the Fund and a counterparty to buy or sell a foreign currency at a specific exchange rate on a future date.
The Fund entered into credit default swap contracts primarily to manage and/or gain exposure to credit risk. A credit default swap is an agreement between the Fund and a counterparty whereby the buyer of the contract receives credit protection and the seller of the contract guarantees the credit worthiness of a referenced debt obligation. These agreements may be privately negotiated in the over-the-counter market (OTC credit default swaps) or may be executed in a multilateral trade facility platform, such as a registered exchange (centrally cleared credit default swaps). The underlying referenced debt obligation may be a single issuer of corporate or sovereign debt, a credit index, a basket of issuers or indices, or a tranche of a credit index or basket of issuers or indices. In the event of a default of the underlying referenced debt obligation, the buyer is entitled to receive the notional amount of the credit default swap contract from the seller in exchange for the referenced debt obligation, a net settlement amount equal to the notional amount of the credit default swap less the recovery value of the referenced debt obligation, or other agreed upon amount. For centrally cleared credit default swaps, required initial margins are pledged by the Fund, and the daily change in fair value is accounted for as a variation margin payable or receivable in the Consolidated Statement of Assets and Liabilities. Over the term of the contract, the buyer pays the seller a periodic stream of payments, provided that no event of default has occurred. Such periodic payments are accrued daily as an unrealized appreciation or depreciation until the payments are made, at which time they are realized. Upfront payments and receipts are reflected in the Consolidated Statement of Assets and Liabilities and represent compensating factors between stated terms of the credit default swap agreement and prevailing market conditions (credit spreads and other relevant factors). These upfront payments and receipts are amortized over the term of the contract as a realized gain or loss in the Consolidated Statement of Operations.
The Fund entered into OTC cross currency swap contracts primarily to manage and/or gain exposure to certain foreign currencies. A cross currency swap is an agreement between the Fund and a counterparty to exchange cash flows (determined using either a fixed or floating rate) based on the notional amounts of two different currencies. The notional amounts are typically determined based on the spot exchange rates at the opening of the contract. Cross currency swaps may require the exchange of notional amounts at the opening and/or closing of the contract. Over the term of the contract, contractually required payments to be paid and to be received are accrued daily and recorded as unrealized depreciation and appreciation until the payments are made, at which time they are realized. Upfront payments and receipts, if any, are reflected in the Consolidated Statement of Assets and Liabilities and represent compensating factors between stated terms of the cross currency swap contract and prevailing market conditions (interest rate spreads and other relevant factors). These upfront payments and receipts are amortized over the term of the contract as a realized gain or loss in the Consolidated Statement of Operations.
The Fund entered into interest rate swap contracts primarily to manage interest rate risk. An interest rate swap is an agreement between the Fund and a counterparty to exchange cash flows based on the difference between two interest rates, applied to a notional amount. These agreements may be privately negotiated in the over-the-counter market (OTC interest rate swaps) or may be executed on a registered exchange (centrally cleared interest rate swaps). For centrally cleared interest rate swaps, required initial margins are pledged by the Fund, and the daily change in fair value is accounted for as a variation margin payable or receivable in the Consolidated Statement of Assets and Liabilities. Over the term of the contract, contractually required payments to be paid and to be received are accrued daily and recorded as unrealized depreciation and appreciation until the payments are made, at which time they are realized.
The Fund entered into OTC total return swap contracts primarily to manage and/or gain exposure to interest rate, equity price and credit risk of an underlying instrument such as a stock, bond, index or basket of securities or indices. A total return swap is an agreement between the Fund and a counterparty to exchange a return linked to an underlying instrument for a floating or fixed rate payment, both based upon a notional amount. Over the term of the contract, contractually required payments to be paid or received are accrued daily and recorded as unrealized appreciation or depreciation until the payments are made, at which time they are recognized as realized gain or loss.
| | | | | | |
| franklintempleton.com | | Annual Report | | | 79 | |
FRANKLIN ALTERNATIVE STRATEGIES FUNDS
NOTES TO CONSOLIDATED FINANCIAL STATEMENTS
Franklin K2 Alternative Strategies Fund (continued)
The Fund purchased or wrote exchange traded and/or OTC option contracts primarily to manage and/or gain exposure to interest rate, equity price and foreign exchange rate risk. An option is a contract entitling the holder to purchase or sell a specific amount of shares or units of an asset or notional amount of a swap (swaption), at a specified price. When an option is purchased or written, an amount equal to the premium paid or received is recorded as an asset or liability, respectively. Upon exercise of an option, the acquisition cost or sales proceeds of the underlying investment is adjusted by any premium received or paid. Upon expiration of an option, any premium received or paid is recorded as a realized gain or loss. Upon closing an option other than through expiration or exercise, the difference between the premium received or paid and the cost to close the position is recorded as a realized gain or loss.
See Notes 6 and 9 regarding investment transactions and other derivative information, respectively.
f. Restricted Cash
At May 31, 2018, the Fund held restricted cash in connection with investments in certain derivative securities. Restricted cash is held in a segregated account with the Fund’s custodian/counterparty broker and is reflected in the Consolidated Statement of Assets and Liabilities.
g. Securities Sold Short
The Fund is engaged in selling securities short, which obligates the Fund to replace a borrowed security with the same security at current fair value. The Fund incurs a loss if the price of the security increases between the date of the short sale and the date on which the Fund replaces the borrowed security. The Fund realizes a gain if the price of the security declines between those dates. Gains are limited to the price at which the Fund sold the security short, while losses are potentially unlimited in size.
The Fund is required to establish a margin account with the broker lending the security sold short. While the short sale is outstanding, the broker retains the proceeds of the short sale to the extent necessary to meet margin requirements until the short position is closed out. A deposit must also be maintained with the Fund’s custodian/counterparty broker consisting of cash and/or securities having a value equal to a specified percentage of the value of the securities sold short. The Fund is obligated to pay fees for borrowing the securities sold short and is required to pay the counterparty any dividends and/or interest due on securities sold short. Such dividends and/or interest and any security borrowing fees are recorded as an expense to the Fund.
h. Securities Lending
The Fund participates in an agency based securities lending program to earn additional income. The Fund receives cash collateral against the loaned securities in an amount equal to at least 102% of the fair value of the loaned securities. Collateral is maintained over the life of the loan in an amount not less than 100% of the fair value of the loaned securities, as determined at the close of Fund business each day; any additional collateral required due to changes in security values is delivered to the Fund on the next business day. The collateral is deposited into a joint cash account with other funds and is used to invest in a money market fund managed by Franklin Advisers, Inc., an affiliate of the Fund, and/or a joint repurchase agreement. The Fund may receive income from the investment in cash collateral, in addition to lending fees and rebates paid by the borrower. Income from securities loaned, net of fees paid to the securities lending agent and/or third party vendor, is reported separately in the Consolidated Statement of Operations. The Fund bears the market risk with respect to the collateral investment, securities loaned, and the risk that the agent may default on its obligations to the Fund. If the borrower defaults on its obligations to return the securities loaned, the Fund has the right to repurchase the securities in the open market using the collateral received. The securities lending agent has agreed to indemnify the Fund in the event of default by a third party borrower.
i. Investments in K2 Holdings Investment Corp. (K2 Subsidiary)
The Fund invests in certain financial instruments and commodity-linked derivative investments through its investment in the K2 Subsidiary. The K2 Subsidiary is a Cayman Islands exempted company with limited liability, is a wholly-owned subsidiary of the Fund, and is able to invest in certain financial instruments and commodity-linked derivative investments consistent with the investment objective of the Fund. At May 31, 2018, the K2 Subsidiary’s investments, as well as any other assets and liabilities of the K2 Subsidiary, are reflected in the Fund’s Consolidated Statement of Investments and Consolidated Statement of Assets and Liabilities. The financial statements have been consolidated and include the accounts of the Fund and the K2 Subsidiary. All intercompany transactions and balances have been eliminated. For tax purposes, the Fund is required to increase its taxable income by its share of the K2 Subsidiary’s income. Net losses incurred by the K2 Subsidiary cannot offset income earned by the Fund and cannot be carried back or forward by the K2 Subsidiary to offset income from
| | | | |
| 80 | | Annual Report | | franklintempleton.com |
FRANKLIN ALTERNATIVE STRATEGIES FUNDS
NOTES TO CONSOLIDATED FINANCIAL STATEMENTS
Franklin K2 Alternative Strategies Fund (continued)
1. Organization and Significant Accounting Policies (continued)
i. Investments in K2 Holdings Investment Corp. (K2 Subsidiary) (continued)
prior or future years. At May 31, 2018, the net assets of the K2 Subsidiary were $18,422,720, representing 1.7% of the Fund’s consolidated net assets. The Fund’s investment in the K2 Subsidiary is limited to 25% of consolidated assets.
j. Senior Floating Rate Interests
The Fund invests in senior secured corporate loans that pay interest at rates which are periodically reset by reference to a base lending rate plus a spread. These base lending rates are generally the prime rate offered by a designated U.S. bank or the London InterBank Offered Rate (LIBOR). Senior secured corporate loans often require prepayment of principal from excess cash flows or at the discretion of the borrower. As a result, actual maturity may be substantially less than the stated maturity. Senior secured corporate loans in which the Fund invests are generally readily marketable, but may be subject to certain restrictions on resale.
k. Income and Deferred Taxes
It is the Fund’s policy to qualify as a regulated investment company under the Internal Revenue Code. The Fund intends to distribute to shareholders substantially all of its taxable income and net realized gains to relieve it from federal income and excise taxes. As a result, no provision for U.S. federal income taxes is required.
The Fund may be subject to foreign taxation related to income received, capital gains on the sale of securities and certain foreign currency transactions in the foreign jurisdictions in which it invests. Foreign taxes, if any, are recorded based on the tax regulations and rates that exist in the foreign markets in which the Fund invests. When a capital gain tax is determined to apply, the Fund records an estimated deferred tax liability in an amount that would be payable if the securities were disposed of on the valuation date.
The Fund may recognize an income tax liability related to its uncertain tax positions under U.S. GAAP when the uncertain tax position has a less than 50% probability that it will be sustained upon examination by the tax authorities based on its technical merits. As of May 31, 2018, the Fund has determined that no tax liability is required in its consolidated financial statements related to uncertain tax positions for any open tax years (or expected to
be taken in future tax years). Open tax years are those that remain subject to examination and are based on the statute of limitations in each jurisdiction in which the Fund invests.
l. Security Transactions, Investment Income, Expenses and Distributions
Security transactions are accounted for on trade date. Realized gains and losses on security transactions are determined on a specific identification basis. Interest income and estimated expenses are accrued daily. Amortization of premium and accretion of discount on debt securities are included in interest income. Dividend income and dividends declared on securities sold short are recorded on the ex-dividend date except for certain dividends from securities where the dividend rate is not available. In such cases, the dividend is recorded as soon as the information is received by the Fund. Distributions to shareholders are recorded on the ex-dividend date. Distributable earnings are determined according to income tax regulations (tax basis) and may differ from earnings recorded in accordance with U.S. GAAP. These differences may be permanent or temporary. Permanent differences are reclassified among capital accounts to reflect their tax character. These reclassifications have no impact on net assets or the results of operations. Temporary differences are not reclassified, as they may reverse in subsequent periods.
Common expenses incurred by the Trust are allocated among the Funds based on the ratio of net assets of each Fund to the combined net assets of the Trust. Fund specific expenses are charged directly to the Fund that incurred the expense.
Realized and unrealized gains and losses and net investment income, excluding class specific expenses, are allocated daily to each class of shares based upon the relative proportion of net assets of each class. Differences in per share distributions by class are generally due to differences in class specific expenses.
m. Accounting Estimates
The preparation of financial statements in accordance with U.S. GAAP requires management to make estimates and assumptions that affect the reported amounts of assets and liabilities at the date of the financial statements and the amounts of income and expenses during the reporting period. Actual results could differ from those estimates.
n. Guarantees and Indemnifications
Under the Trust’s organizational documents, its officers and trustees are indemnified by the Trust against certain liabilities
| | | | | | |
| franklintempleton.com | | Annual Report | | | 81 | |
FRANKLIN ALTERNATIVE STRATEGIES FUNDS
NOTES TO CONSOLIDATED FINANCIAL STATEMENTS
Franklin K2 Alternative Strategies Fund (continued)
arising out of the performance of their duties to the Trust. Additionally, in the normal course of business, the Trust, on behalf of the Fund, enters into contracts with service providers that contain general indemnification clauses. The Trust’s maximum
exposure under these arrangements is unknown as this would involve future claims that may be made against the Trust that have not yet occurred. Currently, the Trust expects the risk of loss to be remote.
2. Shares of Beneficial Interest
At May 31, 2018, there were an unlimited number of shares authorized (without par value). Transactions in the Fund’s shares were as follows:
| | | | | | | | | | | | | | | | | | | | |
| | | Year Ended May 31, | |
| | | 2018 | | | | | | 2017 | |
| | | Shares | | | Amount | | | | | | Shares | | | Amount | |
| | | | | |
| Class A Shares: | | | | | | | | | | | | | | | | | | | | |
Shares sold | | | 3,176,630 | | | $ | 35,979,221 | | | | | | | | 2,844,434 | | | $ | 30,795,994 | |
Shares issued in reinvestment of distributions | | | 129,508 | | | | 1,467,319 | | | | | | | | 55,946 | | | | 603,102 | |
Shares redeemed | | | (3,551,224 | ) | | | (40,202,505 | ) | | | | | | | (8,995,275 | ) | | | (97,271,362 | ) |
| | | | |
Net increase (decrease) | | | (245,086 | ) | | $ | (2,755,965 | ) | | | | | | | (6,094,895 | ) | | $ | (65,872,266 | ) |
| | | | |
| Class C Shares: | | | | | | | | | | | | | | | | | | | | |
Shares sold | | | 1,190,986 | | | $ | 13,334,868 | | | | | | | | 930,313 | | | $ | 9,991,199 | |
Shares issued in reinvestment of distributions | | | 23,870 | | | | 268,067 | | | | | | | | — | | | | — | |
Shares redeemed | | | (1,527,860 | ) | | | (17,064,000 | ) | | | | | | | (2,694,807 | ) | | | (28,879,653 | ) |
| | | | |
Net increase (decrease) | | | (313,004 | ) | | $ | (3,461,065 | ) | | | | | | | (1,764,494 | ) | | $ | (18,888,454 | ) |
| | | | |
| Class R Shares: | | | | | | | | | | | | | | | | | | | | |
Shares sold | | | 13,905 | | | $ | 158,094 | | | | | | | | 23,673 | | | $ | 256,901 | |
Shares issued in reinvestment of distributions | | | 496 | | | | 5,635 | | | | | | | | 245 | | | | 2,647 | |
Shares redeemed | | | (11,085 | ) | | | (125,110 | ) | | | | | | | (2,617 | ) | | | (28,169 | ) |
| | | | |
Net increase (decrease) | | | 3,316 | | | $ | 38,619 | | | | | | | | 21,301 | | | $ | 231,379 | |
| | | | |
| Class R6 Shares: | | | | | | | | | | | | | | | | | | | | |
Shares sold | | | 532,029 | | | $ | 6,021,672 | | | | | | | | 819,703 | | | $ | 8,933,673 | |
Shares issued in reinvestment of distributions | | | 220,254 | | | | 2,497,684 | | | | | | | | 207,304 | | | | 2,236,814 | |
Shares redeemed | | | (21,717,786 | ) | | | (247,274,794 | ) | | | | | | | (2,353,888 | ) | | | (25,526,683 | ) |
| | | | |
Net increase (decrease) | | | (20,965,503 | ) | | $ | (238,755,438 | ) | | | | | | | (1,326,881 | ) | | $ | (14,356,196 | ) |
| | | | |
| Advisor Class Shares: | | | | | | | | | | | | | | | | | | | | |
Shares sold | | | 32,825,857 | | | $ | 372,819,294 | | | | | | | | 20,997,587 | | | $ | 228,852,167 | |
Shares issued in reinvestment of distributions | | | 757,060 | | | | 8,585,060 | | | | | | | | 340,700 | | | | 3,676,152 | |
Shares redeemed | | | (15,458,901 | ) | | | (175,337,595 | ) | | | | | | | (29,140,039 | ) | | | (316,215,282 | ) |
| | | | |
Net increase (decrease) | | | 18,124,016 | | | $ | 206,066,759 | | | | | | | | (7,801,752 | ) | | $ | (83,686,963 | ) |
| | | | |
3. Transactions with Affiliates
Franklin Resources, Inc. is the holding company for various subsidiaries that together are referred to as Franklin Templeton Investments. Certain officers and trustees of the Trust are also officers and/or directors of the following subsidiaries:
| | |
| Subsidiary | | Affiliation |
K2/D&S Management Co., L.L.C. (K2 Advisors) | | Investment manager |
Franklin Templeton Services, LLC (FT Services) | | Administrative manager |
Franklin Templeton Distributors, Inc. (Distributors) | | Principal underwriter |
Franklin Templeton Investor Services, LLC (Investor Services) | | Transfer agent |
| | | | |
| 82 | | Annual Report | | franklintempleton.com |
FRANKLIN ALTERNATIVE STRATEGIES FUNDS
NOTES TO CONSOLIDATED FINANCIAL STATEMENTS
Franklin K2 Alternative Strategies Fund (continued)
3. Transactions with Affiliates (continued)
a. Management Fees
The Fund and K2 Subsidiary pay an investment management fee to K2 Advisors of 1.90% per year of the average daily net assets of the Fund and K2 Subsidiary. Management fees paid by the Fund are reduced on assets invested in the K2 Subsidiary, in an amount not to exceed the management fees paid by the K2 Subsidiary.
Prior to October 1, 2017, the Fund and K2 Subsidiary paid fees to K2 Advisors of 2.05% per year of the average daily net assets of the Fund and K2 Subsidiary.
Under each subadvisory agreement, the below entities provide subadvisory services to the Fund or K2 Subsidiary. The subadvisory fees are paid by K2 Advisors based on the Fund and K2 Subsidiary average daily net assets, and is not an additional expense of the Fund or K2 Subsidiary.
|
| Subadvisors |
Basso Capital Management, L.P. |
Chatham Asset Management, LLC |
Chilton Investment Company, LLC |
Emso Asset Management Limited |
Graham Capital Management, L.P. |
Halcyon Arbitrage IC Management LP |
Impala Asset Management, LLC |
Jennison Associates, LLC |
Lazard Asset Management, LLC |
Loomis Sayles & Company, L.P. |
P. Schoenfeld Asset Management L.P. |
Portland Hill Capital LLP |
Wellington Management Company, LLP |
b. Administrative Fees
Under an agreement with K2 Advisors, FT Services provides administrative services to the Fund and K2 Subsidiary. The fee is paid by K2 Advisors based on the Fund and K2 Subsidiary average daily net assets, and is not an additional expense of the Fund or K2 Subsidiary.
c. Distribution Fees
The Board has adopted distribution plans for each share class, with the exception of Class R6 and Advisor Class shares, pursuant to Rule 12b-1 under the 1940 Act. Under the Fund’s Class A reimbursement distribution plan, the Fund reimburses Distributors for costs incurred in connection with the servicing, sale and distribution of the Fund’s shares up to the maximum annual plan rate. Under the Class A reimbursement distribution plan, costs exceeding the maximum for the current plan year cannot be reimbursed in subsequent periods. In addition, under the Fund’s Class C and R compensation distribution plans, the Fund pays Distributors for costs incurred in connection with the servicing, sale and distribution of the Fund’s shares up to the maximum annual plan rate for each class. The plan year, for purposes of monitoring compliance with the maximum annual plan rates, is February 1 through January 31.
The maximum annual plan rates, based on the average daily net assets, for each class, are as follows:
| | | | |
Class A | | | 0.30% | |
Class C | | | 1.00% | |
Class R | | | 0.50% | |
| | | | | | |
| franklintempleton.com | | Annual Report | | | 83 | |
FRANKLIN ALTERNATIVE STRATEGIES FUNDS
NOTES TO CONSOLIDATED FINANCIAL STATEMENTS
Franklin K2 Alternative Strategies Fund (continued)
The Board has set the current rate at 0.25% per year for Class A shares until further notice and approval by the Board.
d. Sales Charges/Underwriting Agreements
Front-end sales charges and contingent deferred sales charges (CDSC) do not represent expenses of the Fund. These charges are deducted from the proceeds of sales of Fund shares prior to investment or from redemption proceeds prior to remittance, as applicable. Distributors has advised the Fund of the following commission transactions related to the sales and redemptions of the Fund’s shares for the year:
| | | | |
Sales charges retained net of commissions paid to unaffiliated brokers/dealers | | $ | 48,514 | |
CDSC retained | | $ | 3,853 | |
e. Transfer Agent Fees
Each class of shares pays transfer agent fees to Investor Services for its performance of shareholder servicing obligations. Effective November 1, 2017, the fees are based on an annualized asset based fee of 0.02% plus a transaction based fee. Prior to November 1, 2017, the fees were account based fees that varied based on fund or account type. In addition, each class reimburses Investor Services for out of pocket expenses incurred and, except for Class R6, reimburses shareholder servicing fees paid to third parties. These fees are allocated daily based upon their relative proportion of such classes’ aggregate net assets. Class R6 pays Investor Services transfer agent fees specific to that class.
For the year ended May 31, 2018, the Fund paid transfer agent fees of $938,448, of which $309,186 was retained by Investor Services.
f. Investments in Affiliated Management Investment Companies
The Fund invests in one or more affiliated management investment companies for purposes other than exercising a controlling influence over the management or policies. Management fees paid by the Fund are waived on assets invested in the affiliated management investment companies, as noted in the Consolidated Statement of Operations, in an amount not to exceed the management and administrative fees paid directly or indirectly by each affiliate. During the year ended May 31, 2018, the Fund held investments in affiliated management investment companies as follows:
| | | | | | | | | | | | | | | | | | | | | | | | | | | | | | | | |
| | | Number of Shares
Held at
Beginning
of Year | | | Gross
Additions | | | Gross
Reductions | | | Number of
Shares Held
at End
of Year | | | Value
at End
of Year | | | Dividend
Income | | | Realized
Gain
(Loss) | | | Net Change in
Unrealized
Appreciation
(Depreciation) | |
| Non-Controlled Affiliates | | | | | | | | | | | | | | | | | | | | | | | | | | | | | |
Institutional Fiduciary Trust Money Market Portfolio, 1.40% | | | — | | | | 16,889,000 | | | | (6,189,000 | ) | | | 10,700,000 | | | $ | 10,700,000 | | | $ | 9,648 | | | $ | — | | | $ | — | |
| | | | | | | | | | | | | | | | | | | | |
g. Waiver and Expense Reimbursements
K2 Advisors and Investor Services have contractually agreed in advance to waive or limit their fees and to assume as their own expense certain expenses otherwise payable by the Fund so that the expenses (excluding distribution fees, acquired fund fees and expenses, and expenses related to securities sold short) for each class of the Fund do not exceed 1.95%, and Class R6 does not exceed 1.85% based on the average net assets of each class (other than certain non-routine expenses or costs, including those relating to litigation, indemnification, reorganizations, and liquidations) until September 30, 2018. Total expenses waived or paid are not subject to recapture subsequent to the Fund’s fiscal year end. Prior to October 1, 2017, expenses for Class R6 were limited to 1.86%.
| | | | |
| 84 | | Annual Report | | franklintempleton.com |
FRANKLIN ALTERNATIVE STRATEGIES FUNDS
NOTES TO CONSOLIDATED FINANCIAL STATEMENTS
Franklin K2 Alternative Strategies Fund (continued)
3. Transactions with Affiliates (continued)
h. Other Affiliated Transactions
At May 31, 2018, the shares of the Fund were owned by the following entities:
| | | | | | | | |
| | | Shares | | | Percentage of
Outstanding Sharesa | |
Franklin NextStep Moderate Fund | | | 12,562 | | | | —%b | |
Franklin NextStep Growth Fund | | | 6,910 | | | | —%b | |
| | | | |
| | | 19,472 | | | | —%b | |
| | | | |
aInvestment activities of significant shareholders could have a material impact on the Fund.
bRounds to less than 0.1%.
4. Expense Offset Arrangement
The Fund has entered into an arrangement with its custodian whereby credits realized as a result of uninvested cash balances are used to reduce a portion of the Fund’s custodian expenses. During the year ended May 31, 2018, the custodian fees were reduced as noted in the Consolidated Statement of Operations.
5. Income Taxes
For tax purposes, capital losses may be carried over to offset future capital gains, if any. During the year ended May 31, 2018, the Fund utilized $19,879,174 of capital loss carryforwards.
For tax purposes, the Fund may elect to defer any portion of a late-year ordinary loss to the first day of the following fiscal year. At May 31, 2018, the Fund deferred late-year ordinary losses of $4,481,585.
The tax character of distributions paid during the years ended May 31, 2018 and 2017, was as follows:
| | | | | | | | |
| | | 2018 | | | 2017 | |
Distributions paid from ordinary income | | $ | 16,115,284 | | | $ | 7,734,925 | |
| | | | |
At May 31, 2018, the cost of investments, net unrealized appreciation (depreciation) and long term capital gains for income tax purposes were as follows:
| | | | |
Cost of investments | | $ | 753,601,191 | |
| | | | |
Unrealized appreciation | | $ | 120,597,711 | |
Unrealized depreciation | | | (57,125,456 | ) |
| | | | |
Net unrealized appreciation (depreciation) | | $ | 63,472,255 | |
| | | | |
Distributable earnings – undistributed long term capital gains | | $ | 16,171,916 | |
| | | | |
Differences between income and/or capital gains as determined on a book basis and a tax basis are primarily due to differing treatments of investments in the K2 Subsidiary and wash sales.
The Fund utilized a tax accounting practice to treat a portion of the proceeds from the capital shares redeemed as a distribution from realized capital gains.
6. Investment Transactions
Purchases and sales of investments and securities sold short (excluding short term securities) for the year ended May 31, 2018, aggregated $2,291,408,106 and $2,308,430,902, respectively.
At May 31, 2018, in connection with securities lending transactions, the Fund loaned equity investments and corporate bonds and notes and received $11,833,654 of cash collateral. The gross amounts of recognized liability for such transactions is included in payable upon return of securities loaned in the Consolidated Statement of Assets and Liabilities. The agreements can be terminated at any time.
| | | | | | |
| franklintempleton.com | | Annual Report | | | 85 | |
FRANKLIN ALTERNATIVE STRATEGIES FUNDS
NOTES TO CONSOLIDATED FINANCIAL STATEMENTS
Franklin K2 Alternative Strategies Fund (continued)
The Fund sold certain long positions held in the portfolio and simultaneously entered into total return swaps on the positions, retaining substantially all of the exposure to the economic return and the related risks on the long positions. At May 31, 2018, the transfers of financial assets accounted for as sales were as follows:
| | | | | | | | | | | | | | | | | | | | |
| | | At Original Transactions Dates | | | At Year Ended May 31, 2018 | |
| | | Cost Basis of Positions Sold | | | Gross
Cash Received
for Positions Sold | | | Fair Value of Transferred Assetsa | | | Gross
Derivative Assets
Recordedb | | | Gross
Derivative Liabilities
Recordedb | |
Sales and total return swaps | | $ | 1,818,478 | | | $ | 1,835,892 | | | $ | (2,882 | ) | | $ | 1,833,010 | | | $ | (1,835,892 | ) |
| | | | | | | | |
a$2,822 of gross derivative liabilities are included as unrealized depreciation on OTC swap contracts in the Consolidated Statement of Assets and Liabilities. See Note 9 regarding other derivative information.
bBalances are presented on a gross basis, based on each leg of the swap contract, before the application of counterparty and cash collateral offsetting.
See Notes 1(e) and 9 regarding derivative financial instruments and other derivative information, respectively.
7. Credit Risk and Defaulted Securities
The Fund may purchase the pre-default or defaulted debt of distressed companies. Distressed companies are financially troubled and could be or are already involved in financial restructuring or bankruptcy. Risks associated with purchasing these securities include the possibility that the bankruptcy or other restructuring process takes longer than expected, or that distributions in restructuring are less than anticipated, either or both of which may result in unfavorable consequences to the Fund. If it becomes probable that the income on debt securities, including those of distressed companies, will not be collected, the Fund discontinues accruing income and recognizes an adjustment for uncollectible interest.
At May 31, 2018, the aggregate long value of distressed company securities for which interest recognition has been discontinued was $10,097,338, representing 0.9% of the Fund’s net assets. For information as to specific securities, see the accompanying Consolidated Statement of Investments.
8. Unfunded Loan Commitments
The Fund enters into certain credit agreements, all or a portion of which may be unfunded. The Fund is obligated to fund these loan commitments at the borrowers’ discretion. Unfunded loan commitments and funded portions of credit agreements are marked to market daily. Funded portions of credit agreements are presented in the Consolidated Statements of Investments.
At May 31, 2018, unfunded commitments were as follows:
| | | | |
| Borrower | | Unfunded
Commitment | |
Gavilan Resources LLC, Initial Term Loan | | $ | 35,000 | |
GFL Environmental, Initial U.S. Term Loan | | | 100,250 | |
GTT Communications Inc., Term Loan | | | 181,105 | |
JBS USA LLC / Finance Inc., Initial Term Loan | | | 64,654 | |
Microchip Technology Inc., Term Loan | | | 110,000 | |
Tectum Holdings Inc., Term Loan | | | 216,366 | |
Telenet Financing USD LLC, Term Loan | | | 128,182 | |
TransDigm Group Inc., New Tranche G Term Loan | | | 232,177 | |
Unitymedia Hessen GmbH & Co. KG, Term Loan | | | 80,000 | |
Vistra Energy Corp., Term Loan | | | 202,542 | |
Wyndham Hotels, Term Loan | | | 65,000 | |
| | | | |
| | $ | 1,415,276 | |
| | | | |
| | | | |
| 86 | | Annual Report | | franklintempleton.com |
FRANKLIN ALTERNATIVE STRATEGIES FUNDS
NOTES TO CONSOLIDATED FINANCIAL STATEMENTS
Franklin K2 Alternative Strategies Fund (continued)
9. Other Derivative Information
At May 31, 2018, the Fund’s investments in derivative contracts are reflected in the Consolidated Statement of Assets and Liabilities as follows:
| | | | | | | | | | | | |
| | | Asset Derivatives | | | Liability Derivatives | |
Derivative Contracts
Not Accounted for as
Hedging Instruments | | Consolidated Statement of
Assets and Liabilities
Location | | Fair Value | | | Consolidated Statement of
Assets and Liabilities
Location | | Fair Value | |
Interest rate contracts | | Investments in securities, at value | | $ | 4,351 | a | | | | | | |
| | Variation margin on futures contracts | | | 1,222,594 | b | | Variation margin on futures contracts | | $ | 407,969 | b |
| | Variation margin on centrally cleared swap contracts | | | 693,989 | b | | Variation margin on centrally cleared swap contracts | | | 564,656 | b |
| | Unrealized appreciation on OTC swap contracts | | | 576,461 | | | Unrealized depreciation on OTC swap contracts | | | 431,808 | |
Foreign exchange contracts | | Investments in securities, at value | | | 30,634 | a | | | | | | |
| | Unrealized appreciation on OTC forward exchange contracts | | | 7,703,513 | | | Unrealized depreciation on OTC forward exchange contracts | | | 6,084,924 | |
Credit contracts | | Variation margin on centrally cleared swap contracts | | | 430,333 | b | | Variation margin on centrally cleared swap contracts | | | 445,959 | b |
| | OTC swap contracts (upfront payments) | | | 73,570 | | | OTC swap contracts (upfront receipts) | | | 16,861 | |
| | Unrealized appreciation on OTC swap contracts | | | 24,518 | | | Unrealized depreciation on OTC swap contracts | | | 71,024 | |
Equity contracts | | Investments in securities, at value | | | 2,106,215 | a | | Options written, at value | | | 428,343 | |
| | Variation margin on futures contracts | | | 913,097 | b | | Variation margin on futures contracts | | | 1,337,171 | b |
| | Unrealized appreciation on OTC swap contracts | | | 11,626,107 | | | Unrealized depreciation on OTC swap contracts | | | 4,644,467 | |
Commodity contracts | | Variation margin on futures contracts | | | 413,236 | b | | Variation margin on futures contracts | | | 1,381,843 | b |
| | | | | | | | | | | | |
Totals | | | | $ | 25,818,618 | | | | | $ | 15,815,025 | |
| | | | | | | | | | | | |
aPurchased option contracts are included in investments in securities, at value in the Consolidated Statement of Assets and Liabilities.
bThis amount reflects the cumulative appreciation (depreciation) of futures contracts and centrally cleared swap contracts as reported in the Consolidated Statement of Investments. Only the variation margin receivable/payable at year end is separately reported within the Consolidated Statement of Assets and Liabilities. Prior variation margin movements were recorded to cash upon receipt or payment.
| | | | | | |
| franklintempleton.com | | Annual Report | | | 87 | |
FRANKLIN ALTERNATIVE STRATEGIES FUNDS
NOTES TO CONSOLIDATED FINANCIAL STATEMENTS
Franklin K2 Alternative Strategies Fund (continued)
For the year ended May 31, 2018, the effect of derivative contracts in the Fund’s Consolidated Statement of Operations was as follows:
| | | | | | | | | | | | |
Derivative Contracts
Not Accounted for as
Hedging Instruments | | Consolidated Statement of
Operations Location | | Net Realized
Gain (Loss)
for the Year | | | Consolidated Statement of
Operations Location | | Net Change in
Unrealized
Appreciation
(Depreciation)
for the Year | |
| | Net realized gain (loss) from: | | | | | | Net change in unrealized appreciation (depreciation) on: | | | | |
Interest rate contracts | | Investments | | $ | (16,517 | )a | | Investments | | $ | (76,237 | )a |
| | | | | | | | Written options | | | 18,653 | |
| | Futures contracts | | | (2,367,275 | ) | | Futures contracts | | | 453,524 | |
| | Swap contracts | | | 5,771,622 | | | Swap contracts | | | 836,396 | |
Foreign exchange contracts | | Investments | | | (89,064 | )a | | Investments | | | 85,600 | a |
| | Foreign exchange contracts | | | (10,807,152 | ) | | Forward exchange contracts | | | 5,450,549 | |
| | Swap contracts | | | (263,679 | ) | | Swap contracts | | | (45,942 | ) |
Credit contracts | | Swap contracts | | | (582,633 | ) | | Swap contracts | | | 481,539 | |
Equity contracts | | Investments | | | (3,907,473 | )a | | Investments | | | (1,128,179 | )a |
| | Written options | | | 472,914 | | | Written options | | | 10,445 | |
| | Futures contracts | | | (8,258,682 | ) | | Futures contracts | | | 2,779,633 | |
| | Swap contracts | | | (415,029 | ) | | Swap contracts | | | 42,182 | |
Commodity contracts | | Futures contracts | | | 3,652,886 | | | Futures contracts | | | (1,144,042 | ) |
| | | | | | | | | | | | |
Totals | | | | $ | (16,810,082 | ) | | | | $ | 7,764,121 | |
| | | | | | | | | | | | |
aPurchased option contracts are included in net realized gain (loss) from investments and net change in unrealized appreciation (depreciation) on investments in the Consolidated Statement of Operations.
For the year ended May 31, 2018, the average month end notional amount of futures contracts, options and swap contracts represented $599,885,246, $9,505,756 and $423,023,190, respectively. The average month end contract value of forward exchange contracts was $333,492,141.
At May 31, 2018, the Fund’s OTC derivative assets and liabilities are as follows:
| | | | | | | | |
| | | Gross Amounts of Assets
and Liabilities Presented in
the Consolidated Statement
of Assets and Liabilities | |
| | | Assetsa | | | Liabilitiesa | |
| Derivatives | | | | | | | | |
Forward Exchange Contracts | | $ | 7,703,513 | | | $ | 6,084,924 | |
Options Purchased | | | 33,766 | | | | — | |
Options Written | | | — | | | | — | |
Swap Contracts | | | 12,300,656 | | | | 5,164,160 | |
| | | | |
Total | | $ | 20,037,935 | | | $ | 11,249,084 | |
| | | | |
aAbsent an event of default or early termination, OTC derivative assets and liabilities are presented gross and not offset in the Consolidated Statement of Assets and Liabilities.
| | | | |
| 88 | | Annual Report | | franklintempleton.com |
FRANKLIN ALTERNATIVE STRATEGIES FUNDS
NOTES TO CONSOLIDATED FINANCIAL STATEMENTS
Franklin K2 Alternative Strategies Fund (continued)
9. Other Derivative Information (continued)
At May 31, 2018, the Fund’s OTC derivative assets, which may be offset against the Fund’s OTC derivative liabilities and collateral received from the counterparty, are as follows:
| | | | | | | | | | | | | | | | | | | | |
| | | | | | Amounts Not Offset in the Consolidated
Statement of Assets and Liabilities | | | | |
| | | Gross Amounts of Assets
Presented in the
Consolidated Statement of
Assets and Liabilities | | | Financial
Instruments
Available for Offset | | | Financials
Instruments
Collateral
Receiveda | | | Cash
Collateral
Receiveda | | | Net Amount (Not
Less than Zero) | |
| Counterparty | | | | | | | | | | | | | | | | | | | | |
BNPP | | $ | 91,684 | | | $ | (91,684 | ) | | $ | — | | | $ | — | | | $ | — | |
BNYM | | | 1,671,434 | | | | (23,398 | ) | | | (1,648,036 | ) | | | — | | | | — | |
BOFA | | | 52,252 | | | | (21,716 | ) | | | — | | | | (30,536 | ) | | | — | |
BZWS | | | 1,652 | | | | (1,652 | ) | | | — | | | | — | | | | — | |
DBAB | | | 2,521,502 | | | | (1,411,570 | ) | | | — | | | | — | | | | 1,109,932 | |
GSCO | | | 4,656 | | | | (4,656 | ) | | | — | | | | — | | | | — | |
HSBC | | | 206 | | | | (206 | ) | | | — | | | | — | | | | — | |
JPHQ | | | 7,957 | | | | (7,957 | ) | | | — | | | | — | | | | — | |
JPHQc | | | 2,545,034 | | | | — | | | | — | | | | — | | | | 2,545,034 | |
MSCO | | | 313,034 | | | | (47,267 | ) | | | — | | | | — | | | | 265,767 | |
MSCOd | | | 1,621,594 | | | | (1,621,594 | ) | | | — | | | | — | | | | — | |
MSCS | | | 251,961 | | | | (49,450 | ) | | | — | | | | — | | | | 202,511 | |
MSCSc | | | 10,924,582 | | | | — | | | | — | | | | — | | | | 10,924,582 | |
UBSW | | | 30,387 | | | | (27,374 | ) | | | — | | | | — | | | | 3,013 | |
| | | | |
Total | | $ | 20,037,935 | | | $ | (3,308,524 | ) | | $ | (1,648,036 | ) | | $ | (30,536 | ) | | $ | 15,050,839 | |
| | | | |
At May 31, 2018, the Fund’s OTC derivative liabilities, which may be offset against the Fund’s OTC derivative assets and collateral pledged to the counterparty, are as follows:
| | | | | | | | | | | | | | | | | | | | |
| | | | | | Amounts Not Offset in the Consolidated
Statement of Assets and Liabilities | | | | |
| | | Gross Amounts of Liabilities
Presented in the
Consolidated Statement of
Assets and Liabilities | | | Financial
Instruments
Available for Offset | | | Financials
Instruments
Collateral
Pledgedb | | | Cash
Collateral
Pledgeda | | | Net Amount (Not
Less than Zero) | |
| Counterparty | | | | | | | | | | | | | | | | | | | | |
BNPP | | $ | 100,528 | | | $ | (91,684 | ) | | $ | — | | | $ | (8,844 | ) | | $ | — | |
BNYM | | | 23,398 | | | | (23,398 | ) | | | — | | | | — | | | | — | |
BOFA | | | 21,716 | | | | (21,716 | ) | | | — | | | | — | | | | — | |
BZWS | | | 14,674 | | | | (1,652 | ) | | | — | | | | — | | | | 13,022 | |
DBAB | | | 1,411,570 | | | | (1,411,570 | ) | | | — | | | | — | | | | — | |
GSCO | | | 19,960 | | | | (4,656 | ) | | | — | | | | — | | | | 15,304 | |
HSBC | | | 309 | | | | (206 | ) | | | — | | | | — | | | | 103 | |
JPHQ | | | 80,346 | | | | (7,957 | ) | | | — | | | | — | | | | 72,389 | |
JPHQc | | | 1,618,912 | | | | — | | | | — | | | | — | | | | 1,618,912 | |
MSCO | | | 47,267 | | | | (47,267 | ) | | | — | | | | — | | | | — | |
MSCOd | | | 3,926,721 | | | | (1,621,594 | ) | | | — | | | | (2,305,127 | ) | | | — | |
MSCS | | | 49,450 | | | | (49,450 | ) | | | — | | | | — | | | | — | |
MSCSc | | | 3,906,859 | | | | — | | | | — | | | | — | | | | 3,906,859 | |
UBSW | | | 27,374 | | | | (27,374 | ) | | | — | | | | — | | | | — | |
| | | | |
Total | | $ | 11,249,084 | | | $ | (3,308,524 | ) | | $ | — | | | $ | (2,313,971 | ) | | $ | 5,626,589 | |
| | | | |
| | | | | | |
| franklintempleton.com | | Annual Report | | | 89 | |
FRANKLIN ALTERNATIVE STRATEGIES FUNDS
NOTES TO CONSOLIDATED FINANCIAL STATEMENTS
Franklin K2 Alternative Strategies Fund (continued)
aIn some instances, the collateral amounts disclosed in the table above were adjusted due to the requirement to limit collateral amounts to avoid the effect of overcollateralization. Actual collateral received and/or pledged may be more than the amounts disclosed herein.
bSee the accompanying Consolidated Statement of Investments for securities pledged as collateral for derivatives.
cRepresents derivatives not subject to an ISDA master agreement.
dRepresents derivatives owned by the K2 Holdings Investment Corp., a wholly-owned subsidiary of the Fund. See Note 1(i).
See Notes 1(e) and 6 regarding derivative financial instruments and investment transactions, respectively.
See Abbreviations on page 92.
10. Credit Facility
The Fund, together with other U.S. registered and foreign investment funds (collectively, Borrowers), managed by Franklin Templeton Investments, are borrowers in a joint syndicated senior unsecured credit facility totaling $2 billion (Global Credit Facility) which matures on February 8, 2019. This Global Credit Facility provides a source of funds to the Borrowers for temporary and emergency purposes, including the ability to meet future unanticipated or unusually large redemption requests.
Under the terms of the Global Credit Facility, the Fund shall, in addition to interest charged on any borrowings made by the Fund and other costs incurred by the Fund, pay its share of fees and expenses incurred in connection with the implementation and maintenance of the Global Credit Facility, based upon its relative share of the aggregate net assets of all of the Borrowers, including an annual commitment fee of 0.15% based upon the unused portion of the Global Credit Facility. These fees are reflected in other expenses in the Consolidated Statement of Operations. During the year ended May 31, 2018, the Fund did not use the Global Credit Facility.
11. Fair Value Measurements
The Fund follows a fair value hierarchy that distinguishes between market data obtained from independent sources (observable inputs) and the Fund’s own market assumptions (unobservable inputs). These inputs are used in determining the value of the Fund’s financial instruments and are summarized in the following fair value hierarchy:
| | • | | Level 1 – quoted prices in active markets for identical financial instruments |
| | • | | Level 2 – other significant observable inputs (including quoted prices for similar financial instruments, interest rates, prepayment speed, credit risk, etc.) |
| | • | | Level 3 – significant unobservable inputs (including the Fund’s own assumptions in determining the fair value of financial instruments) |
The input levels are not necessarily an indication of the risk or liquidity associated with financial instruments at that level.
For movements between the levels within the fair value hierarchy, the Fund has adopted a policy of recognizing the transfers as of the date of the underlying event which caused the movement.
| | | | |
| 90 | | Annual Report | | franklintempleton.com |
FRANKLIN ALTERNATIVE STRATEGIES FUNDS
NOTES TO CONSOLIDATED FINANCIAL STATEMENTS
Franklin K2 Alternative Strategies Fund (continued)
11. Fair Value Measurements (continued)
A summary of inputs used as of May 31, 2018, in valuing the Fund’s assets and liabilities carried at fair value, is as follows:
| | | | | | | | | | | | | | | | |
| | | Level 1 | | | Level 2 | | | Level 3 | | | Total | |
| | | | |
| Assets: | | | | | | | | | | | | | | | | |
Investments in Securities:a | | | | | | | | | | | | | | | | |
Common Stocks and Other Equity Interests | | $ | 521,602,350 | | | $ | 174,808 | | | $ | 3,550,727 | b | | $ | 525,327,885 | |
Exchange Traded Funds | | | 693,158 | | | | — | | | | — | | | | 693,158 | |
Convertible Preferred Stocks | | | — | | | | 85,114 | | | | — | | | | 85,114 | |
Preferred Stocks | | | 814,468 | | | | — | | | | 2,807,304 | | | | 3,621,772 | |
Convertible Bonds | | | — | | | | 86,977,326 | | | | — | | | | 86,977,326 | |
Corporate Bonds and Notes | | | — | | | | 156,115,402 | | | | — | | | | 156,115,402 | |
Corporate Bonds and Notes in Reorganization | | | — | | | | 10,097,338 | | | | — | | | | 10,097,338 | |
Senior Floating Rate Interests | | | — | | | | 10,913,191 | | | | — | | | | 10,913,191 | |
Foreign Government and Agency Securities | | | — | | | | 36,000,843 | | | | — | | | | 36,000,843 | |
Asset-Backed Securities and Commercial Mortgage-Backed Securities | | | — | | | | 26,867,547 | | | | — | | | | 26,867,547 | |
Options Purchased | | | 2,107,434 | | | | 33,766 | | | | — | | | | 2,141,200 | |
Short Term Investments | | | 182,594,274 | | | | 5,854,885 | | | | — | | | | 188,449,159 | |
| | | | |
Total Investments in Securities | | $ | 707,811,684 | | | $ | 333,120,220 | | | $ | 6,358,031 | | | $ | 1,047,289,935 | |
| | | | |
Other Financial Instruments: | | | | | | | | | | | | | | | | |
Futures Contracts | | $ | 2,548,927 | | | $ | — | | | $ | — | | | $ | 2,548,927 | |
Forward Exchange Contracts | | | — | | | | 7,703,513 | | | | — | | | | 7,703,513 | |
Swap Contracts | | | — | | | | 13,207,509 | | | | 143,899 | | | | 13,351,408 | |
Unfunded Loan Commitments | | | — | | | | 1,744 | | | | — | | | | 1,744 | |
| | | | |
Total Other Financial Instruments | | $ | 2,548,927 | | | $ | 20,912,766 | | | $ | 143,899 | | | $ | 23,605,592 | |
| | | | |
| | | | |
| Liabilities: | | | | | | | | | | | | | | | | |
Other Financial Instruments: | | | | | | | | | | | | | | | | |
Options Written | | $ | 428,343 | | | $ | — | b | | $ | — | | | $ | 428,343 | |
Securities Sold Shorta | | | 221,439,329 | | | | 16,812,568 | | | | — | | | | 238,251,897 | |
Futures Contracts | | | 3,126,983 | | | | — | | | | — | | | | 3,126,983 | |
Forward Exchange Contracts | | | — | | | | 6,084,924 | | | | — | | | | 6,084,924 | |
Swap Contracts | | | — | | | | 6,157,914 | | | | — | | | | 6,157,914 | |
| | | | |
Total Other Financial Instruments | | $ | 224,994,655 | | | $ | 29,055,406 | | | $ | — | | | $ | 254,050,061 | |
| | | | |
aFor detailed categories, see the accompanying Consolidated Statement of Investments.
bIncludes securities determined to have no value at May 31, 2018.
A reconciliation of assets in which Level 3 inputs are used in determining fair value is presented when there are significant Level 3 financial instruments at the beginning and/or end of the year.
12. Subsequent Events
The Fund has evaluated subsequent events through the issuance of the consolidated financial statements and determined that no events have occurred that require disclosure, except for the following:
On February 27, 2018, the Board approved an automatic conversion feature for Class C that will convert shareholders’ Class C shares into Class A shares after they have been held for 10 years. On May 17, 2018, the Board approved changes to certain front-end sales charges and dealer commissions on Class A shares. Further details are disclosed in the Fund’s Prospectus. The changes will become effective on a future date prior to the calendar year end of 2018.
| | | | | | |
| franklintempleton.com | | Annual Report | | | 91 | |
FRANKLIN ALTERNATIVE STRATEGIES FUNDS
NOTES TO CONSOLIDATED FINANCIAL STATEMENTS
Franklin K2 Alternative Strategies Fund (continued)
Abbreviations
| | | | | | | | | | |
| Counterparty | | | | Currency | | Selected Portfolio |
| BNPP | | BNP Paribas | | ARS | | Argentine Peso | | ADR | | American Depositary Receipt |
| BNYM | | The Bank of New York Mellon Corp. | | BRL | | Brazilian Real | | ARM | | Adjustable Rate Mortgage |
| BOFA | | Bank of America, N.A. | | CAD | | Canadian Dollar | | ARPP7DRR | | Argentina Central Bank 7 Day Repo Rate |
| BZWS | | Barclays Bank PLC | | CHF | | Swiss Franc | | BADLAR | | Argentina Deposit Rates Badlar Private Banks ARS |
| DBAB | | Deutsche Bank, AG | | CNY | | Chinese Yuan | | | |
| GSCO | | Goldman Sachs International | | COP | | Colombian Peso | | BRLCDI | | Brazil Cetip DI Interbank Deposit Rate |
| HSBC | | HSBC Bank USA, N.A. | | CZK | | Czech Koruna | | CABA | | Canadian Bank’s Acceptance |
| JPHQ | | JP Morgan Chase Bank, N.A. | | EGP | | Egyptian Pound | | CAC | | Cotation Assistee en Continu |
| MSCO | | Morgan Stanley & Co., LLC | | EUR | | Euro | | CBOT | | Chicago Board of Trade |
| MSCS | | Morgan Stanley Capital Services LLC | | GBP | | British Pound | | CME | | Chicago Mercantile Exchange |
| UBSW | | UBS AG | | HKD | | Hong Kong Dollar | | DAX | | Deutscher Aktienindex |
| | | | INR | | Indian Rupee | | DJIA | | Dow Jones Industrial Average |
| | | | JPY | | Japanese Yen | | EONIA | | Euro OverNight Index Average |
| | | | MYR | | Malaysian Ringgit | | ETF | | Exchange Traded Fund |
| | | | MXN | | Mexican Peso | | EURIBOR | | Euro Interbank Offered Rate |
| | | | PEN | | Peruvian Nuevo Sol | | FEDEF | | Federal Funds Effective Rate |
| | | | PLN | | Polish Zloty | | FHLMC | | Federal Home Loan Mortgage Corp. |
| | | | RON | | Romanian Leu | | FRN | | Floating Rate Note |
| | | | RUB | | Russian Ruble | | FTSE | | Financial Times Stock Exchange |
| | | | SEK | | Swedish Krona | | HIBOR | | Hong Kong Interbank Offer Rate |
Index | | SGD | | Singapore Dollar | | HONIX | | Hong Kong Overnight Index Rate |
| | USD | | United States Dollar | | KLIBOR | | Kuala Lumpur Interbank Offered Rate |
| CDX.EM | | CDX Emerging Markets Index | | ZAR | | South African Rand | | LIBOR | | London InterBank Offered Rate |
| CDX.NA.HY | | CDX North America High Yield Index | | | | | | MIB | | Milano Italia Borsa |
| CDX.NA.IG | | CDX North America Investment Grade Index | | | | | | MIBOR | | Mumbai Interbank Offered Rate |
| | | | | | | MSCI | | Morgan Stanley Capital International |
| | | | | | | | PIK | | Payment In-Kind |
| | | | | | | | PRIBOR | | Prague Interbank Offered Rate |
| | | | | | | | REIT | | Real Estate Investment Trust |
| | | | | | | | SGX | | Singapore Exchange |
| | | | | | | | SIBOR | | Singapore Interbank Offered Rate |
| | | | | | | | SONIA | | Sterling Overnight Index Average |
| | | | | | | | SPDR | | S&P Depositary Receipt |
| | | | | | | | SPI | | Swiss Performance Index |
| | | | | | | | STIBOR | | Stockholm Interbank Offered Rate |
| | | | | | | | TIIE | | Interbank Equilibrium Interest Rate |
| | | | | | | | TOPIX | | Tokyo Price Index |
| | | | | | | | ULSD | | Ultra-Low Sulfur Diesel |
| | | | |
| 92 | | Annual Report | | franklintempleton.com |
FRANKLIN ALTERNATIVE STRATEGIES FUNDS
Report of Independent Registered Public Accounting Firm
To the Board of Trustees of Franklin Alternative Strategies Funds and Shareholders of Franklin K2 Alternative Strategies Fund:
Opinion on the Financial Statements
We have audited the accompanying consolidated statement of assets and liabilities of Franklin K2 Alternative Strategies Fund (the “Fund”) (one of the funds constituting the Franklin Alternative Strategies Funds), including the consolidated statement of investments, as of May 31, 2018, and the related consolidated statement of operations for the year then ended, the consolidated statements of changes in net assets for each of the two years in the period then ended, the consolidated financial highlights for each of the 4 years in the period then ended and the period from October 11, 2013 (commencement of operations) through May 31, 2014 and the related notes (collectively referred to as the “financial statements”). In our opinion, the financial statements present fairly, in all material respects, the consolidated financial position of Franklin K2 Alternative Strategies Fund (one of the funds constituting the Franklin Alternative Strategies Funds) at May 31, 2018, the consolidated results of its operations for the year then ended, the consolidated changes in its net assets for each of the two years in the period then ended and its consolidated financial highlights for each of the four years in the period then ended and the period from October 11, 2013 (commencement of operations) through May 31, 2014, in conformity with U.S. generally accepted accounting principles.
Basis for Opinion
These financial statements are the responsibility of the Fund’s management. Our responsibility is to express an opinion on the Fund’s financial statements based on our audits. We are a public accounting firm registered with the Public Company Accounting Oversight Board (United States) (“PCAOB”) and are required to be independent with respect to the Fund in accordance with the U.S. federal securities laws and the applicable rules and regulations of the Securities and Exchange Commission and the PCAOB.
We conducted our audits in accordance with the standards of the PCAOB. Those standards require that we plan and perform the audit to obtain reasonable assurance about whether the financial statements are free of material misstatement, whether due to error or fraud. The Fund is not required to have, nor were we engaged to perform, an audit of the Fund’s internal control over financial reporting. As part of our audits, we are required to obtain an understanding of internal control over financial reporting, but not for the purpose of expressing an opinion on the effectiveness of the Fund’s internal control over financial reporting. Accordingly, we express no such opinion.
Our audits included performing procedures to assess the risks of material misstatement of the financial statements, whether due to error or fraud, and performing procedures that respond to those risks. Such procedures included examining, on a test basis, evidence regarding the amounts and disclosures in the financial statements. Our procedures included confirmation of securities owned as of May 31, 2018, by correspondence with the custodian and others, or by other appropriate auditing procedures where replies from others were not received. Our audits also included evaluating the accounting principles used and significant estimates made by management, as well as evaluating the overall presentation of the financial statements. We believe that our audits provide a reasonable basis for our opinion.

We have served as the auditor of one or more Franklin investment companies since 1987.
Boston, Massachusetts
July 25, 2018
| | | | | | |
| franklintempleton.com | | Annual Report | | | 93 | |
FRANKLIN ALTERNATIVE STRATEGIES FUNDS
Tax Information (unaudited)
Under Section 854(b)(1)(A) of the Internal Revenue Code (Code), the Fund hereby reports 31.20% of the ordinary income dividends as income qualifying for the dividends received deduction for the fiscal year ended May 31, 2018.
Under Section 854(b)(1)(B) of the Code, the Fund hereby reports the maximum amount allowable but no less than $3,647,870 as qualified dividends for purposes of the maximum rate under Section 1(h)(11) of the Code for the fiscal year ended May 31, 2018. Distributions, including qualified dividend income, paid during calendar year 2018 will be reported to shareholders on Form 1099-DIV by mid-February 2019. Shareholders are advised to check with their tax advisors for information on the treatment of these amounts on their individual income tax returns.
Under Section 852(b)(3)(C) of the Code, the Fund hereby reports the maximum amount allowable but no less than $82,103 as long term capital gain dividend for the fiscal year ended May 31, 2018.
| | | | |
| 94 | | Annual Report | | franklintempleton.com |
FRANKLIN ALTERNATIVE STRATEGIES FUNDS
Board Members and Officers
The name, year of birth and address of the officers and board members, as well as their affiliations, positions held with the Funds, principal occupations during at least the past five years and number of US registered portfolios overseen in the Franklin Templeton Investments fund complex, are shown below. Generally, each board member serves until that person’s successor is elected and qualified.
Independent Board Members
| | | | | | | | |
Name, Year of Birth
and Address | | Position | | Length of
Time Served | | Number of Portfolios in
Fund Complex Overseen
by Board Member* | | Other Directorships Held During
at Least the Past 5 Years |
| | | | |
Edward I. Altman, Ph.D. (1941)
c/o Franklin Mutual Advisers, LLC
101 John F. Kennedy Parkway
Short Hills, NJ 07078-2716 | | Trustee | | Since 2011 | | 14 | | None |
|
| Principal Occupation During at Least the Past 5 Years: |
| Max L. Heine Professor of Finance, Emeritus and Director of The Credit and Debt Markets Research Program, Salomon Center, Stern School of Business, New York University; editor and author of numerous financial publications; financial consultant; an adviser to numerous financial and publishing organizations; and formerly, Vice Director, Salomon Center, Stern School of Business, New York University. |
| | | | |
Ann Torre Bates (1958)
c/o Franklin Mutual Advisers, LLC
101 John F. Kennedy Parkway
Short Hills, NJ 07078-2716 | | Trustee | | Since 2011 | | 39 | | Ares Capital Corporation (specialty finance company) (2010-present), United Natural Foods, Inc. (distributor of natural, organic and specialty foods) (2013-present), Allied Capital Corporation (financial services) (2003-2010), SLM Corporation (Sallie Mae) (1997-2014) and Navient Corporation (loan management, servicing and asset recovery) (2014-2016). |
|
| Principal Occupation During at Least the Past 5 Years: |
| Director of various companies; and formerly, Executive Vice President and Chief Financial Officer, NHP Incorporated (manager of multifamily housing) (1995-1997); and Vice President and Treasurer, US Airways, Inc. (until 1995). |
| | | | |
Burton J. Greenwald (1929)
c/o Franklin Mutual Advisers, LLC
101 John F. Kennedy Parkway
Short Hills, NJ 07078-2716 | | Trustee and Vice Chairman of the Board | | Trustee since 2011 and Vice Chairman of the Board since 2015 | | 14 | | Franklin Templeton Emerging Markets Debt Opportunities Fund PLC (1999-present) and Fiduciary International Ireland Limited (1999-2015). |
|
| Principal Occupation During at Least the Past 5 Years: |
| Managing Director, B.J. Greenwald Associates (management consultants to the financial services industry); and formerly, Chairman, Fiduciary Trust International Funds; Executive Vice President, L.F. Rothschild Fund Management, Inc.; President and Director, Merit Mutual Funds; President, Underwriting Division and Director, National Securities & Research Corporation; Governor, Investment Company Institute; and Chairman, ICI Public Information Committee. |
| | | | |
Keith E. Mitchell (1954)
c/o Franklin Mutual Advisers, LLC
101 John F. Kennedy Parkway
Short Hills, NJ 07078-2716 | | Trustee | | Since 2011 | | 14 | | None |
|
| Principal Occupation During at Least the Past 5 Years: |
| Director of various boards of asset management firms; and formerly, Managing Member, Mitchell, Hartley & Bechtel Advisers, LLC (formerly, Mitchell Advisers, LLC) (advisory firm) (2003-2015) and Managing Director, Putman Lovell NBF. |
| | | | | | |
| franklintempleton.com | | Annual Report | | | 95 | |
FRANKLIN ALTERNATIVE STRATEGIES FUNDS
Independent Board Members (continued)
| | | | | | | | |
Name, Year of Birth
and Address | | Position | | Length of
Time Served | | Number of Portfolios in
Fund Complex Overseen
by Board Member* | | Other Directorships Held During
at Least the Past 5 Years |
| | | | |
David W. Niemiec (1949)
c/o Franklin Mutual Advisers, LLC
101 John F. Kennedy Parkway
Short Hills, NJ 07078-2716 | | Trustee | | Since 2015 | | 39 | | Hess Midstream Partners LP (oil and gas midstream infrastructure) (2017-present). |
|
| Principal Occupation During at Least the Past 5 Years: |
| Advisor, Saratoga Partners (private equity fund); and formerly, Managing Director, Saratoga Partners (1998-2001) and SBC Warburg Dillon Read (investment banking) (1997-1998); Vice Chairman, Dillon, Read & Co. Inc. (investment banking) (1991-1997); and Chief Financial Officer, Dillon, Read & Co. Inc. (1982-1997). |
| | | | |
Charles Rubens II (1930)
c/o Franklin Mutual Advisers, LLC
101 John F. Kennedy Parkway
Short Hills, NJ 07078-2716 | | Trustee | | Since 2011 | | 14 | | None |
|
| Principal Occupation During at Least the Past 5 Years: |
| Private investor and president of non-profit organizations; and formerly, an executive of Time, Inc.; and Trustee of Colorado College. |
| | | | |
Jan Hopkins Trachtman (1947)
c/o Franklin Mutual Advisers, LLC
101 John F. Kennedy Parkway
Short Hills, NJ 07078-2716 | | Trustee | | Since 2011 | | 14 | | None |
|
| Principal Occupation During at Least the Past 5 Years: |
| President and Founder, The Jan Hopkins Group (communications consulting firm); serves on Advisory Board of Knight Bagehot Fellowship; and formerly, President, Economic Club of New York (2007-2015); Anchor/Correspondent, CNN Financial News (until 2003); Managing Director and Head of Client Communications, Citigroup Private Bank (until 2005); Off-Air Reporter, ABC News’ World News Tonight; and Editor, CBS Network News. |
| | | | |
Robert E. Wade (1946)
c/o Franklin Mutual Advisers, LLC
101 John F. Kennedy Parkway
Short Hills, NJ 07078-2716 | | Trustee and Chairman of the Board | | Since 2011 | | 39 | | El Oro Ltd (investments) (2003-present). |
|
| Principal Occupation During at Least the Past 5 Years: |
| Attorney at law engaged in private practice as a sole practitioner (1972-2008) and member of various boards. |
| | | | |
Gregory H. Williams (1943)
c/o Franklin Mutual Advisers, LLC
101 John F. Kennedy Parkway
Short Hills, NJ 07078-2716 | | Trustee | | Since 2015 | | 14 | | None |
|
| Principal Occupation During at Least the Past 5 Years: |
| Private investor; Consultant; and formerly, President, University of Cincinnati (2009-2012); President, The City College of New York (2001-2009); Dean, College of Law, Ohio State University (1993-2001); and Associate Vice President, Academic Affairs and Professor of Law, University of Iowa (1977-1993). |
| | | | |
| 96 | | Annual Report | | franklintempleton.com |
FRANKLIN ALTERNATIVE STRATEGIES FUNDS
Interested Board Members and Officers
| | | | | | | | |
Name, Year of Birth
and Address | | Position | | Length of
Time Served | | Number of Portfolios in
Fund Complex Overseen
by Board Member* | | Other Directorships Held During
at Least the Past 5 Years |
| | | | |
**Gregory E. Johnson (1961)
One Franklin Parkway San Mateo, CA 94403-1906 | | Trustee | | Since 2011 | | 151 | | None |
|
| Principal Occupation During at Least the Past 5 Years: |
| Chairman of the Board, Member – Office of the Chairman, Director and Chief Executive Officer, Franklin Resources, Inc.; officer and/or director or trustee, as the case may be, of some of the other subsidiaries of Franklin Resources, Inc. and of 43 of the investment companies in Franklin Templeton Investments; Vice Chairman, Investment Company Institute; and formerly, President, Franklin Resources, Inc. (1994-2015). |
| | | | |
**Jennifer M. Johnson (1964)
One Franklin Parkway San Mateo, CA 94403-1906 | | Trustee | | Since 2015 | | 43 | | None |
|
| Principal Occupation During at Least the Past 5 Years: |
| President and Chief Operating Officer, Franklin Resources, Inc.; officer and/or director or trustee, as the case may be, of some of the other subsidiaries of Franklin Resources, Inc. and of four of the investment companies in Franklin Templeton Investments; and formerly, Chief Operating Officer and Executive Vice President, Franklin Resources, Inc. (1994-2015); Executive Vice President of Operations and Technology, Franklin Resources, Inc. (2005-2010); and Senior Vice President, Franklin Resources, Inc. (2003-2005). |
| | | | |
Alison E. Baur (1964) One Franklin Parkway San Mateo, CA 94403-1906 | | Vice President | | Since 2012 | | Not Applicable | | Not Applicable |
|
| Principal Occupation During at Least the Past 5 Years: |
| Deputy General Counsel, Franklin Templeton Investments; and officer of some of the other subsidiaries of Franklin Resources, Inc. and of 45 of the investment companies in Franklin Templeton Investments. |
| | | | |
Aliya S. Gordon (1973) One Franklin Parkway San Mateo, CA 94403-1906 | | Vice President | | Since 2011 | | Not Applicable | | Not Applicable |
|
| Principal Occupation During at Least the Past 5 Years: |
| Senior Associate General Counsel, Franklin Templeton Investments; and officer of 45 of the investment companies in Franklin Templeton Investments. |
| | | | |
Steven J. Gray (1955) One Franklin Parkway San Mateo, CA 94403-1906 | | Secretary and Vice President | | Since 2011 | | Not Applicable | | Not Applicable |
|
| Principal Occupation During at Least the Past 5 Years: |
| Senior Associate General Counsel, Franklin Templeton Investments; Vice President, Franklin Templeton Distributors, Inc. and FASA, LLC; and officer of 45 of the investment companies in Franklin Templeton Investments. |
| | | | |
Madison S. Gulley (1964) 300 S.E. 2nd Street Fort Lauderdale, FL 33301-1923 | | President and Chief Executive Officer – Investment Management | | Since 2017 | | Not Applicable | | Not Applicable |
|
| Principal Occupation During at Least the Past 5 Years: |
| Executive Vice President, Franklin Advisers, Inc., Franklin Advisory Services, LLC, Franklin Templeton Institutional, LLC; Templeton Global Advisors, Limited, and Templeton Investment Counsel, LLC; Senior Vice President, Franklin Templeton Companies, LLC; officer and/or director or trustee, as the case may be, of some of the other subsidiaries of Franklin Resources, Inc. and of one of the investment companies in Franklin Templeton Investments. |
| | | | | | |
| franklintempleton.com | | Annual Report | | | 97 | |
FRANKLIN ALTERNATIVE STRATEGIES FUNDS
Interested Board Members and Officers (continued)
| | | | | | | | |
Name, Year of Birth
and Address | | Position | | Length of
Time Served | | Number of Portfolios in
Fund Complex Overseen
by Board Member* | | Other Directorships Held During
at Least the Past 5 Years |
| | | | |
Matthew T. Hinkle (1971) One Franklin Parkway San Mateo, CA 94403-1906 | | Chief Executive Officer – Finance and Administration | | Since 2017 | | Not Applicable | | Not Applicable |
|
| Principal Occupation During at Least the Past 5 Years: |
| Senior Vice President, Franklin Templeton Services, LLC; officer of 45 of the investment companies in Franklin Templeton Investments; and formerly, Vice President, Global Tax (2012-April 2017) and Treasurer/Assistant Treasurer, Franklin Templeton Investments (2009-2017). |
| | | | |
Robert G. Kubilis (1973) 300 S.E. 2nd Street Fort Lauderdale, FL 33301-1923 | | Chief Financial Officer, Chief Accounting Officer and Treasurer | | Since 2015 | | Not Applicable | | Not Applicable |
|
| Principal Occupation During at Least the Past 5 Years: |
| Treasurer, U.S. Fund Administration & Reporting, Franklin Templeton Investments; and officer of 17 of the investment companies in Franklin Templeton Investments. |
| | | | |
Robert Lim (1948) One Franklin Parkway San Mateo, CA 94403-1906 | | Vice President – AML Compliance | | Since 2016 | | Not Applicable | | Not Applicable |
|
| Principal Occupation During at Least the Past 5 Years: |
| Vice President, Franklin Templeton Companies, LLC; Chief Compliance Officer, Franklin Templeton Distributors, Inc. and Franklin Templeton Investor Services, LLC; and officer of 45 of the investment companies in Franklin Templeton Investments. |
| | | | |
Kimberly H. Novotny (1972)
300 S.E. 2nd Street Fort Lauderdale, FL 33301-1923 | | Vice President | | Since 2013 | | Not Applicable | | Not Applicable |
|
| Principal Occupation During at Least the Past 5 Years: |
| Associate General Counsel, Franklin Templeton Investments; Vice President and Corporate Secretary, Fiduciary Trust International of the South; Vice President, Templeton Investment Counsel, LLC; Assistant Secretary, Franklin Resources, Inc.; and officer of 45 of the investment companies in Franklin Templeton Investments. |
| | | | |
Robert C. Rosselot (1960)
300 S.E. 2nd Street Fort Lauderdale, FL 33301-1923 | | Chief Compliance Officer | | Since 2013 | | Not Applicable | | Not Applicable |
|
| Principal Occupation During at Least the Past 5 Years: |
| Director, Global Compliance, Franklin Templeton Investments; Vice President, Franklin Templeton Companies, LLC; officer of 45 of the investment companies in Franklin Templeton Investments; and formerly, Senior Associate General Counsel, Franklin Templeton Investments (2007-2013); and Secretary and Vice President, Templeton Group of Funds (2004-2013). |
| | | | |
Karen L. Skidmore (1952)
One Franklin Parkway San Mateo, CA 94403-1906 | | Vice President | | Since 2011 | | Not Applicable | | Not Applicable |
|
| Principal Occupation During at Least the Past 5 Years: |
| Senior Associate General Counsel, Franklin Templeton Investments; and officer of 45 of the investment companies in Franklin Templeton Investments. |
| | | | |
| 98 | | Annual Report | | franklintempleton.com |
FRANKLIN ALTERNATIVE STRATEGIES FUNDS
Interested Board Members and Officers (continued)
| | | | | | | | |
Name, Year of Birth
and Address | | Position | | Length of
Time Served | | Number of Portfolios in
Fund Complex Overseen
by Board Member* | | Other Directorships Held During
at Least the Past 5 Years |
| | | | |
Navid J. Tofigh (1972)
One Franklin Parkway
San Mateo, CA 94403-1906 | | Vice President | | Since 2015 | | Not Applicable | | Not Applicable |
|
| Principal Occupation During at Least the Past 5 Years: |
| Associate General Counsel, Franklin Templeton Investments; and officer of 45 of the investment companies in Franklin Templeton Investments. |
| | | | |
Craig S. Tyle (1960)
One Franklin Parkway
San Mateo, CA 94403-1906 | | Vice President | | Since 2011 | | Not Applicable | | Not Applicable |
|
| Principal Occupation During at Least the Past 5 Years: |
| General Counsel and Executive Vice President, Franklin Resources, Inc.; and officer of some of the other subsidiaries of Franklin Resources, Inc. and of 45 of the investment companies in Franklin Templeton Investments. |
| | | | |
Lori A. Weber (1964)
300 S.E. 2nd Street Fort Lauderdale, FL 33301-1923 | | Vice President | | Since 2011 | | Not Applicable | | Not Applicable |
|
| Principal Occupation During at Least the Past 5 Years: |
| Senior Associate General Counsel, Franklin Templeton Investments; Assistant Secretary, Franklin Resources, Inc.; Vice President and Secretary, Templeton Investment Counsel, LLC; and officer of 45 of the investment companies in Franklin Templeton Investments. |
*We base the number of portfolios on each separate series of the US registered investment companies within the Franklin Templeton Investments fund complex. These portfolios have a common investment manager or affiliated investment managers.
**Gregory E. Johnson is considered to be an interested person of the Fund under the federal securities laws due to his position as an officer and director of Franklin Resources, Inc. (Resources), which is the parent company of the Fund’s investment manager and distributor. Jennifer M. Johnson is considered to be an interested person of the Fund under the federal securities laws due to her position as officer of Resources.
Note 1: Gregory E. Johnson and Jennifer M. Johnson are siblings.
Note 2: Officer information is current as of the date of this report. It is possible that after this date, information about officers may change.
The Sarbanes-Oxley Act of 2002 and Rules adopted by the US Securities and Exchange Commission require the Fund to disclose whether the Fund’s Audit Committee includes at least one member who is an audit committee financial expert within the meaning of such Act and Rules. The Fund’s Board has determined that there is at least one such financial expert on the Audit Committee and has designated each of Edward I. Altman, Ph.D., Ann Torre Bates and David W. Niemiec as an audit committee financial expert. The Board believes that Messrs. Altman and Niemiec and Ms. Bates qualify as such an expert in view of their extensive business background and experience. Mr. Altman has served as a member of the Fund Audit Committee since 2011. He currently serves as a Max L. Hines Professor of Finance, Emeritus and Director of The Credit and Debt Markets Research Program, Salomon Center, Stern School of Business, New York University. Ms. Bates has served as a member of the Fund Audit Committee since 2011. She currently serves as a director of Ares Capital Corporation (2010-present) and United Natural Foods, Inc. (2013-present) and was formerly a director of Navient Corporation from 2014 to 2016, SLM Corporation from 1997 to 2014 and Allied Capital Corporation from 2003 to 2010, Executive Vice President and Chief Financial Officer of NHP Incorporated from 1995 to 1997 and Vice President and Treasurer of US Airways, Inc. until 1995. Mr. Niemiec has served as a member of the Fund Audit Committee since 2015, currently serves as an Advisor to Saratoga Partners and was formerly its Managing Director from 1998 to 2001 and serves as a director of Hess Midstream Partners LP (2017-present). Mr. Niemiec was formerly a director of Emeritus Corporation from 1999 to 2010 and OSI Pharmaceuticals, Inc. from 2006 to 2010, Managing Director of SBC Warburg Dillon Read from 1997 to 1998, and was Vice Chairman from 1991 to 1997 and Chief Financial Officer from 1982 to 1997 of Dillon, Read & Co. Inc. As a result of such background and experience, the Board believes that Messrs. Altman and Niemiec and Ms. Bates have each acquired an understanding of generally accepted accounting principles and financial statements, the general application of such principles in connection with the accounting estimates, accruals and reserves, and analyzing and evaluating financial statements that present a breadth and level of complexity of accounting issues generally comparable to those of the Fund, as well as an understanding of internal controls and procedures for financial reporting and an understanding of audit committee functions. Messrs. Altman and Niemiec and Ms. Bates are independent Board members as that term is defined under the applicable US Securities and Exchange Commission Rules and Releases.
The Statement of Additional Information (SAI) includes additional information about the board members and is available, without charge, upon request. Shareholders may call (800) DIAL BEN/342-5236 to request the SAI.
| | | | | | |
| franklintempleton.com | | Annual Report | | | 99 | |
FRANKLIN ALTERNATIVE STRATEGIES FUNDS
FRANKLIN K2 ALTERNATIVE STRATEGIES FUND
Shareholder Information
Board Approval of Investment Management Agreements and Sub-Advisory Agreements
FRANKLIN ALTERNATIVE STRATEGIES FUNDS
Franklin K2 Alternative Strategies Fund
(Fund)
The Board of Trustees (Board) of Franklin Alternative Strategies Funds (the Trust), including a majority of trustees that are not “interested persons” as such term is defined in section 2(a)(19) of the Investment Company Act of 1940 (hereinafter referred to as “independent trustees”), at an in-person meeting held on May 17, 2018, unanimously approved the renewal of the Fund’s investment management agreement with K2/D&S Management Co., L.L.C. (K2 Advisors), and of each sub-advisory agreement between K2 Advisors and each of following sub-advisors (the Sub-Advisors):
Basso Capital Management, L.P.
Chatham Asset Management, LLC
Chilton Investment Company, LLC
EMSO Asset Management Limited
Graham Capital Management, L.P.
Halcyon Arbitrage Management LP
Impala Asset Management, LLC
Jennison Associates, LLC
Lazard Asset Management, LLC
Loomis Sayles & Company, L.P.
P. Schoenfeld Asset Management L.P.
Portland Hill Asset Management Limited
Wellington Management Company, LLP
Prior to a meeting of all of the trustees for the purpose of considering such renewal, the independent trustees participated in two other meetings held in connection with the renewal process. Throughout the process, the independent trustees received assistance and advice from and met separately with independent counsel. The independent trustees met with and interviewed officers of K2 Advisors and certain Sub-Advisors (including portfolio managers), the transfer agent and shareholder services group and the distributor. In approving the renewal of the investment management agreement and the sub-advisory agreements for the Fund, the Board, including the independent trustees, determined that the investment management fee structure was fair and reasonable and that continuance of the agreement was in the best interests of the Fund and its shareholders.
In making the foregoing approvals, the Board considered various materials related to the investment management agreement and the sub-advisory agreements including: (1) a copy of the investment management agreement and sub-advisory agreements;
(2) information describing the nature, quality and extent of services that K2 Advisors and each Sub-Advisor provided, and are expected to provide, to the Fund, and the investment management fees and sub-advisory fees payable to K2 Advisors and each Sub-Advisor; (3) reports from K2 Advisors on the continued diligence conducted on each Sub-Advisor and the reasons for recommending renewal of each of the sub-advisory agreements, including, but not limited to, each Sub-Advisor’s background, experience, personnel, operations, policies, procedures and compliance functions; and (4) a report from the Trust’s Chief Compliance Officer regarding K2 Advisors’ and each Sub-Advisor’s compliance program and capabilities, including policies and procedures in place to address potential conflicts of interest, and the diligence undertaken by the Trust’s Chief Compliance Officer with respect thereto. The Board also noted that it received an annual report on all payments made by Franklin Templeton Investments (FTI) or the Fund to financial intermediaries engaged in the sale of Fund shares, as well as a memorandum relating to third-party servicing arrangements in response to a Guidance Update from the U.S. Securities and Exchange Commission (SEC) relating to mutual fund distribution and sub-accounting fees.
The Board also took into account information furnished throughout the year at regular Board meetings, as well as information specifically requested and furnished for the renewal process, which culminated in the meetings referred to above for the specific purpose of considering such agreements. Information furnished throughout the year included, among others, reports on the Fund’s investment performance, expenses, portfolio composition, derivatives, asset segregation, portfolio turnover, Rule 12b-1 plan, distribution, shareholder servicing, legal and compliance matters, pricing of securities, sales and redemptions, and marketing support payments made to financial intermediaries, as well as a third-party survey of transfer agent fees charged to funds within the FTI complex in comparison with those charged to other fund complexes deemed comparable. Also, related financial statements and other information about the scope and quality of services provided by K2 Advisors and its affiliates and enhancements to such services over the past year were provided. In addition, the trustees received periodic reports throughout the year and during the renewal process relating to compliance with the Fund’s investment policies and restrictions. During the renewal process, the independent trustees considered K2 Advisors’ methods of operation within the Franklin Templeton group and its activities on behalf of other clients.
The information obtained by the trustees during the renewal process also included a special report prepared by Broadridge
| | | | |
| 100 | | Annual Report | | franklintempleton.com |
FRANKLIN ALTERNATIVE STRATEGIES FUNDS
FRANKLIN K2 ALTERNATIVE STRATEGIES FUND
SHAREHOLDER INFORMATION
Financial Solutions, Inc., an independent third-party analyst that utilizes data from Lipper, Inc. (“Lipper”), comparing the Fund’s investment performance and expenses with those of other mutual funds deemed comparable to such Fund as selected by Lipper (Broadridge Section 15(c) Report). The trustees reviewed the Broadridge Section 15(c) Report and its usefulness in the renewal process with respect to matters such as comparative fees, expenses, expense ratios and performance. The Board considered K2 Advisors’ views that the peer group determined by Lipper for comparison purposes may not be an entirely appropriate representation of the Fund’s peer universe. K2 Advisors explained that the universe of funds that are managed using multi-manager, multi-strategy structures, like the Fund, is still evolving, and has presented challenges in identifying an appropriate set of peers for the Fund. It was noted by K2 Advisors that the peer group compiled by Lipper includes single-manager funds which, due to their nature and relative simplicity, have lower expense ratios and are not true peers for fee comparison purposes (“Base Expense Group”). Because many of the sponsors of funds with multi-manager strategies that K2 Advisors considers to be peers were excluded from the peer group determined by Lipper, K2 Advisors requested a second peer group including funds that K2 Advisors considers to be peer funds (“Alternate Expense Group”). K2 Advisors believes that the Fund’s expenses are in line with the second peer group. While noting the limitations of the Broadridge Section 15(c) Report, the Board concluded that the Broadridge Section 15(c) Report was helpful in the performance of its duties.
In addition, the trustees received a Profitability Study (Profitability Study) prepared by management discussing the profitability to FTI from its overall U.S. fund operations, as well as on an individual fund-by-fund basis. Over the past year, the Board and counsel to the independent trustees continued to receive reports on management’s handling of recent regulatory inquiries and pending legal actions against K2 Advisors and its affiliates. The independent trustees were satisfied with the actions taken to date by management in response to such regulatory and legal matters. The independent trustees also received reports from the Trust’s Chief Compliance Officer on regulatory inquiries and pending legal actions against the Sub-Advisors applicable to the services provided by the Sub-Advisors to the Fund and noted that there were not any issues in this regard that should prevent the renewal of the sub-advisory agreements.
The trustees reviewed the personnel, operations, financial condition, and investment management capabilities, methodologies and resources of K2 Advisors and each Sub-Advisor, including each management team’s expertise in the management of other
alternative strategies funds. As part of this review, particular attention was given to (1) the diligent risk management program of K2 Advisors and its parent, including those aspects of the program related to selecting and overseeing sub-advisors to the Fund and continual monitoring and management of cybersecurity, liquidity and counterparty credit risk, (2) each Sub-Advisor’s risk management program, and (3) derivatives and other complex instruments that are held and expected to be held by the Fund and how such instruments are used to carry out the Fund’s investment goal.
The Board also took into account, among other things, management’s efforts in establishing a global credit facility for the benefit of the Fund and other accounts managed by FTI to provide a source of cash for temporary and emergency purposes or to meet unusual redemption requests as well as the strong financial position of K2 Advisors’ parent company and its commitment to the mutual fund business. The Board noted management’s continuing efforts and expenditures in establishing effective business continuity plans and developing strategies to address areas of heightened concern in the mutual fund industry, such as cybersecurity and liquidity risk management. The Board also recognized management’s commitment to facilitating Board oversight of particular areas, including derivatives and payments to intermediaries, by enhanced reporting. In addition, the Board received updates from management on the compliance of the investment manager with comprehensive rules and regulations promulgated by the SEC and the U.S. Commodity Futures Trading Commission.
In addition to the above and other matters considered by the trustees throughout the course of the year, the following discussion relates to certain primary factors relevant to the Board’s decision. This discussion of the information and factors considered by the Board (including the information and factors discussed above) is not intended to be exhaustive, but rather summarizes certain factors considered by the Board. In view of the wide variety of factors considered, the Board did not, unless otherwise noted, find it practicable to quantify or otherwise assign relative weights to the foregoing factors. In addition, individual trustees may have assigned different weights to various factors.
NATURE, EXTENT AND QUALITY OF SERVICES. The trustees reviewed the nature, extent and quality of the services provided, and to be provided, by K2 Advisors and each Sub-Advisor. In this regard, they reviewed the Fund’s investment goal and K2 Advisors’ and each Sub-Advisor’s investment strategy and sub-strategy, and K2 Advisors’ and each Sub-Advisor’s
| | | | | | |
| franklintempleton.com | | Annual Report | | | 101 | |
FRANKLIN ALTERNATIVE STRATEGIES FUNDS
FRANKLIN K2 ALTERNATIVE STRATEGIES FUND
SHAREHOLDER INFORMATION
ability to implement such investment strategy and/or sub-strategy, including, but not limited to, K2 Advisors’ and each Sub-Advisor’s trading practices, investment decision processes and reputation. K2-ASF and K2-GMOF: The Board also considered the investment management services that the investment manager provides to the Cayman Islands-based company, which is wholly owned by the Fund (Cayman Subsidiary).
The Board noted that the Fund employs a “manager of managers” structure, whereby K2 Advisors is responsible for selecting sub-advisors (subject to Board approval), allocating the Fund’s assets among them, and overseeing the sub-advisors’ day-to-day management of the Fund’s assets. The Board noted the responsibilities that K2 Advisors has as the Fund’s investment manager, including (1) due diligence on the Sub-Advisors and any potential new sub-advisors to the Fund, their respective trading strategies, risk management, operations and businesses, (2) on-going oversight and monitoring of the day-to-day investment activities of Sub-Advisors and other service providers, including their respective compliance with the investment mandate and restrictions, compliance policies and procedures and federal securities laws, and K2 Advisors’ ongoing assessment of their performance, (3) portfolio construction with respect to the allocation of assets among Sub-Advisors, investment funds, cash and other investments, (4) risk management, (5) preparing quarterly reports to the Board, and (6) the implementation of Board directives as they relate to the Fund. The Trustees also considered the successful performance of K2 Advisors in managing the Fund and other investment products with similar investment strategies to the investment strategies of the Fund that are not subject to the Investment Company Act of 1940.
With respect to the sub-advisory services provided, and to be provided, by each Sub-Advisor, the Board noted the responsibilities that each Sub-Advisor has with respect to the portion of the Fund’s assets allocated to the Sub-Advisor by K2 Advisors (Sub-Advised Portion), including, among others, implementing the investment strategies with respect to the Sub-Advised Portion and ensuring compliance with the investment strategies, policies and limitations of the Sub-Advised Portion. The trustees considered the successful performance of each Sub-Advisor in managing the Fund and other investment products with similar investment strategies to the investment strategies of its Sub-Advised Portion of the Fund, including, with respect to certain Sub-Advisors, mutual funds with similar investment strategies. The Board considered K2 Advisors’ rationale for recommending the continued retention of each Sub-Advisor.
The trustees reviewed the Fund’s portfolio management teams at K2 Advisors and each Sub-Advisor, including each such team’s performance, staffing, skills and compensation program. With respect to portfolio manager compensation, management assured the trustees that the Fund’s long-term performance is a significant component of incentive-based compensation for K2 Advisors’ portfolio management team and noted that a portion of a K2 Advisors’ portfolio manager’s incentive-based compensation is paid in shares of pre-designated funds from the portfolio manager’s fund management area. The trustees noted that the portfolio manager compensation program aligned the interests of the portfolio managers with that of Fund shareholders. During regular Board meetings and the aforementioned meetings of the independent trustees, the trustees considered periodic reports provided to them showing that K2 Advisors and the Sub-Advisors complied with the investment policies and restrictions of the Fund as well as other reports periodically furnished to the Board covering matters such as the compliance of portfolio managers and other management personnel with the code of ethics covering the investment management personnel, the adherence to fair value pricing procedures established by the Board and the accuracy of net asset value calculations. The Board noted the extent of the benefits provided to Fund shareholders from being part of the Franklin Templeton group of funds, including the right to exchange investments between funds (same class) without a sales charge, the ability to reinvest Fund dividends into other funds and the right to combine holdings of other funds to obtain reduced sales charges.
The trustees discussed with management various other products, portfolios and entities that are advised by K2 Advisors and each Sub-Advisor and the allocation of assets and expenses among and within them, as well as their relative fees and reasons for differences with respect thereto and any potential conflicts.
The Board also considered a report from the Trust’s Chief Compliance Officer regarding K2 Advisors’ and each Sub-Advisor’s compliance programs and capabilities as such programs and capabilities relate to the operations of the Fund and the monitoring and testing of such program undertaken by the Trust’s Chief Compliance Officer. The Board considered the selection and due diligence process employed by K2 Advisors in selecting and deciding to retain each Sub-Advisor as a sub-advisor to the Fund, including the due diligence undertaken with respect to the Sub-Advisor’s compliance and risk management capabilities. The trustees considered K2 Advisors’ significant efforts in developing and implementing compliance procedures established in accordance with SEC and other requirements.
| | | | |
| 102 | | Annual Report | | franklintempleton.com |
FRANKLIN ALTERNATIVE STRATEGIES FUNDS
FRANKLIN K2 ALTERNATIVE STRATEGIES FUND
SHAREHOLDER INFORMATION
The Board also considered the nature, extent and quality of the services to be provided under the Fund’s other service agreements to determine that, on an overall basis, Fund shareholders were well served. In this connection, the Board also took into account transfer agent and shareholder services provided to Fund shareholders by an affiliate of K2 Advisors, noting continuing expenditures by management to increase and improve the scope of such services and favorable periodic reports on shareholder services conducted by independent third parties. While such considerations directly affected the trustees’ decision in renewing the Fund’s transfer agent and shareholder services agreement, the Board also considered these commitments as incidental benefits to Fund shareholders deriving from the investment management relationship.
Based on their review, the trustees were satisfied with the nature and quality of the overall services provided, and to be provided, by K2 Advisors and its affiliates and each Sub Advisor to the Fund and its shareholders and were confident in the abilities of K2 Advisors and each Sub-Advisor to implement their respective investment strategy and/or sub-strategy and to provide quality services to the Fund and its shareholders.
INVESTMENT PERFORMANCE. As the Fund commenced operations in October 2013, the trustees reviewed the investment performance of the Fund for the one through four-year periods ended December 31, 2017. As part of their review, they inquired of management regarding benchmark and hedging activities. Consideration was also given to performance in the context of available levels of cash, including as affected by net flows, during the periods. The trustees had meetings during the year, including the meetings referred to above held in connection with the renewal process, with the Fund’s portfolio managers to discuss performance and the management of the Fund and each Sub-Advisor.
In addition, attention in assessing performance was given to the Broadridge Section 15(c) Report. That report showed the investment performance of the Fund (Advisor Class shares) in comparison to other funds determined comparable by Lipper.
The comparable funds to the Fund, as chosen by Lipper, included all retail and institutional alternative multi-strategy funds. The Fund had total returns in the best performing quintile for the one-, three- and four-year periods ended December 31, 2017 and total returns in the second-best performing quintile for the two-year period ended December 31, 2017. The Board was satisfied with such performance.
The trustees also compared Fund performance to other industry benchmarks, including measures of risk-adjusted performance of a fund, as part of their evaluation of investment performance. The trustees concluded that the Fund had continued to perform well in comparison to its various benchmarks and in the context of the Fund’s investment goal.
COMPARATIVE EXPENSES AND PROFITABILITY. The trustees considered the cost of the services provided, and to be provided, by K2 Advisors and each Sub-Advisor and the profits realized by K2 Advisors and its affiliates from their relationships with the Fund. As part of the renewal process, they explored with management the trends in expense ratios over the past three fiscal years (or, if earlier, inception) and the reasons for any increases in the Fund’s expense ratios (or components thereof). In considering the appropriateness of the management fee and other expenses charged to the Fund, the Board took into account various factors including investment performance and matters relating to Fund operations, including, but not limited to, the quality and experience of K2 Advisors personnel. The Board also reviewed and considered the investment management fees in light of the nature, extent and quality of the investment management services provided, and to be provided, by K2 Advisors and each Sub-Advisor, as more fully discussed above. The Board noted that the sub-advisory fees are paid by K2 Advisors to each Sub-Advisor and are not additional fees borne by the Fund. The Board also noted that the sub-advisory fees paid, and to be paid, by K2 Advisors to each Sub-Advisor were the product of arms-length negotiations between K2 Advisors and each Sub-Advisor. Furthermore, the Board took into account that information regarding Sub-Advisor profitability is not legally required to be provided. Accordingly, profitability information of the sub-advisors was given lesser weight than other factors. In addition, the Board considered the allocation of the investment management fee charged to the Fund between K2 Advisors and each Sub-Advisor in light of the nature, extent and quality of the investment management services provided, and to be provided, by K2 Advisors and each Sub-Advisor. As part of this discussion, the Board took into account the fee waiver and expense limitation arrangement in effect, and the amount of Fund expenses that were absorbed since inception of the Fund by K2 Advisors through such waivers and arrangements. The Board also considered the investment management services that the investment manager provides to the Cayman Subsidiary and the related fee waivers that were in place.
| | | | | | |
| franklintempleton.com | | Annual Report | | | 103 | |
FRANKLIN ALTERNATIVE STRATEGIES FUNDS
FRANKLIN K2 ALTERNATIVE STRATEGIES FUND
SHAREHOLDER INFORMATION
Consideration was also given to a comparative analysis in the Broadridge Section 15(c) Report of the investment management fee and total expense ratio of the Fund in comparison with those of a group of other funds selected by Lipper as its appropriate Lipper expense group. Lipper expense data is based upon information taken from each fund’s most recent annual report, which reflects historical asset levels that may be quite different from those currently existing, particularly in a period of market volatility.
In reviewing comparative costs, emphasis was given to the Fund’s contractual management fee in comparison with the contractual management fee that would have been charged by other funds within its Lipper expense group assuming they were similar in size to the Fund, as well as the actual total expenses of the Fund in comparison with those of its Lipper expense group. The Lipper contractual management fee analysis includes administrative charges as being part of the management fee, and total expenses, for comparative consistency, are shown by Lipper for Fund Advisor Class shares. The Fund’s contractual management fee rate was in the most expensive quintile of its Base Expense Group and was in the second-most expensive quintile of its Alternate Expense Group. The Fund’s total expenses were in the second-most expensive quintile of its Base Expense Group and were in the second-least expensive quintile of its Alternate Expense Group.
Noting the factors and limitations noted above with respect to the Broadridge Section 15(c) Report and factors relating to the Fund’s operations, such as the quality and experience of K2 Advisors and the Sub-Advisors and the nature and quality of the services provided and to be provided by K2 Advisors and the Sub-Advisors, the Board found such comparative fees and expenses to be acceptable.
The trustees also reviewed the Profitability Study addressing profitability of Franklin Resources, Inc., from its overall U.S. fund business, as well as profitability to K2 Advisors and its affiliates, from providing investment management and other services to the Fund during the 12-month period ended September 30, 2017, the most recent fiscal year-end of Franklin Resources, Inc. The trustees reviewed the basis on which such reports are prepared and the cost allocation methodology utilized in the Profitability Study, it being recognized that allocation methodologies may each be reasonable while producing different results. In this respect, the Board noted that the reasonableness of the cost allocation methodologies was reviewed by independent accountants on an every other year basis.
The independent trustees met with management to discuss the Profitability Study. This included, among other things, a comparison of investment management income with investment management expenses of the Fund; comparison of underwriting revenues and expenses; the relative relationship of investment management and underwriting expenses; shareholder servicing profitability; economies of scale; and the relative contribution of the Fund to the profitability of K2 Advisors and its parent. In discussing the Profitability Study with the Board, K2 Advisors stated its belief that the costs incurred in establishing the infrastructure necessary to operate the type of mutual fund operations conducted by it and its affiliates may not be fully reflected in the expenses allocated to the Fund in determining its profitability.
The Board also took into account management’s expenditures in improving shareholder services provided to the Fund, as well as the need to meet additional regulatory and compliance requirements. The trustees also considered the extent to which K2 Advisors and the Sub-Advisors may derive ancillary benefits from Fund operations, including those derived from the allocation of Fund brokerage and the use of commission dollars to pay for research and other similar services.
Based upon their consideration of all these factors, the trustees determined that the level of profits realized by K2 Advisors and its affiliates in providing services to the Fund was not excessive in view of the nature, quality and extent of services provided. In addition, the Board noted that shareholders are able to redeem their Fund shares at any time if shareholders believe that Fund fees and expenses are too high or if they are dissatisfied with the performance of the Fund.
ECONOMIES OF SCALE. The Board considered economies of scale realized by K2 Advisors and its affiliates and the Sub-Advisors as the Fund grows larger and the extent to which they are shared with Fund shareholders, as for example, in the level of the investment management fees charged, in the quality and efficiency of services rendered and in increased capital commitments benefiting the Fund directly or indirectly. The Board also considered the fee waiver and expense limitation arrangement in effect, and the amount of Fund expenses that were absorbed since inception of the Fund by K2 Advisors through such waiver and arrangement. The Board concluded that economies of scale were deemed not to be a significant factor at that time in light of, among other matters, the fee waiver and expense limitation arrangement in effect and the fact that the Fund had less than five complete years of operating results.
| | | | |
| 104 | | Annual Report | | franklintempleton.com |
FRANKLIN ALTERNATIVE STRATEGIES FUNDS
FRANKLIN K2 ALTERNATIVE STRATEGIES FUND
SHAREHOLDER INFORMATION
Board Approval of Sub-Advisory Agreements
FRANKLIN K2 ALTERNATIVE STRATEGIES FUND (Fund)
The Board of Trustees (Board) of Franklin Alternative Strategies Funds (the Trust), including a majority of trustees that are not “interested persons” as such term is defined in section 2(a)(19) of the Investment Company Act of 1940 (hereinafter referred to as “independent trustees”), at an in-person meeting held on December 8, 2017, unanimously approved the sub-advisory agreements (the “New Sub-Advisory Agreements”) with each of H2O AM LLP (“H2O”) and Grantham Mayo Van Otterloo & Co LLC (“GMO”).
In approving the New Sub-Advisory Agreements, the Board, including the independent trustees, determined that fees to be paid under the New Sub-Advisory Agreements were fair and reasonable and that approval of each of the New Sub-Advisory Agreements was in the best interests of the Fund and its shareholders. As part of the approval process, the trustees considered the process undertaken and information provided during their consideration and approval on May 22, 2017 of the investment management agreement between K2/D&S Management Co., L.L.C., the Fund’s investment manager (“K2 Advisors”), and the Trust, on behalf of the Fund, and the sub-advisory agreements between K2 Advisors and each of the Fund’s existing sub-advisors.
At an independent trustees’ meeting held on December 8, 2017, the independent trustees met with representatives of H2O and GMO. In making the foregoing approvals, the independent trustees received assistance and advice from their independent counsel and, in addition to the materials provided at prior meetings, considered various materials related to the New Sub-Advisory Agreements including: (1) a copy of the proposed form of New Sub-Advisory Agreements for each of H2O and GMO; (2) information describing the nature, quality and extent of services that H2O and GMO would provide to the Fund, and the proposed sub-advisory fees payable to H2O and GMO; (3) a report from K2 Advisors on the diligence conducted on H2O and GMO and the reasons for recommending H2O and GMO as sub-advisors for the Fund, including, but not limited to, H2O’s and GMO’s background, experience, personnel, operations, policies, procedures and compliance functions and plans for the integration of such operations, policies, procedures and compliance functions with those of K2 Advisors; and (4) a report from the Fund’s Chief Compliance Officer regarding H2O’s and GMO’s compliance program and capabilities, including H2O’s
and GMO’s policies and procedures in place to address potential conflicts of interest, and the diligence undertaken by the Fund’s Chief Compliance Officer with respect thereto. The Board noted that the terms of the New Sub-Advisory Agreements were substantially similar to the terms of the sub-advisory agreements with the Fund’s existing sub-advisors.
The Board’s consideration of whether to approve the New Sub-Advisory Agreements on behalf of the Fund took into account several factors including, but not limited to, the following: (1) the nature and quality of the services to be provided by H2O and GMO to the Fund under the New Sub-Advisory Agreements; (2) H2O’s and GMO’s experience as a manager of other accounts; (3) H2O’s and GMO’s strength and reputation within the industry; (4) the fairness of the compensation under the New Sub-Advisory Agreements; (5) the personnel, operations, financial condition, and investment management capabilities, methodologies and resources of H2O and GMO, including, with respect to GMO, the management team’s expertise in the management of other alternative strategy funds; (6) profitability matters; (7) reports from K2 Advisors on the diligence conducted on H2O and GMO and the reasons for recommending H2O and GMO as sub-advisors for the Fund, including, but not limited to, H2O’s and GMO’s background, experience, personnel, operations, policies, procedures and compliance functions and plans for the integration of such operations, policies, procedures and compliance functions with those of K2 Advisors; and (8) a report from the Trust’s Chief Compliance Officer regarding H2O’s and GMO’s compliance program and capabilities, including H2O’s and GMO’s policies and procedures in place to address potential conflicts of interest, and the diligence undertaken by the Trust’s Chief Compliance Officer with respect thereto. Particular attention was given to the due diligence and risk management procedures of K2 Advisors with respect to selecting and overseeing sub-advisors of the Fund, as well as H2O’s and GMO’s risk management program and to derivatives and other complex instruments that are expected to be held by the Fund and how such instruments are expected to be used to pursue the Fund’s investment goals.
The following discussion relates to certain primary factors relevant to the Board’s decision to approve the New Sub-Advisory Agreements. This discussion of the information and factors considered by the Board (including the information and factors discussed above) is not intended to be exhaustive, but rather summarizes certain factors considered by the Board. In view of the wide variety of factors considered, the Board did not, unless otherwise noted, find it practicable to quantify or otherwise
| | | | | | |
| franklintempleton.com | | Annual Report | | | 105 | |
FRANKLIN ALTERNATIVE STRATEGIES FUNDS
FRANKLIN K2 ALTERNATIVE STRATEGIES FUND
SHAREHOLDER INFORMATION
assign relative weights to the following factors. In addition, individual trustees may have assigned different weights to various factors.
NATURE, EXTENT AND QUALITY OF SERVICES. The trustees reviewed the nature, extent and quality of the services to be provided by H2O and GMO. In this regard, they reviewed the Fund’s investment goal and H2O’s and GMO’s proposed investment strategy, and H2O’s and GMO’s ability to implement such investment goal and/or investment strategy, including, but not limited to, H2O’s and GMO’s trading practices and investment decision processes.
With respect to the sub-advisory services to be provided by H2O and GMO, the Board noted the responsibilities that H2O and GMO would have with respect to the Fund’s assets to be allocated to each of H2O and GMO by K2-Advisors (each, a “Sub-Advised Portion”), including, among others, implementing the investment strategies with respect to each Sub-Advised Portion and ensuring compliance with the investment strategies, policies, and limitations of each Sub-Advised Portion. The trustees considered the successful performance of H2O and GMO in managing other investment products with investment strategies similar to the investment strategies of their respective Sub-Advised Portion of the Fund.
The trustees reviewed the portfolio management teams at H2O and GMO that would be responsible for managing each Sub-Advised Portion, including each team’s performance, staffing, skills and compensation program. The trustees considered various other products, portfolios and entities that are advised by H2O and GMO, their relative fees and reasons for differences with respect thereto and any potential conflicts. The Board also considered a report from the Trust’s Chief Compliance Officer regarding H2O’s and GMO’s compliance program as such policies relate to the operations of the Fund. The Board considered the selection and due diligence process employed by K2 Advisors in proposing H2O and GMO as sub-advisors to the Fund, including the due diligence undertaken with respect to H2O’s and GMO’s compliance capabilities, and efforts to integrate H2O’s and GMO’s operations, policies, procedures and compliance functions with those of K2 Advisors.
Based on their review, the trustees were satisfied with the nature and quality of the overall services to be provided by H2O and GMO to the Fund and its shareholders and were confident in the abilities of H2O and GMO to implement its proposed investment strategy, and to provide quality services to the Fund and its shareholders.
INVESTMENT PERFORMANCE. The Board noted that, as H2O and GMO had not provided any services to the Fund, there was no investment performance of H2O or GMO with respect to the Fund. The Board considered the investment performance of H2O and GMO in managing other investment products with similar investment strategies to the investment strategies of their respective Sub-Advised Portion. The Board also considered the performance benchmarks for the Fund and how such benchmarks would be utilized to measure the performance of H2O and GMO in managing their respective Sub-Advised Portion.
COMPARATIVE EXPENSES AND PROFITABILITY. The Board considered the cost of the services to be provided by H2O and GMO. The Board also noted that it could not evaluate H2O’s or GMO’s profitability with respect to the Fund since no assets had yet been allocated to H2O or GMO.
The Board noted that the sub-advisory fees would be paid by K2 Advisors to H2O and GMO and would not be additional fees to be borne by the Fund. The Board also noted that the sub-advisory fees to be paid by K2 Advisors to H2O and GMO were the product of arms-length negotiations between K2 Advisors and each of H2O and GMO and the Board considered the allocation of the investment management fee charged to the Fund between K2 Advisors and each of H2O and GMO in light of the nature, extent and quality of the investment management services expected to be provided by K2 Advisors and each of H2O and GMO. The trustees considered various other products, portfolios and entities that are advised by H2O and GMO and the allocation of assets and expenses among and within them, as well as their relative fees and reasons for differences with respect thereto and any potential conflicts. The Board considered the extent to which H2O and GMO may derive ancillary benefits from the Fund’s operations.
With respect to the impact on K2 Advisors’ and its affiliates’ profitability as a result of hiring H2O and GMO as sub-advisors to the Fund, the Board considered the following: (1) the fee waiver and expense limitation arrangements in effect, and the amount of Fund expenses that were absorbed since the inception of the Fund by K2 Advisors through such arrangements, (2) the sub-advisory fees to be paid to H2O and GMO are the same as the fees charged by all of the Fund’s existing sub-advisors (with the exception of one other sub-adviser), and (3) K2 Advisors’ belief that the hiring of H2O and GMO as sub-advisors will not have any demonstrable impact on K2 Advisors’ profitability.
Based upon its consideration of all these factors, the Board determined that the sub-advisory fee structure for each of H2O and GMO was fair and reasonable.
| | | | |
| 106 | | Annual Report | | franklintempleton.com |
FRANKLIN ALTERNATIVE STRATEGIES FUNDS
FRANKLIN K2 ALTERNATIVE STRATEGIES FUND
SHAREHOLDER INFORMATION
ECONOMIES OF SCALE. The Board considered economies of scale that may be realized by H2O and GMO as the Fund grows larger and the extent to which such economies of scale may be shared with Fund shareholders, as for example, in the level of the sub-advisory fees charged, in the quality and efficiency of services rendered and in increased capital commitments benefiting the Fund directly or indirectly. The Board concluded that economies of scale were deemed not to be a significant factor at that time in light of, among other matters, the fee waiver and expense limitation arrangement in effect.
CONCLUSION. After consideration of the foregoing factors, and such other matters as were deemed relevant, and with no single factor being determinative to their decision, the trustees — including a majority of the independent trustees — with the assistance of independent counsel approved the New Sub-Advisory Agreements, including the fees payable thereunder, with H2O and GMO for the Fund.
Proxy Voting Policies and Procedures
The Fund’s investment manager has established Proxy Voting Policies and Procedures (Policies) that the Fund uses to determine how to vote proxies relating to portfolio securities. Shareholders may view the Fund’s complete Policies online at franklintempleton.com. Alternatively, shareholders may request copies of the Policies free of charge by calling the Proxy Group collect at (954) 527-7678 or by sending a written request to: Franklin Templeton Companies, LLC, 300 S.E. 2nd Street, Fort Lauderdale, FL 33301, Attention: Proxy Group. Copies of the Fund’s proxy voting records are also made available online at franklintempleton.com and posted on the US Securities and Exchange Commission’s website at sec.gov and reflect the most recent 12-month period ended June 30.
Quarterly Consolidated Statement of Investments
The Trust, on behalf of the Fund, files a complete consolidated statement of investments with the US Securities and Exchange Commission for the first and third quarters for each fiscal year on Form N-Q. Shareholders may view the filed Form N-Q by visiting the Commission’s website at sec.gov. The filed form may also be viewed and copied at the Commission’s Public Reference Room in Washington, DC. Information regarding the operations of the Public Reference Room may be obtained by calling (800) SEC-0330.
Householding of Reports and Prospectuses
You will receive the Fund’s financial reports every six months as well as an annual updated summary prospectus (prospectus available upon request). To reduce Fund expenses, we try to identify related shareholders in a household and send only one copy of the financial reports and summary prospectus. This process, called “householding,” will continue indefinitely unless you instruct us otherwise. If you prefer not to have these documents householded, please call us at (800) 632-2301. At any time you may view current prospectuses/summary prospectuses and financial reports on our website. If you choose, you may receive these documents through electronic delivery.
| | | | | | |
| franklintempleton.com | | Annual Report | | | 107 | |
Annual Report and Shareholder Letter
Franklin K2 Alternative Strategies Fund
Investment Manager
K2/D&S Management Co., L.L.C.
Distributor
Franklin Templeton Distributors, Inc.
(800) DIAL BEN® / 342-5236
franklintempleton.com
Shareholder Services
(800) 632-2301
Authorized for distribution only when accompanied or preceded by a summary prospectus and/or prospectus. Investors should carefully consider a fund’s investment goals, risks, charges and expenses before investing. A prospectus contains this and other information; please read it carefully before investing.
To help ensure we provide you with quality service, all calls to and from our service areas are monitored and/or recorded.
| | |
| © 2018 Franklin Templeton Investments. All rights reserved. | | 068 A 07/18 |
Franklin Templeton Investments
Why choose Franklin Templeton Investments?
Successful investing begins with ambition. And achievement only comes when you reach for it. That’s why we continually strive to deliver better outcomes for investors. No matter what your goals are, our deep, global investment expertise allows us to offer solutions that can help.
During our more than 70 years of experience, we’ve managed through all kinds of markets—up, down and those in between. We’re always preparing for what may come next. It’s because of this, combined with our strength as one of the world’s largest asset managers that we’ve earned the trust of millions of investors around the world.
Dear Fellow Shareholder:
During the 12 months ended May 31, 2018, mostly upbeat economic data, better corporate earnings and generally supportive monetary policies, combined with the passage of the US Tax Reform bill, aided US markets. However, investor sentiment was dampened by worries about rising US inflation and trade tensions between the US and China, and a sell-off in technology firms occurred amid concerns about consumer data privacy.
The US Federal Reserve (Fed) began reducing its balance sheet in October 2017 and raised its target for the federal funds rate in June and December 2017 and March 2018. The Fed left its target unchanged at its May 2018 meeting and expressed confidence that inflation was moving closer to its goal. The 10-year US Treasury yield rose during the period mainly based on rising inflation. The yield began the period at 2.21%, reached a seven-year high of 3.11% in mid-May and ended the period at 2.83%. Commodities, as measured by the Bloomberg Commodity Index, generated a +11.02% total return during the 12-month period, aided by strong global growth and geopolitical risks.1
We are committed to our long-term perspective and disciplined investment approach as we conduct a rigorous, fundamental analysis of securities with a regular emphasis on investment risk management.
We believe active, professional investment management serves investors well. We also recognize the important role of financial advisors in today’s markets and encourage investors
CFA® is a trademark owned by CFA Institute.
1. Source: Morningstar.
See www.franklintempletondatasources.com for additional data provider information.
to continue to seek their advice. Amid changing markets and economic conditions, we are confident investors with a well-diversified portfolio and a patient, long-term outlook should be well positioned for the years ahead.
On the following pages, the Fund’s portfolio management team reviews investment decisions that pertain to performance during the past 12 months in light of the economic environment and other factors. Please remember all securities markets fluctuate, as do mutual fund share prices.
We thank you for investing with Franklin Templeton, welcome your questions and comments, and look forward to continuing to serve your investment needs in the years ahead.
Sincerely,
/s/ Madison S. Gulley
Madison S. Gulley, CFA
President and Chief Executive Officer –
Investment Management
Franklin Alternative Strategies Funds
This letter reflects our analysis and opinions as of May 31, 2018, unless otherwise indicated. The information is not a complete analysis of every aspect of any market, country, industry, security or fund. Statements of fact are from sources considered reliable.
| | | | | | | | |
| Not FDIC Insured | | | | | May Lose Value | | | | | No Bank Guarantee |
| | | | |
| | | |
franklintempleton.com | | Not part of the annual report | | 1 |
Contents
Visit franklintempleton.com for fund updates, to access your account, or to find helpful financial planning tools.
| | | | |
| | | |
2 | | Annual Report | | franklintempleton.com |
Annual Report
Franklin Pelagos Commodities Strategy Fund
We are pleased to bring you Franklin Pelagos Commodities Strategy Fund’s annual report for the fiscal year ended May 31, 2018.
Your Fund’s Goal and Main Investments
The Fund seeks long-term total return by providing exposure to the commodities markets. It invests mainly in commodity-linked derivative instruments and securities of the US government, its agencies and instrumentalities and other fixed income securities.
Performance Overview
The Fund’s Class A shares delivered a +11.27% cumulative total return for the 12 months under review. In comparison, the benchmark Bloomberg Commodity Index, which measures performance of exchange-traded futures contracts on physical commodities, generated a +11.02% total return for the same period.1 You can find more of the Fund’s performance data in the Performance Summary beginning on page 7.
Performance data represent past performance, which does not guarantee future results. Investment return and principal value will fluctuate, and you may have a gain or loss when you sell your shares. Current performance may differ from figures shown. For most recent month-end performance, go to franklintempleton.com or call (800) 342-5236.
|
What is a futures contract? |
A futures contract is an agreement between the Fund and a counterparty made through a US or foreign futures exchange to buy or sell an underlying instrument or asset at a specific price on a future date. |
Economic and Market Overview
The US economy grew during the 12 months under review. The economy strengthened in 2017’s third quarter but moderated in the next two quarters. The slower growth in 2018’s first quarter reflected a slowdown in consumer spending, exports, and state
and local government spending, as well as a decline in residential fixed investment. The manufacturing and services sectors expanded during the period. The unemployment rate declined from 4.3% in May 2017, as reported at the beginning of the 12-month period, to an 18-year low of 3.8% at period-end.2 Annual inflation, as measured by the Consumer Price Index, increased from 1.9% in May 2017, as reported at the beginning of the period, to 2.8% at period-end.2
The US Federal Reserve (Fed) raised its target range for the federal funds rate 0.25% at its June and December 2017 meetings and began reducing its balance sheet in October as part of its ongoing effort to normalize monetary policy. In February 2018, new Fed Chair Jerome Powell spoke before Congress and indicated the Fed saw signs of a continued strong labor market and economic growth. He reiterated the Fed’s intention to gradually raise interest rates in an effort to keep the economy from overheating and as inflation increases toward the Fed’s target. However, he noted there was no evidence of the economy overheating and he had yet to see a clear upward move in wages. At its March meeting, the Fed raised its target range for the federal funds rate 0.25% to 1.50%–1.75%. At its May meeting, the Fed kept its target rate unchanged, while expressing more confidence about inflation hitting its target and indicating it may be comfortable with a modest overshoot of inflation.
US equity markets overall rose during the period, benefiting from mostly upbeat economic data and better US corporate earnings. Markets were also supported by the Fed’s indication of gradual rate hikes and the passage of the US Tax Reform bill. However, concerns about political uncertainties in the US and tensions between the US and North Korea curbed market sentiment at times. After reaching new all-time highs in January 2018, US stocks declined in February amid concerns that strong economic growth and rising inflation would lead the Fed to increase its target rate faster than expected. In March, markets were pressured further by a broad sell-off in information technology stocks due to a potential for tighter
1. Source: Morningstar.
The index is unmanaged and includes reinvestment of any income or distributions. It does not reflect any fees, expenses or sales charges. One cannot invest directly in an index, and an index is not representative of the Fund’s portfolio.
2. Source: Bureau of Labor Statistics.
See www.franklintempletondatasources.com for additional data provider information.
The dollar value, number of shares or principal amount, and names of all portfolio holdings are listed in the Fund’s Consolidated Statement of Investments (SOI). The Consolidated SOI begins on page 16.
| | | | |
| | | |
franklintempleton.com | | Annual Report | | 3 |
FRANKLIN PELAGOS COMMODITIES STRATEGY FUND
regulation in the sector arising from concerns about consumer data privacy. The Trump administration’s protectionist policies and uncertainty surrounding the US-China trade relationship also dampened investor sentiment. However, an overall easing of tensions in the Korean peninsula, intermittent US-China trade negotiations and strong first-quarter 2018 earnings results from many companies supported investor sentiment. In this environment, the broad US stock market, as measured by the Standard & Poor’s® 500 Index, generated a +14.38% total return for the period.1
Commodity prices, as measured by the Bloomberg Commodity Index, delivered a +11.02% total return during the period, benefiting from improving global growth and a generally weak US dollar.1 Despite some volatility, oil prices rose, helped by positive global demand trends and geopolitical risks to global supply, especially from the Middle East. Oil prices were also aided by the extension of previously agreed-upon supply curtailments through the end of 2018 by the Organization of the Petroleum Exporting Countries (OPEC) and its partners, including Russia, as well President Trump’s decision to withdraw the US from the 2015 international nuclear agreement and impose sanctions on Iran after a wind-down period. Gold prices rose slightly amid investor concerns about geopolitical tensions and higher interest rates. Industrial metals prices generally rose, buoyed by favorable global economic conditions, with steel and aluminum prices benefitting from anticipation of higher US tariffs on imports from European and North American allies. Among agricultural commodities, prices of wheat, soybean and corn rose, while those of sugar declined.
Investment Strategy
We utilize an actively managed fundamental and quantitative investment process to provide exposure to a variety of commodity sectors and indexes by investing in commodity-linked derivative instruments including commodity-linked total return swaps, commodity futures, commodity index futures and options on commodity futures and commodity index futures, which may provide exposure to foreign and emerging markets. By investing in these derivative instruments, we seek to gain exposure to the returns of real assets that trade in the commodities markets without direct investment in physical commodities. Real assets include such things as industrial and precious metals, gas, oil, livestock, agricultural or meat products and other items.
Manager’s Discussion
During its fiscal year, the Fund obtained its commodities exposure through swaps on commodities indexes and through commodities futures and options on commodities futures. The
|
What is a swap agreement? |
A swap agreement, such as a commodity-linked total return swap, is a contract between the Fund and a counterparty to exchange on a future date the returns, or differentials in return, that would have been earned or realized if a notional amount were invested in specific instruments. |
|
What is an option? |
An option is a contract to buy or sell a specific financial product known as the option’s underlying instrument at a specific price. The buyer of an option has the right, but not the obligation, to buy or sell the underlying instrument at or until a specified expiration date. Conversely, the seller (“writer”) of an option who opens a transaction is obligated to buy or sell the underlying instrument should the option holder exercise that right. |
Portfolio Composition*
5/31/18
| | | | |
| | | % of Consolidated | |
| | | Net Assets | |
U.S. Treasury Bill | | | 89.8% | |
FFCB | | | 5.3% | |
FHLMC | | | 3.3% | |
Institutional Fiduciary Trust Money Market Portfolio | | | 0.2% | |
Other Assets, less Liabilities** | | | 1.4% | |
See Abbreviations on page 33.
*Portfolio composition figures are stated as a percentage of total and may not equal 100% or may be negative due to rounding, use of any derivatives, unsettled trades or other factors.
**Includes unrealized appreciation/depreciation on open commodity futures and swap contracts, as well as other assets and liabilities. See supplementary commodity exposure tables on page 5 for additional information related to the Fund’s economic exposure to commodities.
asset coverage for this exposure was met by the Fund’s investments in US Treasury bills and other fixed income securities. The Fund’s investments are summarized in the Portfolio Composition table on this page, and the Fund’s commodities exposure is summarized in the Fund Exposure to Commodities section on page 5.
During the period, commodity sector returns for the Fund’s benchmark were positive overall, but some sectors detracted. Energy and industrial metals had strong positive returns. Livestock and precious metals sector returns were negative, while agriculture was nearly unchanged for the year. Overall contributions to Fund returns came largely from energy, whereas the livestock sector was the largest detractor. Industrial metals also contributed significantly to Fund returns and agriculture made a smaller contribution. Precious metals detracted from performance for the period.
| | | | |
| | | |
4 | | Annual Report | | franklintempleton.com |
FRANKLIN PELAGOS COMMODITIES STRATEGY FUND
The Fund slightly outperformed its benchmark over the period. The Fund’s positions in energy and agriculture outperformed the benchmark, while those in industrial metals, livestock and precious metals hurt relative performance. Positioning in crude oil, gasoline and natural gas aided relative returns in energy. Copper, zinc and nickel positions hindered industrial metals relative performance and gold positioning hurt precious metals’ relative returns. In agriculture, winter wheat, corn, sugar and cotton provided positive relative returns, while wheat, soybean meal and soybeans hindered returns.
In the energy sector, the petroleum industry posted strong positive returns as West Texas Intermediate crude oil futures gained substantially, ending the period at around US$67. The petroleum environment was driven by the production limit agreement put in place by OPEC and non-OPEC countries in November 2016. As production and storage data confirmed compliance to the agreement, crude oil prices bottomed in June 2017, and have been on a steady climb throughout the period. Also, the continued turmoil in Venezuela led to additional crude oil production declines beyond those outlined in the production limit agreement, aiding crude oil price increases. A conundrum for OPEC has been the ability of US producers to quickly respond to higher crude oil prices, and this period was no different. The oil rig count in the US increased meaningfully, especially as prices moved above US$55 in late calendar-year 2017, leading to US production surging well beyond 10 million barrels per day. In the US natural gas market, the seasonal supply and demand balance improved during the period, particularly as colder-than-normal weather occurred in late December and early January.
Industrial metals posted strong returns over the period due to supply and demand issues. Nickel was a standout performer during the period. Demand has been strong, particularly from China, with stainless steel production requiring nickel and the electric vehicle market beginning to ramp up production, though still a small portion of the market. Supply of nickel has been under pressure given lingering effects from Indonesia’s export ban and mining and production restrictions in the Philippines and China. Copper also benefited from both supply and demand issues, including labor strikes at multiple mines during the period. Finally, in April, aluminum prices were aided by the imposition of sanctions against Rusal, a major aluminum producer in Russia. Precious metals prices were mixed during the period. Gold prices increased, tracking an increase in total known exchange-traded gold securities, while silver prices decreased along with a drop in exchange-traded silver securities.
Fund Exposure to Commodities
The following table summarizes the Fund’s economic exposure to commodities derived through its investment in commodity-linked total return swap contracts. At May 31, 2018, the Fund’s exposure based on notional value represented 79.9% of consolidated net assets.
Commodity-Linked Total Return Swap Exposure*
| | | | |
| | | % of Consolidated Net Assets | |
| | | Long | |
Gold | | | 11.5 | % |
Natural Gas | | | 8.1 | % |
WTI Crude Oil | | | 7.8 | % |
Corn | | | 6.6 | % |
Copper | | | 5.7 | % |
Aluminum | | | 4.5 | % |
Unleaded Gasoline | | | 4.2 | % |
Live Cattle | | | 3.7 | % |
Wheat | | | 3.6 | % |
Soybean Meal | | | 3.5 | % |
Brent Crude Oil | | | 3.0 | % |
Sugar | | | 2.6 | % |
Soybean Oil | | | 2.5 | % |
Coffee | | | 2.3 | % |
Lean Hogs | | | 2.1 | % |
Nickel | | | 2.0 | % |
Zinc | | | 1.8 | % |
Cotton | | | 1.5 | % |
Kansas Wheat | | | 1.5 | % |
Silver | | | 1.4 | % |
*Figures are stated as a percentage of total and may not equal 100% or may be negative due to rounding, use of any derivatives, unsettled trades or other factors. The Fund’s exposure was calculated using the commodity sector weightings of the FP Custom Master Index multiplied by the Fund’s percentage notional exposure.
The following table summarizes the Fund’s economic exposure to commodities derived through its investment in futures contracts. At May 31, 2018, the Fund’s exposure based on notional value represented 19.4% of consolidated net assets.
Commodity Futures Exposure*
| | |
| | | % of Consolidated Net Assets |
| | | Long |
Brent Crude Oil | | 5.2% |
RBOB Gasoline | | 3.6% |
Corn | | 3.0% |
Soybean Meal | | 2.9% |
WTI Crude Oil | | 2.9% |
Gold 100 Oz | | 1.8% |
*Figures are stated as a percentage of total and may not equal 100% or may be negative due to rounding, use of any derivatives, unsettled trades or other factors.
| | | | |
| | | |
| franklintempleton.com | | Annual Report | | 5 |
FRANKLIN PELAGOS COMMODITIES STRATEGY FUND
Agriculture returns were mixed over the period. Although US growing conditions were favorable for corn and soybeans, a drought in Argentina raised concerns of a drop in production and boosted soybean prices. Dry conditions in the US southern plains and Texas region damaged winter wheat and contributed to gains in wheat prices. Those same conditions raised the possibility of poor growing conditions for cotton, leading to significant price increases. Both live cattle and lean hog prices declined as production was elevated above historical averages. Additionally, there was concern about possible tariff retaliation against US pork products, putting downward pressure on prices toward period-end.
Thank you for your participation in Franklin Pelagos Commodities Strategy Fund. We look forward to continuing to serve your financial needs.
| | |
 | | /s/ Stephen P. Burke Stephen P. Burke |
| |
 | | /s/ John C. Pickart John C. Pickart, CFA |
| |
| | Portfolio Management Team |
The foregoing information reflects our analysis, opinions and portfolio holdings as of May 31, 2018, the end of the reporting period. The way we implement our main investment strategies and the resulting portfolio holdings may change depending on factors such as market and economic conditions. These opinions may not be relied upon as investment advice or an offer for a particular security. The information is not a complete analysis of every aspect of any market, country, industry, security or the Fund. Statements of fact are from sources considered reliable, but the investment manager makes no representation or warranty as to their completeness or accuracy. Although historical performance is no guarantee of future results, these insights may help you understand our investment management philosophy.
|
Stephen P. Burke is an executive vice president and co-founder of Franklin Alternative Strategies Advisers, LLC., formerly known as Pelagos Capital Management, LLC (“Pelagos”). Mr. Burke has over 30 years of investment experience across multiple asset classes and has been managing multi-alternative and commodity strategies since 2008. Prior to founding Pelagos, Mr. Burke worked at State Street Global Advisors for 10 years during which time he was the senior global strategist, head of global strategic asset allocation, and head of taxable fixed income. Mr. Burke earned a B.S. from the Carroll School of Management at Boston College. |
|
John C. Pickart is an executive vice president, chief financial officer and co-founder of Franklin Alternative Strategies Advisers, LLC., formerly known as Pelagos Capital Management, LLC. Mr. Pickart has over 29 years of investment experience across multiple alternative and commodity strategies since 2008. Prior to founding Pelagos, Mr. Pickart worked at State Street Global Advisors for six years during which time he managed small-cap and mid-cap equity portfolios. Mr. Pickart earned an M.B.A. from the University of Chicago Booth School of Business and a B.S. from the University of Tampa. He is a Chartered Financial Analyst (CFA) charterholder. |
| | | | |
| | | |
6 | | Annual Report | | franklintempleton.com |
FRANKLIN PELAGOS COMMODITIES STRATEGY FUND
Performance Summary as of May 31, 2018
The performance table and graphs do not reflect any taxes that a shareholder would pay on Fund dividends, capital gain distributions, if any, or any realized gains on the sale of Fund shares. Total return reflects reinvestment of the Fund’s dividends and capital gain distributions, if any, and any unrealized gains or losses. Your dividend income will vary depending on dividends or interest paid by securities in the Fund’s portfolio, adjusted for operating expenses of each class. Capital gain distributions are net profits realized from the sale of portfolio securities.
Performance as of 5/31/181
Cumulative total return excludes sales charges. Average annual total return includes maximum sales charges. Sales charges will vary depending on the size of the investment and the class of share purchased. The maximum is 5.75% and the minimum is 0%. Class A: 5.75% maximum initial sales charge; Advisor Class: no sales charges. For other share classes, visit franklintempleton.com.
| | | | | | | | | | | | |
| | | Cumulative | | | | | | Average Annual | |
| Share Class | | Total Return2 | | | | | | Total Return3 | |
| | | |
A | | | | | | | | | | | | |
1-Year | | | +11.27% | | | | | | | | +4.93% | |
3-Year | | | -4.35% | | | | | | | | -3.38% | |
Since Inception (1/10/14) | | | -23.31% | | | | | | | | -7.13% | |
| | | |
Advisor | | | | | | | | | | | | |
1-Year | | | +11.50% | | | | | | | | +11.50% | |
5-Year | | | -25.98% | | | | | | | | -5.84% | |
Since Inception (12/7/11) | | | -30.20% | | | | | | | | -5.40% | |
Performance data represent past performance, which does not guarantee future results. Investment return and principal value will fluctuate, and you may have a gain or loss when you sell your shares. Current performance may differ from figures shown. For most recent month-end performance, go to franklintempleton.com or call (800) 342-5236.
See page 9 for Performance Summary footnotes.
| | | | |
| | | |
| franklintempleton.com | | Annual Report | | 7 |
FRANKLIN PELAGOS COMMODITIES STRATEGY FUND
PERFORMANCE SUMMARY
Total Return Index Comparison for a Hypothetical $10,000 Investment1
Total return represents the change in value of an investment over the periods shown. It includes any applicable maximum sales charge, Fund expenses, account fees and reinvested distributions. The unmanaged index includes reinvestment of any income or distributions. It differs from the Fund in composition and does not pay management fees or expenses. One cannot invest directly in an index.
Class A (1/10/14–5/31/18)
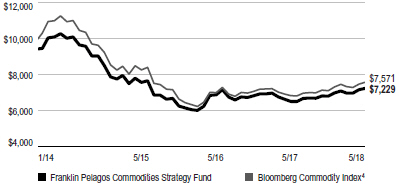
Advisor Class (12/7/11–5/31/18)
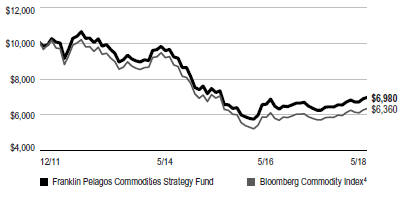
See page 9 for Performance Summary footnotes.
| | | | |
| | | |
8 | | Annual Report | | franklintempleton.com |
FRANKLIN PELAGOS COMMODITIES STRATEGY FUND
PERFORMANCE SUMMARY
Distributions (6/1/17–5/31/18)
| | |
| Share Class | | Net Investment Income |
R6 | | $0.0083 |
Total Annual Operating Expenses5
| | | | | | | | |
| Share Class | | With Waiver | | | Without Waiver | |
A | | | 1.20% | | | | 1.91% | |
Advisor | | | 0.95% | | | | 1.66% | |
Each class of shares is available to certain eligible investors and has different annual fees and expenses, as described in the prospectus.
All investments involve risks, including possible loss of principal. Investing in physical commodities, either directly or through derivative instruments such as commodity-linked total return swaps, commodity futures, commodity index futures and options on commodity futures and commodities index futures, presents unique risks, is speculative and can be extremely volatile. Market prices of commodities may fluctuate rapidly based on numerous factors, including: changes in supply and demand relationships; weather; agriculture; trade; domestic and foreign political and economic events and policies; diseases; pestilence; technological developments; currency exchange rate fluctuations; and monetary and other governmental policies, action and inaction. Derivative instruments involve costs and can create leverage in the Fund’s portfolio, which may result in significant volatility and cause the Fund to participate in losses (as well as gains) in an amount that significantly exceeds the Fund’s initial investment. The Fund may not achieve the anticipated benefits and may realize losses, which could be significant. Bond prices generally move in the opposite direction of interest rates. Thus, as prices of bonds in the Fund adjust to a rise in interest rates, the Fund’s share price may decline. Foreign investing carries additional risks such as currency and market volatility and political, social and economic instability, risks which are heightened in less developed or emerging market countries. The Fund is actively managed but there is no guarantee that the manager’s investment decisions will produce the desired results. The Fund’s prospectus also includes a description of the main investment risks.
1. The Fund has an expense reduction contractually guaranteed through 9/30/18 and a fee waiver related to the management fee paid by a subsidiary. The Fund also has a fee waiver associated with any investments it makes in a Franklin Templeton money fund and/or other Franklin Templeton fund. Fund investment results reflect the expense reduction and fee waivers; without these reductions, the results would have been lower.
2. Cumulative total return represents the change in value of an investment over the periods indicated.
3. Average annual total return represents the average annual change in value of an investment over the periods indicated. Return for less than one year, if any, has not been annualized.
4. Source: Morningstar. The Bloomberg Commodity Index comprises exchange-traded futures on physical commodities, which are weighted to account for economic significance and market liquidity.
5. Figures are as stated in the Fund’s current prospectus and may differ from the expense ratios disclosed in the Your Fund’s Expenses and Consolidated Financial Highlights sections in this report. In periods of market volatility, assets may decline significantly, causing total annual Fund operating expenses to become higher than the figures shown. See www.franklintempletondatasources.com for additional data provider information.
| | | | |
| | | |
franklintempleton.com | | Annual Report | | 9 |
FRANKLIN PELAGOS COMMODITIES STRATEGY FUND
Your Fund’s Expenses
As a Fund shareholder, you can incur two types of costs: (1) transaction costs, including sales charges (loads) on Fund purchases and redemptions; and (2) ongoing Fund costs, including management fees, distribution and service (12b-1) fees, and other Fund expenses. All mutual funds have ongoing costs, sometimes referred to as operating expenses. The table below shows ongoing costs of investing in the Fund and can help you understand these costs and compare them with those of other mutual funds. The table assumes a $1,000 investment held for the six months indicated.
Actual Fund Expenses
The table below provides information about actual account values and actual expenses in the columns under the heading “Actual.” In these columns the Fund’s actual return, which includes the effect of Fund expenses, is used to calculate the “Ending Account Value” for each class of shares. You can estimate the expenses you paid during the period by following these steps (of course, your account value and expenses will differ from those in this illustration): Divide your account value by $1,000 (if your account had an $8,600 value, then $8,600 ÷ $1,000 = 8.6). Then multiply the result by the number in the row for your class of shares under the headings “Actual” and “Expenses Paid During Period” (if Actual Expenses Paid During Period were $7.50, then 8.6 x $7.50 = $64.50). In this illustration, the actual expenses paid this period are $64.50.
Hypothetical Example for Comparison with Other Funds
Under the heading “Hypothetical” in the table, information is provided about hypothetical account values and hypothetical expenses based on the Fund’s actual expense ratio and an assumed rate of return of 5% per year before expenses, which is not the Fund’s actual return. This information may not be used to estimate the actual ending account balance or expenses you paid for the period, but it can help you compare ongoing costs of investing in the Fund with those of other funds. To do so, compare this 5% hypothetical example for the class of shares you hold with the 5% hypothetical examples that appear in the shareholder reports of other funds.
Please note that expenses shown in the table are meant to highlight ongoing costs and do not reflect any transactional costs. Therefore, information under the heading “Hypothetical” is useful in comparing ongoing costs only, and will not help you compare total costs of owning different funds. In addition, if transactional costs were included, your total costs would have been higher.
| | | | | | | | | | | | | | | | | | |
| | | | | | | Actual | | | | Hypothetical | | | | |
| | | | | | | (actual return after expenses) | | | | (5% annual return before expenses) | | | | |
| | | | | | | | | | | | | | |
| | | | | | | | | Expenses | | | | | | Expenses | | | | Net |
| | | Beginning | | | | Ending | | Paid During | | | | Ending | | Paid During | | | | Annualized |
| Share | | Account | | | | Account | | Period | | | | Account | | Period | | | | Expense |
| Class | | Value 12/1/17 | | | | Value 5/31/18 | | 12/1/17–5/31/181,2 | | | | Value 5/31/18 | | 12/1/17–5/31/181,2 | | | | Ratio2 |
| | | | | | | | | | | | |
| A | | $1,000 | | | | $1,064.10 | | $ 6.18 | | | | $1,018.95 | | $6.04 | | | | 1.20% |
| C | | $1,000 | | | | $1,061.20 | | $10.02 | | | | $1,015.21 | | $9.80 | | | | 1.95% |
| R | | $1,000 | | | | $1,063.00 | | $ 7.25 | | | | $1,017.90 | | $7.09 | | | | 1.41% |
| R6 | | $1,000 | | | | $1,067.40 | | $ 3.25 | | | | $1,021.79 | | $3.18 | | | | 0.63% |
| Advisor | | $1,000 | | | | $1,065.60 | | $ 4.89 | | | | $1,020.19 | | $4.78 | | | | 0.95% |
1. Expenses are equal to the annualized expense ratio for the six-month period as indicated above—in the far right column—multiplied by the simple average account value over the period indicated, and then multiplied by 182/365 to reflect the one-half year period.
2. Reflects expenses after fee waivers and expense reimbursements. Does not include acquired fund fees and expenses.
| | | | |
| | | |
10 | | Annual Report | | franklintempleton.com |
FRANKLIN ALTERNATIVE STRATEGIES FUNDS
Consolidated Financial Highlights
Franklin Pelagos Commodities Strategy Fund
| | | | | | | | | | | | | | | | | | | | |
| | | Year Ended May 31, | |
| | | 2018 | | | 2017 | | | 2016 | | | 2015 | | | 2014a | |
| | | | | |
Class A | | | | | | | | | | | | | | | | | | | | |
| | | | | |
Per share operating performance | | | | | | | | | | | | | | | | | | | | |
(for a share outstanding throughout the year) | | | | | | | | | | | | | | | | | | | | |
| | | | | |
Net asset value, beginning of year | | | $6.12 | | | | $ 6.47 | | | | $ 7.12 | | | | $ 9.44 | | | | $ 8.88 | |
| | | | | |
Income from investment operationsb: | | | | | | | | | | | | | | | | | | | | |
| | | | | |
Net investment income (loss)c | | | (— | )d | | | (0.04 | ) | | | (0.08 | ) | | | (0.09 | ) | | | (0.08 | ) |
| | | | | |
Net realized and unrealized gains (losses) | | | 0.69 | | | | (0.31 | ) | | | (0.57 | ) | | | (2.23 | ) | | | 0.64 | |
| | | | | |
Total from investment operations | | | 0.69 | | | | (0.35 | ) | | | (0.65 | ) | | | (2.32 | ) | | | 0.56 | |
| | | | | |
Net asset value, end of year | | | $6.81 | | | | $ 6.12 | | | | $ 6.47 | | | | $ 7.12 | | | | $ 9.44 | |
| | | | | |
Total returne | | | 11.27% | | | | (5.41)% | | | | (9.13)% | | | | (24.58)% | | | | 6.31% | |
| | | | | |
Ratios to average net assetsf | | | | | | | | | | | | | | | | | | | | |
| | | | | |
Expenses before waiver and payments by affiliates | | | 1.65% | | | | 1.71% | | | | 2.14% | | | | 2.05% | | | | 3.38% | |
| | | | | |
Expenses net of waiver and payments by affiliatesg | | | 1.20% | | | | 1.20% | | | | 1.21% | | | | 1.25% | | | | 1.25% | |
| | | | | |
Net investment income (loss) | | | 0.06% | h | | | (0.61)% | | | | (0.79)% | | | | (0.94)% | | | | (0.94)% | |
| | | | | |
Supplemental data | | | | | | | | | | | | | | | | | | | | |
| | | | | |
Net assets, end of year (000’s) | | | $6,549 | | | | $4,846 | | | | $3,814 | | | | $2,080 | | | | $601 | |
| | | | | |
Portfolio turnover rate | | | —% | | | | 42.22% | | | | 28.03% | | | | 62.10% | | | | 34.28% | |
aFor the period January 10, 2014 (commencement of operations) to May 31, 2014.
bThe amount shown for a share outstanding throughout the period may not correlate with the Consolidated Statement of Operations for the period due to the timing of sales and repurchases of the Fund’s shares in relation to income earned and/or fluctuating fair value of the investments of the Fund.
cBased on average daily shares outstanding.
dAmount rounds to less than $0.01 per share.
eTotal return does not reflect sales commissions or contingent deferred sales charges, if applicable, and is not annualized for periods less than one year.
fRatios are annualized for periods less than one year.
gBenefit of expense reduction rounds to less than 0.01%.
hRatio is calculated based on the Fund level net investment income, as reflected in the Consolidated Statement of Operations, and adjusted for class specific expenses. The amount may not correlate with the per share amount due to the timing of income earned and/or fluctuating fair value of the investments of the Fund in relation to the timing of sales and repurchases of Fund shares.
| | | | |
| | | |
franklintempleton.com | | The accompanying notes are an integral part of these consolidated financial statements. | Annual Report | | 11 |
FRANKLIN ALTERNATIVE STRATEGIES FUNDS
CONSOLIDATED FINANCIAL HIGHLIGHTS
Franklin Pelagos Commodities Strategy Fund (continued)
| | | | | | | | | | | | | | | | | | | | |
| | | Year Ended May 31, | |
| | | 2018 | | | 2017 | | | 2016 | | | 2015 | | | 2014a | |
| | | | | |
Class C | | | | | | | | | | | | | | | | | | | | |
| | | | | |
Per share operating performance | | | | | | | | | | | | | | | | | | | | |
(for a share outstanding throughout the year) | | | | | | | | | | | | | | | | | | | | |
| | | | | |
Net asset value, beginning of year | | | $ 5.97 | | | | $ 6.36 | | | | $ 7.05 | | | | $ 9.41 | | | | $ 8.88 | |
| | | | | |
Income from investment operationsb: | | | | | | | | | | | | | | | | | | | | |
| | | | | |
Net investment income (loss)c | | | (0.04 | ) | | | (0.10 | ) | | | (0.16 | ) | | | (0.15 | ) | | | (0.09 | ) |
| | | | | |
Net realized and unrealized gains (losses) | | | 0.66 | | | | (0.29 | ) | | | (0.53 | ) | | | (2.21 | ) | | | 0.62 | |
| | | | | |
Total from investment operations | | | 0.62 | | | | (0.39 | ) | | | (0.69 | ) | | | (2.36 | ) | | | 0.53 | |
| | | | | |
Net asset value, end of year | | | $ 6.59 | | | | $ 5.97 | | | | $ 6.36 | | | | $ 7.05 | | | | $ 9.41 | |
| | | | | |
Total returnd | | | 10.39% | | | | (6.13)% | | | | (9.79)% | | | | (25.08)% | | | | 5.97% | |
| | | | | |
Ratios to average net assetse | | | | | | | | | | | | | | | | | | | | |
| | | | | |
Expenses before waiver and payments by affiliates | | | 2.40% | | | | 2.46% | | | | 2.88% | | | | 2.75% | | | | 4.08% | |
| | | | | |
Expenses net of waiver and payments by affiliatesf | | | 1.95% | | | | 1.95% | | | | 1.95% | | | | 1.95% | | | | 1.95% | |
| | | | | |
Net investment income (loss) | | | (0.69)% | | | | (1.36)% | | | | (1.53)% | | | | (1.64)% | | | | (1.64)% | |
| | | | | |
Supplemental data | | | | | | | | | | | | | | | | | | | | |
| | | | | |
Net assets, end of year (000’s) | | | $1,162 | | | | $963 | | | | $862 | | | | $377 | | | | $60 | |
| | | | | |
Portfolio turnover rate | | | —% | | | | 42.22% | | | | 28.03% | | | | 62.10% | | | | 34.28% | |
aFor the period January 10, 2014 (commencement of operations) to May 31, 2014.
bThe amount shown for a share outstanding throughout the period may not correlate with the Consolidated Statement of Operations for the period due to the timing of sales and repurchases of the Fund’s shares in relation to income earned and/or fluctuating fair value of the investments of the Fund.
cBased on average daily shares outstanding.
dTotal return does not reflect sales commissions or contingent deferred sales charges, if applicable, and is not annualized for periods less than one year.
eRatios are annualized for periods less than one year.
fBenefit of expense reduction rounds to less than 0.01%.
| | | | |
| | | |
12 | | Annual Report | The accompanying notes are an integral part of these consolidated financial statements. | | franklintempleton.com |
FRANKLIN ALTERNATIVE STRATEGIES FUNDS
CONSOLIDATED FINANCIAL HIGHLIGHTS
Franklin Pelagos Commodities Strategy Fund (continued)
| | | | | | | | | | | | | | | | | | | | |
| | | Year Ended May 31, | |
| | | 2018 | | | 2017 | | | 2016 | | | 2015 | | | 2014a | |
| | | | | |
Class R | | | | | | | | | | | | | | | | | | | | |
| | | | | |
Per share operating performance | | | | | | | | | | | | | | | | | | | | |
(for a share outstanding throughout the year) | | | | | | | | | | | | | | | | | | | | |
| | | | | |
Net asset value, beginning of year | | | $ 6.08 | | | | $ 6.44 | | | | $ 7.10 | | | | $ 9.44 | | | | $ 8.88 | |
| | | | | |
Income from investment operationsb: | | | | | | | | | | | | | | | | | | | | |
| | | | | |
Net investment income (loss)c | | | (0.02 | ) | | | (0.05 | ) | | | (0.06 | ) | | | (0.10 | ) | | | (0.06 | ) |
| | | | | |
Net realized and unrealized gains (losses) | | | 0.69 | | | | (0.31 | ) | | | (0.60 | ) | | | (2.24 | ) | | | 0.62 | |
| | | | | |
Total from investment operations | | | 0.67 | | | | (0.36 | ) | | | (0.66 | ) | | | (2.34 | ) | | | 0.56 | |
| | | | | |
Net asset value, end of year | | | $ 6.75 | | | | $ 6.08 | | | | $ 6.44 | | | | $ 7.10 | | | | $ 9.44 | |
| | | | | |
Total returnd | | | 11.02% | | | | (5.59)% | | | | (9.30)% | | | | (24.79)% | | | | 6.31% | |
| | | | | |
Ratios to average net assetse | | | | | | | | | | | | | | | | | | | | |
| | | | | |
Expenses before waiver and payments by affiliates | | | 1.86% | | | | 1.85% | | | | 2.34% | | | | 2.27% | | | | 3.58% | |
| | | | | |
Expenses net of waiver and payments by affiliatesf | | | 1.41% | | | | 1.34% | | | | 1.41% | | | | 1.47% | | | | 1.45% | |
| | | | | |
Net investment income (loss) | | | (0.15)% | | | | (0.75)% | | | | (0.99)% | | | | (1.16)% | | | | (1.14)% | |
| | | | | |
Supplemental data | | | | | | | | | | | | | | | | | | | | |
| | | | | |
Net assets, end of year (000’s) | | | $26 | | | | $23 | | | | $9 | | | | $4 | | | | $5 | |
| | | | | |
Portfolio turnover rate | | | —% | | | | 42.22% | | | | 28.03% | | | | 62.10% | | | | 34.28% | |
aFor the period January 10, 2014 (commencement of operations) to May 31, 2014.
bThe amount shown for a share outstanding throughout the period may not correlate with the Consolidated Statement of Operations for the period due to the timing of sales and repurchases of the Fund’s shares in relation to income earned and/or fluctuating fair value of the investments of the Fund.
cBased on average daily shares outstanding.
dTotal return is not annualized for periods less than one year.
eRatios are annualized for periods less than one year.
fBenefit of expense reduction rounds to less than 0.01%.
| | | | |
| | | |
franklintempleton.com | | The accompanying notes are an integral part of these consolidated financial statements. | Annual Report | | 13 |
FRANKLIN ALTERNATIVE STRATEGIES FUNDS
CONSOLIDATED FINANCIAL HIGHLIGHTS
Franklin Pelagos Commodities Strategy Fund (continued)
| | | | | | | | | | | | | | | | | | | | |
| | | Year Ended May 31, | |
| | | 2018 | | | 2017 | | | 2016 | | | 2015 | | | 2014a | |
| | | | | |
Class R6 | | | | | | | | | | | | | | | | | | | | |
| | | | | |
Per share operating performance | | | | | | | | | | | | | | | | | | | | |
(for a share outstanding throughout the year) | | | | | | | | | | | | | | | | | | | | |
| | | | | |
Net asset value, beginning of year | | | $ 6.21 | | | | $ 6.53 | | | | $ 7.16 | | | | $ 9.46 | | | | $ 8.88 | |
| | | | | |
Income from investment operationsb: | | | | | | | | | | | | | | | | | | | | |
| | | | | |
Net investment income (loss)c | | | 0.04 | | | | (0.01 | ) | | | (0.02 | ) | | | (0.04 | ) | | | (0.03 | ) |
| | | | | |
Net realized and unrealized gains (losses) | | | 0.70 | | | | (0.31 | ) | | | (0.61 | ) | | | (2.26 | ) | | | 0.61 | |
| | | | | |
Total from investment operations | | | 0.74 | | | | (0.32 | ) | | | (0.63 | ) | | | (2.30 | ) | | | 0.58 | |
| | | | | |
Less distributions from net investment income | | | (0.01 | ) | | | — | | | | — | | | | — | | | | — | |
| | | | | |
Net asset value, end of year | | | $ 6.94 | | | | $ 6.21 | | | | $ 6.53 | | | | $ 7.16 | | | | $ 9.46 | |
| | | | | |
Total returnd | | | 11.89% | | | | (4.90)% | | | | (8.80)% | | | | (24.31)% | | | | 6.53% | |
| | | | | |
Ratios to average net assetse | | | | | | | | | | | | | | | | | | | | |
| | | | | |
Expenses before waiver and payments by affiliates | | | 1.02% | | | | 1.02% | | | | 1.10% | | | | 1.53% | | | | 1.58% | |
| | | | | |
Expenses net of waiver and payments by affiliatesf | | | 0.65% | | | | 0.70% | | | | 0.76% | | | | 0.86% | | | | 0.86% | |
| | | | | |
Net investment income (loss) | | | 0.61% | | | | (0.11)% | | | | (0.34)% | | | | (0.55)% | | | | (0.55)% | |
| | | | | |
Supplemental data | | | | | | | | | | | | | | | | | | | | |
| | | | | |
Net assets, end of year (000’s) | | | $288,037 | | | | $118,839 | | | | $131,500 | | | | $53,068 | | | | $67,732 | |
| | | | | |
Portfolio turnover rate | | | —% | | | | 42.22% | | | | 28.03% | | | | 62.10% | | | | 34.28% | |
aFor the period January 10, 2014 (commencement of operations) to May 31, 2014.
bThe amount shown for a share outstanding throughout the period may not correlate with the Consolidated Statement of Operations for the period due to the timing of sales and repurchases of the Fund’s shares in relation to income earned and/or fluctuating fair value of the investments of the Fund.
cBased on average daily shares outstanding.
dTotal return is not annualized for periods less than one year.
eRatios are annualized for periods less than one year.
fBenefit of expense reduction rounds to less than 0.01%.
| | | | |
| | | |
14 | | Annual Report | The accompanying notes are an integral part of these consolidated financial statements. | | franklintempleton.com |
FRANKLIN ALTERNATIVE STRATEGIES FUNDS
CONSOLIDATED FINANCIAL HIGHLIGHTS
Franklin Pelagos Commodities Strategy Fund (continued)
| | | | | | | | | | | | | | | | | | | | |
| | | Year Ended May 31, | |
| | | 2018 | | | 2017 | | | 2016 | | | 2015 | | | 2014 | |
| | | | | |
Advisor Class | | | | | | | | | | | | | | | | | | | | |
| | | | | |
Per share operating performance | | | | | | | | | | | | | | | | | | | | |
(for a share outstanding throughout the year) | | | | | | | | | | | | | | | | | | | | |
| | | | | |
Net asset value, beginning of year | | | $6.26 | | | | $ 6.60 | | | | $ 7.25 | | | | $ 9.58 | | | | $ 9.43 | |
| | | | | |
Income from investment operationsa: | | | | | | | | | | | | | | | | | | | | |
| | | | | |
Net investment income (loss)b | | | — | c | | | (0.03 | ) | | | (0.09 | ) | | | (0.07 | ) | | | (0.05 | ) |
| | | | | |
Net realized and unrealized gains (losses) | | | 0.72 | | | | (0.31 | ) | | | (0.56 | ) | | | (2.26 | ) | | | 0.20 | |
| | | | | |
Total from investment operations | | | 0.72 | | | | (0.34 | ) | | | (0.65 | ) | | | (2.33 | ) | | | 0.15 | |
| | | | | |
Net asset value, end of year | | | $6.98 | | | | $ 6.26 | | | | $ 6.60 | | | | $ 7.25 | | | | $ 9.58 | |
| | | | | |
Total return | | | 11.50% | | | | (5.15)% | | | | (8.97)% | | | | (24.32)% | | | | 1.59% | |
| | | | | |
Ratios to average net assets | | | | | | | | | | | | | | | | | | | | |
| | | | | |
Expenses before waiver and payments by affiliates | | | 1.40% | | | | 1.46% | | | | 1.88% | | | | 1.75% | | | | 1.88% | |
| | | | | |
Expenses net of waiver and payments by affiliatesd | | | 0.95% | | | | 0.95% | | | | 0.95% | | | | 0.95% | | | | 1.04% | |
| | | | | |
Net investment income (loss) | | | 0.31% | | | | (0.36)% | | | | (0.53)% | | | | (0.64)% | | | | (0.70)% | |
| | | | | |
Supplemental data | | | | | | | | | | | | | | | | | | | | |
| | | | | |
Net assets, end of year (000’s) | | | $1,736 | | | | $2,062 | | | | $675 | | | | $248 | | | | $126 | |
| | | | | |
Portfolio turnover rate | | | —% | | | | 42.22% | | | | 28.03% | | | | 62.10% | | | | 34.28% | |
aThe amount shown for a share outstanding throughout the period may not correlate with the Consolidated Statement of Operations for the period due to the timing of sales and repurchases of the Fund’s shares in relation to income earned and/or fluctuating fair value of the investments of the Fund.
bBased on average daily shares outstanding.
cAmount rounds to less than $0.01 per share.
dBenefit of expense reduction rounds to less than 0.01%.
| | | | |
| | | |
franklintempleton.com | | The accompanying notes are an integral part of these consolidated financial statements. | Annual Report | | 15 |
FRANKLIN ALTERNATIVE STRATEGIES FUNDS
Consolidated Statement of Investments, May 31, 2018
Franklin Pelagos Commodities Strategy Fund
| | | | | | | | |
| | | Principal
Amount | | | Value | |
U.S. Government and Agency Securities 6.7% | | | | | | | | |
FFCB, 0.96%, 7/27/18 | | | $10,000,000 | | | | $ 9,985,530 | |
FHLMC, 1.25%, 7/26/19 | | | 10,000,000 | | | | 9,867,820 | |
| | | | | | | | |
Total U.S. Government and Agency Securities (Cost $20,000,000) | | | | | | | 19,853,350 | |
| | | | | | | | |
| | |
Short Term Investments 91.9% | | | | | | | | |
U.S. Government and Agency Securities 91.7% | | | | | | | | |
a,b FFCB, 6/01/18 | | | 5,825,000 | | | | 5,825,000 | |
b U.S. Treasury Bill,
a,c 7/05/18 | | | 29,000,000 | | | | 28,941,758 | |
7/19/18 | | | 49,900,000 | | | | 49,782,070 | |
8/16/18 | | | 39,500,000 | | | | 39,345,939 | |
a 10/11/18 | | | 71,500,000 | | | | 70,994,674 | |
1/03/19 | | | 26,500,000 | | | | 26,176,435 | |
5/23/19 | | | 53,000,000 | | | | 51,869,230 | |
| | | | | | | | |
| | |
Total U.S. Government and Agency Securities (Cost $273,071,713) | | | | | | | 272,935,106 | |
| | | | | | | | |
Total Investments before Money Market Funds | | | | | | | | |
(Cost $293,071,713) | | | | | | | 292,788,456 | |
| | | | | | | | |
| | |
| | | Shares | | | | |
| | |
Money Market Funds (Cost $556,761) 0.2% | | | | | | | | |
d,e Institutional Fiduciary Trust Money Market Portfolio, 1.40% | | | 556,761 | | | | 556,761 | |
| | | | | | | | |
Total Investments (Cost $293,628,474) 98.6% | | | | | | | 293,345,217 | |
f Other Assets, less Liabilities 1.4% | | | | | | | 4,164,892 | |
| | | | | | | | |
Net Assets 100.0% | | | | | | | $297,510,109 | |
| | | | | | | | |
aA portion or all of the security is owned by FPC Holdings Corp., a wholly-owned subsidiary of the Fund. See Note 1(d).
bThe security was issued on a discount basis with no stated coupon rate.
cA portion or all of the security has been segregated as collateral for open futures contracts. At May 31, 2018, the value of this security and/or cash pledged amounted to $2,396,066, representing 0.8% of net assets.
dSee Note 3(f) regarding investments in affiliated management investment companies.
eThe rate shown is the annualized seven-day effective yield at period end.
fIncludes unrealized appreciation/depreciation on open commodity futures and swap contracts, as well as other assets and liabilities.
| | | | |
| | | |
16 | | Annual Report | | franklintempleton.com |
FRANKLIN ALTERNATIVE STRATEGIES FUNDS
CONSOLIDATED STATEMENT OF INVESTMENTS
Franklin Pelagos Commodities Strategy Fund (continued)
At May 31, 2018, the Fund had the following futures contracts outstanding. See Note 1(b).
Futures Contractsa
| | | | | | | | | | | | | | | | | | | | |
| Description | | Type | | | Number of
Contracts | | | Notional
Amount* | | | Expiration
Date | | | Value/
Unrealized
Appreciation (Depreciation) | |
| | | | | |
Commodity Contracts | | | | | | | | | | | | | | | | | | | | |
Brent Crude Oil | | | Long | | | | 200 | | | | $15,450,000 | | | | 7/31/18 | | | | $ 545,502 | |
Corn | | | Long | | | | 450 | | | | 8,865,000 | | | | 7/13/18 | | | | (1,312 | ) |
Gold 100 Oz | | | Long | | | | 42 | | | | 5,479,740 | | | | 8/29/18 | | | | (15,250 | ) |
RBOB Gasoline | | | Long | | | | 119 | | | | 10,798,179 | | | | 6/29/18 | | | | 196,546 | |
Soybean Meal | | | Long | | | | 230 | | | | 8,631,900 | | | | 7/13/18 | | | | (136,505 | ) |
WTI Crude Oil | | | Long | | | | 127 | | | | 8,514,080 | | | | 6/20/18 | | | | 272,380 | |
| | | | | |
Total Futures Contracts | | | | | | | | | | | | | | | | | | | $ 861,361 | |
*As of period end.
At May 31, 2018, the Fund had the following commodity-linked total return swap contracts outstanding. See Note 1(b).
Commodity-Linked Total Return Swap Contractsa
| | | | | | | | | | | | | | | | | | | | | | | | |
| Underlying Instruments | | Pay
Fixed
Rate | | | Payment
Frequency | | | Counterparty | | | Maturity Date | | | Notional Value | | | Value/ Unrealized Appreciation (Depreciation) | |
| | | | | | |
OTC Swap Contracts | | | | | | | | | | | | | | | | | | | | | | | | |
Longb | | | | | | | | | | | | | | | | | | | | | | | | |
FP Custom Master Indexc | | | 0.22% | | | | At maturity | | | | MSCS | | | | 6/01/18 | | | | $237,786,623 | | | | $3,786,623 | |
aA portion or all of the contract is owned by FPC Holdings Corp., a wholly-owned subsidiary of the Fund. See Note 1(d).
bThe Fund receives the total return on the underlying instrument and pays a fixed financing rate.
cRepresents a custom index comprised of a basket of underlying instruments. Additional information regarding the underlying instruments and their respective values including fees are as follows:
| | | | | | | | | | | | |
| | | | | | Value/ | | | | |
| | | | | | Unrealized | | | Percentage of | |
| | | | | | Appreciation | | | Net Assets | |
| Underlying Instruments | | Notional Valued | | | (Depreciation) | | | (%) | |
| | | |
Bloomberg Commodity Aluminum Sub-index 3 Month Forward | | | $ 13,316,051 | | | | $ 528,285 | | | | 0.2 | |
Bloomberg Commodity Brent Crude Oil Sub-index | | | 8,798,105 | | | | 491,417 | | | | 0.2 | |
Bloomberg Commodity Coffee Sub-index | | | 6,895,812 | | | | 70,798 | | | | — | e |
Bloomberg Commodity Copper Sub-index 3 Month Forward | | | 17,120,637 | | | | (39,809) | | | | (— | )e |
Bloomberg Commodity Corn Sub-index | | | 19,736,290 | | | | (222,788) | | | | (0.1 | ) |
Bloomberg Commodity Cotton Sub-index 3 Month Forward | | | 4,517,946 | | | | 692,972 | | | | 0.2 | |
Bloomberg Commodity Gold Sub-index | | | 34,241,274 | | | | (640,580) | | | | (0.2 | ) |
Bloomberg Commodity Kansas Wheat Sub-index | | | 4,517,946 | | | | 99,745 | | | | — | e |
Bloomberg Commodity Lean Hogs Sub-index | | | 6,182,452 | | | | 337,901 | | | | 0.1 | |
Bloomberg Commodity Live Cattle Sub-index | | | 10,938,185 | | | | (74,759) | | | | (— | )e |
Bloomberg Commodity Natural Gas Sub-index | | | 24,016,449 | | | | 1,176,200 | | | | 0.4 | |
Bloomberg Commodity Nickel Sub-index 3 Month Forward | | | 5,944,665 | | | | 549,015 | | | | 0.2 | |
| | | | |
| | | |
franklintempleton.com | | Annual Report | | 17 |
FRANKLIN ALTERNATIVE STRATEGIES FUNDS
CONSOLIDATED STATEMENT OF INVESTMENTS
Franklin Pelagos Commodities Strategy Fund (continued)
Commodity-Linked Total Return Swap Contractsa (continued)
| | | | | | | | | | | | |
| | | | | | Value/ | | | | |
| | | | | | Unrealized | | | Percentage of | |
| | | | | | Appreciation | | | Net Assets | |
| Underlying Instruments | | Notional Valued | | | (Depreciation) | | | (%) | |
| |
| | | |
Bloomberg Commodity Silver Sub-index | | | $ 4,280,159 | | | | $ (10,740 | ) | | | (— | )e |
Bloomberg Commodity Soybean Meal Sub-index | | | 10,462,611 | | | | (522,834 | ) | | | (0.2 | ) |
Bloomberg Commodity Soybean Oil Sub-index 3 Month Forward | | | 7,371,385 | | | | 83,767 | | | | — | e |
Bloomberg Commodity Sugar Sub-index | | | 7,609,172 | | | | 824,110 | | | | 0.3 | |
Bloomberg Commodity Unleaded Gasoline Sub-index | | | 12,602,691 | | | | 228,067 | | | | 0.1 | |
Bloomberg Commodity Wheat Sub-index | | | 10,700,398 | | | | 584,212 | | | | 0.2 | |
Bloomberg Commodity WTI Crude Oil Sub-index | | | 23,303,089 | | | | (321,358 | ) | | | (0.1 | ) |
Bloomberg Commodity Zinc Sub-index 3 Month Forward | | | 5,231,306 | | | | (46,998 | ) | | | (— | )e |
| | | | |
Total | | | $237,786,623 | | | | $3,786,623 | | | | 1.3 | |
| | | | |
dNotional value represents the fair value at period end of each underlying instrument (including the financing rate fee which is calculated based on the swap contract’s original notional value of $234,000,000, allocated to each underlying instrument on a pro-rata basis).
eRounds to less than 0.1%.
See Abbreviations on page 33.
| | | | |
| | | |
18 | | Annual Report | The accompanying notes are an integral part of these consolidated financial statements. | | franklintempleton.com |
FRANKLIN ALTERNATIVE STRATEGIES FUNDS
Consolidated Financial Statements
Consolidated Statement of Assets and Liabilities
May 31, 2018
Franklin Pelagos Commodities Strategy Fund
| | | | |
Assets: | | | | |
Investments in securities: | | | | |
Cost - Unaffiliated issuers | | | $293,071,713 | |
Cost - Non-controlled affiliates (Note 3f) | | | 556,761 | |
| | | | |
Value - Unaffiliated issuers | | | $292,788,456 | |
Value - Non-controlled affiliates (Note 3f) | | | 556,761 | |
Cash | | | 661,637 | |
Restricted cash for OTC derivative contracts (Note 1c) | | | 3,551,000 | |
Receivables: | | | | |
Capital shares sold | | | 84,270 | |
Interest | | | 75,856 | |
Affiliates | | | 22,664 | |
Unrealized appreciation on OTC swap contracts | | | 3,786,623 | |
Other assets | | | 100 | |
| | | | |
| |
Total assets | | | 301,527,367 | |
| | | | |
Liabilities: | | | | |
Payables: | | | | |
Capital shares redeemed | | | 17,441 | |
Management fees | | | 112,817 | |
Distribution fees | | | 2,312 | |
Variation margin on futures contracts | | | 271,176 | |
Deposits from brokers for: | | | | |
OTC derivative contracts | | | 3,551,000 | |
Accrued expenses and other liabilities | | | 62,512 | |
| | | | |
| |
Total liabilities | | | 4,017,258 | |
| | | | |
| |
Net assets, at value | | | $297,510,109 | |
| | | | |
Net assets consist of: | | | | |
Paid-in capital | | | $292,745,125 | |
Undistributed net investment income | | | 630,716 | |
Net unrealized appreciation (depreciation) | | | 4,364,727 | |
Accumulated net realized gain (loss) | | | (230,459 | ) |
| | | | |
| |
Net assets, at value | | | $297,510,109 | |
| | | | |
| | | | |
| | | |
franklintempleton.com | | The accompanying notes are an integral part of these consolidated financial statements. | Annual Report | | 19 |
FRANKLIN ALTERNATIVE STRATEGIES FUNDS
CONSOLIDATED FINANCIAL STATEMENTS
Consolidated Statement of Assets and Liabilities (continued)
May 31, 2018
Franklin Pelagos Commodities Strategy Fund
| | | | |
Class A: | | | | |
Net assets, at value | | | $ 6,549,451 | |
| | | | |
Shares outstanding | | | 961,475 | |
| | | | |
Net asset value per sharea | | | $6.81 | |
| | | | |
Maximum offering price per share (net asset value per share ÷ 94.25%) | | | $7.23 | |
| | | | |
Class C: | | | | |
Net assets, at value | | | $ 1,162,454 | |
| | | | |
Shares outstanding | | | 176,303 | |
| | | | |
Net asset value and maximum offering price per sharea | | | $6.59 | |
| | | | |
Class R: | | | | |
Net assets, at value | | | $ 25,789 | |
| | | | |
Shares outstanding | | | 3,818 | |
| | | | |
Net asset value and maximum offering price per share | | | $6.75 | |
| | | | |
Class R6: | | | | |
Net assets, at value | | | $288,036,665 | |
| | | | |
Shares outstanding | | | 41,474,197 | |
| | | | |
Net asset value and maximum offering price per share | | | $6.94 | |
| | | | |
Advisor Class: | | | | |
Net assets, at value | | | $ 1,735,750 | |
| | | | |
Shares outstanding | | | 248,664 | |
| | | | |
Net asset value and maximum offering price per share | | | $6.98 | |
| | | | |
aRedemption price is equal to net asset value less contingent deferred sales charges, if applicable.
| | | | |
| | | |
20 | | Annual Report | The accompanying notes are an integral part of these consolidated financial statements. | | franklintempleton.com |
FRANKLIN ALTERNATIVE STRATEGIES FUNDS
CONSOLIDATED FINANCIAL STATEMENTS
Consolidated Statement of Operations
for the year ended May 31, 2018
Franklin Pelagos Commodities Strategy Fund
| | | | |
Investment income: | | | | |
Dividends: | | | | |
Non-controlled affiliates (Note 3f) | | | $ 10,066 | |
Interest: | | | | |
Unaffiliated issuers | | | 2,092,117 | |
| | | | |
Total investment income | | | 2,102,183 | |
| | | | |
Expenses: | | | | |
Management fees (Note 3a) | | | 1,418,367 | |
Distribution fees: (Note 3c) | | | | |
Class A | | | 13,401 | |
Class C | | | 10,286 | |
Class R | | | 112 | |
Transfer agent fees: (Note 3e) | | | | |
Class A | | | 21,142 | |
Class C | | | 4,057 | |
Class R | | | 95 | |
Class R6 | | | 23,128 | |
Advisor Class | | | 6,519 | |
Custodian fees (Note 4) | | | 1,296 | |
Reports to shareholders | | | 34,713 | |
Registration and filing fees | | | 89,710 | |
Professional fees | | | 80,812 | |
Trustees’ fees and expenses | | | 51,460 | |
Other | | | 14,191 | |
| | | | |
| |
Total expenses | | | 1,769,289 | |
Expense reductions (Note 4) | | | (1,061 | ) |
Expenses waived/paid by affiliates (Note 3f and 3g) | | | (644,891 | ) |
| | | | |
Net expenses | | | 1,123,337 | |
| | | | |
Net investment income | | | 978,846 | |
| | | | |
Realized and unrealized gains (losses): | | | | |
Net realized gain (loss) from: | | | | |
Investments: | | | | |
Unaffiliated issuers | | | 188,902 | |
Written options | | | 317,682 | |
Futures contracts | | | 5,354,343 | |
Swap contracts | | | 8,405,881 | |
| | | | |
Net realized gain (loss) | | | 14,266,808 | |
| | | | |
Net change in unrealized appreciation (depreciation) on: | | | | |
Investments: | | | | |
Unaffiliated issuers | | | (2,241 | ) |
Written options | | | (140,832 | ) |
Futures contracts | | | 1,704,279 | |
Swap contracts | | | 3,786,623 | |
| | | | |
Net change in unrealized appreciation (depreciation) | | | 5,347,829 | |
| | | | |
Net realized and unrealized gain (loss) | | | 19,614,637 | |
| | | | |
Net increase (decrease) in net assets resulting from operations | | | $20,593,483 | |
| | | | |
| | | | |
| | | |
franklintempleton.com | | The accompanying notes are an integral part of these consolidated financial statements. | Annual Report | | 21 |
FRANKLIN ALTERNATIVE STRATEGIES FUNDS
CONSOLIDATED FINANCIAL STATEMENTS
Consolidated Statements of Changes in Net Assets
Franklin Pelagos Commodities Strategy Fund
| | | | | | | | |
| | | Year Ended May 31, | |
| | | 2018 | | | 2017 | |
Increase (decrease) in net assets: | | | | | | | | |
Operations: | | | | | | | | |
Net investment income (loss) | | $ | 978,846 | | | $ | (179,958 | ) |
Net realized gain (loss) | | | 14,266,808 | | | | (5,709,788 | ) |
Net change in unrealized appreciation (depreciation) | | | 5,347,829 | | | | (785,460 | ) |
| | | | |
Net increase (decrease) in net assets resulting from operations | | | 20,593,483 | | | | (6,675,206 | ) |
| | | | |
Distributions to shareholders from: | | | | | | | | |
Net investment income: | | | | | | | | |
Class R6 | | | (155,612 | ) | | | — | |
| | | | |
Total distributions to shareholders | | | (155,612 | ) | | | — | |
| | | | |
Capital share transactions: (Note 2) | | | | | | | | |
Class A | | | 1,120,485 | | | | 1,308,813 | |
Class C | | | 96,764 | | | | 170,718 | |
Class R | | | 184 | | | | 15,801 | |
Class R6 | | | 149,683,677 | | | | (6,433,256 | ) |
Advisor Class | | | (560,990 | ) | | | 1,486,143 | |
| | | | |
Total capital share transactions | | | 150,340,120 | | | | (3,451,781 | ) |
| | | | |
Net increase (decrease) in net assets | | | 170,777,991 | | | | (10,126,987 | ) |
Net assets: | | | | | | | | |
Beginning of year | | | 126,732,118 | | | | 136,859,105 | |
| | | | |
| | |
End of year | | $ | 297,510,109 | | | $ | 126,732,118 | |
| | | | |
Undistributed net investment income included in net assets: | | | | | | | | |
End of year | | $ | 630,716 | | | $ | — | |
| | | | |
Accumulated net investment loss included in net assets: | | | | | | | | |
End of year | | $ | — | | | $ | (101,488 | ) |
| | | | |
| | | | |
| | | |
22 | | Annual Report | The accompanying notes are an integral part of these consolidated financial statements. | | franklintempleton.com |
FRANKLIN ALTERNATIVE STRATEGIES FUNDS
Notes to Consolidated Financial Statements
Franklin Pelagos Commodities Strategy Fund
1. Organization and Significant Accounting Policies
Franklin Alternative Strategies Funds (Trust) is registered under the Investment Company Act of 1940 (1940 Act) as an open-end management investment company, consisting of four separate funds and applies the specialized accounting and reporting guidance in U.S. Generally Accepted Accounting Principles (U.S. GAAP). Franklin Pelagos Commodities Strategy Fund (Fund) is included in this report. The Fund offers five classes of shares: Class A, Class C, Class R, Class R6 and Advisor Class. Each class of shares may differ by its initial sales load, contingent deferred sales charges, voting rights on matters affecting a single class, its exchange privilege and fees due to differing arrangements for distribution and transfer agent fees.
The following summarizes the Fund’s significant accounting policies.
a. Financial Instrument Valuation
The Fund’s investments in financial instruments are carried at fair value daily. Fair value is the price that would be received to sell an asset or paid to transfer a liability in an orderly transaction between market participants on the measurement date. The Fund calculates the net asset value (NAV) per share as of 4 p.m. Eastern time each day the New York Stock Exchange (NYSE) is open for trading. Under compliance policies and procedures approved by the Trust’s Board of Trustees (the Board), the Fund’s administrator has responsibility for oversight of valuation, including leading the cross-functional Valuation Committee (VC). The VC provides administration and oversight of the Fund’s valuation policies and procedures, which are approved annually by the Board. Among other things, these procedures allow the Fund to utilize independent pricing services, quotations from securities and financial instrument dealers, and other market sources to determine fair value.
Debt securities generally trade in the over-the-counter (OTC) market rather than on a securities exchange. The Fund’s pricing services use multiple valuation techniques to determine fair value. In instances where sufficient market activity exists, the pricing services may utilize a market-based approach through which quotes from market makers are used to determine fair value. In instances where sufficient market activity may not exist or is limited, the pricing services also utilize proprietary valuation models which may consider market characteristics
such as benchmark yield curves, credit spreads, estimated default rates, anticipated market interest rate volatility, coupon rates, anticipated timing of principal repayments, underlying collateral, and other unique security features in order to estimate the relevant cash flows, which are then discounted to calculate the fair value.
Investments in open-end mutual funds are valued at the closing NAV.
Derivative financial instruments listed on an exchange are valued at the official closing price of the day. Certain derivative financial instruments are centrally cleared or trade in the OTC market. The Fund’s pricing services use various techniques including industry standard option pricing models and proprietary discounted cash flow models to determine the fair value of those instruments. The Fund’s net benefit or obligation under the derivative contract, as measured by the fair value of the contract, is included in net assets.
The Fund has procedures to determine the fair value of financial instruments for which market prices are not reliable or readily available. Under these procedures, the VC convenes on a regular basis to review such financial instruments and considers a number of factors, including significant unobservable valuation inputs, when arriving at fair value. The VC primarily employs a market-based approach which may use related or comparable assets or liabilities, recent transactions, market multiples, book values, and other relevant information for the investment to determine the fair value of the investment. An income-based valuation approach may also be used in which the anticipated future cash flows of the investment are discounted to calculate fair value. Discounts may also be applied due to the nature or duration of any restrictions on the disposition of the investments. Due to the inherent uncertainty of valuations of such investments, the fair values may differ significantly from the values that would have been used had an active market existed. The VC employs various methods for calibrating these valuation approaches including a regular review of key inputs and assumptions, transactional back-testing or disposition analysis, and reviews of any related market activity.
b. Derivative Financial Instruments
The Fund invested in derivative financial instruments in order to manage risk or gain exposure to various other investments or markets. Derivatives are financial contracts based on an underlying or notional amount, require no initial investment or
| | | | |
| | | |
franklintempleton.com | | Annual Report | | 23 |
FRANKLIN ALTERNATIVE STRATEGIES FUNDS
NOTES TO CONSOLIDATED FINANCIAL STATEMENTS
Franklin Pelagos Commodities Strategy Fund (continued)
1. Organization and Significant Accounting
Policies (continued)
b. Derivative Financial Instruments (continued)
an initial net investment that is smaller than would normally be required to have a similar response to changes in market factors, and require or permit net settlement. Derivatives contain various risks including the potential inability of the counterparty to fulfill their obligations under the terms of the contract, the potential for an illiquid secondary market, and/or the potential for market movements which expose the Fund to gains or losses in excess of the amounts shown in the Consolidated Statement of Assets and Liabilities. Realized gain and loss and unrealized appreciation and depreciation on these contracts for the period are included in the Consolidated Statement of Operations.
Derivative counterparty credit risk is managed through a formal evaluation of the creditworthiness of all potential counterparties. The Fund attempts to reduce its exposure to counterparty credit risk on OTC derivatives, whenever possible, by entering into International Swaps and Derivatives Association (ISDA) master agreements with certain counterparties. These agreements contain various provisions, including but not limited to collateral requirements, events of default, or early termination. Termination events applicable to the counterparty include certain deteriorations in the credit quality of the counterparty. Termination events applicable to the Fund include failure of the Fund to maintain certain net asset levels and/or limit the decline in net assets over various periods of time. In the event of default or early termination, the ISDA master agreement gives the non-defaulting party the right to net and close-out all transactions traded, whether or not arising under the ISDA agreement, to one net amount payable by one counterparty to the other. However, absent an event of default or early termination, OTC derivative assets and liabilities are presented gross and not offset in the Consolidated Statement of Assets and Liabilities. Early termination by the counterparty may result in an immediate payment by the Fund of any net liability owed to that counterparty under the ISDA agreement.
The Fund attempts to reduce its exposure to
counterparty credit
Collateral requirements differ by type of derivative. Collateral or initial margin requirements are set by the broker or exchange clearing house for exchange traded and centrally cleared derivatives. Initial margin deposited is held at the exchange and can be in the form of cash and/or securities. For OTC derivatives traded under an ISDA master agreement, posting of collateral is required by either the Fund or the applicable
counterparty if the total net exposure of all OTC derivatives with the applicable counterparty exceeds the minimum transfer amount, which typically ranges from $100,000 to $250,000, and can vary depending on the counterparty and the type of the agreement. Generally, collateral is determined at the close of Fund business each day and any additional collateral required due to changes in derivative values may be delivered by the Fund or the counterparty the next business day, or within a few business days. Collateral pledged and/or received by the Fund for OTC derivatives, if any, is held in segregated accounts with the Fund’s custodian/counterparty broker and can be in the form of cash and/or securities. Unrestricted cash may be invested according to the Fund’s investment objectives. To the extent that the amounts due to the Fund from its counterparties are not subject to collateralization or are not fully collateralized, the Fund bears the risk of loss from counterparty non-performance.
The Fund entered into exchange traded futures contracts primarily to gain exposure to commodity price risk. A futures contract is an agreement between the Fund and a counterparty to buy or sell an asset at a specified price on a future date. Required initial margins are pledged by the Fund, and the daily change in fair value is accounted for as a variation margin payable or receivable in the Consolidated Statement of Assets and Liabilities.
The Fund entered into OTC commodity-linked total return swap contracts primarily to gain exposure to commodity price risk of an underlying instrument such as a stock, bond, index or basket of securities or indices. A total return swap is an agreement between the Fund and a counterparty to exchange a return linked to an underlying instrument for a floating or fixed rate payment, both based upon a notional amount. Over the term of the contract, contractually required payments to be paid or received are accrued daily and recorded as unrealized appreciation or depreciation until the payments are made, at which time they are recognized as realized gain or loss.
The Fund purchased or wrote exchange traded option contracts primarily to manage and/or gain exposure to commodity price risk. An option is a contract entitling the holder to purchase or sell a specific amount of shares or units of an asset or notional amount of a swap (swaption), at a specified price. When an option is purchased or written, an amount equal to the premium paid or received is recorded as an asset or liability, respectively. Upon exercise of an option, the acquisition cost or sales proceeds of the underlying investment is adjusted by any premium received or paid. Upon expiration of an option, any
| | | | |
| | | |
24 | | Annual Report | | franklintempleton.com |
FRANKLIN ALTERNATIVE STRATEGIES FUNDS
NOTES TO CONSOLIDATED FINANCIAL STATEMENTS
Franklin Pelagos Commodities Strategy Fund (continued)
premium received or paid is recorded as a realized gain or loss. Upon closing an option other than through expiration or exercise, the difference between the premium received or paid and the cost to close the position is recorded as a realized gain or loss.
See Note 7 regarding other derivative information.
c. Restricted Cash
At May 31, 2018, the Fund held restricted cash in connection with investments in certain derivative securities. Restricted cash is held in a segregated account with the Fund’s custodian and is reflected in the Consolidated Statement of Assets and Liabilities.
d. Investments in FPC Holdings Corp. (FP Subsidiary)
The Fund invests in certain financial instruments and commodity-linked derivative investments through its investment in the FP Subsidiary. The FP Subsidiary is a Cayman Islands exempted company with limited liability, is a wholly-owned subsidiary of the Fund, and is able to invest in certain financial instruments and commodity-linked derivative investments consistent with the investment objective of the Fund. At May 31, 2018, the FP Subsidiary’s investments as well as any other assets and liabilities of the FP Subsidiary are reflected in the Fund’s Consolidated Statement of Investments and Consolidated Statement of Assets and Liabilities. The financial statements have been consolidated and include the accounts of the Fund and the FP Subsidiary. All intercompany transactions and balances have been eliminated. For tax purposes, the Fund is required to increase its taxable income by its share of the FP Subsidiary’s income. Net losses incurred by the FP Subsidiary cannot offset income earned by the Fund and cannot be carried back or forward by the FP Subsidiary to offset income from prior or future years. At May 31, 2018, the net assets of the FP Subsidiary were $67,692,752, representing 22.8% of the Fund’s consolidated net assets. The Fund’s investment in the FP Subsidiary is limited to 25% of consolidated assets.
e. Income Taxes
It is the Fund’s policy to qualify as a regulated investment company under the Internal Revenue Code. The Fund intends to distribute to shareholders substantially all of its taxable income and net realized gains to relieve it from federal income and excise taxes. As a result, no provision for U.S. federal income taxes is required.
The Fund may recognize an income tax liability related to its uncertain tax positions under U.S. GAAP when the uncertain tax position has a less than 50% probability that it will be sustained upon examination by the tax authorities based on its technical merits. As of May 31, 2018, the Fund has determined that no tax liability is required in its consolidated financial statements related to uncertain tax positions for any open tax years (or expected to be taken in future tax years). Open tax years are those that remain subject to examination and are based on the statute of limitations in each jurisdiction in which the Fund invests.
f. Security Transactions, Investment Income, Expenses and Distributions
Security transactions are accounted for on trade date. Realized gains and losses on security transactions are determined on a specific identification basis. Interest income and estimated expenses are accrued daily. Amortization of premium and accretion of discount on debt securities are included in interest income. Dividend income is recorded on the ex-dividend date. Distributions to shareholders are recorded on the ex-dividend date. Distributable earnings are determined according to income tax regulations (tax basis) and may differ from earnings recorded in accordance with U.S. GAAP. These differences may be permanent or temporary. Permanent differences are reclassified among capital accounts to reflect their tax character. These reclassifications have no impact on net assets or the results of operations. Temporary differences are not reclassified, as they may reverse in subsequent periods.
Common expenses incurred by the Trust are allocated among the Funds based on the ratio of net assets of each Fund to the combined net assets of the Trust. Fund specific expenses are charged directly to the Fund that incurred the expense.
Realized and unrealized gains and losses and net investment income, excluding class specific expenses, are allocated daily to each class of shares based upon the relative proportion of net assets of each class. Differences in per share distributions by class are generally due to differences in class specific expenses.
g. Accounting Estimates
The preparation of financial statements in accordance with U.S. GAAP requires management to make estimates and assumptions that affect the reported amounts of assets and
| | | | |
| | | |
franklintempleton.com | | Annual Report | | 25 |
FRANKLIN ALTERNATIVE STRATEGIES FUNDS
NOTES TO CONSOLIDATED FINANCIAL STATEMENTS
Franklin Pelagos Commodities Strategy Fund (continued)
1. Organization and Significant Accounting
Policies (continued)
g. Accounting Estimates (continued)
liabilities at the date of the financial statements and the amounts of income and expenses during the reporting period. Actual results could differ from those estimates.
h. Guarantees and Indemnifications
Under the Trust’s organizational documents, its officers and trustees are indemnified by the Trust against certain liabilities arising out of the performance of their duties to the Trust.
Additionally, in the normal course of business, the Trust, on behalf of the Fund, enters into contracts with service providers that contain general indemnification clauses. The Trust’s maximum exposure under these arrangements is unknown as this would involve future claims that may be made against the Trust that have not yet occurred. Currently, the Trust expects the risk of loss to be remote.
2. Shares of Beneficial Interest
At May 31, 2018, there were an unlimited number of shares authorized (without par value). Transactions in the Fund’s shares were as follows:
| | | | | | | | | | | | | | | | |
| | | Year Ended May 31, | |
| | | 2018 | | | 2017 | |
| | | Shares | | | Amount | | | Shares | | | Amount | |
| | | | |
Class A Shares: | | | | | | | | | | | | | | | | |
Shares sold | | | 397,914 | | | $ | 2,583,465 | | | | 468,367 | | | $ | 3,019,447 | |
Shares redeemed | | | (227,728 | ) | | | (1,462,980 | ) | | | (266,214 | ) | | | (1,710,634 | ) |
Net increase (decrease) | | | 170,186 | | | $ | 1,120,485 | | | | 202,153 | | | $ | 1,308,813 | |
| | | | |
Class C Shares: | | | | | | | | | | | | | | | | |
Shares sold | | | 66,363 | | | $ | 417,943 | | | | 86,217 | | | $ | 545,742 | |
Shares redeemed | | | (51,364 | ) | | | (321,179 | ) | | | (60,610 | ) | | | (375,024 | ) |
Net increase (decrease) | | | 14,999 | | | $ | 96,764 | | | | 25,607 | | | $ | 170,718 | |
| | | | |
Class R Shares: | | | | | | | | | | | | | | | | |
Shares sold | | | 47 | | | $ | 306 | | | | 3,232 | | | $ | 20,979 | |
Shares redeemed | | | (18 | ) | | | (122 | ) | | | (798 | ) | | | (5,178 | ) |
Net increase (decrease) | | | 29 | | | $ | 184 | | | | 2,434 | | | $ | 15,801 | |
| | | | |
Class R6 Shares: | | | | | | | | | | | | | | | | |
Shares sold | | | 23,421,423 | | | $ | 156,598,917 | | | | 282,587 | | | $ | 1,822,567 | |
Shares issued in reinvestment of distributions | | | 23,435 | | | | 155,612 | | | | — | | | | — | |
Shares redeemed | | | (1,097,586 | ) | | | (7,070,852 | ) | | | (1,279,804 | ) | | | (8,255,823 | ) |
Net increase (decrease) | | | 22,347,272 | | | $ | 149,683,677 | | | | (997,217 | ) | | $ | (6,433,256 | ) |
| | | | |
Advisor Class Shares: | | | | | | | | | | | | | | | | |
Shares sold | | | 222,426 | | | $ | 1,453,033 | | | | 286,725 | | | $ | 1,872,420 | |
Shares redeemed | | | (303,092 | ) | | | (2,014,023 | ) | | | (59,539 | ) | | | (386,277 | ) |
Net increase (decrease) | | | (80,666 | ) | | $ | (560,990 | ) | | | 227,186 | | | $ | 1,486,143 | |
| | | | |
| | | |
26 | | Annual Report | | franklintempleton.com |
FRANKLIN ALTERNATIVE STRATEGIES FUNDS
NOTES TO CONSOLIDATED FINANCIAL STATEMENTS
Franklin Pelagos Commodities Strategy Fund (continued)
3. Transactions with Affiliates
Franklin Resources, Inc. is the holding company for various subsidiaries that together are referred to as Franklin Templeton Investments. Certain officers and trustees of the Trust are also officers and/or directors of the following subsidiaries:
| | |
| Subsidiary | | Affiliation |
FASA, LLC (FASA)
(formerly FT AlphaParity, LLC) | | Investment manager |
Franklin Templeton Services, LLC (FT Services) | | Administrative manager |
Franklin Templeton Distributors, Inc. (Distributors) | | Principal underwriter |
Franklin Templeton Investor Services, LLC (Investor Services) | | Transfer agent |
a. Management Fees
The Fund and FP Subsidiary pay an investment management fee to FASA of 0.85% per year of the average daily net assets of the Fund and FP Subsidiary. Management fees paid by the Fund are reduced on assets invested in the FP Subsidiary, in an amount not to exceed the management fees paid by the FP Subsidiary.
b. Administrative Fees
Under an agreement with FASA, FT Services provides administrative services to the Fund and FP Subsidiary. The fee is paid by FASA based on the Fund and FP Subsidiary average daily net assets, and is not an additional expense of the Fund or FP Subsidiary.
c. Distribution Fees
The Board has adopted distribution plans for each share class, with the exception of Class R6 and Advisor Class shares, pursuant to Rule 12b-1 under the 1940 Act. Under the Fund’s Class A reimbursement distribution plan, the Fund reimburses Distributors for costs incurred in connection with the servicing, sale and distribution of the Fund’s shares up to the maximum annual plan rate. Under the Class A reimbursement distribution plan, costs exceeding the maximum for the current plan year cannot be reimbursed in subsequent periods. In addition, under the Fund’s Class C and R compensation distribution plans, the Fund pays Distributors for costs incurred in connection with the servicing, sale and distribution of the Fund’s shares up to the maximum annual plan rate for each class. The plan year, for purposes of monitoring compliance with the maximum annual plan rates, is February 1 through January 31.
The maximum annual plan rates, based on the average daily net assets, for each class, are as follows:
| | | | |
Class A | | | 0.30 | % |
Class C | | | 1.00 | % |
Class R | | | 0.50 | % |
The Board has set the current rate at 0.25% per year for Class A shares until further notice and approval by the Board.
d. Sales Charges/Underwriting Agreements
Front-end sales charges and contingent deferred sales charges (CDSC) do not represent expenses of the Fund. These charges are deducted from the proceeds of sales of Fund shares prior to investment or from redemption proceeds prior to remittance, as applicable. Distributors has advised the Fund of the following commission transactions related to the sales and redemptions of the Fund’s shares for the year:
| | | | |
Sales charges retained net of commissions paid to unaffiliated brokers/dealers | | $ | 5,004 | |
CDSC retained | | $ | 140 | |
| | | | |
| | | |
franklintempleton.com | | Annual Report | | 27 |
FRANKLIN ALTERNATIVE STRATEGIES FUNDS
NOTES TO CONSOLIDATED FINANCIAL STATEMENTS
Franklin Pelagos Commodities Strategy Fund (continued)
3. Transactions with Affiliates (continued)
e. Transfer Agent Fees
Each class of shares pays transfer agent fees to Investor Services for its performance of shareholder servicing obligations. Effective November 1, 2017, the fees are based on an annualized asset based fee of 0.02% plus a transaction based fee. Prior to November 1, 2017, the fees were account based fees that varied based on fund or account type. In addition, each class reimburses Investor Services for out of pocket expenses incurred and, except for Class R6, reimburses shareholder servicing fees paid to third parties. These fees are allocated daily based upon their relative proportion of such classes’ aggregate net assets. Class R6 pays Investor Services transfer agent fees specific to that class.
For the year ended May 31, 2018, the Fund paid transfer agent fees of $54,941, of which $40,037 was retained by Investor Services.
f. Investments in Affiliated Management Investment Companies
The Fund invests in one or more affiliated management investment companies for purposes other than exercising a controlling influence over the management or policies. Management fees paid by the Fund are waived on assets invested in the affiliated management investment companies, as noted in the Consolidated Statement of Operations, in an amount not to exceed the management and administrative fees paid directly or indirectly by each affiliate. During the year ended May 31, 2018, the Fund held investments in affiliated management investment companies as follows:
| | | | | | | | | | | | | | | | | | | | | | | | | | | | | | | | |
| | | Number of
Shares Held
at Beginning
of Year | | | Gross
Additions | | | Gross
Reductions | | | Number of
Shares
Held at End
of Year | | | Value
at End
of Year | | | Dividend
Income | | | Realized
Gain (Loss) | | | Net Change in
Unrealized
Appreciation
(Depreciation) | |
Non-Controlled Affiliates | | | | | | | | | | | | | | | | | | | | | | | | | | | | | | | | |
Institutional Fiduciary Trust Money Market Portfolio, 1.40% | | | — | | | | 46,757,445 | | | | (46,200,684 | ) | | | 556,761 | | | | $556,761 | | | | $10,066 | | | | $ — | | | | $ — | |
| | | | | | | | | | | | | | | | | | | | |
g. Waiver and Expense Reimbursements
FASA and Investor Services has contractually agreed in advance to waive or limit their respective fees and to assume as their own expense certain expenses otherwise payable by the Fund so that the expenses (excluding distribution fees, acquired fund fees and expenses) for each class of the Fund do not exceed 0.95% and Class R6 does not exceed 0.63% based on the average net assets of each class (other than certain non-routine expenses or costs, including those relating to litigation, indemnification, reorganizations, and liquidations) until September 30, 2018. Total expenses waived or paid are not subject to recapture subsequent to the Fund’s fiscal year end. Prior to October 1, 2017, expenses for Class R6 were limited to 0.68%.
| | | | |
| | | |
28 | | Annual Report | | franklintempleton.com |
FRANKLIN ALTERNATIVE STRATEGIES FUNDS
NOTES TO CONSOLIDATED FINANCIAL STATEMENTS
Franklin Pelagos Commodities Strategy Fund (continued)
h. Other Affiliated Transactions
At May 31, 2018, the shares of the Fund were owned by the following entities:
| | | | | | | | |
| | | | | | Percentage of | |
| | | Shares | | | Outstanding Sharesa | |
| | |
Franklin Moderate Allocation Fund | | | 16,117,652 | | | | 37.6% | |
Franklin Conservative Allocation Fund | | | 10,218,222 | | | | 23.8% | |
Franklin Growth Allocation Fund | | | 10,051,315 | | | | 23.4% | |
Franklin LifeSmart 2025 Retirement Target Fund | | | 1,006,343 | | | | 2.3% | |
Franklin Real Return Fund | | | 897,760 | | | | 2.1% | |
Franklin LifeSmart 2035 Retirement Target Fund | | | 878,087 | | | | 2.0% | |
Franklin LifeSmart 2045 Retirement Target Fund | | | 628,856 | | | | 1.5% | |
Franklin LifeSmart 2030 Retirement Target Fund | | | 380,790 | | | | 0.9% | |
Franklin LifeSmart 2040 Retirement Target Fund | | | 306,676 | | | | 0.7% | |
Franklin LifeSmart 2020 Retirement Target Fund | | | 304,289 | | | | 0.7% | |
Franklin LifeSmart 2050 Retirement Target Fund | | | 263,072 | | | | 0.6% | |
Franklin LifeSmart 2055 Retirement Target Fund | | | 85,454 | | | | 0.2% | |
Franklin NextStep Moderate Fund | | | 41,451 | | | | 0.1% | |
Franklin NextStep Growth Fund | | | 22,671 | | | | 0.1% | |
Franklin Resources, Inc. | | | 563 | | | | —%b | |
| | | | |
| | | 41,203,201 | | | | 96.0% | |
| | | | |
aInvestment activities of significant shareholders could have a material impact on the Fund.
bRounds to less than 0.1%.
4. Expense Offset Arrangement
The Fund has entered into an arrangement with its custodian whereby credits realized as a result of uninvested cash balances are used to reduce a portion of the Fund’s custodian expenses. During the year ended May 31, 2018, the custodian fees were reduced as noted in the Consolidated Statement of Operations.
5. Income Taxes
For tax purposes, capital losses may be carried over to offset future capital gains, if any. At May 31, 2018, the capital loss carryforwards were as follows:
| | | | |
Capital loss carryforwards not subject to expiration: | | | | |
Short Term | | $ | 8,605 | |
Long Term | | | 221,851 | |
Total capital loss carryforwards | | $ | 230,456 | |
The tax character of distributions paid during the years ended May 31, 2018 and 2017, was as follows:
| | | | | | | | |
| | | 2018 | | | 2017 | |
Distributions paid from ordinary income | | $ | 155,612 | | | $ | — | |
| | | | |
| | | |
franklintempleton.com | | Annual Report | | 29 |
FRANKLIN ALTERNATIVE STRATEGIES FUNDS
NOTES TO CONSOLIDATED FINANCIAL STATEMENTS
Franklin Pelagos Commodities Strategy Fund (continued)
5. Income Taxes (continued)
At May 31, 2018, the cost of investments, net unrealized appreciation (depreciation) and undistributed ordinary income for income tax purposes were as follows:
| | | | |
Cost of investments | | $ | 309,714,658 | |
| |
Unrealized appreciation | | $ | 4,821,559 | |
Unrealized depreciation | | | (16,539,233 | ) |
Net unrealized appreciation (depreciation) | | $ | (11,717,674 | ) |
| |
Distributable earnings: | | | | |
Undistributed ordinary income | | $ | 16,762,161 | |
Differences between income and/or capital gains as determined on a book basis and a tax basis are primarily due to differing treatment of investments in the FP Subsidiary.
6. Investment Transactions
Sales of investments (excluding short term securities) for the year ended May 31, 2018, totaled $22,999,981. There were no purchases of investments (other than short term securities).
7. Other Derivative Information
At May 31, 2018, the Fund’s investments in derivative contracts are reflected in the Consolidated Statement of Assets and Liabilities as follows:
| | | | | | | | | | | | | | | | | | | | |
| | | Asset Derivatives | | | | | | Liability Derivatives | |
Derivative Contracts Not Accounted for as Hedging Instruments | | Consolidated Statement of Assets and Liabilities Location | | | Fair Value | | | | | | Consolidated Statement of Assets and Liabilities Location | | | Fair Value | |
Commodity contracts | |
| Variation margin on futures
contracts |
| | $ | 1,014,428 | a | | | | | |
| Variation margin on futures
contracts |
| | $ | 153,067 | a |
| | | Unrealized appreciation on OTC | | | | 3,786,623 | | | | | | | | Unrealized depreciation on OTC | | | | — | |
| | | swap contracts | | | | | | | | | | | | swap contracts | | | | | |
| | | | | | | | | | | | | | | | | | | | |
Totals | | | | | | $ | 4,801,051 | | | | | | | | | | | $ | 153,067 | |
| | | | | | | | | | | | | | | | | | | | |
a This amount reflects the cumulative appreciation (depreciation) of futures contracts as reported in the Consolidated Statement of Investments. Only the variation margin receivable/payable at year end is separately reported within the Consolidated Statement of Assets and Liabilities. Prior variation margin movements were recorded to cash upon receipt or payment.
| | | | |
| | | |
30 | | Annual Report | | franklintempleton.com |
FRANKLIN ALTERNATIVE STRATEGIES FUNDS
NOTES TO CONSOLIDATED FINANCIAL STATEMENTS
Franklin Pelagos Commodities Strategy Fund (continued)
For the year ended May 31, 2018, the effect of derivative contracts in the Fund’s Consolidated Statement of Operations was as follows:
| | | | | | | | | | | | | | |
Derivative Contracts Not Accounted for as Hedging Instruments | | Consolidated Statement of Operations Location | | Net Realized
Gain (Loss) for
the Year | | | Consolidated Statement of Operations Location | | | Net Change in Unrealized
Appreciation (Depreciation) for the Year | |
| | Net realized gain (loss) from: | | | | | | | Net change in unrealized | | | | | |
| | | | | | | | | appreciation (depreciation) on: | | | | | |
Commodity contracts | | Investments | | | $ 149,719 | a | | | Investments | | | | $ 96,279 | a |
| | Written options | | | 317,682 | | | | Written options | | | | (140,832 | ) |
| | Futures contracts | | | 5,354,343 | | | | Futures contracts | | | | 1,704,279 | |
| | Swap contracts | | | 8,405,881 | | | | Swap contracts | | | | 3,786,623 | |
| | | | | | | | | | | | | | |
Totals | | | | | $14,227,625 | | | | | | | | $5,446,349 | |
| | | | | | | | | | | | | | |
aPurchased option contracts are included in net realized gain (loss) from investments and net change in unrealized appreciation (depreciation) on investments in the Consolidated Statement of Operations.
For the year ended May 31, 2018, the average month end notional amount of futures contracts, options and swap contracts represented $34,266,490, $70,538 and $138,369,231, respectively.
At May 31, 2018, the Fund’s OTC derivative assets and liabilities are as follows:
| | | | | | | | |
| | | Gross Amounts of | |
| | | Assets and Liabilities Presented | |
| | | in the Consolidated Statement of Assets and Liabilities | |
| | | Assetsa | | | Liabilitiesa | |
Derivatives | | | | | | | | |
Swap contracts | | | $3,786,623 | | | | $ — | |
| | | | |
aAbsent an event of default or early termination, OTC derivative assets and liabilities are presented gross and not offset in the Consolidated Statement of Assets and Liabilities.
At May 31, 2018, the Fund’s OTC derivative assets, which may be offset against the Fund’s OTC derivative liabilities and collateral received from the counterparty, are as follows:
| | | | | | | | | | | | | | | | | | | | |
| | | | | | Amounts Not Offset in the | | | | |
| | | | | | Consolidated Statement of Assets and Liabilities | | | | |
| | | Gross | | | | | | | | | | | | | |
| | | Amounts of | | | Financial | | | Financial | | | | | | | |
| | | Assets Presented in | | | Instruments | | | Instruments | | | Cash | | | Net Amount | |
| | | the Consolidated Statement of | | | Available for | | | Collateral | | | Collateral | | | (Not less | |
| | | Assets and Liabilities | | | Offseta | | | Received | | | Received | | | than zero) | |
Counterparty | | | | | | | | | | | | | | | | | | | | |
MSCS | | | $ 3,786,623 | | | | $ — | | | | $ — | | | $ | (3,551,000 | ) | | | $235,623 | |
| | | | |
aAt May 31, 2018, the Fund had no OTC derivative liabilities.
See Note 1(b) regarding derivative financial instruments.
See Abbreviations on page 33.
| | | | |
| | | |
franklintempleton.com | | Annual Report | | 31 |
FRANKLIN ALTERNATIVE STRATEGIES FUNDS
NOTES TO CONSOLIDATED FINANCIAL STATEMENTS
Franklin Pelagos Commodities Strategy Fund (continued)
8. Credit Facility
The Fund, together with other U.S. registered and foreign investment funds (collectively, Borrowers), managed by Franklin Templeton Investments, are borrowers in a joint syndicated senior unsecured credit facility totaling $2 billion (Global Credit Facility) which matures on February 8, 2019. This Global Credit Facility provides a source of funds to the Borrowers for temporary and emergency purposes, including the ability to meet future unanticipated or unusually large redemption requests.
Under the terms of the Global Credit Facility, the Fund shall, in addition to interest charged on any borrowings made by the Fund and other costs incurred by the Fund, pay its share of fees and expenses incurred in connection with the implementation and maintenance of the Global Credit Facility, based upon its relative share of the aggregate net assets of all of the Borrowers, including an annual commitment fee of 0.15% based upon the unused portion of the Global Credit Facility. These fees are reflected in other expenses in the Consolidated Statement of Operations. During the year ended May 31, 2018, the Fund did not use the Global Credit Facility.
9. Fair Value Measurements
The Fund follows a fair value hierarchy that distinguishes between market data obtained from independent sources (observable inputs) and the Fund’s own market assumptions (unobservable inputs). These inputs are used in determining the value of the Fund’s financial instruments and are summarized in the following fair value hierarchy:
| | • | | Level 1 – quoted prices in active markets for identical financial instruments |
| | • | | Level 2 – other significant observable inputs (including quoted prices for similar financial instruments, interest rates, prepayment speed, credit risk, etc.) |
| | • | | Level 3 – significant unobservable inputs (including the Fund’s own assumptions in determining the fair value of financial instruments) |
The input levels are not necessarily an indication of the risk or liquidity associated with financial instruments at that level.
For movements between the levels within the fair value hierarchy, the Fund has adopted a policy of recognizing the transfers as of the date of the underlying event which caused the movement.
A summary of inputs used as of May 31, 2018, in valuing the Fund’s assets and liabilities carried at fair value, is as follows:
| | | | | | | | | | | | | | | | |
| | | Level 1 | | | Level 2 | | | Level 3 | | | Total | |
Assets: | | | | | | | | | | | | | | | | |
Investments in Securities:a | | | | | | | | | | | | | | | | |
U.S. Government and Agency Securities | | $ | — | | | $ | 19,853,350 | | | $ | — | | | $ | 19,853,350 | |
Short Term Investments | | | 267,666,867 | | | | 5,825,000 | | | | — | | | | 273,491,867 | |
Total Investments in Securities | | $ | 267,666,867 | | | $ | 25,678,350 | | | $ | — | | | $ | 293,345,217 | |
| | | | |
Other Financial Instruments: | | | | | | | | | | | | | | | | |
Futures Contracts | | $ | 1,014,428 | | | $ | — | | | $ | — | | | $ | 1,014,428 | |
Swap Contracts | | | — | | | | 3,786,623 | | | | — | | | | 3,786,623 | |
Total Other Financial Instruments | | $ | 1,014,428 | | | $ | 3,786,623 | | | $ | — | | | $ | 4,801,051 | |
| | | | |
Liabilities: | | | | | | | | | | | | | | | | |
Other Financial Instruments: | | | | | | | | | | | | | | | | |
Futures Contracts | | $ | 153,067 | | | $ | — | | | $ | — | | | $ | 153,067 | |
aFor detailed categories, see the accompanying Consolidated Statement of Investments.
| | | | |
| | | |
32 | | Annual Report | | franklintempleton.com |
FRANKLIN ALTERNATIVE STRATEGIES FUNDS
NOTES TO CONSOLIDATED FINANCIAL STATEMENTS
Franklin Pelagos Commodities Strategy Fund (continued)
10. Subsequent Events
The Fund has evaluated subsequent events through the issuance of the consolidated financial statements and determined that no events have occurred that require disclosure, except for the following:
On February 27, 2018, the Board approved an automatic conversion feature for Class C that will convert shareholders’ Class C shares into Class A shares after they have been held for 10 years. On May 17, 2018, the Board approved changes to certain front-end sales charges and dealer commissions on Class A shares. Further details are disclosed in the Fund’s Prospectus. The changes will become effective on a future date prior to the calendar year end of 2018.
| | |
Abbreviations | | |
| Counterparty | | Selected Portfolio |
| MSCS Morgan Stanley Capital Services LLC | | FFCB Federal Farm Credit Bank |
| | FHLMC Federal Home Loan Mortgage Corp. |
| | | | |
| | | |
franklintempleton.com | | Annual Report | | 33 |
FRANKLIN ALTERNATIVE STRATEGIES FUNDS
Report of Independent Registered Public Accounting Firm
To the Board of Trustees of Franklin Alternative Strategies Funds and Shareholders of
Franklin Pelagos Commodities Strategy Fund:
Opinion on the Financial Statements
We have audited the accompanying consolidated statement of assets and liabilities of Franklin Pelagos Commodities Strategy Fund (the “Fund”) (one of the funds constituting the Franklin Alternative Strategies Funds), including the consolidated statement of investments, as of May 31, 2018, and the related consolidated statement of operations for the year then ended, the consolidated statements of changes in net assets for each of the two years in the period then ended, the consolidated financial highlights for each of the five years in the period then ended and the related notes (collectively referred to as the “financial statements”). In our opinion, the financial statements present fairly, in all material respects, the consolidated financial position of Franklin Pelagos Commodities Strategy Fund (one of the funds constituting the Franklin Alternative Strategies Funds) at May 31, 2018, the consolidated results of its operations for the year then ended, the consolidated changes in its net assets for each of the two years in the period then ended and its consolidated financial highlights for each of the five years in the period then ended, in conformity with U.S. generally accepted accounting principles.
Basis for Opinion
These financial statements are the responsibility of the Fund’s management. Our responsibility is to express an opinion on the Fund’s financial statements based on our audits. We are a public accounting firm registered with the Public Company Accounting Oversight Board (United States) (“PCAOB”) and are required to be independent with respect to the Fund in accordance with the U.S. federal securities laws and the applicable rules and regulations of the Securities and Exchange Commission and the PCAOB.
We conducted our audits in accordance with the standards of the PCAOB. Those standards require that we plan and perform the audit to obtain reasonable assurance about whether the financial statements are free of material misstatement, whether due to error or fraud. The Fund is not required to have, nor were we engaged to perform, an audit of the Fund’s internal control over financial reporting. As part of our audits, we are required to obtain an understanding of internal control over financial reporting, but not for the purpose of expressing an opinion on the effectiveness of the Fund’s internal control over financial reporting. Accordingly, we express no such opinion.
Our audits included performing procedures to assess the risks of material misstatement of the financial statements, whether due to error or fraud, and performing procedures that respond to those risks. Such procedures included examining, on a test basis, evidence regarding the amounts and disclosures in the financial statements. Our procedures included confirmation of securities owned as of May 31, 2018, by correspondence with the custodian and brokers. Our audits also included evaluating the accounting principles used and significant estimates made by management, as well as evaluating the overall presentation of the financial statements. We believe that our audits provide a reasonable basis for our opinion.

We have served as the auditor of one or more Franklin investment companies since 1987.
Boston, MA
July 25, 2018
| | | | |
| | | |
34 | | Annual Report | | franklintempleton.com |
FRANKLIN ALTERNATIVE STRATEGIES FUNDS
Board Members and Officers
The name, year of birth and address of the officers and board members, as well as their affiliations, positions held with the Funds, principal occupations during at least the past five years and number of US registered portfolios overseen in the Franklin Templeton Investments fund complex, are shown below. Generally, each board member serves until that person’s successor is elected and qualified.
Independent Board Members
| | | | | | | | |
| | | | | | | Number of Portfolios in | | |
Name, Year of Birth and Address | | Position | | Length of
Time Served | | Fund Complex Overseen
by Board Member* | | Other Directorships Held During at Least the Past 5 Years |
Edward I. Altman, Ph.D. (1941) c/o Franklin Mutual Advisers, LLC 101 John F. Kennedy Parkway Short Hills, NJ 07078-2716 | | Trustee | | Since 2011 | | 14 | | None |
Principal Occupation During at Least the Past 5 Years: |
| Max L. Heine Professor of Finance, Emeritus and Director of The Credit and Debt Markets Research Program, Salomon Center, Stern School of Business, New York University; editor and author of numerous financial publications; financial consultant; an adviser to numerous financial and publishing organizations; and formerly, Vice Director, Salomon Center, Stern School of Business, New York University. |
| | | | |
Ann Torre Bates (1958) c/o Franklin Mutual Advisers, LLC 101 John F. Kennedy Parkway Short Hills, NJ 07078-2716 | | Trustee | | Since 2011 | | 39 | | Ares Capital Corporation (specialty finance company) (2010-present), United Natural Foods, Inc. (distributor of natural, organic and specialty foods) (2013-present), Allied Capital Corporation (financial services) (2003-2010), SLM Corporation (Sallie Mae) (1997-2014) and Navient Corporation (loan management, servicing and asset recovery) (2014-2016). |
|
| Principal Occupation During at Least the Past 5 Years: |
| Director of various companies; and formerly, Executive Vice President and Chief Financial Officer, NHP Incorporated (manager of multifamily housing) (1995-1997); and Vice President and Treasurer, US Airways, Inc. (until 1995). |
| | | | |
Burton J. Greenwald (1929) c/o Franklin Mutual Advisers, LLC 101 John F. Kennedy Parkway Short Hills, NJ 07078-2716 | | Trustee and
Vice
Chairman of
the Board | | Trustee since
2011 and Vice
Chairman of the
Board since 2015 | | 14 | | Franklin Templeton Emerging Markets Debt Opportunities Fund PLC (1999-present) and Fiduciary International Ireland Limited (1999-2015). |
|
| Principal Occupation During at Least the Past 5 Years: |
| Managing Director, B.J. Greenwald Associates (management consultants to the financial services industry); and formerly, Chairman, Fiduciary Trust International Funds; Executive Vice President, L.F. Rothschild Fund Management, Inc.; President and Director, Merit Mutual Funds; President, Underwriting Division and Director, National Securities & Research Corporation; Governor, Investment Company Institute; and Chairman, ICI Public Information Committee. |
| | | | |
Keith E. Mitchell (1954) c/o Franklin Mutual Advisers, LLC 101 John F. Kennedy Parkway Short Hills, NJ 07078-2716 | | Trustee | | Since 2011 | | 14 | | None |
|
| Principal Occupation During at Least the Past 5 Years: |
| Director of various boards of asset management firms; and formerly, Managing Member, Mitchell, Hartley & Bechtel Advisers, LLC (formerly, Mitchell Advisers, LLC) (advisory firm) (2003-2015) and Managing Director, Putman Lovell NBF. |
| | | | |
David W. Niemiec (1949) c/o Franklin Mutual Advisers, LLC 101 John F. Kennedy Parkway Short Hills, NJ 07078-2716 | | Trustee | | Since 2015 | | 39 | | Hess Midstream Partners LP (oil and gas midstream infrastructure) (2017-present). |
|
| Principal Occupation During at Least the Past 5 Years: |
| Advisor, Saratoga Partners (private equity fund); and formerly, Managing Director, Saratoga Partners (1998-2001) and SBC Warburg Dillon Read (investment banking) (1997-1998); Vice Chairman, Dillon, Read & Co. Inc. (investment banking) (1991-1997); and Chief Financial Officer, Dillon, Read & Co. Inc. (1982-1997). |
| | | | |
| | | |
franklintempleton.com | | Annual Report | | 35 |
FRANKLIN ALTERNATIVE STRATEGIES FUNDS
Independent Board Members (continued)
| | | | | | | | |
| | | | | | | Number of Portfolios in | | |
Name, Year of Birth and Address | | Position | | Length of Time Served | | Fund Complex Overseen
by Board Member* | | Other Directorships Held
During at Least the Past 5 Years |
| Charles Rubens II (1930) | | Trustee | | Since 2011 | | 14 | | None |
| c/o Franklin Mutual Advisers, LLC | | | | | | | | |
| 101 John F. Kennedy Parkway | | | | | | | | |
| Short Hills, NJ 07078-2716 | | | | | | | | |
|
| Principal Occupation During at Least the Past 5 Years: |
| Private investor and president of non-profit organizations; and formerly, an executive of Time, Inc.; and Trustee of Colorado College. |
| | | | |
| Jan Hopkins Trachtman (1947) | | Trustee | | Since 2011 | | 14 | | None |
| c/o Franklin Mutual Advisers, LLC | | | | | | | | |
| 101 John F. Kennedy Parkway | | | | | | | | |
| Short Hills, NJ 07078-2716 | | | | | | | | |
|
| Principal Occupation During at Least the Past 5 Years: |
| President and Founder, The Jan Hopkins Group (communications consulting firm); serves on Advisory Board of Knight Bagehot Fellowship; and formerly, President, Economic Club of New York (2007-2015); Anchor/Correspondent, CNN Financial News (until 2003); Managing Director and Head of Client Communications, Citigroup Private Bank (until 2005); Off-Air Reporter, ABC News’ World News Tonight; and Editor, CBS Network News. |
| | | | |
| Robert E. Wade (1946) | | Trustee and | | Since 2011 | | 39 | | El Oro Ltd (investments) |
| c/o Franklin Mutual Advisers, LLC | | Chairman of | | | | | | (2003-present). |
| 101 John F. Kennedy Parkway | | the Board | | | | | | |
| Short Hills, NJ 07078-2716 | | | | | | | | |
|
| Principal Occupation During at Least the Past 5 Years: |
| Attorney at law engaged in private practice as a sole practitioner (1972-2008) and member of various boards. |
| | | | |
| Gregory H. Williams (1943) | | Trustee | | Since 2015 | | 14 | | None |
| c/o Franklin Mutual Advisers, LLC | | | | | | | | |
| 101 John F. Kennedy Parkway | | | | | | | | |
| Short Hills, NJ 07078-2716 | | | | | | | | |
|
| Principal Occupation During at Least the Past 5 Years: |
| Private investor; Consultant; and formerly, President, University of Cincinnati (2009-2012); President, The City College of New York (2001-2009); Dean, College of Law, Ohio State University (1993-2001); and Associate Vice President, Academic Affairs and Professor of Law, University of Iowa (1977-1993). |
|
| Interested Board Members and Officers |
| | | | |
| | | | | | | Number of Portfolios in | | |
Name, Year of Birth and Address | | Position | | Length of
Time Served | | Fund Complex Overseen
by Board Member* | | Other Directorships Held
During at Least the Past 5 Years |
| **Gregory E. Johnson (1961) | | Trustee | | Since 2011 | | 152 | | None |
| One Franklin Parkway | | | | | | | | |
| San Mateo, CA 94403-1906 | | | | | | | | |
|
| Principal Occupation During at Least the Past 5 Years: |
| Chairman of the Board, Member – Office of the Chairman, Director and Chief Executive Officer, Franklin Resources, Inc.; officer and/or director or trustee, as the case may be, of some of the other subsidiaries of Franklin Resources, Inc. and of 43 of the investment companies in Franklin Templeton Investments; Vice Chairman, Investment Company Institute; and formerly, President, Franklin Resources, Inc. (1994-2015). |
| | | | |
| **Jennifer M. Johnson (1964) | | Trustee | | Since 2015 | | 43 | | None |
| One Franklin Parkway | | | | | | | | |
| San Mateo, CA 94403-1906 | | | | | | | | |
|
| Principal Occupation During at Least the Past 5 Years: |
| President and Chief Operating Officer, Franklin Resources, Inc.; officer and/or director or trustee, as the case may be, of some of the other subsidiaries of Franklin Resources, Inc. and of four of the investment companies in Franklin Templeton Investments; and formerly,Chief Operating Officer and Executive Vice President, Franklin Resources, Inc. (1994-2015); Executive Vice President of Operations and Technology, Franklin Resources, Inc. (2005-2010); and Senior Vice President, Franklin Resources, Inc. (2003-2005). |
| | | | |
| | | |
36 | | Annual Report | | franklintempleton.com |
FRANKLIN ALTERNATIVE STRATEGIES FUNDS
Interested Board Members and Officers (continued)
| | | | | | | | |
Name, Year of Birth and Address | | Position | | Length of Time Served | | Number of Portfolios in
Fund Complex Overseen
by Board Member* | | Other Directorships Held
During at Least the Past 5 Years |
| Alison E. Baur (1964) | | Vice President | | Since 2012 | | Not Applicable | | Not Applicable |
| One Franklin Parkway | | | | | | | | |
| San Mateo, CA 94403-1906 | | | | | | | | |
|
| Principal Occupation During at Least the Past 5 Years: |
| Deputy General Counsel, Franklin Templeton Investments; and officer of some of the other subsidiaries of Franklin Resources, Inc. and of 45 of the investment companies in Franklin Templeton Investments. |
| | | | |
| Aliya S. Gordon (1973) | | Vice President | | Since 2011 | | Not Applicable | | Not Applicable |
| One Franklin Parkway | | | | | | | | |
| San Mateo, CA 94403-1906 | | | | | | | | |
|
| Principal Occupation During at Least the Past 5 Years: |
| Senior Associate General Counsel, Franklin Templeton Investments; and officer of 45 of the investment companies in Franklin Templeton Investments. |
| | | | |
| Steven J. Gray (1955) | | Secretary and | | Since 2011 | | Not Applicable | | Not Applicable |
| One Franklin Parkway | | Vice President | | | | | | |
| San Mateo, CA 94403-1906 | | | | | | | | |
|
| Principal Occupation During at Least the Past 5 Years: |
| Senior Associate General Counsel, Franklin Templeton Investments; Vice President, Franklin Templeton Distributors, Inc. and FASA, LLC; and officer of 45 of the investment companies in Franklin Templeton Investments. |
| | | | |
| Madison S. Gulley (1964) | | President and | | Since 2017 | | Not Applicable | | Not Applicable |
| 300 S.E. 2nd Street | | Chief Executive | | | | | | |
| Fort Lauderdale, FL 33301-1923 | | Officer – | | | | | | |
| | Investment | | | | | | |
| | Management | | | | | | |
|
| Principal Occupation During at Least the Past 5 Years: |
| Executive Vice President, Franklin Advisers, Inc., Franklin Advisory Services, LLC, Franklin Templeton Institutional, LLC; Templeton Global Advisors, Limited, and Templeton Investment Counsel, LLC; Senior Vice President, Franklin Templeton Companies, LLC; officer and/or director or trustee, as the case may be, of some of the other subsidiaries of Franklin Resources, Inc. and of one of the investment companies in Franklin Templeton Investments. |
| | | | |
| Matthew T. Hinkle (1971) | | Chief Executive | | Since 2017 | | Not Applicable | | Not Applicable |
| One Franklin Parkway | | Officer - | | | | | | |
| San Mateo, CA 94403-1906 | | Finance and | | | | | | |
| | Administration | | | | | | |
|
| Principal Occupation During at Least the Past 5 Years: |
| Senior Vice President, Franklin Templeton Services, LLC; officer of 45 of the investment companies in Franklin Templeton Investments; and formerly, Vice President, Global Tax (2012-April 2017) and Treasurer/Assistant Treasurer, Franklin Templeton Investments (2009-2017). |
| | | | |
| Robert G. Kubilis (1973) | | Chief Financial | | Since 2015 | | Not Applicable | | Not Applicable |
| 300 S.E. 2nd Street | | Officer, Chief | | | | | | |
| Fort Lauderdale, FL 33301-1923 | | Accounting | | | | | | |
| | Officer and | | | | | | |
| | Treasurer | | | | | | |
|
| Principal Occupation During at Least the Past 5 Years: |
| Treasurer, U.S. Fund Administration & Reporting, Franklin Templeton Investments; and officer of 17 of the investment companies in Franklin Templeton Investments. |
| | | | |
| Robert Lim (1948) | | Vice | | Since 2016 | | Not Applicable | | Not Applicable |
| One Franklin Parkway | | President – | | | | | | |
| San Mateo, CA 94403-1906 | | AML | | | | | | |
| | Compliance | | | | | | |
|
| Principal Occupation During at Least the Past 5 Years: |
| Vice President, Franklin Templeton Companies, LLC; Chief Compliance Officer, Franklin Templeton Distributors, Inc. and Franklin Templeton Investor Services, LLC; and officer of 45 of the investment companies in Franklin Templeton Investments. |
| | | | |
| | | |
franklintempleton.com | | Annual Report | | 37 |
FRANKLIN ALTERNATIVE STRATEGIES FUNDS
Interested Board Members and Officers (continued)
| | | | | | | | | | |
Name, Year of Birth and Address | | Position | | Length of Time Served | | Number of Portfolios in
Fund Complex Overseen
by Board Member* | | | Other Directorships Held
During at Least the Past 5 Years |
| | | | |
| Kimberly H. Novotny (1972) | | Vice President | | Since 2013 | | | Not Applicable | | | Not Applicable |
| 300 S.E. 2nd Street | | | | | | | | | | |
| Fort Lauderdale, FL 33301-1923 | | | | | | | | | | |
| | |
Principal Occupation During at Least the Past 5 Years: | | | | | | |
| Associate General Counsel, Franklin Templeton Investments; Vice President and Corporate Secretary, Fiduciary Trust International of the South; Vice President, Templeton Investment Counsel, LLC; Assistant Secretary, Franklin Resources, Inc.; and officer of 45 of the investment companies in Franklin Templeton Investments. |
| | | | |
| Robert C. Rosselot (1960) | | Chief | | Since 2013 | | | Not Applicable | | | Not Applicable |
| 300 S.E. 2nd Street | | Compliance | | | | | | | | |
| Fort Lauderdale, FL 33301-1923 | | Officer | | | | | | | | |
| | |
Principal Occupation During at Least the Past 5 Years: | | | | | | |
| Director, Global Compliance, Franklin Templeton Investments; Vice President, Franklin Templeton Companies, LLC; officer of 45 of the investment companies in Franklin Templeton Investments; and formerly, Senior Associate General Counsel, Franklin Templeton Investments (2007-2013); and Secretary and Vice President, Templeton Group of Funds (2004-2013). |
| | | | |
| Karen L. Skidmore (1952) | | Vice President | | Since 2011 | | | Not Applicable | | | Not Applicable |
| One Franklin Parkway | | | | | | | | | | |
| San Mateo, CA 94403-1906 | | | | | | | | | | |
| | |
Principal Occupation During at Least the Past 5 Years: | | | | | | |
| Senior Associate General Counsel, Franklin Templeton Investments; and officer of 45 of the investment companies in Franklin Templeton Investments. |
| | | | |
| Navid J. Tofigh (1972) | | Vice President | | Since 2015 | | | Not Applicable | | | Not Applicable |
| One Franklin Parkway | | | | | | | | | | |
| San Mateo, CA 94403-1906 | | | | | | | | | | |
| | |
Principal Occupation During at Least the Past 5 Years: | | | | | | |
| Associate General Counsel, Franklin Templeton Investments; and officer of 45 of the investment companies in Franklin Templeton Investments. |
| | | | |
| Craig S. Tyle (1960) | | Vice President | | Since 2011 | | | Not Applicable | | | Not Applicable |
| One Franklin Parkway | | | | | | | | | | |
| San Mateo, CA 94403-1906 | | | | | | | | | | |
| | |
Principal Occupation During at Least the Past 5 Years: | | | | | | |
| General Counsel and Executive Vice President, Franklin Resources, Inc.; and officer of some of the other subsidiaries of Franklin Resources, Inc. and of 45 of the investment companies in Franklin Templeton Investments. |
| | | | |
| Lori A. Weber (1964) | | Vice President | | Since 2011 | | | Not Applicable | | | Not Applicable |
| 300 S.E. 2nd Street | | | | | | | | | | |
| Fort Lauderdale, FL 33301-1923 | | | | | | | | | | |
Principal Occupation During at Least the Past 5 Years:
Senior Associate General Counsel, Franklin Templeton Investments; Assistant Secretary, Franklin Resources, Inc.; Vice President and Secretary, Templeton Investment Counsel, LLC; and officer of 45 of the investment companies in Franklin Templeton Investments.
| | | | |
| | | |
38 | | Annual Report | | franklintempleton.com |
FRANKLIN ALTERNATIVE STRATEGIES FUNDS
*We base the number of portfolios on each separate series of the US registered investment companies within the Franklin Templeton Investments fund complex. These portfolios have a common investment manager or affiliated investment managers.
**Gregory E. Johnson is considered to be an interested person of the Fund under the federal securities laws due to his position as an officer and director of Franklin
Resources, Inc. (Resources), which is the parent company of the Fund’s investment manager and distributor. Jennifer M. Johnson is considered to be an interested person of the Fund under the federal securities laws due to her position as officer of Resources.
Note 1: Gregory E. Johnson and Jennifer M. Johnson are siblings.
Note 2: Officer information is current as of the date of this report. It is possible that after this date, information about officers may change.
The Sarbanes-Oxley Act of 2002 and Rules adopted by the US Securities and Exchange Commission require the Fund to disclose whether the Fund’s Audit Committee includes at least one member who is an audit committee financial expert within the meaning of such Act and Rules. The Fund’s Board has determined that there is at least one such financial expert on the Audit Committee and has designated each of Edward I. Altman, Ph.D., Ann Torre Bates and David W. Niemiec as an audit committee financial expert. The Board believes that Messrs. Altman and Niemiec and Ms. Bates qualify as such an expert in view of their extensive business background and experience. Mr. Altman has served as a member of the Fund Audit Committee since 2011. He currently serves as a Max L. Hines Professor of Finance, Emeritus and Director of The Credit and Debt Markets Research Program, Salomon Center, Stern School of Business, New York University. Ms. Bates has served as a member of the Fund Audit Committee since 2011. She currently serves as a director of Ares Capital Corporation (2010-present) and United Natural Foods, Inc. (2013-present) and was formerly a director of Navient Corporation from 2014 to 2016, SLM Corporation from 1997 to 2014 and Allied Capital Corporation from 2003 to 2010, Executive Vice President and Chief Financial Officer of NHP Incorporated from 1995 to 1997 and Vice President and Treasurer of US Airways, Inc. until 1995. Mr. Niemiec has served as a member of the Fund Audit Committee since 2015, currently serves as an Advisor to Saratoga Partners and was formerly its Managing Director from 1998 to 2001 and serves as a director of Hess Midstream Partners LP (2017-present). Mr. Niemiec was formerly a director of Emeritus Corporation from 1999 to 2010 and OSI Pharmaceuticals, Inc. from 2006 to 2010, Managing Director of SBC Warburg Dillon Read from 1997 to 1998, and was Vice Chairman from 1991 to 1997 and Chief Financial Officer from 1982 to 1997 of Dillon, Read & Co. Inc. As a result of such background and experience, the Board believes that Messrs. Altman and Niemiec and Ms. Bates have each acquired an understanding of generally accepted accounting principles and financial statements, the general application of such principles in connection with the accounting estimates, accruals and reserves, and analyzing and evaluating financial statements that present a breadth and level of complexity of accounting issues generally comparable to those of the Fund, as well as an understanding of internal controls and procedures for financial reporting and an understanding of audit committee functions. Messrs. Altman and Niemiec and Ms. Bates are independent Board members as that term is defined under the applicable US Securities and Exchange Commission Rules and Releases.
The Statement of Additional Information (SAI) includes additional information about the board members and is available, without charge, upon request. Shareholders may call (800) DIAL BEN/342-5236 to request the SAI.
| | | | |
| | | |
franklintempleton.com | | Annual Report | | 39 |
FRANKLIN ALTERNATIVE STRATEGIES FUNDS
FRANKLIN PELAGOS COMMODITIES STRATEGY FUND
Shareholder Information
Board Approval of Investment Management Agreements
FRANKLIN ALTERNATIVE STRATEGIES FUNDS
Franklin Pelagos Commodities Strategy Fund
(Fund)
The Board of Trustees (Board) of the Fund, including a majority of trustees that are not “interested persons” as such term is defined in section 2(a)(19) of the Investment Company Act of 1940 (hereinafter referred to as “independent trustees”), at an in-person meeting held on May 17, 2018, unanimously approved the renewal of the Fund’s investment management agreement. Prior to a meeting of all of the trustees for the purpose of considering such renewal, the independent trustees participated in two other meetings held in connection with the renewal process. Throughout the process, the independent trustees received assistance and advice from and met separately with independent counsel. The independent trustees met with and interviewed officers of the investment manager (including portfolio managers), the transfer agent and shareholder services group and the distributor. In approving the renewal of the investment management agreement for the Fund, the Board, including the independent trustees, determined that the investment management fee structure was fair and reasonable and that continuance of the agreement was in the best interests of the Fund and its shareholders.
In reaching their decision on the investment management agreement, the trustees took into account information furnished throughout the year at regular Board meetings, as well as information specifically requested and furnished for the renewal process, which culminated in the meetings referred to above for the specific purpose of considering such agreement. Information furnished throughout the year included, among others, reports on the Fund’s investment performance, expenses, portfolio composition, derivatives, asset segregation, portfolio turnover, Rule 12b-1 plan, distribution, shareholder servicing, legal and compliance matters, pricing of securities, sales and redemptions, and marketing support payments made to financial intermediaries, as well as a third-party survey of transfer agent fees charged to funds within the Franklin Templeton Investments (FTI) complex in comparison with those charged to other fund complexes deemed comparable. Also, related financial statements and other information about the scope and quality of services provided by the investment manager and its affiliates and enhancements to such services over the past year were provided. In addition, the trustees received periodic reports throughout the year and during the
renewal process relating to compliance with the Fund’s investment policies and restrictions. During the renewal process, the independent trustees considered the investment manager’s methods of operation within the Franklin Templeton group and its activities on behalf of other clients. The Board also noted that it received an annual report on all payments made by FTI or the Fund to financial intermediaries engaged in the sale of Fund shares, as well as a memorandum relating to third-party servicing arrangements in response to a Guidance Update from the U.S. Securities and Exchange Commission (SEC) relating to mutual fund distribution and sub-accounting fees.
The information obtained by the trustees during the renewal process also included a special report prepared by Broadridge Financial Solutions, Inc., an independent third-party analyst that utilizes data from Lipper, Inc. (“Lipper”), comparing the Fund’s investment performance and expenses with those of other mutual funds deemed comparable to the Fund as selected by Lipper (Broadridge Section 15(c) Report). The trustees reviewed the Broadridge Section 15(c) Report and its usefulness in the renewal process with respect to matters such as comparative fees, expenses, expense ratios and performance. They concluded that the report continues to be a reliable resource in the performance of their duties.
In addition, the trustees received a Profitability Study (Profitability Study) prepared by management discussing the profitability to FTI from its overall U.S. fund operations, as well as on an individual fund-by-fund basis. Over the past year, the Board and counsel to the independent trustees continued to receive reports on management’s handling of recent regulatory inquiries and pending legal actions against the investment manager and its affiliates. The independent trustees were satisfied with the actions taken to date by management in response to such regulatory and legal matters.
The trustees reviewed the personnel, operations, financial condition, and investment management capabilities, methodologies and resources of the investment manager. As part of this review, particular attention was given to the diligent risk management program of the investment manager and its parent, including continual monitoring and management of cybersecurity, liquidity and counterparty credit risk, and attention given to derivatives and other complex instruments that are held and expected to be held by the Fund and how such instruments are used to carry out the Fund’s investment goal. The Board also took into account, among other things, management’s efforts in establishing a global credit facility for
| | | | |
| | | |
40 | | Annual Report | | franklintempleton.com |
FRANKLIN ALTERNATIVE STRATEGIES FUNDS
FRANKLIN PELAGOS COMMODITIES STRATEGY FUND
SHAREHOLDER INFORMATION
the benefit of the Fund and other accounts managed by FTI to provide a source of cash for temporary and emergency purposes or to meet unusual redemption requests as well as the strong financial position of the investment manager’s parent company and its commitment to the mutual fund business. The Board noted management’s continuing efforts and expenditures in establishing effective business continuity plans and developing strategies to address areas of heightened concern in the mutual fund industry, such as cybersecurity and liquidity risk management. The Board also recognized management’s commitment to facilitating Board oversight of particular areas, including derivatives and payments to intermediaries, by enhanced reporting. In addition, the Board received updates from management on the compliance of the investment manager with comprehensive rules and regulations promulgated by the SEC and the U.S. Commodity Futures Trading Commission.
In addition to the above and other matters considered by the trustees throughout the course of the year, the following discussion relates to certain primary factors relevant to the Board’s decision. This discussion of the information and factors considered by the Board (including the information and factors discussed above) is not intended to be exhaustive, but rather summarizes certain factors considered by the Board. In view of the wide variety of factors considered, the Board did not, unless otherwise noted, find it practicable to quantify or otherwise assign relative weights to the foregoing factors. In addition, individual trustees may have assigned different weights to various factors.
NATURE, EXTENT AND QUALITY OF SERVICES. The trustees reviewed the nature, extent and quality of the services provided, and to be provided, by the investment manager. In this regard, they reviewed the Fund’s actively managed fundamental and quantitative investment philosophy and process and the investment manager’s ability to implement such philosophy and process, including, but not limited to, the investment manager’s trading practices and investment decision processes and efforts to ensure compliance with the Fund’s investment goals, policies, and limitations. The Board also considered the investment management services that the investment manager provides to the Cayman Islands-based company, which is wholly owned by the Fund (Cayman Subsidiary). The trustees reviewed the Fund’s portfolio management team, including its performance, staffing, skills and compensation program. With respect to portfolio manager compensation, management assured the trustees that the Fund’s long-term performance is a significant component of
incentive-based compensation and noted that a portion of a portfolio manager’s incentive-based compensation is paid in shares of pre-designated funds from the portfolio manager’s fund management area. The trustees noted that the portfolio manager compensation program aligned the interests of the portfolio managers with that of shareholders of the Fund.
The trustees discussed with management various other products, portfolios and entities that are advised by the investment manager and the allocation of assets and expenses among and within them, as well as their relative fees and reasons for differences with respect thereto and any potential conflicts. During regular Board meetings and the aforementioned meetings of the independent trustees, the trustees considered periodic reports provided to them showing that the investment manager complied with the investment policies and restrictions of the Fund as well as other reports periodically furnished to the Board covering matters such as the compliance of portfolio managers and other management personnel with the code of ethics covering the investment management personnel, the adherence to fair value pricing procedures established by the Board and the accuracy of net asset value calculations. The Board noted the extent of the benefits provided to Fund shareholders from being part of the Franklin Templeton group of funds, including the right to exchange investments between funds (same class) without a sales charge, the ability to reinvest Fund dividends into other funds and the right to combine holdings of other funds to obtain reduced sales charges. The Board considered the investment manager’s significant efforts in developing and implementing compliance procedures established in accordance with SEC and other requirements.
The Board also considered the nature, extent and quality of the services to be provided under the Fund’s other service agreements to determine that, on an overall basis, Fund shareholders were well served. In this connection, the Board also took into account transfer agent and shareholder services provided to Fund shareholders by an affiliate of the investment manager, noting continuing expenditures by management to increase and improve the scope of such services and favorable periodic reports on shareholder services conducted by independent third parties. While such considerations directly affected the trustees’ decision in renewing the Fund’s transfer agent and shareholder services agreement, the Board also considered these commitments as incidental benefits to Fund shareholders deriving from the investment management relationship. Based on their review, the trustees were satisfied with the nature and quality of the overall services provided, and
| | | | |
| | | |
franklintempleton.com | | Annual Report | | 41 |
FRANKLIN ALTERNATIVE STRATEGIES FUNDS
FRANKLIN PELAGOS COMMODITIES STRATEGY FUND
SHAREHOLDER INFORMATION
to be provided, by the investment manager and its affiliates to the Fund and its shareholders and were confident in the abilities of the management team to continue to implement the Fund’s actively managed fundamental and quantitative investment philosophy and process and to provide quality services to the Fund and its shareholders.
INVESTMENT PERFORMANCE. As the Fund commenced operations in December 2011, the trustees reviewed the investment performance of the Fund for the one-, three- and five-year periods ended December 31, 2017. As part of their review, they inquired of management regarding benchmark and hedging activities. Consideration was also given to performance in the context of available levels of cash, including as affected by net flows, during the periods. The trustees had meetings during the year, including the meetings referred to above held in connection with the renewal process, with the Fund’s portfolio managers to discuss performance and the management of the Fund. In addition, particular attention in assessing performance was given to the Broadridge Section 15(c) Report. That report showed the investment performance of the Fund (Class A and Advisor Class shares) in comparison to other funds determined comparable by Lipper. The comparable funds to the Fund, as chosen by Lipper, included all retail and institutional commodities general funds. The Fund had total returns in the lowest performing quintile for the one-year period ended December 31, 2017, and had annualized total returns for the three- and five-year periods in the second-highest and middle performing quintiles, respectively. The trustees discussed with management the reasons for the relative underperformance for the one-year period ended December 31, 2017. While noting such discussions, overall, the Board found such comparative performance to be acceptable.
COMPARATIVE EXPENSES AND PROFITABILITY. The trustees considered the cost of the services provided and to be provided and the losses incurred by the investment manager and its affiliates from their respective relationships with the Fund. As part of the renewal process, they explored with management the trends in expense ratios over the past three fiscal years and the reasons for any increases in the Fund’s expense ratios (or components thereof). In considering the appropriateness of the management fee and other expenses charged to the Fund, the Board took into account various factors including investment performance and matters relating to Fund operations, including, but not limited to, the quality and experience of its portfolio managers and research staff. As part of this discussion, the Board took into account the fee
waiver and expense limitation arrangement in effect. The Board also considered the investment management services that the investment manager provides to the Cayman Subsidiary and the related fee waivers that were in place. Consideration was also given to a comparative analysis in the Broadridge Section 15(c) Report of the investment management fee and total expense ratio of the Fund in comparison with those of a group of other funds selected by Lipper as its appropriate Lipper expense group. Lipper expense data is based upon information taken from each fund’s most recent annual report, which reflects historical asset levels that may be quite different from those currently existing, particularly in a period of market volatility. While recognizing such inherent limitation and the fact that expense ratios generally increase as assets decline and decrease as assets grow, the Board believed the independent analysis conducted by Lipper to be an appropriate measure of comparative expenses.
In reviewing comparative costs, emphasis was given to the Fund’s contractual management fee in comparison with the contractual management fee that would have been charged by other funds within its Lipper expense group assuming they were similar in size to the Fund, as well as the actual total expenses of the Fund in comparison with those of its Lipper expense group. The Lipper contractual management fee analysis includes administrative charges as being part of the management fee, and total expenses, for comparative consistency, are shown by Lipper for Fund Class A and Advisor Class shares. With respect to Class A shares, the Fund’s contractual management fee rate was in the middle quintile of its Lipper expense group and its total expenses (including Rule 12b-1 fees) were in the second-least expensive quintile of such group. With respect to Advisor Class shares, the Fund’s contractual management fee rate was in the second-most expensive quintile of its Lipper expense group and its total expenses (including Rule 12b-1 fees) were in the middle quintile of such group. The Board was satisfied with such comparative fees and expenses.
The trustees also reviewed the Profitability Study addressing profitability of Franklin Resources, Inc., from its overall U.S. fund business, as well as profitability to the Fund’s investment manager and its affiliates, from providing investment management and other services to the Fund during the 12-month period ended September 30, 2017, the most recent fiscal year end of Franklin Resources, Inc. The trustees reviewed the basis on which such reports are prepared and the cost allocation methodology utilized in the Profitability Study, it being recognized that allocation methodologies may each be
| | | | |
| | | |
42 | | Annual Report | | franklintempleton.com |
FRANKLIN ALTERNATIVE STRATEGIES FUNDS
FRANKLIN PELAGOS COMMODITIES STRATEGY FUND
SHAREHOLDER INFORMATION
reasonable while producing different results. In this respect, the Board noted that the reasonableness of the cost allocation methodologies was reviewed by independent accountants on an every other year basis.
The independent trustees met with management to discuss the Profitability Study. This included, among other things, a comparison of investment management income with investment management expenses of the Fund; comparison of underwriting revenues and expenses; the relative relationship of investment management and underwriting expenses; shareholder servicing profitability; economies of scale; and the relative contribution of the Fund to the profitability of the investment manager and its parent. In discussing the Profitability Study with the Board, the investment manager stated its belief that the costs incurred in establishing the infrastructure necessary to operate the type of mutual fund operations conducted by it and its affiliates may not be fully reflected in the expenses allocated to the Fund in determining its profitability. The Board also took into account management’s expenditures in improving shareholder services provided to the Fund, as well as the need to meet additional regulatory and compliance requirements. The trustees also considered the extent to which the investment manager may derive ancillary benefits from Fund operations.
ECONOMIES OF SCALE. The Board considered economies of scale realized by the investment manager and its affiliates as the Fund grows larger and the extent to which they are shared with Fund shareholders, as for example, in the level of the investment management fees charged, in the quality and efficiency of services rendered and in increased capital commitments benefiting the Fund directly or indirectly. The Board also considered the fee waiver and expense limitation arrangement in effect, and the amount of Fund expenses that were absorbed since inception of the Fund by the investment manager through such waiver and arrangement. The Board concluded that economies of scale were deemed not to be a significant factor at that time in light of, among other matters, the fee waiver and expense limitation arrangement in effect and the limited size of assets under management.
Proxy Voting Policies and Procedures
The Fund’s investment manager has established Proxy Voting Policies and Procedures (Policies) that the Fund uses to determine how to vote proxies relating to portfolio securities. Shareholders may view the Fund’s complete Policies online at franklintempleton.com. Alternatively, shareholders may request copies of the Policies free of charge by calling the Proxy Group collect at (954) 527-7678 or by sending a written request
to: Franklin Templeton Companies, LLC, 300 S.E. 2nd Street, Fort Lauderdale, FL 33301, Attention: Proxy Group. Copies of the Fund’s proxy voting records are also made available online at franklintempleton.com and posted on the US Securities and Exchange Commission’s website at sec.gov and reflect the most recent 12-month period ended June 30.
Quarterly Consolidated Statement of Investments
The Trust, on behalf of the Fund, files a complete consolidated statement of investments with the US Securities and Exchange Commission for the first and third quarters for each fiscal year on Form N-Q. Shareholders may view the filed Form N-Q by visiting the Commission’s website at sec.gov. The filed form may also be viewed and copied at the Commission’s Public Reference Room in Washington, DC. Information regarding the operations of the Public Reference Room may be obtained by calling (800) SEC-0330.
Householding of Reports and Prospectuses
You will receive the Fund’s financial reports every six months as well as an annual updated summary prospectus (prospectus available upon request). To reduce Fund expenses, we try to identify related shareholders in a household and send only one copy of the financial reports and summary prospectus. This process, called “householding,” will continue indefinitely unless you instruct us otherwise. If you prefer not to have these documents householded, please call us at (800) 632-2301. At any time you may view current prospectuses/summary prospectuses and financial reports on our website. If you choose, you may receive these documents through electronic delivery.
| | | | |
| | | |
| franklintempleton.com | | Annual Report | | 43 |
This page intentionally left blank.
| | |
 | | Annual Report and Shareholder Letter Franklin Pelagos Commodities Strategy Fund Investment Manager FASA, LLC Distributor Franklin Templeton Distributors, Inc. (800) DIAL BEN® / 342-5236 franklintempleton.com Shareholder Services (800) 632-2301 |
Authorized for distribution only when accompanied or preceded by a summary prospectus and/or prospectus. Investors should carefully consider a fund’s investment goals, risks, charges and expenses before investing. A prospectus contains this and other information; please read it carefully before investing.
To help ensure we provide you with quality service, all calls to and from our service areas are monitored and/or recorded.
| | |
© 2018 Franklin Templeton Investments. All rights reserved. | | 995 A 07/18 |
| | |
 | | Annual Report and Shareholder Letter May 31, 2018 |
Franklin K2 Long Short Credit Fund
A SERIES OF FRANKLIN ALTERNATIVE STRATEGIES FUNDS

Sign up for electronic delivery at franklintempleton.com/edelivery
Franklin Templeton Investments
Why choose Franklin Templeton Investments?
Successful investing begins with ambition. And achievement only comes when you reach for it. That’s why we continually strive to deliver better outcomes for investors. No matter what your goals are, our deep, global investment expertise allows us to offer solutions that can help.
During our more than 70 years of experience, we’ve managed through all kinds of markets—up, down and those in between. We’re always preparing for what may come next. It’s because of this, combined with our strength as one of the world’s largest asset managers that we’ve earned the trust of millions of investors around the world.
Dear Fellow Shareholder:
During the 12 months ended May 31, 2018, global markets were aided by price gains in commodities, generally upbeat economic data across regions and encouraging corporate earnings reports. Markets were also supported by the European Central Bank’s extension of its monetary easing program and the passage of US tax reforms. However, investor sentiment was dampened by Korean peninsula tensions, protectionist US trade policies and US-China trade disputes, consumer data privacy concerns, and worries that central banks could raise interest rates in response to strong economic growth and rising inflation. In this environment, global developed stock markets, as measured by the MSCI World Index, generated a +12.18% total return for the period.1 Global emerging market stocks, as measured by the MSCI Emerging Markets Index, produced a +14.43% total return.1 Global government bonds, as measured by the Citigroup World Government Bond Index, posted a +2.06% total return.1
We are committed to our long-term perspective and disciplined investment approach as we conduct a rigorous, fundamental analysis of securities with a regular emphasis on investment risk management.
We believe active, professional investment management serves investors well. We also recognize the important role of financial advisors in today’s markets and encourage investors to continue to seek their advice. Amid changing markets and economic
conditions, we are confident investors with a well-diversified
portfolio and a patient, long-term outlook should be well positioned for the years ahead.
On the following pages, the Fund’s portfolio management team reviews investment decisions that pertain to performance during the past 12 months in light of the economic environment and other factors. Please remember all securities markets fluctuate, as do mutual fund share prices.
We thank you for investing with Franklin Templeton, welcome your questions and comments, and look forward to continuing to serve your investment needs in the years ahead.
Sincerely,

Madison S. Gulley, CFA
President and Chief Executive Officer – Investment Management
Franklin Alternative Strategies Funds
This letter reflects our analysis and opinions as of May 31, 2018, unless otherwise indicated. The information is not a complete analysis of every aspect of any market, country, industry, security or fund. Statements of fact are from sources considered reliable.
CFA® is a trademark owned by CFA Institute.
1. Source: Morningstar.
See www.franklintempletondatasources.com for additional data provider information.
| | | | | | | | |
| Not FDIC Insured | | | | | May Lose Value | | | | | No Bank Guarantee |
| | | | | | |
| franklintempleton.com | | Not part of the annual report | | | 1 | |
Contents
Annual Report
Visit franklintempleton.com for fund updates, to access your account, or to find helpful financial planning tools.
| | | | | | |
| | 2 | | | Annual Report | | franklintempleton.com |
Annual Report
Franklin K2 Long Short Credit Fund
We are pleased to bring you Franklin K2 Long Short Credit Fund’s annual report for the fiscal year ended May 31, 2018.
Your Fund’s Goal and Main Investments
The Fund seeks total return through a combination of current income, capital preservation and capital appreciation. The Fund seeks to achieve its investment goal by allocating its assets across multiple non-traditional or “alternative” fixed income and credit strategies, including, but not limited to, some or all of the following: credit long short, structured credit and emerging market fixed income. The Fund is structured as a multi-manager fund, meaning the Fund’s assets are managed by multiple subadvisors, and the Fund’s investment manager has overall responsibility for the Fund’s investments.
Under normal market conditions, the Fund invests at least 80% of its net assets, plus the amount of any borrowings for investment purposes, in credit-related investments. The Fund invests in a wide range of securities and other investments including, but not limited to: corporate bonds, mortgage-backed securities (MBS) and asset-backed securities (ABS), US government and agency securities, collateralized debt and loan obligations, foreign government and supranational debt securities, loans and loan participations and derivatives with similar economic characteristics. The Fund may also invest in repurchase agreements, reverse repurchase agreements, mortgage real estate investment trusts (REITs) and other similar transactions.
Performance Overview
The Fund’s Class A shares delivered a +3.63% cumulative total return for the 12 months under review. For comparison, the Fund’s new primary and old secondary benchmark, the HFRX Fixed Income-Credit Index, which measures performance of strategies with exposure to credit across a broad continuum of credit substrategies, generated a +2.36% total return for the same period.1 As the investment manager believes the composition of the HFRX Fixed Income-Credit Index more accurately reflects the Fund’s holdings, it has replaced the ICE BofA
Merrill Lynch US 3-Month Treasury Bill Index as the Fund’s primary benchmark. Also for comparison, the Fund’s new secondary and old primary benchmark, the ICE BofA Merrill Lynch US 3-Month Treasury Bill Index, which is an index of short-term US government securities with a remaining term to final maturity of less than three months, posted a +1.28% total return.2 You can find more of the Fund’s performance data in the Performance Summary beginning on page 8.
Performance data represent past performance, which does not guarantee future results. Investment return and principal value will fluctuate, and you may have a gain or loss when you sell your shares. Current performance may differ from figures shown. For most recent month-end performance, go to franklintempleton.com or call (800) 342-5236.
Economic and Market Overview
The global economy expanded during the 12-month period under review amid generally upbeat economic data across regions. In this environment, global developed and emerging market stocks reached a new all-time high in January 2018 and generated a +12.43% total return for the period, as measured by the MSCI All Country World Index.2 Global markets were aided by price gains in oil and other commodities, as well as the European Central Bank’s (ECB’s) extension of its monetary easing program. Further supporting global stocks were the passage of the US tax reform bill and encouraging corporate earnings reports.
However, global markets reflected investor concerns about tensions in the Korean peninsula and political uncertainties in the US and the European Union, as well as worries that strong economic growth and rising inflation in some parts of the world, particularly in the US, would lead central banks to increase interest rates sooner than expected. Global markets were further pressured by the Trump administration’s protectionist trade policies, uncertainty surrounding the US-China trade relationship, and a broad sell-off in information technology stocks in March due to a potential for tighter regulation in the sector arising
1. Source: FactSet. Hedge Fund Research, Inc. – www.hedgefundresearch.com. The HFRX Fixed Income-Credit Index is being used under license from Hedge Fund Research, Inc., which does not endorse or approve of any of the contents of this report.
2. Source: Morningstar.
The indexes are unmanaged and include reinvestment of any income or distributions. They do not reflect any fees, expenses or sales charges. One cannot invest directly in an index, and an index is not representative of the Fund’s portfolio. Unlike most asset class indexes, HFR Index returns reflect fees and expenses.
The dollar value, number of shares or principal amount, and names of all portfolio holdings are listed in the Fund’s Statement of Investments (SOI). The SOI begins on page 17.
| | | | | | |
| franklintempleton.com | | Annual Report | | | 3 | |
FRANKLIN K2 LONG SHORT CREDIT FUND
from concerns about consumer data privacy. However, an overall easing of tensions in the Korean peninsula and intermittent US-China trade negotiations partially offset some of these concerns during the period.
After accelerating in 2017’s third quarter, the US economy expanded at a slower pace in the fourth quarter. Growth continued to moderate in 2018’s first quarter due to a slowdown in consumer spending, exports, and state and local government spending, as well as a decline in residential fixed income investment. The unemployment rate declined from 4.3% in May 2017, as reported at the beginning of the 12-month period, to an 18-year low of 3.8% at period-end.3 Annual inflation, as measured by the Consumer Price Index, increased from 1.9% in May 2017, as reported at the beginning of the period, to 2.8% at period-end.3 The US Federal Reserve (Fed) raised its target range for the federal funds rate three times during the period and began reducing its balance sheet in October as part of its ongoing plan to normalize its monetary policy.
In Europe, the UK’s economic growth accelerated in 2017’s third quarter over the previous quarter and remained stable in the fourth quarter. However, growth moderated in 2018’s first quarter amid a decline in construction output. In November, the Bank of England raised its key policy rate for the first time in a decade. The eurozone’s quarterly growth held steady in 2017’s third and fourth quarters but moderated in 2018’s first quarter. The bloc’s annual inflation rate ended the period higher than in May 2017. The ECB kept its benchmark interest rate unchanged during the period. However, at its October meeting, the ECB extended the time frame for its massive bond-buying program from December 2017 to at least September 2018, while reducing the amount of monthly bond purchases in half beginning in January 2018.
In Asia, Japan’s quarterly gross domestic product (GDP) growth held steady in 2017’s third quarter but slowed in the fourth quarter. GDP growth in 2018’s first quarter declined, the country’s first contraction since 2015’s fourth quarter, mainly due to a decline in private residential investment. The Bank of Japan left its benchmark interest rate unchanged during the period and continued its monetary stimulus measures.
In emerging markets, Brazil’s quarterly GDP grew in 2017’s third and fourth quarters, although at a slower pace than the previous quarters. However, growth accelerated in 2018’s first quarter. The country’s central bank cut its benchmark interest rate several times during the period to spur economic growth.
Russia’s annual GDP growth rate remained positive in 2017’s third and fourth quarters as well as 2018’s first quarter, amid the Bank of Russia’s continued policy support. China’s annual GDP moderated in 2017’s third quarter but grew at a stable rate in the following two quarters. The People’s Bank of China left its benchmark interest rate unchanged during the period. Overall, emerging market stocks, as measured by the MSCI Emerging Markets Index, rose during the period.
Investment Strategy
We manage the Fund using a multi-manager approach. While we have overall responsibility for the Fund’s investments, we allocate the Fund’s assets to multiple subadvisors, each of whom independently manages a separate portion of the Fund’s portfolio in accordance with some or all of the following strategies: credit long short, structured credit and emerging market fixed income. We allocate the Fund’s assets among these strategies utilizing a top-down approach, generating the Fund’s strategy and subadvisor weightings by taking into account market conditions, risk factors, diversification, liquidity, transparency, and other investment options, among other things.
Credit long short strategies seek to isolate issuer-specific exposure, while limiting general market risks, by taking long and/or short positions in debt securities and other related instruments. Structured credit strategies aim to profit from trading in interest-rate sensitive securities such as residential and commercial MBS, REITs, credit default swaps on various indexes, collateralized loan obligations and ABS. Emerging market fixed income strategies invest in corporate and/or sovereign securities in emerging markets countries with a focus on fixed income.
What are swap agreements?
Swap agreements, such as interest rate, currency and credit default swaps, are contracts between the Fund and another party (the swap counterparty). In a basic swap transaction, the Fund agrees with the swap counterparty to exchange the returns (or differentials in rates of return) earned or realized on a particular “notional amount” of underlying instruments. The notional amount is the set amount selected by the parties as the basis on which to calculate the obligations that they have agreed to exchange. The parties typically do not actually exchange the notional amount. Instead, they agree to exchange the returns that would be earned or realized if the notional amount were invested in given instruments or at given interest rates.
The Fund takes long and/or short positions in a wide range of asset classes, including credit, fixed income, and currencies,
3. Source: US Bureau of Labor Statistics.
See www.franklintempletondatasources.com for additional data provider information.
| | | | |
| 4 | | Annual Report | | franklintempleton.com |
FRANKLIN K2 LONG SHORT CREDIT FUND
| | | | |
| Subadvisors | | | |
| 5/31/18 | | | |
| |
| Credit Long Short | | | | |
Apollo Credit Management LLC | | | | |
Chatham Asset Management, LLC | | | | |
| |
| Structured Credit | | | | |
Ellington Global Asset Management, L.L.C. | | | | |
Medalist Partners, LP | | | | |
| |
| Emerging Markets Fixed Income | | | | |
Emso Asset Management Limited | | | | |
among others. The Fund may gain long or short exposure to select instruments by utilizing derivatives, engaging in short sales or entering into a series of purchase and sale contracts or repurchase agreements. Long positions benefit from an increase in the price of the underlying instrument, while short positions benefit from a decrease in that price. The Fund may also use derivatives for hedging and nonhedging (investment) purposes. Such derivative investments may include currency forward contracts; futures contracts; put and call options on currencies, securities, indexes and exchange-traded funds; and swaps. As a result of the Fund’s use of derivatives, the Fund may have economic leverage, which means the sum of the Fund’s investment exposures through its use of derivatives may significantly exceed the amount of assets invested in the Fund, although these exposures may vary over time. The Fund may engage in active and frequent trading as part of its investment strategies.
What is a currency forward contract?
A currency forward contract is an agreement between the Fund and a counterparty to buy or sell a foreign currency in exchange for another currency at a specific exchange rate on a future date. Currency forward contracts are privately traded in the interbank market, not on a centralized exchange.
What is a futures contract?
A futures contract is an agreement between the Fund and a counterparty made through a US or foreign futures exchange to buy or sell an underlying instrument or asset at a specific price on a future date.
What is an option?
An option is a contract to buy or sell a specific financial product known as the option’s underlying instrument at a specific price. The buyer of an option has the right, but not the obligation, to buy or sell the underlying instrument at or until a specified expiration date. Conversely, the seller (“writer”) of an option who opens a transaction is obligated to buy or sell the underlying instrument should the option holder exercise that right.
Portfolio Composition*
Based on Total Investments as of 5/31/18
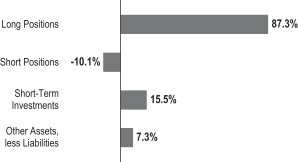
*Figures represent the net Fund exposure and include certain derivatives held in the portfolio (or their underlying reference assets) and may not total 100% or may be negative due to rounding, use of any derivatives or other factors.
Manager’s Discussion
The Fund’s subadvisors for the 12-month period under review were Apollo Credit Management, Chatham Asset Management, Ellington Global Asset Management, Medalist Partners (formerly part of Candlewood Investment Group), and Emso Asset Management Limited. All subadvisors contributed to the Fund’s positive performance. Ellington was the top performer among subadvisors, followed by Chatham, Apollo, Medalist and Emso, respectively. These subadvisors are also listed in the Subadvisors table on this page.
In terms of strategy performance, the largest contributors to the Fund’s performance were credit long short and structured credit, followed by emerging markets fixed income. The percentages of the Fund’s long and short positions at period-end are listed in the Portfolio Composition bar chart on this page. The top contributors to the Fund’s aggregate performance by asset class were credit and interest rates, while currency exposures detracted.
In terms of aggregate sector exposures, the top performance drivers for the Fund were MBS, consumer discretionary and ABS. Conversely, a top detractor from aggregate sector performance was equity index hedges, notably for the Standard & Poor’s 500® Index.
The Fund’s structured credit subadvisors benefited from cash flows received from MBS and ABS holdings. The subadvisors noted that fundamentals remained strong in residential MBS. The Fund’s performance was also boosted by credit long short subadvisors’ long positioning in the consumer discretionary sector, including a publishing company and a payment and processing solutions firm.
| | | | | | |
| franklintempleton.com | | Annual Report | | | 5 | |
FRANKLIN K2 LONG SHORT CREDIT FUND
Subadvisor credit default swaps, held in the form of short hedges in a high yield credit index, detracted from returns because there were very few defaults and credit conditions remained benign over the past year. Elsewhere, a subadvisor’s exposure to energy-related master limited partnerships detracted from returns resulting from a negative tax ruling from the Federal Energy Regulatory Commission.
Despite a few Fund holdings that detracted from performance during the period, the Fund did not experience strong market directional sensitivities within its portfolio, as is generally the case. If the odds of stronger portfolio directional sensitivities to market movements appear significant, the Fund may implement its Conditional Risk Overlay (CRO) strategy to invest in derivatives or other instruments in an effort to provide a hedge against negative market events. The CRO strategy was not used during the period.
What is a conditional risk overlay (CRO) strategy?
From time to time, the Fund’s investment manager may implement its CRO strategy, which seeks to neutralize certain market sensitivities that may exist in the Fund. The CRO strategy involves investing in derivatives or other instruments in an effort to reduce volatility and provide a hedge against market declines. When implemented, the strategy will reduce the Fund’s ability to benefit from positive market movements.
Thank you for your participation in Franklin K2 Long Short Credit Fund. We look forward to continuing to serve your future investment needs.
| | |
 | | 
Charmaine Chin |
| | |
 | | 
Jeff Schmidt |
| | |
 | | 
Robert Christian |
| | David C. Saunders |
| | Portfolio Management Team |
The foregoing information reflects our analysis, opinions and portfolio holdings as of May 31, 2018, the end of the reporting period. The way we implement our main investment strategies and the resulting portfolio holdings may change depending on factors such as market and economic conditions. These opinions may not be relied upon as investment advice or an offer for a particular security. The information is not a complete analysis of every aspect of any market, country, industry, security or the Fund. Statements of fact are from sources considered reliable, but the investment manager makes no representation or warranty as to their completeness or accuracy. Although historical performance is no guarantee of future results, these insights may help you understand our investment management philosophy.
| | | | |
| 6 | | Annual Report | | franklintempleton.com |
FRANKLIN K2 LONG SHORT CREDIT FUND
Charmaine Chin is a managing director at K2 Advisors, which she joined in March 2008. She heads K2’s credit, relative value and event driven manager research team and leads the evaluation and selection of hedge fund subadvisors in these strategies. She also oversees manager selection and monitoring for K2’s Asian hedge fund exposure. Before joining K2, Ms. Chin worked at Goldman, Sachs & Co. in the special situations group and in the financial institutions group. Ms. Chin received a B.A. in economics at Harvard University where she graduated magna cum laude and Phi Beta Kappa.
Jeff Schmidt joined K2 Advisors in July 2013 and is managing director of portfolio construction. Prior to joining K2, Mr. Schmidt was the head of client solutions, North America for InfraHedge Limited, a subsidiary of State Street Corporation. Other previous positions he held include senior vice president and head of business development for WR Platform Advisors, LP; director of Merrill Lynch’s hedge fund development and management group; and managing director and chief operations officer of Marathon Capital Growth Partners, LLC. Mr. Schmidt graduated from Tulane University in 1980 with a B.A. in economics as well as an M.B.A. in economics and finance in 1982.
Robert Christian is a senior managing director and head of investment research for K2 Advisors, which he joined in 2010. Mr. Christian worked at Graham Capital Management LP from 1998 to 2003 as a portfolio manager and researcher of quantitative-based trading strategies. At Julius Baer Investment Management from 2003 to 2005, he was the head of macro strategies. From 2005 to 2010, he worked at FRM Americas LLC where he was the global head of directional trading strategies and portfolio advisor to numerous funds. Mr. Christian holds a Bachelor of Arts and Science in biology and economics from Stanford University (1985) and an M.B.A. in finance from Leonard N. Stern School of Business – New York University (1990).
David C. Saunders is the founding managing director of K2 Advisors, which he co-founded in 1994. He has worked at Tucker Anthony & R.L. Day as an equity trader; First Boston Corp. as vice president on the equity block trading desk; WaterStreet Capital, a hedge fund, as head trader; Tiger Management, as head trader; WorldSec Securities as president and ABN Amro Inc. as a senior managing director. Mr. Saunders graduated from the University of Maryland, College Park, with a B.S. degree in business.
| | | | | | |
| franklintempleton.com | | Annual Report | | | 7 | |
FRANKLIN K2 LONG SHORT CREDIT FUND
Performance Summary as of May 31, 2018
The performance table and graphs do not reflect any taxes that a shareholder would pay on Fund dividends, capital gain distributions, if any, or any realized gains on the sale of Fund shares. Total return reflects reinvestment of the Fund’s dividends and capital gain distributions, if any, and any unrealized gains or losses. Your dividend income will vary depending on dividends or interest paid by securities in the Fund’s portfolio, adjusted for operating expenses of each class. Capital gain distributions are net profits realized from the sale of portfolio securities.
Performance as of 5/31/181
Cumulative total return excludes sales charges. Average annual total return includes maximum sales charges. Sales charges will vary depending on the size of the investment and the class of share purchased. The maximum is 5.75% and the minimum is 0%. Class A: 5.75% maximum initial sales charge; Advisor Class: no sales charges. For other share classes, visit franklintempleton.com.
| | | | | | | | |
| Share Class | | Cumulative
Total Return2 | | | Average Annual
Total Return3 | |
| | |
| A | | | | | | | | |
1-Year | | | +3.63% | | | | -2.33% | |
Since Inception (9/8/15) | | | +14.82% | | | | +2.94% | |
| | |
| Advisor | | | | | | | | |
1-Year | | | +3.75% | | | | +3.75% | |
Since Inception (9/8/15) | | | +15.08% | | | | +5.28% | |
Performance data represent past performance, which does not guarantee future results. Investment return and principal value will fluctuate, and you may have a gain or loss when you sell your shares. Current performance may differ from figures shown. For most recent month-end performance, go to franklintempleton.com or call (800) 342-5236.
See page 10 for Performance Summary footnotes.
| | | | |
| 8 | | Annual Report | | franklintempleton.com |
FRANKLIN K2 LONG SHORT CREDIT FUND
PERFORMANCE SUMMARY
Total Return Index Comparison for a Hypothetical $10,000 Investment1
Total return represents the change in value of an investment over the periods shown. It includes any applicable maximum sales charge, Fund expenses, account fees and reinvested distributions. The unmanaged indexes include reinvestment of any income or distributions. These differ from the Fund in composition and, except for the HFR Index, do not pay management fees or expenses. Unlike most asset class indexes, HFR Index returns reflect fees and expenses. One cannot invest directly in an index.
Class A (9/8/15–5/31/18)
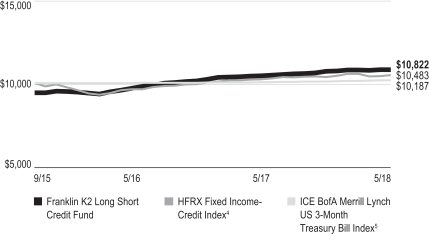
Advisor Class (9/8/15–5/31/18)
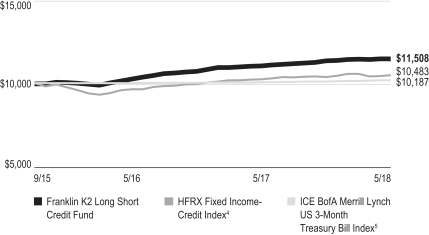
See page 10 for Performance Summary footnotes.
| | | | | | |
| franklintempleton.com | | Annual Report | | | 9 | |
FRANKLIN K2 LONG SHORT CREDIT FUND
PERFORMANCE SUMMARY
Distributions (6/1/17–5/31/18)
| | | | | | | | | | | | | | | | |
| Share Class | | Net Investment
Income | | | Short-Term
Capital Gain | | | Long-Term
Capital Gain | | | Total | |
A | | | $0.1938 | | | | $0.1136 | | | | $0.0599 | | | | $0.3673 | |
C | | | $0.1038 | | | | $0.1136 | | | | $0.0599 | | | | $0.2773 | |
R | | | $0.1659 | | | | $0.1136 | | | | $0.0599 | | | | $0.3394 | |
R6 | | | $0.2080 | | | | $0.1136 | | | | $0.0599 | | | | $0.3815 | |
Advisor | | | $0.2071 | | | | $0.1136 | | | | $0.0599 | | | | $0.3806 | |
| | | | | | | | |
Total Annual Operating Expenses6 | |
| Share Class | | With Waiver | | | Without Waiver | |
A | | | 2.99% | | | | 3.57% | |
Advisor | | | 2.74% | | | | 3.32% | |
Each class of shares is available to certain eligible investors and has different annual fees and expenses, as described in the prospectus.
All investments involve risks, including possible loss of principal. The market values of securities owned by the Fund will go up or down, sometimes rapidly or unpredictably. The Fund’s performance depends on the manager’s skill in selecting, overseeing and allocating Fund assets to the subadvisors. The Fund is actively managed and could experience losses if the manager’s and subadvisors’ judgment about particular Fund portfolio investments prove to be incorrect. Some subadvisors may have little or no experience managing the assets of a registered investment company. Bond prices generally move in the opposite direction of interest rates. Changes in the financial strength of a bond issuer or in a bond’s credit rating may affect its value. Lower rated or high yield debt securities (junk bonds) involve greater credit risk, including the possibility of default or bankruptcy. Liquidity risk exists when securities become more difficult to sell, or are unable to be sold, at the price at which they’ve been valued. Investments in derivatives involve costs and create economic leverage, which may result in significant volatility and cause the Fund to participate in losses (as well as gains) that significantly exceed the Fund’s initial investment. The Fund may make short sales of securities, which involves the risk that losses may exceed the original amount invested. The Fund’s prospectus also includes a description of the main investment risks.
1. The Fund has an expense reduction contractually guaranteed through 9/30/18. Fund investment results reflect the expense reduction; without this reduction, the results would have been lower.
2. Cumulative total return represents the change in value of an investment over the periods indicated.
3. Average annual total return represents the average annual change in value of an investment over the periods indicated. Return for less than one year, if any, has not been annualized.
4. Source: FactSet. Hedge Fund Research, Inc. – www.hedgefundresearch.com. The HFRX Fixed Income-Credit Index measures performance of strategies with exposure to credit across a broad continuum of credit substrategies, including corporate, sovereign, distressed, convertible, asset backed, capital structure arbitrage, multi-strategy and other relative value and event driven substrategies. Investment thesis across all strategies is predicated on realization of a valuation discrepancy between the related credit instruments. Strategies may also include and utilize equity securities, credit derivatives, government fixed income, commodities, currencies or other hybrid securities.
5. Source: Morningstar. The ICE BofA Merrill Lynch US 3-Month Treasury Bill Index is an index of short-term US government securities with a remaining term to final maturity of less than three months.
6. Figures are as stated in the Fund’s current prospectus and may differ from the expense ratios disclosed in the Your Fund’s Expenses and Financial Highlights sections in this report. In periods of market volatility, assets may decline significantly, causing total annual Fund operating expenses to become higher than the figures shown.
See www.franklintempletondatasources.com for additional data provider information.
| | | | |
| 10 | | Annual Report | | franklintempleton.com |
FRANKLIN K2 LONG SHORT CREDIT FUND
Your Fund’s Expenses
As a Fund shareholder, you can incur two types of costs: (1) transaction costs, including sales charges (loads) on Fund purchases and redemptions; and (2) ongoing Fund costs, including management fees, distribution and service (12b-1) fees, and other Fund expenses. All mutual funds have ongoing costs, sometimes referred to as operating expenses. The table below shows ongoing costs of investing in the Fund and can help you understand these costs and compare them with those of other mutual funds. The table assumes a $1,000 investment held for the six months indicated.
Actual Fund Expenses
The table below provides information about actual account values and actual expenses in the columns under the heading “Actual.” In these columns the Fund’s actual return, which includes the effect of Fund expenses, is used to calculate the “Ending Account Value” for each class of shares. You can estimate the expenses you paid during the period by following these steps (of course, your account value and expenses will differ from those in this illustration): Divide your account value by $1,000 (if your account had an $8,600 value, then $8,600 ÷ $1,000 = 8.6). Then multiply the result by the number in the row for your class of shares under the headings “Actual” and “Expenses Paid During Period” (if Actual Expenses Paid During Period were $7.50, then 8.6 × $7.50 = $64.50). In this illustration, the actual expenses paid this period are $64.50.
Hypothetical Example for Comparison with Other Funds
Under the heading “Hypothetical” in the table, information is provided about hypothetical account values and hypothetical expenses based on the Fund’s actual expense ratio and an assumed rate of return of 5% per year before expenses, which is not the Fund’s actual return. This information may not be used to estimate the actual ending account balance or expenses you paid for the period, but it can help you compare ongoing costs of investing in the Fund with those of other funds. To do so, compare this 5% hypothetical example for the class of shares you hold with the 5% hypothetical examples that appear in the shareholder reports of other funds.
Please note that expenses shown in the table are meant to highlight ongoing costs and do not reflect any transactional costs. Therefore, information under the heading “Hypothetical” is useful in comparing ongoing costs only, and will not help you compare total costs of owning different funds. In addition, if transactional costs were included, your total costs would have been higher.
| | | | | | | | | | | | | | | | | | | | | | | | |
| | | | | | Actual
(actual return after expenses) | | | Hypothetical
(5% annual return before expenses) | | | | |
Share Class | | Beginning
Account
Value 12/1/17 | | | Ending
Account
Value 5/31/18 | | | Expenses
Paid During
Period
12/1/17–5/31/181,2 | | | Ending
Account
Value 5/31/18 | | | Expenses
Paid During
Period
12/1/17–5/31/181,2 | | | Net
Annualized
Expense
Ratio2 | |
| A | | $ | 1,000 | | | $ | 1,009.40 | | | $ | 15.78 | | | $ | 1,009.22 | | | $ | 15.78 | | | | 3.15 | % |
| C | | $ | 1,000 | | | $ | 1,004.60 | | | $ | 20.14 | | | $ | 1,004.84 | | | $ | 20.14 | | | | 4.03 | % |
| R | | $ | 1,000 | | | $ | 1,008.60 | | | $ | 17.48 | | | $ | 1,007.53 | | | $ | 17.47 | | | | 3.49 | % |
| R6 | | $ | 1,000 | | | $ | 1,010.70 | | | $ | 15.14 | | | $ | 1,009.87 | | | $ | 15.13 | | | | 3.02 | % |
| Advisor | | $ | 1,000 | | | $ | 1,010.60 | | | $ | 15.19 | | | $ | 1,009.82 | | | $ | 15.18 | | | | 3.03 | % |
1. Expenses are equal to the annualized expense ratio for the six-month period as indicated above—in the far right column—multiplied by the simple average account value over the period indicated, and then multiplied by 182/365 to reflect the one-half year period.
2. Reflects expenses after fee waivers and expense reimbursements. Does not include acquired fund fees and expenses.
| | | | | | |
| franklintempleton.com | | Annual Report | | | 11 | |
FRANKLIN ALTERNATIVE STRATEGIES FUNDS
Financial Highlights
Franklin K2 Long Short Credit Fund
| | | | | | | | | | | | |
| | | Year Ended May 31, | |
| | | 2018 | | | 2017 | | | 2016a | |
| Class A | | | | | | | | | | | | |
Per share operating performance
(for a share outstanding throughout the year) | | | | | | | | | | | | |
| | | |
Net asset value, beginning of year | | $ | 10.49 | | | $ | 10.15 | | | $ | 10.00 | |
| | | | |
| | | |
| Income from investment operationsb: | | | | | | | | | | | | |
| | | |
Net investment incomec | | | 0.29 | | | | 0.23 | | | | 0.21 | |
| | | |
Net realized and unrealized gains (losses) | | | 0.08 | | | | 0.53 | | | | 0.08 | |
| | | | |
| | | |
Total from investment operations | | | 0.37 | | | | 0.76 | | | | 0.29 | |
| | | | |
| | | |
| Less distributions from: | | | | | | | | | | | | |
| | | |
Net investment income | | | (0.19 | ) | | | (0.32 | ) | | | (0.08 | ) |
| | | |
Net realized gains | | | (0.17 | ) | | | (0.10 | ) | | | (0.06 | ) |
| | | | |
| | | |
Total distributions | | | (0.36 | ) | | | (0.42 | ) | | | (0.14 | ) |
| | | | |
| | | |
Net asset value, end of year | | $ | 10.50 | | | $ | 10.49 | | | $ | 10.15 | |
| | | | |
| | | |
Total returnd | | | 3.63% | | | | 7.58% | | | | 2.99% | |
| | | |
| Ratios to average net assetse | | | | | | | | | | | | |
| | | |
Expenses before waiver, payments by affiliates and expense reductionf | | | 3.51% | | | | 3.50% | | | | 3.37% | |
| | | |
Expenses net of waiver, payments by affiliates and expense reductionf | | | 2.98% | g | | | 2.75% | | | | 2.30% | g |
| | | |
Expenses incurred in connection with securities sold short | | | 0.89% | | | | 0.76% | | | | 0.40% | |
| | | |
Net investment income | | | 2.71% | | | | 2.24% | | | | 2.85% | |
| | | |
| Supplemental data | | | | | | | | | | | | |
| | | |
Net assets, end of year (000���s) | | | $45,088 | | | | $41,001 | | | | $28,198 | |
| | | |
Portfolio turnover rate | | | 251.81% | | | | 317.70% | | | | 511.62% | |
aFor the period September 8, 2015 (commencement of operations) to May 31, 2016.
bThe amount shown for a share outstanding throughout the period may not correlate with the Statement of Operations for the period due to the timing of sales and repurchases of the Fund’s shares in relation to income earned and/or fluctuating fair value of the investments of the Fund.
cBased on average daily shares outstanding.
dTotal return does not reflect sales commissions or contingent deferred sales charges, if applicable, and is not annualized for periods less than one year.
eRatios are annualized for periods less than one year.
fIncludes dividend and/or interest expense on securities sold short and security borrowing fees, if any. See below for the ratios of such expenses to average net assets for the periods presented. See Note 1(g).
gBenefit of expense reduction rounds to less than 0.01%.
| | | | |
| 12 | | Annual Report | The accompanying notes are an integral part of these financial statements. | | franklintempleton.com |
FRANKLIN ALTERNATIVE STRATEGIES FUNDS
FINANCIAL HIGHLIGHTS
Franklin K2 Long Short Credit Fund (continued)
| | | | | | | | | | | | |
| | | Year Ended May 31, | |
| | | 2018 | | | 2017 | | | 2016a | |
| Class C | | | | | | | | | | | | |
Per share operating performance
(for a share outstanding throughout the year) | | | | | | | | | | | | |
| | | |
Net asset value, beginning of year | | $ | 10.35 | | | $ | 10.07 | | | $ | 10.00 | |
| | | | |
| | | |
| Income from investment operationsb: | | | | | | | | | | | | |
| | | |
Net investment incomec | | | 0.19 | | | | 0.14 | | | | 0.09 | |
| | | |
Net realized and unrealized gains (losses) | | | 0.07 | | | | 0.52 | | | | 0.12 | |
| | | | |
| | | |
Total from investment operations | | | 0.26 | | | | 0.66 | | | | 0.21 | |
| | | | |
| | | |
| Less distributions from: | | | | | | | | | | | | |
| | | |
Net investment income | | | (0.10 | ) | | | (0.28 | ) | | | (0.08 | ) |
| | | |
Net realized gains | | | (0.17 | ) | | | (0.10 | ) | | | (0.06 | ) |
| | | | |
| | | |
Total distributions | | | (0.27 | ) | | | (0.38 | ) | | | (0.14 | ) |
| | | | |
| | | |
Net asset value, end of year | | $ | 10.34 | | | $ | 10.35 | | | $ | 10.07 | |
| | | | |
| | | |
Total returnd | | | 2.70% | | | | 6.56% | | | | 2.20% | |
| | | |
| Ratios to average net assetse | | | | | | | | | | | | |
| | | |
Expenses before waiver, payments by affiliates and expense reductionf | | | 4.37% | | | | 4.44% | | | | 3.62% | |
| | | |
Expenses net of waiver, payments by affiliates and expense reductionf | | | 3.84% | g | | | 3.69% | | | | 2.55% | g |
| | | |
Expenses incurred in connection with securities sold short | | | 0.89% | | | | 0.76% | | | | 0.40% | |
| | | |
Net investment income | | | 1.85% | | | | 1.30% | | | | 2.60% | |
| | | |
| Supplemental data | | | | | | | | | | | | |
| | | |
Net assets, end of year (000’s) | | | $2,503 | | | | $1,507 | | | | $270 | |
| | | |
Portfolio turnover rate | | | 251.81% | | | | 317.70% | | | | 511.62% | |
aFor the period September 8, 2015 (commencement of operations) to May 31, 2016.
bThe amount shown for a share outstanding throughout the period may not correlate with the Statement of Operations for the period due to the timing of sales and repurchases of the Fund’s shares in relation to income earned and/or fluctuating fair value of the investments of the Fund.
cBased on average daily shares outstanding.
dTotal return does not reflect sales commissions or contingent deferred sales charges, if applicable, and is not annualized for periods less than one year.
eRatios are annualized for periods less than one year.
fIncludes dividend and/or interest expense on securities sold short and security borrowing fees, if any. See below for the ratios of such expenses to average net assets for the periods presented. See Note 1(g).
gBenefit of expense reduction rounds to less than 0.01%.
| | | | | | |
| franklintempleton.com | | The accompanying notes are an integral part of these financial statements. | Annual Report | | | 13 | |
FRANKLIN ALTERNATIVE STRATEGIES FUNDS
FINANCIAL HIGHLIGHTS
Franklin K2 Long Short Credit Fund (continued)
| | | | | | | | | | | | |
| | | Year Ended May 31, | |
| | | 2018 | | | 2017 | | | 2016a | |
| Class R | | | | | | | | | | | | |
Per share operating performance
(for a share outstanding throughout the year) | | | | | | | | | | | | |
| | | |
Net asset value, beginning of year | | $ | 10.41 | | | $ | 10.10 | | | $ | 10.00 | |
| | | | |
| | | |
| Income from investment operationsb: | | | | | | | | | | | | |
| | | |
Net investment incomec | | | 0.25 | | | | 0.20 | | | | 0.08 | |
| | | |
Net realized and unrealized gains (losses) | | | 0.09 | | | | 0.53 | | | | 0.16 | |
| | | | |
| | | |
Total from investment operations | | | 0.34 | | | | 0.73 | | | | 0.24 | |
| | | | |
| | | |
| Less distributions from: | | | | | | | | | | | | |
| | | |
Net investment income | | | (0.17 | ) | | | (0.32 | ) | | | (0.08 | ) |
| | | |
Net realized gains | | | (0.17 | ) | | | (0.10 | ) | | | (0.06 | ) |
| | | | |
| | | |
Total distributions | | | (0.34 | ) | | | (0.42 | ) | | | (0.14 | ) |
| | | | |
| | | |
Net asset value, end of year | | $ | 10.41 | | | $ | 10.41 | | | $ | 10.10 | |
| | | | |
| | | |
Total returnd | | | 3.29% | | | | 7.29% | | | | 2.48% | |
| | | |
| Ratios to average net assetse | | | | | | | | | | | | |
| | | |
Expenses before waiver, payments by affiliates and expense reductionf | | | 3.82% | | | | 3.83% | | | | 3.37% | |
| | | |
Expenses net of waiver, payments by affiliates and expense reductionf | | | 3.29% | g | | | 3.08% | | | | 2.30% | g |
| | | | |
Expenses incurred in connection with securities sold short | | | 0.89% | | | | 0.76% | | | | 0.40% | |
| | | |
Net investment income | | | 2.40% | | | | 1.91% | | | | 2.85% | |
| | | |
| Supplemental data | | | | | | | | | | | | |
| | | |
Net assets, end of year (000’s) | | | $162 | | | | $127 | | | | $12 | |
| | | |
Portfolio turnover rate | | | 251.81% | | | | 317.70% | | | | 511.62% | |
aFor the period September 8, 2015 (commencement of operations) to May 31, 2016.
bThe amount shown for a share outstanding throughout the period may not correlate with the Statement of Operations for the period due to the timing of sales and repurchases of the Fund’s shares in relation to income earned and/or fluctuating fair value of the investments of the Fund.
cBased on average daily shares outstanding.
dTotal return is not annualized for periods less than one year.
eRatios are annualized for periods less than one year.
fIncludes dividend and/or interest expense on securities sold short and security borrowing fees, if any. See below for the ratios of such expenses to average net assets for the periods presented. See Note 1(g).
gBenefit of expense reduction rounds to less than 0.01%.
| | | | |
| 14 | | Annual Report | The accompanying notes are an integral part of these financial statements. | | franklintempleton.com |
FRANKLIN ALTERNATIVE STRATEGIES FUNDS
FINANCIAL HIGHLIGHTS
Franklin K2 Long Short Credit Fund (continued)
| | | | | | | | | | | | |
| | | Year Ended May 31, | |
| | | 2018 | | | 2017 | | | 2016a | |
| Class R6 | | | | | | | | | | | | |
Per share operating performance
(for a share outstanding throughout the year) | | | | | | | | | | | | |
| | | |
Net asset value, beginning of year | | $ | 10.50 | | | $ | 10.15 | | | $ | 10.00 | |
| | | | |
| | | |
| Income from investment operationsb: | | | | | | | | | | | | |
| | | |
Net investment incomec | | | 0.31 | | | | 0.24 | | | | 0.23 | |
| | | |
Net realized and unrealized gains (losses) | | | 0.08 | | | | 0.53 | | | | 0.06 | |
| | | | |
| | | |
Total from investment operations | | | 0.39 | | | | 0.77 | | | | 0.29 | |
| | | | |
| | | |
| Less distributions from: | | | | | | | | | | | | |
| | | |
Net investment income | | | (0.21 | ) | | | (0.32 | ) | | | (0.08 | ) |
| | | |
Net realized gains | | | (0.17 | ) | | | (0.10 | ) | | | (0.06 | ) |
| | | | |
| | | |
Total distributions | | | (0.38 | ) | | | (0.42 | ) | | | (0.14 | ) |
| | | | |
| | | |
Net asset value, end of year | | $ | 10.51 | | | $ | 10.50 | | | $ | 10.15 | |
| | | | |
| | | |
Total returnd | | | 3.76% | | | | 7.71% | | | | 3.01% | |
| | | |
| Ratios to average net assetse | | | | | | | | | | | | |
| | | |
Expenses before waiver, payments by affiliates and expense reductionf | | | 3.35% | | | | 3.43% | | | | 3.35% | |
| | | |
Expenses net of waiver, payments by affiliates and expense reductionf | | | 2.83% | g | | | 2.68% | | | | 2.28% | g |
| | | | |
Expenses incurred in connection with securities sold short | | | 0.89% | | | | 0.76% | | | | 0.40% | |
| | | |
Net investment income | | | 2.86% | | | | 2.31% | | | | 2.87% | |
| | | |
| Supplemental data | | | | | | | | | | | | |
| | | |
Net assets, end of year (000’s) | | | $13 | | | | $13,052 | | | | $12,384 | |
| | | |
Portfolio turnover rate | | | 251.81% | | | | 317.70% | | | | 511.62% | |
aFor the period September 8, 2015 (commencement of operations) to May 31, 2016.
bThe amount shown for a share outstanding throughout the period may not correlate with the Statement of Operations for the period due to the timing of sales and repurchases of the Fund’s shares in relation to income earned and/or fluctuating fair value of the investments of the Fund.
cBased on average daily shares outstanding.
dTotal return is not annualized for periods less than one year.
eRatios are annualized for periods less than one year.
fIncludes dividend and/or interest expense on securities sold short and security borrowing fees, if any. See below for the ratios of such expenses to average net assets for the periods presented. See Note 1(g).
gBenefit of expense reduction rounds to less than 0.01%.
| | | | | | |
| franklintempleton.com | | The accompanying notes are an integral part of these financial statements. | Annual Report | | | 15 | |
FRANKLIN ALTERNATIVE STRATEGIES FUNDS
FINANCIAL HIGHLIGHTS
Franklin K2 Long Short Credit Fund (continued)
| | | | | | | | | | | | |
| | | Year Ended May 31, | |
| | | 2018 | | | 2017 | | | 2016a | |
| Advisor Class | | | | | | | | | | | | |
Per share operating performance
(for a share outstanding throughout the year) | | | | | | | | | | | | |
| | | |
Net asset value, beginning of year | | $ | 10.50 | | | $ | 10.15 | | | $ | 10.00 | |
| | | | |
| | | |
| Income from investment operationsb: | | | | | | | | | | | | |
| | | |
Net investment incomec | | | 0.30 | | | | 0.24 | | | | 0.20 | |
| | | |
Net realized and unrealized gains (losses) | | | 0.09 | | | | 0.53 | | | | 0.09 | |
| | | | |
| | | |
Total from investment operations | | | 0.39 | | | | 0.77 | | | | 0.29 | |
| | | | |
| | | |
| Less distributions from: | | | | | | | | | | | | |
| | | |
Net investment income | | | (0.21 | ) | | | (0.32 | ) | | | (0.08 | ) |
| | | |
Net realized gains | | | (0.17 | ) | | | (0.10 | ) | | | (0.06 | ) |
| | | | |
| | | |
Total distributions | | | (0.38 | ) | | | (0.42 | ) | | | (0.14 | ) |
| | | | |
| | | |
Net asset value, end of year | | $ | 10.51 | | | $ | 10.50 | | | $ | 10.15 | |
| | | | |
| | | |
Total returnd | | | 3.75% | | | | 7.70% | | | | 2.99% | |
| | | |
| Ratios to average net assetse | | | | | | | | | | | | |
| | | |
Expenses before waiver, payments by affiliates and expense reductionf | | | 3.37% | | | | 3.44% | | | | 3.36% | |
| | | |
Expenses net of waiver, payments by affiliates and expense reductionf | | | 2.84% | g | | | 2.69% | | | | 2.29% | g |
| | | |
Expenses incurred in connection with securities sold short | | | 0.89% | | | | 0.76% | | | | 0.40% | |
| | | |
Net investment income | | | 2.85% | | | | 2.30% | | | | 2.86% | |
| | | |
| Supplemental data | | | | | | | | | | | | |
| | | |
Net assets, end of year (000’s) | | | $45,514 | | | | $25,125 | | | | $23,058 | |
| | | |
Portfolio turnover rate | | | 251.81% | | | | 317.70% | | | | 511.62% | |
aFor the period September 8, 2015 (commencement of operations) to May 31, 2016.
bThe amount shown for a share outstanding throughout the period may not correlate with the Statement of Operations for the period due to the timing of sales and repurchases of the Fund’s shares in relation to income earned and/or fluctuating fair value of the investments of the Fund.
cBased on average daily shares outstanding.
dTotal return is not annualized for periods less than one year.
eRatios are annualized for periods less than one year.
fIncludes dividend and/or interest expense on securities sold short and security borrowing fees, if any. See below for the ratios of such expenses to average net assets for the periods presented. See Note 1(g).
gBenefit of expense reduction rounds to less than 0.01%.
| | | | |
| 16 | | Annual Report | The accompanying notes are an integral part of these financial statements. | | franklintempleton.com |
FRANKLIN ALTERNATIVE STRATEGIES FUNDS
Statement of Investments, May 31, 2018
| | | | | | | | | | | | | | |
| Franklin K2 Long Short Credit Fund | |
| | | | | Country | | | Shares/Rights | | | Value | |
| | | Common Stocks and Other Equity Interests 5.0% | | | | | | | | | |
| | | Consumer Finance 0.4% | | | | | | | | | |
| a,b | | iPayment Inc. | | | United States | | | | 466,839 | | | $ | 378,140 | |
| | | | | | | | | | | | | | |
| | | Equity Real Estate Investment Trusts (REITs) 1.7% | | | | | | | | | |
| c | | Gaming And Leisure Properties Inc. | | | United States | | | | 6,300 | | | | 221,130 | |
| c,d | | Northstar Realty Europe Corp. | | | United States | | | | 20,519 | | | | 287,471 | |
| c | | Safety Income & Growth Inc. | | | United States | | | | 5,211 | | | | 99,947 | |
| c | | Vici Properties Inc. | | | United States | | | | 49,052 | | | | 950,138 | |
| | | | | | | | | | | | | | |
| | | | | | | | | | | | | 1,558,686 | |
| | | | | | | | | | | | | | |
| | | Independent Power & Renewable Electricity Producers 1.0% | | | | | | | | | |
| c | | NRG Yield Inc., A | | | United States | | | | 26,671 | | | | 465,942 | |
| d | | NRG Yield Inc., C | | | United States | | | | 22,452 | | | | 392,910 | |
| | Pattern Energy Group Inc., A | | | United States | | | | 2,793 | | | | 51,894 | |
| | | | | | | | | | | | | | |
| | | | | | | | | | | | | 910,746 | |
| | | | | | | | | | | | | | |
| | | Media 1.4% | | | | | | | | | |
| b | | Altice NV, rts., 6/18/18 | | | Netherlands | | | | 50,966 | | | | 371,830 | |
| a | | Altice NV, A | | | Netherlands | | | | 49,749 | | | | 176,221 | |
| a,c | | DISH Network Corp., A | | | United States | | | | 2,163 | | | | 63,917 | |
| a,c | | Postmedia Network Canada Corp. | | | Canada | | | | 56,068 | | | | 43,242 | |
| c | | Time Warner Inc. | | | United States | | | | 7,216 | | | | 679,459 | |
| | | | | | | | | | | | | | |
| | | | | | | | | | | | | 1,334,669 | |
| | | | | | | | | | | | | | |
| | | Metals & Mining 0.0%† | | | | | | | | | |
| | Vedanta Ltd., ADR | | | India | | | | 3,509 | | | | 51,582 | |
| | | | | | | | | | | | | | |
| | | Multiline Retail 0.1% | | | | | | | | | |
| | Hudson’s Bay Co. | | | Canada | | | | 8,912 | | | | 66,259 | |
| | | | | | | | | | | | | | |
| | | Oil, Gas & Consumable Fuels 0.1% | | | | | | | | | |
| c,d | | Targa Resources Corp. | | | United States | | | | 2,211 | | | | 107,521 | |
| | | | | | | | | | | | | | |
| | | Pharmaceuticals 0.0%† | | | | | | | | | |
| a | | Sanofi, Contingent Value, rts., 12/31/20 | | | France | | | | 26,594 | | | | 13,297 | |
| | | | | | | | | | | | | | |
| | | Semiconductors & Semiconductor Equipment 0.1% | | | | | | | | | |
| a | | NXP Semiconductors NV | | | Netherlands | | | | 719 | | | | 81,966 | |
| | | | | | | | | | | | | | |
| | | Software 0.2% | | | | | | | | | |
| a,c | | Dell Technologies Inc., V | | | United States | | | | 2,450 | | | | 197,617 | |
| | | | | | | | | | | | | | |
| | Total Common Stocks and Other Equity Interests
(Cost $4,415,190) | | | | | | | | | | | 4,700,483 | |
| | | | | | | | | | | | | | |
| | | Preferred Stocks 0.4% | | | | | | | | | |
| | | Consumer Finance 0.3% | | | | | | | | | |
| a,b | | iPayment Inc., pfd. | | | United States | | | | 2,989 | | | | 298,900 | |
| | | | | | | | | | | | | | |
| | | Thrifts & Mortgage Finance 0.1% | | | | | | | | | |
| a,c | | FHLMC, 8.375%, pfd., Z | | | United States | | | | 5,717 | | | | 36,074 | |
| a | | FNMA, 8.25%, pfd., S | | | United States | | | | 2,575 | | | | 16,248 | |
| a | | FNMA, 8.25%, pfd., T | | | United States | | | | 2,275 | | | | 14,219 | |
| | | | | | | | | | | | | | |
| | | | | | | | | | | | | 66,541 | |
| | | | | | | | | | | | | | |
| | Total Preferred Stocks (Cost $366,832) | | | | | | | | | | | 365,441 | |
| | | | | | | | | | | | | | |
| | | | | | |
| franklintempleton.com | | Annual Report | | | 17 | |
FRANKLIN ALTERNATIVE STRATEGIES FUNDS
STATEMENT OF INVESTMENTS
Franklin K2 Long Short Credit Fund (continued)
| | | | | | | | | | | | | | |
| | | | | Country | | | Principal
Amount* | | | Value | |
| | | Convertible Bonds 2.5% | | | | | | | | | |
| | | Automobiles 0.0%† | | | | | | | | | |
| | Tesla Inc., senior note, 0.25%, 3/01/19 | | | United States | | | | 46,000 | | | $ | 46,560 | |
| | | | | | | | | | | | | | |
| | | Energy Equipment & Services 0.7% | | | | | | | | | |
| | SEACOR Holdings Inc., senior bond, 3.00%, 11/15/28 | | | United States | | | | 187,000 | | | | 181,588 | |
| c | | Weatherford International Ltd., senior note, 5.875%, 7/01/21 | | | United States | | | | 440,000 | | | | 430,914 | |
| | | | | | | | | | | | | | |
| | | | | | | | | | | | | 612,502 | |
| | | | | | | | | | | | | | |
| | | Equity Real Estate Investment Trusts (REITs) 0.8% | | | | | | | | | |
| c | | Colony NorthStar Inc., senior note, 3.875%, 1/15/21 | | | United States | | | | 268,000 | | | | 256,616 | |
| c,f | | iStar Inc., senior note, 144A, 3.125%, 9/15/22 | | | United States | | | | 456,000 | | | | 445,572 | |
| | | | | | | | | | | | | | |
| | | | | | | | | | | | | 702,188 | |
| | | | | | | | | | | | | | |
| | | Independent Power & Renewable Electricity Producers 0.6% | | | | | | | | | |
| c,f | | NRG Yield Inc., senior note, 144A, 3.50%, 2/01/19 | | | United States | | | | 217,000 | | | | 216,640 | |
| | Pattern Energy Group Inc., senior note, 4.00%, 7/15/20 | | | United States | | | | 359,000 | | | | 361,162 | |
| | | | | | | | | | | | | | |
| | | | | | | | | | | | | 577,802 | |
| | | | | | | | | | | | | | |
| | | Internet & Direct Marketing Retail 0.2% | | | | | | | | | |
| f | | Wayfair Inc., senior note, 144A, 0.375%, 9/01/22 | | | United States | | | | 144,000 | | | | 159,610 | |
| | | | | | | | | | | | | | |
| | | Media 0.2% | | | | | | | | | |
| f | | Gannett Co. Inc., senior note, 144A, 4.75%, 4/15/24 | | | United States | | | | 152,000 | | | | 164,507 | |
| | | | | | | | | | | | | | |
| | | Semiconductors & Semiconductor Equipment 0.0%† | | | | | | | | | |
| | Sunpower Corp., senior note, 4.00%, 1/15/23 | | | United States | | | | 37,000 | | | | 31,045 | |
| | | | | | | | | | | | | | |
| | Total Convertible Bonds (Cost $2,276,753) | | | | | | | | | | | 2,294,214 | |
| | | | | | | | | | | | | | |
| | | Corporate Bonds and Notes 37.4% | | | | | | | | | |
| | | Banks 0.7% | | | | | | | | | |
| e | | Bank of America Corp., senior bond, FRN, 3.419%, (3-Month USD LIBOR + 1.04%), 12/20/28 | | | United States | | | | 73,000 | | | | 68,914 | |
| | JP Morgan Structured Products BV, zero cpn., | | | | | | | | | | | | |
| | 7/19/18 | | | Egypt | | | | 7,078,000 | EGP | | | 386,256 | |
| | g Reg S, 8/02/18 | | | Egypt | | | | 2,677,000 | EGP | | | 145,588 | |
| e | | JPMorgan Chase & Co., senior bond, FRN, 4.005%, (3-Month USD LIBOR + 1.12%), 4/23/29 | | | United States | | | | 73,000 | | | | 72,347 | |
| | | | | | | | | | | | | | |
| | | | | | | | | | | | | 673,105 | |
| | | | | | | | | | | | | | |
| | | Beverages 0.1% | | | | | | | | | |
| | Anheuser-Busch InBev Worldwide Inc., senior bond, 4.60%, 4/15/48 | | | Belgium | | | | 73,000 | | | | 73,046 | |
| | | | | | | | | | | | | | |
| | | Capital Markets 0.1% | | | | | | | | | |
| e | | The Goldman Sachs Group Inc., senior bond, FRN, 4.223%, (3-Month USD LIBOR + 1.30%), 5/01/29 | | | United States | | | | 73,000 | | | | 72,130 | |
| | | | | | | | | | | | | | |
| | | Commercial Services & Supplies 3.1% | | | | | | | | | |
| f | | Harland Clarke Holdings Corp., 144A, | | | | | | | | | | | | |
| | senior note, 9.25%, 3/01/21 | | | United States | | | | 1,772,000 | | | | 1,776,430 | |
| | senior secured note, 8.375%, 8/15/22 | | | United States | | | | 310,000 | | | | 312,325 | |
| | R.R. Donnelley & Sons Co., | | | | | | | | | | | | |
| | senior bond, 6.50%, 11/15/23 | | | United States | | | | 296,000 | | | | 292,300 | |
| | c senior bond, 6.00%, 4/01/24 | | | United States | | | | 338,000 | | | | 323,213 | |
| | c senior note, 7.00%, 2/15/22 | | | United States | | | | 231,000 | | | | 238,507 | |
| | | | | | | | | | | | | | |
| | | | | | | | | | | | | 2,942,775 | |
| | | | | | | | | | | | | | |
| | | | |
| 18 | | Annual Report | | franklintempleton.com |
FRANKLIN ALTERNATIVE STRATEGIES FUNDS
STATEMENT OF INVESTMENTS
Franklin K2 Long Short Credit Fund (continued)
| | | | | | | | | | | | | | |
| | | | | Country | | | Principal
Amount* | | | Value | |
| | | Corporate Bonds and Notes (continued) | | | | | | | | | |
| | | Communications Equipment 0.3% | | | | | | | | | |
| c,f | | Riverbed Technology Inc., senior note, 144A, 8.875%, 3/01/23 | | | United States | | | | 300,000 | | | $ | 282,375 | |
| | | | | | | | | | | | | | |
| | | Construction & Engineering 0.3% | | | | | | | | | |
| | Engility Corp., senior note, 8.875%, 9/01/24 | | | United States | | | | 291,000 | | | | 305,914 | |
| | Great Lakes Dredge & Dock Corp., senior note, 8.00%, 5/15/22 | | | United States | | | | 21,000 | | | | 21,420 | |
| | | | | | | | | | | | | | |
| | | | | | | | | | | | | 327,334 | |
| | | | | | | | | | | | | | |
| | | Construction Materials 0.2% | | | | | | | | | |
| c,f | | Standard Industries Inc., senior note, 144A, 5.50%, 2/15/23 | | | United States | | | | 218,000 | | | | 223,178 | |
| | | | | | | | | | | | | | |
| | | Consumer Finance 0.7% | | | | | | | | | |
| f | | Everi Payments Inc., senior note, 144A, 7.50%, 12/15/25 | | | United States | | | | 616,000 | | | | 626,010 | |
| | | | | | | | | | | | | | |
| | | Diversified Financial Services 2.4% | | | | | | | | | |
| g | | Citigroup Global Markets Holdings Inc., Reg S, zero cpn., 9/13/18 | | | Egypt | | | | 12,756,209 | EGP | | | 681,051 | |
| f | | One Call Corp., 144A, | | | | | | | | | | | | |
| | secured note, second lien, 10.00%, 10/01/24 | | | United States | | | | 551,000 | | | | 487,635 | |
| | senior secured note, first lien, 7.50%, 7/01/24 | | | United States | | | | 932,000 | | | | 918,020 | |
| f | | Tervita Escrow Corp., senior secured note, 144A, 7.625%, 12/01/21 | | | Canada | | | | 147,000 | | | | 149,205 | |
| | | | | | | | | | | | | | |
| | | | | | | | | | | | | 2,235,911 | |
| | | | | | | | | | | | | | |
| | | Diversified Telecommunication Services 2.4% | | | | | | | | | |
| c,f | | Altice Finco SA, secured bond, 144A, 8.125%, 1/15/24 | | | Luxembourg | | | | 158,000 | | | | 161,555 | |
| | Frontier Communications Corp., senior note, | | | | | | | | | | | | |
| | 10.50%, 9/15/22 | | | United States | | | | 465,000 | | | | 420,825 | |
| | 11.00%, 9/15/25 | | | United States | | | | 361,000 | | | | 290,605 | |
| c | | Intelsat Jackson Holdings SA, | | | | | | | | | | | | |
| | senior bond, 7.25%, 10/15/20 | | | Luxembourg | | | | 234,000 | | | | 230,490 | |
| | f senior secured note, first lien, 144A, 9.50%, 9/30/22 | | | Luxembourg | | | | 939,000 | | | | 1,090,413 | |
| | Sprint Capital Corp., senior bond, 8.75%, 3/15/32 | | | United States | | | | 61,000 | | | | 65,804 | |
| | | | | | | | | | | | | | |
| | | | | | | | | | | | | 2,259,692 | |
| | | | | | | | | | | | | | |
| | | Energy Equipment & Services 1.8% | | | | | | | | | |
| f | | Transocean Inc., senior note, 144A, | | | | | | | | | | | | |
| | 9.00%, 7/15/23 | | | United States | | | | 229,000 | | | | 247,606 | |
| | c 7.50%, 1/15/26 | | | United States | | | | 544,000 | | | | 552,840 | |
| f | | USA Compression Partners LP / USA Compression Finance Corp., senior note, 144A, 6.875%, 4/01/26 | | | United States | | | | 51,000 | | | | 52,721 | |
| c,f | | Weatherford International LLC, senior note, 144A, 9.875%, 3/01/25 | | | United States | | | | 485,000 | | | | 476,513 | |
| c | | Weatherford International Ltd., senior note, 5.125%, 9/15/20 | | | United States | | | | 396,000 | | | | 396,990 | |
| | | | | | | | | | | | | | |
| | | | | | | | | | | | | 1,726,670 | |
| | | | | | | | | | | | | | |
| | | Equity Real Estate Investment Trusts (REITs) 1.1% | | | | | | | | | |
| c | | iStar Inc., senior note, 5.25%, 9/15/22 | | | United States | | | | 214,000 | | | | 208,650 | |
| f | | Uniti Group LP / Uniti Fiber Holdings Inc. / CSL Capital LLC, senior note, 144A, 7.125%, 12/15/24 | | | United States | | | | 257,000 | | | | 240,860 | |
| f | | Uniti Group LP / Uniti Group Finance Inc. / CSL Capital LLC, senior secured note, 144A, 6.00%, 4/15/23 | | | United States | | | | 570,000 | | | | 558,244 | |
| | | | | | | | | | | | | | |
| | | | | | | | | | | | | 1,007,754 | |
| | | | | | | | | | | | | | |
| | | Food & Staples Retailing 0.4% | | | | | | | | | |
| c,f | | Sigma Holdco BV, senior note, 144A, 7.875%, 5/15/26 | | | Netherlands | | | | 366,000 | | | | 352,275 | |
| | | | | | | | | | | | | | |
| | | Food Products 2.7% | | | | | | | | | |
| f | | Dean Foods Co., senior note, 144A, 6.50%, 3/15/23 | | | United States | | | | 609,000 | | | | 598,343 | |
| | | | | | |
| franklintempleton.com | | Annual Report | | | 19 | |
FRANKLIN ALTERNATIVE STRATEGIES FUNDS
STATEMENT OF INVESTMENTS
Franklin K2 Long Short Credit Fund (continued)
| | | | | | | | | | | | | | |
| | | | | Country | | | Principal
Amount* | | | Value | |
| | | Corporate Bonds and Notes (continued) | | | | | | | | | |
| | | Food Products (continued) | | | | | | | | | |
| | Deutsche Bank AG/London, zero cpn., | | | | | | | | | | | | |
| | 8/28/18 | | | Germany | | | | 3,300,000 | EGP | | $ | 177,513 | |
| | 8/30/18 | | | Germany | | | | 5,000,000 | EGP | | | 268,438 | |
| f | | JBS USA LLC/Finance Inc., senior bond, 144A, 6.75%, 2/15/28 | | | Brazil | | | | 1,515,000 | | | | 1,433,569 | |
| | | | | | | | | | | | | | |
| | | | | | | | | | | | | 2,477,863 | |
| | | | | | | | | | | | | | |
| | | Health Care Providers & Services 0.2% | | | | �� | | | | | |
| f | | Centene Escrow I Corp., senior note, 144A, 5.375%, 6/01/26 | | | United States | | | | 187,000 | | | | 189,337 | |
| | | | | | | | | | | | | | |
| | | Hotels, Restaurants & Leisure 2.3% | | | | | | | | | |
| f | | Golden Nugget Inc., senior note, 144A, | | | | | | | | | | | | |
| | 6.75%, 10/15/24 | | | United States | | | | 376,000 | | | | 381,170 | |
| | 8.75%, 10/01/25 | | | United States | | | | 443,000 | | | | 462,935 | |
| c,f | | Jack Ohio Finance LLC / Jack Ohio Finance 1 Corp., senior secured note, second lien, 144A, 10.25%, 11/15/22 | | | United States | | | | 167,000 | | | | 182,030 | |
| f | | Mohegan Gaming & Entertainment, senior note, 144A, 7.875%, 10/15/24 | | | United States | | | | 895,000 | | | | 854,725 | |
| f | | Rivers Pittsburgh Borrower LP/Rivers Pittsburgh Finance Corp., secured note, 144A, 6.125%, 8/15/21 | | | United States | | | | 259,000 | | | | 259,000 | |
| | | | | | | | | | | | | | |
| | | | | | | | | | | | | 2,139,860 | |
| | | | | | | | | | | | | | |
| | | Household Durables 1.1% | | | | | | | | | |
| c,f | | K Hovnanian Enterprises Inc., secured note, 144A, 10.00%, 7/15/22 | | | United States | | | | 1,009,000 | | | | 1,077,107 | |
| | | | | | | | | | | | | | |
| | | Independent Power & Renewable Electricity Producers 0.5% | | | | | | | | | |
| c,f | | Atlantica Yield PLC, senior note, 144A, 7.00%, 11/15/19 | | | Spain | | | | 437,000 | | | | 455,572 | |
| | | | | | | | | | | | | | |
| | | Insurance 0.0%† | | | | | | | | | |
| f | | Ambac Assurance Corp., sub. bond, 144A, 5.10%, 6/07/20 | | | United States | | | | 2 | | | | 3 | |
| e,f | | Ambac LSNI LLC, senior secured note, 144A, FRN, 6.811%, (3-Month USD LIBOR + 5.00%), 2/12/23 | | | Cayman Islands | | | | 9 | | | | 10 | |
| | | | | | | | | | | | | | |
| | | | | | | | | | | | | 13 | |
| | | | | | | | | | | | | | |
| | | Internet & Direct Marketing Retail 0.1% | | | | | | | | | |
| f | | Amazon.com Inc., senior bond, 144A, 4.05%, 8/22/47 | | | United States | | | | 73,000 | | | | 73,004 | |
| | | | | | | | | | | | | | |
| | | Leisure Equipment & Products 0.8% | | | | | | | | | |
| | Mattel Inc., | | | | | | | | | | | | |
| | senior bond, 5.45%, 11/01/41 | | | United States | | | | 127,000 | | | | 102,527 | |
| | f senior note, 144A, 6.75%, 12/31/25 | | | United States | | | | 687,000 | | | | 671,886 | |
| | | | | | | | | | | | | | |
| | | | | | | | | | | | | 774,413 | |
| | | | | | | | | | | | | | |
| | | Machinery 0.2% | | | | | | | | | |
| f | | Navistar International Corp., senior note, 144A, 6.625%, 11/01/25 | | | United States | | | | 157,000 | | | | 162,887 | |
| f | | Titan International Inc., senior secured note, 144A, 6.50%, 11/30/23 | | | United States | | | | 66,000 | | | | 66,495 | |
| | | | | | | | | | | | | | |
| | | | | | | | | | | | | 229,382 | |
| | | | | | | | | | | | | | |
| | | Media 7.1% | | | | | | | | | |
| f | | Altice Luxembourg SA, senior note, 144A, 7.75%, 5/15/22 | | | Luxembourg | | | | 165,000 | | | | 159,019 | |
| c,f | | Altice U.S. Finance I Corp., senior secured bond, 144A, 5.50%, 5/15/26 | | | United States | | | | 370,000 | | | | 356,236 | |
| f | | American Media Inc., | | | | | | | | | | | | |
| | secured note, second lien, 144A, 5.50%, 9/01/21 | | | United States | | | | 305,508 | | | | 297,488 | |
| | sub. note, 144A, zero cpn. 3/01/22 | | | United States | | | | 2,546,010 | | | | 2,199,116 | |
| | Charter Communications Operating LLC / Charter Communications Operating Capital, senior secured bond, 5.75%, 4/01/48 | | | United States | | | | 73,000 | | | | 71,637 | |
| | | | |
| 20 | | Annual Report | | franklintempleton.com |
FRANKLIN ALTERNATIVE STRATEGIES FUNDS
STATEMENT OF INVESTMENTS
Franklin K2 Long Short Credit Fund (continued)
| | | | | | | | | | | | | | |
| | | | | Country | | | Principal
Amount* | | | Value | |
| | | Corporate Bonds and Notes (continued) | | | | | | | | | |
| | | Media (continued) | | | | | | | | | |
| f | | Lee Enterprises Inc., senior secured note, first lien, 144A, 9.50%, 3/15/22 | | | United States | | | | 589,000 | | | $ | 614,032 | |
| | The McClatchy Co., | | | | | | | | | | | | |
| | senior bond, 7.15%, 11/01/27 | | | United States | | | | 48,000 | | | | 57,840 | |
| | senior bond, 6.875%, 3/15/29 | | | United States | | | | 566,000 | | | | 731,555 | |
| | senior secured note, first lien, 9.00%, 12/15/22 | | | United States | | | | 83,000 | | | | 86,528 | |
| f | | Meredith Corp., senior note, 144A, 6.875%, 2/01/26 | | | United States | | | | 703,000 | | | | 711,788 | |
| c,f,h | | Postmedia Network Inc., secured note, second lien, 144A, PIK, 10.25%, 7/15/23 | | | Canada | | | | 509,863 | | | | 604,188 | |
| f | | Univision Communications Inc., senior secured note, 144A, | | | | | | | | | | | | |
| | 5.125%, 5/15/23 | | | United States | | | | 72,000 | | | | 68,400 | |
| | c 5.125%, 2/15/25 | | | United States | | | | 728,000 | | | | 672,235 | |
| | | | | | | | | | | | | | |
| | | | | | | | | | | | | 6,630,062 | |
| | | | | | | | | | | | | | |
| | | Oil, Gas & Consumable Fuels 2.5% | | | | | | | | | |
| | Calumet Specialty Products Partners LP / Calumet Finance Corp., senior note, | | | | | | | | | | | | |
| | 6.50%, 4/15/21 | | | United States | | | | 245,000 | | | | 242,244 | |
| | 7.75%, 4/15/23 | | | United States | | | | 218,000 | | | | 218,545 | |
| | Cheniere Corpus Christi Holdings LLC, senior secured bond, 5.125%, 6/30/27 | | | United States | | | | 267,000 | | | | 266,332 | |
| f | | Endeavor Energy Resources LP / EER Finance Inc., senior note, 144A, 5.50%, 1/30/26 | | | United States | | | | 38,000 | | | | 37,335 | |
| e,g | | EP PetroEcuador via Noble Sovereign Funding I Ltd., FRN, Reg S, 7.925%, (3-Month USD LIBOR + 5.63%), 9/24/19 | | | Ecuador | | | | 78,947 | | | | 78,332 | |
| c,f | | Moss Creek Resources Holdings Inc., senior note, 144A, 7.50%, 1/15/26 | | | United States | | | | 687,000 | | | | 684,424 | |
| | MPLX LP, senior bond, 4.70%, 4/15/48 | | | United States | | | | 73,000 | | | | 70,233 | |
| f | | Par Petroleum LLC / Petroleum Finance Corp., first lien, 144A, 7.75%, 12/15/25 | | | United States | | | | 58,000 | | | | 59,305 | |
| | Petrobras Global Finance BV, senior note, | | | | | | | | | | | | |
| | 6.125%, 1/17/22 | | | Brazil | | | | 387,000 | | | | 406,350 | |
| | 6.25%, 3/17/24 | | | Brazil | | | | 168,000 | | | | 170,352 | |
| | Southwestern Energy Co., senior note, 4.10%, 3/15/22 | | | United States | | | | 155,000 | | | | 151,125 | |
| | | | | | | | | | | | | | |
| | | | | | | | | | | | | 2,384,577 | |
| | | | | | | | | | | | | | |
| | | Paper & Forest Products 2.6% | | | | | | | | | |
| c,f,h | | ARD Securities Finance SARL, senior secured note, 144A, PIK, 8.75%, 1/31/23 | | | Luxembourg | | | | 265,127 | | | | 271,755 | |
| f | | Mercer International Inc., senior note, 144A, 5.50%, 1/15/26 | | | Canada | | | | 36,000 | | | | 35,370 | |
| c | | Resolute Forest Products Inc., senior note, 5.875%, 5/15/23 | | | United States | | | | 2,071,000 | | | | 2,091,710 | |
| | | | | | | | | | | | | | |
| | | | | | | | | | | | | 2,398,835 | |
| | | | | | | | | | | | | | |
| | | Personal Products 0.7% | | | | | | | | | |
| c | | Avon Products Inc., senior note, 6.60%, 3/15/20 | | | United Kingdom | | | | 623,000 | | | | 626,115 | |
| | | | | | | | | | | | | | |
| | | Pharmaceuticals 0.3% | | | | | | | | | |
| | Teva Pharmaceutical Finance Netherlands III BV, | | | | | | | | | | | | |
| | senior bond, 4.10%, 10/01/46 | | | Israel | | | | 150,000 | | | | 109,744 | |
| | senior note, 2.80%, 7/21/23 | | | Israel | | | | 226,000 | | | | 193,601 | |
| | | | | | | | | | | | | | |
| | | | | | | | | | | | | 303,345 | |
| | | | | | | | | | | | | | |
| | | Software 0.1% | | | | | | | | | |
| | Oracle Corp., senior bond, 4.00%, 11/15/47 | | | United States | | | | 73,000 | | | | 71,441 | |
| | | | | | | | | | | | | | |
| | | Specialty Retail 1.5% | | | | | | | | | |
| | Bed Bath & Beyond Inc., senior bond, 5.165%, 8/01/44 | | | United States | | | | 384,000 | | | | 290,534 | |
| c,f | | PetSmart Inc., 144A, | | | | | | | | | | | | |
| | senior note, 8.875%, 6/02/25 | | | United States | | | | 327,000 | | | | 157,777 | |
| | senior secured note, first lien, 5.875%, 6/01/25 | | | United States | | | | 1,344,000 | | | | 934,080 | |
| | | | | | | | | | | | | | |
| | | | | | | | | | | | | 1,382,391 | |
| | | | | | | | | | | | | | |
| | | | | | |
| franklintempleton.com | | Annual Report | | | 21 | |
FRANKLIN ALTERNATIVE STRATEGIES FUNDS
STATEMENT OF INVESTMENTS
Franklin K2 Long Short Credit Fund (continued)
| | | | | | | | | | | | | | |
| | | | | Country | | | Principal
Amount* | | | Value | |
| | | Corporate Bonds and Notes (continued) | | | | | | | | | |
| | | Technology Hardware, Storage & Peripherals 0.5% | | | | | | | | | |
| c,f | | Dell International LLC / EMC Corp., senior note, 144A, 7.125%, 6/15/24 | | | United States | | | | 434,000 | | | $ | 466,433 | |
| | | | | | | | | | | | | | |
| | | Wireless Telecommunication Services 0.6% | | | | | | | | | |
| g | | Digicel Group Ltd., senior note, Reg S, 8.25%, 9/30/20 | | | Jamaica | | | | 73,000 | | | | 55,663 | |
| g | | Digicel Ltd., senior note, Reg S, 6.00%, 4/15/21 | | | Jamaica | | | | 504,000 | | | | 464,310 | |
| | | | | | | | | | | | | | |
| | | | | | | | | | | | | 519,973 | |
| | | | | | | | | | | | | | |
| | Total Corporate Bonds and Notes (Cost $33,427,574) | | | | | | | | | | | 35,001,978 | |
| | | | | | | | | | | | | | |
| | | Foreign Government and Agency Securities 6.2% | | | | | | | | | |
| | Government of Argentina, | | | | | | | | | | | | |
| | 3.75%, 2/08/19 | | | Argentina | | | | 6,572,000 | ARS | | | 276,609 | |
| | 7.82%, 12/31/33 | | | Argentina | | | | 156,876 | EUR | | | 192,467 | |
| | 2.26% to 3/31/19, 4.74% thereafter, 12/31/38 | | | Argentina | | | | 328,282 | EUR | | | 242,427 | |
| | g senior note, Reg S, 3.875%, 1/15/22 | | | Argentina | | | | 200,000 | EUR | | | 228,987 | |
| | senior note, 5.625%, 1/26/22 | | | Argentina | | | | 416,000 | | | | 399,360 | |
| | senior note, 4.625%, 1/11/23 | | | Argentina | | | | 122,000 | | | | 111,159 | |
| | senior note, 5.875%, 1/11/28 | | | Argentina | | | | 43,000 | | | | 37,797 | |
| g | | Government of Ecuador, senior note, Reg S, 10.75%, 3/28/22 | | | Ecuador | | | | 200,000 | | | | 209,290 | |
| g | | Government of Hellenic Republic, senior bond, Reg S, 3.90%, 1/30/33 | | | Greece | | | | 270,603 | EUR | | | 286,333 | |
| g | | Government of Paraguay, senior note, Reg S, 4.625%, 1/25/23 | | | Paraguay | | | | 200,000 | | | | 202,250 | |
| g | | Government of Peru, senior bond, Reg S, | | | | | | | | | | | | |
| | 8.20%, 8/12/26 | | | Peru | | | | 590,000 | PEN | | | 217,263 | |
| | 6.95%, 8/12/31 | | | Peru | | | | 756,000 | PEN | | | 254,504 | |
| | Government of Russia, | | | | | | | | | | | | |
| | 7.75%, 9/16/26 | | | Russia | | | | 5,103,000 | RUB | | | 84,518 | |
| | 8.50%, 9/17/31 | | | Russia | | | | 32,750,000 | RUB | | | 575,024 | |
| | g senior bond, Reg S, 5.25%, 6/23/47 | | | Russia | | | | 200,000 | | | | 190,360 | |
| | g senior note, Reg S, 5.00%, 4/29/20 | | | Russia | | | | 100,000 | | | | 102,492 | |
| | g senior note, Reg S, 4.50%, 4/04/22 | | | Russia | | | | 200,000 | | | | 204,105 | |
| | Government of South Africa, | | | | | | | | | | | | |
| | 5.50%, 3/09/20 | | | South Africa | | | | 215,000 | | | | 221,902 | |
| | 8.75%, 2/28/48 | | | South Africa | | | | 11,958,455 | ZAR | | | 874,949 | |
| | R186, 10.50%, 12/21/26 | | | South Africa | | | | 3,725,000 | ZAR | | | 326,501 | |
| | senior bond, 8.50%, 1/31/37 | | | South Africa | | | | 1,233,000 | ZAR | | | 89,835 | |
| | Government of Turkey, senior bond, 7.00%, 6/05/20 | | | Turkey | | | | 263,000 | | | | 271,678 | |
| g | | National Highways Authority of India, senior note, Reg S, 7.30%, 5/18/22 | | | India | | | | 10,000,000 | INR | | | 147,146 | |
| | | | | | | | | | | | | | |
| | Total Foreign Government and Agency Securities
(Cost $5,994,401) | | | | | | | | | | | 5,746,956 | |
| | | | | | | | | | | | | | |
| | | Asset-Backed Securities and Commercial Mortgage-Backed
Securities 35.1% | | | | | | | | | |
| | | Capital Markets 0.1% | | | | | | | | | |
| | Lehman Mortgage Trust, 2005-3, 2A3, 5.50%, 1/25/36 | | | United States | | | | 122,662 | | | | 117,696 | |
| | | | | | | | | | | | | | |
| | | Diversified Financial Services 15.0% | | | | | | | | | |
| | Alternative Loan Trust, 2005-J10, 2A4, 6.00%, 10/25/35 | | | United States | | | | 495,061 | | | | 400,311 | |
| f,i | | Anchorage Capital CLO 6 Ltd., 2015-6A, DR, 144A, FRN, 5.898%, (3-Month USD LIBOR + 3.55%), 7/15/30 | | | United States | | | | 450,000 | | | | 455,430 | |
| f,i | | Ashford Hospitality Trust, 2018-ASHF, D, 144A, FRN, 4.019%, (1-Month USD LIBOR + 2.10%), 4/15/35 | | | United States | | | | 750,000 | | | | 751,406 | |
| i | | Asset Backed Securities Corp. Home Equity Loan Trust, 2001-HE1, M2, FRN, 3.644%, (1-Month USD LIBOR + 1.73%), 4/15/31 | | | United States | | | | 421,674 | | | | 370,094 | |
| | | | |
| 22 | | Annual Report | | franklintempleton.com |
FRANKLIN ALTERNATIVE STRATEGIES FUNDS
STATEMENT OF INVESTMENTS
Franklin K2 Long Short Credit Fund (continued)
| | | | | | | | | | | | | | |
| | | | | Country | | | Principal
Amount* | | | Value | |
| | | Asset-Backed Securities and Commercial Mortgage-Backed
Securities (continued) | | | | | | | | | |
| | | Diversified Financial Services (continued) | | | | | | | | | |
| i | | Bear Stearns ALT-A Trust, 2004-6, B1, FRN, 4.81%, (1-Month USD LIBOR + 2.85%), 7/25/34 | | | United States | | | | 346,495 | | | $ | 356,773 | |
| f,i | | Goldenttree Loan Management US CLO 1 Ltd., 2017-1A, D, 144A, FRN, 5.709%, (3-Month USD LIBOR + 3.35%), 4/20/29 | | | United States | | | | 500,000 | | | | 504,009 | |
| f,i | | Grippen Park CLO Ltd., 2017-1A, D, 144A, FRN, 5.659%, (3-Month USD LIBOR + 3.30%), 1/20/30 | | | United States | | | | 500,000 | | | | 507,385 | |
| i | | GSAMP Trust, 2004-HE2, M2, FRN, 3.61%, (1-Month USD LIBOR + 1.65%), 9/25/34 | | | United States | | | | 151,063 | | | | 147,564 | |
| f | | GSMSC Pass-Through Trust, 144A, FRN, | | | | | | | | | | | | |
| | i 2009-4R, 2A3, 2.347%, (1-Month USD LIBOR + 0.45%), 12/26/36 | | | United States | | | | 884,814 | | | | 521,436 | |
| | j 2009-5R, 3A2, 5.50%, 10/26/35 | | | United States | | | | 366,401 | | | | 319,800 | |
| f,i | | Home Partners of America Trust, 144A, FRN, | | | | | | | | | | | | |
| | 2017-1, F, 5.478%, (1-Month USD LIBOR + 3.54%), 7/17/34 | | | United States | | | | 500,000 | | | | 507,018 | |
| | k 2018-1, E, 3.784%, (1-Month USD LIBOR + 1.85%), 7/17/37 | | | United States | | | | 1,200,000 | | | | 1,202,250 | |
| f,i | | Hospitality Mortgage Trust, 2017-HIT, F, 144A, FRN, 6.423%, (1-Month USD LIBOR + 4.50%), 5/08/30 | | | United States | | | | 400,000 | | | | 405,406 | |
| f | | Maps Ltd., 2018-1A, A, 144A, 4.212%, 5/15/43 | | | Bermuda | | | | 500,000 | | | | 503,987 | |
| b,j | | Master Adjustable Rate Mortgages Trust, 2004-10, B1, FRN, 3.842%, 10/25/34 | | | United States | | | | 674,825 | | | | 421,168 | |
| i | | Morgan Stanley ABS Capital I Inc. Trust, 2004-NC6, M3, FRN, 4.135%, (1-Month USD LIBOR + 2.18%), 7/25/34 | | | United States | | | | 411,948 | | | | 409,349 | |
| i | | National Collegiate Student Loan Trust, FRN, | | | | | | | | | | | | |
| | 2007-1, A3, 2.20%, (1-Month USD LIBOR + 0.24%), 7/25/30 | | | United States | | | | 1,048,125 | | | | 1,029,981 | |
| | 2007-4, A3A2, 5.468%, (28 Day T-Bill), 3/25/38 | | | United States | | | | 950,000 | | | | 888,739 | |
| f,i | | Palmer Square CLO Ltd., 2017-1A, 144A, FRN, 5.831%, (3-Month USD LIBOR + 3.50%), 5/21/29 | | | United States | | | | 1,000,000 | | | | 1,006,253 | |
| i | | RAAC Series Trust, 2007-SP1, M1, FRN, 2.53%, (1-Month USD LIBOR + 0.57%), 3/25/37 | | | United States | | | | 100,000 | | | | 99,757 | |
| | Residential Asset Securitization Trust, 2006-A1, 1A1, 6.00%, 4/25/36 | | | United States | | | | 478,593 | | | | 375,096 | |
| f | | S-Jets Ltd., 2017-1, A, 144A, 3.967%, 8/15/42 | | | Bermuda | | | | 950,000 | | | | 950,996 | |
| j | | STARM Mortgage Loan Trust, 2007-2, 4A1, FRN, 3.832%, 4/25/37 | | | United States | | | | 155,134 | | | | 130,741 | |
| i | | Terwin Mortgage Trust, 2003-6HE, M2, FRN, 4.585%, (1-Month USD LIBOR + 2.63%), 11/25/33 | | | United States | | | | 206,319 | | | | 177,351 | |
| f | | Wendys Funding LLC, 2018-1A, A2I, 144A, 3.573%, 3/15/48 | | | United States | | | | 997,500 | | | | 975,605 | |
| f,i | | Westchester CLO Ltd., 2007-1A, E, 144A, FRN, 6.658%, (3-Month USD LIBOR + 4.30%), 8/01/22 | | | United States | | | | 595,616 | | | | 593,946 | |
| | | | | | | | | | | | | | |
| | | | | | | | | | | | | 14,011,851 | |
| | | | | | | | | | | | | | |
| | | Mortgage Real Estate Investment Trusts (REITs) 19.3% | | | | | | | | | |
| j | | American Home Mortgage Assets Trust, 2005-1, 1A1, FRN, 3.736%, 11/25/35 | | | United States | | | | 217,342 | | | | 194,115 | |
| j | | Banc of America Mortgage Trust, FRN, | | | | | | | | | | | | |
| | 2005-K, 2A1, 3.639%, 12/25/35 | | | United States | | | | 400,532 | | | | 392,328 | |
| | 2005-L, 3A1, 3.597%, 1/25/36 | | | United States | | | | 420,332 | | | | 398,985 | |
| f,j | | BCAP LLC Trust, 2010-RR1, 1A4, 144A, FRN, 3.634%, 3/26/37 | | | United States | | | | 469,884 | | | | 410,924 | |
| j | | Bear Stearns ARM Trust, 2006-2, 4A1, FRN, 3.667%, 7/25/36 | | | United States | | | | 78,905 | | | | 68,954 | |
| f,i | | BX Trust, 2017-APPL, E, 144A, FRN, 5.069%, (1-Month USD LIBOR + 3.15%), 7/15/34 | | | United States | | | | 1,627,872 | | | | 1,645,513 | |
| | Citigroup Mortgage Loan Trust, FRN, | | | | | | | | | | | | |
| | i 2004-OPT1, M4, 2.965%, (1-Month USD LIBOR + 1.01%), 10/25/34 | | | United States | | | | 461,072 | | | | 425,384 | |
| | j 2007-AR5, 2A1A, 3.738%, 4/25/37 | | | United States | | | | 179,155 | | | | 171,750 | |
| | f,i 2008-RR1, A1A1, 144A, 2.03%, (1-Month USD LIBOR + 0.07%), 1/25/37 | | | United States | | | | 854,666 | | | | 799,653 | |
| | | | | | |
| franklintempleton.com | | Annual Report | | | 23 | |
FRANKLIN ALTERNATIVE STRATEGIES FUNDS
STATEMENT OF INVESTMENTS
Franklin K2 Long Short Credit Fund (continued)
| | | | | | | | | | | | | | |
| | | | | Country | | | Principal
Amount* | | | Value | |
| | | Asset-Backed Securities and Commercial Mortgage-Backed
Securities (continued) | | | | | | | | | |
| | | Mortgage Real Estate Investment Trusts (REITs) (continued) | | | | | | | | | |
| | Countrywide Alternative Loan Trust, | | | | | | | | | | | | |
| | 2005-73CB, 1A2, 6.25%, 1/25/36 | | | United States | | | | 237,938 | | | $ | 243,869 | |
| | i 2005-IM1, A1, FRN, 2.56%, (1-Month USD LIBOR + 0.60%), 1/25/36 | | | United States | | | | 200,900 | | | | 192,859 | |
| | 2006-4CB, 2A3, 5.50%, 4/25/36 | | | United States | | | | 107,246 | | | | 106,564 | |
| | CS First Boston Mortgage Securities Corp., | | | | | | | | | | | | |
| | 2002-9, 1A2, 7.50%, 3/25/32 | | | United States | | | | 532,509 | | | | 601,771 | |
| | j 2004-AR3, CB2, FRN, 3.71%, 4/25/34 | | | United States | | | | 138,364 | | | | 125,709 | |
| | f,i 2004-CF2, 2M2, 144A, FRN, 3.36%, (1-Month USD LIBOR + 1.40%), 5/25/44 | | | United States | | | | 347,377 | | | | 334,980 | |
| | CSMC Mortgage-Backed Trust, 2006-4, 9A1, 6.50%, 5/25/36 | | | United States | | | | 855,854 | | | | 543,110 | |
| f,j | | FHLMC Seasoned Credit Risk Transfer Trust, 2017-2, M1, 144A, FRN, 4.00%, 8/25/56 | | | United States | | | | 400,000 | | | | 390,500 | |
| | GSR Mortgage Loan Trust, | | | | | | | | | | | | |
| | 2004-6F, 2A4, 5.50%, 5/25/34 | | | United States | | | | 247,435 | | | | 255,336 | |
| | 2007-1F, 1A1, 5.00%, 12/25/35 | | | United States | | | | 247,674 | | | | 267,786 | |
| | Home Equity Mortgage Trust, 2004-6, M2, 5.821%, 4/25/35 | | | United States | | | | 188,987 | | | | 190,596 | |
| f,i | | Hyatt Hotel Portfolio Trust, 2017-HYT2, F, 144A, FRN, 4.97%, (1-Month USD LIBOR + 3.05%), 8/09/32 | | | United States | | | | 625,000 | | | | 631,671 | |
| i | | Impac CMB Trust, FRN, | | | | | | | | | | | | |
| | 2004-8, 3B, 4.585%, (1-Month USD LIBOR + 2.63%), 8/25/34 | | | United States | | | | 188,757 | | | | 182,378 | |
| | 2004-9, 1A2, 2.84%, (1-Month USD LIBOR + 0.88%), 1/25/35 | | | United States | | | | 820,987 | | | | 777,060 | |
| | 2005-2, 2B, 4.435%, (1-Month USD LIBOR + 2.48%), 4/25/35 | | | United States | | | | 162,990 | | | | 156,229 | |
| | 2005-4, 2B1, 4.435%, (1-Month USD LIBOR + 2.48%), 5/25/35 | | | United States | | | | 187,011 | | | | 179,908 | |
| i | | IndyMac Home Equity Loan Asset-Backed Trust, 2001-A, AV, FRN, 2.48%, (1-Month USD LIBOR + 0.52%), 3/25/31 | | | United States | | | | 725,376 | | | | 704,236 | |
| i | | IndyMac INDX Mortgage Loan Trust, FRN, | | | | | | | | | | | | |
| | 2004-AR14, 2A1A, 2.68%, (1-Month USD LIBOR + 0.72%), 1/25/35 | | | United States | | | | 894,396 | | | | 771,379 | |
| | 2005-16IP, A1, 2.60%, (1-Month USD LIBOR + 0.64%), 7/25/45 | | | United States | | | | 284,469 | | | | 275,666 | |
| | 2006-AR12, A1, 2.15%, (1-Month USD LIBOR + 0.19%), 9/25/46 | | | United States | | | | 147,362 | | | | 136,936 | |
| | 2006-AR29, A2, 2.04%, (1-Month USD LIBOR + 0.08%), 11/25/36 | | | United States | | | | 214,114 | | | | 199,851 | |
| j | | JP Morgan Mortgage Trust, FRN, | | | | | | | | | | | | |
| | 2006-A5, 6A1, 3.421%, 8/25/36 | | | United States | | | | 474,198 | | | | 386,459 | |
| | 2006-A7, 2A3, 3.603%, 1/25/37 | | | United States | | | | 200,210 | | | | 190,934 | |
| | 2007-A2, 2A1, 3.733%, 4/25/37 | | | United States | | | | 311,297 | | | | 300,501 | |
| | JPMorgan Chase Commercial Mortgage Securities Trust, | | | | | | | | | | | | |
| | 2006-LDP9, AM, 5.372%, 5/15/47 | | | United States | | | | 164,822 | | | | 166,032 | |
| | j 2007-LD11, AM, FRN, 6.005%, 6/15/49 | | | United States | | | | 206,764 | | | | 210,524 | |
| | f,i 2018-ASH8, F, 144A, FRN, 5.897%, (1-Month USD LIBOR + 4.00%), 2/15/35 | | | United States | | | | 1,000,000 | | | | 1,005,141 | |
| j | | MASTR Seasoned Securitization Trust, 2004-1, 4A1, FRN, 3.605%, 10/25/32 | | | United States | | | | 80,642 | | | | 81,980 | |
| f,i | | Motel 6 Trust, 2017-MTL6, E, 144A, FRN, 5.147%, (1-Month USD LIBOR + 3.25%), 8/15/34 | | | United States | | | | 1,125,043 | | | | 1,139,170 | |
| j | | Provident Funding Mortgage Loan Trust, FRN, | | | | | | | | | | | | |
| | 2003-1, B1, 3.738%, 8/25/33 | | | United States | | | | 86,592 | | | | 82,017 | |
| | 2004-1, B1, 3.843%, 4/25/34 | | | United States | | | | 55,580 | | | | 52,365 | |
| j | | Rali Trust, | | | | | | | | | | | | |
| | 2005-QA8, NB2, FRN, 3.749%, 7/25/35 | | | United States | | | | 110,184 | | | | 98,593 | |
| | 2005-QA8, NB3, FRN, 4.65%, 7/25/35 | | | United States | | | | 63,133 | | | | 53,015 | |
| i | | Securitized Asset Backed Receivables LLC Trust, 2004-OP2, A2, FRN, 2.66%, (1-Month USD LIBOR + 0.70%), 8/25/34 | | | United States | | | | 199,024 | | | | 190,108 | |
| | | | |
| 24 | | Annual Report | | franklintempleton.com |
FRANKLIN ALTERNATIVE STRATEGIES FUNDS
STATEMENT OF INVESTMENTS
Franklin K2 Long Short Credit Fund (continued)
| | | | | | | | | | | | | | |
| | | | | Country | | | Principal
Amount* | | | Value | |
| | | Asset-Backed Securities and Commercial Mortgage-Backed
Securities (continued) | | | | | | | | | |
| | | Mortgage Real Estate Investment Trusts (REITs) (continued) | | | | | | | | | |
| j | | Structured ARM Loan Trust, FRN, | | | | | | | | | | | | |
| | 2004-2, 1A1, 4.337%, 3/25/34 | | | United States | | | | 156,367 | | | $ | 155,806 | |
| | 2004-4, B1, 3.927%, 4/25/34 | | | United States | | | | 498,268 | | | | 454,194 | |
| i | | WaMu Mortgage Pass-Through Certificates Trust, 2007-OA3, 2A1A, FRN, 2.318%, (1 Year CMT + 0.76%), 4/25/47 | | | United States | | | | 78,191 | | | | 77,719 | |
| j | | Washington Mutual MSC Mortgage Pass-Through Certificates Series Trust, FRN, | | | | | | | | | | | | |
| | 2003-AR2, M, 3.194%, 5/25/33 | | | United States | | | | 155,824 | | | | 136,105 | |
| | 2003-AR3, B1, 3.685%, 6/25/33 | | | United States | | | | 397,701 | | | | 355,452 | |
| | Wells Fargo Mortgage Backed Securities Trust, | | | | | | | | | | | | |
| | j 2004-G, B1, FRN, 3.969%, 6/25/34 | | | United States | | | | 255,662 | | | | 237,094 | |
| | j 2005-AR2, 2A2, FRN, 3.912%, 3/25/35 | | | United States | | | | 106,981 | | | | 109,591 | |
| | 2006-19, A4, 5.25%, 12/26/36 | | | United States | | | | 337,472 | | | | 338,322 | |
| | 2007-3, 3B1, 5.50%, 4/25/22 | | | United States | | | | 401,743 | | | | 370,848 | |
| | | | | | | | | | | | | | |
| | | | | | | | | | | | | 17,967,970 | |
| | | | | | | | | | | | | | |
| | | Thrifts & Mortgage Finance 0.7% | | | | | | | | | |
| f,j | | FHLMC, 2018-SPI1, M2, 144A, FRN, 3.746%, 2/25/48 | | | United States | | | | 693,000 | | | | 611,020 | |
| | | | | | | | | | | | | | |
| | Total Asset-Backed Securities and Commercial Mortgage-Backed Securities (Cost $31,953,007) | | | | | | | | | | | 32,708,537 | |
| | | | | | | | | | | | | | |
| | | | | | | | | | | | | | | | | | |
| | | | | |
| | | | | Country | | | Number of
Contracts | | | Notional
Amount# | | | | |
| | | Options Purchased 0.1% | | | | | | | | | | | | |
| | | Calls – Exchange-Traded 0.0%† | | | | | | | | | | | | |
| | Bed Bath & Beyond Inc., January Strike Price $22.50, Expires 1/18/19 | | | United States | | | | 105 | | | | 10,500 | | | | 8,347 | |
| | Buckeye Partners LP, August Strike Price $40.00, Expires 8/17/18 | | | United States | | | | 52 | | | | 5,200 | | | | 2,600 | |
| | Buckeye Partners LP, August Strike Price $45.00, Expires 8/17/18 | | | United States | | | | 64 | | | | 6,400 | | | | 640 | |
| | Buckeye Partners LP, August Strike Price $50.00, Expires 8/17/18 | | | United States | | | | 60 | | | | 6,000 | | | | 300 | |
| | Buckeye Partners LP, November Strike Price $45.00, Expires 11/16/18 | | | United States | | | | 65 | | | | 6,500 | | | | 1,950 | |
| | Gray Television Inc., August Strike Price $12.50, Expires 8/17/18 | | | United States | | | | 76 | | | | 7,600 | | | | 2,280 | |
| | The Macerich Co., September Strike Price $65.00, Expires 9/21/18 | | | United States | | | | 32 | | | | 3,200 | | | | 1,840 | |
| | MBIA Inc., June Strike Price $10.00, Expires 6/15/18 | | | United States | | | | 78 | | | | 7,800 | | | | 312 | |
| | MBIA Inc., July Strike Price $10.00, Expires 7/20/18 | | | United States | | | | 78 | | | | 7,800 | | | | 546 | |
| | PG&E Corp., September Strike Price $50.00, Expires 9/21/18 | | | United States | | | | 45 | | | | 4,500 | | | | 5,850 | |
| | Sinclair Broadcast Group Inc., September Strike Price $40.00, Expires 9/21/18 | | | United States | | | | 161 | | | | 16,100 | | | | 4,428 | |
| | SunPower Corp., June Strike Price $9.00, Expires 6/15/18 | | | United States | | | | 3 | | | | 300 | | | | 45 | |
| | SunPower Corp., June Strike Price $10.00, Expires 6/15/18 | | | United States | | | | 105 | | | | 10,500 | | | | 525 | |
| | Trinity Industries Inc., July Strike Price $40.00, Expires 7/20/18 | | | United States | | | | 18 | | | | 1,800 | | | | 252 | |
| | | | | | | | | | | | | | | | | | |
| | | | | | | | | | | | | | | | | 29,915 | |
| | | | | | | | | | | | | | | | | | |
| | | Puts – Exchange-Traded 0.1% | | | | | | | | | | | | |
| | Dean Foods Co., June Strike Price $8.00, Expires 6/15/18 | | | United States | | | | 72 | | | | 7,200 | | | | 216 | |
| | Facebook Inc., January Strike Price $150.00, Expires 1/18/19 | | | United States | | | | 10 | | | | 1,000 | | | | 2,860 | |
| | GTT Communications Inc., August Strike Price $40.00, Expires 8/17/18 | | | United States | | | | 28 | | | | 2,800 | | | | 3,290 | |
| | Kohl’s Corp., October Strike Price $50.00, Expires 10/19/18 | | | United States | | | | 48 | | | | 4,800 | | | | 3,960 | |
| | S&P 500 Index, June Strike Price $2,550.00, Expires 6/15/18 | | | United States | | | | 28 | | | | 2,800 | | | | 9,240 | |
| | | | | | |
| franklintempleton.com | | Annual Report | | | 25 | |
FRANKLIN ALTERNATIVE STRATEGIES FUNDS
STATEMENT OF INVESTMENTS
Franklin K2 Long Short Credit Fund (continued)
| | | | | | | | | | | | | | | | | | |
| | | | | Country | | | Number of
Contracts | | | Notional
Amount# | | | Value | |
| | | Options Purchased (continued) | | | | | | | | | | | | |
| | | Puts – Exchange-Traded (continued) | | | | | | | | | | | | |
| | S&P 500 Index, June Strike Price $2,600.00, Expires 6/15/18 | | | United States | | | | 29 | | | | 2,900 | | | $ | 15,863 | |
| | S&P 500 Index, June Strike Price $2,575.00, Expires 6/29/18 | | | United States | | | | 19 | | | | 1,900 | | | | 19,228 | |
| | SPDR S&P 500 ETF Trust, August Strike Price $263.00, Expires 8/17/18 | | | United States | | | | 110 | | | | 11,000 | | | | 43,780 | |
| | Teva Pharmaceutical Industries Ltd., ADR, January Strike Price $15.00, Expires 1/18/19 | | | Israel | | | | 40 | | | | 4,000 | | | | 1,840 | |
| | Teva Pharmaceutical Industries Ltd., ADR, January Strike Price $20.00, Expires 1/18/19 | | | Israel | | | | 41 | | | | 4,100 | | | | 7,052 | |
| | | | | | | | | | | | | | | | | | |
| | | | | | | | | | | | | | | | | 107,329 | |
| | | | | | | | | | | | | | | | | | |
| | Total Options Purchased (Cost $240,305) | | | | | | | | | | | | | | | 137,244 | |
| | | | | | | | | | | | | | | | | | |
| | | | | | | | | | | | | | |
| | | | |
| | | | | Country | | | Principal
Amount* | | | | |
| | | U.S. Government and Agency Securities 0.6% | | | | | | | | | |
| | U.S. Treasury Bond, 3.00%, 2/15/48 | | | United States | | | | 109,000 | | | | 108,615 | |
| | U.S. Treasury Note, 2.50%, 3/31/23 | | | United States | | | | 445,000 | | | | 441,349 | |
| | | | | | | | | | | | | | |
| | Total U.S. Government and Agency Securities
(Cost $547,530) | | | | | | | | | | | 549,964 | |
| | | | | | | | | | | | | | |
| | Total Investments before Short Term Investments
(Cost $79,221,592) | | | | | | | | | | | 81,504,817 | |
| | | | | | | | | | | | | | |
| | | Short Term Investments 15.5% | | | | | | | | | |
| | | Foreign Government and Agency Securities (Cost $127,775) 0.1% | | | | | | | | | |
| l | | Argentina Treasury Bill, 9/14/18 | | | Argentina | | | | 2,575,745 | ARS | | | 105,711 | |
| | | | | | | | | | | | | | |
| | | | |
| | | | | | | | Shares | | | | |
| | | Money Market Funds (Cost $10,696,709) 11.5% | | | | | | | | | |
| m | | Fidelity Investments Money Market Funds, 1.68% | | | United States | | | | 10,696,709 | | | | 10,696,709 | |
| | | | | | | | | | | | | | |
| | | | |
| | | | | | | | Principal
Amount* | | | | |
| | | Repurchase Agreements (Cost $3,609,485) 3.9% | | | | | | | | | |
| n | | Joint Repurchase Agreement, 1.76%, 6/01/18
(Maturity Value $3,609,662)
| | | United States | | | | 3,609,485 | | | | 3,609,485 | |
| | BNP Paribas Securities Corp. (Maturity Value $1,587,674)
Deutsche Bank Securities Inc. (Maturity Value $235,855)
HSBC Securities (USA) Inc. (Maturity Value $1,587,674)
Merrill Lynch, Pierce, Fenner & Smith Inc. (Maturity Value $198,459) | | | | | | | | | | | | |
| | Collateralized by U.S. Government Agency Securities, 1.375% - 1.875%, 9/18/18 - 5/01/20; lU.S. Treasury Bill, 12/06/18 - 4/25/19; and U.S. Treasury Note, 0.875% - 3.50%, 10/31/18 - 10/31/21 (valued at $3,684,815) | | | | | | | | | | | | |
| | | | | | | | | | | | | | |
| | Total Investments (Cost $93,655,561) 102.8% | | | | | | | | | | | 95,916,722 | |
| | Options Written (0.1)% | | | | | | | | | | | (88,237 | ) |
| | Securities Sold Short (10.0)% | | | | | | | | | | | (9,338,940 | ) |
| | Other Assets, less Liabilities 7.3% | | | | | | | | | | | 6,789,513 | |
| | | | | | | | | | | | | | |
| | Net Assets 100.0% | | | | | | | | | | $ | 93,279,058 | |
| | | | | | | | | | | | | | |
| | | | |
| 26 | | Annual Report | | franklintempleton.com |
FRANKLIN ALTERNATIVE STRATEGIES FUNDS
STATEMENT OF INVESTMENTS
Franklin K2 Long Short Credit Fund (continued)
| | | | | | | | | | | | | | | | | | |
| | | | | Country | | | Number of
Contracts | | | Notional
Amount# | | | Value | |
| o | | Options Written (0.1)% | | | | | | | | | | | | |
| | | Calls – Exchange-Traded (0.0)%† | | | | | | | | | | | | |
| | Altice USA Inc., June Strike Price $19.00, Expires 6/15/18 | | | United States | | | | 100 | | | | 10,000 | | | $ | (6,000 | ) |
| | Enterprise Products Partners LP, July Strike Price $29.00, Expires 7/20/18 | | | United States | | | | 43 | | | | 4,300 | | | | (3,225 | ) |
| | The Macerich Co., September Strike Price $75.00, Expires 9/21/18 | | | United States | | | | 32 | | | | 3,200 | | | | (1,440 | ) |
| | NorthStar Realty Europe Corp., September Strike Price $15.00, Expires 9/21/18 | | | United States | | | | 156 | | | | 15,600 | | | | (5,460 | ) |
| | NRG Yield Inc., C, August Strike Price $17.50, Expires 8/17/18 | | | United States | | | | 98 | | | | 9,800 | | | | (7,350 | ) |
| | Targa Resources Corp., June Strike Price $50.00, Expires 6/15/18 | | | United States | | | | 10 | | | | 1,000 | | | | (450 | ) |
| | | | | | | | | | | | | | | | | | |
| | | | | | | | | | | | | | | | | (23,925 | ) |
| | | | | | | | | | | | | | | | | | |
| | | Puts – Exchange-Traded (0.1)% | | | | | | | | | | | | |
| | Buckeye Partners LP, November Strike Price $30.00, Expires 11/16/18 | | | United States | | | | 64 | | | | 6,400 | | | | (6,336 | ) |
| | NRG Yield Inc., A, June Strike Price $20.00, Expires 6/15/18 | | | United States | | | | 78 | | | | 7,800 | | | | (20,085 | ) |
| | NRG Yield Inc., C, August Strike Price $15.00, Expires 8/17/18 | | | United States | | | | 134 | | | | 13,400 | | | | (1,675 | ) |
| | SPDR S&P 500 ETF Trust, August Strike Price $270.00, Expires 8/17/18 | | | United States | | | | 44 | | | | 4,400 | | | | (26,136 | ) |
| | Time Warner Inc., August Strike Price $85.00, Expires 8/17/18 | | | United States | | | | 56 | | | | 5,600 | | | | (10,080 | ) |
| | | | | | | | | | | | | | | | | | |
| | | | | | | | | | | | | | | | | (64,312 | ) |
| | | | | | | | | | | | | | | | | | |
| | Total Options Written
(Premiums Received $94,949) | | | | | | | | | | | | | | | (88,237 | ) |
| | | | | | | | | | | | | | | | | | |
| | | | | | | | | | | | | | |
| | | | |
| | | | | Country | | | Shares | | | | |
| p | | Securities Sold Short (10.0)% | | | | | | | | | |
| | | Common Stocks (1.2)% | | | | | | | | | |
| | | Energy Equipment & Services (0.1)% | | | | | | | | | |
| | SEACOR Holdings Inc. | | | United States | | | | 894 | | | | (46,694 | ) |
| | Weatherford International PLC | | | United States | | | | 19,934 | | | | (67,576 | ) |
| | | | | | | | | | | | | | |
| | | | | | | | | | | | | (114,270 | ) |
| | | | | | | | | | | | | | |
| | | Equity Real Estate Investment Trusts (REITs) (0.3)% | | | | | | | | | |
| | Seritage Growth Properties, A | | | United States | | | | 6,061 | | | | (252,501 | ) |
| | | | | | | | | | | | | | |
| | | Independent Power & Renewable Electricity Producers (0.5)% | | | | | | | | | |
| | NRG Yield Inc., C | | | United States | | | | 24,537 | | | | (429,398 | ) |
| | | | | | | | | | | | | | |
| | | Internet & Direct Marketing Retail (0.1)% | | | | | | | | | |
| | Wayfair Inc., A | | | United States | | | | 895 | | | | (82,653 | ) |
| | | | | | | | | | | | | | |
| | | Media (0.2)% | | | | | | | | | |
| q | | Altice USA Inc., A, when-issued | | | United States | | | | 10,256 | | | | (200,607 | ) |
| | | | | | | | | | | | | | |
| | | Professional Services (0.0)%† | | | | | | | | | |
| | CoStar Group Inc. | | | United States | | | | 107 | | | | (40,791 | ) |
| | | | | | | | | | | | | | |
| | | Total Common Stocks (Proceeds $1,137,280) | | | | | | | | (1,120,220) | |
| | | | | | | | | | | | | | |
| | | | |
| | | | | | | | Principal
Amount* | | | | |
| | | Convertible Bonds (Proceeds $27,755) (0.0)%† | | | | | | | | | |
| | | Electrical Equipment (0.0)%† | | | | | | | | | |
| | SolarCity Corp., senior note, 1.625%, 11/01/19 | | | United States | | | | 30,000 | | | | (27,784 | ) |
| | | | | | | | | | | | | | |
| | | | | | |
| franklintempleton.com | | Annual Report | | | 27 | |
FRANKLIN ALTERNATIVE STRATEGIES FUNDS
STATEMENT OF INVESTMENTS
Franklin K2 Long Short Credit Fund (continued)
| | | | | | | | | | | | | | |
| | | | | Country | | | Principal
Amount* | | | Value | |
| p | | Securities Sold Short (continued) | | | | | | | | | |
| | | Corporate Bonds and Notes (8.1)% | | | | | | | | | |
| | | Auto Components (0.2)% | | | | | | | | | |
| f | | Drivetime Automotive Group Inc., senior secured note, 144A, 8.00%, 6/01/21 | | | United States | | | | 155,000 | | | $ | (155,775 | ) |
| | | | | | | | | | | | | | |
| | | Chemicals (0.7)% | | | | | | | | | |
| f | | CVR Partners LP / CVR Nitrogen Finance Corp., senior note, 144A, 9.25%, 6/15/23 | | | United States | | | | 432,000 | | | | (445,500 | ) |
| g | | K+S AG, Reg S, | | | | | | | | | | | | |
| | senior bond, 3.00%, 6/20/22 | | | Germany | | | | 83,000 | EUR | | | (103,436 | ) |
| | senior note, 2.625%, 4/06/23 | | | Germany | | | | 100,000 | EUR | | | (122,002 | ) |
| | | | | | | | | | | | | | |
| | | | | | | | | | | | | (670,938 | ) |
| | | | | | | | | | | | | | |
| | | Commercial Services & Supplies (0.2)% | | | | | | | | | |
| | Quad/Graphics Inc., senior note, 7.00%, 5/01/22 | | | United States | | | | 105,000 | | | | (105,919 | ) |
| f | | West Corp., senior note, 144A, 8.50%, 10/15/25 | | | United States | | | | 73,000 | | | | (68,072 | ) |
| | | | | | | | | | | | | | |
| | | | | | | | | | | | | (173,991 | ) |
| | | | | | | | | | | | | | |
| | | Communications Equipment (0.1)% | | | | | | | | | |
| f | | Plantronics Inc., senior note, 144A, 5.50%, 5/31/23 | | | United States | | | | 69,000 | | | | (68,827 | ) |
| | | | | | | | | | | | | | |
| | | Construction & Engineering (0.1)% | | | | | | | | | |
| g | | Astaldi SpA, senior note, Reg S, 7.125%, 12/01/20 | | | Italy | | | | 142,000 | EUR | | | (122,135 | ) |
| | | | | | | | | | | | | | |
| | | Containers & Packaging (0.1)% | | | | | | | | | |
| f | | Plastipak Holdings Inc., senior note, 144A, 6.25%, 10/15/25 | | | United States | | | | 102,000 | | | | (97,920 | ) |
| | | | | | | | | | | | | | |
| | | Diversified Financial Services (0.3)% | | | | | | | | | |
| g | | Garfunkelux Holdco 2 SA, secured note, Reg S, 11.00%, 11/01/23 | | | Luxembourg | | | | 200,000 | GBP | | | (273,121 | ) |
| | | | | | | | | | | | | | |
| | | Diversified Telecommunication Services (0.5)% | | | | | | | | | |
| | AT&T Inc., senior bond, 4.55%, 3/09/49 | | | United States | | | | 167,000 | | | | (148,895 | ) |
| f | | Frontier Communications Corp., secured note, 144A, 8.50%, 4/01/26 | | | United States | | | | 300,000 | | | | (291,750 | ) |
| | | | | | | | | | | | | | |
| | | | | | | | | | | | | (440,645 | ) |
| | | | | | | | | | | | | | |
| | | Electric Utilities (0.2)% | | | | | | | | | |
| g | | Eskom Holdings SOC Ltd., senior bond, Reg S, 7.125%, 2/11/25 | | | South Africa | | | | 200,000 | | | | (201,868 | ) |
| | | | | | | | | | | | | | |
| | | Energy Equipment & Services (0.1)% | | | | | | | | | |
| f | | Precision Drilling Corp., senior note, 144A, 7.125%, 1/15/26 | | | Canada | | | | 109,000 | | | | (111,453 | ) |
| | | | | | | | | | | | | | |
| | | Equity Real Estate Investment Trusts (REITs) (0.0)%† | | | | | | | | | |
| f | | Rayonier AM Products Inc., senior bond, 144A, 5.50%, 6/01/24 | | | United States | | | | 22,000 | | | | (20,900 | ) |
| | | | | | | | | | | | | | |
| | | Food & Staples Retailing (0.3)% | | | | | | | | | |
| g | | Rallye SA, E, senior note, Reg S, 4.00%, 4/02/21 | | | France | | | | 200,000 | EUR | | | (229,528 | ) |
| | | | | | | | | | | | | | |
| | | Health Care Providers & Services (0.5)% | | | | | | | | | |
| f | | Air Medical Group Holdings Inc., senior note, 144A, 6.375%, 5/15/23 | | | United States | | | | 58,000 | | | | (54,955 | ) |
| f | | Mallinckrodt International Finance SA / Mallinckrodt CB LLC, senior note, 144A, 5.75%, 8/01/22 | | | United States | | | | 425,000 | | | | (369,750 | ) |
| f | | West Street Merger Sub Inc., senior note, 144A, 6.375%, 9/01/25 | | | United States | | | | 78,000 | | | | (74,880 | ) |
| | | | | | | | | | | | | | |
| | | | | | | | | | | | | (499,585 | ) |
| | | | | | | | | | | | | | |
| | | Hotels, Restaurants & Leisure (0.3)% | | | | | | | | | |
| f | | CRC Escrow Issuer LLC / CRC Finco Inc., senior note, 144A, 5.25%, 10/15/25 | | | United States | | | | 169,000 | | | | (162,240 | ) |
| f | | Mohegan Gaming & Entertainment, senior note, 144A, 7.875%, 10/15/24 | | | United States | | | | 166,000 | | | | (158,530 | ) |
| | | | | | | | | | | | | | |
| | | | | | | | | | | | | (320,770 | ) |
| | | | | | | | | | | | | | |
| | | Independent Power & Renewable Electricity Producers (0.2)% | | | | | | | | | |
| | Calpine Corp., senior bond, 5.75%, 1/15/25 | | | United States | | | | 237,000 | | | | (216,263 | ) |
| | | | | | | | | | | | | | |
| | | | |
| 28 | | Annual Report | | franklintempleton.com |
FRANKLIN ALTERNATIVE STRATEGIES FUNDS
STATEMENT OF INVESTMENTS
Franklin K2 Long Short Credit Fund (continued)
| | | | | | | | | | | | | | |
| | | | | Country | | | Principal
Amount* | | | Value | |
| p | | Securities Sold Short (continued) | | | | | | | | | |
| | | Internet Software & Services (0.5)% | | | | | | | | | |
| f | | GTT Communications Inc., senior note, 144A, 7.875%, 12/31/24 | | | United States | | | | 438,000 | | | $ | (440,190 | ) |
| | | | | | | | | | | | | | |
| | | Leisure Equipment & Products (0.1)% | | | | | | | | | |
| | Vista Outdoor Inc., senior note, 5.875%, 10/01/23 | | | United States | | | | 83,000 | | | | (78,435 | ) |
| | | | | | | | | | | | | | |
| | | Machinery (0.1)% | | | | | | | | | |
| g | | Galapagos Holding SA, senior secured note, first lien, Reg S, 7.00%, 6/15/22 | | | Luxembourg | | | | 117,000 | EUR | | | (94,947 | ) |
| | | | | | | | | | | | | | |
| | | Media (0.8)% | | | | | | | | | |
| g | | Altice Luxembourg SA, senior bond, Reg S, 6.25%, 2/15/25 | | | Luxembourg | | | | 300,000 | EUR | | | (342,529 | ) |
| f | | Altice Luxembourg SA, senior bond, 144A, 7.625%, 2/15/25 | | | Luxembourg | | | | 384,000 | | | | (341,284 | ) |
| | AMC Entertainment Holdings Inc., senior note, 5.75%, 6/15/25 | | | United States | | | | 100,000 | | | | (98,125 | ) |
| | | | | | | | | | | | | | |
| | | | | | | | | | | | | (781,938 | ) |
| | | | | | | | | | | | | | |
| | | Multiline Retail (0.1)% | | | | | | | | | |
| | Kohl’s Corp., senior bond, 4.25%, 7/17/25 | | | United States | | | | 89,000 | | | | (88,851 | ) |
| | | | | | | | | | | | | | |
| | | Oil, Gas & Consumable Fuels (0.5)% | | | | | | | | | |
| | Petroleos de Venezuela SA, 8.50%, 10/27/20 | | | Venezuela | | | | 175,500 | | | | (150,053 | ) |
| | Southwestern Energy Co., senior bond, 7.75%, 10/01/27 | | | United States | | | | 311,000 | | | | (326,550 | ) |
| | | | | | | | | | | | | | |
| | | | | | | | | | | | | (476,603 | ) |
| | | | | | | | | | | | | | |
| | | Pharmaceuticals (1.5)% | | | | | | | | | |
| | Mylan NV, senior note, 3.95%, 6/15/26 | | | United States | | | | 145,000 | | | | (138,477 | ) |
| | Teva Pharmaceutical Finance Co. LLC, senior bond, 6.15%, 2/01/36 | | | Israel | | | | 122,000 | | | | (118,523 | ) |
| | Teva Pharmaceutical Finance Netherlands III BV, | | | | | | | | | | | | |
| | senior bond, 3.15%, 10/01/26 | | | Israel | | | | 222,000 | | | | (179,601 | ) |
| | senior note, 6.75%, 3/01/28 | | | Israel | | | | 944,000 | | | | (957,800 | ) |
| | | | | | | | | | | | | | |
| | | | | | | | | | | | | (1,394,401 | ) |
| | | | | | | | | | | | | | |
| | | Specialty Retail (0.2)% | | | | | | | | | |
| f | | Staples Inc., senior note, 144A, 8.50%, 9/15/25 | | | United States | | | | 165,000 | | | | (155,018 | ) |
| | | | | | | | | | | | | | |
| | | Wireless Telecommunication Services (0.5)% | | | | | | | | | |
| g | | Digicel Group Ltd., senior note, Reg S, 7.125%, 4/01/22 | | | Jamaica | | | | 565,000 | | | | (394,794 | ) |
| | Sprint Corp., senior note, 7.625%, 2/15/25 | | | United States | | | | 39,000 | | | | (40,267 | ) |
| | | | | | | | | | | | | | |
| | | | | | | | | | | | | (435,061 | ) |
| | | | | | | | | | | | | | |
| | | Total Corporate Bonds and Notes (Proceeds $7,850,471) | | | | | | | | (7,549,163) | |
| | | | | | | | | | | | | | |
| | Foreign Government and Agency Securities (Proceeds $358,931) (0.3)% | | | | | | | | | | | | |
| | Italian Treasury Bond, senior bond, 2.00%, 2/01/28 | | | Italy | | | | 285,000 | EUR | | | (310,068 | ) |
| | | | | | | | | | | | | | |
| | U.S. Government and Agency Securities (Proceeds $330,713) (0.4)% | | | | | | | | | | | | |
| | U.S. Treasury Note, 2.875%, 5/15/28 | | | United States | | | | 331,000 | | | | (331,705 | ) |
| | | | | | | | | | | | | | |
| | Total Securities Sold Short (Proceeds $9,705,150) | | | | | | | | | | $ | (9,338,940 | ) |
| | | | | | | | | | | | | | |
| | | | | | |
| franklintempleton.com | | Annual Report | | | 29 | |
FRANKLIN ALTERNATIVE STRATEGIES FUNDS
STATEMENT OF INVESTMENTS
Franklin K2 Long Short Credit Fund (continued)
See Abbreviations on page 54.
†Rounds to less than 0.1% of net assets.
*The principal amount is stated in U.S. dollars unless otherwise indicated.
# Notional amount is the number of units specified in the contract, and can include currency units, bushels, shares, pounds, barrels or other units. Currency units are stated in U.S. dollars unless otherwise indicated.
aNon-income producing.
bSee Note 10 regarding fair value measurements.
cA portion or all of the security has been segregated as collateral for securities sold short, open swap contracts, open forward exchange contracts, open futures contracts and open written option contracts. At May 31, 2018, the aggregate value of these securities and/or cash pledged amounted to $16,121,577, representing 17.3% of net assets.
dA portion or all of the security is held in connection with written option contracts open at period end.
eThe coupon rate shown represents the rate at period end.
fSecurity was purchased pursuant to Rule 144A under the Securities Act of 1933 and may be sold in transactions exempt from registration only to qualified institutional buyers or in public offering registered under the Securities Act of 1933. These securities have been deemed liquid under guidelines approved by the Trust’s Board of Trustees. At May 31, 2018, the net value of these securities was $37,848,043, representing 40.6% of net assets.
gSecurity was purchased pursuant to Regulation S under the Securities Act of 1933, which exempts from registration securities offered and sold outside of the United States. Such a security cannot be sold in the United States without either an effective registration statement filed pursuant to the Securities Act of 1933, or pursuant to an exemption from registration. These securities have been deemed liquid under guidelines approved by the Trust’s Board of Trustees. At May 31, 2018, the net value of these securities was $1,583,314, representing 1.7% of net assets.
hIncome may be received in additional securities and/or cash.
iThe coupon rate shown represents the rate inclusive of any caps or floors, if applicable, in effect at period end.
jAdjustable rate security with an interest rate that is not based on a published reference index and spread. The rate is based on the structure of the agreement and current market conditions. The coupon rate shown represents the rate at period end.
kA portion or all of the security purchased on a delayed delivery basis. See Note 1(d).
lThe security was issued on a discount basis with no stated coupon rate.
mThe rate shown is the annualized seven-day yield at period end.
nSee Note 1(c) regarding joint repurchase agreement.
oSee Note 1(e) regarding written options.
pSee Note 1(g) regarding securities sold short.
qSecurity sold on a when-issued basis resulting in a short position. As such, the Fund is not subject to the deposit requirement or fees and expenses associated with short sale transactions. See Note 1(g).
At May 31, 2018, the Fund had the following futures contracts outstanding. See Note 1(e).
| | | | | | | | | | | | | | | | | | | | |
| Futures Contracts | | | | | | | | | | | | | | | |
| Description | | Type | | | Number of
Contracts | | | Notional
Amount* | | | Expiration
Date | | | Value/Unrealized
Appreciation
(Depreciation) | |
| Equity Contracts | | | | | | | | | | | | | | | | | | | | |
S&P 500 E-Mini Index | | | Short | | | | 3 | | | $ | 405,825 | | | | 6/15/18 | | | $ | (5,376 | ) |
| | | | | |
| Interest Rate Contracts | | | | | | | | | | | | | | | | | | | | |
Euro BUXL 30 Yr. Bond | | | Short | | | | 2 | | | | 399,252 | | | | 6/07/18 | | | | (21,252 | ) |
Euro-BTP | | | Short | | | | 1 | | | | 147,545 | | | | 6/07/18 | | | | 15,152 | |
Euro-Bund | | | Short | | | | 1 | | | | 189,549 | | | | 6/07/18 | | | | (481 | ) |
U.S. Treasury 5 Yr. Note | | | Short | | | | 4 | | | | 455,562 | | | | 9/28/18 | | | | 211 | |
U.S. Treasury 10 Yr. Note | | | Short | | | | 1 | | | | 120,438 | | | | 9/19/18 | | | | (399 | ) |
| | | | | | | | | | | | | | | | | | | | |
| | | | | | | | | | | 1,312,346 | | | | | | | | (6,769 | ) |
| | | | | | | | | | | | | | | | | | | | |
Total Futures Contracts | | | $ | (12,145 | ) |
| | | | | | | | | | | | | | | | | | | | |
*As of period end.
| | | | |
| 30 | | Annual Report | | franklintempleton.com |
FRANKLIN ALTERNATIVE STRATEGIES FUNDS
STATEMENT OF INVESTMENTS
Franklin K2 Long Short Credit Fund (continued)
At May 31, 2018, the Fund had the following forward exchange contracts outstanding. See Note 1(e).
| | | | | | | | | | | | | | | | | | | | | | | | | | | | | | | | |
| Forward Exchange Contracts | | | | | | | | | | | | | | | | | | | |
| Currency | | Counterpartya | | | Type | | | Quantity | | | Contract
Amount* | | | Settlement
Date | | | Unrealized
Appreciation | | | Unrealized
Depreciation | |
| OTC Forward Exchange Contracts | | | | | | | | | | | | | | | | | | | | | |
Argentine Peso | | | JPHQ | | | | Sell | | | | 3,937,112 | | | | 186,644 | | | | | | | | 6/04/18 | | | $ | 29,575 | | | $ | — | |
Brazilian Real | | | JPHQ | | | | Buy | | | | 2,335,946 | | | | 648,394 | | | | | | | | 6/04/18 | | | | 965 | | | | (22,344 | ) |
Brazilian Real | | | JPHQ | | | | Sell | | | | 2,335,946 | | | | 634,713 | | | | | | | | 6/04/18 | | | | 8,663 | | | | (964 | ) |
South Korean Won | | | JPHQ | | | | Buy | | | | 182,762,470 | | | | 170,012 | | | | | | | | 6/04/18 | | | | — | | | | (443 | ) |
South Korean Won | | | JPHQ | | | | Sell | | | | 182,762,470 | | | | 170,233 | | | | | | | | 6/04/18 | | | | 664 | | | | — | |
Peruvian Nuevo Sol | | | JPHQ | | | | Buy | | | | 541,908 | | | | 164,965 | | | | | | | | 6/07/18 | | | | 598 | | | | — | |
Peruvian Nuevo Sol | | | JPHQ | | | | Sell | | | | 1,640,804 | | | | 500,894 | | | | | | | | 6/07/18 | | | | 82 | | | | (482 | ) |
Argentine Peso | | | JPHQ | | | | Sell | | | | 1,849,253 | | | | 70,448 | | | | | | | | 6/18/18 | | | | — | | | | (2,240 | ) |
Indian Rupee | | | JPHQ | | | | Sell | | | | 17,172,879 | | | | 252,264 | | | | | | | | 6/18/18 | | | | — | | | | (1,696 | ) |
Peruvian Nuevo Sol | | | JPHQ | | | | Sell | | | | 559,199 | | | | 170,358 | | | | | | | | 6/18/18 | | | | — | | | | (353 | ) |
Chinese Yuan | | | JPHQ | | | | Sell | | | | 1,393,279 | | | | 219,021 | | | | | | | | 6/20/18 | | | | 1,897 | | | | — | |
Euro | | | JPHQ | | | | Buy | | | | 988,579 | | | | 1,184,724 | | | | | | | | 6/20/18 | | | | 114 | | | | (27,263 | ) |
Euro | | | JPHQ | | | | Sell | | | | 1,822,605 | | | | 2,211,724 | | | | | | | | 6/20/18 | | | | 78,367 | | | | (827 | ) |
Euro | | | JPHQ | | | | Sell | | | | 284,437 | | | | 2,174,634 | | | | CNY | | | | 6/20/18 | | | | 8,270 | | | | (2,444 | ) |
Euro | | | JPHQ | | | | Sell | | | | 551,683 | | | | 14,030,277 | | | | CZK | | | | 6/20/18 | | | | 37,590 | | | | (47,581 | ) |
Euro | | | JPHQ | | | | Sell | | | | 233,496 | | | | 1,095,075 | | | | RON | | | | 6/20/18 | | | | 15,927 | | | | (14,786 | ) |
Indian Rupee | | | JPHQ | | | | Sell | | | | 11,481,886 | | | | 175,296 | | | | | | | | 6/20/18 | | | | 5,535 | | | | — | |
Japanese Yen | | | JPHQ | | | | Buy | | | | 1,070,772 | | | | 10,027 | | | | | | | | 6/20/18 | | | | — | | | | (170 | ) |
Japanese Yen | | | JPHQ | | | | Sell | | | | 1,070,772 | | | | 10,110 | | | | | | | | 6/20/18 | | | | 253 | | | | — | |
Mexican Peso | | | JPHQ | | | | Buy | | | | 9,579,509 | | | | 505,713 | | | | | | | | 6/20/18 | | | | — | | | | (27,134 | ) |
Mexican Peso | | | JPHQ | | | | Sell | | | | 9,579,509 | | | | 516,961 | | | | | | | | 6/20/18 | | | | 38,382 | | | | — | |
Romanian Leu | | | JPHQ | | | | Sell | | | | 1,855,498 | | | | 395,510 | | | | EUR | | | | 6/20/18 | | | | 20,100 | | | | (22,181 | ) |
Russian Ruble | | | JPHQ | | | | Buy | | | | 71,102,094 | | | | 1,145,945 | | | | | | | | 6/20/18 | | | | 1,032 | | | | (10,802 | ) |
Russian Ruble | | | JPHQ | | | | Sell | | | | 78,145,382 | | | | 1,314,525 | | | | | | | | 6/20/18 | | | | 65,802 | | | | — | |
Singapore Dollar | | | JPHQ | | | | Buy | | | | 182,879 | | | | 136,876 | | | | | | | | 6/20/18 | | | | — | | | | (231 | ) |
Singapore Dollar | | | JPHQ | | | | Sell | | | | 182,879 | | | | 136,968 | | | | | | | | 6/20/18 | | | | 323 | | | | — | |
South African Rand | | | JPHQ | | | | Buy | | | | 7,724,278 | | | | 637,085 | | | | | | | | 6/20/18 | | | | — | | | | (31,961 | ) |
South African Rand | | | JPHQ | | | | Sell | | | | 25,191,523 | | | | 2,039,555 | | | | | | | | 6/20/18 | | | | 68,061 | | | | (2,027 | ) |
Turkish Lira | | | JPHQ | | | | Buy | | | | 5,946,337 | | | | 1,390,172 | | | | | | | | 6/20/18 | | | | 411 | | | | (87,871 | ) |
Turkish Lira | | | JPHQ | | | | Sell | | | | 5,938,400 | | | | 1,399,475 | | | | | | | | 6/20/18 | | | | 98,502 | | | | — | |
Indian Rupee | | | JPHQ | | | | Buy | | | | 11,536,504 | | | | 168,569 | | | | | | | | 6/21/18 | | | | 1,980 | | | | — | |
Indian Rupee | | | JPHQ | | | | Sell | | | | 11,536,504 | | | | 169,293 | | | | | | | | 6/21/18 | | | | — | | | | (1,256 | ) |
Indonesian Rupiah | | | JPHQ | | | | Buy | | | | 4,739,133,629 | | | | 337,185 | | | | | | | | 6/21/18 | | | | 3,042 | | | | — | |
Taiwan Dollar | | | JPHQ | | | | Sell | | | | 11,638,857 | | | | 389,546 | | | | | | | | 6/21/18 | | | | 467 | | | | — | |
Indian Rupee | | | JPHQ | | | | Buy | | | | 11,584,428 | | | | 169,281 | | | | | | | | 6/22/18 | | | | 1,957 | | | | — | |
Indian Rupee | | | JPHQ | | | | Sell | | | | 11,584,428 | | | | 169,326 | | | | | | | | 6/22/18 | | | | — | | | | (1,912 | ) |
British Pound | | | JPHQ | | | | Sell | | | | 90,000 | | | | 127,680 | | | | | | | | 6/29/18 | | | | 7,853 | | | | — | |
Canadian Dollar | | | JPHQ | | | | Sell | | | | 80,000 | | | | 62,387 | | | | | | | | 6/29/18 | | | | 634 | | | | — | |
Brazilian Real | | | JPHQ | | | | Buy | | | | 612,834 | | | | 167,567 | | | | | | | | 7/03/18 | | | | — | | | | (3,536 | ) |
Egyptian Pound | | | BZWS | | | | Sell | | | | 2,517,950 | | | | 136,674 | | | | | | | | 8/16/18 | | | | — | | | | (988 | ) |
Egyptian Pound | | | BZWS | | | | Sell | | | | 759,572 | | | | 41,236 | | | | | | | | 8/23/18 | | | | — | | | | (206 | ) |
Chinese Yuan | | | JPHQ | | | | Buy | | | | 950,952 | | | | 149,237 | | | | | | | | 8/24/18 | | | | — | | | | (1,480 | ) |
Taiwan Dollar | | | JPHQ | | | | Sell | | | | 4,427,113 | | | | 149,237 | | | | | | | | 8/24/18 | | | | 449 | | | | — | |
Euro | | | JPHQ | | | | Buy | | | | 360,000 | | | | 453,155 | | | | | | | | 9/28/18 | | | | — | | | | (28,279 | ) |
Euro | | | JPHQ | | | | Sell | | | | 840,000 | | | | 1,046,227 | | | | | | | | 9/28/18 | | | | 56,800 | | | | (1,950 | ) |
| | | | | | | | | | | | | | | | | | | | | | | | | | | | |
Total Forward Exchange Contracts | | | $ | 554,295 | | | $ | (343,407 | ) |
| | | | | | | | | | | | | | | | | | | | | | | | | | | | |
Net unrealized appreciation (depreciation) | | | $ | 210,888 | | | | | |
| | | | | | | | | | | | | | | | | | | | | | | | | | | | | | | | |
*In U.S. dollars unless otherwise indicated.
aMay be comprised of multiple contracts with the same counterparty, currency and settlement date.
| | | | | | |
| franklintempleton.com | | Annual Report | | | 31 | |
FRANKLIN ALTERNATIVE STRATEGIES FUNDS
STATEMENT OF INVESTMENTS
Franklin K2 Long Short Credit Fund (continued)
At May 31, 2018, the Fund had the following credit default swap contracts outstanding. See Note 1(e).
Credit Default Swap Contracts
| | | | | | | | | | | | | | | | | | | | | | | | | | | | | | | | | | | | |
| Description | | Periodic
Payment
Rate
Received
(Paid) | | | Payment
Frequency | | | | | | Maturity
Date | | | Notional
Amounta | | | Value | | | Unamortized
Upfront
Payments
(Receipts) | | | Unrealized
Appreciation
(Depreciation) | | | Ratingb | |
| Centrally Cleared Swap Contracts | | | | | | | | | | | | | | | | | | | | | | | | | | | | | | | | | | | | |
| | | | | | | | | |
| Contracts to Buy Protectionc | | | | | | | | | | | | | | | | | | | | | | | | | | | | | | | | | | | | |
| | | | | | | | | |
| Single Name | | | | | | | | | | | | | | | | | | | | | | | | | | | | | | | | | | | | |
Government of Mexico | | | (1.00 | %) | | | Quarterly | | | | | | | | 6/20/23 | | | | 341,000 | | | $ | 6,271 | | | $ | 647 | | | $ | 5,624 | | | | | |
Government of South Africa | | | (1.00 | %) | | | Quarterly | | | | | | | | 12/20/21 | | | | 394,000 | | | | 4,050 | | | | 26,965 | | | | (22,915 | ) | | | | |
Government of South Africa | | | (1.00 | %) | | | Quarterly | | | | | | | | 6/20/22 | | | | 376,000 | | | | 6,202 | | | | 19,788 | | | | (13,586 | ) | | | | |
Government of South Korea | | | (1.00 | %) | | | Quarterly | | | | | | | | 12/20/21 | | | | 355,184 | | | | (8,252 | ) | | | (10,020 | ) | | | 1,768 | | | | | |
Government of South Korea | | | (1.00 | %) | | | Quarterly | | | | | | | | 12/20/22 | | | | 50,290 | | | | (1,304 | ) | | | (1,201 | ) | | | (103 | ) | | | | |
Government of Turkey | | | (1.00 | %) | | | Quarterly | | | | | | | | 12/20/20 | | | | 503,000 | | | | 12,758 | | | | 41,382 | | | | (28,624 | ) | | | | |
Government of Turkey | | | (1.00 | %) | | | Quarterly | | | | | | | | 6/20/21 | | | | 159,000 | | | | 5,169 | | | | 10,950 | | | | (5,781 | ) | | | | |
Government of Turkey | | | (1.00 | %) | | | Quarterly | | | | | | | | 12/20/21 | | | | 98,000 | | | | 4,114 | | | | 5,993 | | | | (1,879 | ) | | | | |
Government of Turkey | | | (1.00 | %) | | | Quarterly | | | | | | | | 6/20/22 | | | | 6,000 | | | | 306 | | | | 316 | | | | (10 | ) | | | | |
| | | | | | | | | |
| Traded Index | | | | | | | | | | | | | | | | | | | | | | | | | | | | | | | | | | | | |
CDX.NA.HY.25 | | | (5.00 | %) | | | Quarterly | | | | | | | | 12/20/20 | | | | 1,401,600 | | | | (94,166 | ) | | | 14,016 | | | | (108,182 | ) | | | | |
CDX.NA.HY.28 | | | (5.00 | %) | | | Quarterly | | | | | | | | 6/20/22 | | | | 891,000 | | | | (64,379 | ) | | | (65,793 | ) | | | 1,414 | | | | | |
| | | | | | | | | |
| Contracts to Sell Protectionc,d | | | | | | | | | | | | | | | | | | | | | | | | | | | | | | | | | | | | |
| | | | | | | | | |
| Single Name | | | | | | | | | | | | | | | | | | | | | | | | | | | | | | | | | | | | |
Government of Russia | | | 1.00 | % | | | Quarterly | | | | | | | | 6/20/21 | | | | 457,000 | | | | 266 | | | | (33,432 | ) | | | 33,698 | | | | BB+ | |
Government of Russia | | | 1.00 | % | | | Quarterly | | | | | | | | 12/20/21 | | | | 189,000 | | | | (460 | ) | | | (7,019 | ) | | | 6,559 | | | | BB+ | |
Government of South Africa | | | 1.00 | % | | | Quarterly | | | | | | | | 12/20/22 | | | | 184,000 | | | | (4,719 | ) | | | (3,412 | ) | | | (1,307 | ) | | | BB+ | |
Government of Turkey | | | 1.00 | % | | | Quarterly | | | | | | | | 12/20/22 | | | | 136,000 | | | | (8,572 | ) | | | (6,150 | ) | | | (2,422 | ) | | | BB+ | |
| | | | | | | | | | | | | | | | | | | | | | | | | | | | |
Total Centrally Cleared Swap Contracts | | | $ | (142,716 | ) | | $ | (6,970 | ) | | $ | (135,746 | ) | | | | |
| | | | | | | | | | | | | | | | | | | | | | | | | | | | |
| OTC Swap Contracts | | | | | | | | | | | | | | | | | | | | | | | | | | | | | | | | | | | | |
| | | | | | | | | |
| Contracts to Buy Protectionc | | | | | | | | | | | | | | | | | | | | | | | | | | | | | | | | | | | | |
| Single Name | | | | | | | | | | | Counterparty | | | | | | | | | | | | | | | | | | | | | | | | | |
Altice Luxembourg S.A. | | | (5.00 | %) | | | Quarterly | | | | BZWS | | | | 12/20/22 | | | | 18,000 | EUR | | | 318 | | | | 318 | | | | — | | | | | |
Altice Luxembourg S.A. | | | (5.00 | %) | | | Quarterly | | | | BZWS | | | | 12/20/22 | | | | 74,000 | EUR | | | 1,308 | | | | 987 | | | | 321 | | | | | |
Altice Luxembourg S.A. | | | (5.00 | %) | | | Quarterly | | | | JPHQ | | | | 12/20/22 | | | | 94,000 | EUR | | | 1,662 | | | | 2,064 | | | | (402 | ) | | | | |
American Axle & Manufacturing Holdings Inc. | | | (5.00 | %) | | | Quarterly | | | | JPHQ | | | | 12/20/22 | | | | 283,000 | | | | (32,235 | ) | | | (29,646 | ) | | | (2,589 | ) | | | | |
Avis Budget Group, Inc. | | | (5.00 | %) | | | Quarterly | | | | GSCO | | | | 12/20/22 | | | | 234,000 | | | | (21,690 | ) | | | (20,272 | ) | | | (1,418 | ) | | | | |
Avis Budget Group, Inc. | | | (5.00 | %) | | | Quarterly | | | | GSCO | | | | 12/20/22 | | | | 150,000 | | | | (13,904 | ) | | | (10,030 | ) | | | (3,874 | ) | | | | |
Avis Budget Group, Inc. | | | (5.00 | %) | | | Quarterly | | | | JPHQ | | | | 12/20/22 | | | | 78,000 | | | | (7,230 | ) | | | (6,926 | ) | | | (304 | ) | | | | |
Avis Budget Group, Inc. | | | (5.00 | %) | | | Quarterly | | | | GSCO | | | | 12/20/22 | | | | 47,000 | | | | (4,357 | ) | | | (3,975 | ) | | | (382 | ) | | | | |
Avis Budget Group, Inc. | | | (5.00 | %) | | | Quarterly | | | | JPHQ | | | | 12/20/22 | | | | 75,000 | | | | (6,952 | ) | | | (3,960 | ) | | | (2,992 | ) | | | | |
Avis Budget Group, Inc. | | | (5.00 | %) | | | Quarterly | | | | JPHQ | | | | 6/20/23 | | | | 101,000 | | | | (8,229 | ) | | | (7,899 | ) | | | (330 | ) | | | | |
Avon Products Inc. | | | (5.00 | %) | | | Quarterly | | | | JPHQ | | | | 3/20/20 | | | | 307,000 | | | | (9,055 | ) | | | (9,740 | ) | | | 685 | | | | | |
Avon Products Inc. | | | (5.00 | %) | | | Quarterly | | | | BZWS | | | | 3/20/20 | | | | 154,000 | | | | (4,542 | ) | | | (4,672 | ) | | | 130 | | | | | |
Avon Products Inc. | | | (5.00 | %) | | | Quarterly | | | | JPHQ | | | | 3/20/20 | | | | 77,000 | | | | (2,271 | ) | | | (2,537 | ) | | | 266 | | | | | |
Avon Products Inc. | | | (5.00 | %) | | | Quarterly | | | | BZWS | | | | 3/20/20 | | | | 77,000 | | | | (2,271 | ) | | | (2,537 | ) | | | 266 | | | | | |
Caterpillar Financial Services Corp. | | | (1.00 | %) | | | Quarterly | | | | JPHQ | | | | 6/20/21 | | | | 618,000 | | | | (14,578 | ) | | | 1,600 | | | | (16,178 | ) | | | | |
Dean Foods Co. | | | (5.00 | %) | | | Quarterly | | | | GSCO | | | | 12/20/22 | | | | 47,000 | | | | (2,955 | ) | | | (2,572 | ) | | | (383 | ) | | | | |
Dean Foods Co. | | | (5.00 | %) | | | Quarterly | | | | GSCO | | | | 12/20/22 | | | | 32,000 | | | | (2,012 | ) | | | (1,651 | ) | | | (361 | ) | | | | |
Dean Foods Co. | | | (5.00 | %) | | | Quarterly | | | | GSCO | | | | 6/20/23 | | | | 148,000 | | | | (7,363 | ) | | | (5,401 | ) | | | (1,962 | ) | | | | |
Dell Inc. | | | (1.00 | %) | | | Quarterly | | | | BZWS | | | | 6/20/23 | | | | 424,000 | | | | 26,835 | | | | 28,087 | | | | (1,252 | ) | | | | |
Ford Motor Co. | | | (5.00 | %) | | | Quarterly | | | | GSCO | | | | 12/20/22 | | | | 363,000 | | | | (63,709 | ) | | | (63,251 | ) | | | (458 | ) | | | | |
Ford Motor Credit Co. LLC | | | (5.00 | %) | | | Quarterly | | | | GSCO | | | | 12/20/22 | | | | 187,000 | | | | (34,354 | ) | | | (32,584 | ) | | | (1,770 | ) | | | | |
Frontier Communications Corp. | | | (5.00 | %) | | | Quarterly | | | | MSCS | | | | 12/20/22 | | | | 15,000 | | | | 3,610 | | | | 3,900 | | | | (290 | ) | | | | |
Frontier Communications Corp. | | | (5.00 | %) | | | Quarterly | | | | GSCO | | | | 12/20/22 | | | | 17,000 | | | | 4,092 | | | | 5,034 | | | | (942 | ) | | | | |
| | | | |
| 32 | | Annual Report | | franklintempleton.com |
FRANKLIN ALTERNATIVE STRATEGIES FUNDS
STATEMENT OF INVESTMENTS
Franklin K2 Long Short Credit Fund (continued)
Credit Default Swap Contracts (continued)
| | | | | | | | | | | | | | | | | | | | | | | | | | | | | | | | | | | | |
| Description | | Periodic
Payment
Rate
Received
(Paid) | | | Payment
Frequency | | | Counterparty | | | Maturity
Date | | | Notional
Amounta | | | Value | | | Unamortized
Upfront
Payments
(Receipts) | | | Unrealized
Appreciation
(Depreciation) | | | Ratingb | |
| OTC Swap Contracts (continued) | | | | | | | | | | | | | | | | | | | | | | | | | | | | | | | | | |
| | | | | | | | |
| Contracts to Buy Protectionc (continued) | | | | | | | | | | | | | | | | | | | | | | | | | | | | | | | | | |
| | | | | | | | |
| Single Name (continued) | | | | | | | | | | | | | | | | | | | | | | | | | | | | | | | | | |
Frontier Communications Corp. | | | (5.00 | %) | | | Quarterly | | | | BZWS | | | | 12/20/22 | | | | 22,000 | | | $ | 5,295 | | | $ | 6,515 | | | $ | (1,220 | ) | | | | |
Frontier Communications Corp. | | | (5.00 | %) | | | Quarterly | | | | MSCS | | | | 12/20/22 | | | | 26,000 | | | | 6,258 | | | | 7,828 | | | | (1,570 | ) | | | | |
Frontier Communications Corp. | | | (5.00 | %) | | | Quarterly | | | | JPHQ | | | | 12/20/22 | | | | 49,000 | | | | 11,794 | | | | 13,985 | | | | (2,191 | ) | | | | |
Frontier Communications Corp. | | | (5.00 | %) | | | Quarterly | | | | GSCO | | | | 12/20/22 | | | | 56,000 | | | | 13,479 | | | | 16,850 | | | | (3,371 | ) | | | | |
Frontier Communications Corp. | | | (5.00 | %) | | | Quarterly | | | | BZWS | | | | 12/20/22 | | | | 57,000 | | | | 13,719 | | | | 17,423 | | | | (3,704 | ) | | | | |
Frontier Communications Corp. | | | (5.00 | %) | | | Quarterly | | | | JPHQ | | | | 12/20/22 | | | | 75,000 | | | | 18,052 | | | | 20,243 | | | | (2,191 | ) | | | | |
Frontier Communications Corp. | | | (5.00 | %) | | | Quarterly | | | | JPHQ | | | | 12/20/22 | | | | 94,000 | | | | 22,625 | | | | 28,620 | | | | (5,995 | ) | | | | |
Frontier Communications Corp. | | | (5.00 | %) | | | Quarterly | | | | GSCO | | | | 12/20/22 | | | | 94,000 | | | | 22,625 | | | | 28,732 | | | | (6,107 | ) | | | | |
Frontier Communications Corp. | | | (5.00 | %) | | | Quarterly | | | | GSCO | | | | 12/20/22 | | | | 115,000 | | | | 27,680 | | | | 34,170 | | | | (6,490 | ) | | | | |
Frontier Communications Corp. | | | (5.00 | %) | | | Quarterly | | | | JPHQ | | | | 6/20/23 | | | | 65,000 | | | | 17,844 | | | | 16,495 | | | | 1,349 | | | | | |
Galapagos Holding SA | | | (5.00 | %) | | | Quarterly | | | | BZWS | | | | 6/20/18 | | | | 71,000 | EUR | | | (598 | ) | | | 29 | | | | (627 | ) | | | | |
Galapagos Holding SA | | | (5.00 | %) | | | Quarterly | | | | GSCO | | | | 6/20/20 | | | | 53,000 | EUR | | | 7,262 | | | | 4,791 | | | | 2,471 | | | | | |
Glencore International AG | | | (5.00 | %) | | | Quarterly | | | | JPHQ | | | | 12/20/22 | | | | 196,000 | EUR | | | (40,380 | ) | | | (38,652 | ) | | | (1,728 | ) | | | | |
Glencore International AG | | | (5.00 | %) | | | Quarterly | | | | JPHQ | | | | 12/20/22 | | | | 196,000 | EUR | | | (40,380 | ) | | | (38,345 | ) | | | (2,035 | ) | | | | |
HEMA BondCo I BV | | | (5.00 | %) | | | Quarterly | | | | BZWS | | | | 6/20/23 | | | | 33,000 | EUR | | | (1,004 | ) | | | (911 | ) | | | (93 | ) | | | | |
HEMA BondCo I BV | | | (5.00 | %) | | | Quarterly | | | | BZWS | | | | 6/20/23 | | | | 26,000 | EUR | | | (791 | ) | | | (563 | ) | | | (228 | ) | | | | |
Honeywell International Inc. | | | (1.00 | %) | | | Quarterly | | | | MSCO | | | | 12/20/22 | | | | 403,000 | | | | (13,118 | ) | | | (12,760 | ) | | | (358 | ) | | | | |
Honeywell International Inc. | | | (1.00 | %) | | | Quarterly | | | | JPHQ | | | | 6/20/23 | | | | 220,000 | | | | (7,439 | ) | | | (6,915 | ) | | | (524 | ) | | | | |
Itochu Corp. | | | (1.00 | %) | | | Quarterly | | | | GSCO | | | | 6/20/22 | | | | 17,300,000 | JPY | | | (5,157 | ) | | | (4,177 | ) | | | (980 | ) | | | | |
Itochu Corp. | | | (1.00 | %) | | | Quarterly | | | | JPHQ | | | | 6/20/22 | | | | 4,307,000 | JPY | | | (1,284 | ) | | | (1,073 | ) | | | (211 | ) | | | | |
JFE Holdings, Inc. | | | (1.00 | %) | | | Quarterly | | | | GSCO | | | | 6/20/22 | | | | 5,746,000 | JPY | | | (1,631 | ) | | | (1,431 | ) | | | (200 | ) | | | | |
JFE Holdings, Inc. | | | (1.00 | %) | | | Quarterly | | | | JPHQ | | | | 6/20/22 | | | | 3,802,000 | JPY | | | (1,079 | ) | | | (961 | ) | | | (118 | ) | | | | |
K. Hovnanian Enterprises Inc. | | | (5.00 | %) | | | Quarterly | | | | GSCO | | | | 6/20/18 | | | | 37,000 | | | | 180 | | | | 1,299 | | | | (1,119 | ) | | | | |
K. Hovnanian Enterprises Inc. | | | (5.00 | %) | | | Quarterly | | | | GSCO | | | | 6/20/18 | | | | 15,000 | | | | 73 | | | | 1,321 | | | | (1,248 | ) | | | | |
K. Hovnanian Enterprises Inc. | | | (5.00 | %) | | | Quarterly | | | | GSCO | | | | 6/20/18 | | | | 16,000 | | | | 78 | | | | 1,791 | | | | (1,713 | ) | | | | |
K. Hovnanian Enterprises Inc. | | | (5.00 | %) | | | Quarterly | | | | GSCO | | | | 6/20/18 | | | | 74,000 | | | | 360 | | | | 11,248 | | | | (10,888 | ) | | | | |
K. Hovnanian Enterprises Inc. | | | (5.00 | %) | | | Quarterly | | | | JPHQ | | | | 6/20/23 | | | | 44,000 | | | | 6,820 | | | | 6,820 | | | | — | | | | | |
Kohl’s Corp. | | | (1.00 | %) | | | Quarterly | | | | GSCO | | | | 6/20/23 | | | | 162,000 | | | | 2,358 | | | | 2,627 | | | | (269 | ) | | | | |
Kohl’s Corp. | | | (1.00 | %) | | | Quarterly | | | | GSCO | | | | 6/20/23 | | | | 162,000 | | | | 2,358 | | | | 3,629 | | | | (1,271 | ) | | | | |
Kohl’s Corp. | | | (1.00 | %) | | | Quarterly | | | | GSCO | | | | 6/20/23 | | | | 324,000 | | | | 4,715 | | | | 6,834 | | | | (2,119 | ) | | | | |
Lloyds Bank PLC | | | (1.00 | %) | | | Quarterly | | | | JPHQ | | | | 12/20/22 | | | | 196,000 | EUR | | | (1,699 | ) | | | (2,387 | ) | | | 688 | | | | | |
Lloyds Bank PLC | | | (1.00 | %) | | | Quarterly | | | | BOFA | | | | 12/20/22 | | | | 196,000 | EUR | | | (1,699 | ) | | | (2,188 | ) | | | 489 | | | | | |
Marubeni Corp. | | | (1.00 | %) | | | Quarterly | | | | GSCO | | | | 6/20/22 | | | | 27,269,000 | JPY | | | (7,047 | ) | | | (5,447 | ) | | | (1,600 | ) | | | | |
Marubeni Corp. | | | (1.00 | %) | | | Quarterly | | | | JPHQ | | | | 6/20/22 | | | | 6,291,000 | JPY | | | (1,626 | ) | | | (1,328 | ) | | | (298 | ) | | | | |
MBIA Inc. | | | (5.00 | %) | | | Quarterly | | | | GSCO | | | | 12/20/20 | | | | 28,000 | | | | (340 | ) | | | 1,666 | | | | (2,006 | ) | | | | |
MBIA Inc. | | | (5.00 | %) | | | Quarterly | | | | GSCO | | | | 12/20/20 | | | | 99,000 | | | | (1,202 | ) | | | 3,355 | | | | (4,557 | ) | | | | |
MBIA Inc. | | | (5.00 | %) | | | Quarterly | | | | GSCO | | | | 12/20/20 | | | | 139,000 | | | | (1,688 | ) | | | 10,122 | | | | (11,810 | ) | | | | |
Mitsui O.S.K. Lines Ltd. | | | (1.00 | %) | | | Quarterly | | | | JPHQ | | | | 6/20/22 | | | | 9,678,000 | JPY | | | (902 | ) | | | (600 | ) | | | (302 | ) | | | | |
Mitsui O.S.K. Lines Ltd. | | | (1.00 | %) | | | Quarterly | | | | JPHQ | | | | 6/20/22 | | | | 3,618,000 | JPY | | | (337 | ) | | | (225 | ) | | | (112 | ) | | | | |
Pitney Bowes Inc. | | | (1.00 | %) | | | Quarterly | | | | BZWS | | | | 6/20/23 | | | | 43,000 | | | | 6,626 | | | | 5,962 | | | | 664 | | | | | |
Pitney Bowes Inc. | | | (1.00 | %) | | | Quarterly | | | | GSCO | | | | 6/20/23 | | | | 72,000 | | | | 11,094 | | | | 10,228 | | | | 866 | | | | | |
Pitney Bowes Inc. | | | (1.00 | %) | | | Quarterly | | | | MSCS | | | | 6/20/23 | | | | 144,000 | | | | 22,188 | | | | 20,456 | | | | 1,732 | | | | | |
R. R. Donnelley & Sons Co. | | | (5.00 | %) | | | Quarterly | | | | GSCO | | | | 12/20/22 | | | | 156,000 | | | | 9,064 | | | | 7,395 | | | | 1,669 | | | | | |
R. R. Donnelley & Sons Co. | | | (5.00 | %) | | | Quarterly | | | | GSCO | | | | 6/20/23 | | | | 47,000 | | | | 3,864 | | | | 2,377 | | | | 1,487 | | | | | |
Rallye SA | | | (5.00 | %) | | | Quarterly | | | | BZWS | | | | 6/20/19 | | | | 71,000 | EUR | | | (370 | ) | | | 2,567 | | | | (2,937 | ) | | | | |
Rallye SA | | | (5.00 | %) | | | Quarterly | | | | JPHQ | | | | 6/20/19 | | | | 175,000 | EUR | | | (913 | ) | | | 6,801 | | | | (7,714 | ) | | | | |
Rallye SA | | | (5.00 | %) | | | Quarterly | | | | GSCO | | | | 12/20/19 | | | | 10,000 | EUR | | | 257 | | | | 342 | | | | (85 | ) | | | | |
Rallye SA | | | (5.00 | %) | | | Quarterly | | | | BZWS | | | | 6/20/21 | | | | 42,000 | EUR | | | 4,694 | | | | 3,504 | | | | 1,190 | | | | | |
Rallye SA | | | (5.00 | %) | | | Quarterly | | | | GSCO | | | | 12/20/22 | | | | 49,000 | EUR | | | 9,218 | | | | 552 | | | | 8,666 | | | | | |
Sharp Corp. | | | (1.00 | %) | | | Quarterly | | | | JPHQ | | | | 12/20/18 | | | | 4,914,000 | JPY | | | (236 | ) | | | 182 | | | | (418 | ) | | | | |
| | | | | | |
| franklintempleton.com | | Annual Report | | | 33 | |
FRANKLIN ALTERNATIVE STRATEGIES FUNDS
STATEMENT OF INVESTMENTS
Franklin K2 Long Short Credit Fund (continued)
Credit Default Swap Contracts (continued)
| | | | | | | | | | | | | | | | | | | | | | | | | | | | | | | | | | | | |
| Description | | Periodic
Payment
Rate
Received
(Paid) | | | Payment
Frequency | | | Counterparty | | | Maturity
Date | | | Notional
Amounta | | | Value | | | Unamortized
Upfront
Payments
(Receipts) | | | Unrealized
Appreciation
(Depreciation) | | | Ratingb | |
| OTC Swap Contracts (continued) | | | | | | | | | | | | | | | | | | | | | | | | | | | | | | | | | |
| | | | | | | | |
| Contracts to Buy Protectionc (continued) | | | | | | | | | | | | | | | | | | | | | | | | | | | | | | | | | |
| | | | | | | | |
| Single Name (continued) | | | | | | | | | | | | | | | | | | | | | | | | | | | | | | | | | |
The Hertz Corp. | | | (5.00 | %) | | | Quarterly | | | | MSCO | | | | 6/20/22 | | | | 22,000 | | | $ | 2,149 | | | $ | 3,497 | | | $ | (1,348 | ) | | | | |
The Hertz Corp. | | | (5.00 | %) | | | Quarterly | | | | GSCO | | | | 6/20/22 | | | | 69,000 | | | | 6,739 | | | | 4,845 | | | | 1,894 | | | | | |
The Hertz Corp. | | | (5.00 | %) | | | Quarterly | | | | GSCO | | | | 6/20/22 | | | | 42,000 | | | | 4,102 | | | | 5,018 | | | | (916 | ) | | | | |
The Hertz Corp. | | | (5.00 | %) | | | Quarterly | | | | BZWS | | | | 6/20/22 | | | | 102,000 | | | | 9,962 | | | | 12,195 | | | | (2,233 | ) | | | | |
The Hertz Corp. | | | (5.00 | %) | | | Quarterly | | | | GSCO | | | | 12/20/22 | | | | 30,000 | | | | 3,660 | | | | 2,672 | | | | 988 | | | | | |
The Hertz Corp. | | | (5.00 | %) | | | Quarterly | | | | GSCO | | | | 12/20/22 | | | | 45,000 | | | | 5,490 | | | | 4,640 | | | | 850 | | | | | |
The Hertz Corp. | | | (5.00 | %) | | | Quarterly | | | | GSCO | | | | 12/20/22 | | | | 105,000 | | | | 12,810 | | | | 8,854 | | | | 3,956 | | | | | |
The Hertz Corp. | | | (5.00 | %) | | | Quarterly | | | | GSCO | | | | 12/20/22 | | | | 173,000 | | | | 21,106 | | | | 14,704 | | | | 6,402 | | | | | |
The McClatchy Co. | | | (5.00 | %) | | | Quarterly | | | | GSCO | | | | 6/20/23 | | | | 72,000 | | | | (4,243 | ) | | | (5,567 | ) | | | 1,324 | | | | | |
The McClatchy Co. | | | (5.00 | %) | | | Quarterly | | | | JPHQ | | | | 6/20/23 | | | | 72,000 | | | | (4,243 | ) | | | (5,245 | ) | | | 1,002 | | | | | |
Transocean Inc. | | | (5.00 | %) | | | Quarterly | | | | BZWS | | | | 6/20/22 | | | | 2,000 | | | | (201 | ) | | | 63 | | | | (264 | ) | | | | |
Transocean Inc. | | | (5.00 | %) | | | Quarterly | | | | GSCO | | | | 6/20/22 | | | | 43,000 | | | | (4,330 | ) | | | 1,710 | | | | (6,040 | ) | | | | |
Transocean Inc. | | | (5.00 | %) | | | Quarterly | | | | GSCO | | | | 6/20/23 | | | | 98,000 | | | | (8,823 | ) | | | (3,312 | ) | | | (5,511 | ) | | | | |
Transocean Inc. | | | (5.00 | %) | | | Quarterly | | | | GSCO | | | | 6/20/23 | | | | 109,000 | | | | (9,813 | ) | | | (2,623 | ) | | | (7,190 | ) | | | | |
Transocean Inc. | | | (5.00 | %) | | | Quarterly | | | | GSCO | | | | 6/20/23 | | | | 34,000 | | | | (3,061 | ) | | | (2,252 | ) | | | (809 | ) | | | | |
Weatherford International Ltd. | | | (1.00 | %) | | | Quarterly | | | | MSCS | | | | 6/20/21 | | | | 25,000 | | | | 2,435 | | | | 3,928 | | | | (1,493 | ) | | | | |
Weatherford International Ltd. | | | (1.00 | %) | | | Quarterly | | | | JPHQ | | | | 6/20/21 | | | | 25,000 | | | | 2,435 | | | | 4,016 | | | | (1,581 | ) | | | | |
Weatherford International Ltd. | | | (1.00 | %) | | | Quarterly | | | | JPHQ | | | | 6/20/21 | | | | 25,000 | | | | 2,435 | | | | 4,189 | | | | (1,754 | ) | | | | |
Weatherford International Ltd. | | | (1.00 | %) | | | Quarterly | | | | BZWS | | | | 6/20/21 | | | | 37,000 | | | | 3,604 | | | | 5,479 | | | | (1,875 | ) | | | | |
Weatherford International Ltd. | | | (1.00 | %) | | | Quarterly | | | | JPHQ | | | | 6/20/21 | | | | 37,000 | | | | 3,604 | | | | 5,831 | | | | (2,227 | ) | | | | |
Weatherford International Ltd. | | | (1.00 | %) | | | Quarterly | | | | GSCO | | | | 6/20/21 | | | | 37,000 | | | | 3,604 | | | | 5,901 | | | | (2,297 | ) | | | | |
Weatherford International Ltd. | | | (1.00 | %) | | | Quarterly | | | | GSCO | | | | 6/20/21 | | | | 37,000 | | | | 3,604 | | | | 5,918 | | | | (2,314 | ) | | | | |
Weatherford International Ltd. | | | (1.00 | %) | | | Quarterly | | | | JPHQ | | | | 6/20/21 | | | | 37,000 | | | | 3,604 | | | | 6,288 | | | | (2,684 | ) | | | | |
Weatherford International Ltd. | | | (1.00 | %) | | | Quarterly | | | | GSCO | | | | 6/20/21 | | | | 37,000 | | | | 3,604 | | | | 6,776 | | | | (3,172 | ) | | | | |
Weatherford International Ltd. | | | (1.00 | %) | | | Quarterly | | | | GSCO | | | | 6/20/21 | | | | 61,000 | | | | 5,942 | | | | 7,523 | | | | (1,581 | ) | | | | |
Weatherford International Ltd. | | | (1.00 | %) | | | Quarterly | | | | JPHQ | | | | 6/20/21 | | | | 61,000 | | | | 5,942 | | | | 7,826 | | | | (1,884 | ) | | | | |
Weatherford International Ltd. | | | (1.00 | %) | | | Quarterly | | | | GSCO | | | | 6/20/21 | | | | 61,000 | | | | 5,942 | | | | 8,373 | | | | (2,431 | ) | | | | |
Weatherford International Ltd. | | | (1.00 | %) | | | Quarterly | | | | MSCS | | | | 6/20/21 | | | | 62,000 | | | | 6,039 | | | | 11,050 | | | | (5,011 | ) | | | | |
| | | | | | | | | |
| Contracts to Sell Protectionc,d | | | | | | | | | | | | | | | | | | | | | | | | | | | | | | | | | | | | |
| | | | | | | | | |
| Single Name | | | | | | | | | | | | | | | | | | | | | | | | | | | | | | | | | | | | |
Astaldi SpA | | | 5.00 | % | | | Quarterly | | | | GSCO | | | | 6/20/23 | | | | 57,000 | EUR | | | (32,386 | ) | | | (25,429 | ) | | | (6,957 | ) | | | CCC | |
Galapagos Holding SA | | | 5.00 | % | | | Quarterly | | | | GSCO | | | | 6/20/23 | | | | 123,000 | EUR | | | (38,667 | ) | | | (29,266 | ) | | | (9,401 | ) | | | CCC+ | |
K. Hovnanian Enterprsies Inc. | | | 5.00 | % | | | Quarterly | | | | JPHQ | | | | 6/20/18 | | | | 31,000 | | | | (151 | ) | | | (2,821 | ) | | | 2,670 | | | | CC | |
| | | | | | | | | | | | | | | | | | | | | | | | | | | | |
Total OTC Swap Contracts | | | $ | (67,328 | ) | | $ | 87,914 | | | $ | (155,242 | ) | | | | |
| | | | | | | | | | | | | | | | | | | | | | | | | | | | |
Total Credit Default Swap Contracts | | | $ | (210,044 | ) | | $ | 80,944 | | | $ | (290,988 | ) | | | | |
| | | | | | | | | | | | | | | | | | | | | | | | | | | | |
aIn U.S. dollars unless otherwise indicated. For contracts to sell protection, the notional amount is equal to the maximum potential amount of the future payments and no recourse provisions have been entered into in association with the contracts.
bBased on Standard and Poor’s (S&P) Rating for single name swaps.
cPerformance triggers for settlement of contract include default, bankruptcy or restructuring for single name swaps and failure to pay or bankruptcy of the underlying securities for traded index swaps.
dThe Fund enters contracts to sell protection to create a long credit position.
| | | | |
| 34 | | Annual Report | | franklintempleton.com |
FRANKLIN ALTERNATIVE STRATEGIES FUNDS
STATEMENT OF INVESTMENTS
Franklin K2 Long Short Credit Fund (continued)
At May 31, 2018, the Fund had the following interest rate swap contracts outstanding. See Note 1(e).
| | | | | | | | | | | | | | | | | | | | |
| Interest Rate Swap Contracts | | | | | | | | | | | | | | | |
| Description | | Payment
Frequency | | | | | | Maturity
Date | | | Notional
Amount* | | | Value/Unrealized
Appreciation
(Depreciation) | |
| Centrally Cleared Swap Contracts | | | | | | | | | | | | | | | | | | | | |
Receive Floating rate 3 Month USD-LIBOR
Pay Fixed rate 1.75% | | | Semi-Annually | | | | | | | | 3/21/20 | | | | 1,012,000 | | | $ | 9,324 | |
Receive Floating rate 3 Month USD-LIBOR
Pay Fixed rate 1.75% | | | Semi-Annually | | | | | | | | 6/20/20 | | | | 1,500,000 | | | | (4,261 | ) |
Receive Fixed rate 8.09%
Pay Floating rate BRL-BRLCDI | | | Annually | | | | | | | | 1/04/21 | | | | 2,876,394 | BRL | | | (14,148 | ) |
Receive Fixed rate 8.95%
Pay Floating rate BRL-BRLCDI | | | Annually | | | | | | | | 1/04/21 | | | | 785,269 | BRL | | | 930 | |
Receive Floating rate 1 Month MXN TIIE
Pay Fixed rate 7.57% | | | Monthly | | | | | | | | 4/19/21 | | | | 8,813,777 | MXN | | | 5,597 | |
Receive Floating rate 6 Month CZK-PRIBOR
Pay Fixed rate 1.64% | | | Annually | | | | | | | | 3/21/23 | | | | 6,980,851 | CZK | | | 536 | |
Receive Floating rate 6 Month CZK-PRIBOR
Pay Fixed rate 1.67% | | | Annually | | | | | | | | 3/21/23 | | | | 4,762,919 | CZK | | | 24 | |
Receive Floating rate 6 Month CZK-PRIBOR
Pay Fixed rate 1.74% | | | Annually | | | | | | | | 3/21/23 | | | | 1,690,199 | CZK | | | (282 | ) |
Receive Floating rate 6 Month CZK-PRIBOR
Pay Fixed rate 1.80% | | | Annually | | | | | | | | 3/21/23 | | | | 1,842,351 | CZK | | | (558 | ) |
Receive Floating rate 6 Month CZK-PRIBOR
Pay Fixed rate 1.86% | | | Annually | | | | | | | | 3/21/23 | | | | 7,291,583 | CZK | | | (3,230 | ) |
Receive Floating rate 6 Month CZK-PRIBOR
Pay Fixed rate 1.84% | | | Annually | | | | | | | | 5/22/23 | | | | 10,223,058 | CZK | | | (3,643 | ) |
Receive Floating rate MIBOR
Pay Fixed rate 6.67% | | | Annually | | | | | | | | 6/20/23 | | | | 13,265,333 | INR | | | 2,918 | |
Receive Fixed rate 10.36%
Pay Floating rate BRL-BRLCDI | | | Annually | | | | | | | | 1/02/25 | | | | 1,947,062 | BRL | | | (10,386 | ) |
Receive Floating rate 3 Month USD-LIBOR
Pay Fixed rate 2.25% | | | Semi-Annually | | | | | | | | 6/20/28 | | | | 1,100,000 | | | | (14,360 | ) |
Receive Floating rate 6 Month GBP-LIBOR
Pay Fixed rate 1.56% | | | Semi-Annually | | | | | | | | 11/29/46 | | | | 112,459 | GBP | | | 1,674 | |
Receive Floating rate 6 Month GBP-LIBOR
Pay Fixed rate 1.60% | | | Semi-Annually | | | | | | | | 12/03/46 | | | | 82,713 | GBP | | | 251 | |
Receive Floating rate 6 Month GBP-LIBOR
Pay Fixed rate 1.44% | | | Semi-Annually | | | | | | | | 1/07/47 | | | | 156,995 | GBP | | | 7,714 | |
Receive Floating rate 6 Month GBP-LIBOR
Pay Fixed rate 1.41% | | | Semi-Annually | | | | | | | | 8/04/67 | | | | 108,000 | GBP | | | 3,459 | |
Receive Floating rate 6 Month GBP-LIBOR
Pay Fixed rate 1.34% | | | Semi-Annually | | | | | | | | 12/14/67 | | | | 18,000 | GBP | | | 1,170 | |
Receive Floating rate 6 Month GBP-LIBOR
Pay Fixed rate 1.37% | | | Semi-Annually | | | | | | | | 1/05/67 | | | | 100,000 | GBP | | | 5,525 | |
Receive Floating rate 6 Month GBP-LIBOR
Pay Fixed rate 1.29% | | | Semi-Annually | | | | | | | | 2/28/67 | | | | 21,000 | GBP | | | 1,972 | |
| | | | | | | | | | | | | | | | | | | | |
Total Centrally Cleared Swap Contracts | | | | (9,774 | ) |
| | | | | | | | | | | | | | | | | | | | |
| OTC Swap Contracts | | | | | | | Counterparty | | | | | | | | | | | | | |
Receive Floating rate 3 Month KLIBOR
Pay Fixed rate 4.14% | | | Quarterly | | | | MSCS | | | | 5/18/23 | | | | 511,748 | MYR | | | (1,596 | ) |
Receive Floating rate 3 Month KLIBOR
Pay Fixed rate 4.14% | | | Quarterly | | | | BOFA | | | | 5/21/23 | | | | 518,950 | MYR | | | (1,612 | ) |
| | | | | | | | | | | | | | | | | | | | |
Total OTC Swap Contracts | | | | (3,208 | ) |
| | | | | | | | | | | | | | | | | | | | |
Total Interest Rate Swap Contracts | | | $ | (12,982 | ) |
| | | | | | | | | | | | | | | | | | | | |
*In U.S. dollars unless otherwise indicated.
| | | | | | |
| franklintempleton.com | | Annual Report | | | 35 | |
FRANKLIN ALTERNATIVE STRATEGIES FUNDS
STATEMENT OF INVESTMENTS
Franklin K2 Long Short Credit Fund (continued)
At May 31, 2018, the Fund had the following total return swap contracts outstanding. See Note 1(e).
| | | | | | | | | | | | | | | | | | | | | | | | |
| Total Return Swap Contracts | |
| Underlying Instrument | | Financing Rate | | | Payment
Frequency | | | Counterparty | | | Maturity
Date | | | Notional
Value | | | Value/
Unrealized
Appreciation
(Depreciation) | |
| OTC Swap Contracts | | | | | | | | | | | | | | | | | | | | | | | | |
| Credit Contracts - Shorta | | | | | | | | | | | | | | | | | | | | | | | | |
iBoxx USD Liquid High Yield Index | | | 3-Month LIBOR | | | | Quarterly | | | | MSCS | | | | 6/20/18 | | | $ | 132,000 | | | $ | (417 | ) |
iBoxx USD Liquid High Yield Index | | | 3-Month LIBOR | | | | Quarterly | | | | MSCS | | | | 6/20/18 | | | | 135,000 | | | | 635 | |
iBoxx USD Liquid High Yield Index | | | 3-Month LIBOR | | | | Quarterly | | | | JPHQ | | | | 6/20/18 | | | | 75,000 | | | | 347 | |
iBoxx USD Liquid High Yield Index | | | 3-Month LIBOR | | | | Quarterly | | | | JPHQ | | | | 6/20/18 | | | | 94,000 | | | | (279 | ) |
iBoxx USD Liquid High Yield Index | | | 3-Month LIBOR | | | | Quarterly | | | | JPHQ | | | | 6/20/18 | | | | 102,000 | | | | (127 | ) |
iBoxx USD Liquid High Yield Index | | | 3-Month LIBOR | | | | Quarterly | | | | JPHQ | | | | 6/20/18 | | | | 535,000 | | | | (535 | ) |
iBoxx USD Liquid High Yield Index | | | 3-Month LIBOR | | | | Quarterly | | | | MSCS | | | | 6/20/18 | | | | 128,000 | | | | (260 | ) |
iBoxx USD Liquid High Yield Index | | | 3-Month LIBOR | | | | Quarterly | | | | MSCS | | | | 6/20/18 | | | | 26,000 | | | | (63 | ) |
iBoxx USD Liquid High Yield Index | | | 3-Month LIBOR | | | | Quarterly | | | | JPHQ | | | | 6/20/18 | | | | 227,000 | | | | (1,398 | ) |
iBoxx USD Liquid High Yield Index | | | 3-Month LIBOR | | | | Quarterly | | | | MSCS | | | | 6/20/18 | | | | 131,000 | | | | (267 | ) |
iBoxx USD Liquid High Yield Index | | | 3-Month LIBOR | | | | Quarterly | | | | JPHQ | | | | 6/20/18 | | | | 220,000 | | | | (1,510 | ) |
iBoxx USD Liquid High Yield Index | | | 3-Month LIBOR | | | | Quarterly | | | | JPHQ | | | | 6/20/18 | | | | 382,000 | | | | (1,101 | ) |
iBoxx USD Liquid High Yield Index | | | 3-Month LIBOR | | | | Quarterly | | | | JPHQ | | | | 6/20/18 | | | | 118,000 | | | | (1,237 | ) |
iBoxx USD Liquid High Yield Index | | | 3-Month LIBOR | | | | Quarterly | | | | GSCO | | | | 6/20/18 | | | | 120,000 | | | | (1,260 | ) |
iBoxx USD Liquid High Yield Index | | | 3-Month LIBOR | | | | Quarterly | | | | GSCO | | | | 6/20/18 | | | | 136,000 | | | | (869 | ) |
| | | | | | | | | | | | | | | | | | | | | | | | |
| | | | | | | | | | | | | | | | | | | | | | | (8,341 | ) |
| | | | | | | | | | | | | | | | | | | | | | | | |
| Equity Contracts - Longb | | | | | | | | | | | | | | | | | | | | | | | | |
Buckeye Partners LP | | | 1-Month LIBOR + 0.85 | % | | | Monthly | | | | BZWS | | | | 2/28/19 | | | | 588,848 | | | | (94,927 | ) |
Buckeye Partners LP | | | 1-Month LIBOR + 0.65 | % | | | Monthly | | | | JPHQ | | | | 6/10/19 | | | | 117,400 | | | | (8,998 | ) |
Energy Transfer Equity LP | | | 1-Month LIBOR + 0.65 | % | | | Monthly | | | | JPHQ | | | | 3/13/19 | | | | 65,416 | | | | 2,183 | |
Energy Transfer Partners LP | | | 1-Month LIBOR + 0.65 | % | | | Monthly | | | | JPHQ | | | | 3/13/19 | | | | 70,811 | | | | 3,820 | |
Enterprise Products Partners LP | | | 1-Month LIBOR + 0.90 | % | | | Monthly | | | | GSCO | | | | 12/14/18 | | | | 424,915 | | | | 40,433 | |
Gaming and Leisure Properties Inc. | | | 1-Month LIBOR + 0.90 | % | | | Monthly | | | | GSCO | | | | 1/09/19 | | | | 94,522 | | | | (4,000 | ) |
Northstar Realty Europe Corp. | | | 1-Month LIBOR + 0.65 | % | | | Monthly | | | | GSCO | | | | 3/14/19 | | | | 26,951 | | | | 7,878 | |
Suncoke Energy Partners LP | | | 1-Month LIBOR + 2.50 | % | | | Monthly | | | | MSCS | | | | 6/01/19 | | | | 13,425 | | | | 54 | |
| | | | | | | | | | | | | | | | | | | | | | | | |
| | | | | | | | | | | | | | | | | | | | | | | (53,557 | ) |
| | | | | | | | | | | | | | | | | | | | | | | | |
Total Return Swap Contracts | | | $ | (61,898 | ) |
| | | | | | | | | | | | | | | | | | | | | | | | |
aThe Fund receives the variable financing rate and pays the total return on the underlying instrument.
bThe Fund receives the total return on the underlying instrument and pays a variable financing rate.
See Abbreviations on page 54.
| | | | |
| 36 | | Annual Report | The accompanying notes are an integral part of these financial statements. | | franklintempleton.com |
FRANKLIN ALTERNATIVE STRATEGIES FUNDS
Financial Statements
Statement of Assets and Liabilities
May 31, 2018
Franklin K2 Long Short Credit Fund
| | | | |
Assets: | | | | |
Investments in securities: | | | | |
Cost - Unaffiliated issuers | | $ | 90,046,076 | |
Cost - Unaffiliated repurchase agreements | | | 3,609,485 | |
| | | | |
Value - Unaffiliated issuers | | $ | 92,307,237 | |
Value - Unaffiliated repurchase agreements | | | 3,609,485 | |
Cash | | | 272,873 | |
Restricted Cash for OTC derivative contracts (Note 1f) | | | 160,000 | |
Foreign currency, at value (cost $125,753) | | | 253,855 | |
Receivables: | | | | |
Investment securities sold | | | 1,242,850 | |
Capital shares sold | | | 153,735 | |
Dividends and interest | | | 708,112 | |
Deposits with brokers for: | | | | |
Securities sold short | | | 5,233,700 | |
OTC derivative contracts | | | 940,000 | |
Futures contracts | | | 33,206 | |
Centrally cleared swap contracts | | | 911,021 | |
Due from brokers | | | 173,586 | |
Variation margin on centrally cleared swap contracts | | | 6,065 | |
OTC swap contracts (upfront payments $553,835) | | | 490,045 | |
Unrealized appreciation on OTC forward exchange contracts | | | 554,295 | |
Unrealized appreciation on OTC swap contracts | | | 97,375 | |
Other assets | | | 49 | |
| | | | |
Total assets | | | 107,147,489 | |
| | | | |
Liabilities: | | | | |
Payables: | | | | |
Investment securities purchased | | | 2,920,002 | |
Capital shares redeemed | | | 4,126 | |
Management fees | | | 56,995 | |
Distribution fees | | | 6,705 | |
Transfer agent fees | | | 1,236 | |
Variation margin on futures contracts | | | 2,024 | |
OTC swap contracts (upfront receipts $441,199) | | | 402,131 | |
Options written, at value (premiums received $94,949) | | | 88,237 | |
Securities sold short, at value (proceeds $9,705,150) | | | 9,338,940 | |
Due to brokers | | | 257,232 | |
Unrealized depreciation on OTC forward exchange contracts | | | 343,407 | |
Unrealized depreciation on OTC swap contracts | | | 317,723 | |
Accrued expenses and other liabilities | | | 129,673 | |
| | | | |
Total liabilities | | | 13,868,431 | |
| | | | |
Net assets, at value | | $ | 93,279,058 | |
| | | | |
Net assets consist of: | | | | |
Paid-in capital | | $ | 89,691,129 | |
Undistributed net investment income | | | 496,750 | |
Net unrealized appreciation (depreciation) | | | 2,593,134 | |
Accumulated net realized gain (loss) | | | 498,045 | |
| | | | |
Net assets, at value | | $ | 93,279,058 | |
| | | | |
| | | | | | |
| franklintempleton.com | | The accompanying notes are an integral part of these financial statements. | Annual Report | | | 37 | |
FRANKLIN ALTERNATIVE STRATEGIES FUNDS
FINANCIAL STATEMENTS
Statement of Assets and Liabilities (continued)
May 31, 2018
Franklin K2 Long Short Credit Fund
| | | | |
| Class A: | | | | |
Net assets, at value | | | $45,087,756 | |
| | | | |
Shares outstanding | | | 4,293,489 | |
| | | | |
Net asset value per sharea | | | $10.50 | |
| | | | |
Maximum offering price per share (net asset value per share ÷ 94.25%) | | | $11.14 | |
| | | | |
| |
| Class C: | | | | |
Net assets, at value | | | $2,502,874 | |
| | | | |
Shares outstanding | | | 242,015 | |
| | | | |
Net asset value and maximum offering price per sharea | | | $10.34 | |
| | | | |
| |
| Class R: | | | | |
Net assets, at value | | | $161,856 | |
| | | | |
Shares outstanding | | | 15,549 | |
| | | | |
Net asset value and maximum offering price per share | | | $10.41 | |
| | | | |
| |
| Class R6: | | | | |
Net assets, at value | | | $12,550 | |
| | | | |
Shares outstanding | | | 1,195 | |
| | | | |
Net asset value and maximum offering price per share | | | $10.51 | |
| | | | |
| |
| Advisor Class: | | | | |
Net assets, at value | | | $45,514,022 | |
| | | | |
Shares outstanding | | | 4,329,542 | |
| | | | |
Net asset value and maximum offering price per share | | | $10.51 | |
| | | | |
aRedemption price is equal to net asset value less contingent deferred sales charges, if applicable.
| | | | |
| 38 | | Annual Report | The accompanying notes are an integral part of these financial statements. | | franklintempleton.com |
FRANKLIN ALTERNATIVE STRATEGIES FUNDS
FINANCIAL STATEMENTS
Statement of Operations
for the year ended May 31, 2018
Franklin K2 Long Short Credit Fund
| | | | |
Investment income: | | | | |
Dividends: (net of foreign taxes)* | | | | |
Unaffiliated issuers | | $ | 231,592 | |
Interest: (net of foreign taxes)~ | | | | |
Unaffiliated issuers: | | | | |
Paydown gain (loss) | | | 445,933 | |
Paid in cash | | | 4,125,089 | |
| | | | |
Total investment income | | | 4,802,614 | |
| | | | |
Expenses: | | | | |
Management fees (Note 3a) | | | 1,643,153 | |
Distribution fees: (Note 3c) | | | | |
Class A | | | 59,071 | |
Class C | | | 18,489 | |
Class R | | | 714 | |
Transfer agent fees: (Note 3e) | | | | |
Class A | | | 18,545 | |
Class C | | | 818 | |
Class R | | | 69 | |
Class R6 | | | 1,354 | |
Advisor Class | | | 14,207 | |
Custodian fees (Note 4) | | | 84,806 | |
Reports to shareholders | | | 20,887 | |
Registration and filing fees | | | 86,876 | |
Professional fees | | | 159,698 | |
Trustees fees and expenses | | | 35,224 | |
Dividends and interest on securities sold short | | | 590,136 | |
Security borrowing fees | | | 162,493 | |
Other | | | 25,243 | |
| | | | |
Total expenses | | | 2,921,783 | |
Expense reductions (Note 4) | | | (5,339 | ) |
Expenses waived/paid by affiliates (Note 3f) | | | (441,459 | ) |
| | | | |
Net expenses | | | 2,474,985 | |
| | | | |
Net investment income | | | 2,327,629 | |
| | | | |
Realized and unrealized gains (losses): | | | | |
Net realized gain (loss) from: | | | | |
Investments: | | | | |
Unaffiliated issuers | | | 617,852 | |
Written options | | | 98,250 | |
Foreign currency transactions | | | 173,390 | |
Forward exchange contracts | | | (524,352 | ) |
Futures contracts | | | (14,521 | ) |
Securities sold short | | | 17,857 | |
Swap contracts | | | 113,445 | |
| | | | |
Net realized gain (loss) | | | 481,921 | |
| | | | |
Net change in unrealized appreciation (depreciation) on: | | | | |
Investments: | | | | |
Unaffiliated issuers | | | (744,801 | ) |
Translation of other assets and liabilities denominated in foreign currencies | | | (43,107 | ) |
Forward exchange contracts | | | 357,290 | |
Written options | | | 8,749 | |
Futures contracts | | | (3,372 | ) |
Securities sold short | | | 688,596 | |
Swap contracts | | | (56,804 | ) |
| | | | |
Net change in unrealized appreciation (depreciation) | | | 206,551 | |
| | | | |
Net realized and unrealized gain (loss) | | | 688,472 | |
| | | | |
Net increase (decrease) in net assets resulting from operations | | $ | 3,016,101 | |
| | | | |
*Foreign taxes witheld on dividends | | $ | 22 | |
~Foreign taxes witheld on interest | | $ | 3,331 | |
| | | | | | |
| franklintempleton.com | | The accompanying notes are an integral part of these financial statements. | Annual Report | | | 39 | |
FRANKLIN ALTERNATIVE STRATEGIES FUNDS
FINANCIAL STATEMENTS
Statements of Changes in Net Assets
Franklin K2 Long Short Credit Fund
| | | | | | | | |
| | | Year Ended May 31, | |
| | | 2018 | | | 2017 | |
Increase (decrease) in net assets: | | | | | | | | |
Operations: | | | | | | | | |
Net investment income | | $ | 2,327,629 | | | $ | 1,655,358 | |
Net realized gain (loss) | | | 481,921 | | | | 2,240,829 | |
Net change in unrealized appreciation (depreciation) | | | 206,551 | | | | 1,375,722 | |
| | | | |
Net increase (decrease) in net assets resulting from operations | | | 3,016,101 | | | | 5,271,909 | |
| | | | |
Distributions to shareholders from: | | | | | | | | |
Net investment income: | | | | | | | | |
Class A | | | (798,159 | ) | | | (1,140,497 | ) |
Class C | | | (16,539 | ) | | | (31,012 | ) |
Class R | | | (2,505 | ) | | | (2,328 | ) |
Class R6 | | | (229,423 | ) | | | (380,096 | ) |
Advisor Class | | | (581,543 | ) | | | (755,488 | ) |
Net realized gains: | | | | | | | | |
Class A | | | (714,554 | ) | | | (368,226 | ) |
Class C | | | (27,644 | ) | | | (11,313 | ) |
Class R | | | (2,620 | ) | | | (758 | ) |
Class R6 | | | (191,370 | ) | | | (121,801 | ) |
Advisor Class | | | (487,193 | ) | | | (242,776 | ) |
| | | | |
Total distributions to shareholders | | | (3,051,550 | ) | | | (3,054,295 | ) |
| | | | |
Capital share transactions: (Note 2) | | | | | | | | |
Class A | | | 4,137,021 | | | | 11,826,722 | |
Class C | | | 996,451 | | | | 1,228,788 | |
Class R | | | 34,638 | | | | 115,130 | |
Class R6 | | | (13,046,394 | ) | | | 231,683 | |
Advisor Class | | | 20,379,574 | | | | 1,271,511 | |
| | | | |
Total capital share transactions | | | 12,501,290 | | | | 14,673,834 | |
| | | | |
Net increase (decrease) in net assets | | | 12,465,841 | | | | 16,891,448 | |
Net assets: | | | | | | | | |
Beginning of year | | | 80,813,217 | | | | 63,921,769 | |
| | | | |
End of year | | $ | 93,279,058 | | | $ | 80,813,217 | |
| | | | |
Undistributed net investment income included in net assets: | | | | | | | | |
End of year | | $ | 496,750 | | | $ | 281,852 | |
| | | | |
| | | | |
| 40 | | Annual Report | The accompanying notes are an integral part of these financial statements. | | franklintempleton.com |
FRANKLIN ALTERNATIVE STRATEGIES FUNDS
Notes to Financial Statements
Franklin K2 Long Short Credit Fund
1. Organization and Significant Accounting Policies
Franklin Alternative Strategies Funds (Trust) is registered under the Investment Company Act of 1940 (1940 Act) as an open-end management investment company, consisting of four separate funds and applies the specialized accounting and reporting guidance in U.S. Generally Accepted Accounting Principles (U.S. GAAP). Franklin K2 Long Short Credit Fund (Fund) is included in this report. The Fund offers five classes of shares: Class A, Class C, Class R, Class R6 and Advisor Class. Each class of shares may differ by its initial sales load, contingent deferred sales charges, voting rights on matters affecting a single class, its exchange privilege and fees due to differing arrangements for distribution and transfer agent fees.
The following summarizes the Fund’s significant accounting policies.
a. Financial Instrument Valuation
The Fund’s investments in financial instruments are carried at fair value daily. Fair value is the price that would be received to sell an asset or paid to transfer a liability in an orderly transaction between market participants on the measurement date. The Fund calculates the net asset value (NAV) per share as of 4 p.m. Eastern time each day the New York Stock Exchange (NYSE) is open for trading. Under compliance policies and procedures approved by the Trust’s Board of Trustees (the Board), the Fund’s administrator has responsibility for oversight of valuation, including leading the cross-functional Valuation Committee (VC). The VC provides administration and oversight of the Fund’s valuation policies and procedures, which are approved annually by the Board. Among other things, these procedures allow the Fund to utilize independent pricing services, quotations from securities and financial instrument dealers, and other market sources to determine fair value.
Equity securities, exchange traded funds and derivative financial instruments listed on an exchange or on the NASDAQ National Market System are valued at the last quoted sale price or the official closing price of the day, respectively. Foreign equity securities are valued as of the close of trading on the foreign stock exchange on which the security is primarily traded or as of 4 p.m. Eastern time. The value is then converted into its U.S. dollar equivalent at the foreign exchange rate in effect at 4 p.m. Eastern time on the day that the value of the security is determined. Over-the-counter (OTC) securities are valued within the range of the most recent quoted bid and ask prices. Securities that trade in multiple markets or on multiple
exchanges are valued according to the broadest and most representative market. Certain equity securities are valued based upon fundamental characteristics or relationships to similar securities.
Debt securities generally trade in the OTC market rather than on a securities exchange. The Fund’s pricing services use multiple valuation techniques to determine fair value. In instances where sufficient market activity exists, the pricing services may utilize a market-based approach through which quotes from market makers are used to determine fair value. In instances where sufficient market activity may not exist or is limited, the pricing services also utilize proprietary valuation models which may consider market characteristics such as benchmark yield curves, credit spreads, estimated default rates, anticipated market interest rate volatility, coupon rates, anticipated timing of principal repayments, underlying collateral, and other unique security features in order to estimate the relevant cash flows, which are then discounted to calculate the fair value. Securities denominated in a foreign currency are converted into their U.S. dollar equivalent at the foreign exchange rate in effect at 4 p.m. Eastern time on the date that the values of the foreign debt securities are determined.
Investments in open-end mutual funds are valued at the closing NAV. Investments in repurchase agreements are valued at cost, which approximates fair value.
Certain derivative financial instruments are centrally cleared or trade in the OTC market. The Fund’s pricing services use various techniques including industry standard option pricing models and proprietary discounted cash flow models to determine the fair value of those instruments. The Fund’s net benefit or obligation under the derivative contract, as measured by the fair value of the contract, is included in net assets.
The Fund has procedures to determine the fair value of financial instruments for which market prices are not reliable or readily available. Under these procedures, the VC convenes on a regular basis to review such financial instruments and considers a number of factors, including significant unobservable valuation inputs, when arriving at fair value. The VC primarily employs a market-based approach which may use related or comparable assets or liabilities, recent transactions, market multiples, book values, and other relevant information for the investment to determine the fair value of the investment. An income-based valuation approach may also be used in which the anticipated future cash flows of the investment are discounted to calculate fair value. Discounts may also be applied due to the nature or
| | | | | | |
| franklintempleton.com | | Annual Report | | | 41 | |
FRANKLIN ALTERNATIVE STRATEGIES FUNDS
NOTES TO FINANCIAL STATEMENTS
Franklin K2 Long Short Credit Fund (continued)
duration of any restrictions on the disposition of the investments. Due to the inherent uncertainty of valuations of such investments, the fair values may differ significantly from the values that would have been used had an active market existed. The VC employs various methods for calibrating these valuation approaches including a regular review of key inputs and assumptions, transactional back-testing or disposition analysis, and reviews of any related market activity.
Trading in securities on foreign securities stock exchanges and OTC markets may be completed before 4 p.m. Eastern time. In addition, trading in certain foreign markets may not take place on every Fund’s business day. Occasionally, events occur between the time at which trading in a foreign security is completed and 4 p.m. Eastern time that might call into question the reliability of the value of a portfolio security held by the Fund. As a result, differences may arise between the value of the Fund’s portfolio securities as determined at the foreign market close and the latest indications of value at 4 p.m. Eastern time. In order to minimize the potential for these differences, the VC monitors price movements following the close of trading in foreign stock markets through a series of country specific market proxies (such as baskets of American Depositary Receipts, futures contracts and exchange traded funds). These price movements are measured against established trigger thresholds for each specific market proxy to assist in determining if an event has occurred that may call into question the reliability of the values of the foreign securities held by the Fund. If such an event occurs, the securities may be valued using fair value procedures, which may include the use of independent pricing services.
When the last day of the reporting period is a non-business day, certain foreign markets may be open on those days that the Fund’s NAV is not calculated, which could result in differences between the value of the Fund’s portfolio securities on the last business day and the last calendar day of the reporting period. Any significant security valuation changes due to an open foreign market are adjusted and reflected by the Fund for financial reporting purposes.
b. Foreign Currency Translation
Portfolio securities and other assets and liabilities denominated in foreign currencies are translated into U.S. dollars based on the exchange rate of such currencies against U.S. dollars on the date of valuation. The Fund may enter into foreign currency exchange contracts to facilitate transactions denominated in a foreign currency. Purchases and sales of securities, income and expense items denominated in foreign currencies are translated
into U.S. dollars at the exchange rate in effect on the transaction date. Portfolio securities and assets and liabilities denominated in foreign currencies contain risks that those currencies will decline in value relative to the U.S. dollar. Occasionally, events may impact the availability or reliability of foreign exchange rates used to convert the U.S. dollar equivalent value. If such an event occurs, the foreign exchange rate will be valued at fair value using procedures established and approved by the Board.
The Fund does not separately report the effect of changes in foreign exchange rates from changes in market prices on securities held. Such changes are included in net realized and unrealized gain or loss from investments in the Statement of Operations.
Realized foreign exchange gains or losses arise from sales of foreign currencies, currency gains or losses realized between the trade and settlement dates on securities transactions and the difference between the recorded amounts of dividends, interest, and foreign withholding taxes and the U.S. dollar equivalent of the amounts actually received or paid. Net unrealized foreign exchange gains and losses arise from changes in foreign exchange rates on foreign denominated assets and liabilities other than investments in securities held at the end of the reporting period.
c. Joint Repurchase Agreement
The Fund enters into a joint repurchase agreement whereby its uninvested cash balance is deposited into a joint cash account with other funds managed by the investment manager or an affiliate of the investment manager and is used to invest in one or more repurchase agreements. The value and face amount of the joint repurchase agreement are allocated to the funds based on their pro-rata interest. A repurchase agreement is accounted for as a loan by the Fund to the seller, collateralized by securities which are delivered to the Fund’s custodian. The fair value, including accrued interest, of the initial collateralization is required to be at least 102% of the dollar amount invested by the funds, with the value of the underlying securities marked to market daily to maintain coverage of at least 100%. Repurchase agreements are subject to the terms of Master Repurchase Agreements (MRAs) with approved counterparties (sellers). The MRAs contain various provisions, including but not limited to events of default and maintenance of collateral for repurchase agreements. In the event of default by either the seller or the Fund, certain MRAs may permit the non-defaulting party to net and close-out all transactions, if any, traded under such agreements. The Fund may sell securities it holds as collateral and apply the proceeds towards the repurchase price and any other
| | | | |
| 42 | | Annual Report | | franklintempleton.com |
FRANKLIN ALTERNATIVE STRATEGIES FUNDS
NOTES TO FINANCIAL STATEMENTS
Franklin K2 Long Short Credit Fund (continued)
1. Organization and Significant Accounting Policies (continued)
c. Joint Repurchase Agreement (continued)
amounts owed by the seller to the Fund in the event of default by the seller. This could involve costs or delays in addition to a loss on the securities if their value falls below the repurchase price owed by the seller. The joint repurchase agreement held by the Fund at year end, as indicated in the Statement of Investments, had been entered into on May 31, 2018.
d. Securities Purchased on a Delayed Delivery Basis
The Fund purchases securities on a delayed delivery basis, with payment and delivery scheduled for a future date. These transactions are subject to market fluctuations and are subject to the risk that the value at delivery may be more or less than the trade date purchase price. Although the Fund will generally purchase these securities with the intention of holding the securities, it may sell the securities before the settlement date. Sufficient assets have been segregated for these securities.
e. Derivative Financial Instruments
The Fund invested in derivative financial instruments in order to manage risk or gain exposure to various other investments or markets. Derivatives are financial contracts based on an underlying or notional amount, require no initial investment or an initial net investment that is smaller than would normally be required to have a similar response to changes in market factors, and require or permit net settlement. Derivatives contain various risks including the potential inability of the counterparty to fulfill their obligations under the terms of the contract, the potential for an illiquid secondary market, and/or the potential for market movements which expose the Fund to gains or losses in excess of the amounts shown in the Statement of Assets and Liabilities. Realized gain and loss and unrealized appreciation and depreciation on these contracts for the period are included in the Statement of Operations.
Derivative counterparty credit risk is managed through a formal evaluation of the creditworthiness of all potential counterparties. The Fund attempts to reduce its exposure to counterparty credit risk on OTC derivatives, whenever possible, by entering into International Swaps and Derivatives Association (ISDA) master agreements with certain counterparties. These agreements contain various provisions, including but not limited to collateral requirements, events of default, or early termination. Termination events applicable to the counterparty
include certain deteriorations in the credit quality of the counterparty. Termination events applicable to the Fund include failure of the Fund to maintain certain net asset levels and/or limit the decline in net assets over various periods of time. In the event of default or early termination, the ISDA master agreement gives the non-defaulting party the right to net and close-out all transactions traded, whether or not arising under the ISDA agreement, to one net amount payable by one counterparty to the other. However, absent an event of default or early termination, OTC derivative assets and liabilities are presented gross and not offset in the Statement of Assets and Liabilities. Early termination by the counterparty may result in an immediate payment by the Fund of any net liability owed to that counterparty under the ISDA agreement.
Collateral requirements differ by type of derivative. Collateral or initial margin requirements are set by the broker or exchange clearing house for exchange traded and centrally cleared derivatives. Initial margin deposited is held at the exchange and can be in the form of cash and/or securities. For OTC derivatives traded under an ISDA master agreement, posting of collateral is required by either the Fund or the applicable counterparty if the total net exposure of all OTC derivatives with the applicable counterparty exceeds the minimum transfer amount, which typically ranges from $100,000 to $250,000, and can vary depending on the counterparty and the type of the agreement. Generally, collateral is determined at the close of Fund business each day and any additional collateral required due to changes in derivative values may be delivered by the Fund or the counterparty the next business day, or within a few business days. Collateral pledged and/or received by the Fund for OTC derivatives, if any, is held in segregated accounts with the Fund’s custodian/counterparty broker and can be in the form of cash and/or securities. Unrestricted cash may be invested according to the Fund’s investment objectives. To the extent that the amounts due to the Fund from its counterparties are not subject to collateralization or are not fully collateralized, the Fund bears the risk of loss from counterparty non-performance.
The Fund entered into exchange traded futures contracts primarily to manage and/or gain exposure to interest rate and equity price risk. A futures contract is an agreement between the Fund and a counterparty to buy or sell an asset at a specified price on a future date. Required initial margins are pledged by the Fund, and the daily change in fair value is accounted for as a variation margin payable or receivable in the Statement of Assets and Liabilities.
| | | | | | |
| franklintempleton.com | | Annual Report | | | 43 | |
FRANKLIN ALTERNATIVE STRATEGIES FUNDS
NOTES TO FINANCIAL STATEMENTS
Franklin K2 Long Short Credit Fund (continued)
The Fund entered into OTC forward exchange contracts primarily to manage and/or gain exposure to certain foreign currencies. A forward exchange contract is an agreement between the Fund and a counterparty to buy or sell a foreign currency at a specific exchange rate on a future date.
The Fund entered into credit default swap contracts primarily to manage and/or gain exposure to credit risk. A credit default swap is an agreement between the Fund and a counterparty whereby the buyer of the contract receives credit protection and the seller of the contract guarantees the credit worthiness of a referenced debt obligation. These agreements may be privately negotiated in the over-the-counter market (OTC credit default swaps) or may be executed in a multilateral trade facility platform, such as a registered exchange (centrally cleared credit default swaps). The underlying referenced debt obligation may be a single issuer of corporate or sovereign debt, a credit index, a basket of issuers or indices, or a tranche of a credit index or basket of issuers or indices. In the event of a default of the underlying referenced debt obligation, the buyer is entitled to receive the notional amount of the credit default swap contract from the seller in exchange for the referenced debt obligation, a net settlement amount equal to the notional amount of the credit default swap less the recovery value of the referenced debt obligation, or other agreed upon amount. For centrally cleared credit default swaps, required initial margins are pledged by the Fund, and the daily change in fair value is accounted for as a variation margin payable or receivable in the Statement of Assets and Liabilities. Over the term of the contract, the buyer pays the seller a periodic stream of payments, provided that no event of default has occurred. Such periodic payments are accrued daily as an unrealized appreciation or depreciation until the payments are made, at which time they are realized. Upfront payments and receipts are reflected in the Statement of Assets and Liabilities and represent compensating factors between stated terms of the credit default swap agreement and prevailing market conditions (credit spreads and other relevant factors). These upfront payments and receipts are amortized over the term of the contract as a realized gain or loss in the Statement of Operations.
The Fund entered into OTC cross currency swap contracts primarily to manage and/or gain exposure to certain foreign currencies. A cross currency swap is an agreement between the Fund and a counterparty to exchange cash flows (determined using either a fixed or floating rate) based on the notional amounts of two different currencies. The notional amounts are typically determined based on the spot exchange rates at the opening of the contract. Cross currency swaps may require the
exchange of notional amounts at the opening and/or closing of the contract. Over the term of the contract, contractually required payments to be paid and to be received are accrued daily and recorded as unrealized depreciation and appreciation until the payments are made, at which time they are realized. Upfront payments and receipts, if any, are reflected in the Statement of Assets and Liabilities and represent compensating factors between stated terms of the cross currency swap contract and prevailing market conditions (interest rate spreads and other relevant factors). These upfront payments and receipts are amortized over the term of the contract as a realized gain or loss in the Statement of Operations.
The Fund entered into interest rate swap contracts primarily to manage interest rate risk. An interest rate swap is an agreement between the Fund and a counterparty to exchange cash flows based on the difference between two interest rates, applied to a notional amount. These agreements may be privately negotiated in the over-the-counter market (OTC interest rate swaps) or may be executed on a registered exchange (centrally cleared interest rate swaps). For centrally cleared interest rate swaps, required initial margins are pledged by the Fund, and the daily change in fair value is accounted for as a variation margin payable or receivable in the Statement of Assets and Liabilities. Over the term of the contract, contractually required payments to be paid and to be received are accrued daily and recorded as unrealized depreciation and appreciation until the payments are made, at which time they are realized.
The Fund entered into OTC total return swap contracts primarily to manage and/or gain exposure to interest rate, equity price and credit risk of an underlying instrument such as a stock, bond, index or basket of securities or indices. A total return swap is an agreement between the Fund and a counterparty to exchange a return linked to an underlying instrument for a floating or fixed rate payment, both based upon a notional amount. Over the term of the contract, contractually required payments to be paid or received are accrued daily and recorded as unrealized appreciation or depreciation until the payments are made, at which time they are recognized as realized gain or loss.
The Fund purchased or wrote exchange traded and/or OTC option contracts primarily to manage and/or gain exposure to interest rate, equity price and foreign exchange rate risk. An option is a contract entitling the holder to purchase or sell a specific amount of shares or units of an asset or notional amount of a swap (swaption), at a specified price. When an option is purchased or written, an amount equal to the premium paid or
| | | | |
| 44 | | Annual Report | | franklintempleton.com |
FRANKLIN ALTERNATIVE STRATEGIES FUNDS
NOTES TO FINANCIAL STATEMENTS
Franklin K2 Long Short Credit Fund (continued)
1. Organization and Significant Accounting Policies (continued)
e. Derivative Financial Instruments (continued)
received is recorded as an asset or liability, respectively. Upon exercise of an option, the acquisition cost or sales proceeds of the underlying investment is adjusted by any premium received or paid. Upon expiration of an option, any premium received or paid is recorded as a realized gain or loss. Upon closing an option other than through expiration or exercise, the difference between the premium received or paid and the cost to close the position is recorded as a realized gain or loss.
See Note 8 regarding other derivative information.
f. Restricted Cash
At May 31, 2018, the Fund held restricted cash in connection with investments in certain derivative securities. Restricted cash is held in a segregated account with the Fund’s custodian/counterparty broker and is reflected in the Statement of Assets and Liabilities.
g. Securities Sold Short
The Fund is engaged in selling securities short, which obligates the Fund to replace a borrowed security with the same security at current fair value. The Fund incurs a loss if the price of the security increases between the date of the short sale and the date on which the Fund replaces the borrowed security. The Fund realizes a gain if the price of the security declines between those dates. Gains are limited to the price at which the Fund sold the security short, while losses are potentially unlimited in size.
The Fund is required to establish a margin account with the broker lending the security sold short. While the short sale is outstanding, the broker retains the proceeds of the short sale to the extent necessary to meet margin requirements until the short position is closed out. A deposit must also be maintained with the Fund’s custodian/counterparty broker consisting of cash and/or securities having a value equal to a specified percentage of the value of the securities sold short. The Fund is obligated to pay fees for borrowing the securities sold short and is required to pay the counterparty any dividends and/or interest due on securities sold short. Such dividends and/or interest and any security borrowing fees are recorded as an expense to the Fund.
h. Income and Deferred Taxes
It is the Fund’s policy to qualify as a regulated investment company under the Internal Revenue Code. The Fund intends to
distribute to shareholders substantially all of its taxable income and net realized gains to relieve it from federal income and excise taxes. As a result, no provision for U.S. federal income taxes is required.
The Fund may be subject to foreign taxation related to income received, capital gains on the sale of securities and certain foreign currency transactions in the foreign jurisdictions in which it invests. Foreign taxes, if any, are recorded based on the tax regulations and rates that exist in the foreign markets in which the Fund invests. When a capital gain tax is determined to apply, the Fund records an estimated deferred tax liability in an amount that would be payable if the securities were disposed of on the valuation date.
The Fund may recognize an income tax liability related to its uncertain tax positions under U.S. GAAP when the uncertain tax position has a less than 50% probability that it will be sustained upon examination by the tax authorities based on its technical merits. As of May 31, 2018, the Fund has determined that no tax liability is required in its financial statements related to uncertain tax positions for any open tax years (or expected to be taken in future tax years). Open tax years are those that remain subject to examination and are based on the statute of limitations in each jurisdiction in which the Fund invests.
i. Security Transactions, Investment Income, Expenses and Distributions
Security transactions are accounted for on trade date. Realized gains and losses on security transactions are determined on a specific identification basis. Interest income and estimated expenses are accrued daily. Amortization of premium and accretion of discount on debt securities are included in interest income. Paydown gains and losses are recorded as an adjustment to interest income separately in the Statement of Operations. Dividend income and dividends declared on securities sold short are recorded on the ex-dividend date except for certain dividends from securities where the dividend rate is not available. In such cases, the dividend is recorded as soon as the information is received by the Fund. Distributions to shareholders are recorded on the ex-dividend date. Distributable earnings are determined according to income tax regulations (tax basis) and may differ from earnings recorded in accordance with U.S. GAAP. These differences may be permanent or temporary. Permanent differences are reclassified among capital accounts to reflect their tax character. These reclassifications have no impact on net assets or the results of operations. Temporary differences are not reclassified, as they may reverse in subsequent periods.
| | | | | | |
| franklintempleton.com | | Annual Report | | | 45 | |
FRANKLIN ALTERNATIVE STRATEGIES FUNDS
NOTES TO FINANCIAL STATEMENTS
Franklin K2 Long Short Credit Fund (continued)
Common expenses incurred by the Trust are allocated among the Funds based on the ratio of net assets of each Fund to the combined net assets of the Trust. Fund specific expenses are charged directly to the Fund that incurred the expense.
Realized and unrealized gains and losses and net investment income, excluding class specific expenses, are allocated daily to each class of shares based upon the relative proportion of net assets of each class. Differences in per share distributions by class are generally due to differences in class specific expenses.
j. Accounting Estimates
The preparation of financial statements in accordance with U.S. GAAP requires management to make estimates and assump
tions that affect the reported amounts of assets and liabilities at
the date of the financial statements and the amounts of income and expenses during the reporting period. Actual results could differ from those estimates.
k. Guarantees and Indemnifications
Under the Trust’s organizational documents, its officers and trustees are indemnified by the Trust against certain liabilities arising out of the performance of their duties to the Trust. Additionally, in the normal course of business, the Trust, on behalf of the Fund, enters into contracts with service providers that contain general indemnification clauses. The Trust’s maximum exposure under these arrangements is unknown as this would involve future claims that may be made against the Trust that have not yet occurred. Currently, the Trust expects the risk of loss to be remote.
2. Shares of Beneficial Interest
At May 31, 2018, there were an unlimited number of shares authorized (without par value). Transactions in the Fund’s shares were as follows:
| | | | | | | | | | | | | | | | | | | | |
| | | Year Ended May 31, | |
| | | 2018 | | | | | | 2017 | |
| | | Shares | | | Amount | | | | | | Shares | | | Amount | |
| | | | | |
| Class A Shares: | | | | | | | | | | | | | | | | | | | | |
Shares sold | | | 1,068,222 | | | $ | 11,330,973 | | | | | | | | 1,264,686 | | | $ | 13,252,348 | |
Shares issued in reinvestment of distributions | | | 48,302 | | | | 502,336 | | | | | | | | 34,170 | | | | 351,266 | |
Shares redeemed | | | (730,238 | ) | | | (7,696,288 | ) | | | | | | | (169,475 | ) | | | (1,776,892 | ) |
| | | | |
Net increase (decrease) | | | 386,286 | | | $ | 4,137,021 | | | | | | | | 1,129,381 | | | $ | 11,826,722 | |
| | | | |
| Class C Shares: | | | | | | | | | | | | | | | | | | | | |
Shares sold | | | 156,509 | | | $ | 1,621,784 | | | | | | | | 188,527 | | | $ | 1,949,434 | |
Shares issued in reinvestment of distributions | | | 4,283 | | | | 44,033 | | | | | | | | 4,162 | | | | 42,325 | |
Shares redeemed | | | (64,430 | ) | | | (669,366 | ) | | | | | | | (73,843 | ) | | | (762.971 | ) |
| | | | |
Net increase (decrease) | | | 96,362 | | | $ | 996,451 | | | | | | | | 118,846 | | | $ | 1,228,788 | |
| | | | |
| Class R Shares: | | | | | | | | | | | | | | | | | | | | |
Shares sold | | | 2,884 | | | $ | 30,055 | | | | | | | | 10,774 | | | $ | 112,554 | |
Shares issued in reinvestment of distributions | | | 457 | | | | 4,720 | | | | | | | | 253 | | | | 2,586 | |
Shares redeemed | | | (13 | ) | | | (137 | ) | | | | | | | (1 | ) | | | (10 | ) |
| | | | |
Net increase (decrease) | | | 3,328 | | | $ | 34,638 | | | | | | | | 11,026 | | | $ | 115,130 | |
| | | | |
| Class R6 Shares: | | | | | | | | | | | | | | | | | | | | |
Shares sold | | | 90,935 | | | $ | 964,819 | | | | | | | | 111,147 | | | $ | 1,158,073 | |
Shares issued in reinvestment of distributions | | | 40,378 | | | | 420,337 | | | | | | | | 48,773 | | | | 501,391 | |
Shares redeemed | | | (1,373,217 | ) | | | (14,431,550 | ) | | | | | | | (136,747 | ) | | | (1,427,781 | ) |
| | | | |
Net increase (decrease) | | | (1,241,904 | ) | | $ | (13,046,394 | ) | | | | | | | 23,173 | | | $ | 231,683 | |
| | | | |
| Advisor Class Shares: | | | | | | | | | | | | | | | | | | | | |
Shares sold | | | 2,309,752 | | | $ | 24,300,041 | | | | | | | | 150,611 | | | $ | 1,573,709 | |
Shares issued in reinvestment of distributions | | | 20,313 | | | | 211,456 | | | | | | | | 4,635 | | | | 47,694 | |
Shares redeemed | | | (392,942 | ) | | | (4,131,923 | ) | | | | | | | (33,736 | ) | | | (348,892 | ) |
| | | | |
Net increase (decrease) | | | 1,937,123 | | | $ | 20,379,574 | | | | | | | | 121,510 | | | $ | 1,271,511 | |
| | | | |
| | | | |
| 46 | | Annual Report | | franklintempleton.com |
FRANKLIN ALTERNATIVE STRATEGIES FUNDS
NOTES TO FINANCIAL STATEMENTS
Franklin K2 Long Short Credit Fund (continued)
3. Transactions with Affiliates
Franklin Resources, Inc. is the holding company for various subsidiaries that together are referred to as Franklin Templeton Investments. Certain officers and trustees of the Trust are also officers and/or directors of the following subsidiaries:
| | |
| Subsidiary | | Affiliation |
K2/D&S Management Co., L.L.C. (K2 Advisors) | | Investment manager |
Franklin Templeton Services, LLC (FT Services) | | Administrative manager |
Franklin Templeton Distributors, Inc. (Distributors) | | Principal underwriter |
Franklin Templeton Investor Services, LLC (Investor Services) | | Transfer agent |
a. Management Fees
The Fund pays an investment management fee to K2 Advisors of 1.90% per year of the average daily net assets of the Fund.
Prior to October 1, 2017, the Fund paid fees to K2 Advisors of 2.05% per year of the average daily net assets of the Fund.
Under each subadvisory agreement, the below entities provide subadvisory services to the Fund. The subadvisory fees are paid by K2 Advisors based on the Fund’s average daily net assets, and is not an additional expense of the Fund.
|
| Subadvisors |
Apollo Credit Management LLC |
Chatham Asset Management, LLC |
Ellington Global Asset Management, L.L.C. |
Emso Asset Management Limited |
Medalist Partners, LP |
b. Administrative Fees
Under an agreement with K2 Advisors, FT Services provides administrative services to the Fund. The fee is paid by K2 Advisors based on the Fund’s average daily net assets, and is not an additional expense of the Fund.
c. Distribution Fees
The Board has adopted distribution plans for each share class, with the exception of Class R6 and Advisor Class shares, pursuant to Rule 12b-1 under the 1940 Act. Under the Fund’s Class A reimbursement distribution plan, the Fund reimburses Distributors for costs incurred in connection with the servicing, sale and distribution of the Fund’s shares up to the maximum annual plan rate. Under the Class A reimbursement distribution plan, costs exceeding the maximum for the current plan year cannot be reimbursed in subsequent periods. In addition, under the Fund’s Class C and R compensation distribution plans, the Fund pays Distributors for costs incurred in connection with the servicing, sale and distribution of the Fund’s shares up to the maximum annual plan rate for each class. The plan year, for purposes of monitoring compliance with the maximum annual plan rates, is February 1 through January 31.
The maximum annual plan rates, based on the average daily net assets, for each class, are as follows:
| | | | |
Class A | | | 0.25% | |
Class C | | | 1.00% | |
Class R | | | 0.50% | |
| | | | | | |
| franklintempleton.com | | Annual Report | | | 47 | |
FRANKLIN ALTERNATIVE STRATEGIES FUNDS
NOTES TO FINANCIAL STATEMENTS
Franklin K2 Long Short Credit Fund (continued)
d. Sales Charges/Underwriting Agreements
Front-end sales charges and contingent deferred sales charges (CDSC) do not represent expenses of the Fund. These charges are deducted from the proceeds of sales of Fund shares prior to investment or from redemption proceeds prior to remittance, as applicable. Distributors has advised the Fund of the following commission transactions related to the sales and redemptions of the Fund’s shares for the year:
| | | | |
Sales charges retained net of commissions paid to unaffiliated brokers/dealers | | $ | 3,637 | |
CDSC retained | | $ | 101 | |
e. Transfer Agent Fees
Each class of shares pays transfer agent fees to Investor Services for its performance of shareholder servicing obligations. Effective November 1, 2017, the fees are based on an annualized asset based fee of 0.02% plus a transaction based fee. Prior to November 1, 2017, the fees were account based fees that varied based on fund or account type. In addition, each class reimburses Investor Services for out of pocket expenses incurred and, except for Class R6, reimburses shareholder servicing fees paid to third parties. These fees are allocated daily based upon their relative proportion of such classes’ aggregate net assets. Class R6 pays Investor Services transfer agent fees specific to that class.
For the year ended May 31, 2018, the Fund paid transfer agent fees of $34,993, of which $21,600 was retained by Investor Services.
f. Waiver and Expense Reimbursements
K2 Advisors and Investor Services has contractually agreed in advance to waive or limit their fees and to assume as their own expense certain expenses otherwise payable by the Fund so that the expenses (excluding distribution fees, acquired fund fees and expenses, and expenses related to securities sold short) for each class of the Fund do not exceed 1.95%, and Class R6 does not exceed 1.94% based on the average net assets of each class (other than certain non-routine expenses or costs, including those relating to litigation, indemnification, reorganizations, and liquidations) until September 30, 2018. Total expenses waived or paid are not subject to recapture subsequent to the Fund’s fiscal year end.
g. Other Affiliated Transactions
At May 31, 2018, Franklin Resources, Inc. owned 56.3% of the Fund’s outstanding shares. Investment activities of this shareholder could have a material impact on the Fund.
4. Expense Offset Arrangement
The Fund has entered into an arrangement with its custodian whereby credits realized as a result of uninvested cash balances are used to reduce a portion of the Fund’s custodian expenses. During the year ended May 31, 2018, the custodian fees were reduced as noted in the Statement of Operations.
5. Income Taxes
The tax character of distributions paid during the years ended May 31, 2018 and 2017, was as follows:
| | | | | | | | |
| | | 2018 | | | 2017 | |
| Distributions paid from: | | | | | | | | |
Ordinary income | | $ | 2,560,135 | | | $ | 3,054,295 | |
Long term capital gains | | | 491,415 | | | | — | |
| | | | |
Total distributions paid | | $ | 3,051,550 | | | $ | 3,054,295 | |
| | | | |
| | | | |
| 48 | | Annual Report | | franklintempleton.com |
FRANKLIN ALTERNATIVE STRATEGIES FUNDS
NOTES TO FINANCIAL STATEMENTS
Franklin K2 Long Short Credit Fund (continued)
5. Income Taxes (continued)
At May 31, 2018, the cost of investments, net unrealized appreciation (depreciation), undistributed ordinary income and undistributed long term capital gains for income tax purposes were as follows:
| | | | |
Cost of investments | | $ | 84,546,224 | |
| | | | |
Unrealized appreciation | | $ | 4,473,223 | |
Unrealized depreciation | | | (2,397,469 | ) |
| | | | |
Net unrealized appreciation (depreciation) | | $ | 2,075,754 | |
| | | | |
Undistributed ordinary income | | $ | 956,338 | |
Undistributed long term capital gains | | | 427,327 | |
| | | | |
Distributable earnings | | $ | 1,383,665 | |
| | | | |
Differences between income and/or capital gains as determined on a book basis and a tax basis are primarily due to differing treatments of bond discounts and premiums, foreign currency transactions, paydown losses and wash sales.
The Fund utilized a tax accounting practice to treat a portion of the proceeds from the capital shares redeemed as a distribution from realized capital gains.
6. Investment Transactions
Purchases and sales of investments and securities sold short (excluding short term securities) for the year ended May 31, 2018, aggregated $209,175,628 and $190,164,621, respectively.
7. Credit Risk
At May 31, 2018, the Fund had 21.5% of its portfolio invested in high yield and other securities rated below investment grade. These securities may be more sensitive to economic conditions causing greater price volatility and are potentially subject to a greater risk of loss due to default than higher rated securities.
8. Other Derivative Information
At May 31, 2018, the Fund’s investments in derivative contracts are reflected in the Statement of Assets and Liabilities as follows:
| | | | | | | | | | | | |
| | | Asset Derivatives | | | Liability Derivatives | |
Derivative Contracts
Not Accounted for as
Hedging Instruments | | Statement of Assets and
Liabilities Location | | Fair Value | | | Statement of Assets and
Liabilities Location | | Fair Value | |
Interest rate contracts | | Variation margin on futures contracts | | $ | 15,363 | a | | Variation margin on futures contracts | | $ | 22,132 | a |
| | Variation margin on centrally cleared swap contracts | | | 41,094 | a | | Variation margin on centrally cleared swap contracts | | | 50,868 | a |
| | | | | | | | Unrealized depreciation on OTC swap contracts | | | 3,208 | |
Foreign exchange contracts | | Unrealized appreciation on OTC forward exchange contracts | | | 554,295 | | | Unrealized depreciation on OTC forward exchange contracts | | | 343,407 | |
| | | | | | |
| franklintempleton.com | | Annual Report | | | 49 | |
FRANKLIN ALTERNATIVE STRATEGIES FUNDS
NOTES TO FINANCIAL STATEMENTS
Franklin K2 Long Short Credit Fund (continued)
| | | | | | | | | | | | |
| | | Asset Derivatives | | | Liability Derivatives | |
Derivative Contracts
Not Accounted for as
Hedging Instruments | | Statement of Assets and
Liabilities Location | | Fair Value | | | Statement of Assets and
Liabilities Location | | Fair Value | |
Credit contracts | | Variation margin on centrally cleared swap contracts | | $ | 49,063 | a | | Variation margin on centrally cleared swap contracts | | $ | 184,809 | a |
| | OTC swap contracts (upfront payments) | | | 490,045 | | | OTC swap contracts (upfront receipts) | | | 402,131 | |
| | Unrealized appreciation on OTC swap contracts | | | 43,007 | | | Unrealized depreciation on OTC swap contracts | | | 206,590 | |
Equity contracts | | Investments in securities, at value | | | 137,244 | b | | Options written, at value | | | 88,237 | |
| | Unrealized appreciation on OTC swap contracts | | | 54,368 | | | Unrealized depreciation on OTC swap contracts | | | 107,925 | |
| | | | | | | | Variation margin on futures contracts | | | 5,376 | a |
| | | | | | | | | | | | |
Totals | | | | $ | 1,384,479 | | | | | $ | 1,414,683 | |
| | | | | | | | | | | | |
aThis amount reflects the cumulative appreciation (depreciation) of futures contracts and centrally cleared swap contracts as reported in the Statement of Investments. Only the variation margin receivable/payable at year end is separately reported within the Statement of Assets and Liabilities. Prior variation margin movements were recorded to cash upon receipt or payment.
bPurchased option contracts are included in investments in securities, at value in the Statement of Assets and Liabilities.
For the year ended May 31, 2018, the effect of derivative contracts in the Fund’s Statement of Operations was as follows:
| | | | | | | | | | | | |
Derivative Contracts
Not Accounted for as
Hedging Instruments | | Statement of
Operations Location | | Net Realized
Gain (Loss)
for the Year | | | Statement of
Operations Location | | Net Change in
Unrealized
Appreciation
(Depreciation)
for the Year | |
| | Net realized gain (loss) from: | | | | | | Net change in unrealized appreciation (depreciation) on: | | | | |
Interest rate contracts | | Investments | | $ | (10,834 | )a | | Futures contracts | | $ | (2,499 | ) |
| | Futures contracts | | | 17,376 | | | Swap contracts | | | 5,306 | |
| | Swap contracts | | | 42,693 | | | | | | | |
Foreign exchange contracts | | Investments | | | (7,026 | )a | | Investments | | | 4,432 | a |
| | Forward exchange contracts | | | (524,352 | ) | | Forward exchange contracts | | | 357,290 | |
| | Swap contracts | | | (52,949 | ) | | Swap contracts | | | (8,534 | ) |
Credit contracts | | Swap contracts | | | 5,109 | | | Swap contracts | | | (19 | ) |
Equity contracts | | Investments | | | (554,007 | )a | | Investments | | | (35,527 | )a |
| | Written options | | | 98,250 | | | Written options | | | 8,749 | |
| | Futures contracts | | | (31,897 | ) | | Futures contracts | | | (873 | ) |
| | Swap contracts | | | 118,592 | | | Swap contracts | | | (53,557 | ) |
| | | | | | | | | | | | |
Totals | | | | $ | (899,045 | ) | | | | $ | 274,768 | |
| | | | | | | | | | | | |
aPurchased option contracts are included in net realized gain (loss) from investments and net change in unrealized appreciation (depreciation) on investments in the Statement of Operations.
For the year ended May 31, 2018, the average month end notional amount of futures contracts, options and swap contracts represented $1,948,165, $724,392 and $21,221,264, respectively. The average month end contract value of forward exchange contracts was $12,864,876.
| | | | |
| 50 | | Annual Report | | franklintempleton.com |
FRANKLIN ALTERNATIVE STRATEGIES FUNDS
NOTES TO FINANCIAL STATEMENTS
Franklin K2 Long Short Credit Fund (continued)
8. Other Derivative Information (continued)
At May 31, 2018, the Fund’s OTC derivative assets and liabilities are as follows:
| | | | | | | | |
| | | Gross Amounts
of Assets and Liabilities
Presented in the
Statement of
Assets and Liabilities | |
| | | Assetsa | | | Liabilitiesa | |
| Derivatives | | | | | | | | |
Forward Exchange Contracts | | $ | 554,295 | | | $ | 343,407 | |
Swap Contracts | | | 587,420 | | | | 719,854 | |
| | | | |
Total | | $ | 1,141,715 | | | $ | 1,063,261 | |
| | | | |
aAbsent an event of default or early termination, OTC derivative assets and liabilities are presented gross and not offset in the Statement of Assets and Liabilities.
At May 31, 2018, the Fund’s OTC derivative assets, which may be offset against the Fund’s OTC derivative liabilities, and collateral received from the counterparty, are as follows:
| | | | | | | | | | | | | | | | | | | | |
| | | | | | Amounts Not Offset in the
Statement of Assets and Liabilities | | | | |
| | | Gross
Amounts of Assets
Presented in the
Statement of
Assets and Liabilities | | | Financial
Instruments
Available for Offset | | | Financial
Instruments
Collateral
Received | | | Cash
Collateral
Receiveda | | | Net Amount (Not
less than zero) | |
| Counterparty | | | | | | | | | | | | | | | | | | | | |
BOFA | | $ | 489 | | | $ | (489 | ) | | $ | — | | | $ | — | | | $ | — | |
BZWS | | | 85,700 | | | | (85,700 | ) | | | — | | | | — | | | | — | |
GSCO | | | 310,181 | | | | (310,181 | ) | | | — | | | | — | | | | — | |
JPHQ | | | 190,253 | | | | (188,372 | ) | | | — | | | | (1,881 | ) | | | — | |
JPHQc | | | 502,012 | | | | — | | | | — | | | | | | | | 502,012 | |
MSCO | | | 3,497 | | | | (3,497 | ) | | | — | | | | — | | | | — | |
MSCS | | | 49,583 | | | | (10,967 | ) | | | — | | | | — | | | | 38,616 | |
| | | | |
Total | | $ | 1,141,715 | | | $ | (599,206 | ) | | $ | — | | | $ | (1,881 | ) | | $ | 540,628 | |
| | | | |
At May 31, 2018, the Fund’s OTC derivative liabilities, which may be offset against the Fund’s OTC derivative assets, and collateral pledged to the counterparty, are as follows:
| | | | | | | | | | | | | | | | | | | | |
| | | | | | Amounts Not Offset in the
Statement of Assets and Liabilities | | | | |
| | | Gross
Amounts of Liabilities
Presented in the
Statement of
Assets and Liabilities | | | Financial
Instruments
Available for Offset | | | Financial
Instruments
Collateral
Pledgedb | | | Cash
Collateral
Pledgeda | | | Net Amount (Not
less than zero) | |
| Counterparty | | | | | | | | | | | | | | | | | | | | |
BOFA | | $ | 3,800 | | | $ | (489 | ) | | $ | — | | | $ | — | | | $ | 3,311 | |
BZWS | | | 119,237 | | | | (85,700 | ) | | | — | | | | (33,537 | ) | | | — | |
GSCO | | | 341,371 | | | | (310,181 | ) | | | — | | | | (31,190 | ) | | | — | |
JPHQ | | | 188,372 | | | | (188,372 | ) | | | — | | | | — | | | | — | |
JPHQc | | | 385,048 | | | | — | | | | | | | | — | | | | 385,048 | |
MSCO | | | 14,466 | | | | (3,497 | ) | | | — | | | | — | | | | 10,969 | |
MSCS | | | 10,967 | | | | (10,967 | ) | | | — | | | | — | | | | — | |
| | | | |
Total | | $ | 1,063,261 | | | $ | (599,206 | ) | | $ | — | | | $ | (64,727 | ) | | $ | 399,328 | |
| | | | |
| | | | | | |
| franklintempleton.com | | Annual Report | | | 51 | |
FRANKLIN ALTERNATIVE STRATEGIES FUNDS
NOTES TO FINANCIAL STATEMENTS
Franklin K2 Long Short Credit Fund (continued)
aIn some instances, the collateral amounts disclosed in the table above were adjusted due to the requirement to limit collateral amounts to avoid the effect of over collateralization. Actual collateral received and/or pledged may be more than the amounts disclosed herein.
bSee the accompanying Statement of Investments for securities pledged as collateral for derivatives.
cRepresents derivatives not subject to an ISDA master agreement.
See Note 1(e) regarding derivative financial instruments.
See Abbreviations on page 54.
9. Credit Facility
The Fund, together with other U.S. registered and foreign investment funds (collectively, Borrowers), managed by Franklin Templeton Investments, are borrowers in a joint syndicated senior unsecured credit facility totaling $2 billion (Global Credit Facility) which matures on February 8, 2019. This Global Credit Facility provides a source of funds to the Borrowers for temporary and emergency purposes, including the ability to meet future unanticipated or unusually large redemption requests.
Under the terms of the Global Credit Facility, the Fund shall, in addition to interest charged on any borrowings made by the Fund and other costs incurred by the Fund, pay its share of fees and expenses incurred in connection with the implementation and maintenance of the Global Credit Facility, based upon its relative share of the aggregate net assets of all of the Borrowers, including an annual commitment fee of 0.15% based upon the unused portion of the Global Credit Facility. These fees are reflected in other expenses in the Statement of Operations. During the year ended May 31, 2018, the Fund did not use the Global Credit Facility.
10. Fair Value Measurements
The Fund follows a fair value hierarchy that distinguishes between market data obtained from independent sources (observable inputs) and the Fund’s own market assumptions (unobservable inputs). These inputs are used in determining the value of the Fund’s financial instruments and are summarized in the following fair value hierarchy:
| | • | | Level 1 – quoted prices in active markets for identical financial instruments |
| | • | | Level 2 – other significant observable inputs (including quoted prices for similar financial instruments, interest rates, prepayment speed, credit risk, etc.) |
| | • | | Level 3 – significant unobservable inputs (including the Fund’s own assumptions in determining the fair value of financial instruments) |
The input levels are not necessarily an indication of the risk or liquidity associated with financial instruments at that level.
For movements between the levels within the fair value hierarchy, the Fund has adopted a policy of recognizing the transfers as of the date of the underlying event which caused the movement.
A summary of inputs used as of May 31, 2018, in valuing the Fund’s assets and liabilities carried at fair value, is as follows:
| | | | | | | | | | | | | | | | |
| | | Level 1 | | | Level 2 | | | Level 3 | | | Total | |
| | | | |
| Assets: | | | | | | | | | | | | | | | | |
Investments in Securities:a | | | | | | | | | | | | | | | | |
Common Stocks and Other Equity Interests | | $ | 3,950,513 | | | $ | — | | | $ | 749,970 | | | $ | 4,700,483 | |
Preferred Stocks | | | 66,541 | | | | — | | | | 298,900 | | | | 365,441 | |
Convertible Bonds | | | — | | | | 2,294,214 | | | | — | | | | 2,294,214 | |
Corporate Bonds and Notes | | | — | | | | 35,001,978 | | | | — | | | | 35,001,978 | |
Foreign Government and Agency Securities | | | — | | | | 5,746,956 | | | | — | | | | 5,746,956 | |
Asset-Backed Securities and Commercial Mortgage-Backed Securities | | | — | | | | 32,287,369 | | | | 421,168 | | | | 32,708,537 | |
Options Purchased | | | 137,244 | | | | — | | | | — | | | | 137,244 | |
U.S. Government and Agency Securities | | | — | | | | 549,964 | | | | — | | | | 549,964 | |
Short Term Investments | | | 10,696,709 | | | | 3,715,196 | | | | — | | | | 14,411,905 | |
| | | | |
Total Investments in Securities | | $ | 14,851,007 | | | $ | 79,595,677 | | | $ | 1,470,038 | | | $ | 95,916,722 | |
| | | | |
| | | | |
| 52 | | Annual Report | | franklintempleton.com |
FRANKLIN ALTERNATIVE STRATEGIES FUNDS
NOTES TO FINANCIAL STATEMENTS
Franklin K2 Long Short Credit Fund (continued)
10. Fair Value Measurements (continued)
| | | | | | | | | | | | | | | | |
| | | Level 1 | | | Level 2 | | | Level 3 | | | Total | |
Other Financial Instruments: | | | | | | | | | | | | | | | | |
Futures Contracts | | $ | 15,363 | | | $ | — | | | $ | — | | | $ | 15,363 | |
Forward Exchange Contracts | | | — | | | | 554,295 | | | | — | | | | 554,295 | |
Swap Contracts | | | — | | | | 187,532 | | | | — | | | | 187,532 | |
| | | | |
Total Other Financial Instruments | | $ | 15,363 | | | $ | 741,827 | | | $ | — | | | $ | 757,190 | |
| | | | |
| | | | |
| Liabilities: | | | | | | | | | | | | | | | | |
Other Financial Instruments: | | | | | | | | | | | | | | | | |
Options Written | | $ | 88,237 | | | $ | — | | | $ | — | | | $ | 88,237 | |
Securities Sold Shorta | | | 1,120,220 | | | | 8,218,720 | | | | — | | | | 9,338,940 | |
Futures Contracts | | | 27,508 | | | | — | | | | — | | | | 27,508 | |
Forward Exchange Contracts | | | — | | | | 343,407 | | | | — | | | | 343,407 | |
Swap Contracts | | | — | | | | 553,400 | | | | — | | | | 553,400 | |
| | | | |
Total Other Financial Instruments | | $ | 1,235,965 | | | $ | 9,115,527 | | | $ | — | | | $ | 10,351,492 | |
| | | | |
aFor detailed categories, see the accompanying Statement of Investments.
A reconciliation of assets in which Level 3 inputs are used in determining fair value is presented when there are significant Level 3 financial instruments at the beginning and/or end of the year. At May 31, 2018, the reconciliation of assets, is as follows:
| | | | | | | | | | | | | | | | | | | | | | | | | | | | | | | | | | | | |
| | | Balance at
Beginning
of Year | | | Purchases | | | Sales | | | Transfer
Into
(Out of)
Level 3 | | | Cost Basis
Adjustmentsa | | | Net
Realized
Gain
(Loss) | | | Net
Unrealized
Appreciation
(Depreciation) | | | Balance
at End
of Year | | | Net Change in
Unrealized
Appreciation
(Depreciation)
on Assets
Held at
Year End | |
| | | | | | | | | |
| Assets: | | | | | | | | | | | | | | | | | | | | | | | | | | | | | | | | | | | | |
Investments in Securities: | | | | | | | | | | | | | | | | | | | | | | | | | | | | | | | | | | | | |
Common Stocks and Other Equity Interests | | $ | 186,736 | | | $ | 419,608 | | | $ | — | | | $ | — | | | $ | — | | | $ | — | | | $ | 143,626 | | | $ | 749,970 | | | $ | 143,626 | |
Preferred Stocks | | | 298,969 | | | | — | | | | — | | | | — | | | | (69 | ) | | | — | | | | — | | | | 298,900 | | | | — | |
Asset-Backed Securities and Commercial Mortgage-Backed Securities | | | 303,284 | | | | 502,590 | | | | (373,503 | ) | | | — | | | | — | | | | (35,229 | ) | | | 24,026 | | | | 421,168 | | | | 191 | |
| | | | |
Total Investments in Securities | | $ | 788,989 | | | $ | 922,198 | | | $ | (373,503 | ) | | $ | — | | | $ | (69 | ) | | $ | (35,229 | ) | | $ | 167,652 | | | $ | 1,470,038 | | | $ | 143,817 | |
| | | | |
aMay include accretion, amortization, partnership adjustments, and/or other cost basis adjustments.
Level 3 investments in securities include financial instruments with values derived using private transaction prices or non-public third party pricing information which is unobservable. They may also include fair value of immaterial financial instruments and/or other assets developed using various valuation techniques and unobservable inputs.
| | | | | | |
| franklintempleton.com | | Annual Report | | | 53 | |
FRANKLIN ALTERNATIVE STRATEGIES FUNDS
NOTES TO FINANCIAL STATEMENTS
Franklin K2 Long Short Credit Fund (continued)
11. Subsequent Events
The Fund has evaluated subsequent events through the issuance of the financial statements and determined that no events have occurred that require disclosure, except for the following:
On February 27, 2018, the Board approved an automatic conversion feature for Class C that will convert shareholders’ Class C shares into Class A shares after they have been held for 10 years. On May 17, 2018, the Board approved changes to certain front-end sales charges and dealer commissions on Class A shares. Further details are disclosed in the Fund’s Prospectus. The changes will become effective on a future date prior to the calendar year end of 2018.
Ab breviations
| | | | | | | | | | | | | | |
| Counterparty | | Currency | | Selected Portfolio | | Index | | |
| BOFA | | Bank of America, N.A. | | ARS | | Argentine Peso | | ADR | | American Depositary Receipt | | CDX.NA.HY | | CDX North America High Yield |
| BZWS | | Barclays Bank PLC | | BRL | | Brazilian Real | | ARM | | Adjustable Rate Mortgage | | | |
| GSCO | | Goldman Sachs International | | CNY | | Chinese Yuan | | BRLCDI | | Brazil Cetip Di Interbank Deposit Rate | |
| JPHQ | | JP Morgan Chase Bank, N.A. | | CZK | | Czech Koruna | | CLO | | Collateralized Loan Obligation | |
| MSCO | | Morgan Stanley & Co., LLC | | EGP | | Egyptian Pound | | CMT | | Constant Maturity Treasury Index | |
| MSCS | | Morgan Stanley Capital Services LLC | | EUR | | Euro | | ETF | | Exchange Traded Fund | | | | |
| | | GBP | | British Pound | | FHLMC | | Federal Home Loan Mortgage Corp. | | |
| | | | INR | | Indian Rupee | | FNMA | | Federal National Mortgage Association | | |
| | | | JPY | | Japanese Yen | | FRN | | Floating Rate Note | | | | |
| | | | MXN | | Mexican Peso | | KLIBOR | | Kuala Lumpur InterBank Offered Rate | | |
| | | | MYR | | Malaysian Ringgit | | LIBOR | | London InterBank Offered Rate | | |
| | | | PEN | | Peruvian Nuevo Sol | | MIBOR | | Mumbai InterBank Offered Rate | | |
| | | | RON | | Romanian Leu | | PIK | | Payment In-Kind | | | | |
| | | | RUB | | Russian Ruble | | PRIBOR | | Prague InterBank Offered Rate | | |
| | | | USD | | United States Dollar | | REIT | | Real Estate Investment Trust | | |
| | | | ZAR | | South African Rand | | SPDR | | S&P Depositary Receipt | | | | |
| | | | | | | | TIIE | | Interbank Equilibrium Interest Rate | | |
| | | | |
| 54 | | Annual Report | | franklintempleton.com |
FRANKLIN ALTERNATIVE STRATEGIES FUNDS
Report of Independent Registered Public Accounting Firm
To the Board of Trustees of Franklin Alternative Strategies Funds and Shareholders of
Franklin K2 Long Short Credit Fund:
Opinion on the Financial Statements
We have audited the accompanying statement of assets and liabilities of Franklin K2 Long Short Credit Fund (the “Fund”) (one of the funds constituting the Franklin Alternative Strategies Funds), including the statement of investments, as of May 31, 2018, and the related statement of operations for the year then ended, the statements of changes in net assets for each of the two years in the period then ended, the financial highlights for each of the two years in the period then ended and the period from September 8, 2015 (commencement of operations) through May 31, 2016 and the related notes (collectively referred to as the “financial statements”). In our opinion, the financial statements present fairly, in all material respects, the financial position of Franklin K2 Long Short Credit Fund (one of the funds constituting the Franklin Alternative Strategies Funds) at May 31, 2018, the results of its operations for the year then ended, the changes in its net assets for each of the two years in the period then ended and its financial highlights for each of the two years in the period then ended and the period from September 8, 2015 (commencement of operations) through May 31, 2016, in conformity with U.S. generally accepted accounting principles.
Basis for Opinion
These financial statements are the responsibility of the Fund’s management. Our responsibility is to express an opinion on the Fund’s financial statements based on our audits. We are a public accounting firm registered with the Public Company Accounting Oversight Board (United States) (“PCAOB”) and are required to be independent with respect to the Fund in accordance with the U.S. federal securities laws and the applicable rules and regulations of the Securities and Exchange Commission and the PCAOB.
We conducted our audits in accordance with the standards of the PCAOB. Those standards require that we plan and perform the audit to obtain reasonable assurance about whether the financial statements are free of material misstatement, whether due to error or fraud. The Fund is not required to have, nor were we engaged to perform, an audit of the Fund’s internal control over financial reporting. As part of our audits, we are required to obtain an understanding of internal control over financial reporting, but not for the purpose of expressing an opinion on the effectiveness of the Fund’s internal control over financial reporting. Accordingly, we express no such opinion.
Our audits included performing procedures to assess the risks of material misstatement of the financial statements, whether due to error or fraud, and performing procedures that respond to those risks. Such procedures included examining, on a test basis, evidence regarding the amounts and disclosures in the financial statements. Our procedures included confirmation of securities owned as of May 31, 2018, by correspondence with the custodian and brokers, or by other appropriate auditing procedures where replies from brokers were not received. Our audits also included evaluating the accounting principles used and significant estimates made by management, as well as evaluating the overall presentation of the financial statements. We believe that our audits provide a reasonable basis for our opinion.

We have served as the auditor of one or more Franklin investment companies since 1987.
Boston, MA
July 25, 2018
| | | | | | |
| franklintempleton.com | | Annual Report | | | 55 | |
FRANKLIN ALTERNATIVE STRATEGIES FUNDS
Tax Information (unaudited)
Under Section 852(b)(3)(C) of the Internal Revenue Code (Code), the Fund hereby reports the maximum amount allowable but no less than $682,802 as long term capital gain dividend for the fiscal year ended May 31, 2018.
Under Section 871(k)(2)(C) of the Code, the Fund hereby reports the maximum amount allowable but no less than $931,966 as short term capital gain dividend for purposes of the tax imposed under Section 871(a)(1)(A) of the Code for the fiscal year ended May 31, 2018.
| | | | |
| 56 | | Annual Report | | franklintempleton.com |
FRANKLIN ALTERNATIVE STRATEGIES FUNDS
Board Members and Officers
The name, year of birth and address of the officers and board members, as well as their affiliations, positions held with the Funds, principal occupations during at least the past five years and number of US registered portfolios overseen in the Franklin Templeton Investments fund complex, are shown below. Generally, each board member serves until that person’s successor is elected and qualified.
Independent Board Members
| | | | | | | | |
Name, Year of Birth
and Address | | Position | | Length of
Time Served | | Number of Portfolios in
Fund Complex Overseen
by Board Member* | | Other Directorships Held During
at Least the Past 5 Years |
| | | | |
Edward I. Altman, Ph.D. (1941)
c/o Franklin Mutual Advisers, LLC
101 John F. Kennedy Parkway
Short Hills, NJ 07078-2716 | | Trustee | | Since 2011 | | 14 | | None |
|
| Principal Occupation During at Least the Past 5 Years: |
| Max L. Heine Professor of Finance, Emeritus and Director of The Credit and Debt Markets Research Program, Salomon Center, Stern School of Business, New York University; editor and author of numerous financial publications; financial consultant; an adviser to numerous financial and publishing organizations; and formerly, Vice Director, Salomon Center, Stern School of Business, New York University. |
| | | | |
Ann Torre Bates (1958)
c/o Franklin Mutual Advisers, LLC
101 John F. Kennedy Parkway
Short Hills, NJ 07078-2716 | | Trustee | | Since 2011 | | 39 | | Ares Capital Corporation (specialty finance company) (2010-present), United Natural Foods, Inc. (distributor of natural, organic and specialty foods) (2013-present), Allied Capital Corporation (financial services) (2003-2010), SLM Corporation (Sallie Mae) (1997-2014) and Navient Corporation (loan management, servicing and asset recovery) (2014-2016). |
|
| Principal Occupation During at Least the Past 5 Years: |
| Director of various companies; and formerly, Executive Vice President and Chief Financial Officer, NHP Incorporated (manager of multifamily housing) (1995-1997); and Vice President and Treasurer, US Airways, Inc. (until 1995). |
| | | | |
Burton J. Greenwald (1929)
c/o Franklin Mutual Advisers, LLC
101 John F. Kennedy Parkway
Short Hills, NJ 07078-2716 | | Trustee and Vice Chairman of the Board | | Trustee since 2011 and Vice Chairman of the Board since 2015 | | 14 | | Franklin Templeton Emerging Markets Debt Opportunities Fund PLC (1999-present) and Fiduciary International Ireland Limited (1999-2015). |
|
| Principal Occupation During at Least the Past 5 Years: |
| Managing Director, B.J. Greenwald Associates (management consultants to the financial services industry); and formerly, Chairman, Fiduciary Trust International Funds; Executive Vice President, L.F. Rothschild Fund Management, Inc.; President and Director, Merit Mutual Funds; President, Underwriting Division and Director, National Securities & Research Corporation; Governor, Investment Company Institute; and Chairman, ICI Public Information Committee. |
| | | | |
Keith E. Mitchell (1954)
c/o Franklin Mutual Advisers, LLC
101 John F. Kennedy Parkway
Short Hills, NJ 07078-2716 | | Trustee | | Since 2011 | | 14 | | None |
|
| Principal Occupation During at Least the Past 5 Years: |
| Director of various boards of asset management firms; and formerly, Managing Member, Mitchell, Hartley & Bechtel Advisers, LLC (formerly, Mitchell Advisers, LLC) (advisory firm) (2003-2015) and Managing Director, Putman Lovell NBF. |
| | | | | | |
| franklintempleton.com | | Annual Report | | | 57 | |
FRANKLIN ALTERNATIVE STRATEGIES FUNDS
Independent Board Members (continued)
| | | | | | | | |
Name, Year of Birth
and Address | | Position | | Length of
Time Served | | Number of Portfolios in
Fund Complex Overseen
by Board Member* | | Other Directorships Held During
at Least the Past 5 Years |
| | | | |
David W. Niemiec (1949)
c/o Franklin Mutual Advisers, LLC
101 John F. Kennedy Parkway
Short Hills, NJ 07078-2716 | | Trustee | | Since 2015 | | 39 | | Hess Midstream Partners LP (oil and gas midstream infrastructure) (2017-present). |
|
| Principal Occupation During at Least the Past 5 Years: |
| Advisor, Saratoga Partners (private equity fund); and formerly, Managing Director, Saratoga Partners (1998-2001) and SBC Warburg Dillon Read (investment banking) (1997-1998); Vice Chairman, Dillon, Read & Co. Inc. (investment banking) (1991-1997); and Chief Financial Officer, Dillon, Read & Co. Inc. (1982-1997). |
| | | | |
Charles Rubens II (1930)
c/o Franklin Mutual Advisers, LLC
101 John F. Kennedy Parkway
Short Hills, NJ 07078-2716 | | Trustee | | Since 2011 | | 14 | | None |
|
| Principal Occupation During at Least the Past 5 Years: |
| Private investor and president of non-profit organizations; and formerly, an executive of Time, Inc.; and Trustee of Colorado College. |
| | | | |
Jan Hopkins Trachtman (1947)
c/o Franklin Mutual Advisers, LLC
101 John F. Kennedy Parkway
Short Hills, NJ 07078-2716 | | Trustee | | Since 2011 | | 14 | | None |
|
| Principal Occupation During at Least the Past 5 Years: |
| President and Founder, The Jan Hopkins Group (communications consulting firm); serves on Advisory Board of Knight Bagehot Fellowship; and formerly, President, Economic Club of New York (2007-2015); Anchor/Correspondent, CNN Financial News (until 2003); Managing Director and Head of Client Communications, Citigroup Private Bank (until 2005); Off-Air Reporter, ABC News’ World News Tonight; and Editor, CBS Network News. |
| | | | |
Robert E. Wade (1946)
c/o Franklin Mutual Advisers, LLC
101 John F. Kennedy Parkway
Short Hills, NJ 07078-2716 | | Trustee and Chairman of the Board | | Since 2011 | | 39 | | El Oro Ltd (investments) (2003-present). |
|
| Principal Occupation During at Least the Past 5 Years: |
| Attorney at law engaged in private practice as a sole practitioner (1972-2008) and member of various boards. |
| | | | |
Gregory H. Williams (1943)
c/o Franklin Mutual Advisers, LLC
101 John F. Kennedy Parkway
Short Hills, NJ 07078-2716 | | Trustee | | Since 2015 | | 14 | | None |
|
| Principal Occupation During at Least the Past 5 Years: |
| Private investor; Consultant; and formerly, President, University of Cincinnati (2009-2012); President, The City College of New York (2001-2009); Dean, College of Law, Ohio State University (1993-2001); and Associate Vice President, Academic Affairs and Professor of Law, University of Iowa (1977-1993). |
| | | | |
| 58 | | Annual Report | | franklintempleton.com |
FRANKLIN ALTERNATIVE STRATEGIES FUNDS
Interested Board Members and Officers
| | | | | | | | |
Name, Year of Birth
and Address | | Position | | Length of
Time Served | | Number of Portfolios in
Fund Complex Overseen
by Board Member* | | Other Directorships Held During
at Least the Past 5 Years |
| | | | |
**Gregory E. Johnson (1961)
One Franklin Parkway San Mateo, CA 94403-1906 | | Trustee | | Since 2011 | | 151 | | None |
|
| Principal Occupation During at Least the Past 5 Years: |
| Chairman of the Board, Member – Office of the Chairman, Director and Chief Executive Officer, Franklin Resources, Inc.; officer and/or director or trustee, as the case may be, of some of the other subsidiaries of Franklin Resources, Inc. and of 43 of the investment companies in Franklin Templeton Investments; Vice Chairman, Investment Company Institute; and formerly, President, Franklin Resources, Inc. (1994-2015). |
| | | | |
**Jennifer M. Johnson (1964)
One Franklin Parkway San Mateo, CA 94403-1906 | | Trustee | | Since 2015 | | 43 | | None |
|
| Principal Occupation During at Least the Past 5 Years: |
| President and Chief Operating Officer, Franklin Resources, Inc.; officer and/or director or trustee, as the case may be, of some of the other subsidiaries of Franklin Resources, Inc. and of four of the investment companies in Franklin Templeton Investments; and formerly, Chief Operating Officer and Executive Vice President, Franklin Resources, Inc. (1994-2015); Executive Vice President of Operations and Technology, Franklin Resources, Inc. (2005-2010); and Senior Vice President, Franklin Resources, Inc. (2003-2005). |
| | | | |
Alison E. Baur (1964) One Franklin Parkway San Mateo, CA 94403-1906 | | Vice President | | Since 2012 | | Not Applicable | | Not Applicable |
|
| Principal Occupation During at Least the Past 5 Years: |
| Deputy General Counsel, Franklin Templeton Investments; and officer of some of the other subsidiaries of Franklin Resources, Inc. and of 45 of the investment companies in Franklin Templeton Investments. |
| | | | |
Aliya S. Gordon (1973) One Franklin Parkway San Mateo, CA 94403-1906 | | Vice President | | Since 2011 | | Not Applicable | | Not Applicable |
|
| Principal Occupation During at Least the Past 5 Years: |
| Senior Associate General Counsel, Franklin Templeton Investments; and officer of 45 of the investment companies in Franklin Templeton Investments. |
| | | | |
Steven J. Gray (1955) One Franklin Parkway San Mateo, CA 94403-1906 | | Secretary and Vice President | | Since 2011 | | Not Applicable | | Not Applicable |
|
| Principal Occupation During at Least the Past 5 Years: |
| Senior Associate General Counsel, Franklin Templeton Investments; Vice President, Franklin Templeton Distributors, Inc. and FASA, LLC; and officer of 45 of the investment companies in Franklin Templeton Investments. |
| | | | |
Madison S. Gulley (1964) 300 S.E. 2nd Street Fort Lauderdale, FL 33301-1923 | | President and Chief Executive Officer – Investment Management | | Since 2017 | | Not Applicable | | Not Applicable |
|
| Principal Occupation During at Least the Past 5 Years: |
| Executive Vice President, Franklin Advisers, Inc., Franklin Advisory Services, LLC, Franklin Templeton Institutional, LLC; Templeton Global Advisors, Limited, and Templeton Investment Counsel, LLC; Senior Vice President, Franklin Templeton Companies, LLC; officer and/or director or trustee, as the case may be, of some of the other subsidiaries of Franklin Resources, Inc. and of one of the investment companies in Franklin Templeton Investments. |
| | | | | | |
| franklintempleton.com | | Annual Report | | | 59 | |
FRANKLIN ALTERNATIVE STRATEGIES FUNDS
Interested Board Members and Officers (continued)
| | | | | | | | |
Name, Year of Birth
and Address | | Position | | Length of
Time Served | | Number of Portfolios in
Fund Complex Overseen
by Board Member* | | Other Directorships Held During
at Least the Past 5 Years |
| | | | |
Matthew T. Hinkle (1971) One Franklin Parkway San Mateo, CA 94403-1906 | | Chief Executive Officer – Finance and Administration | | Since 2017 | | Not Applicable | | Not Applicable |
|
| Principal Occupation During at Least the Past 5 Years: |
| Senior Vice President, Franklin Templeton Services, LLC; officer of 45 of the investment companies in Franklin Templeton Investments; and formerly, Vice President, Global Tax (2012-April 2017) and Treasurer/Assistant Treasurer, Franklin Templeton Investments (2009-2017). |
| | | | |
Robert G. Kubilis (1973) 300 S.E. 2nd Street Fort Lauderdale, FL 33301-1923 | | Chief Financial Officer, Chief Accounting Officer and Treasurer | | Since 2015 | | Not Applicable | | Not Applicable |
|
| Principal Occupation During at Least the Past 5 Years: |
| Treasurer, U.S. Fund Administration & Reporting, Franklin Templeton Investments; and officer of 17 of the investment companies in Franklin Templeton Investments. |
| | | | |
Robert Lim (1948) One Franklin Parkway San Mateo, CA 94403-1906 | | Vice President – AML Compliance | | Since 2016 | | Not Applicable | | Not Applicable |
|
| Principal Occupation During at Least the Past 5 Years: |
| Vice President, Franklin Templeton Companies, LLC; Chief Compliance Officer, Franklin Templeton Distributors, Inc. and Franklin Templeton Investor Services, LLC; and officer of 45 of the investment companies in Franklin Templeton Investments. |
| | | | |
Kimberly H. Novotny (1972)
300 S.E. 2nd Street Fort Lauderdale, FL 33301-1923 | | Vice President | | Since 2013 | | Not Applicable | | Not Applicable |
|
| Principal Occupation During at Least the Past 5 Years: |
| Associate General Counsel, Franklin Templeton Investments; Vice President and Corporate Secretary, Fiduciary Trust International of the South; Vice President, Templeton Investment Counsel, LLC; Assistant Secretary, Franklin Resources, Inc.; and officer of 45 of the investment companies in Franklin Templeton Investments. |
| | | | |
Robert C. Rosselot (1960)
300 S.E. 2nd Street Fort Lauderdale, FL 33301-1923 | | Chief Compliance Officer | | Since 2013 | | Not Applicable | | Not Applicable |
|
| Principal Occupation During at Least the Past 5 Years: |
| Director, Global Compliance, Franklin Templeton Investments; Vice President, Franklin Templeton Companies, LLC; officer of 45 of the investment companies in Franklin Templeton Investments; and formerly, Senior Associate General Counsel, Franklin Templeton Investments (2007-2013); and Secretary and Vice President, Templeton Group of Funds (2004-2013). |
| | | | |
Karen L. Skidmore (1952)
One Franklin Parkway San Mateo, CA 94403-1906 | | Vice President | | Since 2011 | | Not Applicable | | Not Applicable |
|
| Principal Occupation During at Least the Past 5 Years: |
| Senior Associate General Counsel, Franklin Templeton Investments; and officer of 45 of the investment companies in Franklin Templeton Investments. |
| | | | |
| 60 | | Annual Report | | franklintempleton.com |
FRANKLIN ALTERNATIVE STRATEGIES FUNDS
Interested Board Members and Officers (continued)
| | | | | | | | |
Name, Year of Birth
and Address | | Position | | Length of
Time Served | | Number of Portfolios in
Fund Complex Overseen
by Board Member* | | Other Directorships Held During
at Least the Past 5 Years |
| | | | |
Navid J. Tofigh (1972)
One Franklin Parkway
San Mateo, CA 94403-1906 | | Vice President | | Since 2015 | | Not Applicable | | Not Applicable |
|
| Principal Occupation During at Least the Past 5 Years: |
| Associate General Counsel, Franklin Templeton Investments; and officer of 45 of the investment companies in Franklin Templeton Investments. |
| | | | |
Craig S. Tyle (1960)
One Franklin Parkway
San Mateo, CA 94403-1906 | | Vice President | | Since 2011 | | Not Applicable | | Not Applicable |
|
| Principal Occupation During at Least the Past 5 Years: |
| General Counsel and Executive Vice President, Franklin Resources, Inc.; and officer of some of the other subsidiaries of Franklin Resources, Inc. and of 45 of the investment companies in Franklin Templeton Investments. |
| | | | |
Lori A. Weber (1964)
300 S.E. 2nd Street Fort Lauderdale, FL 33301-1923 | | Vice President | | Since 2011 | | Not Applicable | | Not Applicable |
|
| Principal Occupation During at Least the Past 5 Years: |
| Senior Associate General Counsel, Franklin Templeton Investments; Assistant Secretary, Franklin Resources, Inc.; Vice President and Secretary, Templeton Investment Counsel, LLC; and officer of 45 of the investment companies in Franklin Templeton Investments. |
*We base the number of portfolios on each separate series of the US registered investment companies within the Franklin Templeton Investments fund complex. These portfolios have a common investment manager or affiliated investment managers.
**Gregory E. Johnson is considered to be an interested person of the Fund under the federal securities laws due to his position as an officer and director of Franklin Resources, Inc. (Resources), which is the parent company of the Fund’s investment manager and distributor. Jennifer M. Johnson is considered to be an interested person of the Fund under the federal securities laws due to her position as officer of Resources.
Note 1: Gregory E. Johnson and Jennifer M. Johnson are siblings.
Note 2: Officer information is current as of the date of this report. It is possible that after this date, information about officers may change.
The Sarbanes-Oxley Act of 2002 and Rules adopted by the US Securities and Exchange Commission require the Fund to disclose whether the Fund’s Audit Committee includes at least one member who is an audit committee financial expert within the meaning of such Act and Rules. The Fund’s Board has determined that there is at least one such financial expert on the Audit Committee and has designated each of Edward I. Altman, Ph.D., Ann Torre Bates and David W. Niemiec as an audit committee financial expert. The Board believes that Messrs. Altman and Niemiec and Ms. Bates qualify as such an expert in view of their extensive business background and experience. Mr. Altman has served as a member of the Fund Audit Committee since 2011. He currently serves as a Max L. Hines Professor of Finance, Emeritus and Director of The Credit and Debt Markets Research Program, Salomon Center, Stern School of Business, New York University. Ms. Bates has served as a member of the Fund Audit Committee since 2011. She currently serves as a director of Ares Capital Corporation (2010-present) and United Natural Foods, Inc. (2013-present) and was formerly a director of Navient Corporation from 2014 to 2016, SLM Corporation from 1997 to 2014 and Allied Capital Corporation from 2003 to 2010, Executive Vice President and Chief Financial Officer of NHP Incorporated from 1995 to 1997 and Vice President and Treasurer of US Airways, Inc. until 1995. Mr. Niemiec has served as a member of the Fund Audit Committee since 2015, currently serves as an Advisor to Saratoga Partners and was formerly its Managing Director from 1998 to 2001 and serves as a director of Hess Midstream Partners LP (2017-present). Mr. Niemiec was formerly a director of Emeritus Corporation from 1999 to 2010 and OSI Pharmaceuticals, Inc. from 2006 to 2010, Managing Director of SBC Warburg Dillon Read from 1997 to 1998, and was Vice Chairman from 1991 to 1997 and Chief Financial Officer from 1982 to 1997 of Dillon, Read & Co. Inc. As a result of such background and experience, the Board believes that Messrs. Altman and Niemiec and Ms. Bates have each acquired an understanding of generally accepted accounting principles and financial statements, the general application of such principles in connection with the accounting estimates, accruals and reserves, and analyzing and evaluating financial statements that present a breadth and level of complexity of accounting issues generally comparable to those of the Fund, as well as an understanding of internal controls and procedures for financial reporting and an understanding of audit committee functions. Messrs. Altman and Niemiec and Ms. Bates are independent Board members as that term is defined under the applicable US Securities and Exchange Commission Rules and Releases.
The Statement of Additional Information (SAI) includes additional information about the board members and is available, without charge, upon request. Shareholders may call (800) DIAL BEN/342-5236 to request the SAI.
| | | | | | |
| franklintempleton.com | | Annual Report | | | 61 | |
FRANKLIN ALTERNATIVE STRATEGIES FUNDS
FRANKLIN K2 LONG SHORT CREDIT FUND
Shareholder Information
Board Approval of Investment Management Agreements and Sub-Advisory Agreements
FRANKLIN ALTERNATIVE STRATEGIES FUNDS
Franklin K2 Long Short Credit Fund
(Fund)
The Board of Trustees (Board) of Franklin Alternative Strategies Funds (the Trust), including a majority of trustees that are not “interested persons” as such term is defined in section 2(a)(19) of the Investment Company Act of 1940 (hereinafter referred to as “independent trustees”), at an in-person meeting held on May 17, 2018, unanimously approved the renewal of the Fund’s investment management agreement with K2/D&S Management Co., L.L.C. (K2 Advisors), and of each sub-advisory agreement between K2 Advisors and each of following sub-advisors (the Sub-Advisors):
Apollo Credit Management, LLC
Medalist Partners, LP
Chatham Asset Management, LLC
Ellington Global Asset Management, L.L.C.
EMSO Asset Management Limited
It was noted that the sub-advisory agreement for Medalist Partners, LP was approved at the Board’s April 23, 2018 and was being reapproved in order to bring the Board’s annual consideration of such agreement into line with those of the other sub-advisers of the Fund.
Prior to a meeting of all of the trustees for the purpose of considering such renewal, the independent trustees participated in two other meetings held in connection with the renewal process. Throughout the process, the independent trustees received assistance and advice from and met separately with independent counsel. The independent trustees met with and interviewed officers of K2 Advisors and certain Sub-Advisors (including portfolio managers), the transfer agent and shareholder services group and the distributor. In approving the renewal of the investment management agreement and the sub-advisory agreements for the Fund, the Board, including the independent trustees, determined that the investment management fee structure was fair and reasonable and that continuance of the agreement was in the best interests of the Fund and its shareholders.
In making the foregoing approvals, the Board considered various materials related to the investment management agreement and the sub-advisory agreements including: (1) a copy of the investment management agreement and sub-advisory agreements; (2) information describing the nature, quality and extent
of services that K2 Advisors and each Sub-Advisor provided, and are expected to provide, to the Fund, and the investment management fees and sub-advisory fees payable to K2 Advisors and each Sub-Advisor; (3) reports from K2 Advisors on the continued diligence conducted on each Sub-Advisor and the reasons for recommending renewal of each of the sub-advisory agreements, including, but not limited to, each Sub-Advisor’s background, experience, personnel, operations, policies, procedures and compliance functions; and (4) a report from the Trust’s Chief Compliance Officer regarding K2 Advisors’ and each Sub-Advisor’s compliance program and capabilities, including policies and procedures in place to address potential conflicts of interest, and the diligence undertaken by the Trust’s Chief Compliance Officer with respect thereto. The Board also noted that it received an annual report on all payments made by Franklin Templeton Investments (FTI) or the Fund to financial intermediaries engaged in the sale of Fund shares, as well as a memorandum relating to third-party servicing arrangements in response to a Guidance Update from the U.S. Securities and Exchange Commission (SEC) relating to mutual fund distribution and sub-accounting fees.
The Board also took into account information furnished throughout the year at regular Board meetings, as well as information specifically requested and furnished for the renewal process, which culminated in the meetings referred to above for the specific purpose of considering such agreements. Information furnished throughout the year included, among others, reports on the Fund’s investment performance, expenses, portfolio composition, derivatives, asset segregation, portfolio turnover, Rule 12b-1 plan, distribution, shareholder servicing, legal and compliance matters, pricing of securities, sales and redemptions, and marketing support payments made to financial intermediaries, as well as a third-party survey of transfer agent fees charged to funds within the FTI complex in comparison with those charged to other fund complexes deemed comparable. Also, related financial statements and other information about the scope and quality of services provided by K2 Advisors and its affiliates and enhancements to such services over the past year were provided. In addition, the trustees received periodic reports throughout the year and during the renewal process relating to compliance with the Fund’s investment policies and restrictions. During the renewal process, the independent trustees considered K2 Advisors’ methods of operation within the Franklin Templeton group and its activities on behalf of other clients.
The information obtained by the trustees during the renewal process also included a special report prepared by Broadridge
| | | | |
| 62 | | Annual Report | | franklintempleton.com |
FRANKLIN ALTERNATIVE STRATEGIES FUNDS
FRANKLIN K2 LONG SHORT CREDIT FUND
SHAREHOLDER INFORMATION
Financial Solutions, Inc., an independent third-party analyst that utilizes data from Lipper, Inc. (“Lipper”), comparing the Fund’s investment performance and expenses with those of other mutual funds deemed comparable to such Fund as selected by Lipper (Broadridge Section 15(c) Report). The trustees reviewed the Broadridge Section 15(c) Report and its usefulness in the renewal process with respect to matters such as comparative fees, expenses, expense ratios and performance. The Board considered K2 Advisors’ views that the peer group determined by Lipper for comparison purposes may not be an entirely appropriate representation of the Fund’s peer universe. K2 Advisors explained that the universe of funds that are managed using multi-manager, multi-strategy structures, like the Fund, is still evolving, and has presented challenges in identifying an appropriate set of peers for the Fund. It was noted by K2 Advisors that the peer group compiled by Lipper includes single-manager funds which, due to their nature and relative simplicity, have lower expense ratios and are not true peers for fee comparison purposes (“Base Expense Group”). Because many of the sponsors of funds with multi-manager strategies that K2 Advisors considers to be peers were excluded from the peer group determined by Lipper, K2 Advisors requested a second peer group including funds that K2 Advisors considers to be peer funds (“Alternate Expense Group”). K2 Advisors believes that the Fund’s expenses are in line with the second peer group. While noting the limitations of the Broadridge Section 15(c) Report, the Board concluded that the Broadridge Section 15(c) Report was helpful in the performance of its duties.
In addition, the trustees received a Profitability Study (Profitability Study) prepared by management discussing the profitability to FTI from its overall U.S. fund operations, as well as on an individual fund-by-fund basis. Over the past year, the Board and counsel to the independent trustees continued to receive reports on management’s handling of recent regulatory inquiries and pending legal actions against K2 Advisors and its affiliates. The independent trustees were satisfied with the actions taken to date by management in response to such regulatory and legal matters. The independent trustees also received reports from the Trust’s Chief Compliance Officer on regulatory inquiries and pending legal actions against the Sub-Advisors applicable to the services provided by the Sub-Advisors to the Fund and noted that there were not any issues in this regard that should prevent the renewal of the sub-advisory agreements.
The trustees reviewed the personnel, operations, financial condition, and investment management capabilities, methodologies and resources of K2 Advisors and each Sub-Advisor, including
each management team’s expertise in the management of other alternative strategies funds. As part of this review, particular attention was given to (1) the diligent risk management program of K2 Advisors and its parent, including those aspects of the program related to selecting and overseeing sub-advisors to the Fund and continual monitoring and management of cybersecurity, liquidity and counterparty credit risk, (2) each Sub-Advisor’s risk management program, and (3) derivatives and other complex instruments that are held and expected to be held by the Fund and how such instruments are used to carry out the Fund’s investment goal.
The Board also took into account, among other things, management’s efforts in establishing a global credit facility for the benefit of the Fund and other accounts managed by FTI to provide a source of cash for temporary and emergency purposes or to meet unusual redemption requests as well as the strong financial position of K2 Advisors’ parent company and its commitment to the mutual fund business. The Board noted management’s continuing efforts and expenditures in establishing effective business continuity plans and developing strategies to address areas of heightened concern in the mutual fund industry, such as cybersecurity and liquidity risk management. The Board also recognized management’s commitment to facilitating Board oversight of particular areas, including derivatives and payments to intermediaries, by enhanced reporting. In addition, the Board received updates from management on the compliance of the investment manager with comprehensive rules and regulations promulgated by the SEC and the U.S. Commodity Futures Trading Commission.
In addition to the above and other matters considered by the trustees throughout the course of the year, the following discussion relates to certain primary factors relevant to the Board’s decision. This discussion of the information and factors considered by the Board (including the information and factors discussed above) is not intended to be exhaustive, but rather summarizes certain factors considered by the Board. In view of the wide variety of factors considered, the Board did not, unless otherwise noted, find it practicable to quantify or otherwise assign relative weights to the foregoing factors. In addition, individual trustees may have assigned different weights to various factors.
NATURE, EXTENT AND QUALITY OF SERVICES. The trustees reviewed the nature, extent and quality of the services provided, and to be provided, by K2 Advisors and each Sub-Advisor. In this regard, they reviewed the Fund’s investment goal and K2 Advisors’ and each Sub-Advisor’s
| | | | | | |
| franklintempleton.com | | Annual Report | | | 63 | |
FRANKLIN ALTERNATIVE STRATEGIES FUNDS
FRANKLIN K2 LONG SHORT CREDIT FUND
SHAREHOLDER INFORMATION
investment strategy and sub-strategy, and K2 Advisors’ and each Sub-Advisor’s ability to implement such investment strategy and/or sub-strategy, including, but not limited to, K2 Advisors’ and each Sub-Advisor’s trading practices, investment decision processes and reputation.
The Board noted that the Fund employs a “manager of managers” structure, whereby K2 Advisors is responsible for selecting sub-advisors (subject to Board approval), allocating the Fund’s assets among them, and overseeing the sub-advisors’ day-to-day management of the Fund’s assets. The Board noted the responsibilities that K2 Advisors has as the Fund’s investment manager, including (1) due diligence on the Sub-Advisors and any potential new sub-advisors to the Fund, their respective trading strategies, risk management, operations and businesses, (2) on-going oversight and monitoring of the day-to-day investment activities of Sub-Advisors and other service providers, including their respective compliance with the investment mandate and restrictions, compliance policies and procedures and federal securities laws, and K2 Advisors’ ongoing assessment of their performance, (3) portfolio construction with respect to the allocation of assets among Sub-Advisors, investment funds, cash and other investments, (4) risk management, (5) preparing quarterly reports to the Board, and (6) the implementation of Board directives as they relate to the Fund. The Trustees also considered the successful performance of K2 Advisors in managing the Fund and other investment products with similar investment strategies to the investment strategies of the Fund that are not subject to the Investment Company Act of 1940.
With respect to the sub-advisory services provided, and to be provided, by each Sub-Advisor, the Board noted the responsibilities that each Sub-Advisor has with respect to the portion of the Fund’s assets allocated to the Sub-Advisor by K2 Advisors (Sub-Advised Portion), including, among others, implementing the investment strategies with respect to the Sub-Advised Portion and ensuring compliance with the investment strategies, policies and limitations of the Sub-Advised Portion. The trustees considered the successful performance of each Sub-Advisor in managing the Fund and other investment products with similar investment strategies to the investment strategies of its Sub-Advised Portion of the Fund, including, with respect to certain Sub-Advisors, mutual funds with similar investment strategies. The Board considered K2 Advisors’ rationale for recommending the continued retention of each Sub-Advisor.
The trustees reviewed the Fund’s portfolio management teams at K2 Advisors and each Sub-Advisor, including each such team’s performance, staffing, skills and compensation program.
With respect to portfolio manager compensation, management assured the trustees that the Fund’s long-term performance is a significant component of incentive-based compensation for K2 Advisors’ portfolio management team and noted that a portion of a K2 Advisors’ portfolio manager’s incentive-based compensation is paid in shares of pre-designated funds from the portfolio manager’s fund management area. The trustees noted that the portfolio manager compensation program aligned the interests of the portfolio managers with that of Fund shareholders. During regular Board meetings and the aforementioned meetings of the independent trustees, the trustees considered periodic reports provided to them showing that K2 Advisors and the Sub-Advisors complied with the investment policies and restrictions of the Fund as well as other reports periodically furnished to the Board covering matters such as the compliance of portfolio managers and other management personnel with the code of ethics covering the investment management personnel, the adherence to fair value pricing procedures established by the Board and the accuracy of net asset value calculations. The Board noted the extent of the benefits provided to Fund shareholders from being part of the Franklin Templeton group of funds, including the right to exchange investments between funds (same class) without a sales charge, the ability to reinvest Fund dividends into other funds and the right to combine holdings of other funds to obtain reduced sales charges.
The trustees discussed with management various other products, portfolios and entities that are advised by K2 Advisors and each Sub-Advisor and the allocation of assets and expenses among and within them, as well as their relative fees and reasons for differences with respect thereto and any potential conflicts.
The Board also considered a report from the Trust’s Chief Compliance Officer regarding K2 Advisors’ and each Sub-Advisor’s compliance programs and capabilities as such programs and capabilities relate to the operations of the Fund and the monitoring and testing of such program undertaken by the Trust’s Chief Compliance Officer. The Board considered the selection and due diligence process employed by K2 Advisors in selecting and deciding to retain each Sub-Advisor as a sub-advisor to the Fund, including the due diligence undertaken with respect to the Sub-Advisor’s compliance and risk management capabilities. The trustees considered K2 Advisors’ significant efforts in developing and implementing compliance procedures established in accordance with SEC and other requirements.
The Board also considered the nature, extent and quality of the services to be provided under the Fund’s other service agreements to determine that, on an overall basis, Fund shareholders
| | | | |
| 64 | | Annual Report | | franklintempleton.com |
FRANKLIN ALTERNATIVE STRATEGIES FUNDS
FRANKLIN K2 LONG SHORT CREDIT FUND
SHAREHOLDER INFORMATION
were well served. In this connection, the Board also took into account transfer agent and shareholder services provided to Fund shareholders by an affiliate of K2 Advisors, noting continuing expenditures by management to increase and improve the scope of such services and favorable periodic reports on shareholder services conducted by independent third parties. While such considerations directly affected the trustees’ decision in renewing the Fund’s transfer agent and shareholder services agreement, the Board also considered these commitments as incidental benefits to Fund shareholders deriving from the investment management relationship.
Based on their review, the trustees were satisfied with the nature and quality of the overall services provided, and to be provided, by K2 Advisors and its affiliates and each Sub Advisor to the Fund and its shareholders and were confident in the abilities of K2 Advisors and each Sub-Advisor to implement their respective investment strategy and/or sub-strategy and to provide quality services to the Fund and its shareholders.
INVESTMENT PERFORMANCE. As the Fund commenced operations in September 2015, the trustees reviewed the investment performance of the Fund for the one– and two-year periods ended December 31, 2017. As part of their review, they inquired of management regarding benchmark and hedging activities. Consideration was also given to performance in the context of available levels of cash, including as affected by net flows, during the periods. The trustees had meetings during the year, including the meetings referred to above held in connection with the renewal process, with the Fund’s portfolio managers to discuss performance and the management of the Fund and each Sub-Advisor.
In addition, attention in assessing performance was given to the Broadridge Section 15(c) Report. That report showed the investment performance of the Fund (Advisor Class shares) in comparison to other funds determined comparable by Lipper.
The comparable funds to the Fund, as chosen by Lipper, included all retail and institutional alternative credit focus funds. The Fund had total returns in the second-best performing quintile for the one- and two-year periods ended December 31, 2017. The Board was satisfied with such performance.
The trustees also compared Fund performance to other industry benchmarks, including measures of risk-adjusted performance of a fund, as part of their evaluation of investment performance. The trustees concluded that the Fund had continued to perform well in comparison to its various benchmarks and in the context of the Fund’s investment goal.
COMPARATIVE EXPENSES AND PROFITABILITY. The trustees considered the cost of the services provided, and to be provided, by K2 Advisors and each Sub-Advisor and the losses realized by K2 Advisors and its affiliates from their relationships with the Fund. As part of the renewal process, they explored with management the trends in expense ratios over the past three fiscal years (or, if earlier, inception) and the reasons for any increases in the Fund’s expense ratios (or components thereof). In considering the appropriateness of the management fee and other expenses charged to the Fund, the Board took into account various factors including investment performance and matters relating to Fund operations, including, but not limited to, the quality and experience of K2 Advisors personnel. The Board also reviewed and considered the investment management fees in light of the nature, extent and quality of the investment management services provided, and to be provided, by K2 Advisors and each Sub-Advisor, as more fully discussed above. The Board noted that the sub-advisory fees are paid by K2 Advisors to each Sub-Advisor and are not additional fees borne by the Fund. The Board also noted that the sub-advisory fees paid, and to be paid, by K2 Advisors to each Sub-Advisor were the product of arms-length negotiations between K2 Advisors and each Sub-Advisor. Furthermore, the Board took into account that information regarding Sub-Advisor profitability is not legally required to be provided. Accordingly, profitability information of the sub-advisors was given lesser weight than other factors. In addition, the Board considered the allocation of the investment management fee charged to the Fund between K2 Advisors and each Sub-Advisor in light of the nature, extent and quality of the investment management services provided, and to be provided, by K2 Advisors and each Sub-Advisor. As part of this discussion, the Board took into account the fee waiver and expense limitation arrangement in effect, and the amount of Fund expenses that were absorbed since inception of the Fund by K2 Advisors through such waivers and arrangements.
Consideration was also given to a comparative analysis in the Broadridge Section 15(c) Report of the investment management fee and total expense ratio of the Fund in comparison with those of a group of other funds selected by Lipper as its appropriate Lipper expense group. Lipper expense data is based upon information taken from each fund’s most recent annual report, which reflects historical asset levels that may be quite different from those currently existing, particularly in a period of market volatility.
In reviewing comparative costs, emphasis was given to the Fund’s contractual management fee in comparison with the
| | | | | | |
| franklintempleton.com | | Annual Report | | | 65 | |
FRANKLIN ALTERNATIVE STRATEGIES FUNDS
FRANKLIN K2 LONG SHORT CREDIT FUND
SHAREHOLDER INFORMATION
contractual management fee that would have been charged by other funds within its Lipper expense group assuming they were similar in size to the Fund, as well as the actual total expenses of the Fund in comparison with those of its Lipper expense group. The Lipper contractual management fee analysis includes administrative charges as being part of the management fee, and total expenses, for comparative consistency, are shown by Lipper for Fund Advisor Class shares. The Fund’s contractual management fee rate was in the most expensive quintile of both its Base Expense Group and Alternate Expense Group. The Fund’s total expenses were also in the most expensive quintile of both its Base Expense Group and Alternate Expense Group.
Noting the factors and limitations noted above with respect to the Broadridge Section 15(c) Report and factors relating to the Fund’s operations, such as the quality and experience of K2 Advisors and the Sub-Advisors and the nature and quality of the services provided and to be provided by K2 Advisors and the Sub-Advisors, the Board found such comparative fees and expenses to be acceptable.
The trustees also reviewed the Profitability Study addressing profitability of Franklin Resources, Inc., from its overall U.S. fund business, as well as profitability to K2 Advisors and its affiliates, from providing investment management and other services to the Fund during the 12-month period ended September 30, 2017, the most recent fiscal year-end of Franklin Resources, Inc. The trustees reviewed the basis on which such reports are prepared and the cost allocation methodology utilized in the Profitability Study, it being recognized that allocation methodologies may each be reasonable while producing different results. In this respect, the Board noted that the reasonableness of the cost allocation methodologies was reviewed by independent accountants on an every other year basis.
The independent trustees met with management to discuss the Profitability Study. This included, among other things, a comparison of investment management income with investment management expenses of the Fund; comparison of underwriting revenues and expenses; the relative relationship of investment management and underwriting expenses; shareholder servicing profitability; economies of scale; and the relative contribution of the Fund to the profitability of K2 Advisors and its parent. In discussing the Profitability Study with the Board, K2 Advisors stated its belief that the costs incurred in establishing the infrastructure necessary to operate the type of mutual fund operations conducted by it and its affiliates may not be fully
reflected in the expenses allocated to the Fund in determining its profitability.
The Board also took into account management’s expenditures in improving shareholder services provided to the Fund, as well as the need to meet additional regulatory and compliance requirements. The trustees also considered the extent to which K2 Advisors and the Sub-Advisors may derive ancillary benefits from Fund operations, including those derived from the allocation of Fund brokerage and the use of commission dollars to pay for research and other similar services.
The Board noted that shareholders are able to redeem their Fund shares at any time if shareholders believe that Fund fees and expenses are too high or if they are dissatisfied with the performance of the Fund.
ECONOMIES OF SCALE. The Board considered economies of scale realized by K2 Advisors and its affiliates and the Sub-Advisors as the Fund grows larger and the extent to which they are shared with Fund shareholders, as for example, in the level of the investment management fees charged, in the quality and efficiency of services rendered and in increased capital commitments benefiting the Fund directly or indirectly. The Board also considered the fee waiver and expense limitation arrangement in effect, and the amount of Fund expenses that were absorbed since inception of the Fund by K2 Advisors through such waiver and arrangement. The Board concluded that economies of scale were deemed not to be a significant factor at that time in light of, among other matters, the fee waiver and expense limitation arrangement in effect and the fact that the Fund had less than three complete years of operating results.
Board Approval of Sub-Advisory Agreement
FRANKLIN K2 LONG SHORT CREDIT FUND
(Fund)
The Board of Trustees (Board) of Franklin Alternative Strategies Funds (the Trust), including a majority of trustees that are not “interested persons” as such term is defined in section 2(a)(19) of the Investment Company Act of 1940 (hereinafter referred to as “independent trustees”), at an in-person meeting held on April 24, 2018, unanimously approved the sub-advisory agreement (the “New Sub-Advisory Agreement”) with Medalist Partners, LP (“Medalist”). Medalist was formed as a result of a transaction (“Transaction”) whereby the structured credit team of Candlewood Investment Group, LP, a sub-adviser to Fund since inception of the Fund (“Candlewood”), would formally separate from Candlewood and form Medalist, an independent investment adviser.
| | | | |
| 66 | | Annual Report | | franklintempleton.com |
FRANKLIN ALTERNATIVE STRATEGIES FUNDS
FRANKLIN K2 LONG SHORT CREDIT FUND
SHAREHOLDER INFORMATION
In approving the New Sub-Advisory Agreement, the Board, including the independent trustees, determined that fees to be paid under the New Sub-Advisory Agreement were fair and reasonable and that approval of the New Sub-Advisory Agreement was in the best interests of the Fund and its shareholders. At an independent trustees’ meeting held on April 23, 2018, the independent trustees met with representatives of Medalist. In making the foregoing approvals, the independent trustees received assistance and advice from their independent counsel and, in addition to the materials provided at prior meetings, considered various information related to the New Sub-Advisory Agreement including: (1) the information arising out of their discussions with representatives of Medalist at the April 23, 2018 meeting; (2) a description of the terms of the proposed form of New Sub-Advisory Agreement; (3) information describing the nature, quality and extent of services that Medalist would provide to the Fund, and the proposed sub-advisory fees payable to Medalist; (4) an oral report from K2/D&S Management Co., L.L.C., the Fund’s investment manager (“K2 Advisors”), on the diligence conducted on Medalist and the reasons K2 Advisors was recommending Medalist as a sub-advisor for the Fund, including, but not limited to, Medalist’s background, experience, personnel, operations, policies, procedures and compliance functions and plans for the integration of such operations, policies, procedures and compliance functions with those of K2 Advisors; and (5) representations from the Trust’s management regarding Medalist’s compliance program and capabilities, including Medalist’s policies and procedures in place to address potential conflicts of interest, and the diligence undertaken by management with respect thereto. The Board considered that Candlewood was in the process of executing the Transaction, whereby the Candlewood structured credit team would formally separate from Candlewood and form Medalist, an independent investment adviser. The Board considered the services that had been provided by Candlewood since the Fund’s inception and the fact that the investment team and compliance program would each remain intact at Medalist following the Transaction. The Board noted that the material terms of the New Sub-Advisory Agreement are identical to the subadvisory agreement that was previously in place with Candlewood, and the terms of the New Sub-Advisory Agreement were substantially similar to the terms of the sub-advisory agreements with the Fund’s existing sub-advisors.
The Board’s consideration of whether to approve the New Sub-Advisory Agreement on behalf of the Fund took into account several factors including, but not limited to, the following: (1) the nature and quality of the services to be provided by Medalist to the Fund under the New Sub-Advisory Agreement, as well as the nature and quality of the services previously
provided by Medalist’s portfolio management team to the Fund while employed at Candlewood; (2) the experience of Medalist’s portfolio management team managing the Fund at Candlewood and as a manager of other accounts; (3) strength and reputation of Medalist’s portfolio management team within the industry; (4) the fairness of the compensation under the New Sub-Advisory Agreement; (5) the personnel, operations, financial condition, and investment management capabilities, methodologies and resources of Medalist, including the management team’s expertise in the management of other alternative strategy funds; (6) profitability matters; (7) oral reports from K2 Advisors on the diligence conducted on Medalist and the reasons for recommending Medalist as a sub-advisor for the Fund, including, but not limited to, Medalist’s background, experience, personnel, operations, policies, procedures and compliance functions and plans for the integration of such operations, policies, procedures and compliance functions with those of K2 Advisors; and (8) representations from the Trust’s management regarding Medalist’s compliance program and capabilities, including Medalist’s policies and procedures in place to address potential conflicts of interest, and the diligence undertaken with respect thereto. Particular attention was given to the due diligence and risk management procedures of K2 Advisors with respect to selecting and overseeing sub-advisors of the Fund, as well as Medalist’s risk management program and to derivatives and other complex instruments that are expected to be held by the Fund and how such instruments are expected to be used to pursue the Fund’s investment goals.
The following discussion relates to certain primary factors relevant to the Board’s decision to approve the New Sub-Advisory Agreement. This discussion of the information and factors considered by the Board (including the information and factors discussed above) is not intended to be exhaustive, but rather summarizes certain factors considered by the Board. In view of the wide variety of factors considered, the Board did not, unless otherwise noted, find it practicable to quantify or otherwise assign relative weights to the following factors. In addition, individual trustees may have assigned different weights to various factors.
NATURE, EXTENT AND QUALITY OF SERVICES. The trustees reviewed the nature, extent and quality of the services to be provided by Medalist, as well as the nature and quality of the services previously provided by Medalist’s portfolio management team to the Fund while employed at Candlewood. In this regard, they reviewed the Fund’s investment goal and Medalist’s proposed investment strategy, and Medalist’s ability to implement such investment goal and/or investment strategy,
| | | | | | |
| franklintempleton.com | | Annual Report | | | 67 | |
FRANKLIN ALTERNATIVE STRATEGIES FUNDS
FRANKLIN K2 LONG SHORT CREDIT FUND
SHAREHOLDER INFORMATION
including, but not limited to, Medalist’s trading practices and investment decision processes.
With respect to the sub-advisory services to be provided by Medalist, the Board noted the responsibilities that Medalist would have with respect to the Fund’s assets to be allocated to Medalist by K2-Advisors (the “Sub-Advised Portion”), including, among others, implementing the investment strategies with respect to the Sub-Advised Portion and ensuring compliance with the investment strategies, policies, and limitations of the Sub-Advised Portion. The trustees considered the performance of Medalist’s structured credit team in managing the Sub-Advised Portion of the Fund when the team was at Candlewood.
The trustees reviewed the portfolio management team at Medalist that would be responsible for managing the Sub-Advised Portion, including the team’s performance, staffing, skills and compensation program. The trustees considered that Medalist does not anticipate any changes to the investment team responsible for managing the portion of the Fund currently allocated to Candlewood as a result of the Transaction. The Board also considered information from the Trust’s management regarding Medalist’s compliance program as such policies relate to the operations of the Fund. The Board considered the selection and due diligence process employed by K2 Advisors with respect to Medalist, including the due diligence undertaken with respect to Medalist’s compliance capabilities, efforts to integrate Medalist’s operations, policies, procedures and compliance functions with those of K2 Advisors, and Medalist’s plans to transition such operations, policies, procedures and compliance functions from Candlewood. The Board also considered that in connection with the initial approval of Candlewood, the Board approved Candlewood’s compliance policies and procedures (including, among other items, its code of ethics), and the Board had received updates on Candlewood’s compliance program from management during the course of Candlewood’s service as a sub-adviser to the Fund. The Board also considered assurances from Medalist that its compliance policies and procedures were not materially different than those of Candlewood.
Based on their review, the trustees were satisfied with the nature and quality of the overall services to be provided by Medalist to the Fund and its shareholders and were confident in the abilities of Medalist to implement its proposed investment strategy, and to provide quality services to the Fund and its shareholders.
INVESTMENT PERFORMANCE. The Board noted that, as Medalist has not provided any services to the Fund, there was no investment performance of Medalist with respect to the
Fund. The Board considered the investment performance of Medalist’s structured credit team, including Candlewood’s performance as a sub-adviser to the Fund. The Board also considered the proposed performance benchmarks for the Fund and how such benchmarks would be utilized to measure the performance of Medalist in managing the Sub-Advised Portion.
COMPARATIVE EXPENSES AND PROFITABILITY. The Board considered the cost of the services to be provided by Medalist. The Board also noted that it could not evaluate Medalist’s profitability with respect to the Fund since no assets had yet been allocated to Medalist.
The Board noted that the sub-advisory fees would be paid by K2 Advisors to Medalist, were the same as the sub-advisory fees paid by K2 Advisors to Candlewood, and would not be additional fees to be borne by the Fund. The Board also noted that the sub-advisory fees to be paid by K2 Advisors to Medalist were the product of arms-length negotiations between K2 Advisors and Medalist and the Board considered the allocation of the investment management fee charged to the Fund between K2 Advisors and Medalist in light of the nature, extent and quality of the investment management services expected to be provided by K2 Advisors and Medalist. The Board considered the extent to which Medalist may derive ancillary benefits from the Fund’s operations.
With respect to the impact on K2 Advisors’ and its affiliates’ profitability as a result of hiring Medalist as a sub-advisor to the Fund, the Board considered the following: (1) the limited operating history of the Fund, (2) the fee waiver and expense limitation arrangements in effect, and the amount of Fund expenses that were absorbed since the inception of the Fund by K2 Advisors through such arrangements, (3) the sub-advisory fees to be paid to Medalist are at the same rate as fees previously paid under the subadvisory agreement with Candlewood, and are the same as the fees charged by all of the Fund’s existing sub-advisors, and (4) K2 Advisors’ belief that the hiring of Medalist as a sub-advisor will not have any demonstrable impact on K2 Advisors’ profitability.
Based upon its consideration of all these factors, the Board determined that the sub-advisory fee structure was fair and reasonable.
ECONOMIES OF SCALE. The Board considered economies of scale that may be realized by Medalist as the Fund grows larger and the extent to which such economies of scale may be shared with Fund shareholders, as for example, in the level of the sub-advisory fees charged, in the quality and efficiency of services rendered and in increased capital commitments
| | | | |
| 68 | | Annual Report | | franklintempleton.com |
FRANKLIN ALTERNATIVE STRATEGIES FUNDS
FRANKLIN K2 LONG SHORT CREDIT FUND
SHAREHOLDER INFORMATION
benefiting the Fund directly or indirectly. Because Medalist had not commenced operations and the Fund had only recently commenced operations, and among other considerations, the Board concluded that economies of scale were difficult to consider at this time.
CONCLUSION. After consideration of the foregoing factors, and such other matters as were deemed relevant, and with no single factor being determinative to their decision, the trustees—including a majority of the independent trustees—with the assistance of independent counsel approved the New Sub-Advisory Agreement, including the fees payable thereunder, with Medalist for the Fund.
Proxy Voting Policies and Procedures
The Fund’s investment manager has established Proxy Voting Policies and Procedures (Policies) that the Fund uses to determine how to vote proxies relating to portfolio securities. Shareholders may view the Fund’s complete Policies online at franklintempleton.com. Alternatively, shareholders may request copies of the Policies free of charge by calling the Proxy Group collect at (954) 527-7678 or by sending a written request to: Franklin Templeton Companies, LLC, 300 S.E. 2nd Street, Fort Lauderdale, FL 33301, Attention: Proxy Group. Copies of the Fund’s proxy voting records are also made available online at franklintempleton.com and posted on the US Securities and Exchange Commission’s website at sec.gov and reflect the most recent 12-month period ended June 30.
Quarterly Statement of Investments
The Trust, on behalf of the Fund, files a complete statement of investments with the US Securities and Exchange Commission for the first and third quarters for each fiscal year on Form N-Q. Shareholders may view the filed Form N-Q by visiting the Commission’s website at sec.gov. The filed form may also be viewed and copied at the Commission’s Public Reference Room in Washington, DC. Information regarding the operations of the Public Reference Room may be obtained by calling (800) SEC-0330.
Householding of Reports and Prospectuses
You will receive the Fund’s financial reports every six months as well as an annual updated summary prospectus (prospectus available upon request). To reduce Fund expenses, we try to identify related shareholders in a household and send only one copy of the financial reports and summary prospectus. This process, called “householding,” will continue indefinitely unless you instruct us otherwise. If you prefer not to have these documents householded, please call us at (800) 632-2301. At any time you may view current prospectuses/summary prospectuses and financial reports on our website. If you choose, you may receive these documents through electronic delivery.
| | | | | | |
| franklintempleton.com | | Annual Report | | | 69 | |
Annual Report and Shareholder Letter
Franklin K2 Long Short Credit Fund
Investment Manager
K2/D&S Management Co., L.L.C.
Distributor
Franklin Templeton Distributors, Inc.
(800) DIAL BEN® / 342-5236
franklintempleton.com
Shareholder Services
(800) 632-2301
Authorized for distribution only when accompanied or preceded by a summary prospectus and/or prospectus. Investors should carefully consider a fund’s investment goals, risks, charges and expenses before investing. A prospectus contains this and other information; please read it carefully before investing.
To help ensure we provide you with quality service, all calls to and from our service areas are monitored and/or recorded.
| | |
| © 2018 Franklin Templeton Investments. All rights reserved. | | 948 A 07/18 |
| | |
 | | Annual Report and Shareholder Letter May 31, 2018 |
Franklin K2 Global Macro Opportunities Fund
A SERIES OF FRANKLIN ALTERNATIVE STRATEGIES FUNDS

Sign up for electronic delivery at franklintempleton.com/edelivery
Franklin Templeton Investments
Why choose Franklin Templeton Investments?
Successful investing begins with ambition. And achievement only comes when you reach for it. That’s why we continually strive to deliver better outcomes for investors. No matter what your goals are, our deep, global investment expertise allows us to offer solutions that can help.
During our more than 70 years of experience, we’ve managed through all kinds of markets—up, down and those in between. We’re always preparing for what may come next. It’s because of this, combined with our strength as one of the world’s largest asset managers that we’ve earned the trust of millions of investors around the world.
Dear Fellow Shareholder:
During the 12 months ended May 31, 2018, global markets were aided by price gains in commodities, generally upbeat economic data across regions and encouraging corporate earnings reports. Markets were also supported by the European Central Bank’s extension of its monetary easing program and the passage of US tax reforms. However, investor sentiment was dampened by Korean peninsula tensions, protectionist US trade policies and US-China trade disputes, consumer data privacy concerns, and worries that central banks could raise interest rates in response to strong economic growth and rising inflation. In this environment, global developed stock markets, as measured by the MSCI World Index, generated a +12.18% total return for the period.1 Global emerging market stocks, as measured by the MSCI Emerging Markets Index, produced a +14.43% total return.1 Global government bonds, as measured by the Citigroup World Government Bond Index, posted a +2.06% total return.1
We are committed to our long-term perspective and disciplined investment approach as we conduct a rigorous, fundamental analysis of securities with a regular emphasis on investment risk management.
We believe active, professional investment management serves investors well. We also recognize the important role of financial advisors in today’s markets and encourage investors to continue to seek their advice. Amid changing markets and economic
conditions, we are confident investors with a well-diversified portfolio and a patient, long-term outlook should be well positioned for the years ahead.
On the following pages, the Fund’s portfolio management team reviews investment decisions that pertain to performance during the past 12 months in light of the economic environment and other factors. Please remember all securities markets fluctuate, as do mutual fund share prices.
We thank you for investing with Franklin Templeton, welcome your questions and comments, and look forward to continuing to serve your investment needs in the years ahead.
Sincerely,

Madison S. Gulley, CFA
President and Chief Executive Officer – Investment Management
Franklin Alternative Strategies Funds
This letter reflects our analysis and opinions as of May 31, 2018, unless otherwise indicated. The information is not a complete analysis of every aspect of any market, country, industry, security or fund. Statements of fact are from sources considered reliable.
CFA® is a trademark owned by CFA Institute.
1. Source: Morningstar.
See www.franklintempletondatasources.com for additional data provider information.
| | | | | | | | |
| Not FDIC Insured | | | | | May Lose Value | | | | | No Bank Guarantee |
| | | | | | |
| franklintempleton.com | | Not part of the annual report | | | 1 | |
Contents
Annual Report
Visit franklintempleton.com for fund updates, to access your account, or to find helpful financial planning tools.
| | | | | | |
| | 2 | | | Annual Report | | franklintempleton.com |
Annual Report
Franklin K2 Global Macro Opportunities Fund
This annual report for Franklin K2 Global Macro Opportunities Fund covers the fiscal year ended May 31, 2018.
Your Fund’s Goal and Main Investments
The Fund seeks capital appreciation over a full business and economic cycle, which may include periods of rising and declining interest rates. The Fund seeks to achieve this goal by allocating its assets across global macro-focused investment strategies, which are “non-traditional” or “alternative” strategies that generally focus on macroeconomic opportunities across numerous markets and investments. Macroeconomic refers to economic factors such as changes in unemployment, national income, gross domestic product, and inflation and price levels. The Fund is structured as a multi-manager fund, meaning the Fund’s assets are managed by multiple subadvisors, and the Fund’s investment manager has overall responsibility for the Fund’s investments. The Fund’s principal investments include both US and foreign (including emerging markets) securities and exchange-traded and over-the-counter (OTC) derivative instruments, and may include asset classes such as equities, fixed income, interest rates, currencies or commodities. The Fund invests primarily in a wide range of derivative instruments that provide the Fund with broad exposure, either long or short, to these various asset classes. Long positions benefit from an increase in the price of the underlying instrument or asset class, while short positions benefit from a decrease in that price.
Performance Overview
The Fund’s Class A shares had a -1.74% cumulative total return for the 12 months under review. For comparison, the Fund’s new primary and old secondary benchmark, the HFRX Macro/CTA Index, which measures performance of global macro strategies with exposure to equity, fixed income, hard currency and commodity markets, produced a +0.87% total return for the same period.1 As the investment manager believes the composition of the HFRX Macro/CTA Index more accurately reflects the Fund’s holdings, it has replaced the ICE BofA Merrill Lynch US 3-Month Treasury Bill Index as the Fund’s primary benchmark. Also for comparison, the ICE BofA Merrill Lynch US 3-Month Treasury Bill Index, the Fund’s new secondary and old primary benchmark, which is an index of short-term
Portfolio Composition*
Based on Total Investments as of 5/31/18
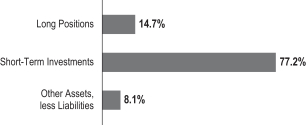
*Figures represent the net Fund exposure and include certain derivatives held in the portfolio (or their underlying reference assets) or unsettled trades and may not total 100% or may be negative due to rounding, use of any derivatives or other factors.
US government securities with a remaining term to final maturity of less than three months, posted a +1.28% total return for the same period.2 You can find more of the Fund’s performance data in the Performance Summary beginning on page 7.
Performance data represent past performance, which does not guarantee future results. Investment return and principal value will fluctuate, and you may have a gain or loss when you sell your shares. Current performance may differ from figures shown. For most recent month-end performance, go to franklintempleton.com or call (800) 342-5236.
Economic and Market Overview
The global economy expanded during the 12-month period under review amid generally upbeat economic data across regions. In this environment, global developed and emerging market stocks reached a new all-time high in January 2018 and generated a +12.43% total return for the period, as measured by the MSCI All Country World Index.2 Global markets were aided by price gains in oil and other commodities, as well as the European Central Bank’s (ECB’s) extension of its monetary easing program. Further supporting global stocks were the passage of the US tax reform bill and encouraging corporate earnings reports.
However, global markets reflected investor concerns about tensions in the Korean peninsula and political uncertainties in the US and the European Union, as well as worries that strong economic growth and rising inflation in some parts of the world, particularly in the US, would lead central banks to increase interest rates
1. Source: FactSet. Hedge Fund Research, Inc. – www.hedgefundresearch.com. The HFRX Macro/CTA Index is being used under license from Hedge Fund Research, Inc., which does not endorse or approve of any of the contents of this report.
2. Source: Morningstar.
The indexes are unmanaged and include reinvestment of any income or distributions. They do not reflect any fees, expenses or sales charges. One cannot invest directly in an index, and an index is not representative of the Fund’s portfolio. Unlike most asset class indexes, HFR Index returns reflect fees and expenses.
The dollar value, number of shares or principal amount, and names of all portfolio holdings are listed in the Fund’s Consolidated Statement of Investments (SOI). The Consolidated SOI begins on page 16.
| | | | | | |
| franklintempleton.com | | Annual Report | | | 3 | |
FRANKLIN K2 GLOBAL MACRO OPPORTUNITIES FUND
sooner than expected. Global markets were further pressured by the Trump administration’s protectionist trade policies, uncertainty surrounding the US-China trade relationship, and a broad sell-off in information technology stocks in March due to a potential for tighter regulation in the sector arising from concerns about consumer data privacy. However, an overall easing of tensions in the Korean peninsula and intermittent US-China trade negotiations partially offset some of these concerns during the period.
After accelerating in 2017’s third quarter, the US economy expanded at a slower pace in the fourth quarter. Growth continued to moderate in 2018’s first quarter due to a slowdown in consumer spending, exports, and state and local government spending, as well as a decline in residential fixed income investment. The unemployment rate declined from 4.3% in May 2017, as reported at the beginning of the 12-month period, to an 18-year low of 3.8% at period-end.3 Annual inflation, as measured by the Consumer Price Index, increased from 1.9% in May 2017, as reported at the beginning of the period, to 2.8% at period-end.3 The US Federal Reserve (Fed) raised its target range for the federal funds rate three times during the period and began reducing its balance sheet in October as part of its ongoing plan to normalize its monetary policy.
In Europe, the UK’s economic growth accelerated in 2017’s third quarter over the previous quarter and remained stable in the fourth quarter. However, growth moderated in 2018’s first quarter amid a decline in construction output. In November, the Bank of England raised its key policy rate for the first time in a decade. The eurozone’s quarterly growth held steady in 2017’s third and fourth quarters but moderated in 2018’s first quarter. The bloc’s annual inflation rate ended the period higher than in May 2017. The ECB kept its benchmark interest rate unchanged during the period. However, at its October meeting, the ECB extended the time frame for its massive bond-buying program from December 2017 to at least September 2018, while reducing the amount of monthly bond purchases in half beginning in January 2018.
In Asia, Japan’s quarterly gross domestic product (GDP) growth held steady in 2017’s third quarter but slowed in the fourth quarter. GDP growth in 2018’s first quarter declined, the country’s first contraction since 2015’s fourth quarter, mainly due to a decline in private residential investment. The Bank of Japan left its benchmark interest rate unchanged during the period and continued its monetary stimulus measures.
In emerging markets, Brazil’s quarterly GDP grew in 2017’s third and fourth quarters, although at a slower pace than the
previous quarters. However, growth accelerated in 2018’s first quarter. The country’s central bank cut its benchmark interest rate several times during the period to spur economic growth. Russia’s annual GDP growth rate remained positive in 2017’s third and fourth quarters as well as 2018’s first quarter, amid the Bank of Russia’s continued policy support. China’s annual GDP moderated in 2017’s third quarter but grew at a stable rate in the following two quarters. The People’s Bank of China left its benchmark interest rate unchanged during the period. Overall, emerging market stocks, as measured by the MSCI Emerging Markets Index, rose during the period.
Investment Strategy
We manage the Fund using a multi-manager approach. We have overall responsibility for the Fund’s investments and principally allocate assets among multiple subadvisors, each of whom independently manages a separate portion of the Fund’s portfolio in accordance with discretionary and systematic focused global macro strategies. We allocate the Fund’s assets among these strategies utilizing a top-down approach, generating the Fund’s strategy weightings by taking into account market conditions, risk factors, diversification, liquidity, and availability of various subadvisors and other investment options, among other things. We allocate the Fund’s assets to specific subadvisors utilizing a bottom-up approach, selecting subadvisors and their weighting within the Fund’s portfolio by taking into account their correlation to various markets and to each other, risk profiles and their return expectations.
Discretionary global macro strategies seek to profit by tactically investing across different asset classes, markets (including emerging markets) and investment opportunities through a combination of fundamental market analysis and quantitative modeling. Systematic global macro strategies seek to profit by utilizing quantitative models to identify investment opportunities across different asset classes and markets in order to construct a portfolio of investments. Quantitative trading models are proprietary systems that rely on mathematical computations to identify trading opportunities. Subadvisors may use strategies which include a combination of discretionary and systematic focused strategies.
The Fund may invest in equities and various debt instruments, such as securities of the US government, its agencies and instrumentalities and sovereign, quasi-sovereign and corporate bonds. Such debt instruments may have variable or fixed interest rates, may be of any maturity, duration or credit rating and may include high yield (junk) bonds and distressed debt securities (securities
3. Source: US Bureau of Labor Statistics.
See www.franklintempletondatasources.com for additional data provider information.
| | | | |
| 4 | | Annual Report | | franklintempleton.com |
FRANKLIN K2 GLOBAL MACRO OPPORTUNITIES FUND
of companies that are, or are about to be, involved in reorganizations, financial restructurings or bankruptcy). The Fund may use derivatives for both hedging and non-hedging (investment) purposes, although no subadvisor is required to hedge any of the Fund’s positions or to use derivatives. The subadvisors will use a variety of derivatives to implement their respective investment strategies, which may include futures contracts, swaps, currency forward contracts and options. As a result of the Fund’s use of derivatives, the Fund may have economic leverage, which means the sum of the Fund’s investment exposures through its use of derivatives may significantly exceed the amount of assets invested in the Fund, although these exposures may vary over time. The Fund may engage in active and frequent trading as part of its investment strategies.
What is a futures contract?
A futures contract is an agreement between the Fund and a counterparty made through a US or foreign futures exchange to buy or sell an underlying instrument or asset at a specific price on a future date.
What are swap agreements?
Swap agreements, such as interest rate, currency and credit default swaps, are contracts between the Fund and another party (the swap counterparty). In a basic swap transaction, the Fund agrees with the swap counterparty to exchange the returns (or differentials in rates of return) earned or realized on a particular “notional amount” of underlying instruments. The notional amount is the set amount selected by the parties as the basis on which to calculate the obligations that they have agreed to exchange. The parties typically do not actually exchange the notional amount. Instead, they agree to exchange the returns that would be earned or realized if the notional amount were invested in given instruments or at given interest rates.
What is a currency forward contract?
A currency forward contract is an agreement between the Fund and a counterparty to buy or sell a foreign currency in exchange for another currency at a specific exchange rate on a future date. Currency forward contracts are privately traded in the interbank market, not on a centralized exchange.
What is an option?
An option is a contract to buy or sell a specific financial product known as the option’s underlying instrument at a specific price. The buyer of an option has the right, but not the obligation, to buy or sell the underlying instrument at or until a specified expiration date. Conversely, the seller (“writer”) of an option who opens a transaction is obligated to buy or sell the underlying instrument should the option holder exercise that right.
Manager’s Discussion
The Fund’s subadvisors for the period were P/E GLOBAL, Aspect Capital, Graham Capital Management and Emso Asset
| | | | |
| Subadvisors | | | |
| 5/31/18 | | | |
| |
| Discretionary Macro | | | | |
Emso Asset Management Limited | | | | |
| |
| Systematic Macro | | | | |
Aspect Capital Limited | | | | |
Graham Capital Management, L.P. | | | | |
P/E GLOBAL LLC | | | | |
Management. Negative performance for two underlying subadvisors, Graham Capital Management and Aspect Capital, led the Fund to post a negative overall result for the review period. Conversely, positive performance for two subadvisors, Emso Asset Management and P/E GLOBAL, benefited Fund returns.
In terms of the Fund’s aggregate asset class exposure, leading detractors from performance included currencies and interest rate exposures. In contrast, leading contributors to performance included commodities, credit, cash and equity.
With regard to aggregate sector/industry and security exposure, the top detractors from performance were currencies, government bonds, and agriculture and livestock. Conversely, energy and environment, interest-rate derivatives, cash and cash equivalents, financials and energy benefited returns.
In terms of geographic exposures, Canada, Germany, Australia and New Zealand detracted from performance. Conversely, European positions outside Germany, along with Hong Kong, Japan and Egypt, benefited results.
Quantitative-based strategies rallied from mixed results in 2017’s third quarter and delivered positive results in 2017’s fourth quarter as identifiable trends in equities, fixed income and commodities persisted. However, reversals in price trends across a number of markets in 2018’s first quarter left the systematic subadvisors with little reprieve, despite the diversified nature of their portfolios. For example, early 2018’s steep equity market correction, combined with rising bond yields, credit risk and an appreciating US dollar led to considerable losses. Emerging markets-focused discretionary macro subadvisor Emso Asset Management’s long positioning in government bonds benefited performance. For example, long positions in Egyptian Treasury bills generated strong returns, as reforms implemented by the government over the past 18 months (in connection with a US$12 billion International Monetary Fund loan agreement) led to improved investor sentiment and a stable currency. In addition, long positions in Argentine government bonds appreciated earlier in the period amid a credit ratings upgrade, progress on a tax reform plan and a positive outcome in parliamentary elections—however, these gains were mostly
| | | | | | |
| franklintempleton.com | | Annual Report | | | 5 | |
FRANKLIN K2 GLOBAL MACRO OPPORTUNITIES FUND
offset by a broad emerging market selloff in May 2018, accompanied by strength in the US dollar.
As fellow shareholders, we were disappointed with the Fund’s performance in the recent challenging environment for global macro-focused strategies. However, we remain committed to our active investment process and long-term perspective, keeping in mind that volatility is not uncommon for global financial markets. Thank you for your participation in Franklin K2 Global Macro Opportunities Fund. We look forward to continuing to serve your investment needs.
| | |
 | | 
Robert Christian |
| | |
 | | 
Brooks Ritchey |
| | |
 | | 
Anthony Zanolla, CFA |
| | Portfolio Management Team |
The foregoing information reflects our analysis, opinions and portfolio holdings as of May 31, 2018, the end of the reporting period. The way we implement our main investment strategies and the resulting portfolio holdings may change depending on factors such as market and economic conditions. These opinions may not be relied upon as investment advice or an offer for a particular security. The information is not a complete analysis of every aspect of any market, country, industry, security or the Fund. Statements of fact are from sources considered reliable, but the investment manager makes no representation or warranty as to their completeness or accuracy. Although historical performance is no guarantee of future results, these insights may help you understand our investment management philosophy.
Robert Christian is a senior managing director and head of investment research for K2 Advisors, which he joined in 2010. Mr. Christian worked at Graham Capital Management LP from 1998 to 2003 as a portfolio manager and researcher of quantitative-based trading strategies. At Julius Baer Investment Management from 2003 to 2005, he was the head of macro strategies. From 2005 to 2010, he worked at FRM Americas LLC where he was the global head of directional trading strategies and portfolio advisor to numerous funds. Mr. Christian holds a Bachelor of Arts and Science in biology and economics from Stanford University (1985) and an M.B.A. in finance from Leonard N. Stern School of Business – New York University (1990).
Brooks Ritchey is a senior managing director and head of portfolio construction for K2 Advisors. Since 1987 Mr. Ritchey has managed multi-asset mutual fund and hedge fund portfolios during his employment with organizations including Steinhardt Partners, Citibank, Finch Asset Management, Paribas, AIG and ING. Mr. Ritchey joined K2 Advisors in 2005. Mr. Ritchey graduated from Franklin & Marshall College in 1982 and holds a National Futures Association Series 3 license.
Anthony Zanolla joined K2 Advisors in October 2014 and serves as senior vice president and portfolio manager. Mr. Zanolla began his investment career in 1994 at Bankers Trust and worked on the business risk team for senior management. Mr. Zanolla joined Citibank in 1996 as portfolio manager of global equity and balanced investment mandates. In 2000, he joined Scudder Kemper Investments as vice president of venture capital. In 2001, Mr. Zanolla joined former Citigroup colleagues as a founding partner and equity analyst at Norquest Capital, a hedge fund. He joined Allianz Hedge Fund Partners in 2002 as an investment committee member and strategy head responsible for global long-short equity, event driven, distressed and commodity trading advisors. After joining the Hedge Fund group of Northern Trust in October 2005 as co-portfolio manager, in 2007 Mr. Zanolla was promoted to senior vice president and portfolio manager responsible for fund of funds and custom portfolios. Mr. Zanola graduated from Bernard M. Baruch College in January 1994 with a B.B.A. in accounting. He earned the CFA designation in 1999 and holds an NFA Series 3 license.
| | | | |
| 6 | | Annual Report | | franklintempleton.com |
FRANKLIN K2 GLOBAL MACRO OPPORTUNITIES FUND
Performance Summary as of May 31, 2018
The performance table and graphs do not reflect any taxes that a shareholder would pay on Fund dividends, capital gain distributions, if any, or any realized gains on the sale of Fund shares. Total return reflects reinvestment of the Fund’s dividends and capital gain distributions, if any, and any unrealized gains or losses. Your dividend income will vary depending on dividends or interest paid by securities in the Fund’s portfolio, adjusted for operating expenses of each class. Capital gain distributions are net profits realized from the sale of portfolio securities.
Performance as of 5/31/181
Cumulative total return excludes sales charges. Average annual total return includes maximum sales charges. Sales charges will vary depending on the size of the investment and the class of share purchased. The maximum is 5.75% and the minimum is 0%. Class A: 5.75% maximum initial sales charge; Advisor Class: no sales charges. For other share classes, visit franklintempleton.com.
| | | | | | | | |
| Share Class | | Cumulative
Total Return2 | | | Average Annual
Total Return3 | |
| | |
| A | | | | | | | | |
1-Year | | | -1.74% | | | | -7.38% | |
Since Inception (7/11/16) | | | -9.15% | | | | -7.89% | |
| | |
| Advisor | | | | | | | | |
1-Year | | | -1.41% | | | | -1.41% | |
Since Inception (7/11/16) | | | -8.83% | | | | -4.78% | |
Performance data represent past performance, which does not guarantee future results. Investment return and principal value will fluctuate, and you may have a gain or loss when you sell your shares. Current performance may differ from figures shown. For most recent month-end performance, go to franklintempleton.com or call (800) 342-5236.
See page 9 for Performance Summary footnotes.
| | | | | | |
| franklintempleton.com | | Annual Report | | | 7 | |
FRANKLIN K2 GLOBAL MACRO OPPORTUNITIES FUND
PERFORMANCE SUMMARY
Total Return Index Comparison for a Hypothetical $10,000 Investment1
Total return represents the change in value of an investment over the periods shown. It includes any applicable maximum sales charge, Fund expenses, account fees and reinvested distributions. The unmanaged indexes include reinvestment of any income or distributions. These differ from the Fund in composition and, except for the HFR Index, do not pay management fees or expenses. Unlike most asset class indexes, HFR Index returns reflect management fees and expenses. One cannot invest directly in an index.
Class A (7/11/16–5/31/18)
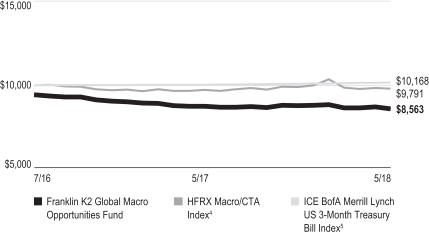
Advisor Class (7/11/16–5/31/18)
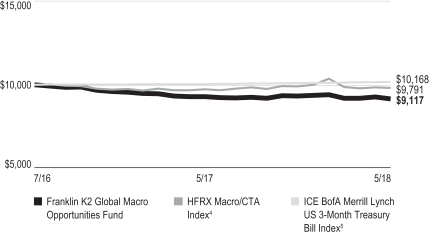
See page 9 for Performance Summary footnotes.
| | | | |
| 8 | | Annual Report | | franklintempleton.com |
FRANKLIN K2 GLOBAL MACRO OPPORTUNITIES FUND
PERFORMANCE SUMMARY
| | | | | | | | |
| Total Annual Operating Expenses6 | |
| Share Class | | With Waiver | | | Without Waiver | |
A | | | 2.26% | | | | 4.58% | |
Advisor | | | 2.01% | | | | 4.33% | |
Each class of shares is available to certain eligible investors and has different annual fees and expenses, as described in the prospectus.
All investments involve risks, including possible loss of principal. The Fund is actively managed and could experience losses if the investment manager’s or subadvisors’ judgment about particular investments made for the Fund prove to be incorrect. Investments in derivatives involve costs and create economic leverage, which may result in significant volatility and cause the Fund to participate in losses (as well as gains) that significantly exceed the Fund’s initial investment. The market values of securities owned by the Fund will go up or down, sometimes rapidly or unpredictably. Liquidity risk may exist when securities have become more difficult to sell, or are unable to be sold, at the price at which they have been valued. The subadvisors may not be successful in maintaining effective and operational trading models used to implement systematic strategies. An issuer of debt securities may fail to make interest payments or repay principal when due. Lower rated or high yield debt securities involve greater credit risk, including the possibility of default or bankruptcy. When interest rates rise, debt security prices tend to fall. Foreign investments are subject to greater investment risk such as political, economic, credit, information and currency fluctuation risks. Investments in emerging markets are subject to the risks of foreign investing and have additional heightened risks. Commodity and commodity-linked investments present unique risks, are speculative and can be extremely volatile. The Fund’s prospectus also includes a description of the main investment risks.
1. The Fund has an expense reduction contractually guaranteed through 9/30/18 and a fee waiver related to the management fee paid by a subsidiary. Fund investment results reflect the expense reduction and fee waiver; without these reductions, the results would have been lower.
2. Cumulative total return represents the change in value of an investment over the periods indicated.
3. Average annual total return represents the average annual change in value of an investment over the periods indicated. Return for less than one year, if any, has not been annualized.
4. Source: FactSet. Hedge Fund Research, Inc. – www.hedgefundresearch.com. The HFRX Macro/CTA Index is being used under license from Hedge Fund Research, Inc., which does not endorse or approve of any of the contents of this report. The HFRX Macro/CTA Index measures performance of global macro strategies with exposure to equity, fixed income, hard currency and commodity markets
5. Source: Morningstar. The ICE BofA Merrill Lynch US 3-Month Treasury Bill Index is an index of short-term US government securities with a remaining term to final maturity of less than three months.
6. Figures are as stated in the Fund’s current prospectus and may differ from the expense ratios disclosed in the Your Fund’s Expenses and Consolidated Financial Highlights sections in this report. In periods of market volatility, assets may decline significantly, causing total annual Fund operating expenses to become higher than the figures shown.
See www.franklintempletondatasources.com for additional data provider information.
| | | | | | |
| franklintempleton.com | | Annual Report | | | 9 | |
FRANKLIN K2 GLOBAL MACRO OPPORTUNITIES FUND
Your Fund’s Expenses
As a Fund shareholder, you can incur two types of costs: (1) transaction costs, including sales charges (loads) on Fund purchases and redemptions; and (2) ongoing Fund costs, including management fees, distribution and service (12b-1) fees, and other Fund expenses. All mutual funds have ongoing costs, sometimes referred to as operating expenses. The table below shows ongoing costs of investing in the Fund and can help you understand these costs and compare them with those of other mutual funds. The table assumes a $1,000 investment held for the six months indicated.
Actual Fund Expenses
The table below provides information about actual account values and actual expenses in the columns under the heading “Actual.” In these columns the Fund’s actual return, which includes the effect of Fund expenses, is used to calculate the “Ending Account Value” for each class of shares. You can estimate the expenses you paid during the period by following these steps (of course, your account value and expenses will differ from those in this illustration): Divide your account value by $1,000 (if your account had an $8,600 value, then $8,600 ÷ $1,000 = 8.6). Then multiply the result by the number in the row for your class of shares under the headings “Actual” and “Expenses Paid During Period” (if Actual Expenses Paid During Period were $7.50, then 8.6 x $7.50 =$64.50). In this illustration, the actual expenses paid this period are $64.50.
Hypothetical Example for Comparison with Other Funds
Under the heading “Hypothetical” in the table, information is provided about hypothetical account values and hypothetical expenses based on the Fund’s actual expense ratio and an assumed rate of return of 5% per year before expenses, which is not the Fund’s actual return. This information may not be used to estimate the actual ending account balance or expenses you paid for the period, but it can help you compare ongoing costs of investing in the Fund with those of other funds. To do so, compare this 5% hypothetical example for the class of shares you hold with the 5% hypothetical examples that appear in the shareholder reports of other funds.
Please note that expenses shown in the table are meant to highlight ongoing costs and do not reflect any transactional costs. Therefore, information under the heading “Hypothetical” is useful in comparing ongoing costs only, and will not help you compare total costs of owning different funds. In addition, if transactional costs were included, your total costs would have been higher.
| | | | | | | | | | | | | | | | | | | | | | | | |
| | | | | | Actual
(actual return after expenses) | | | Hypothetical
(5% annual return before expenses) | | | | |
Share Class | | Beginning
Account
Value 12/1/17 | | | Ending
Account
Value 5/31/18 | | | Expenses
Paid During
Period
12/1/17–5/31/181,2 | | | Ending
Account
Value 5/31/18 | | | Expenses
Paid During
Period
12/1/17–5/31/181,2 | | | Net
Annualized
Expense
Ratio2 | |
| A | | $ | 1,000 | | | $ | 978.30 | | | $ | 10.85 | | | $ | 1,013.96 | | | $ | 11.05 | | | | 2.20 | % |
| C | | $ | 1,000 | | | $ | 973.70 | | | $ | 14.52 | | | $ | 1,010.22 | | | $ | 14.78 | | | | 2.95 | % |
| R | | $ | 1,000 | | | $ | 978.30 | | | $ | 10.95 | | | $ | 1,013.86 | | | $ | 11.15 | | | | 2.22 | % |
| R6 | | $ | 1,000 | | | $ | 979.40 | | | $ | 9.62 | | | $ | 1,015.21 | | | $ | 9.80 | | | | 1.95 | % |
| Advisor | | $ | 1,000 | | | $ | 979.50 | | | $ | 9.62 | | | $ | 1,015.21 | | | $ | 9.80 | | | | 1.95 | % |
1. Expenses are equal to the annualized expense ratio for the six-month period as indicated above—in the far right column—multiplied by the simple average account value over the period indicated, and then multiplied by 182/365 to reflect the one-half year period.
2. Reflects expenses after fee waivers and expense reimbursements. Does not include acquired fund fees and expenses.
| | | | |
| 10 | | Annual Report | | franklintempleton.com |
FRANKLIN ALTERNATIVE STRATEGIES FUNDS
Consolidated Financial Highlights
Franklin K2 Global Macro Opportunities Fund
| | | | | | | | |
| | | Year Ended May 31, | |
| | | 2018 | | | 2017a | |
| Class A | | | | | | | | |
Per share operating performance (for a share outstanding throughout the year) | | | | | | | | |
| | |
Net asset value, beginning of year | | $ | 9.19 | | | $ | 10.00 | |
| | | | |
| | |
| Income from investment operationsb: | | | | | | | | |
| | |
Net investment income (loss)c | | | 0.01 | | | | (0.09 | ) |
| | |
Net realized and unrealized gains (losses) | | | (0.17 | ) | | | (0.66 | ) |
| | | | |
| | |
Total from investment operations | | | (0.16 | ) | | | (0.75 | ) |
| | | | |
| | |
Less distributions from net investment income | | | — | | | | (0.06 | ) |
| | | | |
| | |
Net asset value, end of year | | | $9.03 | | | | $9.19 | |
| | | | |
| | |
Total returnd | | | (1.74)% | | | | (7.64)% | |
| | |
| Ratios to average net assetse | | | | | | | | |
| | |
Expenses before waiver and payments by affiliates | | | 3.84% | | | | 4.22% | |
| | |
Expenses net of waiver and payments by affiliatesf | | | 2.20% | | | | 2.16% | |
| | |
Net investment income (loss) | | | 0.14% | | | | (1.04)% | |
| | |
| Supplemental data | | | | | | | | |
| | |
Net assets, end of year (000’s) | | | $161 | | | | $90 | |
| | |
Portfolio turnover rate | | | 240.21% | | | | 239.84% | |
aFor the period July 11, 2016 (commencement of operations) to May 31, 2017.
bThe amount shown for a share outstanding throughout the period may not correlate with the Consolidated Statement of Operations for the period due to the timing of sales and repurchases of the Fund’s shares in relation to income earned and/or fluctuating fair value of the investments of the Fund.
cBased on average daily shares outstanding.
dTotal return does not reflect sales commissions or contingent deferred sales charges, if applicable, and is not annualized for periods less than one year.
eRatios are annualized for periods less than one year, except for non-recurring expenses, if any.
fBenefit of expense reduction rounds to less than 0.01%.
| | | | | | |
| franklintempleton.com | | The accompanying notes are an integral part of these financial statements. | Annual Report | | | 11 | |
FRANKLIN ALTERNATIVE STRATEGIES FUNDS
CONSOLIDATED FINANCIAL STATEMENTS
Franklin K2 Global Macro Opportunities Fund (continued)
| | | | | | | | |
| | | Year Ended May 31, | |
| | | 2018 | | | 2017a | |
| Class C | | | | | | | | |
Per share operating performance (for a share outstanding throughout the year) | | | | | | | | |
| | |
Net asset value, beginning of year | | $ | 9.13 | | | $ | 10.00 | |
| | | | |
| | |
| Income from investment operationsb: | | | | | | | | |
| | |
Net investment income (loss)c | | | (0.06 | ) | | | (0.15 | ) |
| | |
Net realized and unrealized gains (losses) | | | (0.17 | ) | | | (0.68 | ) |
| | | | |
| | |
Total from investment operations | | | (0.23 | ) | | | (0.83 | ) |
| | | | |
| | |
Less distributions from net investment income | | | — | | | | (0.04 | ) |
| | | | |
| | |
Net asset value, end of year | | | $8.90 | | | | $9.13 | |
| | | | |
| | |
Total returnd | | | (2.52)% | | | | (8.27)% | |
| | |
| Ratios to average net assetse | | | | | | | | |
| | |
Expenses before waiver and payments by affiliates | | | 4.59% | | | | 4.98% | |
| | |
Expenses net of waiver and payments by affiliatesf | | | 2.95% | | | | 2.92% | |
| | |
Net investment income (loss) | | | (0.61)% | | | | (1.80)% | |
| | |
| Supplemental data | | | | | | | | |
| | |
Net assets, end of year (000’s) | | | $147 | | | | $188 | |
| | |
Portfolio turnover rate | | | 240.21% | | | | 239.84% | |
aFor the period July 11, 2016 (commencement of operations) to May 31, 2017.
bThe amount shown for a share outstanding throughout the period may not correlate with the Consolidated Statement of Operations for the period due to the timing of sales and repurchases of the Fund’s shares in relation to income earned and/or fluctuating fair value of the investments of the Fund.
cBased on average daily shares outstanding.
dTotal return does not reflect sales commissions or contingent deferred sales charges, if applicable, and is not annualized for periods less than one year.
eRatios are annualized for periods less than one year, except for non-recurring expenses, if any.
fBenefit of expense reduction rounds to less than 0.01%.
| | | | |
| 12 | | Annual Report | The accompanying notes are an integral part of these financial statements. | | franklintempleton.com |
FRANKLIN ALTERNATIVE STRATEGIES FUNDS
CONSOLIDATED FINANCIAL STATEMENTS
Franklin K2 Global Macro Opportunities Fund (continued)
| | | | | | | | |
| | | Year Ended May 31, | |
| | | 2018 | | | 2017a | |
| Class R | | | | | | | | |
Per share operating performance (for a share outstanding throughout the year) | | | | | | | | |
| | |
Net asset value, beginning of year | | $ | 9.18 | | | $ | 10.00 | |
| | | | |
| | |
| Income from investment operationsb: | | | | | | | | |
| | |
Net investment income (loss)c | | | 0.01 | | | | (0.08 | ) |
| | |
Net realized and unrealized gains (losses) | | | (0.17 | ) | | | (0.68 | ) |
| | | | |
| | |
Total from investment operations | | | (0.16 | ) | | | (0.76 | ) |
| | | | |
| | |
Less distributions from net investment income | | | — | | | | (0.06 | ) |
| | | | |
| | |
Net asset value, end of year | | | $9.02 | | | | $9.18 | |
| | | | |
| | |
Total returnd | | | (1.74)% | | | | (7.63)% | |
| | |
| Ratios to average net assetse | | | | | | | | |
| | |
Expenses before waiver and payments by affiliates | | | 3.86% | | | | 4.18% | |
| | |
Expenses net of waiver and payments by affiliatesf | | | 2.22% | | | | 2.12% | |
| | |
Net investment income (loss) | | | 0.12% | | | | (1.00)% | |
| | |
| Supplemental data | | | | | | | | |
| | |
Net assets, end of year (000’s) | | | $9 | | | | $9 | |
| | |
Portfolio turnover rate | | | 240.21% | | | | 239.84% | |
aFor the period July 11, 2016 (commencement of operations) to May 31, 2017.
bThe amount shown for a share outstanding throughout the period may not correlate with the Consolidated Statement of Operations for the period due to the timing of sales and repurchases of the Fund’s shares in relation to income earned and/or fluctuating fair value of the investments of the Fund.
cBased on average daily shares outstanding.
dTotal return is not annualized for periods less than one year.
eRatios are annualized for periods less than one year, except for non-recurring expenses, if any.
fBenefit of expense reduction rounds to less than 0.01%.
| | | | | | |
| franklintempleton.com | | The accompanying notes are an integral part of these financial statements. | Annual Report | | | 13 | |
FRANKLIN ALTERNATIVE STRATEGIES FUNDS
CONSOLIDATED FINANCIAL STATEMENTS
Franklin K2 Global Macro Opportunities Fund (continued)
| | | | | | | | |
| | | Year Ended May 31, | |
| | | 2018 | | | 2017a | |
| Class R6 | | | | | | | | |
Per share operating performance (for a share outstanding throughout the year) | | | | | | | | |
| | |
Net asset value, beginning of year | | $ | 9.19 | | | $ | 10.00 | |
| | | | |
| | |
| Income from investment operationsb: | | | | | | | | |
| | |
Net investment income (loss)c | | | 0.03 | | | | (0.07 | ) |
| | |
Net realized and unrealized gains (losses) | | | (0.17 | ) | | | (0.68 | ) |
| | | | |
| | |
Total from investment operations | | | (0.14 | ) | | | (0.75 | ) |
| | | | |
| | |
Less distributions from net investment income | | | — | | | | (0.06 | ) |
| | | | |
| | |
Net asset value, end of year | | | $9.05 | | | | $9.19 | |
| | | | |
| | |
Total returnd | | | (1.52)% | | | | (7.52)% | |
| | |
| Ratios to average net assetse | | | | | | | | |
| | |
Expenses before waiver and payments by affiliates | | | 4.84% | | | | 4.30% | |
| | |
Expenses net of waiver and payments by affiliatesf | | | 1.95% | | | | 1.94% | |
| | |
Net investment income (loss) | | | 0.39% | | | | (0.82)% | |
| | |
| Supplemental data | | | | | | | | |
| | |
Net assets, end of year (000’s) | | | $9 | | | | $9 | |
| | |
Portfolio turnover rate | | | 240.21% | | | | 239.84% | |
aFor the period July 11, 2016 (commencement of operations) to May 31, 2017.
bThe amount shown for a share outstanding throughout the period may not correlate with the Consolidated Statement of Operations for the period due to the timing of sales and repurchases of the Fund’s shares in relation to income earned and/or fluctuating fair value of the investments of the Fund.
cBased on average daily shares outstanding.
dTotal return is not annualized for periods less than one year.
eRatios are annualized for periods less than one year, except for non-recurring expenses, if any.
fBenefit of expense reduction rounds to less than 0.01%.
| | | | |
| 14 | | Annual Report | The accompanying notes are an integral part of these financial statements. | | franklintempleton.com |
FRANKLIN ALTERNATIVE STRATEGIES FUNDS
CONSOLIDATED FINANCIAL STATEMENTS
Franklin K2 Global Macro Opportunities Fund (continued)
| | | | | | | | |
| | | Year Ended May 31, | |
| | | 2018 | | | 2017a | |
| Advisor Class | | | | | | | | |
Per share operating performance (for a share outstanding throughout the year) | | | | | | | | |
| | |
Net asset value, beginning of year | | | $9.19 | | | | $10.00 | |
| | | | |
| | |
| Income from investment operationsb: | | | | | | | | |
| | |
Net investment income (loss)c | | | 0.04 | | | | (0.07 | ) |
| | |
Net realized and unrealized gains (losses) | | | (0.17 | ) | | | (0.68 | ) |
| | | | |
| | |
Total from investment operations | | | (0.13 | ) | | | (0.75 | ) |
| | | | |
| | |
Less distributions from net investment income | | | — | | | | (0.06 | ) |
| | | | |
| | |
Net asset value, end of year | | | $9.06 | | | | $9.19 | |
| | | | |
| | |
Total returnd | | | (1.41)% | | | | (7.42)% | |
| | |
| Ratios to average net assetse | | | | | | | | |
| | |
Expenses before waiver and payments by affiliates | | | 3.59% | | | | 3.99% | |
| | |
Expenses net of waiver and payments by affiliatesf | | | 1.95% | | | | 1.93% | |
| | |
Net investment income (loss) | | | 0.39% | | | | (0.81)% | |
| | |
| Supplemental data | | | | | | | | |
| | |
Net assets, end of year (000’s) | | $ | 22,744 | | | $ | 22,975 | |
| | |
Portfolio turnover rate | | | 240.21% | | | | 239.84% | |
aFor the period July 11, 2016 (commencement of operations) to May 31, 2017.
bThe amount shown for a share outstanding throughout the period may not correlate with the Consolidated Statement of Operations for the period due to the timing of sales and repurchases of the Fund’s shares in relation to income earned and/or fluctuating fair value of the investments of the Fund.
cBased on average daily shares outstanding.
dTotal return is not annualized for periods less than one year.
eRatios are annualized for periods less than one year, except for non-recurring expenses, if any.
fBenefit of expense reduction rounds to less than 0.01%.
| | | | | | |
| franklintempleton.com | | The accompanying notes are an integral part of these financial statements. | Annual Report | | | 15 | |
FRANKLIN ALTERNATIVE STRATEGIES FUNDS
Consolidated Statement of Investments, May 31, 2018
| | | | | | | | | | | | | | |
| Franklin K2 Global Macro Opportunities Fund | |
| | | | | Country | | | Principal
Amount* | | | Value | |
| | | | | | | | | | | | | | |
| | | Corporate Bonds and Notes 4.9% | | | | | | | | | |
| | | Banks 3.6% | | | | | | | | | |
| | JP Morgan Structured Products BV, zero cpn., | | | | | | | | | | | | |
| | 7/19/18 | | | Egypt | | | | 6,341,000 | EGP | | $ | 346,037 | |
| | a Reg S, 8/02/18 | | | Egypt | | | | 8,972,000 | EGP | | | 487,940 | |
| | | | | | | | | | | | | | |
| | | | | | | | | | | | | 833,977 | |
| | | | | | | | | | | | | | |
| | | Oil, Gas & Consumable Fuels 1.3% | | | | | | | | | |
| | Petrobras Global Finance BV, senior note, | | | | | | | | | | | | |
| | 6.125%, 1/17/22 | | | Brazil | | | | 186,000 | | | | 195,300 | |
| | 6.25%, 3/17/24 | | | Brazil | | | | 93,000 | | | | 94,302 | |
| | | | | | | | | | | | | | |
| | | | | | | | | | | | | 289,602 | |
| | | | | | | | | | | | | | |
| | Total Corporate Bonds and Notes (Cost $1,130,939) | | | | | | | | | | | 1,123,579 | |
| | | | | | | | | | | | | | |
| | | Foreign Government and Agency Securities 9.8% | | | | | | | | | |
| | Government of Argentina, | | | | | | | | | | | | |
| | 3.75%, 2/08/19 | | | Argentina | | | | 2,817,000 | ARS | | | 118,565 | |
| | 7.82%, 12/31/33 | | | Argentina | | | | 34,403 | EUR | | | 42,208 | |
| | 2.26% to 3/31/19, 4.74% thereafter, 12/31/38 | | | Argentina | | | | 228,585 | EUR | | | 168,803 | |
| | a senior note, Reg S, 3.875%, 1/15/22 | | | Argentina | | | | 100,000 | EUR | | | 114,493 | |
| | senior note, 5.625%, 1/26/22 | | | Argentina | | | | 195,000 | | | | 187,200 | |
| | senior note, 4.625%, 1/11/23 | | | Argentina | | | | 66,000 | | | | 60,135 | |
| | senior note, 5.875%, 1/11/28 | | | Argentina | | | | 20,000 | | | | 17,580 | |
| a | | Government of Hellenic Republic, senior bond, Reg S, 3.90%, 1/30/33 | | | Greece | | | | 113,606 | EUR | | | 120,210 | |
| a | | Government of Peru, senior bond, Reg S, | | | | | | | | | | | | |
| | 8.20%, 8/12/26 | | | Peru | | | | 315,000 | PEN | | | 115,996 | |
| | 6.95%, 8/12/31 | | | Peru | | | | 369,000 | PEN | | | 124,222 | |
| | Government of Russia, | | | | | | | | | | | | |
| | 7.75%, 9/16/26 | | | Russia | | | | 2,490,000 | RUB | | | 41,240 | |
| | 8.50%, 9/17/31 | | | Russia | | | | 15,985,000 | RUB | | | 280,664 | |
| | Government of South Africa, | | | | | | | | | | | | |
| | 5.50%, 3/09/20 | | | South Africa | | | | 100,000 | | | | 103,210 | |
| | 8.75%, 2/28/48 | | | South Africa | | | | 5,836,816 | ZAR | | | 427,055 | |
| | R186, 10.50%, 12/21/26 | | | South Africa | | | | 1,772,000 | ZAR | | | 155,318 | |
| | senior bond, 8.50%, 1/31/37 | | | South Africa | | | | 602,000 | ZAR | | | 43,861 | |
| | Government of Turkey, senior bond, 7.00%, 6/05/20 | | | Turkey | | | | 143,000 | | | | 147,719 | |
| | | | | | | | | | | | | | |
| | Total Foreign Government and Agency Securities
(Cost $2,400,379) | | | | | | | | | | | 2,268,479 | |
| | | | | | | | | | | | | | |
| | Total Investments before Short Term Investments
(Cost $3,531,318) | | | | | | | | | | | 3,392,058 | |
| | | | | | | | | | | | | | |
| | | Short Term Investments 77.2% | | | | | | | | | |
| | | Foreign Government and Agency Securities
(Cost $54,753) 0.2% | | | | | | | | | |
| b | | Argentina Treasury Bill, 9/14/18 | | | Argentina | | | | 1,103,733 | ARS | | | 45,299 | |
| | | | | | | | | | | | | | |
| | | | |
| 16 | | Annual Report | | franklintempleton.com |
FRANKLIN ALTERNATIVE STRATEGIES FUNDS
CONSOLIDATED STATEMENT OF INVESTMENTS
Franklin K2 Global Macro Opportunities Fund (continued)
| | | | | | | | | | | | | | |
| | | | | Country | | | Shares | | | Value | |
| | | Short Term Investments (continued) | | | | | | | | | |
| | | Money Market Funds 77.0% | | | | | | | | | |
| c,d | | Dreyfus Government Cash Management, Institutional Shares, 1.64% | | | United States | | | | 5,372,084 | | | $ | 5,372,084 | |
| c | | Fidelity Investments Money Market Funds, 1.68% | | | United States | | | | 12,394,004 | | | | 12,394,004 | |
| | | | | | | | | | | | | | |
| | Total Money Market Funds (Cost $17,766,088) | | | | | | | | | | | 17,766,088 | |
| | | | | | | | | | | | | | |
| | Total Investments (Cost $21,352,159) 91.9% | | | | | | | | | | | 21,203,445 | |
| | Other Assets, less Liabilities 8.1% | | | | | | | | | | | 1,866,675 | |
| | | | | | | | | | | | | | |
| | Net Assets 100.0% | | | | | | | | | | $ | 23,070,120 | |
| | | | | | | | | | | | | | |
See Abbreviations on page 37.
*The principal amount is stated in U.S. dollars unless otherwise indicated.
aSecurity was purchased pursuant to Regulation S under the Securities Act of 1933, which exempts from registration securities offered and sold outside of the United States. Such a security cannot be sold in the United States without either an effective registration statement filed pursuant to the Securities Act of 1933, or pursuant to an exemption from registration. These securities have been deemed liquid under guidelines approved by the Trust’s Board of Trustees. At May 31, 2018, the aggregate value of these securities was $962,861, representing 4.2% of net assets.
bThe security was issued on a discount basis with no stated coupon rate.
cThe rate shown is the annualized seven-day yield at period end.
dA portion or all of the security is owned by K2 GMOF Holdings Corp., a wholly-owned subsidiary of the Fund. See Note 1(d).
At May 31, 2018, the Fund had the following futures contracts outstanding. See Note 1(c).
| | | | | | | | | | | | | | | | | | | | |
| Futures Contracts | | | | | | | | | | | | | | | |
| Description | | Type | | | Number of
Contracts | | | Notional
Amount* | | | Expiration
Date | | | Value/Unrealized
Appreciation
(Depreciation) | |
| Commodity Contractsa | | | | | | | | | | | | | | | | | | | | |
Aluminum | | | Long | | | | 9 | | | $ | 517,106 | | | | 6/18/18 | | | $ | 7,121 | |
Aluminum | | | Short | | | | 9 | | | | 517,106 | | | | 6/18/18 | | | | (47,091 | ) |
Aluminum | | | Long | | | | 1 | | | | 57,312 | | | | 9/17/18 | | | | 485 | |
Brent Crude Oil | | | Long | | | | 7 | | | | 542,920 | | | | 6/29/18 | | | | (4,701 | ) |
Brent Crude Oil | | | Long | | | | 1 | | | | 77,250 | | | | 7/31/18 | | | | 2,368 | |
Cocoa | | | Long | | | | 3 | | | | 70,708 | | | | 7/16/18 | | | | (1,644 | ) |
Coffee | | | Short | | | | 2 | | | | 94,425 | | | | 9/18/18 | | | | (2,706 | ) |
Copper | | | Long | | | | 7 | | | | 1,198,313 | | | | 6/18/18 | | | | (24,208 | ) |
Copper | | | Short | | | | 7 | | | | 1,198,313 | | | | 6/18/18 | | | | 474 | |
Copper | | | Long | | | | 1 | | | | 171,462 | | | | 9/17/18 | | | | (1,840 | ) |
Copper | | | Short | | | | 1 | | | | 171,462 | | | | 9/17/18 | | | | 2,228 | |
Corn | | | Long | | | | 2 | | | | 39,400 | | | | 7/13/18 | | | | (718 | ) |
Cotton No.2 | | | Long | | | | 2 | | | | 91,640 | | | | 12/06/18 | | | | 6,139 | |
Gasoline RBOB | | | Long | | | | 6 | | | | 544,446 | | | | 6/29/18 | | | | (35 | ) |
Gold 100 Oz | | | Long | | | | 3 | | | | 391,410 | | | | 8/29/18 | | | | (507 | ) |
Gold 100 Oz | | | Short | | | | 1 | | | | 130,470 | | | | 8/29/18 | | | | (1,062 | ) |
Hard Red Winter Wheat | | | Long | | | | 4 | | | | 108,500 | | | | 7/13/18 | | | | (3,448 | ) |
Low Sulphur Gas Oil | | | Long | | | | 6 | | | | 409,050 | | | | 7/12/18 | | | | 15,616 | |
Low Sulphur Gas Oil | | | Long | | | | 1 | | | | 68,075 | | | | 8/10/18 | | | | 2,348 | |
Natural Gas | | | Long | | | | 1 | | | | 29,520 | | | | 6/27/18 | | | | 518 | |
Natural Gas | | | Short | | | | 2 | | | | 59,040 | | | | 6/27/18 | | | | (3,594 | ) |
Nickel | | | Long | | | | 1 | | | | 90,993 | | | | 6/18/18 | | | | 6,216 | |
Nickel | | | Short | | | | 1 | | | | 90,993 | | | | 6/18/18 | | | | (7,710 | ) |
Nickel | | | Long | | | | 1 | | | | 91,434 | | | | 9/17/18 | | | | 7,767 | |
NY Harbor ULSD | | | Long | | | | 5 | | | | 462,966 | | | | 6/29/18 | | | | 7,763 | |
NY Harbor ULSD | | | Long | | | | 1 | | | | 92,702 | | | | 7/31/18 | | | | (431 | ) |
Soybean | | | Long | | | | 3 | | | | 152,775 | | | | 7/13/18 | | | | (3,033 | ) |
Soybean Meal | | | Long | | | | 3 | | | | 112,590 | | | | 7/13/18 | | | | (3,718 | ) |
Sugar | | | Short | | | | 2 | | | | 29,165 | | | | 9/28/18 | | | | (487 | ) |
| | | | | | |
| franklintempleton.com | | Annual Report | | | 17 | |
FRANKLIN ALTERNATIVE STRATEGIES FUNDS
CONSOLIDATED STATEMENT OF INVESTMENTS
Franklin K2 Global Macro Opportunities Fund (continued)
| | | | | | | | | | | | | | | | | | | | |
| Futures Contracts (continued) | | | | | | | | | | | | | | | |
| Description | | Type | | | Number of
Contracts | | | Notional
Amount* | | | Expiration
Date | | | Value/Unrealized
Appreciation
(Depreciation) | |
| Commodity Contractsa (continued) | | | | | | | | | | | | | | | | | | | | |
Wheat | | | Long | | | | 1 | | | $ | 26,313 | | | | 7/13/18 | | | $ | (103 | ) |
Wheat | | | Short | | | | 1 | | | | 26,313 | | | | 7/13/18 | | | | (1,015 | ) |
WTI Crude Oil | | | Long | | | | 1 | | | | 66,910 | | | | 7/20/18 | | | | (3,922 | ) |
WTI Crude Oil | | | Long | | | | 8 | | | | 536,320 | | | | 6/20/18 | | | | (30,177 | ) |
Zinc | | | Long | | | | 5 | | | | 388,188 | | | | 6/18/18 | | | | (38,489 | ) |
Zinc | | | Short | | | | 5 | | | | 388,188 | | | | 6/18/18 | | | | 7,823 | |
Zinc | | | Long | | | | 2 | | | | 155,000 | | | | 9/17/18 | | | | 219 | |
Zinc | | | Short | | | | 2 | | | | 155,000 | | | | 9/17/18 | | | | (893 | ) |
| | | | | | | | | | | | | | | | | | | | |
| | | | | | | | | | | 9,353,778 | | | | | | | | (114,447 | ) |
| | | | | | | | | | | | | | | | | | | | |
| Currency Contracts | | | | | | | | | | | | | | | | | | | | |
AUD/USD | | | Short | | | | 26 | | | | 1,967,420 | | | | 6/18/18 | | | | 30,302 | |
CAD/USD | | | Short | | | | 8 | | | | 617,720 | | | | 6/19/18 | | | | (4 | ) |
CHF/USD | | | Short | | | | 12 | | | | 1,524,600 | | | | 6/18/18 | | | | 45,046 | |
EUR/USD | | | Short | | | | 55 | | | | 8,044,094 | | | | 6/18/18 | | | | 312,288 | |
GBP/USD | | | Long | | | | 6 | | | | 498,712 | | | | 6/18/18 | | | | (27,045 | ) |
GBP/USD | | | Short | | | | 7 | | | | 581,831 | | | | 6/18/18 | | | | 7,321 | |
MXN/USD | | | Short | | | | 16 | | | | 399,840 | | | | 6/18/18 | | | | 2,537 | |
NZD/USD | | | Short | | | | 8 | | | | 560,240 | | | | 6/18/18 | | | | (3,029 | ) |
USD/SEK | | | Long | | | | 1 | | | | 99,772 | | | | 6/18/18 | | | | 1,247 | |
ZAR/USD | | | Short | | | | 3 | | | | 117,675 | | | | 6/18/18 | | | | 368 | |
| | | | | | | | | | | | | | | | | | | | |
| | | | | | | | | | | 14,411,904 | | | | | | | | 369,031 | |
| | | | | | | | | | | | | | | | | | | | |
| Equity Contracts | | | | | | | | | | | | | | | | | | | | |
Amsterdam Index | | | Long | | | | 2 | | | | 258,218 | | | | 6/15/18 | | | | (4,694 | ) |
CAC 40 10 Euro Index | | | Long | | | | 4 | | | | 251,485 | | | | 6/15/18 | | | | (4,058 | ) |
CME E-Mini Russell 2000 Index | | | Long | | | | 4 | | | | 326,840 | | | | 6/15/18 | | | | 1,453 | |
DAX Index | | | Long | | | | 1 | | | | 368,600 | | | | 6/15/18 | | | | (10,555 | ) |
DJIA Mini E-CBOT Index | | | Long | | | | 1 | | | | 122,085 | | | | 6/15/18 | | | | (3,112 | ) |
DJIA Mini E-CBOT Index | | | Short | | | | 5 | | | | 610,425 | | | | 6/15/18 | | | | 5,235 | |
E-Mini S&P MidCap 400 Index | | | Long | | | | 1 | | | | 194,700 | | | | 6/15/18 | | | | 58 | |
EURO STOXX 50 Index | | | Long | | | | 5 | | | | 199,147 | | | | 6/15/18 | | | | (3,392 | ) |
FTSE 100 Index | | | Long | | | | 3 | | | | 305,882 | | | | 6/15/18 | | | | 7,042 | |
FTSE/MIB Index | | | Long | | | | 1 | | | | 127,286 | | | | 6/15/18 | | | | (2,454 | ) |
Hang Seng China Enterprises Index | | | Long | | | | 2 | | | | 152,106 | | | | 6/28/18 | | | | 1,403 | |
Hang Seng Index | | | Short | | | | 1 | | | | 194,417 | | | | 6/28/18 | | | | 2 | |
Mini MSCI EAFE Index | | | Long | | | | 1 | | | | 99,350 | | | | 6/15/18 | | | | (1,847 | ) |
Mini MSCI Emerging Market Index | | | Long | | | | 1 | | | | 56,085 | | | | 6/15/18 | | | | (4,747 | ) |
NASDAQ 100 E-Mini Index | | | Long | | | | 1 | | | | 139,540 | | | | 6/15/18 | | | | (17 | ) |
Nikkei 225 Index | | | Long | | | | 2 | | | | 212,582 | | | | 6/07/18 | | | | (3,921 | ) |
OMX Stockholm 30 Index | | | Long | | | | 8 | | | | 140,014 | | | | 6/15/18 | | | | (5,011 | ) |
S&P 500 E-Mini Index | | | Long | | | | 1 | | | | 135,275 | | | | 6/15/18 | | | | (1,039 | ) |
S&P 500 E-Mini Index | | | Short | | | | 1 | | | | 135,275 | | | | 6/15/18 | | | | (652 | ) |
S&P/TSX 60 Index | | | Long | | | | 3 | | | | 439,287 | | | | 6/14/18 | | | | 7,884 | |
SPI 200 Index | | | Long | | | | 3 | | | | 341,221 | | | | 6/21/18 | | | | 3,080 | |
TOPIX Index | | | Long | | | | 1 | | | | 160,362 | | | | 6/07/18 | | | | (1,337 | ) |
| | | | | | | | | | | | | | | | | | | | |
| | | | | | | | | | | 4,970,182 | | | | | | | | (20,679 | ) |
| | | | | | | | | | | | | | | | | | | | |
| Interest Rate Contracts | | | | | | | | | | | | | | | | | | | | |
10 Yr. Mini Japan Government Bond | | | Long | | | | 5 | | | | 693,754 | | | | 6/12/18 | | | | 819 | |
90 Day Bank Bill | | | Short | | | | 1 | | | | 752,597 | | | | 12/13/18 | | | | (20 | ) |
90 Day Eurodollar | | | Short | | | | 2 | | | | 487,200 | | | | 12/17/18 | | | | 3,446 | |
90 Day Eurodollar | | | Short | | | | 4 | | | | 973,550 | | | | 3/18/19 | | | | 3,954 | |
90 Day Eurodollar | | | Short | | | | 4 | | | | 972,700 | | | | 6/17/19 | | | | 3,729 | |
90 Day Eurodollar | | | Short | | | | 4 | | | | 972,050 | | | | 9/16/19 | | | | 3,504 | |
90 Day Eurodollar | | | Short | | | | 4 | | | | 971,550 | | | | 12/16/19 | | | | 2,742 | |
| | | | |
| 18 | | Annual Report | | franklintempleton.com |
FRANKLIN ALTERNATIVE STRATEGIES FUNDS
CONSOLIDATED STATEMENT OF INVESTMENTS
Franklin K2 Global Macro Opportunities Fund (continued)
| | | | | | | | | | | | | | | | | | | | |
| Futures Contracts (continued) | | | | | | | | | | | | | | | |
| Description | | Type | | | Number of
Contracts | | | Notional
Amount* | | | Expiration
Date | | | Value/Unrealized
Appreciation
(Depreciation) | |
| Interest Rate Contracts (continued) | | | | | | | | | | | | | | | | | | | | |
90 Day Eurodollar | | | Short | | | | 3 | | | $ | 728,550 | | | | 3/16/20 | | | $ | 3,082 | |
90 Day Eurodollar | | | Short | | | | 3 | | | | 728,512 | | | | 6/15/20 | | | | 2,807 | |
90 Day Eurodollar | | | Short | | | | 3 | | | | 728,437 | | | | 9/14/20 | | | | (506 | ) |
90 Day Sterling | | | Short | | | | 2 | | | | 329,511 | | | | 3/20/19 | | | | (812 | ) |
90 Day Sterling | | | Short | | | | 2 | | | | 329,046 | | | | 9/18/19 | | | | (701 | ) |
90 Day Sterling | | | Short | | | | 4 | | | | 657,627 | | | | 12/18/19 | | | | (910 | ) |
90 Day Sterling | | | Short | | | | 2 | | | | 328,647 | | | | 3/18/20 | | | | (339 | ) |
90 Day Sterling | | | Short | | | | 4 | | | | 656,962 | | | | 6/17/20 | | | | (186 | ) |
90 Day Sterling | | | Short | | | | 4 | | | | 656,697 | | | | 9/16/20 | | | | (1,919 | ) |
Australian 3 Yr. Bond | | | Short | | | | 6 | | | | 504,653 | | | | 6/15/18 | | | | (322 | ) |
Australian 10 Yr. Bond | | | Short | | | | 4 | | | | 390,497 | | | | 6/15/18 | | | | (4,833 | ) |
Canadian 10 Yr. Bond | | | Short | | | | 13 | | | | 1,362,964 | | | | 9/19/18 | | | | (21,376 | ) |
Euro-BOBL | | | Long | | | | 2 | | | | 309,867 | | | | 6/07/18 | | | | 4,126 | |
Euro-Bund | | | Long | | | | 4 | | | | 758,195 | | | | 6/07/18 | | | | 10,791 | |
Euro BUXL 30 Yr. Bond | | | Short | | | | 1 | | | | 199,626 | | | | 6/07/18 | | | | (13,374 | ) |
Euro-OAT | | | Long | | | | 2 | | | | 364,040 | | | | 6/07/18 | | | | 7,764 | |
Euro-SCHATZ | | | Long | | | | 1 | | | | 131,149 | | | | 6/07/18 | | | | 311 | |
Long Gilt | | | Long | | | | 3 | | | | 492,363 | | | | 9/26/18 | | | | 7,428 | |
Long Gilt | | | Short | | | | 1 | | | | 164,121 | | | | 9/26/18 | | | | (2,095 | ) |
U.S. Treasury 2 Yr. Note | | | Short | | | | 5 | | | | 1,061,172 | | | | 9/28/18 | | | | (1,476 | ) |
U.S. Treasury 5 Yr. Note | | | Short | | | | 28 | | | | 3,188,938 | | | | 9/28/18 | | | | (14,744 | ) |
U.S. Treasury 10 Yr. Note | | | Short | | | | 38 | | | | 4,576,626 | | | | 9/19/18 | | | | (41,349 | ) |
U.S. Treasury Long Bond | | | Short | | | | 6 | | | | 870,750 | | | | 9/19/18 | | | | (15,423 | ) |
| | | | | | | | | | | | | | | | | | | | |
| | | | | | | | | | | 25,342,351 | | | | | | | | (65,882 | ) |
| | | | | | | | | | | | | | | | | | | | |
Total Futures Contracts | | | $ | 168,023 | |
| | | | | | | | | | | | | | | | | | | | |
*As of period end.
aA portion or all of the contracts are owned by K2 GMOF Holdings Corp., a wholly-owned subsidiary of the Fund. See Note 1(d).
At May 31, 2018, the Fund had the following forward exchange contracts outstanding. See Note 1(c).
| | | | | | | | | | | | | | | | | | | | | | | | | | | | |
| Forward Exchange Contracts | | | | | | | | | | | | | | | | | | | |
| Currency | | Counterpartya | | | Type | | | Quantity | | | Contract
Amount* | | | Settlement
Date | | | Unrealized
Appreciation | | | Unrealized
Depreciation | |
| OTC Forward Exchange Contracts | | | | | | | | | | | | | | | | | | | | | | | | | |
Argentine Peso | | | JPHQ | | | | Sell | | | | 1,922,102 | | | | 91,120 | | | | 6/04/18 | | | $ | 14,439 | | | $ | — | |
Brazilian Real | | | JPHQ | | | | Buy | | | | 1,140,411 | | | | 316,547 | | | | 6/04/18 | | | | 471 | | | | (10,909 | ) |
Brazilian Real | | | JPHQ | | | | Sell | | | | 1,140,411 | | | | 309,986 | | | | 6/04/18 | | | | 4,347 | | | | (470 | ) |
South Korean Won | | | JPHQ | | | | Buy | | | | 89,232,983 | | | | 83,007 | | | | 6/04/18 | | | | — | | | | (215 | ) |
South Korean Won | | | JPHQ | | | | Sell | | | | 89,232,983 | | | | 83,116 | | | | 6/04/18 | | | | 324 | | | | — | |
Peruvian Nuevo Sol | | | JPHQ | | | | Buy | | | | 232,377 | | | | 70,739 | | | | 6/07/18 | | | | 256 | | | | — | |
Peruvian Nuevo Sol | | | JPHQ | | | | Sell | | | | 780,493 | | | | 238,275 | | | | 6/07/18 | | | | 39 | | | | (219 | ) |
Argentine Peso | | | JPHQ | | | | Sell | | | | 1,088,299 | | | | 41,459 | | | | 6/18/18 | | | | — | | | | (1,319 | ) |
Indian Rupee | | | JPHQ | | | | Sell | | | | 7,364,844 | | | | 108,187 | | | | 6/18/18 | | | | — | | | | (727 | ) |
Peruvian Nuevo Sol | | | JPHQ | | | | Sell | | | | 162,396 | | | | 49,473 | | | | 6/18/18 | | | | — | | | | (103 | ) |
Brazilian Real | | | JPHQ | | | | Buy | | | | 163,338 | | | | 50,000 | | | | 6/20/18 | | | | — | | | | (6,226 | ) |
Brazilian Real | | | JPHQ | | | | Sell | | | | 872,853 | | | | 250,000 | | | | 6/20/18 | | | | 16,075 | | | | — | |
Chilean Peso | | | JPHQ | | | | Buy | | | | 207,224,315 | | | | 350,000 | | | | 6/20/18 | | | | — | | | | (21,100 | ) |
Chilean Peso | | | JPHQ | | | | Sell | | | | 155,624,775 | | | | 250,000 | | | | 6/20/18 | | | | 3,014 | | | | (16 | ) |
Chinese Yuan | | | JPHQ | | | | Buy | | | | 1,271,895 | | | | 200,000 | | | | 6/20/18 | | | | — | | | | (1,792 | ) |
Chinese Yuan | | | JPHQ | | | | Sell | | | | 1,434,755 | | | | 226,129 | | | | 6/20/18 | | | | 2,542 | | | | — | |
Euro | | | JPHQ | | | | Buy | | | | 447,088 | | | | 535,393 | | | | 6/20/18 | | | | 55 | | | | (11,927 | ) |
Euro | | | JPHQ | | | | Sell | | | | 836,034 | | | | 1,015,944 | | | | 6/20/18 | | | | 37,335 | | | | (346 | ) |
Euro | | | JPHQ | | | | Sell | | | | 135,309 | | | | 1,034,495 | CNY | | | 6/20/18 | | | | 3,934 | | | | (1,162 | ) |
| | | | | | |
| franklintempleton.com | | Annual Report | | | 19 | |
FRANKLIN ALTERNATIVE STRATEGIES FUNDS
CONSOLIDATED STATEMENT OF INVESTMENTS
Franklin K2 Global Macro Opportunities Fund (continued)
| | | | | | | | | | | | | | | | | | | | | | | | | | | | |
| Forward Exchange Contracts (continued) | | | | | | | | | | | | | | | | | | | |
| Currency | | Counterpartya | | | Type | | | Quantity | | | Contract
Amount* | | | Settlement
Date | | | Unrealized
Appreciation | | | Unrealized
Depreciation | |
| OTC Forward Exchange Contracts (continued) | | | | | | | | | | | | | | | | | | | | | | | | | |
Euro | | | JPHQ | | | | Sell | | | | 269,084 | | | | 6,844,574 | CZK | | | 6/20/18 | | | $ | 18,465 | | | $ | (23,280 | ) |
Euro | | | JPHQ | | | | Sell | | | | 200,000 | | | | 62,203,771 | HUF | | | 6/20/18 | | | | 13,984 | | | | (20,475 | ) |
Euro | | | JPHQ | | | | Sell | | | | 350,000 | | | | 3,350,788 | NOK | | | 6/20/18 | | | | 18,752 | | | | (18,753 | ) |
Euro | | | JPHQ | | | | Sell | | | | 350,000 | | | | 1,472,767 | PLN | | | 6/20/18 | | | | 27,499 | | | | (38,559 | ) |
Euro | | | JPHQ | | | | Sell | | | | 134,464 | | | | 630,625 | RON | | | 6/20/18 | | | | 9,172 | | | | (8,515 | ) |
Euro | | | JPHQ | | | | Sell | | | | 400,000 | | | | 4,133,183 | SEK | | | 6/20/18 | | | | 11,551 | | | | (10,496 | ) |
Hungarian Forint | | | JPHQ | | | | Sell | | | | 157,952,967 | | | | 500,000 | EUR | | | 6/20/18 | | | | 28,549 | | | | (21,264 | ) |
Indian Rupee | | | JPHQ | | | | Buy | | | | 13,168,436 | | | | 200,000 | | | | 6/20/18 | | | | — | | | | (5,303 | ) |
Indian Rupee | | | JPHQ | | | | Sell | | | | 13,460,641 | | | | 200,000 | | | | 6/20/18 | | | | 1,480 | | | | (496 | ) |
Japanese Yen | | | JPHQ | | | | Buy | | | | 590,401 | | | | 5,529 | | | | 6/20/18 | | | | — | | | | (94 | ) |
Japanese Yen | | | JPHQ | | | | Sell | | | | 590,401 | | | | 5,574 | | | | 6/20/18 | | | | 139 | | | | — | |
Mexican Peso | | | JPHQ | | | | Buy | | | | 4,829,664 | | | | 254,990 | | | | 6/20/18 | | | | — | | | | (13,707 | ) |
Mexican Peso | | | JPHQ | | | | Sell | | | | 4,829,664 | | | | 260,377 | | | | 6/20/18 | | | | 19,094 | | | | — | |
New Israeli Shekel | | | JPHQ | | | | Buy | | | | 688,220 | | | | 200,000 | | | | 6/20/18 | | | | — | | | | (6,652 | ) |
New Israeli Shekel | | | JPHQ | | | | Sell | | | | 1,068,338 | | | | 300,000 | | | | 6/20/18 | | | | 909 | | | | (1,047 | ) |
Norwegian Krone | | | JPHQ | | | | Sell | | | | 957,585 | | | | 100,000 | EUR | | | 6/20/18 | | | | 4,334 | | | | (4,361 | ) |
Philippine Peso | | | JPHQ | | | | Buy | | | | 5,222,387 | | | | 100,000 | | | | 6/20/18 | | | | 107 | | | | (813 | ) |
Philippine Peso | | | JPHQ | | | | Sell | | | | 2,633,763 | | | | 50,000 | | | | 6/20/18 | | | | — | | | | (76 | ) |
Polish Zloty | | | JPHQ | | | | Sell | | | | 1,065,850 | | | | 250,000 | EUR | | | 6/20/18 | | | | 15,639 | | | | (11,496 | ) |
Romanian Leu | | | JPHQ | | | | Sell | | | | 1,001,898 | | | | 213,562 | EUR | | | 6/20/18 | | | | 11,182 | | | | (12,303 | ) |
Russian Ruble | | | JPHQ | | | | Buy | | | | 53,311,574 | | | | 889,662 | | | | 6/20/18 | | | | 504 | | | | (38,274 | ) |
Russian Ruble | | | JPHQ | | | | Sell | | | | 57,424,423 | | | | 957,459 | | | | 6/20/18 | | | | 41,653 | | | | (1,806 | ) |
Singapore Dollar | | | JPHQ | | | | Buy | | | | 482,778 | | | | 366,732 | | | | 6/20/18 | | | | — | | | | (6,006 | ) |
Singapore Dollar | | | JPHQ | | | | Sell | | | | 285,554 | | | | 216,777 | | | | 6/20/18 | | | | 3,414 | | | | — | |
South African Rand | | | JPHQ | | | | Buy | | | | 5,962,884 | | | | 495,710 | | | | 6/20/18 | | | | — | | | | (28,574 | ) |
South African Rand | | | JPHQ | | | | Sell | | | | 13,817,928 | | | | 1,120,400 | | | | 6/20/18 | | | | 38,764 | | | | (869 | ) |
South Korean Won | | | JPHQ | | | | Buy | | | | 321,301,281 | | | | 300,000 | | | | 6/20/18 | | | | 94 | | | | (1,823 | ) |
South Korean Won | | | JPHQ | | | | Sell | | | | 106,914,073 | | | | 100,000 | | | | 6/20/18 | | | | 749 | | | | — | |
Swedish Krona | | | JPHQ | | | | Sell | | | | 9,186,599 | | | | 900,000 | EUR | | | 6/20/18 | | | | 82,566 | | | | (72,105 | ) |
Taiwan Dollar | | | JPHQ | | | | Sell | | | | 5,936,080 | | | | 200,000 | | | | 6/20/18 | | | | 1,794 | | | | (217 | ) |
Thailand Baht | | | JPHQ | | | | Buy | | | | 9,426,994 | | | | 300,000 | | | | 6/20/18 | | | | 11 | | | | (5,123 | ) |
Thailand Baht | | | JPHQ | | | | Sell | | | | 6,300,116 | | | | 200,000 | | | | 6/20/18 | | | | 3,172 | | | | (248 | ) |
Turkish Lira | | | JPHQ | | | | Buy | | | | 4,432,962 | | | | 1,051,699 | | | | 6/20/18 | | | | 3,938 | | | | (84,471 | ) |
Turkish Lira | | | JPHQ | | | | Sell | | | | 4,415,959 | | | | 1,055,961 | | | | 6/20/18 | | | | 88,522 | | | | — | |
Indian Rupee | | | JPHQ | | | | Buy | | | | 4,945,758 | | | | 72,266 | | | | 6/21/18 | | | | 849 | | | | — | |
Indian Rupee | | | JPHQ | | | | Sell | | | | 4,945,758 | | | | 72,577 | | | | 6/21/18 | | | | — | | | | (538 | ) |
Indonesian Rupiah | | | JPHQ | | | | Buy | | | | 2,034,175,371 | | | | 144,730 | | | | 6/21/18 | | | | 1,305 | | | | — | |
Taiwan Dollar | | | JPHQ | | | | Sell | | | | 4,989,638 | | | | 167,000 | | | | 6/21/18 | | | | 200 | | | | — | |
Australian Dollar | | | MSCO | | | | Buy | | | | 143,000 | | | | 109,774 | | | | 6/22/18 | | | | 78 | | | | (1,695 | ) |
Australian Dollar | | | MSCO | | | | Sell | | | | 1,269,000 | | | | 960,445 | | | | 6/22/18 | | | | 5,209 | | | | (4,576 | ) |
British Pound | | | MSCO | | | | Buy | | | | 997,000 | | | | 1,395,990 | | | | 6/22/18 | | | | — | | | | (69,068 | ) |
British Pound | | | MSCO | | | | Sell | | | | 997,000 | | | | 1,354,532 | | | | 6/22/18 | | | | 27,610 | | | | — | |
Canadian Dollar | | | MSCO | | | | Buy | | | | 577,000 | | | | 449,794 | | | | 6/22/18 | | | | 100 | | | | (4,593 | ) |
Canadian Dollar | | | MSCO | | | | Sell | | | | 1,312,000 | | | | 1,020,464 | | | | 6/22/18 | | | | 7,921 | | | | — | |
Euro | | | MSCO | | | | Buy | | | | 1,316,000 | | | | 1,637,992 | | | | 6/22/18 | | | | — | | | | (96,767 | ) |
Euro | | | MSCO | | | | Sell | | | | 1,827,000 | | | | 2,203,741 | | | | 6/22/18 | | | | 68,212 | | | | (4,149 | ) |
Indian Rupee | | | JPHQ | | | | Buy | | | | 4,965,281 | | | | 72,557 | | | | 6/22/18 | | | | 839 | | | | — | |
Indian Rupee | | | JPHQ | | | | Sell | | | | 4,965,281 | | | | 72,576 | | | | 6/22/18 | | | | — | | | | (820 | ) |
Japanese Yen | | | MSCO | | | | Buy | | | | 231,806,000 | | | | 2,175,491 | | | | 6/22/18 | | | | 2,140 | | | | (43,353 | ) |
Japanese Yen | | | MSCO | | | | Sell | | | | 157,774,000 | | | | 1,461,738 | | | | 6/22/18 | | | | 11,605 | | | | (2,520 | ) |
Mexican Peso | | | MSCO | | | | Buy | | | | 6,037,000 | | | | 323,857 | | | | 6/22/18 | | | | — | | | | (22,365 | ) |
Mexican Peso | | | MSCO | | | | Sell | | | | 4,083,000 | | | | 211,950 | | | | 6/22/18 | | | | 8,063 | | | | (19 | ) |
New Zealand Dollar | | | MSCO | | | | Buy | | | | 689,000 | | | | 500,819 | | | | 6/22/18 | | | | 87 | | | | (18,740 | ) |
New Zealand Dollar | | | MSCO | | | | Sell | | | | 760,000 | | | | 549,705 | | | | 6/22/18 | | | | 18,646 | | | | (793 | ) |
Swiss Franc | | | MSCO | | | | Buy | | | | 57,000 | | | | 57,605 | | | | 6/22/18 | | | | 347 | | | | — | |
Swiss Franc | | | MSCO | | | | Sell | | | | 197,000 | | | | 198,979 | | | | 6/22/18 | | | | — | | | | (1,312 | ) |
| | | | |
| 20 | | Annual Report | | franklintempleton.com |
FRANKLIN ALTERNATIVE STRATEGIES FUNDS
CONSOLIDATED STATEMENT OF INVESTMENTS
Franklin K2 Global Macro Opportunities Fund (continued)
| | | | | | | | | | | | | | | | | | | | | | | | | | | | |
| Forward Exchange Contracts (continued) | | | | | | | | | | | | | | | | | | | |
| Currency | | Counterpartya | | | Type | | | Quantity | | | Contract
Amount* | | | Settlement
Date | | | Unrealized
Appreciation | | | Unrealized
Depreciation | |
| OTC Forward Exchange Contracts (continued) | | | | | | | | | | | | | | | | | | | | | | | | | |
Brazilian Real | | | JPHQ | | | | Buy | | | | 257,240 | | | | 70,337 | | | | 7/03/18 | | | $ | — | | | $ | (1,484 | ) |
Egyptian Pound | | | BZWS | | | | Sell | | | | 1,572,220 | | | | 85,217 | | | | 8/16/18 | | | | — | | | | (740 | ) |
Egyptian Pound | | | BZWS | | | | Sell | | | | 382,198 | | | | 20,749 | | | | 8/23/18 | | | | — | | | | (104 | ) |
Chinese Yuan | | | JPHQ | | | | Buy | | | | 399,311 | | | | 62,666 | | | | 8/24/18 | | | | — | | | | (622 | ) |
Taiwan Dollar | | | JPHQ | | | | Sell | | | | 1,858,973 | | | | 62,666 | | | | 8/24/18 | | | | 189 | | | | — | |
Egyptian Pound | | | JPHQ | | | | Sell | | | | 1,984,079 | | | | 106,671 | | | | 8/27/18 | | | | — | | | | (1,454 | ) |
Turkish Lira | | | JPHQ | | | | Sell | | | | 469,540 | | | | 100,000 | | | | 9/19/18 | | | | 926 | | | | — | |
| | | | | | | | | | | | | | | | | | | | | | | | |
Total Forward Exchange Contracts | | | $ | 683,194 | | | $ | (769,449 | ) |
| | | | | | | | | | | | | | | | | | | | | | | | |
Net unrealized appreciation (depreciation) | | | $ | (86,255 | ) |
| | | | | | | | | | | | | | | | | | | | | | | | | | | | |
*In U.S. dollars unless otherwise indicated.
aMay be comprised of multiple contracts with the same counterparty, currency and settlement date.
At May 31, 2018, the Fund had the following credit default swap contracts outstanding. See Note 1(c).
| | | | | | | | | | | | | | | | | | | | | | | | | | | | | | | | |
| Credit Default Swap Contracts | | | | | | | | | | | | | | | | | | | | | | |
| Description | | Periodic
Payment
Rate
Received
(Paid) | | | Payment
Frequency | | | Maturity
Date | | | Notional
Amounta | | | Value | | | Unamortized
Upfront
Payments
(Receipts) | | | Unrealized
Appreciation
(Depreciation) | | | Ratingb | |
| Centrally Cleared Swap Contracts | | | | | | | | | | | | | | | | | | | | | | | | | | | | | | | | |
| | | | | | | | |
| Contracts to Buy Protectionc | | | | | | | | | | | | | | | | | | | | | | | | | | | | | | | | |
| | | | | | | | |
| Single Name | | | | | | | | | | | | | | | | | | | | | | | | | | | | | | | | |
Government of Mexico | | | (1.00 | %) | | | Quarterly | | | | 6/20/23 | | | $ | 166,000 | | | $ | 3,053 | | | $ | 315 | | | $ | 2,738 | | | | | |
Government of South Africa | | | (1.00 | %) | | | Quarterly | | | | 12/20/21 | | | | 275,000 | | | | 2,827 | | | | 18,824 | | | | (15,997 | ) | | | | |
Government of South Africa | | | (1.00 | %) | | | Quarterly | | | | 6/20/22 | | | | 168,000 | | | | 2,771 | | | | 8,826 | | | | (6,055 | ) | | | | |
Government of South Korea | | | (1.00 | %) | | | Quarterly | | | | 12/20/21 | | | | 207,885 | | | | (4,830 | ) | | | (5,982 | ) | | | 1,152 | | | | | |
Government of South Korea | | | (1.00 | %) | | | Quarterly | | | | 12/20/22 | | | | 27,280 | | | | (707 | ) | | | (652 | ) | | | (55 | ) | | | | |
Government of Turkey | | | (1.00 | %) | | | Quarterly | | | | 6/20/21 | | | | 405,000 | | | | 13,167 | | | | 24,334 | | | | (11,167 | ) | | | | |
Government of Turkey | | | (1.00 | %) | | | Quarterly | | | | 12/20/21 | | | | 43,000 | | | | 1,805 | | | | 2,630 | | | | (825 | ) | | | | |
| | | | | | | | |
| Contracts to Sell Protectionc,d | | | | | | | | | | | | | | | | | | | | | | | | | | | | | | | | |
| | | | | | | | |
| Single Name | | | | | | | | | | | | | | | | | | | | | | | | | | | | | | | | |
Government of Russia | | | 1.00 | % | | | Quarterly | | | | 12/20/21 | | | | 393,000 | | | | (957 | ) | | | (14,594 | ) | | | 13,637 | | | | BB+ | |
Government of South Africa | | | 1.00 | % | | | Quarterly | | | | 12/20/22 | | | | 111,000 | | | | (2,847 | ) | | | (2,056 | ) | | | (791 | ) | | | BB+ | |
Government of Turkey | | | 1.00 | % | | | Quarterly | | | | 12/20/22 | | | | 105,000 | | | | (6,618 | ) | | | (4,748 | ) | | | (1,870 | ) | | | BB+ | |
| | | | | | | | | | | | | | | | | | | | | | | | |
Total Credit Default Swap Contracts | | | $ | 7,664 | | | $ | 26,897 | | | $ | (19,233 | ) | | | | |
| | | | | | | | | | | | | | | | | | | | | | | | |
aFor contracts to sell protection, the notional amount is equal to the maximum potential amount of the future payments and no recourse provisions have been entered into in association with the contracts.
bBased on Standard and Poor’s (S&P) Rating for single name swaps.
cPerformance triggers for settlement of contract include default, bankruptcy or restructuring for single name swaps.
dThe Fund enters contracts to sell protection to create a long credit position.
| | | | | | |
| franklintempleton.com | | Annual Report | | | 21 | |
FRANKLIN ALTERNATIVE STRATEGIES FUNDS
CONSOLIDATED STATEMENT OF INVESTMENTS
Franklin K2 Global Macro Opportunities Fund (continued)
At May 31, 2018, the Fund had the following interest rate swap contracts outstanding. See Note 1(c).
| | | | | | | | | | | | | | | | | | | | |
| Interest Rate Swap Contracts | | | | | | | | | | | | | | | |
| Description | | Payment
Frequency | | | | | | Maturity
Date | | | Notional
Amount | | | Value/Unrealized
Appreciation
(Depreciation) | |
| Centrally Cleared Swap Contracts | | | | | | | | | | | | | | | | | | | | |
Receive Fixed rate 8.09%
Pay Floating rate BRL-BRLCDI | | | Annually | | | | | | | | 1/04/21 | | | | 1,402,936 | BRL | | $ | (6,901 | ) |
Receive Fixed rate 8.95%
Pay Floating rate BRL-BRLCDI | | | Annually | | | | | | | | 1/04/21 | | | | 133,517 | BRL | | | 158 | |
Receive Floating rate 1 Month MXN TIIE
Pay Fixed rate 7.57% | | | Monthly | | | | | | | | 4/19/21 | | | | 3,701,219 | MXN | | | 2,351 | |
Receive Floating rate 6 Month CZK-PRIBOR
Pay Fixed rate 1.64% | | | Annually | | | | | | | | 3/21/23 | | | | 3,784,788 | CZK | | | 290 | |
Receive Floating rate 6 Month CZK-PRIBOR
Pay Fixed rate 1.67% | | | Annually | | | | | | | | 3/21/23 | | | | 1,364,972 | CZK | | | 7 | |
Receive Floating rate 6 Month CZK-PRIBOR
Pay Fixed rate 1.74% | | | Annually | | | | | | | | 3/21/23 | | | | 928,227 | CZK | | | (155 | ) |
Receive Floating rate 6 Month CZK-PRIBOR
Pay Fixed rate 1.80% | | | Annually | | | | | | | | 3/21/23 | | | | 1,285,718 | CZK | | | (389 | ) |
Receive Floating rate 6 Month CZK-PRIBOR
Pay Fixed rate 1.86% | | | Annually | | | | | | | | 3/21/23 | | | | 3,372,503 | CZK | | | (1,494 | ) |
Receive Floating rate 6 Month CZK-PRIBOR
Pay Fixed rate 1.84% | | | Annually | | | | | | | | 5/22/23 | | | | 3,318,958 | CZK | | | (1,183 | ) |
Receive Floating rate MIBOR
Pay Fixed rate 6.67% | | | Annually | | | | | | | | 6/20/23 | | | | 6,471,391 | INR | | | 1,423 | |
Receive Fixed rate 10.36%
Pay Floating rate BRL-BRLCDI | | | Annually | | | | | | | | 1/02/25 | | | | 834,629 | BRL | | | (4,453 | ) |
Receive Floating rate 6 Month GBP-LIBOR
Pay Fixed rate 1.56% | | | Semi-Annually | | | | | | | | 11/29/46 | | | | 78,445 | GBP | | | 1,168 | |
Receive Floating rate 6 Month GBP-LIBOR
Pay Fixed rate 1.60% | | | Semi-Annually | | | | | | | | 12/03/46 | | | | 38,267 | GBP | | | 116 | |
Receive Floating rate 6 Month GBP-LIBOR
Pay Fixed rate 1.44% | | | Semi-Annually | | | | | | | | 1/07/47 | | | | 85,166 | GBP | | | 4,185 | |
Receive Floating rate 6 Month GBP-LIBOR
Pay Fixed rate 1.41% | | | Semi-Annually | | | | | | | | 8/04/67 | | | | 27,000 | GBP | | | 857 | |
Receive Floating rate 6 Month GBP-LIBOR
Pay Fixed rate 1.29% | | | Semi-Annually | | | | | | | | 2/28/67 | | | | 71,000 | GBP | | | 6,668 | |
| | | | | | | | | | | | | | | | | | | | |
Total Centrally Cleared Swap Contracts | | | | 2,648 | |
| | | | | | | | | | | | | | | | | | | | |
| | | | | |
| | | | | | Counterparty | | | | | | | | | | |
| OTC Swap Contracts | | | | | | | | | | | | | | | | | | | | |
Receive Floating rate 3 Month KLIBOR
Pay Fixed rate 4.14% | | | Quarterly | | | | MSCS | | | | 5/18/23 | | | | 219,367 | MYR | | | (685 | ) |
Receive Floating rate 3 Month KLIBOR
Pay Fixed rate 4.14% | | | Quarterly | | | | BOFA | | | | 5/21/23 | | | | 222,359 | MYR | | | (691 | ) |
| | | | | | | | | | | | | | | | | | | | |
Total OTC Swap Contracts | | | | (1,376 | ) |
| | | | | | | | | | | | | | | | | | | | |
Total Interest Rate Swap Contracts | | | $ | 1,272 | |
| | | | | | | | | | | | | | | | | | | | |
See Abbreviations on page 38.
| | | | |
| 22 | | Annual Report | The accompanying notes are an integral part of these financial statements. | | franklintempleton.com |
FRANKLIN ALTERNATIVE STRATEGIES FUNDS
Consolidated Financial Statements
Consolidated Statement of Assets and Liabilities
May 31, 2018
Franklin K2 Global Macro Opportunities Fund
| | | | |
Assets: | | | | |
Investments in securities: | | | | |
Cost - Unaffiliated issuers | | $ | 21,352,159 | |
| | | | |
Value - Unaffiliated issuers | | $ | 21,203,445 | |
Cash | | | 282 | |
Foreign currency, at value (cost $26,326) | | | 25,136 | |
Receivables: | | | | |
Investment securities sold | | | 6,920 | |
Interest | | | 73,565 | |
Affiliates | | | 109,809 | |
Deposits with brokers for: | | | | |
OTC derivative contracts | | | 590,000 | |
Futures contracts | | | 880,281 | |
Centrally cleared swap contracts | | | 458,694 | |
Due from brokers | | | 138,729 | |
Variation margin on centrally cleared swap contracts | | | 2,942 | |
Unrealized appreciation on OTC forward exchange contracts | | | 683,194 | |
| | | | |
Total assets | | | 24,172,997 | |
| | | | |
Liabilities: | | | | |
Payables: | | | | |
Investment securities purchased | | | 40,765 | |
Distribution fees | | | 163 | |
Transfer agent fees | | | 210 | |
Variation margin on futures contracts | | | 62,261 | |
Due to brokers | | | 133,872 | |
Unrealized depreciation on OTC forward exchange contracts | | | 769,449 | |
Unrealized depreciation on OTC swap contracts | | | 1,376 | |
Accrued expenses and other liabilities | | | 94,781 | |
| | | | |
Total liabilities | | | 1,102,877 | |
| | | | |
Net assets, at value | | $ | 23,070,120 | |
| | | | |
Net assets consist of: | | | | |
Paid-in capital | | $ | 24,627,305 | |
Accumulated net investment loss | | | (160,830 | ) |
Net unrealized appreciation (depreciation) | | | (87,940 | ) |
Accumulated net realized gain (loss) | | | (1,308,415 | ) |
| | | | |
Net assets, at value | | $ | 23,070,120 | |
| | | | |
| | | | | | |
| franklintempleton.com | | The accompanying notes are an integral part of these financial statements. | Annual Report | | | 23 | |
FRANKLIN ALTERNATIVE STRATEGIES FUNDS
CONSOLIDATED FINANCIAL STATEMENTS
Consolidated Statement of Assets and Liabilities (continued)
May 31, 2018
Franklin K2 Global Macro Opportunities Fund
| | | | |
| Class A: | | | | |
Net assets, at value | | $ | 160,900 | |
| | | | |
Shares outstanding | | | 17,820 | |
| | | | |
Net asset value per sharea | | $ | 9.03 | |
| | | | |
Maximum offering price per share (net asset value per share ÷ 94.25%) | | $ | 9.58 | |
| | | | |
| |
| Class C: | | | | |
Net assets, at value | | $ | 147,479 | |
| | | | |
Shares outstanding | | | 16,565 | |
| | | | |
Net asset value and maximum offering price per sharea | | $ | 8.90 | |
| | | | |
| |
| Class R: | | | | |
Net assets, at value | | $ | 9,017 | |
| | | | |
Shares outstanding | | | 1,000 | |
| | | | |
Net asset value and maximum offering price per share | | $ | 9.02 | |
| | | | |
| |
| Class R6: | | | | |
Net assets, at value | | $ | 9,053 | |
| | | | |
Shares outstanding | | | 1,000 | |
| | | | |
Net asset value and maximum offering price per share | | $ | 9.05 | |
| | | | |
| |
| Advisor Class: | | | | |
Net assets, at value | | $ | 22,743,671 | |
| | | | |
Shares outstanding | | | 2,511,653 | |
| | | | |
Net asset value and maximum offering price per share | | $ | 9.06 | |
| | | | |
aRedemption price is equal to net asset value less contingent deferred sales charges, if applicable.
| | | | |
| 24 | | Annual Report | The accompanying notes are an integral part of these financial statements. | | franklintempleton.com |
FRANKLIN ALTERNATIVE STRATEGIES FUNDS
CONSOLIDATED FINANCIAL STATEMENTS
Consolidated Statement of Operations
for the year ended May 31, 2018
Franklin K2 Global Macro Opportunities Fund
| | | | |
Investment income: | | | | |
Dividends: | | | | |
Unaffiliated issuers | | $ | 196,074 | |
Interest: | | | | |
Unaffiliated issuers | | | 349,364 | |
| | | | |
Total investment income | | | 545,438 | |
| | | | |
Expenses: | | | | |
Management fees (Note 3a) | | | 454,537 | |
Distribution fees: (Note 3c) | | | | |
Class A | | | 301 | |
Class C | | | 1,545 | |
Class R | | | 24 | |
Transfer agent fees: (Note 3e) | | | | |
Class A | | | 19 | |
Class C | | | 24 | |
Class R | | | 2 | |
Class R6 | | | 117 | |
Advisor Class | | | 3,549 | |
Custodian fees (Note 4) . | | | 64,919 | |
Reports to shareholders | | | 13,788 | |
Registration and filing fees | | | 82,813 | |
Professional fees | | | 170,224 | |
Amortization of offering costs | | | 38,861 | |
Other | | | 7,075 | |
| | | | |
Total expenses | | | 837,798 | |
Expense reductions (Note 4) | | | (20 | ) |
Expenses waived/paid by affiliates (Note 3f) | | | (380,700 | ) |
| | | | |
Net expenses | | | 457,078 | |
| | | | |
Net investment income | | | 88,360 | |
| | | | |
Realized and unrealized gains (losses): | | | | |
Net realized gain (loss) from: | | | | |
Investments: | | | | |
Unaffiliated issuers | | | 55,629 | |
Foreign currency transactions | | | 12,647 | |
Forward exchange contracts | | | (446,033 | ) |
Futures contracts | | | (196,759 | ) |
Swap contracts | | | (53,595 | ) |
| | | | |
Net realized gain (loss) | | | (628,111 | ) |
| | | | |
Net change in unrealized appreciation (depreciation) on: | | | | |
Investments: | | | | |
Unaffiliated issuers | | | (204,670 | ) |
Translation of other assets and liabilities denominated in foreign currencies | | | (3,405 | ) |
Forward exchange contracts | | | 194,186 | |
Futures contracts | | | 185,244 | |
Swap contracts | | | 13,755 | |
| | | | |
Net change in unrealized appreciation (depreciation) | | | 185,110 | |
| | | | |
Net realized and unrealized gain (loss) | | | (443,001 | ) |
| | | | |
Net increase (decrease) in net assets resulting from operations | | $ | (354,641 | ) |
| | | | |
| | | | | | |
| franklintempleton.com | | The accompanying notes are an integral part of these financial statements. | Annual Report | | | 25 | |
FRANKLIN ALTERNATIVE STRATEGIES FUNDS
CONSOLIDATED FINANCIAL STATEMENTS
Consolidated Statements of Changes in Net Assets
Franklin K2 Global Macro Opportunities Fund
| | | | | | | | |
| | | Year Ended May 31, | |
| | | 2018 | | | 2017a | |
Increase (decrease) in net assets: | | | | | | | | |
Operations: | | | | | | | | |
Net investment income (loss) | | $ | 88,360 | | | $ | (175,068 | ) |
Net realized gain (loss) | | | (628,111 | ) | | | (1,433,043 | ) |
Net change in unrealized appreciation (depreciation) | | | 185,110 | | | | (273,050 | ) |
| | | | |
Net increase (decrease) in net assets resulting from operations | | | (354,641 | ) | | | (1,881,161 | ) |
| | | | |
Distributions to shareholders from: | | | | | | | | |
Net investment income: | | | | | | | | |
Class A | | | — | | | | (183 | ) |
Class C | | | — | | | | (661 | ) |
Class R | | | — | | | | (60 | ) |
Class R6 | | | — | | | | (60 | ) |
Advisor Class | | | — | | | | (148,675 | ) |
| | | | |
Total distributions to shareholders | | | — | | | | (149,639 | ) |
| | | | |
Capital share transactions: (Note 2) | | | | | | | | |
Class A | | | 73,777 | | | | 91,676 | |
Class C | | | (36,491 | ) | | | 200,616 | |
Class R | | | — | | | | 10,000 | |
Class R6 | | | — | | | | 10,000 | |
Advisor Class | | | 116,163 | | | | 24,989,820 | |
| | | | |
Total capital share transactions | | | 153,449 | | | | 25,302,112 | |
| | | | |
Net increase (decrease) in net assets | | | (201,192 | ) | | | 23,271,312 | |
Net assets: | | | | | | | | |
Beginning of year | | | 23,271,312 | | | | — | |
| | | | |
End of year | | $ | 23,070,120 | | | $ | 23,271,312 | |
| | | | |
Undistributed net investment income included in net assets: | | | | | | | | |
End of year | | $ | — | | | $ | 156,975 | |
| | | | |
Accumulated net investment loss included in net assets: | | | | | | | | |
End of year | | $ | (160,830 | ) | | $ | — | |
| | | | |
aFor the period July 11, 2016 (commencement of operations) to May 31, 2017.
| | | | |
| 26 | | Annual Report | The accompanying notes are an integral part of these financial statements. | | franklintempleton.com |
FRANKLIN ALTERNATIVE STRATEGIES FUNDS
Notes to Consolidated Financial Statements
Franklin K2 Global Macro Opportunities Fund
1. Organization and Significant Accounting Policies
Franklin Alternative Strategies Funds (Trust) is registered under the Investment Company Act of 1940 (1940 Act) as an open-end management investment company, consisting of four separate funds and applies the specialized accounting and reporting guidance in U.S. Generally Accepted Accounting Principles (U.S. GAAP). Franklin K2 Global Macro Opportunities Fund (Fund) is included in this report. The Fund offers five classes of shares: Class A, Class C, Class R, Class R6 and Advisor Class. Each class of shares may differ by its initial sales load, contingent deferred sales charges, voting rights on matters affecting a single class, its exchange privilege and fees due to differing arrangements for distribution and transfer agent fees.
The following summarizes the Fund’s significant accounting policies.
a. Financial Instrument Valuation
The Fund’s investments in financial instruments are carried at fair value daily. Fair value is the price that would be received to sell an asset or paid to transfer a liability in an orderly transaction between market participants on the measurement date. The Fund calculates the net asset value (NAV) per share as of 4 p.m. Eastern time each day the New York Stock Exchange (NYSE) is open for trading. Under compliance policies and procedures approved by the Trust’s Board of Trustees (the Board), the Fund’s administrator has responsibility for oversight of valuation, including leading the cross-functional Valuation Committee (VC). The VC provides administration and oversight of the Fund’s valuation policies and procedures, which are approved annually by the Board. Among other things, these procedures allow the Fund to utilize independent pricing services, quotations from securities and financial instrument dealers, and other market sources to determine fair value.
Debt securities generally trade in the over-the-counter (OTC) market rather than on a securities exchange. The Fund’s pricing services use multiple valuation techniques to determine fair value. In instances where sufficient market activity exists, the pricing services may utilize a market-based approach through which quotes from market makers are used to determine fair value. In instances where sufficient market activity may not exist or is limited, the pricing services also utilize proprietary valuation models which may consider market characteristics such as benchmark yield curves, credit spreads, estimated
default rates, anticipated market interest rate volatility, coupon rates, anticipated timing of principal repayments, underlying collateral, and other unique security features in order to estimate the relevant cash flows, which are then discounted to calculate the fair value. Securities denominated in a foreign currency are converted into their U.S. dollar equivalent at the foreign exchange rate in effect at 4 p.m. Eastern time on the date that the values of the foreign debt securities are determined.
Investments in open-end mutual funds are valued at the closing NAV.
Derivative financial instruments listed on an exchange are valued at the official closing price of the day. Certain derivative financial instruments are centrally cleared or trade in the OTC market. The Fund’s pricing services use various techniques including industry standard option pricing models and proprietary discounted cash flow models to determine the fair value of those instruments. The Fund’s net benefit or obligation under the derivative contract, as measured by the fair value of the contract, is included in net assets.
The Fund has procedures to determine the fair value of financial instruments for which market prices are not reliable or readily available. Under these procedures, the VC convenes on a regular basis to review such financial instruments and considers a number of factors, including significant unobservable valuation inputs, when arriving at fair value. The VC primarily employs a market-based approach which may use related or comparable assets or liabilities, recent transactions, market multiples, book values, and other relevant information for the investment to determine the fair value of the investment. An income-based valuation approach may also be used in which the anticipated future cash flows of the investment are discounted to calculate fair value. Discounts may also be applied due to the nature or duration of any restrictions on the disposition of the investments. Due to the inherent uncertainty of valuations of such investments, the fair values may differ significantly from the values that would have been used had an active market existed. The VC employs various methods for calibrating these valuation approaches including a regular review of key inputs and assumptions, transactional back-testing or disposition analysis, and reviews of any related market activity.
b. Foreign Currency Translation
Portfolio securities and other assets and liabilities denominated in foreign currencies are translated into U.S. dollars based on
| | | | | | |
| franklintempleton.com | | Annual Report | | | 27 | |
FRANKLIN ALTERNATIVE STRATEGIES FUNDS
NOTES TO CONSOLIDATED FINANCIAL STATEMENTS
Franklin K2 Global Macro Opportunities Fund (continued)
1. Organization and Significant Accounting Policies (continued)
b. Foreign Currency Translation (continued)
the exchange rate of such currencies against U.S. dollars on the date of valuation. The Fund may enter into foreign currency exchange contracts to facilitate transactions denominated in a foreign currency. Purchases and sales of securities, income and expense items denominated in foreign currencies are translated into U.S. dollars at the exchange rate in effect on the transaction date. Portfolio securities and assets and liabilities denominated in foreign currencies contain risks that those currencies will decline in value relative to the U.S. dollar. Occasionally, events may impact the availability or reliability of foreign exchange rates used to convert the U.S. dollar equivalent value. If such an event occurs, the foreign exchange rate will be valued at fair value using procedures established and approved by the Board.
The Fund does not separately report the effect of changes in foreign exchange rates from changes in market prices on securities held. Such changes are included in net realized and unrealized gain or loss from investments in the Consolidated Statement of Operations.
Realized foreign exchange gains or losses arise from sales of foreign currencies, currency gains or losses realized between the trade and settlement dates on securities transactions and the difference between the recorded amounts of dividends, interest, and foreign withholding taxes and the U.S. dollar equivalent of the amounts actually received or paid. Net unrealized foreign exchange gains and losses arise from changes in foreign exchange rates on foreign denominated assets and liabilities other than investments in securities held at the end of the reporting period.
c. Derivative Financial Instruments
The Fund invested in derivative financial instruments in order to manage risk or gain exposure to various other investments or markets. Derivatives are financial contracts based on an underlying or notional amount, require no initial investment or an initial net investment that is smaller than would normally be required to have a similar response to changes in market factors, and require or permit net settlement. Derivatives contain various risks including the potential inability of the counterparty to fulfill their obligations under the terms of the contract, the potential for an illiquid secondary market, and/or the potential for market movements which expose the Fund to gains or losses
in excess of the amounts shown in the Consolidated Statement of Assets and Liabilities. Realized gain and loss and unrealized appreciation and depreciation on these contracts for the period are included in the Consolidated Statement of Operations.
Derivative counterparty credit risk is managed through a formal evaluation of the creditworthiness of all potential counterparties. The Fund attempts to reduce its exposure to counterparty credit risk on OTC derivatives, whenever possible, by entering into International Swaps and Derivatives Association (ISDA) master agreements with certain counterparties. These agreements contain various provisions, including but not limited to collateral requirements, events of default, or early termination. Termination events applicable to the counterparty include certain deteriorations in the credit quality of the counterparty. Termination events applicable to the Fund include failure of the Fund to maintain certain net asset levels and/or limit the decline in net assets over various periods of time. In the event of default or early termination, the ISDA master agreement gives the non-defaulting party the right to net and close-out all transactions traded, whether or not arising under the ISDA agreement, to one net amount payable by one counterparty to the other. However, absent an event of default or early termination, OTC derivative assets and liabilities are presented gross and not offset in the Consolidated Statement of Assets and Liabilities. Early termination by the counterparty may result in an immediate payment by the Fund of any net liability owed to that counterparty under the ISDA agreement.
Collateral requirements differ by type of derivative. Collateral or initial margin requirements are set by the broker or exchange clearing house for exchange traded and centrally cleared derivatives. Initial margin deposited is held at the exchange and can be in the form of cash and/or securities. For OTC derivatives traded under an ISDA master agreement, posting of collateral is required by either the Fund or the applicable counterparty if the total net exposure of all OTC derivatives with the applicable counterparty exceeds the minimum transfer amount, which typically ranges from $100,000 to $250,000, and can vary depending on the counterparty and the type of the agreement. Generally, collateral is determined at the close of Fund business each day and any additional collateral required due to changes in derivative values may be delivered by the Fund or the counterparty the next business day, or within a few business days. Collateral pledged and/or received by the Fund for OTC derivatives, if any, is held in segregated accounts with the Fund’s custodian/counterparty broker and can be in the form of cash and/or securities. Unrestricted cash may be invested according
| | | | |
| 28 | | Annual Report | | franklintempleton.com |
FRANKLIN ALTERNATIVE STRATEGIES FUNDS
NOTES TO CONSOLIDATED FINANCIAL STATEMENTS
Franklin K2 Global Macro Opportunities Fund (continued)
to the Fund’s investment objectives. To the extent that the amounts due to the Fund from its counterparties are not subject to collateralization or are not fully collateralized, the Fund bears the risk of loss from counterparty non-performance.
The Fund entered into exchange traded futures contracts primarily to manage and/or gain exposure to commodity price, interest rate, certain foreign currencies and equity price risk. A futures contract is an agreement between the Fund and a counterparty to buy or sell an asset at a specified price on a future date. Required initial margins are pledged by the Fund, and the daily change in fair value is accounted for as a variation margin payable or receivable in the Consolidated Statement of Assets and Liabilities.
The Fund entered into OTC forward exchange contracts primarily to manage and/or gain exposure to certain foreign currencies. A forward exchange contract is an agreement between the Fund and a counterparty to buy or sell a foreign currency at a specific exchange rate on a future date.
The Fund entered into credit default swap contracts primarily to manage and/or gain exposure to credit risk. A credit default swap is an agreement between the Fund and a counterparty whereby the buyer of the contract receives credit protection and the seller of the contract guarantees the credit worthiness of a referenced debt obligation. These agreements may be privately negotiated in the over-the-counter market (OTC credit default swaps) or may be executed in a multilateral trade facility platform, such as a registered exchange (centrally cleared credit default swaps). The underlying referenced debt obligation may be a single issuer of corporate or sovereign debt, a credit index, a basket of issuers or indices, or a tranche of a credit index or basket of issuers or indices. In the event of a default of the underlying referenced debt obligation, the buyer is entitled to receive the notional amount of the credit default swap contract from the seller in exchange for the referenced debt obligation, a net settlement amount equal to the notional amount of the credit default swap less the recovery value of the referenced debt obligation, or other agreed upon amount. For centrally cleared credit default swaps, required initial margins are pledged by the Fund, and the daily change in fair value is accounted for as a variation margin payable or receivable in the Consolidated Statement of Assets and Liabilities. Over the term of the contract, the buyer pays the seller a periodic stream of payments, provided that no event of default has occurred. Such periodic payments are accrued daily as an unrealized appreciation or depreciation until the payments are made, at which time they
are realized. Upfront payments and receipts are reflected in the Consolidated Statement of Assets and Liabilities and represent compensating factors between stated terms of the credit default swap agreement and prevailing market conditions (credit spreads and other relevant factors). These upfront payments and receipts are amortized over the term of the contract as a realized gain or loss in the Consolidated Statement of Operations.
The Fund entered into OTC cross currency swap contracts primarily to manage and/or gain exposure to certain foreign currencies. A cross currency swap is an agreement between the Fund and a counterparty to exchange cash flows (determined using either a fixed or floating rate) based on the notional amounts of two different currencies. The notional amounts are typically determined based on the spot exchange rates at the opening of the contract. Cross currency swaps may require the exchange of notional amounts at the opening and/or closing of the contract. Over the term of the contract, contractually required payments to be paid and to be received are accrued daily and recorded as unrealized depreciation and appreciation until the payments are made, at which time they are realized. Upfront payments and receipts, if any, are reflected in the Consolidated Statement of Assets and Liabilities and represent compensating factors between stated terms of the cross currency swap contract and prevailing market conditions (interest rate spreads and other relevant factors). These upfront payments and receipts are amortized over the term of the contract as a realized gain or loss in the Consolidated Statement of Operations.
The Fund entered into interest rate swap contracts primarily to manage interest rate risk. An interest rate swap is an agreement between the Fund and a counterparty to exchange cash flows based on the difference between two interest rates, applied to a notional amount. These agreements may be privately negotiated in the over-the-counter market (OTC interest rate swaps) or may be executed on a registered exchange (centrally cleared interest rate swaps). For centrally cleared interest rate swaps, required initial margins are pledged by the Fund, and the daily change in fair value is accounted for as a variation margin payable or receivable in the Consolidated Statement of Assets and Liabilities. Over the term of the contract, contractually required payments to be paid and to be received are accrued daily and recorded as unrealized depreciation and appreciation until the payments are made, at which time they are realized.
The Fund entered into OTC total return swap contracts primarily to manage and/or gain exposure to interest rate risk. A total
| | | | | | |
| franklintempleton.com | | Annual Report | | | 29 | |
FRANKLIN ALTERNATIVE STRATEGIES FUNDS
NOTES TO CONSOLIDATED FINANCIAL STATEMENTS
Franklin K2 Global Macro Opportunities Fund (continued)
1. Organization and Significant Accounting Policies (continued)
c. Derivative Financial Instruments (continued)
return swap is an agreement between the Fund and a counterparty to exchange a return linked to an underlying instrument for a floating or fixed rate payment, both based upon a notional amount. Over the term of the contract, contractually required payments to be paid or received are accrued daily and recorded as unrealized appreciation or depreciation until the payments are made, at which time they are recognized as realized gain or loss.
See Note 7 regarding other derivative information.
d. Investments in K2 GMOF Holdings Corp. (K2 Subsidiary)
The Fund invests in certain financial instruments and commodity-linked derivative investments through its investment in the K2 Subsidiary. The K2 Subsidiary is a Cayman Islands exempted company with limited liability, is a wholly owned subsidiary of the Fund, and is able to invest in certain financial instruments and commodity-linked derivative investments consistent with the investment objective of the Fund. At May 31, 2018, the K2 Subsidiary’s investments, as well as any other assets and liabilities of the K2 Subsidiary, are reflected in the Fund’s Consolidated Statement of Investments and Consolidated Statement of Assets and Liabilities. The financial statements have been consolidated and include the accounts of the Fund and the K2 Subsidiary. All inter-company transactions and balances have been eliminated. For tax purposes, the Fund is required to increase its taxable income by its share of the K2 Subsidiary’s income. Net losses incurred by the K2 Subsidiary cannot offset income earned by the Fund and cannot be carried back or forward by the K2 Subsidiary to offset income from prior or future years. At May 31, 2018, the net assets of the K2 Subsidiary were $5,528,024, representing 24.0% of the Fund’s consolidated net assets. The Fund’s investment in the K2 Subsidiary is limited to 25% of consolidated assets.
e. Income and Deferred Taxes
It is the Fund’s policy to qualify as a regulated investment company under the Internal Revenue Code. The Fund intends to distribute to shareholders substantially all of its taxable income and net realized gains to relieve it from federal income and excise taxes. As a result, no provision for U.S. federal income taxes is required.
The Fund may be subject to foreign taxation related to income received, capital gains on the sale of securities and certain foreign currency transactions in the foreign jurisdictions in which it invests. Foreign taxes, if any, are recorded based on the tax regulations and rates that exist in the foreign markets in which the Fund invests. When a capital gain tax is determined to apply, the Fund records an estimated deferred tax liability in an amount that would be payable if the securities were disposed of on the valuation date.
The Fund may recognize an income tax liability related to its uncertain tax positions under U.S. GAAP when the uncertain tax position has a less than 50% probability that it will be sustained upon examination by the tax authorities based on its technical merits. As of May 31, 2018, the Fund has determined that no tax liability is required in its consolidated financial statements related to uncertain tax positions for any open tax years (or expected to be taken in future tax years). Open tax years are those that remain subject to examination and are based on the statute of limitations in each jurisdiction in which the Fund invests.
f. Security Transactions, Investment Income, Expenses and Distributions
Security transactions are accounted for on trade date. Realized gains and losses on security transactions are determined on a specific identification basis. Interest income and estimated expenses are accrued daily. Amortization of premium and accretion of discount on debt securities are included in interest income. Dividend income is recorded on the ex-dividend date. Distributions to shareholders are recorded on the ex-dividend date. Distributable earnings are determined according to income tax regulations (tax basis) and may differ from earnings recorded in accordance with U.S. GAAP. These differences may be permanent or temporary. Permanent differences are reclassified among capital accounts to reflect their tax character. These reclassifications have no impact on net assets or the results of operations. Temporary differences are not reclassified, as they may reverse in subsequent periods.
Common expenses incurred by the Trust are allocated among the Funds based on the ratio of net assets of each Fund to the combined net assets of the Trust. Fund specific expenses are charged directly to the Fund that incurred the expense.
Realized and unrealized gains and losses and net investment income, excluding class specific expenses, are allocated daily to each class of shares based upon the relative proportion of net
| | | | |
| 30 | | Annual Report | | franklintempleton.com |
FRANKLIN ALTERNATIVE STRATEGIES FUNDS
NOTES TO CONSOLIDATED FINANCIAL STATEMENTS
Franklin K2 Global Macro Opportunities Fund (continued)
assets of each class. Differences in per share distributions by class are generally due to differences in class specific expenses.
g. Offering Costs
Offering costs are amortized on a straight line basis over the first twelve months of operations.
h. Accounting Estimates
The preparation of financial statements in accordance with U.S. GAAP requires management to make estimates and assumptions that affect the reported amounts of assets and liabilities at the date of the financial statements and the amounts of income
and expenses during the reporting period. Actual results could differ from those estimates.
i. Guarantees and Indemnifications
Under the Trust’s organizational documents, its officers and trustees are indemnified by the Trust against certain liabilities arising out of the performance of their duties to the Trust. Additionally, in the normal course of business, the Trust, on behalf of the Fund, enters into contracts with service providers that contain general indemnification clauses. The Trust’s maximum exposure under these arrangements is unknown as this would involve future claims that may be made against the Trust that have not yet occurred. Currently, the Trust expects the risk of loss to be remote.
2. Shares of Beneficial Interest
At May 31, 2018, there were an unlimited number of shares authorized (without par value). Transactions in the Fund’s shares were as follows:
| | | | | | | | | | | | | | | | | | | | |
| | | Year Ended May 31, | |
| | | 2018 | | | | | | 2017a | |
| | | Shares | | | Amount | | | | | | Shares | | | Amount | |
| | | | | |
| Class A Shares: | | | | | | | | | | | | | | | | | | | | |
Shares sold | | | 8,179 | | | $ | 74,787 | | | | | | | | 9,921 | | | $ | 93,309 | |
Shares issued in reinvestment of distributions | | | — | | | | — | | | | | | | | 13 | | | | 125 | |
Shares redeemed | | | (111 | ) | | | (1,010 | ) | | | | | | | (182 | ) | | | (1,758 | ) |
| | | | |
Net increase (decrease) | | | 8,068 | | | $ | 73,777 | | | | | | | | 9,752 | | | $ | 91,676 | |
| | | | |
| Class C Shares: | | | | | | | | | | | | | | | | | | | | |
Shares sold | | | 5,335 | | | $ | 48,630 | | | | | | | | 20,588 | | | $ | 200,170 | |
Shares issued in reinvestment of distributions | | | — | | | | — | | | | | | | | 65 | | | | 617 | |
Shares redeemed | | | (9,405 | ) | | | (85,121 | ) | | | | | | | (18 | ) | | | (171 | ) |
| | | | |
Net increase (decrease) | | | (4,070 | ) | | $ | (36,491 | ) | | | | | | | 20,635 | | | $ | 200,616 | |
| | | | |
| Class R Shares: | | | | | | | | | | | | | | | | | | | | |
Shares sold | | | — | | | $ | — | | | | | | | | 1,001 | | | $ | 10,010 | |
Shares redeemed | | | — | | | | — | | | | | | | | (1 | ) | | | (10 | ) |
| | | | |
Net increase (decrease) | | | — | | | $ | — | | | | | | | | 1,000 | | | $ | 10,000 | |
| | | | |
| Class R6 Shares: | | | | | | | | | | | | | | | | | | | | |
Shares sold | | | — | | | $ | — | | | | | | | | 1,001 | | | $ | 10,010 | |
Shares redeemed | | | — | | | | — | | | | | | | | (1 | ) | | | (10 | ) |
| | | | |
Net increase (decrease) | | | — | | | $ | — | | | | | | | | 1,000 | | | $ | 10,000 | |
| | | | |
| Advisor Class Shares: | | | | | | | | | | | | | | | | | | | | |
Shares sold | | | 14,058 | | | $ | 129,263 | | | | | | | | 2,499,776 | | | $ | 24,996,798 | |
Shares issued in reinvestment of distributions | | | — | | | | — | | | | | | | | 17 | | | | 163 | |
Shares redeemed | | | (1,424 | ) | | | (13,100 | ) | | | | | | | (774 | ) | | | (7,141 | ) |
| | | | |
Net increase (decrease) | | | 12,634 | | | $ | 116,163 | | | | | | | | 2,499,019 | | | $ | 24,989,820 | |
| | | | |
aFor the period July 11, 2016 (commencement of operations) to May 31, 2017.
| | | | | | |
| franklintempleton.com | | Annual Report | | | 31 | |
FRANKLIN ALTERNATIVE STRATEGIES FUNDS
NOTES TO CONSOLIDATED FINANCIAL STATEMENTS
Franklin K2 Global Macro Opportunities Fund (continued)
3. Transactions with Affiliates
Franklin Resources, Inc. is the holding company for various subsidiaries that together are referred to as Franklin Templeton Investments. Certain officers and trustees of the Trust are also officers and/or directors of the following subsidiaries:
| | |
| Subsidiary | | Affiliation |
K2/D&S Management Co., L.L.C. (K2 Advisors) | | Investment manager |
Franklin Templeton Services, LLC (FT Services) | | Administrative manager |
Franklin Templeton Distributors, Inc. (Distributors) | | Principal underwriter |
Franklin Templeton Investor Services, LLC (Investor Services) | | Transfer agent |
a. Management Fees
The Fund and K2 Subsidiary pay an investment management fee to K2 Advisors of 1.90% per year of the average daily net assets of the Fund and K2 Subsidiary. Management fees paid by the Fund are reduced on assets invested in the K2 Subsidiary, in an amount not to exceed the management fees paid by the K2 Subsidiary.
Prior to October 1, 2017, the Fund and K2 Subsidiary paid fees to K2 Advisors of 2.05% per year of the average daily net assets of the Fund and K2 Subsidiary.
Under each subadvisory agreement, the below entities provide subadvisory services to the Fund or K2 Subsidiary. The subadvisory fees are paid by K2 Advisors based on the Fund and K2 Subsidiary average daily net assets, and is not an additional expense of the Fund or K2 Subsidiary.
|
| Subadvisors |
Aspect Capital Limited |
Emso Asset Management Limited |
Graham Capital Management L.P. |
P/E GLOBAL LLC |
b. Administrative Fees
Under an agreement with K2 Advisors, FT Services provides administrative services to the Fund and K2 Subsidiary. The fee is paid by K2 Advisors based on the Fund and K2 Subsidiary average daily net assets, and is not an additional expense of the Fund or K2 Subsidiary.
c. Distribution Fees
The Board has adopted distribution plans for each share class, with the exception of Class R6 and Advisor Class shares, pursuant to Rule 12b-1 under the 1940 Act. Under the Fund’s Class A reimbursement distribution plan, the Fund reimburses Distributors for costs incurred in connection with the servicing, sale and distribution of the Fund’s shares up to the maximum annual plan rate. Under the Class A reimbursement distribution plan, costs exceeding the maximum for the current plan year cannot be reimbursed in subsequent periods. In addition, under the Fund’s Class C and R compensation distribution plans, the Fund pays Distributors for costs incurred in connection with the servicing, sale and distribution of the Fund’s shares up to the maximum annual plan rate for each class. The plan year, for purposes of monitoring compliance with the maximum annual plan rates, is February 1 through January 31.
The maximum annual plan rates, based on the average daily net assets, for each class, are as follows:
| | | | |
Class A | | | 0.25% | |
Class C | | | 1.00% | |
Class R | | | 0.50% | |
| | | | |
| 32 | | Annual Report | | franklintempleton.com |
FRANKLIN ALTERNATIVE STRATEGIES FUNDS
NOTES TO CONSOLIDATED FINANCIAL STATEMENTS
Franklin K2 Global Macro Opportunities Fund (continued)
d. Sales Charges/Underwriting Agreements
Front-end sales charges and contingent deferred sales charges (CDSC) do not represent expenses of the Fund. These charges are deducted from the proceeds of sales of Fund shares prior to investment or from redemption proceeds prior to remittance, as applicable. Distributors has advised the Fund of the following commission transactions related to the sales and redemptions of the Fund’s shares for the year:
| | | | |
Sales charges retained net of commissions paid to unaffiliated brokers/dealers | | $ | 100 | |
CDSC retained | | $ | 140 | |
e. Transfer Agent Fees
Each class of shares pays transfer agent fees to Investor Services for its performance of shareholder servicing obligations. Effective November 1, 2017, the fees are based on an annualized asset based fee of 0.02% plus a transaction based fee. Prior to November 1, 2017, the fees were account based fees that varied based on fund or account type. In addition, each class reimburses Investor Services for out of pocket expenses incurred and, except for Class R6, reimburses shareholder servicing fees paid to third parties. These fees are allocated daily based upon their relative proportion of such classes’ aggregate net assets. Class R6 pays Investor Services transfer agent fees specific to that class.
For the year ended May 31, 2018, the Fund paid transfer agent fees of $3,711, of which $3,561 was retained by Investor Services.
f. Waiver and Expense Reimbursements
K2 Advisors has contractually agreed in advance to waive or limit its fees and to assume as its own expense certain expenses otherwise payable by the Fund so that the expenses (excluding distribution fees, acquired fund fees and expenses, and expenses related to securities sold short) for each class of the Fund do not exceed 1.95% based on the average net assets of each class (other than certain non-routine expenses or costs, including those relating to litigation, indemnification, reorganizations, and liquidations) until September 30, 2018. Total expenses waived or paid are not subject to recapture subsequent to the Fund’s fiscal year end. Prior to October 1, 2017, expenses for Class R6 were limited to 1.94%.
g. Other Affiliated Transactions
At May 31, 2018, Franklin Resources, Inc. owned 98.1% of the Fund’s outstanding shares. Investment activities of this shareholder could have a material impact on the Fund.
4. Expense Offset Arrangement
The Fund has entered into an arrangement with its custodian whereby credits realized as a result of uninvested cash balances are used to reduce a portion of the Fund’s custodian expenses. During the year ended May 31, 2018, the custodian fees were reduced as noted in the Consolidated Statement of Operations.
5. Income Taxes
For tax purposes, capital losses may be carried over to offset future capital gains, if any. At May 31, 2018, the capital loss carryforwards were as follows:
| | | | |
| Capital loss carryforwards not subject to expiration: | | | | |
Short term | | $ | 232,824 | |
Long term | | | 781,378 | |
| | | | |
Total capital loss carryforwards | | $ | 1,014,202 | |
| | | | |
| | | | | | |
| franklintempleton.com | | Annual Report | | | 33 | |
FRANKLIN ALTERNATIVE STRATEGIES FUNDS
NOTES TO CONSOLIDATED FINANCIAL STATEMENTS
Franklin K2 Global Macro Opportunities Fund (continued)
5. Income Taxes (continued)
The tax character of distributions paid during the years ended May 31, 2018 and 2017, was as follows:
| | | | | | | | |
| | | 2018 | | | 2017 | |
Distributions paid from ordinary income | | $ | — | | | $ | 149,639 | |
| | | | |
At May 31, 2018, the cost of investments, net unrealized appreciation (depreciation) and undistributed ordinary income for income tax purposes were as follows:
| | | | |
Cost of investments | | $ | 21,909,718 | |
| | | | |
Unrealized appreciation | | $ | 1,058,080 | |
Unrealized depreciation | | | (1,672,874 | ) |
| | | | |
Net unrealized appreciation (depreciation) | | $ | (614,794 | ) |
| | | | |
Distributable earnings – undistributed ordinary income | | $ | 81,386 | |
| | | | |
Differences between income and/or capital gains as determined on a book basis and a tax basis are primarily due to differing treatments of foreign currency transactions and investments in the K2 Subsidiary.
6. Investment Transactions
Purchases and sales of investments (excluding short term securities) for the year ended May 31, 2018, aggregated $6,753,946 and $6,925,953, respectively.
7. Other Derivative Information
At May 31, 2018, the Fund’s investments in derivative contracts are reflected in the Consolidated Statement of Assets and Liabilities as follows:
| | | | | | | | | | | | |
| | | Asset Derivatives | | | Liability Derivatives | |
Derivative Contracts
Not Accounted for as
Hedging Instruments | | Consolidated Statement of
Assets and Liabilities
Location | | Fair Value | | | Consolidated Statement of
Assets and Liabilities
Location | | Fair Value | |
Interest rate contracts | | Variation margin on futures contracts | | $ | 54,503 | a | | Variation margin on futures contracts | | $ | 120,385 | a |
| | Variation margin on centrally cleared swap contracts | | | 17,223 | a | | Variation margin on centrally cleared swap contracts | | | 14,575 | a |
| | | | | | | | Unrealized depreciation on OTC swap contracts | | | 1,376 | |
Foreign exchange contracts | | Variation margin on futures contracts | | | 399,109 | a | | Variation margin on futures contracts | | | 30,078 | a |
| | Unrealized appreciation on OTC forward exchange contracts | | | 683,194 | | | Unrealized depreciation on OTC forward exchange contracts | | | 769,449 | |
Credit contracts | | Variation margin on centrally cleared swap contracts | | | 17,527 | a | | Variation margin on centrally cleared swap contracts | | | 36,760 | a |
Equity contracts | | Variation margin on futures contracts | | | 26,157 | a | | Variation margin on futures contracts | | | 46,836 | a |
Commodity contracts | | Variation margin on futures contracts | | | 67,085 | a | | Variation margin on futures contracts | | | 181,532 | a |
| | | | | | | | | | | | |
Totals | | | | $ | 1,264,798 | | | | | $ | 1,200,991 | |
| | | | | | | | | | | | |
aThis amount reflects the cumulative appreciation (depreciation) of futures contracts and centrally cleared swap contracts as reported in the Consolidated Statement of Investments. Only the variation margin receivable/payable at year end is separately reported within the Consolidated Statement of Assets and Liabilities. Prior variation margin movements were recorded to cash upon receipt or payment.
| | | | |
| 34 | | Annual Report | | franklintempleton.com |
FRANKLIN ALTERNATIVE STRATEGIES FUNDS
NOTES TO CONSOLIDATED FINANCIAL STATEMENTS
Franklin K2 Global Macro Opportunities Fund (continued)
For the year ended May 31, 2018, the effect of derivative contracts in the Fund’s Consolidated Statement of Operations was as follows:
| | | | | | | | | | | | |
Derivative Contracts Not Accounted
for as Hedging Instruments | | Consolidated Statement of
Operations Location | | Net Realized
Gain (Loss)
for the Year | | | Consolidated Statement of
Operations Location | | Net Change in
Unrealized
Appreciation
(Depreciation)
for the Year | |
| | Net realized gain (loss) from: | | | Net change in unrealized appreciation (depreciation) on: | |
Interest rate contracts | | Futures contracts | | $ | (194,257 | ) | | Futures contracts | | $ | (119,791 | ) |
| | Swap contracts | | | 19,015 | | | Swap contracts | | | 9,338 | |
Foreign exchange contracts | | Forward exchange contracts | | | (446,033 | ) | | Forward exchange contracts | | | 194,186 | |
| | Futures contracts | | | (589,427 | ) | | Futures contracts | | | 550,265 | |
| | Swap contracts | | | (33,312 | ) | | | | | | |
Credit contracts | | Swap contracts | | | (39,298 | ) | | Swap contracts | | | 4,417 | |
Equity contracts | | Futures contracts | | | 152,068 | | | Futures contracts | | | (123,278 | ) |
Commodity contracts | | Futures contracts | | | 434,857 | | | Futures contracts | | | (121,952 | ) |
| | | | | | | | | | | | |
Totals | | | | $ | (696,387 | ) | | | | $ | 393,185 | |
| | | | | | | | | | | | |
For the year ended May 31, 2018, the average month end notional amount of futures contracts and swap contracts represented $50,179,570 and $3,986,835, respectively. The average month end contract value of forward exchange contracts was $24,929,651.
At May 31, 2018, the Fund’s OTC derivative assets and liabilities are as follows:
| | | | | | | | |
| | | Gross Amounts of
Assets and Liabilities
Presented in the
Consolidated
Statement of Assets
and Liabilities | |
| | | Assetsa | | | Liabilitiesa | |
| Derivatives | | | | | | | | |
Forward Exchange Contracts | | $ | 683,194 | | | $ | 769,449 | |
Swap Contracts | | | — | | | | 1,376 | |
| | | | |
Total | | $ | 683,194 | | | $ | 770,825 | |
| | | | |
aAbsent an event of default or early termination, OTC derivative assets and liabilities are presented gross and not offset in the Consolidated Statement of Assets and Liabilities.
At May 31, 2018, the Fund’s OTC derivative assets, which may be offset against the Fund’s OTC derivative liabilities and collateral received from the counterparty, are as follows:
| | | | | | | | | | | | | | | | | | | | |
| | | | | | Amounts Not Offset in the Consolidated
Statement of Assets and Liabilities | | | | |
| | | Gross Amounts of Assets
Presented in the
Consolidated Statement
of Assets and Liabilities | | | Financial
Instruments
Available for Offset | | | Financials
Instruments
Collateral
Received | | | Cash
Collateral
Received | | | Net Amount (Not
Less than Zero) | |
| Counterparty | | | | | | | | | | | | | | | | | | | | |
BOFA | | $ | — | | | $ | — | | | $ | — | | | $ | — | | | $ | — | |
BZWS | | | — | | | | — | | | | — | | | | — | | | | — | |
JPHQb | | | 533,176 | | | | — | | | | — | | | | — | | | | 533,176 | |
MSCO | | | 150,018 | | | | (150,018 | ) | | | — | | | | — | | | | — | |
MSCS | | | — | | | | — | | | | — | | | | — | | | | — | |
| | | | |
Total | | $ | 683,194 | | | $ | (150,018 | ) | | $ | — | | | $ | — | | | $ | 533,176 | |
| | | | |
| | | | | | |
| franklintempleton.com | | Annual Report | | | 35 | |
FRANKLIN ALTERNATIVE STRATEGIES FUNDS
NOTES TO CONSOLIDATED FINANCIAL STATEMENTS
Franklin K2 Global Macro Opportunities Fund (continued)
7. Other Derivative Information (continued)
At May 31, 2018, the Fund’s OTC derivative liabilities, which may be offset against the Fund’s OTC derivative assets and collateral pledged to the counterparty, are as follows:
| | | | | | | | | | | | | | | | | | | | |
| | | | | | Amounts Not Offset in the Consolidated
Statement of Assets and Liabilities | | | | |
| | | Gross Amounts of Liabilities
Presented in the
Consolidated Statement of
Assets and Liabilities | | | Financial
Instruments
Available for Offset | | | Financials
Instruments
Collateral
Pledged | | | Cash
Collateral
Pledgeda | | | Net Amount (Not
Less than Zero) | |
| Counterparty | | | | | | | | | | | | | | | | | | | | |
BOFA | | $ | 691 | | | $ | — | | | $ | — | | | $ | — | | | $ | 691 | |
BZWS | | | 844 | | | | — | | | | — | | | | — | | | | 844 | |
JPHQb | | | 498,655 | | | | — | | | | — | | | | — | | | | 498,655 | |
MSCO | | | 269,950 | | | | (150,018 | ) | | | — | | | | (119,932 | ) | | | — | |
MSCS | | | 685 | | | | — | | | | — | | | | — | | | | 685 | |
| | | | |
Total | | $ | 770,825 | | | $ | (150,018 | ) | | $ | — | | | $ | (119,932 | ) | | $ | 500,875 | |
| | | | |
aIn some instances, the collateral amounts disclosed in the table above were adjusted due to the requirement to limit collateral amounts to avoid the effect of overcollateralization. Actual collateral received and/or pledged may be more than the amounts disclosed herein.
bRepresents derivatives not subject to an ISDA master agreement.
See Note 1(c) regarding derivative financial instruments.
See Abbreviations on page 37.
8. Credit Facility
The Fund, together with other U.S. registered and foreign investment funds (collectively, Borrowers), managed by Franklin Templeton Investments, are borrowers in a joint syndicated senior unsecured credit facility totaling $2 billion (Global Credit Facility) which matures on February 8, 2019. This Global Credit Facility provides a source of funds to the Borrowers for temporary and emergency purposes, including the ability to meet future unanticipated or unusually large redemption requests.
Under the terms of the Global Credit Facility, the Fund shall, in addition to interest charged on any borrowings made by the Fund and other costs incurred by the Fund, pay its share of fees and expenses incurred in connection with the implementation and maintenance of the Global Credit Facility, based upon its relative share of the aggregate net assets of all of the Borrowers, including an annual commitment fee of 0.15% based upon the unused portion of the Global Credit Facility. These fees are reflected in other expenses in the Consolidated Statement of Operations. During the year ended May 31, 2018, the Fund did not use the Global Credit Facility.
9. Fair Value Measurements
The Fund follows a fair value hierarchy that distinguishes between market data obtained from independent sources (observable inputs) and the Fund’s own market assumptions (unobservable inputs). These inputs are used in determining the value of the Fund’s financial instruments and are summarized in the following fair value hierarchy:
| | • | | Level 1 – quoted prices in active markets for identical financial instruments |
| | • | | Level 2 – other significant observable inputs (including quoted prices for similar financial instruments, interest rates, prepayment speed, credit risk, etc.) |
| | • | | Level 3 – significant unobservable inputs (including the Fund’s own assumptions in determining the fair value of financial instruments) |
| | | | |
| 36 | | Annual Report | | franklintempleton.com |
FRANKLIN ALTERNATIVE STRATEGIES FUNDS
NOTES TO CONSOLIDATED FINANCIAL STATEMENTS
Franklin K2 Global Macro Opportunities Fund (continued)
The input levels are not necessarily an indication of the risk or liquidity associated with financial instruments at that level.
For movements between the levels within the fair value hierarchy, the Fund has adopted a policy of recognizing the transfers as of the date of the underlying event which caused the movement.
A summary of inputs used as of May 31, 2018, in valuing the Fund’s assets and liabilities carried at fair value, is as follows:
| | | | | | | | | | | | | | | | |
| | | Level 1 | | | Level 2 | | | Level 3 | | | Total | |
| | | | |
| Assets: | | | | | | | | | | | | | | | | |
Investments in Securities:a | | | | | | | | | | | | | | | | |
Corporate Bonds and Notes | | $ | — | | | $ | 1,123,579 | | | $ | — | | | $ | 1,123,579 | |
Foreign Government and Agency Securities | | | — | | | | 2,268,479 | | | | — | | | | 2,268,479 | |
Short Term Investments | | | 17,766,088 | | | | 45,299 | | | | — | | | | 17,811,387 | |
| | | | |
Total Investments in Securities | | $ | 17,766,088 | | | $ | 3,437,357 | | | $ | — | | | $ | 21,203,445 | |
| | | | |
Other Financial Instruments: | | | | | | | | | | | | | | | | |
Futures Contracts | | $ | 546,854 | | | $ | — | | | $ | — | | | $ | 546,854 | |
Forward Exchange Contracts | | | — | | | | 683,194 | | | | — | | | | 683,194 | |
Swap Contracts | | | — | | | | 34,750 | | | | — | | | | 34,750 | |
| | | | |
Total Other Financial Instruments | | $ | 546,854 | | | $ | 717,944 | | | $ | — | | | $ | 1,264,798 | |
| | | | |
| | | | |
| Liabilities: | | | | | | | | | | | | | | | | |
Other Financial Instruments: | | | | | | | | | | | | | | | | |
Futures Contracts | | $ | 378,831 | | | $ | — | | | $ | — | | | $ | 378,831 | |
Forward Exchange Contracts | | | — | | | | 769,449 | | | | — | | | | 769,449 | |
Swap Contracts | | | — | | | | 52,711 | | | | — | | | | 52,711 | |
| | | | |
Total Other Financial Instruments | | $ | 378,831 | | | $ | 822,160 | | | $ | — | | | $ | 1,200,991 | |
| | | | |
aFor detailed categories, see the accompanying Consolidated Statement of Investments.
10. Subsequent Events
The Fund has evaluated subsequent events through the issuance of the consolidated financial statements and determined that no events have occurred that require disclosure, except for the following:
On February 27, 2018, the Board approved an automatic conversion feature for Class C that will convert shareholders’ Class C shares into Class A shares after they have been held for 10 years. On May 17, 2018, the Board approved changes to certain front-end sales charges and dealer commissions on Class A shares. Further details are disclosed in the Fund’s Prospectus. The changes will become effective on a future date prior to the calendar year end of 2018.
| | | | | | |
| franklintempleton.com | | Annual Report | | | 37 | |
FRANKLIN ALTERNATIVE STRATEGIES FUNDS
NOTES TO CONSOLIDATED FINANCIAL STATEMENTS
Franklin K2 Global Macro Opportunities Fund (continued)
Abbreviations
| | | | | | | | | | |
| Counterparty | | Currency | | Selected Portfolio |
| BOFA | | Bank of America, N.A. | | ARS | | Argentine Peso | | BRLCDI | | Brazil Cetip Di Interbank Deposit Rate |
| BZWS | | Barclays Bank PLC | | AUD | | Australian Dollar | | CAC | | Cotation Assistée en Continu |
| JPHQ | | JP Morgan Chase Bank, N.A. | | BRL | | Brazilian Real | | DAX | | Deutscher Aktienindex |
| MSCO | | Morgan Stanley & Co., LLC | | CAD | | Canadian Dollar | | DJIA | | Dow Jones Industrial Average |
| MSCS | | Morgan Stanley Capital Services LLC | | CHF | | Swiss Franc | | EAFE | | Europe, Australasia & Far East |
| | | | CNY | | Chinese Yuan | | FTSE | | Financial Times Stock Exchange |
| | | | CZK | | Czech Koruna | | KLIBOR | | Kuala Lumpur Interbank Offered Rate |
| | | | EGP | | Egyptian Pound | | LIBOR | | London InterBank Offered Rate |
| | | | EUR | | Euro | | MIB | | Milano Italia Borsa |
| | | | GBP | | British Pound | | MIBOR | | Mumbai Interbank Offered Rate |
| | | | HUF | | Hungarian Forint | | MSCI | | Morgan Stanley Capital International PLC |
| | | | INR | | Indian Rupee | | OAT | | Obligations Assimilables du Tresor |
| | | | MXN | | Mexican Peso | | OMX | | Stockholm Stock Exchange |
| | | | MYR | | Malaysian Ringgit | | PRIBOR | | Prague Interbank Offered Rate |
| | | | NOK | | Norwegian Krone | | SPI | | Swiss Performance Index |
| | | | NZD | | New Zealand Dollar | | TIIE | | Interbank Equilibrium Interest Rate |
| | | | PEN | | Peruvian Nuevo Sol | | TOPIX | | Tokyo Price Index |
| | | | PLN | | Polish Zloty | | TSX | | Toronto Stock Exchange |
| | | | RON | | Romanian Leu | | ULSD | | Ultra-Low Sulfur Diesel |
| | | | RUB | | Russian Ruble | | | | |
| | | | SEK | | Swedish Krona | | | | |
| | | | USD | | United States Dollar | | | | |
| | | | ZAR | | South African Rand | | | | |
| | | | |
| 38 | | Annual Report | | franklintempleton.com |
FRANKLIN ALTERNATIVE STRATEGIES FUNDS
Report of Independent Registered Public Accounting Firm
To the Board of Trustees of Franklin Alternative Strategies Funds and Shareholders of Franklin K2 Global Macro Opportunities Fund:
Opinion on the Financial Statements
We have audited the accompanying consolidated statement of assets and liabilities of Franklin K2 Global Macro Opportunities Fund (the “Fund”) (one of the funds constituting the Franklin Alternative Strategies Funds), including the consolidated statement of investments, as of May 31, 2018, and the related consolidated statement of operations for the year then ended, the consolidated statements of changes in net assets and the consolidated financial highlights for the year ended May 31, 2018 and the period from July 11, 2016 (commencement of operations) through May 31, 2017 and the related notes (collectively referred to as the “financial statements”). In our opinion, the financial statements present fairly, in all material respects, the consolidated financial position of Franklin K2 Global Macro Opportunities Fund (one of the funds constituting the Franklin Alternative Strategies Funds) at May 31, 2018, the consolidated results of its operations for the year then ended, the consolidated changes in its net assets and its consolidated financial highlights for the year ended May 31, 2018 and the period from July 11, 2016 (commencement of operations) through May 31, 2017, in conformity with U.S. generally accepted accounting principles.
Basis for Opinion
These financial statements are the responsibility of the Fund’s management. Our responsibility is to express an opinion on the Fund’s financial statements based on our audits. We are a public accounting firm registered with the Public Company Accounting Oversight Board (United States) (“PCAOB”) and are required to be independent with respect to the Fund in accordance with the U.S. federal securities laws and the applicable rules and regulations of the Securities and Exchange Commission and the PCAOB.
We conducted our audits in accordance with the standards of the PCAOB. Those standards require that we plan and perform the audit to obtain reasonable assurance about whether the financial statements are free of material misstatement, whether due to error or fraud. The Fund is not required to have, nor were we engaged to perform, an audit of the Fund’s internal control over financial reporting. As part of our audits, we are required to obtain an understanding of internal control over financial reporting, but not for the purpose of expressing an opinion on the effectiveness of the Fund’s internal control over financial reporting. Accordingly, we express no such opinion.
Our audits included performing procedures to assess the risks of material misstatement of the financial statements, whether due to error or fraud, and performing procedures that respond to those risks. Such procedures included examining, on a test basis, evidence regarding the amounts and disclosures in the financial statements. Our procedures included confirmation of securities owned as of May 31, 2018, by correspondence with the custodian and brokers, or by other appropriate auditing procedures where replies from brokers were not received. Our audits also included evaluating the accounting principles used and significant estimates made by management, as well as evaluating the overall presentation of the financial statements. We believe that our audits provide a reasonable basis for our opinion.

We have served as the auditor of one or more Franklin investment companies since 1987.
Boston, Massachusetts
July 25, 2018
| | | | | | |
| franklintempleton.com | | Annual Report | | | 39 | |
FRANKLIN ALTERNATIVE STRATEGIES FUNDS
Board Members and Officers
The name, year of birth and address of the officers and board members, as well as their affiliations, positions held with the Funds, principal occupations during at least the past five years and number of US registered portfolios overseen in the Franklin Templeton Investments fund complex, are shown below. Generally, each board member serves until that person’s successor is elected and qualified.
Independent Board Members
| | | | | | | | |
Name, Year of Birth
and Address | | Position | | Length of
Time Served | | Number of Portfolios in
Fund Complex Overseen
by Board Member* | | Other Directorships Held During
at Least the Past 5 Years |
| | | | |
Edward I. Altman, Ph.D. (1941)
c/o Franklin Mutual Advisers, LLC
101 John F. Kennedy Parkway
Short Hills, NJ 07078-2716 | | Trustee | | Since 2011 | | 14 | | None |
|
| Principal Occupation During at Least the Past 5 Years: |
| Max L. Heine Professor of Finance, Emeritus and Director of The Credit and Debt Markets Research Program, Salomon Center, Stern School of Business, New York University; editor and author of numerous financial publications; financial consultant; an adviser to numerous financial and publishing organizations; and formerly, Vice Director, Salomon Center, Stern School of Business, New York University. |
| | | | |
Ann Torre Bates (1958)
c/o Franklin Mutual Advisers, LLC
101 John F. Kennedy Parkway
Short Hills, NJ 07078-2716 | | Trustee | | Since 2011 | | 39 | | Ares Capital Corporation (specialty finance company) (2010-present), United Natural Foods, Inc. (distributor of natural, organic and specialty foods) (2013-present), Allied Capital Corporation (financial services) (2003-2010), SLM Corporation (Sallie Mae) (1997-2014) and Navient Corporation (loan management, servicing and asset recovery) (2014-2016). |
|
| Principal Occupation During at Least the Past 5 Years: |
| Director of various companies; and formerly, Executive Vice President and Chief Financial Officer, NHP Incorporated (manager of multifamily housing) (1995-1997); and Vice President and Treasurer, US Airways, Inc. (until 1995). |
| | | | |
Burton J. Greenwald (1929)
c/o Franklin Mutual Advisers, LLC
101 John F. Kennedy Parkway
Short Hills, NJ 07078-2716 | | Trustee and Vice Chairman of the Board | | Trustee since 2011 and Vice Chairman of the Board since 2015 | | 14 | | Franklin Templeton Emerging Markets Debt Opportunities Fund PLC (1999-present) and Fiduciary International Ireland Limited (1999-2015). |
|
| Principal Occupation During at Least the Past 5 Years: |
| Managing Director, B.J. Greenwald Associates (management consultants to the financial services industry); and formerly, Chairman, Fiduciary Trust International Funds; Executive Vice President, L.F. Rothschild Fund Management, Inc.; President and Director, Merit Mutual Funds; President, Underwriting Division and Director, National Securities & Research Corporation; Governor, Investment Company Institute; and Chairman, ICI Public Information Committee. |
| | | | |
Keith E. Mitchell (1954)
c/o Franklin Mutual Advisers, LLC
101 John F. Kennedy Parkway
Short Hills, NJ 07078-2716 | | Trustee | | Since 2011 | | 14 | | None |
|
| Principal Occupation During at Least the Past 5 Years: |
| Director of various boards of asset management firms; and formerly, Managing Member, Mitchell, Hartley & Bechtel Advisers, LLC (formerly, Mitchell Advisers, LLC) (advisory firm) (2003-2015) and Managing Director, Putman Lovell NBF. |
| | | | |
| 40 | | Annual Report | | franklintempleton.com |
FRANKLIN ALTERNATIVE STRATEGIES FUNDS
Independent Board Members (continued)
| | | | | | | | |
Name, Year of Birth
and Address | | Position | | Length of
Time Served | | Number of Portfolios in
Fund Complex Overseen
by Board Member* | | Other Directorships Held During
at Least the Past 5 Years |
| | | | |
David W. Niemiec (1949)
c/o Franklin Mutual Advisers, LLC
101 John F. Kennedy Parkway
Short Hills, NJ 07078-2716 | | Trustee | | Since 2015 | | 39 | | Hess Midstream Partners LP (oil and gas midstream infrastructure) (2017-present). |
|
| Principal Occupation During at Least the Past 5 Years: |
| Advisor, Saratoga Partners (private equity fund); and formerly, Managing Director, Saratoga Partners (1998-2001) and SBC Warburg Dillon Read (investment banking) (1997-1998); Vice Chairman, Dillon, Read & Co. Inc. (investment banking) (1991-1997); and Chief Financial Officer, Dillon, Read & Co. Inc. (1982-1997). |
| | | | |
Charles Rubens II (1930)
c/o Franklin Mutual Advisers, LLC
101 John F. Kennedy Parkway
Short Hills, NJ 07078-2716 | | Trustee | | Since 2011 | | 14 | | None |
|
| Principal Occupation During at Least the Past 5 Years: |
| Private investor and president of non-profit organizations; and formerly, an executive of Time, Inc.; and Trustee of Colorado College. |
| | | | |
Jan Hopkins Trachtman (1947)
c/o Franklin Mutual Advisers, LLC
101 John F. Kennedy Parkway
Short Hills, NJ 07078-2716 | | Trustee | | Since 2011 | | 14 | | None |
|
| Principal Occupation During at Least the Past 5 Years: |
| President and Founder, The Jan Hopkins Group (communications consulting firm); serves on Advisory Board of Knight Bagehot Fellowship; and formerly, President, Economic Club of New York (2007-2015); Anchor/Correspondent, CNN Financial News (until 2003); Managing Director and Head of Client Communications, Citigroup Private Bank (until 2005); Off-Air Reporter, ABC News’ World News Tonight; and Editor, CBS Network News. |
| | | | |
Robert E. Wade (1946)
c/o Franklin Mutual Advisers, LLC
101 John F. Kennedy Parkway
Short Hills, NJ 07078-2716 | | Trustee and Chairman of the Board | | Since 2011 | | 39 | | El Oro Ltd (investments) (2003-present). |
|
| Principal Occupation During at Least the Past 5 Years: |
| Attorney at law engaged in private practice as a sole practitioner (1972-2008) and member of various boards. |
| | | | |
Gregory H. Williams (1943)
c/o Franklin Mutual Advisers, LLC
101 John F. Kennedy Parkway
Short Hills, NJ 07078-2716 | | Trustee | | Since 2015 | | 14 | | None |
|
| Principal Occupation During at Least the Past 5 Years: |
| Private investor; Consultant; and formerly, President, University of Cincinnati (2009-2012); President, The City College of New York (2001-2009); Dean, College of Law, Ohio State University (1993-2001); and Associate Vice President, Academic Affairs and Professor of Law, University of Iowa (1977-1993). |
| | | | | | |
| franklintempleton.com | | Annual Report | | | 41 | |
FRANKLIN ALTERNATIVE STRATEGIES FUNDS
Interested Board Members and Officers (continued)
| | | | | | | | |
Name, Year of Birth
and Address | | Position | | Length of
Time Served | | Number of Portfolios in
Fund Complex Overseen
by Board Member* | | Other Directorships Held During
at Least the Past 5 Years |
| | | | |
**Gregory E. Johnson (1961)
One Franklin Parkway San Mateo, CA 94403-1906 | | Trustee | | Since 2011 | | 151 | | None |
|
| Principal Occupation During at Least the Past 5 Years: |
| Chairman of the Board, Member – Office of the Chairman, Director and Chief Executive Officer, Franklin Resources, Inc.; officer and/or director or trustee, as the case may be, of some of the other subsidiaries of Franklin Resources, Inc. and of 43 of the investment companies in Franklin Templeton Investments; Vice Chairman, Investment Company Institute; and formerly, President, Franklin Resources, Inc. (1994-2015). |
| | | | |
**Jennifer M. Johnson (1964)
One Franklin Parkway San Mateo, CA 94403-1906 | | Trustee | | Since 2015 | | 43 | | None |
|
| Principal Occupation During at Least the Past 5 Years: |
| President and Chief Operating Officer, Franklin Resources, Inc.; officer and/or director or trustee, as the case may be, of some of the other subsidiaries of Franklin Resources, Inc. and of four of the investment companies in Franklin Templeton Investments; and formerly, Chief Operating Officer and Executive Vice President, Franklin Resources, Inc. (1994-2015); Executive Vice President of Operations and Technology, Franklin Resources, Inc. (2005-2010); and Senior Vice President, Franklin Resources, Inc. (2003-2005). |
| | | | |
Alison E. Baur (1964) One Franklin Parkway San Mateo, CA 94403-1906 | | Vice President | | Since 2012 | | Not Applicable | | Not Applicable |
|
| Principal Occupation During at Least the Past 5 Years: |
| Deputy General Counsel, Franklin Templeton Investments; and officer of some of the other subsidiaries of Franklin Resources, Inc. and of 45 of the investment companies in Franklin Templeton Investments. |
| | | | |
Aliya S. Gordon (1973) One Franklin Parkway San Mateo, CA 94403-1906 | | Vice President | | Since 2011 | | Not Applicable | | Not Applicable |
|
| Principal Occupation During at Least the Past 5 Years: |
| Senior Associate General Counsel, Franklin Templeton Investments; and officer of 45 of the investment companies in Franklin Templeton Investments. |
| | | | |
Steven J. Gray (1955) One Franklin Parkway San Mateo, CA 94403-1906 | | Secretary and Vice President | | Since 2011 | | Not Applicable | | Not Applicable |
|
| Principal Occupation During at Least the Past 5 Years: |
| Senior Associate General Counsel, Franklin Templeton Investments; Vice President, Franklin Templeton Distributors, Inc. and FASA, LLC; and officer of 45 of the investment companies in Franklin Templeton Investments. |
| | | | |
Madison S. Gulley (1964) 300 S.E. 2nd Street Fort Lauderdale, FL 33301-1923 | | President and Chief Executive Officer – Investment Management | | Since 2017 | | Not Applicable | | Not Applicable |
|
| Principal Occupation During at Least the Past 5 Years: |
| Executive Vice President, Franklin Advisers, Inc., Franklin Advisory Services, LLC, Franklin Templeton Institutional, LLC; Templeton Global Advisors, Limited, and Templeton Investment Counsel, LLC; Senior Vice President, Franklin Templeton Companies, LLC; officer and/or director or trustee, as the case may be, of some of the other subsidiaries of Franklin Resources, Inc. and of one of the investment companies in Franklin Templeton Investments. |
| | | | |
| 42 | | Annual Report | | franklintempleton.com |
FRANKLIN ALTERNATIVE STRATEGIES FUNDS
Interested Board Members and Officers (continued)
| | | | | | | | |
Name, Year of Birth
and Address | | Position | | Length of
Time Served | | Number of Portfolios in
Fund Complex Overseen
by Board Member* | | Other Directorships Held During
at Least the Past 5 Years |
| | | | |
Matthew T. Hinkle (1971) One Franklin Parkway San Mateo, CA 94403-1906 | | Chief Executive Officer – Finance and Administration | | Since 2017 | | Not Applicable | | Not Applicable |
|
| Principal Occupation During at Least the Past 5 Years: |
| Senior Vice President, Franklin Templeton Services, LLC; officer of 45 of the investment companies in Franklin Templeton Investments; and formerly, Vice President, Global Tax (2012-April 2017) and Treasurer/Assistant Treasurer, Franklin Templeton Investments (2009-2017). |
| | | | |
Robert G. Kubilis (1973) 300 S.E. 2nd Street Fort Lauderdale, FL 33301-1923 | | Chief Financial Officer, Chief Accounting Officer and Treasurer | | Since 2015 | | Not Applicable | | Not Applicable |
|
| Principal Occupation During at Least the Past 5 Years: |
| Treasurer, U.S. Fund Administration & Reporting, Franklin Templeton Investments; and officer of 17 of the investment companies in Franklin Templeton Investments. |
| | | | |
Robert Lim (1948) One Franklin Parkway San Mateo, CA 94403-1906 | | Vice President – AML Compliance | | Since 2016 | | Not Applicable | | Not Applicable |
|
| Principal Occupation During at Least the Past 5 Years: |
| Vice President, Franklin Templeton Companies, LLC; Chief Compliance Officer, Franklin Templeton Distributors, Inc. and Franklin Templeton Investor Services, LLC; and officer of 45 of the investment companies in Franklin Templeton Investments. |
| | | | |
Kimberly H. Novotny (1972)
300 S.E. 2nd Street Fort Lauderdale, FL 33301-1923 | | Vice President | | Since 2013 | | Not Applicable | | Not Applicable |
|
| Principal Occupation During at Least the Past 5 Years: |
| Associate General Counsel, Franklin Templeton Investments; Vice President and Corporate Secretary, Fiduciary Trust International of the South; Vice President, Templeton Investment Counsel, LLC; Assistant Secretary, Franklin Resources, Inc.; and officer of 45 of the investment companies in Franklin Templeton Investments. |
| | | | |
Robert C. Rosselot (1960)
300 S.E. 2nd Street Fort Lauderdale, FL 33301-1923 | | Chief Compliance Officer | | Since 2013 | | Not Applicable | | Not Applicable |
|
| Principal Occupation During at Least the Past 5 Years: |
| Director, Global Compliance, Franklin Templeton Investments; Vice President, Franklin Templeton Companies, LLC; officer of 45 of the investment companies in Franklin Templeton Investments; and formerly, Senior Associate General Counsel, Franklin Templeton Investments (2007-2013); and Secretary and Vice President, Templeton Group of Funds (2004-2013). |
| | | | |
Karen L. Skidmore (1952)
One Franklin Parkway San Mateo, CA 94403-1906 | | Vice President | | Since 2011 | | Not Applicable | | Not Applicable |
|
| Principal Occupation During at Least the Past 5 Years: |
| Senior Associate General Counsel, Franklin Templeton Investments; and officer of 45 of the investment companies in Franklin Templeton Investments. |
| | | | | | |
| franklintempleton.com | | Annual Report | | | 43 | |
FRANKLIN ALTERNATIVE STRATEGIES FUNDS
Interested Board Members and Officers (continued)
| | | | | | | | |
Name, Year of Birth
and Address | | Position | | Length of
Time Served | | Number of Portfolios in
Fund Complex Overseen
by Board Member* | | Other Directorships Held During
at Least the Past 5 Years |
| | | | |
Navid J. Tofigh (1972)
One Franklin Parkway
San Mateo, CA 94403-1906 | | Vice President | | Since 2015 | | Not Applicable | | Not Applicable |
|
| Principal Occupation During at Least the Past 5 Years: |
| Associate General Counsel, Franklin Templeton Investments; and officer of 45 of the investment companies in Franklin Templeton Investments. |
| | | | |
Craig S. Tyle (1960)
One Franklin Parkway
San Mateo, CA 94403-1906 | | Vice President | | Since 2011 | | Not Applicable | | Not Applicable |
|
| Principal Occupation During at Least the Past 5 Years: |
| General Counsel and Executive Vice President, Franklin Resources, Inc.; and officer of some of the other subsidiaries of Franklin Resources, Inc. and of 45 of the investment companies in Franklin Templeton Investments. |
| | | | |
Lori A. Weber (1964)
300 S.E. 2nd Street Fort Lauderdale, FL 33301-1923 | | Vice President | | Since 2011 | | Not Applicable | | Not Applicable |
|
| Principal Occupation During at Least the Past 5 Years: |
| Senior Associate General Counsel, Franklin Templeton Investments; Assistant Secretary, Franklin Resources, Inc.; Vice President and Secretary, Templeton Investment Counsel, LLC; and officer of 45 of the investment companies in Franklin Templeton Investments. |
*We base the number of portfolios on each separate series of the US registered investment companies within the Franklin Templeton Investments fund complex. These portfolios have a common investment manager or affiliated investment managers.
**Gregory E. Johnson is considered to be an interested person of the Fund under the federal securities laws due to his position as an officer and director of Franklin Resources, Inc. (Resources), which is the parent company of the Fund’s investment manager and distributor. Jennifer M. Johnson is considered to be an interested person of the Fund under the federal securities laws due to her position as officer of Resources.
Note 1: Gregory E. Johnson and Jennifer M. Johnson are siblings.
Note 2: Officer information is current as of the date of this report. It is possible that after this date, information about officers may change.
The Sarbanes-Oxley Act of 2002 and Rules adopted by the US Securities and Exchange Commission require the Fund to disclose whether the Fund’s Audit Committee includes at least one member who is an audit committee financial expert within the meaning of such Act and Rules. The Fund’s Board has determined that there is at least one such financial expert on the Audit Committee and has designated each of Edward I. Altman, Ph.D., Ann Torre Bates and David W. Niemiec as an audit committee financial expert. The Board believes that Messrs. Altman and Niemiec and Ms. Bates qualify as such an expert in view of their extensive business background and experience. Mr. Altman has served as a member of the Fund Audit Committee since 2011. He currently serves as a Max L. Hines Professor of Finance, Emeritus and Director of The Credit and Debt Markets Research Program, Salomon Center, Stern School of Business, New York University. Ms. Bates has served as a member of the Fund Audit Committee since 2011. She currently serves as a director of Ares Capital Corporation (2010-present) and United Natural Foods, Inc. (2013-present) and was formerly a director of Navient Corporation from 2014 to 2016, SLM Corporation from 1997 to 2014 and Allied Capital Corporation from 2003 to 2010, Executive Vice President and Chief Financial Officer of NHP Incorporated from 1995 to 1997 and Vice President and Treasurer of US Airways, Inc. until 1995. Mr. Niemiec has served as a member of the Fund Audit Committee since 2015, currently serves as an Advisor to Saratoga Partners and was formerly its Managing Director from 1998 to 2001 and serves as a director of Hess Midstream Partners LP (2017-present). Mr. Niemiec was formerly a director of Emeritus Corporation from 1999 to 2010 and OSI Pharmaceuticals, Inc. from 2006 to 2010, Managing Director of SBC Warburg Dillon Read from 1997 to 1998, and was Vice Chairman from 1991 to 1997 and Chief Financial Officer from 1982 to 1997 of Dillon, Read & Co. Inc. As a result of such background and experience, the Board believes that Messrs. Altman and Niemiec and Ms. Bates have each acquired an understanding of generally accepted accounting principles and financial statements, the general application of such principles in connection with the accounting estimates, accruals and reserves, and analyzing and evaluating financial statements that present a breadth and level of complexity of accounting issues generally comparable to those of the Fund, as well as an understanding of internal controls and procedures for financial reporting and an understanding of audit committee functions. Messrs. Altman and Niemiec and Ms. Bates are independent Board members as that term is defined under the applicable US Securities and Exchange Commission Rules and Releases.
The Statement of Additional Information (SAI) includes additional information about the board members and is available, without charge, upon request. Shareholders may call (800) DIAL BEN/342-5236 to request the SAI.
| | | | |
| 44 | | Annual Report | | franklintempleton.com |
FRANKLIN ALTERNATIVE STRATEGIES FUNDS
FRANKLIN K2 GLOBAL MACRO OPPORTUNITIES FUND
Shareholder Information
Board Approval of Investment Management Agreements and Sub-Advisory Agreements
FRANKLIN ALTERNATIVE STRATEGIES FUNDS
Franklin K2 Global Macro Opportunities Fund
(Fund)
The Board of Trustees (Board) of Franklin Alternative Strategies Funds (the Trust), including a majority of trustees that are not “interested persons” as such term is defined in section 2(a)(19) of the Investment Company Act of 1940 (hereinafter referred to as “independent trustees”), at an in-person meeting held on April 24, 2018, unanimously approved the renewal of the Fund’s investment management agreement with K2/D&S Management Co., L.L.C. (K2 Advisors), and of each sub-advisory agreement between K2 Advisors and each of following sub-advisors (the Sub-Advisors):
Aspect Capital Limited
Emso Asset Management Limited
Graham Capital Management, L.P.
P/E Investments, LLC
Prior to a meeting of all of the trustees for the purpose of considering such renewal, the independent trustees participated in one other meeting held in connection with the renewal process. Throughout the process, the independent trustees received assistance and advice from and met separately with independent counsel. The independent trustees met with and interviewed officers of K2 Advisors and certain Sub-Advisors (including portfolio managers), the transfer agent and shareholder services group and the distributor. In approving the renewal of the investment management agreement and the sub-advisory agreements for the Fund, the Board, including the independent trustees, determined that the investment management fee structure was fair and reasonable and that continuance of the agreement was in the best interests of the Fund and its shareholders.
In making the foregoing approvals, the Board considered various materials related to the investment management agreement and the sub-advisory agreements including: (1) a copy of the investment management agreement and sub-advisory agreements; (2) information describing the nature, quality and extent of services that K2 Advisors and each Sub-Advisor provided, and are expected to provide, to the Fund, and the investment management fees and sub-advisory fees payable to K2 Advisors and each Sub-Advisor; (3) reports from K2 Advisors on the continued diligence conducted on each Sub-Advisor and the reasons for recommending renewal of each of the sub-advisory
agreements, including, but not limited to, each Sub-Advisor’s background, experience, personnel, operations, policies, procedures and compliance functions; and (4) a report from the Trust’s Chief Compliance Officer regarding K2 Advisors’ and each Sub-Advisor’s compliance program and capabilities, including policies and procedures in place to address potential conflicts of interest, and the diligence undertaken by the Trust’s Chief Compliance Officer with respect thereto. The Board also noted that it received an annual report on all payments made by Franklin Templeton Investments (FTI) or the Fund to financial intermediaries engaged in the sale of Fund shares, as well as a memorandum relating to third-party servicing arrangements in response to a Guidance Update from the U.S. Securities and Exchange Commission (SEC) relating to mutual fund distribution and sub-accounting fees.
The Board also took into account information furnished throughout the year at regular Board meetings, as well as information specifically requested and furnished for the renewal process, which culminated in the meetings referred to above for the specific purpose of considering such agreements. Information furnished throughout the year included, among others, reports on the Fund’s investment performance, expenses, portfolio composition, derivatives, asset segregation, portfolio turnover, Rule 12b-1 plan, distribution, shareholder servicing, legal and compliance matters, pricing of securities, sales and redemptions, and marketing support payments made to financial intermediaries, as well as a third-party survey of transfer agent fees charged to funds within the FTI complex in comparison with those charged to other fund complexes deemed comparable. Also, related financial statements and other information about the scope and quality of services provided by K2 Advisors and its affiliates and enhancements to such services over the past year were provided. In addition, the trustees received periodic reports throughout the year and during the renewal process relating to compliance with the Fund’s investment policies and restrictions. During the renewal process, the independent trustees considered K2 Advisors’ methods of operation within the Franklin Templeton group and its activities on behalf of other clients.
The information obtained by the trustees during the renewal process also included a special report prepared by Broadridge Financial Solutions, Inc., an independent third-party analyst that utilizes data from Lipper, Inc. (“Lipper”), comparing the Fund’s investment performance and expenses with those of other mutual funds deemed comparable to such Fund as selected by Lipper (Broadridge Section 15(c) Report). The trustees reviewed the Broadridge Section 15(c) Report and its usefulness in the renewal process with respect to matters such as
| | | | | | |
| franklintempleton.com | | Annual Report | | | 45 | |
FRANKLIN ALTERNATIVE STRATEGIES FUNDS
FRANKLIN K2 GLOBAL MACRO OPPORTUNITIES FUND
SHAREHOLDER INFORMATION
comparative fees, expenses, expense ratios and performance. The Board considered K2 Advisors’ views that the peer group determined by Lipper for comparison purposes may not be an entirely appropriate representation of the Fund’s peer universe. K2 Advisors explained that the universe of funds that are managed using multi-manager, multi-strategy structures, like the Fund, is still evolving, and has presented challenges in identifying an appropriate set of peers for the Fund. It was noted by K2 Advisors that the peer group compiled by Lipper includes single-manager funds which, due to their nature and relative simplicity, have lower expense ratios and are not true peers for fee comparison purposes (“Base Expense Group”). While noting the limitations of the Broadridge Section 15(c) Report, the Board concluded that the Broadridge Section 15(c) Report was helpful in the performance of its duties.
In addition, the trustees received a Profitability Study (Profitability Study) prepared by management discussing the profitability to FTI from its overall U.S. fund operations, as well as on an individual fund-by-fund basis. Over the past year, the Board and counsel to the independent trustees continued to receive reports on management’s handling of recent regulatory inquiries and pending legal actions against K2 Advisors and its affiliates. The independent trustees were satisfied with the actions taken to date by management in response to such regulatory and legal matters. The independent trustees also received reports from the Trust’s Chief Compliance Officer on regulatory inquiries and pending legal actions against the Sub-Advisors applicable to the services provided by the Sub-Advisors to the Fund and noted that there were not any issues in this regard that should prevent the renewal of the sub-advisory agreements.
The trustees reviewed the personnel, operations, financial condition, and investment management capabilities, methodologies and resources of K2 Advisors and each Sub-Advisor, including each management team’s expertise in the management of other alternative strategies funds. As part of this review, particular attention was given to (1) the diligent risk management program of K2 Advisors and its parent, including those aspects of the program related to selecting and overseeing sub-advisors to the Fund and continual monitoring and management of cybersecurity, liquidity and counterparty credit risk, (2) each Sub-Advisor’s risk management program, and (3) derivatives and other complex instruments that are held and expected to be held by the Fund and how such instruments are used to carry out the Fund’s investment goal.
The Board also took into account, among other things, management’s efforts in establishing a global credit facility for the
benefit of the Fund and other accounts managed by FTI to provide a source of cash for temporary and emergency purposes or to meet unusual redemption requests as well as the strong financial position of K2 Advisors’ parent company and its commitment to the mutual fund business. The Board noted management’s continuing efforts and expenditures in establishing effective business continuity plans and developing strategies to address areas of heightened concern in the mutual fund industry, such as cybersecurity and liquidity risk management. The Board also recognized management’s commitment to facilitating Board oversight of particular areas, including derivatives and payments to intermediaries, by enhanced reporting. In addition, the Board received updates from management on the compliance of the investment manager with comprehensive rules and regulations promulgated by the SEC and the U.S. Commodity Futures Trading Commission.
In addition to the above and other matters considered by the trustees throughout the course of the year, the following discussion relates to certain primary factors relevant to the Board’s decision. This discussion of the information and factors considered by the Board (including the information and factors discussed above) is not intended to be exhaustive, but rather summarizes certain factors considered by the Board. In view of the wide variety of factors considered, the Board did not, unless otherwise noted, find it practicable to quantify or otherwise assign relative weights to the foregoing factors. In addition, individual trustees may have assigned different weights to various factors.
NATURE, EXTENT AND QUALITY OF SERVICES. The trustees reviewed the nature, extent and quality of the services provided, and to be provided, by K2 Advisors and each Sub-Advisor. In this regard, they reviewed the Fund’s investment goal and K2 Advisors’ and each Sub-Advisor’s investment strategy and sub-strategy, and K2 Advisors’ and each Sub-Advisor’s ability to implement such investment strategy and/or sub-strategy, including, but not limited to, K2 Advisors’ and each Sub-Advisor’s trading practices, investment decision processes and reputation. The Board also considered the investment management services that the investment manager provides to the Cayman Islands-based company, which is wholly owned by the Fund (Cayman Subsidiary).
The Board noted that the Fund employs a “manager of managers” structure, whereby K2 Advisors is responsible for selecting sub-advisors (subject to Board approval), allocating the Fund’s assets among them, and overseeing the sub-advisors’ day-to-day management of the Fund’s assets. The Board noted the
| | | | |
| 46 | | Annual Report | | franklintempleton.com |
FRANKLIN ALTERNATIVE STRATEGIES FUNDS
FRANKLIN K2 GLOBAL MACRO OPPORTUNITIES FUND
SHAREHOLDER INFORMATION
responsibilities that K2 Advisors has as the Fund’s investment manager, including (1) due diligence on the Sub-Advisors and any potential new sub-advisors to the Fund, their respective trading strategies, risk management, operations and businesses, (2) on-going oversight and monitoring of the day-to-day investment activities of Sub-Advisors and other service providers, including their respective compliance with the investment mandate and restrictions, compliance policies and procedures and federal securities laws, and K2 Advisors’ ongoing assessment of their performance, (3) portfolio construction with respect to the allocation of assets among Sub-Advisors, investment funds, cash and other investments, (4) risk management, (5) preparing quarterly reports to the Board, and (6) the implementation of Board directives as they relate to the Fund. The Trustees also considered the successful performance of K2 Advisors in managing the Fund and other investment products with similar investment strategies to the investment strategies of the Fund that are not subject to the Investment Company Act of 1940.
With respect to the sub-advisory services provided, and to be provided, by each Sub-Advisor, the Board noted the responsibilities that each Sub-Advisor has with respect to the portion of the Fund’s assets allocated to the Sub-Advisor by K2 Advisors (Sub-Advised Portion), including, among others, implementing the investment strategies with respect to the Sub-Advised Portion and ensuring compliance with the investment strategies, policies and limitations of the Sub-Advised Portion. The trustees considered the successful performance of each Sub-Advisor in managing the Fund and other investment products with similar investment strategies to the investment strategies of its Sub-Advised Portion of the Fund, including, with respect to certain Sub-Advisors, mutual funds with similar investment strategies. The Board considered K2 Advisors’ rationale for recommending the continued retention of each Sub-Advisor.
The trustees reviewed the Fund’s portfolio management teams at K2 Advisors and each Sub-Advisor, including each such team’s performance, staffing, skills and compensation program. With respect to portfolio manager compensation, management assured the trustees that the Fund’s long-term performance is a significant component of incentive-based compensation for K2 Advisors’ portfolio management team and noted that a portion of a K2 Advisors’ portfolio manager’s incentive-based compensation is paid in shares of pre-designated funds from the portfolio manager’s fund management area. The trustees noted that the portfolio manager compensation program aligned the interests of the portfolio managers with that of Fund shareholders. During regular Board meetings and the aforementioned meetings of the independent trustees, the trustees considered
periodic reports provided to them showing that K2 Advisors and the Sub-Advisors complied with the investment policies and restrictions of the Fund as well as other reports periodically furnished to the Board covering matters such as the compliance of portfolio managers and other management personnel with the code of ethics covering the investment management personnel, the adherence to fair value pricing procedures established by the Board and the accuracy of net asset value calculations. The Board noted the extent of the benefits provided to Fund shareholders from being part of the Franklin Templeton group of funds, including the right to exchange investments between funds (same class) without a sales charge, the ability to reinvest Fund dividends into other funds and the right to combine holdings of other funds to obtain reduced sales charges.
The trustees discussed with management various other products, portfolios and entities that are advised by K2 Advisors and each Sub-Advisor and the allocation of assets and expenses among and within them, as well as their relative fees and reasons for differences with respect thereto and any potential conflicts.
The Board also considered a report from the Trust’s Chief Compliance Officer regarding K2 Advisors’ and each Sub-Advisor’s compliance programs and capabilities as such programs and capabilities relate to the operations of the Fund and the monitoring and testing of such program undertaken by the Trust’s Chief Compliance Officer. The Board considered the selection and due diligence process employed by K2 Advisors in selecting and deciding to retain each Sub-Advisor as a sub-advisor to the Fund, including the due diligence undertaken with respect to the Sub-Advisor’s compliance and risk management capabilities. The trustees considered K2 Advisors’ significant efforts in developing and implementing compliance procedures established in accordance with SEC and other requirements.
The Board also considered the nature, extent and quality of the services to be provided under the Fund’s other service agreements to determine that, on an overall basis, Fund shareholders were well served. In this connection, the Board also took into account transfer agent and shareholder services provided to Fund shareholders by an affiliate of K2 Advisors, noting continuing expenditures by management to increase and improve the scope of such services and favorable periodic reports on shareholder services conducted by independent third parties. While such considerations directly affected the trustees’ decision in renewing the Fund’s transfer agent and shareholder services agreement, the Board also considered these commitments as incidental benefits to Fund shareholders deriving from the investment management relationship.
| | | | | | |
| franklintempleton.com | | Annual Report | | | 47 | |
FRANKLIN ALTERNATIVE STRATEGIES FUNDS
FRANKLIN K2 GLOBAL MACRO OPPORTUNITIES FUND
SHAREHOLDER INFORMATION
Based on their review, the trustees were satisfied with the nature and quality of the overall services provided, and to be provided, by K2 Advisors and its affiliates and each Sub Advisor to the Fund and its shareholders and were confident in the abilities of K2 Advisors and each Sub-Advisor to implement their respective investment strategy and/or sub-strategy and to provide quality services to the Fund and its shareholders.
INVESTMENT PERFORMANCE. As the Fund commenced operations in July 2016, the trustees reviewed the investment performance of the Fund for the one-year period ended December 31, 2017. As part of their review, they inquired of management regarding benchmark and hedging activities. Consideration was also given to performance in the context of available levels of cash, including as affected by net flows, during the periods. The trustees had meetings during the year, including the meetings referred to above held in connection with the renewal process, with the Fund’s portfolio managers to discuss performance and the management of the Fund and each Sub-Advisor.
In addition, attention in assessing performance was given to the Broadridge Section 15(c) Report. That report showed the investment performance of the Fund (Advisor Class shares) in comparison to other funds determined comparable by Lipper.
The comparable funds to the Fund, as chosen by Lipper, included all retail and institutional alternative global macro funds. The Fund had total returns in the lowest performing quintile for the one-year period ended December 31, 2017. The trustees discussed with management the reasons for the relative underperformance for the one-year period ended December 31, 2017, including a discussion regarding the impact of, and difficulties associated with, certain currency positions. The trustees also compared Fund performance to other industry benchmarks, including measures of risk-adjusted performance, as part of their evaluation of investment performance. The trustees also noted the Fund’s short history of investment performance. In light of the foregoing, overall, the Board concluded that the Fund had performed in an acceptable manner in the context of the Fund’s goal.
COMPARATIVE EXPENSES AND PROFITABILITY. The trustees considered the cost of the services provided, and to be provided, by K2 Advisors and each Sub-Advisor and the losses realized by K2 Advisors and its affiliates from their relationships with the Fund. As part of the renewal process, they explored with management the trends in expense ratios since inception and the reasons for any increases in the Fund’s
expense ratios (or components thereof). In considering the appropriateness of the management fee and other expenses charged to the Fund, the Board took into account various factors including investment performance and matters relating to Fund operations, including, but not limited to, the quality and experience of K2 Advisors personnel. The Board also reviewed and considered the investment management fees in light of the nature, extent and quality of the investment management services provided, and to be provided, by K2 Advisors and each Sub-Advisor, as more fully discussed above. The Board noted that the sub-advisory fees are paid by K2 Advisors to each Sub-Advisor and are not additional fees borne by the Fund. The Board also noted that the sub-advisory fees paid, and to be paid, by K2 Advisors to each Sub-Advisor were the product of arms-length negotiations between K2 Advisors and each Sub-Advisor. Furthermore, the Board took into account that information regarding Sub-Advisor profitability is not legally required to be provided. Accordingly, profitability information of the sub-advisors was given lesser weight than other factors. In addition, the Board considered the allocation of the investment management fee charged to the Fund between K2 Advisors and each Sub-Advisor in light of the nature, extent and quality of the investment management services provided, and to be provided, by K2 Advisors and each Sub-Advisor. As part of this discussion, the Board took into account the fee waiver and expense limitation arrangement in effect, and the amount of Fund expenses that were absorbed since inception of the Fund by K2 Advisors through such waivers and arrangements. The Board also considered the investment management services that the investment manager provides to the Cayman Subsidiary and the related fee waivers that were in place.
Consideration was also given to a comparative analysis in the Broadridge Section 15(c) Report of the investment management fee and total expense ratio of the Fund in comparison with those of a group of other funds selected by Lipper as its appropriate Lipper expense group. Lipper expense data is based upon information taken from each fund’s most recent annual report, which reflects historical asset levels that may be quite different from those currently existing, particularly in a period of market volatility.
In reviewing comparative costs, emphasis was given to the Fund’s contractual management fee in comparison with the contractual management fee that would have been charged by other funds within its Lipper expense group assuming they were similar in size to the Fund, as well as the actual total expenses of the Fund in comparison with those of its Lipper expense group. The Lipper contractual management fee analysis
| | | | |
| 48 | | Annual Report | | franklintempleton.com |
FRANKLIN ALTERNATIVE STRATEGIES FUNDS
FRANKLIN K2 GLOBAL MACRO OPPORTUNITIES FUND
SHAREHOLDER INFORMATION
includes administrative charges as being part of the management fee, and total expenses, for comparative consistency, are shown by Lipper for Fund Advisor Class shares. The Fund’s contractual management fee rate was in the most expensive quintile of its Base Expense Group and its total expenses were also in the most expensive quintile of its Base Expense Group.
Noting the factors and limitations noted above with respect to the Broadridge Section 15(c) Report and factors relating to the Fund’s operations, such as the quality and experience of K2 Advisors and the Sub-Advisors and the nature and quality of the services provided and to be provided by K2 Advisors and the Sub-Advisors, the Board found such comparative fees and expenses to be acceptable.
The trustees also reviewed the Profitability Study addressing profitability of Franklin Resources, Inc., from its overall U.S. fund business, as well as profitability to K2 Advisors and its affiliates, from providing investment management and other services to the Fund during the 12-month period ended September 30, 2017, the most recent fiscal year-end of Franklin Resources, Inc. The trustees reviewed the basis on which such reports are prepared and the cost allocation methodology utilized in the Profitability Study, it being recognized that allocation methodologies may each be reasonable while producing different results. In this respect, the Board noted that the reasonableness of the cost allocation methodologies was reviewed by independent accountants on an every other year basis.
The independent trustees met with management to discuss the Profitability Study. This included, among other things, a comparison of investment management income with investment management expenses of the Fund; comparison of underwriting revenues and expenses; the relative relationship of investment management and underwriting expenses; shareholder servicing profitability; economies of scale; and the relative contribution of the Fund to the profitability of K2 Advisors and its parent. In discussing the Profitability Study with the Board, K2 Advisors stated its belief that the costs incurred in establishing the infrastructure necessary to operate the type of mutual fund operations conducted by it and its affiliates may not be fully reflected in the expenses allocated to the Fund in determining its profitability.
The Board also took into account management’s expenditures in improving shareholder services provided to the Fund, as well as the need to meet additional regulatory and compliance requirements. The trustees also considered the extent to which K2 Advisors and the Sub-Advisors may derive ancillary benefits from Fund operations, including those derived from the
allocation of Fund brokerage and the use of commission dollars to pay for research and other similar services.
The Board noted that shareholders are able to redeem their Fund shares at any time if shareholders believe that Fund fees and expenses are too high or if they are dissatisfied with the performance of the Fund.
ECONOMIES OF SCALE. The Board considered economies of scale realized by K2 Advisors and its affiliates and the Sub-Advisors as the Fund grows larger and the extent to which they are shared with Fund shareholders, as for example, in the level of the investment management fees charged, in the quality and efficiency of services rendered and in increased capital commitments benefiting the Fund directly or indirectly. The Board also considered the fee waiver and expense limitation arrangement in effect, and the amount of Fund expenses that were absorbed since inception of the Fund by K2 Advisors through such waiver and arrangement. The Board concluded that economies of scale were deemed not to be a significant factor at that time in light of, among other matters, the fee waiver and expense limitation arrangement in effect and the fact that the Fund had less than two complete years of operating results.
Board Approval of Investment Management Agreements and Sub-Advisory Agreements
FRANKLIN ALTERNATIVE STRATEGIES FUNDS
Franklin K2 Global Macro Opportunities Fund
(Fund)
The Board of Trustees (Board) of Franklin Alternative Strategies Funds (the Trust), including a majority of trustees that are not “interested persons” as such term is defined in section 2(a)(19) of the Investment Company Act of 1940 (hereinafter referred to as “independent trustees”), at an in-person meeting held on May 17, 2018, unanimously approved the renewal of the Fund’s investment management agreement with K2/D&S Management Co., L.L.C. (K2 Advisors), and of each sub-advisory agreement between K2 Advisors and each of following sub-advisors (the Sub-Advisors):
Aspect Capital Limited
Emso Asset Management Limited
Graham Capital Management, L.P.
P/E Investments, LLC
It was noted that investment management and sub-advisory agreements for the Fund were approved at the Board’s April 23,
| | | | | | |
| franklintempleton.com | | Annual Report | | | 49 | |
FRANKLIN ALTERNATIVE STRATEGIES FUNDS
FRANKLIN K2 GLOBAL MACRO OPPORTUNITIES FUND
SHAREHOLDER INFORMATION
2018 and were being reapproved in order to bring the Board’s annual consideration of such agreements into line with those of the other series of the Trust.
Prior to a meeting of all of the trustees for the purpose of considering such renewal, the independent trustees participated in two other meetings held in connection with the renewal process. Throughout the process, the independent trustees received assistance and advice from and met separately with independent counsel. The independent trustees met with and interviewed officers of K2 Advisors and certain Sub-Advisors (including portfolio managers), the transfer agent and shareholder services group and the distributor. In approving the renewal of the investment management agreement and the sub-advisory agreements for the Fund, the Board, including the independent trustees, determined that the investment management fee structure was fair and reasonable and that continuance of the agreement was in the best interests of the Fund and its shareholders.
In making the foregoing approvals, the Board considered various materials related to the investment management agreement and the sub-advisory agreements including: (1) a copy of the investment management agreement and sub-advisory agreements; (2) information describing the nature, quality and extent of services that K2 Advisors and each Sub-Advisor provided, and are expected to provide, to the Fund, and the investment management fees and sub-advisory fees payable to K2 Advisors and each Sub-Advisor; (3) reports from K2 Advisors on the continued diligence conducted on each Sub-Advisor and the reasons for recommending renewal of each of the sub-advisory agreements, including, but not limited to, each Sub-Advisor’s background, experience, personnel, operations, policies, procedures and compliance functions; and (4) a report from the Trust’s Chief Compliance Officer regarding K2 Advisors’ and each Sub-Advisor’s compliance program and capabilities, including policies and procedures in place to address potential conflicts of interest, and the diligence undertaken by the Trust’s Chief Compliance Officer with respect thereto. The Board also noted that it received an annual report on all payments made by Franklin Templeton Investments (FTI) or the Fund to financial intermediaries engaged in the sale of Fund shares, as well as a memorandum relating to third-party servicing arrangements in response to a Guidance Update from the U.S. Securities and Exchange Commission (SEC) relating to mutual fund distribution and sub-accounting fees.
The Board also took into account information furnished throughout the year at regular Board meetings, as well as information specifically requested and furnished for the renewal
process, which culminated in the meetings referred to above for the specific purpose of considering such agreements. Information furnished throughout the year included, among others, reports on the Fund’s investment performance, expenses, portfolio composition, derivatives, asset segregation, portfolio turnover, Rule 12b-1 plan, distribution, shareholder servicing, legal and compliance matters, pricing of securities, sales and redemptions, and marketing support payments made to financial intermediaries, as well as a third-party survey of transfer agent fees charged to funds within the FTI complex in comparison with those charged to other fund complexes deemed comparable. Also, related financial statements and other information about the scope and quality of services provided by K2 Advisors and its affiliates and enhancements to such services over the past year were provided. In addition, the trustees received periodic reports throughout the year and during the renewal process relating to compliance with the Fund’s investment policies and restrictions. During the renewal process, the independent trustees considered K2 Advisors’ methods of operation within the Franklin Templeton group and its activities on behalf of other clients.
The information obtained by the trustees during the renewal process also included a special report prepared by Broadridge Financial Solutions, Inc., an independent third-party analyst that utilizes data from Lipper, Inc. (“Lipper”), comparing the Fund’s investment performance and expenses with those of other mutual funds deemed comparable to such Fund as selected by Lipper (Broadridge Section 15(c) Report). The trustees reviewed the Broadridge Section 15(c) Report and its usefulness in the renewal process with respect to matters such as comparative fees, expenses, expense ratios and performance. The Board considered K2 Advisors’ views that the peer group determined by Lipper for comparison purposes may not be an entirely appropriate representation of the Fund’s peer universe. K2 Advisors explained that the universe of funds that are managed using multi-manager, multi-strategy structures, like the Fund, is still evolving, and has presented challenges in identifying an appropriate set of peers for the Fund. It was noted by K2 Advisors that the peer group compiled by Lipper includes single-manager funds which, due to their nature and relative simplicity, have lower expense ratios and are not true peers for fee comparison purposes (“Base Expense Group”). While noting the limitations of the Broadridge Section 15(c) Report, the Board concluded that the Broadridge Section 15(c) Report was helpful in the performance of its duties.
In addition, the trustees received a Profitability Study (Profitability Study) prepared by management discussing the
| | | | |
| 50 | | Annual Report | | franklintempleton.com |
FRANKLIN ALTERNATIVE STRATEGIES FUNDS
FRANKLIN K2 GLOBAL MACRO OPPORTUNITIES FUND
SHAREHOLDER INFORMATION
profitability to FTI from its overall U.S. fund operations, as well as on an individual fund-by-fund basis. Over the past year, the Board and counsel to the independent trustees continued to receive reports on management’s handling of recent regulatory inquiries and pending legal actions against K2 Advisors and its affiliates. The independent trustees were satisfied with the actions taken to date by management in response to such regulatory and legal matters. The independent trustees also received reports from the Trust’s Chief Compliance Officer on regulatory inquiries and pending legal actions against the Sub-Advisors applicable to the services provided by the Sub-Advisors to the Fund and noted that there were not any issues in this regard that should prevent the renewal of the sub-advisory agreements.
The trustees reviewed the personnel, operations, financial condition, and investment management capabilities, methodologies and resources of K2 Advisors and each Sub-Advisor, including each management team’s expertise in the management of other alternative strategies funds. As part of this review, particular attention was given to (1) the diligent risk management program of K2 Advisors and its parent, including those aspects of the program related to selecting and overseeing sub-advisors to the Fund and continual monitoring and management of cybersecurity, liquidity and counterparty credit risk, (2) each Sub-Advisor’s risk management program, and (3) derivatives and other complex instruments that are held and expected to be held by the Fund and how such instruments are used to carry out the Fund’s investment goal.
The Board also took into account, among other things, management’s efforts in establishing a global credit facility for the benefit of the Fund and other accounts managed by FTI to provide a source of cash for temporary and emergency purposes or to meet unusual redemption requests as well as the strong financial position of K2 Advisors’ parent company and its commitment to the mutual fund business. The Board noted management’s continuing efforts and expenditures in establishing effective business continuity plans and developing strategies to address areas of heightened concern in the mutual fund industry, such as cybersecurity and liquidity risk management. The Board also recognized management’s commitment to facilitating Board oversight of particular areas, including derivatives and payments to intermediaries, by enhanced reporting. In addition, the Board received updates from management on the compliance of the investment manager with comprehensive rules and regulations promulgated by the SEC and the U.S. Commodity Futures Trading Commission.
In addition to the above and other matters considered by the trustees throughout the course of the year, the following discussion relates to certain primary factors relevant to the Board’s decision. This discussion of the information and factors considered by the Board (including the information and factors discussed above) is not intended to be exhaustive, but rather summarizes certain factors considered by the Board. In view of the wide variety of factors considered, the Board did not, unless otherwise noted, find it practicable to quantify or otherwise assign relative weights to the foregoing factors. In addition, individual trustees may have assigned different weights to various factors.
NATURE, EXTENT AND QUALITY OF SERVICES. The trustees reviewed the nature, extent and quality of the services provided, and to be provided, by K2 Advisors and each Sub-Advisor. In this regard, they reviewed the Fund’s investment goal and K2 Advisors’ and each Sub-Advisor’s investment strategy and sub-strategy, and K2 Advisors’ and each Sub-Advisor’s ability to implement such investment strategy and/or sub-strategy, including, but not limited to, K2 Advisors’ and each Sub-Advisor’s trading practices, investment decision processes and reputation. The Board also considered the investment management services that the investment manager provides to the Cayman Islands-based company, which is wholly owned by the Fund (Cayman Subsidiary).
The Board noted that the Fund employs a “manager of managers” structure, whereby K2 Advisors is responsible for selecting sub-advisors (subject to Board approval), allocating the Fund’s assets among them, and overseeing the sub-advisors’ day-to-day management of the Fund’s assets. The Board noted the responsibilities that K2 Advisors has as the Fund’s investment manager, including (1) due diligence on the Sub-Advisors and any potential new sub-advisors to the Fund, their respective trading strategies, risk management, operations and businesses, (2) on-going oversight and monitoring of the day-to-day investment activities of Sub-Advisors and other service providers, including their respective compliance with the investment mandate and restrictions, compliance policies and procedures and federal securities laws, and K2 Advisors’ ongoing assessment of their performance, (3) portfolio construction with respect to the allocation of assets among Sub-Advisors, investment funds, cash and other investments, (4) risk management, (5) preparing quarterly reports to the Board, and (6) the implementation of Board directives as they relate to the Fund. The Trustees also considered the successful performance of K2 Advisors in managing the Fund and other investment products with similar
| | | | | | |
| franklintempleton.com | | Annual Report | | | 51 | |
FRANKLIN ALTERNATIVE STRATEGIES FUNDS
FRANKLIN K2 GLOBAL MACRO OPPORTUNITIES FUND
SHAREHOLDER INFORMATION
investment strategies to the investment strategies of the Fund that are not subject to the Investment Company Act of 1940.
With respect to the sub-advisory services provided, and to be provided, by each Sub-Advisor, the Board noted the responsibilities that each Sub-Advisor has with respect to the portion of the Fund’s assets allocated to the Sub-Advisor by K2 Advisors (Sub-Advised Portion), including, among others, implementing the investment strategies with respect to the Sub-Advised Portion and ensuring compliance with the investment strategies, policies and limitations of the Sub-Advised Portion. The trustees considered the successful performance of each Sub-Advisor in managing the Fund and other investment products with similar investment strategies to the investment strategies of its Sub-Advised Portion of the Fund, including, with respect to certain Sub-Advisors, mutual funds with similar investment strategies. The Board considered K2 Advisors’ rationale for recommending the continued retention of each Sub-Advisor.
The trustees reviewed the Fund’s portfolio management teams at K2 Advisors and each Sub-Advisor, including each such team’s performance, staffing, skills and compensation program. With respect to portfolio manager compensation, management assured the trustees that the Fund’s long-term performance is a significant component of incentive-based compensation for K2 Advisors’ portfolio management team and noted that a portion of a K2 Advisors’ portfolio manager’s incentive-based compensation is paid in shares of pre-designated funds from the portfolio manager’s fund management area. The trustees noted that the portfolio manager compensation program aligned the interests of the portfolio managers with that of Fund shareholders. During regular Board meetings and the aforementioned meetings of the independent trustees, the trustees considered periodic reports provided to them showing that K2 Advisors and the Sub-Advisors complied with the investment policies and restrictions of the Fund as well as other reports periodically furnished to the Board covering matters such as the compliance of portfolio managers and other management personnel with the code of ethics covering the investment management personnel, the adherence to fair value pricing procedures established by the Board and the accuracy of net asset value calculations. The Board noted the extent of the benefits provided to Fund shareholders from being part of the Franklin Templeton group of funds, including the right to exchange investments between funds (same class) without a sales charge, the ability to reinvest Fund dividends into other funds and the right to combine holdings of other funds to obtain reduced sales charges.
The trustees discussed with management various other products, portfolios and entities that are advised by K2 Advisors and each Sub-Advisor and the allocation of assets and expenses among and within them, as well as their relative fees and reasons for differences with respect thereto and any potential conflicts.
The Board also considered a report from the Trust’s Chief Compliance Officer regarding K2 Advisors’ and each Sub-Advisor’s compliance programs and capabilities as such programs and capabilities relate to the operations of the Fund and the monitoring and testing of such program undertaken by the Trust’s Chief Compliance Officer. The Board considered the selection and due diligence process employed by K2 Advisors in selecting and deciding to retain each Sub-Advisor as a sub-advisor to the Fund, including the due diligence undertaken with respect to the Sub-Advisor’s compliance and risk management capabilities. The trustees considered K2 Advisors’ significant efforts in developing and implementing compliance procedures established in accordance with SEC and other requirements.
The Board also considered the nature, extent and quality of the services to be provided under the Fund’s other service agreements to determine that, on an overall basis, Fund shareholders were well served. In this connection, the Board also took into account transfer agent and shareholder services provided to Fund shareholders by an affiliate of K2 Advisors, noting continuing expenditures by management to increase and improve the scope of such services and favorable periodic reports on shareholder services conducted by independent third parties. While such considerations directly affected the trustees’ decision in renewing the Fund’s transfer agent and shareholder services agreement, the Board also considered these commitments as incidental benefits to Fund shareholders deriving from the investment management relationship.
Based on their review, the trustees were satisfied with the nature and quality of the overall services provided, and to be provided, by K2 Advisors and its affiliates and each Sub Advisor to the Fund and its shareholders and were confident in the abilities of K2 Advisors and each Sub-Advisor to implement their respective investment strategy and/or sub-strategy and to provide quality services to the Fund and its shareholders.
INVESTMENT PERFORMANCE. As the Fund commenced operations in July 2016, the trustees reviewed the investment performance of the Fund for the one-year period ended December 31, 2017. As part of their review, they inquired of management regarding benchmark and hedging activities. Consideration was also given to performance in the context of
| | | | |
| 52 | | Annual Report | | franklintempleton.com |
FRANKLIN ALTERNATIVE STRATEGIES FUNDS
FRANKLIN K2 GLOBAL MACRO OPPORTUNITIES FUND
SHAREHOLDER INFORMATION
available levels of cash, including as affected by net flows, during the periods. The trustees had meetings during the year, including the meetings referred to above held in connection with the renewal process, with the Fund’s portfolio managers to discuss performance and the management of the Fund and each Sub-Advisor.
In addition, attention in assessing performance was given to the Broadridge Section 15(c) Report. That report showed the investment performance of the Fund (Advisor Class shares) in comparison to other funds determined comparable by Lipper.
The comparable funds to the Fund, as chosen by Lipper, included all retail and institutional alternative global macro funds. The Fund had total returns in the lowest performing quintile for the one-year period ended December 31, 2017. The trustees discussed with management the reasons for the relative underperformance for the one-year period ended December 31, 2017, including a discussion regarding the impact of, and difficulties associated with, certain currency positions. The trustees also compared Fund performance to other industry benchmarks, including measures of risk-adjusted performance, as part of their evaluation of investment performance. The trustees also noted the Fund’s short history of investment performance. In light of the foregoing, overall, the Board concluded that the Fund had performed in an acceptable manner in the context of the Fund’s goal.
COMPARATIVE EXPENSES AND PROFITABILITY. The trustees considered the cost of the services provided, and to be provided, by K2 Advisors and each Sub-Advisor and the losses realized by K2 Advisors and its affiliates from their relationships with the Fund. As part of the renewal process, they explored with management the trends in expense ratios over the past three fiscal years (or, if earlier, inception) and the reasons for any increases in the Fund’s expense ratios (or components thereof). In considering the appropriateness of the management fee and other expenses charged to the Fund, the Board took into account various factors including investment performance and matters relating to Fund operations, including, but not limited to, the quality and experience of K2 Advisors personnel. The Board also reviewed and considered the investment management fees in light of the nature, extent and quality of the investment management services provided, and to be provided, by K2 Advisors and each Sub-Advisor, as more fully discussed above. The Board noted that the sub-advisory fees are paid by K2 Advisors to each Sub-Advisor and are not additional fees borne by the Fund. The Board also noted that the sub-advisory fees paid, and to be paid, by K2 Advisors to each Sub-Advisor
were the product of arms-length negotiations between K2 Advisors and each Sub-Advisor. Furthermore, the Board took into account that information regarding Sub-Advisor profitability is not legally required to be provided. Accordingly, profitability information of the sub-advisors was given lesser weight than other factors. In addition, the Board considered the allocation of the investment management fee charged to the Fund between K2 Advisors and each Sub-Advisor in light of the nature, extent and quality of the investment management services provided, and to be provided, by K2 Advisors and each Sub-Advisor. As part of this discussion, the Board took into account the fee waiver and expense limitation arrangement in effect, and the amount of Fund expenses that were absorbed since inception of the Fund by K2 Advisors through such waivers and arrangements. The Board also considered the investment management services that the investment manager provides to the Cayman Subsidiary and the related fee waivers that were in place.
Consideration was also given to a comparative analysis in the Broadridge Section 15(c) Report of the investment management fee and total expense ratio of the Fund in comparison with those of a group of other funds selected by Lipper as its appropriate Lipper expense group. Lipper expense data is based upon information taken from each fund’s most recent annual report, which reflects historical asset levels that may be quite different from those currently existing, particularly in a period of market volatility.
In reviewing comparative costs, emphasis was given to the Fund’s contractual management fee in comparison with the contractual management fee that would have been charged by other funds within its Lipper expense group assuming they were similar in size to the Fund, as well as the actual total expenses of the Fund in comparison with those of its Lipper expense group. The Lipper contractual management fee analysis includes administrative charges as being part of the management fee, and total expenses, for comparative consistency, are shown by Lipper for Fund Advisor Class shares. The Fund’s contractual management fee rate was in the most expensive quintile of its Base Expense Group and its total expenses were also in the most expensive quintile of its Base Expense Group.
Noting the factors and limitations noted above with respect to the Broadridge Section 15(c) Report and factors relating to the Fund’s operations, such as the quality and experience of K2 Advisors and the Sub-Advisors and the nature and quality of the services provided and to be provided by K2 Advisors and the Sub-Advisors, the Board found such comparative fees and expenses to be acceptable.
| | | | | | |
| franklintempleton.com | | Annual Report | | | 53 | |
FRANKLIN ALTERNATIVE STRATEGIES FUNDS
FRANKLIN K2 GLOBAL MACRO OPPORTUNITIES FUND
SHAREHOLDER INFORMATION
The trustees also reviewed the Profitability Study addressing profitability of Franklin Resources, Inc., from its overall U.S. fund business, as well as profitability to K2 Advisors and its affiliates, from providing investment management and other services to the Fund during the 12-month period ended September 30, 2017, the most recent fiscal year-end of Franklin Resources, Inc. The trustees reviewed the basis on which such reports are prepared and the cost allocation methodology utilized in the Profitability Study, it being recognized that allocation methodologies may each be reasonable while producing different results. In this respect, the Board noted that the reasonableness of the cost allocation methodologies was reviewed by independent accountants on an every other year basis.
The independent trustees met with management to discuss the Profitability Study. This included, among other things, a comparison of investment management income with investment management expenses of the Fund; comparison of underwriting revenues and expenses; the relative relationship of investment management and underwriting expenses; shareholder servicing profitability; economies of scale; and the relative contribution of the Fund to the profitability of K2 Advisors and its parent. In discussing the Profitability Study with the Board, K2 Advisors stated its belief that the costs incurred in establishing the infrastructure necessary to operate the type of mutual fund operations conducted by it and its affiliates may not be fully reflected in the expenses allocated to the Fund in determining its profitability.
The Board also took into account management’s expenditures in improving shareholder services provided to the Fund, as well as the need to meet additional regulatory and compliance requirements. The trustees also considered the extent to which K2 Advisors and the Sub-Advisors may derive ancillary benefits from Fund operations, including those derived from the allocation of Fund brokerage and the use of commission dollars to pay for research and other similar services.
The Board noted that shareholders are able to redeem their Fund shares at any time if shareholders believe that Fund fees and expenses are too high or if they are dissatisfied with the performance of the Fund.
ECONOMIES OF SCALE. The Board considered economies of scale realized by K2 Advisors and its affiliates and the Sub-Advisors as the Fund grows larger and the extent to which they are shared with Fund shareholders, as for example, in the level of the investment management fees charged, in the quality and efficiency of services rendered and in increased capital commitments benefiting the Fund directly or indirectly. The Board also
considered the fee waiver and expense limitation arrangement in effect, and the amount of Fund expenses that were absorbed since inception of the Fund by K2 Advisors through such waiver and arrangement. The Board concluded that economies of scale were deemed not to be a significant factor at that time in light of, among other matters, the fee waiver and expense limitation arrangement in effect and the fact that the Fund had less than two complete years of operating results.
Proxy Voting Policies and Procedures
The Fund’s investment manager has established Proxy Voting Policies and Procedures (Policies) that the Fund uses to determine how to vote proxies relating to portfolio securities. Shareholders may view the Fund’s complete Policies online at franklintempleton.com. Alternatively, shareholders may request copies of the Policies free of charge by calling the Proxy Group collect at (954) 527-7678 or by sending a written request to: Franklin Templeton Companies, LLC, 300 S.E. 2nd Street, Fort Lauderdale, FL 33301, Attention: Proxy Group. Copies of the Fund’s proxy voting records are also made available online at franklintempleton.com and posted on the US Securities and Exchange Commission’s website at sec.gov and reflect the most recent 12-month period ended June 30.
Quarterly Consolidated Statement of Investments
The Trust, on behalf of the Fund, files a complete consolidated statement of investments with the US Securities and Exchange Commission for the first and third quarters for each fiscal year on Form N-Q. Shareholders may view the filed Form N-Q by visiting the Commission’s website at sec.gov. The filed form may also be viewed and copied at the Commission’s Public Reference Room in Washington, DC. Information regarding the operations of the Public Reference Room may be obtained by calling (800) SEC-0330.
Householding of Reports and Prospectuses
You will receive the Fund’s financial reports every six months as well as an annual updated summary prospectus (prospectus available upon request). To reduce Fund expenses, we try to identify related shareholders in a household and send only one copy of the financial reports and summary prospectus. This process, called “householding,” will continue indefinitely unless you instruct us otherwise. If you prefer not to have these documents householded, please call us at (800) 632-2301. At any time you may view current prospectuses/summary prospectuses and financial reports on our website. If you choose, you may receive these documents through electronic delivery.
| | | | |
| 54 | | Annual Report | | franklintempleton.com |
Annual Report and Shareholder Letter
Franklin K2 Global Macro Opportunities Fund
Investment Manager
K2/D&S Management Co., L.L.C.
Distributor
Franklin Templeton Distributors, Inc.
(800) DIAL BEN® / 342-5236
franklintempleton.com
Shareholder Services
(800) 632-2301
Authorized for distribution only when accompanied or preceded by a summary prospectus and/or prospectus. Investors should carefully consider a fund’s investment goals, risks, charges and expenses before investing. A prospectus contains this and other information; please read it carefully before investing.
To help ensure we provide you with quality service, all calls to and from our service areas are monitored and/or recorded.
| | |
| © 2018 Franklin Templeton Investments. All rights reserved. | | 973 A 07/18 |
Item 2. Code of Ethics.
(a) The Registrant has adopted a code of ethics that applies to its principal executive officers and principal financial and accounting officer.
(c) N/A
(d) N/A
(f) Pursuant to Item 12(a)(1), the Registrant is attaching as an exhibit a copy of its code of ethics that applies to its principal executive officers and principal financial and accounting officer.
Item 3. Audit Committee Financial Expert.
(a)(1) The Registrant has an audit committee financial expert serving on its audit committee.
(2) The audit committee financial expert is Ann Torre Bates and she is “independent” as defined under the relevant Securities and Exchange Commission Rules and Releases.
Item 4. Principal Accountant Fees and Services.
(a) Audit Fees
The aggregate fees paid to the principal accountant for professional services rendered by the principal accountant for the audit of the registrant’s annual financial statements or for services that are normally provided by the principal accountant in connection with statutory and regulatory filings or engagements were $323,667 for the fiscal year ended May 31, 2018 and $308,106 for the fiscal year ended May 31, 2017.
(b) Audit-Related Fees
There were no fees paid to the principal accountant for assurance and related services rendered by the principal accountant to the registrant that are reasonably related to the performance of the audit of the registrant’s financial statements and are not reported under paragraph (a) of Item 4.
There were no fees paid to the principal accountant for assurance and related services rendered by the principal accountant to the registrant’s investment adviser and any entity controlling, controlled by or under common control with the investment adviser that provides ongoing services to the registrant that are reasonably related to the performance of the audit of their financial statements.
(c) Tax Fees
The aggregate fees paid to the principal accountant for professional services rendered by the principal accountant to the registrant for tax compliance, tax advice and tax planning were $10,575 for the fiscal year ended May 31, 2018 and $4,445 for the fiscal year ended May 31, 2017. The services for which these fees were paid include identifying
passive foreign investment companies to manage exposure to tax liabilities.
The aggregate fees paid to the principal accountant for professional services rendered by the principal accountant to the registrant’s investment adviser and any entity controlling, controlled by or under common control with the investment adviser that provides ongoing services to the registrant for tax compliance, tax advice and tax planning were $81,210 for the fiscal year ended May 31, 2018 and $75,060 for the fiscal year ended May 31, 2017. The services for which these fees were paid included technical tax consultation for withholding tax report to foreign governments, application of local country tax laws and tax advice.
(d) All Other Fees
There were no fees paid to the principal accountant for products and services rendered by the principal accountant to the registrant not reported in paragraphs (a)-(c) of Item 4.
There were no fees paid to the principal accountant for products and services rendered by the principal accountant to the registrant’s investment adviser and any entity controlling, controlled by or under common control with the investment adviser that provides ongoing services to the registrant other than the services reported in paragraphs (a)-(c) of Item 4.
(e) (1) The registrant’s audit committee is directly responsible for approving the services to be provided by the auditors, including:
(i) pre-approval of all audit and audit related services;
(ii) pre-approval of all non-audit related services to be provided to the Fund by the auditors;
(iii) pre-approval of all non-audit related services to be provided to the registrant by the auditors to the registrant’s investment adviser or to any entity that controls, is controlled by or is under common control with the registrant’s investment adviser and that provides ongoing services to the registrant where the non-audit services relate directly to the operations or financial reporting of the registrant; and
(iv) establishment by the audit committee, if deemed necessary or appropriate, as an alternative to committee pre-approval of services to be provided by the auditors, as required by paragraphs (ii) and (iii) above, of policies and procedures to permit such services to be pre-approved by other means, such as through establishment of guidelines or by action of a designated member or members of the committee; provided the policies and procedures are detailed as to the particular service and the committee is informed of each service and such policies and procedures do not include delegation of audit committee responsibilities, as contemplated under the Securities Exchange Act of 1934, to management; subject, in the case of (ii) through (iv), to any waivers, exceptions or exemptions that may be available under applicable law or rules.
(e) (2) None of the services provided to the registrant described in paragraphs (b)-(d) of Item 4 were approved by the audit committee pursuant to paragraph (c)(7)(i)(C) of Rule 2-01 of regulation S-X.
(f) No disclosures are required by this Item 4(f).
(g) The aggregate non-audit fees paid to the principal accountant for services rendered by the principal accountant to the registrant and the registrant’s investment adviser and any entity controlling, controlled by or under common control with the investment adviser that provides ongoing services to the registrant were $91,785 for the fiscal year ended May 31, 2018 and $79,505 for the fiscal year ended May 31, 2017.
(h) The registrant’s audit committee of the board has considered whether the provision of non-audit services that were rendered to the registrant’s investment adviser (not including any sub-adviser whose role is primarily portfolio management and is subcontracted with or overseen by another investment adviser), and any entity controlling, controlled by, or under common control with the investment adviser that provides ongoing services to the registrant that were not pre-approved pursuant to paragraph (c)(7)(ii) of Rule 2-01 of Regulation S-X is compatible with maintaining the principal accountant’s independence.
| | |
| Item 5. Audit Committee of Listed Registrants. | | N/A |
| |
| Item 6. Schedule of Investments. | | N/A |
| |
| Item 7. Disclosure of Proxy Voting Policies and Procedures for Closed- End Management Investment Companies. | | N/A |
| |
| Item 8. Portfolio Managers of Closed-End Management Investment Companies. | | N/A |
| |
| Item 9. Purchases of Equity Securities by Closed-End Management Investment Company and Affiliated Purchasers. | | N/A |
Item 10. Submission of Matters to a Vote of Security Holders.
There have been no changes to the procedures by which shareholders may recommend nominees to the Registrant’s Board of Trustees that would require disclosure herein.
Item 11. Controls and Procedures.
(a) Evaluation of Disclosure Controls and Procedures. The Registrant maintains disclosure controls and procedures that are designed to ensure that information required to be disclosed in the Registrant’s filings under the Securities Exchange Act of 1934 and the Investment Company Act of 1940 is recorded, processed, summarized and reported within the periods specified in the rules and forms of the Securities
and Exchange Commission. Such information is accumulated and communicated to the Registrant’s management, including its principal executive officer and principal financial officer, as appropriate, to allow timely decisions regarding required disclosure. The Registrant’s management, including the principal executive officer and the principal financial officer, recognizes that any set of controls and procedures, no matter how well designed and operated, can provide only reasonable assurance of achieving the desired control objectives.
Within 90 days prior to the filing date of this Shareholder Report on Form N-CSR, the Registrant had carried out an evaluation, under the supervision and with the participation of the Registrant’s management, including the Registrant’s principal executive officer and the Registrant’s principal financial officer, of the effectiveness of the design and operation of the Registrant’s disclosure controls and procedures. Based on such evaluation, the Registrant’s principal executive officer and principal financial officer concluded that the Registrant’s disclosure controls and procedures are effective.
(b) Changes in Internal Controls. There have been no changes in the Registrant’s internal controls or in other factors that could materially affect the internal controls over financial reporting subsequent to the date of their evaluation in connection with the preparation of this Shareholder Report on Form N-CSR.
Item 12. Disclosure of Securities Lending Activities for Closed-End Management Investment Company. N/A
Item 13. Exhibits.
(a) (1) Code of Ethics
(a) (2) Certifications pursuant to Section 302 of the Sarbanes-Oxley Act of 2002 of Matthew T. Hinkle, Chief Executive Officer - Finance and Administration, and Robert G. Kubilis, Chief Financial Officer and Chief Accounting Officer
(b) Certifications pursuant to Section 906 of the Sarbanes-Oxley Act of 2002 of Matthew T. Hinkle, Chief Executive Officer - Finance and Administration, and Robert G. Kubilis, Chief Financial Officer and Chief Accounting Officer
SIGNATURES
Pursuant to the requirements of the Securities Exchange Act of 1934 and the Investment Company Act of 1940, the registrant has duly caused this report to be signed on its behalf by the undersigned, thereunto duly authorized.
FRANKLIN ALTERATIVE STRATEGIES FUNDS
| | |
| By | | /s/ MATTHEW T. HINKLE |
| | Matthew T. Hinkle |
| | Chief Executive Officer – |
| | Finance and Administration |
| Date | | July 26, 2018 |
Pursuant to the requirements of the Securities Exchange Act of 1934 and the Investment Company Act of 1940, this report has been signed below by the following persons on behalf of the registrant and in the capacities and on the dates indicated.
| | |
| By | | /s/ MATTHEW T. HINKLE |
| | Matthew T. Hinkle |
| | Chief Executive Officer – |
| | Finance and Administration |
| Date | | July 26, 2018 |
| |
| By | | /s/ ROBERT G. KUBILIS |
| | Robert G. Kubilis |
| | Chief Financial Officer and |
| | Chief Accounting Officer |
| Date | | July 26, 2018 |