Annual Report
Franklin Pelagos Commodities Strategy Fund
Discussion of Fund Performance
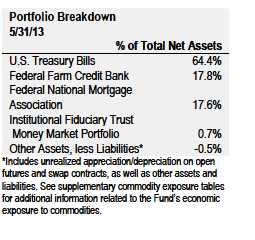
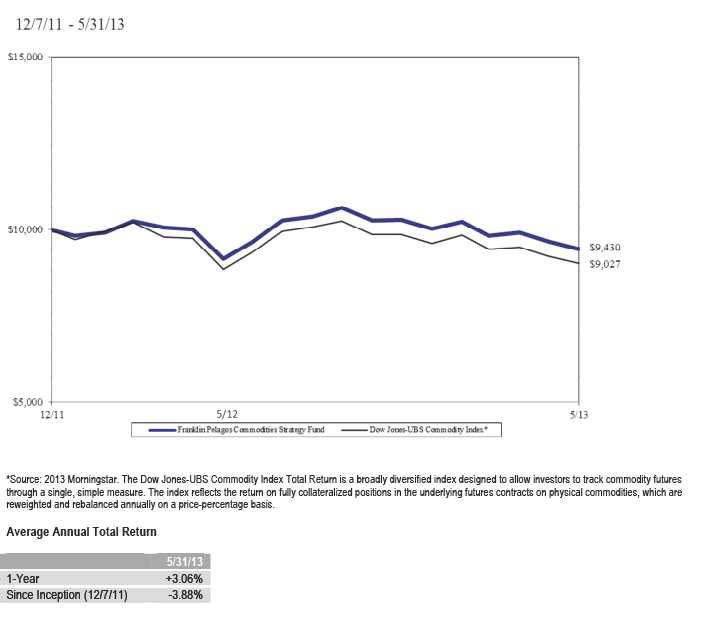
For the 12 months ended May 31, 2013, Franklin Pelagos Commodities Strategy Fund delivered a +3.06% cumulative total return.1 In comparison, its benchmark, the Dow Jones-UBS Commodity Index Total ReturnSM, which measures performance of fully collateralized positions of 22 underlying commodity futures (see the table on page 2), posted a total return of +1.84%.2 During the fiscal year, the Fund obtained its commodities exposure through swaps on commodities indexes and through commodities futures. These exposures were supported with U.S. Treasury bills and other fixed income securities. The value of these securities generally exceeded the notional value of the swaps and commodity futures.
During the period under review, commodities posted positive returns in aggregate, yet returns varied by sector. The grains sector led performance, with corn as the best performing commodity. The Fund benefited from an early summer 2012 overweighting in corn relative to the benchmark before moving to an underweighted position later in the summer. Accelerated U.S. planting of corn created vulnerabilities to summer heat, which reduced yields and supported higher corn prices. As corn conditions stabilized at historical ratings of “good” and “excellent,” the Fund moved toward an underweighting in grains because much of the impact from lower crop yields was no longer a factor. As a result, the Fund’s grain weightings over the summer months contributed positively to results, as did the ensuing underweighting. In contrast, the Fund’s underweighting in soybeans, another agricultural commodity that performed well, detracted from relative performance.
The Fund benefited from its underweighting in certain industrial metals over the period relative to its benchmark. Rising inventories against a backdrop of an increasing metals surplus weighed on price levels. Chinese metals demand slowed in reaction to a lack of large-scale government stimulus initiatives. The Chinese policy shift toward consumer-driven economic growth led to a declining intensity of metals use and muted restocking activity.
The energy sector was a strong performer over the period, led by natural gas and gasoline. The Fund benefited on an absolute basis from positive total returns for each energy commodity, and seasonal plays generally allowed the Fund’s energy sector holdings to outperform the benchmark’s. The U.S. natural gas supply glut diminished over the period as high inventory levels fell below five-year averages over the course of a colder-than-average winter. U.S. gasoline inventories remained below average for much of the period, which supported prices and kept refining margins attractive.
The precious metals sector lost value during the period as inflation expectations waned and investor sentiment deteriorated, evidenced by sustained outflows from gold exchange-traded holdings. Precious metals demonstrated strong performance in the first half of the period but turned sharply lower during the second half. Overall, the sector detracted from returns.
1 Fund investment results reflect an expense reduction, without which the return would have been lower. See the table on page 5.
2 Source: © 2013 Morningstar. All Rights Reserved. The information contained herein: (1) is proprietary to Morningstar and/or its content providers; (2) may not be copied or distributed; and (3) is not warranted to be accurate, complete or timely. Neither Morningstar nor its content providers are responsible for any damages or losses arising from any use of this information. Past performance is no guarantee of future results. The Dow Jones-UBS Commodity Indexes are calculated, distributed and marketed by CME Group Index Services, LLC (“CME Indexes”) pursuant to an agreement with UBS Securities, LLC and have been licensed for use. All content of the Dow Jones-UBS Commodity Indexes © CME Group Index Services, LLC and UBS Securities, LLC 2013. “Dow Jones®” is a registered trademark of Dow Jones Trademark Holdings LLC and has been licensed for use by CME Indexes. “UBS®” is a registered trademark of UBS AG. The index is unmanaged and includes reinvested dividends. One cannot invest directly in an index, and an index is not representative of the Fund’s portfolio.
Annual Report À 1
Fund Exposure to Commodities
The following table summarizes the Fund’s economic exposure to commodities derived through its investment in excess return swap contracts. At 5/31/13, the Fund’s exposure based on notional value represented 90.3% of consolidated net assets.

Annual Report À 2
Total Return Index Comparison for a Hypothetical $10,000 Investment
Total return represents the change in value of an investment over the periods shown. The performance table and graph do not reflect any taxes that a shareholder would pay on Fund dividends, capital gain distributions, if any, or any realized gains on the sales of Fund shares. Total return reflects reinvestment of the Fund’s dividends and capital gain distributions, if any, and any unrealized gains or losses. It includes any applicable maximum sales charge, Fund expenses, account fees and reinvested distributions. Fund investment results reflect an expense reduction, without which the total return would have been lower. The unmanaged index includes reinvestment of any income or distributions. It differs from the Fund in composition and does not pay management fees or expenses. One cannot invest directly in an index. Past performance does not guarantee future results.
Annual Report À 3
Your Fund’s Expenses
As a Fund shareholder, you can incur two types of costs:
· Transaction costs, including sales charges (loads) on Fund purchases, if any; and
· Ongoing Fund costs, including management fees, distribution and service (12b-1) fees, if any, and other Fund expenses. All mutual funds have ongoing costs, sometimes referred to as operating expenses.
The following table shows ongoing costs of investing in the Fund and can help you understand these costs and compare them with those of other mutual funds. The table assumes a $1,000 investment held for the six months indicated.
Actual Fund Expenses
The first line (Actual) listed in the table provides actual account values and expenses. The “Ending Account Value” is derived from the Fund’s actual return, which includes the effect of Fund expenses.
You can estimate the expenses you paid during the period by following these steps. Of course, your account value and expenses will differ from those in this illustration:
1. Divide your account value by $1,000.
If an account had an $8,600 value, then $8,600¸ $1,000 = 8.6.
2. Multiply the result by the number under the heading “Expenses Paid During Period.”
If Expenses Paid During Period were $7.50, then 8.6´ $7.50 = $64.50.
In this illustration, the estimated expenses paid this period are $64.50.
Hypothetical Example for Comparison with Other Funds
Information in the second line (Hypothetical) of the table can help you compare ongoing costs of investing in the Fund with those of other mutual funds. This information may not be used to estimate the actual ending account balance or expenses you paid during the period. The hypothetical “Ending Account Value” is based on the Fund’s actual expense ratio and an assumed 5% annual rate of return before expenses, which does not represent the Fund’s actual return. The figure under the heading “Expenses Paid During Period” shows the hypothetical expenses your account would have incurred under this scenario. You can compare this figure with the 5% hypothetical examples that appear in shareholder reports of other funds.
Annual Report À 4
Your Fund’s Expenses (continued)
Please note that expenses shown in the table are meant to highlight ongoing costs and do not reflect any transaction costs, such as sales charges, if any. Therefore, the second line is useful in comparing ongoing costs only, and will not help you compare total costs of owning different funds. In addition, if transaction costs were included, your total costs would have been higher.

*Expenses are calculated using the most recent annualized six-month expense ratio, net of expense waivers, of 1.10%, multiplied by the average account value over the period, multiplied by 182/365 to reflect the one-half year period.
Annual Report À 5
Franklin Pelagos Managed Futures Strategy Fund
Discussion of Fund Performance
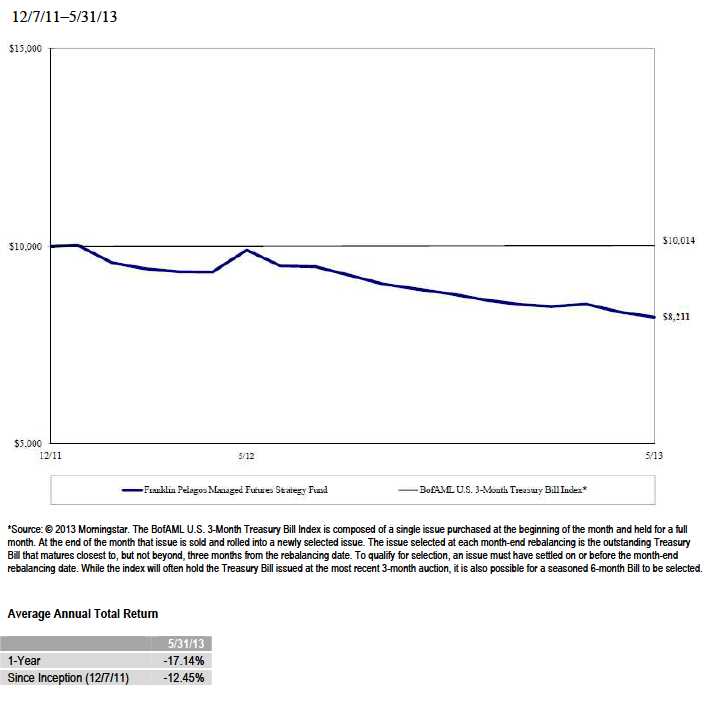
For the 12 months ended May 31, 2013, Franklin Pelagos Managed Futures Strategy Fund had a -17.14% cumulative total return.1 In comparison, the Bank of America Merrill Lynch (BofAML) U.S. 3-Month Treasury Bill Index posted a +0.12% total return.2
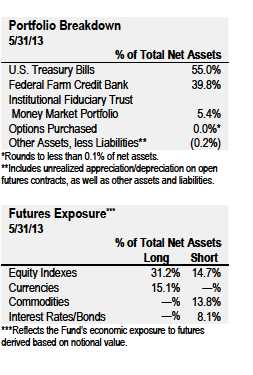
During the period under review, the Fund had exposures to futures and options on equity indexes, currencies, interest rates, bonds and commodities.
Global equity markets rose strongly for the period, with the Deutsche Boerse AG German Stock Index (DAX), France’s CAC 40 Index and Spain’s IBEX 35 Index outperforming the +27.28% total return of the Standard and Poor’s® 500 Index (S&P 500®).2 Short futures positions in the Euro STOXX 50, STOXX Europe 600 Banks, IBEX 35 and DAX, mostly in the earlier part of the period, accounted for the majority of the Fund’s negative performance.3 The Fund’s positioning in U.S. equity index futures also detracted from returns, as the benefit of long positions in the S&P 500 and NASDAQ 100 futures in 2013 were more than offset by losses from bearish futures and options positions in the S&P 500 and Russell 2000® indexes, largely in 2012.4 In contrast, short positioning in the Mexican Bolsa Index contributed to Fund performance.
Interest rate positioning detracted from Fund returns as a positive contribution from intermediate U.S. Treasury futures positioning was more than offset by losses from a bullish position in long-dated U.S. Treasury futures and bearish positions in Italian and French government bond futures.3 Currency market positioning detracted from Fund returns, with the exception of positioning in the Canadian dollar against the U.S. dollar, as our negative view on the exchange rate helped Fund returns. Australian dollar,3 euro,3 Japanese yen,3 Mexican peso3 and British pound positioning detracted from Fund performance.
Commodities, as measured by the Dow Jones-UBS Commodity Index, posted modest gains for the 12-month period.5 However, returns among individual commodities varied greatly as they became less correlated with one another, as well as with risk-based assets, during the period. Overall positioning in commodities detracted from Fund performance over the period. U.S. energy market positioning was a key detractor, particularly a long position in natural gas futures and a bearish put on West Texas Intermediate crude oil.3 Long positions in aluminum,3 silver3 and wheat3 also hurt returns, as did short positioning in soybeans and overall positioning in cotton3 and copper. In contrast, a major contributor to performance within commodities was a long position in corn, the top commodity performer.3 The Fund’s long positions in Brent crude oil and in gold, as well as short positions in platinum and zinc, also helped returns.3
1 Fund investment results reflect an expense reduction, without which the return would have been lower. See the table on page 9.
2 Source: © 2013 Morningstar. All Rights Reserved. The information contained herein: (1) is proprietary to Morningstar and/or its content providers; (2) may not be copied
or distributed; and (3) is not warranted to be accurate, complete or timely. Neither Morningstar nor its content providers are responsible for any damages or losses arising
from any use of this information. Past performance is no guarantee of future results. The index is unmanaged and includes reinvestment of any income or distributions.
One cannot invest directly in an index, and an index is not representative of the Fund’s portfolio. STANDARD & POOR’S®, S&P® and S&P 500® are registered
trademarks of Standard & Poor’s Financial Services LLC.
3 No longer held at period-end.
4 RUSSELL® is a trademark of the Frank Russell Company.
5 The Dow Jones-UBS Commodity Indexes are calculated, distributed and marketed by CME Group Index Services, LLC (“CME Indexes”) pursuant to an agreement with
UBS Securities, LLC and have been licensed for use. All content of the Dow Jones-UBS Commodity Indexes © CME Group Index Services, LLC and UBS Securities,
LLC 2013. “Dow Jones®” is a registered trademark of Dow Jones Trademark Holdings LLC and has been licensed for use by CME Indexes. “UBS®” is a registered
trademark of UBS AG.
Annual Report À 6
Total Return Index Comparison for a Hypothetical $10,000 Investment
Total return represents the change in value of an investment over the periods shown. The performance table and graph do not reflect any taxes that a shareholder would pay on Fund dividends, capital gain distributions, if any, or any realized gains on the sale of Fund shares. Total return reflects reinvestment of the Fund’s dividends and capital gain distributions, if any, and any unrealized gains or losses. It includes any applicable maximum sales charge, Fund expenses, account fees and reinvested distributions. Fund investment results reflect an expense reduction, without which the total return would have been lower. The unmanaged index includes reinvestment of any income or distributions. It differs from the Fund in composition and does not pay management fees or expenses. One cannot invest directly in an index. Past performance does not guarantee future results.
Annual Report À 7
Your Fund’s Expenses
As a Fund shareholder, you can incur two types of costs:
- Transaction costs, including sales charges (loads) on Fund purchases, if any; and
- Ongoing Fund costs, including management fees, distribution and service (12b-1) fees, if any, and other Fund expenses. All mutual funds have ongoing costs, sometimes referred to as operating expenses.
The following table shows ongoing costs of investing in the Fund and can help you understand these costs and compare them with those of other mutual funds. The table assumes a $1,000 investment held for the six months indicated.
Actual Fund Expenses
The first line (Actual) of the table provides actual account values and expenses. The “Ending Account Value” is derived from the Fund’s actual return, which includes the effect of Fund expenses.
You can estimate the expenses you paid during the period by following these steps. Of course, your account value and expenses will differ from those in this illustration:
1. Divide your account value by $1,000.
If an account had an $8,600 value, then $8,600¸ $1,000 = 8.6.
2. Multiply the result by the number under the heading “Expenses Paid During Period.”
If Expenses Paid During Period were $7.50, then 8.6´ $7.50 = $64.50.
In this illustration, the estimated expenses paid this period are $64.50.
Hypothetical Example for Comparison with Other Funds
Information in the second line (Hypothetical) of the table can help you compare ongoing costs of investing in the Fund with those of other mutual funds. This information may not be used to estimate the actual ending account balance or expenses you paid during the period. The hypothetical “Ending Account Value” is based on the Fund’s actual expense ratio and an assumed 5% annual rate of return before expenses, which does not represent the Fund’s actual return. The figure under the heading “Expenses Paid During Period” shows the hypothetical expenses your account would have incurred under this scenario. You can compare this figure with the 5% hypothetical examples that appear in shareholder reports of other funds.
Annual Report À 8
Your Fund’s Expenses (continued)
Please note that expenses shown in the table are meant to highlight ongoing costs and do not reflect any transaction costs, such as sales charges, if any. Therefore, the second line is useful in comparing ongoing costs only, and will not help you compare total costs of owning different funds. In addition, if transaction costs were included, your total costs would have been higher.

*Expenses are calculated using the most recent annualized six-month expense ratio, net of expense waivers, of 1.10%, multiplied by the average account value over the period, multiplied by 182/365 to reflect the one-half year period.
Annual Report À 9
Franklin Alternative Strategies Funds
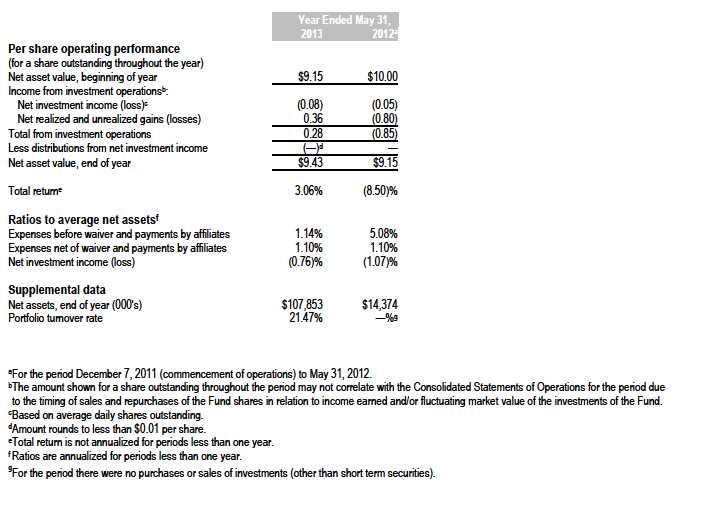
Consolidated Financial Highlights
Franklin Pelagos Commodities Strategy Fund
Annual Report | The accompanying notes are an integral part of these consolidated financial statements. | 10
Annual Report | The accompanying notes are an integral part of these consolidated financial statements. | 11
Franklin Alternative Strategies Funds
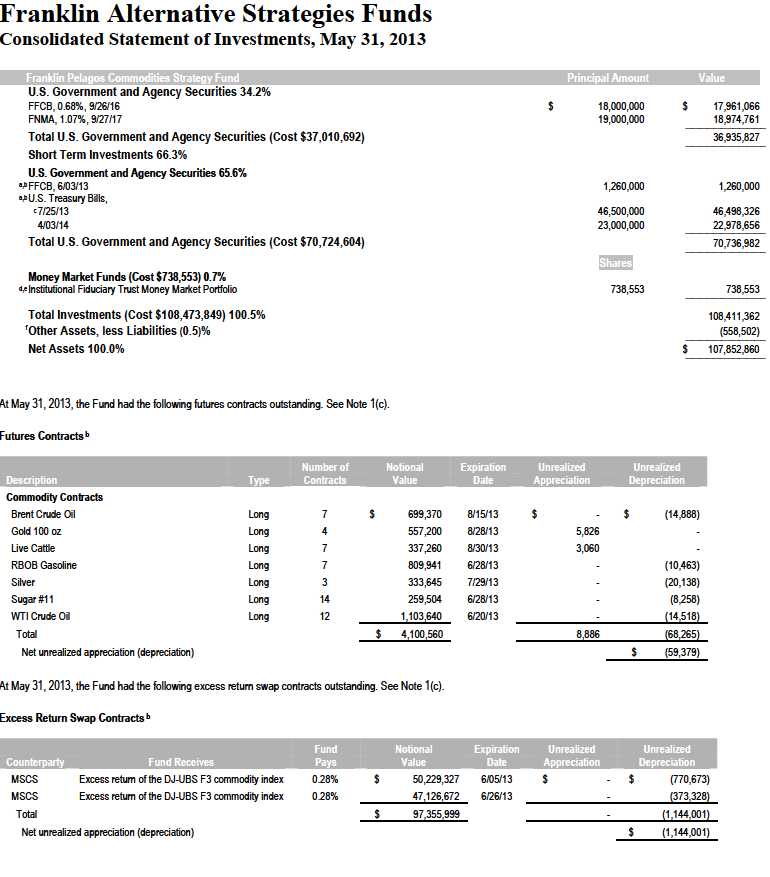
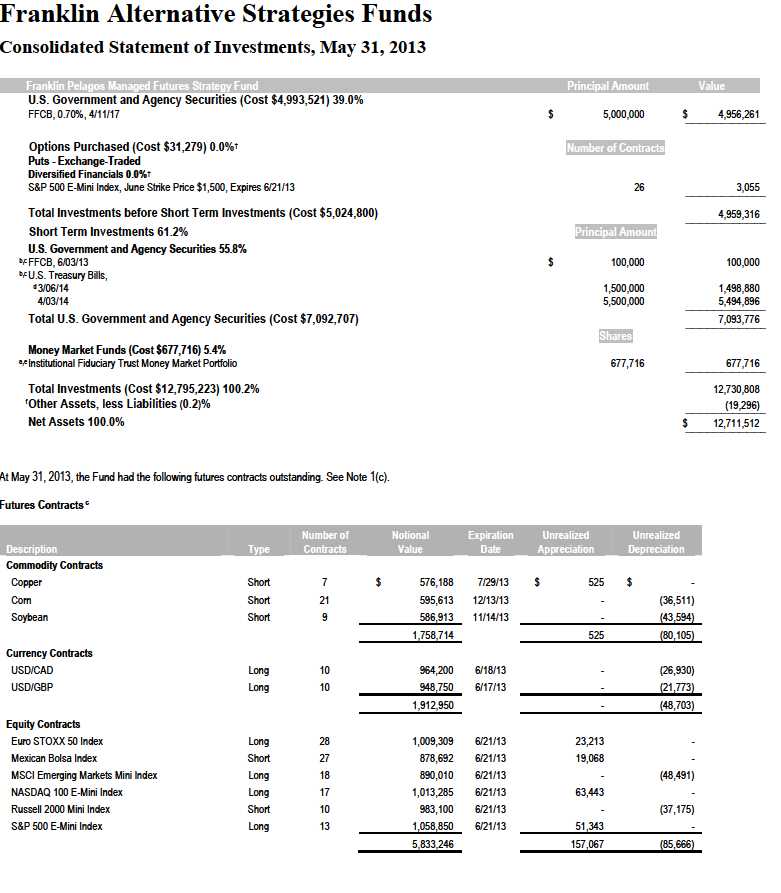
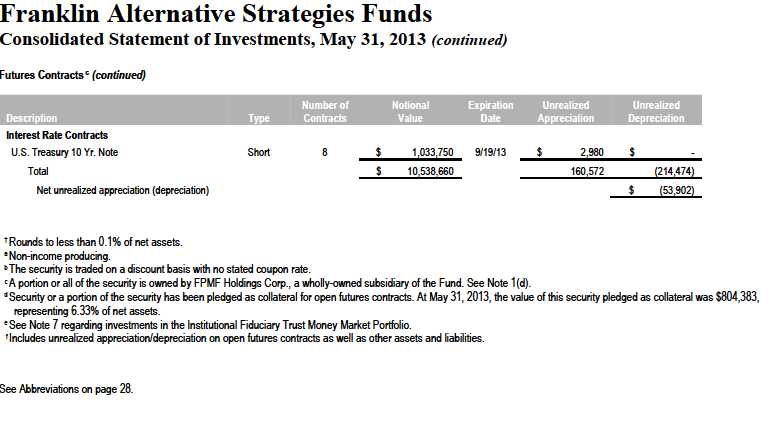
Consolidated Statement of Investments, May 31, 2013 (continued)
a The security is traded on a discount basis with no stated coupon rate.
b A portion or all of the security is owned by FPC Holdings Corp., a wholly-owned subsidiary of the Fund. See Note 1(d).
c Security or a portion of the security has been pledged as collateral for open futures and swap contracts. At May 31, 2013, the value of this security pledged as collateral was
$1,324,981, representing 1.23% of net assets.
d Non-income producing.
e See Note 7 regarding investments in the Institutional Fiduciary Trust Money Market Portfolio.
f Includes unrealized appreciation/depreciation on open futures and swap contracts, as well as other assets and liabilities.
See Abbreviations on page 28.
Annual Report | The accompanying notes are an integral part of these consolidated financial statements. | 12
Franklin Alternative Strategies Funds
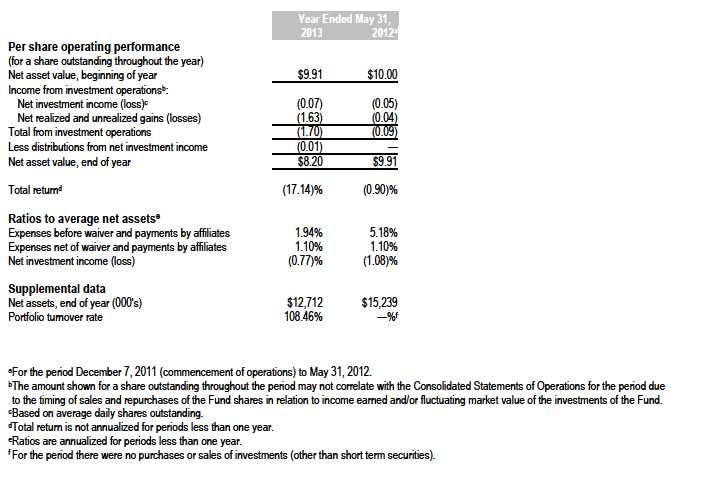
Consolidated Financial Highlights
Franklin Pelagos Managed Futures Strategy Fund
Annual Report | The accompanying notes are an integral part of these consolidated financial statements. | 13
Annual Report | The accompanying notes are an integral part of these consolidated financial statements. | 14
Annual Report | The accompanying notes are an integral part of these consolidated financial statements. | 15
Franklin Alternative Strategies Funds
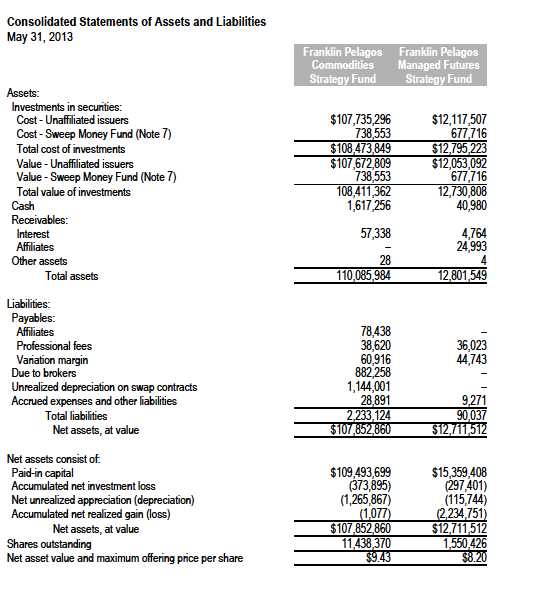
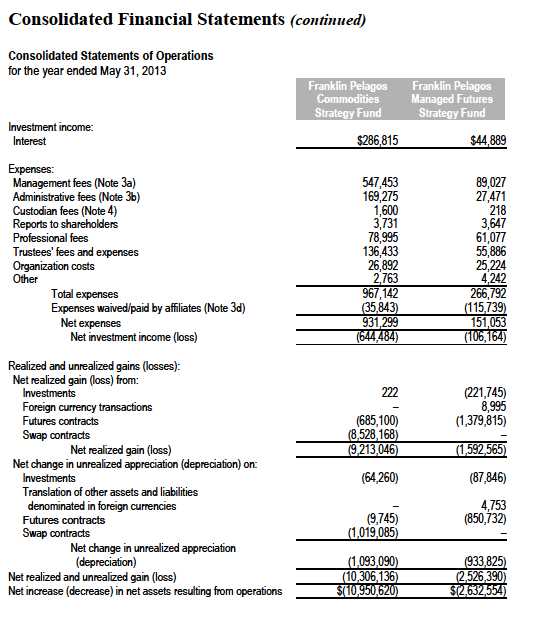
Consolidated Financial Statements
Annual Report | The accompanying notes are an integral part of these consolidated financial statements. | 16
Franklin Alternative Strategies Funds
Annual Report | The accompanying notes are an integral part of these consolidated financial statements. | 17
Franklin Alternative Strategies Funds
Consolidated Financial Statements (continued)
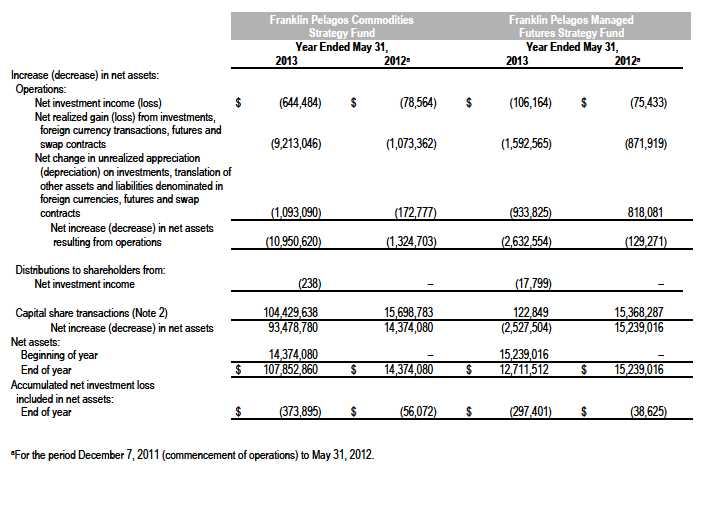
Consolidated Statements of Changes in Net Assets
Annual Report | The accompanying notes are an integral part of these consolidated financial statements. | 18
Franklin Alternative Strategies Funds
Notes to Consolidated Financial Statements
1. ORGANIZATION AND SIGNIFICANT ACCOUNTING POLICIES
Franklin Alternative Strategies Funds (Trust) is registered under the Investment Company Act of 1940, as amended, (1940 Act) as an open-end investment company, consisting of two funds, the Franklin Pelagos Commodities Strategy Fund and the Franklin Pelagos Managed Futures Strategy Fund (Funds). The shares of the Funds are issued in private placements and are exempt from registration under the Securities Act of 1933.
The following summarizes the Funds' significant accounting policies.
a. Financial Instrument Valuation
The Funds' investments in financial instruments are carried at fair value daily. Fair value is the price that would be received to sell an asset or paid to transfer a liability in an orderly transaction between market participants on the measurement date. Under procedures approved by the Trust's Board of Trustees (the Board), the Funds' administrator, investment manager and other affiliates have formed the Valuation and Liquidity Oversight Committee (VLOC). The VLOC provides administration and oversight of the Funds' valuation policies and procedures, which are approved annually by the Board. Among other things, these procedures allow the Funds to utilize independent pricing services, quotations from securities and financial instrument dealers, and other market sources to determine fair value.
Debt securities generally trade in the over-the-counter (OTC) market rather than on a securities exchange. The Funds' pricing services use multiple valuation techniques to determine fair value. In instances where sufficient market activity exists, the pricing services may utilize a market-based approach through which quotes from market makers are used to determine fair value. In instances where sufficient market activity may not exist or is limited, the pricing services also utilize proprietary valuation models which may consider market characteristics such as benchmark yield curves, credit spreads, estimated default rates, anticipated market interest rate volatility, coupon rates, anticipated timing of principal repayments, underlying collateral, and other unique security features in order to estimate the relevant cash flows, which are then discounted to calculate the fair value. Investments in open-end mutual funds are valued at the closing net asset value.
Derivative financial instruments (derivatives) listed on an exchange are valued at the official closing price of the day. Certain derivatives trade in the OTC market. The Funds’ pricing services use various techniques including industry standard option pricing models and proprietary discounted cash flow models to determine the fair value of those instruments. The Funds’ net benefit or obligation under the derivative contract, as measured by the fair market value of the contract, is included in net assets.
The Funds have procedures to determine the fair value of financial instruments for which market prices are not reliable or readily available. Under these procedures, the VLOC convenes on a regular basis to review such financial instruments and considers a number of factors, including significant unobservable valuation inputs, when arriving at fair value. The VLOC primarily employs a market-based approach which may use related or comparable assets or liabilities, recent transactions, market multiples, book values, and other relevant information for the investment to determine the fair value of the investment. An income-based valuation approach may also be used in which the anticipated future cash flows of the investment are discounted to calculate fair value. Discounts may also be applied due to the nature or duration of any restrictions on the disposition of the investments. Due to the inherent uncertainty of valuations of such investments, the fair values may differ significantly from the values that would have been used had an active market existed. The VLOC employs various methods for calibrating these valuation approaches including a regular review of key inputs and assumptions, transactional back-testing or disposition analysis, and reviews of any related market activity.
b. Foreign Currency Translation
Portfolio securities and other assets and liabilities denominated in foreign currencies are translated into U.S. dollars based on the exchange rate of such currencies against U.S. dollars on the date of valuation. The Funds may enter into foreign currency exchange contracts to facilitate transactions denominated in a foreign currency. Purchases and sales of securities, income and expense items denominated in foreign currencies are translated into U.S. dollars at the exchange rate in effect on the transaction date. Portfolio securities and assets and liabilities denominated in foreign currencies contain risks that those currencies will decline in value relative to the U.S. dollar. Occasionally, events may impact the availability or reliability of foreign exchange rates used to convert the U.S. dollar equivalent value. If such an event occurs, the foreign exchange rate will be valued at fair value using procedures established and approved by the Board.
The Funds do not separately report the effect of changes in foreign exchange rates from changes in market prices on securities held. Such changes are included in net realized and unrealized gain or loss from investments on the Consolidated Statements of Operations.
Annual Report | 19
Franklin Alternative Strategies Funds
Notes to Consolidated Financial Statements (continued)
| 1. | ORGANIZATION AND SIGNIFICANT ACCOUNTING POLICIES (continued) |
| b. | Foreign Currency Translation (continued) |
Realized foreign exchange gains or losses arise from sales of foreign currencies, currency gains or losses realized between the trade and settlement dates on securities transactions and the difference between the recorded amounts of dividends, interest, and foreign withholding taxes and the U.S. dollar equivalent of the amounts actually received or paid. Net unrealized foreign exchange gains and losses arise from changes in foreign exchange rates on foreign denominated assets and liabilities other than investments in securities held at the end of the reporting period.
c. Derivative Financial Instruments
The Funds invested in derivatives in order to gain exposure to various other investments or markets. Derivatives are financial contracts based on an underlying or notional amount, require no initial investment or an initial net investment that is smaller than would normally be required to have a similar response to changes in market factors, and require or permit net settlement. Derivatives contain various risks including the potential inability of the counterparty to fulfill their obligations under the terms of the contract, the potential for an illiquid secondary market, and/or the potential for market movements which expose the fund to gains or losses in excess of the amounts shown on the Consolidated Statements of Assets and Liabilities. Realized gain and loss and unrealized appreciation and depreciation on these contracts for the period are included in the Consolidated Statements of Operations.
The Franklin Pelagos Commodities Strategy Fund’s investments in OTC derivatives are subject to the terms of International Swaps and Derivatives Association Master Agreements and other related agreements between the fund and certain derivative counterparties. These agreements contain various provisions, including but not limited to collateral requirements, events of default, requirements for the fund to maintain certain net asset levels and/or limit the decline in net assets over various periods of time. Should the fund fail to meet any of these provisions, the derivative counterparty has the right to terminate the derivative contract and require immediate payment by the fund for those OTC derivatives with that particular counterparty that are in a net liability position. At May 31, 2013, the fund had OTC derivatives in a net liability position of $1,144,001 and the value of collateral pledged for such contracts was $810,000.
The Funds entered into exchange traded futures contracts primarily to gain exposure to commodity price, interest rate, or equity price risk and certain foreign currencies. A futures contract is an agreement between the fund and a counterparty to buy or sell an asset for a specified price on a future date. Required initial margin deposits of cash or securities are pledged by the fund. Subsequent payments, known as variation margin, are made or received by the fund, depending on fluctuations in the value of the asset underlying the futures contract. Such variation margin is accounted for as unrealized appreciation or depreciation until the contract is closed, at which time the gains or losses are realized.
The Franklin Pelagos Commodities Strategy Fund entered into OTC excess return swap contracts primarily to gain exposure to commodity price risk of an underlying asset or index. An excess return swap is an agreement between the fund and a counterparty to exchange a market linked return for a floating rate or fixed rate payment, both based upon a notional principal amount. Over the term of the contract, contractually required payments to be paid or received are accrued daily and recorded as unrealized depreciation or appreciation until the payments are made, at which time they are realized. Payments received or paid to recognize changes in the value of the underlying asset or index are recorded as realized gain or loss. Pursuant to the terms of the excess return swap contract, cash or securities may be required to be deposited as collateral. Unrestricted cash may be invested according to the fund’s investment objectives.
The Franklin Pelagos Managed Futures Strategy Fund purchased or wrote exchange traded option contracts primarily to gain exposure to equity price risk. An option is a contract entitling the holder to purchase or sell a specific amount of shares or units of an asset or notional amount of a swap (swaption), at a specified price. Options purchased are recorded as an asset while options written are recorded as a liability. Upon exercise of an option, the acquisition cost or sales proceeds of the underlying investment is adjusted by any premium received or paid. Upon expiration of an option, any premium received or paid is recorded as a realized gain or loss. Upon closing an option other than through expiration or exercise, the difference between the premium and the cost to close the position is recorded as a realized gain or loss. Pursuant to the terms of the written option contract, cash or securities may be required to be deposited as collateral.
See Note 8 regarding other derivative information.
Annual Report | 20
Franklin Alternative Strategies Funds
Notes to Consolidated Financial Statements (continued)
| 1. | ORGANIZATION AND SIGNIFICANT ACCOUNTING POLICIES (continued) |
| d. | Investments in FPC Holdings Corp. and FPMF Holdings Corp. (FP Subsidiaries) |
The Funds invest in certain financial instruments and commodity-linked derivative investments through their respective investments in the FP Subsidiaries. Both the FP Subsidiaries are Cayman Islands exempted liability companies, are wholly-owned subsidiaries of their respective funds, and are able to invest in certain financial instruments and commodity-linked derivative investments consistent with the investment objective of their respective funds. At May 31, 2013, the FP Subsidiaries’ investments, as well as any other assets and liabilities of the FP Subsidiaries are reflected in the Funds’ Consolidated Statements of Investments and Consolidated Statements of Assets and Liabilities. The financial statements have been consolidated and include the accounts of the Funds and their respective FP Subsidiaries. All intercompany transactions and balances have been eliminated. At May 31, 2013, the Funds’ investments in the FP Subsidiaries were as follows:

e. Income Taxes
It is each fund’s policy to qualify as a regulated investment company under the Internal Revenue Code. Each fund intends to distribute to shareholders substantially all of its taxable income and net realized gains to relieve it from federal income and excise taxes. As a result, no provision for U.S. federal income taxes is required.
Each fund recognizes the tax benefits of uncertain tax positions only when the position is “more likely than not” to be sustained upon examination by the tax authorities based on the technical merits of the tax position. As of May 31, 2013, and for all open tax years, each fund has determined that no liability for unrecognized tax benefits is required in each fund's consolidated financial statements related to uncertain tax positions taken on a tax return (or expected to be taken on future tax returns). Open tax years are those that remain subject to examination and are based on each tax jurisdiction statute of limitation.
f. Security Transactions, Investment Income, Expenses and Distributions
Security transactions are accounted for on trade date. Realized gains and losses on security transactions are determined on a specific identification basis. Interest income and estimated expenses are accrued daily. Amortization of premium and accretion of discount on debt securities are included in interest income. Distributions to shareholders are recorded on the ex-dividend date and are determined according to income tax regulations (tax basis). Distributable earnings determined on a tax basis may differ from earnings recorded in accordance with accounting principles generally accepted in the United States of America. These differences may be permanent or temporary. Permanent differences are reclassified among capital accounts to reflect their tax character. These reclassifications have no impact on net assets or the results of operations. Temporary differences are not reclassified, as they may reverse in subsequent periods. Common expenses incurred by the Trust are allocated among the Funds based on the ratio of net assets of each fund to the combined net assets of the Trust. Fund specific expenses are charged directly to the fund that incurred the expense.
g. Organization Costs
Organization costs were expensed as incurred.
h. Accounting Estimates
The preparation of consolidated financial statements in accordance with accounting principles generally accepted in the United States of America requires management to make estimates and assumptions that affect the reported amounts of assets and liabilities at the date of the consolidated financial statements and the amounts of income and expenses during the reporting period. Actual results could differ from those estimates.
Annual Report | 21
Franklin Alternative Strategies Funds
Notes to Consolidated Financial Statements (continued)
1. ORGANIZATION AND SIGNIFICANT ACCOUNTING POLICIES (continued) i. Guarantees and Indemnifications
Under the Trust's organizational documents, its officers and trustees are indemnified by the Trust against certain liabilities arising out of the performance of their duties to the Trust. Additionally, in the normal course of business, the Trust, on behalf of the Funds, enters into contracts with service providers that contain general indemnification clauses. The Trust's maximum exposure under these arrangements is unknown as this would involve future claims that may be made against the Trust that have not yet occurred. Currently, the Trust expects the risk of loss to be remote.
2. SHARES OF BENEFICIAL INTEREST
At May 31, 2013, there were an unlimited number of shares authorized (without par value). Transactions in the Funds' shares were as follows:

3. TRANSACTIONS WITH AFFILIATES
Franklin Resources, Inc. is the holding company for various subsidiaries that together are referred to as Franklin Templeton Investments. Certain officers and trustees of the Trust are also officers and/or directors of the following subsidiaries:

The Funds and FP Subsidiaries pay an investment management fee to Advisers of 0.65% per year of the average daily net assets of each of the Funds and FP Subsidiaries. Management fees paid by the Funds are reduced on assets invested in their respective FP Subsidiaries, in an amount not to exceed the management fees paid by the FP Subsidiaries.
Under subadvisory agreements between Advisers and Pelagos Capital Management, LLC (Pelagos), Pelagos provides subadvisory services to the Funds and FP Subsidiaries. The subadvisory fee is paid by Advisers based on the average daily net assets of each of the Funds and FP Subsidiaries, and is not an additional expense of the Funds or FP Subsidiaries.
Franklin Templeton Institutional LLC (FTI), an indirect subsidiary of Franklin Resources Inc., has a 20% ownership position in Pelagos. Effective June 13, 2013, FTI acquired 100% ownership position of Pelagos.
b. Administrative Fees
The Funds and FP Subsidiaries pay an administrative fee to FT Services of 0.20% per year of the average daily net assets of each of the Funds and FP Subsidiaries. Administrative fees paid by the Funds are reduced on assets invested in their respective FP Subsidiaries, in an amount not to exceed the administrative fees paid by the FP Subsidiaries.
Annual Report | 22
Franklin Alternative Strategies Funds
Notes to Consolidated Financial Statements (continued)
3. TRANSACTIONS WITH AFFILIATES (continued) c. Transfer Agent Fees
Investor Services, under terms of an agreement, performs shareholder servicing for the Funds and is not paid by the Funds for the services.
d. Waiver and Expense Reimbursements
Advisers and FT Services have contractually agreed in advance to waive or limit their respective fees and to assume as their own expense certain expenses otherwise payable by the Funds so that the expenses (excluding acquired fund fees and expenses) of the Funds do not exceed 1.10% (other than certain non-routine expenses or costs, including those relating to litigation, indemnification, reorganizations, and liquidations) until December 31, 2014.
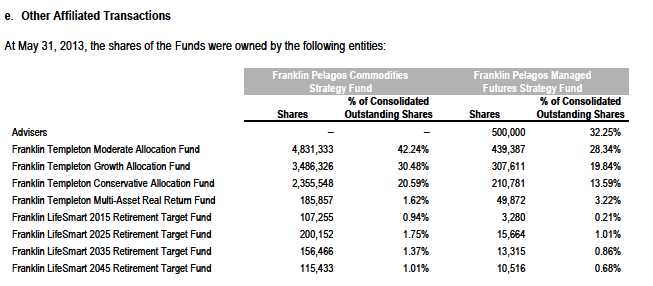
4. EXPENSE OFFSET ARRANGEMENT
The Funds have entered into an arrangement with their custodian whereby credits realized as a result of uninvested cash balances are used to reduce a portion of the Funds' custodian expenses. During the year ended May 31, 2013, there were no credits earned.
5. INCOME TAXES
For tax purposes, capital losses may be carried over to offset future capital gains, if any. At May 31, 2013, the capital loss carryforwards were as follows:

Annual Report | 23
Franklin Alternative Strategies Funds
Notes to Consolidated Financial Statements (continued)
5. INCOME TAXES (continued)
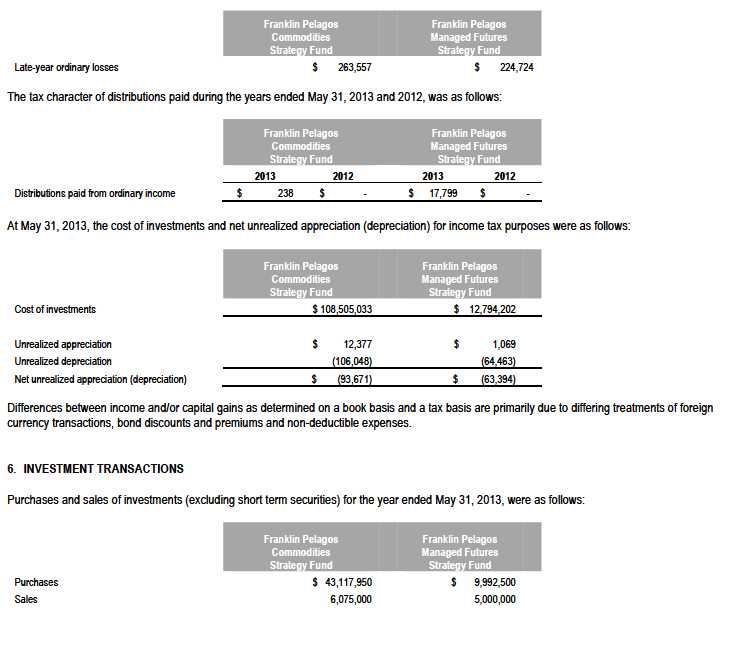
For tax purposes, the Funds may elect to defer any portion of a late-year ordinary loss to the first day of the following fiscal year. At May 31, 2013, the deferred late-year ordinary losses were as follows:
Annual Report | 24
Franklin Alternative Strategies Funds
Notes to Consolidated Financial Statements (continued)
7. INVESTMENTS IN INSTITUTIONAL FIDUCIARY TRUST MONEY MARKET PORTFOLIO
The Funds invest in the Institutional Fiduciary Trust Money Market Portfolio (Sweep Money Fund), an open-end investment company managed by Advisers. Management fees paid by the Funds are reduced on assets invested in the Sweep Money Fund, in an amount not to exceed the management and administrative fees paid by the Sweep Money Fund.
8. OTHER DERIVATIVE INFORMATION
At May 31, 2013, the Funds' investments in derivative contracts are reflected on the Consolidated Statements of Assets and Liabilities as follows:

Annual Report | 25
Franklin Alternative Strategies Funds
Notes to Consolidated Financial Statements (continued)
8. OTHER DERIVATIVE INFORMATION (continued)
For the year ended May 31, 2013, the effect of derivative contracts on the Funds’ Consolidated Statements of Operations was as follows:
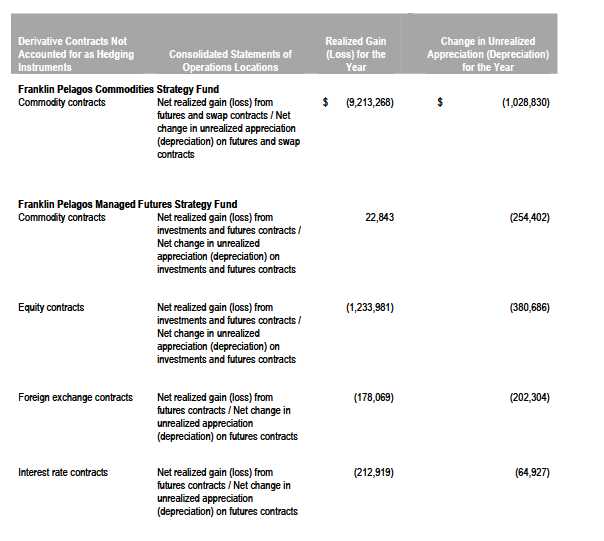
For the year ended May 31, 2013, the average month end market value of derivatives represented 4.74% and 5.59%, respectively, of average month end net assets. The average month end number of open derivative contracts for the year was 7 and 13, respectively.
See Note 1(c) regarding derivative financial instruments.
9. CREDIT FACILITY
The Funds, together with other U.S. registered and foreign investment funds (collectively, Borrowers), managed by Franklin Templeton Investments, are borrowers in a joint syndicated senior unsecured credit facility totaling $1.5 billion (Global Credit Facility) which matures on January 17, 2014. This Global Credit Facility provides a source of funds to the Borrowers for temporary and emergency purposes, including the ability to meet future unanticipated or unusually large redemption requests.
Under the terms of the Global Credit Facility, the Funds shall, in addition to interest charged on any borrowings made by the Funds and other costs incurred by the Funds, pay their share of fees and expenses incurred in connection with the implementation and maintenance of the Global Credit
Annual Report | 26
Franklin Alternative Strategies Funds
Notes to Consolidated Financial Statements (continued)
9. CREDIT FACILITY (continued)
Facility, based upon their relative share of the aggregate net assets of all of the Borrowers, including an annual commitment fee of 0.07% based upon the unused portion of the Global Credit Facility. These fees are reflected in other expenses on the Consolidated Statements of Operations. During the year ended May 31, 2013, the Funds did not use the Global Credit Facility.
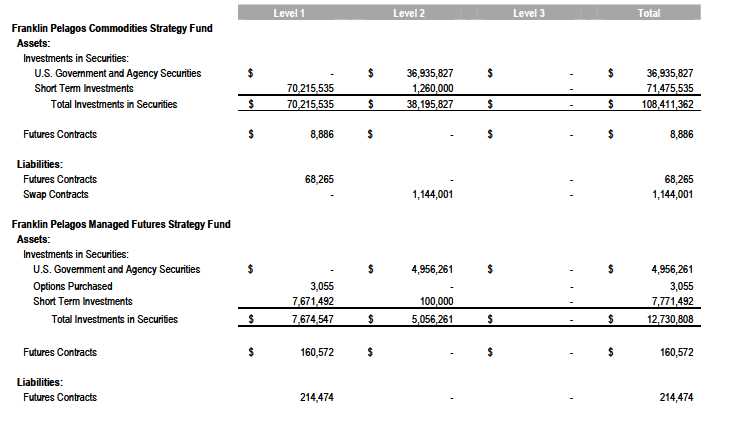
10. FAIR VALUE MEASUREMENTS
The Funds follow a fair value hierarchy that distinguishes between market data obtained from independent sources (observable inputs) and the Funds’ own market assumptions (unobservable inputs). These inputs are used in determining the value of the Funds’ financial instruments and are summarized in the following fair value hierarchy:
· Level 1 – quoted prices in active markets for identical financial instruments
· Level 2 – other significant observable inputs (including quoted prices for similar financial instruments, interest rates, prepayment speed, credit risk, etc.)· Level 3 – significant unobservable inputs (including the Funds’ own assumptions in determining the fair value of financial instruments)
The inputs or methodology used for valuing financial instruments are not an indication of the risk associated with investing in those financial instruments.
For movements between the levels within the fair value hierarchy, the Funds have adopted a policy of recognizing the transfers as of the date of the underlying event which caused the movement.
A summary of inputs used as of May 31, 2013, in valuing the Funds’ assets and liabilities carried at fair value, is as follows:
Annual Report | 27
Franklin Alternative Strategies Funds
Notes to Consolidated Financial Statements (continued)
11. NEW ACCOUNTING PRONOUNCEMENTS
In December 2011, the Financial Accounting Standards Board (FASB) issued Accounting Standards Update (ASU) No. 2011-11, Balance Sheet (Topic 210): Disclosures about Offsetting Assets and Liabilities. The amendments in the ASU enhance disclosures about offsetting of financial assets and liabilities to enable investors to understand the effect of these arrangements on a fund’s financial position. In January 2013, FASB issued ASU No. 2013-01, Balance Sheet (Topic 210): Clarifying the Scope of Disclosures about Offsetting Assets and Liabilities. The amendments in ASU No. 2013-01 clarify the intended scope of disclosures required by ASU No. 2011-11. These ASUs are effective for interim and annual reporting periods beginning on or after January 1, 2013. The Funds believe the adoption of these ASUs will not have a material impact on their consolidated financial statements.
In June 2013, FASB issued ASU No. 2013-08, Investment Companies (Topic 946): Amendments to the Scope, Measurement, and Disclosure Requirements. The ASU modifies the criteria used in defining an investment company under U.S. Generally Accepted Accounting Principles and also sets forth certain measurement and disclosure requirements. Under the ASU, an entity that is regulated under the 1940 Act automatically qualifies as an investment company. The ASU is effective for interim and annual reporting periods beginning after December 15, 2013. The Funds are currently reviewing the requirements and believe the adoption of this ASU will not have a material impact on their consolidated financial statements.
12. SUBSEQUENT EVENTS
The Funds have evaluated subsequent events through the issuance of the consolidated financial statements and determined that no events have occurred that require disclosure other than those already disclosed in the consolidated financial statements.

Annual Report | 28
Franklin Alternative Strategies Funds
Report of Independent Registered Public Accounting Firm
To the Board of Trustees of Franklin Alternative Strategies Funds and Shareholders of Franklin Pelagos Commodities Strategy Fund and Franklin Pelagos Managed Futures Strategy Fund:
We have audited the accompanying statements of assets and liabilities of Franklin Pelagos Commodities Strategy Fund and Franklin Pelagos Managed Futures Strategy Fund (the Funds constituting the Franklin Alternative Strategies Funds) (the “Funds”), including the consolidated statements of investments, as of May 31, 2013, the related statements of operations for the year then ended, the statements of changes in net assets and the financial highlights for each of the periods indicated therein. These financial statements and financial highlights are the responsibility of the Funds’ management. Our responsibility is to express an opinion on these consolidated financial statements and financial highlights based on our audits.
We conducted our audits in accordance with the standards of the Public Company Accounting Oversight Board (United States). Those standards require that we plan and perform the audit to obtain reasonable assurance about whether the financial statements and financial highlights are free of material misstatement. We were not engaged to perform an audit of the Funds’ internal control over financial reporting. Our audits included consideration of internal control over financial reporting as a basis for designing audit procedures that are appropriate in the circumstances, but not for the purpose of expressing an opinion on the effectiveness of the Funds’ internal control over financial reporting. Accordingly, we express no such opinion. An audit also includes examining, on a test basis, evidence supporting the amounts and disclosures in the financial statements and financial highlights, assessing the accounting principles used and significant estimates made by management, and evaluating the overall financial statement presentation. Our procedures included confirmation of securities owned as of May 31, 2013, by correspondence with the custodian and brokers. We believe that our audits provide a reasonable basis for our opinion.
In our opinion, the financial statements and financial highlights referred to above present fairly, in all material respects, the financial positions of Franklin Pelagos Commodities Strategy Fund and Franklin Pelagos Managed Futures Strategy Fund at May 31, 2013, the results of their operations for the year then ended, the changes in their net assets and the financial highlights for each of the periods indicated therein, in conformity with U.S. generally accepted accounting principles.

Boston, Massachusetts
July 23, 2013
Annual Report | 29
Franklin Alternative Strategies Funds
Board Members and Officers
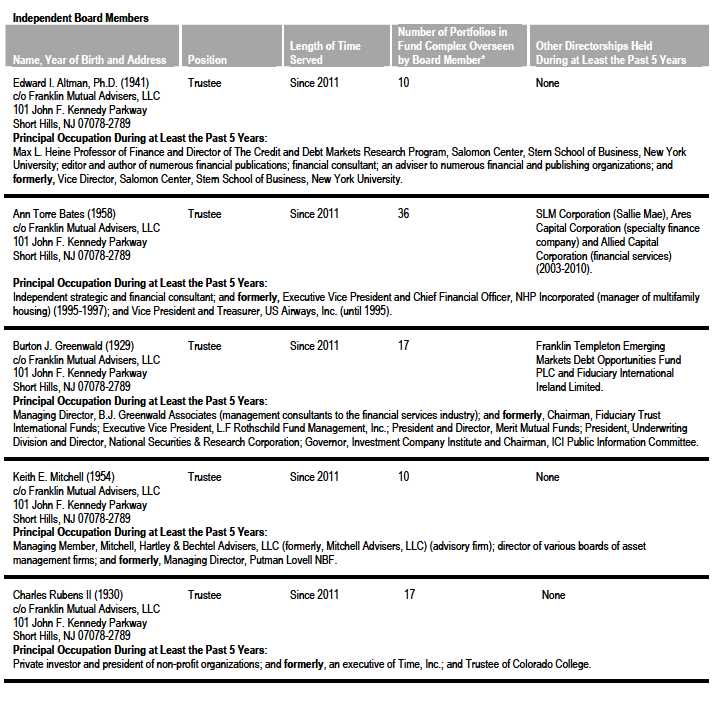
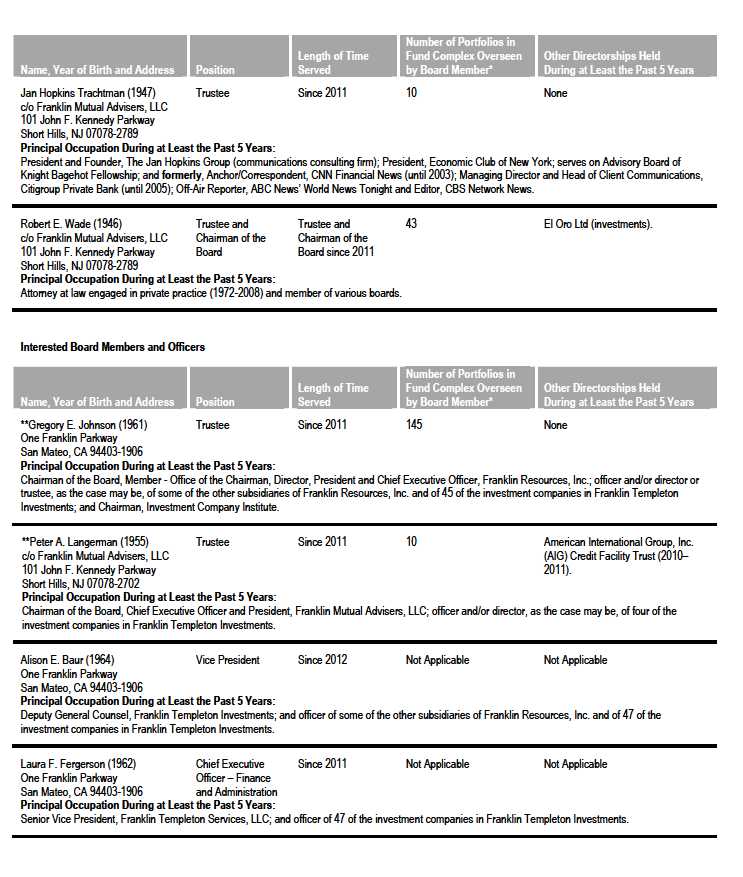
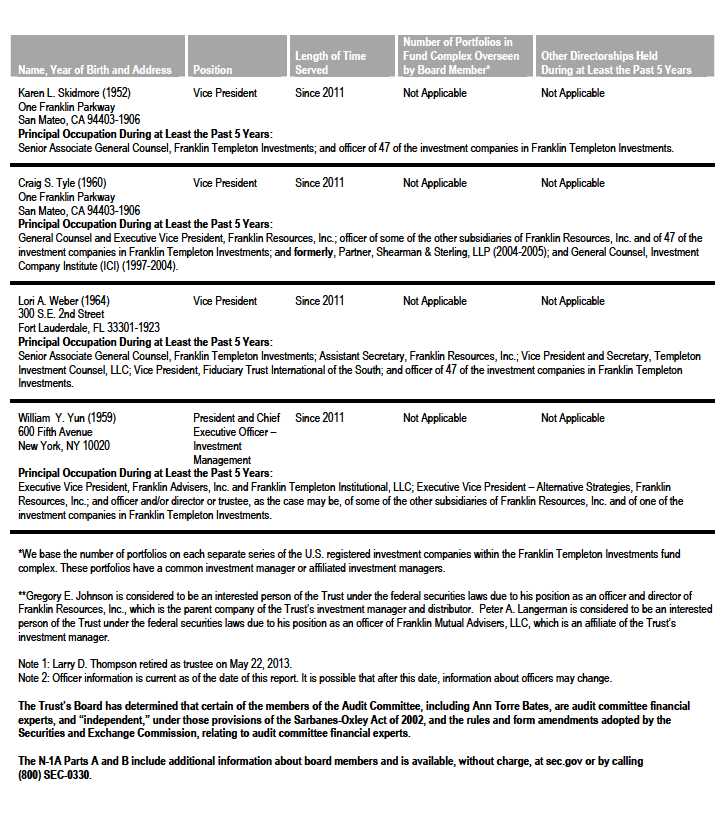
The name, year of birth and address of the officers and board members, as well as their affiliations, positions held with the Trust, principal occupations during at least the past five years and numbers of portfolios overseen in the Franklin Templeton Investments fund complex are shown below. Generally, each board member serves until that person’s successor is elected and qualified.
Annual Report À 30
Annual Report À 31

Annual Report À 32
Annual Report À 33
Franklin Alternative Strategies Funds
Shareholder Information
Board Review of Investment Management Agreement
Background Information
Since each Fund commenced operations on December 7, 2011, Franklin Advisers, Inc. (“FAI”) has served as the investment manager and Pelagos Capital Management, LLC (“Pelagos”) has served as a subadviser to each Fund pursuant to separate investment management agreements (each an “Investment Management Agreement”) and subadvisory agreements (each a “Current Subadvisory Agreement”) dated November 4, 2011. Prior to the commencement of operations of each Fund, Franklin Templeton Institutional, LLC (“FTI”), an affiliate of FAI and an indirect subsidiary of Franklin Resources, Inc., acquired a 20% ownership interest in Pelagos with the right to increase its equity ownership. Stephen P. Burke, Chief Executive Officer, Chief Compliance Officer and Portfolio Manager of Pelagos, and John C. Pickart, Chief Financial Officer, Chief Investment Officer and Portfolio Manager of Pelagos, are the other principal shareholders of Pelagos. FTI determined to exercise its right to acquire the remaining 80% equity interest in Pelagos from Messrs. Burke and Pickart and acquired the remaining equity interest on June 6, 2013 (the “Management Buyout”).
The closing of the Management Buyout constituted an “assignment” (as defined in the Investment Company Act of 1940, as amended (the “1940 Act”)) of each of the Current Subadvisory Agreements and, as a result, the Current Subadvisory Agreements with Pelagos terminated automatically pursuant to the 1940 Act. Section 15(a) of the 1940 Act requires that the Board of Trustees (the “Board”) and the shareholders of each Fund approve a new subadvisory agreement between FAI and Pelagos with respect to each Fund (each a “New Subadvisory Agreement” and collectively, the “New Subadvisory Agreements”) that would become effective upon the termination of the Current Subadvisory Agreements. On June 5, 2013, shareholders of each Fund approved their New Subadvisory Agreement.
The discussion set forth below describes the Board’s approval of the New Subadvisory Agreements and renewal of the Investment Management Agreements, as well as the Funds’ administrative services agreements. To account for the possibility that the New Subadvisory Agreements would not be approved by shareholders, the Board also approved renewal of the Current Subadvisory Agreements, a discussion of which is also included below. The Investment Management Agreements, the New Subadvisory Agreements and the Current Subadvisory Agreements are sometimes collectively referred to herein as the “Agreements.”
Renewal and/or Approval of the Agreements
The Board, including a majority of the Trustees who are not “interested persons” as defined in the 1940 Act (“Independent Trustees”) of the Trust, at an in-person meeting held on May 21, 2013, unanimously approved each New Subadvisory Agreement and determined to recommend that shareholders approve the New Subadvisory Agreements. In addition, the Board approved renewal of the Investment Management Agreements, the Funds’ administrative services agreements and the Current Subadvisory Agreements.
Prior to a meeting of all of the Trustees for the purpose of considering such approval, the Independent Trustees held two meetings dedicated to the approval process (those Trustees unable to attend in person were present by telephonic conference means). Throughout the process, the Independent Trustees received assistance and advice from and met separately with independent counsel. The Independent Trustees met with and interviewed officers of FAI and Pelagos (including portfolio managers).
In approving the Agreements, the Board, including the Independent Trustees, determined that the existing investment management fee structure was fair and reasonable and that approval of each Agreement was in the best interests of each Fund and its shareholders. In this regard, the Board noted that the terms of the New Subadvisory Agreements were substantially similar to those of the Current Subadvisory Agreements. The Board also concluded that the Management Buyout would not result in an increase in investment management fee rates and was not expected to result in a decrease in quality or quantity of services from Pelagos, or impose an “unfair burden” on the Funds. In this regard, the Board considered the terms and conditions of the Management Buyout and the consideration paid to Messrs. Burke and Pickart. The Board noted that Messrs. Burke and Pickart would continue to have primary day-to-day portfolio responsibilities for the Funds. The Board also noted that, consistent with Section 15(f) of the 1940 Act, FAI, FTI and Pelagos had agreed that no “unfair burden” would be imposed on the Funds for the first two years after the Management Buyout.
In reaching their decision on the Agreements, the Trustees took into account information furnished throughout the year at regular Board meetings, as well as information specifically requested and furnished for the approval process, which culminated in the meetings referred to above for the specific purpose of considering the Agreements. Information furnished throughout the year included, among others, the Funds’
Annual Report À 34
Registration Statement on Form N-1A, reports on each Fund’s investment performance, expenses, portfolio composition, derivatives, asset segregation, portfolio turnover, legal and compliance matters, pricing of securities and net flows, along with related financial statements and other information about the scope and quality of services provided by FAI and Pelagos and enhancements to such services over the past year. In addition, the Trustees received periodic reports throughout the year and during the approval process relating to compliance with each Fund’s investment policies and restrictions and reports by FAI on the diligence conducted by FAI and/or its affiliates and representatives on Pelagos, including, but not limited to, Pelagos’s operations, policies, procedures and compliance functions and the integration of such operations, policies, procedures and compliance functions with those of FAI. During the approval process, the Independent Trustees considered FAI’s and Pelagos’s methods of operation within the Franklin Templeton group and their activities on behalf of other clients.
The information obtained by the Trustees during the approval process also included a special report prepared by Lipper, Inc. (“Lipper”), an independent third-party analyst, comparing each Fund’s investment performance and expenses with those of other mutual funds deemed comparable to such Fund as selected by Lipper (“Lipper Section 15(c) Report”). The Trustees reviewed the Lipper Section 15(c) Report and its usefulness in the approval process with respect to matters such as comparative fees, expenses, expense ratios and performance. They concluded that the report was a reliable resource in the performance of their duties.
In addition, the Trustees received a profitability study prepared by management discussing the profitability to Franklin Templeton Investments from its overall U.S. fund operations, as well as on an individual fund-by-fund basis. Over the past year, the Board and counsel to the Independent Trustees continued to receive reports on management’s handling of recent regulatory actions and pending legal actions against the investment manager and its affiliates. The Independent Trustees were satisfied with the actions taken to date by management in response to such regulatory and legal proceedings.
Particular attention was given to the diligent risk management procedures of FAI and Pelagos, including continuous monitoring and management of counterparty credit risk and collateral, and attention given to derivatives and other complex instruments that are held and expected to be held by the Funds and how such instruments are used to carry out the Funds’ investment objectives. The Board also took into account, among other things, management’s efforts in establishing a global credit facility for the benefit of the Funds and other accounts managed by Franklin Templeton Investments to provide a source of cash for temporary and emergency purposes or to meet unusual redemption requests as well as the strong financial position of the investment manager’s parent company and its commitment to the mutual fund business. In addition, the Board received updates from management on the SEC’s progress in implementing the rule-making requirements established by the Dodd-Frank Wall Street Reform and Consumer Protection Act, which was enacted July 21, 2010, and the compliance of FAI and Pelagos with rules and regulations already promulgated by the SEC under such act, as well as the compliance of FAI and Pelagos with new rules and regulations promulgated by the U.S. Commodity Futures Trading Commission.
In addition to the above and other matters considered by the Trustees throughout the course of the year, the following discussion relates to certain primary factors relevant to the Board’s decision. This discussion of the information and factors considered by the Board (as well as the discussion above) is not intended to be exhaustive, but rather summarizes certain factors considered by the Board. In view of the wide variety of factors considered, the Board did not, unless otherwise noted, find it practicable to quantify or otherwise assign relative weights to the foregoing factors. In addition, individual Trustees may have assigned different weights to various factors.
Nature, Extent and Quality of Services. The Trustees reviewed the nature, extent and quality of the services provided, and to be provided following the Management Buyout, by FAI and Pelagos. In this regard, they reviewed each Fund’s actively managed fundamental and quantitative investment philosophy and process and FAI’s and Pelagos’s ability to implement such philosophy and process, including, but not limited to, FAI’s and Pelagos’s trading practices and investment decision processes. In reviewing the nature, extent, and quality of services, the Board considered that each New Subadvisory Agreement will be substantially similar to the Current Subadvisory Agreement. In addition, the Board noted that would be no changes in the investment personnel or management of Pelagos as a result of the Management Buyout.
The Board noted the responsibilities that FAI has as the Funds’ investment manager, including overall supervisory responsibility for the general management of the Funds, ultimate responsibility, subject to oversight by the Board, for oversight of Pelagos, preparing quarterly reporting to the Board, and the implementation of Board directives as they relate to the Funds.
With respect to the subadvisory services provided by Pelagos, the Board noted the significant responsibilities that Pelagos has as the Funds’ subadviser, including, among others, implementing the Funds’ investment goals and ensuring compliance with the Funds’ investment goals, policies, and limitations. The Trustees also considered the successful performance of Pelagos in managing another mutual fund with similar investment goals as the Funds. The Board also considered the subadvisory services that Pelagos provides to each Cayman Island-based company, which is wholly owned by each Fund (each a “Cayman Subsidiary”).
Annual Report À 35
The Trustees reviewed each Fund’s portfolio management team at FAI and Pelagos, including its performance, staffing, skills and compensation program. With respect to portfolio manager compensation, management assured the Trustees that each Fund’s long-term performance is a significant component of incentive-based compensation. The Trustees noted that the portfolio manager compensation program aligned the interests of the portfolio managers with that of shareholders of the Funds. The Trustees considered various other products, portfolios and entities that are advised by FAI and Pelagos and the allocation of assets and expenses among and within them, as well as their relative fees and reasons for differences with respect thereto and any potential conflicts. The Board considered FAI’s significant efforts in developing and implementing compliance procedures established in accordance with SEC and other requirements and the integration of Pelagos’ operations, policies, procedures and compliance functions with those of FAI. The Board also considered the nature, extent and quality of the services to be provided under the other service agreements with affiliates of FAI.
During regular Board meetings and the aforementioned meetings of the Independent Trustees, the Trustees considered periodic reports provided to them showing that FAI and Pelagos complied with the investment policies and restrictions of the Funds as well as other reports periodically furnished to the Board covering matters such as the compliance of portfolio managers and other management personnel with the code of ethics covering the investment management personnel, the adherence to fair value pricing procedures established by the Board and the accuracy of net asset value calculations.
Based on their review, the Trustees were satisfied with the nature and quality of the overall services provided, and to be provided following the Management Buyout, by FAI and Pelagos to each Fund and its shareholders and were confident in the abilities of the management team to continue to implement each Fund’s actively managed fundamental and quantitative investment philosophy and process and to provide quality services to each Fund and its shareholders.
Investment Performance. As the Funds commenced operations in December 2011, the Trustees reviewed the investment performance of each Fund for the one-year period ended December 31, 2012 and since inception. In light of the limited operating history of the Funds, the Board considered the investment performance of Pelagos with respect to the other mutual fund it subadvises with similar investment objectives as the Funds. As part of their review, they inquired of management regarding benchmarks, hedging activities, and restrictions on permitted investments. Consideration was also given to performance in the context of available levels of cash, including as affected by net flows, during the periods. The Trustees had meetings during the year, including the meetings referred to above held in connection with the approval process, with the Funds’ portfolio managers to discuss performance and the management of the Funds. The Trustees also compared Fund performance to other industry benchmarks as part of their evaluation of investment performance.
In addition, attention in assessing performance was given to the Lipper Section 15(c) Report. That report showed the investment performance of each Fund in comparison to other funds determined comparable by Lipper.
With respect to the Franklin Pelagos Commodities Fund (the “Commodities Fund”), the comparable funds to the Commodities Fund, as chosen by Lipper, included all retail and institutional commodities general funds. The Commodities Fund had total returns in the second best performing quintile for the one-year period ended December 31, 2012. The Board was satisfied with such comparative performance.
With respect to the Franklin Pelagos Managed Futures Fund (the “Managed Futures Fund”), the comparable funds to the Managed Futures Fund, as chosen by Lipper, included all retail and institutional managed futures funds. The Managed Futures Fund had total returns in the lowest performing quintile for the one-year period ended December 31, 2012. The Board discussed with FAI and Pelagos the reasons for the relative underperformance for the one-year period ended December 31, 2012. While noting such discussions and the comparative costs and the limited operating history of the Managed Futures Fund, and intending to continuously monitor future performance, the Board found such comparative performance to be acceptable.
Comparative Expenses and Profitability. The Trustees considered the cost of the services provided and to be provided and the losses incurred by FAI and its affiliates (other than Pelagos) from their respective relationships with the Funds. The Trustees also considered the cost of the services provided and to be provided and the profits realized by Pelagos from its relationship with the Funds. The Board considered the extent to which FAI and Pelagos may derive ancillary benefits from Fund operations. In considering the appropriateness of the management fee and other expenses charged to each Fund, the Board took into account various factors including investment performance and matters relating to Fund operations, including, but not limited to, the quality and experience of the portfolio managers and research staff. The Board noted that the subadvisory fees would be paid by FAI to Pelagos and would not be additional fees to be borne by the Funds. As part of this discussion, the Board took into account the fee waiver and expense limitation arrangement in effect through December 31, 2014. The Board also considered the subadvisory services that Pelagos provides to each Cayman Subsidiary and the related fee waivers that were in place. The Board considered the nature of the services provided by Pelagos to the other mutual fund it subadvises with similar investment objectives as the Funds, the fees that it charges for such services and any potential conflicts.
Annual Report À 36
Consideration was also given to a comparative analysis in the Lipper Section 15(c) Report of the investment management fee and total expense ratio of each Fund in comparison with those of a group of other funds selected by Lipper as its appropriate Lipper expense group. In reviewing comparative costs, emphasis was given to each Fund’s contractual management fee in comparison with the contractual management fee that would have been charged by other funds within its Lipper expense group assuming they were similar in size to such Fund, as well as the actual total expenses of each Fund in comparison with those of its Lipper expense group. It was noted that the Lipper contractual management fee analysis includes administrative charges as being part of the management fee.
With respect to the Commodities Fund, the Commodities Fund’s contractual management fee rate was in the second-least expensive quintile of its Lipper expense group, its total expenses (excluding Rule 12b-1 fees) were in the middle quintile of such group and its total expenses (including Rule 12b-1 fees) were in the second-least expensive quintile of such group. The Board was satisfied with such comparative fees and expenses.
With respect to the Managed Futures Fund, the Managed Futures Fund’s contractual management fee rate was in the least expensive quintile of its Lipper expense group and its total expenses (both including and excluding Rule 12b-1 fees) were also in the least expensive quintile of such group. The Board was satisfied with such comparative fees and expenses.
Economies of Scale. The Board considered economies of scale realized by FAI and its affiliates and Pelagos as each Fund grows larger and the extent to which they are shared with Fund shareholders, as for example, in the level of the investment management and subadvisory fees charged, in the quality and efficiency of services rendered and in increased capital commitments benefiting such Fund directly or indirectly. Since each Fund had only commenced operations in December 2011, the Board concluded that economies of scale were difficult to consider at that time.
Proxy Voting Policies and Procedures
The Trust’s investment manager has established Proxy Voting Policies and Procedures (Policies) that the Trust uses to determine how to vote proxies relating to portfolio securities. Alternatively, shareholders may request copies of the Policies free of charge by calling the Proxy Group collect at (954) 527-7678 or by sending a written request to: Franklin Templeton Companies, LLC, 300 S.E. 2nd Street, Fort Lauderdale, FL 33301, Attention: Proxy Group. Copies of the Trust’s proxy voting records are posted on the U.S. Securities and Exchange Commission’s website at sec.gov and reflect the most recent 12-month period ended June 30.
Quarterly Statement of Investments
The Trust files a complete statement of investments with the U.S. Securities and Exchange Commission for the first and third quarters for each fiscal year on Form N-Q. Shareholders may view the filed Form N-Q by visiting the Commission’s website at sec.gov. The filed form may also be viewed and copied at the Commission’s Public Reference Room in Washington, DC. Information regarding the operations of the Public Reference Room may be obtained by calling (800) SEC-0330.
Annual Report À 37
Item 2. Code of Ethics.
(a) The Registrant has adopted a code of ethics that applies to its principal executive officers and principal financial and accounting officer.
(c) N/A
(d) N/A
(f) Pursuant to Item 12(a)(1), the Registrant is attaching as an exhibit a copy of its code of ethics that applies to its principal executive officers and principal financial and accounting officer.
Item 3. Audit Committee Financial Expert.
(a)(1) The Registrant has an audit committee financial expert serving on its audit committee.
(2) The audit committee financial expert is Ann Torre Bates and she is “independent” as defined under the relevant Securities and Exchange Commission Rules and Releases.
Item 4. Principal Accountant Fees and Services.
(a) Audit Fees
The aggregate fees paid to the principal accountant for professional services rendered by the principal accountant for the audit of the registrant’s annual financial statements or for services that are normally provided by the principal accountant in connection with statutory and regulatory filings or engagements were $56,000 for the fiscal year ended May 31, 2013 and $58,800 for the fiscal year ended May 31, 2012.
(b) Audit-Related Fees
There were no fees paid to the principal accountant for assurance and related services rendered by the principal accountant to the registrant that are reasonably related to the performance of the audit of the registrant's financial statements and are not reported under paragraph (a) of Item 4.
There were no fees paid to the principal accountant for assurance and related services rendered by the principal accountant to the registrant's investment adviser and any entity controlling, controlled by or under common control with the investment adviser that provides ongoing services to the registrant that are reasonably related to the performance of the audit of their financial statements.
(c) Tax Fees
There were no fees paid to the principal accountant for professional services rendered by the principal accountant to the registrant for tax compliance, tax advice and tax planning.
The aggregate fees paid to the principal accountant for professional services rendered by the principal accountant to the registrant’s investment adviser and any entity controlling, controlled by or under common control with the investment adviser that provides ongoing services to the registrant for tax compliance, tax advice and tax planning were $67,000 for the fiscal year ended May 31, 2013 and $0 for the fiscal year ended May 31, 2012. The services for which these fees were paid included web based application providing technical information related to withholding tax rates, treaties, procedures, and form/instructions for portfolio dividends and interest, and capital gains in foreign governments
d) All Other Fees
There were no fees paid to the principal accountant for products and services rendered by the principal accountant to the registrant not reported in paragraphs (a)-(c) of Item 4.
There were no fees paid to the principal accountant for products and services rendered by the principal accountant to the registrant’s investment adviser and any entity controlling, controlled by or under common control with the investment adviser that provides ongoing services to the registrant other than the services reported in paragraphs (a)-(c) of Item 4.
(e) (1) The registrant’s audit committee is directly responsible for approving the services to be provided by the auditors, including:
(i) pre-approval of all audit and audit related services;
(ii) pre-approval of all non-audit related services to be provided to the Fund by the auditors;
(iii) pre-approval of all non-audit related services to be provided to the registrant by the auditors to the registrant’s investment adviser or to any entity that controls, is controlled by or is under common control with the registrant’s investment adviser and that provides ongoing services to the registrant where the non-audit services relate directly to the operations or financial reporting of the registrant; and
(iv) establishment by the audit committee, if deemed necessary or appropriate, as an alternative to committee pre-approval of services to be provided by the auditors, as required by paragraphs (ii) and (iii) above, of policies and procedures to permit such services to be pre-approved by other means, such as through establishment of guidelines or by action of a designated member or members of the committee; provided the policies and procedures are detailed as to the particular service and the committee is informed of each service and such policies and procedures do not include delegation of audit committee responsibilities, as contemplated under the Securities Exchange Act of 1934, to management; subject, in the case of (ii) through (iv), to any waivers, exceptions or exemptions that may be available under applicable law or rules.
(e) (2) None of the services provided to the registrant described in paragraphs (b)-(d) of Item 4 were approved by the audit committee pursuant to paragraph (c)(7)(i)(C) of Rule 2-01 of regulation S-X.
(f) No disclosures are required by this Item 4(f).
(g) The aggregate non-audit fees paid to the principal accountant for services rendered by the principal accountant to the registrant and the registrant’s investment adviser and any entity controlling, controlled by or under common control with the investment adviser that provides ongoing services to the registrant were $67,000 for the fiscal year ended May 31, 2013 and $0 for the fiscal year ended May 31, 2012.
(h) The registrant’s audit committee of the board has considered whether the provision of non-audit services that were rendered to the registrant’s investment adviser (not including any sub-adviser whose role is primarily portfolio management and is subcontracted with or overseen by another investment adviser), and any entity controlling, controlled by, or under common control with the investment adviser that provides ongoing services to the registrant that were not pre-approved pursuant to paragraph (c)(7)(ii) of Rule 2-01 of Regulation S-X is compatible with maintaining the principal accountant’s independence.
Item 5. Audit Committee of Listed Registrants. N/A
Item 6. Schedule of Investments. N/A
Item 7. Disclosure of Proxy Voting Policies and Procedures for Closed-End Management Investment Companies. N/A
Item 8. Portfolio Managers of Closed-End Management Investment Companies. N/A
Item 9. Purchases of Equity Securities by Closed-End Management Investment Company and Affiliated Purchasers. N/A
Item 10. Submission of Matters to a Vote of Security Holders.
There have been no changes to the procedures by which shareholders may recommend nominees to the Registrant's Board of Trustees that would require disclosure herein.
Item 11. Controls and Procedures.
(a) Evaluation of Disclosure Controls and Procedures. The Registrant maintains disclosure controls and procedures that are designed to ensure that information required to be disclosed in the Registrant’s filings under the Securities Exchange Act of 1934 and the Investment Company Act of 1940 is recorded, processed, summarized and reported within the periods specified in the rules and forms of the Securities and Exchange Commission. Such information is accumulated and communicated to the Registrant’s management, including its principal executive officer and principal financial officer, as appropriate, to allow timely decisions regarding required disclosure. The Registrant’s
management, including the principal executive officer and the principal financial officer, recognizes that any set of controls and procedures, no matter how well designed and operated, can provide only reasonable assurance of achieving the desired control objectives.
Within 90 days prior to the filing date of this Shareholder Report on Form N-CSR, the Registrant had carried out an evaluation, under the supervision and with the participation of the Registrant’s management, including the Registrant’s principal executive officer and the Registrant’s principal financial officer, of the effectiveness of the design and operation of the Registrant’s disclosure controls and procedures. Based on such evaluation, the Registrant’s principal executive officer and principal financial officer concluded that the Registrant’s disclosure controls and procedures are effective.
(b) Changes in Internal Controls. There have been no changes in the Registrant’s internal controls or in other factors that could materially affect the internal controls over financial reporting subsequent to the date of their evaluation in connection with the preparation of this Shareholder Report on Form N-CSR.
Item 12. Exhibits.
(a) (1) Code of Ethics
(a)(2) Certifications pursuant to Section 302 of the Sarbanes-Oxley Act of 2002 of Laura F. Fergerson, Chief Executive Officer - Finance and Administration, and Robert G. Kubilis, Chief Financial Officer and Chief Accounting Officer (b) Certifications pursuant to Section 906 of the Sarbanes-Oxley Act of 2002 of Laura F. Fergerson, Chief Executive Officer - Finance and Administration, and Robert G. Kubilis, Chief Financial Officer and Chief Accounting Officer
SIGNATURES
Pursuant to the requirements of the Securities Exchange Act of 1934 and the Investment Company Act of 1940, the registrant has duly caused this report to be signed on its behalf by the undersigned, thereunto duly authorized.
FRANKLIN ALTERATIVE STRATEGIES FUNDS
By /s/LAURA F. FERGERSON
Laura F. Fergerson
Chief Executive Officer - Finance and Administration
Date July 26, 2013
Pursuant to the requirements of the Securities Exchange Act of 1934 and the Investment Company Act of 1940, this report has been signed below by the following persons on behalf of the registrant and in the capacities and on the dates indicated.
By /s/LAURA F. FERGERSON
Laura F. Fergerson
Chief Executive Officer - Finance and Administration
Date July 26, 2013
By /s/ROBERT G. KUBILIS
Robert G. Kubilis
Chief Financial Officer and
Chief Accounting Officer
Date July 26, 2013