united states
securities and exchange commission
washington, d.c. 20549
form n-csr
certified shareholder report of registered management
investment companies
Investment Company Act file number 811-22655
Northern Lights Fund Trust III
(Exact name of registrant as specified in charter)
225 Pictoria Drive, Suite 450, Cincinnati, OH 45246
(Address of principal executive offices) (Zip code)
The Corporation Trust Company
1209 Orange Street, Wilmington, DE 19801
(Name and address of agent for service)
Registrant's telephone number, including area code: 631-470-2688
Date of fiscal year end: 12/31
Date of reporting period: 12/31/22
Item 1. Reports to Stockholders.
ACM Dynamic Opportunity Fund
Class A Shares – ADOAX
Class I Shares – ADOIX
ACM Tactical Income Fund
Class A Shares – TINAX
Class I Shares – TINIX
Annual Report
December 31, 2022
1-844-798-3833
www.acm-funds.com
Distributed by Northern Lights Distributors, LLC
Member FINRA
Dear Shareholder,
The year 2022 was a year of mostly playing defense for both funds. Financial markets were down pretty much across the board during the year, making it difficult to generate positive performance. There is an old adage about bear markets that “he who loses least wins”—and that was our main focus.
The ACM Dynamic Opportunity Fund (ADOIX) started the year with a cautious outlook, given that we had seen many leading areas of the market top out already in 2021 and enter bear markets of their own. So, we leaned heavily on our dynamic hedge model, which helped us adjust our net market exposure throughout the year and get defensive when markets were rolling over and experiencing sharp selloffs. The ability to significantly hedge the portfolio helps most when markets are most volatile. To wit, during the three largest down months for the S&P 500 (April, June, and September), the Fund’s downside exposure was only about 25% compared to the market. This helps our investors sleep at night.
2022 also saw its share of bear market rallies, which resulted in some large positive months for the market. Most of these rallies were led by heavily shorted stocks (short covering) and unprofitable tech names. Although it would have been nice to capture some of the fireworks, our investment strategy doesn’t include buying speculative, low-quality stocks for short-term trades. When a new bull market is set to unfold in a sustainable fashion, we would expect to see dozens of new, high-quality stocks beginning to exert leadership and thus showing up in our screens and making their way into the Portfolio.
We have not yet seen the signs that a new bull market is about to surface. The Fed is still raising rates in what has been an historic monetary tightening over the last 9 months. The yield curve remains heavily inverted, and earnings estimates still look high and are being revised lower by analysts. There are a myriad of additional factors that give us pause and continue to warrant caution in the investment outlook as we enter 2023. We hope that the bear market will run its course fairly soon, but we would like to see at least some of the above-mentioned factors begin to ameliorate first.
Turning to the ACM Tactical Income Fund (TINIX), the fixed income markets also experienced negative returns roughly across the board. The Fed pursued a series of interest rate hikes starting in March in continuing through December, with several 75 basis points along the way. The historic pace of interest rate hikes made the AGG Index experience one of its worst calendar years on record.
The Fund utilized its tactical approach to raise significant amounts of cash during risk-off, defensive periods. And tactically reinvesting in the strongest sectors during market rebounds to capture some positive returns and continue to generate monthly dividends for our income-oriented investors. At one point in 2022, the Fund had its highest cash amount since Fund inception (roughly 80%). This is rare but highlights the pervasive headwinds nearly all areas of fixed income were facing.
For its part, the 10-year yield appeared to have peaked in mid-October and began drifting lower. This took a lot of pressure off of various fixed income sub-sectors, which saw nice bounces from the steep selloffs they had endured. It is quite possible that the 10-year yields have seen its highs for this cycle, which would mean that fixed income markets are further along in their bottoming processes than equities.
For calendar 2022, the Fund experienced a negative return, but one that was far smaller than the overall Agg Index. As we enter 2023, we are looking forward to a better environment for fixed income as well as some very attractive yields. In many areas, yields haven’t been this high in over a decade, which creates a lot of opportunities for investors.
Thank you for your continued support.
Sincerely,
Jordan L. Kahn, CFA
President & CIO
6084-NLD-02/22/2023
1
Defined terms: S&P 500 Index – tracks 500 individual stocks chosen for market size, liquidity and industry grouping, among other factors. Long – the holder of the position owns the security and will profit if the price of the security goes up. Short – the holder of the position sells securities it does not own in anticipation of a decline in the market price of the securities. P/E Ratio – Companies share price divided by its earnings per share.
6084-NLD-02/22/2023
2
| ACM Dynamic Opportunity Fund |
| Portfolio Review |
| December 31, 2022 |
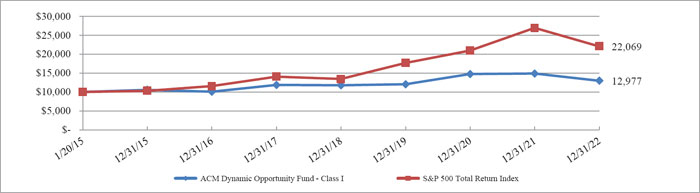
Average Annual Total Return through December 31, 2022*, as compared to its benchmarks:
| Since | ||||
| 1 Year | 3 Year | 5 Year | Inception***** | |
| ACM Dynamic Opportunity Fund - Class A | -12.98% | 2.36% | 1.57% | 3.13% |
| ACM Dynamic Opportunity Fund - Class A with load | -17.98% | 0.35% | 0.38% | 2.36% |
| ACM Dynamic Opportunity Fund - Class I | -12.79% | 2.54% | 1.78% | 3.33% |
| S&P 500 Total Return Index ** | -18.11% | 7.66% | 9.42% | 10.48% |
| S&P 500 Price Index *** | -19.44% | 5.92% | 7.51% | 8.40% |
| HFRX Equity Hedge Index **** | -3.18% | 4.33% | 2.63% | 2.68% |
| * | The performance data quoted is historical. Past performance is no guarantee of future results. Current performance may be higher or lower than the performance data quoted. The principal value and investment return of an investment will fluctuate so that your shares, when redeemed, may be worth more or less than their original cost. The returns shown do not reflect the deduction of taxes that a shareholder would pay on Fund distributions or on the redemptions of Fund shares. The Fund’s advisor has contractually agreed to waive its fees and reimburse expenses of the Fund, at least until April 30, 2023, to ensure that Total Annual Fund Operating Expenses After Fee Waiver and Reimbursement (exclusive of any front-end or contingent deferred loads; brokerage fees and commissions, acquired fund fees and expenses; borrowing costs (such as interest and dividend expense on securities sold short); taxes; and extraordinary expenses, such as litigation expenses (which may include indemnification of Fund officers and Trustees, contractual indemnification of Fund service providers (other than advisor))) will not exceed 2.40% and 2.15% of average daily net assets attributable to Class A and Class I shares, respectively. The Fund’s total gross operating expenses per the most recent prospectus is 1.94% and 1.69% for Class A and Class I shares, respectively. Class A shares are subject to a maximum sales charge of 5.75%. Redemptions made within 30 days of purchase may be assessed a redemption fee of 1.00%. For performance information current to the most recent month-end, please call 1-844-798-3833. |
| ** | The S&P 500 Total Return Index, is a market capitalization-weighted index of 500 widely held common stocks. Investors cannot invest directly in an index. |
| *** | The S&P 500 Price Index, is a stock market index that measures the stock performance of 500 large companies listed on the stock exchange. Investors cannot invest directly in an index. |
| **** | The HFRX Equity Hedge Index is an index managed by Hedge Fund Research, Inc. (“HFR”). HFR is the established global leader in the indexation, analysis and research of the hedge fund industry. With over 150 indices ranging from broad composites down to specific, niche areas of sub-strategy and regional investment focus, the HFRX Indices are considered the industry standard benchmarks of hedge fund performance. The HFRX branded indices are daily indices utilizing a rigorous quantitative selection process to represent the larger hedge fund universe. Investors cannot invest directly in an index. |
| ***** | Inception date is January 20, 2015. |
Comparison of the Change in Value of a $10,000 Investment
| Portfolio Composition as of December 31, 2022 | % of Net Assets | |||
| Common Stocks: | ||||
| Biotechnology & Pharmaceutical | 3.9 | % | ||
| Technology Services | 3.5 | % | ||
| Technology Hardware | 2.4 | % | ||
| Health Care Facilities & Services | 2.2 | % | ||
| Aerospace & Defense | 2.1 | % | ||
| Retail - Discretionary | 2.0 | % | ||
| Internet Media & Services | 1.7 | % | ||
| Semiconductors | 1.7 | % | ||
| E-Commerce Discretionary | 1.1 | % | ||
| Exchange Traded Funds - Equity | 7.5 | % | ||
| U.S. Government & Agencies - U.S. Treasury Bill | 1.3 | % | ||
| Short-Term Investments - Money Market Funds | 43.0 | % | ||
| Other assets in excess of liabilities - net | 27.6 | % | ||
| 100.0 | % | |||
Please refer to the Schedule of Investments in this annual report for a detailed listing of the Fund’s holdings.
3
| ACM Tactical Income Fund |
| Portfolio Review |
| December 31, 2022 |
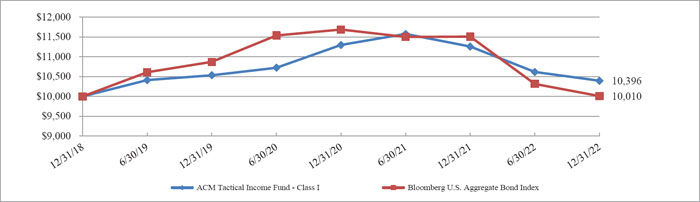
Average Annual Total Return through December 31, 2022*, as compared to its benchmark:
| 1 Year | 3 Year | Since Inception*** | |
| ACM Tactical Income Fund - Class A | -7.89% | -0.68% | 0.74% |
| ACM Tactical Income Fund - Class A with load | -13.21% | -2.63% | -0.74% |
| ACM Tactical Income Fund - Class I | -7.66% | -0.44% | 0.98% |
| Bloomberg U.S. Aggregate Bond Index ** | -13.01% | -2.71% | 0.03% |
| * | The performance data quoted is historical. Past performance is no guarantee of future results. Current performance may be higher or lower than the performance data quoted. The principal value and investment return of an investment will fluctuate so that your shares, when redeemed, may be worth more or less than their original cost. The returns shown do not reflect the deduction of taxes that a shareholder would pay on Fund distributions or on the redemptions of Fund shares. The Fund’s advisor has contractually agreed to waive its fees and reimburse expenses of the Fund, at least until April 30, 2023, to ensure that Total Annual Fund Operating Expenses After Fee Waiver and Reimbursement (exclusive of any front-end or contingent deferred loads; brokerage fees and commissions, acquired fund fees and expenses; borrowing costs (such as interest and dividend expense on securities sold short); taxes; and extraordinary expenses, such as litigation expenses (which may include indemnification of Fund officers and Trustees, contractual indemnification of Fund service providers (other than the advisor))) will not exceed 2.25% and 2.00% of average daily net assets attributable to Class A and Class I shares, respectively. The Fund’s total gross operating expenses per the most recent prospectus is 3.03% and 2.78% for Class A and Class I shares, respectively. Class A shares are subject to a maximum sales charge of 5.75%. Redemptions made within 30 days of purchase may be assessed a redemption fee of 1.00%. For performance information current to the most recent month-end, please call 1-844-798-3833. |
| ** | The Bloomberg U.S. Aggregate Bond Index is an unmanaged index comprised of U.S. investment grade, fixed rate bond market securities, including government, government agency, corporate and mortgage-backed securities between one and ten years. Investors cannot invest directly in an index. |
| *** | Inception date is December 31, 2018. |
Comparison of the Change in Value of a $10,000 Investment
| Portfolio Composition as of December 31, 2022 | % of Net Assets | |||
| Exchange-Traded Funds - Fixed Income | 47.0 | % | ||
| Short-Term Investments - Money Market Funds | 23.1 | % | ||
| U.S. Government & Agencies - U.S. Treasury Bill | 4.6 | % | ||
| Common Stock - Mortgage Finance | 0.8 | % | ||
| Exchange-Traded Funds - Equity | 0.8 | % | ||
| Other assets in excess of liabilities - net | 23.7 | % | ||
| 100.0 | % | |||
Please refer to the Schedule of Investments in this annual report for a detailed listing of the Fund’s holdings.
4
| ACM DYNAMIC OPPORTUNITY FUND |
| SCHEDULE OF INVESTMENTS |
| December 31, 2022 |
| Shares | Fair Value | |||||||
| COMMON STOCKS — 27.4% | ||||||||
| ADVERTISING & MARKETING - 0.6% | ||||||||
| 10,000 | Trade Desk, Inc. (The), Class A(a) | $ | 448,300 | |||||
| AEROSPACE & DEFENSE - 2.1% | ||||||||
| 3,000 | Northrop Grumman Corporation | 1,636,830 | ||||||
| BEVERAGES - 1.0% | ||||||||
| 7,600 | Celsius Holdings, Inc.(a) | 790,704 | ||||||
| BIOTECHNOLOGY & PHARMACEUTICAL - 3.9% | ||||||||
| 3,000 | Eli Lilly and Company | 1,097,520 | ||||||
| 2,000 | Moderna, Inc.(a) | 359,240 | ||||||
| 3,000 | Neurocrine Biosciences, Inc.(a) | 358,320 | ||||||
| 500 | Regeneron Pharmaceuticals, Inc.(a) | 360,745 | ||||||
| 2,000 | United Therapeutics Corporation(a) | 556,180 | ||||||
| 1,300 | Vertex Pharmaceuticals, Inc.(a) | 375,414 | ||||||
| 3,107,419 | ||||||||
| E-COMMERCE DISCRETIONARY - 1.1% | ||||||||
| 10,000 | Amazon.com, Inc.(a) | 840,000 | ||||||
| ENGINEERING & CONSTRUCTION - 1.0% | ||||||||
| 5,500 | Quanta Services, Inc. | 783,750 | ||||||
| HEALTH CARE FACILITIES & SERVICES - 2.2% | ||||||||
| 5,500 | Cardinal Health, Inc. | 422,785 | ||||||
| 1,500 | Cigna Corporation | 497,010 | ||||||
| 1,500 | UnitedHealth Group, Inc. | 795,270 | ||||||
| 1,715,065 | ||||||||
| HOME CONSTRUCTION - 1.0% | ||||||||
| 21,000 | Griffon Corporation | 751,590 | ||||||
| INSTITUTIONAL FINANCIAL SERVICES - 0.9% | ||||||||
| 7,200 | Intercontinental Exchange, Inc. | 738,648 | ||||||
See accompanying notes to financial statements.
5
| ACM DYNAMIC OPPORTUNITY FUND |
| SCHEDULE OF INVESTMENTS(Continued) |
| December 31, 2022 |
| Shares | Fair Value | |||||||
| COMMON STOCKS — 27.4% (Continued) | ||||||||
| INTERNET MEDIA & SERVICES - 1.7% | ||||||||
| 15,000 | Alphabet, Inc., Class A(a) | $ | 1,323,450 | |||||
| LEISURE FACILITIES & SERVICES - 0.5% | ||||||||
| 1,500 | McDonald’s Corporation | 395,295 | ||||||
| RENEWABLE ENERGY - 0.3% | ||||||||
| 1,000 | Enphase Energy, Inc.(a) | 264,960 | ||||||
| RETAIL - DISCRETIONARY - 2.0% | ||||||||
| 2,500 | Lululemon Athletica, Inc.(a) | 800,950 | ||||||
| 1,000 | O’Reilly Automotive, Inc.(a) | 844,030 | ||||||
| 1,644,980 | ||||||||
| SEMICONDUCTORS - 1.7% | ||||||||
| 10,000 | Advanced Micro Devices, Inc.(a) | 647,700 | ||||||
| 4,500 | NVIDIA Corporation | 657,630 | ||||||
| 1,305,330 | ||||||||
| SOFTWARE - 0.5% | ||||||||
| 1,700 | Microsoft Corporation | 407,694 | ||||||
| TECHNOLOGY HARDWARE - 2.4% | ||||||||
| 6,000 | Apple, Inc. | 779,580 | ||||||
| 4,500 | Jabil, Inc. | 306,900 | ||||||
| 13,000 | Logitech International S.A. | 809,250 | ||||||
| 1,895,730 | ||||||||
| TECHNOLOGY SERVICES - 3.5% | ||||||||
| 4,000 | Booz Allen Hamilton Holding Corporation | 418,080 | ||||||
| 2,000 | EPAM Systems, Inc.(a) | 655,480 | ||||||
| 1,300 | Fair Isaac Corporation(a) | 778,154 | ||||||
| 4,500 | Visa, Inc., Class A | 934,921 | ||||||
| 2,786,635 | ||||||||
See accompanying notes to financial statements.
6
| ACM DYNAMIC OPPORTUNITY FUND |
| SCHEDULE OF INVESTMENTS (Continued) |
| December 31, 2022 |
| Shares | Fair Value | |||||||
| COMMON STOCKS — 27.4% (Continued) | ||||||||
| WHOLESALE - CONSUMER STAPLES - 1.0% | ||||||||
| 8,500 | Archer-Daniels-Midland Company | $ | 789,225 | |||||
| TOTAL COMMON STOCKS (Cost $16,584,253) | $ | 21,625,605 | ||||||
| Shares | Fair Value | |||||||
| EXCHANGE-TRADED FUNDS — 7.5% | ||||||||
| EQUITY - 7.5% | ||||||||
| 18,000 | Health Care Select Sector SPDR Fund | 2,445,300 | ||||||
| 46,000 | iShares U.S. Medical Devices ETF | 2,418,220 | ||||||
| 12,500 | SPDR S&P Biotech ETF(a) | 1,037,500 | ||||||
| 5,901,020 | ||||||||
| TOTAL EXCHANGE-TRADED FUNDS (Cost $5,885,014) | 5,901,020 | |||||||
| Principal | Coupon Rate | |||||||||||
| Amount ($) | (%) | Maturity | Fair Value | |||||||||
| U.S. GOVERNMENT & AGENCIES — 1.3% | ||||||||||||
| U.S. TREASURY BILL — 1.3% | ||||||||||||
| 1,000,000 | United States Cash Management Bill(b) | — | 01/31/23 | 996,939 | ||||||||
| TOTAL U.S. GOVERNMENT & AGENCIES (Cost $996,792) | 996,939 | |||||||||||
| Shares | Fair Value | |||||||
| SHORT-TERM INVESTMENTS — 43.0% | ||||||||
| MONEY MARKET FUNDS - 43.0% | ||||||||
| 28,757,112 | First American Government Obligations Fund, Class X, 4.08%(c) | 28,757,112 | ||||||
| 5,063,176 | Goldman Sachs Financial Square Government Fund, 3.88%(c) | 5,063,176 | ||||||
| TOTAL MONEY MARKET FUNDS (Cost $33,820,288) | 33,820,288 | |||||||
| TOTAL SHORT-TERM INVESTMENTS (Cost $33,820,288) | 33,820,288 | |||||||
| Contracts(d) | Broker/ Counterparty | Expiration Date | Exercise Price | Notional Value | Fair Value | |||||||||||||||
| EQUITY OPTIONS PURCHASED - 1.1% | ||||||||||||||||||||
| CALL OPTIONS PURCHASED - 0.5% | ||||||||||||||||||||
| 2,000 | SPDR S&P 500 ETF Trust | GOL | 01/20/2023 | $ | 400 | $ | 76,486,000 | $ | 330,000 | |||||||||||
| TOTAL CALL OPTIONS PURCHASED (Cost - $777,193) | ||||||||||||||||||||
See accompanying notes to financial statements.
7
| ACM DYNAMIC OPPORTUNITY FUND |
| SCHEDULE OF INVESTMENTS (Continued) |
| December 31, 2022 |
| Contracts(d) | Broker/ Counterparty | Expiration Date | Exercise Price | Notional Value | Fair Value | |||||||||||||||
| EQUITY OPTIONS PURCHASED - 1.1% (Continued) | ||||||||||||||||||||
| PUT OPTIONS PURCHASED - 0.6% | ||||||||||||||||||||
| 100 | Advanced Micro Devices, Inc. | GOL | 02/17/2023 | $ | 60 | $ | 647,700 | $ | 31,400 | |||||||||||
| 15 | Lululemon Athletica, Inc. | GOL | 01/20/2023 | 320 | 480,570 | 18,825 | ||||||||||||||
| 45 | NVIDIA Corporation | GOL | 02/17/2023 | 150 | 657,630 | 61,650 | ||||||||||||||
| 500 | SPDR S&P 500 ETF Trust | GOL | 03/17/2023 | 360 | 19,121,500 | 349,000 | ||||||||||||||
| 75 | Trade Desk, Inc. (The) | GOL | 02/17/2023 | 45 | 336,225 | 35,700 | ||||||||||||||
| TOTAL PUT OPTIONS PURCHASED (Cost - $531,522) | 496,575 | |||||||||||||||||||
| TOTAL EQUITY OPTIONS PURCHASED (Cost - $1,308,715) | 826,575 | |||||||||||||||||||
| TOTAL INVESTMENTS - 80.3% (Cost $58,595,062) | $ | 63,170,427 | ||||||||||||||||||
| OTHER ASSETS IN EXCESS OF LIABILITIES - 19.7% | 15,510,174 | |||||||||||||||||||
| NET ASSETS - 100.0% | $ | 78,680,601 | ||||||||||||||||||
See accompanying notes to financial statements.
8
| ACM DYNAMIC OPPORTUNITY FUND |
| SCHEDULE OF SECURITIES SOLD SHORT |
| December 31, 2022 |
| Shares | Fair Value | |||||||
| EXCHANGE-TRADED FUNDS — (17.1)% | ||||||||
| EQUITY - (17.1)% | ||||||||
| (50,000 | ) | Financial Select Sector SPDR Fund | $ | (1,710,000 | ) | |||
| (10,000 | ) | iShares Russell 2000 ETF | (1,743,600 | ) | ||||
| (8,000 | ) | iShares Transportation Average ETF | (1,708,400 | ) | ||||
| (24,000 | ) | Materials Select Sector SPDR Fund | (1,864,320 | ) | ||||
| (8,000 | ) | SPDR S&P 500 ETF Trust | (3,059,440 | ) | ||||
| (30,000 | ) | SPDR S&P Regional Banking ETF | (1,762,200 | ) | ||||
| (8,000 | ) | VanEck Semiconductor ETF | (1,623,520 | ) | ||||
| (13,471,480 | ) | |||||||
| TOTAL SECURITIES SOLD SHORT - (Proceeds - $13,335,550) | $ | (13,471,480 | ) | |||||
| ETF | - Exchange-Traded Fund |
| S/A | - Société Anonyme |
| SPDR | - Standard & Poor’s Depositary Receipt |
| GOL | - Goldman Sachs |
| (a) | Non-income producing security. |
| (b) | Zero coupon bond. |
| (c) | Rate disclosed is the seven day effective yield as of December 31, 2022. |
| (d) | Each option contract allows the holder of the option to purchase or sell 100 shares of the underlying security. |
See accompanying notes to financial statements.
9
| ACM TACTICAL INCOME FUND |
| SCHEDULE OF INVESTMENTS |
| December 31, 2022 |
| Shares | Fair Value | |||||||
| COMMON STOCK — 0.8% | ||||||||
| MORTGAGE FINANCE - 0.8% | ||||||||
| 35,000 | AGNC Investment Corporation | $ | 362,250 | |||||
| TOTAL COMMON STOCK (Cost $345,759) | 362,250 | |||||||
| Shares | Fair Value | |||||||
| EXCHANGE-TRADED FUNDS — 47.8% | ||||||||
| EQUITY - 0.8% | ||||||||
| 25,000 | VanEck Vectors BDC Income ETF | 353,750 | ||||||
| FIXED INCOME - 47.0% | ||||||||
| 66,000 | Invesco Senior Loan ETF | 1,354,980 | ||||||
| 61,000 | Invesco Taxable Municipal Bond | 1,568,310 | ||||||
| 20,000 | iShares 1-3 Year Treasury Bond ETF | 1,623,400 | ||||||
| 17,000 | iShares 20+ Year Treasury Bond ETF | 1,692,520 | ||||||
| 80,000 | iShares Floating Rate Bond ETF | 4,026,400 | ||||||
| 12,500 | iShares iBoxx $ Investment Grade Corporate Bond ETF | 1,317,875 | ||||||
| 16,000 | iShares JP Morgan USD Emerging Markets Bond ETF | 1,353,440 | ||||||
| 19,000 | iShares MBS ETF | 1,762,250 | ||||||
| 17,000 | iShares National Muni Bond ETF | 1,793,840 | ||||||
| 50,000 | ProShares Short 20+ Year Treasury | 1,134,000 | ||||||
| 25,000 | SPDR Blackstone Senior Loan ETF | 1,022,500 | ||||||
| 20,000 | VanEck Emerging Markets High Yield Bond ETF | 364,200 | ||||||
| 55,000 | VanEck Fallen Angel High Yield Bond ETF | 1,486,100 | ||||||
| 20,499,815 | ||||||||
| TOTAL EXCHANGE-TRADED FUNDS (Cost $21,064,842) | 20,853,565 | |||||||
| Principal | Coupon Rate | |||||||||||
| Amount ($) | (%) | Maturity | Fair Value | |||||||||
| U.S. GOVERNMENT & AGENCIES — 4.6% | ||||||||||||
| U.S. TREASURY BILL — 4.6% | ||||||||||||
| 2,000,000 | United States Cash Management Bill(a) | — | 01/31/23 | 1,993,879 | ||||||||
| TOTAL U.S. GOVERNMENT & AGENCIES (Cost $1,993,483) | 1,993,879 | |||||||||||
See accompanying notes to financial statements.
10
| ACM TACTICAL INCOME FUND |
| SCHEDULE OF INVESTMENTS(Continued) |
| December 31, 2022 |
| Shares | Fair Value | |||||||
| SHORT-TERM INVESTMENTS — 23.1% | ||||||||
| MONEY MARKET FUNDS - 23.1% | ||||||||
| 8,573,543 | First American Government Obligations Fund, Class X, 4.08%(b) | $ | 8,573,543 | |||||
| 1,526,845 | Goldman Sachs Financial Square Government Fund, 3.88%(b) | 1,526,845 | ||||||
| TOTAL MONEY MARKET FUNDS (Cost $10,100,388) | 10,100,388 | |||||||
| TOTAL SHORT-TERM INVESTMENTS (Cost $10,100,388) | 10,100,388 | |||||||
| TOTAL INVESTMENTS - 76.3% (Cost $33,504,472) | $ | 33,310,082 | ||||||
| OTHER ASSETS IN EXCESS OF LIABILITIES - 23.7% | 10,358,021 | |||||||
| NET ASSETS - 100.0% | $ | 43,668,103 | ||||||
| ETF | - Exchange-Traded Fund |
| SPDR | - Standard & Poor’s Depositary Receipt |
| (a) | Zero coupon bond. |
| (b) | Rate disclosed is the seven day effective yield as of December 31, 2022. |
See accompanying notes to financial statements.
11
| ACM Funds |
| STATEMENTS OF ASSETS AND LIABILITIES |
| December 31, 2022 |
| ACM Dynamic | ACM Tactical | |||||||
| Opportunity Fund | Income Fund | |||||||
| ASSETS | ||||||||
| Investment securities, at value (Cost $58,595,062 and $33,504,472) | $ | 63,170,427 | $ | 33,310,082 | ||||
| Cash | 17,509,062 | 10,612,424 | ||||||
| Deposits with broker | 7,895,575 | 25,075 | ||||||
| Receivable for securities sold | 6,772,044 | 150,152 | ||||||
| Dividend and interest receivable | 158,526 | 35,591 | ||||||
| Prepaid expenses | 18,420 | 913 | ||||||
| TOTAL ASSETS | 95,524,054 | 44,134,237 | ||||||
| LIABILITIES | ||||||||
| Securities sold short, at value (Proceeds $13,335,550 and $0) | 13,471,480 | — | ||||||
| Payable for securities purchased | 3,169,137 | — | ||||||
| Payable for fund shares repurchased | 13,144 | 331,602 | ||||||
| Investment advisory fees payable | 85,363 | 40,294 | ||||||
| Payable to related parties | 63,812 | 50,971 | ||||||
| Distribution (12b-1) fees payable | 477 | 557 | ||||||
| Accrued expenses and other liabilities | 40,040 | 42,710 | ||||||
| TOTAL LIABILITIES | 16,843,453 | 466,134 | ||||||
| NET ASSETS | $ | 78,680,601 | $ | 43,668,103 | ||||
| Composition of Net Assets: | ||||||||
| Paid in capital | $ | 75,647,175 | $ | 50,971,903 | ||||
| Accumulated Earnings (Losses) | 3,033,426 | (7,303,800 | ) | |||||
| NET ASSETS | $ | 78,680,601 | $ | 43,668,103 | ||||
| Net Asset Value Per Share: | ||||||||
| Class A Shares: | ||||||||
| Net Assets | $ | 2,166,898 | $ | 2,142,438 | ||||
| Shares of beneficial interest outstanding ($0 par value, unlimited shares authorized) | 130,706 | 235,292 | ||||||
| Net asset value (Net Assets ÷ Shares Outstanding) and redemption price per share (a) | $ | 16.58 | $ | 9.11 | ||||
| Maximum offering price per share (net asset value plus maximum sales charge of 5.75%) | $ | 17.59 | $ | 9.67 | ||||
| Class I Shares: | ||||||||
| Net Assets | $ | 76,513,703 | $ | 41,525,665 | ||||
| Shares of beneficial interest outstanding ($0 par value, unlimited shares authorized) | 4,532,447 | 4,558,734 | ||||||
| Net asset value (Net Assets ÷ Shares Outstanding), offering price and redemption price per share (a) | $ | 16.88 | $ | 9.11 | ||||
| (a) | The Fund imposes a 1.00% redemption fee for any redemptions of Fund shares occurring within 30 days of purchase. |
See accompanying notes to financial statements.
12
| ACM Funds |
| STATEMENTS OF OPERATIONS |
| For the Year Ended December 31, 2022 |
| ACM Dynamic | ACM Tactical | |||||||
| Opportunity Fund | Income Fund | |||||||
| INVESTMENT INCOME | ||||||||
| Dividend Income (Foreign withholding tax $59,630, $0) | $ | 429,044 | $ | 1,731,743 | ||||
| Interest | 770,392 | 398,251 | ||||||
| TOTAL INVESTMENT INCOME | 1,199,436 | 2,129,994 | ||||||
| EXPENSES | ||||||||
| Advisory fees | 1,089,572 | 533,934 | ||||||
| Distribution (12b-1) fees: | ||||||||
| Class A | 6,662 | 8,316 | ||||||
| Administrative services fees | 100,226 | 73,869 | ||||||
| Third party administrative services fees | 79,116 | 39,637 | ||||||
| Dividend expense on securities sold short | 70,316 | — | ||||||
| Accounting services fees | 46,227 | 29,799 | ||||||
| Registration fees | 43,050 | 38,340 | ||||||
| Transfer agent fees | 39,250 | 37,422 | ||||||
| Audit fees | 16,501 | 17,499 | ||||||
| Legal fees | 15,249 | 14,905 | ||||||
| Compliance officer fees | 14,858 | 12,711 | ||||||
| Trustees fees and expenses | 14,752 | 14,610 | ||||||
| Printing and postage expenses | 12,622 | 10,804 | ||||||
| Custodian fees | 9,485 | 7,548 | ||||||
| Interest expense | 7,487 | — | ||||||
| Insurance expense | 3,915 | 3,090 | ||||||
| Other expenses | 6,515 | 6,396 | ||||||
| TOTAL EXPENSES | 1,575,803 | 848,880 | ||||||
| NET INVESTMENT INCOME (LOSS) | (376,367 | ) | 1,281,114 | |||||
| NET REALIZED AND UNREALIZED GAIN (LOSS) ON INVESTMENTS | ||||||||
| Net realized gain (loss) from: | ||||||||
| Investments and foreign currency transactions | 5,215,566 | (4,418,319 | ) | |||||
| Options written | (17,067 | ) | 131,473 | |||||
| Securities sold short | 261,967 | (4,302 | ) | |||||
| Net realized gain (loss) | 5,460,466 | (4,291,148 | ) | |||||
| Net change in unrealized appreciation (depreciation) on: | ||||||||
| Investments and foreign currency translations | (17,219,102 | ) | (1,534,346 | ) | ||||
| Options written | 23,616 | — | ||||||
| Securities sold short | (135,929 | ) | — | |||||
| Net change in unrealized depreciation on investments | (17,331,415 | ) | (1,534,346 | ) | ||||
| NET REALIZED AND UNREALIZED LOSS ON INVESTMENTS | (11,870,949 | ) | (5,825,494 | ) | ||||
| NET DECREASE IN NET ASSETS RESULTING FROM OPERATIONS | $ | (12,247,316 | ) | $ | (4,544,380 | ) | ||
See accompanying notes to financial statements.
13
| ACM Funds |
| STATEMENTS OF CHANGES IN NET ASSETS |
| ACM Dynamic Opportunity Fund | ||||||||
| For the Year Ended | For the Year Ended | |||||||
| December 31, 2022 | December 31, 2021 | |||||||
| INCREASE (DECREASE) IN NET ASSETS FROM OPERATIONS | ||||||||
| Net investment loss | $ | (376,367 | ) | $ | (973,029 | ) | ||
| Net realized gain on investments, foreign currency transactions, options written and securities sold short | 5,460,466 | 2,084,012 | ||||||
| Net change in unrealized depreciation on investments, foreign currency translations, options written and securities sold short | (17,331,415 | ) | (860,436 | ) | ||||
| Net increase (decrease) in net assets resulting from operations | (12,247,316 | ) | 250,547 | |||||
| DISTRIBUTIONS TO SHAREHOLDERS | ||||||||
| From distributable earnings | ||||||||
| Class A | (138,328 | ) | (77,251 | ) | ||||
| Class I | (4,759,902 | ) | (2,386,723 | ) | ||||
| From return of capital | ||||||||
| Class A | — | (486 | ) | |||||
| Class I | — | (15,024 | ) | |||||
| Total distributions to shareholders | (4,898,230 | ) | (2,479,484 | ) | ||||
| SHARES OF BENEFICIAL INTEREST | ||||||||
| Proceeds from shares sold: | ||||||||
| Class A | 203,034 | 1,329,614 | ||||||
| Class I | 10,295,894 | 29,792,109 | ||||||
| Net asset value of shares issued in reinvestment of distributions: | ||||||||
| Class A | 126,158 | 72,312 | ||||||
| Class I | 4,708,168 | 2,368,692 | ||||||
| Redemption fee proceeds: | ||||||||
| Class A | 113 | 68 | ||||||
| Class I | 178 | 2,246 | ||||||
| Payments for shares redeemed: | ||||||||
| Class A | (846,222 | ) | (728,117 | ) | ||||
| Class I | (23,838,495 | ) | (11,912,988 | ) | ||||
| Net increase (decrease) from shares of beneficial interest transactions | (9,351,172 | ) | 20,923,936 | |||||
| NET INCREASE (DECREASE) IN NET ASSETS | (26,496,718 | ) | 18,694,999 | |||||
| NET ASSETS | ||||||||
| Beginning of Year | 105,177,319 | 86,482,320 | ||||||
| End of Year | $ | 78,680,601 | $ | 105,177,319 | ||||
| SHARE ACTIVITY | ||||||||
| Class A: | ||||||||
| Shares Sold | 10,849 | 61,433 | ||||||
| Shares Reinvested | 7,572 | 3,566 | ||||||
| Shares Redeemed | (45,175 | ) | (33,728 | ) | ||||
| Net increase (decrease) in shares of beneficial interest outstanding | (26,754 | ) | 31,271 | |||||
| Class I: | ||||||||
| Shares Sold | 539,109 | 1,365,909 | ||||||
| Shares Reinvested | 277,604 | 115,152 | ||||||
| Shares Redeemed | (1,229,705 | ) | (545,839 | ) | ||||
| Net increase (decrease) in shares of beneficial interest outstanding | (412,992 | ) | 935,222 | |||||
See accompanying notes to financial statements.
14
| ACM Funds |
| STATEMENTS OF CHANGES IN NET ASSETS |
| ACM Tactical Income Fund | ||||||||
| For the Year Ended | For the Year Ended | |||||||
| December 31, 2022 | December 31, 2021 | |||||||
| INCREASE (DECREASE) IN NET ASSETS FROM OPERATIONS | ||||||||
| Net investment income | $ | 1,281,114 | $ | 2,365,959 | ||||
| Net realized loss on investments, options written and securities sold short | (4,291,148 | ) | (1,969,452 | ) | ||||
| Distributions of realized gains by underlying investment companies | — | 3,224 | ||||||
| Net change in unrealized depreciation on investments and options written | (1,534,346 | ) | (950,771 | ) | ||||
| Net decrease in net assets resulting from operations | (4,544,380 | ) | (551,040 | ) | ||||
| DISTRIBUTIONS TO SHAREHOLDERS | ||||||||
| From distributable earnings | ||||||||
| Class A | (68,106 | ) | (138,097 | ) | ||||
| Class I | (1,207,069 | ) | (2,078,162 | ) | ||||
| From return of capital | ||||||||
| Class A | — | (895 | ) | |||||
| Class I | — | (14,013 | ) | |||||
| Total distributions to shareholders | (1,275,175 | ) | (2,231,167 | ) | ||||
| SHARES OF BENEFICIAL INTEREST | ||||||||
| Proceeds from shares sold: | ||||||||
| Class A | 802,502 | 1,680,712 | ||||||
| Class I | 8,916,241 | 31,617,017 | ||||||
| Net asset value of shares issued in reinvestment of distributions: | ||||||||
| Class A | 51,235 | 76,597 | ||||||
| Class I | 1,173,708 | 2,032,469 | ||||||
| Redemption fee proceeds: | ||||||||
| Class A | 6 | 148 | ||||||
| Class I | 99 | 2,290 | ||||||
| Payments for shares redeemed: | ||||||||
| Class A | (2,317,274 | ) | (1,517,836 | ) | ||||
| Class I | (25,242,784 | ) | (12,311,867 | ) | ||||
| Net increase (decrease) from shares of beneficial interest transactions | (16,616,267 | ) | 21,579,530 | |||||
| NET INCREASE (DECREASE) IN NET ASSETS | (22,435,822 | ) | 18,797,323 | |||||
| NET ASSETS | ||||||||
| Beginning of Year | 66,103,925 | 47,306,602 | ||||||
| End of Year | $ | 43,668,103 | $ | 66,103,925 | ||||
| SHARE ACTIVITY | ||||||||
| Class A: | ||||||||
| Shares Sold | 83,216 | 159,245 | ||||||
| Shares Reinvested | 5,472 | 7,334 | ||||||
| Shares Redeemed | (244,479 | ) | (144,457 | ) | ||||
| Net increase (decrease) in shares of beneficial interest outstanding | (155,791 | ) | 22,122 | |||||
| Class I: | ||||||||
| Shares Sold | 926,776 | 2,997,985 | ||||||
| Shares Reinvested | 124,902 | 194,569 | ||||||
| Shares Redeemed | (2,630,855 | ) | (1,175,222 | ) | ||||
| Net increase (decrease) in shares of beneficial interest outstanding | (1,579,177 | ) | 2,017,332 | |||||
See accompanying notes to financial statements.
15
| ACM Dynamic Opportunity Fund |
| FINANCIAL HIGHLIGHTS |
| Per Share Data and Ratios for a Share of Beneficial Interest Outstanding Throughout each Year Presented |
| Class A | ||||||||||||||||||||
| For the Year Ended | For the Year Ended | For the Year Ended | For Year Ended | For Year Ended | ||||||||||||||||
| December 31, 2022 | December 31, 2021 | December 31, 2020 | December 31, 2019 | December 31, 2018 | ||||||||||||||||
| Net asset value, beginning of year | $ | 20.32 | $ | 20.67 | $ | 17.63 | $ | 17.33 | $ | 17.71 | ||||||||||
| Increase (decrease) from investment operations: | ||||||||||||||||||||
| Net investment loss (1) | (0.13 | ) | (0.25 | ) | (0.30 | ) | (0.20 | ) | (0.25 | ) | ||||||||||
| Net realized and unrealized gain (loss) on investments | (2.50 | ) | 0.39 | 4.25 | 0.56 | 0.04 | (5) | |||||||||||||
| Total from investment operations | (2.63 | ) | 0.14 | 3.95 | 0.36 | (0.21 | ) | |||||||||||||
| Less distributions from: | ||||||||||||||||||||
| Net realized gains | (1.11 | ) | (0.49 | ) | (0.89 | ) | (0.06 | ) | (0.17 | ) | ||||||||||
| Return of capital | — | (0.00 | ) (4) | (0.02 | ) | — | — | |||||||||||||
| Total distributions | (1.11 | ) | (0.49 | ) | (0.91 | ) | (0.06 | ) | (0.17 | ) | ||||||||||
| Redemption fees collected (1) | 0.00 | (4) | 0.00 | (4) | 0.00 | (4) | — | 0.00 | (4) | |||||||||||
| Net asset value, end of year | $ | 16.58 | $ | 20.32 | $ | 20.67 | $ | 17.63 | $ | 17.33 | ||||||||||
| Total return (2) | (12.98 | )% | 0.70 | % | 22.37 | % | 2.09 | % | (1.15 | )% | ||||||||||
| Net assets, at end of year (000s) | $ | 2,167 | $ | 3,200 | $ | 2,609 | $ | 3,686 | $ | 8,961 | ||||||||||
| Ratios/Supplemental Data: | ||||||||||||||||||||
| Ratio of expenses to average net assets including dividends from securities sold short and interest expense (3) | 2.05 | % | 1.94 | % | 2.07 | % | 1.95 | % | 2.04 | % | ||||||||||
| Ratio of expenses to average net assets excluding dividends from securities sold short and interest expense (3) | 1.97 | % | 1.88 | % | 1.97 | % | 1.93 | % | 1.92 | % | ||||||||||
| Ratio of net investment loss to average net assets (3)(6) | (0.70 | )% | (1.18 | )% | (1.61 | )% | (1.10 | )% | (1.37 | )% | ||||||||||
| Portfolio Turnover Rate | 742 | % | 330 | % | 437 | % | 325 | % | 271 | % | ||||||||||
| (1) | Per share amounts calculated using the average shares method, which more appropriately presents the per share data for the year. |
| (2) | Total returns shown exclude the effect of applicable sales charges and redemption fees and assumes reinvestment of all distributions. |
| (3) | Does not include the expenses of other investment companies in which the Fund invests. |
| (4) | Represents less than $0.01 per share. |
| (5) | Net realized and unrealized gain on investments does not accord with the net amount reported in the Statements of Operations for the year ended December 31, 2018 due to timing of shareholder subscriptions and redemptions relative to fluctuating market values during the year. |
| (6) | Recognition of net investment loss by the Fund is affected by the timing and declaration of dividends by the underlying investment companies in which the Fund invests. |
See accompanying notes to financial statements.
16
| ACM Dynamic Opportunity Fund |
| FINANCIAL HIGHLIGHTS |
| Per Share Data and Ratios for a Share of Beneficial Interest Outstanding Throughout each Year Presented |
| Class I | ||||||||||||||||||||
| For the Year Ended | For the Year Ended | For the Year Ended | For Year Ended | For Year Ended | ||||||||||||||||
| December 31, 2022 | December 31, 2021 | December 31, 2020 | December 31, 2019 | December 31, 2018 | ||||||||||||||||
| Net asset value, beginning of year | $ | 20.62 | $ | 20.92 | $ | 17.82 | $ | 17.48 | $ | 17.82 | ||||||||||
| Increase (decrease) from investment operations: | ||||||||||||||||||||
| Net investment loss (1) | (0.08 | ) | (0.20 | ) | (0.26 | ) | (0.15 | ) | (0.20 | ) | ||||||||||
| Net realized and unrealized gain (loss) on investments | (2.55 | ) | 0.39 | 4.27 | 0.55 | 0.03 | (5) | |||||||||||||
| Total from investment operations | (2.63 | ) | 0.19 | 4.01 | 0.40 | (0.17 | ) | |||||||||||||
| Less distributions from: | ||||||||||||||||||||
| Net realized gains | (1.11 | ) | (0.49 | ) | (0.89 | ) | (0.06 | ) | (0.17 | ) | ||||||||||
| Return of capital | — | (0.00 | ) (4) | (0.02 | ) | — | — | |||||||||||||
| Total distributions | (1.11 | ) | (0.49 | ) | (0.91 | ) | (0.06 | ) | (0.17 | ) | ||||||||||
| Redemption fees collected (1) | 0.00 | (4) | 0.00 | (4) | 0.00 | (4) | 0.00 | (4) | 0.00 | (4) | ||||||||||
| Net asset value, end of year | $ | 16.88 | $ | 20.62 | $ | 20.92 | $ | 17.82 | $ | 17.48 | ||||||||||
| Total return (2) | (12.79 | )% (6) | 0.93 | % | 22.47 | % | 2.30 | % (6) | (0.92 | )% (6) | ||||||||||
| Net assets, at end of year (000s) | $ | 76,514 | $ | 101,977 | $ | 83,874 | $ | 70,270 | $ | 77,999 | ||||||||||
| Ratios/Supplemental Data: | ||||||||||||||||||||
| Ratio of expenses to average net assets including dividends from securities sold short and interest expense (3) | 1.80 | % | 1.69 | % | 1.82 | % | 1.70 | % | 1.79 | % | ||||||||||
| Ratio of expenses to average net assets excluding dividends from securities sold short and interest expense (3) | 1.72 | % | 1.63 | % | 1.72 | % | 1.68 | % | 1.67 | % | ||||||||||
| Ratio of net investment loss to average net assets (3)(7) | (0.42 | )% | (0.93 | )% | (1.36 | )% | (0.85 | )% | (1.12 | )% | ||||||||||
| Portfolio Turnover Rate | 742 | % | 330 | % | 437 | % | 325 | % | 271 | % | ||||||||||
| (1) | Per share amounts calculated using the average shares method, which more appropriately presents the per share data for the year. |
| (2) | Total returns shown exclude the effect of redemption fees and assumes reinvestment of all distributions. |
| (3) | Does not include the expenses of other investment companies in which the Fund invests. |
| (4) | Represents less than $0.01 per share. |
| (5) | Net realized and unrealized gain on investments does not accord with the net amount reported in the Statements of Operations for the year ended December 31, 2018 due to timing of shareholder subscriptions and redemptions relative to fluctuating net asset values during the year. |
| (6) | Includes adjustments in accordance with accounting principles generally accepted in the United States and, consequently, the net asset values for financial reporting purposes and the returns based upon those net asset values may differ from the net asset values and returns for shareholder transactions. |
| (7) | Recognition of net investment loss by the Fund is affected by the timing and declaration of dividends by the underlying investment companies in which the Fund invests. |
See accompanying notes to financial statements.
17
| ACM Tactical Income Fund |
| FINANCIAL HIGHLIGHTS |
| Per Share Data and Ratios for a Share of Beneficial Interest Outstanding Throughout each Period Presented |
| Class A | ||||||||||||||||
| For the Year Ended | For Year Ended | For Year Ended | For the Period Ended | |||||||||||||
| December 31, 2022 | December 31, 2021 | December 31, 2020 | December 31, 2019 (1) | |||||||||||||
| Net asset value, beginning of period | $ | 10.12 | $ | 10.54 | $ | 10.13 | $ | 10.00 | ||||||||
| Increase (decrease) from investment operations: | ||||||||||||||||
| Net investment income (2) | 0.21 | 0.38 | 0.34 | 0.48 | ||||||||||||
| Net realized and unrealized gain (loss) on investments | (1.00 | ) | (0.44 | ) | 0.34 | 0.03 | (5) | |||||||||
| Total from investment operations | (0.79 | ) | (0.06 | ) | 0.68 | 0.51 | ||||||||||
| Less distributions from: | ||||||||||||||||
| Net investment income | (0.22 | ) | (0.36 | ) | (0.28 | ) | (0.37 | ) | ||||||||
| Return of capital | — | (0.00 | ) (6) | (0.01 | ) | (0.01 | ) | |||||||||
| Total distributions | (0.22 | ) | (0.36 | ) | (0.29 | ) | (0.38 | ) | ||||||||
| Redemption fees collected (2) | 0.00 | (6) | 0.00 | (6) | 0.02 | 0.00 | (6) | |||||||||
| Net asset value, end of period | $ | 9.11 | $ | 10.12 | $ | 10.54 | $ | 10.13 | ||||||||
| Total return (3) | (7.89 | )% | (0.61 | )% | 7.01 | % | 5.13 | % (7) | ||||||||
| Net assets, at end of period (000s) | $ | 2,142 | $ | 3,958 | $ | 3,887 | $ | 1,272 | ||||||||
| Ratios/Supplemental Data: | ||||||||||||||||
| Ratio of gross expenses to average net assets before waiver/recapture (4) | 1.83 | % | 1.76 | % | 1.82 | % | 2.35 | % (9)(10) | ||||||||
| Ratio of net expenses to average net assets after waiver/recapture (4) | 1.83 | % | 1.76 | % | 1.86 | % (8) | 2.25 | % (9)(10) | ||||||||
| Ratio of net investment income to average net assets (4)(11) | 2.11 | % | 3.65 | % | 3.31 | % | 5.08 | % (10) | ||||||||
| Portfolio Turnover Rate | 894 | % | 555 | % | 478 | % | 645 | % (7) | ||||||||
| (1) | The Fund commenced operations on January 2, 2019. |
| (2) | Per share amounts calculated using the average shares method, which more appropriately presents the per share data for the year/period. |
| (3) | Total returns shown exclude the effect of applicable sales charges and redemption fees and assumes reinvestment of all distributions. |
| (4) | Does not include the expenses of other investment companies in which the Fund invests. |
| (5) | The amount of net realized and unrealized gain on investment per share for the period ended December 31, 2019 does not accord with the amounts in the Statement of Operations due to the timing of purchases and sales of Fund shares in relation to fluctuating market values. |
| (6) | Represents less than $0.01 per share. |
| (7) | Not annualized. |
| (8) | Includes recapture of 0.04% during the year. |
| (9) | Includes less than 0.01% of interest expense. |
| (10) | Annualized for periods less than one full year. |
| (11) | Recognition of net investment loss by the Fund is affected by the timing and declaration of dividends by the underlying investment companies in which the Fund invests. |
See accompanying notes to financial statements.
18
| ACM Tactical Income Fund |
| FINANCIAL HIGHLIGHTS |
| Per Share Data and Ratios for a Share of Beneficial Interest Outstanding Throughout each Period Presented |
| Class I | ||||||||||||||||
| For the Year Ended | For Year Ended | For Year Ended | For the Period Ended | |||||||||||||
| December 31, 2022 | December 31, 2021 | December 31, 2020 | December 31, 2019 (1) | |||||||||||||
| Net asset value, beginning of period | $ | 10.12 | $ | 10.54 | $ | 10.13 | $ | 10.00 | ||||||||
| Increase (decrease) from investment operations: | ||||||||||||||||
| Net investment income (2) | 0.23 | 0.42 | 0.37 | 0.48 | ||||||||||||
| Net realized and unrealized gain (loss) on investments | (1.00 | ) | (0.45 | ) | 0.33 | 0.05 | (5) | |||||||||
| Total from investment operations | (0.77 | ) | (0.03 | ) | 0.70 | 0.53 | ||||||||||
| Less distributions from: | ||||||||||||||||
| Net investment income | (0.24 | ) | (0.39 | ) | (0.30 | ) | (0.39 | ) | ||||||||
| Return of capital | — | (0.00 | ) (6) | (0.01 | ) | (0.01 | ) | |||||||||
| Total distributions | (0.24 | ) | (0.39 | ) | (0.31 | ) | (0.40 | ) | ||||||||
| Redemption fees collected (2) | 0.00 | (6) | 0.00 | (6) | 0.02 | 0.00 | (6) | |||||||||
| Net asset value, end of period | $ | 9.11 | $ | 10.12 | $ | 10.54 | $ | 10.13 | ||||||||
| Total return (3) | ||||||||||||||||
| (7.66 | )% | (0.36 | )% | 7.26 | % | 5.35 | % (7) | |||||||||
| Net assets, at end of period (000s) | $ | 41,526 | $ | 62,146 | $ | 43,420 | $ | 19,215 | ||||||||
| Ratios/Supplemental Data: | ||||||||||||||||
| Ratio of gross expenses to average net assets before waiver/recapture (4) | 1.58 | % | 1.51 | % | 1.57 | % | 2.10 | % (9)(10) | ||||||||
| Ratio of net expenses to average net assets after waiver/recapture (4) | 1.58 | % | 1.51 | % | 1.61 | % (8) | 2.00 | % (9)(10) | ||||||||
| Ratio of net investment income to average net assets (4)(11) | 2.42 | % | 4.04 | % | 3.56 | % | 4.83 | % (10) | ||||||||
| Portfolio Turnover Rate | 894 | % | 555 | % | 478 | % | 645 | % (7) | ||||||||
| (1) | The Fund commenced operations on January 2, 2019. |
| (2) | Per share amounts calculated using the average shares method, which more appropriately presents the per share data for the year/period. |
| (3) | Total returns shown exclude the effect of redemption fees and assumes reinvestment of all distributions. |
| (4) | Does not include the expenses of other investment companies in which the Fund invests. |
| (5) | The amount of net realized and unrealized gain on investment per share for the period ended December 31, 2019 does not accord with the amounts in the Statement of Operations timing of purchases and sales of Fund shares in relation to fluctuating market values. |
| (6) | Represents less than $0.01 per share. |
| (7) | Not annualized. |
| (8) | Includes recapture of 0.04% during the year. |
| (9) | Includes less than 0.01% of interest expense. |
| (10) | Annualized for periods less than one full year. |
| (11) | Recognition of net investment loss by the Fund is affected by the timing and declaration of dividends by the underlying investment companies in which the Fund invests. |
See accompanying notes to financial statements.
19
| ACM Funds |
| NOTES TO FINANCIAL STATEMENTS |
| December 31, 2022 |
| 1. | ORGANIZATION |
The ACM Dynamic Opportunity Fund (“Dynamic Opportunity Fund”) and ACM Tactical Income Fund (“Tactical Income Fund”) (each a “Fund” and collectively, the “Funds”) are diversified series of shares of beneficial interest of Northern Lights Fund Trust III (the “Trust”), a statutory trust organized under the laws of the State of Delaware on December 5, 2011, and registered under the Investment Company Act of 1940, as amended (the “1940 Act”), as an open-end management investment company. The Dynamic Opportunity Fund commenced operations on January 20, 2015. The Dynamic Opportunity Fund seeks long-term capital appreciation with a short -term focus on capital preservation. The Tactical Income Fund commenced operations on January 2, 2019. The Tactical Income Fund seeks to generate income, with capital preservation as a secondary objective.
Each Fund offers Class A and Class I shares. Class A shares are offered at net asset value plus a maximum sales charge of 5.75%. Class I shares of the Fund are sold at NAV without an initial sales charge and are not subject to 12b-1 distribution fees, but have a higher minimum initial investment than Class A shares. All classes are subject to a 1.00% redemption fee on redemptions made within 30 days of the original purchase. Each share class represents an interest in the same assets of the Fund and classes are identical except for differences in their sales charge structures and ongoing service and distribution charges. All classes of shares have equal voting privileges except that each class has exclusive voting rights with respect to its service and/or distribution plans. The Funds’ income, expenses (other than class specific distribution fees) and realized and unrealized gains and losses are allocated proportionately each day based upon the relative net assets of each class.
| 2. | SIGNIFICANT ACCOUNTING POLICIES |
The following is a summary of significant accounting policies followed by the Funds in preparation of their financial statements. The policies are in conformity with U.S. generally accepted accounting principles (“GAAP”). The preparation of the financial statements requires management to make estimates and assumptions that affect the reported amounts of assets and liabilities and disclosure of contingent assets and liabilities at the date of the financial statements and the reported amounts of income and expenses for the year then ended. Actual results could differ from those estimates. Each Fund is an investment company and accordingly follows the investment company accounting and reporting guidance of the Financial Accounting Standards Board (“FASB”) Accounting Standards Codification Topic 946 “Financial Services Investment Companies” including FASB Accounting Standards Update (“ASU”) 2013-08.
Securities Valuation – Securities are valued at the last sale price on the exchange in which such securities are primarily traded, as of the close of business on the day the securities are being valued. In the absence of a sale on the primary exchange, such securities shall be valued at the mean between the current bid and ask prices on the day of valuation. NASDAQ traded securities are valued using the NASDAQ Official Closing Price (“NOCP”). Options contracts listed on a securities exchange or board of trade (not including Index Options contracts) for which market quotations are readily available shall be valued at the last quoted sales price or, in the absence of a sale, at the mean between the current bid and ask prices on the valuation date. Index Options listed on a securities exchange or board of trade for which market quotations are readily available shall be valued at the mean between the current bid and ask prices on the valuation date. Investments in open -end investment companies are valued at net asset value. Debt securities (other than short-term obligations) are valued each day by an independent pricing service approved by the Trust’s Board of Trustees (the “Board”) using methods which include current market quotations from a major market maker in the securities and based on methods which include the consideration of yields or prices of securities of comparable quality, coupon, maturity and type. The independent pricing service does not distinguish between smaller-sized bond positions known as “odd lots” and larger institutional-sized bond positions known as “round lots”. A Fund may fair value a particular bond if the advisor does not believe that the round lot value provided by the independent pricing service reflects fair value of the Fund’s holding. Short-term debt obligations having 60 days or less remaining until maturity, at time of purchase, may be valued at amortized cost
The Funds may hold securities, such as private investments, interests in commodity pools, other non-traded securities or temporarily illiquid securities, for which market quotations are not readily available or are determined to be unreliable. These securities will be valued using the “fair value” procedures approved by the Board. The Board has designated the Adviser as its valuation designee (the “Valuation Designee”) for execution of these procedures. The Board may also enlist third party consultants such as a valuation specialist at a public accounting firm, valuation consultant or financial officer of a security issuer on an as-needed basis to assist the Valuation Designee in determining a security-specific fair value. The
20
| ACM Funds |
| NOTES TO FINANCIAL STATEMENTS (Continued) |
| December 31, 2022 |
Board is responsible for reviewing and approving fair value methodologies utilized by the Valuation Designee, which approval shall be based upon whether the Valuation Designee followed the valuation procedures established by the Board.
Fair Valuation Process – The applicable investments are valued by the Valuation Designee pursuant to valuation procedures established by the Board. For example, fair value determinations are required for the following securities: (i) securities for which market quotations are insufficient or not readily available on a particular business day (including securities for which there is a short and temporary lapse in the provision of a price by the regular pricing source); (ii) securities for which, in the judgment of the Valuation Designee, the prices or values available do not represent the fair value of the instrument; factors which may cause the Valuation Designee to make such a judgment include, but are not limited to, the following: only a bid price or an asked price is available; the spread between bid and asked prices is substantial; the frequency of sales; the thinness of the market; the size of reported trades; and actions of the securities markets, such as the suspension or limitation of trading; (iii) securities determined to be illiquid; and (iv) securities with respect to which an event that will affect the value the reof has occurred (a “significant event”) since the closing prices were established on the principal exchange on which they are traded, but prior to a Fund’s calculation of its net asset value. Specifically, interests in commodity pools or managed futures pools are valued on a daily basis by reference to the closing market prices of each futures contract or other asset held by a pool, as adjusted for pool expenses. Restricted or illiquid securities, such as private investments or non-traded securities are valued based upon the current bid for the security from two or more independent dealers or other parties reasonably familiar with the facts and circumstances of the security (who should take into consideration all relevant factors as may be appropriate under the circumstances). If a current bid from such independent dealers or other independent parties is unavailable, the Valuation Designee shall determine, the fair value of such security using the following factors: (i) the type of security; (ii) the cost at date of purchase; (iii) the size and nature of the Fund’s holdings; (iv) the discount from market value of unrestricted securities of the same class at the time of purchase and subsequent thereto; (v) information as to any transactions or offers with respect to the security; (vi) the nature and duration of restrictions on disposition of the security and the existence of any registration rights; (vii) how the yield of the security compares to similar securities of companies of similar or equal creditworthiness; (viii) the level of recent trades of similar or comparable securities; (ix) the liquidity characteristics of the security; (x) current market conditions; and (xi) the market value of any securities into which the security is convertible or exchangeable.
Valuation of Fund of Funds – The Funds may invest in portfolios of open-end or closed-end investment companies (the “Underlying Funds”). The Underlying Funds value securities in their portfolios for which market quotations are readily available at their market values (generally the last reported sale price) and all other securities and assets at their fair value to the methods established by the board of directors of the Underlying Funds.
Open-end investment companies are valued at their respective net asset values as reported by such investment companies. The shares of many closed -end investment companies, after their initial public offering, frequently trade at a price per share, which is different than the net asset value per share. The difference represents a market premium or market discount of such shares. There can be no assurances that the market discount or market premium on shares of any closed-end investment company purchased by the Funds will not change.
The Funds utilize various methods to measure the fair value of all of their investments on a recurring basis. GAAP establishes a hierarchy that prioritizes inputs to valuation methods. The three levels of input are:
Level 1 – Unadjusted quoted prices in active markets for identical assets and liabilities that a Fund has the ability to access.
Level 2 – Observable inputs other than quoted prices included in Level 1 that are observable for the asset or liability, either directly or indirectly. These inputs may include quoted prices for the identical instrument in an inactive market, prices for similar instruments, interest rates, prepayment speeds, credit risk, yield curves, default rates and similar data.
Level 3 – Unobservable inputs for the asset or liability, to the extent relevant observable inputs are not available; representing a Fund’s own assumptions about the assumptions a market participant would use in valuing the asset or liability, and would be based on the best information available.
The availability of observable inputs can vary from security to security and is affected by a wide variety of factors, including, for example, the type of security, whether the security is new and not yet established in the marketplace, the liquidity of markets, and other characteristics particular to the security. To the extent that valuation is based on models or inputs that are
21
| ACM Funds |
| NOTES TO FINANCIAL STATEMENTS (Continued) |
| December 31, 2022 |
less observable or unobservable in the market, the determination of fair value requires more judgment. Accordingly, the degree of judgment exercised in determining fair value is greatest for instruments categorized in Level 3.
The inputs used to measure fair value may fall into different levels of the fair value hierarchy. In such cases, for disclosure purposes, the level in the fair value hierarchy within which the fair value measurement falls in its entirety, is determined based on the lowest level input that is significant to the fair value measurement in its entirety.
The inputs or methodology used for valuing securities are not necessarily an indication of the risk associated with investing in those securities. The following tables summarize the inputs used as of December 31, 2022 for the Funds’ assets and liabilities measured at fair value:
| ACM Dynamic Opportunity Fund | ||||||||||||||||
| Assets | Level 1 | Level 2 | Level 3 | Total | ||||||||||||
| Investments * | ||||||||||||||||
| Common Stocks | $ | 21,625,605 | $ | — | $ | — | $ | 21,625,605 | ||||||||
| Exchange - Traded Funds | 5,901,020 | — | — | 5,901,020 | ||||||||||||
| U.S. Government & Agencies | — | 996,939 | — | 996,939 | ||||||||||||
| Short-Term Investments | 33,820,288 | — | — | 33,820,288 | ||||||||||||
| Call Options Purchased | 330,000 | — | — | 330,000 | ||||||||||||
| Put Options Purchased | 496,575 | — | — | 496,575 | ||||||||||||
| Total Investments | $ | 62,173,488 | $ | 996,939 | $ | — | $ | 63,170,427 | ||||||||
| Liabilities * | ||||||||||||||||
| Securities Sold Short | $ | 13,471,480 | $ | — | $ | — | $ | 13,471,480 | ||||||||
| Total Liabilities | $ | 13,471,480 | $ | — | $ | — | $ | 13,471,480 | ||||||||
| ACM Tactical Income Fund | ||||||||||||||||
| Investments * | ||||||||||||||||
| Common Stock | $ | 362,250 | $ | — | $ | — | $ | 362,250 | ||||||||
| Exchange - Traded Funds | 20,853,565 | — | — | 20,853,565 | ||||||||||||
| U.S. Government & Agencies | — | 1,993,879 | — | 1,993,879 | ||||||||||||
| Short-Term Investments | 10,100,388 | — | — | 10,100,388 | ||||||||||||
| Total Investments | $ | 31,316,203 | $ | 1,993,879 | $ | — | $ | 33,310,082 | ||||||||
| * | Refer to the Schedule of Investments for industry classification. |
The Funds did not hold any Level 3 securities at year ended December 31, 2022.
Exchange - Traded Funds – The Funds may invest in exchange - traded funds (“ETFs”). ETFs are a type of fund bought and sold on a securities exchange. An ETF trades like common stock and represents a fixed portfolio of securities. The risks of owning an ETF generally reflect the risks of owning the underlying securities they are designed to track, although the lack of liquidity on an ETF could result in it being more volatile. Additionally, ETFs have fees and expenses that reduce their value.
Security Transactions and Related Income – Security transactions are accounted for on a trade date basis. Interest income is recognized on an accrual basis. Discounts are accreted and premiums are amortized on securities purchased over the lives of the respective securities. Dividend income is recorded on the ex-dividend date. Realized gains or losses from sales of securities are determined by comparing the identified cost of the security lot sold with the net sales proceeds.
Short Sales – A “short sale” is a transaction in which a Fund sells a security it does not own but has borrowed in anticipation that the market price of the security will decline. A Fund is obligated to replace the security borrowed by purchasing it on the open market at a later date. If the price of the security sold short increases between the time of the short sale and the time a Fund replaces the borrowed security, the Fund will incur a loss, potentially unlimited in size. Conversely, if the price declines, the Fund will realize a gain, limited to the price at which the Fund sold the security short.
22
| ACM Funds |
| NOTES TO FINANCIAL STATEMENTS (Continued) |
| December 31, 2022 |
Option Transactions – The Funds are subject to equity price risk in the normal course of pursuing their investment objectives and may purchase or sell options to help hedge against risk. When a Fund writes put and call options, an amount equal to the premium received is included in the Statement of Assets and Liabilities as a liability. The amount of the liability is subsequently marked-to-market to reflect the current market value of the option. If an option expires on its stipulated expiration date or if a Fund enters into a closing purchase transaction, a gain or loss is realized. If a written call option is exercised, a gain or loss is realized for the sale of the underlying security and the proceeds from the sale are increased by the premium originally received. As writer of an option, the Funds have no control over whether the option will be exercised and, as a result, retain the market risk of an unfavorable change in the price of the security underlying the written option.
Put options are purchased to hedge against a decline in the value of securities held in the Funds’ portfolios. If such a decline occurs, the put options will permit a Fund to sell the securities underlying such options at the exercise price, or to close out the options at a profit. The premium paid for a put or call option plus any transaction costs will reduce the benefit, if any, realized by a Fund upon exercise of the option, and, unless the price of the underlying security rises or declines sufficiently, the option may expire worthless to the Fund. In addition, in the event that the price of the security in connection with which an option was purchased moves in a direction favorable to a Fund, the benefits realized by the Fund as a result of such favorable movement will be reduced by the amount of the premium paid for the option and related transaction costs. Written and purchased options are non-income producing securities. With purchased options, there is minimal counterparty risk to the Fund since these options are exchange traded and the exchange’s clearinghouse, as counterparty to all exchange traded options, guarantees against a possible default.
The notional value of the derivative instruments outstanding as of December 31, 2022, as disclosed in the Schedule of Investments and the amounts realized and changes in unrealized gains and losses on derivative instruments during the period, as disclosed and within the Statements of Operations, serve as indicators of the volume of derivative activity for the Funds.
Impact of Derivatives on the Statements of Assets and Liabilities and Statements of Operations
The locations on the Statements of Assets and Liabilities of derivative instruments by type of exposure, all of which are not accounted for as hedging instruments under GAAP, are as follows:
Dynamic Opportunity Fund
| Assets: | ||||||||
| Location of Derivatives on | ||||||||
| Derivative Investment | Primary Risk | Statements of Assets and | Fair Value of Asset | |||||
| Type | Exposure | Liabilities | Derivatives | |||||
| Dynamic Opportunity | ||||||||
| Fund | ||||||||
| Call options purchased | Equity Risk | Investment securities, at value | $ | 330,000 | ||||
| Put options purchased | Equity Risk | Investment securities, at value | 496,575 | |||||
| Total | $ | 826,575 | ||||||
The following is a summary of the location of derivative investments on the Funds’ Statements of Operations for the year ended December 31, 2022:
| Derivative Investment Type | Location of Gain/Loss on Derivative | ||
| Options purchased | Net realized gain (loss) from investments and foreign currency transactions | ||
| Options written | Net realized gain (loss) from options written | ||
| Options purchased | Net change in unrealized appreciation (depreciation) on investments and foreign currency translations | ||
| Options written | Net change in unrealized appreciation (depreciation) on options written | ||
23
| ACM Funds |
| NOTES TO FINANCIAL STATEMENTS (Continued) |
| December 31, 2022 |
The following is a summary of the Funds realized gain (loss) on derivative investments recognized in the Statements of Operations categorized by primary risk exposure for the year ended December 31, 2022:
| Realized gain (loss) on derivatives recognized in the Statements of Operations | ||||||||
| Total for the | ||||||||
| Year Ended | ||||||||
| December 31, 2022 | ||||||||
| Dynamic Opportunity | ||||||||
| Derivative Investment Type | Fund | Tactical Income Fund | ||||||
| Options purchased - Equity Risk | $ | 5,747,123 | $ | 182,472 | ||||
| Options written - Equity Risk | (17,067 | ) | 131,473 | |||||
| Total | $ | 5,730,056 | $ | 313,945 | ||||
| Changes in unrealized appreciation (depreciation) on derivatives recognized in the Statements of Operations | ||||||||
| Total for the | ||||||||
| Year Ended | ||||||||
| December 31, 2022 | ||||||||
| Dynamic Opportunity | ||||||||
| Derivative Investment Type | Fund | Tactical Income Fund | ||||||
| Options purchased - Equity Risk | $ | (1,089,995 | ) | $ | — | |||
| Option written - Equity Risk | 23,616 | — | ||||||
| Total | $ | (1,066,379 | ) | $ | — | |||
Dividends and Distributions to Shareholders – Dividends from net investment income are declared and distributed annually for the Dynamic Opportunity Fund and declared and paid monthly for the Tactical Income Fund. Distributable net realized capital gains are declared and distributed annually. Dividends from net investment income and distributions from net realized gains are recorded on the ex-dividend date and determined in accordance with federal income tax regulations, which may differ from GAAP. These “book/tax” differences are considered either temporary (i.e., deferred losses, capital loss carry forwards) or permanent in nature. To the extent these differences are permanent in nature, such amounts are reclassified within the composition of net assets based on their federal tax-basis treatment. Temporary differences do not require reclassification.
Federal Income Taxes – The Funds intend to continue to qualify as regulated investment companies by complying with the provisions of the Internal Revenue Code that are applicable to regulated investment companies and to distribute substantially all of their taxable income and net realized gains to shareholders. Therefore, no federal income tax provision has been recorded.
The Funds recognize the tax benefits of uncertain tax positions only where the position is “more likely than not” to be sustained assuming examination by tax authorities. Management has analyzed the Funds’ tax positions and has concluded that no liability for unrecognized tax benefits should be recorded related to uncertain tax positions taken on returns filed for open tax years ended December 31, 2019 through December 31, 2021, or expected to be taken in the Funds’ December 31, 2022 year-end tax returns. The Funds identify their major tax jurisdictions as U.S. federal, Ohio (Nebraska in prior years), and foreign jurisdictions where the Funds make significant investments. The Funds are not aware of any tax positions for which it is reasonably possible that the total amounts of unrecognized tax benefits will change materially in the next twelve months.
Expenses – Expenses of the Trust that are directly identifiable to a specific fund are charged to that fund. Expenses, which are not readily identifiable to a specific fund, are allocated in such a manner as deemed equitable, taking into consideration the nature and type of expense and the relative sizes of the funds in the Trust.
Indemnification – The Trust indemnifies its officers and the Board for certain liabilities that may arise from the performance of their duties to the Trust. Additionally, in the normal course of business, the Funds enter into contracts that contain a variety
24
| ACM Funds |
| NOTES TO FINANCIAL STATEMENTS (Continued) |
| December 31, 2022 |
of representations and warranties and which provide general indemnities. The Funds’ maximum exposure under these arrangements is unknown, as this would involve future claims that may be made against the Funds that have not yet occurred. However, based on experience, the risk of loss due to these warranties and indemnities appears to be remote.
Cash and cash equivalents – Cash and cash equivalents are held with a financial institution. The assets of the Funds may be placed in deposit accounts at U.S. banks and such deposits generally exceed Federal Deposit Insurance Corporation (“FDIC”) insurance limits. The FDIC insures deposit accounts up to $250,000 for each accountholder. The Funds maintain cash balances, which, at times, may exceed federally insured limits. The counterparty is generally a single bank rather than a group of financial institutions; thus, there may be a greater counterparty credit risk. The Funds place deposits only with those counterparties which are believed to be creditworthy and there has been no history of loss.
| 3. | INVESTMENT TRANSACTIONS |
For the year ended December 31, 2022, cost of purchases and proceeds from sales of portfolio securities, other than short-term investments, amounted to $228,500,457 and $249,455,308, respectively, for the Dynamic Opportunity Fund and $266,712,834 and $300,666,205, respectively, for the Tactical Income Fund.
| 4. | INVESTMENT ADVISORY AGREEMENT AND TRANSACTIONS WITH RELATED PARTIES |
Ascendant Capital Management, LLC (the “Advisor”) serves as the Funds’ investment advisor. Pursuant to an advisory agreement with the Trust, on behalf of the Funds, the Advisor, under the oversight of the Board, directs the daily operations of the Funds and supervises the performance of administrative and professional services provided by others. As compensation for its services and the related expenses borne by the Advisor, each Fund pays the Advisor a fee computed and accrued daily and paid monthly, based on the Fund’s average daily net assets and is computed at the annual rate of 1.25% for the Dynamic Opportunity Fund and 1.00% for the Tactical Income Fund. For the year ended December 31, 2022, the Advisor earned advisory fees of $1,089,572 and $533,934 for the Dynamic Opportunity Fund and Tactical Income Fund, respectively.
The Advisor has contractually agreed to reduce its fees and/or absorb expenses of the Dynamic Opportunity Fund and Tactical Income Fund (“Waiver Agreement”) until at least April 30, 2023, to ensure that Total Annual Fund Operating Expenses After Fee Waiver and/or Reimbursement (exclusive of any front-end or contingent deferred loads; brokerage fees and commissions, acquired fund fees and expenses; borrowing costs, such as interest and dividend expense on securities sold short; taxes; and extraordinary expenses, such as litigation expenses which may include indemnification of Fund officers and Trustees and contractual indemnification of Fund service providers other than the Advisor), will not exceed 2.40% and 2.15% of the daily average net assets attributable to Dynamic Opportunity Fund’s Class A and Class I shares, respectively, and 2.25% and 2.00% of the daily average net assets attributable to Tactical Income Fund’s Class A and Class I shares, respectively. The Advisor may seek reimbursement for expenses waived or paid by it during the prior three years; provided, however, that such expenses may only be reimbursed to the extent they were waived or paid after the date of the Waiver Agreement (or any similar agreement) and if recoupment can be achieved within the aforementioned expense limits and expense limits at the time of waiver. The Board may terminate this expense reimbursement arrangement at any time. During the year ended December 31, 2022, Dynamic Opportunity Fund and Tactical Income Fund each waived $0 in advisory fees pursuant to the Waiver Agreement. There are no recapture balances for either Fund to recoup.
Northern Lights Distributors, LLC (the “Distributor”)
The Distributor acts as the Funds’ principal underwriter in a continuous public offering of Fund shares. During the year ended December 31, 2022, the Distributor received $6,767 and $1,268 in underwriting commissions for sales of Class A shares of Dynamic Opportunity Fund and Tactical Income Fund, respectively, of which $886 and $161 was retained by the principal underwriter or other affiliated broker-dealers.
The Trust has adopted, with respect to the Funds, the Trust’s Master Distribution and Shareholder Servicing Plan for the Funds’ Class A shares (the “Plan”) pursuant to Rule 12b-1 under the 1940 Act, to pay for certain distribution activities and shareholder services. The Plan provides a monthly service and/or distribution fee that will be calculated at an annual rate of 0.25% per year of the average daily net assets of each Fund’s Class A shares and paid to the Distributor to be used to pay for distribution and shareholder servicing activities. For the year ended December 31, 2022, pursuant to the Plan, Class A shares of Dynamic Opportunity Fund and Tactical Income Fund incurred costs of $6,662 and $8,316, respectively.
25
| ACM Funds |
| NOTES TO FINANCIAL STATEMENTS (Continued) |
| December 31, 2022 |
In addition, certain affiliates of the Distributor provide services to the Funds as follows:
Ultimus Fund Solutions, LLC (“UFS”)
UFS, an affiliate of the Distributor, provides administration, fund accounting, and transfer agent services to the Trust. Pursuant to a separate servicing agreement with UFS, the Funds pay UFS customary fees for providing administration, fund accounting and transfer agency services to the Funds. Certain officers of the Trust are also officers of UFS, and are not paid any fees directly by the Funds for serving in such capacities.
Northern Lights Compliance Services, LLC (“NLCS”)
NLCS, an affiliate of UFS and the Distributor, provides a Chief Compliance Officer to the Trust, as well as related compliance services, pursuant to a consulting agreement between NLCS and the Trust. Under the terms of such agreement, NLCS receives customary fees from the Funds.
BluGiant, LLC (“BluGiant”)
BluGiant, an affiliate of UFS and the Distributor, provides EDGAR conversion and filing services as well as print management services for the Funds on an ad-hoc basis. For the provision of these services, BluGiant receives customary fees from the Funds.
| 5. | REDEMPTION FEES |
The Funds may assess a short-term redemption fee of 1.00% of the total redemption amount if shareholders sell their shares after holding them for less than thirty days. The redemption fee is paid directly to the Funds. Please refer to the Statements of Changes in Net Assets for the collected redemption fees.
| 6. | DISTRIBUTIONS AND TAX COMPONENTS OF CAPITAL |
The Statements of Assets and Liabilities represents cost for financial reporting purposes. Aggregate cost of investments for federal tax purposes including options purchased and securities sold short is $45,818,073 and $34,425,104 for the Dynamic Opportunity Fund and Tactical Income Fund, respectively, and differs from market value by net unrealized appreciation/ depreciation as follows:
| Dynamic Opportunity Fund | Tactical Income Fund | |||||||
| Gross unrealized appreciation: | $ | 5,218,417 | $ | 171,235 | ||||
| Gross unrealized depreciation: | (1,337,543 | ) | (1,286,257 | ) | ||||
| Net unrealized appreciation (depreciation) | $ | 3,880,874 | $ | (1,115,022 | ) | |||
The tax character of distributions paid for the fiscal year ended December 31, 2022 and fiscal year ended December 31, 2021 was as follows:
| For the year ended December 31, 2022: | ||||||||||||||||||||
| Ordinary | Long-Term | Exempt | Return | |||||||||||||||||
| Portfolio | Income | Capital Gains | Income | of Capital | Total | |||||||||||||||
| Dynamic Opportunity | $ | — | $ | 4,898,230 | $ | — | $ | — | $ | 4,898,230 | ||||||||||
| Tactical Income | 1,275,175 | — | — | — | 1,275,175 | |||||||||||||||
| For the year ended December 31, 2021: | ||||||||||||||||||||
| Ordinary | Long-Term | Exempt | Return | |||||||||||||||||
| Portfolio | Income | Capital Gains | Income | of Capital | Total | |||||||||||||||
| Dynamic Opportunity | $ | — | $ | 2,463,974 | $ | — | $ | 15,510 | $ | 2,479,484 | ||||||||||
| Tactical Income | 2,043,660 | — | 172,599 | 14,908 | 2,231,167 | |||||||||||||||
26
| ACM Funds |
| NOTES TO FINANCIAL STATEMENTS (Continued) |
| December 31, 2022 |
As of December 31, 2022, the components of accumulated earnings/(deficit) on a tax basis were as follows:
| Undistributed | Undistributed | Post October Loss | Capital Loss | Other | Unrealized | Total | ||||||||||||||||||||||
| Ordinary | Long-Term | and | Carry | Book/Tax | Appreciation/ | Accumulated | ||||||||||||||||||||||
| Portfolio | Income | Gains | Late Year Loss | Forwards | Differences | (Depreciation) | Earnings/(Losses) | |||||||||||||||||||||
| Dynamic Opportunity | $ | — | $ | — | $ | (553,463 | ) | $ | — | $ | (293,985 | ) | $ | 3,880,874 | $ | 3,033,426 | ||||||||||||
| Tactical Income | — | — | — | (6,188,728 | ) | (50 | ) | (1,115,022 | ) | (7,303,800 | ) | |||||||||||||||||
The difference between book basis and tax basis accumulated net realized gain (loss), and unrealized appreciation from investments is primarily attributable to the tax deferral of losses on wash sales and C-Corporation return of capital distributions. In addition, the amount listed under other book/tax differences is primarily attributable to the tax deferral of losses on straddles.
Capital losses incurred after October 31 within the fiscal year are deemed to arise on the first business day of the following fiscal year for tax purposes were as follows:
| Post October | ||||
| Losses | ||||
| Dynamic Opportunity Fund | $ | 553,463 | ||
| Tactical Income Fund | — | |||
At December 31, 2022, remaining capital loss carry forwards for federal income tax purposes were as follows:
| Non-Expiring | ||||||||||||||||
| Portfolio | Short-Term | Long-Term | Total | CLCF Utilized | ||||||||||||
| Dynamic Opportunity | $ | — | $ | — | $ | — | $ | — | ||||||||
| Tactical Income | 6,188,728 | — | 6,188,728 | — | ||||||||||||
Permanent book and tax differences, primarily attributable to the book/tax basis treatment of net operating losses and distributions in excess, resulted in reclassification for the year ended December 31, 2022 as follows:
| Paid | ||||||||
| In | Accumulated | |||||||
| Capital | Earnings (Losses) | |||||||
| Dynamic Opportunity Fund | $ | (301,822 | ) | $ | 301,822 | |||
| Tactical Income Fund | (106,404 | ) | 106,404 | |||||
| 7. | BENEFICIAL OWNERSHIP |
The beneficial ownership, either directly or indirectly, of more than 25% of voting securities of a fund creates a presumption of control of the Fund, under Section 2(a)(9) of the 1940 Act. As of December 31, 2022, Charles Schwab held 61.79% and 63.33% of the voting securities for the sole benefit of customers and may be deemed to control the Dynamic Opportunity Fund and Tactical Income Fund, respectively. Persons controlling the Funds can determine the outcome of any proposal submitted to the shareholders for approval, including changes to the Funds’ fundamental policies or the terms of the advisory agreement with the Advisor.
27
| ACM Funds |
| NOTES TO FINANCIAL STATEMENTS (Continued) |
| December 31, 2022 |
| 8. | UNDERLYING INVESTMENT IN OTHER INVESTMENT COMPANIES |
Dynamic Opportunity Fund currently invests a portion of its assets in the First American Government Obligations Fund - Class X (“First American”). First American is registered under the 1940 Act as open-end management investment company. Dynamic Opportunity Fund may redeem its investment in First American at any time if the Adviser determines that it is in the best interest of the Fund and its shareholders to do so. The performance of the Dynamic Opportunity Fund will be directly affected by the performance of First American. The financial statements of First American, including its portfolios of investments, can be found at the Securities and Exchange Commission’s website, www.sec.gov, and should be read in conjunction with Dynamic Opportunity Fund’s financial statements. As of December 31, 2022, the percentage of Dynamic Opportunity Fund’s net assets invested in First American Government Obligations Fund - Class X was 36.5%.
| 9. | MARKET AND GEOPOLITICAL RISK |
The increasing interconnectivity between global economies and financial markets increases the likelihood that events or conditions in one region or financial market may adversely impact issuers in a different country, region or financial market. Securities in the Funds may underperform due to inflation (or expectations for inflation), interest rates, global demand for particular products or resources, natural disasters, climate-change and climate-related events, pandemics, epidemics, terrorism, international conflicts, regulatory events and governmental or quasi-governmental actions. The occurrence of global events similar to those in recent years, such as terrorist attacks around the world, natural disasters, social and political discord or debt crises and downgrades, among others, may result in market volatility and may have long term effects on both the U.S. and global financial markets. It is difficult to predict when similar events affecting the U.S. or global financial markets may occur, the effects that such events may have and the duration of those effects. Any such event(s) could have a significant adverse impact on the value and risk profile of the Funds.
Please refer to the Funds’ prospectus and statement of additional information for a full listing of risks associated with the Funds’ investment strategies.
| 10. | NEW ACCOUNTING PRONOUNCEMENTS |
In October 2020, the Securities and Exchange Commission (the “SEC”) adopted new regulations governing the use of derivatives by registered investment companies (“Rule 18f-4”). Rule 18f-4 imposes limits on the amount of derivatives a fund can enter into, eliminates the asset segregation framework currently used by funds to comply with Section 18 of the 1940 Act, treats derivatives as senior securities and requires funds whose use of derivatives is more than a limited specified exposure amount to establish and maintain a comprehensive derivatives risk management program and appoint a derivatives risk manager.
| 11. | SUBSEQUENT EVENTS |
Subsequent events after the date of the Statements of Assets and Liabilities have been evaluated through the date the financial statements were issued. Management has determined that no events or transactions occurred requiring adjustment or disclosure in the financial statements.
28

REPORT OF INDEPENDENT REGISTERED PUBLIC ACCOUNTING FIRM
To the Board of Trustees of Northern Lights Fund Trust III
and the Shareholders of ACM Dynamic Opportunity Fund and ACM Tactical Income Fund
Opinion on the Financial Statements
We have audited the accompanying statements of assets and liabilities of ACM Dynamic Opportunity Fund and ACM Tactical Income Fund, each a series of shares of beneficial interest in Northern Lights Fund Trust III (the “Funds”), including the schedules of investments, as of December 31, 2022, and the related statements of operations for the year then ended, the statements of changes in net assets for each of the years in the two-year period then ended, the financial highlights as noted in the table below, and the related notes (collectively referred to as the “financial statements”). In our opinion, the financial statements present fairly, in all material respects, the financial position of the Funds as of December 31, 2022, and the results of their operations for the year then ended, the changes in their net assets for each of the years in the two-year period then ended and their financial highlights for each of the periods noted in the table below, in conformity with accounting principles generally accepted in the United States of America.
| Fund | Financial Highlights Presented |
| ACM Dynamic Opportunity Fund | The financial highlights for each of the years in the five- year period ended December 31, 2022 |
| ACM Tactical Income Fund | The financial highlights for each of the years in the three- year period ended December 31, 2022 and for the period from January 2, 2019 (commencement of operations) through December 31, 2019 |
Basis for Opinion
These financial statements are the responsibility of the Funds’ management. Our responsibility is to express an opinion on the Funds’ financial statements based on our audits. We are a public accounting firm registered with the Public Company Accounting Oversight Board (United States) (“PCAOB”) and are required to be independent with respect to the Funds in accordance with the U.S. federal securities law and the applicable rules and regulations of the Securities and Exchange Commission and the PCAOB.
29
We conducted our audits in accordance with the standards of the PCAOB. Those standards require that we plan and perform the audits to obtain reasonable assurance about whether the financial statements are free of material misstatement, whether due to error or fraud. The Funds are not required to have, nor were we engaged to perform, an audit of their internal control over financial reporting. As part of our audits we are required to obtain an understanding of internal control over financial reporting but not for the purpose of expressing an opinion on the effectiveness of the Funds’ internal control over financial reporting. Accordingly, we express no such opinion.
Our audits included performing procedures to assess the risk of material misstatement of the financial statements, whether due to error or fraud, and performing procedures that respond to those risks. Such procedures included examining, on a test basis, evidence regarding the amounts and disclosures in the financial statements. Our procedures included confirmation of securities owned as of December 31, 2022 by correspondence with the custodian, brokers, or by other appropriate auditing procedures where replies from brokers were not received. Our audits also included evaluating the accounting principles used and significant estimates made by management, as well as evaluating the overall presentation of the financial statements. We believe that our audits provide a reasonable basis for our opinion.

BBD, LLP
We have served as the auditor of one or more of the Funds in the Northern Lights Fund Trust III since 2012.
Philadelphia, Pennsylvania
March 1, 2023
30
| ACM Funds |
| ADDITIONAL INFORMATION (Unaudited) |
| December 31, 2022 |
Renewal of Advisory Agreements – ACM Dynamic Opportunity Fund and ACM Tactical Income Fund*
In connection with a meeting held on November 29-30, 2022, the Board, including a majority of the Trustees who are not “interested persons,” as that term is defined in the 1940 Act, discussed the renewal of the investment advisory agreements (the “Advisory Agreements”) between the Adviser and the Trust, with respect to ACM Dynamic Opportunity Fund (“ACM Dynamic”) and ACM Tactical Income Fund (“ACM Tactical”) (collectively, the “ACM Funds”). In considering the renewal of the Advisory Agreements, the Board received materials specifically relating to the ACM Funds and the Advisory Agreements.
The Board relied upon the advice of independent legal counsel and its own business judgment in determining the material factors to be considered in evaluating the Advisory Agreements and the weight to be given to each such factor. The Board’s conclusions were based on an evaluation of all of the information provided and were not the result of any one factor. Moreover, each Trustee may have afforded different weight to the various factors in reaching conclusions with respect to the Advisory Agreements.
Nature, Extent & Quality of Services. The Board noted the Adviser had approximately $134 million in assets under management. The Board acknowledged the years of experience and academic credentials of the Adviser’s investment team. The Board discussed the Adviser’s investment strategy for each ACM Fund and recognized that the Adviser provided research, analysis, risk management and compliance monitoring for the ACM Funds. The Board observed that the Adviser applied risk mitigation processes in an effort to limit downside exposure and preserve capital in down markets. The Board recognized that the Adviser utilized a third-party compliance firm to provide checklists for monthly, quarterly and annual compliance monitoring and that it reviewed investment limitations daily. The Board commented that there were no material compliance or litigation concerns with the Adviser in the past year. The Board acknowledged that the Adviser had cybersecurity protocols in place and reported no incidents in the past year. The Board agreed that the Adviser provided sufficient resources to support the ACM Funds and provided solid risk management and compliance programs.
Performance.
ACM Dynamic—The Board recognized that ACM Dynamic earned a 3-star Morningstar rating and outperformed the S&P 500 Total Return Index over the 1-year period but underperformed its peer group and Morningstar category over the same period. The Board observed that over the 3-year period ACM Dynamic outperformed its Morningstar category, was on par with its peer group, and underperformed the S&P 500 Total Return Index. The Board recognized that ACM Dynamic underperformed the S&P 500 Total Return Index and peer group over the 5-year period and performed in line with its Morningstar category over the same period. The Board further noted that ACM Dynamic underperformed the S&P 500 Total Return Index, but performed substantially in line with its Morningstar category and equal to that of its peer group for the period since inception. The Board recalled that the Adviser attributed underperformance to ACM Dynamic’s focus on investing in leading stocks, which had underperformed the broader
31
| ACM Funds |
| ADDITIONAL INFORMATION (Unaudited)(Continued) |
| December 31, 2022 |
market since the end of 2021. The Board noted that the Adviser recently adjusted its strategy by expanding the universe of ETFs that could be shorted for hedging purposes to help ACM Dynamic remain flexible and adapt to current market trends. The Board acknowledged that ACM Dynamic’s standard deviation ranked in the first quartile among its peer group across all time periods. The Board concluded that the Adviser should be given the opportunity to continue to seek positive performance for shareholders.
ACM Tactical—The Board noted that ACM Tactical earned a 3-star Morningstar rating and outperformed the Bloomberg Barclays US Aggregate Bond Total Return Index across all periods. The Board observed that ACM Tactical outperformed its peer group over the 1-year and slightly underperformed its Morningstar category over the same period. The Board recognized that ACM Tactical outperformed its peer group and Morningstar category over the 3-year period. The Board considered that ACM Tactical underperformed its peer group and Morningstar category over the since inception period. The Board acknowledged the Adviser’s position that the peer funds in the Morningstar category had different strategies than ACM Tactical which made it difficult to identify specific factors that led to relative underperformance during certain periods. The Board noted that the Adviser had and could be expected to continue to provide reasonable returns to the Fund and its shareholders.
Fees and Expenses.
ACM Dynamic—The Board noted that the advisory fee for ACM Dynamic was equal to the Morningstar category and peer group medians but slightly lower than the averages of its peer group and Morningstar category. The Board observed that ACM Dynamic’s net expense ratio was higher than the peer group and Morningstar category averages and medians. The Board acknowledged that the Adviser attributed its fees to its active management and daily hedging activity. The Board acknowledged that the Adviser currently had an expense limitation in place of 2.40% for Class A shares and 2.15% for Class I shares. Given these and other considerations, the Board concluded that the Adviser’s advisory fee for ACM Dynamic was not unreasonable.
ACM Tactical—The Board discussed that the advisory fee for ACM Tactical was higher than the Morningstar category and peer group averages and medians, but below the category high. The Board observed that the net expense ratio was the highest of its Morningstar category and peer group. The Board reviewed the Adviser’s explanations that its higher fees for ACM Tactical were warranted because the Adviser actively managed ACM Tactical’s risk by trading in and out of “risk-on” and “risk-off” sectors on a daily basis and was more active than the other buy-and-hold individual bond portfolios in the Morningstar category. The Board acknowledged that the Adviser currently had an expense limitation in place of 2.25% for Class A shares and 2.00% for Class I shares. Given these and other considerations, the Board concluded that the Adviser’s advisory fee for ACM Tactical was not unreasonable.
Economies of Scale. The Board noted the Adviser agreed to discuss the implementation of breakpoints when either ACM Fund reached specific asset levels. The Board agreed to monitor and revisit the issue at the appropriate time.
32
| ACM Funds |
| ADDITIONAL INFORMATION (Unaudited)(Continued) |
| December 31, 2022 |
Profitability. The Board considered the Adviser’s soft dollar arrangement and the benefits of such soft dollars in supporting the Adviser’s research efforts. The Board reviewed the Adviser’s profitability analysis in connection with its management of each ACM Fund and acknowledged that the Adviser earned a profit in connection with each ACM Fund. The Board recalled factors offered by the Adviser to support its levels of profit which included business, operational, regulatory, and reputational risks assumed in managing the ACM Funds, as well as the resources required to execute the active trading strategy of each Fund. The Board concluded that the Adviser’s profitability was not excessive.
Conclusion. Having requested and reviewed such information from the Adviser as the Board believed to be reasonably necessary to evaluate the terms of the Advisory Agreements, and as assisted by the advice of independent counsel, the Board concluded that renewal of the Advisory Agreements were in the best interests of each ACM Fund and its respective shareholders.
| * | Due to timing of the contract renewal schedule, these deliberations may or may not relate to the current performance results of the ACM Funds. |
33
| ACM Funds |
| EXPENSE EXAMPLES |
| December 31, 2022 |
As a shareholder of the Funds, you incur two types of costs: (1) transaction costs, such as sales charges (loads) on purchases and redemption fees; and (2) ongoing costs, including management fees; distribution and/or service (12b-1) fees, and other Fund expenses. This example is intended to help you understand your ongoing costs (in dollars) of investing in the Funds and to compare these costs with the ongoing costs of investing in other mutual funds.
The example is based on an investment of $1,000 invested at the beginning of the period and held for the entire period beginning July 1, 2022 and ending December 31, 2022.
Actual Expenses
The “Actual Expenses” lines in the table below provide information about actual account values and actual expenses. You may use the information below; together with the amount you invested, to estimate the expenses that you paid over the period. Simply divide your account value by $1,000 (for example, an $8,600 account value divided by $1,000 = 8.6), then multiply the result by the number provided under the heading “Expenses Paid During Period”.
Hypothetical Example for Comparison Purposes
The “Hypothetical” lines in the table below provide information about hypothetical account values and hypothetical expenses based on the Funds’ actual expense ratio and an assumed rate of return of 5% per year before expenses, which is not the Funds’ actual return. The hypothetical account values and expenses may not be used to estimate the actual ending account balances or expenses you paid for the period. You may use this information to compare this 5% hypothetical example with the 5% hypothetical examples that appear in the shareholder reports of other funds.
Please note that the expenses shown table are meant to highlight your ongoing costs only and do not reflect any transactional costs, such as sales charges (loads), or redemption fees. Therefore, the table is useful in comparing ongoing costs only, and will not help you determine the relative total costs of owning different funds. In addition, if these transactional costs were included, your costs would have been higher.
| Expenses Paid | ||||
| Beginning | Ending Account | During Period * | ||
| Annualized | Account Value | Value | 7/1/2022 - | |
| Actual Expenses | Expense Ratio | 7/1/22 | 12/31/2022 | 12/31/2022 |
| Dynamic Opportunity Class A | 2.05% | $1,000.00 | $943.60 | $10.07 |
| Dynamic Opportunity Class I | 1.80% | $1,000.00 | $944.50 | $8.83 |
| Tactical Income Class A | 1.83% | $1,000.00 | $978.90 | $9.11 |
| Tactical Income Class I | 1.58% | $1,000.00 | $979.10 | $7.86 |
| Beginning | Ending Account | Expenses Paid | ||
| Hypothetical | Annualized | Account Value | Value | During Period * |
| (5% return before expenses) | Expense Ratio | 7/1/22 | 12/31/2022 | 12/31/2022 |
| Dynamic Opportunity Class A | 2.05% | $1,000.00 | $1,014.86 | $10.44 |
| Dynamic Opportunity Class I | 1.80% | $1,000.00 | $1,016.13 | $9.15 |
| Tactical Income Class A | 1.83% | $1,000.00 | $1,016.00 | $9.28 |
| Tactical Income Class I | 1.58% | $1,000.00 | $1,017.26 | $8.01 |
| * | Expenses are equal to each Fund’s annualized expense ratio, multiplied by the number of days in the period (184) divided by the number of days in the fiscal year (365). |
34
| ACM Funds |
| Additional Information (Unaudited) |
| December 31, 2022 |
LIQUIDITY RISK MANAGEMENT PROGRAM
The Funds have adopted and implemented a written liquidity risk management program as required by Rule 22e-4 (the “Liquidity Rule”) under the Investment Company Act of 1940, as amended. The program is reasonably designed to assess and manage the Funds’ liquidity risk, taking into consideration, among other factors, the Funds’ investment strategies and the liquidity of their portfolio investments during normal and reasonably foreseeable stressed conditions; their short and long-term cash flow projections; and their cash holdings and access to other funding sources.
During the year ended December 31, 2022, the Trust’s Liquidity Risk Management Program Committee (the “Committee”) reviewed the Funds’ investments and determined that the Funds held adequate levels of cash and highly liquid investments to meet shareholder redemption activities in accordance with applicable requirements. Accordingly, the Committee concluded that (i) the Funds’ liquidity risk management program is reasonably designed to prevent violations of the Liquidity Rule and (ii) the Funds’ liquidity risk management program has been effectively implemented.
35
| ACM Funds |
| SUPPLEMENTAL INFORMATION (Unaudited) |
| December 31, 2022 |
The Trustees and officers of the Trust, together with information as to their principal business occupations during the past five years and other information, are shown below. Unless otherwise noted, the address of each Trustee and officer is 225 Pictoria Drive, Suite 450, Cincinnati, Ohio 45246.
| Independent Trustees | |||||
| Name, Address, Year of Birth | Position(s) Held with Registrant | Length of Service and Term | Principal Occupation(s) During Past 5 Years | Number of Funds Overseen In The Fund Complex* | Other Directorships Held During Past 5 Years** |
| Patricia Luscombe 1961 | Trustee | Since January 2015, Indefinite | Managing Director of the Valuations and Opinions Group, Lincoln International LLC (since August 2007). | 2 | Northern Lights Fund Trust III (for series not affiliated with the Fund since 2015); Monetta Mutual Funds (since November 2015). |
| John V. Palancia 1954 | Trustee, Chairman | Trustee, since February 2012, Indefinite; Chairman of the Board since May 2014. | Retired (since 2011); formerly, Director of Global Futures Operations Control, Merrill Lynch, Pierce, Fenner & Smith, Inc. (1975-2011). | 2 | Northern Lights Fund Trust III (for series not affiliated with the Fund since 2012); Northern Lights Fund Trust (since 2011); Northern Lights Variable Trust (since 2011); Alternative Strategies Fund (since 2012). |
| Mark H. Taylor 1964 | Trustee, Chairman of the Audit Committee | Since February 2012, Indefinite | PhD (Accounting), CPA; Professor and Director, Lynn Pippenger School of Accountancy, Muma College of Business, University of South Florida (2019 – present); Professor and Department of Accountancy Chair, Case Western Reserve University (2009-2019); President, American Accounting Association (AAA) commencing August 2022 (President- Elect 2022-2023, President 2023-2024; Past President 2024-2025). AAA Vice President-Finance (2017-2020); President, Auditing Section of the AAA; Member, AICPA Auditing Standards Board (2009-2012); Academic Fellow, Office of the Chief Accountant, United States Securities Exchange Commission (2005-2006); Center for Audit Quality research grants (2014, 2012). | 2 | Northern Lights Fund Trust III (for series not affiliated with the Fund since 2012); Northern Lights Fund Trust (since 2007); Northern Lights Variable Trust (since 2007); Alternative Strategies Fund (since June 2010). |
| Jeffery D. Young 1956 | Trustee | Since January 2015, Indefinite | Co-owner and Vice President, Latin America Agriculture Development Corp. (since May 2015); President, Celeritas Rail Consulting (since June 2014); Asst. Vice President - Transportation Systems, Union Pacific Railroad Company (June 1976 to April 2014). | 2 | Northern Lights Fund Trust III (for series not affiliated with the Fund since 2015). |
| * | As of December 31, 2022, the Trust was comprised of 31 active portfolios managed by 15 unaffiliated investment advisers. The term “Fund Complex” applies only to the Funds. The Funds do not hold themselves out as related to any other series within the Trust for investment purposes, nor do they share the same investment adviser with any other series. |
| ** | Only includes directorships held within the past 5 years in a company with a class of securities registered pursuant to Section 12 of the Securities Exchange Act of 1934 or subject to the requirements of Section 15(d) of the Securities Exchange Act of 1934, or any company registered as an investment company under the 1940 Act. |
12/31/22-NLFT III-v2
36
| ACM Funds |
| SUPPLEMENTAL INFORMATION (Unaudited) (Continued) |
| December 31, 2022 |
Officers of the Trust
| Name, Address, Year of Birth | Position(s) Held with Registrant | Length of Service and Term | Principal Occupation(s) During Past 5 Years |
| Eric Kane 1981 | President | Since August 2022, indefinite | Vice President and Senior Managing Counsel, Ultimus Fund Solutions, LLC (since 2022); Vice President and Managing Counsel, Ultimus Fund Solutions, LLC (2020-2022); Vice President and Counsel, Gemini Fund Services, LLC (2017-2020); Assistant Vice President, Gemini Fund Services, LLC (2014- 2017). |
| Brian Curley 1970 | Treasurer | Since February 2013, indefinite | Vice President, Ultimus Fund Solutions, LLC (since 2020); Vice President, Gemini Fund Services, LLC (2015-2020). |
| Viktoriya Pallino 1995 | Secretary | Since August 2022, indefinite | Legal Administrator II, Ultimus Fund Solutions, LLC (since 2021); Legal Administrator I, Ultimus Fund Solutions, LLC (2019-2021); Legal Administration Associate, Gemini Fund Services, LLC (2017-2019). |
| William Kimme 1962 | Chief Compliance Officer | Since February 2012, indefinite | Senior Compliance Officer of Northern Lights Compliance Services, LLC (since 2011). |
The Funds’ Statement of Additional Information includes additional information about the Trustees and is available free of charge, upon request, by calling toll-free at 1-844-798-3833.
12/31/22-NLFT III-v2
37
| PRIVACY NOTICE |
NORTHERN LIGHTS FUND TRUST III
Rev. February 2014
| FACTS | WHAT DOES NORTHERN LIGHTS FUND TRUST III DO WITH YOUR PERSONAL INFORMATION? |
| Why? | Financial companies choose how they share your personal information. Federal law gives consumers the right to limit some but not all sharing. Federal law also requires us to tell you how we collect, share, and protect your personal information. Please read this notice carefully to understand what we do. |
| What? | The types of personal information we collect and share depend on the product or service you have with us. This information can include:
■ Social Security number and income
■ assets, account transfers and transaction history
■ investment experience and risk tolerance
When you are no longer our customer, we continue to share your information as described in this notice. |
| How? | All financial companies need to share customers’ personal information to run their everyday business. In the section below, we list the reasons financial companies can share their customers’ personal information; the reasons Northern Lights Fund Trust III chooses to share and whether you can limit this sharing. |
| Reasons we can share your personal information | Does Northern Lights Fund Trust III share? | Can you limit this sharing? |
| For our everyday business purposes– such as to process your transactions, maintain your account(s), respond to court orders and legal investigations, or report to credit bureaus | YES | NO |
| For our marketing purposes– to offer our products and services to you | NO | We do not share |
| For joint marketing with other financial companies | NO | We do not share |
| For our affiliates’ everyday business purposes–information about your transactions and experiences | NO | We do not share |
| For our affiliates’ everyday business purposes–information about your creditworthiness | NO | We do not share |
| For our affiliates to market to you | NO | We do not share |
| For nonaffiliates to market to you | NO | We do not share |
| Questions? | Call 1-888-339-4230 |
38
| Page 2 |
| What we do | |
How does Northern Lights Fund Trust III protect my personal information? | To protect your personal information from unauthorized access and use, we use security measures that comply with federal law. These measures include computer safeguards and secured files and buildings.
Our service providers are held accountable for adhering to strict policies and procedures to prevent any misuse of your nonpublic personal information.
|
How does Northern Lights Fund Trust III collect my personal information? | We collect your personal information, for example, when you
■ open an account or give us contact information
■ provide account information or give us your income information
■ make deposits or withdrawals from your account
We also collect your personal information from other companies.
|
Why can’t I limit all sharing? | Federal law gives you the right to limit only
■ sharing for affiliates’ everyday business purposes—information about your creditworthiness
■ affiliates from using your information to market to you
■ sharing for nonaffiliates to market to you
State laws and individual companies may give you additional rights to limit sharing
|
| Definitions | |
| Affiliates | Companies related by common ownership or control. They can be financial and nonfinancial companies.
■ Northern Lights Fund Trust III does not share with our affiliates.
|
| Nonaffiliates | Companies not related by common ownership or control. They can be financial and nonfinancial companies.
■ Northern Lights Fund Trust III does not share with nonaffiliates so they can market to you.
|
| Joint marketing | A formal agreement between nonaffiliated financial companies that together market financial products or services to you.
■ Northern Lights Fund Trust III does not jointly market.
|
39
PROXY VOTING POLICY
Information regarding how the Funds voted proxies relating to portfolio securities for the most recent twelve month period ended June 30 as well as a description of the policies and procedures that the Funds use to determine how to vote proxies is available without charge, upon request, by calling 1-844-798-3833 or by referring to the Securities and Exchange Commission’s (“SEC”) website at http://www.sec.gov.
PORTFOLIO HOLDINGS
Each Fund files its complete schedule of portfolio holdings with the SEC for the first and third quarters of each fiscal year as an exhibit to its reports on Form N-PORT, within sixty days after the end of the period. Form N-PORT reports are available at the SEC’s website at www.sec.gov. The information on Form N-PORT is available without charge, upon request, by calling 1-844-798-3833.
| INVESTMENT ADVISOR |
| Ascendant Capital Management, LLC |
| 10866 Wilshire Blvd., Suite 1600 |
| Los Angeles, CA 90024 |
| ADMINISTRATOR |
| Ultimus Fund Solutions, LLC |
| 225 Pictoria Drive, Suite 450 |
| Cincinnati, OH 45246 |
| ACM-A22 |
(b) Not applicable
Item 2. Code of Ethics.
(a) As of the end of the period covered by this report, the registrant has adopted a code of ethics that applies to the registrant's principal executive officer, principal financial officer, principal accounting officer or controller, or persons performing similar functions, regardless of whether these individuals are employed by the registrant or a third party.
(b) For purposes of this item, “code of ethics” means written standards that are reasonably designed to deter wrongdoing and to promote:
| (1) | Honest and ethical conduct, including the ethical handling of actual or apparent conflicts of interest between personal and professional relationships; |
| (2) | Full, fair, accurate, timely, and understandable disclosure in reports and documents that a registrant files with, or submits to, the Commission and in other public communications made by the registrant; |
(3) Compliance with applicable governmental laws, rules, and regulations;
| (4) | The prompt internal reporting of violations of the code to an appropriate person or persons identified in the code; and |
(5) Accountability for adherence to the code.
(c) Amendments: During the period covered by the report, there have not been any amendments to the provisions of the code of ethics.
(d) Waivers: During the period covered by the report, the registrant has not granted any express or implicit waivers from the provisions of the code of ethics.
(e) The Code of Ethics is not posted on Registrant’ website.
(f) A copy of the Code of Ethics is attached as an exhibit.
Item 3. Audit Committee Financial Expert.
(a)(1)ii The Registrant’s board of trustees has determined that Mark H. Taylor is an audit committee financial expert, as defined in Item 3 of Form N-CSR. Mr. Taylor is independent for purposes of this Item 3.
(a)(2) Not applicable.
(a)(3) In this regard, no member of the audit committee was identified as having all of the required technical attributes identified in instruction 2 (b) to item 3 of Form N-CSR to qualify as an “audit committee financial expert,” whether through the type of specialized education or experience required by that instruction. At this time, the board believes the experience provided by each member of the audit committee collectively offers the fund adequate oversight by its audit committee given the fund’s level of financial complexity. The board will from time to time reexamine such belief.
Item 4. Principal Accountant Fees and Services.
| (a) | Audit Fees |
2022 – $28,000
2021 – $28,000
| (b) | Audit-Related Fees |
2022 – None
2021 – None
| (c) | Tax Fees |
2022 – $6,000
2021 – $5,000
Preparation of Federal & State income tax returns, assistance with calculation of required income, capital gain and excise distributions and preparation of Federal excise tax returns.
| (d) | All Other Fees |
2022 - None
2021 - None
| (e) | (1) Audit Committee’s Pre-Approval Policies |
The registrant’s Audit Committee is required to pre-approve all audit services and, when appropriate, any non-audit services (including audit-related, tax and all other services) to the registrant. The registrant’s Audit Committee also is required to pre-approve, when appropriate, any non-audit services (including audit-related, tax and all other services) to
its adviser, or any entity controlling, controlled by or under common control with the adviser that provides ongoing services to the registrant, to the extent that the services may be determined to have an impact on the operations or financial reporting of the registrant. Services are reviewed on an engagement by engagement basis by the Audit Committee.
| (2) | Percentages of Services Approved by the Audit Committee |
2022 2021
Audit-Related Fees: 0.00% 0.00%
Tax Fees: 0.00% 0.00%
All Other Fees: 0.00% 0.00%
| (f) | During the audit of registrant's financial statements for the most recent fiscal year, less than 50 percent of the hours expended on the principal accountant's engagement were attributed to work performed by persons other than the principal accountant's full-time, permanent employees. |
| (g) | The aggregate non-audit fees billed by the registrant's accountant for services rendered to the registrant, and rendered to the registrant's investment adviser (not including any sub-adviser whose role is primarily portfolio management and is subcontracted with or overseen by another investment adviser), and any entity controlling, controlled by, or under common control with the adviser that provides ongoing services to the registrant: |
2022 - $ 6,000
2021 - $ 5,000
(h) The registrant's audit committee has considered whether the provision of non-audit services to the registrant's investment adviser (not including any sub-adviser whose role is primarily portfolio management and is subcontracted with or overseen by another investment adviser), and any entity controlling, controlled by, or under common control with the investment adviser that provides ongoing services to the registrant, that were not pre-approved pursuant to paragraph (c)(7)(ii) of Rule 2-01 of Regulation S-X, is compatible with maintaining the principal accountant's independence.
Item 5. Audit Committee of Listed Companies. Not applicable to open-end investment companies.
Item 6. Schedule of Investments. Schedule of investments in securities of unaffiliated issuers is included under Item 1.
Item 7. Disclosure of Proxy Voting Policies and Procedures for Closed-End Funds. Not applicable to open-end investment companies.
Item 8. Portfolio Managers of Closed-End Management Investment Companies. Not applicable to open-end investment companies.
Item 9. Purchases of Equity Securities by Closed-End Funds. Not applicable to open-end investment companies.
Item 10. Submission of Matters to a Vote of Security Holders. None
Item 11. Controls and Procedures.
(a) Based on an evaluation of the Registrant’s disclosure controls and procedures as of a date within 90 days of filing date of this Form N-CSR, the principal executive officer and principal financial officer
of the Registrant have concluded that the disclosure controls and procedures of the Registrant are reasonably designed to ensure that the information required in filings on Form N-CSR is recorded, processed, summarized, and reported by the filing date, including that information required to be disclosed is accumulated and communicated to the Registrant’s management, including the Registrant’s principal executive officer and principal financial officer, as appropriate to allow timely decisions regarding required disclosure.
(b) There were no significant changes in the Registrant’s internal control over financial reporting that occurred during the Registrant’s last fiscal half-year that have materially affected, or are reasonably likely to materially affect, the Registrant’s internal control over financial reporting.
Item 12. Disclosure of Securities Lending Activities for Closed-End Management Investment Companies.
Not applicable Fund is an open-end management investment company
Item 13. Exhibits.
(a)(1) Code of Ethics filed herewith.
(a)(3) Not applicable for open-end investment companies.
SIGNATURES
Pursuant to the requirements of the Securities Exchange Act of 1934 and the Investment Company Act of 1940, the registrant has duly caused this report to be signed on its behalf by the undersigned, thereunto duly authorized.
(Registrant) Northern Lights Fund Trust III
By (Signature and Title)
/s/ Eric Kane
Eric Kane , Principal Executive Officer/President
Date 3/10/2023
Pursuant to the requirements of the Securities Exchange Act of 1934 and the Investment Company Act of 1940, this report has been signed below by the following persons on behalf of the registrant and in the capacities and on the dates indicated.
By (Signature and Title)
/s/ Eric Kane
Eric Kane , Principal Executive Officer/President
Date 3/10/2023
By (Signature and Title)
/s/ Brian Curley
Brian Curley, Principal Financial Officer/Treasure
Date 3/10/2023