united states
securities and exchange commission
washington, d.c. 20549
form n-csr
certified shareholder report of registered management
investment companies
Investment Company Act file number 811-22655
Northern Lights Fund Trust III
(Exact name of registrant as specified in charter)
225 Pictoria Drive, Suite 450 Cincinnati, OH 45246
(Address of principal executive offices) (Zip code)
Eric Kane 80 Arkay Drive, Suite 110, Hauppauge, New York, 11788
(Name and address of agent for service)
Registrant's telephone number, including area code: 631-490-4300
Date of fiscal year end: 3/31
Date of reporting period: 3/31/23
Item 1. Reports to Stockholders.

Newfound Risk Managed U.S. Growth Fund
Class I Shares NFDIX
Annual Report
March 31, 2023
Dear Shareholders,
We are pleased to provide our eighth Annual Letter to Shareholders, for the fiscal year ended March 31, 2023. As a reminder, the strategy underlying the Fund is designed with the thesis that equity market extremes are becoming more frequent and more severe. For lack of a better word, things will most likely remain “weird”. To align with this thesis, the Fund employs a barbell approach, marrying a ladder of increasingly convex positions seeking to outperform in equity left tails with a ladder of increasingly convex positions that seeks to outperform in the right.
At its core is a strategic equity position comprised of momentum and defensive style tilts (approximately 30% in each sleeve; 60% total). We complement the core equity position with a systematic trend-following strategy (approximately 30%) which has the flexibility to tilt from fully invested into short -term U.S. Treasuries. We implement a ladder of out-of-the-money put and call options (approximately 2.5% in each) in an effort to maximize defense in extreme down markets and participation in extreme up markets. Finally, we use the remaining capital (approximately 5%) as collateral for an active U.S. Treasury futures strategy, which seeks to provide a second, diversifying source of returns to the portfolio.
PERFORMANCE
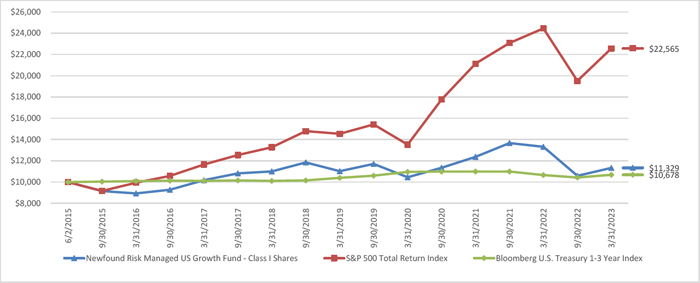
From its inception of June 2, 2015, to March 31, 2023, the Fund returned 1.61% annualized. Over this same period, the Fund’s primary benchmark, the S&P 500 Total Return Index, returned 10.95% and the secondary benchmark, 50% S&P 500 Total Return Index / 50% Bloomberg US Treasury 1-3 Year Index, returned 6.13%.
For the one-year period ended March 31, 2023, the Fund returned -14.98%. Long holdings in U.S. equities and 10 Year U.S. Treasury Futures were largely detractors from performance, with equity holdings exhibiting momentum characteristics lagging the broad equity market. In addition, equity trends have been indistinct, leading to the Fund holding an underweight to equities through most of the period. The Fund’s primary benchmark returned -7.73% and the secondary benchmark returned -3.29% over the same period.
Structurally, the Fund provides simultaneous access to both U.S. equities and U.S. Treasuries via Treasury futures to provide exposure in a capital efficient manner. As a baseline, we expect the long-term notional exposure of the Fund to be approximately 150% and split evenly between stocks and bonds. During the one-year period ended March 31, 2023, the returns of a 75/75 portfolio of U.S. stocks and 10-Year U.S. Treasury futures returned - 10.57% largely due to a challenging equity market and a volatile interest rate regime.
CURRENT MARKET ENVIRONMENT
As we reflect on the past 12 months, we want to provide you with an update on the significant economic headwinds that emerged during the reporting period and how they have impacted the Fund.
1
2022 was characterized by uncertainty with dramatically changing economic conditions and volatile markets. The U.S. economy experienced a contraction in the first half of 2022 before returning to modest growth in the second half of the year. This marked a shift to a more challenging post -reopening economic environment, with changes in consumer spending patterns and a tight labor market leading to elevated inflation, which reached a 40-year high before starting to moderate. As of the time of this writing, inflation remains higher than target levels, leaving future Federal Reserve (“the Fed”) action a key variable in the coming months. Additionally, the ongoing war resulting from Russia’s invasion of Ukraine has presented challenges for both investors and policymakers as geopolitical tensions remain heightened and supply chains have been disrupted in its wake.
During the reporting period, we witnessed equity prices falling as interest rates rose, particularly in the first half of the year. Both large- and small-capitalization U.S. stocks experienced declines, although equities began to recover in the second half of the period as inflation eased and economic growth resumed. The U.S. equity market has appreciated considerably from its lows in 2022, however, the fog of inflation and future central bank intervention has kept prices largely range-bound.
The bond market also faced inflationary headwinds, with the 10-year U.S. Treasury yield rising notably as investors reacted to fluctuating inflation data and attempted to anticipate its impact on future interest rate changes. In response to elevating inflation, the Fed has raised the effective Federal Funds rate eight times, surpassing the 10-year U.S. Treasury yield in November of last year.
In 2021, we released a white paper entitled Return Stacking™: Strategies for Overcoming a Low Return Environment in which we highlight an investment technique, utilized by institutional investors for decades, which we have coined “Return Stacking™”. This technique employs capital efficient investment instruments to achieve exposure to a specific asset with substantially less capital, allowing the remaining capital to be allocated to diversifying or alpha-focused investments. Given the uncertain geopolitical landscape as well as the challenges introduced by elevated inflation and the economic implications embedded in such an environment, we believe that controlling emotions by having a comprehensive risk management plan in place and maximizing diversification is the best strategy for dealing with uncertainty. By incorporating the concept of Return Stacking™, diversifying allocation exposures, and positioning for market extremes can result in a robust method of protecting capital during market declines, as well as participating when markets are favorable.
| Fund Performance (Performance at NAV1, 2, 3, performance as of March 31, 2023) | ||||||
| 3 Months | 6 Months | 1 Year | 3 Year | 5 Year | Inception | |
| NFDIX NAV | 3.05% | 6.97% | -14.98% | 2.71% | 0.59% | 1.61% |
| S&P 500 Total Return Index | 7.50% | 15.62% | -7.73% | 18.60% | 11.19% | 10.95% |
| 50/50 S&P 500 Total Return Index / Bloomberg US Treasury 1-3 Year Index | 4.55% | 8.99% | -3.29% | 8.93% | 6.49% | 6.13% |
2
Inception for NFDIX is June 2, 2015. Inception for S&P 500 is calculated from June 2, 2015. The performance data quoted here represents past performance. For more current information, please call toll-free 1-855-394-9777 or visit our website, www.thinknewfoundfunds.com. Current performance may be lower or higher than the performance data quoted above. Past performance is no guarantee of future results. The investment return and principal value of an investment in the Fund will fluctuate so that investors’ shares, when redeemed, may be worth more or less than their original cost. The Fund’s investment advisor has contractually agreed to reduce its fees and/or absorb expenses until at least August 1, 2024. Without these waivers, the Class I Shares total annual operating expenses would be 1.32% as of the August 2022 prospectus update. The fee waivers ensure that the net annual, operating expenses of the Class I Shares will not exceed 1.25% subject to possible recoupment from the Fund in future years. Please review the Fund’s prospectus for more information regarding the Fund’s fees and expenses.
We thank you for your continued support and for allowing us to serve you and the Fund.
Sincerely,
Corey Hoffstein, Chief Investment Officer
Investors should carefully consider the investment objectives, risks, charges and expenses of the Newfound Risk Managed U.S. Growth Fund. This and other important information about the Fund is contained in the prospectus, which can be obtained by calling 1-855-394-9777. The prospectus should be read carefully before investing.
The Newfound Risk Managed U.S. Growth Fund is distributed by Northern Lights Distributors, LLC, Member FINRA/SIPC. Newfound Research LLC is not affiliated with Northern Lights Distributors, LLC.
| 1) | Performance at net asset value (“NAV”) does not include the effect of sales charges. |
| 2) | The S&P 500 Index is widely regarded as the best single gauge of large cap U.S. equities. The index includes 500 leading companies listed in the United States and captures approximately 80% of available market capitalization. The 50/50 S&P 500 / Bloomberg US 1-3 Year Treasury Bond benchmark consists of a hypothetical portfolio that is 50% allocated to the S&P 500 Total Return Index and 50% allocated to the Bloomberg US 1-3 Year Treasury Bond index, rebalanced monthly. |
| 3) | Performance results include the effect of expense reduction arrangements for some or all of the periods shown. If those arrangements had not been in place, the performance results for those periods would have been lower. |
Risk Factors
There is no assurance that any fund will achieve its investment objectives.
Mutual funds involve risk including the possible loss of principal. These risks could include liquidity risk, sector risk, as well as risks associated with fixed income securities, real estate investments, and commodities, to name a few. Typically, a rise in interest rates causes a decline in the value of fixed income securities. A higher fund turnover will result in higher transactional and brokerage costs.
3
Like all quantitative analysis, the adviser’s investment model carries a risk that the mathematical model used might be based on one or more incorrect assumptions. No assurance can be given that the Fund will be successful under all or any market conditions. Overall equity and fixed income securities market risks affect the value of the Fund. Factors such as domestic economic growth and market conditions, interest rate levels, and political events affect the securities markets. The earnings prospects of small and medium sized companies are more volatile than larger companies and may experience higher failure rates than larger companies.
Options Risk: There are risks associated with the sale and purchase of call and put options. As the seller (writer) of a put option, the Fund will tend to lose money if the value of the reference index or security falls below the strike price. As the seller (writer) of a call option, the Fund will tend to lose money if the value of the reference index or security rises above the strike price. The Fund may lose the entire put option premium paid if the reference index or underlying security does not decrease in value. The Fund may lose the entire call option premium paid if the reference index or underlying security does not increase in value.
Click HERE for the current NFDIX prospectus.
NLD Review Code: 7284-NLD 04/18/2023
Newfound Case # 5451c36e-adf8-4303-b8a7-3da87779fab8
4
| Newfound Risk Managed U.S. Growth Fund |
| PORTFOLIO REVIEW (Unaudited) |
| March 31, 2023 |
Average Annual Total Return through March 31, 2023*, as compared to its benchmarks:
| 1 Year | 5 Years | Since Inception (1) | |
| Newfound Risk Managed U.S. Growth Fund - Class I Shares | -14.98% | 0.59% | 1.61% |
| S&P 500 Total Return Index ** | -7.73% | 11.19% | 10.95% |
| Bloomberg U.S. Treasury 1-3 Year Index *** | 0.23% | 1.09% | 0.84% |
| 50/50 S&P 500/ 1-3 Year Treasury Blend **** | -3.29% | 6.49% | 6.13% |
| * | The performance data quoted is historical. Past performance is no guarantee of future results. Current performance may be higher or lower than the performance data quoted. The principal value and investment return of an investment will fluctuate so that your shares, when redeemed, may be worth more or less than their original cost. The returns shown do not reflect the deduction of taxes that a shareholder may be required to pay on Fund distributions or on the redemptions of Fund shares. The Fund’s adviser has contractually agreed to waive its fees and reimburse expenses of the Fund, at least until August 1, 2024, to ensure that Total Annual Fund Operating Expenses After Fee Waiver and Reimbursement (exclusive of front-end or contingent deferred loads; brokerage fees and commissions, acquired fund fees and expenses; borrowing costs (such as interest and dividend expense on securities sold short); taxes; and extraordinary expenses, such as litigation expenses (which may include indemnification of Fund officers and Trustees, and contractual indemnification of Fund service providers (other than the adviser))) will not exceed 1.25% of average daily net assets attributable to Class I shares. The Fund’s gross total operating expenses as of its most recent prospectus is 1.32% of average daily net assets attributable to Class I shares. For performance information current to the most recent month-end, please call 1-855-394-9777. |
| ** | The S&P 500 Total Return Index is an unmanaged composite of 500 large capitalization companies. This index is widely used by professional investors as a performance benchmark for large-cap stocks. You cannot invest directly in an index and unmanaged index returns do not reflect any fees, expenses or sales charges. |
| *** | The Bloomberg U.S. 1-3 Year Treasury Index measures US dollar-denominated, fixed-rate, nominal debt issued by the US Treasury. Treasury bills are excluded by the maturity constraint, but are part of a separate Short Treasury Index. You cannot invest directly in an index and unmanaged index returns do not reflect any fees, expenses or sales charges. |
| **** | This Blended Benchmark is an equally weighted custom composite of the S&P 500 Total Return Index and the Bloomberg U.S. Treasury 1-3 Year Index. You cannot invest directly in an index and unmanaged index returns do not reflect any fees, expenses or sales charges. |
| (1) | The Newfound Risk Managed U.S. Growth Fund commenced operations on June 2, 2015. |
Comparison of the Change in Value of a $10,000 Investment
The Fund’s top ten holdings by asset class as of March 31, 2023 are as follows:
| Portfolio Composition | % of Net Assets | |||
| Exchange Traded Funds - Equity | 66.1 | % | ||
| Exchange Traded Funds - Fixed Income | 9.5 | % | ||
| Common Stock - Medical Equipment & Devices | 2.5 | % | ||
| Common Stock - Technology Services | 1.6 | % | ||
| Common Stock - Biotech & Pharma | 1.4 | % | ||
| Common Stock - Software | 1.1 | % | ||
| Common Stock - Beverages | 1.0 | % | ||
| Common Stock - Technology Hardware | 0.9 | % | ||
| Common Stock - Household Products | 0.8 | % | ||
| Other Investments | 9.5 | % | ||
| Other Assets in Excess of Liabilities | 5.6 | % | ||
| Total | 100.0 | % | ||
Please refer to the Schedule of Investments in this annual report for a detailed listing of the Fund’s holdings.
5
| NEWFOUND RISK MANAGED US GROWTH FUND |
| SCHEDULE OF INVESTMENTS |
| March 31, 2023 |
| Shares | Fair Value | |||||||
| COMMON STOCKS — 16.2% | ||||||||
| AEROSPACE & DEFENSE - 0.5% | ||||||||
| 188 | General Dynamics Corporation | $ | 42,903 | |||||
| 200 | HEICO Corporation | 34,208 | ||||||
| 70 | Lockheed Martin Corporation | 33,091 | ||||||
| 160 | Teledyne Technologies, Inc.(a) | 71,578 | ||||||
| 181,780 | ||||||||
| ASSET MANAGEMENT - 0.1% | ||||||||
| 1,101 | Icahn Enterprises, L.P. | 56,933 | ||||||
| BEVERAGES - 1.0% | ||||||||
| 1,017 | Brown-Forman Corporation, Class B | 65,363 | ||||||
| 1,122 | Coca-Cola Company (The) | 69,598 | ||||||
| 294 | Constellation Brands, Inc., Class A | 66,412 | ||||||
| 1,887 | Keurig Dr Pepper, Inc. | 66,573 | ||||||
| 908 | Monster Beverage Corporation(a) | 49,041 | ||||||
| 320 | PepsiCo, Inc. | 58,336 | ||||||
| 375,323 | ||||||||
| BIOTECH & PHARMA - 1.4% | ||||||||
| 359 | AbbVie, Inc. | 57,214 | ||||||
| 135 | Amgen, Inc. | 32,636 | ||||||
| 346 | BioMarin Pharmaceutical, Inc.(a) | 33,645 | ||||||
| 785 | Bristol-Myers Squibb Company | 54,408 | ||||||
| 712 | Incyte Corporation(a) | 51,456 | ||||||
| 406 | Johnson & Johnson | 62,930 | ||||||
| 1,742 | Royalty Pharma plc, Class A | 62,764 | ||||||
| 467 | Seagen, Inc.(a) | 94,554 | ||||||
| 110 | Vertex Pharmaceuticals, Inc.(a) | 34,658 | ||||||
| 420 | Zoetis, Inc. | 69,905 | ||||||
| 554,170 | ||||||||
| CABLE & SATELLITE - 0.1% | ||||||||
| 7,765 | Sirius XM Holdings, Inc. | 30,827 | ||||||
| CHEMICALS - 0.2% | ||||||||
| 124 | Air Products and Chemicals, Inc. | 35,614 | ||||||
See accompanying notes to financial statements.
6
| NEWFOUND RISK MANAGED US GROWTH FUND |
| SCHEDULE OF INVESTMENTS (Continued) |
| March 31, 2023 |
| Shares | Fair Value | |||||||
| COMMON STOCKS — 16.2% (Continued) | ||||||||
| CHEMICALS - 0.2% (Continued) | ||||||||
| 171 | New Linde plc | $ | 60,780 | |||||
| 96,394 | ||||||||
| COMMERCIAL SUPPORT SERVICES - 0.7% | ||||||||
| 103 | Cintas Corporation | 47,656 | ||||||
| 434 | Republic Services, Inc. | 58,685 | ||||||
| 1,258 | Rollins, Inc. | 47,213 | ||||||
| 421 | Waste Connections, Inc. | 58,548 | ||||||
| 364 | Waste Management, Inc. | 59,394 | ||||||
| 271,496 | ||||||||
| CONSTRUCTION MATERIALS - 0.1% | ||||||||
| 190 | Vulcan Materials Company | 32,596 | ||||||
| DIVERSIFIED INDUSTRIALS - 0.3% | ||||||||
| 277 | Eaton Corp plc | 47,461 | ||||||
| 225 | Honeywell International, Inc. | 43,002 | ||||||
| 200 | Illinois Tool Works, Inc. | 48,690 | ||||||
| 139,153 | ||||||||
| ELECTRICAL EQUIPMENT - 0.6% | ||||||||
| 850 | Amphenol Corporation, Class A | 69,462 | ||||||
| 1,042 | Fortive Corporation | 71,033 | ||||||
| 273 | Keysight Technologies, Inc.(a) | 44,084 | ||||||
| 157 | Roper Technologies, Inc. | 69,188 | ||||||
| 253,767 | ||||||||
| ENTERTAINMENT CONTENT - 0.4% | ||||||||
| 878 | Activision Blizzard, Inc. | 75,148 | ||||||
| 587 | Electronic Arts, Inc. | 70,704 | ||||||
| 145,852 | ||||||||
| FOOD - 0.7% | ||||||||
| 193 | Hershey Company (The) | 49,101 | ||||||
| 1,533 | Hormel Foods Corporation | 61,136 | ||||||
| 220 | J M Smucker Company (The) | 34,621 | ||||||
| 717 | McCormick & Company, Inc. | 59,662 | ||||||
| 1,025 | Mondelez International, Inc., Class A | 71,463 | ||||||
| 275,983 | ||||||||
See accompanying notes to financial statements.
7
| NEWFOUND RISK MANAGED US GROWTH FUND |
| SCHEDULE OF INVESTMENTS (Continued) |
| March 31, 2023 |
| Shares | Fair Value | |||||||
| COMMON STOCKS — 16.2% (Continued) | ||||||||
| HEALTH CARE FACILITIES & SERVICES - 0.1% | ||||||||
| 386 | Quest Diagnostics, Inc. | $ | 54,611 | |||||
| HOUSEHOLD PRODUCTS - 0.8% | ||||||||
| 829 | Church & Dwight Company, Inc. | 73,292 | ||||||
| 297 | Clorox Company (The) | 46,997 | ||||||
| 902 | Colgate-Palmolive Company | 67,785 | ||||||
| 522 | Kimberly-Clark Corporation | 70,063 | ||||||
| 469 | Procter & Gamble Company (The) | 69,736 | ||||||
| 327,873 | ||||||||
| INDUSTRIAL SUPPORT SERVICES - 0.2% | ||||||||
| 1,317 | Fastenal Company | 71,039 | ||||||
| INTERNET MEDIA & SERVICES - 0.3% | ||||||||
| 693 | Alphabet, Inc., Class A(a) | 71,885 | ||||||
| 273 | VeriSign, Inc.(a) | 57,693 | ||||||
| 129,578 | ||||||||
| LEISURE FACILITIES & SERVICES - 0.5% | ||||||||
| 37 | Chipotle Mexican Grill, Inc.(a) | 63,207 | ||||||
| 253 | McDonald’s Corporation | 70,741 | ||||||
| 454 | Yum! Brands, Inc. | 59,964 | ||||||
| 193,912 | ||||||||
| MACHINERY - 0.2% | ||||||||
| 255 | IDEX Corporation | 58,913 | ||||||
| 142 | Nordson Corporation | 31,561 | ||||||
| 90,474 | ||||||||
| MEDICAL EQUIPMENT & DEVICES - 2.5% | ||||||||
| 648 | Abbott Laboratories | 65,616 | ||||||
| 238 | Agilent Technologies, Inc. | 32,925 | ||||||
| 277 | Becton Dickinson and Company | 68,569 | ||||||
| 1,196 | Boston Scientific Corporation(a) | 59,836 | ||||||
| 263 | Danaher Corporation | 66,287 | ||||||
| 847 | Edwards Lifesciences Corporation(a) | 70,072 | ||||||
| 97 | Embecta Corporation | 2,728 | ||||||
| 574 | Hologic, Inc.(a) | 46,322 | ||||||
See accompanying notes to financial statements.
8
| NEWFOUND RISK MANAGED US GROWTH FUND |
| SCHEDULE OF INVESTMENTS (Continued) |
| March 31, 2023 |
| Shares | Fair Value | |||||||
| COMMON STOCKS — 16.2% (Continued) | ||||||||
| MEDICAL EQUIPMENT & DEVICES - 2.5% (Continued) | ||||||||
| 105 | IDEXX Laboratories, Inc.(a) | $ | 52,508 | |||||
| 218 | Intuitive Surgical, Inc.(a) | 55,692 | ||||||
| 682 | Medtronic plc | 54,983 | ||||||
| 23 | Mettler-Toledo International, Inc.(a) | 35,195 | ||||||
| 307 | ResMed, Inc. | 67,230 | ||||||
| 228 | STERIS plc | 43,612 | ||||||
| 172 | Stryker Corporation | 49,101 | ||||||
| 121 | Thermo Fisher Scientific, Inc. | 69,741 | ||||||
| 205 | Waters Corporation(a) | 63,474 | ||||||
| 249 | West Pharmaceutical Services, Inc. | 86,271 | ||||||
| 990,162 | ||||||||
| RETAIL - CONSUMER STAPLES - 0.2% | ||||||||
| 140 | Costco Wholesale Corporation | 69,562 | ||||||
| RETAIL - DISCRETIONARY - 0.3% | ||||||||
| 224 | Home Depot, Inc. (The) | 66,107 | ||||||
| 135 | Lululemon Athletica, Inc.(a) | 49,166 | ||||||
| 115,273 | ||||||||
| SEMICONDUCTORS - 0.5% | ||||||||
| 336 | Analog Devices, Inc. | 66,266 | ||||||
| 137 | Monolithic Power Systems, Inc. | 68,574 | ||||||
| 390 | Texas Instruments, Inc. | 72,544 | ||||||
| 207,384 | ||||||||
| SOFTWARE - 1.1% | ||||||||
| 496 | Akamai Technologies, Inc.(a) | 38,837 | ||||||
| 218 | ANSYS, Inc.(a) | 72,550 | ||||||
| 251 | Cadence Design Systems, Inc.(a) | 52,733 | ||||||
| 270 | Microsoft Corporation | 77,841 | ||||||
| 448 | PTC, Inc.(a) | 57,447 | ||||||
| 127 | Synopsys, Inc.(a) | 49,054 | ||||||
| 393 | Veeva Systems, Inc., Class A(a) | 72,229 | ||||||
| 420,691 | ||||||||
| TECHNOLOGY HARDWARE - 0.9% | ||||||||
| 474 | Apple, Inc. | 78,163 | ||||||
See accompanying notes to financial statements.
9
| NEWFOUND RISK MANAGED US GROWTH FUND |
| SCHEDULE OF INVESTMENTS (Continued) |
| March 31, 2023 |
| Shares | Fair Value | |||||||
| COMMON STOCKS — 16.2% (Continued) | ||||||||
| TECHNOLOGY HARDWARE - 0.9% (Continued) | ||||||||
| 316 | Arista Networks, Inc.(a) | $ | 53,044 | |||||
| 1,398 | Cisco Systems, Inc. | 73,080 | ||||||
| 712 | Garmin Ltd. | 71,855 | ||||||
| 127 | Motorola Solutions, Inc. | 36,339 | ||||||
| 164 | Ubiquiti, Inc. | 44,557 | ||||||
| 357,038 | ||||||||
| TECHNOLOGY SERVICES - 1.6% | ||||||||
| 239 | Accenture PLC, Class A | 68,309 | ||||||
| 384 | Broadridge Financial Solutions, Inc. | 56,283 | ||||||
| 471 | CoStar Group, Inc.(a) | 32,428 | ||||||
| 135 | FactSet Research Systems, Inc. | 56,037 | ||||||
| 190 | Mastercard, Inc., Class A | 69,048 | ||||||
| 153 | Moody’s Corporation | 46,821 | ||||||
| 87 | MSCI, Inc. | 48,693 | ||||||
| 580 | Paychex, Inc. | 66,462 | ||||||
| 197 | S&P Global, Inc. | 67,920 | ||||||
| 360 | Verisk Analytics, Inc. | 69,070 | ||||||
| 262 | Visa, Inc., Class A | 59,070 | ||||||
| 640,141 | ||||||||
| TOBACCO & CANNABIS - 0.3% | ||||||||
| 1,467 | Altria Group, Inc. | 65,458 | ||||||
| 690 | Philip Morris International, Inc. | 67,103 | ||||||
| 132,561 | ||||||||
| TRANSPORTATION & LOGISTICS - 0.4% | ||||||||
| 1,435 | CSX Corporation | 42,964 | ||||||
| 409 | Expeditors International of Washington, Inc. | 45,039 | ||||||
| 141 | Old Dominion Freight Line, Inc. | 48,058 | ||||||
| 217 | Union Pacific Corporation | 43,673 | ||||||
| 179,734 | ||||||||
| WHOLESALE - DISCRETIONARY - 0.2% | ||||||||
| 844 | Copart, Inc.(a) | 63,477 | ||||||
See accompanying notes to financial statements.
10
| NEWFOUND RISK MANAGED US GROWTH FUND |
| SCHEDULE OF INVESTMENTS (Continued) |
| March 31, 2023 |
| Shares | Fair Value | |||||||
| TOTAL COMMON STOCKS (Cost $6,036,120) | $ | 6,457,784 | ||||||
| EXCHANGE-TRADED FUNDS — 75.6% | ||||||||
| EQUITY - 66.1% | ||||||||
| 3,690 | Communication Services Select Sector SPDR Fund | 213,909 | ||||||
| 4,216 | Consumer Discretionary Select Sector SPDR Fund | 630,461 | ||||||
| 831 | Consumer Staples Select Sector SPDR Fund | 62,084 | ||||||
| 21,133 | Fidelity Low Volatility Factor ETF | 1,003,395 | ||||||
| 49,003 | Fidelity Momentum Factor ETF | 2,188,028 | ||||||
| 21,241 | Fidelity Quality Factor ETF | 1,007,800 | ||||||
| 19,467 | Financial Select Sector SPDR Fund | 625,864 | ||||||
| 5,677 | Industrial Select Sector SPDR Fund | 574,399 | ||||||
| 13,797 | iShares MSCI USA Min Vol Factor ETF | 1,003,594 | ||||||
| 15,712 | iShares MSCI USA Momentum Factor ETF | 2,184,596 | ||||||
| 8,103 | iShares MSCI USA Quality Factor ETF | 1,005,299 | ||||||
| 55,411 | JPMorgan US Momentum Factor ETF | 2,198,708 | ||||||
| 24,472 | JPMorgan US Quality Factor ETF | 1,008,981 | ||||||
| 2,510 | Materials Select Sector SPDR Fund | 202,457 | ||||||
| 7,321 | Real Estate Select Sector SPDR Fund | 273,659 | ||||||
| 7,380 | SPDR SSGA US Large Cap Low Volatility Index ETF | 1,009,584 | ||||||
| 6,931 | Technology Select Sector SPDR Fund | 1,046,650 | ||||||
| 2,210 | Utilities Select Sector SPDR Fund | 149,595 | ||||||
| 20,583 | Vanguard S&P 500 ETF | 7,740,649 | ||||||
| 19,651 | Vanguard US Momentum Factor ETF | 2,211,502 | ||||||
| 26,341,214 | ||||||||
| FIXED INCOME - 9.5% | ||||||||
| 45,763 | iShares 1-3 Year Treasury Bond ETF | 3,759,888 | ||||||
| TOTAL EXCHANGE-TRADED FUNDS (Cost $28,411,809) | 30,101,102 | |||||||
See accompanying notes to financial statements.
11
| NEWFOUND RISK MANAGED US GROWTH FUND |
| SCHEDULE OF INVESTMENTS (Continued) |
| March 31, 2023 |
| Contracts(b) | Counterparty | Expiration Date | Exercise Price | Notional Value | Fair Value | |||||||||||||||
| INDEX OPTIONS PURCHASED - 3.2% | ||||||||||||||||||||
| CALL OPTIONS PURCHASED – 2.0% | ||||||||||||||||||||
| 30 | S&P 500 INDEX | GS | 09/15/2023 | $ | 4,600 | $ | 13,800,000 | $ | 102,750 | |||||||||||
| 32 | S&P 500 INDEX | GS | 10/20/2023 | 4,900 | 15,680,000 | 40,480 | ||||||||||||||
| 26 | S&P 500 INDEX | GS | 11/17/2023 | 4,700 | 12,220,000 | 107,900 | ||||||||||||||
| 33 | S&P 500 INDEX | GS | 12/15/2023 | 4,700 | 15,510,000 | 172,920 | ||||||||||||||
| 30 | S&P 500 INDEX | GS | 01/19/2024 | 4,850 | 14,550,000 | 109,050 | ||||||||||||||
| 27 | S&P 500 INDEX | GS | 02/16/2024 | 4,625 | 12,487,500 | 275,265 | ||||||||||||||
| TOTAL CALL OPTIONS PURCHASED (Cost - $1,176,843) | 808,365 | |||||||||||||||||||
| PUT OPTIONS PURCHASED - 1.2% | ||||||||||||||||||||
| 18 | S&P 500 INDEX | GS | 06/16/2023 | $ | 3,340 | $ | 6,012,000 | $ | 20,790 | |||||||||||
| 12 | S&P 500 INDEX | GS | 06/16/2023 | 3,490 | 4,188,000 | 20,940 | ||||||||||||||
| 5 | S&P 500 INDEX | GS | 09/15/2023 | 3,550 | 1,775,000 | 28,775 | ||||||||||||||
| 7 | S&P 500 INDEX | GS | 10/20/2023 | 3,600 | 2,520,000 | 54,460 | ||||||||||||||
| 8 | S&P 500 INDEX | GS | 11/17/2023 | 3,500 | 2,800,000 | 59,560 | ||||||||||||||
| 9 | S&P 500 INDEX | GS | 12/15/2023 | 3,650 | 3,285,000 | 95,400 | ||||||||||||||
| 8 | S&P 500 INDEX | GS | 01/19/2024 | 3,750 | 3,000,000 | 107,960 | ||||||||||||||
| 7 | S&P 500 INDEX | GS | 02/16/2024 | 3,575 | 2,502,500 | 78,190 | ||||||||||||||
| TOTAL PUT OPTIONS PURCHASED (Cost - $857,435) | 466,075 | |||||||||||||||||||
| TOTAL INDEX OPTIONS PURCHASED (Cost - $2,034,278) | 1,274,440 | |||||||||||||||||||
| TOTAL INVESTMENTS - 95.0% (Cost $36,482,207) | $ | 37,833,326 | ||||||||||||||||||
| CALL OPTIONS WRITTEN - (0.3)% (Proceeds - $84,330) | (92,775 | ) | ||||||||||||||||||
| PUT OPTIONS WRITTEN - (0.3)% (Proceeds - $209,109) | (123,105 | ) | ||||||||||||||||||
| OTHER ASSETS IN EXCESS OF LIABILITIES- 5.6%(c) | 2,216,897 | |||||||||||||||||||
| NET ASSETS - 100.0% | $ | 39,834,343 | ||||||||||||||||||
| Contracts(b) | Counterparty | Expiration Date | Exercise Price | Notional Value | Fair Value | |||||||||||||||
| WRITTEN INDEX OPTIONS - (0.6)% | ||||||||||||||||||||
| CALL OPTIONS WRITTEN - (0.3)% | ||||||||||||||||||||
| 33 | S&P 500 INDEX | GS | 12/15/2023 | $ | 5,200 | $ | 17,160,000 | $ | 25,575 | |||||||||||
| 30 | S&P 500 INDEX | GS | 01/19/2024 | 5,400 | 16,200,000 | 17,250 | ||||||||||||||
| 27 | S&P 500 INDEX | GS | 02/16/2024 | 5,100 | 13,770,000 | 49,950 | ||||||||||||||
| TOTAL CALL OPTIONS WRITTEN (Proceeds - $84,330) | 92,775 | |||||||||||||||||||
| PUT OPTIONS WRITTEN - (0.3)% | ||||||||||||||||||||
| 7 | S&P 500 INDEX | GS | 10/20/2023 | $ | 2,800 | $ | 1,960,000 | $ | 13,685 | |||||||||||
See accompanying notes to financial statements.
12
| NEWFOUND RISK MANAGED US GROWTH FUND |
| SCHEDULE OF INVESTMENTS (Continued) |
| March 31, 2023 |
| Contracts(b) (continued) | Counterparty | Expiration Date | Exercise Price | Notional Value | Fair Value | |||||||||||||||
| WRITTEN INDEX OPTIONS - (0.6)% (Continued) | ||||||||||||||||||||
| PUT OPTIONS WRITTEN - (0.3)% (Continued) | ||||||||||||||||||||
| 8 | S&P 500 INDEX | GS | 11/17/2023 | $ | 2,750 | $ | 2,200,000 | $ | 17,440 | |||||||||||
| 9 | S&P 500 INDEX | GS | 12/15/2023 | 2,950 | 2,655,000 | 30,465 | ||||||||||||||
| 8 | S&P 500 INDEX | GS | 01/19/2024 | 3,000 | 2,400,000 | 33,200 | ||||||||||||||
| 7 | S&P 500 INDEX | GS | 02/16/2024 | 2,900 | 2,030,000 | 28,315 | ||||||||||||||
| TOTAL PUT OPTIONS WRITTEN (Proceeds - $209,109) | 123,105 | |||||||||||||||||||
| TOTAL INDEX OPTIONS WRITTEN (Proceeds - $293,439) | $ | 215,880 | ||||||||||||||||||
| OPEN FUTURES CONTRACTS | ||||||||||||||
| Number of Contracts | Open Long Futures Contracts | Expiration Date | Notional Amount(d) | Value and Unrealized Appreciation | ||||||||||
| 129 | CBOT 10 Year US Treasury Note | 06/21/2023 | $ | 14,824,938 | $ | 420,938 | ||||||||
| TOTAL FUTURES CONTRACTS | ||||||||||||||
| ETF | - Exchange-Traded Fund |
| LP | - Limited Partnership |
| LTD | - Limited Company |
| MSCI | - Morgan Stanley Capital International |
| PLC | - Public Limited Company |
| SPDR | - Standard & Poor’s Depositary Receipt |
| GS | -Goldman Sachs |
| (a) | Non-income producing security. |
| (b) | Each option contract allows the holder of the option to purchase or sell 100 shares of the underlying security. |
| (c) | Subject to call and put options written. |
| (d) | The amounts shown are the underlying reference notional amounts to stock exchange indices and equities upon which the fair value of the futures contracts held by the Fund are based. Notional values do not represent the current fair value of, and are not necessarily indicative of the future cash flows of the Fund’s futures contracts. Further, the underlying price changes in relation to the variables specified by the notional values affects the fair value of these derivative financial instruments. The notional values as set forth within this schedule do not purport to represent economic value at risk to the Fund. |
See accompanying notes to financial statements.
13
| Newfound Risk Managed U.S. Growth Fund |
| STATEMENT OF ASSETS AND LIABILITIES |
| March 31, 2023 |
| ASSETS | ||||
| Investment securities: | ||||
| At cost | $ | 36,482,207 | ||
| At fair value | $ | 37,833,326 | ||
| Deposits with brokers | 1,678,102 | |||
| Receivable for securities sold | 1,814,444 | |||
| Net unrealized appreciation on futures contracts | 420,938 | |||
| Prepaid registration fees | 15,054 | |||
| Dividends and interest receivable | 9,120 | |||
| TOTAL ASSETS | 41,770,984 | |||
| LIABILITIES | ||||
| Due to Custodian | 938,286 | |||
| Options written, at fair value (premium received $293,439) | 215,880 | |||
| Payable for investments purchased | 590,849 | |||
| Payable for fund shares redeemed | 133,870 | |||
| Investment advisory fees payable | 12,532 | |||
| Payable to related parties | 20,078 | |||
| Accrued expenses and other liabilities | 25,146 | |||
| TOTAL LIABILITIES | 1,936,641 | |||
| NET ASSETS | $ | 39,834,343 | ||
| Net Assets Consist Of: | ||||
| Paid-in capital ($0 par value, unlimited shares authorized) | $ | 49,011,936 | ||
| Accumulated losses | (9,177,593 | ) | ||
| NET ASSETS | $ | 39,834,343 | ||
| Net Asset Value Per Share: | ||||
| Class I Shares: | ||||
| Net Assets | $ | 39,834,343 | ||
| Shares of beneficial interest outstanding | 4,054,541 | |||
| Net asset value (Net Assets ÷ Shares Outstanding), offering price and redemption price per share (a) | $ | 9.82 | ||
| (a) | Redemptions made within 30 days of purchase may be assessed a redemption fee of 1.00%. |
See accompanying notes to financial statements.
14
| Newfound Risk Managed U.S. Growth Fund |
| STATEMENT OF OPERATIONS |
| For Year Ended March 31, 2023 |
| INVESTMENT INCOME | ||||
| Dividend and interest income | $ | 701,429 | ||
| Less: Foreign withholding taxes | (58 | ) | ||
| TOTAL INVESTMENT INCOME | 701,371 | |||
| EXPENSES | ||||
| Investment advisory fees | 415,369 | |||
| Administrative services fees | 88,448 | |||
| Registration fees | 37,855 | |||
| Transfer agent fees | 37,701 | |||
| Accounting services fees | 31,047 | |||
| Compliance officer fees | 24,200 | |||
| Audit and tax fees | 21,711 | |||
| Third party administrative fees | 20,223 | |||
| Legal fees | 19,367 | |||
| Trustees fees and expenses | 14,889 | |||
| Printing expenses | 12,194 | |||
| Interest expense | 7,900 | |||
| Custodian fees | 6,660 | |||
| Insurance expense | 922 | |||
| Other expenses | 1,996 | |||
| TOTAL EXPENSES | 740,482 | |||
| Less: Fees waived by the Adviser | (76,804 | ) | ||
| NET EXPENSES | 663,678 | |||
| NET INVESTMENT INCOME | 37,693 | |||
| REALIZED AND UNREALIZED GAIN (LOSS) FROM INVESTMENTS | ||||
| Net realized loss from investments | (4,377,714 | ) | ||
| Net realized loss from futures contracts | (4,111,105 | ) | ||
| Net realized gain from options written | 649,775 | |||
| (7,839,044 | ) | |||
| Net change in unrealized appreciation (depreciation) on: | ||||
| Investments | (5,143,085 | ) | ||
| Futures contracts | 1,732,540 | |||
| Options written | 84,684 | |||
| (3,325,861 | ) | |||
| NET REALIZED AND UNREALIZED LOSS FROM INVESTMENTS | (11,164,905 | ) | ||
| NET DECREASE IN NET ASSETS RESULTING FROM OPERATIONS | $ | (11,127,212 | ) | |
See accompanying notes to financial statements.
15
| Newfound Risk Managed U.S. Growth Fund |
| STATEMENTS OF CHANGES IN NET ASSETS |
| For the | For the | |||||||
| Year Ended | Year Ended | |||||||
| March 31, 2023 | March 31, 2022 | |||||||
| INCREASE (DECREASE) IN NET ASSETS: | ||||||||
| FROM OPERATIONS | ||||||||
| Net investment gain (loss) | $ | 37,693 | $ | (91,396 | ) | |||
| Net realized loss from investments, futures contracts and options written | (7,839,044 | ) | (445,971 | ) | ||||
| Net change in unrealized appreciation (depreciation) on investments, futures contracts and options written | (3,325,861 | ) | 1,816,877 | |||||
| Net increase (decrease) in net assets resulting from operations | (11,127,212 | ) | 1,279,510 | |||||
| FROM DISTRIBUTIONS TO SHAREHOLDERS | ||||||||
| From return of capital | ||||||||
| Class I | (816 | ) | (2,630 | ) | ||||
| From net investment income | ||||||||
| Class I | — | (2,340,297 | ) | |||||
| Total distributions to shareholders | (816 | ) | (2,342,927 | ) | ||||
| FROM SHARES OF BENEFICIAL INTEREST | ||||||||
| Proceeds from shares sold | ||||||||
| Class I | 26,517,714 | 61,451,434 | ||||||
| Distributions reinvested | ||||||||
| Class I | 630 | 2,044,691 | ||||||
| Redemption fee proceeds | ||||||||
| Class I | 4,955 | 714 | ||||||
| Cost of shares redeemed | ||||||||
| Class I | (56,359,072 | ) | (26,695,368 | ) | ||||
| Net increase (decrease) in net assets from shares of beneficial interest | (29,835,773 | ) | 36,801,471 | |||||
| TOTAL INCREASE (DECREASE) IN NET ASSETS | (40,963,801 | ) | 35,738,054 | |||||
| NET ASSETS | ||||||||
| Beginning of year | 80,798,144 | 45,060,090 | ||||||
| End of year | $ | 39,834,343 | $ | 80,798,144 | ||||
| SHARE ACTIVITY | ||||||||
| Class I: | ||||||||
| Shares Sold | 2,649,359 | 4,968,387 | ||||||
| Shares Reinvested | 65 | 159,866 | ||||||
| Shares Redeemed | (5,589,619 | ) | (2,221,194 | ) | ||||
| Net increase (decrease) in shares of beneficial interest outstanding | (2,940,195 | ) | 2,907,059 | |||||
See accompanying notes to financial statements.
16
| Newfound Risk Managed U.S. Growth Fund |
| FINANCIAL HIGHLIGHTS |
| Per Share Data and Ratios for a Share of Beneficial Interest Outstanding Throughout the Periods Presented |
| Class I | ||||||||||||||||||||
| For the | For the | For the | For the | For the | ||||||||||||||||
| Year Ended | Year Ended | Year Ended | Year Ended | Year Ended | ||||||||||||||||
| March 31, 2023 | March 31, 2022 | March 31, 2021 | March 31, 2020 | March 31, 2019 | ||||||||||||||||
| Net asset value, beginning of year | $ | 11.55 | $ | 11.02 | $ | 9.39 | $ | 9.97 | $ | 10.65 | ||||||||||
| Activity from investment operations: | ||||||||||||||||||||
| Net investment income (loss) (1) | 0.01 | (0.02 | ) | 0.04 | 0.06 | 0.10 | ||||||||||||||
| Net realized and unrealized gain (loss) on investments | (1.74 | ) | 0.91 | 1.67 | (0.57 | ) | (0.10 | ) | ||||||||||||
| Total from investment operations | (1.73 | ) | 0.89 | 1.71 | (0.51 | ) | 0.00 | (6) | ||||||||||||
| Less distributions from: | ||||||||||||||||||||
| Return of capital | (0.00 | ) (6) | (0.00 | ) (6) | (0.00 | ) (6) | — | — | ||||||||||||
| Net investment income | — | — | (0.04 | ) | (0.07 | ) | (0.10 | ) | ||||||||||||
| Net realized gains | — | (0.36 | ) | (0.04 | ) | — | (0.58 | ) | ||||||||||||
| Total distributions | (0.00 | ) (6) | (0.36 | ) | (0.08 | ) | (0.07 | ) | (0.68 | ) | ||||||||||
| Paid-in-Capital From Redemption Fees (6) | 0.00 | 0.00 | 0.00 | 0.00 | 0.00 | |||||||||||||||
| Net asset value, end of year | $ | 9.82 | $ | 11.55 | $ | 11.02 | $ | 9.39 | $ | 9.97 | ||||||||||
| Total return (2) | (14.98 | )% | 7.74 | % | 18.28 | % | (5.20 | )% | 0.25 | % | ||||||||||
| Net assets, at end of year (000s) | $ | 39,834 | $ | 80,798 | $ | 45,060 | $ | 46,040 | $ | 38,842 | ||||||||||
| Ratio of gross expenses to average net assets (3)(4) | 1.41 | % (7) | 1.19 | % (7)(9) | 1.47 | % (7) | 1.31 | % | 1.55 | % | ||||||||||
| Ratio of net expenses to average net assets(4)(8) | 1.27 | % (7) | 1.22 | % (7)(9) | 1.26 | % (7) | 1.25 | % | 1.25 | % | ||||||||||
| Ratio of net investment income to average net assets (4)(5) | 0.07 | % (7) | (0.14 | )% (7) | 0.43 | % (7) | 0.53 | % | 0.90 | % | ||||||||||
| Portfolio Turnover Rate | 136 | % | 82 | % | 317 | % | 177 | % | 360 | % | ||||||||||
| (1) | Per share amounts calculated using the average shares method, which more appropriately presents the per share data for the period. |
| (2) | Total return in the above table is historical in nature and represents the rate that the investor would have earned or lost on an investment in the Fund assuming reinvestment of dividends and capital gains distributions, if any, and does not reflect the impact of redemption fees. Had the adviser not waived fees or reimbursed a portion of the Fund’s expenses, total returns would have been lower. |
| (3) | Represents the ratio of expenses to average net assets absent fee waivers and/or expense reimbursements by the adviser and affiliates. |
| (4) | Does not include the expenses of other investment companies in which the Fund invests. |
| (5) | Recognition of net investment income by the Fund is affected by the timing of the declaration of dividends by the underlying investment companies in which the Fund invests. |
| (6) | Amount represents less than $0.01 per share. |
| (7) | Excluding interest expense, the following ratios would have been: |
| March 31, 2023 | March 31, 2022 | March 31, 2021 | ||||||||||
| Gross expenses to average net assets | 1.39 | % | 1.19 | % | 1.46 | % | ||||||
| Net expenses to average net assets | 1.25 | % | 1.22 | % | 1.25 | % | ||||||
| Net investment income to average net assets | 0.09 | % | (0.14 | )% | 0.44 | % | ||||||
| (8) | Represents the ratio of expenses to average net assets inclusive of fee waivers and/or expense reimbursements by the adviser and affiliates. |
| (9) | Includes recapture of 0.03% during the year. |
See accompanying notes to financial statements.
17
| Newfound Risk Managed U.S. Growth Fund |
| NOTES TO FINANCIAL STATEMENTS |
| March 31, 2023 |
| 1. | ORGANIZATION |
The Newfound Risk Managed U.S. Growth Fund (the “Fund”) is a diversified series of shares of beneficial interest of the Northern Lights Fund Trust III (the “Trust”), a Delaware statutory trust organized on December 5, 2011 under the laws of the state of Delaware registered under the Investment Company Act of 1940, as amended, (the “1940 Act”), as an open-end management investment company. The Fund seeks long term capital appreciation with an emphasis on preservation of capital. The Fund commenced operations on June 2, 2015.
The Fund currently offers Class I shares. Class I shares are offered at net asset value.
| 2. | SIGNIFICANT ACCOUNTING POLICIES |
The following is a summary of significant accounting policies followed by the Fund in preparation of its financial statements. The policies are in conformity with accounting principles generally accepted in the United States of America (“U.S. GAAP”). The preparation of financial statements requires management to make estimates and assumptions that affect the reported amounts of assets and liabilities and disclosure of contingent assets and liabilities at the date of the financial statements and the reported amounts of income and expenses for the period. Actual results could differ from those estimates. The Fund is an investment company and accordingly follows the investment company accounting and reporting guidance of the Financial Accounting Standards Board (“FASB”) Accounting Standards Codification Topic 946 “Financial Services Investment Companies” including Accounting Standards Update 2013-08.
Securities Valuation – Securities listed on an exchange are valued at the last reported sale price at the close of the regular trading session of the exchange on the business day the value is being determined, or in the case of securities listed on NASDAQ at the NASDAQ Official Closing Price. Options contracts listed on a securities exchange or board of trade (not including index options contracts) for which market quotations are readily available shall be valued at the last quoted sales price or, in the absence of a sale, at the mean between the current bid and ask prices on the valuation date. Index options listed on a securities exchange or board of trade for which market quotations are readily available shall be valued at the mean between the current bid and ask prices on the valuation date. In the absence of a sale, such securities shall be valued at the mean between the current bid and ask prices on the day of valuation. Futures and options on futures are valued at the settlement price determined by the exchange. Debt securities (other than short-term obligations) are valued each day by an independent pricing service approved by the Trust’s Board of Trustees (the “Board”) using methods which include current market quotations from a major market maker in the securities and based on methods which include the consideration of yields or prices of securities of comparable quality, coupon, maturity and type. The independent pricing service does not distinguish between smaller-sized bond positions known as “odd lots” and larger institutional-sized bond positions known as “round lots”. The Fund may fair value a particular bond if the adviser does not believe that the round lot value provided by the independent pricing service reflects the fair value of the Fund’s holding. Short-term debt obligations with remaining maturities in excess of sixty days are valued at current market prices by an independent pricing service approved by the Board. Short-term debt obligations having 60 days or less remaining until maturity, at time of purchase, may be valued at amortized cost, which approximates fair value.
The Fund may hold securities, such as private investments, interests in commodity pools, other non-traded securities or temporarily illiquid securities, for which market quotations are not readily available or are determined to be unreliable. These securities are valued using the “fair value” procedures approved by the Board. The Board has designated the adviser as its valuation designee (the “Valuation Designee”) to execute these procedures. The Board may also enlist third party consultants such a valuation specialist at a public accounting firm, valuation consultant or financial officer of a security issuer on an as-needed basis to assist the Valuation Designee in determining a security-specific fair value. The Board is responsible for reviewing and approving fair value methodologies utilized by the Valuation Designee, approval of which shall be based upon whether the Valuation Designee followed the valuation procedures established by the Board.
18
| Newfound Risk Managed U.S. Growth Fund |
| NOTES TO FINANCIAL STATEMENTS (Continued) |
| March 31, 2023 |
Fair Valuation Process – Applicable investments are valued by the Valuation Designee pursuant to valuation procedures established by the Board. For example, fair value determinations are required for the following securities: (i) securities for which market quotations are insufficient or not readily available on a particular business day (including securities for which there is a short and temporary lapse in the provision of a price by the regular pricing source); (ii) securities for which, in the judgment of the Valuation Designee, the prices or values available do not represent the fair value of the instrument; factors which may cause the Valuation Designee to make such a judgment include, but are not limited to, the following: only a bid price or an asked price is available; the spread between bid and asked prices is substantial; the frequency of sales; the thinness of the market; the size of reported trades; and actions of the securities markets, such as the suspension or limitation of trading; (iii) securities determined to be illiquid; and (iv) securities with respect to which an event that affects the value thereof has occurred (a “significant event”) since the closing prices were established on the principal exchange on which they are traded, but prior to a Fund’s calculation of its net asset value. Specifically, interests in commodity pools or managed futures pools are valued on a daily basis by reference to the closing market prices of each futures contract or other asset held by a pool, as adjusted for pool expenses. Restricted or illiquid securities, such as private investments or non -traded securities are valued based upon the current bid for the security from two or more independent dealers or other parties reasonably familiar with the facts and circumstances of the security (who should take into consideration all relevant factors as may be appropriate under the circumstances). If a current bid from such independent dealers or other independent parties is unavailable, the Valuation Designee shall determine the fair value of such security using the following factors: (i) the type of security; (ii) the cost at date of purchase; (iii) the size and nature of the Fund’s holdings; (iv) the discount from market value of unrestricted securities of the same class at the time of purchase and subsequent thereto; (v) information as to any transactions or offers with respect to the security; (vi) the nature and duration of restrictions on disposition of the security and the existence of any registration rights; (vii) how the yield of the security compares to similar securities of companies of similar or equal creditworthiness; (viii) the level of recent trades of similar or comparable securities; (ix) the liquidity characteristics of the security; (x) current market conditions; and (xi) the market value of any securities into which the security is convertible or exchangeable.
Valuation of Fund of Funds – The Fund may invest in portfolios of open-end or closed-end investment companies (the “Underlying Funds”). The Underlying Funds value securities in their portfolios for which market quotations are readily available at their market values (generally the last reported sale price) and all other securities and assets at their fair value to the methods established by the board of directors of the Underlying Funds.
Open-end investment companies are valued at their respective net asset values as reported by such investment companies. The shares of many closed-end investment companies, after their initial public offering, frequently trade at a price per share, which is different than the net asset value per share. The difference represents a market premium or market discount of such shares. There can be no assurances that the market discount or market premium on shares of any closed-end investment company purchased by the Fund will not change.
Exchange Traded Funds – The Fund may invest in exchange traded funds (“ETFs”). ETFs are a type of fund bought and sold on a securities exchange. An ETF trades like a common stock and may be actively managed or represent a fixed portfolio of securities. The risks of owning an ETF generally reflect the risks of owning the underlying securities in which they invest, although the lack of liquidity on an ETF could result in it being more volatile. Additionally, ETFs have fees and expenses that reduce their value.
Exchange Traded Notes – The Fund may invest in exchange traded notes (“ETNs”). ETNs are a type of debt security that is linked to the performance of underlying securities. The risks of owning ETNs generally reflect the risks of owning the underlying securities they are designed to track. In addition, ETNs are subject to credit risk generally to the same extent as debt securities.
19
| Newfound Risk Managed U.S. Growth Fund |
| NOTES TO FINANCIAL STATEMENTS (Continued) |
| March 31, 2023 |
Futures Contracts – The Fund may purchase or sell futures contracts to gain exposure to, or hedge against, changes in the value of equities, interest rates, foreign currencies, or commodities. Initial margin deposits required upon entering into futures contracts are satisfied by the segregation of specific securities or cash as collateral for the account of the broker (the Fund’s agent in acquiring the futures position). During the period the futures contracts are open, changes in the value of the contracts are recognized as unrealized gains or losses by “marking to market” on a daily basis to reflect the market value of the contracts at the end of each day’s trading. Variation margin payments are received or made depending upon whether unrealized gains or losses are incurred. When the contracts are closed, the Fund recognizes a realized gain or loss equal to the difference between the proceeds from, or cost of, the closing transaction and the Fund’s basis in the contract. If the Fund is unable to liquidate a futures contract and/or enter into an offsetting closing transaction, the Fund would continue to be subject to market risk with respect to the value of the contracts and continue to be required to maintain the margin deposits on the futures contracts. Risks may exceed amounts recognized in the consolidated statement of assets and liabilities. With futures contracts, there is minimal counterparty credit risk to the Fund since futures contracts are exchange traded and the exchange’s clearinghouse, as counterparty to all exchange traded futures, guarantees the futures against default.
Option Transactions – The Fund is subject to equity price risk in the normal course of pursuing their investment objectives and may purchase or sell options to help hedge against risk. When the Fund writes put and call options, an amount equal to the premium received is included in the Statement of Assets and Liability as a liability. The amount of the liability is subsequently marked-to-market to reflect the current market value of the option. If an option expires on its stipulated expiration date or if the Fund enters into a closing purchase transaction, a gain or loss is realized. If a written call option is exercised, a gain or loss is realized for the sale of the underlying security and the proceeds from the sale are increased by the premium originally received. As writer of an option, the Fund has no control over whether the option will be exercised and, as a result, retain the market risk of an unfavorable change in the price of the security underlying the written option.
Put options are purchased to hedge against a decline in the value of securities held in the Fund’s portfolio. If such a decline occurs, the put options will permit the Fund to sell the securities underlying such options at the exercise price, or to close out the options at a profit. The premium paid for a put or call option plus any transaction costs will reduce the benefit, if any, realized by the Fund upon exercise of the option, and, unless the price of the underlying security rises or declines sufficiently, the option may expire worthless to the Fund. In addition, in the event that the price of the security in connection with which an option was purchased moves in a direction favorable to the Fund, the benefits realized by the Fund as a result of such favorable movement will be reduced by the amount of the premium paid for the option and related transaction costs. Written and purchased options are non-income producing securities. With purchased options, there is minimal counterparty risk to the Fund since these options are exchange traded and the exchange’s clearinghouse, as counterparty to all exchange traded options, guarantees against a possible default.
The Fund utilizes various methods to measure the fair value of all of its investments on a recurring basis. U.S. GAAP establishes a hierarchy that prioritizes inputs to valuation methods. The three levels of inputs are:
Level 1 – Unadjusted quoted prices in active markets for identical assets and liabilities that the Fund has the ability to access.
Level 2 – Observable inputs other than quoted prices included in Level 1 that are observable for the asset or liability, either directly or indirectly. These inputs may include quoted prices for the identical instrument in an inactive market, prices for similar instruments, interest rates, prepayment speeds, credit risk, yield curves, default rates and similar data.
Level 3 – Unobservable inputs for the asset or liability, to the extent relevant observable inputs are not available, representing the Fund’s own assumptions about the assumptions a market participant would use in valuing the asset or liability, and would be based on the best information available.
20
| Newfound Risk Managed U.S. Growth Fund |
| NOTES TO FINANCIAL STATEMENTS (Continued) |
| March 31, 2023 |
The availability of observable inputs can vary from security to security and is affected by a wide variety of factors, including, for example, the type of security, whether the security is new and not yet established in the marketplace, the liquidity of markets, and other characteristics particular to the security. To the extent that valuation is based on models or inputs that are less observable or unobservable in the market, the determination of fair value requires more judgment. Accordingly, the degree of judgment exercised in determining fair value is greatest for instruments categorized in Level 3.
The inputs used to measure fair value may fall into different levels of the fair value hierarchy. In such cases, for disclosure purposes, the level in the fair value hierarchy within which the fair value measurement falls in its entirety, is determined based on the lowest level input that is significant to the fair value measurement in its entirety.
The inputs or methodology used for valuing securities are not necessarily an indication of the risk associated with investing in those securities. The following tables summarize the inputs used as of March 31, 2023, for the Fund’s assets and liabilities measured at fair value:
| Level 3 (Other | ||||||||||||||||
| Level 2 (Other | Significant | |||||||||||||||
| Significant | Unobservable | |||||||||||||||
| Assets * | Level 1 (Quoted Prices) | Observable Inputs) | Inputs) | Total | ||||||||||||
| Exchange Traded Funds | $ | 30,101,102 | $ | — | $ | — | $ | 30,101,102 | ||||||||
| Common Stocks | 6,457,784 | — | — | 6,457,784 | ||||||||||||
| Call Options Purchased | 424,050 | 384,315 | — | 808,365 | ||||||||||||
| Put Options Purchased | 387,885 | 78,190 | — | 466,075 | ||||||||||||
| Futures contracts ** | 420,938 | — | — | 420,938 | ||||||||||||
| Total | $ | 37,791,759 | $ | 462,505 | $ | — | $ | 38,254,264 | ||||||||
| Liabilities * | ||||||||||||||||
| Call Options Written | 42,825 | 49,950 | — | 92,775 | ||||||||||||
| Put Options Written | 94,790 | 28,315 | — | 123,105 | ||||||||||||
| Total | $ | 137,615 | $ | 78,265 | $ | — | $ | 215,880 | ||||||||
The Fund did not hold any Level 3 securities during the year.
| * | Refer to the Schedule of Investments for classification by asset class. |
| ** | Net unrealized appreciation of futures contracts is reported in the above table. |
Offsetting of Financial Assets and Derivative Assets
The Fund’s policy is to recognize a net asset or liability equal to the net variation margin for futures contracts. During the year ended March 31, 2023, the Fund was not subject to any master netting arrangements. The following table shows additional information regarding the offsetting of assets and liabilities at March 31, 2023 for the Fund.
21
| Newfound Risk Managed U.S. Growth Fund |
| NOTES TO FINANCIAL STATEMENTS (Continued) |
| March 31, 2023 |
| Gross Amounts Not Offset in the Statement of | ||||||||||||||||||||||||
| Assets: | Assets & Liabilities | |||||||||||||||||||||||
| Net Amounts of Assets | ||||||||||||||||||||||||
| Gross Amounts of | Gross Amounts Offset | Presented in the | ||||||||||||||||||||||
| Recognized Asset & | in the Statement of | Statement of Assets & | Pledged Collateral | |||||||||||||||||||||
| Description | Liabilities | Assets & Liabilities | Liabilities | Financial Instruments | Received * | Net Amount | ||||||||||||||||||
| Futures Contracts | $ | 420,938 | (1) | $ | — | $ | 420,938 | $ | — | $ | 420,938 | $ | — | |||||||||||
| Total | $ | 420,938 | $ | — | $ | 420,938 | $ | — | $ | 420,938 | $ | — | ||||||||||||
| Liabilities: | ||||||||||||||||||||||||
| Options written | $ | (215,880 | ) | $ | — | $ | (215,880 | ) | $ | — | $ | (215,880 | ) | $ | — | |||||||||
| Total | $ | (215,880 | ) | $ | — | $ | (215,880 | ) | $ | — | $ | (215,880 | ) | $ | — | |||||||||
| (1) | Gross unrealized appreciation as presented in the Schedule of Investments. |
| * | Collateral pledged is limited to the net outstanding amount due to/from one individual counterparty. The actual collateral amounts pledged may exceed these amount and fluctuate in value. |
Impact of Derivatives on the Statements of Assets and Liabilities and Statements of Operations
The derivative instruments outstanding as of March 31, 2023 as disclosed in the Schedule of Investments and the amounts of realized gain (loss) and net change in unrealized appreciation (depreciation) on derivative instruments during the period as disclosed in the Statement of Operations serves as indicators of the volume of derivative activity for the Fund.
The following is a summary of the location and primary risk exposure of derivative investments on the Fund’s Statement of Assets and Liabilities as of March 31, 2023:
| Asset Derivatives | ||||||
| Contract Type/Primary Risk Exposure | Balance Sheet Location | Fair Value | ||||
| Future Contracts - Interest Risk | Net unrealized appreciation on futures contracts | $ | 420,938 | |||
| Call Options Purchased - Equity Risk | Investment securities; At fair value | 808,365 | ||||
| Put Options Purchased - Equity Risk | Investment securities; At fair value | 466,075 | ||||
| $ | 1,695,378 | |||||
| Liability Derivatives | ||||||
| Contract Type/Primary Risk Exposure | Balance Sheet Location | Fair Value | ||||
| Call Options Written - Equity Risk | Options written, at fair value | $ | 92,775 | |||
| Put Options Written - Equity Risk | Options written, at fair value | 123,105 | ||||
| $ | 215,880 | |||||
The following is a summary of the location of derivative investments on the Fund’s Statement of Operations as of March 31, 2023:
| Derivative Investment Type | Location of Derivatives | |
| Interest Rate Futures Contracts | Net realized loss from futures contracts/Net change in unrealized appreciation on futures contracts | |
| Options Purchased | Net realized loss from investments/Net change in unrealized depreciation on investments | |
| Options Written | Net realized gain from options written/Net change in unrealized appreciation on options written |
22
| Newfound Risk Managed U.S. Growth Fund |
| NOTES TO FINANCIAL STATEMENTS (Continued) |
| March 31, 2023 |
The following is a summary of the Fund’s realized gain (loss) and net change in unrealized appreciation (depreciation) on derivative investments recognized in the Statement of Operations categorized by primary risk exposure for the year ended March 31, 2023:
| Realized gain (loss) on derivatives recognized in the Statements of Operations | ||||||||||||
| Total for the | ||||||||||||
| Derivative Investment Type | Equity Risk | Interest Rate Risk | Year Ended March 31, 2023 | |||||||||
| Futures contracts | $ | — | $ | (4,111,105 | ) | $ | (4,111,105 | ) | ||||
| Options Written | 649,775 | — | 649,775 | |||||||||
| Options Purchased | (3,183,963 | ) | — | (3,183,963 | ) | |||||||
| Net change in unrealized appreciation (depreciation) on derivatives recognized in the Statements of Operations | ||||||||||||
| Total for the | ||||||||||||
| Derivative Investment Type | Equity Risk | Interest Rate Risk | Year Ended March 31, 2023 | |||||||||
| Futures contracts | $ | — | $ | 1,732,540 | $ | 1,732,540 | ||||||
| Options Written | 84,684 | — | 84,684 | |||||||||
| Options Purchased | 215,809 | — | 215,809 | |||||||||
Security Transactions and Related Income – Security transactions are accounted for on the trade date. Interest income is recognized on an accrual basis. Discounts are accreted and premiums are amortized on securities purchased over the lives of the respective securities. Dividend income is recorded on the ex -dividend date. Realized gains or losses from sales of securities are determined by comparing the identified cost of the security lot sold with the net sales proceeds.
Dividends and Distributions to Shareholders – Dividends from net investment income, if any, are declared and paid quarterly for the Fund. Distributable net realized capital gains, if any, are declared and distributed annually. Dividends from net investment income and distributions from net realized gains are determined in accordance with federal income tax regulations, which may differ from U.S. GAAP. These “book/tax” differences are considered either temporary (i.e., deferred losses, capital loss carry forwards) or permanent in nature. To the extent these differences are permanent in nature, such amounts are reclassified within the composition of net assets based on their federal tax-basis treatment; temporary differences do not require reclassification. Dividends and distributions to shareholders are recorded on the ex-dividend date.
Expenses – Expenses of the Trust that are directly identifiable to a specific fund are charged to that fund. Expenses, which are not readily identifiable to a specific fund, are allocated in such a manner as deemed equitable, taking into consideration the nature and type of expense and the relative sizes of the funds in the Trust.
Federal Income Taxes – The Fund intends to comply with the requirements of the Internal Revenue Code applicable to regulated investment companies and to distribute all of its taxable income to its shareholders. Therefore, no provision for federal income tax is required. The Fund recognizes the tax benefits of uncertain tax positions only where the position is “more likely than not” to be sustained assuming examination by tax authorities. Management has analyzed the Fund’s tax positions and has concluded that no liability for unrecognized tax benefits should be recorded related to uncertain tax positions taken on returns filed for open tax years ended 2020-2022, or expected to be taken in the Fund’s March 31, 2023, year- end tax returns. The Fund identifies it’s major tax jurisdictions as U.S. federal, Ohio and foreign jurisdictions where the Fund makes significant investments; however, the Fund is not aware of any tax positions for which it is reasonably possible that the total amounts of unrecognized tax benefits will change materially in the next twelve months.
23
| Newfound Risk Managed U.S. Growth Fund |
| NOTES TO FINANCIAL STATEMENTS (Continued) |
| March 31, 2023 |
Indemnification – The Trust indemnifies its officers and trustees for certain liabilities that may arise from the performance of their duties to the Trust. Additionally, in the normal course of business, the Fund enters into contracts that contain a variety of representations and warranties and which provide general indemnities. The Fund’s maximum exposure under these arrangements is unknown, as this would involve future claims that may be made against the Fund that has not yet occurred. However, based on experience, the Fund expects the risk of loss due to these warranties and indemnities to be remote.
Securities Lending – The Fund has entered into a securities lending arrangement with Securities Finance Trust Company (“SFTC”), whereby SFTC facilitates securities lending transactions between the Fund and one or more borrowers (each a “Borrower”). Under the terms of the agreement, the Fund is authorized to loan securities to the Borrower. In exchange, the Fund receives cash collateral in the amount of at least 102% of the value of the securities loaned. The cash collateral is invested in short-term instruments as noted in the Fund’s Schedule of Investments. Although risk is mitigated by the collateral, the Fund could experience a delay in recovering their securities and possible loss of income or value if the Borrower fails to return them.
Gain or loss in the fair value of securities loaned that may occur during the term of the loan will be for the account of the Fund. The Fund has the right under the securities lending agreement to recover the securities from the Borrower on demand. If the fair value of the collateral falls below 102% plus accrued interest of the loaned securities, the Fund’s agent shall request additional collateral from the Borrower to bring the collateralization back to 102%. Under the terms of the securities lending agreement, the Fund is indemnified for such losses by the security lending agreement. Should the Borrower of the securities fail financially, the Fund has the right to repurchase the securities using the collateral in the open market. During the year ended March 31, 2023, there was no securities lending during the period.
| 3. | INVESTMENT TRANSACTIONS |
For the year ended March 31, 2023, cost of purchases and proceeds from sales of portfolio securities, other than short-term investments, amounted to $65,013,912 and $98,817,995, respectively.
| 4. | INVESTMENT ADVISORY AGREEMENT AND TRANSACTIONS WITH RELATED PARTIES |
Newfound Research LLC serves as the Fund’s investment adviser (the “Adviser”). Pursuant to an advisory agreement with the Trust on behalf of the Fund, the Adviser, under the oversight of the Board, directs the daily operations of the Fund and supervises the performance of administrative and professional services provided by others.
As compensation for its services and the related expenses borne by the Adviser, the Fund pays the Adviser a management fee, calculated and accrued daily and paid monthly, at an annual rate of 0.79%.
Pursuant to a written contract (the “Waiver Agreement”), the Adviser has agreed, at least until August 1, 2024 to waive a portion of its management fees and reimburse expenses of the Fund, to ensure that Total Annual Fund Operating Expenses After Fee Waiver and Reimbursement (exclusive of front-end or contingent deferred loads; brokerage fees and commissions, acquired fund fees and expenses; borrowing costs (such as interest and dividend expense on securities sold short); taxes; and extraordinary expenses, such as litigation expenses (which may include indemnification of Fund officers and Trustees, and contractual indemnification of Fund service providers (other than the adviser))) will not exceed 1.25% of the Fund’s average daily net assets. Contractual waivers and expense payments may be recaptured by the Adviser to the extent that overall expenses fall below the lesser of the expense limitation then in place or in place at the time of the waiver, within three years of when the amounts were waived.
If the Adviser waives any fee or reimburses any expense pursuant to the Waiver Agreement, and the Fund’s management fees are subsequently less than the agreed upon percentage of average daily net assets, the Adviser shall be entitled to reimbursement by the Fund for such waiver only if reimbursement is within the expense limitation. For the year ended March 31, 2023 the Adviser waived $76,804 in expenses for the Fund, pursuant to
24
| Newfound Risk Managed U.S. Growth Fund |
| NOTES TO FINANCIAL STATEMENTS (Continued) |
| March 31, 2023 |
the Waiver Agreement. As of March 31, 2023, the Adviser has waived fees/reimbursed expenses that may be recovered no later than March 31 of the year indicated below:
| 2024 | 2025 | 2026 |
| $87,531 | $0 | $76,804 |
Northern Lights Distributors, LLC (the “Distributor”) acts as the Fund’s principal underwriter in a continuous public offering of the Fund’s shares. For the year ended March 31, 2023 the Distributor received $0 for the Fund, of which $0 was retained by the principal underwriter or other affiliated broker-dealers.
In addition, certain affiliates of the Distributor provide services to the Fund as follows:
Ultimus Fund Solutions, LLC (“UFS”), an affiliate of the Distributor, provides administration, fund accounting, and transfer agent services to the Trust. Pursuant to a separate servicing agreement with UFS, the Fund pays UFS customary fees for providing administration, fund accounting and transfer agency services to the Fund. Certain officers of the Trust are also officers of UFS and are not paid any fees directly by the Funds for serving in such capacities.
Northern Lights Compliance Services, LLC (” NLCS”), an affiliate of UFS and the Distributor, provides a Chief Compliance Officer to the Trust, as well as related compliance services, pursuant to a consulting agreement between NLCS and the Trust. Under the terms of such agreement, NLCS receives customary fees from the Fund.
Blu Giant, LLC (“Blu Giant”), an affiliate of UFS and the Distributor, provides EDGAR conversion and filing services as well as print management services for the Fund on an ad-hoc basis. For the provision of these services, Blu Giant receives customary fees from the Fund.
| 5. | UNDERLYING FUND RISK |
Each Underlying Fund, including each ETF, is subject to specific risks, depending on the nature of the Underlying Fund. These risks could include liquidity risk, sector risk, foreign and related currency risk, as well as risks associated with real estate investments and commodities. Investors in the Fund will indirectly bear fees and expenses charged by the underlying investment companies in which the Fund invests in addition to the Fund’s direct fees and expenses.
| 6. | REDEMPTION FEES |
A 1.00% redemption fee is imposed by the Fund to offset transaction costs and other expenses associated with short-term investing. The fee is imposed on redemptions of shares made within 30 days of purchase date. Redemption fees are recorded by the Fund as a redemption of Fund shares and as a credit to paid-in-capital. For the year ended March 31, 2023, the Fund received $4,955 in redemption fees.
| 7. | DISTRIBUTIONS TO SHAREHOLDERS AND TAX COMPONENTS OF CAPITAL |
The below table represents aggregate cost for federal tax purposes for the Fund as of March 31, 2023, and differs from market value by net unrealized appreciation/depreciation which consisted of:
| Net Unrealized | ||||||||||||||
| Gross Unrealized | Gross Unrealized | Appreciation/ | ||||||||||||
| Aggregate Cost | Appreciation | Depreciation | (Depreciation) | |||||||||||
| $ | 36,907,389 | $ | 2,358,028 | $ | (1,227,033 | ) | $ | 1,130,995 | ||||||
25
| Newfound Risk Managed U.S. Growth Fund |
| NOTES TO FINANCIAL STATEMENTS (Continued) |
| March 31, 2023 |
The tax character of Fund distributions paid for the years ended March 31, 2023 and March 31, 2022 was as follows:
| For the year ended March 31, 2023 | For the year ended March 31, 2022 | |||||||||||||||||||||||||||||
| Ordinary | Long-Term | Return of | Ordinary | Long-Term | Return of | |||||||||||||||||||||||||
| Income | Capital Gains | Capital | Total | Income | Capital Gains | Capital | Total | |||||||||||||||||||||||
| $ | — | $ | — | $ | 816 | $ | 816 | $ | 1,814,647 | $ | 525,650 | $ | 2,630 | $ | 2,342,927 | |||||||||||||||
As of March 31, 2023, the components of accumulated earnings/(deficit) on a tax basis were as follows:
| Undistributed | Undistributed | Post October Loss | Capital Loss | Other | Unrealized | Total | ||||||||||||||||||||
| Ordinary | Long-Term | and | Carry | Book/Tax | Appreciation/ | Accumulated | ||||||||||||||||||||
| Income | Capital Gains | Late Year Loss | Forwards | Differences | (Depreciation) | Earnings/(Deficits) | ||||||||||||||||||||
| — | — | $ | (1,088,307 | ) | $ | (9,220,281 | ) | — | $ | 1,130,995 | $ | (9,177,593 | ) | |||||||||||||
The difference between book basis and tax basis unrealized appreciation, undistributed net investment income and accumulated net realized losses from investments is primarily attributable to the tax deferral of losses on wash sales, the mark to market on open futures and options contracts and adjustments for partnerships.
Late year losses incurred after December 31 within the fiscal year are deemed to arise on the first business day of the following fiscal year for tax purposes. The Fund incurred and elected to defer such late year losses of $1,885.
Capital losses incurred after October 31 within the fiscal year are deemed to arise on the first business day of the following fiscal year for tax purposes. The Fund incurred and elected to defer such capital losses of $1,086,422.
At March 31, the Fund has capital loss carry forwards for federal income tax purposes available to offset future capital gains, as follows:
| Short-Term | Long-Term | Total | CLCF Utilized | |||||||||||
| $ | 5,639,695 | $ | 3,580,586 | $ | 9,220,281 | $ | — | |||||||
Permanent book and tax differences, primarily attributable to the book/tax basis treatment of net operating losses, and distributions in excess, resulted in reclassifications for the Fund for the fiscal year ended March 31, 2023 as follows:
| Paid In | Accumulated | |||||
| Capital | Deficit | |||||
| $ | (9,790 | ) | $ | 9,790 | ||
| 8. | CONTROL OWNERSHIP |
The beneficial ownership, either directly or indirectly, of 25% or more of the outstanding shares of a fund creates a presumption of control of the fund under Section 2(a)(9) of the 1940 Act. As of March 31, 2023, National Financial Services, LLC (“NFS”) was the record owner of 48.16% of the Fund’s outstanding shares. NFS may be the beneficial owner of some or all the shares for the Fund or may hold the shares for the benefit of others. As a result, NFS may be deemed to control the Fund. Persons controlling the Fund can determine the outcome of any proposal submitted to the shareholders for approval, including changes to the Fund’s fundamental policies or the terms of the advisory agreement with the Adviser.
26
| Newfound Risk Managed U.S. Growth Fund |
| NOTES TO FINANCIAL STATEMENTS (Continued) |
| March 31, 2023 |
| 9. | SUBSEQUENT EVENTS |
Subsequent events after the date of the Statements of Assets and Liabilities have been evaluated through the date the financial statements were available to be issued. Management has determined that no events or transactions occurred requiring adjustment or disclosure in the financial statements.
27
| Newfound Risk Managed U.S. Growth Fund |
| Supplemental Information (Unaudited) |
| March 31, 2023 |
LIQUIDITY RISK MANAGEMENT PROGRAM
The Fund has adopted and implemented a written liquidity risk management program as required by Rule 22e-4 (the “Liquidity Rule”) under the Investment Company Act of 1940, as amended. The program is reasonably designed to assess and manage the Fund’s liquidity risk, taking into consideration, among other factors, the Fund’s investment strategy and the liquidity of its portfolio investments during normal and reasonably foreseeable stressed conditions; its short and long-term cash flow projections; and its cash holdings and access to other funding sources.
During the year ended March 31, 2023, the Trust’s Liquidity Risk Management Program Committee (the “Committee”) reviewed the Fund’s investments and determined that the Fund held adequate levels of cash and highly liquid investments to meet shareholder redemption activities in accordance with applicable requirements. Accordingly, the Committee concluded that (i) the Fund’s liquidity risk management program is reasonably designed to prevent violations of the Liquidity Rule and (ii) the Fund’s liquidity risk management program has been effectively implemented.
28
Report of Independent Registered Public Accounting Firm
Board of Trustees of Northern Lights Fund Trust III and
the Shareholders of Newfound Risk Managed U.S. Growth Fund
Opinion on the Financial Statements
We have audited the accompanying statement of assets and liabilities of Newfound Risk Managed U.S. Growth Fund (the Fund), including the schedule of investments, as of March 31, 2023, the related statement of operations for the year then ended, the statements of changes in net assets for each of the two years in the period then ended, and the related notes to the financial statements (collectively, the financial statements), and the financial highlights for each of the five years in the period then ended. In our opinion, the financial statements and financial highlights present fairly, in all material respects, the financial position of the Fund as of March 31, 2023, the results of its operations for the year then ended, the changes in net assets for each of the two years in the period then ended, and the financial highlights for each of the five years in the period then ended, in conformity with accounting principles generally accepted in the United States of America.
Basis for Opinion
These financial statements are the responsibility of the Fund’s management. Our responsibility is to express an opinion on the Fund’s financial statements and financial highlights based on our audits. We are a public accounting firm registered with the Public Company Accounting Oversight Board (United States) (PCAOB) and are required to be independent with respect to the Fund in accordance with U.S. federal securities laws and the applicable rules and regulations of the Securities and Exchange Commission and the PCAOB.
We conducted our audits in accordance with the standards of the PCAOB. Those standards require that we plan and perform the audits to obtain reasonable assurance about whether the financial statements are free of material misstatement, whether due to error or fraud. The Fund is not required to have, nor were we engaged to perform, an audit of its internal control over financial reporting. As part of our audits, we are required to obtain an understanding of internal control over financial reporting but not for the purpose of expressing an opinion on the effectiveness of the Fund’s internal control over financial reporting. Accordingly, we express no such opinion.
Our audits included performing procedures to assess the risks of material misstatement of the financial statements, whether due to error or fraud, and performing procedures that respond to those risks. Such procedures included examining, on a test basis, evidence regarding the amounts and disclosures in the financial statements. Our procedures included confirmation of securities owned as of March 31, 2023, by correspondence with the custodian, brokers or by other appropriate auditing procedures where replies were not received. Our audits also included evaluating the accounting principles used and significant estimates made by management, as well as evaluating the overall presentation of the financial statements. We believe that our audits provide a reasonable basis for our opinion.
/s/ RSM US LLP
We have served as the auditor of one or more Newfound Research LLC’s investment companies since 2015.
Denver, Colorado
May 30, 2023
29
| Newfound Risk Managed U.S. Growth Fund |
| Supplemental Information (Unaudited) (Continued) |
| March 31, 2023 |
Renewal of Advisory Agreement – Newfound Risk Managed U.S. Growth Fund*
In connection with a meeting held on February 22-23, 2023, the Board, including a majority of the Trustees who are not “interested persons” as that term is defined in the 1940 Act, discussed the renewal of the investment advisory agreement (the “Advisory Agreement”) between Newfound Research LLC (the “Adviser”) and the Trust, with respect to Newfound Risk Managed U.S. Growth Fund (“Newfound”). In considering the renewal of the Advisory Agreement, the Board reviewed materials specifically relating to Newfound and the Advisory Agreement.
The Board discussed the Adviser’s presentation and materials. The Board relied upon the advice of independent legal counsel and its own business judgment in determining the material factors to be considered in evaluating the Advisory Agreement and the weight to be given to each such factor. The Board’s conclusions were based on an evaluation of all of the information provided and were not the result of any one factor. Moreover, each Trustee may have afforded different weight to the various factors in reaching his or her conclusions with respect to the Advisory Agreement.
Nature, Extent and Quality of Services. The Board noted that the Adviser was founded in 2008 and managed approximately $235 million in assets. The Board observed that the Adviser’s management team had distinguished academic backgrounds with expertise in portfolio management, tactical quantitative analysis, compliance and technology. The Board discussed that the Adviser’s proprietary quantitative model was used to manage rules-based equity and ETF portfolios. The Board acknowledged that the model, coupled with the Adviser’s own evaluation of market trends and active management style, determined when it was necessary to rebalance Newfound’s portfolio. The Board remarked that the Adviser’s risk management process included a high degree of automation and the ability to address code errors and faulty input data. The Board observed that the Adviser used product diversification to manage concentration, liquidity and volatility risk and actively managed Newfound’s portfolio to react to market changes and reduce exposures by allocating to cash and cash equivalents when desirable. The Board noted that the Adviser selected and maintained broker-dealers on the basis of best execution and reviewed the transactions of its broker-dealers quarterly. The Board noted that the Adviser was respected in the institutional marketplace for its research and writings and was committed to following its rules-based models to bring value and manage risk. The Board concluded that the Adviser provided quality service to Newfound and its shareholders.
Performance. The Board noted that Newfound was a 1-star Morningstar rated fund and underperformed its peer group, Morningstar category, and benchmark across all periods. The Board recalled the Adviser’s explanation that the simultaneous decline in the value of stocks and bonds had adversely effected Newfound’s performance. The Board considered that the Adviser reaffirmed its position that portfolio diversification generally served as a benefit to Newfound’s performance. The Board agreed to continue to monitor performance.
Fees and Expenses. The Board noted that the Adviser’s advisory fee for Newfound was lower than the averages and medians of its Morningstar category and peer group. The Board discussed that Newfound’s net expense ratio was equal to its peer group average, 1-basis point higher than its peer group median, and higher than its Morningstar category median and average. The Board concluded that the Adviser’s advisory fee was not unreasonable.
Economies of Scale. The Board discussed the size of Newfound and its prospects for growth and concluded that the Adviser did not appear to have achieved meaningful economies with respect to Newfound that would necessitate the establishment of breakpoints at this time. The Board noted the Adviser was willing to discuss the implementation of breakpoints as the assets of Newfound grew and the Adviser achieved material economies of scale related to its operations. The Board agreed to monitor and revisit this issue at the appropriate time.
Profitability. The Board reviewed the Adviser’s profitability analysis and noted that the Adviser was managing Newfound at a reasonable profit. The Board concluded that excessive profitability was not currently an issue for the Adviser.
30
| Newfound Risk Managed U.S. Growth Fund |
| Supplemental Information (Unaudited) (Continued) |
| March 31, 2023 |
Conclusion. Having requested and reviewed such information from the Adviser as the Board believed to be reasonably necessary to evaluate the terms of the Advisory Agreement, and as assisted by the advice of independent counsel, the Board concluded that renewal of the Advisory Agreement was in the best interests of Newfound and its shareholders.
| * | Due to timing of the contract renewal schedule, these deliberations may or may not relate to the current performance results of Newfound. |
31
| Newfound Risk Managed U.S. Growth Fund |
| SUPPLEMENTAL INFORMATION (Unaudited) |
| March 31, 2023 |
The Trustees and officers of the Trust, together with information as to their principal business occupations during the past five years and other information, are shown below. Unless otherwise noted, the address of each Trustee and officer is 225 Pictoria Drive, Suite 450, Cincinnati, Ohio 45246.
| Independent Trustees | |||||
| Name, Address, Year of Birth | Position(s) Held with Registrant | Length of Service and Term | Principal Occupation(s) During Past 5 Years | Number of Funds Overseen In The Fund Complex* | Other Directorships Held During Past 5 Years** |
| Patricia Luscombe 1961 | Trustee | Since January 2015, Indefinite | Managing Director of the Valuations and Opinions Group, Lincoln International LLC (since August 2007). | 1 | Northern Lights Fund Trust III (for series not affiliated with the Fund since 2015); Monetta Mutual Funds (since November 2015). |
| John V. Palancia 1954 | Trustee, Chairman | Trustee, since February 2012, Indefinite; Chairman of the Board since May 2014 | Retired (since 2011); formerly, Director of Global Futures Operations Control, Merrill Lynch, Pierce, Fenner & Smith, Inc. (1975-2011). | 1 | Northern Lights Fund Trust III (for series not affiliated with the Fund since 2012); Northern Lights Fund Trust (since 2011); Northern Lights Variable Trust (since 2011); Alternative Strategies Fund (since 2012). |
| Mark H. Taylor 1964 | Trustee, Chairman of the Audit Committee | Since February 2012, Indefinite | PhD (Accounting), CPA; Professor and Director, Lynn Pippenger School of Accountancy, Muma College of Business, University of South Florida (2019 – present); Professor and Department of Accountancy Chair, Case Western Reserve University (2009-2019); President, American Accounting Association (AAA) commencing August 2022 (President-Elect 2022-2023, President 2023-2024; Past President 2024-2025). AAA Vice President-Finance (2017-2020); President, Auditing Section of the AAA; Member, AICPA Auditing Standards Board (2009-2012); Academic Fellow, Office of the Chief Accountant, United States Securities Exchange Commission (2005-2006); Center for Audit Quality research grants (2014, 2012). | 1 | Northern Lights Fund Trust III (for series not affiliated with the Fund since 2012); Northern Lights Fund Trust (since 2007); Northern Lights Variable Trust (since 2007); Alternative Strategies Fund (since June 2010). |
| Jeffery D. Young 1956 | Trustee | Since January 2015, Indefinite | Co-owner and Vice President, Latin America Agriculture Development Corp. (since May 2015); President, Celeritas Rail Consulting (since June 2014); Asst. Vice President-Transportation Systems, Union Pacific Railroad Company (June 1976 to April 2014). | 1 | Northern Lights Fund Trust III (for series not affiliated with the Fund since 2015). |
| * | As of March 31, 2023, the Trust was comprised of 31 active portfolios managed by 15 unaffiliated investment advisers. The term “Fund Complex” applies only to the Fund. The Fund does not hold itself out as related to any other series within the Trust for investment purposes, nor does it share the same investment adviser with any other series. |
| ** | Only includes directorships held within the past 5 years in a company with a class of securities registered pursuant to Section 12 of the Securities Exchange Act of 1934 or subject to the requirements of Section 15(d) of the Securities Exchange Act of 1934, or any company registered as an investment company under the 1940 Act. |
3/31/23-NLFT III-v1
32
| Newfound Risk Managed U.S. Growth Fund |
| SUPPLEMENTAL INFORMATION (Unaudited) (Continued) |
| March 31, 2023 |
Officers of the Trust
| Name, Address, Year of Birth | Position(s) Held with Registrant | Length of Service and Term | Principal Occupation(s) During Past 5 Years |
| Eric Kane 1981 | President | Since August 2022, indefinite | Vice President and Senior Managing Counsel, Ultimus Fund Solutions, LLC (since 2022); Vice President and Managing Counsel, Ultimus Fund Solutions, LLC (2020-2022); Vice President and Counsel, Gemini Fund Services, LLC (2017- 2020). |
| Brian Curley 1970 | Treasurer | Since February 2013, indefinite | Vice President, Ultimus Fund Solutions, LLC (since 2020); Vice President, Gemini Fund Services, LLC (2015-2020). |
| Viktoriya Pallino 1995 | Secretary | Since August 2022, indefinite | Legal Administrator II, Ultimus Fund Solutions, LLC (since 2021); Legal Administrator I, Ultimus Fund Solutions, LLC (2019-2021); Legal Administration Associate, Gemini Fund Services, LLC (2017-2019). |
| William Kimme 1962 | Chief Compliance Officer | Since February 2012, indefinite | Senior Compliance Officer of Northern Lights Compliance Services, LLC (since 2011). |
The Fund’s Statement of Additional Information includes additional information about the Trustees and is available free of charge, upon request, by calling toll-free at 1-855-294-9777.
3/31/23-NLFT III-v1
33
| Newfound Risk Managed U.S. Growth Fund |
| Expense Examples (Unaudited) |
| March 31, 2023 |
Example
As a shareholder of the Fund you will incur two types of costs: (1) transaction costs, including sales loads and/or redemption fees; and (2) ongoing expenses, such as advisory fees, distribution and service fees (12b-1), and/or other fund expenses. The following examples are intended to help you understand the ongoing cost (in dollars) of investing in the Fund and to compare these costs with the ongoing costs of investing in other mutual funds. Please note, the expenses shown in the tables are meant to highlight ongoing costs only and do not reflect any transactional costs, such as sales charges (loads), or contingent deferred sales charges on redemptions which may be assessed by mutual funds. This Example is based on an investment of $1,000 invested at the beginning of the period and held for the entire period as indicated below.
Actual Expenses
The columns under the heading entitled “Actual” help you estimate the actual expenses you paid over the period. The “Actual Ending Account Value” shown is derived from the Fund’s actual return, and the “Actual Expenses Paid During Period” shows the dollar amount that would have been paid by an investor who started with $1,000 in the Fund. To estimate the expenses you paid on your account during this period, simply divide your account value by $1,000 (for example, an $8,600 account value divided by $1,000 = 8.6), then multiply the result by the number in the column under the heading entitled “Actual Expenses Paid During Period”.
Hypothetical Examples for Comparison Purposes
The columns under the heading entitled “Hypothetical” provide information about hypothetical account value and hypothetical expenses based on the Fund’s actual expense ratio and an assumed rate of return of 5% per year before expenses, which is not the Fund’s actual return. The hypothetical account values and expenses may not be used to estimate the actual ending account balance or expenses you paid for the period. You may use this information to compare the ongoing costs of investing in the Fund and other funds. To do so, compare this 5% hypothetical example with the 5% hypothetical examples that appear in the shareholder reports of other funds.
Please note that the expenses shown in the table are meant to highlight your ongoing costs only and do not reflect any transactional costs which may be applicable to your account. Therefore, the last column of the table (Hypothetical Expenses Paid During Period) is useful in comparing ongoing costs only and will not help you determine the relative total costs of owning different funds. In addition, if these transactional costs were included, your costs would have been higher.
| Hypothetical | |||||||||||||
| Actual | (5% return before expenses) | ||||||||||||
| Fund’s | Beginning | Ending | Expenses | Ending | Expenses | ||||||||
| Annualized | Account Value | Account Value | Paid During | Account Value | Paid During | ||||||||
| Expense Ratio | 10/1/22 | 3/31/23 | Period | 3/31/23 | Period | ||||||||
| Newfound Risk Managed U.S. Growth Fund – Class I (a) | 1.25% | $1,000.00 | $1,069.70 | $6.45 | $1,018.70 | $6.29 | |||||||
| (a) | Actual Expenses Paid During Period are equal to the Fund’s annualized expense ratio, multiplied by the average account value over the period, multiplied by 182 days and divided by 365. |
34
PRIVACY NOTICE | ||||
| Rev. June 2021 | ||||
| FACTS | WHAT DOES NORTHERN LIGHTS FUND TRUST III DO WITH YOUR PERSONAL INFORMATION? | |||
| Why? | Financial companies choose how they share your personal information. Federal law gives consumers the right to limit some but not all sharing. Federal law also requires us to tell you how we collect, share, and protect your personal information. Please read this notice carefully to understand what we do. | |||
| What? | The types of personal information we collect and share depend on the product or service you have with us. This information can include: | |||
■ Social Security number
■ Assets
■ Retirement Assets
■ Transaction History
■ Checking Account Information | ■ Purchase History
■ Account Balances
■ Account Transactions
■ Wire Transfer Instructions
| |||
| When you are no longer our customer, we continue to share your information as described in this notice. | ||||
| How? | All financial companies need to share customers’ personal information to run their everyday business. In the section below, we list the reasons financial companies can share their customers’ personal information; the reasons Northern Lights Fund Trust III chooses to share; and whether you can limit this sharing. | |||
| Reasons we can share your personal information | Does Northern Lights Fund Trust III share? | Can you limit this sharing? | ||
For our everyday business purposes – such as to process your transactions, maintain your account(s), respond to court orders and legal investigations, or report to credit bureaus | Yes | No | ||
For our marketing purposes – to offer our products and services to you | No | We don’t share | ||
| For joint marketing with other financial companies | No | We don’t share | ||
For our affiliates’ everyday business purposes – information about your transactions and experiences | No | We don’t share | ||
For our affiliates’ everyday business purposes – information about your creditworthiness | No | We don’t share | ||
| For nonaffiliates to market to you | No | We don’t share | ||
| Questions? | Call (631) 490-4300 | |||
35
| Who we are | |
| Who is providing this notice? | Northern Lights Fund Trust III
|
| What we do | |
| How does Northern Lights Fund Trust III protect my personal information? | To protect your personal information from unauthorized access and use, we use security measures that comply with federal law. These measures include computer safeguards and secured files and buildings.
Our service providers are held accountable for adhering to strict policies and procedures to prevent any misuse of your nonpublic personal information. |
| How does Northern Lights Fund Trust III collect my personal information? | We collect your personal information, for example, when you
■ Open an account
■ Provide account information
■ Give us your contact information
■ Make deposits or withdrawals from your account
■ Make a wire transfer
■ Tell us where to send the money
■ Tells us who receives the money
■ Show your government-issued ID
■ Show your driver’s license
We also collect your personal information from other companies. |
| Why can’t I limit all sharing? | Federal law gives you the right to limit only
■ Sharing for affiliates’ everyday business purposes – information about your creditworthiness
■ Affiliates from using your information to market to you
■ Sharing for nonaffiliates to market to you
State laws and individual companies may give you additional rights to limit sharing. |
| Definitions | |
| Affiliates | Companies related by common ownership or control. They can be financial and nonfinancial companies.
■ Northern Lights Fund Trust III does not share with our affiliates. |
| Nonaffiliates | Companies not related by common ownership or control. They can be financial and nonfinancial companies
■ Northern Lights Fund Trust III does not share with nonaffiliates so they can market to you. |
| Joint marketing | A formal agreement between nonaffiliated financial companies that together market financial products or services to you.
■ Northern Lights Fund Trust III doesn’t jointly market. |
36
PROXY VOTING POLICY
Information regarding how the Fund voted proxies relating to portfolio securities for the most recent twelve month period ended June 30 as well as a description of the policies and procedures that the Fund uses to determine how to vote proxies is available without charge, upon request, by calling 1-855-394-9777 or by referring to the Securities and Exchange Commission’s (“SEC”) website at http://www.sec.gov.
PORTFOLIO HOLDINGS
The Fund files its complete schedule of portfolio holdings with the SEC for the first and third quarters of each fiscal year as an exhibit to its reports on Form N-PORT, within sixty days after the end of the period. Form N-PORT reports are available at the SEC’s website at www.sec.gov.
| INVESTMENT ADVISER |
| Newfound Research LLC |
| 380 Washington Street, Second Floor |
| Wellesley Hills, MA 02481 |
| ADMINISTRATOR |
| Ultimus Fund Solutions, LLC |
| 225 Pictoria Drive, Suite 450 |
| Cincinnati, OH 45246 |
NF-AR23
(b) Not Applicable
Item 2. Code of Ethics.
(a) As of the end of the period covered by this report, the registrant has adopted a code of ethics that applies to the registrant's principal executive officer, principal financial officer, principal accounting officer or controller, or persons performing similar functions, regardless of whether these individuals are employed by the registrant or a third party.
(b) For purposes of this item, “code of ethics” means written standards that are reasonably designed to deter wrongdoing and to promote:
| (1) | Honest and ethical conduct, including the ethical handling of actual or apparent conflicts of interest between personal and professional relationships; |
| (2) | Full, fair, accurate, timely, and understandable disclosure in reports and documents that a registrant files with, or submits to, the Commission and in other public communications made by the registrant; | |
| (3) | Compliance with applicable governmental laws, rules, and regulations; |
| (4) | The prompt internal reporting of violations of the code to an appropriate person or persons identified in the code; and | |
| (5) | Accountability for adherence to the code. |
(c) Amendments: During the period covered by the report, there have not been any amendments to the provisions of the code of ethics.
(d) Waivers: During the period covered by the report, the registrant has not granted any express or implicit waivers from the provisions of the code of ethics.
(e) The Code of Ethics is not posted on Registrant’ website.
(f) A copy of the Code of Ethics is attached as an exhibit.
Item 3. Audit Committee Financial Expert.
(a)(1)ii The board of directors of the fund has determined that Mark Taylor is an independent audit committee financial expert.
(a)(2) Not applicable.
Item 4. Principal Accountant Fees and Services.
| (a) | Audit Fees |
2023 - $18,000
2022 - $16,875
| (b) | Audit-Related Fees |
2023 - None
2022 - None
| (c) | Tax Fees |
2023 - $3,750
2022 - $3,575
Preparation of Federal & State income tax returns, assistance with calculation of required income, capital gain and excise distributions and preparation of Federal excise tax returns.
| (d) | All Other Fees |
2023 – None
2022 - None
| (e) | (1) Audit Committee’s Pre-Approval Policies |
The registrant’s Audit Committee is required to pre-approve all audit services and, when appropriate, any non-audit services (including audit-related, tax and all other services) to the registrant. The registrant’s Audit Committee also is required to pre-approve, when appropriate, any non-audit services (including audit-related, tax and all other services) to its adviser, or any entity controlling, controlled by or under common control with the adviser that provides ongoing services to the registrant, to the extent that the services may be determined to have an impact on the operations or financial reporting of the registrant. Services are reviewed on an engagement by engagement basis by the Audit Committee.
| (2) | Percentages of Services Approved by the Audit Committee |
| 2023 | 2022 | |||||||
| Audit-Related Fees: | 0.00 | % | 0.00 | % | ||||
| Tax Fees: | 0.00 | % | 0.00 | % | ||||
| All Other Fees: | 0.00 | % | 0.00 | % |
| (f) | During the audit of registrant's financial statements for the most recent fiscal year, less than 50 percent of the hours expended on the principal accountant's engagement were attributed to work performed by persons other than the principal accountant's full-time, permanent employees. |
| (g) | The aggregate non-audit fees billed by the registrant's accountant for services rendered to the registrant, and rendered to the registrant's investment adviser (not including any sub-adviser whose role is primarily portfolio management and is subcontracted with or overseen by another investment adviser), and any entity controlling, controlled by, or under common control with the adviser that provides ongoing services to the registrant: |
2023 - $3,750
2022 - $3,575
(h) The registrant's audit committee has considered whether the provision of non-audit services to the registrant's investment adviser (not including any sub-adviser whose role is primarily portfolio management and is subcontracted with or overseen by another investment adviser), and any entity controlling, controlled by, or under common control with the investment adviser that provides ongoing services to the registrant, that were not pre-approved pursuant to paragraph (c)(7)(ii) of Rule 2-01 of Regulation S-X, is compatible with maintaining the principal accountant's independence.
(i) Not applicable
(j) Not applicable
Item 5. Audit Committee of Listed Companies. Not applicable to open-end investment companies.
Item 6. Schedule of Investments. Schedule of investments in securities of unaffiliated issuers is included under Item 1.
Item 7. Disclosure of Proxy Voting Policies and Procedures for Closed-End Funds. Not applicable to open-end investment companies.
Item 8. Portfolio Managers of Closed-End Management Investment Companies. Not applicable to open-end investment companies.
Item 9. Purchases of Equity Securities by Closed-End Funds. Not applicable to open-end investment companies.
Item 10. Submission of Matters to a Vote of Security Holders. None
Item 11. Controls and Procedures.
(a) Based on an evaluation of the Registrant’s disclosure controls and procedures as of a date within 90 days of filing date of this Form N-CSR, the principal executive officer and principal financial officer of the Registrant have concluded that the disclosure controls and procedures of the Registrant are reasonably designed to ensure that the information required in filings on Form N-CSR is recorded, processed, summarized, and reported by the filing date, including that information required to be disclosed is accumulated and communicated to the Registrant’s management, including the Registrant’s principal executive officer and principal financial officer, as appropriate to allow timely decisions regarding required disclosure.
(b) There were no significant changes in the Registrant’s internal control over financial reporting that occurred during the period covered by this report that have materially affected, or are reasonably likely to materially affect, the Registrant’s internal control over financial reporting.
Item 12. Disclosure of Securities Lending Activities for Closed-End Management Investment Companies.
Not applicable Fund is an open-end management investment company
Item 13. Exhibits.
(a)(1) Code of Ethics filed herewith.
(a)(3) Not applicable for open-end investment companies.
SIGNATURES
Pursuant to the requirements of the Securities Exchange Act of 1934 and the Investment Company Act of 1940, the registrant has duly caused this report to be signed on its behalf by the undersigned, thereunto duly authorized.
(Registrant) Northern Lights Fund Trust III
By (Signature and Title)
/s/ Brian Curley
Brian Curley, Principal Executive Officer/President
Date 06/2/2023
Pursuant to the requirements of the Securities Exchange Act of 1934 and the Investment Company Act of 1940, this report has been signed below by the following persons on behalf of the registrant and in the capacities and on the dates indicated.
By (Signature and Title)
/s/ Brian Curley
Brian Curley, Principal Executive Officer/President
Date 06/2/2023
By (Signature and Title)
/s/ Rich Gleason
Rich Gleason, Principal Financial Officer/Treasurer
Date 06/2/2023