UNITED STATES
SECURITIES AND EXCHANGE COMMISSION
Washington, D.C. 20549
FORM N-CSR
CERTIFIED SHAREHOLDER REPORT OF REGISTERED
MANAGEMENT INVESTMENT COMPANY
| Investment Company Act file number | 811-22680 |
| Ultimus Managers Trust |
| (Exact name of registrant as specified in charter) |
| 225 Pictoria Drive, Suite 450 Cincinnati, Ohio | 45246 |
| (Address of principal executive offices) | (Zip code) |
Frank L. Newbauer, Esq.
Ultimus Fund Solutions, LLC 225 Pictoria Drive, Suite 450 Cincinnati, Ohio 45246_ |
| (Name and address of agent for service) |
| Registrant's telephone number, including area code: | (513) 587-3400 |
| Date of fiscal year end: | May 31 | |
| Date of reporting period: | May 31, 2017 |
Form N-CSR is to be used by management investment companies to file reports with the Commission not later than 10 days after the transmission to stockholders of any report that is required to be transmitted to stockholders under Rule 30e-1 under the Investment Company Act of 1940 (17 CFR 270.30e-1). The Commission may use the information provided on Form N-CSR in its regulatory, disclosure review, inspection, and policymaking roles.
A registrant is required to disclose the information specified by Form N-CSR, and the Commission will make this information public. A registrant is not required to respond to the collection of information contained in Form N-CSR unless the Form displays a currently valid Office of Management and Budget ("OMB") control number. Please direct comments concerning the accuracy of the information collection burden estimate and any suggestions for reducing the burden to Secretary, Securities and Exchange Commission, 450 Fifth Street, NW, Washington, DC 20549-0609. The OMB has reviewed this collection of information under the clearance requirements of 44 U.S.C. § 3507.
| Item 1. | Reports to Stockholders. |

APEXcm SMALL/MID-CAP GROWTH FUND
(APSGX)
Annual Report
May 31, 2017
APEXcm SMALL/MID-CAP GROWTH FUND LETTER TO SHAREHOLDERS | May 31, 2017 |
Dear APEXcm Small/Mid-Cap Growth Fund Shareholder:
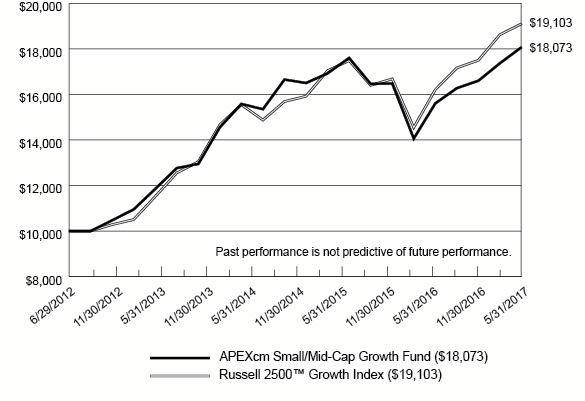
For the year ended May 31, 2017, the APEXcm Small/Mid-Cap Growth Fund (the “Fund”) returned +15.80% (net of fees). The Fund slightly underperformed its category benchmark, the Russell Midcap Growth Index, which returned +16.68%, and the Russell 2500 Growth Index (“Russell 2500 Growth”), which returned +17.85%, for the same one year period. We continue to invest for the long-term and believe a disciplined, prudent approach during this time of unpredictability will best serve our shareholders.
APEX PHILOSOPHY
We believe that the best way to provide value-added returns is to identify companies that exhibit certain favorable fundamental advantages and benefit from secular growth trends, allowing us to structure the portfolio in high-conviction areas of longer-term sustainable growth. Embedded in our portfolio construction is the recognition of companies at different stages of their growth cycle, which we designate as “stable” and “emerging” growth stocks. We believe that having a spectrum of growth companies ranging from those that are truly innovative and growing rapidly to those that are more established, can provide relative stability while allowing the opportunity to drive outperformance versus our benchmark and peers over time. In addition, we believe the SMID style provides the opportunity to invest in higher growth companies and capture a longer period of growth as these companies mature.
MARKET ENVIRONMENT
We began the reporting period in June 2016 with voters in the U.K. putting in motion a withdrawal from the European Union, prompting uncertainty and an intense move toward less risky assets. The Bank of England took aggressive action to steady the volatile response and mitigate near term economic concerns. The U.S. elections offered up another surprise in November with the Republicans winning the presidency and maintaining the majority in the House and Senate. Following what now appears to have been a commodity-driven industrial recession in the latter part of 2015 into 2016, the foundation for GDP growth was already stirring and would only be reinforced with the inclusion of proposed pro-growth strategies and significant fiscal stimulus from the new administration. As we moved into the second half of this reporting period, most markets rose in unison as stabilizing commodities and synchronized global growth provided a tailwind to the markets. Healthier industrial activity coupled with a weakening dollar, major emerging markets pulling out of a two year slump and the world’s most powerful economies finally showing signs of escaping the remnants of the financial crisis have, at least temporarily, offset the deferral of the Trump administration’s pro-growth strategies. We believe the prospects of lower taxes, less regulation and increased infrastructure spending still have the complacent equity markets buoying around all-time highs. It seems worrisome to reach new heights
1
concurrent with the Federal Reserve attempting to normalize monetary policy, key indicators of the health of housing, automotive and retail sectors reflecting fatigue and a buildup of emerging-market debt. With the U.S. economic expansion approaching eight years we would anticipate more market volatility as it wrestles with some weariness and the perception of a goldilocks environment of reasonable growth, benign inflation and continued accommodative central bank policy.
FUND PERFORMANCE FOR THE YEAR ENDED MAY 31, 2017
The Fund and the markets have recovered from the commodity-driven industrial recession in 2015/2016 and the ensuing anomalies of performance drivers appear to have normalized. Although the continuous shifting of market leadership can try investors’ patience, we believe the decisive driver of performance will be revenue and earnings growth supported by an improving global economic expansion.
Through all the twists and turns during the fiscal year, ultimately the Fund’s largest overweight – Information Technology – led the Russell 2500 Growth performance, up ~ 27.5% for this one year period. Our portfolio structure also added value during the reporting period as the overweights in Information Technology, Financials and Healthcare along with our underweights in Consumer Staples and Real Estate added approximately +2.2%. Towards the end of the reporting period Energy continued its decline and our overweight detracted ~-1.5%.
During the reporting period, the cash drag on the portfolio detracted approximately -0.7% from performance along with slightly negative stock selection detracting an additional ~- 0.8%. Stock selection was solid in Energy, Healthcare, Industrials, Materials and Real Estate, adding approximately +2.2%, but was offset by negative selection in Financials and Technology, which detracted ~-1.1%, as well as the consumer driven areas of Discretionary and Staples negatively impacting performance by approximately -2.0%. Although the Fund had some strong performers in the consumer sectors such as Burlington Stores, Wyndham Worldwide, China Lodging and Dave & Buster’s, several good businesses such as Michaels, Skechers (sold), Nordstrom and Carter’s lost value as brick and mortar retail continued to be under assault. Several other consumer businesses saw declines during this time period, such as Hain Celestial (sold), Boston Beer and IMAX. Although we see great value in these businesses, we continue to assess their growth opportunities in this ever changing consumer landscape.
Strong individual stock selection across multiple sectors was observed by top performers such as MercadoLibre, Align Technology, Arista Networks, IDEXX Laboratories and IAC/Interactive. These top five performers are good examples of our conviction in secular growth trends such as e-commerce and cloud computing (MercadoLibre, IAC, and Arista Networks) and the secular opportunities in Healthcare (Align Technology and IDEXX Labs). Although we noted significant winners in Healthcare, specialty pharma and biotech stocks have been in the crosshairs all year and three of the portfolio’s top five detractors were not immune to the downside volatility, absorbing significant declines in holdings Ophthotech (sold), Jazz Pharmaceuticals (sold) and Akorn (sold).
2
OUTLOOK
As we move into the second half of 2017, a lot of the anticipation of immediate change from the new administration has gradually dissipated. Infrastructure spending, deregulation, tax cuts and health care reform all remain possible but have gradually been discounted by the market for any meaningful impact in the near future. While the macro and political landscapes continue to swing and leadership in the market reallocates between risk/risk-off and secular/cyclical growth, fundamentals have improved during the most recent quarter with solid revenue growth and earnings growth (S&P Q1 earnings exhibited the strongest growth in almost six years) emerging as key drivers of performance. Although we remain concerned about the narrowing of winners in this market and investor complacency as we enter the second half of 2017, we believe the economy will remain resilient as synchronized global growth typically provides a sustained moderate but sturdy advance allowing for continued accommodative policies from central banks. There are still several risks such as tight labor markets fueling wage inflation, concern as to if or when higher sentiment and net worth translates into increased consumer spending and the impact of oil remaining below $50 per barrel highlight the challenging environment. We believe the length of this historic expansion still has some legs and we will be monitoring the rise in inflation expectations and compensation growth as keys to heightened central bank actions. Coincidently, growth must accelerate to support achievable earnings momentum and we will apply our cycle-tested investment process to balance these market undercurrents with our long-term secular views.
Sincerely,
Nitin N. Kumbhani
Vice Chairman and Chief of Growth Equity Strategies
Fiera Capital Inc.
Vice Chairman and Chief of Growth Equity Strategies
Fiera Capital Inc.
Index Definitions
Russell Midcap Growth Index measures the performance of the mid-capitalization growth sector of the U.S. equity market. It is a market capitalization weighted index representing the smallest 800 companies in the Russell 1000 Index.
Russell 2500 Growth Index is designed to measure the performance of those Russell 2500 companies with higher price-to-book ratios and higher forecasted growth values. The Russell 2500 Index covers the small and mid-capitalizations
3
Past performance is not predictive of future performance. Investment results and principal value will fluctuate so that shares, when redeemed, may be worth more or less than their original cost. Current performance may be higher or lower than the performance data quoted. Performance data current to the most recent month end are available by calling 1-888-575-4800.
An investor should consider the investment objectives, risks, charges and expenses of the Fund carefully before investing. The Fund’s prospectus contains this and other important information. To obtain a copy of the Fund’s prospectus please visit our website at www.apexcmfund.com or call 1-888-575-4800 and a copy will be sent to you free of charge. Please read the prospectus carefully before you invest. The APEXcm Small/Mid Cap Growth Fund is distributed by Ultimus Fund Distributors, LLC.
This Letter to Shareholders seeks to describe some of the Adviser’s current opinions and views of the financial markets. Although the Adviser believes it has a reasonable basis for any opinions or views expressed, actual results may differ, sometimes significantly so, from those expected or expressed. The securities held by the Fund that are discussed in the Letter to Shareholders were held during the period covered by this Report. They do not comprise the entire investment portfolio of the Fund, may be sold at any time and may no longer be held by the Fund. For a complete list of securities held by the Fund as of May 31, 2017, please see the Schedule of Investments section of the annual report. The opinions of the Adviser with respect to those securities may change at any time.
Statements in the Letter to Shareholders that reflect projections or expectations for future financial or economic performance of the Fund and the market in general and statements of the Fund’s plans and objectives for future operations are forward-looking statements. No assurance can be given that actual results or events will not differ materially from those projected, estimated, assumed, or anticipated in any such forward-looking statements. Important factors that could result in such differences, in addition to factors noted with such forward-looking statements include, without limitation, general economic conditions, such as inflation, recession, and interest rates.
4
APEXcm SMALL/MID-CAP GROWTH FUND
PERFORMANCE INFORMATION
May 31, 2017 (Unaudited)
PERFORMANCE INFORMATION
May 31, 2017 (Unaudited)
Comparison of the Change in Value of a $10,000 Investment in
APEXcm Small/Mid-Cap Growth Fund versus the Russell 2500TM Growth Index
Average Annual Total Returns For Periods Ended May 31, 2017 | ||||
| 1 Year | 3 Years | Since Inception(b) | ||
APEXcm Small/Mid-Cap Growth Fund(a) | 15.80% | 5.59% | 12.78% | |
Russell 2500TM Growth Index | 17.85% | 8.69% | 14.06% | |
(a) | The Fund’s total returns do not reflect the deduction of taxes a shareholder would pay on Fund distributions or the redemption of Fund shares. |
(b) | The Fund commenced operations on June 29, 2012. |
5
APEXcm SMALL/MID-CAP GROWTH FUND
PORTFOLIO INFORMATION
May 31, 2017 (Unaudited)
PORTFOLIO INFORMATION
May 31, 2017 (Unaudited)
Sector Diversification (% of Net Assets)

Top 10 Equity Holdings
| Security Description | % of Net Assets |
| MercadoLibre, Inc. | 3.9% |
| Align Technology, Inc. | 3.0% |
| Arista Networks, Inc. | 2.9% |
| Trimble, Inc. | 2.0% |
| Reinsurance Group of America, Inc. | 2.0% |
| Foot Locker, Inc. | 1.9% |
| IAC/InterActiveCorp | 1.9% |
| CBRE Group, Inc. - Class A | 1.9% |
| United Rentals, Inc. | 1.8% |
| Berry Global Group, Inc. | 1.8% |
6
APEXcm SMALL/MID-CAP GROWTH FUND SCHEDULE OF INVESTMENTS May 31, 2017 | ||||||||
| COMMON STOCKS — 97.5% | Shares | Value | ||||||
| Consumer Discretionary — 20.0% | ||||||||
| Auto Components — 2.7% | ||||||||
| Autoliv, Inc. | 32,247 | $ | 3,576,837 | |||||
| BorgWarner, Inc. | 101,053 | 4,295,763 | ||||||
| 7,872,600 | ||||||||
| Hotels, Restaurants & Leisure — 5.7% | ||||||||
| China Lodging Group Ltd. - ADS * | 46,768 | 3,573,075 | ||||||
| Dave & Buster's Entertainment, Inc. * | 59,661 | 3,979,389 | ||||||
| Dunkin’ Brands Group, Inc. | 75,909 | 4,441,436 | ||||||
| Wyndham Worldwide Corporation | 47,727 | 4,819,950 | ||||||
| 16,813,850 | ||||||||
| Household Durables — 1.5% | ||||||||
| PulteGroup, Inc. | 191,788 | 4,347,834 | ||||||
| Media — 1.3% | ||||||||
| Cinemark Holdings, Inc. | 47,580 | 1,882,741 | ||||||
| IMAX Corporation * | 76,869 | 1,925,568 | ||||||
| 3,808,309 | ||||||||
| Multi-line Retail — 2.7% | ||||||||
| Burlington Stores, Inc. * | 48,807 | 4,775,765 | ||||||
| Nordstrom, Inc. | 74,396 | 3,109,753 | ||||||
| 7,885,518 | ||||||||
| Specialty Retail — 5.1% | ||||||||
| Foot Locker, Inc. | 94,085 | 5,589,590 | ||||||
| Lithia Motors, Inc. - Class A | 27,566 | 2,504,371 | ||||||
| Michaels Companies, Inc. (The) * | 164,749 | 3,184,598 | ||||||
| Williams-Sonoma, Inc. | 75,823 | 3,689,547 | ||||||
| 14,968,106 | ||||||||
| Textiles, Apparel & Luxury Goods — 1.0% | ||||||||
| Carter's, Inc. | 35,626 | 2,927,032 | ||||||
| Consumer Staples — 0.7% | ||||||||
| Beverages — 0.7% | ||||||||
| Boston Beer Company, Inc. (The) - Class A * | 14,020 | 2,001,355 | ||||||
| Energy — 3.4% | ||||||||
| Energy Equipment & Services — 0.4% | ||||||||
| Superior Energy Services, Inc. * | 112,870 | 1,170,462 | ||||||
7
APEXcm SMALL/MID-CAP GROWTH FUND SCHEDULE OF INVESTMENTS (Continued) | ||||||||
| COMMON STOCKS — 97.5% (Continued) | Shares | Value | ||||||
| Energy — 3.4% (Continued) | ||||||||
| Oil, Gas & Consumable Fuels — 3.0% | ||||||||
| Cheniere Energy, Inc. * | 66,329 | $ | 3,231,549 | |||||
| Diamondback Energy, Inc. * | 36,213 | 3,359,118 | ||||||
| RSP Permian, Inc. * | 64,572 | 2,298,117 | ||||||
| 8,888,784 | ||||||||
| Financials — 5.8% | ||||||||
| Banks — 1.8% | ||||||||
| Bank of the Ozarks, Inc. | 57,771 | 2,553,478 | ||||||
| Western Alliance Bancorp * | 59,516 | 2,721,072 | ||||||
| 5,274,550 | ||||||||
| Capital Markets — 0.9% | ||||||||
| Evercore Partners, Inc. - Class A | 37,394 | 2,535,313 | ||||||
| Consumer Finance — 1.1% | ||||||||
| Navient Corporation | 227,887 | 3,288,409 | ||||||
| Insurance — 2.0% | ||||||||
| Reinsurance Group of America, Inc. | 46,317 | 5,766,930 | ||||||
| Health Care — 16.2% | ||||||||
| Biotechnology — 4.6% | ||||||||
| Alkermes plc * | 75,257 | 4,346,844 | ||||||
| Ionis Pharmaceuticals, Inc. * | 74,703 | 3,420,650 | ||||||
| Momenta Pharmaceuticals, Inc. * | 141,430 | 2,050,735 | ||||||
| Radius Health, Inc. * | 40,214 | 1,392,209 | ||||||
| TESARO, Inc. * | 15,318 | 2,287,131 | ||||||
| 13,497,569 | ||||||||
| Health Care Equipment & Supplies — 5.0% | ||||||||
| Align Technology, Inc. * | 60,073 | 8,722,600 | ||||||
| DexCom, Inc. * | 53,416 | 3,570,325 | ||||||
| ICU Medical, Inc. * | 13,701 | 2,209,971 | ||||||
| 14,502,896 | ||||||||
| Health Care Technology — 2.6% | ||||||||
| Medidata Solutions, Inc. * | 62,156 | 4,424,264 | ||||||
| Veeva Systems, Inc. - Class A * | 48,951 | 3,110,347 | ||||||
| 7,534,611 | ||||||||
| Life Sciences Tools & Services — 1.6% | ||||||||
| ICON plc * | 51,331 | 4,830,247 | ||||||
8
APEXcm SMALL/MID-CAP GROWTH FUND SCHEDULE OF INVESTMENTS (Continued) | ||||||||
| COMMON STOCKS — 97.5% (Continued) | Shares | Value | ||||||
| Health Care — 16.2% (Continued) | ||||||||
| Pharmaceuticals — 2.4% | ||||||||
| Horizon Pharma plc * | 90,740 | $ | 907,400 | |||||
| Prestige Brands Holdings, Inc. * | 42,536 | 2,142,964 | ||||||
| Supernus Pharmaceuticals, Inc. * | 107,502 | 4,042,075 | ||||||
| 7,092,439 | ||||||||
| Industrials — 14.2% | ||||||||
| Airlines — 1.2% | ||||||||
| Hawaiian Holdings, Inc. * | 70,509 | 3,532,501 | ||||||
| Building Products — 0.8% | ||||||||
| Owens Corning | 37,082 | 2,313,917 | ||||||
| Construction & Engineering — 1.0% | ||||||||
| EMCOR Group, Inc. | 45,732 | 2,882,031 | ||||||
| Machinery — 5.6% | ||||||||
| Middleby Corporation (The) * | 35,416 | 4,545,998 | ||||||
| Nordson Corporation | 42,837 | 4,963,952 | ||||||
| Wabtec Corporation | 46,349 | 3,789,031 | ||||||
| Xylem, Inc. | 58,177 | 3,033,349 | ||||||
| 16,332,330 | ||||||||
| Professional Services — 0.7% | ||||||||
| WageWorks, Inc. * | 27,980 | 1,979,585 | ||||||
| Road & Rail — 1.6% | ||||||||
| Old Dominion Freight Line, Inc. * | 52,786 | 4,714,846 | ||||||
| Trading Companies & Distributors — 3.3% | ||||||||
| HD Supply Holdings, Inc. * | 109,824 | 4,431,398 | ||||||
| United Rentals, Inc. * | 49,663 | 5,399,858 | ||||||
| 9,831,256 | ||||||||
| Information Technology — 31.3% | ||||||||
| Communications Equipment — 2.9% | ||||||||
| Arista Networks, Inc. * | 56,648 | 8,348,782 | ||||||
| Electronic Equipment, Instruments & Components — 3.1% | ||||||||
| Dolby Laboratories, Inc. - Class A | 64,073 | 3,228,638 | ||||||
| Trimble, Inc. * | 164,679 | 5,935,031 | ||||||
| 9,163,669 | ||||||||
9
APEXcm SMALL/MID-CAP GROWTH FUND SCHEDULE OF INVESTMENTS (Continued) | ||||||||
| COMMON STOCKS — 97.5% (Continued) | Shares | Value | ||||||
| Information Technology — 31.3% (Continued) | ||||||||
| Internet Software & Services — 5.8% | ||||||||
| IAC/InterActiveCorp * | 52,158 | $ | 5,546,482 | |||||
| MercadoLibre, Inc. | 41,240 | 11,345,536 | ||||||
| 16,892,018 | ||||||||
| IT Services — 9.3% | ||||||||
| Broadridge Financial Solutions, Inc. | 62,181 | 4,718,916 | ||||||
| CSRA, Inc. | 106,255 | 3,204,651 | ||||||
| Gartner, Inc. * | 32,621 | 3,901,472 | ||||||
| Global Payments, Inc. | 45,963 | 4,210,670 | ||||||
| Sabre Corporation | 167,676 | 3,760,973 | ||||||
| Teradata Corporation * | 84,098 | 2,292,511 | ||||||
| Total System Services, Inc. | 84,619 | 5,039,061 | ||||||
| 27,128,254 | ||||||||
| Semiconductors & Semiconductor Equipment — 4.1% | ||||||||
| Advanced Energy Industries, Inc. * | 53,779 | 4,137,218 | ||||||
| Entegris, Inc. * | 193,442 | 4,778,017 | ||||||
| Power Integrations, Inc. | 47,019 | 3,147,922 | ||||||
| 12,063,157 | ||||||||
| Software — 6.1% | ||||||||
| ACI Worldwide, Inc. * | 124,670 | 2,849,956 | ||||||
| BroadSoft, Inc. * | 76,188 | 3,047,520 | ||||||
| Fortinet, Inc. * | 115,281 | 4,535,155 | ||||||
| Guidewire Software, Inc. * | 49,310 | 3,275,170 | ||||||
| Splunk, Inc.* | 67,130 | 4,111,041 | ||||||
| 17,818,842 | ||||||||
| Materials — 4.0% | ||||||||
| Construction Materials — 1.3% | ||||||||
| Eagle Materials, Inc. | 41,146 | 3,880,068 | ||||||
| Containers & Packaging — 1.8% | ||||||||
| Berry Global Group, Inc. * | 90,915 | 5,272,161 | ||||||
| Paper & Forest Products — 0.9% | ||||||||
| KapStone Paper and Packaging Corporation | 120,619 | 2,548,679 | ||||||
| Real Estate — 1.9% | ||||||||
| Real Estate Management & Development — 1.9% | ||||||||
| CBRE Group, Inc. - Class A * | 158,537 | 5,529,771 | ||||||
Total Common Stocks (Cost $237,304,724) | $ | 285,238,681 | ||||||
10
APEXcm SMALL/MID-CAP GROWTH FUND SCHEDULE OF INVESTMENTS (Continued) | ||||||||
| MONEY MARKET FUNDS — 2.1% | Shares | Value | ||||||
Fidelity Institutional Money Market Portfolio - Class I, 0.67% (a) (Cost $6,281,250) | 6,281,250 | $ | 6,281,250 | |||||
Total Investments at Value — 99.6% (Cost $243,585,974) | $ | 291,519,931 | ||||||
| Other Assets in Excess of Liabilities — 0.4% | 1,177,339 | |||||||
| Net Assets — 100.0% | $ | 292,697,270 | ||||||
| ADS - American Depositary Shares | |
| * | Non-income producing security. |
(a) | The rate shown is the 7-day effective yield as of May 31, 2017 |
| See accompanying notes to financial statements. | |
11
APEXcm SMALL/MID-CAP GROWTH FUND STATEMENT OF ASSETS AND LIABILITIES May 31, 2017 | ||||
| ASSETS | ||||
| Investments in securities: | ||||
| At acquisition cost | $ | 243,585,974 | ||
| At value (Note 2) | $ | 291,519,931 | ||
| Receivable for capital shares sold | 1,262,062 | |||
| Dividends receivable | 183,625 | |||
| Other assets | 15,910 | |||
| Total assets | 292,981,528 | |||
| LIABILITIES | ||||
| Payable for capital shares redeemed | 24,899 | |||
| Payable to Adviser (Note 4) | 217,232 | |||
| Payable to administrator (Note 4) | 33,115 | |||
| Other accrued expenses and liabilities | 9,012 | |||
| Total liabilities | 284,258 | |||
| NET ASSETS | $ | 292,697,270 | ||
| NET ASSETS CONSIST OF: | ||||
| Paid-in capital | $ | 252,523,989 | ||
| Accumulated net investment loss | (493,639 | ) | ||
| Accumulated net realized losses from security transactions | (7,267,037 | ) | ||
| Net unrealized appreciation on investments | 47,933,957 | |||
| NET ASSETS | $ | 292,697,270 | ||
| Shares of beneficial interest outstanding (unlimited number of shares authorized, no par value) | 16,490,003 | |||
| Net asset value, offering price and redemption price per share (Note 2) | $ | 17.75 | ||
| See accompanying notes to financial statements. |
12
APEXcm SMALL/MID-CAP GROWTH FUND STATEMENT OF OPERATIONS For the Year Ended May 31, 2017 | ||||
| INVESTMENT INCOME | ||||
| Dividend income (net of foreign taxes of $4,024) | $ | 1,554,684 | ||
| EXPENSES | ||||
| Investment advisory fees (Note 4) | 2,727,551 | |||
| Administration fees (Note 4) | 267,480 | |||
| Fund accounting fees (Note 4) | 57,338 | |||
| Professional fees | 37,633 | |||
| Registration and filing fees | 31,281 | |||
| Custody and bank service fees | 30,488 | |||
| Compliance fees (Note 4) | 29,543 | |||
| Transfer agent fees (Note 4) | 18,887 | |||
| Printing of shareholder reports | 12,856 | |||
| Postage and supplies | 10,432 | |||
| Trustees’ fees and expenses (Note 4) | 9,611 | |||
| Insurance expense | 2,078 | |||
| Other expenses | 25,399 | |||
| Total expenses | 3,260,577 | |||
| Less fee reductions by the Adviser (Note 4) | (394,216 | ) | ||
| Net expenses | 2,866,361 | |||
| NET INVESTMENT LOSS | (1,311,677 | ) | ||
| REALIZED AND UNREALIZED GAINS (LOSSES) ON INVESTMENTS | ||||
| Net realized losses from security transactions | (4,450,716 | ) | ||
| Net change in unrealized appreciation (depreciation) on investments | 46,120,751 | |||
| NET REALIZED AND UNREALIZED GAINS ON INVESTMENTS | 41,670,035 | |||
| NET INCREASE IN NET ASSETS RESULTING FROM OPERATIONS | $ | 40,358,358 | ||
| See accompanying notes to financial statements. |
13
APEXcm SMALL/MID-CAP GROWTH FUND STATEMENTS OF CHANGES IN NET ASSETS | ||||||||
| Year Ended May 31, 2017 | Year Ended May 31, 2016 | |||||||
| FROM OPERATIONS | ||||||||
| Net investment loss | $ | (1,311,677 | ) | $ | (1,090,736 | ) | ||
| Net realized losses from security transactions | (4,450,716 | ) | (677,149 | ) | ||||
| Net change in unrealized appreciation (depreciation) on investments | 46,120,751 | (29,749,518 | ) | |||||
| Net increase (decrease) in net assets resulting from operations | 40,358,358 | (31,517,403 | ) | |||||
| DISTRIBUTIONS TO SHAREHOLDERS (Note 2) | ||||||||
| From net realized gains | (743,317 | ) | (1,414,635 | ) | ||||
| CAPITAL SHARE TRANSACTIONS | ||||||||
| Proceeds from shares sold | 101,284,904 | 149,542,431 | ||||||
| Net asset value of shares issued in reinvestment of distributions to shareholders | 716,969 | 1,277,590 | ||||||
| Payments for shares redeemed | (107,870,747 | ) | (99,682,011 | ) | ||||
| Net increase (decrease) in net assets from capital share transactions | (5,868,874 | ) | 51,138,010 | |||||
| TOTAL INCREASE IN NET ASSETS | 33,746,167 | 18,205,972 | ||||||
| NET ASSETS | ||||||||
| Beginning of year | 258,951,103 | 240,745,131 | ||||||
| End of year | $ | 292,697,270 | $ | 258,951,103 | ||||
| ACCUMULATED NET INVESTMENT LOSS | $ | (493,639 | ) | $ | (529,959 | ) | ||
| CAPITAL SHARE ACTIVITY | ||||||||
| Shares sold | 6,277,194 | 9,569,552 | ||||||
| Shares reinvested | 44,671 | 81,740 | ||||||
| Shares redeemed | (6,682,018 | ) | (6,609,395 | ) | ||||
| Net increase (decrease) in shares outstanding | (360,153 | ) | 3,041,897 | |||||
| Shares outstanding at beginning of year | 16,850,156 | 13,808,259 | ||||||
| Shares outstanding at end of year | 16,490,003 | 16,850,156 | ||||||
| See accompanying notes to financial statements. |
14
APEXcm SMALL/MID-CAP GROWTH FUND FINANCIAL HIGHLIGHTS | ||||||||||||||||||||
| Per Share Data for a Share Outstanding Throughout Each Period | ||||||||||||||||||||
| Year Ended May 31, 2017 | Year Ended May 31, 2016 | Year Ended May 31, 2015 | Year Ended May 31, 2014 | Period Ended May 31, 2013(a) | ||||||||||||||||
| Net asset value at beginning of period | $ | 15.37 | $ | 17.43 | $ | 15.20 | $ | 12.69 | $ | 10.00 | ||||||||||
| Income (loss) from investment operations: | ||||||||||||||||||||
| Net investment income (loss) | (0.08 | ) | (0.06 | ) | (0.04 | ) | (0.03 | ) | 0.04 | (b) | ||||||||||
| Net realized and unrealized gains (losses) on investments | 2.50 | (1.92 | ) | 2.27 | 2.60 | 2.72 | ||||||||||||||
| Total from investment operations | 2.42 | (1.98 | ) | 2.23 | 2.57 | 2.76 | ||||||||||||||
| Less distributions: | ||||||||||||||||||||
| From net investment income | — | — | — | — | (0.07 | ) | ||||||||||||||
| From net realized gains | (0.04 | ) | (0.08 | ) | — | (0.06 | ) | — | ||||||||||||
| Total distributions | (0.04 | ) | (0.08 | ) | — | (0.06 | ) | (0.07 | ) | |||||||||||
| Net asset value at end of period | $ | 17.75 | $ | 15.37 | $ | 17.43 | $ | 15.20 | $ | 12.69 | ||||||||||
Total return (c) | 15.80 | % | (11.34 | %) | 14.67 | % | 20.26 | % | 27.65 | %(d) | ||||||||||
| Net assets at end of period (000's) | $ | 292,697 | $ | 258,951 | $ | 240,745 | $ | 88,477 | $ | 13,153 | ||||||||||
| Ratios/supplementary data: | ||||||||||||||||||||
| Ratio of total expenses to average net assets | 1.19 | % | 1.21 | % | 1.26 | % | 1.49 | % | 4.87 | %(e) | ||||||||||
Ratio of net expenses to average net assets (f) | 1.05 | % | 1.05 | % | 1.05 | % | 1.05 | % | 1.05 | %(e) | ||||||||||
Ratio of net investment income (loss) to average net assets (f) | (0.48 | %) | (0.42 | %) | (0.48 | %) | (0.38 | %) | 0.26 | %(e) | ||||||||||
| Portfolio turnover rate | 55 | % | 35 | % | 58 | % | 47 | % | 18 | %(d) | ||||||||||
(a) | Represents the period from the commencement of operations (June 29, 2012) through May 31, 2013. |
(b) | Calculated using weighted average shares outstanding during the period. |
(c) | Total return is a measure of the change in value of an investment in the Fund over the period covered. The returns shown do not reflect the deduction of taxes a shareholder would pay on Fund distributions, if any, or the redemption of Fund shares. The total returns would be lower if the Adviser had not reduced advisory fees and/or reimbursed expenses (Note 4). |
(d) | Not annualized. |
(e) | Annualized. |
(f) | Ratio was determined after advisory fee reductions and/or expense reimbursements (Note 4). |
| See accompanying notes to financial statements. | |
15
APEXcm SMALL/MID-CAP GROWTH FUND
NOTES TO FINANCIAL STATEMENTS
May 31, 2017
NOTES TO FINANCIAL STATEMENTS
May 31, 2017
1. Organization
APEXcm Small/Mid-Cap Growth Fund (the “Fund”) is a diversified series of Ultimus Managers Trust (the “Trust”), an open-end investment company established as an Ohio business trust under a Declaration of Trust dated February 28, 2012. Other series of the Trust are not incorporated in this report. The Fund commenced operations on June 29, 2012.
The investment objective of the Fund is to seek to achieve long-term capital growth.
2. Significant Accounting Policies
In October 2016, the U.S. Securities and Exchange Commission (the “SEC”) adopted amendments to Regulation S-X which will impact financial statement presentation, particularly the presentation of derivative investments. Although still evaluating the impact, management believes that many of the Regulation S-X amendments are consistent with the Fund’s current financial statement presentation and expects that the Fund will be able to comply with the amendments by the August 1, 2017 compliance date.
The following is a summary of the Fund’s significant accounting policies. These policies are in conformity with accounting principles generally accepted in the United States of America (“GAAP”). As an investment company, as defined in Financial Accounting Standards Board (“FASB”) Accounting Standards Update 2013-08, the Fund follows accounting and reporting guidance under FASB Accounting Standards Codification Topic 946, “Financial Services – Investment Companies.”
Securities valuation – The Fund values its portfolio securities at market value as of the close of regular trading on the New York Stock Exchange (the “NYSE”) (normally 4:00 p.m. Eastern time) on each business day the NYSE is open for business. The Fund values its listed securities on the basis of the security’s last sale price on the security’s primary exchange, if available, otherwise at the exchange’s most recently quoted mean price. NASDAQ-listed securities are valued at the NASDAQ Official Closing Price. In the event that market quotations are not readily available or are considered unreliable due to market or other events, the Fund values its securities and other assets at fair value in accordance with procedures established by and under the general supervision of the Board of Trustees (the “Board”). Under these procedures, the securities will be classified as Level 2 or 3 within the fair value hierarchy (see below), depending on the inputs used. Unavailable or unreliable market quotes may be due to the following factors: a substantial bid-ask spread; infrequent sales resulting in stale prices; insufficient trading volume; small trade sizes; a temporary lapse in any reliable pricing source; and actions of the securities
16
APEXcm SMALL/MID-CAP GROWTH FUND
NOTES TO FINANCIAL STATEMENTS (Continued)
NOTES TO FINANCIAL STATEMENTS (Continued)
or futures markets, such as the suspension or limitation of trading. As a result, the prices of securities used to calculate the Fund’s net asset value (“NAV”) may differ from quoted or published prices for the same securities.
GAAP establishes a single authoritative definition of fair value, sets out a framework for measuring fair value, and requires additional disclosures about fair value measurements.
Various inputs are used in determining the value of the Fund’s investments. These inputs are summarized in the three broad levels listed below:
| ● | Level 1 – quoted prices in active markets for identical securities |
| ● | Level 2 – other significant observable inputs |
| ● | Level 3 – significant unobservable inputs |
The inputs or methods used for valuing securities are not necessarily an indication of the risks associated with investing in those securities. The inputs used to measure fair value may fall into different levels of the fair value hierarchy. In such cases, for disclosure purposes, the level in the fair value hierarchy within which the fair value measurement falls in its entirety is determined based on the lowest level input that is significant to the fair value measurement.
The following is a summary of the inputs used to value the Fund’s investments as of May 31, 2017:
| Level 1 | Level 2 | Level 3 | Total | |||||||||||||
| Common Stocks | $ | 285,238,681 | $ | — | $ | — | $ | 285,238,681 | ||||||||
| Money Market Funds | 6,281,250 | — | — | 6,281,250 | ||||||||||||
| Total | $ | 291,519,931 | $ | — | $ | — | $ | 291,519,931 | ||||||||
Refer to the Fund’s Schedule of Investments for a listing of the common stocks by industry type. As of May 31, 2017, the Fund did not have any transfers between Levels. In addition, the Fund did not hold derivative instruments or any assets or liabilities that were measured at fair value on a recurring basis using significant unobservable inputs (Level 3) as of May 31, 2017. It is the Fund’s policy to recognize transfers between Levels at the end of the reporting period.
Share valuation – The NAV per share of the Fund is calculated daily by dividing the total value of the Fund’s assets, less liabilities, by the number of shares outstanding. The offering price and redemption price per share of the Fund is equal to the NAV per share.
17
APEXcm SMALL/MID-CAP GROWTH FUND
NOTES TO FINANCIAL STATEMENTS (Continued)
NOTES TO FINANCIAL STATEMENTS (Continued)
Investment income – Dividend income is recorded on the ex-dividend date. Interest income is accrued as earned. Withholding taxes on foreign dividends have been recorded in accordance with the Fund’s understanding of the appropriate country’s rules and tax rates.
Security transactions – Security transactions are accounted for on the trade date. Realized gains and losses on securities sold are determined on a specific identification basis.
Common expenses – Common expenses of the Trust are allocated among the Fund and the other series of the Trust based on the relative net assets of each series or the nature of the services performed and the relative applicability to each series.
Distributions to shareholders – The Fund will distribute to shareholders any net investment income dividends and net realized capital gains distributions at least once each year. The amount of such dividends and distributions are determined in accordance with federal income tax regulations, which may differ from GAAP. Dividends and distributions are recorded on the ex-dividend date. The tax character of the Fund’s distributions paid during the years ended May 31, 2017 and 2016 was as follows:
| Year Ended | Ordinary Income | Long-Term Capital Gains | Total Distributions | |||||||||
| May 31, 2017 | $ | — | $ | 743,317 | $ | 743,317 | ||||||
| May 31, 2016 | $ | 353,659 | $ | 1,060,976 | $ | 1,414,635 | ||||||
Estimates – The preparation of financial statements in conformity with GAAP requires management to make estimates and assumptions that affect the reported amounts of assets and liabilities and disclosure of contingent assets and liabilities as of the date of the financial statements and the reported amounts of income and expenses during the reporting period. Actual results could differ from those estimates.
Federal income tax – The Fund has qualified and intends to continue to qualify as a regulated investment company under the Internal Revenue Code of 1986 (the “Code”). Qualification generally will relieve the Fund of liability for federal income taxes to the extent 100% of its net investment income and net realized capital gains are distributed in accordance with the Code.
In order to avoid imposition of the excise tax applicable to regulated investment companies, it is also the Fund’s intention to declare as dividends in each calendar year at least 98% of its net investment income (earned during the calendar year) and 98.2% of its net realized capital gains (earned during the twelve months ended October 31) plus undistributed amounts from prior years.
18
APEXcm SMALL/MID-CAP GROWTH FUND
NOTES TO FINANCIAL STATEMENTS (Continued)
NOTES TO FINANCIAL STATEMENTS (Continued)
The following information is computed on a tax basis for each item as of May 31, 2017:
| Tax cost of portfolio investments | $ | 245,069,986 | ||
| Gross unrealized appreciation | $ | 59,533,659 | ||
| Gross unrealized depreciation | (13,083,714 | ) | ||
| Net unrealized appreciation | 46,449,945 | |||
| Accumulated capital and other losses | (6,276,664 | ) | ||
| Accumulated earnings | $ | 40,173,281 |
The federal income tax cost of portfolio investments and the tax components of accumulated earnings may temporarily differ from the financial statement cost of portfolio investments and components of net assets (“book/tax difference”). These book/tax differences are due to the recognition of capital gains or losses under income tax regulations and GAAP, primarily due to the tax deferral of losses on wash sales.
Qualified late year losses incurred after December 31, 2016 and within the taxable year are deemed to arise on the first day of the Fund’s next taxable year. For the year ended May 31, 2017, the Fund deferred $493,639 of late year ordinary losses until June 1, 2017 for federal income tax purposes.
As of May 31, 2017, the Fund had the following capital loss carryforwards:
| Capital loss carryforward - short-term | $ | 5,562,683 | ||
| Capital loss carryforward - long-term | 220,342 | |||
| Total capital loss carryforwards | $ | 5,783,025 |
These capital loss carryforwards, which do no expire, may be utilized in future years to offset net realized capital gains, if any, prior to distributing such gains to shareholders.
For the year ended May 31, 2017, the Fund reclassified $1,347,997 of net investment loss and $743,317 of net realized loss against paid-in capital on its Statement of Assets and Liabilities. Such reclassifications, the result of permanent differences between financial statement and income tax reporting requirements, had no effect on the Fund’s total net assets or NAV per share.
The Fund recognizes the tax benefits or expenses of uncertain tax positions only when the position is “more likely than not” to be sustained assuming examination by tax authorities. Management has reviewed the Fund’s tax positions for all open tax
19
APEXcm SMALL/MID-CAP GROWTH FUND
NOTES TO FINANCIAL STATEMENTS (Continued)
NOTES TO FINANCIAL STATEMENTS (Continued)
periods (periods ended May 31, 2014 through May 31, 2017) and has concluded that no provision for unrecognized tax benefits or expenses is required in these financial statements. The Fund identifies its major tax jurisdiction as U.S. Federal.
3. Investment Transactions
During the year ended May 31, 2017, cost of purchases and proceeds from sales of investment securities, other than short-term investments, were $143,455,629 and $151,286,149, respectively.
4. Transactions with Related Parties
INVESTMENT ADVISORY AGREEMENT
The Fund’s investments are managed by Fiera Capital, Inc. (the “Adviser”) pursuant to the terms of an Investment Advisory Agreement. Under the Investment Advisory Agreement, the Fund pays the Adviser an advisory fee, computed and accrued daily and paid monthly, at the annual rate of 1.00% of its average daily net assets.
Pursuant to an Expense Limitation Agreement (“ELA”) between the Fund and the Adviser, the Adviser has contractually agreed, until October 1, 2017, to reduce investment advisory fees and reimburse other operating expenses to the extent necessary to limit total annual operating expenses of the Fund (exclusive of brokerage costs, taxes, interest, acquired fund fees and expenses, extraordinary expenses such as litigation and merger or reorganization costs, and other expenses not incurred in the ordinary course of the Fund’s business) to an amount not exceeding 1.05% of the Fund’s average daily net assets. Accordingly, during the year ended May 31, 2017, the Adviser reduced its advisory fees in the amount of $394,216.
Under the terms of the ELA, investment advisory fee reductions and expense reimbursements by the Adviser are subject to recoupment by the Adviser for a period of three years after such fees and expenses were incurred, provided the recoupments do not cause total annual operating expenses of the Fund to exceed the lesser of (i) the expense limitation then in effect, if any, or (ii) the expense limitation in effect at the time the expenses to be paid were incurred. As of May 31, 2017, the Adviser may seek recoupment of investment advisory fee reductions in the amount of $1,110,302 no later than the dates as stated below:
| May 31, 2018 | $ | 317,860 | ||
| May 31, 2019 | 398,226 | |||
| May 31, 2020 | 394,216 |
20
APEXcm SMALL/MID-CAP GROWTH FUND
NOTES TO FINANCIAL STATEMENTS (Continued)
NOTES TO FINANCIAL STATEMENTS (Continued)
OTHER SERVICE PROVIDERS
Ultimus Fund Solutions, LLC (“Ultimus”) provides administration, fund accounting, compliance and transfer agency services to the Fund. The Fund pays Ultimus fees in accordance with the agreements for such services. In addition, the Fund pays out-of-pocket expenses including, but not limited to, postage, supplies and costs of pricing the Fund’s portfolio securities.
Under the terms of a Distribution Agreement with the Trust, Ultimus Fund Distributors, LLC (the “Distributor”) serves as principal underwriter to the Fund. The Distributor is a wholly-owned subsidiary of Ultimus. The Distributor is compensated by the Adviser (not the Fund) for acting as principal underwriter.
Certain officers and a Trustee of the Trust are also officers of Ultimus and the Distributor.
TRUSTEE COMPENSATION
Effective October 1, 2016, each Trustee who is not an “interested person” of the Trust (“Independent Trustee”) receives a $1,000 annual retainer from the Fund, paid quarterly, except for the Board Chair who receives a $1,200 annual retainer from the Fund, paid quarterly. Each Independent Trustee also receives from the Fund a fee of $500 for each Board meeting attended plus reimbursement for travel and other meeting-related expenses. Prior to October 1, 2016, the Fund paid each Independent Trustee a fee of $500 for each Board meeting attended, plus a $500 annual retainer.
PRINICIPAL HOLDERS OF FUND SHARES
As of May 31, 2017, the following shareholders owned of record 5% or more of the outstanding shares of the Fund:
| Name of Record Owner | % Ownership |
| UBS Financial Services, Inc. (for the benefit of its customers) | 30% |
| Charles Schwab & Company, Inc. (for the benefit of its customers) | 26% |
| National Financial Services LLC (for the benefit of its customers) | 15% |
| U.S. Bank, N.A. (for the benefit of its customers) | 6% |
A beneficial owner of 25% or more of a Fund’s outstanding shares may be considered a controlling person. That shareholder’s vote could have a more significant effect on matters presented at a shareholder’s meeting.
5. Sector Risk
If a Fund has significant investments in the securities of issuers within a particular sector, any development affecting that sector will have a greater impact on the value of the net assets of the Fund than would be the case if the Fund did not have
21
APEXcm SMALL/MID-CAP GROWTH FUND
NOTES TO FINANCIAL STATEMENTS (Continued)
NOTES TO FINANCIAL STATEMENTS (Continued)
significant investments in that sector. In addition, this may increase the risk of loss in the Fund and increase the volatility of the Fund’s NAV per share. For instance, economic or market factors, regulatory changes or other developments may negatively impact all companies in a particular sector, and therefore the value of the Fund’s portfolio will be adversely affected. As of May 31, 2017, the Fund had 31.3% of the value of its net assets invested in stocks within the Information Technology sector.
6. Contingencies and Commitments
The Fund indemnifies the Trust’s officers and Trustees for certain liabilities that might arise from their performance of their duties to the Fund. Additionally, in the normal course of business the Fund enters into contracts that contain a variety of representations and warranties and which provide general indemnifications. The Fund’s maximum exposure under these arrangements is unknown, as this would involve future claims that may be made against the Fund that have not yet occurred. However, based on experience, the Fund expects the risk of loss to be remote.
7. Subsequent Events
The Fund is required to recognize in the financial statements the effects of all subsequent events that provide additional evidence about conditions that existed as of the date of the Statement of Assets and Liabilities. For non-recognized subsequent events that must be disclosed to keep the financial statements from being misleading, the Fund is required to disclose the nature of the event as well as an estimate of its financial effect, or a statement that such an estimate cannot be made. Management has evaluated subsequent events through the issuance of these financial statements and has noted no such events, except as reflected in the following paragraph:
At an in-person meeting held on July 25, 2017, the Board approved the reorganization of the Fund into Fiera Capital Small/Mid-Cap Growth Fund, a series of Fiera Capital Series Trust (the “Acquiring Fund”). The Acquiring Fund will have the same investment objective, policies, and strategies of the Fund and be managed by the Adviser. The reorganization of the Fund is subject to shareholder approval. Shareholders of the Fund as of record date (to be determined) will be eligible to vote at the Special Meeting of Shareholders. All shareholders of record as of the record date will receive a combined proxy statement/prospectus describing the terms and conditions of the proposed reorganization along with proxy voting information.
22
APEXcm SMALL/MID-CAP GROWTH FUND
REPORT OF INDEPENDENT REGISTERED
PUBLIC ACCOUNTING FIRM
REPORT OF INDEPENDENT REGISTERED
PUBLIC ACCOUNTING FIRM
To the Board of Trustees of Ultimus Managers Trust
and the Shareholders of APEXcm Small/Mid Cap Growth Fund
and the Shareholders of APEXcm Small/Mid Cap Growth Fund
We have audited the accompanying statement of assets and liabilities of APEXcm Small/Mid Cap Growth Fund, a series of shares of beneficial interest in Ultimus Managers Trust, (the “Fund”) including the schedule of investments, as of May 31, 2017, and the related statement of operations for the year then ended, the statements of changes in net assets for each of the years in the two-year period then ended and the financial highlights for each of the years in the four-year period then ended and for the period from June 29, 2012 (commencement of operations) through May 31, 2013. These financial statements and financial highlights are the responsibility of the Fund’s management. Our responsibility is to express an opinion on these financial statements and financial highlights based on our audits.
We conducted our audits in accordance with the standards of the Public Company Accounting Oversight Board (United States). Those standards require that we plan and perform the audits to obtain reasonable assurance about whether the financial statements and financial highlights are free of material misstatement. An audit includes examining, on a test basis, evidence supporting the amounts and disclosures in the financial statements. Our procedures included confirmation of securities owned as of May 31, 2017 by correspondence with the custodian. An audit also includes assessing the accounting principles used and significant estimates made by management, as well as evaluating the overall financial statement presentation. We believe that our audits provide a reasonable basis for our opinion.
In our opinion, the financial statements and financial highlights referred to above present fairly, in all material respects, the financial position of APEXcm Small/Mid Cap Growth Fund as of May 31, 2017, and the results of its operations for the year then ended, the changes in its net assets for each of the years in the two-year period then ended and its financial highlights for each of the years in the four-year period then ended and for the period June 29, 2012 through May 31, 2013, in conformity with accounting principles generally accepted in the United States of America.
 | |
| BBD, LLP |
Philadelphia, Pennsylvania
July 27, 2017
July 27, 2017
23
APEXcm SMALL/MID-CAP GROWTH FUND
ABOUT YOUR FUND’S EXPENSES (Unaudited)
ABOUT YOUR FUND’S EXPENSES (Unaudited)
We believe it is important for you to understand the impact of costs on your investment. As a shareholder of the Fund, you incur ongoing costs, including management fees and other operating expenses. The following examples are intended to help you understand your ongoing costs (in dollars) of investing in the Fund and to compare these costs with the ongoing costs of investing in other mutual funds.
A mutual fund’s ongoing costs are expressed as a percentage of its average net assets. This figure is known as the expense ratio. The expenses in the table below are based on an investment of $1,000 made at the beginning of the most recent period (December 1, 2016) and held until the end of the period (May 31, 2017).
The table below illustrates the Fund’s ongoing costs in two ways:
Actual fund return – This section helps you to estimate the actual expenses that you paid over the period. The “Ending Account Value” shown is derived from the Fund’s actual return, and the third column shows the dollar amount of operating expenses that would have been paid by an investor who started with $1,000 in the Fund. You may use the information here, together with the amount you invested, to estimate the expenses that you paid over the period.
To do so, simply divide your account value by $1,000 (for example, an $8,600 account value divided by $1,000 = 8.6), then multiply the result by the number given for the Fund under the heading “Expenses Paid During Period.”
Hypothetical 5% return – This section is intended to help you compare the Fund’s ongoing costs with those of other mutual funds. It assumes that the Fund had an annual return of 5% before expenses during the period shown, but that the expense ratio is unchanged. In this case, because the return used is not the Fund’s actual return, the results do not apply to your investment. The example is useful in making comparisons because the SEC requires all mutual funds to calculate expenses based on a 5% return. You can assess the Fund’s ongoing costs by comparing this hypothetical example with the hypothetical examples that appear in shareholder reports of other funds.
Note that expenses shown in the table are meant to highlight and help you compare ongoing costs only. The Fund does not charge transaction fees, such as purchase or redemption fees, nor does it carry a “sales load.”
The calculations assume no shares were bought or sold during the period. Your actual costs may have been higher or lower, depending on the amount of your investment and the timing of any purchases or redemptions.
24
APEXcm SMALL/MID-CAP GROWTH FUND
ABOUT YOUR FUND’S EXPENSES (Unaudited) (Continued)
ABOUT YOUR FUND’S EXPENSES (Unaudited) (Continued)
More information about the Fund’s expenses can be found in this report. For additional information on operating expenses and other shareholder costs, please refer to the Fund’s prospectus.
| Beginning Account Value December 1, 2016 | Ending Account Value May 31, 2017 | Expenses Paid During Period* | |
| Based on Actual Fund Return | $ 1,000.00 | $ 1,088.60 | $ 5.47 |
| Based on Hypothetical 5% Return (before expenses) | $ 1,000.00 | $ 1,019.70 | $ 5.29 |
| * | Expenses are equal to the Fund’s annualized net expense ratio of 1.05% for the period, multiplied by the average account value over the period, multiplied by 182/365 (to reflect the one-half year period). |
OTHER INFORMATION (Unaudited)
A description of the policies and procedures that the Fund uses to vote proxies relating to portfolio securities is available without charge upon request by calling toll-free 1-888-575-4800, or on the SEC’s website at http://www.sec.gov. Information regarding how the Fund voted proxies relating to portfolio securities during the most recent 12-month period ended June 30 is available without charge upon request by calling toll-free 1-888-575-4800, or on the SEC’s website at http://www.sec.gov.
The Trust files a complete listing of portfolio holdings for the Fund with the SEC as of the end of the first and third quarters of each fiscal year on Form N-Q. These filings are available upon request by calling 1-888-575-4800. Furthermore, you may obtain a copy of the filings on the SEC’s website at http://www.sec.gov. The Trust’s Forms N-Q may also be reviewed and copied at the SEC’s Public Reference Room in Washington, DC, and information on the operation of the Public Reference Room may be obtained by calling 1-800-SEC-0330.
25
APEXcm SMALL/MID-CAP GROWTH FUND
FEDERAL TAX INFORMATION (Unaudited)
FEDERAL TAX INFORMATION (Unaudited)
In accordance with federal tax requirements, the following provides shareholders with information concerning distributions made by the Fund during the year ended May 31, 2017. Certain dividends paid by the Fund may be subject to a maximum tax rate of 23.8%. The Fund intends to designate up to a maximum amount of $743,317 as a long-term capital gain distribution.
As required by federal regulations, complete information was computed and reported in conjunction with your 2016 Form 1099-DIV.
26
APEXcm SMALL/MID-CAP GROWTH FUND
BOARD OF TRUSTEES AND EXECUTIVE OFFICERS
(Unaudited)
BOARD OF TRUSTEES AND EXECUTIVE OFFICERS
(Unaudited)
The Board of Trustees has overall responsibility for management of the Trust’s affairs. The Trustees serve during the lifetime of the Trust and until its termination, or until death, resignation, retirement, or removal. The Trustees, in turn, elect the officers of the Fund to actively supervise its day-to-day operations. The officers have been elected for an annual term. Unless otherwise noted, each Trustee’s and officer’s address is 225 Pictoria Drive, Suite 450, Cincinnati, Ohio 45246. The following are the Trustees and executive officers of the Fund:
| Name and Year of Birth | Length of Time Served | Position(s) Held with Trust | Principal Occupation(s) During Past 5 Years | Number of Funds in Trust Overseen by Trustee | Directorships of Public Companies Held by Trustee During Past 5 Years |
| Interested Trustees: | |||||
Robert G. Dorsey* Year of Birth: 1957 | Since February 2012 | Trustee (February 2012 to present) President (June 2012 to October 2013) | President and Managing Director of Ultimus Fund Solutions, LLC and Ultimus Fund Distributors, LLC (1999 to present) | 26 | None |
| Independent Trustees: | |||||
Janine L. Cohen Year of Birth: 1952 | Since January 2016 | Trustee | Retired since 2013; Chief Financial Officer from 2004 to 2013 and Chief Compliance Officer from 2008 to 2013 at AER Advisors, Inc. | 26 | None |
David M. Deptula Year of Birth: 1958 | Since June 2012 | Trustee | Vice President of Legal and Special Projects at Dayton Freight Lines, Inc. since 2016; Vice President of Tax Treasury at The Standard Register Inc. (formerly The Standard Register Company) from 2011 to 2016 | 26 | None |
27
APEXcm SMALL/MID-CAP GROWTH FUND
BOARD OF TRUSTEES AND EXECUTIVE OFFICERS
(Unaudited) (Continued)
BOARD OF TRUSTEES AND EXECUTIVE OFFICERS
(Unaudited) (Continued)
| Name and Year of Birth | Length of Time Served | Position(s) Held with Trust | Principal Occupation(s) During Past 5 Years | Number of Funds in Trust Overseen by Trustee | Directorships of Public Companies Held by Trustee During Past 5 Years |
| Independent Trustees (Continued): | |||||
John J. Discepoli Year of Birth: 1963 | Since June 2012 | Chairman (May 2016 to present) Trustee (June 2012 to present) | Owner of Discepoli Financial Planning, LLC (personal financial planning company) since 2004 | 26 | None |
| * | Mr. Dorsey is considered an “interested person” of the Trust within the meaning of Section 2(a)(19) of the Investment Company Act of 1940 because of his relationship with the Trust’s administrator, transfer agent and distributor. |
| Name and Year of Birth | Length of Time Served | Position(s) Held with Trust | Principal Occupation(s) During Past 5 Years |
| Executive Officers: | |||
David R. Carson Year of Birth: 1958 | Since April 2013 | Principal Executive Officer (April 2017 to present) President (October 2013 to present) Vice President (April 2013 to October 2013) | Vice President and Director of Client Strategies of Ultimus Fund Solutions, LLC (2013 to present); President, Unified Series Trust (2016 to present); Chief Compliance Officer, FSI LBAR Fund (2013 to 2016), The Huntington Funds (2005 to 2013), Huntington Strategy Shares (2012 to 2013), and Huntington Asset Advisors (2013); Vice President, Huntington National Bank (2001 to 2013) |
Jennifer L. Leamer Year of Birth: 1976 | Since April 2014 | Treasurer (October 2014 to present) Assistant Treasurer (April 2014 to October 2014) | Vice President, Mutual Fund Controller of Ultimus Fund Solutions, LLC (2014 to present); Business Analyst of Ultimus Fund Solutions, LLC (2007 to 2014) |
28
APEXcm SMALL/MID-CAP GROWTH FUND
BOARD OF TRUSTEES AND EXECUTIVE OFFICERS
(Unaudited) (Continued)
BOARD OF TRUSTEES AND EXECUTIVE OFFICERS
(Unaudited) (Continued)
| Name and Year of Birth | Length of Time Served | Position(s) Held with Trust | Principal Occupation(s) During Past 5 Years |
| Executive Officers (Continued): | |||
Frank L. Newbauer Year of Birth: 1954 | Since February 2012 | Secretary (July 2017 to present) Assistant Secretary (April 2015 to July 2017) Secretary (February 2012 to April 2015) | Assistant Vice President of Ultimus Fund Solutions, LLC (2010 to present) |
Charles C. Black Year of Birth: 1979 | Since April 2015 | Chief Compliance Officer (January 2016 to present) Assistant Chief Compliance Officer (April 2015 to January 2016) | Senior Compliance Officer of Ultimus Fund Solutions, LLC (2015 to present); Chief Compliance Officer of The Caldwell & Orkin Funds, Inc. (2016 to present); Senior Compliance Manager at Touchstone Mutual Funds (2013 to 2015); Senior Compliance Manager at Fund Evaluation Group (2011 to 2013) |
Additional information about members of the Board and executive officers is available in the Fund’s Statement of Additional Information (“SAI”). To obtain a free copy of the SAI, please call 1-888-575-4800.
29
 |
BARROW VALUE OPPORTUNITY FUND
(BALIX)
BARROW LONG/SHORT OPPORTUNITY FUND
(BFSLX)
Annual Report
May 31, 2017
| BARROW VALUE OPPORTUNITY FUND LETTER TO SHAREHOLDERS | June 28, 2017 |
Dear Shareholder,
We are pleased to report on the status and performance of the Barrow Value Opportunity Fund (“the Fund”) for the twelve months ended May 31, 2017.
We believe that the Fund owns a well-positioned portfolio of equity interests in excellent businesses at attractive valuations. This portfolio is highly diversified by market capitalization segments (large, middle, small), industry sectors, and issuers. In selecting investments for the Fund, we search for businesses that we believe feature high returns on capital, wide operating margins, and low debt loads. Based on our estimates of intrinsic value, we believe our portfolio’s valuation is attractively low on an absolute basis and less expensive than the U.S. stock market as represented by the S&P 500® Index (the “S&P 500”).
The Fund’s long-term performance has been excellent, with an annual average total return of 14.62% since inception. The Fund has exceeded the total return of the S&P 500 in five of the past eight calendar years. During the most recent twelve months ended May 31, 2017, the Fund returned +12.14% net of all fees and expenses, which underperformed the S&P 500 by 5.33%.
Barrow Street Advisors, LLC (the “Advisor”) continues to use its proprietary private-equity approach to find companies that meet its Quality-meets-Value criteria. Using the Advisor’s extensive research, the Fund seeks to generate long-term capital appreciation by investing in companies with fundamental operating and financial attributes representative of both quality and value. To increase the Fund’s chances for success, the Fund invests in a variety of positions that are diversified across market capitalization and industry sectors.
Over the past twelve-months, we uncovered 120 new investment opportunities, composed of 50 small-caps, 27 mid-caps, and 43 large-caps, across seven different industry sectors. We believe all of these new additions to the Fund’s portfolio are excellent companies with strong balance sheets and robust earnings capabilities. These companies are generally using their ample free cash flow to: a) re-invest in growth opportunities at high rates of return on investment; b) pay dividends; c) repurchase stock at attractive valuations; and/or d) retire outstanding debt.
In keeping with our practice since the beginning of 2009, over the past twelve months the Fund’s investments were sourced by taking account of the opportunity set of all companies in our broad investment universe each time we committed capital to a new position. We believe this approach allows us to uncover excellent investment opportunities that arise from temporary market inefficiencies and to gather up the most compelling investments across a wide array of industries and market capitalizations, while avoiding the damaging behavioral biases inherent in concentrated-stock and sector-specialized investing.
��
1
Thirteen of the Fund’s holdings were announced as take-over targets over the past twelve months, which was approximately 2.6x the market average. The Fund has had investments in 93 take-overs since December 31, 20081, or roughly 3.5x the market average2. The control premiums we have captured by virtue of holding stocks that end up being merger targets has made repeated and meaningful contributions to the Fund’s total returns, and we expect continued benefits from this effect going forward. We typically sell companies from the Fund’s portfolio soon after they are announced as take-over targets and re-invest that capital.
Over the past twelve months, the Fund’s portfolio generated total returns, before fees and expenses, of +13.38%, including +12.40% for large-caps, +12.63% for mid-caps and +13.09% for small-caps. This compares to +17.47% for the S&P 500 (for large-caps), +17.16% for the S&P 400 Midcap (for mid-caps), and +20.36% for the Russell 2000 (for small-caps) over the same period. The Fund’s sectors with the best absolute performance were Industrials and Information Technology, which generated total returns of +28.01% and +22.68%, respectively. The Fund’s sectors with the worst absolute performance were Consumer Discretionary and Energy, which returned +2.84% and +6.75%, respectively.
Strategy Review
Given the Fund’s recent soft performance, we have carefully reviewed our “Quality-meets-Value” strategy. This process has reaffirmed our belief in the Fund’s investment process and approach. We remain committed to dispassionately purchasing diversified portfolios of quality businesses at prices below our estimate of their intrinsic value, and doing the inverse when selling short.
Over the past twelve months, “quality” stocks have significantly underperformed the overall market. The S&P 500 Quality Index has trailed the S&P 500 Index by 250 bps over this period (source: Bloomberg). While underperformance is frustrating, we remain optimistic as “quality” stocks have outperformed the market over most periods going back to 1994. The current “risk-on” stock market environment appears to be waning. In the long run, investment approaches that combine quality and value do very well.
Moving forward, we remain committed to: a) disciplined execution of our Quality-meets-Value strategy; b) resisting pressure to change our strategy due to periods of soft performance; and c) communicating what we do and why. We are willing to make adjustments with new information, but the bar is high.
You can find additional commentary and reports about the Advisor’s management of the Fund’s portfolio on the Barrow Funds’ website (www.barrowfunds.com).
Sincerely,
| Nicholas Chermayeff | Robert F. Greenhill, Jr. | David R. Bechtel |
| Co-Portfolio Manager, | Co-Portfolio Manager, | Principal, |
| Investment Committee | Investment Committee | Investment Committee |
2
1 | The investment related and performance information discussed above for periods prior to Barrow Value Opportunity Fund’s reorganization date (August 30, 2013) are based on the activities of the Fund’s predecessor, the Barrow Street Fund L.P., an unregistered limited partnership managed by the portfolio managers of Barrow Value Opportunity Fund (the “Predecessor Private Fund”). The Predecessor Private Fund was reorganized into the Institutional Class shares of the Barrow Value Opportunity Fund on August 30, 2013, the date that the Fund commenced operations (the “Reorganization”). Barrow Value Opportunity Fund has been managed in the same style and by the same portfolio managers since the Predecessor Private Fund’s inception on December 31, 2008. The performance information shows the Predecessor Private Fund’s returns calculated using the actual fees and expenses charged by the Predecessor Private Fund. This prior performance is net of management fees and other expenses, but does not include the effect of the Predecessor Private Fund’s performance fee, which was in place until October 7, 2012. Prior to the Reorganization, the Predecessor Private Fund was not subject to certain investment restrictions, diversification requirements, and other restrictions of the Investment Company Act of 1940, as amended, or Subchapter M of the Internal Revenue Code of 1986, as amended, which, if they had been applicable, might have adversely affected Barrow Value Opportunity Fund’s performance. |
2 | The frequency of merger and acquisition (“M&A”) activity in the Fund’s portfolio is calculated on a quarterly basis by dividing the cumulative number of portfolio holdings that have been announced as merger or acquisition targets by the cumulative number of unique holdings held in the Fund’s portfolio. The frequency of M&A activity in the market is calculated on a quarterly basis by dividing the cumulative number of publicly-traded U.S. common stocks that have been announced as acquisition targets per Bloomberg by the total universe of publicly-traded U.S. common stocks as identified by Bloomberg (approximately 10,000). |
Past performance is not predictive of future performance. Investment results and principal value will fluctuate so that shares, when redeemed, may be worth more or less than their original cost. Current performance may be higher or lower than the performance data quoted. Performance data current to the most recent month end are available by calling 1-877-767-6633.
An investor should consider the investment objectives, risks, charges and expenses of the Fund carefully before investing. The Fund’s prospectus contains this and other important information. To obtain a copy of the Fund’s prospectus please visit our website at www.barrowfunds.com or call 1-877-767-6633 and a copy will be sent to you free of charge. Please read the prospectus carefully before you invest. The Fund is distributed by Ultimus Fund Distributors, LLC.
The Letter to Shareholders seeks to describe some of the Advisor’s current opinions and views of the financial markets. Although the Advisor believes it has a reasonable basis for any opinions or views expressed, actual results may differ, sometimes significantly so, from those expected or expressed. The securities held by the Fund that are discussed in the Letter to Shareholders were held during the period covered by this Report. They do not comprise the entire investment portfolio of the Fund, may be sold at any time and may no longer be held by the Fund. For a complete list of securities held by the Fund as of May 31, 2017, please see the Schedule of Investments section of the Annual Report. The opinions of the Fund’s Advisor with respect to those securities may change at any time.
Statements in the Letter to Shareholders that reflect projections or expectations for future financial or economic performance of the Fund and the market in general and statements of the Fund’s plans and objectives for future operations are forward-looking statements. No assurance can be given that actual results or events will not differ materially from those projected, estimated, assumed, or anticipated in any such forward-looking statements. Important factors that could result in such differences, in addition to factors noted with such forward-looking statements include, without limitation, general economic conditions, such as inflation, recession, and interest rates. Past performance is not a guarantee of future results.
3
BARROW VALUE OPPORTUNITY FUND
PERFORMANCE INFORMATION
May 31, 2017 (Unaudited)
PERFORMANCE INFORMATION
May 31, 2017 (Unaudited)
Comparison of the Change in Value of a $10,000 Investment in
Barrow Value Opportunity Fund
versus the S&P 500® Index
Barrow Value Opportunity Fund
versus the S&P 500® Index

Average Annual Total Returns For the periods ended May 31, 2017 | ||||
| 1 Year | 5 Years | Since Inception(c) | ||
Barrow Value Opportunity Fund(a)(b) | 12.14% | 14.01% | 14.62% | |
S&P 500® Index | 17.47% | 15.42% | 14.83% | |
4
BARROW VALUE OPPORTUNITY FUND
PERFORMANCE INFORMATION
May 31, 2017 (Unaudited) (Continued)
PERFORMANCE INFORMATION
May 31, 2017 (Unaudited) (Continued)
Comparison of Yearly Returns with the S&P 500® Index | ||||
Barrow Value Opportunity Fund(a) | S&P 500® Index | Difference | ||
| Yearly Total Returns for Calendar Years: | ||||
| 2009 | 30.10% | 26.46% | 3.64% | |
| 2010 | 18.75% | 15.06% | 3.69% | |
| 2011 | 5.50% | 2.11% | 3.39% | |
| 2012 | 18.77% | 16.00% | 2.77% | |
| 2013 | 36.69% | 32.39% | 4.30% | |
| 2014 | 5.13% | 13.69% | (8.56%) | |
| 2015 | 0.81% | 1.38% | (0.57%) | |
| 2016 | 7.41% | 11.96% | (4.55%) | |
| Total Return Since Inception (not annualized, as of 12/31/16) | 201.26% | 194.48% | 6.78% | |
(a) | The Barrow Value Opportunity Fund (the “Fund”) performance includes the performance of the Barrow Street Fund L.P. (the “Predecessor Private Fund”), the Fund’s predecessor, for the periods before the Fund’s registration statement became effective. The Predecessor Private Fund was reorganized into the Fund at the close of business on August 30, 2013 (the “Reorganization”), the date the Fund commenced operations. The Fund has been managed in the same style and by the same portfolio managers since the Predecessor Private Fund’s inception on December 31, 2008. The Fund’s investment goals, policies, guidelines and restrictions are, in all material respects, equivalent to those of the Predecessor Private Fund. The performance of the Predecessor Private Fund is net of management fees of 1.50% of assets but does not include the effect of a 20% performance fee which was in place until October 7, 2012. Prior to the Reorganization, the Predecessor Private Fund was not subject to certain investment restrictions, diversification requirements and other restrictions of the Investment Company Act of 1940, as amended, or Subchapter M of the Internal Revenue Code of 1986, as amended. If such restrictions had been applicable, they might have adversely affected the Predecessor Private Fund’s performance. |
(b) | The Fund’s total returns do not reflect the deduction of taxes a shareholder would pay on Fund distributions, if any, or the redemption of Fund shares. |
(c) | Represents the period from December 31, 2008(a) through May 31, 2017. |
5
| BARROW LONG/SHORT OPPORTUNITY FUND | |
| LETTER TO SHAREHOLDERS | |
Dear Shareholder,
We are pleased to report on the status and performance of the Barrow Long/Short Opportunity Fund (“the Fund”) for the twelve months ended May 31, 2017.
We believe the Fund owns a well-positioned long portfolio of equity positions in excellent businesses at attractive valuations that we believe feature high returns on capital, wide operating margins, and low debt load. The Fund also maintains short positions in the common stock of companies that we believe have poor business characteristics and are trading at high prices. The Fund’s long and short portfolios are highly diversified by market cap segments (large, mid, small), industry sectors, and issuers.
We believe the Fund is well positioned to do well in most future market conditions, especially a bear market. In our opinion, the Fund’s long and short portfolios are cheap and expensive, respectively, on an absolute basis and in relation to the U.S. stock market as represented by the S&P 500® Index (“S&P 500”). We believe the Fund’s short portfolio, the value of which is approximately 70% of the long portfolio, provides a meaningful hedge against the market’s potential downside volatility.
For the twelve months ended May 31, 2017, the Fund posted a total return of -3.38%, which compares to +17.47% for the S&P 500 and +10.89% for the HFRI Equity Hedge Index. The Fund underperformed the S&P 500 due mainly to the underperformance of its long positions.
The Fund maintains a target gross exposure of approximately 220% of its net assets, with long exposure of 130%, short exposure of 90%, and net exposure of 40%. For the twelve months ended May 31, 2017, the Fund’s long portfolio generated an unleveraged total return before fees and expenses of +13.25%, which underperformed the S&P 500 by 4.22%. The Fund’s short portfolio generated an unleveraged total return, before fees and expenses, of +19.93% or 2.46% more than the S&P 500. A positive return in the short portfolio results in negative return contributions to the Fund.
Barrow Street Advisors, LLC (the “Advisor”) continues to use its proprietary private equity approach to find companies that meet its Quality-meets-Value criteria. Using the Advisor’s extensive research, the Fund seeks to generate above-average returns through capital appreciation by investing long in companies with fundamental operating and financial attributes representative of both quality and value and selling short companies of both lower quality and high price. Using this approach the Fund continued to uncover potential opportunities to: 1) purchase quality companies trading at temporary discounts to their intrinsic values; and 2) sell short the stock of lower quality companies trading at prices well above their intrinsic values. To increase the Fund’s chances for success, the Fund invests in a variety of positions diversified across market capitalization and industry sectors.
Over the past twelve months, we uncovered 127 new long opportunities in seven industry sectors, including 52 small-caps, 29 mid-caps, and 46 large-caps. We believe all of these new additions to the Fund’s portfolio are excellent companies with strong balance sheets and robust earnings capability. They are generally using their ample free cash flow to:
6
a) re-invest in growth opportunities at high rates of return on investment; b) pay dividends; c) repurchase stock at attractive valuations; and/or d) retire outstanding debt. In tandem, we initiated 149 new short positions, including 74 small-caps, 43 mid-caps and 32 large-caps. We believe these companies are overpriced and exhibit weak quality characteristics.
In keeping with our past practice, over the past twelve months the Fund’s investments were sourced by taking account of the opportunity set of all companies in our broad investment universe each time we committed capital to a new position. We believe this approach allows us to uncover excellent investment opportunities that arise from temporary market inefficiencies and to gather up the most compelling investments across a wide array of industries and market capitalizations while avoiding the damaging behavioral biases inherent in concentrated-stock and sector-specialized investing.
Over the past twelve months, the Fund’s long portfolio generated unleveraged total returns before fees and expenses of +13.25%, including +12.11% for large-caps, +12.79% for mid-caps and +13.40% for small-caps. This compares to +17.47% for the S&P 500 (for large-caps), +17.16% for the S&P 400 Midcap (for mid-caps), and +20.36% for the Russell 2000 (for small-caps) over the same period. The Fund’s sectors with the best absolute performance were Industrials and Information Technology, which generated total returns of +28.57% and +23.59%, respectively. The Fund’s sectors with the worst absolute performance were Consumer Discretionary and Energy, which returned +3.15% and +5.99%, respectively.
Over the same period, the Fund’s short portfolio generated total returns before fees and expenses of +19.93%, including +15.82% for large-caps, +18.06% for mid-caps and +24.88% for small-caps. A positive return in the short portfolio results in negative return contribution to the Fund. The Fund’s sectors with the best absolute performance were Energy and Consumer Staples, which returned +3.45% and +11.54%, respectively. The Fund’s sectors that provided the most negative return contribution were Information Technology and Materials, which generated total returns of +37.23% and +32.85%, respectively.
Strategy Review
Given the Fund’s recent soft performance, we have carefully reviewed our “Quality-meets-Value” strategy. This process has reaffirmed our belief in the Fund’s investment process and approach. We remain committed to dispassionately purchasing diversified portfolios of quality businesses at prices below our estimate of their intrinsic value, and doing the inverse when selling short.
Over the past twelve months, “quality” stocks have significantly underperformed the overall market. The S&P 500 Quality Index has trailed the S&P 500 Index by 250 bps over this period (source: Bloomberg). While underperformance is frustrating, we remain optimistic as “quality” stocks have outperformed the market over most periods going back to 1994. The current “risk-on” stock market environment appears to be waning. In the long run, investment approaches that combine quality and value do very well.
Moving forward, we remain committed to: a) disciplined execution of our Quality-meets-Value strategy; b) resisting pressure to change our strategy due to periods of soft performance; and c) communicating what we do and why. We are willing to make adjustments with new information, but the bar is high.
7
You can find additional commentary and reports about the Advisor’s management of the Fund’s portfolio on the Barrow Funds’ website (www.barrowfunds.com).
Sincerely,
| Nicholas Chermayeff | Robert F. Greenhill, Jr. | David R. Bechtel |
| Co-Portfolio Manager, | Co-Portfolio Manager, | Principal, |
| Investment Committee | Investment Committee | Investment Committee |
1 | The frequency of merger and acquisition (“M&A”) activity in the Fund’s portfolio is calculated on a quarterly basis by dividing the cumulative number of portfolio holdings that have been announced as merger or acquisition targets by the cumulative number of unique holdings held in the Fund’s portfolio. The frequency of M&A activity in the market is calculated on a quarterly basis by dividing the cumulative number of publicly-traded U.S. common stocks that have been announced as acquisition targets per Bloomberg by the total universe of publicly-traded U.S. common stocks as identified by Bloomberg (approximately 10,000). |
Past performance is not predictive of future performance. Investment results and principal value will fluctuate so that shares, when redeemed, may be worth more or less than their original cost. Current performance may be higher or lower than the performance data quoted. Performance data current to the most recent month end are available by calling 1-877-767-6633.
An investor should consider the investment objectives, risks, charges and expenses of the Fund carefully before investing. The Fund’s prospectus contains this and other important information. To obtain a copy of the Fund’s prospectus please visit our website at www.barrowfunds.com or call 1-877-767-6633 and a copy will be sent to you free of charge. Please read the prospectus carefully before you invest. The Fund is distributed by Ultimus Fund Distributors, LLC.
The Letter to Shareholders seeks to describe some of the Advisor’s current opinions and views of the financial markets. Although the Advisor believes it has a reasonable basis for any opinions or views expressed, actual results may differ, sometimes significantly so, from those expected or expressed. The securities held by the Fund that are discussed in the Letter to Shareholders were held during the period covered by this Report. They do not comprise the entire investment portfolio of the Fund, may be sold at any time and may no longer be held by the Fund. For a complete list of securities held by the Fund as of May 31, 2017, please see the Schedule of Investments and Schedule of Securities Sold Short sections of the Annual Report. The opinions of the Fund’s Advisor with respect to those securities may change at any time.
Statements in the Letter to Shareholders that reflect projections or expectations for future financial or economic performance of the Fund and the market in general and statements of the Fund’s plans and objectives for future operations are forward-looking statements. No assurance can be given that actual results or events will not differ materially from those projected, estimated, assumed, or anticipated in any such forward-looking statements. Important factors that could result in such differences, in addition to factors noted with such forward-looking statements include, without limitation, general economic conditions, such as inflation, recession, and interest rates. Past performance is not a guarantee of future results.
8
BARROW LONG/SHORT OPPORTUNITY FUND
PERFORMANCE INFORMATION
May 31, 2017 (Unaudited)
PERFORMANCE INFORMATION
May 31, 2017 (Unaudited)
Comparison of the Change in Value of a $10,000 Investment in
Barrow Long/Short Opportunity Fund
versus the S&P 500® Index
Barrow Long/Short Opportunity Fund
versus the S&P 500® Index

Average Annual Total Returns For the periods ended May 31, 2017 | |||
| 1 Year | Since Inception(b) | ||
Barrow Long/Short Opportunity Fund(a) | (3.38%) | 0.55% | |
S&P 500® Index | 17.47% | 13.32% | |
(a) | The Fund's total returns do not reflect the deduction of taxes a shareholder would pay on Fund distributions, if any, or the redemption of Fund shares. |
(b) | The Fund commenced operations on August 30, 2013. |
9
BARROW VALUE OPPORTUNITY FUND
PORTFOLIO INFORMATION
May 31, 2017 (Unaudited)
PORTFOLIO INFORMATION
May 31, 2017 (Unaudited)
Sector Diversification
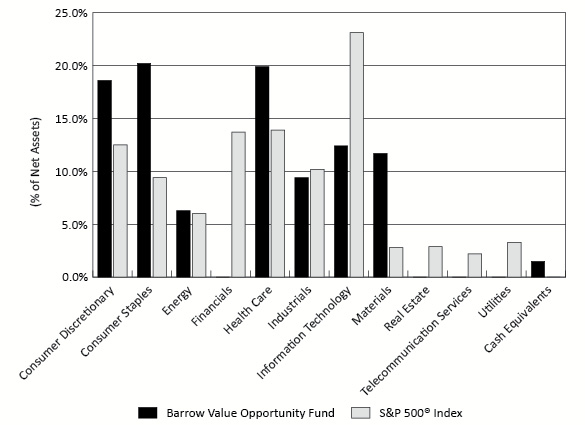
Top 10 Long Equity Holdings
| Security Description | % of Net Assets |
| Globus Medical, Inc. - Class A | 1.6% |
| Quest Diagnostics, Inc. | 1.6% |
| AmerisourceBergen Corporation | 1.5% |
| Chemed Corporation | 1.5% |
| Best Buy Company, Inc. | 1.5% |
| USANA Health Sciences, Inc. | 1.4% |
| Sanderson Farms, Inc. | 1.3% |
| McKesson Corporation | 1.3% |
| Herbalife Ltd. | 1.3% |
| Dr Pepper Snapple Group, Inc. | 1.2% |
10
BARROW LONG/SHORT OPPORTUNITY FUND
PORTFOLIO INFORMATION
May 31, 2017 (Unaudited)
PORTFOLIO INFORMATION
May 31, 2017 (Unaudited)
Net Sector Exposure Diversification*
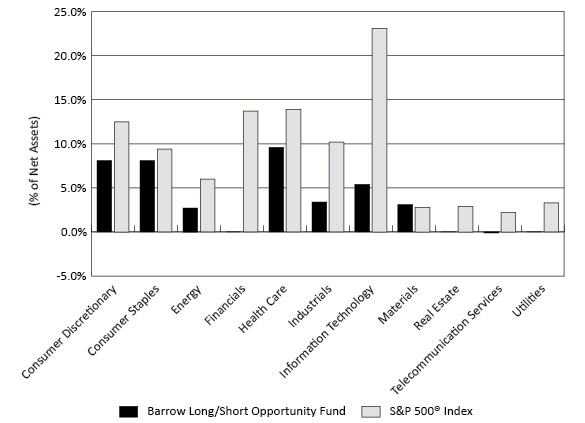
| * | The net percentages are computed by taking the net dollar exposure, including short positions, and dividing by the net assets of the Fund. Consequently, the percentages will not total to 100%. |
| Top 10 Long Equity Holdings | Top 10 Short Equity Holdings | |||
| Security Description | % of Net Assets | Security Description | % of Net Assets | |
| USANA Health Sciences, Inc. | 1.7% | Coca-Cola Bottling Company Consolidated | (0.9%) | |
| Boston Beer Company, Inc. (The) - Class A | 1.7% | Henry Schein, Inc. | (0.9%) | |
| Varian Medical Systems, Inc. | 1.7% | Darling Ingredients, Inc. | (0.8%) | |
| Inter Parfums, Inc. | 1.6% | Calavo Growers, Inc. | (0.8%) | |
| DaVita, Inc. | 1.6% | Patterson Companies, Inc. | (0.8%) | |
| Hologic, Inc. | 1.6% | Envision Healthcare Corporation | (0.8%) | |
| HealthSouth Corporation | 1.6% | Hostess Brands, Inc. | (0.8%) | |
| Globus Medical, Inc. - Class A | 1.6% | J & J Snack Foods Corporation | (0.8%) | |
| Masimo Corporation | 1.5% | Acadia Healthcare Company, Inc. | (0.8%) | |
| Sanderson Farms, Inc. | 1.5% | National Beverage Corporation | (0.8%) | |
11
| BARROW VALUE OPPORTUNITY FUND SCHEDULE OF INVESTMENTS May 31, 2017 | ||||||||
| COMMON STOCKS — 98.5% | Shares | Value | ||||||
| Consumer Discretionary — 18.6% | ||||||||
| Auto Components — 1.7% | ||||||||
American Axle & Manufacturing Holdings, Inc. (a) | 430 | $ | 6,497 | |||||
| Cooper Tire & Rubber Company | 189 | 6,804 | ||||||
Cooper-Standard Holdings, Inc. (a) | 67 | 7,237 | ||||||
Gentex Corporation (b) | 13,567 | 257,502 | ||||||
| Lear Corporation | 237 | 35,322 | ||||||
Motorcar Parts of America, Inc. (a) | 8,039 | 233,694 | ||||||
| Tenneco, Inc. | 589 | 33,485 | ||||||
| 580,541 | ||||||||
| Automobiles — 0.3% | ||||||||
| LCI Industries | 588 | 52,332 | ||||||
| Thor Industries, Inc. | 363 | 32,862 | ||||||
| 85,194 | ||||||||
| Diversified Consumer Services — 0.8% | ||||||||
| H&R Block, Inc. | 10,831 | 287,455 | ||||||
| Hotels, Restaurants & Leisure — 1.2% | ||||||||
Bojangles', Inc. (a) | 7,574 | 132,545 | ||||||
| Choice Hotels International, Inc. | 524 | 34,034 | ||||||
| DineEquity, Inc. | 181 | 8,281 | ||||||
| Dunkin' Brands Group, Inc. | 606 | 35,457 | ||||||
Hilton Grand Vacations, Inc. (a) | 965 | 34,518 | ||||||
| Hilton Worldwide Holdings, Inc. | 925 | 61,485 | ||||||
| ILG, Inc. | 2,007 | 54,069 | ||||||
| Wyndham Worldwide Corporation | 349 | 35,245 | ||||||
| Yum! Brands, Inc. | 308 | 22,373 | ||||||
| 418,007 | ||||||||
| Household Durables — 0.7% | ||||||||
NVR, Inc. (a) | 70 | 159,767 | ||||||
Tempur Sealy International, Inc. (a) | 1,137 | 52,802 | ||||||
| Tupperware Brands Corporation | 481 | 34,589 | ||||||
| 247,158 | ||||||||
Internet & Direct Marketing Retail — 0.0% (c) | ||||||||
| PetMed Express, Inc. | 325 | 11,404 | ||||||
| Leisure Products — 1.8% | ||||||||
American Outdoor Brands Corporation (a) | 5,350 | 121,178 | ||||||
Nautilus, Inc. (a) | 5,576 | 101,204 | ||||||
| Sturm, Ruger & Company, Inc. | 6,046 | 385,130 | ||||||
| 607,512 | ||||||||
12
| BARROW VALUE OPPORTUNITY FUND SCHEDULE OF INVESTMENTS (Continued) | ||||||||
| COMMON STOCKS — 98.5% (Continued) | Shares | Value | ||||||
| Consumer Discretionary — 18.6% (Continued) | ||||||||
| Media — 6.1% | ||||||||
AMC Networks, Inc. - Class A (a) (b) | 1,680 | $ | 89,006 | |||||
Discovery Communications, Inc. - Series A (a) | 7,731 | 204,872 | ||||||
| Interpublic Group of Companies, Inc. (The) | 13,087 | 326,259 | ||||||
Liberty Formula One Group - Series A (a) | 3,144 | 100,294 | ||||||
| Meredith Corporation | 558 | 30,188 | ||||||
MSG Networks, Inc. - Class A (a) | 9,702 | 204,227 | ||||||
Omnicom Group, Inc. (b) | 4,090 | 342,415 | ||||||
| Scripps Networks Interactive, Inc. - Class A | 3,828 | 253,490 | ||||||
TEGNA, Inc. (b) | 15,943 | 378,487 | ||||||
| Twenty-First Century Fox, Inc. - Class A | 4,587 | 124,399 | ||||||
Viacom, Inc. - Class B (b) | 903 | 31,415 | ||||||
| 2,085,052 | ||||||||
| Multi-Line Retail — 0.4% | ||||||||
| Big Lots, Inc. | 148 | 7,227 | ||||||
| Dollar General Corporation | 1,555 | 114,121 | ||||||
| 121,348 | ||||||||
| Specialty Retail — 4.4% | ||||||||
| American Eagle Outfitters, Inc. | 4,720 | 54,280 | ||||||
AutoZone, Inc. (a) | 130 | 78,770 | ||||||
Best Buy Company, Inc. (b) | 8,413 | 499,648 | ||||||
| Children's Place, Inc. (The) | 67 | 7,249 | ||||||
| DSW, Inc. - Class A | 3,191 | 53,705 | ||||||
Express, Inc. (a) | 1,215 | 9,428 | ||||||
Francesca's Holdings Corporation (a) | 18,475 | 233,894 | ||||||
| GameStop Corporation - Class A | 7,338 | 162,463 | ||||||
Hibbett Sports, Inc. (a) | 1,122 | 26,030 | ||||||
| L Brands, Inc. | 607 | 31,321 | ||||||
Michaels Companies, Inc. (The) (a) | 4,383 | 84,723 | ||||||
| Ross Stores, Inc. | 979 | 62,578 | ||||||
Sally Beauty Holdings, Inc. (a) | 2,618 | 47,176 | ||||||
Select Comfort Corporation (a) | 237 | 6,826 | ||||||
| TJX Companies, Inc. (The) | 1,074 | 80,776 | ||||||
| Winmark Corporation | 702 | 85,995 | ||||||
| 1,524,862 | ||||||||
| Textiles, Apparel & Luxury Goods — 1.2% | ||||||||
| Carter's, Inc. | 400 | 32,864 | ||||||
| Coach, Inc. | 301 | 13,909 | ||||||
| Movado Group, Inc. | 317 | 6,689 | ||||||
Skechers U.S.A., Inc. - Class A (a) | 1,410 | 35,983 | ||||||
13
| BARROW VALUE OPPORTUNITY FUND SCHEDULE OF INVESTMENTS (Continued) | ||||||||
| COMMON STOCKS — 98.5% (Continued) | Shares | Value | ||||||
| Consumer Discretionary — 18.6% (Continued) | ||||||||
| Textiles, Apparel & Luxury Goods — 1.2% (Continued) | ||||||||
Steven Madden Ltd. (a) | 8,481 | $ | 332,879 | |||||
| 422,324 | ||||||||
| Consumer Staples — 20.2% | ||||||||
| Beverages — 3.8% | ||||||||
Boston Beer Company, Inc. (The) - Class A (a) | 74 | 10,564 | ||||||
| Brown-Forman Corporation - Class B | 6,517 | 338,558 | ||||||
Dr Pepper Snapple Group, Inc. (b) | 4,574 | 424,513 | ||||||
| MGP Ingredients, Inc. | 952 | 48,752 | ||||||
| Molson Coors Brewing Company - Class B | 1,129 | 107,018 | ||||||
| National Beverage Corporation | 3,792 | 363,842 | ||||||
| 1,293,247 | ||||||||
| Food & Staples Retailing — 1.4% | ||||||||
| CVS Health Corporation | 779 | 59,851 | ||||||
Sprouts Farmers Market, Inc. (a) | 14,263 | 341,741 | ||||||
United Natural Foods, Inc. (a) | 753 | 30,075 | ||||||
| Whole Foods Market, Inc. | 1,798 | 62,912 | ||||||
| 494,579 | ||||||||
| Food Products — 5.2% | ||||||||
| B&G Foods, Inc. | 2,287 | 92,738 | ||||||
| Calavo Growers, Inc. | 1,592 | 107,778 | ||||||
Cal-Maine Foods, Inc. (a) | 1,365 | 50,778 | ||||||
| Dean Foods Company | 1,474 | 26,886 | ||||||
| Flowers Foods, Inc. | 5,962 | 110,178 | ||||||
| Hormel Foods Corporation | 2,390 | 80,376 | ||||||
| J & J Snack Foods Corporation | 260 | 33,826 | ||||||
Lancaster Colony Corporation (b) | 2,015 | 249,517 | ||||||
| Mondelēz International, Inc. - Class A | 3,768 | 175,551 | ||||||
Pilgrim's Pride Corporation (a) (b) | 16,559 | 385,328 | ||||||
Sanderson Farms, Inc. (b) | 3,875 | 459,962 | ||||||
| 1,772,918 | ||||||||
| Household Products — 2.0% | ||||||||
| Church & Dwight Company, Inc. | 4,467 | 230,765 | ||||||
| Clorox Company (The) | 258 | 35,018 | ||||||
| Energizer Holdings, Inc. | 4,090 | 219,224 | ||||||
| Spectrum Brands Holdings, Inc. | 795 | 106,888 | ||||||
WD-40 Company (b) | 1,062 | 112,254 | ||||||
| 704,149 | ||||||||
| Personal Products — 5.8% | ||||||||
Avon Products, Inc. (a) | 46,475 | 158,015 | ||||||
Herbalife Ltd. (a) (b) | 6,242 | 448,051 | ||||||
Inter Parfums, Inc. (b) | 9,915 | 345,042 | ||||||
14
| BARROW VALUE OPPORTUNITY FUND SCHEDULE OF INVESTMENTS (Continued) | ||||||||
| COMMON STOCKS — 98.5% (Continued) | Shares | Value | ||||||
| Consumer Staples — 20.2% (Continued) | ||||||||
| Personal Products — 5.8% (Continued) | ||||||||
| Medifast, Inc. | 7,896 | $ | 328,552 | |||||
Nu Skin Enterprises, Inc. - Class A (b) | 4,177 | 229,234 | ||||||
USANA Health Sciences, Inc. (a) (b) | 7,640 | 492,016 | ||||||
| 2,000,910 | ||||||||
| Tobacco — 2.0% | ||||||||
| Altria Group, Inc. | 3,615 | 272,716 | ||||||
| Universal Corporation | 946 | 62,814 | ||||||
Vector Group Ltd. (b) | 16,761 | 364,384 | ||||||
| 699,914 | ||||||||
| Energy — 6.3% | ||||||||
| Oil, Gas & Consumable Fuels — 6.3% | ||||||||
| Alliance Holdings GP, L.P. | 424 | 12,003 | ||||||
| Alliance Resource Partners, L.P. | 3,086 | 66,349 | ||||||
| Delek Logistics Partners, L.P. | 6,896 | 208,949 | ||||||
| EQT GP Holdings, L.P. | 512 | 13,389 | ||||||
EQT Midstream Partners, L.P. (b) | 4,458 | 328,822 | ||||||
| Green Plains Partners, L.P. | 14,800 | 276,020 | ||||||
Hess Midstream Partners, L.P. (a) | 445 | 10,342 | ||||||
| HollyFrontier Corporation | 353 | 8,437 | ||||||
| PBF Energy, Inc. - Class A | 3,884 | 75,039 | ||||||
| PBF Logistics, L.P. | 8,221 | 161,132 | ||||||
REX American Resources Corporation (a) | 2,821 | 268,333 | ||||||
| Shell Midstream Partners, L.P. | 4,641 | 138,441 | ||||||
| Tesoro Corporation | 3,270 | 272,195 | ||||||
| Tesoro Logistics, L.P. | 1,039 | 55,046 | ||||||
| Valero Energy Partners, L.P. | 5,753 | 260,093 | ||||||
| World Fuel Services Corporation | 98 | 3,463 | ||||||
| 2,158,053 | ||||||||
| Health Care — 19.9% | ||||||||
| Health Care Equipment & Supplies — 4.6% | ||||||||
| Abaxis, Inc. | 904 | 43,754 | ||||||
Anika Therapeutics, Inc. (a) (b) | 8,485 | 392,601 | ||||||
| Atrion Corporation | 83 | 45,787 | ||||||
| Danaher Corporation | 296 | 25,142 | ||||||
Edwards Lifesciences Corporation (a) | 221 | 25,431 | ||||||
Globus Medical, Inc. - Class A (a) (b) | 17,985 | 553,039 | ||||||
Hologic, Inc. (a) | 1,292 | 55,957 | ||||||
Intuitive Surgical, Inc. (a) | 29 | 26,526 | ||||||
Lantheus Holdings, Inc. (a) | 5,069 | 84,145 | ||||||
| LeMaitre Vascular, Inc. | 1,460 | 44,618 | ||||||
Masimo Corporation (a) | 358 | 31,160 | ||||||
15
| BARROW VALUE OPPORTUNITY FUND SCHEDULE OF INVESTMENTS (Continued) | ||||||||
| COMMON STOCKS — 98.5% (Continued) | Shares | Value | ||||||
| Health Care — 19.9% (Continued) | ||||||||
| Health Care Equipment & Supplies — 4.6% (Continued) | ||||||||
| Meridian Bioscience, Inc. | 2,674 | $ | 36,901 | |||||
Natus Medical, Inc. (a) | 407 | 13,797 | ||||||
OraSure Technologies, Inc. (a) | 2,017 | 30,396 | ||||||
| ResMed, Inc. | 392 | 27,871 | ||||||
Varian Medical Systems, Inc. (a) | 1,363 | 134,964 | ||||||
| 1,572,089 | ||||||||
| Health Care Providers & Services — 13.8% | ||||||||
| AmerisourceBergen Corporation | 5,590 | 512,994 | ||||||
AMN Healthcare Services, Inc. (a) | 9,261 | 335,711 | ||||||
Cardinal Health, Inc. (b) | 1,553 | 115,372 | ||||||
Chemed Corporation (b) | 2,499 | 511,445 | ||||||
CorVel Corporation (a) | 1,381 | 64,355 | ||||||
DaVita, Inc. (a) | 4,576 | 303,206 | ||||||
HCA Healthcare, Inc. (a) | 1,475 | 120,817 | ||||||
| HealthSouth Corporation | 9,108 | 412,866 | ||||||
LHC Group, Inc. (a) | 5,777 | 347,775 | ||||||
| McKesson Corporation | 2,776 | 452,738 | ||||||
MEDNAX, Inc. (a) (b) | 3,023 | 164,149 | ||||||
Premier, Inc. - Class A (a) | 10,883 | 375,681 | ||||||
Quest Diagnostics, Inc. (b) | 4,990 | 542,762 | ||||||
Surgery Partners, Inc. (a) | 3,590 | 78,262 | ||||||
Tivity Health, Inc. (a) | 2,445 | 83,008 | ||||||
| U.S. Physical Therapy, Inc. | 3,119 | 197,277 | ||||||
| Universal Health Services, Inc. - Class B | 1,045 | 118,775 | ||||||
| 4,737,193 | ||||||||
| Health Care Services — 0.6% | ||||||||
Envision Healthcare Corporation (a) | 3,943 | 215,327 | ||||||
| Health Care Technology — 0.1% | ||||||||
Inovalon Holdings, Inc. - Class A (a) | 3,680 | 50,048 | ||||||
| Pharmaceuticals — 0.8% | ||||||||
Corcept Therapeutics, Inc. (a) | 1,554 | 17,576 | ||||||
Innoviva, Inc. (a) | 6,982 | 85,320 | ||||||
| Phibro Animal Health Corporation - Class A | 495 | 17,449 | ||||||
Prestige Brands Holdings, Inc. (a) | 2,195 | 110,584 | ||||||
Sucampo Pharmaceuticals, Inc. - Class A (a) | 3,568 | 35,680 | ||||||
Supernus Pharmaceuticals, Inc. (a) | 443 | 16,657 | ||||||
| 283,266 | ||||||||
16
| BARROW VALUE OPPORTUNITY FUND SCHEDULE OF INVESTMENTS (Continued) | ||||||||
| COMMON STOCKS — 98.5% (Continued) | Shares | Value | ||||||
| Industrials — 9.4% | ||||||||
| Aerospace & Defense — 2.2% | ||||||||
Engility Holdings, Inc. (a) | 90 | $ | 2,370 | |||||
General Dynamics Corporation (b) | 1,920 | 390,240 | ||||||
| Huntington Ingalls Industries, Inc. | 30 | 5,874 | ||||||
| National Presto Industries, Inc. | 25 | 2,661 | ||||||
| Raytheon Company | 1,983 | 325,232 | ||||||
| TransDigm Group, Inc. | 24 | 6,434 | ||||||
| United Technologies Corporation | 106 | 12,856 | ||||||
| 745,667 | ||||||||
| Air Freight & Logistics — 0.7% | ||||||||
| C.H. Robinson Worldwide, Inc. | 1,150 | 77,062 | ||||||
| Expeditors International of Washington, Inc. | 2,738 | 146,154 | ||||||
| 223,216 | ||||||||
| Building Products — 0.4% | ||||||||
American Woodmark Corporation (a) | 858 | 79,622 | ||||||
| Apogee Enterprises, Inc. | 49 | 2,611 | ||||||
| Insteel Industries, Inc. | 75 | 2,382 | ||||||
| Masco Corporation | 1,039 | 38,703 | ||||||
Patrick Industries, Inc. (a) | 38 | 2,516 | ||||||
PGT Innovations, Inc. (a) | 239 | 2,736 | ||||||
Ply Gem Holdings, Inc. (a) | 134 | 2,191 | ||||||
| 130,761 | ||||||||
| Commercial Services & Supplies — 0.9% | ||||||||
| Brady Corporation - Class A | 67 | 2,405 | ||||||
| Deluxe Corporation | 4,208 | 286,817 | ||||||
| Herman Miller, Inc. | 80 | 2,524 | ||||||
| Kimball International, Inc. - Class B | 150 | 2,577 | ||||||
| Knoll, Inc. | 111 | 2,387 | ||||||
SP Plus Corporation (a) | 75 | 2,213 | ||||||
| Steelcase, Inc. - Class A | 155 | 2,596 | ||||||
| 301,519 | ||||||||
| Electrical Equipment — 0.1% | ||||||||
| Acuity Brands, Inc. | 35 | 5,702 | ||||||
| Rockwell Automation, Inc. | 239 | 37,934 | ||||||
| 43,636 | ||||||||
Industrial Conglomerates — 0.0% (c) | ||||||||
| Honeywell International, Inc. | 97 | 12,900 | ||||||
| Machinery — 2.4% | ||||||||
| Douglas Dynamics, Inc. | 81 | 2,466 | ||||||
| Global Brass & Copper Holdings, Inc. | 75 | 2,272 | ||||||
Greenbrier Companies, Inc. (The) (b) | 9,426 | 417,101 | ||||||
17
| BARROW VALUE OPPORTUNITY FUND SCHEDULE OF INVESTMENTS (Continued) | ||||||||
| COMMON STOCKS — 98.5% (Continued) | Shares | Value | ||||||
| Industrials — 9.4% (Continued) | ||||||||
| Machinery — 2.4% (Continued) | ||||||||
| Hillenbrand, Inc. | 71 | $ | 2,535 | |||||
Meritor, Inc. (a) | 149 | 2,320 | ||||||
Wabash National Corporation (b) | 20,364 | 407,076 | ||||||
| 833,770 | ||||||||
| Professional Services — 2.3% | ||||||||
CBIZ, Inc. (a) | 171 | 2,582 | ||||||
| Dun & Bradstreet Corporation (The) | 56 | 5,864 | ||||||
FTI Consulting, Inc. (a) | 71 | 2,451 | ||||||
GP Strategies Corporation (a) | 94 | 2,308 | ||||||
Huron Consulting Group, Inc. (a) | 765 | 31,786 | ||||||
ICF International, Inc. (a) | 59 | 2,776 | ||||||
| Insperity, Inc. | 29 | 2,188 | ||||||
| Kforce, Inc. | 116 | 2,088 | ||||||
| ManpowerGroup, Inc. | 60 | 6,112 | ||||||
Navigant Consulting, Inc. (a) | 108 | 2,105 | ||||||
| Nielsen Holdings plc | 154 | 5,926 | ||||||
Robert Half International, Inc. (b) | 7,585 | 352,626 | ||||||
RPX Corporation (a) (b) | 26,957 | 356,911 | ||||||
TriNet Group, Inc. (a) | 89 | 2,753 | ||||||
| 778,476 | ||||||||
Road & Rail — 0.0% (c) | ||||||||
| Landstar System, Inc. | 199 | 16,626 | ||||||
| Trading Companies & Distributors — 0.4% | ||||||||
| Grainger (W.W.), Inc. | 32 | 5,513 | ||||||
HD Supply Holdings, Inc. (a) | 153 | 6,174 | ||||||
United Rentals, Inc. (a) | 1,139 | 123,843 | ||||||
| 135,530 | ||||||||
| Information Technology — 12.4% | ||||||||
| Communications Equipment — 2.4% | ||||||||
F5 Networks, Inc. (a) | 278 | 35,620 | ||||||
| Harris Corporation | 69 | 7,739 | ||||||
InterDigital, Inc. (b) | 4,505 | 364,905 | ||||||
| Juniper Networks, Inc. | 8,857 | 259,776 | ||||||
| Motorola Solutions, Inc. | 90 | 7,521 | ||||||
NETGEAR, Inc. (a) | 535 | 22,443 | ||||||
Oclaro, Inc. (a) | 2,677 | 23,772 | ||||||
| Plantronics, Inc. | 314 | 16,617 | ||||||
Ubiquiti Networks, Inc. (a) | 1,900 | 89,604 | ||||||
| 827,997 | ||||||||
18
| BARROW VALUE OPPORTUNITY FUND SCHEDULE OF INVESTMENTS (Continued) | ||||||||
| COMMON STOCKS — 98.5% (Continued) | Shares | Value | ||||||
| Information Technology — 12.4% (Continued) | ||||||||
| Electronic Equipment, Instruments & Components — 1.2% | ||||||||
| CDW Corporation | 786 | $ | 47,301 | |||||
| CTS Corporation | 3,755 | 79,043 | ||||||
Insight Enterprises, Inc. (a) | 161 | 6,688 | ||||||
| Methode Electronics, Inc. | 6,270 | 251,741 | ||||||
| PC Connection, Inc. | 879 | 22,924 | ||||||
| 407,697 | ||||||||
| Internet Software & Services — 1.5% | ||||||||
Blucora, Inc. (a) | 796 | 16,318 | ||||||
eBay, Inc. (a) | 4,616 | 158,329 | ||||||
Match Group, Inc. (a) | 253 | 4,928 | ||||||
| NIC, Inc. | 773 | 15,653 | ||||||
Shutterstock, Inc. (a) | 266 | 12,385 | ||||||
Stamps.com, Inc. (a) | 133 | 18,341 | ||||||
Trade Desk, Inc. (The) - Class A (a) | 107 | 5,885 | ||||||
VeriSign, Inc. (a) | 2,350 | 211,876 | ||||||
Web.com Group, Inc. (a) | 568 | 12,922 | ||||||
WebMD Health Corporation (a) | 962 | 53,853 | ||||||
XO Group, Inc. (a) | 217 | 3,583 | ||||||
| 514,073 | ||||||||
| IT Services — 2.5% | ||||||||
| Alliance Data Systems Corporation | 25 | 6,028 | ||||||
| Booz Allen Hamilton Holding Corporation | 132 | 5,206 | ||||||
| Broadridge Financial Solutions, Inc. | 68 | 5,160 | ||||||
CACI International, Inc. - Class A (a) | 40 | 4,924 | ||||||
| Cognizant Technology Solutions Corporation - Class A | 1,102 | 73,735 | ||||||
| Computer Services, Inc. | 628 | 28,574 | ||||||
| Convergys Corporation | 2,122 | 51,586 | ||||||
| CSG Systems International, Inc. | 2,897 | 115,561 | ||||||
| DST Systems, Inc. | 39 | 4,712 | ||||||
Euronet Worldwide, Inc. (a) | 57 | 4,972 | ||||||
Fiserv, Inc. (a) | 54 | 6,765 | ||||||
| Forrester Research, Inc. | 406 | 15,996 | ||||||
| Genpact Ltd. | 196 | 5,355 | ||||||
| Hackett Group, Inc. (The) | 2,221 | 32,560 | ||||||
| ManTech International Corporation - Class A | 424 | 16,239 | ||||||
| MAXIMUS, Inc. | 77 | 4,780 | ||||||
| Paychex, Inc. | 109 | 6,456 | ||||||
Perficient, Inc. (a) | 939 | 16,217 | ||||||
| Science Applications International Corporation | 65 | 4,939 | ||||||
Sykes Enterprises, Inc. (a) | 496 | 16,532 | ||||||
| Syntel, Inc. | 9,039 | 158,002 | ||||||
19
| BARROW VALUE OPPORTUNITY FUND SCHEDULE OF INVESTMENTS (Continued) | ||||||||
| COMMON STOCKS — 98.5% (Continued) | Shares | Value | ||||||
| Information Technology — 12.4% (Continued) | ||||||||
| IT Services — 2.5% | ||||||||
Unisys Corporation (a) | 1,032 | $ | 12,178 | |||||
| Western Union Company (The) | 13,651 | 259,642 | ||||||
| 856,119 | ||||||||
| Semiconductors & Semiconductor Equipment — 0.1% | ||||||||
Acacia Communications, Inc. (a) | 487 | 22,908 | ||||||
| Software — 3.3% | ||||||||
ACI Worldwide, Inc. (a) | 4,803 | 109,797 | ||||||
| CA, Inc. | 10,051 | 319,320 | ||||||
| Ebix, Inc. | 287 | 15,885 | ||||||
ePlus, Inc. (a) | 4,247 | 334,451 | ||||||
Manhattan Associates, Inc. (a) | 102 | 4,778 | ||||||
MicroStrategy, Inc. - Class A (a) | 318 | 57,991 | ||||||
| Oracle Corporation | 6,192 | 281,055 | ||||||
| 1,123,277 | ||||||||
| Technology Hardware, Storage & Peripherals — 1.4% | ||||||||
| Apple, Inc. | 797 | 121,750 | ||||||
Eastman Kodak Company (a) | 656 | 6,068 | ||||||
HP, Inc. (b) | 19,486 | 365,557 | ||||||
NCR Corporation (a) | 187 | 7,205 | ||||||
| 500,580 | ||||||||
| Materials — 11.7% | ||||||||
| Chemicals — 9.9% | ||||||||
| Air Products & Chemicals, Inc. | 1,083 | 156,017 | ||||||
| Chase Corporation | 1,502 | 158,461 | ||||||
| Ciner Resources, L.P. | 7,448 | 201,096 | ||||||
| Dow Chemical Company (The) | 1,079 | 66,855 | ||||||
| FutureFuel Corporation | 16,374 | 221,704 | ||||||
GCP Applied Technologies, Inc. (a) | 3,064 | 92,226 | ||||||
| Innospec, Inc. | 1,634 | 104,576 | ||||||
LyondellBasell Industries N.V. - Class A (b) | 4,466 | 359,602 | ||||||
NewMarket Corporation (b) | 574 | 267,111 | ||||||
| PolyOne Corporation | 314 | 11,725 | ||||||
| PPG Industries, Inc. | 895 | 95,192 | ||||||
| Scotts Miracle-Gro Company (The) | 2,275 | 197,038 | ||||||
| Sherwin-Williams Company (The) | 1,058 | 351,013 | ||||||
Trinseo S.A. (b) | 5,976 | 385,153 | ||||||
| W.R. Grace & Company | 1,727 | 123,809 | ||||||
20
| BARROW VALUE OPPORTUNITY FUND SCHEDULE OF INVESTMENTS (Continued) | ||||||||
| COMMON STOCKS — 98.5% (Continued) | Shares | Value | ||||||
| Materials — 11.7% (Continued | ||||||||
| Chemicals — 9.9% (Continued) | ||||||||
Westlake Chemical Corporation (b) | 3,026 | $ | 185,978 | |||||
Westlake Chemical Partners, L.P. (b) | 17,181 | 417,498 | ||||||
| 3,395,054 | ||||||||
| Containers & Packaging — 1.7% | ||||||||
| Avery Dennison Corporation | 4,190 | 353,049 | ||||||
Crown Holdings, Inc. (a) | 1,317 | 76,044 | ||||||
| Sealed Air Corporation | 1,642 | 72,938 | ||||||
| Sonoco Products Company | 1,336 | 67,748 | ||||||
| 569,779 | ||||||||
| Paper & Forest Products — 0.1% | ||||||||
| Neenah Paper, Inc. | 598 | 46,644 | ||||||
Total Common Stocks (Cost $28,088,400) | $ | 33,858,779 | ||||||
| MONEY MARKET FUNDS — 1.5% | Shares | Value | ||||||
Fidelity Institutional Money Market Government Portfolio - Class I, 0.65% (d) (Cost $512,906) | 512,906 | $ | 512,906 | |||||
Total Investments at Value — 100.0% (Cost $28,601,306) | $ | 34,371,685 | ||||||
Other Assets in Excess of Liabilities — 0.0% (c) | 1,009 | |||||||
Net Assets — 100.0% | $ | 34,372,694 | ||||||
(a) | Non-income producing security. |
(b) | All or a portion of the shares have been pledged as collateral for the bank line of credit (Note 5). |
(c) | Percentage rounds to less than 0.1%. |
(d) | The rate shown is the 7-day effective yield as of May 31, 2017. |
| See accompanying notes to financial statements. | |
21
| BARROW LONG/SHORT OPPORTUNITY FUND SCHEDULE OF INVESTMENTS May 31, 2017 | ||||||||
| COMMON STOCKS — 133.8% | Shares | Value | ||||||
| Consumer Discretionary — 28.2% | ||||||||
| Auto Components — 3.2% | ||||||||
American Axle & Manufacturing Holdings, Inc. (a) | 4,012 | $ | 60,621 | |||||
| Cooper Tire & Rubber Company | 3,111 | 111,996 | ||||||
Cooper-Standard Holdings, Inc. (a) | 717 | 77,443 | ||||||
Gentex Corporation (b) | 9,277 | 176,078 | ||||||
Lear Corporation (b) | 1,318 | 196,435 | ||||||
Motorcar Parts of America, Inc. (a) (b) | 4,147 | 120,553 | ||||||
Tenneco, Inc. (b) | 3,159 | 179,589 | ||||||
| 922,715 | ||||||||
| Automobiles — 0.4% | ||||||||
| LCI Industries | 1,316 | 117,124 | ||||||
| Diversified Consumer Services — 0.7% | ||||||||
H&R Block, Inc. (b) | 7,312 | 194,060 | ||||||
| Hotels, Restaurants & Leisure — 3.7% | ||||||||
Bojangles', Inc. (a) (b) | 6,679 | 116,883 | ||||||
| Choice Hotels International, Inc. | 1,960 | 127,302 | ||||||
Dunkin' Brands Group, Inc. (b) | 1,861 | 108,887 | ||||||
Hilton Grand Vacations, Inc. (a) (b) | 5,321 | 190,332 | ||||||
| Hilton Worldwide Holdings, Inc. | 3,520 | 233,974 | ||||||
Wyndham Worldwide Corporation (b) | 1,936 | 195,517 | ||||||
| Yum! Brands, Inc. | 1,100 | 79,904 | ||||||
| 1,052,799 | ||||||||
| Household Durables — 2.0% | ||||||||
| La-Z-Boy, Inc. | 1,878 | 49,767 | ||||||
NVR, Inc. (a) (b) | 87 | 198,567 | ||||||
Tempur Sealy International, Inc. (a) | 3,088 | 143,407 | ||||||
Tupperware Brands Corporation (b) | 2,566 | 184,521 | ||||||
| 576,262 | ||||||||
| Internet & Direct Marketing Retail — 0.4% | ||||||||
PetMed Express, Inc. (b) | 2,900 | 101,761 | ||||||
| Leisure Products — 1.3% | ||||||||
American Outdoor Brands Corporation (a) (b) | 5,712 | 129,377 | ||||||
Nautilus, Inc. (a) (b) | 6,755 | 122,603 | ||||||
Sturm, Ruger & Company, Inc. (b) | 2,074 | 132,114 | ||||||
| 384,094 | ||||||||
| Media — 3.9% | ||||||||
AMC Networks, Inc. - Class A (a) (b) | 3,341 | 177,006 | ||||||
Entercom Communications Corporation - Class A (b) | 5,735 | 59,071 | ||||||
22
| BARROW LONG/SHORT OPPORTUNITY FUND SCHEDULE OF INVESTMENTS (Continued) | ||||||||
| COMMON STOCKS — 133.8% (Continued) | Shares | Value | ||||||
| Consumer Discretionary — 28.2% (Continued) | ||||||||
| Media — 3.9% (Continued) | ||||||||
| Entravision Communications Corporation - Class A | 9,504 | $ | 54,648 | |||||
Interpublic Group of Companies, Inc. (The) (b) | 7,694 | 191,811 | ||||||
Liberty Formula One Group - Series A (a) | 1,074 | 34,261 | ||||||
MSG Networks, Inc. - Class A (a) (b) | 5,325 | 112,091 | ||||||
National CineMedia, Inc. (b) | 5,724 | 41,613 | ||||||
Scripps Networks Interactive, Inc. - Class A (b) | 2,632 | 174,291 | ||||||
TEGNA, Inc. (b) | 7,721 | 183,297 | ||||||
Viacom, Inc. - Class B (b) | 2,344 | 81,548 | ||||||
| 1,109,637 | ||||||||
| Multi-Line Retail — 1.6% | ||||||||
| Big Lots, Inc. | 2,453 | 119,780 | ||||||
Dollar General Corporation (b) | 4,386 | 321,889 | ||||||
| 441,669 | ||||||||
| Specialty Retail — 8.5% | ||||||||
| American Eagle Outfitters, Inc. | 9,225 | 106,088 | ||||||
AutoZone, Inc. (a) (b) | 457 | 276,906 | ||||||
Best Buy Company, Inc. (b) | 6,159 | 365,783 | ||||||
Buckle, Inc. (The) (b) | 6,660 | 113,220 | ||||||
| Cato Corporation (The) - Class A | 2,401 | 48,404 | ||||||
| Children's Place, Inc. (The) | 1,028 | 111,230 | ||||||
| DSW, Inc. - Class A | 6,006 | 101,081 | ||||||
Express, Inc. (a) | 6,233 | 48,368 | ||||||
Francesca's Holdings Corporation (a) (b) | 8,276 | 104,774 | ||||||
GameStop Corporation - Class A (b) | 5,270 | 116,678 | ||||||
Hibbett Sports, Inc. (a) (b) | 4,807 | 111,522 | ||||||
J.Jill, Inc. (a) | 4,091 | 52,160 | ||||||
L Brands, Inc. (b) | 6,302 | 325,183 | ||||||
Select Comfort Corporation (a) | 3,905 | 112,464 | ||||||
TJX Companies, Inc. (The) (b) | 4,049 | 304,525 | ||||||
Winmark Corporation (b) | 968 | 118,580 | ||||||
| 2,416,966 | ||||||||
| Textiles, Apparel & Luxury Goods — 2.5% | ||||||||
Carter's, Inc. (b) | 2,036 | 167,278 | ||||||
Coach, Inc. (b) | 2,551 | 117,882 | ||||||
| Movado Group, Inc. | 5,171 | 109,108 | ||||||
Skechers U.S.A., Inc. - Class A (a) (b) | 7,718 | 196,963 | ||||||
Steven Madden Ltd. (a) (b) | 3,337 | 130,977 | ||||||
| 722,208 | ||||||||
23
| BARROW LONG/SHORT OPPORTUNITY FUND SCHEDULE OF INVESTMENTS (Continued) | ||||||||
| COMMON STOCKS — 133.8% (Continued) | Shares | Value | ||||||
| Consumer Staples — 28.3% | ||||||||
| Beverages — 4.2% | ||||||||
Boston Beer Company, Inc. (The) - Class A (a) (b) | 3,375 | $ | 481,781 | |||||
Brown-Forman Corporation - Class B (b) | 4,711 | 244,737 | ||||||
Dr Pepper Snapple Group, Inc. (b) | 2,483 | 230,447 | ||||||
Molson Coors Brewing Company - Class B (b) | 2,430 | 230,340 | ||||||
| 1,187,305 | ||||||||
Food & Staples Retailing — 0.0% (c) | ||||||||
Smart & Final Stores, Inc. (a) (b) | 881 | 11,541 | ||||||
| Food Products — 6.4% | ||||||||
| Dean Foods Company | 288 | 5,253 | ||||||
| General Mills, Inc. | 1,629 | 92,430 | ||||||
Hormel Foods Corporation (b) | 6,540 | 219,940 | ||||||
Kellogg Company (b) | 69 | 4,941 | ||||||
Lancaster Colony Corporation (b) | 3,218 | 398,485 | ||||||
Omega Protein Corporation (b) | 5,183 | 90,443 | ||||||
Pilgrim's Pride Corporation (a) (b) | 15,771 | 366,991 | ||||||
Sanderson Farms, Inc. (b) | 3,692 | 438,240 | ||||||
Tyson Foods, Inc. - Class A (b) | 3,710 | 212,731 | ||||||
| 1,829,454 | ||||||||
| Household Products — 5.1% | ||||||||
Church & Dwight Company, Inc. (b) | 7,857 | 405,893 | ||||||
Clorox Company (The) (b) | 1,018 | 138,173 | ||||||
Colgate-Palmolive Company (b) | 3,144 | 240,076 | ||||||
Energizer Holdings, Inc. (b) | 7,086 | 379,809 | ||||||
| Procter & Gamble Company (The) | 1,063 | 93,640 | ||||||
Spectrum Brands Holdings, Inc. (b) | 1,327 | 178,415 | ||||||
| 1,436,006 | ||||||||
| Personal Products — 9.1% | ||||||||
Avon Products, Inc. (a) (b) | 121,161 | 411,948 | ||||||
Herbalife Ltd. (a) (b) | 5,946 | 426,804 | ||||||
Inter Parfums, Inc. (b) | 12,884 | 448,363 | ||||||
Medifast, Inc. (b) | 10,364 | 431,246 | ||||||
Nu Skin Enterprises, Inc. - Class A (b) | 7,085 | 388,825 | ||||||
USANA Health Sciences, Inc. (a) (b) | 7,693 | 495,429 | ||||||
| 2,602,615 | ||||||||
| Tobacco — 3.5% | ||||||||
Altria Group, Inc. (b) | 3,205 | 241,785 | ||||||
Universal Corporation (b) | 5,246 | 348,335 | ||||||
Vector Group Ltd. (b) | 18,426 | 400,581 | ||||||
| 990,701 | ||||||||
24
| BARROW LONG/SHORT OPPORTUNITY FUND SCHEDULE OF INVESTMENTS (Continued) | ||||||||
| COMMON STOCKS — 133.8% (Continued) | Shares | Value | ||||||
| Energy — 8.3% | ||||||||
| Oil, Gas & Consumable Fuels — 8.3% | ||||||||
Alliance Holdings GP, L.P. (b) | 6,222 | $ | 176,145 | |||||
Alliance Resource Partners, L.P. (b) | 7,880 | 169,420 | ||||||
| Alon USA Partners, L.P. | 6,821 | 75,508 | ||||||
CVR Refining, L.P. (a) | 11,226 | 108,892 | ||||||
Delek Logistics Partners, L.P. (b) | 3,316 | 100,475 | ||||||
EQT GP Holdings, L.P. (b) | 7,790 | 203,709 | ||||||
EQT Midstream Partners, L.P. (b) | 2,740 | 202,102 | ||||||
Green Plains Partners, L.P. (b) | 8,944 | 166,806 | ||||||
Hess Midstream Partners, L.P. (a) (b) | 3,950 | 91,798 | ||||||
Marathon Oil Corporation (b) | 209 | 2,721 | ||||||
| PBF Energy, Inc. - Class A | 263 | 5,081 | ||||||
| PBF Logistics, L.P. | 3,791 | 74,304 | ||||||
Phillips 66 (b) | 57 | 4,338 | ||||||
REX American Resources Corporation (a) (b) | 1,790 | 170,265 | ||||||
Shell Midstream Partners, L.P. (b) | 6,385 | 190,465 | ||||||
Tesoro Corporation (b) | 2,580 | 214,759 | ||||||
Tesoro Logistics, L.P. (b) | 3,881 | 205,615 | ||||||
Valero Energy Partners, L.P. (b) | 4,473 | 202,224 | ||||||
| 2,364,627 | ||||||||
| Financials — 0.0% | ||||||||
| Insurance — 0.0% | ||||||||
Gerova Financial Group Ltd. (a) (b) (d) | 2 | 0 | ||||||
| Health Care — 29.3% | ||||||||
| Health Care Equipment & Supplies — 15.2% | ||||||||
Abaxis, Inc. (b) | 4,552 | 220,317 | ||||||
Align Technology, Inc. (a) (b) | 68 | 9,873 | ||||||
Anika Therapeutics, Inc. (a) (b) | 4,800 | 222,096 | ||||||
Atrion Corporation (b) | 417 | 230,038 | ||||||
Danaher Corporation (b) | 4,587 | 389,620 | ||||||
Edwards Lifesciences Corporation (a) (b) | 3,448 | 396,761 | ||||||
Globus Medical, Inc. - Class A (a) (b) | 14,365 | 441,724 | ||||||
Hologic, Inc. (a) (b) | 10,270 | 444,794 | ||||||
Intuitive Surgical, Inc. (a) (b) | 451 | 412,521 | ||||||
Lantheus Holdings, Inc. (a) (b) | 11,204 | 185,986 | ||||||
LeMaitre Vascular, Inc. (b) | 4,164 | 127,252 | ||||||
Masimo Corporation (a) (b) | 5,056 | 440,074 | ||||||
Meridian Bioscience, Inc. (b) | 14,872 | 205,234 | ||||||
Natus Medical, Inc. (a) | 1,456 | 49,358 | ||||||
OraSure Technologies, Inc. (a) | 6,047 | 91,128 | ||||||
25
| BARROW LONG/SHORT OPPORTUNITY FUND SCHEDULE OF INVESTMENTS (Continued) | ||||||||
| COMMON STOCKS — 133.8% (Continued) | Shares | Value | ||||||
| Health Care — 29.3% (Continued) | ||||||||
| Health Care Equipment & Supplies — 15.2% (Continued) | ||||||||
Varian Medical Systems, Inc. (a) (b) | 4,846 | $ | 479,851 | |||||
| 4,346,627 | ||||||||
| Health Care Providers & Services — 10.4% | ||||||||
American Renal Associates Holdings, Inc. (a) (b) | 12,804 | 207,425 | ||||||
AmerisourceBergen Corporation (b) | 4,436 | 407,092 | ||||||
AMN Healthcare Services, Inc. (a) (b) | 5,524 | 200,245 | ||||||
DaVita, Inc. (a) (b) | 6,753 | 447,454 | ||||||
Express Scripts Holding Company (a) (b) | 6,233 | 372,422 | ||||||
HealthSouth Corporation (b) | 9,748 | 441,877 | ||||||
Laboratory Corporation of America Holdings (a) (b) | 23 | 3,197 | ||||||
LHC Group, Inc. (a) (b) | 956 | 57,551 | ||||||
MEDNAX, Inc. (a) (b) | 7,951 | 431,739 | ||||||
Surgery Partners, Inc. (a) | 4,152 | 90,513 | ||||||
Tivity Health, Inc. (a) | 5,026 | 170,633 | ||||||
U.S. Physical Therapy, Inc. (b) | 1,921 | 121,503 | ||||||
| 2,951,651 | ||||||||
| Pharmaceuticals — 3.7% | ||||||||
Corcept Therapeutics, Inc. (a) | 14,570 | 164,787 | ||||||
Innoviva, Inc. (a) (b) | 18,583 | 227,084 | ||||||
Phibro Animal Health Corporation - Class A (b) | 7,054 | 248,654 | ||||||
Sucampo Pharmaceuticals, Inc. - Class A (a) (b) | 16,178 | 161,780 | ||||||
Supernus Pharmaceuticals, Inc. (a) (b) | 6,692 | 251,619 | ||||||
| 1,053,924 | ||||||||
| Industrials — 11.3% | ||||||||
| Aerospace & Defense — 2.5% | ||||||||
BWX Technologies, Inc. (b) | 41 | 1,993 | ||||||
Engility Holdings, Inc. (a) | 323 | 8,505 | ||||||
General Dynamics Corporation (b) | 1,002 | 203,656 | ||||||
| Huntington Ingalls Industries, Inc. | 491 | 96,143 | ||||||
| National Presto Industries, Inc. | 412 | 43,857 | ||||||
Raytheon Company (b) | 1,236 | 202,716 | ||||||
| TransDigm Group, Inc. | 387 | 103,747 | ||||||
| United Technologies Corporation | 378 | 45,844 | ||||||
| 706,461 | ||||||||
| Air Freight & Logistics — 0.7% | ||||||||
C.H. Robinson Worldwide, Inc. (b) | 1,330 | 89,123 | ||||||
Expeditors International of Washington, Inc. (b) | 1,744 | 93,095 | ||||||
Hub Group, Inc. - Class A (a) | 534 | 19,144 | ||||||
| 201,362 | ||||||||
26
| BARROW LONG/SHORT OPPORTUNITY FUND SCHEDULE OF INVESTMENTS (Continued) | ||||||||
| COMMON STOCKS — 133.8% (Continued) | Shares | Value | ||||||
| Industrials — 11.3% (Continued) | ||||||||
| Building Products — 1.3% | ||||||||
American Woodmark Corporation (a) (b) | 466 | $ | 43,245 | |||||
| Apogee Enterprises, Inc. | 793 | 42,251 | ||||||
Continental Building Products, Inc. (a) | 610 | 14,884 | ||||||
| Insteel Industries, Inc. | 1,257 | 39,922 | ||||||
Masco Corporation (b) | 2,584 | 96,254 | ||||||
Patrick Industries, Inc. (a) | 607 | 40,183 | ||||||
PGT Innovations, Inc. (a) | 3,751 | 42,949 | ||||||
Ply Gem Holdings, Inc. (a) | 2,342 | 38,292 | ||||||
| 357,980 | ||||||||
| Commercial Services & Supplies — 1.0% | ||||||||
| Brady Corporation - Class A | 1,097 | 39,382 | ||||||
Deluxe Corporation (b) | 586 | 39,942 | ||||||
| Herman Miller, Inc. | 1,302 | 41,078 | ||||||
| Kimball International, Inc. - Class B | 2,407 | 41,352 | ||||||
| Knoll, Inc. | 1,823 | 39,195 | ||||||
SP Plus Corporation (a) | 1,372 | 40,474 | ||||||
| Steelcase, Inc. - Class A | 2,545 | 42,629 | ||||||
| 284,052 | ||||||||
| Electrical Equipment — 0.9% | ||||||||
| Acuity Brands, Inc. | 302 | 49,199 | ||||||
Atkore International Group, Inc. (a) | 1,414 | 29,496 | ||||||
| Emerson Electric Company | 2,597 | 153,535 | ||||||
| Hubbell, Inc. | 284 | 32,918 | ||||||
| 265,148 | ||||||||
| Industrial Conglomerates — 0.7% | ||||||||
Honeywell International, Inc. (b) | 1,489 | 198,022 | ||||||
| Machinery — 0.9% | ||||||||
| Douglas Dynamics, Inc. | 1,376 | 41,899 | ||||||
| Global Brass & Copper Holdings, Inc. | 1,297 | 39,299 | ||||||
Greenbrier Companies, Inc. (The) (b) | 980 | 43,365 | ||||||
| Hillenbrand, Inc. | 1,154 | 41,198 | ||||||
Meritor, Inc. (a) | 2,525 | 39,314 | ||||||
Wabash National Corporation (b) | 1,944 | 38,861 | ||||||
| 243,936 | ||||||||
| Professional Services — 2.2% | ||||||||
CBIZ, Inc. (a) | 607 | 9,166 | ||||||
| Dun & Bradstreet Corporation (The) | 864 | 90,469 | ||||||
FTI Consulting, Inc. (a) | 1,223 | 42,230 | ||||||
GP Strategies Corporation (a) | 337 | 8,273 | ||||||
Huron Consulting Group, Inc. (a) | 212 | 8,809 | ||||||
27
| BARROW LONG/SHORT OPPORTUNITY FUND SCHEDULE OF INVESTMENTS (Continued) | ||||||||
| COMMON STOCKS — 133.8% (Continued) | Shares | Value | ||||||
| Industrials — 11.3% (Continued) | ||||||||
| Professional Services — 2.2% (Continued) | ||||||||
ICF International, Inc. (a) | 945 | $ | 44,462 | |||||
Insperity, Inc. (b) | 533 | 40,215 | ||||||
| Kforce, Inc. | 2,090 | 37,620 | ||||||
| ManpowerGroup, Inc. | 926 | 94,332 | ||||||
Navigant Consulting, Inc. (a) | 1,956 | 38,122 | ||||||
| Nielsen Holdings plc | 551 | 21,202 | ||||||
Robert Half International, Inc. (b) | 2,018 | 93,817 | ||||||
RPX Corporation (a) (b) | 3,148 | 41,680 | ||||||
TriNet Group, Inc. (a) | 1,386 | 42,869 | ||||||
| VSE Corporation | 338 | 14,142 | ||||||
| 627,408 | ||||||||
| Road & Rail — 0.1% | ||||||||
| Landstar System, Inc. | 502 | 41,942 | ||||||
| Trading Companies & Distributors — 1.0% | ||||||||
| Grainger (W.W.), Inc. | 505 | 87,001 | ||||||
HD Supply Holdings, Inc. (a) | 2,371 | 95,670 | ||||||
United Rentals, Inc. (a) (b) | 870 | 94,595 | ||||||
| 277,266 | ||||||||
| Information Technology — 17.9% | ||||||||
| Communications Equipment — 3.3% | ||||||||
F5 Networks, Inc. (a) (b) | 899 | 115,189 | ||||||
| Harris Corporation | 1,047 | 117,432 | ||||||
InterDigital, Inc. (b) | 1,328 | 107,568 | ||||||
Juniper Networks, Inc. (b) | 3,792 | 111,219 | ||||||
| Motorola Solutions, Inc. | 1,345 | 112,402 | ||||||
NETGEAR, Inc. (a) | 2,479 | 103,994 | ||||||
Oclaro, Inc. (a) | 13,539 | 120,226 | ||||||
| Plantronics, Inc. | 657 | 34,769 | ||||||
Ubiquiti Networks, Inc. (a) (b) | 2,334 | 110,071 | ||||||
| 932,870 | ||||||||
Electronic Equipment, Instruments & Components — 2.2% | ||||||||
CDW Corporation (b) | 1,935 | 116,448 | ||||||
CTS Corporation (b) | 5,306 | 111,691 | ||||||
Insight Enterprises, Inc. (a) | 2,494 | 103,601 | ||||||
Methode Electronics, Inc. (b) | 2,711 | 108,847 | ||||||
| PC Connection, Inc. | 3,941 | 102,781 | ||||||
Tech Data Corporation (a) | 915 | 88,728 | ||||||
| 632,096 | ||||||||
28
| BARROW LONG/SHORT OPPORTUNITY FUND SCHEDULE OF INVESTMENTS (Continued) | ||||||||
| COMMON STOCKS — 133.8% (Continued) | Shares | Value | ||||||
| Information Technology — 17.9% (Continued) | ||||||||
| Internet Software & Services — 1.9% | ||||||||
Blucora, Inc. (a) | 1,983 | $ | 40,651 | |||||
eBay, Inc. (a) (b) | 3,260 | 111,818 | ||||||
Match Group, Inc. (a) | 3,906 | 76,089 | ||||||
| NIC, Inc. | 2,877 | 58,259 | ||||||
Stamps.com, Inc. (a) | 539 | 74,328 | ||||||
Trade Desk, Inc. (The) - Class A (a) | 1,428 | 78,540 | ||||||
VeriSign, Inc. (a) (b) | 193 | 17,401 | ||||||
WebMD Health Corporation (a) (b) | 1,094 | 61,242 | ||||||
XO Group, Inc. (a) | 1,939 | 32,013 | ||||||
| 550,341 | ||||||||
IT Services — 5.3% | ||||||||
| Alliance Data Systems Corporation | 352 | 84,878 | ||||||
| Automatic Data Processing, Inc. | 888 | 90,905 | ||||||
| Booz Allen Hamilton Holding Corporation | 2,065 | 81,444 | ||||||
| Broadridge Financial Solutions, Inc. | 1,057 | 80,216 | ||||||
CACI International, Inc. - Class A (a) | 611 | 75,214 | ||||||
Cognizant Technology Solutions Corporation - Class A (b) | 1,767 | 118,230 | ||||||
Convergys Corporation (b) | 2,597 | 63,133 | ||||||
CSG Systems International, Inc. (b) | 1,542 | 61,510 | ||||||
| DST Systems, Inc. | 140 | 16,915 | ||||||
Euronet Worldwide, Inc. (a) | 203 | 17,708 | ||||||
Fiserv, Inc. (a) | 194 | 24,304 | ||||||
| Forrester Research, Inc. | 1,001 | 39,439 | ||||||
| Genpact Ltd. | 1,698 | 46,389 | ||||||
Hackett Group, Inc. (The) (b) | 3,446 | 50,518 | ||||||
| Jack Henry & Associates, Inc. | 586 | 62,239 | ||||||
| ManTech International Corporation - Class A | 1,582 | 60,591 | ||||||
| MAXIMUS, Inc. | 1,193 | 74,061 | ||||||
| Paychex, Inc. | 1,892 | 112,063 | ||||||
Perficient, Inc. (a) | 3,566 | 61,585 | ||||||
| Science Applications International Corporation | 1,013 | 76,978 | ||||||
Sykes Enterprises, Inc. (a) | 1,945 | 64,827 | ||||||
Syntel, Inc. (b) | 3,345 | 58,471 | ||||||
Teradata Corporation (a) | 1,981 | 54,002 | ||||||
Unisys Corporation (a) | 3,849 | 45,418 | ||||||
| 1,521,038 | ||||||||
| Semiconductors & Semiconductor Equipment — 0.4% | ||||||||
Acacia Communications, Inc. (a) | 2,462 | 115,812 | ||||||
29
| BARROW LONG/SHORT OPPORTUNITY FUND SCHEDULE OF INVESTMENTS (Continued) | ||||||||
| COMMON STOCKS — 133.8% (Continued) | Shares | Value | ||||||
| Information Technology — 17.9% (Continued) | ||||||||
| Software — 2.3% | ||||||||
ACI Worldwide, Inc. (a) (b) | 1,219 | $ | 27,866 | |||||
Aspen Technology, Inc. (a) | 983 | 60,120 | ||||||
CA, Inc. (b) | 2,280 | 72,436 | ||||||
Citrix Systems, Inc. (a) | 658 | 54,311 | ||||||
| Ebix, Inc. | 1,008 | 55,793 | ||||||
ePlus, Inc. (a) (b) | 1,567 | 123,401 | ||||||
Manhattan Associates, Inc. (a) | 1,618 | 75,787 | ||||||
MicroStrategy, Inc. - Class A (a) (b) | 321 | 58,538 | ||||||
Oracle Corporation (b) | 2,435 | 110,525 | ||||||
| 638,777 | ||||||||
| Technology Hardware, Storage & Peripherals — 2.5% | ||||||||
Apple, Inc. (b) | 2,027 | 309,645 | ||||||
Eastman Kodak Company (a) | 2,337 | 21,617 | ||||||
HP, Inc. (b) | 15,937 | 298,978 | ||||||
NCR Corporation (a) | 1,794 | 69,123 | ||||||
| 699,363 | ||||||||
| Materials — 10.5% | ||||||||
| Chemicals — 7.3% | ||||||||
Chase Corporation (b) | 2,445 | 257,947 | ||||||
Ciner Resources, L.P. (b) | 9,036 | 243,972 | ||||||
| Eastman Chemical Company | 831 | 66,571 | ||||||
Ferro Corporation (a) (b) | 179 | 3,000 | ||||||
FutureFuel Corporation (b) | 16,870 | 228,420 | ||||||
GCP Applied Technologies, Inc. (a) (b) | 7,932 | 238,753 | ||||||
Koppers Holdings, Inc. (a) (b) | 196 | 7,066 | ||||||
NewMarket Corporation (b) | 236 | 109,823 | ||||||
PolyOne Corporation (b) | 5,264 | 196,558 | ||||||
Scotts Miracle-Gro Company (The) (b) | 457 | 39,581 | ||||||
Terra Nitrogen Company, L.P. (b) | 2,852 | 232,609 | ||||||
Trinseo S.A. (b) | 3,236 | 208,560 | ||||||
Westlake Chemical Partners, L.P. (b) | 10,162 | 246,937 | ||||||
| 2,079,797 | ||||||||
| Containers & Packaging — 2.9% | ||||||||
Avery Dennison Corporation (b) | 2,455 | 206,858 | ||||||
Crown Holdings, Inc. (a) (b) | 3,625 | 209,308 | ||||||
Sealed Air Corporation (b) | 4,693 | 208,463 | ||||||
Sonoco Products Company (b) | 3,945 | 200,051 | ||||||
| 824,680 | ||||||||
30
| BARROW LONG/SHORT OPPORTUNITY FUND SCHEDULE OF INVESTMENTS (Continued) | ||||||||
| COMMON STOCKS — 133.8% (Continued) | Shares | Value | ||||||
| Materials — 10.5% (Continued) | ||||||||
Metals & Mining — 0.0% (c) | ||||||||
Reliance Steel & Aluminum Company (b) | 7 | $ | 511 | |||||
| Paper & Forest Products — 0.3% | ||||||||
Louisiana-Pacific Corporation (a) | 4,026 | 89,699 | ||||||
Total Common Stocks (Cost $35,820,779) | $ | 38,102,307 | ||||||
| MONEY MARKET FUNDS — 3.7% | Shares | Value | ||||||
Fidelity Institutional Money Market Government Portfolio - Class I, 0.65% (e) (Cost $1,052,639) | 1,052,639 | $ | 1,052,639 | |||||
Total Investments at Value — 137.5% (Cost $36,873,418) | $ | 39,154,946 | ||||||
Liabilities in Excess of Other Assets (f) — (37.5%) | (10,670,688 | ) | ||||||
Net Assets — 100.0% | $ | 28,484,258 | ||||||
(a) | Non-income producing security. |
(b) | All or a portion of the shares have been pledged as collateral for open short positions and trading purposes. |
(c) | Percentage rounds to less than 0.1%. |
(d) | Security value has been determined in good faith pursuant to procedures adopted by the Board of Trustees. The total value of such securities is $0 at May 31, 2017 representing 0.0% of net assets (Note 2). |
(e) | The rate shown is the 7-day effective yield as of May 31, 2017. |
(f) | Includes cash held as margin deposits for short positions. |
| See accompanying notes to financial statements. | |
31
| BARROW LONG/SHORT OPPORTUNITY FUND SCHEDULE OF SECURITIES SOLD SHORT May 31, 2017 | ||||||||
| COMMON STOCKS — 93.5% | Shares | Value | ||||||
| Consumer Discretionary — 20.1% | ||||||||
| Auto Components — 0.6% | ||||||||
| BorgWarner, Inc. | 1,011 | $ | 42,977 | |||||
| Dana, Inc. | 2,397 | 50,625 | ||||||
| Fox Factory Holding Corporation | 742 | 24,375 | ||||||
| Modine Manufacturing Company | 3,359 | 51,057 | ||||||
| Superior Industries International, Inc. | 692 | 13,494 | ||||||
| 182,528 | ||||||||
| Distributors — 0.1% | ||||||||
| Core-Mark Holding Company, Inc. | 1,169 | 39,804 | ||||||
| Diversified Consumer Services — 0.5% | ||||||||
| 2U, Inc. | 469 | 20,050 | ||||||
| Regis Corporation | 2,318 | 21,905 | ||||||
| Service Corporation International | 1,969 | 62,771 | ||||||
| Sotheby's | 564 | 29,661 | ||||||
| 134,387 | ||||||||
| Hotels, Restaurants & Leisure — 7.9% | ||||||||
| Aramark | 577 | 21,499 | ||||||
| Biglari Holdings, Inc. | 100 | 38,021 | ||||||
| BJ's Restaurants, Inc. | 924 | 41,395 | ||||||
| Bloomin' Brands, Inc. | 1,910 | 38,257 | ||||||
| Bob Evans Farms, Inc. | 613 | 43,161 | ||||||
| Buffalo Wild Wings, Inc. | 338 | 48,571 | ||||||
| Carrols Restaurant Group, Inc. | 3,027 | 35,870 | ||||||
| Cedar Fair, L.P. | 900 | 63,918 | ||||||
| Cheesecake Factory, Inc. (The) | 346 | 20,407 | ||||||
| Chipotle Mexican Grill, Inc. | 130 | 62,056 | ||||||
| Churchill Downs, Inc. | 84 | 14,083 | ||||||
| Chuy's Holdings, Inc. | 1,366 | 36,745 | ||||||
| Dave & Buster's Entertainment, Inc. | 969 | 64,632 | ||||||
| Denny's Corporation | 3,381 | 40,234 | ||||||
| Eldorado Resorts, Inc. | 2,073 | 43,015 | ||||||
| Extended Stay America, Inc. | 3,578 | 65,120 | ||||||
| Fiesta Restaurant Group, Inc. | 1,759 | 38,786 | ||||||
| Habit Restaurants, Inc. (The) - Class A | 2,147 | 39,827 | ||||||
| Hyatt Hotels Corporation - Class A | 1,098 | 63,355 | ||||||
| ILG, Inc. | 2,525 | 68,024 | ||||||
| International Speedway Corporation - Class A | 1,114 | 39,324 | ||||||
| Jack in the Box, Inc. | 276 | 29,416 | ||||||
| Las Vegas Sands Corporation | 2,034 | 120,270 | ||||||
| Marcus Corporation (The) | 1,248 | 41,184 | ||||||
32
| BARROW LONG/SHORT OPPORTUNITY FUND SCHEDULE OF SECURITIES SOLD SHORT (Continued) | ||||||||
| COMMON STOCKS — 93.5% (Continued) | Shares | Value | ||||||
| Consumer Discretionary — 20.1% (Continued) | ||||||||
| Hotels, Restaurants & Leisure — 7.9% (Continued) | ||||||||
| Marriott International, Inc. - Class A | 1,211 | $ | 130,364 | |||||
| Marriott Vacations Worldwide Corporation | 554 | 64,552 | ||||||
| McDonald's Corporation | 357 | 53,868 | ||||||
| MGM Resorts International | 3,885 | 123,232 | ||||||
| Norwegian Cruise Line Holdings Ltd. | 1,191 | 59,514 | ||||||
| Red Robin Gourmet Burgers, Inc. | 695 | 50,092 | ||||||
| Red Rock Resorts, Inc. - Class A | 2,717 | 64,230 | ||||||
| Royal Caribbean Cruises Ltd. | 1,129 | 124,393 | ||||||
| SeaWorld Entertainment, Inc. | 2,274 | 40,591 | ||||||
| Shake Shack, Inc. - Class A | 1,190 | 44,054 | ||||||
| Six Flags Entertainment Corporation | 1,013 | 61,165 | ||||||
| Speedway Motorsports, Inc. | 2,345 | 40,381 | ||||||
| Texas Roadhouse, Inc. | 1,300 | 63,596 | ||||||
| Vail Resorts, Inc. | 318 | 68,020 | ||||||
| Wendy's Company (The) | 4,160 | 67,267 | ||||||
| Wynn Resorts Ltd. | 506 | 65,122 | ||||||
| 2,237,611 | ||||||||
| Household Durables — 2.2% | ||||||||
| Cavco Industries, Inc. | 118 | 13,009 | ||||||
| Century Communities, Inc. | 1,542 | 38,396 | ||||||
| Helen of Troy Ltd. | 150 | 13,650 | ||||||
| Installed Building Products, Inc. | 812 | 40,275 | ||||||
| Lennar Corporation - Class A | 1,258 | 64,548 | ||||||
| M/I Homes, Inc. | 622 | 17,534 | ||||||
| MDC Holdings, Inc. | 1,253 | 42,164 | ||||||
| Meritage Homes Corporation | 1,039 | 41,456 | ||||||
| Mohawk Industries, Inc. | 340 | 81,362 | ||||||
| Newell Brands, Inc. | 2,439 | 129,145 | ||||||
| Taylor Morrison Home Corporation - Class A | 631 | 14,671 | ||||||
| Toll Brothers, Inc. | 1,729 | 63,817 | ||||||
| TRI Pointe Group, Inc. | 3,308 | 40,920 | ||||||
| Universal Electronics, Inc. | 619 | 39,987 | ||||||
| 640,934 | ||||||||
| Internet & Direct Marketing Retail — 2.7% | ||||||||
| 1-800-FLOWERS.COM, Inc. - Class A | 3,066 | 30,660 | ||||||
| Amazon.com, Inc. | 129 | 128,306 | ||||||
| Etsy, Inc. | 3,805 | 51,025 | ||||||
| Expedia, Inc. | 864 | 124,226 | ||||||
| FTD Companies, Inc. | 2,066 | 35,783 | ||||||
| Groupon, Inc. | 11,644 | 35,049 | ||||||
| Liberty Expedia Holdings, Inc. - Series A | 1,259 | 65,682 | ||||||
33
| BARROW LONG/SHORT OPPORTUNITY FUND SCHEDULE OF SECURITIES SOLD SHORT (Continued) | ||||||||
| COMMON STOCKS — 93.5% (Continued) | Shares | Value | ||||||
| Consumer Discretionary — 20.1% (Continued) | ||||||||
| Internet & Direct Marketing Retail — 2.7% (Continued) | ||||||||
| Liberty TripAdvisor Holdings, Inc. - Series A | 2,780 | $ | 32,943 | |||||
| Liberty Ventures - Series A | 671 | 36,160 | ||||||
| Netflix, Inc. | 765 | 124,749 | ||||||
| Shutterfly, Inc. | 794 | 39,295 | ||||||
| TripAdvisor, Inc. | 1,385 | 53,336 | ||||||
| 757,214 | ||||||||
| Leisure Products — 0.6% | ||||||||
| Callaway Golf Company | 3,322 | 42,322 | ||||||
| Mattel, Inc. | 2,827 | 64,767 | ||||||
| Polaris Industries, Inc. | 725 | 60,610 | ||||||
| Vista Outdoor, Inc. | 846 | 17,749 | ||||||
| 185,448 | ||||||||
| Media — 2.6% | ||||||||
| Cable One, Inc. | 95 | 68,267 | ||||||
| Gannett Company, Inc. | 4,947 | 38,834 | ||||||
| John Wiley & Sons, Inc. - Class A | 1,193 | 60,485 | ||||||
| Liberty Braves Group - Series A | 1,705 | 40,443 | ||||||
| Lions Gate Entertainment Corporation - Class A | 2,469 | 66,910 | ||||||
| Live Nation Entertainment, Inc. | 1,926 | 66,428 | ||||||
| Loral Space & Communications, Inc. | 600 | 23,700 | ||||||
| Madison Square Garden Company (The) - Class A | 316 | 61,750 | ||||||
| Meredith Corporation | 372 | 20,125 | ||||||
| New Media Investment Group, Inc. | 3,123 | 40,380 | ||||||
| New York Times Company (The) - Class A | 3,509 | 61,758 | ||||||
| News Corporation - Class A | 4,984 | 66,686 | ||||||
| Pandora Media, Inc. | 1,959 | 17,435 | ||||||
| Scholastic Corporation | 526 | 22,371 | ||||||
| Time, Inc. | 2,826 | 35,325 | ||||||
| World Wrestling Entertainment, Inc. - Class A | 2,016 | 41,146 | ||||||
| 732,043 | ||||||||
Multi-Line Retail — 0.0% (a) | ||||||||
| Macy's, Inc. | 491 | 11,539 | ||||||
| Specialty Retail — 1.9% | ||||||||
| Abercrombie & Fitch Company - Class A | 3,206 | 42,287 | ||||||
| At Home Group, Inc. | 2,279 | 42,708 | ||||||
| Barnes & Noble Education, Inc. | 4,057 | 38,501 | ||||||
| Barnes & Noble, Inc. | 4,972 | 33,312 | ||||||
| Guess?, Inc. | 3,770 | 45,391 | ||||||
| Lithia Motors, Inc. - Class A | 96 | 8,722 | ||||||
| Lowe's Companies, Inc. | 475 | 37,416 | ||||||
34
| BARROW LONG/SHORT OPPORTUNITY FUND SCHEDULE OF SECURITIES SOLD SHORT (Continued) | ||||||||
| COMMON STOCKS — 93.5% (Continued) | Shares | Value | ||||||
| Consumer Discretionary — 20.1% (Continued) | ||||||||
| Specialty Retail — 1.9% (Continued) | ||||||||
| Lumber Liquidators Holdings, Inc. | 1,763 | $ | 51,092 | |||||
| MarineMax, Inc. | 2,095 | 37,815 | ||||||
| Systemax, Inc. | 1,629 | 25,950 | ||||||
| Tile Shop Holdings, Inc. | 1,991 | 39,123 | ||||||
| Ulta Beauty, Inc. | 412 | 125,594 | ||||||
| 527,911 | ||||||||
| Textiles, Apparel & Luxury Goods — 1.0% | ||||||||
| Crocs, Inc. | 6,349 | 43,364 | ||||||
| Deckers Outdoor Corporation | 687 | 47,650 | ||||||
| Fossil Group, Inc. | 1,359 | 14,636 | ||||||
| G-III Apparel Group Ltd. | 1,772 | 34,678 | ||||||
| NIKE, Inc. - Class B | 742 | 39,318 | ||||||
| Ralph Lauren Corporation | 797 | 54,037 | ||||||
| Unifi, Inc. | 963 | 27,099 | ||||||
| Wolverine World Wide, Inc. | 717 | 18,642 | ||||||
| 279,424 | ||||||||
| Consumer Staples — 20.2% | ||||||||
| Beverages — 3.6% | ||||||||
| Brown-Forman Corporation - Class B | 4 | 208 | ||||||
| Coca-Cola Bottling Company Consolidated | 1,109 | 252,564 | ||||||
| Coca-Cola Company (The) | 2,446 | 111,220 | ||||||
| Constellation Brands, Inc. - Class A | 604 | 110,381 | ||||||
| MGP Ingredients, Inc. | 4,164 | 213,238 | ||||||
| National Beverage Corporation | 2,246 | 215,504 | ||||||
| PepsiCo, Inc. | 943 | 110,208 | ||||||
| 1,013,323 | ||||||||
| Food & Staples Retailing — 0.3% | ||||||||
| Diplomat Pharmacy, Inc. | 4,646 | 79,632 | ||||||
| Smart & Final Stores, Inc. | 881 | 11,541 | ||||||
| 91,173 | ||||||||
| Food Products — 14.2% | ||||||||
| Archer-Daniels-Midland Company | 2,481 | 103,160 | ||||||
| Blue Buffalo Pet Products, Inc. | 1,706 | 40,074 | ||||||
| Bunge Ltd. | 2,658 | 212,560 | ||||||
| Calavo Growers, Inc. | 3,465 | 234,581 | ||||||
| Campbell Soup Company | 1,859 | 107,171 | ||||||
| Conagra Brands, Inc. | 2,812 | 108,374 | ||||||
| Darling Ingredients, Inc. | 15,133 | 237,134 | ||||||
| Farmer Brothers Company | 1,466 | 43,980 | ||||||
| Flowers Foods, Inc. | 9,836 | 181,769 | ||||||
| Fresh Del Monte Produce, Inc. | 3,447 | 174,694 | ||||||
35
| BARROW LONG/SHORT OPPORTUNITY FUND SCHEDULE OF SECURITIES SOLD SHORT (Continued) | ||||||||
| COMMON STOCKS — 93.5% (Continued) | Shares | Value | ||||||
| Consumer Staples — 20.2% (Continued) | ||||||||
| Food Products — 14.2% (Continued) | ||||||||
| Freshpet, Inc. | 6,808 | $ | 103,482 | |||||
| Hershey Company (The) | 993 | 114,463 | ||||||
| Hostess Brands, Inc. | 14,172 | 223,067 | ||||||
| J & J Snack Foods Corporation | 1,712 | 222,731 | ||||||
| JM Smucker Company (The) | 849 | 108,545 | ||||||
| John B. Sanfilippo & Son, Inc. | 1,908 | 123,581 | ||||||
| Kellogg Company | 1,580 | 113,128 | ||||||
| Kraft Heinz Company (The) | 1,188 | 109,534 | ||||||
| McCormick & Company, Inc. | 1,898 | 197,677 | ||||||
| Mondelēz International, Inc. - Class A | 2,364 | 110,139 | ||||||
| Pinnacle Foods, Inc. | 3,264 | 203,380 | ||||||
| Post Holdings, Inc. | 2,317 | 186,148 | ||||||
| Seaboard Corporation | 47 | 190,327 | ||||||
| Snyder's-Lance, Inc. | 5,396 | 198,303 | ||||||
| Tootsie Roll Industries, Inc. | 6,199 | 215,105 | ||||||
| TreeHouse Foods, Inc. | 2,419 | 186,698 | ||||||
| 4,049,805 | ||||||||
| Household Products — 0.7% | ||||||||
| Central Garden & Pet Company | 6,255 | 187,150 | ||||||
| Personal Products — 1.4% | ||||||||
| Coty, Inc. - Class A | 7,915 | 149,910 | ||||||
| Edgewell Personal Care Company | 2,006 | 146,719 | ||||||
| Estée Lauder Companies, Inc. (The) - Class A | 1,166 | 109,767 | ||||||
| 406,396 | ||||||||
| Energy — 5.6% | ||||||||
| Oil, Gas & Consumable Fuels — 5.6% | ||||||||
| American Midstream Partners, L.P. | 2,469 | 29,751 | ||||||
| Arch Coal, Inc. - Class A | 898 | 63,551 | ||||||
| Cheniere Energy Partners L.P. Holdings, LLC | 2,655 | 71,287 | ||||||
| CONSOL Energy, Inc. | 4,324 | 62,741 | ||||||
| Crestwood Equity Partners, L.P. | 2,600 | 59,540 | ||||||
| CrossAmerica Partners, L.P. | 2,535 | 60,916 | ||||||
| CVR Energy, Inc. | 4,238 | 84,591 | ||||||
| DCP Midstream, L.P. | 1,012 | 34,185 | ||||||
| Delek US Holdings, Inc. | 3,814 | 93,519 | ||||||
| Dominion Midstream Partners, L.P. | 2,202 | 63,087 | ||||||
| Enable Midstream Partners, L.P. | 4,098 | 63,232 | ||||||
| Enbridge Energy Management, LLC | 3,783 | 60,831 | ||||||
| Enbridge Energy Partners, L.P. | 3,812 | 63,127 | ||||||
| EnLink Midstream Partners, L.P. | 3,183 | 54,016 | ||||||
36
| BARROW LONG/SHORT OPPORTUNITY FUND SCHEDULE OF SECURITIES SOLD SHORT (Continued) | ||||||||
| COMMON STOCKS — 93.5% (Continued) | Shares | Value | ||||||
| Energy — 5.6% (Continued) | ||||||||
| Oil, Gas & Consumable Fuels — 5.6% (Continued) | ||||||||
| EnLink Midstream, LLC | 3,741 | $ | 63,784 | |||||
| Genesis Energy, L.P. | 2,182 | 68,057 | ||||||
| HollyFrontier Corporation | 2,628 | 62,809 | ||||||
| Marathon Oil Corporation | 209 | 2,721 | ||||||
| MPLX, L.P. | 1,935 | 63,952 | ||||||
| NuStar Energy, L.P. | 339 | 15,452 | ||||||
| Par Pacific Holdings, Inc. | 5,559 | 95,670 | ||||||
| Peabody Energy Corporation | 1,198 | 29,099 | ||||||
| Phillips 66 | 57 | 4,338 | ||||||
| Phillips 66 Partners, L.P. | 285 | 14,113 | ||||||
| Renewable Energy Group, Inc. | 3,360 | 37,968 | ||||||
| SemGroup Corporation - Class A | 916 | 28,396 | ||||||
| Sprague Resources, L.P. | 2,459 | 62,582 | ||||||
| Summit Midstream Partners, L.P. | 2,191 | 50,612 | ||||||
| Targa Resources Corporation | 1,303 | 59,847 | ||||||
| TC PipeLines, L.P. | 909 | 51,149 | ||||||
| TransMontaigne Partners, L.P. | 561 | 23,310 | ||||||
| 1,598,233 | ||||||||
| Health Care — 19.7% | ||||||||
| Health Care Equipment & Supplies — 9.6% | ||||||||
| Align Technology, Inc. | 68 | 9,874 | ||||||
| Antares Pharma, Inc. | 15,317 | 37,220 | ||||||
| AtriCure, Inc. | 3,555 | 74,264 | ||||||
| Baxter International, Inc. | 3,526 | 209,127 | ||||||
| Boston Scientific Corporation | 7,520 | 203,266 | ||||||
| Cardiovascular Systems, Inc. | 2,451 | 73,604 | ||||||
| Cerus Corporation | 3,986 | 9,128 | ||||||
| Cooper Companies, Inc. (The) | 792 | 173,250 | ||||||
| DENTSPLY SIRONA, Inc. | 1,091 | 69,300 | ||||||
| DexCom, Inc. | 2,206 | 147,449 | ||||||
| Endologix, Inc. | 10,527 | 50,740 | ||||||
| GenMark Diagnostics, Inc. | 5,921 | 76,618 | ||||||
| Haemonetics Corporation | 1,808 | 73,730 | ||||||
| Hill-Rom Holdings, Inc. | 695 | 53,765 | ||||||
| Insulet Corporation | 1,844 | 77,393 | ||||||
| Integra LifeSciences Holdings Corporation | 3,486 | 175,520 | ||||||
| Invacare Corporation | 3,936 | 55,695 | ||||||
| K2M Group Holdings, Inc. | 3,491 | 79,420 | ||||||
| Merit Medical Systems, Inc. | 2,304 | 81,792 | ||||||
| Nevro Corporation | 1,463 | 100,698 | ||||||
| NuVasive, Inc. | 2,240 | 168,067 | ||||||
37
| BARROW LONG/SHORT OPPORTUNITY FUND SCHEDULE OF SECURITIES SOLD SHORT (Continued) | ||||||||
| COMMON STOCKS — 93.5% (Continued) | Shares | Value | ||||||
| Health Care — 19.7% (Continued) | ||||||||
| Health Care Equipment & Supplies — 9.6% (Continued) | ||||||||
| NxStage Medical, Inc. | 3,006 | $ | 65,110 | |||||
| Penumbra, Inc. | 1,859 | 154,018 | ||||||
| Spectranetics Corporation (The) | 2,685 | 72,495 | ||||||
| Teleflex, Inc. | 350 | 70,007 | ||||||
| West Pharmaceutical Services, Inc. | 1,710 | 165,904 | ||||||
| Zimmer Biomet Holdings, Inc. | 1,662 | 198,127 | ||||||
| 2,725,581 | ||||||||
| Health Care Providers & Services — 6.2% | ||||||||
| Acadia Healthcare Company, Inc. | 5,324 | 220,094 | ||||||
| Aceto Corporation | 2,825 | 39,974 | ||||||
| Addus HomeCare Corporation | 789 | 29,272 | ||||||
| Almost Family, Inc. | 1,085 | 62,279 | ||||||
| Amedisys, Inc. | 1,316 | 78,855 | ||||||
| AmerisourceBergen Corporation | 4 | 367 | ||||||
| BioTelemetry, Inc. | 1,644 | 47,429 | ||||||
| Cross Country Healthcare, Inc. | 3,309 | 38,219 | ||||||
| HCA Healthcare, Inc. | 2,106 | 172,503 | ||||||
| Henry Schein, Inc. | 1,334 | 245,416 | ||||||
| Laboratory Corporation of America Holdings | 993 | 138,027 | ||||||
| McKesson Corporation | 294 | 47,948 | ||||||
| Patterson Companies, Inc. | 5,306 | 234,313 | ||||||
| PharMerica Corporation | 3,165 | 78,176 | ||||||
| Providence Service Corporation (The) | 1,680 | 78,523 | ||||||
| Quest Diagnostics, Inc. | 1,652 | 179,688 | ||||||
| Teladoc, Inc. | 2,834 | 86,720 | ||||||
| 1,777,803 | ||||||||
| Health Care Services — 0.8% | ||||||||
| Envision Healthcare Corporation | 4,145 | 226,358 | ||||||
| Pharmaceuticals — 3.1% | ||||||||
| Abbott Laboratories | 4,487 | 204,877 | ||||||
| Achaogen, Inc. | 3,163 | 63,829 | ||||||
| Aclaris Therapeutics, Inc. | 2,835 | 67,416 | ||||||
| Aerie Pharmaceuticals, Inc. | 1,860 | 103,137 | ||||||
| Dermira, Inc. | 2,533 | 69,455 | ||||||
| Horizon Pharma plc | 2,584 | 25,840 | ||||||
| Impax Laboratories, Inc. | 5,052 | 77,043 | ||||||
| Intersect ENT, Inc. | 3,398 | 85,970 | ||||||
| Intra-Cellular Therapies, Inc. | 4,361 | 44,700 | ||||||
38
| BARROW LONG/SHORT OPPORTUNITY FUND SCHEDULE OF SECURITIES SOLD SHORT (Continued) | ||||||||
| COMMON STOCKS — 93.5% (Continued) | Shares | Value | ||||||
| Health Care — 19.7% (Continued) | ||||||||
| Pharmaceuticals — 3.1% (Continued) | ||||||||
| Pacira Pharmaceuticals, Inc. | 1,180 | $ | 52,392 | |||||
| Revance Therapeutics, Inc. | 3,537 | 78,698 | ||||||
| 873,357 | ||||||||
| Industrials — 7.9% | ||||||||
| Aerospace & Defense — 1.4% | ||||||||
| AAR Corporation | 422 | 14,745 | ||||||
| Aerojet Rocketdyne Holdings, Inc. | 688 | 15,067 | ||||||
| AeroVironment, Inc. | 506 | 15,706 | ||||||
| Boeing Company (The) | 371 | 69,611 | ||||||
| BWX Technologies, Inc. | 41 | 1,993 | ||||||
| Cubic Corporation | 305 | 14,137 | ||||||
| Esterline Technologies Corporation | 368 | 35,862 | ||||||
| HEICO Corporation | 353 | 26,196 | ||||||
| Hexcel Corporation | 657 | 33,789 | ||||||
| KEYW Holding Corporation (The) | 907 | 8,353 | ||||||
| KLX, Inc. | 314 | 15,194 | ||||||
| Kratos Defense & Security Solutions, Inc. | 1,773 | 19,184 | ||||||
| Orbital ATK, Inc. | 340 | 34,564 | ||||||
| Rockwell Collins, Inc. | 149 | 16,248 | ||||||
| Teledyne Technologies, Inc. | 252 | 33,141 | ||||||
| Textron, Inc. | 706 | 33,747 | ||||||
| 387,537 | ||||||||
| Air Freight & Logistics — 0.8% | ||||||||
| Air Transport Services Group, Inc. | 693 | 16,528 | ||||||
| Echo Global Logistics, Inc. | 775 | 14,454 | ||||||
| FedEx Corporation | 355 | 68,813 | ||||||
| Forward Air Corporation | 289 | 15,066 | ||||||
| United Parcel Service, Inc. - Class B | 637 | 67,503 | ||||||
| XPO Logistics, Inc. | 632 | 33,243 | ||||||
| 215,607 | ||||||||
| Building Products — 0.4% | ||||||||
| Advanced Drainage Systems, Inc. | 647 | 12,390 | ||||||
| Armstrong Flooring, Inc. | 762 | 14,089 | ||||||
| Armstrong World Industries, Inc. | 163 | 6,789 | ||||||
| CSW Industrials, Inc. | 418 | 14,756 | ||||||
| Griffon Corporation | 623 | 13,519 | ||||||
| JELD-WEN Holdings, Inc. | 1,021 | 31,896 | ||||||
| Quanex Building Products Corporation | 718 | 14,791 | ||||||
| 108,230 | ||||||||
39
| BARROW LONG/SHORT OPPORTUNITY FUND SCHEDULE OF SECURITIES SOLD SHORT (Continued) | ||||||||
| COMMON STOCKS — 93.5% (Continued) | Shares | Value | ||||||
| Industrials — 7.9% (Continued) | ||||||||
| Commercial Services & Supplies — 1.8% | ||||||||
| ABM Industries, Inc. | 345 | $ | 14,849 | |||||
| Advanced Disposal Services, Inc. | 214 | 4,990 | ||||||
| Brink's Company (The) | 543 | 34,263 | ||||||
| Casella Waste Systems, Inc. - Class A | 1,019 | 14,286 | ||||||
| Clean Harbors, Inc. | 568 | 33,177 | ||||||
| Essendant, Inc. | 675 | 10,868 | ||||||
| Healthcare Services Group, Inc. | 727 | 34,801 | ||||||
| InnerWorkings, Inc. | 1,334 | 14,461 | ||||||
| Johnson Controls International plc | 1,612 | 67,317 | ||||||
| KAR Auction Services, Inc. | 779 | 33,941 | ||||||
| MSA Safety, Inc. | 422 | 34,224 | ||||||
| Quad/Graphics, Inc. | 126 | 2,806 | ||||||
| Republic Services, Inc. | 1,068 | 67,935 | ||||||
| Rollins, Inc. | 837 | 36,050 | ||||||
| Stericycle, Inc. | 392 | 32,054 | ||||||
| Team, Inc. | 570 | 14,621 | ||||||
| Waste Management, Inc. | 930 | 67,806 | ||||||
| 518,449 | ||||||||
| Electrical Equipment — 0.6% | ||||||||
| Babcock & Wilcox Enterprises, Inc. | 1,494 | 15,911 | ||||||
| Eaton Corporation plc | 679 | 52,541 | ||||||
| EnerSys | 403 | 29,846 | ||||||
| General Cable Corporation | 178 | 2,946 | ||||||
| Sensata Technologies Holding N.V. | 833 | 33,678 | ||||||
| Sunrun, Inc. | 3,022 | 15,231 | ||||||
| Thermon Group Holdings, Inc. | 724 | 13,409 | ||||||
| Vicor Corporation | 837 | 14,187 | ||||||
| 177,749 | ||||||||
| Industrial Conglomerates — 0.3% | ||||||||
| General Electric Company | 2,354 | 64,453 | ||||||
| Raven Industries, Inc. | 478 | 16,180 | ||||||
| 80,633 | ||||||||
| Machinery — 1.1% | ||||||||
| Actuant Corporation - Class A | 550 | 14,273 | ||||||
| Albany International Corporation - Class A | 307 | 14,828 | ||||||
| Altra Industrial Motion Corporation | 357 | 15,422 | ||||||
| Briggs & Stratton Corporation | 594 | 14,125 | ||||||
| Chart Industries, Inc. | 418 | 14,358 | ||||||
| CIRCOR International, Inc. | 233 | 15,019 | ||||||
| Energy Recovery, Inc. | 392 | 2,975 | ||||||
| EnPro Industries, Inc. | 209 | 13,963 | ||||||
40
| BARROW LONG/SHORT OPPORTUNITY FUND SCHEDULE OF SECURITIES SOLD SHORT (Continued) | ||||||||
| COMMON STOCKS — 93.5% (Continued) | Shares | Value | ||||||
| Industrials — 7.9% (Continued) | ||||||||
| Machinery — 1.1% (Continued) | ||||||||
| Gorman-Rupp Company (The) | 540 | $ | 12,998 | |||||
| Harsco Corporation | 1,032 | 15,377 | ||||||
| Hyster-Yale Materials Handling, Inc. | 215 | 16,046 | ||||||
| Lindsay Corporation | 115 | 9,819 | ||||||
| Manitowoc Company, Inc. (The) | 2,534 | 14,342 | ||||||
| Milacron Holdings Corporation | 657 | 11,425 | ||||||
| NACCO Industries, Inc. - Class A | 110 | 7,288 | ||||||
| RBC Bearings, Inc. | 65 | 6,586 | ||||||
| Rev Group, Inc. | 542 | 14,553 | ||||||
| Rexnord Corporation | 627 | 14,296 | ||||||
| SPX Corporation | 580 | 13,972 | ||||||
| SPX FLOW, Inc. | 397 | 14,820 | ||||||
| Sun Hydraulics Corporation | 365 | 15,618 | ||||||
| Titan International, Inc. | 1,396 | 14,477 | ||||||
| TriMas Corporation | 649 | 14,148 | ||||||
| 300,728 | ||||||||
| Professional Services — 0.3% | ||||||||
| Advisory Board Company (The) | 299 | 15,458 | ||||||
| Insperity, Inc. | 26 | 1,962 | ||||||
| Mistras Group, Inc. | 678 | 14,184 | ||||||
| TransUnion | 344 | 15,036 | ||||||
| TrueBlue, Inc. | 551 | 14,794 | ||||||
| WageWorks, Inc. | 461 | 32,616 | ||||||
| 94,050 | ||||||||
| Road & Rail — 0.6% | ||||||||
| ArcBest Corporation | 679 | 12,765 | ||||||
| Genesee & Wyoming, Inc. - Class A | 512 | 33,536 | ||||||
| J.B. Hunt Transport Services, Inc. | 83 | 7,086 | ||||||
| Kansas City Southern | 368 | 35,034 | ||||||
| Knight Transportation, Inc. | 1,005 | 33,517 | ||||||
| Old Dominion Freight Line, Inc. | 387 | 34,567 | ||||||
| Werner Enterprises, Inc. | 556 | 15,151 | ||||||
| 171,656 | ||||||||
| Trading Companies & Distributors — 0.5% | ||||||||
| Applied Industrial Technologies, Inc. | 51 | 3,149 | ||||||
| Beacon Roofing Supply, Inc. | 674 | 32,507 | ||||||
| BMC Stock Holdings, Inc. | 361 | 7,039 | ||||||
| DXP Enterprises, Inc. | 426 | 15,264 | ||||||
| GMS, Inc. | 138 | 4,507 | ||||||
| MRC Global, Inc. | 797 | 14,386 | ||||||
| NOW, Inc. | 860 | 14,199 | ||||||
41
| BARROW LONG/SHORT OPPORTUNITY FUND SCHEDULE OF SECURITIES SOLD SHORT (Continued) | ||||||||
| COMMON STOCKS — 93.5% (Continued) | Shares | Value | ||||||
| Industrials — 7.9% (Continued) | ||||||||
| Trading Companies & Distributors — 0.5% (Continued) | ||||||||
| Rush Enterprises, Inc. - Class A | 397 | $ | 14,232 | |||||
| SiteOne Landscape Supply, Inc. | 304 | 16,167 | ||||||
| Univar, Inc. | 1,085 | 33,006 | ||||||
| 154,456 | ||||||||
| Transportation Infrastructure — 0.1% | ||||||||
| Macquarie Infrastructure Corporation | 419 | 32,640 | ||||||
| Information Technology — 12.5% | ||||||||
| Communications Equipment — 1.9% | ||||||||
| Applied Optoelectronics, Inc. | 462 | 32,257 | ||||||
| Arista Networks, Inc. | 280 | 41,266 | ||||||
| ARRIS International plc | 1,467 | 41,135 | ||||||
| CalAmp Corporation | 2,174 | 41,089 | ||||||
| Ciena Corporation | 1,728 | 40,573 | ||||||
| EchoStar Corporation - Class A | 698 | 41,217 | ||||||
| Extreme Networks, Inc. | 4,560 | 43,913 | ||||||
| Harmonic, Inc. | 1,471 | 7,428 | ||||||
| Infinera Corporation | 4,132 | 40,163 | ||||||
| Lumentum Holdings, Inc. | 823 | 46,952 | ||||||
| Palo Alto Networks, Inc. | 349 | 41,388 | ||||||
| Quantenna Communications, Inc. | 2,056 | 39,311 | ||||||
| ShoreTel, Inc. | 1,990 | 11,542 | ||||||
| ViaSat, Inc. | 617 | 40,259 | ||||||
| Viavi Solutions, Inc. | 3,549 | 39,855 | ||||||
| 548,348 | ||||||||
| Electronic Equipment, Instruments & Components — 2.9% | ||||||||
| Amphenol Corporation - Class A | 1,936 | 144,426 | ||||||
| Coherent, Inc. | 178 | 44,171 | ||||||
| Corning, Inc. | 4,852 | 141,193 | ||||||
| FARO Technologies, Inc. | 1,131 | 39,302 | ||||||
| Fitbit, Inc. - Class A | 6,651 | 34,785 | ||||||
| Flex Ltd. | 2,514 | 43,392 | ||||||
| Jabil Circuit, Inc. | 1,374 | 41,110 | ||||||
| KEMET Corporation | 1,297 | 17,899 | ||||||
| Knowles Corporation | 1,512 | 25,900 | ||||||
| Littelfuse, Inc. | 242 | 39,192 | ||||||
| Mercury Systems, Inc. | 374 | 14,874 | ||||||
| MTS Systems Corporation | 817 | 42,361 | ||||||
| National Instruments Corporation | 1,136 | 43,338 | ||||||
| OSI Systems, Inc. | 513 | 40,624 | ||||||
42
| BARROW LONG/SHORT OPPORTUNITY FUND SCHEDULE OF SECURITIES SOLD SHORT (Continued) | ||||||||
| COMMON STOCKS — 93.5% (Continued) | Shares | Value | ||||||
| Information Technology — 12.5% (Continued) | ||||||||
| Electronic Equipment, Instruments & Components — 2.9% (Continued) | ||||||||
| Trimble, Inc. | 1,146 | $ | 41,302 | |||||
| Universal Display Corporation | 404 | 45,814 | ||||||
| Zebra Technologies Corporation - Class A | 417 | 43,510 | ||||||
| 843,193 | ||||||||
| Internet Software & Services — 2.1% | ||||||||
| Actua Corporation | 1,449 | 20,286 | ||||||
| Alphabet, Inc. - Class A | 31 | 30,600 | ||||||
| AppFolio, Inc. - Class A | 747 | 21,401 | ||||||
| Apptio, Inc. - Class A | 1,512 | 24,978 | ||||||
| Bankrate, Inc. | 825 | 8,621 | ||||||
| Benefitfocus, Inc. | 671 | 21,338 | ||||||
| Cornerstone OnDemand, Inc. | 538 | 20,100 | ||||||
| Envestnet, Inc. | 579 | 20,757 | ||||||
| Facebook, Inc. - Class A | 60 | 9,088 | ||||||
| GoDaddy, Inc. - Class A | 644 | 26,494 | ||||||
| Hortonworks, Inc. | 1,801 | 22,260 | ||||||
| IAC/InterActiveCorporation | 264 | 28,074 | ||||||
| Instructure, Inc. | 812 | 21,680 | ||||||
| LivePerson, Inc. | 874 | 8,347 | ||||||
| LogMeIn, Inc. | 220 | 24,420 | ||||||
| MINDBODY, Inc. - Class A | 745 | 20,897 | ||||||
| MuleSoft, Inc. | 879 | 22,871 | ||||||
| New Relic, Inc. | 489 | 21,355 | ||||||
| Nutanix, Inc. - Class A | 1,295 | 24,152 | ||||||
| Okta, Inc. | 840 | 21,924 | ||||||
| PayPal Holdings, Inc. | 632 | 32,997 | ||||||
| Q2 Holdings, Inc. | 530 | 20,988 | ||||||
| Quotient Technology, Inc. | 449 | 4,939 | ||||||
| TrueCar, Inc. | 1,184 | 20,815 | ||||||
| Twitter, Inc. | 1,381 | 25,300 | ||||||
| Yahoo!, Inc. | 817 | 41,111 | ||||||
| Yelp, Inc. | 405 | 11,308 | ||||||
| Zillow Group, Inc. - Class A | 612 | 26,861 | ||||||
| 603,962 | ||||||||
| IT Services — 0.6% | ||||||||
| Conduent, Inc. | 1,492 | 24,484 | ||||||
| Fidelity National Information Services, Inc. | 324 | 27,822 | ||||||
| Gartner, Inc. | 95 | 11,362 | ||||||
| Global Payments, Inc. | 72 | 6,596 | ||||||
43
| BARROW LONG/SHORT OPPORTUNITY FUND SCHEDULE OF SECURITIES SOLD SHORT (Continued) | ||||||||
| COMMON STOCKS — 93.5% (Continued) | Shares | Value | ||||||
| Information Technology — 12.5% (Continued) | ||||||||
| IT Services — 0.6% (Continued) | ||||||||
| Leidos Holdings, Inc. | 108 | $ | 6,000 | |||||
| Square, Inc. - Class A | 1,273 | 29,266 | ||||||
| VeriFone Systems, Inc. | 2,185 | 39,964 | ||||||
| WEX, Inc. | 250 | 25,540 | ||||||
| 171,034 | ||||||||
| Software — 3.8% | ||||||||
| 8x8, Inc. | 1,521 | 20,762 | ||||||
| A10 Networks, Inc. | 2,431 | 19,861 | ||||||
| Adobe Systems, Inc. | 295 | 41,849 | ||||||
| Autodesk, Inc. | 427 | 47,726 | ||||||
| Blackbaud, Inc. | 315 | 26,060 | ||||||
| Blackline, Inc. | 637 | 21,505 | ||||||
| Bottomline Technologies (de), Inc. | 613 | 15,331 | ||||||
| Box, Inc. - Class A | 1,140 | 21,318 | ||||||
| Callidus Software, Inc. | 325 | 7,767 | ||||||
| Ellie Mae, Inc. | 235 | 25,747 | ||||||
| FireEye, Inc. | 1,603 | 24,029 | ||||||
| Fortinet, Inc. | 637 | 25,060 | ||||||
| Guidewire Software, Inc. | 410 | 27,232 | ||||||
| HubSpot, Inc. | 321 | 23,144 | ||||||
| Imperva, Inc. | 447 | 22,082 | ||||||
| MobileIron, Inc. | 1,627 | 8,786 | ||||||
| NetScout Systems, Inc. | 1,151 | 42,127 | ||||||
| Nuance Communications, Inc. | 1,370 | 25,359 | ||||||
| Paycom Software, Inc. | 95 | 6,217 | ||||||
| Pegasystems, Inc. | 500 | 29,225 | ||||||
| Progress Software Corporation | 683 | 19,944 | ||||||
| Proofpoint, Inc. | 318 | 27,348 | ||||||
| PROS Holdings, Inc. | 804 | 24,015 | ||||||
| PTC, Inc. | 470 | 27,063 | ||||||
| Rapid7, Inc. | 1,171 | 21,499 | ||||||
| RealPage, Inc. | 695 | 24,047 | ||||||
| Red Hat, Inc. | 453 | 40,575 | ||||||
| salesforce.com, inc. | 458 | 41,055 | ||||||
| ServiceNow, Inc. | 416 | 43,534 | ||||||
| Silver Spring Networks, Inc. | 1,904 | 19,383 | ||||||
| Splunk, Inc. | 379 | 23,210 | ||||||
| Symantec Corporation | 1,267 | 38,403 | ||||||
| Synchronoss Technologies, Inc. | 435 | 5,559 | ||||||
| Tableau Software, Inc. - Class A | 431 | 26,726 | ||||||
| Take-Two Interactive Software, Inc. | 382 | 29,315 | ||||||
44
| BARROW LONG/SHORT OPPORTUNITY FUND SCHEDULE OF SECURITIES SOLD SHORT (Continued) | ||||||||
| COMMON STOCKS — 93.5% (Continued) | Shares | Value | ||||||
| Information Technology — 12.5% (Continued) | ||||||||
| Software — 3.8% (Continued) | ||||||||
| Tyler Technologies, Inc. | 87 | $ | 14,866 | |||||
| Ultimate Software Group, Inc. (The) | 120 | 26,489 | ||||||
| Varonis Systems, Inc. | 615 | 22,355 | ||||||
| Workday, Inc. - Class A | 447 | 44,691 | ||||||
| Workiva, Inc. | 1,199 | 21,822 | ||||||
| Zendesk, Inc. | 889 | 23,096 | ||||||
| Zynga, Inc. - Class A | 7,229 | 25,446 | ||||||
| 1,071,628 | ||||||||
| Technology Hardware, Storage & Peripherals — 1.2% | ||||||||
| 3D Systems Corporation | 1,713 | 35,031 | ||||||
| Cray, Inc. | 2,182 | 38,731 | ||||||
| Diebold Nixdorf, Inc. | 1,441 | 38,114 | ||||||
| Pure Storage, Inc. - Class A | 3,587 | 46,416 | ||||||
| Stratasys Ltd. | 1,476 | 39,704 | ||||||
| Western Digital Corporation | 1,586 | 142,835 | ||||||
| 340,831 | ||||||||
| Materials — 7.4% | ||||||||
| Chemicals — 4.5% | ||||||||
| A. Schulman, Inc. | 2,911 | 85,292 | ||||||
| Albemarle Corporation | 142 | 16,131 | ||||||
| American Vanguard Corporation | 5,340 | 89,979 | ||||||
| Ashland Global Holdings, Inc. | 581 | 38,660 | ||||||
| Axalta Coating Systems Ltd. | 2,269 | 71,020 | ||||||
| Balchem Corporation | 880 | 69,274 | ||||||
| Calgon Carbon Corporation | 6,400 | 89,920 | ||||||
| CF Industries Holdings, Inc. | 2,635 | 70,881 | ||||||
| Chemours Company (The) | 1,716 | 68,623 | ||||||
| Ferro Corporation | 1,883 | 31,559 | ||||||
| Flotek Industries, Inc. | 8,333 | 82,330 | ||||||
| FMC Corporation | 978 | 73,712 | ||||||
| Koppers Holdings, Inc. | 196 | 7,066 | ||||||
| Kronos Worldwide, Inc. | 5,023 | 92,122 | ||||||
| Mosaic Company (The) | 2,930 | 66,306 | ||||||
| NL Industries, Inc. | 656 | 4,854 | ||||||
| Olin Corporation | 2,286 | 67,071 | ||||||
| Sensient Technologies Corporation | 877 | 70,414 | ||||||
| Tredegar Corporation | 5,540 | 87,532 | ||||||
| Valvoline, Inc. | 1,595 | 35,680 | ||||||
| Westlake Chemical Corporation | 1,145 | 70,372 | ||||||
| 1,288,798 | ||||||||
45
| BARROW LONG/SHORT OPPORTUNITY FUND SCHEDULE OF SECURITIES SOLD SHORT (Continued) | ||||||||
| COMMON STOCKS — 93.5% (Continued) | Shares | Value | ||||||
| Materials — 7.4% (Continued) | ||||||||
| Construction Materials — 0.3% | ||||||||
| RPM International, Inc. | 1,360 | $ | 73,753 | |||||
| Containers & Packaging — 1.4% | ||||||||
| Ball Corporation | 1,780 | 72,802 | ||||||
| Berry Global Group, Inc. | 400 | 23,196 | ||||||
| Graphic Packaging Holding Company | 2,368 | 31,992 | ||||||
| Ingevity Corporation | 1,259 | 74,369 | ||||||
| Myers Industries, Inc. | 5,322 | 89,942 | ||||||
| Silgan Holdings, Inc. | 1,218 | 38,745 | ||||||
| WestRock Company | 1,320 | 71,834 | ||||||
| 402,880 | ||||||||
Metals & Mining — 0.0% (a) | ||||||||
| Reliance Steel & Aluminum Company | 7 | 511 | ||||||
| Paper & Forest Products — 1.2% | ||||||||
| Boise Cascade Company | 3,011 | 81,146 | ||||||
| Deltic Timber Corporation | 1,163 | 78,921 | ||||||
| Domtar Corporation | 499 | 18,154 | ||||||
| KapStone Paper and Packaging Corporation | 4,316 | 91,197 | ||||||
| P.H. Glatfelter Company | 4,627 | 84,813 | ||||||
| 354,231 | ||||||||
| Telecommunication Services — 0.1% | ||||||||
| Wireless Telecommunication Services — 0.1% | ||||||||
| RingCentral, Inc. - Class A | 633 | 21,585 | ||||||
Total Common Stocks (Proceeds $25,203,144) | $ | 26,640,511 | ||||||
WARRANTS — 0.0% (a) | Shares | Value | ||||||
| BioTime, Inc. (Proceeds $2) | 1 | $ | 1 | |||||
Total Securities Sold Short — 93.5% (Proceeds $25,203,146) | $ | 26,640,512 | ||||||
(a) | Percentage rounds to less than 0.1%. |
| See accompanying notes to financial statements. | |
46
| BARROW FUNDS STATEMENTS OF ASSETS AND LIABILITIES May 31, 2017 | ||||||||
| Barrow Value Opportunity Fund | Barrow Long/Short Opportunity Fund | |||||||
| ASSETS | ||||||||
| Investments in securities: | ||||||||
| At acquisition cost | $ | 28,601,306 | $ | 36,873,418 | ||||
| At value (Note 2) | $ | 34,371,685 | $ | 39,154,946 | ||||
| Deposits with brokers for securities sold short (Note 2) | — | 16,369,195 | ||||||
| Receivable for capital shares sold | — | 100 | ||||||
| Dividends receivable | 28,112 | 36,164 | ||||||
| Other assets | 5,196 | 4,607 | ||||||
| TOTAL ASSETS | 34,404,993 | 55,565,012 | ||||||
| LIABILITIES | ||||||||
| Securities sold short, at value (Note 2) (proceeds $— and $25,203,146, respectively) | — | 26,640,512 | ||||||
| Dividends payable on securities sold short (Note 2) | — | 27,325 | ||||||
| Payable for capital shares redeemed | — | 334,470 | ||||||
| Payable to Adviser (Note 4) | 17,774 | 25,331 | ||||||
| Payable to administrator (Note 4) | 7,860 | 7,490 | ||||||
| Accrued brokerage expense on securities sold short (Note 2) | — | 35,091 | ||||||
| Other accrued expenses and liabilities | 6,665 | 10,535 | ||||||
| TOTAL LIABILITIES | 32,299 | 27,080,754 | ||||||
| NET ASSETS | $ | 34,372,694 | $ | 28,484,258 | ||||
| Net assets consist of: | ||||||||
| Paid-in capital | $ | 28,228,362 | $ | 30,156,703 | ||||
| Undistributed net investment income (loss) | 289,961 | (329,719 | ) | |||||
| Accumulated net realized gains (losses) from security transactions | 83,992 | (2,186,888 | ) | |||||
| Net unrealized appreciation (depreciation) on: | ||||||||
| Investments | 5,770,379 | 2,281,528 | ||||||
| Short positions | — | (1,437,366 | ) | |||||
| Net assets | $ | 34,372,694 | $ | 28,484,258 | ||||
| Shares of beneficial interest outstanding (unlimited number of shares authorized, no par value) | 1,245,424 | 2,841,995 | ||||||
| Net asset value, offering price and redemption price per share (Note 2) | $ | 27.60 | $ | 10.02 | ||||
| See accompanying notes to financial statements. |
47
| BARROW FUNDS STATEMENTS OF OPERATIONS For the Year Ended May 31, 2017 | ||||||||
| Barrow Value Opportunity Fund | Barrow Long/Short Opportunity Fund | |||||||
| INVESTMENT INCOME | ||||||||
| Dividends | $ | 757,258 | $ | 1,037,024 | ||||
| EXPENSES | ||||||||
| Investment advisory fees (Note 4) | 337,831 | 518,424 | ||||||
| Brokerage expense on securities sold short (Note 2) | — | 437,967 | ||||||
| Dividend expense on securities sold short (Note 2) | — | 412,016 | ||||||
| Professional fees | 37,237 | 38,237 | ||||||
| Administration fees (Note 4) | 34,091 | 34,602 | ||||||
| Accounting services fees (Note 4) | 33,405 | 33,451 | ||||||
| Custodian and bank service fees | 16,398 | 33,478 | ||||||
| Registration and filing fees | 19,841 | 22,287 | ||||||
| Transfer agent fees (Note 4) | 15,000 | 15,000 | ||||||
| Compliance service fees (Note 4) | 12,273 | 12,273 | ||||||
| Pricing fees | 3,790 | 19,040 | ||||||
| Trustees’ fees and expenses (Note 4) | 9,587 | 9,587 | ||||||
| Printing of shareholder reports | 3,786 | 4,506 | ||||||
| Postage and supplies | 3,075 | 3,381 | ||||||
| Insurance expense | 2,180 | 2,180 | ||||||
| Borrowing costs (Note 5) | 2,599 | 474 | ||||||
| Other expenses | 7,164 | 6,807 | ||||||
| TOTAL EXPENSES | 538,257 | 1,603,710 | ||||||
| Investment advisory fee reductions by Adviser (Note 4) | (143,227 | ) | (152,355 | ) | ||||
| NET EXPENSES | 395,030 | 1,451,355 | ||||||
| NET INVESTMENT INCOME (LOSS) | 362,228 | (414,331 | ) | |||||
| REALIZED AND UNREALIZED GAINS (LOSSES) ON INVESTMENTS AND SECURITIES SOLD SHORT | ||||||||
| Net realized gains (losses) from: | ||||||||
| Investments | 362,237 | 4,371,421 | ||||||
| Securities sold short | — | (5,868,868 | ) | |||||
| Net change in unrealized appreciation (depreciation) on: | ||||||||
| Investments | 3,167,589 | 403,160 | ||||||
| Securities sold short | — | 286,613 | ||||||
| NET REALIZED AND UNREALIZED GAINS (LOSSES) ON INVESTMENTS | 3,529,826 | (807,674 | ) | |||||
| NET INCREASE (DECREASE) IN NET ASSETS RESULTING FROM OPERATIONS | $ | 3,892,054 | $ | (1,222,005 | ) | |||
| See accompanying notes to financial statements. |
48
| BARROW VALUE OPPORTUNITY FUND STATEMENTS OF CHANGES IN NET ASSETS | ||||||||
| Year Ended May 31, 2017 | Year Ended May 31, 2016 | |||||||
| FROM OPERATIONS | ||||||||
| Net investment income | $ | 362,228 | $ | 360,184 | ||||
| Net realized gains (losses) from security transactions | 362,237 | (286,001 | ) | |||||
| Net change in unrealized appreciation (depreciation) on investments | 3,167,589 | (2,041,141 | ) | |||||
| Net increase (decrease) in net assets resulting from operations | 3,892,054 | (1,966,958 | ) | |||||
| DISTRIBUTIONS TO SHAREHOLDERS (Note 2) | ||||||||
| Investment income, Institutional Class | (167,099 | ) | (266,621 | ) | ||||
| Realized gains, Institutional Class | (56,937 | ) | (281,697 | ) | ||||
| Decrease in net assets from distributions to shareholders | (224,036 | ) | (548,318 | ) | ||||
| CAPITAL SHARE TRANSACTIONS (Note 1) | ||||||||
| Institutional Class | ||||||||
| Proceeds from shares sold | 900,733 | 8,014,825 | ||||||
| Net asset value of shares issued in reinvestment of distributions | 223,340 | 543,321 | ||||||
| Payments for shares redeemed | (4,941,868 | ) | (3,465,224 | ) | ||||
| Net increase (decrease) in Institutional Class net assets from capital share transactions | (3,817,795 | ) | 5,092,922 | |||||
| Investor Class | ||||||||
| Payments for shares redeemed | — | (275,749 | ) | |||||
| TOTAL INCREASE (DECREASE) IN NET ASSETS | (149,777 | ) | 2,301,897 | |||||
| NET ASSETS | ||||||||
| Beginning of year | 34,522,471 | 32,220,574 | ||||||
| End of year | $ | 34,372,694 | $ | 34,522,471 | ||||
| UNDISTRIBUTED NET INVESTMENT INCOME | $ | 289,961 | $ | 195,001 | ||||
| CAPITAL SHARE ACTIVITY (Note 1) | ||||||||
| Institutional Class | ||||||||
| Shares sold | 33,363 | 313,016 | ||||||
| Shares reinvested | 8,470 | 21,979 | ||||||
| Shares redeemed | (189,414 | ) | (143,732 | ) | ||||
| Net increase (decrease) in shares outstanding | (147,581 | ) | 191,263 | |||||
| Shares outstanding, beginning of year | 1,393,005 | 1,201,742 | ||||||
| Shares outstanding, end of year | 1,245,424 | 1,393,005 | ||||||
| Investor Class | ||||||||
| Shares redeemed | — | (10,392 | ) | |||||
| Shares outstanding, beginning of year | — | 10,392 | ||||||
| Shares outstanding, end of year | — | — | ||||||
| See accompanying notes to financial statements. |
49
| BARROW LONG/SHORT OPPORTUNITY FUND STATEMENTS OF CHANGES IN NET ASSETS | ||||||||
| Year Ended May 31, 2017 | Year Ended May 31, 2016 | |||||||
| FROM OPERATIONS | ||||||||
| Net investment loss | $ | (414,331 | ) | $ | (141,241 | ) | ||
| Net realized gains (losses) from: | ||||||||
| Investments | 4,371,421 | (74,973 | ) | |||||
| Securities sold short | (5,868,868 | ) | (358,159 | ) | ||||
| Net change in unrealized appreciation (depreciation) on: | ||||||||
| Investments | 403,160 | 369,069 | ||||||
| Securities sold short | 286,613 | (1,169,227 | ) | |||||
| Net decrease in net assets resulting from operations | (1,222,005 | ) | (1,374,531 | ) | ||||
| CAPITAL SHARE TRANSACTIONS (Note 1) | ||||||||
| Institutional Class | ||||||||
| Proceeds from shares sold | 4,752,090 | 31,363,694 | ||||||
| Payments for shares redeemed | (13,098,045 | ) | (1,607,462 | ) | ||||
| Net increase (decrease) in Institutional Class net assets from capital share transactions | (8,345,955 | ) | 29,756,232 | |||||
| Investor Class | ||||||||
| Payments for shares redeemed | — | (191,532 | ) | |||||
| TOTAL INCREASE (DECREASE) IN NET ASSETS | (9,567,960 | ) | 28,190,169 | |||||
| NET ASSETS | ||||||||
| Beginning of year | 38,052,218 | 9,862,049 | ||||||
| End of year | $ | 28,484,258 | $ | 38,052,218 | ||||
| ACCUMULATED NET INVESTMENT LOSS | $ | (329,719 | ) | $ | (88,626 | ) | ||
| CAPITAL SHARE ACTIVITY (Note 1) | ||||||||
| Institutional Class | ||||||||
| Shares sold | 461,767 | 2,909,103 | ||||||
| Shares redeemed | (1,287,871 | ) | (150,836 | ) | ||||
| Net increase (decrease) in shares outstanding | (826,104 | ) | 2,758,267 | |||||
| Shares outstanding, beginning of year | 3,668,099 | 909,832 | ||||||
| Shares outstanding, end of year | 2,841,995 | 3,668,099 | ||||||
| Investor Class | ||||||||
| Shares redeemed | — | (18,074 | ) | |||||
| Shares outstanding, beginning of year | — | 18,074 | ||||||
| Shares outstanding, end of year | — | — | ||||||
| See accompanying notes to financial statements. |
50
| BARROW VALUE OPPORTUNITY FUND* FINANCIAL HIGHLIGHTS | ||||||||||||||||
| Per share data for a share outstanding throughout each period: | ||||||||||||||||
| Year Ended May 31, 2017 | Year Ended May 31, 2016 | Year Ended May 31, 2015 | Period Ended May 31, 2014(a) | |||||||||||||
| Net asset value at beginning of period | $ | 24.78 | $ | 26.58 | $ | 26.40 | $ | 23.30 | ||||||||
| Income (loss) from investment operations: | ||||||||||||||||
| Net investment income | 0.31 | 0.27 | (b) | 0.27 | 0.18 | |||||||||||
| Net realized and unrealized gains (losses) on investments | 2.69 | (1.68 | ) | 2.25 | 3.47 | |||||||||||
| Total from investment operations | 3.00 | (1.41 | ) | 2.52 | 3.65 | |||||||||||
| Less distributions: | ||||||||||||||||
| From net investment income | (0.13 | ) | (0.19 | ) | (0.20 | ) | (0.06 | ) | ||||||||
| From net realized gains from investments | (0.05 | ) | (0.20 | ) | (2.14 | ) | (0.49 | ) | ||||||||
| Total distributions | (0.18 | ) | (0.39 | ) | (2.34 | ) | (0.55 | ) | ||||||||
| Net asset value at end of period | $ | 27.60 | $ | 24.78 | $ | 26.58 | $ | 26.40 | ||||||||
Total return (c) | 12.14 | % | (5.29 | %) | 10.10 | % | 15.73 | %(d) | ||||||||
| Ratios and supplemental data: | ||||||||||||||||
| Net assets at end of period (000’s) | $ | 34,373 | $ | 34,522 | $ | 31,945 | $ | 21,380 | ||||||||
| Ratio of total expenses to average net assets | 1.57 | % | 1.60 | % | 1.79 | % | 1.86 | %(e) | ||||||||
Ratio of net expenses to average net assets (f) | 1.16 | %(g) | 1.16 | %(g) | 1.15 | % | 1.15 | %(e) | ||||||||
Ratio of net investment income to average net assets (f) | 1.06 | % | 1.08 | % | 1.29 | % | 1.01 | %(e) | ||||||||
| Portfolio turnover rate | 88 | % | 84 | % | 112 | % | 45 | %(d) | ||||||||
| * | Formerly (prior to July 1, 2015) known as Barrow All-Cap Core Fund - Institutional Class (Note 1). |
(a) | Represents the period from the commencement of operations (close of business August 30, 2013) through May 31, 2014. |
(b) | Calculated using average shares outstanding. |
(c) | Total return is a measure of the change in value of an investment in the Fund over the periods covered, which assumes any dividends or capital gains distributions are reinvested in shares of the Fund. The returns shown do not reflect the deduction of taxes a shareholder would pay on Fund distributions or the redemption of Fund shares. The total returns would have been lower if the Adviser had not reduced advisory fees and/or reimbursed expenses. |
(d) | Not annualized. |
(e) | Annualized. |
(f) | Ratio was determined after fee reductions and/or expense reimbursements by the Adviser (Note 4). |
(g) | Ratio includes borrowing costs of 0.01% and 0.01% for the years ended May 31, 2017 and 2016, respectively (Note 5). |
| See accompanying notes to financial statements. | |
51
| BARROW LONG/SHORT OPPORTUNITY FUND* FINANCIAL HIGHLIGHTS | ||||||||||||||||
| Per share data for a share outstanding throughout each period: | ||||||||||||||||
| Year Ended May 31, 2017 | Year Ended May 31, 2016 | Year Ended May 31, 2015 | Period Ended May 31, 2014(a) | |||||||||||||
| Net asset value at beginning of period | $ | 10.37 | $ | 10.63 | $ | 10.41 | $ | 10.00 | ||||||||
| Income (loss) from investment operations: | ||||||||||||||||
| Net investment loss | (0.15 | ) | (0.07 | )(b) | (0.02 | ) | (0.03 | ) | ||||||||
| Net realized and unrealized gains (losses) on investments | (0.20 | ) | (0.19 | ) | 0.43 | 0.44 | ||||||||||
| Total from investment operations | (0.35 | ) | (0.26 | ) | 0.41 | 0.41 | ||||||||||
| Less distributions: | ||||||||||||||||
| From net realized gains from investments | — | — | (0.19 | ) | — | |||||||||||
| Net asset value at end of period | $ | 10.02 | $ | 10.37 | $ | 10.63 | $ | 10.41 | ||||||||
Total return (c) | (3.38 | %) | (2.45 | %) | 4.01 | % | 4.10 | %(d) | ||||||||
| Ratios and supplemental data: | ||||||||||||||||
| Net assets at end of period (000’s) | $ | 28,484 | $ | 38,052 | $ | 9,671 | $ | 4,212 | ||||||||
| Ratio of total expenses to average net assets | 4.64 | % | 4.58 | % | 6.16 | % | 8.69 | %(f) | ||||||||
Ratio of net expenses to average net assets (e) | 4.20 | % | 3.72 | % | 3.70 | % | 3.51 | %(f) | ||||||||
Ratio of net expenses to average net assets excluding dividend expense (e) | 3.00 | % | 2.54 | % | 2.54 | % | 2.51 | %(f) | ||||||||
Ratio of net expenses to average net assets excluding dividend expense, brokerage expense on securities sold short and borrowing costs (e) | 1.74 | % | 1.74 | % | 1.74 | % | 1.74 | %(f) | ||||||||
Ratio of net investment loss to average net assets (e) | (1.20 | %) | (0.65 | %)(g) | (0.05 | %)(g) | (0.37 | %)(f)(g) | ||||||||
| Portfolio turnover rate | 122 | % | 64 | % | 111 | % | 76 | %(d) | ||||||||
| * | Formerly (prior to July 1, 2015) known as Barrow All-Cap Long/Short Fund - Institutional Class (Note 1). |
(a) | Represents the period from the commencement of operations (close of business August 30, 2013) through May 31, 2014. |
(b) | Calculated using average shares outstanding. |
(c) | Total return is a measure of the change in value of an investment in the Fund over the periods covered, which assumes any dividends or capital gains distributions are reinvested in shares of the Fund. The returns shown do not reflect the deduction of taxes a shareholder would pay on Fund distributions or the redemption of Fund shares. The total returns would have been lower if the Adviser had not reduced advisory fees and/or reimbursed expenses. |
(d) | Not annualized. |
(e) | Ratio was determined after fee reductions and/or expense reimbursements by the Adviser (Note 4). |
(f) | Annualized. |
(g) | The Fund earned interest income on the margin account balance that was associated with securities sold short. The ratio of interest income to average net assets for the periods ended May 31, 2016, 2015 and 2014 is 0.11%, 0.30% and 0.28%(f), respectively. |
| See accompanying notes to financial statements. | |
52
BARROW FUNDS
NOTES TO FINANCIAL STATEMENTS
May 31, 2017
NOTES TO FINANCIAL STATEMENTS
May 31, 2017
1. Organization
Barrow Value Opportunity Fund and Barrow Long/Short Opportunity Fund (individually, a “Fund” and collectively, the “Funds”) are each a diversified series of Ultimus Managers Trust (the “Trust”), an open-end investment company established as an Ohio business trust under a Declaration of Trust dated February 28, 2012. Other series of the Trust are not incorporated in this report. The Funds commenced operations at the close of business on August 30, 2013.
The investment objective of Barrow Value Opportunity Fund is to seek to generate long-term capital appreciation. The investment objective of Barrow Long/Short Opportunity Fund is to seek to generate above-average returns through capital appreciation, while also attempting to reduce volatility and preserve capital during market downturns.
Each Fund currently offers one class of shares which are sold without any sales loads or distribution fees. Prior to July 1, 2015, each Fund offered two classes of shares: Institutional Class shares (sold without any sales loads or distribution fees and required a $250,000 initial investment) and Investor Class shares (sold without any sales loads, but subject to a distribution fee of up to 0.25% of the average daily net assets attributable to Investor Class shares, and required a $2,500 initial investment). Each class of shares represented an ownership interest in the same investment portfolio. On June 30, 2015, all existing Investor Class shares of each Fund were converted into Institutional Class shares and the initial minimum investment was reduced to $2,500 (the “Conversion”). After the Conversion, the Institutional Class designation no longer applied to shares of the Fund.
2. Significant Accounting Policies
The following is a summary of the Funds’ significant accounting policies. The policies are in conformity with accounting principles generally accepted in the United States of America (“GAAP”). As an investment company, as defined in Financial Accounting Standards Board (“FASB”) Accounting Standards Update 2013-08, the Funds follow accounting and reporting guidance under FASB Accounting Standards Codification Topic 946, “Financial Services – Investment Companies.”
In October 2016, the U.S. Securities and Exchange Commission (the “SEC”) adopted amendments to Regulation S-X which will impact financial statement presentation, particularly the presentation of derivative investments. Although still evaluating the impact, management believes that many of the Regulation S-X amendments are consistent with the Funds’ current financial statement presentation and expects that the Funds will be able to comply with the amendments by the August 1, 2017 compliance date.
53
| BARROW FUNDS NOTES TO FINANCIAL STATEMENTS (Continued) |
Securities valuation – Each Fund values its portfolio securities at market value as of the close of regular trading on the New York Stock Exchange (the “NYSE”) (normally 4:00 p.m. Eastern time) on each business day the NYSE is open for business. The Funds value their listed securities on the basis of the security’s last sale price on the security’s primary exchange, if available, otherwise at the exchange’s most recently quoted mean price. NASDAQ-listed securities are valued at the NASDAQ Official Closing Price. In the event that market quotations are not readily available or are considered unreliable due to market or other events, the Funds value their securities and other assets at fair value in accordance with procedures established by and under the general supervision of the Trust’s Board of Trustees (the “Board”). Under these procedures, the securities will be classified as Level 2 or 3 within the fair value hierarchy (see below), depending on the inputs used. Unavailable or unreliable market quotes may be due to the following factors: a substantial bid-ask spread; infrequent sales resulting in stale prices; insufficient trading volume; small trade sizes; a temporary lapse in any reliable pricing source; and actions of the securities or futures markets, such as the suspension or limitation of trading. As a result, the prices of securities used to calculate each Fund’s net asset value (“NAV”) may differ from quoted or published prices for the same securities.
GAAP establishes a single authoritative definition of fair value, sets out a framework for measuring fair value, and requires additional disclosures about fair value measurements.
Various inputs are used in determining the value of each Fund’s investments and other financial instruments. These inputs are summarized in the three broad levels listed below:
| ● | Level 1 – quoted prices in active markets for identical securities |
| ● | Level 2 – other significant observable inputs |
| ● | Level 3 – significant unobservable inputs |
The inputs or methods used for valuing securities are not necessarily an indication of the risks associated with investing in those securities. The inputs used to measure fair value may fall into different levels of the fair value hierarchy. In such cases, for disclosure purposes, the level in the fair value hierarchy within which the fair value measurement falls in its entirety is determined based on the lowest level input that is significant to the fair value measurement.
54
| BARROW FUNDS NOTES TO FINANCIAL STATEMENTS (Continued) |
The following is a summary of the inputs used to value the Funds’ investments and other financial instruments as of May 31, 2017:
| Barrow Value Opportunity Fund | Level 1 | Level 2 | Level 3 | Total | ||||||||||||
Investments in Securities: | ||||||||||||||||
| Common Stocks | $ | 33,858,779 | $ | — | $ | — | $ | 33,858,779 | ||||||||
| Money Market Funds | 512,906 | — | — | 512,906 | ||||||||||||
| Total | $ | 34,371,685 | $ | — | $ | — | $ | 34,371,685 | ||||||||
| Barrow Long/Short Opportunity Fund | Level 1 | Level 2 | Level 3 | Total | ||||||||||||
Investments in Securities: | ||||||||||||||||
| Common Stocks | $ | 38,102,307 | $ | 0 | (a) | $ | — | $ | 38,102,307 | |||||||
| Money Market Funds | 1,052,639 | — | — | 1,052,639 | ||||||||||||
| Total | $ | 39,154,946 | $ | 0 | $ | — | $ | 39,154,946 | ||||||||
Other Financial Instruments: | ||||||||||||||||
| Common Stocks – Sold Short | $ | (26,640,511 | ) | $ | — | $ | — | $ | (26,640,511 | ) | ||||||
| Warrants – Sold Short | (1 | ) | — | — | (1 | ) | ||||||||||
| Total | $ | (26,640,512 | ) | $ | — | $ | — | $ | (26,640,512 | ) | ||||||
(a) | Barrow Long/Short Opportunity Fund holds a Level 2 security which is valued at $0. |
Refer to each Fund’s Schedule of Investments and Schedule of Securities Sold Short, as applicable, for a listing of securities by industry type. As of May 31, 2017, the Funds did not have any transfers between Levels. There were no Level 3 securities or derivative instruments held by the Funds as of May 31, 2017. It is the Funds’ policy to recognize transfers between Levels at the end of the reporting period.
Share valuation – The NAV per share of each Fund is calculated daily by dividing the total value of its assets, less liabilities, by the number of shares outstanding. The offering price and redemption price per share of each Fund is equal to the NAV per share.
Investment income/expense – Dividend income and expense are recorded on the ex-dividend date. Interest income is accrued as earned.
Security transactions – Security transactions are accounted for on the trade date. Realized gains and losses on securities sold are determined on a specific identification basis.
Common expenses – Common expenses of the Trust are allocated among the Funds and the other series of the Trust based on the relative net assets of each series or the nature of the services performed and the relative applicability to each series.
55
| BARROW FUNDS NOTES TO FINANCIAL STATEMENTS (Continued) |
Distributions to shareholders – The Funds distribute to shareholders any net investment income dividends and net realized capital gains distributions at least once each year. The amount of such dividends and distributions are determined in accordance with federal income tax regulations, which may differ from GAAP. Dividends and distributions to shareholders are recorded on the ex-dividend date. The tax character of distributions paid to shareholders of Barrow Value Opportunity Fund during the years ended May 31, 2017 and 2016 was as follows:
| Year Ended | Ordinary Income | Long-Term Capital Gains | Total Distributions |
| Institutional Class | |||
| May 31, 2017 | $167,099 | $56,937 | $224,036 |
| May 31, 2016 | $266,621 | $281,697 | $548,318 |
| Investor Class | |||
| May 31, 2017 | N/A | N/A | N/A |
| May 31, 2016 | $— | $— | $— |
Barrow Long/Short Opportunity Fund did not pay any distributions to shareholders during the years ended May 31, 2017 and 2016.
Short Sales – Barrow Long/Short Opportunity Fund may sell securities short. For financial statement purposes, an amount equal to the settlement amount is included in the Statements of Assets and Liabilities as an asset and an equivalent liability is then subsequently marked-to-market daily to reflect the current value of the short position. Subsequent fluctuations in the market prices of securities sold, but not yet purchased, may require purchasing the securities at prices which may differ from the market value reflected on the Statements of Assets and Liabilities. The Fund is liable for any dividends payable on securities while those securities are in a short position and will also bear other costs, such as charges for the prime brokerage accounts, in connection with the short positions. These costs are reported as dividend expense and brokerage expense on securities sold short, respectively, in the Statements of Operations. As collateral for its short positions, the Fund is required under the Investment Company Act of 1940 (the “1940 Act”) to maintain assets consisting of cash, cash equivalents or other liquid securities equal to the market value of the securities sold short. The cash deposits with brokers for securities sold short are reported on the Statements of Assets and Liabilities. The amount of collateral is required to be adjusted daily to reflect changes in the value of the securities sold short. To the extent Barrow Long/Short Opportunity Fund invests the proceeds received from selling securities short, the Fund is engaging in a form of leverage. The use of leverage by the Fund may make any change in the Fund’s NAV greater than it would be without the use of leverage. Short sales are speculative transactions and involve special risks, including greater reliance on the ability of Barrow Street Advisers LLC (the “Adviser”) to accurately anticipate the future value of a security.
56
| BARROW FUNDS NOTES TO FINANCIAL STATEMENTS (Continued) |
Estimates – The preparation of financial statements in conformity with GAAP requires management to make estimates and assumptions that affect the reported amounts of assets and liabilities and disclosure of contingent assets and liabilities as of the date of the financial statements and the reported amounts of income and expenses during the reporting period. Actual results could differ from those estimates.
Federal income tax – Each Fund has qualified and intends to continue to qualify each year as a regulated investment company under the Internal Revenue Code of 1986, as amended (the “Code”). Qualification generally will relieve each Fund of liability for federal income taxes to the extent 100% of its net investment income and net realized capital gains are distributed in accordance with the Code.
In order to avoid imposition of the excise tax applicable to regulated investment companies, it is also each Fund’s intention to declare as dividends in each calendar year at least 98% of its net investment income (earned during the calendar year) and 98.2% of its net realized capital gains (earned during the twelve months ended October 31) plus undistributed amounts from prior years.
The following information is computed on a tax basis for each item as of May 31, 2017:
| Barrow Value Opportunity Fund | Barrow Long/Short Opportunity Fund | |||||||
| Cost of portfolio investments | $ | 28,722,370 | $ | 37,101,281 | ||||
| Gross unrealized appreciation | $ | 6,049,166 | $ | 3,394,853 | ||||
| Gross unrealized depreciation | (399,851 | ) | (1,341,188 | ) | ||||
| Net unrealized appreciation | 5,649,315 | 2,053,665 | ||||||
| Net unrealized depreciation on securities sold short | — | (2,187,756 | ) | |||||
| Undistributed ordinary income | 178,223 | — | ||||||
| Undistributed long-term gains | 316,794 | — | ||||||
| Accumulated capital and other losses | — | (1,538,354 | ) | |||||
| Accumulated earnings (deficit) | $ | 6,144,332 | $ | (1,672,445 | ) | |||
As of May 31, 2017, the proceeds of securities sold short on a tax basis is $24,452,756 for Barrow Long/Short Opportunity Fund.
The value of the federal income tax cost of portfolio investments and securities sold short and tax components of accumulated earnings (deficit) may temporarily differ from the financial statement cost of portfolio investments and securities sold short and components of net assets (“book/tax differences”). These book/tax differences are due to the recognition of capital gains or losses under income tax regulations and GAAP, primarily the tax deferral of losses on wash sales and the tax treatment of income and capital gains on publicly-traded partnerships held by the Funds.
57
| BARROW FUNDS NOTES TO FINANCIAL STATEMENTS (Continued) |
As of May 31, 2017, Barrow Long/Short Opportunity Fund had a short-term capital loss carryforward of $1,102,601 for federal income tax purposes. This capital loss carryforward, which does not expire, may be utilized in future years to offset net realized capital gains, if any, prior to distributing such gains to shareholders.
Net qualified late year losses include late year ordinary losses incurred after December 31, 2016 and within the taxable year, are deemed to arise on the first day of the Funds’ next taxable year. For the year ended May 31, 2017, Barrow Long/Short Opportunity Fund intends to defer to June 1, 2017 for federal tax purposes late year ordinary losses of $435,753.
For the year ended May 31, 2017, the following reclassifications were made as a result of permanent differences between financial statement and income tax reporting requirements:
| Barrow Value Opportunity Fund | Barrow Long/Short Opportunity Fund | |||||||
| Paid-in capital | $ | (224 | ) | $ | (328,028 | ) | ||
| Undistributed net investment income (loss) | (100,169 | ) | 173,238 | |||||
| Accumulated net realized gains (losses) from securities transactions | 100,393 | 154,790 | ||||||
Such reclassifications had no effect on either Fund’s total net assets or net asset value per share.
The Funds recognize tax benefits or expenses of uncertain tax positions only when the position is “more likely than not” of being sustained assuming examination by tax authorities. Management has reviewed the tax positions taken on Federal income tax returns for all open tax years (tax years ended May 31, 2014 through May 31, 2017) and has concluded that no provision for unrecognized tax benefits or expenses is required in these financial statements. The Funds identify their major tax jurisdiction as U.S. Federal.
3. Investment Transactions
During the year ended May 31, 2017, cost of purchases and proceeds from sales of investment securities, other than short-term investments and short positions, amounted to $30,078,212 and $34,074,832, respectively, for Barrow Value Opportunity Fund and $54,848,581 and $70,886,334, respectively, for Barrow Long/Short Opportunity Fund.
58
| BARROW FUNDS NOTES TO FINANCIAL STATEMENTS (Continued) |
4. Transactions with Related Parties
INVESTMENT ADVISORY AGREEMENT
Each Fund’s investments are managed by the Adviser pursuant to the terms of an Investment Advisory Agreement. Barrow Value Opportunity Fund pays the Adviser an investment advisory fee, computed and accrued daily and paid monthly, at the annual rate of 0.99% of its average daily net assets. Barrow Long/Short Opportunity Fund pays the Adviser an investment advisory fee, computed and accrued daily and paid monthly, at the annual rate of 1.50% of its average daily net assets.
Pursuant to an Expense Limitation Agreement (“ELA”) between the Funds and the Adviser, the Adviser has contractually agreed, until October 1, 2018, to reduce investment advisory fees and reimburse other operating expenses to limit total annual operating expenses of the Funds (exclusive of brokerage fees and commissions, taxes, borrowing costs such as interest and dividend expenses on securities sold short, interest, acquired fund fees and expenses, extraordinary expenses such as litigation and merger or reorganization costs, and other expenses not incurred in the ordinary course of the Funds’ business, and amounts, if any, payable to a plan adopted in accordance with Rule 12b-1 under the 1940 Act) to an amount not exceeding the following percentages of each Fund’s average daily net assets:
| Barrow Value Opportunity Fund | 1.15% |
| Barrow Long/Short Opportunity Fund | 1.74% |
Accordingly, during the year ended May 31, 2017, the Adviser reduced its investment advisory fees as follows:
| Investment Advisory Fee Reductions | ||||
| Barrow Value Opportunity Fund | $ | 143,227 | ||
| Barrow Long/Short Opportunity Fund | $ | 152,355 | ||
59
| BARROW FUNDS NOTES TO FINANCIAL STATEMENTS (Continued) |
Under the terms of the ELA, investment advisory fee reductions and expense reimbursements by the Adviser are subject to recoupment by the Adviser for a period of three years after such fees and expenses were incurred, provided that the recoupments do not cause total annual operating expenses of the Funds to exceed (i) the expense limitation then in effect, if any, and (ii) the expense limitation in effect at the time the expenses to be repaid were incurred. As of May 31, 2017, the Adviser may seek recoupment of investment advisory fee reductions and/or expense reimbursements no later than the dates as stated below:
| May 31, 2018 | May 31, 2019 | May 31, 2020 | Total | |
| Barrow Value Opportunity Fund | $ 180,140 | $ 157,109 | $ 143,227 | $ 480,476 |
| Barrow Long/Short Opportunity Fund | $ 212,647 | $ 193,578 | $ 152,355 | $ 558,580 |
OTHER SERVICE PROVIDERS
Ultimus Fund Solutions, LLC (“Ultimus”) provides administration, fund accounting, compliance, and transfer agency services to the Funds. Each Fund pays Ultimus fees in accordance with the agreements for such services. In addition, each Fund pays out-of-pocket expenses including, but not limited to, postage, supplies, and costs of pricing its portfolio securities.
Under the terms of a Distribution Agreement with the Trust, Ultimus Fund Distributors, LLC (the “Distributor”) serves as principal underwriter to each Fund. The Distributor is a wholly-owned subsidiary of Ultimus. The Distributor is compensated by the Adviser (not the Funds) for acting as principal underwriter.
Certain officers and a Trustee of the Trust are also officers of Ultimus and the Distributor.
TRUSTEE COMPENSATION
Effective October 1, 2016, each Trustee who is not an “interested person” of the Trust (“Independent Trustee”) receives a $1,000 annual retainer from each Fund, paid quarterly, except for the Board Chair who receives a $1,200 annual retainer from each Fund, paid quarterly. Each Independent Trustee also receives from each Fund a fee of $500 for each Board meeting attended plus reimbursement for travel and other meeting-related expenses. Prior to October 1, 2016, each Fund paid each Independent Trustee a fee of $500 for each Board meeting attended, plus a $500 annual retainer.
60
| BARROW FUNDS NOTES TO FINANCIAL STATEMENTS (Continued) |
PRINCIPAL HOLDERS OF FUND SHARES
As of May 31, 2017, the following shareholders owned of record 5% or more of the outstanding shares of each Fund:
| Name of Record Owner | % Ownership |
| Barrow Value Opportunity Fund: | |
| Socatean Partners | 49% |
| Charles Schwab & Company, Inc. (for the benefit of its customers) | 29% |
| Robert F. Greenhill, Jr. (a principal of the Adviser) | 14% |
| Barrow Long/Short Opportunity Fund: | |
| Charles Schwab & Company, Inc. (for the benefit of its customers) | 57% |
| Socatean Partners | 17% |
| Robert F. Greenhill, Jr. (a principal of the Adviser) | 5% |
A beneficial owner of 25% or more of a Fund’s outstanding shares may be considered a controlling person. That shareholder’s vote could have a more significant effect on matters presented at a shareholder’s meeting.
5. Borrowing Costs
From time to time, a Fund may have an overdrawn cash balance at the custodian due to redemptions or market movements. When this occurs, the Fund will incur borrowing costs charged by the custodian. Accordingly, during the year ended May 31, 2017, Barrow Value Opportunity Fund and Barrow Long/Short Opportunity Fund incurred $2,599 and $474, respectively, of borrowing costs charged by the custodian.
6. Contingencies and Commitments
The Funds indemnify the Trust’s officers and Trustees for certain liabilities that might arise from their performance of their duties to the Funds. Additionally, in the normal course of business the Funds enter into contracts that contain a variety of representations and warranties and which provide general indemnifications. The Funds’ maximum exposure under these arrangements is unknown, as this would involve future claims that may be made against the Funds that have not yet occurred. However, based on experience, the Funds expect the risk of loss to be remote.
61
| BARROW FUNDS NOTES TO FINANCIAL STATEMENTS (Continued) |
7. Sector Risk
If a Fund has significant investments in the securities of issuers within a particular sector, any development affecting that sector will have a greater impact on the value of the net assets of the Fund than would be the case if the Fund did not have significant investments in that sector. In addition, this may increase the risk of loss in the Fund and increase the volatility of the Fund’s NAV per share. Occasionally, market conditions, regulatory changes, or other developments may negatively impact a particular sector, and therefore the value of the Fund’s portfolio will be adversely affected. As of May 31, 2017, Barrow Long/Short Opportunity Fund had the following percentages of the value of its net assets invested or sold short in stocks within the following sectors:
| Sector | Long Positions | Short Positions | Net Exposure |
| Consumer Discretionary | 28.2% | (20.1%) | 8.1% |
| Consumer Staples | 28.3% | (20.2%) | 8.1% |
| Health Care | 29.3% | (19.7%) | 9.6% |
As shown above, although the Fund has greater than 25% of the Fund’s net assets invested in long positions in the sector noted, the sector exposure is mitigated by short positions. As part of the Fund’s principal investment strategies, the Adviser monitors the Fund’s sector exposure to ensure the Fund’s portfolio is adequately diversified.
8. Subsequent Events
The Funds are required to recognize in the financial statements the effects of all subsequent events that provide additional evidence about conditions that existed as of the date of the Statements of Assets and Liabilities. For non-recognized subsequent events that must be disclosed to keep the financial statements from being misleading, the Funds are required to disclose the nature of the event as well as an estimate of its financial effect, or a statement that such an estimate cannot be made. Management has evaluated subsequent events through the issuance of these financial statements and has noted no such events.
62
| BARROW FUNDS REPORT OF INDEPENDENT REGISTERED PUBLIC ACCOUNTING FIRM |
To the Board of Trustees of Ultimus Managers Trust
and the Shareholders of Barrow Value Opportunity Fund
and Barrow Long/Short Opportunity Fund
and the Shareholders of Barrow Value Opportunity Fund
and Barrow Long/Short Opportunity Fund
We have audited the accompanying statements of assets and liabilities of Barrow Value Opportunity Fund and Barrow Long/Short Opportunity Fund, each a series of shares of beneficial interest in Ultimus Managers Trust (the “Funds”), including the schedules of investments, as of May 31, 2017, and the related statements of operations for the year then ended, the statements of changes in net assets for each of the years in the two-year period then ended and the financial highlights for each of the years in the three-year period then ended and for the period August 30, 2013 (commencement of operations) through May 31, 2014. These financial statements and financial highlights are the responsibility of the Funds’ management. Our responsibility is to express an opinion on these financial statements and financial highlights based on our audits.
We conducted our audits in accordance with the standards of the Public Company Accounting Oversight Board (United States). Those standards require that we plan and perform the audits to obtain reasonable assurance about whether the financial statements and financial highlights are free of material misstatement. An audit includes examining, on a test basis, evidence supporting the amounts and disclosures in the financial statements. Our procedures included confirmation of securities owned as of May 31, 2017 by correspondence with the custodian and brokers. An audit also includes assessing the accounting principles used and significant estimates made by management, as well as evaluating the overall financial statement presentation. We believe that our audits provide a reasonable basis for our opinion.
In our opinion, the financial statements and financial highlights referred to above present fairly, in all material respects, the financial position of Barrow Value Opportunity Fund and Barrow Long/Short Opportunity Fund as of May 31, 2017, and the results of their operations for the year then ended, the changes in their net assets for each of the years in the two-year period then ended and their financial highlights for each of the years in the three-year period then ended and for the period August 30, 2013 through May 31, 2014, in conformity with accounting principles generally accepted in the United States of America.
 | |
| BBD, LLP |
Philadelphia, Pennsylvania
July 27, 2017
July 27, 2017
63
| BARROW FUNDS ABOUT YOUR FUNDS’ EXPENSES (Unaudited) |
We believe it is important for you to understand the impact of costs on your investment. As a shareholder of the Funds, you incur ongoing costs, including management fees and other operating expenses. The following examples are intended to help you understand your ongoing costs (in dollars) of investing in the Funds and to compare these costs with the ongoing costs of investing in other mutual funds.
A mutual fund’s ongoing costs are expressed as a percentage of its average net assets. This figure is known as the expense ratio. The expenses in the table below are based on an investment of $1,000 made at the beginning of the most recent period (December 1, 2016) and held until the end of the period (May 31, 2017).
The table below illustrates each Fund’s ongoing costs in two ways:
Actual fund return – This section helps you to estimate the actual expenses that you paid over the period. The “Ending Account Value” shown is derived from each Fund’s actual return, and the fourth column shows the dollar amount of operating expenses that would have been paid by an investor who started with $1,000 in the Funds. You may use the information here, together with the amount you invested, to estimate the expenses that you paid over the period.
To do so, simply divide your account value by $1,000 (for example, an $8,600 account value divided by $1,000 = 8.6), then multiply the result by the number given for the Funds under the heading “Expenses Paid During Period.”
Hypothetical 5% return – This section is intended to help you compare the Funds’ ongoing costs with those of other mutual funds. It assumes that each Fund had an annual return of 5% before expenses during the period shown, but that the expense ratio is unchanged. In this case, because the return used is not the Funds’ actual return, the results do not apply to your investment. The example is useful in making comparisons because the SEC requires all mutual funds to calculate expenses based on a 5% return. You can assess each Fund’s ongoing costs by comparing this hypothetical example with the hypothetical examples that appear in shareholder reports of other funds.
Note that expenses shown in the table are meant to highlight and help you compare ongoing costs only. The Funds do not charge transaction fees, such as purchase or redemption fees, nor do they carry a “sales load.”
The calculations assume no shares were bought or sold during the period. Your actual costs may have been higher or lower, depending on the amount of your investment and the timing of any purchases or redemptions.
64
| BARROW FUNDS ABOUT YOUR FUNDS’ EXPENSES (Unaudited) (Continued) |
More information about the Funds’ expenses can be found in this report. For additional information on operating expenses and other shareholder costs, please refer to the Funds’ prospectus.
| Beginning Account Value December 1, 2016 | Ending Account Value May 31, 2017 | Net Expense Ratio(a) | Expenses Paid During Period(b) | |
| Barrow Value Opportunity Fund | ||||
| Based on Actual Fund Return | $1,000.00 | $ 1,070.90 | 1.15% | $ 5.94 |
| Based on Hypothetical 5% Return (before expenses) | $1,000.00 | $ 1,019.20 | 1.15% | $ 5.79 |
| Barrow Long/Short Opportunity Fund | ||||
| Based on Actual Fund Return | $1,000.00 | $ 997.00 | 4.53% | $ 22.55 |
| Based on Hypothetical 5% Return (before expenses) | $1,000.00 | $ 1,002.34 | 4.53% | $ 22.61 |
(a) | Annualized, based on each Fund’s most recent one-half year expenses. |
(b) | Expenses are equal to each Fund’s annualized net expense ratio multiplied by the average account value over the period, multiplied by 182/365 (to reflect the one-half year period). |
65
| BARROW FUNDS OTHER INFORMATION (Unaudited) |
A description of the policies and procedures that the Funds use to vote proxies relating to portfolio securities is available without charge upon request by calling toll-free 1-877-767-6633, or on the SEC’s website at http://www.sec.gov. Information regarding how the Funds voted proxies relating to portfolio securities during the most recent 12 month period ended June 30 is also available without charge upon request by calling toll-free 1-877-767-6633, or on the SEC’s website at http://www.sec.gov.
The Trust files a complete listing of portfolio holdings for each Fund with the SEC as of the end of the first and third quarters of each fiscal year on Form N-Q. These filings are available upon request by calling 1-877-767-6633. Furthermore, you may obtain a copy of the filings on the SEC’s website at http://www.sec.gov. The Trust’s Forms N-Q may also be reviewed and copied at the SEC’s Public Reference Room in Washington, DC, and information on the operation of the Public Reference Room may be obtained by calling 1-800-SEC-0330.
FEDERAL TAX INFORMATION (Unaudited)
In accordance with federal tax requirements, the following provides shareholders with information concerning distributions from ordinary income and net realized capital gains made by each Fund during the fiscal year ended May 31, 2017. Certain dividends paid by Barrow Value Opportunity Fund may be subject to a maximum tax rate of 23.8%. Barrow Value Opportunity Fund intends to designate up to a maximum amount of $167,099 as taxed at a maximum rate of 23.8%. Additionally, Barrow Value Opportunity Fund intends to designate up to a maximum amount of $56,937 as a long-term capital gain distribution. As required by federal regulations, complete information was computed and reported in conjunction with your 2016 Form 1099-DIV.
66
| BARROW FUNDS BOARD OF TRUSTEES AND EXECUTIVE OFFICERS (Unaudited) |
The Board of Trustees has overall responsibility for management of the Trust’s affairs. The Trustees serve during the lifetime of the Trust and until its termination, or until death, resignation, retirement, or removal. The Trustees, in turn, elect the officers of the Fund to actively supervise its day-to-day operations. The officers have been elected for an annual term. Unless otherwise noted, each Trustee’s and officer’s address is 225 Pictoria Drive, Suite 450, Cincinnati, OH 45246. The following are the Trustees and executive officers of the Fund:
| Name and Year of Birth | Length of Time Served | Position(s) Held with Trust | Principal Occupation(s) During Past 5 Years | Number of Funds in Trust Overseen by Trustee | Directorships of Public Companies Held by Trustee During Past 5 Years |
| Interested Trustees: | |||||
Robert G. Dorsey* Year of Birth: 1957 | Since February 2012 | Trustee (February 2012 to present) President (July 2012 to October 2013) | President and Managing Director of Ultimus Fund Solutions, LLC and Ultimus Fund Distributors, LLC (1999 to present) | 26 | None |
| Independent Trustees: | |||||
Janine L. Cohen Year of Birth: 1952 | Since January 2016 | Trustee | Retired since 2013; Chief Financial Officer from 2004 to 2013 and Chief Compliance Officer from 2008 to 2013 at AER Advisors, Inc. | 26 | None |
David M. Deptula Year of Birth: 1958 | Since June 2012 | Trustee | Vice President of Legal and Special Projects at Dayton Freight Lines, Inc. since 2016; Vice President of Tax Treasury at The Standard Register Inc. (formerly The Standard Register Company) from 2011 to 2016 | 26 | None |
67
| BARROW FUNDS BOARD OF TRUSTEES AND EXECUTIVE OFFICERS (Unaudited) (Continued) |
| Name and Year of Birth | Length of Time Served | Position(s) Held with Trust | Principal Occupation(s) During Past 5 Years | Number of Funds in Trust Overseen by Trustee | Directorships of Public Companies Held by Trustee During Past 5 Years |
| Independent Trustees (Continued): | |||||
John J. Discepoli Year of Birth: 1963 | Since June 2012 | Chairman (May 2016 to present) Trustee (June 2012 to present) | Owner of Discepoli Financial Planning, LLC (personal financial planning company) since 2004 | 26 | None |
| * | Mr. Dorsey is considered an “interested person” of the Trust within the meaning of Section 2(a)(19) of the 1940 Act because of his relationship with the Trust’s administrator, transfer agent and distributor. |
| Name and Year of Birth | Length of Time Served | Position(s) Held with Trust | Principal Occupation(s) During Past 5 Years |
| Executive Officers: | |||
David R. Carson Year of Birth: 1958 | Since April 2013 | Principal Executive Officer (April 2017 to present) President (October 2013 to present) Vice President (April 2013 to October 2013) | Vice President and Director of Client Strategies of Ultimus Fund Solutions, LLC (2013 to present); President, Unified Series Trust (2016 to present); Chief Compliance Officer, FSI Low Beta Absolute Return Fund (2013 to 2016), The Huntington Funds (2005 to 2013), Huntington Strategy Shares (2012 to 2013), and Huntington Asset Advisors (2013); Vice President, Huntington National Bank (2001 to 2013) |
68
| BARROW FUNDS BOARD OF TRUSTEES AND EXECUTIVE OFFICERS (Unaudited) (Continued) |
| Name and Year of Birth | Length of Time Served | Position(s) Held with Trust | Principal Occupation(s) During Past 5 Years |
| Executive Officers (Continued): | |||
Jennifer L. Leamer Year of Birth: 1976 | Since April 2014 | Treasurer (October 2014 to present) Assistant Treasurer (April 2014 to October 2014) | Vice President, Mutual Fund Controller of Ultimus Fund Solutions, LLC (2014 to present); Business Analyst of Ultimus Fund Solutions, LLC (2007 to 2014) |
Frank L. Newbauer Year of Birth: 1954 | Since February 2012 | Secretary (July 2017 to present) Assistant Secretary (April 2015 to July 2017) Secretary (February 2012 to April 2015) | Assistant Vice President of Ultimus Fund Solutions, LLC (2010 to present) |
| Charles C. Black Year of Birth: 1979 | Since April 2015 | Chief Compliance Officer (January 2016 to present) Assistant Chief Compliance Officer (April 2015 to January 2016) | Senior Compliance Officer of Ultimus Fund Solutions, LLC (2015 to present); Chief Compliance Officer of The Caldwell & Orkin Funds, Inc. (2016 to present); Senior Compliance Manager at Touchstone Mutual Funds (2013 to 2015); Senior Compliance Manager at Fund Evaluation Group (2011 to 2013) |
Additional information about members of the Board and executive officers is available in the Funds’ Statement of Additional Information (“SAI”). To obtain a free copy of the SAI, please call 1-877-767-6633.
69
| BARROW FUNDS DISCLOSURE REGARDING APPROVAL OF INVESTMENT ADVISORY AGREEMENT (Unaudited) |
The Board of Trustees (the “Board”), including the Independent Trustees voting separately, has reviewed and approved the Funds’ Investment Advisory Agreement with the Barrow Street Advisors LLC (the “Adviser”) for an additional annual term. Approval took place at an in-person meeting held on January 23-24, 2017, at which all of the Trustees were present.
In the course of their deliberations, the Board was advised by legal counsel. The Board received and reviewed a substantial amount of information provided by the Adviser in response to requests of the Board and counsel.
In deciding whether to approve the renewal of the Investment Advisory Agreement, the Board recalled its review of the materials related to the Funds and the Adviser throughout the preceding 12 months and its numerous discussions with Trust management and the Adviser about the operations and performance of the Funds during that period. The Board further considered those materials and discussions and other numerous factors, including the factors described below.
The nature, extent, and quality of the services provided by the Adviser. In this regard, the Board reviewed the services being provided by the Adviser to each of the Funds including, without limitation, its investment advisory services since the Fund’s inception, the Adviser’s compliance procedures and practices, and its efforts to promote each Fund and assist in their distribution. The Board also noted that a principal of the Adviser serves as the Funds’ Principal Executive Officer without additional compensation. After reviewing the foregoing information and further information regarding the Adviser’s business, the Board concluded that the quality, extent, and nature of the services provided by the Adviser were satisfactory and adequate for the Funds.
The investment performance of the Funds. In this regard, the Board compared the performance of each Fund with the performance of its benchmark indexes and related Morningstar categories. The Board also considered the consistency of the Adviser’s management with each Fund’s investment objective and policies. Following discussion of the investment performance of each Fund and its performance relative to its respective Morningstar categories, the Adviser’s experience in managing mutual funds, its historical investment performance, and other factors, the Board concluded that the investment performance of the Funds has been satisfactory.
The costs of the services provided and profits realized by the Adviser and its affiliates from its relationship with the Funds. In this regard, the Board considered the Adviser’s staffing, personnel, and methods of operations; the education and experience of its personnel; compliance program, policies, and procedures; financial condition and the level of commitment to each Fund, and, generally, the Adviser’s advisory business; the asset level of each Fund; the overall expenses of each Fund, including the advisory fee; and the differences in fees and services to the Adviser’s other similar clients that may be similar to the Funds. The Board considered the Adviser’s Expense Limitation
70
| BARROW FUNDS DISCLOSURE REGARDING APPROVAL OF INVESTMENT ADVISORY AGREEMENT (Unaudited) (Continued) |
Agreement (the “ELA”) with the Funds, and considered the Adviser’s current and past fee reductions and expense reimbursements for each Fund. The Board further took into account the Adviser’s commitment to continue the ELA for each Fund until at least October 1, 2018.
The Board also considered potential benefits for the Adviser in managing the Funds, including promotion of the Adviser’s name and the potential for it to receive research, statistical, or other services from the Funds’ trades. The Board compared each Fund’s advisory fee and overall expense ratio to the average advisory fees and average expense ratios for its peer group and Morningstar category. In addition, the Board compared each Fund to the other mutual funds in its Morningstar category and peer group in terms of the style of investment management, the size of the fund, and the nature of the investment strategies. The Board noted that the advisory fee for the Value Opportunity Fund was slightly below the average and slightly above the median for its peer group and the overall expense ratio for the Value Opportunity Fund was also below the average and above the median for its peer group. The Board further noted that the advisory fee for the Value Opportunity Fund was slightly above the 25th percentile for its Morningstar category and the overall expense ratio for the Value Opportunity Fund was also slightly above the 25th percentile for its Morningstar category. The Board noted that the advisory fee for the Long/Short Opportunity Fund was slightly below the average and the median for its peer group and the overall expense ratio for the Long/Short Opportunity Fund was also slightly below the average and equal to the median for its peer group. The Board further noted that the advisory fee for the Long/Short Opportunity Fund was higher than the average and the median for its Morningstar category, and the overall expense ratio for the Long/Short Opportunity Fund was higher than the average and the median for its Morningstar category. The Board also noted that both Funds generally had fewer assets than most funds in their respective peer groups and Morningstar categories. The Board also compared the fees paid by each Fund to the fees paid by other clients of the Adviser, and considered the similarities and differences of services received by such other clients as compared to the services provided to each Fund. Following these comparisons and upon further consideration and discussion of the foregoing, the Board concluded that the advisory fee paid to the Adviser by each Fund is fair and reasonable.
The extent to which economies of scale would be realized as each Fund grows and whether advisory fee levels reflect these economies of scale for the benefit of each of the Fund’s investors. In this regard, the Board considered that each Fund’s fee arrangements with the Adviser involve both the advisory fee and the ELA. The Board determined that while the advisory fee remained the same as asset levels increased, the shareholders of each Fund have experienced benefits from the ELA and shareholders of the Funds will continue to experience benefits from the ELA until the Funds’ assets grow to level where their expenses otherwise fall below the expense limit. Following
71
| BARROW FUNDS DISCLOSURE REGARDING APPROVAL OF INVESTMENT ADVISORY AGREEMENT (Unaudited) (Continued) |
further discussion of each Fund’s asset levels, expectations for growth, and level of fees, the Board determined that each Fund’s fee arrangement with the Adviser would continue to provide benefits. The Board also determined that the fee arrangements were fair and reasonable given each Fund’s projected asset levels for the next year.
Brokerage and portfolio transactions. In this regard, the Board considered the Adviser’s policies, procedures, and performance in seeking best execution for the Funds. The Board also considered the historical portfolio turnover rate for each Fund; the process by which evaluations are made of the overall reasonableness of commissions paid; the method and basis for selecting and evaluating the broker-dealers used; and any anticipated allocation of portfolio business to persons affiliated with the Adviser. After further review and discussion, the Board determined that the Adviser’s practices regarding brokerage and portfolio transactions were satisfactory.
Possible conflicts of interest. In evaluating the possibility for conflicts of interest, the Board considered such matters as the experience and abilities of the advisory personnel assigned to each Fund, the Adviser’s process for allocating trades among its different clients, and the substance and administration of the Adviser’s Code of Ethics. Following further consideration and discussion, the Board found that the Adviser’s standards and practices relating to the identification and mitigation of potential conflicts of interests were satisfactory.
Conclusion
After full consideration of the above factors as well as other factors, the Board unanimously concluded that approval of the Investment Advisory Agreement was in the best interests of each of the Funds and their respective shareholders. It was noted that in the Trustees’ deliberation regarding the approval of the renewal of the Investment Advisory Agreement, the Trustees did not identify any particular information or factor that was all-important or controlling, and that each individual Trustee may have attributed different weights to the various factors noted above.
72
This page intentionally left blank.

CINCINNATI ASSET MANAGEMENT FUNDS:
BROAD MARKET STRATEGIC INCOME FUND
Annual Report
May 31, 2017
CINCINNATI ASSET MANAGEMENT FUNDS: BROAD MARKET STRATEGIC INCOME FUND LETTER TO SHAREHOLDERS | June 27, 2017 |
Dear Fellow Shareholders,
Our Annual report for the Cincinnati Asset Management Funds: Broad Market Strategic Income Fund (the “Fund”) presents data and performance for the year ended May 31, 2017. All of us at Cincinnati Asset Management, Inc. want to thank you for your investment in the Fund and your confidence in our investment management.
The Fund is invested primarily in investment-grade and high-yield corporate bonds that we consider undervalued. We believe that our proprietary analysis enhances our ability to identify such opportunities and enables us to sell securities when more attractive opportunities present themselves. These investment decisions are made with the important discipline of maintaining portfolio diversification and with the dual objectives of achieving a high level of income while preserving capital. Our objective is to improve quality, increase yield and shorten maturity.
Our disciplined investing strategy resulted in the Fund holding 92 positions in the bonds of 74 different corporations on May 31. The Fund continues to be fully invested, as is its objective. The Fund trailed the Bloomberg Barclays U.S. Corporate Baa Index (the “Benchmark”) for the 12-month fiscal period ended May 31, with a total return of 4.22% compared to a return of 5.94% for the Benchmark. The Fund achieves its Baa credit quality by diversifying its holdings across the credit spectrum, although it does not purchase securities of companies rated below B3/B-. The lowest rated credits in the high yield universe significantly outperformed the high yield index as a whole, and the Baa credits in the investment grade universe also significantly outperformed A-rated and higher rated bonds. So the Fund, by holding higher rated high yield bonds and higher rated investment grade bonds, was adversely impacted as a result. We continue to believe that a broader diversification of credit risk will benefit Fund investors over reasonable time periods.
Interest rates were volatile during the year. On June 1, 2016, the yield on the 10-year Treasury Bond was 1.84%; it subsequently fell to 1.36% during July, rose to 1.85% pre-election; continued to increase to 2.60% during mid-December, fell to 2.20% at the end of May, and continues to trade at approximately that level as of the date of this letter. During the same period, the premium yield on A rated corporate bonds versus Treasuries declined from 1.16% to 0.95% and on BBB rated corporate bonds the premium declined from 2.00% to 1.46% (Barclays Daily Credit Call). Significantly, the premium yield on BB and B rated securities declined by 1.26% and 1.96%, respectively. Although bond prices decline as rates increase, and the net asset value of the Fund will reflect those changes in interest rates, the compression in the premium yields that corporate bonds experienced versus Treasuries during the year enabled the Fund to experience price appreciation in spite of the increasing Treasury rate. The Federal Reserve Board (the “FED”) increased the Federal Funds Target Rate by ¼% during December (and again during June), a move that had been generally anticipated for several months. Typically, changes in the Target Rate don’t significantly influence the 10-year Treasury rate but rather result in rate increases over the shorter portion of the yield curve; that dynamic can be observed in the “flattening” of the yield curve where the difference between yields on the 10-year and 2-year Treasuries declined from 0.97% to
1
0.92% over the course of the year. At this time, the timing of additional rate increases is less critical than the questions of “how high” and “how fast.” As of May 31, bonds that the Fund owns were yielding 3.58% to average maturity, around 1.5% more than U.S. Treasury yields. We believe that the Fund’s positions will continue to provide excellent value relative to other investment-grade rated fixed-income alternatives.
During the Fund’s fiscal year, reported gross domestic product (“GDP”) for the calendar year 2016 was 1.9% (per Bureau of Economic Analysis), while revised GDP for the first calendar quarter of 2017 was 1.2%. Current consensus forecast for GDP growth for 2017 is 2.4% (per Organisation for Economic Co-operation and Development). Unemployment has declined to its lowest levels since the 2008 financial crisis and initial jobless claims during the last six months have been steady at reduced levels. The FED’s measure of inflation is below their target of 2.0%. Although interest rates will be impacted by “headline” news and the so-called “risk-off/risk-on” trades that cause short-term volatility, we intend to continue to focus on the relative value of corporate and high-yield bonds and will maintain our focus on the intermediate-term maturity of the portfolio. It is the underlying credit quality of the companies we purchase that influences our investment decisions, not short-term interest rate fluctuations.
Oil prices increased during late summer 2016 and remained generally in a trading range of $50-55 until May 2017 when prices declined into the low/mid-$40 range. The Fund holds several positions in companies who are engaged in the energy sector, and we continue to actively monitor these credits to determine how they may perform over a full market cycle, always seeking to be rewarded for the risks we assume.
We expect increased volatility in fixed-income markets as some participants continually readjust positioning. High yield bond funds had negative flows during the Fund’s last fiscal quarter, while investment grade funds experienced robust increases. In a world of low interest rates, corporate and high yield bonds continue to offer value relative to Treasury securities. As always, we will continue to search for value and adjust positions as we uncover compelling situations.
We appreciate your confidence in our Fund. Our fellow investors are very important to us and if you have any questions regarding market conditions or the Fund, please don’t hesitate to call us (513.554.8500).
Sincerely,
Cincinnati Asset Management Funds: Broad Market Strategic Income Fund
Managed by Cincinnati Asset Management, Inc.
Managed by Cincinnati Asset Management, Inc.
2
Past performance is not predictive of future performance. Investment results and principal value will fluctuate so that shares, when redeemed, may be worth more or less than their original cost. Current performance may be higher or lower than the performance data quoted. Performance data current to the most recent month end are available by calling 1-866-738-1128.
An investor should consider the investment objectives, risks, charges and expenses of the Fund carefully before investing. The Fund’s prospectus contains this and other important information. To obtain a copy of the Fund’s prospectus please visit our website at www.cambondfunds.com or call 1-866-738-1128 and a copy will be sent to you free of charge. Please read the prospectus carefully before you invest. Cincinnati Asset Management Funds: Broad Market Strategic Income Fund is distributed by Ultimus Fund Distributors, LLC.
The Letter to Shareholders seeks to describe some of the adviser’s current opinions and views of the financial markets. Although the adviser believes it has a reasonable basis for any opinions or views expressed, actual results may differ, sometimes significantly so, from those expected or expressed. The securities held by the Fund that are discussed in the Letter to Shareholders were held during the period covered by this Report. They do not comprise the entire investment portfolio of the Fund, may be sold at any time and may no longer be held by the Fund. For a complete list of securities held by the Fund as of May 31, 2017, please see the Schedule of Investments section of the Annual Report. The opinions of the Fund’s adviser with respect to those securities may change at any time.
Statements in the Letter to Shareholders that reflect projections or expectations for future financial or economic performance of the Fund and the market in general and statements of the Fund’s plans and objectives for future operations are forward-looking statements. No assurance can be given that actual results or events will not differ materially from those projected, estimated, assumed, or anticipated in any such forward-looking statements. Important factors that could result in such differences, in addition to factors noted with such forward-looking statements include, without limitation, general economic conditions, such as inflation, recession, and interest rates. Past performance is not a guarantee of future results.
3
CINCINNATI ASSET MANAGEMENT FUNDS:
BROAD MARKET STRATEGIC INCOME FUND
PERFORMANCE INFORMATION
May 31, 2017 (Unaudited)
BROAD MARKET STRATEGIC INCOME FUND
PERFORMANCE INFORMATION
May 31, 2017 (Unaudited)
Comparison of the Change in Value of a $10,000 Investment
in Cincinnati Asset Management Funds: Broad Market Strategic
Income Fund versus the Bloomberg Barclays U.S. Corporate BAA Index
in Cincinnati Asset Management Funds: Broad Market Strategic
Income Fund versus the Bloomberg Barclays U.S. Corporate BAA Index
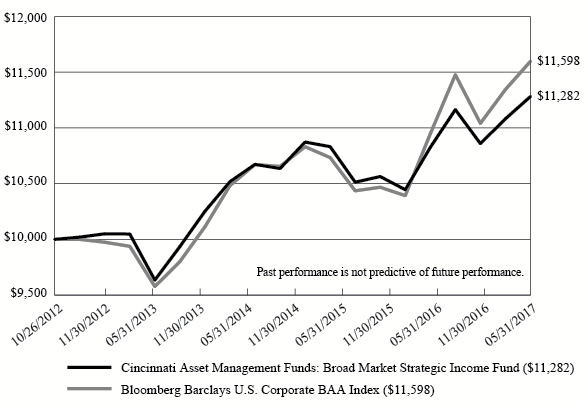
Average Annual Total Returns For Periods Ended May 31, 2017 | ||||
| 1 Year | 3 Years | Since Inception(b) | ||
Cincinnati Asset Management Funds: Broad Market Strategic Income Fund (a) | 4.22% | 2.37% | 2.66% | |
| Bloomberg Barclays U.S. Corporate BAA Index | 5.94% | 3.43% | 3.28% | |
(a) | The Fund’s total returns do not reflect the deduction of taxes a shareholder would pay on Fund distributions or the redemption of Fund shares. |
(b) | The Fund commenced operations on October 26, 2012. |
4
CINCINNATI ASSET MANAGEMENT FUNDS:
BROAD MARKET STRATEGIC INCOME FUND
PORTFOLIO INFORMATION
May 31, 2017 (Unaudited)
BROAD MARKET STRATEGIC INCOME FUND
PORTFOLIO INFORMATION
May 31, 2017 (Unaudited)
Sector Diversification (% of Net Assets)

Top 10 Investments
| Security Description | % of Net Assets |
| Vulcan Materials Co., 3.900%, due 04/01/27 | 2.9% |
| Exxon Mobil Corp., 3.043%, due 03/01/26 | 2.9% |
| Apple, Inc., 3.250%, due 02/23/26 | 2.4% |
| L-3 Communications Corp., 3.950%, due 05/28/24 | 2.3% |
| Toll Brothers Finance Corp., 5.875%, due 02/15/22 | 2.2% |
| Microsoft Corp., 2.400%, due 08/08/26 | 2.2% |
| United Airlines, Inc., Class A Pass-Through Certificates, Series 2014-2, 3.750%, due 03/03/28 | 2.1% |
| Wells Fargo & Co., 4.125%, due 08/15/23 | 2.1% |
| Halliburton Co., 3.500%, due 08/01/23 | 2.1% |
| Morgan Stanley, 3.700%, due 10/23/24 | 2.1% |
| Credit Rating Allocation | ||
| S&P Credit Quality | % of Portfolio | |
| AAA | 5.9% | |
| AA | 16.0% | |
| A | 28.1% | |
| BBB | 18.8% | |
| BB | 18.7% | |
| B | 12.5% | |
5
| CINCINNATI ASSET MANAGEMENT FUNDS: BROAD MARKET STRATEGIC INCOME FUND SCHEDULE OF INVESTMENTS May 31, 2017 | |||||||||||||
| CORPORATE BONDS — 97.0% | Coupon | Maturity | Par Value | Value | |||||||||
| Consumer Discretionary — 11.8% | |||||||||||||
| AMC Entertainment Holdings, Inc. | 5.750 | % | 06/15/25 | $ | 67,000 | $ | 69,720 | ||||||
| Avis Budget Car Rental, LLC | 5.500 | % | 04/01/23 | 75,000 | 73,781 | ||||||||
| Ford Motor Co. | 4.346 | % | 12/08/26 | 100,000 | 102,332 | ||||||||
| Ford Motor Credit Co., LLC | 4.250 | % | 09/20/22 | 150,000 | 157,518 | ||||||||
| MGM Resorts International, Inc. | 4.625 | % | 09/01/26 | 71,000 | 71,444 | ||||||||
| Penske Auto Group, Inc. | 5.375 | % | 12/01/24 | 60,000 | 60,750 | ||||||||
| QVC, Inc. | 4.450 | % | 02/15/25 | 70,000 | 69,451 | ||||||||
| Regal Entertainment Group | 5.750 | % | 02/01/25 | 70,000 | 72,450 | ||||||||
| Service Corp. International | 7.500 | % | 04/01/27 | 56,000 | 65,940 | ||||||||
| Tenneco, Inc. | 5.375 | % | 12/15/24 | 55,000 | 57,750 | ||||||||
| Tenneco, Inc. | 5.000 | % | 07/15/26 | 15,000 | 15,206 | ||||||||
| Toll Brothers Finance Corp. | 5.875 | % | 02/15/22 | 175,000 | 193,594 | ||||||||
| Toll Brothers Finance Corp. | 5.625 | % | 01/15/24 | 21,000 | 22,680 | ||||||||
| 1,032,616 | |||||||||||||
| Consumer Staples — 4.8% | |||||||||||||
| Anheuser-Busch InBev SA/NV | 2.625 | % | 01/17/23 | 100,000 | 99,991 | ||||||||
| B&G Foods, Inc. | 4.625 | % | 06/01/21 | 32,000 | 32,800 | ||||||||
| Ingles Markets, Inc. | 5.750 | % | 06/15/23 | 75,000 | 76,500 | ||||||||
| Pinn Foods Finance, LLC | 5.875 | % | 01/15/24 | 67,000 | 71,690 | ||||||||
| Spectrum Brands, Inc. | 5.750 | % | 07/15/25 | 64,000 | 68,327 | ||||||||
| Wal-Mart Stores, Inc. | 2.550 | % | 04/11/23 | 65,000 | 66,135 | ||||||||
| 415,443 | |||||||||||||
| Energy — 11.2% | |||||||||||||
| Cheniere Corpus Christi Holdings, LLC | 5.875 | % | 03/31/25 | 64,000 | 68,960 | ||||||||
| Chevron Corp. | 2.355 | % | 12/05/22 | 150,000 | 149,776 | ||||||||
| Chevron Corp. | 2.954 | % | 05/16/26 | 100,000 | 100,076 | ||||||||
| Exxon Mobil Corp. | 3.043 | % | 03/01/26 | 250,000 | 254,142 | ||||||||
| Halliburton Co. | 3.500 | % | 08/01/23 | 175,000 | 181,392 | ||||||||
| Schlumberger Ltd. | 3.650 | % | 12/01/23 | 150,000 | 158,703 | ||||||||
| Sunoco, L.P. | 6.375 | % | 04/01/23 | 65,000 | 69,550 | ||||||||
| 982,599 | |||||||||||||
| Financials — 18.3% | |||||||||||||
| Aircastle Ltd. | 5.500 | % | 02/15/22 | 58,000 | 63,220 | ||||||||
| Bank of New York Mellon Corp. (The) | 3.000 | % | 02/24/25 | 100,000 | 100,454 | ||||||||
| Berkshire Hathaway, Inc. | 3.125 | % | 03/15/26 | 125,000 | 127,521 | ||||||||
| Branch Banking & Trust Co. | 3.625 | % | 09/16/25 | 150,000 | 156,162 | ||||||||
| Corrections Corp. of America | 5.000 | % | 10/15/22 | 35,000 | 36,225 | ||||||||
| Corrections Corp. of America | 4.625 | % | 05/01/23 | 2,000 | 2,025 | ||||||||
| International Lease Finance Corp. | 5.875 | % | 08/15/22 | 150,000 | 170,608 | ||||||||
| Morgan Stanley | 3.700 | % | 10/23/24 | 175,000 | 180,793 | ||||||||
| PNC Financial Services Group, Inc. (The) | 3.900 | % | 04/29/24 | 150,000 | 158,209 | ||||||||
6
| CINCINNATI ASSET MANAGEMENT FUNDS: BROAD MARKET STRATEGIC INCOME FUND SCHEDULE OF INVESTMENTS (Continued) | |||||||||||||
| CORPORATE BONDS — 97.0% (Continued) | Coupon | Maturity | Par Value | Value | |||||||||
| Financials — 18.3% (Continued) | |||||||||||||
| Progressive Corp. (The) | 2.450 | % | 01/15/27 | $ | 75,000 | $ | 72,004 | ||||||
| State Street Corp. | 2.650 | % | 05/19/26 | 175,000 | 171,350 | ||||||||
| U.S. Bancorp | 2.950 | % | 07/15/22 | 175,000 | 178,833 | ||||||||
| Wells Fargo & Co. | 4.125 | % | 08/15/23 | 175,000 | 185,801 | ||||||||
| 1,603,205 | |||||||||||||
| Health Care — 4.5% | |||||||||||||
| DaVita HealthCare Partners, Inc. | 5.000 | % | 05/01/25 | 80,000 | 79,700 | ||||||||
| HCA Holdings, Inc. | 5.375 | % | 02/01/25 | 60,000 | 63,225 | ||||||||
| HCA Holdings, Inc. | 5.875 | % | 02/15/26 | 15,000 | 16,331 | ||||||||
| HealthSouth Corp. | 5.750 | % | 11/01/24 | 60,000 | 62,250 | ||||||||
| HealthSouth Corp. | 5.750 | % | 09/15/25 | 15,000 | 15,675 | ||||||||
| Medtronic, Inc. | 3.500 | % | 03/15/25 | 150,000 | 156,681 | ||||||||
| 393,862 | |||||||||||||
| Industrials — 10.6% | |||||||||||||
| General Dynamics Corp. | 2.250 | % | 11/15/22 | 100,000 | 99,905 | ||||||||
| Hawaiian Airlines, Inc., Series 2013-1A | 3.900 | % | 01/15/26 | 62,567 | 64,131 | ||||||||
| Iron Mountain, Inc. | 5.750 | % | 08/15/24 | 85,000 | 87,656 | ||||||||
| L-3 Communications Corp. | 3.950 | % | 05/28/24 | 195,000 | 202,050 | ||||||||
| United Airlines, Inc., Class B Pass-Through Certificates, Series 2013-1 | 5.375 | % | 02/15/23 | 33,169 | 34,951 | ||||||||
| United Airlines, Inc., Class A Pass-Through Certificates, Series 2014-2 | 3.750 | % | 03/03/28 | 182,757 | 188,012 | ||||||||
| United Rentals North America, Inc. | 5.875 | % | 09/15/26 | 30,000 | 31,912 | ||||||||
| United Rentals North America, Inc. | 5.500 | % | 05/15/27 | 35,000 | 36,050 | ||||||||
| US Airways, Inc., Class B Pass-Through Certificates, Series 2012-2 | 6.750 | % | 12/03/22 | 32,904 | 35,784 | ||||||||
| US Airways, Inc., Class A Pass-Through Certificates, Series 2012-2 | 4.625 | % | 12/03/26 | 133,800 | 142,497 | ||||||||
| 922,948 | |||||||||||||
| Information Technology — 9.4% | |||||||||||||
| Apple, Inc. | 3.250 | % | 02/23/26 | 205,000 | 210,328 | ||||||||
| Equinix, Inc. | 5.875 | % | 01/15/26 | 20,000 | 21,794 | ||||||||
| Intel Corp. | 2.700 | % | 12/15/22 | 150,000 | 152,817 | ||||||||
| Intel Corp. | 2.600 | % | 05/19/26 | 50,000 | 48,715 | ||||||||
| Intel Corp. | 3.150 | % | 05/11/27 | 50,000 | 50,459 | ||||||||
| Microsoft Corp. | 2.400 | % | 08/08/26 | 200,000 | 193,069 | ||||||||
| Microsoft Corp. | 3.300 | % | 02/06/27 | 50,000 | 51,800 | ||||||||
| Oracle Corp. | 2.650 | % | 07/15/26 | 100,000 | 97,193 | ||||||||
| 826,175 | |||||||||||||
| Materials — 6.5% | |||||||||||||
| Berry Plastics Corp. | 5.125 | % | 07/15/23 | 66,000 | 69,415 | ||||||||
| Graphic Packaging International, Inc. | 4.125 | % | 08/15/24 | 85,000 | 86,488 | ||||||||
| Huntsman International, LLC | 5.125 | % | 11/15/22 | 10,000 | 10,825 | ||||||||
7
| CINCINNATI ASSET MANAGEMENT FUNDS: BROAD MARKET STRATEGIC INCOME FUND SCHEDULE OF INVESTMENTS (Continued) | |||||||||||||
| CORPORATE BONDS — 97.0% (Continued) | Coupon | Maturity | Par Value | Value | |||||||||
| Materials — 6.5% (Continued) | |||||||||||||
| Praxair, Inc. | 2.200 | % | 08/15/22 | $ | 150,000 | $ | 149,020 | ||||||
| Vulcan Materials Co. | 3.900 | % | 04/01/27 | 250,000 | 256,300 | ||||||||
| 572,048 | |||||||||||||
| Real Estate — 2.9% | |||||||||||||
| Geo Group, Inc. (The) | 6.000 | % | 04/15/26 | 66,000 | 68,640 | ||||||||
| Simon Property Group, L.P. | 3.750 | % | 02/01/24 | 150,000 | 156,841 | ||||||||
| Simon Property Group, L.P. | 3.250 | % | 11/30/26 | 25,000 | 24,971 | ||||||||
| 250,452 | |||||||||||||
| Telecommunication Services — 13.8% | |||||||||||||
| AT&T, Inc. | 2.625 | % | 12/01/22 | 100,000 | 98,502 | ||||||||
| CCO Holdings, LLC/CCO Holdings Capital Corp. | 5.750 | % | 01/15/24 | 67,000 | 71,146 | ||||||||
| Charter Communications, LLC | 4.908 | % | 07/23/25 | 150,000 | 163,074 | ||||||||
| Comcast Corp. | 3.600 | % | 03/01/24 | 80,000 | 84,610 | ||||||||
| Comcast Corp. | 3.150 | % | 03/01/26 | 115,000 | 116,000 | ||||||||
| CSC Holdings, LLC | 5.250 | % | 06/01/24 | 69,000 | 70,639 | ||||||||
| Frontier Communications Corp. | 11.000 | % | 09/15/25 | 15,000 | 14,100 | ||||||||
| Frontier Communications Corp. | 9.000 | % | 08/15/31 | 55,000 | 45,375 | ||||||||
| Lamar Media Corp. | 5.750 | % | 02/01/26 | 67,000 | 72,779 | ||||||||
| Level 3 Financing, Inc. | 5.375 | % | 05/01/25 | 66,000 | 69,526 | ||||||||
| Mediacom, LLC/Mediacom Capital Corp. | 5.500 | % | 04/15/21 | 8,000 | 8,250 | ||||||||
| Mediacom, LLC/Mediacom Capital Corp. | 6.375 | % | 04/01/23 | 66,000 | 69,465 | ||||||||
| Qwest Corp. | 6.750 | % | 12/01/21 | 150,000 | 168,110 | ||||||||
| T-Mobile USA, Inc. | 6.375 | % | 03/01/25 | 4,000 | 4,345 | ||||||||
| T-Mobile USA, Inc. | 5.375 | % | 04/15/27 | 59,000 | 62,983 | ||||||||
| Zayo Group, LLC | 6.375 | % | 05/15/25 | 80,000 | 86,300 | ||||||||
| 1,205,204 | |||||||||||||
| Utilities — 3.2% | |||||||||||||
| AES Corp. (The) | 5.500 | % | 03/15/24 | 43,000 | 44,827 | ||||||||
| AES Corp. (The) | 5.500 | % | 04/15/25 | 30,000 | 31,350 | ||||||||
| Amerigas Finance, LLC | 5.875 | % | 08/20/26 | 72,000 | 73,800 | ||||||||
| Calpine Corp. | 5.750 | % | 01/15/25 | 74,000 | 70,578 | ||||||||
| Suburban Propane Partners, L.P. | 5.500 | % | 06/01/24 | 60,000 | 60,450 | ||||||||
| 281,005 | |||||||||||||
Total Investments at Value — 97.0% (Cost $8,368,920) | $ | 8,485,557 | |||||||||||
Other Assets in Excess of Liabilities — 3.0% | 263,813 | ||||||||||||
Net Assets — 100.0% | $ | 8,749,370 | |||||||||||
| See accompanying notes to financial statements. |
8
| CINCINNATI ASSET MANAGEMENT FUNDS: BROAD MARKET STRATEGIC INCOME FUND STATEMENT OF ASSETS AND LIABILITIES May 31, 2017 | ||||
| ASSETS | ||||
| Investments in securities: | ||||
| At acquisition cost | $ | 8,368,920 | ||
| At value (Note 2) | $ | 8,485,557 | ||
| Cash | 295,271 | |||
| Receivable from Adviser (Note 4) | 13,896 | |||
| Interest receivable | 98,686 | |||
| Other assets | 15,635 | |||
| Total assets | 8,909,045 | |||
| LIABILITIES | ||||
| Payable for investment securities purchased | 142,363 | |||
| Payable to administrator (Note 4) | 7,075 | |||
| Accrued distribution fees (Note 4) | 1,517 | |||
| Other accrued expenses | 8,720 | |||
| Total liabilities | 159,675 | |||
| NET ASSETS | $ | 8,749,370 | ||
| NET ASSETS CONSIST OF: | ||||
| Paid-in capital | $ | 8,860,566 | ||
| Undistributed net investment income | 43,644 | |||
| Accumulated net realized losses from security transactions | (271,477 | ) | ||
| Net unrealized appreciation on investments | 116,637 | |||
| NET ASSETS | $ | 8,749,370 | ||
| Shares of beneficial interest outstanding (unlimited number of shares authorized, no par value) | 893,759 | |||
| Net asset value, offering price and redemption price per share (Note 2) | $ | 9.79 | ||
| See accompanying notes to financial statements. |
9
| CINCINNATI ASSET MANAGEMENT FUNDS: BROAD MARKET STRATEGIC INCOME FUND STATEMENT OF OPERATIONS For the Year Ended May 31, 2017 | ||||
| INVESTMENT INCOME | ||||
| Interest | $ | 304,719 | ||
| EXPENSES | ||||
| Investment advisory fees (Note 4) | 62,108 | |||
| Professional fees | 39,914 | |||
| Fund accounting fees (Note 4) | 30,835 | |||
| Administration fees (Note 4) | 30,000 | |||
| Registration and filing fees | 22,518 | |||
| Pricing fees | 20,831 | |||
| Distribution fees (Note 4) | 20,703 | |||
| Compliance fees (Note 4) | 12,000 | |||
| Transfer agent fees (Note 4) | 12,000 | |||
| Trustees’ fees and expenses (Note 4) | 9,611 | |||
| Custody and bank service fees | 7,537 | |||
| Postage and supplies | 2,503 | |||
| Insurance expense | 2,078 | |||
| Other expenses | 10,465 | |||
| Total expenses | 283,103 | |||
| Less fee waivers and expense reimbursements by the Adviser (Note 4) | (229,275 | ) | ||
| Net expenses | 53,828 | |||
| NET INVESTMENT INCOME | 250,891 | |||
| REALIZED AND UNREALIZED GAINS ON INVESTMENTS | ||||
| Net realized gains from security transactions | 62,822 | |||
| Net change in unrealized appreciation (depreciation) on investments | 23,033 | |||
| NET REALIZED AND UNREALIZED GAINS ON INVESTMENTS | 85,855 | |||
| NET INCREASE IN NET ASSETS RESULTING FROM OPERATIONS | $ | 336,746 | ||
| See accompanying notes to financial statements. |
10
| CINCINNATI ASSET MANAGEMENT FUNDS: BROAD MARKET STRATEGIC INCOME FUND STATEMENTS OF CHANGES IN NET ASSETS | ||||||||
| Year Ended May 31, 2017 | Year Ended May 31, 2016 | |||||||
| FROM OPERATIONS | ||||||||
| Net investment income | $ | 250,891 | $ | 234,307 | ||||
| Net realized gains (losses) from security transactions | 62,822 | (331,563 | ) | |||||
| Net change in unrealized appreciation (depreciation) on investments | 23,033 | 99,081 | ||||||
| Net increase in net assets resulting from operations | 336,746 | 1,825 | ||||||
| DISTRIBUTIONS TO SHAREHOLDERS | ||||||||
| From net investment income | (245,599 | ) | (238,438 | ) | ||||
| FROM CAPITAL SHARE TRANSACTIONS | ||||||||
| Proceeds from shares sold | 1,441,899 | 506,515 | ||||||
| Net asset value of shares issued in reinvestment of distributions to shareholders | 245,599 | 238,438 | ||||||
| Payments for shares redeemed | (594,992 | ) | (174,874 | ) | ||||
| Net increase in net assets from capital share transactions | 1,092,506 | 570,079 | ||||||
| TOTAL INCREASE IN NET ASSETS | 1,183,653 | 333,466 | ||||||
| NET ASSETS | ||||||||
| Beginning of year | 7,565,717 | 7,232,251 | ||||||
| End of year | $ | 8,749,370 | $ | 7,565,717 | ||||
| UNDISTRIBUTED NET INVESTMENT INCOME | $ | 43,644 | $ | 37,840 | ||||
| CAPITAL SHARE ACTIVITY | ||||||||
| Shares sold | 147,943 | 53,320 | ||||||
| Shares reinvested | 25,400 | 24,991 | ||||||
| Shares redeemed | (61,207 | ) | (18,186 | ) | ||||
| Net increase in shares outstanding | 112,136 | 60,125 | ||||||
| Shares outstanding at beginning of year | 781,623 | 721,498 | ||||||
| Shares outstanding at end of year | 893,759 | 781,623 | ||||||
| See accompanying notes to financial statements. |
11
| CINCINNATI ASSET MANAGEMENT FUNDS: BROAD MARKET STRATEGIC INCOME FUND FINANCIAL HIGHLIGHTS | ||||||||||||||||||||
| Per Share Data for a Share Outstanding Throughout Each Period | ||||||||||||||||||||
| Year Ended May 31, 2017 | Year Ended May 31, 2016 | Year Ended May 31, 2015 | Year Ended May 31, 2014 | Period Ended May 31, 2013(a) | ||||||||||||||||
| Net asset value at beginning of period | $ | 9.68 | $ | 10.02 | $ | 10.05 | $ | 9.94 | $ | 10.00 | ||||||||||
| Income (loss) from investment operations: | ||||||||||||||||||||
| Net investment income | 0.29 | 0.32 | 0.33 | 0.33 | 0.16 | |||||||||||||||
| Net realized and unrealized gains (losses) on investments | 0.11 | (0.33 | ) | (0.04 | ) | 0.11 | (0.11 | ) | ||||||||||||
| Total from investment operations | 0.40 | (0.01 | ) | 0.29 | 0.44 | 0.05 | ||||||||||||||
| Less distributions: | ||||||||||||||||||||
| From net investment income | (0.29 | ) | (0.33 | ) | (0.32 | ) | (0.33 | ) | (0.11 | ) | ||||||||||
| Net asset value at end of period | $ | 9.79 | $ | 9.68 | $ | 10.02 | $ | 10.05 | $ | 9.94 | ||||||||||
Total return (b) | 4.22 | % | (0.06 | %) | 2.99 | % | 4.68 | % | 0.48 | %(c) | ||||||||||
| Net assets at end of period (000’s) | $ | 8,749 | $ | 7,566 | $ | 7,232 | $ | 6,407 | $ | 5,220 | ||||||||||
| Ratios/supplementary data: | ||||||||||||||||||||
| Ratio of total expenses to average net assets | 3.41 | % | 3.77 | % | 3.71 | % | 4.53 | % | 3.69 | %(d) | ||||||||||
Ratio of net expenses to average net assets (e) | 0.65 | % | 0.65 | % | 0.65 | % | 0.65 | % | 0.65 | %(d) | ||||||||||
Ratio of net investment income to average net assets (e) | 3.02 | % | 3.30 | % | 3.35 | % | 3.41 | % | 2.81 | %(d) | ||||||||||
| Portfolio turnover rate | 31 | % | 18 | % | 23 | % | 11 | % | 13 | %(c) | ||||||||||
(a) | Represents the period from the commencement of operations (October 26, 2012) through May 31, 2013. |
(b) | Total return is a measure of the change in value of an investment in the Fund over the periods covered. The returns shown do not reflect the deduction of taxes a shareholder would pay on Fund distributions, if any, or the redemption of Fund shares. The total returns would be lower if the Adviser had not waived advisory fees and reimbursed expenses. |
(c) | Not annualized. |
(d) | Annualized. |
(e) | Ratio was determined after advisory fee waivers and expense reimbursements (Note 4). |
| See accompanying notes to financial statements. | |
12
CINCINNATI ASSET MANAGEMENT FUNDS:
BROAD MARKET STRATEGIC INCOME FUND
NOTES TO FINANCIAL STATEMENTS
May 31, 2017
BROAD MARKET STRATEGIC INCOME FUND
NOTES TO FINANCIAL STATEMENTS
May 31, 2017
1. Organization
Cincinnati Asset Management Funds: Broad Market Strategic Income Fund (the “Fund”) is a diversified series of Ultimus Managers Trust (the “Trust”), an open-end investment company established as an Ohio business trust under a Declaration of Trust dated February 28, 2012. Other series of the Trust are not incorporated in this report. The Fund commenced operations on October 26, 2012.
The investment objective of the Fund is to seek to achieve a high level of income consistent with a secondary goal of capital preservation.
2. Significant Accounting Policies
The following is a summary of the Fund’s significant accounting policies. These policies are in conformity with accounting principles generally accepted in the United States of America (“GAAP”). As an investment company, as defined in Financial Accounting Standards Board (“FASB”) Accounting Standards Update 2013-08, the Fund follows accounting and reporting guidance under FASB Accounting Standards Codification Topic 946, “Financial Services – Investment Companies.”
In October 2016, the U.S. Securities and Exchange Commission (the “SEC”) adopted amendments to Regulation S-X which will impact financial statement presentation, particularly the presentation of derivative investments. Although still evaluating the impact, management believes that many of the Regulation S-X amendments are consistent with the Fund’s current financial statement presentation and expects that the Fund will be able to comply with the amendments by the August 1, 2017 compliance date.
Securities valuation – The Fund’s fixed income securities are valued using prices provided by an independent pricing service approved by the Trust’s Board of Trustees (the “Board”). The independent pricing service uses information with respect to transactions in bonds, quotations from bond dealers, market transactions in comparable securities, and various relationships between securities in determining these prices. The methods used by the independent pricing service and the quality of valuations so established are reviewed by Cincinnati Asset Management, Inc. (the “Adviser”), under the general supervision of the Board. Securities for which market quotations are not readily available are valued at fair value as determined in good faith under procedures adopted by the Board.
GAAP establishes a single authoritative definition of fair value, sets out a framework for measuring fair value, and requires additional disclosures about fair value measurements.
Various inputs are used in determining the value of the Fund’s investments. These inputs are summarized in the three broad levels listed below:
| ● | Level 1 – quoted prices in active markets for identical securities |
| ● | Level 2 – other significant observable inputs |
13
| CINCINNATI ASSET MANAGEMENT FUNDS: BROAD MARKET STRATEGIC INCOME FUND NOTES TO FINANCIAL STATEMENTS (Continued) |
| ● | Level 3 – significant unobservable inputs |
Corporate bonds are classified as Level 2 since values are based on prices provided by an independent pricing service that utilizes various “other significant observable inputs” including bid and ask quotations, prices of similar securities, and interest rates, among other factors. The inputs or methods used for valuing securities are not necessarily an indication of the risks associated with investing in those securities. The inputs used to measure fair value may fall into different levels of the fair value hierarchy. In such cases, for disclosure purposes, the level in the fair value hierarchy within which the fair value measurement falls in its entirety is determined based on the lowest level input that is significant to the fair value measurement.
The following is a summary of the inputs used to value the Fund’s investments as of May 31, 2017:
| Level 1 | Level 2 | Level 3 | Total | |||||||||||||
| Corporate Bonds | $ | — | $ | 8,485,557 | $ | — | $ | 8,485,557 | ||||||||
Refer to the Fund’s Schedule of Investments for a listing of the securities by sector type. As of May 31, 2017, the Fund did not have any transfers between Levels. In addition, the Fund did not have derivative instruments or any assets or liabilities that were measured at fair value on a recurring basis using significant unobservable inputs (Level 3) as of May 31, 2017. It is the Fund’s policy to recognize transfers between Levels at the end of the reporting period.
Share valuation – The net asset value (“NAV”) per share of the Fund is calculated daily by dividing the total value of the Fund’s assets, less liabilities, by the number of shares outstanding. The offering price and redemption price per share of the Fund is equal to the NAV per share.
Investment income – Interest income is accrued as earned. Discounts and premiums on fixed income securities purchased are accreted or amortized using the effective interest method. Dividend income is recorded on the ex-dividend date.
Security transactions – Security transactions are accounted for on the trade date. Realized gains and losses on securities sold are determined on a specific identification basis.
Common expenses – Common expenses of the Trust are allocated among the Fund and other series of the Trust based on the relative net assets of each series or the nature of the services performed and the relative applicability to each series.
Distributions to shareholders – Dividends from net investment income are declared and paid quarterly to shareholders. Net realized capital gains, if any, are distributed at least once each year. The amount of distributions from net investment income and net realized capital gains are determined in accordance with federal income tax regulations, which may differ from GAAP. Dividends and distributions to shareholders are recorded on the ex-dividend
14
CINCINNATI ASSET MANAGEMENT FUNDS: BROAD MARKET STRATEGIC INCOME FUND NOTES TO FINANCIAL STATEMENTS (Continued) |
date. The tax character of the Fund’s distributions during the years ended May 31, 2017 and 2016 was ordinary income. On June 30, 2017, the Fund paid an ordinary income dividend of $0.0710 per share to shareholders of record on June 29, 2017.
Estimates – The preparation of financial statements in conformity with GAAP requires management to make estimates and assumptions that affect the reported amounts of assets and liabilities and disclosure of contingent assets and liabilities as of the date of the financial statements and the reported amounts of income and expenses during the reporting period. Actual results could differ from those estimates.
Federal income tax – The Fund has qualified and intends to continue to qualify as a regulated investment company under the Internal Revenue Code of 1986 (the “Code”). Qualification generally will relieve the Fund of liability for federal income taxes to the extent 100% of its net investment income and net realized capital gains are distributed in accordance with the Code.
In order to avoid imposition of the excise tax applicable to regulated investment companies, it is also the Fund’s intention to declare as dividends in each calendar year at least 98% of its net investment income (earned during the calendar year) and 98.2% of its net realized capital gains (earned during the twelve months ended October 31) plus undistributed amounts from prior years.
The following information is computed on a tax basis for each item as of May 31, 2017:
| Tax cost of portfolio investments | $ | 8,368,920 | ||
| Gross unrealized appreciation | $ | 173,786 | ||
| Gross unrealized depreciation | (57,149 | ) | ||
| Net unrealized appreciation on investments | 116,637 | |||
| Undistributed ordinary income | 43,644 | |||
| Capital loss carryforwards | (271,477 | ) | ||
| Accumulated deficit | $ | (111,196 | ) |
During the year ended May 31, 2017, the Fund utilized $11,327 of short-term capital loss carryforwards and $50,983 of long-term capital loss carryforwards to offset current year capital gains.
As of May 31, 2017, the Fund had short-term capital loss carryforwards of $82,864 and long-term capital loss carryfowards of $188,613. These capital loss carryforwards, which do not expire, may be utilized in future years to offset net realized capital gains, if any, prior to distributing such gains to shareholders.
For the year ended May 31, 2017, the Fund reclassified $512 of undistributed net investment income against accumulated net realized losses from security transactions on the Statement of Assets and Liabilities due to permanent differences in the recognition of capital gains or
15
CINCINNATI ASSET MANAGEMENT FUNDS: BROAD MARKET STRATEGIC INCOME FUND NOTES TO FINANCIAL STATEMENTS (Continued) |
losses under income tax regulations and GAAP. This difference is due to the tax treatment of paydown adjustments. Such reclassification had no effect on the Fund’s net assets or NAV per share.
The Fund recognizes the tax benefits or expenses of uncertain tax positions only when the position is “more likely than not” to be sustained assuming examination by tax authorities. Management has reviewed the Fund’s tax positions for all open tax periods (periods ended May 31, 2014 through May 31, 2017) and has concluded that no provision for unrecognized tax benefits or expenses is required in these financial statements. The Fund identifies its major tax jurisdiction as U.S. Federal.
3. Investment Transactions
During the year ended May 31, 2017, cost of purchases and proceeds from sales of investment securities, other than short-term investments, were $3,814,480 and $2,492,312, respectively.
4. Transactions with Related Parties
INVESTMENT ADVISORY AGREEMENT
The Fund’s investments are managed by the Adviser pursuant to the terms of an Investment Advisory Agreement. Under the Investment Advisory Agreement, the Fund pays the Adviser an advisory fee, computed and accrued daily and paid monthly, at the annual rate of 0.75% of its average daily net assets.
Pursuant to an expense limitation agreement between the Fund and the Adviser, the Adviser has contractually agreed until October 1, 2018 to reduce investment advisory fees and reimburse certain other operating expenses to the extent necessary to limit total annual operating expenses of the Fund (exclusive of brokerage costs such as fees and commissions; taxes; borrowing costs such as interest and dividend expenses on securities sold short; acquired fund fees and expenses; other expenditures which are capitalized in accordance with GAAP; extraordinary costs such as expenses related to organizing a fund, mergers or reorganizations, litigation and other expenses not incurred in the ordinary course of the Fund’s business, and amounts, if any, payable to a plan adopted in accordance with Rule 12b-1 under the Investment Company Act of 1940, as amended (the “1940 Act”)) to an amount not exceeding 0.65% of the Fund’s average daily net assets. Accordingly, the Adviser did not collect any of its advisory fees and, in addition, reimbursed other operating expenses totaling $167,167 during the year ended May 31, 2017.
DISTRIBUTION PLAN
The Fund has adopted a distribution plan pursuant to Rule 12b-1 under the 1940 Act (the “Rule 12b-1 Plan”), pursuant to which the Fund may incur certain costs for distribution and/or shareholder servicing expenses not to exceed 0.25% per annum of the Fund’s average daily net assets. During the year ended May 31, 2017, the Fund incurred $20,703 in distribution and service fees under the Rule 12b-1 Plan.
16
| CINCINNATI ASSET MANAGEMENT FUNDS: BROAD MARKET STRATEGIC INCOME FUND NOTES TO FINANCIAL STATEMENTS (Continued) |
OTHER SERVICE PROVIDERS
Ultimus Fund Solutions, LLC (“Ultimus”) provides administration, fund accounting, compliance and transfer agency services to the Fund. The Fund pays Ultimus fees in accordance with the agreements for such services. In addition, the Fund pays out-of-pocket expenses including, but not limited to, postage, supplies and costs of pricing the Fund’s portfolio securities.
Under the terms of a Distribution Agreement with the Trust, Ultimus Fund Distributors, LLC (the “Distributor”) serves as principal underwriter to the Fund. The Distributor is a wholly-owned subsidiary of Ultimus. The Distributor is compensated by the Adviser (not the Fund) for acting as principal underwriter.
Certain officers and a Trustee of the Trust are also officers of Ultimus and the Distributor.
TRUSTEE COMPENSATION
Effective October 1, 2016, each Trustee who is not an “interested person” of the Trust (“Independent Trustee”) receives a $1,000 annual retainer from the Fund, paid quarterly, except for the Board Chair who receives a $1,200 annual retainer from the Fund, paid quarterly. Each Independent Trustee also receives from the Fund a fee of $500 for each Board meeting attended plus reimbursement for travel and other meeting-related expenses. Prior to October 1, 2016, the Fund paid each Independent Trustee a fee of $500 for each Board meeting attended, plus a $500 annual retainer.
PRINCIPAL HOLDERS OF FUND SHARES
As of May 31, 2017, the following shareholders owned of record 5% or more of the outstanding shares of the Fund:
| Name of Record Owner | % Ownership |
| Mary S. Sloneker | 35% |
| Cincinnati Asset Management, Inc. | 30% |
| William S. Sloneker | 16% |
| Charles Schwab & Co., Inc. (for the benefit of its customers) | 11% |
| UBS Financial Services, Inc. (for the benefit of its customers) | 6% |
A beneficial owner of 25% or more of the Fund’s outstanding shares may be considered a controlling person. That shareholder’s vote could have a more significant effect on matters presented at a shareholder’s meeting.
17
| CINCINNATI ASSET MANAGEMENT FUNDS: BROAD MARKET STRATEGIC INCOME FUND NOTES TO FINANCIAL STATEMENTS (Continued) |
5. Contingencies and Commitments
The Fund indemnifies the Trust’s officers and Trustees for certain liabilities that might arise from their performance of their duties to the Fund. Additionally, in the normal course of business, the Fund enters into contracts that contain a variety of representations and warranties and which provide general indemnifications. The Fund’s maximum exposure under these arrangements is unknown, as this would involve future claims that may be made against the Fund that have not yet occurred. However, based on experience, the Fund expects the risk of loss to be remote.
6. Subsequent Events
The Fund is required to recognize in the financial statements the effects of all subsequent events that provide additional evidence about conditions that existed as of the date of the Statement of Assets and Liabilities. For non-recognized subsequent events that must be disclosed to keep the financial statements from being misleading, the Fund is required to disclose the nature of the event as well as an estimate of its financial effect, or a statement that such an estimate cannot be made. Management has evaluated subsequent events through the issuance of these financial statements and has noted no such events other than the ordinary income dividend paid on June 30, 2017, as noted in Note 2.
18
CINCINNATI ASSET MANAGEMENT FUNDS:
BROAD MARKET STRATEGIC INCOME FUND
REPORT OF INDEPENDENT REGISTERED
PUBLIC ACCOUNTING FIRM
BROAD MARKET STRATEGIC INCOME FUND
REPORT OF INDEPENDENT REGISTERED
PUBLIC ACCOUNTING FIRM
To the Board of Trustees of Ultimus Managers Trust
and the Shareholders of Cincinnati Asset Management Funds:
Broad Market Strategic Income Fund
and the Shareholders of Cincinnati Asset Management Funds:
Broad Market Strategic Income Fund
We have audited the accompanying statement of assets and liabilities of Cincinnati Asset Management Funds: Broad Market Strategic Income Fund, a series of shares of beneficial interest in Ultimus Managers Trust, (the “Fund”) including the schedule of investments, as of May 31, 2017, and the related statement of operations for the year then ended, the statements of changes in net assets for each of the years in the two-year period then ended and the financial highlights for each of the years in the four-year period then ended and for the period October 26, 2012 (commencement of operations) through May 31, 2013. These financial statements and financial highlights are the responsibility of the Fund’s management. Our responsibility is to express an opinion on these financial statements and financial highlights based on our audits.
We conducted our audits in accordance with the standards of the Public Company Accounting Oversight Board (United States). Those standards require that we plan and perform the audits to obtain reasonable assurance about whether the financial statements and financial highlights are free of material misstatement. An audit includes examining, on a test basis, evidence supporting the amounts and disclosures in the financial statements. Our procedures included confirmation of securities owned as of May 31, 2017 by correspondence with the custodian and brokers. An audit also includes assessing the accounting principles used and significant estimates made by management, as well as evaluating the overall financial statement presentation. We believe that our audits provide a reasonable basis for our opinion.
In our opinion, the financial statements and financial highlights referred to above present fairly, in all material respects, the financial position of Cincinnati Asset Management Funds: Broad Market Strategic Income Fund as of May 31, 2017, and the results of its operations for the year then ended, the changes in its net assets for each of the years in the two-year period then ended and its financial highlights for each of the years in the four-year period then ended and for the period October 26, 2012 through May 31, 2013, in conformity with accounting principles generally accepted in the United States of America.
 | |
| BBD, LLP |
Philadelphia, Pennsylvania
July 27, 2017
July 27, 2017
19
| CINCINNATI ASSET MANAGEMENT FUNDS: BROAD MARKET STRATEGIC INCOME FUND ABOUT YOUR FUND’S EXPENSES (Unaudited) |
We believe it is important for you to understand the impact of costs on your investment. As a shareholder of the Fund, you incur ongoing costs, including management fees, distribution (12b-1) fees and other operating expenses. The following examples are intended to help you understand your ongoing costs (in dollars) of investing in the Fund and to compare these costs with the ongoing costs of investing in other mutual funds.
A mutual fund’s ongoing costs are expressed as a percentage of its average net assets. This figure is known as the expense ratio. The expenses in the table below are based on an investment of $1,000 made at the beginning of the most recent period (December 1, 2016) and held until the end of the period (May 31, 2017).
The table below illustrates the Fund’s ongoing costs in two ways:
Actual fund return – This section helps you to estimate the actual expenses that you paid over the period. The “Ending Account Value” shown is derived from the Fund’s actual return, and the third column shows the dollar amount of operating expenses that would have been paid by an investor who started with $1,000 in the Fund. You may use the information here, together with the amount you invested, to estimate the expenses that you paid over the period.
To do so, simply divide your account value by $1,000 (for example, an $8,600 account value divided by $1,000 = 8.6), then multiply the result by the number given for the Fund under the heading “Expenses Paid During Period.”
Hypothetical 5% return – This section is intended to help you compare the Fund’s ongoing costs with those of other mutual funds. It assumes that the Fund had an annual return of 5% before expenses during the period shown, but that the expense ratio is unchanged. In this case, because the return used is not the Fund’s actual return, the results do not apply to your investment. The example is useful in making comparisons because the SEC requires all mutual funds to calculate expenses based on a 5% return. You can assess the Fund’s ongoing costs by comparing this hypothetical example with the hypothetical examples that appear in shareholder reports of other funds.
Note that expenses shown in the table are meant to highlight and help you compare ongoing costs only. The Fund does not charge transaction fees, such as purchase or redemption fees, nor does it carry a “sales load.” The calculations assume no shares were bought or sold during the period. Your actual costs may have been higher or lower, depending on the amount of your investment and the timing of any purchases or redemptions.
20
| CINCINNATI ASSET MANAGEMENT FUNDS: BROAD MARKET STRATEGIC INCOME FUND ABOUT YOUR FUND’S EXPENSES (Unaudited) (Continued) |
More information about the Fund’s expenses can be found in this report. For additional information on operating expenses and other shareholder costs, please refer to the Fund’s prospectus.
| Beginning Account Value December 1, 2016 | Ending Account Value May 31, 2017 | Expenses Paid During Period* | |
| Based on Actual Fund Return | $1,000.00 | $1,038.90 | $3.30 |
| Based on Hypothetical 5% Return (before expenses) | $1,000.00 | $1,021.69 | $3.27 |
| * | Expenses are equal to the Fund’s annualized net expense ratio of 0.65% for the period, multiplied by the average account value over the period, multiplied by 182/365 (to reflect the one-half year period). |
OTHER INFORMATION (Unaudited)
A description of the policies and procedures that the Fund uses to vote proxies relating to portfolio securities is available without charge upon request by calling toll-free 1-866-738-1128, or on the SEC’s website at http://www.sec.gov. Information regarding how the Fund voted proxies relating to portfolio securities during the most recent 12-month period ended June 30 is available without charge upon request by calling toll-free 1-866-738-1128, or on the SEC’s website at http://www.sec.gov.
The Trust files a complete listing of portfolio holdings for the Fund with the SEC as of the end of the first and third quarters of each fiscal year on Form N-Q. These filings are available upon request by calling 1-866-738-1128. Furthermore, you may obtain a copy of the filings on the SEC’s website at http://www.sec.gov. The Trust’s Forms N-Q may also be reviewed and copied at the SEC’s Public Reference Room in Washington, DC, and information on the operation of the Public Reference Room may be obtained by calling 1-800-SEC-0330.
21
CINCINNATI ASSET MANAGEMENT FUNDS:
BROAD MARKET STRATEGIC INCOME FUND
BOARD OF TRUSTEES AND EXECUTIVE OFFICERS
(Unaudited)
BROAD MARKET STRATEGIC INCOME FUND
BOARD OF TRUSTEES AND EXECUTIVE OFFICERS
(Unaudited)
The Board of Trustees has overall responsibility for management of the Trust’s affairs. The Trustees serve during the lifetime of the Trust and until its termination, or until death, resignation, retirement, or removal. The Trustees, in turn, elect the officers of the Fund to actively supervise its day-to-day operations. The officers have been elected for an annual term. Unless otherwise noted, each Trustee’s and officer’s address is 225 Pictoria Drive, Suite 450, Cincinnati, OH 45246. The following are the Trustees and executive officers of the Fund:
| Name and Year of Birth | Length of Time Served | Position(s) Held with Trust | Principal Occupation(s) During Past 5 Years | Number of Funds in Trust Overseen by Trustee | Directorships of Public Companies Held by Trustee During Past 5 Years |
| Interested Trustees: | |||||
Robert G. Dorsey* Year of Birth: 1957 | Since February 2012 | Trustee (February 2012 to present) President (June 2012 to October 2013) | President and Managing Director of Ultimus Fund Solutions, LLC and Ultimus Fund Distributors, LLC (1999 to present) | 26 | None |
| Independent Trustees: | |||||
Janine L. Cohen Year of Birth: 1952 | Since January 2016 | Trustee | Retired since 2013; Chief Financial Officer from 2004 to 2013 and Chief Compliance Officer from 2008 to 2013 at AER Advisors, Inc. | 26 | None |
David M. Deptula Year of Birth: 1958 | Since June 2012 | Trustee | Vice President of Legal and Special Projects at Dayton Freight Lines, Inc. since 2016; Vice President of Tax Treasury at The Standard Register, Inc. (formerly The Standard Register Company) from 2011 to 2016 | 26 | None |
22
CINCINNATI ASSET MANAGEMENT FUNDS:
BROAD MARKET STRATEGIC INCOME FUND
BOARD OF TRUSTEES AND EXECUTIVE OFFICERS
(Unaudited) (Continued)
BROAD MARKET STRATEGIC INCOME FUND
BOARD OF TRUSTEES AND EXECUTIVE OFFICERS
(Unaudited) (Continued)
| Name and Year of Birth | Length of Time Served | Position(s) Held with Trust | Principal Occupation(s) During Past 5 Years | Number of Funds in Trust Overseen by Trustee | Directorships of Public Companies Held by Trustee During Past 5 Years |
| Independent Trustees: (Continued) | |||||
John J. Discepoli Year of Birth: 1963 | Since June 2012 | Chairman (May 2016 to present) Trustee (June 2012 to present) | Owner of Decepoli Financial Planning, LLC (personal financial planning company) since 2004 | 26 | None |
| * | Mr. Dorsey is considered an “interested person” of the Trust within the meaning of Section 2(a)(19) of the 1940 Act because of his relationship with the Trust’s administrator, transfer agent and distributor. |
| Name and Year of Birth | Length of Time Served | Position(s) Held with Trust | Principal Occupation(s) During Past 5 Years |
| Executive Officers: | |||
David R. Carson Year of Birth: 1958 | Since April 2013 | Principal Executive Officer (April 2017 to present) President (October 2013 to present) Vice President (April 2013 to October 2013) | Vice President and Director of Client Strategies of Ultimus Fund Solutions, LLC (2013 to present); President, Unified Series Trust (2016 to present); Chief Compliance Officer, FSI LBAR Fund (2013 to 2016), The Huntington Funds (2005 to 2013), Huntington Strategy Shares (2012 to 2013), and Huntington Asset Advisors (2013); Vice President, Huntington National Bank (2001 to 2013) |
Jennifer L. Leamer Year of Birth: 1976 | Since April 2014 | Treasurer (October 2014 to present) Assistant Treasurer (April 2014 to October 2014) | Vice President, Mutual Fund Controller of Ultimus Fund Solutions, LLC (2014 to present); Business Analyst of Ultimus Fund Solutions, LLC (2007 to 2014) |
23
CINCINNATI ASSET MANAGEMENT FUNDS:
BROAD MARKET STRATEGIC INCOME FUND
BOARD OF TRUSTEES AND EXECUTIVE OFFICERS
(Unaudited) (Continued)
BROAD MARKET STRATEGIC INCOME FUND
BOARD OF TRUSTEES AND EXECUTIVE OFFICERS
(Unaudited) (Continued)
| Name and Year of Birth | Length of Time Served | Position(s) Held with Trust | Principal Occupation(s) During Past 5 Years |
| Executive Officers: (Continued) | |||
Frank L. Newbauer Year of Birth: 1954 | Since February 2012 | Secretary (July 2017 to present) Assistant Secretary (April 2015 to July 2017) Secretary (February 2012 to April 2015) | Assistant Vice President of Ultimus Fund Solutions, LLC (2010 to present) |
Charles C. Black Year of Birth: 1979 | Since April 2015 | Chief Compliance Officer (January 2016 to present) Assistant Chief Compliance Officer (April 2015 to January 2016) | Senior Compliance Officer of Ultimus Fund Solutions, LLC (2015 to present); Chief Compliance Officer of The Caldwell & Orkin Funds, Inc. (2016 to present); Senior Compliance Manager at Touchstone Mutual Funds (2013 to 2015); Senior Compliance Manager at Fund Evaluation Group (2011 to 2013) |
Additional information about members of the Board and executive officers is available in the Fund’s Statement of Additional Information (“SAI”). To obtain a free copy of the SAI, please call 1-866-738-1128.
24
CINCINNATI ASSET MANAGEMENT FUNDS:
BROAD MARKET STRATEGIC INCOME FUND
DISCLOSURE REGARDING APPROVAL OF INVESTMENT ADVISORY AGREEMENT (Unaudited)
BROAD MARKET STRATEGIC INCOME FUND
DISCLOSURE REGARDING APPROVAL OF INVESTMENT ADVISORY AGREEMENT (Unaudited)
The Board of Trustees (the “Board”), including the Independent Trustees voting separately, has reviewed and approved the Fund’s Investment Advisory Agreement with Cincinnati Asset Management, Inc. (the “Adviser”) for an additional annual term. Approval took place at an in-person meeting held on April 24-25, 2017, at which all of the Trustees were present.
In the course of their deliberations, the Board was advised by legal counsel. The Board received and reviewed a substantial amount of information provided by the Adviser in response to requests of the Board and counsel.
In deciding whether to approve the renewal of the Investment Advisory Agreement, the Board recalled its review of the materials related to the Fund and the Adviser throughout the preceding 12 months and its numerous discussions with Trust management and the Adviser about the operations and performance of the Fund during that period. The Board further considered those materials and discussions and other numerous factors, including
The nature, extent, and quality of the services provided by the Adviser. In this regard, the Board reviewed the services being provided by the Adviser to the Fund including, without limitation, its investment advisory services since the Fund’s inception, the Adviser’s compliance procedures and practices, its efforts to promote the Fund and assist in its distribution, and its compliance program. After reviewing the foregoing information and further information regarding the Adviser’s business, the Board concluded that the quality, extent, and nature of the services provided by the Adviser were satisfactory and adequate for the Fund.
The investment performance of the Fund. In this regard, the Board compared the performance of the Fund with the performance of its benchmark index, custom peer group, and related Morningstar category. The Board noted that while, for the one- and three-year periods reported (through March 31, 2017), the Fund had: (i) underperformed its benchmark for the three-year period and for the one-year period; (ii) underperformed the average and median of the peer group for both periods; and (iii) underperformed the average of funds of comparable size and structure in the Morningstar category (Multisector Bond Funds, no load, under $250 million) for both periods, the Adviser had explained the reasons for the Fund’s underperformance and the Fund had outperformed the median of comparable funds in the Morningstar category for the three-year period. The Board also considered the consistency of the Adviser’s management with the Fund’s investment objective and policies. Following discussion of the investment performance of the Fund and its performance relative to its peer group and comparable funds in the Morningstar category, the Adviser’s experience in managing mutual funds, its historical investment performance, and other factors, the Board concluded that the investment performance of the Fund has been satisfactory.
The costs of the services provided and profits realized by the Adviser from its relationship with the Fund. In this regard, the Board considered the Adviser’s staffing, personnel, and methods of operations; the education and experience of its personnel; compliance program, policies, and procedures; financial condition and the level of commitment to the Fund,
25
CINCINNATI ASSET MANAGEMENT FUNDS:
BROAD MARKET STRATEGIC INCOME FUND
DISCLOSURE REGARDING APPROVAL OF INVESTMENT ADVISORY AGREEMENT (Unaudited) (Continued)
BROAD MARKET STRATEGIC INCOME FUND
DISCLOSURE REGARDING APPROVAL OF INVESTMENT ADVISORY AGREEMENT (Unaudited) (Continued)
and, generally, the Adviser’s advisory business; the asset level of the Fund; the overall expenses of the Fund, including the advisory fee; and the differences in fees and services to the Adviser’s other accounts with similar strategies to the Fund. The Board considered the Adviser’s Expense Limitation Agreement (the “ELA”) with the Fund, and considered the Adviser’s current and past fee reductions and expense reimbursements for the Fund. The Board further took into account the Adviser’s commitment to continue the ELA for the Fund until at least October 1, 2018.
The Board also considered potential benefits for the Adviser in managing the Fund, including promotion of the Adviser’s name and the potential for it to receive research, statistical, or other services from the Fund’s trades. The Board compared the Fund’s advisory fee and overall expense ratio to the average advisory fees and average expense ratios for its Morningstar category. In addition, the Board compared the Fund to the comparable mutual funds in its Morningstar category and peer group in terms of the style of investment management, the size of the fund, and the nature of the investment strategies. The Board noted that the advisory fee for the Fund was above the 80th percentile for its peer group and above the 80th percentile for comparable funds in the Morningstar category. The Board also considered the Adviser’s commitment to limit the Fund’s expenses under the ELA. The Board noted that the overall expense ratio for the Fund was below the average and median of its peer group and comparable funds in the Morningstar category. The Board also compared the fees paid by the Fund to the fees paid by other accounts of the Adviser with similar strategies, and considered the similarities and differences of services received by such other accounts as compared to the service provided to the Fund. The Board noted that the fee structures applicable to the Adviser’s other clients were not indicative of any unreasonableness with respect to the advisory fees payable to the Fund. The Board also considered the investment strategy and style used by the Adviser in managing the portfolio of the Fund. Following these comparisons and upon further consideration and discussion of the foregoing, the Board concluded that the advisory fee paid to the Adviser by the Fund is fair and reasonable.
The extent to which economies of scale would be realized as the Fund grows and whether advisory fee levels reflect these economies of scale for the benefit of the Fund’s investors. In this regard, the Board considered that the Fund’s fee arrangement with the Adviser involves both the advisory fee and the ELA. The Board determined that while the advisory fee remained the same as asset levels increased, the shareholders of the Fund have experienced benefits from the ELA and will continue to experience benefits from the ELA until the Fund’s assets grow to a level where its expenses otherwise fall below the expense limit. Following further discussion of the Fund’s asset levels, expectations for growth, and level of fees, the Board determined that the Fund’s fee arrangement with the Adviser would continue to provide benefits. The Board also determined that the fee arrangement is fair and reasonable in relation to the nature and quality of services being provided by the Adviser given the Fund’s projected asset levels for the next year.
26
CINCINNATI ASSET MANAGEMENT FUNDS:
BROAD MARKET STRATEGIC INCOME FUND
DISCLOSURE REGARDING APPROVAL OF INVESTMENT ADVISORY AGREEMENT (Unaudited) (Continued)
BROAD MARKET STRATEGIC INCOME FUND
DISCLOSURE REGARDING APPROVAL OF INVESTMENT ADVISORY AGREEMENT (Unaudited) (Continued)
Brokerage and portfolio transactions. In this regard, the Board considered the Adviser’s trading policies, procedures, and performance in seeking best execution for the Fund. The Board also considered the historical portfolio turnover rate for the Fund; the process by which evaluations are made of the overall reasonableness of commissions paid; the process by which the Adviser evaluates best execution; the method and basis for selecting and evaluating the broker-dealers used; and any anticipated allocation of portfolio business to persons affiliated with the Adviser. After further review and discussion, the Board determined that for the Fund, the Adviser’s practices regarding brokerage and portfolio transactions were satisfactory.
Possible conflicts of interest. In evaluating the possibility for conflicts of interest, the Board considered such matters as the experience and abilities of the advisory personnel assigned to the Fund, the Adviser’s process for allocating trades among the Fund and its different clients, and the substance and administration of the Adviser’s Code of Ethics. Following further consideration and discussion, the Board found that the Adviser’s standards and practices relating to the identification and mitigation of potential conflicts of interests were satisfactory.
Conclusion
After full consideration of the above factors as well as other factors, the Board unanimously concluded that approval of the Investment Advisory Agreement was in the best interests of the Fund and its shareholders. It was noted that in the Trustees’ deliberation regarding the approval of the renewal of the Investment Advisory Agreement, the Trustees did not identify any particular information or factor that was all-important or controlling, and that each individual Trustee may have attributed different weights to the various factors noted above.
27
This page intentionally left blank.
This page intentionally left blank.

Annual Report
May 31, 2017

WAVELENGTH INTEREST RATE NEUTRAL FUND
| WAVELENGTH INTEREST RATE NEUTRAL FUND | |
| LETTER TO SHAREHOLDERS | July 11, 2017 |
Dear Fellow Shareholders:
Since our last annual letter, we have entered a new environment for economic policy and markets have reconnected with the fundamental drivers that shape our investment principles. Consistent with our expectations, heightened levels of cash were redeployed into investments that offer positive expected returns over the long-term.
A balanced exposure to the macroeconomic factors driving markets produced excess returns across a wide range of conditions through this cycle. As the economy adjusts to a new set of potential outcomes, the opportunity for investing based on these factors continues to grow.
What follows is designed to provide a context for returns that fosters a deeper understanding of the investment process that supports them. By doing so we hope to build on the partnership your investment creates.
PERFORMANCE SUMMARY
For the twelve months ended May 31, 2017, the Wavelength Interest Rate Neutral Fund (the “Fund”) delivered a return of +6.83% versus a benchmark return of +0.39% for the S&P/ BGCantor 0-3 Month U.S. Treasury Bill Index (which seeks to represent the return from not taking risk in financial markets). Performance over the period was achieved within targeted risk parameters, and the Fund benefited from its disciplined balance in line with investment objectives.
WAVELENGTH PHILOSOPHY
We believe that macroeconomic conditions drive asset prices and central banks use interest rates to manage macroeconomic conditions. Based on this fundamental logic, we seek to build a portfolio that is hedged to changes in interest rates by balancing investment exposure between instruments we expect to outperform in rising and falling macroeconomic conditions.
INVESTMENT ENVIRONMENT
As an extension of our investment philosophy we believe that changing expectations for these conditions drive investment decisions, which in turn drive market prices. Over the period since our last letter, growth and inflation were significant factors for market pricing amidst rising geopolitical tensions and an uncertain economic trajectory.
The economy expanded through the second half of 2016, and growth-related data often exceeded consensus expectations. Levels of inflation remained subdued relative to history and were consistently below the Federal Reserve’s stated target. In this context, the cycle of rising interest rates continued and coincided with overarching political transition and a number of market surprises.
The UK’s Brexit vote was the first in a series of unexpected political outcomes that were impactful for markets and the economy. Following initial bouts of volatility, investors began processing this information, and we believe the third quarter of 2016 marked an inflection point for yields on long-term government bonds.
1
The change in sentiment gained momentum heading into the fourth quarter, and the US elections in November reinforced market dynamics that were already in place. Corporate assets tied to growth outperformed government securities substantially into year-end, and expectations were recalibrated based on a new outlook for public policy.
In the first quarter of 2017, markets continued to rally and expectations for growth of corporate profits held strong. Government bonds also rebounded across the yield curve despite meaningful changes to the outlook for monetary policy. Inflation measures ticked up off of historically low levels, and markets responded to increased clarity on the economy’s trajectory moving forward.
PERFORMANCE DISCUSSION
The Fund delivered positive results by design over the period, monetizing opportunities across asset classes with an economy in transition. Factors related to value, carry and momentum each contributed to excess returns, and risk was managed effectively based on a wide range of potential outcomes.
The portfolio benefited meaningfully from its targeted balance as volatility increased in June and was well-positioned for the market moves that followed. Falling growth assets, such as US Treasuries and TIPS, made positive contributions initially, and as these sold off profits from corporate credit and emerging market debt were key drivers of portfolio performance.
In the fourth quarter of 2016, rising yields produced challenging conditions for many fixed income markets, particularly investment grade bonds and inflation-linked securities which suffered losses. The portfolio benefited from a steepening US yield curve and corporate credit exposures which outperformed based on increased expectations for growth.
Amidst rising political uncertainty in January, the portfolio outperformed and built on profits established in the recalibration of markets following the election. While reflationary themes which had driven yields higher were less impactful, investment grade bonds and emerging market debt produced profits while the performance of US Treasury positions was mixed.
The portfolio continued to deliver positive performance in February, as the post-election rally was supported by stronger-than-expected growth conditions. Corporate assets, such as convertible bonds and credit, were among the most profitable on the month, and government bonds also contributed positively to performance. Returns grew increasingly bifurcated as the quarter came to a close, and the portfolio saw profits in convertible bonds and emerging market debt offset by modest losses in corporate credit.
In April, balanced positive returns were generated through convertible bonds, credit and emerging market debt, and this outperformance continued into May. The portfolio benefited from both corporate and government assets, while the impact of inflation-related positions was less significant during the month.
OUTLOOK
Markets have responded powerfully to expectations for growth and adjusted to the new normal for economic policy. While valuation metrics have become stretched across financial markets, the portfolio is balanced to factors driving these changes. As potential outcomes
2
grow wider and uncertainty more acute, positions are consistent with the Fund’s investment mandate. The portfolio is balanced to the economic factors that drive markets, and seeks to deliver absolute returns as prices adjust to new conditions.
Thank you for your trust and commitment through investment.
Sincerely,

Andrew Dassori
Founding Partner & Chief Investment Officer
Wavelength Capital Management
Wavelength Capital Management
Past performance is not predictive of future performance. Investment results and principal value will fluctuate so that shares, when redeemed, may be worth more or less than their original cost. Current performance may be higher or lower than the performance data quoted. Performance data current to the most recent month end are available by calling 1-866-896-9292.
An investor should consider the investment objectives, risks, charges and expenses of the Fund carefully before investing. The Fund’s prospectus contains this and other important information. To obtain a copy of the Fund’s prospectus please visit the Fund’s website at www.wavelengthfunds.com or call 1-866-896-9292 and a copy will be sent to you free of charge. Please read the prospectus carefully before you invest. The Wavelength Interest Rate Neutral Fund is distributed by Ultimus Fund Distributors, LLC.
The Letter to Shareholders seeks to describe some of the Adviser’s current opinions and views of the financial markets. Although the Adviser believes it has a reasonable basis for any opinions or views expressed, actual results may differ, sometimes significantly so, from those expected or expressed. The securities held by the Fund that are discussed in the Letter to Shareholders were held during the period covered by this Report. They do not comprise the entire investment portfolio of the Fund, may be sold at any time and may no longer be held by the Fund. For a complete list of securities held by the Fund as of May 31, 2017, please see the Schedule of Investments section of the Annual Report. The opinions of the Adviser with respect to those securities may change at any time.
Statements in the Letter to Shareholders that reflect projections or expectations for future financial or economic performance of the Fund and the market in general and statements of the Fund’s plans and objectives for future operations are forward-looking statements. No assurance can be given that actual results or events will not differ materially from those projected, estimated, assumed, or anticipated in any such forward-looking statements. Important factors that could result in such differences, in addition to factors noted with such forward-looking statements include, without limitation, general economic conditions, such as inflation, recession, and interest rates. Past performance is not a guarantee of future results.
3
WAVELENGTH INTEREST RATE NEUTRAL FUND
PERFORMANCE INFORMATION
May 31, 2017 (Unaudited)
PERFORMANCE INFORMATION
May 31, 2017 (Unaudited)
Comparison of the Change in Value of a $100,000 Investment in
Wavelength Interest Rate Neutral Fund versus the
S&P/BGCantor 0-3 Month U.S. Treasury Bill Index
Wavelength Interest Rate Neutral Fund versus the
S&P/BGCantor 0-3 Month U.S. Treasury Bill Index

Average Annual Total Returns For Periods Ended May 31, 2017 | ||||
| 1 Year | 3 Years | Since Inception(b) | ||
Wavelength Interest Rate Neutral Fund(a) | 6.83% | 1.01% | 2.07% | |
| S&P/BGCantor 0-3 Month U.S. Treasury Bill Index | 0.39% | 0.17% | 0.15% | |
(a) | The Fund’s total returns do not reflect the deduction of taxes a shareholder would pay on Fund distributions or the redemption of Fund shares. |
(b) | The Fund commenced operations on September 30, 2013. |
4
WAVELENGTH INTEREST RATE NEUTRAL FUND
PORTFOLIO INFORMATION
May 31, 2017 (Unaudited)
PORTFOLIO INFORMATION
May 31, 2017 (Unaudited)
Portfolio Allocation (% of Net Assets)

Top 10 Holdings
| Security Description | % of Net Assets |
| PowerShares Senior Loan Portfolio | 16.2% |
iShares® TIPS Bond ETF | 12.8% |
| Vanguard Short-Term Corporate Bond ETF | 12.2% |
SPDR® Bloomberg Barclays Short Term High Yield Bond ETF | 8.1% |
iShares® J.P. Morgan USD Emerging Markets Bond ETF | 7.9% |
SPDR® Bloomberg Barclays Convertible Securities ETF | 5.9% |
| PowerShares Emerging Markets Sovereign Debt Portfolio | 4.9% |
SPDR® Bloomberg Barclays High Yield Bond ETF | 4.8% |
| Vanguard Short-Term Inflation-Protected Securities ETF | 4.2% |
iShares® iBoxx $ High Yield Corporate Bond ETF | 4.1% |
5
| WAVELENGTH INTEREST RATE NEUTRAL FUND SCHEDULE OF INVESTMENTS May 31, 2017 | ||||||||
| EXCHANGE-TRADED FUNDS — 88.1% | Shares | Value | ||||||
| Emerging Markets Debt — 15.9% | ||||||||
iShares® J.P. Morgan USD Emerging Markets Bond ETF | 14,623 | $ | 1,690,857 | |||||
| PowerShares Emerging Markets Sovereign Debt Portfolio | 35,392 | 1,046,188 | ||||||
| VanEck Vectors Emerging Markets High Yield Bond ETF | 27,193 | 674,386 | ||||||
| 3,411,431 | ||||||||
| Real Estate Investment Trusts (REITs) — 1.0% | ||||||||
| Vanguard REIT ETF | 2,500 | 205,475 | ||||||
| U.S. Fixed Income — 71.2% | ||||||||
iShares® iBoxx $ High Yield Corporate Bond ETF | 9,820 | 870,543 | ||||||
iShares® iBoxx $ Investment Grade Corporate Bond ETF | 1,855 | 223,064 | ||||||
iShares® TIPS Bond ETF | 23,908 | 2,741,769 | ||||||
| PowerShares Senior Loan Portfolio | 148,471 | 3,460,859 | ||||||
SPDR® Bloomberg Barclays Convertible Securities ETF | 25,737 | 1,264,459 | ||||||
SPDR® Bloomberg Barclays High Yield Bond ETF | 27,433 | 1,025,720 | ||||||
SPDR® Bloomberg Barclays Short Term High Yield Bond ETF | 61,309 | 1,725,235 | ||||||
| Vanguard Mortgage-Backed Securities ETF | 7,433 | 393,131 | ||||||
| Vanguard Short-Term Corporate Bond ETF | 32,552 | 2,609,043 | ||||||
| Vanguard Short-Term Inflation-Protected Securities ETF | 18,319 | 905,875 | ||||||
| 15,219,698 | ||||||||
Total Exchange-Traded Funds (Cost $18,479,571) | $ | 18,836,604 | ||||||
| MONEY MARKET FUNDS — 7.5% | Shares | Value | ||||||
Fidelity Institutional Money Market Government Portfolio - Class I, 0.65% (a) (Cost $1,603,310) | 1,603,310 | $ | 1,603,310 | |||||
Total Investments at Value — 95.6% (Cost $20,082,881) | $ | 20,439,914 | ||||||
| Other Assets in Excess of Liabilities — 4.4% | 951,012 | |||||||
| Net Assets — 100.0% | $ | 21,390,926 | ||||||
(a) | The rate shown is the 7-day effective yield as of May 31, 2017. |
| See accompanying notes to financial statements. | |
6
| WAVELENGTH INTEREST RATE NEUTRAL FUND SCHEDULE OF FUTURES CONTRACTS May 31, 2017 | |||||||||||||
| FUTURES CONTRACTS | Expiration Date | Contracts | Aggregate Market Value of Contracts | Unrealized Appreciation (Depreciation) | |||||||||
| Commodity Futures | |||||||||||||
| COMEX miNY Gold Future | 7/27/2017 | 2 | $ | 127,175 | $ | (3 | ) | ||||||
| Index Futures | |||||||||||||
| E-Mini Dow CBOT DJIA Future | 6/16/2017 | 7 | 734,755 | 6,611 | |||||||||
| E-Mini Nasdaq 100 Future | 6/16/2017 | 5 | 579,475 | 10,850 | |||||||||
E-Mini S&P 500® Future | 6/16/2017 | 1 | 120,550 | 1,123 | |||||||||
| Total Index Futures | 1,434,780 | 18,584 | |||||||||||
| Treasury Futures | |||||||||||||
| 5-Year U.S. Treasury Note Future | 9/29/2017 | 18 | 2,128,922 | 2,246 | |||||||||
| 10-Year U.S. Treasury Note Future | 9/20/2017 | 4 | 504,812 | 993 | |||||||||
| Total Treasury Futures | 2,633,734 | 3,239 | |||||||||||
| Total Futures Contracts | $ | 4,195,689 | $ | 21,820 | |||||||||
| FUTURES CONTRACTS SOLD SHORT | Expiration Date | Contracts | Aggregate Market Value of Contracts | Unrealized Depreciation | |||||||||
| Commodity Futures | |||||||||||||
| E-Mini Crude Oil Future | 6/19/2017 | 1 | $ | 24,113 | $ | (52 | ) | ||||||
| Treasury Futures | |||||||||||||
| U.S. Treasury Bond Future | 9/20/2017 | 2 | 307,187 | (1,750 | ) | ||||||||
| Total Futures Contracts Sold Short | $ | 331,300 | $ | (1,802 | ) | ||||||||
| See accompanying notes to financial statements. |
7
| WAVELENGTH INTEREST RATE NEUTRAL FUND STATEMENT OF ASSETS AND LIABILITIES May 31, 2017 | ||||
| ASSETS | ||||
| Investments in securities: | ||||
| At acquisition cost | $ | 20,082,881 | ||
| At value (Note 2) | $ | 20,439,914 | ||
| Cash | 4,096 | |||
| Margin deposits for futures contracts (Notes 2 and 5) | 964,970 | |||
| Receivable for capital shares sold | 20,000 | |||
| Dividends and interest receivable | 1,484 | |||
| Other assets | 1,727 | |||
| Total assets | 21,432,191 | |||
| LIABILITIES | ||||
| Variation margin payable (Notes 2 and 5) | 1,242 | |||
| Payable for investment securities purchased | 22,940 | |||
| Payable to Adviser (Note 4) | 4,969 | |||
| Payable to administrator (Note 4) | 7,430 | |||
| Other accrued expenses | 4,684 | |||
| Total liabilities | 41,265 | |||
| NET ASSETS | $ | 21,390,926 | ||
| NET ASSETS CONSIST OF: | ||||
| Paid-in capital | $ | 21,667,232 | ||
| Undistributed net investment income | 66,403 | |||
| Accumulated net realized losses from security transactions and other financial instruments | (719,760 | ) | ||
| Net unrealized appreciation on: | ||||
| Investments | 357,033 | |||
| Futures contracts | 20,018 | |||
| NET ASSETS | $ | 21,390,926 | ||
| Shares of beneficial interest outstanding (unlimited number of shares authorized, no par value) | 2,141,251 | |||
| Net asset value, offering price and redemption price per share (Note 2) | $ | 9.99 | ||
| See accompanying notes to financial statements. |
8
| WAVELENGTH INTEREST RATE NEUTRAL FUND STATEMENT OF OPERATIONS For the Year Ended May 31, 2017 | ||||
| INVESTMENT INCOME | ||||
| Interest | $ | 886 | ||
| Dividends | 562,470 | |||
| Total investment income | 563,356 | |||
| EXPENSES | ||||
| Investment advisory fees (Note 4) | 178,120 | |||
| Professional fees | 39,414 | |||
| Fund accounting fees (Note 4) | 31,882 | |||
| Administration fees (Note 4) | 30,000 | |||
| Transfer agent fees (Note 4) | 15,000 | |||
| Compliance fees (Note 4) | 12,169 | |||
| Trustees' fees and expenses (Note 4) | 9,611 | |||
| Custody and bank service fees | 7,370 | |||
| Registration and filing fees | 6,271 | |||
| Postage and supplies | 2,553 | |||
| Insurance expense | 2,082 | |||
| Other expenses | 13,042 | |||
| Total expenses | 347,514 | |||
| Less fee reductions by the Adviser (Note 4) | (161,894 | ) | ||
| Net expenses | 185,620 | |||
| NET INVESTMENT INCOME | 377,736 | |||
| REALIZED AND UNREALIZED GAINS ON INVESTMENTS AND FUTURES CONTRACTS | ||||
| Net realized gains from: | ||||
| Investments | 57,812 | |||
| Futures contracts (Note 5) | 425,010 | |||
| Capital gain distributions from regulated investment companies | 926 | |||
| Net change in unrealized appreciation (depreciation) on: | ||||
| Investments | 369,968 | |||
| Futures contracts (Note 5) | 1,326 | |||
| NET REALIZED AND UNREALIZED GAINS ON INVESTMENTS AND FUTURES CONTRACTS | 855,042 | |||
| NET INCREASE IN NET ASSETS RESULTING FROM OPERATIONS | $ | 1,232,778 | ||
| See accompanying notes to financial statements. |
9
| WAVELENGTH INTEREST RATE NEUTRAL FUND STATEMENTS OF CHANGES IN NET ASSETS | ||||||||
| Year Ended May 31, 2017 | Year Ended May 31, 2016 | |||||||
| FROM OPERATIONS | ||||||||
| Net investment income | $ | 377,736 | $ | 356,903 | ||||
| Net realized gains (losses) from: | ||||||||
| Investments | 57,812 | (791,771 | ) | |||||
| Futures contracts (Note 5) | 425,010 | (242,528 | ) | |||||
| Capital gain distributions from regulated investment companies | 926 | 1,602 | ||||||
| Net change in unrealized appreciation (depreciation) on: | ||||||||
| Investments | 369,968 | 33,201 | ||||||
| Futures contracts (Note 5) | 1,326 | 26,867 | ||||||
| Net increase (decrease) in net assets from operations | 1,232,778 | (615,726 | ) | |||||
| DISTRIBUTIONS TO SHAREHOLDERS (Note 2) | ||||||||
| From net investment income | (360,818 | ) | (355,504 | ) | ||||
| CAPITAL SHARE TRANSACTIONS | ||||||||
| Proceeds from shares sold | 3,534,514 | 544,904 | ||||||
| Net asset value of shares issued in reinvestment of distributions to shareholders | 360,818 | 350,339 | ||||||
| Payments for shares redeemed | (137,545 | ) | (978,011 | ) | ||||
| Net increase (decrease) in net assets from capital share transactions | 3,757,787 | (82,768 | ) | |||||
| TOTAL INCREASE (DECREASE) IN NET ASSETS | 4,629,747 | (1,053,998 | ) | |||||
| NET ASSETS | ||||||||
| Beginning of year | 16,761,179 | 17,815,177 | ||||||
| End of year | $ | 21,390,926 | $ | 16,761,179 | ||||
| UNDISTRIBUTED NET INVESTMENT INCOME | $ | 66,403 | $ | 49,485 | ||||
| See accompanying notes to financial statements. |
10
| WAVELENGTH INTEREST RATE NEUTRAL FUND STATEMENTS OF CHANGES IN NET ASSETS (Continued) | ||||||||
| Year Ended May 31, 2017 | Year Ended May 31, 2016 | |||||||
| CAPITAL SHARE ACTIVITY | ||||||||
| Shares sold | 361,512 | 57,617 | ||||||
| Shares issued in reinvestment of distributions to shareholders | 37,052 | 37,420 | ||||||
| Shares redeemed | (14,153 | ) | (103,873 | ) | ||||
| Net increase (decrease) in shares outstanding | 384,411 | (8,836 | ) | |||||
| Shares outstanding at beginning of year | 1,756,840 | 1,765,676 | ||||||
| Shares outstanding at end of year | 2,141,251 | 1,756,840 | ||||||
| See accompanying notes to financial statements. |
11
| WAVELENGTH INTEREST RATE NEUTRAL FUND FINANCIAL HIGHLIGHTS | ||||||||||||||||
| Per Share Data for a Share Outstanding Throughout Each Period | ||||||||||||||||
| Year Ended May 31, 2017 | Year Ended May 31, 2016 | Year Ended May 31, 2015 | Period Ended May 31, 2014 (a) | |||||||||||||
| Net asset value at beginning of period | $ | 9.54 | $ | 10.09 | $ | 10.38 | $ | 10.00 | ||||||||
| Income (loss) from investment operations: | ||||||||||||||||
| Net investment income | 0.20 | 0.21 | 0.23 | 0.10 | ||||||||||||
| Net realized and unrealized gains (losses) on investments and futures contracts | 0.45 | (0.56 | ) | (0.25 | ) | 0.36 | ||||||||||
| Total from investment operations | 0.65 | (0.35 | ) | (0.02 | ) | 0.46 | ||||||||||
| Less distributions: | ||||||||||||||||
| Distributions from net investment income | (0.20 | ) | (0.20 | ) | (0.23 | ) | (0.07 | ) | ||||||||
| Distributions from net realized gains | — | — | (0.04 | ) | (0.01 | ) | ||||||||||
| Total distributions | (0.20 | ) | (0.20 | ) | (0.27 | ) | (0.08 | ) | ||||||||
| Net asset value at end of period | $ | 9.99 | $ | 9.54 | $ | 10.09 | $ | 10.38 | ||||||||
Total return (b) | 6.83 | % | (3.37 | %) | (0.17 | %) | 4.62 | %(c) | ||||||||
| Net assets at end of period (000's) | $ | 21,391 | $ | 16,761 | $ | 17,815 | $ | 4,717 | ||||||||
| Ratios/supplementary data: | ||||||||||||||||
Ratio of total expenses to average net assets (d) | 1.85 | % | 2.00 | % | 2.19 | % | 4.42 | %(e) | ||||||||
Ratio of net expenses to average net assets (d) (f) | 0.99 | % | 0.99 | % | 0.99 | % | 0.99 | %(e) | ||||||||
Ratio of net investment income to average net assets (f) (g) | 2.01 | % | 2.16 | % | 2.52 | % | 1.55 | %(e) | ||||||||
| Portfolio turnover rate | 53 | % | 103 | % | 107 | % | 114 | %(c) | ||||||||
(a) | Represents the period from the commencement of operations (September 30, 2013) through May 31, 2014. |
(b) | Total return is a measure of the change in value of an investment in the Fund over the periods covered. The returns shown do not reflect the deduction of taxes a shareholder would pay on Fund distributions, if any, or the redemption of Fund shares. The total returns would be lower if the Adviser had not reduced advisory fees and/or reimbursed expenses. |
(c) | Not annualized. |
(d) | The ratios of expenses to average net assets do not reflect the Fund’s proportionate share of expenses of the underlying investment companies in which the Fund invests. |
(e) | Annualized. |
(f) | Ratio was determined after advisory fee reductions and/or expense reimbursements (Note 4). |
(g) | Recognition of net investment income by the Fund is affected by the timing of the declarations of dividends by the underlying investment companies in which the Fund invests. |
| See accompanying notes to financial statements. | |
12
WAVELENGTH INTEREST RATE NEUTRAL FUND
NOTES TO FINANCIAL STATEMENTS
May 31, 2017
NOTES TO FINANCIAL STATEMENTS
May 31, 2017
1. Organization
Wavelength Interest Rate Neutral Fund (the “Fund”) is a diversified series of Ultimus Managers Trust (the “Trust”), an open-end investment company established as an Ohio business trust under a Declaration of Trust dated February 28, 2012. Other series of the Trust are not incorporated in this report. The Fund commenced operations on September 30, 2013.
The investment objective of the Fund is to seek total return.
2. Significant Accounting Policies
In October 2016, the U.S. Securities and Exchange Commission (the “SEC”) adopted amendments to Regulation S-X which will impact financial statement presentation, particularly the presentation of derivative investments. Although still evaluating the impact, management believes that many of the Regulation S-X amendments are consistent with the Fund’s current financial statement presentation and expects that the Fund will be able to comply with the amendments by the August 1, 2017 compliance date.
The following is a summary of the Fund’s significant accounting policies. The policies are in conformity with Generally Accepted Accounting Principles in the United States of America (“GAAP”). As an investment company, as defined in Financial Accounting Standards Board (“FASB”) Accounting Standards Update 2013-08, the Fund follows accounting and reporting guidance under FASB Accounting Standards Codification Topic 946, “Financial Services – Investment Companies.”
Securities and futures valuation – The Fund values its portfolio securities at market value as of the close of regular trading on the New York Stock Exchange (the “NYSE”) (normally 4:00 p.m. Eastern time) on each business day the NYSE is open. The Fund values its listed securities on the basis of the security’s last sale price on the security’s primary exchange, if available, otherwise at the exchange’s most recently quoted mean price. NASDAQ-listed securities are valued at the NASDAQ Official Closing Price. The Fund values its exchange-traded futures contracts at their last sale price as of the close of regular trading on the NYSE. Prices for these futures contracts are monitored daily by Wavelength Capital Management, LLC (the “Adviser”) until the close of regular trading to determine if fair valuation is required.
In the event that market quotations are not readily available or are considered unreliable due to market or other events, the Fund values its securities and other assets at fair value pursuant to the procedures adopted by and under the general supervision of the Trust’s Board of Trustees (the “Board”). Under these procedures, the securities will be classified as Level 2 or 3 within the fair value hierarchy (see below), depending on the inputs used. Unavailable or unreliable market quotes may be due to the following factors: a substantial bid-ask spread; infrequent sales resulting in stale prices; insufficient trading volume; small trade sizes; a temporary lapse in any reliable pricing source; and actions of the securities or futures markets, such as the suspension or limitation of trading.
13
WAVELENGTH INTEREST RATE NEUTRAL FUND
NOTES TO FINANCIAL STATEMENTS (Continued)
NOTES TO FINANCIAL STATEMENTS (Continued)
GAAP establishes a single authoritative definition of fair value, sets out a framework for measuring fair value, and requires additional disclosures about fair value measurements.
Various inputs are used in determining the value of the Fund’s investments. These inputs are summarized in the three broad levels listed below:
| ● | Level 1 – quoted prices in active markets for identical securities |
| ● | Level 2 – other significant observable inputs |
| ● | Level 3 – significant unobservable inputs |
The inputs or methods used for valuing securities are not necessarily an indication of the risks associated with investing in those securities. The inputs used to measure fair value may fall into different levels of the fair value hierarchy. In such cases, for disclosure purposes, the level in the fair value hierarchy within which the fair value measurement falls in its entirety is determined based on the lowest level input that is significant to the fair value measurement.
The following is a summary of the inputs used to value the Fund’s investments and other financial instruments as of May 31, 2017:
| Level 1 | Level 2 | Level 3 | Total | |||||||||||||
Investments in Securities | ||||||||||||||||
| Exchange-Traded Funds | $ | 18,836,604 | $ | — | $ | — | $ | 18,836,604 | ||||||||
| Money Market Funds | 1,603,310 | — | — | 1,603,310 | ||||||||||||
| Total | $ | 20,439,914 | $ | — | $ | — | $ | 20,439,914 | ||||||||
Other Financial Instruments | ||||||||||||||||
| Futures Contracts | $ | 21,820 | $ | — | $ | — | $ | 21,820 | ||||||||
| Futures Contracts Sold Short | (1,802 | ) | — | — | (1,802 | ) | ||||||||||
| Total | $ | 20,018 | $ | — | $ | — | $ | 20,018 | ||||||||
As of May 31, 2017, the Fund did not have any transfers between Levels. In addition, the Fund did not have any assets or liabilities that were measured at fair value on a recurring basis using significant unobservable inputs (Level 3) as of May 31, 2017. It is the Fund’s policy to recognize transfers between Levels at the end of the reporting period.
Share valuation – The net asset value (“NAV”) per share of the Fund is calculated daily by dividing the total value of the Fund’s assets, less liabilities, by the number of shares outstanding. The offering price and redemption price per share of the Fund is equal to the NAV per share.
Investment income – Dividend income is recorded on the ex-dividend date. Interest income is accrued as earned.
Security transactions – Security transactions are accounted for on the trade date. Realized gains and losses on securities sold are determined on a specific identification basis.
14
WAVELENGTH INTEREST RATE NEUTRAL FUND
NOTES TO FINANCIAL STATEMENTS (Continued)
NOTES TO FINANCIAL STATEMENTS (Continued)
Common expenses – Common expenses of the Trust are allocated among the Fund and the other series of the Trust based on the relative net assets of each series or the nature of the services performed and the relative applicability to each series.
Distributions to shareholders – The Fund will distribute to shareholders any net investment income on a quarterly basis and any net realized capital gains at least annually. The amount of such dividends and distributions are determined in accordance with federal income tax regulations, which may differ from GAAP. Dividends and distributions to shareholders are recorded on the ex-dividend date. The tax character of distributions paid during the years ended May 31, 2017 and 2016 was ordinary income. On June 30, 2017, the Fund paid an ordinary income dividend of $0.0492 per share to shareholders of record on June 29, 2017.
Futures contracts – The Fund may use futures contracts to gain exposure to or to hedge against changes in the value of equities, real estate, interest rates or commodities. A futures contract represents a commitment for the future purchase or sale of an asset at a specified price on a specified date. When the Fund purchases or sells a futures contract, no price is paid to or received by the Fund. Instead, the Fund is required to deposit in a segregated asset account an amount of cash or qualifying securities currently ranging from 2% to 10% of the contract amount. This is called the “initial margin deposit.” Subsequent payments, known as “variation margin,” are made or received by the Fund each day, depending on the daily fluctuations in the fair value of the underlying asset. The Fund recognizes an unrealized gain or loss equal to the daily variation margin. If market conditions move unexpectedly, the Fund may not achieve the anticipated benefits of the futures contracts and may realize a loss. The margin deposits for futures contracts and the variation margin payable are reported on the Statement of Assets and Liabilities.
Estimates – The preparation of financial statements in conformity with GAAP requires management to make estimates and assumptions that affect the reported amounts of assets and liabilities and disclosure of contingent assets and liabilities as of the date of the financial statements and the reported amounts of income and expenses during the reporting period. Actual results could differ from those estimates.
Federal income tax – The Fund has qualified and intends to continue to qualify as a regulated investment company under the Internal Revenue Code of 1986 (the “Code”). Qualification generally will relieve the Fund of liability for federal income taxes to the extent 100% of its net investment income and net realized captial gains are distributed in accordance with the Code.
In order to avoid imposition of the excise tax applicable to regulated investment companies, it is also the Fund’s intention to declare as dividends in each calendar year at least 98% of its net investment income (earned during the calendar year) and 98.2% of its net realized capital gains (earned during the twelve months ended October 31) plus undistributed amounts from prior years.
15
WAVELENGTH INTEREST RATE NEUTRAL FUND
NOTES TO FINANCIAL STATEMENTS (Continued)
NOTES TO FINANCIAL STATEMENTS (Continued)
The following information is computed on a tax basis for each item as of May 31, 2017:
| Tax cost of portfolio investments | $ | 20,337,247 | ||
| Gross unrealized appreciation | $ | 262,964 | ||
| Gross unrealized depreciation | (160,297 | ) | ||
| Net unrealized appreciation | 102,667 | |||
| Undistributed ordinary income | 66,403 | |||
| Accumulated capital and other losses | (445,376 | ) | ||
| Total accumulated deficit | $ | (276,306 | ) |
The value of the federal income tax cost of portfolio investments and the tax components of the accumulated deficit may temporarily differ from the financial statement cost and components of net assets (“book/tax difference”). These book/tax differences are due to the recognition of capital gains or losses under income tax regulations and GAAP, primarily the tax deferral of losses on wash sales and the tax treatment of realized and unrealized gains and losses on futures contracts.
During the year ended May 31, 2017, the Fund utilized $125,887 of short-term capital loss carryforwards and $71,528 of long-term capital loss carryforwards to offset current year capital gains.
As of May 31, 2017, the Fund had a short-term capital loss carryforward of $217,936 and a long-term capital loss carryforward of $227,440 for federal income tax purposes. These capital loss carryforwards, which do not expire, may be utilized in future years to offset net realized capital gains, if any, prior to distributing such gains to shareholders.
The Fund recognizes the tax benefits or expenses of uncertain tax positions only when the position is “more likely than not” to be sustained assuming examination by tax authorities. Management has reviewed the Fund’s tax positions for all open tax periods (periods ended May 31, 2014 through May 31, 2017) and has concluded that no provision for unrecognized tax benefits or expenses is required in these financial statements. The Fund identifies its major tax jurisdiction as U.S. Federal.
3. Investment Transactions
During the year ended May 31, 2017, cost of purchases and proceeds from sales of investment securities, other than short-term investments, were $12,141,359 and $8,370,457, respectively.
4. Transactions with Related Parties
INVESTMENT ADVISORY AGREEMENT
The Fund’s investments are managed by the Adviser pursuant to the terms of an Investment Advisory Agreement. Under the Investment Advisory Agreement, the Fund pays the Adviser an advisory fee, computed and accrued daily and paid monthly, at the annual rate of 0.95% of its average daily net assets.
16
WAVELENGTH INTEREST RATE NEUTRAL FUND
NOTES TO FINANCIAL STATEMENTS (Continued)
NOTES TO FINANCIAL STATEMENTS (Continued)
Pursuant to an Expense Limitation Agreement (“ELA”) between the Fund and the Adviser, the Adviser has contractually agreed, until October 1, 2018, to reduce investment advisory fees and reimburse other operating expenses to the extent necessary to limit total annual operating expenses of the Fund (exclusive of brokerage costs; taxes; interest; acquired fund fees and expenses; extraordinary expenses such as litigation and merger or reorganization costs; other expenses not incurred in the ordinary course of the Fund’s business; and amounts, if any, payable pursuant to a plan adopted in accordance with Rule 12b-1 under the Investment Company Act of 1940, as amended (the “1940 Act”)) to an amount not exceeding 0.99% of the Fund’s average daily net assets. During the year ended May 31, 2017, the Adviser reduced its investment advisory fees by $161,894.
Under the terms of the ELA, investment advisory fee reductions and expense reimbursements by the Adviser are subject to recoupment by the Adviser for a period of three years after such fees and expenses were incurred, provided that the recoupments do not cause total annual operating expenses of the Fund to exceed (i) the expense limitation then in effect, if any, and (ii) the expense limitation in effect at the time the expenses to be repaid were incurred. As of May 31, 2017, the Adviser may seek recoupment of investment advisory fee reductions and expense reimbursements in the amount of $485,790 no later than the dates as stated below:
| May 31, 2018 | May 31, 2019 | May 31, 2020 | Total |
| $157,675 | $166,221 | $161,894 | $485,790 |
OTHER SERVICE PROVIDERS
Ultimus Fund Solutions, LLC (“Ultimus”) provides administration, fund accounting, compliance and transfer agency services to the Fund. The Fund pays Ultimus fees in accordance with the agreements for such services. In addition, the Fund pays out-of-pocket expenses including, but not limited to, postage, supplies and costs of pricing the Fund’s portfolio securities.
Under the terms of a Distribution Agreement with the Trust, Ultimus Fund Distributors, LLC (the “Distributor”) serves as the principal underwriter to the Fund. The Distributor is a wholly-owned subsidiary of Ultimus. The Distributor is compensated by the Adviser (not the Fund) for acting as principal underwriter.
Certain officers and a Trustee of the Trust are also officers of Ultimus and the Distributor.
TRUSTEE COMPENSATION
Effective October 1, 2016, each Trustee who is not an “interested person” of the Trust (“Independent Trustee”) receives a $1,000 annual retainer from the Fund, paid quarterly, except for the Board Chair who receives a $1,200 annual retainer from the Fund, paid quarterly. Each Independent Trustee also receives from the Fund a fee of $500 for each Board meeting attended plus reimbursement for travel and other meeting-related expenses. Prior to October 1, 2016, the Fund paid each Independent Trustee a fee of $500 for each Board meeting attended, plus a $500 annual retainer.
17
WAVELENGTH INTEREST RATE NEUTRAL FUND
NOTES TO FINANCIAL STATEMENTS (Continued)
NOTES TO FINANCIAL STATEMENTS (Continued)
PRINCIPAL HOLDERS OF FUND SHARES
As of May 31, 2017, the following shareholders owned of record 5% or more of the outstanding shares of the Fund:
| Name of Record Owner | % Ownership |
| Interactive Brokers, LLC (for the benefit of its customers) | 60% |
| R&T Partners, LLC (for the benefit of its customers) | 10% |
| Frederic Davis Dassori | 10% |
| Charles Schwab & Co., Inc. (for the benefit of its customers) | 8% |
A shareholder owning of record or beneficially 25% or more of the Fund’s outstanding shares may be considered a controlling person. That shareholder’s vote could have a more significant effect on matters presented at a shareholders’ meeting.
5. Derivatives Transactions
The Fund’s positions in derivative instruments as of May 31, 2017 are recorded in the following location in the Statement of Assets and Liabilities:
| Derivative Investment Type | Location |
| Futures contracts | Variation margin payable |
The following table sets forth the values of variation margin of the Fund as of May 31, 2017:
| Variation Margin | ||||||||||||
| Receivable | (Payable) | Total | ||||||||||
| Asset Derivatives | ||||||||||||
| Futures contracts | ||||||||||||
| Commodity | $ | — | $ | (3 | ) | $ | (3 | ) | ||||
| Index | 610 | (1,567 | ) | (957 | ) | |||||||
| Treasury | 328 | — | 328 | |||||||||
| Total Asset Derivatives | 938 | (1,570 | ) | (632 | ) | |||||||
| Liability Derivatives | ||||||||||||
| Futures contracts | ||||||||||||
| Commodity | $ | — | $ | (52 | ) | $ | (52 | ) | ||||
| Treasury | — | (558 | ) | (558 | ) | |||||||
| Total Liability Derivatives | — | (610 | ) | (610 | ) | |||||||
| Total | $ | 938 | $ | (2,180 | ) | $ | (1,242 | ) | ||||
18
WAVELENGTH INTEREST RATE NEUTRAL FUND
NOTES TO FINANCIAL STATEMENTS (Continued)
NOTES TO FINANCIAL STATEMENTS (Continued)
The Fund’s transactions in derivative instruments during the year ended May 31, 2017 are recorded in the following locations in the Statement of Operations:
| Derivative Investment Type | Location |
| Futures contracts | Net realized gains from futures contracts |
| Net change in unrealized appreciation (depreciation) on futures contracts |
The following is a summary of the Fund’s net realized gains and net change in unrealized appreciation (depreciation) on derivative instruments recognized in the Statement of Operations during the year ended May 31, 2017:
| Type of Derivative | Net Realized Gains | Net Change in Unrealized Appreciation (Depreciation) | ||||||
| Futures contracts | ||||||||
| Commodity | $ | 9,065 | $ | (1,059 | ) | |||
| Index | 378,694 | (1,319 | ) | |||||
| Treasury | 37,251 | 3,704 | ||||||
Total | $ | 425,010 | $ | 1,326 | ||||
The average monthly notional amount of futures contracts purchased during the year ended May 31, 2017 was $2,683,838, and the gross notional amount of futures contracts and future contracts sold short outstanding at May 31, 2017 was $4,195,689 and $(331,300), respectively.
In the ordinary course of business, the Fund may enter into transactions subject to enforceable netting agreements or other similar arrangements (“netting agreements”). Generally, the right to offset in netting agreements allows the Fund to offset any exposure to a specific counterparty with any collateral received or delivered to that counterparty based on the terms of the agreements. Generally, the Fund manages its cash collateral securities and securities collateral on a counterparty basis.
19
WAVELENGTH INTEREST RATE NEUTRAL FUND
NOTES TO FINANCIAL STATEMENTS (Continued)
NOTES TO FINANCIAL STATEMENTS (Continued)
As of May 31, 2017, the offsetting of financial assets and derivative assets is as follows:
| Description | Gross Amounts of Recognized Assets | Gross Amounts Offset in Statements of Assets and Liabilities | Net Amounts of Assets Presented in Statements of Assets and Liabilities | Collateral Pledged | Net Amount | |||||||||||||||
| Variation margin receivable -futures contracts | $ | 938 | $ | (1,570 | ) | $ | (632 | ) | $ | 894,350 | $ | 893,718 | ||||||||
| Total subject to a master netting or similar arrangement | $ | 938 | $ | (1,570 | ) | $ | (632 | ) | $ | 894,350 | $ | 893,718 | ||||||||
As of May 31, 2017, the offsetting of financial liabilities and derivative liabilities is as follows:
| Description | Gross Amounts of Recognized Liabilities | Gross Amounts Offset in Statements of Assets and Liabilities | Net Amounts of Liabilities Presented in Statements of Assets and Liabilities | Collateral Pledged | Net Amount | |||||||||||||||
| Variation margin receivable - futures contracts | $ | — | $ | (610 | ) | $ | (610 | ) | $ | 70,620 | $ | 70,010 | ||||||||
| Total subject to a master netting or similar arrangement | $ | — | $ | (610 | ) | $ | (610 | ) | $ | 70,620 | $ | 70,010 | ||||||||
6. Certain Investments and Risks
The securities in which the Fund invests, as well as the risks associated with these securities, are described in the Fund’s prospectus. Among these risks are those associated with investments in exchange-traded funds (“ETFs”). ETFs issue their shares to authorized participants in return for a specific basket of securities. The authorized participants then sell the ETF’s shares on the secondary market. In other words, ETF shares are traded on a securities exchange based on their market value. Investments in ETFs are subject to the risk that the ETF’s shares may trade at a premium (creating the risk that the Fund pays more than NAV for an ETF when making a purchase) or discount (creating the risk that the Fund receives less than NAV when selling an ETF) to the ETF’s NAV. Investments in ETFs are also subject to index-tracking risk because the total return generated by the securities will be reduced by transaction costs and expenses not incurred by the indices. Certain securities comprising the index tracked by an ETF may, from time to time, temporarily be
20
WAVELENGTH INTEREST RATE NEUTRAL FUND
NOTES TO FINANCIAL STATEMENTS (Continued)
NOTES TO FINANCIAL STATEMENTS (Continued)
unavailable, which may further impede the ETF’s ability to track its applicable index or match the index’s performance. To the extent that the Fund invests in an ETF, the Fund incurs additional expenses because the Fund bears its pro-rata portion of such ETF’s advisory fees and operational expenses. Finally, ETF shares are also subject to the risks applicable to the underlying basket of securities. As of May 31, 2017, the Fund had 88.1% of the value of its net assets invested in ETFs.
7. Contingencies and Commitments
The Fund indemnifies the Trust’s officers and Trustees for certain liabilities that might arise from their performance of their duties to the Fund. Additionally, in the normal course of business, the Fund enters into contracts that contain a variety of representations and warranties and which provide general indemnifications. The Fund’s maximum exposure under these arrangements is unknown, as this would involve future claims that may be made against the Fund that have not yet occurred. However, based on experience, the Fund expects the risk of loss to be remote.
8. Subsequent Events
The Fund is required to recognize in the financial statements the effects of all subsequent events that provide additional evidence about conditions that existed as of the date of the Statement of Assets and Liabilities. For non-recognized subsequent events that must be disclosed to keep the financial statements from being misleading, the Fund is required to disclose the nature of the event as well as an estimate of its financial effect, or a statement that such an estimate cannot be made. Management has evaluated subsequent events through the issuance of these financial statements and has noted no such events other than the ordinary income dividend paid on June 30, 2017, as noted in Note 2.
21
WAVELENGTH INTEREST RATE NEUTRAL FUND
REPORT OF INDEPENDENT REGISTERED
PUBLIC ACCOUNTING FIRM
REPORT OF INDEPENDENT REGISTERED
PUBLIC ACCOUNTING FIRM
To the Board of Trustees of Ultimus Managers Trust
and the Shareholders of Wavelength Interest Rate Neutral Fund
and the Shareholders of Wavelength Interest Rate Neutral Fund
We have audited the accompanying statement of assets and liabilities of Wavelength Interest Rate Neutral Fund, a series of shares of beneficial interest in Ultimus Managers Trust, (the “Fund”) including the schedule of investments, as of May 31, 2017, and the related statement of operations for the year then ended, the statement of changes in net assets for each of the years in the two-year period then ended and the financial highlights for each of the years in the three-year period then ended and for the period September 30, 2013 (commencement of operations) through May 31, 2014. These financial statements and financial highlights are the responsibility of the Fund’s management. Our responsibility is to express an opinion on these financial statements and financial highlights based on our audits.
We conducted our audits in accordance with the standards of the Public Company Accounting Oversight Board (United States). Those standards require that we plan and perform the audits to obtain reasonable assurance about whether the financial statements and financial highlights are free of material misstatement. An audit includes examining, on a test basis, evidence supporting the amounts and disclosures in the financial statements. Our procedures included confirmation of securities owned as of May 31, 2017 by correspondence with the custodian and brokers or by other appropriate auditing procedures where replies from brokers were not received. An audit also includes assessing the accounting principles used and significant estimates made by management, as well as evaluating the overall financial statement presentation. We believe that our audits provide a reasonable basis for our opinion.
In our opinion, the financial statements and financial highlights referred to above present fairly, in all material respects, the financial position of Wavelength Interest Rate Neutral Fund as of May 31, 2017, and the results of its operations for the year then ended, the changes in its net assets for each of the years in the two-year period then ended and its financial highlights for each of the years in the three-year period then ended and for the period September 30, 2013 through May 31, 2014, in conformity with accounting principles generally accepted in the United States of America.
 | |
| BBD, LLP |
Philadelphia, Pennsylvania
July 27, 2017
July 27, 2017
22
WAVELENGTH INTEREST RATE NEUTRAL FUND
ABOUT YOUR FUND’S EXPENSES (Unaudited)
ABOUT YOUR FUND’S EXPENSES (Unaudited)
We believe it is important for you to understand the impact of costs on your investment. As a shareholder of the Fund, you incur ongoing costs, including management fees and other operating expenses. The following examples are intended to help you understand your ongoing costs (in dollars) of investing in the Fund and to compare these costs with the ongoing costs of investing in other mutual funds.
A mutual fund’s ongoing costs are expressed as a percentage of its average net assets. This figure is known as the expense ratio. The expenses in the table below are based on an investment of $1,000 made at the beginning of the most recent period (December 1, 2016) and held until the end of the period (May 31, 2017).
The table below illustrates the Fund’s ongoing costs in two ways:
Actual fund return – This section helps you to estimate the actual expenses that you paid over the period. The “Ending Account Value” shown is derived from the Fund’s actual return, and the third column shows the dollar amount of operating expenses that would have been paid by an investor who started with $1,000 in the Fund. You may use the information here, together with the amount you invested, to estimate the expenses that you paid over the period.
To do so, simply divide your account value by $1,000 (for example, an $8,600 account value divided by $1,000 = 8.6), then multiply the result by the number given for the Fund under the heading “Expenses Paid During Period.”
Hypothetical 5% return – This section is intended to help you compare the Fund’s ongoing costs with those of other mutual funds. It assumes that the Fund had an annual return of 5% before expenses during the period shown, but that the expense ratio is unchanged. In this case, because the return used is not the Fund’s actual return, the results do not apply to your investment. The example is useful in making comparisons because the SEC requires all mutual funds to calculate expenses based on a 5% return. You can assess the Fund’s ongoing costs by comparing this hypothetical example with the hypothetical examples that appear in shareholder reports of other funds.
Note that expenses shown in the table are meant to highlight and help you compare ongoing costs only. The Fund does not charge transaction fees, such as purchase or redemption fees, nor does it carry a “sales load.”
The calculations assume no shares were bought or sold during the period. Your actual costs may have been higher or lower, depending on the amount of your investment and the timing of any purchases or redemptions.
23
WAVELENGTH INTEREST RATE NEUTRAL FUND
ABOUT YOUR FUND’S EXPENSES (Unaudited)
ABOUT YOUR FUND’S EXPENSES (Unaudited)
More information about the Fund’s expenses can be found in this report. For additional information on operating expenses and other shareholder costs, please refer to the Fund’s prospectus.
Beginning Account Value December 1, 2016 | Ending Account Value May 31, 2017 | Expenses Paid During Period* | |
| Based on Actual Fund Return | $ 1,000.00 | $ 1,042.70 | $ 5.04 |
| Based on Hypothetical 5% Return (before expenses) | $ 1,000.00 | $ 1,020.00 | $ 4.99 |
| * | Expenses are equal to the Fund’s annualized net expense ratio of 0.99% for the period, multiplied by the average account value over the period, multiplied by 182/365 (to reflect the one-half year period). |
OTHER INFORMATION (Unaudited)
A description of the policies and procedures that the Fund uses to vote proxies relating to portfolio securities is available without charge upon request by calling toll-free 1-866-896-9292, or on the SEC’s website at http://www.sec.gov. Information regarding how the Fund voted proxies relating to portfolio securities during the most recent 12-month period ended June 30 is available without charge upon request by calling toll-free 1-866-896-9292, or on the SEC’s website at http://www.sec.gov.
The Trust files a complete listing of portfolio holdings for the Fund with the SEC as of the end of the first and third quarters of each fiscal year on Form N-Q. These filings are available upon request by calling 1-866-896-9292. Furthermore, you may obtain a copy of the filings on the SEC’s website at http://www.sec.gov. The Trust’s Forms N-Q may also be reviewed and copied at the SEC’s Public Reference Room in Washington, DC, and information on the operation of the Public Reference Room may be obtained by calling 1-800-SEC-0330.
24
WAVELENGTH INTEREST RATE NEUTRAL FUND
FEDERAL TAX INFORMATION (Unaudited)
FEDERAL TAX INFORMATION (Unaudited)
In accordance with federal tax requirements, the following provides shareholders with information concerning distributions from ordinary income made by the Fund during the fiscal year ended May 31, 2017. Certain dividends paid by the fund may be subject to a maximum tax rate of 23.8%. As required by federal regulations, complete information was computed and reported in conjunction with your 2016 Form 1099-DIV.
25
WAVELENGTH INTEREST RATE NEUTRAL FUND
BOARD OF TRUSTEES AND EXECUTIVE OFFICERS (Unaudited)
BOARD OF TRUSTEES AND EXECUTIVE OFFICERS (Unaudited)
The Board of Trustees has overall responsibility for management of the Trust’s affairs. The Trustees serve during the lifetime of the Trust and until its termination, or until death, resignation, retirement, or removal. The Trustees, in turn, elect the officers of the Fund to actively supervise its day-to-day operations. The officers have been elected for an annual term. Unless otherwise noted, each Trustee’s and officer’s address is 225 Pictoria Drive, Suite 450, Cincinnati, OH 45246. The following are the Trustees and executive officers of the Fund:
| Name and Year of Birth | Length of Time Served | Position(s) Held with Trust | Principal Occupation(s) During Past 5 Years | Number of Funds in Trust Overseen by Trustee | Directorships of Public Companies Held by Trustee During Past 5 Years |
| Interested Trustees: | |||||
| Robert G. Dorsey* Year of Birth: 1957 | Since February 2012 | Trustee (February 2012 to present) President (June 2012 to October 2013) | President and Managing Director of Ultimus Fund Solutions, LLC and Ultimus Fund Distributors, LLC (1999 to present) | 26 | None |
| Independent Trustees: | |||||
| Janine L. Cohen Year of Birth: 1952 | Since January 2016 | Trustee | Retired since 2013; Chief Financial Officer from 2004 to 2013 and Chief Compliance Officer from 2008 to 2013 at AER Advisors, Inc. | 26 | None |
| David M. Deptula Year of Birth: 1958 | Since June 2012 | Trustee | Vice President of Legal and Special Projects at Dayton Freight Lines, Inc. since 2016; Vice President of Tax Treasury at The Standard Register, Inc. (formerly The Standard Register Company) from 2011 to 2016 | 26 | None |
26
WAVELENGTH INTEREST RATE NEUTRAL FUND
BOARD OF TRUSTEES AND EXECUTIVE OFFICERS (Unaudited) (Continued)
BOARD OF TRUSTEES AND EXECUTIVE OFFICERS (Unaudited) (Continued)
| Name and Year of Birth | Length of Time Served | Position(s) Held with Trust | Principal Occupation(s) During Past 5 Years | Number of Funds in Trust Overseen by Trustee | Directorships of Public Companies Held by Trustee During Past 5 Years |
| Independent Trustees (continued): | |||||
| John J. Discepoli Year of Birth: 1963 | Since June 2012 | Chairman (May 2016 to present) Trustee (June 2012 to present) | Owner of Discepoli Financial Planning, LLC (personal financing planning company) since 2004 | 26 | None |
| * | Mr. Dorsey is considered an “interested person” of the Trust within the meaning of Section 2(a)(19) of the 1940 Act because of his relationship with the Trust’s administrator, transfer agent and distributor. |
| Name and Year of Birth | Length of Time Served | Position(s) Held with Trust | Principal Occupation(s) During Past 5 Years |
| Executive Officers: | |||
| David R. Carson Year of Birth: 1958 | Since April 2013 | Principal Executive Officer (April 2017 to present) President (October 2013 to present) Vice President (April 2013 to October 2013) | Vice President and Director of Client Strategies of Ultimus Fund Solutions, LLC (2013 to present); President, Unified Series Trust (2016 to present); Chief Compliance Officer, FSI Low Beta Absolute Return Fund (2013 to 2016), The Huntington Funds (2005 to 2013), Huntington Strategy Shares (2012 to 2013), and Huntington Asset Advisors (2013); Vice President, Huntington National Bank (2001 to 2013) |
| Jennifer L. Leamer Year of Birth: 1976 | Since April 2014 | Treasurer (October 2014 to present) Assistant Treasurer (April 2014 to October 2014) | Vice President, Mutual Fund Controller of Ultimus Fund Solutions, LLC (2014 to present); Business Analyst of Ultimus Fund Solutions, LLC (2007 to 2014) |
27
WAVELENGTH INTEREST RATE NEUTRAL FUND
BOARD OF TRUSTEES AND EXECUTIVE OFFICERS (Unaudited) (Continued)
BOARD OF TRUSTEES AND EXECUTIVE OFFICERS (Unaudited) (Continued)
| Name and Year of Birth | Length of Time Served | Position(s) Held with Trust | Principal Occupation(s) During Past 5 Years |
| Executive Officers (Continued): | |||
Frank L. Newbauer Year of Birth: 1954 | Since February 2012 | Secretary (July 2017 to present) Assistant Secretary (April 2015 to July 2017) Secretary (February 2012 to April 2015) | Assistant Vice President of Ultimus Fund Solutions, LLC (2010 to present) |
| Charles C. Black Year of Birth: 1979 | Since April 2015 | Chief Compliance Officer (January 2016 to present) Assistant Chief Compliance Officer (April 2015 to January 2016) | Senior Compliance Officer of Ultimus Fund Solutions, LLC (2015 to present); Chief Compliance Officer of The Caldwell & Orkin Funds, Inc. (2016 to present); Senior Compliance Manager at Touchstone Mutual Funds (2013 to 2015); Senior Compliance Manager at Fund Evaluation Group (2011 to 2013) |
Additional information about members of the Board and executive officers is available in the Fund’s Statement of Additional Information (“SAI”). To obtain a free copy of the SAI, please call 1-866-738-1128.
28
WAVELENGTH INTEREST RATE NEUTRAL FUND
DISCLOSURE REGARDING APPROVAL OF INVESTMENT ADVISORY AGREEMENT (Unaudited)
DISCLOSURE REGARDING APPROVAL OF INVESTMENT ADVISORY AGREEMENT (Unaudited)
The Board of Trustees (the “Board”), including the Independent Trustees voting separately, has reviewed and approved the Fund’s Investment Advisory Agreement with Wavelength Capital Management, LLC (the “Adviser”) for an additional annual term. Approval took place at an in-person meeting held on April 24-25, 2017, at which all of the Trustees were present.
In the course of their deliberations, the Board was advised by legal counsel. The Board received and reviewed a substantial amount of information provided by the Adviser in response to requests of the Board and counsel.
In deciding whether to approve the renewal of the Investment Advisory Agreement, the Board recalled its review of the materials related to the Fund and the Adviser throughout the preceding 12 months and its numerous discussions with Trust management and the Adviser about the operations and performance of the Fund during that period. The Board further considered those materials and discussions and other numerous factors, including
The nature, extent, and quality of the services provided by the Adviser. In this regard, the Board reviewed the services being provided by the Adviser to the Fund including, without limitation, its investment advisory services since the Fund’s inception, the Adviser’s compliance procedures and practices, and its efforts to promote the Fund and assist in its distribution, and its compliance program. After reviewing the foregoing information and further information regarding the Adviser’s business, the Board concluded that the quality, extent, and nature of the services provided by the Adviser were satisfactory and adequate for the Fund.
The investment performance of the Fund. In this regard, the Board compared the performance of the Fund with the performance of its benchmark index, custom peer group and related Morningstar category. The Board also considered the consistency of the Adviser’s management with the Fund’s investment objective and policies. The Board noted that, relative to its peer group and funds of similar size and structure in the Fund’s Morningstar category (Nontraditional Bond under $25 million, No Load), the Fund had outperformed the peer group’s average and median for the one- and three-year periods, outperformed the Morningstar category’s average for the one- and three-year periods, and outperformed the Morningstar category’s median for the one-year period and equaled the median for the three-year period. In addition, the Fund’s performance was comparable with or better than many of the funds in the peer group and Morningstar category. Following discussion of the investment performance of the Fund, the Adviser’s experience in managing a mutual fund, its historical investment performance, and other factors, the Board concluded that the investment performance of the Fund has been satisfactory.
The costs of the services provided and profits realized by the Adviser and its affiliates from its relationship with the Fund. In this regard, the Board considered the Adviser’s staffing, personnel, and methods of operations; the education and experience of its personnel; compliance program, policies, and procedures; financial condition and the level of commitment to the Fund, and, generally, the Adviser’s advisory business; the asset level
29
WAVELENGTH INTEREST RATE NEUTRAL FUND
DISCLOSURE REGARDING APPROVAL OF INVESTMENT ADVISORY AGREEMENT (Unaudited) (Continued)
DISCLOSURE REGARDING APPROVAL OF INVESTMENT ADVISORY AGREEMENT (Unaudited) (Continued)
of the Fund; and the overall expenses of the Fund, including the advisory fee. The Board considered the Adviser’s Expense Limitation Agreement (the “ELA”) with the Fund and considered the Adviser’s current and past fee reductions and expense reimbursements for the Fund. The Board further took into account the Adviser’s commitment to continue the ELA for the Fund until at least October 1, 2018.
The Board also considered potential benefits for the Adviser in managing the Fund, including promotion of the Adviser’s name and the potential for it to receive research, statistical, or other services from the Fund’s trades. The Board compared the Fund’s advisory fee and overall expense ratio to the average advisory fees and average expense ratios for its peer group and Morningstar category. The Board noted that the 0.95% advisory fee for the Fund was above the average and the median for the Fund’s peer group and Morningstar category, but less than the advisory fee for some of the funds in the peer group and Morningstar category. The Board considered the investment strategy and style used by the Adviser in managing the portfolio of the Fund. The Board further noted that the overall annual expense ratio of 0.99% for the Fund is lower than the average and median for the Fund’s peer group, and lower than the Morningstar category’s average and median expense ratios. Following these comparisons and upon further consideration and discussion of the foregoing, the Board concluded that the advisory fee paid to the Adviser by the Fund is fair and reasonable.
The extent to which economies of scale would be realized as the Fund grows and whether advisory fee levels reflect these economies of scale for the benefit of the Fund’s investors. In this regard, the Board considered that the Fund’s fee arrangements with the Adviser involve both the advisory fee and the ELA. The Board determined that while the advisory fee remained the same as asset levels increased, the shareholders of the Fund have experienced benefits from the ELA and will continue to experience benefits from the ELA until the Fund assets grow to a level where its expenses otherwise fall below the expense limit. Following further discussion of the Fund’s asset level, expectations for growth, and level of fees, the Board determined that the Fund’s fee arrangements with the Adviser would continue to provide benefits. The Board also determined that the fee arrangements were fair and reasonable in relation to the nature and quality of services be provided by the Adviser, and given the Fund’s projected asset levels for the next year.
Brokerage and portfolio transactions. In this regard, the Board considered the Adviser’s trading policies, procedures, and performance in seeking best execution for the Fund. The Board also considered the historical portfolio turnover rate for the Fund; the process by which evaluations are made of the overall reasonableness of commissions paid; the process by which the Adviser evaluates best execution; the method and basis for selecting and evaluating the broker-dealers used; and any anticipated allocation of portfolio business to persons affiliated with the Adviser. After further review and discussion, the Board determined that the Adviser’s practices regarding brokerage and portfolio transactions were satisfactory.
30
WAVELENGTH INTEREST RATE NEUTRAL FUND
DISCLOSURE REGARDING APPROVAL OF INVESTMENT ADVISORY AGREEMENT (Unaudited) (Continued)
DISCLOSURE REGARDING APPROVAL OF INVESTMENT ADVISORY AGREEMENT (Unaudited) (Continued)
Possible conflicts of interest. In evaluating the possibility for conflicts of interest, the Board considered such matters as the experience and abilities of the advisory personnel assigned to the Fund, the Adviser’s process for allocating trades among its different clients, and the substance and administration of the Adviser’s Code of Ethics. Following further consideration and discussion, the Board found that the Adviser’s standards and practices relating to the identification and mitigation of potential conflicts of interests were satisfactory.
Conclusion
After full consideration of the above factors as well as other factors, the Board unanimously concluded that approval of the Investment Advisory Agreement was in the best interests of the Fund and its shareholders. It was noted that in the Trustees’ deliberation regarding the approval of the renewal of the Investment Advisory Agreement, the Trustees did not identify any particular information or factor that was all-important or controlling, and that each individual Trustee may have attributed different weights to the various factors noted above.
31
This page intentionally left blank.
This page intentionally left blank.
| Item 2. | Code of Ethics. |
As of the end of the period covered by this report, the registrant has adopted a code of ethics that applies to the registrant's principal executive officer, principal financial officer, principal accounting officer or controller, or persons performing similar functions, regardless of whether these individuals are employed by the registrant or a third party. Pursuant to Item 12(a)(1), a copy of registrant's code of ethics is filed as an exhibit to this Form N-CSR. During the period covered by this report, the code of ethics has not been amended, and the registrant has not granted any waivers, including implicit waivers, from the provisions of the code of ethics.
| Item 3. | Audit Committee Financial Expert. |
The registrant's board of trustees has determined that the registrant has at least one audit committee financial expert serving on its audit committee. The name of the audit committee financial expert is David M. Deptula. Mr. Deptula is "independent" for purposes of this Item.
| Item 4. | Principal Accountant Fees and Services. |
| (a) | Audit Fees. The aggregate fees billed for professional services rendered by the principal accountant for the audit of the registrant's annual financial statements or for services that are normally provided by the accountant in connection with statutory and regulatory filings or engagements were $70,500 and $67,500 with respect to the registrant's fiscal years ended May 31, 2017 and 2016, respectively. |
| (b) | Audit-Related Fees. No fees were billed in either of the last two fiscal years for assurance and related services by the principal accountant that are reasonably related to the performance of the audit of the registrant's financial statements and are not reported under paragraph (a) of this Item. |
| (c) | Tax Fees. The aggregate fees billed for professional services rendered by the principal accountant for tax compliance, tax advice, and tax planning were $10,000 and $10,000 with respect to the registrant's fiscal years ended May 31, 2017 and 2016, respectively. The services comprising these fees are the preparation of the registrant's federal income and excise tax returns. |
| (d) | All Other Fees. No fees were billed in either of the last two fiscal years for products and services provided by the principal accountant, other than the services reported in paragraphs (a) through (c) of this Item. |
| (e)(1) | The audit committee has not adopted pre-approval policies and procedures described in paragraph (c)(7) of Rule 2-01 of Regulation S-X. |
| (e)(2) | None of the services described in paragraph (b) through (d) of this Item were approved by the audit committee pursuant to paragraph (c)(7)(i)(C) of Rule 2-01 of Regulation S-X. |
| (f) | Less than 50% of hours expended on the principal accountant's engagement to audit the registrant's financial statements for the most recent fiscal year were attributed to work performed by persons other than the principal accountant's full-time, permanent employees. |
| (g) | During the fiscal years ended May 31, 2017 and 2016, aggregate non-audit fees of $10,000 and $10,000, respectively, were billed by the registrant's accountant for services rendered to the registrant. No non-audit fees were billed in either of the last two fiscal years by the registrant's accountant for services rendered to the registrant's investment adviser (not including any sub-adviser whose role is primarily portfolio management and is subcontracted with or overseen by another investment adviser), and any entity controlling, controlled by, or under common control with the adviser that provides ongoing services to the registrant. |
| (h) | The principal accountant has not provided any non-audit services to the registrant's investment adviser (not including any sub-adviser whose role is primarily portfolio management and is subcontracted with or overseen by another investment adviser), and any entity controlling, controlled by, or under common control with the investment adviser that provides ongoing services to the registrant. |
| Item 5. | Audit Committee of Listed Registrants. |
Not applicable
| Item 6. | Schedule of Investments. |
| (a) | Not applicable [schedule filed with Item 1] |
| (b) | Not applicable |
| Item 7. | Disclosure of Proxy Voting Policies and Procedures for Closed-End Management Investment Companies. |
Not applicable
| Item 8. | Portfolio Managers of Closed-End Management Investment Companies. |
Not applicable
| Item 9. | Purchases of Equity Securities by Closed-End Management Investment Company and Affiliated Purchasers. |
Not applicable
Item 10. Submission of Matters to a Vote of Security Holders.
The registrant’s Committee of Independent Trustees shall review shareholder recommendations to fill vacancies on the registrant’s board of trustees if such recommendations are submitted in writing, addressed to the Committee at the registrant’s offices and meet any minimum qualifications adopted by the Committee. The Committee may adopt, by resolution, a policy regarding its procedures for considering candidates for the board of trustees, including any recommended by shareholders.
| Item 11. | Controls and Procedures. |
(a) Based on their evaluation of the registrant’s disclosure controls and procedures (as defined in Rule 30a-3(c) under the Investment Company Act of 1940) as of a date within 90 days of the filing date of this report, the registrant’s principal executive officer and principal financial officer have concluded that such disclosure controls and procedures are reasonably designed and are operating effectively to ensure that material information relating to the registrant, including its consolidated subsidiaries, is made known to them by others within those entities, particularly during the period in which this report is being prepared, and that the information required in filings on Form N-CSR is recorded, processed, summarized, and reported on a timely basis.
(b) There were no changes in the registrant’s internal control over financial reporting (as defined in Rule 30a-3(d) under the Investment Company Act of 1940) that occurred during the second fiscal quarter of the period covered by this report that have materially affected, or are reasonably likely to materially affect, the registrant’s internal control over financial reporting.
| Item 12. | Exhibits. |
File the exhibits listed below as part of this Form. Letter or number the exhibits in the sequence indicated.
(a)(1) Any code of ethics, or amendment thereto, that is the subject of the disclosure required by Item 2, to the extent that the registrant intends to satisfy the Item 2 requirements through filing of an exhibit: Attached hereto
(a)(2) A separate certification for each principal executive officer and principal financial officer of the registrant as required by Rule 30a-2(a) under the Act (17 CFR 270.30a-2(a)): Attached hereto
(a)(3) Any written solicitation to purchase securities under Rule 23c-1 under the Act (17 CFR 270.23c-1) sent or given during the period covered by the report by or on behalf of the registrant to 10 or more persons: Not applicable
(b) Certifications required by Rule 30a-2(b) under the Act (17 CFR 270.30a-2(b)): Attached hereto
| Exhibit 99.CODE ETH | Code of Ethics |
| Exhibit 99.CERT | Certifications required by Rule 30a-2(a) under the Act |
| Exhibit 99.906CERT | Certifications required by Rule 30a-2(b) under the Act |
SIGNATURES
Pursuant to the requirements of the Securities Exchange Act of 1934 and the Investment Company Act of 1940, the registrant has duly caused this report to be signed on its behalf by the undersigned, thereunto duly authorized.
| (Registrant) | Ultimus Managers Trust | |
| By (Signature and Title)* | /s/ Frank L. Newbauer | |
| Frank L. Newbauer, Secretary | ||
| Date | August 8, 2017 | |
| Pursuant to the requirements of the Securities Exchange Act of 1934 and the Investment Company Act of 1940, this report has been signed below by the following persons on behalf of the registrant and in the capacities and on the dates indicated. | ||
| By (Signature and Title)* | /s/ David R. Carson | |
| David R. Carson, Principal Executive Officer of APEXcm Small/Mid-Cap Growth Fund, Cincinnati Asset Management Funds: Broad Market Strategic Income Fund, Barrow Value Opportunity Fund, Barrow Long/Short Opportunity Fund, Wavelength Interest Rate Neutral Fund | ||
| Date | August 8, 2017 | |
| By (Signature and Title)* | /s/ Jennifer L. Leamer | |
| Jennifer L. Leamer, Treasurer and Principal Financial Officer | ||
| Date | August 8, 2017 | |
| * | Print the name and title of each signing officer under his or her signature. |