| OMB APPROVAL |
OMB Number: 3235-0570 Expires: January 31, 2017 Estimated average burden hours per response: 20.6 |
| Investment Company Act file number | 811-22680 |
| Ultimus Managers Trust |
| (Exact name of registrant as specified in charter) |
| 225 Pictoria Drive, Suite 450 Cincinnati, Ohio | 45246 |
| (Address of principal executive offices) | (Zip code) |
Ultimus Fund Solutions, LLC 225 Pictoria Drive, Suite 450 Cincinnati, Ohio 45246_ |
| (Name and address of agent for service) |
| Registrant's telephone number, including area code: | (513) 587-3400 |
| Date of fiscal year end: | November 30 | |
| Date of reporting period: | November 30, 2016 |
| Item 1. | Reports to Stockholders. |

LYRICAL U.S. VALUE EQUITY FUND
Institutional Class (LYRIX)
Investor Class (LYRBX)
LYRICAL U.S. HEDGED VALUE FUND
Institutional Class (LYRHX)
Investor Class (LYRDX)
Annual Report
November 30, 2016
LYRICAL FUNDS | December 16, 2016 |
Dear Fellow Shareholders,
Enclosed is the annual report to shareholders of the Lyrical U.S. Value Equity Fund (the “Value Fund”) and Lyrical U.S. Hedged Value Fund (the “Hedged Value Fund”) (collectively, the “Funds”). On behalf of the Funds and their investment adviser, Lyrical Asset Management LP, I would like to thank you for your investment.
Lyrical U.S. Value Equity Fund
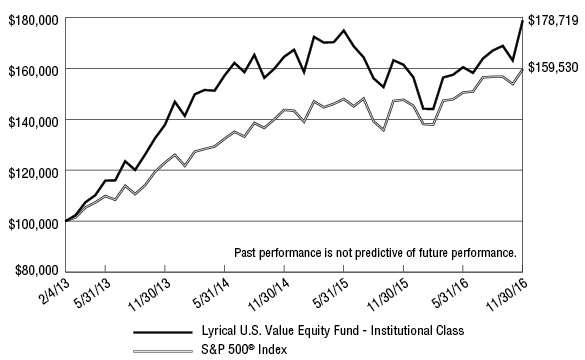
Since its launch on February 4, 2013 through November 30, 2016, the Value Fund – Institutional Class has produced a cumulative total return of +78.72%, compared to the +59.53% cumulative total return for the S&P 500 Index (the “S&P 500”). For the twelve months ended November 30, 2016, the Value Fund – Institutional Class produced a total return of +10.73% compared to the total return for the S&P 500 of +8.06%. The biggest winners for the twelve month period ended November 30, 2016 were LNC (+52%), SYMC (+47%), and NCR (+43%). The biggest losers were HTZ (-55%), QVCA (-22%) and AFSI (-21%). We maintain our positions in each of these largest winners and detractors with the exception of AFSI.
In analyzing the Fund portfolio’s performance attribution, we find it helpful to examine both the investment success rate and any skew in the distribution of returns. Our success rate has been high over the life of the Value Fund, as 84% of the Fund’s investments posted gains, and 63% outperformed the S&P 500. Skew has also been a positive factor, as the Fund’s outperformers have outperformed by 50%, while our underperformers have underperformed by 35% over the life of the Fund. For the twelve month period ended November 30, 2016, 73% of the Fund’s investments posted gains, and 51% outperformed the S&P 500. For the twelve month period skew has been a positive factor as the Fund’s outperformers have outperformed by 16%, while our underperformers have underperformed by 13%.
During the life of the Value Fund we have sold sixteen positions, as four companies announced they were being acquired, nine approached our estimates of fair value, for one we lost conviction in our thesis, for one the company announced or completed acquisitions which increased the complexity and decreased analyzability and for one the risk/reward became less compelling than other opportunities. For each sale we added a new position from our pipeline of opportunities. We are still finding attractive stock opportunities to add to the portfolio, even as some of our existing positions begin to approach our estimates of fair value.
As of November 30, 2016, the valuation of our portfolio is 13.5x next twelve months consensus earnings. The S&P 500 has a valuation of 16.9x on this same basis, a premium of 25% over the Fund.
1
Lyrical U.S. Hedged Value Fund
In July 2014 we launched the Hedged Value Fund as a liquid alternatives product that employs the same long portfolio as the Value Fund (see discussion above). Sector exchange-traded fund (ETF) hedges are used on the short side to create a portfolio that aims to maintain net long exposures of 50%. This provides a hedged option for those wishing exposure to the long portfolio but unwilling to accept unhedged equity market exposure.
Since its launch on July 14, 2014 through November 30, 2016, the Hedged Value Fund – Institutional Class has produced a cumulative total return of +0.07%, compared to the +17.02% cumulative total return for the S&P 500. For the twelve months ended November 30, 2016, the Hedged Value Fund – Institutional Class produced a total return of +5.88% compared to the total return for the S&P 500 of +8.06%. In rising equity markets one should expect Hedged Value Fund’s performance to lag that of the S&P 500, as it did for both the above periods, as our hedges detract from total return.
Lyrical Asset Management’s Investment Philosophy and Portfolio Construction
As there have been a significant number of new investors since our previous letter to the Funds’ shareholders, we’d like to briefly outline our investment philosophy and portfolio construction approach.
We believe our strategy and approach to investing differentiate us from other investment managers, even those that share a value approach to investing. We are deep value investors and by this we mean that we look to invest in companies trading significantly below intrinsic value. We believe this separates us from other value managers who focus on relative value or core value approaches and whose portfolio characteristics have higher Price/Earnings, Price/Book and Price/Cash Flow multiples. We assess valuation based on current price relative to long-term normalized earnings, which contrasts us to those that rely on Price/Book or dividend yield. We only invest in what we consider to be quality businesses that we believe should earn good returns on invested capital, and avoid volatile businesses and companies with excessive leverage. Other value investors may consider owning any business regardless of quality if they believe the price is low enough. Lastly, we only invest in businesses we can understand, and avoid those that are excessively complex or require specialized technical knowledge, even though they may appear cheap from a high-level perspective.
We construct our portfolio purely bottom up and without regard to what is or is not contained in a benchmark. We are concerned with concentration risk, and have strict limits on how much capital can be invested in any one position or any one industry. Our long portfolio is constructed to be balanced and diversified across approximately 33 positions, giving us exposure to many different types of companies and situations without sacrificing our strict investment standards.
Thank you for your continued trust and interest in Lyrical Asset Management.
Sincerely,
Andrew Wellington
Portfolio Manager
2
Past performance is not predictive of future performance. Investment results and principal value will fluctuate so that shares, when redeemed, may be worth more or less than their original cost. Current performance may be higher or lower than the performance data quoted. Performance data current to the most recent month end are available by calling 1-888-884-8099.
An investor should consider the investment objectives, risks, charges and expenses of the Funds carefully before investing. The Funds’ prospectus contains this and other important information. To obtain a copy of the Funds’ prospectus please visit the Funds’ website at www.lyricalvaluefunds.com or call 1-888-884-8099 and a copy will be sent to you free of charge. Please read the prospectus carefully before you invest. The Funds are distributed by Ultimus Fund Distributors, LLC.
The Letter to Shareholders seeks to describe some of the Adviser’s current opinions and views of the financial markets. Although the Adviser believes it has a reasonable basis for any opinions or views expressed, actual results may differ, sometimes significantly so, from those expected or expressed. The securities held by the Funds that are discussed in the Letter to Shareholders were held during the period covered by this Report. They do not comprise the entire investment portfolios of the Funds, may be sold at any time, and may no longer be held by the Funds. For a complete list of securities held by the Funds as of November 30, 2016, please see the Schedules of Investments and Schedule of Securities Sold Short sections of the Annual Report. The opinions of the Funds’ adviser with respect to those securities may change at any time.
Statements in the Letter to Shareholders that reflect projections or expectations for future financial or economic performance of the Funds and the market in general and statements of the Funds’ plans and objectives for future operations are forward-looking statements. No assurance can be given that actual results or events will not differ materially from those projected, estimated, assumed, or anticipated in any such forward-looking statements. Important factors that could result in such differences, in addition to factors noted with such forward-looking statements include, without limitation, general economic conditions, such as inflation, recession, and interest rates. Past performance is not a guarantee of future results.
3
LYRICAL U.S. VALUE EQUITY FUND
PERFORMANCE INFORMATION (Unaudited)
Comparison of the Change in Value of a $100,000 Investment in
Lyrical U.S. Value Equity Fund - Institutional Class(a) versus
the S&P 500® Index
Average Annual Total Returns (for the periods ended November 30, 2016) | ||
1 Year | Since | |
Lyrical U.S. Value Equity Fund - Institutional Class(b) | 10.73% | 16.42% |
Lyrical U.S. Value Equity Fund - Investor Class(b) | 10.36% | 6.70% |
S&P 500® Index(d) | 8.06% | 13.01%(e) |
(a) | The line graph above represents performance of the Institutional Class only, which will vary from the performance of the Investor Class based on the difference in fees paid by shareholders in the different classes. |
(b) | The Fund’s total returns do not reflect the deduction of taxes a shareholder would pay on Fund distributions or the redemption of Fund shares. |
(c) | Commencement of operations for Institutional Class shares was February 4, 2013. Commencement of operations for Investor Class shares was February 24, 2014. |
(d) | The S&P 500® Index is a market capitalization weighted index of 500 large companies that is widely used as a barometer of U.S. stock market performance. The index is unmanaged and shown for illustration purposes only. An investor cannot invest in an index and its returns are not indicative of the performance of any specific investment. |
(e) | Represents the period from February 4, 2013 (date of commencement of operations of Institutional Class shares) through November 30, 2016. |
4
LYRICAL U.S. HEDGED VALUE FUND
PERFORMANCE INFORMATION (Unaudited)
Comparison of the Change in Value of a $100,000 Investment in
Lyrical U.S. Hedged Value Fund - Institutional Class(a) versus
the S&P 500® Index

Average Annual Total Returns (for the periods ended November 30, 2016) | ||
1 Year | Since | |
Lyrical U.S. Hedged Value Fund - Institutional Class(b) | 5.88% | 0.03% |
Lyrical U.S. Hedged Value Fund - Investor Class(b) | 5.58% | (0.22%) |
S&P 500® Index(d) | 8.06% | 6.83% |
(a) | The line graph above represents performance of the Institutional Class only, which will vary from the performance of the Investor Class based on the difference in fees paid by shareholders in the different classes. |
(b) | The Fund’s total returns do not reflect the deduction of taxes a shareholder would pay on Fund distributions or the redemption of Fund shares. |
(c) | Commencement of operations for Institutional Class and Investor Class shares was July 14, 2014. |
(d) | The S&P 500® Index is a market capitalization weighted index of 500 large companies that is widely used as a barometer of U.S. stock market performance. The index is unmanaged and shown for illustration purposes only. An investor cannot invest in an index and its returns are not indicative of the performance of any specific investment. |
5
LYRICAL U.S. VALUE EQUITY FUND
PORTFOLIO INFORMATION
November 30, 2016 (Unaudited)
Lyrical U.S. Value Equity Fund vs S&P 500® Index
Sector Diversification

Top Ten Equity Holdings
Security Description | % of |
Broadcom Ltd. | 6.1% |
Aetna, Inc. | 4.9% |
Comcast Corporation - Class A | 4.4% |
Corning, Inc. | 4.4% |
EOG Resources, Inc. | 4.4% |
Aflac, Inc. | 4.2% |
Lincoln National Corporation | 4.1% |
Symantec Corporation | 4.1% |
Suncor Energy, Inc. | 3.9% |
Johnson Controls International plc | 3.9% |
6
LYRICAL U.S. HEDGED VALUE FUND
PORTFOLIO INFORMATION
November 30, 2016 (Unaudited)
Lyrical U.S. Hedged Value Fund vs S&P 500® Index
Sector Diversification
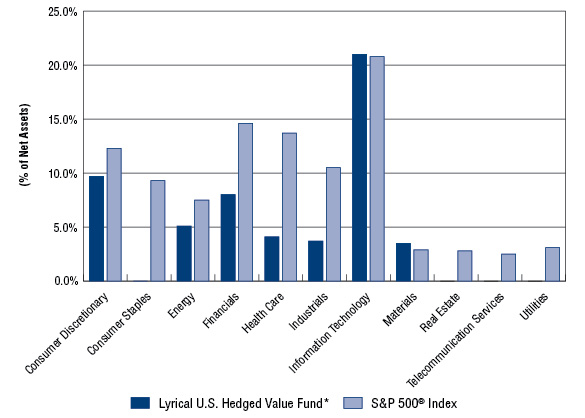
* | The percentages above for Lyrical U.S. Hedged Value Fund represent the net percentages for the Fund and are computed by taking the net dollar exposure, including short positions, and dividing by the net assets of the Fund. |
Top Ten Long Positions
Security Description | % of |
Anthem, Inc. | 4.8% |
Aetna, Inc. | 4.8% |
Comcast Corporation - Class A | 4.8% |
Corning, Inc. | 4.8% |
TE Connectivity Ltd. | 4.7% |
Aflac, Inc. | 4.7% |
Lincoln National Corporation | 4.7% |
Broadcom Ltd. | 4.6% |
Symantec Corporation | 4.6% |
Celanese Corporation - Series A | 4.4% |
7
LYRICAL U.S. VALUE EQUITY FUND | ||||||||
COMMON STOCKS — 99.9% | Shares | Value | ||||||
Consumer Discretionary — 13.7% | ||||||||
Auto Components — 3.4% | ||||||||
Goodyear Tire & Rubber Company (The) | 806,142 | $ | 24,740,498 | |||||
Tenneco, Inc. (a) | 180,828 | 10,659,810 | ||||||
35,400,308 | ||||||||
Household Durables — 3.2% | ||||||||
Whirlpool Corporation | 206,532 | 33,549,058 | ||||||
Internet & Direct Marketing Retail — 2.7% | ||||||||
Liberty Interactive Corporation QVC Group - Series A (a) | 1,387,442 | 28,733,924 | ||||||
Media — 4.4% | ||||||||
Comcast Corporation - Class A | 669,921 | 46,566,209 | ||||||
Energy — 11.2% | ||||||||
Energy Equipment & Services — 2.9% | ||||||||
National Oilwell Varco, Inc. | 822,966 | 30,746,010 | ||||||
Oil, Gas & Consumable Fuels — 8.3% | ||||||||
EOG Resources, Inc. | 446,593 | 45,784,714 | ||||||
Suncor Energy, Inc. | 1,300,599 | 41,437,084 | ||||||
87,221,798 | ||||||||
Financials — 16.8% | ||||||||
Capital Markets — 3.7% | ||||||||
Ameriprise Financial, Inc. | 343,724 | 39,256,718 | ||||||
Insurance — 13.1% | ||||||||
Aflac, Inc. | 619,964 | 44,253,030 | ||||||
Assurant, Inc. | 208,937 | 18,039,621 | ||||||
Lincoln National Corporation | 674,888 | 43,260,321 | ||||||
Willis Towers Watson plc | 254,209 | 31,615,973 | ||||||
137,168,945 | ||||||||
Health Care — 8.8% | ||||||||
Health Care Providers & Services — 8.8% | ||||||||
Aetna, Inc. | 392,069 | 51,298,308 | ||||||
Anthem, Inc. | 289,283 | 41,231,506 | ||||||
92,529,814 | ||||||||
Industrials — 13.7% | ||||||||
Commercial Services & Supplies — 3.9% | ||||||||
Johnson Controls International plc | 921,161 | 41,433,822 | ||||||
8
LYRICAL U.S. VALUE EQUITY FUND | ||||||||
COMMON STOCKS — 99.9% (Continued) | Shares | Value | ||||||
Industrials — 13.7% (Continued) | ||||||||
Construction & Engineering — 1.4% | ||||||||
AECOM (a) | 406,654 | $ | 14,781,873 | |||||
Electrical Equipment — 3.9% | ||||||||
Eaton Corporation plc | 614,384 | 40,862,680 | ||||||
Road & Rail — 1.9% | ||||||||
Avis Budget Group, Inc. (a) | 314,468 | 12,040,980 | ||||||
Hertz Global Holdings, Inc. (a) | 325,383 | 8,193,144 | ||||||
20,234,124 | ||||||||
Trading Companies & Distributors — 2.6% | ||||||||
AerCap Holdings N.V. (a) | 628,023 | 26,910,785 | ||||||
Information Technology — 31.3% | ||||||||
Communications Equipment — 3.1% | ||||||||
ARRIS International plc (a) | 442,158 | 12,685,513 | ||||||
CommScope Holding Company, Inc. (a) | 555,859 | 19,999,807 | ||||||
32,685,320 | ||||||||
Electronic Equipment, Instruments & Components — 8.2% | ||||||||
Corning, Inc. | 1,906,302 | 45,808,437 | ||||||
TE Connectivity Ltd. | 604,454 | 40,885,269 | ||||||
86,693,706 | ||||||||
IT Services — 3.2% | ||||||||
Western Union Company (The) | 1,589,140 | 33,419,614 | ||||||
Semiconductors & Semiconductor Equipment — 7.6% | ||||||||
Broadcom Ltd. | 375,063 | 63,944,491 | ||||||
Microsemi Corporation (a) | 297,918 | 16,311,010 | ||||||
80,255,501 | ||||||||
Software — 4.1% | ||||||||
Symantec Corporation | 1,746,338 | 42,593,184 | ||||||
Technology Hardware, Storage & Peripherals — 5.1% | ||||||||
NCR Corporation (a) | 507,006 | 19,646,483 | ||||||
Western Digital Corporation | 537,223 | 34,199,616 | ||||||
53,846,099 | ||||||||
Materials — 4.4% | ||||||||
Chemicals — 3.5% | ||||||||
Celanese Corporation - Series A | 458,735 | 36,386,860 | ||||||
9
LYRICAL U.S. VALUE EQUITY FUND | ||||||||
COMMON STOCKS — 99.9% (Continued) | Shares | Value | ||||||
Materials — 4.4% (Continued) | ||||||||
Containers & Packaging — 0.9% | ||||||||
Owens-Illinois, Inc. (a) | 499,286 | $ | 9,171,884 | |||||
Total Common Stocks (Cost $899,849,917) | $ | 1,050,448,236 | ||||||
MONEY MARKET FUNDS — 1.0% | Shares | Value | ||||||
Invesco Short-Term Investments Trust - Treasury Portfolio - Institutional Shares, 0.26% (b) (Cost $10,620,620) | 10,620,620 | $ | 10,620,620 | |||||
Total Investments at Value — 100.9% (Cost $910,470,537) | $ | 1,061,068,856 | ||||||
Liabilities in Excess of Other Assets — (0.9%) | (8,952,591 | ) | ||||||
Net Assets — 100.0% | $ | 1,052,116,265 | ||||||
(a) | Non-income producing security. |
(b) | The rate shown is the 7-day effective yield as of November 30, 2016. |
N.V. — Naamloze Vennootschap |
plc — Public Limited Company |
See accompanying notes to financial statements. |
10
LYRICAL U.S. HEDGED VALUE FUND | ||||||||
COMMON STOCKS — 108.7% | Shares | Value | ||||||
Consumer Discretionary — 15.7% | ||||||||
Auto Components — 4.0% | ||||||||
Goodyear Tire & Rubber Company (The) (a) | 1,288 | $ | 39,528 | |||||
Tenneco, Inc. (b) | 283 | 16,683 | ||||||
56,211 | ||||||||
Household Durables — 3.7% | ||||||||
Whirlpool Corporation (a) | 315 | 51,168 | ||||||
Internet & Direct Marketing Retail — 3.2% | ||||||||
Liberty Interactive Corporation QVC Group - Series A (a) (b) | 2,156 | 44,651 | ||||||
Media — 4.8% | ||||||||
Comcast Corporation - Class A (a) | 964 | 67,008 | ||||||
Energy — 10.4% | ||||||||
Energy Equipment & Services — 2.3% | ||||||||
National Oilwell Varco, Inc. (a) | 871 | 32,541 | ||||||
Oil, Gas & Consumable Fuels — 8.1% | ||||||||
EOG Resources, Inc. (a) | 585 | 59,974 | ||||||
Suncor Energy, Inc. (a) | 1,657 | 52,792 | ||||||
112,766 | ||||||||
Financials — 18.8% | ||||||||
Capital Markets — 4.2% | ||||||||
Ameriprise Financial, Inc. (a) | 509 | 58,133 | ||||||
Insurance — 14.6% | ||||||||
Aflac, Inc. (a) | 921 | 65,741 | ||||||
Assurant, Inc. (a) | 352 | 30,392 | ||||||
Lincoln National Corporation | 1,021 | 65,446 | ||||||
Willis Towers Watson plc (a) | 346 | 43,032 | ||||||
204,611 | ||||||||
Health Care — 9.6% | ||||||||
Health Care Providers & Services — 9.6% | ||||||||
Aetna, Inc. (a) | 514 | 67,252 | ||||||
Anthem, Inc. (a) | 472 | 67,274 | ||||||
134,526 | ||||||||
Industrials — 15.4% | ||||||||
Commercial Services & Supplies — 4.3% | ||||||||
Johnson Controls International plc (a) | 1,319 | 59,329 | ||||||
11
LYRICAL U.S. HEDGED VALUE FUND | ||||||||
COMMON STOCKS — 108.7% (Continued) | Shares | Value | ||||||
Industrials — 15.4% (Continued) | ||||||||
Construction & Engineering — 1.5% | ||||||||
AECOM (a) (b) | 577 | $ | 20,974 | |||||
Electrical Equipment — 4.0% | ||||||||
Eaton Corporation plc (a) | 842 | 56,001 | ||||||
Road & Rail — 2.4% | ||||||||
Avis Budget Group, Inc. (a) (b) | 527 | 20,179 | ||||||
Hertz Global Holdings, Inc. (a) (b) | 522 | 13,144 | ||||||
33,323 | ||||||||
Trading Companies & Distributors — 3.2% | ||||||||
AerCap Holdings N.V. (a) (b) | 1,052 | 45,078 | ||||||
Information Technology — 33.3% | ||||||||
Communications Equipment — 3.5% | ||||||||
ARRIS International plc (b) | 703 | 20,169 | ||||||
CommScope Holding Company, Inc. (a) (b) | 800 | 28,784 | ||||||
48,953 | ||||||||
Electronic Equipment, Instruments & Components — 9.5% | ||||||||
Corning, Inc. (a) | 2,755 | 66,202 | ||||||
TE Connectivity Ltd. (a) | 975 | 65,949 | ||||||
132,151 | ||||||||
IT Services — 4.0% | ||||||||
Western Union Company (The) (a) | 2,662 | 55,982 | ||||||
Semiconductors & Semiconductor Equipment — 6.4% | ||||||||
Broadcom Ltd. (a) | 376 | 64,104 | ||||||
Microsemi Corporation (b) | 466 | 25,514 | ||||||
89,618 | ||||||||
Software — 4.6% | ||||||||
Symantec Corporation (a) | 2,628 | 64,097 | ||||||
Technology Hardware, Storage & Peripherals — 5.3% | ||||||||
NCR Corporation (b) | 836 | 32,395 | ||||||
Western Digital Corporation (a) | 656 | 41,761 | ||||||
74,156 | ||||||||
Materials — 5.5% | ||||||||
Chemicals — 4.4% | ||||||||
Celanese Corporation - Series A (a) | 774 | 61,393 | ||||||
12
LYRICAL U.S. HEDGED VALUE FUND | ||||||||
COMMON STOCKS — 108.7% (Continued) | Shares | Value | ||||||
Materials — 5.5% (Continued) | ||||||||
Containers & Packaging — 1.1% | ||||||||
Owens-Illinois, Inc. (a) (b) | 824 | $ | 15,137 | |||||
Total Common Stocks (Cost $1,482,677) | $ | 1,517,807 | ||||||
MONEY MARKET FUNDS — 1.2% | Shares | Value | ||||||
Invesco Short-Term Investments Trust - Treasury Portfolio - Institutional Shares, 0.26% (c) (Cost $16,436) | 16,436 | $ | 16,436 | |||||
Total Investments at Value — 109.9% (Cost $1,499,113) | $ | 1,534,243 | ||||||
Liabilities in Excess of Other Assets(d) — (9.9%) | (137,770 | ) | ||||||
Net Assets — 100.0% | $ | 1,396,473 | ||||||
(a) | All or a portion of the shares have been committed as collateral for open short positions (Note 2). |
(b) | Non-income producing security. |
(c) | The rate shown is the 7-day effective yield as of November 30, 2016. |
(d) | Includes cash held as margin deposits for short positions. |
N.V. — Naamloze Vennootschap |
plc — Public Limited Company |
See accompanying notes to financial statements. |
13
LYRICAL U.S. HEDGED VALUE FUND | ||||||||
EXCHANGE-TRADED FUNDS — 53.6% | Shares | Value | ||||||
Consumer Discretionary Select Sector SPDR® Fund (The) | 1,017 | $ | 83,242 | |||||
Energy Select Sector SPDR® Fund (The) | 997 | 74,207 | ||||||
Financial Select Sector SPDR® Fund (The) | 6,720 | 151,267 | ||||||
Health Care Select Sector SPDR® Fund (The) | 1,121 | 77,069 | ||||||
Industrial Select Sector SPDR® Fund (The) | 2,615 | 163,202 | ||||||
Materials Select Sector SPDR® Fund (The) | 561 | 28,016 | ||||||
Technology Select Sector SPDR® Fund (The) | 3,622 | 172,045 | ||||||
Total Securities Sold Short — 53.6% (Proceeds $679,510) | $ | 749,048 | ||||||
See accompanying notes to financial statements. |
14
LYRICAL FUNDS | ||||||||
| Lyrical U.S. | Lyrical U.S. | ||||||
ASSETS | ||||||||
Investments in securities: | ||||||||
At acquisition cost | $ | 910,470,537 | $ | 1,499,113 | ||||
At value (Note 2) | $ | 1,061,068,856 | $ | 1,534,243 | ||||
Deposits with brokers for securities sold short (Note 2) | — | 608,993 | ||||||
Dividends receivable | 1,558,493 | 2,324 | ||||||
Receivable for capital shares sold | 1,523,601 | 150 | ||||||
Receivable from Adviser (Note 4) | — | 15,067 | ||||||
Other assets | 17,597 | 5,661 | ||||||
Total assets | 1,064,168,547 | 2,166,438 | ||||||
LIABILITIES | ||||||||
Distributions payable | 2,627,445 | 595 | ||||||
Securities sold short, at value (Note 2) (proceeds $— and $679,510 respectively) | — | 749,048 | ||||||
Payable for capital shares redeemed | 8,230,645 | 4,777 | ||||||
Payable to Adviser (Note 4) | 1,058,522 | — | ||||||
Payable to administrator (Note 4) | 82,340 | 8,510 | ||||||
Accrued brokerage expense on securities sold short (Note 2) | — | 165 | ||||||
Other accrued expenses | 53,330 | 6,870 | ||||||
Total liabilities | 12,052,282 | 769,965 | ||||||
NET ASSETS | $ | 1,052,116,265 | $ | 1,396,473 | ||||
NET ASSETS CONSIST OF: | ||||||||
Paid-in capital | $ | 900,500,395 | $ | 1,430,321 | ||||
Accumulated net investment income (loss) | 15,200,942 | (133 | ) | |||||
Accumulated net realized gains (losses) from security transactions | (14,183,391 | ) | 693 | |||||
Net unrealized appreciation (depreciation) on: | ||||||||
Investments | 150,598,319 | 35,130 | ||||||
Securities sold short | — | (69,538 | ) | |||||
NET ASSETS | $ | 1,052,116,265 | $ | 1,396,473 | ||||
NET ASSET VALUE PER SHARE: | ||||||||
INSTITUTIONAL CLASS | ||||||||
Net assets applicable to Institutional Class | $ | 993,903,564 | $ | 821,429 | ||||
Institutional Class shares of beneficial interest outstanding (unlimited number of shares authorized, no par value) | 59,884,896 | 84,959 | ||||||
Net asset value, offering price and redemption price per share (Note 2) | $ | 16.60 | $ | 9.67 | ||||
INVESTOR CLASS | ||||||||
Net assets applicable to Investor Class | $ | 58,212,701 | $ | 575,044 | ||||
Investor Class shares of beneficial interest outstanding (unlimited number of shares authorized, no par value) | 3,522,978 | 59,838 | ||||||
Net asset value, offering price and redemption price per share (Note 2) | $ | 16.52 | $ | 9.61 | ||||
See accompanying notes to financial statements. |
15
LYRICAL FUNDS | ||||||||
| Lyrical U.S. | Lyrical U.S. | ||||||
INVESTMENT INCOME | ||||||||
Dividend income | $ | 29,084,905 | $ | 39,068 | ||||
Foreign withholding taxes on dividends | (297,672 | ) | (355 | ) | ||||
Total investment income | 28,787,233 | 38,713 | ||||||
EXPENSES | ||||||||
Investment advisory fees (Note 4) | 11,976,891 | (a) | 20,928 | |||||
Administration fees (Note 4) | 665,436 | 28,000 | ||||||
Distribution fees - Investor Class (Note 4) | 189,100 | 1,465 | ||||||
Fund accounting fees (Note 4) | 109,053 | 34,385 | ||||||
Transfer agent fees (Note 4) | 87,623 | 24,000 | ||||||
Compliance fees (Note 4) | 97,931 | 12,000 | ||||||
Custody and bank service fees | 92,402 | 6,552 | ||||||
Registration and filing fees | 85,848 | 10,086 | ||||||
Professional fees | 40,146 | 34,968 | ||||||
Postage and supplies | 38,132 | 3,230 | ||||||
Networking fees | 14,605 | 14,605 | ||||||
Trustees' fees and expenses (Note 4) | 10,165 | 10,165 | ||||||
Dividend expense on securities sold short (Note 2) | — | 14,191 | ||||||
Printing of shareholder reports | 10,813 | 3,220 | ||||||
Insurance expense | 2,546 | 2,546 | ||||||
Prime brokerage expense on securities sold short (Note 2) | — | 4,515 | ||||||
Other expenses | 33,582 | 5,611 | ||||||
Total expenses | 13,454,273 | 230,467 | ||||||
Fee reductions and expense reimbursements by Adviser (Note 4) | — | (186,666 | ) | |||||
Net expenses | 13,454,273 | 43,801 | ||||||
NET INVESTMENT INCOME (LOSS) | 15,332,960 | (5,088 | ) | |||||
REALIZED AND UNREALIZED GAINS (LOSSES) ON INVESTMENTS AND SECURITIES SOLD SHORT | ||||||||
Net realized gains (losses) from: | ||||||||
Investments | 4,951,586 | 41,829 | ||||||
Securities sold short | — | (1,927 | ) | |||||
Net change in unrealized appreciation (depreciation) on: | ||||||||
Investments | 135,673,446 | 95,448 | ||||||
Securities sold short | — | (54,825 | ) | |||||
NET REALIZED AND UNREALIZED GAINS ON INVESTMENTS AND SECURITIES SOLD SHORT | 140,625,032 | 80,525 | ||||||
NET INCREASE IN NET ASSETS RESULTING FROM OPERATIONS | $ | 155,957,992 | $ | 75,437 | ||||
(a) | Includes $22,152 of prior years’ investment advisory fee reductions and expense reimbursements recouped by the Adviser (Note 4). |
See accompanying notes to financial statements. |
16
LYRICAL U.S. VALUE EQUITY FUND | ||||||||
| Year | Year | ||||||
FROM OPERATIONS | ||||||||
Net investment income | $ | 15,332,960 | $ | 1,440,862 | ||||
Net realized gains from security transactions | 4,951,586 | 12,579,532 | ||||||
Net change in unrealized appreciation (depreciation) on investments | 135,673,446 | (31,320,202 | ) | |||||
Net increase (decrease) in net assets resulting from operations | 155,957,992 | (17,299,808 | ) | |||||
DISTRIBUTIONS TO SHAREHOLDERS (Note 2) | ||||||||
From net investment income, Institutional Class | (1,403,762 | ) | (168,471 | ) | ||||
From net investment income, Investor Class | (6,340 | ) | — | |||||
From net realized gains, Institutional Class | (29,274,092 | ) | (11,690,275 | ) | ||||
From net realized gains, Investor Class | (2,366,361 | ) | (193,318 | ) | ||||
Decrease in net assets from distributions to shareholders | (33,050,555 | ) | (12,052,064 | ) | ||||
CAPITAL SHARE TRANSACTIONS | ||||||||
Institutional Class | ||||||||
Proceeds from shares sold | 653,121,923 | 339,352,309 | ||||||
Net asset value of shares issued in reinvestment of distributions to shareholders | 24,129,237 | 9,377,973 | ||||||
Payments for shares redeemed | (395,236,728 | ) | (282,422,299 | ) | ||||
Net increase in Institutional Class net assets from capital share transactions | 282,014,432 | 66,307,983 | ||||||
Investor Class | ||||||||
Proceeds from shares sold | 59,719,286 | 118,329,002 | ||||||
Net asset value of shares issued in reinvestment of distributions to shareholders | 2,323,727 | 181,114 | ||||||
Payments for shares redeemed | (66,805,457 | ) | (59,563,305 | ) | ||||
Net increase (decrease) in Investor Class net assets from capital share transactions | (4,762,444 | ) | 58,946,811 | |||||
TOTAL INCREASE IN NET ASSETS | 400,159,425 | 95,902,922 | ||||||
NET ASSETS | ||||||||
Beginning of year | 651,956,840 | 556,053,918 | ||||||
End of year | $ | 1,052,116,265 | $ | 651,956,840 | ||||
UNDISTRIBUTED NET INVESTMENT INCOME | $ | 15,200,942 | $ | 1,278,084 | ||||
See accompanying notes to financial statements. |
17
LYRICAL U.S. VALUE EQUITY FUND | ||||||||
| Year | Year | ||||||
CAPITAL SHARE ACTIVITY | ||||||||
Institutional Class | ||||||||
Shares sold | 47,161,187 | 21,132,995 | ||||||
Shares issued in reinvestment of distributions to shareholders | 1,509,246 | 592,967 | ||||||
Shares redeemed | (26,574,555 | ) | (17,510,391 | ) | ||||
Net increase in shares outstanding | 22,095,878 | 4,215,571 | ||||||
Shares outstanding at beginning of year | 37,789,018 | 33,573,447 | ||||||
Shares outstanding at end of year | 59,884,896 | 37,789,018 | ||||||
Investor Class | ||||||||
Shares sold | 3,943,726 | 7,202,116 | ||||||
Shares issued in reinvestment of distributions to shareholders | 147,285 | 11,470 | ||||||
Shares redeemed | (4,510,214 | ) | (3,826,599 | ) | ||||
Net increase (decrease) in shares outstanding | (419,203 | ) | 3,386,987 | |||||
Shares outstanding at beginning of year | 3,942,181 | 555,194 | ||||||
Shares outstanding at end of year | 3,522,978 | 3,942,181 | ||||||
See accompanying notes to financial statements. |
18
LYRICAL U.S. HEDGED VALUE FUND | ||||||||
| Year | Year | ||||||
FROM OPERATIONS | ||||||||
Net investment loss | $ | (5,088 | ) | $ | (22,709 | ) | ||
Net realized gains (losses) from: | ||||||||
Investments | 41,829 | 21,575 | ||||||
Securities sold short | (1,927 | ) | (3,393 | ) | ||||
Net change in unrealized appreciation (depreciation) on: | ||||||||
Investments | 95,448 | (60,317 | ) | |||||
Securities sold short | (54,825 | ) | 2,207 | |||||
Net increase (decrease) in net assets resulting from operations | 75,437 | (62,637 | ) | |||||
DISTRIBUTIONS TO SHAREHOLDERS (Note 2) | ||||||||
From net realized gains, Institutional Class | (27,448 | ) | (54 | ) | ||||
From net realized gains, Investor Class | (20,037 | ) | (57 | ) | ||||
Decrease in net assets from distributions to shareholders | (47,485 | ) | (111 | ) | ||||
CAPITAL SHARE TRANSACTIONS | ||||||||
Institutional Class | ||||||||
Proceeds from shares sold | — | 220,000 | ||||||
Net asset value of shares issued in reinvestment of distributions to shareholders | 26,757 | 54 | ||||||
Net increase in Institutional Class net assets from capital share transactions | 26,757 | 220,054 | ||||||
Investor Class | ||||||||
Proceeds from shares sold | 13,373 | 126,747 | ||||||
Net asset value of shares issued in reinvestment of distributions to shareholders | 19,764 | 54 | ||||||
Payments for shares redeemed | (86,803 | ) | (94,359 | ) | ||||
Net increase (decrease) in Investor Class net assets from capital share transactions | (53,666 | ) | 32,442 | |||||
TOTAL INCREASE IN NET ASSETS | 1,043 | 189,748 | ||||||
NET ASSETS | ||||||||
Beginning of year | 1,395,430 | 1,205,682 | ||||||
End of year | $ | 1,396,473 | $ | 1,395,430 | ||||
ACCUMULATED NET INVESTMENT LOSS | $ | (133 | ) | $ | — | |||
See accompanying notes to financial statements. |
19
LYRICAL U.S. HEDGED VALUE FUND | ||||||||
| Year | Year | ||||||
CAPITAL SHARE ACTIVITY | ||||||||
Institutional Class | ||||||||
Shares sold | — | 21,883 | ||||||
Shares issued in reinvestment of distributions to shareholders | 2,782 | 6 | ||||||
Net increase in shares outstanding | 2,782 | 21,889 | ||||||
Shares outstanding at beginning of year | 82,177 | 60,288 | ||||||
Shares outstanding at end of year | 84,959 | 82,177 | ||||||
Investor Class | ||||||||
Shares sold | 1,471 | 12,770 | ||||||
Shares issued in reinvestment of distributions to shareholders | 2,067 | 6 | ||||||
Shares redeemed | (9,416 | ) | (9,763 | ) | ||||
Net increase (decrease) in shares outstanding | (5,878 | ) | 3,013 | |||||
Shares outstanding at beginning of year | 65,716 | 62,703 | ||||||
Shares outstanding at end of year | 59,838 | 65,716 | ||||||
See accompanying notes to financial statements. |
20
LYRICAL U.S. VALUE EQUITY FUND | ||||||||||||||||
Per Share Data for a Share Outstanding Throughout Each Period: | ||||||||||||||||
| Year 2016 | Year 2015 | Year 2014 | Period | ||||||||||||
Net asset value at beginning of period | $ | 15.63 | $ | 16.29 | $ | 13.78 | $ | 10.00 | ||||||||
Income (loss) from investment operations: | ||||||||||||||||
Net investment income (loss) | 0.24 | 0.04 | (0.00 | )(b) | 0.00 | (b) | ||||||||||
Net realized and unrealized gains (losses) on investments | 1.40 | (0.35 | ) | 2.66 | 3.78 | |||||||||||
Total from investment operations | 1.64 | (0.31 | ) | 2.66 | 3.78 | |||||||||||
Less distributions: | ||||||||||||||||
Dividends from net investment income | (0.04 | ) | (0.00 | )(b) | (0.00 | )(b) | — | |||||||||
Distributions from net realized gains | (0.63 | ) | (0.35 | ) | (0.15 | ) | — | |||||||||
Total distributions | (0.67 | ) | (0.35 | ) | (0.15 | ) | — | |||||||||
Net asset value at end of period | $ | 16.60 | $ | 15.63 | $ | 16.29 | $ | 13.78 | ||||||||
Total return (c) | 10.73 | % | (1.91 | %) | 19.41 | % | 37.80 | %(d) | ||||||||
Net assets at end of period (000's) | $ | 993,904 | $ | 590,582 | $ | 547,021 | $ | 97,948 | ||||||||
Ratios/supplementary data: | ||||||||||||||||
Ratio of total expenses to average net assets | 1.38 | % | 1.42 | % | 1.45 | % | 1.93 | %(e) | ||||||||
Ratio of net expenses to average net assets | 1.38 | % | 1.42 | % | 1.44 | %(f) | 1.45 | %(e)(f) | ||||||||
Ratio of net investment income (loss) to average net assets | 1.62 | % | 0.24 | % | (0.00 | %)(g)(f) | 0.01 | %(e)(f) | ||||||||
Portfolio turnover rate | 36 | % | 21 | % | 20 | % | 26 | %(d) | ||||||||
(a) | Represents the period from the commencement of operations (February 4, 2013) through November 30, 2013. |
(b) | Amount rounds to less than $0.01 per share. |
(c) | Total return is a measure of the change in value of an investment in the Fund over the periods covered. The returns shown do not reflect the deduction of taxes a shareholder would pay on Fund distributions, if any, or the redemption of Fund shares. The total returns would be lower if the Adviser had not reduced advisory fees and/or reimbursed expenses for the periods ended November 30, 2014 and 2013 (Note 4). |
(d) | Not annualized. |
(e) | Annualized. |
(f) | Ratio was determined after advisory fee reductions and/or expense reimbursements (Note 4). |
(g) | Amount rounds to less than 0.01%. |
See accompanying notes to financial statements. |
21
LYRICAL U.S. VALUE EQUITY FUND | ||||||||||||
Per Share Data for a Share Outstanding Throughout Each Period: | ||||||||||||
| Year 2016 | Year | Period | |||||||||
Net asset value at beginning of period | $ | 15.57 | $ | 16.27 | $ | 14.68 | ||||||
Income (loss) from investment operations: | ||||||||||||
Net investment income (loss) | 0.30 | 0.01 | (0.01 | ) | ||||||||
Net realized and unrealized gains (losses) on investments | 1.28 | (0.36 | ) | 1.60 | ||||||||
Total from investment operations | 1.58 | (0.35 | ) | 1.59 | ||||||||
Less distributions: | ||||||||||||
Distributions from net investment income | (0.00 | )(b) | — | — | ||||||||
Distributions from net realized gains | (0.63 | ) | (0.35 | ) | — | |||||||
Total distributions | (0.63 | ) | (0.35 | ) | — | |||||||
Net asset value at end of period | $ | 16.52 | $ | 15.57 | $ | 16.27 | ||||||
Total return (c) | 10.36 | % | (2.19 | %) | 10.83 | %(d) | ||||||
Net assets at end of period (000's) | $ | 58,213 | $ | 61,375 | $ | 9,033 | ||||||
Ratios/supplementary data: | ||||||||||||
Ratio of total expenses to average net assets | 1.70 | % | 1.72 | % | 2.39 | %(e) | ||||||
Ratio of net expenses to average net assets | 1.70 | % | 1.70 | %(f) | 1.70 | %(e)(f) | ||||||
Ratio of net investment income (loss) to average net assets | 1.39 | % | 0.03 | %(f) | (0.18 | %)(e)(f) | ||||||
Portfolio turnover rate | 36 | % | 21 | % | 20 | %(d)(g) | ||||||
(a) | Represents the period from the commencement of operations (February 24, 2014) through November 30, 2014. |
(b) | Amount rounds to less than $0.01 per share. |
(c) | Total return is a measure of the change in value of an investment in the Fund over the periods covered. The returns shown do not reflect the deduction of taxes a shareholder would pay on Fund distributions, if any, or the redemption of Fund shares. The total returns would be lower if the Adviser had not reduced advisory fees and/or reimbursed expenses for the periods ended November 30, 2014 and 2013 (Note 4). |
(d) | Not annualized. |
(e) | Annualized. |
(f) | Ratio was determined after advisory fee reductions and/or expense reimbursements (Note 4). |
(g) | Represents the year ended November 30, 2014. |
See accompanying notes to financial statements. |
22
LYRICAL U.S. HEDGED VALUE FUND | ||||||||||||
Per Share Data for a Share Outstanding Throughout Each Period: | ||||||||||||
| Year 2016 | Year | Period | |||||||||
Net asset value at beginning of period | $ | 9.45 | $ | 9.81 | $ | 10.00 | ||||||
Income (loss) from investment operations: | ||||||||||||
Net investment loss | (0.02 | ) | (0.13 | ) | (0.04 | ) | ||||||
Net realized and unrealized gains (losses) on investments and securities sold short | 0.57 | (0.23 | ) | (0.15 | ) | |||||||
Total from investment operations | 0.55 | (0.36 | ) | (0.19 | ) | |||||||
Less distributions: | ||||||||||||
Distributions from net realized gains | (0.33 | ) | (0.00 | )(b) | — | |||||||
Net asset value at end of period | $ | 9.67 | $ | 9.45 | $ | 9.81 | ||||||
Total return (c) | 5.88 | % | (3.66 | %) | (1.90% | )(d) | ||||||
Net assets at end of period (000's) | $ | 821 | $ | 777 | $ | 591 | ||||||
Ratios/supplementary data: | ||||||||||||
Ratio of total expenses to average net assets | 16.71 | % | 14.76 | % | 16.57 | %(e) | ||||||
Ratio of net expenses to average net assets (f) | 3.14 | % | 3.16 | % | 2.59 | %(e) | ||||||
Ratio of net expenses to average net assets excluding dividend expense (f) | 2.08 | % | 2.27 | % | 1.99 | %(e) | ||||||
Ratio of net expenses to average net assets excluding dividend expense and prime brokerage expense on securities sold short (f) | 1.75 | % | 1.75 | % | 1.75 | %(e) | ||||||
Ratio of net investment loss to average net assets (f) | (0.26 | %) | (1.49 | %) | (1.15 | %)(e) | ||||||
Portfolio turnover rate | 17 | % | 7 | % | 9 | %(d) | ||||||
(a) | Represents the period from the commencement of operations (July 14, 2014) through November 30, 2014. |
(b) | Amount rounds to less than $0.01 per share. |
(c) | Total return is a measure of the change in value of an investment in the Fund over the periods covered. The returns shown do not reflect the deduction of taxes a shareholder would pay on Fund distributions, if any, or the redemption of Fund shares. The total returns would be lower if the Adviser had not reduced advisory fees and reimbursed expenses (Note 4). |
(d) | Not annualized. |
(e) | Annualized. |
(f) | Ratio was determined after advisory fee reductions and expense reimbursements (Note 4). |
See accompanying notes to financial statements. |
23
LYRICAL U.S. HEDGED VALUE FUND | ||||||||||||
Per Share Data for a Share Outstanding Throughout Each Period: | ||||||||||||
| Year 2016 | Year | Period | |||||||||
Net asset value at beginning of period | $ | 9.42 | $ | 9.80 | $ | 10.00 | ||||||
Income (loss) from investment operations: | ||||||||||||
Net investment loss | (0.06 | ) | (0.18 | ) | (0.05 | ) | ||||||
Net realized and unrealized gains (losses) on investments and securities sold short | 0.58 | (0.20 | ) | (0.15 | ) | |||||||
Total from investment operations | 0.52 | (0.38 | ) | (0.20 | ) | |||||||
Less distributions: | ||||||||||||
Distributions from net realized gains | (0.33 | ) | (0.00 | )(b) | — | |||||||
Net asset value at end of period | $ | 9.61 | $ | 9.42 | $ | 9.80 | ||||||
Total return (c) | 5.58 | % | (3.87 | %) | (2.00% | )(d) | ||||||
Net assets at end of period (000's) | $ | 575 | $ | 619 | $ | 614 | ||||||
Ratios/supplementary data: | ||||||||||||
Ratio of total expenses to average net assets | 17.54 | % | 15.49 | % | 16.95 | %(e) | ||||||
Ratio of net expenses to average net assets (f) | 3.39 | % | 3.41 | % | 2.84 | %(e) | ||||||
Ratio of net expenses to average net assets excluding dividend expense (f) | 2.34 | % | 2.52 | % | 2.24 | %(e) | ||||||
Ratio of net expenses to average net assets excluding dividend expense and prime brokerage expense on securities sold short (f) | 2.00 | % | 2.00 | % | 2.00 | %(e) | ||||||
Ratio of net investment loss to average net assets (f) | (0.53 | %) | (1.78 | %) | (1.38 | %)(e) | ||||||
Portfolio turnover rate | 17 | % | 7 | % | 9 | %(d) | ||||||
(a) | Represents the period from the commencement of operations (July 14, 2014) through November 30, 2014. |
(b) | Amount rounds to less than $0.01 per share. |
(c) | Total return is a measure of the change in value of an investment in the Fund over the periods covered. The returns shown do not reflect the deduction of taxes a shareholder would pay on Fund distributions, if any, or the redemption of Fund shares. The total returns would be lower if the Adviser had not reduced advisory fees and reimbursed expenses (Note 4). |
(d) | Not annualized. |
(e) | Annualized. |
(f) | Ratio was determined after advisory fee reductions and expense reimbursements (Note 4). |
See accompanying notes to financial statements. |
24
LYRICAL FUNDS
NOTES TO FINANCIAL STATEMENTS
November 30, 2016
1. Organization
Lyrical U.S. Value Equity Fund and Lyrical U.S. Hedged Value Fund (individually, a “Fund” and collectively, the “Funds”) are each a diversified series of Ultimus Managers Trust (the “Trust”), an open-end investment company established as an Ohio business trust under a Declaration of Trust dated February 28, 2012. Other series of the Trust are not incorporated in this report. Lyrical U.S. Value Equity Fund commenced operations on February 4, 2013. Lyrical U.S. Hedged Value Fund commenced operations on July 14, 2014.
The investment objective of each Fund is to seek to achieve long-term capital growth.
Each Fund offers two classes of shares: Institutional Class shares (sold without any sales loads and distribution and/or shareholder service fees and requiring a $100,000 initial investment) and Investor Class shares (sold without any sales loads, but subject to a distribution and/or shareholder service fee of up to 0.25% of the average daily net assets attributable to Investor Class shares, and requiring a $2,500 initial investment). Each share class represents an ownership interest in the same investment portfolio.
2. Significant Accounting Policies
The following is a summary of the Funds’ significant accounting policies. The policies are in conformity with accounting principles generally accepted in the United States of America (“GAAP”). As an investment company, as defined in Financial Accounting Standards Board (“FASB”) Accounting Standards Update 2013-08, the Funds follow accounting and reporting guidance under FASB Accounting Standards Codification Topic 946, “Financial Services – Investment Companies.”
In October 2016, the Securities and Exchange Commission (the “SEC”) released its final rule on Investment Company Reporting Modernization (the “Rule”). The Rule, which introduces two new regulatory reporting forms for investment companies – Form N-PORT and Form N-CEN, also contains amendments to Regulation S-X which impact financial statement presentation, particularly the presentation of derivative investments. Although still evaluating the impact of the Rule, management believes that many of the Regulation S-X amendments are consistent with the Funds’ current financial statement presentation and expects that the Funds will be able to comply with the Rule’s Regulation S-X amendments by the August 1, 2017 compliance date.
Securities valuation – Each Fund values its portfolio securities at market value as of the close of regular trading on the New York Stock Exchange (the “NYSE”) (normally 4:00 p.m. Eastern time) on each business day the NYSE is open for business. The Funds value their listed securities on the basis of the security’s last sale price on the security’s primary exchange, if available, otherwise at the exchange’s most recently quoted mean price. NASDAQ-listed securities are valued at the NASDAQ Official Closing Price. In the event that market quotations are not readily available or are considered unreliable due
25
LYRICAL FUNDS |
to market or other events, the Funds value their securities and other assets at fair value in accordance with procedures established by and under the general supervision of the Board of Trustees (the “Board”). Under these procedures, the securities will be classified as Level 2 or 3 within the fair value hierarchy (see below), depending on the inputs used. Unavailable or unreliable market quotes may be due to the following factors: a substantial bid-ask spread; infrequent sales resulting in stale prices; insufficient trading volume; small trade sizes; a temporary lapse in any reliable pricing source; and actions of the securities or futures markets, such as the suspension or limitation of trading. As a result, the prices of securities used to calculate each Fund’s net asset value (“NAV”) may differ from quoted or published prices for the same securities.
GAAP establishes a single authoritative definition of fair value, sets out a framework for measuring fair value, and requires additional disclosures about fair value measurements.
Various inputs are used in determining the value of each Fund’s investments. These inputs are summarized in the three broad levels listed below:
● | Level 1 – quoted prices in active markets for identical securities |
● | Level 2 – other significant observable inputs |
● | Level 3 – significant unobservable inputs |
The inputs or methods used for valuing securities are not necessarily an indication of the risks associated with investing in those securities. The inputs used to measure fair value may fall into different levels of the fair value hierarchy. In such cases, for disclosure purposes, the level in the fair value hierarchy within which the fair value measurement falls in its entirety is determined based on the lowest level input that is significant to the fair value measurement.
The following is a summary of the inputs used to value the Funds’ investments and other financial instruments as of November 30, 2016:
Lyrical U.S. Value Equity Fund | Level 1 | Level 2 | Level 3 | Total | ||||||||||||
Investments in Securities | ||||||||||||||||
Common Stocks | $ | 1,050,448,236 | $ | — | $ | — | $ | 1,050,448,236 | ||||||||
Money Market Funds | 10,620,620 | — | — | 10,620,620 | ||||||||||||
Total | $ | 1,061,068,856 | $ | — | $ | — | $ | 1,061,068,856 | ||||||||
26
LYRICAL FUNDS |
Lyrical U.S. Hedged Value Fund | Level 1 | Level 2 | Level 3 | Total | ||||||||||||
Investments in Securities | ||||||||||||||||
Common Stocks | $ | 1,517,807 | $ | — | $ | — | $ | 1,517,807 | ||||||||
Money Market Funds | 16,436 | — | — | 16,436 | ||||||||||||
Total | $ | 1,534,243 | $ | — | $ | — | $ | 1,534,243 | ||||||||
Other Financial Instruments | ||||||||||||||||
Exchange-Traded Funds - Sold Short | $ | (749,048 | ) | $ | — | $ | — | $ | (749,048 | ) | ||||||
Refer to the Funds’ Schedules of Investments and Schedule of Securities Sold Short, as applicable, for a listing of securities by industry or sector type. As of November 30, 2016, the Funds did not have any transfers between Levels. In addition, the Funds did not hold any derivative instruments or any assets or liabilities that were measured at fair value on a recurring basis using significant unobservable inputs (Level 3) as of November 30, 2016. It is the Funds’ policy to recognize transfers between Levels at the end of the reporting period.
Share valuation – The NAV per share of each class of each Fund is calculated daily by dividing the total value of the assets attributable to that class, less liabilities attributable to that class, by the number of shares outstanding of that class. The offering price and redemption price per share of each class of each Fund is equal to the NAV per share of such class.
Investment income – Dividend income is recorded on the ex-dividend date. Interest income is accrued as earned. Withholding taxes on foreign dividends have been recorded in accordance with the Funds’ understanding of the appropriate country’s rules and tax rates.
Security transactions – Security transactions are accounted for on the trade date. Realized gains and losses on securities sold are determined on a specific identification basis.
Common expenses – Common expenses of the Trust are allocated among the Funds and the other series of the Trust based on the relative net assets of each series or the nature of the services performed and the relative applicability to each series.
Distributions to shareholders – Each Fund distributes to shareholders any net investment income dividends and net realized capital gains distributions at least once each year. The amount of such dividends and distributions are determined in accordance with federal income tax regulations, which may differ from GAAP. Dividends and distributions to
27
LYRICAL FUNDS |
shareholders are recorded on the ex-dividend date. The tax character of distributions paid to shareholders by the Funds during the years ended November 30, 2016 and 2015 was as follows:
Year | Ordinary | Long-Term Capital Gains | Total | |
Lyrical U.S. Value Equity Fund - | 11/30/2016 | $ 3,276,517 | $ 27,401,337 | $ 30,677,854 |
Institutional Class | 11/30/2015 | $ 7,662,064 | $ 4,196,682 | $ 11,858,746 |
Lyrical U.S. Value Equity Fund - | 11/30/2016 | $ 116,943 | $ 2,255,758 | $ 2,372,701 |
Investor Class | 11/30/2015 | $ 123,919 | $ 69,399 | $ 193,318 |
Lyrical U.S. Hedged Value Fund - | 11/30/2016 | $ — | $ 27,448 | $ 27,448 |
Institutional Class | 11/30/2015 | $ 34 | $ 20 | $ 54 |
Lyrical U.S. Hedged Value Fund - | 11/30/2016 | $ — | $ 20,037 | $ 20,037 |
Investor Class | 11/30/2015 | $ 36 | $ 21 | $ 57 |
Lyrical U.S. Value Equity Fund made the following distributions subsequent to November 30, 2016 to shareholders of record on December 29, 2016:
Per Share | |||
Record | Ex-Date | Ordinary | |
Lyrical U.S. Value Equity Fund - Institutional Class | 12/29/2016 | 12/30/2016 | $ 0.2375 |
Lyrical U.S. Value Equity Fund - Investor Class | 12/29/2016 | 12/30/2016 | 0.1719 |
Short Positions – Lyrical U.S. Hedged Value Fund may sell securities short. For financial statement purposes, an amount equal to the settlement amount is included in the Statements of Assets and Liabilities as an asset and an equivalent liability is then subsequently marked-to-market daily to reflect the current value of the short position. Subsequent fluctuations in the market prices of securities sold, but not yet purchased, may require purchasing the securities at prices which may differ from the market value reflected on the Statements of Assets and Liabilities. The Fund is liable for any dividends payable on securities while those securities are in a short position and will also bear other costs, such as charges for the prime brokerage accounts, in connection with the short positions. These costs are reported as dividend expense and prime brokerage expense on securities sold short, respectively, in the Statements of Operations. As collateral for its short positions, the Fund is required under the Investment Company Act of 1940 (“1940 Act”) to maintain assets consisting of cash, cash equivalents or other liquid securities equal to the market value of the securities sold short. The deposits with brokers for securities sold short are reported on the Statements of Assets and Liabilities. The amount of collateral is required to be adjusted daily to reflect changes in the value of the securities
28
LYRICAL FUNDS |
sold short. To the extent Lyrical U.S. Hedged Value Fund invests the proceeds received from selling securities short, the Fund is engaging in a form of leverage. The use of leverage by the Fund may make any change in the Fund’s NAV greater than it would be without the use of leverage. Short sales are speculative transactions and involve special risks, including greater reliance on the ability of Lyrical Asset Management LP (the “Adviser”) to accurately anticipate the future value of a security.
The Fund typically takes short positions in shares of exchange-traded funds (“ETFs”), which are subject to additional risks including premium or discount risk (when the market value of an ETF’s shares trade at a premium or discount to the ETF’s NAV) and index-tracking risk.
Estimates – The preparation of financial statements in conformity with GAAP requires management to make estimates and assumptions that affect the reported amounts of assets and liabilities and disclosure of contingent assets and liabilities as of the date of the financial statements and the reported amounts of income and expenses during the reporting period. Actual results could differ from those estimates.
Federal income tax – Each Fund has qualified and intends to continue to qualify as a regulated investment company under the Internal Revenue Code of 1986 (the “Code”). Qualification generally will relieve each Fund of liability for federal income taxes to the extent 100% of its net investment income and net realized capital gains are distributed in accordance with the Code.
In order to avoid imposition of the excise tax applicable to regulated investment companies, it is also each Fund’s intention to declare as dividends in each calendar year at least 98% of its net investment income (earned during the calendar year) and 98.2% of its net realized capital gains (earned during the twelve months ended October 31) plus undistributed amounts from prior years.
The following information is computed on a tax basis for each item as of November 30, 2016:
| Lyrical U.S. Value Equity Fund | Lyrical U.S. Hedged Value Fund | ||||||
Tax cost of portfolio investments | $ | 925,242,428 | $ | 1,499,113 | ||||
Gross unrealized appreciation | $ | 181,248,360 | $ | 188,052 | ||||
Gross unrealized depreciation | (45,421,932 | ) | (152,922 | ) | ||||
Net unrealized appreciation | 135,826,428 | 35,130 | ||||||
Net unrealized depreciation on securities sold short | — | (72,400 | ) | |||||
Undistributed ordinary income | 15,416,437 | — | ||||||
Undistributed long-term gains | 373,005 | 3,555 | ||||||
Accumulated capital and other losses | — | (133 | ) | |||||
Distributable earnings | $ | 151,615,870 | $ | (33,848 | ) | |||
29
LYRICAL FUNDS |
As of November 30, 2016, the proceeds of securities sold short on a tax basis is $676,648 for Lyrical U.S. Hedged Value Fund.
The difference between the federal income tax cost of portfolio investments and securities sold short and the financial statement cost of portfolio investments and securities sold short is due to certain timing differences in the recognition of capital gains or losses under income tax regulations and GAAP. These “book/tax” differences are temporary in nature and are primarily due to the tax deferral of losses on wash sales.
Net qualified late year losses represent ordinary losses incurred after December 31, 2015 and specified capital losses incurred after October 31, 2016. These losses are deemed to arise on the first day of the Fund’s next taxable year. For the year ended November 30, 2016, Lyrical U.S. Hedged Value Fund intends to defer $133 of late year ordinary losses to December 1, 2016 for federal income tax purposes.
For the year ended November 30, 2016, the following reclassifications were made as a result of permanent differences between financial statement and income tax reporting requirements:
| Lyrical U.S. Value Equity Fund | Lyrical U.S. Hedged Value Fund | ||||||
Paid-in capital | $ | — | $ | (4,955 | ) | |||
Accumulated net investment income (loss) | — | 4,955 | ||||||
Accumulated net realized gains (losses) from security transactions | — | — | ||||||
The Funds recognize the tax benefits or expenses of uncertain tax positions only when the position is “more likely than not” of being sustained assuming examination by tax authorities. Management has reviewed the Funds’ tax positions for all open tax periods (periods ended November 30, 2013 through November 30, 2016 for Lyrical U.S. Value Equity Fund and November 30, 2014 through November 30, 2016 for Lyrical U.S. Hedged Value Fund) and has concluded that no provision for unrecognized tax benefits or expenses is required in these financial statements. The Funds identify their major tax jurisdiction as U.S. Federal.
3. Investment Transactions
During the year ended November 30, 2016, cost of purchases and proceeds from sales of investment securities, other than short-term investments and short positions, amounted to $606,334,158 and $339,641,057, respectively, for Lyrical U.S. Value Equity Fund and $232,460 and $237,112, respectively, for Lyrical U.S. Hedged Value Fund.
30
LYRICAL FUNDS |
4. Transactions with Related Parties
INVESTMENT ADVISORY AGREEMENT
Each Fund’s investments are managed by the Adviser pursuant to the terms of an Investment Advisory Agreement. Lyrical U.S. Value Equity Fund and Lyrical U.S. Hedged Value Fund pay the Adviser an investment advisory fee, computed and accrued daily and paid monthly, at the annual rate of 1.25% and 1.55%, respectively, of average daily net assets.
Pursuant to an Expense Limitation Agreement (“ELA”) between each Fund and the Adviser, the Adviser has contractually agreed, until March 31, 2018, to reduce investment advisory fees and reimburse other operating expenses to limit total annual operating expenses of the Funds (exclusive of brokerage costs, taxes, borrowing costs such as interest and dividend expenses on securities sold short, interest, acquired fund fees and expenses, extraordinary expenses such as litigation and merger or reorganization costs, and other expenses not incurred in the ordinary course of each Fund’s business) to an amount not exceeding the following percentages of average daily net assets attributable to each respective class:
| Institutional Class | Investor Class |
Lyrical U.S. Value Equity Fund | 1.45% | 1.70% |
Lyrical U.S. Hedged Value Fund | 1.75% | 2.00% |
Accordingly, during the year ended November 30, 2016, the Adviser did not collect any of its investment advisory fees from Lyrical U.S. Hedged Value Fund and, in addition, reimbursed other operating expenses of $165,738.
Under the terms of the ELA, investment advisory fee reductions and expense reimbursements by the Adviser are subject to repayment by the Fund for a period of three years after such fees and expenses were incurred, provided that the repayments do not cause total annual fund operating expenses of the Funds to exceed the foregoing expense limitations. During the year ended November 30, 2016, the Adviser recouped from Lyrical U.S. Value Equity Fund $22,152 of prior years’ investment advisory fee reductions and expense reimbursements. As of November 30, 2016, the Adviser may seek recoupment of investment advisory fee reductions and expense reimbursements no later than the dates as stated below:
| November 30, 2017 | November 30, 2018 | November 30, 2019 | Total |
Lyrical U.S. Value Equity Fund | $ — | $ 2,918 | $ — | $ 2,918 |
Lyrical U.S. Hedged Value Fund | $ 59,418 | $ 164,816 | $ 186,666 | $ 410,900 |
The Principal Executive Officer of the Funds is also an officer of the Adviser.
31
LYRICAL FUNDS |
OTHER SERVICE PROVIDERS
Ultimus Fund Solutions, LLC (“Ultimus”) provides administration, fund accounting, compliance and transfer agency services to the Funds. Each Fund pays Ultimus fees in accordance with the agreements for such services. In addition, each Fund pays out-of-pocket expenses including but not limited to postage, supplies and costs of pricing its portfolio securities.
Under the terms of a Distribution Agreement with the Trust, Ultimus Fund Distributors, LLC (the “Distributor”) serves as the principal underwriter to each Fund. The Distributor is a wholly-owned subsidiary of Ultimus. The Distributor is compensated by the Adviser (not the Funds).
A Trustee and certain officers of the Trust are also officers of Ultimus and/or the Distributor.
DISTRIBUTION PLAN
The Funds have adopted a plan of distribution (the “Plan”) pursuant to Rule 12b-1 under the 1940 Act, which permits Investor Class shares of each Fund to directly incur or reimburse the Funds’ principal underwriter for certain expenses related to the distribution of its shares. The annual limitation for payment of expenses pursuant to the Plan is 0.25% of each Fund’s average daily net assets allocable to Investor Class shares. The Funds have not adopted a plan of distribution with respect to the Institutional Class shares. During the year ended November 30, 2016, the Investor Class shares of Lyrical U.S. Value Equity Fund and Lyrical U.S. Hedged Value Fund incurred $189,100 and $1,465, respectively, of distribution fees under the Plan.
TRUSTEE COMPENSATION
Effective October 1, 2016, each Trustee who is not an “interested person” of the Trust (“Independent Trustee”) receives a $1,000 annual retainer from each Fund, paid quarterly, except for the Board Chair who receives a $1,200 annual retainer from each Fund, paid quarterly. Each Independent Trustee also receives from each Fund a fee of $500 for each Board meeting attended plus reimbursement for travel and other meeting-related expenses. Prior to October 1, 2016, each Fund paid each Independent Trustee a fee of $500 for each Board meeting attended plus a $500 annual retainer.
32
LYRICAL FUNDS |
PRINCIPAL HOLDERS OF FUND SHARES
As of November 30, 2016, the following shareholders owned of record 5% or more of the outstanding shares of each class of each Fund:
NAME OF RECORD OWNER | % Ownership |
Lyrical U.S. Value Equity Fund - Institutional Class | |
Morgan Stanley Smith Barney LLC (for the benefit of its customers) | 37% |
Charles Schwab & Company, Inc. (for the benefit of its customers) | 17% |
Merrill Lynch, Pierce, Fenner & Smith (for the benefit of its customers) | 7% |
Lyrical U.S. Value Equity Fund - Investor Class | |
Charles Schwab & Company, Inc. (for the benefit of its customers) | 86% |
Lyrical U.S. Hedged Value Fund - Institutional Class | |
Lyrical Asset Management LP | 61% |
Ann S. Riesenberg | 24% |
George Wellington | 13% |
Lyrical U.S. Hedged Value Fund - Investor Class | |
Lyrical Asset Management LP | 86% |
A beneficial owner of 25% or more of a Fund’s outstanding shares may be considered a controlling person of that Fund. That shareholder’s vote could have a more significant effect on matters presented at a shareholder’s meeting.
5. Sector Risk
If a Fund has significant investments in the securities of issuers within a particular sector, any development affecting that sector will have a greater impact on the value of the net assets of the Fund than would be the case if the Fund did not have significant investments in that sector. In addition, this may increase the risk of loss in the Fund and increase the volatility of the Fund’s NAV per share. Occasionally, market conditions, regulatory changes or other developments may negatively impact a particular sector. As of November 30, 2016, Lyrical U.S. Value Equity Fund and Lyrical U.S. Hedged Value Fund had 31.3% and 33.3%, respectively, of the value of their net assets invested in stocks within the Information Technology sector.
6. Contingencies and Commitments
The Funds indemnify the Trust’s officers and Trustees for certain liabilities that might arise from their performance of their duties to the Funds. Additionally, in the normal course of business the Funds enter into contracts that contain a variety of representations and warranties and which provide general indemnifications. The Funds’ maximum exposure under these arrangements is unknown, as this would involve future claims that may be made against the Funds that have not yet occurred. However, based on experience, the Funds expect the risk of loss to be remote.
33
LYRICAL FUNDS |
7. Subsequent Events
The Funds are required to recognize in the financial statements the effects of all subsequent events that provide additional evidence about conditions that existed as of the date of the Statements of Assets and Liabilities. For non-recognized subsequent events that must be disclosed to keep the financial statements from being misleading, the Funds are required to disclose the nature of the event as well as an estimate of its financial effect, or a statement that such an estimate cannot be made. Management has evaluated subsequent events through the issuance of these financial statements and has noted no such events except for the payment of ordinary income dividends subsequent to the end of the reporting period, as disclosed in Note 2.
34
LYRICAL FUNDS |
To the Board of Trustees of Ultimus Managers Trust
and the Shareholders of Lyrical U.S. Value Equity Fund
and Lyrical U.S. Hedged Value Fund
We have audited the accompanying statements of assets and liabilities of Lyrical U.S. Value Equity Fund and Lyrical U.S. Hedged Value Fund, each a series of shares of beneficial interest in Ultimus Managers Trust (the “Funds”), including the schedules of investments, as of November 30, 2016, and the related statements of operations for the year then ended, the statements of changes in net assets for each of the years in the two-year period then ended, and the financial highlights for each of the years or periods presented. These financial statements and financial highlights are the responsibility of the Funds’ management. Our responsibility is to express an opinion on these financial statements and financial highlights based on our audits.
We conducted our audits in accordance with the standards of the Public Company Accounting Oversight Board (United States). Those standards require that we plan and perform the audits to obtain reasonable assurance about whether the financial statements and financial highlights are free of material misstatement. An audit includes examining, on a test basis, evidence supporting the amounts and disclosures in the financial statements. Our procedures included confirmation of securities owned as of November 30, 2016 by correspondence with the custodian and brokers. An audit also includes assessing the accounting principles used and significant estimates made by management, as well as evaluating the overall financial statement presentation. We believe that our audits provide a reasonable basis for our opinion.
In our opinion, the financial statements and financial highlights referred to above present fairly, in all material respects, the financial position of Lyrical U.S. Value Equity Fund and Lyrical U.S. Hedged Value Fund as of November 30, 2016, and the results of their operations for the year then ended, the changes in their net assets for each of the years in the two-year period then ended and their financial highlights for each of the years or periods presented, in conformity with accounting principles generally accepted in the United States of America.
| |
BBD, LLP |

Philadelphia, Pennsylvania
January 26, 2017
35
LYRICAL FUNDS |
We believe it is important for you to understand the impact of costs on your investment. As a shareholder of the Funds, you incur ongoing costs, including management fees, class-specific expenses (such as distribution fees) and other operating expenses. The following examples are intended to help you understand your ongoing costs (in dollars) of investing in the Funds and to compare these costs with the ongoing costs of investing in other mutual funds.
A mutual fund’s ongoing costs are expressed as a percentage of its average net assets. This figure is known as the expense ratio. The expenses in the table below are based on an investment of $1,000 made at the beginning of the most recent period (June 1, 2016) and held until the end of the period (November 30, 2016).
The table below illustrates each Fund’s ongoing costs in two ways:
Actual fund return – This section helps you to estimate the actual expenses that you paid over the period. The “Ending Account Value” shown is derived from each Fund’s actual return, and the fourth column shows the dollar amount of operating expenses that would have been paid by an investor who started with $1,000 in the Funds. You may use the information here, together with the amount you invested, to estimate the expenses that you paid over the period.
To do so, simply divide your account value by $1,000 (for example, an $8,600 account value divided by $1,000 = 8.6), then multiply the result by the number given for the Fund under the heading “Expenses Paid During Period.”
Hypothetical 5% return – This section is intended to help you compare each Fund’s ongoing costs with those of other mutual funds. It assumes that each Fund had an annual return of 5% before expenses during the period shown, but that the expense ratio is unchanged. In this case, because the return used is not the Funds’ actual return, the results do not apply to your investment. The example is useful in making comparisons because the U.S. Securities and Exchange Commission (“SEC”) requires all mutual funds to calculate expenses based on a 5% return. You can assess each Fund’s ongoing costs by comparing this hypothetical example with the hypothetical examples that appear in shareholder reports of other funds.
Note that expenses shown in the table are meant to highlight and help you compare ongoing costs only. The Funds do not charge transaction fees, such as purchase or redemption fees, nor do they carry a “sales load.”
The calculations assume no shares were bought or sold during the period. Your actual costs may have been higher or lower, depending on the amount of your investment and the timing of any purchases or redemptions.
36
LYRICAL FUNDS
ABOUT YOUR FUNDS’ EXPENSES (Unaudited) (Continued)
More information about the Funds’ expenses can be found in this report. For additional information on operating expenses and other shareholder costs, please refer to the Funds’ prospectus.
| Beginning | Ending | Net Ratio(a) | Expenses Paid During Period(b) |
Lyrical U.S. Value Equity Fund | ||||
Institutional Class | ||||
Based on Actual Fund Returns | $ 1,000.00 | $ 1,114.00 | 1.38% | $ 7.29 |
Based on Hypothetical 5% Return (before expenses) | $ 1,000.00 | $ 1,018.10 | 1.38% | $ 6.96 |
Investor Class | ||||
Based on Actual Fund Returns | $ 1,000.00 | $ 1,111.70 | 1.70% | $ 8.97 |
Based on Hypothetical 5% Return (before expenses) | $ 1,000.00 | $ 1,016.50 | 1.70% | $ 8.57 |
Lyrical U.S. Hedged Value Fund | ||||
Institutional Class | ||||
Based on Actual Fund Returns | $ 1,000.00 | $ 1,066.20 | 3.00% | $ 15.50 |
Based on Hypothetical 5% Return (before expenses) | $ 1,000.00 | $ 1,010.00 | 3.00% | $ 15.08 |
Investor Class | ||||
Based on Actual Fund Returns | $ 1,000.00 | $ 1,065.40 | 3.25% | $ 16.78 |
Based on Hypothetical 5% Return (before expenses) | $ 1,000.00 | $ 1,008.75 | 3.25% | $ 16.32 |
(a) | Annualized, based on the Fund's most recent one-half year expenses. |
(b) | Expenses are equal to each Fund’s annualized net expense ratio multiplied by the average account value over the period, multiplied by 183/366 (to reflect the one-half year period). |
37
LYRICAL FUNDS
OTHER INFORMATION (Unaudited)
A description of the policies and procedures that the Funds use to vote proxies relating to portfolio securities is available without charge upon request by calling toll-free 1-888-884-8099, or on the SEC’s website at http://www.sec.gov. Information regarding how the Funds voted proxies relating to portfolio securities during the most recent 12-month period ended June 30 is available without charge upon request by calling toll-free 1-888-884-8099, or on the SEC’s website at http://www.sec.gov.
The Trust files a complete listing of portfolio holdings for the Funds with the SEC as of the end of the first and third quarters of each fiscal year on Form N-Q. These filings are available upon request by calling 1-888-884-8099. Furthermore, you may obtain a copy of the filings on the SEC’s website at http://www.sec.gov. The Trust’s Forms N-Q may also be reviewed and copied at the SEC’s Public Reference Room in Washington, DC, and information on the operation of the Public Reference Room may be obtained by calling 1-800-SEC-0330.
FEDERAL TAX INFORMATION (Unaudited)
In accordance with federal tax requirements, the following provides shareholders with information concerning distributions from ordinary income and net realized gains made by each Fund during the fiscal year ended November 30, 2016. Certain dividends paid by the Funds may be subject to a maximum tax rate of 23.8%, as provided by the Jobs and Growth Tax Relief Reconciliation Act of 2003. Lyrical U.S. Value Equity Fund intends to designate up to a maximum amount of $3,393,460 as taxed at a maximum rate of 23.8%. Additionally, Lyrical U.S. Value Equity Fund and Lyrical U.S. Hedged Value Fund intend to designate up to a maximum amount of $29,657,095 and $47,485, respectively, as a long-term capital gain distribution. As required by federal regulations, complete information was computed and reported in conjunction with your 2016 Form 1099-DIV.
38
LYRICAL FUNDS
BOARD OF TRUSTEES AND EXECUTIVE OFFICERS
(Unaudited)
Overall responsibility for management of the Funds rests with the Board of Trustees. The Trustees serve during the lifetime of the Trust and until its termination, or until death, resignation, retirement or removal. The Trustees, in turn, elect the officers of the Funds to actively supervise its day-to-day operations. The officers have been elected for an annual term. Unless otherwise noted, each Trustee’s and officer’s address is 225 Pictoria Drive, Suite 450, Cincinnati, Ohio 45246.
Name and | Length of Time Served | Position Held | Principal Occupation(s) | Number of Funds in Trust Overseen by Trustee | Directorships of Public Companies Held by Trustee During Past 5 Years |
Interested Trustees: |
|
|
|
|
|
Robert G. Dorsey* | Since February 2012 | Trustee
President | President and Managing Director of Ultimus Fund Solutions, LLC and Ultimus Fund Distributors, LLC (1999 to present) | 25 | None |
Independent Trustees: |
|
|
|
|
|
Janine L. Cohen | Since January 2016 | Trustee | Retired since 2013; Chief Financial Officer from 2004 to 2013 and Chief Compliance Officer from 2008 to 2013 at AER Advisors, Inc. | 25 | None |
David M. Deptula | Since June 2012 | Trustee | Vice President of Legal and Special Projects at Dayton Freight Lines, Inc. since 2016; Vice President of Tax Treasury at Standard Register, Inc. (formerly The Standard Register Company) from 2011 to 2016 | 25 | None |
John J. Discepoli | Since June 2012 | Chairman
Trustee | Owner of Discepoli Financial Planning, LLC (personal financial planning company) since 2004 | 25 | None |
* | Mr. Dorsey is considered an “interested person” of the Trust within the meaning of Section 2(a)(19) of the 1940 Act because of his relationship with the Trust’s administrator, transfer agent and distributor. |
39
LYRICAL FUNDS
BOARD OF TRUSTEES AND EXECUTIVE OFFICERS
(Unaudited) (Continued)
Name and | Length of Time Served | Position Held | Principal Occupation(s) |
Executive Officers: | |||
Andrew B. Wellington 405 Park Avenue, 6th Floor, | Since January 2013 | Principal Executive Officer of Lyrical U.S. Value Equity Fund and Lyrical U.S. Hedged Value Fund | Managing Director of Lyrical Asset Management LP (2008 to present) |
David R. Carson | Since April 2013 | President
Vice President | Vice President and Director of Client Strategies of Ultimus Fund Solutions, LLC (2013 to present); President, Unified Series Trust (2016 to present); Chief Compliance Officer, The Huntington Funds (2005 to 2013), The Flex-Funds (2006 to 2011), Meeder Financial (2007 to 2011), Huntington Strategy Shares (2012 to 2013), and Huntington Asset Advisors (2013); Vice President, Huntington National Bank (2001 to 2013). |
Jennifer L. Leamer | Since April 2014 | Treasurer
Assistant Treasurer | V.P., Mutual Fund Controller of Ultimus Fund Solutions, LLC (2014 to present); Business Analyst of Ultimus Fund Solutions, LLC (2007 to 2014) |
40
LYRICAL FUNDS
BOARD OF TRUSTEES AND EXECUTIVE OFFICERS
(Unaudited) (Continued)
Name and | Length of Time Served | Position Held | Principal Occupation(s) |
Bo J. Howell | Since October 2014 | Secretary (April 2015 to present); Assistant Secretary (October 2014 to April 2015) | Secretary, Unified Series Trust (2016 to present); V.P., Director of Fund Administration for Ultimus Fund Solutions, LLC (2014 to present); Counsel – Securities and Mutual Funds for Western & Southern Financial Group (2012 to 2014); U.S. Securities and Exchange Commission, Senior Counsel (2009 to 2012) |
Charles C. Black Year of Birth: 1979 | Since April 2015 | Chief Compliance Officer (January 2016 to present)
Assistant Chief Compliance Officer (April 2015 to January 2016) | Chief Compliance Officer of The Caldwell & Orkin Funds, Inc. (2016 to present); Senior Compliance Officer of Ultimus Fund Solutions, LLC (2015 to present); Senior Compliance Manager at Touchstone Mutual Funds (2013 to 2015); Senior Compliance Manager at Fund Evaluation Group (2011 to 2013) |
Additional information about members of the Board and executive officers is available in the Funds’ Statement of Additional Information (“SAI”). To obtain a free copy of the SAI, please call 1-888-884-8099.
41
LYRICAL FUNDS
DISCLOSURE REGARDING APPROVAL OF INVESTMENT ADVISORY AGREEMENT (Unaudited)
The Board of Trustees (the “Board”), including the Independent Trustees voting separately, has reviewed and approved the Funds’ Investment Advisory Agreement with Lyrical Asset Management LP (the “Adviser”) for an additional annual term. Approval took place at an in-person meeting held on October 24-25, 2016, at which all of the Trustees were present.
In the course of their deliberations, the Board was advised by legal counsel. The Board received and reviewed a substantial amount of information provided by the Adviser in response to requests of the Board and its counsel. The Board also recalled its review of the materials related to the Funds and the Adviser throughout the preceding 12 months and its numerous discussions with Trust management and the Adviser about the operations and performance of the Funds during that period.
In considering whether to approve the continuation of the Investment Advisory Agreement and reaching their conclusions with respect thereto, the Board reviewed and analyzed various factors that they determined were relevant, including the factors described below.
The nature, extent, and quality of the services provided by the Adviser. In this regard, the Board reviewed the services being provided by the Adviser to each Fund including, without limitation, its investment advisory services since each Fund’s inception; its compliance procedures and practices; its efforts to promote the Fund and assist in its distribution; and its compliance program. The Board also noted that the Funds’ Principal Executive Officer is an employee of the Adviser and serves the Funds without additional compensation. After reviewing the foregoing information and further information regarding the Adviser’s business, the Board concluded that the quality, extent, and nature of the services provided by the Adviser to each Fund were satisfactory and adequate.
The investment performance of the Funds. In this regard, the Board compared the performance of each Fund with the performance of its benchmark indexes, custom peer group, and Morningstar categories. The Board also considered the consistency of the Adviser’s management with each Fund’s investment objective and policies. The Board noted that the Lyrical Value Fund had overperformed relative to its peer group and Morningstar category for the three-year period and underperformed over the one-year period, each period ending September 30, 2016. Following additional discussion of the investment performance of each Fund; the Adviser’s experience in managing mutual funds, private funds, and separate accounts; the Adviser’s historical investment performance; and other factors, the Board concluded that the investment performance of each Fund has been satisfactory.
The costs of the services provided and profits realized by the Adviser and its affiliates from their relationship with the Funds. In this regard, the Board considered the Adviser’s staffing; methods of operating; the education and experience of its personnel; its compliance program; its financial condition and the level of commitment to the Funds; the asset level of each Fund; the overall expenses of each Fund, including the advisory fee; and the differences in fees and services to the Adviser’s other similar clients. The Board
42
LYRICAL FUNDS
DISCLOSURE REGARDING APPROVAL OF INVESTMENT ADVISORY AGREEMENT (Unaudited) (Continued)
considered its discussion with the Adviser regarding its Expense Limitation Agreement (the “ELA”) with the Funds, and considered the Adviser’s current and past fee reductions and expense reimbursements for the Funds. The Board further took into account the Adviser’s willingness to continue the ELA for the Funds until at least March 31, 2018.
The Board also considered potential benefits for the Adviser in managing the Funds, including promotion of the Adviser’s name. The Board compared each Fund’s advisory fee and overall expense ratio to the average and median advisory fees and expense ratios for its peer group and Morningstar categories and fees charged to the Adviser’s other client accounts. In considering the comparison in fees and expense ratios between the Funds and other comparable funds, the Board looked at the differences in types of funds being compared, the style of investment management, the size of the Fund, and the nature of the investment strategies. The Board noted that each Fund’s advisory fee was higher than the average and median advisory fee for the fund’s peer group and Morningstar category. The Board also considered the Adviser’s commitment to limit each Fund’s expenses under the ELA. The Board further noted that the overall expense ratio for each Fund was higher than the average and median expense ratio for the other funds in each Fund’s peer group and Morningstar category. The Board also compared the fees paid by each Fund to the fees paid by other clients of the Adviser, and considered the similarities and differences of services received by such other clients as compared to the services received by the Funds. The Board noted that the fee structures applicable to the Adviser’s other clients were not indicative of any unreasonableness with respect to the advisory fees proposed to be payable to each of the Funds. The Board further considered the investment strategy and style used by the Adviser in managing the portfolio of each Fund. Following these comparisons and considerations and upon further consideration and discussion of the foregoing, the Board concluded that for each Fund, the advisory fees paid to the Adviser by the Fund are fair and reasonable.
The extent to which the Funds and their investors would benefit from economies of scale. In this regard, the Board considered that for each Fund, the fee arrangements with the Adviser involve both the advisory fee and the ELA. The Board determined that while the advisory fee remained the same as asset levels increased, the shareholders of the Funds have experienced benefits from the ELA and shareholders of the Lyrical Hedged Fund will continue to experience benefits from the ELA until the Fund’s assets grow to a level where its expenses otherwise fall below the expense limit. Following further discussion of the asset levels for each Fund, expectations for asset growth, and level of fees, the Board determined that the fee arrangements with the Adviser will continue to provide benefits and that each Fund’s arrangements were fair and reasonable in relation to the nature and quality of services being provided by the Adviser.
Brokerage and portfolio transactions. In this regard, the Board considered the Adviser’s policies and procedures and performance in seeking best execution for its clients, including the Funds. The Board also considered the historical portfolio turnover rate
43
LYRICAL FUNDS
DISCLOSURE REGARDING APPROVAL OF INVESTMENT ADVISORY AGREEMENT (Unaudited) (Continued)
for each Fund; the process by which the Adviser evaluates best execution; the method and basis for selecting and evaluating broker-dealers; and any anticipated allocation of portfolio business to persons affiliated with the Adviser. After further review and discussion, the Board determined for each Fund that the Adviser’s practices regarding brokerage and portfolio transactions are satisfactory.
Possible conflicts of interest. In evaluating the possibility for conflicts of interest, the Board considered such matters as the experience and abilities of the advisory personnel assigned to the Funds; the Adviser’s process for allocating trades among the Funds and its other clients; and the substance and administration of the Adviser’s Code of Ethics. Following further consideration and discussion, the Board found for each Fund that the Adviser’s standards and practices relating to the identification and mitigation of potential conflicts of interests were satisfactory.
Conclusion
After full consideration of the above factors as well as other factors, the Board unanimously concluded that approval of the Investment Advisory Agreement was in the best interests of each Fund and its shareholders.
44
This page intentionally left blank.

RYAN LABS CORE BOND FUND
(RLCBX)
RYAN LABS LONG CREDIT FUND
(RLLCX)
Annual Report
November 30, 2016
RYAN LABS FUNDS | December 20, 2016 |
Dear Shareholders,
Following is the Annual Report to shareholders of Ryan Labs Core Bond Fund and Ryan Labs Long Credit Fund (collectively, the “Funds”) for the fiscal year ended November 30, 2016. On behalf of the investment manager, Ryan Labs Asset Management, Inc., we would like to thank you for your continued investment.
MARKET RECAP
We believe strength in commodity-related sectors has helped stabilize credit markets after oil prices largely contributed to the first quarter turmoil. Liquidity has improved recently as demand for corporate credit has been strong from both domestic and international buyers. In corporates, third quarter earnings growth has been flat yet has exceeded depressed analyst expectations, while leverage remains higher than a few years ago. Despite this, corporate management has been able to take advantage of the low cost of capital environment to continue to access the debt markets. YTD ending November 30, 2016 the Bloomberg Barclays U.S. Corporate Index has generated excess returns (over duration neutral Treasuries) of 4.07% while the Bloomberg Barclays U.S. Corporate Long Index generated excess returns of 7.57%. The 10 year US treasury yield has increased from 1.58% on August 31, 2016 to 2.38% on November 30, 2016. CMBS spreads have tightened alongside other credit sectors yet pockets of the market remain wide due to commercial real estate (CRE) fundamental concerns. We believe the largest fear has primarily been the outlook for the retail sector, as malls have had mixed performance with the rise of Amazon and other Internet based retailers gaining market share. In ABS, credit has tightened materially over the last several months, as lower macro volatility and higher front-end yields have helped technically, attracting capital to the sector. Fundamentally, the US consumer has continued to perform well, helping ABS subsectors tied to consumer credit such as auto receivables and credit cards. Student loan debt remains the exception, as the future of the space continues to experience policy uncertainty. In the Agency MBS sector, the steepening of the yield curve has led to underperformance of lower coupon conventional mortgage paper as the negative convexity inherent in the space was on full display. The MBS index lengthened into the rates sell-off, exacerbating underperformance versus treasuries.
RYAN LABS CORE BOND FUND (RLCBX)
INVESTMENT PHILOSOPHY
The overall investment objective of Ryan Labs Core Bond Fund (the “Fund”) is to seek total return, consisting of current income and capital appreciation, versus the Bloomberg Barclays U.S. Aggregate Bond Index (the “Benchmark”). We attempt to accomplish this investment objective by investing at least 80% of Fund assets in US dollar-denominated, investment-grade fixed income securities. There have been no changes to this philosophy.
1
PERFORMANCE SUMMARY
Quarter-to-date ending November 30, 2016, the Fund returned -3.10% compared to the Benchmark return of –3.17%, outperforming the Benchmark by 7 bps. For the year ending November 30, 2016 the Fund returned 2.69% compared to the Benchmark return of 2.17%, outperforming by 52 bps. We continued to be overweight Financials in Q4 2016 which contributed towards outperformance. Our decision to overweight securitized issuers hurt performance in the fourth quarter. Issuers that contributed to outperformance were the Kingdom of Saudi Arabia, a few CMBS issuers and Voya. The top five underperformers were mainly securitized issuers.
RYAN LABS LONG CREDIT FUND
INVESTMENT PHILOSOPHY
The investment objective of Ryan Labs Long Credit Fund (the “Long Credit Fund”) is to seek total return (consisting of current income and capital appreciation). The benchmark for this strategy is the Bloomberg Barclays U.S. Long Credit Index (the “Long Credit Benchmark”). We attempt to accomplish this investment objective by investing at least 80% of Long Credit Fund assets in U.S. dollar-denominated investment-grade debt securities. There have been no changes to this philosophy. The inception date of the Long Credit Fund is November 13, 2015.
PERFORMANCE SUMMARY
Quarter-to-date ending November 30, 2016, the Long Credit Fund’s total return was -8.07% compared to the Long Credit Benchmark return of -7.81%, underperforming the Benchmark by 26 bps. For the year ending November 30, 2016 the Long Credit Fund returned 7.11% compared to the Long Credit Benchmark return of 7.20%, underperforming by 9 bps. The portfolio was underweight Industrials while being overweight the Financial sector. This positioning of the portfolio contributed towards negative excess returns relative to the Long Credit Benchmark. Top performers included Teachers Insurance and Annuity Association of America, Buckeye Partners, French utility EDF, and Energy Transfer Partners. Underperformers included Wells Fargo, JP Morgan, AT&T, Mexico and New York City Water and Sewer bonds.
OUTLOOK
The main themes for 2017 are President-elect Trump’s policy changes related to cash repatriation, lowering corporate taxes, increasing infrastructure spending, defense spending and the Federal Open Market Committee's (the "FOMC") unexpected hawkish view looking into 2017. So far this has meant higher bond yields, a stronger U.S. dollar, tighter corporate bond spreads, strong equity performance against political uncertainty in Europe and new questions about international relations with China and Russia. Trump’s proposed reforms in immigration could lead to higher costs from labor and lowering profit margins. We are monitoring the impact of changes in corporate taxation on supply dynamics in corporate credit.
After the FOMC’s rate hike on December 15, 2016, and with its more hawkish view for 2017, we could see an accelerated pace of corporate debt issuance early, but if changes to corporate taxes limit or eliminate interest deductibility this could offset those gains,
2
particularly in the long run. Higher oil prices post OPEC deal could help lower the high debt levels versus cash flow in the energy sector. We continue to be cautious on credit markets as leverage is historically high and spreads adjusted for leverage are at long term tight levels. However, we would look to add to corporate credit names, some of which have deleveraged their balance sheets and provide what we believe to be acceptable risk/reward profiles, and add through new issue concessions.

Sean McShea
President, Ryan Labs Asset Management
Past performance is not predictive of future performance. Investment results and principal value will fluctuate so that shares, when redeemed, may be worth more or less than their original cost. Current performance may be higher or lower than the performance data quoted. Performance data current to the most recent month end are available by calling 1-866-561-3087.
An investor should consider the investment objectives, risks, charges and expenses of the Funds carefully before investing. The Funds’ prospectus contains this and other important information. To obtain a copy of the Funds’ prospectus, please visit our website at www.ryanlabsfunds.com or call 1-866-561-3087 and a copy will be sent to you free of charge. Please read the prospectus carefully before you invest. Ryan Labs Core Bond Fund and Ryan Labs Long Credit Fund are distributed by Ultimus Fund Distributors, LLC.
The Letter to Shareholders seeks to describe some of the Adviser’s current opinions and views of the financial markets. Although the Adviser believes it has a reasonable basis for any opinions or views expressed, actual results may differ, sometimes significantly so, from those expected or expressed. The securities held by the Funds that are discussed in the Letter to Shareholders were held during the period covered by this Report. They do not comprise the entire investment portfolios of the Funds, may be sold at any time and may no longer be held by the Funds. The opinions of the Funds’ Adviser with respect to those securities may change at any time. For a complete list of securities held by the Funds as of November 30, 2016, please see the Schedules of Investments sections of the Annual Report.
Statements in the Letter to Shareholders that reflect projections or expectations for future financial or economic performance of the Funds and the market in general and statements of the Funds’ plans and objectives for future operations are forward-looking statements. No assurance can be given that actual results or events will not differ materially from those projected, estimated, assumed, or anticipated in any such forward-looking statements. Important factors that could result in such differences, in addition to factors noted with such forward-looking statements include, without limitation, general economic conditions, such as inflation, recession, and interest rates. Past performance is not a guarantee of future results.
3
RYAN LABS CORE BOND FUND
PERFORMANCE INFORMATION
November 30, 2016 (Unaudited)
Comparison of the Change in Value of a $10,000 Investment in
Ryan Labs Core Bond Fund versus the
Bloomberg Barclays U.S. Aggregate Bond Index
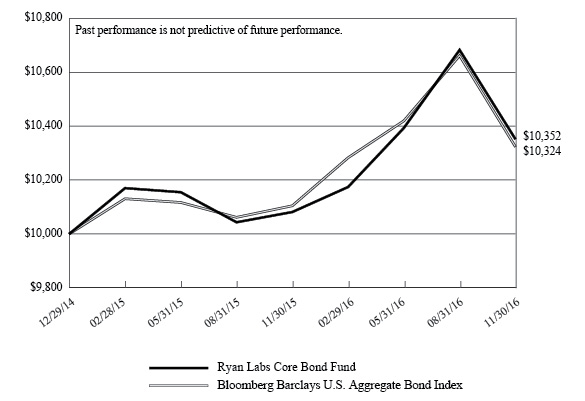
Average Annual Total Returns | ||
1 Year | Since | |
Ryan Labs Core Bond Fund(a) | 2.69% | 1.82% |
Bloomberg Barclays U.S. Aggregate Bond Index | 2.17% | 1.67% |
(a) | The Fund’s total return does not reflect the deduction of taxes that a shareholder would pay on Fund distributions, if any, or the redemption of shares. |
(b) | The Fund commenced operations on December 29, 2014. |
4
RYAN LABS LONG CREDIT FUND
PERFORMANCE INFORMATION
November 30, 2016 (Unaudited)
Comparison of the Change in Value of a $10,000 Investment in
Ryan Labs Long Credit Fund versus the
Bloomberg Barclays U.S. Long Credit Index
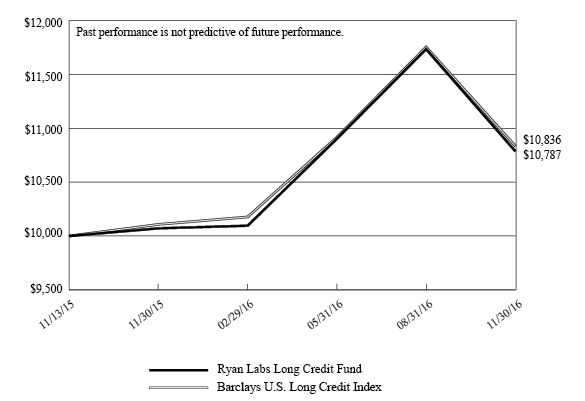
Average Annual Total Returns | ||
1 Year | Since | |
Ryan Labs Long Credit Fund(a) | 7.11% | 7.51% |
Bloomberg Barclays U.S. Long Credit Index | 7.20% | 7.97% |
(a) | The Fund’s total return does not reflect the deduction of taxes that a shareholder would pay on Fund distributions, if any, or the redemption of shares. |
(b) | The Fund commenced operations on November 13, 2015. |
5
RYAN LABS CORE BOND FUND
PORTFOLIO INFORMATION
November 30, 2016 (Unaudited)
Asset Allocation (% of Net Assets)

Top 10 Holdings
Security Description | % of |
U.S. Treasury Notes, 1.375%, due 10/31/2020 | 6.5% |
U.S. Treasury Notes, 0.750%, due 10/31/2017 | 3.6% |
U.S. Treasury Notes, 1.375%, due 08/31/2020 | 3.0% |
U.S. Treasury Notes, 2.125%, due 12/31/2021 | 2.8% |
U.S. Treasury Notes, 0.750%, due 09/30/2018 | 2.5% |
Federal Home Loan Mortgage Corporation, Pool #G08707, 4.000%, due 05/01/2046 | 2.4% |
Federal Home Loan Mortgage Corporation, Pool #G08737, 3.000%, due 12/01/2046 | 1.9% |
U.S. Treasury Notes, 2.500%, due 05/15/2024 | 1.9% |
U.S. Treasury Bonds, 2.250%, due 08/15/2046 | 1.7% |
U.S. Treasury Bonds, 5.375%, due 02/15/2031 | 1.6% |
6
RYAN LABS LONG CREDIT FUND
PORTFOLIO INFORMATION
November 30, 2016 (Unaudited)
Asset Allocation (% of Net Assets)
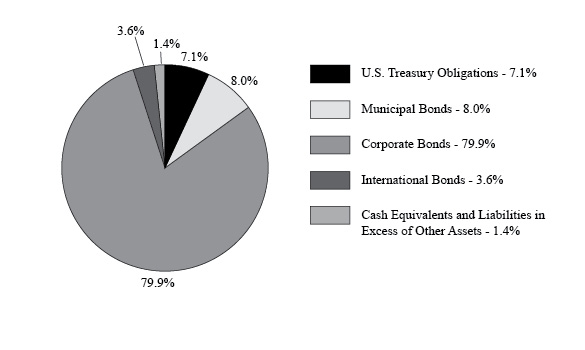
Top 10 Holdings
Security Description | % of |
U.S. Treasury Bonds, 2.250%, due 08/15/2046 | 4.9% |
U.S. Treasury Notes, 2.000%, due 11/15/2026 | 2.2% |
AT&T, Inc., 4.500%, due 05/15/2035 | 1.9% |
GE Capital International Funding Company, 144A, 4.418%, due 11/15/2035 | 1.9% |
Teachers Insurance & Annuity Association of America, 144A, 4.900%, due 09/15/2044 | 1.8% |
Verizon Communications, Inc., 4.400%, 11/01/2034 | 1.6% |
Comcast Corporation, 4.250%, due 01/15/2033 | 1.6% |
United Mexican States, 4.750%, due 03/08/2044 | 1.5% |
Anheuser-Busch InBev SA/NV, 4.900%, due 02/01/2046 | 1.5% |
JPMorgan Chase & Company, 3.900%, due 07/15/2025 | 1.5% |
7
RYAN LABS CORE BOND FUND | |||||||||||||
U.S. TREASURY OBLIGATIONS — 37.1% | Coupon | Maturity | Par Value | Value | |||||||||
U.S. Treasury Notes — 27.9% | |||||||||||||
U.S. Treasury Notes | 0.750 | % | 10/31/17 | $ | 3,600,000 | $ | 3,596,767 | ||||||
U.S. Treasury Notes | 0.750 | % | 09/30/18 | 2,500,000 | 2,483,693 | ||||||||
U.S. Treasury Notes | 1.250 | % | 11/15/18 | 145,000 | 145,363 | ||||||||
U.S. Treasury Notes | 1.000 | % | 11/15/19 | 180,000 | 177,961 | ||||||||
U.S. Treasury Notes | 1.375 | % | 03/31/20 | 335,000 | 333,482 | ||||||||
U.S. Treasury Notes | 1.375 | % | 08/31/20 | 2,995,000 | 2,965,400 | ||||||||
U.S. Treasury Notes | 1.375 | % | 09/30/20 | 500,000 | 494,571 | ||||||||
U.S. Treasury Notes | 1.375 | % | 10/31/20 | 6,580,000 | 6,502,632 | ||||||||
U.S. Treasury Notes | 1.125 | % | 02/28/21 | 285,000 | 277,619 | ||||||||
U.S. Treasury Notes | 1.375 | % | 04/30/21 | 105,000 | 103,138 | ||||||||
U.S. Treasury Notes | 2.250 | % | 04/30/21 | 160,000 | 163,075 | ||||||||
U.S. Treasury Notes | 1.125 | % | 06/30/21 | 250,000 | 242,344 | ||||||||
U.S. Treasury Notes | 1.125 | % | 07/31/21 | 500,000 | 484,121 | ||||||||
U.S. Treasury Notes | 1.125 | % | 08/31/21 | 15,000 | 14,518 | ||||||||
U.S. Treasury Notes | 1.125 | % | 09/30/21 | 530,000 | 512,154 | ||||||||
U.S. Treasury Notes | 2.125 | % | 09/30/21 | 360,000 | 364,064 | ||||||||
U.S. Treasury Notes | 1.250 | % | 10/31/21 | 1,105,000 | 1,073,317 | ||||||||
U.S. Treasury Notes | 2.125 | % | 12/31/21 | 2,760,000 | 2,786,198 | ||||||||
U.S. Treasury Notes | 2.000 | % | 02/15/22 | 40,000 | 40,131 | ||||||||
U.S. Treasury Notes | 1.625 | % | 11/15/22 | 415,000 | 404,625 | ||||||||
U.S. Treasury Notes | 1.375 | % | 09/30/23 | 560,000 | 531,913 | ||||||||
U.S. Treasury Notes | 1.625 | % | 10/31/23 | 1,340,000 | 1,293,309 | ||||||||
U.S. Treasury Notes | 2.750 | % | 02/15/24 | 150,000 | 155,402 | ||||||||
U.S. Treasury Notes | 2.500 | % | 05/15/24 | 1,840,000 | 1,870,187 | ||||||||
U.S. Treasury Notes | 1.625 | % | 05/15/26 | 140,000 | 131,086 | ||||||||
U.S. Treasury Notes | 1.500 | % | 08/15/26 | 590,000 | 544,920 | ||||||||
U.S. Treasury Notes | 2.000 | % | 11/15/26 | 335,000 | 324,126 | ||||||||
28,016,116 | |||||||||||||
U.S. Treasury Bonds — 9.2% | |||||||||||||
U.S. Treasury Bonds | 5.375 | % | 02/15/31 | 1,190,000 | 1,594,461 | ||||||||
U.S. Treasury Bonds | 4.500 | % | 02/15/36 | 1,235,000 | 1,572,937 | ||||||||
U.S. Treasury Bonds | 5.000 | % | 05/15/37 | 165,000 | 223,156 | ||||||||
U.S. Treasury Bonds | 4.375 | % | 02/15/38 | 55,000 | 68,877 | ||||||||
U.S. Treasury Bonds | 4.500 | % | 05/15/38 | 415,000 | 528,314 | ||||||||
U.S. Treasury Bonds | 4.250 | % | 05/15/39 | 810,000 | 991,522 | ||||||||
U.S. Treasury Bonds | 3.000 | % | 05/15/42 | 1,240,000 | 1,235,835 | ||||||||
U.S. Treasury Bonds | 2.500 | % | 02/15/46 | 145,000 | 129,792 | ||||||||
U.S. Treasury Bonds | 2.500 | % | 05/15/46 | 1,235,000 | 1,105,229 | ||||||||
8
RYAN LABS CORE BOND FUND | |||||||||||||
U.S. TREASURY OBLIGATIONS — 37.1% (Continued) | Coupon | Maturity | Par Value | Value | |||||||||
U.S. Treasury Bonds — 9.2% (Continued) | |||||||||||||
U.S. Treasury Bonds | 2.250 | % | 08/15/46 | $ | 2,070,000 | $ | 1,751,737 | ||||||
9,201,860 | |||||||||||||
Total U.S. Treasury Obligations (Cost $37,585,645) | $ | 37,217,976 | |||||||||||
MORTGAGE-BACKED SECURITIES — 23.0% | Coupon | Maturity | Par Value | Value | |||||||||
Commercial — 9.3% | |||||||||||||
AMSR Mortgage Trust, Series 2016-SFR1, Class D, 144A (a) | 2.950 | % | 11/17/33 | $ | 1,000,000 | $ | 999,998 | ||||||
CD Commercial Mortgage Trust, Series 2016-CD2, Class C (b) | 4.031 | % | 11/10/49 | 215,000 | 213,251 | ||||||||
Commercial Mortgage Trust, Series 2012-CR4, Class D, 144A (a) | 4.724 | % | 10/15/45 | 440,000 | 417,359 | ||||||||
Commercial Mortgage Trust, Series 2013-LC6, Class AM | 3.282 | % | 01/10/46 | 49,000 | 49,676 | ||||||||
Commercial Mortgage Trust, Series 2015-LC21, Class C (a) | 4.312 | % | 07/10/48 | 120,000 | 107,534 | ||||||||
Credit Suisse Mortgage Trust, Series 2013-IVR3, Class A1, 144A | 2.500 | % | 05/25/43 | 506,127 | 476,155 | ||||||||
CSAIL Commercial Mortgage Trust, Series 2015-C3, Class D (a) | 3.505 | % | 08/15/48 | 808,687 | 590,715 | ||||||||
CSAIL Commercial Mortgage Trust, Series 2015-C2, Class D (a) | 4.352 | % | 06/15/57 | 260,000 | 185,046 | ||||||||
GS Mortgage Securities Trust, Series 2016-GS3-C, Class C (a) | 3.999 | % | 10/10/49 | 230,000 | 219,909 | ||||||||
JPMBB Commercial Mortgage Securities Trust, Series 2015-C28, Class C (a) | 4.380 | % | 10/15/48 | 755,000 | 675,475 | ||||||||
JPMCC Commercial Mortgage Securities Trust, Series 2016-NINE, Class A, 144A (a) | 2.949 | % | 10/06/38 | 70,000 | 68,114 | ||||||||
JPMCC Commercial Mortgage Securities Trust, Series 2014-FRR1, Class B702, 144A | 4.234 | % | 04/27/44 | 630,000 | 615,887 | ||||||||
JPMCC Commercial Mortgage Securities Trust, Series 2012-LC9, Class E, 144A (a) | 4.562 | % | 12/15/47 | 711,000 | 657,786 | ||||||||
9
RYAN LABS CORE BOND FUND | |||||||||||||
MORTGAGE-BACKED SECURITIES — 23.0% (Continued) | Coupon | Maturity | Par Value | Value | |||||||||
Commercial — 9.3% (Continued) | |||||||||||||
JPMCC Commercial Mortgage Securities Trust, Series 2014-FRR1, Class BK10, 144A (a) | 2.874 | % | 11/27/49 | $ | 420,000 | $ | 386,812 | ||||||
JPMDB Commercial Mortgage Securities Trust, Series 2016-C4, Class B (a) | 3.638 | % | 12/15/49 | 170,000 | 170,516 | ||||||||
Starwood Retail Property Trust, | 3.038 | % | 11/15/27 | 45,000 | 44,295 | ||||||||
UBS-Citigroup Commercial Mortgage Trust, Series 2011-C1, Class E, | 6.063 | % | 01/10/45 | 1,000,000 | 1,066,114 | ||||||||
Wachovia Bank Commercial Mortgage Trust, Series 2007-C30, Class AM | 5.383 | % | 12/15/43 | 240,000 | 240,510 | ||||||||
Wells Fargo Commercial Mortgage Trust, Series 2016-BNK1, Class B | 2.967 | % | 08/15/49 | 210,000 | 200,798 | ||||||||
WF-RBS Commercial Mortgage Trust, Series 2012-C10, Class D, 144A (a) | 4.601 | % | 12/15/45 | 1,335,000 | 1,201,705 | ||||||||
WF-RBS Commercial Mortgage Trust, Series 2014-C22, Class D (a) | 4.056 | % | 09/15/57 | 1,000,000 | 742,383 | ||||||||
9,330,038 | |||||||||||||
Federal Home Loan Mortgage Corporation — 7.2% | |||||||||||||
Federal Home Loan Mortgage Corporation, Pool #J19087 | 3.000 | % | 05/01/27 | 360,386 | 370,647 | ||||||||
Federal Home Loan Mortgage Corporation, Pool #G18481 | 3.000 | % | 09/01/28 | 256,318 | 263,631 | ||||||||
Federal Home Loan Mortgage Corporation, Pool #G18622 | 2.500 | % | 12/01/31 | 400,000 | 401,846 | ||||||||
Federal Home Loan Mortgage Corporation, Pool #A93093 | 4.500 | % | 07/01/40 | 113,589 | 123,539 | ||||||||
Federal Home Loan Mortgage Corporation, Pool #A94472 | 4.000 | % | 10/01/40 | 189,352 | 200,109 | ||||||||
Federal Home Loan Mortgage Corporation, Pool #Q19470 | 3.000 | % | 06/01/43 | 219,066 | 218,753 | ||||||||
Federal Home Loan Mortgage Corporation, Pool #Q20576 | 3.000 | % | 08/01/43 | 404,491 | 403,372 | ||||||||
Federal Home Loan Mortgage Corporation, Pool #G08572 | 3.500 | % | 02/01/44 | 149,880 | 153,899 | ||||||||
Federal Home Loan Mortgage Corporation, Pool #G08677 | 4.000 | % | 11/01/45 | 666,143 | 700,895 | ||||||||
Federal Home Loan Mortgage Corporation, Pool #G08707 | 4.000 | % | 05/01/46 | 2,263,851 | 2,382,544 | ||||||||
10
RYAN LABS CORE BOND FUND | |||||||||||||
MORTGAGE-BACKED SECURITIES — 23.0% (Continued) | Coupon | Maturity | Par Value | Value | |||||||||
Federal Home Loan Mortgage Corporation — 7.2% (Continued) | |||||||||||||
Federal Home Loan Mortgage Corporation, Pool #G08737 | 3.000 | % | 12/01/46 | $ | 1,960,000 | $ | 1,952,993 | ||||||
7,172,228 | |||||||||||||
Federal National Mortgage Association — 4.9% | |||||||||||||
Federal National Mortgage Association, Series 2015-M7, Class AB2 | 2.502 | % | 12/25/24 | 160,000 | 155,426 | ||||||||
Federal National Mortgage Association, Pool #AJ7494 | 3.000 | % | 12/01/26 | 253,396 | 261,127 | ||||||||
Federal National Mortgage Association, Pool #AO7976 | 3.000 | % | 06/01/27 | 91,994 | 94,747 | ||||||||
Federal National Mortgage Association, Pool #AB5490 | 3.000 | % | 07/01/27 | 89,916 | 92,601 | ||||||||
Federal National Mortgage Association, Pool #AE0443 | 6.500 | % | 10/01/39 | 26,252 | 29,737 | ||||||||
Federal National Mortgage Association, Pool #AB5379 | 3.500 | % | 06/01/42 | 1,428,623 | 1,467,872 | ||||||||
Federal National Mortgage Association, Pool #AB6670 | 3.000 | % | 10/01/42 | 199,123 | 199,377 | ||||||||
Federal National Mortgage Association, Pool #AB9345 | 3.000 | % | 05/01/43 | 394,591 | 395,092 | ||||||||
Federal National Mortgage Association, Pool #AB9350 | 3.000 | % | 05/01/43 | 171,319 | 171,536 | ||||||||
Federal National Mortgage Association, Pool #AB9558 | 3.000 | % | 06/01/43 | 409,129 | 409,649 | ||||||||
Federal National Mortgage Association, Pool #AT5860 | 3.500 | % | 06/01/43 | 741,478 | 764,693 | ||||||||
Federal National Mortgage Association, Pool #AL4010 | 3.500 | % | 07/01/43 | 179,764 | 185,716 | ||||||||
Federal National Mortgage Association, Pool #AS1338 | 5.000 | % | 12/01/43 | 234,014 | 256,386 | ||||||||
Federal National Mortgage Association, Pool #AL5625 | 3.500 | % | 03/01/44 | 107,844 | 111,376 | ||||||||
Federal National Mortgage Association, Pool #AL5538 | 4.000 | % | 07/01/44 | 79,413 | 84,317 | ||||||||
Federal National Mortgage Association, Pool #AS5165 | 3.000 | % | 06/01/45 | 213,304 | 213,390 | ||||||||
4,893,042 | |||||||||||||
11
RYAN LABS CORE BOND FUND | |||||||||||||
MORTGAGE-BACKED SECURITIES — 23.0% (Continued) | Coupon | Maturity | Par Value | Value | |||||||||
Government National Mortgage Association — 1.6% | |||||||||||||
Government National Mortgage Association, Pool #5175 | 4.500 | % | 09/20/41 | $ | 106,887 | $ | 116,536 | ||||||
Government National Mortgage Association, Pool #MA3937 | 3.500 | % | 09/20/46 | 1,288,295 | 1,342,967 | ||||||||
Government National Mortgage Association, Series 2014-13, Class VA | 3.000 | % | 01/16/54 | 171,313 | 183,233 | ||||||||
1,642,736 | |||||||||||||
Total Mortgage-Backed Securities (Cost $23,436,348) | $ | 23,038,044 | |||||||||||
| |||||||||||||
ASSET-BACKED SECURITIES — 11.2% | Coupon | Maturity | Par Value | Value | |||||||||
American Credit Acceptance Receivables Trust, Series 2016-3, Class B, 144A | 2.870 | % | 08/12/22 | $ | 455,000 | $ | 451,793 | ||||||
American Credit Acceptance Receivables Trust, Series 2016-4, Class D, 144A | 4.110 | % | 04/12/23 | 500,000 | 494,840 | ||||||||
AmeriCredit Automobile Receivables Trust, Series 2015-2, Class D | 3.000 | % | 06/08/21 | 570,000 | 577,548 | ||||||||
AmeriCredit Automobile Receivables Trust, Series 2016-1, Class D | 3.590 | % | 02/08/22 | 275,000 | 281,163 | ||||||||
AmeriCredit Automobile Receivables Trust, Series 2016-3, Class D | 2.710 | % | 09/08/22 | 400,000 | 395,218 | ||||||||
Avis Budget Rental Car Funding (AESOP), LLC, Series 2012-3A, Class B, 144A | 3.040 | % | 03/20/19 | 90,000 | 90,421 | ||||||||
Avis Budget Rental Car Funding (AESOP), LLC, Series 2013-1A, Class B, 144A | 2.620 | % | 09/20/19 | 70,000 | 69,870 | ||||||||
CPS Auto Trust, Series 2015-C, Class A, 144A | 1.770 | % | 06/17/19 | 90,780 | 90,919 | ||||||||
Cronos Containers Program Ltd., Series 2013-1A, Class A, 144A | 3.080 | % | 04/18/28 | 25,667 | 24,666 | ||||||||
Drive Auto Receivables Trust, Series 2016-BA, Class C, 144A (a) | 3.190 | % | 07/15/22 | 540,000 | 545,084 | ||||||||
Drive Auto Receivables Trust, Series 2016-BA, Class D, 144A | 4.530 | % | 08/15/23 | 980,000 | 988,945 | ||||||||
12
RYAN LABS CORE BOND FUND | |||||||||||||
ASSET-BACKED SECURITIES — 11.2% (Continued) | Coupon | Maturity | Par Value | Value | |||||||||
Drive Auto Receivables Trust, Series 2016-CA, Class D, 144A (b) | 4.180 | % | 03/15/24 | $ | 1,100,000 | $ | 1,099,784 | ||||||
Exeter Automobile Receivables Trust, Series 2016-3A, Class C, 144A | 4.220 | % | 06/15/22 | 770,000 | 763,775 | ||||||||
Morgan Stanley Capital I Trust, Series 2016-UB11, Class D, 144A | 3.500 | % | 08/15/49 | 260,000 | 190,793 | ||||||||
MVW Owner Trust, Series 2013-1A, Class B, 144A | 2.740 | % | 04/22/30 | 43,461 | 43,595 | ||||||||
Santander Drive Auto Receivables Trust, Series 2015-1, Class D | 3.240 | % | 04/15/21 | 150,000 | 152,221 | ||||||||
Santander Drive Auto Receivables Trust, Series 2015-3, Class D | 3.490 | % | 05/17/21 | 1,280,000 | 1,303,890 | ||||||||
Santander Drive Auto Receivables Trust, Series 2016-1, Class D | 4.020 | % | 04/15/22 | 600,000 | 621,612 | ||||||||
Santander Drive Auto Receivables Trust, Series 2016-2, Class D (a) | 3.390 | % | 04/15/22 | 790,000 | 799,769 | ||||||||
Santander Drive Auto Receivables Trust, Series 2016-3, Class D | 2.800 | % | 08/15/22 | 660,000 | 651,507 | ||||||||
Shops at Crystals Trust, Series 2016-CSTL, Class D, 144A | 3.731 | % | 07/05/36 | 510,000 | 467,176 | ||||||||
Sierra Receivables Funding Company, LLC, Series 2014-2A, Class B | 2.400 | % | 06/20/31 | 83,107 | 83,142 | ||||||||
Sierra Receivables Funding Company, LLC, Series 2016-3A, Class B, 144A | 2.630 | % | 10/20/33 | 458,626 | 453,051 | ||||||||
Structured Agency Credit Risk Debt Notes, Series 15-DN1, Class M2 (a) | 2.984 | % | 01/25/25 | 401,360 | 403,208 | ||||||||
Structured Agency Credit Risk Debt Notes, Series 2016-DNA2, Class M2 (a) | 2.784 | % | 10/25/28 | 180,000 | 182,044 | ||||||||
Total Asset-Backed Securities (Cost $11,224,406) | $ | 11,226,034 | |||||||||||
| |||||||||||||
CORPORATE BONDS — 26.9% | Coupon | Maturity | Par Value | Value | |||||||||
Consumer Discretionary — 1.6% | |||||||||||||
21st Century Fox America, 144A | 4.750 | % | 11/15/46 | $ | 90,000 | $ | 91,316 | ||||||
Alibaba Group Holding Ltd. | 2.500 | % | 11/28/19 | 205,000 | 206,361 | ||||||||
Comcast Corporation | 3.600 | % | 03/01/24 | 510,000 | 527,836 | ||||||||
Mattel, Inc. | 2.350 | % | 08/15/21 | 315,000 | 308,779 | ||||||||
Priceline Group, Inc. (The) | 3.600 | % | 06/01/26 | 290,000 | 286,944 | ||||||||
Starbucks Corporation | 2.100 | % | 02/04/21 | 210,000 | 209,026 | ||||||||
1,630,262 | |||||||||||||
13
RYAN LABS CORE BOND FUND | |||||||||||||
CORPORATE BONDS — 26.9% (Continued) | Coupon | Maturity | Par Value | Value | |||||||||
Consumer Staples — 1.2% | |||||||||||||
Bunge Ltd. Finance Corporation | 3.250 | % | 08/15/26 | $ | 455,000 | $ | 438,099 | ||||||
Kraft Heinz Foods Company | 5.200 | % | 07/15/45 | 370,000 | 393,464 | ||||||||
Walgreens Boots Alliance, Inc. | 3.100 | % | 06/01/23 | 360,000 | 355,450 | ||||||||
1,187,013 | |||||||||||||
Energy — 2.2% | |||||||||||||
BP Capital Markets plc | 1.375 | % | 05/10/18 | 90,000 | 89,683 | ||||||||
BP Capital Markets plc | 3.216 | % | 11/28/23 | 280,000 | 279,827 | ||||||||
Chevron Corporation | 1.561 | % | 05/16/19 | 250,000 | 248,513 | ||||||||
Chevron Corporation | 2.419 | % | 11/17/20 | 165,000 | 166,175 | ||||||||
Enbridge, Inc. | 5.500 | % | 12/01/46 | 275,000 | 282,159 | ||||||||
Exxon Mobil Corporation | 2.726 | % | 03/01/23 | 180,000 | 179,761 | ||||||||
Phillips 66 | 4.875 | % | 11/15/44 | 330,000 | 339,722 | ||||||||
Plains All American Pipeline LP/PAA Finance Corporation | 4.500 | % | 12/15/26 | 115,000 | 113,564 | ||||||||
Shell International Finance B.V. | 1.875 | % | 05/10/21 | 185,000 | 180,269 | ||||||||
Shell International Finance B.V. | 4.000 | % | 05/10/46 | 350,000 | 324,859 | ||||||||
Total Capital Canada Ltd. | 1.550 | % | 06/28/17 | 40,000 | 40,049 | ||||||||
2,244,581 | |||||||||||||
Financials — 14.0% | |||||||||||||
Air Lease Corporation | 2.125 | % | 01/15/20 | 250,000 | 246,049 | ||||||||
American International Group, Inc. | 3.900 | % | 04/01/26 | 435,000 | 441,499 | ||||||||
Bank of America Corporation | 1.650 | % | 03/26/18 | 905,000 | 905,043 | ||||||||
Bank of America Corporation | 7.625 | % | 06/01/19 | 210,000 | 236,457 | ||||||||
Bank of America Corporation | 5.875 | % | 01/05/21 | 185,000 | 206,802 | ||||||||
Bank of America Corporation | 3.500 | % | 04/19/26 | 340,000 | 335,704 | ||||||||
Bank of America Corporation | 3.248 | % | 10/21/27 | 285,000 | 271,598 | ||||||||
Bank of Montreal | 1.500 | % | 07/18/19 | 200,000 | 197,407 | ||||||||
Bank of New York Mellon Corporation | 3.000 | % | 10/30/28 | 480,000 | 455,840 | ||||||||
Bear Stearns Companies, LLC | 7.250 | % | 02/01/18 | 405,000 | 430,172 | ||||||||
Berkshire Hathaway, Inc. | 2.100 | % | 08/14/19 | 80,000 | 80,708 | ||||||||
BNP Paribas | 2.400 | % | 12/12/18 | 1,390,000 | 1,403,005 | ||||||||
Citigroup, Inc. | 2.050 | % | 12/07/18 | 70,000 | 70,028 | ||||||||
Citigroup, Inc. | 3.300 | % | 04/27/25 | 185,000 | 181,090 | ||||||||
Citigroup, Inc. | 4.600 | % | 03/09/26 | 370,000 | 381,370 | ||||||||
Citigroup, Inc. | 4.450 | % | 09/29/27 | 325,000 | 329,514 | ||||||||
Fifth Third Bank | 1.625 | % | 09/27/19 | 155,000 | 152,876 | ||||||||
General Electric Capital Corporation | 5.625 | % | 05/01/18 | 165,000 | 174,737 | ||||||||
Goldman Sachs Group, Inc. | 2.625 | % | 01/31/19 | 300,000 | 303,173 | ||||||||
Goldman Sachs Group, Inc. | 2.750 | % | 09/15/20 | 190,000 | 190,897 | ||||||||
Goldman Sachs Group, Inc. | 3.750 | % | 02/25/26 | 225,000 | 226,440 | ||||||||
14
RYAN LABS CORE BOND FUND | |||||||||||||
CORPORATE BONDS — 26.9% (Continued) | Coupon | Maturity | Par Value | Value | |||||||||
Financials — 14.0% (Continued) | |||||||||||||
Huntington Bancshares, Inc. | 2.600 | % | 08/02/18 | $ | 115,000 | $ | 116,109 | ||||||
Huntington Bancshares, Inc. | 2.300 | % | 01/14/22 | 225,000 | 218,788 | ||||||||
JPMorgan Chase & Company | 2.250 | % | 01/23/20 | 1,245,000 | 1,241,139 | ||||||||
JPMorgan Chase & Company | 3.625 | % | 12/01/27 | 255,000 | 248,325 | ||||||||
Lazard Group, LLC | 3.625 | % | 03/01/27 | 455,000 | 432,786 | ||||||||
Loews Corporation | 3.750 | % | 04/01/26 | 320,000 | 325,033 | ||||||||
Morgan Stanley | 5.550 | % | 04/27/17 | 285,000 | 289,738 | ||||||||
Morgan Stanley | 3.125 | % | 07/27/26 | 185,000 | 177,234 | ||||||||
Morgan Stanley | 3.950 | % | 04/23/27 | 175,000 | 173,248 | ||||||||
Paccar Financial Corporation | 1.400 | % | 11/17/17 | 75,000 | 75,173 | ||||||||
Royal Bank of Canada | 1.625 | % | 04/15/19 | 185,000 | 183,444 | ||||||||
State Street Corporation | 1.950 | % | 05/19/21 | 195,000 | 191,175 | ||||||||
Sumitomo Mitsui Financial Group, Inc. | 2.442 | % | 10/19/21 | 435,000 | 427,922 | ||||||||
Suntrust Banks, Inc. | 2.700 | % | 01/27/22 | 285,000 | 285,079 | ||||||||
Toyota Motor Credit Corporation | 1.375 | % | 01/10/18 | 130,000 | 129,958 | ||||||||
Toyota Motor Credit Corporation | 2.100 | % | 01/17/19 | 145,000 | 145,793 | ||||||||
Toyota Motor Credit Corporation | 3.400 | % | 09/15/21 | 105,000 | 109,610 | ||||||||
U.S. Bancorp | 1.950 | % | 11/15/18 | 125,000 | 125,680 | ||||||||
Voya Financial, Inc. | 3.650 | % | 06/15/26 | 200,000 | 193,144 | ||||||||
Voya Financial, Inc. | 4.800 | % | 06/15/46 | 370,000 | 349,408 | ||||||||
Wells Fargo & Company | 3.000 | % | 10/23/26 | 40,000 | 38,275 | ||||||||
Wells Fargo & Company | 4.300 | % | 07/22/27 | 185,000 | 191,262 | ||||||||
Westpac Banking Corporation | 2.100 | % | 05/13/21 | 190,000 | 186,201 | ||||||||
Westpac Banking Corporation | 4.322 | % | 11/23/31 | 940,000 | 931,921 | ||||||||
14,006,854 | |||||||||||||
Health Care — 1.7% | |||||||||||||
Abbvie, Inc. | 4.450 | % | 05/14/46 | 100,000 | 93,801 | ||||||||
Actavis, Inc. | 1.875 | % | 10/01/17 | 695,000 | 696,302 | ||||||||
Amgen, Inc. | 4.400 | % | 05/01/45 | 315,000 | 300,777 | ||||||||
Biogen, Inc. | 4.050 | % | 09/15/25 | 265,000 | 272,793 | ||||||||
Celgene Corporation | 3.875 | % | 08/15/25 | 5,000 | 5,083 | ||||||||
Celgene Corporation | 5.000 | % | 08/15/45 | 185,000 | 191,253 | ||||||||
Medtronic, Inc. | 1.375 | % | 04/01/18 | 80,000 | 79,888 | ||||||||
Medtronic, Inc. | 2.500 | % | 03/15/20 | 30,000 | 30,293 | ||||||||
1,670,190 | |||||||||||||
Industrials — 0.4% | |||||||||||||
CSX Corporation | 2.600 | % | 11/01/26 | 220,000 | 206,134 | ||||||||
CSX Corporation | 3.800 | % | 11/01/46 | 125,000 | 113,401 | ||||||||
FedEx Corporation | 4.550 | % | 04/01/46 | 100,000 | 99,678 | ||||||||
15
RYAN LABS CORE BOND FUND | |||||||||||||
CORPORATE BONDS — 26.9% (Continued) | Coupon | Maturity | Par Value | Value | |||||||||
Industrials — 0.4% (Continued) | |||||||||||||
Glencore Funding, LLC, 144A | 2.500 | % | 01/15/19 | $ | 9,000 | $ | 8,933 | ||||||
428,146 | |||||||||||||
Information Technology — 1.3% | |||||||||||||
Apple, Inc. | 1.000 | % | 05/03/18 | 235,000 | 233,924 | ||||||||
Cisco Systems, Inc. | 1.400 | % | 02/28/18 | 200,000 | 200,099 | ||||||||
Intel Corporation | 1.350 | % | 12/15/17 | 80,000 | 80,160 | ||||||||
Microsoft Corporation | 3.700 | % | 08/08/46 | 360,000 | 335,050 | ||||||||
Motorola Solutions, Inc. | 3.750 | % | 05/15/22 | 400,000 | 400,770 | ||||||||
1,250,003 | |||||||||||||
Materials — 0.8% | |||||||||||||
Ecolab, Inc. | 1.450 | % | 12/08/17 | 125,000 | 124,958 | ||||||||
LyondellBasell Industries N.V. | 5.000 | % | 04/15/19 | 65,000 | 68,799 | ||||||||
Monsanto Company | 5.500 | % | 08/15/25 | 315,000 | 351,158 | ||||||||
Southern Copper Corporation | 3.875 | % | 04/23/25 | 290,000 | 282,448 | ||||||||
827,363 | |||||||||||||
Real Estate — 0.2% | |||||||||||||
Hospitality Properties Trust | 4.500 | % | 03/15/25 | 215,000 | 208,936 | ||||||||
Welltower, Inc. | 2.250 | % | 03/15/18 | 25,000 | 25,122 | ||||||||
234,058 | |||||||||||||
Telecommunication Services — 2.4% | |||||||||||||
América Móvil S.A.B. de C.V. | 5.000 | % | 10/16/19 | 570,000 | 615,333 | ||||||||
AT&T, Inc. | 4.600 | % | 02/15/21 | 315,000 | 333,592 | ||||||||
Comcast Corporation | 4.250 | % | 01/15/33 | 100,000 | 102,967 | ||||||||
Comision Federal de Electricidad, 144A | 4.750 | % | 02/23/27 | 200,000 | 186,000 | ||||||||
Sprint Spectrum Company LLC, 144A | 3.360 | % | 03/20/23 | 980,000 | 982,450 | ||||||||
Verizon Communications, Inc. | 4.500 | % | 09/15/20 | 15,000 | 16,057 | ||||||||
Verizon Communications, Inc. | 6.550 | % | 09/15/43 | 71,000 | 88,495 | ||||||||
Verizon Communications, Inc. | 4.125 | % | 08/15/46 | 50,000 | 44,599 | ||||||||
2,369,493 | |||||||||||||
Utilities — 1.1% | |||||||||||||
Buckeye Partners, L.P. | 6.050 | % | 01/15/18 | 305,000 | 318,022 | ||||||||
Buckeye Partners, L.P. | 2.650 | % | 11/15/18 | 125,000 | 125,839 | ||||||||
Duke Energy Progress, Inc. | 5.300 | % | 01/15/19 | 45,000 | 48,297 | ||||||||
Oglethorpe Power Corporation | 6.100 | % | 03/15/19 | 60,000 | 64,970 | ||||||||
PacifiCorp | 4.100 | % | 02/01/42 | 195,000 | 195,090 | ||||||||
Public Service Electric & Gas Company | 2.300 | % | 09/15/18 | 125,000 | 126,536 | ||||||||
Virginia Electric & Power Company | 1.200 | % | 01/15/18 | 190,000 | 189,186 | ||||||||
1,067,940 | |||||||||||||
Total Corporate Bonds (Cost $27,287,290) | $ | 26,915,903 | |||||||||||
16
RYAN LABS CORE BOND FUND | |||||||||||||
INTERNATIONAL BONDS — 0.6% | Coupon | Maturity | Par Value | Value | |||||||||
Kingdom of Saudi Arabia, 144A | 4.500 | % | 10/26/46 | $ | 535,000 | $ | 515,536 | ||||||
United Mexican States | 4.000 | % | 10/02/23 | 120,000 | 119,700 | ||||||||
Total International Bonds (Cost $644,797) | $ | 635,236 | |||||||||||
MONEY MARKET FUNDS — 18.5% | Shares | Value | ||||||
Fidelity Institutional Money Market Government Portfolio - Class I, 0.28% (c) | 14,195,083 | $ | 14,195,083 | |||||
Invesco Short-Term Investments Trust - Treasury Portfolio - Institutional Shares, 0.26% (c) | 4,370,730 | 4,370,730 | ||||||
Total Money Market Funds (Cost $18,565,813) | $ | 18,565,813 | ||||||
Total Investments at Value — 117.3% (Cost $118,744,299) | $ | 117,599,006 | ||||||
Liabilities in Excess of Other Assets — (17.3%) | (17,362,533 | ) | ||||||
Net Assets — 100.0% | $ | 100,236,473 | ||||||
144A - | This is a restricted security that was sold in a transaction exempt from Rule 144A of the Securities Act of 1933. This security may be sold in transactions exempt from registration, normally to qualified institutional buyers. The total value of such securities is $13,493,172 at November 30, 2016, representing 13.5% of net assets. |
(a) | Variable rate security. The rate shown is the effective interest rate as of November 30, 2016. |
(b) | Security values have been determined in good faith pursuant to procedures adopted by the Board of Trustees. The total value of such securities is $1,313,035 at November 30, 2016, representing 1.3% of net assets (Note 2). |
(c) | The rate shown is the 7-day effective yield as of November 30, 2016. |
See accompanying notes to financial statements. |
17
RYAN LABS LONG CREDIT FUND | |||||||||||||
U.S. TREASURY OBLIGATIONS — 7.1% | Coupon | Maturity | Par Value | Value | |||||||||
U.S. Treasury Notes — 2.2% | |||||||||||||
U.S. Treasury Notes | 2.000 | % | 11/15/26 | $ | 1,205,000 | $ | 1,165,885 | ||||||
U.S. Treasury Bonds — 4.9% | |||||||||||||
U.S. Treasury Bonds | 2.250 | % | 08/15/46 | 3,090,000 | 2,614,912 | ||||||||
Total U.S. Treasury Obligations(Cost $3,802,944) | $ | 3,780,797 | |||||||||||
MUNICIPAL BONDS — 8.0% | Coupon | Maturity | Par Value | Value | |||||||||
Bay Area, CA, Toll Authority Toll Bridge, Revenue | 6.263 | % | 04/01/49 | $ | 500,000 | $ | 685,450 | ||||||
California State, Build America Bonds, General Obligation | 7.550 | % | 04/01/39 | 500,000 | 743,020 | ||||||||
New York City Transitional Finance Authority Build America Bonds, Revenue | 5.508 | % | 08/01/37 | 325,000 | 397,257 | ||||||||
New York City Water & Sewer System, Build America Bonds, Revenue | 5.750 | % | 06/15/41 | 565,000 | 721,906 | ||||||||
Port Authority of New York & New Jersey Bonds, Revenue | 4.926 | % | 10/01/51 | 555,000 | 623,742 | ||||||||
San Diego County, CA, Water Authority Financing Agency, Revenue, Series B, | 6.138 | % | 05/01/49 | 445,000 | 582,843 | ||||||||
University of California, Revenue | 4.131 | % | 05/15/45 | 540,000 | 536,123 | ||||||||
Total Municipal Bonds (Cost $4,417,878) | $ | 4,290,341 | |||||||||||
CORPORATE BONDS — 79.9% | Coupon | Maturity | Par Value | Value | |||||||||
Consumer Discretionary — 10.1% | |||||||||||||
21st Century Fox America, Inc. | 4.950 | % | 10/15/45 | $ | 720,000 | $ | 742,326 | ||||||
Comcast Corporation | 4.250 | % | 01/15/33 | 850,000 | 875,223 | ||||||||
Ford Motor Company | 4.750 | % | 01/15/43 | 320,000 | 299,281 | ||||||||
Hasbro, Inc. | 6.350 | % | 03/15/40 | 240,000 | 278,418 | ||||||||
Home Depot, Inc. | 4.250 | % | 04/01/46 | 540,000 | 555,852 | ||||||||
Home Depot, Inc. | 3.500 | % | 09/15/56 | 150,000 | 130,886 | ||||||||
Johnson (S.C.) & Son, Inc., 144A | 4.350 | % | 09/30/44 | 540,000 | 537,599 | ||||||||
18
RYAN LABS LONG CREDIT FUND | |||||||||||||
CORPORATE BONDS — 79.9% (Continued) | Coupon | Maturity | Par Value | Value | |||||||||
Consumer Discretionary — 10.1% (Continued) | |||||||||||||
Macy's Retail Holdings, Inc. | 6.650 | % | 07/15/24 | $ | 255,000 | $ | 289,277 | ||||||
Newell Brands, Inc. | 5.500 | % | 04/01/46 | 565,000 | 640,195 | ||||||||
Nike, Inc. | 3.375 | % | 11/01/46 | 450,000 | 403,768 | ||||||||
PepsiCo, Inc. | 3.450 | % | 10/06/46 | 120,000 | 107,060 | ||||||||
Time Warner, Inc. | 7.700 | % | 05/01/32 | 240,000 | 317,059 | ||||||||
Time Warner, Inc. | 6.750 | % | 06/15/39 | 200,000 | 225,959 | ||||||||
5,402,903 | |||||||||||||
Consumer Staples — 3.9% | |||||||||||||
Anheuser-Busch InBev SA/NV | 4.900 | % | 02/01/46 | 755,000 | 807,785 | ||||||||
Bunge Ltd. Finance Corporation | 3.250 | % | 08/15/26 | 380,000 | 365,885 | ||||||||
CVS Health Corporation | 5.125 | % | 07/20/45 | 380,000 | 416,894 | ||||||||
Wal-Mart Stores, Inc. | 4.300 | % | 04/22/44 | 455,000 | 477,592 | ||||||||
2,068,156 | |||||||||||||
Energy — 7.6% | |||||||||||||
Boardwalk Pipelines, L.P. | 5.950 | % | 06/01/26 | 375,000 | 400,611 | ||||||||
BP Capital Markets plc | 3.723 | % | 11/28/28 | 240,000 | 241,515 | ||||||||
Energy Transfer Partners, L.P. | 6.050 | % | 06/01/41 | 125,000 | 123,570 | ||||||||
Energy Transfer Partners, L.P. | 6.500 | % | 02/01/42 | 600,000 | 623,363 | ||||||||
Enterprise Products Operating, L.P. | 5.100 | % | 02/15/45 | 220,000 | 218,373 | ||||||||
Exxon Mobil Corporation | 4.114 | % | 03/01/46 | 545,000 | 547,135 | ||||||||
Kinder Morgan Energy Partners, L.P. | 6.500 | % | 09/01/39 | 325,000 | 337,201 | ||||||||
Marathon Petroleum Corporation | 5.850 | % | 12/15/45 | 215,000 | 198,342 | ||||||||
Petroleos Mexicanos | 5.500 | % | 06/27/44 | 170,000 | 131,495 | ||||||||
Shell International Finance B.V. | 4.375 | % | 05/11/45 | 710,000 | 700,048 | ||||||||
Shell International Finance B.V. | 3.750 | % | 09/12/46 | 145,000 | 130,105 | ||||||||
Statoil ASA | 3.950 | % | 05/15/43 | 125,000 | 116,578 | ||||||||
Williams Partners, L.P. | 4.000 | % | 09/15/25 | 315,000 | 303,901 | ||||||||
4,072,237 | |||||||||||||
Financials — 17.7% | |||||||||||||
Alleghany Corporation | 4.900 | % | 09/15/44 | 600,000 | 563,959 | ||||||||
Citigroup, Inc. | 4.450 | % | 09/29/27 | 515,000 | 522,153 | ||||||||
FMR, LLC, 144A | 6.500 | % | 12/14/40 | 445,000 | 545,644 | ||||||||
GE Capital International Funding Company, 144A | 4.418 | % | 11/15/35 | 985,000 | 1,025,354 | ||||||||
Goldman Sachs Group, Inc | 3.500 | % | 11/16/26 | 235,000 | 230,919 | ||||||||
Goldman Sachs Group, Inc. | 4.250 | % | 10/21/25 | 125,000 | 126,882 | ||||||||
HSBC Bank USA | 5.875 | % | 11/01/34 | 500,000 | 574,531 | ||||||||
JPMorgan Chase & Company | 3.900 | % | 07/15/25 | 775,000 | 799,661 | ||||||||
Lincoln National Corporation | 7.000 | % | 06/15/40 | 480,000 | 591,642 | ||||||||
19
RYAN LABS LONG CREDIT FUND | |||||||||||||
CORPORATE BONDS — 79.9% (Continued) | Coupon | Maturity | Par Value | Value | |||||||||
Financials — 17.7% (Continued) | |||||||||||||
MetLife, Inc. | 4.875 | % | 11/13/43 | $ | 450,000 | $ | 481,237 | ||||||
Nationwide Financial Services, Inc., 144A | 5.300 | % | 11/18/44 | 480,000 | 491,235 | ||||||||
Pacific LifeCorp, 144A | 5.125 | % | 01/30/43 | 490,000 | 496,020 | ||||||||
Protective Life Corporation | 8.450 | % | 10/15/39 | 325,000 | 428,774 | ||||||||
Santander Issuances S.A. | 5.179 | % | 11/19/25 | 400,000 | 394,673 | ||||||||
Societe Generale S.A., 144A | 4.750 | % | 11/24/25 | 310,000 | 307,365 | ||||||||
Teachers Insurance & Annuity Association of America, 144A | 4.900 | % | 09/15/44 | 915,000 | 976,965 | ||||||||
Wells Fargo & Company | 4.300 | % | 07/22/27 | 750,000 | 775,388 | ||||||||
Wells Fargo & Company | 3.900 | % | 05/01/45 | 105,000 | 98,703 | ||||||||
Westpac Banking Corporation | 4.322 | % | 11/23/31 | 90,000 | 89,226 | ||||||||
9,520,331 | |||||||||||||
Health Care — 9.5% | |||||||||||||
Amgen, Inc. | 5.150 | % | 11/15/41 | 275,000 | 290,439 | ||||||||
Baxalta, Inc. | 4.000 | % | 06/23/25 | 610,000 | 615,819 | ||||||||
Celgene Corporation | 5.000 | % | 08/15/45 | 390,000 | 403,182 | ||||||||
Gilead Sciences, Inc. | 4.750 | % | 03/01/46 | 110,000 | 113,040 | ||||||||
Gilead Sciences, Inc. | 4.150 | % | 03/01/47 | 720,000 | 674,314 | ||||||||
Johns Hopkins Health System Corporation (The) | 3.837 | % | 05/15/46 | 595,000 | 567,450 | ||||||||
Koninklijke Philips N.V. | 5.000 | % | 03/15/42 | 525,000 | 538,726 | ||||||||
Novartis Capital Corporation | 4.000 | % | 11/20/45 | 370,000 | 370,818 | ||||||||
Petroleos Mexicanos | 6.750 | % | 09/21/47 | 337,000 | 295,589 | ||||||||
Pfizer, Inc. | 4.125 | % | 12/15/46 | 120,000 | 120,016 | ||||||||
Stryker Corporation | 4.625 | % | 03/15/46 | 440,000 | 438,766 | ||||||||
UnitedHealth Group, Inc. | 4.750 | % | 07/15/45 | 615,000 | 676,082 | ||||||||
5,104,241 | |||||||||||||
Industrials — 3.5% | |||||||||||||
CSX Corporation | 4.250 | % | 11/01/66 | 220,000 | 198,303 | ||||||||
Dow Chemical Company (The) | 4.625 | % | 10/01/44 | 190,000 | 187,124 | ||||||||
General Electric Company | 4.500 | % | 03/11/44 | 200,000 | 210,696 | ||||||||
Grainger (W.W.), Inc. | 3.750 | % | 05/15/46 | 250,000 | 232,336 | ||||||||
International Paper Company | 4.800 | % | 06/15/44 | 90,000 | 86,768 | ||||||||
Mosaic Company | 5.625 | % | 11/15/43 | 315,000 | 296,615 | ||||||||
United Parcel Service, Inc. | 3.400 | % | 11/15/46 | 120,000 | 107,968 | ||||||||
United Technologies Corporation | 3.750 | % | 11/01/46 | 485,000 | 455,171 | ||||||||
Xylem, Inc. | 3.250 | % | 11/01/26 | 120,000 | 115,946 | ||||||||
1,890,927 | |||||||||||||
20
RYAN LABS LONG CREDIT FUND | |||||||||||||
CORPORATE BONDS — 79.9% (Continued) | Coupon | Maturity | Par Value | Value | |||||||||
Information Technology — 3.5% | |||||||||||||
Apple, Inc. | 3.450 | % | 02/09/45 | $ | 500,000 | $ | 439,440 | ||||||
Intel Corporation | 4.900 | % | 07/29/45 | 85,000 | 94,658 | ||||||||
Intel Corporation | 4.100 | % | 05/19/46 | 290,000 | 283,231 | ||||||||
KLA-Tencor Corporation | 5.650 | % | 11/01/34 | 400,000 | 413,574 | ||||||||
LAM Research Corporation | 3.800 | % | 03/15/25 | 275,000 | 275,711 | ||||||||
Microsoft Corporation | 3.700 | % | 08/08/46 | 100,000 | 93,070 | ||||||||
Oracle Corporation | 6.500 | % | 04/15/38 | 230,000 | 300,574 | ||||||||
1,900,258 | |||||||||||||
Materials — 1.9% | |||||||||||||
BHP Billiton Finance USA Ltd. | 5.000 | % | 09/30/43 | 350,000 | 389,576 | ||||||||
Burlington Resources Finance Company | 7.200 | % | 08/15/31 | 400,000 | 499,480 | ||||||||
CF Industries, Inc., 144A | 4.500 | % | 12/01/26 | 130,000 | 127,637 | ||||||||
1,016,693 | |||||||||||||
Real Estate — 3.8% | |||||||||||||
Hospitality Properties Trust | 4.650 | % | 03/15/24 | 630,000 | 625,055 | ||||||||
Host Hotels & Resorts, L.P. | 4.000 | % | 06/15/25 | 500,000 | 492,118 | ||||||||
Ventas Realty, L.P. | 3.250 | % | 10/15/26 | 480,000 | 456,650 | ||||||||
Welltower, Inc. | 4.000 | % | 06/01/25 | 450,000 | 460,126 | ||||||||
2,033,949 | |||||||||||||
Telecommunication Services — 4.4% | |||||||||||||
América Móvil S.A.B. de C.V. | 4.375 | % | 07/16/42 | 225,000 | 204,215 | ||||||||
AT&T, Inc. | 4.500 | % | 05/15/35 | 1,100,000 | 1,042,975 | ||||||||
Motorola Solutions, Inc. | 5.500 | % | 09/01/44 | 250,000 | 227,121 | ||||||||
Verizon Communications, Inc. | 4.400 | % | 11/01/34 | 905,000 | 881,479 | ||||||||
2,355,790 | |||||||||||||
Utilities — 14.0% | |||||||||||||
Buckeye Partners, L.P. | 5.600 | % | 10/15/44 | 585,000 | 565,788 | ||||||||
Commonwealth Edison Company | 3.650 | % | 06/15/46 | 225,000 | 210,965 | ||||||||
Consolidated Edison Company | 4.500 | % | 12/01/45 | 400,000 | 418,570 | ||||||||
DTE Electric Company | 3.700 | % | 06/01/46 | 390,000 | 374,026 | ||||||||
DTE Energy Company | 2.850 | % | 10/01/26 | 595,000 | 555,368 | ||||||||
Duke Energy Progress, Inc. | 4.375 | % | 03/30/44 | 715,000 | 737,485 | ||||||||
Électricité de France S.A., 144A | 4.950 | % | 10/13/45 | 750,000 | 753,923 | ||||||||
Exelon Generation Company, LLC | 5.600 | % | 06/15/42 | 325,000 | 312,319 | ||||||||
Florida Power & Light Company | 5.950 | % | 10/01/33 | 205,000 | 254,468 | ||||||||
Kentucky Utilities Company | 4.375 | % | 10/01/45 | 195,000 | 203,394 | ||||||||
PacifiCorp | 6.250 | % | 10/15/37 | 325,000 | 421,225 | ||||||||
Public Service Electric & Gas Company | 3.950 | % | 05/01/42 | 445,000 | 446,909 | ||||||||
Southern California Edison Company | 4.650 | % | 10/01/43 | 645,000 | 708,622 | ||||||||
21
RYAN LABS LONG CREDIT FUND | |||||||||||||
CORPORATE BONDS — 79.9% (Continued) | Coupon | Maturity | Par Value | Value | |||||||||
Utilities — 14.0% (Continued) | |||||||||||||
Southern Company Gas Capital Corporation | 3.950 | % | 10/01/46 | $ | 305,000 | $ | 280,089 | ||||||
Southwestern Public Service Company | 4.500 | % | 08/15/41 | 575,000 | 600,168 | ||||||||
Virginia Electric & Power Company | 6.350 | % | 11/30/37 | 515,000 | 660,023 | ||||||||
7,503,342 | |||||||||||||
Total Corporate Bonds (Cost $43,296,556) | $ | 42,868,827 | |||||||||||
INTERNATIONAL BONDS — 3.6% | Coupon | Maturity | Par Value | Value | |||||||||
Kingdom of Saudi Arabia, 144A | 4.500 | % | 10/26/46 | $ | 195,000 | $ | 187,906 | ||||||
Republic of Colombia | 5.000 | % | 06/15/45 | 375,000 | 345,937 | ||||||||
Republic of Philippines | 3.700 | % | 03/01/41 | 125,000 | 122,203 | ||||||||
Republic of Turkey | 4.250 | % | 04/14/26 | 500,000 | 446,735 | ||||||||
United Mexican States | 4.750 | % | 03/08/44 | 919,000 | 815,613 | ||||||||
Total International Bonds (Cost $1,977,280) | $ | 1,918,394 | |||||||||||
MONEY MARKET FUNDS — 4.2% | Shares | Value | ||||||
Invesco Short-Term Investments Trust - Treasury Portfolio - Institutional Shares, 0.26% (a) (Cost $2,279,661) | 2,279,661 | $ | 2,279,661 | |||||
Total Investments at Value — 102.8% (Cost $55,774,319) | $ | 55,138,020 | ||||||
Liabilities in Excess of Other Assets — (2.8%) | (1,497,949 | ) | ||||||
Net Assets — 100.0% | $ | 53,640,071 | ||||||
144A - | This is a restricted security that was sold in a transaction exempt from Rule 144A of the Securities Act of 1933. This security may be sold in transactions exempt from registration, normally to qualified institutional buyers. The total value of such securities is $5,449,648 at November 30, 2016, representing 10.2% of net assets. |
(a) | The rate shown is the 7-day effective yield as of November 30, 2016. |
See accompanying notes to financial statements. |
22
RYAN LABS FUNDS | ||||||||
| Ryan Labs Core Bond Fund | Ryan Labs Long Credit Fund | ||||||
ASSETS | ||||||||
Investments in securities: | ||||||||
At acquisition cost | $ | 118,744,299 | $ | 55,774,319 | ||||
At value (Note 2) | $ | 117,599,006 | $ | 55,138,020 | ||||
Receivable for securities sold | 1,559,112 | — | ||||||
Dividends and interest receivable | 357,553 | 507,677 | ||||||
Other assets | 2,865 | 2,978 | ||||||
TOTAL ASSETS | 119,518,536 | 55,648,675 | ||||||
LIABILITIES | ||||||||
Payable for securities purchased | 19,173,596 | 1,820,722 | ||||||
Distributions payable | 66,614 | 161,066 | ||||||
Payable to Adviser (Note 4) | 2,793 | 5,946 | ||||||
Payable to administrator (Note 4) | 10,990 | 8,760 | ||||||
Other accrued expenses | 28,070 | 12,110 | ||||||
TOTAL LIABILITIES | 19,282,063 | 2,008,604 | ||||||
NET ASSETS | $ | 100,236,473 | $ | 53,640,071 | ||||
NET ASSETS CONSIST OF: | ||||||||
Paid-in capital | $ | 100,291,498 | $ | 52,007,534 | ||||
Accumulated net investment income | 3,586 | 3,725 | ||||||
Accumulated net realized gains from security transactions | 1,086,682 | 2,265,111 | ||||||
Net unrealized depreciation on investments | (1,145,293 | ) | (636,299 | ) | ||||
NET ASSETS | $ | 100,236,473 | $ | 53,640,071 | ||||
Shares of beneficial interest outstanding (unlimited number of shares authorized, no par value) | 10,133,585 | 5,193,650 | ||||||
Net asset value, offering price and redemption price per share (Note 2) | $ | 9.89 | $ | 10.33 | ||||
See accompanying notes to financial statements. |
23
RYAN LABS FUNDS | ||||||||
| Ryan Labs Core Bond Fund | Ryan Labs Long Credit Fund | ||||||
INVESTMENT INCOME | ||||||||
Interest | $ | 1,903,225 | $ | 2,326,270 | ||||
Dividend | 47,469 | 1,025 | ||||||
TOTAL INCOME | 1,950,694 | 2,327,295 | ||||||
EXPENSES | ||||||||
Investment advisory fees (Note 4) | 289,536 | 266,039 | ||||||
Administration fees (Note 4) | 72,377 | 52,964 | ||||||
Professional fees | 36,723 | 30,120 | ||||||
Fund accounting fees (Note 4) | 33,665 | 28,307 | ||||||
Pricing costs | 41,783 | 14,506 | ||||||
Compliance fees (Note 4) | 12,141 | 12,141 | ||||||
Transfer agent fees (Note 4) | 12,000 | 12,000 | ||||||
Trustees’ fees and expenses (Note 4) | 10,197 | 9,907 | ||||||
Custody and bank service fees | 10,365 | 7,539 | ||||||
Registration and filing fees | 7,440 | 4,207 | ||||||
Printing of shareholder reports | 3,055 | 2,785 | ||||||
Insurance expense | 3,297 | 1,761 | ||||||
Postage and supplies | 2,111 | 1,658 | ||||||
Other expenses | 5,479 | 3,605 | ||||||
TOTAL EXPENSES | 540,169 | 447,539 | ||||||
Less fee reductions by the Adviser (Note 4) | (250,634 | ) | (181,499 | ) | ||||
NET EXPENSES | 289,535 | 266,040 | ||||||
NET INVESTMENT INCOME | 1,661,159 | 2,061,255 | ||||||
REALIZED AND UNREALIZED GAINS (LOSSES) ON INVESTMENTS | ||||||||
Net realized gains from investment transactions | 1,181,819 | 2,268,602 | ||||||
Net change in unrealized appreciation (depreciation) on investments | (1,070,422 | ) | (740,354 | ) | ||||
NET REALIZED AND UNREALIZED GAINS ON INVESTMENTS | 111,397 | 1,528,248 | ||||||
NET INCREASE IN NET ASSETS FROM OPERATIONS | $ | 1,772,556 | $ | 3,589,503 | ||||
See accompanying notes to financial statements. |
24
RYAN LABS CORE BOND FUND | ||||||||
| Year Ended | Period Ended | ||||||
FROM OPERATIONS | ||||||||
Net investment income | $ | 1,661,159 | $ | 425,356 | ||||
Net realized gains from investment transactions | 1,181,819 | 40,150 | ||||||
Net change in unrealized appreciation (depreciation) on investments | (1,070,422 | ) | (74,871 | ) | ||||
Net increase in net assets from operations | 1,772,556 | 390,635 | ||||||
DISTRIBUTIONS TO SHAREHOLDERS (Note 2) | ||||||||
From net investment income | (1,741,637 | ) | (425,350 | ) | ||||
From net realized gains from security transactions | (51,229 | ) | — | |||||
Decrease in net assets from distributions to shareholders | (1,792,866 | ) | (425,350 | ) | ||||
CAPITAL SHARE TRANSACTIONS | ||||||||
Proceeds from shares sold | 30,172,474 | 72,008,782 | ||||||
Net asset value of shares issued in reinvestment of distributions to shareholders | 577,108 | 283,659 | ||||||
Payments for shares redeemed | (750,025 | ) | (2,000,500 | ) | ||||
Net increase from capital share transactions | 29,999,557 | 70,291,941 | ||||||
TOTAL INCREASE IN NET ASSETS | 29,979,247 | 70,257,226 | ||||||
NET ASSETS | ||||||||
Beginning of period | 70,257,226 | — | ||||||
End of period | $ | 100,236,473 | $ | 70,257,226 | ||||
ACCUMULATED NET INVESTMENT INCOME | $ | 3,586 | $ | 24,345 | ||||
CAPITAL SHARE ACTIVITY | ||||||||
Shares sold | 3,034,781 | 7,286,856 | ||||||
Shares reinvested | 57,599 | 28,495 | ||||||
Shares redeemed | (73,895 | ) | (200,251 | ) | ||||
Net increase in shares outstanding | 3,018,485 | 7,115,100 | ||||||
Shares outstanding at beginning of period | 7,115,100 | — | ||||||
Shares outstanding at end of period | 10,133,585 | 7,115,100 | ||||||
(a) | Represents the period from the commencement of operations (December 29, 2014) through November 30, 2015. |
See accompanying notes to financial statements. |
25
RYAN LABS LONG CREDIT FUND | ||||||||
| Year Ended | Period Ended | ||||||
FROM OPERATIONS | ||||||||
Net investment income | $ | 2,061,255 | $ | 55,705 | ||||
Net realized gains from investment transactions | 2,268,602 | 173,530 | ||||||
Net change in unrealized appreciation (depreciation) on investments | (740,354 | ) | 104,055 | |||||
Net increase in net assets from operations | 3,589,503 | 333,290 | ||||||
DISTRIBUTIONS TO SHAREHOLDERS (Note 2) | ||||||||
From net investment income | (2,057,734 | ) | (55,501 | ) | ||||
From net realized gains from security transactions | (177,021 | ) | — | |||||
Decrease in net assets from distributions to shareholders | (2,234,755 | ) | (55,501 | ) | ||||
CAPITAL SHARE TRANSACTIONS | ||||||||
Proceeds from shares sold | 1,827,921 | 50,000,500 | ||||||
Net asset value of shares issued in reinvestment of distributions to shareholders | 179,154 | 1 | ||||||
Payments for shares redeemed | (42 | ) | — | |||||
Net increase from capital share transactions | 2,007,033 | 50,000,501 | ||||||
TOTAL INCREASE IN NET ASSETS | 3,361,781 | 50,278,290 | ||||||
NET ASSETS | ||||||||
Beginning of period | 50,278,290 | — | ||||||
End of period | $ | 53,640,071 | $ | 50,278,290 | ||||
ACCUMULATED NET INVESTMENT INCOME | $ | 3,725 | $ | 204 | ||||
CAPITAL SHARE ACTIVITY | ||||||||
Shares sold | 175,424 | 5,000,050 | ||||||
Shares reinvested | 18,180 | 0 | (b) | |||||
Shares redeemed | (4 | ) | — | |||||
Net increase in shares outstanding | 193,600 | 5,000,050 | ||||||
Shares outstanding at beginning of period | 5,000,050 | — | ||||||
Shares outstanding at end of period | 5,193,650 | 5,000,050 | ||||||
(a) | Represents the period from the commencement of operations (November 13, 2015) through November 30, 2015. |
(b) | Rounds to less than 1 share. |
See accompanying notes to financial statements. |
26
RYAN LABS CORE BOND FUND | ||||||||
Per Share Data for a Share Outstanding Throughout Each Period | ||||||||
| Year Ended | Period Ended | ||||||
Net asset value at beginning of period | $ | 9.87 | $ | 10.00 | ||||
Income (loss) from investment operations: | ||||||||
Net investment income | 0.23 | 0.21 | ||||||
Net realized and unrealized gains (losses) on investments | 0.04 | (0.13 | ) | |||||
Total from investment operations | 0.27 | 0.08 | ||||||
Less distributions from: | ||||||||
Net investment income | (0.24 | ) | (0.21 | ) | ||||
Net realized gains from security transactions | (0.01 | ) | — | |||||
Total distributions | (0.25 | ) | (0.21 | ) | ||||
Net asset value at end of period | $ | 9.89 | $ | 9.87 | ||||
Total return (b) | 2.69 | % | 0.81 | %(c) | ||||
Net assets at end of period (000’s) | $ | 100,236 | $ | 70,257 | ||||
Ratios/supplementary data: | ||||||||
Ratio of total expenses to average net assets | 0.75 | % | 1.18 | %(d) | ||||
Ratio of net expenses to average net assets (e) | 0.40 | % | 0.40 | %(d) | ||||
Ratio of net investment income to average net assets (e) | 2.29 | % | 2.21 | %(d) | ||||
Portfolio turnover rate | 118 | % | 161 | %(c) | ||||
(a) | Represents the period from the commencement of operations (December 29, 2014) through November 30, 2015. |
(b) | Total return is a measure of the change in value of an investment in the Fund over the periods covered, which assumes any dividends or capital gains distributions are reinvested in shares of the Fund. The returns shown do not reflect the deduction of taxes a shareholder would pay on Fund distributions or the redemption of Fund shares. The total returns would have been lower if the Adviser had not reduced advisory fees and/or reimbursed expenses (Note 4). |
(c) | Not annualized. |
(d) | Annualized. |
(e) | Ratio was determined after investment advisory fee reductions and/or expense reimbursements. (Note 4). |
See accompanying notes to financial statements. |
27
RYAN LABS LONG CREDIT FUND | ||||||||
Per Share Data for a Share Outstanding Throughout Each Period | ||||||||
| Year Ended | Period Ended | ||||||
Net asset value at beginning of period | $ | 10.06 | $ | 10.00 | ||||
Income from investment operations: | ||||||||
Net investment income | 0.41 | 0.01 | ||||||
Net realized and unrealized gains on investments | 0.30 | 0.06 | ||||||
Total from investment operations | 0.71 | 0.07 | ||||||
Less distributions from: | ||||||||
Net investment income | (0.41 | ) | (0.01 | ) | ||||
Net realized gains from security transactions | (0.03 | ) | — | |||||
Total distributions | (0.44 | ) | (0.01 | ) | ||||
Net asset value at end of period | $ | 10.33 | $ | 10.06 | ||||
Total return (b) | 7.11 | % | 0.71 | %(c) | ||||
Net assets at end of period (000’s) | $ | 53,640 | $ | 50,278 | ||||
Ratios/supplementary data: | ||||||||
Ratio of total expenses to average net assets | 0.84 | % | 1.12 | %(d) | ||||
Ratio of net expenses to average net assets (e) | 0.50 | % | 0.50 | %(d) | ||||
Ratio of net investment income to average net assets (e) | 3.87 | % | 2.38 | %(d) | ||||
Portfolio turnover rate | 156 | % | 93 | %(c) | ||||
(a) | Represents the period from the commencement of operations (November 13, 2015) through November 30, 2015. |
(b) | Total return is a measure of the change in value of an investment in the Fund over the periods covered, which assumes any dividends or capital gains distributions are reinvested in shares of the Fund. The returns shown do not reflect the deduction of taxes a shareholder would pay on Fund distributions or the redemption of Fund shares. The total returns would have been lower if the Adviser had not reduced advisory fees and/or reimbursed expenses (Note 4). |
(c) | Not annualized. |
(d) | Annualized. |
(e) | Ratio was determined after investment advisory fee reductions and/or expense reimbursements. (Note 4). |
See accompanying notes to financial statements. |
28
RYAN LABS FUNDS
NOTES TO FINANCIAL STATEMENTS
November 30, 2016
1. Organization
Ryan Labs Core Bond Fund and Ryan Labs Long Credit Fund (individually, a “Fund,” and collectively, the “Funds”) are each a diversified series of Ultimus Managers Trust (the “Trust”), an open-end investment company established as an Ohio business trust under a Declaration of Trust dated February 28, 2012. Other series of the Trust are not incorporated in this report. Ryan Labs Core Bond Fund and Ryan Labs Long Credit Fund commenced operations on December 29, 2014 and November 13, 2015, respectively.
Each Fund’s investment objective is total return, consisting of current income and capital appreciation.
2. Significant Accounting Policies
The following is a summary of the Funds’ significant accounting policies. The policies are in conformity with Generally Accepted Accounting Principals in the United States of America (“GAAP”). As an investment company, as defined in Financial Accounting Standards Board (“FASB”) Accounting Standards Update 2013-08, the Funds follow accounting and reporting guidance under FASB Accounting Standards Codification Topic 946, “Financial Services – Investment Companies.”
In October 2016, the Securities and Exchange Commission (the “SEC”) released its final rule on Investment Company Reporting Modernization (the “Rule”). The Rule, which introduces two new regulatory reporting forms for investment companies – Form N-PORT and Form N-CEN, also contains amendments to Regulation S-X which impact financial statement presentation, particularly the presentation of derivative investments. Although still evaluating the impact of the Rule, management believes that many of the Regulation S-X amendments are consistent with the Funds’ current financial statement presentation and expects that the Funds will be able to comply with the Rule’s Regulation S-X amendments by the August 1, 2017 compliance date.
Securities valuation – The Funds’ fixed income securities are generally valued using prices provided by an independent pricing service approved by the Trust’s Board of Trustees (the “Board”). The independent pricing service uses information with respect to transactions in bonds, quotations from bond dealers, market transactions in comparable securities, and various relationships between securities in determining these prices. The methods used by the independent pricing service and the quality of valuations so established are reviewed by Ryan Labs, Inc. (the “Adviser”), under the general supervision of the Board. Exchange-traded funds (“ETFs”), if any, are valued at market value as of the close of regular trading on the New York Stock Exchange (the “NYSE”) (normally 4:00 p.m. Eastern time) on each business day the NYSE is open for business. ETFs are valued at the security’s last sale price
29
RYAN LABS FUNDS |
on the primary exchange, if available, otherwise at the exchange’s most recently quoted mean price. Securities for which market quotations are not readily available are valued at fair value as determined in good faith under procedures adopted by the Board.
GAAP establishes a single authoritative definition of fair value, sets out a framework for measuring fair value, and requires additional disclosures about fair value measurements.
Various inputs are used in determining the value of the Funds’ investments. These inputs are summarized in the three broad levels listed below:
● | Level 1 – quoted prices in active markets for identical securities |
● | Level 2 – other significant observable inputs |
● | Level 3 – significant unobservable inputs |
Fixed income securities held by the Funds are classified as Level 2 since values are based on prices provided by an independent pricing service that utilizes various “other significant observable inputs” including bid and ask quotations, prices of similar securities, and interest rates, among other factors.
The inputs or methods used for valuing securities are not necessarily an indication of the risks associated with investing in those securities. The inputs used to measure fair value may fall into different levels of the fair value hierarchy. In such cases, for disclosure purposes, the level in the fair value hierarchy within which the fair value measurement falls in its entirety is determined based on the lowest level input that is significant to the fair value measurement.
The following is a summary of the inputs used to value each Fund’s investments as of November 30, 2016:
Ryan Labs Core Bond Fund | Level 1 | Level 2 | Level 3 | Total | ||||||||||||
U.S. Treasury Obligations | $ | — | $ | 37,217,976 | $ | — | $ | 37,217,976 | ||||||||
Mortgage-Backed Securities | — | 23,038,044 | — | 23,038,044 | ||||||||||||
Asset-Backed Securities | — | 11,226,034 | — | 11,226,034 | ||||||||||||
Corporate Bonds | — | 26,915,903 | — | 26,915,903 | ||||||||||||
International Bonds | — | 635,236 | — | 635,236 | ||||||||||||
Money Market Funds | 18,565,813 | — | — | 18,565,813 | ||||||||||||
Total | $ | 18,565,813 | $ | 99,033,193 | $ | — | $ | 117,599,006 | ||||||||
30
RYAN LABS FUNDS |
Ryan Labs Long Credit Fund | Level 1 | Level 2 | Level 3 | Total | ||||||||||||
U.S. Treasury Obligations | $ | — | $ | 3,780,797 | $ | — | $ | 3,780,797 | ||||||||
Municipal Bonds | — | 4,290,341 | — | 4,290,341 | ||||||||||||
Corporate Bonds | — | 42,868,827 | — | 42,868,827 | ||||||||||||
International Bonds | — | 1,918,394 | — | 1,918,394 | ||||||||||||
Money Market Funds | 2,279,661 | — | — | 2,279,661 | ||||||||||||
Total | $ | 2,279,661 | $ | 52,858,359 | $ | — | $ | 55,138,020 | ||||||||
As of November 30, 2016, the Funds did not have any transfers between Levels. In addition, the Funds did not hold derivative instruments or any assets or liabilities that were measured at fair value on a recurring basis using significant unobservable inputs (Level 3) as of November 30, 2016. It is the Funds’ policy to recognize transfers between Levels at the end of the reporting period.
Share valuation – The net asset value (“NAV”) per share of each Fund is calculated daily by dividing the total value of its assets, less liabilities, by the number of shares outstanding. The offering price and redemption price per share of each Fund is equal to the NAV per share.
Investment income – Interest income is accrued as earned. Discounts and premiums on fixed income securities purchased are accreted or amortized using the effective interest method. Dividend income is recorded on the ex-dividend date.
Security transactions – Security transactions are accounted for on the trade date. Realized gains and losses on securities sold are determined on a specific identification basis.
Common expenses – Common expenses of the Trust are allocated among the Funds and other series of the Trust based on the relative net assets of each series or the nature of the services performed and the relative applicability to each series.
Distributions to shareholders – Dividends from net investment income are declared and paid monthly to shareholders. Net realized capital gains, if any, are distributed at least once each year. The amount of distributions from net investment income and net realized capital gains are determined in accordance with federal income tax regulations, which may differ from GAAP. Dividends and distributions to shareholders are recorded on the ex-dividend date. The tax character of distributions paid during the periods ended November 30, 2016 and 2015 was ordinary income. On December 30, 2016, Ryan Labs Core Bond Fund and Ryan Labs Long Credit Bond Fund paid net investment income dividends of $0.0195 and $0.0299 per share, respectively, and short-term capital gains distributions of $0.1331 and $0.3891 per share, respectively, to shareholders of record on December 29, 2016.
31
RYAN LABS FUNDS |
Estimates – The preparation of financial statements in conformity with GAAP requires management to make estimates and assumptions that affect the reported amounts of assets and liabilities and disclosure of contingent assets and liabilities as of the date of the financial statements and the reported amounts of income and expenses during the reporting period. Actual results could differ from those estimates.
Federal income tax – Each Fund has qualified and intends to continue to qualify as a regulated investment company under the Internal Revenue Code of 1986 (the “Code”). Qualification generally will relieve each Fund of liability for federal income taxes to the extent 100% of its net investment income and net realized capital gains are distributed in accordance with the Code.
In order to avoid imposition of the excise tax applicable to regulated investment companies, it is also each Fund’s intention to declare as dividends in each calendar year at least 98% of its net investment income (earned during the calendar year) and 98.2% of its net realized capital gains (earned during the twelve months ended October 31) plus undistributed amounts from prior years.
The following information is computed on a tax basis for each item as of November 30, 2016:
| Ryan Labs Fund | Ryan Labs Fund | ||||||
Tax cost of portfolio investments | $ | 118,841,600 | $ | 55,779,904 | ||||
Gross unrealized appreciation | $ | 191,245 | $ | 815,361 | ||||
Gross unrealized depreciation | (1,433,839 | ) | (1,457,245 | ) | ||||
Net unrealized depreciation on investments | (1,242,594 | ) | (641,884 | ) | ||||
Undistributed ordinary income | 1,285,320 | 2,291,127 | ||||||
Accumulated capital and other losses | (164,365 | ) | (177,772 | ) | ||||
Distributions payable | 66,614 | 161,066 | ||||||
Total distributable earnings (deficit) | $ | (55,025 | ) | $ | 1,632,537 | |||
The difference between the federal income tax cost of portfolio investments and the financial statement cost for each Fund is due to certain timing differences in the recognition of capital gains or losses under income tax regulations and GAAP. These “book/tax” differences are temporary in nature and are primarily due to the tax deferral of losses on wash sales.
Certain capital losses incurred after October 31, 2016 and within the current taxable year are deemed to arise on the first business day of a Fund’s following taxable year. For the year ended November 30, 2016, Ryan Labs Core Bond Fund and Ryan Labs Long Credit Fund deferred until December 1, 2016 post-October capital losses in the amount of $164,365 and $177,772, respectively.
32
RYAN LABS FUNDS |
For the year ended November 30, 2016, Ryan Labs Core Bond Fund reclassified $59,719 of accumulated net investment income against accumulated net realized gains from security transactions on the Statements of Assets and Liabilities due to permanent differences in the recognition of capital gains or losses under income tax regulations and GAAP. These differences are due to the tax treatment of paydown adjustments. Such reclassification had no effect on the Fund’s net assets or NAV per share.
The Funds recognize the tax benefits or expenses of uncertain tax positions only when the position is “more likely than not” to be sustained assuming examination by tax authorities. Management has reviewed each Fund’s tax positions for all open tax periods (periods ended November 30, 2015 and November 30, 2016) and has concluded that no provision for unrecognized tax benefits or expenses is required in these financial statements. The Funds indentify their major tax jurisdiction as U.S. Federal.
3. Investment Transactions
During the year ended November 30, 2016, cost of purchases and proceeds from sales and maturities of investment securities, other than U.S. Government securities and short-term investments, were as follows:
| Ryan Labs Fund | Ryan Labs Fund | ||||||
Purchase of investment securities | $ | 58,532,630 | $ | 47,623,067 | ||||
Proceeds from sales and maturities of investment securities | $ | 40,337,045 | $ | 45,661,740 | ||||
During the year ended November 30, 2016, cost of purchases and proceeds from sales and maturities of long-term U.S. Government securities were as follows:
| Ryan Labs Fund | Ryan Labs Fund | ||||||
Purchase of U.S. Government securities | $ | 59,061,021 | $ | 36,164,533 | ||||
Proceeds from sales and maturities of U.S. Government securities | $ | 45,282,564 | $ | 35,932,257 | ||||
33
RYAN LABS FUNDS |
4. Transactions with Related Parties
INVESTMENT ADVISORY AGREEMENT
The Adviser is a wholly-owned subsidiary of Sun Life Financial, Inc. Each Fund is managed by the Adviser pursuant to the terms of an Investment Advisory Agreement. Under the Investment Advisory Agreements, Ryan Labs Core Bond Fund and Ryan Labs Long Credit Fund pay the Adviser an advisory fee, computed and accrued daily and paid monthly, at the annual rate of 0.40% and 0.50%, respectively, of each Fund’s average daily net assets.
Pursuant to Expense Limitation Agreements (“ELAs”) between each Fund and the Adviser, the Adviser has agreed, until March 31, 2017 for Ryan Labs Core Bond Fund and until March 31, 2018 for Ryan Labs Long Credit Fund, to reduce advisory fees and reimburse other expenses in order to limit total annual operating expenses (exclusive of brokerage transaction costs and commissions; taxes; interest; costs related to any securities lending program; transaction charges and interest on borrowed money; acquired fund fees and expenses; distribution and/or shareholder servicing fees, including, without limitation, any amounts, if any, payable pursuant to a plan adopted in accordance with Rule 12b-1 under the Investment Company Act of 1940, as amended; extraordinary expenses such as litigation and merger or reorganization costs; proxy solicitation and liquidation costs; indemnification payments to the Funds’ service providers, including, without limitation, the Adviser; other expenses not incurred in the ordinary course of business; and any other expenses the exclusion of which may from time to time be deemed appropriate as an excludable expense and specifically approved by the Trustees of the Trust) to an amount not exceeding 0.40% and 0.50% of the average daily net assets of Ryan Labs Core Bond Fund and Ryan Labs Long Credit Fund, respectively. Accordingly, during the year ended November 30, 2016, the Adviser reduced advisory fees in the amounts of $250,634 and $181,499 for Ryan Labs Core Bond Fund and Ryan Labs Long Credit Fund, respectively.
Under the terms of the ELAs, investment advisory fee reductions and expense reimbursements by the Adviser are subject to recoupment by the Adviser for a period of three years after such fees and expenses were incurred, provided the recoupments do not cause total annual operating expenses to exceed (i) the expense limitation then in effect, if any, and (ii) the expense limitation in effect at the time the expenses to be recouped were incurred. As of November 30, 2016, the Adviser may seek recoupment of investment advisory fee reductions and expense reimbursements no later than the dates as stated below:
| November 30, 2018 | November 30, 2019 | Total | |||||||||
Ryan Labs Core Bond Fund | $ | 151,891 | $ | 250,634 | $ | 402,525 | ||||||
Ryan Labs Long Credit Fund | $ | 14,580 | $ | 181,499 | $ | 196,079 | ||||||
34
RYAN LABS FUNDS |
OTHER SERVICE PROVIDERS
Ultimus Fund Solutions, LLC (“Ultimus”) provides administration, fund accounting, compliance and transfer agency services to the Funds. The Funds pay Ultimus fees in accordance with the agreements for such services. In addition, the Funds pay out-of-pocket expenses including, but not limited to, postage, supplies and costs of pricing the Funds’ portfolio securities.
Under the terms of a Distribution Agreement with the Trust, Ultimus Fund Distributors, LLC (the “Distributor”) serves as principal underwriter to the Funds. The Distributor is a wholly-owned subsidiary of Ultimus. The Distributor is compensated by the Adviser (not the Funds) for acting as principal underwriter.
Certain officers and a Trustee of the Trust are also officers of Ultimus and the Distributor and are not paid by the Funds for serving in such capacities.
TRUSTEE COMPENSATION
Effective October 1, 2016 each Trustee who is not an “interested person” of the Trust (“Independent Trustee”) receives a $1,000 annual retainer from each Fund, paid quarterly, except for the Board Chair who receives a $1,200 annual retainer from each Fund, paid quarterly. Each Independent Trustee also receives from each Fund a fee of $500 for each Board meeting attended plus reimbursement for travel and other meeting-related expenses. Prior to October 1, 2016, each Fund paid each Independent Trustee a fee of $500 for each Board meeting attended, plus a $500 annual retainer.
PRINCIPAL HOLDERS OF FUND SHARES
As of November 30, 2016, the following shareholders owned of record 5% or more of the outstanding shares of each Fund:
NAME OF RECORD OWNER | % Ownership |
Ryan Labs Core Bond Fund | |
Citibank, N.A. (for the benefit of its customers) | 50% |
SEI Private Trust Company (for the benefit of its customers) | 18% |
U.S. Bank, N.A. (for the benefit of its customers) | 17% |
National Financial Services, LLC (for the benefit of its customers) | 12% |
Ryan Labs Long Credit Fund | |
Citibank, N.A. (for the benefit of its customers) | 97% |
A beneficial owner of 25% or more of a Fund’s outstanding shares may be considered a controlling person of that Fund. That shareholder’s vote could have a more significant effect on matters presented at a shareholder’s meeting.
35
RYAN LABS FUNDS |
5. Contingencies and Commitments
The Funds indemnify the Trust’s officers and Trustees for certain liabilities that might arise from their performance of their duties to the Funds. Additionally, in the normal course of business the Funds enter into contracts that contain a variety of representations and warranties and which provide general indemnifications. The Funds’ maximum exposure under these arrangements is unknown, as this would involve future claims that may be made against the Funds that have not yet occurred. However, based on experience, the Funds expect the risk of loss to be remote.
6. Subsequent Events
The Funds are required to recognize in the financial statements the effects of all subsequent events that provide additional evidence about conditions that existed as of the date of the Statements of Assets and Liabilities. For non-recognized subsequent events that must be disclosed to keep the financial statements from being misleading, the Funds are required to disclose the nature of the event as well as an estimate of its financial effect, or a statement that such an estimate cannot be made. Management has evaluated subsequent events through the issuance of these financial statements and has noted no such events other than the ordinary income dividends and short-term capital gain distributions paid on December 30, 2016, as noted in Note 2.
36
RYAN LABS FUNDS |
To the Board of Trustees of Ultimus Managers Trust
and the Shareholders of Ryan Labs Core Bond Fund and Ryan Labs Long Credit Fund
We have audited the accompanying statement of assets and liabilities of Ryan Labs Core Bond Fund, a series of shares of beneficial interest in Ultimus Managers Trust (the “Fund”), including the schedule of investments, as of November 30, 2016, the related statement of operations for the year then ended, and the statement of changes in net assets and the financial highlights for the year then ended and for the period December 29, 2014 (commencement of operations) through November 30, 2015. We have also audited the accompanying statement of assets and liabilities of Ryan Labs Long Credit Fund, a series of shares of beneficial interest in Ultimus Managers Trust (the “Fund”), including the schedule of investments, as of November 30, 2016, the related statement of operations for the year then ended, and the statement of changes in net assets and the financial highlights for the year then ended and for the period November 13, 2015 (commencement of operations) through November 30, 2015. These financial statements and financial highlights are the responsibility of the Funds' management. Our responsibility is to express an opinion on these financial statements and financial highlights based on our audits.
We conducted our audits in accordance with the standards of the Public Company Accounting Oversight Board (United States). Those standards require that we plan and perform the audits to obtain reasonable assurance about whether the financial statements and financial highlights are free of material misstatement. An audit includes examining, on a test basis, evidence supporting the amounts and disclosures in the financial statements. Our procedures included confirmation of securities owned as of November 30, 2016 by correspondence with the custodian and brokers, or by other appropriate procedures where confirmations were not received. An audit also includes assessing the accounting principles used and significant estimates made by management, as well as evaluating the overall financial statement presentation. We believe that our audits provide a reasonable basis for our opinion.
In our opinion, the financial statements and financial highlights referred to above present fairly, in all material respects, the financial position of Ryan Labs Core Bond Fund and Ryan Labs Long Credit Fund as of November 30, 2016, the results of their operations for the year then ended, and the changes in their net assets and their financial highlights for the year and periods presented, in conformity with accounting principles generally accepted in the United States of America.
BBD, LLP |

Philadelphia, Pennsylvania
January 26, 2017
37
RYAN LABS FUNDS |
We believe it is important for you to understand the impact of costs on your investment. As a shareholder of the Funds, you incur ongoing costs, including management fees and other operating expenses. The following examples are intended to help you understand your ongoing costs (in dollars) of investing in the Funds and to compare these costs with the ongoing costs of investing in other mutual funds.
A mutual fund’s ongoing costs are expressed as a percentage of its average net assets. This figure is known as the expense ratio. The expenses in the table below are based on an investment of $1,000 made at the beginning of the most recent period (June 1, 2016) and held until the end of the period (November 30, 2016).
The table below illustrates each Fund’s ongoing costs in two ways:
Actual fund return – This section helps you to estimate the actual expenses that you paid over the period. The “Ending Account Value” shown is derived from each Fund’s actual return, and the fourth column shows the dollar amount of operating expenses that would have been paid by an investor who started with $1,000 in the Funds. You may use the information here, together with the amount you invested, to estimate the expenses that you paid over the period.
To do so, simply divide your account value by $1,000 (for example, an $8,600 account value divided by $1,000 = 8.6), then multiply the result by the number given for each Fund under the heading “Expenses Paid During Period.”
Hypothetical 5% return – This section is intended to help you compare each Fund’s ongoing costs with those of other mutual funds. It assumes that each Fund had an annual return of 5% before expenses during the period shown, but that the expense ratio is unchanged. In this case, because the return used is not each Fund’s actual return, the results do not apply to your investment. The example is useful in making comparisons because the U.S. Securities and Exchange Commission (the “SEC”) requires all mutual funds to calculate expenses based on a 5% return. You can assess each Fund’s ongoing costs by comparing this hypothetical example with the hypothetical examples that appear in shareholder reports of other funds.
Note that expenses shown in the table are meant to highlight and help you compare ongoing costs only. The Funds do not charge transaction fees, such as purchase or redemption fees, nor do they carry a “sales load.”
The calculations assume no shares were bought or sold during the period. Your actual costs may have been higher or lower, depending on the amount of your investment and the timing of any purchases or redemptions.
38
RYAN LABS FUNDS |
More information about each Fund’s expenses can be found in this report. For additional information on operating expenses and other shareholder costs, please refer to each Fund’s prospectus.
| Beginning Account Value June 1, 2016 | Ending | Net Expense Ratio (a) | Expenses |
Ryan Labs Core Bond Fund | ||||
Based on Actual Fund Return | $1,000.00 | $ 996.00 | 0.40% | $2.00 |
Based on Hypothetical 5% Return (before expenses) | $1,000.00 | $ 1,023.00 | 0.40% | $2.02 |
Ryan Labs Long Credit Fund | ||||
Based on Actual Fund Return | $1,000.00 | $ 989.50 | 0.50% | $2.49 |
Based on Hypothetical 5% Return (before expenses) | $1,000.00 | $ 1,022.50 | 0.50% | $2.53 |
(a) | Annualized, based on each Fund’s most recent one-half year expenses. |
(b) | Expenses are equal to each Fund’s annualized net expense ratio multiplied by the average account value over the period, multiplied by 183/366 (to reflect the one-half year period). |
39
RYAN LABS FUNDS |
A description of the policies and procedures that the Funds use to vote proxies relating to portfolio securities is available without charge upon request by calling toll-free 1-866-561-3087, or on the SEC’s website at http://www.sec.gov. Information regarding how the Funds voted proxies relating to portfolio securities during the most recent 12-month period ended June 30 is available without charge upon request on or before August 31, 2016 by calling toll-free 1-866-561-3087, or on the SEC’s website at http://www.sec.gov.
The Trust files a complete listing of portfolio holdings for the Funds with the SEC as of the end of the first and third quarters of each fiscal year on Form N-Q. These filings are available upon request by calling 1-866-561-3087. Furthermore, you may obtain a copy of the filings on the SEC’s website at http://www.sec.gov. The Trust’s Forms N-Q may also be reviewed and copied at the SEC’s Public Reference Room in Washington, DC, and information on the operation of the Public Reference Room may be obtained by calling 1-800-SEC-0330.
40
RYAN LABS FUNDS |
The Board has overall responsibility for management of the Trust’s affairs. The Trustees serve during the lifetime of the Trust and until its termination, or until death, resignation, retirement, or removal. The Trustees, in turn, elect the officers of the Fund to actively supervise its day-to-day operations. The officers have been elected for an annual term. Unless otherwise noted, each Trustee’s and officer’s address is 225 Pictoria Drive, Suite 450, Cincinnati, Ohio 45246.
Name and | Length of Time Served | Position(s) Held with Trust | Principal Occupation(s) | Number of Funds in Trust Overseen by Trustee | Directorships of Public Companies Held by Trustee During Past 5 Years |
Interested Trustees: | |||||
Robert G. Dorsey* Year of Birth: 1957 | Since | Trustee (February 2012 to present)
President (June 2012 to October 2013) | President and Managing Director of Ultimus Fund Solutions, LLC and Ultimus Fund Distributors, LLC (1999 to present) | 25 | None |
Independent Trustees: | |||||
Janine L. Cohen Year of Birth: 1952 | Since January | Trustee | Retired since 2013; Chief Financial Officer from 2004 to 2013 and Chief Compliance Officer from 2008 to 2013 at AER Advisors, Inc. | 25 | None |
David M. Deptula Year of Birth: 1958 | Since | Trustee | Vice President of Legal and Special Projects at Dayton Freight Lines, Inc. since 2016; Vice President of Tax Treasury at The Standard Register Inc. (formerly the Standard Register Company) from 2011 to 2016 | 25 | None |
* | Mr. Dorsey is considered an “interested person” of the Trust within the meaning of Section 2(a)(19) of the Investment Company Act of 1940, as amended, because of his relationship with the Trust’s administrator, transfer agent and distributor. |
41
RYAN LABS FUNDS |
Name and | Length of Time Served | Position(s) Held with Trust | Principal Occupation(s) | Number of Funds in Trust Overseen by Trustee | Directorships of Public Companies Held by Trustee During Past 5 Years |
Independent Trustees (continued): | |||||
John J. Discepoli Year of Birth: 1963 | Since | Chairman
Trustee | Owner of Discepoli Financial Planning, LLC (personal financial planning company) since 2004 | 25 | None |
42
RYAN LABS FUNDS |
Name and | Length of Time Served | Position(s) Held with Trust | Principal Occupation(s) During Past 5 Years |
Executive Officers: | |||
David R. Carson Year of Birth: 1958 | Since | President (October 2013 to present)
Principal Executive Officer of Ryan Labs Funds (October 2014 to present)
Vice President (April 2013 to October 2013) | Vice President and Director of Client Strategies of Ultimus Fund Solutions, LLC (2013 to present); President, Unified Series Trust (2016 to present); Chief Compliance Officer, FSI LBAR Fund (2013 to 2016); The Huntington Funds (2005 to 2013), The Flex Funds (2006 to 2011), Meeder Financial (2007 to 2011) Huntington Strategy Shares (2012 to 2013), and Huntington Asset Advisors (2013); Vice President, Huntington National Bank (2001 to 2013) |
Jennifer L. Leamer Year of Birth: 1976 | Since | Treasurer
Assistant Treasurer (April 2014 to October 2014) | Vice President, Mutual Fund Controller of Ultimus Fund Solutions, LLC (2014 to present); Business Analyst of Ultimus Fund Solutions, LLC (2007 to 2014) |
Bo J. Howell Year of Birth: 1981 | Since | Secretary
Assistant Secretary (October 2014 to April 2015) | Secretary, Unified Series Trust (2016 to present); Vice President, Director of Fund Administration for Ultimus Fund Solutions, LLC (2014 to present); Counsel – Securities and Mutual Funds for Western & Southern Financial Group (2012 to 2014); U.S. Securities and Exchange Commission, Senior Counsel (2009 to 2012) |
Charles C. Black Year of Birth: 1979 | Since | Chief Compliance Officer (January 2016 to present) | Chief Compliance Officer of The Caldwell & Orkin Funds, Inc. (2016 to present); Senior Compliance Officer of Ultimus Fund Solutions, LLC (2015 to present); Senior Compliance Manager at Touchstone Mutual Funds (2013 to 2015); Senior Compliance Manager at Fund Evaluation Group (2011 to 2013) |
Additional information about members of the Board and executive officers is available in the Funds’ Statement of Additional Information (“SAI”). To obtain a free copy of the SAI, please call 1-866-561-3087.
43
This page intentionally left blank.
This page intentionally left blank.
| Item 2. | Code of Ethics. |
| Item 3. | Audit Committee Financial Expert. |
| Item 4. | Principal Accountant Fees and Services. |
| (a) | Audit Fees. The aggregate fees billed for professional services rendered by the principal accountant for the audit of the registrant’s annual financial statements or for services that are normally provided by the accountant in connection with statutory and regulatory filings or engagements were $55,000 and $64,500 with respect to the registrant’s fiscal years ended November 30, 2016 and November 30, 2015, respectively. |
| (b) | Audit-Related Fees. No fees were billed in the last fiscal year for assurance and related services by the principal accountant that are reasonably related to the performance of the audit of the registrant’s financial statements and are not reported under paragraph (a) of this Item. |
| (c) | Tax Fees. The aggregate fees billed for professional services rendered by the principal accountant for tax compliance, tax advice, and tax planning were $8,000 and $10,000 with respect to the registrant’s fiscal years ended November 30, 2016 and November 30, 2015, respectively. The services comprising these fees are the preparation of the registrant’s federal income and excise tax returns. |
| (d) | All Other Fees. No fees were billed in the last fiscal year for products and services provided by the principal accountant, other than the services reported in paragraphs (a) through (c) of this Item. |
| (e)(1) | The audit committee has not adopted pre-approval policies and procedures described in paragraph (c)(7) of Rule 2-01 of Regulation S-X. |
| (e)(2) | None of the services described in paragraph (b) through (d) of this Item were approved by the audit committee pursuant to paragraph (c)(7)(i)(C) of Rule 2-01 of Regulation S-X. |
| (f) | Less than 50% of hours expended on the principal accountant’s engagement to audit the registrant’s financial statements for the most recent fiscal year were attributed to work performed by persons other than the principal accountant’s full-time, permanent employees. |
| (g) | During the fiscal years ended November 30, 2016 and 2015, aggregate non-audit fees of $8,000 and $10,000, respectively, were billed by the registrant’s principal accountant for services rendered to the registrant. No non-audit fees were billed in the last fiscal year by the registrant’s principal accountant for services rendered to the registrant’s investment adviser (not including any sub-adviser whose role is primarily portfolio management and is subcontracted with or overseen by another investment adviser), and any entity controlling, controlled by, or under common control with the adviser that provides ongoing services to the registrant. |
| (h) | The principal accountant has not provided any non-audit services to the registrant’s investment adviser (not including any sub-adviser whose role is primarily portfolio management and is subcontracted with or overseen by another investment adviser), and any entity controlling, controlled by, or under common control with the investment adviser that provides ongoing services to the registrant. |
| Item 5. | Audit Committee of Listed Registrants. |
| Item 6. | Schedule of Investments. |
| (a) | Not applicable [schedule filed with Item 1] |
| (b) | Not applicable |
| Item 7. | Disclosure of Proxy Voting Policies and Procedures for Closed-End Management Investment Companies. |
| Item 8. | Portfolio Managers of Closed-End Management Investment Companies. |
| Item 9. | Purchases of Equity Securities by Closed-End Management Investment Company and Affiliated Purchasers. |
| Item 10. | Submission of Matters to a Vote of Security Holders. |
| Item 11. | Controls and Procedures. |
| Item 12. | Exhibits. |
| Exhibit 99.CODE ETH | Code of Ethics |
| Exhibit 99.CERT | Certifications required by Rule 30a-2(a) under the Act |
| Exhibit 99.906CERT | Certifications required by Rule 30a-2(b) under the Act |
| (Registrant) | Ultimus Managers Trust | ||
| By (Signature and Title)* | /s/ Frank L. Newbauer | ||
| Frank L. Newbauer, Assistant Secretary | |||
| Date | February 1, 2017 | ||
| By (Signature and Title)* | /s/ Andrew B. Wellington | ||
| Andrew B. Wellington, Principal Executive Officer of Lyrical U.S. Value Equity Fund and Lyrical U.S. Hedged Value Fund | |||
| Date | February 1, 2017 | ||
| By (Signature and Title)* | /s/ David R. Carson | ||
| David R. Carson, Principal Executive Officer of Ryan Labs Core Bond Fund and Ryan Labs Long Credit Fund | |||
| Date | February 1, 2017 | ||
| By (Signature and Title)* | /s/ Jennifer L. Leamer | ||
| Jennifer L. Leamer, Treasurer and Principal Financial Officer | |||
| Date | February 1, 2017 | ||
* | Print the name and title of each signing officer under his or her signature. |