OMB APPROVAL |
OMB Number: 3235-0570 Expires: January 31, 2017 Estimated average burden hours per response: 20.6 |
| Investment Company Act file number | 811-22680 |
| Ultimus Managers Trust |
| (Exact name of registrant as specified in charter) |
| 225 Pictoria Drive, Suite 450 Cincinnati, Ohio | 45246 |
| (Address of principal executive offices) | (Zip code) |
| Ultimus Fund Solutions, LLC 225 Pictoria Drive, Suite 450 Cincinnati, Ohio 45246 |
| (Name and address of agent for service) |
| Registrant's telephone number, including area code: | (212) 888-8123 |
| Date of fiscal year end: | October 31, 2016 | |
| Date of reporting period: | October 31, 2016 |
| Item 1. | Reports to Stockholders. |
STRALEM EQUITY FUND
LETTER TO SHAREHOLDERS
December 2016
Dear Shareholder,
Each year following the close of Stralem Equity Fund’s (the “Fund”) fiscal year on October 31, 2016, the Fund reports to you on its results and Stralem & Company Incorporated’s (Stralem) current investment outlook.
Performance
For the fiscal year ended October 31, 2016, the Fund (STEFX) outperformed the benchmark S&P 500 Index (the “Index” or the “Benchmark”) by 21bps returning 4.72% before taxes and after fees and expenses versus the Index return of 4.51% (which of course has no fees, taxes or expenses) as shown in the table below.
AVERAGE ANNUAL TOTAL RETURNS BEFORE TAXES AND AFTER FEES AND EXPENSES
Periods Ended 10/31/16 | ||||
1 YR | 5 YRS | 10 YRS | Since Inception* | |
Stralem Equity Fund | 4.72% | 10.26% | 6.21% | 5.21% |
S&P 500 Index | 4.51% | 13.57% | 6.70% | 4.28% |
* | Inception: January 18, 2000. |
PERFORMANCE NOTES: Stralem Equity Fund is advised by Stralem & Company Incorporated (“Stralem”), an independent, SEC registered investment adviser established in 1966. The performance data quoted represents past performance. Past performance does not guarantee future results. The investment return and principal value of an investment will fluctuate so that an investor’s shares, when redeemed, may be worth more or less than their original cost. Current performance may be lower or higher than the performance data quoted. For performance data current to the most recent month end or to receive a prospectus, please call (866) 822-9555 toll free or visit the Fund’s website at www.stralemequityfund.com. Performance results for the Fund are stated after investment advisory fees and expenses (net) but do not reflect the deduction of taxes that a shareholder would pay on Fund distributions or on the redemption of Fund shares. The Fund can suffer losses as well as gains. Performance results are calculated on a total return basis, which includes all income from dividends and interest and realized and unrealized gains or losses. Assuming dividends are reinvested, the growth in dollars of an investment in a period can be computed using these rates of return. The S&P 500 Index is widely used as a barometer of U.S. stock market performance. The S&P 500 Index is the Standard & Poor’s Composite Index of 500 Stocks, a widely recognized, unmanaged index of common stock prices. It is shown with dividends included and reflects no deduction for fees, expenses or taxes.
Over the course of the Fund’s fiscal year 2016, Stralem continued to see mounting evidence of the breakdown of the extraordinary confluence of market conditions that had prevailed over the six years prior to 2015 characterized by annual returns close to double historical averages; volatility at the very low end of the historical range; and a sustained high level of individual stocks’ correlations with the S&P 500. The breakdown of this extraordinary confluence of market conditions began in the Fund’s fiscal 2015,
1
and continued in fiscal 2016 with: a respectable, but not extraordinary, return of +4.5% for the S&P 500; intermittent jumps in volatility that brought the “VIX” volatility index off its low; and a continued overall downward trend in stock correlations.
While the Fund’s conservative positioning proved a slight drag on fiscal year 2015 performance, the strategy’s discipline paid off in fiscal year 2016 with the Down Market allocation driving outperformance. Although both the Fund and the overall market advanced over the year, that progress came with increased volatility and some pronounced drawdowns such that the “down-market protection” offered by the portfolio came into play.
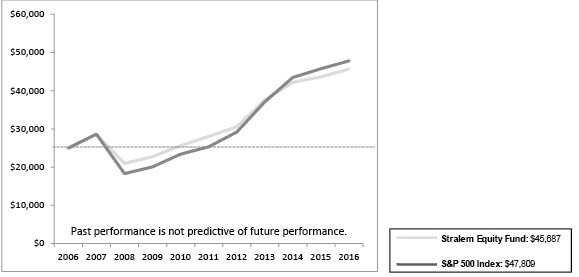
Comparison of the Change in Value of a $25,000 Investment in Stralem Equity Fund- vs. S&P 500 Index
Portfolio Review
Stralem’s objective is to build long term wealth over time by providing capital growth with capital preservation or “participation with protection” in a long-only, concentrated portfolio of approximately 30 high-quality stocks.
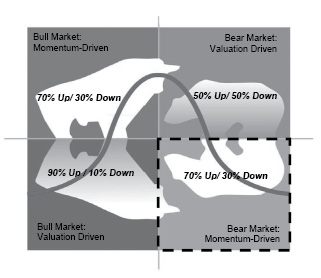
The investment philosophy of Stralem’s strategy is predicated on a structural framework that identifies four types of market environments within a full market cycle. Stralem uses this framework to manage risk and opportunity using portfolio structure. The strategy seeks to add value by purchasing a set of fundamentally solid growth companies (Up Market Sector) along with those that deliver strong cash flows (Down Market Sector) and adjusting the balance between these two groups through the market cycle.
Within the two sectors, Up Market Stocks and Down Market Stocks, the portfolio is further divided into five categories. The Up Market Sector is comprised of three categories of stocks that history has shown lead the market when it is rising: New Industries, New Products and Dominant Firms. The Down Market Sector is comprised of two categories of stocks that have historically preserved capital when the market declines: Low Ratio of Price/Cash Flow and High Dividend Yield. Category weightings as well as the balance between growth and capital preservation are adapted to the market environment according to time tested metrics as calculated by our proprietary Relative
2
Growth Valuation Model. By adjusting portfolio structure, Stralem has successfully built long term capital by delivering excess returns over the Index with reduced risk and reduced volatility.
Portfolio Structure and Positioning
As of October 31, 2016, the overall allocation stood at 65% Up Market/ 35% Down Market.
Investment Outlook
Fiscal 2016 saw the return of some of the normal volatility that historically characterizes the stock market but had been absent in recent years. January/February saw a steep decline after Bank of Japan and European Central Bank monetary policy actions fell flat, some weak macroeconomic data was released and a resurgence of worries over the health of banks emerged. And then in June, in the days following the surprise result of the “Brexit” vote, there was an acute (albeit brief) downdraft in the markets, on concern that this would lead to the breakup of the European Union. And the end of the fiscal year saw additional market volatility, in the waning days of the contentious and acrimonious U.S. Presidential campaign.
Although we believe the election campaign has consumed much of investors’ attention over the last several months, at the end of the Fund’s fiscal 2016, there was a better tenor to some important U.S. economic data. Wage gains have been gathering steam as Average Hourly Earnings in October showed the fastest growth in 7 years (+2.8%). Lower Initial Jobless Claims, continued Nonfarm Payroll additions and a Labor Force Participation Rate that has been starting to tick up, together indicate solid employment and labor market tightening. Employment and wage growth historically lead to growth in consumption, and along with a firming of commodity prices, may lead to a welcome uptick in inflation off of recent disinflationary levels. Furthermore, Q3 GDP growth in the U.S. has ticked up to +3.2%, the highest reading in 2 years. And with the majority of S&P 500 companies having reported Q3 earnings, those companies in aggregate, look set to report their first combined top- and bottom-line growth in 5 quarters.
3
While there has been definite progress in the growth prospects of the U.S. economy, that progress continues to be fragile, and the headwinds are many, including, but not limited to, the continued excess of debt, the growth in U.S. federal government budget deficits, ballooning future entitlement obligations, and the rise of populist governments around the globe. As the incoming Trump administration fleshes out its policy intentions over the coming months, and as the implications for different industries take shape, uncertainty and market volatility are likely to continue to be a significant part of the investment landscape.
Given the return of some normal volatility to the markets, and continued evidence that the confluence of extraordinary market conditions continues to break down, Stralem firmly believes that stock market winners will increasingly be separated from losers on the basis of fundamentals, operational execution and relative valuation. We believe this overall trend, combined with the continued market headwinds and policy uncertainty, makes it more imperative than ever to employ a strategy that focuses on identifying quality companies at reasonable valuations with a significant down-market protection component. Both these features have historically been an integral part of the Stralem portfolio, and will continue to be so.
Performance Attribution
The Fund’s relative outperformance for the fiscal year 2016 was driven by the Down Market sector. While the overall market advanced, it came with increased volatility, and some pronounced drawdowns (as explained above), which highlighted the value of “down-market protection”.
The relative outperformance of the Down Market sector was driven by both the Low Price to Cash Flow category, and the High Yield category. Within Low Price to Cash Flow, Chevron returned +20.6%, as investors gained confidence that the trough in oil prices was reached earlier in the year, and that major capital projects are coming online requiring far less demands on the company’s capital. We believe this will result in a drastic improvement in free cash flow generation and a reduced risk profile. Leading commercial P&C insurance company Chubb was +14.4% after the successful completion of its merger with Ace early in the year. The company has steadily increased its projected cost savings from the integration of the two companies, while also maintaining pricing discipline and its best-in-class underwriting. The High Yield category’s relative outperformance was driven by a broad range of names from different industries, as declining interest rates for most of the fiscal year helped highlight the relative appeal of high dividend yield stocks. Regulated utility Duke Energy (+17.0%) expanded its regulated rate base through the acquisition of Piedmont Natural Gas and by ramping up gas-pipeline infrastructure projects such as the Atlantic Coast Pipeline. AT&T (+15.4%) worked on integrating and delivering the cost savings from its 2015 acquisition of DirecTV, and has been ramping up its bundled offerings with DirecTV video services. Philip Morris International (+13.9%) benefitted from increased enthusiasm for its heated-tobacco “reduced-risk product” iQOS, which had successful launches in Japan and Italy.
On the negative side of the ledger, the New Industries category within the Up Market sector partially offset the portfolio’s relative outperformance, held back by Oracle (+0.5%), which has been experiencing a slower-than-expected transition of its enterprise software to subscription-model cloud software. We continue to believe the transition is
4
occurring, albeit more slowly, and will be a big net positive for patient investors. The absence of Amazon.com (+26.2%) from the Stralem strategy also hurt the New Industries category, given that stock’s performance and increased weight in the benchmark index. To a lesser extent, some individual names held back the relative performance of the Dominant Companies category within the Up Market. Disney (-17.4%) was hurt by concerns over the attrition of subscribers to its ESPN cable networks, but we remain confident that Disney content is “must have” for all cable and satellite distribution packages and the company is also making progress in developing its own “direct-to-consumer” offerings. CVS Health (-13.3%) had a difficult year as it was dragged down in sympathy with pharmaceutical stocks as politicians and regulators investigate some egregious instances of pricing abuses.
Purchases and Sales
During the Fund’s fiscal year ended October 31, 2016, General Electric (GE), Coca-Cola Company (KO) and Fortive (FTV) were sold, and Facebook (FB) and Kraft Heinz (KHC) were purchased.
During the month of August, General Electric was sold from the Dominant Companies category and replaced with Facebook in the New Industries category. Also in August, in the High Yield category, Coca-Cola Company was sold and replaced with Kraft Heinz.
GE was sold as the company’s end markets and RGV (Relative Growth Valuation) score had been softening, and multiple catalysts from the last year had been largely priced in (selling GE Capital and the Appliance business, Alstom acquisition, and SIFI de-designation), making this an opportune time to step away from this fully valued name. Facebook was added to the strategy on that company’s vast and growing targeted digital advertising opportunity, its unrivaled data trove that allows advertisers to more efficiently and effectively target potential customers, and the increasing penetration of major platforms that Facebook hasn’t even begun to monetize (Instagram, Messenger, WhatsApp). The Coca-Cola Company was sold due to ongoing challenges in end markets for carbonated soft drinks, purchasing power headwinds in emerging countries, and management’s insufficient cost-reduction actions to offset the company’s top-line challenges. Kraft Heinz was purchased as the combined company is a packaged foods industry juggernaut with a stable of iconic brands, a long runway for further margin expansion (under 3G Capital’s proven playbook), significant ownership by Warren Buffett’s Berkshire Hathaway, and for the opportunities for further growth via tuck-in acquisitions.
In early July, the portfolio multi-industry company Danaher spun off most of its industrial businesses into a separately-listed company called Fortive (FTV). Stralem favors the higher-growth profiles and less-volatile end markets of the collection of businesses that Danaher retained (Life Sciences, Diagnostics, Dental, Environmental and Product Identification) and therefore decided to exit the Fortive stub in August.
Conclusion
Stralem’s long-held investment discipline is based on the principle of “participation with protection” because, in our view, it is the most efficient way to build wealth over time. Despite the challenges of outperforming the S&P 500 from the market low in
5
2009 through the end of calendar year 2014, Stralem chose not to chase performance for performance sake and remained disciplined awaiting a return to a more “normalized” historical environment. We believe that inflection point occurred at the end of calendar year 2014 with the disruption of the confluence of extraordinary market conditions – extreme returns, historically low volatility, and elevated stock correlations. As these market conditions appear to return to a more normal state, Stralem continues to be convinced that fundamental analysis, and investment prudence and discipline are critical.
Since the peak of the market (October 9th, 2007) before the financial crisis through the end of this fiscal year, the Fund has returned 5.3% annualized (before taxes and after fees) versus the Index return of 5.9%. This means that the 17.9% annualized double digit, historically unprecedented market returns since the crisis have barely (0.6% annualized) made up for the losses incurred during the crisis. The ability to preserve capital, to go down less when the market declines, not only promotes peace of mind; it actually enables the wealth building process to restart from a higher base.
Market corrections – both large and small – happen, and they typically occur when least expected. At Stralem, even at the cost of sometimes trailing the Benchmark we will remain steadfast in our discipline and patient in our approach – continuing to maintain an allocation to downside protection while seeking fundamentally advantaged, high quality companies that meet our criteria for growth and valuation. A return to fundamental investing unencumbered by very loose monetary policy should, in our view, amply reward such discipline.
Please do not hesitate to contact us with any questions.
Sincerely,
Andrea Baumann Lustig
President, Stralem & Company Incorporated
6
Past performance is not predictive of future performance. Investment results and principal value will fluctuate so that shares, when redeemed, may be worth more or less than their original cost. Current performance may be higher or lower than the performance data quoted. Performance data current to the most recent month-end are available by calling 1-866-822-9555.
An investor should consider the investment objectives, risks, charges, and expenses of the Fund carefully before investing. The Fund’s prospectus contains this and other important information. To obtain a copy of the Fund’s prospectus please visit the Fund’s website at www.stralemequityfund.com or call 1-866-822-9555 and a copy will be sent to you free of charge. Please read the prospectus carefully before you invest. The Fund is distributed by Ultimus Fund Distributors, LLC.
The Letter to Shareholders seeks to describe some of the Adviser’s current opinions and views of the financial markets. Although the Adviser believes it has a reasonable basis for any opinions or views expressed, actual results may differ, sometimes significantly so, from those expected or expressed. The securities held by the Fund that are discussed in the Letter to Shareholders were held during the period covered by this Report. They do not comprise the entire investment portfolio of the Fund, may be sold at any time, and may no longer be held by the Fund. For a complete list of securities held by the Fund as of October 31, 2016, please see the Schedule of Investments section of the annual report. The opinions of the Fund’s adviser with respect to those securities may change at any time.
Statements in the Letter to Shareholders that reflect projections or expectations for future financial or economic performance of the Fund and the market in general and statements of the Fund’s plans and objectives for future operations are forward-looking statements. No assurance can be given that actual results or events will not differ materially from those projected, estimated, assumed, or anticipated in any such forward-looking statements. Important factors that could result in such differences, in addition to factors noted with such forward-looking statements, include, without limitation, general economic conditions, such as inflation, recession, and interest rates. Past performance is not a guarantee of future results.
7
STRALEM EQUITY FUND
PORTFOLIO INFORMATION
October 31, 2016 (Unaudited)

As of October 31, 2015 | As of October 31, 2016 | ||||||||||||||||
Value | % of Total Investments | Value | % of Total Investments | ||||||||||||||
UP MARKET | NEW PRODUCTS | $ | 18,965,012 | 9.8 | % | $ | 14,077,242 | 9.8 | % | ||||||||
NEW INDUSTRIES | 20,257,685 | 10.5 | % | 22,236,765 | 15.6 | % | |||||||||||
DOMINANT COMPANIES | 80,010,765 | 41.4 | % | 53,937,484 | 37.7 | % | |||||||||||
DOWN MARKET | LOW PRICE TO CASH FLOW | 19,068,290 | 9.9 | % | 12,485,152 | 8.7 | % | ||||||||||
| HIGH YIELD | 46,022,464 | 23.8 | % | 34,336,618 | 24.0 | % | |||||||||||
MONEY MARKET | 8,832,727 | 4.6 | % | 5,951,877 | 4.2 | % | |||||||||||
$ | 193,156,943 | 100.0 | % | $ | 143,025,138 | 100.0 | % | ||||||||||
8
STRALEM EQUITY FUND
SCHEDULE OF INVESTMENTS
October 31, 2016
Shares | Common Stocks — 95.9% | Value | |||||
Consumer Discretionary — 8.0% | |||||||
Auto Components — 0.3% | |||||||
9,599 | Adient plc (a) | $ | 436,837 | ||||
Hotels, Restaurants & Leisure — 2.6% | |||||||
69,700 | Starbucks Corp. | 3,698,979 | |||||
Media — 2.5% | |||||||
38,900 | Walt Disney Co. (The) | 3,605,641 | |||||
Specialty Retail — 2.6% | |||||||
55,900 | Lowe's Cos., Inc. | 3,725,735 | |||||
Consumer Staples — 11.8% | |||||||
Food & Staples Retailing — 2.6% | |||||||
43,600 | CVS Health Corp. | 3,666,760 | |||||
Food Products — 6.3% | |||||||
51,000 | Kraft Heinz Co. (The) | 4,536,450 | |||||
98,300 | Mondelēz International, Inc. - Class A | 4,417,602 | |||||
8,954,052 | |||||||
Tobacco — 2.9% | |||||||
43,700 | Philip Morris International, Inc. | 4,214,428 | |||||
Energy — 9.8% | |||||||
Energy Equipment & Services — 3.2% | |||||||
58,600 | Schlumberger Ltd. | 4,584,278 | |||||
Oil, Gas & Consumable Fuels — 6.6% | |||||||
29,400 | Chevron Corp. | 3,079,650 | |||||
33,500 | EOG Resources, Inc. | 3,029,070 | |||||
40,100 | Exxon Mobil Corp. | 3,341,132 | |||||
9,449,852 | |||||||
Financials — 5.1% | |||||||
Diversified Financial Services — 3.0% | |||||||
15,700 | Intercontinental Exchange, Inc. | 4,245,123 | |||||
Insurance — 2.1% | |||||||
23,900 | Chubb Ltd. | 3,035,300 | |||||
See notes to financial statements. |
9
STRALEM EQUITY FUND
SCHEDULE OF INVESTMENTS (Continued)
Shares | Common Stocks — 95.9% (Continued) | Value | |||||
Health Care — 21.7% | |||||||
Biotechnology — 3.6% | |||||||
17,900 | Amgen, Inc. | $ | 2,526,764 | ||||
26,000 | Celgene Corp. (a) | 2,656,680 | |||||
5,183,444 | |||||||
Health Care Equipment & Supplies — 4.3% | |||||||
65,200 | Abbott Laboratories | 2,558,448 | |||||
44,900 | Danaher Corp. | 3,526,895 | |||||
6,085,343 | |||||||
Health Care Providers & Services — 3.3% | |||||||
33,600 | UnitedHealth Group, Inc. | 4,748,688 | |||||
Life Sciences Tools & Services — 2.2% | |||||||
21,000 | Thermo Fisher Scientific, Inc. | 3,087,630 | |||||
Pharmaceuticals — 8.3% | |||||||
28,000 | Johnson & Johnson | 3,247,720 | |||||
79,600 | Merck & Co., Inc. | 4,674,112 | |||||
126,200 | Pfizer, Inc. | 4,001,802 | |||||
11,923,634 | |||||||
Industrials — 5.9% | |||||||
Air Freight & Logistics — 3.2% | |||||||
26,200 | FedEx Corp. | 4,567,184 | |||||
Commercial Services & Supplies — 2.7% | |||||||
95,987 | Johnson Controls International plc | 3,870,196 | |||||
Information Technology — 18.7% | |||||||
Internet Software & Services — 6.5% | |||||||
5,600 | Alphabet, Inc. - Class A (a) | 4,535,440 | |||||
36,400 | Facebook, Inc. - Class A (a) | 4,768,036 | |||||
9,303,476 | |||||||
IT Services — 3.1% | |||||||
53,900 | Visa, Inc. - Class A | 4,447,289 | |||||
Software — 9.1% | |||||||
44,900 | Adobe Systems, Inc. (a) | 4,827,199 | |||||
65,200 | Microsoft Corp. | 3,906,784 | |||||
109,300 | Oracle Corp. | 4,199,306 | |||||
12,933,289 | |||||||
Materials —3.1% | |||||||
Chemicals — 3.1% | |||||||
81,700 | Dow Chemical Co. (The) | 4,396,277 | |||||
See notes to financial statements. |
10
STRALEM EQUITY FUND
SCHEDULE OF INVESTMENTS (Continued)
Shares | Common Stocks — 95.9% (Continued) | Value | |||||
Telecommunication Services — 2.7% | |||||||
Diversified Telecommunication Services — 2.7% | |||||||
107,000 | AT&T, Inc. | $ | 3,936,530 | ||||
Utilities — 9.1% | |||||||
Electric Utilities — 5.9% | |||||||
55,900 | Duke Energy Corp. | 4,473,118 | |||||
115,700 | PPL Corp. | 3,973,138 | |||||
8,446,256 | |||||||
Multi-Utilities — 3.2% | |||||||
60,200 | Dominion Resources, Inc. | 4,527,040 | |||||
Total Common Stocks (Cost $102,781,542) | $ | 137,073,261 | |||||
Shares | Money Market Funds — 4.2% | Value | |||||
3,377,254 | Dreyfus Government Cash Management Money Market Fund - Class I, 0.03% * | $ | 3,377,254 | ||||
2,574,623 | Dreyfus Treasury Prime Cash Management Fund - Class I, 0.01% * | 2,574,623 | |||||
Total Money Market Funds (Cost $5,951,877) | $ | 5,951,877 | |||||
Total Investments at Value — 100.1% (Cost $108,733,419) | $ | 143,025,138 | |||||
Liabilities in Excess of Other Assets — (0.1%) | (60,242 | ) | |||||
Net Assets — 100.0% | $ | 142,964,896 | |||||
(a) | Non-income producing. |
* | Rate shown is the 7-day effective yield at October 31, 2016. |
See notes to financial statements. | |
11
STRALEM EQUITY FUND
STATEMENT OF ASSETS AND LIABILITIES
October 31, 2016
ASSETS | ||||
Investments, at value (Notes 1 and 2) (Cost $108,733,419) | $ | 143,025,138 | ||
Cash | 5,611 | |||
Dividends receivable | 106,436 | |||
Receivable for capital shares sold | 102 | |||
Other | 10,630 | |||
Total Assets | 143,147,917 | |||
LIABILITIES | ||||
Payable to Investment Adviser (Note 3) | 144,501 | |||
Payable to administrator (Note 3) | 18,470 | |||
Accrued expenses | 20,050 | |||
Total Liabilities | 183,021 | |||
NET ASSETS | $ | 142,964,896 | ||
NET ASSETS CONSIST OF: | ||||
Paid-in capital | $ | 89,563,955 | ||
Undistributed net investment income | 1,712,324 | |||
Undistributed net realized gain from securities transactions | 17,396,898 | |||
Net unrealized appreciation | 34,291,719 | |||
Net Assets | $ | 142,964,896 | ||
Shares of beneficial interest outstanding | 13,590,987 | |||
Net asset value, offering price and redemption price per share (a) | $ | 10.52 | ||
(a) | Redemption price varies based on length of time held (Note 1). |
See notes to financial statements. | |
12
STRALEM EQUITY FUND
STATEMENT OF OPERATIONS
For the Year Ended October 31, 2016
INVESTMENT INCOME | ||||
Dividends | $ | 3,717,609 | ||
EXPENSES | ||||
Investment advisory fees (Note 3) | 1,490,280 | |||
Legal fees | 256,969 | |||
Administration fees (Note 3) | 186,621 | |||
Trustees’ fees and expenses (Note 3) | 56,479 | |||
Registration and filing fees | 25,936 | |||
Auditing fees | 19,664 | |||
Transfer agent fees (Note 3) | 18,000 | |||
Postage and supplies | 12,105 | |||
Insurance | 10,902 | |||
Bank service fees | 7,191 | |||
Printing | 6,915 | |||
Other | 23,480 | |||
Total Expenses | 2,114,542 | |||
Advisory fee reductions (Note 3): | (655,786 | ) | ||
Net Expenses | 1,458,756 | |||
NET INVESTMENT INCOME | 2,258,853 | |||
REALIZED AND UNREALIZED GAINS (LOSSES) ON INVESTMENTS | ||||
Net realized gains from securities transactions | 17,583,284 | |||
Net change in unrealized appreciation (depreciation) on investments | (13,670,324 | ) | ||
NET REALIZED AND UNREALIZED GAINS ON INVESTMENTS | 3,912,960 | |||
NET INCREASE IN NET ASSETS RESULTING FROM OPERATIONS | $ | 6,171,813 | ||
See notes to financial statements. |
13
STRALEM EQUITY FUND
STATEMENTS OF CHANGES IN NET ASSETS
| Year | Year | ||||||
OPERATIONS | ||||||||
Net investment income | $ | 2,258,853 | $ | 2,985,032 | ||||
Net realized gains from securities transactions | 17,583,284 | 51,697,078 | ||||||
Net change in unrealized appreciation (depreciation) on investments | (13,670,324 | ) | (45,734,652 | ) | ||||
Net increase in net assets resulting from operations | 6,171,813 | 8,947,458 | ||||||
DISTRIBUTIONS TO SHAREHOLDERS (Note 4) | ||||||||
From investment income, Institutional Class | (2,508,198 | ) | (4,265,064 | ) | ||||
From investment income, Adviser Class | — | (98,888 | ) | |||||
From realized gains, Institutional Class | (51,600,896 | ) | (38,440,390 | ) | ||||
From realized gains, Adviser Class | — | (1,082,030 | ) | |||||
Decrease in net assets from distributions to shareholders | (54,109,094 | ) | (43,886,372 | ) | ||||
CAPITAL SHARE TRANSACTIONS | ||||||||
Institutional Class | ||||||||
Proceeds from shares sold | 13,720,437 | 8,394,175 | ||||||
Shares exchanged from Adviser Class | — | 2,264,428 | ||||||
Net asset value of shares issued in reinvestment of distributions | 46,261,924 | 36,260,508 | ||||||
Proceeds from redemption fees (Note 1) | 15 | 1,463 | ||||||
Payments for shares redeemed | (59,880,443 | ) | (142,349,795 | ) | ||||
Net increase (decrease) in Institutional Class net assets from capital share transactions | 101,933 | (95,429,221 | ) | |||||
Adviser Class | ||||||||
Proceeds from shares sold | — | 2,266,224 | ||||||
Net asset value of shares issued in reinvestment of distributions | — | 1,176,684 | ||||||
Proceeds from redemption fees (Note 1) | — | 83 | ||||||
Payments for shares redeemed | — | (7,051,989 | ) | |||||
Shares exchanged for Institutional Class | — | (2,264,428 | ) | |||||
Net decrease in Adviser Class net assets from capital share transactions | — | (5,873,426 | ) | |||||
TOTAL DECREASE IN NET ASSETS | (47,835,348 | ) | (136,241,561 | ) | ||||
NET ASSETS | ||||||||
Beginning of year | 190,800,244 | 327,041,805 | ||||||
End of year | $ | 142,964,896 | $ | 190,800,244 | ||||
UNDISTRIBUTED NET INVESTMENT INCOME | $ | 1,712,324 | $ | 1,961,669 | ||||
See notes to financial statements. |
14
STRALEM EQUITY FUND
STATEMENTS OF CHANGES IN NET ASSETS (Continued)
| Year | Year | ||||||
CAPITAL SHARE ACTIVITY | ||||||||
Institutional Class (Note 1) | ||||||||
Shares sold | 1,362,244 | 646,772 | ||||||
Shares issued in connection with exchange of Adviser Class | — | 146,596 | ||||||
Shares reinvested | 4,612,355 | 2,359,174 | ||||||
Shares redeemed | (4,671,027 | ) | (9,098,017 | ) | ||||
Net increase (decrease) in shares outstanding | 1,303,572 | (5,945,475 | ) | |||||
Shares outstanding, beginning of year | 12,287,415 | 18,232,890 | ||||||
Shares outstanding, end of year | 13,590,987 | 12,287,415 | ||||||
Adviser Class (Note 1) | ||||||||
Shares sold | — | 20,525 | ||||||
Shares reinvested | — | 76,707 | ||||||
Shares redeemed | — | (456,638 | ) | |||||
Shares exchanged for Institutional Class shares | — | (147,012 | ) | |||||
Net decrease in shares outstanding | — | (506,418 | ) | |||||
Shares outstanding, beginning of year | — | 506,418 | ||||||
Shares outstanding, end of year | — | — | ||||||
See notes to financial statements. |
15
STRALEM EQUITY FUND(a)
FINANCIAL HIGHLIGHTS
(For a share outstanding throughout each year) | ||||||||||||||||||||
Year Ended October 31, | ||||||||||||||||||||
| 2016 | 2015 | 2014 | 2013 (b) | 2012 (b) | |||||||||||||||
Net asset value, beginning of year | $ | 15.53 | $ | 17.45 | $ | 16.77 | $ | 14.10 | $ | 13.09 | ||||||||||
Income from investment operations: | ||||||||||||||||||||
Net investment income | 0.22 | 0.23 | 0.24 | 0.27 | 0.23 | |||||||||||||||
Net gain on securities | 0.24 | 0.34 | 1.70 | 2.87 | 0.95 | |||||||||||||||
Total from investment operations | 0.46 | 0.57 | 1.94 | 3.14 | 1.18 | |||||||||||||||
Less distributions: | ||||||||||||||||||||
Dividends from net investment income | (0.25 | ) | (0.25 | ) | (0.26 | ) | (0.25 | ) | (0.17 | ) | ||||||||||
Dividends from net realized gains | (5.22 | ) | (2.24 | ) | (1.00 | ) | (0.22 | ) | — | |||||||||||
Total distributions | (5.47 | ) | (2.49 | ) | (1.26 | ) | (0.47 | ) | (0.17 | ) | ||||||||||
Proceeds from redemption fees collected (Note 1) | 0.00 | (c) | 0.00 | (c) | 0.00 | (c) | 0.00 | (c) | 0.00 | (c) | ||||||||||
Net asset value, end of year | $ | 10.52 | $ | 15.53 | $ | 17.45 | $ | 16.77 | $ | 14.10 | ||||||||||
Total return (d) | 4.72 | % | 3.43 | % | 12.18 | % | 22.97 | % | 9.06 | % | ||||||||||
Ratios/supplemental data: | ||||||||||||||||||||
Net assets, end of year (000’s) | $ | 142,965 | $ | 190,800 | $ | 318,237 | $ | 365,022 | $ | 343,579 | ||||||||||
Ratio of total expenses to average net assets | 1.42 | % | 1.21 | % | 1.12 | % | 1.09 | % | 1.14 | % | ||||||||||
Ratio of net expenses to average net assets (e) | 0.98 | % | 0.98 | % | 0.98 | % | 0.98 | % | 0.98 | % | ||||||||||
Ratio of net investment income to average net assets (e) | 1.52 | % | 1.17 | % | 1.27 | % | 1.61 | % | 1.68 | % | ||||||||||
Portfolio turnover rate | 8 | % | 33 | % | 19 | % | 14 | % | 20 | % | ||||||||||
(a) | The comparative financial highlights are for the Institutional Class only (Note 1). |
(b) | Per share amounts reflect the 10:1 stock split effective February 22, 2013 (Note 1). |
(c) | Amount rounds to less than $0.01 per share. |
(d) | Total return is the measure of the change in value of an investment in the Fund over the period covered, which assumes any dividends or capital gains distributions are reinvested in shares of the Fund. Returns shown do not reflect the deduction of taxes a shareholder would pay on Fund distributions or the redemption of Fund shares. The total returns would be lower if the Adviser had not reduced advisory fees and/or reimbursed expenses (Note 3). |
(e) | Ratio was determined after advisory fee reductions and/or expense reimbursements by the Investment Adviser (Note 3). |
See notes to financial statements. | |
16
STRALEM EQUITY FUND
NOTES TO FINANCIAL STATEMENTS
October 31, 2016
1. | ORGANIZATION AND SUMMARY OF SIGNIFICANT ACCOUNTING POLICIES |
Stralem Equity Fund (the “Fund”) is a non-diversified series of Ultimus Managers Trust (the “Trust”). The Trust is an open-end management investment company registered under the Investment Company Act of 1940 (the “1940 Act”). The Fund was reorganized into the Trust on October 17, 2016. It was formerly a series of Stralem Fund.
Reorganization:
The Fund is the legal successor to the Stralem Equity Fund (the “Predecessor Fund”), a series of Stralem Fund, an unaffiliated registered Investment Company. On October 17, 2016 the Fund (which had no prior activity or net assets) acquired all the net assets of the Predecessor Fund pursuant to a plan of reorganization (the “Reorganization”).
The Reorganization was accomplished by a tax-free exchange of 13,598,816 shares of the Predecessor Fund valued at $143,313,280 for exact same shares and value of the Fund. For financial reporting purposes, assets received and shares issued by the Fund were recorded at fair value; however, the cost basis of the investments received from the Predecessor Fund was carried forward to align ongoing reporting of the Fund’s realized and unrealized gains and losses with amounts distributable to shareholders for tax purposes. Immediately prior to the merger, the net assets of the Predecessor Fund were $143,313,280, including $35,056,223 of unrealized appreciation, $1,286,377 of undistributed net investment income, and $17,323,985 of accumulated realized gains.
The Predecessor Fund commenced operations on January 18, 2000. The accounting and performance history of the Predecessor Fund were re-designated as that of the Fund. The Fund’s investment objective is long-term capital appreciation.
The Fund currently offers one class of shares, which is sold without any sales loads and distribution fees. On August 14, 2015, the Adviser Class shares of the Predecessor Fund were discontinued and all outstanding shares were exchanged into Institutional Class shares. After the exchange, the Adviser Class designation no longer applied to shares of the Predecessor Fund. Adviser Class shares had been sold without any sales load but subject to a 12b-1 fee of up to 0.25% of the average daily net assets attributable to the Adviser Class shares.
The following is a summary of the Fund’s significant accounting policies used in the preparation of its financial statements. These policies are in conformity with accounting principles generally accepted in the United States of America (“GAAP”). As an investment company, as defined in Financial Accounting Standards Board (“FASB”) Accounting Standards Update 2013-08, the Fund follows accounting and reporting guidance under FASB Accounting Standards Codification Topic 946, “Financial Services – Investment Companies.”
17
STRALEM EQUITY FUND
NOTES TO FINANCIAL STATEMENTS (Continued)
In October 2016, the Securities and Exchange Commission (the “SEC”) released its Final Rule on Investment Company Reporting Modernization (the “Rule”). The Rule which introduces two new regulatory reporting forms for investment companies – Form N-PORT and Form N-CEN – also contains amendments to Regulation S-X which impact financial statement presentation, particularly the presentation of derivative investments. Although still evaluating the impact of the Rule, management believes that many of the Regulation S-X amendments are consistent with the Fund’s current financial statement presentation and expects that the Fund will be able to comply with the Rule’s Regulation S-X amendments by the August 1, 2017 compliance date.
Investment valuation:
GAAP establishes a single authoritative definition of fair value, sets out a framework for measuring fair value and requires additional disclosures about fair value measurements.
Various inputs are used in determining the value of the Fund’s investments. These inputs are summarized in the three broad levels listed below:
Level 1 – quoted prices in active markets for identical securities
Level 2 – other significant observable inputs
Level 3 – significant unobservable inputs
The inputs or methodology used for valuing securities are not necessarily an indication of the risks associated with investing in those securities. The inputs used to measure fair value may fall into different levels of the above fair value hierarchy. In such cases, for disclosure purposes, the level in the fair value hierarchy within which the fair value measurement falls is determined based on the lowest level input that is significant to the fair value measurement.
The Fund’s portfolio securities are valued as of the close of business of the regular session of trading on the New York Stock Exchange (“NYSE”) (normally 4:00 p.m., Eastern time). Common stocks which are traded on stock exchanges are valued at the closing price on the day the securities are being valued, or, if not traded on a particular day, at the closing mean price. Securities quoted by NASDAQ are valued at the NASDAQ Official Closing Price. Securities traded in the over-the-counter market are valued at the last sale price, if available, otherwise, at the last quoted bid price. Investments in money market funds are valued at net asset value (“NAV”).
When using a quoted price and when the market for the security is considered active, the security will be classified as Level 1 within the fair value hierarchy. Securities without a readily available price quotation may be priced at fair value as determined in good faith by the management of the Trust. Fair value pricing would be utilized in instances when prices of individual portfolio securities are “not readily available,” the market for a security is not active or when there is an occurrence of a “significant event” that occurs after market closings but before the Fund’s NAV is determined. Such fair value pricing is determined according to procedures adopted by the Fund and approved by the Board of Trustees.
18
STRALEM EQUITY FUND
NOTES TO FINANCIAL STATEMENTS (Continued)
Investment transactions and income:
Security transactions are accounted for on the trade date. Realized gains and losses on sales of investments are calculated on a specific identification basis. Dividend income is recorded on the ex-dividend date, and interest income is recognized on the accrual basis.
Common expenses:
Common expenses of the Trust are allocated among the Fund and other series of the Trust based on the relative net assets of each series or the nature of the services performed and the relative applicability to each series.
Share valuation and redemption fees:
The NAV per share of the Fund is calculated as of the close of regular trading on the NYSE (normally 4:00 pm, Eastern time) on each day the NYSE is open for business by dividing the total value of the Fund’s assets, less liabilities, by the number of shares outstanding. The offering price and redemption price per share is equal to the NAV per share, except that shares are subject to a redemption fee of 1% if shares are redeemed within 60 days of purchase. During the years ended October 31, 2016 and 2015, proceeds from redemption fees totaled $15 and $1,546, respectively.
Stock split:
The Board of Trustees of the former Trust, Stralem Fund, approved a ten-for-one stock split for the Predecessor Fund, effective February 22, 2013. All references to share and per share amounts in these financial statements have been retroactively adjusted to reflect the ten-for-one stock split for all periods presented.
Taxes:
The Fund has qualified and intends to continue to qualify as a regulated investment company under the Internal Revenue Code of 1986 (the “Code”). Qualification generally will relieve the Fund of liability for federal income taxes to the extent its net investment income and net realized capital gains are distributed in accordance with the Code.
In order to avoid imposition of a federal excise tax applicable to regulated investment companies, the Fund must declare and pay as dividends in each calendar year at least 98% of its net investment income (earned during the calendar year) and 98.2% of its net realized capital gains (earned during the twelve months ended October 31) plus undistributed amounts from prior years.
The Fund recognizes the tax benefits or expenses of uncertain tax positions only when the position is “more likely than not” to be sustained assuming examination by tax authorities. Management has reviewed the Fund’s tax positions for all open tax years (tax years ended October 31, 2013 through October 31, 2016) and has concluded that no provision for unrecognized tax benefits or expenses is required in these financial statements.
19
STRALEM EQUITY FUND
NOTES TO FINANCIAL STATEMENTS (Continued)
Use of estimates:
The preparation of financial statements in conformity with GAAP requires management to make estimates and assumptions that affect the reported amounts of assets and liabilities and disclosure of contingent assets and liabilities as of the date of the financial statements and the reported amounts of income and expenses during the reporting period. Actual results could differ from those estimates.
2. | FAIR VALUE MEASUREMENT |
The following is a summary of the inputs used to value the Fund’s investments by security type as of October 31, 2016:
| Level 1 | Level 2 | Level 3 | Total | ||||||||||||
Common Stocks | $ | 137,073,261 | $ | — | $ | — | $ | 137,073,261 | ||||||||
Money Market Funds | 5,951,877 | — | — | 5,951,877 | ||||||||||||
Total | $ | 143,025,138 | $ | — | $ | — | $ | 143,025,138 | ||||||||
Refer to the Fund’s Schedule of Investments for a listing of the common stocks by industry type. As of October 31, 2016, the Fund did not have any transfers between Levels. There were no Level 2 or Level 3 securities or derivative instruments held by the Fund as of October 31, 2016. It is the Fund’s policy to recognize transfers between Levels at the end of the reporting period.
3. | RELATED PARTY TRANSACTIONS |
Pursuant to an Investment Advisory Agreement with Stralem & Company Incorporated (the “Investment Adviser”), the Fund pays the Investment Adviser an annual advisory fee, payable quarterly, based on the average weekly net assets of the Fund, equal to 1.25% of the first $50 million of such net assets, 1.00% of the next $50 million of such net assets and 0.75% of such net assets in excess of $100 million.
Effective October 10, 2016, the Investment Adviser has agreed contractually, until at least March 1, 2019, to reduce advisory fees and reimburse Other Expenses to the extent necessary to limit Total Annual Fund Operating Expenses (excluding brokerage costs, taxes, interest, acquired fund fees and expenses, costs to organize the Fund, extraordinary expenses such as litigation and merger or reorganization costs and other expenses not incurred in the ordinary course of the Fund’s business) and amounts, if any, payable pursuant to a plan adopted in accordance with Rule 12b-1 under the 1940 Act to 0.95% of the Fund’s average daily net assets. Prior to October 10, 2016, the Investment Adviser had agreed to reduce its advisory fees and/or reimburse Fund expenses to the extent necessary to maintain the Fund’s annual ratio of expenses to average net assets at no greater than 0.98%. During the year ended October 31, 2016, the Investment Adviser reduced its advisory fees in the amount of $655,786.
20
STRALEM EQUITY FUND
NOTES TO FINANCIAL STATEMENTS (Continued)
Advisory fee reductions and expense reimbursements by the Investment Adviser are subject to repayment by the Fund for a period of three years after such fees and expenses were incurred, provided that the repayments do not cause Total Annual Fund Operating Expenses to exceed (i) the expense limitation then in effect, if any, and (ii) the expense limitation in effect at the time the expenses to be repaid were incurred. Prior to March 1, 2019, this agreement may not be modified or terminated without the approval of the Board. This agreement will terminate automatically if the Fund’s investment advisory agreement with the Investment Adviser is terminated. As of October 31, 2016, the amount of fee reductions and expense reimbursements available for recovery by the Investment Adviser is $1,790,471, portions of which must be recovered no later than the dates stated below:
October 31, 2017 | $ | 519,286 | ||
October 31, 2018 | 615,399 | |||
October 31, 2019 | 655,786 |
Under the terms of servicing agreements between the Fund and Ultimus Fund Solutions, LLC (“Ultimus”), Ultimus provides administrative, pricing, accounting, dividend disbursing, shareholder servicing and transfer agent services for the Fund. For these services, the Fund pays Ultimus fees in accordance with such agreements. In addition, the Fund pays out-of-pocket expenses including, but not limited to, postage, supplies and costs of pricing the Fund’s portfolio securities.
Pursuant to a Distribution Agreement with Ultimus Fund Distributors, LLC (the “Distributor”), the Distributor provides distribution services and serves as principal underwriter for the Fund. The Distributor is a wholly owned subsidiary of Ultimus. The Distributor does not receive a fee from the Fund or the Investment Adviser for its distribution services.
Certain officers and a Trustee of the Trust are also officers of Ultimus and the Distributor and are not paid by the Fund for serving in such capacities.
Effective October 17, 2016, each Trustee who is not an “interested person” of the Trust (“Independent Trustee”) receives a $1,000 annual retainer from the Fund, except for the Board Chairman who receives a $1,200 annual retainer from the Fund. Each Independent Trustee also receives from the Fund a fee of $500 for each Board meeting attended plus reimbursement of travel and other meeting-related expenses. Prior to October 17, 2016, the Predecessor Fund paid each Independent Trustee a fee of $250 for each regularly scheduled meeting attended in person and an annual retainer of $17,000, paid quarterly, plus reimbursement of travel and other expenses; and both the Lead Independent Trustee and the Chairman of the Audit Committee received an additional annual retainer of $2,000, paid quarterly. Any Trustee who was affiliated with the Investment Adviser did not receive compensation from the Predecessor Fund.
21
STRALEM EQUITY FUND
NOTES TO FINANCIAL STATEMENTS (Continued)
4. | DISTRIBUTIONS TO SHAREHOLDERS |
Distributions arising from net investment income and net realized capital gains, if any, are declared and paid to shareholders annually. The amount of distributions from net investment income and net realized capital gains are determined in accordance with the Code, which may differ from GAAP. The tax character of distributions paid to shareholders during the years ended October 31, 2016 and 2015 were as follows:
Years Ended | Ordinary | Long-Term | Total | |||||||||
Institutional Class: | ||||||||||||
October 31, 2016 | $ | 2,508,198 | $ | 51,600,896 | $ | 54,109,094 | ||||||
October 31, 2015 | $ | 6,299,962 | $ | 36,405,492 | $ | 42,705,454 | ||||||
Adviser Class: | ||||||||||||
October 31, 2016 | N/A | N/A | N/A | |||||||||
October 31, 2015 | $ | 156,167 | $ | 1,024,751 | $ | 1,180,918 | ||||||
5. | TAX MATTERS |
The following information is computed on a tax basis for each item as of October 31, 2016:
Cost of portfolio investments | $ | 108,874,884 | ||
Gross unrealized appreciation | $ | 36,167,244 | ||
Gross unrealized depreciation | (2,016,990 | ) | ||
Net unrealized appreciation | 34,150,254 | |||
Undistributed ordinary income | 2,091,955 | |||
Undistributed long-term capital gains | 17,158,732 | |||
Distributable earnings | $ | 53,400,941 |
The difference between the federal income tax cost of portfolio investments and the financial statement cost and the difference between the book-basis and tax-basis net unrealized appreciation is due to certain timing differences in the recognition of capital gains or losses under income tax regulations and GAAP. These “book/tax” differences are temporary in nature and are due to the tax deferral of losses on wash sales.
6. | INVESTMENT TRANSACTIONS |
During the year ended October 31, 2016, cost of purchases and proceeds from sales of investment securities, other than short-term investments, amounted to $11,684,763 and $63,223,287, respectively.
22
STRALEM EQUITY FUND
NOTES TO FINANCIAL STATEMENTS (Continued)
7. | PRINCIPAL HOLDER OF FUND SHARES |
As of October 31, 2016, the following shareholder owned of record 5% or more of the outstanding shares of the Fund:
Name of Record Owner | % Ownership |
Pershing LLC (for the benefit of its customers) | 55% |
A beneficial owner of 25% or more of the Fund’s outstanding shares may be considered a controlling person. That shareholder’s vote could have a more significant effect on matters presented at a shareholder’s meeting.
8. | CONTINGENCIES AND COMMITMENTS |
The Fund indemnifies the Trust’s officers and Trustees for certain liabilities that might arise from their performance of their duties to the Fund. Additionally, in the normal course of business the Fund enters into contracts that contain a variety of representations and warranties and which provide general indemnifications. The Fund’s maximum exposure under these arrangements is unknown, as this would involve future claims that may be made against the Fund that have not yet occurred. However, the Fund has not had any prior claims or losses pursuant to these arrangements.
9. | SUBSEQUENT EVENTS |
Management has evaluated subsequent events through the issuance of these financial statements and notes no additional conditions that existed as of such issuance. The Trustees of the Trust have approved an ordinary income dividend, a short-term capital gain distribution and a long-term capital gain distribution to be distributed to shareholders of record of the Fund as of close of business on a declaration date to be determined by the officers of the Fund. The amounts of the ordinary income dividend, short-term capital gain distribution and long-term capital gain distribution are to be determined by the officers of the Trust and distributed on a payment date prior to January 1, 2017.
23
STRALEM EQUITY FUND
REPORT OF INDEPENDENT REGISTERED PUBLIC ACCOUNTING FIRM
To the Shareholders of Stralem Equity Fund and
Board of Trustees of Ultimus Managers Trust
We have audited the accompanying statement of assets and liabilities, including the schedule of investments, of Stralem Equity Fund (the “Fund”), a series of Ultimus Managers Trust, as of October 31, 2016, and the related statements of operations and changes in net assets, and the financial highlights for the year then ended. These financial statements and financial highlights are the responsibility of the Fund’s management. Our responsibility is to express an opinion on these financial statements and financial highlights based on our audit. The Fund’s financial statements and financial highlights for the years ended prior to October 31, 2016, were audited by other auditors, whose report dated December 10, 2015, expressed an unqualified opinion on those financial statements and financial highlights.
We conducted our audit in accordance with the standards of the Public Company Accounting Oversight Board (United States). Those standards require that we plan and perform the audit to obtain reasonable assurance about whether the financial statements and financial highlights are free of material misstatement. An audit includes examining, on a test basis, evidence supporting the amounts and disclosures in the financial statements. Our procedures included confirmation of securities owned as of October 31,2016, by correspondence with the custodian. An audit also includes assessing the accounting principles used and significant estimates made by management, as well as evaluating the overall financial statement presentation. We believe that our audit provides a reasonable basis for our opinion.
In our opinion, the financial statements and financial highlights referred to above present fairly, in all material respects, the financial position of Stralem Equity Fund as of October 31, 2016, the results of its operations, changes in its net assets, and the financial highlights for the year then ended, in conformity with accounting principles generally accepted in the United States of America.

COHEN & COMPANY, LTD.
Cleveland, Ohio
December 22, 2016
24
STRALEM EQUITY FUND
DISCLOSURE OF FUND EXPENSES (Unaudited)
As a shareholder of the Fund, you incur ongoing costs, including management fees and other Fund expenses, which are deducted from the Fund’s gross income. This Example is intended to help you understand your ongoing costs (in dollars) of investing in the Fund and to compare these costs with the ongoing costs of investing in other mutual funds.
The Example is based on an investment of $1,000 invested at the beginning of the period (May 1, 2016) and held until the end of the period (October 31, 2016).
Actual Expenses
The first line of the table below provides information about actual account values and actual expenses. You may use the information in this line, together with the amount you invested, to estimate the expenses that you paid over the period. Simply divide your account value by $1,000 (for example, an $8,600 account value divided by $1,000 = 8.6), then multiply the result by the number in the first line under the heading entitled “Expenses Paid During Period” to estimate the expenses you paid on your account during this period.
Hypothetical Example for Comparison Purposes
The second line of the table below provides information about hypothetical account values and hypothetical expenses based on the Fund’s actual expense ratio and an assumed rate of return of 5% per year before expenses, which is not the Fund’s actual return. The hypothetical account values and expenses may not be used to estimate the actual ending account balance or expenses you paid for the period. You may use this information to compare the ongoing costs of investing in the Fund and other mutual funds. To do so, compare this 5% hypothetical example with the 5% hypothetical examples that appear in the shareholder reports of other funds.
Beginning | Ending | Expenses Paid | |
Based on Actual Fund Return | $ 1,000.00 | $ 1,020.40 | $ 4.98 |
Based on Hypothetical 5% Return | $ 1,000.00 | $ 1,020.21 | $ 4.98 |
* | Expenses are equal to the annualized net expense ratio of 0.98% for the period, multiplied by the average account value over the period, multiplied by 184/366 (to reflect the one-half year period). |
25
STRALEM EQUITY FUND
CHANGE IN INDEPENDENT AUDITOR (Unaudited)
On October 17, 2016, in conjunction with the Reorganization into the Ultimus Managers Trust, Cohen & Company, Ltd. (“Cohen”) is now the new independent auditor for the Fund. The Predecessor Fund was audited by EisnerAmper LLP (“Eisner”).
Eisner’s reports on the Predecessor Fund’s financial statements for the prior two fiscal years did not contain an adverse opinion or a disclaimer of opinion, and were not qualified or modified as to uncertainty, audit scope or accounting principles. During such fiscal years, and through the date of Eisner’s replacement, there were no disagreements between the Predecessor Trust and Eisner on any matter of accounting principles or practices, financial statement disclosure, or auditing scope or procedures, which disagreements, if not resolved to the satisfaction of Eisner, would have caused it to make reference to the subject matter of the disagreements in connection with its reports on the financial statements for such years.
26
STRALEM EQUITY FUND
DISCLOSURE REGARDING APPROVAL OF INVESTMENT ADVISORY AGREEMENT (Unaudited)
The Board of Trustees (the “Board”), including the Independent Trustees voting separately, has reviewed and approved Stralem Equity Fund’s (the “Fund”) Investment Advisory Agreement with Stralem & Company Incorporated (the “Adviser”) for an initial two-year term. Approval of the Investment Advisory Agreement took place at an in-person meeting held on July 25-26, 2016, at which all of the Trustees were present.
In the course of their deliberations, the Board was advised by legal counsel. The Board received and reviewed information provided by the Adviser in response to requests of the Board and legal counsel.
In considering the Investment Advisory Agreement and reaching their conclusions with respect thereto, the Board reviewed and analyzed various factors that they determined were relevant, including the factors described below.
The nature, extent, and quality of the services to be provided by the Adviser. In this regard, the Board considered the responsibilities the Adviser would have under the Investment Advisory Agreement. The Board also considered the Adviser’s proposed services to the Fund including, without limitation: the Adviser’s procedures for formulating investment recommendations and assuring compliance with the Fund’s investment objective and limitations; the proposed initial marketing and distribution efforts; and the Adviser’s compliance procedures and practices. The Board also considered that the services to be provided under the Investment Advisory Agreement would be substantially similar to those the Adviser currently provides to Stralem Equity Fund, a series of Stralem Fund (the “Predecessor Fund”). After reviewing the foregoing and further information provided in the Adviser’s materials to the Board (e.g., descriptions of Stralem’s business and Form ADV), the Board concluded that the quality, extent, and nature of the services to be provided by the Adviser to the Fund were satisfactory and adequate.
The investment management capabilities and experience of the Adviser. The Board considered the investment management experience of the Adviser and thoroughly discussed with the Adviser’s representative the investment objective and strategies for the Fund. The Board also discussed the Adviser’s experience in managing similar types of strategies, and its plans for implementing such strategies. The Board also considered the performance of the Predecessor Fund.After consideration of these and other factors, the Board determined that the Adviser has the requisite experience to serve as investment adviser for the Fund.
The costs of the services to be provided and profits to be realized by the Adviser and its affiliates from the relationship with the Fund. The Board considered the Adviser’s personnel and methods of operation; the education and experience of its personnel; its compliance program, policies, and procedures; its financial condition and the level of financial commitment to the Fund; the projected asset levels of the Fund; and the overall expenses of the Fund, including the advisory fee. The Board reviewed the Adviser’s Expense Limitation Agreement (the “ELA”) and noted the benefit to the Fund from the Adviser’s contractual obligation to reduce its advisory fee or reimburse other
27
STRALEM EQUITY FUND
DISCLOSURE REGARDING APPROVAL OF INVESTMENT ADVISORY AGREEMENT (Unaudited) (Continued)
operating expenses through March 1, 2019. The Board discussed the Adviser’s financial condition and its ability to satisfy its financial commitments to the Fund. The Board also considered potential benefits for the Adviser in managing the Fund, including promotion of the Adviser’s name. The Board noted that the Fund’s advisory fee of 1.25% for the first tier of assets was above the average and the median for the Fund’s custom peer group, and the fee was in the twentieth-fifth percentile of the larger Morningstar Large Cap Blend Category. The Board also noted that the Fund’s advisory fee contained breakpoints, so the effective advisory fee was lower than 1.25%, as provided in the Investment Advisory Agreement provided in the materials provided to the Board. The Board considered that the terms of the ELA effectively lowered the advisory fee so that the actual advisory fee paid by the Fund is below the contractual advisory fee. The Board further noted that the proposed total expense ratio of 0.95% is slightly above the average and median for the Fund’s custom peer group, but below the average and median of the Morningstar Large Cap Blend Category. The Board also considered that the advisory fee and breakpoints under the Investment Advisory Agreement would be the same as those for the Predecessor Fund, and that the ELA would lower the Fund’s annual expense ratio from the current 0.98% to 0.95%. Upon further consideration and discussion of the foregoing, the Board concluded that the proposed advisory fee and total expense limit for the Fund is within the range of what would have been negotiated at arms-length in light of all the surrounding circumstances.
The extent to which the Fund and its investors would benefit from economies of scale. In this regard, the Board considered the Investment Advisory Agreement and the ELA. The Board determined that the shareholders of the Fund would benefit from the ELA until the Fund’s assets grew to a level where its expenses otherwise fall below the expense limit. Following further discussion of the Fund’s projected asset levels, expectations for growth, and level of fees, the Board determined that the Fund’s fee arrangements with the Adviser would provide benefits for the next two years, and thereafter shareholders would benefit from the breakpoints in the management fee schedule. After further discussion, the Board concluded the Fund’s arrangements with the Adviser were fair and reasonable in relationship to the nature and quality of services to be provided by the Adviser and would benefit the Fund and its shareholders.
Brokerage and portfolio transactions. The Board considered the Adviser’s policies and procedures as it relates to seeking best execution for its clients. The Board also considered the anticipated portfolio turnover rate for the Fund; the method and basis for selecting and evaluating the broker-dealers used to complete the Fund’s portfolio transactions; any anticipated allocation of portfolio business to persons affiliated with the Adviser; and the extent to which the Fund’s trades may be allocated to soft-dollar arrangements. After further review and discussion, the Board determined that the Adviser’s practices regarding brokerage and portfolio transactions were satisfactory.
28
STRALEM EQUITY FUND
DISCLOSURE REGARDING APPROVAL OF INVESTMENT ADVISORY AGREEMENT (Unaudited) (Continued)
Possible conflicts of interest. In evaluating the possibility for conflicts of interest, the Board considered such matters as the Adviser’s process for allocating trades among its different clients, including the Fund. The Board also considered the substance and administration of the Adviser’s Code of Ethics. Following further consideration and discussion, the Board determined that the Adviser’s standards and practices relating to the identification and mitigation of potential conflicts of interests were satisfactory.
Conclusion
After consideration of the above factors as well as other factors, the Board unanimously concluded that approval of the Investment Advisory Agreement was in the best interests of the Fund and its shareholders.
29
STRALEM EQUITY FUND
SUBMISSION OF MATTERS TO A VOTE OF SECURITY HOLDERS (Unaudited)
On October 11, 2016 a Special Meeting of Shareholders of Stralem Equity Fund, a series of the Stralem Fund (the “Predecessor Fund”), was held for the purpose of voting on the following Proposal:
Proposal 1:To approve the reorganization of the Predecessor Fund into the “New Fund” (as defined below) (such transactions, collectively the “Reorganization”), pursuant to an Agreement and Plan of Reorganization (the “Plan”). Pursuant to the Plan, the Predecessor Fund will transfer substantially all of its assets to the new Stralem Equity Fund (the “New Fund”), a new series of the Ultimus Managers Trust(“UMT”), an open end management investment company organized as an Ohio business trust in exchange for shares of the New Fund and the New Fund’s assumption of all of the liabilities of the Predecessor Fund. The shares of the New Fund received by the Predecessor Fund will be distributed pro rata to the Predecessor Fund’s shareholders. After the Reorganization the Predecessor Fund will be terminated as a series of Stralem. The New Fund has the same investment objective and principal investment strategies as the Existing Fund.
A total of 13,731,984 shares of the Fund were entitled to vote on the Proposal. A total of 6,879,724 shares constitute a quorum of voters for purposes of the Proposal. A total of 7,407,413 shares were voted, representing 53.94% of total shares.
Shareholders of record on August 30, 2016 voted to approve Reorganization. The votes cast with respect to Proposal 1 were as follows:
Number of shares | |||
For | Against | Withheld | |
Proposal 1 | 7,405,986 | 1,427 | 0 |
30
STRALEM EQUITY FUND
ADDITIONAL INFORMATION (Unaudited)
PROXY VOTING POLICIES AND PROCEDURES
A description of the Fund’s proxy voting policies and procedures is available, without charge, upon request by calling toll free (866) 822-9555, or on the Securities and Exchange Commission’s (“SEC”) website at http://www.sec.gov. The Fund’s proxy voting record for the most recent 12-month period ended June 30th is also available from the SEC’s website at http://www.sec.gov or upon request by calling the Fund at (866) 822-9555.
QUARTERLY PORTFOLIO HOLDINGS
The Fund’s Forms N-Q containing a complete schedule of portfolio holdings as of the end of the first and third quarters of each fiscal year are available on the SEC’s website at http://www.sec.gov or are available upon request, without charge, by calling toll free at (866) 822-9555. The Fund’s Forms N-Q may also be reviewed and copied at the SEC’s Public Reference Room in Washington, DC, and information on the operation of the Public Reference Room may be obtained by calling 1-(800) SEC-0338.
HOUSEHOLDING
The Fund will generally send only one copy of the summary prospectus, proxy material, annual report and semi-annual report to shareholders residing at the same “household.” This reduces Fund expenses which benefits all shareholders, minimizes the volume of mail you receive and eliminates duplicates of the same information. If you need additional copies of these documents, a copy of the prospectus or do not want your mailings to be “householded,” please send us a written request or call us toll free at (866) 822-9555.
31
STRALEM EQUITY FUND
BOARD OF TRUSTEES AND EXECUTIVE OFFICERS (Unaudited)
The Board of Trustees has overall responsibility for management of the Trust’s affairs. The Trustees serve during the lifetime of the Trust and until its termination, or until death, resignation, retirement, or removal. The Trustees, in turn, elect the officers of the Fund to actively supervise its day-to-day operations. The officers have been elected for an annual term. Unless otherwise noted, each Trustee’s and officer’s address is 225 Pictoria Drive, Suite 450, Cincinnati, Ohio 45246. The following are the Trustees and executive officers of the Fund:
Name and | Length | Position(s) | Principal Occupation(s) | Number | Directorships |
Interested Trustees: | |||||
Robert G. Dorsey* | Since | Trustee | Managing Director of Ultimus Fund Solutions, LLC and Ultimus Fund Distributors, LLC (1999 to present) | 25 | None |
Independent Trustees: | |||||
Janine L. Cohen | Since | Trustee | Retired since 2013; Chief Financial Officer from 2004 to 2013 and Chief Compliance Officer from 2008 to 2013 at AER Advisors, Inc. | 25 | None |
David M. Deptula | Since | Trustee | Vice President of Legal and Special Projects at Dayton Freight Lines, Inc. since 2016; Vice President of Tax Treasury at Standard Register Inc. (formerly The Standard Register Company) from 2011 to 2016 | 25 | None |
32
STRALEM EQUITY FUND
BOARD OF TRUSTEES AND EXECUTIVE OFFICERS (Unaudited) (Continued)
Name and | Length | Position(s) | Principal Occupation(s) | Number | Directorships |
Independent Trustees (Continued): | |||||
John J. Discepoli | Since | Chairman | Owner of Discepoli Financial Planning, LLC (personal financial planning company) since 2004 | 25 | None |
* | Mr. Dorsey is considered an “interested person” of the Trust within the meaning of Section 2(a)(19) of the 1940 Act because of his relationship with the Trust’s administrator, transfer agent and distributor. |
Name and | Length | Position(s) Held with Trust | Principal Occupation(s) |
Executive Officers | |||
David R. Carson | Since | President | Vice President and Director of Client Strategies of Ultimus Fund Solutions, LLC (2013 to present); President, Unified Series Trust (2016 to present); Chief Compliance Officer, FSI LBAR Fund (2013 to present), The Huntington Funds (2005 to 2013), The Flex-Funds (2006 to 2011), Meeder Financial (2007 to 2011), Huntington Strategy Shares (2012 to 2013), and Huntington Asset Advisors (2013); Vice President, Huntington National Bank (2001 to 2013) |
Jennifer L. Leamer | Since | Treasurer | V.P., Mutual Fund Controller of Ultimus Fund Solutions, LLC (2014 to present); Business Analyst of Ultimus Fund Solutions, LLC (2007 to 2014) |
33
STRALEM EQUITY FUND
BOARD OF TRUSTEES AND EXECUTIVE OFFICERS (Unaudited) (Continued)
Name, Address and Year of Birth | Position(s) held | Length of | Principal Occupation |
Executive Officers | |||
Bo J. Howell | Since | Secretary | V.P., Director of Fund Administration for Ultimus Fund Solutions, LLC (2014 to present); Counsel – Securities and Mutual Funds for Western & Southern Financial Group (2012 to 2014); U.S. Securities and Exchange Commission, Senior Counsel (2009 to 2012) |
Charles C. Black | Since | Chief Compliance Officer | Senior Compliance Officer of Ultimus Fund Solutions, LLC (2015 to present); Senior Compliance Manager for Touchstone Mutual Funds (2013 to 2015); Senior Compliance Manager for Fund Evaluation Group (2011 to 2013) |
Additional information about members of the Board and executive officers is available in the Fund’s Statement of Additional Information (“SAI”). To obtain a free copy of the SAI, please call 1-866-822-9555.
34
STRALEM EQUITY FUND
INVESTMENT ADVISER
Stralem & Company Incorporated
645 Madison Avenue
New York, NY 10022
Telephone (212) 888-8123
Fax (212) 888-8152
This report is prepared for the information of the Fund’s shareholders. It is not authorized for distribution to prospective investors in the Fund unless it is preceded or accompanied by a current summary prospectus and/or prospectus which each describe the Fund’s objectives, risks, policies, expenses and other important information. Investors are advised to read the summary prospectus and/or prospectus carefully before investing. Past performance is not indicative of future results. Current performance may be lower or higher than the data contained herein. For performance information current through the most recent month end, please visit the Fund’s website at www.stralemfund.com or call toll-free (866) 822-9555. The Fund can suffer losses as well as gains.
35
[This page intentionally left blank]
[This page intentionally left blank]

| Item 2. | Code of Ethics. |
| Item 3. | Audit Committee Financial Expert. |
| Item 4. | Principal Accountant Fees and Services. |
| (a) | Audit Fees. The aggregate fees billed for professional services rendered by the principal accountant for the audit of the registrant’s annual financial statements or for services that are normally provided by the accountant in connection with statutory and regulatory filings or engagements were $12,500 and $36,000 with respect to the registrant’s fiscal years ended October 31, 2016 and October 31, 2015, respectively. |
| (b) | Audit-Related Fees. The aggregate fees billed for assurance and related services by the principal accountant that are reasonably related to the performance of the audit of the registrant’s financial statements and are not reported under paragraph (a) of this Item were $6,400 and $16,200 with respect to the fiscal years ended October 31, 2016 and October 31, 2015, respectively. The services comprising these fees are related to the review of the prospectus, semi-annual financial statements and periodic security counts, and attendance at audit committee meetings. |
| (c) | Tax Fees. The aggregate fees billed for professional services rendered by the principal accountant for tax compliance, tax advice, and tax planning were $2,500 and $13,000 with respect to the registrant’s fiscal years ended October 31, 2016 and October 31, 2015, respectively. The services comprising these fees relate to tax preparation of the registrant’s federal income and excise tax returns. |
| (d) | All Other Fees. No fees were billed in either of the last two fiscal years for products and services provided by the principal accountant, other than the services reported in paragraphs (a) through (c) of this Item. |
| (e)(1) | The audit committee has not adopted pre-approval policies and procedures described in paragraph (c)(7) of Rule 2-01 of Regulation S-X. |
| (e)(2) | All of the services described in paragraph (b) through (d) of this Item were approved by the audit committee pursuant to paragraph (c)(7)(i)(C) of Rule 2-01 of Regulation S-X. |
| (f) | Less than 50% of hours expended on the principal accountant’s engagement to audit the registrant’s financial statements for the most recent fiscal year were attributed to work performed by persons other than the principal accountant’s full-time, permanent employees. |
| (g) | With respect to the fiscal years ended October 31, 2016 and October 31, 2015, aggregate non-audit fees of $13,400 and $13,000, respectively, were billed by the registrant’s accountant for services rendered to the registrant. With respect to the fiscal years ended October 31, 2016 and October 31, 2015, aggregate non-audit fees of $0 and $21,500, respectively, were billed by the registrant’s accountant for services rendered to the registrant’s investment adviser (not including any sub-adviser whose role is primarily portfolio management and is subcontracted with or overseen by another investment adviser), and any entity controlling, controlled by, or under common control with the adviser that provides ongoing services to the registrant. |
| (h) | The registrant’s Committee of Independent Trustees of the Board of Trustees determined that the provision of non-audit services that were rendered to the registrant’s investment adviser (not including any sub-adviser whose role is primarily portfolio management and is subcontracted with or overseen by another investment adviser), and any entity controlling, controlled by, or under common control with the investment adviser that provides ongoing services to the registrant that were pre-approved pursuant to paragraph (c)(7)(ii) of Rule 2-01 of Regulation S-X is compatible with maintaining the principal accountant’s independence. |
| Item 5. | Audit Committee of Listed Registrants. |
| Item 6. | Schedule of Investments. |
| Item 7. | Disclosure of Proxy Voting Policies and Procedures for Closed-End Management Investment Companies. |
| Item 8. | Portfolio Managers of Closed-End Management Investment Companies. |
| Item 9. | Purchases of Equity Securities by Closed-End Management Investment Company and Affiliated Purchasers. |
| Item 10. | Submission of Matters to a Vote of Security Holders. |
| Item 12. | Exhibits. |
| Exhibit 99.CODE ETH | Code of Ethics |
| Exhibit 99.CERT | Certifications required by Rule 30a-2(a) under the Act |
| Exhibit 99.906CERT | Certifications required by Rule 30a-2(b) under the Act |
| (Registrant) | Ultimus Managers Trust | ||
| By (Signature and Title)* | /s/ Frank L. Newbauer | ||
| Frank L. Newbauer, Assistant Secretary | |||
| Date | January 5, 2017 | ||
| Pursuant to the requirements of the Securities Exchange Act of 1934 and the Investment Company Act of 1940, this report has been signed below by the following persons on behalf of the registrant and in the capacities and on the dates indicated. | |||
| By (Signature and Title)* | /s/ David R. Carson | ||
| David R. Carson, Principal Executive Officer of Stralem Equity Fund | |||
| Date | January 5, 2017 | ||
| By (Signature and Title)* | /s/ Jennifer L. Leamer | ||
| Jennifer L. Leamer, Treasurer and Principal Accounting Officer | |||
| Date | January 5, 2017 | ||
* | Print the name and title of each signing officer under his or her signature. |