| OMB APPROVAL | ||
OMB Number: 3235-0570 | ||
Expires: August 31, 2020 | ||
Estimated average burden hours per response: 20.6 |
| Investment Company Act file number | 811-22680 |
| Ultimus Managers Trust |
| (Exact name of registrant as specified in charter) |
| 225 Pictoria Drive, Suite 450 Cincinnati, Ohio | 45246 |
| (Address of principal executive offices) | (Zip code) |
| Ultimus Fund Solutions, LLC 225 Pictoria Drive, Suite 450 Cincinnati, Ohio 45246 |
| (Name and address of agent for service) |
| Registrant's telephone number, including area code: | (513) 587-3400 |
| Date of fiscal year end: | July 31 | |
| Date of reporting period: | July 31, 2017 |
| Item 1. | Reports to Stockholders. |
KEMPNER MULTI-CAP DEEP VALUE
EQUITY FUND
Institutional Class (FIKDX)
Investor Class (FAKDX)
Annual Report
July 31, 2017
KEMPNER MULTI-CAP DEEP VALUE EQUITY FUND LETTER TO SHAREHOLDERS | September 11, 2017 |
Fund Objective
The Kempner Multi-Cap Deep Value Equity Fund seeks to generate a total pre-tax return, including capital growth and dividends, greater than the rate of inflation over a minimum three to five year period. For the fiscal year ended July 31, 2017 the Fund produced a total return of 16.30% (Institutional Class Shares) and 16.06% (Investor Class Shares), both net of fees. For the trailing three fiscal years ended July 31, 2017, the Fund produced a total return of 3.85% annualized (Institutional Class Shares) and 3.59% annualized (Investor Class Shares), both net of fees. The Headline CPI inflation rates over the periods were 1.73% for one year and 0.92% for three years compounded. Comparatively, over the same time periods the Lipper Multi Cap Value Funds Classification Index returned 14.91% for one year and 7.32% for three years annualized; and the S&P 500 Value Index returned 14.34% for one year and 8.83% for three years annualized.
U.S. Economic Commentary
The United States GDP in the first half of 2017 attained a 2.1% real growth with a slow first quarter at 1.4%, balanced by 3.0% in the second quarter ending June 30th. The question though, is where do we go from here?
We see multiple cross currents. On the strong side, in July 2017, service industries, as measured by the ISM (Institute for Supply Management) was actually quite weak but then strengthened to a strong 55.3% in August. Service industries account for roughly 90% of all U.S. economic activity. If this strength is continued, it’s quite telling.
Manufacturing, which is most of the rest, “expanded in August at the fastest pace in 6 years” according to Bloomberg. Additionally, August factory job increases to 36,000 was the largest since June 2011. These are clearly indications of strengthening in the U.S. economy.
However, on the other side, the overall job increase for August was a very low 115,000 and previous months’ numbers were adjusted down significantly. Wages remain stagnant, despite 9 years of recovery and it is unlikely they will increase very much in the near-term. Without significant wage increases, any high consumer confidences is still unlikely to result in substantially increased sales and goods demand.
And finally, at this writing, two major storms will affect the U.S. economy – Hurricane Harvey has hit; Hurricane Irma is about to. Note that these are in different parts of the U.S., therefore their effects will be quite widespread. What usually happens after a major hurricane is that overall economic activity is depressed for the next 6 weeks or so. For example, jobless claims will surge for several months. Then there is an economic resurgence from such things as auto replacement sales and the massive amount of building and infrastructure rebuild which is necessary. We do not expect this resurgence to take place until the middle of the 4th quarter, so the 3rd quarter will be much weaker than it could have been otherwise.
All in, we believe that the U.S. economy will slow down from here through the end of the year and average less than 2% growth for the entire year.
1
Overseas Economics Commentary
In brief, Europe is much stronger than it’s been since 2008 and Japan and China are powering ahead. There are few major countries in economic difficulty, except for Venezuela which is in a depression. However, North Korea could be a black swan for all world economy. There is no way to prepare for the worst that could happen there.
Portfolio Strategy
Our investment approach continues to be one of investing in deeply undervalued companies and selling when the underlying value becomes realized by other market participants and reflected in current price. The past several years of rising markets has therefore resulted in greater number of sale opportunities than purchase opportunities. Cash is always considered a buying reserve.
Over the past year we established positions in Gilead Sciences Inc. (GILD), Kroger Company (KR), Pfizer, Inc. (PFE), Roche Holdings Ltd. (RHHBY), Verizon Communications Inc. (VZ), William-Sonoma, Inc. (WSM) and Zimmer Biomet Holdings Inc. (ZBH). During the same time frame we added to our positions in Johnson Controls International PLC (JCI), National Oilwell Varco Inc. (NOV), Occidental Petroleum Corp. (OXY), Schlumberger Ltd. (SLB), and TEVA Pharmaceuticals Industries, Ltd ADR (TEVA). We reduced our positions in Applied Materials (AMAT), Boeing Company (BA), Annaly Capital Mgmt. Inc. (NLY), Capital One Financial Corp. (COF), Citigroup Inc. (C), Dow Chemical Co. (DOW), Lincoln National Corp. (LNC), Merck & Co. (MRK), Rio Tinto Plc. (RIO), Union Pacific Corp. (UNP), Wal-Mart Stores Inc. (WMT) and Zimmer Biomet Holdings Inc. (ZBH). Also during this time frame we sold entirely out of Allstate Corporation (ALL), Archer Daniels Midland (ADM), Dover Corporation (DOV), Ensco Plc ADS (ESV), Ericsson ADS (ERIC), Raytheon Company (RTN), and Sanofi ADS (SNY).
We continue to scour the equity universe to locate stocks which meet our investment criteria of: 1) a relatively low forecast P/E multiple, usually 15 or less, 2) a dividend yield is paid, or expected to be, 3) public debt, if any, is investment grade, 4) a minimum of $500 million market capitalization, and 5) current stock price is within 20% of the 52 week low price. In addition to meeting these criteria, stocks are quantitatively and qualitatively analyzed to determine company prospects and reasonableness of valuation.
During this 12-month period, our focus on energy stocks and financials provided us superior returns to the market in general and the S&P 500 Value Index during the same months.
We maintain our long-term focus in the Kempner Multi-Cap Deep Value Equity Fund on areas which are overlooked by the market. We are particularly interested at this point in values that may present themselves in the property and casualty insurance industry. Harris L. Kempner, Jr. and M. Shawn Gault are the portfolio managers for the Kempner Multi-Cap Deep Value Equity Fund.
2
Past performance is not predictive of future performance. Investment results and principal value will fluctuate so that shares, when redeemed, may be worth more or less than their original cost. Current performance may be higher or lower than the performance data quoted. Performance data current to the most recent month end are available by calling 1-800-665-9778.
An investor should consider the investment objectives, risks, charges and expenses of the Fund carefully before investing. The Fund’s prospectus contains this and other important information. To obtain a copy of the Fund’s prospectus please call 1-800-665-9778 and a copy will be sent to you free of charge. Please read the prospectus carefully before you invest. Kempner Multi-Cap Deep Value Equity Fund is distributed by Ultimus Fund Distributors, LLC.
This Letter to Shareholders seeks to describe some of the Adviser’s current opinions and views of the financial markets. Although the Adviser believes it has a reasonable basis for any opinions or views expressed, actual results may differ, sometimes significantly so, from those expected or expressed. The securities held by the Fund that are discussed in the Letter to Shareholders were held during the period covered by this Report. They do not comprise the entire investment portfolio of the Fund, may be sold at any time and may no longer be held by the Fund. For a complete list of securities held by the Fund as of July 31, 2017, please see the Schedule of Investments section of the annual report. The opinions of the Adviser with respect to those securities may change at any time.
Statements in the Letter to Shareholders that reflect projections or expectations for future financial or economic performance of the Fund and the market in general and statements of the Fund’s plans and objectives for future operations are forward-looking statements. No assurance can be given that actual results or events will not differ materially from those projected, estimated, assumed, or anticipated in any such forward-looking statements. Important factors that could result in such differences, in addition to factors noted with such forward-looking statements include, without limitation, general economic conditions, such as inflation, recession, and interest rates. Past performance is not a guarantee of future results.
3
KEMPNER MULTI-CAP DEEP VALUE EQUITY FUND
PERFORMANCE INFORMATION
July 31, 2017 (Unaudited)
Comparison of the Change in Value of a $500,000 Investment
in Kempner Multi-Cap Deep Value Equity Fund - Institutional Class
versus the S&P 500 Value Index*
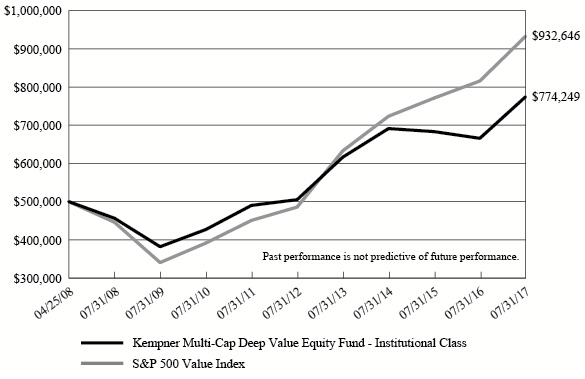
Average Annual Total Returns (for periods ended July 31, 2017) | ||||
1 Year | 5 Years | Since Inception (a) | ||
Kempner Multi-Cap Deep Value Equity Fund - Institutional Class (b) | 16.30% | 8.92% | 4.83% | |
S&P 500 Value Index | 14.34% | 13.94% | 6.96% | |
Kempner Multi-Cap Deep Value Equity Fund - Investor Class (b)(c) | 16.06% | 8.66% | 5.78% | |
S&P 500 Value Index | 14.34% | 13.94% | 8.62% | |
* | The graph is based on only Institutional Class; performance for Investor Class differs due to differences in inception dates. |
(a) | Institutional Class commenced operation on April 25, 2008 and Investor Class commenced operation on June 30, 2008. |
(b) | The total returns shown do not reflect the deduction of taxes that a shareholder would pay on Fund distributions or the redemption of Fund shares. |
(c) | Effective March 31, 2015, Class A Shares were re-designated as Investor Class. Prior to March 31, 2015, shareholders were charged a sales charge on purchases and redemptions of Class A Shares. The performance information provided for the period between inception date and March 30, 2015 represents the performance of Investor Class when they were called Class A Shares. The share class change had no impact on the Fund’s operations or investment policy. |
4
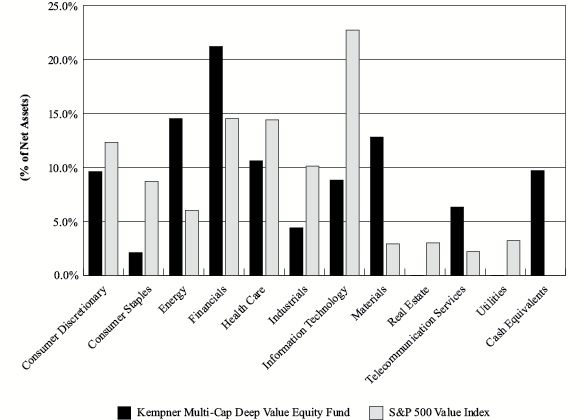
KEMPNER MULTI-CAP DEEP VALUE EQUITY FUND
PORTFOLIO INFORMATION
July 31, 2017 (Unaudited)
Sector Diversification (% of Net Assets)
Top 10 Investments
Security Description | % of Net Assets |
XL Group Ltd. | 5.9% |
Bank of America Corp. | 5.3% |
General Motors Co. | 5.2% |
Citigroup, Inc. | 5.2% |
Applied Materials, Inc. | 4.8% |
WestRock Co. | 4.5% |
Dow Chemical Co. (The) | 4.1% |
AT&T, Inc. | 4.1% |
Western Union Co. (The) | 4.0% |
Teva Pharmaceutical Industries Ltd. - ADR | 3.8% |
5
KEMPNER MULTI-CAP DEEP VALUE EQUITY FUND |
COMMON STOCKS — 90.2% | Shares | Value | ||||||
Consumer Discretionary — 9.6% | ||||||||
Automobiles — 8.0% | ||||||||
General Motors Co. | 121,200 | $ | 4,360,776 | |||||
Honda Motors Co. Ltd. - ADR | 82,900 | 2,322,858 | ||||||
6,683,634 | ||||||||
Specialty Retail — 1.6% | ||||||||
Williams-Sonoma, Inc. | 28,100 | 1,304,683 | ||||||
Consumer Staples — 2.1% | ||||||||
Food & Staples Retailing — 2.1% | ||||||||
Kroger Co. (The) | 38,600 | 946,472 | ||||||
Wal-Mart Stores, Inc. | 10,300 | 823,897 | ||||||
1,770,369 | ||||||||
Energy — 14.5% | ||||||||
Energy Equipment & Services — 5.9% | ||||||||
National Oilwell Varco, Inc. | 64,320 | 2,103,907 | ||||||
Schlumberger Ltd. | 41,100 | 2,819,460 | ||||||
4,923,367 | ||||||||
Oil, Gas & Consumable Fuels — 8.6% | ||||||||
BP plc - ADR | 87,800 | 3,085,292 | ||||||
Occidental Petroleum Corp. | 36,800 | 2,279,024 | ||||||
Royal Dutch Shell plc - Class A - ADR | 32,200 | 1,820,266 | ||||||
7,184,582 | ||||||||
Financials — 21.1% | ||||||||
Banks — 11.7% | ||||||||
Bank of America Corp. | 181,570 | 4,379,468 | ||||||
BB&T Corp. | 21,900 | 1,036,308 | ||||||
Citigroup, Inc. | 63,100 | 4,319,195 | ||||||
9,734,971 | ||||||||
Consumer Finance — 1.9% | ||||||||
Capital One Financial Corp. | 18,640 | 1,606,395 | ||||||
Insurance — 7.1% | ||||||||
Lincoln National Corp. | 13,967 | 1,020,429 | ||||||
XL Group Ltd. | 110,050 | 4,886,220 | ||||||
5,906,649 | ||||||||
Mortgage Real Estate Investment Trusts — 0.4% | ||||||||
Annaly Capital Management, Inc. | 24,000 | 288,720 | ||||||
Health Care — 10.6% | ||||||||
Biotechnology — 3.0% | ||||||||
Gilead Sciences, Inc. | 33,100 | 2,518,579 | ||||||
6
KEMPNER MULTI-CAP DEEP VALUE EQUITY FUND |
COMMON STOCKS — 90.2% (Continued) | Shares | Value | ||||||
Health Care — 10.6% (Continued) | ||||||||
Health Care Equipment & Supplies — 0.8% | ||||||||
Zimmer Biomet Holdings, Inc. | 5,500 | $ | 667,260 | |||||
Pharmaceuticals — 6.8% | ||||||||
Merck & Co., Inc. | 14,600 | 932,648 | ||||||
Pfizer, Inc. | 25,600 | 848,896 | ||||||
Roche Holding AG - ADR | 22,100 | 700,636 | ||||||
Teva Pharmaceutical Industries Ltd. - ADR | 98,000 | 3,152,660 | ||||||
5,634,840 | ||||||||
Industrials — 4.4% | ||||||||
Aerospace & Defense — 0.5% | ||||||||
Boeing Co. (The) | 1,560 | 378,238 | ||||||
Building Products — 1.7% | ||||||||
Johnson Controls International plc | 37,049 | 1,443,059 | ||||||
Road & Rail — 2.2% | ||||||||
Union Pacific Corp. | 18,000 | 1,853,280 | ||||||
Information Technology — 8.8% | ||||||||
IT Services — 4.0% | ||||||||
Western Union Co. (The) | 166,700 | 3,292,325 | ||||||
Semiconductors & Semiconductor Equipment — 4.8% | ||||||||
Applied Materials, Inc. | 90,660 | 4,017,145 | ||||||
Materials — 12.8% | ||||||||
Chemicals — 6.5% | ||||||||
Dow Chemical Co. (The) | 53,200 | 3,417,568 | ||||||
Mosaic Co. (The) | 83,150 | 2,007,241 | ||||||
5,424,809 | ||||||||
Containers & Packaging — 4.5% | ||||||||
WestRock Co. | 64,700 | 3,715,074 | ||||||
Metals & Mining — 1.8% | ||||||||
Rio Tinto plc - ADR | 31,600 | 1,497,208 | ||||||
Telecommunication Services — 6.3% | ||||||||
Diversified Telecommunication Services — 6.3% | ||||||||
AT&T, Inc. | 86,692 | 3,380,988 | ||||||
Verizon Communications, Inc. | 38,600 | 1,868,240 | ||||||
5,249,228 | ||||||||
Total Common Stocks (Cost $71,945,995) | $ | 75,094,415 | ||||||
7
KEMPNER MULTI-CAP DEEP VALUE EQUITY FUND |
MONEY MARKET FUNDS — 9.0% | Shares | Value | ||||||
BlackRock Liquidity Funds - Treasury Trust Fund - Institutional Shares, 0.86% (a) (Cost $7,461,272) | 7,461,272 | $ | 7,461,272 | |||||
Total Investments at Value — 99.2% (Cost $79,407,267) | $ | 82,555,687 | ||||||
Other Assets in Excess of Liabilities — 0.8% | 628,132 | |||||||
Net Assets — 100.0% | $ | 83,183,819 | ||||||
(a) | The rate shown is the 7-day effective yield as of July 31, 2017. |
ADR - American Depositary Receipt | |
See accompanying notes to financial statements. |
8
KEMPNER MULTI-CAP DEEP VALUE EQUITY FUND |
ASSETS | ||||
Investments in securities: | ||||
At acquisition cost | $ | 79,407,267 | ||
At value (Note 2) | $ | 82,555,687 | ||
Receivable for capital shares sold | 492 | |||
Receivable for investment securities sold | 1,417,416 | |||
Dividends receivable | 113,605 | |||
Foreign tax reclaims receivable | 6,443 | |||
Other assets | 23,272 | |||
Total assets | 84,116,915 | |||
LIABILITIES | ||||
Payable for investment securities purchased | 851,033 | |||
Payable to Adviser (Note 4) | 42,687 | |||
Payable to administrator (Note 4) | 14,210 | |||
Accrued distribution fees (Note 4) | 3,437 | |||
Other accrued expenses | 21,729 | |||
Total liabilities | 933,096 | |||
NET ASSETS | $ | 83,183,819 | ||
NET ASSETS CONSIST OF: | ||||
Paid-in capital | $ | 78,421,825 | ||
Undistributed net investment income | 3,797 | |||
Undistributed net realized gains from investments | 1,609,777 | |||
Net unrealized appreciation on investments | 3,148,420 | |||
NET ASSETS | $ | 83,183,819 | ||
NET ASSET VALUE PER SHARE: | ||||
INSTITUTIONAL CLASS | ||||
Net assets applicable to Institutional Class | $ | 67,863,147 | ||
Institutional Class shares of beneficial interest outstanding (unlimited number of shares authorized, no par value) | 6,478,598 | |||
Net asset value, offering price and redemption price per share (Note 2) | $ | 10.47 | ||
INVESTOR CLASS | ||||
Net assets applicable to Investor Class | $ | 15,320,672 | ||
Investor Class shares of beneficial interest outstanding (unlimited number of shares authorized, no par value) | 1,464,013 | |||
Net asset value, offering price and redemption price per share (Note 2) | $ | 10.46 | ||
See accompanying notes to financial statements. |
9
KEMPNER MULTI-CAP DEEP VALUE EQUITY FUND |
INVESTMENT INCOME | ||||
Dividend income | $ | 2,584,625 | ||
Foreign withholding taxes on dividends | (48,438 | ) | ||
Total investment income | 2,536,187 | |||
EXPENSES | ||||
Investment advisory fees (Note 4) | 531,375 | |||
Administration fees (Note 4) | 81,759 | |||
Distribution fees - Investor Class (Note 4) | 37,524 | |||
Professional fees | 33,968 | |||
Registration and filing fees | 32,519 | |||
Transfer agent fees (Note 4) | 31,880 | |||
Fund accounting fees (Note 4) | 11,122 | |||
Trustees’ fees and expenses (Note 4) | 8,604 | |||
Custody and bank service fees | 7,277 | |||
Printing of shareholder reports | 6,323 | |||
Compliance fees (Note 4) | 3,806 | |||
Insurance expense | 1,436 | |||
Other expenses | 6,702 | |||
Total expenses | 794,295 | |||
NET INVESTMENT INCOME | 1,741,892 | |||
REALIZED AND UNREALIZED GAINS ON INVESTMENTS | ||||
Net realized gains from investments | 2,885,915 | |||
Net change in unrealized appreciation (depreciation) on investments | 9,006,006 | |||
NET REALIZED AND UNREALIZED GAINS ON INVESTMENTS | 11,891,921 | |||
NET INCREASE IN NET ASSETS RESULTING FROM OPERATIONS | $ | 13,633,813 | ||
See accompanying notes to financial statements. |
10
KEMPNER MULTI-CAP DEEP VALUE EQUITY FUND |
| Year | Year | ||||||
FROM OPERATIONS | ||||||||
Net investment income | $ | 1,741,892 | $ | 2,829,824 | ||||
Net realized gains (losses) from investments | 2,885,915 | (1,199,480 | ) | |||||
Net change in unrealized appreciation (depreciation) on investments | 9,006,006 | (7,208,932 | ) | |||||
Net increase (decrease) in net assets resulting from operations | 13,633,813 | (5,578,588 | ) | |||||
DISTRIBUTIONS TO SHAREHOLDERS (Note 2) | ||||||||
From net investment income, Institutional Class | (1,478,112 | ) | (2,481,674 | ) | ||||
From net investment income, Investor Class | (259,983 | ) | (369,480 | ) | ||||
From net realized gains, Institutional Class | — | (8,264,723 | ) | |||||
From net realized gains, Investor Class | — | (1,385,701 | ) | |||||
From return of capital, Institutional Class | — | (7,274 | ) | |||||
From return of capital, Investor Class | — | (1,184 | ) | |||||
Decrease in net assets from distributions to shareholders | (1,738,095 | ) | (12,510,036 | ) | ||||
CAPITAL SHARE TRANSACTIONS | ||||||||
Institutional Class | ||||||||
Proceeds from shares sold | 1,725,001 | 2,936,631 | ||||||
Net asset value of shares issued in reinvestment of distributions to shareholders | 59,077 | 823,762 | ||||||
Payments for shares redeemed | (39,679,018 | ) | (23,371,191 | ) | ||||
Net decrease in Institutional Class net assets from capital share transactions | (37,894,940 | ) | (19,610,798 | ) | ||||
Investor Class | ||||||||
Proceeds from shares sold | 134,182 | 1,368,357 | ||||||
Net asset value of shares issued in reinvestment of distributions to shareholders | 249,704 | 1,563,852 | ||||||
Payments for shares redeemed | (1,926,407 | ) | (6,569,922 | ) | ||||
Net decrease in Investor Class net assets from capital share transactions | (1,542,521 | ) | (3,637,713 | ) | ||||
TOTAL DECREASE IN NET ASSETS | (27,541,743 | ) | (41,337,135 | ) | ||||
NET ASSETS | ||||||||
Beginning of year | 110,725,562 | 152,062,697 | ||||||
End of year | $ | 83,183,819 | $ | 110,725,562 | ||||
UNDISTRIBUTED NET INVESTMENT INCOME | $ | 3,797 | $ | — | ||||
See accompanying notes to financial statements. |
11
KEMPNER MULTI-CAP DEEP VALUE EQUITY FUND |
| Year | Year | ||||||
CAPITAL SHARE ACTIVITY | ||||||||
Institutional Class | ||||||||
Shares sold | 169,617 | 327,800 | ||||||
Shares issued in reinvestment of distributions to shareholders | 5,976 | 94,303 | ||||||
Shares redeemed | (4,140,076 | ) | (2,536,892 | ) | ||||
Net decrease in shares outstanding | (3,964,483 | ) | (2,114,789 | ) | ||||
Shares outstanding at beginning of year | 10,443,081 | 12,557,870 | ||||||
Shares outstanding at end of year | 6,478,598 | 10,443,081 | ||||||
Investor Class | ||||||||
Shares sold | 13,381 | 140,508 | ||||||
Shares issued in reinvestment of distributions to shareholders | 25,278 | 179,289 | ||||||
Shares redeemed | (197,183 | ) | (741,749 | ) | ||||
Net decrease in shares outstanding | (158,524 | ) | (421,952 | ) | ||||
Shares outstanding at beginning of year | 1,622,537 | 2,044,489 | ||||||
Shares outstanding at end of year | 1,464,013 | 1,622,537 | ||||||
See accompanying notes to financial statements. |
12
KEMPNER MULTI-CAP DEEP VALUE EQUITY FUND |
Per Share Data for a Share Outstanding Throughout Each Year |
| Year | Year | Year | Year | Year | |||||||||||||||
Net asset value at beginning of year | $ | 9.18 | $ | 10.42 | $ | 11.53 | $ | 10.69 | $ | 8.99 | ||||||||||
Income (loss) from investment operations: | ||||||||||||||||||||
Net investment income | 0.19 | 0.21 | 0.18 | 0.18 | 0.16 | |||||||||||||||
Net realized and unrealized gains (losses) on investments | 1.29 | (0.54 | ) | (0.29 | ) | 1.09 | 1.79 | |||||||||||||
Total from investment operations | 1.48 | (0.33 | ) | (0.11 | ) | 1.27 | 1.95 | |||||||||||||
Less distributions: | ||||||||||||||||||||
Dividends from net investment income | (0.19 | ) | (0.21 | )(a) | (0.19 | ) | (0.18 | ) | (0.17 | ) | ||||||||||
Distributions from net realized gains | — | (0.70 | ) | (0.81 | ) | (0.25 | ) | (0.08 | ) | |||||||||||
Total distributions | (0.19 | ) | (0.91 | ) | (1.00 | ) | (0.43 | ) | (0.25 | ) | ||||||||||
Net asset value at end of year | $ | 10.47 | $ | 9.18 | $ | 10.42 | $ | 11.53 | $ | 10.69 | ||||||||||
Total return (b) | 16.30 | % | (2.56 | %) | (1.16 | %) | 12.14 | % | 22.03 | % | ||||||||||
Net assets at end of year (000's) | $ | 67,863 | $ | 95,846 | $ | 130,791 | $ | 175,593 | $ | 174,867 | ||||||||||
Ratios/supplementary data: | ||||||||||||||||||||
Ratio of total expenses to average net assets | 0.84 | % | 0.78 | % | 0.77 | % | 0.77 | % | 0.77 | % | ||||||||||
Ratio of net investment income to average net assets | 1.98 | % | 2.30 | % | 1.66 | % | 1.60 | % | 1.70 | % | ||||||||||
Portfolio turnover rate | 18 | % | 10 | % | 40 | % | 22 | % | 18 | % | ||||||||||
(a) | Includes a return of capital of less than $0.01 per share. |
(b) | Total return is a measure of the change in value of an investment in the Fund over the periods covered. The returns shown do not reflect the deduction of taxes a shareholder would pay on Fund distributions, if any, or the redemption of Fund shares.
|
See accompanying notes to financial statements. | |
13
KEMPNER MULTI-CAP DEEP VALUE EQUITY FUND |
Per Share Data for a Share Outstanding Throughout Each Year |
| Year | Year | Year | Year | Year | |||||||||||||||
Net asset value at beginning of year | $ | 9.17 | $ | 10.40 | $ | 11.53 | $ | 10.69 | $ | 8.99 | ||||||||||
Income (loss) from investment operations: | ||||||||||||||||||||
Net investment income | 0.17 | 0.19 | 0.15 | 0.15 | 0.14 | |||||||||||||||
Net realized and unrealized gains (losses) on investments | 1.29 | (0.53 | ) | (0.31 | ) | 1.10 | 1.79 | |||||||||||||
Total from investment operations | 1.46 | (0.34 | ) | (0.16 | ) | 1.25 | 1.93 | |||||||||||||
Less distributions: | ||||||||||||||||||||
Dividends from net investment income | (0.17 | ) | (0.19 | )(a) | (0.16 | ) | (0.16 | ) | (0.15 | ) | ||||||||||
Distributions from net realized gains | — | (0.70 | ) | (0.81 | ) | (0.25 | ) | (0.08 | ) | |||||||||||
Total distributions | (0.17 | ) | (0.89 | ) | (0.97 | ) | (0.41 | ) | (0.23 | ) | ||||||||||
Net asset value at end of year | $ | 10.46 | $ | 9.17 | $ | 10.40 | $ | 11.53 | $ | 10.69 | ||||||||||
Total return (b) | 16.06 | % | (2.70 | %) | (1.56 | %) | 11.90 | % | 21.76 | % | ||||||||||
Net assets at end of year (000's) | $ | 15,321 | $ | 14,880 | $ | 21,272 | $ | 20,942 | $ | 21,217 | ||||||||||
Ratios/supplementary data: | ||||||||||||||||||||
Ratio of total expenses to average net assets | 1.09 | % | 1.03 | % | 1.02 | % | 1.02 | % | 1.02 | % | ||||||||||
Ratio of net investment income to average net assets | 1.70 | % | 2.05 | % | 1.37 | % | 1.35 | % | 1.47 | % | ||||||||||
Portfolio turnover rate | 18 | % | 10 | % | 40 | % | 22 | % | 18 | % | ||||||||||
(a) | Includes a return of capital of less than $0.01 per share. |
(b) | Total return is a measure of the change in value of an investment in the Fund over the periods covered. The returns shown do not reflect the deduction of taxes a shareholder would pay on Fund distributions, if any, or the redemption of Fund shares.
|
See accompanying notes to financial statements. | |
14
KEMPNER MULTI-CAP DEEP VALUE EQUITY FUND
NOTES TO FINANCIAL STATEMENTS
July 31, 2017
1. Organization
Kempner Multi-Cap Deep Value Equity Fund (the “Fund”) is a diversified series of Ultimus Managers Trust (the “Trust”). The Trust is an open-end management investment company registered under the Investment Company Act of 1940, as amended (the “1940 Act”). The Fund was reorganized into the Trust on April 27, 2017.
The Fund is a legal successor to the Frost Kempner Multi-Cap Deep Value Equity Fund (the “Predecessor Fund”), a series of The Advisors’ Inner Circle Fund II, an unaffiliated registered investment company. On April 27, 2017, the Fund (which had no prior activity or net assets) acquired all of the net assets of the Predecessor Fund pursuant to an agreement and plan of reorganization (the “Reorganization”).
The Reorganization was accomplished by a tax-free exchange of 6,791,538 Institutional Class shares and 1,498,512 Investor Class shares of the Predecessor Fund, valued at $69,164,427 and $15,243,918, respectively, for the exact same number of shares of the Fund having the same value. For financial reporting purposes, assets received and shares issued by the Fund were recorded at fair value; however, the cost basis of the investments received from the Predecessor Fund was carried forward to align ongoing reporting of the Fund’s realized and unrealized gains and losses with amounts distributable to shareholders for tax purposes. Immediately prior to the Reorganization, the net assets of the Predecessor Fund were $84,408,345, including $3,013,138 of unrealized appreciation, $3,076 of distributions in excess of net investment income, and $632,144 of accumulated realized losses.
The Predecessor Fund commenced operations on April 25, 2008. The Fund has succeeded to the accounting and performance history of the Predecessor Fund. The Fund’s investment objective is to seek to generate a total pre-tax return, including capital growth and dividends, that is greater than the rate of inflation over a three-to-five year period.
The Fund currently offers two classes of shares: Institutional Class shares (sold without any sales loads and distribution and/or shareholder servicing fees and requiring a $500,000 initial investment) and Investor Class shares (sold without any sales loads, but subject to a distribution and/or shareholder servicing fee of up to 0.25% of the average daily net assets attributable to Investor Class shares, and requiring a $500 initial investment). Each share class represents an ownership interest in the same investment portfolio.
2. Significant Accounting Policies
In October 2016, the U.S. Securities and Exchange Commission (the “SEC”) adopted amendments to Regulation S-X which will impact financial statement presentation, particularly the presentation of derivative investments. Many of the Regulation S-X amendments are generally consistent with the Fund’s current financial statement presentation; therefore, management has evaluated the new standards and is in a position to be able to comply with the amendments effective August 1, 2017.
15
KEMPNER MULTI-CAP DEEP VALUE EQUITY FUND |
The following is a summary of the Fund’s significant accounting policies. The policies are in conformity with accounting principles generally accepted in the United States of America (“GAAP”). As an investment company, as defined in Financial Accounting Standards Board (“FASB”) Accounting Standards Update 2013-08, the Fund follows accounting and reporting guidance under FASB Accounting Standards Codification Topic 946, “Financial Services – Investment Companies.”
Securities valuation – The Fund values its portfolio securities at market value as of the close of regular trading on the New York Stock Exchange (the “NYSE”) (normally 4:00 p.m. Eastern time) on each business day the NYSE is open for business. The Fund values its listed securities on the basis of the security’s last sale price on the security’s primary exchange, if available, otherwise at the exchange’s most recently quoted mean price. NASDAQ-listed securities are valued at the NASDAQ Official Closing Price. In the event that market quotations are not readily available or are considered unreliable due to market or other events, the Fund values its securities and other assets at fair value in accordance with procedures established by and under the general supervision of the Board of Trustees (the “Board”). Under these procedures, the securities will be classified as Level 2 or 3 within the fair value hierarchy (see below), depending on the inputs used. Unavailable or unreliable market quotes may be due to the following factors: a substantial bid-ask spread; infrequent sales resulting in stale prices; insufficient trading volume; small trade sizes; a temporary lapse in any reliable pricing source; and actions of the securities or futures markets, such as the suspension or limitation of trading. As a result, the prices of securities used to calculate the Fund’s net asset value (“NAV”) may differ from quoted or published prices for the same securities.
GAAP establishes a single authoritative definition of fair value, sets out a framework for measuring fair value, and requires additional disclosures about fair value measurements.
Various inputs are used in determining the value of the Fund’s investments. These inputs are summarized in the three broad levels listed below:
• | Level 1 – quoted prices in active markets for identical securities |
• | Level 2 – other significant observable inputs |
• | Level 3 – significant unobservable inputs |
The inputs or methods used for valuing securities are not necessarily an indication of the risks associated with investing in those securities. The inputs used to measure fair value may fall into different levels of the fair value hierarchy. In such cases, for disclosure purposes, the level in the fair value hierarchy within which the fair value measurement falls in its entirety is determined based on the lowest level input that is significant to the fair value measurement.
16
KEMPNER MULTI-CAP DEEP VALUE EQUITY FUND |
The following is a summary of the inputs used to value the Fund’s investments as of July 31, 2017:
| Level 1 | Level 2 | Level 3 | Total | ||||||||||||
Common Stocks | $ | 75,094,415 | $ | — | $ | — | $ | 75,094,415 | ||||||||
Money Market Funds | 7,461,272 | — | — | 7,461,272 | ||||||||||||
Total | $ | 82,555,687 | $ | — | $ | — | $ | 82,555,687 | ||||||||
Refer to the Fund’s Schedule of Investments for a listing of securities by industry type. As of July 31, 2017, the Fund did not have any transfers between Levels. In addition, the Fund did not hold any derivative instruments or any assets or liabilities that were measured at fair value on a recurring basis using significant unobservable inputs (Level 3) as of July 31, 2017. It is the Fund’s policy to recognize transfers between Levels at the end of the reporting period.
Share valuation – The NAV per share of each class of the Fund is calculated daily by dividing the total value of the assets attributable to that class, less liabilities attributable to that class, by the number of shares outstanding of that class. The offering price and redemption price per share of each class of the Fund is equal to the NAV per share of such class.
Investment income – Dividend income is recorded on the ex-dividend date. Interest income is accrued as earned. Withholding taxes on foreign dividends have been recorded in accordance with the Fund’s understanding of the appropriate country’s rules and tax rates.
Security transactions – Security transactions are accounted for on the trade date. Realized gains and losses on securities sold are determined on a specific identification basis.
Common expenses – Common expenses of the Trust are allocated among the Fund and the other series of the Trust based on the relative net assets of each series or the nature of the services performed and the relative applicability to each series.
Distributions to shareholders – Effective August 1, 2017, the Fund intends to declare and distribute net investment income dividends, if any, on a quarterly basis. Prior to August 1, 2017, the Fund declared and distributed net investment income dividends, if any, on a monthly basis. In addition, the Fund will declare and distribute net realized capital gains, if any, on an annual basis. The amount of such dividends and distributions are determined in accordance with federal income tax regulations, which may differ from GAAP. Dividends and distributions to shareholders are recorded on ex-dividend date. The tax character of distributions paid to shareholders by the Fund during the years ended July 31, 2017 and 2016 was as follows:
Years | Ordinary | Long-Term | Return | Total | ||||||||||||
7/31/2017 | $ | 1,738,095 | $ | — | $ | — | $ | 1,738,095 | ||||||||
7/31/2016 | $ | 4,000,969 | $ | 8,500,609 | $ | 8,458 | $ | 12,510,036 | ||||||||
17
KEMPNER MULTI-CAP DEEP VALUE EQUITY FUND |
Estimates – The preparation of financial statements in conformity with GAAP requires management to make estimates and assumptions that affect the reported amounts of assets and liabilities and disclosure of contingent assets and liabilities as of the date of the financial statements and the reported amounts of income and expenses during the reporting period. Actual results could differ from those estimates.
Federal income tax – The Fund has qualified and intends to continue to qualify as a regulated investment company under the Internal Revenue Code of 1986 (the “Code”). Qualification generally will relieve the Fund of liability for federal income taxes to the extent 100% of its net investment income and net realized capital gains are distributed in accordance with the Code.
In order to avoid imposition of the excise tax applicable to regulated investment companies, it is also the Fund’s intention to declare as dividends in each calendar year at least 98% of its net investment income (earned during the calendar year) and 98.2% of its net realized capital gains (earned during the twelve months ended October 31) plus undistributed amounts from prior years.
The following information is computed on a tax basis for each item as of July 31, 2017:
Tax cost of portfolio investments | $ | 79,504,314 | ||
Gross unrealized appreciation | $ | 10,730,937 | ||
Gross unrealized depreciation | (7,679,564 | ) | ||
Net unrealized appreciation | 3,051,373 | |||
Undistributed ordinary income | 3,797 | |||
Undistributed long-term capital gains | 1,706,824 | |||
Distributable earnings | $ | 4,761,994 |
The difference between the federal income tax cost of portfolio investments and the financial statement cost of portfolio investments is due to certain timing differences in the recognition of capital gains or losses under income tax regulations and GAAP. These “book/tax” differences are temporary in nature and are primarily due to the tax deferral of losses on wash sales.
During the year ended July 31, 2017, the Fund utilized short-term and long-term capital loss carryforwards in the amounts of $713,192 and $465,899, respectively, to offset current year realized gains.
The Fund recognizes the tax benefits or expenses of uncertain tax positions only when the position is “more likely than not” of being sustained assuming examination by tax authorities. Management has reviewed the Fund’s tax positions for all open tax periods (periods ended July 31, 2014 through July 31, 2017) and has concluded that no provision for unrecognized tax benefits or expenses is required in these financial statements. The Fund identifies its major tax jurisdiction as U.S. Federal.
18
KEMPNER MULTI-CAP DEEP VALUE EQUITY FUND |
3. Investment Transactions
During the year ended July 31, 2017, cost of purchases and proceeds from sales of investment securities, other than short-term investments, amounted to $14,262,045 and $46,683,680, respectively.
4. Transactions with Related Parties
INVESTMENT ADVISORY AGREEMENT
Effective April 27, 2017, the Fund’s investments are managed by Kempner Capital Management, Inc. (the “Adviser”) pursuant to the terms of an Investment Advisory Agreement. The Fund pays the Adviser an investment advisory fee, computed and accrued daily and paid monthly, at the annual rate of 0.59% of average daily net assets. During the year ended July 31, 2017, the Adviser earned $130,808 in advisory fees. Prior to April 27, 2017, the Predecessor Fund was managed by Frost Investment Advisors, LLC (“Frost”) and sub-advised by the Adviser. Fees were computed and accrued daily and paid monthly, at the annual rate of 0.59% of average daily net assets. During the year ended July 31, 2017, Frost earned $400,567 of advisory fees. The Adviser was paid fees by Frost out of the advisory fees that it received from the Fund.
The Adviser has agreed contractually, until at least November 30, 2018, to reduce advisory fees and reimburse other expenses to the extent necessary to limit total annual fund operating expenses (exclusive of brokerage costs, taxes, interest, Acquired Fund fees and expenses, costs to organize the Fund, extraordinary expenses such as litigation and merger or reorganization costs and other expenses not incurred in the ordinary course of the Fund’s business and amounts, if any, payable pursuant to a plan adopted in accordance with Rule 12b-1 under the 1940 Act) to an amount not exceeding 1.05% and 1.30% of average daily net assets for Institutional Class and Investor Class shares of the Fund, respectively.
Advisory fee reductions and expense reimbursements by the Adviser are subject to repayment by the Fund for a period of three years after such fees and expenses were incurred, provided that the repayments do not cause the Fund’s total annual fund operating expenses to exceed the lesser of (i) the expense limitation then in effect, if any, and (ii) the expense limitation in effect at the time the expenses to be repaid were incurred. Prior to November 30, 2018, the agreement to limit expenses of the Fund may not be modified or terminated without the approval of the Fund’s Board. This agreement will terminate automatically if the Investment Advisory Agreement is terminated.
OTHER SERVICE PROVIDERS
Effective April 27, 2017, Ultimus Fund Solutions, LLC (“Ultimus”) provides administration, fund accounting, compliance and transfer agency services to the Fund. The Fund pays Ultimus fees in accordance with the agreements for such services. In addition, the Fund pays out-of-pocket expenses including, but not limited to, postage, supplies and costs of pricing the Fund’s portfolio securities. During the year ended July 31, 2017, Ultimus earned $42,129 for such services. Prior to April 27, 2017, SEI Investments Global Fund Services (“SEI”)
19
KEMPNER MULTI-CAP DEEP VALUE EQUITY FUND |
provided administration and fund accounting and DST Systems, Inc. (“DST”) provided transfer agency services to the Predecessor Fund. During the year ended July 31, 2017, SEI and DST earned $60,502 and $25,130, respectively, for such services.
Effective April 27, 2017, under the terms of a Distribution Agreement with the Trust, Ultimus Fund Distributors, LLC (the “Distributor”) serves as principal underwriter to the Fund. The Distributor is a wholly-owned subsidiary of Ultimus. The Distributor is compensated partially by the Adviser and partially by the Investor Class shares of the Fund for acting as principal underwriter. Prior to April 27, 2017, SEI Investments Distribution Co. served as the principal underwriter to the Predecessor Fund.
A Trustee and certain officers of the Trust are also officers of Ultimus and/or the Distributor.
DISTRIBUTION PLAN
The Fund has adopted a plan of distribution (the “Plan”), pursuant to Rule 12b-1 under the 1940 Act, which permits Investor Class shares of the Fund to directly incur or reimburse the Fund’s principal underwriter for certain expenses related to the distribution of Investor Class shares. The annual limitation for payment of expenses pursuant to the Plan is 0.25% of the Fund’s average daily net assets allocable to Investor Class shares. The Fund has not adopted a plan of distribution with respect to Institutional Class shares. During the year ended July 31, 2017, Investor Class shares of the Fund incurred $37,524 of distribution fees under the Plan.
TRUSTEE COMPENSATION
Effective April 27, 2017, each Trustee who is not an “interested person” of the Trust (“Independent Trustee”) receives a $1,000 annual retainer from the Fund, paid quarterly, except for the Board Chair who receives a $1,200 annual retainer from the Fund, paid quarterly. Each Independent Trustee also receives from the Fund a fee of $500 for each Board meeting attended plus reimbursement for travel and other meeting-related expenses. Prior to April 27, 2017, fees totaling $2,504 were paid to Trustees of The Advisors’ Inner Circle Fund II.
PRINCIPAL HOLDERS OF FUND SHARES
As of July 31, 2017, the following shareholders owned of record 5% or more of the outstanding shares of each class of the Fund:
Name of Record Owner | % Ownership |
Institutional Class | |
SEI Private Trust Company (for the benefit of its customers) | 97% |
Investor Class | |
SEI Private Trust Company (for the benefit of its customers) | 52% |
Carroll Kempner Goldstone | 14% |
James C. Kempner II | 14% |
Harris Bank NA | 7% |
20
KEMPNER MULTI-CAP DEEP VALUE EQUITY FUND |
A beneficial owner of 25% or more of the Fund’s outstanding shares may be considered a controlling person. That shareholder’s vote could have a more significant effect on matters presented at a shareholder’s meeting.
5. Contingencies and Commitments
The Fund indemnifies the Trust’s officers and Trustees for certain liabilities that might arise from their performance of their duties to the Fund. Additionally, in the normal course of business the Fund enters into contracts that contain a variety of representations and warranties and which provide general indemnifications. The Fund’s maximum exposure under these arrangements is unknown, as this would involve future claims that may be made against the Fund that have not yet occurred. However, based on experience, the Fund expects the risk of loss to be remote.
6. Subsequent Events
The Fund is required to recognize in the financial statements the effects of all subsequent events that provide additional evidence about conditions that existed as of the date of the Statement of Assets and Liabilities. For non-recognized subsequent events that must be disclosed to keep the financial statements from being misleading, the Fund is required to disclose the nature of the event as well as an estimate of its financial effect, or a statement that such an estimate cannot be made. Management has evaluated subsequent events through the issuance of these financial statements and has noted no such events.
21
KEMPNER MULTI-CAP DEEP VALUE EQUITY FUND
REPORT OF INDEPENDENT REGISTERED
PUBLIC ACCOUNTING FIRM
To the Board of Trustees of Ultimus Managers Trust
and the Shareholders of Kempner Multi-Cap Deep Value Equity Fund
We have audited the accompanying statement of assets and liabilities of Kempner Multi-Cap Deep Value Equity Fund, a series of shares of beneficial interest in Ultimus Managers Trust (formerly Frost Kempner Multi-Cap Deep Value Equity Fund and formerly a series of The Advisors’ Inner Circle Fund II), (the “Fund”) including the schedule of investments, as of July 31, 2017, and the related statements of operations and changes in net assets and the financial highlights for the year then ended. These financial statements and financial highlights are the responsibility of the Fund’s management. Our responsibility is to express an opinion on these financial statements and financial highlights based on our audit. The statement of changes in net assets and the financial highlights for each of the years presented through July 31, 2016 were audited by other auditors, whose report dated September 29, 2016 expressed an unqualified opinion on that financial statement and those financial highlights.
We conducted our audit in accordance with the standards of the Public Company Accounting Oversight Board (United States). Those standards require that we plan and perform the audit to obtain reasonable assurance about whether the financial statements and financial highlights are free of material misstatement. An audit includes examining, on a test basis, evidence supporting the amounts and disclosures in the financial statements. Our procedures included confirmation of securities owned as of July 31, 2017 by correspondence with the custodian and brokers. An audit also includes assessing the accounting principles used and significant estimates made by management, as well as evaluating the overall financial statement presentation. We believe that our audit provides a reasonable basis for our opinion.
In our opinion, the financial statements and financial highlights referred to above present fairly, in all material respects, the financial position of Kempner Multi-Cap Deep Value Equity Fund as of July 31, 2017, and the results of its operations, the changes in its net assets and its financial highlights for the year then ended, in conformity with accounting principles generally accepted in the United States of America.

BBD, LLP
Philadelphia, Pennsylvania
September 21, 2017
22
KEMPNER MULTI-CAP DEEP VALUE EQUITY FUND |
We believe it is important for you to understand the impact of costs on your investment. As a shareholder of the Fund, you incur ongoing costs, including management fees, class-specific expenses (such as distribution fees) and other operating expenses. The following examples are intended to help you understand your ongoing costs (in dollars) of investing in the Fund and to compare these costs with the ongoing costs of investing in other mutual funds.
A mutual fund’s ongoing costs are expressed as a percentage of its average net assets. This figure is known as the expense ratio. The expenses in the table below are based on an investment of $1,000 made at the beginning of the most recent period (February 1, 2017) and held until the end of the period (July 31, 2017).
The table below illustrates the Fund’s ongoing costs in two ways:
Actual fund return – This section helps you to estimate the actual expenses that you paid over the period. The “Ending Account Value” shown is derived from the Fund’s actual return, and the fourth column shows the dollar amount of operating expenses that would have been paid by an investor who started with $1,000 in the Fund. You may use the information here, together with the amount you invested, to estimate the expenses that you paid over the period.
To do so, simply divide your account value by $1,000 (for example, an $8,600 account value divided by $1,000 = 8.6), then multiply the result by the number given for the Fund under the heading “Expenses Paid During Period.”
Hypothetical 5% return – This section is intended to help you compare the Fund’s ongoing costs with those of other mutual funds. It assumes that the Fund had an annual return of 5% before expenses during the period shown, but that the expense ratio is unchanged. In this case, because the return used is not the Fund’s actual return, the results do not apply to your investment. The example is useful in making comparisons because the SEC requires all mutual funds to calculate expenses based on a 5% return. You can assess the Fund’s ongoing costs by comparing this hypothetical example with the hypothetical examples that appear in shareholder reports of other funds.
Note that expenses shown in the table are meant to highlight and help you compare ongoing costs only. The Fund does not charge transaction fees, such as purchase or redemption fees, nor does it carry a “sales load.”
The calculations assume no shares were bought or sold during the period. Your actual costs may have been higher or lower, depending on the amount of your investment and the timing of any purchases or redemptions.
23
KEMPNER MULTI-CAP DEEP VALUE EQUITY FUND |
More information about the Fund’s expenses can be found in this report. For additional information on operating expenses and other shareholder costs, please refer to the Fund’s prospectus.
| Beginning | Ending | Expense Ratio(a) | Expenses Period(b) |
Institutional Class | ||||
Based on Actual | $1,000.00 | $1,051.10 | 0.89% | $4.53 |
Based on Hypothetical 5% Return (before expenses) | $1,000.00 | $1,020.38 | 0.89% | $4.46 |
Investor Class | ||||
Based on Actual | $1,000.00 | $1,048.90 | 1.14% | $5.79 |
Based on Hypothetical 5% Return (before expenses) | $1,000.00 | $1,019.14 | 1.14% | $5.71 |
(a) | Annualized, based on the Fund’s most recent one-half year expenses. |
(b) | Expenses are equal to the Fund’s annualized expense ratio multiplied by the average account value over the period, multiplied by 181/365 (to reflect the one-half year period). |
CHANGE IN INDEPENDENT AUDITORS (Unaudited)
On April 27, 2017, in conjunction with the Reorganization into the Ultimus Managers Trust, BBD, LLP (“BBD”) was appointed as the independent auditor for the Fund. The Predecessor Fund was audited by Ernst & Young LLP (“EY”).
EY’s reports on the Predecessor Fund’s financial statements for the prior two fiscal years did not contain an adverse opinion or a disclaimer of opinion, and were not qualified or modified as to uncertainty, audit scope or accounting principles. During such fiscal years, and through the date of EY’s replacement, there were no disagreements between the Predecessor Fund and EY on any matter of accounting principles or practices, financial statement disclosure, or auditing scope or procedures, which disagreements, if not resolved to the satisfaction of EY, would have caused it to make reference to the subject matter of the disagreements in conjunction with its reports on the financial statements for such years.
24
KEMPNER MULTI-CAP DEEP VALUE EQUITY FUND |
A description of the policies and procedures that the Fund uses to vote proxies relating to portfolio securities is available without charge upon request by calling toll-free 1-800-665-9778, or on the SEC’s website at http://www.sec.gov. Information regarding how the Fund voted proxies relating to portfolio securities during the most recent 12-month period ended June 30 is available without charge upon request by calling toll-free 1-800-665-9778, or on the SEC’s website at http://www.sec.gov.
The Trust files a complete listing of portfolio holdings for the Fund with the SEC as of the end of the first and third quarters of each fiscal year on Form N-Q. These filings are available upon request by calling 1-800-665-9778. Furthermore, you may obtain a copy of the filings on the SEC’s website at http://www.sec.gov. The Trust’s Forms N-Q may also be reviewed and copied at the SEC’s Public Reference Room in Washington, DC, and information on the operation of the Public Reference Room may be obtained by calling 1-800-SEC-0330.
FEDERAL TAX INFORMATION (Unaudited)
In accordance with federal tax requirements, the following provides shareholders with information concerning distributions from ordinary income made by the Fund during the fiscal year ended July 31, 2017. Certain dividends paid by the Fund may be subject to a maximum tax rate of 23.8%. The Fund intends to designate up to a maximum amount of $1,738,095 as taxed at a maximum rate of 23.8%. As required by federal regulations, complete information was computed and reported in conjunction with your 2016 Form 1099-DIV.
25
KEMPNER MULTI-CAP DEEP VALUE EQUITY FUND
BOARD OF TRUSTEES AND EXECUTIVE OFFICERS
(Unaudited)
The Board has overall responsibility for management of the Trust’s affairs. The Trustees serve during the lifetime of the Trust and until its termination, or until death, resignation, retirement, or removal. The Trustees, in turn, elect the officers of the Fund to actively supervise its day-to-day operations. The officers have been elected for an annual term. Unless otherwise noted, each Trustee’s and officer’s address is 225 Pictoria Drive, Suite 450, Cincinnati, Ohio 45246. The following are the Trustees and executive officers of the Fund:
Name and | Length of Time Served | Position(s) Held with Trust | Principal Occupation(s) During Past 5 Years | Number of Funds in Trust Overseen by Trustee | Directorships of Public Companies Held by Trustee During Past 5 Years |
Interested Trustees: | |||||
Robert G. Dorsey* Year of Birth: 1957 | Since February 2012 | Trustee (February 2012 to present)
President (June 2012 to October 2013) | President and Managing Director of Ultimus Fund Solutions, LLC and Ultimus Fund Distributors, LLC (1999 to present) | 26 | None |
Independent Trustees: | |||||
Janine L. Cohen Year of Birth: 1952 | Since January 2016 | Trustee | Retired since 2013; Chief Financial Officer from 2004 to 2013 and Chief Compliance Officer from 2008 to 2013 at AER Advisors, Inc. | 26 | None |
David M. Deptula Year of Birth: 1958 | Since June 2012 | Trustee | Vice President of Legal and Special Projects at Dayton Freight Lines, Inc. since 2016; Vice President of Tax Treasury at The Standard Register Inc. (formerly The Standard Register Company) from 2011 to 2016 | 26 | None |
26
KEMPNER MULTI-CAP DEEP VALUE EQUITY FUND
BOARD OF TRUSTEES AND EXECUTIVE OFFICERS
(Unaudited) (Continued)
Name and | Length of Time Served | Position(s) Held with Trust | Principal Occupation(s) During Past 5 Years | Number of Funds in Trust Overseen by Trustee | Directorships of Public Companies Held by Trustee During Past 5 Years |
Independent Trustees (Continued): | |||||
John J. Discepoli Year of Birth: 1963 | Since June 2012 | Chairman (May 2016 to present)
Trustee (June 2012 to present) | Owner of Discepoli Financial Planning, LLC (personal financial planning company) since 2004 | 26 | None |
* | Mr. Dorsey is considered an “interested person” of the Trust within the meaning of Section 2(a)(19) of the 1940 Act because of his relationship with the Trust’s administrator, transfer agent and distributor. |
Name and | Length of Time Served | Position(s) Held with Trust | Principal Occupation(s) During Past 5 Years |
Executive Officers: | |||
David R. Carson Year of Birth: 1958 | Since April 2013 | Principal Executive Officer (April 2017 to present)
President (October 2013 to present)
Vice President (April 2013 to October 2013) | Vice President and Director of Client Strategies of Ultimus Fund Solutions, LLC (2013 to present); President, Unified Series Trust (2016 to present); Chief Compliance Officer, FSI LBAR Fund (2013 to 2016), The Huntington Funds (2005 to 2013), Huntington Strategy Shares (2012 to 2013), and Huntington Asset Advisors (2013); Vice President, Huntington National Bank (2001 to 2013) |
Jennifer L. Leamer Year of Birth: 1976 | Since April 2014 | Treasurer (October 2014 to present)
Assistant Treasurer (April 2014 to October 2014) | Vice President, Mutual Fund Controller of Ultimus Fund Solutions, LLC (2014 to present); Business Analyst of Ultimus Fund Solutions, LLC (2007 to 2014) |
27
KEMPNER MULTI-CAP DEEP VALUE EQUITY FUND
BOARD OF TRUSTEES AND EXECUTIVE OFFICERS
(Unaudited) (Continued)
Name and | Length of Time Served | Position(s) Held with Trust | Principal Occupation(s) During Past 5 Years |
Executive Officers (Continued): | |||
Frank L. Newbauer Year of Birth: 1954 | Since February 2012 | Secretary (July 2017 to present)
Assistant Secretary (April 2015 to July 2017)
Secretary (February 2012 to April 2015) | Assistant Vice President of Ultimus Fund Solutions, LLC (2010 to present) |
Charles C. Black Year of Birth: 1979 | Since April 2015 | Chief Compliance Officer (January 2016 to present)
Assistant Chief Compliance Officer (April 2015 to January 2016) | Senior Compliance Officer of Ultimus Fund Solutions, LLC (2015 to present); Chief Compliance Officer of The Caldwell & Orkin Funds, Inc. (2016 to present); Senior Compliance Manager at Touchstone Mutual Funds (2013 to 2015); Senior Compliance Manager at Fund Evaluation Group (2011 to 2013) |
Additional information about members of the Board and executive officers is available in the Fund’s Statement of Additional Information (“SAI”). To obtain a free copy of the SAI, please call 1-800-665-9778.
28
KEMPNER MULTI-CAP DEEP VALUE EQUITY FUND
DISCLOSURE REGARDING APPROVAL OF INVESTMENT ADVISORY AGREEMENT (Unaudited)
The Board of Trustees (the “Board”), including the Independent Trustees voting separately, has reviewed and approved the Fund’s (the “Fund”) Investment Advisory Agreement with Kempner Capital Management, Inc. (the “Adviser”) for an initial two-year term. Approval of the Investment Advisory Agreement took place at an in-person meeting held on January 23-24, 2017, at which all of the Trustees were present.
In the course of their deliberations, the Board was advised by legal counsel. The Board received and reviewed information provided by the Adviser in response to requests of the Board and counsel.
In deciding whether to approve the Investment Advisory Agreement, the Board recalled its discussions with Mr. Harris L. Kempner, President and Chief Investment Officer of the Adviser, its discussions with Trust management about the operations and performance of the Adviser in connection with the Frost Kempner Multi-Cap Deep Value Equity Fund, a series of the Advisors’ Inner Circle Fund II (the “Predecessor Fund”), and its review of the various materials related to the Adviser and the Fund. The Board further considered those materials and discussions and other numerous factors, including the factors described below.
The nature, extent, and quality of the services to be provided by the Adviser. In this regard, the Board considered the responsibilities that the Adviser would have under the Investment Advisory Agreement and the Adviser’s proposed services to the Fund including, without limitation: the Adviser’s procedures for formulating investment recommendations and assuring compliance with the Fund’s investment objective and limitations; the proposed initial marketing and distribution efforts; and the Adviser’s compliance procedures and practices. The Board also considered that the services to be provided under the Investment Advisory Agreement would be substantially similar to those the Adviser currently provides as sub-adviser to the Predecessor Fund. After reviewing the foregoing and further information provided in the Adviser’s materials to the Board (e.g., descriptions of Kempner’s business and Form ADV), the Board concluded that the quality, extent, and nature of the services to be provided by the Adviser to the Fund were satisfactory and adequate.
The investment management capabilities and experience of the Adviser. The Board considered the investment management experience of the Adviser and thoroughly discussed with the Adviser’s representatives the investment objective and strategies for the Fund. The Board also discussed the Adviser’s experience in managing similar types of strategies. In particular, the Board reviewed the Adviser’s prior experience and performance with the Predecessor Fund and with other accounts that had similar investment objectives and strategies as the Fund, including the Adviser’s private fund. The Board also considered the similarities and differences between these products. The Board considered the succession arrangement for the Fund in the event Mr. Kempner left or was unable to perform his duties at the Adviser. After consideration of these and other factors, the Board determined that the Adviser has the requisite experience to serve as investment adviser for the Fund.
The costs of the services to be provided and profits to be realized by the Adviser and its affiliates from the relationship with the Fund. The Board considered the Adviser’s personnel and methods of operation; the education and experience of its personnel; its compliance
29
KEMPNER MULTI-CAP DEEP VALUE EQUITY FUND
DISCLOSURE REGARDING APPROVAL OF INVESTMENT ADVISORY AGREEMENT (Unaudited) (Continued)
program, policies, and procedures; its financial condition and the level of financial commitment to the Fund; the projected asset level of the Fund; and the overall expenses of the Fund, including the advisory fee. The Board reviewed the Adviser’s Expense Limitation Agreement (the “ELA”) and noted the benefit to the Fund from the Adviser’s contractual obligation to reduce its advisory fee or reimburse other operating expenses through November 30, 2018. The Board discussed the Adviser’s financial condition and its ability to satisfy its financial commitments to the Fund. The Board also considered potential benefits for the Adviser in managing the Fund, including the promotion of the Adviser’s name. The Board compared the Fund’s proposed advisory fee and overall expense ratio to other comparable funds (in terms of the type of fund, the style of investment management, the projected size of the Fund, and the nature of the investment strategy) and the fees charged by the Adviser to its other managed accounts. The Board noted that the Fund’s advisory fee of 0.59% was equal to the average and below the median for the Fund’s peer group. The Board also noted that the advisory fee was below the average and median for the Fund’s Morningstar Large Cap Value Fund category. In addition, the Board noted that the overall proposed expense ratio of 1.05% per annum (after applying the ELA) for the Fund’s Institutional Class of shares, would be higher than the average expense ratio for the Fund’s peer group and comparable funds in the Morningstar Large Cap Value Fund category, but would be less than the maximum expense ratio for comparable funds reported for the Morningstar category. The Board further noted that the Investor Class of shares expense ratio of 1.30% would be higher than the average expense ratio for the Fund’s peer group and comparable funds in the Morningstar Large Cap Value Fund category, and would be higher than the maximum expense ratio for comparable funds reported for the Morningstar category. Upon further consideration and discussion of the foregoing, the Board concluded that the proposed advisory fee and total expense limit for the Fund were within the range of what would have been negotiated at arms-length in light of all the surrounding circumstances and were fair and reasonable.
The extent to which the Fund and its investors would benefit from economies of scale. In this regard, the Board considered the Investment Advisory Agreement and the ELA. The Board determined that the shareholders of the Fund would benefit from the ELA if the Fund’s assets declined to a level where its expenses would be above the expense limit. Following further discussion of the Fund’s projected asset levels, expectations for growth, and level of fees, the Board determined that the Fund’s fee arrangements with the Adviser would provide benefits through the next two years, and the Board could review the arrangements going forward as necessary. After further discussion, the Board concluded the arrangements for the Fund with the Adviser were fair and reasonable in relation to the nature and quality of services to be provided by the Adviser and would benefit the Fund and its shareholders.
Brokerage and portfolio transactions. The Board considered the Adviser’s policies and procedures as it relates to seeking best execution for its clients. The Board also considered the anticipated portfolio turnover rate for the Fund; the method and basis for selecting and evaluating the broker-dealers used to complete the Fund’s portfolio transactions; any anticipated allocation of portfolio business to persons affiliated with the Adviser; and
30
KEMPNER MULTI-CAP DEEP VALUE EQUITY FUND
DISCLOSURE REGARDING APPROVAL OF INVESTMENT ADVISORY AGREEMENT (Unaudited) (Continued)
the extent to which the Fund’s trades may be allocated to soft-dollar arrangements. After further review and discussion, the Board determined that the Adviser’s practices regarding brokerage and portfolio transactions for the Fund were satisfactory.
Possible conflicts of interest. In evaluating the possibility for conflicts of interest, the Board considered such matters as the experience and abilities of the advisory personnel to be assigned to the Fund; the Adviser’s process for allocating trades among its different clients, including the Adviser’s private fund. The Board also considered the substance and administration of the Adviser’s Code of Ethics. Following further consideration and discussion, the Board determined that the Adviser’s standards and practices relating to the identification and mitigation of potential conflicts of interests for the Fund were satisfactory.
Conclusion
After consideration of the above factors as well as other factors, the Board unanimously concluded that approval of the Investment Advisory Agreement was in the best interests of the Fund and its shareholders. It was noted that in the Trustees’ deliberation regarding the approval of the Investment Advisory Agreement, the Trustees did not identify any particular information or factor that was all-important or controlling, and that each individual Trustee may have attributed different weights to the various factors noted above.
31
KEMPNER MULTI-CAP DEEP VALUE EQUITY FUND
SUBMISSION OF MATTERS TO A VOTE OF
SECURITY HOLDERS (Unaudited)
On April 25, 2017 a Special Meeting of Shareholders of Frost Kempner Multi-Cap Deep Value Equity Fund (the “Predecessor Fund”), a series of the Advisors’ Inner Circle Fund II, was held for the purpose of voting on the following Proposal:
Proposal 1: To approve an Agreement and Plan of Reorganization between the Predecessor Fund and Kempner Multi-Cap Deep Value Equity Fund (the “New Fund”), a new series of Ultimus Managers Trust, an open-end management investment company organized as an Ohio business trust, providing for: (a) the acquisition of all of the assets and assumption of all of the liabilities of the Predecessor Fund by the New Fund in exchange for Investor Class and Institutional Class shares of the New Fund, as applicable; (b) the distribution of such shares to the shareholders of the Predecessor Fund; and (c) the liquidation and termination of the Predecessor Fund (the “Reorganization”).
A total of 8,301,005 shares of the Predecessor Fund were entitled to vote on the Proposal. A total of 6,726,559 shares were voted, representing 81.03% of total shares.
Shareholders of record on February 28, 2017 voted to approve the Reorganization. The votes cast with respect to Proposal 1 were as follows:
Number of shares | ||
For | Against | Abstain |
6,726,559 | 0 | 0 |
32
This page intentionally left blank.
| Item 2. | Code of Ethics. |
| Item 3. | Audit Committee Financial Expert. |
| Item 4. | Principal Accountant Fees and Services. |
| (a) | Audit Fees. The aggregate fees billed for professional services rendered by the principal accountant for the audit of the registrant’s annual financial statements or for services that are normally provided by the accountant in connection with statutory and regulatory filings or engagements was $13,500 with respect to the registrant’s first fiscal period ended July 31, 2017, respectively. |
| (b) | Audit-Related Fees. No fees were billed in the first fiscal period for assurance and related services by the principal accountant that are reasonably related to the performance of the audit of the registrant’s financial statements and are not reported under paragraph (a) of this Item. |
| (c) | Tax Fees. The aggregate fees billed for professional services rendered by the principal accountant for tax compliance, tax advice, and tax planning was $2,000 with respect to the registrant’s first fiscal period ended July 31, 2017, respectively. The services comprising these fees are the preparation of the registrant’s federal income and excise tax returns. |
| (d) | All Other Fees. No fees were billed in the first fiscal period for products and services provided by the principal accountant, other than the services reported in paragraphs (a) through (c) of this Item. |
| (e)(1) | The audit committee has not adopted pre-approval policies and procedures described in paragraph (c)(7) of Rule 2-01 of Regulation S-X. |
| (e)(2) | None of the services described in paragraph (b) through (d) of this Item were approved by the audit committee pursuant to paragraph (c)(7)(i)(C) of Rule 2-01 of Regulation S-X. |
| (f) | Less than 50% of hours expended on the principal accountant’s engagement to audit the registrant’s financial statements for the most recent fiscal year were attributed to work performed by persons other than the principal accountant’s full-time, permanent employees. |
| (g) | During the first fiscal period ended July 31, 2017, aggregate non-audit fees of $2,000, respectively, was billed by the registrant’s accountant for services rendered to the registrant. No non-audit fees were billed in either of the first fiscal period by the registrant’s accountant for services rendered to the registrant’s investment adviser (not including any sub-adviser whose role is primarily portfolio management and is subcontracted with or overseen by another investment adviser), and any entity controlling, controlled by, or under common control with the adviser that provides ongoing services to the registrant. |
| (h) | The principal accountant has not provided any non-audit services to the registrant’s investment adviser (not including any sub-adviser whose role is primarily portfolio management and is subcontracted with or overseen by another investment adviser), and any entity controlling, controlled by, or under common control with the investment adviser that provides ongoing services to the registrant. |
| Item 5. | Audit Committee of Listed Registrants. |
| Item 6. | Schedule of Investments. |
| (a) | Not applicable [schedule filed with Item 1] |
| (b) | Not applicable |
| Item 7. | Disclosure of Proxy Voting Policies and Procedures for Closed-End Management Investment Companies. |
| Item 8. | Portfolio Managers of Closed-End Management Investment Companies. |
| Item 9. | Purchases of Equity Securities by Closed-End Management Investment Company and Affiliated Purchasers. |
| Item 10. | Submission of Matters to a Vote of Security Holders. |
| Item 11. | Controls and Procedures. |
| Item 12. | Exhibits. |
| Exhibit 99.CODE ETH | Code of Ethics |
| Exhibit 99.CERT | Certifications required by Rule 30a-2(a) under the Act |
| Exhibit 99.906CERT | Certifications required by Rule 30a-2(b) under the Act |
| (Registrant) | Ultimus Managers Trust | ||
| By (Signature and Title)* | /s/ Natalie S. Anderson | ||
| Natalie S. Anderson, Assistant Secretary | |||
| Date | October 5, 2017 | ||
| Pursuant to the requirements of the Securities Exchange Act of 1934 and the Investment Company Act of 1940, this report has been signed below by the following persons on behalf of the registrant and in the capacities and on the dates indicated. | |||
| By (Signature and Title)* | /s/ David R. Carson | ||
| David R. Carson, Principal Executive Officer of Kempner Multi-Cap Deep Value Equity Fund | |||
| Date | October 5, 2017 | ||
| By (Signature and Title)* | /s/ Jennifer L. Leamer | ||
| Jennifer L. Leamer, Treasurer and Principal Financial Officer | |||
| Date | October 5, 2017 | ||
| * | Print the name and title of each signing officer under his or her signature. |