| OMB APPROVAL |
OMB Number: 3235-0570
Expires: August 31, 2020
Estimated average burden hours per response: 20.6 |
UNITED STATES
SECURITIES AND EXCHANGE COMMISSION
Washington, D.C. 20549
FORM N-CSR
CERTIFIED SHAREHOLDER REPORT OF REGISTERED
MANAGEMENT INVESTMENT COMPANY
| Investment Company Act file number | 811-22680 |
| Ultimus Managers Trust |
| (Exact name of registrant as specified in charter) |
| 225 Pictoria Drive, Suite 450 Cincinnati, Ohio | 45246 |
| (Address of principal executive offices) | (Zip code) |
Frank L. Newbauer, Esq.
| Ultimus Fund Solutions, LLC 225 Pictoria Drive, Suite 450 Cincinnati, Ohio 45246 |
| (Name and address of agent for service) |
| Registrant's telephone number, including area code: | (513) 587-3400 |
| Date of fiscal year end: | November 30 | |
| Date of reporting period: | November 30, 2017 |
Form N-CSR is to be used by management investment companies to file reports with the Commission not later than 10 days after the transmission to stockholders of any report that is required to be transmitted to stockholders under Rule 30e-1 under the Investment Company Act of 1940 (17 CFR 270.30e-1). The Commission may use the information provided on Form N-CSR in its regulatory, disclosure review, inspection, and policymaking roles.
A registrant is required to disclose the information specified by Form N-CSR, and the Commission will make this information public. A registrant is not required to respond to the collection of information contained in Form N-CSR unless the Form displays a currently valid Office of Management and Budget ("OMB") control number. Please direct comments concerning the accuracy of the information collection burden estimate and any suggestions for reducing the burden to the Secretary, Securities and Exchange Commission, 450 Fifth Street, NW, Washington, DC 20549-0609. The OMB has reviewed this collection of information under the clearance requirements of 44 U.S.C. § 3507.
| Item 1. | Reports to Stockholders. |

LYRICAL U.S. VALUE EQUITY FUND
Institutional Class (LYRIX)
Investor Class (LYRBX)
Annual Report
November 30, 2017
LYRICAL U.S. VALUE EQUITY FUND | November 30, 2017 |
Dear Fellow Shareholders,
Enclosed is the Annual Report to shareholders of the Lyrical U.S. Value Equity Fund (the “Fund”). On behalf of the Fund and its investment adviser, Lyrical Asset Management LP, I would like to thank you for your investment.
Since its launch on February 4, 2013 through November 30, 2017, the Fund – Institutional Class has produced a cumulative total return of +117.50%, compared to the +96.02% cumulative total return for the S&P 500® Index (the “S&P 500”). For the twelve months ended November 30, 2017, the Fund – Institutional Class produced a total return of +21.70% compared to the total return for the S&P 500 of +22.87%. For the twelve months ended November 30, 2017, the three positions that most positively impacted performance were Broadcom Limited (AVGO), Anthem, Inc. (ANTM), and Aetna Inc. (AET) with contributions of 407 basis points (bps) (up 65%), 261 bps (up 67%) and 179 bps (up 39%), respectively; conversely, the three positions that most negatively impacted performance were Johnson Controls International plc (JCI), National Oilwell Varco, Inc. (NOV), and Hertz Global Holdings, Inc. (HTZ) which detracted 57 bps (down 14%), 30 bps (down 10%) and 28 bps (down 25%), respectively.
In analyzing the Fund portfolio’s performance attribution, we find it helpful to examine both the investment success rate and any skew in the distribution of returns. Our success rate has been high over the life of the Fund, as 87% of the Fund’s investments posted gains, and 56% outperformed the S&P 500. Skew has also been a positive factor, as the Fund’s outperformers have outperformed by 73%, while our underperformers have underperformed by 46% over the life of the Fund. For the twelve month period ended November 30, 2017, 81% of the Fund’s investments posted gains, and 44% outperformed the S&P 500. For the twelve month period skew has been a negative factor as the Fund’s outperformers have outperformed by 14%, while our underperformers have underperformed by 20%.
During the life of the Fund we have sold nineteen positions, as four companies announced they were being acquired, twelve approached our estimates of fair value, for one we lost conviction in our thesis, for one the company announced or completed acquisitions which increased the complexity and decreased analyzability and for one the risk/reward became less compelling than other opportunities. For each sale we added a new position from our pipeline of opportunities. We are still finding attractive stock opportunities to add to the portfolio, even as some of our existing positions begin to approach our estimates of fair value.
As of November 30, 2017, the valuation of our portfolio is 13.8x next twelve months consensus earnings. The S&P 500 has a valuation of 18.3x on this same basis, a premium of 33% over the Fund.
1
Lyrical Asset Management’s Investment Philosophy and Portfolio Construction
As there have been a significant number of new investors since our previous letter to the Funds’ shareholders, we’d like to briefly outline our investment philosophy and portfolio construction approach.
We believe our strategy and approach to investing differentiate us from other investment managers, even those that share a value approach to investing. We are deep value investors and by this we mean that we look to invest in companies trading significantly below intrinsic value. This separates us from other value managers who focus on relative value or core value approaches and whose portfolio characteristics have higher Price/Earnings, Price/Book and Price/Cash Flow multiples. We assess valuation based on current price relative to long-term normalized earnings, which contrasts us to those that rely on Price/Book or dividend yield. We only invest in what we consider to be quality businesses that we believe should earn good returns on invested capital, and avoid volatile businesses and companies with excessive leverage. Other value investors may consider owning any business regardless of quality if they believe the price is low enough. Lastly, we only invest in businesses we can understand, and avoid those that are excessively complex or require specialized technical knowledge, even though they may appear cheap from a high-level perspective.
We construct our portfolio purely bottom up and without regard to what is or is not contained in a benchmark. We are concerned with concentration risk, and have strict limits on how much capital can be invested in any one position or any one industry. Our long portfolio is constructed to be balanced and diversified across approximately 33 positions, giving us exposure to many different types of companies and situations without sacrificing our strict investment standards.
Thank you for your continued trust and interest in Lyrical Asset Management.
Sincerely,
Andrew Wellington
Portfolio Manager
Past performance is not predictive of future performance. Investment results and principal value will fluctuate so that shares, when redeemed, may be worth more or less than their original cost. Current performance may be higher or lower than the performance data quoted. Performance data current to the most recent month end are available by calling 1-888-884-8099.
An investor should consider the investment objectives, risks, charges and expenses of the Fund carefully before investing. The Fund’s prospectus contains this and other important information. To obtain a copy of the Fund’s prospectus please call 1-888-884-8099 and a copy will be sent to you free of charge. Please read the prospectus carefully before you invest. The Fund is distributed by Ultimus Fund Distributors, LLC.
The Letter to Shareholders seeks to describe some of the Adviser’s current opinions and views of the financial markets. Although the Adviser believes it has a reasonable basis for any opinions or views expressed, actual results may differ, sometimes significantly so, from those expected or expressed. The securities held by the Fund that are discussed in
2
the Letter to Shareholders were held during the period covered by this Report. They do not comprise the entire investment portfolio of the Fund, may be sold at any time, and may no longer be held by the Fund. For a complete list of securities held by the Fund as of November 30, 2017, please see the Schedule of Investments section of this Report. The opinions of the Adviser with respect to those securities may change at any time.
Statements in the Letter to Shareholders that reflect projections or expectations for future financial or economic performance of the Fund and the market in general and statements of the Fund’s plans and objectives for future operations are forward-looking statements. No assurance can be given that actual results or events will not differ materially from those projected, estimated, assumed, or anticipated in any such forward-looking statements. Important factors that could result in such differences, in addition to factors noted with such forward-looking statements include, without limitation, general economic conditions, such as inflation, recession, and interest rates. Past performance is not a guarantee of future results.
3
LYRICAL U.S. VALUE EQUITY FUND
PERFORMANCE INFORMATION (Unaudited)
Comparison of the Change in Value of a $100,000 Investment in
Lyrical U.S. Value Equity Fund - Institutional Class(a) versus
the S&P 500® Index
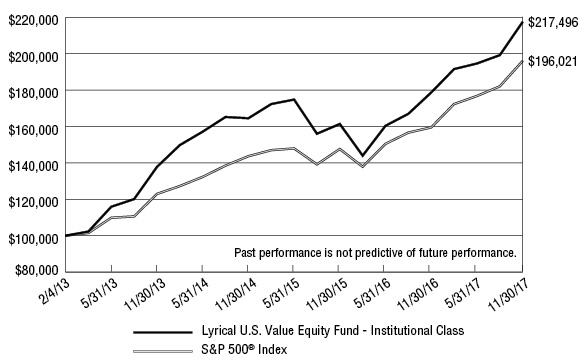
Average Annual Total Returns (for the periods ended November 30, 2017) | |||
1 Year | 3 Years | Since | |
Lyrical U.S. Value Equity Fund - Institutional Class(b) | 21.70% | 9.75% | 17.50% |
Lyrical U.S. Value Equity Fund - Investor Class(b) | 21.32% | 9.41% | 10.40% |
S&P 500® Index(d) | 22.87% | 10.91% | 14.99%(e) |
(a) | The line graph above represents performance of the Institutional Class only, which will vary from the performance of the Investor Class based on the difference in fees paid by shareholders in the different classes. |
(b) | The Fund’s total returns do not reflect the deduction of taxes a shareholder would pay on Fund distributions or the redemption of Fund shares. |
(c) | Commencement of operations for Institutional Class shares was February 4, 2013. Commencement of operations for Investor Class shares was February 24, 2014. |
(d) | The S&P 500® Index is a market capitalization weighted index of 500 large companies that is widely used as a barometer of U.S. stock market performance. The index is unmanaged and shown for illustration purposes only. An investor cannot invest in an index and its returns are not indicative of the performance of any specific investment. |
(e) | Represents the period from February 4, 2013 (date of commencement of operations of Institutional Class shares) through November 30, 2017. |
4
LYRICAL U.S. VALUE EQUITY FUND
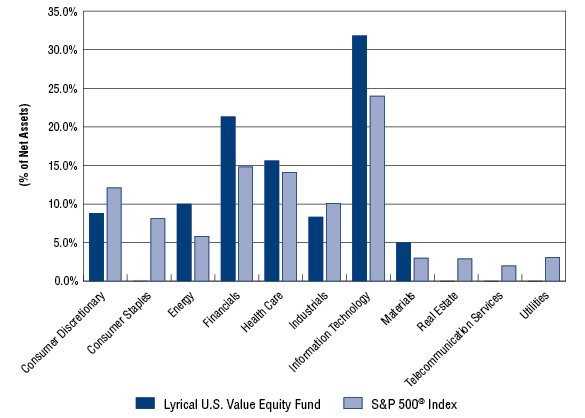
PORTFOLIO INFORMATION
November 30, 2017 (Unaudited)
Lyrical U.S. Value Equity Fund vs S&P 500® Index
Sector Diversification
Top Ten Equity Holdings
Security Description | % of |
Broadcom Ltd. | 8.1% |
Aetna, Inc. | 5.7% |
Anthem, Inc. | 5.5% |
Corning, Inc. | 5.0% |
TE Connectivity Ltd. | 4.7% |
Ameriprise Financial, Inc. | 4.6% |
Aflac, Inc. | 4.5% |
HCA Healthcare, Inc. | 4.4% |
Lincoln National Corporation | 4.2% |
Celanese Corporation - Series A | 4.0% |
5
| LYRICAL U.S. VALUE EQUITY FUND SCHEDULE OF INVESTMENTS November 30, 2017 | ||||||||
| COMMON STOCKS — 100.8% | Shares | Value | ||||||
| Consumer Discretionary — 8.8% | ||||||||
| Auto Components — 3.0% | ||||||||
| Goodyear Tire & Rubber Company (The) | 763,060 | $ | 24,700,252 | |||||
| Tenneco, Inc. | 170,084 | 10,104,691 | ||||||
| 34,804,943 | ||||||||
| Household Durables — 2.9% | ||||||||
| Whirlpool Corporation | 198,791 | 33,510,199 | ||||||
| Internet & Direct Marketing Retail — 2.9% | ||||||||
Liberty Interactive Corporation QVC Group - Series A (a) | 1,352,001 | 32,988,824 | ||||||
| Energy — 10.0% | ||||||||
| Energy Equipment & Services — 2.4% | ||||||||
| National Oilwell Varco, Inc. | 816,870 | 27,405,988 | ||||||
| Oil, Gas & Consumable Fuels — 7.6% | ||||||||
| EOG Resources, Inc. | 428,046 | 43,797,667 | ||||||
| Suncor Energy, Inc. | 1,251,263 | 43,493,902 | ||||||
| 87,291,569 | ||||||||
| Financials — 21.3% | ||||||||
| Capital Markets — 7.4% | ||||||||
| Affiliated Managers Group, Inc. | 161,642 | 32,113,416 | ||||||
| Ameriprise Financial, Inc. | 328,315 | 53,590,858 | ||||||
| 85,704,274 | ||||||||
| Insurance — 13.9% | ||||||||
| Aflac, Inc. | 588,263 | 51,555,369 | ||||||
| Assurant, Inc. | 194,609 | 19,630,210 | ||||||
| Lincoln National Corporation | 639,074 | 48,921,115 | ||||||
| Willis Towers Watson plc | 250,347 | 40,255,797 | ||||||
| 160,362,491 | ||||||||
| Health Care — 15.6% | ||||||||
| Health Care Providers & Services — 15.6% | ||||||||
| Aetna, Inc. | 365,253 | 65,811,286 | ||||||
| Anthem, Inc. | 271,966 | 63,901,131 | ||||||
HCA Healthcare, Inc. (a) | 593,107 | 50,414,095 | ||||||
| 180,126,512 | ||||||||
| Industrials — 8.3% | ||||||||
| Building Products — 2.9% | ||||||||
| Johnson Controls International plc | 893,395 | 33,627,388 | ||||||
6
| LYRICAL U.S. VALUE EQUITY FUND SCHEDULE OF INVESTMENTS (Continued) | ||||||||
| COMMON STOCKS — 100.8% (Continued) | Shares | Value | ||||||
| Industrials — 8.3% (Continued) | ||||||||
| Construction & Engineering — 1.3% | ||||||||
AECOM (a) | 393,470 | $ | 14,755,125 | |||||
| Road & Rail — 1.5% | ||||||||
Avis Budget Group, Inc. (a) | 292,579 | 11,147,260 | ||||||
Hertz Global Holdings, Inc. (a) | 302,401 | 5,730,499 | ||||||
| 16,877,759 | ||||||||
| Trading Companies & Distributors — 2.6% | ||||||||
AerCap Holdings N.V. (a) | 586,817 | 30,496,879 | ||||||
| Information Technology — 31.8% | ||||||||
| Communications Equipment — 2.8% | ||||||||
ARRIS International plc (a) | 429,746 | 12,879,488 | ||||||
CommScope Holding Company, Inc. (a) | 532,648 | 19,170,001 | ||||||
| 32,049,489 | ||||||||
| Electronic Equipment, Instruments & Components — 12.2% | ||||||||
| Corning, Inc. | 1,781,706 | 57,709,458 | ||||||
Flex Ltd. (a) | 1,598,819 | 28,890,659 | ||||||
| TE Connectivity Ltd. | 573,545 | 54,165,590 | ||||||
| 140,765,707 | ||||||||
| IT Services — 2.5% | ||||||||
| Western Union Company (The) | 1,496,473 | 29,465,553 | ||||||
| Semiconductors & Semiconductor Equipment — 9.5% | ||||||||
| Broadcom Ltd. | 337,900 | 93,915,926 | ||||||
Microsemi Corporation (a) | 288,849 | 15,265,670 | ||||||
| 109,181,596 | ||||||||
| Technology Hardware, Storage & Peripherals — 4.8% | ||||||||
NCR Corporation (a) | 467,829 | 14,638,369 | ||||||
| Western Digital Corporation | 513,646 | 40,506,124 | ||||||
| 55,144,493 | ||||||||
| Materials — 5.0% | ||||||||
| Chemicals — 4.0% | ||||||||
| Celanese Corporation - Series A | 433,015 | 46,436,529 | ||||||
| Containers & Packaging — 1.0% | ||||||||
Owens-Illinois, Inc. (a) | 474,800 | 11,499,656 | ||||||
| Total Common Stocks (Cost $866,113,833) | $ | 1,162,494,974 | ||||||
7
| LYRICAL U.S. VALUE EQUITY FUND SCHEDULE OF INVESTMENTS (Continued) | ||||||||
| MONEY MARKET FUNDS — 1.7% | Shares | Value | ||||||
Invesco Short-Term Investments Trust - Treasury Portfolio - Institutional Shares, 0.98% (b) (Cost $19,222,378) | 19,222,378 | $ | 19,222,378 | |||||
| Total Investments at Value — 102.5% (Cost $885,336,211) | $ | 1,181,717,352 | ||||||
| Liabilities in Excess of Other Assets — (2.5%) | (28,355,887 | ) | ||||||
| Net Assets — 100.0% | $ | 1,153,361,465 | ||||||
(a) | Non-income producing security. |
(b) | The rate shown is the 7-day effective yield as of November 30, 2017. |
See accompanying notes to financial statements.
8
| LYRICAL U.S. VALUE EQUITY FUND STATEMENT OF ASSETS AND LIABILITIES November 30, 2017 | ||||
| ASSETS | ||||
| Investments in securities: | ||||
| At acquisition cost | $ | 885,336,211 | ||
| At value (Note 2) | $ | 1,181,717,352 | ||
| Receivable for capital shares sold | 8,181,042 | |||
| Dividends receivable | 1,485,657 | |||
| Other assets | 17,799 | |||
| Total assets | 1,191,401,850 | |||
| LIABILITIES | ||||
| Distributions payable | 18,969,909 | |||
| Payable for capital shares redeemed | 17,764,231 | |||
| Payable to Adviser (Note 4) | 1,195,280 | |||
| Payable to administrator (Note 4) | 89,757 | |||
| Accrued distribution fees (Note 4) | 254 | |||
| Other accrued expenses | 20,954 | |||
| Total liabilities | 38,040,385 | |||
| NET ASSETS | $ | 1,153,361,465 | ||
| NET ASSETS CONSIST OF: | ||||
| Paid-in capital | $ | 872,290,692 | ||
| Undistributed net investment income | 236,790 | |||
| Accumulated net realized losses from investment transactions | (15,547,158 | ) | ||
| Net unrealized appreciation on investments | 296,381,141 | |||
| NET ASSETS | $ | 1,153,361,465 | ||
| NET ASSET VALUE PER SHARE: | ||||
| INSTITUTIONAL CLASS | ||||
| Net assets applicable to Institutional Class | $ | 1,116,584,375 | ||
| Institutional Class shares of beneficial interest outstanding (unlimited number of shares authorized, no par value) | 59,981,369 | |||
| Net asset value, offering price and redemption price per share (Note 2) | $ | 18.62 | ||
| INVESTOR CLASS | ||||
| Net assets applicable to Investor Class | $ | 36,777,090 | ||
| Investor Class shares of beneficial interest outstanding (unlimited number of shares authorized, no par value) | 1,984,175 | |||
| Net asset value, offering price and redemption price per share (Note 2) | $ | 18.54 | ||
See accompanying notes to financial statements. |
9
| LYRICAL U.S. VALUE EQUITY FUND STATEMENT OF OPERATIONS Year Ended November 30, 2017 | ||||
| INVESTMENT INCOME | ||||
| Dividend income | $ | 16,123,239 | ||
| Foreign withholding taxes on dividends | (194,313 | ) | ||
| Total investment income | 15,928,926 | |||
| EXPENSES | ||||
| Investment advisory fees (Note 4) | 14,174,999 | (a) | ||
| Administration fees (Note 4) | 734,616 | |||
| Fund accounting fees (Note 4) | 117,725 | |||
| Compliance fees (Note 4) | 116,068 | |||
| Distribution fees - Investor Class (Note 4) | 105,135 | |||
| Transfer agent fees (Note 4) | 101,785 | |||
| Custody and bank service fees | 84,651 | |||
| Postage and supplies | 61,712 | |||
| Registration and filing fees | 54,059 | |||
| Professional fees | 41,912 | |||
| Networking fees | 39,276 | |||
| Trustees' fees and expenses (Note 4) | 10,049 | |||
| Printing of shareholder reports | 9,461 | |||
| Insurance expense | 2,898 | |||
| Borrowing costs (Note 5) | 1,339 | |||
| Other expenses | 27,634 | |||
| Total expenses | 15,683,319 | |||
| NET INVESTMENT INCOME | 245,607 | |||
| REALIZED AND UNREALIZED GAINS ON INVESTMENTS | ||||
| Net realized gains from investments | 75,451,576 | |||
| Net change in unrealized appreciation (depreciation) on investments | 145,782,822 | |||
| NET REALIZED AND UNREALIZED GAINS ON INVESTMENTS | 221,234,398 | |||
| NET INCREASE IN NET ASSETS RESULTING FROM OPERATIONS | $ | 221,480,005 | ||
(a) | Includes $2,918 of prior years’ investment advisory fee reductions and expense reimbursements recouped by the Adviser (Note 4). |
See accompanying notes to financial statements. | |
10
| LYRICAL U.S. VALUE EQUITY FUND STATEMENTS OF CHANGES IN NET ASSETS | ||||||||
| Year Ended November 30, 2017 | Year Ended November 30, 2016 | |||||||
| FROM OPERATIONS | ||||||||
| Net investment income | $ | 245,607 | $ | 15,332,960 | ||||
| Net realized gains from investment transactions | 75,451,576 | 4,951,586 | ||||||
| Net change in unrealized appreciation (depreciation) on investments | 145,782,822 | 135,673,446 | ||||||
| Net increase in net assets resulting from operations | 221,480,005 | 155,957,992 | ||||||
| DISTRIBUTIONS TO SHAREHOLDERS (Note 2) | ||||||||
| From net investment income, Institutional Class | (14,603,810 | ) | (1,403,762 | ) | ||||
| From net investment income, Investor Class | (605,949 | ) | (6,340 | ) | ||||
| From net realized gains, Institutional Class | (74,292,482 | ) | (29,274,092 | ) | ||||
| From net realized gains, Investor Class | (2,522,861 | ) | (2,366,361 | ) | ||||
| Decrease in net assets from distributions to shareholders | (92,025,102 | ) | (33,050,555 | ) | ||||
| CAPITAL SHARE TRANSACTIONS | ||||||||
| Institutional Class | ||||||||
| Proceeds from shares sold | 340,448,217 | 653,121,923 | ||||||
| Net asset value of shares issued in reinvestment of distributions to shareholders | 67,241,541 | 24,129,237 | ||||||
| Payments for shares redeemed | (408,713,799 | ) | (395,236,728 | ) | ||||
| Net increase (decrease) in Institutional Class net assets from capital share transactions | (1,024,041 | ) | 282,014,432 | |||||
| Investor Class | ||||||||
| Proceeds from shares sold | 7,832,427 | 59,719,286 | ||||||
| Net asset value of shares issued in reinvestment of distributions to shareholders | 2,940,288 | 2,323,727 | ||||||
| Payments for shares redeemed | (37,958,377 | ) | (66,805,457 | ) | ||||
| Net decrease in Investor Class net assets from capital share transactions | (27,185,662 | ) | (4,762,444 | ) | ||||
| TOTAL INCREASE IN NET ASSETS | 101,245,200 | 400,159,425 | ||||||
| NET ASSETS | ||||||||
| Beginning of year | 1,052,116,265 | 651,956,840 | ||||||
| End of year | $ | 1,153,361,465 | $ | 1,052,116,265 | ||||
| UNDISTRIBUTED NET INVESTMENT INCOME | $ | 236,790 | $ | 15,200,942 | ||||
See accompanying notes to financial statements. |
11
| LYRICAL U.S. VALUE EQUITY FUND STATEMENTS OF CHANGES IN NET ASSETS (Continued) | ||||||||
| Year Ended November 30, 2017 | Year Ended November 30, 2016 | |||||||
| CAPITAL SHARE ACTIVITY | ||||||||
| Institutional Class | ||||||||
| Shares sold | 19,205,975 | 47,161,187 | ||||||
| Shares issued in reinvestment of distributions to shareholders | 3,695,697 | 1,509,246 | ||||||
| Shares redeemed | (22,805,199 | ) | (26,574,555 | ) | ||||
| Net increase in shares outstanding | 96,473 | 22,095,878 | ||||||
| Shares outstanding at beginning of year | 59,884,896 | 37,789,018 | ||||||
| Shares outstanding at end of year | 59,981,369 | 59,884,896 | ||||||
| Investor Class | ||||||||
| Shares sold | 441,214 | 3,943,726 | ||||||
| Shares issued in reinvestment of distributions to shareholders | 162,690 | 147,285 | ||||||
| Shares redeemed | (2,142,707 | ) | (4,510,214 | ) | ||||
| Net decrease in shares outstanding | (1,538,803 | ) | (419,203 | ) | ||||
| Shares outstanding at beginning of year | 3,522,978 | 3,942,181 | ||||||
| Shares outstanding at end of year | 1,984,175 | 3,522,978 | ||||||
See accompanying notes to financial statements. |
12
| LYRICAL U.S. VALUE EQUITY FUND INSTITUTIONAL CLASS FINANCIAL HIGHLIGHTS | ||||||||||||||||||||
| Per Share Data for a Share Outstanding Throughout Each Period: | ||||||||||||||||||||
| Year Ended Nov. 30, 2017 | Year Ended Nov. 30, 2016 | Year Ended Nov. 30, 2015 | Year Ended Nov. 30, 2014 | Period | ||||||||||||||||
| Net asset value at beginning of period | $ | 16.60 | $ | 15.63 | $ | 16.29 | $ | 13.78 | $ | 10.00 | ||||||||||
| Income (loss) from investment operations: | ||||||||||||||||||||
| Net investment income (loss) | 0.01 | (b) | 0.24 | 0.04 | (0.00 | )(c) | 0.00 | (c) | ||||||||||||
| Net realized and unrealized gains (losses) on investments | 3.54 | 1.40 | (0.35 | ) | 2.66 | 3.78 | ||||||||||||||
| Total from investment operations | 3.55 | 1.64 | (0.31 | ) | 2.66 | 3.78 | ||||||||||||||
| Less distributions: | ||||||||||||||||||||
| Dividends from net investment income | (0.24 | ) | (0.04 | ) | (0.00 | )(b) | (0.00 | )(b) | — | |||||||||||
| Distributions from net realized gains | (1.29 | ) | (0.63 | ) | (0.35 | ) | (0.15 | ) | — | |||||||||||
| Total distributions | (1.53 | ) | (0.67 | ) | (0.35 | ) | (0.15 | ) | — | |||||||||||
| Net asset value at end of period | $ | 18.62 | $ | 16.60 | $ | 15.63 | $ | 16.29 | $ | 13.78 | ||||||||||
Total return (d) | 21.70 | % | 10.73 | % | (1.91 | %) | 19.41 | % | 37.80 | %(e) | ||||||||||
| Net assets at end of period (000's) | $ | 1,116,584 | $ | 993,904 | $ | 590,582 | $ | 547,021 | $ | 97,948 | ||||||||||
| Ratios/supplementary data: | ||||||||||||||||||||
| Ratio of total expenses to average net assets | 1.37 | % | 1.38 | % | 1.42 | % | 1.45 | % | 1.93 | %(f) | ||||||||||
| Ratio of net expenses to average net assets | 1.37 | % | 1.38 | % | 1.42 | % | 1.44 | %(g) | 1.45 | %(f)(g) | ||||||||||
| Ratio of net investment income (loss) to average net assets | 0.03 | % | 1.62 | % | 0.24 | % | (0.00 | %)(g)(h) | 0.01 | %(f)(g) | ||||||||||
| Portfolio turnover rate | 22 | % | 36 | % | 21 | % | 20 | % | 26 | %(e) | ||||||||||
(a) | Represents the period from the commencement of operations (February 4, 2013) through November 30, 2013. |
(b) | Per share net investment income has been determined on the basis of average number of shares outstanding during the period. |
(c) | Amount rounds to less than $0.01 per share. |
(d) | Total return is a measure of the change in value of an investment in the Fund over the periods covered. The returns shown do not reflect the deduction of taxes a shareholder would pay on Fund distributions, if any, or the redemption of Fund shares. The total returns would be lower if the Adviser had not reduced advisory fees and/or reimbursed expenses for the periods ended November 30, 2014 and 2013 (Note 4). |
(e) | Not annualized. |
(f) | Annualized. |
(g) | Ratio was determined after advisory fee reductions and/or expense reimbursements (Note 4). |
(h) | Amount rounds to less than 0.01%. |
See accompanying notes to financial statements. | |
13
| LYRICAL U.S. VALUE EQUITY FUND INVESTOR CLASS FINANCIAL HIGHLIGHTS | ||||||||||||||||
| Per Share Data for a Share Outstanding Throughout Each Period: | ||||||||||||||||
| Year Ended Nov. 30, 2017 | Year Ended Nov. 30, 2016 | Year Ended Nov. 30, 2015 | Period | |||||||||||||
| Net asset value at beginning of period | $ | 16.52 | $ | 15.57 | $ | 16.27 | $ | 14.68 | ||||||||
| Income (loss) from investment operations: | ||||||||||||||||
| Net investment income (loss) | (0.05 | )(b) | 0.30 | 0.01 | (0.01 | ) | ||||||||||
| Net realized and unrealized gains (losses) on investments | 3.53 | 1.28 | (0.36 | ) | 1.60 | |||||||||||
| Total from investment operations | 3.48 | 1.58 | (0.35 | ) | 1.59 | |||||||||||
| Less distributions: | ||||||||||||||||
| Distributions from net investment income | (0.17 | ) | (0.00 | )(c) | — | — | ||||||||||
| Distributions from net realized gains | (1.29 | ) | (0.63 | ) | (0.35 | ) | — | |||||||||
| Total distributions | (1.46 | ) | (0.63 | ) | (0.35 | ) | — | |||||||||
| Net asset value at end of period | $ | 18.54 | $ | 16.52 | $ | 15.57 | $ | 16.27 | ||||||||
Total return (d) | 21.32 | % | 10.36 | % | (2.19 | %) | 10.83 | %(e) | ||||||||
| Net assets at end of period (000's) | $ | 36,777 | $ | 58,213 | $ | 61,375 | $ | 9,033 | ||||||||
| Ratios/supplementary data: | ||||||||||||||||
| Ratio of total expenses to average net assets | 1.70 | % | 1.70 | % | 1.72 | % | 2.39 | %(f) | ||||||||
| Ratio of net expenses to average net assets | 1.70 | % | 1.70 | % | 1.70 | %(g) | 1.70 | %(f)(g) | ||||||||
| Ratio of net investment income (loss) to average net assets | (0.32 | %) | 1.39 | % | 0.03 | %(g) | (0.18 | %)(f)(g) | ||||||||
| Portfolio turnover rate | 22 | % | 36 | % | 21 | % | 20 | %(e)(h) | ||||||||
(a) | Represents the period from the commencement of operations (February 24, 2014) through November 30, 2014. |
(b) | Per share net investment loss has been determined on the basis of average number of shares outstanding during the period. |
(c) | Amount rounds to less than $0.01 per share. |
(d) | Total return is a measure of the change in value of an investment in the Fund over the periods covered. The returns shown do not reflect the deduction of taxes a shareholder would pay on Fund distributions, if any, or the redemption of Fund shares. The total returns would be lower if the Adviser had not reduced advisory fees and/or reimbursed expenses for the periods ended November 30, 2015 and 2014 (Note 4). |
(e) | Not annualized. |
(f) | Annualized. |
(g) | Ratio was determined after advisory fee reductions and/or expense reimbursements (Note 4). |
(h) | Represents the year ended November 30, 2014. |
See accompanying notes to financial statements. | |
14
LYRICAL U.S. VALUE EQUITY FUND
NOTES TO FINANCIAL STATEMENTS
November 30, 2017
1. Organization
Lyrical U.S. Value Equity Fund (the “Fund”) is a diversified series of Ultimus Managers Trust (the “Trust”), an open-end investment company established as an Ohio business trust under a Declaration of Trust dated February 28, 2012. Other series of the Trust are not incorporated in this report. The Fund commenced operations on February 4, 2013.
The investment objective of the Fund is to seek to achieve long-term capital growth.
The Fund offers two classes of shares: Institutional Class shares (sold without any sales loads and distribution and/or shareholder service fees and requiring a $100,000 initial investment) and Investor Class shares (sold without any sales loads, but subject to a distribution and/or shareholder service fee of up to 0.25% of the average daily net assets attributable to Investor Class shares, and requiring a $2,500 initial investment). Each share class represents an ownership interest in the same investment portfolio.
2. Significant Accounting Policies
In October 2016, the U.S. Securities and Exchange Commission (the “SEC”) adopted amendments to Regulation S-X, which impact financial statement presentation, particularly the presentation of derivative investments. The Fund has adopted these amendments, which were effective August 1, 2017, with these financial statements.
The following is a summary of the Fund’s significant accounting policies. The policies are in conformity with accounting principles generally accepted in the United States of America (“GAAP”). The Fund follows accounting and reporting guidance under Financial Accounting Standards Board Accounting Standards Codification Topic 946, “Financial Services – Investment Companies.”
Securities valuation – The Fund values its portfolio securities at market value as of the close of regular trading on the New York Stock Exchange (the “NYSE”) (normally 4:00 p.m. Eastern time) on each business day the NYSE is open for business. The Fund values its listed securities on the basis of the security’s last sale price on the security’s primary exchange, if available, otherwise at the exchange’s most recently quoted mean price. NASDAQ-listed securities are valued at the NASDAQ Official Closing Price. When using a quoted price and when the market is considered active, the security will be classified as Level 1 within the fair value hierarchy (see below). In the event that market quotations are not readily available or are considered unreliable due to market or other events, the Fund values its securities and other assets at fair value in accordance with procedures established by and under the general supervision of the Board of Trustees (the “Board”). Under these procedures, the securities will be classified as Level 2 or 3 within the fair value hierarchy, depending on the inputs used. Unavailable or unreliable market quotes may be due to the following factors: a substantial bid-ask spread; infrequent sales resulting in stale prices; insufficient trading volume; small trade sizes; a temporary lapse
15
LYRICAL U.S. VALUE EQUITY FUND |
in any reliable pricing source; and actions of the securities or futures markets, such as the suspension or limitation of trading. As a result, the prices of securities used to calculate the Fund’s net asset value (“NAV”) may differ from quoted or published prices for the same securities.
GAAP establishes a single authoritative definition of fair value, sets out a framework for measuring fair value, and requires additional disclosures about fair value measurements.
Various inputs are used in determining the value of the Fund’s investments. These inputs are summarized in the three broad levels listed below:
● | Level 1 – quoted prices in active markets for identical securities |
● | Level 2 – other significant observable inputs |
● | Level 3 – significant unobservable inputs |
The inputs or methods used for valuing securities are not necessarily an indication of the risks associated with investing in those securities. The inputs used to measure fair value may fall into different levels of the fair value hierarchy. In such cases, for disclosure purposes, the level in the fair value hierarchy within which the fair value measurement falls in its entirety is determined based on the lowest level input that is significant to the fair value measurement.
The following is a summary of the inputs used to value the Fund’s investments and other financial instruments as of November 30, 2017:
| Level 1 | Level 2 | Level 3 | Total | |||||||||||||
| Investments in Securities | ||||||||||||||||
| Common Stocks | $ | 1,162,494,974 | $ | — | $ | — | $ | 1,162,494,974 | ||||||||
| Money Market Funds | 19,222,378 | — | — | 19,222,378 | ||||||||||||
| Total | $ | 1,181,717,352 | $ | — | $ | — | $ | 1,181,717,352 | ||||||||
Refer to the Fund’s Schedule of Investments for a listing of securities by industry type. As of November 30, 2017, the Fund did not have any transfers between Levels. In addition, the Fund did not hold any derivative instruments or any assets or liabilities that were measured at fair value on a recurring basis using significant unobservable inputs (Level 3) as of November 30, 2017. It is the Fund’s policy to recognize transfers between Levels at the end of the reporting period.
Share valuation – The NAV per share of each class of the Fund is calculated daily by dividing the total value of the assets attributable to that class, less liabilities attributable to that class, by the number of shares outstanding of that class. The offering price and redemption price per share of each class of the Fund is equal to the NAV per share of such class.
16
LYRICAL U.S. VALUE EQUITY FUND |
Investment income – Dividend income is recorded on the ex-dividend date. Interest income is accrued as earned. Withholding taxes on foreign dividends have been recorded in accordance with the Fund’s understanding of the applicable country’s rules and tax rates.
Investment transactions – Investment transactions are accounted for on the trade date. Realized gains and losses on investments sold are determined on a specific identification basis.
Allocation between Classes – Investment income earned, realized capital gains and losses, and unrealized appreciation and depreciation are allocated daily to each Class of the Fund based upon its proportionate share of total net assets of the Fund. Class-specific expenses are charged directly to the Class incurring the expense. Common expenses which are not attributable to a specific Class are allocated daily to each Class of shares of the Fund based upon its proportionate share of total net assets of the Fund
Distributions to shareholders – The Fund distributes to shareholders any net investment income dividends and net realized capital gains distributions at least once each year. The amount of such dividends and distributions are determined in accordance with federal income tax regulations, which may differ from GAAP. Dividends and distributions to shareholders are recorded on the ex-dividend date. The tax character of distributions paid to shareholders by the Fund during the years ended November 30, 2017 and 2016 was as follows:
| Year Ended | Ordinary Income | Long-Term Capital Gains | Total Distributions | |||||||||||
11/30/2017 | $ | 21,153,113 | $ | 70,871,989 | $ | 92,025,102 | ||||||||
| 11/30/2016 | $ | 3,393,460 | $ | 29,657,095 | $ | 33,050,555 | ||||||||
The Fund paid the following distributions to shareholders subsequent to November 30, 2017:
Per Share | |||
Record | Ex-Date | Ordinary | |
Lyrical U.S. Value Equity Fund - Institutional Class | 12/28/2017 | 12/29/2017 | $ 0.0061 |
Lyrical U.S. Value Equity Fund - Investor Class | 12/28/2017 | 12/29/2017 | $ 0.0022 |
Estimates – The preparation of financial statements in conformity with GAAP requires management to make estimates and assumptions that affect the reported amounts of assets and liabilities and disclosure of contingent assets and liabilities as of the date of the financial statements and the reported amounts of income and expenses during the reporting period. Actual results could differ from those estimates.
17
LYRICAL U.S. VALUE EQUITY FUND |
Federal income tax – The Fund has qualified and intends to continue to qualify as a regulated investment company under the Internal Revenue Code of 1986, as amended (the “Code”). Qualification generally will relieve the Fund of liability for federal income taxes to the extent 100% of its net investment income and net realized capital gains are distributed in accordance with the Code.
In order to avoid imposition of the excise tax applicable to regulated investment companies, it is also the Fund’s intention to declare as dividends in each calendar year at least 98% of its net investment income (earned during the calendar year) and 98.2% of its net realized capital gains (earned during the twelve months ended October 31) plus undistributed amounts from prior years.
The following information is computed on a tax basis for each item as of November 30, 2017:
| Tax cost of portfolio investments | $ | 901,017,127 | ||
| Gross unrealized appreciation | $ | 316,955,730 | ||
| Gross unrealized depreciation | (36,255,505 | ) | ||
| Net unrealized appreciation | 280,700,225 | |||
| Undistributed ordinary income | 370,548 | |||
| Accumulated earnings | $ | 281,070,773 |
The difference between the federal income tax cost of portfolio investments and the financial statement cost of portfolio investments is due to certain timing differences in the recognition of capital gains or losses under income tax regulations and GAAP. These “book/tax” differences are temporary in nature and are primarily due to the tax deferral of losses on wash sales.
The Fund recognizes the tax benefits or expenses of uncertain tax positions only when the position is “more likely than not” of being sustained assuming examination by tax authorities. Management has reviewed the Fund’s tax positions for all open tax periods (periods ended November 30, 2014 through November 30, 2017) and has concluded that no provision for unrecognized tax benefits or expenses is required in these financial statements. The Fund identifies its major tax jurisdiction as U.S. Federal.
3. Investment Transactions
During the year ended November 30, 2017, cost of purchases and proceeds from sales of investment securities, other than short-term investments, amounted to $240,635,424 and $348,274,314, respectively, for the Fund.
18
LYRICAL U.S. VALUE EQUITY FUND |
4. Transactions with Related Parties
INVESTMENT ADVISORY AGREEMENT
The Fund’s investments are managed by Lyrical Asset Management L.P. (the “Adviser”) pursuant to the terms of an Investment Advisory Agreement. The Fund pays the Adviser an investment advisory fee, computed and accrued daily and paid monthly, at the annual rate of 1.25% of average daily net assets.
Pursuant to an Expense Limitation Agreement (“ELA”) between the Fund and the Adviser, the Adviser has contractually agreed, until March 31, 2019, to reduce investment advisory fees and reimburse other operating expenses to limit total annual operating expenses of the Fund (exclusive of brokerage costs, taxes, borrowing costs, interest, acquired fund fees and expenses, extraordinary expenses such as litigation and merger or reorganization costs, and other expenses not incurred in the ordinary course of the Fund’s business) to an amount not exceeding the following percentages of average daily net assets attributable to each respective class:
Institutional Class | Investor Class |
1.45% | 1.70% |
Under the terms of the ELA, investment advisory fee reductions and expense reimbursements by the Adviser are subject to repayment by the Fund for a period of three years after such fees and expenses were incurred, provided that the repayments do not cause total annual fund operating expenses to exceed the lesser of (i) the expense limitation then in effect, if any, and (ii) the expense limitation in effect at the time the expenses to be repaid were incurred. During the year ended November 30, 2017, the Adviser recouped from the Fund $2,918 of prior years’ investment advisory fee reductions and expense reimbursements. There are no fee reductions or expense reimbursements available for recoupment by the Adviser from the Fund as of November 30, 2017.
OTHER SERVICE PROVIDERS
Ultimus Fund Solutions, LLC (“Ultimus”) provides administration, fund accounting, compliance and transfer agency services to the Fund. The Fund pays Ultimus fees in accordance with the agreements for such services. In addition, the Fund pays out-of-pocket expenses including, but not limited to, postage, supplies and costs of pricing its portfolio securities.
Under the terms of a Distribution Agreement with the Trust, Ultimus Fund Distributors, LLC (the “Distributor”) serves as the principal underwriter to the Fund. The Distributor is a wholly-owned subsidiary of Ultimus. The Distributor is compensated partially by the Adviser and by the Investor Class shares of the Fund for acting as principal underwriter.
A Trustee and certain officers of the Trust are also officers of Ultimus and/or the Distributor.
19
LYRICAL U.S. VALUE EQUITY FUND |
DISTRIBUTION PLAN
The Fund has adopted a plan of distribution (the “Plan”) pursuant to Rule 12b-1 under the 1940 Act, which permits Investor Class shares of the Fund to directly incur or reimburse the Fund’s principal underwriter for certain expenses related to the distribution of its shares. The annual limitation for payment of expenses pursuant to the Plan is 0.25% of the Fund’s average daily net assets allocable to Investor Class shares. The Fund has not adopted a plan of distribution with respect to the Institutional Class shares. During the year ended November 30, 2017, the Investor Class shares incurred $105,135 of distribution fees under the Plan.
TRUSTEE COMPENSATION
Each Trustee who is not an “interested person” of the Trust (“Independent Trustee”) receives a $1,000 annual retainer from the Fund, paid quarterly, except for the Board Chair who receives a $1,200 annual retainer from the Fund, paid quarterly. Each Independent Trustee also receives from the Fund a fee of $500 for each Board meeting attended plus reimbursement for travel and other meeting-related expenses.
PRINCIPAL HOLDERS OF FUND SHARES
As of November 30, 2017, the following shareholders owned of record 5% or more of the outstanding shares of each class of the Fund:
NAME OF RECORD OWNER | % Ownership |
Lyrical U.S. Value Equity Fund - Institutional Class | |
Charles Schwab & Company, Inc. (for the benefit of its customers) | 20% |
Morgan Stanley Smith Barney LLC (for the benefit of its customers) | 17% |
Merrill Lynch, Pierce Fenner & Smith (for the benefit of its customers) | 13% |
Lyrical U.S. Value Equity Fund - Investor Class | |
Charles Schwab & Company, Inc. (for the benefit of its customers) | 71% |
A beneficial owner of 25% or more of the Fund’s outstanding shares may be considered a controlling person of the Fund. That shareholder’s vote could have a more significant effect on matters presented at a shareholder’s meeting.
5. Borrowing Costs
From time to time, the Fund may have an overdrawn cash balance at the custodian due to redemptions or market movements. When this occurs, the Fund will incur borrowing costs charged by the custodian. Accordingly, during the year ended November 30, 2017, the Fund incurred $1,339 of borrowing costs charged by the custodian.
20
LYRICAL U.S. VALUE EQUITY FUND |
6. Sector Risk
If the Fund has significant investments in the securities of issuers within a particular sector, any development affecting that sector will have a greater impact on the value of the net assets of the Fund than would be the case if the Fund did not have significant investments in that sector. In addition, this may increase the risk of loss in the Fund and increase the volatility of the Fund’s NAV per share. Occasionally, market conditions, regulatory changes or other developments may negatively impact a particular sector. As of November 30, 2017, the Fund had 31.8% of the value of its net assets invested in stocks with the Information Technology sector.
As part of the Fund’s principal investment strategies, the Adviser monitors the Fund’s sector exposure to ensure the Fund’s portfolio is adequately diversified.
7. Contingencies and Commitments
The Fund indemnifies the Trust’s officers and Trustees for certain liabilities that might arise from their performance of their duties to the Fund. Additionally, in the normal course of business the Fund enters into contracts that contain a variety of representations and warranties and which provide general indemnifications. The Fund’s maximum exposure under these arrangements is unknown, as this would involve future claims that may be made against the Fund that have not yet occurred. However, based on experience, the Fund expects the risk of loss to be remote.
8. Subsequent Events
The Fund is required to recognize in the financial statements the effects of all subsequent events that provide additional evidence about conditions that existed as of the date of the Statements of Assets and Liabilities. For non-recognized subsequent events that must be disclosed to keep the financial statements from being misleading, the Fund is required to disclose the nature of the event as well as an estimate of its financial effect, or a statement that such an estimate cannot be made. Management has evaluated subsequent events through the issuance of these financial statements and has noted no such events other than the ordinary income dividend paid to shareholders on December 29, 2017, as disclosed in Note 2.
21
LYRICAL U.S. VALUE EQUITY FUND |
To the Board of Trustees of Ultimus Managers Trust
and the Shareholders of Lyrical U.S. Value Equity Fund
We have audited the accompanying statement of assets and liabilities of Lyrical U.S. Value Equity Fund, a series of shares of beneficial interest in Ultimus Managers Trust (the “Fund”), including the schedule of investments, as of November 30, 2017, and the related statement of operations for the year then ended, the statements of changes in net assets for each of the years in the two-year period then ended and the financial highlights for each of the years or periods presented. These financial statements and financial highlights are the responsibility of the Fund’s management. Our responsibility is to express an opinion on these financial statements and financial highlights based on our audits.
We conducted our audits in accordance with the standards of the Public Company Accounting Oversight Board (United States). Those standards require that we plan and perform the audits to obtain reasonable assurance about whether the financial statements and financial highlights are free of material misstatement. An audit includes examining, on a test basis, evidence supporting the amounts and disclosures in the financial statements. Our procedures included confirmation of securities owned as of November 30, 2017 by correspondence with the custodian. An audit also includes assessing the accounting principles used and significant estimates made by management, as well as evaluating the overall financial statement presentation. We believe that our audits provide a reasonable basis for our opinion.
In our opinion, the financial statements and financial highlights referred to above present fairly, in all material respects, the financial position of Lyrical U.S. Value Equity Fund as of November 30, 2017, and the results of its operations for the year then ended, the changes in its net assets for each of the years in the two-year period then ended and its financial highlights for each of the years or periods presented, in conformity with accounting principles generally accepted in the United States of America.
| |
BBD, LLP |

Philadelphia, Pennsylvania
January 25, 2018
22
LYRICAL U.S. VALUE EQUITY FUND |
We believe it is important for you to understand the impact of costs on your investment. As a shareholder of the Fund, you incur ongoing costs, including management fees, class-specific expenses (such as distribution fees) and other operating expenses. The following examples are intended to help you understand your ongoing costs (in dollars) of investing in the Fund and to compare these costs with the ongoing costs of investing in other mutual funds.
A mutual fund’s ongoing costs are expressed as a percentage of its average net assets. This figure is known as the expense ratio. The expenses in the table below are based on an investment of $1,000 made at the beginning of the most recent period (June 1, 2017) and held until the end of the period (November 30, 2017).
The table below illustrates the Fund’s ongoing costs in two ways:
Actual fund return – This section helps you to estimate the actual expenses that you paid over the period. The “Ending Account Value” shown is derived from the Fund’s actual return, and the fourth column shows the dollar amount of operating expenses that would have been paid by an investor who started with $1,000 in the Fund. You may use the information here, together with the amount you invested, to estimate the expenses that you paid over the period.
To do so, simply divide your account value by $1,000 (for example, an $8,600 account value divided by $1,000 = 8.6), then multiply the result by the number given for the Fund under the heading “Expenses Paid During Period.”
Hypothetical 5% return – This section is intended to help you compare the Fund’s ongoing costs with those of other mutual funds. It assumes that the Fund had an annual return of 5% before expenses during the period shown, but that the expense ratio is unchanged. In this case, because the return used is not the Fund’s actual return, the results do not apply to your investment. The example is useful in making comparisons because the SEC requires all mutual funds to calculate expenses based on a 5% return. You can assess the Fund’s ongoing costs by comparing this hypothetical example with the hypothetical examples that appear in shareholder reports of other funds.
Note that expenses shown in the table are meant to highlight and help you compare ongoing costs only. The Fund does not charge transaction fees, such as purchase or redemption fees, nor do they carry a “sales load.”
The calculations assume no shares were bought or sold during the period. Your actual costs may have been higher or lower, depending on the amount of your investment and the timing of any purchases or redemptions.
23
LYRICAL U.S. VALUE EQUITY FUND
ABOUT YOUR FUNDS’ EXPENSES (Unaudited) (Continued)
More information about the Fund’s expenses can be found in this report. For additional information on operating expenses and other shareholder costs, please refer to the Fund’s prospectus.
Beginning | Ending | Net | Expenses Paid During Period(b) | |
Lyrical U.S. Value Equity Fund | ||||
Institutional Class | ||||
Based on Actual Fund Returns | $ 1,000.00 | $ 1,117.50 | 1.37% | $ 7.27 |
Based on Hypothetical 5% Return (before expenses) | $ 1,000.00 | $ 1,018.20 | 1.37% | $ 6.93 |
Investor Class | ||||
Based on Actual Fund Returns | $ 1,000.00 | $ 1,115.50 | 1.70% | $ 9.02 |
Based on Hypothetical 5% Return (before expenses) | $ 1,000.00 | $ 1,016.55 | 1.70% | $ 8.59 |
(a) | Annualized, based on the Fund's most recent one-half year expenses. |
(b) | Expenses are equal to the Fund’s annualized net expense ratio multiplied by the average account value over the period, multiplied by 183/365 (to reflect the one-half year period). |
24
LYRICAL U.S. VALUE EQUITY FUND
OTHER INFORMATION (Unaudited)
A description of the policies and procedures that the Fund uses to vote proxies relating to portfolio securities is available without charge upon request by calling toll-free 1-888-884-8099, or on the SEC’s website at http://www.sec.gov. Information regarding how the Fund voted proxies relating to portfolio securities during the most recent 12-month period ended June 30 is available without charge upon request by calling toll-free 1-888-884-8099, or on the SEC’s website at http://www.sec.gov.
The Trust files a complete listing of portfolio holdings for the Fund with the SEC as of the end of the first and third quarters of each fiscal year on Form N-Q. These filings are available upon request by calling 1-888-884-8099. Furthermore, you may obtain a copy of the filings on the SEC’s website at http://www.sec.gov. The Trust’s Forms N-Q may also be reviewed and copied at the SEC’s Public Reference Room in Washington, DC, and information on the operation of the Public Reference Room may be obtained by calling 1-800-SEC-0330.
FEDERAL TAX INFORMATION (Unaudited)
Qualified Dividend Income – Lyrical U.S. Value Equity Fund designates 100%, or up to the maximum amount of such dividends allowable pursuant to the Internal Revenue Code, as qualified dividend income eligible for the reduced tax rate of 15%.
Dividends Received Deduction – Corporate shareholders are generally entitled to take the dividends received deduction on the portion of a Fund’s dividend distribution that qualifies under tax law. For Lyrical U.S. Value Equity Fund’s fiscal year 2017 ordinary income dividends, 100% qualifies for the corporate dividends received deduction.
Long-Term Capital Gains – For the year ended November 30, 2017, the Fund designated the following long-term capital gains distributions:
| Lyrical U.S. Value Equity Fund | $ | 70,871,989 |
25
LYRICAL U.S. VALUE EQUITY FUND
BOARD OF TRUSTEES AND EXECUTIVE OFFICERS
(Unaudited)
The Board of Trustees has overall responsibility for management of the Trust’s affairs. The Trustees serve during the lifetime of the Trust and until its termination, or until death, resignation, retirement, or removal. The Trustees, in turn, elect the officers of the Trust to actively supervise its day-to-day operations. The officers have been elected for an annual term. Each Trustee’s and officer’s address is 225 Pictoria Drive, Suite 450, Cincinnati, Ohio 45246. The following are the Trustees and executive officers of the Trust:
Name and | Length of Time | Position(s) | Principal | Number of Funds in Trust Overseen by Trustee | Directorships |
Interested Trustees: |
|
|
|
|
|
Robert G. Dorsey* | Since February 2012 | Trustee | Chief Executive Officer and Managing Director of Ultimus Fund Solutions, LLC and Ultimus Fund Distributors, LLC (1999 to present) | 27 | None |
Independent Trustees: |
|
|
|
|
|
Janine L. Cohen | Since January 2016 | Trustee | Retired since 2013; Chief Financial Officer from 2004 to 2013 and Chief Compliance Officer from 2008 to 2013 at AER Advisors, Inc. | 27 | None |
David M. Deptula | Since June 2012 | Trustee | Vice President of Legal and Special Projects at Dayton Freight Lines, Inc. since 2016; Vice President of Tax Treasury at Standard Register Inc. (formerly The Standard Register Company) from 2011 to 2016 | 27 | None |
John J. Discepoli | Since June 2012 | Chairman (May 2016 to present) | Owner of Discepoli Financial Planning, LLC (personal financial planning company) since 2004 | 27 | None |
* | Mr. Dorsey is considered an “interested person” of the Trust within the meaning of Section 2(a)(19) of the 1940 Act because of his relationship with the Trust’s administrator, transfer agent and distributor. |
26
LYRICAL U.S. VALUE EQUITY FUND
BOARD OF TRUSTEES AND EXECUTIVE OFFICERS
(Unaudited) (Continued)
Name and | Length of Time | Position(s) | Principal Occupation(s) |
Executive Officers: | |||
David R. Carson | Since April 2013 | Principal Executive Officer | Vice President and Director of Client Strategies of Ultimus Fund Solutions, LLC (2013 to present); President, Unified Series Trust (2016 to present); Chief Compliance Officer, FSI LBAR Fund (2013 to 2016), The Huntington Funds (2005 to 2013), Huntington Strategy Shares (2012 to 2013), and Huntington Asset Advisors (2013); Vice President, Huntington National Bank (2001 to 2013) |
Jennifer L. Leamer | Since April 2014 | Treasurer (October 2014 to present) | Vice President, Mutual Fund Controller of Ultimus Fund Solutions, LLC (2014 to present); Business Analyst of Ultimus Fund Solutions, LLC (2007 to 2014) |
Frank L. Newbauer | Since February 2012 | Secretary | Assistant Vice President of Ultimus Fund Solutions, LLC (2010 to present) |
27
LYRICAL U.S. VALUE EQUITY FUND
BOARD OF TRUSTEES AND EXECUTIVE OFFICERS
(Unaudited) (Continued)
Name and | Length of Time | Position(s) | Principal Occupation(s) |
Executive Officers: (continued) | |||
Charles C. Black | Since April 2015 | Chief Compliance Officer (January 2016 to present) | Senior Compliance Officer of Ultimus Fund Solutions, LLC (2015 to present); Chief Compliance Officer of The Caldwell & Orkin Funds, Inc. (2016 to present); Senior Compliance Manager for Touchstone Mutual Funds (2013 to 2015); Senior Compliance Manager for Fund Evaluation Group (2011 to 2013) |
Additional information about members of the Board and executive officers is available in the Fund’s Statement of Additional Information (“SAI”). To obtain a free copy of the SAI, please call 1-866-884-5968.
28
LYRICAL U.S. VALUE EQUITY FUND
DISCLOSURE REGARDING APPROVAL OF INVESTMENT ADVISORY AGREEMENT (Unaudited)
The Board of Trustees (the “Board”), including the Independent Trustees voting separately, has reviewed and approved the Fund’s Investment Advisory Agreement with Lyrical Asset Management LP (the “Adviser”) for an additional annual term. Approval took place at an in-person meeting held on October 23-24, 2017, at which all of the Trustees were present.
In the course of their deliberations, the Board was advised by legal counsel. The Board received and reviewed a substantial amount of information provided by the Adviser in response to requests of the Board and its counsel.
In deciding whether to approve the renewal of the Investment Advisory Agreement, the Board recalled its review of the materials related to the Fund and the Adviser throughout the preceding 12 months and its numerous discussions with Trust management and the Adviser about the operations and performance of the Fund during that period. The Board further considered those materials and discussions and other numerous factors.
The nature, extent, and quality of the services provided by the Adviser. In this regard, the Board reviewed the services being provided by the Adviser to the Fund including, without limitation, its investment advisory services since the Fund’s inception; its compliance procedures and practices; its efforts to promote the Fund and assist in its distribution; and its compliance program. After reviewing the foregoing information and further information regarding the Adviser’s business, the Board concluded that the quality, extent, and nature of the services provided by the Adviser to the Fund was satisfactory and adequate.
The investment performance of the Fund. In this regard, the Board compared the performance of the Fund with the performance of its benchmark indexes, custom peer group, and Morningstar categories. The Board also considered the consistency of the Adviser’s management with the Fund’s investment objective and policies. The Board noted that the Fund had outperformed relative to its peer group and Morningstar category for the one- and three-year periods, each period ending June 30, 2017. Following additional discussion of the investment performance of the Fund; the Adviser’s experience in managing mutual funds, private funds, and separate accounts; the Adviser’s historical investment performance; and other factors, the Board concluded that the investment performance of the Fund has been satisfactory.
The costs of the services provided and profits realized by the Adviser and its affiliates from their relationship with the Fund. In this regard, the Board considered the Adviser’s staffing; methods of operating; the education and experience of its personnel; its compliance program; its financial condition and the level of commitment to the Fund; the asset level of the Fund; the overall expenses of the Fund, including the advisory fee; and the differences in fees and services to the Adviser’s other similar clients. The Board considered its discussion with the Adviser regarding the Expense Limitation Agreement (the “ELA”) with the Fund, and considered the Adviser’s current and past fee reductions and expense reimbursements for the Fund. The Board further took into account the Adviser’s willingness to continue the ELA for the Fund until at least March 31, 2019.
29
LYRICAL U.S. VALUE EQUITY FUND
DISCLOSURE REGARDING APPROVAL OF INVESTMENT ADVISORY AGREEMENT (Unaudited) (Continued)
The Board also considered potential benefits for the Adviser in managing the Fund, including promotion of the Adviser’s name. The Board compared the Fund’s advisory fee and overall expense ratio to the average and median advisory fees and expense ratios for its peer group and Morningstar categories and fees charged to the Adviser’s other client accounts. In considering the comparison in fees and expense ratios between the Fund and other comparable funds, the Board looked at the differences in types of funds being compared, the style of investment management, the size of the funds, and the nature of the investment strategies. The Board noted that the Fund’s advisory fee was higher than the average and median advisory fee for the Fund’s peer group and Morningstar category. The Board also considered the Adviser’s commitment to limit the Fund’s expenses under the ELA. The Board further noted that the overall expense ratio for the Fund was higher than the average and median expense ratio for the other funds in the Fund’s peer group and Morningstar category. The Board also compared the fees paid by the Fund to the fees paid by other clients of the Adviser, and considered the similarities and differences of services received by such other clients as compared to the services received by the Fund. The Board noted that the fee structures applicable to the Adviser’s other clients were not indicative of any unreasonableness with respect to the advisory fees proposed to be payable by the Fund. The Board further considered the investment strategy and style used by the Adviser in managing the portfolio of the Fund. Following these comparisons and considerations and upon further consideration and discussion of the foregoing, the Board concluded that the advisory fees paid to the Adviser by the Fund are fair and reasonable.
The extent to which the Fund and its investors would benefit from economies of scale. In this regard, the Board considered that the fee arrangements with the Adviser involve both the advisory fee and the ELA. The Board determined that while the advisory fee remained the same as asset levels increased, the shareholders of the Fund have experienced benefits from the ELA. Following further discussion of the asset levels for the Fund, expectations for asset growth, and level of fees, the Board determined that the fee arrangements with the Adviser will continue to provide benefits and that the Fund’s arrangements were fair and reasonable in relation to the nature and quality of services being provided by the Adviser.
Brokerage and portfolio transactions. In this regard, the Board considered the Adviser’s policies and procedures and performance in seeking best execution for its clients, including the Fund. The Board also considered the historical portfolio turnover rate for the Fund; the process by which the Adviser evaluates best execution; the method and basis for selecting and evaluating broker-dealers; and any anticipated allocation of portfolio business to persons affiliated with the Adviser. After further review and discussion, the Board determined for the Fund that the Adviser’s practices regarding brokerage and portfolio transactions are satisfactory.
30
LYRICAL U.S. VALUE EQUITY FUND
DISCLOSURE REGARDING APPROVAL OF INVESTMENT ADVISORY AGREEMENT (Unaudited) (Continued)
Possible conflicts of interest. In evaluating the possibility for conflicts of interest, the Board considered such matters as the experience and abilities of the advisory personnel assigned to the Fund; the Adviser’s process for allocating trades among the Fund and its other clients; and the substance and administration of the Adviser’s Code of Ethics. Following further consideration and discussion, the Board found for the Fund that the Adviser’s standards and practices relating to the identification and mitigation of potential conflicts of interests were satisfactory.
Conclusion
After full consideration of the above factors as well as other factors, the Board unanimously concluded that approval of the Investment Advisory Agreement was in the best interests of the Fund and its shareholders. It was noted that in the Trustees’ deliberation regarding the approval of the renewal of the Investment Advisory Agreement, the Trustees did not identify any particular information or factor that was all-important or controlling, and that each individual Trustee may have attributed different weights to the various factors noted above.
31
This page intentionally left blank.
This page intentionally left blank.
LYRICAL U.S. HEDGED VALUE FUND
Institutional Class (LYRHX)
Investor Class (LYRDX)
Annual Report
November 30, 2017
| LYRICAL U.S. HEDGED VALUE FUND LETTER TO SHAREHOLDERS | November 30, 2017 |
Dear Fellow Shareholders,
Enclosed is the Annual Report to shareholders of the Lyrical U.S. Hedged Value Fund (the “Fund”). On behalf of the Fund and its investment adviser, Lyrical Asset Management LP, I would like to thank you for your investment.
Since the Fund’s launch on July 14, 2014 through November 30, 2017, the Fund – Institutional Class has produced a cumulative total return of +9.59%, compared to the +43.79% cumulative total return for the S&P 500. For the twelve months ended November 30, 2017, the Hedged Value Fund – Institutional Class produced a total return of +9.52% compared to the total return for the S&P 500 of +22.87%.
For the twelve months ended November 30, 2017, the three positions that most positively impacted performance were Broadcom Limited (AVGO), Anthem, Inc. (ANTM), and Aetna Inc. (AET); conversely, the three positions that most negatively impacted performance were Johnson Controls International plc (JCI), National Oilwell Varco, Inc. (NOV), and Hertz Global Holdings, Inc. (HTZ).
Sector exchange-traded fund (ETF) hedges are used in the short portfolio of the Fund to create a net portfolio that aims to maintain net long exposures of 50%. This provides a hedged option for those wishing exposure to the long portfolio but unwilling to accept unhedged equity market exposure. In rising equity markets, one should expect the Fund’s performance to lag that of the S&P 500, as it did for both the above periods, as our hedges detract from total return.
Lyrical Asset Management’s Investment Philosophy and Portfolio Construction
We believe our strategy and approach to investing differentiate us from other investment managers, even those that share a value approach to investing. We are deep value investors and by this we mean that we look to invest in companies trading significantly below intrinsic value. This separates us from other value managers who focus on relative value or core value approaches and whose portfolio characteristics have higher Price/Earnings, Price/Book and Price/Cash Flow multiples. We assess valuation based on current price relative to long-term normalized earnings, which contrasts us to those that rely on Price/Book or dividend yield. We only invest in what we consider to be quality businesses that we believe should earn good returns on invested capital, and avoid volatile businesses and companies with excessive leverage. Other value investors may consider owning any business regardless of quality if they believe the price is low enough. Lastly, we only invest in businesses we can understand, and avoid those that are excessively complex or require specialized technical knowledge, even though they may appear cheap from a high-level perspective.
We construct our portfolio purely bottom up and without regard to what is or is not contained in a benchmark. We are concerned with concentration risk, and have strict limits on how much capital can be invested in any one position or any one industry. Our
1
long portfolio is constructed to be balanced and diversified across approximately 33 positions, giving us exposure to many different types of companies and situations without sacrificing our strict investment standards.
The Board of Trustees of the Trust, in consultation with the Adviser, determined and approved at a Board meeting on December 18, 2017, to discontinue the Fund’s operations based on, among other factors, the Adviser’s belief that it would be in the best interests of the Fund and its shareholders to discontinue the Fund’s operations. Effective December 19, 2017, the Fund terminated the public offering of its shares, and will discontinue its operation effective January 29, 2018.
Sincerely,
Andrew Wellington
Portfolio Manager
Past performance is not predictive of future performance. Investment results and principal value will fluctuate so that shares, when redeemed, may be worth more or less than their original cost. Current performance may be higher or lower than the performance data quoted. Performance data current to the most recent month end are available by calling 1-888-884-8099.
An investor should consider the investment objectives, risks, charges and expenses of the Fund carefully before investing. The Fund’s prospectus contains this and other important information. To obtain a copy of the Fund’s prospectus please call 1-888-884-8099 and a copy will be sent to you free of charge. Please read the prospectus carefully before you invest. The Fund is distributed by Ultimus Fund Distributors, LLC.
The Letter to Shareholders seeks to describe some of the Adviser’s current opinions and views of the financial markets. Although the Adviser believes it has a reasonable basis for any opinions or views expressed, actual results may differ, sometimes significantly so, from those expected or expressed. The securities held by the Fund that are discussed in the Letter to Shareholders were held during the period covered by this Report. They do not comprise the entire investment portfolios of the Fund, may be sold at any time, and may no longer be held by the Fund. For a complete list of securities held by the Fund as of November 30, 2017, please see the Schedule of Investments and Schedule of Securities Sold Short sections of this Report. The opinions of the Adviser with respect to those securities may change at any time.
Statements in the Letter to Shareholders that reflect projections or expectations for future financial or economic performance of the Fund and the market in general and statements of the Fund’s plans and objectives for future operations are forward-looking statements. No assurance can be given that actual results or events will not differ materially from those projected, estimated, assumed, or anticipated in any such forward-looking statements. Important factors that could result in such differences, in addition to factors noted with such forward-looking statements include, without limitation, general economic conditions, such as inflation, recession, and interest rates. Past performance is not a guarantee of future results.
2
LYRICAL U.S. HEDGED VALUE FUND
PERFORMANCE INFORMATION (Unaudited)
Comparison of the Change in Value of a $100,000 Investment in
Lyrical U.S. Hedged Value Fund - Institutional Class(a) versus
the S&P 500® Index
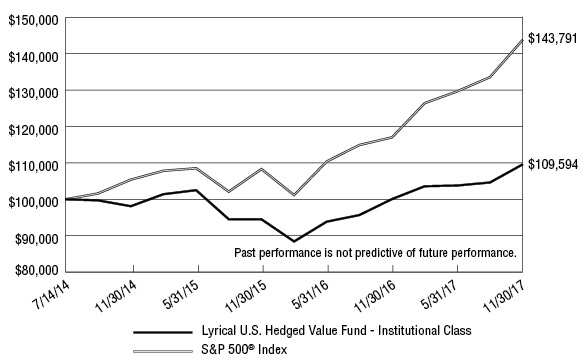
Average Annual Total Returns (for the periods ended November 30, 2017) | |||
| 1 Year | 3 Years | Since Inception(c) | |
| Lyrical U.S. Hedged Value Fund - Institutional Class(b) | 9.52% | 3.76% | 2.75% |
| Lyrical U.S. Hedged Value Fund - Investor Class(b) | 9.27% | 3.51% | 2.49% |
| S&P 500® Index(d) | 22.87% | 10.91% | 11.34% |
| (a) | The line graph above represents performance of the Institutional Class only, which will vary from the performance of the Investor Class based on the difference in fees paid by shareholders in the different classes. |
| (b) | The Fund’s total returns do not reflect the deduction of taxes a shareholder would pay on Fund distributions or the redemption of Fund shares. |
| (c) | Commencement of operations for Institutional Class and Investor Class shares was July 14, 2014. |
| (d) | The S&P 500® Index is a market capitalization weighted index of 500 large companies that is widely used as a barometer of U.S. stock market performance. The index is unmanaged and shown for illustration purposes only. An investor cannot invest in an index and its returns are not indicative of the performance of any specific investment. |
3
LYRICAL U.S. HEDGED VALUE FUND
PORTFOLIO INFORMATION
November 30, 2017 (Unaudited)
Lyrical U.S. Hedged Value Fund vs S&P 500® Index
Sector Diversification
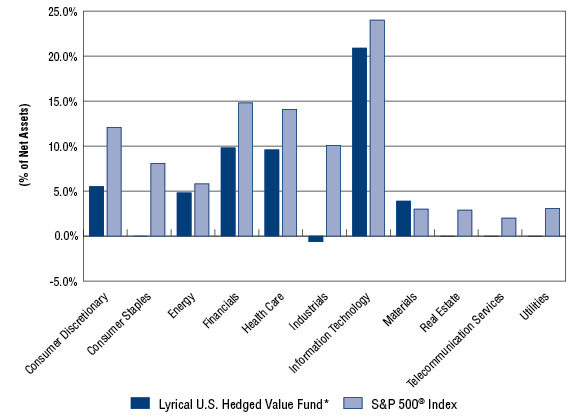
* The percentages above for Lyrical U.S. Hedged Value Fund represent the net percentages for the Fund and are computed by taking the net dollar exposure, including short positions, and dividing by the net assets of the Fund.
Top Ten Long Positions
| Security Description | % of Net Assets |
| Anthem, Inc. | 6.6% |
| Broadcom Ltd. | 6.3% |
| Aetna, Inc. | 5.6% |
| TE Connectivity Ltd. | 5.5% |
| Corning, Inc. | 5.4% |
| Ameriprise Financial, Inc. | 5.0% |
| Celanese Corporation - Series A | 5.0% |
| Aflac, Inc. | 4.9% |
| Lincoln National Corporation | 4.7% |
| HCA Healthcare, Inc. | 4.6% |
4
| LYRICAL U.S. HEDGED VALUE FUND SCHEDULE OF INVESTMENTS November 30, 2017 | ||||||||
| COMMON STOCKS — 106.1% | Shares | Value | ||||||
| Consumer Discretionary — 9.9% | ||||||||
| Auto Components — 3.5% | ||||||||
| Goodyear Tire & Rubber Company (The) | 1,165 | $ | 37,711 | |||||
| Tenneco, Inc. | 256 | 15,209 | ||||||
| 52,920 | ||||||||
| Household Durables — 3.2% | ||||||||
| Whirlpool Corporation | 285 | 48,043 | ||||||
| Internet & Direct Marketing Retail — 3.2% | ||||||||
| Liberty Interactive Corporation QVC Group – Series A (a) | 1,950 | 47,580 | ||||||
| Energy — 8.8% | ||||||||
| Energy Equipment & Services — 1.8% | ||||||||
| National Oilwell Varco, Inc. | 788 | 26,437 | ||||||
| Oil, Gas & Consumable Fuels — 7.0% | ||||||||
| EOG Resources, Inc. | 529 | 54,127 | ||||||
| Suncor Energy, Inc. | 1,498 | 52,071 | ||||||
| 106,198 | ||||||||
| Financials — 22.9% | ||||||||
| Capital Markets — 7.9% | ||||||||
| Affiliated Managers Group, Inc. | 223 | 44,303 | ||||||
| Ameriprise Financial, Inc. | 460 | 75,086 | ||||||
| 119,389 | ||||||||
| Insurance — 15.0% | ||||||||
| Aflac, Inc. | 833 | 73,004 | ||||||
| Assurant, Inc. | 318 | 32,077 | ||||||
| Lincoln National Corporation | 923 | 70,656 | ||||||
| Willis Towers Watson plc (b) | 313 | 50,330 | ||||||
| 226,067 | ||||||||
| Health Care — 16.8% | ||||||||
| Health Care Providers & Services — 16.8% | ||||||||
| Aetna, Inc. (b) | 465 | 83,784 | ||||||
| Anthem, Inc. | 427 | 100,328 | ||||||
| HCA Healthcare, Inc. (a) | 810 | 68,850 | ||||||
| 252,962 | ||||||||
| Industrials — 9.4% | ||||||||
| Building Products — 3.0% | ||||||||
| Johnson Controls International plc | 1,193 | 44,905 | ||||||
| Construction & Engineering — 1.3% | ||||||||
| AECOM (a) | 522 | 19,575 | ||||||
5
| LYRICAL U.S. HEDGED VALUE FUND SCHEDULE OF INVESTMENTS (Continued) | ||||||||
| COMMON STOCKS — 106.1% (Continued) | Shares | Value | ||||||
| Industrials — 9.4% (Continued) | ||||||||
| Road & Rail — 1.8% | ||||||||
| Avis Budget Group, Inc. (a) | 477 | $ | 18,174 | |||||
| Hertz Global Holdings, Inc. (a) | 472 | 8,944 | ||||||
| 27,118 | ||||||||
| Trading Companies & Distributors — 3.3% | ||||||||
| AerCap Holdings N.V. (a) | 951 | 49,423 | ||||||
| Information Technology — 32.1% | ||||||||
| Communications Equipment — 3.0% | ||||||||
| ARRIS International plc (a) | 636 | 19,061 | ||||||
| CommScope Holding Company, Inc. (a) | 723 | 26,021 | ||||||
| 45,082 | ||||||||
| Electronic Equipment, Instruments & Components — 13.5% | ||||||||
| Corning, Inc. | 2,491 | 80,684 | ||||||
| Flex Ltd. (a) | 2,164 | 39,103 | ||||||
| TE Connectivity Ltd. | 882 | 83,296 | ||||||
| 203,083 | ||||||||
| IT Services — 3.1% | ||||||||
| Western Union Company (The) | 2,407 | 47,394 | ||||||
| Semiconductors & Semiconductor Equipment — 7.8% | ||||||||
| Broadcom Ltd. | 340 | 94,499 | ||||||
| Microsemi Corporation (a) | 421 | 22,250 | ||||||
| 116,749 | ||||||||
| Technology Hardware, Storage & Peripherals — 4.7% | ||||||||
| NCR Corporation (a) | 756 | 23,655 | ||||||
| Western Digital Corporation | 593 | 46,764 | ||||||
| 70,419 | ||||||||
| Materials — 6.2% | ||||||||
| Chemicals — 5.0% | ||||||||
| Celanese Corporation - Series A | 700 | 75,068 | ||||||
| Containers & Packaging — 1.2% | ||||||||
| Owens-Illinois, Inc. (a) | 745 | 18,044 | ||||||
| Total Common Stocks (Cost $1,313,890) | $ | 1,596,456 | ||||||
6
| LYRICAL U.S. HEDGED VALUE FUND SCHEDULE OF INVESTMENTS (Continued) | ||||||||
| MONEY MARKET FUNDS — 13.2% | Shares | Value | ||||||
| Invesco Short-Term Investments Trust - Treasury Portfolio - Institutional Shares, 0.98% (c) (Cost $198,418) | 198,418 | $ | 198,418 | |||||
| Total Investments at Value — 119.3% (Cost $1,512,308) | $ | 1,794,874 | ||||||
| Liabilities in Excess of Other Assets — (19.3%) (d) | (289,769 | ) | ||||||
| Net Assets — 100.0% | $ | 1,505,105 | ||||||
| (a) | Non-income producing security. |
| (b) | All or a portion of the shares have been committed as collateral for open short positions (Note 2). |
| (c) | The rate shown is the 7-day effective yield as of November 30, 2017. |
| (d) | Includes cash held as margin deposits for short positions. |
| See accompanying notes to financial statements. | |
7
| LYRICAL U.S. HEDGED VALUE FUND SCHEDULE OF SECURITIES SOLD SHORT November 30, 2017 | ||||||||
| EXCHANGE-TRADED FUNDS — 52.2% | Shares | Value | ||||||
| Consumer Discretionary Select Sector SPDR® Fund (The) | 684 | $ | 66,108 | |||||
| Energy Select Sector SPDR® Fund (The) | 889 | 61,430 | ||||||
| Financial Select Sector SPDR® Fund (The) | 7,190 | 197,869 | ||||||
| Health Care Select Sector SPDR® Fund (The) | 1,306 | 109,012 | ||||||
| Industrial Select Sector SPDR® Fund (The) | 2,007 | 149,541 | ||||||
| Materials Select Sector SPDR® Fund (The) | 571 | 34,009 | ||||||
| Technology Select Sector SPDR® Fund (The) | 2,631 | 167,963 | ||||||
| Total Securities Sold Short — 52.2% (Proceeds $610,792) | $ | 785,932 | ||||||
| See accompanying notes to financial statements. |
8
| LYRICAL U.S. HEDGED VALUE FUND STATEMENT OF ASSETS AND LIABILITIES November 30, 2017 | ||||
| ASSETS | ||||
| Investments in securities: | ||||
| At acquisition cost | $ | 1,512,308 | ||
| At value (Note 2) | $ | 1,794,874 | ||
| Deposits with brokers for securities sold short (Note 2) | 487,268 | |||
| Dividends receivable | 2,241 | |||
| Receivable from Adviser (Note 4) | 13,262 | |||
| Other assets | 5,997 | |||
| Total assets | 2,303,642 | |||
| LIABILITIES | ||||
| Distributions payable | 333 | |||
| Securities sold short, at value (Note 2) (proceeds $610,792) | 785,932 | |||
| Payable to administrator (Note 4) | 8,510 | |||
| Accrued brokerage expense on securities sold short (Note 2) | 473 | |||
| Other accrued expenses | 3,289 | |||
| Total liabilities | 798,537 | |||
| NET ASSETS | $ | 1,505,105 | ||
| NET ASSETS CONSIST OF: | ||||
| Paid-in capital | $ | 1,422,528 | ||
| Accumulated net investment loss | (22,916 | ) | ||
| Accumulated net realized losses from investment transactions | (1,933 | ) | ||
| Net unrealized appreciation (depreciation) on: | ||||
| Investments | 282,566 | |||
| Securities sold short | (175,140 | ) | ||
| NET ASSETS | $ | 1,505,105 | ||
| NET ASSET VALUE PER SHARE: | ||||
| INSTITUTIONAL CLASS | ||||
| Net assets applicable to Institutional Class | $ | 920,232 | ||
| Institutional Class shares of beneficial interest outstanding (unlimited number of shares authorized, no par value) | 87,730 | |||
| Net asset value, offering price and redemption price per share (Note 2) | $ | 10.49 | ||
| INVESTOR CLASS | ||||
| Net assets applicable to Investor Class | $ | 584,873 | ||
| Investor Class shares of beneficial interest outstanding (unlimited number of shares authorized, no par value) | 56,247 | |||
| Net asset value, offering price and redemption price per share (Note 2) | $ | 10.40 | ||
| See accompanying notes to financial statements. |
9
| LYRICAL U.S. HEDGED VALUE FUND STATEMENT OF OPERATIONS Year Ended November 30, 2017 | ||||
| INVESTMENT INCOME | ||||
| Dividend income | $ | 22,172 | ||
| Foreign withholding taxes on dividends | (222 | ) | ||
| Total investment income | 21,950 | |||
| EXPENSES | ||||
| Professional fees | 40,712 | |||
| Fund accounting fees (Note 4) | 36,144 | |||
| Administration fees (Note 4) | 30,000 | |||
| Transfer agent fees (Note 4) | 24,000 | |||
| Investment advisory fees (Note 4) | 22,456 | |||
| Dividend expense on securities sold short (Note 2) | 13,321 | |||
| Compliance fees (Note 4) | 12,614 | |||
| Registration and filing fees | 10,739 | |||
| Trustees' fees and expenses (Note 4) | 10,044 | |||
| Custody and bank service fees | 6,098 | |||
| Prime brokerage expense on securities sold short (Note 2) | 4,612 | |||
| Printing of shareholder reports | 3,520 | |||
| Postage and supplies | 3,462 | |||
| Insurance expense | 2,898 | |||
| Distribution fees - Investor Class (Note 4) | 1,446 | |||
| Other expenses | 6,578 | |||
| Total expenses | 228,644 | |||
| Fee reductions and expense reimbursements by Adviser (Note 4) | (183,911 | ) | ||
| Net expenses | 44,733 | |||
| NET INVESTMENT LOSS | (22,783 | ) | ||
| REALIZED AND UNREALIZED GAINS (LOSSES) ON INVESTMENTS AND SECURITIES SOLD SHORT | ||||
| Net realized gains (losses) from: | ||||
| Investments | 46,675 | |||
| Securities sold short | (35,382 | ) | ||
| Net change in unrealized appreciation (depreciation) on: | ||||
| Investments | 247,436 | |||
| Securities sold short | (105,602 | ) | ||
| NET REALIZED AND UNREALIZED GAINS ON INVESTMENTS AND SECURITIES SOLD SHORT | 153,127 | |||
| NET INCREASE IN NET ASSETS RESULTING FROM OPERATIONS | $ | 130,344 | ||
| See accompanying notes to financial statements. |
10
| LYRICAL U.S. HEDGED VALUE FUND STATEMENTS OF CHANGES IN NET ASSETS | ||||||||
| Year Ended November 30, 2017 | Year Ended November 30, 2016 | |||||||
| FROM OPERATIONS | ||||||||
| Net investment loss | $ | (22,783 | ) | $ | (5,088 | ) | ||
| Net realized gains (losses) from: | ||||||||
| Investments | 46,675 | 41,829 | ||||||
| Securities sold short | (35,382 | ) | (1,927 | ) | ||||
| Net change in unrealized appreciation (depreciation) on: | ||||||||
| Investments | 247,436 | 95,448 | ||||||
| Securities sold short | (105,602 | ) | (54,825 | ) | ||||
| Net increase in net assets resulting from operations | 130,344 | 75,437 | ||||||
| DISTRIBUTIONS TO SHAREHOLDERS (Note 2) | ||||||||
| From net realized gains, Institutional Class | (8,483 | ) | (27,448 | ) | ||||
| From net realized gains, Investor Class | (5,436 | ) | (20,037 | ) | ||||
| Return of capital, Institutional Class | (253 | ) | — | |||||
| Return of capital, Investor Class | (163 | ) | — | |||||
| Decrease in net assets from distributions to shareholders | (14,335 | ) | (47,485 | ) | ||||
| CAPITAL SHARE TRANSACTIONS | ||||||||
| Institutional Class | ||||||||
| Proceeds from shares sold | 20,350 | — | ||||||
| Net asset value of shares issued in reinvestment of distributions to shareholders | 8,427 | 26,757 | ||||||
| Payments for shares redeemed | (440 | ) | — | |||||
| Net increase in Institutional Class net assets from capital share transactions | 28,337 | 26,757 | ||||||
| Investor Class | ||||||||
| Proceeds from shares sold | 13,250 | 13,373 | ||||||
| Net asset value of shares issued in reinvestment of distributions to shareholders | 5,574 | 19,764 | ||||||
| Payments for shares redeemed | (54,538 | ) | (86,803 | ) | ||||
| Net decrease in Investor Class net assets from capital share transactions | (35,714 | ) | (53,666 | ) | ||||
| TOTAL INCREASE IN NET ASSETS | 108,632 | 1,043 | ||||||
| NET ASSETS | ||||||||
| Beginning of year | 1,396,473 | 1,395,430 | ||||||
| End of year | $ | 1,505,105 | $ | 1,396,473 | ||||
| ACCUMULATED NET INVESTMENT LOSS | $ | (22,916 | ) | $ | (133 | ) | ||
| See accompanying notes to financial statements. |
11
| LYRICAL U.S. HEDGED VALUE FUND STATEMENTS OF CHANGES IN NET ASSETS (Continued) | ||||||||
| Year Ended November 30, 2017 | Year Ended November 30, 2016 | |||||||
| CAPITAL SHARE ACTIVITY | ||||||||
| Institutional Class | ||||||||
| Shares sold | 2,011 | — | ||||||
| Shares issued in reinvestment of distributions to shareholders | 803 | 2,782 | ||||||
| Shares redeemed | (43 | ) | — | |||||
| Net increase in shares outstanding | 2,771 | 2,782 | ||||||
| Shares outstanding at beginning of year | 84,959 | 82,177 | ||||||
| Shares outstanding at end of year | 87,730 | 84,959 | ||||||
| Investor Class | ||||||||
| Shares sold | 1,327 | 1,471 | ||||||
| Shares issued in reinvestment of distributions to shareholders | 536 | 2,067 | ||||||
| Shares redeemed | (5,454 | ) | (9,416 | ) | ||||
| Net decrease in shares outstanding | (3,591 | ) | (5,878 | ) | ||||
| Shares outstanding at beginning of year | 59,838 | 65,716 | ||||||
| Shares outstanding at end of year | 56,247 | 59,838 | ||||||
| See accompanying notes to financial statements. |
12
| LYRICAL U.S. HEDGED VALUE FUND INSTITUTIONAL CLASS FINANCIAL HIGHLIGHTS | ||||||||||||||||
| Per Share Data for a Share Outstanding Throughout Each Period: | ||||||||||||||||
| Year Ended Nov. 30, 2017 | Year Ended Nov. 30, 2016 | Year Ended Nov. 30, 2015 | Period Ended Nov. 30, 2014 (a) | |||||||||||||
| Net asset value at beginning of period | $ | 9.67 | $ | 9.45 | $ | 9.81 | $ | 10.00 | ||||||||
| Income (loss) from investment operations: | ||||||||||||||||
| Net investment loss | (0.15 | )(b) | (0.02 | ) | (0.13 | ) | (0.04 | ) | ||||||||
| Net realized and unrealized gains (losses) on investments and securities sold short | 1.07 | 0.57 | (0.23 | ) | (0.15 | ) | ||||||||||
| Total from investment operations | 0.92 | 0.55 | (0.36 | ) | (0.19 | ) | ||||||||||
| Less distributions: | ||||||||||||||||
| Distributions from net realized gains | (0.10 | ) | (0.33 | ) | (0.00 | )(c) | — | |||||||||
| Return of capital | (0.00 | )(c) | — | — | — | |||||||||||
| Total distributions | (0.10 | ) | (0.33 | ) | (0.00 | ) | — | |||||||||
| Net asset value at end of period | $ | 10.49 | $ | 9.67 | $ | 9.45 | $ | 9.81 | ||||||||
| Total return (d) | 9.52 | % | 5.88 | % | (3.66 | %) | (1.90 | %)(e) | ||||||||
| Net assets at end of period (000's) | $ | 920 | $ | 821 | $ | 777 | $ | 591 | ||||||||
| Ratios/supplementary data: | ||||||||||||||||
| Ratio of total expenses to average net assets | 15.18 | % | 16.71 | % | 14.76 | % | 16.57 | %(f) | ||||||||
| Ratio of net expenses to average net assets (g) | 2.99 | % | 3.14 | % | 3.16 | % | 2.59 | %(f) | ||||||||
| Ratio of net expenses to average net assets excluding dividend expense (g) | 2.07 | % | 2.08 | % | 2.27 | % | 1.99 | %(f) | ||||||||
| Ratio of net expenses to average net assets excluding dividend expense and prime brokerage expense on securities sold short (g) | 1.75 | % | 1.75 | % | 1.75 | % | 1.75 | %(f) | ||||||||
| Ratio of net investment loss to average net assets (g) | (1.47 | %) | (0.26 | %) | (1.49 | %) | (1.15 | %)(f) | ||||||||
| Portfolio turnover rate | 9 | % | 17 | % | 7 | % | 9 | %(e) | ||||||||
| (a) | Represents the period from the commencement of operations (July 14, 2014) through November 30, 2014. |
| (b) | Per share net investment loss has been determined on the basis of average number of shares outstanding during the period. |
| (c) | Amount rounds to less than $0.01 per share. |
| (d) | Total return is a measure of the change in value of an investment in the Fund over the periods covered. The returns shown do not reflect the deduction of taxes a shareholder would pay on Fund distributions, if any, or the redemption of Fund shares. The total returns would be lower if the Adviser had not reduced advisory fees and reimbursed expenses (Note 4). |
| (e) | Not annualized. |
| (f) | Annualized. |
| (g) | Ratio was determined after advisory fee reductions and expense reimbursements (Note 4). |
| See accompanying notes to financial statements. | |
13
| LYRICAL U.S. HEDGED VALUE FUND INVESTOR CLASS FINANCIAL HIGHLIGHTS | ||||||||||||||||
| Per Share Data for a Share Outstanding Throughout Each Period: | ||||||||||||||||
| Year Ended Nov. 30, 2017 | Year Ended Nov. 30, 2016 | Year Ended Nov. 30, 2015 | Period Ended Nov. 30, 2014 (a) | |||||||||||||
| Net asset value at beginning of period | $ | 9.61 | $ | 9.42 | $ | 9.80 | $ | 10.00 | ||||||||
| Income (loss) from investment operations: | ||||||||||||||||
| Net investment loss | (0.17 | )(b) | (0.06 | ) | (0.18 | ) | (0.05 | ) | ||||||||
| Net realized and unrealized gains (losses) on investments and securities sold short | 1.06 | 0.58 | (0.20 | ) | (0.15 | ) | ||||||||||
| Total from investment operations | 0.89 | 0.52 | (0.38 | ) | (0.20 | ) | ||||||||||
| Less distributions: | ||||||||||||||||
| Distributions from net realized gains | (0.10 | ) | (0.33 | ) | (0.00 | )(c) | — | |||||||||
| Return of capital | (0.00 | )(c) | — | — | — | |||||||||||
| Total distributions | (0.10 | ) | (0.33 | ) | (0.00 | ) | — | |||||||||
| Net asset value at end of period | $ | 10.40 | $ | 9.61 | $ | 9.42 | $ | 9.80 | ||||||||
| Total return (d) | 9.27 | % | 5.58 | % | (3.87 | %) | (2.00 | %)(e) | ||||||||
| Net assets at end of period (000's) | $ | 585 | $ | 575 | $ | 619 | $ | 614 | ||||||||
| Ratios/supplementary data: | ||||||||||||||||
| Ratio of total expenses to average net assets | 16.67 | % | 17.54 | % | 15.49 | % | 16.95 | %(f) | ||||||||
| Ratio of net expenses to average net assets (g) | 3.24 | % | 3.39 | % | 3.41 | % | 2.84 | %(f) | ||||||||
| Ratio of net expenses to average net assets excluding dividend expense (g) | 2.32 | % | 2.34 | % | 2.52 | % | 2.24 | %(f) | ||||||||
| Ratio of net expenses to average net assets excluding dividend expense and prime brokerage expense on securities sold short (g) | 2.00 | % | 2.00 | % | 2.00 | % | 2.00 | %(f) | ||||||||
| Ratio of net investment loss to average net assets (g) | (1.73 | %) | (0.53 | %) | (1.78 | %) | (1.38 | %)(f) | ||||||||
| Portfolio turnover rate | 9 | % | 17 | % | 7 | % | 9 | %(e) | ||||||||
| (a) | Represents the period from the commencement of operations (July 14, 2014) through November 30, 2014. |
| (b) | Per share net investment loss has been determined on the basis of average number of shares outstanding during the period. |
| (c) | Amount rounds to less than $0.01 per share. |
| (d) | Total return is a measure of the change in value of an investment in the Fund over the periods covered. The returns shown do not reflect the deduction of taxes a shareholder would pay on Fund distributions, if any, or the redemption of Fund shares. The total returns would be lower if the Adviser had not reduced advisory fees and reimbursed expenses (Note 4). |
| (e) | Not annualized. |
| (f) | Annualized. |
| (g) | Ratio was determined after advisory fee reductions and expense reimbursements (Note 4). |
| See accompanying notes to financial statements. | |
14
LYRICAL U.S. HEDGED VALUE FUND
NOTES TO FINANCIAL STATEMENTS
November 30, 2017
1. Organization
Lyrical U.S. Hedged Value Fund (the “Fund”) is a diversified series of Ultimus Managers Trust (the “Trust”), an open-end investment company established as an Ohio business trust under a Declaration of Trust dated February 28, 2012. Other series of the Trust are not incorporated in this report. The Fund commenced operations on July 14, 2014.
The investment objective of the Fund is to seek to achieve long-term capital growth.
The Fund offers two classes of shares: Institutional Class shares (sold without any sales loads and distribution and/or shareholder service fees and requiring a $100,000 initial investment) and Investor Class shares (sold without any sales loads, but subject to a distribution and/or shareholder service fee of up to 0.25% of the average daily net assets attributable to Investor Class shares, and requiring a $2,500 initial investment). Each share class represents an ownership interest in the same investment portfolio.
2. Significant Accounting Policies
In October 2016, the U.S. Securities and Exchange Commission (the “SEC”) adopted amendments to Regulation S-X, which impact financial statement presentation, particularly the presentation of derivative investments. The Fund has adopted these amendments, which were effective August 1, 2017, with these financial statements.
The following is a summary of the Fund’s significant accounting policies. The policies are in conformity with accounting principles generally accepted in the United States of America (“GAAP”). The Fund follows accounting and reporting guidance under Financial Accounting Standards Board Accounting Standards Codification Topic 946, “Financial Services – Investment Companies.”
Securities valuation – The Fund values its portfolio securities at market value as of the close of regular trading on the New York Stock Exchange (the “NYSE”) (normally 4:00 p.m. Eastern time) on each business day the NYSE is open for business. The Fund values its listed securities on the basis of the security’s last sale price on the security’s primary exchange, if available, otherwise at the exchange’s most recently quoted mean price. NASDAQ-listed securities are valued at the NASDAQ Official Closing Price. When using a quoted price and when the market is considered active, the security will be classified as Level 1 within the fair value hierarchy (see below). In the event that market quotations are not readily available or are considered unreliable due to market or other events, the Fund values its securities and other assets at fair value in accordance with procedures established by and under the general supervision of the Board of Trustees (the “Board”). Under these procedures, the securities will be classified as Level 2 or 3 within the fair value hierarchy, depending on the inputs used. Unavailable or unreliable market quotes may be due to the following factors: a substantial bid-ask spread; infrequent sales resulting in stale prices; insufficient trading volume; small trade sizes; a temporary lapse
15
| LYRICAL U.S. HEDGED VALUE FUND NOTES TO FINANCIAL STATEMENTS (Continued) |
in any reliable pricing source; and actions of the securities or futures markets, such as the suspension or limitation of trading. As a result, the prices of securities used to calculate the Fund’s net asset value (“NAV”) may differ from quoted or published prices for the same securities.
GAAP establishes a single authoritative definition of fair value, sets out a framework for measuring fair value, and requires additional disclosures about fair value measurements.
Various inputs are used in determining the value of the Fund’s investments. These inputs are summarized in the three broad levels listed below:
| ● | Level 1 – quoted prices in active markets for identical securities |
| ● | Level 2 – other significant observable inputs |
| ● | Level 3 – significant unobservable inputs |
The inputs or methods used for valuing securities are not necessarily an indication of the risks associated with investing in those securities. The inputs used to measure fair value may fall into different levels of the fair value hierarchy. In such cases, for disclosure purposes, the level in the fair value hierarchy within which the fair value measurement falls in its entirety is determined based on the lowest level input that is significant to the fair value measurement.
The following is a summary of the inputs used to value the Fund’s investments and other financial instruments as of November 30, 2017:
| Level 1 | Level 2 | Level 3 | Total | |||||||||||||
| Investments in Securities | ||||||||||||||||
| Common Stocks | $ | 1,596,456 | $ | — | $ | — | $ | 1,596,456 | ||||||||
| Money Market Funds | 198,418 | — | — | 198,418 | ||||||||||||
| Total | $ | 1,794,874 | $ | — | $ | — | $ | 1,794,874 | ||||||||
| Other Financial Instruments | ||||||||||||||||
| Exchange-Traded Funds - Sold Short | $ | (785,932 | ) | $ | — | $ | — | $ | (785,932 | ) | ||||||
Refer to the Fund’s Schedule of Investments and Schedule of Securities Sold Short, as applicable, for a listing of securities by industry or sector type. As of November 30, 2017, the Fund did not have any transfers between Levels. In addition, the Fund did not hold any derivative instruments or any assets or liabilities that were measured at fair value on a recurring basis using significant unobservable inputs (Level 3) as of November 30, 2017. It is the Fund’s policy to recognize transfers between Levels at the end of the reporting period.
16
| LYRICAL U.S. HEDGED VALUE FUND NOTES TO FINANCIAL STATEMENTS (Continued) |
Share valuation – The NAV per share of each class of the Fund is calculated daily by dividing the total value of the assets attributable to that class, less liabilities attributable to that class, by the number of shares outstanding of that class. The offering price and redemption price per share of each class of the Fund is equal to the NAV per share of such class.
Investment income – Dividend income is recorded on the ex-dividend date. Interest income is accrued as earned. Withholding taxes on foreign dividends have been recorded in accordance with the Fund’s understanding of the applicable country’s rules and tax rates.
Investment transactions – Investment transactions are accounted for on the trade date. Realized gains and losses on investments sold are determined on a specific identification basis.
Allocation between Classes – Investment income earned, realized capital gains and losses, and unrealized appreciation and depreciation are allocated daily to each Class of the Fund based upon its proportionate share of total net assets of the Fund. Class-specific expenses are charged directly to the Class incurring the expense. Common expenses which are not attributable to a specific Class are allocated daily to each Class of shares of the Fund based upon its proportionate share of total net assets of the Fund.
Distributions to shareholders – The Fund distributes to shareholders any net investment income dividends and net realized capital gains distributions at least once each year. The amount of such dividends and distributions are determined in accordance with federal income tax regulations, which may differ from GAAP. Dividends and distributions to shareholders are recorded on the ex-dividend date. The tax character of distributions paid to shareholders by the Fund during the years ended November 30, 2017 and 2016 was as follows:
| Year Ended | Long-Term Capital Gains | Return of Capital | Total Distributions | |||||||||||
| 11/30/2017 | $ | 13,919 | $ | 416 | $ | 14,335 | ||||||||
| 11/30/2016 | $ | 47,485 | $ | — | $ | 47,485 | ||||||||
Short Positions – The Fund sells securities short. When the Fund sells a security short, it must borrow the security sold short and deliver it to the broker-dealer through which it made the short sale. A gain, limited to the price at which the Fund sold the security short, or a loss, unlimited in size, will be recognized upon the termination of a short sale. The Fund is also subject to the risk that it may be unable to reacquire a security to terminate a short position except at a price substantially in excess of the last quoted price. The Fund is liable for dividends payable on securities while those securities are in a short position and will also bear other costs, such as charge for the prime brokerage accounts, in connection with the short positions. These costs are reported as dividend expense and
17
| LYRICAL U.S. HEDGED VALUE FUND NOTES TO FINANCIAL STATEMENTS (Continued) |
brokerage expense on securities sold short, respectively, in the Statements of Operation. As collateral for its short positions, the Fund is required under the Investment Company Act of 1940, as amended (“1940 Act”), to maintain assets consisting of cash, cash equivalents or other liquid securities equal to the market value of the securities sold short. The cash deposits with brokers for securities sold short are reported on the Statement of Assets and Liabilities. The amount of collateral is required to be adjusted daily to reflect changes in the value of the securities sold short. To the extent the Fund invests the proceeds received from selling securities short, it is engaging in a form of leverage. The use of leverage by the Fund may make any change in the Fund’s NAV greater than it would be without the use of leverage. Short sales are speculative transactions and involve special risks, including greater reliance on the ability of Lyrical Asset Management LP (the “Adviser”) to accurately anticipate the future value of a security.
The Fund typically takes short positions in shares of exchange-traded funds (“ETFs”), which are subject to additional risks including premium or discount risk (when the market value of an ETF’s shares trade at a premium or discount to the ETF’s NAV) and index-tracking risk.
Estimates – The preparation of financial statements in conformity with GAAP requires management to make estimates and assumptions that affect the reported amounts of assets and liabilities and disclosure of contingent assets and liabilities as of the date of the financial statements and the reported amounts of income and expenses during the reporting period. Actual results could differ from those estimates.
Federal income tax – The Fund has qualified and intends to continue to qualify as a regulated investment company under the Internal Revenue Code of 1986, as amended (the “Code”). Qualification generally will relieve the Fund of liability for federal income taxes to the extent 100% of its net investment income and net realized capital gains are distributed in accordance with the Code.
In order to avoid imposition of the excise tax applicable to regulated investment companies, it is also the Fund’s intention to declare as dividends in each calendar year at least 98% of its net investment income (earned during the calendar year) and 98.2% of its net realized capital gains (earned during the twelve months ended October 31) plus undistributed amounts from prior years.
18
| LYRICAL U.S. HEDGED VALUE FUND NOTES TO FINANCIAL STATEMENTS (Continued) |
The following information is computed on a tax basis for each item as of November 30, 2017:
| Tax cost of portfolio investments and securities sold short | $ | 903,449 | ||
| Gross unrealized appreciation | $ | 416,206 | ||
| Gross unrealized depreciation | (310,713 | ) | ||
| Net unrealized appreciation | 105,493 | |||
| Accumulated capital and other losses | (22,916 | ) | ||
| Accumulated earnings | $ | 82,577 |
The difference between the federal income tax cost of portfolio investments and securities sold short and the financial statement cost of portfolio investments and securities sold short is due to certain timing differences in the recognition of capital gains or losses under income tax regulations and GAAP. These “book/tax” differences are temporary in nature and are primarily due to the tax deferral of losses on wash sales.
Net qualified late year losses incurred after December 31, 2016 and within the taxable year are deemed to arise on the first day of a Fund’s next taxable year. For the year ended November 30, 2017, the Fund intends to defer $22,916 of late year ordinary losses to December 1, 2017 for federal income tax purposes.
The Fund recognizes the tax benefits or expenses of uncertain tax positions only when the position is “more likely than not” of being sustained assuming examination by tax authorities. Management has reviewed the Fund’s tax positions for all open tax periods (periods ended November 30, 2014 through November 30, 2017) and has concluded that no provision for unrecognized tax benefits or expenses is required in these financial statements. The Fund identifies its major tax jurisdiction as U.S. Federal.
3. Investment Transactions
During the year ended November 30, 2017, cost of purchases and proceeds from sales of investment securities, other than short-term investments and short positions, amounted to $133,657 and $347,213, respectively, for the Fund.
4. Transactions with Related Parties
INVESTMENT ADVISORY AGREEMENT
The Fund’s investments are managed by the Adviser pursuant to the terms of an Investment Advisory Agreement. The Fund pays the Adviser an investment advisory fee, computed and accrued daily and paid monthly, at the annual rate of 1.55% of average daily net assets.
19
| LYRICAL U.S. HEDGED VALUE FUND NOTES TO FINANCIAL STATEMENTS (Continued) |
Pursuant to an Expense Limitation Agreement (“ELA”) between the Fund and the Adviser, the Adviser has contractually agreed, until March 31, 2019, to reduce investment advisory fees and reimburse other operating expenses to limit total annual operating expenses of the Fund (exclusive of brokerage costs, taxes, borrowing costs such as interest and dividend expenses on securities sold short, interest, acquired fund fees and expenses, extraordinary expenses such as litigation and merger or reorganization costs, and other expenses not incurred in the ordinary course of the Fund’s business) to an amount not exceeding the following percentages of average daily net assets attributable to each respective class:
| Institutional Class | Investor Class |
| 1.75% | 2.00% |
Accordingly, during the year ended November 30, 2017, the Adviser did not collect any of its investment advisory fees from the Fund and, in addition, reimbursed other operating expenses of $161,455.
Under the terms of the ELA, investment advisory fee reductions and expense reimbursements by the Adviser are subject to repayment by the Fund for a period of three years after such fees and expenses were incurred, provided that the repayments do not cause total annual fund operating expenses to exceed the lesser of (i) the expense limitation then in effect, if any, and (ii) the expense limitation in effect at the time the expenses to be repaid were incurred. As of November 30, 2017, the Adviser may seek repayment of investment advisory fee reductions and expense reimbursements no later than the dates as stated below:
| November 30, 2018 | November 30, 2019 | November 30, 2020 | Total |
| $164,816 | $186,666 | $183,911 | $535,393 |
OTHER SERVICE PROVIDERS
Ultimus Fund Solutions, LLC (“Ultimus”) provides administration, fund accounting, compliance and transfer agency services to the Fund. The Fund pays Ultimus fees in accordance with the agreements for such services. In addition, the Fund pays out-of-pocket expenses including, but not limited to, postage, supplies and costs of pricing its portfolio securities.
Under the terms of a Distribution Agreement with the Trust, Ultimus Fund Distributors, LLC (the “Distributor”) serves as the principal underwriter to the Fund. The Distributor is a wholly-owned subsidiary of Ultimus. The Distributor is compensated partially by the Adviser and by the Investor Class shares of the Fund for acting as principal underwriter.
A Trustee and certain officers of the Trust are also officers of Ultimus and/or the Distributor.
20
| LYRICAL U.S. HEDGED VALUE FUND NOTES TO FINANCIAL STATEMENTS (Continued) |
DISTRIBUTION PLAN
The Fund has adopted a plan of distribution (the “Plan”) pursuant to Rule 12b-1 under the 1940 Act, which permits Investor Class shares of the Fund to directly incur or reimburse the Fund’s principal underwriter for certain expenses related to the distribution of its shares. The annual limitation for payment of expenses pursuant to the Plan is 0.25% of the Fund’s average daily net assets allocable to Investor Class shares. The Fund has not adopted a plan of distribution with respect to the Institutional Class shares. During the year ended November 30, 2017, the Investor Class shares of the Fund incurred $1,446 of distribution fees under the Plan.
TRUSTEE COMPENSATION
Each Trustee who is not an “interested person” of the Trust (“Independent Trustee”) receives a $1,000 annual retainer from the Fund, paid quarterly, except for the Board Chair who receives a $1,200 annual retainer from the Fund, paid quarterly. Each Independent Trustee also receives from the Fund a fee of $500 for each Board meeting attended plus reimbursement for travel and other meeting-related expenses.
PRINCIPAL HOLDERS OF FUND SHARES
As of November 30, 2017, the following shareholders owned of record 5% or more of the outstanding shares of each class of the Fund:
| NAME OF RECORD OWNER | % Ownership |
| Lyrical U.S. Hedged Value Fund - Institutional Class | |
| Lyrical Asset Management LP | 60% |
| Ann S. Riesenberg | 24% |
| George Wellington | 12% |
| Lyrical U.S. Hedged Value Fund - Investor Class | |
| Lyrical Asset Management LP | 93% |
A beneficial owner of 25% or more of the Fund’s outstanding shares may be considered a controlling person of the Fund. That shareholder’s vote could have a more significant effect on matters presented at a shareholder’s meeting.
5. Borrowing Costs
From time to time, the Fund may have an overdrawn cash balance at the custodian due to redemptions or market movements. When this occurs, the Fund will incur borrowing costs charged by the custodian. The Fund did not incur any borrowing costs during the year ended November 30, 2017.
21
| LYRICAL U.S. HEDGED VALUE FUND NOTES TO FINANCIAL STATEMENTS (Continued) |
6. Sector Risk
If the Fund has significant investments in the securities of issuers within a particular sector, any development affecting that sector will have a greater impact on the value of the net assets of the Fund than would be the case if the Fund did not have significant investments in that sector. In addition, this may increase the risk of loss in the Fund and increase the volatility of the Fund’s NAV per share. Occasionally, market conditions, regulatory changes or other developments may negatively impact a particular sector. As of November 30, 2017, the Fund had the following percentages of the value of its net assets invested or sold short in securities within the following sector:
| Sector | Long Positions | Short Positions | Net Exposure |
| Information Technology | 32.1% | (11.2%) | 20.9% |
As shown above, although the Fund has greater than 25% of its net assets invested in long positions in the sector noted, the sector exposure is mitigated by short positions. As part of the Fund’s principal investment strategies, the Adviser monitors the Fund’s sector exposure to ensure the Fund’s portfolio is adequately diversified.
7. Contingencies and Commitments
The Fund indemnifies the Trust’s officers and Trustees for certain liabilities that might arise from their performance of their duties to the Fund. Additionally, in the normal course of business the Fund enters into contracts that contain a variety of representations and warranties and which provide general indemnifications. The Fund’s maximum exposure under these arrangements is unknown, as this would involve future claims that may be made against the Fund that have not yet occurred. However, based on experience, the Fund expects the risk of loss to be remote.
8. Subsequent Events
The Fund is required to recognize in the financial statements the effects of all subsequent events that provide additional evidence about conditions that existed as of the date of the Statements of Assets and Liabilities. For non-recognized subsequent events that must be disclosed to keep the financial statements from being misleading, the Fund is required to disclose the nature of the event as well as an estimate of its financial effect, or a statement that such an estimate cannot be made. Management has evaluated subsequent events through the issuance of these financial statements and has noted no such events, except as reflected in the following paragraph:
The Board of Trustees has determined to discontinue the operations of the Fund. All outstanding shares of the Fund will be redeemed on or before January 29, 2018.
22
| LYRICAL U.S. HEDGED VALUE FUND REPORT OF INDEPENDENT REGISTERED PUBLIC ACCOUNTING FIRM |
To the Board of Trustees of Ultimus Managers Trust
and the Shareholders of Lyrical U.S. Hedged Value Fund
We have audited the accompanying statement of assets and liabilities of Lyrical U.S. Hedged Value Fund, a series of shares of beneficial interest in Ultimus Managers Trust (the “Fund”), including the schedule of investments, as of November 30, 2017, and the related statement of operations for the year then ended, the statements of changes in net assets for each of the years in the two-year period then ended and the financial highlights for each of the years in the three year period then ended and for the period July 14, 2014 (commencement of operations) through November 30, 2014. These financial statements and financial highlights are the responsibility of the Fund’s management. Our responsibility is to express an opinion on these financial statements and financial highlights based on our audits.
We conducted our audits in accordance with the standards of the Public Company Accounting Oversight Board (United States). Those standards require that we plan and perform the audits to obtain reasonable assurance about whether the financial statements and financial highlights are free of material misstatement. An audit includes examining, on a test basis, evidence supporting the amounts and disclosures in the financial statements. Our procedures included confirmation of securities owned as of November 30, 2017 by correspondence with the custodian and brokers. An audit also includes assessing the accounting principles used and significant estimates made by management, as well as evaluating the overall financial statement presentation. We believe that our audits provide a reasonable basis for our opinion.
In our opinion, the financial statements and financial highlights referred to above present fairly, in all material respects, the financial position of Lyrical U.S. Hedged Value Fund as of November 30, 2017, and the results of its operations for the year then ended, the changes in its net assets for each of the years in the two-year period then ended and its financial highlights for each of the years in the three year period then ended and for the period July 14, 2014 through November 30, 2014, in conformity with accounting principles generally accepted in the United States of America.
 | |
| BBD, LLP |
Philadelphia, Pennsylvania
January 25, 2018
23
| LYRICAL U.S. HEDGED VALUE FUND ABOUT YOUR FUNDS’ EXPENSES (Unaudited) |
We believe it is important for you to understand the impact of costs on your investment. As a shareholder of the Fund, you incur ongoing costs, including management fees, class-specific expenses (such as distribution fees) and other operating expenses. The following examples are intended to help you understand your ongoing costs (in dollars) of investing in the Fund and to compare these costs with the ongoing costs of investing in other mutual funds.
A mutual fund’s ongoing costs are expressed as a percentage of its average net assets. This figure is known as the expense ratio. The expenses in the table below are based on an investment of $1,000 made at the beginning of the most recent period (June 1, 2017) and held until the end of the period (November 30, 2017).
The table below illustrates the Fund’s ongoing costs in two ways:
Actual fund return – This section helps you to estimate the actual expenses that you paid over the period. The “Ending Account Value” shown is derived from the Fund’s actual return, and the fourth column shows the dollar amount of operating expenses that would have been paid by an investor who started with $1,000 in the Fund. You may use the information here, together with the amount you invested, to estimate the expenses that you paid over the period.
To do so, simply divide your account value by $1,000 (for example, an $8,600 account value divided by $1,000 = 8.6), then multiply the result by the number given for the Fund under the heading “Expenses Paid During Period.”
Hypothetical 5% return – This section is intended to help you compare the Fund’s ongoing costs with those of other mutual funds. It assumes that the Fund had an annual return of 5% before expenses during the period shown, but that the expense ratio is unchanged. In this case, because the return used is not the Fund’s actual return, the results do not apply to your investment. The example is useful in making comparisons because the SEC requires all mutual funds to calculate expenses based on a 5% return. You can assess the Fund’s ongoing costs by comparing this hypothetical example with the hypothetical examples that appear in shareholder reports of other funds.
Note that expenses shown in the table are meant to highlight and help you compare ongoing costs only. The Fund does not charge transaction fees, such as purchase or redemption fees, nor do they carry a “sales load.”
The calculations assume no shares were bought or sold during the period. Your actual costs may have been higher or lower, depending on the amount of your investment and the timing of any purchases or redemptions.
24
LYRICAL U.S. HEDGED VALUE FUND
ABOUT YOUR FUNDS’ EXPENSES (Unaudited) (Continued)
More information about the Fund’s expenses can be found in this report. For additional information on operating expenses and other shareholder costs, please refer to the Fund’s prospectus.
| Beginning Account Value June 1, 2017 | Ending Account Value November 30, 2017 | Net Expense Ratio(a) | Expenses Paid During Period(b) | |
| Lyrical U.S. Hedged Value Fund | ||||
| Institutional Class | ||||
| Based on Actual Fund Returns | $ 1,000.00 | $ 1,055.90 | 2.99% | $ 15.41 |
| Based on Hypothetical 5% Return (before expenses) | $ 1,000.00 | $ 1,010.08 | 2.99% | $ 15.07 |
| Investor Class | ||||
| Based on Actual Fund Returns | $ 1,000.00 | $ 1,054.30 | 3.24% | $ 16.69 |
| Based on Hypothetical 5% Return (before expenses) | $ 1,000.00 | $ 1,008.82 | 3.24% | $ 16.32 |
| (a) | Annualized, based on the Fund's most recent one-half year expenses. |
| (b) | Expenses are equal to the Fund’s annualized net expense ratio multiplied by the average account value over the period, multiplied by 183/365 (to reflect the one-half year period). |
25
LYRICAL U.S. HEDGED VALUE FUND
OTHER INFORMATION (Unaudited)
A description of the policies and procedures that the Fund uses to vote proxies relating to portfolio securities is available without charge upon request by calling toll-free 1-888-884-8099, or on the SEC’s website at http://www.sec.gov. Information regarding how the Fund voted proxies relating to portfolio securities during the most recent 12-month period ended June 30 is available without charge upon request by calling toll-free 1-888-884-8099, or on the SEC’s website at http://www.sec.gov.
The Trust files a complete listing of portfolio holdings for the Fund with the SEC as of the end of the first and third quarters of each fiscal year on Form N-Q. These filings are available upon request by calling 1-888-884-8099. Furthermore, you may obtain a copy of the filings on the SEC’s website at http://www.sec.gov. The Trust’s Forms N-Q may also be reviewed and copied at the SEC’s Public Reference Room in Washington, DC, and information on the operation of the Public Reference Room may be obtained by calling 1-800-SEC-0330.
FEDERAL TAX INFORMATION (Unaudited)
Long-Term Capital Gains – For the year ended November 30, 2017, the Fund designated the following long-term capital gains distributions:
| Lyrical U.S. Hedged Value Fund | $ | 13,919 |
26
LYRICAL U.S. HEDGED VALUE FUND
BOARD OF TRUSTEES AND EXECUTIVE OFFICERS
(Unaudited)
The Board of Trustees has overall responsibility for management of the Trust’s affairs. The Trustees serve during the lifetime of the Trust and until its termination, or until death, resignation, retirement, or removal. The Trustees, in turn, elect the officers of the Trust to actively supervise its day-to-day operations. The officers have been elected for an annual term. Each Trustee’s and officer’s address is 225 Pictoria Drive, Suite 450, Cincinnati, Ohio 45246. The following are the Trustees and executive officers of the Trust:
| Name and Year of Birth | Length of Time Served | Position(s) Held with Trust | Principal Occupation(s) During Past 5 Years | Number of Funds in Trust Overseen by Trustee | Directorships of Public Companies Held by Trustee During Past 5 Years |
| Interested Trustees: | |||||
| Robert G. Dorsey* Year of Birth: 1957 | Since February 2012 | Trustee (February 2012 to present) President (June 2012 to October 2013) | Chief Executive Officer and Managing Director of Ultimus Fund Solutions, LLC and Ultimus Fund Distributors, LLC (1999 to present) | 27 | None |
| Independent Trustees: | |||||
| Janine L. Cohen Year of Birth: 1952 | Since January 2016 | Trustee | Retired since 2013; Chief Financial Officer from 2004 to 2013 and Chief Compliance Officer from 2008 to 2013 at AER Advisors, Inc. | 27 | None |
| David M. Deptula Year of Birth: 1958 | Since June 2012 | Trustee | Vice President of Legal and Special Projects at Dayton Freight Lines, Inc. since 2016; Vice President of Tax Treasury at Standard Register Inc. (formerly The Standard Register Company) from 2011 to 2016 | 27 | None |
| John J. Discepoli Year of Birth: 1963 | Since June 2012 | Chairman (May 2016 to present) Trustee (June 2012 to present) | Owner of Discepoli Financial Planning, LLC (personal financial planning company) since 2004 | 27 | None |
| * | Mr. Dorsey is considered an “interested person” of the Trust within the meaning of Section 2(a)(19) of the 1940 Act because of his relationship with the Trust’s administrator, transfer agent and distributor. |
27
LYRICAL U.S. HEDGED VALUE FUND
BOARD OF TRUSTEES AND EXECUTIVE OFFICERS
(Unaudited) (Continued)
| Name and Year of Birth | Length of Time Served | Position(s) Held with Trust | Principal Occupation(s) During Past 5 Years |
| Executive Officers: | |||
| David R. Carson Year of Birth: 1958 | Since April 2013 | Principal Executive Officer (April 2017 to present) President (October 2013 to present) Vice President (April 2013 to October 2013) | Vice President and Director of Client Strategies of Ultimus Fund Solutions, LLC (2013 to present); President, Unified Series Trust (2016 to present); Chief Compliance Officer, FSI LBAR Fund (2013 to 2016), The Huntington Funds (2005 to 2013), Huntington Strategy Shares (2012 to 2013), and Huntington Asset Advisors (2013); Vice President, Huntington National Bank (2001 to 2013) |
| Jennifer L. Leamer Year of Birth: 1976 | Since April 2014 | Treasurer (October 2014 to present) Assistant Treasurer (April 2014 to October 2014) | Vice President, Mutual Fund Controller of Ultimus Fund Solutions, LLC (2014 to present); Business Analyst of Ultimus Fund Solutions, LLC (2007 to 2014) |
| Frank L. Newbauer Year of Birth: 1954 | Since February 2012 | Secretary (July 2017 to present) Assistant Secretary (April 2015 to July 2017) Secretary (February 2012 to April 2015) | Assistant Vice President of Ultimus Fund Solutions, LLC (2010 to present) |
28
LYRICAL U.S. HEDGED VALUE FUND
BOARD OF TRUSTEES AND EXECUTIVE OFFICERS
(Unaudited) (Continued)
| Name and Year of Birth | Length of Time Served | Position(s) Held with Trust | Principal Occupation(s) During Past 5 Years |
| Executive Officers: (continued) | |||
| Charles C. Black Year of Birth: 1979 | Since April 2015 | Chief Compliance Officer (January 2016 to present) Assistant Chief Compliance Officer (April 2015 to January 2016) | Senior Compliance Officer of Ultimus Fund Solutions, LLC (2015 to present); Chief Compliance Officer of The Caldwell & Orkin Funds, Inc. (2016 to present); Senior Compliance Manager for Touchstone Mutual Funds (2013 to 2015); Senior Compliance Manager for Fund Evaluation Group (2011 to 2013) |
Additional information about members of the Board and executive officers is available in the Fund’s Statement of Additional Information (“SAI”). To obtain a free copy of the SAI, please call 1-866-884-5968.
29
LYRICAL U.S. HEDGED VALUE FUND
DISCLOSURE REGARDING APPROVAL OF INVESTMENT ADVISORY AGREEMENT (Unaudited)
The Board of Trustees (the “Board”), including the Independent Trustees voting separately, has reviewed and approved the Fund’s Investment Advisory Agreement with Lyrical Asset Management LP (the “Adviser”) for an additional annual term. Approval took place at an in-person meeting held on October 23-24, 2017, at which all of the Trustees were present.
In the course of their deliberations, the Board was advised by legal counsel. The Board received and reviewed a substantial amount of information provided by the Adviser in response to requests of the Board and its counsel.
In deciding whether to approve the renewal of the Investment Advisory Agreement, the Board recalled its review of the materials related to the Fund and the Adviser throughout the preceding 12 months and its numerous discussions with Trust management and the Adviser about the operations and performance of the Fund during that period. The Board further considered those materials and discussions and other numerous factors.
The nature, extent, and quality of the services provided by the Adviser. In this regard, the Board reviewed the services being provided by the Adviser to the Fund including, without limitation, its investment advisory services since the Fund’s inception; its compliance procedures and practices; its efforts to promote the Fund and assist in its distribution; and its compliance program. After reviewing the foregoing information and further information regarding the Adviser’s business, the Board concluded that the quality, extent, and nature of the services provided by the Adviser to the Fund was satisfactory and adequate.
The investment performance of the Fund. In this regard, the Board compared the performance of the Fund with the performance of its benchmark indexes, custom peer group, and Morningstar categories. The Board also considered the consistency of the Adviser’s management with the Fund’s investment objective and policies. The Board noted that the Fund had outperformed relative to its peer group and Morningstar category for the one-year period ending June 30, 2017. Following additional discussion of the investment performance of the Fund; the Adviser’s experience in managing mutual funds, private funds, and separate accounts; the Adviser’s historical investment performance; and other factors, the Board concluded that the investment performance of the Fund has been satisfactory.
The costs of the services provided and profits realized by the Adviser and its affiliates from their relationship with the Fund. In this regard, the Board considered the Adviser’s staffing; methods of operating; the education and experience of its personnel; its compliance program; its financial condition and the level of commitment to the Fund; the asset level of the Fund; the overall expenses of the Fund, including the advisory fee; and the differences in fees and services to the Adviser’s other similar clients. The Board considered its discussion with the Adviser regarding the Expense Limitation Agreement (the “ELA”) with the Fund, and considered the Adviser’s current and past fee reductions and expense reimbursements for the Fund. The Board further took into account the Adviser’s willingness to continue the ELA for the Fund until at least March 31, 2019.
30
LYRICAL U.S. HEDGED VALUE FUND
DISCLOSURE REGARDING APPROVAL OF INVESTMENT ADVISORY AGREEMENT (Unaudited) (Continued)
The Board also considered potential benefits for the Adviser in managing the Fund, including promotion of the Adviser’s name. The Board compared the Fund’s advisory fee and overall expense ratio to the average and median advisory fees and expense ratios for its peer group and Morningstar categories and fees charged to the Adviser’s other client accounts. In considering the comparison in fees and expense ratios between the Fund and other comparable funds, the Board looked at the differences in types of funds being compared, the style of investment management, the size of the funds, and the nature of the investment strategies. The Board noted that the Fund’s advisory fee was higher than the average and median advisory fee for the Fund’s peer group and Morningstar category. The Board also considered the Adviser’s commitment to limit the Fund’s expenses under the ELA. The Board further noted that the overall expense ratio for the Fund was higher than the average and median expense ratio for the other funds in the Fund’s peer group and Morningstar category. The Board also compared the fees paid by the Fund to the fees paid by other clients of the Adviser, and considered the similarities and differences of services received by such other clients as compared to the services received by the Fund. The Board noted that the fee structures applicable to the Adviser’s other clients were not indicative of any unreasonableness with respect to the advisory fees proposed to be payable by the Fund. The Board further considered the investment strategy and style used by the Adviser in managing the portfolio of the Fund. Following these comparisons and considerations and upon further consideration and discussion of the foregoing, the Board concluded that the advisory fees paid to the Adviser by the Fund are fair and reasonable.
The extent to which the Fund and its investors would benefit from economies of scale. In this regard, the Board considered that the fee arrangements with the Adviser involve both the advisory fee and the ELA. The Board determined that while the advisory fee remained the same as asset levels increased, the shareholders of the Fund will continue to experience benefits from the ELA until the Fund’s assets grow to a level where its expenses otherwise fall below the expense limit. Following further discussion of the asset levels for the Fund, expectations for asset growth, and level of fees, the Board determined that the fee arrangements with the Adviser will continue to provide benefits and that the Fund’s arrangements were fair and reasonable in relation to the nature and quality of services being provided by the Adviser.
Brokerage and portfolio transactions. In this regard, the Board considered the Adviser’s policies and procedures and performance in seeking best execution for its clients, including the Fund. The Board also considered the historical portfolio turnover rate for the Fund; the process by which the Adviser evaluates best execution; the method and basis for selecting and evaluating broker-dealers; and any anticipated allocation of portfolio business to persons affiliated with the Adviser. After further review and discussion, the Board determined for the Fund that the Adviser’s practices regarding brokerage and portfolio transactions are satisfactory.
31
LYRICAL U.S. HEDGED VALUE FUND
DISCLOSURE REGARDING APPROVAL OF INVESTMENT ADVISORY AGREEMENT (Unaudited) (Continued)
Possible conflicts of interest. In evaluating the possibility for conflicts of interest, the Board considered such matters as the experience and abilities of the advisory personnel assigned to the Fund; the Adviser’s process for allocating trades among the Fund and its other clients; and the substance and administration of the Adviser’s Code of Ethics. Following further consideration and discussion, the Board found for the Fund that the Adviser’s standards and practices relating to the identification and mitigation of potential conflicts of interests were satisfactory.
Conclusion
After full consideration of the above factors as well as other factors, the Board unanimously concluded that approval of the Investment Advisory Agreement was in the best interests of the Fund and its shareholders. It was noted that in the Trustees’ deliberation regarding the approval of the renewal of the Investment Advisory Agreement, the Trustees did not identify any particular information or factor that was all-important or controlling, and that each individual Trustee may have attributed different weights to the various factors noted above.
32
This page intentionally left blank.

RYAN LABS CORE BOND FUND
(RLCBX)
RYAN LABS LONG CREDIT FUND
(RLLCX)
Annual Report
November 30, 2017
| RYAN LABS FUNDS LETTER TO SHAREHOLDERS | December 22, 2017 |
Dear Shareholders,
Following is the Annual Report to shareholders of Ryan Labs Core Bond Fund and Ryan Labs Long Credit Fund (collectively, the “Funds”) for the fiscal year ended November 30, 2017. On behalf of the investment manager, Ryan Labs Asset Management, Inc., we would like to thank you for your continued investment.
MARKET RECAP
Year to date, corporate credit spreads have tightened into November, though widening a little in August due to geo political tensions. Since the selloff, largely triggered by North Korea/US tensions, credit traded back to its tightest levels into the end of the November. Fundamentals have remained solid from a free cash flow perspective, as second and third quarter earnings have mostly exceeded analysts’estimates. Year-to-date, investment grade supply has been ~$1.25 trillion with Financials contributing to 43% of total issuance followed by Technology at 8.6%. Energy related sectors have outperformed as oil prices rallied in November, with crude oil (WTI) posting its year-to-date high of $59/barrel. The market’s expectation of Trump’s proposed tax reform has contributed to positive returns of the S&P 500 Index as well as other risk assets. The Federal Reserve has raised overnight rates several times this year causing the yield curve to flatten. The most recent quarter was subdued in terms of macro volatility, with a corresponding compression of wider spreads, particularly in wider ABS mezzanine tranches. Subprime auto, shipping containers, and whole business franchise ABS were some of the best performers of the quarter within ABS, with spreads pushing towards all-time tights. In CMBS, new issue risk retention conduit deals continued to have strong execution and remained relatively rangebound. Wider trading seasoned 2.0 conduit CMBS mezzanine bonds rallied towards the end of the quarter, while heavier retail backed tranches remained wide on class B mall concerns. Freddie Mac’s private subordinate credit tranches off backed by multifamily (apartment) assets (their Freddie K series) continued to outperform, and recovered after a brief widening period caused by property damage concerns from the heavy hurricane season. In agency MBS, low rate volatility, a range-bound 10-year yield and a flatter yield curve led to continued low option adjusted spread. Negative convexity inherent in the space did not punish investors as rate volatility remained muted.
RYAN LABS CORE BOND FUND (RLCBX)
INVESTMENT PHILOSOPHY
The investment objective of Ryan Labs Core Bond Fund (the “Core Bond Fund”) is to seek total return (consisting of current income and capital appreciation) versus the Barclays U.S. Aggregate Bond Index (the “Core Bond Benchmark”). The Core Bond Fund seeks this investment objective while providing protection against interest rate risk. We attempt to accomplish this investment objective by investing at least 80% of Core Bond Fund assets in U.S. dollar-denominated, investment-grade debt securities. The portfolio’s sensitivity to interest rate changes is intended to track the market for domestic, investment-grade fixed-income securities. The modified duration of the Core Bond Fund’s investment portfolio at the
1
end of each calendar month will typically be within half a year of the Core Bond Benchmark. The primary strategies utilized for value-add are sector rotation, issue selection, and yield curve positioning. The inception date of the Fund was December 29, 2014.
PERFORMANCE SUMMARY
During the quarter ended November 30, 2017, the Fund returned -0.33% compared to the Benchmark return of -0.55%, outperforming the Benchmark by +22bps. During the one year period ended November 30, 2017, the Fund returned +3.84% compared to the Benchmark return of +3.21%, outperforming by +63bps. The Fund’s portfolio was overweight industrials and securitized sectors, which contributed to outperformance. Names that contributed to outperformance were industrial names likes Verizon, MPLX, Cenovus Energy, and a few CMBS/ABS issuers. Top 5 underperformers included American Financials Group, Sprints, Broadcom, Domtar and a CMBS issuer.
RYAN LABS LONG CREDIT FUND
INVESTMENT PHILOSOPHY
The investment objective of Ryan Labs Long Credit Fund (the “Long Credit Fund”) is to seek total return (consisting of current income and capital appreciation). The benchmark for this strategy is the Barclays U.S. Long Credit Index (the “Long Credit Benchmark”). We attempt to accomplish this investment objective by investing at least 80% of Long Credit Fund’s net assets in U.S. dollar-denominated investment-grade debt securities. The portfolio’s sensitivity to interest rate changes is intended to track the market for domestic, investment-grade fixed-income securities. The modified duration of the Long Credit Fund’s investment portfolio at the end of each calendar month will typically be within half a year of the Long Credit Benchmark. The primary strategies utilized for value-add are sector rotation, issue selection, and yield curve positioning. The inception date of the Long Credit Fund was November 13, 2015.
PERFORMANCE SUMMARY
During the quarter ended November 30, 2017, the Long Credit Fund’s total return was +0.28% compared to the Long Credit Benchmark return of +0.98%, underperforming the benchmark by 70bps. During the year ended November 30, 2017, the Fund returned +10.27% compared to the Long Credit Benchmark return +11.67%, underperforming by 140bps. The Long Credit Fund’s portfolio was underweight industrials while being overweight the financial and utilities sectors. Top performers included General Motors, Florida Light & Power, Ford, BHP Billiton and NJ Turnpike Authority. Underperformers included United Healthcare, Enel SpA, Glencore, CBS Corp and CVS.
OUTLOOK
After a positive environment in 2017 for most of the capital markets, it is tempting to expect similar trends in 2018. Over the last twelve months interest rates have been very stable, equity markets are higher, and volatility as expressed through the CBOE Volatility Index (VIX) has been subdued. So far, we believe the Federal Reserve (“Fed”) has done a good job managing expectations which is not easy now that they have curtailed and reversed easing credit. We expect that these trends can continue but there are risks.
2
Positively, although equities have performed well, earnings multiples are still reasonable. There is still market discipline in subsectors of the equity market where fundamentals have been pressured. Interest rates have been quite stable with the combination of well telegraphed Fed moves and low inflation. In credit markets, investment grade spreads are tight but not the tightest they have been in the last five years. Credit fundamentals as measured by debt to EBITDA are stretched but have recently stabilized due to revenue growth, strong cash flows and stable margins. In high yield credit, defaults have been below historical levels and many issuers are de-levering.
We think there’s reason to believe these trends can continue. The tax plan moving through Congress is a net positive for corporations and has elements that encourage more conservative balance sheets. We have yet to experience the sort of panicked “risk-on” buying that signifies a market top but there are risks. As the Fed continues to normalize short rates the yield curve has flattened. If the curve inverts sometime in 2018, we think this would be a strong signal that credit is being constricted and economic slowdown may not be far off. The other risk is that after worldwide central bank easing we may finally experience real inflation. In this scenario, rates could rise quickly disrupting the sweet spot markets have been experiencing for the last couple years.
Richard Familetti
President, Ryan Labs Asset Management
Past performance is not predictive of future performance. Investment results and principal value will fluctuate so that shares, when redeemed, may be worth more or less than their original cost. Current performance may be higher or lower than the performance data quoted. Performance data current to the most recent month end are available by calling 1-866-561-3087.
An investor should consider the investment objectives, risks, charges and expenses of the Funds carefully before investing. The Funds’ prospectus contains this and other important information. To obtain a copy of the Funds’ prospectus, please visit our website at www.ryanlabsfunds.com or call 1-866-561-3087 and a copy will be sent to you free of charge. Please read the prospectus carefully before you invest. Ryan Labs Core Bond Fund and Ryan Labs Long Credit Fund are distributed by Ultimus Fund Distributors, LLC.
The Letter to Shareholders seeks to describe some of the Adviser’s current opinions and views of the financial markets. Although the Adviser believes it has a reasonable basis for any opinions or views expressed, actual results may differ, sometimes significantly so, from those expected or expressed. The securities held by the Funds that are discussed in the Letter to Shareholders were held during the period covered by this Report. They do not comprise the entire investment portfolios of the Funds, may be sold at any time and may no longer be held by the Funds. The opinions of the Funds’ Adviser with respect to those securities may change at any time. For a complete list of securities held by the Funds as of November 30, 2017, please see the Schedules of Investments sections of the Annual Report.
3
Statements in the Letter to Shareholders that reflect projections or expectations for future financial or economic performance of the Funds and the market in general and statements of the Funds’ plans and objectives for future operations are forward-looking statements. No assurance can be given that actual results or events will not differ materially from those projected, estimated, assumed, or anticipated in any such forward-looking statements. Important factors that could result in such differences, in addition to factors noted with such forward-looking statements include, without limitation, general economic conditions, such as inflation, recession, and interest rates. Past performance is not a guarantee of future results.
4
RYAN LABS CORE BOND FUND
PERFORMANCE INFORMATION
November 30, 2017 (Unaudited)
Comparison of the Change in Value of a $10,000 Investment in
Ryan Labs Core Bond Fund versus the
Bloomberg Barclays U.S. Aggregate Bond Index
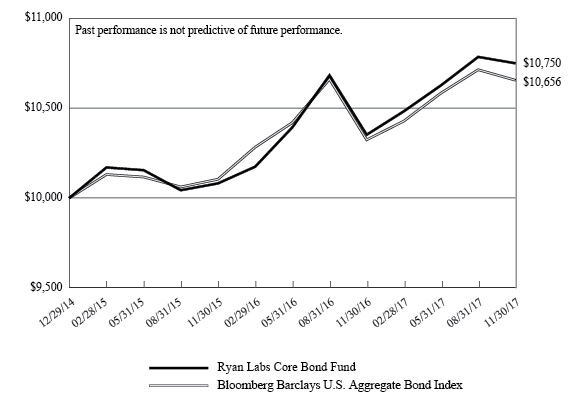
| Average Annual Total Returns For the Periods Ended November 30, 2017 | ||
| 1 Year | Since Inception(b) | |
| Ryan Labs Core Bond Fund(a) | 3.84% | 2.51% |
| Bloomberg Barclays U.S. Aggregate Bond Index | 3.21% | 2.20% |
| (a) | The Fund’s total returns do not reflect the deduction of taxes that a shareholder would pay on Fund distributions, if any, or the redemption of shares. |
| (b) | The Fund commenced operations on December 29, 2014. |
5
RYAN LABS LONG CREDIT FUND
PERFORMANCE INFORMATION
November 30, 2017 (Unaudited)
Comparison of the Change in Value of a $10,000 Investment in
Ryan Labs Long Credit Fund versus the
Bloomberg Barclays U.S. Long Credit Index
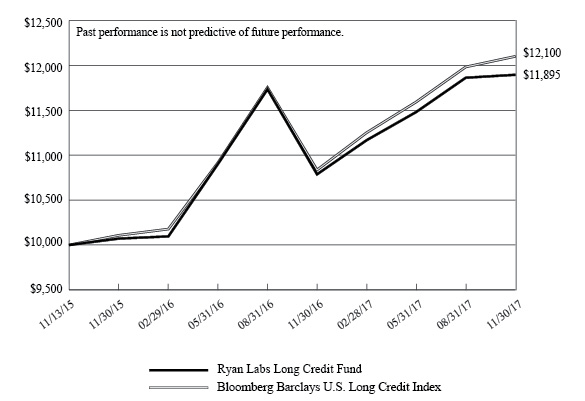
| Average Annual Total Returns For the Periods Ended November 30, 2017 | ||
| 1 Year | Since Inception(b) | |
| Ryan Labs Long Credit Fund(a) | 10.27% | 8.85% |
| Bloomberg Barclays U.S. Long Credit Index | 11.67% | 9.76% |
| (a) | The Fund’s total returns do not reflect the deduction of taxes that a shareholder would pay on Fund distributions, if any, or the redemption of shares. |
| (b) | The Fund commenced operations on November 13, 2015. |
6
RYAN LABS CORE BOND FUND
PORTFOLIO INFORMATION
November 30, 2017 (Unaudited)
Asset Allocation (% of Net Assets)
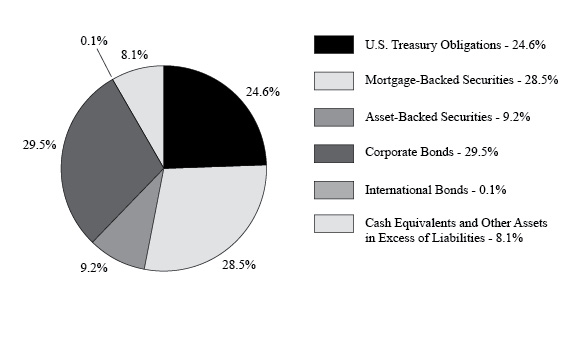
Top 10 Bond Holdings
| Security Description | % of Net Assets |
| U.S. Treasury Notes, 1.375%, due 10/31/2020 | 6.3% |
| Federal Home Loan Mortgage Corporation, Pool #G08707, 4.000%, due 05/01/2046 | 1.9% |
| Federal Home Loan Mortgage Corporation, Pool #G08737, 3.000%, due 12/01/2046 | 1.8% |
| U.S. Treasury Bonds, 4.500%, due 02/15/2036 | 1.6% |
| U.S. Treasury Notes, 1.375%, due 08/31/2020 | 1.4% |
| U.S. Treasury Notes, 1.000%, due 11/15/2019 | 1.4% |
| Government National Mortgage Association, Pool #MA3937, 3.500%, due 09/20/2046 | 1.4% |
| Federal National Mortgage Association, Pool #AB5379, 3.500%, due 06/01/2042 | 1.3% |
| U.S. Treasury Notes, 0.750%, due 09/30/2018 | 1.2% |
| U.S. Treasury Notes, 1.625%, due 08/31/2022 | 1.2% |
7
RYAN LABS LONG CREDIT FUND
PORTFOLIO INFORMATION
November 30, 2017 (Unaudited)
Asset Allocation (% of Net Assets)
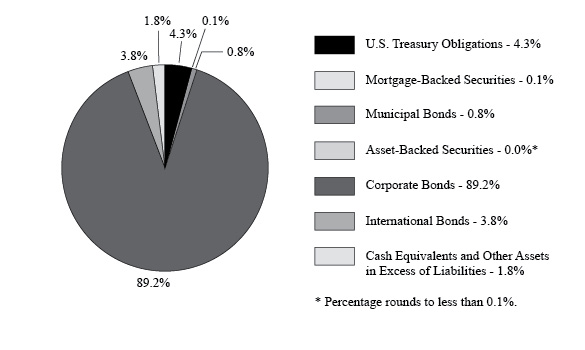
Top 10 Bond Holdings
| Security Description | % of Net Assets |
| U.S. Treasury Bonds, 2.750%, due 08/15/2047 | 3.9% |
| Verizon Communications, Inc., 4.400%, due 11/01/2034 | 2.2% |
| JPMorgan Chase & Company, 3.540%, due 05/01/2028 | 2.2% |
| Wells Fargo & Company, 3.900%, due 05/01/2045 | 1.5% |
| United Mexican States, 4.750%, due 03/08/2044 | 1.5% |
| Florida Power & Light Company, 3.700%, due 12/01/2047 | 1.4% |
| UnitedHealth Group, Inc., 4.750%, due 07/15/2045 | 1.4% |
| Apple, Inc., 4.375%, due 05/13/2045 | 1.4% |
| Anheuser-Busch InBev S.A./N.V., 4.900%, due 02/01/2046 | 1.4% |
| GE Capital International Funding Company, 4.418%, due 11/15/2035 | 1.3% |
8
| RYAN LABS CORE BOND FUND SCHEDULE OF INVESTMENTS November 30, 2017 | ||||||||||||||||
| U.S. TREASURY OBLIGATIONS — 24.6% | Coupon | Maturity | Par Value | Value | ||||||||||||
| U.S. Treasury Notes – 19.0% | ||||||||||||||||
| U.S. Treasury Notes | 0.750 | % | 09/30/18 | $ | 1,250,000 | $ | 1,241,016 | |||||||||
| U.S. Treasury Notes | 1.000 | % | 11/15/19 | 1,460,000 | 1,437,929 | |||||||||||
| U.S. Treasury Notes | 1.375 | % | 03/31/20 | 110,000 | 108,814 | |||||||||||
| U.S. Treasury Notes | 1.500 | % | 06/15/20 | 560,000 | 554,925 | |||||||||||
| U.S. Treasury Notes | 1.500 | % | 07/15/20 | 12,000 | 11,885 | |||||||||||
| U.S. Treasury Notes | 1.500 | % | 08/15/20 | 1,100,000 | 1,089,086 | |||||||||||
| U.S. Treasury Notes | 1.375 | % | 08/31/20 | 1,485,000 | 1,464,813 | |||||||||||
| U.S. Treasury Notes | 1.375 | % | 09/30/20 | 500,000 | 492,812 | |||||||||||
| U.S. Treasury Notes | 1.375 | % | 10/31/20 | 6,480,000 | 6,381,534 | |||||||||||
| U.S. Treasury Notes | 1.125 | % | 02/28/21 | 285,000 | 277,463 | |||||||||||
| U.S. Treasury Notes | 1.125 | % | 07/31/21 | 500,000 | 484,219 | |||||||||||
| U.S. Treasury Notes | 2.125 | % | 09/30/21 | 360,000 | 361,139 | |||||||||||
| U.S. Treasury Notes | 1.250 | % | 10/31/21 | 100,000 | 96,992 | |||||||||||
| U.S. Treasury Notes | 1.875 | % | 07/31/22 | 330,000 | 326,210 | |||||||||||
| U.S. Treasury Notes | 1.625 | % | 08/31/22 | 1,204,000 | 1,176,440 | |||||||||||
| U.S. Treasury Notes | 1.875 | % | 09/30/22 | 385,000 | 380,308 | |||||||||||
| U.S. Treasury Notes | 2.000 | % | 10/31/22 | 1,025,000 | 1,018,433 | |||||||||||
| U.S. Treasury Notes | 1.500 | % | 02/28/23 | 285,000 | 275,459 | |||||||||||
| U.S. Treasury Notes | 2.500 | % | 05/15/24 | 365,000 | 369,577 | |||||||||||
| U.S. Treasury Notes | 1.875 | % | 08/31/24 | 185,000 | 180,115 | |||||||||||
| U.S. Treasury Notes | 2.125 | % | 09/30/24 | 970,000 | 958,709 | |||||||||||
| U.S. Treasury Notes | 2.250 | % | 02/15/27 | 80,000 | 78,866 | |||||||||||
| U.S. Treasury Notes | 2.375 | % | 05/15/27 | 110,000 | 109,527 | |||||||||||
| U.S. Treasury Notes | 2.250 | % | 08/15/27 | 102,000 | 100,394 | |||||||||||
| U.S. Treasury Notes | 2.250 | % | 11/15/27 | 355,000 | 349,772 | |||||||||||
| 19,326,437 | ||||||||||||||||
| U.S. Treasury Bonds — 5.6% | ||||||||||||||||
| U.S. Treasury Bonds | 5.375 | % | 02/15/31 | 485,000 | 642,739 | |||||||||||
| U.S. Treasury Bonds | 4.500 | % | 02/15/36 | 1,235,000 | 1,580,511 | |||||||||||
| U.S. Treasury Bonds | 5.000 | % | 05/15/37 | 165,000 | 224,703 | |||||||||||
| U.S. Treasury Bonds | 4.375 | % | 02/15/38 | 55,000 | 69,687 | |||||||||||
| U.S. Treasury Bonds | 4.500 | % | 05/15/38 | 415,000 | 534,507 | |||||||||||
| U.S. Treasury Bonds | 4.250 | % | 05/15/39 | 810,000 | 1,012,816 | |||||||||||
| U.S. Treasury Bonds | 3.000 | % | 05/15/42 | 1,085,000 | 1,124,670 | |||||||||||
| U.S. Treasury Bonds | 2.875 | % | 11/15/46 | 80,000 | 80,619 | |||||||||||
| U.S. Treasury Bonds | 3.000 | % | 02/15/47 | 60,000 | 61,973 | |||||||||||
| U.S. Treasury Bonds | 2.750 | % | 08/15/47 | 420,000 | 412,847 | |||||||||||
| 5,745,072 | ||||||||||||||||
| Total U.S. Treasury Obligations (Cost $25,172,373) | $ | 25,071,509 | ||||||||||||||
9
| RYAN LABS CORE BOND FUND SCHEDULE OF INVESTMENTS (Continued) | ||||||||||||||||
| MORTGAGE-BACKED SECURITIES — 28.5% | Coupon | Maturity | Par Value | Value | ||||||||||||
| Commercial — 14.8% | ||||||||||||||||
| AMSR Mortgage Trust, Series 2016-SFR1, Class D, 144A (1MO LIBOR + 240) (a) | 3.650 | % | 11/17/33 | $ | 1,000,000 | $ | 1,009,291 | |||||||||
| BAMLL Commercial Mortgage Security, Series 2017-BNK6, Class D, 144A | 3.100 | % | 07/15/60 | 340,000 | 270,426 | |||||||||||
| Commercial Mortgage Trust, Series 2014-CR19, Class D, 144A (a) | 4.873 | % | 08/10/47 | 265,000 | 224,943 | |||||||||||
| Credit Suisse Mortgage Trust, Series 2013-IVR3, Class A1, 144A | 2.500 | % | 05/25/43 | 440,111 | 417,418 | |||||||||||
| CSAIL Commercial Mortgage Trust, Series 2015-C3, Class D (a) | 3.503 | % | 08/15/48 | 808,687 | 622,943 | |||||||||||
| Deutsche Bank Commercial Mortgage Trust, Series 2017-C6, Class D, 144A | 3.380 | % | 06/10/50 | 700,000 | 569,646 | |||||||||||
| FREMF Mortgage Trust, Series 2013-K33, Class C, 144A (a) | 3.616 | % | 08/25/46 | 580,000 | 566,614 | |||||||||||
| FREMF Mortgage Trust, Series 2015-K44, Class B, 144A (a) | 3.810 | % | 01/25/48 | 520,000 | 527,138 | |||||||||||
| FREMF Mortgage Trust, Series 2015-K44, Class C, 144A (a) | 3.810 | % | 01/25/48 | 620,000 | 593,437 | |||||||||||
| FREMF Mortgage Trust, Series 2016-K54, Class B, 144A (a) | 4.189 | % | 04/25/48 | 300,000 | 308,675 | |||||||||||
| FREMF Mortgage Trust, Series 2016-K55, Class C, 144A (a) | 4.295 | % | 04/25/49 | 330,000 | 321,337 | |||||||||||
| FREMF Mortgage Trust, Series 2016-K56, Class C, 144A (a) | 4.073 | % | 06/25/49 | 830,000 | 801,251 | |||||||||||
| JPMBB Commercial Mortgage Securities Trust, Series 2015-C28, Class C (a) | 4.378 | % | 10/15/48 | 235,000 | 225,620 | |||||||||||
| JPMCC Commercial Mortgage Securities Trust, Series 2016-NINE, Class A, 144A (a) | 2.949 | % | 10/06/38 | 70,000 | 68,386 | |||||||||||
| JPMorgan Mortgage Trust, Series 2017-3, Class 1A3, 144A | 3.500 | % | 08/25/47 | 580,769 | 587,507 | |||||||||||
| OCP CLO Ltd., Series 2016-12A, Class A1, 144A (3MO LIBOR + 157) (a) | 2.924 | % | 10/18/28 | 1,050,000 | 1,058,454 | |||||||||||
| SFAVE Commercial Mortgage Securities Trust, Series 2015-5AVE, Class A1, 144A | 3.872 | % | 01/05/43 | 624,000 | 624,044 | |||||||||||
| Shackleton CLO Ltd., Series 2017-10A, Class A, 144A (3MO LIBOR + 133) (a) | 2.693 | % | 04/20/29 | 890,000 | 894,070 | |||||||||||
| Towd Point Mortgage Trust, Series 2015-1, Class A5, 144A (a) | 3.518 | % | 10/25/53 | 835,000 | 860,371 | |||||||||||
| Towd Point Mortgage Trust, Series 2017-1, Class M2, 144A | 3.750 | % | 10/25/56 | 740,000 | 730,949 | |||||||||||
10
| RYAN LABS CORE BOND FUND SCHEDULE OF INVESTMENTS (Continued) | ||||||||||||||||
| MORTGAGE-BACKED SECURITIES — 28.5% (Continued) | Coupon | Maturity | Par Value | Value | ||||||||||||
| Commercial — 14.8% (Continued) | ||||||||||||||||
| Towd Point Mortgage Trust, Series 2016-5, Class M2, 144A | 3.375 | % | 10/25/56 | $ | 620,000 | $ | 603,328 | |||||||||
| Tralee CDO Ltd., Series 2013-1A, Class AR, 144A (3MO LIBOR + 132) (a) | 2.598 | % | 07/20/29 | 640,000 | 639,133 | |||||||||||
| UBS-Citigroup Commercial Mortgage Trust, Series 2011-C1, Class E, 144A (a) | 6.250 | % | 01/10/45 | 910,000 | 891,790 | |||||||||||
| UBS-Citigroup Commercial Mortgage Trust, Series 2017-C1, Class D, 144A (a) | 5.002 | % | 06/15/50 | 535,000 | 515,326 | |||||||||||
| Wells Fargo Commercial Mortgage Trust, Series 2017-C39, Class D, 144A (a) | 4.502 | % | 09/15/50 | 320,000 | 304,005 | |||||||||||
| Wells Fargo Commercial Mortgage Trust, Series 2017-RC1, Class C | 4.591 | % | 01/15/60 | 260,000 | 262,519 | |||||||||||
| WF-RBS Commercial Mortgage Trust, Series 2012-C10, Class C (a) | 4.531 | % | 12/15/45 | 220,000 | 219,151 | |||||||||||
| WF-RBS Commercial Mortgage Trust, Series 2014-C22, Class D, 144A (a) | 4.055 | % | 09/15/57 | 500,000 | 391,865 | |||||||||||
| 15,109,637 | ||||||||||||||||
| Federal Home Loan Mortgage Corporation — 7.8% | ||||||||||||||||
| Federal Home Loan Mortgage Corporation, Pool #J19087 | 3.000 | % | 05/01/27 | 292,309 | 297,931 | |||||||||||
| Federal Home Loan Mortgage Corporation, Pool #G18481 | 3.000 | % | 09/01/28 | 207,585 | 211,591 | |||||||||||
| Federal Home Loan Mortgage Corporation, Pool #G18622 | 2.500 | % | 12/01/31 | 360,748 | 360,242 | |||||||||||
| Federal Home Loan Mortgage Corporation, Pool #A93093 | 4.500 | % | 07/01/40 | 91,827 | 98,879 | |||||||||||
| Federal Home Loan Mortgage Corporation, Pool #A94472 | 4.000 | % | 10/01/40 | 155,360 | 162,956 | |||||||||||
| Federal Home Loan Mortgage Corporation, Series 4667, Class LA | 3.500 | % | 01/15/43 | 986,720 | 1,012,263 | |||||||||||
| Federal Home Loan Mortgage Corporation, Pool #Q19470 | 3.000 | % | 06/01/43 | 192,346 | 192,965 | |||||||||||
| Federal Home Loan Mortgage Corporation, Pool #Q20576 | 3.000 | % | 08/01/43 | 363,253 | 363,669 | |||||||||||
| Federal Home Loan Mortgage Corporation, Pool #G08572 | 3.500 | % | 02/01/44 | 126,269 | 130,086 | |||||||||||
| Federal Home Loan Mortgage Corporation, Pool #G08677 | 4.000 | % | 11/01/45 | 539,284 | 563,467 | |||||||||||
| Federal Home Loan Mortgage Corporation, Pool #G08707 | 4.000 | % | 05/01/46 | 1,890,366 | 1,975,274 | |||||||||||
11
| RYAN LABS CORE BOND FUND SCHEDULE OF INVESTMENTS (Continued) | ||||||||||||||||
| MORTGAGE-BACKED SECURITIES — 28.5% (Continued) | Coupon | Maturity | Par Value | Value | ||||||||||||
| Federal Home Loan Mortgage Corporation — 7.8% (Continued) | ||||||||||||||||
| Federal Home Loan Mortgage Corporation, Pool #G08737 | 3.000 | % | 12/01/46 | $ | 1,843,636 | $ | 1,841,387 | |||||||||
| Federal Home Loan Mortgage Corporation, Pool #G08772 | 4.500 | % | 06/01/47 | 656,394 | 697,748 | |||||||||||
| 7,908,458 | ||||||||||||||||
| Federal National Mortgage Association — 3.8% | ||||||||||||||||
| Federal National Mortgage Association, Pool #AJ7494 | 3.000 | % | 12/01/26 | 211,101 | 215,690 | |||||||||||
| Federal National Mortgage Association, Pool #AB5490 | 3.000 | % | 07/01/27 | 70,632 | 72,165 | |||||||||||
| Federal National Mortgage Association, Pool #AE0443 | 6.500 | % | 10/01/39 | 19,545 | 22,077 | |||||||||||
| Federal National Mortgage Association, Pool #AB5379 | 3.500 | % | 06/01/42 | 1,248,844 | 1,286,512 | |||||||||||
| Federal National Mortgage Association, Pool #AB6670 | 3.000 | % | 10/01/42 | 170,538 | 171,052 | |||||||||||
| Federal National Mortgage Association, Pool #AB9345 | 3.000 | % | 05/01/43 | 339,115 | 340,092 | |||||||||||
| Federal National Mortgage Association, Pool #AB9350 | 3.000 | % | 05/01/43 | 150,214 | 150,669 | |||||||||||
| Federal National Mortgage Association, Pool #AB9558 | 3.000 | % | 06/01/43 | 345,828 | 346,809 | |||||||||||
| Federal National Mortgage Association, Pool #AT5860 | 3.500 | % | 06/01/43 | 627,303 | 645,172 | |||||||||||
| Federal National Mortgage Association, Pool #AL4010 | 3.500 | % | 07/01/43 | 153,739 | 158,742 | |||||||||||
| Federal National Mortgage Association, Pool #AL5625 | 3.500 | % | 03/01/44 | 93,364 | 96,318 | |||||||||||
| Federal National Mortgage Association, Pool #AL5538 | 4.000 | % | 07/01/44 | 65,237 | 68,925 | |||||||||||
| Federal National Mortgage Association, Pool #AS5165 | 3.000 | % | 06/01/45 | 197,848 | 198,305 | |||||||||||
| Federal National Mortgage Association, Pool #MA3143 | 3.000 | % | 09/01/47 | 75,000 | 74,860 | |||||||||||
| 3,847,388 | ||||||||||||||||
| Government National Mortgage Association — 2.1% | ||||||||||||||||
| Government National Mortgage Association, Pool #5175 | 4.500 | % | 09/20/41 | 83,868 | 89,299 | |||||||||||
| Government National Mortgage Association, Pool #MA3937 | 3.500 | % | 09/20/46 | 1,370,006 | 1,418,171 | |||||||||||
12
| RYAN LABS CORE BOND FUND SCHEDULE OF INVESTMENTS (Continued) | ||||||||||||||||
| MORTGAGE-BACKED SECURITIES — 28.5% (Continued) | Coupon | Maturity | Par Value | Value | ||||||||||||
| Government National Mortgage Association — 2.1% (Continued) | ||||||||||||||||
| Government National Mortgage Association, Series 2014-13, Class VA | 3.000 | % | 01/16/54 | $ | 159,279 | $ | 167,018 | |||||||||
| Government National Mortgage Association, Series 2015-41, Class C (a) | 3.161 | % | 01/16/57 | 490,000 | 469,795 | |||||||||||
| 2,144,283 | ||||||||||||||||
| Total Mortgage-Backed Securities (Cost $29,243,478) | $ | 29,009,766 | ||||||||||||||
| ASSET-BACKED SECURITIES — 9.2% | Coupon | Maturity | Par Value | Value | ||||||||||||
| American Credit Acceptance Receivables Trust, Series 2017-3, Class D, 144A | 3.430 | % | 10/10/23 | $ | 330,000 | $ | 329,168 | |||||||||
| AmeriCredit Automobile Receivables Trust, Series 2016-3, Class D | 2.710 | % | 09/08/22 | 390,000 | 388,392 | |||||||||||
| AmeriCredit Automobile Receivables Trust, Series 2017-3, Class D | 3.180 | % | 07/18/23 | 410,000 | 411,620 | |||||||||||
| CPS Auto Trust, Series 2015-C, Class A, 144A | 1.770 | % | 06/17/19 | 3,231 | 3,231 | |||||||||||
| Domino's Pizza Master Issuer, LLC, Series 2017-1A, Class A23, 144A (a) | 4.118 | % | 07/25/47 | 249,375 | 255,749 | |||||||||||
| Drive Auto Receivables Trust, Series 2017-BA, Class D, 144A | 3.720 | % | 10/17/22 | 790,000 | 795,724 | |||||||||||
| Drive Auto Receivables Trust, Series 17-AA, Class D, 144A | 4.160 | % | 05/15/24 | 400,000 | 410,487 | |||||||||||
| DT Auto Owner Trust, Series 2016-3A, Class D, 144A | 4.520 | % | 06/15/23 | 885,000 | 902,098 | |||||||||||
| Exeter Automobile Receivables Trust, Series 2016-3A, Class C, 144A | 4.220 | % | 06/15/22 | 980,000 | 998,344 | |||||||||||
| Exeter Automobile Receivables Trust, Series 2017-1A, Class C, 144A | 3.950 | % | 12/15/22 | 790,000 | 798,520 | |||||||||||
| Exeter Automobile Receivables Trust, Series 2017-3A, Class C, 144A | 3.680 | % | 07/17/23 | 510,000 | 509,119 | |||||||||||
| Five Guys Funding, LLC, Series 2017-1A, Class A2, 144A (a) | 4.600 | % | 07/25/47 | 359,100 | 366,816 | |||||||||||
| MVW Owner Trust, Series 2013-1A, Class B, 144A | 2.740 | % | 04/22/30 | 29,728 | 29,456 | |||||||||||
| Santander Drive Auto Receivables Trust, Series 2016-2, Class D (a) | 3.390 | % | 04/15/22 | 790,000 | 799,743 | |||||||||||
13
| RYAN LABS CORE BOND FUND SCHEDULE OF INVESTMENTS (Continued) | ||||||||||||||||
| ASSET-BACKED SECURITIES — 9.2% (Continued) | Coupon | Maturity | Par Value | Value | ||||||||||||
| Santander Drive Auto Receivables Trust, Series 2016-3, Class D | 2.800 | % | 08/15/22 | $ | 660,000 | $ | 658,388 | |||||||||
| Shops at Crystals Trust, Series 2016-CSTL, Class D, 144A | 3.855 | % | 07/05/36 | 510,000 | 474,728 | |||||||||||
| Sierra Receivables Funding Company, LLC, Series 2016-3A, Class B, 144A | 2.630 | % | 10/20/33 | 243,516 | 239,227 | |||||||||||
| SoFi Consumer Loan Program Trust, Series 2016-2, Class B, 144A | 4.770 | % | 10/27/25 | 245,000 | 253,299 | |||||||||||
| SoFi Consumer Loan Program Trust, Series 2017-3, Class B, 144A (a) | 3.850 | % | 05/25/26 | 200,000 | 201,916 | |||||||||||
| SoFi Consumer Loan Program Trust, Series 2017-5, Class B, 144A | 3.690 | % | 09/25/26 | 534,000 | 533,591 | |||||||||||
| Total Asset-Backed Securities (Cost $9,313,418) | $ | 9,359,616 | ||||||||||||||
| CORPORATE BONDS — 29.5% | Coupon | Maturity | Par Value | Value | ||||||||||||
| Consumer Discretionary — 1.7% | ||||||||||||||||
| Alibaba Group Holding Ltd. | 2.500 | % | 11/28/19 | $ | 205,000 | $ | 205,611 | |||||||||
| Alibaba Group Holding Ltd. | 3.600 | % | 11/28/24 | 345,000 | 354,523 | |||||||||||
| Charter Communications Operating, LLC/CAP | 5.375 | % | 05/01/47 | 75,000 | 75,754 | |||||||||||
| Coach, Inc. | 4.125 | % | 07/15/27 | 505,000 | 506,204 | |||||||||||
| Wyndham Worldwide Corporation | 4.150 | % | 04/01/24 | 555,000 | 557,634 | |||||||||||
| 1,699,726 | ||||||||||||||||
| Consumer Staples — 0.9% | ||||||||||||||||
| Bunge Ltd. Finance Corporation | 3.750 | % | 09/25/27 | 70,000 | 69,145 | |||||||||||
| Kraft Heinz Foods Company (The) | 5.200 | % | 07/15/45 | 368,000 | 398,044 | |||||||||||
| Kroger Company (The) | 4.450 | % | 02/01/47 | 515,000 | 500,089 | |||||||||||
| 967,278 | ||||||||||||||||
| Energy — 4.6% | ||||||||||||||||
| Andeavor, 144A | 4.750 | % | 12/15/23 | 520,000 | 556,060 | |||||||||||
| Boardwalk Pipelines, L.P. | 4.450 | % | 07/15/27 | 500,000 | 509,007 | |||||||||||
| Cenovus Energy, Inc. | 6.750 | % | 11/15/39 | 450,000 | 530,299 | |||||||||||
| Chevron Corporation | 2.419 | % | 11/17/20 | 165,000 | 165,959 | |||||||||||
| Enable Midstream Partners, L.P. | 4.400 | % | 03/15/27 | 505,000 | 512,828 | |||||||||||
| Kinder Morgan, Inc. | 3.150 | % | 01/15/23 | 178,000 | 176,850 | |||||||||||
| Motiva Enterprises, LLC, 144A | 6.850 | % | 01/15/40 | 375,000 | 461,351 | |||||||||||
| Oneok, Inc. | 4.950 | % | 07/13/47 | 505,000 | 509,253 | |||||||||||
| Sabine Pass Liquefaction, LLC | 5.000 | % | 03/15/27 | 530,000 | 564,392 | |||||||||||
| Shell International Finance B.V. | 1.875 | % | 05/10/21 | 185,000 | 182,318 | |||||||||||
| Suncor Energy, Inc. | 4.000 | % | 11/15/47 | 70,000 | 70,105 | |||||||||||
| TC Pipelines, L.P. | 4.375 | % | 03/13/25 | 290,000 | 301,150 | |||||||||||
14
| RYAN LABS CORE BOND FUND SCHEDULE OF INVESTMENTS (Continued) | ||||||||||||||||
| CORPORATE BONDS — 29.5% (Continued) | Coupon | Maturity | Par Value | Value | ||||||||||||
| Energy — 4.6% (Continued) | ||||||||||||||||
| TC Pipelines, L.P. | 3.900 | % | 05/25/27 | $ | 180,000 | $ | 180,146 | |||||||||
| 4,719,718 | ||||||||||||||||
| Financials — 8.8% | ||||||||||||||||
| Air Lease Corporation | 2.125 | % | 01/15/20 | 250,000 | 248,544 | |||||||||||
| American Express Credit Corporation | 3.300 | % | 05/03/27 | 271,000 | 272,611 | |||||||||||
| American Financial Group, Inc. | 4.500 | % | 06/15/47 | 440,000 | 448,474 | |||||||||||
| Bank of America Corporation | 7.625 | % | 06/01/19 | 210,000 | 226,026 | |||||||||||
| Bank of America Corporation | 5.875 | % | 01/05/21 | 185,000 | 203,354 | |||||||||||
| Bank of America Corporation | 3.705 | % | 04/24/28 | 510,000 | 522,435 | |||||||||||
| Bank of Montreal | 1.500 | % | 07/18/19 | 200,000 | 198,266 | |||||||||||
| Bear Stearns Companies, LLC | 7.250 | % | 02/01/18 | 405,000 | 408,483 | |||||||||||
| Berkshire Hathaway, Inc. | 2.100 | % | 08/14/19 | 80,000 | 80,078 | |||||||||||
| Boral Finance Properties Ltd., 144A | 3.000 | % | 11/01/22 | 380,000 | 377,748 | |||||||||||
| Brighthouse Financial, Inc., 144A | 4.700 | % | 06/22/47 | 515,000 | 503,271 | |||||||||||
| Citigroup, Inc. | 4.450 | % | 09/29/27 | 265,000 | 278,507 | |||||||||||
| Credit Suisse AG of New York | 3.625 | % | 09/09/24 | 586,000 | 605,492 | |||||||||||
| General Motors Financial Company, Inc. | 3.450 | % | 01/14/22 | 292,000 | 296,249 | |||||||||||
| General Motors Financial Company, Inc. | 4.350 | % | 01/17/27 | 405,000 | 416,203 | |||||||||||
| Goldman Sachs Group, Inc. (The) | 3.850 | % | 01/26/27 | 314,000 | 320,508 | |||||||||||
| Goldman Sachs Group, Inc. (The) | 4.017 | % | 10/31/38 | 130,000 | 132,518 | |||||||||||
| Huntington Bancshares, Inc. | 2.600 | % | 08/02/18 | 115,000 | 115,444 | |||||||||||
| Hyundai Capital America, 144A | 2.600 | % | 03/19/20 | 235,000 | 233,407 | |||||||||||
| Intesa Sanpaolo S.P.A., 144A | 3.875 | % | 07/14/27 | 350,000 | 350,205 | |||||||||||
| JPMorgan Chase & Company | 3.625 | % | 12/01/27 | 490,000 | 491,419 | |||||||||||
| Markel Corporation | 4.300 | % | 11/01/47 | 500,000 | 498,660 | |||||||||||
| Morgan Stanley | 3.950 | % | 04/23/27 | 280,000 | 283,562 | |||||||||||
| SMBC Aviation Capital Finance Designated Activity, 144A | 2.650 | % | 07/15/21 | 325,000 | 320,099 | |||||||||||
| Sumitomo Mitsui Financial Group, Inc. | 2.442 | % | 10/19/21 | 435,000 | 431,003 | |||||||||||
| Sumitomo Mitsui Financial Group, Inc. | 2.784 | % | 07/12/22 | 290,000 | 288,827 | |||||||||||
| Voya Financial, Inc. | 4.800 | % | 06/15/46 | 415,000 | 443,501 | |||||||||||
| 8,994,894 | ||||||||||||||||
| Health Care — 0.8% | ||||||||||||||||
| Celgene Corporation | 4.350 | % | 11/15/47 | 445,000 | 449,777 | |||||||||||
| Unitedhealth Group, Inc. | 3.750 | % | 10/15/47 | 420,000 | 417,429 | |||||||||||
| 867,206 | ||||||||||||||||
| Industrials — 1.1% | ||||||||||||||||
| Celulosa Arauco y Constitucion S.A., 144A | 3.875 | % | 11/02/27 | 475,000 | 469,062 | |||||||||||
| Celulosa Arauco y Constitucion S.A., 144A | 5.500 | % | 11/02/47 | 435,000 | 446,136 | |||||||||||
15
| RYAN LABS CORE BOND FUND SCHEDULE OF INVESTMENTS (Continued) | ||||||||||||||||
| CORPORATE BONDS — 29.5% (Continued) | Coupon | Maturity | Par Value | Value | ||||||||||||
| Industrials — 1.1% (Continued) | ||||||||||||||||
| General Electric Company | 5.625 | % | 05/01/18 | $ | 165,000 | $ | 167,599 | |||||||||
| 1,082,797 | ||||||||||||||||
| Information Technology — 3.8% | ||||||||||||||||
| Apple, Inc. | 1.000 | % | 05/03/18 | 235,000 | 234,439 | |||||||||||
| Arrow Electronics, Inc. | 3.250 | % | 09/08/24 | 310,000 | 305,417 | |||||||||||
| Arrow Electronics, Inc. | 3.875 | % | 01/12/28 | 505,000 | 503,330 | |||||||||||
| Broadcom Corporation/Broadcom Cayman Finance Ltd., 144A | 3.875 | % | 01/15/27 | 540,000 | 529,150 | |||||||||||
| Cisco Systems, Inc. | 1.400 | % | 02/28/18 | 200,000 | 199,875 | |||||||||||
| Citrix Systems, Inc. | 4.500 | % | 12/01/27 | 80,000 | 80,860 | |||||||||||
| Corning, Inc. | 4.375 | % | 11/15/57 | 130,000 | 127,948 | |||||||||||
| Dell, Inc., 144A | 8.350 | % | 07/15/46 | 370,000 | 465,565 | |||||||||||
| Motorola Solutions, Inc. | 3.750 | % | 05/15/22 | 400,000 | 409,823 | |||||||||||
| Oracle Corporation | 4.000 | % | 11/15/47 | 55,000 | 56,783 | |||||||||||
| Seagate HDD Cayman, 144A | 4.875 | % | 03/01/24 | 270,000 | 269,693 | |||||||||||
| Seagate HDD Cayman | 4.875 | % | 06/01/27 | 180,000 | 171,767 | |||||||||||
| Tech Data Corporation | 4.950 | % | 02/15/27 | 480,000 | 503,062 | |||||||||||
| 3,857,712 | ||||||||||||||||
| Materials — 1.4% | ||||||||||||||||
| Domtar Corporation | 6.750 | % | 02/15/44 | 320,000 | 359,726 | |||||||||||
| Ecolab, Inc. | 1.450 | % | 12/08/17 | 125,000 | 124,996 | |||||||||||
| Glencore Funding, LLC, 144A | 4.000 | % | 03/27/27 | 510,000 | 505,870 | |||||||||||
| Glencore Funding, LLC, 144A | 3.875 | % | 10/27/27 | 85,000 | 83,401 | |||||||||||
| LyondellBasell Industries N.V. | 5.000 | % | 04/15/19 | 33,000 | 33,961 | |||||||||||
| Monsanto Company | 5.500 | % | 08/15/25 | 315,000 | 355,778 | |||||||||||
| 1,463,732 | ||||||||||||||||
| Other — 0.3% | ||||||||||||||||
| Hudson Pacific Properties, L.P. | 3.950 | % | 11/01/27 | 265,000 | 263,153 | |||||||||||
| Real Estate — 1.8% | ||||||||||||||||
| Alexandria Real Estate Equities, Inc. | 3.450 | % | 04/30/25 | 450,000 | 448,154 | |||||||||||
| Crown Castle International Corporation | 3.200 | % | 09/01/24 | 550,000 | 542,125 | |||||||||||
| Crown Castle International Corporation | 4.750 | % | 05/15/47 | 480,000 | 497,705 | |||||||||||
| Tanger Properties, L.P. | 3.875 | % | 07/15/27 | 315,000 | 311,938 | |||||||||||
| 1,799,922 | ||||||||||||||||
| Telecommunication Services — 2.6% | ||||||||||||||||
| Américan Móvil S.A.B. de C.V. | 5.000 | % | 10/16/19 | 380,000 | 398,650 | |||||||||||
| AT&T, Inc. | 4.250 | % | 03/01/27 | 250,000 | 255,676 | |||||||||||
| AT&T, Inc. | 5.250 | % | 03/01/37 | 263,000 | 274,749 | |||||||||||
| Comisión Federal de Electricidad, 144A | 4.750 | % | 02/23/27 | 200,000 | 209,750 | |||||||||||
| Sprint Spectrum, L.P., 144A | 3.360 | % | 03/20/23 | 980,000 | 987,644 | |||||||||||
16
| RYAN LABS CORE BOND FUND SCHEDULE OF INVESTMENTS (Continued) | ||||||||||||||||
| CORPORATE BONDS — 29.5% (Continued) | Coupon | Maturity | Par Value | Value | ||||||||||||
| Telecommunication Services — 2.6% (Continued) | ||||||||||||||||
| Verizon Communications, Inc. | 5.500 | % | 03/16/47 | $ | 465,000 | $ | 519,628 | |||||||||
| 2,646,097 | ||||||||||||||||
| Utilities — 1.7% | ||||||||||||||||
| Buckeye Partners, L.P. | 6.050 | % | 01/15/18 | 305,000 | 306,399 | |||||||||||
| Buckeye Partners, L.P. | 2.650 | % | 11/15/18 | 125,000 | 125,478 | |||||||||||
| Duke Energy Progress, Inc. | 5.300 | % | 01/15/19 | 45,000 | 46,651 | |||||||||||
| ENEL Finance International N.V., 144A | 4.750 | % | 05/25/47 | 515,000 | 534,709 | |||||||||||
| Oglethorpe Power Corporation | 6.100 | % | 03/15/19 | 60,000 | 62,821 | |||||||||||
| Southern California Edison Company | 4.000 | % | 04/01/47 | 430,000 | 457,867 | |||||||||||
| Virginia Electric & Power Company | 1.200 | % | 01/15/18 | 190,000 | 189,905 | |||||||||||
| 1,723,830 | ||||||||||||||||
| Total Corporate Bonds (Cost $29,828,272) | $ | 30,086,065 | ||||||||||||||
| INTERNATIONAL BONDS — 0.1% | Coupon | Maturity | Par Value | Value | ||||||||||||
| United Mexican States (Cost $103,048) | 4.000 | % | 10/02/23 | $ | 100,000 | $ | 105,150 | |||||||||
17
| RYAN LABS CORE BOND FUND SCHEDULE OF INVESTMENTS (Continued) | ||||||||
| MONEY MARKET FUNDS — 7.8% | Shares | Value | ||||||
| Fidelity Institutional Money Market Government Portfolio - Class I, 0.97% (b) | 2,923,537 | $ | 2,923,537 | |||||
| Invesco Short-Term Investments Trust - Treasury Portfolio - Institutional Shares, 0.98% (b) | 5,000,930 | 5,000,930 | ||||||
| Total Money Market Funds (Cost $7,924,467) | $ | 7,924,467 | ||||||
| Total Investments at Value — 99.7% (Cost $101,585,056) | $ | 101,556,573 | ||||||
| Other Assets in Excess of Liabilities — 0.3% | 354,789 | |||||||
| Net Assets — 100.0% | $ | 101,911,362 | ||||||
| 144A - | This is a restricted security that was sold in a transaction under Rule 144A of the Securities Act of 1933. This security may be sold in transactions exempt from registration, normally to qualified institutional buyers. The total value of such securities is $28,183,998 at November 30, 2017, representing 27.7% of net assets. |
| (a) | Variable rate security. The rate shown is the effective interest rate as of November 30, 2017. The benchmark on which the rate is calculated is shown parenthetically; otherwise, the rate fluctuations may be based on index changes, prepayment of underlying positions and/or other variables. |
| (b) | The rate shown is the 7-day effective yield as of November 30, 2017. |
See accompanying notes to financial statements.
18
| RYAN LABS LONG CREDIT FUND SCHEDULE OF INVESTMENTS November 30, 2017 | ||||||||||||||||
| U.S. TREASURY OBLIGATIONS — 4.3% | Coupon | Maturity | Par Value | Value | ||||||||||||
| U.S. Treasury Notes — 0.4% | ||||||||||||||||
| U.S. Treasury Notes | 2.250 | % | 11/15/27 | $ | 400,000 | $ | 394,109 | |||||||||
| U.S. Treasury Bonds — 3.9% | ||||||||||||||||
| U.S. Treasury Bonds | 2.750 | % | 08/15/47 | 3,715,000 | 3,651,729 | |||||||||||
| Total U.S. Treasury Obligations (Cost $4,072,052) | $ | 4,045,838 | ||||||||||||||
| MORTGAGE-BACKED SECURITIES — 0.1% | Coupon | Maturity | Par Value | Value | ||||||||||||
| Commercial — 0.1% | ||||||||||||||||
| Commercial Mortgage Trust, Series 2013-CR7, Class D, 144A (a) (Cost $71,904) | 4.426 | % | 03/10/46 | $ | 82,500 | $ | 65,084 | |||||||||
| MUNICIPAL BONDS — 0.8% | Coupon | Maturity | Par Value | Value | ||||||||||||
| New York City Transitional Finance Authority Build America Bonds, Revenue | 5.508 | % | 08/01/37 | $ | 260,000 | $ | 331,409 | |||||||||
| New York State Dormitory Authority, Build America Bonds, Revenue | 5.600 | % | 03/15/40 | 10,000 | 12,734 | |||||||||||
| State of Illinois Taxable Pension Funding, General Obligation | 5.100 | % | 06/01/33 | 420,000 | 417,396 | |||||||||||
| Total Municipal Bonds (Cost $714,729) | $ | 761,539 | ||||||||||||||
| ASSET-BACKED SECURITIES — 0.0% (b) | Coupon | Maturity | Par Value | Value | ||||||||||||
| MVW Owner Trust, Series 2013-1A , Class Class B, 144A (Cost $17,112) | 2.740 | % | 04/22/30 | $ | 17,342 | $ | 17,183 | |||||||||
19
| RYAN LABS LONG CREDIT FUND SCHEDULE OF INVESTMENTS (Continued) | ||||||||||||||||
| CORPORATE BONDS — 89.2% | Coupon | Maturity | Par Value | Value | ||||||||||||
| Consumer Discretionary — 13.2% | ||||||||||||||||
| 21st Century Fox America, Inc. | 6.200 | % | 12/15/34 | $ | 890,000 | $ | 1,095,342 | |||||||||
| Amazon.com, Inc., 144A | 3.875 | % | 08/22/37 | 770,000 | 803,187 | |||||||||||
| CBS Corporation | 4.850 | % | 07/01/42 | 715,000 | 731,888 | |||||||||||
| Charter Communications Operating, LLC/CAP | 3.750 | % | 02/15/28 | 525,000 | 500,010 | |||||||||||
| Comcast Corporation | 4.250 | % | 01/15/33 | 1,045,000 | 1,113,868 | |||||||||||
| Ford Motor Company | 4.750 | % | 01/15/43 | 720,000 | 713,296 | |||||||||||
| General Motors Company, Inc. | 5.150 | % | 04/01/38 | 294,000 | 307,921 | |||||||||||
| General Motors Company, Inc. | 6.750 | % | 04/01/46 | 440,000 | 543,877 | |||||||||||
| Hasbro, Inc. | 6.350 | % | 03/15/40 | 422,000 | 509,283 | |||||||||||
| Home Depot, Inc. (The) | 4.250 | % | 04/01/46 | 975,000 | 1,053,897 | |||||||||||
| Johnson (S.C.) & Son, Inc., 144A | 4.350 | % | 09/30/44 | 690,000 | 737,412 | |||||||||||
| Lowe's Companies, Inc. | 4.050 | % | 05/03/47 | 855,000 | 885,038 | |||||||||||
| Macy's Retail Holdings, Inc. | 6.650 | % | 07/15/24 | 180,000 | 194,863 | |||||||||||
| Newell Brands, Inc. | 5.500 | % | 04/01/46 | 750,000 | 886,745 | |||||||||||
| NIKE, Inc. | 3.375 | % | 11/01/46 | 805,000 | 758,987 | |||||||||||
| Time Warner, Inc. | 6.500 | % | 11/15/36 | 460,000 | 564,737 | |||||||||||
| Time Warner, Inc. | 6.750 | % | 06/15/39 | 450,000 | 525,810 | |||||||||||
| Walt Disney Company (The) | 4.125 | % | 06/01/44 | 470,000 | 499,442 | |||||||||||
| 12,425,603 | ||||||||||||||||
| Consumer Staples — 5.5% | ||||||||||||||||
| Anheuser-Busch InBev S.A./N.V. | 4.700 | % | 02/01/36 | 350,000 | 387,825 | |||||||||||
| Anheuser-Busch InBev S.A./N.V. | 4.900 | % | 02/01/46 | 1,135,000 | 1,281,343 | |||||||||||
| CVS Health Corporation | 5.125 | % | 07/20/45 | 975,000 | 1,072,038 | |||||||||||
| Kroger Company (The) | 4.450 | % | 02/01/47 | 890,000 | 864,232 | |||||||||||
| PepsiCo, Inc. | 4.450 | % | 04/14/46 | 420,000 | 467,789 | |||||||||||
| Procter & Gamble Company (The) | 3.500 | % | 10/25/47 | 450,000 | 443,789 | |||||||||||
| Target Corporation | 3.625 | % | 04/15/46 | 705,000 | 665,270 | |||||||||||
| 5,182,286 | ||||||||||||||||
| Energy — 10.4% | ||||||||||||||||
| Boardwalk Pipelines, L.P. | 5.950 | % | 06/01/26 | 731,000 | 813,318 | |||||||||||
| Boardwalk Pipelines, L.P. | 4.450 | % | 07/15/27 | 640,000 | 651,530 | |||||||||||
| Energy Transfer Partners, L.P. | 7.500 | % | 07/01/38 | 220,000 | 271,441 | |||||||||||
| Energy Transfer Partners, L.P. | 6.500 | % | 02/01/42 | 740,000 | 830,165 | |||||||||||
| Energy Transfer Partners, L.P. | 5.950 | % | 10/01/43 | 110,000 | 115,703 | |||||||||||
| Enterprise Products Operating, L.P. | 5.100 | % | 02/15/45 | 875,000 | 968,301 | |||||||||||
| EQT Corporation | 3.900 | % | 10/01/27 | 885,000 | 868,641 | |||||||||||
| Kinder Morgan Energy Partners, L.P. | 6.500 | % | 09/01/39 | 475,000 | 550,429 | |||||||||||
| Marathon Petroleum Corporation | 5.850 | % | 12/15/45 | 545,000 | 613,400 | |||||||||||
| Oneok, Inc. | 4.950 | % | 07/13/47 | 525,000 | 529,421 | |||||||||||
| Petroleos Mexicanos | 5.500 | % | 06/27/44 | 170,000 | 159,035 | |||||||||||
| Petroleos Mexicanos | 6.750 | % | 09/21/47 | 612,000 | 647,129 | |||||||||||
| Sabine Pass Liquefaction, LLC | 5.000 | % | 03/15/27 | 960,000 | 1,022,296 | |||||||||||
20
| RYAN LABS LONG CREDIT FUND SCHEDULE OF INVESTMENTS (Continued) | ||||||||||||||
| CORPORATE BONDS — 89.2% (Continued) | Coupon | Maturity | Par Value | Value | ||||||||||
| Energy — 10.4% (Continued) | ||||||||||||||
| Shell International Finance B.V. | 4.375 | % | 05/11/45 | $ | 1,085,000 | $ | 1,167,189 | |||||||
| Shell International Finance B.V. | 3.750 | % | 09/12/46 | 210,000 | 205,150 | |||||||||
| Suncor Energy, Inc. | 4.000 | % | 11/15/47 | 330,000 | 330,493 | |||||||||
| 9,743,641 | ||||||||||||||
| Financials — 17.7% | ||||||||||||||
| Allstate Corporation | 4.200 | % | 12/15/46 | 1,040,000 | 1,100,095 | |||||||||
| Bank of America Corporation | 4.244 | % | 04/24/38 | 1,000,000 | 1,065,595 | |||||||||
| Brighthouse Financial, Inc., 144A | 4.700 | % | 06/22/47 | 995,000 | 972,340 | |||||||||
| Capital One Financial Corporation | 3.750 | % | 03/09/27 | 965,000 | 973,297 | |||||||||
| Farmers Insurance Exchange, 144A | 4.747 | % | 11/01/57 | 450,000 | 452,250 | |||||||||
| GE Capital International Funding Company | 4.418 | % | 11/15/35 | 1,180,000 | 1,258,645 | |||||||||
| Goldman Sachs Group, Inc. (The) | 6.125 | % | 02/15/33 | 195,000 | 245,945 | |||||||||
| HSBC Bank USA | 5.875 | % | 11/01/34 | 700,000 | 888,231 | |||||||||
| JPMorgan Chase & Company | 3.900 | % | 07/15/25 | 320,000 | 335,511 | |||||||||
| JPMorgan Chase & Company | 3.540 | % | 05/01/28 | 2,015,000 | 2,032,277 | |||||||||
| Lincoln National Corporation | 7.000 | % | 06/15/40 | 655,000 | 884,780 | |||||||||
| Manulife Financial Corporation | 4.061 | % | 02/24/32 | 595,000 | 597,389 | |||||||||
| Northwestern Mutual Life Insurance Company (The), 144A | 3.850 | % | 09/30/47 | 527,000 | 514,617 | |||||||||
| Progressive Corporation (The) | 4.125 | % | 04/15/47 | 880,000 | 929,738 | |||||||||
| Protective Life Corporation | 8.450 | % | 10/15/39 | 508,000 | 755,025 | |||||||||
| Santander Issuances S.A. | 5.179 | % | 11/19/25 | 930,000 | 998,103 | |||||||||
| Wells Fargo & Company | 3.900 | % | 05/01/45 | 1,420,000 | 1,436,116 | |||||||||
| Westpac Banking Corporation | 4.322 | % | 11/23/31 | 1,125,000 | 1,154,744 | |||||||||
| 16,594,698 | ||||||||||||||
| Health Care — 8.3% | ||||||||||||||
| AbbVie, Inc. | 4.300 | % | 05/14/36 | 1,010,000 | 1,054,559 | |||||||||
| Anthem, Inc. | 3.650 | % | 12/01/27 | 440,000 | 443,837 | |||||||||
| Anthem, Inc. | 4.375 | % | 12/01/47 | 440,000 | 452,346 | |||||||||
| Celgene Corporation | 4.350 | % | 11/15/47 | 435,000 | 439,669 | |||||||||
| Duke University Health System, Inc. | 3.920 | % | 06/01/47 | 1,110,000 | 1,140,754 | |||||||||
| Gilead Sciences, Inc. | 4.150 | % | 03/01/47 | 360,000 | 371,179 | |||||||||
| Johnson & Johnson | 4.375 | % | 12/05/33 | 540,000 | 609,469 | |||||||||
| Johnson & Johnson | 3.400 | % | 01/15/38 | 220,000 | 220,621 | |||||||||
| Johnson & Johnson | 3.500 | % | 01/15/48 | 305,000 | 304,258 | |||||||||
| Medtronic, Inc. | 4.375 | % | 03/15/35 | 915,000 | 1,003,964 | |||||||||
| Novartis Capital Corporation | 4.000 | % | 11/20/45 | 180,000 | 191,118 | |||||||||
| Pfizer, Inc. | 4.125 | % | 12/15/46 | 250,000 | 267,933 | |||||||||
| UnitedHealth Group, Inc. | 4.750 | % | 07/15/45 | 1,150,000 | 1,320,610 | |||||||||
| 7,820,317 | ||||||||||||||
21
| RYAN LABS LONG CREDIT FUND SCHEDULE OF INVESTMENTS (Continued) | ||||||||||||||
| CORPORATE BONDS — 89.2% (Continued) | Coupon | Maturity | Par Value | Value | ||||||||||
| Industrials — 2.1% | ||||||||||||||
| Celulosa Arauco y Constitucion S.A., 144A | 3.875 | % | 11/02/27 | $ | 690,000 | $ | 681,375 | |||||||
| Mosaic Company | 5.625 | % | 11/15/43 | 215,000 | 228,525 | |||||||||
| United Parcel Service, Inc. | 3.750 | % | 11/15/47 | 665,000 | 671,781 | |||||||||
| United Technologies Corporation | 3.750 | % | 11/01/46 | 210,000 | 206,074 | |||||||||
| United Technologies Corporation | 4.050 | % | 05/04/47 | 175,000 | 180,277 | |||||||||
| 1,968,032 | ||||||||||||||
| Information Technology — 5.1% | ||||||||||||||
| Alibaba Group Holding Ltd. | 3.400 | % | 12/06/27 | 915,000 | 910,956 | |||||||||
| Apple, Inc. | 4.375 | % | 05/13/45 | 1,185,000 | 1,298,077 | |||||||||
| Apple, Inc. | 3.750 | % | 11/13/47 | 425,000 | 424,245 | |||||||||
| Microsoft Corporation | 4.100 | % | 02/06/37 | 1,055,000 | 1,154,455 | |||||||||
| Oracle Corporation | 3.800 | % | 11/15/37 | 665,000 | 679,847 | |||||||||
| Seagate HDD Cayman | 4.875 | % | 06/01/27 | 350,000 | 333,991 | |||||||||
| 4,801,571 | ||||||||||||||
| Materials — 2.1% | ||||||||||||||
| Burlington Resources Finance Company | 7.200 | % | 08/15/31 | 525,000 | 701,651 | |||||||||
| Glencore Funding, LLC, 144A | 4.000 | % | 03/27/27 | 1,230,000 | 1,220,039 | |||||||||
| 1,921,690 | ||||||||||||||
| Real Estate — 2.1% | ||||||||||||||
| Crown Castle International Corporation | 4.750 | % | 05/15/47 | 720,000 | 746,557 | |||||||||
| Highwoods Realty, L.P. | 3.875 | % | 03/01/27 | 735,000 | 735,405 | |||||||||
| Kimco Realty Corporation | 4.450 | % | 09/01/47 | 385,000 | 382,914 | |||||||||
| Simon Property Group, L.P. (c) | 3.375 | % | 12/01/27 | 115,000 | 114,096 | |||||||||
| 1,978,972 | ||||||||||||||
| Telecommunication Services — 7.7% | ||||||||||||||
| AT&T, Inc. | 4.500 | % | 05/15/35 | 1,200,000 | 1,170,125 | |||||||||
| AT&T, Inc. | 5.250 | % | 03/01/37 | 645,000 | 673,812 | |||||||||
| AT&T, Inc. | 4.900 | % | 08/14/37 | 800,000 | 797,424 | |||||||||
| AT&T, Inc. | 4.350 | % | 06/15/45 | 10,000 | 9,042 | |||||||||
| AT&T, Inc. | 5.300 | % | 08/14/58 | 425,000 | 418,816 | |||||||||
| Motorola Solutions, Inc. | 5.500 | % | 09/01/44 | 300,000 | 303,100 | |||||||||
| Telefónica Emisiones S.A.U. | 5.213 | % | 03/08/47 | 666,000 | 728,395 | |||||||||
| Verizon Communications, Inc. | 4.400 | % | 11/01/34 | 2,070,000 | 2,081,244 | |||||||||
| Verizon Communications, Inc. | 5.250 | % | 03/16/37 | 735,000 | 799,650 | |||||||||
| Verizon Communications, Inc. | 4.522 | % | 09/15/48 | 250,000 | 243,279 | |||||||||
| 7,224,887 | ||||||||||||||
| Utilities — 15.0% | ||||||||||||||
| Alabama Power Company | 4.300 | % | 01/02/46 | 920,000 | 1,002,251 | |||||||||
| Ameren Illinois Company | 3.700 | % | 12/01/47 | 880,000 | 880,087 | |||||||||
| Consolidated Edison Company | 4.500 | % | 12/01/45 | 1,000,000 | 1,123,054 | |||||||||
| DTE Electric Company | 3.700 | % | 06/01/46 | 781,000 | 782,818 | |||||||||
22
| RYAN LABS LONG CREDIT FUND SCHEDULE OF INVESTMENTS (Continued) | ||||||||||||||||
| CORPORATE BONDS — 89.2% (Continued) | Coupon | Maturity | Par Value | Value | ||||||||||||
| Utilities — 15.0% (Continued) | ||||||||||||||||
| Duke Energy Progress, LLC | 4.375 | % | 03/30/44 | $ | 940,000 | $ | 1,039,328 | |||||||||
| Duke Energy Progress, LLC | 3.600 | % | 09/15/47 | 460,000 | 455,023 | |||||||||||
| Électricité de France S.A., 144A | 4.950 | % | 10/13/45 | 1,090,000 | 1,191,286 | |||||||||||
| ENEL Finance International N.V., 144A | 4.750 | % | 05/25/47 | 590,000 | 612,579 | |||||||||||
| Exelon Generation Company, LLC | 5.600 | % | 06/15/42 | 470,000 | 493,288 | |||||||||||
| Florida Power & Light Company | 3.700 | % | 12/01/47 | 1,305,000 | 1,334,395 | |||||||||||
| MidAmerican Energy Company | 4.800 | % | 09/15/43 | 990,000 | 1,168,250 | |||||||||||
| Pacific Gas & Electric Company | 6.050 | % | 03/01/34 | 220,000 | 273,126 | |||||||||||
| Potomac Electric Power | 4.150 | % | 03/15/43 | 1,050,000 | 1,129,243 | |||||||||||
| PPL Electric Utilities Corporation | 4.750 | % | 07/15/43 | 775,000 | 909,460 | |||||||||||
| Southern California Edison Company | 4.650 | % | 10/01/43 | 194,000 | 225,734 | |||||||||||
| Southwestern Public Service Company | 4.500 | % | 08/15/41 | 985,000 | 1,102,045 | |||||||||||
| Virginia Electric & Power Company | 6.350 | % | 11/30/37 | 275,000 | 375,038 | |||||||||||
| 14,097,005 | ||||||||||||||||
| Total Corporate Bonds (Cost $81,732,212) | $ | 83,758,702 | ||||||||||||||
| INTERNATIONAL BONDS — 3.8% | Coupon | Maturity | Par Value | Value | ||||||||||||
| Republic of Colombia | 5.000 | % | 06/15/45 | $ | 885,000 | $ | 924,825 | |||||||||
| Republic of Philippines | 3.700 | % | 03/01/41 | 125,000 | 124,629 | |||||||||||
| Republic of Philippines | 3.700 | % | 02/02/42 | 845,000 | 841,173 | |||||||||||
| Saudi International Bond, 144A | 4.625 | % | 10/04/47 | 250,000 | 255,258 | |||||||||||
| United Mexican States | 4.750 | % | 03/08/44 | 1,409,000 | 1,431,544 | |||||||||||
| Total International Bonds (Cost $3,441,309) | $ | 3,577,429 | ||||||||||||||
23
| RYAN LABS LONG CREDIT FUND SCHEDULE OF INVESTMENTS (Continued) | ||||||||
| MONEY MARKET FUNDS — 0.9% | Shares | Value | ||||||
| Invesco Short-Term Investments Trust - Treasury Portfolio - Institutional Shares, 0.98% (d) (Cost $853,996) | 853,996 | $ | 853,996 | |||||
| Total Investments at Value — 99.1% (Cost $90,903,314) | $ | 93,079,771 | ||||||
| Other Assets in Excess of Liabilities — 0.9% | 805,718 | |||||||
| Net Assets — 100.0% | $ | 93,885,489 | ||||||
| 144A - | This is a restricted security that was sold in a transaction under Rule 144A of the Securities Act of 1933. This security may be sold in transactions exempt from registration, normally to qualified institutional buyers. The total value of such securities is $7,522,610 at November 30, 2017, representing 8.0% of net assets. |
| (a) | Variable rate security. The rate shown is the effective interest rate as of November 30, 2017. The benchmark on which the rate is calculated is shown parenthetically; otherwise, the rate fluctuations may be based on index changes, prepayment of underlying positions and/or other variables. |
| (b) | Percentage rounds to less than 0.1%. |
| (c) | Security value has been determined in good faith pursuant to procedures adopted by the Board of Trustees. The total value of such securities is $114,096 at November 30, 2017, representing 0.1% of net assets (Note 2). |
| (d) | The rate shown is the 7-day effective yield as of November 30, 2017. |
See accompanying notes to financial statements.
24
| RYAN LABS FUNDS STATEMENTS OF ASSETS AND LIABILITIES November 30, 2017 | ||||||||
| Ryan Labs Core Bond Fund | Ryan Labs Long Credit Fund | |||||||
| ASSETS | ||||||||
| Investments in securities: | ||||||||
| At acquisition cost | $ | 101,585,056 | $ | 90,903,314 | ||||
| At value (Note 2) | $ | 101,556,573 | $ | 93,079,771 | ||||
| Receivable for securities sold | 481,953 | 1,443,655 | ||||||
| Dividends and interest receivable | 505,862 | 913,418 | ||||||
| Other assets | 3,535 | 4,499 | ||||||
| TOTAL ASSETS | 102,547,923 | 95,441,343 | ||||||
| LIABILITIES | ||||||||
| Due to custodian | 42 | — | ||||||
| Distributions payable | 111,337 | 157,417 | ||||||
| Payable for securities purchased | 490,007 | 1,356,867 | ||||||
| Payable to Adviser (Note 4) | 9,151 | 16,321 | ||||||
| Payable to administrator (Note 4) | 13,725 | 12,510 | ||||||
| Other accrued expenses | 12,299 | 12,739 | ||||||
| TOTAL LIABILITIES | 636,561 | 1,555,854 | ||||||
| NET ASSETS | $ | 101,911,362 | $ | 93,885,489 | ||||
| NET ASSETS CONSIST OF: | ||||||||
| Paid-in capital | $ | 102,165,879 | $ | 90,357,183 | ||||
| Undistributed net investment income | 6,983 | 9,746 | ||||||
| Accumulated net realized gains (losses) from investment transactions | (233,017 | ) | 1,342,103 | |||||
| Net unrealized appreciation (depreciation) on investments | (28,483 | ) | 2,176,457 | |||||
| NET ASSETS | $ | 101,911,362 | $ | 93,885,489 | ||||
| Shares of beneficial interest outstanding (unlimited number of shares authorized, no par value) | 10,324,233 | 8,869,911 | ||||||
| Net asset value, offering price and redemption price per share (Note 2) | $ | 9.87 | $ | 10.58 | ||||
| See accompanying notes to financial statements. |
25
| RYAN LABS FUNDS STATEMENTS OF OPERATIONS For the Year Ended November 30, 2017 | ||||||||
| Ryan Labs Core Bond Fund | Ryan Labs Long Credit Fund | |||||||
| INVESTMENT INCOME | ||||||||
| Interest | $ | 2,939,790 | $ | 2,985,811 | ||||
| Dividend | 25,394 | 3,952 | ||||||
| TOTAL INCOME | 2,965,184 | 2,989,763 | ||||||
| EXPENSES | ||||||||
| Investment advisory fees (Note 4) | 403,459 | 358,758 | ||||||
| Administration fees (Note 4) | 100,969 | 71,816 | ||||||
| Professional fees | 37,596 | 37,596 | ||||||
| Pricing costs | 49,216 | 25,312 | ||||||
| Fund accounting fees (Note 4) | 40,115 | 34,217 | ||||||
| Custody and bank service fees | 13,180 | 12,067 | ||||||
| Compliance fees (Note 4) | 12,172 | 12,069 | ||||||
| Transfer agent fees (Note 4) | 12,000 | 12,000 | ||||||
| Trustees’ fees and expenses (Note 4) | 9,989 | 9,989 | ||||||
| Registration and filing fees | 6,847 | 9,141 | ||||||
| Insurance expense | 2,180 | 3,699 | ||||||
| Printing of shareholder reports | 2,873 | 2,873 | ||||||
| Postage and supplies | 2,701 | 2,431 | ||||||
| Other expenses | 8,960 | 9,073 | ||||||
| TOTAL EXPENSES | 702,257 | 601,041 | ||||||
| Less fee reductions by the Adviser (Note 4) | (298,798 | ) | (242,282 | ) | ||||
| NET EXPENSES | 403,459 | 358,759 | ||||||
| NET INVESTMENT INCOME | 2,561,725 | 2,631,004 | ||||||
| REALIZED AND UNREALIZED GAINS ON INVESTMENTS | ||||||||
| Net realized gains from investment transactions | 112,983 | 1,525,529 | ||||||
| Net change in unrealized appreciation on investments | 1,116,810 | 2,812,756 | ||||||
| NET REALIZED AND UNREALIZED GAINS ON INVESTMENTS | 1,229,793 | 4,338,285 | ||||||
| NET INCREASE IN NET ASSETS FROM OPERATIONS | $ | 3,791,518 | $ | 6,969,289 | ||||
| See accompanying notes to financial statements. |
26
| RYAN LABS CORE BOND FUND STATEMENTS OF CHANGES IN NET ASSETS | ||||||||
| Year Ended November 30, 2017 | Year Ended November 30, 2016 | |||||||
| FROM OPERATIONS | ||||||||
| Net investment income | $ | 2,561,725 | $ | 1,661,159 | ||||
| Net realized gains from investment transactions | 112,983 | 1,181,819 | ||||||
| Net change in unrealized appreciation (depreciation) on investments | 1,116,810 | (1,070,422 | ) | |||||
| Net increase in net assets from operations | 3,791,518 | 1,772,556 | ||||||
| DISTRIBUTIONS TO SHAREHOLDERS (Note 2) | ||||||||
| From net investment income | (2,642,230 | ) | (1,741,637 | ) | ||||
| From net realized gains from investment transactions | (1,348,780 | ) | (51,229 | ) | ||||
| Decrease in net assets from distributions to shareholders | (3,991,010 | ) | (1,792,866 | ) | ||||
| CAPITAL SHARE TRANSACTIONS | ||||||||
| Proceeds from shares sold | 1,560,000 | 30,172,474 | ||||||
| Net asset value of shares issued in reinvestment of distributions to shareholders | 2,658,906 | 577,108 | ||||||
| Payments for shares redeemed | (2,344,525 | ) | (750,025 | ) | ||||
| Net increase from capital share transactions | 1,874,381 | 29,999,557 | ||||||
| TOTAL INCREASE IN NET ASSETS | 1,674,889 | 29,979,247 | ||||||
| NET ASSETS | ||||||||
| Beginning of year | 100,236,473 | 70,257,226 | ||||||
| End of year | $ | 101,911,362 | $ | 100,236,473 | ||||
| UNDISTRIBUTED NET INVESTMENT INCOME | $ | 6,983 | $ | 3,586 | ||||
| CAPITAL SHARE ACTIVITY | ||||||||
| Shares sold | 156,937 | 3,034,781 | ||||||
| Shares reinvested | 271,242 | 57,599 | ||||||
| Shares redeemed | (237,531 | ) | (73,895 | ) | ||||
| Net increase in shares outstanding | 190,648 | 3,018,485 | ||||||
| Shares outstanding at beginning of year | 10,133,585 | 7,115,100 | ||||||
| Shares outstanding at end of year | 10,324,233 | 10,133,585 | ||||||
| See accompanying notes to financial statements. |
27
| RYAN LABS LONG CREDIT FUND STATEMENTS OF CHANGES IN NET ASSETS | ||||||||
| Year Ended November 30, 2017 | Year Ended November 30, 2016 | |||||||
| FROM OPERATIONS | ||||||||
| Net investment income | $ | 2,631,004 | $ | 2,061,255 | ||||
| Net realized gains from investment transactions | 1,525,529 | 2,268,602 | ||||||
| Net change in unrealized appreciation (depreciation) on investments | 2,812,756 | (740,354 | ) | |||||
| Net increase in net assets from operations | 6,969,289 | 3,589,503 | ||||||
| DISTRIBUTIONS TO SHAREHOLDERS (Note 2) | ||||||||
| From net investment income | (2,625,023 | ) | (2,057,734 | ) | ||||
| From net realized gains from investment transactions | (2,448,497 | ) | (177,021 | ) | ||||
| Decrease in net assets from distributions to shareholders | (5,073,520 | ) | (2,234,755 | ) | ||||
| CAPITAL SHARE TRANSACTIONS | ||||||||
| Proceeds from shares sold | 35,580,366 | 1,827,921 | ||||||
| Net asset value of shares issued in reinvestment of distributions to shareholders | 3,139,783 | 179,154 | ||||||
| Payments for shares redeemed | (370,500 | ) | (42 | ) | ||||
| Net increase from capital share transactions | 38,349,649 | 2,007,033 | ||||||
| TOTAL INCREASE IN NET ASSETS | 40,245,418 | 3,361,781 | ||||||
| NET ASSETS | ||||||||
| Beginning of year | 53,640,071 | 50,278,290 | ||||||
| End of year | $ | 93,885,489 | $ | 53,640,071 | ||||
| UNDISTRIBUTED NET INVESTMENT INCOME | $ | 9,746 | $ | 3,725 | ||||
| CAPITAL SHARE ACTIVITY | ||||||||
| Shares sold | 3,401,270 | 175,424 | ||||||
| Shares reinvested | 310,760 | 18,180 | ||||||
| Shares redeemed | (35,769 | ) | (4 | ) | ||||
| Net increase in shares outstanding | 3,676,261 | 193,600 | ||||||
| Shares outstanding at beginning of year | 5,193,650 | 5,000,050 | ||||||
| Shares outstanding at end of year | 8,869,911 | 5,193,650 | ||||||
| See accompanying notes to financial statements. |
28
| RYAN LABS CORE BOND FUND FINANCIAL HIGHLIGHTS | ||||||||||||
| Per Share Data for a Share Outstanding Throughout Each Period | ||||||||||||
| Year Ended November 30, 2017 | Year Ended November 30, 2016 | Period Ended November 30, 2015 (a) | ||||||||||
| Net asset value at beginning of period | $ | 9.89 | $ | 9.87 | $ | 10.00 | ||||||
| Income (loss) from investment operations: | ||||||||||||
| Net investment income | 0.25 | 0.23 | 0.21 | |||||||||
| Net realized and unrealized gains (losses) on investments | 0.12 | 0.04 | (0.13 | ) | ||||||||
| Total from investment operations | 0.37 | 0.27 | 0.08 | |||||||||
| Less distributions from: | ||||||||||||
| Net investment income | (0.26 | ) | (0.24 | ) | (0.21 | ) | ||||||
| Net realized gains from investment transactions | (0.13 | ) | (0.01 | ) | — | |||||||
| Total distributions | (0.39 | ) | (0.25 | ) | (0.21 | ) | ||||||
| Net asset value at end of period | $ | 9.87 | $ | 9.89 | $ | 9.87 | ||||||
| Total return (b) | 3.84 | % | 2.69 | % | 0.81 | %(c) | ||||||
| Net assets at end of period (000’s) | $ | 101,911 | $ | 100,236 | $ | 70,257 | ||||||
| Ratios/supplementary data: | ||||||||||||
| Ratio of total expenses to average net assets | 0.70 | % | 0.75 | % | 1.18 | %(d) | ||||||
| Ratio of net expenses to average net assets (e) | 0.40 | % | 0.40 | % | 0.40 | %(d) | ||||||
| Ratio of net investment income to average net assets (e) | 2.54 | % | 2.29 | % | 2.21 | %(d) | ||||||
| Portfolio turnover rate | 103 | % | 118 | % | 161 | %(c) | ||||||
| (a) | Represents the period from the commencement of operations (December 29, 2014) through November 30, 2015. |
| (b) | Total return is a measure of the change in value of an investment in the Fund over the periods covered, which assumes any dividends or capital gains distributions are reinvested in shares of the Fund. The returns shown do not reflect the deduction of taxes a shareholder would pay on Fund distributions or the redemption of Fund shares. The total returns would have been lower if the Adviser had not reduced advisory fees and/or reimbursed expenses (Note 4). |
| (c) | Not annualized. |
| (d) | Annualized. |
| (e) | Ratio was determined after investment advisory fee reductions and/or expense reimbursements. (Note 4). |
See accompanying notes to financial statements.
29
| RYAN LABS LONG CREDIT FUND FINANCIAL HIGHLIGHTS | ||||||||||||
| Per Share Data for a Share Outstanding Throughout Each Period | ||||||||||||
| Year Ended November 30, 2017 | Year Ended November 30, 2016 | Period Ended November 30, 2015 (a) | ||||||||||
| Net asset value at beginning of period | $ | 10.33 | $ | 10.06 | $ | 10.00 | ||||||
| Income from investment operations: | ||||||||||||
| Net investment income | 0.37 | 0.41 | 0.01 | |||||||||
| Net realized and unrealized gains on investments | 0.64 | 0.30 | 0.06 | |||||||||
| Total from investment operations | 1.01 | 0.71 | 0.07 | |||||||||
| Less distributions from: | ||||||||||||
| Net investment income | (0.37 | ) | (0.41 | ) | (0.01 | ) | ||||||
| Net realized gains from investment transactions | (0.39 | ) | (0.03 | ) | — | |||||||
| Total distributions | (0.76 | ) | (0.44 | ) | (0.01 | ) | ||||||
| Net asset value at end of period | $ | 10.58 | $ | 10.33 | $ | 10.06 | ||||||
| Total return (b) | 10.27 | % | 7.11 | % | 0.71 | %(c) | ||||||
| Net assets at end of period (000’s) | $ | 93,885 | $ | 53,640 | $ | 50,278 | ||||||
| Ratios/supplementary data: | ||||||||||||
| Ratio of total expenses to average net assets | 0.84 | % | 0.84 | % | 1.12 | %(d) | ||||||
| Ratio of net expenses to average net assets (e) | 0.50 | % | 0.50 | % | 0.50 | %(d) | ||||||
| Ratio of net investment income to average net assets (e) | 3.66 | % | 3.87 | % | 2.38 | %(d) | ||||||
| Portfolio turnover rate | 191 | % | 156 | % | 93 | %(c) | ||||||
| (a) | Represents the period from the commencement of operations (November 13, 2015) through November 30, 2015. |
| (b) | Total return is a measure of the change in value of an investment in the Fund over the periods covered, which assumes any dividends or capital gains distributions are reinvested in shares of the Fund. The returns shown do not reflect the deduction of taxes a shareholder would pay on Fund distributions or the redemption of Fund shares. The total returns would have been lower if the Adviser had not reduced advisory fees and/or reimbursed expenses (Note 4). |
| (c) | Not annualized. |
| (d) | Annualized. |
| (e) | Ratio was determined after investment advisory fee reductions and/or expense reimbursements. (Note 4). |
See accompanying notes to financial statements.
30
RYAN LABS FUNDS
NOTES TO FINANCIAL STATEMENTS
November 30, 2017
1. Organization
Ryan Labs Core Bond Fund and Ryan Labs Long Credit Fund (individually, a “Fund,” and collectively, the “Funds”) are each a diversified series of Ultimus Managers Trust (the “Trust”), an open-end investment company established as an Ohio business trust under a Declaration of Trust dated February 28, 2012. Other series of the Trust are not incorporated in this report. Ryan Labs Core Bond Fund and Ryan Labs Long Credit Fund commenced operations on December 29, 2014 and November 13, 2015, respectively.
Each Fund’s investment objective is to seek total return, consisting of current income and capital appreciation.
2. Significant Accounting Policies
In October 2016, the U.S. Securities and Exchange Commission (the “SEC”) adopted amendments to Regulation S-X, which impact financial statement presentation, particularly the presentation of derivative investments. The Funds have adopted these amendments, which were effective August 1, 2017, with these financial statements.
The following is a summary of the Funds’ significant accounting policies. The policies are in conformity with accounting principals generally accepted in the United States of America (“GAAP”). The Funds follow accounting and reporting guidance under Financial Accounting Standards Board Accounting Standards Codification Topic 946, “Financial Services – Investment Companies.”
Securities valuation – The Funds’ fixed income securities are generally valued using prices provided by an independent pricing service approved by the Trust’s Board of Trustees (the “Board”). The independent pricing service uses information with respect to transactions in bonds, quotations from bond dealers, market transactions in comparable securities, and various relationships between securities in determining these prices. The methods used by the independent pricing service and the quality of valuations so established are reviewed by Ryan Labs, Inc. (the “Adviser”), under the general supervision of the Board. Exchange-traded funds (“ETFs”), if any, are valued at market value as of the close of regular trading on the New York Stock Exchange (the “NYSE”) (normally 4:00 p.m. Eastern time) on each business day the NYSE is open for business. ETFs are valued at the security’s last sale price on the primary exchange, if available, otherwise at the exchange’s most recently quoted mean price. Securities for which market quotations are not readily available are valued at fair value as determined in good faith under procedures adopted by the Board.
GAAP establishes a single authoritative definition of fair value, sets out a framework for measuring fair value, and requires additional disclosures about fair value measurements.
31
RYAN LABS FUNDS
NOTES TO FINANCIAL STATEMENTS (Continued)
Various inputs are used in determining the value of the Funds’ investments. These inputs are summarized in the three broad levels listed below:
| ● | Level 1 – quoted prices in active markets for identical securities |
| ● | Level 2 – other significant observable inputs |
| ● | Level 3 – significant unobservable inputs |
Fixed income securities held by the Funds are classified as Level 2 since values are based on prices provided by an independent pricing service that utilizes various “other significant observable inputs” including bid and ask quotations, prices of similar securities, and interest rates, among other factors.
The inputs or methods used for valuing securities are not necessarily an indication of the risks associated with investing in those securities. The inputs used to measure fair value may fall into different levels of the fair value hierarchy. In such cases, for disclosure purposes, the level in the fair value hierarchy within which the fair value measurement falls in its entirety is determined based on the lowest level input that is significant to the fair value measurement.
The following is a summary of the inputs used to value each Fund’s investments as of November 30, 2017:
| Ryan Labs Core Bond Fund | Level 1 | Level 2 | Level 3 | Total | ||||||||||||
| U.S. Treasury Obligations | $ | — | $ | 25,071,509 | $ | — | $ | 25,071,509 | ||||||||
| Mortgage-Backed Securities | — | 29,009,766 | — | 29,009,766 | ||||||||||||
| Asset-Backed Securities | — | 9,359,616 | — | 9,359,616 | ||||||||||||
| Corporate Bonds | — | 30,086,065 | — | 30,086,065 | ||||||||||||
| International Bonds | — | 105,150 | — | 105,150 | ||||||||||||
| Money Market Funds | 7,924,467 | — | — | 7,924,467 | ||||||||||||
| Total | $ | 7,924,467 | $ | 93,632,106 | $ | — | $ | 101,556,573 | ||||||||
| Ryan Labs Long Credit Fund | Level 1 | Level 2 | Level 3 | Total | ||||||||||||
| U.S. Treasury Obligations | $ | — | $ | 4,045,838 | $ | — | $ | 4,045,838 | ||||||||
| Mortgage-Backed Securities | — | 65,084 | — | 65,084 | ||||||||||||
| Municipal Bonds | — | 761,539 | — | 761,539 | ||||||||||||
| Asset-Backed Securities | — | 17,183 | — | 17,183 | ||||||||||||
| Corporate Bonds | — | 83,758,702 | — | 83,758,702 | ||||||||||||
| International Bonds | — | 3,577,429 | — | 3,577,429 | ||||||||||||
| Money Market Funds | 853,996 | — | — | 853,996 | ||||||||||||
| Total | $ | 853,996 | $ | 92,225,775 | $ | — | $ | 93,079,771 | ||||||||
32
RYAN LABS FUNDS
NOTES TO FINANCIAL STATEMENTS (Continued)
As of November 30, 2017, the Funds did not have any transfers between Levels. In addition, the Funds did not hold derivative instruments or any assets or liabilities that were measured at fair value on a recurring basis using significant unobservable inputs (Level 3) as of November 30, 2017. It is the Funds’ policy to recognize transfers between Levels at the end of the reporting period.
Share valuation – The net asset value (“NAV”) per share of each Fund is calculated daily by dividing the total value of its assets, less liabilities, by the number of shares outstanding. The offering price and redemption price per share of each Fund is equal to the NAV per share.
Investment income – Interest income is accrued as earned. Discounts and premiums on fixed income securities purchased are accreted or amortized using the effective interest method. Dividend income is recorded on the ex-dividend date.
Investment transactions – Investment transactions are accounted for on the trade date. Realized gains and losses on securities sold are determined on a specific identification basis.
Common expenses – Common expenses of the Trust are allocated among the Funds and other series of the Trust based on the relative net assets of each series or the nature of the services performed and the relative applicability to each series.
Distributions to shareholders – Dividends from net investment income are declared and paid monthly to shareholders. Net realized capital gains, if any, are distributed at least once each year. The amount of distributions from net investment income and net realized capital gains are determined in accordance with federal income tax regulations, which may differ from GAAP. Dividends and distributions to shareholders are recorded on the ex-dividend date. The tax character of distributions paid by each Fund during the years ended November 30, 2017 and 2016 was ordinary income. On December 29, 2017, Ryan Labs Core Bond Fund and Ryan Labs Long Credit Fund paid net investment income dividends of $0.0215 and $0.0309 per share, respectively, to shareholders of record on December 28, 2017. Additionally, Ryan Labs Long Credit Fund paid short-term and long-term capital gains per share of $0.0624 and $0.0980, respectively, to shareholders of record on December 28, 2017
Estimates – The preparation of financial statements in conformity with GAAP requires management to make estimates and assumptions that affect the reported amounts of assets and liabilities and disclosure of contingent assets and liabilities as of the date of the financial statements and the reported amounts of income and expenses during the reporting period. Actual results could differ from those estimates.
Federal income tax – Each Fund has qualified and intends to continue to qualify as a regulated investment company under the Internal Revenue Code of 1986, as amended (the “Code”). Qualification generally will relieve each Fund of liability for federal income taxes to the extent 100% of its net investment income and net realized capital gains are distributed in accordance with the Code.
33
RYAN LABS FUNDS
NOTES TO FINANCIAL STATEMENTS (Continued)
In order to avoid imposition of the excise tax applicable to regulated investment companies, it is each Fund’s intention to declare as dividends in each calendar year at least 98% of its net investment income (earned during the calendar year) and 98.2% of its net realized capital gains (earned during the twelve months ended October 31) plus undistributed amounts from prior years.
The following information is computed on a tax basis for each item as of November 30, 2017:
| Ryan Labs Core Bond Fund | Ryan Labs Long Credit Fund | |||||||
| Tax cost of portfolio investments | $ | 101,588,879 | $ | 90,909,244 | ||||
| Gross unrealized appreciation | $ | 602,889 | $ | 2,532,284 | ||||
| Gross unrealized depreciation | (635,195 | ) | (361,757 | ) | ||||
| Net unrealized appreciation (depreciation) on investments | (32,306 | ) | 2,170,527 | |||||
| Undistributed ordinary income | 6,983 | 534,169 | ||||||
| Undistributed long-term capital gains | — | 823,610 | ||||||
| Accumulated capital and other gains (losses) | (229,194 | ) | — | |||||
| Total accumulated earnings (deficit) | $ | (254,517 | ) | $ | 3,528,306 | |||
The difference between the federal income tax cost of portfolio investments and the financial statement cost for each Fund is due to certain timing differences in the recognition of capital gains or losses under income tax regulations and GAAP. These “book/tax” differences are temporary in nature and are primarily due to the tax deferral of losses on wash sales.
As of November 30, 2017, Ryan Labs Core Bond Fund has short-term capital loss carryforwards of $229,194. These capital loss carryforwards, which do not expire, may be utilized in future years to offset net realized capital gains, if any, prior to distributing such gains to shareholders.
For the year ended November 30, 2017, the following reclassifications were made on the Statements of Assets and Liabilities for the Funds as a result of permanent differences in the recognition of capital gains or losses under income tax regulations and GAAP:
| Ryan Labs Core Bond Fund | Ryan Labs Long Credit Fund | |||||||
| Undistributed net investment income | $ | 83,902 | $ | 40 | ||||
| Accumulated net realized gains (losses) from investment transactions | $ | (83,902 | ) | $ | (40 | ) | ||
34
RYAN LABS FUNDS
NOTES TO FINANCIAL STATEMENTS (Continued)
Such reclassifications, the result of permanent differences between financial statement and income tax reporting requirements, have no effect on each Fund’s net assets or NAV per share. These permanent differences are due to the tax treatment of paydown adjustments and differing tax treatments of distributions.
The Funds recognize the tax benefits or expenses of uncertain tax positions only when the position is “more likely than not” to be sustained assuming examination by tax authorities. Management has reviewed each Fund’s tax positions for all open tax periods (periods ended November 30, 2015 through November 30, 2017) and has concluded that no provision for unrecognized tax benefits or expenses is required in these financial statements. The Funds identify their major tax jurisdiction as U.S. Federal.
3. Investment Transactions
During the year ended November 30, 2017, cost of purchases and proceeds from sales and maturities of investment securities, other than U.S. Government securities and short-term investments, were as follows:
| Ryan Labs Core Bond Fund | Ryan Labs Long Credit Fund | |||||||
| Purchase of investment securities | $ | 62,947,767 | $ | 95,784,803 | ||||
| Proceeds from sales and maturities of investment securities | $ | 56,109,891 | $ | 65,655,222 | ||||
During the year ended November 30, 2017, cost of purchases and proceeds from sales and maturities of long-term U.S. Government securities were as follows:
| Ryan Labs Core Bond Fund | Ryan Labs Long Credit Fund | |||||||
| Purchase of U.S. Government securities | $ | 37,274,577 | $ | 63,954,780 | ||||
| Proceeds from sales and maturities of U.S. Government securities | $ | 47,351,032 | $ | 70,177,965 | ||||
4. Transactions with Related Parties
INVESTMENT ADVISORY AGREEMENT
The Adviser is a wholly-owned subsidiary of Sun Life Financial, Inc. Each Fund is managed by the Adviser pursuant to the terms of an Investment Advisory Agreement. Under the Investment Advisory Agreements, Ryan Labs Core Bond Fund and Ryan Labs Long Credit Fund pay the Adviser an advisory fee, computed and accrued daily and paid monthly, at the annual rate of 0.40% and 0.50%, respectively, of average daily net assets.
35
RYAN LABS FUNDS
NOTES TO FINANCIAL STATEMENTS (Continued)
Pursuant to Expense Limitation Agreements (“ELAs”) between each Fund and the Adviser, the Adviser has agreed, until March 31, 2018, to reduce advisory fees and reimburse other expenses in order to limit total annual operating expenses (exclusive of brokerage transaction costs and commissions; taxes; interest; costs related to any securities lending program; transaction charges and interest on borrowed money; acquired fund fees and expenses; distribution and/or shareholder servicing fees, including, without limitation, amounts, if any, payable pursuant to a plan adopted in accordance with Rule 12b-1 under the Investment Company Act of 1940, as amended (the “1940 Act”); extraordinary expenses such as litigation and merger or reorganization costs, proxy solicitation and liquidation costs; indemnification payments to the Funds’ service providers, including, without limitation, the Adviser; other expenses not incurred in the ordinary course of business; and any other expenses the exclusion of which may from time to time be deemed appropriate as an excludable expense and specifically approved by the Board) to an amount not exceeding 0.40% and 0.50% of the average daily net assets of Ryan Labs Core Bond Fund and Ryan Labs Long Credit Fund, respectively. Accordingly, during the year ended November 30, 2017, the Adviser reduced its advisory fees in the amounts of $298,798 and $242,282 for Ryan Labs Core Bond Fund and Ryan Labs Long Credit Fund, respectively.
Under the terms of the ELAs, investment advisory fee reductions and expense reimbursements by the Adviser are subject to recoupment by the Adviser for a period of three years after such fees and expenses were incurred, provided the recoupments do not cause total annual operating expenses to exceed the lesser of (i) the expense limitation then in effect, if any, or (ii) the expense limitation in effect at the time the expenses to be recouped were incurred. As of November 30, 2017, the Adviser may seek recoupment of investment advisory fee reductions and expense reimbursements no later than the dates as stated below:
| November 30, 2018 | November 30, 2019 | November 30, 2020 | Total | |||||||||||||
| Ryan Labs Core Bond Fund | $ | 151,891 | $ | 250,634 | $ | 298,798 | $ | 701,323 | ||||||||
| Ryan Labs Long Credit Fund | $ | 14,580 | $ | 181,499 | $ | 242,282 | $ | 438,361 | ||||||||
OTHER SERVICE PROVIDERS
Ultimus Fund Solutions, LLC (“Ultimus”) provides administration, fund accounting, compliance and transfer agency services to the Funds. The Funds pay Ultimus fees in accordance with the agreements for such services. In addition, the Funds pay out-of-pocket expenses including, but not limited to, postage, supplies and costs of pricing the Funds’ portfolio securities.
36
RYAN LABS FUNDS
NOTES TO FINANCIAL STATEMENTS (Continued)
Under the terms of a Distribution Agreement with the Trust, Ultimus Fund Distributors, LLC (the “Distributor”) serves as principal underwriter to the Funds. The Distributor is a wholly-owned subsidiary of Ultimus. The Distributor is compensated by the Adviser (not the Funds) for acting as principal underwriter.
Certain officers and a Trustee of the Trust are also officers of Ultimus and the Distributor and are not paid by the Funds for serving in such capacities.
TRUSTEE COMPENSATION
Each Trustee who is not an “interested person” of the Trust (“Independent Trustee”) receives a $1,000 annual retainer from each Fund, paid quarterly, except for the Board Chair who receives a $1,200 annual retainer from each Fund, paid quarterly. Each Independent Trustee also receives from each Fund a fee of $500 for each Board meeting attended plus reimbursement for travel and other meeting-related expenses.
PRINCIPAL HOLDERS OF FUND SHARES
As of November 30, 2017, the following shareholders owned of record 5% or more of the outstanding shares of each Fund:
| NAME OF RECORD OWNER | % Ownership |
| Ryan Labs Core Bond Fund | |
| Citibank, N.A. (for the benefit of its customers) | 50% |
| SEI Private Trust Company (for the benefit of its customers) | 18% |
| U.S. Bank, N.A. (for the benefit of its customers) | 18% |
| National Financial Services, LLC (for the benefit of its customers) | 10% |
| Ryan Labs Long Credit Fund | |
| Citibank, N.A. (for the benefit of its customers) | 59% |
| Charles Schwab & Company (for the benefit of its customers) | 20% |
| Wells Fargo Bank, N.A. (for the benefit of its customers) | 15% |
A beneficial owner of 25% or more of a Fund’s outstanding shares may be considered a controlling person of that Fund. That shareholder’s vote could have a more significant effect on matters presented at a shareholder’s meeting.
5. Risks Associated with Mortgage-Backed Securities
The Funds’ investments in mortgage-backed securities are subject to prepayment risk, especially when interest rates decline. Prepayment risk is the risk that the principal on mortgage-backed securities, other asset-backed securities or any fixed-income security with an embedded call option may be prepaid at any time, which could reduce yield and market value. This could reduce the effective maturity of a mortgage-backed security and cause the Funds to reinvest their assets at a lower prevailing interest rate. Mortgage-backed securities are also subject to extension risk, which is the risk that rising interest rates will increase the
37
RYAN LABS FUNDS
NOTES TO FINANCIAL STATEMENTS (Continued)
effective maturity of mortgage-backed securities due to the deceleration of prepayments. Mortgage-backed securities may also be subject to risks unique to the housing industry, including mortgage lending practices, defaults, foreclosures and changes in real estate values. The Funds’ investments in collateralized mortgage obligations are subject to default risk, prepayment and extension risk and market risk when interest rates rise. As of November 30, 2017, Ryan Labs Core Bond Fund had 28.5% of the value of its net assets invested in mortgage-backed securities.
6. Contingencies and Commitments
The Funds indemnify the Trust’s officers and Trustees for certain liabilities that might arise from their performance of their duties to the Funds. Additionally, in the normal course of business the Funds enter into contracts that contain a variety of representations and warranties and which provide general indemnifications. The Funds’ maximum exposure under these arrangements is unknown, as this would involve future claims that may be made against the Funds that have not yet occurred. However, based on experience, the Funds expect the risk of loss to be remote.
7. Subsequent Events
The Funds are required to recognize in the financial statements the effects of all subsequent events that provide additional evidence about conditions that existed as of the date of the Statements of Assets and Liabilities. For non-recognized subsequent events that must be disclosed to keep the financial statements from being misleading, the Funds are required to disclose the nature of the event as well as an estimate of its financial effect, or a statement that such an estimate cannot be made. Management has evaluated subsequent events through the issuance of these financial statements and has noted no such events other than the payment of net investment income dividends and capital gain distributions on December 29, 2017, as discussed in Note 2.
38
RYAN LABS FUNDS
REPORT OF INDEPENDENT REGISTERED
PUBLIC ACCOUNTING FIRM
To the Board of Trustees of Ultimus Managers Trust
and the Shareholders of Ryan Labs Core Bond Fund and Ryan Labs Long Credit Fund
We have audited the accompanying statements of assets and liabilities of Ryan Labs Core Bond Fund and Ryan Labs Long Credit Fund, each a series of shares of beneficial interest in Ultimus Managers Trust (the “Funds”), including the schedules of investments, as of November 30, 2017, and the related statements of operations for the year then ended, the statements of changes in net assets for each of the years in the two-year period then ended and the financial highlights for each of the years or periods presented. These financial statements and financial highlights are the responsibility of the Funds' management. Our responsibility is to express an opinion on these financial statements and financial highlights based on our audits.
We conducted our audits in accordance with the standards of the Public Company Accounting Oversight Board (United States). Those standards require that we plan and perform the audits to obtain reasonable assurance about whether the financial statements and financial highlights are free of material misstatement. An audit includes examining, on a test basis, evidence supporting the amounts and disclosures in the financial statements. Our procedures included confirmation of securities owned as of November 30, 2017 by correspondence with the custodian and brokers, or by other appropriate auditing procedures where replies from brokers were not received. An audit also includes assessing the accounting principles used and significant estimates made by management, as well as evaluating the overall financial statement presentation. We believe that our audits provide a reasonable basis for our opinion.
In our opinion, the financial statements and financial highlights referred to above present fairly, in all material respects, the financial position of Ryan Labs Core Bond Fund and Ryan Labs Long Credit Fund as of November 30, 2017, and the results of their operations for the year then ended, the changes in their net assets for each of the years in the two-year period then ended and their financial highlights for each of the years or periods presented, in conformity with accounting principles generally accepted in the United States of America.
BBD, LLP |

Philadelphia, Pennsylvania
January 25, 2018
39
RYAN LABS FUNDS
ABOUT YOUR FUNDS’ EXPENSES (Unaudited)
We believe it is important for you to understand the impact of costs on your investment. As a shareholder of the Funds, you incur ongoing costs, including management fees and other operating expenses. The following examples are intended to help you understand your ongoing costs (in dollars) of investing in the Funds and to compare these costs with the ongoing costs of investing in other mutual funds.
A mutual fund’s ongoing costs are expressed as a percentage of its average net assets. This figure is known as the expense ratio. The expenses in the table below are based on an investment of $1,000 made at the beginning of the most recent period (June 1, 2017) and held until the end of the period (November 30, 2017).
The table below illustrates each Fund’s ongoing costs in two ways:
Actual fund return – This section helps you to estimate the actual expenses that you paid over the period. The “Ending Account Value” shown is derived from each Fund’s actual return, and the fourth column shows the dollar amount of operating expenses that would have been paid by an investor who started with $1,000 in the Funds. You may use the information here, together with the amount you invested, to estimate the expenses that you paid over the period.
To do so, simply divide your account value by $1,000 (for example, an $8,600 account value divided by $1,000 = 8.6), then multiply the result by the number given for each Fund under the heading “Expenses Paid During Period.”
Hypothetical 5% return – This section is intended to help you compare each Fund’s ongoing costs with those of other mutual funds. It assumes that each Fund had an annual return of 5% before expenses during the period shown, but that the expense ratio is unchanged. In this case, because the return used is not each Fund’s actual return, the results do not apply to your investment. The example is useful in making comparisons because the SEC requires all mutual funds to calculate expenses based on a 5% return. You can assess each Fund’s ongoing costs by comparing this hypothetical example with the hypothetical examples that appear in shareholder reports of other funds.
Note that expenses shown in the table are meant to highlight and help you compare ongoing costs only. The Funds do not charge transaction fees, such as purchase or redemption fees, nor do they carry a “sales load.”
The calculations assume no shares were bought or sold during the period. Your actual costs may have been higher or lower, depending on the amount of your investment and the timing of any purchases or redemptions.
40
RYAN LABS FUNDS
ABOUT YOUR FUNDS’ EXPENSES (Unaudited) (Continued)
More information about each Fund’s expenses can be found in this report. For additional information on operating expenses and other shareholder costs, please refer to each Fund’s prospectus.
| Beginning Account Value June 1, 2017 | Ending Account Value November 30, 2017 | Net Expense Ratio (a) | Expenses Paid During Period (b) | |
| Ryan Labs Core Bond Fund | ||||
| Based on Actual Fund Return | $1,000.00 | $1,011.50 | 0.40% | $2.02 |
| Based on Hypothetical 5% Return (before expenses) | $1,000.00 | $1,023.06 | 0.40% | $2.03 |
| Ryan Labs Long Credit Fund | ||||
| Based on Actual Fund Return | $1,000.00 | $1,036.10 | 0.50% | $2.55 |
| Based on Hypothetical 5% Return (before expenses) | $1,000.00 | $1,022.56 | 0.50% | $2.54 |
| (a) | Annualized, based on each Fund’s most recent one-half year expenses. |
| (b) | Expenses are equal to each Fund’s annualized net expense ratio multiplied by the average account value over the period, multiplied by 183/365 (to reflect the one-half year period). |
41
RYAN LABS FUNDS
OTHER INFORMATION (Unaudited)
A description of the policies and procedures that the Funds use to vote proxies relating to portfolio securities is available without charge upon request by calling toll-free 1-866-561-3087, or on the SEC’s website at http://www.sec.gov. Information regarding how the Funds voted proxies relating to portfolio securities during the most recent 12-month period ended June 30 is available without charge upon request by calling toll-free 1-866-561-3087, or on the SEC’s website at http://www.sec.gov.
The Trust files a complete listing of portfolio holdings for the Funds with the SEC as of the end of the first and third quarters of each fiscal year on Form N-Q. These filings are available upon request by calling 1-866-561-3087. Furthermore, you may obtain a copy of the filings on the SEC’s website at http://www.sec.gov. The Trust’s Forms N-Q may also be reviewed and copied at the SEC’s Public Reference Room in Washington, DC, and information on the operation of the Public Reference Room may be obtained by calling 1-800-SEC-0330.
42
RYAN LABS FUNDS
BOARD OF TRUSTEES AND EXECUTIVE OFFICERS (Unaudited)
The Board has overall responsibility for management of the Trust’s affairs. The Trustees serve during the lifetime of the Trust and until its termination, or until death, resignation, retirement, or removal. The Trustees, in turn, elect the officers of the Fund to actively supervise its day-to-day operations. The officers have been elected for an annual term. Unless otherwise noted, each Trustee’s and officer’s address is 225 Pictoria Drive, Suite 450, Cincinnati, Ohio 45246.
| Name and Year of Birth | Length of Time Served | Position(s) Held with Trust | Principal Occupation(s) During Past 5 Years | Number of Funds in Trust Overseen by Trustee | Directorships of Public Companies Held by Trustee During Past 5 Years |
| Interested Trustees: | |||||
Robert G. Dorsey* Year of Birth: 1957 | Since February 2012 | Trustee (February 2012 to present)
President (June 2012 to October 2013) | Chief Executive Officer and Managing Director of Ultimus Fund Solutions, LLC and Ultimus Fund Distributors, LLC (1999 to present) | 27 | None |
| Independent Trustees: | |||||
Janine L. Cohen Year of Birth: 1952 | Since January 2016 | Trustee | Retired since 2013; Chief Financial Officer from 2004 to 2013 and Chief Compliance Officer from 2008 to 2013 at AER Advisors, Inc. | 27 | None |
David M. Deptula Year of Birth: 1958 | Since June 2012 | Trustee | Vice President of Legal and Special Projects at Dayton Freight Lines, Inc. since 2016; Vice President of Tax Treasury at Standard Register Inc. (formerly The Standard Register Company) from 2011 to 2016 | 27 | None |
| * | Mr. Dorsey is considered an “interested person” of the Trust within the meaning of Section 2(a)(19) of the 1940 Act, as amended, because of his relationship with the Trust’s administrator, transfer agent and distributor. |
43
RYAN LABS FUNDS
BOARD OF TRUSTEES AND EXECUTIVE OFFICERS (Unaudited) (Continued)
| Name and Year of Birth | Length of Time Served | Position(s) Held with Trust | Principal Occupation(s) During Past 5 Years | Number of Funds in Trust Overseen by Trustee | Directorships of Public Companies Held by Trustee During Past 5 Years |
| Independent Trustees (continued): | |||||
John J. Discepoli Year of Birth: 1963 | Since June 2012 | Chairman (May 2016 to present)
Trustee (June 2012 to present) | Owner of Discepoli Financial Planning, LLC (personal financial planning company) since 2004 | 27 | None |
| Name and Year of Birth | Length of Time Served | Position(s) Held with Trust | Principal Occupation(s) During Past 5 Years |
| Executive Officers: | |||
David R. Carson Year of Birth: 1958 | Since April 2013 | Principal Executive Officer (October 2014 to present)
President (October 2013 to present)
Vice President (April 2013 to October 2013) | Vice President and Director of Client Strategies of Ultimus Fund Solutions, LLC (2013 to present); President, Unified Series Trust (2016 to present); Chief Compliance Officer, FSI LBAR Fund (2013 to 2016); The Huntington Funds (2005 to 2013), Huntington Strategy Shares (2012 to 2013), and Huntington Asset Advisors (2013); Vice President, Huntington National Bank (2001 to 2013) |
Jennifer L. Leamer Year of Birth: 1976 | Since April 2014 | Treasurer (October 2014 to present)
Assistant Treasurer (April 2014 to October 2014) | Vice President, Mutual Fund Controller of Ultimus Fund Solutions, LLC (2014 to present); Business Analyst of Ultimus Fund Solutions, LLC (2007 to 2014) |
44
RYAN LABS FUNDS
BOARD OF TRUSTEES AND EXECUTIVE OFFICERS (Unaudited) (Continued)
| Name and Year of Birth | Length of Time Served | Position(s) Held with Trust | Principal Occupation(s) During Past 5 Years |
Frank L. Newbauer Year of Birth: 1954 | Since February 2012 | Secretary (July 2017 to present)
Assistant Secretary (April 2015 to
Secretary (February 2012 to April 2015) | Assistant Vice President of Ultimus Fund Solutions, LLC (2010 to present) |
Charles C. Black Year of Birth: 1979 | Since April 2015 | Chief Compliance Officer (January 2016 to present)
Assistant Chief Compliance Officer (April 2015 to January 2016) | Chief Compliance Officer of The Caldwell & Orkin Funds, Inc. (2016 to present); Senior Compliance Officer of Ultimus Fund Solutions, LLC (2015 to present); Senior Compliance Manager for Touchstone Mutual Funds (2013 to 2015); Senior Compliance Manager for Fund Evaluation Group (2011 to 2013) |
Additional information about members of the Board and executive officers is available in the Funds’ Statement of Additional Information (“SAI”). To obtain a free copy of the SAI, please call 1-866-561-3087.
45
Item 2. Code of Ethics.
As of the end of the period covered by this report, the registrant has adopted a code of ethics that applies to the registrant’s principal executive officer, principal financial officer, principal accounting officer or controller, or persons performing similar functions, regardless of whether these individuals are employed by the registrant or a third party. Pursuant to Item 12(a)(1), a copy of registrant’s code of ethics is filed as an exhibit to this Form N-CSR. During the period covered by this report, the code of ethics has not been amended, and the registrant has not granted any waivers, including implicit waivers, from the provisions of the code of ethics.
Item 3. Audit Committee Financial Expert.
The registrant’s board of trustees has determined that the registrant has at least one audit committee financial expert serving on its audit committee. The names of the audit committee financial expert is David M. Deptula. Mr. Deptula is “independent” for purposes of this Item.
Item 4. Principal Accountant Fees and Services.
| (a) | Audit Fees. The aggregate fees billed for professional services rendered by the principal accountant for the audit of the registrant’s annual financial statements or for services that are normally provided by the accountant in connection with statutory and regulatory filings or engagements were $56,400 and $55,000 with respect to the registrant’s fiscal years ended November 30, 2017 and November 30, 2016, respectively. |
| (b) | Audit-Related Fees. No fees were billed in the last fiscal year for assurance and related services by the principal accountant that are reasonably related to the performance of the audit of the registrant’s financial statements and are not reported under paragraph (a) of this Item. |
| (c) | Tax Fees. The aggregate fees billed for professional services rendered by the principal accountant for tax compliance, tax advice, and tax planning were $8,000 and $8,000 with respect to the registrant’s fiscal years ended November 30, 2017 and November 30, 2016, respectively. The services comprising these fees are the preparation of the registrant’s federal income and excise tax returns. |
| (d) | All Other Fees. No fees were billed in the last fiscal year for products and services provided by the principal accountant, other than the services reported in paragraphs (a) through (c) of this Item. |
| (e)(1) | The audit committee has not adopted pre-approval policies and procedures described in paragraph (c)(7) of Rule 2-01 of Regulation S-X. |
| (e)(2) | None of the services described in paragraph (b) through (d) of this Item were approved by the audit committee pursuant to paragraph (c)(7)(i)(C) of Rule 2-01 of Regulation S-X. |
| (f) | Less than 50% of hours expended on the principal accountant’s engagement to audit the registrant’s financial statements for the most recent fiscal year were attributed to work performed by persons other than the principal accountant’s full-time, permanent employees. |
| (g) | During the fiscal years ended November 30, 2017 and 2016, aggregate non-audit fees of $8,000 and $8,000, respectively, were billed by the registrant’s principal accountant for services rendered to the registrant. No non-audit fees were billed in the last fiscal year by the registrant’s principal accountant for services rendered to the registrant’s investment adviser (not including any sub-adviser whose role is primarily portfolio management and is subcontracted with or overseen by another investment adviser), and any entity controlling, controlled by, or under common control with the adviser that provides ongoing services to the registrant. |
| (h) | The principal accountant has not provided any non-audit services to the registrant’s investment adviser (not including any sub-adviser whose role is primarily portfolio management and is subcontracted with or overseen by another investment adviser), and any entity controlling, controlled by, or under common control with the investment adviser that provides ongoing services to the registrant. |
Item 5. Audit Committee of Listed Registrants.
Not applicable
Item 6. Schedule of Investments.
| (a) | Not applicable [schedule filed with Item 1] |
| (b) | Not applicable |
Item 7. Disclosure of Proxy Voting Policies and Procedures for Closed-End Management Investment Companies.
Not applicable
Item 8. Portfolio Managers of Closed-End Management Investment Companies.
Not applicable
Item 9. Purchases of Equity Securities by Closed-End Management Investment Company and Affiliated Purchasers.
Not applicable
Item 10. Submission of Matters to a Vote of Security Holders.
The registrant’s Committee of Independent Trustees shall review shareholder recommendations for nominations to fill vacancies on the registrant’s board of trustees if such recommendations are submitted in writing and addressed to the Committee at the registrant’s offices. The Committee may adopt, by resolution, a policy regarding its procedures for considering candidates for the board of trustees, including any recommended by shareholders.
Item 11. Controls and Procedures.
(a) Based on their evaluation of the registrant’s disclosure controls and procedures (as defined in Rule 30a-3(c) under the Investment Company Act of 1940) as of a date within 90 days of the filing date of this report, the registrant’s principal executive officer and principal financial officer have concluded that such disclosure controls and procedures are reasonably designed and are operating effectively to ensure that material information relating to the registrant, including its consolidated subsidiaries, is made known to them by others within those entities, particularly during the period in which this report is being prepared, and that the information required in filings on Form N-CSR is recorded, processed, summarized, and reported on a timely basis.
(b) There were no changes in the registrant’s internal control over financial reporting (as defined in Rule 30a-3(d) under the Investment Company Act of 1940) that occurred during the second fiscal quarter of the period covered by this report that have materially affected, or are reasonably likely to materially affect, the registrant’s internal control over financial reporting.
Item 12. Disclosure of Securities Lending Activities for Closed-End Management Investment Companies.
Not applicable
Item 13. Exhibits.
File the exhibits listed below as part of this Form. Letter or number the exhibits in the sequence indicated.
(a)(1) Any code of ethics, or amendment thereto, that is the subject of the disclosure required by Item 2, to the extent that the registrant intends to satisfy the Item 2 requirements through filing of an exhibit: Attached hereto
(a)(2) A separate certification for each principal executive officer and principal financial officer of the registrant as required by Rule 30a-2(a) under the Act (17 CFR 270.30a-2(a)): Attached hereto
(a)(3) Any written solicitation to purchase securities under Rule 23c-1 under the Act (17 CFR 270.23c-1) sent or given during the period covered by the report by or on behalf of the registrant to 10 or more persons: Not applicable
(b) Certifications required by Rule 30a-2(b) under the Act (17 CFR 270.30a-2(b)): Attached hereto
| Exhibit 99.CODE ETH | Code of Ethics |
| Exhibit 99.CERT | Certifications required by Rule 30a-2(a) under the Act |
| Exhibit 99.906CERT | Certifications required by Rule 30a-2(b) under the Act |
SIGNATURES
Pursuant to the requirements of the Securities Exchange Act of 1934 and the Investment Company Act of 1940, the registrant has duly caused this report to be signed on its behalf by the undersigned, thereunto duly authorized.
| (Registrant) | Ultimus Managers Trust | ||
| By (Signature and Title)* | /s/ Frank L. Newbauer | ||
| Frank L. Newbauer, Secretary | |||
| Date | February 2, 2018 | ||
Pursuant to the requirements of the Securities Exchange Act of 1934 and the Investment Company Act of 1940, this report has been signed below by the following persons on behalf of the registrant and in the capacities and on the dates indicated.
| By (Signature and Title)* | /s/ David R. Carson | ||
| David R. Carson, Principal Executive Officer of Lyrical U.S. Hedged Value Fund, Lyrical U.S. Value Equity Fund, Ryan Labs Core Bond Fund and Ryan Labs Long Credit Fund | |||
| Date | February 2, 2018 | ||
| By (Signature and Title)* | /s/ Jennifer L. Leamer | ||
| Jennifer L. Leamer, Treasurer and Principal Financial Officer | |||
| Date | February 2, 2018 | ||
| * | Print the name and title of each signing officer under his or her signature. |