| OMB APPROVAL |
OMB Number: 3235-0570
Expires: August 31, 2020
Estimated average burden hours per response: 20.6 |
UNITED STATES
SECURITIES AND EXCHANGE COMMISSION
Washington, D.C. 20549
FORM N-CSR
CERTIFIED SHAREHOLDER REPORT OF REGISTERED
MANAGEMENT INVESTMENT COMPANY
| Investment Company Act file number | 811-22680 |
| Ultimus Managers Trust |
| (Exact name of registrant as specified in charter) |
| 225 Pictoria Drive, Suite 450 Cincinnati, Ohio | 45246 |
| (Address of principal executive offices) | (Zip code) |
Matthew J. Beck, Esq.
| Ultimus Fund Solutions, LLC 225 Pictoria Drive, Suite 450 Cincinnati, Ohio 45246 |
| (Name and address of agent for service) |
| Registrant's telephone number, including area code: | (513) 587-3400 |
| Date of fiscal year end: | July 31 | |
| Date of reporting period: | July 31, 2018 |
Form N-CSR is to be used by management investment companies to file reports with the Commission not later than 10 days after the transmission to stockholders of any report that is required to be transmitted to stockholders under Rule 30e-1 under the Investment Company Act of 1940 (17 CFR 270.30e-1). The Commission may use the information provided on Form N-CSR in its regulatory, disclosure review, inspection, and policymaking roles.
A registrant is required to disclose the information specified by Form N-CSR, and the Commission will make this information public. A registrant is not required to respond to the collection of information contained in Form N-CSR unless the Form displays a currently valid Office of Management and Budget ("OMB") control number. Please direct comments concerning the accuracy of the information collection burden estimate and any suggestions for reducing the burden to Secretary, Securities and Exchange Commission, 450 Fifth Street, NW, Washington, DC 20549-0609. The OMB has reviewed this collection of information under the clearance requirements of 44 U.S.C. § 3507.
| Item 1. | Reports to Stockholders. |
KEMPNER MULTI-CAP DEEP VALUE FUND
Institutional Class (FIKDX)
Investor Class (FAKDX)
Annual Report
July 31, 2018
KEMPNER MULTI-CAP DEEP VALUE FUND | |
LETTER TO SHAREHOLDERS | September 13, 2018 |
Fund Objective
The Kempner Multi-Cap Deep Value Fund seeks to generate a total pre-tax return, including capital growth and dividends, greater than the rate of inflation over a minimum three to five-year period. For the fiscal year ended July 31, 2018 the Fund produced a total return of 11.79% (Institutional Class Shares) and 11.55% (Investor Class Shares), both net of fees. For the trailing three fiscal years ended July 31, 2018, the Fund produced a total return of 8.21% annualized (Institutional Class Shares) and 8.00% annualized (Investor Class Shares), both net of fees. The Headline CPI inflation rates over the periods were 2.89% for one year and 1.83% for three years compounded. Comparatively, over the same time periods the Lipper Multi-Cap Value Funds Classification Index returned 8.88% for one year and 8.22% for three years annualized; and the S&P 500 Value Index returned 10.43% for one year and 10.13% for three years annualized.
U.S. Economic Commentary
Rarely in our experiences have we seen such collision potential currently between a very strong U.S. economy and major pitfalls that await it. We still think the core strength at present, as has been indicated by a strong 2nd quarter of over 4% growth, could be enough to push the economy to 2.75% - 3% growth for all of 2018. However there are clear cut, potential obstacles to growth growing in the economic path – obstacles which could make the growth projection optimistic.
The base concerns are the problems presented by the developing trade war with China, Europe, Mexico, Canada, etc. The administration’s main tactic is tariffs – applied or threatened in each of the above cases. These have already begun to have a negative effect. Where applied in the U.S., they have caused overnight price increases. One example is washing machines, which increased by 10% overnight as specific tariffs were applied. We have also seen surges in lumber and steel prices. If the Administration takes the next major step and proceeds with the present threats of over $200 billion in tariffs to China alone, much less those threatened against other countries, the estimates are that a huge range of consumer products will have instant price increases just as the previous example of the washing machine. Think TVs, telephones, foods, etc. This will increase inflation pressure on the Federal Reserve to raise rates, and negatively impact consumer spending on goods and services.
Above all, this effect on the American consumer is the key to economic prospects. Consumer activity is 70% of all U.S. economic activity – twice as much as business and government spending combined. However, wages for the great majority are growing slowly. We believe that if the tariffs on large numbers of goods and services, and their cost impacts take place during this year, consumer spending will rapidly stagnate and thus the economy will as well.
Further there has been rapid increase in business uncertainty due to potential tariffs. Already there have been well publicized pull-backs in business investment plans, and threats by businesses such as Harley-Davidson and General Motors to move production elsewhere to avoid tariffs, all of which is obviously economically negative for the U.S. economic growth. This will be a much larger factor if tariffs become widespread.
1
And all of this is compounded by the fact that the Administration’s goals are so unclear. There’s no way at present of knowing when they’ll declare a success, and therefore for business and consumers to be able to plan for any end to the trade war process. Confusion creates uncertainty, which can create economic pull-back.
So the present strong growth of the U.S. economy in jobs, investments, and consumer and business confidence may well be vulnerable to shocks caused by the Administration’s trade policy as the year progresses. Shocks that can cause higher prices overnight, reductions in investments by corporations, and stress on consumers spending. Still, the economy is presently strong enough to make us believe that we could have a 2.75% - 3% economic growth in 2018, even if the tariffs are expanded later in the year. The view into 2019 however, will be based substantially on whether the monkey wrench is actually thrown into the washing machinery. This looming problem of tariffs has led us to a cautious buying approach this year, a result of which is that cash as a buying reserve has built to a larger level than usual in our portfolio.
Portfolio Strategy
Our investment approach continues to be one of investing in deeply undervalued companies and selling when the underlying value becomes realized by other market participants and reflected in the current price. The past several years of rising markets has therefore resulted in a greater number of sale opportunities than purchase opportunities. Cash is always considered a buying reserve.
Over the past year we established positions in Allergan PLC (AGN), Acuity Brands Inc. (AYI), Axis Capital Holdings, Ltd. (AXS), Cardinal Health, Inc. (CAH), Disney (Walt) Company (DIS), General Electric (GE), General Mills, Inc. (GIS), McKesson Corporation (MCK) and Walgreens Boots Alliance (WBA). During the same time frame, we added to our positions in Johnson Controls International PLC (JCI), Merck & Company, Inc. (MRK), Roche Holdings Ltd, ADR (RHHBY), and Schlumberger Ltd. (SLB). We reduced our positions in Applied Materials (AMAT), BB&T Corporation (BBT), Bank of America (BAC), Citigroup Inc. (C), Dow Chemical Co. (DWDP), General Motors (GM), Teva Pharmaceutical Ind. Ltd ADR (TEVA), Union Pacific Corp. (UNP), WestRock Company (WRK), Western Union (WU) and Williams-Sonoma, Inc. (WSM). Also, during this time frame, we sold entirely out of Annaly Capital Management (NLY), Boeing Company (BA), Gilead Sciences, Inc. (GILD), Kroger Company (KR), Lincoln National Corporation (LNC), National Oilwell Varco (NOV), Rio Tinto Plc (RIO), Wal-Mart Stores, Inc. (WMT) and XL Group Ltd. (XL).
The three securities with the most significant price increases during the fiscal year were related both to the overall increase in the economy and particularly to the increase in the outlook for oil and gas prices. They are as follows:
Union Pacific | (UNP) | +45.6% |
National Oilwell Varco | (NOV) | +39.5% |
Occidental Petroleum | (OXY) | +29.7% |
2
The three securities with the worst performance in the portfolio were an eclectic group with individual stock circumstances. They are as follows:
General Electric | (GE) | -33.12% |
Teva Pharmaceuticals | (TEVA) | -25.6% |
ATT Inc | (T) | -18.1% |
We continue to scour the equity universe to locate stocks which meet our investment criteria of: 1) a relatively low forecast P/E multiple, usually 15 or less, 2) a dividend yield is paid, or expected to be, 3) public debt, if any, is investment grade, 4) a minimum of $500 million market capitalization, and 5) current stock price is within 20% of the 52-week low price. In addition to meeting these criteria, stocks are quantitatively and qualitatively analyzed to determine company prospects and reasonableness of valuation.
During this 12-month period, our focus on energy stocks and financials provided us superior returns to the market in general and the S&P 500 Value Index during the same months.
We maintain our long-term focus in the Kempner Multi-Cap Deep Value Fund on areas which are overlooked by the market. We are particularly interested at this point in values that may present themselves in the health care industries. Harris L. Kempner, Jr. and M. Shawn Gault are the portfolio managers for the Kempner Multi-Cap Deep Value Fund.
Past performance is not predictive of future performance. Investment results and principal value will fluctuate so that shares, when redeemed, may be worth more or less than their original cost. Current performance may be higher or lower than the performance data quoted. Performance data current to the most recent month end are available by calling 1-800-665-9778.
An investor should consider the investment objectives, risks, charges and expenses of the Fund carefully before investing. The Fund’s prospectus contains this and other important information. To obtain a copy of the Fund’s prospectus please call 1-800-665-9778 and a copy will be sent to you free of charge. Please read the prospectus carefully before you invest. Kempner Multi-Cap Deep Value Fund is distributed by Ultimus Fund Distributors, LLC.
This Letter to Shareholders seeks to describe some of the Adviser’s current opinions and views of the financial markets. Although the Adviser believes it has a reasonable basis for any opinions or views expressed, actual results may differ, sometimes significantly so, from those expected or expressed. The securities held by the Fund that are discussed in the Letter to Shareholders were held during the period covered by this Report. They do not comprise the entire investment portfolio of the Fund, may be sold at any time and may no longer be held by the Fund. For a complete list of securities held by the Fund as of July 31, 2018, please see the Schedule of Investments section of the annual report. The opinions of the Adviser with respect to those securities may change at any time.
Statements in the Letter to Shareholders that reflect projections or expectations for future financial or economic performance of the Fund and the market in general and statements of the Fund’s plans and objectives for future operations are forward-looking statements. No assurance can be given that actual results or events will not differ materially from those projected, estimated, assumed, or anticipated in any such forward-looking statements. Important factors that could result in such differences, in addition to factors noted with such forward-looking statements include, without limitation, general economic conditions, such as inflation, recession, and interest rates. Past performance is not a guarantee of future results.
3
KEMPNER MULTI-CAP DEEP VALUE FUND
PERFORMANCE INFORMATION
July 31, 2018 (Unaudited)
Comparison of the Change in Value of a $500,000 Investment
in Kempner Multi-Cap Deep Value Fund - Institutional Class versus the
S&P 500 Value Index*
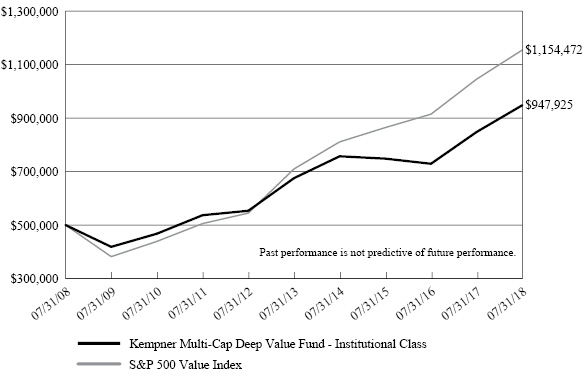
Average Annual Total Returns (for the periods ended July 31, 2018) | ||||
1 Year | 5 Years | 10 Years | ||
Kempner Multi-Cap Deep Value Fund - Institutional Class (a) | 11.79% | 7.03% | 6.61% | |
Kempner Multi-Cap Deep Value Fund - Investor Class (a)(b) | 11.55% | 6.77% | 6.35% | |
S&P 500 Value Index | 10.43% | 10.23% | 8.73% | |
* | The graph is based on the performance of Institutional Class only; performance for Investor Class varies due to differences in fees paid by shareholders in the different classes. |
(a) | The total returns shown do not reflect the deduction of taxes that a shareholder would pay on Fund distributions or the redemption of Fund shares. |
(b) | Effective March 31, 2015, Class A Shares were re-designated as Investor Class. Prior to March 31, 2015, shareholders were charged a sales charge on purchases and redemptions of Class A Shares. The performance information provided for the period prior to March 31, 2015 represents the performance of Investor Class when they were called Class A Shares. The share class change had no impact on the Fund’s operations or investment policy. |
4
KEMPNER MULTI-CAP DEEP VALUE FUND
PORTFOLIO INFORMATION
July 31, 2018 (Unaudited)
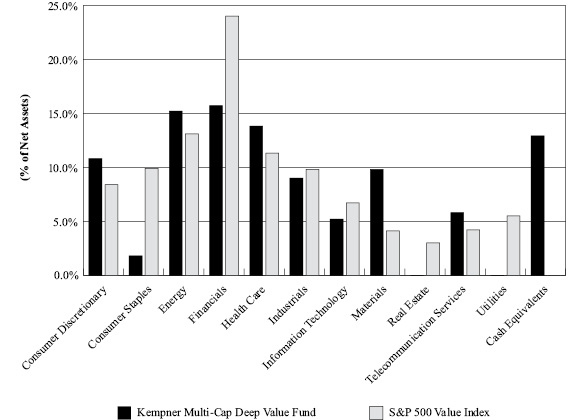
Sector Diversification (% of Net Assets)
Top 10 Equity Investments
Security Description | % of Net Assets |
Bank of America Corporation | 5.4% |
BP plc - ADR | 4.9% |
Citigroup, Inc. | 4.4% |
General Motors Company | 4.3% |
Schlumberger Ltd. | 3.9% |
Occidental Petroleum Corporation | 3.7% |
WestRock Company | 3.4% |
AT&T, Inc. | 3.4% |
DowDuPont, Inc. | 3.3% |
Applied Materials, Inc. | 3.2% |
5
KEMPNER MULTI-CAP DEEP VALUE FUND | ||||||||
COMMON STOCKS — 87.1% | Shares | Value | ||||||
Consumer Discretionary — 10.8% | ||||||||
Automobiles — 7.3% | ||||||||
General Motors Company | 92,720 | $ | 3,515,015 | |||||
Honda Motor Company Ltd. - ADR | 82,900 | 2,541,714 | ||||||
| 6,056,729 | ||||||||
Media — 2.0% | ||||||||
Walt Disney Company (The) | 14,100 | 1,601,196 | ||||||
Specialty Retail — 1.5% | ||||||||
Williams-Sonoma, Inc. | 21,075 | 1,232,677 | ||||||
Consumer Staples — 1.8% | ||||||||
Food & Staples Retailing — 1.1% | ||||||||
Walgreen Boots Alliance, Inc. | 13,400 | 906,108 | ||||||
Food Products — 0.7% | ||||||||
General Mills, Inc. | 13,400 | 617,204 | ||||||
Energy — 15.2% | ||||||||
Energy Equipment & Services — 3.9% | ||||||||
Schlumberger Ltd. | 47,555 | 3,210,913 | ||||||
Oil, Gas & Consumable Fuels — 11.3% | ||||||||
BP plc - ADR | 89,120 | 4,018,421 | ||||||
Occidental Petroleum Corporation | 36,800 | 3,088,624 | ||||||
Royal Dutch Shell plc - Class A - ADR | 32,689 | 2,234,947 | ||||||
| 9,341,992 | ||||||||
Financials — 15.7% | ||||||||
Banks — 10.8% | ||||||||
Bank of America Corporation | 145,270 | 4,485,937 | ||||||
BB&T Corporation | 15,300 | 777,393 | ||||||
Citigroup, Inc. | 50,500 | 3,630,445 | ||||||
| 8,893,775 | ||||||||
Consumer Finance — 2.1% | ||||||||
Capital One Financial Corporation | 18,640 | 1,758,125 | ||||||
Insurance — 2.8% | ||||||||
Axis Capital Holdings Ltd. | 41,400 | 2,341,584 | ||||||
Health Care — 13.8% | ||||||||
Health Care Equipment & Supplies — 0.8% | ||||||||
Zimmer Biomet Holdings, Inc. | 5,500 | 690,360 | ||||||
6
KEMPNER MULTI-CAP DEEP VALUE FUND | ||||||||
COMMON STOCKS — 87.1% (Continued) | Shares | Value | ||||||
Health Care — 13.8% (Continued) | ||||||||
Health Care Providers & Services — 4.4% | ||||||||
Cardinal Health, Inc. | 42,765 | $ | 2,136,112 | |||||
McKesson Corporation | 11,580 | 1,454,448 | ||||||
| 3,590,560 | ||||||||
Pharmaceuticals — 8.6% | ||||||||
Allergan plc | 3,950 | 727,155 | ||||||
Merck & Company, Inc. | 38,780 | 2,554,439 | ||||||
Pfizer, Inc. | 25,600 | 1,022,208 | ||||||
Roche Holding AG - ADR | 61,400 | 1,883,138 | ||||||
Teva Pharmaceutical Industries Ltd. - ADR | 36,700 | 878,598 | ||||||
| 7,065,538 | ||||||||
Industrials — 9.0% | ||||||||
Building Products — 3.0% | ||||||||
Johnson Controls International plc | 65,749 | 2,466,245 | ||||||
Electrical Equipment — 2.0% | ||||||||
Acuity Brands, Inc. | 12,050 | 1,675,312 | ||||||
Industrial Conglomerates — 2.3% | ||||||||
General Electric Company | 138,150 | 1,882,985 | ||||||
Road & Rail — 1.7% | ||||||||
Union Pacific Corporation | 9,450 | 1,416,460 | ||||||
Information Technology — 5.2% | ||||||||
IT Services — 2.0% | ||||||||
Western Union Company (The) | 83,300 | 1,679,328 | ||||||
Semiconductors & Semiconductor Equipment — 3.2% | ||||||||
Applied Materials, Inc. | 54,360 | 2,643,527 | ||||||
Materials — 9.8% | ||||||||
Chemicals — 6.4% | ||||||||
DowDuPont, Inc. | 39,900 | 2,743,923 | ||||||
Mosaic Company (The) | 83,150 | 2,503,647 | ||||||
| 5,247,570 | ||||||||
Containers & Packaging — 3.4% | ||||||||
WestRock Company | 48,500 | 2,812,030 | ||||||
7
KEMPNER MULTI-CAP DEEP VALUE FUND | ||||||||
COMMON STOCKS — 87.1% (Continued) | Shares | Value | ||||||
Telecommunication Services — 5.8% | ||||||||
Diversified Telecommunication Services — 5.8% | ||||||||
AT&T, Inc. | 86,692 | $ | 2,771,543 | |||||
Verizon Communications, Inc. | 38,600 | 1,993,304 | ||||||
| 4,764,847 | ||||||||
Total Common Stocks (Cost $63,694,393) | $ | 71,895,065 | ||||||
| ||||||||
MONEY MARKET FUNDS — 12.8% | Shares | Value | ||||||
BlackRock Liquidity Funds Treasury Trust Fund - Institutional Class, 1.77% (a) (Cost $10,592,019) | 10,592,019 | $ | 10,592,019 | |||||
Total Investments at Value — 99.9% (Cost $74,286,412) | $ | 82,487,084 | ||||||
Other Assets in Excess of Liabilities — 0.1% | 41,209 | |||||||
Net Assets — 100.0% | $ | 82,528,293 | ||||||
(a) | The rate shown is the 7-day effective yield as of July 31, 2018. |
ADR – American Depositary Receipt. | |
See accompanying notes to financial statements. |
8
KEMPNER MULTI-CAP DEEP VALUE FUND | ||||
ASSETS | ||||
Investments in securities: | ||||
At cost | $ | 74,286,412 | ||
At value (Note 2) | $ | 82,487,084 | ||
Receivable for capital shares sold | 513 | |||
Dividends receivable | 116,496 | |||
Foreign tax reclaims receivable | 958 | |||
Other assets | 8,047 | |||
Total assets | 82,613,098 | |||
LIABILITIES | ||||
Payable for capital shares redeemed | 5,500 | |||
Payable to Adviser (Note 4) | 40,941 | |||
Payable to administrator (Note 4) | 13,890 | |||
Accrued distribution fees (Note 4) | 2,104 | |||
Other accrued expenses | 22,370 | |||
Total liabilities | 84,805 | |||
NET ASSETS | $ | 82,528,293 | ||
NET ASSETS CONSIST OF: | ||||
Paid-in capital | $ | 73,515,562 | ||
Undistributed net investment income | 103,356 | |||
Undistributed net realized gains from investment transactions | 708,703 | |||
Net unrealized appreciation on investments | 8,200,672 | |||
NET ASSETS | $ | 82,528,293 | ||
NET ASSET VALUE PER SHARE: | ||||
INSTITUTIONAL CLASS | ||||
Net assets applicable to Institutional Class | $ | 67,725,247 | ||
Institutional Class shares of beneficial interest outstanding (unlimited number of shares authorized, no par value) | 6,149,514 | |||
Net asset value, offering price and redemption price per share (Note 2) | $ | 11.01 | ||
INVESTOR CLASS | ||||
Net assets applicable to Investor Class | $ | 14,803,046 | ||
Investor Class shares of beneficial interest outstanding (unlimited number of shares authorized, no par value) | 1,345,583 | |||
Net asset value, offering price and redemption price per share (Note 2) | $ | 11.00 | ||
See accompanying notes to financial statements. |
9
KEMPNER MULTI-CAP DEEP VALUE FUND | ||||
INVESTMENT INCOME | ||||
Dividend income | $ | 2,258,316 | ||
Foreign withholding taxes on dividends | (48,758 | ) | ||
Total investment income | 2,209,558 | |||
EXPENSES | ||||
Investment advisory fees (Note 4) | 487,048 | |||
Administration fees (Note 4) | 82,541 | |||
Fund accounting fees (Note 4) | 44,259 | |||
Professional fees | 43,130 | |||
Distribution fees - Investor Class (Note 4) | 37,022 | |||
Registration and filing fees | 27,680 | |||
Transfer agent fees (Note 4) | 27,000 | |||
Custody and bank service fees | 14,189 | |||
Compliance fees (Note 4) | 12,607 | |||
Trustees’ fees and expenses (Note 4) | 9,980 | |||
Printing of shareholder reports | 4,767 | |||
Insurance expense | 2,661 | |||
Postage and supplies | 2,554 | |||
Other expenses | 15,402 | |||
Total expenses | 810,840 | |||
NET INVESTMENT INCOME | 1,398,718 | |||
REALIZED AND UNREALIZED GAINS ON INVESTMENTS | ||||
Net realized gains from investment transactions | 2,753,620 | |||
Net change in unrealized appreciation (depreciation) on investments | 5,052,252 | |||
NET REALIZED AND UNREALIZED GAINS ON INVESTMENTS | 7,805,872 | |||
NET INCREASE IN NET ASSETS RESULTING FROM OPERATIONS | $ | 9,204,590 | ||
See accompanying notes to financial statements. |
10
KEMPNER MULTI-CAP DEEP VALUE FUND | ||||||||
| Year | Year | ||||||
FROM OPERATIONS | ||||||||
Net investment income | $ | 1,398,718 | $ | 1,741,892 | ||||
Net realized gains from investment transactions | 2,753,620 | 2,885,915 | ||||||
Net change in unrealized appreciation (depreciation) on investments | 5,052,252 | 9,006,006 | ||||||
Net increase in net assets resulting from operations | 9,204,590 | 13,633,813 | ||||||
DISTRIBUTIONS TO SHAREHOLDERS (Note 2) | ||||||||
From net investment income, Institutional Class | (1,094,827 | ) | (1,478,112 | ) | ||||
From net investment income, Investor Class | (204,332 | ) | (259,983 | ) | ||||
From net realized gains, Institutional Class | (3,014,644 | ) | — | |||||
From net realized gains, Investor Class | (640,050 | ) | — | |||||
Decrease in net assets from distributions to shareholders | (4,953,853 | ) | (1,738,095 | ) | ||||
CAPITAL SHARE TRANSACTIONS | ||||||||
Institutional Class | ||||||||
Proceeds from shares sold | 4,012,842 | 1,725,001 | ||||||
Net asset value of shares issued in reinvestment of distributions to shareholders | 213,541 | 59,077 | ||||||
Payments for shares redeemed | (7,880,872 | ) | (39,679,018 | ) | ||||
Net decrease in Institutional Class net assets from capital share transactions | (3,654,489 | ) | (37,894,940 | ) | ||||
Investor Class | ||||||||
Proceeds from shares sold | 124,599 | 134,182 | ||||||
Net asset value of shares issued in reinvestment of distributions to shareholders | 808,246 | 249,704 | ||||||
Payments for shares redeemed | (2,184,619 | ) | (1,926,407 | ) | ||||
Net decrease in Investor Class net assets from capital share transactions | (1,251,774 | ) | (1,542,521 | ) | ||||
TOTAL DECREASE IN NET ASSETS | (655,526 | ) | (27,541,743 | ) | ||||
NET ASSETS | ||||||||
Beginning of year | 83,183,819 | 110,725,562 | ||||||
End of year | $ | 82,528,293 | $ | 83,183,819 | ||||
UNDISTRIBUTED NET INVESTMENT INCOME | $ | 103,356 | $ | 3,797 | ||||
See accompanying notes to financial statements. |
11
KEMPNER MULTI-CAP DEEP VALUE FUND | ||||||||
| Year | Year | ||||||
CAPITAL SHARE ACTIVITY | ||||||||
Institutional Class | ||||||||
Shares sold | 376,111 | 169,617 | ||||||
Shares issued in reinvestment of distributions to shareholders | 20,257 | 5,976 | ||||||
Shares redeemed | (725,452 | ) | (4,140,076 | ) | ||||
Net decrease in shares outstanding | (329,084 | ) | (3,964,483 | ) | ||||
Shares outstanding at beginning of year | 6,478,598 | 10,443,081 | ||||||
Shares outstanding at end of year | 6,149,514 | 6,478,598 | ||||||
Investor Class | ||||||||
Shares sold | 11,550 | 13,381 | ||||||
Shares issued in reinvestment of distributions to shareholders | 76,743 | 25,278 | ||||||
Shares redeemed | (206,723 | ) | (197,183 | ) | ||||
Net decrease in shares outstanding | (118,430 | ) | (158,524 | ) | ||||
Shares outstanding at beginning of year | 1,464,013 | 1,622,537 | ||||||
Shares outstanding at end of year | 1,345,583 | 1,464,013 | ||||||
See accompanying notes to financial statements. |
12
KEMPNER MULTI-CAP DEEP VALUE FUND | ||||||||||||||||||||
Per Share Data for a Share Outstanding Throughout Each Year | ||||||||||||||||||||
| Year | Year | Year | Year | Year | |||||||||||||||
Net asset value at beginning of year | $ | 10.47 | $ | 9.18 | $ | 10.42 | $ | 11.53 | $ | 10.69 | ||||||||||
Income (loss) from investment operations: | ||||||||||||||||||||
Net investment income | 0.19 | 0.19 | 0.21 | 0.18 | 0.18 | |||||||||||||||
Net realized and unrealized gains (losses) on investments | 1.00 | 1.29 | (0.54 | ) | (0.29 | ) | 1.09 | |||||||||||||
Total from investment operations | 1.19 | 1.48 | (0.33 | ) | (0.11 | ) | 1.27 | |||||||||||||
Less distributions: | ||||||||||||||||||||
Dividends from net investment income | (0.17 | ) | (0.19 | ) | (0.21 | )(a) | (0.19 | ) | (0.18 | ) | ||||||||||
Distributions from net realized gains | (0.48 | ) | — | (0.70 | ) | (0.81 | ) | (0.25 | ) | |||||||||||
Total distributions | (0.65 | ) | (0.19 | ) | (0.91 | ) | (1.00 | ) | (0.43 | ) | ||||||||||
Net asset value at end of year | $ | 11.01 | $ | 10.47 | $ | 9.18 | $ | 10.42 | $ | 11.53 | ||||||||||
Total return (b) | 11.79 | % | 16.30 | % | (2.56 | %) | (1.16 | %) | 12.14 | % | ||||||||||
Net assets at end of year (000's) | $ | 67,725 | $ | 67,863 | $ | 95,846 | $ | 130,791 | $ | 175,593 | ||||||||||
Ratios/supplementary data: | ||||||||||||||||||||
Ratio of total expenses to average net assets | 0.94 | % | 0.84 | % | 0.78 | % | 0.77 | % | 0.77 | % | ||||||||||
Ratio of net investment income to average net assets | 1.74 | % | 1.98 | % | 2.30 | % | 1.66 | % | 1.60 | % | ||||||||||
Portfolio turnover rate | 25 | % | 18 | % | 10 | % | 40 | % | 22 | % | ||||||||||
(a) | Includes a return of capital of less than $0.01 per share. |
(b) | Total return is a measure of the change in value of an investment in the Fund over the periods covered. The returns shown do not reflect the deduction of taxes a shareholder would pay on Fund distributions, if any, or the redemption of Fund shares.
|
See accompanying notes to financial statements. | |
13
KEMPNER MULTI-CAP DEEP VALUE FUND | ||||||||||||||||||||
Per Share Data for a Share Outstanding Throughout Each Year | ||||||||||||||||||||
| Year | Year | Year | Year | Year | |||||||||||||||
Net asset value at beginning of year | $ | 10.46 | $ | 9.17 | $ | 10.40 | $ | 11.53 | $ | 10.69 | ||||||||||
Income (loss) from investment operations: | ||||||||||||||||||||
Net investment income | 0.17 | 0.17 | 0.19 | 0.15 | 0.15 | |||||||||||||||
Net realized and unrealized gains (losses) on investments | 1.00 | 1.29 | (0.53 | ) | (0.31 | ) | 1.10 | |||||||||||||
Total from investment operations | 1.17 | 1.46 | (0.34 | ) | (0.16 | ) | 1.25 | |||||||||||||
Less distributions: | ||||||||||||||||||||
Dividends from net investment income | (0.15 | ) | (0.17 | ) | (0.19 | )(a) | (0.16 | ) | (0.16 | ) | ||||||||||
Distributions from net realized gains | (0.48 | ) | — | (0.70 | ) | (0.81 | ) | (0.25 | ) | |||||||||||
Total distributions | (0.63 | ) | (0.17 | ) | (0.89 | ) | (0.97 | ) | (0.41 | ) | ||||||||||
Net asset value at end of year | $ | 11.00 | $ | 10.46 | $ | 9.17 | $ | 10.40 | $ | 11.53 | ||||||||||
Total return (b) | 11.55 | % | 16.06 | % | (2.70 | %) | (1.56 | %) | 11.90 | % | ||||||||||
Net assets at end of year (000's) | $ | 14,803 | $ | 15,321 | $ | 14,880 | $ | 21,272 | $ | 20,942 | ||||||||||
Ratios/supplementary data: | ||||||||||||||||||||
Ratio of total expenses to average net assets | 1.19 | % | 1.09 | % | 1.03 | % | 1.02 | % | 1.02 | % | ||||||||||
Ratio of net investment income to average net assets | 1.49 | % | 1.70 | % | 2.05 | % | 1.37 | % | 1.35 | % | ||||||||||
Portfolio turnover rate | 25 | % | 18 | % | 10 | % | 40 | % | 22 | % | ||||||||||
(a) | Includes a return of capital of less than $0.01 per share. |
(b) | Total return is a measure of the change in value of an investment in the Fund over the periods covered. The returns shown do not reflect the deduction of taxes a shareholder would pay on Fund distributions, if any, or the redemption of Fund shares.
|
See accompanying notes to financial statements. | |
14
KEMPNER MULTI-CAP DEEP VALUE FUND
NOTES TO FINANCIAL STATEMENTS
July 31, 2018
1. Organization
Kempner Multi-Cap Deep Value Fund (formerly Kempner Multi-Cap Deep Value Equity Fund) (the “Fund”) is a diversified series of Ultimus Managers Trust (the “Trust”). The Trust is an open-end management investment company registered under the Investment Company Act of 1940, as amended (the “1940 Act”). The Fund was reorganized into the Trust on April 28, 2017.
The Fund currently offers two classes of shares: Institutional Class shares (sold without any sales loads and distribution and/or shareholder servicing fees and requiring a $500,000 initial investment) and Investor Class shares (sold without any sales loads, but subject to a distribution and/or shareholder servicing fee of up to 0.25% of the average daily net assets attributable to Investor Class shares, and requiring a $500 initial investment). Each share class represents an ownership interest in the same investment portfolio.
2. Significant Accounting Policies
The following is a summary of the Fund’s significant accounting policies. These policies are in conformity with accounting principles generally accepted in the United States of America (“GAAP”). As an investment company, the Fund follows accounting and reporting guidance under Financial Accounting Standards Board Accounting Standards Codification Topic 946, “Financial Services – Investment Companies.”
Securities valuation – The Fund values its portfolio securities at market value as of the close of regular trading on the New York Stock Exchange (the “NYSE”) (normally 4:00 p.m. Eastern time) on each business day the NYSE is open for business. The Fund values its listed securities on the basis of the security’s last sale price on the security’s primary exchange, if available, otherwise at the exchange’s most recently quoted mean price. NASDAQ-listed securities are valued at the NASDAQ Official Closing Price. When using a quoted price and when the market for the security is considered active, the security will be classified as Level 1 within the fair value hierarchy (see below). In the event that market quotations are not readily available or are considered unreliable due to market or other events, the Fund values its securities and other assets at fair value in accordance with procedures established by and under the general supervision of the Board of Trustees (the “Board”). Under these procedures, the securities will be classified as Level 2 or 3 within the fair value hierarchy, depending on the inputs used. Unavailable or unreliable market quotes may be due to the following factors: a substantial bid-ask spread; infrequent sales resulting in stale prices; insufficient trading volume; small trade sizes; a temporary lapse in any reliable pricing source; and actions of the securities or futures markets, such as the suspension or limitation of trading. As a result, the prices of securities used to calculate the Fund’s net asset value (“NAV”) may differ from quoted or published prices for the same securities.
15
KEMPNER MULTI-CAP DEEP VALUE FUND |
GAAP establishes a single authoritative definition of fair value, sets out a framework for measuring fair value, and requires additional disclosures about fair value measurements.
Various inputs are used in determining the value of the Fund’s investments. These inputs are summarized in the three broad levels listed below:
● | Level 1 – quoted prices in active markets for identical securities |
● | Level 2 – other significant observable inputs |
● | Level 3 – significant unobservable inputs |
The inputs or methods used for valuing securities are not necessarily an indication of the risks associated with investing in those securities. The inputs used to measure fair value may fall into different levels of the fair value hierarchy. In such cases, for disclosure purposes, the level in the fair value hierarchy within which the fair value measurement falls in its entirety is determined based on the lowest level input that is significant to the fair value measurement.
The following is a summary of the inputs used to value the Fund’s investments as of July 31, 2018:
| Level 1 | Level 2 | Level 3 | Total | ||||||||||||
Common Stocks | $ | 71,895,065 | $ | — | $ | — | $ | 71,895,065 | ||||||||
Money Market Funds | 10,592,019 | — | — | 10,592,019 | ||||||||||||
Total | $ | 82,487,084 | $ | — | $ | — | $ | 82,487,084 | ||||||||
Refer to the Fund’s Schedule of Investments for a listing of securities by industry type. As of July 31, 2018, the Fund did not have any transfers between Levels. In addition, the Fund did not hold any derivative instruments or any assets or liabilities that were measured at fair value on a recurring basis using significant unobservable inputs (Level 3) as of July 31, 2018. It is the Fund’s policy to recognize transfers between Levels at the end of the reporting period.
Share valuation – The NAV per share of each class of the Fund is calculated daily by dividing the total value of the assets attributable to that class, less liabilities attributable to that class, by the number of shares outstanding of that class. The offering price and redemption price per share of each class of the Fund is equal to the NAV per share of such class.
Investment income – Dividend income is recorded on the ex-dividend date. Interest income is accrued as earned. Withholding taxes on foreign dividends have been recorded in accordance with the Fund’s understanding of the applicable country’s rules and tax rates.
Investment transactions – Investment transactions are accounted for on the trade date. Realized gains and losses on investments sold are determined on a specific identification basis.
16
KEMPNER MULTI-CAP DEEP VALUE FUND |
Common expenses – Common expenses of the Trust are allocated among the Fund and the other series of the Trust based on the relative net assets of each series or the nature of the services performed and the relative applicability to each series.
Distributions to shareholders – The Fund intends to declare and distribute net investment income dividends on a quarterly basis. In addition, the Fund will declare and distribute net realized capital gains, if any, on an annual basis. The amount of such dividends and distributions are determined in accordance with federal income tax regulations, which may differ from GAAP. Dividends and distributions to shareholders are recorded on the ex-dividend date. The tax character of distributions paid to shareholders by the Fund during the years ended July 31, 2018 and 2017 was as follows:
Year | Ordinary | Long-Term | Total | |||||||||
7/31/2018 | $ | 1,299,159 | $ | 3,654,694 | $ | 4,953,853 | ||||||
7/31/2017 | $ | 1,738,095 | $ | — | $ | 1,738,095 | ||||||
Estimates – The preparation of financial statements in conformity with GAAP requires management to make estimates and assumptions that affect the reported amounts of assets and liabilities and disclosure of contingent assets and liabilities as of the date of the financial statements and the reported amounts of income and expenses during the reporting period. Actual results could differ from those estimates.
Federal income tax – The Fund has qualified and intends to continue to qualify as a regulated investment company under the Internal Revenue Code of 1986 (the “Code”). Qualification generally will relieve the Fund of liability for federal income taxes to the extent 100% of its net investment income and net realized capital gains are distributed in accordance with the Code.
In order to avoid imposition of the excise tax applicable to regulated investment companies, it is also the Fund’s intention to declare as dividends in each calendar year at least 98% of its net investment income (earned during the calendar year) and 98.2% of its net realized capital gains (earned during the twelve months ended October 31) plus undistributed amounts from prior years.
The following information is computed on a tax basis for each item as of July 31, 2018:
Tax cost of portfolio investments | $ | 74,295,264 | ||
Gross unrealized appreciation | $ | 12,100,714 | ||
Gross unrealized depreciation | (3,908,894 | ) | ||
Net unrealized appreciation | 8,191,820 | |||
Undistributed ordinary income | 599,439 | |||
Undistributed long-term capital gains | 221,472 | |||
Distributable earnings | $ | 9,012,731 |
17
KEMPNER MULTI-CAP DEEP VALUE FUND |
The difference between the federal income tax cost of portfolio investments and the financial statement cost of portfolio investments is due to certain timing differences in the recognition of capital gains or losses under income tax regulations and GAAP. These “book/tax” differences are temporary in nature and are primarily due to the tax deferral of losses on wash sales.
The Fund recognizes the tax benefits or expenses of uncertain tax positions only when the position is “more likely than not” of being sustained assuming examination by tax authorities. Management has reviewed the Fund’s tax positions for all open tax periods (periods ended July 31, 2015 through July 31, 2018) and has concluded that no provision for unrecognized tax benefits or expenses is required in these financial statements. The Fund identifies its major tax jurisdiction as U.S. Federal.
3. Investment Transactions
During the year ended July 31, 2018, cost of purchases and proceeds from sales of investment securities, other than short-term investments, amounted to $17,847,865 and $28,842,743, respectively.
4. Transactions with Related Parties
INVESTMENT ADVISORY AGREEMENT
The Fund’s investments are managed by Kempner Capital Management, Inc. (the “Adviser”) pursuant to the terms of an Investment Advisory Agreement. The Fund pays the Adviser an investment advisory fee, computed and accrued daily and paid monthly, at the annual rate of 0.59% of average daily net assets.
The Adviser has agreed contractually, until at least November 30, 2018, to reduce its advisory fees and reimburse other expenses to the extent necessary to limit total annual fund operating expenses (exclusive of brokerage costs; taxes; interest; costs to organize the Fund; acquired fund fees and expenses; extraordinary expenses such as litigation and merger or reorganization costs and other expenses not incurred in the ordinary course of the Fund’s business; and amounts, if any, payable pursuant to a plan adopted in accordance with Rule 12b-1 under the 1940 Act) to an amount not exceeding 1.05% and 1.30% of average daily net assets for Institutional Class and Investor Class shares, respectively.
Advisory fee reductions and expense reimbursements by the Adviser are subject to repayment by the Fund for a period of three years after such fees and expenses were incurred, provided that the repayments do not cause the Fund’s total annual fund operating expenses to exceed the lesser of (i) the expense limitation then in effect, if any, and (ii) the expense limitation in effect at the time the expenses to be repaid were incurred. Prior to November 30, 2018, the agreement to limit expenses of the Fund may not be modified or terminated without the approval of the Board. This agreement will terminate automatically if the Investment Advisory Agreement is terminated. During the year ended July 31, 2018, the Adviser did not reduce its advisory fees or reimburse other expenses of the Fund.
18
KEMPNER MULTI-CAP DEEP VALUE FUND |
OTHER SERVICE PROVIDERS
Ultimus Fund Solutions, LLC (“Ultimus”) provides administration, fund accounting, compliance and transfer agency services to the Fund. The Fund pays Ultimus fees in accordance with the agreements for such services. In addition, the Fund pays out-of-pocket expenses including, but not limited to, postage, supplies and costs of pricing the Fund’s portfolio securities.
Under the terms of a Distribution Agreement with the Trust, Ultimus Fund Distributors, LLC (the “Distributor”) serves as principal underwriter to the Fund. The Distributor is a wholly-owned subsidiary of Ultimus. The Distributor is compensated partially by the Adviser and partially by the Investor Class shares of the Fund for acting as principal underwriter.
A Trustee and certain officers of the Trust are also officers of Ultimus and/or the Distributor.
DISTRIBUTION PLAN
The Fund has adopted a plan of distribution (the “Plan”), pursuant to Rule 12b-1 under the 1940 Act, which permits Investor Class shares of the Fund to directly incur or reimburse the Fund’s principal underwriter for certain expenses related to the distribution of Investor Class shares. The annual limitation for payment of expenses pursuant to the Plan is 0.25% of the Fund’s average daily net assets allocable to Investor Class shares. The Fund has not adopted a plan of distribution with respect to Institutional Class shares. During the year ended July 31, 2018, Investor Class shares of the Fund incurred $37,022 of distribution fees under the Plan.
TRUSTEE COMPENSATION
Each Trustee who is not an “interested person” of the Trust (“Independent Trustee”) received a $1,000 annual retainer from the Fund, paid quarterly, except for the Board Chairperson who received a $1,200 annual retainer from the Fund, paid quarterly. Each Independent Trustee also received from the Fund a fee of $500 for each Board meeting attended plus reimbursement for travel and other meeting-related expenses. Effective August 1, 2018, each Independent Trustee will receive a $1,300 annual retainer from the Fund, paid quarterly, except for the Board Chairperson who will receive a $1,500 annual retainer from the Fund, paid quarterly. Each Independent Trustee will also receive from the Fund a fee of $500 for each Board meeting attended plus reimbursement for travel and other meeting-related expenses.
19
KEMPNER MULTI-CAP DEEP VALUE FUND |
PRINCIPAL HOLDERS OF FUND SHARES
As of July 31, 2018, the following shareholders owned of record 5% or more of the outstanding shares of each class of the Fund:
NAME OF RECORD OWNER | % Ownership |
Institutional Class | |
SEI Private Trust Company (for the benefit of its customers) | 99% |
Investor Class | |
SEI Private Trust Company (for the benefit of its customers) | 49% |
Morgan Stanley Smith Barney LLC (for the benefit of its customers) | 40% |
National Financial Services LLC (for the benefit of its customers) | 11% |
A beneficial owner of 25% or more of the Fund’s outstanding shares may be considered a controlling person. That shareholder’s vote could have a more significant effect on matters presented at a shareholder’s meeting.
5. Contingencies and Commitments
The Fund indemnifies the Trust’s officers and Trustees for certain liabilities that might arise from their performance of their duties to the Fund. Additionally, in the normal course of business the Fund enters into contracts that contain a variety of representations and warranties and which provide general indemnifications. The Fund’s maximum exposure under these arrangements is unknown, as this would involve future claims that may be made against the Fund that have not yet occurred. However, based on experience, the Fund expects the risk of loss to be remote.
6. Subsequent Events
The Fund is required to recognize in the financial statements the effects of all subsequent events that provide additional evidence about conditions that existed as of the date of the Statement of Assets and Liabilities. For non-recognized subsequent events that must be disclosed to keep the financial statements from being misleading, the Fund is required to disclose the nature of the event as well as an estimate of its financial effect, or a statement that such an estimate cannot be made. Management has evaluated subsequent events through the issuance of these financial statements and has noted no such events.
20
KEMPNER MULTI-CAP DEEP VALUE FUND
REPORT OF INDEPENDENT REGISTERED
PUBLIC ACCOUNTING FIRM
To the Board of Trustees of Ultimus Managers Trust
and the Shareholders of Kempner Multi-Cap Deep Value Fund
Opinion on the Financial Statements
We have audited the accompanying statement of assets and liabilities of Kempner Multi-Cap Deep Value Fund, a series of shares of beneficial interest in Ultimus Managers Trust (the “Fund”), including the schedule of investments, as of July 31, 2018, and the related statement of operations for the year then ended, the statements of changes in net assets and the financial highlights for each of the years in the two-year period then ended, and the related notes (collectively referred to as the “financial statements”). In our opinion, the financial statements present fairly, in all material respects, the financial position of the Fund as of July 31, 2018, and the results of its operations for the year then ended, the changes in its net assets and its financial highlights for each of the years in the two-year period then ended in conformity with accounting principles generally accepted in the United States of America. The financial highlights for each of the years presented through July 31, 2016 were audited by other auditors whose report September 29, 2016 expressed an unqualified opinion on those financial highlights.
Basis for Opinion
These financial statements are the responsibility of the Fund’s management. Our responsibility is to express an opinion on the Fund’s financial statements based on our audits. We are a public accounting firm registered with the Public Company Accounting Oversight Board (United States) (“PCAOB”) and are required to be independent with respect to the Fund in accordance with the U.S. federal securities law and the applicable rules and regulations of the Securities and Exchange Commission and the PCAOB.
We conducted our audits in accordance with the standards of the PCAOB. Those standards require that we plan and perform the audits to obtain reasonable assurance about whether the financial statements are free of material misstatement, whether due to error or fraud. The Fund is not required to have, nor were we engaged to perform, an audit of its internal control over financial reporting. As part of our audits we are required to obtain an understanding of internal control over financial reporting but not for the purpose of expressing an opinion on the effectiveness of the Fund’s internal control over financial reporting. Accordingly, we express no such opinion.
21
KEMPNER MULTI-CAP DEEP VALUE FUND
REPORT OF INDEPENDENT REGISTERED
PUBLIC ACCOUNTING FIRM (Continued)
Our audits included performing procedures to assess the risk of material misstatement of the financial statements, whether due to error or fraud, and performing procedures that respond to those risks. Such procedures include examining, on a test basis, evidence regarding the amounts and disclosures in the financial statements. Our procedures included confirmation of securities owned as of July 31, 2018 by correspondence with the custodian and brokers. Our audits also included evaluating the accounting principles used and significant estimates made by management, as well as evaluating the overall presentation of the financial statements. We believe that our audits provide a reasonable basis for our opinion.

BBD, LLP
We have served as the auditor of one or more of the Funds in the Ultimus Managers Trust since 2013.
Philadelphia, Pennsylvania
September 20, 2018
22
KEMPNER MULTI-CAP DEEP VALUE FUND |
We believe it is important for you to understand the impact of costs on your investment. As a shareholder of the Fund, you incur ongoing costs, including management fees, class-specific expenses (such as distribution fees) and other operating expenses. The following examples are intended to help you understand your ongoing costs (in dollars) of investing in the Fund and to compare these costs with the ongoing costs of investing in other mutual funds.
A mutual fund’s ongoing costs are expressed as a percentage of its average net assets. This figure is known as the expense ratio. The expenses in the table below are based on an investment of $1,000 made at the beginning of the most recent period (February 1, 2018) and held until the end of the period (July 31, 2018).
The table below illustrates the Fund’s ongoing costs in two ways:
Actual fund return – This section helps you to estimate the actual expenses that you paid over the period. The “Ending Account Value” shown is derived from the Fund’s actual return, and the fourth column shows the dollar amount of operating expenses that would have been paid by an investor who started with $1,000 in the Fund. You may use the information here, together with the amount you invested, to estimate the expenses that you paid over the period.
To do so, simply divide your account value by $1,000 (for example, an $8,600 account value divided by $1,000 = 8.6), then multiply the result by the number given for the Fund under the heading “Expenses Paid During Period.”
Hypothetical 5% return – This section is intended to help you compare the Fund’s ongoing costs with those of other mutual funds. It assumes that the Fund had an annual return of 5% before expenses during the period shown, but that the expense ratio is unchanged. In this case, because the return used is not the Fund’s actual return, the results do not apply to your investment. The example is useful in making comparisons because the U.S. Securities and Exchange Commission (the “SEC”) requires all mutual funds to calculate expenses based on a 5% return. You can assess the Fund’s ongoing costs by comparing this hypothetical example with the hypothetical examples that appear in shareholder reports of other funds.
Note that expenses shown in the table are meant to highlight and help you compare ongoing costs only. The Fund does not charge transaction fees, such as purchase or redemption fees, nor does it carry a “sales load.”
The calculations assume no shares were bought or sold during the period. Your actual costs may have been higher or lower, depending on the amount of your investment and the timing of any purchases or redemptions.
23
KEMPNER MULTI-CAP DEEP VALUE FUND |
More information about the Fund’s expenses can be found in this report. For additional information on operating expenses and other shareholder costs, please refer to the Fund’s prospectus.
| Beginning | Ending | Expense | Expenses |
Institutional Class | ||||
Based on Actual | $1,000.00 | $1,015.30 | 0.90% | $4.50 |
Based on Hypothetical 5% Return (before expenses) | $1,000.00 | $1,020.33 | 0.90% | $4.51 |
Investor Class | ||||
Based on Actual | $1,000.00 | $1,014.00 | 1.15% | $5.74 |
Based on Hypothetical 5% Return (before expenses) | $1,000.00 | $1,019.09 | 1.15% | $5.76 |
(a) | Annualized, based on the Fund’s most recent one-half year expenses. |
(b) | Expenses are equal to the Fund’s annualized expense ratio multiplied by the average account value over the period, multiplied by 181/365 (to reflect the one-half year period). |
24
KEMPNER MULTI-CAP DEEP VALUE FUND |
A description of the policies and procedures that the Fund uses to vote proxies relating to portfolio securities is available without charge upon request by calling toll-free 1-800-665-9778, or on the SEC’s website at http://www.sec.gov. Information regarding how the Fund voted proxies relating to portfolio securities during the most recent 12-month period ended June 30 is available without charge upon request by calling toll-free 1-800-665-9778, or on the SEC’s website at http://www.sec.gov.
The Trust files a complete listing of portfolio holdings for the Fund with the SEC as of the end of the first and third quarters of each fiscal year on Form N-Q. These filings are available upon request by calling 1-800-665-9778. Furthermore, you may obtain a copy of the filings on the SEC’s website at http://www.sec.gov. The Trust’s Forms N-Q may also be reviewed and copied at the SEC’s Public Reference Room in Washington, DC, and information on the operation of the Public Reference Room may be obtained by calling 1-800-SEC-0330.
FEDERAL TAX INFORMATION (Unaudited)
For the fiscal year ended July 31, 2018, the Fund designated $3,654,694 as long-term capital gain distributions subject to a maximum tax rate of 20%.
Qualified Dividend Income – The Fund designates 98.28% of its ordinary income dividends, or up to the maximum amount of such dividends allowable pursuant to the Internal Revenue Code, as qualified dividend income eligible for the reduced tax rate of 15%.
Dividends Received Deduction – Corporate shareholders are generally entitled to take the dividends received deduction on the portion of a Fund’s dividend distribution that qualifies under tax law. For the Fund’s fiscal year ended July 31, 2018, 79.01% of ordinary income dividends qualifies for the corporate dividends received deduction.
25
KEMPNER MULTI-CAP DEEP VALUE FUND
BOARD OF TRUSTEES AND EXECUTIVE OFFICERS
(Unaudited)
The Board has overall responsibility for management of the Trust’s affairs. The Trustees serve during the lifetime of the Trust and until its termination, or until death, resignation, retirement, or removal. The Trustees, in turn, elect the officers of the Fund to actively supervise its day-to-day operations. The officers have been elected for an annual term. Unless otherwise noted, each Trustee’s and officer’s address is 225 Pictoria Drive, Suite 450, Cincinnati, OH 45246. The following are the Trustees and executive officers of the Fund:
Name and | Length | Position(s) Held | Principal Occupation(s) | Number | Directorships |
Interested Trustees: | |||||
Robert G. Dorsey* Year of Birth: 1957 | Since February 2012 | Trustee (February 2012 to present)
President (June 2012 to October 2013) | Managing Director (1999 to present), Co-CEO (April 2018 to present), and President (1999 to April 2018) of Ultimus Fund Solutions, LLC and its subsidiaries (except as otherwise noted for FINRA-regulated broker dealer entities) | 20 | None |
Independent Trustees: | |||||
Janine L. Cohen Year of Birth: 1952 | Since January 2016 | Trustee | Retired since 2013; Chief Financial Officer from 2004 to 2013 and Chief Compliance Officer from 2008 to 2013 at AER Advisors, Inc. | 20 | None |
David M. Deptula Year of Birth: 1958 | Since June 2012 | Trustee | Vice President of Legal and Special Projects at Dayton Freight Lines, Inc. since 2016; Vice President of Tax Treasury at The Standard Register Inc. (formerly The Standard Register Company) from 2011 to 2016 | 20 | None |
26
KEMPNER MULTI-CAP DEEP VALUE FUND
BOARD OF TRUSTEES AND EXECUTIVE OFFICERS
(Unaudited) (Continued)
Name and | Length | Position(s) Held | Principal Occupation(s) | Number | Directorships |
Independent Trustees: (Continued) | |||||
John J. Discepoli Year of Birth: 1963 | Since June 2012 | Chairperson (May 2016 to present)
Trustee (June 2012 to present) | Owner of Discepoli Financial Planning, LLC (personal financial planning company) since 2004 | 20 | None |
* | Mr. Dorsey is considered an “interested person” of the Trust within the meaning of Section 2(a)(19) of the 1940 Act because of his relationship with the Trust’s administrator, transfer agent and distributor. |
Name and | Length | Position(s) Held | Principal Occupation(s) During Past 5 Years |
Executive Officers: | |||
David R. Carson Year of Birth: 1958 | Since 2013 | Principal Executive Officer (April 2017 to present)
President (October 2013 to present)
Vice President | Vice President and Director of Client Strategies of Ultimus Fund Solutions, LLC (2013 to present); President, Unified Series Trust (2016 to present); Chief Compliance Officer, FSI Low Beta Absolute Return Fund (2013 to 2016), The Huntington Funds (2005 to 2013), Huntington Strategy Shares (2012 to 2013), and Huntington Asset Advisors (2013); Vice President, Huntington National Bank (2001 to 2013) |
Todd E. Heim Year of Birth: 1967 | Since 2014 | Vice President | Client Implementation Manager of Ultimus Managers Trust (2014 to present); Naval Flight Officer of United States Navy (May 1989 to present); Business Project Manager of Vantiv, Inc. (February 2013 to March 2014) |
27
KEMPNER MULTI-CAP DEEP VALUE FUND
BOARD OF TRUSTEES AND EXECUTIVE OFFICERS
(Unaudited) (Continued)
Name and | Length | Position(s) Held | Principal Occupation(s) During Past 5 Years |
Executive Officers: (Continued) | |||
Jennifer L. Leamer Year of Birth: 1976 | Since 2014 | Treasurer (October 2014 to present)
Assistant Treasurer (April 2014 to October 2014) | Vice President, Mutual Fund Controller of Ultimus Fund Solutions, LLC (2014 to present); Business Analyst of Ultimus Fund Solutions, LLC (2007 to 2014) |
Matthew J. Beck Year of Birth: 1988 | Since 2018 | Secretary (July 2018 to present) | Senior Attorney of Ultimus Fund Solutions, LLC (2018 to present); General Counsel of The Nottingham Company (2014 to 2018) |
Charles C. Black Year of Birth: 1979 | Since 2015 | Chief Compliance Officer (January 2016 to present)
Assistant Chief Compliance Officer (April 2015 to January 2016) | Senior Compliance Officer of Ultimus Fund Solutions, LLC (2015 to present); Chief Compliance Officer of The Caldwell & Orkin Funds, Inc. (2016 to present); Senior Compliance Manager at Touchstone Mutual Funds (2013 to 2015); Senior Compliance Manager at Fund Evaluation Group (2011 to 2013) |
Additional information about members of the Board and executive officers is available in the Fund’s Statement of Additional Information (“SAI”). To obtain a free copy of the SAI, please call 1-800-665-9778.
28
This page intentionally left blank.
| Item 2. | Code of Ethics. |
As of the end of the period covered by this report, the registrant has adopted a code of ethics that applies to the registrant’s principal executive officer, principal financial officer, principal accounting officer or controller, or persons performing similar functions, regardless of whether these individuals are employed by the registrant or a third party. Pursuant to Item 12(a)(1), a copy of registrant’s code of ethics is filed as an exhibit to this Form N-CSR. During the period covered by this report, the code of ethics has not been amended, and the registrant has not granted any waivers, including implicit waivers, from the provisions of the code of ethics.
| Item 3. | Audit Committee Financial Expert. |
The registrant’s board of trustees has determined that the registrant has at least one audit committee financial expert serving on its audit committee. The name of the audit committee financial expert is David M. Deptula. Mr. Deptula is “independent” for purposes of this Item.
| Item 4. | Principal Accountant Fees and Services. |
| (a) | Audit Fees. The aggregate fees billed for professional services rendered by the principal accountant for the audit of the registrant’s annual financial statements or for services that are normally provided by the accountant in connection with statutory and regulatory filings or engagements were $13,500 and $13,700 with respect to the registrant’s fiscal years ended July 31, 2017 and July 31, 2018, respectively. |
| (b) | Audit-Related Fees. No fees were billed in the first fiscal period for assurance and related services by the principal accountant that are reasonably related to the performance of the audit of the registrant’s financial statements and are not reported under paragraph (a) of this Item. |
| (c) | Tax Fees. The aggregate fees billed for professional services rendered by the principal accountant for tax compliance, tax advice, and tax planning were $2,000 and $2,000 with respect to the registrant’s fiscal years ended July 31, 2017, and July 31, 2018, respectively. The services comprising these fees are the preparation of the registrant’s federal income and excise tax returns. |
| (d) | All Other Fees. No fees were billed in the first fiscal period for products and services provided by the principal accountant, other than the services reported in paragraphs (a) through (c) of this Item. |
| (e)(1) | The audit committee has not adopted pre-approval policies and procedures described in paragraph (c)(7) of Rule 2-01 of Regulation S-X. |
| (e)(2) | None of the services described in paragraph (b) through (d) of this Item were approved by the audit committee pursuant to paragraph (c)(7)(i)(C) of Rule 2-01 of Regulation S-X. |
| (f) | Less than 50% of hours expended on the principal accountant’s engagement to audit the registrant’s financial statements for the most recent fiscal year were attributed to work performed by persons other than the principal accountant’s full-time, permanent employees. |
| (g) | During the fiscal years ended July 31, 2017 and July 31, 2018, aggregate non-audit fees of $2,000 and $2,000, respectively, were billed by the registrant’s accountant for services rendered to the registrant. No non-audit fees were billed in the last fiscal year by the registrant’s accountant for services rendered to the registrant’s investment adviser (not including any sub-adviser whose role is primarily portfolio management and is subcontracted with or overseen by another investment adviser), and any entity controlling, controlled by, or under common control with the adviser that provides ongoing services to the registrant. |
| (h) | The principal accountant has not provided any non-audit services to the registrant’s investment adviser (not including any sub-adviser whose role is primarily portfolio management and is subcontracted with or overseen by another investment adviser), and any entity controlling, controlled by, or under common control with the investment adviser that provides ongoing services to the registrant. |
| Item 5. | Audit Committee of Listed Registrants. |
Not applicable
| Item 6. | Schedule of Investments. |
| (a) | Not applicable [schedule filed with Item 1] |
| (b) | Not applicable |
| Item 7. | Disclosure of Proxy Voting Policies and Procedures for Closed-End Management Investment Companies. |
Not applicable
| Item 8. | Portfolio Managers of Closed-End Management Investment Companies. |
Not applicable
| Item 9. | Purchases of Equity Securities by Closed-End Management Investment Company and Affiliated Purchasers. |
Not applicable
| Item 10. | Submission of Matters to a Vote of Security Holders. |
The registrant’s Committee of Independent Trustees shall review shareholder recommendations to fill vacancies on the registrant’s board of trustees if such recommendations are submitted in writing, addressed to the Committee at the registrant’s offices and meet any minimum qualifications adopted by the Committee. The Committee may adopt, by resolution, a policy regarding its procedures for considering candidates for the board of trustees, including any recommended by shareholders.
| Item 11. | Controls and Procedures. |
(a) Based on their evaluation of the registrant’s disclosure controls and procedures (as defined in Rule 30a-3(c) under the Investment Company Act of 1940) as of a date within 90 days of the filing date of this report, the registrant’s principal executive officer and principal financial officer have concluded that such disclosure controls and procedures are reasonably designed and are operating effectively to ensure that material information relating to the registrant, including its consolidated subsidiaries, is made known to them by others within those entities, particularly during the period in which this report is being prepared, and that the information required in filings on Form N-CSR is recorded, processed, summarized, and reported on a timely basis.
(b) There were no changes in the registrant’s internal control over financial reporting (as defined in Rule 30a-3(d) under the Investment Company Act of 1940) that occurred during the second fiscal quarter of the period covered by this report that have materially affected, or are reasonably likely to materially affect, the registrant’s internal control over financial reporting.
| Item 12. | Disclosure of Securities Lending Activities for Closed-End Management Investment Companies. |
Not applicable.
| Item 13. | Exhibits. |
File the exhibits listed below as part of this Form. Letter or number the exhibits in the sequence indicated.
(a)(1) Any code of ethics, or amendment thereto, that is the subject of the disclosure required by Item 2, to the extent that the registrant intends to satisfy the Item 2 requirements through filing of an exhibit: Attached hereto
(a)(2) A separate certification for each principal executive officer and principal financial officer of the registrant as required by Rule 30a-2(a) under the Act (17 CFR 270.30a-2(a)): Attached hereto
(a)(3) Any written solicitation to purchase securities under Rule 23c-1 under the Act (17 CFR 270.23c-1) sent or given during the period covered by the report by or on behalf of the registrant to 10 or more persons: Not applicable
(a)(4) Change in the registrant’s independent public accountants: Not applicable.
(b) Certifications required by Rule 30a-2(b) under the Act (17 CFR 270.30a-2(b)): Attached hereto
| Exhibit 99.CODE ETH | Code of Ethics |
| Exhibit 99.CERT | Certifications required by Rule 30a-2(a) under the Act |
| Exhibit 99.906CERT | Certifications required by Rule 30a-2(b) under the Act |
SIGNATURES
Pursuant to the requirements of the Securities Exchange Act of 1934 and the Investment Company Act of 1940, the registrant has duly caused this report to be signed on its behalf by the undersigned, thereunto duly authorized.
| (Registrant) | Ultimus Managers Trust | ||
| By (Signature and Title)* | /s/ Matthew J. Beck | ||
| Matthew J. Beck, Secretary | |||
| Date | October 2, 2018 | ||
| Pursuant to the requirements of the Securities Exchange Act of 1934 and the Investment Company Act of 1940, this report has been signed below by the following persons on behalf of the registrant and in the capacities and on the dates indicated. | |||
| By (Signature and Title)* | /s/ David R. Carson | ||
| David R. Carson, Principal Executive Officer of Kempner Multi-Cap Deep Value Fund | |||
| Date | October 2, 2018 | ||
| By (Signature and Title)* | /s/ Jennifer L. Leamer | ||
| Jennifer L. Leamer, Treasurer and Principal Financial Officer | |||
| Date | October 2, 2018 | ||
| * | Print the name and title of each signing officer under his or her signature. |