| OMB APPROVAL |
OMB Number: 3235-0570
Expires: August 31, 2020
Estimated average burden hours per response: 20.6 |
UNITED STATES
SECURITIES AND EXCHANGE COMMISSION
Washington, D.C. 20549
FORM N-CSR
CERTIFIED SHAREHOLDER REPORT OF REGISTERED
MANAGEMENT INVESTMENT COMPANY
| Investment Company Act file number | 811-22680 |
| Ultimus Managers Trust |
| (Exact name of registrant as specified in charter) |
| 225 Pictoria Drive, Suite 450 Cincinnati, Ohio | 45246 |
| (Address of principal executive offices) | (Zip code) |
Matthew J. Beck
| Ultimus Fund Solutions, LLC 225 Pictoria Drive, Suite 450 Cincinnati, Ohio 45246 |
| (Name and address of agent for service) |
| Registrant's telephone number, including area code: | (513) 587-3400 |
| Date of fiscal year end: | August 31 | |
| Date of reporting period: | August 31, 2018 |
Form N-CSR is to be used by management investment companies to file reports with the Commission not later than 10 days after the transmission to stockholders of any report that is required to be transmitted to stockholders under Rule 30e-1 under the Investment Company Act of 1940 (17 CFR 270.30e-1). The Commission may use the information provided on Form N-CSR in its regulatory, disclosure review, inspection, and policymaking roles.
A registrant is required to disclose the information specified by Form N-CSR, and the Commission will make this information public. A registrant is not required to respond to the collection of information contained in Form N-CSR unless the Form displays a currently valid Office of Management and Budget ("OMB") control number. Please direct comments concerning the accuracy of the information collection burden estimate and any suggestions for reducing the burden to the Secretary, Securities and Exchange Commission, 450 Fifth Street, NW, Washington, DC 20549-0609. The OMB has reviewed this collection of information under the clearance requirements of 44 U.S.C. § 3507.
| Item 1. | Reports to Stockholders. |

Alambic Small Cap Value Plus Fund (ALAMX)
Alambic Small Cap Growth Plus Fund (ALGSX)
Alambic Mid Cap Value Plus Fund (ALMVX)
Alambic Mid Cap Growth Plus Fund (ALMGX)
Annual Report
August 31, 2018
ALAMBIC FUNDS | October 2018 |
Dear Alambic Funds Shareholder:
We are once again pleased to present you with the Alambic Funds’ Annual Report for our fiscal year ended August 31, 2018. This has been an interesting period in the US equity markets and, while portfolio management has been challenging, opportunities for small and mid-cap investors are plentiful for managers with the right strategy. We are honored to have had your support over the past year while we continued to refine our portfolios and validate our belief that a long-term view and disciplined systematic approach to fundamental investing will reward patient, value-focused investors.
The past fiscal year has been dominated first by the expectation, and then reality, of tax cuts, which drove multiples to near historical highs. During this period of “risk on” trading, growth and momentum stocks have consistently outperformed value stocks, and valuation has diminished as a return forecasting factor. Recent concerns over rising inflation, tighter Fed policy, and trade related conflicts have introduced higher volatility. However, volatility has dropped once again as investors appear to ignore the macro challenges for the time being.
Currently, US equities remain broadly expensive vs. history, with every size segment trading at double digit premiums to their historical median valuations. Earnings growth in many cases justifies current levels, but with shares being priced for near perfect results, many firms, particularly in the rapid growth sectors, are vulnerable to disappointing news. It appears that this is not a very popular bull market and, while the equity market keeps rising, investors seem to be focused on what will take the market lower instead of higher.
Performance Review
Alambic Small Cap Value Plus Fund (“ALAMX”)
For the fiscal year ended 8/31/2018, ALAMX delivered a total return of 19.36%, compared to the 20.05% return for its benchmark, the Russel 2000 Value® Index. At the end of the fiscal year, this fund was placed in the 42nd percentile of its small cap value peers according to Morningstar. The Fund’s portfolio is managed with a focus on equities that are attractive from a fundamental value perspective and have a very low allocation to growth or momentum stocks. The Fund’s portfolio also tends to have a bias more towards smaller small cap stocks than most of our peer managers, and we tend to be underweight in the financial sector as well. The Funds’ portfolios continue to be built with a systematic, disciplined risk-controlled process, with the goal of delivering excess returns over time.
With the exception of periods where our underweight in financials hurt our performance, we have generally either tracked or beat our benchmark index, the Russell 2000 Value Index. Given that we use almost no growth or momentum factors for this portfolio during the selection process, we are happy with our returns.
Alambic Small Cap Growth Plus Fund (“ALGSX”)
For the fiscal year ended 8/31/2018, ALGSX delivered a total return of 21.31%, compared to the 30.72% return for its benchmark, the Russell 2000 Growth® Index. The Fund’s portfolio Is managed with a focus on smaller market cap equities that score well on traditional growth factors, such as sales growth, cash flow growth and book value growth. Given our fundamental
1
value bias, we also include value-oriented stocks with certain growth characteristics, which results in our characteristic “value tilt.” Thus, we expect the Fund’s portfolio to outperform its benchmark during market cycles where value stocks outperform growth stocks. During periods where the value and growth stocks’ relative performance is roughly equivalent, we would expect our performance to exceed the benchmark over time, but by a lesser amount. Since inception, this fund has delivered an average annual total return of 18.33%.
Over the past 12 months, growth stocks have consistently outperformed value stocks. Our value bias in this fund relative to other small cap growth funds is reflected in its underperformance this year relative to its benchmark and its peer group. As growth stocks are now very expensive relative to value and earnings, we are broadening out across both sectors and expect this market trend to begin to reverse.
Alambic Mid Cap Value Plus Fund (“ALMVX”)
For the fiscal year ended 8/31/2018, ALMVX delivered a total return of 12.46%, compared to the 12.67% return for its benchmark, the Russell Mid Cap Value® Index. We manage the Fund’s portfolio without the traditional biases of our small cap funds relating to value factors and portfolio average market caps. Our focus on fundamental value stock selection, and the fact that we have avoided intentional portfolio biases, has resulted in returns during the past year that have often exceeded the benchmark.
As this fund was launched less than 2 years ago, its net assets are significantly lower than our small cap funds and, as a result, we carry fewer positions. This results in less diversification than the two small cap funds we manage, and sector weights and individual stocks can have a greater proportional impact on ALMVX’s performance than in those other funds. In the past year, occasional disappointing stock picks had a measurable impact on the fund’s performance, which would have been substantially reduced with a larger number of positions. Although we are pleased with the performance of this fund, we expect performance variability relative to its benchmark to decline as net assets increase.
Alambic Mid Cap Growth Plus Fund (“ALMGX”)
For the fiscal year ended 8/31/2018, ALMGX delivered a total return of 15.56%, compared to the 25.06% return for its benchmark, the Russell Mid Cap Growth® Index. Consistent with our small cap growth fund, the Fund’s portfolio has a significant position in mid cap growth stocks, but also includes a significant number of value stocks that have certain growth characteristics. On a style basis, this fund is intentionally aligned more towards mid-cap core than mid cap growth. We expect this value bias to negatively impact the portfolio in strong growth/momentum driven markets, and this is what we experienced during the fiscal year. Conversely, we believe this fund should perform well relative to its benchmark in strong value driven markets.
As with the mid cap growth fund, this fund also has relatively low net assets and, thus, a considerably smaller number of positions than the small cap funds we manage. As it is difficult to maintain similar sector and market segment weights in this fund relative to its benchmark because of its small size, sector and segment imbalances are amplified.
We now have a three-year track record with the Alambic Small Cap Value Fund. We are developing a deeper understanding of how this fund, along with our more recent funds, performs in different market conditions. In some cases, we have tweaked our model to achieve a lower tracking error to our benchmarks, but in most cases, we will promote each fund with
2
the knowledge of its individual idiosyncrasies. We prefer to rely on our model’s long-term predictive characteristics and our systematic approach and will resist reacting to portfolio effects we see in the “rear view mirror.” We will continue to work on building optimal portfolios that will provide attractive returns over time, relative to each fund’s benchmark and its peers.
Thank you for your ongoing trust and commitment.
Sincerely
Albert Richards | Brian Thompson | Rob Slaymaker |
CEO | CRO | Partner |
Past performance is not predictive of future performance. Investment results and principal value will fluctuate so that shares, when redeemed, may be worth more or less than their original cost. Current performance may be higher or lower than the performance data quoted. Performance data current to the most recent month end are available by calling 1-888-890-8988.
An investor should consider the investment objectives, risks, charges and expenses of the Funds carefully before investing. The Funds’ prospectus contains this and other important information. To obtain a copy of the Funds’ prospectus, please visit our website at http://alambicfunds.com or call 1-888-890-8988 and a copy will be sent to you free of charge. Please read the prospectus carefully before you invest. The Alambic Funds are distributed by Ultimus Fund Distributors, LLC.
The Letter to Shareholders seeks to describe some of the Adviser’s current opinions and views of the financial markets. Although the Adviser believes it has a reasonable basis for any opinions or views expressed, actual results may differ, sometimes significantly so, from those expected or expressed. The securities held by the Funds that are discussed in the Letter to Shareholders were held during the period covered by this Report. They do not comprise the entire investment portfolio of the Funds, may be sold at any time and may no longer be held by the Funds. For a complete list of securities held by the Funds as of August 31, 2018, please see the Schedule of Investments sections of the Annual Report. The opinions of the Funds’ Adviser with respect to those securities may change at any time.
Statements in the Letter to Shareholders that reflect projections or expectations for future financial or economic performance of the Funds and the market in general and statements of the Funds’ plans and objectives for future operations are forward-looking statements. No assurance can be given that actual results or events will not differ materially from those projected, estimated, assumed, or anticipated in any such forward-looking statements. Important factors that could result in such differences, in addition to factors noted with such forward-looking statements include, without limitation, general economic conditions, such as inflation, recession, and interest rates. Past performance is not a guarantee of future results.
3
ALAMBIC SMALL CAP VALUE PLUS FUND
PERFORMANCE INFORMATION
August 31, 2018 (Unaudited)
Comparison of the Change in Value of a $10,000 Investment
in Alambic Small Cap Value Plus Fund versus the
Russell 2000® Value Index.
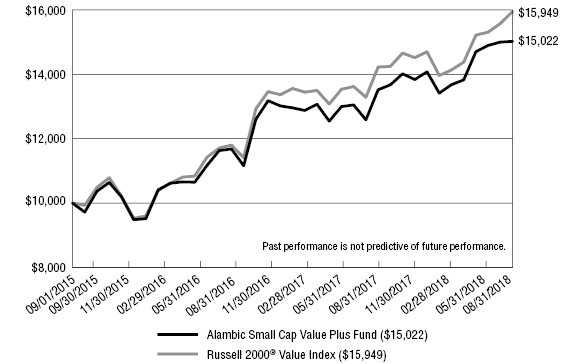
Average Annual Total Returns | |||
1 Year | Since | ||
Alambic Small Cap Value Plus Fund(a) | 19.36% | 14.53% | |
Russell 2000® Value Index | 20.05% | 16.84% | |
(a) | The total returns shown do not reflect the deduction of taxes a shareholder would pay on Fund distributions, if any, or the redemption of Fund Shares. |
(b) | Commencement of operations for Alambic Small Cap Value Plus Fund was September 1, 2015. |
4
ALAMBIC SMALL CAP GROWTH PLUS FUND
PERFORMANCE INFORMATION
August 31, 2018 (Unaudited)
Comparison of the Change in Value of a $10,000 Investment
in Alambic Small Cap Growth Plus Fund versus the
Russell 2000® Growth Index.
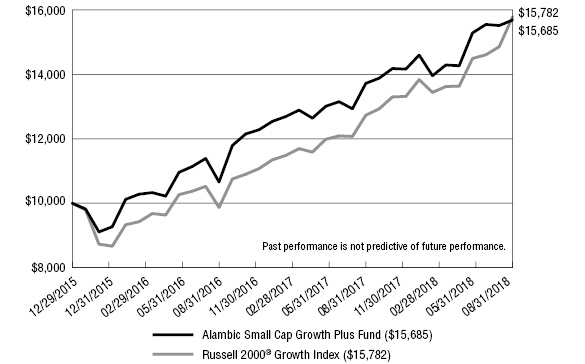
Average Annual Total Returns | |||
1 Year | Since | ||
Alambic Small Cap Growth Plus Fund(a) | 21.31% | 18.33% | |
Russell 2000® Growth Index | 30.72% | 18.61% | |
(a) | The total returns shown do not reflect the deduction of taxes a shareholder would pay on Fund distributions, if any, or the redemption of Fund Shares. |
(b) | Commencement of operations for Alambic Small Cap Growth Plus Fund was December 29, 2015. |
5
ALAMBIC MID CAP VALUE PLUS FUND
PERFORMANCE INFORMATION
August 31, 2018 (Unaudited)
Comparison of the Change in Value of a $10,000 Investment
in Alambic Mid Cap Value Plus Fund versus the
Russell Mid Cap Value Index.
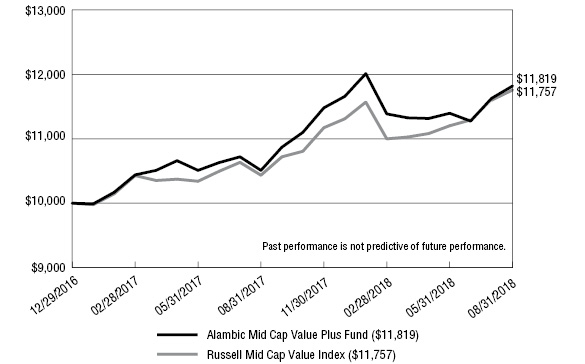
Average Annual Total Returns | |||
1 Year | Since | ||
Alambic Mid Cap Value Plus Fund(a) | 12.46% | 10.52% | |
Russell Mid Cap Value Index | 12.67% | 10.17% | |
(a) | The total returns shown do not reflect the deduction of taxes a shareholder would pay on Fund distributions, if any, or the redemption of Fund Shares. |
(b) | Commencement of operations for Alambic Mid Cap Value Plus Fund was December 29, 2016. |
6
ALAMBIC MID CAP GROWTH PLUS FUND
PERFORMANCE INFORMATION
August 31, 2018 (Unaudited)
Comparison of the Change in Value of a $10,000 Investment
in Alambic Mid Cap Growth Plus Fund versus the
Russell Mid Cap Growth Index.
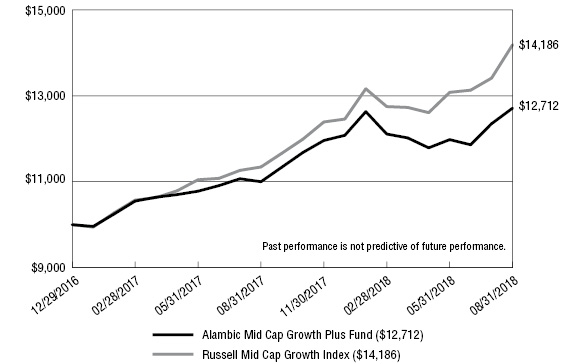
Average Annual Total Returns | |||
1 Year | Since | ||
Alambic Mid Cap Growth Plus Fund(a) | 15.56% | 15.44% | |
Russell Mid Cap Growth Index | 25.06% | 23.27% | |
(a) | The total returns shown do not reflect the deduction of taxes a shareholder would pay on Fund distributions, if any, or the redemption of Fund Shares. |
(b) | Commencement of operations for Alambic Mid Cap Growth Plus Fund was December 29, 2016. |
7
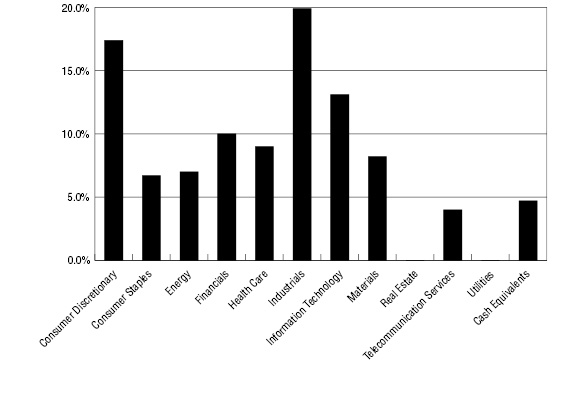
ALAMBIC SMALL CAP VALUE PLUS FUND
PORTFOLIO INFORMATION
August 31, 2018 (Unaudited)
Sector Diversification (% of Net Assets)
Top 10 Equity Holdings
Security Description | % of Net Assets |
ARC Document Solutions, Inc. | 2.6% |
Tredegar Corporation | 2.5% |
DSP Group, Inc. | 2.3% |
Xcerra Corporation | 2.2% |
Tower International, Inc. | 2.0% |
Bridgepoint Education, Inc. | 1.9% |
Speedway Motorsports, Inc. | 1.8% |
Ooma, Inc. | 1.8% |
Nautilus, Inc. | 1.6% |
Acacia Research Corporation | 1.6% |
8
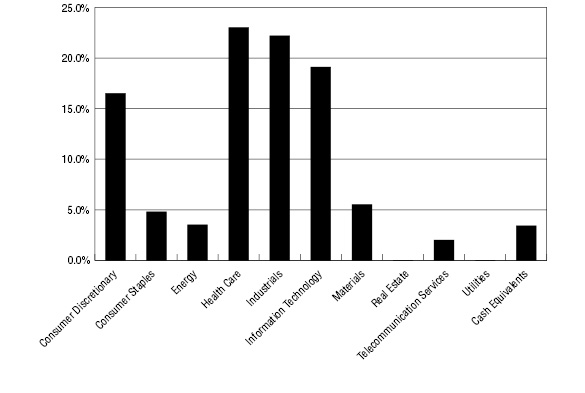
ALAMBIC SMALL CAP GROWTH PLUS FUND
PORTFOLIO INFORMATION
August 31, 2018 (Unaudited)
Sector Diversification (% of Net Assets)
Top 10 Equity Holdings
Security Description | % of Net Assets |
Xcerra Corporation | 3.0% |
Tredegar Corporation | 2.2% |
Commercial Vehicle Group, Inc. | 2.1% |
Tower International, Inc. | 1.9% |
DSP Group, Inc. | 1.9% |
Pfenex, Inc. | 1.7% |
Luminex Corporation | 1.7% |
EVERTEC, Inc. | 1.7% |
Natural Grocers by Vitamin Cottage, Inc. | 1.7% |
XO Group, Inc. | 1.6% |
9
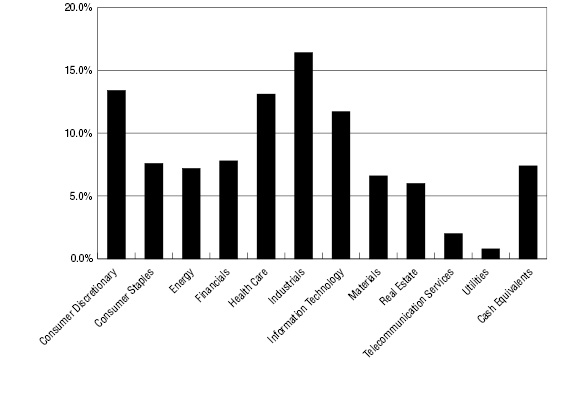
ALAMBIC MID CAP VALUE PLUS FUND
PORTFOLIO INFORMATION
August 31, 2018 (Unaudited)
Sector Diversification (% of Net Assets)
Top 10 Equity Holdings
Security Description | % of Net Assets |
Archer-Daniels-Midland Company | 2.7% |
AGCO Corporation | 2.6% |
Bio-Rad Laboratories, Inc. - Class A | 2.4% |
Xerox Corporation | 2.3% |
Allison Transmission Holdings, Inc. | 2.1% |
Hewlett Packard Enterprise Company | 2.0% |
United States Cellular Corporation | 2.0% |
Textron, Inc. | 1.8% |
Hunstman Corporation | 1.7% |
Viacom, Inc. - Class B | 1.6% |
10
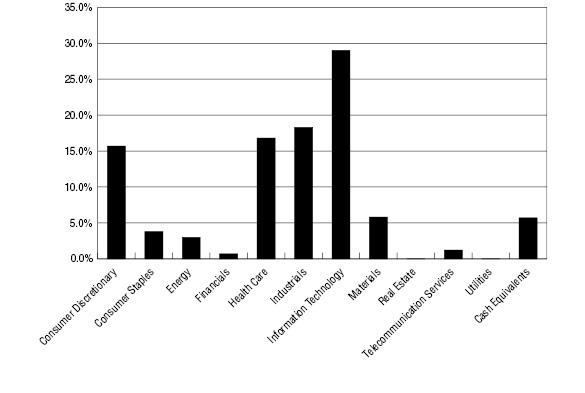
ALAMBIC MID CAP GROWTH PLUS FUND
PORTFOLIO INFORMATION
August 31, 2018 (Unaudited)
Sector Diversification (% of Net Assets)
Top 10 Equity Holdings
Security Description | % of Net Assets |
AGCO Corporation | 2.8% |
Xerox Corporation | 2.2% |
Bio-Rad Laboratories, Inc. - Class A | 2.2% |
Allison Transmission Holdings, Inc. | 2.2% |
Hewlett Packard Enterprise Company | 2.2% |
WestRock Company | 1.9% |
CA, Inc. | 1.8% |
Archer-Daniels-Midland Company | 1.7% |
Zebra Technologies Corporation - Class A | 1.7% |
Laureate Education, Inc. - Class A | 1.6% |
11
ALAMBIC SMALL CAP VALUE PLUS FUND | ||||||||
COMMON STOCKS — 95.3% | Shares | Value | ||||||
Consumer Discretionary — 17.4% | ||||||||
Auto Components — 3.1% | ||||||||
Stoneridge, Inc. (a) | 781 | $ | 23,375 | |||||
Tenneco, Inc. | 250 | 10,698 | ||||||
Tower International, Inc. | 2,000 | 67,600 | ||||||
| 101,673 | ||||||||
Distributors — 0.2% | ||||||||
VOXX International Corporation (a) | 1,459 | 7,879 | ||||||
Diversified Consumer Services — 4.3% | ||||||||
American Public Education, Inc. (a) | 600 | 20,850 | ||||||
Bridgepoint Education, Inc. (a) | 5,455 | 64,151 | ||||||
K12, Inc. (a) | 2,450 | 40,572 | ||||||
Laureate Education, Inc. - Class A (a) | 1,100 | 17,567 | ||||||
| 143,140 | ||||||||
Hotels, Restaurants & Leisure — 2.5% | ||||||||
Carrols Restaurant Group, Inc. (a) | 200 | 3,160 | ||||||
Potbelly Corporation (a) | 1,487 | 20,149 | ||||||
Speedway Motorsports, Inc. | 3,400 | 60,826 | ||||||
| 84,135 | ||||||||
Household Durables — 1.2% | ||||||||
Bassett Furniture Industries, Inc. | 380 | 8,873 | ||||||
Flexsteel Industries, Inc. | 834 | 29,757 | ||||||
| 38,630 | ||||||||
Leisure Products — 1.6% | ||||||||
Nautilus, Inc. (a) | 3,587 | 52,550 | ||||||
Media — 3.5% | ||||||||
Gannett Company, Inc. | 1,700 | 17,476 | ||||||
Lee Enterprises, Inc. (a) | 17,729 | 50,528 | ||||||
MSG Networks, Inc. - Class A (a) | 1,165 | 28,309 | ||||||
Townsquare Media, Inc. - Class A (a) | 300 | 2,679 | ||||||
tronc, Inc. (a) | 1,012 | 16,698 | ||||||
| 115,690 | ||||||||
Specialty Retail — 0.5% | ||||||||
Ascena Retail Group, Inc. (a) | 2,100 | 9,618 | ||||||
Citi Trends, Inc. | 200 | 6,188 | ||||||
| 15,806 | ||||||||
Textiles, Apparel & Luxury Goods — 0.5% | ||||||||
Movado Group, Inc. | 200 | 8,520 | ||||||
Vera Bradley, Inc. (a) | 472 | 6,919 | ||||||
| 15,439 | ||||||||
12
See accompanying notes to financial statements.
ALAMBIC SMALL CAP VALUE PLUS FUND | ||||||||
COMMON STOCKS — 95.3% (Continued) | Shares | Value | ||||||
Consumer Staples — 6.7% | ||||||||
Beverages — 0.5% | ||||||||
Boston Beer Company, Inc. (The) - Class A (a) | 20 | $ | 6,063 | |||||
Coca-Cola Bottling Company Consolidated | 40 | 6,782 | ||||||
Keurig Dr Pepper, Inc. | 100 | 2,280 | ||||||
| 15,125 | ||||||||
Food & Staples Retailing — 3.2% | ||||||||
Natural Grocers by Vitamin Cottage, Inc. (a) | 2,630 | 51,048 | ||||||
SpartanNash Company | 424 | 9,052 | ||||||
Village Super Market, Inc. - Class A | 1,609 | 46,951 | ||||||
| 107,051 | ||||||||
Food Products — 0.5% | ||||||||
Dean Foods Company | 2,196 | 16,734 | ||||||
Household Products — 2.3% | ||||||||
Central Garden & Pet Company - Class A (a) | 800 | 29,064 | ||||||
Oil-Dri Corporation of America | 1,150 | 46,748 | ||||||
| 75,812 | ||||||||
Personal Products — 0.2% | ||||||||
LifeVantage Corporation (a) | 500 | 6,280 | ||||||
Energy — 7.0% | ||||||||
Energy Equipment & Services — 1.5% | ||||||||
FTS International, Inc. (a) | 600 | 6,618 | ||||||
Helix Energy Solutions Group, Inc. (a) | 300 | 2,808 | ||||||
Mammoth Energy Services, Inc. | 800 | 21,984 | ||||||
Pioneer Energy Services Corporation (a) | 1,268 | 4,057 | ||||||
Superior Energy Services, Inc. (a) | 1,091 | 9,819 | ||||||
Unit Corporation (a) | 200 | 5,258 | ||||||
| 50,544 | ||||||||
Oil, Gas & Consumable Fuels — 5.5% | ||||||||
Adams Resources & Energy, Inc. | 1,018 | 46,727 | ||||||
Evolution Petroleum Corporation | 1,900 | 19,095 | ||||||
Overseas Shipholding Group, Inc. - Class A (a) | 10,712 | 36,742 | ||||||
PBF Energy, Inc. - Class A | 50 | 2,596 | ||||||
Renewable Energy Group, Inc. (a) | 600 | 16,170 | ||||||
VAALCO Energy, Inc. (a) | 14,379 | 34,797 | ||||||
W&T Offshore, Inc. (a) | 3,656 | 24,751 | ||||||
| 180,878 | ||||||||
Financials — 10.0% | ||||||||
Banks — 9.9% | ||||||||
Associated Banc-Corp | 300 | 8,175 | ||||||
Cadence Bancorporation | 600 | 16,950 | ||||||
Cathay General Bancorp | 200 | 8,460 | ||||||
13
See accompanying notes to financial statements.
ALAMBIC SMALL CAP VALUE PLUS FUND | ||||||||
COMMON STOCKS — 95.3% (Continued) | Shares | Value | ||||||
Financials — 10.0% (Continued) | ||||||||
Banks — 9.9% (Continued) | ||||||||
Chemical Financial Corporation | 550 | $ | 31,416 | |||||
Columbia Banking System, Inc. | 350 | 14,788 | ||||||
Community Bank System, Inc. | 150 | 9,920 | ||||||
Customers Bancorp, Inc. (a) | 100 | 2,470 | ||||||
CVB Financial Corporation | 100 | 2,405 | ||||||
First Busey Corporation | 100 | 3,205 | ||||||
First Citizens BancShares, Inc. - Class A | 10 | 4,750 | ||||||
First Financial Bancorp | 300 | 9,420 | ||||||
First Financial Bankshares, Inc. | 100 | 6,040 | ||||||
First Midwest Bancorp, Inc. | 300 | 8,154 | ||||||
Fulton Financial Corporation | 300 | 5,460 | ||||||
Glacier Bancorp, Inc. | 100 | 4,568 | ||||||
Great Western Bancorp, Inc. | 500 | 21,770 | ||||||
Hancock Whitney Corporation | 300 | 15,465 | ||||||
Heartland Financial USA, Inc. | 150 | 9,120 | ||||||
Home BancShares, Inc. | 200 | 4,682 | ||||||
Hope Bancorp, Inc. | 600 | 10,506 | ||||||
IBERIABANK Corporation | 90 | 7,799 | ||||||
Independent Bank Corporation | 20 | 1,822 | ||||||
Independent Bank Group, Inc. | 50 | 3,463 | ||||||
International Bancshares Corporation | 50 | 2,342 | ||||||
MB Financial, Inc. | 200 | 9,692 | ||||||
Preferred Bank | 50 | 3,060 | ||||||
Renasant Corporation | 150 | 7,003 | ||||||
Republic First Bancorp, Inc. (a) | 500 | 3,900 | ||||||
ServisFirst Bancshares, Inc. | 150 | 6,465 | ||||||
Simmons First National Corporation - Class A | 200 | 6,320 | ||||||
South State Corporation | 260 | 21,437 | ||||||
TCF Financial Corporation | 200 | 5,070 | ||||||
UMB Financial Corporation | 180 | 13,543 | ||||||
United Bankshares, Inc. | 400 | 15,760 | ||||||
United Community Banks, Inc. | 600 | 18,204 | ||||||
Valley National Bancorp | 400 | 4,820 | ||||||
| 328,424 | ||||||||
Insurance — 0.1% | ||||||||
American Equity Investment Life Holding Company | 100 | 3,709 | ||||||
Health Care — 9.0% | ||||||||
Biotechnology — 2.5% | ||||||||
Acorda Therapeutics, Inc. (a) | 300 | 8,640 | ||||||
Calithera Biosciences, Inc. (a) | 1,499 | 8,170 | ||||||
14
See accompanying notes to financial statements.
ALAMBIC SMALL CAP VALUE PLUS FUND | ||||||||
COMMON STOCKS — 95.3% (Continued) | Shares | Value | ||||||
Health Care — 9.0% (Continued) | ||||||||
Biotechnology — 2.5% (Continued) | ||||||||
Jounce Therapeutics, Inc. (a) | 1,894 | $ | 14,868 | |||||
Pfenex, Inc. (a) | 7,580 | 40,022 | ||||||
REGENXBIO, Inc. (a) | 50 | 3,522 | ||||||
Vanda Pharmaceuticals, Inc. (a) | 400 | 7,730 | ||||||
| 82,952 | ||||||||
Health Care Equipment & Supplies — 2.9% | ||||||||
Accuray, Inc. (a) | 2,567 | 10,268 | ||||||
AngioDynamics, Inc. (a) | 920 | 20,626 | ||||||
RTI Surgical, Inc. (a) | 5,465 | 24,456 | ||||||
Varex Imaging Corporation (a) | 1,300 | 40,820 | ||||||
| 96,170 | ||||||||
Health Care Providers & Services — 0.3% | ||||||||
American Renal Associates Holdings, Inc. (a) | 386 | 8,473 | ||||||
Health Care Technology — 1.9% | ||||||||
Allscripts Healthcare Solutions, Inc. (a) | 2,500 | 36,525 | ||||||
HealthStream, Inc. | 300 | 9,519 | ||||||
Quality Systems, Inc. (a) | 800 | 18,312 | ||||||
| 64,356 | ||||||||
Life Sciences Tools & Services — 1.0% | ||||||||
Luminex Corporation | 1,200 | 33,852 | ||||||
Pharmaceuticals — 0.4% | ||||||||
Assertio Therapeutics, Inc. (a) | 300 | 1,914 | ||||||
Lannett Company, Inc. (a) | 2,200 | 11,770 | ||||||
| 13,684 | ||||||||
Industrials — 19.9% | ||||||||
Aerospace & Defense — 2.0% | ||||||||
Engility Holdings, Inc. (a) | 200 | 6,942 | ||||||
Esterline Technologies Corporation (a) | 500 | 42,975 | ||||||
Moog, Inc. - Class A | 200 | 15,782 | ||||||
| 65,699 | ||||||||
Building Products — 1.9% | ||||||||
Armstrong Flooring, Inc. (a) | 1,964 | 34,390 | ||||||
NCI Building Systems, Inc. (a) | 1,800 | 30,420 | ||||||
| 64,810 | ||||||||
Commercial Services & Supplies — 3.6% | ||||||||
ARC Document Solutions, Inc. (a) | 26,200 | 84,364 | ||||||
Brady Corporation - Class A | 421 | 17,029 | ||||||
Kimball International, Inc. - Class B | 1,000 | 17,470 | ||||||
| 118,863 | ||||||||
15
See accompanying notes to financial statements.
ALAMBIC SMALL CAP VALUE PLUS FUND | ||||||||
COMMON STOCKS — 95.3% (Continued) | Shares | Value | ||||||
Industrials — 19.9% (Continued) | ||||||||
Construction & Engineering — 1.3% | ||||||||
HC2 Holdings, Inc. (a) | 2,400 | $ | 15,048 | |||||
Orion Group Holdings, Inc. (a) | 3,100 | 26,722 | ||||||
| 41,770 | ||||||||
Electrical Equipment — 2.1% | ||||||||
Allied Motion Technologies, Inc. | 200 | 9,768 | ||||||
Atkore International Group, Inc. (a) | 600 | 16,428 | ||||||
Preformed Line Products Company | 540 | 44,118 | ||||||
| 70,314 | ||||||||
Machinery — 5.6% | ||||||||
AGCO Corporation | 550 | 32,813 | ||||||
Commercial Vehicle Group, Inc. (a) | 3,531 | 34,463 | ||||||
Global Brass & Copper Holdings, Inc. | 400 | 15,420 | ||||||
Hurco Companies, Inc. | 875 | 37,537 | ||||||
L.B. Foster Company - Class A (a) | 2,136 | 48,594 | ||||||
Meritor, Inc. (a) | 700 | 15,162 | ||||||
| 183,989 | ||||||||
Professional Services — 2.0% | ||||||||
Acacia Research Corporation (a) | 13,318 | 51,940 | ||||||
Heidrick & Struggles International, Inc. | 300 | 13,260 | ||||||
| 65,200 | ||||||||
Road & Rail — 0.7% | ||||||||
Covenant Transportation Group, Inc. - Class A (a) | 33 | 986 | ||||||
YRC Worldwide, Inc. (a) | 2,477 | 23,705 | ||||||
| 24,691 | ||||||||
Trading Companies & Distributors — 0.7% | ||||||||
BMC Stock Holdings, Inc. (a) | 500 | 11,250 | ||||||
Nexeo Solutions, Inc. (a) | 1,127 | 11,281 | ||||||
| 22,531 | ||||||||
Information Technology — 13.1% | ||||||||
Communications Equipment — 0.4% | ||||||||
Bel Fuse, Inc. - Class B | 200 | 5,730 | ||||||
Calix, Inc. (a) | 900 | 7,020 | ||||||
| 12,750 | ||||||||
Electronic Equipment, Instruments & Components — 0.4% | ||||||||
Insight Enterprises, Inc. (a) | 100 | 5,514 | ||||||
Vishay Precision Group, Inc. (a) | 200 | 8,660 | ||||||
| 14,174 | ||||||||
Internet Software & Services — 2.8% | ||||||||
Aerohive Networks, Inc. (a) | 8,300 | 35,026 | ||||||
eGain Corporation (a) | 700 | 10,010 | ||||||
Endurance International Group Holdings, Inc. (a) | 200 | 1,930 | ||||||
16
See accompanying notes to financial statements.
ALAMBIC SMALL CAP VALUE PLUS FUND | ||||||||
COMMON STOCKS — 95.3% (Continued) | Shares | Value | ||||||
Information Technology — 13.1% (Continued) | ||||||||
Internet Software & Services — 2.8% (Continued) | ||||||||
QuinStreet, Inc. (a) | 800 | $ | 12,136 | |||||
XO Group, Inc. (a) | 1,140 | 34,268 | ||||||
| 93,370 | ||||||||
IT Services — 2.5% | ||||||||
EVERTEC, Inc. | 1,600 | 38,480 | ||||||
Sykes Enterprises, Inc. (a) | 1,469 | 44,423 | ||||||
| 82,903 | ||||||||
Semiconductors & Semiconductor Equipment — 6.2% | ||||||||
Amkor Technology, Inc. (a) | 2,100 | 18,333 | ||||||
DSP Group, Inc. (a) | 5,796 | 74,479 | ||||||
Nanometrics, Inc. (a) | 150 | 6,571 | ||||||
Photronics, Inc. (a) | 2,150 | 23,005 | ||||||
Veeco Instruments, Inc. (a) | 800 | 9,600 | ||||||
Xcerra Corporation (a) | 5,090 | 73,703 | ||||||
| 205,691 | ||||||||
Software — 0.3% | ||||||||
Agilysys, Inc. (a) | 333 | 5,351 | ||||||
American Software, Inc. - Class A | 267 | 4,801 | ||||||
| 10,152 | ||||||||
Technology Hardware, Storage & Peripherals — 0.5% | ||||||||
Avid Technology, Inc. (a) | 2,636 | 15,605 | ||||||
Materials — 8.2% | ||||||||
Chemicals — 4.0% | ||||||||
AdvanSix, Inc. (a) | 700 | 23,688 | ||||||
Kronos Worldwide, Inc. | 400 | 8,052 | ||||||
OMNOVA Solutions, Inc. (a) | 101 | 914 | ||||||
Tredegar Corporation | 3,825 | 83,959 | ||||||
Valhi, Inc. | 4,344 | 14,335 | ||||||
| 130,948 | ||||||||
Construction Materials — 1.5% | ||||||||
United States Lime & Minerals, Inc. | 674 | 51,150 | ||||||
Containers & Packaging — 1.6% | ||||||||
Owens-Illinois, Inc. (a) | 2,900 | 51,243 | ||||||
Metals & Mining — 1.1% | ||||||||
Cleveland-Cliffs, Inc. (a) | 200 | 2,010 | ||||||
Gold Resource Corporation | 4,738 | 24,448 | ||||||
Schnitzer Steel Industries, Inc. - Class A | 300 | 7,905 | ||||||
SunCoke Energy, Inc. (a) | 200 | 2,232 | ||||||
| 36,595 | ||||||||
17
See accompanying notes to financial statements.
ALAMBIC SMALL CAP VALUE PLUS FUND | ||||||||
COMMON STOCKS — 95.3% (Continued) | Shares | Value | ||||||
Telecommunication Services — 4.0% | ||||||||
Diversified Telecommunication Services — 1.8% | ||||||||
Ooma, Inc. (a) | 3,600 | $ | 57,600 | |||||
Wireless Telecommunication Services — 2.2% | ||||||||
Spok Holdings, Inc. | 2,274 | 34,906 | ||||||
United States Cellular Corporation (a) | 900 | 38,484 | ||||||
| 73,390 | ||||||||
Total Common Stocks (Cost $2,753,798) | $ | 3,152,424 | ||||||
| ||||||||
RIGHTS — 0.0% (b) | Shares | Value | ||||||
Media General, Inc. - CVR (a)(c) (Cost $0) | 100 | $ | 5 | |||||
Total Investments at Value — 95.3% (Cost $2,753,798) | $ | 3,152,429 | ||||||
Other Assets in Excess of Liabilities — 4.7% | 154,296 | |||||||
Net Assets — 100.0% | $ | 3,306,725 | ||||||
CVR - Contingent Value Right.
| (a) | Non-income producing security. |
| (b) | Percentage rounds to less than 0.1%. |
| (c) | Illiquid security. Security value has been determined in good faith pursuant to procedures adopted by the Board of Trustees. The total value of such securities was $5 as of August 31, 2018, representing 0.0% (b) of net assets (Note 2). |
18
See accompanying notes to financial statements.
ALAMBIC SMALL CAP GROWTH PLUS FUND | ||||||||
COMMON STOCKS — 96.6% | Shares | Value | ||||||
Consumer Discretionary — 16.5% | ||||||||
Auto Components — 2.7% | ||||||||
Tenneco, Inc. | 550 | $ | 23,534 | |||||
Tower International, Inc. | 1,800 | 60,840 | ||||||
| 84,374 | ||||||||
Distributors — 0.0% (a) | ||||||||
VOXX International Corporation (b) | 150 | 810 | ||||||
Diversified Consumer Services — 4.6% | ||||||||
American Public Education, Inc. (b) | 600 | 20,850 | ||||||
Bridgepoint Education, Inc. (b) | 3,620 | 42,571 | ||||||
K12, Inc. (b) | 2,775 | 45,954 | ||||||
Laureate Education, Inc. - Class A (b) | 1,200 | 19,164 | ||||||
Weight Watchers International, Inc. (b) | 200 | 14,980 | ||||||
| 143,519 | ||||||||
Hotels, Restaurants & Leisure — 3.0% | ||||||||
BBX Capital Corporation | 680 | 5,052 | ||||||
Bojangles', Inc. (b) | 792 | 11,563 | ||||||
International Speedway Corporation - Class A | 300 | 13,245 | ||||||
Marcus Corporation (The) | 100 | 4,060 | ||||||
Potbelly Corporation (b) | 1,100 | 14,905 | ||||||
Speedway Motorsports, Inc. | 2,023 | 36,192 | ||||||
Town Sports International Holdings, Inc. (b) | 945 | 8,647 | ||||||
| 93,664 | ||||||||
Household Durables — 1.4% | ||||||||
Flexsteel Industries, Inc. | 1,055 | 37,643 | ||||||
LGI Homes, Inc. (b) | 142 | 8,179 | ||||||
| 45,822 | ||||||||
Leisure Products — 1.1% | ||||||||
Johnson Outdoors, Inc. - Class A | 60 | 6,077 | ||||||
Nautilus, Inc. (b) | 2,026 | 29,681 | ||||||
| 35,758 | ||||||||
Media — 2.0% | ||||||||
Gannett Company, Inc. | 400 | 4,112 | ||||||
Lee Enterprises, Inc. (b) | 8,810 | 25,108 | ||||||
MSG Networks, Inc. - Class A (b) | 500 | 12,150 | ||||||
Townsquare Media, Inc. - Class A (b) | 600 | 5,358 | ||||||
tronc, Inc. (b) | 900 | 14,850 | ||||||
| 61,578 | ||||||||
Specialty Retail — 0.5% | ||||||||
Citi Trends, Inc. | 400 | 12,376 | ||||||
Express, Inc. (b) | 300 | 3,366 | ||||||
| 15,742 | ||||||||
19
See accompanying notes to financial statements.
ALAMBIC SMALL CAP GROWTH PLUS FUND | ||||||||
COMMON STOCKS — 96.6% (Continued) | Shares | Value | ||||||
Consumer Discretionary — 16.5% (Continued) | ||||||||
Textiles, Apparel & Luxury Goods — 1.2% | ||||||||
Movado Group, Inc. | 300 | $ | 12,780 | |||||
Vera Bradley, Inc. (b) | 1,677 | 24,585 | ||||||
| 37,365 | ||||||||
Consumer Staples — 4.8% | ||||||||
Food & Staples Retailing — 2.4% | ||||||||
Natural Grocers by Vitamin Cottage, Inc. (b) | 2,700 | 52,407 | ||||||
SpartanNash Company | 3 | 64 | ||||||
Village Super Market, Inc. - Class A | 791 | 23,081 | ||||||
| 75,552 | ||||||||
Household Products — 2.0% | ||||||||
Central Garden & Pet Company - Class A (b) | 700 | 25,431 | ||||||
Energizer Holdings, Inc. | 250 | 15,898 | ||||||
Oil-Dri Corporation of America | 557 | 22,642 | ||||||
| 63,971 | ||||||||
Personal Products — 0.4% | ||||||||
LifeVantage Corporation (b) | 1,000 | 12,560 | ||||||
Energy — 3.5% | ||||||||
Energy Equipment & Services — 0.6% | ||||||||
Mammoth Energy Services, Inc. | 550 | 15,114 | ||||||
Superior Energy Services, Inc. (b) | 364 | 3,276 | ||||||
| 18,390 | ||||||||
Oil, Gas & Consumable Fuels — 2.9% | ||||||||
Adams Resources & Energy, Inc. | 511 | 23,455 | ||||||
Evolution Petroleum Corporation | 1,700 | 17,085 | ||||||
Overseas Shipholding Group, Inc. - Class A (b) | 2,048 | 7,024 | ||||||
VAALCO Energy, Inc. (b) | 10,221 | 24,735 | ||||||
W&T Offshore, Inc. (b) | 2,958 | 20,026 | ||||||
| 92,325 | ||||||||
Health Care — 23.0% | ||||||||
Biotechnology — 9.5% | ||||||||
Acorda Therapeutics, Inc. (b) | 800 | 23,040 | ||||||
AMAG Pharmaceuticals, Inc. (b) | 300 | 7,320 | ||||||
Amicus Therapeutics, Inc. (b) | 800 | 10,784 | ||||||
Calithera Biosciences, Inc. (b) | 1,000 | 5,450 | ||||||
ChemoCentryx, Inc. (b) | 200 | 2,636 | ||||||
Emergent BioSolutions, Inc. (b) | 250 | 15,500 | ||||||
Enanta Pharmaceuticals, Inc. (b) | 260 | 23,642 | ||||||
Genomic Health, Inc. (b) | 250 | 15,292 | ||||||
Halozyme Therapeutics, Inc. (b) | 1,200 | 22,092 | ||||||
Inovio Pharmaceuticals, Inc. (b) | 700 | 3,682 | ||||||
Jounce Therapeutics, Inc. (b) | 1,864 | 14,632 | ||||||
20
See accompanying notes to financial statements.
ALAMBIC SMALL CAP GROWTH PLUS FUND | ||||||||
COMMON STOCKS — 96.6% (Continued) | Shares | Value | ||||||
Health Care — 23.0% (Continued) | ||||||||
Biotechnology — 9.5% (Continued) | ||||||||
MacroGenics, Inc. (b) | 900 | $ | 19,683 | |||||
Pfenex, Inc. (b) | 10,359 | 54,696 | ||||||
PTC Therapeutics, Inc. (b) | 50 | 2,087 | ||||||
REGENXBIO, Inc. (b) | 350 | 24,657 | ||||||
Retrophin, Inc. (b) | 600 | 19,014 | ||||||
Vanda Pharmaceuticals, Inc. (b) | 1,700 | 32,853 | ||||||
| 297,060 | ||||||||
Health Care Equipment & Supplies — 5.1% | ||||||||
Accuray, Inc. (b) | 4,298 | 17,192 | ||||||
AngioDynamics, Inc. (b) | 1,220 | 27,352 | ||||||
Cardiovascular Systems, Inc. (b) | 100 | 3,853 | ||||||
Cerus Corporation (b) | 1,200 | 9,336 | ||||||
FONAR Corporation (b) | 100 | 2,620 | ||||||
Integer Holdings Corporation (b) | 250 | 19,975 | ||||||
Meridian Bioscience, Inc. | 100 | 1,570 | ||||||
Orthofix Medical, Inc. (b) | 350 | 18,746 | ||||||
RTI Surgical, Inc. (b) | 5,900 | 26,403 | ||||||
STAAR Surgical Company (b) | 700 | 33,390 | ||||||
| 160,437 | ||||||||
Health Care Providers & Services — 1.3% | ||||||||
American Renal Associates Holdings, Inc. (b) | 900 | 19,755 | ||||||
Cardinal Health, Inc. | 100 | 5,219 | ||||||
Express Scripts Holding Company (b) | 50 | 4,401 | ||||||
Select Medical Holdings Corporation (b) | 600 | 11,880 | ||||||
| 41,255 | ||||||||
Health Care Technology — 2.2% | ||||||||
Allscripts Healthcare Solutions, Inc. (b) | 2,300 | 33,603 | ||||||
HealthStream, Inc. | 908 | 28,811 | ||||||
Quality Systems, Inc. (b) | 300 | 6,867 | ||||||
| 69,281 | ||||||||
Life Sciences Tools & Services — 2.5% | ||||||||
Luminex Corporation | 1,900 | 53,599 | ||||||
Medpace Holdings, Inc. (b) | 400 | 23,916 | ||||||
| 77,515 | ||||||||
Pharmaceuticals — 2.4% | ||||||||
Innoviva, Inc. (b) | 1,000 | 14,520 | ||||||
Lannett Company, Inc. (b) | 300 | 1,605 | ||||||
Mylan N.V. (b) | 600 | 23,478 | ||||||
Nektar Therapeutics (b) | 250 | 16,622 | ||||||
Supernus Pharmaceuticals, Inc. (b) | 450 | 19,935 | ||||||
| 76,160 | ||||||||
21
See accompanying notes to financial statements.
ALAMBIC SMALL CAP GROWTH PLUS FUND | ||||||||
COMMON STOCKS — 96.6% (Continued) | Shares | Value | ||||||
Industrials — 22.2% | ||||||||
Aerospace & Defense — 2.0% | ||||||||
Engility Holdings, Inc. (b) | 800 | $ | 27,768 | |||||
Esterline Technologies Corporation (b) | 190 | 16,330 | ||||||
Moog, Inc. - Class A | 250 | 19,728 | ||||||
| 63,826 | ||||||||
Building Products — 1.5% | ||||||||
Armstrong Flooring, Inc. (b) | 938 | 16,424 | ||||||
Continental Building Products, Inc. (b) | 300 | 11,190 | ||||||
NCI Building Systems, Inc. (b) | 1,139 | 19,249 | ||||||
| 46,863 | ||||||||
Commercial Services & Supplies — 4.1% | ||||||||
ARC Document Solutions, Inc. (b) | 15,800 | 50,876 | ||||||
Brady Corporation - Class A | 537 | 21,722 | ||||||
Ennis, Inc. | 300 | 6,540 | ||||||
Herman Miller, Inc. | 600 | 22,980 | ||||||
Kimball International, Inc. - Class B | 1,451 | 25,349 | ||||||
| 127,467 | ||||||||
Construction & Engineering — 1.3% | ||||||||
Ameresco, Inc. - Class A (b) | 121 | 1,736 | ||||||
HC2 Holdings, Inc. (b) | 1,350 | 8,465 | ||||||
Orion Group Holdings, Inc. (b) | 3,700 | 31,894 | ||||||
| 42,095 | ||||||||
Electrical Equipment — 3.0% | ||||||||
Allied Motion Technologies, Inc. | 550 | 26,862 | ||||||
Atkore International Group, Inc. (b) | 1,000 | 27,380 | ||||||
Preformed Line Products Company | 325 | 26,553 | ||||||
Vicor Corporation (b) | 200 | 12,490 | ||||||
| 93,285 | ||||||||
Machinery — 6.9% | ||||||||
AGCO Corporation | 600 | 35,796 | ||||||
Allison Transmission Holdings, Inc. | 300 | 14,898 | ||||||
Commercial Vehicle Group, Inc. (b) | 6,707 | 65,460 | ||||||
Global Brass & Copper Holdings, Inc. | 800 | 30,840 | ||||||
Hurco Companies, Inc. | 734 | 31,489 | ||||||
L.B. Foster Company - Class A (b) | 774 | 17,608 | ||||||
Meritor, Inc. (b) | 900 | 19,494 | ||||||
| 215,585 | ||||||||
Professional Services — 2.6% | ||||||||
Acacia Research Corporation (b) | 9,475 | 36,952 | ||||||
Heidrick & Struggles International, Inc. | 427 | 18,873 | ||||||
Korn/Ferry International | 350 | 23,496 | ||||||
Resources Connection, Inc. | 200 | 3,310 | ||||||
| 82,631 | ||||||||
22
See accompanying notes to financial statements.
ALAMBIC SMALL CAP GROWTH PLUS FUND | ||||||||
COMMON STOCKS — 96.6% (Continued) | Shares | Value | ||||||
Industrials — 22.2% (Continued) | ||||||||
Road & Rail — 0.5% | ||||||||
YRC Worldwide, Inc. (b) | 1,512 | $ | 14,470 | |||||
Trading Companies & Distributors — 0.3% | ||||||||
BMC Stock Holdings, Inc. (b) | 400 | 9,000 | ||||||
Information Technology — 19.1% | ||||||||
Communications Equipment — 0.9% | ||||||||
Bel Fuse, Inc. - Class B | 700 | 20,055 | ||||||
Calix, Inc. (b) | 600 | 4,680 | ||||||
Digi International, Inc. (b) | 276 | 3,712 | ||||||
| 28,447 | ||||||||
Electronic Equipment, Instruments & Components —1.4% | ||||||||
Electro Scientific Industries, Inc. (b) | 300 | 6,585 | ||||||
Insight Enterprises, Inc. (b) | 350 | 19,299 | ||||||
Vishay Precision Group, Inc. (b) | 400 | 17,320 | ||||||
| 43,204 | ||||||||
Internet Software & Services — 4.5% | ||||||||
Aerohive Networks, Inc. (b) | 6,500 | 27,430 | ||||||
eGain Corporation (b) | 2,786 | 39,840 | ||||||
Endurance International Group Holdings, Inc. (b) | 600 | 5,790 | ||||||
QuinStreet, Inc. (b) | 1,000 | 15,170 | ||||||
XO Group, Inc. (b) | 1,720 | 51,703 | ||||||
| 139,933 | ||||||||
IT Services — 2.9% | ||||||||
EVERTEC, Inc. | 2,185 | 52,549 | ||||||
Sykes Enterprises, Inc. (b) | 1,300 | 39,312 | ||||||
| 91,861 | ||||||||
Semiconductors & Semiconductor Equipment — 6.1% | ||||||||
DSP Group, Inc. (b) | 4,586 | 58,930 | ||||||
Nanometrics, Inc. (b) | 550 | 24,096 | ||||||
Photronics, Inc. (b) | 301 | 3,221 | ||||||
Rudolph Technologies, Inc. (b) | 400 | 11,120 | ||||||
Xcerra Corporation (b) | 6,588 | 95,394 | ||||||
| 192,761 | ||||||||
Software — 2.7% | ||||||||
Agilysys, Inc. (b) | 1,567 | 25,182 | ||||||
American Software, Inc. - Class A | 1,226 | 22,043 | ||||||
OneSpan, Inc. (b) | 900 | 16,875 | ||||||
QAD, Inc. - Class A | 300 | 18,195 | ||||||
Rosetta Stone, Inc. (b) | 120 | 1,896 | ||||||
| 84,191 | ||||||||
23
See accompanying notes to financial statements.
ALAMBIC SMALL CAP GROWTH PLUS FUND | ||||||||
COMMON STOCKS — 96.6% (Continued) | Shares | Value | ||||||
Information Technology — 19.1% (Continued) | ||||||||
Technology Hardware, Storage & Peripherals — 0.6% | ||||||||
Avid Technology, Inc. (b) | 3,061 | $ | 18,121 | |||||
Materials — 5.5% | ||||||||
Chemicals — 3.6% | ||||||||
AdvanSix, Inc. (b) | 500 | 16,920 | ||||||
FutureFuel Corporation | 278 | 4,123 | ||||||
Kronos Worldwide, Inc. | 900 | 18,117 | ||||||
OMNOVA Solutions, Inc. (b) | 101 | 914 | ||||||
Tredegar Corporation | 3,200 | 70,240 | ||||||
Valhi, Inc. | 922 | 3,043 | ||||||
| 113,357 | ||||||||
Construction Materials — 0.8% | ||||||||
United States Lime & Minerals, Inc. | 300 | 22,767 | ||||||
Containers & Packaging — 0.2% | ||||||||
Owens-Illinois, Inc. (b) | 400 | 7,068 | ||||||
Metals & Mining — 0.9% | ||||||||
Cleveland-Cliffs, Inc. (b) | 1,100 | 11,055 | ||||||
Gold Resource Corporation | 2,389 | 12,327 | ||||||
Schnitzer Steel Industries, Inc. - Class A | 200 | 5,270 | ||||||
| 28,652 | ||||||||
Telecommunication Services — 2.0% | ||||||||
Diversified Telecommunication Services — 1.1% | ||||||||
Ooma, Inc. (b) | 2,185 | 34,960 | ||||||
Wireless Telecommunication Services — 0.9% | ||||||||
Spok Holdings, Inc. | 1,202 | 18,451 | ||||||
United States Cellular Corporation (b) | 200 | 8,552 | ||||||
| 27,003 | ||||||||
Total Investments at Value — 96.6% (Cost $2,561,443) | $ | 3,030,685 | ||||||
Other Assets in Excess of Liabilities — 3.4% | 106,738 | |||||||
Net Assets — 100.0% | $ | 3,137,423 | ||||||
(a) | Percentage rounds to less than 0.1%. |
(b) | Non-income producing security. |
24
See accompanying notes to financial statements.
ALAMBIC MID CAP VALUE PLUS FUND | ||||||||
COMMON STOCKS — 92.6% | Shares | Value | ||||||
Consumer Discretionary — 13.4% | ||||||||
Auto Components — 1.7% | ||||||||
BorgWarner, Inc. | 180 | $ | 7,879 | |||||
Goodyear Tire & Rubber Company (The) | 250 | 5,672 | ||||||
Lear Corporation | 40 | 6,488 | ||||||
| 20,039 | ||||||||
Automobiles — 1.1% | ||||||||
General Motors Company | 370 | 13,339 | ||||||
Diversified Consumer Services — 1.5% | ||||||||
Laureate Education, Inc. - Class A (a) | 1,100 | 17,567 | ||||||
Hotels, Restaurants & Leisure — 0.9% | ||||||||
Wyndham Destinations, Inc. | 240 | 10,608 | ||||||
Household Durables — 1.0% | ||||||||
PulteGroup, Inc. | 400 | 11,180 | ||||||
Internet & Direct Marketing Retail — 0.2% | ||||||||
Qurate Retail, Inc. (a) | 100 | 2,079 | ||||||
Leisure Products — 0.6% | ||||||||
Brunswick Corporation | 100 | 6,642 | ||||||
Media — 2.1% | ||||||||
News Corporation - Class A | 450 | 5,881 | ||||||
Viacom, Inc. - Class B | 650 | 19,032 | ||||||
| 24,913 | ||||||||
Multi-Line Retail — 2.1% | ||||||||
Kohl's Corporation | 200 | 15,822 | ||||||
Macy's, Inc. | 150 | 5,483 | ||||||
Nordstrom, Inc. | 60 | 3,771 | ||||||
| 25,076 | ||||||||
Textiles, Apparel & Luxury Goods — 2.2% | ||||||||
Columbia Sportswear Company | 20 | 1,814 | ||||||
Ralph Lauren Corporation | 100 | 13,281 | ||||||
Skechers U.S.A., Inc. - Class A (a) | 350 | 10,318 | ||||||
| 25,413 | ||||||||
Consumer Staples — 7.6% | ||||||||
Beverages — 1.9% | ||||||||
Keurig Dr Pepper, Inc. | 400 | 9,120 | ||||||
Molson Coors Brewing Company - Class B | 60 | 4,004 | ||||||
25
See accompanying notes to financial statements.
ALAMBIC MID CAP VALUE PLUS FUND | ||||||||
COMMON STOCKS — 92.6% (Continued) | Shares | Value | ||||||
Consumer Staples — 7.6% (Continued) | ||||||||
Beverages — 1.9% (Continued) | ||||||||
PepsiCo, Inc. | 80 | $ | 8,961 | |||||
| 22,085 | ||||||||
Food & Staples Retailing — 1.5% | ||||||||
Kroger Company (The) | 550 | 17,325 | ||||||
Food Products — 4.0% | ||||||||
Archer-Daniels-Midland Company | 620 | 31,248 | ||||||
Conagra Brands, Inc. | 250 | 9,187 | ||||||
Seaboard Corporation | 2 | 7,370 | ||||||
| 47,805 | ||||||||
Personal Products — 0.2% | ||||||||
Herbalife Nutrition Ltd. (a) | 40 | 2,264 | ||||||
Energy — 7.2% | ||||||||
Oil, Gas & Consumable Fuels — 7.2% | ||||||||
Apache Corporation | 40 | 1,753 | ||||||
Hess Corporation | 41 | 2,761 | ||||||
HollyFrontier Corporation | 200 | 14,904 | ||||||
Marathon Oil Corporation | 650 | 13,982 | ||||||
Marathon Petroleum Corporation | 120 | 9,875 | ||||||
Murphy Oil Corporation | 550 | 16,956 | ||||||
Newfield Exploration Company (a) | 250 | 6,820 | ||||||
Noble Energy, Inc. | 100 | 2,972 | ||||||
PBF Energy, Inc. - Class A | 200 | 10,384 | ||||||
Valero Energy Corporation | 30 | 3,536 | ||||||
| 83,943 | ||||||||
Financials — 7.8% | ||||||||
Banks — 4.4% | ||||||||
Bank OZK | 60 | 2,428 | ||||||
Citizens Financial Group, Inc. | 50 | 2,058 | ||||||
Comerica, Inc. | 60 | 5,849 | ||||||
East West Bancorp, Inc. | 140 | 8,875 | ||||||
Fifth Third Bancorp | 50 | 1,471 | ||||||
Huntington Bancshares, Inc. | 200 | 3,242 | ||||||
KeyCorp | 300 | 6,321 | ||||||
M&T Bank Corporation | 10 | 1,771 | ||||||
PacWest Bancorp | 40 | 2,020 | ||||||
Regions Financial Corporation | 100 | 1,946 | ||||||
SunTrust Banks, Inc. | 100 | 7,356 | ||||||
SVB Financial Group (a) | 10 | 3,227 | ||||||
26
See accompanying notes to financial statements.
ALAMBIC MID CAP VALUE PLUS FUND | ||||||||
COMMON STOCKS — 92.6% (Continued) | Shares | Value | ||||||
Financials — 7.8% (Continued) | ||||||||
Banks — 4.4% (Continued) | ||||||||
Western Alliance Bancorporation (a) | 20 | $ | 1,153 | |||||
Wintrust Financial Corporation | 40 | 3,542 | ||||||
| 51,259 | ||||||||
Capital Markets — 1.4% | ||||||||
Ameriprise Financial, Inc. | 20 | 2,839 | ||||||
E*TRADE Financial Corporation (a) | 20 | 1,177 | ||||||
Eaton Vance Corporation | 80 | 4,218 | ||||||
MSCI, Inc. | 10 | 1,803 | ||||||
Northern Trust Corporation | 30 | 3,224 | ||||||
Raymond James Financial, Inc. | 20 | 1,861 | ||||||
T. Rowe Price Group, Inc. | 10 | 1,159 | ||||||
| 16,281 | ||||||||
Consumer Finance — 0.6% | ||||||||
Ally Financial, Inc. | 50 | 1,344 | ||||||
Discover Financial Services | 20 | 1,562 | ||||||
Synchrony Financial | 150 | 4,751 | ||||||
| 7,657 | ||||||||
Insurance — 1.4% | ||||||||
Aflac, Inc. | 40 | 1,850 | ||||||
Assurant, Inc. | 40 | 4,113 | ||||||
Berkley (W.R.) Corporation | 20 | 1,565 | ||||||
Lincoln National Corporation | 40 | 2,623 | ||||||
Markel Corporation (a) | 1 | 1,209 | ||||||
Principal Financial Group, Inc. | 20 | 1,104 | ||||||
Progressive Corporation (The) | 40 | 2,701 | ||||||
Torchmark Corporation | 20 | 1,758 | ||||||
| 16,923 | ||||||||
Health Care — 13.1% | ||||||||
Biotechnology — 1.0% | ||||||||
Regeneron Pharmaceuticals, Inc. (a) | 5 | 2,034 | ||||||
United Therapeutics Corporation (a) | 80 | 9,839 | ||||||
| 11,873 | ||||||||
Health Care Equipment & Supplies — 3.2% | ||||||||
DENTSPLY SIRONA, Inc. | 100 | 3,992 | ||||||
Hill-Rom Holdings, Inc. | 80 | 7,782 | ||||||
Hologic, Inc. (a) | 220 | 8,747 | ||||||
Zimmer Biomet Holdings, Inc. | 140 | 17,308 | ||||||
| 37,829 | ||||||||
Health Care Providers & Services — 2.1% | ||||||||
Cardinal Health, Inc. | 160 | 8,351 | ||||||
Express Scripts Holding Company (a) | 20 | 1,760 | ||||||
27
See accompanying notes to financial statements.
ALAMBIC MID CAP VALUE PLUS FUND | ||||||||
COMMON STOCKS — 92.6% (Continued) | Shares | Value | ||||||
Health Care — 13.1% (Continued) | ||||||||
Health Care Providers & Services — 2.1% (Continued) | ||||||||
Molina Healthcare, Inc. (a) | 100 | $ | 13,800 | |||||
| 23,911 | ||||||||
Life Sciences Tools & Services — 4.4% | ||||||||
Agilent Technologies, Inc. | 220 | 14,859 | ||||||
Bio-Rad Laboratories, Inc. - Class A (a) | 85 | 27,650 | ||||||
Bruker Corporation | 260 | 9,251 | ||||||
| 51,760 | ||||||||
Pharmaceuticals — 2.4% | ||||||||
Merck & Company, Inc. | 80 | 5,487 | ||||||
Mylan N.V. (a) | 450 | 17,609 | ||||||
Nektar Therapeutics (a) | 80 | 5,319 | ||||||
| 28,415 | ||||||||
Industrials — 16.4% | ||||||||
Aerospace & Defense — 3.5% | ||||||||
Arconic, Inc. | 700 | 15,666 | ||||||
Curtiss-Wright Corporation | 20 | 2,679 | ||||||
Spirit AeroSystems Holdings, Inc. - Class A | 20 | 1,710 | ||||||
Textron, Inc. | 310 | 21,399 | ||||||
| 41,454 | ||||||||
Air Freight & Logistics — 0.7% | ||||||||
XPO Logistics, Inc. (a) | 80 | 8,520 | ||||||
Airlines — 0.9% | ||||||||
American Airlines Group, Inc. | 40 | 1,619 | ||||||
United Continental Holdings, Inc. (a) | 100 | 8,742 | ||||||
| 10,361 | ||||||||
Building Products — 1.3% | ||||||||
Owens Corning | 280 | 15,854 | ||||||
Construction & Engineering — 1.6% | ||||||||
EMCOR Group, Inc. | 100 | 8,010 | ||||||
Quanta Services, Inc. (a) | 300 | 10,377 | ||||||
| 18,387 | ||||||||
Industrial Conglomerates — 1.2% | ||||||||
Carlisle Companies, Inc. | 110 | 13,949 | ||||||
Machinery — 5.9% | ||||||||
AGCO Corporation | 520 | 31,023 | ||||||
Allison Transmission Holdings, Inc. | 500 | 24,830 | ||||||
Cummins, Inc. | 16 | 2,269 | ||||||
28
See accompanying notes to financial statements.
ALAMBIC MID CAP VALUE PLUS FUND | ||||||||
COMMON STOCKS — 92.6% (Continued) | Shares | Value | ||||||
Industrials — 16.4% (Continued) | ||||||||
Machinery — 5.9% (Continued) | ||||||||
Oshkosh Corporation | 60 | $ | 4,216 | |||||
PACCAR, Inc. | 100 | 6,842 | ||||||
| 69,180 | ||||||||
Professional Services — 1.3% | ||||||||
ManpowerGroup, Inc. | 80 | 7,498 | ||||||
Robert Half International, Inc. | 100 | 7,818 | ||||||
| 15,316 | ||||||||
Information Technology — 11.7% | ||||||||
Communications Equipment — 0.7% | ||||||||
ARRIS International plc (a) | 300 | 7,773 | ||||||
Electronic Equipment, Instruments & Components — 2.1% | ||||||||
Dolby Laboratories, Inc. - Class A | 60 | 4,211 | ||||||
Jabil, Inc. | 400 | 11,824 | ||||||
Zebra Technologies Corporation - Class A (a) | 50 | 8,587 | ||||||
| 24,622 | ||||||||
IT Services — 1.7% | ||||||||
Alliance Data Systems Corporation | 30 | 7,157 | ||||||
International Business Machines Corporation | 10 | 1,465 | ||||||
MAXIMUS, Inc. | 120 | 7,980 | ||||||
Sabre Corporation | 150 | 3,917 | ||||||
| 20,519 | ||||||||
Semiconductors & Semiconductor Equipment — 1.0% | ||||||||
Mellanox Technologies Ltd. (a) | 140 | 11,648 | ||||||
Software — 1.6% | ||||||||
CA, Inc. | 230 | 10,074 | ||||||
Cadence Design Systems, Inc. (a) | 140 | 6,586 | ||||||
Citrix Systems, Inc. (a) | 20 | 2,280 | ||||||
| 18,940 | ||||||||
Technology Hardware, Storage & Peripherals — 4.6% | ||||||||
Hewlett Packard Enterprise Company | 1,400 | 23,142 | ||||||
Western Digital Corporation | 75 | 4,743 | ||||||
Xerox Corporation | 950 | 26,467 | ||||||
| 54,352 | ||||||||
Materials — 6.6% | ||||||||
Chemicals — 3.7% | ||||||||
Cabot Corporation | 100 | 6,492 | ||||||
Chemours Company (The) | 80 | 3,488 | ||||||
Eastman Chemical Company | 70 | 6,792 | ||||||
Huntsman Corporation | 640 | 19,514 | ||||||
29
See accompanying notes to financial statements.
ALAMBIC MID CAP VALUE PLUS FUND | ||||||||
COMMON STOCKS — 92.6% (Continued) | Shares | Value | ||||||
Materials — 6.6% (Continued) | ||||||||
Chemicals — 3.7% (Continued) | ||||||||
Mosaic Company (The) | 100 | $ | 3,127 | |||||
Westlake Chemical Corporation | 40 | 3,783 | ||||||
| 43,196 | ||||||||
Containers & Packaging — 0.5% | ||||||||
Bemis Company, Inc. | 60 | 2,957 | ||||||
Owens-Illinois, Inc. (a) | 100 | 1,767 | ||||||
WestRock Company | 20 | 1,101 | ||||||
| 5,825 | ||||||||
Metals & Mining — 1.6% | ||||||||
Alcoa Corporation (a) | 80 | 3,574 | ||||||
Freeport-McMoRan, Inc. | 100 | 1,405 | ||||||
Nucor Corporation | 40 | 2,500 | ||||||
Reliance Steel & Aluminum Company | 20 | 1,758 | ||||||
Steel Dynamics, Inc. | 80 | 3,658 | ||||||
United States Steel Corporation | 200 | 5,936 | ||||||
| 18,831 | ||||||||
Paper & Forest Products — 0.8% | ||||||||
Louisiana-Pacific Corporation | 350 | 10,206 | ||||||
Real Estate — 6.0% | ||||||||
Equity Real Estate Investment Trusts (REITs) — 6.0% | ||||||||
Alexandria Real Estate Equities, Inc. | 10 | 1,284 | ||||||
Boston Properties, Inc. | 20 | 2,609 | ||||||
Brixmor Property Group, Inc. | 100 | 1,822 | ||||||
CyrusOne, Inc. | 40 | 2,678 | ||||||
Extra Space Storage, Inc. | 20 | 1,844 | ||||||
Gaming and Leisure Properties, Inc. | 300 | 10,737 | ||||||
Host Hotels & Resorts, Inc. | 150 | 3,230 | ||||||
Iron Mountain, Inc. | 50 | 1,805 | ||||||
Kimco Realty Corporation | 200 | 3,422 | ||||||
Macerich Company (The) | 100 | 5,874 | ||||||
Medical Properties Trust, Inc. | 300 | 4,515 | ||||||
Omega Healthcare Investors, Inc. | 50 | 1,653 | ||||||
Park Hotels & Resorts, Inc. | 150 | 5,017 | ||||||
Prologis, Inc. | 142 | 9,540 | ||||||
Realty Income Corporation | 60 | 3,514 | ||||||
Ventas, Inc. | 20 | 1,197 | ||||||
VICI Properties, Inc. | 100 | 2,091 | ||||||
Weyerhaeuser Company | 220 | 7,636 | ||||||
| 70,468 | ||||||||
30
See accompanying notes to financial statements.
ALAMBIC MID CAP VALUE PLUS FUND | ||||||||
COMMON STOCKS — 92.6% (Continued) | Shares | Value | ||||||
Telecommunication Services — 2.0% | ||||||||
Wireless Telecommunication Services — 2.0% | ||||||||
United States Cellular Corporation (a) | 540 | $ | 23,090 | |||||
Utilities — 0.8% | ||||||||
Electric Utilities — 0.4% | ||||||||
PG&E Corporation | 100 | 4,618 | ||||||
Multi-Utilities — 0.4% | ||||||||
CMS Energy Corporation | 60 | 2,954 | ||||||
Public Service Enterprise Group, Inc. | 40 | 2,094 | ||||||
| 5,048 | ||||||||
Total Common Stocks (Cost $963,956) | $ | 1,088,343 | ||||||
| ||||||||
RIGHTS — 0.0% (b) | Shares | Value | ||||||
Media General, Inc. - CVR (a)(c) (Cost $0) | 120 | $ | 6 | |||||
Total Investments at Value — 92.6% (Cost $963,956) | $ | 1,088,349 | ||||||
Other Assets in Excess of Liabilities — 7.4% | 86,640 | |||||||
Net Assets — 100.0% | $ | 1,174,989 | ||||||
CVR - Contingent Value Right
| (a) | Non-income producing security. |
| (b) | Percentage rounds to less than 0.1%. |
| (c) | Illiquid security. Security value has been determined in good faith pursuant to procedures adopted by the Board of Trustees. The total value of such securities was $6 as of August 31, 2018, representing 0.0% (b) of net assets (Note 2). |
31
See accompanying notes to financial statements.
ALAMBIC MID CAP GROWTH PLUS FUND | ||||||||
COMMON STOCKS — 94.3% | Shares | Value | ||||||
Consumer Discretionary — 15.7% | ||||||||
Auto Components — 2.6% | ||||||||
BorgWarner, Inc. | 260 | $ | 11,380 | |||||
Gentex Corporation | 350 | 8,183 | ||||||
Goodyear Tire & Rubber Company (The) | 350 | 7,942 | ||||||
Lear Corporation | 20 | 3,244 | ||||||
| 30,749 | ||||||||
Diversified Consumer Services — 1.6% | ||||||||
Laureate Education, Inc. - Class A (a) | 1,200 | 19,164 | ||||||
Hotels, Restaurants & Leisure — 1.2% | ||||||||
Darden Restaurants, Inc. | 20 | 2,321 | ||||||
Hyatt Hotels Corporation - Class A | 40 | 3,094 | ||||||
Texas Roadhouse, Inc. | 80 | 5,516 | ||||||
Wyndham Destinations, Inc. | 80 | 3,536 | ||||||
| 14,467 | ||||||||
Household Durables — 1.1% | ||||||||
PulteGroup, Inc. | 450 | 12,577 | ||||||
Internet & Direct Marketing Retail — 0.3% | ||||||||
Qurate Retail, Inc. (a) | 200 | 4,158 | ||||||
Leisure Products — 0.4% | ||||||||
Brunswick Corporation | 80 | 5,314 | ||||||
Media — 2.1% | ||||||||
Discovery, Inc. - Series A (a) | 300 | 8,349 | ||||||
News Corporation - Class A | 136 | 1,777 | ||||||
Viacom, Inc. - Class B | 500 | 14,640 | ||||||
| 24,766 | ||||||||
Multi-Line Retail — 2.5% | ||||||||
Kohl's Corporation | 180 | 14,240 | ||||||
Macy's, Inc. | 100 | 3,655 | ||||||
Nordstrom, Inc. | 180 | 11,313 | ||||||
| 29,208 | ||||||||
Specialty Retail — 1.3% | ||||||||
American Eagle Outfitters, Inc. | 250 | 6,490 | ||||||
Best Buy Company, Inc. | 40 | 3,182 | ||||||
Ross Stores, Inc. | 60 | 5,747 | ||||||
| 15,419 | ||||||||
32
See accompanying notes to financial statements.
ALAMBIC MID CAP GROWTH PLUS FUND | ||||||||
COMMON STOCKS — 94.3% (Continued) | Shares | Value | ||||||
Consumer Discretionary — 15.7% (Continued) | ||||||||
Textiles, Apparel & Luxury Goods — 2.6% | ||||||||
Columbia Sportswear Company | 120 | $ | 10,884 | |||||
Ralph Lauren Corporation | 60 | 7,969 | ||||||
Skechers U.S.A., Inc. - Class A (a) | 400 | 11,792 | ||||||
| 30,645 | ||||||||
Consumer Staples — 3.8% | ||||||||
Beverages — 0.8% | ||||||||
Keurig Dr Pepper, Inc. | 400 | 9,120 | ||||||
Food & Staples Retailing — 1.0% | ||||||||
Kroger Company (The) | 400 | 12,600 | ||||||
Food Products — 2.0% | ||||||||
Archer-Daniels-Midland Company | 400 | 20,160 | ||||||
Seaboard Corporation | 1 | 3,685 | ||||||
| 23,845 | ||||||||
Energy — 3.0% | ||||||||
Oil, Gas & Consumable Fuels — 3.0% | ||||||||
HollyFrontier Corporation | 130 | 9,688 | ||||||
Marathon Oil Corporation | 50 | 1,075 | ||||||
Murphy Oil Corporation | 400 | 12,332 | ||||||
Newfield Exploration Company (a) | 250 | 6,820 | ||||||
PBF Energy, Inc. - Class A | 100 | 5,192 | ||||||
Peabody Energy Corporation | 20 | 826 | ||||||
| 35,933 | ||||||||
Financials — 0.7% | ||||||||
Capital Markets — 0.7% | ||||||||
Ameriprise Financial, Inc. | 40 | 5,678 | ||||||
T. Rowe Price Group, Inc. | 20 | 2,318 | ||||||
| 7,996 | ||||||||
Health Care — 16.8% | ||||||||
Biotechnology — 3.4% | ||||||||
Alexion Pharmaceuticals, Inc. (a) | 20 | 2,445 | ||||||
BioMarin Pharmaceutical, Inc. (a) | 40 | 3,999 | ||||||
Incyte Corporation (a) | 140 | 10,347 | ||||||
Ionis Pharmaceuticals, Inc. (a) | 80 | 3,655 | ||||||
Neurocrine Biosciences, Inc. (a) | 40 | 4,918 | ||||||
United Therapeutics Corporation (a) | 130 | 15,989 | ||||||
| 41,353 | ||||||||
Health Care Equipment & Supplies — 4.0% | ||||||||
ABIOMED, Inc. (a) | 10 | 4,066 | ||||||
DexCom, Inc. (a) | 10 | 1,444 | ||||||
33
See accompanying notes to financial statements.
ALAMBIC MID CAP GROWTH PLUS FUND | ||||||||
COMMON STOCKS — 94.3% (Continued) | Shares | Value | ||||||
Health Care — 16.8% (Continued) | ||||||||
Health Care Equipment & Supplies — 4.0% (Continued) | ||||||||
Globus Medical, Inc. - Class A (a) | 60 | $ | 3,196 | |||||
Hill-Rom Holdings, Inc. | 100 | 9,727 | ||||||
Hologic, Inc. (a) | 300 | 11,928 | ||||||
Masimo Corporation (a) | 40 | 4,716 | ||||||
Zimmer Biomet Holdings, Inc. | 100 | 12,363 | ||||||
| 47,440 | ||||||||
Health Care Providers & Services — 2.9% | ||||||||
AmerisourceBergen Corporation | 100 | 8,997 | ||||||
Cardinal Health, Inc. | 140 | 7,307 | ||||||
McKesson Corporation | 10 | 1,287 | ||||||
Molina Healthcare, Inc. (a) | 100 | 13,800 | ||||||
WellCare Health Plans, Inc. (a) | 10 | 3,026 | ||||||
| 34,417 | ||||||||
Life Sciences Tools & Services — 3.9% | ||||||||
Agilent Technologies, Inc. | 100 | 6,754 | ||||||
Bio-Rad Laboratories, Inc. - Class A (a) | 80 | 26,024 | ||||||
Bruker Corporation | 190 | 6,760 | ||||||
Charles River Laboratories International, Inc. (a) | 55 | 6,793 | ||||||
| 46,331 | ||||||||
Pharmaceuticals — 2.6% | ||||||||
Mylan N.V. (a) | 450 | 17,609 | ||||||
Nektar Therapeutics (a) | 201 | 13,364 | ||||||
| 30,973 | ||||||||
Industrials — 18.3% | ||||||||
Aerospace & Defense — 3.3% | ||||||||
Arconic, Inc. | 600 | 13,428 | ||||||
Curtiss-Wright Corporation | 60 | 8,037 | ||||||
Textron, Inc. | 260 | 17,948 | ||||||
| 39,413 | ||||||||
Air Freight & Logistics — 0.4% | ||||||||
XPO Logistics, Inc. (a) | 40 | 4,260 | ||||||
Building Products — 0.1% | ||||||||
Owens Corning | 20 | 1,132 | ||||||
Construction & Engineering — 1.7% | ||||||||
EMCOR Group, Inc. | 100 | 8,010 | ||||||
Quanta Services, Inc. (a) | 350 | 12,106 | ||||||
| 20,116 | ||||||||
Industrial Conglomerates — 1.1% | ||||||||
Carlisle Companies, Inc. | 100 | 12,681 | ||||||
34
See accompanying notes to financial statements.
ALAMBIC MID CAP GROWTH PLUS FUND | ||||||||
COMMON STOCKS — 94.3% (Continued) | Shares | Value | ||||||
Industrials — 18.3% (Continued) | ||||||||
Machinery — 7.6% | ||||||||
AGCO Corporation | 560 | $ | 33,410 | |||||
Allison Transmission Holdings, Inc. | 520 | 25,823 | ||||||
Cummins, Inc. | 90 | 12,762 | ||||||
ITT, Inc. | 100 | 5,911 | ||||||
Oshkosh Corporation | 40 | 2,811 | ||||||
PACCAR, Inc. | 120 | 8,210 | ||||||
Parker-Hannifin Corporation | 10 | 1,756 | ||||||
| 90,683 | ||||||||
Professional Services — 3.1% | ||||||||
Korn/Ferry International | 60 | 4,028 | ||||||
ManpowerGroup, Inc. | 180 | 16,871 | ||||||
Robert Half International, Inc. | 200 | 15,636 | ||||||
| 36,535 | ||||||||
Road & Rail — 0.2% | ||||||||
Schneider National, Inc. - Class B | 100 | 2,705 | ||||||
Trading Companies & Distributors — 0.8% | ||||||||
United Rentals, Inc. (a) | 20 | 3,118 | ||||||
W.W. Grainger, Inc. | 20 | 7,081 | ||||||
| 10,199 | ||||||||
Information Technology — 29.0% | ||||||||
Communications Equipment — 2.1% | ||||||||
ARRIS International plc (a) | 350 | 9,068 | ||||||
F5 Networks, Inc. (a) | 80 | 15,130 | ||||||
| 24,198 | ||||||||
Electronic Equipment, Instruments & Components — 4.5% | ||||||||
Avnet, Inc. | 40 | 1,936 | ||||||
CDW Corporation | 20 | 1,751 | ||||||
Dolby Laboratories, Inc. - Class A | 220 | 15,442 | ||||||
Jabil, Inc. | 300 | 8,868 | ||||||
National Instruments Corporation | 120 | 5,730 | ||||||
Zebra Technologies Corporation - Class A (a) | 115 | 19,750 | ||||||
| 53,477 | ||||||||
IT Services — 5.6% | ||||||||
Alliance Data Systems Corporation | 60 | 14,315 | ||||||
Booz Allen Hamilton Holding Corporation | 200 | 10,232 | ||||||
Fiserv, Inc. (a) | 60 | 4,804 | ||||||
MAXIMUS, Inc. | 192 | 12,768 | ||||||
Sabre Corporation | 600 | 15,666 | ||||||
Teradata Corporation (a) | 220 | 9,123 | ||||||
| 66,908 | ||||||||
35
See accompanying notes to financial statements.
ALAMBIC MID CAP GROWTH PLUS FUND | ||||||||
COMMON STOCKS — 94.3% (Continued) | Shares | Value | ||||||
Information Technology — 29.0% (Continued) | ||||||||
Semiconductors & Semiconductor Equipment — 5.4% | ||||||||
Cypress Semiconductor Corporation | 500 | $ | 8,605 | |||||
KLA-Tencor Corporation | 30 | 3,486 | ||||||
Lam Research Corporation | 75 | 12,982 | ||||||
Maxim Integrated Products, Inc. | 40 | 2,419 | ||||||
Mellanox Technologies Ltd. (a) | 200 | 16,640 | ||||||
MKS Instruments, Inc. | 70 | 6,503 | ||||||
ON Semiconductor Corporation (a) | 650 | 13,871 | ||||||
| 64,506 | ||||||||
Software — 6.0% | ||||||||
CA, Inc. | 480 | 21,024 | ||||||
Cadence Design Systems, Inc. (a) | 220 | 10,349 | ||||||
Fair Isaac Corporation (a) | 50 | 11,549 | ||||||
Red Hat, Inc. (a) | 10 | 1,477 | ||||||
SS&C Technologies Holdings, Inc. | 160 | 9,495 | ||||||
Synopsys, Inc. (a) | 130 | 13,278 | ||||||
Zynga, Inc. - Class A (a) | 1,100 | 4,576 | ||||||
| 71,748 | ||||||||
Technology Hardware, Storage & Peripherals — 5.4% | ||||||||
Hewlett Packard Enterprise Company | 1,550 | 25,622 | ||||||
NetApp, Inc. | 140 | 12,153 | ||||||
Xerox Corporation | 950 | 26,467 | ||||||
| 64,242 | ||||||||
Materials — 5.8% | ||||||||
Chemicals — 2.3% | ||||||||
Cabot Corporation | 100 | 6,492 | ||||||
Chemours Company (The) | 20 | 872 | ||||||
Eastman Chemical Company | 30 | 2,911 | ||||||
Huntsman Corporation | 540 | 16,464 | ||||||
| 26,739 | ||||||||
Containers & Packaging — 1.9% | ||||||||
WestRock Company | 420 | 23,134 | ||||||
Metals & Mining — 1.0% | ||||||||
Alcoa Corporation (a) | 80 | 3,574 | ||||||
Nucor Corporation | 20 | 1,250 | ||||||
United States Steel Corporation | 250 | 7,420 | ||||||
| 12,244 | ||||||||
Paper & Forest Products — 0.6% | ||||||||
Louisiana-Pacific Corporation | 250 | 7,290 | ||||||
36
See accompanying notes to financial statements.
ALAMBIC MID CAP GROWTH PLUS FUND | ||||||||
COMMON STOCKS — 94.3% (Continued) | Shares | Value | ||||||
Telecommunication Services — 1.2% | ||||||||
Wireless Telecommunication Services — 1.2% | ||||||||
United States Cellular Corporation (a) | 340 | $ | 14,539 | |||||
Total Investments at Value — 94.3% (Cost $983,866) | $ | 1,123,224 | ||||||
Other Assets in Excess of Liabilities — 5.7% | 67,362 | |||||||
Net Assets — 100.0% | $ | 1,190,586 | ||||||
(a) | Non-income producing security. |
37
See accompanying notes to financial statements.
ALAMBIC FUNDS | ||||||||
| Alambic Small | Alambic Small | ||||||
ASSETS | ||||||||
Investments in securities: | ||||||||
At cost | $ | 2,753,798 | $ | 2,561,443 | ||||
At value (Note 2) | $ | 3,152,429 | $ | 3,030,685 | ||||
Cash (Note 2) | 169,773 | 111,463 | ||||||
Dividends receivable | 1,403 | 1,258 | ||||||
Receivable for investment securities sold | 88,356 | 68,664 | ||||||
Receivable from Adviser (Note 4) | 9,670 | 9,801 | ||||||
Other assets | 2,380 | 2,379 | ||||||
Total assets | 3,424,011 | 3,224,250 | ||||||
LIABILITIES | ||||||||
Payable for investment securities purchased | 104,005 | 73,548 | ||||||
Payable to administrator (Note 4) | 7,028 | 7,026 | ||||||
Other accrued expenses | 6,253 | 6,253 | ||||||
Total liabilities | 117,286 | 86,827 | ||||||
NET ASSETS | $ | 3,306,725 | $ | 3,137,423 | ||||
NET ASSETS CONSIST OF: | ||||||||
Paid-in capital | $ | 2,579,960 | $ | 2,310,096 | ||||
Accumulated net investment loss | (2,347 | ) | (6,623 | ) | ||||
Undistributed net realized gains from investment transactions | 330,481 | 364,708 | ||||||
Net unrealized appreciation on investments | 398,631 | 469,242 | ||||||
NET ASSETS | $ | 3,306,725 | $ | 3,137,423 | ||||
Shares of beneficial interest outstanding (unlimited number of shares authorized, no par value) | 250,845 | 228,849 | ||||||
Net asset value, offering price and redemption price (Note 2) | $ | 13.18 | $ | 13.71 | ||||
See accompanying notes to financial statements. |
38
ALAMBIC FUNDS | ||||||||
| Alambic Mid | Alambic Mid | ||||||
ASSETS | ||||||||
Investments in securities: | ||||||||
At cost | $ | 963,956 | $ | 983,866 | ||||
At value (Note 2) | $ | 1,088,349 | $ | 1,123,224 | ||||
Cash (Note 2) | 81,505 | 67,229 | ||||||
Dividends receivable | 1,694 | 1,370 | ||||||
Receivable for investment securities sold | 31,325 | 37,517 | ||||||
Receivable from Adviser (Note 4) | 10,971 | 10,777 | ||||||
Other assets | 2,924 | 2,375 | ||||||
Total assets | 1,216,768 | 1,242,492 | ||||||
LIABILITIES | ||||||||
Payable for investment securities purchased | 29,166 | 39,293 | ||||||
Payable to administrator (Note 4) | 6,510 | 6,510 | ||||||
Other accrued expenses | 6,103 | 6,103 | ||||||
Total liabilities | 41,779 | 51,906 | ||||||
NET ASSETS | $ | 1,174,989 | $ | 1,190,586 | ||||
NET ASSETS CONSIST OF: | ||||||||
Paid-in capital | $ | 1,032,706 | $ | 962,454 | ||||
Undistributed net investment income | 6,697 | 3,057 | ||||||
Undistributed net realized gains from investment transactions | 11,193 | 85,717 | ||||||
Net unrealized appreciation on investments | 124,393 | 139,358 | ||||||
NET ASSETS | $ | 1,174,989 | $ | 1,190,586 | ||||
Shares of beneficial interest outstanding (unlimited number of shares authorized, no par value) | 100,234 | 93,880 | ||||||
Net asset value, offering price and redemption price (Note 2) | $ | 11.72 | $ | 12.68 | ||||
See accompanying notes to financial statements. |
39
ALAMBIC FUNDS | ||||||||
| Alambic Small | Alambic Small | ||||||
INVESTMENT INCOME | ||||||||
Dividend income | $ | 35,322 | $ | 21,011 | ||||
Foreign withholding taxes on dividends | (2 | ) | (5 | ) | ||||
Total investment income | 35,320 | 21,006 | ||||||
EXPENSES | ||||||||
Professional fees | 37,152 | 37,152 | ||||||
Fund accounting fees (Note 4) | 30,314 | 29,291 | ||||||
Administration fees (Note 4) | 30,000 | 29,000 | ||||||
Investment advisory fees (Note 4) | 29,813 | 27,687 | ||||||
Compliance fees (Note 4) | 12,240 | 12,240 | ||||||
Transfer agent fees (Note 4) | 12,000 | 12,000 | ||||||
Trustees' fees and expenses (Note 4) | 10,009 | 10,009 | ||||||
Pricing costs | 4,496 | 4,372 | ||||||
Insurance expense | 2,680 | 2,680 | ||||||
Registration and filing fees | 2,108 | 2,107 | ||||||
Postage and supplies | 2,246 | 1,960 | ||||||
Printing of shareholder reports | 2,058 | 2,028 | ||||||
Other expenses | 7,010 | 7,095 | ||||||
Total expenses | 182,126 | 177,621 | ||||||
Less fee reductions and expense reimbursements by the Adviser (Note 4) | (152,313 | ) | (149,933 | ) | ||||
Net expenses | 29,813 | 27,688 | ||||||
NET INVESTMENT INCOME (LOSS) | 5,507 | (6,682 | ) | |||||
REALIZED AND UNREALIZED GAINS ON INVESTMENTS | ||||||||
Net realized gains from investment transactions | 375,360 | 479,597 | ||||||
Net change in unrealized appreciation (depreciation) on investments | 162,454 | 81,190 | ||||||
NET REALIZED AND UNREALIZED GAINS ON INVESTMENTS | 537,814 | 560,787 | ||||||
NET INCREASE IN NET ASSETS RESULTING FROM OPERATIONS | $ | 543,321 | $ | 554,105 | ||||
See accompanying notes to financial statements. |
40
ALAMBIC FUNDS | ||||||||
| Alambic Mid | Alambic Mid | ||||||
INVESTMENT INCOME | ||||||||
Dividend income | $ | 18,886 | $ | 13,485 | ||||
Foreign withholding taxes on dividends | (10 | ) | (10 | ) | ||||
Total investment income | 18,876 | 13,475 | ||||||
EXPENSES | ||||||||
Professional fees | 37,152 | 37,152 | ||||||
Fund accounting fees (Note 4) | 26,112 | 26,112 | ||||||
Administration fees (Note 4) | 26,000 | 26,000 | ||||||
Compliance fees (Note 4) | 12,240 | 12,240 | ||||||
Transfer agent fees (Note 4) | 12,000 | 12,000 | ||||||
Trustees' fees and expenses (Note 4) | 10,009 | 10,009 | ||||||
Investment advisory fees (Note 4) | 7,779 | 7,867 | ||||||
Pricing costs | 3,516 | 2,971 | ||||||
Custody and bank service fees | 3,166 | 3,166 | ||||||
Insurance expense | 2,679 | 2,679 | ||||||
Registration and filing fees | 2,919 | 2,170 | ||||||
Printing of shareholder reports | 1,968 | 1,908 | ||||||
Postage and supplies | 1,838 | 1,834 | ||||||
Other expenses | 6,782 | 6,784 | ||||||
Total expenses | 154,160 | 152,892 | ||||||
Less fee reductions and expense reimbursements by the Adviser (Note 4) | (144,714 | ) | (143,339 | ) | ||||
Net expenses | 9,446 | 9,553 | ||||||
NET INVESTMENT INCOME | 9,430 | 3,922 | ||||||
REALIZED AND UNREALIZED GAINS ON INVESTMENTS | ||||||||
Net realized gains from investment transactions | 22,286 | 85,972 | ||||||
Net change in unrealized appreciation (depreciation) on investments | 91,463 | 70,519 | ||||||
NET REALIZED AND UNREALIZED GAINS ON INVESTMENTS | 113,749 | 156,491 | ||||||
NET INCREASE IN NET ASSETS RESULTING FROM OPERATIONS | $ | 123,179 | $ | 160,413 | ||||
See accompanying notes to financial statements. |
41
ALAMBIC SMALL CAP VALUE PLUS FUND | ||||||||
| Year | Year | ||||||
FROM OPERATIONS | ||||||||
Net investment income | $ | 5,507 | $ | 1,201 | ||||
Net realized gains from investment transactions | 375,360 | 372,341 | ||||||
Net change in unrealized appreciation (depreciation) on investments | 162,454 | (163,060 | ) | |||||
Net increase in net assets resulting from operations | 543,321 | 210,482 | ||||||
DISTRIBUTIONS TO SHAREHOLDERS (Note 2) | ||||||||
From net investment income | (4,978 | ) | (9,727 | ) | ||||
From net realized gains | (358,527 | ) | — | |||||
Total distributions to shareholders | (363,505 | ) | (9,727 | ) | ||||
CAPITAL SHARE TRANSACTIONS | ||||||||
Proceeds from shares sold | 86,363 | 1,132,000 | ||||||
Net asset value of shares issued in reinvestment of distributions to shareholders | 363,505 | 9,727 | ||||||
Payments for shares redeemed | (69,662 | ) | (1,162,825 | ) | ||||
Net increase (decrease) from capital share transactions | 380,206 | (21,098 | ) | |||||
TOTAL INCREASE IN NET ASSETS | 560,022 | 179,657 | ||||||
NET ASSETS | ||||||||
Beginning of year | 2,746,703 | 2,567,046 | ||||||
End of year | $ | 3,306,725 | $ | 2,746,703 | ||||
DISTIBUTIONS IN EXCESS OF NET INVESTMENT INCOME | $ | (2,347 | ) | $ | (2,876 | ) | ||
CAPITAL SHARE ACTIVITY | ||||||||
Shares sold | 6,593 | 87,279 | ||||||
Shares issued in reinvestment of distributions to shareholders | 29,943 | 742 | ||||||
Shares redeemed | (5,335 | ) | (89,645 | ) | ||||
Net increase (decrease) in shares outstanding | 31,201 | (1,624 | ) | |||||
Shares outstanding at beginning of year | 219,644 | 221,268 | ||||||
Shares outstanding at end of year | 250,845 | 219,644 | ||||||
See accompanying notes to financial statements. |
42
ALAMBIC SMALL CAP GROWTH PLUS FUND | ||||||||
| Year | Year | ||||||
FROM OPERATIONS | ||||||||
Net investment loss | $ | (6,682 | ) | $ | (12,454 | ) | ||
Net realized gains from investment transactions | 479,597 | 262,862 | ||||||
Net change in unrealized appreciation (depreciation) on investments | 81,190 | 110,903 | ||||||
Net increase in net assets resulting from operations | 554,105 | 361,311 | ||||||
DISTRIBUTIONS TO SHAREHOLDERS (Note 2) | ||||||||
From net realized gains | (358,457 | ) | — | |||||
CAPITAL SHARE TRANSACTIONS | ||||||||
Proceeds from shares sold | — | 788,000 | ||||||
Net asset value of shares issued in reinvestment of distributions to shareholders | 358,457 | — | ||||||
Payments for shares redeemed | (35,512 | ) | (776,180 | ) | ||||
Net increase from capital share transactions | 322,945 | 11,820 | ||||||
TOTAL INCREASE IN NET ASSETS | 518,593 | 373,131 | ||||||
NET ASSETS | ||||||||
Beginning of year | 2,618,830 | 2,245,699 | ||||||
End of year | $ | 3,137,423 | $ | 2,618,830 | ||||
ACCUMULATED NET INVESTMENT LOSS | $ | (6,623 | ) | $ | (10,299 | ) | ||
CAPITAL SHARE ACTIVITY | ||||||||
Shares sold | — | 63,894 | ||||||
Shares issued in reinvestment of distributions to shareholders | 28,954 | — | ||||||
Shares redeemed | (2,675 | ) | (62,921 | ) | ||||
Net increase in shares outstanding | 26,279 | 973 | ||||||
Shares outstanding at beginning of year | 202,570 | 201,597 | ||||||
Shares outstanding at end of year | 228,849 | 202,570 | ||||||
See accompanying notes to financial statements. |
43
ALAMBIC MID CAP VALUE PLUS FUND | ||||||||
| Year | Period | ||||||
FROM OPERATIONS | ||||||||
Net investment income | $ | 9,430 | $ | 6,454 | ||||
Net realized gains (losses) from investment transactions | 22,286 | (11,093 | ) | |||||
Net change in unrealized appreciation (depreciation) on investments | 91,463 | 32,930 | ||||||
Net increase in net assets resulting from operations | 123,179 | 28,291 | ||||||
DISTRIBUTIONS TO SHAREHOLDERS (Note 2) | ||||||||
From net investment income | (9,187 | ) | — | |||||
CAPITAL SHARE TRANSACTIONS | ||||||||
Proceeds from shares sold | 64,923 | 958,596 | ||||||
Net asset value of shares issued in reinvestment of distributions to shareholders | 9,187 | — | ||||||
Net increase from capital share transactions | 74,110 | 958,596 | ||||||
TOTAL INCREASE IN NET ASSETS | 188,102 | 986,887 | ||||||
NET ASSETS | ||||||||
Beginning of period | 986,887 | — | ||||||
End of period | $ | 1,174,989 | $ | 986,887 | ||||
ACCUMULATED NET INVESTMENT INCOME | $ | 6,697 | $ | 6,454 | ||||
CAPITAL SHARE ACTIVITY | ||||||||
Shares sold | 5,507 | 93,932 | ||||||
Shares issued in reinvestment of distributions to shareholders | 795 | — | ||||||
Net increase in shares outstanding | 6,302 | 93,932 | ||||||
Shares outstanding at beginning of period | 93,932 | — | ||||||
Shares outstanding at end of period | 100,234 | 93,932 | ||||||
| (a) | Represents the period from the commencement of operations (December 29, 2016) through August 31, 2017. |
See accompanying notes to financial statements.
44
ALAMBIC MID CAP GROWTH PLUS FUND | ||||||||
| Year | Period | ||||||
FROM OPERATIONS | ||||||||
Net investment income | $ | 3,922 | $ | 1,660 | ||||
Net realized gains from investment transactions | 85,972 | 39 | ||||||
Net change in unrealized appreciation (depreciation) on investments | 70,519 | 68,839 | ||||||
Net increase in net assets resulting from operations | 160,413 | 70,538 | ||||||
DISTRIBUTIONS TO SHAREHOLDERS (Note 2) | ||||||||
From net investment income | (2,519 | ) | — | |||||
From net realized gains | (300 | ) | — | |||||
Total distributions to shareholders | (2,819 | ) | — | |||||
CAPITAL SHARE TRANSACTIONS | ||||||||
Proceeds from shares sold | — | 959,635 | ||||||
Net asset value of shares issued in reinvestment of distributions to shareholders | 2,819 | — | ||||||
Net increase from capital share transactions | 2,819 | 959,635 | ||||||
TOTAL INCREASE IN NET ASSETS | 160,413 | 1,030,173 | ||||||
NET ASSETS | ||||||||
Beginning of period | 1,030,173 | — | ||||||
End of period | $ | 1,190,586 | $ | 1,030,173 | ||||
ACCUMULATED NET INVESTMENT INCOME | $ | 3,057 | $ | 1,660 | ||||
CAPITAL SHARE ACTIVITY | ||||||||
Shares sold | — | 93,646 | ||||||
Shares issued in reinvestment of distributions to shareholders | 234 | — | ||||||
Net increase in shares outstanding | 234 | 93,646 | ||||||
Shares outstanding at beginning of period | 93,646 | — | ||||||
Shares outstanding at end of period | 93,880 | 93,646 | ||||||
| (a) | Represents the period from the commencement of operations (December 29, 2016) through August 31, 2017. |
See accompanying notes to financial statements.
45
ALAMBIC SMALL CAP VALUE PLUS FUND | ||||||||||||
Per Share Data for a Share Outstanding Throughout Each Period | ||||||||||||
| Year | Year | Period | |||||||||
Net asset value at beginning of period | $ | 12.51 | $ | 11.60 | $ | 10.00 | ||||||
Income from investment operations: | ||||||||||||
Net investment income | 0.03 | 0.01 | 0.05 | |||||||||
Net realized and unrealized gains on investments | 2.25 | 0.94 | 1.58 | |||||||||
Total from investment operations | 2.28 | 0.95 | 1.63 | |||||||||
Less distributions: | ||||||||||||
From net investment income | (0.02 | ) | (0.04 | ) | (0.03 | ) | ||||||
From net realized gains | (1.59 | ) | — | — | ||||||||
Total distributions | (1.61 | ) | (0.04 | ) | (0.03 | ) | ||||||
Net asset value at end of period | $ | 13.18 | $ | 12.51 | $ | 11.60 | ||||||
Total return (b) | 19.36 | % | 8.20 | % | 16.31 | %(c) | ||||||
Net assets at end of period (000's) | $ | 3,307 | $ | 2,747 | $ | 2,567 | ||||||
Ratios/supplementary data: | ||||||||||||
Ratio of total expenses to average net assets | 5.80 | % | 6.65 | % | 7.24 | %(d) | ||||||
Ratio of net expenses to average net assets (e) | 0.95 | % | 1.18 | % | 1.20 | %(d) | ||||||
Ratio of net investment income to average net assets (e) | 0.18 | % | 0.04 | % | 0.53 | %(d) | ||||||
Portfolio turnover rate | 225 | % | 226 | % | 350 | %(c) | ||||||
(a) | Represents the period from the commencement of operations (September 1, 2015) through August 31, 2016. |
(b) | Total return is a measure of the change in value of an investment in the Fund over the periods covered. The returns shown do not reflect the deduction of taxes a shareholder would pay on Fund distributions, if any, or the redemption of Fund shares. The total returns would be lower if the Adviser had not reduced advisory fees and reimbursed expenses (Note 4). |
(c) | Not annualized. |
(d) | Annualized. |
(e) | Ratio was determined after advisory fee reductions and expense reimbursements (Note 4). |
See accompanying notes to financial statements.
46
ALAMBIC SMALL CAP GROWTH PLUS FUND | ||||||||||||
Per Share Data for a Share Outstanding Throughout Each Period | ||||||||||||
| Year | Year | Period | |||||||||
Net asset value at beginning of period | $ | 12.93 | $ | 11.14 | $ | 10.00 | ||||||
Income (loss) from investment operations: | ||||||||||||
Net investment loss | (0.02 | ) | (0.06 | ) | (0.01 | ) | ||||||
Net realized and unrealized gains on investments | 2.58 | 1.85 | 1.15 | |||||||||
Total from investment operations | 2.56 | 1.79 | �� | 1.14 | ||||||||
Less distributions: | ||||||||||||
From net realized gains | (1.78 | ) | — | — | ||||||||
Net asset value at end of period | $ | 13.71 | $ | 12.93 | $ | 11.14 | ||||||
Total return (b) | 21.31 | % | 16.07 | % | 11.40 | %(c) | ||||||
Net assets at end of period (000's) | $ | 3,137 | $ | 2,619 | $ | 2,246 | ||||||
Ratios/supplementary data: | ||||||||||||
Ratio of total expenses to average net assets | 6.09 | % | 7.22 | % | 8.89 | %(d) | ||||||
Ratio of net expenses to average net assets (e) | 0.95 | % | 1.18 | % | 1.20 | %(d) | ||||||
Ratio of net investment loss to average net assets (e) | (0.23 | %) | (0.50 | %) | (0.16 | %)(d) | ||||||
Portfolio turnover rate | 220 | % | 199 | % | 309 | %(c) | ||||||
(a) | Represents the period from the commencement of operations (December 29, 2015) through August 31, 2016. |
(b) | Total return is a measure of the change in value of an investment in the Fund over the periods covered. The returns shown do not reflect the deduction of taxes a shareholder would pay on Fund distributions, if any, or the redemption of Fund shares. The total returns would be lower if the Adviser had not reduced advisory fees and reimbursed expenses (Note 4). |
(c) | Not annualized. |
(d) | Annualized. |
(e) | Ratio was determined after advisory fee reductions and expense reimbursements (Note 4). |
See accompanying notes to financial statements.
47
ALAMBIC MID CAP VALUE PLUS FUND | ||||||||
Per Share Data for a Share Outstanding Throughout Each Period | ||||||||
| Year | Period | ||||||
Net asset value at beginning of period | $ | 10.51 | $ | 10.00 | ||||
Income from investment operations: | ||||||||
Net investment income | 0.10 | 0.07 | ||||||
Net realized and unrealized gains on investments | 1.21 | 0.44 | ||||||
Total from investment operations | 1.31 | 0.51 | ||||||
Less distributions: | ||||||||
From net investment income | (0.10 | ) | — | |||||
Net asset value at end of period | $ | 11.72 | $ | 10.51 | ||||
Total return (b) | 12.46 | % | 5.10 | %(c) | ||||
Net assets at end of period (000's) | $ | 1,175 | $ | 987 | ||||
Ratios/supplementary data: | ||||||||
Ratio of total expenses to average net assets | 13.87 | % | 17.03 | %(d) | ||||
Ratio of net expenses to average net assets (e) | 0.85 | % | 0.85 | %(d) | ||||
Ratio of net investment income to average net assets (e) | 0.85 | % | 1.22 | %(d) | ||||
Portfolio turnover rate | 184 | % | 239 | %(c) | ||||
(a) | Represents the period from the commencement of operations (December 29, 2016) through August 31, 2017. |
(b) | Total return is a measure of the change in value of an investment in the Fund over the periods covered. The returns shown do not reflect the deduction of taxes a shareholder would pay on Fund distributions, if any, or the redemption of Fund shares. The total returns would be lower if the Adviser had not reduced advisory fees and reimbursed expenses (Note 4). |
(c) | Not annualized. |
(d) | Annualized. |
(e) | Ratio was determined after advisory fee reductions and expense reimbursements (Note 4). |
See accompanying notes to financial statements.
48
| ALAMBIC MID CAP GROWTH PLUS FUND FINANCIAL HIGHLIGHTS | ||||||||
| Per Share Data for a Share Outstanding Throughout Each Period | ||||||||
| Year Ended August 31, 2018 | Period | |||||||
| Net asset value at beginning of period | $ | 11.00 | $ | 10.00 | ||||
| Income from investment operations: | ||||||||
| Net investment income | 0.04 | 0.02 | ||||||
| Net realized and unrealized gains on investments | 1.67 | 0.98 | ||||||
| Total from investment operations | 1.71 | 1.00 | ||||||
| Less distributions: | ||||||||
| From net investment income | (0.03 | ) | — | |||||
| From net realized gains | (0.00 | )(b) | — | |||||
| Total distributions | (0.03 | ) | — | |||||
| Net asset value at end of period | $ | 12.68 | $ | 11.00 | ||||
Total return (c) | 15.56 | % | 10.00 | %(d) | ||||
| Net assets at end of period (000's) | $ | 1,191 | $ | 1,030 | ||||
| Ratios/supplementary data: | ||||||||
| Ratio of total expenses to average net assets | 13.60 | % | 16.22 | %(e) | ||||
Ratio of net expenses to average net assets (f) | 0.85 | % | 0.85 | %(e) | ||||
Ratio of net investment income to average net assets (f) | 0.35 | % | 0.30 | %(e) | ||||
| Portfolio turnover rate | 183 | % | 217 | %(d) | ||||
(a) | Represents the period from the commencement of operations (December 29, 2016) through August 31, 2017. |
(b) | Amount rounds to less than $0.01 per share. |
(c) | Total return is a measure of the change in value of an investment in the Fund over the periods covered. The returns shown do not reflect the deduction of taxes a shareholder would pay on Fund distributions, if any, or the redemption of Fund shares. The total returns would be lower if the Adviser had not reduced advisory fees and reimbursed expenses (Note 4). |
(d) | Not annualized. |
(e) | Annualized. |
(f) | Ratio was determined after advisory fee reductions and expense reimbursements (Note 4). |
See accompanying notes to financial statements.
49
ALAMBIC FUNDS
NOTES TO FINANCIAL STATEMENTS
August 31, 2018
1. Organization
Alambic Small Cap Value Plus Fund, Alambic Small Cap Growth Plus Fund, Alambic Mid Cap Value Plus Fund and Alambic Mid Cap Growth Plus Fund (individually, a “Fund” and collectively, the “Funds”) are each a diversified series of Ultimus Managers Trust (the “Trust”), an open-end investment company established as an Ohio business trust under a Declaration of Trust dated February 28, 2012. Other series of the Trust are not incorporated in this report.
The investment objective of each Fund is to seek long-term capital appreciation.
2. Significant Accounting Policies
The following is a summary of the Funds’ significant accounting policies used in the preparation of their financial statements. These policies are in conformity with accounting principles generally accepted in the United States of America (“GAAP”). The Funds follow accounting and reporting guidance under Financial Accounting Standards Board Accounting Standards Codification Topic 946, “Financial Services – Investment Companies.”
Securities valuation – Each Fund values its portfolio securities at market value as of the close of regular trading on the New York Stock Exchange (the “NYSE”) (normally 4:00 p.m. Eastern time) on each business day the NYSE is open for business. The Funds value their listed securities, including common stocks, on the basis of the security’s last sale price on the security’s primary exchange, if available, otherwise at the exchange’s most recently quoted mean price. NASDAQ-listed securities are valued at the NASDAQ Official Closing Price. The Funds value securities traded in the over-the-counter market at the last sale price, if available, otherwise at the most recently quoted mean price. When using a quoted price and when the market for the security is considered active, the security will be classified as Level 1 within the fair value hierarchy (see below). In the event that market quotations are not readily available or are considered unreliable due to market or other events, the Funds value their securities and other assets at fair value pursuant to procedures established by and under the direction of the Board of Trustees (the “Board”) of the Trust. Under these procedures, the securities will be classified as Level 2 or 3 within the fair value hierarchy, depending on the inputs used. Unavailable or unreliable market quotes may be due to the following factors: a substantial bid-ask spread; infrequent sales resulting in stale prices; insufficient trading volume; small trade sizes; a temporary lapse in any reliable pricing source; and actions of the securities or futures markets, such as the suspension or limitation of trading. As a result, the prices of securities used to calculate each Fund’s net asset value (“NAV”) may differ from quoted or published prices for the same securities.
GAAP establishes a single authoritative definition of fair value, sets out a framework for measuring fair value, and requires additional disclosures about fair value measurements.
Various inputs are used in determining the value of each Fund’s investments. These inputs are summarized in the three broad levels listed below:
● | Level 1 – quoted prices in active markets for identical securities |
● | Level 2 – other significant observable inputs |
● | Level 3 – significant unobservable inputs |
50
ALAMBIC FUNDS |
The inputs or methods used for valuing securities are not necessarily an indication of the risks associated with investing in those securities. The inputs used to measure fair value may fall into different levels of the fair value hierarchy. In such cases, for disclosure purposes, the level in the fair value hierarchy within which the fair value measurement falls in its entirety is determined based on the lowest level input that is significant to the fair value measurement.
The following is a summary of the inputs used to value the Funds’ investments as of August 31, 2018:
Alambic Small Cap Value Plus Fund | Level 1 | Level 2 | Level 3 | Total | ||||||||||||
Common Stocks | $ | 3,152,424 | $ | — | $ | — | $ | 3,152,424 | ||||||||
Rights | — | — | 5 | 5 | ||||||||||||
Total | $ | 3,152,424 | $ | — | $ | 5 | $ | 3,152,429 | ||||||||
Alambic Small Cap Growth Plus Fund | Level 1 | Level 2 | Level 3 | Total | ||||||||||||
Common Stocks | $ | 3,030,685 | $ | — | $ | — | $ | 3,030,685 | ||||||||
Alambic Mid Cap Value Plus Fund | Level 1 | Level 2 | Level 3 | Total | ||||||||||||
Common Stocks | $ | 1,088,343 | $ | — | $ | — | $ | 1,088,343 | ||||||||
Rights | — | — | 6 | 6 | ||||||||||||
Total | $ | 1,088,343 | $ | — | $ | 6 | $ | 1,088,349 | ||||||||
Alambic Mid Cap Growth Plus Fund | Level 1 | Level 2 | Level 3 | Total | ||||||||||||
Common Stocks | $ | 1,123,224 | $ | — | $ | — | $ | 1,123,224 | ||||||||
Refer to the Funds’ Schedules of Investments for a listing of the common stocks by industry type. As of August 31, 2018, the Funds did not have any transfers between Levels. It is the Funds’ policy to recognize transfers between Levels at the end of the reporting period. There were no Level 3 securities held by Alambic Small Cap Growth Plus Fund and Alambic Mid Cap Growth Plus Fund as of August 31, 2018.
The following is a reconciliation of Level 3 securities of Alambic Small Cap Value Plus Fund and Alambic Mid Cap Value Plus Fund for which significant unobservable inputs were used to determine fair value between August 31, 2017 and August 31, 2018.
51
ALAMBIC FUNDS |
| Alambic Small | Alambic Mid | ||||||
Balance as of August 31, 2017 | $ | 0 | * | $ | 0 | * | ||
Unrealized appreciation | 5 | 6 | ||||||
Balance as of August 31, 2018 | $ | 5 | $ | 6 | ||||
* | Alambic Small Cap Value Plus Fund and Alambic Mid Cap Value Plus Fund each held Rights which were fair valued at $0 as of August 31, 2017. |
The following table summarizes the valuation techniques used and unobservable inputs developed by the Board to determine the fair value of the Level 3 investments:
Alambic Small Cap Value Plus Fund
| |||||||||||
| Fair Value at 08/31/2018 | Valuation | Unobservable | Range | Impact to Valuation from an Input ** | ||||||
Rights | $ | 5 | Discount on Future Cash Flows | Estimate of Future Cash Flows | 100% | Increase | |||||
Alambic Mid Cap Value Plus Fund
| |||||||||||
| Fair Value at | Valuation | Unobservable | Range | Impact to Valuation from an Decrease in Input ** | ||||||
Rights | $ | 6 | Discount on Future Cash Flows | Estimate of Future Cash Flows | 100% | Increase | |||||
** | This column represents the directional change in fair value of the Level 3 investments that would result in an increase from the corresponding input. A decrease to the unobservable input would have the opposite effect. Significant increases and decreases in these inputs in isolation could result in significantly higher or lower fair value measurements. |
Cash account – Each Fund’s cash is held in a bank account with balances which may exceed the amount covered by federal deposit insurance. As of August 31, 2018, the cash balances reflected on the Statements of Assets and Liabilities for each Fund represent the amount held in a deposit sweep account.
Share valuation – The NAV per share of each Fund is calculated daily by dividing the total value of its assets, less liabilities, by the number of shares outstanding. The offering price and redemption price per share of each Fund is equal to the NAV per share.
52
ALAMBIC FUNDS |
Investment income – Dividend income is recorded on the ex-dividend date. Interest income, if any, is accrued as earned. Withholding taxes on foreign dividends have been recorded for in accordance with the Funds’ understanding of the applicable country’s tax rules and rates.
Investments in REITs – with respect to each Fund, dividend income is recorded based on the income included in distributions received from its REIT investments using published REIT reclassifications. The actual amounts of income, return of capital, and capital gains are only determined by each REIT after its fiscal year end.
Investment transactions – Investment transactions are accounted for on the trade date. Realized gains and losses on investments sold are determined on a specific identification basis.
Common expenses – Common expenses of the Trust are allocated among the Funds and the other series of the Trust based on the relative net assets of each series or the nature of the services performed and the relative applicability to each series.
Distributions to shareholders – The Funds distribute to shareholders any net investment income dividends and net realized capital gains distributions at least once each year. The amount of such dividends and distributions are determined in accordance with federal income tax regulations, which may differ from GAAP. Dividends and distributions to shareholders are recorded on the ex-dividend date. The tax character of distributions paid by each Fund to shareholders during the periods ended August 31, 2018 and 2017 was as follows:
| Periods | Ordinary | Long-Term | Total | |||||||||
Alambic Small Cap Value Plus Fund | 8/31/2018 | $ | 4,978 | $ | 358,527 | $ | 363,505 | ||||||
8/31/2017 | $ | 9,727 | $ | — | $ | 9,727 | |||||||
Alambic Small Cap Growth Plus Fund | 8/31/2018 | $ | — | $ | 358,457 | $ | 358,457 | ||||||
8/31/2017 | $ | — | $ | — | $ | — | |||||||
Alambic Mid Cap Value Plus Fund | 8/31/2018 | $ | 9,187 | $ | — | $ | 9,187 | ||||||
8/31/2017 | $ | — | $ | — | $ | — | |||||||
Alambic Mid Cap Growth Plus Fund | 8/31/2018 | $ | 2,819 | $ | — | $ | 2,819 | ||||||
8/31/2017 | $ | — | $ | — | $ | — | |||||||
Estimates – The preparation of financial statements in conformity with GAAP requires management to make estimates and assumptions which affect the reported amounts of assets and liabilities and disclosure of contingent assets and liabilities as of the date of the financial statements and the reported amounts of income and expenses during the reporting period. Actual results could differ from those estimates.
53
ALAMBIC FUNDS |
Federal income tax – Each Fund has qualified and intends to continue to qualify as a regulated investment company under the Internal Revenue Code of 1986, as amended (the “Code”). Qualification generally will relieve each Fund of liability for federal income taxes to the extent 100% of its net investment income and net realized capital gains are distributed in accordance with the Code.
In order to avoid imposition of the excise tax applicable to regulated investment companies, it is also each Fund’s intention to declare as dividends in each calendar year at least 98% of its net investment income (earned during the calendar year) and 98.2% of its net realized capital gains (earned during the 12 months ended October 31) plus undistributed amounts from prior years.
The following information is computed on a tax basis for each item as of August 31, 2018:
| Alambic Small | Alambic Small | Alambic | Alambic | ||||||||||||
Tax cost of portfolio investments | $ | 2,755,367 | $ | 2,561,839 | $ | 963,956 | $ | 983,891 | ||||||||
Gross unrealized appreciation | $ | 450,034 | $ | 501,584 | $ | 130,298 | $ | 143,997 | ||||||||
Gross unrealized depreciation | (52,972 | ) | (32,738 | ) | (5,905 | ) | (4,664 | ) | ||||||||
Net unrealized appreciation | 397,062 | 468,846 | 124,393 | 139,333 | ||||||||||||
Undistributed ordinary income | — | — | 6,697 | 3,057 | ||||||||||||
Undistributed long-term capital gains | 332,050 | 365,104 | 11,193 | 85,742 | ||||||||||||
Accumulated capital and other losses | (2,347 | ) | (6,623 | ) | — | — | ||||||||||
Accumulated earnings | $ | 726,765 | $ | 827,327 | $ | 142,283 | $ | 228,132 | ||||||||
The difference between the federal income tax cost of portfolio investments and the financial statement cost of portfolio investments for Alambic Small Cap Value Plus Fund, Alambic Small Cap Growth Plus Fund, and Alambic Mid Cap Growth Plus Fund is due to certain timing differences in the recognition of capital gains or losses under income tax regulations and GAAP. These “book/tax” differences are temporary in nature and are due primarily to the tax deferral of losses on wash sales.
During the year ended August 31, 2018, Alambic Mid Cap Value Plus Fund utilized short-term capital loss carryforwards in the amount of $10,969 to offset current year net realized capital gains.
Qualified late year ordinary losses incurred after December 31, 2017 and within the taxable year are deemed to arise on the first day of a Fund’s next taxable year. For the year ended August 31, 2018, Alambic Small Cap Value Plus Fund and Alambic Small Cap Growth Plus Fund deferred until September 1, 2018 late year ordinary losses of $2,347 and $6,623, respectively.
54
ALAMBIC FUNDS |
For the year ended August 31, 2018, the following reclassifications were made on the Statements of Assets and Liabilities as a result of permanent differences in the recognition of capital gains or losses under income tax regulations and GAAP:
| Paid-in Capital | Undistributed net | Undistributed net | |||||||||
Alambic Small Cap Value Plus Fund | $ | — | $ | — | $ | — | ||||||
Alambic Small Cap Growth Plus Fund | $ | (10,358 | ) | $ | 10,358 | $ | — | |||||
Alambic Mid Cap Value Plus Fund | $ | — | $ | — | $ | — | ||||||
Alambic Mid Cap Growth Plus Fund | $ | — | $ | (6 | ) | $ | 6 | |||||
Such reclassifications, the result of permanent differences between financial statement and income tax reporting requirements, had no effect on each of the Fund’s net assets or NAV per share.
The Funds recognize the tax benefits or expenses of uncertain tax positions only when the position is “more likely than not” of being sustained assuming examination by tax authorities. Management has reviewed each Fund’s tax positions for all open tax periods (periods ended August 31, 2016 through August 31, 2018, if applicable) and has concluded that no provision for unrecognized tax benefits or expenses is required in these financial statements. The Funds identify their major tax jurisdiction as U.S. Federal.
3. Investment Transactions
During the year ended August 31, 2018, costs of purchases and proceeds from sales of investment securities, other than short-term investments, were as follows:
| Alambic Small | Alambic Small | Alambic | Alambic | ||||||||||||
Purchases of investment securities | $ | 6,726,830 | �� | $ | 6,154,287 | $ | 1,955,973 | $ | 1,973,677 | |||||||
Proceeds from sales of investment securities | $ | 6,699,370 | $ | 6,171,773 | $ | 1,917,143 | $ | 2,013,615 | ||||||||
4. Transactions with Related Parties
INVESTMENT ADVISORY AGREEMENT
Each Fund’s investments are managed by Alambic Investment Management, L.P. (the “Adviser”) pursuant to the terms of an Investment Advisory Agreement. Under the Investment Advisory Agreement, each Fund pays the Adviser an investment advisory fee, computed and accrued daily and paid monthly, at the annual rate of 0.95% of average daily net assets with
55
ALAMBIC FUNDS |
respect to Alambic Small Cap Value Plus Fund and Alambic Small Cap Growth Plus Fund and at the annual rate of 0.70% of average daily net assets with respect to Alambic Mid Cap Value Plus Fund and Alambic Mid Cap Growth Plus Fund.
Pursuant to an Expense Limitation Agreement (the “ELA”) between each Fund and the Adviser, the Adviser has contractually agreed, until December 31, 2019, to reduce investment advisory fees and reimburse other expenses to the extent necessary to limit total annual operating expenses (exclusive of brokerage costs; taxes; interest; borrowing costs such as interest and dividend expense on securities sold short; costs to organize the Fund; acquired fund fees and expenses; extraordinary expenses such as litigation and merger or reorganization costs; and other expenses not incurred in the ordinary course of the Fund’s business) to 0.95% of average daily net assets with respect to Alambic Small Cap Value Plus Fund and Alambic Small Cap Growth Plus Fund and to 0.85% of average daily net assets with respect to Alambic Mid Cap Value Plus Fund and Alambic Mid Cap Growth Plus Fund.
Accordingly, during the year ended August 31, 2018, the Adviser did not collect any of its investment advisory fees and reimbursed other operating expenses totaling $122,500, $122,246, $136,935 and $135,472 with respect to Alambic Small Cap Value Plus Fund, Alambic Small Cap Growth Plus Fund, Alambic Mid Cap Value Plus Fund and Alambic Mid Cap Growth Plus Fund, respectively.
Under the terms of the ELA, investment advisory fee reductions and expense reimbursements by the Adviser are subject to repayment by each Fund for a period of three years after such fees and expenses were incurred, provided the repayments do not cause total annual operating expenses to exceed the lesser of (i) the expense limitation then in effect, if any, and (ii) the expense limitations in effect at the time the expenses to be repaid were incurred. As of August 31, 2018, the Adviser may seek repayment of investment advisory fee reductions and expense reimbursements totaling $430,219, $383,530, $230,706 and $229,490 with respect to Alambic Small Cap Value Plus Fund, Alambic Small Cap Growth Plus Fund, Alambic Mid Cap Value Plus Fund and Alambic Mid Cap Growth Plus Fund, respectively, no later than the dates as stated below:
| Alambic Small | Alambic Small | Alambic | Alambic | ||||||||||||
August 31, 2019 | $ | 126,406 | $ | 82,902 | $ | — | $ | — | ||||||||
August 31, 2020 | 151,500 | 150,695 | 85,992 | 86,151 | ||||||||||||
August 31, 2021 | 152,313 | 149,933 | 144,714 | 143,339 | ||||||||||||
| $ | 430,219 | $ | 383,530 | $ | 230,706 | $ | 229,490 | |||||||||
OTHER SERVICE PROVIDERS
Ultimus Fund Solutions, LLC (“Ultimus”) provides administration, fund accounting, compliance and transfer agency services to the Funds. Each Fund pays Ultimus fees in accordance with the agreements for such services. In addition, each Fund pays out-of-pocket expenses including, but not limited to, postage, supplies and costs of pricing its portfolio securities.
56
ALAMBIC FUNDS |
Under the terms of a Distribution Agreement with the Trust, Ultimus Fund Distributors, LLC (the “Distributor”) serves as the principal underwriter to each Fund. The Distributor is a wholly-owned subsidiary of Ultimus. The Distributor is compensated by the Adviser (not the Funds) for acting as principal underwriter.
Certain officers and a Trustee of the Trust are also officers of Ultimus and the Distributor and are not paid by the Funds for serving in such capacities.
TRUSTEE COMPENSATION
Effective August 1, 2018, each Trustee who is not an “interested person” of the Trust (“Independent Trustee”) receives a $1,300 annual retainer from each Fund, paid quarterly, except for the Board Chairperson who receives a $1,500 annual retainer from each Fund, paid quarterly. Each Independent Trustee also receives from each Fund a fee of $500 for each Board meeting attended plus reimbursement for travel and other meeting-related expenses. Prior to August 1, 2018, each Independent Trustee received a $1,000 annual retainer from each Fund, paid quarterly, except for the Board Chairperson who received a $1,200 annual retainer from each Fund, paid quarterly. Each Independent Trustee also received from each Fund a fee of $500 for each Board meeting attended plus reimbursement for travel and other meeting-related expenses.
PRINCIPAL HOLDERS OF FUND SHARES
As of August 31, 2018, the following shareholders owned of record 5% or more of the outstanding shares of each Fund:
Name of Record Owner | % Ownership |
Alambic Small Cap Value Plus Fund | |
Charles Schwab & Co. (for the benefit of its customers) | 54% |
Kawishiwi Partners Trust | 28% |
Lauren Richards | 6% |
William Richards | 6% |
Jonathan Richards | 6% |
Alambic Small Cap Growth Plus Fund | |
Charles Schwab & Co. (for the benefit of its customers) | 44% |
Kawishiwi Partners Trust | 32% |
Lauren Richards | 8% |
William Richards | 8% |
Jonathan Richards | 8% |
Alambic Mid Cap Value Plus Fund | |
Charles Schwab & Co. (for the benefit of its customers) | 56% |
Kawishiwi Partners Trust | 29% |
Lauren Richards | 5% |
William Richards | 5% |
Jonathan Richards | 5% |
57
ALAMBIC FUNDS |
Name of Record Owner | % Ownership |
Alambic Mid Cap Growth Plus Fund | |
Charles Schwab & Co. (for the benefit of its customers) | 54% |
Kawishiwi Partners Trust | 31% |
Lauren Richards | 5% |
William Richards | 5% |
Jonathan Richards | 5% |
A beneficial owner of 25% or more of a Fund’s outstanding shares may be considered a controlling person. That shareholder’s vote could have a more significant effect on matters presented at a shareholders’ meeting.
5. Sector Risk
If a Fund has significant investments in the securities of issuers within a particular sector, any development affecting that sector will have a greater impact on the value of the net assets of the Fund than would be the case if the Fund did not have significant investments in that sector. In addition, this may increase the risk of loss in the Fund and increase the volatility of the Fund’s NAV per share. For instance, economic or market factors, regulatory changes or other developments may negatively impact all companies in a particular sector, and therefore the value of the Fund’s portfolio will be adversely affected. As of August 31, 2018, Alambic Mid Cap Growth Plus Fund had 29.0% of the value of its net assets invested in stocks within the Information Technology sector.
6. Contingencies and Commitments
The Funds indemnify the Trust’s officers and Trustees for certain liabilities that might arise from their performance of their duties to the Funds. Additionally, in the normal course of business the Funds enter into contracts that contain a variety of representations and warranties and which provide general indemnifications. The Funds’ maximum exposure under these arrangements is unknown, as this would involve future claims that may be made against the Funds that have not yet occurred. However, based on experience, the Funds expect the risk of loss to be remote.
7. Subsequent Events
The Funds are required to recognize in the financial statements the effects of all subsequent events that provide additional evidence about conditions that existed as of the date of the Statements of Assets and Liabilities. For non-recognized subsequent events that must be disclosed to keep the financial statements from being misleading, the Funds are required to disclose the nature of the event as well as an estimate of its financial effect, or a statement that such an estimate cannot be made. Management has evaluated subsequent events through the issuance of these financial statements and has noted no such events.
58
ALAMBIC FUNDS |
To the Shareholders of Alambic Small Cap Value Plus Fund, Alambic Small Cap Growth Plus Fund, Alambic Mid Cap Value Plus Fund, and Alambic Mid Cap Growth Plus Fund and Board of Trustees of Ultimus Managers Trust
Opinion on the Financial Statements
We have audited the accompanying statements of assets and liabilities, including the schedules of investments, of Alambic Small Cap Value Plus Fund, Alambic Small Cap Growth Plus Fund, Alambic Mid Cap Value Plus Fund, and Alambic Mid Cap Growth Plus Fund (the “Funds”), each a series of Ultimus Managers Trust, as of August 31, 2018, and the related statements of operations for the year then ended, the statements of changes in net assets for each of the two periods in the period then ended, including the related notes, and the financial highlights for each of the periods indicated in the period then ended (collectively referred to as the “financial statements”). In our opinion, the financial statements present fairly, in all material respects, the financial position of each of the Funds as of August 31, 2018, the results of their operations, the changes in their net assets, and the financial highlights for each of the periods indicated in the period then ended, in conformity with accounting principles generally accepted in the United States of America.
Basis for Opinion
These financial statements are the responsibility of the Funds’ management. Our responsibility is to express an opinion on the Funds’ financial statements based on our audits. We are a public accounting firm registered with the Public Company Accounting Oversight Board (United States) (“PCAOB”) and are required to be independent with respect to the Funds in accordance with the U.S. federal securities laws and the applicable rules and regulations of the Securities and Exchange Commission and the PCAOB.
We conducted our audits in accordance with the standards of the PCAOB. Those standards require that we plan and perform the audit to obtain reasonable assurance about whether the financial statements are free of material misstatement, whether due to error or fraud.
Our audits include performing procedures to assess the risks of material misstatement of the financial statements, whether due to error or fraud, and performing procedures that respond to those risks. Such procedures include examining, on a test basis, evidence regarding the amounts and disclosures in the financial statements and confirmation of securities owned as of August 31, 2018, by correspondence with the custodian and broker. Our audits also included evaluating the accounting principles used and significant estimates made by management, as well as evaluating the overall presentation of the financial statements. We believe that our audits provide a reasonable basis for our opinion.
We have served as the auditor of one or more investment companies within the family of Funds since 2016.
COHEN & COMPANY, LTD.
Cleveland, Ohio
October 25, 2018
59
ALAMBIC FUNDS |
We believe it is important for you to understand the impact of costs on your investment. As a shareholder of the Funds, you incur ongoing costs, including management fees and other operating expenses. The following examples are intended to help you understand your ongoing costs (in dollars) of investing in the Funds and to compare these costs with the ongoing costs of investing in other mutual funds.
A mutual fund’s ongoing costs are expressed as a percentage of its average net assets. This figure is known as the expense ratio. The expenses in the table below are based on an investment of $1,000 made at the beginning of the most recent period (March 1, 2018) and held until the end of the period (August 31, 2018).
The table below illustrates each Fund’s ongoing costs in two ways:
Actual fund return – This section helps you to estimate the actual expenses that you paid over the period. The “Ending Account Value” shown is derived from each Fund’s actual return, and the fourth column shows the dollar amount of operating expenses that would have been paid by an investor who started with $1,000 in the Funds. You may use the information here, together with the amount you invested, to estimate the expenses that you paid over the period.
To do so, simply divide your account value by $1,000 (for example, an $8,600 account value divided by $1,000 = 8.6), then multiply the result by the number given for the applicable Fund under the heading “Expenses Paid During Period.”
Hypothetical 5% return – This section is intended to help you compare each Fund’s ongoing costs with those of other mutual funds. It assumes that each Fund had an annual return of 5% before expenses during the period shown, but that the expense ratio is unchanged. In this case, because the return used is not the Funds’ actual return, the results do not apply to your investment. The example is useful in making comparisons because the U.S. Securities and Exchange Commission (the “SEC”) requires all mutual funds to calculate expenses based on a 5% return. You can assess each Fund’s ongoing costs by comparing this hypothetical example with the hypothetical examples that appear in shareholder reports of other funds. The hypothetical returns example does not reflect actual trading in any Fund, but is used for illustrative purposes only.
Note that expenses shown in the table are meant to highlight and help you compare ongoing costs only. The Funds do not charge transaction fees, such as purchase or redemption fees, nor do they carry a “sales load.”
The calculations assume no shares were bought or sold during the period. Your actual costs may have been higher or lower, depending on the amount of your investment and the timing of any purchases or redemptions.
More information about the Funds’ expenses can be found in this report. For additional information on operating expenses and other shareholder costs, please refer to each Fund’s prospectus.
60
ALAMBIC FUNDS |
| Beginning | Ending | Net | Expenses |
Alambic Small Cap Value Plus Fund | ||||
Based on Actual Fund Return | $1,000.00 | $1,119.80 | 0.95% | $5.08 |
Based on Hypothetical 5% Return (before expenses) | $1,000.00 | $1,020.42 | 0.95% | $4.84 |
Alambic Small Cap Growth Plus Fund | ||||
Based on Actual Fund Return | $1,000.00 | $1,123.80 | 0.95% | $5.09 |
Based on Hypothetical 5% Return (before expenses) | $1,000.00 | $1,020.42 | 0.95% | $4.84 |
Alambic Mid Cap Value Plus Fund | ||||
Based on Actual Fund Return | $1,000.00 | $1,038.10 | 0.85% | $4.37 |
Based on Hypothetical 5% Return (before expenses) | $1,000.00 | $1,020.92 | 0.85% | $4.33 |
Alambic Mid Cap Growth Plus Fund | ||||
Based on Actual Fund Return | $1,000.00 | $1,049.70 | 0.85% | $4.39 |
Based on Hypothetical 5% Return (before expenses) | $1,000.00 | $1,020.92 | 0.85% | $4.33 |
(a) | Annualized, based on each Fund’s expenses for the previous six month period. |
(b) | Expenses are equal to each Fund’s annualized net expense ratio multiplied by the average account value over the period, multiplied by 184/365 (to reflect the one-half year period). |
61
ALAMBIC FUNDS |
A description of the policies and procedures that the Funds use to vote proxies relating to portfolio securities is available without charge upon request by calling toll-free 1-888-890-8988, or on the SEC website at http://www.sec.gov. Information regarding how the Funds voted proxies relating to portfolio securities during the most recent 12-month period ended June 30 is available without charge upon request by calling toll-free 1-888-890-8988, or on the SEC’s website at http://www.sec.gov.
The Trust files a complete listing of portfolio holdings for the Funds with the SEC as of the end of the first and third quarters of each fiscal year on Form N-Q. These filings are available upon request by calling 1-888-890-8988. Furthermore, you may obtain a copy of the filings on the SEC’s website at http://www.sec.gov. The Trust’s Forms N-Q may also be reviewed and copied at the SEC’s Public Reference Room in Washington, DC, and information on the operation of the Public Reference Room may be obtained by calling 1-800-SEC-0330.
OTHER FEDERAL TAX INFORMATION (Unaudited)
For the fiscal year ended August 31, 2018, Alambic Small Cap Value Plus Fund and Alambic Small Cap Growth Plus Fund designated $358,527 and $358,457, respectively, as long-term capital gain distributions subject to a maximum tax rate of 20%.
Qualified Dividend Income – Alambic Small Cap Value Plus Fund, Alambic Mid Cap Value Plus Fund and Alambic Mid Cap Growth Plus Fund designates 100%, 99.85% and 100%, respectively of their ordinary income dividends, or up to the maximum amount of such dividends allowable pursuant to the Internal Revenue Code, as qualified dividend income eligible for the reduced tax rate of 15%.
Dividends Received Deduction – Corporate shareholders are generally entitled to take the dividends received deduction on the portion of the Fund’s dividend distributions that qualifies under tax law. For the fiscal year ended August 31, 2018, 100% of ordinary income dividends paid by Alambic Small Cap Value Plus Fund, Alambic Mid Cap Value Plus Fund and Alambic Mid Cap Growth Plus Fund qualified for the corporate dividends received deduction.
62
ALAMBIC FUNDS
BOARD OF TRUSTEES AND EXECUTIVE OFFICERS
(Unaudited)
The Board has overall responsibility for management of the Trust’s affairs. The Trustees serve during the lifetime of the Trust and until its termination, or until death, resignation, retirement, or removal. The Trustees, in turn, elect the officers of the Fund to actively supervise its day-to-day operations. The officers have been elected for an annual term. Each Trustee’s and officer’s address is 225 Pictoria Drive, Suite 450, Cincinnati, Ohio 45246. The following are the Trustees and executive officers of the Fund:
Name and | Length | Position(s) Held | Principal Occupation(s) | Number | Directorships |
Interested Trustees: | |||||
Robert G. Dorsey* Year of Birth: 1957 | Since | Trustee (February 2012 to present)
President (June 2012 to October 2013) | Managing Director (1999 to present), Co-CEO (April 2018 to present), and President (1999 to April 2018) of Ultimus Fund Solutions, LLC and its subsidiaries (except as otherwise noted for FINRA-regulated broker dealer entities) | 19 | Interested Trustee of Capital Series Trust (10 Funds) |
Independent Trustees: | |||||
Janine L. Cohen Year of Birth: 1952 | Since | Trustee | Retired since 2013; Chief Financial Officer from 2004 to 2013 and Chief Compliance Officer from 2008 to 2013 at AER Advisors, Inc. | 19 | None |
David M. Deptula Year of Birth: 1958 | Since | Trustee | Vice President of Legal and Special Projects at Dayton Freight Lines, Inc. since 2016; Vice President of Tax Treasury at The Standard Register Inc. (formerly The Standard Register Company) from 2011 to 2016 | 19 | None |
John J. Discepoli Year of Birth: 1963 | Since | Chairperson (May 2016
Trustee (June 2012 to present) | Owner of Discepoli Financial Planning, LLC (personal financial planning company) since 2004 | 19 | None |
* | Mr. Dorsey is considered an “interested person” of the Trust within the meaning of Section 2(a)(19) of the Investment Act of 1940, as amended, because of his relationship with the Trust’s administrator, transfer agent and distributor. |
63
ALAMBIC FUNDS
BOARD OF TRUSTEES AND EXECUTIVE OFFICERS
(Unaudited) (Continued)
Name and | Length | Position(s) | Principal Occupation(s) During Past 5 Years |
Executive Officers: | |||
David R. Carson Year of Birth: 1958 | Since | Principal
President (October 2013 to present)
Vice President (April 2013 to October 2013) | Vice President and Director of Client Strategies of Ultimus Fund Solutions, LLC (2013 to present); President, Unified Series Trust (2016 to present); Chief Compliance Officer, FSI Low Beta Absolute Return Fund (2013 to 2016); Chief Compliance Officer, The Huntington Funds (2005 to 2013), Huntington Strategy Shares (2012 to 2013), and Huntington Asset Advisors (2013); Vice President, Huntington National Bank (2001 to 2013) |
Todd E. Heim Year of Birth: 1967 | Since 2014 | Vice President (2014 to present) | Client Implementation Manager of Ultimus Managers Trust (2014 to present); Naval Flight Officer of United States Navy (1989 to present); Business Project Manager of Vantiv, Inc. (2013 to 2014) |
Jennifer L. Leamer Year of Birth: 1976 | Since | Treasurer (October 2014 to present)
Assistant Treasurer (April 2014 to October 2014) | Vice President, Mutual Fund Controller of Ultimus Fund Solutions, LLC (2014 to present); Business Analyst of Ultimus Fund Solutions, LLC (2007 to 2014) |
Matthew J. Beck Year of Birth: 1988 | Since | Secretary | Senior Attorney of Ultimus Fund Solutions, LLC (2018 to present); General Counsel of The Nottingham Company (2014 to 2018) |
Charles C. Black Year of Birth: 1979 | Since | Chief Compliance Officer
Assistant Chief Compliance Officer (April 2015 to January 2016) | Senior Compliance Officer of Ultimus Fund Solutions, LLC (2015 to present); Chief Compliance Officer of The Caldwell & Orkin Funds, Inc. (2016 to present); Senior Compliance Manager for Touchstone Mutual Funds (2013 to 2015); Senior Compliance Manager for Fund Evaluation Group (2011 to 2013) |
Additional information about members of the Board and executive officers is available in the Funds’ Statement of Additional Information (“SAI”). To obtain a free copy of the SAI, please call 1-888-890-8988.
64
ALAMBIC FUNDS |
The Board of Trustees (the “Board”), including the Independent Trustees voting separately, has reviewed and approved the Funds’ Investment Advisory Agreement with Alambic Investment Management, L.P. (the “Adviser”) for an additional one-year term (the “Agreement”). The Board approved the Agreement at an in-person meeting held on July 23-24, 2018, at which all of the Trustees were present.
Legal counsel advised the Board during its deliberations. Additionally, the Board received and reviewed a substantial amount of information provided by the Adviser in response to requests of the Board and counsel. In considering whether to approve the Agreement and in reaching its conclusions with respect thereto, the Board reviewed and analyzed various factors that it determined were relevant to the Agreement, including the following factors.
The nature, extent, and quality of the services to be provided by the Adviser. In this regard, the Board reviewed the services being provided by the Adviser to each Fund including, without limitation, its investment advisory services since each Fund’s inception; its compliance procedures and practices; its efforts to promote the Funds and assist in their distribution; and its compliance program. After reviewing the foregoing information and further information in the Adviser Memorandum (e.g., description of its business and Form ADV), the Board concluded that the quality, extent, and nature of the services provided by the Adviser to each Fund were satisfactory and adequate.
The investment performance of the Funds. In this regard, the Board compared the performance of each Fund with the performance of its benchmark index, custom peer group, and Morningstar categories. The Board also considered the consistency of the Adviser’s management with each Fund’s investment objective and policies. The Board noted that:
● | the Alambic Small Cap Value Plus Fund out-performed the average and median of its custom peer group and out-performed the average and median of its Morningstar category (Small Cap Value Category Under $50 Million, True No-Load), for a one-year period, and out-performed its benchmark, the Russell 2000 Value Index, for a one-year period; |
● | the Alambic Small Cap Growth Plus Fund under-performed the average and median of its custom peer group and out-performed the average and median of its Morningstar category (Small Cap Blend Category Under $50 Million, True No-Load) for a one-year period, and under-performed its benchmark, the Russell 2000 Growth Index, for a one-year period; |
● | the Alambic Mid Cap Value Plus Fund under-performed the average and median of its custom peer group, and out-performed its Morningstar category’s (Mid Cap Value Category Under $50 Million, True No-Load) average, but under-performed its median, for a one-year period, and out-performed its benchmark, the Russell Mid-Cap Value Index, for a one-year period; and |
● | the Alambic Mid Cap Growth Plus Fund under-performed the average and median of its custom peer group, and under-performed the average and median of its Morningstar category (Mid Cap Blend Category Under $50 Million, True No-Load) for a one-year period, and under-performed its benchmark, the Russell Mid-Cap Growth Index, for a one-year period. |
65
ALAMBIC FUNDS |
The Board indicated that the Adviser had satisfactorily explained its performance results for the Funds. Following additional discussion of the investment performance of each Fund; the Adviser’s experience in managing mutual funds, private funds, and separate accounts; the Adviser’s historical investment performance; and other factors, the Board concluded that the investment performance of each Fund has been satisfactory.
The costs of the services provided and profits to be realized by the Adviser and its affiliates from the relationship with the Funds. In this regard, the Board considered the Adviser’s staffing; personnel, methods of operations; the education and experience of its personnel; its compliance program, policies and procedures; the Adviser’s advisory business generally; its financial condition and the level of commitment to the Funds; the asset level of each Fund; the overall expenses of each Fund, including the advisory fee; and the differences in fees and services to the Adviser’s other similar clients. The Board considered its discussion with the Adviser regarding the Adviser’s expense limitation agreement, and considered the Adviser’s current and past fee reductions and expense reimbursements for the Funds. The Board further took into account the Adviser’s willingness to continue the Adviser’s expense limitation agreement for the Funds until at least December 31, 2019.
The Board also considered potential benefits for the Adviser in managing the Funds, including promotion of the Adviser’s name and the potential for it to receive research, statistical, or other services from the Funds’ trades. The Board compared each Fund’s advisory fee and overall expense ratio to the average and median advisory fees and expense ratios for its custom peer group and Morningstar categories and fees charged to the Adviser’s other client accounts. In considering the comparison in fees and expense ratios between the Fund and other comparable funds, the Board looked at the differences in types of funds being compared, the style of investment management, the size of the Fund, and the nature of the investment strategies. The Board noted that:
● | the Alambic Small Cap Value Plus Fund’s advisory fee was lower than the average and median advisory fee for the Alambic Small Cap Value Plus Fund’s custom peer group and higher than the average and median for the Alambic Small Cap Value Plus Fund’s Morningstar category (Small Cap Value Category Under $50 Million, True No-Load); |
● | the Alambic Small Cap Growth Plus Fund’s advisory fee was higher than the average and median advisory fee for the Alambic Small Cap Growth Plus Fund’s custom peer group and the Alambic Small Cap Growth Plus Fund’s Morningstar category (Small Cap Blend Category Under $50 Million, True No-Load), but equal to the fortieth percentile for the Alambic Small Cap Growth Plus Fund’s Morningstar category; |
● | the Alambic Mid Cap Value Plus Fund’s advisory fee was higher than the average and median advisory fee for the Alambic Mid Cap Value Plus Fund’s custom peer group and lower than the average and median advisory fee for the Alambic Mid Cap Value Plus Fund’s Morningstar category (Mid Cap Value Category Under $50 Million, True No-Load); and |
66
ALAMBIC FUNDS |
● | the Alambic Mid Cap Growth Plus Fund’s advisory fee was higher than the average and lower than the median advisory fee for the Alambic Mid Cap Growth Plus Fund’s custom peer group and lower than the average and median advisory fee for the Alambic Mid Cap Growth Plus Fund’s Morningstar category (Mid Cap Blend Category Under $50 Million, True No-Load). |
The Board also considered the Adviser’s commitment to limit each Fund’s expenses under the Adviser’s expense limitation agreement. The Board further noted that for the overall expense ratio:
● | the Alambic Small Cap Value Plus Fund’s overall expense ratio was lower than the average and median expense ratio for the Alambic Small Cap Value Plus Fund’s custom peer group and the Alambic Small Cap Value Plus Fund’s Morningstar category; |
● | the Alambic Small Cap Growth Plus Fund’s overall expense ratio was higher than the average and median expense ratio for the Alambic Small Cap Growth Plus Fund’s custom peer group, but lower than the average and median expense ratio for the Alambic Small Cap Growth Plus Fund’s Morningstar category; |
● | the Alambic Mid Cap Value Plus Fund’s overall expense ratio was higher than the average and median expense ratio for the Alambic Mid Cap Value Plus Fund’s custom peer group and lower than the average and median expense ratio for the Alambic Mid Cap Value Plus Fund’s Morningstar category; and |
● | the Alambic Mid Cap Growth Plus Fund’s was lower than the average and the median expense ratio for the Alambic Mid Cap Growth Plus Fund’s custom peer group and lower than the average and median expense ratio for the Alambic Mid Cap Growth Plus Fund’s Morningstar category. |
The Board also compared the fees paid by each Fund to the fees paid by other clients of the Adviser, and considered the similarities and differences of services received by such other clients as compared to the services received by the Funds. The Board noted that the fee structures applicable to the Adviser’s other clients were not indicative of any unreasonableness with respect to the advisory fees proposed to be payable to each of the Funds. The Board further considered the investment strategy and style used by the Adviser in managing the portfolio of each Fund and the Adviser’s commitment to limit the expenses of each Fund under the Adviser’s expense limitation agreement. Following these comparisons and considerations and upon further consideration and discussion of the foregoing, the Board concluded that for each Fund, the advisory fees paid to the Adviser by the fund are fair and reasonable.
The extent to which economies of scale would be realized as the Funds grow and whether advisory fee levels reflect these economies of scale for the benefit of the Funds’ investors. In this regard, the Board considered that for each Fund, the fee arrangement with the Adviser involves both the advisory fee and the Adviser’s expense limitation agreement. The Board determined that while the advisory fee remained the same as asset levels increased, the shareholders of the Funds will continue to experience benefits from the Adviser’s expense limitation agreement until each fund’s assets grow to a level where its expenses otherwise fall below the expense
67
ALAMBIC FUNDS |
limit. Following further discussion of the asset levels for each Fund, expectations for asset growth, and level of fees, the Board determined that the fee arrangements with the Adviser will continue to provide benefits and that each Fund’s arrangements were fair and reasonable in relation to the nature and quality of services being provided by the Adviser, and given each Fund’s projected asset levels for the next year.
Brokerage and portfolio transactions. In this regard, the Board considered the Adviser’s policies, procedures and performance in seeking best execution for its clients, including the Funds. The Board also considered the historical portfolio turnover rate for each Fund; the process by which the Adviser evaluates the overall reasonableness of commissions paid; the process by which the Adviser evaluates best execution; the method and basis for selecting and evaluating broker-dealers; and any anticipated allocation of portfolio business to persons affiliated with the Adviser. After further review and discussion, the Board determined that the Adviser’s practices regarding brokerage and portfolio transactions are satisfactory.
Possible conflicts of interest. In evaluating the possibility for conflicts of interest, the Board considered such matters as the experience and abilities of the advisory personnel assigned to the Funds, the Adviser’s process for allocating trades among its different clients, including the Adviser’s private fund and the Funds. The Board also considered the substance and administration of the Adviser’s Code of Ethics. Following further consideration and discussion, the Board determined for each Fund that the Adviser’s standards and practices relating to the identification and mitigation of potential conflicts of interests were satisfactory.
After full consideration of the above factors as well as other factors, the Board unanimously concluded that approval of the Agreement was in the best interests of the Fund and its shareholders.
68
This page intentionally left blank.

BLUE CURRENT GLOBAL DIVIDEND FUND
INSTITUTIONAL CLASS (BCGDX)
Annual Report
August 31, 2018
BLUE CURRENT GLOBAL DIVIDEND FUND | August 31, 2018 |
Dear Shareholders.
PERFORMANCE SUMMARY
The Blue Current Global Dividend Fund (the “Fund”) returned 5.58% over the last twelve months ended August 31, 2018. The Fund’s benchmark, the MSCI World High Dividend Yield Index, returned 6.43% over the same period. The MSCI World High Dividend Yield Index most accurately reflects the Fund’s investment objective to invest in high-quality, dividend paying stocks globally. Since inception, the Fund has returned 24.53%, which compares to a 19.96% return for the MSCI World High Dividend Yield Index. It is important to remind our investors that we are not managing the Fund to track or beat an index. We do not select securities to align with an index, or the underlying sector and country holdings, but rather we aim to construct a portfolio of high quality companies that are committed to dividend growth and offer an attractive yield.
Total Returns for periods ended August 31, 2018 | ||||
Fund Name (Institutional Share Class) | QTD (since | YTD (since | Trailing 1 | Since |
Blue Current Global Dividend | 2.92% | -0.27% | 5.58% | 24.53% |
MSCI World High Div Yield Index | 4.05% | 0.27% | 6.43% | 19.96% |
Source: Bloomberg
Past performance is not predictive of future performance. Investment results and principal value will fluctuate so that shares, when redeemed, may be worth more or less than their original cost. Current performance may be higher or lower than the performance data quoted. Performance data current to the most recent month end are available by calling 1-800-514-3583.
Over the past twelve months there has been a material performance gap between our U.S.-based investments and our securities that are domiciled outside of the U.S.. Much of the dispersion has been created in 2018 due to several factors including a strengthening U.S. economy accelerated by recent fiscal initiatives, and coincidentally, the continuation of a tepid recovery across other developed international markets. Outside of the U.S., political uncertainty due to Brexit in the UK, the inability for Italy to form a government, and the breakdown of trade relations between the U.S. and its counterparts have all created challenges for a portfolio invested in multi-national companies, no matter the balance sheet strength or quality of the company. Given this backdrop, the U.S. Dollar has appreciated materially this year, increasing global currency volatility, and adding another performance challenge for U.S.-based investors. We do not know for how long the economic and earnings discrepancy between the U.S. and the rest of world will persist, however, the portfolio’s underlying companies, domestic and foreign, continue to deliver dividend growth. Absent an appreciation in price by the underlying securities, the portfolio’s yield will continue to rise given the cash flow growth of our companies. We believe the portfolio will finish the calendar year with a double-digit percentage rise in dividends.
1
Within the U.S., our technology sector investments were the best performers over the past 12 months. Historically, technology has not been a significant sector investment in the Fund, largely due to our requirement that new positions have a 2% minimum dividend yield at purchase, a factor that eliminates many of the innovators and highest growers. Generally, semiconductor manufacturers and equipment producers are heavily represented in our select universe. However, the industry is highly volatile, prone to commodity-like pricing, and can often lack end market diversification, adding investment challenges. Within that group we identified Texas Instruments several years ago, a leader in the category due to its leading edge technology, and broad end-market exposure. Along with Texas Instruments, we have found several other great dividend growth companies in the sector (Microsoft and Cisco), but have not been willing to compromise our quality and dividend expectations to size the sector beyond its current 15% weighting in the portfolio.
The performance of our international investments has been exceptionally frustrating in 2018. Three positions, Atlantia, Bayer, and ING, have been materially and negatively impacted by idiosyncratic factors (i.e. the horrific Genoa bridge collapse impacting Atlantia), legal risks (i.e. Bayer’s acquisition of Monsanto), and emerging market uncertainty (i.e. ING). All of these risks are inherent in managing an equity portfolio, but the frequency of the events, combined with the underlying stock reaction, have been unprecedented since the launch of the strategy. We have made several adjustments to the international holdings, including the sale of Atlantia, and the rebalancing of Bayer and ING.
The top five contributors over the last twelve months were led by Microsoft, Texas Instruments, Cisco, LVMH, and Abbott Labs. The top five detractors were Atlantia, Bayer, ING, Vodafone, and British American Tobacco.
Our exposure by geography (excluding cash) is approximately 56% U.S. and 44% Non-U.S.. This is slightly changed since last semi-annual period when the portfolio was approximately 50% allocated to the U.S.. The decline in non-U.S. exposure is due to the sale of Atlantia and relative outperformance by our U.S. names.
BLUE CURRENT PHILOSOPHY & OBJECTIVES
It is important to remind the Fund’s shareholders of our philosophy and objectives. In the current environment, investors need to make every penny work for them. With yield in short supply and safe income streams providing little return, quality companies with growing and sustainable cash flow from across the globe might be less risky than you think – and more fruitful. Over the long run, dividends matter, and dividend growth investors have outperformed.
The Fund utilizes its investment expertise in growing cash flow through what we believe is a niche universe of high quality, dividend-paying companies with sustainable business models and dividend policies. The primary objectives are to pay a stable and increasing dividend each quarter and deliver attractive long term capital appreciation to investors.
The Blue Current investment team concentrates on a select portfolio of 25-50 companies across developed markets that meet our stringent qualities. We focus on companies that we believe have a strong history of rewarding shareholders and have the financial ability
2
to continue to increase the dividend over time. We also focus on the future earnings potential of each company and strive to purchase those businesses when they are trading at a discount to their true value.
OUTLOOK SUMMARY
Despite a frustrating semi-annual period from unforeseen company specific events, we believe we are seeing the most attractive combination of value and fundamentals in our collective portfolio in the Fund’s history. The portfolio is now trading at 14x estimated earnings, yielding 3.4%, and we are anticipating a dividend growth rate that should exceed 10%. Dividend payers are out of favor thus far in 2018 which makes us very excited about the return potential ahead for dividend payers and our portfolio in particular. The key near-term risks remain with tariffs, the midterm election, and the overall currency stability in the emerging markets.
Sincerely,
|
|
Henry “Harry” M. T. Jones | Dennis Sabo, CFA |


Disclosure and Risk Summary
The Letter to Shareholders seeks to describe some of the current opinions and views of the financial markets of Edge Capital Group, LLC (the “Adviser”). Although the Adviser believes it has a reasonable basis for any opinions or views expressed, actual results may differ, sometimes significantly so, from those expected or expressed. The securities held by the Fund that are discussed in the Letter to Shareholders were held during the period covered by this Report. They do not comprise the entire investment portfolio of the Fund, may be sold at any time and may no longer be held by the Fund. For a complete list of securities held in the Fund as of August 31, 2018, please see the Schedule of Investments section of the annual report. The opinions of the Adviser with respect to those securities may change at any time.
The opinions expressed herein are those of the Adviser, and the report is not meant as legal, tax, or financial advice. You should consult your own professional advisors as to the legal, tax, financial, or other matters relevant to the suitability of investing. The external data presented in this report have been obtained from independent sources (as noted) and
3
are believed to be accurate, but no independent verification has been made and accuracy is not guaranteed. The information contained in this report is not intended to address the needs of any particular investor.
The information contained in this document does not constitute an offer to sell any securities nor a solicitation to purchase any securities. Index returns reflect the reinvestment of dividends. An investor should consider the investment objectives, risks, charges and expenses of the Fund carefully before investing. The Fund’s prospectus contains this and other important information. To obtain a copy of the Fund’s prospectus please visit our website at www.bluecurrentfunds.com or call 1-800-514-3583 and a copy will be sent to you free of charge. Please read the prospectus carefully before you invest. The Blue Current Global Dividend Fund is distributed by Ultimus Fund Distributors, LLC.
PAST PERFORMANCE CANNOT BE CONSTRUED AS AN INDICATOR OF FUTURE RESULTS BECAUSE OF, AMONG OTHER THINGS, POSSIBLE DIFFERENCES IN MARKET CONDITIONS, INVESTMENT STRATEGY, AND REGULATORY CLIMATE. THERE IS NO ASSURANCE THAT THE FUND WILL ACHIEVE ITS INVESTMENT OBJECTIVE. INVESTMENT RESULTS AND PRINCIPAL VALUE WILL FLUCTUATE SO THAT SHARES, WHEN REDEEMED, MAY BE WORTH MORE OR LESS THAN THEIR ORIGINAL COST. CURRENT PERFORMANCE MAY BE HIGHER OR LOWER THAN THE PERFORMANCE DATA QUOTED. PERFORMANCE DATA CURRENT TO THE MOST RECENT MONTH END IS AVAILABLE BY CALLING 1-800-514-3583. THE FUND INVESTS PRIMARILY IN DIVIDEND PAYING COMPANIES AND IT IS POSSIBLE THESE COMPANIES MAY ELIMINATE OR REDUCE THEIR DIVIDEND PAYMENTS. INDEX INFORMATION (I) IS INCLUDED MERELY TO SHOW THE GENERAL TREND IN THE EQUITY MARKETS FOR THE PERIOD INDICATED AND IS NOT INTENDED TO IMPLY THAT THE FUND’S PORTFOLIO WILL BE SIMILAR TO THE INDICES EITHER IN COMPOSITION OR RISK AND (II) HAS BEEN OBTAINED FROM SOURCES BELIEVED TO BE ACCURATE.
Statements in the Letter to Shareholders that reflect projections or expectations for future financial or economic performance of the Fund and the market in general and statements of the Fund’s plans and objectives for future operations are forward-looking statements. No assurance can be given that actual results or events will not differ materially from those projected, estimated, assumed, or anticipated in any such forward-looking statements. Important factors that could result in such differences, in addition to factors noted with such forward-looking statements, include, without limitation, general economic conditions, such as inflation, recession, and interest rates. Past performance is not a guarantee of future results.
4
BLUE CURRENT GLOBAL DIVIDEND FUND
PERFORMANCE INFORMATION
August 31, 2018 (Unaudited)
Comparison of the Change in Value of a $100,000 Investment in
Blue Current Global Dividend Fund -
Institutional Class vs. the MSCI World Index
and the MSCI World High Dividend Yield Index
Average Annual Total Returns (for the periods ended August 31, 2018) | ||||
1 Year | 3 Years | Since | ||
Blue Current Global Dividend Fund - Institutional Class(a) | 5.58% | 9.31% | 5.71% | |
MSCI World Index | 13.10% | 11.92% | 7.84% | |
MSCI World High Dividend Yield Index | 6.43% | 9.68% | 4.72% | |
(a) | The Fund’s total returns do not reflect the deduction of taxes a shareholder would pay on Fund distributions or the redemption of Fund shares. |
(b) | The Fund commenced operations on September 18, 2014. |
5
BLUE CURRENT GLOBAL DIVIDEND FUND
PORTFOLIO INFORMATION
August 31, 2018 (Unaudited)
Sector Diversification
(% of Net Assets)
Top Ten Equity Holdings
Security Description | % of Net Assets |
Microsoft Corporation | 4.6% |
Cisco Systems, Inc. | 3.8% |
United Technologies Corporation | 3.0% |
Deutsche Post AG | 3.0% |
Johnson & Johnson | 3.0% |
Novartis AG - ADR | 3.0% |
Sanofi - ADR | 2.8% |
CoreSite Realty Corporation | 2.8% |
Crown Castle International Corporation | 2.7% |
International Paper Company | 2.7% |
6
BLUE CURRENT GLOBAL DIVIDEND FUND | ||||||||
COMMON STOCKS — 96.7% | Shares | Value | ||||||
Consumer Discretionary — 9.4% | ||||||||
Household Durables — 2.5% | ||||||||
Leggett & Platt, Inc. | 35,600 | $ | 1,617,664 | |||||
Leisure Products — 2.1% | ||||||||
Hasbro, Inc. | 13,900 | 1,380,409 | ||||||
Media — 2.5% | ||||||||
Publicis Groupe S.A. (a) | 25,350 | 1,621,039 | ||||||
Textiles, Apparel & Luxury Goods — 2.3% | ||||||||
LVMH Moet Hennessy Louis Vuitton SE (a) | 4,380 | 1,535,437 | ||||||
Consumer Staples — 14.9% | ||||||||
Beverages — 2.0% | ||||||||
Diageo plc - ADR | 9,347 | 1,303,065 | ||||||
Food Products — 6.7% | ||||||||
Danone S.A. (a) | 22,630 | 1,782,135 | ||||||
Nestlé S.A. - ADR | 14,815 | 1,240,756 | ||||||
Unilever plc - ADR | 24,340 | 1,384,216 | ||||||
| 4,407,107 | ||||||||
Household Products — 4.0% | ||||||||
Clorox Company (The) | 8,200 | 1,188,836 | ||||||
Procter & Gamble Company (The) | 16,750 | 1,389,412 | ||||||
| 2,578,248 | ||||||||
Tobacco — 2.2% | ||||||||
British American Tobacco plc (a) | 30,000 | 1,450,563 | ||||||
Energy — 9.0% | ||||||||
Oil, Gas & Consumable Fuels — 9.0% | ||||||||
BP plc - ADR | 36,550 | 1,567,264 | ||||||
Enterprise Products Partners, L.P. | 53,650 | 1,534,390 | ||||||
ONEOK, Inc. | 19,110 | 1,259,540 | ||||||
Royal Dutch Shell plc - Class B - ADR | 23,240 | 1,565,911 | ||||||
| 5,927,105 | ||||||||
See accompanying notes to financial statements. |
7
BLUE CURRENT GLOBAL DIVIDEND FUND | ||||||||
COMMON STOCKS — 96.7% (Continued) | Shares | Value | ||||||
Financials — 13.0% | ||||||||
Banks — 8.5% | ||||||||
BB&T Corporation | 30,350 | $ | 1,567,881 | |||||
ING Groep N.V. - ADR | 48,500 | 658,630 | ||||||
PNC Financial Services Group, Inc. (The) | 11,400 | 1,636,356 | ||||||
SunTrust Banks, Inc. | 23,100 | 1,699,236 | ||||||
| 5,562,103 | ||||||||
Insurance — 4.5% | ||||||||
Allianz SE (a) | 7,240 | 1,543,169 | ||||||
Swiss Re AG (a) | 15,400 | 1,385,587 | ||||||
| 2,928,756 | ||||||||
Health Care — 13.2% | ||||||||
Health Care Equipment & Supplies — 2.0% | ||||||||
Abbott Laboratories | 20,000 | 1,336,800 | ||||||
Pharmaceuticals — 11.2% | ||||||||
Bayer AG (a) | 17,365 | 1,620,600 | ||||||
Johnson & Johnson | 14,625 | 1,969,841 | ||||||
Novartis AG - ADR | 23,470 | 1,948,245 | ||||||
Sanofi - ADR | 42,115 | 1,804,628 | ||||||
| 7,343,314 | ||||||||
Industrials — 9.6% | ||||||||
Aerospace & Defense — 3.0% | ||||||||
United Technologies Corporation | 15,150 | 1,995,255 | ||||||
Air Freight & Logistics — 3.0% | ||||||||
Deutsche Post AG (a) | 54,600 | 1,985,682 | ||||||
Electrical Equipment — 1.9% | ||||||||
Eaton Corporation plc | 14,739 | 1,225,400 | ||||||
Machinery — 1.7% | ||||||||
Cummins, Inc. | 7,780 | 1,103,204 | ||||||
See accompanying notes to financial statements. |
8
BLUE CURRENT GLOBAL DIVIDEND FUND | ||||||||
COMMON STOCKS — 96.7% (Continued) | Shares | Value | ||||||
Information Technology — 15.0% | ||||||||
Communications Equipment — 3.8% | ||||||||
Cisco Systems, Inc. | 52,200 | $ | 2,493,594 | |||||
Electronic Equipment, Instruments & Components — 2.6% | ||||||||
Corning, Inc. | 50,900 | 1,705,659 | ||||||
Semiconductors & Semiconductor Equipment — 4.0% | ||||||||
Taiwan Semiconductor Manufacturing Company Ltd. - ADR | 19,900 | 867,640 | ||||||
Texas Instruments, Inc. | 15,355 | 1,725,902 | ||||||
| 2,593,542 | ||||||||
Software — 4.6% | ||||||||
Microsoft Corporation | 26,705 | 2,999,773 | ||||||
Materials — 5.2% | ||||||||
Chemicals — 2.5% | ||||||||
DowDuPont, Inc. | 23,540 | 1,650,860 | ||||||
Containers & Packaging — 2.7% | ||||||||
International Paper Company | 35,000 | 1,789,900 | ||||||
Real Estate — 5.5% | ||||||||
Equity Real Estate Investment Trusts (REITs) — 5.5% | ||||||||
CoreSite Realty Corporation | 15,450 | 1,799,462 | ||||||
Crown Castle International Corporation | 15,740 | 1,794,832 | ||||||
| 3,594,294 | ||||||||
Telecommunication Services — 1.9% | ||||||||
Wireless Telecommunication Services — 1.9% | ||||||||
Vodafone Group plc - ADR | 56,320 | 1,217,075 | ||||||
Total Common Stocks (Cost $55,011,161) | $ | 63,345,848 | ||||||
See accompanying notes to financial statements. |
9
BLUE CURRENT GLOBAL DIVIDEND FUND | ||||||||
MONEY MARKET FUNDS — 2.9% | Shares | Value | ||||||
First American Government Obligations Fund - Class Z, 1.80% (b) (Cost $1,924,550) | 1,924,550 | $ | 1,924,550 | |||||
Total Investments at Value — 99.6% (Cost $56,935,711) | $ | 65,270,398 | ||||||
Other Assets in Excess of Liabilities — 0.4% | 272,764 | |||||||
Net Assets — 100.0% | $ | 65,543,162 | ||||||
ADR – American Depositary Receipt.
| (a) | Level 2 security (Note 2). |
| (b) | The rate shown is the 7-day effective yield as of August 31, 2018. |
See accompanying notes to financial statements.
10
BLUE CURRENT GLOBAL DIVIDEND FUND | ||||||||
Country | Value | % of Net | ||||||
United States | $ | 35,638,806 | 54.4 | % | ||||
United Kingdom | 8,488,094 | 12.9 | % | |||||
France | 6,743,239 | 10.3 | % | |||||
Germany | 5,149,451 | 7.9 | % | |||||
Switzerland | 4,574,588 | 7.0 | % | |||||
Ireland | 1,225,400 | 1.9 | % | |||||
Taiwan Province of China | 867,640 | 1.3 | % | |||||
Netherlands | 658,630 | 1.0 | % | |||||
| $ | 63,345,848 | 96.7 | % | |||||
| SCHEDULE OF FORWARD FOREIGN CURRENCY CONTRACTS August 31, 2018 | ||||||||||||||||||
| Counterparty | Settlement Date | Currency To Deliver | Currency To Receive | Net Unrealized Appreciation | ||||||||||||||
| BNY Mellon | 9/4/2018 | EUR | 3,200,000 | USD | 3,753,600 | $ | 39,148 | |||||||||||
EUR - Euro
USD - U.S. Dollar
The average net monthly notional value of forward foreign currency contracts for the year ended August 31, 2018 was $7,167,416.
See accompanying notes to financial statements. |
11
BLUE CURRENT GLOBAL DIVIDEND FUND | ||||
ASSETS |
| |||
Investments in securities: | ||||
At cost | $ | 56,935,711 | ||
At value (Note 2) | $ | 65,270,398 | ||
Receivable for capital shares sold | 105,055 | |||
Dividends receivable | 177,241 | |||
Unrealized appreciation on forward foreign currency contracts (Notes 2 and 5) | 39,148 | |||
Other assets | 6,479 | |||
Total assets | 65,598,321 | |||
LIABILITIES | ||||
Payable to Adviser (Note 4) | 34,050 | |||
Payable to administrator (Note 4) | 11,620 | |||
Other accrued expenses | 9,489 | |||
Total liabilities | 55,159 | |||
| ||||
NET ASSETS | $ | 65,543,162 | ||
| ||||
NET ASSETS CONSIST OF: | ||||
Paid-in capital | $ | 57,304,551 | ||
Undistributed net investment income | 350,742 | |||
Accumulated net realized losses from investment transactions | (485,966 | ) | ||
Net unrealized appreciation on investments | 8,334,687 | |||
Net unrealized appreciation on forward foreign currency contracts | 39,148 | |||
NET ASSETS | $ | 65,543,162 | ||
PRICING OF INSTITUTIONAL SHARES (Note 1) | ||||
Net assets applicable to Institutional Shares | $ | 65,543,162 | ||
Shares of Institutional Shares outstanding (no par value, unlimited number of shares outstanding) | 5,716,515 | |||
Net asset value, offering and redemption price per share (a) (Note 2) | $ | 11.47 | ||
| (a) | Redemption fee may apply to redemptions of shares held for 7 days or less. |
See accompanying notes to financial statements.
12
BLUE CURRENT GLOBAL DIVIDEND FUND | ||||
INVESTMENT INCOME | ||||
Dividends | $ | 2,123,144 | ||
Foreign withholding taxes on dividends | (174,916 | ) | ||
Total investment income | 1,948,228 | |||
EXPENSES | ||||
Investment advisory fees (Note 4) | 631,776 | |||
Administration fees (Note 4) | 63,822 | |||
Professional fees | 45,750 | |||
Fund accounting fees (Note 4) | 42,431 | |||
Custodian and bank service fees | 18,003 | |||
Transfer agent fees (Note 4) | 18,000 | |||
Compliance fees and expenses (Note 4) | 12,244 | |||
Registration and filing fees | 12,171 | |||
Trustees’ fees and expenses (Note 4) | 10,009 | |||
Printing of shareholder reports | 7,500 | |||
Pricing fees | 5,593 | |||
Postage and supplies | 5,243 | |||
Insurance expense | 2,717 | |||
Other expenses | 13,521 | |||
Total expenses | 888,780 | |||
Fee reductions by the Adviser (Note 4) | (257,004 | ) | ||
Net expenses | 631,776 | |||
NET INVESTMENT INCOME | 1,316,452 | |||
| ||||
REALIZED AND UNREALIZED GAINS (LOSSES) ON INVESTMENTS, DERIVATIVES AND FOREIGN CURRENCY TRANSLATION | ||||
Net realized gains (losses) from: | ||||
Investments | 329,634 | |||
Forward foreign currency contracts (Notes 2 and 5) | (472,454 | ) | ||
Foreign currency transactions (Note 2) | (13,660 | ) | ||
Net change in unrealized appreciation (depreciation) on: | ||||
Investments | 2,001,653 | |||
Forward foreign currency contracts (Notes 2 and 5) | 138,199 | |||
Foreign currency translation (Note 2) | (195 | ) | ||
NET REALIZED AND UNREALIZED GAINS ON INVESTMENTS, DERIVATIVES AND FOREIGN CURRENCY TRANSLATION | 1,983,177 | |||
NET INCREASE IN NET ASSETS RESULTING FROM OPERATIONS | $ | 3,299,629 | ||
See accompanying notes to financial statements. |
13
BLUE CURRENT GLOBAL DIVIDEND FUND | ||||||||
| Year | Year | ||||||
FROM OPERATIONS | ||||||||
Net investment income | $ | 1,316,452 | $ | 1,209,550 | ||||
Net realized gains (losses) from: | ||||||||
Investments | 329,634 | 1,356,530 | ||||||
Forward foreign currency contracts | (472,454 | ) | — | |||||
Foreign currency transactions | (13,660 | ) | (17,859 | ) | ||||
Net change in unrealized appreciation (depreciation) on: | ||||||||
Investments | 2,001,653 | 4,061,572 | ||||||
Forward foreign currency contracts | 138,199 | (99,051 | ) | |||||
Foreign currency translation | (195 | ) | 195 | |||||
Net increase in net assets from operations | 3,299,629 | 6,510,937 | ||||||
DISTRIBUTIONS TO SHAREHOLDERS (Note 2) | ||||||||
Net investment income, Institutional Shares | (778,879 | ) | (981,628 | ) | ||||
Realized capital gains, Institutional Shares | (1,162,832 | ) | — | |||||
Decrease in net assets from distributions to shareholders | (1,941,711 | ) | (981,628 | ) | ||||
FROM CAPITAL SHARE TRANSACTIONS | ||||||||
Institutional Shares | ||||||||
Proceeds from shares sold | 8,580,932 | 16,759,462 | ||||||
Net asset value of shares issued in reinvestment of distributions | 1,454,021 | 747,191 | ||||||
Proceeds from redemption fees collected (Note 2) | 764 | — | ||||||
Payments for shares redeemed | (5,698,681 | ) | (2,819,565 | ) | ||||
Net increase in Institutional Shares net assets from capital share transactions | 4,337,036 | 14,687,088 | ||||||
TOTAL INCREASE IN NET ASSETS | 5,694,954 | 20,216,397 | ||||||
NET ASSETS | ||||||||
Beginning of year | 59,848,208 | 39,631,811 | ||||||
End of year | $ | 65,543,162 | $ | 59,848,208 | ||||
UNDISTRIBUTED NET INVESTMENT INCOME | $ | 350,742 | $ | 423,441 | ||||
CAPITAL SHARE ACTIVITY | ||||||||
Institutional Shares | ||||||||
Shares sold | 742,293 | 1,604,703 | ||||||
Shares reinvested | 127,013 | 70,912 | ||||||
Shares redeemed | (495,023 | ) | (274,670 | ) | ||||
Net increase in shares outstanding | 374,283 | 1,400,945 | ||||||
Shares outstanding, beginning of year | 5,342,232 | 3,941,287 | ||||||
Shares outstanding, end of year | 5,716,515 | 5,342,232 | ||||||
See accompanying notes to financial statements. |
14
BLUE CURRENT GLOBAL DIVIDEND FUND | ||||||||||||||||
Per Share Data for a Share Outstanding Throughout Each Period | ||||||||||||||||
| Year Ended | Year Ended | Year Ended | Period Ended | ||||||||||||
Net asset value at beginning of period | $ | 11.20 | $ | 10.06 | $ | 9.42 | $ | 10.00 | ||||||||
Income (loss) from investment operations: | ||||||||||||||||
Net investment income | 0.23 | 0.24 | 0.22 | 0.16 | ||||||||||||
Net realized and unrealized gains (losses) on investments and foreign currencies | 0.39 | 1.11 | 0.61 | (0.62 | ) | |||||||||||
Total from investment operations | 0.62 | 1.35 | 0.83 | (0.46 | ) | |||||||||||
Less distributions: | ||||||||||||||||
From net investment income | (0.14 | ) | (0.21 | ) | (0.19 | ) | (0.12 | ) | ||||||||
From net realized gains | (0.21 | ) | — | — | — | |||||||||||
Total distributions | (0.35 | ) | (0.21 | ) | (0.19 | ) | (0.12 | ) | ||||||||
Proceeds from redemption fees collected (Note 2) | 0.00 | (b) | — | — | — | |||||||||||
Net asset value at end of period | $ | 11.47 | $ | 11.20 | $ | 10.06 | $ | 9.42 | ||||||||
Total return (c) | 5.58 | % | 13.57 | % | 8.92 | % | (4.65 | %)(d) | ||||||||
Net assets at end of period (000’s) | $ | 65,543 | $ | 59,848 | $ | 39,632 | $ | 30,098 | ||||||||
Ratios/supplementary data: | ||||||||||||||||
Ratio of total expenses to average net assets | 1.39 | % | 1.45 | % | 1.55 | % | 1.68 | %(e) | ||||||||
Ratio of net expenses to average net assets (f) | 0.99 | % | 0.99 | % | 0.99 | % | 0.99 | %(e) | ||||||||
Ratio of net investment income to average net assets (f) | 2.06 | % | 2.47 | % | 2.37 | % | 2.04 | %(e) | ||||||||
Portfolio turnover rate | 50 | % | 61 | % | 58 | % | 72 | %(d) | ||||||||
(a) | Represents the period from the commencement of operations (September 18, 2014) through August 31, 2015. |
(b) | Amount rounds to less than $0.01 per share. |
(c) | Total return is a measure of the change in value of an investment in the Fund over the periods covered, which assumes any dividends and capital gain distributions are reinvested in shares of the Fund. The returns shown do not reflect the deduction of taxes a shareholder would pay on Fund distributions or the redemption of Fund shares. The total returns would be lower if the Adviser had not reduced advisory fees (Note 4). |
(d) | Not annualized. |
(e) | Annualized. |
(f) | Ratio was determined after advisory fee reductions by the Adviser (Note 4). |
See accompanying notes to financial statements.
15
BLUE CURRENT GLOBAL DIVIDEND FUND
NOTES TO FINANCIAL STATEMENTS
August 31, 2018
1. Organization
Blue Current Global Dividend Fund (the “Fund”) is a diversified series of Ultimus Managers Trust (the “Trust”), an open-end investment company established as an Ohio business trust under a Declaration of Trust dated February 28, 2012. Other series of the Trust are not incorporated in this report.
The investment objective of the Fund is to seek current income and capital appreciation.
The Fund currently offers one class of shares: Institutional Class shares (sold without any sales loads or distribution fees and subject to a $100,000 initial investment requirement). As of August 31, 2018, the Investor Class shares (to be sold without any sales loads, but subject to a distribution fee of up to 0.25% of Investor Class’ average daily net assets and subject to a $2,500 initial investment requirement) are not currently offered. When both classes are offered, each share class will represent an ownership interest in the same investment portfolio.
2. Significant Accounting Policies
The following is a summary of the Fund’s significant accounting policies. The policies are in conformity with accounting principles generally accepted in the United States of America (“GAAP”). The Fund follows accounting and reporting guidance under Financial Accounting Standards Board Accounting Standards Codification Topic 946, “Financial Services – Investment Companies.”
Securities valuation – The Fund values its portfolio securities at market value as of the close of regular trading on the New York Stock Exchange (the “NYSE”) (normally 4:00 p.m. Eastern Time) on each day the NYSE is open for business. The Fund generally values its listed securities on the basis of the security’s last sale price on the security’s primary exchange, if available, otherwise at the exchange’s most recently quoted mean price. NASDAQ-listed securities are valued at the NASDAQ Official Closing Price. When using a quoted price and when the market is considered active, the security will be classified as Level 1 within the fair value hierarchy (see below). In the event that market quotations are not readily available or are considered unreliable due to market or other events, the Fund values its securities and other assets at fair value in accordance with procedures established by and under the general supervision of the Board of Trustees (the “Board”) of the Trust. Under these procedures, the securities will be classified as Level 2 or 3 within the fair value hierarchy, depending on the inputs used. Unavailable or unreliable market quotes may be due to the following factors: a substantial bid-ask spread; infrequent sales resulting in stale prices; insufficient trading volume; small trade sizes; a temporary lapse in any reliable pricing source; and actions of the securities or futures markets, such as the suspension or limitation of trading. As a result, the prices of securities used to calculate the Fund’s net asset value (“NAV”) may differ from quoted or published prices for the
16
BLUE CURRENT GLOBAL DIVIDEND FUND
NOTES TO FINANCIAL STATEMENTS (Continued)
same securities. Securities traded on foreign exchanges are typically fair valued by an independent pricing service and translated from the local currency into U.S. dollars using currency exchange rates supplied by an independent pricing service.
GAAP establishes a single authoritative definition of fair value, sets out a framework for measuring fair value, and requires additional disclosures about fair value measurements.
Various inputs are used in determining the value of the Fund’s investments. These inputs are summarized in the three broad levels listed below:
● | Level 1 – quoted prices in active markets for identical securities |
● | Level 2 – other significant observable inputs |
● | Level 3 – significant unobservable inputs |
The inputs or methods used for valuing securities are not necessarily an indication of the risks associated with investing in those securities. The inputs used to measure fair value may fall into different levels of the fair value hierarchy. In such cases, for disclosure purposes, the level in the fair value hierarchy within which the fair value measurement falls in its entirety is determined based on the lowest level input that is significant to the fair value measurement.
The Fund’s foreign equity securities actively traded in foreign markets may be classified as Level 2 despite the availability of closing prices because such securities are typically fair valued by an independent pricing service. The Board has authorized the Fund to retain an independent pricing service to determine the fair value of its foreign securities because the value of such securities may be materially affected by events occurring before the Fund’s pricing time but after the close of the primary markets or exchanges on which such foreign securities are traded. These intervening events might be country-specific (e.g., natural disaster, economic or political developments, interest rate change); issuer specific (e.g., earnings report or merger announcement); or U.S. market-specific (such as a significant movement in the U.S. market that is deemed to affect the value of foreign securities). The pricing service uses an automated system that incorporates a model based on multiple parameters, including a security’s local closing price, relevant general and sector indices, currency fluctuations, trading in depositary receipts and futures, if applicable, and/or research valuations by its staff, in determining what it believes is the fair value of the securities.
The following is a summary of the inputs used to value the Fund’s investments as of August 31, 2018:
Investments in Securities | Level 1 | Level 2 | Level 3 | Total | ||||||||||||
Common Stocks | $ | 50,421,636 | $ | 12,924,212 | $ | — | $ | 63,345,848 | ||||||||
Money Market Funds | 1,924,550 | — | — | 1,924,550 | ||||||||||||
Total | $ | 52,346,186 | $ | 12,924,212 | $ | — | $ | 65,270,398 | ||||||||
17
BLUE CURRENT GLOBAL DIVIDEND FUND
NOTES TO FINANCIAL STATEMENTS (Continued)
Other Financial Instruments: | Level 1 | Level 2 | Level 3 | Total | ||||||||||||
Forward Foreign Currency Contracts | $ | — | $ | 39,148 | $ | — | $ | 39,148 | ||||||||
Total | $ | — | $ | 39,148 | $ | — | $ | 39,148 | ||||||||
Refer to the Fund’s Schedule of Investments for a listing of the common stocks by industry type. As of August 31, 2018, the Fund did not have any transfers between Levels. In addition, the Fund did not have any assets or liabilities that were measured at fair value on a recurring basis using significant unobservable inputs (Level 3) as of August 31, 2018. It is the Fund’s policy to recognize transfers between Levels at the end of the reporting period.
Foreign currency translation – Securities and other assets and liabilities denominated in or expected to settle in foreign currencies are translated into U.S. dollars based on exchange rates on the following basis:
A. | The fair values of investment securities and other assets and liabilities are translated as of the close of the NYSE each day. |
B. | Purchases and sales of investment securities and income and expenses are translated at the rate of exchange prevailing as of 4:00 p.m. Eastern Time on the respective date of such transactions. |
C. | The Fund does not isolate that portion of the results of operations caused by changes in foreign exchange rates on investments from those caused by changes in market prices of securities held. Such fluctuations are included with the net realized and unrealized gains or losses on investments. |
Reported net realized foreign exchange gains or losses arise from 1) purchases and sales of foreign currencies, 2) currency gains or losses realized between the trade and settlement dates on securities transactions and 3) the difference between the amounts of dividends and foreign withholding taxes recorded on the Fund’s books and the U.S. dollar equivalent of the amounts actually received or paid. Reported net unrealized foreign exchange gains and losses arise from changes in the value of assets and liabilities that result from changes in exchange rates.
Forward foreign currency contracts – The Fund, at times, uses forward foreign currency contracts to offset the exposure to foreign currency. All foreign currency contracts are “marked-to-market” daily at the applicable translation rates, resulting in unrealized gains or losses. Realized and unrealized gains or losses from transactions in foreign currency contracts will be included in the Fund’s Statement of Assets and Liabilities and Statement of Operations. Risks associated with these contracts include the potential inability of counterparties to meet the terms of their contracts and unanticipated movements in the value of a foreign currency relative to the U.S. dollar.
18
BLUE CURRENT GLOBAL DIVIDEND FUND
NOTES TO FINANCIAL STATEMENTS (Continued)
Share valuation – The NAV per share of each class of the Fund is calculated daily by dividing the total value of the assets attributable to that class, less liabilities attributable to that class, by the number of shares outstanding of that class. The offering price and redemption price per share of each class of the Fund is equal to the NAV per share of such class, except that shareholders of the Fund are subject to a redemption fee equal to 2.00% of the value of Fund shares redeemed within 7 days of purchase, excluding involuntary redemptions of accounts that fall below the minimum investment amount or the redemption of Fund shares representing reinvested dividends, capital gain distributions, or capital appreciation. During the years ended August 31, 2018 and 2017, proceeds from redemption fees, recorded in capital, totaled $764 and $0, respectively.
Investment income – Dividend income is recorded on the ex-dividend date. Interest income is accrued as earned. The Fund may invest in real estate investment trusts (“REITs”) that pay distributions to their shareholders based on available funds from operations. It is common for these distributions to exceed the REIT’s taxable earnings and profits resulting in the excess portion of such distribution to be designated as return of capital. Distributions received from REITs are generally recorded as dividend income and, if necessary, are reclassified annually in accordance with tax information provided by the underlying REITs. The Fund may also invest in master limited partnerships (“MLPs”) whose distributions generally are comprised of ordinary income, capital gains and return of capital from the MLP. For financial statement purposes, the Fund records all income received as ordinary income. This amount may be subsequently revised based on information received from the MLPs after their tax reporting periods are concluded, as the actual character of these distributions is not known until after the fiscal year end of the Fund. Withholding taxes on foreign dividends have been recorded for in accordance with the Fund’s understanding of the applicable country’s tax rules and rates.
Investment transactions – Investment transactions are accounted for on the trade date. Realized gains and losses on investments sold are determined on a specific identification basis.
Common expenses – Common expenses of the Trust are allocated among the Fund and the other series of the Trust based on the relative net assets of each series or the nature of the services performed and the relative applicability to each series.
Distributions to shareholders – Distributions to shareholders arising from net investment income are declared and paid quarterly to shareholders. Net realized capital gains, if any, are distributed at least annually. The amount of distributions from net investment income and net realized capital gains are determined in accordance with federal income tax regulations, which may differ from GAAP. Dividends and distributions to shareholders are recorded on the ex-dividend date. The tax character of distributions paid during the years ended August 31, 2018 and 2017 was as follows:
Years Ended | Ordinary | Long-Term | Total | |||||||||
08/31/18 | $ | 952,107 | $ | 989,604 | $ | 1,941,711 | ||||||
08/31/17 | $ | 981,628 | $ | — | $ | 981,628 | ||||||
19
BLUE CURRENT GLOBAL DIVIDEND FUND
NOTES TO FINANCIAL STATEMENTS (Continued)
On September 28, 2018, the Fund paid an ordinary income dividend of $0.0304 per share to shareholders of record on September 27, 2018.
Estimates – The preparation of financial statements in conformity with GAAP requires management to make estimates and assumptions that affect the reported amounts of assets and liabilities and disclosure of contingent assets and liabilities, each as of the date of the financial statements, and the reported amounts of income and expenses during the reporting period. Actual results could differ from those estimates.
Federal income tax – The Fund has qualified and intends to continue to qualify as a regulated investment company under the Internal Revenue Code of 1986, as amended (the “Code”). Qualification generally will relieve the Fund of liability for federal income taxes to the extent 100% of its net investment income and net realized capital gains are distributed in accordance with the Code.
In order to avoid imposition of the excise tax applicable to regulated investment companies, it is also the Fund’s intention to declare as dividends in each calendar year at least 98% of its net investment income (earned during the calendar year) and 98.2% of its net realized capital gains (earned during the 12 months ended October 31) plus undistributed amounts from prior years.
The following information is computed on a tax basis for each item as of August 31, 2018:
Tax cost of portfolio investments | $ | 57,010,658 | ||
Gross unrealized appreciation | $ | 9,617,579 | ||
Gross unrealized depreciation | (1,357,839 | ) | ||
Net unrealized appreciation on investments | 8,259,740 | |||
Accumulated capital and other losses | (21,129 | ) | ||
Accumulated earnings | $ | 8,238,611 |
The difference between the federal income tax cost of portfolio investments and the financial statement cost is due to certain timing differences in the recognition of capital gains or losses under income tax regulations and GAAP. These “book/tax” differences are temporary in nature and are primarily due to the tax deferral of losses on wash sales, the tax treatment of the cost of securities received as in-kind subscriptions at the inception of the Fund, and the tax treatment of income and capital gains on publicly-traded partnerships held by the Fund.
Specified capital losses incurred after October 31, 2017 and within the taxable year are deemed to arise on the first day of the Fund’s next taxable year. For the year ended August 31, 2018, the Fund deferred until September 1, 2018 short-term post-October capital losses of $21,129.
20
BLUE CURRENT GLOBAL DIVIDEND FUND
NOTES TO FINANCIAL STATEMENTS (Continued)
For the year ended August 31, 2018, the following reclassifications were made on the Statement of Assets and Liabilities as a result of permanent difference in the recognition of capital gains or losses under income tax regulations and GAAP:
Paid-in capital | $ | (123 | ) | |
Undistributed net investment income | $ | (610,272 | ) | |
Accumulated net realized losses from investment transactions | $ | 610,395 |
These differences are primarily due to the tax treatment of net realized losses from forward foreign currency contracts and foreign currency transactions and the reclassification of distributions in excess of net realized capital gains. Such reclassifications, the result of permanent differences between financial statement and income tax reporting requirements, had no effect on the Fund’s net assets or NAV per share.
The Fund recognizes the tax benefits or expenses of uncertain tax positions only when the position is “more likely than not” to be sustained assuming examination by tax authorities. Management has reviewed the Fund’s tax positions for all open tax years (tax years ended August 31, 2015 through August 31, 2018) and has concluded that no provision for unrecognized tax benefits or expenses is required in these financial statements. The Fund identifies its major tax jurisdiction as U.S. federal.
3. Investment Transactions
During the year ended August 31, 2018, cost of purchases and proceeds from sales of investment securities, other than short-term investments, were $35,206,803 and $30,774,061, respectively.
4. Transactions with Related Parties
On August 1, 2018, Edge Advisors, LLC (the “Previous Adviser”), the Fund’s previous investment advisor, closed a transaction (the “Transaction”) under which the Previous Adviser was acquired by Edge Capital Group, LLC (the “New Adviser”), a wholly-owned subsidiary of Focus Operating, LLC, which in turn is wholly-owned by Focus Financial Partners, LLC. Focus Financial Partners, LLC is controlled by its managing member, Focus Financial Partners Inc. (collectively, “Focus”). Focus Financial Partners Inc. is a publicly traded company, the stock of which is traded on NASDAQ Global Select (FOCS).
The Transaction was deemed to be a change in control, and therefore an “assignment” under the Investment Company Act of 1940, as amended (the “1940 Act”), of the Fund’s previous investment advisory agreement with the Previous Adviser (the “Previous Investment Advisory Agreement”) and resulted in its automatic termination. An interim investment advisory agreement (the “Interim Investment Advisory Agreement”) and a new investment advisory agreement (the “New Investment Advisory Agreement”), each with the New Adviser and each with substantially the same terms as the previous
21
BLUE CURRENT GLOBAL DIVIDEND FUND
NOTES TO FINANCIAL STATEMENTS (Continued)
agreement, except for the start and end date of the agreements and, in the case of the interim investment advisory agreement, various terms related to compliance with Rule 15a-4 of the 1940 Act, were approved by the Trust’s Board of Trustees at a meeting held on July 23-24, 2018, and the New Investment Advisory Agreement was submitted to the Fund’s shareholders for approval on September 11, 2018.
PREVIOUS INVESTMENT ADVISORY AGREEMENT
Prior to August 1, 2018, the Fund’s investments were managed by the Previous Adviser pursuant to the terms of the Previous Investment Advisory Agreement. Under the Previous Investment Advisory Agreement, the Fund paid the Previous Adviser an investment advisory fee, computed and accrued daily and paid monthly, at the annual rate of 0.99% of its average daily net assets.
Pursuant to an Expense Limitation Agreement between the Fund and the Previous Adviser (the “Previous ELA”), the Previous Adviser had agreed, until January 1, 2020, to reduce its investment advisory fees and reimburse other expenses to limit total annual operating expenses (exclusive of brokerage costs; taxes; interest; borrowing costs such as interest and dividends expenses on securities sold short; acquired fund fees and expenses; extraordinary expenses such as litigation and merger or reorganization costs and other expenses not incurred in the ordinary course of the Fund’s business) to an amount not exceeding 0.99% of the Fund’s average daily net assets.
INTERIM INVESTMENT ADVISORY AGREEMENT
The Fund’s investments are managed by the New Adviser pursuant to the terms of an Interim Investment Advisory Agreement. Under the Interim Investment Advisory Agreement, the Fund pays the Adviser an investment advisory fee, computed and accrued daily and paid monthly, at the annual rate of 0.99% of its average daily net assets.
Pursuant to an Interim Expense Limitation Agreement between the Fund and the New Adviser (the “Interim ELA”), the New Adviser has agreed, until January 1, 2020, to reduce its investment advisory fees and reimburse other expenses to limit total annual operating expenses (exclusive of brokerage costs; taxes; interest; borrowing costs such as interest and dividends expenses on securities sold short; acquired fund fees and expenses; extraordinary expenses such as litigation and merger or reorganization costs and other expenses not incurred in the ordinary course of the Fund’s business) to an amount not exceeding 0.99% of the Fund’s average daily net assets of the Institutional Class shares.
Accordingly, under each of the Previous ELA and the Interim ELA, the Previous Adviser and the New Adviser, respectively, reduced their investment advisory fees in the aggregate amount of $257,004 during the year ended August 31, 2018.
Under the terms of the Interim ELA, investment advisory fee reductions and expense reimbursements by the Adviser are subject to repayment by the Fund for a period of three years after such fees and expenses were incurred, provided that the repayments do not cause the Fund’s total annual operating expenses to exceed the lesser of (i) the
22
BLUE CURRENT GLOBAL DIVIDEND FUND
NOTES TO FINANCIAL STATEMENTS (Continued)
expense limitation then in effect, if any, and (ii) the expense limitation in effect at the time the expenses to be repaid were incurred. As of August 31, 2018, the Adviser may seek recoupment of investment advisory fee reductions in the amount of $671,744 no later than the dates stated below:
August 31, 2019 | $ | 189,186 | ||
August 31, 2020 | 225,554 | |||
August 31, 2021 | 257,004 | |||
Total | $ | 671,744 |
OTHER SERVICE PROVIDERS
Ultimus Fund Solutions, LLC (“Ultimus”) provides administration, fund accounting, compliance and transfer agency services to the Fund. The Fund pays Ultimus fees in accordance with the agreements for such services. In addition, the Fund pays out-of-pocket expenses including, but not limited to, postage, supplies, and costs of pricing the Fund’s portfolio securities.
Under the terms of a Distribution Agreement with the Trust, Ultimus Fund Distributors, LLC (the “Distributor”) serves as principal underwriter to the Fund. The Distributor is a wholly-owned subsidiary of Ultimus. The Distributor is compensated by the Adviser (not the Fund) for acting as principal underwriter.
Certain officers and a Trustee of the Trust are also officers of Ultimus and the Distributor and are not paid by the Fund for serving in such capacities.
TRUSTEE COMPENSATION
Effective August 1, 2018, each Trustee who is not an “interested person” of the Trust (“Independent Trustee”) receives a $1,300 annual retainer from the Fund, paid quarterly, except for the Board Chairperson who receives a $1,500 annual retainer from the Fund, paid quarterly. Each Independent Trustee also receives from the Fund a fee of $500 for each Board meeting attended plus reimbursement for travel and other meeting-related expenses. Prior to August 1, 2018, each Independent Trustee received a $1,000 annual retainer from the Fund, paid quarterly, except for the Board Chairperson who received a $1,200 annual retainer from the Fund, paid quarterly. Each Independent Trustee also received from the Fund a fee of $500 for each Board meeting attended plus reimbursement for travel and other meeting-related expenses.
23
BLUE CURRENT GLOBAL DIVIDEND FUND
NOTES TO FINANCIAL STATEMENTS (Continued)
PRINCIPAL HOLDERS OF FUND SHARES
As of August 31, 2018, the following shareholders owned of record 5% or more of the outstanding shares of the Fund:
Name of Record Owner | % Ownership |
Pershing, LLC (for the benefit of multiple shareholders) | 79% |
Charles Schwab & Co., Inc. (for the benefit of multiple shareholders) | 11% |
National Financial Services, LLC (for the benefit of multiple shareholders) | 5% |
A beneficial owner of 25% or more of the Fund’s outstanding shares may be considered a controlling person. That shareholder’s vote could have a more significant effect on matters presented at a shareholders’ meeting.
5. Derivative Transactions
At August 31, 2018, the Fund was invested in derivative contracts which are reflected in the Statement of Assets and Liabilities as follows:
Derivative Assets | Derivative Liabilities | ||||||||||
Risk | Derivative | Statement of | Fair Value | Statement of | Fair Value | ||||||
Currency | Forward foreign currency contracts | Unrealized appreciation on forward foreign currency contracts | $ | 39,148 | Unrealized depreciation on forward foreign currency contracts | $ | — | ||||
For the year ended August 31, 2018, the effect of derivative contracts in the Fund’s Statement of Operations was as follows:
Risk | Derivative Type | Net Realized | Net Change | ||||||
Currency | Forward foreign currency contracts | $ | (472,454 | ) | $ | 138,199 | |||
In the ordinary course of business, the Fund may enter into transactions subject to enforceable netting agreements or other similar arrangements (“netting agreements”). Generally, the right to offset in netting agreements allows the Fund to offset the exposure
24
BLUE CURRENT GLOBAL DIVIDEND FUND
NOTES TO FINANCIAL STATEMENTS (Continued)
it has on any transactions with a specific counterparty with any collateral it has received or delivered in connection with other transactions with that counterparty. Generally, the Fund manages its cash collateral and securities collateral, if any, on a counterparty basis.
The following table presents, by derivative type, the Fund’s financial derivative instruments net of the related collateral (received)/pledged, if any, at August 31, 2018:
Gross | Gross | Net Amounts | Gross Amounts Not | Net | ||||||||||||||||||||
Derivative Type | Amounts of | Offset in the | in the | Financial | Collateral | |||||||||||||||||||
Forward Foreign Currency Contracts | $ | 39,148 | $ | — | $ | 39,148 | $ | — | $ | — | $ | 39,148 | ||||||||||||
Total subject to a master netting or similar arrangement | $ | 39,148 | $ | — | $ | 39,148 | $ | — | $ | — | $ | 39,148 | ||||||||||||
6. Foreign Investment Risk
Compared with investing in the U.S., investing in foreign markets involves a greater degree and variety of risk. Investors in foreign markets may face delayed settlements, currency controls, and adverse economic developments as well as higher overall transaction costs. In addition, fluctuations in the U.S. dollar’s value versus other currencies may erode or reverse gains or increase losses from investments denominated in foreign currencies. Foreign governments may expropriate assets, impose capital or currency controls, impose punitive taxes, impose limits on ownership or nationalize a company or industry. Any of these actions could have a severe effect on security prices and impair an investor’s ability to bring its capital or income back to the U.S. The value of foreign securities may be affected by incomplete, less frequent, or inaccurate financial information about their issuers, social upheavals, or political actions ranging from tax code changes to government collapse. Foreign companies may also receive less coverage by market analysts than U.S. companies and may be subject to different reporting standards or regulatory requirements than those applicable to U.S. companies.
7. Contingencies and Commitments
The Fund indemnifies the Trust’s officers and Trustees for certain liabilities that might arise from their performance of their duties to the Fund. Additionally, in the normal course of business, the Fund enters into contracts that contain a variety of representations, warranties, and general indemnifications. The Fund’s maximum exposure under these
25
BLUE CURRENT GLOBAL DIVIDEND FUND
NOTES TO FINANCIAL STATEMENTS (Continued)
arrangements is unknown, as this would involve future claims that may be made against the Fund that have not yet occurred. However, based on experience, the Fund expects the risk of loss to be remote.
8. Subsequent Events
The Fund is required to recognize in the financial statements the effects of all subsequent events that provide additional evidence about conditions that existed as of the date of the Statement of Assets and Liabilities. For non-recognized subsequent events that must be disclosed to keep the financial statements from being misleading, the Fund is required to disclose the nature of the event as well as an estimate of its financial effect, or a statement that such an estimate cannot be made. Management has evaluated subsequent events through the issuance of these financial statements and has noted no such events other than the ordinary income dividend paid on September 28, 2018, as discussed in Note 2, and the following:
A meeting of the Fund’s shareholders is scheduled for October 29, 2018, at which the shareholders will consider the approval of the New Investment Advisory Agreement with the New Adviser. In the event that the Fund’s shareholders elect not to approve the New Investment Advisory Agreement, the Trust’s Board of Trustees will consider other possible options available to the Fund, including, without limitation, seeking another investment adviser for the Fund or possibly closing the Fund.
26
BLUE CURRENT GLOBAL DIVIDEND FUND
REPORT OF INDEPENDENT REGISTERED
PUBLIC ACCOUNTING FIRM
To the Shareholders of Blue Current Global Dividend Fund and
Board of Trustees of Ultimus Managers Trust
Opinion on the Financial Statements
We have audited the accompanying statement of assets and liabilities, including the schedule of investments and schedule of forward foreign currency contracts, of Blue Current Global Dividend Fund (the “Fund”), a series of Ultimus Managers Trust, as of August 31, 2018, and the related statement of operations for the year then ended, the statements of changes in net assets for each of the two years in the period then ended, including the related notes, and the financial highlights for each of the four periods in the period then ended (collectively referred to as the “financial statements”). In our opinion, the financial statements present fairly, in all material respects, the financial position of the Fund as of August 31, 2018, the results of its operations for the year then ended, the changes in its net assets for each of the two years in the period then ended, and the financial highlights for each of the four periods in the period then ended, in conformity with accounting principles generally accepted in the United States of America.
Basis for Opinion
These financial statements are the responsibility of the Fund’s management. Our responsibility is to express an opinion on the Fund’s financial statements based on our audits. We are a public accounting firm registered with the Public Company Accounting Oversight Board (United States) (“PCAOB”) and are required to be independent with respect to the Fund in accordance with the U.S. federal securities laws and the applicable rules and regulations of the Securities and Exchange Commission and the PCAOB.
We conducted our audits in accordance with the standards of the PCAOB. Those standards require that we plan and perform the audit to obtain reasonable assurance about whether the financial statements are free of material misstatement, whether due to error or fraud.
Our audits include performing procedures to assess the risks of material misstatement of the financial statements, whether due to error or fraud, and performing procedures that respond to those risks. Such procedures include examining, on a test basis, evidence regarding the amounts and disclosures in the financial statements and confirmation of securities owned as of August 31, 2018, by correspondence with the custodian and brokers. Our audits also included evaluating the accounting principles used and significant estimates made by management, as well as evaluating the overall presentation of the financial statements. We believe that our audits provide a reasonable basis for our opinion.
We have served as the Fund’s auditor since 2014.
COHEN & COMPANY, LTD.
Cleveland, Ohio
October 25, 2018
27
BLUE CURRENT GLOBAL DIVIDEND FUND
ABOUT YOUR FUND’S EXPENSES (Unaudited)
We believe it is important for you to understand the impact of costs on your investment. As a shareholder of the Fund, you incur ongoing costs, including management fees and other operating expenses. The following examples are intended to help you understand your ongoing costs (in dollars) of investing in the Fund and to compare these costs with the ongoing costs of investing in other mutual funds.
A mutual fund’s ongoing costs are expressed as a percentage of its average net assets. This figure is known as the expense ratio. The expenses in the table below are based on an investment of $1,000 made at the beginning of the most recent period (March 1, 2018) and held until the end of the period (August 31, 2018).
The table below illustrates the Fund’s ongoing costs in two ways:
Actual fund return – This section helps you to estimate the actual expenses that you paid over the period. The “Ending Account Value” shown is derived from the Fund’s actual return, and the fourth column shows the dollar amount of operating expenses that would have been paid by an investor who started with $1,000 in the Fund. You may use the information here, together with the amount you invested, to estimate the expenses that you paid over the period.
To do so, simply divide your account value by $1,000 (for example, an $8,600 account value divided by $1,000 = 8.6), then multiply the result by the number given for the Fund under the heading “Expenses Paid During Period.”
Hypothetical 5% return – This section is intended to help you compare the Fund’s ongoing costs with those of other mutual funds. It assumes that the Fund had an annual return of 5% before expenses during the period shown, but that the expense ratio is unchanged. In this case, because the return used is not the Fund’s actual return, the results do not apply to your investment. The example is useful in making comparisons because the U.S. Securities and Exchange Commission (the “SEC”) requires all mutual funds to calculate expenses based on a 5% return. You can assess the Fund’s ongoing costs by comparing this hypothetical example with the hypothetical examples that appear in shareholder reports of other funds.
Note that expenses shown in the table are meant to highlight and help you compare ongoing costs only. The Fund does not charge sales loads. However, a redemption fee of 2% is applied on the sale of shares held for less than 7 days.
The calculations assume no shares were bought or sold during the period. Your actual costs may have been higher or lower, depending on the amount of your investment and the timing of any purchases or redemptions.
More information about the Fund’s expenses can be found in this report. For additional information on operating expenses and other shareholder costs, please refer to the Fund’s prospectus.
28
BLUE CURRENT GLOBAL DIVIDEND FUND
ABOUT YOUR FUND’S EXPENSES (Unaudited) (Continued)
Institutional Class | Beginning | Ending | Net Expense | Expenses |
Based on Actual Fund Return | $1,000.00 | $1,007.70 | 0.99% | $5.01 |
Based on Hypothetical 5% Return (before expenses) | $1,000.00 | $1,020.21 | 0.99% | $5.04 |
(a) | Annualized, based on the Fund’s most recent one-half year expenses. |
(b) | Expenses are equal to the Fund’s annualized net expense ratio multiplied by the average account value over the period, multiplied by 184/365 (to reflect the one-half year period). |
29
BLUE CURRENT GLOBAL DIVIDEND FUND
OTHER INFORMATION (Unaudited)
A description of the policies and procedures that the Fund uses to vote proxies relating to portfolio securities is available without charge upon request by calling 1-800-514-3583, or on the SEC’s website at http://www.sec.gov. Information regarding how the Fund voted proxies relating to portfolio securities during the most recent 12-month period ended June 30 is also available without charge upon request by calling 1-800-514-3583, or on the SEC’s website at http://www.sec.gov.
The Trust files a complete listing of portfolio holdings for the Fund with the SEC as of the end of the first and third quarters of each fiscal year on Form N-Q. These filings are available upon request by calling 1-800-514-3583. Furthermore, you may obtain a copy of the filings on the SEC’s website at http://www.sec.gov. The Trust’s Forms N-Q may also be reviewed and copied at the SEC’s Public Reference Room in Washington, DC, and information on the operation of the Public Reference Room may be obtained by calling 1-800-SEC-0330.
OTHER FEDERAL TAX INFORMATION (Unaudited)
For the fiscal year ended August 31, 2018, the Fund designated $989,604 as long-term capital gain distributions subject to a maximum tax rate of 20%.
Qualified Dividend Income – The Fund designates 100% of its ordinary income dividends, or up to the maximum amount of such dividends allowable pursuant to the Internal Revenue Code, as qualified dividend income eligible for the reduced tax rate of 15%.
Dividends Received Deduction – Corporate shareholders are generally entitled to take the dividends received deduction on the portion of the Fund’s dividend distributions that qualifies under tax law. For the fiscal year ended August 31, 2018, 83.02% of ordinary income dividends qualified for the corporate dividends received deduction.
30
BLUE CURRENT GLOBAL DIVIDEND FUND
BOARD OF TRUSTEES AND EXECUTIVE OFFICERS
(Unaudited)
The Board has overall responsibility for management of the Trust’s affairs. The Trustees serve during the lifetime of the Trust and until its termination, or until death, resignation, retirement, or removal. The Trustees, in turn, elect the officers of the Fund to actively supervise its day-to-day operations. The officers have been elected for an annual term. Each Trustee’s and officer’s address is 225 Pictoria Drive, Suite 450, Cincinnati, Ohio 45246. The following are the Trustees and executive officers of the Fund:
Name and | Length | Position(s) Held | Principal Occupation(s) | Number | Directorships |
Interested Trustees: | |||||
Robert G. Dorsey* Year of Birth: 1957 | Since | Trustee (February 2012 to present)
President (June 2012 to October 2013) | Managing Director (1999 to present), Co-CEO (April 2018 to present), and President (1999 to April 2018) of Ultimus Fund Solutions, LLC and its subsidiaries (except as otherwise noted for FINRA-regulated broker dealer entities) | 19 | Interested Trustee of Capital Series Trust (10 Funds) |
Independent Trustees: | |||||
Janine L. Cohen Year of Birth: 1952 | Since | Trustee | Retired since 2013; Chief Financial Officer from 2004 to 2013 and Chief Compliance Officer from 2008 to 2013 at AER Advisors, Inc. | 19 | None |
David M. Deptula Year of Birth: 1958 | Since | Trustee | Vice President of Legal and Special Projects at Dayton Freight Lines, Inc. since 2016; Vice President of Tax Treasury at The Standard Register Inc. (formerly The Standard Register Company) from 2011 to 2016 | 19 | None |
John J. Discepoli Year of Birth: 1963 | Since | Chairperson (May 2016
Trustee (June 2012 to present) | Owner of Discepoli Financial Planning, LLC (personal financial planning company) since 2004 | 19 | None |
31
BLUE CURRENT GLOBAL DIVIDEND FUND
BOARD OF TRUSTEES AND EXECUTIVE OFFICERS
(Unaudited) (Continued)
* | Mr. Dorsey is considered an “interested person” of the Trust within the meaning of Section 2(a)(19) of the Investment Act of 1940, as amended, because of his relationship with the Trust’s administrator, transfer agent and distributor. |
Name and | Length | Position(s) | Principal Occupation(s) During Past 5 Years |
Executive Officers: | |||
David R. Carson Year of Birth: 1958 | Since | Principal Executive Officer (April 2017 to present)
President (October 2013 to present)
Vice President (April 2013 to October 2013) | Vice President and Director of Client Strategies of Ultimus Fund Solutions, LLC (2013 to present); President, Unified Series Trust (2016 to present); Chief Compliance Officer, FSI Low Beta Absolute Return Fund (2013 to 2016); Chief Compliance Officer, The Huntington Funds (2005 to 2013), Huntington Strategy Shares (2012 to 2013), and Huntington Asset Advisors (2013); Vice President, Huntington National Bank (2001 to 2013) |
Todd E. Heim Year of Birth: 1967 | Since 2014 | Vice President (2014 to present) | Client Implementation Manager of Ultimus Managers Trust (2014 to present); Naval Flight Officer of United States Navy (1989 to present); Business Project Manager of Vantiv, Inc. (2013 to 2014) |
Jennifer L. Leamer Year of Birth: 1976 | Since | Treasurer (October 2014 to present)
Assistant Treasurer (April 2014 to October 2014) | Vice President, Mutual Fund Controller of Ultimus Fund Solutions, LLC (2014 to present); Business Analyst of Ultimus Fund Solutions, LLC (2007 to 2014) |
Matthew J. Beck Year of Birth: 1988 | Since | Secretary | Senior Attorney of Ultimus Fund Solutions, LLC (2018 to present); General Counsel of The Nottingham Company (2014 to 2018) |
32
BLUE CURRENT GLOBAL DIVIDEND FUND
BOARD OF TRUSTEES AND EXECUTIVE OFFICERS
(Unaudited) (Continued)
Name and | Length | Position(s) | Principal Occupation(s) During Past 5 Years |
Charles C. Black Year of Birth: 1979 | Since | Chief Compliance Officer
Assistant Chief Compliance Officer (April 2015 to January 2016) | Senior Compliance Officer of Ultimus Fund Solutions, LLC (2015 to present); Chief Compliance Officer of The Caldwell & Orkin Funds, Inc. (2016 to present); Senior Compliance Manager for Touchstone Mutual Funds (2013 to 2015); Senior Compliance Manager for Fund Evaluation Group (2011 to 2013) |
Additional information about members of the Board and executive officers is available in the Fund’s Statement of Additional Information (“SAI”). To obtain a free copy of the SAI, please call 1-800-514-3583.
33
BLUE CURRENT GLOBAL DIVIDEND FUND
DISCLOSURE REGARDING APPROVAL OF PREVIOUS INVESTMENT
ADVISORY AGREEMENT (Unaudited)
The Board of Trustees (the “Board”), including the Independent Trustees voting separately, reviewed and approved the Previous Investment Advisory Agreement. The Board approved the Previous Investment Advisory Agreement at an in-person meeting held on April 22-23, 2018, at which all of the Trustees were present.
Legal counsel advised the Board during its deliberations. Additionally, the Board received and reviewed a substantial amount of information provided by the Previous Adviser in response to requests of the Board and counsel. In considering whether to approve the Previous Investment Advisory Agreement and in reaching its conclusions with respect thereto, the Board reviewed and analyzed various factors that it determined were relevant to the Previous Investment Advisory Agreement, including the following factors.
The nature, extent, and quality of the services provided by the Previous Adviser. In this regard, the Board reviewed the services being provided by the Previous Adviser to the Fund including, without limitation, its investment advisory services since the Fund’s inception, the Previous Adviser’s compliance policies and procedures, its efforts to promote the Fund and assist in its distribution, and its compliance program. After reviewing the foregoing information and further information in the Previous Adviser Memorandum (e.g., descriptions of its business and Form ADV), the Board concluded that the quality, extent, and nature of the services provided by the Previous Adviser were satisfactory and adequate for the Fund.
The investment performance of the Fund. In this regard, the Board compared the performance of the Fund with the performance of its benchmark index, custom peer group and related Morningstar category. The Board noted that the Fund had outperformed its custom peer group’s average performance for the one year period and the median performance since inception and slightly under performed its custom peer group’s average performance since the Fund’s inception; while underperforming its Morningstar category’s (World Large Stock Funds under $100 million, True No-Load) median and average performance for the one year period and since the Fund’s inception. The Board also considered the consistency of the Previous Adviser’s management with the Fund’s investment objective and policies. The Board indicated that the Previous Adviser had satisfactorily explained its performance results for the Fund. Following discussion of the investment performance of the Fund and its performance relative to its Morningstar category, the Previous Adviser’s experience in managing a mutual fund and separate accounts, its historical investment performance, and other factors, the Board concluded that the investment performance of the Fund has been satisfactory.
The costs of the services provided and profits realized by the Previous Adviser and its affiliates from its relationship with the Fund. In this regard, the Board considered the Previous Adviser’s staffing, personnel, and methods of operations; the education and experience of its personnel; compliance program, policies, and procedures; financial condition and the level of commitment to the Fund, and, generally, the Previous Adviser’s
34
BLUE CURRENT GLOBAL DIVIDEND FUND
DISCLOSURE REGARDING APPROVAL OF PREVIOUS INVESTMENT
ADVISORY AGREEMENT (Unaudited)
advisory business; the asset level of the Fund; and the overall expenses of the Fund, including the advisory fee. The Board considered the expense limitation agreement with the Previous Adviser, and considered the Previous Adviser’s current and past fee reductions and expense reimbursements for the Fund. The Board further took into account the Previous Adviser’s commitment to continue the expense limitation agreement until at least January 1, 2020.
The Board also considered potential benefits for the Previous Adviser in managing the Fund, including promotion of the Previous Adviser’s name and the potential for it to receive research, statistical, or other services from the Fund’s trades. The Board compared the Fund’s advisory fee and overall expense ratio to the average advisory fees and average expense ratios for its Morningstar category. The Board noted that the 0.99% advisory fee for the Fund was above the average and the median for the Fund’s custom peer group, and above the average and median of funds of similar size and structure in the Fund’s Morningstar category, but less than the highest advisor fee in its Morningstar category. The Board further noted that the overall annual expense ratio of 0.99% for the Fund is above the average and median for the Fund’s custom peer group, and below the average and median for its Morningstar category. The Board also considered the fee charged by the Previous Adviser to its other accounts that have a substantially similar strategy as the Fund and considered the similarities and differences of services received by such other accounts as compared to the services received by the Fund. The Board noted that the fee structures applicable to the Previous Adviser’s other clients were not indicative of any unreasonableness with respect to the advisory fees payable to the Fund. The Board further considered the investment strategy and style used by the Previous Adviser in managing the portfolio of the Fund. Following these comparisons and upon further consideration and discussion of the foregoing, the Board concluded that the advisory fee paid to the Previous Adviser by the Fund is fair and reasonable.
The extent to which economies of scale would be realized as the Fund grows and whether advisory fee levels reflect these economies of scale for the benefit of the Fund’s investors. In this regard, the Board considered that the Fund’s fee arrangements with the Previous Adviser involve both the advisory fee and the expense limitation agreement with the Previous Adviser. The Board determined that while the advisory fee remained the same as asset levels increased, the shareholders of the Fund have experienced benefits from the expense limitation agreement. Following further discussion of the Fund’s asset level, expectations for growth, and level of fees, the Board determined that the Fund’s fee arrangements with the Previous Adviser would continue to provide benefits. The Board also determined that the fee arrangements were fair and reasonable in relation to the nature and quality of services being provided by the Previous Adviser, given the Fund’s projected asset levels for the next year.
35
BLUE CURRENT GLOBAL DIVIDEND FUND
DISCLOSURE REGARDING APPROVAL OF PREVIOUS INVESTMENT
ADVISORY AGREEMENT (Unaudited)
Brokerage and portfolio transactions. In this regard, the Board considered the Previous Adviser’s trading policies, procedures, and performance in seeking best execution for its clients, including the Fund. The Board also considered the historical portfolio turnover rate for the Fund; the process by which evaluations are made of the overall reasonableness of commissions paid; the process by which the Previous Adviser evaluates best execution; the method and basis for selecting and evaluating the broker-dealers used; and any anticipated allocation of portfolio business to persons affiliated with the Previous Adviser. After further review and discussion, the Board determined that the Previous Adviser’s practices regarding brokerage and portfolio transactions were satisfactory.
Possible conflicts of interest. In evaluating the possibility for conflicts of interest, the Board considered such matters as the experience and abilities of the advisory personnel assigned to the Fund, the Previous Adviser’s process for allocating trades among its different clients, and the substance and administration of the Previous Adviser’s Code of Ethics. Following further consideration and discussion, the Board found that the Previous Adviser’s standards and practices relating to the identification and mitigation of potential conflicts of interests were satisfactory.
After full consideration of the above factors as well as other factors, the Board unanimously concluded that approval of the Previous Investment Advisory Agreement was in the best interests of the Fund and its shareholders.
36
BLUE CURRENT GLOBAL DIVIDEND FUND
DISCLOSURE REGARDING APPROVAL OF INTERIM AND NEW INVESTMENT ADVISORY AGREEMENTS (Unaudited)
The Board of Trustees (the “Board”), including the Independent Trustees voting separately, has reviewed and approved the Fund’s Interim Investment Advisory Agreement and New Investment Advisory Agreement with the New Adviser for a 150-day term and a two-year term, respectively (the “Agreements”), subsequent to the termination of the Previous Investment Advisory Agreements between the Fund the Previous Adviser. The Previous Investment Advisory Agreements terminated upon the acquisition of the Previous Adviser by the New Adviser, which closed on August 1, 2018 (the “Transaction”). The New Adviser is expected to retain the same principals and officers as the Previous Adviser, and the Fund’s portfolio managers are expected to remain the same, but the New Adviser is wholly owned by Focus Financial Partners, LLC, which is in turn controlled by its managing member, Focus Financial Partners, LLC, which is in turn controlled by its managing member, Focus Financial Partners, Inc. a publicly traded company (collectively, “Focus”). The Board approved the Agreements at an in-person meeting held on July 23-24, 2018, at which all of the Trustees were present.
Legal counsel advised the Board during its deliberations. Additionally, the Board received and reviewed a substantial amount of information provided by the New Adviser in response to requests of the Board and counsel. In considering whether to approve the Agreements and in reaching its conclusions with respect thereto, the Board reviewed and analyzed various factors that it determined were relevant to the Agreements, including the following factors.
The nature, extent, and quality of the services provided by the New Adviser. In this regard, the Board reviewed the services being provided by the current portfolio management team to the Fund including, without limitation, the investment advisory services since the Fund’s inception, and their efforts to promote the Fund and assist in its distribution. The Board also considered the New Adviser’s proposed services to the Fund including, without limitation, the New Adviser’s procedures for formulating investment recommendations and assuring compliance with the Fund’s investment objective and limitations; proposed marketing and distribution efforts; and the New Adviser’s compliance procedures and practices. The Board considered that the New Adviser was only recently organized, but the New Adviser had made representations to the Board that no changes were anticipated in the portfolio management team or investment approach as a result of the Transaction. After reviewing the foregoing information and further information regarding the New Adviser’s business (including information in the Form ADV), the Board concluded that the quality, extent, and nature of the services to be provided by the New Adviser were satisfactory and adequate for the Fund.
The investment management capabilities and experience of the New Adviser. In this regard, the Board considered the representations by the New Adviser that the portfolio management team at the Previous Adviser providing investment management services to the Fund had been retained by the New Adviser and that they are expected to continue providing the same investment management services to the Fund after the closing of the
37
BLUE CURRENT GLOBAL DIVIDEND FUND
DISCLOSURE REGARDING APPROVAL OF INTERIM AND NEW INVESTMENT ADVISORY AGREEMENTS (Unaudited) (Continued)
Transaction. The Board also considered the experience of other personnel at the New Adviser’s parent company and affiliates. After consideration of these and other factors, the Board determined that the New Adviser will have the requisite experience to serve as investment adviser for the Fund.
The investment performance of the Fund. In this regard, the Board compared the performance of the Fund with the performance of its benchmark indexes, custom peer group and related Morningstar category. The Board also considered the consistency of the Previous Adviser’s management with the Fund’s investment objective and policies and representations by the New Adviser that no anticipated changes to the Fund’s portfolio management team is expect as a result of the Transaction. The Board noted that while relative to its custom peer group and funds of similar size and structure in the Fund’s Morningstar category (World Large Stock Funds under $100 million, True no-Load), the Fund had underperformed the custom peer groups’ average and median for the one year period, and underperformed the Morningstar category’s average for the one and three year periods, the Fund had outperformed the custom peer group’s average and median for the three year period. The Board also noted that the Fund’s portfolio management team had provided a reasonable explanation for the differences in the performance results. Following discussion of the investment performance of the Fund, the experience of the Fund’s portfolio management team in managing the Fund, its historical investment performance, and other factors, the Board concluded that the investment performance of the Fund has been satisfactory.
The costs of the services provided and profits realized by the New Adviser and its affiliates from its relationship with the Fund. In analyzing the cost of services and potential profitability of the New Adviser from its relationship with the Fund, the Board considered that the Transaction would result in no changes to the advisory fee charged to the Fund under the advisory Agreements with the New Adviser and that the Fund would pay the same advisory fee it currently pays under the advisory Agreements with the Previous Adviser. Further, the Board noted that the New Adviser has agreed to a new expense limitation agreement substantially similar to the original expense limitation agreement with the Previous Adviser and the New Adviser’s commitment to continue the expense limitation agreement for the Fund until at least January 1, 2020. The Board also considered the New Adviser’s proposed staffing, personnel, and methods of operations; the education and experience of those personnel; compliance program, policies, and procedures; financial condition and the level of commitment to the Fund, and, generally, the New Adviser’s proposed advisory business; the asset level of the Fund; and the overall expenses of the Fund, including the advisory fee.
The Board also considered potential benefits for the New Adviser in managing the Fund, including promotion of the New Adviser’s name and the potential for it to receive research, statistical, or other services from the Fund’s trades. The Board compared the Fund’s advisory fee and overall expense ratio under the proposed advisory Agreements with the
38
BLUE CURRENT GLOBAL DIVIDEND FUND
DISCLOSURE REGARDING APPROVAL OF INTERIM AND NEW INVESTMENT ADVISORY AGREEMENTS (Unaudited) (Continued)
New Adviser and new expense limitation agreement with the New Adviser to the average advisory fees and average expense ratios for its custom peer group and Morningstar category. The Board noted that the proposed 0.99% advisory fee under the proposed advisory Agreements with the New Adviser was the same advisory fee rate as charged under the advisory Agreements with the Previous Adviser and was above the average and the median for the Fund’s custom peer group and Morningstar category, but less than the highest advisory fee in the custom peer group and Morningstar category. The Board further noted that the proposed Fund’s overall annual expense ratio of 0.99% and 1.24% for the Institutional Class and Investor Class, respectively, was the same provided under the expense limitation agreement with the Previous Adviser and that the expense ratio of the Institutional Class is lower than the Morningstar category’s average and median expense ratio, and was higher than its peer group’s average and median expense ratio. The Board also considered the proposed fees to be charged by the New Adviser to its other accounts with substantially similar strategies as the Fund and considered the similarities and differences of services to be provided to such other accounts as compared to the services to be provided the Fund. The Board noted that the proposed fee structure applicable to the New Adviser’s other clients were no indicative of any unreasonableness with respect to the advisory fees to be paid by the Fund. The Board further considered the investment strategy and style to be used by the New Adviser in managing the Fund. Following these comparisons and upon further consideration and discussion of the foregoing, the Board concluded that the proposed advisory fee to be paid to the New Adviser and expense cap under the new expense limitation agreement with the New Adviser is fair and reasonable.
The extent to which economies of scale would be realized as the Fund grows and whether advisory fee levels reflect these economies of scale for the benefit of the Fund’s investors. In this regard, the Board considered that the Fund’s fee arrangements with the New Adviser involve both the advisory fee and the new expense limitation agreement. The Board determined that while the advisory fee remained the same as asset levels increased, the shareholders of the Fund will continue to experience benefits under the new expense limitation agreement until the Fund assets grow to a level where its expenses otherwise fall below the expense limit. Following further discussion of the Fund’s asset level, expectations for growth, and level of fees, the Board determined that the Fund’s proposed fee arrangements with the New Adviser would provide benefits for the next two years, and the Board could review the arrangements going forward as necessary. After further discussion, the Board concluded the Fund’s arrangements with the New Adviser were fair and reasonable in relation to the nature and quality of services to be provided by the New Adviser.
Brokerage and portfolio transactions. In this regard, the Board considered the New Adviser’s policies and procedures as they relate to seeking best execution for its clients and noted that they were expected to be similar to those of the Previous Adviser. The
39
BLUE CURRENT GLOBAL DIVIDEND FUND
DISCLOSURE REGARDING APPROVAL OF INTERIM AND NEW INVESTMENT ADVISORY AGREEMENTS (Unaudited) (Continued)
Board also considered the historical portfolio turnover rate for the Fund; the method and basis for selecting and evaluating the broker-dealers used; any anticipated allocation of portfolio business to persons affiliated with the New Adviser; and the extent to which the Fund’s trades may be allocated to soft-dollar arrangements. After further review and discussion, the Board determined that the New Adviser’s practices regarding brokerage and portfolio transactions were satisfactory.
Possible conflicts of interest. In evaluating the possibility for conflicts of interest, the Board considered such matters as the experience and abilities of the advisory personnel to be assigned to the Fund, the New Adviser’s process for allocating trades among its different clients, and the substance and administration of the New Adviser’s Code of Ethics. The Board also considered the New Adviser’s anticipated other clients, including clients that may have similar types of investment objectives and strategies as the Fund. Following further consideration and discussion, the Board determined that the New Adviser’s standards and practices relating to the identification and mitigation of potential conflicts of interests were satisfactory.
After full consideration of the above factors as well as other factors, the Board unanimously concluded that approval of the Agreements was in the best interests of the Fund and its shareholders.
40
This page intentionally left blank.

Annual Report
August 31, 2018
MARSHFIELD CONCENTRATED OPPORTUNITY FUND | |
LETTER TO SHAREHOLDERS | September 21, 2018 |
During the fiscal year ended August 31, 2018, the Marshfield Concentrated Opportunity Fund (the “Fund”) returned 24.70%, compared to the 19.66% return for the S&P 500 Index.
Since the Fund’s inception in late 2015, we have used these letters to reiterate our agnosticism about the macroeconomic and political environment. We refrain from predicting economic events and trends, but we do pay attention to current domestic and global developments because that allows us to understand something about how our companies perform in different environments, both in terms of their operating results and in terms of management’s approach to changes in such things as end market demand. In the absence of good, actionable information about large trends, we always believe it is in the interest of the fund and its shareholders to make our decisions on a bottom-up basis. Irrespective of the external climate, we ask ourselves if a stock is cheap enough to buy, if the stock has a sufficient moat around its business which cannot be exploited by competitors, and if the company’s corporate culture is appropriate to its business. As managers, we feel comfortable making a judgment about those aspects of a business, making sure our investments can withstand shocks and not only survive, but thrive in any type of external environment.
The U.S. equity market in the year ended August 31, 2018 was characterized by a moderately strengthening macro economy and increasing equity prices. Compared to the previous year, which included the surprise election of U.S. President Donald Trump, this year saw positive macro trends that were reasonably stable and consistent despite the near-constant noise produced by the U.S. political environment, which we do our best to tune out when making decisions about securities. One important political event that did have an impact on security pricing and valuations was the passage of the 2017 Tax Cut and Jobs Act in December 2017, which cut U.S. corporate tax rates from 35% to 21%, boosting the values of the majority of the stocks in our portfolio, given the fund’s strong concentration of U.S.-based earnings.
While the portfolio in general benefitted from the improving U.S. economy, many individual names ran their businesses exceptionally well, leading to strong stock market outperformance. Strategic Education (STRA, formerly Strayer Education, up over 73%) continued to attract new students at all degree levels, including more students entering the university via corporate partnerships. Strategic Education completed its merger with Capella Education in August, creating a stronger for-profit education provider with strength in both classroom education and online learning. O’Reilly Autoparts (ORLY, up 71%) and AutoZone (AZO, up 45%) both improved on a cyclically low 2017, taking share from local competitors and growing their sales on the commercial side of the business, selling more parts to independent garages. Mastercard (MA, up 62%) and Visa (V, up 42%) both continued to benefit from the switch from cash to electronic payments, growing significantly faster than the economy in nearly all geographies in which they operate.
1
Moody’s (MCO, up 33% for the year) was the single-biggest contributor to the fund’s outperformance in 2018 given its large size within the fund. Our thesis on Moody’s – it is the biggest player in the global credit ratings market, a market integral to the operation of the financial system, combined with a strong subscription business in their Analytics segment – proved prescient in 2018. Chipotle (CMG, up 50%) was the second biggest contributor to our performance. We owned a position in the stock entering the year, and with a weaker-than-expected recovery in late 2017, we took the opportunity to add to the position in the first and second quarters of the year. Subsequent to our purchase, the company named a new CEO, embarked on a simplified but strong recovery plan, and improved same-store sales, bolstering the stock price.
Three stocks in the portfolio declined in value during the year. Cummins (CMI, down 11%) saw improving performance in their underlying business, but headwinds from potential tariffs and trade war threats, along with a product recall campaign, hurt margins and ultimately led to a decline in the stock price. Arch Capital (ACGL, down 6%) had superior results in their mortgage insurance business, but pressure in the insurance and reinsurance markets and the absence of anticipated pricing power from the 2017 hurricane season challenged the business. NVR (NVR, down 2%) was a top performing stock a year ago but declined during the year as the strong market continued in residential home construction, albeit at a slower pace.
Our historical track record is one of limited turnover, and that was true again this year. We sold one position in its entirety while trimming the size of another position due to significant price appreciation. We sold our position in U.S. Bancorp following the significant run up in commercial bank stocks in the year following the 2016 election. While we believe their business is well run, the commercial banking space is exceptionally competitive and we believe it to be unlikely they will earn outsized returns in the future. Along with a premium price relative to what we believe to be its intrinsic value and a change in leadership at the top which could portend cultural shifts, we felt it best to part with the position in early 2018. NVR climbed over 27% in the first quarter of the fund’s fiscal year, pushing the stock significantly above our intrinsic value estimate and our own internal guideposts, triggering a partial sale of the name. While we have no qualms with the qualitative aspects of this high-return homebuilding business, we felt it prudent to trim the size of our position given the high price.
We did not add any new names during the fiscal year but took advantage of reductions in share prices to add to our positions in Arch Capital, Chipotle, AutoZone, and O’Reilly Auto Parts (mentioned above). A slight decline in the price of Goldman Sachs (GS) also allowed us to increase the size of the position in the fund. Each of the additions is intended to be a long-term holding. While the additions (save Goldman Sachs) experienced an increase in their stock prices from the time we purchased them until the end of the year, we buy stocks for their anticipated business and stock performance over the course of at least a business cycle, not just a single fiscal year.
Our approach in any environment is to stick to our discipline. That means: 1) understanding what’s real and what’s fantasy; 2) acting with equanimity to exploit the misjudgments of the crowd; and 3) being patient and not pulling the trigger before
2
our buy or sell price has been reached. These things won’t change. Process and discipline are why we believe investors choose to invest in the Fund, and we take our mandate to preserve capital and generate risk-adjusted returns very seriously.
We thank you for the opportunity to invest your money and for your confidence in our process and discipline.
Sincerely,
Elise J. Hoffmann | Christopher M. Niemczewski |
Past performance is not predictive of future performance. Investment results and principal value will fluctuate so that shares, when redeemed, may be worth more or less than their original cost. Current performance may be higher or lower than the performance data quoted. Performance data current to the most recent month-end are available by calling 1-855-691-5288.
An investor should consider the investment objectives, risks, charges and expenses of the Fund carefully before investing. The Fund’s prospectus contains this and other important information. To obtain a copy of the Fund’s prospectus please visit our website at www.MarshfieldFunds.com or call 1-855-691-5288 and a copy will be sent to you free of charge. Please read the prospectus carefully before you invest. The Fund is distributed by Ultimus Fund Distributors, LLC.
The Letter to Shareholders seeks to describe some of the Adviser’s current opinions and views of the financial markets. Although the Adviser believes it has a reasonable basis for any opinions or views expressed, actual results may differ, sometimes significantly so, from those expected or expressed. The securities held by the Fund that are discussed in the Letter to Shareholders were held during the period covered by this Report. They do not comprise the entire investment portfolio of the Fund, may be sold at any time, and may no longer be held by the Fund. For a complete list of securities held by the Fund as of August 31, 2018, please see the Schedule of Investments section of the annual report. The opinions of the Fund’s adviser with respect to those securities may change at any time.
Statements in the Letter to Shareholders that reflect projections or expectations for future financial or economic performance of the Fund and the market in general and statements of the Fund’s plans and objectives for future operations are forward-looking statements. No assurance can be given that actual results or events will not differ materially from those projected, estimated, assumed, or anticipated in any such forward-looking statements. Important factors that could result in such differences, in addition to factors noted with such forward-looking statements, include, without limitation, general economic conditions, such as inflation, recession, and interest rates. Past performance is not a guarantee of future results.
3
MARSHFIELD CONCENTRATED OPPORTUNITY FUND
PERFORMANCE INFORMATION (Unaudited)
Comparison of the Change in Value of a $10,000 Investment in
Marshfield Concentrated Opportunity Fund versus
the S&P 500® Index
Average Annual Total Returns (for the periods ended August 31, 2018) | |||
1 Year | Since | ||
Marshfield Concentrated Opportunity Fund(a) | 24.70% | 18.60% | |
S&P 500® Index | 19.66% | 15.64% | |
(a) | The total returns shown do not reflect the deduction of taxes a shareholder would pay on Fund distributions, if any, or the redemption of Fund shares. |
(b) | The Fund commenced operations on December 29, 2015. |
4
MARSHFIELD CONCENTRATED OPPORTUNITY FUND
PORTFOLIO INFORMATION
August 31, 2018 (Unaudited)
Portfolio Allocation (% of Net Assets)
Top 10 Equity Holdings
Security Description | % of Net Assets |
Moody's Corporation | 10.6% |
Arch Capital Group Ltd. | 7.7% |
Chipotle Mexican Grill, Inc. | 6.1% |
Deere & Company | 5.3% |
AutoZone, Inc. | 5.2% |
Mastercard, Inc. - Class A | 5.0% |
Goldman Sachs Group, Inc. (The) | 4.9% |
Visa, Inc. - Class A | 4.7% |
Fastenal Company | 4.5% |
Expeditors International of Washington, Inc. | 4.4% |
5
MARSHFIELD CONCENTRATED OPPORTUNITY FUND | ||||||||
COMMON STOCKS — 85.1% | Shares | Value | ||||||
Consumer Discretionary — 28.9% | ||||||||
Diversified Consumer Services — 3.8% | ||||||||
Strategic Education, Inc. | 6,144 | $ | 852,603 | |||||
Hotels, Restaurants & Leisure — 10.0% | ||||||||
Chipotle Mexican Grill, Inc. (a) | 2,958 | 1,405,582 | ||||||
Yum! Brands, Inc. | 10,186 | 885,062 | ||||||
| 2,290,644 | ||||||||
Household Durables — 2.0% | ||||||||
NVR, Inc. (a) | 172 | 458,973 | ||||||
Specialty Retail — 13.1% | ||||||||
AutoZone, Inc. (a) | 1,553 | 1,190,965 | ||||||
O'Reilly Automotive, Inc. (a) | 2,919 | 979,091 | ||||||
Ross Stores, Inc. | 8,713 | 834,531 | ||||||
| 3,004,587 | ||||||||
Financials — 23.2% | ||||||||
Capital Markets — 15.5% | ||||||||
Goldman Sachs Group, Inc. (The) | 4,683 | 1,113,664 | ||||||
Moody's Corporation | 13,649 | 2,429,795 | ||||||
| 3,543,459 | ||||||||
Insurance — 7.7% | ||||||||
Arch Capital Group Ltd. (a) | 57,978 | 1,772,388 | ||||||
Health Care — 0.9% | ||||||||
Life Sciences Tools & Services — 0.9% | ||||||||
Waters Corporation (a) | 1,124 | 212,976 | ||||||
Industrials — 22.4% | ||||||||
Air Freight & Logistics — 4.4% | ||||||||
Expeditors International of Washington, Inc. | 13,799 | 1,011,191 | ||||||
Machinery — 9.3% | ||||||||
Cummins, Inc. | 6,468 | 917,162 | ||||||
Deere & Company | 8,396 | 1,207,345 | ||||||
| 2,124,507 | ||||||||
See accompanying notes to financial statements. |
6
MARSHFIELD CONCENTRATED OPPORTUNITY FUND | ||||||||
COMMON STOCKS — 85.1% (Continued) | Shares | Value | ||||||
Industrials — 22.4% (Continued) | ||||||||
Road & Rail — 4.2% | ||||||||
Union Pacific Corporation | 6,386 | $ | 961,859 | |||||
Trading Companies & Distributors — 4.5% | ||||||||
Fastenal Company | 17,709 | 1,033,497 | ||||||
Information Technology — 9.7% | ||||||||
IT Services — 9.7% | ||||||||
Mastercard, Inc. - Class A | 5,333 | 1,149,581 | ||||||
Visa, Inc. - Class A | 7,291 | 1,070,975 | ||||||
| 2,220,556 | ||||||||
Total Common Stocks (Cost $14,502,877) | $ | 19,487,240 | ||||||
| ||||||||
MONEY MARKET FUNDS — 14.3% | Shares | Value | ||||||
Goldman Sachs Financial Square Funds - Treasury Instruments Fund - Institutional Shares, 1.83% (b) | 1,581,495 | $ | 1,581,495 | |||||
Vanguard Treasury Money Market Fund, 1.95% (b) | 1,693,821 | 1,693,821 | ||||||
Total Money Market Funds (Cost $3,275,316) | $ | 3,275,316 | ||||||
Total Investments at Value — 99.4% (Cost $17,778,193) | $ | 22,762,556 | ||||||
Other Assets in Excess of Liabilities — 0.6% | 135,685 | |||||||
Net Assets — 100.0% | $ | 22,898,241 | ||||||
(a) | Non-income producing security. |
(b) | The rate shown is the 7-day effective yield as of August 31, 2018. |
See accompanying notes to financial statements.
7
MARSHFIELD CONCENTRATED OPPORTUNITY FUND | ||||
ASSETS | ||||
Investments in securities: | ||||
At cost | $ | 17,778,193 | ||
At value (Note 2) | $ | 22,762,556 | ||
Receivable for capital shares sold | 302,218 | |||
Dividends receivable | 33,910 | |||
Other assets | 9,557 | |||
Total assets | 23,108,241 | |||
LIABILITIES | ||||
Payable for securities purchased | 189,371 | |||
Payable to Adviser (Note 4) | 5,163 | |||
Payable to administrator (Note 4) | 7,680 | |||
Other accrued expenses | 7,786 | |||
Total liabilities | 210,000 | |||
NET ASSETS | $ | 22,898,241 | ||
NET ASSETS CONSIST OF: | ||||
Paid-in capital | $ | 17,590,808 | ||
Undistributed net realized gains from investment transactions | 323,070 | |||
Net unrealized appreciation on investments | 4,984,363 | |||
NET ASSETS | $ | 22,898,241 | ||
Shares of beneficial interest outstanding (unlimited number of shares authorized, no par value) | 1,489,833 | |||
Net asset value, offering price and redemption price per share (Note 2) | $ | 15.37 | ||
See accompanying notes to financial statements. |
8
MARSHFIELD CONCENTRATED OPPORTUNITY FUND | ||||
INVESTMENT INCOME | ||||
Dividend income | $ | 180,946 | ||
Interest | 260 | |||
Total investment income | 181,206 | |||
EXPENSES | ||||
Investment advisory fees (Note 4) | 157,338 | |||
Professional fees | 39,929 | |||
Fund accounting fees (Note 4) | 30,657 | |||
Administration fees (Note 4) | 29,000 | |||
Transfer agent fees (Note 4) | 18,000 | |||
Custody and bank service fees | 15,357 | |||
Registration and filing fees | 13,771 | |||
Compliance fees (Note 4) | 12,000 | |||
Trustees' fees and expenses (Note 4) | 10,009 | |||
Postage and supplies | 4,913 | |||
Printing of shareholder reports | 4,065 | |||
Insurance expense | 2,625 | |||
Pricing fees | 575 | |||
Other expenses | 7,720 | |||
Total expenses | 345,959 | |||
Less fee reductions and expense reimbursements by the Adviser (Note 4) | (163,778 | ) | ||
Net expenses | 182,181 | |||
NET INVESTMENT LOSS | (975 | ) | ||
REALIZED AND UNREALIZED GAINS ON INVESTMENTS | ||||
Net realized gains from investment transactions | 505,753 | |||
Net change in unrealized appreciation (depreciation) on investments | 3,106,123 | |||
NET REALIZED AND UNREALIZED GAINS ON INVESTMENTS | 3,611,876 | |||
NET INCREASE IN NET ASSETS RESULTING FROM OPERATIONS | $ | 3,610,901 | ||
See accompanying notes to financial statements. |
9
MARSHFIELD CONCENTRATED OPPORTUNITY FUND | ||||||||
| Year | Year | ||||||
FROM OPERATIONS | ||||||||
Net investment income (loss) | $ | (975 | ) | $ | 6,721 | |||
Net realized gains from investment transactions | 505,753 | 133,074 | ||||||
Net change in unrealized appreciation (depreciation) on investments | 3,106,123 | 1,262,848 | ||||||
Net increase in net assets resulting from operations | 3,610,901 | 1,402,643 | ||||||
FROM DISTRIBUTIONS TO SHAREHOLDERS (Note 2) | ||||||||
From net investment income | (8,517 | ) | (11,998 | ) | ||||
From net realized gains | (303,783 | ) | (31,503 | ) | ||||
Decrease in net assets from distributions to shareholders | (312,300 | ) | (43,501 | ) | ||||
CAPITAL SHARE TRANSACTIONS | ||||||||
Proceeds from shares sold | 7,384,990 | 5,829,947 | ||||||
Net asset value of shares issued in reinvestment of distributions to shareholders | 301,657 | 43,070 | ||||||
Proceeds from redemption fees collected (Note 2) | 690 | — | ||||||
Payments for shares redeemed | (921,553 | ) | (289,433 | ) | ||||
Net increase in net assets from capital share transactions | 6,765,784 | 5,583,584 | ||||||
TOTAL INCREASE IN NET ASSETS | 10,064,385 | 6,942,726 | ||||||
NET ASSETS | ||||||||
Beginning of year | 12,833,856 | 5,891,130 | ||||||
End of year | $ | 22,898,241 | $ | 12,833,856 | ||||
UNDISTRIBUTED NET INVESTMENT INCOME | $ | — | $ | 8,501 | ||||
CAPITAL SHARE ACTIVITY | ||||||||
Shares sold | 513,412 | 484,894 | ||||||
Shares reinvested | 21,796 | 3,775 | ||||||
Shares redeemed | (65,298 | ) | (24,060 | ) | ||||
Net increase in shares outstanding | 469,910 | 464,609 | ||||||
Shares outstanding at beginning of year | 1,019,923 | 555,314 | ||||||
Shares outstanding at end of year | 1,489,833 | 1,019,923 | ||||||
See accompanying notes to financial statements. |
10
MARSHFIELD CONCENTRATED OPPORTUNITY FUND | ||||||||||||
Per Share Data for a Share Outstanding Throughout Each Period | ||||||||||||
| Year | Year | Period | |||||||||
Net asset value at beginning of period | $ | 12.58 | $ | 10.61 | $ | 10.00 | ||||||
Income from investment operations: | ||||||||||||
Net investment income (loss) | (0.00 | )(b) | 0.00 | (b) | 0.02 | |||||||
Net realized and unrealized gains on investments | 3.08 | 2.04 | 0.59 | |||||||||
Total from investment operations | 3.08 | 2.04 | 0.61 | |||||||||
Less distributions: | ||||||||||||
From net investment income | (0.01 | ) | (0.02 | ) | — | |||||||
From net realized gains | (0.28 | ) | (0.05 | ) | — | |||||||
Total distributions | (0.29 | ) | (0.07 | ) | — | |||||||
Proceeds from redemption fees collected (Note 2) | 0.00 | (b) | — | — | ||||||||
Net asset value at end of period | $ | 15.37 | $ | 12.58 | $ | 10.61 | ||||||
Total return (c) | 24.70 | % | 19.27 | % | 6.10 | %(d) | ||||||
Net assets at end of period (000's) | $ | 22,898 | $ | 12,834 | $ | 5,891 | ||||||
Ratios/supplementary data: | ||||||||||||
Ratio of total expenses to average net assets | 2.09 | % | 2.87 | % | 3.80 | %(e) | ||||||
Ratio of net expenses to average net assets (f) | 1.10 | % | 1.10 | % | 1.22 | %(e) | ||||||
Ratio of net investment income (loss) to average net assets (f) | (0.01 | %) | 0.08 | % | 0.42 | %(e) | ||||||
Portfolio turnover rate | 10 | % | 11 | % | 18 | %(d) | ||||||
(a) | Represents the period from the commencement of operations (December 29, 2015) through August 31, 2016. |
(b) | Amount rounds to less than $0.01 per share. |
(c) | Total return is a measure of the change in value of an investment in the Fund over the periods covered. The returns shown do not reflect the deduction of taxes a shareholder would pay on Fund distributions, if any, or the redemption of Fund shares. The total returns would be lower if the Adviser had not reduced advisory fees and reimbursed expenses (Note 4). |
(d) | Not annualized. |
(e) | Annualized. |
(f) | Ratio was determined after advisory fee reductions and expense reimbursements (Note 4). |
See accompanying notes to financial statements.
11
MARSHFIELD CONCENTRATED OPPORTUNITY FUND
NOTES TO FINANCIAL STATEMENTS
August 31, 2018
1. Organization
Marshfield Concentrated Opportunity Fund (the “Fund”) is a non-diversified series of Ultimus Managers Trust (the “Trust”), an open-end investment company established as an Ohio business trust under a Declaration of Trust dated February 28, 2012. Other series of the Trust are not incorporated in this report.
The investment objective of the Fund is to seek the dual goals of capital preservation and the long-term growth of principal, while targeting a pattern of performance at variance with that of the market.
2. Significant Accounting Policies
The following is a summary of the Fund’s significant accounting policies used in the preparation of its financial statements. These policies are in conformity with accounting principles generally accepted in the United States of America (“GAAP”). The Fund follows accounting and reporting guidance under Financial Accounting Standards Board Accounting Standards Codification Topic 946, “Financial Services – Investment Companies.”
Securities valuation – The Fund values its portfolio securities at market value as of the close of regular trading on the New York Stock Exchange (the “NYSE”) (normally 4:00 p.m. Eastern time) on each business day the NYSE is open for business. The Fund values its listed securities on the basis of the security’s last sale price on the security’s primary exchange, if available, otherwise at the exchange’s most recently quoted mean price. NASDAQ-listed securities are valued at the NASDAQ Official Closing Price. Investments representing shares of other open-end investment companies, including money market funds, are valued at their net asset value (“NAV”) as reported by such companies. When using a quoted price and when the market is considered active, the security will be classified as Level 1 within the fair value hierarchy (see below). Fixed income securities, if any, are generally valued using prices provided by an independent pricing service approved by the Board of Trustees of the Trust (the “Board”). The independent pricing service uses information with respect to transactions in bonds, quotations from bond dealers, market transactions in comparable securities, and various relationships between securities in determining these prices. In the event that market quotations are not readily available or are considered unreliable due to market or other events, the Fund values its securities and other assets at fair value in accordance with procedures established by and under the general supervision of the Board. Under these procedures, the securities will be classified as Level 2 or 3 within the fair value hierarchy, depending on the inputs used. Unavailable or unreliable market quotes may be due to the following factors: a substantial bid-ask spread; infrequent sales resulting in stale prices; insufficient trading volume; small trade sizes; a temporary lapse in any reliable pricing source; and actions of the securities or futures markets,
12
MARSHFIELD CONCENTRATED OPPORTUNITY FUND |
such as the suspension or limitation of trading. As a result, the prices of securities used to calculate the Fund’s NAV may differ from quoted or published prices for the same securities.
GAAP establishes a single authoritative definition of fair value, sets out a framework for measuring fair value, and requires additional disclosures about fair value measurements.
Various inputs are used in determining the value of the Fund’s investments. These inputs are summarized in the three broad levels listed below:
● | Level 1 – quoted prices in active markets for identical securities |
● | Level 2 – other significant observable inputs |
● | Level 3 – significant unobservable inputs |
The inputs or methods used for valuing securities are not necessarily an indication of the risks associated with investing in those securities. The inputs used to measure fair value may fall into different levels of the fair value hierarchy. In such cases, for disclosure purposes, the level in the fair value hierarchy within which the fair value measurement falls in its entirety is determined based on the lowest level input that is significant to the fair value measurement.
The following is a summary of the inputs used to value the Fund’s investments as of August 31, 2018:
| Level 1 | Level 2 | Level 3 | Total | ||||||||||||
Common Stocks | $ | 19,487,240 | $ | — | $ | — | $ | 19,487,240 | ||||||||
Money Market Funds | 3,275,316 | — | — | 3,275,316 | ||||||||||||
Total | $ | 22,762,556 | $ | — | $ | — | $ | 22,762,556 | ||||||||
Refer to the Fund’s Schedule of Investments for a listing of the common stocks by industry type. As of August 31, 2018, the Fund did not have any transfers between Levels. In addition, the Fund did not hold derivative instruments or any assets or liabilities that were measured at fair value on a recurring basis using significant unobservable inputs (Level 3) as of August 31, 2018. It is the Fund’s policy to recognize transfers between Levels at the end of the reporting period.
Share valuation – The NAV per share of the Fund is calculated daily by dividing the total value of the Fund’s assets, less liabilities, by the number of shares outstanding. The offering price and redemption price per share of the Fund is equal to the NAV, except that shares of the Fund are subject to a redemption fee of 2% if redeemed within 90 days of the date of purchase. During the years ended August 31, 2018 and 2017, proceeds from the redemption fees, recorded in capital, totaled $690 and $0, respectively.
13
MARSHFIELD CONCENTRATED OPPORTUNITY FUND |
Investment income – Dividend income is recorded on the ex-dividend date. Interest income is accrued as earned.
Investment transactions – Investment transactions are accounted for on the trade date. Realized gains and losses on investments sold are determined on a specific identification basis.
Common expenses – Common expenses of the Trust are allocated among the Fund and the other series of the Trust based on the relative net assets of each series or the nature of the services performed and the relative applicability to each series.
Distributions to shareholders – The Fund will distribute to shareholders any net investment income dividends and net realized capital gains distributions at least once each year. The amount of such dividends and distributions are determined in accordance with federal income tax regulations, which may differ from GAAP. Dividends and distributions are recorded on the ex-dividend date. The tax character of the Fund’s distributions paid to shareholders during the years ended August 31, 2018 and 2017 was as follows:
| Year Ended | Ordinary Income | Long-Term Capital Gains | Total Distributions | ||||||||||
8/31/2018 | $ | 9,718 | $ | 302,582 | $ | 312,300 | |||||||
8/31/2017 | $ | 43,501 | $ | — | $ | 43,501 | |||||||
Estimates – The preparation of financial statements in conformity with GAAP requires management to make estimates and assumptions that affect the reported amounts of assets and liabilities and disclosure of contingent assets and liabilities as of the date of the financial statements and the reported amounts of income and expenses during the reporting period. Actual results could differ from those estimates.
Federal income tax – The Fund has qualified and intends to continue to qualify as a regulated investment company under the Internal Revenue Code of 1986, as amended (the “Code”). Qualification generally will relieve the Fund of liability for federal income taxes to the extent 100% of its net investment income and net realized capital gains are distributed in accordance with the Code.
In order to avoid imposition of the excise tax applicable to regulated investment companies, it is also the Fund’s intention to declare as dividends in each calendar year at least 98% of its net investment income (earned during the calendar year) and 98.2% of its net realized capital gains (earned during the 12 months ended October 31) plus undistributed amounts from prior years.
14
MARSHFIELD CONCENTRATED OPPORTUNITY FUND |
The following information is computed on a tax basis for each item as of August 31, 2018:
Tax cost of portfolio investments | $ | 17,780,889 | ||
Gross unrealized appreciation | $ | 5,098,777 | ||
Gross unrealized depreciation | (117,110 | ) | ||
Net unrealized appreciation | 4,981,667 | |||
Undistributed ordinary income | 19,188 | |||
Undistributed long-term capital gains | 306,578 | |||
Distributable earnings | $ | 5,307,433 |
The values of the federal income tax cost of portfolio investments and the tax components of distributable earnings and the financial statement cost of portfolio investments and components of net assets may be temporarily different (“book/tax differences”). These book/tax differences are due to the timing of the recognition of capital gains or losses under income tax regulations and GAAP, primarily due to the tax deferral of losses on wash sales.
For the year ended August 31, 2018, the following reclassification was made on the Statement of Assets and Liabilities as a result of permanent differences in the recognition of capital gains or losses under income tax regulations and GAAP:
Undistributed net investment income | $ | 991 | ||
Undistributed net realized gains from investment transactions | $ | (991 | ) |
The Fund recognizes the tax benefits or expenses of uncertain tax positions only when the position is “more likely than not” to be sustained assuming examination by tax authorities. Management has reviewed the Fund’s tax positions for all open tax periods (periods ended September 30, 2016, August 31, 2017 and August 31, 2018) and has concluded that no provision for unrecognized tax benefits or expenses is required in these financial statements. The Fund identifies its major tax jurisdiction as U.S. Federal.
3. Investment Transactions
During the year ended August 31, 2018, cost of purchases and proceeds from sales of investment securities, other than short-term investments, were $5,965,445 and $1,392,025, respectively.
15
MARSHFIELD CONCENTRATED OPPORTUNITY FUND |
4. Transactions with Related Parties
INVESTMENT ADVISORY AGREEMENT
The Fund’s investments are managed by Marshfield Associates, Inc. (the “Adviser”) pursuant to the terms of an Investment Advisory Agreement. Under the Investment Advisory Agreement, the Fund pays the Adviser an advisory fee, computed and accrued daily and paid monthly, at the annual rate of 0.95% of its average daily net assets.
Pursuant to an Expense Limitation Agreement (“ELA”) between the Fund and the Adviser, the Adviser has contractually agreed, until January 1, 2019, to reduce its investment advisory fees and reimburse other expenses to limit total annual operating expenses (exclusive of brokerage costs; taxes; interest; borrowing costs such as interest and dividend expenses on securities sold short; costs to organize the Fund; acquired fund fees and expenses; extraordinary expenses such as litigation and merger or reorganization costs and other expenses not incurred in the ordinary course of the Fund’s business; and amounts, if any, payable pursuant to a plan adopted in accordance with Rule 12b-1 under the Investment Company Act of 1940, as amended (the “1940 Act”)), to an amount not exceeding 1.10% of the Fund’s average daily net assets. Accordingly, during the year ended August 31, 2018, the Adviser did not collect any of its investment advisory fees and reimbursed other operating expenses totaling $6,440.
Under the terms of the ELA, investment advisory fee reductions and expense reimbursements by the Adviser are subject to repayment by the Fund for a period of three years after such fees and expenses were incurred, provided the repayments do not cause total annual operating expenses to exceed the lesser of: (i) the expense limitation then in effect, if any, and (ii) the expense limitation in effect at the time the expenses to be repaid were incurred. As of August 31, 2018, the Adviser may seek repayment of investment advisory fee reductions and expense reimbursements in the amount of $398,538 no later than the dates as stated below:
August 31, 2019 | $ | 85,254 | ||
August 31, 2020 | 149,506 | |||
August 31, 2021 | 163,778 | |||
Total | $ | 398,538 |
OTHER SERVICE PROVIDERS
Ultimus Fund Solutions, LLC (“Ultimus”) provides administration, fund accounting, compliance and transfer agency services to the Fund. The Fund pays Ultimus fees in accordance with the agreements for such services. In addition, the Fund pays out-of-pocket expenses including, but not limited to, postage, supplies, and costs of pricing the Fund’s portfolio securities.
16
MARSHFIELD CONCENTRATED OPPORTUNITY FUND |
Under the terms of a Distribution Agreement with the Trust, Ultimus Fund Distributors, LLC (the “Distributor”) serves as principal underwriter to the Fund. The Distributor is a wholly-owned subsidiary of Ultimus. The Distributor is compensated by the Adviser (not the Fund) for acting as principal underwriter.
Certain officers and a Trustee of the Trust are also officers of Ultimus and the Distributor.
TRUSTEE COMPENSATION
Effective August 1, 2018, each Trustee who is not an “interested person” of the Trust (“Independent Trustee”) receives a $1,300 annual retainer from the Fund, paid quarterly, except for the Board Chairperson who receives a $1,500 annual retainer from the Fund, paid quarterly. Each Independent Trustee also receives from the Fund a fee of $500 for each Board meeting attended plus reimbursement for travel and other meeting-related expenses. Prior to August 1, 2018, each Independent Trustee received a $1,000 annual retainer from the Fund, paid quarterly, except for the Board Chairperson who received a $1,200 annual retainer from the Fund, paid quarterly. Each Independent Trustee also received from the Fund a fee of $500 for each Board meeting attended plus reimbursement for travel and other meeting-related expenses.
PRINCIPAL HOLDERS OF FUND SHARES
As of August 31, 2018, the following shareholders owned of record 5% or more of the outstanding shares of the Fund:
Name of Record Owner | % Ownership |
D.A. Davidson & Co. (for the benefit of its customers) | 28% |
RBC Capital Markets, LLC (for the benefit of its customers) | 13% |
Marshfield Associates 401K Plan | 11% |
Christopher M. Niemczewski | 9% |
William K. Wilburn | 8% |
Elise J. Hoffmann | 7% |
Melissa Vinick Gilbert | 6% |
Carolyn Miller | 6% |
5. Sector Risk
If the Fund has significant investments in the securities of issuers within a particular sector, any development affecting that sector will have a greater impact on the value of the net assets of the Fund than would be the case if the Fund did not have significant investments in that sector. In addition, this may increase the risk of loss in the Fund and increase the volatility of the Fund’s NAV per share. Occasionally, market conditions, regulatory changes or other developments may negatively impact
17
MARSHFIELD CONCENTRATED OPPORTUNITY FUND |
this sector, and therefore the value of the Fund’s portfolio will be adversely affected. As of August 31, 2018, the Fund had 28.9% of the value of its net assets invested in securities within the Consumer Discretionary sector.
6. Contingencies and Commitments
The Fund indemnifies the Trust’s officers and Trustees for certain liabilities that might arise from their performance of their duties to the Fund. Additionally, in the normal course of business the Fund enters into contracts that contain a variety of representations and warranties and which provide general indemnifications. The Fund’s maximum exposure under these arrangements is unknown, as this would involve future claims that may be made against the Fund that have not yet occurred. However, based on experience, the Fund expects the risk of loss to be remote.
7. Subsequent Events
The Fund is required to recognize in the financial statements the effects of all subsequent events that provide additional evidence about conditions that existed as of the date of the Statement of Assets and Liabilities. For non-recognized subsequent events that must be disclosed to keep the financial statements from being misleading, the Fund is required to disclose the nature of the event as well as an estimate of its financial effect, or a statement that such an estimate cannot be made. Management has evaluated subsequent events through the issuance of these financial statements and has noted no such events.
18
MARSHFIELD CONCENTRATED OPPORTUNITY FUND
REPORT OF INDEPENDENT REGISTERED
PUBLIC ACCOUNTING FIRM
To the Shareholders of Marshfield Concentrated Opportunity Fund and
Board of Trustees of Ultimus Managers Trust
Opinion on the Financial Statements
We have audited the accompanying statement of assets and liabilities, including the schedule of investments, of Marshfield Concentrated Opportunity Fund (the “Fund”), a series of Ultimus Managers Trust, as of August 31, 2018, and the related statement of operations for the year then ended, the statements of changes in net assets for each of the two years in the period then ended, including the related notes, and the financial highlights for each of the three periods in the period then ended (collectively referred to as the “financial statements”). In our opinion, the financial statements present fairly, in all material respects, the financial position of the Fund as of August 31, 2018, the results of its operations for the year then ended, the changes in its net assets for each of the two years in the period then ended, and the financial highlights for each of the three periods in the period then ended, in conformity with accounting principles generally accepted in the United States of America.
Basis for Opinion
These financial statements are the responsibility of the Fund’s management. Our responsibility is to express an opinion on the Fund’s financial statements based on our audits. We are a public accounting firm registered with the Public Company Accounting Oversight Board (United States) (“PCAOB”) and are required to be independent with respect to the Fund in accordance with the U.S. federal securities laws and the applicable rules and regulations of the Securities and Exchange Commission and the PCAOB.
We conducted our audits in accordance with the standards of the PCAOB. Those standards require that we plan and perform the audit to obtain reasonable assurance about whether the financial statements are free of material misstatement, whether due to error or fraud.
Our audits include performing procedures to assess the risks of material misstatement of the financial statements, whether due to error or fraud, and performing procedures that respond to those risks. Such procedures include examining, on a test basis, evidence regarding the amounts and disclosures in the financial statements and confirmation of securities owned as of August 31, 2018, by correspondence with the custodian and broker. Our audits also included evaluating the accounting principles used and significant estimates made by management, as well as evaluating the overall presentation of the financial statements. We believe that our audits provide a reasonable basis for our opinion.
We have served as the Fund’s auditor since 2016.
COHEN & COMPANY, LTD.
Cleveland, Ohio
October 25, 2018
19
MARSHFIELD CONCENTRATED OPPORTUNITY FUND |
We believe it is important for you to understand the impact of costs on your investment. As a shareholder of the Fund, you incur two types of cost: (1) transaction costs, including redemption fees; and (2) ongoing costs, including management fees and other operating expenses. The following examples are intended to help you understand your ongoing costs (in dollars) of investing in the Fund and to compare these costs with the ongoing costs of investing in other mutual funds.
A mutual fund’s ongoing costs are expressed as a percentage of its average net assets. This figure is known as the expense ratio. The expenses in the table below are based on an investment of $1,000 made at the beginning of the most recent period (March 1, 2018) and held until the end of the period (August 31, 2018).
The table below illustrates the Fund’s ongoing costs in two ways:
Actual fund return – This section helps you to estimate the actual expenses that you paid over the period. The “Ending Account Value” shown is derived from the Fund’s actual return, and the fourth column shows the dollar amount of operating expenses that would have been paid by an investor who started with $1,000 in the Fund. You may use the information here, together with the amount you invested, to estimate the expenses that you paid over the period.
To do so, simply divide your account value by $1,000 (for example, an $8,600 account value divided by $1,000 = 8.6), then multiply the result by the number given for the Fund under the heading “Expenses Paid During Period.”
Hypothetical 5% return – This section is intended to help you compare the Fund’s ongoing costs with those of other mutual funds. It assumes that the Fund had an annual return of 5% before expenses during the period shown, but that the expense ratio is unchanged. In this case, because the return used is not the Fund’s actual return, the results do not apply to your investment. The example is useful in making comparisons because the U.S. Securities and Exchange Commission (the “SEC”) requires all mutual funds to calculate expenses based on a 5% return. You can assess the Fund’s ongoing costs by comparing this hypothetical example with the hypothetical examples that appear in shareholder reports of other funds.
Note that expenses shown in the table are meant to highlight and help you compare ongoing costs only. The Fund does not charge sales loads. However, a redemption fee of 2% is applied on the sale of shares held for less than 90 days.
The calculations assume no shares were bought or sold during the period. Your actual costs may have been higher or lower, depending on the amount of your investment and the timing of any purchases or redemptions.
More information about the Fund’s expenses can be found in this report. For additional information on operating expenses and other shareholder costs, please refer to the Fund’s prospectus.
20
MARSHFIELD CONCENTRATED OPPORTUNITY FUND |
| Beginning | Ending | Net | Expenses |
Based on Actual Fund Return | $1,000.00 | $1,088.50 | 1.10% | $5.79 |
Based on Hypothetical 5% Return (before expenses) | $1,000.00 | $1,019.66 | 1.10% | $5.60 |
(a) | Annualized, based on the Fund’s most recent one-half year expenses. |
(b) | Expenses are equal to the Fund’s annualized net expense ratio multiplied by the average account value over the period, multiplied by 184/365 (to reflect the one-half year period). |
OTHER INFORMATION (Unaudited)
A description of the policies and procedures that the Fund uses to vote proxies relating to portfolio securities is available without charge upon request by calling toll-free 1-855-691-5288, or on the SEC’s website at http://www.sec.gov. Information regarding how the Fund voted proxies relating to portfolio securities during the most recent 12-month period ended June 30 is available without charge upon request by calling toll-free 1-855-691-5288, or on the SEC’s website at http://www.sec.gov.
The Trust files a complete listing of portfolio holdings for the Fund with the SEC as of the end of the first and third quarters of each fiscal year on Form N-Q. These filings are available upon request by calling 1-855-691-5288. Furthermore, you may obtain a copy of the filings on the SEC’s website at http://www.sec.gov. The Trust’s Forms N-Q may also be reviewed and copied at the SEC’s Public Reference Room in Washington, DC, and information on the operation of the Public Reference Room may be obtained by calling 1-800-SEC-0330.
21
MARSHFIELD CONCENTRATED OPPORTUNITY FUND |
For the fiscal year ended August 31, 2018, the Fund designated $302,582 as long-term capital gain distributions subject to a maximum tax rate of 20%.
Qualified Dividend Income – The Fund designates 100% of its ordinary income dividends, or up to the maximum amount of such dividends allowable pursuant to the Internal Revenue Code, as qualified dividend income eligible for the reduced tax rate of 15%.
Dividends Received Deduction – Corporate shareholders are generally entitled to take the dividends received deduction on the portion of a Fund’s dividend distribution that qualifies under tax law. For the Fund’s fiscal year ended August 31, 2018, 100% of ordinary income dividends qualifies for the corporate dividends received deduction.
22
MARSHFIELD CONCENTRATED OPPORTUNITY FUND |
The Board has overall responsibility for management of the Trust’s affairs. The Trustees serve during the lifetime of the Trust and until its termination, or until death, resignation, retirement, or removal. The Trustees, in turn, elect the officers of the Fund to actively supervise its day-to-day operations. The officers have been elected for an annual term. Unless otherwise noted, each Trustee’s and officer’s address is 225 Pictoria Drive, Suite 450, Cincinnati, OH 45246. The following are the Trustees and executive officers of the Fund:
Name and | Length | Position(s) | Principal Occupation(s) | Number | Directorships |
Interested Trustees: | |||||
Robert G. Dorsey* Year of Birth: 1957 | Since February 2012 | Trustee (February 2012 to present)
President (June 2012 to October 2013) | Managing Director (1999 to present), Co-CEO (April 2018 to present), and President (1999 to April 2018) of Ultimus Fund Solutions, LLC and its subsidiaries (except as otherwise noted for FINRA-regulated broker dealer entities) | 19 | Interested Trustee of Capital Series Trust (10 Funds) |
Independent Trustees: | |||||
Janine L. Cohen Year of Birth: 1952 | Since January 2016 | Trustee | Retired since 2013; Chief Financial Officer from 2004 to 2013 and Chief Compliance Officer from 2008 to 2013 at AER Advisors, Inc. | 19 | None |
David M. Deptula Year of Birth: 1958 | Since June 2012 | Trustee | Vice President of Legal and Special Projects at Dayton Freight Lines, Inc. since 2016; Vice President of Tax Treasury at The Standard Register Inc. (formerly The Standard Register Company) from 2011 to 2016 | 19 | None |
23
MARSHFIELD CONCENTRATED OPPORTUNITY FUND |
Name and | Length | Position(s) | Principal Occupation(s) | Number | Directorships |
Independent Trustees (Continued): | |||||
John J. Discepoli Year of Birth: 1963 | Since June 2012 | Chairperson (May 2016 to present)
Trustee (June 2012 to present) | Owner of Discepoli Financial Planning, LLC (personal financial planning company) since 2004 | 19 | None |
* | Mr. Dorsey is considered an “interested person” of the Trust within the meaning of Section 2(a)(19) of the 1940 Act because of his relationship with the Trust’s administrator, transfer agent and distributor. |
Name and | Length | Position(s) | Principal Occupation(s) During Past 5 Years |
Executive Officers: | |||
David R. Carson Year of Birth: 1958 | Since 2013 | Principal Executive Officer
President (October 2013 to present)
Vice President (April 2013 to October 2013) | Vice President and Director of Client Strategies of Ultimus Fund Solutions, LLC (2013 to present); President, Unified Series Trust (2016 to present); Chief Compliance Officer, FSI Low Beta Absolute Return Fund (2013 to 2016), The Huntington Funds (2005 to 2013), Huntington Strategy Shares (2012 to 2013), and Huntington Asset Advisors (2013); Vice President, Huntington National Bank (2001 to 2013) |
Todd E. Heim Year of Birth: 1967 | Since 2014 | Vice President (2014 to present) | Client Implementation Manager of Ultimus Managers Trust (2014 to present); Naval Flight Officer of United States Navy (1989 to present); Business Project Manager of Vantiv, Inc. (2013 to 2014) |
24
MARSHFIELD CONCENTRATED OPPORTUNITY FUND |
Name and | Length | Position(s) | Principal Occupation(s) During Past 5 Years |
Executive Officers (Continued): | |||
Jennifer L. Leamer Year of Birth: 1976 | Since 2014 | Treasurer (October 2014 to present)
Assistant Treasurer (April 2014 to October 2014) | Vice President, Mutual Fund Controller of Ultimus Fund Solutions, LLC (2014 to present); Business Analyst of Ultimus Fund Solutions, LLC (2007 to 2014) |
Matthew J. Beck Year of Birth: 1988 | Since 2018 | Secretary (July 2018 to present) | Senior Attorney of Ultimus Fund Solutions (2018 to present); General Counsel of The Nottingham Company (2014 to 2018) |
Charles C. Black Year of Birth: 1979 | Since 2015 | Chief Compliance Officer (January 2016 to present)
Assistant Chief Compliance Officer (April 2015 to January 2016) | Senior Compliance Officer of Ultimus Fund Solutions, LLC (2015 to present); Chief Compliance Officer of The Caldwell & Orkin Funds, Inc. (2016 to present); Senior Compliance Manager at Touchstone Mutual Funds (2013 to 2015); Senior Compliance Manager at Fund Evaluation Group (2011 to 2013) |
Additional information about members of the Board and executive officers is available in the Fund’s Statement of Additional Information (“SAI”). To obtain a free copy of the SAI, please call 1-855-691-5288.
25

Topturn OneEighty Fund
Annual Report
August 31, 2018
Topturn OneEighty Fund | August 31, 2018 |
Dear Fellow Shareholders:
For the twelve months ended August 31, 2018, the Topturn OneEighty Fund (TTFOX) (the “Fund”) returned 6.4% versus a benchmark return of 1.4% for the Morningstar Diversified Alternatives Total Return Index. From inception on September 1, 2015, the Fund delivered a cumulative return of +22.4%, or 7.0% annualized, versus a benchmark return of +5.1%, or 1.7% annualized, for the Morningstar Diversified Alternatives Total Return Index.
To fully understand and appreciate Fund performance over the past twelve months, a brief overview of market dynamics covering the same time frame is in order. The start of the most recent twelve-month fund period was highlighted by a widely expected announcement by the Federal Reserve during its September 2017 meeting. The announced program of balance sheet normalization, in effect resulting in Quantitative Tightening (QT) on top of continued increases in the discount rate policy, though largely anticipated, put most asset classes under pressure. Eventually, trades that had worked well after the U.S. presidential elections, found renewed strength as U.S. tax reform policy took center stage.
Moving into December 2017, three key elements seemed to be driving securities markets. First, Bitcoin was on full display with prices doubling in just a few weeks. There are few available comparisons to similar price movements of an asset class, though the great silver spike, and bubble, of 1980 comes to mind. Risk appetite continued to increase across asset classes until, during the middle of the month, the Fed raised interest rates, and Bitcoin started to crater. Ultimately, the first major tax reform since 1986 was passed, and after some initial weakness across asset classes, a division started to develop. Fixed assets that would be hurt from higher inflation, like U.S. Treasuries and the U.S. Dollar, started to trend downward, while assets that tend to hold up when inflation is rising performed well.
As the month of January 2018 progressed, a case of “FOMO” (Fear of missing out) seemed to kick in, with equities, metals, and other commodities rallying significantly. With yields on the 10-year U.S. Treasury approaching 3% in late January, and with equity market sentiment reaching record highs, the markets saw a return of volatility, at levels not experienced for the better part of 2 years. As most asset classes sold off, the downturn was compounded by problems that arose in volatility derivatives which triggered additional downward pressure. By the time the steep decline had abated, all gains from January had been given back…and then some. As markets reached oversold conditions, they finally found some footing and regained a bit of ground into the end of February 2018.
As the 3rd quarter began, equity assets continued to rebound from their first correction in about 500 market days. However, with a lack of broad participation (breadth) and the rise of fears about tariffs and privacy issues surrounding Facebook, market selling pressure resumed and the lows seen in February were once again tested. This said, selling pressure was not as extreme as in early February and markets found support as geopolitical concerns started to abate and equity assets and commodities started to rally. That proved to be short lived as concerns over global trade and doubts surrounding the collapse of a planned summit with North Korea put markets under pressure into the close of the quarter.
1
As the 4th quarter began, a relief rally in global equities also proved short lived, and markets began to correct once again as global tariff and trade fears took center stage. Couple that with rising interest rates, and most asset classes trended lower throughout the end of the fund year. One notable exception has been US stock markets, which have continued to benefit from lower corporate tax rates and the repatriation of overseas profits that have increased dividends, buybacks, and capital investment. This has provided tailwinds to the US economy as seen in the recently reported strong GDP numbers, low unemployment rates, and increases in personal income and consumer spending growth.
So much for markets, now for a discussion of the Fund. As the Fund’s fiscal year began, defensive positioning in the portfolio and a rotation from growth to cyclical value sectors caused increased portfolio volatility and turnover and resulted in a drag on performance. The portfolio, however, continued to benefit from gradually increasing global exposure and new positioning in the oil sector. After the Fed meeting in late September, the portfolio was increasingly tilted towards cyclical value exposures, allowing the portfolio to participate in rallying global equity markets.
As mentioned earlier, volatility increased markedly during the 1st quarter with not only rotations between risk-on and risk-off positions, but also sector rotations within several asset classes (Growth vs Value) taking place. Tactical positioning in response to these rotations caused portfolio turnover to be much higher than previous quarters. These types of rotations are common around significant turning points in markets and should last only until new intermediate-term trends are established, at which point we would expect turnover to recede somewhat.
As the 2nd quarter began, the portfolio continued its rotation from growth to cyclical value sectors to take advantage of strongly trending markets, driven by the perceived benefits that those sectors would enjoy as result of tax reform. As the quarter progressed, exposure to fixed income assets was reduced, as bond market losses accelerated.
With interest rates and volatility spiking, and most major asset classes turning lower, the portfolio began to tactically rotate defensively, with hedging positions in volatility and cash being the preferred destinations for investment exposure. During periods of short-lived corrections, this defensive positioning can become a drag on performance. That said, the rebound in equity markets, to this point, has lacked some bullish signals in breadth thrust indicators that are typically associated with healthy bull market moves. Time will tell whether these warning signs carry weight.
In March the portfolio continued its rotation from safe-haven assets to risk assets to take advantage of rebounding markets, driven by oversold conditions and extreme short-term sentiment. That rally was short lived as risk assets turned lower once again. Exposure was reduced to equities as losses accelerated.
With a successful test of the recent lows, major asset classes turned higher, and the portfolio began to tactically rotate towards risk assets again, with hedging positions in volatility, bonds and cash being reduced. Renewed weakness into the end of the quarter generated some bearish signals in several of our intermediate term equity trend indicators.
As global equities and fixed income assets trended lower, the portfolio rotated towards US equities and tactical trades in various commodities that benefited from strong inflationary fears.
2
Now, let’s take a look forward by first taking a quick look back. Over the three years ending August 31, the fund returned 7.00% per year, compared to 1.7% for the Morningstar Diversified Alternatives Index. While we are pleased with these results and have continued confidence in our strategy, after a great deal of consideration, we have decided that it is in the best interest of our shareholders to liquidate the fund. We intend to offer a similar strategy directly in client accounts. This process is already underway and we expect to have the fund’s liquidation completed by the end of October, 2018.
Your continued trust and interest in Topturn OneEighty Fund over the past three years is noted and greatly appreciated.
Warm regards,
Greg Stewart
Chief Investment Officer / Portfolio Manager
3
Past performance is not predictive of future performance. Investment results and principal value will fluctuate so that shares, when redeemed, may be worth more or less than their original cost. Current performance may be higher or lower than the performance data quoted. Performance data current to the most recent month-end are available by calling 1-888-261-2884.
An investor should consider the investment objectives, risks, charges and expenses of the Fund carefully before investing. The Fund’s prospectus contains this and other important information. To obtain a copy of the Fund’s prospectus please visit our website at www.topturnfunds.com or call 1-888-261-2884 and a copy will be sent to you free of charge. Please read the prospectus carefully before you invest. The Fund is distributed by Ultimus Fund Distributors, LLC.
The Letter to Shareholders seeks to describe some of the Adviser’s current opinions and views of the financial markets. Although the Adviser believes it has a reasonable basis for any opinions or views expressed, actual results may differ, sometimes significantly so, from those expected or expressed. The securities held by the Fund that are discussed in the Letter to Shareholders were held during the period covered by this Report. They do not comprise the entire investment portfolio of the Fund, may be sold at any time, and may no longer be held by the Fund. For a complete list of securities held by the Fund as of August 31, 2018, please see the Schedule of Investments section of the annual report. The opinions of the Adviser with respect to those securities may change at any time.
Statements in the Letter to Shareholders that reflect projections or expectations for future financial or economic performance of the Fund and the market in general and statements of the Fund’s plans and objectives for future operations are forward-looking statements. No assurance can be given that actual results or events will not differ materially from those projected, estimated, assumed, or anticipated in any such forward-looking statements. Important factors that could result in such differences, in addition to factors noted with such forward-looking statements, include, without limitation, general economic conditions, such as inflation, recession, and interest rates. Past performance is not a guarantee of future results.
4
Topturn OneEighty Fund
PERFORMANCE INFORMATION
August 31, 2018 (Unaudited)
Comparison of the Change in Value of a $10,000 Investment
in the Topturn OneEighty Fund versus the
Morningstar Diversified Alternative Total Return Index
Average Annual Total Returns (for periods ended August 31, 2018) | |||
1 Year | Since | ||
Topturn OneEighty Fund(a) | 6.38% | 6.96% | |
Morningstar Diversified Alternative Total Return Index | 1.36% | 1.68% | |
(a) | The Fund’s total returns do not reflect the deduction of taxes that a shareholder would pay on Fund distributions, if any, or the redemption of shares. |
(b) | The Fund commenced operations on September 1, 2015. |
5
Topturn OneEighty Fund
PORTFOLIO INFORMATION
August 31, 2018 (Unaudited)
Sector Diversification (% of Net Assets)
Top 10 Equity Holdings
Security Description | % of Net Assets |
iShares Core S&P 500® ETF | 16.3% |
iShares Core S&P Small-Cap ETF | 10.7% |
Invesco QQQ Trust Series 1 | 9.5% |
Vanguard Dividend Appreciation ETF | 7.6% |
iShares TIPS Bond ETF | 5.8% |
SPDR® Bloomberg Barclays High Yield Bond ETF | 4.4% |
iShares iBoxx $ Investment Grade Corporate Bond ETF | 4.3% |
SPDR® S&P 500® ETF Trust | 3.5% |
iShares 1-3 Year Treasury Bond ETF | 3.2% |
Invesco DB U.S. Dollar Index Bullish Fund | 3.0% |
6
Topturn OneEighty Fund | ||||||||
EXCHANGE-TRADED FUNDS — 96.4% | Shares | Value | ||||||
Commodities & Currencies — 11.9% | ||||||||
Invesco CurrencyShares Japanese Yen Trust (a) | 10,200 | $ | 878,118 | |||||
Invesco DB Agriculture Fund (a) | 25,300 | 431,618 | ||||||
Invesco DB U.S. Dollar Index Bullish Fund (a) | 35,400 | 891,726 | ||||||
United States Natural Gas Fund® LP (a) | 36,900 | 883,755 | ||||||
United States Oil Fund® LP (a) | 30,900 | 454,539 | ||||||
| 3,539,756 | ||||||||
Energy Limited Partnerships — 1.4% | ||||||||
JPMorgan Alerian MLP Index ETN | 15,100 | 420,837 | ||||||
REITS — 1.5% | ||||||||
Vanguard Real Estate ETF | 5,400 | 453,870 | ||||||
U.S. Fixed Income — 26.5% | ||||||||
iShares 1-3 Year Treasury Bond ETF | 11,300 | 941,742 | ||||||
iShares 20+ Year Treasury Bond ETF | 4,800 | 580,776 | ||||||
iShares 7-10 Year Treasury Bond ETF | 3,400 | 348,874 | ||||||
iShares Floating Rate Bond ETF | 15,000 | 765,900 | ||||||
iShares iBoxx $ Investment Grade Corporate Bond ETF | 11,200 | 1,292,928 | ||||||
iShares TIPS Bond ETF | 15,500 | 1,737,395 | ||||||
Schwab U.S. TIPS ETF | 10,000 | 546,400 | ||||||
SPDR® Bloomberg Barclays High Yield Bond ETF | 36,400 | 1,310,400 | ||||||
Vanguard Intermediate-Term Treasury ETF | 6,200 | 388,740 | ||||||
| 7,913,155 | ||||||||
U.S. Large Cap Equities — 44.4% | ||||||||
Invesco QQQ Trust Series 1 | 15,200 | 2,837,080 | ||||||
Invesco S&P 500® Equal Weight ETF | 3,400 | 364,174 | ||||||
iShares Core S&P 500® ETF | 16,600 | 4,854,504 | ||||||
iShares Edge MSCI Minimum Volatility USA ETF | 7,700 | 435,743 | ||||||
iShares Edge MSCI USA Momentum Factor ETF | 6,300 | 744,534 | ||||||
iShares Edge MSCI USA Quality Factor ETF | 4,900 | 439,726 | ||||||
iShares Edge MSCI USA Value Factor ETF | 2,700 | 238,977 | ||||||
SPDR® S&P 500® ETF Trust | 3,600 | 1,045,116 | ||||||
Vanguard Dividend Appreciation ETF | 20,800 | 2,274,688 | ||||||
| 13,234,542 | ||||||||
U.S. Small Cap Equities — 10.7% | ||||||||
iShares Core S&P Small-Cap ETF | 35,400 | 3,196,974 | ||||||
Total Exchange-Traded Funds (Cost $26,616,139) | $ | 28,759,134 | ||||||
7
Topturn OneEighty Fund | ||||||||
MONEY MARKET FUNDS — 3.7% | Shares | Value | ||||||
Fidelity Institutional Money Market Government Portfolio - Class I, 1.823% (b) (Cost $1,115,349) | 1,115,349 | $ | 1,115,349 | |||||
Total Investments at Value — 100.1% (Cost $27,731,488) | $ | 29,874,483 | ||||||
Liabilities in Excess of Other Assets — (0.1%) | (31,767 | ) | ||||||
Net Assets — 100.0% | $ | 29,842,716 | ||||||
(a) | Non-income producing. |
(b) | The rate shown is the 7-day effective yield as of August 31, 2018. |
See accompanying notes to financial statements.
8
Topturn OneEighty Fund | ||||
ASSETS | ||||
Investments in securities: | ||||
At cost | $ | 27,731,488 | ||
At value (Note 2) | $ | 29,874,483 | ||
Dividends receivable | 9,987 | |||
Other assets | 3,748 | |||
Total assets | 29,888,218 | |||
LIABILITIES | ||||
Payable to Adviser (Note 4) | 31,238 | |||
Payable to administrator (Note 4) | 7,270 | |||
Other accrued expenses | 6,994 | |||
Total liabilities | 45,502 | |||
NET ASSETS | $ | 29,842,716 | ||
NET ASSETS CONSIST OF: | ||||
Paid-in capital | $ | 27,397,102 | ||
Distributions in excess of net investment income | (55,607 | ) | ||
Accumulated net realized gains from investment transactions | 358,226 | |||
Net unrealized appreciation on investments | 2,142,995 | |||
NET ASSETS | $ | 29,842,716 | ||
Shares of beneficial interest outstanding (unlimited number of shares authorized, no par value) | 2,569,332 | |||
Net asset value, offering price and redemption price per share (Note 2) | $ | 11.61 | ||
See accompanying notes to financial statements. |
9
Topturn OneEighty Fund | ||||
INVESTMENT INCOME | ||||
Dividend income | $ | 514,748 | ||
EXPENSES | ||||
Investment advisory fees (Note 4) | 277,235 | |||
Professional fees | 39,911 | |||
Fund accounting fees (Note 4) | 32,769 | |||
Administration fees (Note 4) | 30,047 | |||
Compliance fees (Note 4) | 12,960 | |||
Transfer agent fees (Note 4) | 12,000 | |||
Trustees’ fees and expenses (Note 4) | 10,023 | |||
Custody and bank service fees | 6,947 | |||
Registration and filing fees | 5,452 | |||
Printing of shareholder reports | 3,761 | |||
Insurance expense | 2,641 | |||
Postage and supplies | 2,490 | |||
Other expenses | 12,422 | |||
Total expenses | 448,658 | |||
Previous investment advisory fee reductions recouped by the Adviser (Note 4) | 36,502 | |||
Net expenses | 485,160 | |||
NET INVESTMENT INCOME | 29,588 | |||
REALIZED AND UNREALIZED GAINS ON INVESTMENTS | ||||
Net realized gains from investment transactions | 779,371 | |||
Long-term capital gain distributions from regulated investment companies | 36,818 | |||
Net change in unrealized appreciation (depreciation) on investments | 774,086 | |||
NET REALIZED AND UNREALIZED GAINS ON INVESTMENTS | 1,590,275 | |||
NET INCREASE IN NET ASSETS RESULTING FROM OPERATIONS | $ | 1,619,863 | ||
See accompanying notes to financial statements. |
10
Topturn OneEighty Fund | ||||||||
| Year | Year | ||||||
FROM OPERATIONS | ||||||||
Net investment income | $ | 29,588 | $ | 10,485 | ||||
Net realized gains from investment transactions | 779,371 | 544,970 | ||||||
Long-term capital gain distributions from regulated investment companies | 36,818 | 5,329 | ||||||
Net change in unrealized appreciation (depreciation) on investments | 774,086 | 820,115 | ||||||
Net increase in net assets resulting from operations | 1,619,863 | 1,380,899 | ||||||
DISTRIBUTIONS TO SHAREHOLDERS (Note 2) | ||||||||
From net investment income | (47,112 | ) | (47,476 | ) | ||||
From net realized gains on investments | (992,878 | ) | (91,639 | ) | ||||
Decrease in net assets from distributions to shareholders | (1,039,990 | ) | (139,115 | ) | ||||
CAPITAL SHARE TRANSACTIONS | ||||||||
Proceeds from shares sold | 5,231,915 | 9,824,988 | ||||||
Net asset value of shares issued in reinvestment of distributions to shareholders | 1,039,990 | 139,114 | ||||||
Payments for shares redeemed | (1,737,627 | ) | (2,851,411 | ) | ||||
Net increase in net assets from capital share transactions | 4,534,278 | 7,112,691 | ||||||
TOTAL INCREASE IN NET ASSETS | 5,114,151 | 8,354,475 | ||||||
NET ASSETS | ||||||||
Beginning of year | 24,728,565 | 16,374,090 | ||||||
End of year | $ | 29,842,716 | $ | 24,728,565 | ||||
DISTRIBUTIONS IN EXCESS OF NET INVESTMENT INCOME | $ | (55,607 | ) | $ | (42,136 | ) | ||
CAPITAL SHARE ACTIVITY | ||||||||
Shares sold | 453,802 | 902,357 | ||||||
Shares reinvested | 91,953 | 13,161 | ||||||
Shares redeemed | (151,928 | ) | (266,074 | ) | ||||
Net increase in shares outstanding | 393,827 | 649,444 | ||||||
Shares outstanding at beginning of year | 2,175,505 | 1,526,061 | ||||||
Shares outstanding at end of year | 2,569,332 | 2,175,505 | ||||||
See accompanying notes to financial statements. |
11
Topturn OneEighty Fund | ||||||||||||
Per Share Data for a Share Outstanding Throughout Each Period | ||||||||||||
| Year | Year | Period | |||||||||
Net asset value at beginning of period | $ | 11.37 | $ | 10.73 | $ | 10.00 | ||||||
Income from investment operations: | ||||||||||||
Net investment income | 0.02 | 0.01 | 0.03 | |||||||||
Net realized and unrealized gains on investments | 0.69 | 0.72 | 0.73 | |||||||||
Total from investment operations | 0.71 | 0.73 | 0.76 | |||||||||
Less distributions: | ||||||||||||
From net investment income | (0.02 | ) | (0.03 | ) | (0.03 | ) | ||||||
From net realized gains on investments | (0.45 | ) | (0.06 | ) | (0.00 | )(b) | ||||||
Total distributions | (0.47 | ) | (0.09 | ) | (0.03 | ) | ||||||
Net asset value at end of period | $ | 11.61 | $ | 11.37 | $ | 10.73 | ||||||
Total return (c) | 6.38 | % | 6.85 | % | 7.65 | %(d) | ||||||
Net assets at end of period (000’s) | $ | 29,843 | $ | 24,729 | $ | 16,374 | ||||||
Ratios/supplementary data: | ||||||||||||
Ratio of total expenses to average net assets (e) | 1.75 | %(f) | 2.03 | % | 2.38 | %(g) | ||||||
Ratio of net expenses to average net assets (e) | 1.75 | %(h) | 1.75 | %(h) | 1.75 | %(g)(h) | ||||||
Ratio of net investment income to average net assets (i) | 0.11 | %(h) | 0.05 | %(h) | 0.32 | %(g)(h) | ||||||
Portfolio turnover rate | 453 | % | 303 | % | 261 | %(d) | ||||||
(a) | Represents the period from the commencement of operations (September 1, 2015) through August 31, 2016. |
(b) | Amount rounds to less than $0.01 per share. |
(c) | Total return is a measure of the change in value of an investment in the Fund over the periods covered, which assumes dividends or capital gains distributions, if any, are reinvested in shares of the Fund. The returns shown do not reflect the deduction of taxes a shareholder would pay on Fund distributions, if any, or the redemption of Fund shares. The total returns would have been lower if the Adviser had not reduced advisory fees. |
(d) | Not annualized. |
(e) | The ratios of expenses to average net assets do not reflect the Fund’s proportionate share of expenses of the underlying investment companies in which the Fund invests (Note 5). |
(f) | Ratio was determined including prior years’ advisory fee reductions recouped by the Adviser in the amount of 0.13% (Note 4). |
(g) | Annualized. |
(h) | Ratio was determined after advisory fee reductions or recoupments (Note 4). |
(i) | Recognition of net investment income by the Fund is affected by the timing of the declaration of dividends and distributions by the underlying investment companies in which the Fund invests. |
See accompanying notes to financial statements.
12
Topturn OneEighty Fund
NOTES TO FINANCIAL STATEMENTS
August 31, 2018
1. Organization
Topturn OneEighty Fund (the “Fund”) is a diversified series of Ultimus Managers Trust (the “Trust”), an open-end investment company established as an Ohio business trust under a Declaration of Trust dated February 28, 2012. Other series of the Trust are not incorporated in this report.
The investment objective of the Fund is to seek long-term capital appreciation.
2. Significant Accounting Policies
The following is a summary of the Fund’s significant accounting policies used in the preparation of its financial statements. These policies are in conformity with accounting principles generally accepted in the United States of America (“GAAP”). The Fund follows accounting and reporting guidance under Financial Accounting Standard Board Accounting Standards Codification Topic 946, “Financial Services – Investment Companies.”
Securities valuation – The Fund values its portfolio securities at market value as of the close of regular trading on the New York Stock Exchange (the “NYSE”) (normally 4:00 p.m. Eastern time) on each business day the NYSE is open for business. Exchange-traded funds (“ETFs”) are valued at the security’s last sale price on the primary exchange, if available, otherwise at the exchange’s most recently quoted mean price. Investments representing shares of other open-end investment companies, including money market funds, are valued at their net asset value (“NAV”) as reported by such companies. When using a quoted price and when the market is considered active, these securities will be classified as Level 1 within the fair value hierarchy (see below). In the event that market quotations are not readily available or are considered unreliable due to market or other events, the Fund values its securities and other assets at fair value in accordance with procedures established by and under the general supervision of the Board of Trustees (the “Board”) of the Trust. Under these procedures, the securities will be classified as Level 2 or 3 within the fair value hierarchy, depending on the inputs used. Unavailable or unreliable market quotes may be due to the following factors: a substantial bid-ask spread; infrequent sales resulting in stale prices; insufficient trading volume; small trade sizes; a temporary lapse in any reliable pricing source; and actions of the securities or futures markets, such as the suspension or limitation of trading. As a result, the prices of securities used to calculate the Fund’s NAV may differ from quoted or published prices for the same securities.
Fixed income securities, if any, are generally valued using prices provided by an independent pricing service approved by the Board. The independent pricing service will employ methodologies that they believe are appropriate, including actual market transactions, broker-dealer supplied valuations, matrix pricing, or other electronic data processing techniques. These techniques generally consider such factors as security prices, yields, maturities, call features, ratings, and developments relating to specific securities in arriving at valuations.
GAAP establishes a single authoritative definition of fair value, sets out a framework for measuring fair value, and requires additional disclosures about fair value measurements.
13
Topturn OneEighty Fund
NOTES TO FINANCIAL STATEMENTS (Continued)
Various inputs are used in determining the value of the Fund’s investments. These inputs are summarized in the three broad levels listed below:
● | Level 1 – quoted prices in active markets for identical securities |
● | Level 2 – other significant observable inputs |
● | Level 3 – significant unobservable inputs |
The inputs or methods used for valuing securities are not necessarily an indication of the risks associated with investing in those securities. The inputs used to measure fair value may fall into different levels of the fair value hierarchy. In such cases, for disclosure purposes, the level in the fair value hierarchy within which the fair value measurement falls in its entirety is determined based on the lowest level input that is significant to the fair value measurement.
The following is a summary of the inputs used to value the Fund’s investments as of August 31, 2018:
| Level 1 | Level 2 | Level 3 | Total | ||||||||||||
Exchange-Traded Funds | $ | 28,759,134 | $ | — | $ | — | $ | 28,759,134 | ||||||||
Money Market Funds | 1,115,349 | — | — | 1,115,349 | ||||||||||||
Total | $ | 29,874,483 | $ | — | $ | — | $ | 29,874,483 | ||||||||
As of August 31, 2018, the Fund did not have any transfers between Levels. In addition, the Fund did not have derivative instruments or any assets or liabilities that were measured at fair value on a recurring basis using significant unobservable inputs (Level 3) as of August 31, 2018. It is the Fund’s policy to recognize transfers between Levels at the end of the reporting period.
Share valuation – The NAV per share of the Fund is calculated daily by dividing the total value of the Fund’s assets, less liabilities, by the number of shares outstanding. The offering price and redemption price per share of the Fund is equal to the NAV per share.
Investment income – Dividend income and realized capital gain distributions are recorded on the ex-dividend date or as soon as the information is available (if after the ex-dividend date). Long-term capital gain distributions received from underlying funds are reclassed as a reduction of dividend income to realized capital gains. The actual tax character of income, realized capital gains and return of capital distributions from underlying funds may not be known until after the end of the fiscal year, at which time appropriate adjustments are recorded. Interest income is accrued as earned.
Investment transactions – Investment transactions are accounted for on the trade date. Realized gains and losses on investments sold are determined on a specific identification basis.
Common expenses – Common expenses of the Trust are allocated among the Fund and the other series of the Trust based on the relative net assets of each series or the nature of the services performed and the relative applicability to each series.
14
Topturn OneEighty Fund
NOTES TO FINANCIAL STATEMENTS (Continued)
Distributions to shareholders – The Fund will distribute to shareholders any net investment income dividends and net realized capital gains distributions at least once each year. The amount of such dividends and distributions are determined in accordance with federal income tax regulations, which may differ from GAAP. Dividends and distributions to shareholders are recorded on the ex-dividend date. The tax character of distributions paid by the Fund during the years ended August 31, 2018 and 2017 was as follows:
Year Ended | Ordinary | Long-Term | Total | |||||||||
8/31/2018 | $ | 519,775 | $ | 520,215 | $ | 1,039,990 | ||||||
8/31/2017 | $ | 121,974 | $ | 17,141 | $ | 139,115 | ||||||
Estimates – The preparation of financial statements in conformity with GAAP requires management to make estimates and assumptions that affect the reported amounts of assets and liabilities and disclosure of contingent assets and liabilities as of the date of the financial statements and the reported amounts of income and expenses during the reporting period. Actual results could differ from those estimates.
Federal income tax – The Fund has qualified and intends to continue to qualify as a regulated investment company under the Internal Revenue Code of 1986, as amended (the “Code”). Qualification generally will relieve the Fund of liability for federal income taxes to the extent 100% of its net investment income and net realized capital gains are distributed in accordance with the Code.
In order to avoid imposition of the excise tax applicable to regulated investment companies, it is also the Fund’s intention to declare as dividends in each calendar year at least 98% of its net investment income (earned during the calendar year) and 98.2% of its net realized capital gains (earned during the 12 months ended October 31) plus undistributed amounts from prior years.
The following information is computed on a tax basis for each item as of August 31, 2018:
Tax cost of portfolio investments | $ | 27,876,035 | ||
Gross unrealized appreciation | $ | 2,160,772 | ||
Gross unrealized depreciation | (162,324 | ) | ||
Net unrealized appreciation | 1,998,448 | |||
Undistributed ordinary income | 229,397 | |||
Undistributed long-term capital gains | 273,376 | |||
Accumulated capital and other losses | (55,607 | ) | ||
Accumulated earnings | $ | 2,445,614 |
15
Topturn OneEighty Fund
NOTES TO FINANCIAL STATEMENTS (Continued)
The difference between the federal income tax cost of portfolio investments and the financial statement cost of portfolio investments is due to certain timing differences in the recognition of capital gains or losses under income tax regulations and GAAP. These “book/tax” differences are temporary in nature and are primarily due to the tax deferral of losses on wash sales.
Qualified late year ordinary losses incurred after December 31, 2017 and within the taxable year are deemed to arise on the first day of the Fund’s following taxable year. For the year ended August 31, 2018, the Fund deferred $55,607 of late year ordinary losses to September 1, 2018 for federal income tax purposes.
For the year ended August 31, 2018, the following reclassification was made on the Statement of Assets and Liabilities as a result of permanent differences in the recognition of capital gains or losses under income tax regulations and GAAP:
Paid-in Capital | Distributions in excess of net investment income | Accumulated net realized gains from investment transactions |
$ — | $4,053 | $(4,053) |
Such reclassification, the result of permanent differences between financial statement and income tax reporting requirements, had no effect on the Fund’s net assets or NAV per share.
The Fund recognizes the tax benefits or expenses of uncertain tax positions only when the position is “more likely than not” to be sustained assuming examination by tax authorities. Management has reviewed the Fund’s tax positions for all open tax periods (periods ended August 31, 2016 through August 31, 2018) and has concluded that no provision for unrecognized tax benefits or expenses is required in these financial statements. The Fund identifies its major tax jurisdiction as U.S. Federal.
3. Investment Transactions
During the year ended August 31, 2018, cost of purchases and proceeds from sales of investment securities, other than short-term investments, were $121,675,811 and $118,601,801, respectively.
4. Transactions with Related Parties
INVESTMENT ADVISORY AGREEMENT
The Fund’s investments are managed by Topturn Fund Advisors, LLC (the “Adviser”) pursuant to the terms of an Investment Advisory Agreement. Under the Investment Advisory Agreement, the Fund pays the Adviser an investment advisory fee, computed and accrued daily and paid monthly, at the annual rate of 1.00% of its average daily net assets.
16
Topturn OneEighty Fund
NOTES TO FINANCIAL STATEMENTS (Continued)
Pursuant to an Expense Limitation Agreement (“ELA”), the Adviser has contractually agreed, until August 31, 2019, to reduce investment advisory fees and reimburse other expenses to the extent necessary to limit total annual operating expenses (exclusive of brokerage costs; taxes; interest; costs to organize the Fund; acquired fund fees and expenses; extraordinary expenses such as litigation and merger or reorganization costs; other expenses not incurred in the ordinary course of the Fund’s business; and amounts, if any, payable pursuant to a plan adopted in accordance with Rule 12b-1 under the Investment Company Act of 1940, as amended (the “1940 Act”)) to an amount not exceeding 1.75% of the Fund’s average daily net assets. During the year ended August 31, 2018, the Adviser did not reduce its advisory fee.
Under the terms of the ELA, investment advisory fee reductions and expense reimbursements by the Adviser are subject to repayment by the Fund for a period of three years after such fees and expenses were incurred, provided the repayments do not cause total annual operating expenses to exceed the lesser of (i) the expense limitation then in effect, if any, and (ii) the expense limitation in effect at the time the expenses to be repaid were incurred. During the year ended August 31, 2018, the Adviser recouped past fee reductions in the amount of $36,502. As of August 31, 2018, the Adviser may seek recoupment of investment advisory fee reductions totaling $90,993 no later than the dates stated below:
August 31, 2019 | $ | 36,011 | ||
August 31, 2020 | 54,982 | |||
Total | $ | 90,993 |
OTHER SERVICE PROVIDERS
Ultimus Fund Solutions, LLC (“Ultimus”) provides administration, fund accounting, compliance, and transfer agency services to the Fund. The Fund pays Ultimus fees in accordance with the agreements for such services. In addition, the Fund pays out-of-pocket expenses, including, but not limited to, postage, supplies, and costs of pricing the Fund’s portfolio securities.
Under the terms of a Distribution Agreement with the Trust, Ultimus Fund Distributors, LLC (the “Distributor”) serves as principal underwriter to the Fund. The Distributor is a wholly-owned subsidiary of Ultimus. The Distributor is compensated by the Adviser (not the Fund) for acting as principal underwriter.
Certain officers and a Trustee of the Trust are also officers of Ultimus and the Distributor and are not paid by the Fund for serving in such capacities.
TRUSTEE COMPENSATION
Effective August 1, 2018, each Trustee who is not an “interested person” of the Trust (“Independent Trustee”) receives a $1,300 annual retainer from the Fund, paid quarterly, except for the Board Chairperson who receives a $1,500 annual retainer from the Fund, paid quarterly. Each Independent Trustee also receives from the Fund a fee of $500 for each Board meeting attended plus reimbursement for travel and other meeting-related expenses. Prior to August 1, 2018, each Independent Trustee received a $1,000 annual retainer from the Fund,
17
Topturn OneEighty Fund
NOTES TO FINANCIAL STATEMENTS (Continued)
paid quarterly, except for the Board Chairperson who received a $1,200 annual retainer from the Fund, paid quarterly. Each Independent Trustee also received from the Fund a fee of $500 for each Board meeting attended plus reimbursement for travel and other meeting-related expenses.
PRINCIPAL HOLDER OF FUND SHARES
As of August 31, 2018, the following shareholder owned of record 5% or more of the outstanding shares of the Fund:
Name of Record Owner | % Ownership |
Charles Schwab & Company, Inc. (for the benefit of its customers) | 97% |
A beneficial owner of 25% or more of the Fund’s outstanding shares may be considered a controlling person. That shareholder’s vote could have a more significant effect on matters presented at a shareholders’ meeting.
5. Investments in Other Investment Companies
The Fund may invest a significant portion of its assets in shares of one or more investment companies, including ETFs. The Fund will incur additional indirect expenses due to acquired fund fees and expenses to the extent it invests in shares of other investment companies. ETFs issue their shares to authorized participants in return for a specific basket of securities. The authorized participants then sell the ETF’s shares on the secondary market. In other words, ETF shares are traded on a securities exchange based on their market value. There are certain risks associated with investments in ETFs. Investments in ETFs are subject to the risk that the ETF’s shares may trade at a premium (creating the risk that the Fund pays more than NAV for an ETF when making a purchase) or discount (creating the risk that the Fund receives less than NAV when selling an ETF) to the ETF’s NAV. Investments in ETFs are also subject to index-tracking risk because the total return generated by the securities will be reduced by transaction costs and expenses not incurred by the indices. Certain securities comprising the index tracked by an ETF may temporarily be unavailable, which may further impede the ETF’s ability to track their applicable index or match the index’s performance. Finally, ETF shares are also subject to the risks applicable to the underlying basket of securities. As of August 31, 2018, the Fund had 96.4% of the value of its net assets invested in shares of ETFs.
6. Contingencies and Commitments
The Fund indemnifies the Trust’s officers and Trustees for certain liabilities that might arise from their performance of their duties to the Fund. Additionally, in the normal course of business the Fund enters into contracts that contain a variety of representations and warranties and which provide general indemnifications. The Fund’s maximum exposure under these arrangements is unknown, as this would involve future claims that may be made against the Fund that have not yet occurred. However, based on experience, the Fund expects the risk of loss to be remote.
18
Topturn OneEighty Fund
NOTES TO FINANCIAL STATEMENTS (Continued)
7. Subsequent Events
The Fund is required to recognize in the financial statements the effects of all subsequent events that provide additional evidence about conditions that existed as of the date of the Statement of Assets and Liabilities. For non-recognized subsequent events that must be disclosed to keep the financial statements from being misleading, the Fund is required to disclose the nature of the event as well as an estimate of its financial effect, or a statement that such an estimate cannot be made. Management has evaluated subsequent events through the issuance of these financial statements and has noted no such events other than the following:
Liquidation of the Fund
At a meeting of the Trust’s Board of Trustees (the “Board”) held on September 17, 2018, the Board, in consultation with the Fund’s investment adviser, determined that it was in the best interest of the Fund and its shareholders to discontinue the Fund’s operations and to liquidate and close the Fund.
Effective September 21, 2018, the Fund terminated the public offering of its shares, and discontinued operations on October 26, 2018. All outstanding shareholder accounts on October 26, 2018 were closed and the proceeds of each account were sent to each shareholder’s address of record or to such other address as directed by the shareholder.
19
Topturn OneEighty Fund
REPORT OF INDEPENDENT REGISTERED
PUBLIC ACCOUNTING FIRM
To the Shareholders of Topturn OneEighty Fund and
Board of Trustees of Ultimus Managers Trust
Opinion on the Financial Statements
We have audited the accompanying statement of assets and liabilities, including the schedule of investments, of Topturn OneEighty Fund (the “Fund”), a series of Ultimus Managers Trust, as of August 31, 2018, and the related statement of operations for the year then ended, the statements of changes in net assets for each of the two years in the period then ended, including the related notes, and the financial highlights for each of the three periods in the period then ended (collectively referred to as the “financial statements”). In our opinion, the financial statements present fairly, in all material respects, the financial position of the Fund as of August 31, 2018, the results of its operations for the year then ended, the changes in its net assets for each of the two years in the period then ended, and the financial highlights for each of the three periods in the period then ended, in conformity with accounting principles generally accepted in the United States of America.
Basis for Opinion
These financial statements are the responsibility of the Fund’s management. Our responsibility is to express an opinion on the Fund’s financial statements based on our audits. We are a public accounting firm registered with the Public Company Accounting Oversight Board (United States) (“PCAOB”) and are required to be independent with respect to the Fund in accordance with the U.S. federal securities laws and the applicable rules and regulations of the Securities and Exchange Commission and the PCAOB.
We conducted our audits in accordance with the standards of the PCAOB. Those standards require that we plan and perform the audit to obtain reasonable assurance about whether the financial statements are free of material misstatement, whether due to error or fraud.
Our audits include performing procedures to assess the risks of material misstatement of the financial statements, whether due to error or fraud, and performing procedures that respond to those risks. Such procedures include examining, on a test basis, evidence regarding the amounts and disclosures in the financial statements and confirmation of securities owned as of August 31, 2018, by correspondence with the custodian. Our audits also included evaluating the accounting principles used and significant estimates made by management, as well as evaluating the overall presentation of the financial statements. We believe that our audits provide a reasonable basis for our opinion.
Emphasis of Matter
As discussed in Note 7 to the financial statements, the Board of Trustees of Ultimus Managers Trust approved a plan to liquidate the Fund. The liquidation is expected to take place on October 26, 2018. Our opinion is not modified with respect to this matter.
We have served as the Fund’s auditor since 2016.
COHEN & COMPANY, LTD.
Cleveland, Ohio
October 25, 2018
20
Topturn OneEighty Fund
ABOUT YOUR FUND’S EXPENSES (Unaudited)
We believe it is important for you to understand the impact of costs on your investment. As a shareholder of the Fund, you incur ongoing costs, including management fees and other operating expenses. The following examples are intended to help you understand your ongoing costs (in dollars) of investing in the Fund and to compare these costs with the ongoing costs of investing in other mutual funds.
A mutual fund’s ongoing costs are expressed as a percentage of its average net assets. This figure is known as the expense ratio. The expenses in the table below are based on an investment of $1,000 made at the beginning of the most recent period (March 1, 2018) and held until the end of the period (August 31, 2018).
The table below illustrates the Fund’s ongoing costs in two ways:
Actual fund return – This section helps you to estimate the actual expenses that you paid over the period. The “Ending Account Value” shown is derived from the Fund’s actual return, and the fourth column shows the dollar amount of operating expenses that would have been paid by an investor who started with $1,000 in the Fund. You may use the information here, together with the amount you invested, to estimate the expenses that you paid over the period.
To do so, simply divide your account value by $1,000 (for example, an $8,600 account value divided by $1,000 = 8.6), then multiply the result by the number given for the Fund under the heading “Expenses Paid During Period.”
Hypothetical 5% return – This section is intended to help you compare the Fund’s ongoing costs with those of other mutual funds. It assumes that the Fund had an annual return of 5% before expenses during the period shown, but that the expense ratio is unchanged. In this case, because the return used is not the Fund’s actual return, the results do not apply to your investment. The example is useful in making comparisons because the U.S. Securities and Exchange Commission (the “SEC”) requires all mutual funds to calculate expenses based on a 5% return. You can assess the Fund’s ongoing costs by comparing this hypothetical example with the hypothetical examples that appear in shareholder reports of other funds.
Note that expenses shown in the table are meant to highlight and help you compare ongoing costs only. The Fund does not charge transaction fees, such as purchase or redemption fees, nor does it carry a “sales load.”
The calculations assume no shares were bought or sold during the period. Your actual costs may have been higher or lower, depending on the amount of your investment and the timing of any purchases or redemptions.
More information about the Fund’s expenses can be found in this report. For additional information on operating expenses and other shareholder costs, please refer to the Fund’s prospectus.
21
Topturn OneEighty Fund
ABOUT YOUR FUND’S EXPENSES (Unaudited) (Continued)
| Beginning | Ending | Expense | Expenses |
Based on Actual Fund Return | $1,000.00 | $1,029.30 | 1.75% | $8.95 |
Based on Hypothetical 5% Return (before expenses) | $1,000.00 | $1,016.38 | 1.75% | $8.89 |
(a) | Annualized, based on the Fund’s most recent one-half year expenses. |
(b) | Expenses are equal to the Fund’s annualized expense ratio multiplied by the average account value over the period, multiplied by 184/365 (to reflect the one-half year period). |
OTHER INFORMATION (Unaudited)
A description of the policies and procedures that the Fund uses to vote proxies relating to portfolio securities is available without charge upon request by calling toll-free 1-888-261-2884, or on the SEC’s website at http://www.sec.gov. Information regarding how the Fund voted proxies relating to portfolio securities during the most recent 12-month period ended June 30 is available without charge upon request by calling toll-free 1-888-261-2884, or on the SEC’s website at http://www.sec.gov.
The Trust files a complete listing of the Fund’s portfolio holdings with the SEC as of the end of the first and third quarters of each fiscal year on Form N-Q. These filings are available upon request by calling 1-888-261-2884. Furthermore, you may obtain a copy of the filings on the SEC’s website at http://www.sec.gov. The Trust’s Forms N-Q may also be reviewed and copied at the SEC’s Public Reference Room in Washington, DC, and information on the operation of the Public Reference Room may be obtained by calling 1-800-SEC-0330.
OTHER FEDERAL TAX INFORMATION (Unaudited)
For the fiscal year ended August 31, 2018, the Fund designated $520,215 as long-term capital gain distributions subject to a maximum tax rate of 20%.
Qualified Dividend Income – The Fund designates 41.72% of its ordinary income dividends, or up to the maximum amount of such dividends allowable pursuant to the Internal Revenue Code, as qualified dividend income eligible for the reduced tax rate of 15%.
Dividends Received Deduction – Corporate shareholders are generally entitled to take the dividends received deduction on the portion of a Fund’s dividend distribution that qualifies under tax law. For the fiscal year ended August 31, 2018, 28.78% of ordinary income dividends qualifies for the corporate dividends received deduction.
22
Topturn OneEighty Fund
BOARD OF TRUSTEES AND EXECUTIVE OFFICERS
(Unaudited)
The Board has overall responsibility for management of the Trust’s affairs. The Trustees serve during the lifetime of the Trust and until its termination, or until death, resignation, retirement, or removal. The Trustees, in turn, elect the officers of the Fund to actively supervise its day-to-day operations. The officers have been elected for an annual term. Unless otherwise noted, each Trustee’s and officer’s address is 225 Pictoria Drive, Suite 450, Cincinnati, OH 45246. The following are the Trustees and executive officers of the Fund:
Name and | Length | Position(s) Held | Principal Occupation(s) | Number | Directorships |
Interested Trustees: | |||||
Robert G. Dorsey* Year of Birth: 1957 | Since February 2012 | Trustee (February 2012 to present)
President (June 2012 to October 2013) | Managing Director (1999 to present), Co-CEO (April 2018 to present), and President (1999 to April 2018) of Ultimus Fund Solutions, LLC and its subsidiaries (except as otherwise noted for FINRA-regulated broker dealer entities) | 19 | Interested Trustee of Capital Series Trust |
Independent Trustees: | |||||
Janine L. Cohen Year of Birth: 1952 | Since January 2016 | Trustee | Retired since 2013; Chief Financial Officer from 2004 to 2013 and Chief Compliance Officer from 2008 to 2013 at AER Advisors, Inc. | 19 | None |
David M. Deptula Year of Birth: 1958 | Since June 2012 | Trustee | Vice President of Legal and Special Projects at Dayton Freight Lines, Inc. since 2016; Vice President of Tax Treasury at The Standard Register Inc. (formerly The Standard Register Company) from 2011 to 2016 | 19 | None |
23
Topturn OneEighty Fund
BOARD OF TRUSTEES AND EXECUTIVE OFFICERS
(Unaudited) (Continued)
Name and | Length | Position(s) Held | Principal Occupation(s) | Number | Directorships |
Independent Trustees: (Continued) | |||||
John J. Discepoli Year of Birth: 1963 | Since June 2012 | Chairperson (May 2016 to present)
Trustee (June 2012 to present) | Owner of Discepoli Financial Planning, LLC (personal financial planning company) since 2004 | 19 | None |
* | Mr. Dorsey is considered an “interested person” of the Trust within the meaning of Section 2(a)(19) of the 1940 Act because of his relationship with the Trust’s administrator, transfer agent and distributor. |
Name and | Length | Position(s) Held | Principal Occupation(s) During Past 5 Years |
Executive Officers: | |||
David R. Carson Year of Birth: 1958 | Since 2013 | Principal Executive Officer (April 2017 to present)
President (October 2013 to present)
Vice President (April 2013 to October 2013) | Vice President and Director of Client Strategies of Ultimus Fund Solutions, LLC (2013 to present); President, Unified Series Trust (2016 to present); Chief Compliance Officer, FSI Low Beta Absolute Return Fund (2013 to 2016), The Huntington Funds (2005 to 2013), Huntington Strategy Shares (2012 to 2013), and Huntington Asset Advisors (2013); Vice President, Huntington National Bank (2001 to 2013) |
Todd E. Heim Year of Birth: 1967 | Since 2014 | Vice President (2014 to present) | Client Implementation Manager of Ultimus Managers Trust (2014 to present); Naval Flight Officer of United States Navy (1989 to present); Business Project Manager of Vantiv, Inc. (2013 to 2014) |
24
Topturn OneEighty Fund
BOARD OF TRUSTEES AND EXECUTIVE OFFICERS
(Unaudited) (Continued)
Name and | Length | Position(s) Held | Principal Occupation(s) During Past 5 Years |
Executive Officers: (Continued) | |||
Jennifer L. Leamer Year of Birth: 1976 | Since 2014 | Treasurer (October 2014 to present)
Assistant Treasurer (April 2014 to October 2014) | Vice President, Mutual Fund Controller of Ultimus Fund Solutions, LLC (2014 to present); Business Analyst of Ultimus Fund Solutions, LLC (2007 to 2014) |
Matthew J. Beck Year of Birth: 1988 | Since 2018 | Secretary (July 2018 to present) | Senior Attorney of Ultimus Fund Solutions, LLC (2018 to present); General Counsel of The Nottingham Company (2014 to 2018) |
Charles C. Black Year of Birth: 1979 | Since 2015 | Chief Compliance Office (January 2016 to present)
Assistant Chief Compliance Officer (April 2015 to January 2016) | Senior Compliance Officer of Ultimus Fund Solutions, LLC (2015 to present); Chief Compliance Officer of The Caldwell & Orkin Funds, Inc. (2016 to present); Senior Compliance Manager at Touchstone Mutual Funds (2013 to 2015); Senior Compliance Manager at Fund Evaluation Group (2011 to 2013) |
Additional information about members of the Board and executive officers is available in the Fund’s Statement of Additional Information (“SAI”). To obtain a free copy of the SAI, please call 1-800-261-2884.
25
Topturn OneEighty Fund
DISCLOSURE REGARDING APPROVAL OF INVESTMENT
ADVISORY AGREEMENT (Unaudited)
The Board of Trustees (the “Board”), including the Independent Trustees voting separately, has reviewed and approved the Fund’s Investment Advisory Agreement with the Adviser Fund Advisors, LLC (the “Adviser”) for an additional one-year term (the “Agreement”). The Board approved the Agreement at an in-person meeting held on April 22-23, 2018, at which all of the Trustees were present.
Legal counsel advised the Board during its deliberations. Additionally, the Board received and reviewed a substantial amount of information provided by the Adviser in response to requests of the Board and counsel. In considering whether to approve the Agreement and in reaching its conclusions with respect thereto, the Board reviewed and analyzed various factors that it determined were relevant to the Agreement, including the following factors.
The nature, extent, and quality of the services provided by the Adviser. In this regard, the Board reviewed the services being provided by the Adviser to the Fund including, without limitation, its investment advisory services since the Fund’s inception, the Adviser’s compliance procedures and practices, its efforts to promote the Fund and assist in its distribution, and its compliance program. After reviewing the foregoing information and further information in the Adviser Memorandum (e.g., descriptions of its business and Form ADV), the Board concluded that the quality, extent, and nature of the services provided by the Adviser were satisfactory and adequate for the Fund.
The investment performance of the Fund. In this regard, the Board compared the performance of the Fund with the performance of its benchmark index, custom peer group and related Morningstar category. The Board also considered the consistency of the Adviser’s management with the Fund’s investment objective and policies. The Board noted that, relative to its custom peer group and funds of similar size and structure in the Fund’s Morningstar category (Tactical Allocation funds under $50 million, No Load), the Fund had outperformed the custom peer group’s average and median returns for the one-year period and since inception, and had slightly underperformed the funds in its Morningstar category’s average and median returns for the one-year period and outperformed since inception. The Board indicated that the Adviser had satisfactorily explained its performance results for the Fund. Following discussion of the investment performance of the Fund, the Adviser’s experience in managing a mutual fund, its historical investment performance, and other factors, the Board concluded that the investment performance of the Fund has been satisfactory.
The costs of the services provided and profits realized by the Adviser and its affiliates from its relationship with the Fund. In this regard, the Board considered the Adviser’s staffing, personnel, and methods of operations; the education and experience of its personnel; compliance program, policies, and procedures; financial condition and the level of commitment to the Fund, and, generally, the Adviser’s advisory business; the asset level of the Fund; and the overall expenses of the Fund, including the advisory fee schedule with a 1% advisory fee. The Board considered the Adviser’s expense limitation agreement with the Fund, and considered the Adviser’s current and past fee reductions and expense
26
Topturn OneEighty Fund
DISCLOSURE REGARDING APPROVAL OF INVESTMENT
ADVISORY AGREEMENT (Unaudited) (Continued)
reimbursements for the Fund. The Board further took into account the Adviser’s commitment to continue the Adviser’s expense limitation agreement for the Fund until at least August 31, 2019.
The Board also considered potential benefits for the Adviser in managing the Fund, including promotion of the Adviser’s name and the potential for it to receive research, statistical, or other services from the Fund’s trades. The Board compared the Fund’s advisory fee and overall expense ratio to the average advisory fees and average expense ratios for its custom peer group and Morningstar category. The Board noted that the 1.00% advisory fee for the Fund was above the average and the median for the Fund’s custom peer group and was above the average and the median for the funds in its Morningstar category, and was equal to the 40th percentile for the funds in its Morningstar category. The Board further noted that the overall annual expense cap of 1.75% for the Fund was higher than the average and median for the Fund’s custom peer group and its Morningstar category, but was less than the 20th percentile for funds in its Morningstar category. In considering the comparison in fees and expense ratios between the Fund and other comparable funds, the Board looked at the differences in types of funds being compared, the style of investment management, the size of the Fund, and the nature of the investment strategies. The Board also compared the fees paid by the Fund to the fees paid by other accounts of the Adviser with similar strategies, and considered the similarities and differences of services received by such other accounts as compared to the service provided to the Fund. The Board noted that the fee structures applicable to the Adviser’s other clients were not indicative of any unreasonableness with respect to the advisory fees payable to the Fund. The Board also considered the Adviser’s commitment to limit the Fund’s expensed under the ELA. Following these comparisons and upon further consideration and discussion of the foregoing, the Board concluded that the advisory fee paid to the Adviser by the Fund is fair and reasonable.
The extent to which economies of scale would be realized as the Fund grows and whether advisory fee levels reflect these economies of scale for the benefit of the Fund’s investors. In this regard, the Board considered that the Fund’s fee arrangements with the Adviser involve both the advisory fee and the Adviser’s expense limitation agreement. The Board determined that while the advisory fee remained the same as asset levels increased, the shareholders of the Fund have experienced benefits from the Adviser’s expense limitation agreement and will continue to experience benefits from the Adviser’s expense limitation agreement until the Fund assets grow to a level where its expenses otherwise fall below the expense limit. Following further discussion of the Fund’s asset level, expectations for growth, and level of fees, the Board determined that the Fund’s fee arrangements with the Adviser would continue to provide benefits. The Board also determined that the fee arrangements were fair and reasonable in relation to the nature and quality of services being provided by the Adviser, and given the Fund’s projected asset levels for the next year.
Brokerage and portfolio transactions. In this regard, the Board considered the Adviser’s trading policies, procedures, and performance in seeking best execution for the Fund. The Board also considered the historical portfolio turnover rate for the Fund; the process by which evaluations are made of the overall reasonableness of commissions paid; the
27
Topturn OneEighty Fund
DISCLOSURE REGARDING APPROVAL OF INVESTMENT
ADVISORY AGREEMENT (Unaudited) (Continued)
method and basis for selecting and evaluating the broker-dealers used; and any anticipated allocation of portfolio business to persons affiliated with the Adviser. After further review and discussion, the Board determined that the Adviser’s practices regarding brokerage and portfolio transactions were satisfactory.
Possible conflicts of interest. In evaluating the possibility for conflicts of interest, the Board considered such matters as the experience and abilities of the advisory personnel assigned to the Fund, the Adviser’s process for allocating trades among its different clients, and the substance and administration of the Adviser’s Code of Ethics. Following further consideration and discussion, the Board found that the Adviser’s standards and practices relating to the identification and mitigation of potential conflicts of interests were satisfactory.
After full consideration of the above factors as well as other factors, the Board unanimously concluded that approval of the Agreement was in the best interests of the Fund and its shareholders.
28
This page intentionally left blank.
| Item 2. | Code of Ethics. |
As of the end of the period covered by this report, the registrant has adopted a code of ethics that applies to the registrant’s principal executive officer, principal financial officer, principal accounting officer or controller, or persons performing similar functions, regardless of whether these individuals are employed by the registrant or a third party. Pursuant to Item 13(a)(1), a copy of registrant’s code of ethics is filed as an exhibit to this Form N-CSR. During the period covered by this report, the code of ethics has not been amended, and the registrant has not granted any waivers, including implicit waivers, from the provisions of the code of ethics.
| Item 3. | Audit Committee Financial Expert. |
The registrant’s board of trustees has determined that the registrant has at least one audit committee financial expert serving on its audit committee. The name of the audit committee financial expert is David M. Deptula. Mr. Deptula is “independent” for purposes of this Item.
| Item 4. | Principal Accountant Fees and Services. |
| (a) | Audit Fees. The aggregate fees billed for professional services rendered by the principal accountant for the audit of the registrant’s annual financial statements or for services that are normally provided by the accountant in connection with statutory and regulatory filings or engagements were $91,500 and $168,000 with respect to the registrant’s fiscal years ended August 31, 2018 and August 31, 2017, respectively. |
| (b) | Audit-Related Fees. No fees were billed in the last fiscal year for assurance and related services by the principal accountant that are reasonably related to the performance of the audit of the registrant’s financial statements and are not reported under paragraph (a) of this Item. |
| (c) | Tax Fees. The aggregate fees billed for professional services rendered by the principal accountant for tax compliance, tax advice, and tax planning were $22,000 and $37,500 with respect to the registrant’s fiscal years ended August 31, 2018 and August 31, 2017, respectively. The services comprising these fees are the preparation of the registrant’s federal income and excise tax returns. |
| (d) | All Other Fees. No fees were billed in the last fiscal year for products and services provided by the principal accountant, other than the services reported in paragraphs (a) through (c) of this Item. |
| (e)(1) | The audit committee has not adopted pre-approval policies and procedures described in paragraph (c)(7) of Rule 2-01 of Regulation S-X. |
| (e)(2) | None of the services described in paragraph (b) through (d) of this Item were approved by the audit committee pursuant to paragraph (c)(7)(i)(C) of Rule 2-01 of Regulation S-X. |
| (f) | Less than 50% of hours expended on the principal accountant’s engagement to audit the registrant’s financial statements for the most recent fiscal year were attributed to work performed by persons other than the principal accountant’s full-time, permanent employees. |
| (g) | With respect to the fiscal years ended August 31, 2018 and August 31, 2017, aggregate non-audit fees of $22,000 and $37,500, respectively, were billed by the registrant’s principal accountant for services rendered to the registrant. |
| (h) | The registrant’s Committee of Independent Trustees of the Board of Trustees determined that the provision of non-audit services that were rendered to the registrant’s investment adviser (not including any sub-adviser whose role is primarily portfolio management and is subcontracted with or overseen by another investment adviser), and any entity controlling, controlled by, or under common control with the investment adviser that provides ongoing services to the registrant that were pre-approved pursuant to paragraph (c)(7)(ii) of Rule 2-01 of Regulation S-X is compatible with maintaining the principal accountant’s independence. |
| Item 5. | Audit Committee of Listed Registrants. |
Not applicable
| Item 6. | Schedule of Investments. |
| (a) | Not applicable [schedule filed with Item 1] |
| (b) | Not applicable |
| Item 7. | Disclosure of Proxy Voting Policies and Procedures for Closed-End Management Investment Companies. |
Not applicable
| Item 8. | Portfolio Managers of Closed-End Management Investment Companies. |
Not applicable
| Item 9. | Purchases of Equity Securities by Closed-End Management Investment Company and Affiliated Purchasers. |
Not applicable
| Item 10. | Submission of Matters to a Vote of Security Holders. |
The registrant’s Committee of Independent Trustees shall review shareholder recommendations to fill vacancies on the registrant’s board of trustees if such recommendations are submitted in writing, addressed to the Committee at the registrant’s offices and meet any minimum qualifications adopted by the Committee. The Committee may adopt, by resolution, a policy regarding its procedures for considering candidates for the board of trustees, including any recommended by shareholders.
| Item 11. | Controls and Procedures. |
(a) Based on their evaluation of the registrant’s disclosure controls and procedures (as defined in Rule 30a-3(c) under the Investment Company Act of 1940) as of a date within 90 days of the filing date of this report, the registrant’s principal executive officer and principal financial officer have concluded that such disclosure controls and procedures are reasonably designed and are operating effectively to ensure that material information relating to the registrant, including its consolidated subsidiaries, is made known to them by others within those entities, particularly during the period in which this report is being prepared, and that the information required in filings on Form N-CSR is recorded, processed, summarized, and reported on a timely basis.
(b) There were no changes in the registrant’s internal control over financial reporting (as defined in Rule 30a-3(d) under the Investment Company Act of 1940) that occurred during the second fiscal quarter of the period covered by this report that have materially affected, or are reasonably likely to materially affect, the registrant’s internal control over financial reporting.
| Item 12. | Disclosure of Securities Lending Activities for Closed-End Management Investment Companies. |
Not applicable
| Item 13. | Exhibits. |
File the exhibits listed below as part of this Form. Letter or number the exhibits in the sequence indicated.
(a)(1) Any code of ethics, or amendment thereto, that is the subject of the disclosure required by Item 2, to the extent that the registrant intends to satisfy the Item 2 requirements through filing of an exhibit: Attached hereto
(a)(2) A separate certification for each principal executive officer and principal financial officer of the registrant as required by Rule 30a-2(a) under the Act (17 CFR 270.30a-2(a)): Attached hereto
(a)(3) Any written solicitation to purchase securities under Rule 23c-1 under the Act (17 CFR 270.23c-1) sent or given during the period covered by the report by or on behalf of the registrant to 10 or more persons: Not applicable
(a)(4) Change in the registrant’s independent public accountants: Not applicable
(b) Certifications required by Rule 30a-2(b) under the Act (17 CFR 270.30a-2(b)): Attached hereto
| Exhibit 99.CODE ETH | Code of Ethics |
| Exhibit 99.CERT | Certifications required by Rule 30a-2(a) under the Act |
| Exhibit 99.906CERT | Certifications required by Rule 30a-2(b) under the Act |
SIGNATURES
Pursuant to the requirements of the Securities Exchange Act of 1934 and the Investment Company Act of 1940, the registrant has duly caused this report to be signed on its behalf by the undersigned, thereunto duly authorized.
| (Registrant) | Ultimus Managers Trust | ||
| By (Signature and Title)* | /s/ Matthew J. Beck | ||
| Matthew J. Beck, Secretary | |||
| Date | November 6, 2018 | ||
| Pursuant to the requirements of the Securities Exchange Act of 1934 and the Investment Company Act of 1940, this report has been signed below by the following persons on behalf of the registrant and in the capacities and on the dates indicated. | |||
| By (Signature and Title)* | /s/ David R. Carson | ||
| David R. Carson, Principal Executive Officer of Blue Current Global Dividend Fund, Alambic Mid Cap Growth Plus Fund, Alambic Mid Cap Value Plus Fund, Alambic Small Cap Value Plus Fund, Alambic Small Cap Growth Plus Fund, Topturn OneEighty Fund, and Marshfield Concentrated Opportunity Fund | |||
| Date | November 6, 2018 | ||
| By (Signature and Title)* | /s/ Jennifer L. Leamer | ||
| Jennifer L. Leamer, Treasurer and Principal Financial Officer | |||
| Date | November 6, 2018 | ||
| * | Print the name and title of each signing officer under his or her signature. |