| OMB APPROVAL |
OMB Number: 3235-0570
Expires: August 31, 2020
Estimated average burden hours per response: 20.6 |
UNITED STATES
SECURITIES AND EXCHANGE COMMISSION
Washington, D.C. 20549
FORM N-CSR
CERTIFIED SHAREHOLDER REPORT OF REGISTERED
MANAGEMENT INVESTMENT COMPANIES
| Investment Company Act file number | 811-22680 |
| Ultimus Managers Trust |
| (Exact name of registrant as specified in charter) |
| 225 Pictoria Drive, Suite 450 Cincinnati, Ohio | 45246 |
| (Address of principal executive offices) | (Zip code) |
Frank L. Newbauer, Esq.
| Ultimus Fund Solutions, LLC 225 Pictoria Drive, Suite 450 Cincinnati, Ohio 45246 |
| (Name and address of agent for service) |
| Registrant's telephone number, including area code: | (513) 587-3400 |
| Date of fiscal year end: | February 28 | |
| Date of reporting period: | February 28, 2018 |
Form N-CSR is to be used by management investment companies to file reports with the Commission not later than 10 days after the transmission to stockholders of any report that is required to be transmitted to stockholders under Rule 30e-1 under the Investment Company Act of 1940 (17 CFR 270.30e-1). The Commission may use the information provided on Form N-CSR in its regulatory, disclosure review, inspection, and policymaking roles.
A registrant is required to disclose the information specified by Form N-CSR, and the Commission will make this information public. A registrant is not required to respond to the collection of information contained in Form N-CSR unless the Form displays a currently valid Office of Management and Budget ("OMB") control number. Please direct comments concerning the accuracy of the information collection burden estimate and any suggestions for reducing the burden to the Secretary, Securities and Exchange Commission, 450 Fifth Street, NW, Washington, DC 20549-0609. The OMB has reviewed this collection of information under the clearance requirements of 44 U.S.C. § 3507.
| Item 1. | Reports to Stockholders. |

HVIA EQUITY FUND
INSTITUTIONAL CLASS (HVEIX)
Managed by
Hudson Valley Investment Advisors, Inc.
ANNUAL REPORT
February 28, 2018
HVIA EQUITY FUND | April 2018 |
The HVIA Equity Fund (“HVEIX” or the “Fund”) launched on October 3rd 2016. The Fund’s focus is on using a G.A.R.P. investment framework to determine suitable investments. This acronym is “Growth at a Reasonable Price” which focuses on investing in equities that are at a discount to their expected growth rate. In my experience of using this investment philosophy I’ve come to realize that the process does not fit neatly into months, quarters or years but is expected to outperform over the longer term.
Investment Environment
U.S. markets have benefitted from robust economic conditions from both the U.S. and on a worldwide basis. Economic buoyancy flowed through the economy accelerating the pace for both corporate revenues and earnings. Financial markets continued to operate with limited amounts of stress while credit remained available at historically low rates. Economic strength was seen in a number of government statistics and began to worry investors that inflation may be increasing. A perceived higher level of inflation had investors expecting the Federal Reserve to become more aggressive in trying to dampen any inflationary advance. The unwinding of quantitative easing is removing the Federal Reserve from dampening future economic concerns. Perceived inflation risks and the less accommodative Federal Reserve have created greater volatility to stock prices. Markets also absorbed the rise in trade tensions with China which also added to volatility.
The Trump administration has moved forward with a number of initiatives that met resistance when he first entered office. The widest ranging is the tax overhaul bill that was approved at year end 2017. The impact of the tax changes were met with skepticism but the initial impact is placing more money in the hands of consumers and incent companies to invest in capital equipment. These changes make financial engineering not as beneficial and should add to longer term growth and productivity. Another less focused on Trump initiative has been the removal of regulations which have helped remove business friction and has added to economic growth.
We believe that the economic position of the U.S. is continuing to point to an improvement in economic growth, a slightly higher level of inflation and improvement in productivity from historically low levels. We continue to believe that the U.S. will benefit from worldwide economic buoyancy. Based on continued improvement from various leading economic indicators we believe the economy will continue to show solid growth and will have a positive bias for equities.
HVIA focuses on changes to S&P 500 revenues and earnings as they are, in our opinion, the main driver of stocks over the longer term. The equity markets have seen acceleration in both revenues and earnings after a multiyear period in which they were relatively flat and multiple expansion was the main driver of equity prices. The current environment may have the economy outpacing the growth of stock prices. HVIA is continuing to anticipate higher earnings growth in 2018 which will face tougher compares in the back half of 2018. A last thought is that there has never been a U.S. economic recession with corporate profits staying buoyant which is the current environment.
1
Current Market and Economic Conditions
At February 28th, 2018, the current economy is strong. Bond market spreads between high yield and U.S. Treasuries provide insight into the level of perceived risk and remained at low levels. This muted risk level can also be inferred by the strength seen in both consumer and business confidence statistics. Earnings estimates have been seeing continued improvement. More important has been strong high single digit revenue growth which should continue throughout 2018.
President Trump has provided an unexpected shock to the markets. His adversarial tone regarding China and other trading partners has provided uncertainty and has hurt stock prices in the short term. We believe that earnings are the ultimate arbiter of stock prices. Over time we believe the continued strength in earnings should propel prices higher.
We look to the yield curve maintaining a positive slope which points to a continued expectation of economic improvement by fixed income markets. Commodity prices have remained strong but have seen some softness in recent months. Economic strength should continue as PMI’s, employment and confidence measures are all indicating continued strength.
Our stock selection is focused on improvement in economic vitality. In spite of the higher level of P/E ratios, many of our overweight sectors, such as Financials, are trading at lower P/E ratios than that of the overall market. Individual names have benefited from leverage that is seen from their business lines and changes in the overall economy.
Investment Philosophy and Performance
Since inception through February 28, 2018, HVEIX is up a cumulative 32.83% versus 29.21% for the S&P 500 total return. We are investing with an eye for the longer term, which means over 18 months. Our focus is on stocks that are showing improving asset utilization, margin expansion and the efficient use of capital. This can be summed up in an improving Return on Equity, (which is a measure of how well a company uses investments to generate earnings), but are trading at a discount to their historical growth or that of the industry group.
For the year ended February 28th, 2018, HVEIX is up 16.45% versus 17.10% for the S&P 500 total return. The following three positions had the largest impact on the Fund’s performance during the period.
a) | Red Hat Inc. RHT (+78.00%) |
b) | Adobe Systems Inc. ADBE (+76.72%) |
c) | Estee Lauder Companies EL (+69.22%) |
Since inception the Fund invested in stocks that are trading at a discount to their growth rate. We have been benefitting from investments made over 12 months ago. We continue to see leverage to economic growth which benefitted the stocks listed above. RHT is a building block software concern focused on the cloud computing area. The company is seeing growth from both current clients and the size of the contracts being signed. This was the top performer for the Fund and we continue to see upside in both revenues and earnings. As a main player in the cloud computing area it has a strong tailwind. ADBE has benefitted from its move to a subscription model that allows for a greater number of customers and a more consistent sales level. The company is well positioned for the growth in smartphones, the
2
increased need for data analytics and for technology based marketing. EL has transitioned from being a top cosmetics company in major department stores to one that has multiple distribution channels and leveraged its brand from traditional brick and mortar stores to having a robust exposure online. The goodwill that EL has in its brands provide a limited substitute opportunities for consumers. The continued expectation of a strong economic backdrop should help these companies outperform over the coming months.
The following positions had the greatest negative impact on the Fund’s performance since inception through February 28, 2018:
a) | Molson Coors Brewing Co TAP (-22.96%) |
b) | Kraft Heinz Co. KHC (-24.63%) |
c) | Celgene Corp CELG (-29.46%) |
The markets are re-assessing consumer staples names as the industry goes through structural change. The industry has seen a consolidation of shelf space and increased competition from store brands and greater acceptance of online shopping. In addition, younger consumers do not have brand loyalty and are more focused on quality versus brand name. TAP has enjoyed the benefit of cash flow growth and the benefits of consolidation. The trend over the past year has limited operating leverage and the proliferation of craft beer products taking share away from the traditional players. KHZ’s financial improvement from past strategic acquisitions has played out and the company is in need of another merger. In addition, the previously mentioned reduction of shelf space is a headwind over the shorter term. CELG is a premier company in the biotechnology space for a number of years with its main skin cancer drug being a multibillion dollar product for the company. Over the past year the company had two drugs under development get rejected by the FDA reducing the potential for additional revenues in future years. The company is still well positioned but is now more of a wait and see story that will not be removed until earnings are solidified and the pipeline issues are better addressed. We believe the company is still well positioned to take advantage of its current drug pipeline.
Sincerely,
Gustave J. Scacco
Portfolio Manager
Past performance is not predictive of future performance. Investment results and principal value will fluctuate so that shares, when redeemed, may be worth more or less than their original cost. Current performance may be higher or lower than the performance data quoted. Performance data current to the most recent month-end are available by calling 1-888-209-8710.
An investor should consider the investment objectives, risks, charges, and expenses of the Fund carefully before investing. The Fund’s prospectus contains this and other important information. To obtain a copy of the Fund’s prospectus please call 1-888-209-8710 and a copy will be sent to you free of charge. Please read the prospectus carefully before you invest. The Fund is distributed by Ultimus Fund Distributors, LLC.
3
The Letter to Shareholders seeks to describe some of the Adviser’s current opinions and views of the financial markets. Although the Adviser believes it has a reasonable basis for any opinions or views expressed, actual results may differ, sometimes significantly so, from those expected or expressed. The securities held by the Fund that are discussed in the Letter to Shareholders were held during the period covered by this Report. They do not comprise the entire investment portfolio of the Fund, may be sold at any time, and may no longer be held by the Fund. For a complete list of securities held by the Fund as of February 28, 2018, please see the Schedule of Investments section of the annual report. The opinions of the Fund’s adviser with respect to those securities may change at any time.
4
HVIA EQUITY FUND
PERFORMANCE INFORMATION
February 28, 2018 (Unaudited)
Comparison of the Change in Value of a $25,000 Investment in
HVIA Equity Fund - Institutional Class versus the S&P 500® Index
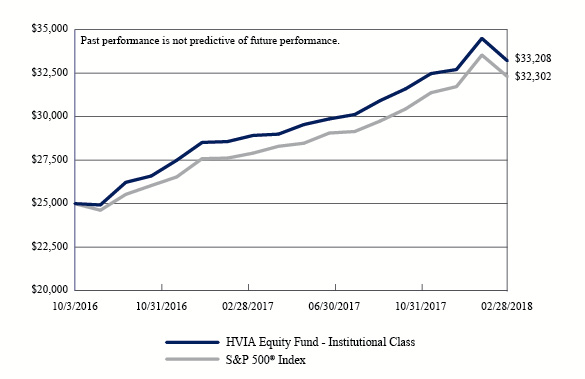
Average Annual Total Returns | |||
1 Year | Since | ||
HVIA Equity Fund - Institutional Class(a) | 16.45% | 22.38% | |
S&P 500® Index | 17.10% | 20.00% | |
(a) | The Fund’s total returns do not reflect the deduction of taxes a shareholder would pay on Fund distributions or the redemption of Fund shares. |
(b) | The Fund commenced operations on October 3, 2016. |
5
HVIA EQUITY FUND
PORTFOLIO INFORMATION
February 28, 2018 (Unaudited)
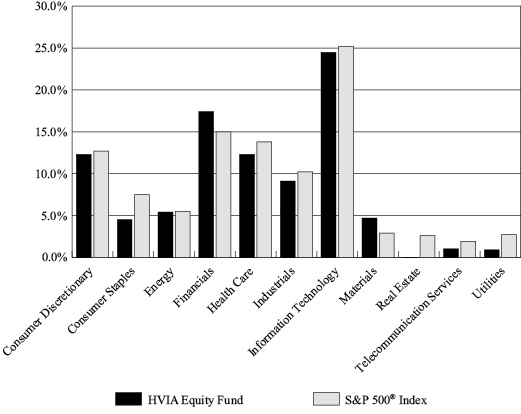
Sector Diversification (% of Net Assets)
Top 10 Equity Holdings
Security Description | % of |
Adobe Systems, Inc. | 3.6% |
JPMorgan Chase & Company | 3.4% |
Red Hat, Inc. | 3.4% |
Bank of America Corporation | 3.4% |
Alphabet, Inc. - Class C | 3.2% |
Apple, Inc. | 2.7% |
Facebook, Inc. - Class A | 2.6% |
Morgan Stanley | 2.6% |
Broadcom Ltd. | 2.5% |
Harris Corporation | 2.3% |
6
| HVIA EQUITY FUND SCHEDULE OF INVESTMENTS February 28, 2018 | ||||||||
| COMMON STOCKS — 92.1% | Shares | Value | ||||||
| Consumer Discretionary — 12.3% | ||||||||
| Auto Components — 0.9% | ||||||||
| Goodyear Tire & Rubber Company (The) | 4,950 | $ | 143,253 | |||||
| Hotels, Restaurants & Leisure — 3.7% | ||||||||
| Royal Caribbean Cruises Ltd. | 2,335 | 295,611 | ||||||
| Starbucks Corporation | 4,500 | 256,950 | ||||||
| 552,561 | ||||||||
| Household Durables — 1.7% | ||||||||
| Lennar Corporation - Class A | 4,400 | 248,952 | ||||||
| Lennar Corporation - Class B | 88 | 3,992 | ||||||
| 252,944 | ||||||||
| Media — 1.0% | ||||||||
| Walt Disney Company (The) | 1,400 | 144,424 | ||||||
| Multi-Line Retail — 0.9% | ||||||||
| Dollar General Corporation | 1,375 | 130,061 | ||||||
| Specialty Retail — 3.2% | ||||||||
AutoZone, Inc. (a) | 195 | 129,620 | ||||||
CarMax, Inc. (a) | 3,175 | 196,596 | ||||||
| Home Depot, Inc. (The) | 850 | 154,930 | ||||||
| 481,146 | ||||||||
| Textiles, Apparel & Luxury Goods — 0.9% | ||||||||
| NIKE, Inc. - Class B | 2,100 | 140,763 | ||||||
| Consumer Staples — 4.5% | ||||||||
| Beverages — 2.2% | ||||||||
| Molson Coors Brewing Company - Class B | 1,950 | 148,688 | ||||||
| PepsiCo, Inc. | 1,650 | 181,054 | ||||||
| 329,742 | ||||||||
| Food Products — 1.1% | ||||||||
| J.M. Smucker Company (The) | 700 | 88,410 | ||||||
| Kraft Heinz Company (The) | 1,200 | 80,460 | ||||||
| 168,870 | ||||||||
| Personal Products — 1.2% | ||||||||
| Estée Lauder Companies, Inc. (The) - Class A | 1,300 | 179,972 | ||||||
| Energy — 5.4% | ||||||||
| Oil, Gas & Consumable Fuels — 5.4% | ||||||||
| ConocoPhillips | 6,100 | 331,291 | ||||||
| Enbridge, Inc. | 4,206 | 133,835 | ||||||
7
| HVIA EQUITY FUND SCHEDULE OF INVESTMENTS (Continued) | ||||||||
| COMMON STOCKS — 92.1% (Continued) | Shares | Value | ||||||
| Energy — 5.4% (Continued) | ||||||||
| Oil, Gas & Consumable Fuels — 5.4% (Continued) | ||||||||
| Exxon Mobil Corporation | 2,300 | $ | 174,202 | |||||
| Williams Companies, Inc. (The) | 6,300 | 174,888 | ||||||
| 814,216 | ||||||||
| Financials — 17.4% | ||||||||
| Banks — 8.9% | ||||||||
| Bank of America Corporation | 15,800 | 507,180 | ||||||
| JPMorgan Chase & Company | 4,450 | 513,975 | ||||||
| SunTrust Banks, Inc. | 4,550 | 317,772 | ||||||
| 1,338,927 | ||||||||
| Capital Markets — 6.4% | ||||||||
| Bank of New York Mellon Corporation (The) | 4,400 | 250,932 | ||||||
| Goldman Sachs Group, Inc. (The) | 1,200 | 315,516 | ||||||
| Morgan Stanley | 7,000 | 392,140 | ||||||
| 958,588 | ||||||||
| Insurance — 2.1% | ||||||||
| Marsh & McLennan Companies, Inc. | 3,900 | 323,778 | ||||||
| Health Care — 12.3% | ||||||||
| Biotechnology — 1.5% | ||||||||
Celgene Corporation (a) | 2,550 | 222,156 | ||||||
| Health Care Equipment & Supplies — 2.8% | ||||||||
| Danaher Corporation | 3,400 | 332,452 | ||||||
| Medtronic plc | 1,200 | 95,868 | ||||||
| 428,320 | ||||||||
| Health Care Providers & Services — 2.0% | ||||||||
| UnitedHealth Group, Inc. | 1,350 | 305,316 | ||||||
| Life Sciences Tools & Services — 3.4% | ||||||||
| PerkinElmer, Inc. | 3,350 | 255,739 | ||||||
| Thermo Fisher Scientific, Inc. | 1,200 | 250,296 | ||||||
| 506,035 | ||||||||
| Pharmaceuticals — 2.6% | ||||||||
| Eli Lilly & Company | 2,300 | 177,146 | ||||||
| Pfizer, Inc. | 6,000 | 217,860 | ||||||
| 395,006 | ||||||||
| Industrials — 9.1% | ||||||||
| Air Freight & Logistics — 2.3% | ||||||||
| FedEx Corporation | 1,400 | 344,974 | ||||||
| Building Products — 1.3% | ||||||||
| Masco Corporation | 4,750 | 195,320 | ||||||
8
| HVIA EQUITY FUND SCHEDULE OF INVESTMENTS (Continued) | ||||||||
| COMMON STOCKS — 92.1% (Continued) | Shares | Value | ||||||
| Industrials — 9.1% (Continued) | ||||||||
| Machinery — 3.7% | ||||||||
| Lincoln Electric Holdings, Inc. | 3,850 | $ | 337,029 | |||||
| Oshkosh Corporation | 2,750 | 217,057 | ||||||
| 554,086 | ||||||||
| Road & Rail — 1.8% | ||||||||
| CSX Corporation | 5,250 | 282,030 | ||||||
| Information Technology — 24.5% | ||||||||
| Communications Equipment — 2.3% | ||||||||
| Harris Corporation | 2,250 | 351,338 | ||||||
| Internet Software & Services — 7.7% | ||||||||
Alphabet, Inc. - Class C (a) | 435 | 480,558 | ||||||
eBay, Inc. (a) | 6,600 | 282,876 | ||||||
Facebook, Inc. - Class A (a) | 2,200 | 392,304 | ||||||
| 1,155,738 | ||||||||
| Semiconductors & Semiconductor Equipment — 2.5% | ||||||||
| Broadcom Ltd. | 1,520 | 374,619 | ||||||
| Software — 9.3% | ||||||||
Adobe Systems, Inc. (a) | 2,600 | 543,738 | ||||||
| Microsoft Corporation | 3,650 | 342,260 | ||||||
Red Hat, Inc. (a) | 3,475 | 512,215 | ||||||
| 1,398,213 | ||||||||
| Technology Hardware, Storage & Peripherals — 2.7% | ||||||||
| Apple, Inc. | 2,250 | 400,770 | ||||||
| Materials — 4.7% | ||||||||
| Chemicals — 4.7% | ||||||||
| DowDuPont, Inc. | 2,850 | 200,355 | ||||||
| LyondellBasell Industries N.V. - Class A | 2,475 | 267,845 | ||||||
| Sherwin-Williams Company (The) | 595 | 238,940 | ||||||
| 707,140 | ||||||||
| Telecommunication Services — 1.0% | ||||||||
| Diversified Telecommunication Services — 1.0% | ||||||||
| Verizon Communications, Inc. | 3,200 | 152,768 | ||||||
| Utilities — 0.9% | ||||||||
| Electric Utilities — 0.6% | ||||||||
| Duke Energy Corporation | 1,200 | 90,408 | ||||||
9
| HVIA EQUITY FUND SCHEDULE OF INVESTMENTS (Continued) | ||||||||
| COMMON STOCKS — 92.1% (Continued) | Shares | Value | ||||||
| Utilities — 0.9% (Continued) | ||||||||
| Independent Power and Renewable Electricity Producers — 0.3% | ||||||||
| AES Corporation | 4,000 | $ | 43,480 | |||||
Total Investments at Value — 92.1% (Cost $10,692,667) | $ | 13,866,962 | ||||||
| Other Assets in Excess of Liabilities — 7.9% | 1,191,580 | |||||||
| Net Assets — 100.0% | $ | 15,058,542 | ||||||
| (a) | Non-income producing security. |
See accompanying notes to financial statements.
10
| HVIA EQUITY FUND STATEMENT OF ASSETS AND LIABILITIES February 28, 2018 | ||||
| ASSETS | ||||
| Investments in securities: | ||||
| At acquisition cost | $ | 10,692,667 | ||
| At value (Note 2) | $ | 13,866,962 | ||
| Cash (Note 2) | 1,101,262 | |||
| Receivable for capital shares sold | 74,100 | |||
| Receivable from Adviser (Note 4) | 6,604 | |||
| Dividends receivable | 19,927 | |||
| Other assets | 6,847 | |||
| TOTAL ASSETS | 15,075,702 | |||
| LIABILITIES | ||||
| Payable for capital shares redeemed | 1,600 | |||
| Payable to administrator (Note 4) | 7,110 | |||
| Other accrued expenses | 8,450 | |||
| TOTAL LIABILITIES | 17,160 | |||
| NET ASSETS | $ | 15,058,542 | ||
| NET ASSETS CONSIST OF: | ||||
| Paid-in capital | $ | 11,839,544 | ||
| Undistributed net investment income | 9,446 | |||
| Accumulated net realized gains from investment transactions | 35,296 | |||
| Net unrealized appreciation (depreciation) on: | ||||
| Investments | 3,174,295 | |||
| Translation of assets and liabilities in foreign currencies | (39 | ) | ||
| NET ASSETS | $ | 15,058,542 | ||
| PRICING OF INSTITUTIONAL SHARES (Note 1) | ||||
| Net assets applicable to Institutional Shares | $ | 15,058,542 | ||
| Shares of Institutional Shares outstanding (unlimited number of shares authorized, no par value) | 1,143,771 | |||
| Net asset value, offering price and redemption price per share (Note 2) | $ | 13.17 | ||
See accompanying notes to financial statements.
11
| HVIA EQUITY FUND STATEMENT OF OPERATIONS For the Year Ended February 28, 2018 | ||||
| INVESTMENT INCOME | ||||
| Dividend income | $ | 199,521 | ||
| Foreign withholding taxes on dividends | (1,631 | ) | ||
| TOTAL INVESTMENT INCOME | 197,890 | |||
| EXPENSES | ||||
| Investment advisory fees (Note 4) | 96,176 | |||
| Professional fees | 42,371 | |||
| Fund accounting fees (Note 4) | 26,552 | |||
| Administration fees (Note 4) | 25,250 | |||
| Transfer agent fees (Note 4) | 18,000 | |||
| Registration and filing fees | 14,859 | |||
| Compliance fees (Note 4) | 12,523 | |||
| Custody and bank service fees | 11,482 | |||
| Trustees' fees (Note 4) | 9,961 | |||
| Printing of shareholder reports | 4,483 | |||
| Postage and supplies | 1,934 | |||
| Insurance fees | 1,717 | |||
| Pricing fees | 1,235 | |||
| Other expenses | 7,661 | |||
| TOTAL EXPENSES | 274,204 | |||
| Less fee reductions and expense reimbursements by the Adviser (Note 4) | (145,536 | ) | ||
| NET EXPENSES | 128,668 | |||
| NET INVESTMENT INCOME | 69,222 | |||
| REALIZED AND UNREALIZED GAINS (LOSSES) ON INVESTMENTS AND FOREIGN CURRENCIES | ||||
| Net realized gains (losses) from: | ||||
| Investments | 57,478 | |||
| Foreign currency transactions | (195 | ) | ||
| Net change in unrealized appreciation (depreciation) on: | ||||
| Investments | 1,844,138 | |||
| Foreign currency translation | (39 | ) | ||
| NET REALIZED AND UNREALIZED GAINS ON INVESTMENTS AND FOREIGN CURRENCIES | 1,901,382 | |||
| NET INCREASE IN NET ASSETS FROM OPERATIONS | $ | 1,970,604 | ||
See accompanying notes to financial statements.
12
| HVIA EQUITY FUND STATEMENTS OF CHANGES IN NET ASSETS | ||||||||
| Year Ended February 28, 2018 | Period | |||||||
| FROM OPERATIONS | ||||||||
| Net investment income | $ | 69,222 | $ | 22,002 | ||||
| Net realized gains (losses) from: | ||||||||
| Investments | 57,478 | 12,844 | ||||||
| Foreign currency transactions | (195 | ) | — | |||||
| Net change in unrealized appreciation (depreciation) on: | ||||||||
| Investments | 1,844,138 | 1,330,157 | ||||||
| Foreign currency translation | (39 | ) | — | |||||
| Net increase in net assets resulting from operations | 1,970,604 | 1,365,003 | ||||||
| DISTRIBUTIONS TO SHAREHOLDERS (Note 2) | ||||||||
| From net investment income, Institutional Shares | (66,697 | ) | (14,803 | ) | ||||
| From net realized gains on investments, Institutional Shares | (35,109 | ) | — | |||||
| Decrease in net assets from distributions to shareholders | (101,806 | ) | (14,803 | ) | ||||
| CAPITAL SHARE TRANSACTIONS | ||||||||
| Institutional Shares | ||||||||
| Proceeds from shares sold | 2,701,090 | 10,308,817 | ||||||
| Net asset value of shares issued in reinvestment of distributions to shareholders | 54 | 1 | ||||||
| Payments for shares redeemed | (891,941 | ) | (278,477 | ) | ||||
| Net increase in Institutional Shares net assets from capital share transactions | 1,809,203 | 10,030,341 | ||||||
| TOTAL INCREASE IN NET ASSETS | 3,678,001 | 11,380,541 | ||||||
| NET ASSETS | ||||||||
| Beginning of period | 11,380,541 | — | ||||||
| End of period | $ | 15,058,542 | $ | 11,380,541 | ||||
| UNDISTRIBUTED NET INVESTMENT INCOME | $ | 9,446 | $ | 7,199 | ||||
| CAPITAL SHARE ACTIVITY | ||||||||
| Institutional Shares | ||||||||
| Shares sold | 215,889 | 1,026,182 | ||||||
| Shares reinvested | 4 | 0 | * | |||||
| Shares redeemed | (71,246 | ) | (27,058 | ) | ||||
| Net increase in shares outstanding | 144,647 | 999,124 | ||||||
| Shares outstanding at beginning of period | 999,124 | — | ||||||
| Shares outstanding at end of period | 1,143,771 | 999,124 | ||||||
| (a) | Represents the period from the commencement of operations (October 3, 2016) through February 28, 2017. |
| * | Shares round to less than 1. |
See accompanying notes to financial statements.
13
| HVIA EQUITY FUND INSTITUTIONAL SHARES FINANCIAL HIGHLIGHTS | ||||||||
| Per Share Data for a Share Outstanding Throughout Each Period | ||||||||
| Year Ended February 28, 2018 | Period | |||||||
| Net asset value at beginning of period | $ | 11.39 | $ | 10.00 | ||||
| Income from investment operations: | ||||||||
| Net investment income | 0.06 | 0.02 | ||||||
| Net realized and unrealized gains on investments and foreign currencies | 1.81 | 1.39 | ||||||
| Total from investment operations | 1.87 | 1.41 | ||||||
| Less distributions: | ||||||||
| From net investment income | (0.06 | ) | (0.02 | ) | ||||
| From net realized gains | (0.03 | ) | — | |||||
| Total distributions | (0.09 | ) | (0.02 | ) | ||||
| Net asset value at end of period | $ | 13.17 | $ | 11.39 | ||||
Total return (b) | 16.45 | % | 14.06 | %(c) | ||||
| Net assets at end of period (000's) | $ | 15,059 | $ | 11,381 | ||||
| Ratios/supplementary data: | ||||||||
| Ratio of total expenses to average net assets | 2.11 | % | 2.36 | %(d) | ||||
Ratio of net expenses to average net assets (e) | 0.99 | % | 0.99 | %(d) | ||||
Ratio of net investment income to average net assets (e) | 0.53 | % | 0.56 | %(d) | ||||
| Portfolio turnover rate | 4 | % | 2 | %(c) | ||||
| (a) | Represents the period from the commencement of operations (October 3, 2016) through February 28, 2017. |
| (b) | Total return is a measure of the change in value of an investment in the Fund over the periods covered. The returns shown do not reflect the deduction of taxes a shareholder would pay on Fund distributions, if any, or the redemption of Fund shares. The total returns would be lower if the Adviser had not reduced advisory fees and reimbursed expenses. |
| (c) | Not annualized. |
| (d) | Annualized. |
| (e) | Ratio was determined after advisory fee reductions and expense reimbursements (Note 4). |
See accompanying notes to financial statements.
14
HVIA EQUITY FUND
NOTES TO FINANCIAL STATEMENTS
February 28, 2018
1. Organization
HVIA Equity Fund (the “Fund”) is a diversified series of Ultimus Managers Trust (the “Trust”), an open-end investment company established as an Ohio business trust under a Declaration of Trust dated February 28, 2012. Other series of the Trust are not incorporated in this report.
The investment objective of the Fund is to seek growth at a reasonable price.
The Fund currently offers one class of shares: Institutional Class shares (sold without any sales loads or distribution fees and subject to a $25,000 initial investment requirement). As of February 28, 2018, the Investor Class shares (to be sold without any sales load, but subject to a distribution fee of up to 0.25% of the class’ average daily net assets and subject to a $2,500 initial investment requirement) are not currently offered. When both classes are offered, each share class will represent an ownership interest in the same investment portfolio.
2. Significant Accounting Policies
In October 2016, the U.S. Securities and Exchange Commission (the “SEC”) adopted amendments to Regulation S-X which impact financial statement presentation, particularly the presentation of derivative investments. The Fund has adopted these amendments, which were effective August 1, 2017, with these financial statements.
The following is a summary of the Fund’s significant accounting policies. The policies are in conformity with accounting principles generally accepted in the United States of America (“GAAP”). The Fund follows accounting and reporting guidance under Financial Accounting Standards Board Accounting Standards Codification Topic 946, “Financial Services – Investment Companies.”
Securities valuation – The Fund values its portfolio securities at market value as of the close of regular trading on the New York Stock Exchange (the “NYSE”) (normally 4:00 p.m. Eastern time) on each business day the NYSE is open for business. The Fund values its common stocks on the basis of the security’s last sale price on the security’s primary exchange, if available, otherwise at the exchange’s most recently quoted mean price. NASDAQ-listed securities are valued at the NASDAQ Official Closing Price. The Fund values securities traded in the over-the-counter market at the last sale price, if available, otherwise at the most recently quoted mean price. When using a quoted price and when the market is considered active, the security will be classified as Level 1 within the fair value hierarchy (see below). In the event that market quotations are not readily available or are considered unreliable due to market or other events, the Fund values its securities and other assets at fair value pursuant to procedures established by and under the direction of the Board of Trustees (the “Board”) of the Trust. Under these procedures, the securities will be classified as Level 2 or 3 within the fair value hierarchy, depending on the inputs used. Unavailable or unreliable market quotes may be due to the following factors: a substantial
15
HVIA EQUITY FUND |
bid-ask spread; infrequent sales resulting in stale prices; insufficient trading volume; small trade sizes; a temporary lapse in any reliable pricing source; and actions of the securities or futures markets, such as the suspension or limitation of trading. As a result, the prices of securities used to calculate the Fund’s net asset value (“NAV”) may differ from quoted or published prices for the same securities.
GAAP establishes a single authoritative definition of fair value, sets out a framework for measuring fair value, and requires additional disclosures about fair value measurements.
Various inputs are used in determining the value of the Fund’s investments. These inputs are summarized in the three broad levels listed below:
● | Level 1 – quoted prices in active markets for identical securities |
● | Level 2 – other significant observable inputs |
● | Level 3 – significant unobservable inputs |
The inputs or methods used for valuing securities are not necessarily an indication of the risks associated with investing in those securities. The inputs used to measure fair value may fall into different levels of the fair value hierarchy. In such cases, for disclosure purposes, the level in the fair value hierarchy within which the fair value measurement falls in its entirety is determined based on the lowest level input that is significant to the fair value measurement.
The following is a summary of the inputs used to value the Fund’s investments as of February 28, 2018:
| Level 1 | Level 2 | Level 3 | Total | |||||||||||||
| Common Stocks | $ | 13,866,962 | $ | — | $ | — | $ | 13,866,962 | ||||||||
Refer to the Fund’s Schedule of Investments for a listing of common stocks by industry type. As of February 28, 2018, the Fund did not have any transfers between Levels. In addition, the Fund did not have derivative instruments or any assets or liabilities that were measured at fair value on a recurring basis using significant unobservable inputs (Level 3) as of February 28, 2018. It is the Fund’s policy to recognize transfers between Levels at the end of the reporting period.
Foreign currency translation – Securities and other assets and liabilities denominated in or expected to settle in foreign currencies, if any, are translated into U.S. dollars based on exchange rates on the following basis:
A. | The fair values of investment securities and other assets and liabilities are translated as of the close of the NYSE each day. |
B. | Purchases and sales of investment securities and income and expenses are translated at the rate of exchange prevailing as of 4:00 p.m. Eastern Time on the respective date of such transactions. |
16
HVIA EQUITY FUND |
C. | The Fund does not isolate that portion of the results of operations caused by changes in foreign exchange rates on investments from those caused by changes in market prices of securities held. Such fluctuations are included with the net realized and unrealized gains or losses on investments. |
Reported net realized foreign exchange gains or losses arise from 1) purchases and sales of foreign currencies, 2) currency gains or losses realized between the trade and settlement dates on securities transactions and 3) the difference between the amounts of dividends and foreign withholding taxes recorded on the Fund’s books and the U.S. dollar equivalent of the amounts actually received or paid. Reported net unrealized foreign exchange gains and losses arise from changes in the value of assets and liabilities that result from changes in exchange rates.
Cash account – The Fund’s cash is held in a bank account with balances which may exceed the amount covered by federal deposit insurance. As of February 28, 2018, the cash balance reflected on the Statement of Assets and Liabilities represents the amount held in a deposit sweep account.
Share valuation – The NAV per share of each class of the Fund is calculated daily by dividing the total value of its assets attributable to that class, less liabilities attributable to that class, by the number of shares outstanding of that class. The offering price and redemption price per share of each class of the Fund is equal to the NAV per share of such class.
Investment income – Dividend income is recorded on the ex-dividend date. Interest income is accrued as earned. Withholding taxes on foreign dividends have been recorded in accordance with the Fund’s understanding of the applicable country’s tax rules and rates.
Investment transactions – Investment transactions are accounted for on the trade date. Realized gains and losses on investments sold are determined on a specific identification basis.
Common expenses – Common expenses of the Trust are allocated among the Fund and the other series of the Trust based on the relative net assets of each series or the nature of the services performed and the relative applicability to each series.
Distributions to shareholders – The Fund will distribute to shareholders any net investment income dividends and net realized capital gains distributions at least once each year. The amount of such dividends and distributions are determined in accordance with federal income tax regulations, which may differ from GAAP. Dividends and distributions to shareholders are recorded on the ex-dividend date. The tax character of distributions paid by the Fund to shareholders during the periods ended February 28, 2018 and 2017 was ordinary income.
Estimates – The preparation of financial statements in conformity with GAAP requires management to make estimates and assumptions which affect the reported amounts of assets and liabilities and disclosure of contingent assets and liabilities as of the date of the financial statements and the reported amounts of income and expenses during the reporting period. Actual results could differ from those estimates.
17
HVIA EQUITY FUND |
Federal income tax – The Fund has qualified and intends to continue to qualify as a regulated investment company under the Internal Revenue Code of 1986, as amended (the “Code”). Qualification generally will relieve the Fund of liability for federal income taxes to the extent 100% of its net investment income and net realized capital gains are distributed in accordance with the Code.
In order to avoid imposition of the excise tax applicable to regulated investment companies, it is also the Fund’s intention to declare as dividends in each calendar year at least 98% of its net investment income (earned during the calendar year) and 98.2% of its net realized capital gains (earned during the 12 months ended October 31) plus undistributed amounts from prior years.
The following information is computed on a tax basis for each item as of February 28, 2018:
| Tax cost of portfolio investments and foreign currencies | $ | 10,692,706 | ||
| Gross unrealized appreciation | $ | 3,489,016 | ||
| Gross unrealized depreciation | (314,760 | ) | ||
| Net unrealized appreciation | 3,174,256 | |||
| Undistributed ordinary income | 9,446 | |||
| Undistributed long-term capital gains | 35,296 | |||
| Accumulated earnings | $ | 3,218,998 |
For the year ended February 28, 2018, the Fund reclassified $195 of net realized losses on foreign currency transactions and $83 of overdistribution of short-term capital gains against accumulated net investment income on the Statement of Assets and Liabilities. These reclassifications are the result of permanent differences between the financial statement and income tax reporting requirements. They had no effect on the Fund’s net assets or its NAV per share.
The Fund recognizes the tax benefits or expenses of uncertain tax positions only when the position is “more likely than not” of being sustained assuming examination by tax authorities. Management has reviewed the Fund’s tax positions for all open tax periods (period ended February 28, 2017 and year ended February 28, 2018) and has concluded that no provision for unrecognized tax benefits or expenses is required in these financial statements. The Fund identifies its major tax jurisdiction as U.S. Federal.
3. Investment Transactions
During the year ended February 28, 2018, cost of purchases and proceeds from sales of investment securities, other than short-term investments, amounted to $1,798,307 and $470,617, respectively.
18
HVIA EQUITY FUND |
4. Transactions with Related Parties
INVESTMENT ADVISORY AGREEMENT
The Fund’s investments are managed by Hudson Valley Investment Advisors, Inc. (the “Adviser”) pursuant to the terms of an Investment Advisory Agreement. Under the Investment Advisory Agreement, the Fund pays the Adviser an investment advisory fee, computed and accrued daily and paid monthly, at the annual rate of 0.74% of its average daily net assets.
Pursuant to an Expense Limitation Agreement (“ELA”), the Adviser has contractually agreed, until July 1, 2019, to reduce investment advisory fees and reimburse other expenses to the extent necessary to limit total annual operating expenses (excluding brokerage costs, taxes, interest, costs to organize the Fund, acquired fund fees and expenses, extraordinary expenses such as litigation and merger or reorganization costs and other expenses not incurred in the ordinary course of the Fund’s business, and amounts, if any, payable pursuant to a plan adopted in accordance with Rule 12b-1 under the Investment Company Act of 1940, as amended (the “1940 Act”)) to an amount not exceeding 0.99% of average daily net assets of Institutional Class shares. Accordingly, the Adviser did not collect any of its investment advisory fees and, in addition, reimbursed other operating expenses totaling $49,360 during the year ended February 28, 2018.
Under the terms of the ELA, investment advisory fee reductions and expense reimbursements by the Adviser are subject to repayment by the Fund for a period of three years after such fees and expenses were incurred, provided the repayments do not cause total annual operating expenses to exceed: (i) the expense limitation then in effect, if any, and (ii) the expense limitation in effect at the time the expenses to be repaid were incurred. As of February 28, 2018, the Adviser may seek repayment of investment advisory fee reductions and expense reimbursements in the amount of $199,371 no later than the dates listed below:
February 29, 2020 | $ | 53,835 | ||
February 28, 2021 | $ | 145,536 |
OTHER SERVICE PROVIDERS
Ultimus Fund Solutions, LLC (“Ultimus”) provides administration, fund accounting, compliance and transfer agency services to the Fund. The Fund pays Ultimus fees in accordance with the agreements for such services. In addition, the Fund pays out-of-pocket expenses including, but not limited to, postage, supplies, and costs of pricing the Fund’s portfolio securities.
Under the terms of a Distribution Agreement with the Trust, Ultimus Fund Distributors, LLC (the “Distributor”) serves as the principal underwriter to the Fund. The Distributor is a wholly-owned subsidiary of Ultimus. The Distributor is compensated by the Adviser (not the Fund) for acting as principal underwriter.
19
HVIA EQUITY FUND |
Certain officers and a Trustee of the Trust are also officers of Ultimus and the Distributor.
TRUSTEE COMPENSATION
Each Trustee who is not an “interested person” of the Trust (“Independent Trustee”) receives a $1,000 annual retainer from the Fund, paid quarterly, except for the Board Chairperson who receives a $1,200 annual retainer from the Fund, paid quarterly. Each Independent Trustee also receives from the Fund a fee of $500 for each Board meeting attended plus reimbursement for travel and other meeting-related expenses.
PRINCIPAL HOLDER OF FUND SHARES
As of February 28, 2018, the following shareholder owned of record more than 5% of the outstanding shares of the Fund:
NAME OF RECORD OWNER | % Ownership |
Pershing, LLC (for the benefit of its customers) | 100% |
A beneficial owner of 25% or more of the Fund’s outstanding shares may be considered a controlling person. That shareholder’s vote could have a more significant effect on matters presented at a shareholders’ meeting.
5. Contingencies and Commitments
The Fund indemnifies the Trust’s officers and Trustees for certain liabilities that might arise from the performance of their duties to the Fund. Additionally, in the normal course of business the Fund enters into contracts that contain a variety of representations and warranties and which provide general indemnifications. The Fund’s maximum exposure under these arrangements is unknown, as this would involve future claims that may be made against the Fund that have not yet occurred. However, based on experience, the Fund expects the risk of loss to be remote.
6. Subsequent Events
The Fund is required to recognize in the financial statements the effects of all subsequent events that provide additional evidence about conditions that existed as of the date of the Statement of Assets and Liabilities. For non-recognized subsequent events that must be disclosed to keep the financial statements from being misleading, the Fund is required to disclose the nature of the event as well as an estimate of its financial effect, or a statement that such an estimate cannot be made. Management has evaluated subsequent events through the issuance of these financial statements and has noted no such events.
20
HVIA EQUITY FUND
REPORT OF INDEPENDENT REGISTERED
PUBLIC ACCOUNTING FIRM
To the Shareholders of HVIA Equity Fund and
Board of Trustees of Ultimus Managers Trust
Opinion on the Financial Statements
We have audited the accompanying statement of assets and liabilities, including the schedule of investments, of HVIA Equity Fund (the “Fund”), a series of Ultimus Managers Trust, as of February 28, 2018, and the related statement of operations for the year then ended and the statements of changes in net assets and the financial highlights for each of the two periods in the period then ended, including the related notes (collectively referred to as the “financial statements”). In our opinion, the financial statements present fairly, in all material respects, the financial position of the Fund as of February 28, 2018, the results of its operations for the year then ended and the changes in its net assets and the financial highlights for each of the two periods in the period then ended, in conformity with accounting principles generally accepted in the United States of America.
Basis for Opinion
These financial statements are the responsibility of the Fund’s management. Our responsibility is to express an opinion on the Fund’s financial statements based on our audits. We are a public accounting firm registered with the Public Company Accounting Oversight Board (United States) (“PCAOB”) and are required to be independent with respect to the Fund in accordance with the U.S. federal securities laws and the applicable rules and regulations of the Securities and Exchange Commission and the PCAOB.
We conducted our audits in accordance with the standards of the PCAOB. Those standards require that we plan and perform the audit to obtain reasonable assurance about whether the financial statements are free of material misstatement, whether due to error or fraud.
Our audits include performing procedures to assess the risks of material misstatement of the financial statements, whether due to error or fraud, and performing procedures that respond to those risks. Such procedures include examining, on a test basis, evidence regarding the amounts and disclosures in the financial statements and confirmation of securities owned as of February 28, 2018, by correspondence with the custodian. Our audits also included evaluating the accounting principles used and significant estimates made by management, as well as evaluating the overall presentation of the financial statements. We believe that our audits provide a reasonable basis for our opinion.
We have served as the Fund’s auditor since 2016.
COHEN & COMPANY, LTD.
Cleveland, Ohio
April 25, 2018
21
HVIA EQUITY FUND |
We believe it is important for you to understand the impact of costs on your investment. As a shareholder of the Fund, you incur ongoing costs, including management fees and other operating expenses. The following examples are intended to help you understand your ongoing costs (in dollars) of investing in the Fund and to compare these costs with the ongoing costs of investing in other mutual funds.
A mutual fund’s ongoing costs are expressed as a percentage of its average net assets. This figure is known as the expense ratio. The expenses in the table below are based on an investment of $1,000 made at the beginning of the most recent period (September 1, 2017) and held until the end of the period (February 28, 2018).
The table below illustrates the Fund’s ongoing costs in two ways:
Actual fund return – This section helps you to estimate the actual expenses that you paid over the period. The “Ending Account Value” shown is derived from the Fund’s actual return, and the fourth column shows the dollar amount of operating expenses that would have been paid by an investor who started with $1,000 in the Fund. You may use the information here, together with the amount you invested, to estimate the expenses that you paid over the period.
To do so, simply divide your account value by $1,000 (for example, an $8,600 account value divided by $1,000 = 8.6), then multiply the result by the number given for the Fund under the heading “Expenses Paid During Period.”
Hypothetical 5% return – This section is intended to help you compare the Fund’s ongoing costs with those of other mutual funds. It assumes that the Fund had an annual return of 5% before expenses during the period shown, but that the expense ratio is unchanged. In this case, because the return used is not the Fund’s actual return, the results do not apply to your investment. The example is useful in making comparisons because the SEC requires all mutual funds to calculate expenses based on a 5% return. You can assess the Fund’s ongoing costs by comparing this hypothetical example with the hypothetical examples that appear in shareholder reports of other funds.
Note that expenses shown in the table are meant to highlight and help you compare ongoing costs only. The Fund does not charge transaction fees, such as purchase or redemption fees, nor does it carry a “sales load.” The calculations assume no shares were bought or sold during the period. Your actual costs may have been higher or lower, depending on the amount of your investment and the timing of any purchases or redemptions.
More information about the Fund’s expenses can be found in this report. For additional information on operating expenses and other shareholder costs, please refer to the Fund’s prospectus.
22
HVIA EQUITY FUND |
Institutional Class | Beginning Account Value September 1, 2017 | Ending February 28, 2018 | Net Expense Ratio (a) | Expenses Period (b) |
Based on Actual Fund Return | $ 1,000.00 | $ 1,102.60 | 0.99% | $ 5.16 |
Based on Hypothetical 5% Return (before expenses) | $ 1,000.00 | $ 1,019.89 | 0.99% | $ 4.96 |
| (a) | Annualized, based on the Fund’s most recent one-half year expenses. |
| (b) | Expenses are equal to the Fund’s annualized net expense ratio multiplied by the average account value over the period, multiplied 181/365 (to reflect the one-half year period). |
23
HVIA EQUITY FUND |
A description of the policies and procedures that the Fund uses to vote proxies relating to portfolio securities is available without charge upon request by calling toll-free 1-888-209-8710, or on the SEC’s website at http://www.sec.gov. Information regarding how the Fund voted proxies relating to portfolio securities during the most recent 12-month period ended June 30 is available without charge upon request by calling toll-free 1-888-209-8710, or on the SEC’s website at http://www.sec.gov.
The Trust files a complete listing of portfolio holdings for the Fund with the SEC as of the end of the first and third quarters of each fiscal year on Form N-Q. These filings are available upon request by calling 1-888-209-8710. Furthermore, you may obtain a copy of the filings on the SEC’s website at http://www.sec.gov. The Trust’s Forms N-Q may also be reviewed and copied at the SEC’s Public Reference Room in Washington, DC, and information on the operation of the Public Reference Room may be obtained by calling 1-800-SEC-0330.
FEDERAL TAX INFORMATION (Unaudited)
Qualified Dividend Income – The Fund designates 100%, or up to the maximum amount of such dividends allowable pursuant to the Internal Revenue Code, as qualified dividend income eligible for the reduced tax rate of 15%.
Dividends Received Deduction – Corporate shareholders are generally entitled to take the dividends received deduction on the portion of the Fund’s dividend distribution that qualifies under tax law. For the Fund’s fiscal year 2018 ordinary income dividends, 100% qualifies for the corporate dividends received deduction.
24
HVIA EQUITY FUND |
The Board has overall responsibility for management of the Trust’s affairs. The Trustees serve during the lifetime of the Trust and until its termination, or until death, resignation, retirement, or removal. The Trustees, in turn, elect the officers of the Fund to actively supervise its day-to-day operations. The officers have been elected for an annual term. Unless otherwise noted, each Trustee’s and officer’s address is 225 Pictoria Drive, Suite 450, Cincinnati, Ohio 45246.
Name and | Length of Time Served | Position(s) | Principal Occupation(s) | Number of Funds in Trust Overseen by Trustee | Directorships of Public Companies Held by Trustee During Past 5 Years |
Interested Trustees: | |||||
Robert G. Dorsey* Year of Birth: 1957 | Since | Trustee (February 2012 to present) President (June 2012 to October 2013) | Chief Executive Officer and Managing Director of Ultimus Fund Solutions, LLC and Ultimus Fund Distributors, LLC (1999 to present) | 19 | None |
Independent Trustees: | |||||
Janine L. Cohen Year of Birth: 1952 | Since January | Trustee | Retired since 2013; Chief Financial Officer from 2004 to 2013 and Chief Compliance Officer from 2008 to 2013 at AER Advisors, Inc. | 19 | None |
David M. Deptula Year of Birth: 1958 | Since | Trustee | Vice President of Legal and Special Projects at Dayton Freight Lines, Inc. since 2016; Vice President of Tax Treasury at The Standard Register Inc. (formerly the Standard Register Company) from 2011 to 2016 | 19 | None |
John J. Discepoli Year of Birth: 1963 | Since | Chairman Trustee | Owner of Discepoli Financial Planning, LLC (personal financial planning company) since 2004 | 19 | None |
| * | Mr. Dorsey is considered an “interested person” of the Trust within the meaning of Section 2(a)(19) of the 1940 Act because of his relationship with the Trust’s administrator, transfer agent and distributor. |
25
HVIA EQUITY FUND |
Name and | Length of Time Served | Position(s) | Principal Occupation(s) During Past 5 Years |
Executive Officers: | |||
David R. Carson Year of Birth: 1958 | Since | Principal President (October 2013 to present) Vice President (April 2013 to October 2013) | Vice President and Director of Client Strategies of Ultimus Fund Solutions, LLC (2013 to present); President, Unified Series Trust (2016 to present); Chief Compliance Officer, FSI LBAR Fund (2013 to 2016), The Huntington Funds (2005 to 2013), Huntington Strategy Shares (2012 to 2013), and Huntington Asset Advisors (2013); Vice President, Huntington National Bank (2001 to 2013) |
Jennifer L. Leamer Year of Birth: 1976 | Since | Treasurer Assistant Treasurer (April 2014 to October 2014) | Vice President, Mutual Fund Controller of Ultimus Fund Solutions, LLC (2014 to present); Business Analyst of Ultimus Fund Solutions, LLC (2007 to 2014) |
Frank L. Newbauer Year of Birth: 1954 | Since | Secretary Assistant Secretary (April 2015 to July 2017) Secretary (February 2012 to April 2015) | Assistant Vice President of Ultimus Fund Solutions, LLC (2010 to present) |
Charles C. Black Year of Birth: 1979 | Since | Chief Compliance Officer (January 2016 to present) Assistant Chief Compliance Officer (April 2015 to January 2016) | Senior Compliance Officer of Ultimus Fund Solutions, LLC (2015 to present); Chief Compliance Officer of The Caldwell & Orkin Funds, Inc. (2016 to present); Senior Compliance Manager at Touchstone Mutual Funds (2013 to 2015); Senior Compliance Manager at Fund Evaluation Group (2011 to 2013) |
Additional information about members of the Board and executive officers is available in the Fund’s Statement of Additional Information (“SAI”). To obtain a free copy of the SAI, please call 1-888-209-8710.
26
This page intentionally left blank.
This page intentionally left blank.
This page intentionally left blank.

LADDER SELECT BOND FUND
INSTITUTIONAL CLASS (LSBIX)
Managed by
Ladder Capital Asset Management LLC
ANNUAL REPORT
February 28, 2018
LADDER SELECT BOND FUND | April 2018 |
Dear Ladder Select Bond Fund Shareholders,
For the annual period ended February 28th, 2018, the Ladder Select Bond Fund (the “Fund”) returned 2.30%. For the same period, the Fund’s benchmark, the Bloomberg Barclays Intermediate Government/Credit Bond Index (the “Benchmark”), returned 0.04%, resulting in the Fund outperforming the Benchmark by 2.26%. For the quarter ending February 28th, 2018, the Fund returned 0.30% compared to the Benchmark return of (1.34%), outperforming by 1.64%.
The Fund seeks to capitalize on the sector-specific knowledge of commercial real estate (“CRE”) and commercial mortgage-backed securities (“CMBS”) of its adviser, Ladder Capital Asset Management (“LCAM”), to select investments that satisfy the Fund’s investment objective of seeking a combination of current income and capital preservation.
Consistent with LCAM’s philosophy of seeking outperformance through deep sector expertise, the performance of the Fund was driven by two of the Fund’s larger holdings.
■ | JPMCC 2016-WPT D – This investment is secured by a highly diverse portfolio of 108 office properties with 417 tenant leases. A significant proportion of the tenants are rated investment grade. The floating rate investment grade security owned by the Fund is rated BBB by S&P and has a coupon of one-month dollar LIBOR +3.75%. Year end 2017 net cash flow for this investment is up approximately 5% versus the October 2016 underwritten net cash flow for the investment. |
■ | COMM 2013-WWP A2, B & C – These investments are secured by a Single Asset Single Borrower (“SASB”) New York City office which was recently recapitalized by the current equity owners and new partners. Goldman Sachs provided new debt financing, which was securitized in November of 2017. The Fund sold its positions in Class A2 and Class C during the recent quarter and realized significant excess spread returns on the sale of these positions. The Fund continues to own its position in the Class B security. |
The Fund’s exposure to fixed rate investments with average lives longer than five years such as HILT 2016-SFP A and COMM 2013-LC13 AM partially offset the Fund’s overall positive performance.
The Fund focused on minimizing its exposure to potential interest rate movements by primarily investing in securities with durations inside of five years and floating rate investments indexed to 1-Month USD Libor. The Fund ended the period with a portfolio comprised of 51.4% floating rate securities, 45.8% fixed rate securities, and 2.8% cash diversified amongst its 29 securities. To further mitigate the portfolio’s exposure to interest rate movements, the Fund employed hedging strategies using derivatives. At the end of the period, the Fund’s portfolio included short positions in 5-year interest rate swap futures contracts and 2-year Treasury futures contract.
1
Market Environment:
Over the Fund’s annual period the Treasury curve has flattened dramatically, and over the past quarter ended February 28th, 2018, Treasury yields have moved considerably higher. It is interesting to look at the relative interest rate moves across the Treasury curve over the past year. During this timeframe, the 3-month Treasury bill yield was 103 basis points higher, closing at 1.65%; the 2-year Treasury yield was 114 basis points higher, closing at 2.25%; the 5-year Treasury yield increased by 65 basis points, closing at 2.64%; the 10-year Treasury yield increased by 41 basis points, closing at 2.86%; and the 30-year Treasury yield increased by 6 basis points, closing at 3.12%. A number of factors contributed to this move higher in Treasury yields such as the end of U.S. Federal Reserve quantitative easing, tighter employment dynamics, increasing stock valuations and positive U.S. GDP figures. Recently the Federal Reserve Bank of Atlanta revised Q1 2018 GDP growth expectations to 2.5%. End of February, 2018 market expectations have Q1 2018 GDP estimates from a high of 3.8% (now-casting.com) down to 2.2% (tradingeconomics.com) with a medium of 2.9% (IHS Markit Survey Data), which is slightly stronger than the Q4 2017 GDP of 2.6%.
The CMBS investment grade credit curve flattened during the annual period, with on the run last cash flow AAAs tighter by 21 basis points and on the run BBB- bonds tighter by 55 basis points according to Deutsche Bank Research. Higher absolute yields in Q4 2017 and Q1 2018 contributed to increased investor demand and the tightening of CMBS new issue spreads. Yet, the market did continue to exhibit a defensive posture in regards to higher interest rates which also drove the investor bid for floating rate and shorter duration investments. For example, spreads on 2013 last cash flow AAA bonds, which LCAM looks at as an example of intermediate-duration performance, tightened by 20 basis points over the annual period.
The CMBS market during the first two months of 2018 is outpacing the prior year 2017 issuance by almost double. The increase in volume can be attributed to the implementation of “risk retention rules” via the Dodd-Frank Wall Street Reform and Consumer Protection Act in December of 2016, which created an uncertainty around CRE lending for securitization during Q4 2016 and Q1 2017. In the end, issuance for year end 2017 was a robust $95.3 billion, up 35% from the year earlier according to Commercial Mortgage Alert. The market concerns that “risk retention rules” would significantly decrease CMBS issuance during 2017 did not materialize.
Outlook:
Entering 2018, LCAM’s views have stayed consistent since the Fund’s inception: the Fund continues to be conservatively positioned in regards to credit exposure and hedged against rising interest rates via significant floating rate holdings, along with the maximum exposure allowed in Treasury and swap future hedges versus the Fund’s fixed rate holdings. In Q4 2017, substantial U.S. tax reform was passed and both the equity and debt markets subsequently responded. As mentioned in our mid-year letter, “We expect the 2nd half of 2017 to provide an increase in market volatility.” It took until the month of February 2018 for the markets to prove our outlook correct. The Fund was well-positioned as its portfolio
2
composition allowed it to perform well with the increased volatility and the move higher in Treasury rates. As stated above, the Fund ended the annual period with a return of 2.30% and an outperformance of the Fund’s Benchmark by 2.26%.
Consistent with its capital preservation objective, the Fund will continue its strategy of investing in CRE debt exhibiting strong fundamental credit metrics while focusing on relative value within each respective transaction’s capital structure. The Fund will also continue to be cautious with respect to higher Treasury interest rates by managing the portfolio’s interest rate exposure via a mix of shorter duration fixed rate investments, investments indexed to USD 1-Month LIBOR and hedging strategies using derivatives.
On behalf of everyone at Ladder Capital Asset Management, we thank you for investing with us. We look forward to the Fund’s continued success.
Sincerely,
|
|
Brian Harris | Craig Sedmak |
Principal Executive Officer and Portfolio Manager | Portfolio Manager |


Past performance is not predictive of future performance. Investment results and principal value will fluctuate so that shares, when redeemed, may be worth more or less than their original cost. Current performance may be higher or lower than the performance data quoted. Performance data current to the most recent month-end are available by calling 1-888-859-5867.
An investor should consider the investment objectives, risks, charges, and expenses of the Fund carefully before investing. The Fund’s prospectus contains this and other important information. To obtain a copy of the Fund’s prospectus please visit the Fund’s website at www.ladderfunds.com or call 1-888-859-5867 and a copy will be sent to you free of charge. Please read the prospectus carefully before you invest. The Fund is distributed by Ultimus Fund Distributors, LLC.
3
The Letter to Shareholders seeks to describe some of the Adviser’s current opinions and views of the financial markets. Although the Adviser believes it has a reasonable basis for any opinions or views expressed, actual results may differ, sometimes significantly so, from those expected or expressed. The securities held by the Fund that are discussed in the Letter to Shareholders were held during the period covered by this Report. They do not comprise the entire investment portfolio of the Fund, may be sold at any time, and may no longer be held by the Fund. For a complete list of securities held by the Fund as of February 28, 2018, please see the Schedule of Investments section of the annual report. The opinions of the Adviser with respect to those securities may change at any time.
Statements in the Letter to Shareholders that reflect projections or expectations for future financial or economic performance of the Fund and the market in general and statements of the Fund’s plans and objectives for future operations are forward-looking statements. No assurance can be given that actual results or events will not differ materially from those projected, estimated, assumed, or anticipated in any such forward-looking statements. Important factors that could result in such differences, in addition to factors noted with such forward-looking statements, include, without limitation, general economic conditions, such as inflation, recession, and interest rates. Past performance is not a guarantee of future results.
4
LADDER SELECT BOND FUND
PERFORMANCE INFORMATION
February 28, 2018 (Unaudited)
Comparison of the Change in Value of a $100,000 Investment in
Ladder Select Bond Fund - Institutional Class versus the
Bloomberg Barclays Intermediate Government/Credit Bond Index
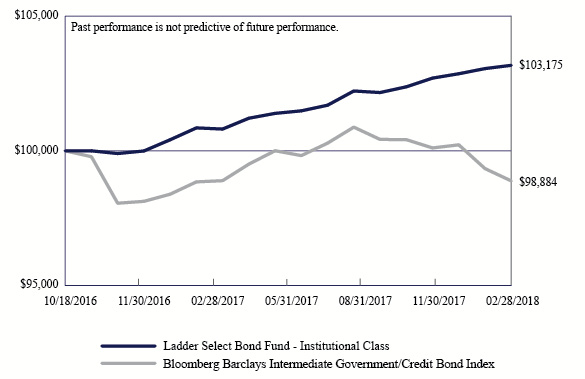
Average Annual Total Returns | |||
1 Year | Since | ||
Ladder Select Bond Fund - Institutional Class (a) | 2.30% | 2.32% | |
Bloomberg Barclays Intermediate Government/Credit Bond Index | 0.04% | (0.82%) | |
| (a) | The Fund’s total return does not reflect the deduction of taxes a shareholder would pay on Fund distributions or the redemption of Fund shares. |
| (b) | The Fund commenced operations on October 18, 2016. |
5
LADDER SELECT BOND FUND
PORTFOLIO INFORMATION
February 28, 2018 (Unaudited)
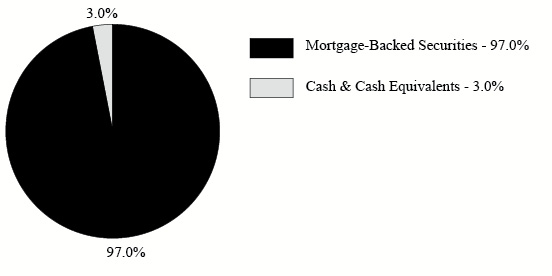
Portfolio Allocation (% of Net Assets)
Top 10 Long-Term Holdings
Security Description | % of |
JPMorgan Chase Commercial Mortgage Securities Trust, Series 2016-WPT, Class D, 144A, 5.309%(a), due 10/15/2033 | 13.5% |
GSCR Commercial Mortgage Trust, Series 2015-HULA, Class B, 144A, 3.859%(a), due 08/15/2032 | 9.7% |
Commercial Mortgage Trust, Series 2014-TWC, Class B, 144A, 3.152%(a), due 02/13/2032 | 7.7% |
Commercial Mortgage Trust, Series 2015-CR23, Class CMD, 144A, 3.684%(a), due 05/10/2048 | 7.3% |
Commercial Mortgage Trust, Series 2012-LC4, Class AM, 4.063%, due 12/10/2044 | 4.3% |
Progressive Residential Trust, Series 2016-SFR1, Class A, 144A, 3.056%(a), due 09/17/2033 | 4.1% |
Commercial Mortgage Trust, Series 2013-WWP, Class B, 144A 3.725%, due 03/10/2031 | 4.1% |
Wells Fargo Commercial Mortgage Trust, Series 2012-LC5, Class B, 4.142%, due 10/15/2045 | 3.9% |
VNO Mortgage Trust, Series 2013-PENN, Class B, 144A, 3.947%(a), due 12/13/2029 | 3.9% |
Commercial Mortgage Trust, Series 2015-CR23, Class CMB, 144A, 3.684%(a), due 05/10/2048 | 3.9% |
| (a) | Variable rate security. The rate shown is the effective interest rate as of February 28, 2018. |
6
| LADDER SELECT BOND FUND SCHEDULE OF INVESTMENTS February 28, 2018 | ||||||||||||||||
| MORTGAGE-BACKED SECURITIES — 97.0% | Coupon | Maturity | Par Value | Value | ||||||||||||
| Commercial — 97.0% | ||||||||||||||||
Aventura Mall Trust, Series 2013-AVM, Class B, 144A (a) | 3.742 | % | 12/05/32 | $ | 250,000 | $ | 253,537 | |||||||||
| Citigroup Commercial Mortgage Trust, Series 2016-SMPL, Class A, 144A | 2.228 | % | 09/10/31 | 51,000 | 49,374 | |||||||||||
Commercial Mortgage Asset Trust, IO, Series 1999-C2, Class X (a) | 1.224 | % | 11/17/32 | 1,523,058 | 3,586 | |||||||||||
| Commercial Mortgage Trust, Series 2013-WWP, Class B, 144A | 3.725 | % | 03/10/31 | 514,000 | 530,497 | |||||||||||
Commercial Mortgage Trust, Series 2014-TWC, Class B, 144A (1MO LIBOR + 160) (a) | 3.152 | % | 02/13/32 | 1,000,000 | 1,001,251 | |||||||||||
| Commercial Mortgage Trust, Series 2012-LC4, Class AM | 4.063 | % | 12/10/44 | 550,000 | 561,376 | |||||||||||
| Commercial Mortgage Trust, Series 2013-LC6, Class AM | 3.282 | % | 01/10/46 | 107,000 | 105,909 | |||||||||||
| Commercial Mortgage Trust, Series 2013-LC13, Class AM, 144A | 4.557 | % | 08/10/46 | 346,000 | 363,371 | |||||||||||
Commercial Mortgage Trust, Series 2015-CR23, Class CMB, | 3.684 | % | 05/10/48 | 500,000 | 502,720 | |||||||||||
Commercial Mortgage Trust, Series 2015-CR23, Class CMD, | 3.684 | % | 05/10/48 | 959,000 | 946,490 | |||||||||||
Credit Suisse Mortgage Trust, Series 2016-BDWN, Class A, 144A (1MO LIBOR + 290) (a) | 4.487 | % | 02/15/29 | 340,000 | 341,487 | |||||||||||
Goldman Sachs Mortgage Securities Trust, IO, Series 2005-ROCK, Class X1, 144A (a) | 0.207 | % | 05/03/32 | 14,016,000 | 248,113 | |||||||||||
GSCR Commercial Mortgage Trust, Series 2015-HULA, Class B, 144A (1MO LIBOR + 230) (a) | 3.859 | % | 08/15/32 | 1,260,000 | 1,264,704 | |||||||||||
| Hilton USA Trust, Series 2016-SFP, Class A, 144A | 2.828 | % | 11/05/35 | 500,000 | 486,071 | |||||||||||
Home Partners of America Trust, Series 2017-1, Class A, 144A | 2.373 | % | 07/17/34 | 236,712 | 237,245 | |||||||||||
Home Partners of America Trust, Series 2017-1, Class B, 144A | 2.906 | % | 07/17/34 | 300,000 | 303,689 | |||||||||||
JPMorgan Chase Commercial Mortgage Securities Trust, Series 2014-CBM, Class C, 144A (1MO LIBOR + 195) (a) | 3.509 | % | 10/15/29 | 250,000 | 250,000 | |||||||||||
7
| LADDER SELECT BOND FUND SCHEDULE OF INVESTMENTS (Continued) | ||||||||||||||||
| MORTGAGE-BACKED SECURITIES — 97.0% (Continued) | Coupon | Maturity | Par Value | Value | ||||||||||||
| Commercial — 97.0% (Continued) | ||||||||||||||||
JPMorgan Chase Commercial Mortgage Securities Trust, Series 2014-CBM, Class D, 144A (1MO LIBOR + 295) (a) | 4.059 | % | 10/15/29 | $ | 326,000 | $ | 326,000 | |||||||||
JPMorgan Chase Commercial Mortgage Securities Trust, Series 2014-FL4, Class B, 144A (1MO LIBOR + 175) (a) | 3.309 | % | 12/15/30 | 157,126 | 157,136 | |||||||||||
JPMorgan Chase Commercial Mortgage Securities Trust, Series 2016-WPT, Class D, 144A (1MO LIBOR + 375) (a) | 5.309 | % | 10/15/33 | 1,750,000 | 1,760,929 | |||||||||||
Morgan Stanley Capital Group Trust, Series 2016-SNR, Class A, 144A (a) | 3.348 | % | 11/15/34 | 500,000 | 489,451 | |||||||||||
Morgan Stanley Capital I Trust, IO, Series 2004-IQ8, Class X1, 144A (a) | 0.439 | % | 06/15/40 | 5,743,603 | 60,480 | |||||||||||
Progressive Residential Trust, Series 2016-SFR1, Class A, 144A (1MO LIBOR + 150) (a) | 3.056 | % | 09/17/33 | 530,906 | 534,475 | |||||||||||
Resource Capital Corporation Ltd., Series 2015-CRE4, Class A, 144A (1MO LIBOR + 140) (a)(b) | 2.956 | % | 08/15/32 | 4,928 | 4,927 | |||||||||||
Tharaldson Hotel Portfolio Trust, Series 2018-THL, Class D, 144A (1MO LIBOR + 200) (a) | 3.549 | % | 11/11/34 | 500,000 | 501,090 | |||||||||||
VNO Mortgage Trust, Series 2013-PENN, Class B, 144A (a) | 3.947 | % | 12/13/29 | 500,000 | 505,316 | |||||||||||
| Wells Fargo Commercial Mortgage Trust, Series 2012-LC5, Class B | 4.142 | % | 10/15/45 | 506,000 | 510,789 | |||||||||||
| WTC Depositor, LLC Trust, Series 2012-7WTC, Class A, 144A | 4.082 | % | 03/13/31 | 17,268 | 17,309 | |||||||||||
| WTC Depositor, LLC Trust, Series 2012-7WTC, Class B, 144A | 5.964 | % | 03/13/31 | 315,000 | 319,614 | |||||||||||
Total Mortgage-Backed Securities (Cost $12,709,741) | $ | 12,636,936 | ||||||||||||||
8
| LADDER SELECT BOND FUND SCHEDULE OF INVESTMENTS (Continued) | ||||||||
| MONEY MARKET FUNDS — 2.3% | Shares | Value | ||||||
Fidelity Institutional Money Market Government Portfolio - Class I, 1.26% (c) (Cost $297,949) | 297,949 | $ | 297,949 | |||||
Total Investments at Value — 99.3% (Cost $13,007,690) | $ | 12,934,885 | ||||||
| Other Assets in Excess of Liabilities — 0.7% | 88,997 | |||||||
| Net Assets — 100.0% | $ | 13,023,882 | ||||||
144A - | This security was purchased in a transaction exempt from registration in compliance with Rule 144A of the Securities Act of 1933. This security may be resold in transactions exempt from registration, normally to qualified institutional buyers. The total value of such securities is $11,455,276 as of February 28, 2018, representing 88.0% of net assets. |
IO - | Interest Only Strip. Par value shown is the notional value, not a true par value. |
LIBOR - | London interbank offered rate. |
| (a) | Variable rate security. Interest rate resets periodically. The rate shown is the effective interest rate as of February 28, 2018. For securities based on a published reference rate and spread, the reference rate and spread are indicated parenthetically. Certain variable rate securities are not based on a published reference rate and spread but are determined by the issuer or agent and are based on current market conditions. These securities, therefore, do not indicate a reference rate and spread. |
| (b) | Security had been determined to be illiquid by the investment adviser. Total value of illiquid securities held as of February 28, 2018, was $4,927, representing 0.0% (d) of net assets. |
| (c) | The rate shown is the 7-day effective yield as of February 28, 2018. |
| (d) | Percentage rounds to less than 0.1%. |
See accompanying notes to financial statements.
9
| LADDER SELECT BOND FUND SCHEDULE OF FUTURES CONTRACTS SOLD SHORT February 28, 2018 | ||||||||||||||
| FUTURES CONTRACTS SOLD SHORT | Contracts | Expiration Date | Notional Value | Value/Unrealized Appreciation | ||||||||||
| Swap Futures | ||||||||||||||
| Primary Fixed Rate 5-Year USD Deliverable Interest Rate Swap Future | 28 | 03/19/2018 | $ | 2,696,531 | $ | 58,205 | ||||||||
| Treasury Futures | ||||||||||||||
| 2-Year U.S. Treasury Note Future | 6 | 06/29/2018 | 1,274,813 | 637 | ||||||||||
| Total Futures Contracts Sold Short | $ | 3,971,344 | $ | 58,842 | ||||||||||
For the year ended February 28, 2018, the average notional amount of futures contracts sold short was ($2,420,006) (Note 5).
See accompanying notes to financial statements.
10
| LADDER SELECT BOND FUND STATEMENT OF ASSETS AND LIABILITIES February 28, 2018 | ||||
| ASSETS | ||||
| Investments in securities: | ||||
| At cost | $ | 13,007,690 | ||
| At value (Note 2) | $ | 12,934,885 | ||
| Margin deposits for futures contracts (Note 2) | 3,046 | |||
| Unrealized appreciation on futures contracts (Notes 2 and 5) | 58,842 | |||
| Dividends and interest receivable | 33,681 | |||
| Receivable from Adviser (Note 4) | 3,941 | |||
| Other assets | 3,488 | |||
| Total assets | 13,037,883 | |||
| LIABILITIES | ||||
| Payable for capital shares redeemed | 1,147 | |||
| Payable to administrator (Note 4) | 6,590 | |||
| Other accrued expenses | 6,264 | |||
| Total liabilities | 14,001 | |||
| NET ASSETS | $ | 13,023,882 | ||
| NET ASSETS CONSIST OF: | ||||
| Paid-in capital | $ | 13,014,215 | ||
| Undistributed net investment income | 1,861 | |||
| Accumulated net realized gains from investments and futures contracts | 21,769 | |||
| Net unrealized appreciation (depreciation) on: | ||||
| Investments | (72,805 | ) | ||
| Futures contracts | 58,842 | |||
| NET ASSETS | $ | 13,023,882 | ||
| PRICING OF INSTITUTIONAL SHARES (Note 1) | ||||
| Net assets applicable to Institutional Shares | $ | 13,023,882 | ||
| Shares of Institutional Shares outstanding (unlimited number of shares authorized, no par value) | 1,301,240 | |||
| Net asset value, offering price and redemption price per share (Note 2) | $ | 10.01 | ||
See accompanying notes to financial statements.
11
| LADDER SELECT BOND FUND STATEMENT OF OPERATIONS For the Year Ended February 28, 2018 | ||||
| INVESTMENT INCOME | ||||
| Interest | $ | 401,704 | ||
| Dividends | 4,263 | |||
| Total Income | 405,967 | |||
| EXPENSES | ||||
| Investment advisory fees (Note 4) | 92,998 | |||
| Professional fees | 45,047 | |||
| Fund accounting fees (Note 4) | 26,236 | |||
| Administration fees (Note 4) | 25,000 | |||
| Pricing fees | 18,039 | |||
| Compliance fees (Note 4) | 12,563 | |||
| Transfer agent fees (Note 4) | 12,000 | |||
| Trustees’ fees and expenses (Note 4) | 9,961 | |||
| Custody and bank service fees | 6,588 | |||
| Printing of shareholder reports | 6,287 | |||
| Registration and filing fees | 4,194 | |||
| Insurance expense | 1,717 | |||
| Postage and supplies | 1,509 | |||
| Other expenses | 7,419 | |||
| Total expenses | 269,558 | |||
| Less fee reductions and expense reimbursements by the Adviser (Note 4) | (151,760 | ) | ||
| Net expenses | 117,798 | |||
| NET INVESTMENT INCOME | 288,169 | |||
| REALIZED AND UNREALIZED GAINS (LOSSES) ON INVESTMENTS AND FUTURES CONTRACTS | ||||
| Net realized gains from: | ||||
| Investments | 26,679 | |||
| Futures contracts (Note 5) | 13,341 | |||
| Net change in unrealized appreciation (depreciation) on: | ||||
| Investments | (104,279 | ) | ||
| Futures contracts (Note 5) | 59,744 | |||
| NET REALIZED AND UNREALIZED LOSSES ON INVESTMENTS AND FUTURES CONTRACTS | (4,515 | ) | ||
| NET INCREASE IN NET ASSETS RESULTING FROM OPERATIONS | $ | 283,654 | ||
See accompanying notes to financial statements.
12
| LADDER SELECT BOND FUND STATEMENTS OF CHANGES IN NET ASSETS | ||||||||
| Year Ended February 28, 2018 | Period Ended February 28, | |||||||
| FROM OPERATIONS | ||||||||
| Net investment income | $ | 288,169 | $ | 42,440 | ||||
| Net realized gains from: | ||||||||
| Investments | 26,679 | 26,989 | ||||||
| Futures contracts (Note 5) | 13,341 | — | ||||||
| Net change in unrealized appreciation (depreciation) on: | ||||||||
| Investments | (104,279 | ) | 31,474 | |||||
| Futures contracts (Note 5) | 59,744 | (902 | ) | |||||
| Net increase in net assets from operations | 283,654 | 100,001 | ||||||
| DISTRIBUTIONS TO SHAREHOLDERS (Note 2) | ||||||||
| From net investment income, Institutional Shares | (296,787 | ) | (43,139 | ) | ||||
| From net realized gains, Institutional Shares | (34,062 | ) | — | |||||
| Decrease in net assets from distributions to shareholders | (330,849 | ) | (43,139 | ) | ||||
| FROM CAPITAL SHARE TRANSACTIONS | ||||||||
| Institutional Shares | ||||||||
| Proceeds from shares sold | 1,268,844 | 12,276,000 | ||||||
| Net asset value of shares issued in reinvestment of distributions to shareholders | 326,022 | 42,086 | ||||||
| Payments for shares redeemed | (898,737 | ) | — | |||||
| Net increase in Institutional Shares net assets from capital share transactions | 696,129 | 12,318,086 | ||||||
| TOTAL INCREASE IN NET ASSETS | 648,934 | 12,374,948 | ||||||
| NET ASSETS | ||||||||
| Beginning of period | 12,374,948 | — | ||||||
| End of period | $ | 13,023,882 | $ | 12,374,948 | ||||
| UNDISTRIBUTED NET INVESTMENT INCOME | $ | 1,861 | $ | 984 | ||||
| CAPITAL SHARE ACTIVITY | ||||||||
| Institutional Shares | ||||||||
| Shares sold | 126,229 | 1,227,655 | ||||||
| Shares reinvested | 32,483 | 4,199 | ||||||
| Shares redeemed | (89,326 | ) | — | |||||
| Net increase in shares outstanding | 69,386 | 1,231,854 | ||||||
| Shares outstanding at beginning of period | 1,231,854 | — | ||||||
| Shares outstanding at end of period | 1,301,240 | 1,231,854 | ||||||
| (a) | Represents the period from the commencement of operations (October 18, 2016) through February 28, 2017. |
See accompanying notes to financial statements.
13
| LADDER SELECT BOND FUND FINANCIAL HIGHLIGHTS | ||||||||
| Per Share Data for a Share Outstanding Throughout Each Period | ||||||||
| Year Ended February 28, 2018 | Period Ended February 28, | |||||||
| Net asset value at beginning of period | $ | 10.05 | $ | 10.00 | ||||
| Income (loss) from investment operations: | ||||||||
| Net investment income | 0.23 | 0.03 | ||||||
Net realized and unrealized gains (losses) on investments and futures contracts (b) | (0.00 | )(c) | 0.06 | |||||
| Total from investment operations | 0.23 | 0.09 | ||||||
| Less distributions: | ||||||||
| From net investment income | (0.24 | ) | (0.04 | ) | ||||
| From net realized gains | (0.03 | ) | — | |||||
| Total distributions | (0.27 | ) | (0.04 | ) | ||||
| Net asset value at end of period | $ | 10.01 | $ | 10.05 | ||||
Total return (d) | 2.30 | % | 0.85 | %(e) | ||||
| Net assets at end of period (000’s) | $ | 13,024 | $ | 12,375 | ||||
| Ratios/supplementary data: | ||||||||
| Ratio of total expenses to average net assets | 2.17 | % | 2.26 | %(f) | ||||
Ratio of net expenses to average net assets (g) | 0.95 | % | 0.95 | %(f) | ||||
Ratio of net investment income to average net assets (g) | 2.32 | % | 0.96 | %(f) | ||||
| Portfolio turnover rate | 85 | % | 91 | %(e) | ||||
| (a) | Represents the period from the commencement of operations (October 18, 2016) through February 28, 2017. |
| (b) | Net realized and unrealized gains (losses) on investments and futures contracts per share are balancing amounts necessary to reconcile with the aggregate gains and losses in the Statement of Operations due to share transactions for the periods covered. |
| (c) | Amount rounds to less than $0.01 per share. |
| (d) | Total return is a measure of the change in value of an investment in the Fund over the periods covered. The returns shown do not reflect the deduction of taxes a shareholder would pay on Fund distributions, if any, or the redemption of Fund shares. The total returns would be lower if the Adviser had not reduced advisory fees and reimbursed expenses. |
| (e) | Not annualized. |
| (f) | Annualized. |
| (g) | Ratio was determined after advisory fee reductions and expense reimbursements (Note 4). |
See accompanying notes to financial statements.
14
LADDER SELECT BOND FUND
NOTES TO FINANCIAL STATEMENTS
February 28, 2018
1. Organization
Ladder Select Bond Fund (the “Fund”) is a non-diversified series of Ultimus Managers Trust (the “Trust”), an open-end investment company established as an Ohio business trust under a Declaration of Trust dated February 28, 2012. Other series of the Trust are not incorporated in this report.
The investment objective of the Fund is to seek a combination of current income and capital preservation.
The Fund currently offers one class of shares: Institutional Class shares (sold without any sales loads or distribution fees and subject to a $100,000 initial investment requirement). As of February 28, 2018, the Advisor Class shares (to be sold without any sales loads, but subject to a distribution fee of up to 0.25% of the average daily net assets allocable to the Advisor Class and subject to a $2,500 initial investment requirement) are not currently offered. When both classes are offered, each share class will represent an ownership interest in the same investment portfolio.
2. Significant Accounting Policies
In October 2016, the U.S. Securities and Exchange Commission (the “SEC”) adopted amendments to Regulation S-X, which impact financial statement presentation, particularly the presentation of derivative investments. The Fund has adopted these amendments, which were effective August 1, 2017, with these financial statements.
The following is a summary of the Fund’s significant accounting policies. These policies are in conformity with accounting principles generally accepted in the United States of America (“GAAP”). The Fund follows accounting and reporting guidance under Financial Accounting Standards Board Accounting Standards Codification Topic 946, “Financial Services – Investment Companies.”
Securities and futures valuation – The Fund’s fixed income securities, including mortgage-backed securities, are typically valued using evaluated bid prices provided by an independent pricing service approved by the Trust’s Board of Trustees (the “Board”). The independent pricing service uses information with respect to transactions in bonds, quotations from bond dealers, market transactions in comparable securities, and various relationships between securities in determining these prices. The methods used by the independent pricing service and the quality of valuations are reviewed by Ladder Capital Asset Management LLC (the “Adviser”), under the general supervision of the Board. The Fund values its futures contracts at their last sale price as of the close of regular trading on the New York Stock Exchange. Prices for these futures contracts are monitored daily by the Adviser until the close of regular trading to determine if fair valuation is required. Securities for which market quotations are not readily available are valued at fair value as determined in good faith under procedures adopted by the Board.
15
LADDER SELECT BOND FUND |
GAAP establishes a single authoritative definition of fair value, sets out a framework for measuring fair value, and requires additional disclosures about fair value measurements.
Various inputs are used in determining the value of the Fund’s investments. These inputs are summarized in the three broad levels listed below:
● | Level 1 – quoted prices in active markets for identical securities |
● | Level 2 – other significant observable inputs |
● | Level 3 – significant unobservable inputs |
Fixed income securities, including mortgage-backed securities, held by the Fund are classified as Level 2 since values are based on prices provided by an independent pricing service that utilizes various “other significant observable inputs” including bid and ask quotations, prices of similar securities, and interest rates, among other factors. The inputs or methods used for valuing securities are not necessarily an indication of the risks associated with investing in those securities. The inputs used to measure fair value may fall into different levels of the fair value hierarchy. In such cases, for disclosure purposes, the level in the fair value hierarchy within which the fair value measurement falls in its entirety is determined based on the lowest level input that is significant to the fair value measurement.
The following is a summary of the inputs used to value the Fund’s investments and other financial instruments as of February 28, 2018:
| Level 1 | Level 2 | Level 3 | Total | |||||||||||||
| Investments in Securities | ||||||||||||||||
| Mortgage-Backed Securities | $ | — | $ | 12,636,936 | $ | — | $ | 12,636,936 | ||||||||
| Money Market Funds | 297,949 | — | — | 297,949 | ||||||||||||
| Total | $ | 297,949 | $ | 12,636,936 | $ | — | $ | 12,934,885 | ||||||||
| Other Financial Instruments | ||||||||||||||||
| Futures Contracts Sold Short | $ | 58,842 | $ | — | $ | — | $ | 58,842 | ||||||||
As of February 28, 2018, the Fund did not have any transfers between Levels. In addition, the Fund did not have any assets or liabilities that were measured at fair value on a recurring basis using significant unobservable inputs (Level 3) as of February 28, 2018. It is the Fund’s policy to recognize transfers between Levels at the end of the reporting period.
Share valuation – The net asset value (“NAV”) per share of each class of the Fund is calculated daily by dividing the total value of the assets attributable to that class, less liabilities attributable to that class, by the number of shares outstanding of that class. The offering price and redemption price per share of each class of the Fund is equal to the NAV per share of such class.
16
LADDER SELECT BOND FUND |
Investment income – Interest income is accrued as earned. Discounts and premiums on fixed income securities purchased are accreted or amortized using the effective interest method. Payments received from interest-only strips (“IOs”) are included in interest income on the Statement of Operations. Because no principal will be received at the maturing of an IO, adjustments are made to the cost of the security on a monthly basis until maturity. These adjustments are also included in interest income on the Statement of Operations. Realized gains and losses on paydowns of mortgage-backed securities are reflected in interest income on the Statement of Operations. Dividend income is recorded on the ex-dividend date.
Investment transactions – Investment transactions are accounted for on the trade date. Realized gains and losses on investments sold are determined on a specific identification basis.
Common expenses – Common expenses of the Trust are allocated among the Fund and other series of the Trust based on the relative net assets of each series or the nature of the services performed and the relative applicability to each series.
Distributions to shareholders – Dividends from net investment income are declared and paid monthly to shareholders. Net realized capital gains, if any, are distributed at least once each year. The amount of distributions from net investment income and net realized capital gains are determined in accordance with federal income tax regulations, which may differ from GAAP. Dividends and distributions to shareholders are recorded on the ex-dividend date. The tax character of the Fund’s distributions during the periods ended February 28, 2018 and 2017 was ordinary income. On March 29, 2018, the Fund paid an ordinary income dividend of $0.0213 per share to shareholders of record on March 28, 2018.
Futures contracts – The Fund uses futures contracts to gain exposure to or to hedge against changes in interest rates, credit spreads, and other risks. A futures contract represents a commitment for the future purchase or sale of an asset at a specified price on a specified date. When the Fund purchases or sells a futures contract, no price is paid to or received by the Fund. Instead, the Fund is required to deposit in a segregated asset account an amount of cash or qualifying securities currently ranging from 2% to 10% of the contract amount. This is called the “initial margin deposit.” Daily fluctuations in the fair value of the assets of the Fund are accumulated in an account each day. The total of this account is received or paid by the Fund when the position is closed. If market conditions move unexpectedly, the Fund may not achieve the anticipated benefits of the futures contracts and may realize a loss. For additional information, see Note 5.
Estimates – The preparation of financial statements in conformity with GAAP requires management to make estimates and assumptions that affect the reported amounts of assets and liabilities and disclosure of contingent assets and liabilities as of the date of the financial statements and the reported amounts of income and expenses during the reporting period. Actual results could differ from those estimates.
17
LADDER SELECT BOND FUND |
Federal income tax – The Fund has qualified and intends to continue to qualify as a regulated investment company under the Internal Revenue Code of 1986, as amended (the “Code”). Qualification generally will relieve the Fund of liability for federal income taxes to the extent 100% of its net investment income and net realized capital gains are distributed in accordance with the Code.
In order to avoid imposition of the excise tax applicable to regulated investment companies, it is also the Fund’s intention to declare as dividends in each calendar year at least 98% of its net investment income (earned during the calendar year) and 98.2% of its net realized capital gains (earned during the 12 months ended October 31) plus undistributed amounts from prior years.
The following information is computed on a tax basis for each item as of February 28, 2018:
| Tax cost of portfolio investments | $ | 13,007,690 | ||
| Gross unrealized appreciation | $ | 38,814 | ||
| Gross unrealized depreciation | (111,619 | ) | ||
| Net unrealized depreciation on investments | (72,805 | ) | ||
| Undistributed ordinary income | 39,697 | |||
| Undistributed long-term capital gains | 42,775 | |||
| Accumulated earnings | $ | 9,667 |
For the year ended February 28, 2018, the following reclassification was made as a result of permanent differences between the financial statement and income tax reporting requirements due to the tax treatment of paydown adjustments:
| Undistributed net investment income | $ | 9,495 | ||
| Accumulated net realized gains from investments and futures contracts | (9,495 | ) |
Such reclassification had no effect on the Fund’s net assets or NAV per share.
The Fund recognizes the tax benefits or expenses of uncertain tax positions only when the position is “more likely than not” to be sustained assuming examination by tax authorities. Management has reviewed the Fund’s tax positions for all open tax periods (periods ended February 28, 2017 and February 28, 2018) and has concluded that no provision for unrecognized tax benefits or expenses is required in these financial statements. The Fund identifies its major tax jurisdiction as U.S. Federal.
3. Investment Transactions
During the year ended February 28, 2018, cost of purchases and proceeds from sales of investment securities, other than short-term investments, were $12,420,369 and $10,165,207, respectively.
18
LADDER SELECT BOND FUND |
4. Transactions with Related Parties
INVESTMENT ADVISORY AGREEMENT
The Fund’s investments are managed by the Adviser pursuant to the terms of an Investment Advisory Agreement. Under the Investment Advisory Agreement, the Fund pays the Adviser an advisory fee, computed and accrued daily and paid monthly, at the annual rate of 0.75% of its average daily net assets.
Pursuant to an Expense Limitation Agreement (“ELA”) between the Fund and the Adviser, the Adviser has contractually agreed, until July 31, 2019, to reduce investment advisory fees and reimburse other operating expenses in order to limit total annual operating expenses (exclusive of portfolio transactions and other investment-related costs (including brokerage costs); taxes; interest; costs to organize the Fund; acquired fund fees and expenses; extraordinary expenses such as litigation and merger or reorganization costs and other expenses not incurred in the ordinary course of the Fund’s business; and amounts, if any, payable pursuant to a distribution or service plan adopted in accordance with Rule 12b-1 under the Investment Company Act of 1940, as amended (the “1940 Act”)) to an amount not exceeding 0.95% of average daily net assets of the applicable class of shares. Accordingly, the Adviser did not collect any of its advisory fees and, in addition, reimbursed other operating expenses totaling $58,762 during the year ended February 28, 2018.
Under the terms of the ELA, investment advisory fee reductions and expense reimbursements by the Adviser are subject to repayment by the Fund for a period of three years after such fees and expenses were incurred, provided that the repayments do not cause total annual operating expenses to exceed: (i) the expense limitation then in effect, if any; and (ii) the expense limitation in effect at the time the expenses to be repaid were incurred. As of February 28, 2018, the Adviser may seek repayment of investment advisory fee reductions and expense reimbursements in the amount of $209,976 no later than the dates listed below:
February 29, 2020 | $ | 58,216 | ||
February 28, 2021 | 151,760 |
OTHER SERVICE PROVIDERS
Ultimus Fund Solutions, LLC (“Ultimus”) provides administration, fund accounting, compliance and transfer agency services to the Fund. The Fund pays Ultimus fees in accordance with the agreements for such services. In addition, the Fund pays out-of-pocket expenses including, but not limited to, postage, supplies, and costs of pricing the Fund’s portfolio securities.
Under the terms of a Distribution Agreement with the Trust, Ultimus Fund Distributors, LLC (the “Distributor”) serves as principal underwriter to the Fund. The Distributor is a wholly-owned subsidiary of Ultimus. The Distributor is compensated by the Adviser (not the Fund) for acting as principal underwriter.
Certain officers and a Trustee of the Trust are also officers of Ultimus and the Distributor.
19
LADDER SELECT BOND FUND |
TRUSTEE COMPENSATION
Each Trustee who is not an “interested person” of the Trust (“Independent Trustee”) receives a $1,000 annual retainer from the Fund, paid quarterly, except for the Board Chairperson who receives a $1,200 annual retainer from the Fund, paid quarterly. Each Independent Trustee also receives from the Fund a fee of $500 for each Board meeting attended plus reimbursement for travel and other meeting-related expenses.
PRINCIPAL HOLDERS OF FUND SHARES
As of February 28, 2018, the following shareholders owned of record 5% or more of the outstanding shares of the Fund:
Name of Record Owner | % Ownership |
Ladder Capital Finance Portfolio II | 79% |
TD Ameritrade, Inc. (for the benefit of its clients) | 7% |
A beneficial owner of 25% or more of the Fund’s outstanding shares may be considered a controlling person. That shareholders’ vote could have a more significant effect on matters presented at a shareholders’ meeting.
5. Derivatives Transactions
The Fund’s positions in derivative instruments as of Feburary 28, 2018 are recorded in the following location in the Statement of Assets and Liabilities:
Derivative Investment Type | Risk | Location |
Futures contracts sold short | Interest Rate | Unrealized appreciation on futures contracts |
The Fund’s transactions in derivative instruments during the year ended February 28, 2018 are recorded in the following location in the Statement of Operations:
Derivative Investment Type | Risk | Location |
Futures contracts sold short | Interest Rate | Net change in unrealized appreciation (depreciation) on futures contracts |
In the ordinary course of business, the Fund may enter into transactions subject to enforceable netting agreements or other similar arrangements (“netting agreements”). Generally, the right to offset in netting agreements allows the Fund to offset any exposure to a specific counterparty with any collateral received or delivered to that counterparty based on the terms of the agreements. Generally, the Fund manages its cash collateral on a counterparty basis.
20
LADDER SELECT BOND FUND |
As of February 28, 2018, the offsetting of financial assets is as follows:
| Description | Gross Amounts of Recognized Assets | Gross Amounts Offset in Statement of Assets and Liabilities | Net Amounts Presented in Statement of Assets and Liabilities | Collateral Received | Net Amount | |||||||||||||||
| Short futures contracts | $ | 58,842 | $ | — | $ | 58,842 | $ | — | $ | 58,842 | ||||||||||
| Total subject to a master netting or similar arrangement | $ | 58,842 | $ | — | $ | 58,842 | $ | — | $ | 58,842 | ||||||||||
6. Contingencies and Commitments
The Fund indemnifies the Trust’s officers and Trustees for certain liabilities that might arise from the performance of their duties to the Fund. Additionally, in the normal course of business, the Fund enters into contracts that contain a variety of representations and warranties and which provide general indemnifications. The Fund’s maximum exposure under these arrangements is unknown, as this would involve future claims that may be made against the Fund that have not yet occurred. However, based on experience, the Fund expects the risk of loss to be remote.
7. Risks Associated with Commercial Mortgage-Backed Securities (“CMBS”)
CMBS are securities that reflect an interest in, and are secured by, a pool of mortgage loans on commercial real property. The mortgage loan pool is transferred to a CMBS trust and distributed as various classes of CMBS (some of which are rated by nationally recognized statistical rating organizations). CMBS are a type of debt security and are subject to the risks generally associated with debt securities. CMBS are subject to credit risk, interest rate risk, prepayment risk, extension risk, and many of the risks of investing in the real estate that secures the underlying mortgage loans. The ability of borrowers to pay interest and repay principal on the mortgage loans held in a CMBS trust is not guaranteed and depends on the cash flows of the underlying commercial real estate property, which in turn depends on many factors, including the overall economic landscape, the refinancing markets for commercial mortgages, and sub-market and property specific characteristics. If one or more of the mortgages that are part of a CMBS trust defaults on its interest or principal obligations, securities held by the Fund may experience losses, the Fund’s current income may be reduced, and the Fund’s NAV may decline. The value of CMBS held by the Fund may also be affected by, among other things, changes or perceived changes in: interest rates; factors concerning the interests in and structure of the issuer or originator of the mortgages or other
21
LADDER SELECT BOND FUND |
assets; the creditworthiness of the entities that provide any supporting letters of credit, surety bonds, or other credit enhancements; or the market’s assessment of the quality of underlying assets. CMBS may be deemed illiquid for a period due to a variety of reasons, such as current market conditions, the seniority in the CMBS trust’s capital structure, and trading conditions such as the number of market makers or trade volume. As a result, CMBS may exhibit greater price volatility than other types of mortgage- or asset-backed securities. CMBS are generally not guaranteed by the U.S. Government or any other entity and are subject to the risk of default on the underlying mortgages. CMBS react differently to changes in interest rates than other debt securities and the prices of CMBS may reflect adverse economic and market conditions. Some CMBS have experienced extraordinary weakness and volatility in recent years. As of February 28, 2018, the Fund had 97.0% of the value of its net assets invested in CMBS.
8. Risks Associated with Rule 144A Securities
Rule 144A securities are securities that are exempt from registration under the Securities Act of 1933, as amended, and the rules thereunder, and may have legal restrictions on resale. Under Rule 144A, these privately placed securities may be resold to qualified institutional buyers (“QIBs”), subject to certain conditions. An insufficient number of QIBs interested in purchasing Rule 144A securities at a particular time could adversely affect the marketability of the securities and the Fund may be unable to dispose of the securities promptly or at a reasonable price. As of February 28, 2018, the Fund had 88.0% of the value of its net assets invested in Rule 144A securities.
9. Subsequent Events
The Fund is required to recognize in the financial statements the effects of all subsequent events that provide additional evidence about conditions that existed as of the date of the Statement of Assets and Liabilities. For non-recognized subsequent events that must be disclosed to keep the financial statements from being misleading, the Fund is required to disclose the nature of the event as well as an estimate of its financial effect, or a statement that such an estimate cannot be made. Management has evaluated subsequent events through the issuance of these financial statements and has noted no such events other than the ordinary income dividend paid on March 29, 2018, as noted in Note 2.
22
LADDER SELECT BOND FUND
REPORT OF INDEPENDENT REGISTERED
PUBLIC ACCOUNTING FIRM
To the Shareholders of Ladder Select Bond Fund and Board of Trustees of Ultimus Managers Trust
Opinion on the Financial Statements
We have audited the accompanying statement of assets and liabilities, including the schedules of investments and futures contracts sold short, of Ladder Select Bond Fund (the “Fund”), a series of Ultimus Managers Trust, as of February 28, 2018, and the related statement of operations for the year then ended and the statements of changes in net assets and the financial highlights for each of the two periods in the period then ended, including the related notes (collectively referred to as the “financial statements”). In our opinion, the financial statements present fairly, in all material respects, the financial position of the Fund as of February 28, 2018, the results of its operations for the year then ended and the changes in its net assets and the financial highlights for each of the two periods in the period then ended, in conformity with accounting principles generally accepted in the United States of America.
Basis for Opinion
These financial statements are the responsibility of the Fund’s management. Our responsibility is to express an opinion on the Fund’s financial statements based on our audits. We are a public accounting firm registered with the Public Company Accounting Oversight Board (United States) (“PCAOB”) and are required to be independent with respect to the Fund in accordance with the U.S. federal securities laws and the applicable rules and regulations of the Securities and Exchange Commission and the PCAOB.
We conducted our audits in accordance with the standards of the PCAOB. Those standards require that we plan and perform the audit to obtain reasonable assurance about whether the financial statements are free of material misstatement, whether due to error or fraud.
Our audits include performing procedures to assess the risks of material misstatement of the financial statements, whether due to error or fraud, and performing procedures that respond to those risks. Such procedures include examining, on a test basis, evidence regarding the amounts and disclosures in the financial statements and confirmation of securities owned as of February 28, 2018, by correspondence with the custodian and broker. Our audits also included evaluating the accounting principles used and significant estimates made by management, as well as evaluating the overall presentation of the financial statements. We believe that our audits provide a reasonable basis for our opinion.
We have served as the Fund’s auditor since 2016.
COHEN & COMPANY, LTD.
Cleveland, Ohio
April 25, 2018
23
LADDER SELECT BOND FUND |
We believe it is important for you to understand the impact of costs on your investment. As a shareholder of the Fund, you incur ongoing costs, including management fees and other operating expenses. The following examples are intended to help you understand your ongoing costs (in dollars) of investing in the Fund and to compare these costs with the ongoing costs of investing in other mutual funds.
A mutual fund’s ongoing costs are expressed as a percentage of its average net assets. This figure is known as the expense ratio. The expenses in the table below are based on an investment of $1,000 made at the beginning of the most recent period (September 1, 2017) and held until the end of the period (February 28, 2018).
The table below illustrates the Fund’s ongoing costs in two ways:
Actual fund return – This section helps you to estimate the actual expenses that you paid over the period. The “Ending Account Value” shown is derived from the Fund’s actual return, and the fourth column shows the dollar amount of operating expenses that would have been paid by an investor who started with $1,000 in the Fund. You may use the information here, together with the amount you invested, to estimate the expenses that you paid over the period.
To do so, simply divide your account value by $1,000 (for example, an $8,600 account value divided by $1,000 = 8.6), then multiply the result by the number given for the Fund under the heading “Expenses Paid During Period.”
Hypothetical 5% return – This section is intended to help you compare the Fund’s ongoing costs with those of other mutual funds. It assumes that the Fund had an annual return of 5% before expenses during the period shown, but that the expense ratio is unchanged. In this case, because the return used is not the Fund’s actual return, the results do not apply to your investment. The example is useful in making comparisons because the SEC requires all mutual funds to calculate expenses based on a 5% return. You can assess the Fund’s ongoing costs by comparing this hypothetical example with the hypothetical examples that appear in shareholder reports of other funds.
Note that expenses shown in the table are meant to highlight and help you compare ongoing costs only. The Fund does not charge transaction fees, such as purchase or redemption fees, nor does it carry a “sales load.” The calculations assume no shares were bought or sold during the period. Your actual costs may have been higher or lower, depending on the amount of your investment and the timing of any purchases or redemptions.
24
LADDER SELECT BOND FUND |
More information about the Fund’s expenses can be found in this report. For additional information on operating expenses and other shareholder costs, please refer to the Fund’s prospectus.
| Institutional Class | Beginning Account Value September 1, 2017 | Ending February 28, 2018 | Net Expense Ratio (a) | Expenses Period (b) | ||||||||||||
| Based on Actual Fund Return | $ | 1,000.00 | $ | 1,009.30 | 0.95 | % | $ | 4.73 | ||||||||
| Based on Hypothetical 5% Return (before expenses) | $ | 1,000.00 | $ | 1,020.08 | 0.95 | % | $ | 4.76 | ||||||||
| (a) | Annualized, based on the Fund’s most recent one-half year expenses. |
| (b) | Expenses are equal to the Fund's annualized net expense ratio multiplied by the average account value over the period, multiplied by 181/365 (to reflect the one-half year period). |
25
LADDER SELECT BOND FUND |
A description of the policies and procedures that the Fund uses to vote proxies relating to portfolio securities is available without charge upon request by calling toll-free 1-888-859-5867, or on the SEC’s website at http://www.sec.gov. Information regarding how the Fund voted proxies relating to portfolio securities during the most recent 12-month period ended June 30 is also available without charge upon request by calling toll-free 1-888-859-5867, or on the SEC’s website at http://www.sec.gov.
The Trust files a complete listing of portfolio holdings for the Fund with the SEC as of the end of the first and third quarters of each fiscal year on Form N-Q. These filings are available upon request by calling 1-888-859-5867. Furthermore, you may obtain a copy of the filings on the SEC’s website at http://www.sec.gov. The Trust’s Forms N-Q may also be reviewed and copied at the SEC’s Public Reference Room in Washington, DC, and information on the operation of the Public Reference Room may be obtained by calling 1-800-SEC-0330.
26
LADDER SELECT BOND FUND |
The Board has overall responsibility for management of the Trust’s affairs. The Trustees serve during the lifetime of the Trust and until its termination, or until death, resignation, retirement, or removal. The Trustees, in turn, elect the officers of the Fund to actively supervise its day-to-day operations. The officers have been elected for an annual term. Unless otherwise noted, each Trustee’s and officer’s address is 225 Pictoria Drive, Suite 450, Cincinnati, Ohio 45246.
Name and | Length of Time Served | Position(s) Held with Trust | Principal Occupation(s) | Number of Funds in Trust Overseen by Trustee | Directorships of Public Companies Held by Trustee During Past 5 Years |
Interested Trustees: | |||||
Robert G. Dorsey* Year of Birth: 1957 | Since | Trustee (February 2012 to present)
President (June 2012 to October 2013) | Chief Executive Officer and Managing Director of Ultimus Fund Solutions, LLC and Ultimus Fund Distributors, LLC (1999 to present) | 19 | None |
Independent Trustees: | |||||
Janine L. Cohen Year of Birth: 1952 | Since January | Trustee | Retired since 2013; Chief Financial Officer from 2004 to 2013 and Chief Compliance Officer from 2008 to 2013 at AER Advisors, Inc. | 19 | None |
David M. Deptula Year of Birth: 1958 | Since | Trustee | Vice President of Legal and Special Projects at Dayton Freight Lines, Inc. since 2016; Vice President of Tax Treasury at The Standard Register Inc. (formerly the Standard Register Company) from 2011 to 2016 | 19 | None |
John J. Discepoli Year of Birth: 1963 | Since | Chairman
Trustee | Owner of Discepoli Financial Planning, LLC (personal financial planning company) since 2004 | 19 | None |
* | Mr. Dorsey is considered an “interested person” of the Trust within the meaning of Section 2(a)(19) of the 1940 Act, because of his relationship with the Trust’s administrator, transfer agent and distributor. |
27
LADDER SELECT BOND FUND |
Name and | Length of Time Served | Position(s) | Principal Occupation(s) During Past 5 Years |
Executive Officers: | |||
David R. Carson Year of Birth: 1958 | Since | Principal (October 2013 to present)
Vice President (April 2013 to October 2013) | Vice President and Director of Client Strategies of Ultimus Fund Solutions, LLC (2013 to present); President, Unified Series Trust (2016 to present); Chief Compliance Officer, FSI LBAR Fund (2013 to 2016), The Huntington Funds (2005 to 2013), Huntington Strategy Shares (2012 to 2013), and Huntington Asset Advisors (2013); Vice President, Huntington National Bank (2001 to 2013) |
Jennifer L. Leamer Year of Birth: 1976 | Since | Treasurer
Assistant Treasurer (April 2014 to October 2014) | Vice President, Mutual Fund Controller of Ultimus Fund Solutions, LLC (2014 to present); Business Analyst of Ultimus Fund Solutions, LLC (2007 to 2014) |
Frank L. Newbauer Year of Birth: 1954 | Since | Secretary
Assistant Secretary (April 2015 to July 2017)
Secretary | Assistant Vice President of Ultimus Fund Solutions, LLC (2010 to present) |
Charles C. Black Year of Birth: 1979 | Since | Chief Compliance Officer (January 2016 to present) | Senior Compliance Officer of Ultimus Fund Solutions, LLC (2015 to present); Chief Compliance Officer of The Caldwell & Orkin Funds, Inc. (2016 to present); Senior Compliance Manager at Touchstone Mutual Funds (2013 to 2015); Senior Compliance Manager at Fund Evaluation Group (2011 to 2013) |
Additional information about members of the Board and executive officers is available in the Funds’ Statement of Additional Information (“SAI”). To obtain a free copy of the SAI, please call 1-866-859-5867.
28
This page intentionally left blank.

WAYCROSS LONG/SHORT EQUITY FUND
(WAYEX)
Annual Report
February 28, 2018
| WAYCROSS LONG/SHORT EQUITY FUND Letter to Sharefolders | February 28, 2018 |
Dear Shareholders,
We are pleased to provide this update for the Waycross Long/Short Equity Fund (the “Fund”). The Fund’s investment approach is based on bottom-up research that combines a thorough examination of a company’s fundamentals, valuation and market sentiment. This comprehensive analysis allows us to construct a portfolio using both long and short positions, which provides growth potential while at the same time seeking to reduce volatility.
Performance Review
The Fund produced a +11.44% return for the fiscal year ended February 28, 2018, while the benchmark, the S&P 500® Index, produced a return of +17.10%. The Fund outperformed the secondary benchmark, which is comprised of 50% S&P 500® Index and 50% 90-day U.S. Treasury Bill Index, which produced a return of +8.84%. Long positions were the primary driver to performance, while short exposure helped protect on the downside during the volatility at the very end of the year in February.
Technology long exposure was the largest contributor to performance for the year. Shares of PayPal Holdings (PYPL), MasterCard (MA), Microsoft (MSFT), and Alphabet (GOOGL) all outperformed the sector. In addition to good security selection during the year, an overweight allocation to the sector also benefited the portfolio. The Technology sector advanced +36% and was the best performing sector. The Fund’s focus on “new tech” for long positions and “old tech” for short positions continued to pay off.
Consumer Discretionary long exposure was also a large contributor to performance during the year. Shares of Amazon.com (AMZN) advanced nearly 80%, leading to outperformance for the sector. Shares of Home Depot (HD) also outperformed the Consumer Discretionary sector.
Industrials sector short exposure detracted from performance during the year. Short positions in Caterpillar (CAT) and Boeing (BA) outperformed the Industrials sector during the year. The outperformance of Industrials short positions led to losses and offset long position gains during the year.
Consumer Staples long exposure also detracted from performance during the year. The long position in Kroger (KR) declined more than the overall sector as lower than expected food inflation and aggressive peer pricing caused earnings estimates to miss expectations.
The Fund remains actively managed, emphasizing long positions where company fundamentals are expected to support future earnings growth. A diversified book of short positions acts as a hedge across the portfolio and allows the Fund to maintain a lower volatility compared to the overall market.
1
Exposures Summary
The Fund seeks to provide superior risk-adjusted returns by maintaining a low correlation to large cap equities. The Fund’s long exposure moved slightly higher during the year, while short exposure decreased modestly. This resulted in the Fund’s overall net exposure increasing during the year to 57% from 53% at the end of February 2017; however, overall gross exposure (longs plus shorts) remained mostly unchanged. In terms of sector positioning, the Fund’s gross long exposure to the Technology and Financials increased while the exposure to Health Care and Consumer Discretionary stocks declined during the year.
Fund Exposures | |
Total Portfolio Exposures | Long/Short Exposure By Sector |
|
|
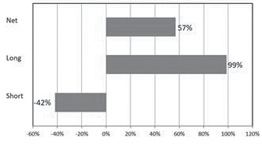

Top Five Long Positions | Top Five Short Positions | |||||
Security Name | Sector | % of | Security Name | Sector | % of | |
AMAZON.COM, INC. | CONSUMER DISCRETIONARY | 4.4% | ACCENTURE PLC - CLASS A | INFORMATION TECHNOLOGY | -2.2% | |
ALPHABET, INC. - CLASS A | INFORMATION TECHNOLOGY | 4.0% | REGIONS FINANCIAL CORPORATION | FINANCIALS | -1.9% | |
BANK OF AMERICA CORPORATION | FINANCIALS | 3.7% | JPMORGAN CHASE & COMPANY | FINANCIALS | -1.8% | |
VISA, INC. - CLASS A | INFORMATION TECHNOLOGY | 3.6% | COCA-COLA COMPANY (THE) | CONSUMER STAPLES | -1.7% | |
MASTERCARD, INC. - CLASS A | INFORMATION TECHNOLOGY | 3.6% | INTEL CORPORATION | INFORMATION TECHNOLOGY | -1.7% | |
Market Outlook
The global economic climate continues to support earnings growth and valuations remain fairly balanced. During the most recent quarterly earnings announcements, more than 75% of companies in the S&P 500 reported better than expected revenues and earnings. Management teams continue to have a positive view on their outlooks.
2
With the backdrop of lowered tax rates, increasing earnings estimates, and overall strong price action, investors will start to focus on the early indications of inflation. Expect more market volatility as the Federal Reserve navigates this delicate balance.
On behalf of Waycross Partners, LLC, thank you for investing in the Fund.
Sincerely,
Benjamin H. Thomas, CFA
Managing Partner | Portfolio Manager
Past performance is not predictive of future performance. Investment results and principal value will fluctuate so that shares, when redeemed, may be worth more or less than their original cost. Current performance may be higher or lower than the performance data quoted. Performance data current to the most recent month-end are available by calling 1-866-267-4304.
An investor should consider the investment objectives, risks, charges and expenses of the Fund carefully before investing. The Fund’s prospectus contains this and other important information. To obtain a copy of the Fund’s prospectus please visit the Fund’s website at www.waycrossfunds.com or call 1-866-267-4304 and a copy will be sent to you free of charge. Please read the prospectus carefully before you invest. The Fund is distributed by Ultimus Fund Distributors, LLC.
The Letter to Shareholders seeks to describe some of the Adviser’s current opinions and views of the financial markets. Although the Adviser believes it has a reasonable basis for any opinions or views expressed, actual results may differ, sometimes significantly so, from those expected or expressed. The securities held by the Fund that are discussed in the Letter to Shareholders were held during the period covered by this Report. They do not comprise the entire investment portfolio of the Fund, may be sold at any time, and may no longer be held by the Fund. For a complete list of securities held by the Fund as of February 28, 2018, please see the Schedule of Investments section of the annual report. The opinions of the Adviser with respect to those securities may change at any time.
Statements in the Letter to Shareholders that reflect projections or expectations for future financial or economic performance of the Fund and the market in general and statements of the Fund’s plans and objectives for future operations are forward-looking statements. No assurance can be given that actual results or events will not differ materially from those projected, estimated, assumed, or anticipated in any such forward-looking statements. Important factors that could result in such differences, in addition to factors noted with such forward-looking statements, include, without limitation, general economic conditions, such as inflation, recession, and interest rates. Past performance is not a guarantee of future results.
3
WAYCROSS LONG/SHORT EQUITY FUND
PERFORMANCE INFORMATION
February 28, 2018 (Unaudited)
Comparison of the Change in Value of a $10,000 Investment in
Waycross Long/Short Equity Fund versus the S&P 500® Index and
50% S&P 500® Index / 50% U.S. Treasury Bill Index
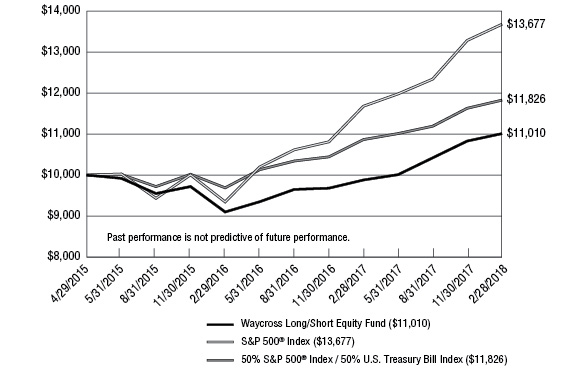
Average Annual Total Returns For Periods Ended February 28, 2018 | |||
1 Year | Since | ||
Waycross Long/Short Equity Fund (a) | 11.44% | 3.45% | |
S&P 500® Index | 17.10% | 11.68% | |
50% S&P 500® Index / 50% U.S. Treasury Bill Index | 8.84% | 6.09% | |
| (a) | The Fund's total returns do not reflect the deduction of taxes a shareholder would pay on Fund distributions or the redemption of Fund shares. |
| (b) | The Fund commenced operations on April 29, 2015. |
4
WAYCROSS LONG/SHORT EQUITY FUND
PORTFOLIO INFORMATION
February 28, 2018 (Unaudited)
Net Sector Exposure versus S&P 500® Index*
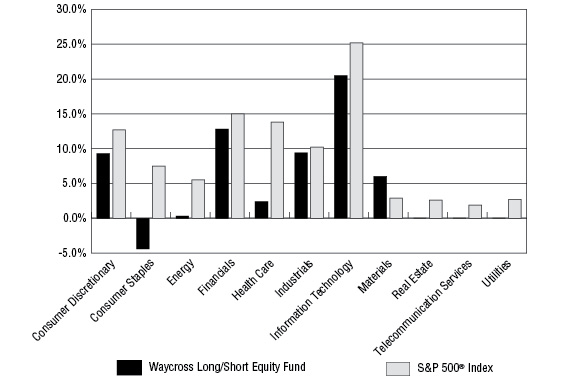
| * | The net percentages are computed by taking the net dollar exposure, including short positions, and dividing by the net assets of the Fund. Consequently, the percentages will not total to 100%. |
Top 10 Long Equity Holdings | Top 10 Short Equity Holdings | |||
Security Description | % of | Security Description | % of | |
Amazon.com, Inc. | 4.4% | Accenture plc - Class A | 2.2% | |
Alphabet, Inc. - Class A | 4.0% | Regions Financial Corporation | 1.9% | |
Bank of American Corporation | 3.7% | JPMorgan Chase & Company | 1.8% | |
Visa, Inc. - Class A | 3.6% | Coca-Cola Company (The) | 1.7% | |
MasterCard, Inc. - Class A | 3.6% | Intel Corporation | 1.7% | |
Microsoft Corporation | 3.6% | Texas Instruments, Inc. | 1.7% | |
Electronic Arts, Inc. | 3.5% | Amgen, Inc. | 1.7% | |
Analog Devices, Inc. | 3.5% | Chevron Corporation | 1.7% | |
Chubb Ltd. | 3.4% | eBay, Inc. | 1.7% | |
Apple, Inc. | 3.4% | Mondelēz International, Inc. - Class A | 1.6% | |
5
| WAYCROSS LONG/SHORT EQUITY FUND SCHEDULE OF INVESTMENTS February 28, 2018 | ||||||||
| COMMON STOCKS — 97.6% | Shares | Value | ||||||
| Consumer Discretionary — 14.9% | ||||||||
| Hotels, Restaurants & Leisure — 5.2% | ||||||||
Chipotle Mexican Grill, Inc. (a) | 1,310 | $ | 417,117 | |||||
Norwegian Cruise Line Holdings Ltd. (a) | 8,684 | 494,120 | ||||||
| 911,237 | ||||||||
| Household Durables — 2.6% | ||||||||
| Whirlpool Corporation | 2,823 | 458,540 | ||||||
| Internet & Direct Marketing Retail — 4.4% | ||||||||
Amazon.com, Inc. (a)(b) | 505 | 763,787 | ||||||
| Specialty Retail — 2.7% | ||||||||
| Home Depot, Inc. (The) | 2,618 | 477,183 | ||||||
| Energy — 3.1% | ||||||||
| Oil, Gas & Consumable Fuels — 3.1% | ||||||||
| EOG Resources, Inc. | 5,290 | 536,512 | ||||||
| Financials — 19.0% | ||||||||
| Banks — 10.1% | ||||||||
Bank of America Corporation (b) | 20,390 | 654,519 | ||||||
| Citigroup, Inc. | 7,160 | 540,508 | ||||||
KeyCorp (b) | 26,619 | 562,460 | ||||||
| 1,757,487 | ||||||||
| Capital Markets — 3.3% | ||||||||
Goldman Sachs Group, Inc. (The) (b) | 2,177 | 572,398 | ||||||
| Insurance — 5.6% | ||||||||
| American International Group, Inc. | 6,730 | 385,898 | ||||||
| Chubb Ltd. | 4,200 | 596,064 | ||||||
| 981,962 | ||||||||
| Health Care — 8.9% | ||||||||
| Biotechnology — 5.6% | ||||||||
Biogen, Inc. (a) | 1,690 | 488,393 | ||||||
Celgene Corporation (a)(b) | 5,674 | 494,319 | ||||||
| 982,712 | ||||||||
| Health Care Equipment & Supplies — 3.3% | ||||||||
Edwards Lifesciences Corporation (a) | 4,238 | 566,493 | ||||||
6
| WAYCROSS LONG/SHORT EQUITY FUND SCHEDULE OF INVESTMENTS (Continued) | ||||||||
| COMMON STOCKS — 97.6% (Continued) | Shares | Value | ||||||
| Industrials — 14.4% | ||||||||
| Air Freight & Logistics — 5.4% | ||||||||
| FedEx Corporation | 1,944 | $ | 479,021 | |||||
United Parcel Service, Inc. - Class B (b) | 4,400 | 459,404 | ||||||
| 938,425 | ||||||||
| Airlines — 5.9% | ||||||||
Delta Air Lines, Inc. (b) | 10,410 | 561,099 | ||||||
| Southwest Airlines Company | 8,070 | 466,769 | ||||||
| 1,027,868 | ||||||||
| Construction & Engineering — 3.1% | ||||||||
| Fluor Corporation | 9,510 | 541,119 | ||||||
| Information Technology — 31.3% | ||||||||
| Internet Software & Services — 7.3% | ||||||||
Alphabet, Inc. - Class A (a)(b) | 630 | 695,469 | ||||||
Facebook, Inc. - Class A (a)(b) | 3,290 | 586,673 | ||||||
| 1,282,142 | ||||||||
| IT Services — 7.2% | ||||||||
MasterCard, Inc. - Class A (b) | 3,591 | 631,154 | ||||||
| Visa, Inc. - Class A | 5,149 | 633,018 | ||||||
| 1,264,172 | ||||||||
| Semiconductors & Semiconductor Equipment — 6.3% | ||||||||
Analog Devices, Inc. (b) | 6,715 | 605,357 | ||||||
| Versum Materials, Inc. | 13,200 | 488,664 | ||||||
| 1,094,021 | ||||||||
| Software — 7.1% | ||||||||
Electronic Arts, Inc. (a) | 4,930 | 609,841 | ||||||
Microsoft Corporation (b) | 6,720 | 630,135 | ||||||
| 1,239,976 | ||||||||
| Technology Hardware, Storage & Peripherals — 3.4% | ||||||||
| Apple, Inc. | 3,338 | 594,565 | ||||||
| Materials — 6.0% | ||||||||
| Chemicals — 6.0% | ||||||||
| Air Products & Chemicals, Inc. | 3,293 | 529,482 | ||||||
| BASF SE - ADR | 19,960 | 524,549 | ||||||
| 1,054,031 | ||||||||
| Total Common Stocks (Cost $13,947,522) | $ | 17,044,630 | ||||||
7
| WAYCROSS LONG/SHORT EQUITY FUND SCHEDULE OF INVESTMENTS (Continued) | ||||||||
| MONEY MARKET FUNDS — 1.0% | Shares | Value | ||||||
Fidelity Institutional Money Market Government Portfolio - Class I, 1.26% (c) (Cost $170,846) | 170,846 | $ | 170,846 | |||||
| Total Investments at Value — 98.6% (Cost $14,118,368) | $ | 17,215,476 | ||||||
| Other Assets in Excess of Liabilities — 1.4% | 253,387 | |||||||
| Net Assets — 100.0% | $ | 17,468,863 | ||||||
ADR - American Depositary Receipt.
| (a) | Non-income producing security. |
| (b) | All or a portion of this security is pledged as collateral for open short positions. The total value of such securities as of February 28, 2018 was $6,490,483. |
| (c) | The rate shown is the 7-day effective yield as of February 28, 2018. |
See accompanying notes to financial statements.
8
| WAYCROSS LONG/SHORT EQUITY FUND SCHEDULE OF SECURITIES SOLD SHORT February 28, 2018 | ||||||||
| COMMON STOCKS — 41.3% | Shares | Value | ||||||
| Consumer Discretionary — 5.6% | ||||||||
| Hotels, Restaurants & Leisure — 2.3% | ||||||||
| Jack in the Box, Inc. | 2,300 | $ | 207,184 | |||||
| Starbucks Corporation | 3,440 | 196,424 | ||||||
| 403,608 | ||||||||
| Media — 1.3% | ||||||||
| Walt Disney Company (The) | 2,170 | 223,857 | ||||||
| Specialty Retail — 1.0% | ||||||||
| Tractor Supply Company | 2,610 | 169,467 | ||||||
| Textiles, Apparel & Luxury Goods — 1.0% | ||||||||
| NIKE, Inc. - Class B | 2,600 | 174,278 | ||||||
| Consumer Staples — 4.4% | ||||||||
| Beverages — 1.7% | ||||||||
| Coca-Cola Company (The) | 6,970 | 301,243 | ||||||
| Food Products — 1.6% | ||||||||
Mondelēz International, Inc. - Class A | 6,324 | 277,624 | ||||||
| Household Products — 1.1% | ||||||||
| Procter & Gamble Company (The) | 2,414 | 189,547 | ||||||
| Energy — 2.8% | ||||||||
| Energy Equipment & Services — 1.1% | ||||||||
| National Oilwell Varco, Inc. | 5,480 | 192,293 | ||||||
| Oil, Gas & Consumable Fuels — 1.7% | ||||||||
| Chevron Corporation | 2,595 | 290,433 | ||||||
| Financials — 6.2% | ||||||||
| Banks — 5.1% | ||||||||
| JPMorgan Chase & Company | 2,740 | 316,470 | ||||||
| Regions Financial Corporation | 16,810 | 326,282 | ||||||
| Wells Fargo & Company | 4,300 | 251,163 | ||||||
| 893,915 | ||||||||
| Insurance — 1.1% | ||||||||
| MetLife, Inc. | 4,083 | 188,594 | ||||||
9
| WAYCROSS LONG/SHORT EQUITY FUND SCHEDULE OF SECURITIES SOLD SHORT (Continued) | ||||||||
| COMMON STOCKS — 41.3% (Continued) | Shares | Value | ||||||
| Health Care — 6.5% | ||||||||
| Biotechnology — 1.7% | ||||||||
| Amgen, Inc. | 1,610 | $ | 295,870 | |||||
| Health Care Providers & Services — 4.0% | ||||||||
| DaVita, Inc. | 2,940 | 211,739 | ||||||
| HCA Healthcare, Inc. | 2,220 | 220,335 | ||||||
| UnitedHealth Group, Inc. | 1,180 | 266,868 | ||||||
| 698,942 | ||||||||
| Pharmaceuticals — 0.8% | ||||||||
| Johnson & Johnson | 1,140 | 148,063 | ||||||
| Industrials — 5.0% | ||||||||
| Airlines — 0.8% | ||||||||
| American Airlines Group, Inc. | 2,710 | 147,017 | ||||||
| Electrical Equipment — 1.0% | ||||||||
| Acuity Brands, Inc. | 1,210 | 172,522 | ||||||
| Industrial Conglomerates — 1.6% | ||||||||
| 3M Company | 723 | 170,274 | ||||||
| General Electric Company | 7,780 | 109,776 | ||||||
| 280,050 | ||||||||
| Machinery — 0.8% | ||||||||
| Ingersoll-Rand plc | 1,560 | 138,528 | ||||||
| Trading Companies & Distributors — 0.8% | ||||||||
| United Rentals, Inc. | 820 | 143,574 | ||||||
| Information Technology — 10.8% | ||||||||
| Internet Software & Services — 1.7% | ||||||||
| eBay, Inc. | 6,740 | 288,876 | ||||||
| IT Services — 2.2% | ||||||||
| Accenture plc - Class A | 2,383 | 383,687 | ||||||
| Semiconductors & Semiconductor Equipment — 3.4% | ||||||||
| Intel Corporation | 6,080 | 299,683 | ||||||
| Texas Instruments, Inc. | 2,750 | 297,963 | ||||||
| 597,646 | ||||||||
10
| WAYCROSS LONG/SHORT EQUITY FUND SCHEDULE OF SECURITIES SOLD SHORT (Continued) | ||||||||
| COMMON STOCKS — 41.3% (Continued) | Shares | Value | ||||||
| Information Technology — 10.8% (Continued) | ||||||||
| Software — 2.4% | ||||||||
| Adobe Systems, Inc. | 930 | $ | 194,491 | |||||
| Check Point Software Technologies Ltd. | 2,232 | 231,882 | ||||||
| 426,373 | ||||||||
| Technology Hardware, Storage & Peripherals — 1.1% | ||||||||
| HP, Inc. | 8,060 | 188,524 | ||||||
| Total Securities Sold Short — 41.3% (Proceeds $6,584,364) | $ | 7,214,531 | ||||||
See accompanying notes to financial statements.
11
| WAYCROSS LONG/SHORT EQUITY FUND STATEMENT OF ASSETS AND LIABILITIES February 28, 2018 | ||||
| ASSETS | ||||
| Investments in securities: | ||||
| At acquisition cost | $ | 14,118,368 | ||
| At value (Note 2) | $ | 17,215,476 | ||
| Cash deposits for securities sold short (Note 2) | 7,276,934 | |||
| Receivable for investment securities sold | 209,229 | |||
| Dividends and interest receivable | 17,814 | |||
| Foreign tax reclaims receivable | 1,483 | |||
| Other assets | 3,211 | |||
| Total assets | 24,724,147 | |||
| LIABILITIES | ||||
| Securities sold short, at value (proceeds $6,584,364) (Note 2) | 7,214,531 | |||
| Dividends payable on securities sold short (Note 2) | 15,907 | |||
| Payable to Adviser (Note 4) | 14,632 | |||
| Payable to administrator (Note 4) | 6,634 | |||
| Other accrued expenses | 3,580 | |||
| Total liabilities | 7,255,284 | |||
| NET ASSETS | $ | 17,468,863 | ||
| NET ASSETS CONSIST OF: | ||||
| Paid-in capital | $ | 15,191,184 | ||
| Accumulated net investment loss | (43,081 | ) | ||
| Accumulated net realized losses from investment transactions | (146,181 | ) | ||
| Net unrealized appreciation (depreciation) on: | ||||
| Investments | 3,097,108 | |||
| Short positions | (630,167 | ) | ||
| NET ASSETS | $ | 17,468,863 | ||
| Shares of beneficial interest outstanding (unlimited number of shares authorized, no par value) | 1,603,208 | |||
| Net asset value, offering price and redemption price per share (Note 2) | $ | 10.90 | ||
See accompanying notes to financial statements.
12
| WAYCROSS LONG/SHORT EQUITY FUND STATEMENT OF OPERATIONS For the Year Ended February 28, 2018 | ||||
| INVESTMENT INCOME | ||||
| Dividend income | $ | 184,359 | ||
| Foreign withholding taxes on dividends | (2,110 | ) | ||
| Interest income | 42,535 | |||
| 224,784 | ||||
| EXPENSES | ||||
| Investment advisory fees (Note 4) | 196,664 | |||
| Dividend expense on securities sold short (Note 2) | 143,398 | |||
| Professional fees | 34,979 | |||
| Fund accounting fees (Note 4) | 31,075 | |||
| Administration fees (Note 4) | 29,500 | |||
| Compliance fees (Note 4) | 12,108 | |||
| Transfer agent fees (Note 4) | 12,000 | |||
| Registration and filing fees | 10,470 | |||
| Trustees’ fees and expenses (Note 4) | 9,961 | |||
| Custody and bank service fees | 7,405 | |||
| Printing of shareholder reports | 4,644 | |||
| Insurance expense | 2,760 | |||
| Postage and supplies | 1,966 | |||
| Other expenses | 8,267 | |||
| Total expenses | 505,197 | |||
| Less fee reductions by the Adviser (Note 4) | (42,710 | ) | ||
| Less fee waivers by the administrator (Note 4) | (6,000 | ) | ||
| Net expenses | 456,487 | |||
| NET INVESTMENT LOSS | (231,703 | ) | ||
| REALIZED AND UNREALIZED GAINS (LOSSES) ON INVESTMENTS | ||||
| Net realized gains (losses) from: | ||||
| Investments | 520,031 | |||
| Securities sold short | (587,693 | ) | ||
| Net change in unrealized appreciation (depreciation) on: | ||||
| Investments | 2,325,998 | |||
| Securities sold short | (313,740 | ) | ||
| NET REALIZED AND UNREALIZED GAINS ON INVESTMENTS | 1,944,596 | |||
| NET INCREASE IN NET ASSETS RESULTING FROM OPERATIONS | $ | 1,712,893 | ||
See accompanying notes to financial statements.
13
| WAYCROSS LONG/SHORT EQUITY FUND STATEMENTS OF CHANGES IN NET ASSETS | ||||||||
| Year Ended February 28, 2018 | Year Ended February 28, 2017 | |||||||
| FROM OPERATIONS | ||||||||
| Net investment loss | $ | (231,703 | ) | $ | (167,408 | ) | ||
| Net realized gains (losses) from: | ||||||||
| Investments | 520,031 | 1,041,962 | ||||||
| Securities sold short | (587,693 | ) | (625,300 | ) | ||||
| Net change in unrealized appreciation (depreciation) on: | ||||||||
| Investments | 2,325,998 | 850,877 | ||||||
| Securities sold short | (313,740 | ) | (380,323 | ) | ||||
| Net increase in net assets resulting from operations | 1,712,893 | 719,808 | ||||||
| DISTRIBUTIONS TO SHAREHOLDERS | ||||||||
| From net realized gains from security transactions | (174,058 | ) | — | |||||
| CAPITAL SHARE TRANSACTIONS | ||||||||
| Proceeds from shares sold | 3,803,161 | 8,944,314 | ||||||
| Net asset value of shares issued in reinvestment of distributions | 143,593 | — | ||||||
| Payments for shares redeemed | (607,940 | ) | (1,852,751 | ) | ||||
| Net increase in net assets from capital share transactions | 3,338,814 | 7,091,563 | ||||||
| TOTAL INCREASE IN NET ASSETS | 4,877,649 | 7,811,371 | ||||||
| NET ASSETS | ||||||||
| Beginning of year | 12,591,214 | 4,779,843 | ||||||
| End of year | $ | 17,468,863 | $ | 12,591,214 | ||||
| ACCUMULATED NET INVESTMENT LOSS | $ | (43,081 | ) | $ | (37,967 | ) | ||
| CAPITAL SHARE ACTIVITY | ||||||||
| Shares sold | 373,646 | 944,674 | ||||||
| Shares reinvested | 13,308 | — | ||||||
| Shares redeemed | (58,110 | ) | (195,574 | ) | ||||
| Net increase in shares outstanding | 328,844 | 749,100 | ||||||
| Shares outstanding at beginning of year | 1,274,364 | 525,264 | ||||||
| Shares outstanding at end of year | 1,603,208 | 1,274,364 | ||||||
See accompanying notes to financial statements.
14
| WAYCROSS LONG/SHORT EQUITY FUND FINANCIAL HIGHLIGHTS | ||||||||||||
| Per Share Data for a Share Outstanding Throughout Each Period | ||||||||||||
| Year Ended February 28, 2018 | Year Ended February 28, 2017 | Period Ended | ||||||||||
| Net asset value at beginning of period | $ | 9.88 | $ | 9.10 | $ | 10.00 | ||||||
| Income (loss) from investment operations: | ||||||||||||
| Net investment loss | (0.14 | ) | (0.11 | ) | (0.13 | ) | ||||||
| Net realized and unrealized gains (losses) on investments | 1.27 | 0.89 | (0.77 | ) | ||||||||
| Total from investment operations | 1.13 | 0.78 | (0.90 | ) | ||||||||
| Less distributions: | ||||||||||||
| Distributions from net realized gains | (0.11 | ) | — | — | ||||||||
| Net asset value at end of period | $ | 10.90 | $ | 9.88 | $ | 9.10 | ||||||
Total return (b) | 11.44 | % | 8.57 | % | (9.00 | %)(c) | ||||||
| Net assets at end of period (000's) | $ | 17,469 | $ | 12,591 | $ | 4,780 | ||||||
| Ratios/supplementary data: | ||||||||||||
| Ratio of total expenses to average net assets | 3.21 | % | 4.77 | % | 7.25 | %(d) | ||||||
Ratio of net expenses to average net assets (e) | 2.90 | % | 2.99 | % | 3.30 | %(d) | ||||||
Ratio of net expenses to average net assets excluding dividend expense and brokerage expense on securities sold short (e) | 1.99 | % | 2.13 | % | 2.15 | %(d) | ||||||
Ratio of net investment loss to average net assets (e) | (1.47 | %) | (1.96 | %) | (2.34 | %)(d) | ||||||
| Portfolio turnover rate | 35 | % | 192 | % | 134 | %(c) | ||||||
| (a) | Represents the period from the commencement of operations (April 29, 2015) through February 29, 2016. |
| (b) | Total return is a measure of the change in value of an investment in the Fund over the period covered. The returns shown do not reflect the deduction of taxes a shareholder would pay on Fund distributions, if any, or the redemption of Fund shares. The total returns would be lower if the Adviser and the administrator had not reduced fees and reimbursed expenses (Note 4). |
| (c) | Not annualized. |
| (d) | Annualized. |
| (e) | Ratio was determined after fee reductions and/or expense reimbursements (Note 4). |
See accompanying notes to financial statements.
15
WAYCROSS LONG/SHORT EQUITY FUND
NOTES TO FINANCIAL STATEMENTS
February 28, 2018
1. Organization
Waycross Long/Short Equity Fund (the “Fund”), formerly Navian Waycross Long/Short Equity Fund, is a diversified series of Ultimus Managers Trust (the “Trust”), an open-end investment company established as an Ohio business trust under a Declaration of Trust dated February 28, 2012. Other series of the Trust are not incorporated in this report. The Fund commenced operations on April 29, 2015.
The investment objective of the Fund is to seek long-term capital appreciation with a secondary emphasis on capital preservation.
2. Significant Accounting Policies
In October 2016, the U.S. Securities and Exchange Commission (the “SEC”) adopted amendments to Regulation S-X, which impact financial statement presentation, particularly the presentation of derivative investments. The Fund has adopted these amendments, which were effective August 1, 2017, with these financial statements.
The following is a summary of the Fund’s significant accounting policies used in the preparation of its financial statements. These policies are in conformity with accounting principles generally accepted in the United States of America (“GAAP”). The Fund follows accounting and reporting guidance under Financial Accounting Standards Board Accounting Standards Codification Topic 946, “Financial Services – Investment Companies.”
Securities valuation – The Fund values its portfolio securities at market value as of the close of regular trading on the New York Stock Exchange (the “NYSE”) (normally 4:00 p.m. Eastern time) on each day the NYSE is open for business. The Fund values its listed securities on the basis of the security’s last sale price on the security’s primary exchange, if available, otherwise at the exchange’s most recently quoted mean price. NASDAQ-listed securities are valued at the NASDAQ Official Closing Price. When using a quoted price and when the market is considered active, the security will be classified as Level 1 within the fair value hierarchy (see below). In the event that market quotations are not readily available or are considered unreliable due to market or other events, the Fund values its securities and other assets at fair value in accordance with procedures established by and under the general supervision of the Board of Trustees (the “Board”) of the Trust. Under these procedures, the securities will be classified as Level 2 or 3 within the fair value hierarchy, depending on the inputs used. Unavailable or unreliable market quotes may be due to the following factors: a substantial bid-ask spread; infrequent sales resulting in stale prices; insufficient trading volume; small trade sizes; a temporary lapse in any reliable pricing source; and actions of the securities or futures markets, such as the suspension or limitation of trading. As a result, the prices of securities used to calculate the Fund’s net asset value (“NAV”) may differ from quoted or published prices for the same securities.
16
WAYCROSS LONG/SHORT EQUITY FUND
NOTES TO FINANCIAL STATEMENTS (Continued)
GAAP establishes a single authoritative definition of fair value, sets out a framework for measuring fair value, and requires additional disclosures about fair value measurements.
Various inputs are used in determining the value of the Fund’s investments. These inputs are summarized in the three broad levels listed below:
● | Level 1 – quoted prices in active markets for identical securities |
● | Level 2 – other significant observable inputs |
● | Level 3 – significant unobservable inputs |
The inputs or methods used for valuing securities are not necessarily an indication of the risks associated with investing in those securities. The inputs used to measure fair value may fall into different levels of the fair value hierarchy. In such cases, for disclosure purposes, the level in the fair value hierarchy within which the fair value measurement falls in its entirety is determined based on the lowest level input that is significant to the fair value measurement.
The following is a summary of the inputs used to value the Fund’s investments and other financial instruments as of February 28, 2018:
| Level 1 | Level 2 | Level 3 | Total | |||||||||||||
| Investments in Securities | ||||||||||||||||
| Common Stocks | $ | 17,044,630 | $ | — | $ | — | $ | 17,044,630 | ||||||||
| Money Market Funds | 170,846 | — | — | 170,846 | ||||||||||||
| Total | $ | 17,215,476 | $ | — | $ | — | $ | 17,215,476 | ||||||||
| Other Financial Instruments | ||||||||||||||||
| Common Stocks - Sold Short | $ | (7,214,531 | ) | $ | — | $ | — | $ | (7,214,531 | ) | ||||||
Refer to the Fund’s Schedule of Investments and Schedule of Securities Sold Short for a listing of the common stocks by industry type. As of February 28, 2018, the Fund did not have any transfers between Levels. In addition, the Fund did not hold derivative instruments or have any assets or liabilities that were measured at fair value on a recurring basis using significant unobservable inputs (Level 3) as of February 28, 2018. It is the Fund’s policy to recognize transfers between Levels at the end of the reporting period.
Share valuation – The NAV per share of the Fund is calculated daily by dividing the total value of the Fund’s assets, less liabilities, by the number of shares outstanding. The offering price and redemption price per share of the Fund is equal to the NAV per share.
Investment income – Dividend income and expense is recorded on the ex-dividend date. Interest income is accrued as earned. Withholding taxes on foreign dividends have been recorded in accordance with the Fund’s understanding of the applicable country’s tax rules and rates.
17
WAYCROSS LONG/SHORT EQUITY FUND
NOTES TO FINANCIAL STATEMENTS (Continued)
Investment transactions – Investment transactions are accounted for on the trade date. Realized gains and losses on securities sold are determined on a specific identification basis.
Common expenses – Common expenses of the Trust are allocated among the Fund and the other series of the Trust based on the relative net assets of each series or the nature of the services performed and the relative applicability to each series.
Distributions to shareholders – Distributions to shareholders arising from net investment income, if any, are declared and paid annually to shareholders. Net realized capital gains, if any, are distributed at least annually. The amount of distributions from net investment income and net realized capital gains are determined in accordance with federal income tax regulations, which may differ from GAAP. Dividends and distributions to shareholders are recorded on the ex-dividend date. The tax character of distributions paid during the year ended February 28, 2018 was long-term capital gains. There were no distributions paid to shareholders during the year ended February 28, 2017.
Short sales – The Fund sells securities short. When the Fund sells a security short, it must borrow the security sold short and deliver it to the broker-dealer through which it made the short sale. A gain, limited to the price at which the Fund sold the security short, or a loss, unlimited in size, will be recognized upon the termination of a short sale. The Fund is also subject to the risk that it may be unable to reacquire a security to terminate a short position except at a price substantially in excess of the last quoted price. The Fund is liable for any dividends payable on securities while those securities are in a short position and will also bear other costs, such as charges for the prime brokerage accounts, in connection with the short position. These costs are reported as dividend expense and brokerage expense on securities sold short, respectively, in the Statement of Operations. Net income earned on short sale proceeds held on deposit with the broker and/or margin interest earned, if any, are included in interest income in the Statement of Operations. As collateral for its short positions, the Fund is required under the Investment Company Act of 1940, as amended (the “1940 Act”), to maintain assets consisting of cash, cash equivalents, or other liquid securities equal to the market value of the securities sold short. The cash deposits with brokers or amounts due to prime brokers for securities sold short are reported on the Statement of Assets and Liabilities. These amounts are considered in conjunction with securities held in the Fund’s collateral account. The amount of collateral is required to be adjusted daily to reflect changes in the value of the securities sold short. To the extent the Fund invests the proceeds received from selling securities short, it is engaging in a form of leverage. The use of leverage by the Fund may make any change in the Fund’s NAV greater than it would be without the use of leverage. Short sales are speculative transactions and involve special risks, including greater reliance on the ability of Waycross Partners, LLC (the “Adviser”) to accurately anticipate the future value of a security.
18
WAYCROSS LONG/SHORT EQUITY FUND
NOTES TO FINANCIAL STATEMENTS (Continued)
Estimates – The preparation of financial statements in conformity with GAAP requires management to make estimates and assumptions that affect the reported amounts of assets and liabilities and disclosure of contingent assets and liabilities as of the date of the financial statements and the reported amounts of income and expenses during the reporting period. Actual results could differ from those estimates.
Federal income tax – The Fund has qualified and intends to continue to qualify as a regulated investment company under the Internal Revenue Code of 1986, as amended (the “Code”). Qualification generally will relieve the Fund of liability for federal income taxes to the extent 100% of its net investment income and net realized capital gains are distributed in accordance with the Code.
In order to avoid imposition of the excise tax applicable to regulated investment companies, it is also the Fund’s intention to declare as dividends in each calendar year at least 98% of its net investment income (earned during the calendar year) and 98.2% of its net realized capital gains (earned during the 12 months ended October 31) plus undistributed amounts from prior years.
The following information is computed on a tax basis for each item as of February 28, 2018:
| Tax cost of portfolio investments and securities sold short | $ | 7,596,164 | ||
| Gross unrealized appreciation | $ | 3,508,526 | ||
| Gross unrealized depreciation | (1,103,745 | ) | ||
| Net unrealized appreciation | 2,404,781 | |||
| Accumulated capital and other losses | (127,102 | ) | ||
| Accumulated earnings | $ | 2,277,679 |
The federal income tax cost of portfolio investments and securities sold short and the tax components of accumulated earnings may temporarily differ from the financial statement cost of portfolio investments and components of net assets (“book/tax difference”). These book/tax differences are due to the recognition of capital gains or losses under income tax regulations and GAAP, primarily due to the tax deferral of losses on wash sales.
As of February 28, 2018, the Fund had a short-term capital loss carryforward of $7,252 for federal income tax purposes. This capital loss carryforward, which does not expire, may be utilized in future years to offset net realized gains, if any, prior to distributing such gains to shareholders.
19
WAYCROSS LONG/SHORT EQUITY FUND
NOTES TO FINANCIAL STATEMENTS (Continued)
Net qualified late year ordinary losses represent losses incurred after December 31, 2017 and specified capital losses incurred after October 31, 2017. These losses are deemed to arise on the first day of the Fund’s next taxable year. For the year ended February 28, 2018, the Fund intends to defer the following losses to March 1, 2018 for income tax purposes:
Late-Year | Late-Year |
$ 43,081 | $ 76,769 |
For the year ended February 28, 2018, the following reclassifications were made on the Statement of Assets and Liabilities for the Fund as a result of permanent differences in the recognition of capital gains and losses under income tax regulations and GAAP:
| Paid-in capital | $ | (225,452 | ) | |
| Accumulated net investment loss | 226,589 | |||
| Accumulated net realized losses from investment transactions | (1,137 | ) |
Such reclassifications, the result of permanent differences between financial statement and income tax reporting requirements, have no effect on the Fund’s net assets or NAV per share.
The Fund recognizes the tax benefits or expenses of uncertain tax positions only when the position is “more likely than not” to be sustained assuming examination by tax authorities. Management has reviewed the Fund’s tax positions for all open tax years (tax years ended February 29, 2016 through February 28, 2018) and has concluded that no provision for unrecognized tax benefits or expenses is required in these financial statements. The Fund identifies its major tax jurisdiction as U.S. federal.
3. Investment Transactions
During the year ended February 28, 2018, cost of purchases and proceeds from sales of investment securities, other than short-term investments and short positions, were $8,243,170 and $5,308,133, respectively.
4. Transactions with Related Parties
INVESTMENT ADVISORY AGREEMENT
The Fund’s investments are managed by the Adviser pursuant to the terms of an Investment Advisory Agreement. Under the Investment Advisory Agreement, the Fund pays the Adviser an advisory fee, computed and accrued daily and paid monthly, at the annual rate of 1.25% of its average daily net assets.
20
WAYCROSS LONG/SHORT EQUITY FUND
NOTES TO FINANCIAL STATEMENTS (Continued)
Pursuant to an Expense Limitation Agreement between the Fund and the Adviser (the “ELA”), the Adviser has contractually agreed, until June 30, 2019, to reduce investment advisory fees and reimburse other expenses to limit total annual operating expenses (exclusive of brokerage costs; taxes; borrowing costs; dividend expenses on securities sold short; interest; costs to organize the Fund; acquired fund fees and expenses; extraordinary expenses such as litigation and merger or reorganization costs and other expenses not incurred in the ordinary course of the Fund’s business; and amounts, if any, payable pursuant to a plan adopted in accordance with Rule 12b-1 under the 1940 Act) to an amount not exceeding 1.99% of the Fund’s average daily net assets. Accordingly, during the year ended February 28, 2018, the Adviser reduced its advisory fees in the amount of $42,710.
Under the terms of the ELA, investment advisory fee reductions and expense reimbursements by the Adviser are subject to repayment by the Fund for a period of three years after such fees and expenses were incurred, provided that the repayments do not cause total annual operating expenses to exceed the lesser of (i) the expense limitation then in effect, if any, and (ii) the expense limitation in effect at the time the expenses to be repaid were incurred. As of February 28, 2018, the Adviser may seek repayment of investment advisory fee reductions and expense reimbursements totaling $298,210 no later than the dates listed below:
February 28, 2019 | February 29, 2020 | February 28, 2021 | Total |
$ 107,661 | $ 147,839 | $ 42,710 | $ 298,210 |
OTHER SERVICE PROVIDERS
Ultimus Fund Solutions, LLC (“Ultimus”) provides administration, fund accounting, compliance and transfer agency services to the Fund. The Fund pays Ultimus fees in accordance with the agreements for such services. In addition, the Fund pays out-of-pocket expenses including, but not limited to, postage, supplies and costs of pricing the Fund’s portfolio securities. During the year ended February 28, 2018, Ultimus voluntarily waived fees in the amount of $6,000. These voluntary waivers are not subject to recoupment by Ultimus.
Under the terms of a Distribution Agreement with the Trust, Ultimus Fund Distributors, LLC (the “Distributor”) serves as principal underwriter to the Fund. The Distributor is a wholly-owned subsidiary of Ultimus. The Distributor is compensated by the Adviser (not the Fund) for acting as principal underwriter.
Certain officers and a Trustee of the Trust are also officers of Ultimus and the Distributor.
21
WAYCROSS LONG/SHORT EQUITY FUND
NOTES TO FINANCIAL STATEMENTS (Continued)
TRUSTEE COMPENSATION
Each Trustee who is not an “interested person” of the Trust (“Independent Trustee”) receives a $1,000 annual retainer from the Fund, paid quarterly, except for the Board Chairperson who receives a $1,200 annual retainer from the Fund, paid quarterly. Each Independent Trustee also receives from the Fund a fee of $500 for each Board meeting attended plus reimbursement for travel and other meeting-related expenses.
PRINCIPAL HOLDERS OF FUND SHARES
As of February 28, 2018, the following shareholders owned of record 5% or more of the outstanding shares of the Fund:
Name of Record Owner | % Ownership |
National Financial Services, LLC (for benefit of its customers) | 79% |
Maril & Company (for benefit of its customers) | 15% |
A beneficial owner of 25% or more of the Fund’s outstanding shares may be considered a controlling person. That shareholder’s vote could have a more significant effect on matters presented at a shareholder’s meeting.
5. Contingencies and Commitments
The Fund indemnifies the Trust’s officers and Trustees for certain liabilities that might arise from their performance of their duties to the Fund. Additionally, in the normal course of business the Fund enters into contracts that contain a variety of representations and warranties and which provide general indemnifications. The Fund’s maximum exposure under these arrangements is unknown, as this would involve future claims that may be made against the Fund that have not yet occurred. However, based on experience, the Fund expects the risk of loss to be remote.
6. Sector Risk
If the Fund has significant investments in the securities of issuers within a particular sector, any development affecting that sector will have a greater impact on the value of the net assets of the Fund than would be the case if the Fund did not have significant investments in that sector. In addition, this may increase the risk of loss in the Fund and increase the volatility of the Fund’s NAV per share. Occasionally, market conditions, regulatory changes, or other developments may negatively impact a particular sector, and therefore the value of the Fund’s portfolio will be adversely affected.
22
WAYCROSS LONG/SHORT EQUITY FUND
NOTES TO FINANCIAL STATEMENTS (Continued)
As of February 28, 2018, the Fund had the following percentages of the value of its net assets invested or sold short in stocks within the Information Technology sector:
Sector | Long Positions | Short Positions | Net Exposure |
Information Technology | 31.3% | (10.8%) | 20.5% |
As shown above, although the Fund has greater than 25% of its net assets invested in long positions in the sector noted, the sector exposure is mitigated by short positions. As part of the Fund’s principal investment strategies, the Adviser monitors the Fund’s sector exposure to ensure the Fund’s portfolio is adequately diversified.
7. Subsequent Events
The Fund is required to recognize in the financial statements the effects of all subsequent events that provide additional evidence about conditions that existed as of the date of the Statement of Assets and Liabilities. For non-recognized subsequent events that must be disclosed to keep the financial statements from being misleading, the Fund is required to disclose the nature of the event as well as an estimate of its financial effect, or a statement that such an estimate cannot be made. Management has evaluated subsequent events through the issuance of these financial statements and has noted no such events.
23
WAYCROSS LONG/SHORT EQUITY FUND
REPORT OF INDEPENDENT REGISTERED
PUBLIC ACCOUNTING FIRM
To the Shareholders of Waycross Long/Short Equity Fund and Board of Trustees of Ultimus Managers Trust
Opinion on the Financial Statements
We have audited the accompanying statement of assets and liabilities, including the schedules of investments and securities sold short, of Waycross Long/Short Equity Fund (the “Fund”), formerly Navian Waycross Long/Short Equity Fund, a series of Ultimus Managers Trust, as of February 28, 2018, and the related statement of operations for the year then ended, the statements of changes in net assets for each of the two years in the period then ended, including the related notes, and the financial highlights for each of the three periods in the period then ended (collectively referred to as the “financial statements”). In our opinion, the financial statements present fairly, in all material respects, the financial position of the Fund as of February 28, 2018, the results of its operations for the year then ended, the changes in its net assets for each of the two years in the period then ended, and the financial highlights for each of the three periods in the period then ended, in conformity with accounting principles generally accepted in the United States of America.
Basis for Opinion
These financial statements are the responsibility of the Fund’s management. Our responsibility is to express an opinion on the Fund’s financial statements based on our audits. We are a public accounting firm registered with the Public Company Accounting Oversight Board (United States) (“PCAOB”) and are required to be independent with respect to the Fund in accordance with the U.S. federal securities laws and the applicable rules and regulations of the Securities and Exchange Commission and the PCAOB.
We conducted our audits in accordance with the standards of the PCAOB. Those standards require that we plan and perform the audit to obtain reasonable assurance about whether the financial statements are free of material misstatement, whether due to error or fraud.
Our audits include performing procedures to assess the risks of material misstatement of the financial statements, whether due to error or fraud, and performing procedures that respond to those risks. Such procedures include examining, on a test basis, evidence regarding the amounts and disclosures in the financial statements and confirmation of securities owned as of February 28, 2018, by correspondence with the custodian and brokers. Our audits also included evaluating the accounting principles used and significant estimates made by management, as well as evaluating the overall presentation of the financial statements. We believe that our audits provide a reasonable basis for our opinion.
We have served as the Fund’s auditor since 2015.
COHEN & COMPANY, LTD.
Cleveland, Ohio
April 25, 2018
24
WAYCROSS LONG/SHORT EQUITY FUND
ABOUT YOUR FUND’S EXPENSES (Unaudited)
We believe it is important for you to understand the impact of costs on your investment. As a shareholder of the Fund, you incur ongoing costs, including management fees and other operating expenses. The following examples are intended to help you understand your ongoing costs (in dollars) of investing in the Fund and to compare these costs with the ongoing costs of investing in other mutual funds.
A mutual fund’s ongoing costs are expressed as a percentage of its average net assets. This figure is known as the expense ratio. The expenses in the table below are based on an investment of $1,000 made at the beginning of the most recent period (September 1, 2017) and held until the end of the period (February 28, 2018).
The table below illustrates the Fund’s ongoing costs in two ways:
Actual fund return – This section helps you to estimate the actual expenses that you paid over the period. The “Ending Account Value” shown is derived from the Fund’s actual return, and the fourth column shows the dollar amount of operating expenses that would have been paid by an investor who started with $1,000 in the Fund. You may use the information here, together with the amount you invested, to estimate the expenses that you paid over the period.
To do so, simply divide your account value by $1,000 (for example, an $8,600 account value divided by $1,000 = 8.6), then multiply the result by the number given for the Fund under the heading “Expenses Paid During Period.”
Hypothetical 5% return – This section is intended to help you compare the Fund’s ongoing costs with those of other mutual funds. It assumes that the Fund had an annual return of 5% before expenses during the period shown, but that the expense ratio is unchanged. In this case, because the return used is not the Fund’s actual return, the results do not apply to your investment. The example is useful in making comparisons because the SEC requires all mutual funds to calculate expenses based on a 5% return. You can assess the Fund’s ongoing costs by comparing this hypothetical example with the hypothetical examples that appear in shareholder reports of other funds.
Note that expenses shown in the table are meant to highlight and help you compare ongoing costs only. The Fund does not charge transaction fees, such as purchase or redemption fees, nor does it carry a “sales load.”
The calculations assume no shares were bought or sold during the period. Your actual costs may have been higher or lower, depending on the amount of your investment and the timing of any purchases or redemptions.
25
WAYCROSS LONG/SHORT EQUITY FUND
ABOUT YOUR FUND’S EXPENSES (Unaudited) (Continued)
More information about the Fund’s expenses can be found in this report. For additional information on operating expenses and other shareholder costs, please refer to the Fund’s prospectus.
Beginning | Ending | Net | Expenses | |
Based on Actual Fund Return | $1,000.00 | $1,056.60 | 2.82% | $14.38 |
Based on Hypothetical 5% Return (before expenses) | $1,000.00 | $1,010.81 | 2.82% | $14.06 |
| (a) | Annualized, based on the Fund's most recent one-half year expenses. |
| (b) | Expenses are equal to the Fund’s annualized net expense ratio multiplied by the average account value over the period, multiplied by 181/365 (to reflect the one-half year period). |
OTHER INFORMATION (Unaudited)
A description of the policies and procedures that the Fund uses to vote proxies relating to portfolio securities is available without charge upon request by calling toll-free 1-866-267-4304, or on the SEC’s website at http://www.sec.gov. Information regarding how the Fund voted proxies relating to portfolio securities during the most recent 12-month period ended June 30 is available without charge upon request by calling toll-free 1-866-267-4304, or on the SEC’s website at http://www.sec.gov.
The Trust files a complete listing of the Fund’s portfolio holdings with the SEC as of the end of the first and third quarters of each fiscal year on Form N-Q. These filings are available upon request by calling 1-866-267-4304. Furthermore, you may obtain a copy of the filings on the SEC’s website at http://www.sec.gov. The Trust’s Forms N-Q may also be reviewed and copied at the SEC’s Public Reference Room in Washington, DC, and information on the operation of the Public Reference Room may be obtained by calling 1-800-SEC-0330.
FEDERAL TAX INFORMATION (Unaudited)
For the fiscal year ended February 28, 2018, the Fund designated $174,058 as long-term capital gain distributions subject to a maximun tax rate of 20%.
26
WAYCROSS LONG/SHORT EQUITY FUND
BOARD OF TRUSTEES AND EXECUTIVE OFFICERS
(Unaudited)
The Board has overall responsibility for management of the Trust’s affairs. The Trustees serve during the lifetime of the Trust and until its termination, or until death, resignation, retirement, or removal. The Trustees, in turn, elect the officers of the Fund to actively supervise its day-to-day operations. The officers have been elected for an annual term. Unless otherwise noted, each Trustee’s and officer’s address is 225 Pictoria Drive, Suite 450, Cincinnati, Ohio 45246. The following are the Trustees and executive officers of the Fund:
Name and | Length of Time Served | Position(s) | Principal Occupation(s) | Number of Funds in Trust Overseen by Trustee | Directorships of Public Companies Held by Trustee During Past 5 Years |
Interested Trustees: | |||||
Robert G. Dorsey* Year of Birth: 1957 | Since | Trustee (February 2012 to present) President (June 2012 to October 2013) | Chief Executive Officer and Managing Director of Ultimus Fund Solutions, LLC and Ultimus Fund Distributors, LLC (1999 to present) | 19 | None |
Independent Trustees: | |||||
Janine L. Cohen Year of Birth: 1952 | Since January | Trustee | Retired since 2013; Chief Financial Officer from 2004 to 2013 and Chief Compliance Officer from 2008 to 2013 at AER Advisors, Inc. | 19 | None |
David M. Deptula Year of Birth: 1958 | Since | Trustee | Vice President of Legal and Special Projects at Dayton Freight Lines, Inc. since 2016; Vice President of Tax Treasury at The Standard Register Inc. (formerly the Standard Register Company) from 2011 to 2016 | 19 | None |
John J. Discepoli Year of Birth: 1963 | Since | Chairman Trustee | Owner of Discepoli Financial Planning, LLC (personal financial planning company) since 2004 | 19 | None |
| * | Mr. Dorsey is considered an “interested person” of the Trust within the meaning of Section 2(a)(19) of the 1940 Act because of his relationship with the Trust’s administrator, transfer agent and distributor. |
27
WAYCROSS LONG/SHORT EQUITY FUND
BOARD OF TRUSTEES AND EXECUTIVE OFFICERS
(Unaudited) (Continued)
Name and | Length of Time Served | Position(s) | Principal Occupation(s) During Past 5 Years |
Executive Officers: | |||
David R. Carson Year of Birth: 1958 | Since | Principal Executive Officer (April 2017 to present) President (October 2013 to present) Vice President (April 2013 to October 2013) | Vice President and Director of Client Strategies of Ultimus Fund Solutions, LLC (2013 to present); President, Unified Series Trust (2016 to present); Chief Compliance Officer, FSI LBAR Fund (2013 to 2016), The Huntington Funds (2005 to 2013), Huntington Strategy Shares (2012 to 2013), and Huntington Asset Advisors (2013); Vice President, Huntington National Bank (2001 to 2013) |
Jennifer L. Leamer Year of Birth: 1976 | Since | Treasurer Assistant Treasurer (April 2014 to October 2014) | Vice President, Mutual Fund Controller of Ultimus Fund Solutions, LLC (2014 to present); Business Analyst of Ultimus Fund Solutions, LLC (2007 to 2014) |
Frank L. Newbauer Year of Birth: 1954 | Since | Secretary Assistant Secretary (April 2015 to July 2017) Secretary (February 2012 to April 2015) | Assistant Vice President of Ultimus Fund Solutions, LLC (2010 to present) |
Charles C. Black Year of Birth: 1979 | Since | Chief Compliance Officer (January 2016 to present) Assistant Chief Compliance Officer (April 2015 to January 2016) | Senior Compliance Officer of Ultimus Fund Solutions, LLC (2015 to present); Chief Compliance Officer of The Caldwell & Orkin Funds, Inc. (2016 to present); Senior Compliance Manager at Touchstone Mutual Funds (2013 to 2015); Senior Compliance Manager at Fund Evaluation Group (2011 to 2013) |
Additional information about members of the Board and executive officers is available in the Fund’s Statement of Additional Information (“SAI”). To obtain a free copy of the SAI, please call 1-866-267-4304.
28
WAYCROSS LONG/SHORT EQUITY FUND
DISCLOSURE REGARDING APPROVAL OF INVESTMENT ADVISORY AGREEMENT (Unaudited)
The Board of Trustees (the “Board”), including the Independent Trustees voting separately, has reviewed and approved the Fund’s Investment Advisory Agreement with Waycross Partners, LLC (the “Adviser”) for an additional term. Approval took place at an in-person meeting held on January 22-23, 2018, at which all of the Trustees were present.
In the course of their deliberations, the Board was advised by legal counsel. The Board received and reviewed a substantial amount of information provided by the Adviser in response to requests of the Board and counsel.
In deciding whether to approve the renewal of the Investment Advisory Agreement, the Board recalled its review of the materials related to the Fund and the Adviser throughout the preceding 12 months and its numerous discussions with Trust management and the Adviser about the operations and performance of the Fund during that period. The Board further considered those materials and discussions and other numerous factors, as noted below.
The nature, extent, and quality of the services provided by the Adviser. In this regard, the Board reviewed the services being provided by the Adviser to the Fund including, without limitation, its investment advisory services since the Fund’s inception; its compliance procedures and practices; its efforts to promote the Fund and assist in its distribution; and its compliance program. After reviewing the foregoing information and further information regarding the Adviser’s business, (e.g., description of its business and Form ADV), the Board concluded that the quality, extent, and nature of the services provided by the Adviser to the Fund were satisfactory and adequate.
The investment performance of the Fund. In this regard, the Board compared the performance of the Fund with the performance of its benchmark indexes, custom peer group, and Morningstar categories. The Board also considered the consistency of the Adviser’s management with the Fund’s investment objective and policies. The Board noted that the Fund’s performance for the one-year period ending December 31, 2017 was greater than the average, but less than the median, performance of its custom peer group and greater than the average and the median of its Morningstar category, and had underperformed relative to its benchmark for the one-year period and since inception as of December 31, 2017. The Board indicated that the Adviser had satisfactorily explained the reasons for the underperformance of the Fund to the performance of its benchmark. Following additional discussion of the investment performance of the Fund; the Adviser’s experience in managing mutual funds, private funds, and separate accounts; the Adviser’s historical investment performance; and other factors, the Board concluded that the investment performance of the Fund has been satisfactory.
The costs of the services provided and profits realized by the Adviser and its affiliates from their relationship with the Fund. In this regard, the Board considered the Adviser’s staffing; methods of operating; the education and experience of its personnel; its compliance program, policies and procedures; its financial condition and the level of
29
WAYCROSS LONG/SHORT EQUITY FUND
DISCLOSURE REGARDING APPROVAL OF INVESTMENT ADVISORY AGREEMENT (Unaudited)(Continued)
commitment to the Fund; the asset level of the Fund; the overall expenses of the Fund, including the advisory fee; and the differences in fees and services to the Adviser’s other similar clients. The Board considered its discussion with the Adviser regarding the Adviser’s Expense Limitation Agreement (the “ELA”) with the Fund, and considered the Adviser’s current and past fee reductions and expense reimbursements for the Fund. The Board further took into account the Adviser’s willingness to continue the ELA for the Fund until at least June 30, 2019.
The Board also considered potential benefits for the Adviser in managing the Fund, including promotion of the Adviser’s name. The Board compared the Fund’s advisory fee and overall expense ratio to the average and median advisory fees and expense ratios for its custom peer group and Morningstar category (Long Short Category Under $25 Million, True No-Load) and fees charged to the Adviser’s other client accounts. In considering the comparison in fees and expense ratios between the Fund and other comparable funds, the Board looked at the differences in types of funds being compared, the style of investment management, the size of the Fund, and the nature of the investment strategies. The Board noted that the Fund’s advisory fee was lower than the average and the median advisory fee for the Fund’s custom peer group and higher than the average and equal to the median advisory fee for the Morningstar category. The Board also considered the Adviser’s commitment to limit the Fund’s expenses under the ELA. The Board further noted that the overall expense ratio for the Fund was higher than the average and median net expense ratio for the other funds in the Fund’s custom peer group and Morningstar category. The Board also compared the fee paid by the Fund to the fees paid by other clients of the Adviser, and considered the similarities and differences of services received by such other clients as compared to the services received by the Fund. The Board noted that the fee structures applicable to the Adviser’s other clients were not indicative of any unreasonableness with respect to the advisory fees proposed to be payable to the Fund. The Board further considered the investment strategy and style used by the Adviser in managing the portfolio of the Fund. Following these comparisons and considerations and upon further consideration and discussion of the foregoing, the Board concluded that for the Fund, the advisory fee paid to the Adviser by the Fund is fair and reasonable.
The extent to which the Fund and its investors would benefit from economies of scale. In this regard, the Board considered that for the Fund, the fee arrangements with the Adviser involve both the advisory fee and the ELA. The Board determined that while the advisory fee remained the same as asset levels increased, the shareholders of the Fund will continue to experience benefits from the ELA until the Fund’s assets grow to a level where its expenses otherwise fall below the expense limit. Following further discussion of the asset levels for the Fund, expectations for asset growth, and level of fees, the Board determined that the fee arrangements with the Adviser will continue to provide benefits and that the Fund’s arrangements were fair and reasonable in relation to the nature and quality of services being provided by the Adviser.
30
WAYCROSS LONG/SHORT EQUITY FUND
DISCLOSURE REGARDING APPROVAL OF INVESTMENT ADVISORY AGREEMENT (Unaudited)(Continued)
Brokerage and portfolio transactions. In this regard, the Board considered the Adviser’s policies and procedures and performance in seeking best execution for its clients, including the Fund. The Board also considered the historical portfolio turnover rate for the Fund; the process by which the Adviser evaluates best execution; the method and basis for selecting and evaluating broker-dealers; and any anticipated allocation of portfolio business to persons affiliated with the Adviser. After further review and discussion, the Board determined for the Fund that the Adviser’s practices regarding brokerage and portfolio transactions are satisfactory.
Possible conflicts of interest. In evaluating the possibility for conflicts of interest, the Board considered such matters as the experience and abilities of the advisory personnel assigned to the Fund; the Adviser’s process for allocating trades among the Fund and its other clients; and the substance and administration of the Adviser’s Code of Ethics. Following further consideration and discussion, the Board found for the Fund that the Adviser’s standards and practices relating to the identification and mitigation of potential conflicts of interests were satisfactory.
Conclusion
After full consideration of the above factors as well as other factors, the Board unanimously concluded that continuance of the Investment Advisory Agreement was in the best interests of the Fund and its shareholders. It was noted that in the Trustees’ deliberation regarding the approval of the renewal of the Investment Advisory Agreement, the Trustees did not identify any particular information or factor that was all-important or controlling, and that each individual Trustee may have attributed different weights to the various factors noted above.
31
This page intentionally left blank.
This page intentionally left blank.
Item 2. Code of Ethics.
As of the end of the period covered by this report, the registrant has adopted a code of ethics that applies to the registrant’s principal executive officer, principal financial officer, principal accounting officer or controller, or persons performing similar functions, regardless of whether these individuals are employed by the registrant or a third party. Pursuant to Item 12(a)(1), a copy of registrant’s code of ethics is filed as an exhibit to this Form N-CSR. During the period covered by this report, the code of ethics has not been amended, and the registrant has not granted any waivers, including implicit waivers, from the provisions of the code of ethics.
Item 3. Audit Committee Financial Expert.
The registrant’s board of trustees has determined that the registrant has at least one audit committee financial expert serving on its audit committee. The name of the audit committee financial expert is David M. Deptula. Mr. Deptula is “independent” for purposes of this Item.
Item 4. Principal Accountant Fees and Services.
| (a) | Audit Fees. The aggregate fees billed for professional services rendered by the principal accountant for the audit of the registrant’s annual financial statements or for services that are normally provided by the accountant in connection with statutory and regulatory filings or engagements were $42,000 and $41,500 with respect to the registrant’s fiscal years ended February 28, 2018 and February 28, 2017, respectively. |
| (b) | Audit-Related Fees. No fees were billed in the last two fiscal years for assurance and related services by the principal accountant that are reasonably related to the performance of the audit of the registrant’s financial statements and are not reported under paragraph (a) of this Item. |
| (c) | Tax Fees. The aggregate fees billed for professional services rendered by the principal accountant for tax compliance, tax advice, and tax planning were $9,000 and $8,000 with respect to the registrant’s fiscal years ended February 28, 2018 and February 28, 2017, respectively. The services comprising these fees are the preparation of the registrant’s federal income and excise tax returns. |
| (d) | All Other Fees. No fees were billed in the last fiscal year for products and services provided by the principal accountant, other than the services reported in paragraphs (a) through (c) of this Item. |
| (e)(1) | The audit committee has not adopted pre-approval policies and procedures described in paragraph (c)(7) of Rule 2-01 of Regulation S-X. |
| (e)(2) | None of the services described in paragraph (b) through (d) of this Item were approved by the audit committee pursuant to paragraph (c)(7)(i)(C) of Rule 2-01 of Regulation S-X. |
| (f) | Less than 50% of hours expended on the principal accountant’s engagement to audit the registrant’s financial statements for the most recent fiscal year were attributed to work performed by persons other than the principal accountant’s full-time, permanent employees. |
| (g) | During the fiscal years ended February 28, 2018 and February 28, 2017, aggregate non-audit fees of $9,000 and $8,000, respectively, were billed by the registrant’s principal accountant for services rendered to the registrant. No non-audit fees were billed in the last two fiscal years by the registrant’s principal accountant for services rendered to the registrant’s investment adviser (not including any sub-adviser whose role is primarily portfolio management and is subcontracted with or overseen by another investment adviser), and any entity controlling, controlled by, or under common control with the adviser that provides ongoing services to the registrant. |
| (h) | The principal accountant has not provided any non-audit services to the registrant’s investment adviser (not including any sub-adviser whose role is primarily portfolio management and is subcontracted with or overseen by another investment adviser), and any entity controlling, controlled by, or under common control with the investment adviser that provides ongoing services to the registrant. |
Item 5. Audit Committee of Listed Registrants.
Not applicable
Item 6. Schedule of Investments.
| (a) | Not applicable [schedule filed with Item 1] |
| (b) | Not applicable |
Item 7. Disclosure of Proxy Voting Policies and Procedures for Closed-End Management Investment Companies.
Not applicable
Item 8. Portfolio Managers of Closed-End Management Investment Companies.
Not applicable
Item 9. Purchases of Equity Securities by Closed-End Management Investment Company and Affiliated Purchasers.
Not applicable
Item 10. Submission of Matters to a Vote of Security Holders.
The registrant’s Committee of Independent Trustees shall review shareholder recommendations to fill vacancies on the registrant’s board of trustees if such recommendations are submitted in writing, addressed to the Committee at the registrant’s offices and meet any minimum qualifications adopted by the Committee. The Committee may adopt, by resolution, a policy regarding its procedures for considering candidates for the board of trustees, including any recommended by shareholders.
Item 11. Controls and Procedures.
(a) Based on their evaluation of the registrant’s disclosure controls and procedures (as defined in Rule 30a-3(c) under the Investment Company Act of 1940) as of a date within 90 days of the filing date of this report, the registrant’s principal executive officer and principal financial officer have concluded that such disclosure controls and procedures are reasonably designed and are operating effectively to ensure that material information relating to the registrant, including its consolidated subsidiaries, is made known to them by others within those entities, particularly during the period in which this report is being prepared, and that the information required in filings on Form N-CSR is recorded, processed, summarized, and reported on a timely basis.
(b) There were no changes in the registrant’s internal control over financial reporting (as defined in Rule 30a-3(d) under the Investment Company Act of 1940) that occurred during the second fiscal quarter of the period covered by this report that have materially affected, or are reasonably likely to materially affect, the registrant’s internal control over financial reporting.
Item 12. Disclosure of Securities Lending Activities for Closed-End Management Investment Companies.
Not applicable
Item 13. Exhibits.
File the exhibits listed below as part of this Form. Letter or number the exhibits in the sequence indicated.
(a)(1) Any code of ethics, or amendment thereto, that is the subject of the disclosure required by Item 2, to the extent that the registrant intends to satisfy the Item 2 requirements through filing of an exhibit: Attached hereto
(a)(2) A separate certification for each principal executive officer and principal financial officer of the registrant as required by Rule 30a-2(a) under the Act (17 CFR 270.30a-2(a)): Attached hereto
(a)(3) Any written solicitation to purchase securities under Rule 23c-1 under the Act (17 CFR 270.23c-1) sent or given during the period covered by the report by or on behalf of the registrant to 10 or more persons: Not applicable
(a)(4) Change in the registrant’s independent public accountants: Not applicable
(b) Certifications required by Rule 30a-2(b) under the Act (17 CFR 270.30a-2(b)): Attached hereto
| Exhibit 99.CODE ETH | Code of Ethics
|
| Exhibit 99.CERT | Certifications required by Rule 30a-2(a) under the Act
|
| Exhibit 99.906CERT | Certifications required by Rule 30a-2(b) under the Act |
SIGNATURES
Pursuant to the requirements of the Securities Exchange Act of 1934 and the Investment Company Act of 1940, the registrant has duly caused this report to be signed on its behalf by the undersigned, thereunto duly authorized.
| (Registrant) | Ultimus Managers Trust | ||
| By (Signature and Title)* | /s/ Frank L. Newbauer | ||
| Frank L. Newbauer, Secretary | |||
| Date | May 9, 2018 | ||
| Pursuant to the requirements of the Securities Exchange Act of 1934 and the Investment Company Act of 1940, this report has been signed below by the following persons on behalf of the registrant and in the capacities and on the dates indicated. | |||
| By (Signature and Title)* | /s/ David R. Carson | ||
| David R. Carson, Principal Executive Officer of HVIA Equity Fund, Ladder Select Bond Fund and Waycross Long/Short Equity Fund | |||
| Date | May 9, 2018 | ||
| By (Signature and Title)* | /s/ Jennifer L. Leamer | ||
| Jennifer L. Leamer, Treasurer and Principal Accounting Officer | |||
| Date | May 9, 2018 | ||
| * | Print the name and title of each signing officer under his or her signature. |