| OMB APPROVAL |
OMB Number: 3235-0570
Expires: August 31, 2020
Estimated average burden hours per response: 20.6 |
UNITED STATES
SECURITIES AND EXCHANGE COMMISSION
Washington, D.C. 20549
FORM N-CSR
CERTIFIED SHAREHOLDER REPORT OF REGISTERED
MANAGEMENT INVESTMENT COMPANIES
| Investment Company Act file number | 811-22680 |
| Ultimus Managers Trust |
| (Exact name of registrant as specified in charter) |
| 225 Pictoria Drive, Suite 450 Cincinnati, Ohio | 45246 |
| (Address of principal executive offices) | (Zip code) |
Matthew J. Beck
| Ultimus Fund Solutions, LLC 225 Pictoria Drive, Suite 450 Cincinnati, Ohio 45246 |
| (Name and address of agent for service) |
| Registrant's telephone number, including area code: | (513) 587-3400 |
| Date of fiscal year end: | May 31 | |
| Date of reporting period: | May 31, 2018 |
Form N-CSR is to be used by management investment companies to file reports with the Commission not later than 10 days after the transmission to stockholders of any report that is required to be transmitted to stockholders under Rule 30e-1 under the Investment Company Act of 1940 (17 CFR 270.30e-1). The Commission may use the information provided on Form N-CSR in its regulatory, disclosure review, inspection, and policymaking roles.
A registrant is required to disclose the information specified by Form N-CSR, and the Commission will make this information public. A registrant is not required to respond to the collection of information contained in Form N-CSR unless the Form displays a currently valid Office of Management and Budget ("OMB") control number. Please direct comments concerning the accuracy of the information collection burden estimate and any suggestions for reducing the burden to Secretary, Securities and Exchange Commission, 450 Fifth Street, NW, Washington, DC 20549-0609. The OMB has reviewed this collection of information under the clearance requirements of 44 U.S.C. § 3507.
| Item 1. | Reports to Stockholders. |
 |
BARROW VALUE OPPORTUNITY FUND
(BALIX)
Annual Report
May 31, 2018
| BARROW VALUE OPPORTUNITY FUND LETTER TO SHAREHOLDERS (Unaudited) | July 10, 2018 |
Dear Shareholder,
We are pleased to report on the status and performance of the Barrow Value Opportunity Fund (“the Fund”) for the twelve months ended May 31, 2018.
We believe that the Fund owns a well-positioned portfolio of equity interests in excellent businesses at attractive valuations. This portfolio is highly diversified by market capitalization segments (large, middle, small), industry sectors, and issuers. In selecting investments for the Fund, we search for businesses that feature high returns on capital, wide operating margins, and low debt loads. Based on our estimates of intrinsic value, we believe our portfolio’s valuation is attractively low on an absolute basis and less expensive than the U.S. stock market as represented by the Russell 3000® Index (the “Russell 3000”).
The Fund’s long-term performance has been excellent, with an annual average total return of 14.43% since inception. The Fund has exceeded the total return of the Russell 2500 Value® Index (the “Russell 2500 Value”) in five of the past nine calendar years1. During the most recent twelve months ended May 31, 2018, the Fund returned +12.81% net of all fees and expenses, which underperformed the Russell 2500 Value by 1.04%. The underperformance was due mainly to the Fund’s overweight position to the Consumer Staples and Health Care sectors which both underperformed the benchmark. The Consumer Staples and Health Care sectors make up approximately 40% of the Fund and each returned 8.08% and 8.39%, respectively.
Barrow Street Advisors, LLC (the “Advisor”) continues to use its proprietary private-equity approach to find companies that meet its Quality-meets-Value criteria. Using the Advisor’s extensive research, the Fund seeks to generate long-term capital appreciation by investing in companies with fundamental operating and financial attributes representative of both quality and value. To increase the Fund’s chances for success, the Fund invests in a variety of positions that are diversified across market capitalization and industry sectors.
Over the past twelve-months, we uncovered 123 new investment opportunities, composed of 48 small-caps, 24 mid-caps, and 51 large-caps, across seven different industry sectors. We believe all of these new additions to the Fund’s portfolio are excellent companies with strong balance sheets and robust earnings capabilities. These companies are generally using their ample free cash flow to: a) re-invest in growth opportunities at high rates of return on investment; b) pay dividends; c) repurchase stock at attractive valuations; and/or d) retire outstanding debt.
In keeping with our practice since the beginning of 2009, over the past twelve months the Fund’s investments were sourced by taking account of the opportunity set of all companies in our broad investment universe each time we committed capital to a new position. We believe this approach allows us to uncover excellent investment opportunities that arise from temporary market inefficiencies and to gather up the most
1
compelling investments across a wide array of industries and market capitalizations, while avoiding the damaging behavioral biases inherent in concentrated-stock and sector-specialized investing.
Fifteen of the Fund’s holdings2 were announced as take-over targets over the past twelve months, which was approximately 3.2x the market average. The Fund has had investments in 108 take-overs since December 31, 20081, or roughly 3.5x the market average3. The control premiums we have captured by virtue of holding stocks that end up being merger targets has made repeated and meaningful contributions to the Fund’s total returns, and we expect continued benefits from this effect going forward. We typically sell companies from the Fund’s portfolio soon after they are announced as take-over targets and re-invest that capital.
Over the past twelve months, the Fund’s portfolio generated total returns of +9.03% for large-caps, +13.13% for mid-caps and +18.81% for small-caps. This compares to +14.38% for the S&P 500 (for large-caps), +14.86% for the S&P 400 Midcap (for mid-caps), and +20.76% for the Russell 2000 (for small-caps) over the same period. The Fund’s sectors with the best absolute performance were Information Technology and Industrials, which generated total returns of +25.97% and +19.43%, respectively. The Fund’s sectors with the worst absolute performance were Consumer Staples and Health Care, which returned +8.08% and +8.39%, respectively.
Our Commitment
Moving forward, we remain committed to: a) disciplined execution of our Quality-meets-Value strategy; b) resisting pressure to change our strategy due to periods of soft performance; and c) communicating what we do and why. We are willing to make adjustments with new information, but the bar is high.
You can find additional commentary and reports about the Advisor’s management of the Fund’s portfolio on the Barrow Fund’s website (www.barrowfunds.com).
Sincerely,
| Nicholas Chermayeff | Robert F. Greenhill, Jr. | David R. Bechtel |
| Co-Portfolio Manager, | Co-Portfolio Manager, | Principal, |
| Investment Committee | Investment Committee | Investment Committee |
| 1 | The investment related and performance information discussed above for periods prior to Barrow Value Opportunity Fund’s reorganization date (August 30, 2013) are based on the activities of the Fund’s predecessor, the Barrow Street Fund L.P., an unregistered limited partnership managed by the portfolio managers of Barrow Value Opportunity Fund (the “Predecessor Private Fund”). The Predecessor Private Fund was reorganized into the Institutional Class shares of the Barrow Value Opportunity Fund on August 30, 2013, the date that the Fund commenced operations (the “Reorganization”). Barrow Value Opportunity Fund has been managed in the same style and by the same portfolio managers since the Predecessor Private Fund’s inception on December 31, 2008. The performance information shows the Predecessor Private Fund’s returns calculated using the actual fees and expenses charged by the Predecessor Private Fund. This prior performance is net of management fees and other expenses, but does not include the effect of the Predecessor Private Fund’s performance fee, which was in place until October 7, 2012. Prior to the Reorganization, the Predecessor Private Fund was not subject to certain investment restrictions, diversification requirements, and other restrictions of the Investment Company Act of 1940, as amended, or Subchapter M of the Internal Revenue Code of 1986, as amended, which, if they had been applicable, might have adversely affected Barrow Value Opportunity Fund’s performance. |
2
| 2 | Whole Foods Market, Scripps Network Interactive, Web MD, Oclaro Inc., Alon USA Partners L.P., RPX Corp., Sucampo Pharmaceuticals, DST Systems Inc., Dr. Pepper Snapple, Ply Gem Holdings Inc., CSRA Inc., Nustar Holding, Mednax, Spectrum Brands, Express Scripts |
| 3 | The frequency of merger and acquisition (“M&A”) activity in the Fund’s portfolio is calculated on a quarterly basis by dividing the cumulative number of portfolio holdings that have been announced as merger or acquisition targets by the cumulative number of unique holdings held in the Fund’s portfolio. The frequency of M&A activity in the market is calculated on a quarterly basis by dividing the cumulative number of publicly-traded U.S. common stocks that have been announced as acquisition targets per Bloomberg by the total universe of publicly-traded U.S. common stocks as identified by Bloomberg (approximately 10,000). |
Past performance is not predictive of future performance. Investment results and principal value will fluctuate so that shares, when redeemed, may be worth more or less than their original cost. Current performance may be higher or lower than the performance data quoted. Performance data current to the most recent month end are available by calling 1-877-767-6633.
An investor should consider the investment objectives, risks, charges and expenses of the Fund carefully before investing. The Fund’s prospectus contains this and other important information. To obtain a copy of the Fund’s prospectus please visit our website at www.barrowfunds.com or call 1-877-767-6633 and a copy will be sent to you free of charge. Please read the prospectus carefully before you invest. The Fund is distributed by Ultimus Fund Distributors, LLC.
The Letter to Shareholders seeks to describe some of the Advisor’s current opinions and views of the financial markets. Although the Advisor believes it has a reasonable basis for any opinions or views expressed, actual results may differ, sometimes significantly so, from those expected or expressed. The securities held by the Fund that are discussed in the Letter to Shareholders were held during the period covered by this Report. They do not comprise the entire investment portfolio of the Fund, may be sold at any time and may no longer be held by the Fund. For a complete list of securities held by the Fund as of May 31, 2018, please see the Schedule of Investments section of the Annual Report. The opinions of the Fund’s Advisor with respect to those securities may change at any time.
Statements in the Letter to Shareholders that reflect projections or expectations for future financial or economic performance of the Fund and the market in general and statements of the Fund’s plans and objectives for future operations are forward-looking statements. No assurance can be given that actual results or events will not differ materially from those projected, estimated, assumed, or anticipated in any such forward-looking statements. Important factors that could result in such differences, in addition to factors noted with such forward-looking statements include, without limitation, general economic conditions, such as inflation, recession, and interest rates. Past performance is not a guarantee of future results.
3
BARROW VALUE OPPORTUNITY FUND
PERFORMANCE INFORMATION
May 31, 2018 (Unaudited)
Comparison of the Change in Value of a $10,000 Investment in
Barrow Value Opportunity Fund
versus the Russell 2500 Value Index* and the S&P 500® Index
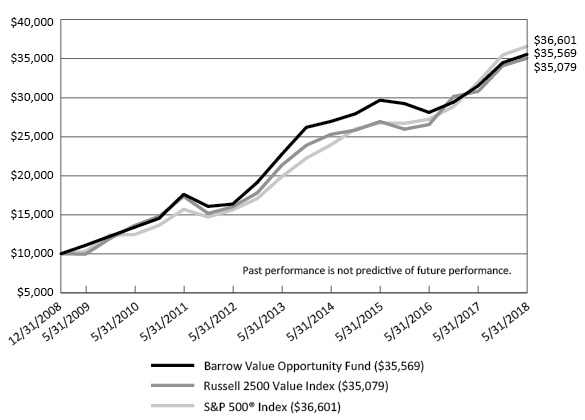
| Average Annual Total Returns For the periods ended May 31, 2018 | |||
| 1 Year | 5 Years | Since Inception(c) | |
| Barrow Value Opportunity Fund(a)(b) | 12.81% | 9.35% | 14.43% |
| Russell 2500 Value Index | 13.85% | 10.44% | 14.26% |
| S&P 500® Index | 14.38% | 12.98% | 14.78% |
| * | Effective June 1, 2018, the Russell 2500 Value Index will be the Fund’s primary benchmark instead of the S&P 500® Index. |
4
BARROW VALUE OPPORTUNITY FUND
PERFORMANCE INFORMATION
May 31, 2018 (Unaudited)
| Comparison of Yearly Returns with the Russell 2500 Value Index | |||
| Barrow Value Opportunity Fund(a) | Russell 2500 Value Index | Difference | |
| Yearly Total Returns for Calendar Years: | |||
| 2009 | 30.10% | 27.68% | 2.42% |
| 2010 | 18.75% | 24.82% | (6.07%) |
| 2011 | 5.50% | (3.36%) | 8.86% |
| 2012 | 18.77% | 19.21% | (0.44%) |
| 2013 | 36.69% | 33.32% | 3.37% |
| 2014 | 5.13% | 7.11% | (1.98%) |
| 2015 | 0.81% | (5.49%) | 6.30% |
| 2016 | 7.41% | 25.20% | (17.79%) |
| 2017 | 16.10% | 10.36% | 5.74% |
| Total Return Since Inception (not annualized, as of 12/31/17) | 249.75% | 242.39% | 7.36% |
| (a) | The Barrow Value Opportunity Fund (the “Fund”) performance includes the performance of the Barrow Street Fund L.P. (the “Predecessor Private Fund”), the Fund’s predecessor, for the periods before the Fund’s registration statement became effective. The Predecessor Private Fund was reorganized into the Fund at the close of business on August 30, 2013 (the “Reorganization”), the date the Fund commenced operations. The Fund has been managed in the same style and by the same portfolio managers since the Predecessor Private Fund’s inception on December 31, 2008. The Fund’s investment goals, policies, guidelines and restrictions are, in all material respects, equivalent to those of the Predecessor Private Fund. The performance of the Predecessor Private Fund is net of management fees of 1.50% of assets but does not include the effect of a 20% performance fee which was in place until October 7, 2012. Prior to the Reorganization, the Predecessor Private Fund was not subject to certain investment restrictions, diversification requirements and other restrictions of the Investment Company Act of 1940, as amended, or Subchapter M of the Internal Revenue Code of 1986, as amended. If such restrictions had been applicable, they might have adversely affected the Predecessor Private Fund’s performance. |
| (b) | The Fund’s total returns do not reflect the deduction of taxes a shareholder would pay on Fund distributions, if any, or the redemption of Fund shares. |
| (c) | Represents the period from December 31, 2008(a) through May 31, 2018. |
5
BARROW VALUE OPPORTUNITY FUND
PORTFOLIO INFORMATION
May 31, 2018 (Unaudited)
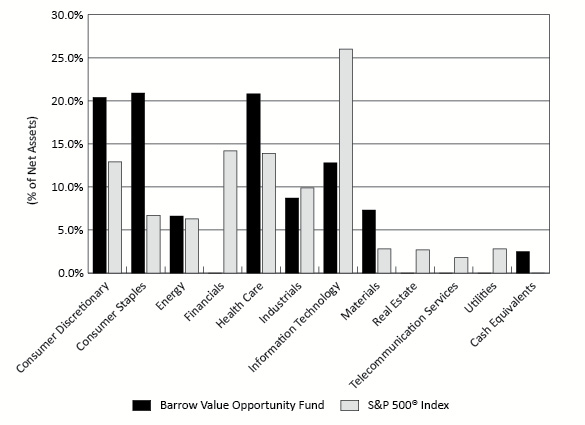
Sector Diversification
Top 10 Equity Holdings
| Security Description | % of Net Assets |
| Universal Corporation | 1.8% |
| Energizer Holdings, Inc. | 1.7% |
| Clorox Company (The) | 1.6% |
| Kellogg Company | 1.5% |
| J.M. Smucker Company (The) | 1.5% |
| Herbalife Nutrition Ltd. | 1.5% |
| Philip Morris International, Inc. | 1.5% |
| Hostess Brands, Inc. | 1.4% |
| USANA Health Sciences, Inc. | 1.4% |
| Vector Group Ltd. | 1.4% |
6
| BARROW VALUE OPPORTUNITY FUND SCHEDULE OF INVESTMENTS May 31, 2018 | ||||||||
| COMMON STOCKS — 97.5% | Shares | Value | ||||||
| Consumer Discretionary — 20.4% | ||||||||
| Auto Components — 2.3% | ||||||||
| BorgWarner, Inc. | 4,621 | $ | 225,412 | |||||
| Cooper-Standard Holdings, Inc. (a) | 1,220 | 151,524 | ||||||
| Dorman Products, Inc. (a) | 2,347 | 151,429 | ||||||
| Gentex Corporation (b) | 10,095 | 242,583 | ||||||
| Lear Corporation (b) | 1,190 | 235,620 | ||||||
| 1,006,568 | ||||||||
| Automobiles — 0.0% (c) | ||||||||
| LCI Industries | 191 | 16,751 | ||||||
| Diversified Consumer Services — 1.0% | ||||||||
| H&R Block, Inc. (b) | 8,441 | 231,706 | ||||||
| ServiceMaster Global Holdings, Inc. (a) | 4,045 | 231,131 | ||||||
| 462,837 | ||||||||
| Hotels, Restaurants & Leisure — 2.6% | ||||||||
| Bluegreen Vacations Corporation | 11,860 | 238,386 | ||||||
| Bojangles', Inc. (a) | 15,127 | 223,880 | ||||||
| Hilton Worldwide Holdings, Inc. | 4,285 | 345,842 | ||||||
| Yum! Brands, Inc. (b) | 4,263 | 346,710 | ||||||
| 1,154,818 | ||||||||
| Household Durables — 1.8% | ||||||||
| D.R. Horton, Inc. | 8,586 | 362,415 | ||||||
| La-Z-Boy, Inc. | 5,159 | 160,961 | ||||||
| NVR, Inc. (a) (b) | 78 | 233,262 | ||||||
| Tupperware Brands Corporation (b) | 563 | 23,736 | ||||||
| 780,374 | ||||||||
| Internet & Direct Marketing Retail — 1.5% | ||||||||
| Booking Holdings, Inc. (a) | 172 | 362,734 | ||||||
| Nutrisystem, Inc. | 1,529 | 57,032 | ||||||
| PetMed Express, Inc. | 6,542 | 235,316 | ||||||
| 655,082 | ||||||||
| Leisure Products — 1.6% | ||||||||
| Brunswick Corporation | 219 | 13,928 | ||||||
| Malibu Boats, Inc. - Class A (a) | 5,565 | 238,627 | ||||||
| MCBC Holdings, Inc. (a) | 7,990 | 235,625 | ||||||
| Nautilus, Inc. (a) | 15,069 | 225,282 | ||||||
| 713,462 | ||||||||
7
| BARROW VALUE OPPORTUNITY FUND SCHEDULE OF INVESTMENTS (Continued) | ||||||||
| COMMON STOCKS — 97.5% (Continued) | Shares | Value | ||||||
| Consumer Discretionary — 20.4% (Continued) | ||||||||
| Media — 2.6% | ||||||||
| AMC Networks, Inc. - Class A (a) (b) | 4,127 | $ | 235,941 | |||||
| Interpublic Group of Companies, Inc. (The) (b) | 9,740 | 220,124 | ||||||
| John Wiley & Sons, Inc. - Class A | 3,543 | 240,215 | ||||||
| Liberty Media Corporation - Liberty SiriusXM - Series A (a) | 5,237 | 242,211 | ||||||
| Viacom, Inc. - Class B | 8,301 | 224,957 | ||||||
| 1,163,448 | ||||||||
| Multi-Line Retail — 1.4% | ||||||||
| Dollar General Corporation (b) | 3,777 | 330,412 | ||||||
| Dollar Tree, Inc. (a) | 3,720 | 307,235 | ||||||
| 637,647 | ||||||||
| Specialty Retail — 3.4% | ||||||||
| Aaron's, Inc. | 5,742 | 228,417 | ||||||
| Bed Bath & Beyond, Inc. | 13,243 | 240,493 | ||||||
| Buckle, Inc. (The) | 9,398 | 237,299 | ||||||
| Chico's FAS, Inc. | 22,870 | 193,480 | ||||||
| DSW, Inc. - Class A (b) | 6,250 | 149,250 | ||||||
| Sally Beauty Holdings, Inc. (a) | 14,997 | 227,055 | ||||||
| Winmark Corporation (b) | 1,707 | 244,442 | ||||||
| 1,520,436 | ||||||||
| Textiles, Apparel & Luxury Goods — 2.2% | ||||||||
| Carter's, Inc. | 2,169 | 236,443 | ||||||
| Hanesbrands, Inc. | 1,516 | 27,637 | ||||||
| Ralph Lauren Corporation | 1,972 | 265,392 | ||||||
| Skechers U.S.A., Inc. - Class A (a) | 7,908 | 229,806 | ||||||
| Tapestry, Inc. | 5,148 | 225,070 | ||||||
| 984,348 | ||||||||
| Consumer Staples — 20.9% | ||||||||
| Food Products — 8.6% | ||||||||
| General Mills, Inc. | 228 | 9,642 | ||||||
| Hershey Company (The) | 3,298 | 296,952 | ||||||
| Hostess Brands, Inc. (a) (b) | 46,902 | �� | 639,274 | |||||
| Ingredion, Inc. (b) | 4,512 | 502,592 | ||||||
| J.M. Smucker Company (The) (b) | 6,267 | 673,703 | ||||||
| Kellogg Company | 10,472 | 674,292 | ||||||
| Pilgrim's Pride Corporation (a) (b) | 8,813 | 171,765 | ||||||
| Sanderson Farms, Inc. (b) | 2,792 | 273,281 | ||||||
| Simply Good Foods Company (The) (a) (b) | 43,196 | 572,347 | ||||||
| 3,813,848 | ||||||||
8
| BARROW VALUE OPPORTUNITY FUND SCHEDULE OF INVESTMENTS (Continued) | ||||||||
| COMMON STOCKS — 97.5% (Continued) | Shares | Value | ||||||
| Consumer Staples — 20.9% (Continued) | ||||||||
| Household Products — 4.0% | ||||||||
| Clorox Company (The) (b) | 5,874 | $ | 709,755 | |||||
| Colgate-Palmolive Company | 4,772 | 301,066 | ||||||
| Energizer Holdings, Inc. (b) | 12,258 | 744,551 | ||||||
| Procter & Gamble Company (The) | 130 | 9,512 | ||||||
| 1,764,884 | ||||||||
| Personal Products — 3.0% | ||||||||
| Edgewell Personal Care Company (a) (b) | 1,501 | 65,624 | ||||||
| Herbalife Nutrition Ltd. (a) (b) | 12,948 | 657,370 | ||||||
| USANA Health Sciences, Inc. (a) (b) | 5,375 | 628,875 | ||||||
| 1,351,869 | ||||||||
| Tobacco — 5.3% | ||||||||
| Altria Group, Inc. (b) | 3,404 | 189,739 | ||||||
| Philip Morris International, Inc. | 8,216 | 653,501 | ||||||
| Turning Point Brands, Inc. | 3,973 | 107,589 | ||||||
| Universal Corporation (b) | 12,307 | 814,108 | ||||||
| Vector Group Ltd. (b) | 31,526 | 611,604 | ||||||
| 2,376,541 | ||||||||
| Energy — 6.6% | ||||||||
| Oil, Gas & Consumable Fuels — 6.6% | ||||||||
| Antero Midstream GP, L.P. | 22,540 | 433,895 | ||||||
| Antero Midstream Partners, L.P. | 4,346 | 131,467 | ||||||
| Arch Coal, Inc. - Class A | 3,473 | 285,342 | ||||||
| Delek Logistics Partners, L.P. | 9,796 | 288,002 | ||||||
| EQT GP Holdings, L.P. | 5,127 | 127,047 | ||||||
| EQT Midstream Partners, L.P. | 605 | 33,777 | ||||||
| Green Plains Partners, L.P. | 16,448 | 286,195 | ||||||
| HollyFrontier Corporation (b) | 4,002 | 308,874 | ||||||
| PBF Logistics, L.P. | 13,985 | 280,399 | ||||||
| Peabody Energy Corporation | 9,952 | 430,623 | ||||||
| Renewable Energy Group, Inc. (a) | 18,037 | 321,961 | ||||||
| 2,927,582 | ||||||||
| Health Care — 20.8% | ||||||||
| Health Care Equipment & Supplies — 9.9% | ||||||||
| Anika Therapeutics, Inc. (a) (b) | 3,675 | 149,426 | ||||||
| Atrion Corporation | 107 | 63,130 | ||||||
| Danaher Corporation | 3,536 | 351,054 | ||||||
| Edwards Lifesciences Corporation (a) | 2,600 | 357,006 | ||||||
| Globus Medical, Inc. - Class A (a) (b) | 8,876 | 493,062 | ||||||
| Heska Corporation (a) | 795 | 85,017 | ||||||
9
| BARROW VALUE OPPORTUNITY FUND SCHEDULE OF INVESTMENTS (Continued) | ||||||||
| COMMON STOCKS — 97.5% (Continued) | Shares | Value | ||||||
| Health Care — 20.8% (Continued) | ||||||||
| Health Care Equipment & Supplies — 9.9% (Continued) | ||||||||
| Hologic, Inc. (a) (b) | 11,612 | $ | 439,979 | |||||
| Integer Holdings Corporation (a) | 4,376 | 288,816 | ||||||
| Lantheus Holdings, Inc. (a) (b) | 3,325 | 46,550 | ||||||
| LeMaitre Vascular, Inc. (b) | 423 | 14,416 | ||||||
| Masimo Corporation (a) (b) | 4,604 | 456,026 | ||||||
| Meridian Bioscience, Inc. (b) | 20,523 | 303,740 | ||||||
| NuVasive, Inc. (a) | 1,617 | 82,887 | ||||||
| Orthofix International N.V. (a) | 1,491 | 81,483 | ||||||
| Quidel Corporation (a) | 4,790 | 300,333 | ||||||
| Varex Imaging Corporation (a) | 2,185 | 80,758 | ||||||
| Varian Medical Systems, Inc. (a) (b) | 3,758 | 442,956 | ||||||
| Zimmer Biomet Holdings, Inc. (b) | 3,130 | 349,026 | ||||||
| 4,385,665 | ||||||||
| Health Care Providers & Services — 8.1% | ||||||||
| American Renal Associates Holdings, Inc. (a) | 13,779 | 198,969 | ||||||
| AmerisourceBergen Corporation (b) | 3,566 | 292,911 | ||||||
| AMN Healthcare Services, Inc. (a) | 3,701 | 209,107 | ||||||
| CVS Health Corporation | 8,321 | 527,468 | ||||||
| Envision Healthcare Corporation (a) (b) | 10,528 | 451,440 | ||||||
| McKesson Corporation | 1,338 | 189,916 | ||||||
| MEDNAX, Inc. (a) (b) | 9,428 | 432,274 | ||||||
| Patterson Companies, Inc. | 9,194 | 192,338 | ||||||
| Premier, Inc. - Class A (a) (b) | 13,819 | 450,776 | ||||||
| Quest Diagnostics, Inc. (b) | 4,321 | 460,316 | ||||||
| Tivity Health, Inc. (a) (b) | 5,486 | 192,284 | ||||||
| 3,597,799 | ||||||||
| Pharmaceuticals — 2.8% | ||||||||
| Akorn, Inc. (a) | 1,908 | 26,655 | ||||||
| ANI Pharmaceuticals, Inc. (a) | 808 | 51,138 | ||||||
| Corcept Therapeutics, Inc. (a) | 13,028 | 241,018 | ||||||
| Innoviva, Inc. (a) (b) | 16,102 | 238,149 | ||||||
| Pacira Pharmaceuticals, Inc. (a) | 751 | 25,722 | ||||||
| Phibro Animal Health Corporation - Class A | 5,404 | 244,261 | ||||||
| Prestige Brands Holdings, Inc. (a) | 5,799 | 193,860 | ||||||
| Supernus Pharmaceuticals, Inc. (a) (b) | 4,052 | 228,330 | ||||||
| 1,249,133 | ||||||||
10
| BARROW VALUE OPPORTUNITY FUND SCHEDULE OF INVESTMENTS (Continued) | ||||||||
| COMMON STOCKS — 97.5% (Continued) | Shares | Value | ||||||
| Industrials — 8.2% | ||||||||
| Aerospace & Defense — 1.2% | ||||||||
| Engility Holdings, Inc. (a) | 1,446 | $ | 45,462 | |||||
| Harris Corporation | 941 | 141,592 | ||||||
| Lockheed Martin Corporation | 455 | 143,116 | ||||||
| National Presto Industries, Inc. (b) | 442 | 49,902 | ||||||
| TransDigm Group, Inc. | 444 | 148,345 | ||||||
| 528,417 | ||||||||
| Air Freight & Logistics — 0.4% | ||||||||
| C.H. Robinson Worldwide, Inc. | 400 | 34,800 | ||||||
| Expeditors International of Washington, Inc. | 2,070 | 154,173 | ||||||
| 188,973 | ||||||||
| Building Products — 1.1% | ||||||||
| CSW Industrials, Inc. (a) | 949 | 46,121 | ||||||
| Fortune Brands Home & Security, Inc. | 321 | 18,031 | ||||||
| Gibraltar Industries, Inc. (a) | 1,264 | 50,118 | ||||||
| Johnson Controls International plc | 4,004 | 134,374 | ||||||
| Masco Corporation (b) | 3,985 | 148,521 | ||||||
| Patrick Industries, Inc. (a) | 734 | 44,480 | ||||||
| PGT Innovations, Inc. (a) | 2,314 | 47,900 | ||||||
| 489,545 | ||||||||
| Commercial Services & Supplies — 1.3% | ||||||||
| ACCO Brands Corporation | 3,813 | 49,188 | ||||||
| Brady Corporation - Class A (b) | 1,219 | 47,541 | ||||||
| Deluxe Corporation | 2,154 | 143,327 | ||||||
| Ennis, Inc. | 2,503 | 45,680 | ||||||
| Herman Miller, Inc. (b) | 1,415 | 46,341 | ||||||
| Interface, Inc. | 1,894 | 42,994 | ||||||
| Kimball International, Inc. - Class B | 2,830 | 45,988 | ||||||
| Knoll, Inc. (b) | 2,165 | 43,733 | ||||||
| McGrath RentCorp | 678 | 44,124 | ||||||
| SP Plus Corporation (a) (b) | 1,265 | 45,540 | ||||||
| Steelcase, Inc. - Class A (b) | 3,091 | 44,510 | ||||||
| 598,966 | ||||||||
| Electrical Equipment — 0.4% | ||||||||
| Acuity Brands, Inc. | 161 | 19,038 | ||||||
| Atkore International Group, Inc. (a) | 2,178 | 47,045 | ||||||
| Generac Holdings, Inc. (a) | 889 | 44,530 | ||||||
| TPI Composites, Inc. (a) | 1,712 | 45,026 | ||||||
| 155,639 | ||||||||
11
| BARROW VALUE OPPORTUNITY FUND SCHEDULE OF INVESTMENTS (Continued) | ||||||||
| COMMON STOCKS — 97.5% (Continued) | Shares | Value | ||||||
| Industrials — 8.2% (Continued) | ||||||||
| Industrial Conglomerates — 0.4% | ||||||||
| Carlisle Companies, Inc. | 326 | $ | 35,009 | |||||
| Honeywell International, Inc. (b) | 987 | 145,987 | ||||||
| 180,996 | ||||||||
| Machinery — 0.8% | ||||||||
| Global Brass & Copper Holdings, Inc. (b) | 1,405 | 44,117 | ||||||
| Greenbrier Companies, Inc. (The) (b) | 959 | 47,662 | ||||||
| Hillenbrand, Inc. | 981 | 45,764 | ||||||
| Lydall, Inc. (a) | 1,062 | 44,498 | ||||||
| Meritor, Inc. (a) | 2,147 | 44,550 | ||||||
| TriMas Corporation (a) | 1,556 | 44,502 | ||||||
| Wabash National Corporation (b) | 2,248 | 44,982 | ||||||
| Welbilt, Inc. (a) | 2,261 | 44,022 | ||||||
| 360,097 | ||||||||
| Professional Services — 1.3% | ||||||||
| Dun & Bradstreet Corporation (The) (b) | 1,222 | 150,074 | ||||||
| FTI Consulting, Inc. (a) | 717 | 44,447 | ||||||
| Kforce, Inc. | 1,329 | 44,721 | ||||||
| Resources Connection, Inc. | 2,900 | 48,285 | ||||||
| Robert Half International, Inc. (b) | 2,388 | 152,068 | ||||||
| TriNet Group, Inc. (a) (b) | 2,832 | 151,908 | ||||||
| 591,503 | ||||||||
| Road & Rail — 0.1% | ||||||||
| AMERCO | 99 | 31,971 | ||||||
| Trading Companies & Distributors — 1.2% | ||||||||
| H&E Equipment Services, Inc. | 1,149 | 39,721 | ||||||
| HD Supply Holdings, Inc. (a) (b) | 3,765 | 153,348 | ||||||
| MSC Industrial Direct Company, Inc. - Class A | 387 | 35,538 | ||||||
| United Rentals, Inc. (a) (b) | 912 | 145,528 | ||||||
| W.W. Grainger, Inc. | 490 | 151,405 | ||||||
| 525,540 | ||||||||
| Information Technology — 12.8% | ||||||||
| Communications Equipment — 1.8% | ||||||||
| Applied Optoelectronics, Inc. (a) | 748 | 34,984 | ||||||
| Casa Systems, Inc. (a) | 5,568 | 106,961 | ||||||
| F5 Networks, Inc. (a) (b) | 1,358 | 235,084 | ||||||
| InterDigital, Inc. (b) | 1,425 | 112,361 | ||||||
| Juniper Networks, Inc. | 8,700 | 231,768 | ||||||
| Ubiquiti Networks, Inc. (a) | 661 | 54,592 | ||||||
| 775,750 | ||||||||
12
| BARROW VALUE OPPORTUNITY FUND SCHEDULE OF INVESTMENTS (Continued) | ||||||||
| COMMON STOCKS — 97.5% (Continued) | Shares | Value | ||||||
| Information Technology — 12.8% (Continued) | ||||||||
| Electronic Equipment, Instruments & Components — 2.1% | ||||||||
| Arrow Electronics, Inc. (a) | 719 | $ | 53,292 | |||||
| AVX Corporation | 980 | 14,984 | ||||||
| Belden, Inc. | 204 | 11,273 | ||||||
| Coherent, Inc. (a) | 224 | 37,419 | ||||||
| Electro Scientific Industries, Inc. (a) | 5,814 | 114,071 | ||||||
| ePlus, Inc. (a) | 1,296 | 117,871 | ||||||
| Insight Enterprises, Inc. (a) | 2,521 | 118,235 | ||||||
| KEMET Corporation (a) | 820 | 16,384 | ||||||
| Methode Electronics, Inc. (b) | 2,720 | 109,208 | ||||||
| PC Connection, Inc. (b) | 3,914 | 115,815 | ||||||
| Systemax, Inc. | 3,651 | 120,556 | ||||||
| Tech Data Corporation (a) | 12 | 1,042 | ||||||
| Vishay Intertechnology, Inc. | 5,254 | 111,385 | ||||||
| 941,535 | ||||||||
| Internet Software & Services — 1.3% | ||||||||
| Blucora, Inc. (a) (b) | 2,246 | 85,236 | ||||||
| Cars.com, Inc. (a) (b) | 3,074 | 78,940 | ||||||
| eBay, Inc. (a) | 2,553 | 96,299 | ||||||
| j2 Global, Inc. | 837 | 70,676 | ||||||
| NIC, Inc. (b) | 4,981 | 76,458 | ||||||
| Stamps.com, Inc. (a) | 290 | 72,732 | ||||||
| VeriSign, Inc. (a) | 563 | 73,438 | ||||||
| Web.com Group, Inc. (a) (b) | 1,132 | 22,131 | ||||||
| 575,910 | ||||||||
| IT Services — 3.8% | ||||||||
| Amdocs Ltd. | 1,089 | 73,464 | ||||||
| Booz Allen Hamilton Holding Corporation (b) | 1,762 | 79,449 | ||||||
| Broadridge Financial Solutions, Inc. | 618 | 71,348 | ||||||
| CACI International, Inc. - Class A (a) | 440 | 73,326 | ||||||
| Cass Information Systems, Inc. | 1,248 | 77,588 | ||||||
| Cognizant Technology Solutions Corporation - Class A (b) | 1,285 | 96,825 | ||||||
| Convergys Corporation | 3,111 | 73,544 | ||||||
| CSG Systems International, Inc. | 1,929 | 79,822 | ||||||
| Euronet Worldwide, Inc. (a) | 31 | 2,598 | ||||||
| First Data Corporation - Class A (a) | 4,924 | 93,556 | ||||||
| Fiserv, Inc. (a) | 1,346 | 97,720 | ||||||
| Hackett Group, Inc. (The) | 4,773 | 76,845 | ||||||
| International Business Machines Corporation | 674 | 95,243 | ||||||
13
| BARROW VALUE OPPORTUNITY FUND SCHEDULE OF INVESTMENTS (Continued) | ||||||||
| COMMON STOCKS — 97.5% (Continued) | Shares | Value | ||||||
| Information Technology — 12.8% (Continued) | ||||||||
| IT Services — 3.8% (Continued) | ||||||||
| Leidos Holdings, Inc. | 1,164 | $ | 69,910 | |||||
| ManTech International Corporation - Class A (b) | 1,215 | 65,501 | ||||||
| MAXIMUS, Inc. (b) | 1,157 | 70,461 | ||||||
| Paychex, Inc. (b) | 1,519 | 99,616 | ||||||
| Presidio, Inc. (a) | 794 | 10,624 | ||||||
| Sabre Corporation | 2,989 | 73,260 | ||||||
| Science Applications International Corporation (b) | 804 | 71,114 | ||||||
| Sykes Enterprises, Inc. (a) | 601 | 16,918 | ||||||
| Syntel, Inc. (a) (b) | 2,528 | 79,632 | ||||||
| TTEC Holdings, Inc. | 2,298 | 81,119 | ||||||
| Western Union Company (The) | 3,584 | 71,286 | ||||||
| 1,700,769 | ||||||||
| Software — 1.3% | ||||||||
| CA, Inc. (b) | 2,033 | 72,659 | ||||||
| CDK Global, Inc. | 1,118 | 71,943 | ||||||
| Citrix Systems, Inc. (a) | 676 | 71,399 | ||||||
| Ebix, Inc. (b) | 1,009 | 75,271 | ||||||
| Manhattan Associates, Inc. (a) (b) | 1,749 | 76,117 | ||||||
| MicroStrategy, Inc. - Class A (a) | 598 | 77,483 | ||||||
| Oracle Corporation (b) | 2,078 | 97,084 | ||||||
| Progress Software Corporation | 1,261 | 47,767 | ||||||
| 589,723 | ||||||||
| Technology Hardware, Storage & Peripherals — 2.5% | ||||||||
| HP, Inc. (b) | 10,272 | 226,292 | ||||||
| NCR Corporation (a) | 7,635 | 229,813 | ||||||
| Seagate Technology plc | 3,922 | 221,005 | ||||||
| Western Digital Corporation | 2,735 | 228,400 | ||||||
| Xerox Corporation | 8,200 | 222,876 | ||||||
| 1,128,386 | ||||||||
| Materials — 7.8% | ||||||||
| Chemicals — 1.5% | ||||||||
| Chemours Company (The) | 4,241 | 207,767 | ||||||
| Eastman Chemical Company | 253 | 26,390 | ||||||
| Huntsman Corporation | 6,815 | 217,876 | ||||||
| Trinseo S.A. | 2,905 | 210,031 | ||||||
| Valvoline, Inc. (b) | 232 | 4,742 | ||||||
| 666,806 | ||||||||
14
| BARROW VALUE OPPORTUNITY FUND SCHEDULE OF INVESTMENTS (Continued) | ||||||||
| COMMON STOCKS — 97.5% (Continued) | Shares | Value | ||||||
| Materials — 7.8% (Continued) | ||||||||
| Containers & Packaging — 2.9% | ||||||||
| Avery Dennison Corporation | 2,033 | $ | 213,526 | |||||
| Greif, Inc. - Class A (b) | 7,345 | 428,287 | ||||||
| Sealed Air Corporation | 5,013 | 218,366 | ||||||
| Silgan Holdings, Inc. | 15,944 | 433,996 | ||||||
| 1,294,175 | ||||||||
| Metals & Mining — 0.8% | ||||||||
| Alcoa Corporation (a) | 3,744 | 179,974 | ||||||
| Steel Dynamics, Inc. | 3,890 | 192,283 | ||||||
| 372,257 | ||||||||
| Paper & Forest Products — 2.6% | ||||||||
| Boise Cascade Company (b) | 10,000 | 477,000 | ||||||
| Louisiana-Pacific Corporation | 7,910 | 230,814 | ||||||
| Schweitzer-Mauduit International, Inc. (b) | 9,997 | 437,968 | ||||||
| 1,145,782 | ||||||||
| Total Common Stocks (Cost $39,573,060) | $ | 43,405,832 | ||||||
| MONEY MARKET FUNDS — 1.8% | Shares | Value | ||||||
| Fidelity Institutional Money Market Government Portfolio - Class I, 1.64% (d) (Cost $780,931) | 780,931 | $ | 780,931 | |||||
| Total Investments at Value — 99.3% (Cost $40,353,991) | $ | 44,186,763 | ||||||
| Other Assets in Excess of Liabilities — 0.7% | 308,519 | |||||||
| Net Assets — 100.0% | $ | 44,495,282 | ||||||
| (a) | Non-income producing security. |
| (b) | All or a portion of the shares have been pledged as collateral for trading purposes. |
| (c) | Percentage rounds to less than 0.1%. |
| (d) | The rate shown is the 7-day effective yield as of May 31, 2018. |
| See accompanying notes to financial statements. | |
15
| BARROW VALUE OPPORTUNITY FUND STATEMENT OF ASSETS AND LIABILITIES May 31, 2018 | ||||
| ASSETS | ||||
| Investments in securities: | ||||
| At acquisition cost | $ | 40,353,991 | ||
| At value (Note 2) | $ | 44,186,763 | ||
| Deposits with brokers | 294,592 | |||
| Dividends receivable | 52,829 | |||
| Other assets | 5,871 | |||
| TOTAL ASSETS | 44,540,055 | |||
| LIABILITIES | ||||
| Payable for capital shares redeemed | 2,200 | |||
| Payable to Adviser (Note 4) | 26,348 | |||
| Payable to administrator (Note 4) | 8,590 | |||
| Other accrued expenses and liabilities | 7,635 | |||
| TOTAL LIABILITIES | 44,773 | |||
| NET ASSETS | $ | 44,495,282 | ||
| Net assets consist of: | ||||
| Paid-in capital | $ | 37,627,504 | ||
| Undistributed net investment income | 339,164 | |||
| Undistributed net realized gains from investment transactions | 2,695,842 | |||
| Net unrealized appreciation on investments | 3,832,772 | |||
| Net assets | $ | 44,495,282 | ||
| Shares of beneficial interest outstanding (unlimited number of shares authorized, no par value) | 1,581,281 | |||
| Net asset value, offering price and redemption price per share (Note 2) | $ | 28.14 | ||
| See accompanying notes to financial statements. |
16
| BARROW VALUE OPPORTUNITY FUND STATEMENT OF OPERATIONS For the Year Ended May 31, 2018 | ||||
| INVESTMENT INCOME | ||||
| Dividends | $ | 716,603 | ||
| EXPENSES | ||||
| Investment advisory fees (Note 4) | 397,328 | |||
| Administration fees (Note 4) | 40,249 | |||
| Professional fees | 38,110 | |||
| Accounting services fees (Note 4) | 34,026 | |||
| Custodian and bank service fees | 19,316 | |||
| Registration and filing fees | 19,026 | |||
| Transfer agent fees (Note 4) | 12,500 | |||
| Compliance service fees (Note 4) | 12,000 | |||
| Trustees’ fees and expenses (Note 4) | 9,866 | |||
| Pricing fees | 4,927 | |||
| Postage and supplies | 3,856 | |||
| Printing of shareholder reports | 3,347 | |||
| Insurance expense | 2,519 | |||
| Other expenses | 8,672 | |||
| TOTAL EXPENSES | 605,742 | |||
| Investment advisory fee reductions (Note 4) | (144,028 | ) | ||
| NET EXPENSES | 461,714 | |||
| NET INVESTMENT INCOME | 254,889 | |||
| REALIZED AND UNREALIZED GAINS (LOSSES) ON INVESTMENTS | ||||
| Net realized gains from investments | 6,433,813 | |||
| Net change in unrealized appreciation (depreciation) on investments | (1,937,607 | ) | ||
| NET REALIZED AND UNREALIZED GAINS ON INVESTMENTS | 4,496,206 | |||
| NET INCREASE IN NET ASSETS RESULTING FROM OPERATIONS | $ | 4,751,095 | ||
| See accompanying notes to financial statements. |
17
| BARROW VALUE OPPORTUNITY FUND STATEMENTS OF CHANGES IN NET ASSETS | ||||||||
| Year Ended May 31, 2018 | Year Ended May 31, 2017 | |||||||
| FROM OPERATIONS | ||||||||
| Net investment income | $ | 254,889 | $ | 362,228 | ||||
| Net realized gains from investment transactions | 6,433,813 | 362,237 | ||||||
| Net change in unrealized appreciation (depreciation) on investments | (1,937,607 | ) | 3,167,589 | |||||
| Net increase in net assets resulting from operations | 4,751,095 | 3,892,054 | ||||||
| DISTRIBUTIONS TO SHAREHOLDERS (Note 2) | ||||||||
| From investment income | (178,341 | ) | (167,099 | ) | ||||
| From net realized gains | (3,847,984 | ) | (56,937 | ) | ||||
| Decrease in net assets from distributions to shareholders | (4,026,325 | ) | (224,036 | ) | ||||
| CAPITAL SHARE TRANSACTIONS | ||||||||
| Proceeds from shares sold | 7,592,521 | 900,733 | ||||||
| Net asset value of shares issued in reinvestment of distributions | 4,023,803 | 223,340 | ||||||
| Payments for shares redeemed | (2,218,506 | ) | (4,941,868 | ) | ||||
| Net increase (decrease) in net assets from capital share transactions | 9,397,818 | (3,817,795 | ) | |||||
| TOTAL INCREASE (DECREASE) IN NET ASSETS | 10,122,588 | (149,777 | ) | |||||
| NET ASSETS | ||||||||
| Beginning of year | 34,372,694 | 34,522,471 | ||||||
| End of year | $ | 44,495,282 | $ | 34,372,694 | ||||
| UNDISTRIBUTED NET INVESTMENT INCOME | $ | 339,164 | $ | 289,961 | ||||
| CAPITAL SHARE ACTIVITY | ||||||||
| Shares sold | 268,435 | 33,363 | ||||||
| Shares reinvested | 146,791 | 8,470 | ||||||
| Shares redeemed | (79,369 | ) | (189,414 | ) | ||||
| Net increase (decrease) in shares outstanding | 335,857 | (147,581 | ) | |||||
| Shares outstanding, beginning of year | 1,245,424 | 1,393,005 | ||||||
| Shares outstanding, end of year | 1,581,281 | 1,245,424 | ||||||
| See accompanying notes to financial statements. |
18
| BARROW VALUE OPPORTUNITY FUND FINANCIAL HIGHLIGHTS | ||||||||||||||||||||
Per share data for a share outstanding throughout each period: | ||||||||||||||||||||
| Year Ended May 31, 2018 | Year Ended May 31, 2017 | Year Ended May 31, 2016 | Year Ended May 31, 2015 | Period Ended May 31, 2014(a) | ||||||||||||||||
| Net asset value at beginning of period | $ | 27.60 | $ | 24.78 | $ | 26.58 | $ | 26.40 | $ | 23.30 | ||||||||||
| Income (loss) from investment operations: | ||||||||||||||||||||
| Net investment income | 0.12 | 0.31 | 0.27 | (b) | 0.27 | 0.18 | ||||||||||||||
| Net realized and unrealized gains (losses) on investments | 3.33 | 2.69 | (1.68 | ) | 2.25 | 3.47 | ||||||||||||||
| Total from investment operations | 3.45 | 3.00 | (1.41 | ) | 2.52 | 3.65 | ||||||||||||||
| Less distributions: | ||||||||||||||||||||
| From net investment income | (0.12 | ) | (0.13 | ) | (0.19 | ) | (0.20 | ) | (0.06 | ) | ||||||||||
| From net realized gains from investments | (2.79 | ) | (0.05 | ) | (0.20 | ) | (2.14 | ) | (0.49 | ) | ||||||||||
| Total distributions | (2.91 | ) | (0.18 | ) | (0.39 | ) | (2.34 | ) | (0.55 | ) | ||||||||||
| Net asset value at end of period | $ | 28.14 | $ | 27.60 | $ | 24.78 | $ | 26.58 | $ | 26.40 | ||||||||||
| Total return (c) | 12.81 | % | 12.14 | % | (5.29 | %) | 10.10 | % | 15.73 | %(d) | ||||||||||
| Ratios and supplemental data: | ||||||||||||||||||||
| Net assets at end of period (000’s) | $ | 44,495 | $ | 34,373 | $ | 34,522 | $ | 31,945 | $ | 21,380 | ||||||||||
| Ratio of total expenses to average net assets | 1.51 | % | 1.57 | % | 1.60 | % | 1.79 | % | 1.86 | %(e) | ||||||||||
| Ratio of net expenses to average net assets (f) | 1.15 | % | 1.16 | %(g) | 1.16 | %(g) | 1.15 | % | 1.15 | %(e) | ||||||||||
| Ratio of net investment income to average net assets (f) | 0.63 | % | 1.06 | % | 1.08 | % | 1.29 | % | 1.01 | %(e) | ||||||||||
| Portfolio turnover rate | 276 | % | 88 | % | 84 | % | 112 | % | 45 | %(d) | ||||||||||
| (a) | Represents the period from the commencement of operations (close of business August 30, 2013) through May 31, 2014. |
| (b) | Calculated using average shares outstanding. |
| (c) | Total return is a measure of the change in value of an investment in the Fund over the periods covered, which assumes any dividends or capital gains distributions are reinvested in shares of the Fund. The returns shown do not reflect the deduction of taxes a shareholder would pay on Fund distributions or the redemption of Fund shares. The total returns would have been lower if the Adviser had not reduced advisory fees and/or reimbursed expenses. |
| (d) | Not annualized. |
| (e) | Annualized. |
| (f) | Ratio was determined after fee reductions and/or expense reimbursements by the Adviser (Note 4). |
| (g) | Ratio includes borrowing costs of 0.01% and 0.01% for the years ended May 31, 2017 and 2016, respectively. |
| See accompanying notes to financial statements. | |
19
BARROW VALUE OPPORTUNITY FUND
NOTES TO FINANCIAL STATEMENTS
May 31, 2018
1. Organization
Barrow Value Opportunity Fund (the “Fund”) is a diversified series of Ultimus Managers Trust (the “Trust”), an open-end investment company established as an Ohio business trust under a Declaration of Trust dated February 28, 2012. Other series of the Trust are not incorporated in this report.
The investment objective of Barrow Value Opportunity Fund is to seek to generate long-term capital appreciation.
2. Significant Accounting Policies
In October 2016, the U.S. Securities and Exchange Commission (the “SEC”) adopted amendments to Regulation S-X, which impact financial statement presentation, particularly the presentation of derivative investments. The Fund has adopted these amendments, which were effective August 1, 2017, with these financial statements.
The following is a summary of the Fund’s significant accounting policies. These policies are in conformity with accounting principles generally accepted in the United States of America (“GAAP”). The Fund follows accounting and reporting guidance under Financial Accounting Standards Board Accounting Standards Codification Topic 946, “Financial Services – Investment Companies.”
Securities valuation – The Fund values its portfolio securities at market value as of the close of regular trading on the New York Stock Exchange (the “NYSE”) (normally 4:00 p.m. Eastern time) on each business day the NYSE is open for business. The Fund values its listed securities on the basis of the security’s last sale price on the security’s primary exchange, if available, otherwise at the exchange’s most recently quoted mean price. NASDAQ-listed securities are valued at the NASDAQ Official Closing Price. When using a quoted price and when the market for the security is considered active, the security will be classified as Level 1 within the fair value hierarchy (see below). In the event that market quotations are not readily available or are considered unreliable due to market or other events, the Fund values its securities and other assets at fair value in accordance with procedures established by and under the general supervision of the Trust’s Board of Trustees (the “Board”). Under these procedures, the securities will be classified as Level 2 or 3 within the fair value hierarchy, depending on the inputs used. Unavailable or unreliable market quotes may be due to the following factors: a substantial bid-ask spread; infrequent sales resulting in stale prices; insufficient trading volume; small trade sizes; a temporary lapse in any reliable pricing source; and actions
20
| BARROW VALUE OPPORTUNITY FUND NOTES TO FINANCIAL STATEMENTS (Continued) |
of the securities or futures markets, such as the suspension or limitation of trading. As a result, the prices of securities used to calculate the Fund’s net asset value (“NAV”) may differ from quoted or published prices for the same securities.
GAAP establishes a single authoritative definition of fair value, sets out a framework for measuring fair value, and requires additional disclosures about fair value measurements.
Various inputs are used in determining the value of the Fund’s investments and other financial instruments. These inputs are summarized in the three broad levels listed below:
| ● | Level 1 – quoted prices in active markets for identical securities |
| ● | Level 2 – other significant observable inputs |
| ● | Level 3 – significant unobservable inputs |
The inputs or methods used for valuing securities are not necessarily an indication of the risks associated with investing in those securities. The inputs used to measure fair value may fall into different levels of the fair value hierarchy. In such cases, for disclosure purposes, the level in the fair value hierarchy within which the fair value measurement falls in its entirety is determined based on the lowest level input that is significant to the fair value measurement.
The following is a summary of the inputs used to value the Fund’s investments as of May 31, 2018:
| Level 1 | Level 2 | Level 3 | Total | |||||||||||||
| Common Stocks | $ | 43,405,832 | $ | — | $ | — | $ | 43,405,832 | ||||||||
| Money Market Funds | 780,931 | — | — | 780,931 | ||||||||||||
| Total | $ | 44,186,763 | $ | — | $ | — | $ | 44,186,763 | ||||||||
Refer to the Fund’s Schedule of Investments for a listing of securities by industry type. As of May 31, 2018, the Fund did not have any transfers between Levels. There were no Level 3 securities or derivative instruments held by the Fund as of May 31, 2018. It is the Fund’s policy to recognize transfers between Levels at the end of the reporting period.
Share valuation – The NAV per share of the Fund is calculated daily by dividing the total value of its assets, less liabilities, by the number of shares outstanding. The offering price and redemption price per share of the Fund is equal to the NAV per share.
Investment income/expense – Dividend income and expense are recorded on the ex-dividend date. Interest income is accrued as earned.
21
| BARROW VALUE OPPORTUNITY FUND NOTES TO FINANCIAL STATEMENTS (Continued) |
Investment transactions – Investment transactions are accounted for on the trade date. Realized gains and losses on investments sold are determined on a specific identification basis.
Common expenses – Common expenses of the Trust are allocated among the Fund and the other series of the Trust based on the relative net assets of each series or the nature of the services performed and the relative applicability to each series.
Distributions to shareholders – The Fund distributes to shareholders any net investment income dividends and net realized capital gains distributions at least once each year. The amount of such dividends and distributions are determined in accordance with federal income tax regulations, which may differ from GAAP. Dividends and distributions to shareholders are recorded on the ex-dividend date. The tax character of distributions paid to shareholders of the Fund was as follows:
| Year Ended | Ordinary Income | Long-Term Capital Gains | Total Distributions | ||||||||||
| May 31, 2018 | $ | 178,341 | $ | 3,847,984 | $ | 4,026,325 | |||||||
| May 31, 2017 | $ | 167,099 | $ | 56,937 | $ | 224,036 | |||||||
Estimates – The preparation of financial statements in conformity with GAAP requires management to make estimates and assumptions that affect the reported amounts of assets and liabilities and disclosure of contingent assets and liabilities as of the date of the financial statements and the reported amounts of income and expenses during the reporting period. Actual results could differ from those estimates.
Federal income tax – The Fund has qualified and intends to continue to qualify each year as a regulated investment company under the Internal Revenue Code of 1986, as amended (the “Code”). Qualification generally will relieve the Fund of liability for federal income taxes to the extent 100% of its net investment income and net realized capital gains are distributed in accordance with the Code.
In order to avoid imposition of the excise tax applicable to regulated investment companies, it is also the Fund’s intention to declare as dividends in each calendar year at least 98% of its net investment income (earned during the calendar year) and 98.2% of its net realized capital gains (earned during the twelve months ended October 31) plus undistributed amounts from prior years.
22
| BARROW VALUE OPPORTUNITY FUND NOTES TO FINANCIAL STATEMENTS (Continued) |
The following information is computed on a tax basis for each item as of May 31, 2018:
| Cost of portfolio investments | $ | 40,592,177 | ||
| Gross unrealized appreciation | $ | 4,423,018 | ||
| Gross unrealized depreciation | (828,432 | ) | ||
| Net unrealized appreciation | 3,594,586 | |||
| Undistributed ordinary income | 2,405,299 | |||
| Undistributed long-term capital gains | 867,893 | |||
| Accumulated earnings | $ | 6,867,778 |
The value of the federal income tax cost of portfolio investments and tax components of accumulated earnings may temporarily differ from the financial statement cost of portfolio investments and components of net assets (“book/tax differences”). These book/tax differences are due to the recognition of capital gains or losses under income tax regulations and GAAP, primarily the tax deferral of losses on wash sales and the tax treatment of income and capital gains on publicly-traded partnerships held by the Fund.
For the year ended May 31, 2018, the following reclassifications were made as a result of permanent differences between financial statement and income tax reporting requirements:
| Paid-in capital | $ | 1,324 | ||
| Undistributed net investment income | (27,345 | ) | ||
| Undistributed net realized gains from investment transactions | 26,021 |
Such reclassifications had no effect on the Fund’s total net assets or NAV per share.
The Fund recognizes tax benefits or expenses of uncertain tax positions only when the position is “more likely than not” of being sustained assuming examination by tax authorities. Management has reviewed the tax positions taken on Federal income tax returns for all open tax years (tax years ended May 31, 2015 through May 31, 2018) and has concluded that no provision for unrecognized tax benefits or expenses is required in these financial statements. The Fund identifies its major tax jurisdiction as U.S. Federal.
3. Investment Transactions
During the year ended May 31, 2018, cost of purchases and proceeds from sales of investment securities, other than short-term investments, amounted to $113,670,611 and $108,617,423, respectively, for the Fund.
23
| BARROW VALUE OPPORTUNITY FUND NOTES TO FINANCIAL STATEMENTS (Continued) |
4. Transactions with Related Parties
INVESTMENT ADVISORY AGREEMENT
The Fund’s investments are managed by the Adviser pursuant to the terms of an Investment Advisory Agreement. The Fund pays the Adviser an investment advisory fee, computed and accrued daily and paid monthly, at the annual rate of 0.99% of its average daily net assets.
Pursuant to an Expense Limitation Agreement (“ELA”) between the Fund and the Adviser, the Adviser has contractually agreed, until October 1, 2019, to reduce investment advisory fees and reimburse other operating expenses to limit total annual operating expenses of the Fund (exclusive of brokerage fees and commissions; taxes; borrowing costs such as interest and dividend expenses on securities sold short; acquired fund fees and expenses; extraordinary expenses such as litigation and merger or reorganization costs and other expenses not incurred in the ordinary course of the Fund’s business; and amounts, if any, payable pursuant to a plan adopted in accordance with Rule 12b-1 under the Investment Company Act of 1940, as amended (the “1940 Act”)) to an amount not exceeding 1.15% of the Fund’s average daily net assets. Accordingly, during the year ended May 31, 2018, the Adviser reduced its investment advisory fees in the amount of $144,028.
Under the terms of the ELA, investment advisory fee reductions and expense reimbursements by the Adviser are subject to recoupment by the Adviser for a period of three years after such fees and expenses were incurred, provided that the recoupments do not cause total annual operating expenses of the Fund to exceed the lesser of (i) the expense limitation then in effect, if any, and (ii) the expense limitation in effect at the time the expenses to be repaid were incurred. As of May 31, 2018, the Adviser may seek recoupment of investment advisory fee reductions and/or expense reimbursements in the amount of $444,364, which must be recouped no later than the dates as stated below:
| May 31, 2019 | May 31, 2020 | May 31, 2021 | Total | |||||||||||
| $ | 157,109 | $ | 143,227 | $ | 144,028 | $ | 444,364 | |||||||
OTHER SERVICE PROVIDERS
Ultimus Fund Solutions, LLC (“Ultimus”) provides administration, fund accounting, compliance, and transfer agency services to the Fund. The Fund pays Ultimus fees in accordance with the agreements for such services. In addition, the Fund pays out-of-pocket expenses including, but not limited to, postage, supplies, and costs of pricing its portfolio securities.
24
| BARROW VALUE OPPORTUNITY FUND NOTES TO FINANCIAL STATEMENTS (Continued) |
Under the terms of a Distribution Agreement with the Trust, Ultimus Fund Distributors, LLC (the “Distributor”) serves as principal underwriter to the Fund. The Distributor is a wholly-owned subsidiary of Ultimus. The Distributor is compensated by the Adviser (not the Fund) for acting as principal underwriter.
Certain officers and a Trustee of the Trust are also officers of Ultimus and the Distributor.
TRUSTEE COMPENSATION
Each Trustee who is not an “interested person” of the Trust (“Independent Trustee”) receives a $1,000 annual retainer from the Fund, paid quarterly, except for the Board Chair who receives a $1,200 annual retainer from the Fund, paid quarterly. Each Independent Trustee also receives from the Fund a fee of $500 for each Board meeting attended plus reimbursement for travel and other meeting-related expenses.
PRINCIPAL HOLDERS OF FUND SHARES
As of May 31, 2018, the following shareholders owned of record 5% or more of the outstanding shares of the Fund:
| Name of Record Owner | % Ownership |
| Socatean Partners | 43% |
| Charles Schwab & Company, Inc. (for the benefit of its customers) | 40% |
| Robert F. Greenhill, Jr. (a principal of the Adviser) | 13% |
A beneficial owner of 25% or more of the Fund’s outstanding shares may be considered a controlling person. That shareholder’s vote could have a more significant effect on matters presented at a shareholder’s meeting.
5. Contingencies and Commitments
The Fund indemnifies the Trust’s officers and Trustees for certain liabilities that might arise from their performance of their duties to the Fund. Additionally, in the normal course of business the Fund enters into contracts that contain a variety of representations and warranties and which provide general indemnifications. The Fund’s maximum exposure under these arrangements is unknown, as this would involve future claims that may be made against the Fund that have not yet occurred. However, based on experience, the Fund expects the risk of loss to be remote.
25
| BARROW VALUE OPPORTUNITY FUND NOTES TO FINANCIAL STATEMENTS (Continued) |
6. Subsequent Events
The Fund is required to recognize in the financial statements the effects of all subsequent events that provide additional evidence about conditions that existed as of the date of the Statements of Assets and Liabilities. For non-recognized subsequent events that must be disclosed to keep the financial statements from being misleading, the Fund is required to disclose the nature of the event as well as an estimate of its financial effect, or a statement that such an estimate cannot be made. Management has evaluated subsequent events through the issuance of these financial statements and has noted no such events.
26
| BARROW VALUE OPPORTUNITY FUND REPORT OF INDEPENDENT REGISTERED PUBLIC ACCOUNTING FIRM |
To the Board of Trustees of Ultimus Managers Trust
and the Shareholders of Barrow Value Opportunity Fund
Opinion on the Financial Statements
We have audited the accompanying statement of assets and liabilities of Barrow Value Opportunity Fund, a series of shares of beneficial interest in Ultimus Managers Trust (the “Fund”), including the schedule of investments, as of May 31, 2018, and the related statement of operations for the year then ended, the statements of changes in net assets for each of the years in the two-year period then ended and the financial highlights for each of the years in the four-year period then ended and for the period August 30, 2013 (commencement of operations) through May 31, 2014, and the related notes (collectively referred to as the “financial statements”). In our opinion, the financial statements present fairly, in all material respects, the financial position of the Fund as of May 31, 2018, and the results of its operations for the year then ended, the changes in its net assets for each of the years in the two-year period then ended and its financial highlights for each of the years in the four-year period then ended and for the period August 30, 2013 through May 31, 2014, in conformity with accounting principles generally accepted in the United States of America.
Basis for Opinion
These financial statements are the responsibility of the Fund’s management. Our responsibility is to express an opinion on the Fund’s financial statements based on our audits. We are a public accounting firm registered with the Public Company Accounting Oversight Board (United States) (“PCAOB”) and are required to be independent with respect to the Fund in accordance with the U.S. federal securities law and the applicable rules and regulations of the Securities and Exchange Commission and the PCAOB.
We conducted our audits in accordance with the standards of the PCAOB. Those standards require that we plan and perform the audits to obtain reasonable assurance about whether the financial statements are free of material misstatement, whether due to error or fraud. The Fund is not required to have, nor were we engaged to perform, an audit of its internal control over financial reporting. As part of our audits we are required to obtain an understanding of internal control over financial reporting but not for the purpose of expressing an opinion on the effectiveness of the Fund’s internal control over financial reporting. Accordingly, we express no such opinion.
Our audits included performing procedures to assess the risk of material misstatement of the financial statements, whether due to error or fraud, and performing procedures that respond to those risks. Such procedures include examining, on a test basis, evidence regarding the amounts and disclosures in the financial statements. Our procedures included confirmation of securities owned as of May 31, 2018 by correspondence with the custodian and brokers. Our audits also included evaluating
27
| BARROW VALUE OPPORTUNITY FUND REPORT OF INDEPENDENT REGISTERED PUBLIC ACCOUNTING FIRM (Continued) |
the accounting principles used and significant estimates made by management, as well as evaluating the overall presentation of the financial statements. We believe that our audits provide a reasonable basis for our opinion.
 | |
| BBD, LLP |
We have served as the auditor of one or more of the Funds in Ultimus Managers Trust since 2013.
Philadelphia, Pennsylvania
July 25, 2018
28
| BARROW VALUE OPPORTUNITY FUND ABOUT YOUR FUND’S EXPENSES (Unaudited) |
We believe it is important for you to understand the impact of costs on your investment. As a shareholder of the Fund, you incur ongoing costs, including management fees and other operating expenses. The following examples are intended to help you understand your ongoing costs (in dollars) of investing in the Fund and to compare these costs with the ongoing costs of investing in other mutual funds.
A mutual fund’s ongoing costs are expressed as a percentage of its average net assets. This figure is known as the expense ratio. The expenses in the table below are based on an investment of $1,000 made at the beginning of the most recent period (December 1, 2017) and held until the end of the period (May 31, 2018).
The table below illustrates the Fund’s ongoing costs in two ways:
Actual fund return – This section helps you to estimate the actual expenses that you paid over the period. The “Ending Account Value” shown is derived from the Fund’s actual return, and the fourth column shows the dollar amount of operating expenses that would have been paid by an investor who started with $1,000 in the Fund. You may use the information here, together with the amount you invested, to estimate the expenses that you paid over the period.
To do so, simply divide your account value by $1,000 (for example, an $8,600 account value divided by $1,000 = 8.6), then multiply the result by the number given for the Fund under the heading “Expenses Paid During Period.”
Hypothetical 5% return – This section is intended to help you compare the Fund’s ongoing costs with those of other mutual funds. It assumes that the Fund had an annual return of 5% before expenses during the period shown, but that the expense ratio is unchanged. In this case, because the return used is not the Fund’s actual return, the results do not apply to your investment. The example is useful in making comparisons because the SEC requires all mutual funds to calculate expenses based on a 5% return. You can assess the Fund’s ongoing costs by comparing this hypothetical example with the hypothetical examples that appear in shareholder reports of other funds.
Note that expenses shown in the table are meant to highlight and help you compare ongoing costs only. The Fund does not charge transaction fees, such as purchase or redemption fees, nor does it carry a “sales load.”
The calculations assume no shares were bought or sold during the period. Your actual costs may have been higher or lower, depending on the amount of your investment and the timing of any purchases or redemptions.
29
| BARROW VALUE OPPORTUNITY FUND ABOUT YOUR FUND’S EXPENSES (Unaudited) (Continued) |
More information about the Fund’s expenses can be found in this report. For additional information on operating expenses and other shareholder costs, please refer to the Fund’s prospectus.
| Beginning Account Value December 1, 2017 | Ending Account Value May 31, 2018 | Net Expense Ratio(a) | Expenses Paid During Period(b) | |
| Based on Actual Fund Return | $1,000.00 | $1,031.30 | 1.15% | 5.82 |
| Based on Hypothetical 5% Return (before expenses) | $1,000.00 | $1,019.20 | 1.15% | 5.82 |
| (a) | Annualized, based on the Fund’s most recent one-half year expenses. |
| (b) | Expenses are equal to the Fund’s annualized net expense ratio multiplied by the average account value over the period, multiplied by 182/365 (to reflect the one-half year period). |
30
| BARROW VALUE OPPORTUNITY FUND OTHER INFORMATION (Unaudited) |
A description of the policies and procedures that the Fund uses to vote proxies relating to portfolio securities is available without charge upon request by calling toll-free 1-877-767-6633, or on the SEC’s website at http://www.sec.gov. Information regarding how the Fund voted proxies relating to portfolio securities during the most recent 12 month period ended June 30 is also available without charge upon request by calling toll-free 1-877-767-6633, or on the SEC’s website at http://www.sec.gov.
The Trust files a complete listing of portfolio holdings for the Fund with the SEC as of the end of the first and third quarters of each fiscal year on Form N-Q. These filings are available upon request by calling 1-877-767-6633. Furthermore, you may obtain a copy of the filings on the SEC’s website at http://www.sec.gov. The Trust’s Forms N-Q may also be reviewed and copied at the SEC’s Public Reference Room in Washington, DC, and information on the operation of the Public Reference Room may be obtained by calling 1-800-SEC-0330.
FEDERAL TAX INFORMATION (Unaudited)
For the fiscal year ended May 31, 2018, the Fund designated $3,847,984 as long-term capital gain distributions subject to a maximum tax rate of 20%.
Qualified Dividend Income – The Fund designates 99.95% of its ordinary income dividends, or up to the maximum amount of such dividends allowable pursuant to the Internal Revenue Code, as qualified dividend income eligible for the reduced tax rate of 15%.
Dividends Received Deduction – Corporate shareholders are generally entitled to take the dividends received deduction on the portion of the Fund’s dividend distribution that qualifies under tax law. For the Fund’s fiscal year ended May 31, 2018, 99.95% of ordinary income dividends qualifies for the corporate dividends received deduction.
31
| BARROW VALUE OPPORTUNITY FUND BOARD OF TRUSTEES AND EXECUTIVE OFFICERS (Unaudited) |
The Board has overall responsibility for management of the Trust’s affairs. The Trustees serve during the lifetime of the Trust and until its termination, or until death, resignation, retirement, or removal. The Trustees, in turn, elect the officers of the Fund to actively supervise its day-to-day operations. The officers have been elected for an annual term. Unless otherwise noted, each Trustee’s and officer’s address is 225 Pictoria Drive, Suite 450, Cincinnati, OH 45246. The following are the Trustees and executive officers of the Fund:
| Name and Year of Birth | Length of Time Served | Position(s) Held with Trust | Principal Occupation(s) During Past 5 Years | Number of Funds in Trust Overseen by Trustee | Directorships of Public Companies Held by Trustee During Past 5 Years |
| Interested Trustees: | |||||
Robert G. Dorsey* Year of Birth: 1957 | Since February 2012 | Trustee (February 2012 to present)
President (July 2012 to October 2013) | Managing Director and Co-Chief Executive Officer of Ultimus Fund Solutions, LLC and its subsidiaries (1999 to present) | 19 | None |
| Independent Trustees: | |||||
Janine L. Cohen Year of Birth: 1952 | Since January 2016 | Trustee | Retired since 2013; Chief Financial Officer from 2004 to 2013 and Chief Compliance Officer from 2008 to 2013 at AER Advisors, Inc. | 19 | None |
David M. Deptula Year of Birth: 1958 | Since June 2012 | Trustee | Vice President of Legal and Special Projects at Dayton Freight Lines, Inc. since 2016; Vice President of Tax Treasury at The Standard Register Inc. (formerly The Standard Register Company) from 2011 to 2016 | 19 | None |
32
| BARROW VALUE OPPORTUNITY FUND BOARD OF TRUSTEES AND EXECUTIVE OFFICERS (Unaudited) (Continued) |
| Name and Year of Birth | Length of Time Served | Position(s) Held with Trust | Principal Occupation(s) During Past 5 Years | Number of Funds in Trust Overseen by Trustee | Directorships of Public Companies Held by Trustee During Past 5 Years |
| Independent Trustees (Continued): | |||||
John J. Discepoli Year of Birth: 1963 | Since June 2012 | Chairman (May 2016
Trustee (June 2012 | Owner of Discepoli Financial Planning, LLC (personal financial planning company) since 2004 | 19 | None |
| * | Mr. Dorsey is considered an “interested person” of the Trust within the meaning of Section 2(a)(19) of the 1940 Act because of his relationship with the Trust’s administrator, transfer agent and distributor. |
| Name and Year of Birth | Length of Time Served | Position(s) Held with Trust | Principal Occupation(s) During Past 5 Years |
| Executive Officers: | |||
David R. Carson Year of Birth: 1958 | Since April 2013 | Principal Executive Officer (April 2017 to present)
President (October 2013 to present)
Vice (April 2013 to October 2013) | Vice President and Director of Client Strategies of Ultimus Fund Solutions, LLC (2013 to present); President, Unified Series Trust (2016 to present); Chief Compliance Officer, FSI Low Beta Absolute Return Fund (2013 to 2016), The Huntington Funds (2005 to 2013), Huntington Strategy Shares (2012 to 2013), and Huntington Asset Advisors (2013); Vice President, Huntington National Bank (2001 to 2013) |
33
| BARROW VALUE OPPORTUNITY FUND BOARD OF TRUSTEES AND EXECUTIVE OFFICERS (Unaudited) (Continued) |
| Name and Year of Birth | Length of Time Served | Position(s) Held with Trust | Principal Occupation(s) During Past 5 Years |
| Executive Officers (Continued): | |||
Jennifer L. Leamer Year of Birth: 1976 | Since April 2014 | Treasurer (October 2014
Assistant Treasurer (April 2014 to October 2014) | Vice President, Mutual Fund Controller of Ultimus Fund Solutions, LLC (2014 to present); Business Analyst of Ultimus Fund Solutions, LLC (2007 to 2014) |
Matthew J. Beck Year of Birth: 1988 | Since June 2018 | Secretary (June 2018 | Senior Attorney of Ultimus Fund Solutions (2018 to present); General Counsel of The Nottingham Company (2014 to 2018) |
| Charles C. Black Year of Birth: 1979 | Since April 2015 | Chief Compliance Officer
Assistant Chief Compliance Officer (April 2015 to January 2016) | Senior Compliance Officer of Ultimus Fund Solutions, LLC (2015 to present); Chief Compliance Officer of The Caldwell & Orkin Funds, Inc. (2016 to present); Senior Compliance Manager at Touchstone Mutual Funds (2013 to 2015); Senior Compliance Manager at Fund Evaluation Group (2011 to 2013) |
Additional information about members of the Board and executive officers is available in the Fund’s Statement of Additional Information (“SAI”). To obtain a free copy of the SAI, please call 1-877-767-6633.
34
| BARROW VALUE OPPORTUNITY FUND DISCLOSURE REGARDING APPROVAL OF INVESTMENT ADVISORY AGREEMENT (Unaudited) |
The Board of Trustees (the “Board”), including the Independent Trustees voting separately, has reviewed and approved the Fund’s Investment Advisory Agreement with the Barrow Street Advisors LLC (the “Adviser”) for an additional annual term. Approval took place at an in-person meeting held on January 22-23, 2018, at which all of the Trustees were present.
In the course of their deliberations, the Board was advised by legal counsel. The Board received and reviewed a substantial amount of information provided by the Adviser in response to requests of the Board and counsel.
In deciding whether to approve the renewal of the Investment Advisory Agreement, the Board recalled its review of the materials related to the Fund and the Adviser throughout the preceding 12 months and its numerous discussions with Trust Management and the Adviser about the operations and performance of the Fund during that period. The Board further considered those materials and discussions and other numerous factors, including the following:
The nature, extent, and quality of the services provided by the Adviser. In this regard, the Board reviewed the services being provided by the Adviser to the Fund including, without limitation, its investment advisory services since the Fund’s inception, the Adviser’s compliance procedures and practices, and its efforts to promote the Fund and assist in its distribution. After reviewing the foregoing information and further information from the Adviser (e.g. description of the Adviser’s business and Form ADV), the Board concluded that the quality, extent, and nature of the services provided by the Adviser were satisfactory and adequate for the Fund.
The investment performance of the Fund. In this regard, the Board compared the performance of the Fund with the performance of its benchmark index and related Morningstar category (Mid Cap Blend Category Under $100 Million, True No-Load). The Board noted that the Fund’s one-year performance was less than its benchmark, and was more than the average and the median performance for its Morningstar category. The Board noted that the Adviser had satisfactorily explained the reasons for the underperformance of the Fund to its benchmark. The Board also considered the consistency of the Adviser’s management with the Fund’s investment objective and policies. Following discussion of the investment performance of the Fund and its performance relative to its category, the Adviser’s experience in managing mutual funds, its historical investment performance, and other factors, the Board concluded that the investment performance of the Fund has been satisfactory.
The costs of the services provided and profits realized by the Adviser and its affiliates from its relationship with the Fund. In this regard, the Board considered the Adviser’s staffing, personnel, and methods of operations; the education and experience of its personnel; compliance program, policies, and procedures; financial condition and the level of commitment to the Fund, and, generally, the Adviser’s advisory business;
35
| BARROW VALUE OPPORTUNITY FUND DISCLOSURE REGARDING APPROVAL OF INVESTMENT ADVISORY AGREEMENT (Unaudited) (Continued) |
the asset level of the Fund; the overall expenses of the Fund, including the advisory fee; and the differences in fees and services to the Adviser’s other similar clients that may be similar to the Fund. The Board considered the Adviser’s Expense Limitation Agreement (the “ELA”) with the Fund, and considered the Adviser’s current and past fee reductions and expense reimbursements for the Fund. The Board further took into account the Adviser’s commitment to continue the ELA for the Fund until at least October 1, 2019.
The Board also considered potential benefits for the Adviser in managing the Fund, including promotion of the Adviser’s name and the potential for it to receive research, statistical, or other services from the Fund’s trades. The Board compared the Fund’s advisory fee and overall expense ratio to the average advisory fees and average expense ratios for its custom peer group and Morningstar category. In addition, the Board compared the Fund to the other mutual funds in its Morningstar category and custom peer group in terms of the style of investment management, the size of the fund, and the nature of the investment strategies. The Board noted that the advisory fee for the Fund was slightly below the average and above the median for its custom peer group and the overall expense ratio for the Fund was also below the average and above the median for its peer group. The Board further noted that the advisory fee for the Fund was in the 20th percentile for its Morningstar category and the overall expense ratio for the Fund was in the 40th percentile for its Morningstar category. The Board also noted that the Fund generally had fewer assets than most funds in its custom peer group and Morningstar category. The Board also compared the fees paid by the Fund to the fees paid by other clients of the Adviser, and considered the similarities and differences of services received by such other clients as compared to the services provided to the Fund. The Board further considered the investment strategy and style used by the Adviser in managing the portfolio of the Fund. Following these comparisons and upon further consideration and discussion of the foregoing, the Board concluded that the advisory fee paid to the Adviser by the Fund is fair and reasonable.
The extent to which economies of scale would be realized as the Fund grows and whether advisory fee levels reflect these economies of scale for the benefit of the Fund’s investors. In this regard, the Board considered that the Fund’s fee arrangements with the Adviser involve both the advisory fee and the ELA. The Board determined that while the advisory fee remained the same as asset levels increased, the shareholders of the Fund have experienced benefits from the ELA and shareholders of the Fund will continue to experience benefits from the ELA until the Fund’s assets grow to the level where its expenses otherwise fall below the expense limit. Following further discussion of the Fund’s asset levels, expectations for growth, and level of fees, the Board determined that the Fund’s fee arrangement with the Adviser would continue to provide benefits. The Board also determined that the fee arrangements were fair and reasonable given the Fund’s projected asset levels for the next year.
36
| BARROW VALUE OPPORTUNITY FUND DISCLOSURE REGARDING APPROVAL OF INVESTMENT ADVISORY AGREEMENT (Unaudited) (Continued) |
Brokerage and portfolio transactions. In this regard, the Board considered the Adviser’s policies, procedures, and performance in seeking best execution for the Fund. The Board also considered the historical portfolio turnover rate for the Fund; the process by which evaluations are made of the overall reasonableness of commissions paid; the method and basis for selecting and evaluating the broker-dealers used; and any anticipated allocation of portfolio business to persons affiliated with the Adviser. After further review and discussion, the Board determined that the Adviser’s practices regarding brokerage and portfolio transactions were satisfactory.
Possible conflicts of interest. In evaluating the possibility for conflicts of interest, the Board considered such matters as the experience and abilities of the advisory personnel assigned to the Fund, the Adviser’s process for allocating trades among its different clients, and the substance and administration of the Adviser’s Code of Ethics. Following further consideration and discussion, the Board found that the Adviser’s standards and practices relating to the identification and mitigation of potential conflicts of interests were satisfactory.
Conclusion
After full consideration of the above factors as well as other factors, the Board unanimously concluded that approval of the Investment Advisory Agreement was in the best interests of the Fund and its shareholders. It was noted that in the Trustees’ deliberation regarding the approval of the renewal of the Investment Advisory Agreement, the Trustees did not identify any particular information or factor that was all-important or controlling, and that each individual Trustee may have attributed different weights to the various factors noted above.
37

CINCINNATI ASSET MANAGEMENT FUNDS:
BROAD MARKET STRATEGIC INCOME FUND
Annual Report
May 31, 2018
| CINCINNATI ASSET MANAGEMENT FUNDS: BROAD MARKET STRATEGIC INCOME FUND LETTER TO SHAREHOLDERS (Unaudited) | July 2, 2018 |
Dear Fellow Shareholders,
Our Annual report for the Cincinnati Asset Management Funds: Broad Market Strategic Income Fund (the “Fund”) presents data and performance for the year ended May 31, 2018. All of us at Cincinnati Asset Management, Inc. want to thank you for your investment in the Fund, and we appreciate your confidence in our investment management.
The Fund is currently invested primarily in investment-grade and high-yield corporate bonds that we consider undervalued. We believe that our proprietary analysis enhances our ability to identify such opportunities and enables us to sell securities when more attractive opportunities present themselves. These investment decisions are made with the important discipline of maintaining portfolio diversification and with the dual objectives of achieving a high level of income while preserving capital. Our objective is to improve quality, increase yield and shorten maturity.
Our disciplined investing strategy resulted in the Fund holding 93 positions in the bonds of 79 different corporations on May 31. The Fund continues to be fully invested. The Fund trailed the Bloomberg Barclays U.S. Corporate Baa Index (the “Benchmark”) for the twelve-month fiscal period ended May 31, with a total return, net of fees, of -1.28% compared to a return of +0.32% for the Benchmark. Unlike the Benchmark, the Fund achieves its Baa credit quality by diversifying its holdings across the credit spectrum, although it does not currently own or plan to purchase securities of companies rated below B3/B-. The Fund’s return deviated from the Benchmark because the lowest rated credits in the high yield universe significantly outperformed the high yield index as a whole, and the Baa credits in the investment grade universe also significantly outperformed A and higher rated bonds. In addition, longer maturity bonds outperformed intermediate maturity bonds during the period, so the Fund was adversely impacted both by holding higher rated high yield bonds and higher rated investment grade bonds as well as by maintaining an intermediate term average maturity. We continue to believe that a broader diversification of credit risk as well as a focus on intermediate term maturities will benefit Fund investors over reasonable time periods.
Interest rates rose during the year. On June 1, 2017, the yield on the 10-year Treasury Bond was 2.21%; it rose gradually to 2.36% by December 1 and then increased rapidly to 2.79% at February 1. It then continued to increase and traded periodically over 3.00% before closing at 2.90% on June 1. The premium yield on both investment grade and high yield bonds began and ended the twelve-month period at approximately the same level, although spreads widened and tightened throughout the year.
The Federal Reserve Board (the “FED”) increased the Federal Funds Target Rate three times during the twelve months to 1.75% at the time of this letter. The rate is expected to be increased at least twice more by the end of calendar 2018, given the expected improvement in GDP. Typically, changes in the Target Rate don’t significantly influence the 10-year Treasury rate but rather result in rate increases over the shorter portion of the yield curve; that dynamic can be observed in the “flattening” of the yield curve where the difference between yields on the 10-year and 2-year Treasuries declined from 0.92% to 0.43% over the course of the twelve months. At this time, the timing of additional rate increases is less critical than
1
the questions of “how high” and “how fast.” As of May 31, bonds that the Fund owns were yielding 4.45% to average maturity, around 1.60% more than 10-year U.S. Treasury yields. We believe that the Fund’s positions will continue to provide excellent value relative to other investment-grade rated fixed-income alternatives.
During the fourth calendar quarter of 2017, GDP increased by 2.9%; the second GDP estimate for the first calendar quarter of 2018 was 2.2% (Bureau of Economic Analysis). Although several sources predict far greater growth in GDP for the second calendar quarter, the Federal Reserve Open Market Committee estimates 2018 GDP growth to be on the order of 2.8%; this implies growth for the balance of the year to be far greater than 2.8%, given the Q1 print of 2.2%. Unemployment has declined to its lowest levels since the 2008 financial crisis and initial jobless claims during the last six months have been steady at reduced levels. The FED’s measure of inflation is around its target of 2.0%. Although interest rates will be impacted by “headline” news and the so-called “risk-off/risk-on” trades that cause short-term volatility, we intend to focus on the relative value of investment grade and high-yield corporate bonds and will maintain our focus on the intermediate-term maturity of the portfolio. It is the underlying credit quality of the companies we purchase that influences our investment decisions, not short-term interest rate fluctuations.
Oil prices increased during the year and after exceeding $70, current WTI is approximately $65 up from the $50 level at this time last year. The Fund holds several positions in companies that are engaged in the energy sector, and we continue to actively monitor these credits to determine how they may perform over a full market cycle, always seeking to be rewarded for the risks we assume.
We expect increased volatility in fixed-income markets as some participants continually readjust positioning. High yield bond funds had negative flows during the Fund’s last fiscal quarter, while investment grade funds experienced robust increases. In a world of low interest rates, corporate and high yield bonds continue to offer value relative to Treasury securities. As always, we will continue to search for value and adjust positions as we uncover compelling situations.
We appreciate your confidence in our Fund. Our fellow investors are very important to us and if you have any questions regarding market conditions or the Fund, please don’t hesitate to call us (513.554.8500).
Sincerely,
Cincinnati Asset Management Funds: Broad Market Strategic Income Fund
Managed by Cincinnati Asset Management, Inc.
2
Past performance is not predictive of future performance. Investment results and principal value will fluctuate so that shares, when redeemed, may be worth more or less than their original cost. Current performance may be higher or lower than the performance data quoted. The index is unmanaged and does not take into account fees, expenses, and transaction costs. It is shown for comparative purposes and is based on information generally available to the public from sources believed to be reliable. Performance data current to the most recent month end are available by calling 1-866-738-1128.
An investor should consider the investment objectives, risks, charges and expenses of the Fund carefully before investing. The Fund’s prospectus contains this and other important information. To obtain a copy of the Fund’s prospectus please visit the Fund’s website at www.cambondfunds.com or call 1-866-738-1128 and a copy will be sent to you free of charge. Please read the prospectus carefully before you invest. Cincinnati Asset Management Funds: Broad Market Strategic Income Fund is distributed by Ultimus Fund Distributors, LLC.
The Letter to Shareholders seeks to describe some of the adviser’s current opinions and views of the financial markets. Although the adviser believes it has a reasonable basis for any opinions or views expressed, actual results may differ, sometimes significantly so, from those expected or expressed. The securities held by the Fund that are discussed in the Letter to Shareholders were held during the period covered by this Report. They do not comprise the entire investment portfolio of the Fund, may be sold at any time and may no longer be held by the Fund. For a complete list of securities held by the Fund as of May 31, 2018, please see the Schedule of Investments section of the Annual Report. The opinions of the Fund’s adviser with respect to those securities may change at any time.
Statements in the Letter to Shareholders that reflect projections or expectations for future financial or economic performance of the Fund and the market in general and statements of the Fund’s plans and objectives for future operations are forward-looking statements. No assurance can be given that actual results or events will not differ materially from those projected, estimated, assumed, or anticipated in any such forward-looking statements. Important factors that could result in such differences, in addition to the factors noted with such forward-looking statements include, without limitation, general economic conditions, such as inflation, recession, and interest rates. Past performance is not a guarantee of future results.
3
CINCINNATI ASSET MANAGEMENT FUNDS:
BROAD MARKET STRATEGIC INCOME FUND
PERFORMANCE INFORMATION
May 31, 2018 (Unaudited)
Comparison of the Change in Value of a $10,000 Investment
in Cincinnati Asset Management Funds: Broad Market Strategic
Income Fund versus the Bloomberg Barclays U.S. Corporate Baa Index
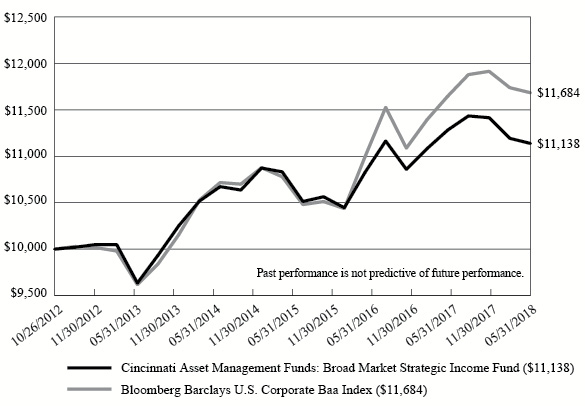
Average Annual Total Returns For Periods Ended May 31, 2018 | |||
| 1 Year | 5 Years | Since Inception(b) | |
| Cincinnati Asset Management Funds: Broad Market Strategic Income Fund (a) | (1.28%) | 2.08% | 1.94% |
| Bloomberg Barclays U.S. Corporate Baa Index | 0.32% | 3.20% | 2.82% |
| (a) | The Fund’s total returns do not reflect the deduction of taxes a shareholder would pay on Fund distributions or the redemption of Fund shares. |
| (b) | The Fund commenced operations on October 26, 2012. |
4
CINCINNATI ASSET MANAGEMENT FUNDS:
BROAD MARKET STRATEGIC INCOME FUND
PORTFOLIO INFORMATION
May 31, 2018 (Unaudited)
Sector Diversification (% of Net Assets)
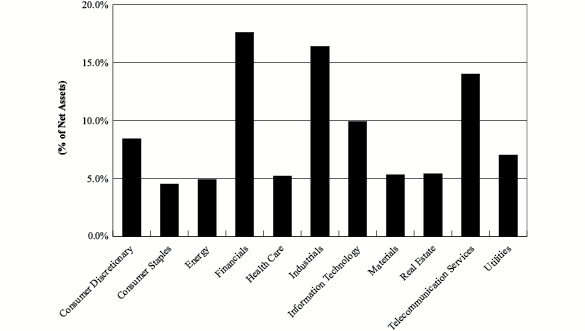
Top 10 Investments
| Security Description | % of Net Assets |
| Exxon Mobil Corp., 3.043%, due 03/01/26 | 2.9% |
| Vulcan Materials Co., 3.900%, due 04/01/27 | 2.9% |
| Union Pacific Corp., 3.000%, due 04/15/27 | 2.9% |
| Commonwealth Edison Co., 2.950%, due 08/15/27 | 2.9% |
| Apple, Inc., 3.250%, due 02/23/26 | 2.4% |
| L-3 Communications Corp., 3.950%, due 05/28/24 | 2.4% |
| U.S. Bancorp, Series MTN, 3.100%, due 04/27/26 | 2.3% |
| Microsoft Corp., 2.400%, due 08/08/26 | 2.2% |
| Morgan Stanley, 3.700%, due 10/23/24 | 2.1% |
| Charter Communications Operating, LLC, 4.908%, due 07/23/25 | 2.1% |
| Credit Rating Allocation | ||
| S&P Credit Quality | % of Portfolio | |
| AAA | 5.9% | |
| AA | 9.5% | |
| A | 35.1% | |
| BBB | 23.2% | |
| BB | 16.7% | |
| B | 9.6% | |
5
| CINCINNATI ASSET MANAGEMENT FUNDS: BROAD MARKET STRATEGIC INCOME FUND SCHEDULE OF INVESTMENTS May 31, 2018 | ||||||||||||||||
| CORPORATE BONDS — 98.6% | Coupon | Maturity | Par Value | Value | ||||||||||||
| Consumer Discretionary — 8.4% | ||||||||||||||||
| AMC Entertainment Holdings, Inc. | 5.750 | % | 06/15/25 | $ | 67,000 | $ | 65,744 | |||||||||
| Ford Motor Co. | 4.346 | % | 12/08/26 | 100,000 | 99,117 | |||||||||||
| Ford Motor Credit Co., LLC | 3.815 | % | 11/02/27 | 150,000 | 140,909 | |||||||||||
| Penske Auto Group, Inc. | 5.375 | % | 12/01/24 | 60,000 | 59,412 | |||||||||||
| PulteGroup, Inc. | 5.000 | % | 01/15/27 | 2,000 | 1,917 | |||||||||||
| QVC, Inc. | 4.450 | % | 02/15/25 | 70,000 | 68,145 | |||||||||||
| Service Corp. International | 7.500 | % | 04/01/27 | 62,000 | 69,672 | |||||||||||
| Tenneco, Inc. | 5.375 | % | 12/15/24 | 55,000 | 53,350 | |||||||||||
| Tenneco, Inc. | 5.000 | % | 07/15/26 | 15,000 | 13,721 | |||||||||||
| Toll Brothers Finance Corp. | 5.625 | % | 01/15/24 | 21,000 | 21,735 | |||||||||||
| Toll Brothers Finance Corp. | 4.875 | % | 03/15/27 | 75,000 | 71,437 | |||||||||||
| United Rentals, Inc. | 5.875 | % | 09/15/26 | 30,000 | 30,788 | |||||||||||
| 695,947 | ||||||||||||||||
| Consumer Staples — 4.5% | ||||||||||||||||
| Anheuser-Busch InBev S.A./N.V. | 2.625 | % | 01/17/23 | 100,000 | 96,766 | |||||||||||
| B&G Foods, Inc. | 5.250 | % | 04/01/25 | 68,000 | 64,090 | |||||||||||
| Ingles Markets, Inc. | 5.750 | % | 06/15/23 | 75,000 | 75,000 | |||||||||||
| Pinnacle Foods Finance, LLC | 5.875 | % | 01/15/24 | 67,000 | 69,177 | |||||||||||
| Spectrum Brands, Inc. | 5.750 | % | 07/15/25 | 70,000 | 69,650 | |||||||||||
| 374,683 | ||||||||||||||||
| Energy — 4.9% | ||||||||||||||||
| Cheniere Corpus Christi Holdings, LLC | 5.875 | % | 03/31/25 | 64,000 | 67,040 | |||||||||||
| Chevron Corp. | 2.954 | % | 05/16/26 | 100,000 | 96,296 | |||||||||||
| Exxon Mobil Corp. | 3.043 | % | 03/01/26 | 250,000 | 243,653 | |||||||||||
| 406,989 | ||||||||||||||||
| Financials — 17.6% | ||||||||||||||||
| Aircastle Ltd. | 5.000 | % | 04/01/23 | 12,000 | 12,270 | |||||||||||
| Bank of America Corp. | 3.970 | % | 03/05/29 | 175,000 | 172,948 | |||||||||||
| Bank of New York Mellon Corp. (The) | 3.000 | % | 02/24/25 | 100,000 | 96,137 | |||||||||||
| Berkshire Hathaway, Inc. | 3.125 | % | 03/15/26 | 125,000 | 121,512 | |||||||||||
| Branch Banking & Trust Co. | 3.625 | % | 09/16/25 | 150,000 | 148,643 | |||||||||||
| International Lease Finance Corp. | 5.875 | % | 08/15/22 | 150,000 | 161,060 | |||||||||||
| Morgan Stanley | 3.700 | % | 10/23/24 | 175,000 | 174,371 | |||||||||||
| PNC Financial Services Group, Inc. (The) | 3.900 | % | 04/29/24 | 150,000 | 150,937 | |||||||||||
| Progressive Corp. (The) | 2.450 | % | 01/15/27 | 75,000 | 68,313 | |||||||||||
| State Street Corp. | 2.650 | % | 05/19/26 | 175,000 | 164,052 | |||||||||||
| U.S. Bancorp, Series MTN | 3.100 | % | 04/27/26 | 200,000 | 189,096 | |||||||||||
| 1,459,339 | ||||||||||||||||
6
| CINCINNATI ASSET MANAGEMENT FUNDS: BROAD MARKET STRATEGIC INCOME FUND SCHEDULE OF INVESTMENTS (Continued) | ||||||||||||||||
| CORPORATE BONDS — 98.6% (Continued) | Coupon | Maturity | Par Value | Value | ||||||||||||
| Health Care — 5.2% | ||||||||||||||||
| DaVita HealthCare Partners, Inc. | 5.000 | % | 05/01/25 | $ | 80,000 | $ | 76,024 | |||||||||
| HCA Holdings, Inc. | 5.375 | % | 02/01/25 | 60,000 | 59,100 | |||||||||||
| HCA Holdings, Inc. | 5.875 | % | 02/15/26 | 15,000 | 15,131 | |||||||||||
| HealthSouth Corp. | 5.750 | % | 11/01/24 | 60,000 | 61,125 | |||||||||||
| HealthSouth Corp. | 5.750 | % | 09/15/25 | 15,000 | 15,375 | |||||||||||
| Medtronic, Inc. | 3.500 | % | 03/15/25 | 150,000 | 149,850 | |||||||||||
| Teleflex, Inc. | 4.625 | % | 11/15/27 | 54,000 | 50,963 | |||||||||||
| 427,568 | ||||||||||||||||
| Industrials — 16.4% | ||||||||||||||||
| AECOM | 5.125 | % | 03/15/27 | 75,000 | 69,750 | |||||||||||
| Arconic, Inc. | 6.750 | % | 01/15/28 | 64,000 | 68,267 | |||||||||||
| General Dynamics Corp. | 2.625 | % | 11/15/27 | 100,000 | 92,574 | |||||||||||
| Hawaiian Airlines, Inc., Series 2013-1A | 3.900 | % | 01/15/26 | 58,192 | 57,863 | |||||||||||
| L-3 Communications Corp. | 3.950 | % | 05/28/24 | 195,000 | 195,168 | |||||||||||
| Masco Corp. | 3.500 | % | 11/15/27 | 175,000 | 164,938 | |||||||||||
| TransDigm, Inc. | 6.375 | % | 06/15/26 | 71,000 | 71,532 | |||||||||||
| Union Pacific Corp. | 3.000 | % | 04/15/27 | 250,000 | 238,863 | |||||||||||
| United Airlines, Inc., Class B Pass-Through Certificates, Series 2013-1 | 5.375 | % | 02/15/23 | 29,204 | 29,823 | |||||||||||
| United Airlines, Inc., Class A Pass-Through Certificates, Series 2014-2 | 3.750 | % | 03/03/28 | 171,459 | 169,984 | |||||||||||
| United Rentals North America, Inc. | 5.500 | % | 05/15/27 | 35,000 | 34,737 | |||||||||||
| US Airways, Inc., Class B Pass-Through Certificates, Series 2012-2 | 6.750 | % | 12/03/22 | 30,902 | 32,729 | |||||||||||
| US Airways, Inc., Class A Pass-Through Certificates, Series 2012-2 | 4.625 | % | 12/03/26 | 125,011 | 128,316 | |||||||||||
| 1,354,544 | ||||||||||||||||
| Information Technology — 9.9% | ||||||||||||||||
| Apple, Inc. | 3.250 | % | 02/23/26 | 205,000 | 202,078 | |||||||||||
| Intel Corp. | 2.600 | % | 05/19/26 | 50,000 | 46,753 | |||||||||||
| Intel Corp. | 3.150 | % | 05/11/27 | 50,000 | 48,712 | |||||||||||
| Microsoft Corp. | 2.400 | % | 08/08/26 | 200,000 | 185,853 | |||||||||||
| Microsoft Corp. | 3.300 | % | 02/06/27 | 50,000 | 49,589 | |||||||||||
| Oracle Corp. | 2.650 | % | 07/15/26 | 100,000 | 93,394 | |||||||||||
| Seagate Technology plc | 4.750 | % | 01/01/25 | 80,000 | 76,993 | |||||||||||
| Visa, Inc. | 2.750 | % | 09/15/27 | 125,000 | 117,806 | |||||||||||
| 821,178 | ||||||||||||||||
7
| CINCINNATI ASSET MANAGEMENT FUNDS: BROAD MARKET STRATEGIC INCOME FUND SCHEDULE OF INVESTMENTS (Continued) | ||||||||||||||||
| CORPORATE BONDS — 98.6% (Continued) | Coupon | Maturity | Par Value | Value | ||||||||||||
| Materials — 5.3% | ||||||||||||||||
| Berry Plastics Corp. | 5.125 | % | 07/15/23 | $ | 33,000 | $ | 32,794 | |||||||||
| Olin Corp. | 5.000 | % | 02/01/30 | 15,000 | 14,138 | |||||||||||
| Steel Dynamics, Inc. | 5.000 | % | 12/15/26 | 80,000 | 79,304 | |||||||||||
| U.S. Concrete, Inc. | 6.375 | % | 06/01/24 | 70,000 | 71,488 | |||||||||||
| Vulcan Materials Co. | 3.900 | % | 04/01/27 | 250,000 | 242,852 | |||||||||||
| 440,576 | ||||||||||||||||
| Real Estate — 5.4% | ||||||||||||||||
| American Tower Corp. | 3.600 | % | 01/15/28 | 100,000 | 94,164 | |||||||||||
| CoreCivic, Inc. | 4.750 | % | 10/15/27 | 3,000 | 2,760 | |||||||||||
| Equinix, Inc. | 5.875 | % | 01/15/26 | 20,000 | 20,425 | |||||||||||
| GEO Group, Inc. (The) | 6.000 | % | 04/15/26 | 69,000 | 67,793 | |||||||||||
| Iron Mountain, Inc. | 5.750 | % | 08/15/24 | 85,000 | 84,039 | |||||||||||
| Simon Property Group, L.P. | 3.750 | % | 02/01/24 | 150,000 | 150,865 | |||||||||||
| Simon Property Group, L.P. | 3.250 | % | 11/30/26 | 25,000 | 23,894 | |||||||||||
| 443,940 | ||||||||||||||||
| Telecommunication Services — 14.0% | ||||||||||||||||
| AT&T, Inc. | 2.625 | % | 12/01/22 | 100,000 | 95,679 | |||||||||||
| CCO Holdings, LLC/CCO Holdings Capital Corp. | 5.750 | % | 01/15/24 | 70,000 | 70,350 | |||||||||||
| Charter Communications Operating, LLC | 4.908 | % | 07/23/25 | 170,000 | 173,575 | |||||||||||
| Charter Communications Operating, LLC | 4.200 | % | 03/15/28 | 80,000 | 75,436 | |||||||||||
| Comcast Corp. | 3.600 | % | 03/01/24 | 80,000 | 79,742 | |||||||||||
| Comcast Corp. | 3.150 | % | 03/01/26 | 115,000 | 108,627 | |||||||||||
| CSC Holdings, LLC | 5.250 | % | 06/01/24 | 73,000 | 69,182 | |||||||||||
| Lamar Media Corp. | 5.750 | % | 02/01/26 | 67,000 | 68,089 | |||||||||||
| Mediacom, LLC/Mediacom Capital Corp. | 5.500 | % | 04/15/21 | 8,000 | 8,109 | |||||||||||
| Outfront Media Capital, LLC | 5.875 | % | 03/15/25 | 42,000 | 42,578 | |||||||||||
| Quebecor Media, Inc. | 5.750 | % | 01/15/23 | 61,000 | 62,372 | |||||||||||
| Qwest Corp. | 6.750 | % | 12/01/21 | 150,000 | 161,618 | |||||||||||
| T-Mobile USA, Inc. | 6.375 | % | 03/01/25 | 4,000 | 4,190 | |||||||||||
| T-Mobile USA, Inc. | 5.375 | % | 04/15/27 | 59,000 | 58,041 | |||||||||||
| Zayo Group, LLC | 6.375 | % | 05/15/25 | 80,000 | 81,400 | |||||||||||
| 1,158,988 | ||||||||||||||||
| See accompanying notes to financial statements. |
8
| CINCINNATI ASSET MANAGEMENT FUNDS: BROAD MARKET STRATEGIC INCOME FUND SCHEDULE OF INVESTMENTS (Continued) | ||||||||||||||||
| CORPORATE BONDS — 98.6% (Continued) | Coupon | Maturity | Par Value | Value | ||||||||||||
| Utilities — 7.0% | ||||||||||||||||
| AES Corp. (The) | 5.500 | % | 04/15/25 | $ | 30,000 | $ | 30,450 | |||||||||
| AES Corp. (The) | 6.000 | % | 05/15/26 | 35,000 | 36,269 | |||||||||||
| American Water Capital Corp. | 2.950 | % | 09/01/27 | 125,000 | 118,134 | |||||||||||
| AmeriGas Finance, LLC | 5.875 | % | 08/20/26 | 72,000 | 70,380 | |||||||||||
| Calpine Corp. | 5.750 | % | 01/15/25 | 74,000 | 67,525 | |||||||||||
| Commonwealth Edison Co. | 2.950 | % | 08/15/27 | 250,000 | 237,729 | |||||||||||
| Suburban Propane Partners, L.P. | 5.500 | % | 06/01/24 | 18,000 | 17,428 | |||||||||||
| 577,915 | ||||||||||||||||
| Total Investments at Value — 98.6% (Cost $8,426,995) | $ | 8,161,667 | ||||||||||||||
| Other Assets in Excess of Liabilities — 1.4% | 116,118 | |||||||||||||||
| Net Assets — 100.0% | $ | 8,277,785 | ||||||||||||||
| See accompanying notes to financial statements. |
9
| CINCINNATI ASSET MANAGEMENT FUNDS: BROAD MARKET STRATEGIC INCOME FUND STATEMENT OF ASSETS AND LIABILITIES May 31, 2018 | ||||
| ASSETS | ||||
| Investments in securities: | ||||
| At acquisition cost | $ | 8,426,995 | ||
| At value (Note 2) | $ | 8,161,667 | ||
| Cash | 12,145 | |||
| Receivable from Adviser (Note 4) | 14,094 | |||
| Interest receivable | 92,433 | |||
| Other assets | 14,479 | |||
| Total assets | 8,294,818 | |||
| LIABILITIES | ||||
| Payable to administrator (Note 4) | 7,070 | |||
| Accrued distribution fees (Note 4) | 1,473 | |||
| Other accrued expenses | 8,490 | |||
| Total liabilities | 17,033 | |||
| NET ASSETS | $ | 8,277,785 | ||
| NET ASSETS CONSIST OF: | ||||
| Paid-in capital | $ | 8,746,921 | ||
| Undistributed net investment income | 49,333 | |||
| Accumulated net realized losses from investment transactions | (253,141 | ) | ||
| Net unrealized depreciation on investments | (265,328 | ) | ||
| NET ASSETS | $ | 8,277,785 | ||
| Shares of beneficial interest outstanding (unlimited number of shares authorized, no par value) | 882,251 | |||
| Net asset value, offering price and redemption price per share (Note 2) | $ | 9.38 | ||
| See accompanying notes to financial statements. |
10
| CINCINNATI ASSET MANAGEMENT FUNDS: BROAD MARKET STRATEGIC INCOME FUND STATEMENT OF OPERATIONS For the Year Ended May 31, 2018 | ||||
| INVESTMENT INCOME | ||||
| Interest | $ | 326,148 | ||
| EXPENSES | ||||
| Investment advisory fees (Note 4) | 65,588 | |||
| Professional fees | 40,407 | |||
| Fund accounting fees (Note 4) | 30,873 | |||
| Administration fees (Note 4) | 30,000 | |||
| Registration and filing fees | 26,205 | |||
| Distribution fees (Note 4) | 21,863 | |||
| Pricing fees | 20,829 | |||
| Compliance fees (Note 4) | 12,000 | |||
| Transfer agent fees (Note 4) | 12,000 | |||
| Trustees’ fees and expenses (Note 4) | 10,032 | |||
| Custody and bank service fees | 7,340 | |||
| Printing of shareholder reports | 3,799 | |||
| Insurance expense | 2,622 | |||
| Postage and supplies | 1,849 | |||
| Other expenses | 8,886 | |||
| Total expenses | 294,293 | |||
| Less fee waivers and expense reimbursements by the Adviser (Note 4) | (237,450 | ) | ||
| Net expenses | 56,843 | |||
| NET INVESTMENT INCOME | 269,305 | |||
| REALIZED AND UNREALIZED GAINS (LOSSES) ON INVESTMENTS | ||||
| Net realized gains from investment transactions | 18,790 | |||
| Net change in unrealized appreciation (depreciation) on investments | (381,965 | ) | ||
| NET REALIZED AND UNREALIZED LOSSES ON INVESTMENTS | (363,175 | ) | ||
| NET DECREASE IN NET ASSETS RESULTING FROM OPERATIONS | $ | (93,870 | ) | |
| See accompanying notes to financial statements. |
11
| CINCINNATI ASSET MANAGEMENT FUNDS: BROAD MARKET STRATEGIC INCOME FUND STATEMENTS OF CHANGES IN NET ASSETS | ||||||||
| Year Ended May 31, 2018 | Year Ended May 31, 2017 | |||||||
| FROM OPERATIONS | ||||||||
| Net investment income | $ | 269,305 | $ | 250,891 | ||||
| Net realized gains from investment transactions | 18,790 | 62,822 | ||||||
| Net change in unrealized appreciation (depreciation) on investments | (381,965 | ) | 23,033 | |||||
| Net increase (decrease) in net assets resulting from operations | (93,870 | ) | 336,746 | |||||
| DISTRIBUTIONS TO SHAREHOLDERS | ||||||||
| From net investment income | (264,070 | ) | (245,599 | ) | ||||
| FROM CAPITAL SHARE TRANSACTIONS | ||||||||
| Proceeds from shares sold | 937,222 | 1,441,899 | ||||||
| Net asset value of shares issued in reinvestment of distributions to shareholders | 55,343 | 245,599 | ||||||
| Payments for shares redeemed | (1,106,210 | ) | (594,992 | ) | ||||
| Net increase (decrease) in net assets from capital share transactions | (113,645 | ) | 1,092,506 | |||||
| TOTAL INCREASE (DECREASE) IN NET ASSETS | (471,585 | ) | 1,183,653 | |||||
| NET ASSETS | ||||||||
| Beginning of year | 8,749,370 | 7,565,717 | ||||||
| End of year | $ | 8,277,785 | $ | 8,749,370 | ||||
| UNDISTRIBUTED NET INVESTMENT INCOME | $ | 49,333 | $ | 43,644 | ||||
| CAPITAL SHARE ACTIVITY | ||||||||
| Shares sold | 96,902 | 147,943 | ||||||
| Shares reinvested | 5,727 | 25,400 | ||||||
| Shares redeemed | (114,137 | ) | (61,207 | ) | ||||
| Net increase (decrease) in shares outstanding | (11,508 | ) | 112,136 | |||||
| Shares outstanding at beginning of year | 893,759 | 781,623 | ||||||
| Shares outstanding at end of year | 882,251 | 893,759 | ||||||
| See accompanying notes to financial statements. |
12
| CINCINNATI ASSET MANAGEMENT FUNDS: BROAD MARKET STRATEGIC INCOME FUND FINANCIAL HIGHLIGHTS | ||||||||||||||||||||
| Per Share Data for a Share Outstanding Throughout Each Year | ||||||||||||||||||||
| Year Ended May 31, 2018 | Year Ended May 31, 2017 | Year Ended May 31, 2016 | Year Ended May 31, 2015 | Year Ended May 31, 2014 | ||||||||||||||||
| Net asset value at beginning of year | $ | 9.79 | $ | 9.68 | $ | 10.02 | $ | 10.05 | $ | 9.94 | ||||||||||
| Income (loss) from investment operations: | ||||||||||||||||||||
| Net investment income | 0.30 | 0.29 | 0.32 | 0.33 | 0.33 | |||||||||||||||
| Net realized and unrealized gains (losses) on investments | (0.42 | ) | 0.11 | (0.33 | ) | (0.04 | ) | 0.11 | ||||||||||||
| Total from investment operations | (0.12 | ) | 0.40 | (0.01 | ) | 0.29 | 0.44 | |||||||||||||
| Less distributions: | ||||||||||||||||||||
| From net investment income | (0.29 | ) | (0.29 | ) | (0.33 | ) | (0.32 | ) | (0.33 | ) | ||||||||||
| Net asset value at end of year | $ | 9.38 | $ | 9.79 | $ | 9.68 | $ | 10.02 | $ | 10.05 | ||||||||||
| Total return (a) | (1.28 | %) | 4.22 | % | (0.06 | %) | 2.99 | % | 4.68 | % | ||||||||||
| Net assets at end of year (000’s) | $ | 8,278 | $ | 8,749 | $ | 7,566 | $ | 7,232 | $ | 6,407 | ||||||||||
| Ratios/supplementary data: | ||||||||||||||||||||
| Ratio of total expenses to average net assets | 3.37 | % | 3.41 | % | 3.77 | % | 3.71 | % | 4.53 | % | ||||||||||
| Ratio of net expenses to average net assets (b) | 0.65 | % | 0.65 | % | 0.65 | % | 0.65 | % | 0.65 | % | ||||||||||
| Ratio of net investment income to average net assets (b) | 3.08 | % | 3.02 | % | 3.30 | % | 3.35 | % | 3.41 | % | ||||||||||
| Portfolio turnover rate | 30 | % | 31 | % | 18 | % | 23 | % | 11 | % | ||||||||||
| (a) | Total return is a measure of the change in value of an investment in the Fund over the period covered. The returns shown do not reflect the deduction of taxes a shareholder would pay on Fund distributions, if any, or the redemption of Fund shares. The total returns would be lower if the Adviser had not waived advisory fees and reimbursed expenses. |
| (b) | Ratio was determined after advisory fee waivers and expense reimbursements (Note 4). |
| See accompanying notes to financial statements. | |
13
CINCINNATI ASSET MANAGEMENT FUNDS:
BROAD MARKET STRATEGIC INCOME FUND
NOTES TO FINANCIAL STATEMENTS
May 31, 2018
1. Organization
Cincinnati Asset Management Funds: Broad Market Strategic Income Fund (the “Fund”) is a diversified series of Ultimus Managers Trust (the “Trust”), an open-end investment company established as an Ohio business trust under a Declaration of Trust dated February 28, 2012. Other series of the Trust are not incorporated in this report.
The investment objective of the Fund is to seek to achieve a high level of income consistent with a secondary goal of capital preservation.
2. Significant Accounting Policies
In October 2016, the U.S. Securities and Exchange Commission (the “SEC”) adopted amendments to Regulation S-X, which impact financial statement presentation, particularly the presentation of derivative investments. The Fund has adopted these amendments, which were effective August 1, 2017, with these financial statements.
The following is a summary of the Fund’s significant accounting policies. These policies are in conformity with accounting principles generally accepted in the United States of America (“GAAP”). The Fund follows accounting and reporting guidance under Financial Accounting Standards Board (“FASB”) Accounting Standards Codification Topic 946, “Financial Services – Investment Companies.”
New Accounting Pronouncement – In March, 2017, FASB issued Accounting Standards Update No. 2017-08 – Receivables – Nonrefundable Fees and Other Costs (Subtopic 310-20): Premium Amortization on Purchased Callable Debt Securities (the “ASU”). The ASU shortens the amortization period for certain callable debt securities, held at a premium, to be amortized to the earliest call date. The ASU does not require an accounting change for securities held at a discount, which continue to be amortized to maturity. The ASU is effective for fiscal years and interim periods within those fiscal years beginning after December 15, 2018. Management is currently evaluating the impact, if any, of applying the ASU.
Securities valuation – The Fund’s fixed income securities are typically valued using prices provided by an independent pricing service approved by the Trust’s Board of Trustees (the “Board”). The independent pricing service uses information with respect to transactions in bonds, quotations from bond dealers, market transactions in comparable securities, and various relationships between securities in determining these prices. The methods used by the independent pricing service and the quality of valuations so established are reviewed by Cincinnati Asset Management, Inc. (the “Adviser”), under the general supervision of the Board. Securities for which market valuations are not provided by the independent pricing service, or when valuations are considered to be unreliable are valued at fair value as determined in good faith under procedures adopted by the Board.
GAAP establishes a single authoritative definition of fair value, sets out a framework for measuring fair value, and requires additional disclosures about fair value measurements.
14
| CINCINNATI ASSET MANAGEMENT FUNDS: BROAD MARKET STRATEGIC INCOME FUND NOTES TO FINANCIAL STATEMENTS (Continued) |
Various inputs are used in determining the value of the Fund’s investments. These inputs are summarized in the three broad levels listed below:
| ● | Level 1 – quoted prices in active markets for identical securities |
| ● | Level 2 – other significant observable inputs |
| ● | Level 3 – significant unobservable inputs |
Corporate bonds are classified as Level 2 since values are based on prices provided by an independent pricing service that utilizes various “other significant observable inputs” including bid and ask quotations, prices of similar securities, and interest rates, among other factors. The inputs or methods used for valuing securities are not necessarily an indication of the risks associated with investing in those securities. The inputs used to measure fair value may fall into different levels of the fair value hierarchy. In such cases, for disclosure purposes, the level in the fair value hierarchy within which the fair value measurement falls in its entirety is determined based on the lowest level input that is significant to the fair value measurement.
The following is a summary of the inputs used to value the Fund’s investments as of May 31, 2018:
| Level 1 | Level 2 | Level 3 | Total | |||||||||||||
| Corporate Bonds | $ | — | $ | 8,161,667 | $ | — | $ | 8,161,667 | ||||||||
Refer to the Fund’s Schedule of Investments for a listing of the securities by sector type. As of May 31, 2018, the Fund did not have any transfers between Levels. In addition, the Fund did not have derivative instruments or any assets or liabilities that were measured at fair value on a recurring basis using significant unobservable inputs (Level 3) as of May 31, 2018. It is the Fund’s policy to recognize transfers between Levels at the end of the reporting period.
Share valuation – The net asset value (“NAV”) per share of the Fund is calculated daily by dividing the total value of the Fund’s assets, less liabilities, by the number of shares outstanding. The offering price and redemption price per share of the Fund is equal to the NAV per share.
Investment income – Interest income is accrued as earned. Discounts and premiums on fixed income securities purchased are accreted or amortized using the effective interest method. Dividend income is recorded on the ex-dividend date.
Investment transactions – Investment transactions are accounted for on the trade date. Realized gains and losses on investments sold are determined on a specific identification basis.
Common expenses – Common expenses of the Trust are allocated among the Fund and other series of the Trust based on the relative net assets of each series or the nature of the services performed and the relative applicability to each series.
15
| CINCINNATI ASSET MANAGEMENT FUNDS: BROAD MARKET STRATEGIC INCOME FUND NOTES TO FINANCIAL STATEMENTS (Continued) |
Distributions to shareholders – Dividends from net investment income are declared and paid quarterly to shareholders. Net realized capital gains, if any, are distributed at least once each year. The amount of distributions from net investment income and net realized capital gains are determined in accordance with federal income tax regulations, which may differ from GAAP. Dividends and distributions to shareholders are recorded on the ex-dividend date. The tax character of the Fund’s distributions during the years ended May 31, 2018 and 2017 was ordinary income. On June 29, 2018, the Fund paid an ordinary income dividend of $0.0777 per share to shareholders of record on June 28, 2018.
Estimates – The preparation of financial statements in conformity with GAAP requires management to make estimates and assumptions that affect the reported amounts of assets and liabilities and disclosure of contingent assets and liabilities as of the date of the financial statements and the reported amounts of income and expenses during the reporting period. Actual results could differ from those estimates.
Federal income tax – The Fund has qualified and intends to continue to qualify as a regulated investment company under the Internal Revenue Code of 1986, as amended (the “Code”). Qualification generally will relieve the Fund of liability for federal income taxes to the extent 100% of its net investment income and net realized capital gains are distributed in accordance with the Code.
In order to avoid imposition of the excise tax applicable to regulated investment companies, it is also the Fund’s intention to declare as dividends in each calendar year at least 98% of its net investment income (earned during the calendar year) and 98.2% of its net realized capital gains (earned during the twelve months ended October 31) plus undistributed amounts from prior years.
The following information is computed on a tax basis for each item as of May 31, 2018:
| Tax cost of portfolio investments | $ | 8,426,995 | ||
| Gross unrealized appreciation | $ | 18,433 | ||
| Gross unrealized depreciation | (283,761 | ) | ||
| Net unrealized depreciation on investments | (265,328 | ) | ||
| Undistributed ordinary income | 49,333 | |||
| Capital loss carryforwards | (253,141 | ) | ||
| Accumulated deficit | $ | (469,136 | ) |
During the year ended May 31, 2018, the Fund utilized $2,302 of short-term capital loss carryforwards and $16,034 of long-term capital loss carryforwards to offset current year capital gains.
16
| CINCINNATI ASSET MANAGEMENT FUNDS: BROAD MARKET STRATEGIC INCOME FUND NOTES TO FINANCIAL STATEMENTS (Continued) |
As of May 31, 2018, the Fund had short-term capital loss carryforwards of $80,562 and long-term capital loss carryfowards of $172,579. These capital loss carryforwards, which do not expire, may be utilized in future years to offset net realized capital gains, if any, prior to distributing such gains to shareholders.
For the year ended May 31, 2018, the following reclassifications were made on the Statement of Assets and Liabilities for the Fund as a result of permanent differences in the recognition of capital gains or losses under income tax regulations and GAAP:
| Undistributed net investment income | $ | 454 | ||
| Accumulated net realized losses from investment transactions | $ | (454 | ) |
Such reclassifications have no effect on the Fund’s net assets or NAV per share. These permanent differences are due to the tax treatment of paydown adjustments.
The Fund recognizes the tax benefits or expenses of uncertain tax positions only when the position is “more likely than not” to be sustained assuming examination by tax authorities. Management has reviewed the Fund’s tax positions for all open tax periods (periods ended May 31, 2015 through May 31, 2018) and has concluded that no provision for unrecognized tax benefits or expenses is required in these financial statements. The Fund identifies its major tax jurisdiction as U.S. Federal.
3. Investment Transactions
During the year ended May 31, 2018, cost of purchases and proceeds from sales of investment securities, other than short-term investments, were $2,606,070 and $2,544,032, respectively.
4. Transactions with Related Parties
INVESTMENT ADVISORY AGREEMENT
The Fund’s investments are managed by the Adviser pursuant to the terms of an Investment Advisory Agreement. Under the Investment Advisory Agreement, the Fund pays the Adviser an advisory fee, computed and accrued daily and paid monthly, at the annual rate of 0.75% of its average daily net assets.
Pursuant to an expense limitation agreement between the Fund and the Adviser, the Adviser has contractually agreed until October 1, 2019 to waive investment advisory fees and reimburse other operating expenses to the extent necessary to limit total annual operating expenses (exclusive of brokerage costs; taxes; interest; borrowing costs such as interest and dividend expenses on securities sold short; acquired fund fees and expenses; extraordinary expenses such as litigation and merger or organization costs, and other expenses not incurred in the ordinary course of the Fund’s business; and amounts, if any, payable pursuant to a plan adopted in accordance with Rule 12b-1 under the Investment Company Act of 1940,
17
| CINCINNATI ASSET MANAGEMENT FUNDS: BROAD MARKET STRATEGIC INCOME FUND NOTES TO FINANCIAL STATEMENTS (Continued) |
as amended (the “1940 Act”)) to an amount not exceeding 0.65% of the Fund’s average daily net assets. Accordingly, the Adviser waived all of its advisory fees and, in addition, reimbursed other operating expenses totaling $171,862 during the year ended May 31, 2018.
DISTRIBUTION PLAN
The Fund has adopted a distribution plan, pursuant to Rule 12b-1 under the 1940 Act (the “Rule 12b-1 Plan”), pursuant to which the Fund may incur certain costs for distribution and/or shareholder servicing fees not to exceed 0.25% per annum of the Fund’s average daily net assets. During the year ended May 31, 2018, the Fund incurred $21,863 in distribution and servicing fees under the Rule 12b-1 Plan.
OTHER SERVICE PROVIDERS
Ultimus Fund Solutions, LLC (“Ultimus”) provides administration, fund accounting, compliance and transfer agency services to the Fund. The Fund pays Ultimus fees in accordance with the agreements for such services. In addition, the Fund pays out-of-pocket expenses including, but not limited to, postage, supplies and costs of pricing the Fund’s portfolio securities.
Under the terms of a Distribution Agreement with the Trust, Ultimus Fund Distributors, LLC (the “Distributor”) serves as principal underwriter to the Fund. The Distributor is a wholly-owned subsidiary of Ultimus. The Distributor is compensated by the Adviser (not the Fund) for acting as principal underwriter.
Certain officers and a Trustee of the Trust are also officers of Ultimus and the Distributor.
TRUSTEE COMPENSATION
Each Trustee who is not an “interested person” of the Trust (“Independent Trustee”) receives a $1,000 annual retainer from the Fund, paid quarterly, except for the Board Chair who receives a $1,200 annual retainer from the Fund, paid quarterly. Each Independent Trustee also receives from the Fund a fee of $500 for each Board meeting attended plus reimbursement for travel and other meeting-related expenses.
PRINCIPAL HOLDERS OF FUND SHARES
As of May 31, 2018, the following shareholders owned of record 5% or more of the outstanding shares of the Fund:
| Name of Record Owner | % Ownership |
| Cincinnati Asset Management, Inc. | 82% |
| Charles Schwab & Co., Inc. (for the benefit of its customers) | 11% |
| UBS Financial Services, Inc. (for the benefit of its customers) | 5% |
A beneficial owner of 25% or more of the Fund’s outstanding shares may be considered a controlling person. That shareholder’s vote could have a more significant effect on matters presented at a shareholder’s meeting.
18
| CINCINNATI ASSET MANAGEMENT FUNDS: BROAD MARKET STRATEGIC INCOME FUND NOTES TO FINANCIAL STATEMENTS (Continued) |
5. Contingencies and Commitments
The Fund indemnifies the Trust’s officers and Trustees for certain liabilities that might arise from their performance of their duties to the Fund. Additionally, in the normal course of business, the Fund enters into contracts that contain a variety of representations and warranties and which provide general indemnifications. The Fund’s maximum exposure under these arrangements is unknown, as this would involve future claims that may be made against the Fund that have not yet occurred. However, based on experience, the Fund expects the risk of loss to be remote.
6. Subsequent Events
The Fund is required to recognize in the financial statements the effects of all subsequent events that provide additional evidence about conditions that existed as of the date of the Statement of Assets and Liabilities. For non-recognized subsequent events that must be disclosed to keep the financial statements from being misleading, the Fund is required to disclose the nature of the event as well as an estimate of its financial effect, or a statement that such an estimate cannot be made. Management has evaluated subsequent events through the issuance of these financial statements and has noted no such events other than the ordinary income dividend paid on June 29, 2018, as noted in Note 2.
19
CINCINNATI ASSET MANAGEMENT FUNDS:
BROAD MARKET STRATEGIC INCOME FUND
REPORT OF INDEPENDENT REGISTERED
PUBLIC ACCOUNTING FIRM
To the Board of Trustees of Ultimus Managers Trust
and the Shareholders of Cincinnati Asset Management Funds:
Broad Market Strategic Income Fund
Opinion on the Financial Statements
We have audited the accompanying statement of assets and liabilities of Cincinnati Asset Management Funds: Broad Market Strategic Income Fund, a series of shares of beneficial interest in Ultimus Managers Trust (the “Fund”), including the schedule of investments, as of May 31, 2018, and the related statement of operations for the year then ended, the statements of changes in net assets for each of the years in the two-year period then ended and the financial highlights for each of the years in the five-year period then ended, and the related notes (collectively referred to as the “financial statements”). In our opinion, the financial statements present fairly, in all material respects, the financial position of the Fund as of May 31, 2018, and the results of its operations for the year then ended, the changes in its net assets for each of the years in the two-year period then ended and its financial highlights for each of the years in the five-year period then ended, in conformity with accounting principles generally accepted in the United States of America.
Basis for Opinion
These financial statements are the responsibility of the Fund’s management. Our responsibility is to express an opinion on the Fund’s financial statements based on our audits. We are a public accounting firm registered with the Public Company Accounting Oversight Board (United States) (“PCAOB”) and are required to be independent with respect to the Fund in accordance with the U.S. federal securities law and the applicable rules and regulations of the Securities and Exchange Commission and the PCAOB.
We conducted our audits in accordance with the standards of the PCAOB. Those standards require that we plan and perform the audits to obtain reasonable assurance about whether the financial statements are free of material misstatement, whether due to error or fraud. The Fund is not required to have, nor were we engaged to perform, an audit of its internal control over financial reporting. As part of our audits we are required to obtain an understanding of internal control over financial reporting but not for the purpose of expressing an opinion on the effectiveness of the Fund’s internal control over financial reporting. Accordingly, we express no such opinion.
20
CINCINNATI ASSET MANAGEMENT FUNDS:
BROAD MARKET STRATEGIC INCOME FUND
REPORT OF INDEPENDENT REGISTERED
PUBLIC ACCOUNTING FIRM (Continued)
Our audits included performing procedures to assess the risk of material misstatement of the financial statements, whether due to error or fraud, and performing procedures that respond to those risks. Such procedures include examining, on a test basis, evidence regarding the amounts and disclosures in the financial statements. Our procedures included confirmation of securities owned as of May 31, 2018 by correspondence with the custodian. Our audits also included evaluating the accounting principles used and significant estimates made by management, as well as evaluating the overall presentation of the financial statements. We believe that our audits provide a reasonable basis for our opinion.
 | |
| BBD, LLP |
We have served as the auditor of one or more of the Funds in Ultimus Managers Trust since 2013.
Philadelphia, Pennsylvania
July 25, 2018
21
| CINCINNATI ASSET MANAGEMENT FUNDS: BROAD MARKET STRATEGIC INCOME FUND ABOUT YOUR FUND’S EXPENSES (Unaudited) |
We believe it is important for you to understand the impact of costs on your investment. As a shareholder of the Fund, you incur ongoing costs, including management fees, distribution (12b-1) fees and other operating expenses. The following examples are intended to help you understand your ongoing costs (in dollars) of investing in the Fund and to compare these costs with the ongoing costs of investing in other mutual funds.
A mutual fund’s ongoing costs are expressed as a percentage of its average net assets. This figure is known as the expense ratio. The expenses in the table below are based on an investment of $1,000 made at the beginning of the most recent period (December 1, 2017) and held until the end of the period (May 31, 2018).
The table below illustrates the Fund’s ongoing costs in two ways:
Actual fund return – This section helps you to estimate the actual expenses that you paid over the period. The “Ending Account Value” shown is derived from the Fund’s actual return, and the third column shows the dollar amount of operating expenses that would have been paid by an investor who started with $1,000 in the Fund. You may use the information here, together with the amount you invested, to estimate the expenses that you paid over the period.
To do so, simply divide your account value by $1,000 (for example, an $8,600 account value divided by $1,000 = 8.6), then multiply the result by the number given for the Fund under the heading “Expenses Paid During Period.”
Hypothetical 5% return – This section is intended to help you compare the Fund’s ongoing costs with those of other mutual funds. It assumes that the Fund had an annual return of 5% before expenses during the period shown, but that the expense ratio is unchanged. In this case, because the return used is not the Fund’s actual return, the results do not apply to your investment. The example is useful in making comparisons because the SEC requires all mutual funds to calculate expenses based on a 5% return. You can assess the Fund’s ongoing costs by comparing this hypothetical example with the hypothetical examples that appear in shareholder reports of other funds.
Note that expenses shown in the table are meant to highlight and help you compare ongoing costs only. The Fund does not charge transaction fees, such as purchase or redemption fees, nor does it carry a “sales load.” The calculations assume no shares were bought or sold during the period. Your actual costs may have been higher or lower, depending on the amount of your investment and the timing of any purchases or redemptions.
22
| CINCINNATI ASSET MANAGEMENT FUNDS: BROAD MARKET STRATEGIC INCOME FUND ABOUT YOUR FUND’S EXPENSES (Unaudited) (Continued) |
More information about the Fund’s expenses can be found in this report. For additional information on operating expenses and other shareholder costs, please refer to the Fund’s prospectus.
| Beginning Account Value December 1, 2017 | Ending Account Value May 31, 2018 | Expenses Paid During Period* | |
| Based on Actual Fund Return | $1,000.00 | $975.70 | $3.20 |
| Based on Hypothetical 5% Return (before expenses) | $1,000.00 | $1,021.69 | $3.28 |
| * | Expenses are equal to the Fund’s annualized net expense ratio of 0.65% for the period, multiplied by the average account value over the period, multiplied by 182/365 (to reflect the one-half year period). |
OTHER INFORMATION (Unaudited)
A description of the policies and procedures that the Fund uses to vote proxies relating to portfolio securities is available without charge upon request by calling toll-free 1-866-738-1128, or on the SEC’s website at http://www.sec.gov. Information regarding how the Fund voted proxies relating to portfolio securities during the most recent 12-month period ended June 30 is available without charge upon request by calling toll-free 1-866-738-1128, or on the SEC’s website at http://www.sec.gov.
The Trust files a complete listing of portfolio holdings for the Fund with the SEC as of the end of the first and third quarters of each fiscal year on Form N-Q. These filings are available upon request by calling 1-866-738-1128. Furthermore, you may obtain a copy of the filings on the SEC’s website at http://www.sec.gov. The Trust’s Forms N-Q may also be reviewed and copied at the SEC’s Public Reference Room in Washington, DC, and information on the operation of the Public Reference Room may be obtained by calling 1-800-SEC-0330.
23
CINCINNATI ASSET MANAGEMENT FUNDS:
BROAD MARKET STRATEGIC INCOME FUND
BOARD OF TRUSTEES AND EXECUTIVE OFFICERS
(Unaudited)
The Board of Trustees has overall responsibility for management of the Trust’s affairs. The Trustees serve during the lifetime of the Trust and until its termination, or until death, resignation, retirement, or removal. The Trustees, in turn, elect the officers of the Fund to actively supervise its day-to-day operations. The officers have been elected for an annual term. Unless otherwise noted, each Trustee’s and officer’s address is 225 Pictoria Drive, Suite 450, Cincinnati, OH 45246. The following are the Trustees and executive officers of the Fund:
| Name and Year of Birth | Length of Time Served | Position(s) Held with Trust | Principal Occupation(s) During Past 5 Years | Number of Funds in Trust Overseen by Trustee | Directorships of Public Companies Held by Trustee During Past 5 Years |
| Interested Trustees: | |||||
Robert G. Dorsey* Year of Birth: 1957 | Since February 2012 | Trustee (February 2012 to present)
President (June 2012 to October 2013) | Managing Director and Co-Chief Executive Officer of Ultimus Fund Solutions, LLC and its subsidiaries (1999 to present) | 19 | None |
| Independent Trustees: | |||||
Janine L. Cohen Year of Birth: 1952 | Since January 2016 | Trustee | Retired since 2013; Chief Financial Officer from 2004 to 2013 and Chief Compliance Officer from 2008 to 2013 at AER Advisors, Inc. | 19 | None |
David M. Deptula Year of Birth: 1958 | Since June 2012 | Trustee | Vice President of Legal and Special Projects at Dayton Freight Lines, Inc. since 2016; Vice President of Tax Treasury at The Standard Register, Inc. (formerly The Standard Register Company) from 2011 to 2016 | 19 | None |
24
CINCINNATI ASSET MANAGEMENT FUNDS:
BROAD MARKET STRATEGIC INCOME FUND
BOARD OF TRUSTEES AND EXECUTIVE OFFICERS
(Unaudited) (Continued)
| Name and Year of Birth | Length of Time Served | Position(s) Held with Trust | Principal Occupation(s) During Past 5 Years | Number of Funds in Trust Overseen by Trustee | Directorships of Public Companies Held by Trustee During Past 5 Years |
| Independent Trustees: (Continued) | |||||
John J. Discepoli Year of Birth: 1963 | Since June 2012 | Chairman
Trustee | Owner of Decepoli Financial Planning, LLC (personal financial planning company) since 2004 | 19 | None |
| * | Mr. Dorsey is considered an “interested person” of the Trust within the meaning of Section 2(a)(19) of the 1940 Act because of his relationship with the Trust’s administrator, transfer agent and distributor. |
| Name and Year of Birth | Length of Time Served | Position(s) Held with Trust | Principal Occupation(s) During Past 5 Years |
| Executive Officers: | |||
David R. Carson Year of Birth: 1958 | Since April 2013 | Principal Executive Officer
President
Vice President (April 2013 to October 2013) | Vice President and Director of Client Strategies of Ultimus Fund Solutions, LLC (2013 to present); President, Unified Series Trust (2016 to present); Chief Compliance Officer, FSI LBAR Fund (2013 to 2016), The Huntington Funds (2005 to 2013), Huntington Strategy Shares (2012 to 2013), and Huntington Asset Advisors (2013); Vice President, Huntington National Bank (2001 to 2013) |
Jennifer L. Leamer Year of Birth: 1976 | Since April 2014 | Treasurer
Assistant Treasurer (April 2014 to October 2014) | Vice President, Mutual Fund Controller of Ultimus Fund Solutions, LLC (2014 to present); Business Analyst of Ultimus Fund Solutions, LLC (2007 to 2014) |
25
CINCINNATI ASSET MANAGEMENT FUNDS:
BROAD MARKET STRATEGIC INCOME FUND
BOARD OF TRUSTEES AND EXECUTIVE OFFICERS
(Unaudited) (Continued)
| Name and Year of Birth | Length of Time Served | Position(s) Held with Trust | Principal Occupation(s) During Past 5 Years |
| Executive Officers: (Continued) | |||
Matthew J. Beck Year of Birth: 1988 | Since June 2018 | Secretary (June 2018 to present) | Senior Attorney of Ultimus Fund Solutions (2018 to present); General Counsel of The Nottingham Company (2014 to 2018) |
Charles C. Black Year of Birth: 1979 | Since April 2015 | Chief Compliance Officer
Assistant Chief Compliance Officer (April 2015 to January 2016) | Senior Compliance Officer of Ultimus Fund Solutions, LLC (2015 to present); Chief Compliance Officer of The Caldwell & Orkin Funds, Inc. (2016 to present); Senior Compliance Manager at Touchstone Mutual Funds (2013 to 2015); Senior Compliance Manager at Fund Evaluation Group (2011 to 2013) |
Additional information about members of the Board and executive officers is available in the Fund’s Statement of Additional Information (“SAI”). To obtain a free copy of the SAI, please call 1-866-738-1128.
26
CINCINNATI ASSET MANAGEMENT FUNDS:
BROAD MARKET STRATEGIC INCOME FUND
DISCLOSURE REGARDING APPROVAL OF INVESTMENT ADVISORY AGREEMENT (Unaudited)
The Board of Trustees (the “Board”), including the Independent Trustees voting separately, has reviewed and approved the Fund’s Investment Advisory Agreement with the Cincinnati Asset Management, Inc. (the “Adviser”) for an additional annual term. Approval took place at an in-person meeting held on April 23-24, 2018, at which all of the Trustees were present.
In the course of their deliberations, the Board was advised by legal counsel. The Board received and reviewed a substantial amount of information provided by the Adviser in response to requests of the Board and counsel.
In deciding whether to approve the renewal of the Investment Advisory Agreement, the Board recalled its review of the materials related to the Fund and the Adviser throughout the preceding 12 months and its numerous discussions with Trust Management and the Adviser about the operations and performance of the Fund during that period. The Board further considered those materials and discussions and other numerous factors, including the following:
The nature, extent, and quality of the services provided by the Adviser. In this regard, the Board reviewed the services being provided by the Adviser to the Fund including, without limitation, its investment advisory services since the Fund’s inception, the Adviser’s compliance procedures and practices, its efforts to promote the Fund and assist in its distribution, and its compliance program. After reviewing the foregoing information and further information in the Adviser Memorandum (e.g., descriptions of its business and Form ADV), the Board concluded that the quality, extent, and nature of the services provided by the Adviser were satisfactory and adequate for the Fund.
The investment performance of the Fund. In this regard, the Board compared the performance of the Fund with the performance of its benchmark index, custom peer group, and related Morningstar category. The Board noted that while, for the performance periods reported (through February 28, 2018), the Fund had: (i) underperformed its benchmark for the one-, three-, and five-year periods and since inception; (ii) underperformed the average and median of the Adviser’s custom peer group for all periods; and (iii) underperformed the average and median of funds of comparable size and structure in the Morningstar category (Multisector Bond Funds, true no load, under $25 million) for all periods, except for the median 5-year period, which it outperformed, the Adviser had reasonably explained the reasons for the Fund’s underperformance. The Board also considered the consistency of the Adviser’s management with the Fund’s investment objective and policies. Following discussion of the investment performance of the Fund and its performance relative to its custom peer group and funds in its Morningstar category, the Adviser’s experience in managing mutual funds, its historical investment performance, and other factors, the Board concluded that the investment performance of the Fund has been satisfactory.
The costs of the services provided and profits realized by the Adviser from its relationship with the Fund. In this regard, the Board considered the Adviser’s staffing, personnel, and methods of operations; the education and experience of its personnel; compliance program,
27
CINCINNATI ASSET MANAGEMENT FUNDS:
BROAD MARKET STRATEGIC INCOME FUND
DISCLOSURE REGARDING APPROVAL OF INVESTMENT ADVISORY AGREEMENT (Unaudited) (Continued)
policies, and procedures; financial condition and the level of commitment to the Fund, and, generally, the Adviser’s advisory business; the asset level of the Fund; the overall expenses of the Fund, including the advisory fee; and the differences in fees and services to the Adviser’s other accounts with similar strategies to the Fund. The Board considered the Adviser’s ELA with the Fund, and considered the Adviser’s current and past fee reductions and expense reimbursements for the Fund. The Board further took into account the Adviser’s commitment to continue the Adviser’s ELA for the Fund until at least October 1, 2019.
The Board also considered potential benefits for the Adviser in managing the Fund, including promotion of the adviser’s name and the potential for it to receive research, statistical, or other services from the Fund’s trades. The Board compared the Fund’s advisory fee and overall expense ratio to the average and median advisory fees and average and median expense ratios for its Morningstar category. In addition, the Board compared the Fund to the funds in its Morningstar category and custom peer group in terms of the style of investment management, the size of the fund, and the nature of the investment strategies. The Board noted that the advisory fee for the Fund was equal to the average advisory fee for its custom peer group and slightly above the 80th percentile for funds in its Morningstar category, but was less than the highest advisory fee of funds in its Morningstar category. The Board also considered the Adviser’s commitment to limit the Fund’s expenses under the Adviser’s ELA. The Board noted that the overall expense ratio for the Fund was below the average and median of its custom peer group and funds in its Morningstar category. The Board also compared the fees paid by the Fund to the fees paid by other accounts of the Adviser with similar strategies, and considered the similarities and differences of services received by such other accounts as compared to the service provided to the Fund. The Board noted that the fee structures applicable to the Adviser’s other clients were not indicative of any unreasonableness with respect to the advisory fees payable to the Fund. The Board also considered the investment strategy and style used by the Adviser in managing the portfolio of the Fund. Following these comparisons and upon further consideration and discussion of the foregoing, the Board concluded that the advisory fee paid to the Adviser by the Fund is fair and reasonable.
The extent to which economies of scale would be realized as the Fund grows and whether advisory fee levels reflect these economies of scale for the benefit of the Fund’s investors. In this regard, the Board considered that the Fund’s fee arrangement with the Adviser involves both the advisory fee and the Adviser’s ELA. The Board determined that while the advisory fee remained the same as asset levels increased, the shareholders of the Fund have experienced benefits from the Adviser’s ELA and will continue to experience benefits from the Adviser’s ELA until the Fund’s assets grow to a level where its expenses otherwise fall below the expense limit. Following further discussion of the Fund’s asset levels, expectations for growth, and level of fees, the Board determined that the Fund’s fee arrangement with the Adviser would continue to provide benefits. The Board also determined that the fee arrangement is fair and reasonable in relation to the nature and quality of services being provided by the Adviser given the Fund’s projected asset levels for the next year.
28
CINCINNATI ASSET MANAGEMENT FUNDS:
BROAD MARKET STRATEGIC INCOME FUND
DISCLOSURE REGARDING APPROVAL OF INVESTMENT ADVISORY AGREEMENT (Unaudited) (Continued)
Brokerage and portfolio transactions. In this regard, the Board considered the Adviser’s trading policies, procedures, and performance in seeking best execution for the Fund. The Board also considered the historical portfolio turnover rate for the Fund; the process by which evaluations are made of the overall reasonableness of commissions paid; the process by which the Adviser evaluates best execution; the method and basis for selecting and evaluating the broker-dealers used; and any anticipated allocation of portfolio business to persons affiliated with the Adviser. After further review and discussion, the Board determined that for the Fund, the Adviser’s practices regarding brokerage and portfolio transactions were satisfactory.
Possible conflicts of interest. In evaluating the possibility for conflicts of interest, the Board considered such matters as the experience and abilities of the advisory personnel assigned to the Fund, the Adviser’s process for allocating trades among the Fund and its different clients, and the substance and administration of the Adviser’s Code of Ethics. Following further consideration and discussion, the Board found that the Adviser’s standards and practices relating to the identification and mitigation of potential conflicts of interests were satisfactory.
Conclusion
After full consideration of the above factors as well as other factors, the Board unanimously concluded that approval of the Investment Advisory Agreement was in the best interests of the Fund and its shareholders.
29
WAVELENGTH INTEREST RATE NEUTRAL FUND | |
LETTER TO SHAREHOLDERS (Unaudited) | July 2018 |
Dear Fellow Shareholders:
Since our last annual letter, linkages between financial markets and the economy developed in a manner that is consistent with our investment principles. Against the headwind of rising interest rates, fundamental pressures built across asset classes and created a profitable environment where risk management was increasingly important for investment performance.
What follows is designed to provide a context for returns that fosters a deeper understanding of the investment process that supports them. By doing so we hope to build on the partnership your investment creates.
PERFORMANCE SUMMARY
For the twelve months ended May 31, 2018, the Wavelength Interest Rate Neutral Fund (the “Fund”) delivered a return of +1.95% versus a benchmark return of +1.22% for the S&P / BGCantor 0-3 Month US Treasury Bill Index (which seeks to represent the return from not taking risk in financial markets). Performance over the period was achieved within targeted risk parameters, and the Fund benefited from its disciplined approach in line with investment objectives.
WAVELENGTH PHILOSOPHY
We believe that macroeconomic conditions drive asset prices and central banks use interest rates to manage macroeconomic conditions. Based on this fundamental logic, we seek to build a portfolio that is hedged to changes in interest rates by balancing investment exposure between instruments we expect to outperform in rising and falling macroeconomic conditions.
INVESTMENT ENVIRONMENT
As an extension of our investment philosophy we believe that changing expectations for growth and inflation drive investment decisions, which in turn drive market prices. Since our last letter, the US economy remained strong and the Federal Reserve continued to raise interest rates, putting pressure on fixed income markets.
The period began with rising interest rates, followed by a series of upside surprises to growth amidst relatively muted levels of inflation. Corporate assets responded positively to these conditions but were also increasingly volatile as geopolitical risks intensified. In this context, fears came to a head in November with North Korea’s most recent test of an intercontinental ballistic missile.
Speculation around changes in leadership at the Federal Reserve also had a meaningful impact on markets over the second half of 2017. This culminated with the nomination of Federal Reserve Governor Jerome Powell as Chairman which added clarity to the outlook for central bank policy.
Following an uneventful close to the year, a resurgence in geopolitical tensions led to a drop in growth-related assets in the first quarter of 2018. The response to these conditions was acute, as stock markets sold off more in the month of February than they had in the previous two years. Policy expectations also shifted meaningfully due to new dynamics of inflation, and markets recalibrated to reflect these changes in a new path for interest rates.
1
The environment of heightened volatility continued through the end of May, and government bond yields continued to rise. Liquidity became a concern in markets where investors had reached for yield, and the Italian bond market experienced its most significant shock in decades. This experience reinforced the importance of liquidity for investors and brought risk management into focus in the new normal for bond markets.
PERFORMANCE DISCUSSION
Over the period, the Fund delivered positive results amidst widespread headwinds for fixed income. The portfolio monetized investment opportunities based on growth and inflation, and its risk budget proved effective at mitigating downside exposures while underlying markets became increasingly volatile.
The portfolio was positioned to profit entering the third quarter of 2017, as markets began pricing new expectations for economic policy. Convertible bonds, corporate credit and emerging market debt each added performance to the upside, and positions related to inflation rebounded toward more fundamental levels. Outperformance continued through August amidst a backdrop of rising geopolitical tensions that drove the rally in US government bonds across the yield curve.
The Federal Reserve announced plans to unwind its purchasing program in September, and this led to negative returns for government bond markets. The portfolio benefited from positioning in convertible bonds, corporate credit and senior loans which led to outperformance. Markets capitulated in October, and the portfolio again produced positive results despite continued stress for global bond markets. Profits from short-term high yield credit were partially-offset by US government bonds, and inflation-related exposures again contributed positively.
In November, asset prices fluctuated due to persistent geopolitical tension, and this led to rangebound performance and decreased levels of portfolio risk. Volatility rose as 2017 came to a close, and the portfolio benefited from its targeted balance to markets tied to growth and inflation.
Market uncertainty increased to begin 2018, and the portfolio profited from changing investor expectations. Positive results were generated amidst a sell-off for fixed income markets in January, and 10-year breakeven inflation notably rose above 2%. In February, a withdrawal of capital from markets led to losses as investors moved out of financial instruments into cash. Risk was reduced systematically over the month, and the portfolio benefited from positioning when cash was redeployed.
The portfolio generated positive results amidst continued stress for global equity markets in March, as fears of a trade war drove prices lower. The Fund’s core allocation to inflation-linked bonds outperformed, and emerging market debt positions also contributed to profits. Government bond markets sold off into the second quarter, and downside exposure was managed by reducing risk while maintaining balance to growth and inflation factors. The cycle continued through May as the Fund captured upside from government and inflation-linked bond positions, closing out another period of positive performance.
OUTLOOK
The intersection of monetary and trade policies in the US has created a notably wide range of potential economic outcomes. As stimulus measures now push the economy toward capital constraints, markets are primed for a new set of policy expectations.
2
The Fund maintains a balance to the economic factors that drive interest rates in line with its investment mandate. By avoiding directional bets through this targeted exposure, the portfolio seeks to monetize investment opportunities driven by growth and inflation and harvest yield across potential economic outcomes moving forward.
Thank you for your trust and commitment through investment.
Sincerely,

Andrew Dassori
Founding Partner & Chief Investment Officer
Wavelength Capital Management
Past performance is not predictive of future performance. Investment results and principal value will fluctuate so that shares, when redeemed, may be worth more or less than their original cost. Current performance may be higher or lower than the performance data quoted. Performance data current to the most recent month end are available by calling 1-866-896-9292.
An investor should consider the investment objectives, risks, charges and expenses of the Fund carefully before investing. The Fund’s prospectus contains this and other important information. To obtain a copy of the Fund’s prospectus please visit our website at www.wavelengthfunds.com or call 1-866-896-9292 and a copy will be sent to you free of charge. Please read the prospectus carefully before you invest. The Wavelength Interest Rate Neutral Fund is distributed by Ultimus Fund Distributors, LLC.
The Letter to Shareholders seeks to describe some of the Adviser’s current opinions and views of the financial markets. Although the Adviser believes it has a reasonable basis for any opinions or views expressed, actual results may differ, sometimes significantly so, from those expected or expressed. The securities held by the Fund that are discussed in the Letter to Shareholders were held during the period covered by this Report. They do not comprise the entire investment portfolio of the Fund, may be sold at any time and may no longer be held by the Fund. For a complete list of securities held by the Fund as of May 31, 2018, please see the Schedule of Investments section of the Annual Report. The opinions of the Adviser with respect to those securities may change at any time.
Statements in the Letter to Shareholders that reflect projections or expectations for future financial or economic performance of the Fund and the market in general and statements of the Fund’s plans and objectives for future operations are forward-looking statements. No assurance can be given that actual results or events will not differ materially from those projected, estimated, assumed, or anticipated in any such forward-looking statements. Important factors that could result in such differences, in addition to factors noted with such forward-looking statements include, without limitation, general economic conditions, such as inflation, recession, and interest rates. Past performance is not a guarantee of future results.
3
WAVELENGTH INTEREST RATE NEUTRAL FUND
PERFORMANCE INFORMATION
May 31, 2018 (Unaudited)
Comparison of the Change in Value of a $100,000 Investment in
Wavelength Interest Rate Neutral Fund versus the
S&P/BGCantor 0-3 Month U.S. Treasury Bill Index
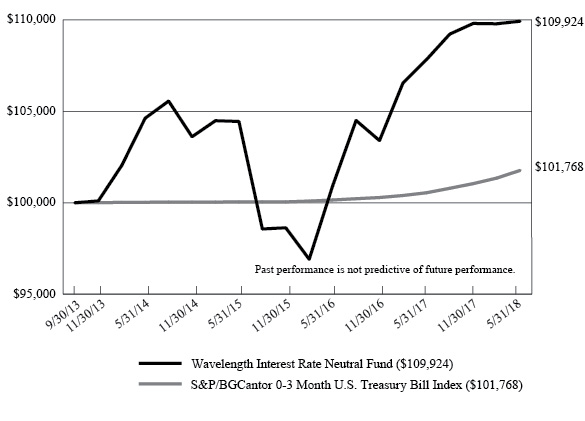
Average Annual Total Returns | ||||
1 Year | 3 Years | Since | ||
Wavelength Interest Rate Neutral Fund(a) | 1.95% | 1.72% | 2.05% | |
S&P/BGCantor 0-3 Month U.S. Treasury Bill Index | 1.22% | 0.57% | 0.38% | |
(a) | The Fund’s total return does not reflect the deduction of taxes a shareholder would pay on Fund distributions or the redemption of Fund shares. |
(b) | The Fund commenced operations on September 30, 2013. |
4
WAVELENGTH INTEREST RATE NEUTRAL FUND
PORTFOLIO INFORMATION
May 31, 2018 (Unaudited)
Portfolio Allocation (% of Net Assets)
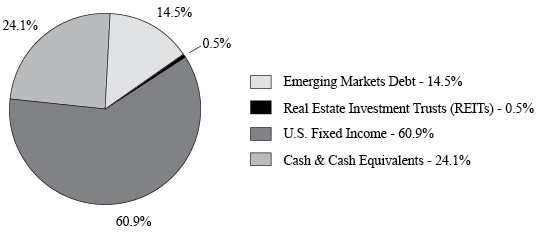
Top 10 Equity Holdings
Security Description | % of |
iShares® TIPS Bond ETF | 16.0% |
Vanguard Short-Term Corporate Bond ETF | 8.6% |
SPDR® Bloomberg Barclays Short Term High Yield Bond ETF | 8.3% |
PowerShares Senior Loan Portfolio | 8.0% |
SPDR® Bloomberg Barclays Convertible Securities ETF | 7.9% |
Vanguard Emerging Markets Government Bond ETF | 5.9% |
iShares® J.P. Morgan USD Emerging Markets Bond ETF | 4.2% |
iShares® iBoxx $ High Yield Corporate Bond ETF | 4.1% |
VanEck Vectors Emerging Markets High Yield Bond ETF | 3.1% |
Vanguard Short-Term Inflation-Protected Securities ETF | 2.8% |
5
| WAVELENGTH INTEREST RATE NEUTRAL FUND SCHEDULE OF INVESTMENTS May 31, 2018 | ||||||||
| EXCHANGE-TRADED FUNDS — 75.9% | Shares | Value | ||||||
| Emerging Markets Debt — 14.5% | ||||||||
iShares® J.P. Morgan USD Emerging Markets Bond ETF | 18,803 | $ | 2,046,518 | |||||
| PowerShares Emerging Markets Sovereign Debt Portfolio | 21,392 | 578,868 | ||||||
| VanEck Vectors Emerging Markets High Yield Bond ETF | 65,349 | 1,516,750 | ||||||
| Vanguard Emerging Markets Government Bond ETF | 37,545 | 2,863,182 | ||||||
| 7,005,318 | ||||||||
| Real Estate Investment Trusts (REITs)— 0.5% | ||||||||
| Vanguard Real Estate ETF | 3,100 | 244,559 | ||||||
| U.S. Fixed Income — 60.9% | ||||||||
iShares® iBoxx $ High Yield Corporate Bond ETF | 23,320 | 1,991,062 | ||||||
iShares® iBoxx $ Investment Grade Corporate Bond ETF | 5,753 | 664,414 | ||||||
iShares® TIPS Bond ETF | 69,008 | 7,762,020 | ||||||
| PowerShares Senior Loan Portfolio | 167,990 | 3,862,090 | ||||||
SPDR® Bloomberg Barclays Convertible Securities ETF | 72,137 | 3,844,902 | ||||||
SPDR® Bloomberg Barclays High Yield Bond ETF | 37,733 | 1,344,049 | ||||||
SPDR® Bloomberg Barclays Short Term High Yield Bond ETF | 147,109 | 4,021,960 | ||||||
| Vanguard Mortgage-Backed Securities ETF | 9,794 | 504,293 | ||||||
| Vanguard Short-Term Corporate Bond ETF | 53,052 | 4,153,441 | ||||||
| Vanguard Short-Term Inflation-Protected Securities ETF | 27,619 | 1,354,436 | ||||||
| 29,502,667 | ||||||||
Total Exchange-Traded Funds (Cost $37,069,752) | $ | 36,752,544 | ||||||
| MONEY MARKET FUNDS — 18.9% | Shares | Value | ||||||
Fidelity Institutional Money Market Government Portfolio- Class I, 1.64% (a) | 4,573,478 | $ | 4,573,478 | |||||
Invesco Short-Term Investments Trust - Treasury Portfolio- Institutional Shares, 1.64% (a) | 4,573,478 | 4,573,478 | ||||||
Total Money Market Funds (Cost $9,146,956) | $ | 9,146,956 | ||||||
Total Investments at Value — 94.8% (Cost $46,216,708) | $ | 45,899,500 | ||||||
| Other Assets in Excess of Liabilities — 5.2% | 2,534,304 | |||||||
| Net Assets — 100.0% | $ | 48,433,804 | ||||||
| (a) | See accompanying notes to financial statements. |
6
| WAVELENGTH INTEREST RATE NEUTRAL FUND SCHEDULE OF FUTURES CONTRACTS May 31, 2018 | ||||||||||||||
| FUTURES CONTRACTS | Contracts | Expiration Date | Notional Value | Value/Unrealized Appreciation (Depreciation) | ||||||||||
| Commodity Futures | ||||||||||||||
| COMEX miNY Gold Future | 3 | 07/27/2018 | $ | 195,713 | $ | (167 | ) | |||||||
| Index Futures | ||||||||||||||
| E-Mini Dow CBOT DJIA Future | 12 | 06/15/2018 | 1,465,500 | 6,670 | ||||||||||
| E-Mini Nasdaq 100 Future | 12 | 06/15/2018 | 1,674,240 | 68,185 | ||||||||||
E-Mini S&P 500® Future | 7 | 06/15/2018 | 947,275 | 16,486 | ||||||||||
Total Index Futures | 4,087,015 | 91,341 | ||||||||||||
| Treasury Futures | ||||||||||||||
| 10-Year U.S. Treasury Note Future | 5 | 09/19/2018 | 601,485 | 273 | ||||||||||
| 5-Year U.S. Treasury Note Future | 42 | 09/28/2018 | 4,780,453 | (1,243 | ) | |||||||||
Total Treasury Futures | 5,381,938 | (970 | ) | |||||||||||
Total Futures Contracts | $ | 9,664,666 | $ | 90,204 | ||||||||||
| FUTURES CONTRACTS SOLD SHORT | Contracts | Expiration Date | Notional Value | Value/Unrealized Appreciation (Depreciation) | ||||||||||
| Commodity Futures | ||||||||||||||
| E-Mini Crude Oil Future | 1 | 06/19/2018 | $ | 33,537 | $ | 2,035 | ||||||||
| E-Mini Silver Future | 2 | 06/27/2018 | 82,188 | (753 | ) | |||||||||
| Total Commodity Futures | 115,725 | 1,282 | ||||||||||||
| Treasury Futures | ||||||||||||||
| U.S. Treasury Long Bond Future | 4 | 09/19/2018 | 578,625 | 462 | ||||||||||
| Total Futures Contracts Sold Short | $ | 694,350 | $ | 1,744 | ||||||||||
The average monthly notional value of futures contracts and futures contracts sold short during the year ended May 31, 2018 was $6,350,432 and ($412,946), respectively.
|
See accompanying notes to financial statements. |
7
| WAVELENGTH INTEREST RATE NEUTRAL FUND STATEMENT OF ASSETS AND LIABILITIES May 31, 2018 | ||||
| ASSETS | ||||
| Investments in securities: | ||||
| At acquisition cost | $ | 46,216,708 | ||
| At value (Note 2) | $ | 45,899,500 | ||
| Cash | 1,500,162 | |||
| Margin deposits for futures contracts (Note 2) | 1,212,719 | |||
| Variation margin receivable (Notes 2 and 5) | 1,562 | |||
| Dividends and interest receivable | 12,388 | |||
| Other assets | 4,601 | |||
| Total assets | 48,630,932 | |||
| LIABILITIES | ||||
| Variation margin payable (Notes 2 and 5) | 35,855 | |||
| Payable for investment securities purchased | 119,865 | |||
| Payable to Adviser (Note 4) | 23,418 | |||
| Payable to administrator (Note 4) | 9,435 | |||
| Other accrued expenses | 8,555 | |||
| Total liabilities | 197,128 | |||
| NET ASSETS | $ | 48,433,804 | ||
| NET ASSETS CONSIST OF: | ||||
| Paid-in capital | $ | 48,888,645 | ||
| Undistributed net investment income | 157,095 | |||
| Accumulated net realized losses from investment transactions and futures contracts | (386,676 | ) | ||
| Net unrealized appreciation (depreciation) on: | ||||
| Investments | (317,208 | ) | ||
| Futures contracts | 91,948 | |||
| NET ASSETS | $ | 48,433,804 | ||
| Shares of beneficial interest outstanding (unlimited number of shares authorized, no par value) | 4,860,005 | |||
| Net asset value, offering price and redemption price per share (Note 2) | $ | 9.97 | ||
See accompanying notes to financial statements. |
8
| WAVELENGTH INTEREST RATE NEUTRAL FUND STATEMENT OF OPERATIONS For the Year Ended May 31, 2018 | ||||
| INVESTMENT INCOME | ||||
| Interest | $ | 6,976 | ||
| Dividends | 979,295 | |||
| Total investment income | 986,271 | |||
| EXPENSES | ||||
| Investment advisory fees (Note 4) | 295,580 | |||
| Professional fees | 39,907 | |||
| Administration fees (Note 4) | 33,903 | |||
| Fund accounting fees (Note 4) | 33,120 | |||
| Transfer agent fees (Note 4) | 17,750 | |||
| Registration and filing fees | 13,625 | |||
| Compliance fees (Note 4) | 12,000 | |||
| Trustees' fees and expenses (Note 4) | 9,936 | |||
| Custody and bank service fees | 8,797 | |||
| Printing of shareholder reports | 4,182 | |||
| Insurance expense | 2,622 | |||
| Postage and supplies | 2,184 | |||
| Other expenses | 9,762 | |||
| Total expenses | 483,368 | |||
| Less fee reductions by the Adviser (Note 4) | (175,345 | ) | ||
| Net expenses | 308,023 | |||
| NET INVESTMENT INCOME | 678,248 | |||
| REALIZED AND UNREALIZED GAINS (LOSSES) ON INVESTMENTS AND FUTURES CONTRACTS | ||||
| Net realized gains from: | ||||
| Investments | 12,427 | |||
| Futures contracts (Note 5) | 320,657 | |||
| Net change in unrealized appreciation (depreciation) on: | ||||
| Investments | (674,241 | ) | ||
| Futures contracts (Note 5) | 71,930 | |||
| NET REALIZED AND UNREALIZED LOSSES ON INVESTMENTS AND FUTURES CONTRACTS | (269,227 | ) | ||
| NET INCREASE IN NET ASSETS RESULTING FROM OPERATIONS | $ | 409,021 | ||
See accompanying notes to financial statements. |
9
| WAVELENGTH INTEREST RATE NEUTRAL FUND STATEMENTS OF CHANGES IN NET ASSETS | ||||||||
| Year Ended May 31, 2018 | Year Ended May 31, 2017 | |||||||
| FROM OPERATIONS | ||||||||
| Net investment income | $ | 678,248 | $ | 377,736 | ||||
| Net realized gains from: | ||||||||
| Investments | 12,427 | 57,812 | ||||||
| Futures contracts (Note 5) | 320,657 | 425,010 | ||||||
| Capital gain distributions from regulated investment companies | — | 926 | ||||||
| Net change in unrealized appreciation (depreciation) on: | ||||||||
| Investments | (674,241 | ) | 369,968 | |||||
| Futures contracts (Note 5) | 71,930 | 1,326 | ||||||
| Net increase in net assets resulting from operations | 409,021 | 1,232,778 | ||||||
| DISTRIBUTIONS TO SHAREHOLDERS (Note 2) | ||||||||
| From net investment income | (587,556 | ) | (360,818 | ) | ||||
| CAPITAL SHARE TRANSACTIONS | ||||||||
| Proceeds from shares sold | 27,939,934 | 3,534,514 | ||||||
| Net asset value of shares issued in reinvestment of distributions to shareholders | 535,880 | 360,818 | ||||||
| Payments for shares redeemed | (1,254,401 | ) | (137,545 | ) | ||||
| Net increase in net assets from capital share transactions | 27,221,413 | 3,757,787 | ||||||
| TOTAL INCREASE IN NET ASSETS | 27,042,878 | 4,629,747 | ||||||
| NET ASSETS | ||||||||
| Beginning of year | 21,390,926 | 16,761,179 | ||||||
| End of year | $ | 48,433,804 | $ | 21,390,926 | ||||
| UNDISTRIBUTED NET INVESTMENT INCOME | $ | 157,095 | $ | 66,403 | ||||
See accompanying notes to financial statements. |
10
| WAVELENGTH INTEREST RATE NEUTRAL FUND STATEMENTS OF CHANGES IN NET ASSETS (Continued) | ||||||||
| Year Ended May 31, 2018 | Year Ended May 31, 2017 | |||||||
| CAPITAL SHARE ACTIVITY | ||||||||
| Shares sold | 2,790,300 | 361,512 | ||||||
| Shares issued in reinvestment of distributions to shareholders | 53,631 | 37,052 | ||||||
| Shares redeemed | (125,177 | ) | (14,153 | ) | ||||
| Net increase in shares outstanding | 2,718,754 | 384,411 | ||||||
| Shares outstanding at beginning of year | 2,141,251 | 1,756,840 | ||||||
| Shares outstanding at end of year | 4,860,005 | 2,141,251 | ||||||
See accompanying notes to financial statements. |
11
| WAVELENGTH INTEREST RATE NEUTRAL FUND FINANCIAL HIGHLIGHTS | ||||||||||||||||||||
| Per Share Data for a Share Outstanding Throughout Each Period | ||||||||||||||||||||
| Year Ended May 31, 2018 | Year Ended May 31, 2017 | Year Ended May 31, 2016 | Year Ended May 31, 2015 | Period | ||||||||||||||||
| Net asset value at beginning of period | $ | 9.99 | $ | 9.54 | $ | 10.09 | $ | 10.38 | $ | 10.00 | ||||||||||
| Income (loss) from investment operations: | ||||||||||||||||||||
| Net investment income | 0.22 | 0.20 | 0.21 | 0.23 | 0.10 | |||||||||||||||
| Net realized and unrealized gains (losses) on investments and futures contracts | (0.03 | ) | 0.45 | (0.56 | ) | (0.25 | ) | 0.36 | ||||||||||||
| Total from investment operations | 0.19 | 0.65 | (0.35 | ) | (0.02 | ) | 0.46 | |||||||||||||
| Less distributions: | ||||||||||||||||||||
| Distributions from net investment income | (0.21 | ) | (0.20 | ) | (0.20 | ) | (0.23 | ) | (0.07 | ) | ||||||||||
| Distributions from net realized gains | — | — | — | (0.04 | ) | (0.01 | ) | |||||||||||||
| Total distributions | (0.21 | ) | (0.20 | ) | (0.20 | ) | (0.27 | ) | (0.08 | ) | ||||||||||
| Net asset value at end of period | $ | 9.97 | $ | 9.99 | $ | 9.54 | $ | 10.09 | $ | 10.38 | ||||||||||
Total return (b) | 1.95 | % | 6.83 | % | (3.37 | %) | (0.17 | %) | 4.62 | %(c) | ||||||||||
| Net assets at end of period (000's) | $ | 48,434 | $ | 21,391 | $ | 16,761 | $ | 17,815 | $ | 4,717 | ||||||||||
| Ratios/supplementary data: | ||||||||||||||||||||
Ratio of total expenses to average net assets (d) | 1.55 | % | 1.85 | % | 2.00 | % | 2.19 | % | 4.42 | %(e) | ||||||||||
Ratio of net expenses to average net assets (d) (f) | 0.99 | % | 0.99 | % | 0.99 | % | 0.99 | % | 0.99 | %(e) | ||||||||||
Ratio of net investment income to average net assets (d) (f) (g) | 2.17 | % | 2.01 | % | 2.16 | % | 2.52 | % | 1.55 | %(e) | ||||||||||
| Portfolio turnover rate | 9 | % | 53 | % | 103 | % | 107 | % | 114 | %(c) | ||||||||||
(a) | Represents the period from the commencement of operations (September 30, 2013) through May 31, 2014. |
(b) | Total return is a measure of the change in value of an investment in the Fund over the periods covered. The returns shown do not reflect the deduction of taxes a shareholder would pay on Fund distributions, if any, or the redemption of Fund shares. The total returns would be lower if the Adviser had not reduced advisory fees and/or reimbursed expenses. |
(c) | Not annualized. |
(d) | The ratios of expenses and net investment income to average net assets do not reflect the Fund’s proportionate share of expenses of the underlying investment companies in which the Fund invests. |
(e) | Annualized. |
(f) | Ratio was determined after advisory fee reductions and/or expense reimbursements (Note 4). |
(g) | Recognition of net investment income by the Fund is affected by the timing of the declarations of dividends by the underlying investment companies in which the Fund invests. |
See accompanying notes to financial statements. | |
12
WAVELENGTH INTEREST RATE NEUTRAL FUND
NOTES TO FINANCIAL STATEMENTS
May 31, 2018
1. Organization
Wavelength Interest Rate Neutral Fund (the “Fund”) is a diversified series of Ultimus Managers Trust (the “Trust”), an open-end investment company established as an Ohio business trust under a Declaration of Trust dated February 28, 2012. Other series of the Trust are not incorporated in this report.
The investment objective of the Fund is to seek total return.
2. Significant Accounting Policies
In October 2016, the U.S. Securities and Exchange Commission (the “SEC”) adopted amendments to Regulation S-X, which impact financial statement presentation, particularly the presentation of derivative investments. The Fund has adopted these amendments, which were effective August 1, 2017, with these financial statements.
The following is a summary of the Fund’s significant accounting policies. The policies are in conformity with accounting principles generally accepted in the United States of America (“GAAP”). The Fund follows accounting and reporting guidance under Financial Accounting Standards Board Accounting Standards Codification Topic 946, “Financial Services – Investment Companies.”
Securities and futures valuation – The Fund values its portfolio securities at market value as of the close of regular trading on the New York Stock Exchange (the “NYSE”) (normally 4:00 p.m. Eastern time) on each business day the NYSE is open. The Fund values its listed securities on the basis of the security’s last sale price on the security’s primary exchange, if available, otherwise at the exchange’s most recently quoted mean price. NASDAQ-listed securities are valued at the NASDAQ Official Closing Price. The Fund values its exchange-traded futures contracts at their last sale price as of the close of regular trading on the NYSE. Prices for these futures contracts are monitored daily by Wavelength Capital Management, LLC (the “Adviser”) until the close of regular trading to determine if fair valuation is required.
When using a quoted price and when the market for the security is considered active, the security will be classified as Level 1 within the fair value hierarchy (see below). In the event that market quotations are not readily available or are considered unreliable due to market or other events, the Fund values its securities and other assets at fair value pursuant to the procedures adopted by and under the general supervision of the Trust’s Board of Trustees (the “Board”). Under these procedures, the securities will be classified as Level 2 or 3 within the fair value hierarchy, depending on the inputs used. Unavailable or unreliable market quotes may be due to the following factors: a substantial bid-ask spread; infrequent sales resulting in stale prices; insufficient trading volume; small trade sizes; a temporary lapse in any reliable pricing source; and actions of the securities or futures markets, such as the suspension or limitation of trading.
GAAP establishes a single authoritative definition of fair value, sets out a framework for measuring fair value, and requires additional disclosures about fair value measurements.
13
WAVELENGTH INTEREST RATE NEUTRAL FUND
NOTES TO FINANCIAL STATEMENTS (Continued)
Various inputs are used in determining the value of the Fund’s investments. These inputs are summarized in the three broad levels listed below:
● | Level 1 – quoted prices in active markets for identical securities |
● | Level 2 – other significant observable inputs |
● | Level 3 – significant unobservable inputs |
The inputs or methods used for valuing securities are not necessarily an indication of the risks associated with investing in those securities. The inputs used to measure fair value may fall into different levels of the fair value hierarchy. In such cases, for disclosure purposes, the level in the fair value hierarchy within which the fair value measurement falls in its entirety is determined based on the lowest level input that is significant to the fair value measurement.
The following is a summary of the inputs used to value the Fund’s investments and other financial instruments as of May 31, 2018:
| Level 1 | Level 2 | Level 3 | Total | |||||||||||||
| Investments in Securities | ||||||||||||||||
| Exchange-Traded Funds | $ | 36,752,544 | $ | — | $ | — | $ | 36,752,544 | ||||||||
| Money Market Funds | 9,146,956 | — | — | 9,146,956 | ||||||||||||
| Total | $ | 45,899,500 | $ | — | $ | — | $ | 45,899,500 | ||||||||
| Other Financial Instruments | ||||||||||||||||
| Futures Contracts | $ | 90,204 | $ | — | $ | — | $ | 90,204 | ||||||||
| Futures Contracts Sold Short | 1,744 | — | — | 1,744 | ||||||||||||
| Total | $ | 91,948 | $ | — | $ | — | $ | 91,948 | ||||||||
As of May 31, 2018, the Fund did not have any transfers between Levels. In addition, the Fund did not have any assets or liabilities that were measured at fair value on a recurring basis using significant unobservable inputs (Level 3) as of May 31, 2018. It is the Fund’s policy to recognize transfers between Levels at the end of the reporting period.
Share valuation – The net asset value (“NAV”) per share of the Fund is calculated daily by dividing the total value of the Fund’s assets, less liabilities, by the number of shares outstanding. The offering price and redemption price per share of the Fund is equal to the NAV per share.
Investment income – Dividend income is recorded on the ex-dividend date. Interest income is accrued as earned.
Investment transactions – Investment transactions are accounted for on the trade date. Realized gains and losses on investments sold are determined on a specific identification basis.
14
WAVELENGTH INTEREST RATE NEUTRAL FUND
NOTES TO FINANCIAL STATEMENTS (Continued)
Common expenses – Common expenses of the Trust are allocated among the Fund and the other series of the Trust based on the relative net assets of each series or the nature of the services performed and the relative applicability to each series.
Distributions to shareholders – The Fund will distribute to shareholders any net investment income on a quarterly basis and any net realized capital gains at least annually. The amount of such dividends and distributions are determined in accordance with federal income tax regulations, which may differ from GAAP. Dividends and distributions to shareholders are recorded on the ex-dividend date. The tax character of distributions paid during the years ended May 31, 2018 and 2017 was ordinary income. On June 29, 2018, the Fund paid an ordinary income dividend of $0.0539 per share to shareholders of record on June 28, 2018.
Futures contracts – The Fund uses futures contracts to gain exposure to or to hedge against changes in the value of equities, real estate, interest rates or commodities. A futures contract represents a commitment for the future purchase or sale of an asset at a specified price on a specified date. When the Fund purchases or sells a futures contract, no price is paid to or received by the Fund. Instead, the Fund is required to deposit in a segregated asset account an amount of cash or qualifying securities currently ranging from 2% to 10% of the contract amount. This is called the “initial margin deposit.” Subsequent payments, known as “variation margin,” are made or received by the Fund each day, depending on the daily fluctuations in the fair value of the underlying asset. The Fund recognizes an unrealized gain or loss equal to the daily variation margin. If market conditions move unexpectedly, the Fund may not achieve the anticipated benefits of the futures contracts and may realize a loss. The margin deposits for futures contracts and the variation margin payable are reported on the Statement of Assets and Liabilities.
Estimates – The preparation of financial statements in conformity with GAAP requires management to make estimates and assumptions that affect the reported amounts of assets and liabilities and disclosure of contingent assets and liabilities as of the date of the financial statements and the reported amounts of income and expenses during the reporting period. Actual results could differ from those estimates.
Federal income tax – The Fund has qualified and intends to continue to qualify as a regulated investment company under the Internal Revenue Code of 1986, as amended (the “Code”). Qualification generally will relieve the Fund of liability for federal income taxes to the extent 100% of its net investment income and net realized capital gains are distributed in accordance with the Code.
In order to avoid imposition of the excise tax applicable to regulated investment companies, it is also the Fund’s intention to declare as dividends in each calendar year at least 98% of its net investment income (earned during the calendar year) and 98.2% of its net realized capital gains (earned during the twelve months ended October 31) plus undistributed amounts from prior years.
15
WAVELENGTH INTEREST RATE NEUTRAL FUND
NOTES TO FINANCIAL STATEMENTS (Continued)
The following information is computed on a tax basis for each item as of May 31, 2018:
| Tax cost of portfolio investments | $ | 46,455,803 | ||
| Gross unrealized appreciation | $ | 269,323 | ||
| Gross unrealized depreciation | (825,626 | ) | ||
| Net unrealized depreciation | (556,303 | ) | ||
| Undistributed ordinary income | 157,095 | |||
| Capital loss carryforwards | (55,633 | ) | ||
| Total accumulated deficit | $ | (454,841 | ) |
The value of the federal income tax cost of portfolio investments and the tax components of the accumulated deficit may temporarily differ from the financial statement cost and components of net assets (“book/tax difference”). These book/tax differences are due to the recognition of capital gains or losses under income tax regulations and GAAP, primarily the tax deferral of losses on wash sales and the tax treatment of realized and unrealized gains and losses on futures contracts.
During the year ended May 31, 2018, the Fund utilized $162,303 of short-term capital loss carryforwards and $227,440 of long-term capital loss carryforwards to offset current year capital gains.
As of May 31, 2018, the Fund had short-term capital loss carryforwards of $55,633 for federal income tax purposes. These capital loss carryforwards, which do not expire, may be utilized in future years to offset net realized capital gains, if any, prior to distributing such gains to shareholders.
The Fund recognizes the tax benefits or expenses of uncertain tax positions only when the position is “more likely than not” to be sustained assuming examination by tax authorities. Management has reviewed the Fund’s tax positions for all open tax periods (periods ended May 31, 2015 through May 31, 2018) and has concluded that no provision for unrecognized tax benefits or expenses is required in these financial statements. The Fund identifies its major tax jurisdiction as U.S. Federal.
3. Investment Transactions
During the year ended May 31, 2018, cost of purchases and proceeds from sales of investment securities, other than short-term investments, were $20,883,858 and $2,303,285, respectively.
4. Transactions with Related Parties
INVESTMENT ADVISORY AGREEMENT
The Fund’s investments are managed by the Adviser pursuant to the terms of an Investment Advisory Agreement. Under the Investment Advisory Agreement, the Fund pays the Adviser an advisory fee, computed and accrued daily and paid monthly, at the annual rate of 0.95% of its average daily net assets.
16
WAVELENGTH INTEREST RATE NEUTRAL FUND
NOTES TO FINANCIAL STATEMENTS (Continued)
Pursuant to an Expense Limitation Agreement (“ELA”) between the Fund and the Adviser, the Adviser has contractually agreed, until October 1, 2019, to reduce investment advisory fees and reimburse other operating expenses to the extent necessary to limit total annual operating expenses of the Fund (exclusive of brokerage costs; taxes; interest; borrowing costs such as interest and dividend expenses on securities sold short; acquired fund fees and expenses; extraordinary expenses such as litigation and merger or reorganization costs and other expenses not incurred in the ordinary course of the Fund’s business; and amounts, if any, payable pursuant to a plan adopted in accordance with Rule 12b-1 under the Investment Company Act of 1940, as amended (the “1940 Act”)) to an amount not exceeding 0.99% of the Fund’s average daily net assets. During the year ended May 31, 2018, the Adviser reduced its investment advisory fees by $175,345.
Under the terms of the ELA, investment advisory fee reductions and expense reimbursements by the Adviser are subject to recoupment by the Adviser for a period of three years after such fees and expenses were incurred, provided that the recoupments do not cause total annual operating expenses of the Fund to exceed the lesser of (i) the expense limitation then in effect, if any, and (ii) the expense limitation in effect at the time the expenses to be repaid were incurred. As of May 31, 2018, the Adviser may seek recoupment of investment advisory fee reductions and expense reimbursements in the amount of $503,460 no later than the dates as stated below:
May 31, 2019 | May 31, 2020 | May 31, 2021 | Total |
$166,221 | $161,894 | $175,345 | $503,460 |
OTHER SERVICE PROVIDERS
Ultimus Fund Solutions, LLC (“Ultimus”) provides administration, fund accounting, compliance and transfer agency services to the Fund. The Fund pays Ultimus fees in accordance with the agreements for such services. In addition, the Fund pays out-of-pocket expenses including, but not limited to, postage, supplies and costs of pricing the Fund’s portfolio securities.
Under the terms of a Distribution Agreement with the Trust, Ultimus Fund Distributors, LLC (the “Distributor”) serves as the principal underwriter to the Fund. The Distributor is a wholly-owned subsidiary of Ultimus. The Distributor is compensated by the Adviser (not the Fund) for acting as principal underwriter.
Certain officers and a Trustee of the Trust are also officers of Ultimus and the Distributor.
TRUSTEE COMPENSATION
Each Trustee who is not an “interested person” of the Trust (“Independent Trustee”) receives a $1,000 annual retainer from the Fund, paid quarterly, except for the Board Chair who receives a $1,200 annual retainer from the Fund, paid quarterly. Each Independent Trustee also receives from the Fund a fee of $500 for each Board meeting attended plus reimbursement for travel and other meeting-related expenses.
17
WAVELENGTH INTEREST RATE NEUTRAL FUND
NOTES TO FINANCIAL STATEMENTS (Continued)
PRINCIPAL HOLDERS OF FUND SHARES
As of May 31, 2018, the following shareholders owned of record 5% or more of the outstanding shares of the Fund:
Name of Record Owner | % Ownership |
Interactive Brokers, LLC (for the benefit of its customers) | 29% |
National Financial Services, LLC (for the benefit of its customers) | 29% |
TD Ameritrade, Inc. (for the benefit of its customers) | 8% |
Charles Schwab & Co., Inc. (for the benefit of its customers) | 8% |
Frederic Davis Dassori | 5% |
A shareholder owning of record or beneficially 25% or more of the Fund’s outstanding shares may be considered a controlling person. That shareholder’s vote could have a more significant effect on matters presented at a shareholder’s meeting.
5. Derivatives Transactions
The Fund’s positions in derivative instruments as of May 31, 2018 are recorded in the following location in the Statement of Assets and Liabilities:
Derivative Investment Type | Location |
Futures contracts | Variation margin receivable/payable |
The following table sets forth the values of variation margin of the Fund as of May 31, 2018:
| Variation Margin | ||||||||||||
| Type of Derivative and Risk | Receivable | (Payable) | Total | |||||||||
| Asset Derivatives | ||||||||||||
| Futures contracts | ||||||||||||
| Commodity | $ | — | $ | (214 | ) | $ | (214 | ) | ||||
| Index | (33,142 | ) | (33,142 | ) | ||||||||
| Treasury | — | (2,499 | ) | (2,499 | ) | |||||||
| Total Asset Derivatives | — | (35,855 | ) | (35,855 | ) | |||||||
| Liability Derivatives | ||||||||||||
| Futures contracts | ||||||||||||
| Commodity | $ | 1,100 | $ | — | $ | 1,100 | ||||||
| Treasury | 462 | — | 462 | |||||||||
| Total Liability Derivatives | 1,562 | — | 1,562 | |||||||||
| Total | $ | 1,562 | $ | (35,855 | ) | $ | (34,293 | ) | ||||
18
WAVELENGTH INTEREST RATE NEUTRAL FUND
NOTES TO FINANCIAL STATEMENTS (Continued)
The Fund’s transactions in derivative instruments during the year ended May 31, 2018 are recorded in the following locations in the Statement of Operations:
Derivative Investment Type | Location |
Futures contracts | Net realized gains from futures contracts |
Net change in unrealized appreciation (depreciation) on futures contracts |
The following is a summary of the Fund’s net realized gains and net change in unrealized appreciation (depreciation) on derivative instruments recognized in the Statement of Operations during the year ended May 31, 2018:
| Type of Derivative and Risk | Net Realized Gains (Losses) | Net Change in Unrealized Appreciation (Depreciation) | ||||||
| Futures contracts | ||||||||
| Commodity | $ | 6,452 | $ | 1,170 | ||||
| Index | 467,847 | 72,758 | ||||||
| Treasury | (153,642 | ) | (1,998 | ) | ||||
| Total | $ | 320,657 | $ | 71,930 | ||||
In the ordinary course of business, the Fund may enter into transactions subject to enforceable netting agreements or other similar arrangements (“netting agreements”). Generally, the right to offset in netting agreements allows the Fund to offset any exposure to a specific counterparty with any collateral received or delivered to that counterparty based on the terms of the agreements. Generally, the Fund manages its cash collateral securities and securities collateral on a counterparty basis.
19
WAVELENGTH INTEREST RATE NEUTRAL FUND
NOTES TO FINANCIAL STATEMENTS (Continued)
As of May 31, 2018, the offsetting of financial assets and derivative assets is as follows:
| Description | Gross Amounts of Recognized Assets | Gross Amounts Offset in Statements of Assets and Liabilities | Net Amounts of Assets Presented in Statements of Assets and Liabilities | Collateral Pledged* | Net Amount | |||||||||||||||
| Variation margin payable - futures contracts | $ | — | $ | (35,855 | ) | $ | (35,855 | ) | $ | 35,855 | $ | — | ||||||||
| Total subject to a master netting or similar arrangement | $ | — | $ | (35,855 | ) | $ | (35,855 | ) | $ | 35,855 | $ | — | ||||||||
* | The amount is limited to the net amounts of financial assets and accordingly does not include excess collateral pledged. |
As of May 31, 2018, the offsetting of financial liabilities and derivative liabilities is as follows:
| Description | Gross Amounts of Recognized Liabilities | Gross Amounts Offset in Statements of Assets and Liabilities | Net Amounts of Liabilities Presented in Statements of Assets and Liabilities | Collateral Pledged | Net Amount | |||||||||||||||
| Variation margin receivable - futures contracts | $ | 1,562 | $ | — | $ | 1,562 | $ | — | $ | 1,562 | ||||||||||
| Total subject to a master netting or similar arrangement | $ | 1,562 | $ | — | $ | 1,562 | $ | — | $ | 1,562 | ||||||||||
6. Certain Investments and Risks
The securities in which the Fund invests, as well as the risks associated with these securities, are described in the Fund’s prospectus. Among these risks are those associated with investments in shares of exchange-traded funds (“ETFs”). ETFs issue their shares to authorized participants in return for a specific basket of securities. The authorized participants then sell the ETF’s shares on the secondary market. In other words, ETF shares are traded on a securities exchange based on their market value. Investments in ETFs are subject to the risk that the ETF’s shares may trade at a premium (creating the risk that the Fund pays more than NAV for an ETF when making a purchase) or discount (creating the risk that the Fund receives less than NAV when selling an ETF) to the ETF’s NAV. Investments in ETFs are also subject to index-tracking risk because the total return generated by the securities will be reduced by transaction costs and
20
WAVELENGTH INTEREST RATE NEUTRAL FUND
NOTES TO FINANCIAL STATEMENTS (Continued)
expenses not incurred by the indices. Certain securities comprising the index tracked by an ETF may, from time to time, temporarily be unavailable, which may further impede the ETF’s ability to track its applicable index or match the index’s performance. To the extent that the Fund invests in an ETF, the Fund incurs additional expenses because the Fund bears its pro-rata portion of such ETF’s advisory fees and operational expenses. Finally, ETF shares are also subject to the risks applicable to the underlying basket of securities. As of May 31, 2018, the Fund had 75.9% of the value of its net assets invested in ETFs.
7. Contingencies and Commitments
The Fund indemnifies the Trust’s officers and Trustees for certain liabilities that might arise from their performance of their duties to the Fund. Additionally, in the normal course of business, the Fund enters into contracts that contain a variety of representations and warranties and which provide general indemnifications. The Fund’s maximum exposure under these arrangements is unknown, as this would involve future claims that may be made against the Fund that have not yet occurred. However, based on experience, the Fund expects the risk of loss to be remote.
8. Subsequent Events
The Fund is required to recognize in the financial statements the effects of all subsequent events that provide additional evidence about conditions that existed as of the date of the Statement of Assets and Liabilities. For non-recognized subsequent events that must be disclosed to keep the financial statements from being misleading, the Fund is required to disclose the nature of the event as well as an estimate of its financial effect, or a statement that such an estimate cannot be made. Management has evaluated subsequent events through the issuance of these financial statements and has noted no such events other than the ordinary income dividend paid on June 29, 2018, as discussed in Note 2 and the following:
Agreement and Change in Control
In June, 2018, Wavelength Capital Management, LLC (“Wavelength”), the Fund’s investment advisor, entered into a transaction (the “Transaction”) under which Wavelength agreed to have majority interest of Wavelength purchased by MANG Investments LLC. The Transaction is expected to close in the third calendar quarter of 2018, subject to customary closing conditions. There can be no assurance that the Transaction will be consummated as contemplated or that necessary conditions will be satisfied.
The Transaction is deemed to be a change in control, and therefore an “assignment” under the Investment Company Act of 1940, as amended, of the Fund’s existing investment advisory agreement with Wavelength and will result in its automatic termination. An interim investment advisory agreement and a new investment advisory agreement, each with substantially the same terms as the current agreement, except for the start and end date of the agreement, were approved by the Trust’s Board of Trustees at a meeting held on July 23-24, and the new investment advisory agreement will be submitted to the Fund’s shareholders for approval in or about September, 2018.
The Transaction is not expected to result in any change in the portfolio management of the Fund or in the Fund’s investment objectives or policies.
21
WAVELENGTH INTEREST RATE NEUTRAL FUND
REPORT OF INDEPENDENT REGISTERED
PUBLIC ACCOUNTING FIRM
To the Board of Trustees of Ultimus Managers Trust
and the Shareholders of Wavelength Interest Rate Neutral Fund
Opinion on the Financial Statements
We have audited the accompanying statement of assets and liabilities of Wavelength Interest Rate Neutral Fund, a series of shares of beneficial interest in Ultimus Managers Trust (the “Fund”), including the schedule of investments, as of May 31, 2018, and the related statement of operations for the year then ended, the statements of changes in net assets for each of the years in the two-year period then ended and the financial highlights for each of the years in the four-year period then ended and for the period September 30, 2013 (commencement of operations) through May 31, 2014, and the related notes (collectively referred to as the “financial statements”). In our opinion, the financial statements present fairly, in all material respects, the financial position of the Fund as of May 31, 2018, and the results of its operations for the year then ended, the changes in its net assets for each of the years in the two-year period then ended and its financial highlights for each of the years in the four-year period then ended and for the period September 30, 2013 through May 31, 2014, in conformity with accounting principles generally accepted in the United States of America.
Basis for Opinion
These financial statements are the responsibility of the Fund’s management. Our responsibility is to express an opinion on the Fund’s financial statements based on our audits. We are a public accounting firm registered with the Public Company Accounting Oversight Board (United States) (“PCAOB”) and are required to be independent with respect to the Fund in accordance with the U.S. federal securities law and the applicable rules and regulations of the Securities and Exchange Commission and the PCAOB.
We conducted our audits in accordance with the standards of the PCAOB. Those standards require that we plan and perform the audits to obtain reasonable assurance about whether the financial statements are free of material misstatement, whether due to error or fraud. The Fund is not required to have, nor were we engaged to perform, an audit of its internal control over financial reporting. As part of our audits we are required to obtain an understanding of internal control over financial reporting but not for the purpose of expressing an opinion on the effectiveness of the Fund’s internal control over financial reporting. Accordingly, we express no such opinion.
Our audits included performing procedures to assess the risk of material misstatement of the financial statements, whether due to error or fraud, and performing procedures that respond to those risks. Such procedures include examining, on a test basis, evidence regarding the amounts and disclosures in the financial statements. Our procedures included confirmation of securities owned as of May 31, 2018 by correspondence with the custodian and broker, or by other appropriate auditing procedured when replies from brokers were not received. Our
22
WAVELENGTH INTEREST RATE NEUTRAL FUND
REPORT OF INDEPENDENT REGISTERED
PUBLIC ACCOUNTING FIRM (Continued)
audits also included evaluating the accounting principles used and significant estimates made by management, as well as evaluating the overall presentation of the financial statements. We believe that our audits provide a reasonable basis for our opinion.
| |
BBD, LLP |

We have served as the auditor of one or more of the Funds in Ultimus Managers Trust since 2013.
Philadelphia, Pennsylvania
July 25, 2018
23
WAVELENGTH INTEREST RATE NEUTRAL FUND
ABOUT YOUR FUND’S EXPENSES (Unaudited)
We believe it is important for you to understand the impact of costs on your investment. As a shareholder of the Fund, you incur ongoing costs, including management fees and other operating expenses. The following examples are intended to help you understand your ongoing costs (in dollars) of investing in the Fund and to compare these costs with the ongoing costs of investing in other mutual funds.
A mutual fund’s ongoing costs are expressed as a percentage of its average net assets. This figure is known as the expense ratio. The expenses in the table below are based on an investment of $1,000 made at the beginning of the most recent period (December 1, 2017) and held until the end of the period (May 31, 2018).
The table below illustrates the Fund’s ongoing costs in two ways:
Actual fund return – This section helps you to estimate the actual expenses that you paid over the period. The “Ending Account Value” shown is derived from the Fund’s actual return, and the third column shows the dollar amount of operating expenses that would have been paid by an investor who started with $1,000 in the Fund. You may use the information here, together with the amount you invested, to estimate the expenses that you paid over the period.
To do so, simply divide your account value by $1,000 (for example, an $8,600 account value divided by $1,000 = 8.6), then multiply the result by the number given for the Fund under the heading “Expenses Paid During Period.”
Hypothetical 5% return – This section is intended to help you compare the Fund’s ongoing costs with those of other mutual funds. It assumes that the Fund had an annual return of 5% before expenses during the period shown, but that the expense ratio is unchanged. In this case, because the return used is not the Fund’s actual return, the results do not apply to your investment. The example is useful in making comparisons because the SEC requires all mutual funds to calculate expenses based on a 5% return. You can assess the Fund’s ongoing costs by comparing this hypothetical example with the hypothetical examples that appear in shareholder reports of other funds.
Note that expenses shown in the table are meant to highlight and help you compare ongoing costs only. The Fund does not charge transaction fees, such as purchase or redemption fees, nor does it carry a “sales load.”
The calculations assume no shares were bought or sold during the period. Your actual costs may have been higher or lower, depending on the amount of your investment and the timing of any purchases or redemptions.
24
WAVELENGTH INTEREST RATE NEUTRAL FUND
ABOUT YOUR FUND’S EXPENSES (Unaudited)
More information about the Fund’s expenses can be found in this report. For additional information on operating expenses and other shareholder costs, please refer to the Fund’s prospectus.
| Beginning Account Value December 1, 2017 | Ending Account Value May 31, 2018 | Expenses Paid During Period* | |
| Based on Actual Fund Return | $1,000.00 | $1,001.10 | $4.94 |
| Based on Hypothetical 5% Return (before expenses) | $1,000.00 | $1,020.00 | $4.99 |
* | Expenses are equal to the Fund’s annualized net expense ratio of 0.99% for the period, multiplied by the average account value over the period, multiplied by 182/365 (to reflect the one-half year period). |
OTHER INFORMATION (Unaudited)
A description of the policies and procedures that the Fund uses to vote proxies relating to portfolio securities is available without charge upon request by calling toll-free 1-866-896-9292, or on the SEC’s website at http://www.sec.gov. Information regarding how the Fund voted proxies relating to portfolio securities during the most recent 12-month period ended June 30 is available without charge upon request by calling toll-free 1-866-896-9292, or on the SEC’s website at http://www.sec.gov.
The Trust files a complete listing of portfolio holdings for the Fund with the SEC as of the end of the first and third quarters of each fiscal year on Form N-Q. These filings are available upon request by calling 1-866-896-9292. Furthermore, you may obtain a copy of the filings on the SEC’s website at http://www.sec.gov. The Trust’s Forms N-Q may also be reviewed and copied at the SEC’s Public Reference Room in Washington, DC, and information on the operation of the Public Reference Room may be obtained by calling 1-800-SEC-0330.
25
WAVELENGTH INTEREST RATE NEUTRAL FUND
FEDERAL TAX INFORMATION (Unaudited)
Qualified Dividend Income – The Fund designates 26.12% of its ordinary income dividends, or up to the maximum amount of such dividends allowable pursuant to the Internal Revenue Code, as qualified dividend income eligible for the reduced tax rate of 15%.
Dividends Received Deduction – Corporate shareholders are generally entitled to take the dividends received deduction on the portion of the Fund’s dividend distribution that qualifies under tax law. For the Fund’s fiscal year ended May 31, 2018, 27.63% of ordinary income dividends qualifies for the corporate dividends received deduction.
26
WAVELENGTH INTEREST RATE NEUTRAL FUND
BOARD OF TRUSTEES AND EXECUTIVE OFFICERS (Unaudited)
The Board has overall responsibility for management of the Trust’s affairs. The Trustees serve during the lifetime of the Trust and until its termination, or until death, resignation, retirement, or removal. The Trustees, in turn, elect the officers of the Fund to actively supervise its day-to-day operations. The officers have been elected for an annual term. Unless otherwise noted, each Trustee’s and officer’s address is 225 Pictoria Drive, Suite 450, Cincinnati, OH 45246. The following are the Trustees and executive officers of the Fund:
Name and | Length | Position(s) | Principal Occupation(s) | Number | Directorships |
Interested Trustees: | |||||
Robert G. Dorsey* | Since February 2012 | Trustee (February 2012 to present) | Managing Director and Co-Chief Executive Officer of Ultimus Fund Solutions, LLC and its subsidiaries (1999 to present) | 19 | None |
Independent Trustees: | |||||
Janine L. Cohen | Since January 2016 | Trustee | Retired since 2013; Chief Financial Officer from 2004 to 2013 and Chief Compliance Officer from 2008 to 2013 at AER Advisors, Inc. | 19 | None |
David M. Deptula | Since | Trustee | Vice President of Legal and Special Projects at Dayton Freight Lines, Inc. since 2016; Vice President of Tax Treasury at The Standard Register, Inc. (formerly The Standard Register Company) from 2011 to 2016 | 19 | None |
27
WAVELENGTH INTEREST RATE NEUTRAL FUND
BOARD OF TRUSTEES AND EXECUTIVE OFFICERS (Unaudited) (Continued)
Name and | Length | Position(s) | Principal Occupation(s) | Number | Directorships |
Independent Trustees (continued): | |||||
John J. Discepoli | Since | Chairman (May 2016 to present)
Trustee | Owner of Discepoli Financial Planning, LLC (personal financing planning company) since 2004 | 19 | None |
* | Mr. Dorsey is considered an “interested person” of the Trust within the meaning of Section 2(a)(19) of the 1940 Act because of his relationship with the Trust’s administrator, transfer agent and distributor. |
Name and | Length | Position(s) | Principal Occupation(s) |
Executive Officers: | |||
David R. Carson | Since | Principal Executive Officer (April 2017 to present)
President | Vice President and Director of Client Strategies of Ultimus Fund Solutions, LLC (2013 to present); President, Unified Series Trust (2016 to present); Chief Compliance Officer, FSI Low Beta Absolute Return Fund (2013 to 2016), The Huntington Funds (2005 to 2013), Huntington Strategy Shares (2012 to 2013), and Huntington Asset Advisors (2013); Vice President, Huntington National Bank (2001 to 2013) |
Jennifer L. Leamer | Since | Treasurer | Vice President, Mutual Fund Controller of Ultimus Fund Solutions, LLC (2014 to present); Business Analyst of Ultimus Fund Solutions, LLC (2007 to 2014) |
28
WAVELENGTH INTEREST RATE NEUTRAL FUND
BOARD OF TRUSTEES AND EXECUTIVE OFFICERS (Unaudited) (Continued)
Name and | Length of Time Served | Position(s) | Principal Occupation(s) |
Executive Officers (Continued): | |||
Matthew J. Beck Year of Birth: 1988 | Since | Secretary | Senior Attorney of Ultimus Fund Solutions, LLC (2018 to present); General Counsel of The Nottingham Company (2014 to 2018) |
Charles C. Black | Since | Chief Compliance Officer | Senior Compliance Officer of Ultimus Fund Solutions, LLC (2015 to present); Chief Compliance Officer of The Caldwell & Orkin Funds, Inc. (2016 to present); Senior Compliance Manager at Touchstone Mutual Funds (2013 to 2015); Senior Compliance Manager at Fund Evaluation Group (2011 to 2013) |
Additional information about members of the Board and executive officers is available in the Fund’s Statement of Additional Information (“SAI”). To obtain a free copy of the SAI, please call 1-866-738-1128.
29
WAVELENGTH INTEREST RATE NEUTRAL FUND
DISCLOSURE REGARDING APPROVAL OF INVESTMENT ADVISORY AGREEMENT (Unaudited)
The Board of Trustees (the “Board”), including the Independent Trustees voting separately, has reviewed and approved the Fund’s Investment Advisory Agreement with the The Adviser Capital Management, LLC (the “Adviser”) for an additional annual term. Approval took place at an in-person meeting held on April 23-24, 2018, at which all of the Trustees were present.
In the course of their deliberations, the Board was advised by legal counsel. The Board received and reviewed a substantial amount of information provided by the Adviser in response to requests of the Board and counsel.
In deciding whether to approve the renewal of the Investment Advisory Agreement, the Board recalled its review of the materials related to the Fund and the Adviser throughout the preceding 12 months and its numerous discussions with Trust Management and the Adviser about the operations and performance of the Fund during that period. The Board further considered those materials and discussions and other numerous factors, including the following:
The nature, extent, and quality of the services provided by the Adviser. In this regard, the Board reviewed the services being provided by the Adviser to the Fund including, without limitation, its investment advisory services since the Fund’s inception, the Adviser’s compliance procedures and practices, and its efforts to promote the Fund and assist in its distribution and its compliance program. After reviewing the foregoing information and further information in the Adviser’s Memorandum (e.g., descriptions of its business and Form ADV), the Board concluded that the quality, extent, and nature of the services provided by the Adviser were satisfactory and adequate for the Fund.
The investment performance of the Fund. In this regard, the Board compared the performance of the Fund with the performance of its benchmark index, custom peer group and related Morningstar category. The Board also considered the consistency of the Adviser’s management with the Fund’s investment objective and policies. The Board noted that relative to its custom peer group and funds of similar size and structure in the Fund’s Morningstar category (Nontraditional Bond $25 – $50 million, No Load), the Fund had outperformed the custom peer group’s average and median for the one- and three-year periods, and underperformed its Morningstar category’s average and median for the one- and three-year periods. The Board indicated that the Adviser had satisfactorily explained its performance results for the Fund. Following discussion of the investment performance of the Fund, the Adviser’s experience in managing a mutual fund, its historical investment performance, and other factors, the Board concluded that the investment performance of the Fund has been satisfactory.
The costs of the services provided and profits realized by The Adviser and its affiliates from its relationship with the Fund. In this regard, the Board considered the Adviser’s staffing, personnel, and methods of operations; the education and experience of its personnel; compliance program, policies, and procedures; financial condition and the level of commitment to the Fund, and, generally, the Adviser’s advisory business; the asset level
30
WAVELENGTH INTEREST RATE NEUTRAL FUND
DISCLOSURE REGARDING APPROVAL OF INVESTMENT ADVISORY AGREEMENT (Unaudited) (Continued)
of the Fund; and the overall expenses of the Fund, including the advisory fee. The Board considered the Adviser’s ELA and considered the Adviser’s current and past fee reductions and expense reimbursements for the Fund. The Board further took into account the Adviser’s commitment to continue the the Adviser ELA for the Fund until at least October 1, 2019.
The Board also considered potential benefits for the Adviser in managing the Fund, including promotion of the Adviser’s name and the potential for it to receive research, statistical, or other services from the Fund’s trades. The Board compared the Fund’s advisory fee and overall expense ratio to the average advisory fees and average expense ratios for its custom peer group and Morningstar category. The Board noted that the 0.95% advisory fee for the Fund was above the average and the median for the Fund’s custom peer group and Morningstar category, but less than the advisory fee for some of the funds in the custom peer group and Morningstar category. The Board considered the investment strategy and style used by the Adviser in managing the portfolio of the Fund. The Board further noted that the overall annual expense ratio (without the acquired fund fees and expenses) of 0.99%, for the Fund is lower than the average and equal to the median for the Fund’s custom peer group, and lower than its Morningstar category’s average and median expense ratios. Following these comparisons and upon further consideration and discussion of the foregoing, the Board concluded that the advisory fee paid to the Adviser by the Fund is fair and reasonable.
The extent to which economies of scale would be realized as the Fund grows and whether advisory fee levels reflect these economies of scale for the benefit of the Fund’s investors. In this regard, the Board considered that the Fund’s fee arrangements with the Adviser involve both the advisory fee and the Adviser’s ELA. The Board determined that while the advisory fee remained the same as asset levels increased, the shareholders of the Fund have experienced benefits from the Adviser’s ELA and will continue to experience benefits from the Adviser’s ELA until the Fund assets grow to a level where its expenses otherwise fall below the expense limit. Following further discussion of the Fund’s asset level, expectations for growth, and level of fees, the Board determined that the Fund’s fee arrangements with the Adviser would continue to provide benefits. The Board also determined that the fee arrangements were fair and reasonable in relation to the nature and quality of services being provided by the Adviser, and given the Fund’s projected asset levels for the next year.
Brokerage and portfolio transactions. In this regard, the Board considered the Adviser’s trading policies, procedures, and performance in seeking best execution for the Fund. The Board also considered the historical portfolio turnover rate for the Fund; the process by which evaluations are made of the overall reasonableness of commissions paid; the process by which the Adviser evaluates best execution; the method and basis for selecting and evaluating the broker-dealers used; and any anticipated allocation of portfolio business to persons affiliated with the Adviser. After further review and discussion, the Board determined that the Adviser’s practices regarding brokerage and portfolio transactions were satisfactory.
Possible conflicts of interest. In evaluating the possibility for conflicts of interest, the Board considered such matters as the experience and abilities of the advisory personnel assigned to the Fund, the Adviser’s process for allocating trades among its different clients, and the
31
WAVELENGTH INTEREST RATE NEUTRAL FUND
DISCLOSURE REGARDING APPROVAL OF INVESTMENT ADVISORY AGREEMENT (Unaudited) (Continued)
substance and administration of the Adviser’s Code of Ethics. Following further consideration and discussion, the Board found that the Adviser’s standards and practices relating to the identification and mitigation of potential conflicts of interests were satisfactory.
Conclusion
After full consideration of the above factors as well as other factors, the Board unanimously concluded that approval of the Investment Advisory Agreement was in the best interests of the Fund and its shareholders. It was noted that in the Trustees’ deliberation regarding the approval of the renewal of the Investment Advisory Agreement, the Trustees did not identify any particular information or factor that was all-important or controlling, and that each individual Trustee may have attributed different weights to the various factors noted above.
32
This page intentionally left blank.
| Item 2. | Code of Ethics. |
As of the end of the period covered by this report, the registrant has adopted a code of ethics that applies to the registrant’s principal executive officer, principal financial officer, principal accounting officer or controller, or persons performing similar functions, regardless of whether these individuals are employed by the registrant or a third party. Pursuant to Item 12(a)(1), a copy of registrant’s code of ethics is filed as an exhibit to this Form N-CSR. During the period covered by this report, the code of ethics has not been amended, and the registrant has not granted any waivers, including implicit waivers, from the provisions of the code of ethics.
| Item 3. | Audit Committee Financial Expert. |
The registrant’s board of trustees has determined that the registrant has at least one audit committee financial expert serving on its audit committee. The name of the audit committee financial expert is David M. Deptula. Mr. Deptula is “independent” for purposes of this Item.
| Item 4. | Principal Accountant Fees and Services. |
| (a) | Audit Fees. The aggregate fees billed for professional services rendered by the principal accountant for the audit of the registrant’s annual financial statements or for services that are normally provided by the accountant in connection with statutory and regulatory filings or engagements were $42,300 and $70,500 with respect to the registrant’s fiscal years ended May 31, 2018 and 2017, respectively. |
| (b) | Audit-Related Fees. No fees were billed in either of the last two fiscal years for assurance and related services by the principal accountant that are reasonably related to the performance of the audit of the registrant’s financial statements and are not reported under paragraph (a) of this Item. |
| (c) | Tax Fees. The aggregate fees billed for professional services rendered by the principal accountant for tax compliance, tax advice, and tax planning were $6,000 and $10,000 with respect to the registrant’s fiscal years ended May 31, 2018 and 2017, respectively. The services comprising these fees are the preparation of the registrant’s federal income and excise tax returns. |
| (d) | All Other Fees. No fees were billed in either of the last two fiscal years for products and services provided by the principal accountant, other than the services reported in paragraphs (a) through (c) of this Item. |
| (e)(1) | The audit committee has not adopted pre-approval policies and procedures described in paragraph (c)(7) of Rule 2-01 of Regulation S-X. |
| (e)(2) | None of the services described in paragraph (b) through (d) of this Item were approved by the audit committee pursuant to paragraph (c)(7)(i)(C) of Rule 2-01 of Regulation S-X. |
| (f) | Less than 50% of hours expended on the principal accountant’s engagement to audit the registrant’s financial statements for the most recent fiscal year were attributed to work performed by persons other than the principal accountant’s full-time, permanent employees. |
| (g) | During the fiscal years ended May 31, 2018 and 2017, aggregate non-audit fees of $6,000 and $10,000, respectively, were billed by the registrant’s accountant for services rendered to the registrant. No non-audit fees were billed in either of the last two fiscal years by the registrant’s accountant for services rendered to the registrant’s investment adviser (not including any sub-adviser whose role is primarily portfolio management and is subcontracted with or overseen by another investment adviser), and any entity controlling, controlled by, or under common control with the adviser that provides ongoing services to the registrant. |
| (h) | The principal accountant has not provided any non-audit services to the registrant’s investment adviser (not including any sub-adviser whose role is primarily portfolio management and is subcontracted with or overseen by another investment adviser), and any entity controlling, controlled by, or under common control with the investment adviser that provides ongoing services to the registrant. |
| Item 5. | Audit Committee of Listed Registrants. |
Not applicable
| Item 6. | Schedule of Investments. |
| (a) | Not applicable [schedule filed with Item 1] |
| (b) | Not applicable |
| Item 7. | Disclosure of Proxy Voting Policies and Procedures for Closed-End Management Investment Companies. |
Not applicable
| Item 8. | Portfolio Managers of Closed-End Management Investment Companies. |
Not applicable
| Item 9. | Purchases of Equity Securities by Closed-End Management Investment Company and Affiliated Purchasers. |
Not applicable
| Item 10. | Submission of Matters to a Vote of Security Holders. |
The registrant’s Committee of Independent Trustees shall review shareholder recommendations to fill vacancies on the registrant’s board of trustees if such recommendations are submitted in writing, addressed to the Committee at the registrant’s offices and meet any minimum qualifications adopted by the Committee. The Committee may adopt, by resolution, a policy regarding its procedures for considering candidates for the board of trustees, including any recommended by shareholders.
| Item 11. | Controls and Procedures. |
(a) Based on their evaluation of the registrant’s disclosure controls and procedures (as defined in Rule 30a-3(c) under the Investment Company Act of 1940) as of a date within 90 days of the filing date of this report, the registrant’s principal executive officer and principal financial officer have concluded that such disclosure controls and procedures are reasonably designed and are operating effectively to ensure that material information relating to the registrant, including its consolidated subsidiaries, is made known to them by others within those entities, particularly during the period in which this report is being prepared, and that the information required in filings on Form N-CSR is recorded, processed, summarized, and reported on a timely basis.
(b) There were no changes in the registrant’s internal control over financial reporting (as defined in Rule 30a-3(d) under the Investment Company Act of 1940) that occurred during the second fiscal quarter of the period covered by this report that have materially affected, or are reasonably likely to materially affect, the registrant’s internal control over financial reporting.
| Item 12. | Disclosure of Securities Lending Activities for Closed-End Management Investment Companies. |
Not applicable
| Item 13. | Exhibits. |
File the exhibits listed below as part of this Form. Letter or number the exhibits in the sequence indicated.
(a)(1) Any code of ethics, or amendment thereto, that is the subject of the disclosure required by Item 2, to the extent that the registrant intends to satisfy the Item 2 requirements through filing of an exhibit: Attached hereto
(a)(2) A separate certification for each principal executive officer and principal financial officer of the registrant as required by Rule 30a-2(a) under the Act (17 CFR 270.30a-2(a)): Attached hereto
(a)(3) Any written solicitation to purchase securities under Rule 23c-1 under the Act (17 CFR 270.23c-1) sent or given during the period covered by the report by or on behalf of the registrant to 10 or more persons: Not applicable
(a)(4) Change in the registrant’s independent public accountants: Not applicable
(b) Certifications required by Rule 30a-2(b) under the Act (17 CFR 270.30a-2(b)): Attached hereto
| Exhibit 99.CODE ETH | Code of Ethics |
| Exhibit 99.CERT | Certifications required by Rule 30a-2(a) under the Act |
| Exhibit 99.906CERT | Certifications required by Rule 30a-2(b) under the Act |
SIGNATURES
Pursuant to the requirements of the Securities Exchange Act of 1934 and the Investment Company Act of 1940, the registrant has duly caused this report to be signed on its behalf by the undersigned, thereunto duly authorized.
| (Registrant) | Ultimus Managers Trust | ||
| By (Signature and Title)* | /s/ Matthew J. Beck | ||
| Matthew J. Beck, Secretary | |||
| Date | August 6, 2018 | ||
| Pursuant to the requirements of the Securities Exchange Act of 1934 and the Investment Company Act of 1940, this report has been signed below by the following persons on behalf of the registrant and in the capacities and on the dates indicated. |
| By (Signature and Title)* | /s/ David R. Carson | ||
| David R. Carson, Principal Executive Officer of Barrow Value Opportunity Fund, Cincinnati Asset Management Funds: Broad Market Strategic Income Fund, Wavelength Interest Rate Neutral Fund | |||
| Date | August 6, 2018 | ||
| By (Signature and Title)* | /s/ Jennifer L. Leamer | ||
| Jennifer L. Leamer, Treasurer and Principal Financial Officer | |||
| Date | August 6, 2018 | ||
| * | Print the name and title of each signing officer under his or her signature. |