OMB APPROVAL | |
OMB Number: 3235-0570
Expires: August 31, 2020
Estimated average burden hours per response: 20.6 |
UNITED STATES
SECURITIES AND EXCHANGE COMMISSION
Washington, D.C. 20549
FORM N-CSR
CERTIFIED SHAREHOLDER REPORT OF REGISTERED
MANAGEMENT INVESTMENT COMPANIES
| Investment Company Act file number | 811-22680 |
| Ultimus Managers Trust |
| (Exact name of registrant as specified in charter) |
| 225 Pictoria Drive, Suite 450 | Cincinnati, Ohio | 45246 |
| (Address of principal executive offices) | (Zip code) | |
Matthew J. Beck
| Ultimus Fund Solutions, LLC | 225 Pictoria Drive, Suite 450 | Cincinnati, Ohio 45246 |
| (Name and address of agent for service) | ||
| Registrant's telephone number, including area code: | (212) 888-8123 |
| Date of fiscal year end: | October 31 | |
| Date of reporting period: | October 31, 2018 |
Form N-CSR is to be used by management investment companies to file reports with the Commission not later than 10 days after the transmission to stockholders of any report that is required to be transmitted to stockholders under Rule 30e-1 under the Investment Company Act of 1940 (17 CFR 270.30e-1). The Commission may use the information provided on Form N-CSR in its regulatory, disclosure review, inspection, and policymaking roles.
A registrant is required to disclose the information specified by Form N-CSR, and the Commission will make this information public. A registrant is not required to respond to the collection of information contained in Form N-CSR unless the Form displays a currently valid Office of Management and Budget ("OMB") control number. Please direct comments concerning the accuracy of the information collection burden estimate and any suggestions for reducing the burden to the Secretary, Securities and Exchange Commission, 450 Fifth Street, NW, Washington, DC 20549-0609. The OMB has reviewed this collection of information under the clearance requirements of 44 U.S.C. § 3507.
| Item 1. | Reports to Stockholders. |
STRALEM EQUITY FUND
LETTER TO SHAREHOLDERS
December 2018
Dear Shareholder,
Each year following the close of Stralem Equity Fund’s (the “Fund”) fiscal year on October 31, the Fund reports to you on its results and Stralem & Company Incorporated’s (Stralem) current investment outlook.
Performance
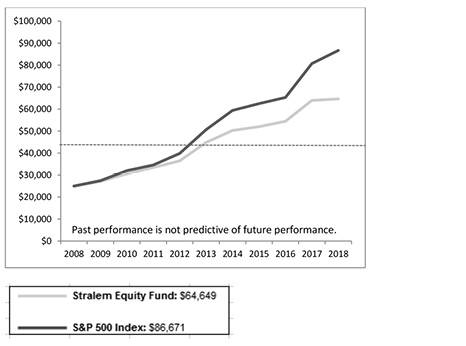
For the fiscal year ended October 31, 2018, the Fund (STEFX) provided a return of 1.13% before taxes and after fees and expenses but trailed the benchmark S&P 500 Index (the “Benchmark”) which returned 7.35% (which of course has no fees, taxes or expenses) as shown in the table below.
AVERAGE ANNUAL TOTAL RETURNS
BEFORE TAXES AND AFTER FEES AND EXPENSES
| Periods Ended 10/31/18 | |||
1 YR | 5 YRS | 10YRS | Since | |
Stralem Equity Fund | 1.13% | 7.60% | 9.97% | 5.60% |
S&P 500 Index | 7.35% | 11.34% | 13.24% | 5.39% |
* | Inception: January 18, 2000. |
Comparison of the Change in Value of a $25,000 Investment in
Stralem Equity Fund- vs. S&P 500 Index
1
PERFORMANCE NOTES: Stralem Equity Fund is advised by Stralem & Company Incorporated (“Stralem”), an independent, SEC registered investment adviser established in 1966. The performance data quoted represents past performance. Past performance does not guarantee future results. The investment return and principal value of an investment will fluctuate so that an investor’s shares, when redeemed, may be worth more or less than their original cost. Current performance may be lower or higher than the performance data quoted. For performance data current to the most recent month end or to receive a prospectus, please call (866) 822-9555 toll free or visit the Fund’s website at www.stralemequityfund.com. Performance results for the Fund are stated after investment advisory fees and expenses (net) but do not reflect the deduction of taxes that a shareholder would pay on Fund distributions or on the redemption of Fund shares. The Fund can suffer losses as well as gains. Performance results are calculated on a total return basis, which includes all income from dividends and interest and realized and unrealized gains or losses. Assuming dividends are reinvested, the growth in dollars of an investment in a period can be computed using these rates of return. The S&P 500 Index is widely used as a barometer of U.S. stock market performance. The S&P 500 Index is the Standard & Poor’s Composite Index of 500 Stocks, a widely recognized, unmanaged index of common stock prices. It is shown with dividends included and reflects no deduction for fees, expenses or taxes. |
From the market bottom in March of 2009 through the end of October 2018, the S&P 500 Index has returned an extraordinary 390% (17.9% annualized) fueled by a slow and steady economic recovery made possible by record-low interest rates, muted inflation and a very accommodative global monetary policy. Over this period, passive investment vehicles have outperformed their actively managed peers and attracted substantial amounts of assets.
As you can imagine, we at Stralem believe that blind faith in passive investing is a risky proposition that will ultimately be proven to be foolhardy. We believe fundamental stock research, risk-management and capital preservation matter, even if these investment tenets have appeared to be less than necessary in a market that only seems to grind higher. We believe that when historical volatility eventually returns, fundamentally advantaged stocks with stronger growth prospects, healthy cash generation, and superior balance sheets are likely to go down less and/or recover faster than weaker companies. Differentiation and dispersion in stock performance will re-emerge. While we can’t predict when this will happen, we believe it to be prudent to be prepared.
The end of calendar year 2017 was marked by anticipation of Congress passing the Tax Cuts and Jobs Act (TCJA), which lowered the statutory tax rates for individuals and corporations. While the impact to individuals can differ dramatically by state and tax bracket, the benefit to corporations is more straightforward, as the rate dropped to 21%. As analysts and investors began to incorporate this lower rate into their earnings estimates, the S&P 500, already near another record high with all-time high margins, was forecasted to grow earnings over 20% higher in 2018 than in 2017 -- a significant catalyst for a weary bull market nearly 10 years old. This fiscal stimulus also had the effect of boosting 2nd quarter GDP to 4.2% while driving unemployment down to 3.7%. And the S&P 500 responded by rallying over 15% from the start of the fiscal year (November 2017) through the end of September 2018.
However, as always, equity investors focus on more than just current year earnings, positive corporate commentary and earnings guidance are critical components in driving equity valuations and pushing up stock prices. Concurrent with Congress launching a new fiscal stimulus, the Federal Reserve (the “Fed”)
2
continued on its course of reversing the longstanding easy monetary policy program that had served as a stimulus since 2009. In addition to buying fewer bonds (Quantitative Tightening), the Fed raised interest rates three times in 2018 and has now raised a total of eight times since the end of 2015. These actions have led the 10-year Treasury yield to increase from a fiscal year low of 2.30% to a high of 3.25% -- well above the 2016 low of 1.31%. Higher rates historically serve as a brake on economic growth as the cost of debt increases, and input costs rise along with interest expense for corporations and consumers alike. The risk of higher rates is only amplified for highly levered companies that can easily choke on rapidly rising interest expenses.
In addition to higher interest rates, the Trump Administration’s hard-line trade policy in North America and China has caused indigestion for many large multi-national companies. These companies depend on China as a significant source of growth, while also relying on globally diverse and optimized supply chains that are easily disrupted by unnecessary tariffs and trade wars.
Through September of 2018, investors seemed more enamored with the accelerating GDP and increased earnings and drove the S&P 500 to new heights. But October brought more skepticism, as investors listened to CEOs discuss increasing wages, mounting inflation, higher interest rates and uncertainty around synchronized global growth clouding their visibility and confidence into 2019 and beyond. These collective worries seemed to trump the accelerated earnings growth and margin expansion, and the S&P 500 dropped 6.8% in the month of October – a potential turning point in the near decade long market rally.
Since the financial crisis Stralem has remained positioned with a slight conservative edge, allocating 35% of the portfolio to capital-preserving Down Market stocks and 65% of the portfolio emphasizing high-quality, larger-market-cap, globally exposed, stable and innovative growth-participating Up Market companies. Although this structure has predictably caused us to trail the S&P 500, we intentionally maintain it out of concern for the multitude of risks we see and are unwilling to ignore.
There have been only 5 market declines greater than 10% over the entire market rally since March 2009. The portfolio structure protected capital in each instance although each proved to merely be a speed bump on the way to a new record high.
While we may sound like a broken record, today just about every market pundit will agree that this market environment is not normal, nor is it likely to be sustainable indefinitely. One of the driving forces behind the rally, this loose monetary policy, has begun to reverse as the Federal Reserve continues on its path to raise rates and slowly unwind its QE policy. This is important because interest rates (and inflation) are inversely correlated with stock market valuations. And while we may still be in a “low rate” environment, and the tax cuts may have increased corporate profitability, the Fed has clearly pivoted and at some point, it will catch up to companies and the economy. Exactly when and to what magnitude is difficult to predict, but it is not hard to predict that more volatility is likely on the way.
3
In summary, despite our concerns about the overall market environment, we are confident in the portfolio’s positioning as well as in the companies we own. We continue to adhere to our time-tested process and discipline and believe “participation with protection” is the best way to build long-term wealth.
Portfolio Structure and Positioning
As of October 31, 2018, the overall allocation stood at 65% Up Market/ 35% Down Market.
Investment Outlook
While the Fund’s fiscal year began strongly based on hopes for faster GDP growth and higher corporate earnings as a result of Congress’ new tax plan, the year ended in a very different place.
Lower personal and corporate taxes drove GDP growth above 4%, unemployment below 4%, and corporate margins to all-time highs. The S&P 500 saw 2018 earnings growth above 20% -- an amazing result 10 years into a bull market. However, as we look forward to the end of calendar year 2018 and into 2019, from a market just off its all-time high, it is more challenging to be as optimistic about what comes next.
While companies are lapping the reduced tax rate, earnings growth peaked in 2018 and is expected to slow for the next 8 quarters. With wage growth creeping up, commodity prices elevated, interest rates higher and tariffs and trade decisions starting to bite, achieving new highs on corporate margins seems difficult.
In addition, while the new tax plan did drive some job growth and consumer spending while also goosing corporate margins and earnings, the outlook into 2019 is for lower GDP growth and lower S&P 500 earnings growth.
At present, with the tax cuts boosting earnings, S&P 500 valuations are only slightly above historical averages. However, with the pivot in monetary policy driving higher interest rates, there is increasing concern that we are approaching peak multiples. This does not necessarily portend the end of the bull market, but rather indicates that returns over the next several years will be more muted and there will be more dispersion among company performance based largely on growth, execution and reasonable valuations. As we said in some of our recent communiques to investors, to think higher interest rates will not have any impact on valuations is a potentially dangerous position and one for which we are actively preparing.
At Stralem, our mantra has long been “Participation with Protection”. At present, the protection element does not seem to be relevant; however, given views on both the macro economy and what we are seeing at the company level, we firmly believe it is more important than ever. However, we also recognize that market timing, and trying to speculate what could be the catalyst to derail the market’s nearly 10-year bull-run, are endeavors fraught with peril. So while maintaining a “Down-Market” protection component in the Large-Cap Equity Strategy, we also continuously try to identify and invest in the most exciting secular growth opportunities that will provide participation in strong markets.
4
Performance Attribution
The Fund’s relative underperformance for the fiscal year ended Oct 31, 2018 was driven proportionally by the Up Market sector (-2.46%) and by the Down Market sector (-2.59%).
The relative underperformance of the Up Market sector was driven by the New Industries category which led the market in FY18 and was up 15.0%. While the Fund had its share of New Industry winners, Adobe (+40.3%) and Microsoft (+30.7%), it did not own Apple (+31.4%) or Amazon (44.6%) which continued to make new highs. Another Fund holding, Broadcom, a high-cash flowing diversified semiconductor company that was up 48% in calendar year 2017, announced plans to buy Computer Associates (CA), a slower growing but high-cash flowing software company. While the deal makes financial sense and is earnings accretive, there was some investor angst about the strategic fit and the stock traded down 12.9%. We believe Broadcom’s CEO is a technology industry visionary with a long history of successful acquisitions, and we are content to wait and see how the company can integrate CA and cross-sell the hardware and software products and increase corporate margins.
In the New Products category, Thermo Fisher Scientific continues to execute incredibly well as it sells its diverse product lineup into the pharma and biotech laboratory testing market globally. While most companies find it difficult to navigate in China, Thermo Fisher continues to grow their sales as China prioritizes the biotechnology industry and Thermo sells their best-in-class solutions.
The Dominant Companies category was a mixed bag as strength in Visa (+26.2%), UnitedHealth Group (+26.0%), Intercontinental Exchange (+18.0%) and Lowe’s (+21.3%) was offset by D.R. Horton (-17.8%) and DowDupont (-23.8%). Visa continues to take advantage of the global secular trend to e-commerce, the shift to cashless, and the integration of Visa Europe which was neglected by its bank owners for many years. UnitedHealth Group continues to benefit from the increased population growth as the Affordable Care Act (ACA) was not repealed by Congress and near flawless execution on a growing client base. Intercontinental Exchange is consistently increasing it’s scale by bolting on smaller acquisition and selling more and more data to hungry investors – in both equities, derivatives and bonds. And lastly, Lowe’s, a perpetual underperformer relative to Home Depot, got a boost when some activist investors announced they were involved and would push for new management (we sold into this strength).
D.R. Horton struggled this fiscal year largely due to the increase in interest rates and the impact on mortgages. We strongly believe the secular trends are in place to drive more first-time homeownership among the Millenial cohort as well as Baby Boomers trading down and moving to locations with better weather. A spike in mortgage rates will always freeze the market temporarily and cause certain investors to sell, but we believe that D.R. Horton has the right product, in the right locations and should continue to execute well against a reasonable plan.
5
DowDupont performed very well in calendar year 2017 (+27.9%), when the merger was officially completed, and the company began to execute on its aggressive cost savings plan, while discussing the ultimate separation into 3 distinct, but focused companies. However, the stock traded sideways through most of the fiscal year until the energy complex sold off hard towards the end of September based on fears of trade wars with China and slowing global growth. Both inputs, as well as issues with U.S. farmers selling crops (namely soybeans) to China became yet another headwind for DowDupont. We still believe strongly in DowDupont’s products, it’s feedstock advantages, it’s innovation and its best-in-class product portfolio and we think that when separated out, each of its business units will obtain a higher multiple than they are afforded with a chemicals conglomerate.
The relative underperformance in the Down Market sector was driven by the High Yield category, where strength in Merck (+37.9%) and Pfizer (+27.4%) was offset by weakness in PPL (-14.5%), Philip Morris (-11.6%) and Abbvie (-10.4%). PPL’s and Philip Morris’ aforementioned difficulties led to both companies being sold from the Fund, and Abbvie’s weakness was likely related to the fact that the stock was up 60% in calendar year 2017.
Purchases and Sales
During the Fund’s fiscal year ended October 31, 2018, the Fund sold the following securities within the Up Market segment of the portfolio: biotechnology company Amgen (AMGN), home improvement retailer Lowe’s (LOW), packaged foods company Mondelez (MDLZ), and coffee retailer Starbucks (SBUX). The Fund also sold integrated oil and gas company Exxon Mobil (XOM), packaged foods company Kraft Heinz (KHI), international cigarette manufacturer Philip Morris (PM), and energy and utility company PPL (PPL) from the Down Market segment of the portfolio.
As replacements, the Fund purchased the following securities within the Up Market segment of the portfolio: orphan drug manufacturer Alexion Pharmaceuticals (ALXN), aerospace manufacturer Boeing (BA), cruise line company Carnival (CCL) and homebuilder D.R. Horton (DHI). We also purchased the following securities in our Down Market segment: large pharmaceutical manufacturer AbbVie (ABBV), regulated utility American Electric Power (AEP), global custody bank Bank of New York Mellon (BK), and oil and gas pipeline and storage company Kinder Morgan (KMI).
Amgen’s 1st-generation biotechnology drugs have been cash cows and performing very well, however, in recent quarters, the company has been experiencing attrition of its core franchise drugs due to biosimilar competition and the development of alternate cancer therapies. The company’s RGV (relative growth valuation) score has been weakening, and we expect will erode further as this trend continues.
6
While the overall home improvement category continues to be one of the best performers within Consumer Discretionary, Lowe’s management failed to execute consistently against their long-term goals and targets, and management changes are required. We have lost our patience and sold the stock based on better options.
Stralem’s 2013 thesis for buying Mondelez was centered around a 5-year margin-expansion program launched by CEO Irene Rosenfeld based on rationalizing a bloated cost structure. After successfully combining and modernizing production facilities, streamlining its supply chain and European distribution centers, and driving margins higher, future growth will be largely dependent on product innovations and additional market penetration and this has proven to be a challenge.
Starbucks was purchased based on strong sales in existing markets driven by more/better food and drink options, e-commerce initiatives built around the company’s Mobile Order and Pay, and rapid expansion in China. This thesis played out well for a couple years, but after some above average growth in North America, the company seems to be searching for additional innovation to drive traffic. Visionary CEO Howard Schulz is stepping down, and the company has settled into a period of slower sales growth.
In the Down Market, Exxon Mobil reached the end of a long run of decreasing capital expenditure intensity, which drove steadily improving free cash flow. This trend is likely to begin to reverse as the company increasingly feels the need to spend in order to replace reserves and take on more early-stage, but risky, large-scale projects.
Kraft Heinz has successfully applied the cost-cutting playbook of its activist investor (3G Capital) since Heinz acquired Kraft Foods in 2015. Unfortunately, the company has not been as successful in reinvigorating top-line through product innovation and organic growth. With the lack of organic growth, the company likely needs to make another major acquisition in order to provide the next boost through massive cost-cutting. However, since the failed $143 billion takeover bid for Unilever in early 2017, no such acquisition has been seriously on the radar, which has caused Kraft Heinz’s shares to languish.
Philip Morris International has benefitted from pricing power (due to inelastic demand) and aspirational consumption (trading up) in emerging countries. However, the company is investing heavily and transitioning its focus to ‘reduced-risk products’ (e-cigarettes), which initially saw some very strong conversion rates. However, in Q1 the adoption rate decelerated significantly and penetration in Japan seems to have plateaued far sooner than expected. We believe this is a true challenge to the business and decided to find a better option.
PPL has spent the last several years successfully transforming itself from a primarily non-regulated utility into an entirely regulated one. The issue with PPL is that its UK utility operations continue to play an outsize role not only in its overall profit generation but have also heaped uncertainty onto what should be steady, unexciting, regulated utility operations. Brexit and PPL’s UK sterling exposure were the main culprits for uncertainty starting in 2016, but that has now expanded to the suddenly tumultuous regulatory situation in the UK where electricity and gas bill inflation is under scrutiny.
7
Alexion Pharmaceuticals replaces Amgen in the New Products category within the Up Market. Alexion is an innovative orphan drug focused biotech company whose primary drug, Soliris, is a ‘C5 complement inhibitor’ that has proven extremely effective in treating the ‘ultra-rare’ genetic blood disorders paroxysmal nocturnal hemoglobinuria (PNH) and atypical hemolytic uremic syndrome (aHUS), both characterized by the death of red blood cells, which can cause blood clotting and organ damage. Soliris was also approved more recently for generalized myasthenia gravis (gMG), a rare but chronic and debilitating neuromuscular disorder. With a new management team, Alexion is leveraging its core competency of identifying and developing drugs for rare-disease populations and has several newer products in late stage clinical trials that are progressing very well.
Aerospace juggernaut Boeing was one of the Dominant Companies bought because it is in a cash flow sweet spot as it ramps up production of its improved fuel-efficient narrow-body 737 MAX and its wide-body 787 Dreamliner, and as unit costs come down as it reaches scale. The company is in the middle of a multi-decade increase in the global demand for air travel as emerging countries reach certain income thresholds and demand leisure travel. The company has a backlog of 5,800 aircraft valued at $486B, and while there is always a market risk, the company’s only real competitor, Airbus, has a 9+ year waiting list on planes as well – so the options for buyers remain limited. The company will generate a significant amount of free cash flow which will provide a bevy of options to the management team.
Carnival Corporation is another Dominant Company replacement and represents the largest player in the cruise industry, an oligopoly with significant barriers to entry (new ships cost over $1B), measured supply growth, strong demand based on affordability, and significant new market expansion opportunities as middle-class consumerism spreads through Asia. Carnival had a strong 2017 but the stock is not overly expensive; the company generates solid and stable cash flow with good visibility into passenger counts and revenues.
The final Dominant Company replacement is D.R. Horton, one of the largest homebuilders in America with a focus on more affordable first-time homebuyers, and retirees trading down in the fastest growing markets in the Southeast, South Central and Southwest. While mortgage rates are ticking higher, pent up demand among Millennials (the largest generation) that are finally beginning to marry and start families (homeownership rates are the lowest in 50 years) and the retiring and downsizing of the Baby Boomers remain as two strong secular drivers for home purchase—especially at D.R. Horton’s price points and in their very desirable geographies.
AbbVie replaces Kraft Heinz in the High Yield category within the Down Market sector. AbbVie is one of the largest pharmaceutical companies in the world, driven by sales of its autoimmune drug Humira, the largest-selling drug in the
8
world. While the “active ingredient” patent for Humira expired in 2016, AbbVie has successfully staved off biosimilar competition, and Humira sales continue to grow. The extension of market dominance for best-in-class Humira will provide abundant cash flow to keep increasing its dividend payout to investors, and to fill its future drug pipeline via acquisitions and internal development.
American Electric Power is a large regulated utility holding company whose service areas span much of the Midwest (11 states) and one that we ultimately found to be more attractive as an investment than PPL. The company operates the largest transmission network in the US (over 40,000 miles) and continues to invest heavily in its regulated transmission assets, propelling the growth of its regulated rate base. At the time of purchase, AEP sported a solid dividend yield of 3.8%, and over the last 5 years has increased its dividend at an annual rate of nearly 5%.
Bank of NY Mellon is an attractive Down Market investment because of its range of steady fee-generating businesses under its Investment Services arm (custody, execution & clearing, asset servicing, treasury services, issuer services) and its Investment Management arm. The company’s technology platforms represent a significant barrier to entry for competitors, it now has a firmly-entrenched cost-cutting and technology-oriented culture, and its new CEO, Charlie Scharf, will continue the technology transformation, just as he successfully engineered at Visa.
Kinder Morgan replaces Exxon in the Low Price to Cash Flow category within the Down Market. Kinder is the largest energy infrastructure company in North America, operating 84,000 miles of pipelines that transport natural gas and other refined petroleum products, along with more than 150 terminals that transload and store petroleum and chemical products. The U.S. shale revolution, Mexican natural gas demand and increasing LNG exports are boosting demand for energy infrastructure, and Kinder generates stable, fee-based cash flow primarily under take-or-pay contracts. Kinder lives within its cash flow (which fully funds expansion capex and dividends), has a transparent corporate structure (unlike opaque MLP structures) and works hard to align management’s and shareholders’ incentives.
Conclusion
Stralem’s long-held investment discipline is based on the principle of “participation with protection” which is based on the understanding that when it comes to building sustainable wealth, the impact of preserving capital in falling markets far outstrips the importance of outperforming in rising ones. So despite the challenges of outperforming the S&P 500 Index from the market low in 2009, Stralem chose not to chase performance for performance sake and remained disciplined awaiting a return to a more “normalized” historical environment. This normalized environment has taken longer to occur than we, or most Wall Street pundits, have expected, however it may finally be upon us.
While the U.S. and global economies have undergone a fair amount of upheaval since the election of Donald Trump and his “America First” doctrine, the critical change to the market is the pivot from easy to tighter monetary policy by the Federal Reserve. While the Fed began raising rates and unwinding the balance sheet in 2015, it is only recently that markets and companies have begun to feel the bite. The recent tax cuts created a sugar high that resulted in record earnings growth and margins, but only served to delay the inevitable. Nearly 10 years into a one-way bull market that has achieved record after record, despite record low volatility, the economy and stock market will likely need to revert to more normalized conditions which, means greater volatility and more muted returns. Stralem continues to be convinced that fundamental analysis, investment prudence and discipline will once again prove to be critical.
9
Market corrections – both large and small – happen, and they typically occur when least expected. At Stralem, even at the cost of sometimes trailing the Benchmark, we will remain steadfast in our discipline and patient in our approach – continuing to maintain an allocation to downside protection while seeking fundamentally advantaged, high quality companies that meet our criteria for growth and valuation. A return to fundamental investing unencumbered by very loose monetary policy should, in our view, amply reward such discipline.
Please do not hesitate to contact us with any questions.
Sincerely,
Andrea Baumann Lustig
President, Stralem & Company Incorporated
10
Past performance is not predictive of future performance. Investment results and principal value will fluctuate so that shares, when redeemed, may be worth more or less than their original cost. Current performance may be higher or lower than the performance data quoted. Performance data current to the most recent month-end are available by calling 1-866-822-9555.
An investor should consider the investment objectives, risks, charges, and expenses of the Fund carefully before investing. The Fund’s prospectus contains this and other important information. To obtain a copy of the Fund’s prospectus please visit the Fund’s website at www.stralemequityfund.com or call 1-866-822-9555 and a copy will be sent to you free of charge. Please read the prospectus carefully before you invest. The Fund is distributed by Ultimus Fund Distributors, LLC.
The Letter to Shareholders seeks to describe some of Stralem’s current opinions and views of the financial markets. Although Stralem believes it has a reasonable basis for any opinions or views expressed, actual results may differ, sometimes significantly so, from those expected or expressed. The securities held by the Fund that are discussed in the Letter to Shareholders were held during the period covered by this Report. They do not comprise the entire investment portfolio of the Fund, may be sold at any time, and may no longer be held by the Fund. For a complete list of securities held by the Fund as of October 31, 2018, please see the Schedule of Investments section of the annual report. The opinions of Stralem with respect to those securities may change at any time.
Statements in the Letter to Shareholders that reflect projections or expectations for future financial or economic performance of the Fund and the market in general and statements of the Fund’s plans and objectives for future operations are forward-looking statements. No assurance can be given that actual results or events will not differ materially from those projected, estimated, assumed, or anticipated in any such forward-looking statements. Important factors that could result in such differences, in addition to factors noted with such forward-looking statements, include, without limitation, general economic conditions, such as inflation, recession, and interest rates. Past performance is not a guarantee of future results.
11
STRALEM EQUITY FUND
PORTFOLIO INFORMATION
October 31, 2018 (Unaudited)
As of October 31, 2017 | As of October 31, 2018 | ||||||||||||||||
|
| Value | % of Total | Value | % of Total | ||||||||||||
UP MARKET | NEW PRODUCTS | $ | 13,516,674 | 9.9 | % | $ | 12,103,796 | 12.5 | % | ||||||||
NEW INDUSTRIES | 26,535,346 | 19.4 | % | 17,883,847 | 18.5 | % | |||||||||||
DOMINANT COMPANIES | 50,299,002 | 36.7 | % | 32,447,888 | 33.5 | % | |||||||||||
DOWN MARKET | LOW PRICE TO CASH FLOW | 11,756,714 | 8.6 | % | 10,810,753 | 11.2 | % | ||||||||||
HIGH YIELD | 30,411,986 | 22.2 | % | 20,108,204 | 20.8 | % | |||||||||||
MONEY MARKET | 4,351,561 | 3.2 | % | 3,345,210 | 3.5 | % | |||||||||||
| $ | 136,871,283 | 100.0 | % | $ | 96,699,698 | 100.0 | % | ||||||||||
12
STRALEM EQUITY FUND
SCHEDULE OF INVESTMENTS
October 31, 2018
COMMON STOCKS — 95.7% | Shares | Value | ||||||
Communication Services — 9.0% | ||||||||
Diversified Telecommunication Services — 3.0% | ||||||||
AT&T, Inc. | 96,700 | $ | 2,966,756 | |||||
Interactive Media & Services — 6.0% | ||||||||
Alphabet, Inc. - Class A (a) | 2,800 | 3,053,624 | ||||||
Facebook, Inc. - Class A (a) | 18,400 | 2,792,936 | ||||||
| 5,846,560 | ||||||||
Consumer Discretionary — 9.7% | ||||||||
Auto Components — 3.0% | ||||||||
Aptiv plc | 38,300 | 2,941,440 | ||||||
Hotels, Restaurants & Leisure — 3.4% | ||||||||
Carnival Corporation | 58,750 | 3,292,350 | ||||||
Household Durables — 3.3% | ||||||||
D.R. Horton, Inc. | 88,900 | 3,196,844 | ||||||
Energy — 6.7% | ||||||||
Oil, Gas & Consumable Fuels — 6.7% | ||||||||
Chevron Corporation | 19,400 | 2,166,010 | ||||||
EOG Resources, Inc. | 20,000 | 2,106,800 | ||||||
Kinder Morgan, Inc. | 129,500 | 2,204,090 | ||||||
| 6,476,900 | ||||||||
Financials — 7.9% | ||||||||
Capital Markets — 5.7% | ||||||||
Bank of New York Mellon Corporation (The) | 45,250 | 2,141,683 | ||||||
Intercontinental Exchange, Inc. | 44,250 | 3,409,020 | ||||||
| 5,550,703 | ||||||||
Insurance — 2.2% | ||||||||
Chubb Ltd. | 17,550 | 2,192,170 | ||||||
Health Care — 28.0% | ||||||||
Biotechnology — 7.7% | ||||||||
AbbVie, Inc. | 36,250 | 2,822,062 | ||||||
Alexion Pharmaceuticals, Inc. (a) | 21,450 | 2,403,902 | ||||||
Celgene Corporation (a) | 31,950 | 2,287,620 | ||||||
| 7,513,584 | ||||||||
See notes to financial statements. |
13
STRALEM EQUITY FUND
SCHEDULE OF INVESTMENTS (Continued)
COMMON STOCKS — 95.7% (Continued) | Shares | Value | ||||||
Health Care — 28.0% (Continued) | ||||||||
Health Care Equipment & Supplies — 5.9% | ||||||||
Abbott Laboratories | 35,650 | $ | 2,457,711 | |||||
Danaher Corporation | 33,000 | 3,280,200 | ||||||
| 5,737,911 | ||||||||
Health Care Providers & Services — 3.4% | ||||||||
UnitedHealth Group, Inc. | 12,600 | 3,293,010 | ||||||
Life Sciences Tools & Services — 2.6% | ||||||||
Thermo Fisher Scientific, Inc. | 10,750 | 2,511,738 | ||||||
Pharmaceuticals — 8.4% | ||||||||
Johnson & Johnson | 17,450 | 2,442,825 | ||||||
Merck & Company, Inc. | 40,100 | 2,951,761 | ||||||
Pfizer, Inc. | 66,300 | 2,854,878 | ||||||
| 8,249,464 | ||||||||
Industrials — 6.8% | ||||||||
Aerospace & Defense — 3.5% | ||||||||
Boeing Company (The) | 9,500 | 3,371,170 | ||||||
Air Freight & Logistics — 3.3% | ||||||||
FedEx Corporation | 14,800 | 3,261,032 | ||||||
Information Technology — 15.8% | ||||||||
IT Services — 3.4% | ||||||||
Visa, Inc. - Class A | 24,250 | 3,342,862 | ||||||
Semiconductors & Semiconductor Equipment — 3.1% | ||||||||
Broadcom, Inc. | 13,400 | 2,994,766 | ||||||
Software — 9.3% | ||||||||
Adobe Systems, Inc. (a) | 12,300 | 3,022,848 | ||||||
Microsoft Corporation | 28,100 | 3,001,361 | ||||||
Oracle Corporation | 61,800 | 3,018,312 | ||||||
| 9,042,521 | ||||||||
Materials — 3.1% | ||||||||
Chemicals — 3.1% | ||||||||
DowDuPont, Inc. | 56,750 | 3,059,960 | ||||||
See notes to financial statements. |
14
STRALEM EQUITY FUND
SCHEDULE OF INVESTMENTS (Continued)
COMMON STOCKS — 95.7% (Continued) | Shares | Value | ||||||
Utilities — 8.7% | ||||||||
Electric Utilities — 5.8% | ||||||||
American Electric Power Company, Inc. | 38,700 | $ | 2,839,032 | |||||
Duke Energy Corporation | 34,350 | 2,838,341 | ||||||
| 5,677,373 | ||||||||
Multi-Utilities — 2.9% | ||||||||
Dominion Energy, Inc. | 39,700 | 2,835,374 | ||||||
Total Common Stocks (Cost $66,963,586) | $ | 93,354,488 | ||||||
MONEY MARKET FUNDS — 3.4% | Shares | Value | ||||||
Dreyfus Treasury Securities Cash Management Fund - Investor Shares, 1.77% (b) (Cost $3,345,210) | 3,345,210 | $ | 3,345,210 | |||||
Total Investments at Value — 99.1% (Cost $70,308,796) | $ | 96,699,698 | ||||||
Other Assets in Excess of Liabilities — 0.9% | 848,369 | |||||||
Net Assets — 100.0% | $ | 97,548,067 | ||||||
(a) | Non-income producing security. |
(b) | The rate shown is the 7-day effective yield as of October 31, 2018. |
See notes to financial statements. | |
15
STRALEM EQUITY FUND
STATEMENT OF ASSETS AND LIABILITIES
October 31, 2018
ASSETS | ||||
Investments, at value (Note 2) (Cost $70,308,796) | $ | 96,699,698 | ||
Cash | 114,745 | |||
Receivable for investment securities sold | 693,782 | |||
Dividends receivable | 141,763 | |||
Other assets | 7,182 | |||
Total Assets | 97,657,170 | |||
LIABILITIES | ||||
Payable to Investment Adviser (Note 4) | 61,477 | |||
Payable to administrator (Note 4) | 15,090 | |||
Accrued expenses | 32,536 | |||
Total Liabilities | 109,103 | |||
NET ASSETS | $ | 97,548,067 | ||
NET ASSETS CONSIST OF: | ||||
Paid-in capital | $ | 48,957,850 | ||
Accumulated earnings | 48,590,217 | |||
Net Assets | $ | 97,548,067 | ||
Shares of beneficial interest outstanding | 9,769,566 | |||
Net asset value, offering price and redemption price per share (a) | $ | 9.98 |
(a) | Redemption price varies based on length of time held (Note 2). |
See notes to financial statements. | |
16
STRALEM EQUITY FUND
STATEMENT OF OPERATIONS
For the Year Ended October 31, 2018
INVESTMENT INCOME | ||||
Dividends (net of foreign withholding taxes of $11) | $ | 2,613,779 | ||
EXPENSES | ||||
Investment advisory fees (Note 4) | 1,330,260 | |||
Administration fees (Note 4) | 120,492 | |||
Professional fees | 61,798 | |||
Fund accounting fees (Note 4) | 42,732 | |||
Registration and filing fees | 16,700 | |||
Compliance fees (Note 4) | 15,432 | |||
Transfer agent fees (Note 4) | 15,000 | |||
Trustees’ fees and expenses (Note 4) | 12,932 | |||
Bank service fees | 6,916 | |||
Printing | 4,960 | |||
Postage and supplies | 4,805 | |||
Insurance expense | 2,953 | |||
Other | 20,812 | |||
Total Expenses | 1,655,792 | |||
Investment advisory fee reductions (Note 4) | (445,789 | ) | ||
Net Expenses | 1,210,003 | |||
NET INVESTMENT INCOME | 1,403,776 | |||
REALIZED AND UNREALIZED GAINS (LOSSES) ON INVESTMENTS | ||||
Net realized gains from investment transactions | 21,339,408 | |||
Net change in unrealized appreciation (depreciation) on investments | (20,505,741 | ) | ||
NET REALIZED AND UNREALIZED GAINS ON INVESTMENTS | 833,667 | |||
NET INCREASE IN NET ASSETS RESULTING FROM OPERATIONS | $ | 2,237,443 |
See notes to financial statements. |
17
STRALEM EQUITY FUND
STATEMENTS OF CHANGES IN NET ASSETS
| Year | Year | ||||||
OPERATIONS | ||||||||
Net investment income | $ | 1,403,776 | $ | 1,372,588 | ||||
Net realized gains from investment transactions | 21,339,408 | 7,346,411 | ||||||
Net change in unrealized appreciation (depreciation) on investments | (20,505,741 | ) | 12,604,924 | |||||
Net increase in net assets resulting from operations | 2,237,443 | 21,323,923 | ||||||
DISTRIBUTIONS TO SHAREHOLDERS (Note 2) | (8,723,481 | ) | (19,648,609 | ) | ||||
CAPITAL SHARE TRANSACTIONS | ||||||||
Proceeds from shares sold | 5,181,862 | 5,811,367 | ||||||
Net asset value of shares issued in reinvestment of distributions | 6,957,351 | 16,004,485 | ||||||
Proceeds from redemption fees (Note 2) | 64 | 5 | ||||||
Payments for shares redeemed | (44,946,201 | ) | (29,615,038 | ) | ||||
Net decrease in net assets from capital share transactions | (32,806,924 | ) | (7,799,181 | ) | ||||
TOTAL DECREASE IN NET ASSETS | (39,292,962 | ) | (6,123,867 | ) | ||||
NET ASSETS | ||||||||
Beginning of year | 136,841,029 | 142,964,896 | ||||||
End of year | $ | 97,548,067 | $ | 136,841,029 | ||||
CAPITAL SHARE ACTIVITY | ||||||||
Shares sold | 505,521 | 597,266 | ||||||
Shares reinvested | 690,899 | 1,720,912 | ||||||
Shares redeemed | (4,426,909 | ) | (2,909,110 | ) | ||||
Net decrease in shares outstanding | (3,230,489 | ) | (590,932 | ) | ||||
Shares outstanding, beginning of year | 13,000,055 | 13,590,987 | ||||||
Shares outstanding, end of year | 9,769,566 | 13,000,055 | ||||||
(a) | The presentation of Distributions to Shareholders has been updated to reflect the changes prescribed in amendments to Regulation S-X, effective November 5, 2018 (Note 2). For the year ended October 31, 2017, distributions to shareholders consisted of $2,109,539 from net investment income and $17,539,070 from net realized gains from investment transactions. As of October 31, 2017, undistributed net investment income was $975,373. |
See notes to financial statements. | |
18
STRALEM EQUITY FUND
FINANCIAL HIGHLIGHTS
(For a share outstanding throughout each year) | ||||||||||||||||||||
Year Ended October 31, | ||||||||||||||||||||
| 2018 | 2017 | 2016 | 2015 | 2014 | |||||||||||||||
Net asset value, beginning of year | $ | 10.53 | $ | 10.52 | $ | 15.53 | $ | 17.45 | $ | 16.77 | ||||||||||
Income (loss) from investment operations: | ||||||||||||||||||||
Net investment income | 0.13 | 0.12 | 0.22 | 0.23 | 0.24 | |||||||||||||||
Net realized and unrealized gains on investments | 0.00 | (a) | 1.49 | 0.24 | 0.34 | 1.70 | ||||||||||||||
Total from investment operations | 0.13 | 1.61 | 0.46 | 0.57 | 1.94 | |||||||||||||||
Less distributions: | ||||||||||||||||||||
Dividends from net investment income | (0.11 | ) | (0.17 | ) | (0.25 | ) | (0.25 | ) | (0.26 | ) | ||||||||||
Distributions from net realized gains | (0.57 | ) | (1.43 | ) | (5.22 | ) | (2.24 | ) | (1.00 | ) | ||||||||||
Total distributions | (0.68 | ) | (1.60 | ) | (5.47 | ) | (2.49 | ) | (1.26 | ) | ||||||||||
Proceeds from redemption fees collected (Note 2) | 0.00 | (a) | 0.00 | (a) | 0.00 | (a) | 0.00 | (a) | 0.00 | (a) | ||||||||||
Net asset value, end of year | $ | 9.98 | $ | 10.53 | $ | 10.52 | $ | 15.53 | $ | 17.45 | ||||||||||
Total return (b) | 1.13 | % | 17.36 | % | 4.72 | % | 3.43 | % | 12.18 | % | ||||||||||
Ratios/supplemental data: | ||||||||||||||||||||
Net assets, end of year (000’s) | $ | 97,548 | $ | 136,841 | $ | 142,965 | $ | 190,800 | $ | 318,237 | ||||||||||
Ratio of total expenses to average net assets | 1.30 | % | 1.28 | % | 1.42 | % | 1.21 | % | 1.12 | % | ||||||||||
Ratio of net expenses to average net assets (c) | 0.95 | % | 0.95 | % | 0.98 | % | 0.98 | % | 0.98 | % | ||||||||||
Ratio of net investment income to average net assets (c) | 1.10 | % | 1.03 | % | 1.52 | % | 1.17 | % | 1.27 | % | ||||||||||
Portfolio turnover rate | 32 | % | 7 | % | 8 | % | 33 | % | 19 | % | ||||||||||
(a) | Amount rounds to less than $0.01 per share. |
(b) | Total return is the measure of the change in value of an investment in the Fund over the periods covered, which assumes any dividends or capital gains distributions are reinvested in shares of the Fund. Returns shown do not reflect the deduction of taxes a shareholder would pay on Fund distributions or the redemption of Fund shares. The total returns would be lower if the Adviser had not reduced advisory fees and/or reimbursed expenses (Note 4). |
(c) | Ratio was determined after advisory fee reductions and/or expense reimbursements by the Adviser (Note 4). |
See notes to financial statements. | |
19
STRALEM EQUITY FUND
NOTES TO FINANCIAL STATEMENTS
October 31, 2018
1. | ORGANIZATION |
Stralem Equity Fund (the “Fund”) is a diversified series of Ultimus Managers Trust (the “Trust”). The Trust is an open-end management investment company registered under the Investment Company Act of 1940, as amended (the “1940 Act”). The Fund was reorganized into the Trust on October 17, 2016. It was formerly a series of Stralem Fund.
The Fund’s investment objective is to seek long-term capital appreciation.
2. | SIGNIFICANT ACCOUNTING POLICIES |
In August 2018, the U.S. Securities and Exchange Commission (the “SEC”) adopted regulations that eliminated or amended disclosure requirements that were redundant or outdated in light of changes in SEC requirements, accounting principles generally accepted in the United States of America (“GAAP”), International Financial Reporting Standards or changes in technology or the business environment. These regulations were effective November 5, 2018, and the Fund is complying with them effective with these financial statements.
The Fund follows accounting and reporting guidance under Financial Accounting Standards Board (“FASB”) Accounting Standards Codification (“ASC”) Topic 946, “Financial Services – Investment Companies.” The following is a summary of the Fund’s significant accounting policies used in the preparation of its financial statements. These policies are in conformity with GAAP.
New Accounting Pronouncement — In August 2018, FASB issued Accounting Standards Update No. 2018-13 (“ASU 2018-13”), “Disclosure Framework – Changes to the Disclosure Requirements for Fair Value Measurement,” which amends the fair value measurement disclosure requirements of ASC Topic 820, “Fair Value Measurement” (“ASC 820”). ASU 2018-13 includes new, eliminated, and modified disclosure requirements for ASC 820. In addition, ASU 2018-13 clarifies that materiality is an appropriate consideration of entities when evaluating disclosure requirements. ASU 2018-13 is effective for fiscal years beginning after December 15, 2019, including interim periods therein. Early adoption is permitted and the Fund has adopted ASU 2018-13 with these financial statements.
Investment valuation:
The Fund’s portfolio securities are valued as of the close of business of the regular session of trading on the New York Stock Exchange (“NYSE”) (normally 4:00 p.m., Eastern time) on each day the NYSE is open. Securities which are traded on stock exchanges are valued at the closing price on the day the securities are being valued, or, if not traded on a particular day, at the closing mean price. Securities quoted by NASDAQ are valued at the NASDAQ Official Closing Price.
20
STRALEM EQUITY FUND
NOTES TO FINANCIAL STATEMENTS (Continued)
Securities traded in the over-the-counter market are valued at the last sale price, if available, otherwise, at the last quoted mean price. Investments in money market funds are valued at net asset value (“NAV”). When using a quoted price and when the market for the security is considered active, the security will be classified as Level 1 within the fair value hierarchy (see below). In the event that market quotations are not readily available or are considered unreliable due to market or other events, the Fund values its securities and other assets at fair value pursuant to procedures established by and under the direction of the Board of Trustees (the “Board”) of the Trust. Under these procedures, the securities will be classified as Level 2 or 3 within the fair value hierarchy, depending on the inputs used. Unavailable or unreliable market quotes may be due to the following factors: a substantial bid-ask spread; infrequent sales resulting in stale prices; insufficient trading volume; small trade sizes; a temporary lapse in any reliable pricing source; and actions of the securities or futures markets, such as the suspension or limitation of trading. As a result, the prices of securities used to calculate the Fund’s NAV may differ from quoted or published prices for the same securities.
GAAP establishes a single authoritative definition of fair value, sets out a framework for measuring fair value and requires additional disclosures about fair value measurements.
Various inputs are used in determining the value of the Fund’s investments. These inputs are summarized in the three broad levels listed below:
Level 1 – quoted prices in active markets for identical securities
Level 2 – other significant observable inputs
Level 3 – significant unobservable inputs
The inputs or methodology used for valuing securities are not necessarily an indication of the risks associated with investing in those securities. The inputs used to measure fair value may fall into different levels of the above fair value hierarchy. In such cases, for disclosure purposes, the level in the fair value hierarchy within which the fair value measurement falls is determined based on the lowest level input that is significant to the fair value measurement.
The following is a summary of the inputs used to value the Fund’s investments by security type as of October 31, 2018:
| Level 1 | Level 2 | Level 3 | Total | ||||||||||||
Common Stocks | $ | 93,354,488 | $ | — | $ | — | $ | 93,354,488 | ||||||||
Money Market Funds | 3,345,210 | — | — | 3,345,210 | ||||||||||||
Total | $ | 96,699,698 | $ | — | $ | — | $ | 96,699,698 | ||||||||
21
STRALEM EQUITY FUND
NOTES TO FINANCIAL STATEMENTS (Continued)
Refer to the Fund’s Schedule of Investments for a listing of the common stocks by sector and industry type. There were no Level 2 or Level 3 securities or derivative instruments held by the Fund as of October 31, 2018.
Share valuation and redemption fees:
The NAV per share of the Fund is calculated daily by dividing the total value of the Fund’s assets, less liabilities, by the number of shares outstanding. The offering price and redemption price per share is equal to the NAV per share, except that shares are subject to a redemption fee of 1% if shares are redeemed within 60 days of purchase. During the years ended October 31, 2018 and 2017, proceeds from redemption fees totaled $64 and $5, respectively.
Investment transactions and income:
Investment transactions are accounted for on the trade date. Realized gains and losses on sales of investments are calculated on a specific identification basis. Dividend income is recorded on the ex-dividend date, and interest income is recognized on the accrual basis. Withholding taxes on foreign dividends have been recorded in accordance with the Fund’s understanding of the applicable country’s rules and tax rates.
Common Expenses:
Common expenses of the Trust are allocated among the Fund and other series of the Trust based on the relative net assets of each series or the nature of the services performed and the relative applicability to each series.
Distributions to shareholders:
Distributions arising from net investment income and net realized capital gains are declared and paid to shareholders annually. The amount of distributions from net investment income and net realized capital gains are determined in accordance with federal income tax regulations, which may differ from GAAP. The tax character of distributions paid to shareholders during the years ended October 31, 2018 and 2017 was as follows:
Years Ended | Ordinary | Long-Term | Total | |||||||||
October 31, 2018 | $ | 1,508,018 | $ | 7,215,463 | $ | 8,723,481 | ||||||
October 31, 2017 | $ | 2,489,305 | $ | 17,159,304 | $ | 19,648,609 | ||||||
Use of estimates:
The preparation of financial statements in conformity with GAAP requires management to make estimates and assumptions that affect the reported amounts of assets and liabilities and disclosure of contingent assets and liabilities as of the date of the financial statements and the reported amounts of income and expenses during the reporting period. Actual results could differ from those estimates.
22
STRALEM EQUITY FUND
NOTES TO FINANCIAL STATEMENTS (Continued)
Federal Income Tax:
The Fund has qualified and intends to continue to qualify as a regulated investment company under the Internal Revenue Code of 1986, as amended (the “Code”). Qualification generally will relieve the Fund of liability for federal income taxes to the extent its net investment income and net realized capital gains are distributed in accordance with the Code.
In order to avoid imposition of a federal excise tax applicable to regulated investment companies, the Fund must declare and pay as dividends in each calendar year at least 98% of its net investment income (earned during the calendar year) and 98.2% of its net realized capital gains (earned during the twelve months ended October 31) plus undistributed amounts from prior years.
The following information is computed on a tax basis for each item as of October 31, 2018:
Cost of portfolio investments | $ | 70,484,723 | ||
Gross unrealized appreciation | $ | 29,823,260 | ||
Gross unrealized depreciation | (3,608,285 | ) | ||
Net unrealized appreciation | 26,214,975 | |||
Undistributed ordinary income | 1,302,359 | |||
Undistributed long-term capital gains | 21,072,883 | |||
Distributable earnings | $ | 48,590,217 |
The difference between the federal income tax cost of portfolio investments and the financial statement cost of portfolio investments is due to certain timing differences in the recognition of capital gains or losses under income tax regulations and GAAP. These “book/tax” differences are temporary in nature and are due to the tax deferral of losses on wash sales.
The Fund recognizes the tax benefits or expenses of uncertain tax positions only when the position is “more likely than not” to be sustained assuming examination by tax authorities. Management has reviewed the Fund’s tax positions for all open tax years (generally three years) and has concluded that no provision for unrecognized tax benefits or expenses is required in these financial statements.
3. | INVESTMENT TRANSACTIONS |
During the year ended October 31, 2018, cost of purchases and proceeds from sales of investment securities, other than short-term investments, amounted to $38,757,354 and $78,756,256, respectively.
23
STRALEM EQUITY FUND
NOTES TO FINANCIAL STATEMENTS (Continued)
4. | TRANSACTIONS WITH RELATED PARTIES |
INVESTMENT ADVISORY AGREEMENT
Pursuant to an Investment Advisory Agreement with Stralem & Company Incorporated (the “Adviser”), the Fund pays the Adviser an advisory fee, payable quarterly, based on the average weekly net assets of the Fund, equal to 1.25% per annum of the first $50 million of such net assets; 1.00% per annum of the next $50 million of such net assets; and 0.75% per annum of such net assets in excess of $100 million.
The Adviser has agreed contractually, until at least March 1, 2020, to reduce its advisory fees and reimburse other expenses to the extent necessary to limit total annual operating expenses (excluding brokerage costs; taxes; interest; costs to organize the Fund; acquired fund fees and expenses; and extraordinary expenses, such as litigation and merger or reorganization costs and other expenses not incurred in the ordinary course of the Fund’s business) to an amount not exceeding 0.95% of the Fund’s average daily net assets. During the year ended October 31, 2018, the Adviser reduced its advisory fees in the amount of $445,789.
Advisory fee reductions and expense reimbursements by the Adviser are subject to repayment by the Fund for a period of three years after such fees and expenses were incurred, provided that the repayments do not cause total annual operating expenses to exceed the lesser of (i) the expense limitation then in effect, if any, and (ii) the expense limitation in effect at the time the expenses to be repaid were incurred. Prior to March 1, 2020, this agreement may not be modified or terminated without the approval of the Board. This agreement will terminate automatically if the Investment Advisory Agreement is terminated. As of October 31, 2018, the amount of fee reductions and expense reimbursements available for recovery by the Adviser is $877,641, which must be recovered no later than the dates stated below:
October 31, 2020 | $ | 431,852 | ||
October 31, 2021 | 445,789 | |||
| $ | 877,641 |
OTHER SERVICE PROVIDERS
Ultimus Fund Solutions, LLC (“Ultimus”) provides administration, fund accounting, compliance, and transfer agent services for the Fund. The Fund pays Ultimus fees in accordance with the agreements for such services. In addition, the Fund pays out-of-pocket expenses including, but not limited to, postage, supplies and costs of pricing the Fund’s portfolio securities.
24
STRALEM EQUITY FUND
NOTES TO FINANCIAL STATEMENTS (Continued)
Pursuant to a Distribution Agreement with Ultimus Fund Distributors, LLC (the “Distributor”), the Distributor provides distribution services and serves as principal underwriter for the Fund. The Distributor is a wholly owned subsidiary of Ultimus. The Distributor is compensated by the Adviser (not the Fund) for acting as principal underwriter.
Certain officers and a Trustee of the Trust are also officers of Ultimus and the Distributor.
TRUSTEE COMPENSATION
Effective August 1, 2018, each Trustee who is not an “interested person” of the Trust (“Independent Trustee”) receives a $1,300 annual retainer from the Fund, paid quarterly, except for the Board Chairperson who receives a $1,500 annual retainer from the Fund, paid quarterly. Each Independent Trustee also receives from the Fund a fee of $500 for each Board meeting attended plus reimbursement for travel and other meeting-related expenses. Prior to August 1, 2018, each Independent Trustee received a $1,000 annual retainer from the Fund, paid quarterly, except for the Board Chairperson who received a $1,200 annual retainer from the Fund, paid quarterly. Each Independent Trustee also received from the Fund a fee of $500 for each Board meeting attended plus reimbursement for travel and other meeting-related expenses.
PRINCIPAL HOLDER OF FUND SHARES
As of October 31, 2018, the following shareholder owned of record 25% or more of the outstanding shares of the Fund:
Name of Record Owner | % Ownership |
Pershing LLC (for the benefit of its customers) | 77% |
A beneficial owner of 25% or more of the Fund’s outstanding shares may be considered a controlling person. That shareholder’s vote could have a more significant effect on matters presented at a shareholders’ meeting.
5. | SECTOR RISK |
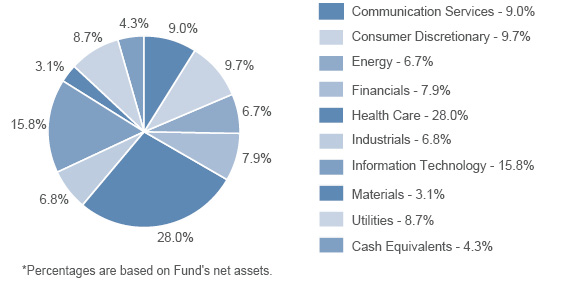
If the Fund has significant investments in the securities of issuers within a particular sector, any development affecting that sector will have a greater impact on the value of the net assets of the Fund than would be the case if the Fund did not have significant investments in that sector. In addition, this may increase the risk of loss in the Fund and increase the volatility of the Fund’s NAV per share. Occasionally, market conditions, regulatory changes or other developments may negatively impact this sector, and therefore the value of the Fund’s portfolio will be adversely affected. As of October 31, 2018, the Fund had 28.0% of the value of its net assets invested in securities within the Health Care sector.
25
STRALEM EQUITY FUND
NOTES TO FINANCIAL STATEMENTS (Continued)
6. | CONTINGENCIES AND COMMITMENTS |
The Fund indemnifies the Trust’s officers and Trustees for certain liabilities that might arise from their performance of their duties to the Fund. Additionally, in the normal course of business the Fund enters into contracts that contain a variety of representations and warranties and which provide general indemnifications. The Fund’s maximum exposure under these arrangements is unknown, as this would involve future claims that may be made against the Fund that have not yet occurred. However, the Fund has not had any prior claims or losses pursuant to these arrangements.
7. | SUBSEQUENT EVENTS |
The Fund is required to recognize in the financial statements the effects of all subsequent events that provide additional evidence about conditions that existed as of the date of the Statement of Assets and Liabilities. For non-recognized subsequent events that must be disclosed to keep the financial statements from being misleading, the Fund is required to disclose the nature of the event as well as an estimate of its financial effect, or a statement that such an estimate cannot be made. Management has evaluated subsequent events through the issuance of these financial statements and has noted no such events.
26
STRALEM EQUITY FUND
REPORT OF INDEPENDENT REGISTERED PUBLIC ACCOUNTING FIRM
To the Shareholders of Stralem Equity Fund and
Board of Trustees of Ultimus Managers Trust
Opinion on the Financial Statements
We have audited the accompanying statement of assets and liabilities, including the schedule of investments, of Stralem Equity Fund (the “Fund”), a series of Ultimus Managers Trust, as of October 31, 2018, and the related statement of operations for the year then ended, the statements of changes in net assets for each of the two years in the period then ended, including the related notes, and the financial highlights for each of the three years in the period then ended (collectively referred to as the “financial statements”). In our opinion, the financial statements present fairly, in all material respects, the financial position of the Fund as of October 31, 2018, the results of its operations for the year then ended, the changes in Its net assets for each of the two years in the period then ended, and the financial highlights for each of the three years in the period then ended, in conformity with accounting principles generally accepted in the United States of America.
The Fund’s financial statements and financial highlights for the years ended prior to October 31, 2016, were audited by other auditors, whose report dated December 10, 2015, expressed an unqualified opinion on those financial statements and financial highlights.
Basis for Opinion
These financial statements are the responsibility of the Fund’s management. Our responsibility is to express an opinion on the Fund’s financial statements based on our audits. We are a public accounting firm registered with the Public Company Accounting Oversight Board (United States) (“PCAOB”) and are required to be independent with respect to the Fund in accordance with the U.S. federal securities laws and the applicable rules and regulations of the Securities and Exchange Commission and the PCAOB.
We conducted our audits in accordance with the standards of the PCAOB. Those standards require that we plan and perform the audit to obtain reasonable assurance about whether the financial statements are free of material misstatement, whether due to error or fraud.
Our audits included performing procedures to assess the risks of material misstatement of the financial statements, whether due to error or fraud, and performing procedures that respond to those risks. Such procedures included examining, on a test basis, evidence regarding the amounts and disclosures in the financial statements. Our procedures included confirmation of securities owned as of October 31, 2018, by correspondence with the custodian and brokers. Our audits also included evaluating the accounting principles used and
27
STRALEM EQUITY FUND
REPORT OF INDEPENDENT REGISTERED PUBLIC ACCOUNTING FIRM (Continued)
significant estimates made by management, as well as evaluating the overall presentation of the financial statements. We believe that our audits provide a reasonable basis for our opinion.
We have served as the Fund’s auditor since 2016.

COHEN & COMPANY, LTD.
Cleveland, Ohio
December 20, 2018
28
STRALEM EQUITY FUND
DISCLOSURE OF FUND EXPENSES (Unaudited)
As a shareholder of the Fund, you incur ongoing costs, including management fees and other Fund expenses, which are deducted from the Fund’s gross income. This Example is intended to help you understand your ongoing costs (in dollars) of investing in the Fund and to compare these costs with the ongoing costs of investing in other mutual funds.
The Example is based on an investment of $1,000 invested at the beginning of the period (May 1, 2018) and held until the end of the period (October 31, 2018).
Actual Expenses
The first line of the table below provides information about actual account values and actual expenses. You may use the information in this line, together with the amount you invested, to estimate the expenses that you paid over the period. Simply divide your account value by $1,000 (for example, an $8,600 account value divided by $1,000 = 8.6), then multiply the result by the number in the first line under the heading entitled “Expenses Paid During Period” to estimate the expenses you paid on your account during this period.
Hypothetical Example for Comparison Purposes
The second line of the table below provides information about hypothetical account values and hypothetical expenses based on the Fund’s actual expense ratio and an assumed rate of return of 5% per year before expenses, which is not the Fund’s actual return. The hypothetical account values and expenses may not be used to estimate the actual ending account balance or expenses you paid for the period. You may use this information to compare the ongoing costs of investing in the Fund and other mutual funds. To do so, compare this 5% hypothetical example with the 5% hypothetical examples that appear in the shareholder reports of other funds.
| Beginning | Ending | Expenses Paid |
Based on Actual Fund Return | $ 1,000.00 | $ 1,011.10 | $ 4.82 |
Based on Hypothetical 5% Return | $ 1,000.00 | $ 1,020.42 | $ 4.84 |
* | Expenses are equal to the Fund’s annualized net expense ratio of 0.95% for the period, multiplied by the average account value over the period, multiplied by 184/365 (to reflect the one-half year period). |
29
STRALEM EQUITY FUND
ADDITIONAL INFORMATION (Unaudited)
PROXY VOTING POLICIES AND PROCEDURES
A description of the Fund’s proxy voting policies and procedures is available, without charge, upon request by calling toll free (866) 822-9555, or on the SEC website at http://www.sec.gov. Information regarding how the Fund voted proxies relating to portfolio securities during the most recent 12-month period ended June 30 is also available, without charge, upon request by calling toll free (866) 822-9555, or on the SEC website at http://www.sec.gov.
QUARTERLY PORTFOLIO HOLDINGS
The Fund’s Forms N-Q containing a complete schedule of portfolio holdings as of the end of the first and third quarters of each fiscal year are available on the SEC’s website at http://www.sec.gov or are available upon request, without charge, by calling toll free at (866) 822-9555.
HOUSEHOLDING
The Fund will generally send only one copy of the summary prospectus, proxy material, annual report and semi-annual report to shareholders residing at the same “household.” This reduces Fund expenses which benefits all shareholders, minimizes the volume of mail you receive and eliminates duplicates of the same information. If you need additional copies of these documents, a copy of the prospectus or do not want your mailings to be “householded,” please send us a written request or call us toll free at (866) 822-9555.
OTHER FEDERAL TAX INFORMATION (Unaudited)
For the fiscal year ended October 31, 2018, the Fund designated $7,215,463 as long-term capital gain distributions subject to a maximum tax rate of 20%.
Qualified Dividend Income — The Fund designates 100% of its ordinary income dividends, or up to the maximum amount of such dividends allowable pursuant to the Internal Revenue Code, as qualified dividend income eligible for the reduced tax rate of 15%.
Dividends Received Deduction — Corporate shareholders are generally entitled to take the dividends received deduction on the portion of the Fund’s dividend distributions that qualifies under tax law. For the fiscal year ended October 31, 2018, 100% of ordinary income dividends qualified for the corporate dividends received deduction.
30
STRALEM EQUITY FUND
BOARD OF TRUSTEES AND EXECUTIVE OFFICERS
(Unaudited)
The Board has overall responsibility for management of the Trust’s affairs. The Trustees serve during the lifetime of the Trust and until its termination, or until death, resignation, retirement, or removal. The Trustees, in turn, elect the officers of the Fund to actively supervise its day-to-day operations. The officers have been elected for an annual term. Each Trustee’s and officer’s address is 225 Pictoria Drive, Suite 450, Cincinnati, Ohio 45246. The following are the Trustees and executive officers of the Fund:
Name and | Length | Position(s) | Principal | Number | Directorships |
Interested Trustees: | |||||
Robert G. Dorsey* Year of Birth: 1957 | Since February | Trustee (February 2012 to present)
President (June 2012 to October 2013) | Managing Director (1999 to present), Co-CEO (April 2018 to present), and President (1999 to April 2018) of Ultimus Fund Solutions, LLC and its subsidiaries (except as otherwise noted for FINRA-regulated broker dealer entities) | 19 | Interested Trustee of Capitol Series Trust (10 Funds) |
Independent Trustees: | |||||
Janine L. Cohen Year of Birth: 1952 | Since | Trustee | Retired since 2013; Chief Financial Officer from 2004 to 2013 and Chief Compliance Officer from 2008 to 2013 at AER Advisors, Inc. | 19 | None |
31
STRALEM EQUITY FUND
BOARD OF TRUSTEES AND EXECUTIVE OFFICERS
(Unaudited) (Continued)
Name and | Length of Time Served | Position(s) Held with Trust | Principal | Number of Funds in Trust Overseen by | Directorships of Public Companies Held by Trustee During Past 5 Years |
David M. Deptula Year of Birth: 1958 | Since | Trustee | Vice President of Legal and Special Projects at Dayton Freight Lines, Inc. since 2016; Vice President of Tax Treasury at The Standard Register Inc. (formerly The Standard Register Company) from 2011 to 2016 | 19 | None |
John J. Discepoli Year of Birth: 1963 | Since | Chairperson (May 2016
Trustee (June 2012 to present) | Owner of Discepoli Financial Planning, LLC (personal financial planning company) since 2004 | 19 | None |
* | Mr. Dorsey is considered an “interested person” of the Trust within the meaning of Section 2(a)(19) of the 1940 Act, as amended, because of his relationship with the Trust’s administrator, transfer agent and distributor. |
Name and | Length of Time Served | Position(s) | Principal Occupation(s) During Past 5 Years |
Executive Officers: | |||
David R. Carson Year of Birth: 1958 | Since | Principal
President (October 2013 to present)
Vice President (April 2013 to October 2013) | Vice President and Director of Client Strategies of Ultimus Fund Solutions, LLC (2013 to present); President, Unified Series Trust (2016 to present); Chief Compliance Officer, FSI Low Beta Absolute Return Fund (2013 to 2016); Chief Compliance Officer, The Huntington Funds (2005 to 2013), Huntington Strategy Shares (2012 to 2013), and Huntington Asset Advisors (2013); Vice President, Huntington National Bank (2001 to 2013) |
32
STRALEM EQUITY FUND
BOARD OF TRUSTEES AND EXECUTIVE OFFICERS
(Unaudited) (Continued)
Name and | Length of Time Served | Position(s) | Principal Occupation(s) During Past 5 Years |
Todd E. Heim Year of Birth: 1967 | Since 2014 | Vice President (2014 to present) | Vice President, Relationship Management Director of Ultimus Fund Solutions, LLC (2018 to present); Client Implementation Manager of Ultimus Fund Solutions, LLC (2014 to 2018); Naval Flight Officer of United States Navy (1989 to 2017); Business Project Manager of Vantiv, Inc. (2013 to 2014) |
Jennifer L. Leamer Year of Birth: 1976 | Since | Treasurer (October 2014 to present)
Assistant Treasurer (April 2014 to October 2014) | Vice President, Mutual Fund Controller of Ultimus Fund Solutions, LLC (2014 to present); Business Analyst of Ultimus Fund Solutions, LLC (2007 to 2014) |
Daniel D. Bauer Year of Birth: 1977 | Since | Assistant Treasurer (April 2016 to present) | Assistant Mutual Fund Controller (September 2015 to present) and Fund Accounting Manager (March 2012 to August 2015) of Ultimus Fund Solutions, LLC |
Matthew J. Beck Year of Birth: 1988 | Since | Secretary | Senior Attorney of Ultimus Fund Solutions, LLC (2018 to present); General Counsel of The Nottingham Company (2014 to 2018) |
Natalie S. Anderson Year of Birth: 1975 | Since | Assistant Secretary (April 2016 to present) | Legal Administration Manager (July 2016 to present) and Paralegal (January 2015 to June 2016) of Ultimus Fund Solutions, LLC; Senior Paralegal of Unirush, LLC (October 2011 to January 2015) |
Charles C. Black Year of Birth: 1979 | Since | Chief Compliance Officer
Assistant Chief Compliance Officer (April 2015 to January 2016) | Senior Compliance Officer of Ultimus Fund Solutions, LLC (2015 to present); Chief Compliance Officer of The Caldwell & Orkin Funds, Inc. (2016 to present); Senior Compliance Manager for Touchstone Mutual Funds (2013 to 2015); Senior Compliance Manager for Fund Evaluation Group (2011 to 2013) |
Additional information about members of the Board and executive officers is available in the Fund’s Statement of Additional Information (“SAI”). To obtain a free copy of the SAI, please call 1-866-822-9555.
33
STRALEM EQUITY FUND
DISCLOSURE REGARDING APPROVAL OF INVESTMENT ADVISORY AGREEMENT (Unaudited)
The Board of Trustees (the “Board”), including the Independent Trustees voting separately, has reviewed and approved the Fund’s Investment Advisory Agreement with the Stralem & Company, Incorporated (the “Adviser”) for an additional one-year term (the “Agreement”). The Board approved the Agreement at an in-person meeting held on July 23-24, 2018, at which all of the Trustees were present.
Legal counsel advised the Board during its deliberations. Additionally, the Board received and reviewed a substantial amount of information provided by the Adviser in response to requests of the Board and counsel. In deciding whether to approve the renewal of the Investment Advisory Agreement, the Board recalled its review of the materials related to the Fund and the Adviser throughout the preceding 12 months and its numerous discussions with Trust management and the Adviser about the operations and performance of the Fund during that period. The Board further considered those materials and discussions and other numerous factors, including
The nature, extent, and quality of the services provided by the Adviser. In this regard, the Board reviewed the services being provided by the Adviser to the Fund including, without limitation, its investment advisory services since the Fund’s inception, the Adviser’s compliance policies and procedures, its efforts to promote the Fund and assist in its distribution, and its compliance program. After reviewing the foregoing information and further information in a memorandum from the Adviser (e.g., descriptions of its business and Form ADV), the Board concluded that the quality, extent, and nature of the services provided by Adviser were satisfactory and adequate for the Fund.
The investment performance of the Fund. In this regard, the Board compared the performance of the Fund with the performance of its benchmark index, custom peer group and related Morningstar category. The Board noted that while the Fund had underperformed its custom peer group’s average and median performance for the one year period and underperformed its custom peer group’s average and median performance since the Fund’s inception and underperformed its Morningstar category’s (Large Cap Blend Category Under $250 million, True No-Load) median and average performance for the one year period, and underperformed the median and underperformed the average performance since the Fund’s inception, the Adviser had satisfactorily explained its performance results for the Fund. The Board also considered the consistency of the Adviser’s management with the Fund’s investment objective and policies. Following discussion of the investment performance of the Fund and its performance relative to its Morningstar category, the Adviser’s experience in managing a mutual fund and separate accounts, its historical investment performance, and other factors, the Board concluded that the investment performance of the Fund has been satisfactory.
34
STRALEM EQUITY FUND
DISCLOSURE REGARDING APPROVAL OF INVESTMENT ADVISORY AGREEMENT (Unaudited) (Continued)
The costs of the services provided and profits realized by the Adviser and its affiliates from its relationship with the Fund. In this regard, the Board considered the Adviser’s staffing, personnel, and methods of operations; the education and experience of its personnel; compliance program, policies, and procedures; financial condition and the level of commitment to the Fund, and, generally, the Adviser’s advisory business; the asset level of the Fund; and the overall expenses of the Fund, including the advisory fee. The Board considered the Adviser’s expense limitation agreement, and considered the Adviser’s current and past fee reductions and expense reimbursements for the Fund. The Board further took into account the Adviser’s commitment to continue the Adviser’s expense limitation agreement until at least March 1, 2020.
The Board also considered potential benefits for the Adviser in managing the Fund, including promotion of the Adviser’s name and the potential for it to receive research, statistical, or other services from the Fund’s trades. The Board compared the Fund’s advisory fee and overall expense ratio to the average advisory fees and average expense ratios for its custom peer group and Morningstar category. The Board noted that the 1.03% advisory fee for the Fund was above the average and the median for the Fund’s custom peer group, and above the average and median of funds of similar size and structure in the Fund’s Morningstar category (Large Cap Blend Category Under $250 million, True No-Load), but less than the highest advisory fee in its Morningstar category. The Board further noted that the overall annual expense ratio of 0.95% for the Fund is below the average and median for the Fund’s custom peer group, and below the average and median for its Morningstar category. The Board also considered the fee charged by the Adviser to its other accounts that have a substantially similar strategy as the Fund and considered the similarities and differences of services received by such other accounts as compared to the services received by the Fund. The Board noted that the fee structures applicable to the Adviser’s other clients were not indicative of any unreasonableness with respect to the advisory fees payable to the Fund. The Board further considered the investment strategy and style used by the Adviser in managing the portfolio of the Fund. Following these comparisons and upon further consideration and discussion of the foregoing, the Board concluded that the advisory fee paid to the Adviser by the Fund is fair and reasonable.
The extent to which economies of scale would be realized as the Fund grows and whether advisory fee levels reflect these economies of scale for the benefit of the Fund’s investors. In this regard, the Board considered that the Fund’s fee arrangements with the Adviser involve both the advisory fee and the Adviser’s expense limitation agreement. The Board determined that the shareholders of the Fund have experienced benefits from the tiered breakpoints in the management fee schedule, and have experienced benefits from the Adviser’s expense limitation agreement and will continue to experience benefits from the Adviser’s
35
STRALEM EQUITY FUND
DISCLOSURE REGARDING APPROVAL OF INVESTMENT ADVISORY AGREEMENT (Unaudited) (Continued)
expense limitation agreement until the Fund assets grow to a level where its expenses otherwise fall below the expense limit. Following further discussion of the Fund’s asset level, expectations for growth, and level of fees, the Board determined that the Fund’s fee arrangements with the Adviser would continue to provide benefits. The Board also determined that the fee arrangements were fair and reasonable in relation to the nature and quality of services being provided by the Adviser, given the Fund’s projected asset levels for the next year.
Brokerage and portfolio transactions. In this regard, the Board considered the Adviser’s trading policies, procedures, and performance in seeking best execution for its clients, including the Fund. The Board also considered the historical portfolio turnover rate for the Fund; the process by which evaluations are made of the overall reasonableness of commissions paid; the process by which the Adviser evaluates best execution; the method and basis for selecting and evaluating the broker-dealers used; and any anticipated allocation of portfolio business to persons affiliated with the Adviser. After further review and discussion, the Board determined that the Adviser’s practices regarding brokerage and portfolio transactions were satisfactory.
Possible conflicts of interest. In evaluating the possibility for conflicts of interest, the Board considered such matters as the experience and abilities of the advisory personnel assigned to the Fund, the Adviser’s process for allocating trades among its different clients, and the substance and administration of the Adviser’s Code of Ethics. Following further consideration and discussion, the Board found that the Adviser’s standards and practices relating to the identification and mitigation of potential conflicts of interests were satisfactory.
After full consideration of the above factors as well as other factors, the Board unanimously concluded that approval of the Agreement was in the best interests of the Fund and its shareholders. It was noted that in the Trustees’ deliberation regarding the approval of the renewal of the Investment Advisory Agreement, the Trustees did not identify any particular information or factor that was all-important or controlling, and that each individual Trustee may have attributed different weights to the various factors noted above.
36
STRALEM EQUITY FUND
INVESTMENT ADVISER
Stralem & Company Incorporated
551 Madison Avenue, 10th Floor
New York, NY 10022
Telephone (212) 888-8123
Fax (212) 888-8152
This report is prepared for the information of the Fund’s shareholders. It is not authorized for distribution to prospective investors in the Fund unless it is preceded or accompanied by a current summary prospectus and/or prospectus which each describe the Fund’s objectives, risks, policies, expenses and other important information. Investors are advised to read the summary prospectus and/or prospectus carefully before investing. Past performance is not indicative of future results. Current performance may be lower or higher than the data contained herein. For performance information current through the most recent month end, please visit the Fund’s website at www.stralemequityfund.com or call toll-free (866) 822-9555. The Fund can suffer losses as well as gains.
37

| MEEHAN FOCUS FUND
ANNUAL REPORT
October 31, 2018
| |||
| This report is for the information of the shareholders of Meehan Focus Fund. Its use in connection with any offering of the Fund’s shares is authorized only in a case of concurrent or prior delivery of the Fund’s current prospectus. Investors should refer to the Fund’s prospectus for a description of risk factors associated with investments in the Fund. | |||
Meehan Focus Fund | Distributor: | ||
MEEHAN FOCUS FUND | December 7, 2018 |
Dear Fellow Shareholders1:
The total return for the Meehan Focus Fund (the Fund) for its fiscal year ended October 31, 2018 was 4.15%.2 The Fund’s net asset value (NAV) on October 31, 2018 was $24.99.
The past six months have been a rollercoaster ride for stock investors and, although the market ended higher than where it began, it didn’t feel that way. The S&P 500, after regaining the losses from its correction in early 2018 and setting an all-time high on September 20, proceeded to drop more than 7% through October 31.
While volatility has defined the markets in 2018, general economic conditions in the United States continue to improve. Economic growth has been robust: third quarter gross domestic product increased at an annual rate of 3.5% after notching a 4.2% rise in the second quarter, and many economists project annual growth will reach 3% for the first time since 2005.3 Other positives include November’s 3.7% unemployment rate, the lowest in 49 years, solid wage growth, and modest inflation.
Corporate earnings, the most important measure for stock investors, have also been strong. S&P 500 earnings growth has exceeded 25% in each of the past three quarters, including estimated growth of 25.9% in the third quarter.4 And earnings growth has been accompanied by solid revenue growth, reflecting continued strength in consumer spending, with sales up 9.3% in the third quarter, following a 10.5% increase in the second quarter.5
Despite the positive current picture here in the United States, a host of issues has unsettled investors of late, including the yield curve and the trajectory of interest rates; slowing global growth; and international trade issues, particularly with China.
The Federal Reserve (the Fed) has now raised its federal funds rate three times in 2018, and a fourth increase is widely expected in December. As the Fed has steadily raised short-term rates, longer-term rates have not kept pace. The narrowing yield spread between 2-year
1 | The views expressed herein are not meant as investment advice. Although some of the described portfolio holdings were viewed favorably as of the date of this letter, there is no guarantee that the Fund will continue to hold these securities in the future. Please consider the investment objectives, risks, charges, and expenses of the Fund before investing. Contact the Fund at (866) 884-5968 for a prospectus, which contains this and other important information about the Fund. Read the prospectus carefully before investing. |
2 | Past performance does not guarantee future results. Performance data quoted above represents past performance, and the investment return and principal value of an investment will fluctuate so that an investor’s shares, when redeemed, may be worth more or less than their original cost. Current performance may be lower or higher than the performance data quoted. To obtain more current performance information, please call (866) 884-5968. |
3 | Bureau of Economic Affairs, Gross Domestic Product, Third Quarter 2018 (Second Estimate), November 28, 2018; Bureau of Economic Affairs, Gross Domestic Product, Second Quarter 2018 (Second Estimate), August 29, 2018; Goldfarb, Sam, Investor Anxiety Outweighs Good Economic Data in Market Rout, The Wall Street Journal, December 5, 2018. |
4 | FactSet Earnings Insight, November 23, 2018; John Butters, S&P 500 Likely to Report Earnings Growth Above 20% for Third Straight Quarter, FactSet Insight, October 5, 2018 |
5 | FactSet Earnings Insight, November 23, 2018 |
1
Treasurys and 10-year Treasurys has raised concerns that further short-term rate increases may cause a yield curve inversion, a situation where short-term interest rates are higher than long-term rates. Although the timing of a subsequent recession has been difficult to predict, an inverted yield curve has preceded each recession since the 1970s, and we are closely watching this measure.
The synchronized global expansion that emerged in 2017 and carried into 2018 has shown signs of breaking down in recent months as growth outside the United States has lagged. Market performance has also been uneven; after outperforming the United States in 2017, European and Japanese markets have both posted negative returns though October, and emerging markets have also struggled, exemplified by China’s Shanghai Composite Index entering a bear market.
We believe the biggest threat to the global economy and markets is the potential for a global trade war, a situation that is more likely the further the Trump administration pushes its plans to impose tariffs on our trade partners, who are already retaliating. Recent steps, including the announcement that the United States would postpone its threat to impose additional tariffs on Chinese goods for 90 days and progress towards renewing our 25-year-old free trade agreement with Canada and Mexico, are encouraging, but difficult issues remain unresolved.
Despite the concerns, we see reasons for optimism, as well as caution, as we head into 2019. While we don’t expect corporate earnings growth in 2019 to match 2018, which benefitted from 2017’s tax reform bill, we do believe that earnings will continue to grow and set another record in 2019. It is also worth noting that the earnings growth experienced in 2018 has not been matched by an increase in stock prices. The market’s forward price/earnings ratio has declined to roughly 15, which is below its five-year average and should support stocks going forward. Any concrete progress on trade issues would offer welcome support to foreign markets and a boost to U.S. multinationals that generate substantial revenue outside the United States.
Portfolio Review
The attached schedule of investments identifies the Fund’s investments and their market value as of October 31, 2018. The Fund’s top ten holdings represented 57.4% of the Fund’s portfolio on October 31, 2018.
As of October 31, 2018, all of the Fund’s top ten holdings showed gains since the Fund purchased them. The Fund’s largest gains, in dollar terms, were in Microsoft Corp. (Microsoft), Lowe’s Companies, Inc. (Lowe’s), and Apple, Inc. (Apple). Strong showings from Apple, Microsoft, and Lowe’s boosted the Fund’s performance over the past six months but declines in United Rentals, Inc. (United Rentals), PNC Financial Services Group, Inc. (PNC), and Affiliated Managers Group, Inc. (Affiliated Managers) offset much of those gains.
Microsoft has continued to execute on the strategy it has pursued since CEO Satya Nadella took the helm, shifting from a personal computer-based business to one focused on a mobile, cloud-based computing platform and a subscription-based version of Office know as Office 365. The network effect created by its massive enterprise footprint across a multitude of products and services has enhanced the effectiveness of Microsoft’s strategic changes.
2
Apple shares have been buoyed by strong quarterly results as sales in the quarter ended September 30 easily topped estimates with an increase of 20% year over year, Apple’s fifth consecutive quarter of double digit sales growth. Earnings surged 41%, and the company generated $19.4 billion in operating cash flow. However, management’s revenue guidance for the December quarter fell short of investors’ expectations, and the shares have declined over the past several weeks.
Shares of Lowe’s benefited from the upward momentum that began with the May announcement that Marvin Ellison would replace long-term CEO Robert Niblock. Ellison, who assumed the CEO position in July, has moved quickly to transform operations at Lowe’s. In addition to revamping management ranks, adding well-regarded executives from CVS and Home Depot, he is winding down the money-losing Orchard Supply business and implementing an inventory rationalization plan. The latter two measures should improve capital efficiency and cash flow and help Lowe’s close its profitability gap with rival Home Depot.
Despite reporting earnings and revenue growth that exceeded estimates and raising its full-year guidance in October, shares of United Rentals have declined in recent months. The positive results and projections appear to be outweighed by market disappointment with rental rate increases and concerns that tariffs will increase United Rentals’ equipment costs. We view the recent decline as an overreaction and believe United Rentals, the largest equipment rental company in the world, is well-positioned for growth going forward.
Shares of Affiliated Managers have declined this year due to disappointing revenue and guidance that has prompted investors to question whether Affiliated Mangers’ affiliates would continue to generate positive fund flows. We sold the Fund’s position in Affiliated Managers at a loss as weakening global/international and emerging markets, which make up roughly 35% of assets under management, and competition from passive investment vehicles have been major headwinds for Affiliated Managers over the past year.
PNC’s stock, like that of many banks, has dropped despite third quarter earnings that beat estimates and grew 31% year-over-year, and we expect the recent share decline to reverse. Commercial lending posted solid 4% growth, and borrowers’ credit quality remained strong. In addition, PNC’s results showed the benefits of higher interest rates as net interest income grew 5% and net interest margin also rose.
Over the past six months we made several changes to the Fund’s portfolio. Semiconductor company Broadcom, Inc. and the SPDR S&P Regional Banking ETF were added to the Fund’s portfolio, and we exited the Fund’s positions in industrial company Johnson Controls International, PLC at a loss and car seating maker Adient, PLC at a gain. We also sold the Fund’s positions in homebuilder Lennar Corp., Affiliated Managers, and the iShares Core MSCI Emerging Markets ETF, in part to realize losses and reduce the Fund’s 2018 capital gain distribution; we continue to like these three stocks and may buy them back at a later time. Finally, AT&T’s acquisition of Fund holding Time Warner generated a solid gain for the Fund as Time Warner shares were exchanged for cash and shares of AT&T stock.
3
Brief Discussion of Two of the Fund’s Holdings*
| Average Cost | October 31, | Percent |
Berkshire Hathaway Inc. | $ 76.97 | $ 205.28 | 166.70% |
Medtronic PLC | $ 81.87 | $ 89.82 | 9.83% |
* | Please note that not all securities held by the Fund have posted gains comparable to those discussed. |
** | Returns shown are cumulative since the date of purchase, not annualized, and do not include the impact of dividends paid, if any. |
Berkshire Hathaway Inc. (BRK.B)
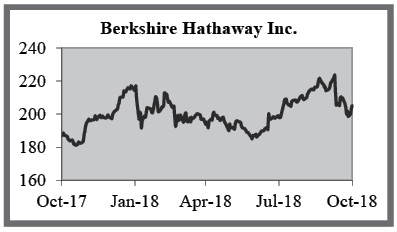
Price (10/31/2018) | $ 205.28 | Forward P/E | 18.2 |
Market Cap ($B) | $ 507.8 | Price/Book | 1.4 |
Dividend Yield | 0% | Price/Sales | 2.0 |
Return on Equity | 18.1% |
Berkshire Hathaway, led by Warren Buffett and Charlie Munger, was the first stock purchased for the Fund in 1999 and remains one of its largest holdings. Over the years Berkshire has evolved, through its many acquisitions, from an investment holding company to an operating company. Berkshire’s operating businesses are focused in four primary areas: insurance; regulated railroads and utilities; manufacturing, service, and retailing; and finance and financial products. The company also continues to own major investment stakes in Apple, Bank of America, Coca-Cola, and American Express, among others, totaling roughly $200 billion.
Berkshire’s biggest business is the highly profitable insurance business, which has long been the core of Berkshire’s operations. Disciplined underwriting leads to profitable insurance operations and generates significant cash from premiums called “float,” which now totals approximately $118 billion. This source of low cost capital has always been one of the most compelling advantages of Berkshire’s business model. When combined with the operating cash flow of its seventy other, non-insurance businesses, this float provides Berkshire with
4
the capital and the clout to make large, opportunistic deals like the preferred investments in Goldman Sachs and Bank of America that were struck during the 2008-2009 credit crisis and have proved very lucrative to shareholders.
Operating earnings at Berkshire have doubled over the past year due to solid performances across its many businesses, and Berkshire has also benefitted from 2017’s tax reform legislation, since most of its operations are in the United States. In addition, Berkshire repurchased $900 million of its stock in the third quarter after its board amended its buyback policy in August. The change eliminated the requirement that shares be trading below 120% of book value before any buybacks could take place. We support this change and anticipate more buybacks in the future.
The question of succession, who will take the places of Buffett and Munger when they leave Berkshire, is important, but we believe it unnecessarily depresses Berkshire’s share price. Buffett cares deeply about Berkshire’s ability to thrive after he’s gone, and we are confident the board has developed a succession plan, including identifying internal candidates amongst whom Buffett’s operational and investment roles will be divided, that will ensure its future.
Berkshire remains one of the Fund’s core holdings, and we are optimistic that the shares will continue to generate solid returns for the Fund in the future.
Medtronic PLC (MDT)
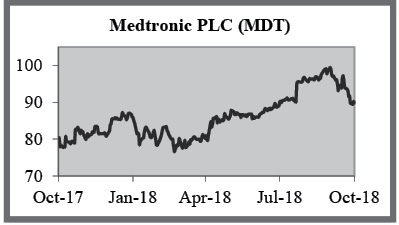
Price (10/31/2018) | $ 89.82 | Forward P/E | 18.9 |
Market Cap ($B) | $ 127.63 | Price/Book | 2.6 |
Dividend Yield | 2.1% | Price/Sales | 4.3 |
Return on Equity | 4.5% |
A recent addition to the Fund, Medtronic is one of the world’s largest medical device companies. It offers a broad range of products and therapies to treat various chronic diseases, including cardiac disease, neurological and spinal conditions, and diabetes. The company operates in four business segments: Cardiac and Vascular Group (38% of total revenues), Minimally Invasive Technologies Group (29%), Restorative Therapies Group (26%), and Diabetes Group (7%). Medtronic is domiciled in Ireland, does business in more than 120 countries worldwide, and generates 47% of its revenues outside the United States.
5
Medtronic has long been known for product innovation and an ability to be the first to market with new products and therapies. The company spends heavily on research and development and has committed to invest an incremental $10 billion over the next decade.
Medtronic has consistently delivered 6%-7% annual sales growth over the last decade. Its recent growth stems from a substantial lineup of new products in cardiac care, surgical robotics, and diabetes, areas in which the company has seen double-digit sales growth. In the company’s core portfolio, heart devices (pacemakers, stents, and heart valves) command as much as 50% market share, while its spinal products and insulin pumps also enjoy top market positions. We believe the large and diversified nature of Medtronic’s product portfolio insulates the company from fluctuations in any particular product line and allows for smooth and consistent earnings growth.
Medtronic enjoys a wide economic moat tied to its market dominance, product innovation, and intellectual property. According to the Patent Board, an independent publication, Medtronic holds the strongest patent portfolio among its peers, based on the number and technological strength of its patents. The company’s moat is also derived from other competitive advantages, including strong relationships with doctors and hospitals who depend upon the company’s deep device knowledge and expertise, creating high switching costs for its products.
Medtronic is financially sound and shareholder friendly. Net profit margins have consistently been above 20%, and returns on invested capital of nearly 20% are double the company’s cost of capital. Medtronic generates free cash flow of almost $4 billion per year and has a strong balance sheet, with $24 billion of long-term debt and $11 billion of cash and marketable securities. Medtronic shares are attractively valued at 18.9 times forward earnings, in line with industry averages. Management is committed to returning at least 50% of free cash flow annually to shareholders and recently increased the dividend by 9% to yield 2.1%. Medtronic’s management and board get high marks for stewardship, with nine of the eleven board seats held by outsiders. We believe Medtronic has solid long-term return prospects.
Sources for charts and text: Morningstar, Value Line, Standard and Poor’s, Argus, Yahoo Finance, company reports, and Edgemoor Investment Advisors estimates.
Conclusion
We appreciate your confidence in our management of the Fund, and we look forward to continued growth and success. You can check the Fund’s NAV online at any time by typing the Fund’s symbol (MEFOX) into most stock quotation services. Best wishes for a happy holiday season – and please do not hesitate to contact us if you have any questions regarding the status of your investment in the Fund.
Sincerely,
|
|
Thomas P. Meehan | Paul P. Meehan |
| |
R. Jordan Smyth, Jr. | |
Portfolio Managers, Meehan Focus Fund |


6
Past performance is not predictive of future performance. Investment results and principal value will fluctuate so that shares, when redeemed, may be worth more or less than their original cost. Current performance may be higher or lower than the performance data quoted. Performance data current to the most recent month end are available by calling 1-866-884-5968.
An investor should consider the investment objectives, risks, charges and expenses of the Fund carefully before investing. The Fund’s prospectus contains this and other important information. To obtain a copy of the Fund’s prospectus visit the Fund’s website at www.meehanmutualfunds.com or call 1-866-884-5968 and a copy will be sent to you free of charge. Please read the prospectus carefully before you invest. The Meehan Focus Fund is distributed by Ultimus Fund Distributors, LLC.
This Letter to Shareholders seeks to describe some of the Adviser’s current opinions and views of the financial markets. Although the Adviser believes it has a reasonable basis for any opinions or views expressed, actual results may differ, sometimes significantly so, from those expected or expressed. The securities held by the Fund that are discussed in the Letter to Shareholders were held during the period covered by this Report. They do not comprise the entire investment portfolio of the Fund, may be sold at any time and may no longer be held by the Fund. For a complete list of securities held by the Fund as of October 31, 2018, please see the Schedule of Investments section of the annual report. The opinions of the Adviser with respect to those securities may change at any time.
Statements in the Letter to Shareholders that reflect projections or expectations for future financial or economic performance of the Fund and the market in general and statements of the Fund’s plans and objectives for future operations are forward-looking statements. No assurance can be given that actual results or events will not differ materially from those projected, estimated, assumed, or anticipated in any such forward-looking statements. Important factors that could result in such differences, in addition to factors noted with such forward-looking statements include, without limitation, general economic conditions, such as inflation, recession, and interest rates.
7
MEEHAN FOCUS FUND
PERFORMANCE INFORMATION
October 31, 2018 (Unaudited)
Comparison of Change in Value of a $10,000 Investment in the
Meehan Focus Fund vs. the Standard & Poor’s 500 Total Return Index
and Russell 1000 Value Index*
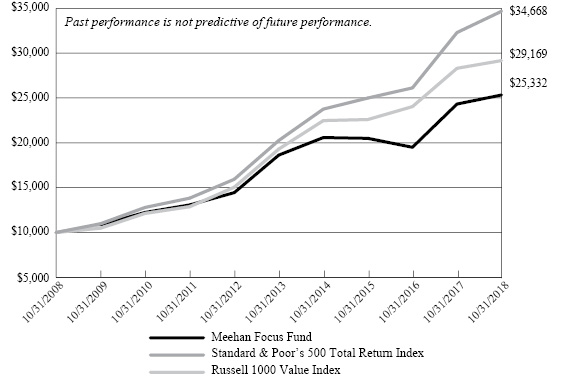
Average Annual Total Returns | ||||||
1 Year | 5 Years | 10 Years | ||||
Meehan Focus Fund(a) | 4.15% | 6.34% | 9.74% | |||
Standard & Poor’s 500 Total Return Index | 7.35% | 11.34% | 13.24% | |||
Russell 1000 Value Index | 3.03% | 8.61% | 11.30% | |||
* | The above graph depicts the performance of the Fund versus the S&P 500® Total Return Index and the Russell 1000 Value Index. It is important to note that the Fund is a professionally managed mutual fund; the S&P 500® Total Return Index by Standard & Poor’s Corp. is a capitalization weighted index comprised of 500 issues listed on various exchanges, representing the performance of the stock market generally; and the Russell 1000 Value Index measures the constituents that exhibit value characteristics within the largest 1,000 U.S. stocks by market cap of the U.S. equity investable universe. An index is not an investment product available for purchase. The Fund’s performance assumes the reinvestment of all dividends and all capital gains. Index returns assume reinvestment of dividends but, unlike the Fund’s returns, do not reflect any fees or expenses. |
(a) | Performance presented represents historical data. The investment return and principal value of an investment will fluctuate so that an investor’s shares, when redeemed, may be worth more or less than their original cost. The Fund’s past performance is not indicative of future performance. The table and graph above do not reflect the deduction of taxes that a shareholder would pay on Fund distributions or the redemption of Fund shares. Current performance may be lower or higher than the performance data quoted. To obtain more current performance information, please contact (866) 884-5968. As disclosed in the Fund’s February 28, 2018 prospectus, the Fund’s total annual operating expenses are 1.02%. |
8
MEEHAN FOCUS FUND
PORTFOLIO INFORMATION
October 31, 2018 (Unaudited)
Sector Diversification (% of Net Assets)
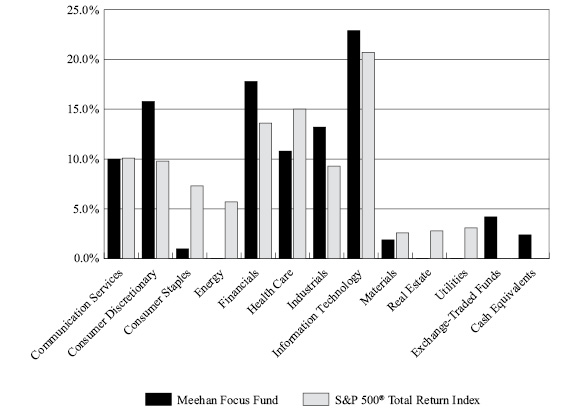
| Top 10 Equity Holdings | |
Security Description | % of |
Microsoft Corporation | 8.9% |
Berkshire Hathaway, Inc. - Class B | 8.4% |
Apple, Inc. | 7.6% |
Lowe's Companies, Inc. | 7.2% |
Alphabet, Inc. - Classes A and C | 5.9% |
PNC Financial Services Group, Inc. (The) | 4.9% |
Boeing Company (The) | 3.9% |
United Rentals, Inc. | 3.6% |
General Motors Company | 3.6% |
Express Scripts Holding Company | 3.2% |
9
MEEHAN FOCUS FUND | ||||||||
COMMON STOCKS — 93.4% | Shares | Value | ||||||
Communication Services — 10.0% | ||||||||
Diversified Telecommunication Services — 1.1% | ||||||||
AT&T, Inc. | 22,992 | $ | 705,395 | |||||
Entertainment — 2.2% | ||||||||
Walt Disney Company (The) | 13,000 | 1,492,790 | ||||||
Interactive Media & Services — 6.7% | ||||||||
Alphabet, Inc. - Class A (a) | 1,600 | 1,744,928 | ||||||
Alphabet, Inc. - Class C (a) | 2,003 | 2,156,770 | ||||||
Facebook, Inc. - Class A (a) | 3,250 | 493,318 | ||||||
| 4,395,016 | ||||||||
Consumer Discretionary — 15.8% | ||||||||
Automobiles — 3.6% | ||||||||
General Motors Company | 64,500 | 2,360,055 | ||||||
Internet & Direct Marketing Retail — 3.2% | ||||||||
Booking Holdings, Inc. (a) | 1,135 | 2,127,648 | ||||||
Specialty Retail — 9.0% | ||||||||
Lowe's Companies, Inc. | 50,000 | 4,761,000 | ||||||
Williams-Sonoma, Inc. | 19,000 | 1,128,220 | ||||||
| 5,889,220 | ||||||||
Consumer Staples — 1.0% | ||||||||
Food Products — 1.0% | ||||||||
Nestlé S.A. - ADR | 7,500 | 632,100 | ||||||
Financials — 17.8% | ||||||||
Banks — 4.9% | ||||||||
PNC Financial Services Group, Inc. (The) | 25,000 | 3,212,250 | ||||||
Capital Markets — 2.0% | ||||||||
BlackRock, Inc. | 3,250 | 1,337,115 | ||||||
Consumer Finance — 2.5% | ||||||||
Capital One Financial Corporation | 18,500 | 1,652,050 | ||||||
Diversified Financial Services — 8.4% | ||||||||
Berkshire Hathaway, Inc. - Class B (a) | 27,000 | 5,542,560 | ||||||
10
MEEHAN FOCUS FUND | ||||||||
COMMON STOCKS — 93.4% (Continued) | Shares | Value | ||||||
Health Care — 10.8% | ||||||||
Health Care Equipment & Supplies — 2.1% | ||||||||
Medtronic plc | 15,000 | $ | 1,347,300 | |||||
Health Care Providers & Services — 3.2% | ||||||||
Express Scripts Holding Company (a) | 22,000 | 2,133,340 | ||||||
Pharmaceuticals — 5.5% | ||||||||
Johnson & Johnson | 7,000 | 979,930 | ||||||
Merck & Company, Inc. | 10,000 | 736,100 | ||||||
Novartis AG - ADR | 22,000 | 1,924,120 | ||||||
| 3,640,150 | ||||||||
Industrials — 13.2% | ||||||||
Aerospace & Defense — 3.9% | ||||||||
Boeing Company (The) | 7,250 | 2,572,735 | ||||||
Air Freight & Logistics — 1.5% | ||||||||
United Parcel Service, Inc. - Class B | 9,000 | 958,860 | ||||||
Airlines — 1.9% | ||||||||
Southwest Airlines Company | 25,000 | 1,227,500 | ||||||
Industrial Conglomerates — 2.3% | ||||||||
3M Company | 8,000 | 1,522,080 | ||||||
Trading Companies & Distributors — 3.6% | ||||||||
United Rentals, Inc. (a) | 20,000 | 2,401,400 | ||||||
Information Technology — 22.9% | ||||||||
IT Services — 4.2% | ||||||||
First Data Corporation - Class A (a) | 52,000 | 974,480 | ||||||
Visa, Inc. - Class A | 13,000 | 1,792,050 | ||||||
| 2,766,530 | ||||||||
Semiconductors & Semiconductor Equipment — 2.2% | ||||||||
Broadcom, Inc. | 6,400 | 1,430,336 | ||||||
Software — 8.9% | ||||||||
Microsoft Corporation | 55,000 | 5,874,550 | ||||||
Technology Hardware, Storage & Peripherals — 7.6% | ||||||||
Apple, Inc. | 22,800 | 4,990,008 | ||||||
11
MEEHAN FOCUS FUND | ||||||||
COMMON STOCKS — 93.4% (Continued) | Shares | Value | ||||||
Materials — 1.9% | ||||||||
Chemicals — 1.9% | ||||||||
Eastman Chemical Company | 16,000 | $ | 1,253,600 | |||||
Total Common Stocks (Cost $32,560,456) | $ | 61,464,588 | ||||||
| ||||||||
EXCHANGE-TRADED FUNDS — 4.2% | Shares | Value | ||||||
iShares MSCI Eurozone ETF | 50,000 | $ | 1,868,500 | |||||
SPDR S&P Regional Banking ETF | 16,700 | 901,633 | ||||||
Total Exchange-Traded Funds (Cost $2,734,498) | $ | 2,770,133 | ||||||
| ||||||||
MONEY MARKET FUNDS — 2.4% | Shares | Value | ||||||
Invesco STIT Government & Agency Portfolio - Institutional Class, 2.08% (b) (Cost $1,566,247) | 1,566,247 | $ | 1,566,247 | |||||
Total Investments at Value — 100.0% (Cost $36,861,201) | $ | 65,800,968 | ||||||
Other Assets in Excess of Liabilities — 0.0% (c) | 17,406 | |||||||
Net Assets — 100.0% | $ | 65,818,374 | ||||||
ADR - American Depositary Receipt. | |
(a) | Non-income producing security. |
(b) | The rate shown is the 7-day effective yield as of October 31, 2018. |
(c) | Percentage rounds to less than 0.1%. |
See accompanying notes to financial statements. | |
12
MEEHAN FOCUS FUND | ||||
ASSETS | ||||
Investments in securities: | ||||
At cost | $ | 36,861,201 | ||
At value (Note 2) | $ | 65,800,968 | ||
Receivable for capital shares sold | 500 | |||
Dividends receivable | 70,128 | |||
Other assets | 4,275 | |||
TOTAL ASSETS | 65,875,871 | |||
LIABILITIES | ||||
Payable to Adviser (Note 4) | 39,570 | |||
Payable to administrator (Note 4) | 11,358 | |||
Other accrued expenses | 6,569 | |||
TOTAL LIABILITIES | 57,497 | |||
NET ASSETS | $ | 65,818,374 | ||
NET ASSETS CONSIST OF: | ||||
Paid-in capital | $ | 35,389,711 | ||
Accumulated earnings | 30,428,663 | |||
NET ASSETS | $ | 65,818,374 | ||
Shares of beneficial interest outstanding | 2,634,271 | |||
Net asset value, offering price and redemption price per share (a) (Note 2) | $ | 24.99 | ||
(a) | Redemption price may differ from the net asset value per share depending upon the length of time held. |
See accompanying notes to financial statements. | |
13
MEEHAN FOCUS FUND | ||||
INVESTMENT INCOME | ||||
Dividend income | $ | 1,061,608 | ||
Foreign withholding taxes on dividends | (12,791 | ) | ||
TOTAL INVESTMENT INCOME | 1,048,817 | |||
EXPENSES | ||||
Investment advisory fees (Note 4) | 545,261 | |||
Administration fees (Note 4) | 68,193 | |||
Professional fees | 41,208 | |||
Fund accounting fees (Note 4) | 36,818 | |||
Transfer agent fees (Note 4) | 18,000 | |||
Compliance fees (Note 4) | 12,229 | |||
Trustees' fees and expenses (Note 4) | 11,618 | |||
Custody and bank service fees | 7,982 | |||
Registration and filing fees | 6,530 | |||
Printing of shareholder reports | 5,163 | |||
Postage and supplies | 4,839 | |||
Insurance expense | 1,158 | |||
Other expenses | 5,045 | |||
TOTAL EXPENSES | 764,044 | |||
Less fee reductions by the Adviser (Note 4) | (82,465 | ) | ||
NET EXPENSES | 681,579 | |||
| ||||
NET INVESTMENT INCOME | 367,238 | |||
REALIZED AND UNREALIZED GAINS ON INVESTMENTS | ||||
Net realized gains from investment transactions | 1,233,281 | |||
Net change in unrealized appreciation (depreciation) on investments | 1,038,701 | |||
NET REALIZED AND UNREALIZED GAINS ON INVESTMENTS | 2,271,982 | |||
NET INCREASE IN NET ASSETS FROM OPERATIONS | $ | 2,639,220 | ||
See accompanying notes to financial statements. |
14
MEEHAN FOCUS FUND | ||||||||
| Year | Year | ||||||
FROM OPERATIONS | ||||||||
Net investment income | $ | 367,238 | $ | 405,950 | ||||
Net realized gains (losses) from investment transactions | 1,233,281 | (35,503 | ) | |||||
Net change in unrealized appreciation (depreciation) on investments | 1,038,701 | 12,441,786 | ||||||
Net increase in net assets from operations | 2,639,220 | 12,812,233 | ||||||
DISTRIBUTIONS TO SHAREHOLDERS (Note 2) | (377,677 | ) | (209,131 | ) | ||||
CAPITAL SHARE TRANSACTIONS | ||||||||
Proceeds from shares sold | 1,408,143 | 1,110,023 | ||||||
Net asset value of shares issued in reinvestment of distributions to shareholders | 372,854 | 207,767 | ||||||
Payments for shares redeemed | (1,966,718 | ) | (2,832,042 | ) | ||||
Net decrease in net assets from capital share transactions | (185,721 | ) | (1,514,252 | ) | ||||
TOTAL INCREASE IN NET ASSETS | 2,075,822 | 11,088,850 | ||||||
NET ASSETS | ||||||||
Beginning of year | 63,742,552 | 52,653,702 | ||||||
End of year | $ | 65,818,374 | $ | 63,742,552 | ||||
CAPITAL SHARE ACTIVITY | ||||||||
Shares sold | 54,733 | 50,394 | ||||||
Shares reinvested | 14,767 | 9,941 | ||||||
Shares redeemed | (77,134 | ) | (129,810 | ) | ||||
Net decrease in shares outstanding | (7,634 | ) | (69,475 | ) | ||||
Shares outstanding at beginning of year | 2,641,905 | 2,711,380 | ||||||
Shares outstanding at end of year | 2,634,271 | 2,641,905 | ||||||
(a) | The presentation of Distributions to Shareholders has been updated to reflect the changes prescribed in amendments to Regulation S-X, effective November 5, 2018 (Note 2). For the year ended October 31, 2017, distributions to shareholders from net investment income were $169,399 and from net realized gains from investment transactions were $39,732. As of October 31, 2017, undistributed net investment income was $301,557. |
See accompanying notes to financial statements. | |
15
MEEHAN FOCUS FUND | ||||||||||||||||||||
Per Share Data for a Share Outstanding Throughout Each Year | ||||||||||||||||||||
| Year | Year | Year | Year | Year | |||||||||||||||
Net asset value at beginning of year | $ | 24.13 | $ | 19.42 | $ | 21.07 | $ | 21.43 | $ | 20.42 | ||||||||||
Income (loss) from investment operations: | ||||||||||||||||||||
Net investment income | 0.14 | 0.15 | 0.28 | 0.17 | 0.18 | |||||||||||||||
Net realized and unrealized gains (losses) on investments | 0.86 | 4.64 | (1.30 | ) | (0.26 | ) | 1.96 | |||||||||||||
Total from investment operations | 1.00 | 4.79 | (1.02 | ) | (0.09 | ) | 2.14 | |||||||||||||
Less distributions: | ||||||||||||||||||||
From net investment income | (0.14 | ) | (0.06 | ) | (0.28 | ) | (0.18 | ) | (0.19 | ) | ||||||||||
From net realized gains from investment transactions | — | (0.02 | ) | (0.35 | ) | (0.09 | ) | (0.94 | ) | |||||||||||
Total distributions | (0.14 | ) | (0.08 | ) | (0.63 | ) | (0.27 | ) | (1.13 | ) | ||||||||||
Net asset value at end of year | $ | 24.99 | $ | 24.13 | $ | 19.42 | $ | 21.07 | $ | 21.43 | ||||||||||
Total return (a) | 4.15 | % | 24.72 | % | (4.86 | %) | (0.43 | %) | 10.50 | % | ||||||||||
| ||||||||||||||||||||
Net assets at end of year (000's) | $ | 65,818 | $ | 63,743 | $ | 52,654 | $ | 56,712 | $ | 57,179 | ||||||||||
Ratios/supplementary data: | ||||||||||||||||||||
Ratio of total expenses to average net assets (b) | 1.12 | % | 1.00 | % | 1.00 | % | 1.00 | % | 1.00 | % | ||||||||||
Ratio of net expenses to average net assets (b) | 1.00 | %(c) | 1.00 | %(c) | 1.00 | % | 1.00 | % | 1.00 | % | ||||||||||
| ||||||||||||||||||||
Ratio of net investment income to average net assets | 0.54 | %(c) | 0.69 | %(c) | 1.44 | % | 0.81 | % | 0.89 | % | ||||||||||
| ||||||||||||||||||||
Portfolio turnover rate | 20 | % | 10 | % | 44 | % | 23 | % | 23 | % | ||||||||||
(a) | Total return is a measure of the change in value of an investment in the Fund over the year covered. The returns shown do not reflect the deduction of taxes a shareholder would pay on Fund distributions, if any, or the redemption of Fund shares. Had the Adviser not reduced its fees, total returns would have been lower. |
(b) | This ratio excludes the impact of expenses of the registered investment companies and exchange-traded funds in which the Fund may invest. |
(c) | Ratio was determined after investment advisory fee reductions (Note 4). |
See accompanying notes to financial statements. | |
16
MEEHAN FOCUS FUND
NOTES TO FINANCIAL STATEMENTS
October 31, 2018
1. Organization
Meehan Focus Fund (the “Fund”) is a non-diversified series of Ultimus Managers Trust (the “Trust”). The Trust is an open-end management investment company registered under the Investment Company Act of 1940, as amended (the “1940 Act”). The Fund was reorganized into the Trust on October 23, 2017. It was formerly a series of Meehan Mutual Funds, Inc.
The Fund’s investment objective is to seek long-term growth of capital.
2. Significant Accounting Policies
In August 2018, the U.S. Securities and Exchange Commission (the “SEC”) adopted regulations that eliminated or amended disclosure requirements that were redundant or outdated in light of changes in SEC requirements, accounting principles generally accepted in the United States of America (“GAAP”), International Financial Reporting Standards or changes in technology or the business environment. These regulations were effective November 5, 2018, and the Fund is complying with them effective with these financial statements.
The Fund follows accounting and reporting guidance under Financial Accounting Standards Board (“FASB”) Accounting Standards Codification (“ASC”) Topic 946, “Financial Services – Investment Companies.” The following is a summary of the Fund’s significant accounting policies used in the preparation of its financial statements. These policies are in conformity with GAAP.
New accounting pronouncement – In August 2018, FASB issued Accounting Standards Update No. 2018-13 (“ASU 2018-13”), “Disclosure Framework – Changes to the Disclosure Requirements for Fair Value Measurement,” which amends the fair value measurement disclosure requirements of ASC Topic 820, “Fair Value Measurement” (“ASC 820”). ASU 2018-13 includes new, eliminated, and modified disclosure requirements for ASC 820. In addition, ASU 2018-13 clarifies that materiality is an appropriate consideration of entities when evaluating disclosure requirements. ASU 2018-13 is effective for fiscal years beginning after December 15, 2019, including interim periods therein. Early adoption is permitted and the Fund has adopted ASU 2018-13 with these financial statements.
Securities valuation – The Fund’s portfolio securities are valued at market value as of the close of regular trading on the New York Stock Exchange (the “NYSE”) (normally 4:00 p.m. Eastern time) on each business day the NYSE is open. Securities listed on the NYSE or other exchanges are valued on the basis of their last sale price on the exchanges on which they are primarily traded. If there are no sales on that day, the securities are valued at the closing mean price on the NYSE or other primary exchange for that day. NASDAQ listed securities are valued at the NASDAQ Official Closing Price. If there are no sales on that day, the securities are valued at the last mean price as reported by NASDAQ. Securities traded in the over-the-counter market are valued at the last reported sale price, if available, otherwise at
17
MEEHAN FOCUS FUND |
the most recently quoted mean price. Investments representing shares of money market funds and other open-end investment companies, except for exchange-traded funds, are valued at their net asset value (“NAV”) as reported by such companies. When using a quoted price and when the market is considered active, the security will be classified as Level 1 within the fair value hierarchy (see below). In the event that market quotations are not readily available or are considered unreliable due to market or other events, the Fund values its securities and other assets at fair value in accordance with procedures established by and under the general supervision of the Board of Trustees of the Trust (the “Board”). Under these procedures, the securities will be classified as Level 2 or 3 within the fair value hierarchy, depending on the inputs used. Unavailable or unreliable market quotes may be due to the following factors: a substantial bid-ask spread; infrequent sales resulting in stale prices; insufficient trading volume; small trade sizes; a temporary lapse in any reliable pricing source; and actions of the securities or futures markets, such as suspension or limitation of trading. As a result, the prices of securities used to calculate the Fund’s NAV may differ from quoted or published prices for the same securities.
GAAP establishes a single authoritative definition of fair value, sets out a framework for measuring fair value and requires additional disclosures about fair value measurements.
Various inputs are used in determining the value of the Fund’s investments. These inputs are summarized in the three broad levels listed below:
● | Level 1 – quoted prices in active markets for identical securities |
● | Level 2 – other significant observable inputs |
● | Level 3 – significant unobservable inputs |
The inputs or methodology used for valuing securities are not necessarily an indication of the risks associated with investing in those securities. The inputs used to measure fair value may fall into different levels of the fair value hierarchy. In such cases, for disclosure purposes, the level in the fair value hierarchy within which the fair value measurement falls in its entirety is determined based on the lowest level input that is significant to the fair value measurement.
The following is a summary of the inputs used to value the Fund’s investments as of October 31, 2018:
| Level 1 | Level 2 | Level 3 | Total | ||||||||||||
Common Stocks | $ | 61,464,588 | $ | — | $ | — | $ | 61,464,588 | ||||||||
Exhange-Traded Funds | 2,770,133 | — | — | 2,770,133 | ||||||||||||
Money Market Funds | 1,566,247 | — | — | 1,566,247 | ||||||||||||
Total | $ | 65,800,968 | $ | — | $ | — | $ | 65,800,968 | ||||||||
18
MEEHAN FOCUS FUND |
Refer to the Fund’s Schedule of Investments for a listing of the common stocks by sector and industry type. The Fund did not hold derivative instruments or any assets or liabilities that were measured at fair value on a recurring basis using significant unobservable inputs (Level 3) as of October 31, 2018.
Share valuation – The NAV per share of the Fund is calculated daily by dividing the total value of the Fund’s assets, less liabilities, by the number of shares outstanding. The offering price and redemption price per share of the Fund is equal to the NAV per share, except that shares of the Fund are subject to a redemption fee of 2% if redeemed within 7 calendar days of the date of purchase. No redemption fees were collected by the Fund during the years ended October 31, 2018 and 2017.
Investment income – Dividend income is recorded on the ex-dividend date. Interest income is accrued as earned. Withholding taxes on foreign dividends have been recorded in accordance with the Fund’s understanding of the applicable country’s rules and tax rates.
Investment transactions – Investment transactions are accounted for on the trade date. Realized gains and losses on investments sold are determined on a specific identification basis.
Common expenses – Common expenses of the Trust are allocated among the Fund and the other series of the Trust based on the relative net assets of each series or the nature of the services performed and the relative applicability to each series.
Distributions to shareholders – Distributions to shareholders arising from net investment income and net realized capital gains, if any, are distributed at least once each year. Distributions to shareholders are recorded on the ex-dividend date. The amount of distributions from net investment income and net realized capital gains are determined in accordance with federal income tax regulations, which may differ from GAAP. The tax character of distributions paid during the years ended October 31, 2018 and 2017 was as follows:
Year Ended | Ordinary | Long-Term | Total | |||||||||
October 31, 2018 | $ | 377,677 | $ | — | $ | 377,677 | ||||||
October 31, 2017 | $ | 169,618 | $ | 39,513 | $ | 209,131 | ||||||
Estimates – The preparation of financial statements in conformity with GAAP requires management to make estimates and assumptions that affect the reported amounts of assets and liabilities and disclosure of contingent assets and liabilities as of the date of the financial statements and the reported amounts of income and expenses during the reporting period. Actual results could differ from those estimates.
19
MEEHAN FOCUS FUND |
Federal income tax – The Fund has qualified and intends to continue to qualify each year as a “regulated investment company” under Subchapter M of the Internal Revenue Code of 1986, as amended (the “Code”). By so qualifying, the Fund will not be subject to federal income taxes to the extent that it distributes its net investment income and any net realized capital gains in accordance with the Code.
In order to avoid imposition of the excise tax applicable to regulated investment companies, it is also the Fund’s intention to declare as dividends in each calendar year at least 98% of its net investment income (earned during the calendar year) and 98.2% of its net realized capital gains (earned during the twelve months ended October 31) plus undistributed amounts from prior years.
The following information is computed on a tax basis for each item as of October 31, 2018:
Tax cost of portfolio investments | $ | 36,861,201 | ||
Gross unrealized appreciation | $ | 29,422,875 | ||
Gross unrealized depreciation | (483,108 | ) | ||
Net unrealized appreciation | 28,939,767 | |||
Undistributed ordinary income | 291,118 | |||
Undistributed long-term capital gains | 1,197,778 | |||
Accumulated earnings | $ | 30,428,663 |
During the year ended October 31, 2018, the Fund utilized short-term capital loss carryforwards in the amount of $35,503 to offset current year net realized capital gains.
The Fund recognizes the tax benefits or expenses of uncertain tax positions only when the position is “more likely than not” to be sustained assuming examination by tax authorities. Management has reviewed the Fund’s tax positions taken on federal income tax returns for all open tax years (generally three years) and has concluded that no provision for unrecognized tax benefits or expenses is required in these financial statements and does not expect this to change over the next twelve months. The Fund identifies its major tax jurisdiction as U.S. Federal.
3. Investment Transactions
During the year ended October 31, 2018, cost of purchases and proceeds from sales of investment securities, other than short-term investments, were $13,379,012 and $13,377,691, respectively.
20
MEEHAN FOCUS FUND |
4. Transactions with Related Parties
INVESTMENT ADVISORY AGREEMENT
The Fund’s investments are managed by Edgemoor Investment Advisors, Inc. (the “Adviser”) pursuant to the terms of an Investment Advisory Agreement. Under the Investment Advisory Agreement, the Fund pays the Adviser an investment advisory fee, computed and accrued daily and paid monthly, at the annual rate of 0.80% of its average daily net assets.
Pursuant to an Expense Limitation Agreement (“ELA”), the Adviser has contractually agreed, until March 1, 2020, to reduce investment advisory fees and reimburse other expenses to the extent necessary to limit total annual operating expenses (exclusive of brokerage costs; taxes; interest; costs to organize the Fund; acquired fund fees and expenses; and extraordinary expenses, such as litigation and merger or reorganization costs and other expenses not incurred in the ordinary course of the Fund’s business) to an amount not exceeding 1.00% of the Fund’s average daily net assets. Accordingly, during the year ended October 31, 2018, the Adviser reduced its advisory fees in the amount of $82,465.
Under the terms of the ELA, investment advisory fee reductions and expense reimbursements by the Adviser are subject to repayment by the Fund for a period of three years after such fees and expenses were incurred, provided the repayments do not cause total annual operating expenses to exceed (i) the expense limitation then in effect, if any, and (ii) the expense limitation in effect at the time the expenses to be repaid were incurred. As of October 31, 2018, the Adviser may seek recoupment of investment advisory fee reductions totaling $83,422 no later than the dates listed below:
October 31, 2020 | $ | 957 | ||
October 31, 2021 | $ | 82,465 |
OTHER SERVICE PROVIDERS
Ultimus Fund Solutions, LLC (“Ultimus”) provides administration, fund accounting, compliance and transfer agency services to the Fund. The Fund pays Ultimus fees in accordance with the agreements for such services. In addition, the Fund pays out-of-pocket expenses including, but not limited to, postage, supplies, and costs of pricing the Fund’s portfolio securities.
Under the terms of a Distribution Agreement with the Trust, Ultimus Fund Distributors, LLC (the “Distributor”) serves as the principal underwriter to the Fund. The Distributor is a wholly-owned subsidiary of Ultimus. The Distributor is compensated by the Adviser (not the Fund) for acting as principal underwriter.
Certain officers and a Trustee of the Trust are also officers of Ultimus and the Distributor.
21
MEEHAN FOCUS FUND |
TRUSTEE COMPENSATION
Effective August 1, 2018, each Trustee who is not an “interested person” of the Trust (“Independent Trustee”) receives a $1,300 annual retainer from each Fund, paid quarterly, except for the Board Chairperson who receives a $1,500 annual retainer from each Fund, paid quarterly. Each Independent Trustee also receives from each Fund a fee of $500 for each Board meeting attended plus reimbursement for travel and other meeting-related expenses. Prior to August 1, 2018, each Independent Trustee received a $1,000 annual retainer from each Fund, paid quarterly, except for the Board Chairperson who received a $1,200 annual retainer from each Fund, paid quarterly. Each Independent Trustee also received from each Fund a fee of $500 for each Board meeting attended plus reimbursement for travel and other meeting-related expenses.
PRINCIPAL HOLDERS OF FUND SHARES
As of October 31, 2018, the following shareholders owned of record 5% or more of the outstanding shares of the Fund:
Name of Record Owner | % Ownership |
Thomas P. Meehan and Marren W. Meehan | 24% |
CLRDS Employees 401k Plan | 6% |
Timothy C. Coughlin Revocable Trust | 5% |
5. Contingencies and Commitments
The Fund indemnifies the Trust’s officers and Trustees for certain liabilities that might arise from their performance of their duties to the Fund. Additionally, in the normal course of business the Fund enters into contracts that contain a variety of representations and warranties and which provide general indemnifications. The Fund’s maximum exposure under these arrangements is unknown, as this would involve future claims that may be made against the Fund that have not yet occurred. However, based on experience, the Trust expects the risk of loss to be remote.
6. Non-Diversification Risk
The Fund is a non-diversified Fund. As a result, the Fund’s holdings may be more concentrated in a limited number of securities and the value of its shares may be more sensitive than a diversified fund to any single economic, business, political, or regulatory occurrence.
7. Subsequent Events
The Fund is required to recognize in the financial statements the effects of all subsequent events that provide additional evidence about conditions that existed as of the date of the Statement of Assets and Liabilities. For non-recognized subsequent events that must be
22
MEEHAN FOCUS FUND |
disclosed to keep the financial statements from being misleading, the Fund is required to disclose the nature of the event as well as an estimate of its financial effect, or a statement that such an estimate cannot be made. Management has evaluated subsequent events through the issuance of these financial statements and has noted no such events except for the following:
The Fund will pay out an ordinary income dividend to shareholders of record of the Fund as of close of business on December 26, 2018. The amount of the ordinary income dividend is to be determined and paid on December 27, 2018.
23
MEEHAN FOCUS FUND
REPORT OF INDEPENDENT REGISTERED
PUBLIC ACCOUNTING FIRM
To the Shareholders of Meehan Focus Fund and
Board of Trustees of Ultimus Managers Trust
Opinion on the Financial Statements
We have audited the accompanying statement of assets and liabilities, including the schedule of investments, of Meehan Focus Fund (the “Fund”), a series of Ultimus Managers Trust, as of October 31, 2018, and the related statement of operations for the year then ended, the statements of changes in net assets for each of the two years in the period then ended, including the related notes, and the financial highlights for each of the five years in the period then ended (collectively referred to as the “financial statements”). In our opinion, the financial statements present fairly, in all material respects, the financial position of the Fund as of October 31, 2018, the results of its operations for the year then ended, the changes in its net assets for each of the two years in the period then ended, and the financial highlights for each of the five years in the period then ended, in conformity with accounting principles generally accepted in the United States of America.
Basis for Opinion
These financial statements are the responsibility of the Fund’s management. Our responsibility is to express an opinion on the Fund’s financial statements based on our audits. We are a public accounting firm registered with the Public Company Accounting Oversight Board (United States) (“PCAOB”) and are required to be independent with respect to the Fund in accordance with the U.S. federal securities laws and the applicable rules and regulations of the Securities and Exchange Commission and the PCAOB.
We conducted our audits in accordance with the standards of the PCAOB. Those standards require that we plan and perform the audit to obtain reasonable assurance about whether the financial statements are free of material misstatement, whether due to error or fraud.
Our audits included performing procedures to assess the risks of material misstatement of the financial statements, whether due to error or fraud, and performing procedures that respond to those risks. Such procedures included examining, on a test basis, evidence regarding the amounts and disclosures in the financial statements. Our procedures included confirmation of securities owned as of October 31, 2018, by correspondence with the custodian. Our audits also included evaluating the accounting principles used and significant estimates made by management, as well as evaluating the overall presentation of the financial statements. We believe that our audits provide a reasonable basis for our opinion.
We have served as the Fund’s auditor since 2010.

COHEN & COMPANY, LTD.
Cleveland, Ohio
December 20, 2018
24
MEEHAN FOCUS FUND |
We believe it is important for you to understand the impact of costs on your investment. As a shareholder of the Fund, you may incur two types of costs: (1) transaction costs, including redemption fees; and (2) ongoing costs, including management fees and other expenses. The following examples are intended to help you understand your ongoing costs (in dollars) of investing in the Fund and to compare these costs with the ongoing costs of investing in other mutual funds.
A mutual fund’s ongoing costs are expressed as a percentage of its average net assets. This figure is known as the expense ratio. The expenses in the table below are based on an investment of $1,000 made at the beginning of the most recent period (May 1, 2018) and held until the end of the period (October 31, 2018).
The table below illustrates the Fund’s ongoing costs in two ways:
Actual fund return – This section helps you to estimate the actual expenses that you paid over the period. The “Ending Account Value” shown is derived from the Fund’s actual return, and the third column shows the dollar amount of operating expenses that would have been paid by an investor who started with $1,000 in the Fund. You may use the information here, together with the amount you invested, to estimate the expenses that you paid over the period.
To do so, simply divide your account value by $1,000 (for example, an $8,600 account value divided by $1,000 = 8.6), then multiply the result by the number given for the Fund under the heading “Expenses Paid During Period.”
Hypothetical 5% return – This section is intended to help you compare the Fund’s ongoing costs with those of other mutual funds. It assumes that the Fund had an annual return of 5% before expenses during the period shown, but that the expense ratio is unchanged. In this case, because the return used is not the Fund’s actual return, the results do not apply to your investment. The example is useful in making comparisons because the SEC requires all mutual funds to calculate expenses based on a 5% return. You can assess the Fund’s ongoing costs by comparing this hypothetical example with the hypothetical examples that appear in shareholder reports of other funds.
Note that expenses shown in the table are meant to highlight and help you compare ongoing costs only. The Fund does not charge sales loads. However, a redemption fee of 2% is applied on the sale of shares of the Fund held for less than 7 calendar days.
The calculations assume no shares were bought or sold during the period. Your actual costs may have been higher or lower, depending on the amount of your investment and the timing of any purchases or redemptions.
More information about the Fund’s expenses, including historical annual expense ratios, can be found in this report. For additional information on operating expenses and other shareholder costs, please refer to the Fund’s prospectus.
25
MEEHAN FOCUS FUND |
| Beginning | Ending | Expenses |
Based on Actual Fund Return | $ 1,000.00 | $ 1,019.20 | $ 5.09 |
Based on Hypothetical 5% Return (before expenses) | $ 1,000.00 | $ 1,020.16 | $ 5.09 |
* | Expenses are equal to the Fund’s annualized net expense ratio of 1.00% for the period, multiplied by the average account value over the period, multiplied by 184/365 (to reflect the one-half year period). |
26
MEEHAN FOCUS FUND |
A description of the policies and procedures that the Fund uses to vote proxies relating to portfolio securities is available without charge upon request by calling toll-free 1-866-884-5968, or on the SEC’s website at http://www.sec.gov. Information regarding how the Fund voted proxies relating to portfolio securities during the most recent 12-month period ended June 30 is available without charge upon request by calling toll-free 1-866-884-5968, or on the SEC’s website at http://www.sec.gov.
The Trust files a complete listing of portfolio holdings for the Fund with the SEC as of the end of the first and third quarters of each fiscal year on Form N-Q. These filings are available upon request by calling 1-866-884-5968. Furthermore, you may obtain a copy of the filings on the SEC’s website at http://www.sec.gov.
FEDERAL TAX INFORMATION (Unaudited)
Qualified Dividend Income – The Fund designates 100% of its ordinary income dividends, or up to the maximum amount of such dividends allowable, as qualified dividend income pursuant to the Internal Revenue Code and the Jobs and Growth Tax Relief Reconciliation Act of 2003.
Dividends Received Deduction – Corporate shareholders are generally entitled to take the dividends received deduction on the portion of the Fund’s dividend distribution that qualifies under tax law. For the Fund’s fiscal year ended October 31, 2018, 100% of ordinary income dividends qualified for the corporate dividends received deduction.
27
MEEHAN FOCUS FUND |
The Board of Trustees has overall responsibility for management of the Trust’s affairs. The Trustees serve during the lifetime of the Trust and until its termination, or until death, resignation, retirement, or removal. The Trustees, in turn, elect the officers of the Trust to actively supervise its day-to-day operations. The officers have been elected for an annual term. Each Trustee’s and officer’s address is 225 Pictoria Drive, Suite 450, Cincinnati, Ohio 45246. The following are the Trustees and executive officers of the Trust:
Name and | Length | Position(s) | Principal Occupation(s) | Number | Directorships |
Interested Trustees: | |||||
Robert G. Dorsey* | Since February 2012 | Trustee | Managing Director (1999 to present), Co-CEO (April 2018 to present), and President (1999 to April 2018) of Ultimus Fund Solutions, LLC and its subsidiaries (except as otherwise noted for FINRA-regulated broker dealer entities) | 19 | Interested Trustee of Capitol Series Trust |
Independent Trustees: | |||||
Janine L. Cohen | Since January 2016 | Trustee | Retired since 2013; Chief Financial Officer from 2004 to 2013 and Chief Compliance Officer from 2008 to 2013 at AER Advisors, Inc. | 19 | None |
David M. Deptula | Since June 2012 | Trustee | Vice President of Legal and Special Projects at Dayton Freight Lines, Inc. since 2016; Vice President of Tax Treasury at Standard Register Inc. (formerly The Standard Register Company) from 2011 to 2016 | 19 | None |
28
MEEHAN FOCUS FUND |
Name and | Length | Position(s) | Principal Occupation(s) | Number | Directorships |
Independent Trustees (Continued): | |||||
John J. Discepoli | Since June 2012 | Chairman (May 2016 to present) | Owner of Discepoli Financial Planning, LLC (personal financial planning company) since 2004 | 19 | None |
* | Mr. Dorsey is considered an “interested person” of the Trust within the meaning of Section 2(a)(19) of the 1940 Act because of his relationship with the Trust’s administrator, transfer agent and distributor. |
Name and | Length | Position(s) | Principal Occupation(s) |
Executive Officers: | |||
David R. Carson | Since 2013 | Principal Executive Officer | Vice President and Director of Client Strategies of Ultimus Fund Solutions, LLC (2013 to present); President, Unified Series Trust (2016 to present); Chief Compliance Officer, FSI LBAR Fund (2013 to 2016), The Huntington Funds (2005 to 2013), Huntington Strategy Shares (2012 to 2013), and Huntington Asset Advisors (2013); Vice President, Huntington National Bank (2001 to 2013) |
Todd E. Heim | Since 2014 | Vice President | Vice President, Relationship Management Director of Ultimus Fund Solutions, LLC (2018 to present); Client Implementation Manager of Ultimus Fund Solutions, LLC (2014 to 2018); Naval Flight Officer of United States Navy (1989 to 2017); Business Project Manager of Vantiv, Inc. (2013 to 2014) |
29
MEEHAN FOCUS FUND |
Name and | Length | Position(s) | Principal Occupation(s) |
Executive Officers (Continued): | |||
Jennifer L. Leamer | Since 2014 | Treasurer | Vice President, Mutual Fund Controller of Ultimus Fund Solutions, LLC (2014 to present); Business Analyst of Ultimus Fund Solutions, LLC (2007 to 2014) |
Daniel D. Bauer | Since 2016 | Assistant Treasurer | Assistant Mutual Fund Controller (September 2015 to present) and Fund Accounting Manager (March 2012 to August 2015) of Ultimus Fund Solutions, LLC |
Matthew J. Beck | Since 2018 | Secretary | Senior Attorney of Ultimus Fund Solutions, LLC (2018 to present); General Counsel of The Nottingham Company (2014 to 2018) |
Natalie S. Anderson Year of Birth: 1975 | Since 2016 | Assistant Secretary | Legal Administration Manager (July 2016 to present) and Paralegal (January 2015 to June 2016) of Ultimus Fund Solutions, LLC; Senior Paralegal of Unirush, LLC (October 2011 to January 2015) |
Charles C. Black | Since 2015 | Chief Compliance Officer | Senior Compliance Officer of Ultimus Fund Solutions, LLC (2015 to present); Chief Compliance Officer of The Caldwell & Orkin Funds, Inc. (2016 to present); Senior Compliance Manager for Touchstone Mutual Funds (2013 to 2015); Senior Compliance Manager for Fund Evaluation Group (2011 to 2013) |
Additional information about members of the Board and executive officers is available in the Fund’s Statement of Additional Information (“SAI”). To obtain a free copy of the SAI, please call 1-866-884-5968.
30
MEEHAN FOCUS FUND |
The Board of Trustees (the “Board”), including the Independent Trustees voting separately, has reviewed and approved the Fund’s Investment Advisory Agreement with the Edgemoor Investment Advisors, Inc. (the “Adviser”) for an additional one-year term (the “Agreement”). The Board approved the Agreement at an in-person meeting held on October 22-23, 2018, at which all of the Trustees were present.
Legal counsel advised the Board during its deliberations. Additionally, the Board received and reviewed a substantial amount of information provided by the Adviser in response to requests of the Board and counsel. In deciding whether to approve the renewal of the Investment Advisory Agreement, the Board recalled its review of the materials related to the Fund and the Adviser throughout the preceding 24 months and its numerous discussions with Trust management and the Adviser about the operations and performance of the Fund during that period. The Board further considered those materials and discussions and numerous other factors, including:
The nature, extent, and quality of the services provided by the Adviser. In this regard, the Board reviewed the services being provided by the Adviser to the Fund including, without limitation, its investment advisory services since the Fund’s inception, the Adviser’s compliance policies and procedures, its efforts to promote the Fund and assist in its distribution, and its compliance program. After reviewing the foregoing information and further information in the Adviser Memorandum (e.g., descriptions of its business and Form ADV), the Board concluded that the quality, extent, and nature of the services provided by the Adviser were satisfactory and adequate for the Fund.
The investment performance of the Fund. In this regard, the Board compared the performance of the Fund with the performance of its benchmark index, custom peer group and related Morningstar category. The Board noted that while the Fund had outperformed its benchmark, the Standard & Poor’s 500 Total Return Stock Index, since inception, the Fund also had underperformed its custom peer group’s average performance for the one year period, matched its custom peer group’s median performance for the one year period, and underperformed its custom peer group’s average and median performance for the three-, five-, and ten-year periods and its Morningstar category’s (Large Cap Blend Category Under $100 million, True No-Load) median and average performance for the one-, three-, five-, and ten-year periods, the Adviser had satisfactorily explained its performance results for the Fund. The Board also considered the consistency of the Adviser’s management with the Fund’s investment objective and policies. Following discussion of the investment performance of the Fund and its performance relative to its Morningstar category, the Adviser’s experience in managing a mutual fund and separate accounts, its historical investment performance, and other factors, the Board concluded that the investment performance of the Fund has been satisfactory.
31
MEEHAN FOCUS FUND |
The costs of the services provided and profits realized by the Adviser and its affiliates from its relationship with the Fund. In this regard, the Board considered the Adviser’s staffing, personnel, and methods of operations; the education and experience of its personnel; compliance program, policies, and procedures; financial condition and the level of commitment to the Fund, and, generally, the Adviser’s advisory business; the asset level of the Fund; and the overall expenses of the Fund, including the advisory fee. The Board considered the Expense Limitation Agreement and considered the Adviser’s current and past fee reductions and expense reimbursements for the Fund. The Board further took into account the Adviser’s commitment to continue the Expense Limitation Agreement until at least March 1, 2020.
The Board also considered potential benefits for the Adviser in managing the Fund, including promotion of the Adviser’s name and the potential for it to receive research, statistical, or other services from the Fund’s trades. The Board compared the Fund’s advisory fee and overall expense ratio to the average advisory fees and average expense ratios for its custom peer group and Morningstar category. The Board noted that the 0.80% advisory fee for the Fund was under the average and the median for the Fund’s custom peer group, and above the average and median of funds of similar size and structure in the Fund’s Morningstar category (Large Cap Blend Category Under $100 million, True No-Load), but less than the highest advisor fee in its Morningstar category. The Board further noted that the overall annual expense ratio of 1.02% for the Fund is under the average and median for the Fund’s custom peer group, and under the average and over the median for its Morningstar category. The Board also considered the fee charged by the Adviser to its other accounts that have a substantially similar strategy as the Fund and considered the similarities and differences of services received by such other accounts as compared to the services received by the Fund. The Board noted that the fee structures applicable to the Adviser’s other clients were not indicative of any unreasonableness with respect to the advisory fees payable to the Fund. The Board further considered the investment strategy and style used by the Adviser in managing the portfolio of the Fund. Following these comparisons and upon further consideration and discussion of the foregoing, the Board concluded that the advisory fee paid to the Adviser by the Fund is fair and reasonable.
The extent to which economies of scale would be realized as the Fund grows and whether advisory fee levels reflect these economies of scale for the benefit of the Fund’s investors. In this regard, the Board considered that the Fund’s fee arrangements with the Adviser involve both the advisory fee and the Expense Limitation Agreement. The Board determined that while the advisory fee remained the same as asset levels increased, the shareholders of the Fund have experienced benefits from the Expense Limitation Agreement and will continue to experience benefits from the Expense Limitation Agreement until the Fund assets grow to a level where its expenses otherwise fall below the expense limit. Following further discussion of the Fund’s asset level, expectations for growth, and level of fees, the Board determined that the Fund’s fee arrangements with the Adviser would continue to provide benefits. The
32
MEEHAN FOCUS FUND |
Board also determined that the fee arrangements were fair and reasonable in relation to the nature and quality of services being provided by the Adviser, given the Fund’s projected asset levels for the next year.
Brokerage and portfolio transactions. In this regard, the Board considered the Adviser’s trading policies, procedures, and performance in seeking best execution for its clients, including the Fund. The Board also considered the historical portfolio turnover rate for the Fund; the process by which evaluations are made of the overall reasonableness of commissions paid; the process by which the Adviser evaluates best execution; the method and basis for selecting and evaluating the broker-dealers used; and any anticipated allocation of portfolio business to persons affiliated with the Adviser. After further review and discussion, the Board determined that the Adviser’s practices regarding brokerage and portfolio transactions were satisfactory.
Possible conflicts of interest. In evaluating the possibility for conflicts of interest, the Board considered such matters as the experience and abilities of the advisory personnel assigned to the Fund, the Adviser’s process for allocating trades among its different clients, and the substance and administration of the Adviser’s Code of Ethics. Following further consideration and discussion, the Board found that the Adviser’s standards and practices relating to the identification and mitigation of potential conflicts of interests were satisfactory.
After full consideration of the above factors as well as other factors, the Board unanimously concluded that approval of the renewal of the Agreement was in the best interests of the Fund and its shareholders. It was noted that in the Trustees’ deliberation regarding the approval of the renewal of the Investment Advisory Agreement, the Trustees did not identify any particular information or factor that was all-important or controlling, and that each individual Trustee may have attributed different weights to the various factors noted above.
33
| Item 2. | Code of Ethics. |
As of the end of the period covered by this report, the registrant has adopted a code of ethics that applies to the registrant’s principal executive officer, principal financial officer, principal accounting officer or controller, or persons performing similar functions, regardless of whether these individuals are employed by the registrant or a third party. Pursuant to Item 13(a)(1), a copy of registrant’s code of ethics is filed as an exhibit to this Form N-CSR. During the period covered by this report, the code of ethics has not been amended, and the registrant has not granted any waivers, including implicit waivers, from the provisions of the code of ethics.
| Item 3. | Audit Committee Financial Expert. |
The registrant’s board of trustees has determined that the registrant has at least one audit committee financial expert serving on its audit committee. The name of the audit committee financial expert is David M. Deptula. Mr. Deptula is “independent” for purposes of this Item.
| Item 4. | Principal Accountant Fees and Services. |
| (a) | Audit Fees. The aggregate fees billed for professional services rendered by the principal accountant for the audit of the registrant’s annual financial statements or for services that are normally provided by the accountant in connection with statutory and regulatory filings or engagements were $26,000 and $26,000 with respect to the registrant’s fiscal years ended October 31, 2018 and October 31, 2017, respectively. |
| (b) | Audit-Related Fees. No aggregate fees were billed for assurance and related services by the principal accountant, other than the services reported in paragraphs (a) and (c) that are reasonably related to the performance of the audit of the registrant’s financial statements and are not reported under paragraph (a) of this Item. The services comprising these fees are related to the review of the prospectus, semi-annual financial statements and periodic security counts, and attendance at audit committee meetings. |
| (c) | Tax Fees. The aggregate fees billed for professional services rendered by the principal accountant for tax compliance, tax advice, and tax planning were $6,000 and $5,500 with respect to the registrant’s fiscal years ended October 31, 2018 and October 31, 2017, respectively. The services comprising these fees relate to tax preparation of the registrant’s federal income and excise tax returns. | |
| (d) | All Other Fees. The aggregate fees billed in either of the last two fiscal years for other products and services provided by the principal accountant, other than the services reported in paragraphs (a) through (c) of this Item were $9,000 and $9,000 with respect to the fiscal years ended October 31, 2018 and October 31, 2017, respectively. |
| (e)(1) | The audit committee has not adopted pre-approval policies and procedures described in paragraph (c)(7) of Rule 2-01 of Regulation S-X. |
| (e)(2) | All of the services described in paragraph (b) through (d) of this Item were approved by the audit committee pursuant to paragraph (c)(7)(i)(C) of Rule 2-01 of Regulation S-X. |
| (f) | Less than 50% of hours expended on the principal accountant’s engagement to audit the registrant’s financial statements for the most recent fiscal year were attributed to work performed by persons other than the principal accountant’s full-time, permanent employees. |
| (g) | With respect to the fiscal years ended October 31, 2018 and October 31, 2017, aggregate non-audit fees of $15,000 and $14,500, respectively, were billed by the registrant’s accountant for services rendered to the registrant. No non-audit fees were billed by the registrant’s accountant for services rendered to the registrant’s investment adviser (not including any sub-adviser whose role is primarily portfolio management and is subcontracted with or overseen by another investment adviser), and any entity controlling, controlled by, or under common control with the adviser that provides ongoing services to the registrant. |
| (h) | The registrant’s Committee of Independent Trustees of the Board of Trustees determined that the provision of non-audit services that were rendered to the registrant’s investment adviser (not including any sub-adviser whose role is primarily portfolio management and is subcontracted with or overseen by another investment adviser), and any entity controlling, controlled by, or under common control with the investment adviser that provides ongoing services to the registrant that were pre-approved pursuant to paragraph (c)(7)(ii) of Rule 2-01 of Regulation S-X is compatible with maintaining the principal accountant’s independence. |
| Item 5. | Audit Committee of Listed Registrants. |
Not applicable
| Item 6. | Schedule of Investments. |
(a) Not applicable [schedule filed with Item 1]
(b) Not applicable
| Item 7. | Disclosure of Proxy Voting Policies and Procedures for Closed-End Management Investment Companies. |
Not applicable
| Item 8. | Portfolio Managers of Closed-End Management Investment Companies. |
Not applicable
| Item 9. | Purchases of Equity Securities by Closed-End Management Investment Company and Affiliated Purchasers. |
Not applicable
| Item 10. | Submission of Matters to a Vote of Security Holders. |
The registrant’s Committee of Independent Trustees shall review shareholder recommendations to fill vacancies on the registrant’s board of trustees if such recommendations are submitted in writing, addressed to the Committee at the registrant’s offices and meet any minimum qualifications adopted by the Committee. The Committee may adopt, by resolution, a policy regarding its procedures for considering candidates for the board of trustees, including any recommended by shareholders.
(a) Based on their evaluation of the registrant’s disclosure controls and procedures (as defined in Rule 30a-3(c) under the Investment Company Act of 1940) as of a date within 90 days of the filing date of this report, the registrant’s principal executive officer and principal financial officer have concluded that such disclosure controls and procedures are reasonably designed and are operating effectively to ensure that material information relating to the registrant, including its consolidated subsidiaries, is made known to them by others within those entities, particularly during the period in which this report is being prepared, and that the information required in filings on Form N-CSR is recorded, processed, summarized, and reported on a timely basis.
(b) There were no changes in the registrant’s internal control over financial reporting (as defined in Rule 30a-3(d) under the Investment Company Act of 1940) that occurred during the second fiscal quarter of the period covered by this report that have materially affected, or are reasonably likely to materially affect, the registrant’s internal control over financial reporting.
| Item 12. | Disclosure of Securities Lending Activities for Closed-End Management Investment Companies. |
Not applicable
| Item 13. | Exhibits. |
File the exhibits listed below as part of this Form. Letter or number the exhibits in the sequence indicated.
(a)(1) Any code of ethics, or amendment thereto, that is the subject of the disclosure required by Item 2, to the extent that the registrant intends to satisfy the Item 2 requirements through filing of an exhibit: Attached hereto
(a)(2) A separate certification for each principal executive officer and principal financial officer of the registrant as required by Rule 30a-2(a) under the Act (17 CFR 270.30a-2(a)): Attached hereto
(a)(3) Any written solicitation to purchase securities under Rule 23c-1 under the Act (17 CFR 270.23c-1) sent or given during the period covered by the report by or on behalf of the registrant to 10 or more persons: Not applicable
(a)(4) Change in the registrant’s independent public accountants: Not applicable
(b) Certifications required by Rule 30a-2(b) under the Act (17 CFR 270.30a-2(b)): Attached hereto
Exhibit 99.CODE ETH Code of Ethics
Exhibit 99.CERT Certifications required by Rule 30a-2(a) under the Act
Exhibit 99.906CERT Certifications required by Rule 30a-2(b) under the Act
SIGNATURES
Pursuant to the requirements of the Securities Exchange Act of 1934 and the Investment Company Act of 1940, the registrant has duly caused this report to be signed on its behalf by the undersigned, thereunto duly authorized.
| (Registrant) | Ultimus Managers Trust | ||
| By (Signature and Title)* | /s/ Matthew J. Beck | ||
| Matthew J. Beck, Secretary | |||
| Date | January 8, 2019 | ||
| Pursuant to the requirements of the Securities Exchange Act of 1934 and the Investment Company Act of 1940, this report has been signed below by the following persons on behalf of the registrant and in the capacities and on the dates indicated. | |||
| By (Signature and Title)* | /s/ David R. Carson | ||
| David R. Carson, Principal Executive Officer of Stralem Equity Fund and Meehan Focus Fund | |||
| Date | January 8, 2019 | ||
| By (Signature and Title)* | /s/ Jennifer L. Leamer | ||
| Jennifer L. Leamer, Treasurer and Principal Financial Officer | |||
| Date | January 8, 2019 | ||
| * | Print the name and title of each signing officer under his or her signature. |